Embed Size (px)
Citation preview
Memorandum
201~ IIAY 30 A~1 10: 13
DATE May 30, 2014 CITY OF DALLAS
TO Members of the Budget, Finance & Audit Committee: Jennifer S. Gates (Vice Chair) , Tennell Atkins, Sheffie Kadane, Philip T. Kingston
SUBJECT Budget, Finance & Audit Committee Meeting
Monday, June 2, 2014, 1 :00 p.m. Dallas City Hall- 6ES, 1500 Marilla St., Dallas, TX 75201
The agenda for the meeting is as follows:
1. Consideration of minutes from the May 19, 2014 Budget, Finance & Audit Committee meeting
2. Five Texas Cities- Budget Comparisons
3. Dallas Water Utilities Commercial Paper Program Selection of Service Providers
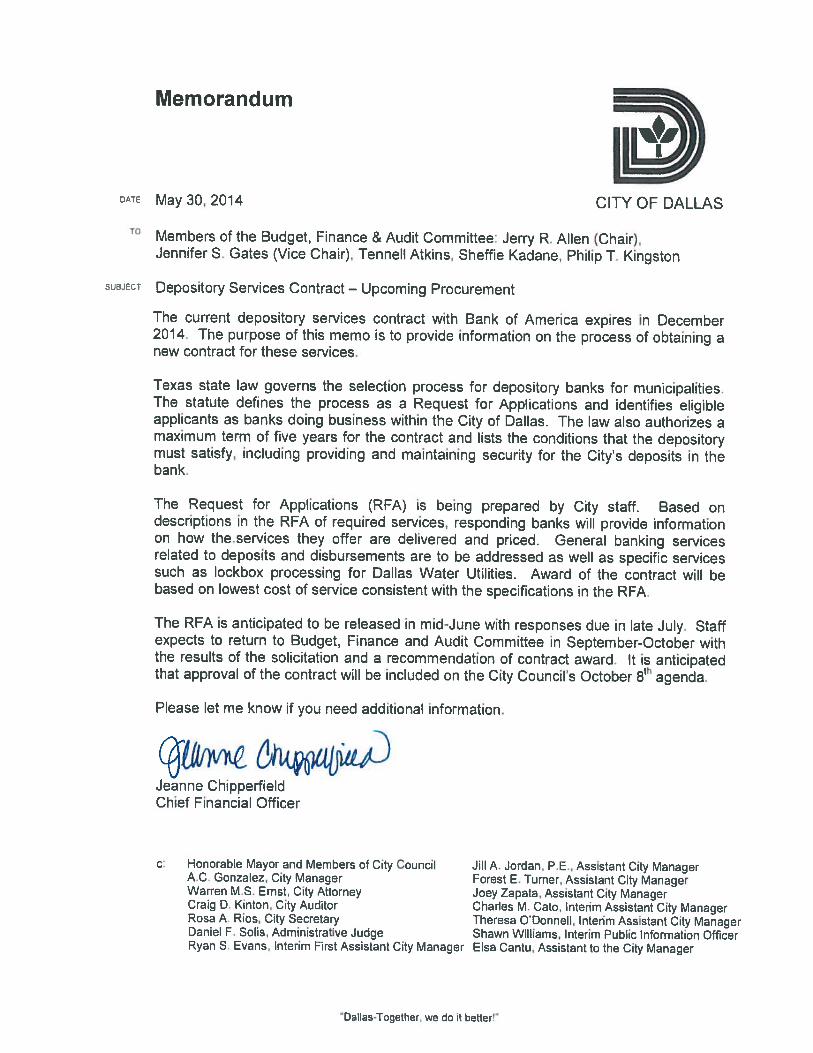
4. Depository Services ContractUpcoming Procurement
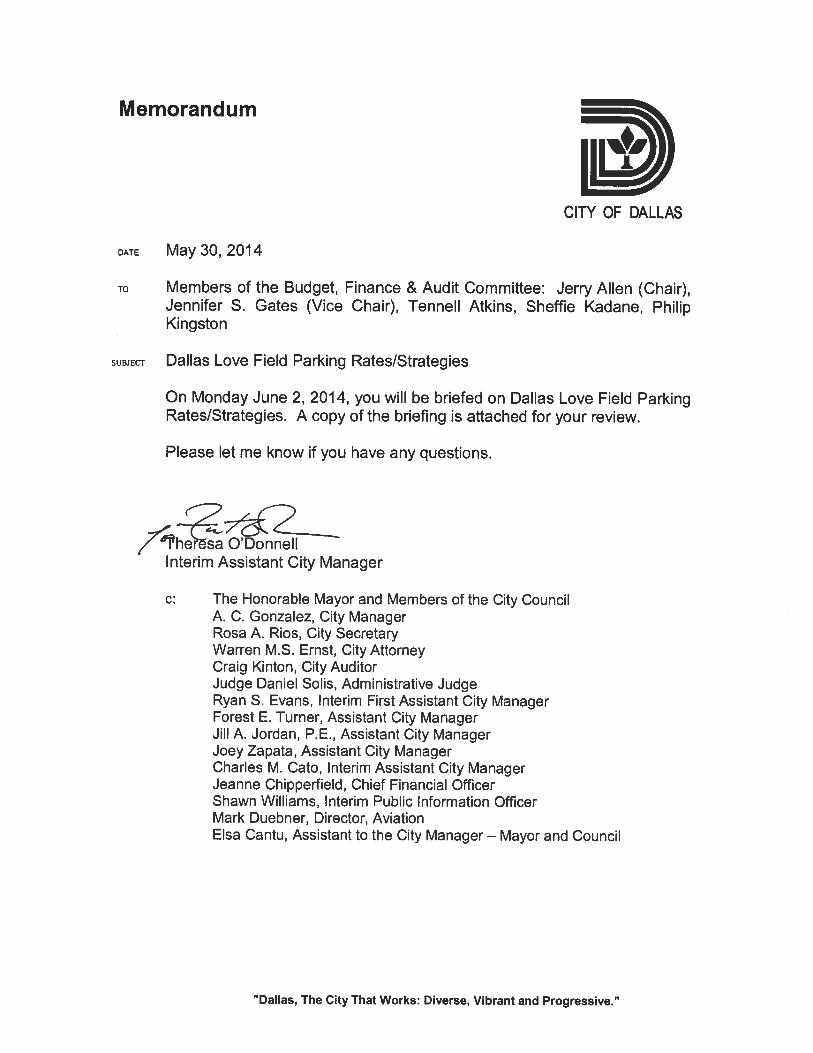
5. Dallas Love Field Parking Rates/ Strategies
6. Metro Dallas Homeless Alliance (MDHA)
Jack Ireland, Director Office of Financial Services
Corrine Steeger, Assistant Director City Controller's Office
Corrine Steeger, Assistant Director City Controller's Office
Mark Duebner, Director Aviation
Theresa O'Donnell Interim Assistant City Manager
Bernadette Mitchell, Interim Director Housing/Community Services
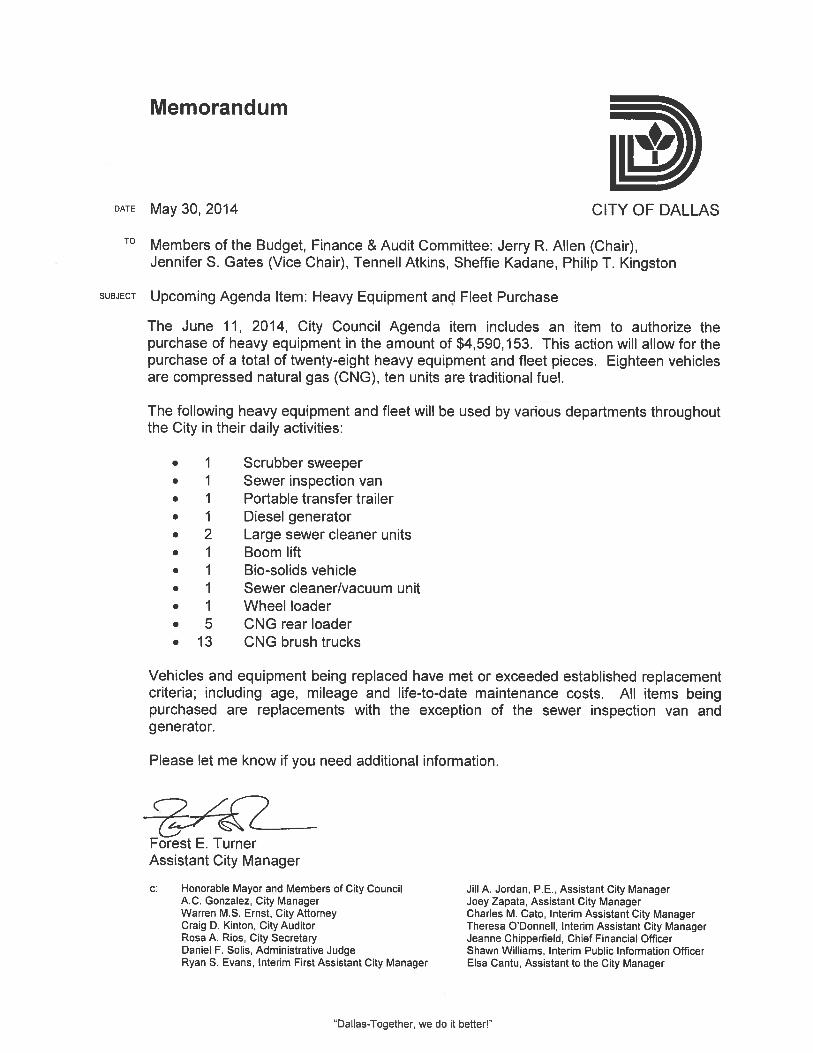
7. Upcoming Agenda Item: Heavy Equipment and Fleet Purchase
8. April 2014 Financial Forecast Report
J~~ Budget, Finance & Audit Committee
"Dallas-Together. we do it better!"
c: Honorable Mayor and Members of City Council A.C. Gonzalez, City Manager Warren M.S. Ernst, City Attorney Craig D. Kinton, City Auditor Rosa A. Rios, City Secretary Daniel F. Solis, Administrative Judge Ryan S. Evans, Interim First Assistant City Manager Jill A. Jordan, P.E., Assistant City Manager
Forest E. Turner, Assistant City Manager Joey Zapata, Assistant City Manager Charles M. Cato, Interim Assistant City Manager Theresa O'Donnell, Interim Assistant City Manager Jeanne Chipperfield, Chief Financial Officer Shawn Williams, Interim Public Information Officer Elsa Cantu, Assistant to the City Manager
A quorum of the Dallas City Council may attend this Council Committee meeting.
A closed executive session may be held if the discussion of any of the above agenda items concerns one of the following:
1. Contemplated or pending litigation or matters where legal advice is requested of the City Attorney. Section 551.071 of the Texas Open Meetings Act.
2. The purchase, exchange, lease or value of real property, if the deliberation in an open meeting would have a detrimental effect on the position of the City in negotiations with a third person. Section 551.072 of the Texas Open Meetings Act.
3. A contract for a prospective gift or donation to the City, if the deliberation in an open meeting would have a detrimental effect on the position of the City in negotiations with a third person. Section 551.073 of the Texas Open Meetings Act.
4. Personnel matters involving the appointment, employment, evaluation, reassignment, duties, discipline or dismissal of a public officer or employee or to hear a complaint against an officer or employee. Section 551.074 of the Texas Open Meetings Act.
5. The deployment, or specific occasions for implementation of security personnel or devices. Section 551 .076 of the Texas Open Meetings Act.
"Dallas-Together, we do it better!"
Budget, Finance & Audit Committee Meeting Record- DRAFT
Meeting Date: 5.19.2014 Convened: 1:05 p.m. Adjourned: 1:50 p.m.
Committee Members Present:
Jerry R. Allen, Chair Jennifer S. Gates, Vice-Chair Philip T. Kingston Sheffie Kadane Tennell Atkins Committee Members Absent: Other Council Members Present:
N/A N/A Staff Present: Jeanne Chipperfield Craig Kinton Renee Hayden Ade Williams Corrine Steeger Edward Scott Forest Turner Tony Aguilar Zeronda Smith Randall Hanks Andrew Merritt Don Knight Michael Frosch Donna Lowe Zachary Peoples William Finch Tommy Ludwig Ted Padgett Errick Thompson Filicia Hernandez Mark Duebner JS Walton Rowena Zhang Wanda Moreland Yasmin Barnes Dolores Lewis David Cossum Bryant Buechele Chad Michael Hainley Jennifer Wang Maria Munoz-Blanco Kenneth Cullins Margie Oliver Kelly High Warren Ernst Molly McCall Others Present: N/A AGENDA: 1. Approval of the May 5, 2014 Minutes
Presenter(s): Information Only: Action Taken/Committee Recommendation(s): A motion was made to approve the May 5, 2014 minutes. Motion passed unanimously.
Motion made by: Tennell Atkins Motion seconded by: Sheffie Kadane
2. Office of the City Auditor Fiscal Year 2014- Third Quarter Update Presenter(s): Craig D. Kinton, City Auditor
Information Only: Action Taken/Committee Recommendation(s):
Committee Chair requested a follow-up briefing on June 16, 2014.
Budget, Finance & Audit Committee Meeting Record- DRAFT
3. Upcoming Agenda Item: Global Positioning System for City Vehicles
Presenter(s): Kelly High, Director, Sanitation Services Errick Thompson, Director, Equipment and Building Services Information Only: ___ Action Taken/Committee Recommendation(s): A motion was made to forward to the City Council for consideration on Wednesday, May 28, 2014. Motion passed unanimously.
Motion made by: Tennell Atkins Motion seconded by: Sheffie Kadane
FYI 5. Quarterly Investment Report as of March 31, 2014
Presenter(s): Information Only: X Action Taken/Committee Recommendation(s): N/A
__________________________________
Jerry R. Allen, Chair Budget, Finance & Audit Committee
Five Texas Cities- Budget Comparisons Budget, Finance, & Audit Committee
June 2, 2014
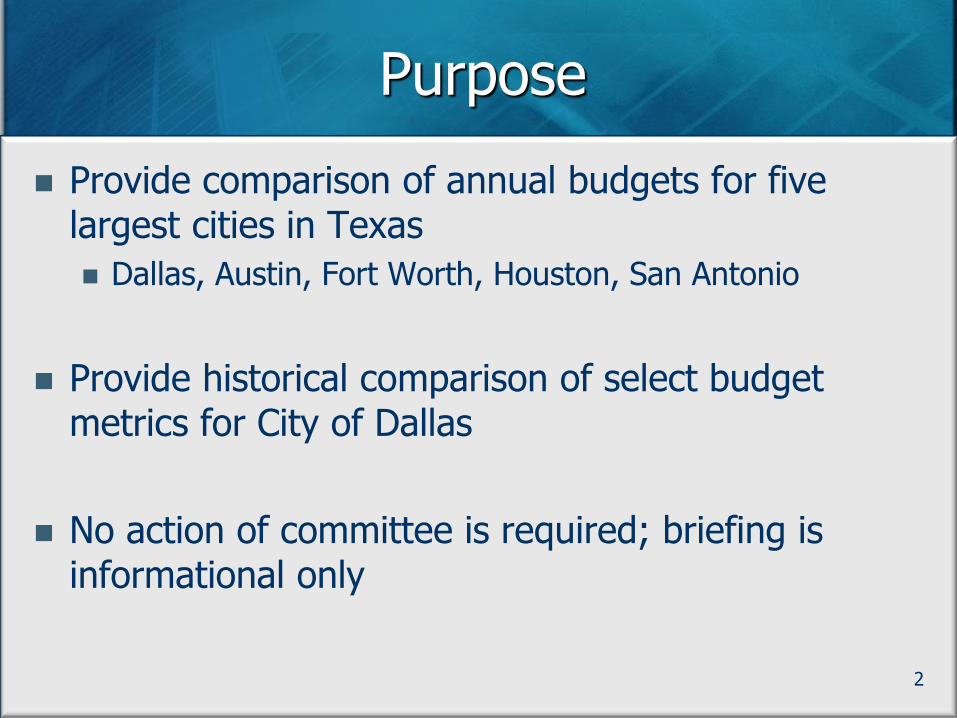
Purpose
Provide comparison of annual budgets for five largest cities in Texas
Dallas, Austin, Fort Worth, Houston, San Antonio
Provide historical comparison of select budget metrics for City of Dallas
No action of committee is required; briefing is informational only
2
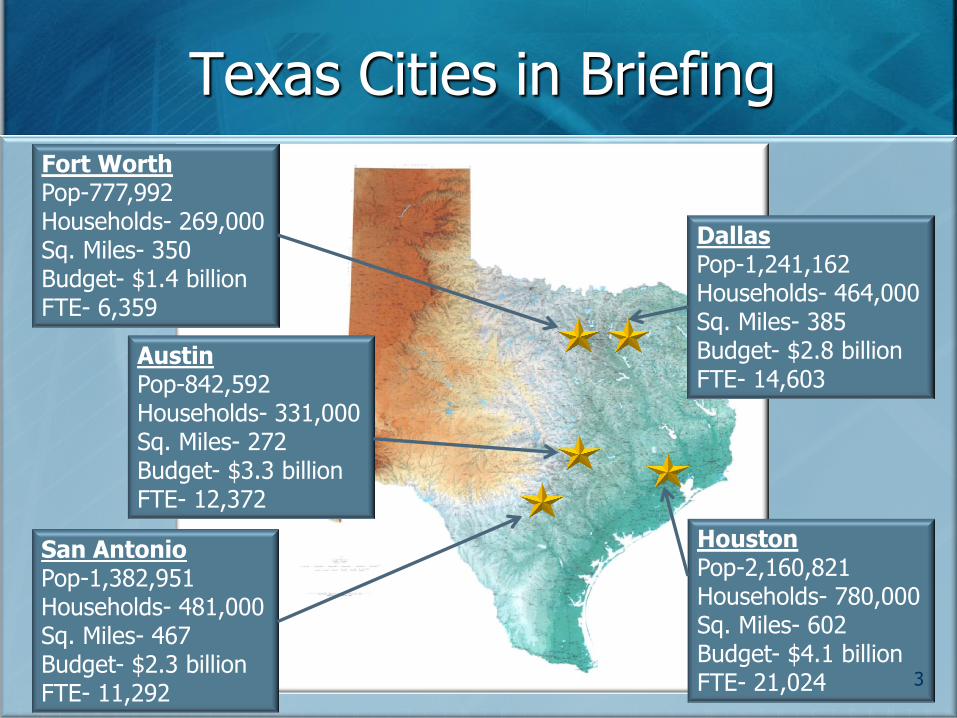
Texas Cities in Briefing
Fort Worth Pop-777,992 Households- 269,000 Sq. Miles- 350 Budget- $1.4 billion FTE- 6,359
San Antonio Pop-1,382,951 Households- 481,000 Sq. Miles- 467 Budget- $2.3 billion FTE- 11,292
Houston Pop-2,160,821 Households- 780,000 Sq. Miles- 602 Budget- $4.1 billion FTE- 21,024
Austin Pop-842,592 Households- 331,000 Sq. Miles- 272 Budget- $3.3 billion FTE- 12,372
Dallas Pop-1,241,162 Households- 464,000 Sq. Miles- 385 Budget- $2.8 billion FTE- 14,603
3
Overview
Comparison of budgets (even at a high-level) for other cities is difficult since every city categorizes budget items differently
Budgets for other four cities have been adjusted to match Dallas’ general fund budget as much as possible:
For example, in Austin, San Antonio, and Fort Worth sanitation services are provided as an enterprise fund not part of general fund
Fort Worth has a ½ percent Crime Control District sales tax; those revenues have been added to its “Other Revenues” and expenses added to the Police Department
Still not an exact apples-to-apples comparison
4
Overview and Observations
Property tax bill is much more than tax rate; and includes value, exemptions, and rate
Dallas homestead and over-65/disabled exemptions benefit home owners yet reduces revenue for City
Sales tax dedicated to transit supports DART yet reduces revenue for City
Transfers from City-owned electric/gas utilities (Austin/San Antonio) and other non-tax revenues (dedicated sales taxes/Transportation User Fees) reduce reliance on property tax
5
Overview and Observations
Dallas ranks below the average and 4th out of 5 for general fund expenditures per capita
Dallas is tied for highest percentage of budget devoted to police and fire services at 58%
Dallas’ debt service tax rate has fallen by 10.5% since FY11
6
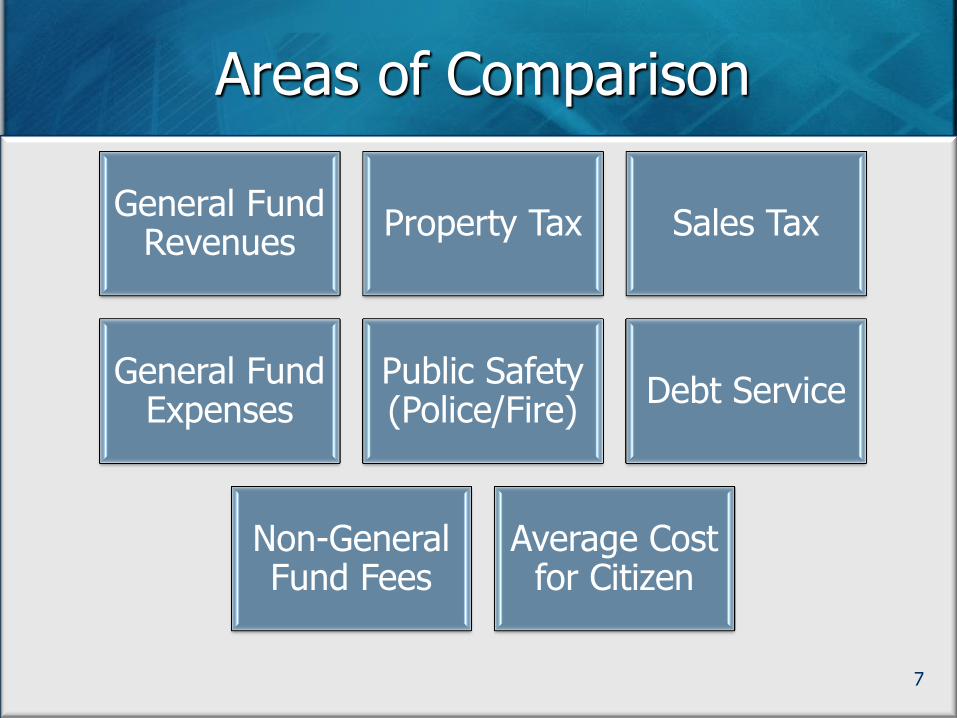
Areas of Comparison
General Fund Revenues
Property Tax Sales Tax
General Fund Expenses
Public Safety (Police/Fire)
Debt Service
Non-General Fund Fees
Average Cost for Citizen
7
General Fund Revenues
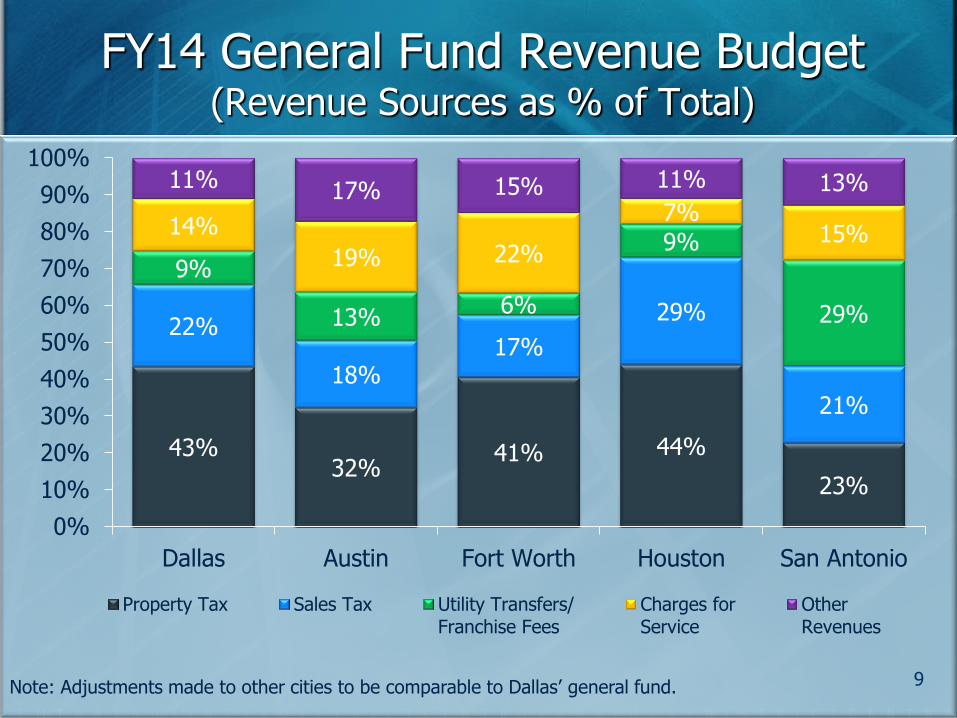
FY14 General Fund Revenue Budget (Revenue Sources as % of Total)
43% 32%
41% 44%
23%
22%
18% 17%
29%
21%
9%
13% 6%
9%
29%
14%
19% 22%
7% 15%
11% 17% 15% 11% 13%
0%
10%
20%
30%
40%
50%
60%
70%
80%
90%
100%
Dallas Austin Fort Worth Houston San Antonio
Property Tax Sales Tax Utility Transfers/Franchise Fees
Charges forService
OtherRevenues
Note: Adjustments made to other cities to be comparable to Dallas’ general fund. 9
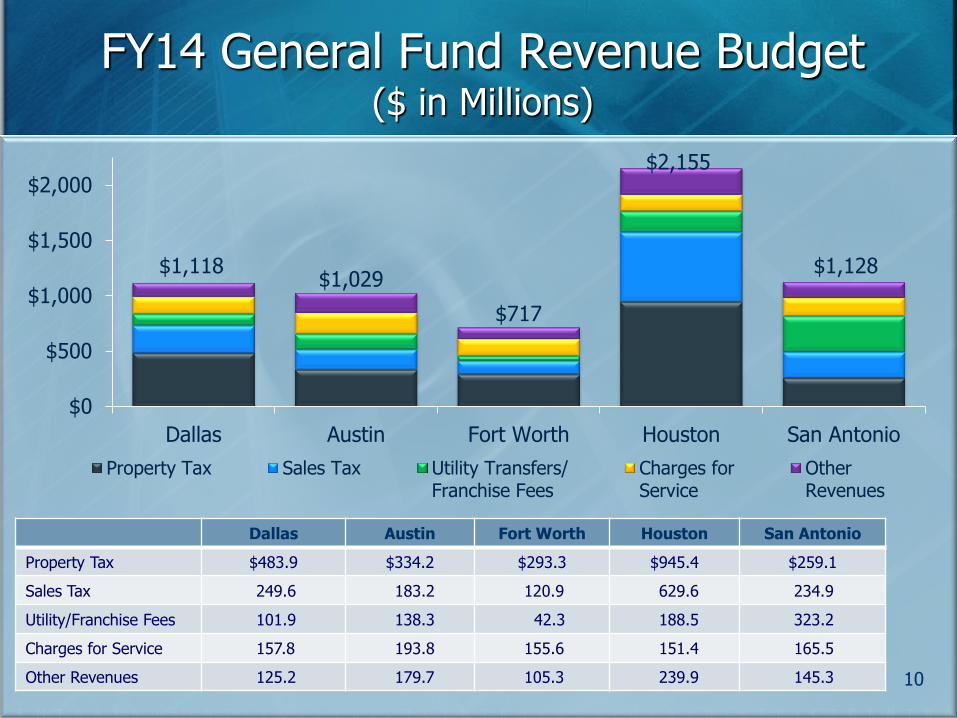
FY14 General Fund Revenue Budget ($ in Millions)
$0
$500
$1,000
$1,500
$2,000
Dallas Austin Fort Worth Houston San Antonio
Property Tax Sales Tax Utility Transfers/Franchise Fees
Charges forService
OtherRevenues
$1,029
$717
$2,155
$1,128 $1,118
Dallas Austin Fort Worth Houston San Antonio
Property Tax $483.9 $334.2 $293.3 $945.4 $259.1
Sales Tax 249.6 183.2 120.9 629.6 234.9
Utility/Franchise Fees 101.9 138.3 42.3 188.5 323.2
Charges for Service 157.8 193.8 155.6 151.4 165.5
Other Revenues 125.2 179.7 105.3 239.9 145.3 10
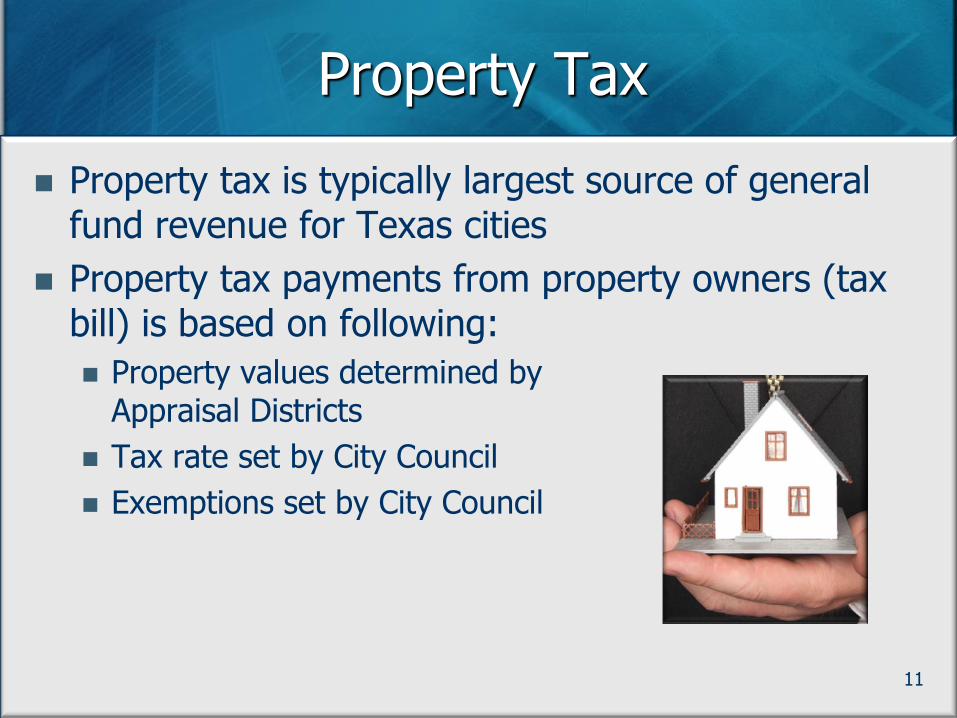
Property Tax
Property tax is typically largest source of general fund revenue for Texas cities
Property tax payments from property owners (tax bill) is based on following:
Property values determined by Appraisal Districts
Tax rate set by City Council
Exemptions set by City Council
11
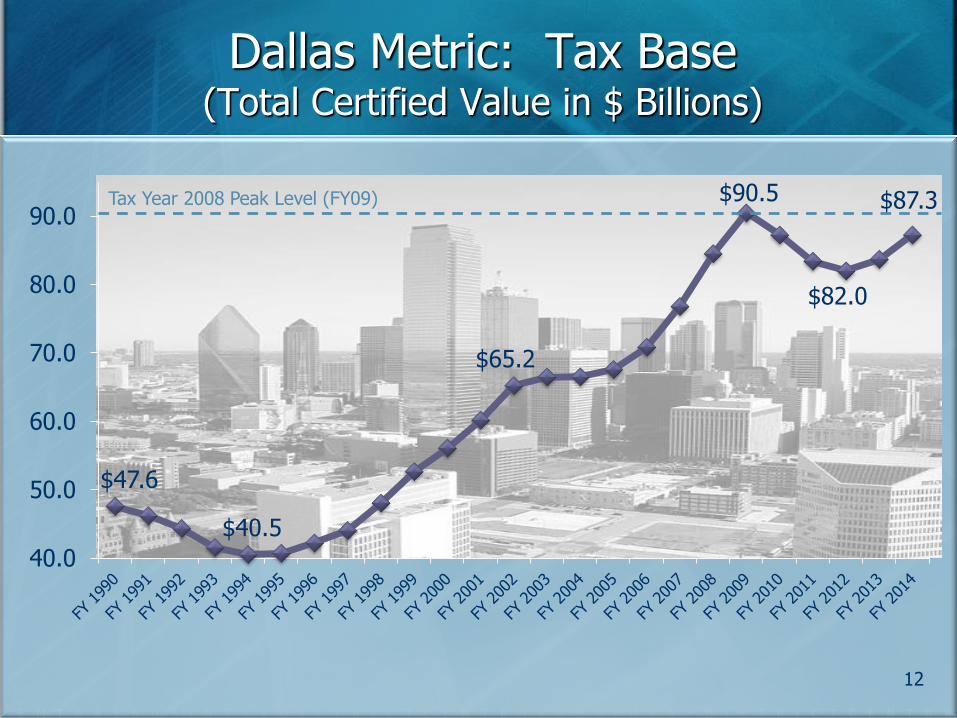
$47.6
$40.5
$65.2
$90.5
$82.0
$87.3
40.0
50.0
60.0
70.0
80.0
90.0
Dallas Metric: Tax Base (Total Certified Value in $ Billions)
12
Tax Year 2008 Peak Level (FY09)
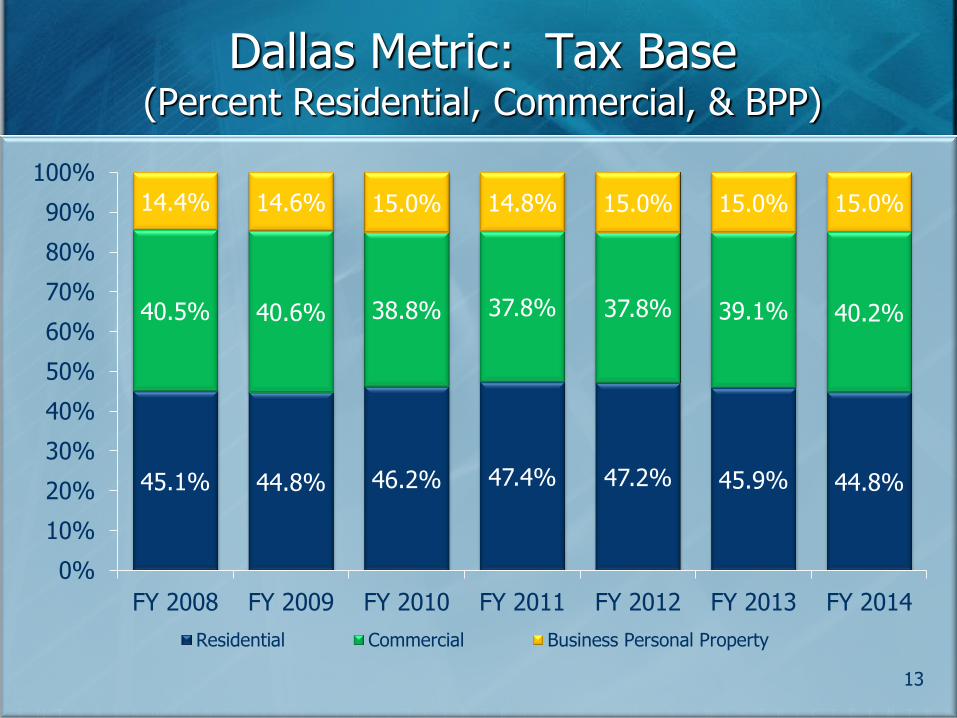
Dallas Metric: Tax Base (Percent Residential, Commercial, & BPP)
13
45.1% 44.8% 46.2% 47.4% 47.2% 45.9% 44.8%
40.5% 40.6% 38.8% 37.8% 37.8% 39.1% 40.2%
14.4% 14.6% 15.0% 14.8% 15.0% 15.0% 15.0%
0%
10%
20%
30%
40%
50%
60%
70%
80%
90%
100%
FY 2008 FY 2009 FY 2010 FY 2011 FY 2012 FY 2013 FY 2014
Residential Commercial Business Personal Property
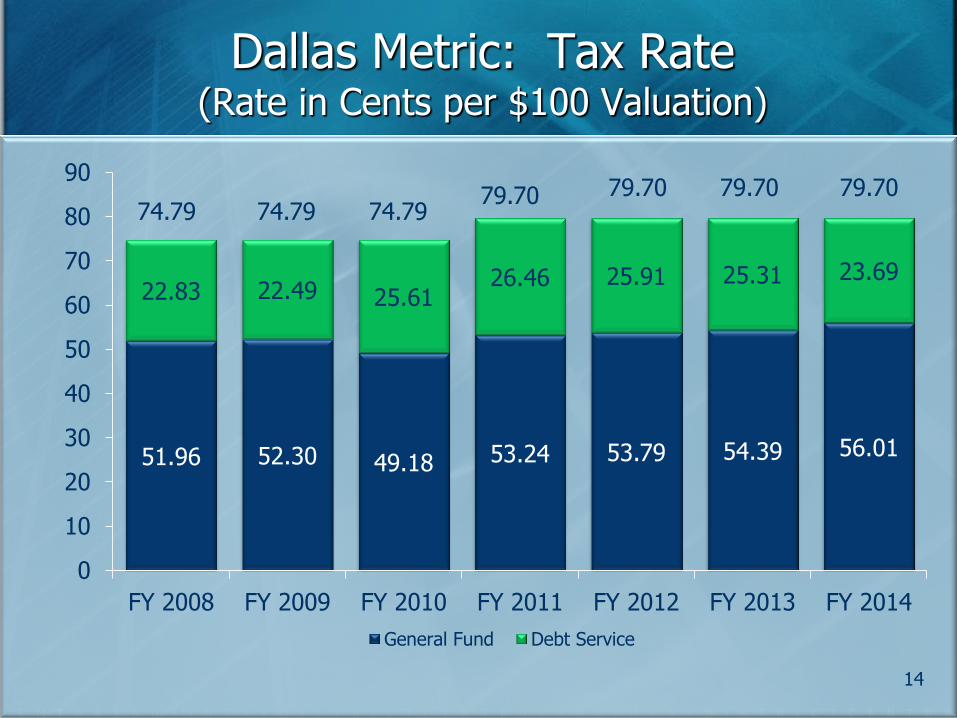
51.96 52.30 49.18 53.24 53.79 54.39 56.01
22.83 22.49 25.61 26.46 25.91 25.31 23.69
0
10
20
30
40
50
60
70
80
90
FY 2008 FY 2009 FY 2010 FY 2011 FY 2012 FY 2013 FY 2014
General Fund Debt Service
Dallas Metric: Tax Rate (Rate in Cents per $100 Valuation)
14
74.79 74.79 74.79 79.70 79.70 79.70 79.70
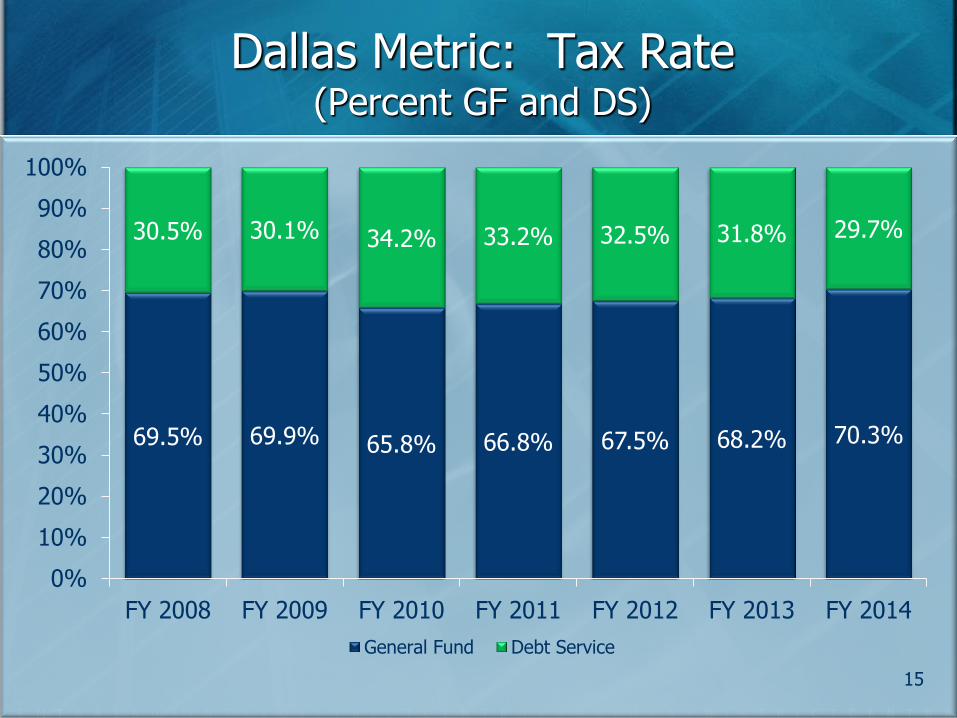
Dallas Metric: Tax Rate (Percent GF and DS)
15
69.5% 69.9% 65.8% 66.8% 67.5% 68.2% 70.3%
30.5% 30.1% 34.2% 33.2% 32.5% 31.8% 29.7%
0%
10%
20%
30%
40%
50%
60%
70%
80%
90%
100%
FY 2008 FY 2009 FY 2010 FY 2011 FY 2012 FY 2013 FY 2014
General Fund Debt Service
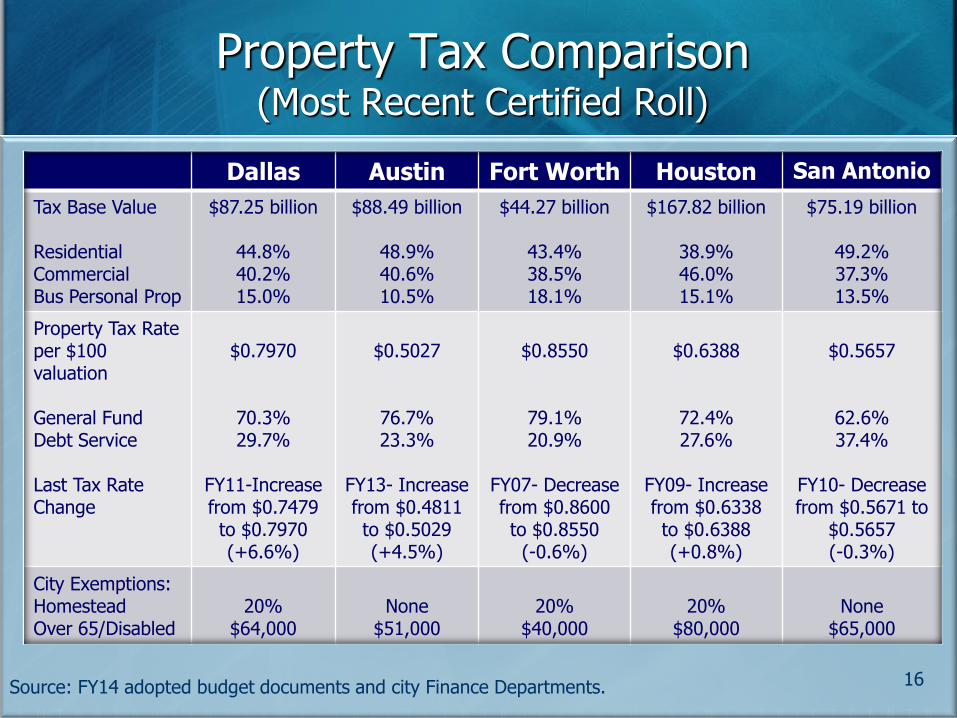
Property Tax Comparison (Most Recent Certified Roll)
Dallas Austin Fort Worth Houston San Antonio
Tax Base Value Residential Commercial Bus Personal Prop
$87.25 billion
44.8% 40.2% 15.0%
$88.49 billion
48.9% 40.6% 10.5%
$44.27 billion
43.4% 38.5% 18.1%
$167.82 billion
38.9% 46.0% 15.1%
$75.19 billion
49.2% 37.3% 13.5%
Property Tax Rate per $100 valuation General Fund Debt Service Last Tax Rate Change
$0.7970
70.3% 29.7%
FY11-Increase from $0.7479 to $0.7970 (+6.6%)
$0.5027
76.7% 23.3%
FY13- Increase from $0.4811 to $0.5029 (+4.5%)
$0.8550
79.1% 20.9%
FY07- Decrease from $0.8600 to $0.8550
(-0.6%)
$0.6388
72.4% 27.6%
FY09- Increase from $0.6338 to $0.6388 (+0.8%)
$0.5657
62.6% 37.4%
FY10- Decrease from $0.5671 to
$0.5657 (-0.3%)
City Exemptions: Homestead Over 65/Disabled
20%
$64,000
None
$51,000
20%
$40,000
20%
$80,000
None
$65,000
Source: FY14 adopted budget documents and city Finance Departments. 16
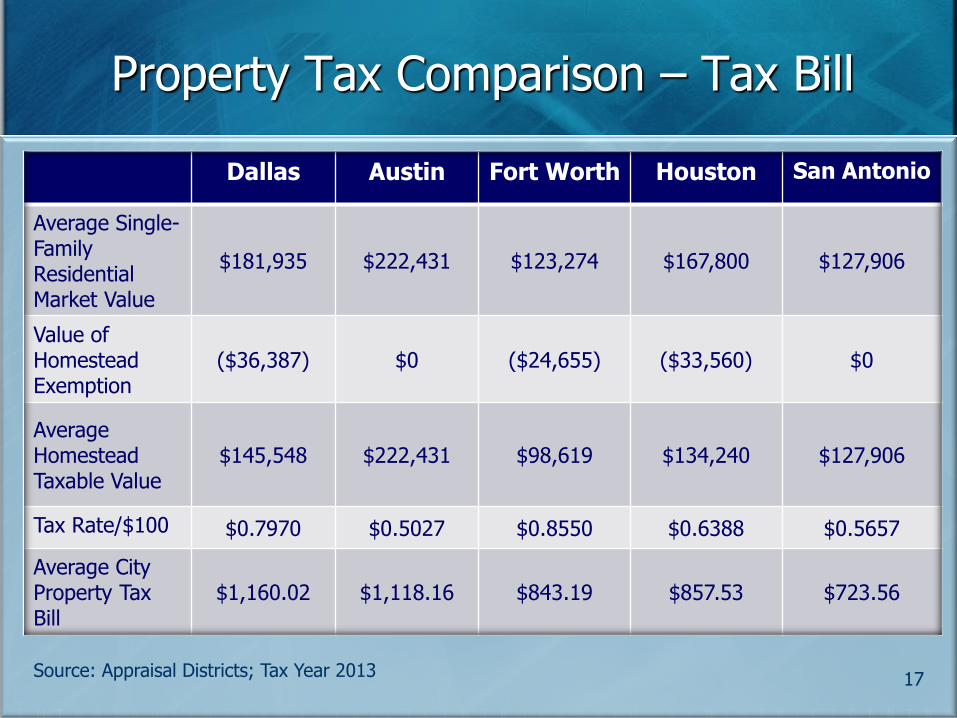
Property Tax Comparison – Tax Bill
Dallas Austin Fort Worth Houston San Antonio
Average Single-Family Residential Market Value
$181,935 $222,431 $123,274 $167,800 $127,906
Value of Homestead Exemption
($36,387) $0 ($24,655) ($33,560) $0
Average Homestead Taxable Value
$145,548 $222,431 $98,619 $134,240 $127,906
Tax Rate/$100 $0.7970 $0.5027 $0.8550 $0.6388 $0.5657
Average City Property Tax Bill
$1,160.02 $1,118.16 $843.19 $857.53 $723.56
Source: Appraisal Districts; Tax Year 2013 17
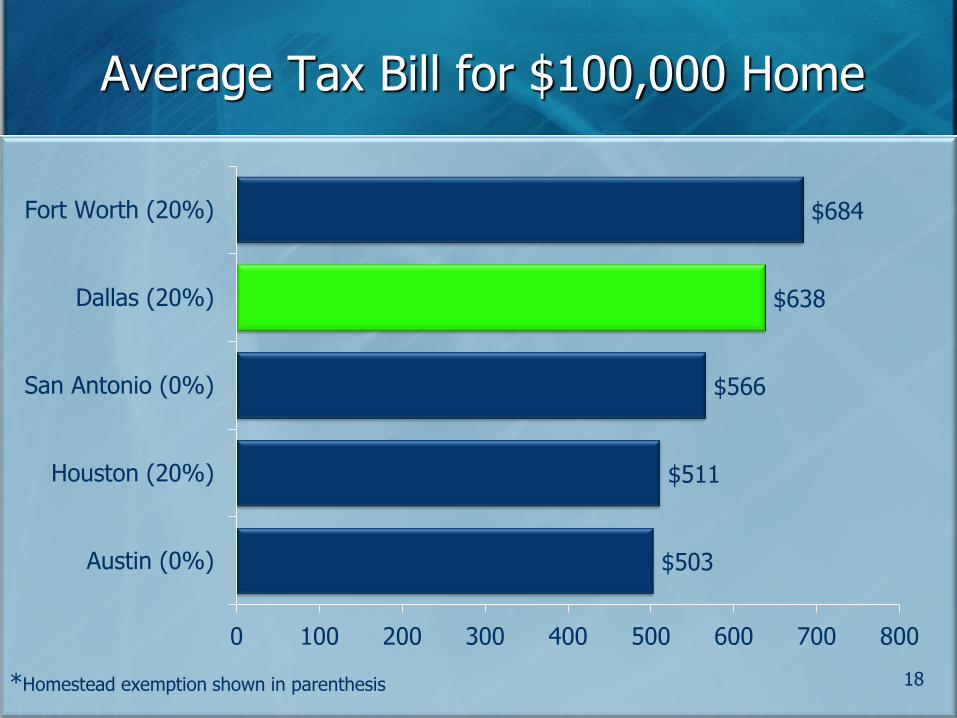
Average Tax Bill for $100,000 Home
$503
$511
$566
$638
$684
0 100 200 300 400 500 600 700 800
Austin (0%)
Houston (20%)
San Antonio (0%)
Dallas (20%)
Fort Worth (20%)
*Homestead exemption shown in parenthesis 18
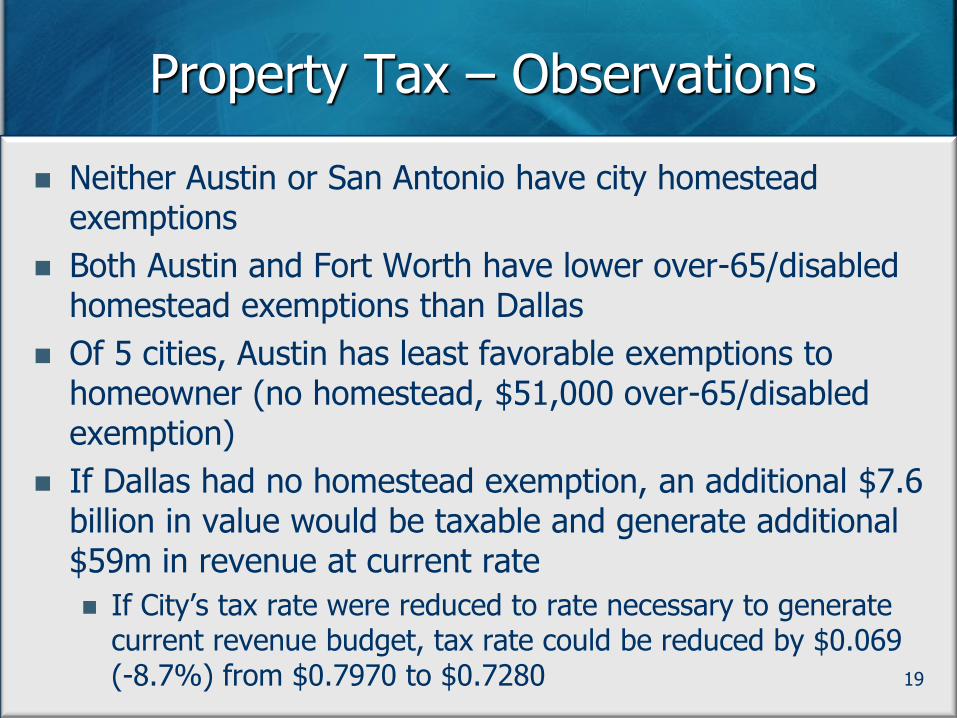
Property Tax – Observations
Neither Austin or San Antonio have city homestead exemptions
Both Austin and Fort Worth have lower over-65/disabled homestead exemptions than Dallas
Of 5 cities, Austin has least favorable exemptions to homeowner (no homestead, $51,000 over-65/disabled exemption)
If Dallas had no homestead exemption, an additional $7.6 billion in value would be taxable and generate additional $59m in revenue at current rate
If City’s tax rate were reduced to rate necessary to generate current revenue budget, tax rate could be reduced by $0.069 (-8.7%) from $0.7970 to $0.7280
19
Sales Tax
Sales tax is also major revenue source for Texas cities
Sales tax is more volatile and is reflective of health of local economy
Typically declines and recovers faster than property tax base
State law caps total sales tax rate at 8.25%
6.25% retained by State
2.00% for local entities (cities, transit authorities)
20
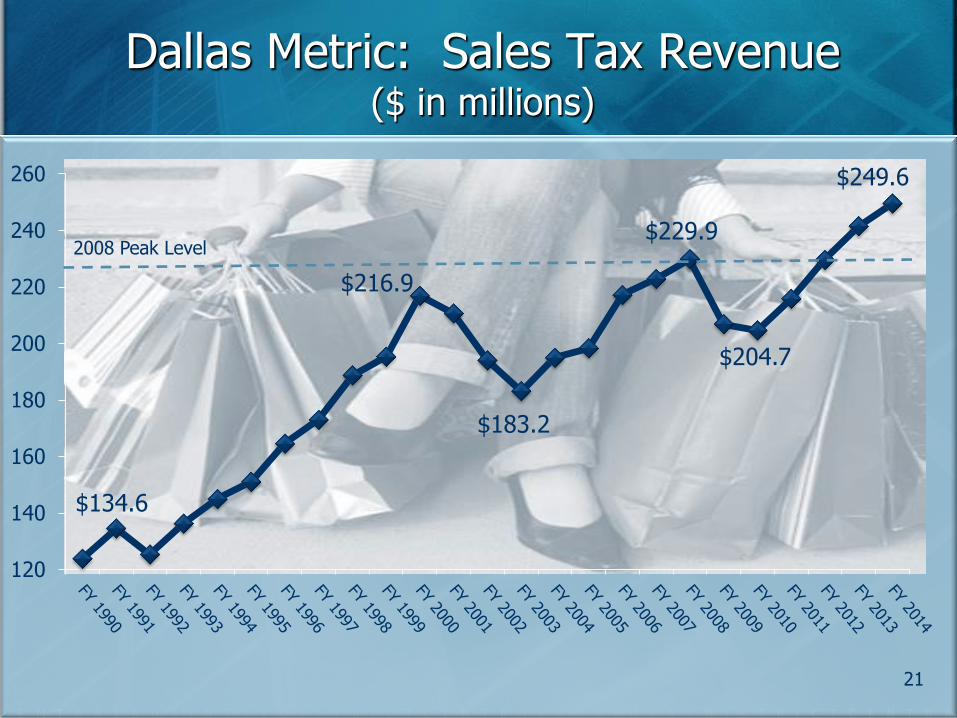
$134.6
$216.9
$183.2
$229.9
$204.7
$249.6
120
140
160
180
200
220
240
260
Dallas Metric: Sales Tax Revenue ($ in millions)
21
2008 Peak Level
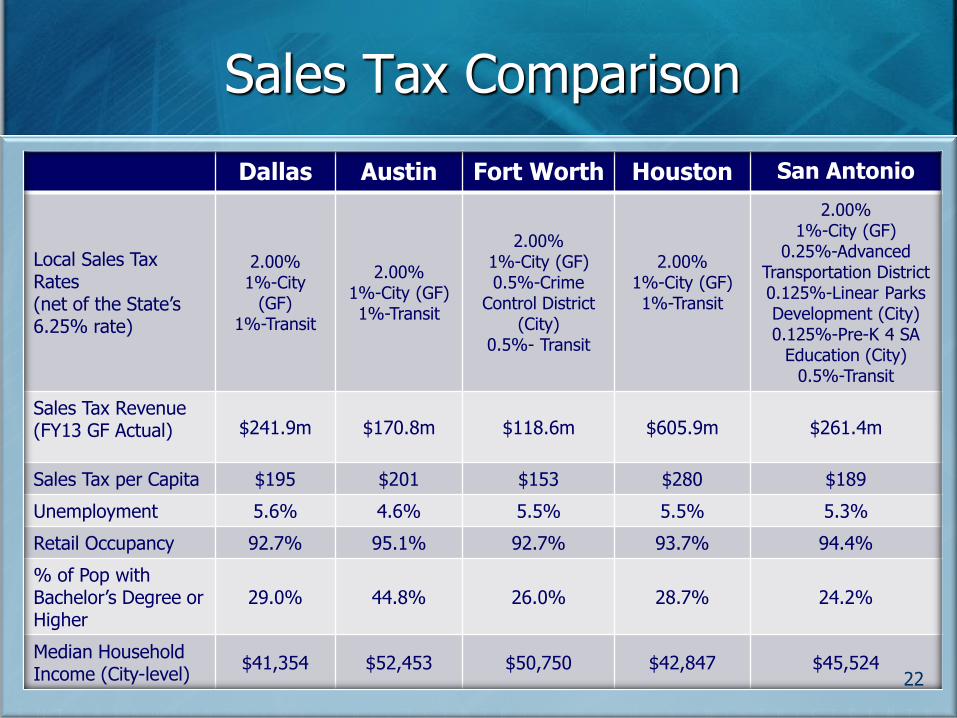
Sales Tax Comparison
Dallas Austin Fort Worth Houston San Antonio
Local Sales Tax Rates (net of the State’s 6.25% rate)
2.00% 1%-City
(GF) 1%-Transit
2.00% 1%-City (GF) 1%-Transit
2.00% 1%-City (GF) 0.5%-Crime
Control District (City)
0.5%- Transit
2.00% 1%-City (GF) 1%-Transit
2.00% 1%-City (GF)
0.25%-Advanced Transportation District 0.125%-Linear Parks Development (City) 0.125%-Pre-K 4 SA
Education (City) 0.5%-Transit
Sales Tax Revenue (FY13 GF Actual) $241.9m $170.8m $118.6m $605.9m $261.4m
Sales Tax per Capita $195 $201 $153 $280 $189
Unemployment 5.6% 4.6% 5.5% 5.5% 5.3%
Retail Occupancy 92.7% 95.1% 92.7% 93.7% 94.4%
% of Pop with Bachelor’s Degree or Higher
29.0% 44.8% 26.0% 28.7% 24.2%
Median Household Income (City-level)
$41,354 $52,453 $50,750 $42,847 $45,524 22
Sales Tax – Observations
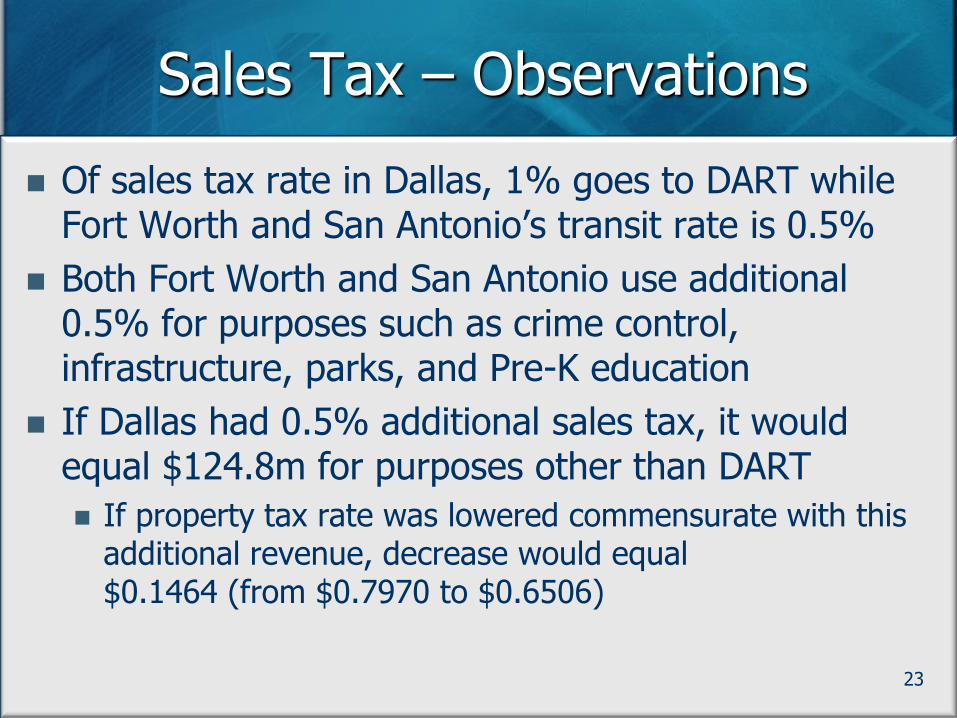
Of sales tax rate in Dallas, 1% goes to DART while Fort Worth and San Antonio’s transit rate is 0.5%
Both Fort Worth and San Antonio use additional 0.5% for purposes such as crime control, infrastructure, parks, and Pre-K education
If Dallas had 0.5% additional sales tax, it would equal $124.8m for purposes other than DART
If property tax rate was lowered commensurate with this additional revenue, decrease would equal $0.1464 (from $0.7970 to $0.6506)
23
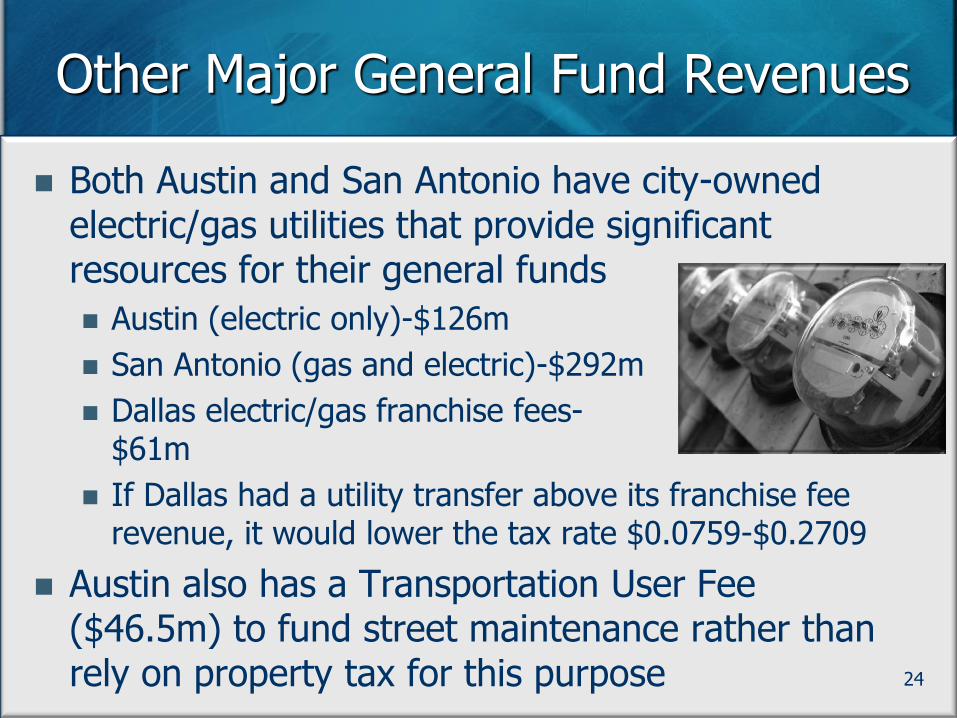
Other Major General Fund Revenues
Both Austin and San Antonio have city-owned electric/gas utilities that provide significant resources for their general funds
Austin (electric only)-$126m
San Antonio (gas and electric)-$292m
Dallas electric/gas franchise fees- $61m
If Dallas had a utility transfer above its franchise fee revenue, it would lower the tax rate $0.0759-$0.2709
Austin also has a Transportation User Fee ($46.5m) to fund street maintenance rather than rely on property tax for this purpose 24
General Fund Expenditures
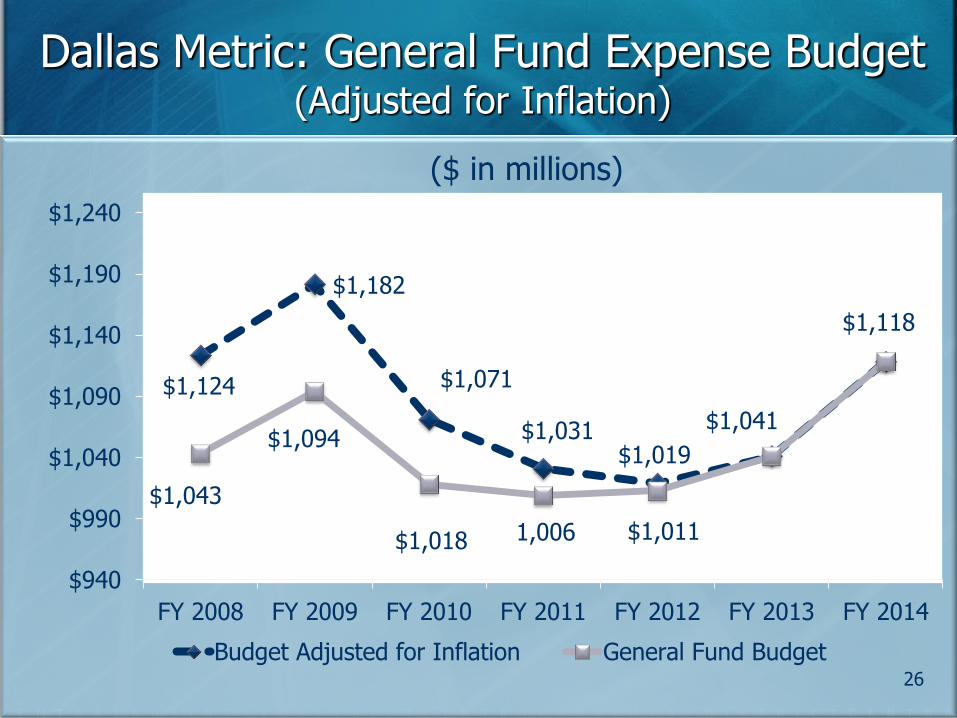
$1,124
$1,182
$1,071
$1,031 $1,019
$1,041
$1,118
$1,043
$1,094
$1,018 1,006 $1,011
$940
$990
$1,040
$1,090
$1,140
$1,190
$1,240
FY 2008 FY 2009 FY 2010 FY 2011 FY 2012 FY 2013 FY 2014
Budget Adjusted for Inflation General Fund Budget
Dallas Metric: General Fund Expense Budget (Adjusted for Inflation)
26
($ in millions)
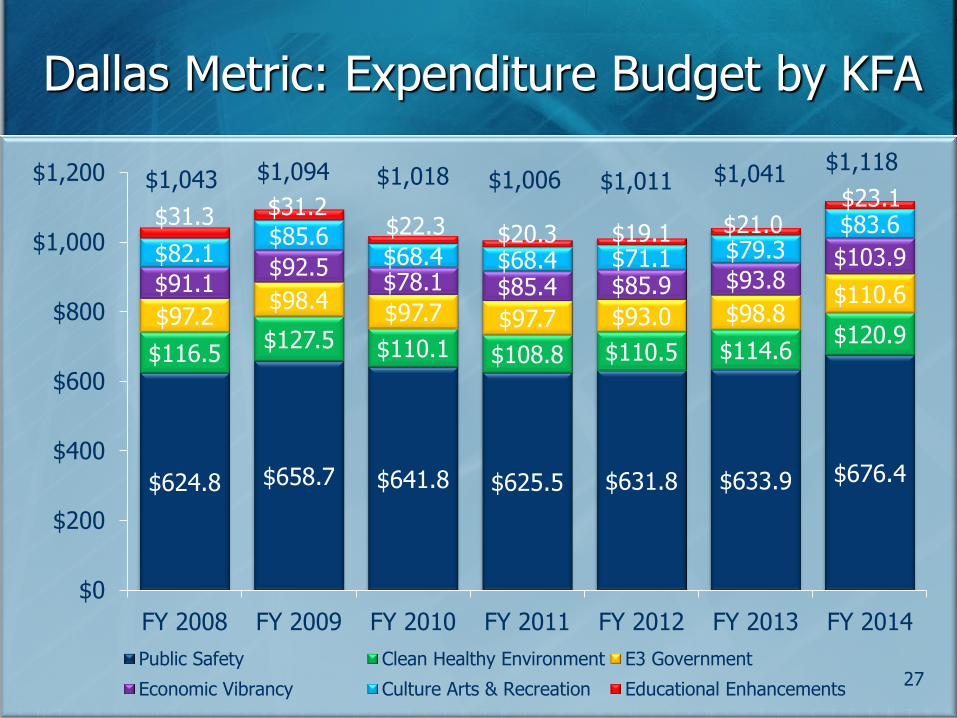
Dallas Metric: Expenditure Budget by KFA
27
$624.8 $658.7 $641.8 $625.5 $631.8 $633.9 $676.4
$116.5 $127.5 $110.1 $108.8 $110.5 $114.6
$120.9 $97.2
$98.4 $97.7 $97.7 $93.0 $98.8
$110.6 $91.1 $92.5
$78.1 $85.4 $85.9 $93.8 $103.9 $82.1
$85.6 $68.4 $68.4 $71.1 $79.3
$83.6 $31.3 $31.2 $22.3 $20.3 $19.1 $21.0
$23.1
$0
$200
$400
$600
$800
$1,000
$1,200
FY 2008 FY 2009 FY 2010 FY 2011 FY 2012 FY 2013 FY 2014
Public Safety Clean Healthy Environment E3 Government
Economic Vibrancy Culture Arts & Recreation Educational Enhancements
$1,094 $1,043 $1,018 $1,006 $1,011 $1,041 $1,118
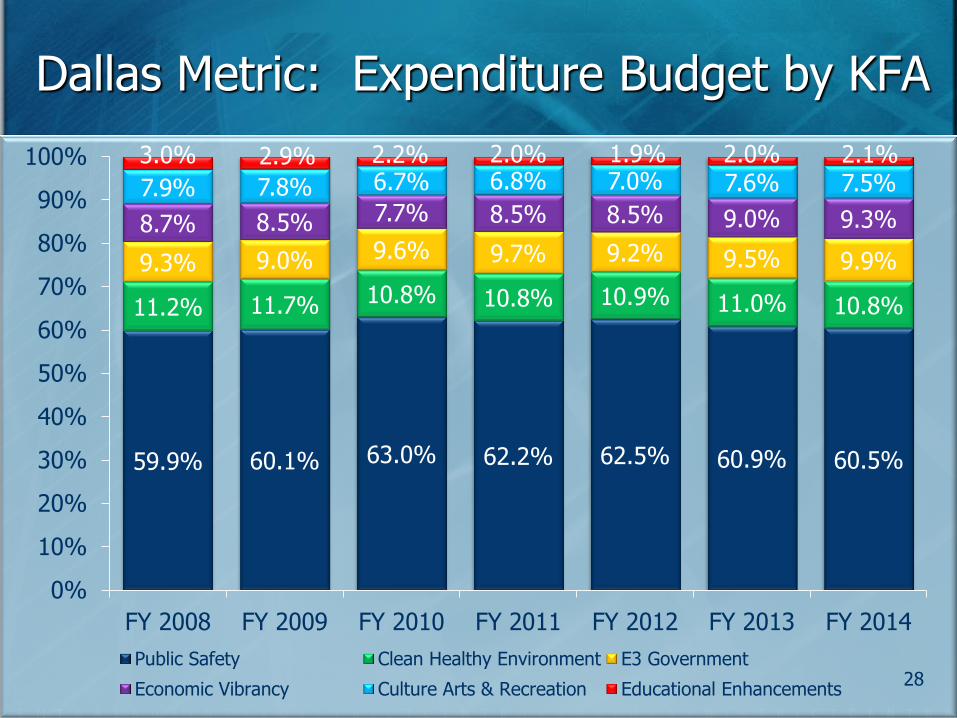
Dallas Metric: Expenditure Budget by KFA
28
59.9% 60.1% 63.0% 62.2% 62.5% 60.9% 60.5%
11.2% 11.7% 10.8% 10.8% 10.9% 11.0% 10.8%
9.3% 9.0% 9.6% 9.7% 9.2% 9.5% 9.9%
8.7% 8.5% 7.7% 8.5% 8.5% 9.0% 9.3%
7.9% 7.8% 6.7% 6.8% 7.0% 7.6% 7.5% 3.0% 2.9% 2.2% 2.0% 1.9% 2.0% 2.1%
0%
10%
20%
30%
40%
50%
60%
70%
80%
90%
100%
FY 2008 FY 2009 FY 2010 FY 2011 FY 2012 FY 2013 FY 2014
Public Safety Clean Healthy Environment E3 Government
Economic Vibrancy Culture Arts & Recreation Educational Enhancements
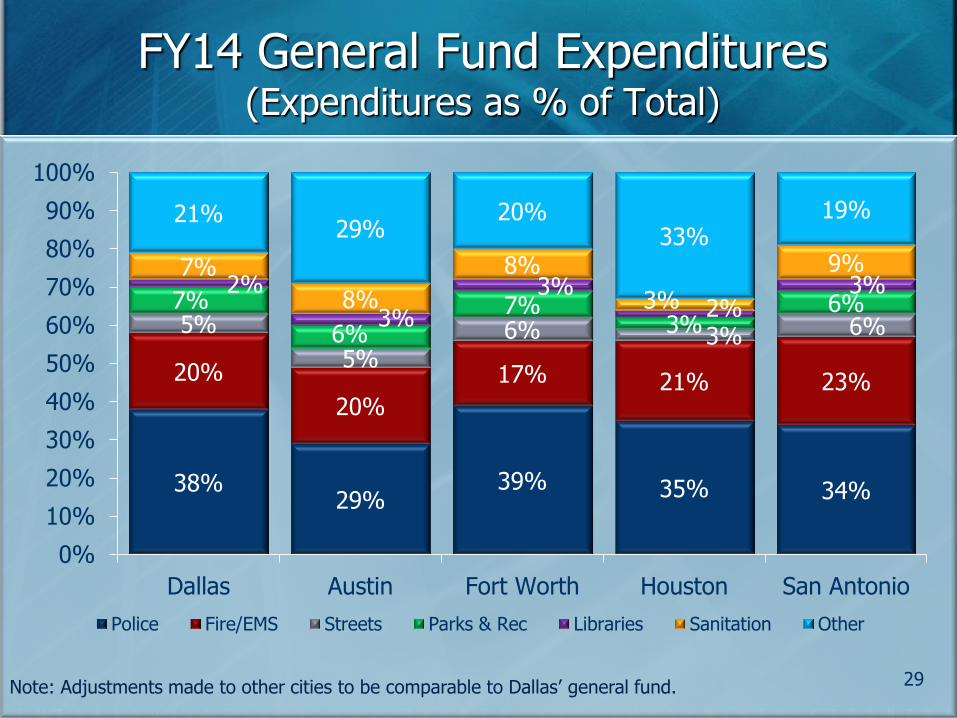
FY14 General Fund Expenditures (Expenditures as % of Total)
38% 29%
39% 35% 34%
20%
20%
17% 21% 23%
5%
5% 6% 3% 6%
7%
6% 7%
3% 6%
2%
3%
3% 2%
3% 7%
8%
8%
3%
9%
21% 29%
20% 33%
19%
0%
10%
20%
30%
40%
50%
60%
70%
80%
90%
100%
Dallas Austin Fort Worth Houston San Antonio
Police Fire/EMS Streets Parks & Rec Libraries Sanitation Other
Note: Adjustments made to other cities to be comparable to Dallas’ general fund. 29
-
500
1,000
1,500
2,000
Dallas Austin Fort Worth Houston San Antonio
Police Fire/EMS Streets Parks & Rec Libraries Sanitation Other
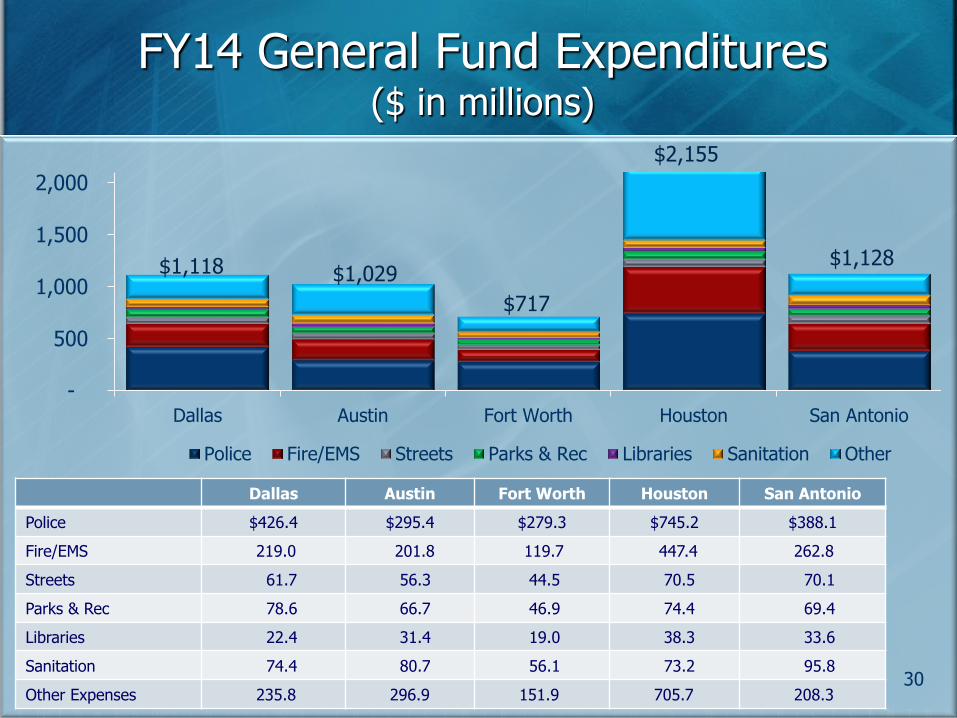
FY14 General Fund Expenditures ($ in millions)
$2,155
$1,118 $1,029
$717
$1,128
Dallas Austin Fort Worth Houston San Antonio
Police $426.4 $295.4 $279.3 $745.2 $388.1
Fire/EMS 219.0 201.8 119.7 447.4 262.8
Streets 61.7 56.3 44.5 70.5 70.1
Parks & Rec 78.6 66.7 46.9 74.4 69.4
Libraries 22.4 31.4 19.0 38.3 33.6
Sanitation 74.4 80.7 56.1 73.2 95.8
Other Expenses 235.8 296.9 151.9 705.7 208.3 30
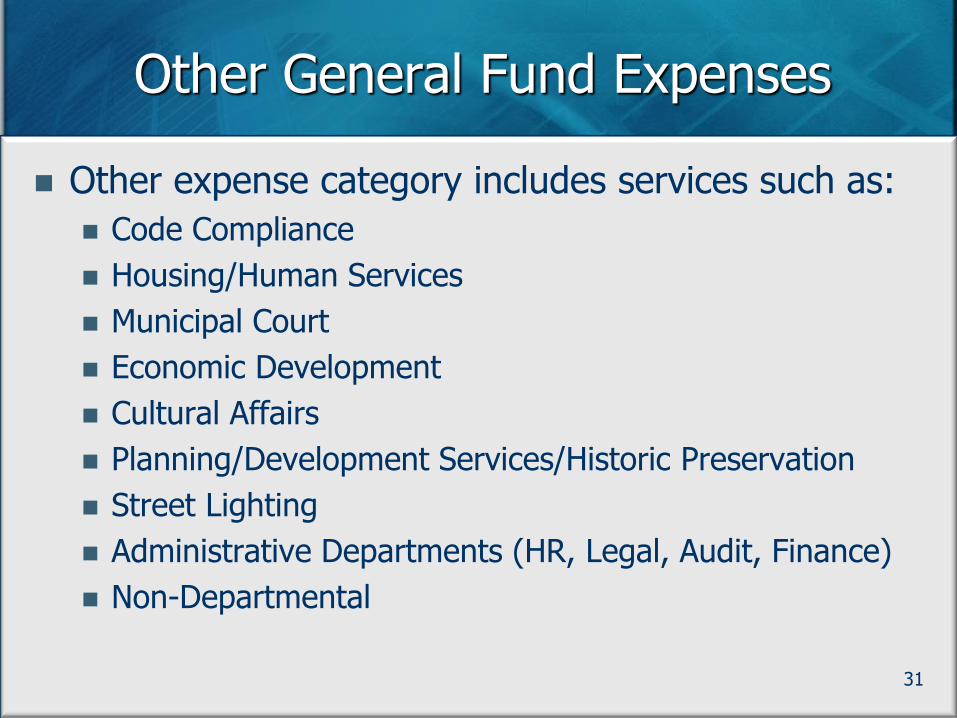
Other General Fund Expenses
Other expense category includes services such as:
Code Compliance
Housing/Human Services
Municipal Court
Economic Development
Cultural Affairs
Planning/Development Services/Historic Preservation
Street Lighting
Administrative Departments (HR, Legal, Audit, Finance)
Non-Departmental
31
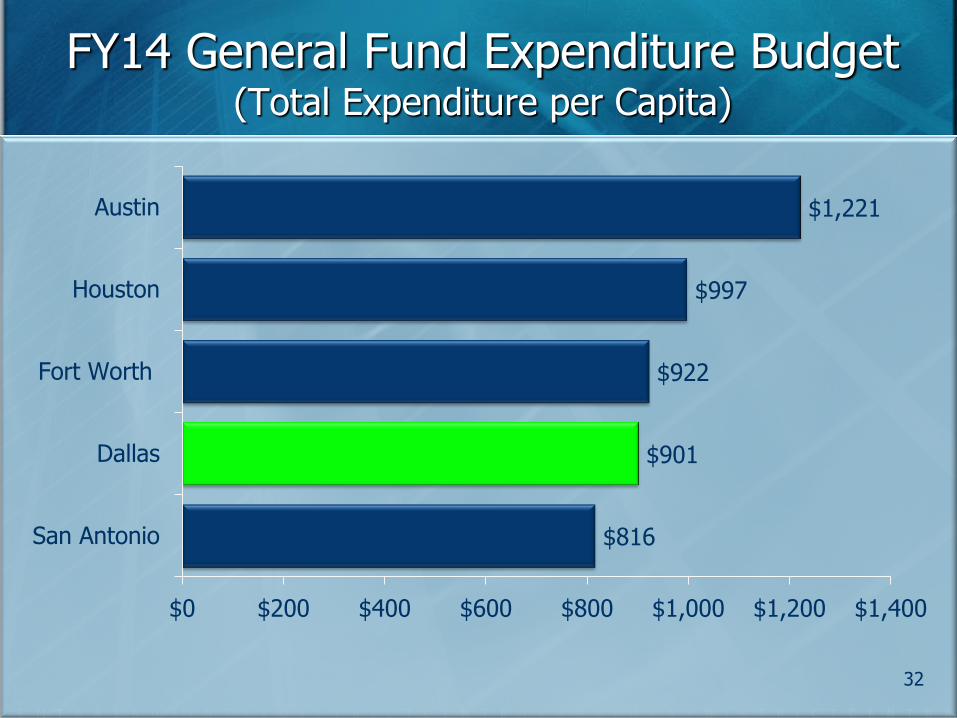
FY14 General Fund Expenditure Budget (Total Expenditure per Capita)
$816
$901
$922
$997
$1,221
$0 $200 $400 $600 $800 $1,000 $1,200 $1,400
San Antonio
Dallas
Fort Worth
Houston
Austin
32

Public Safety
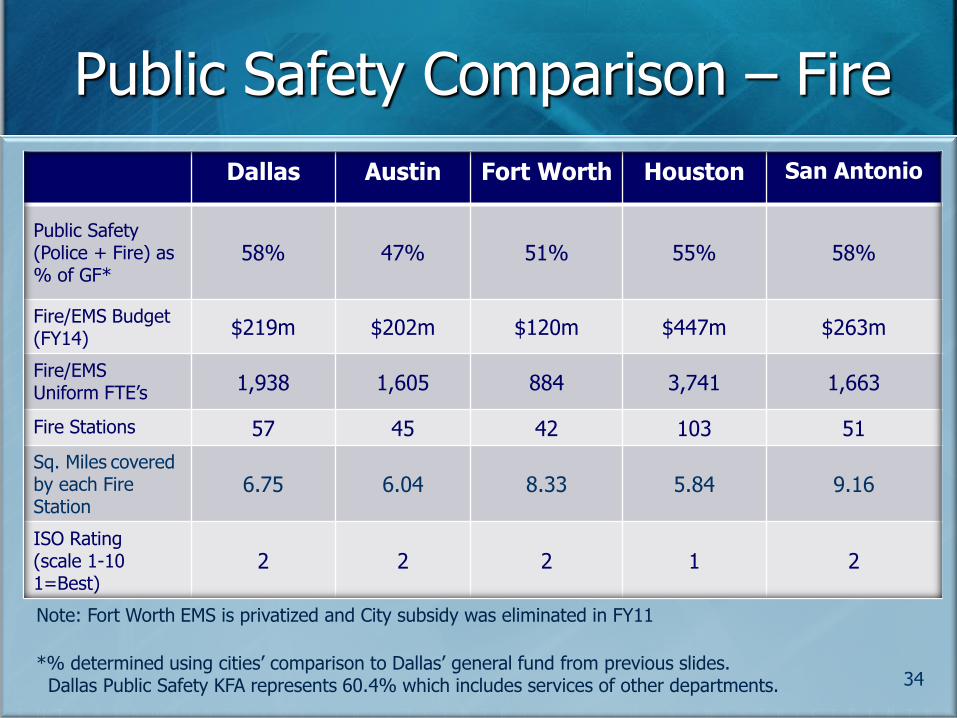
Public Safety Comparison – Fire
Dallas Austin Fort Worth Houston San Antonio
Public Safety (Police + Fire) as % of GF*
58% 47% 51% 55% 58%
Fire/EMS Budget (FY14)
$219m $202m $120m $447m $263m
Fire/EMS Uniform FTE’s 1,938 1,605 884 3,741 1,663
Fire Stations 57 45 42 103 51
Sq. Miles covered by each Fire Station
6.75 6.04 8.33 5.84 9.16
ISO Rating (scale 1-10 1=Best)
2 2 2 1 2
Note: Fort Worth EMS is privatized and City subsidy was eliminated in FY11
*% determined using cities’ comparison to Dallas’ general fund from previous slides. Dallas Public Safety KFA represents 60.4% which includes services of other departments. 34
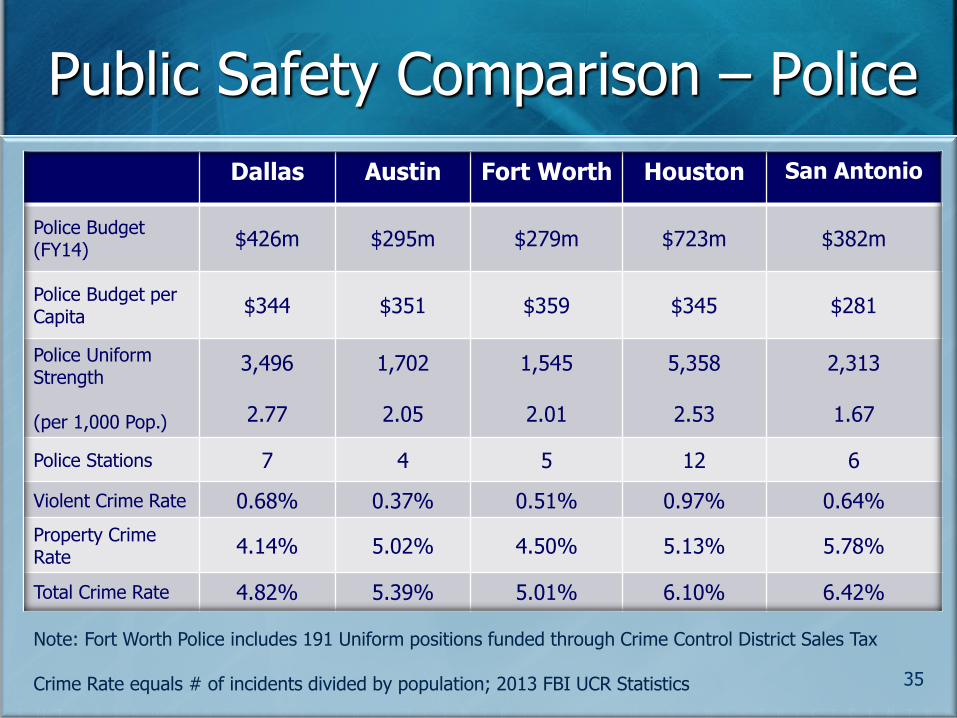
Public Safety Comparison – Police
Dallas Austin Fort Worth Houston San Antonio
Police Budget (FY14)
$426m $295m $279m $723m $382m
Police Budget per Capita
$344 $351 $359 $345 $281
Police Uniform Strength (per 1,000 Pop.)
3,496
2.77
1,702
2.05
1,545
2.01
5,358
2.53
2,313
1.67
Police Stations 7 4 5 12 6
Violent Crime Rate 0.68% 0.37% 0.51% 0.97% 0.64%
Property Crime Rate
4.14% 5.02% 4.50% 5.13% 5.78%
Total Crime Rate 4.82% 5.39% 5.01% 6.10% 6.42%
Note: Fort Worth Police includes 191 Uniform positions funded through Crime Control District Sales Tax Crime Rate equals # of incidents divided by population; 2013 FBI UCR Statistics 35
Public Safety – Police Observations
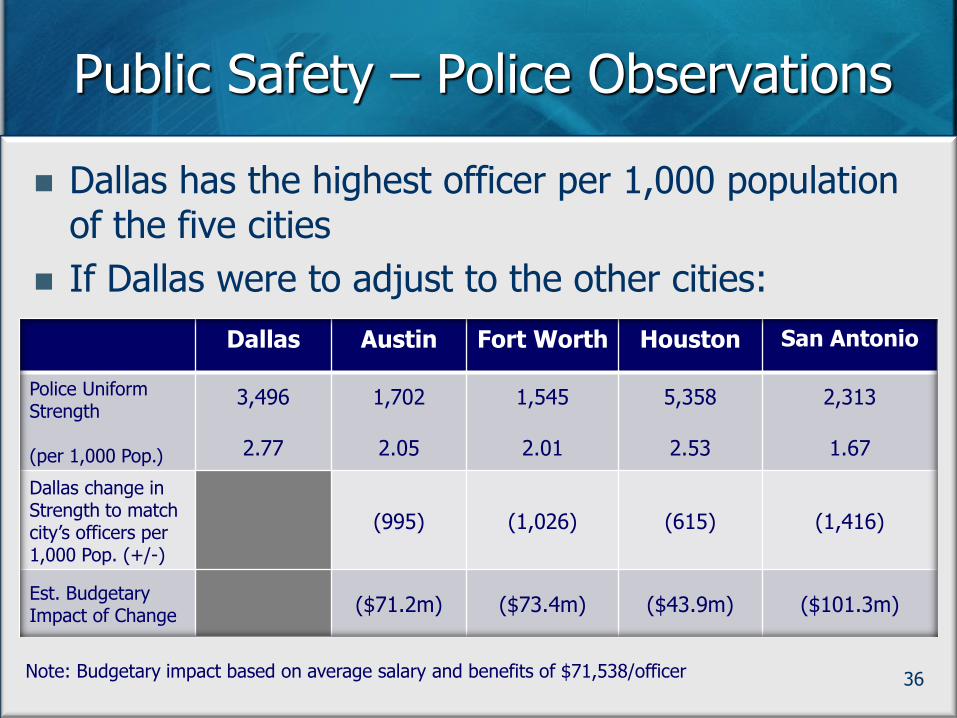
36
Dallas has the highest officer per 1,000 population of the five cities
If Dallas were to adjust to the other cities:
Dallas Austin Fort Worth Houston San Antonio
Police Uniform Strength (per 1,000 Pop.)
3,496
2.77
1,702
2.05
1,545
2.01
5,358
2.53
2,313
1.67
Dallas change in Strength to match city’s officers per 1,000 Pop. (+/-)
(995) (1,026) (615) (1,416)
Est. Budgetary Impact of Change
($71.2m) ($73.4m) ($43.9m) ($101.3m)
Note: Budgetary impact based on average salary and benefits of $71,538/officer

Debt Service
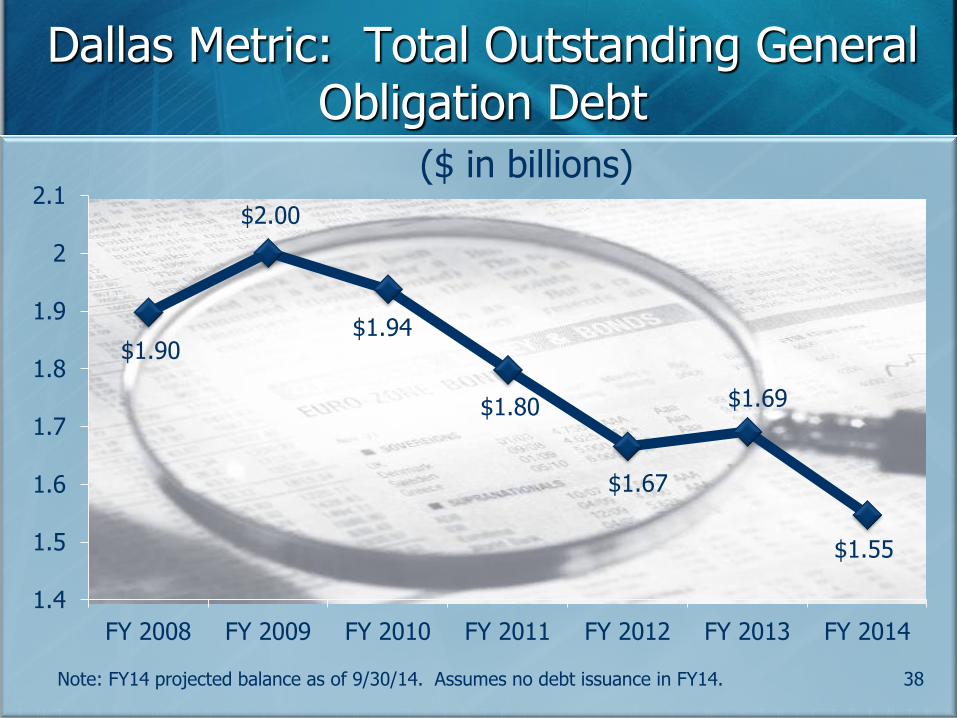
$1.90
$2.00
$1.94
$1.80
$1.67
$1.69
$1.55
1.4
1.5
1.6
1.7
1.8
1.9
2
2.1
FY 2008 FY 2009 FY 2010 FY 2011 FY 2012 FY 2013 FY 2014
Dallas Metric: Total Outstanding General Obligation Debt
38
($ in billions)
Note: FY14 projected balance as of 9/30/14. Assumes no debt issuance in FY14.
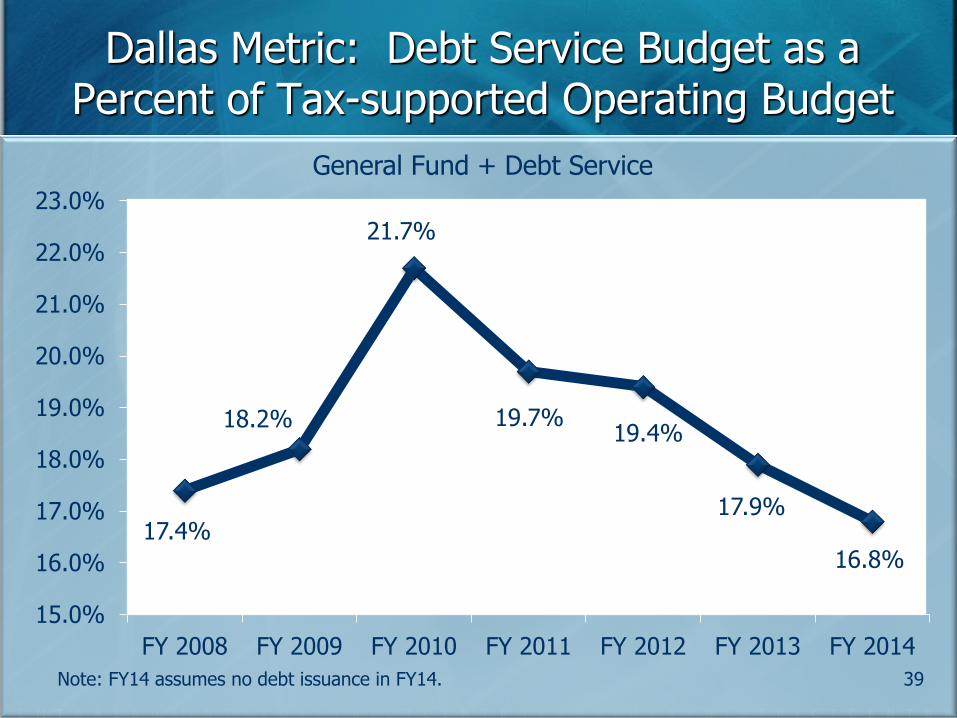
17.4%
18.2%
21.7%
19.7% 19.4%
17.9%
16.8%
15.0%
16.0%
17.0%
18.0%
19.0%
20.0%
21.0%
22.0%
23.0%
FY 2008 FY 2009 FY 2010 FY 2011 FY 2012 FY 2013 FY 2014
General Fund + Debt Service
Dallas Metric: Debt Service Budget as a Percent of Tax-supported Operating Budget
39 Note: FY14 assumes no debt issuance in FY14.
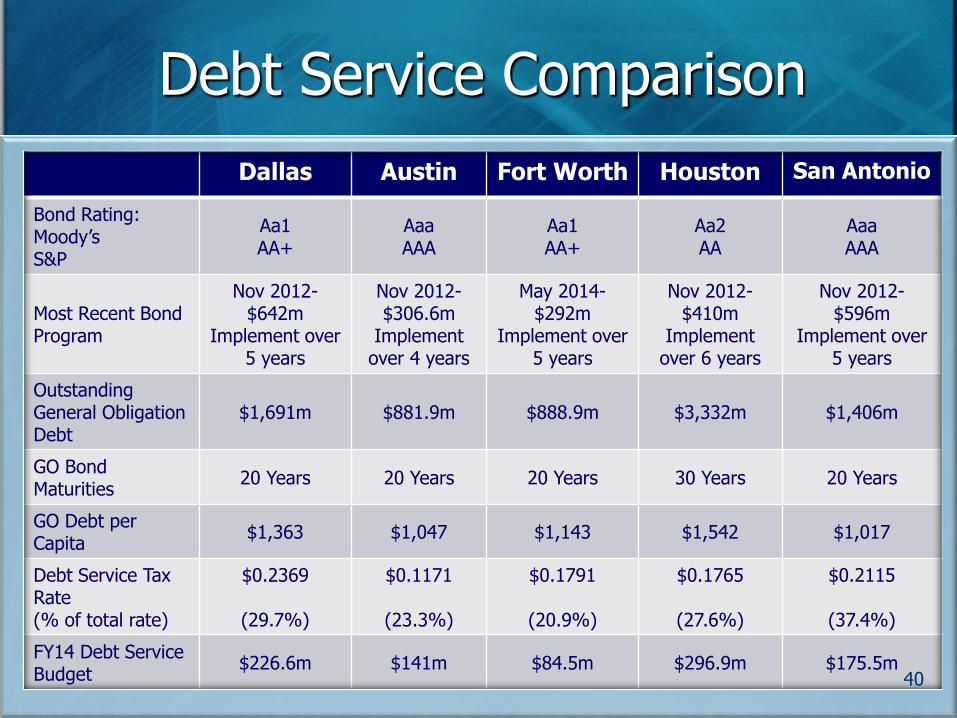
Debt Service Comparison
Dallas Austin Fort Worth Houston San Antonio
Bond Rating: Moody’s S&P
Aa1 AA+
Aaa AAA
Aa1 AA+
Aa2 AA
Aaa AAA
Most Recent Bond Program
Nov 2012- $642m
Implement over 5 years
Nov 2012-$306.6m
Implement over 4 years
May 2014- $292m
Implement over 5 years
Nov 2012-$410m
Implement over 6 years
Nov 2012- $596m
Implement over 5 years
Outstanding General Obligation Debt
$1,691m $881.9m $888.9m $3,332m $1,406m
GO Bond Maturities
20 Years 20 Years 20 Years 30 Years 20 Years
GO Debt per Capita
$1,363 $1,047 $1,143 $1,542 $1,017
Debt Service Tax Rate (% of total rate)
$0.2369
(29.7%)
$0.1171
(23.3%)
$0.1791
(20.9%)
$0.1765
(27.6%)
$0.2115
(37.4%)
FY14 Debt Service Budget
$226.6m $141m $84.5m $296.9m $175.5m 40
Average Annual Cost to Citizens
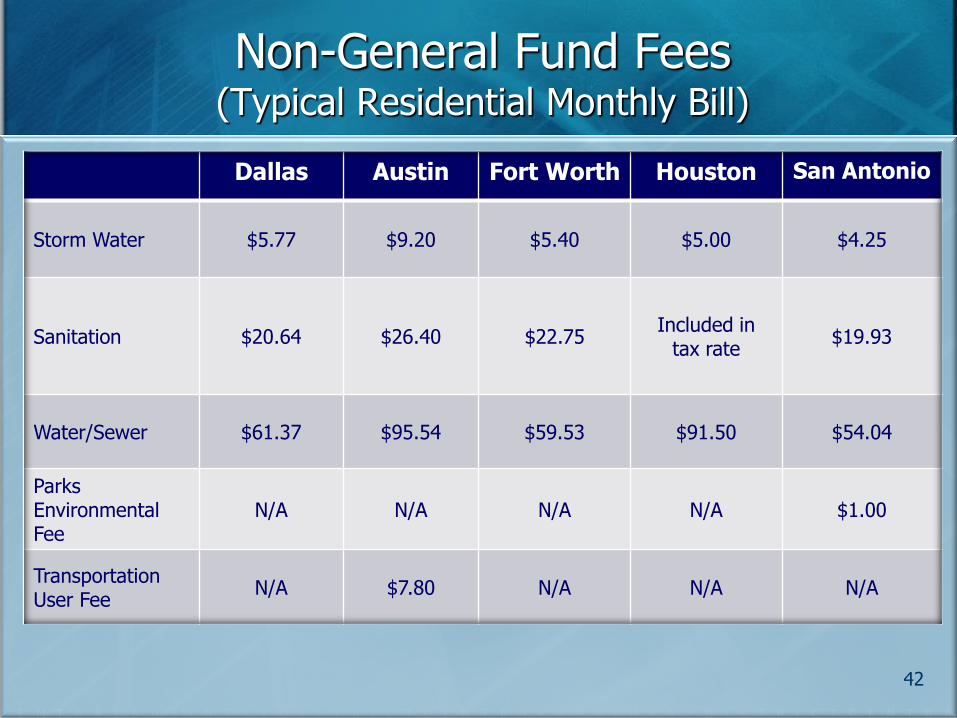
Non-General Fund Fees (Typical Residential Monthly Bill)
Dallas Austin Fort Worth Houston San Antonio
Storm Water $5.77 $9.20 $5.40 $5.00 $4.25
Sanitation $20.64 $26.40 $22.75 Included in
tax rate $19.93
Water/Sewer $61.37 $95.54 $59.53 $91.50 $54.04
Parks Environmental Fee
N/A N/A N/A N/A $1.00
Transportation User Fee
N/A $7.80 N/A N/A N/A
42
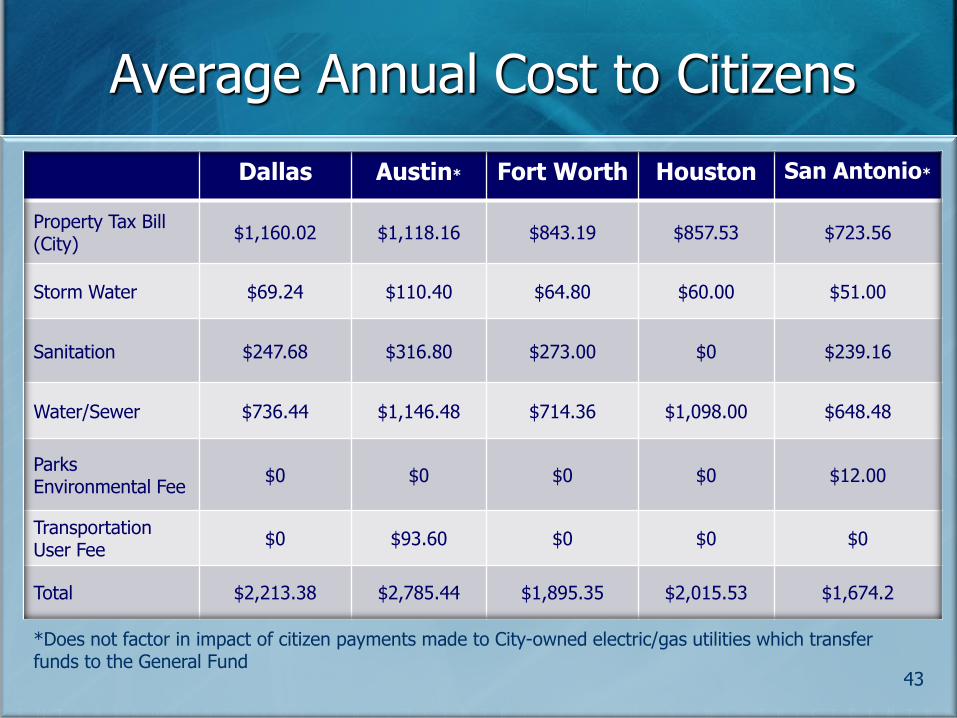
Average Annual Cost to Citizens
Dallas Austin* Fort Worth Houston San Antonio*
Property Tax Bill (City)
$1,160.02 $1,118.16 $843.19 $857.53 $723.56
Storm Water $69.24 $110.40 $64.80 $60.00 $51.00
Sanitation $247.68 $316.80 $273.00 $0 $239.16
Water/Sewer $736.44 $1,146.48 $714.36 $1,098.00 $648.48
Parks Environmental Fee
$0 $0 $0 $0 $12.00
Transportation User Fee
$0 $93.60 $0 $0 $0
Total $2,213.38 $2,785.44 $1,895.35 $2,015.53 $1,674.2
43
*Does not factor in impact of citizen payments made to City-owned electric/gas utilities which transfer funds to the General Fund

Observations and Takeaways
Observations
Comparing budgets across cities, even in same state, is not apples-to-apples since every city categorizes budget items differently
Total cost to citizens is result of much more than just property tax and includes fees for service such as sanitation and water/sewer charges
45
Observations
Property tax bill is much more than tax rate; and includes value, exemptions, and rate
Dallas homestead and over-65/disabled exemptions benefit home owners yet reduces revenue for City
Sales tax dedicated to transit supports DART yet reduces revenue for City
Transfers from City owned electric utilities and other non-tax revenues reduce reliance on property tax
46
Observations
Dallas ranks below average and 4th out of 5 cities for general fund expenditures per capita
Dallas is tied for highest percentage of budget devoted to police and fire services at 58%
Dallas’ debt service tax rate has fallen by 10.5% since FY11
47

Questions?
CITY OF DALLAS
DALLAS WATER UTILITIES
COMMERCIAL PAPER PROGRAM
SELECTION OF SERVICE PROVIDERS
BUDGET, FINANCE & AUDIT
COMMITTEE
June 2, 2014
2
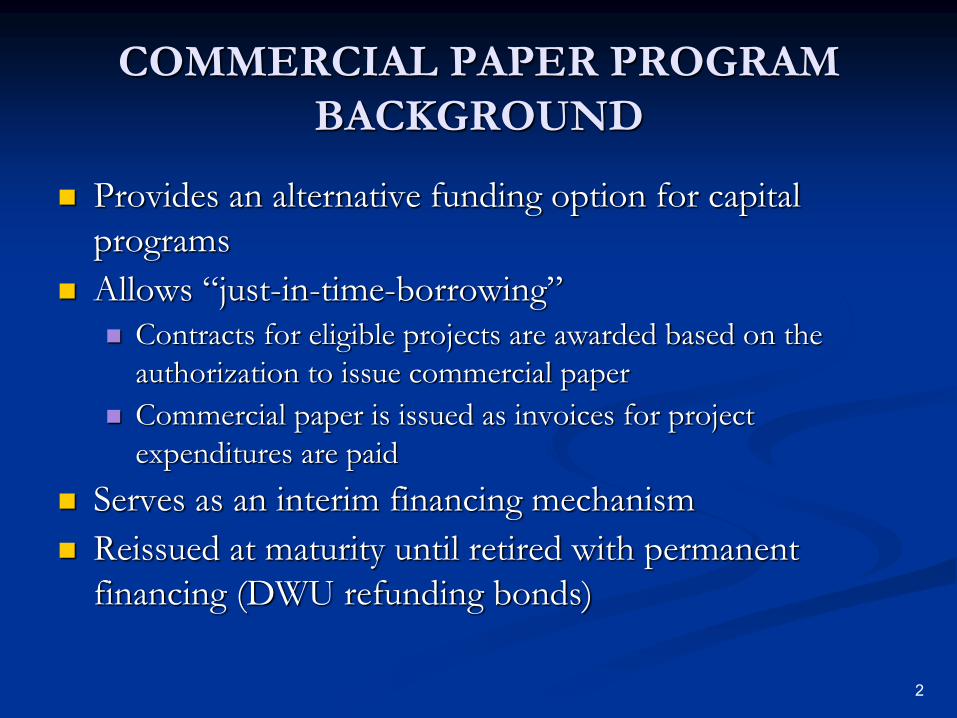
COMMERCIAL PAPER PROGRAM
BACKGROUND
Provides an alternative funding option for capital
programs
Allows “just-in-time-borrowing”
Contracts for eligible projects are awarded based on the
authorization to issue commercial paper
Commercial paper is issued as invoices for project
expenditures are paid
Serves as an interim financing mechanism
Reissued at maturity until retired with permanent
financing (DWU refunding bonds)
3
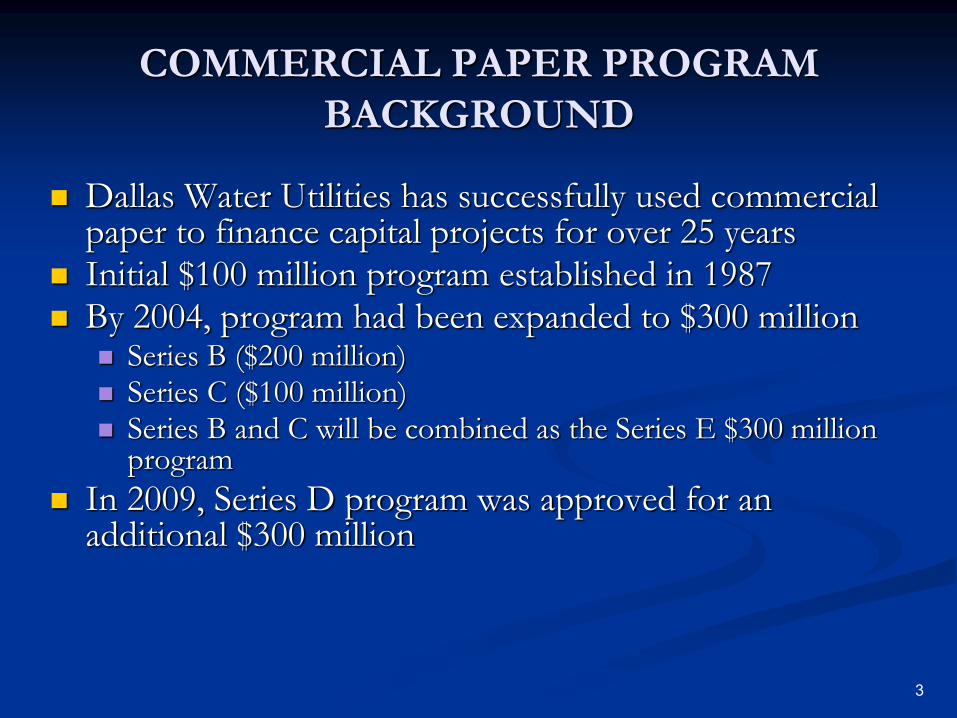
COMMERCIAL PAPER PROGRAM
BACKGROUND
Dallas Water Utilities has successfully used commercial paper to finance capital projects for over 25 years
Initial $100 million program established in 1987 By 2004, program had been expanded to $300 million
Series B ($200 million) Series C ($100 million) Series B and C will be combined as the Series E $300 million
program
In 2009, Series D program was approved for an additional $300 million
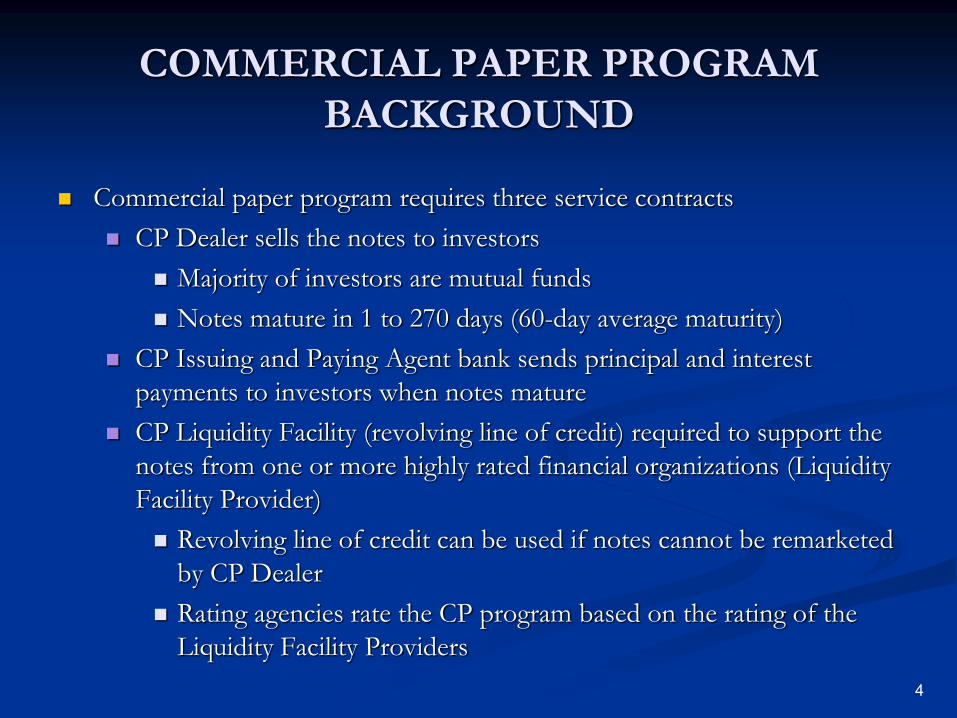
COMMERCIAL PAPER PROGRAM
BACKGROUND
Commercial paper program requires three service contracts
CP Dealer sells the notes to investors
Majority of investors are mutual funds
Notes mature in 1 to 270 days (60-day average maturity)
CP Issuing and Paying Agent bank sends principal and interest
payments to investors when notes mature
CP Liquidity Facility (revolving line of credit) required to support the
notes from one or more highly rated financial organizations (Liquidity
Facility Provider)
Revolving line of credit can be used if notes cannot be remarketed
by CP Dealer
Rating agencies rate the CP program based on the rating of the
Liquidity Facility Providers
4
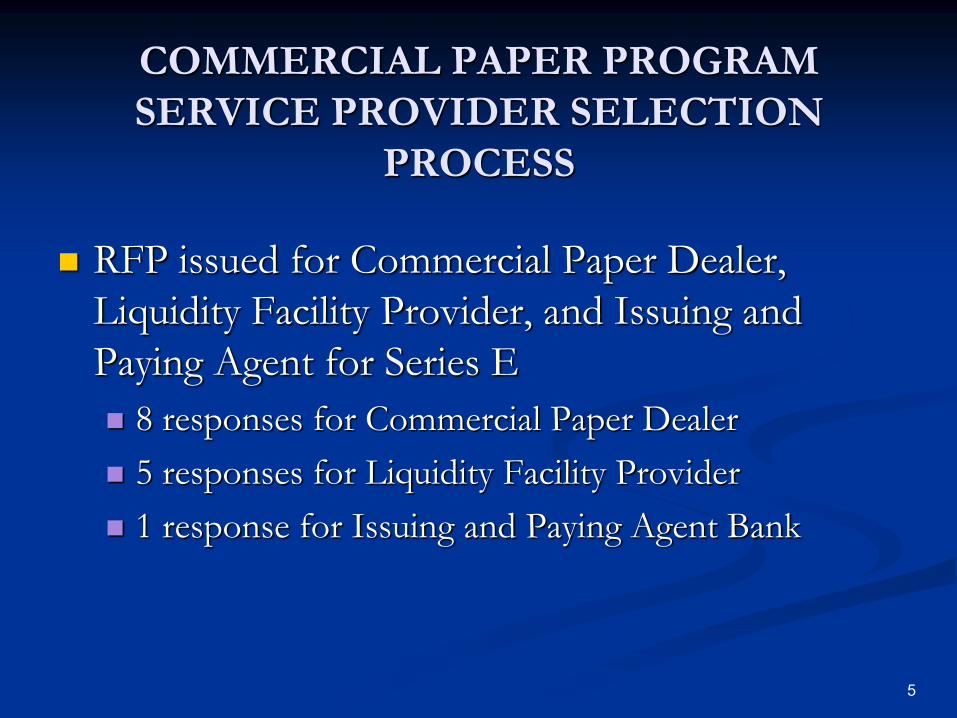
COMMERCIAL PAPER PROGRAM
SERVICE PROVIDER SELECTION
PROCESS
RFP issued for Commercial Paper Dealer,
Liquidity Facility Provider, and Issuing and
Paying Agent for Series E
8 responses for Commercial Paper Dealer
5 responses for Liquidity Facility Provider
1 response for Issuing and Paying Agent Bank
5
COMMERCIAL PAPER PROGRAM
SERVICE PROVIDER SELECTION
PROCESS
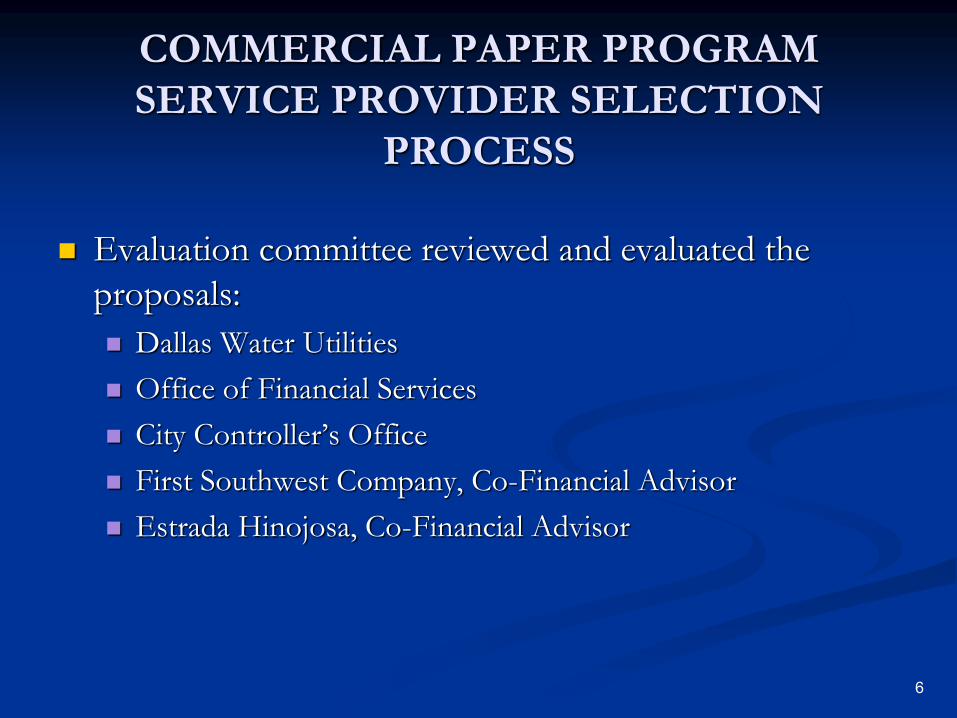
Evaluation committee reviewed and evaluated the
proposals:
Dallas Water Utilities
Office of Financial Services
City Controller’s Office
First Southwest Company, Co-Financial Advisor
Estrada Hinojosa, Co-Financial Advisor
6
7
COMMERCIAL PAPER PROGRAM
SERVICE PROVIDER SELECTION
PROCESS
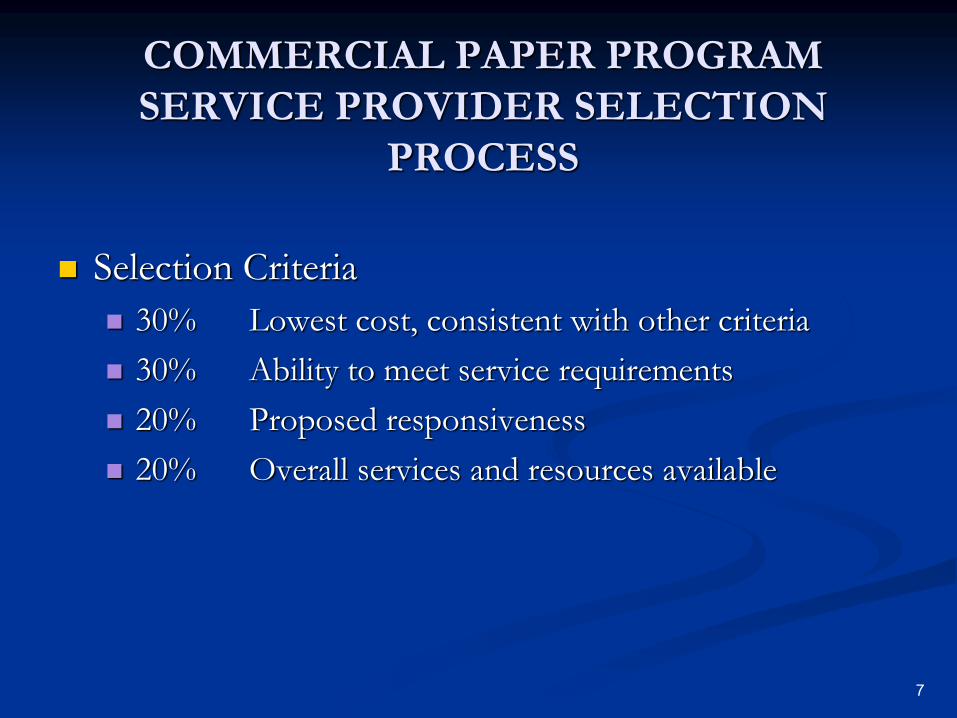
Selection Criteria
30% Lowest cost, consistent with other criteria
30% Ability to meet service requirements
20% Proposed responsiveness
20% Overall services and resources available
COMMERCIAL PAPER PROGRAM
COMMERCIAL PAPER DEALER
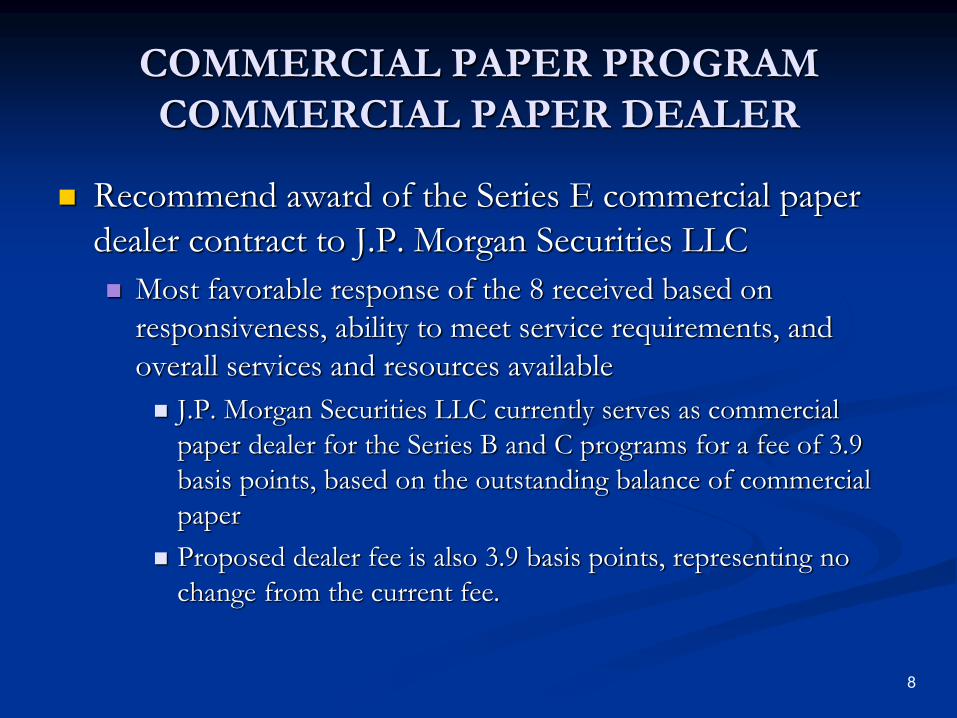
Recommend award of the Series E commercial paper
dealer contract to J.P. Morgan Securities LLC
Most favorable response of the 8 received based on
responsiveness, ability to meet service requirements, and
overall services and resources available
J.P. Morgan Securities LLC currently serves as commercial
paper dealer for the Series B and C programs for a fee of 3.9
basis points, based on the outstanding balance of commercial
paper
Proposed dealer fee is also 3.9 basis points, representing no
change from the current fee.
8
COMMERCIAL PAPER PROGRAM
LIQUIDITY FACILITY
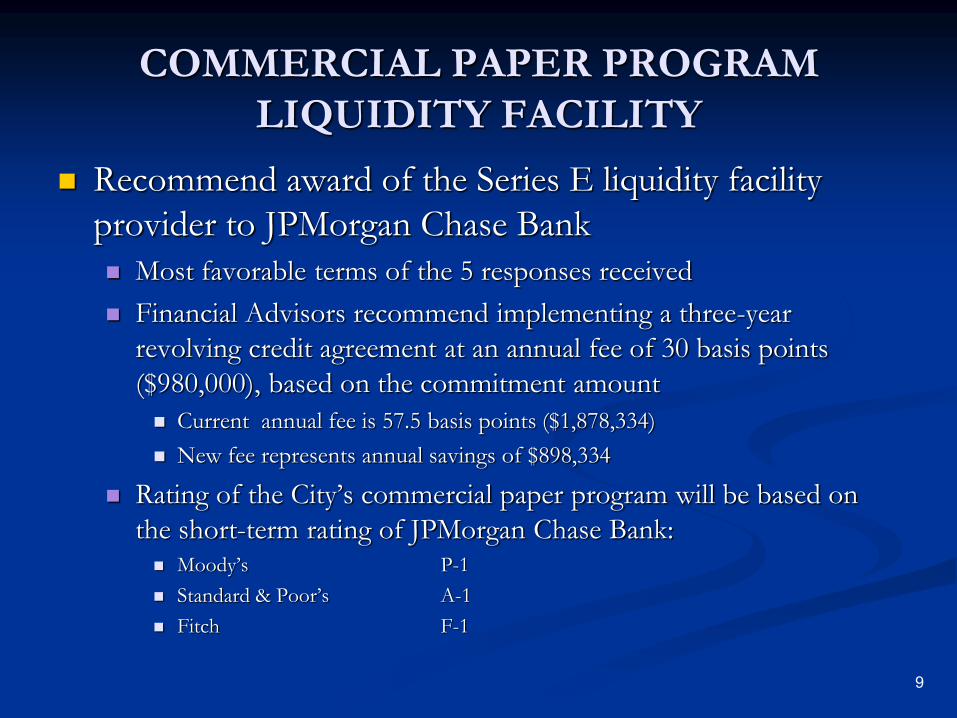
Recommend award of the Series E liquidity facility
provider to JPMorgan Chase Bank
Most favorable terms of the 5 responses received
Financial Advisors recommend implementing a three-year
revolving credit agreement at an annual fee of 30 basis points
($980,000), based on the commitment amount
Current annual fee is 57.5 basis points ($1,878,334)
New fee represents annual savings of $898,334
Rating of the City’s commercial paper program will be based on
the short-term rating of JPMorgan Chase Bank: Moody’s P-1
Standard & Poor’s A-1
Fitch F-1
9
COMMERCIAL PAPER PROGRAM
ISSUING AND PAYING AGENT
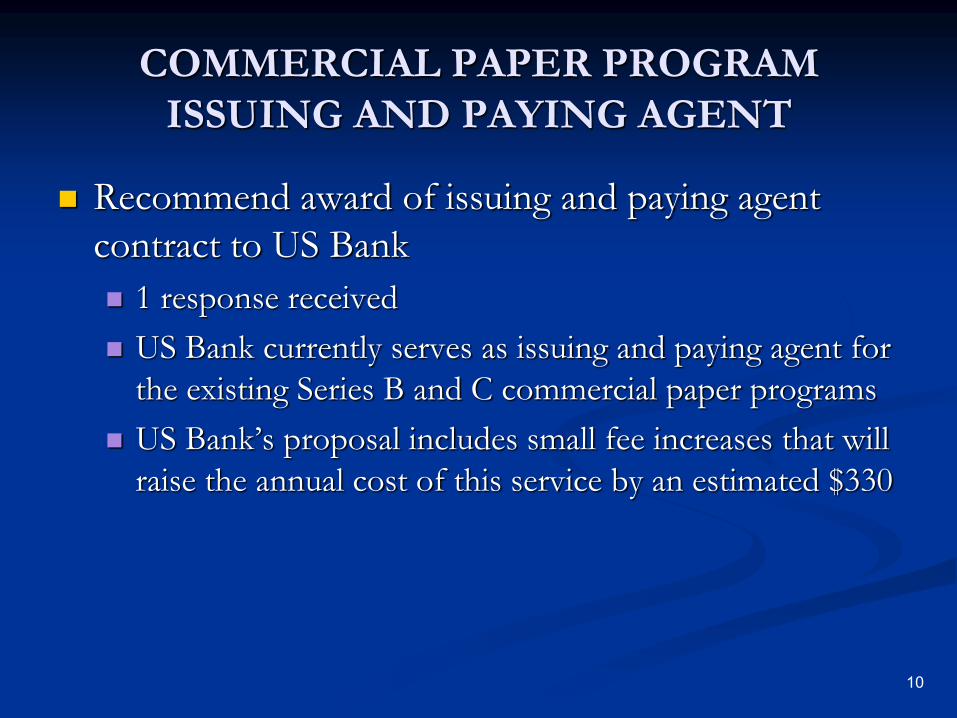
Recommend award of issuing and paying agent
contract to US Bank
1 response received
US Bank currently serves as issuing and paying agent for
the existing Series B and C commercial paper programs
US Bank’s proposal includes small fee increases that will
raise the annual cost of this service by an estimated $330
10
11
RECOMMENDATION
Approval of ordinance on June 25th City Council
agenda to establish Series E commercial paper program,
including award of service contracts for commercial
paper dealer, liquidity facility provider, and issuing and
paying agent
12
Appendix
Series E Commercial Paper Program Annual Cost
(estimated) – Page 13
Series E Commercial Paper Program Closing Costs –
Page 14
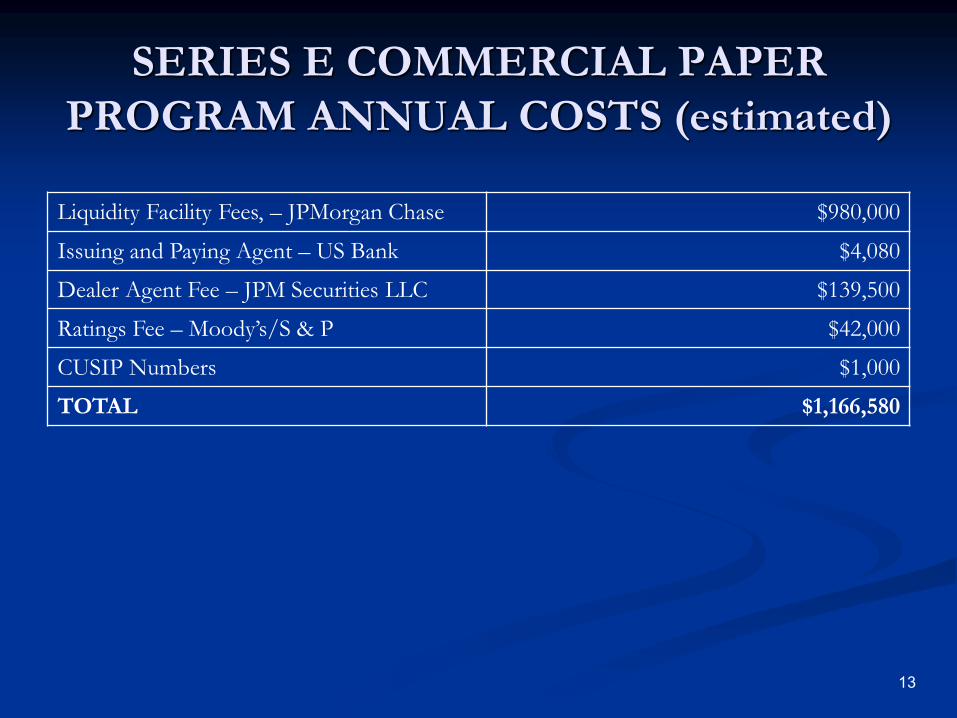
SERIES E COMMERCIAL PAPER
PROGRAM ANNUAL COSTS (estimated)
Liquidity Facility Fees, – JPMorgan Chase $980,000
Issuing and Paying Agent – US Bank $4,080
Dealer Agent Fee – JPM Securities LLC $139,500
Ratings Fee – Moody’s/S & P $42,000
CUSIP Numbers $1,000
TOTAL $1,166,580
13
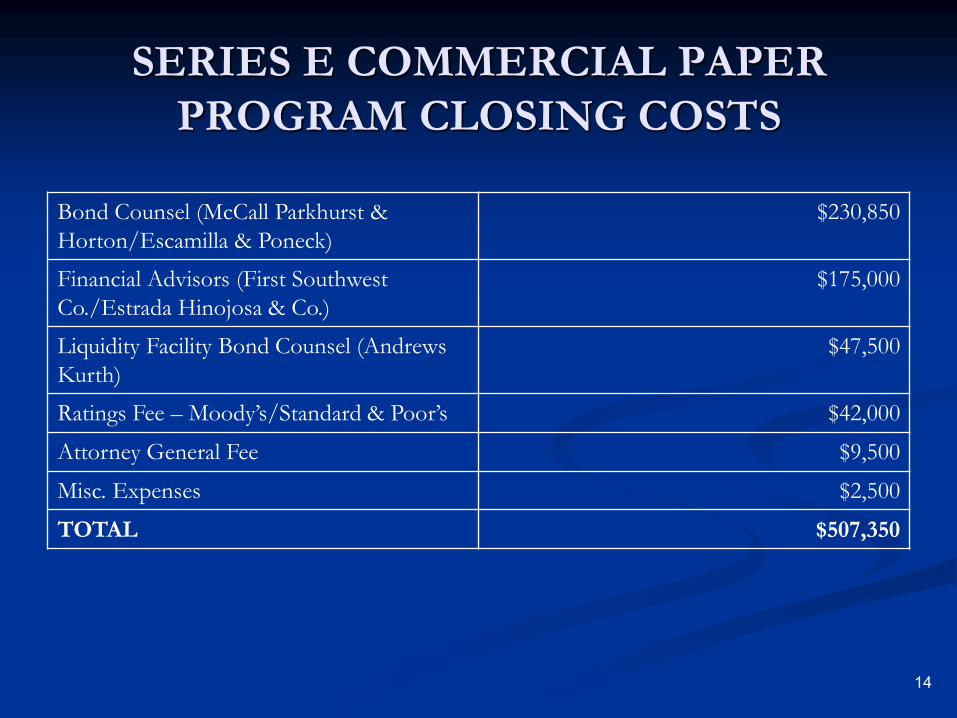
SERIES E COMMERCIAL PAPER
PROGRAM CLOSING COSTS
Bond Counsel (McCall Parkhurst &
Horton/Escamilla & Poneck)
$230,850
Financial Advisors (First Southwest
Co./Estrada Hinojosa & Co.)
$175,000
Liquidity Facility Bond Counsel (Andrews
Kurth)
$47,500
Ratings Fee – Moody’s/Standard & Poor’s $42,000
Attorney General Fee $9,500
Misc. Expenses $2,500
TOTAL $507,350
14
Dallas Love Field
Parking Rates/ Strategies
June 2, 2014
Budget, Finance & Audit Committee
Background
• Dallas Love Field currently maintains two garages
– Garage A – 3,000 spaces
– Garage B – 4,000 spaces
• Two private parking operations also operate close to the airport
– Best Parking – 635 spaces
– The Parking Spot – 2,030 spaces
2
Background Continued
• Garage A built in 1985
• Garage B built in 2002
• Both garages are currently undergoing structural assessments to determine any repairs necessary in the near future
• Revenue control equipment was installed in 1997
• Neither garage has a guidance system to aid customers in finding available spaces
3
Background Continued
• Parking structures were excluded from the Love Field Modernization Program agreements with Southwest Airlines
• Parking demand estimated in 2008 did not foresee additional parking needs based on forecast of 5.8 million enplanements until 2016
• As the repeal of the Wright Amendment restriction nears, the City has revised those projections upward
4
Parking Rates
• Current parking rates
– Garage A – $14 per day
– Garage B – $10 per day
– Valet - $21 per day
• Private parking rates
– Best Parking – $6 per day
– The Parking Spot – $6 per day
5
Parking Rates
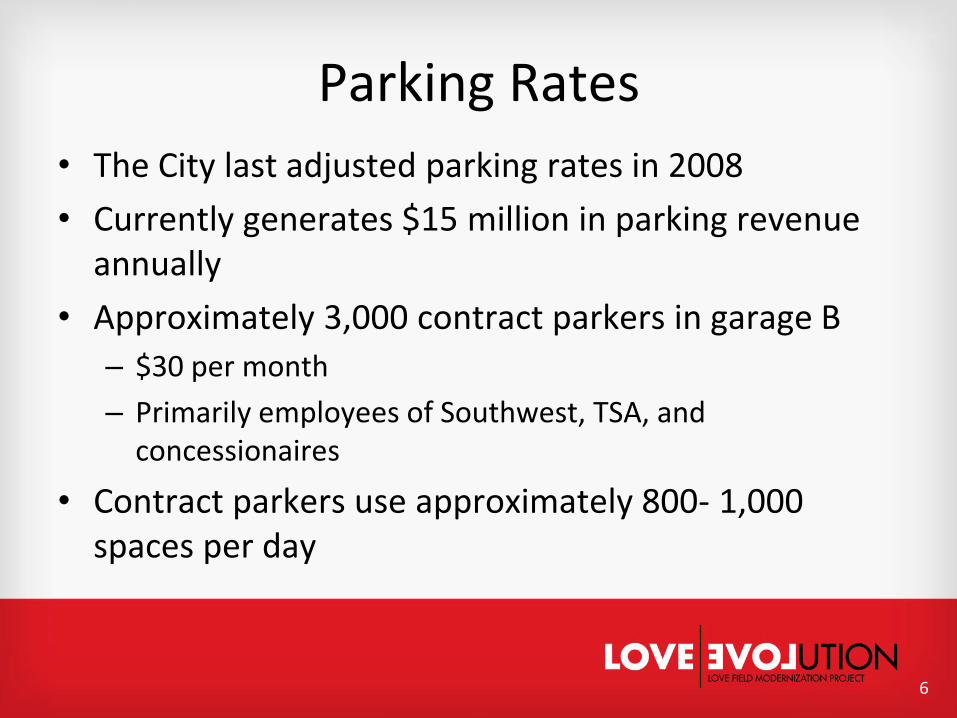
• The City last adjusted parking rates in 2008
• Currently generates $15 million in parking revenue annually
• Approximately 3,000 contract parkers in garage B
– $30 per month
– Primarily employees of Southwest, TSA, and concessionaires
• Contract parkers use approximately 800- 1,000 spaces per day
6
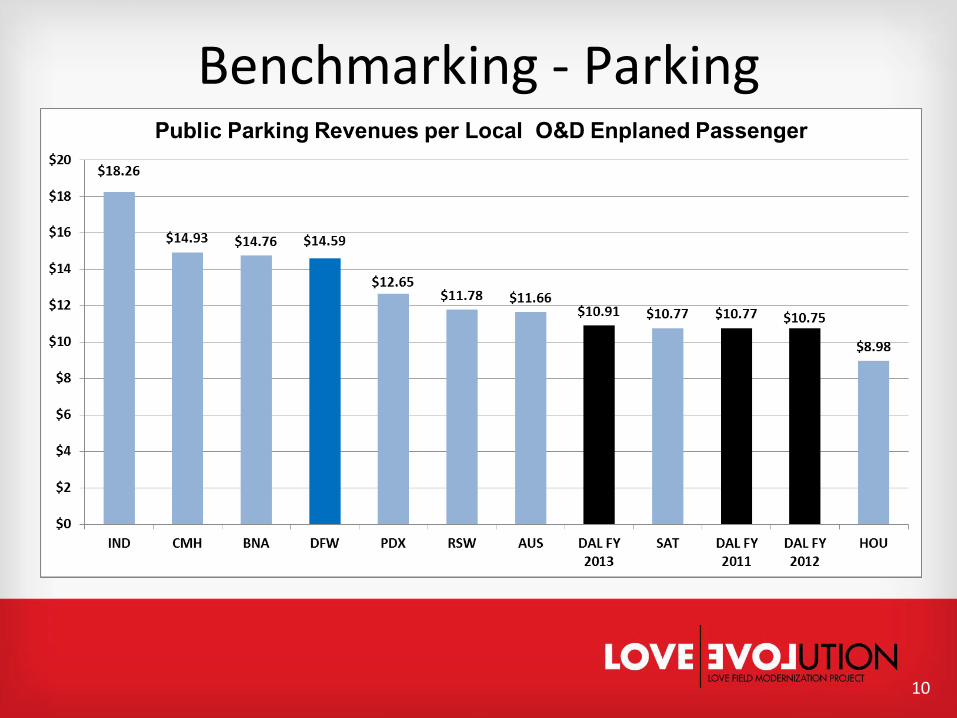
Benchmarking - Parking Rates
7
• DAL Parking Rates were benchmarked against other similar sized Airports (RSW, PDX, BNA, CMH, IND) as well as other Texas Airports (HOU, SAT, AUS, DFW)
• The following slides illustrate the benchmarking comparisons
8
Benchmarking - Parking
Benchmarking – Parking
9
10
Benchmarking - Parking
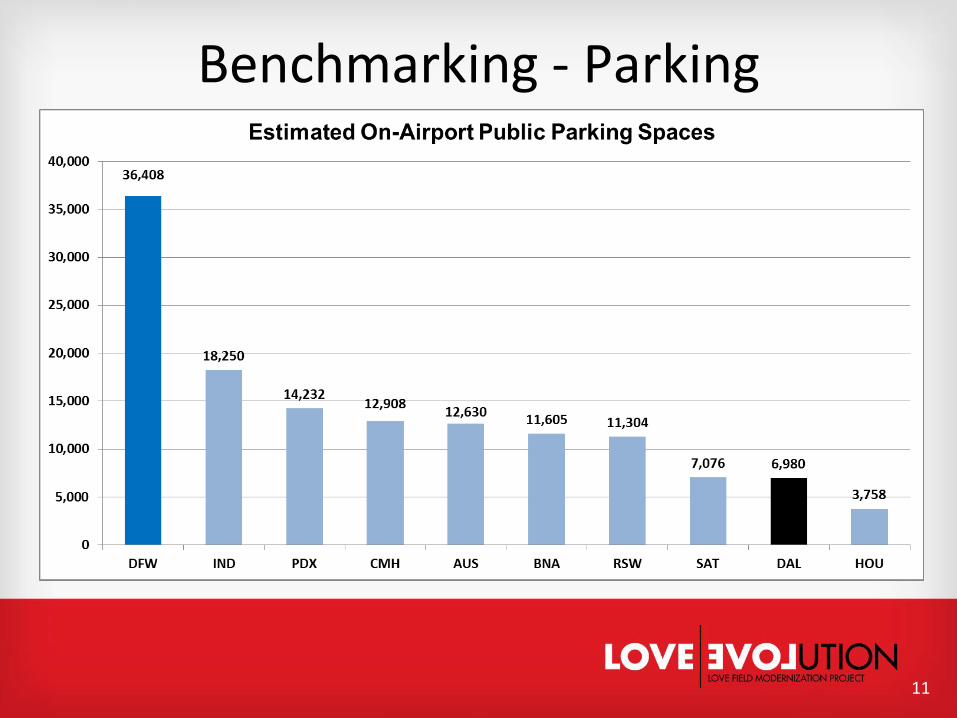
11
Benchmarking - Parking
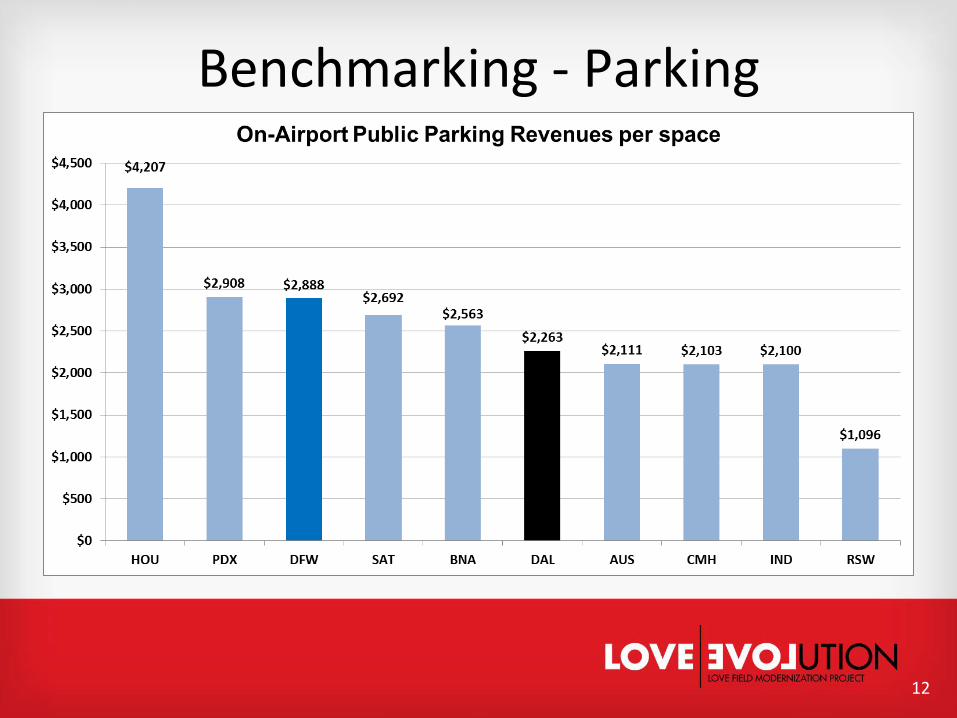
12
Benchmarking - Parking
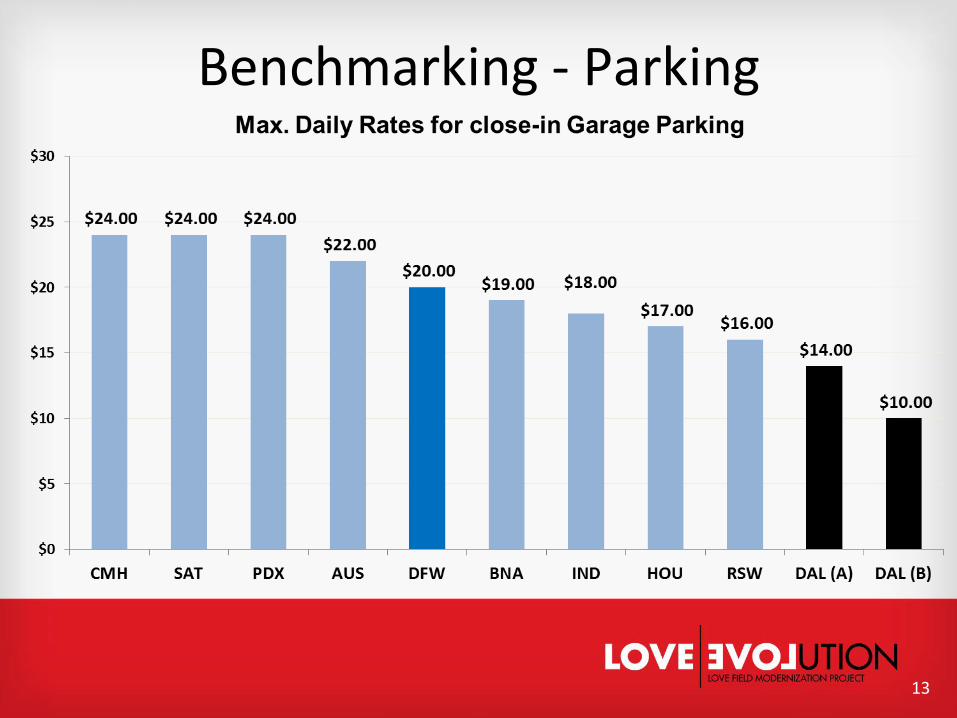
13
Benchmarking - Parking
Forecasted Growth
• Revised forecast now shows Dallas Love Field to be at approximately 6.2 million enplanements by the end of 2015
• New forecast has a number of implications, the most immediate issue being adequate on-airport parking availability
• Dallas Love Field needs to implement a number of strategies to mitigate this surge in traffic to address customer needs
14
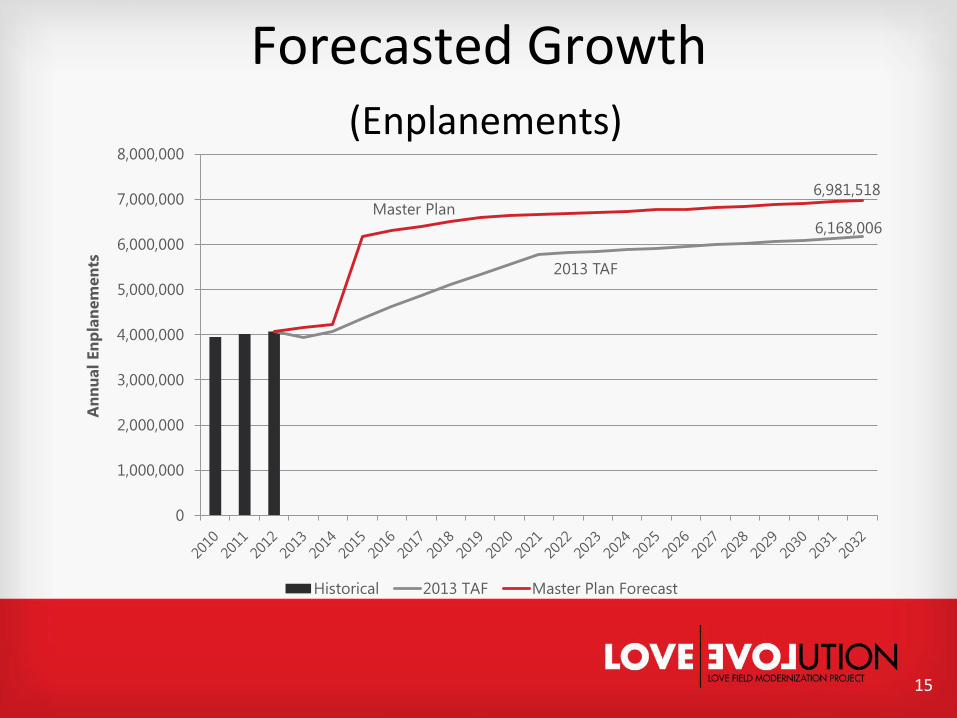
Forecasted Growth (Enplanements)
15
2013 TAF
6,168,006
Master Plan
6,981,518
0
1,000,000
2,000,000
3,000,000
4,000,000
5,000,000
6,000,000
7,000,000
8,000,000
An
nu
al
En
pla
nem
en
ts
Historical 2013 TAF Master Plan Forecast
16
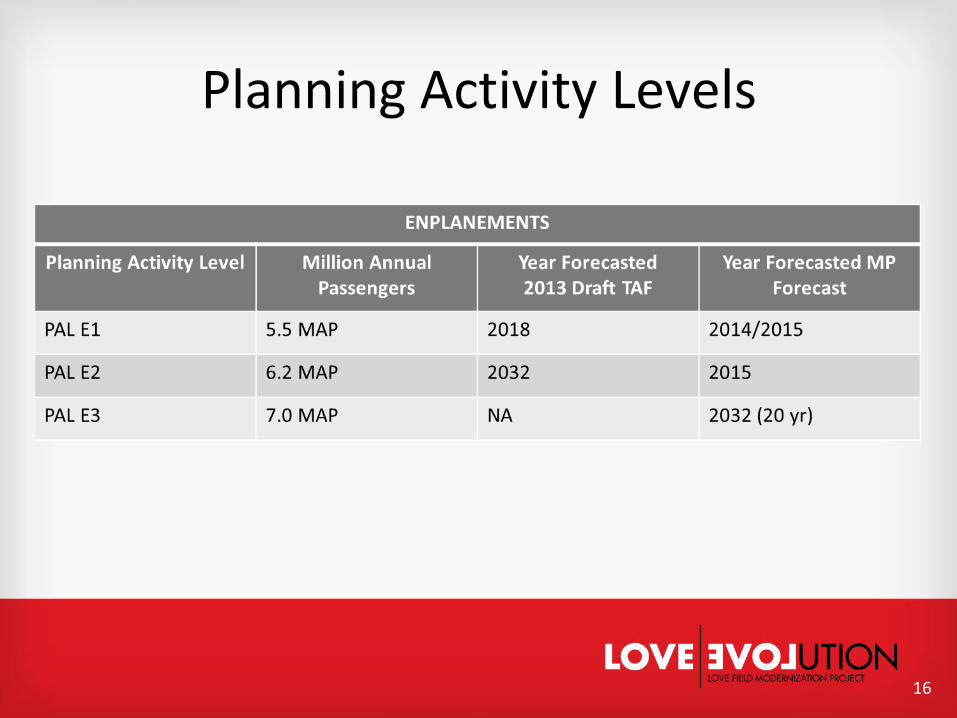
Planning Activity Levels
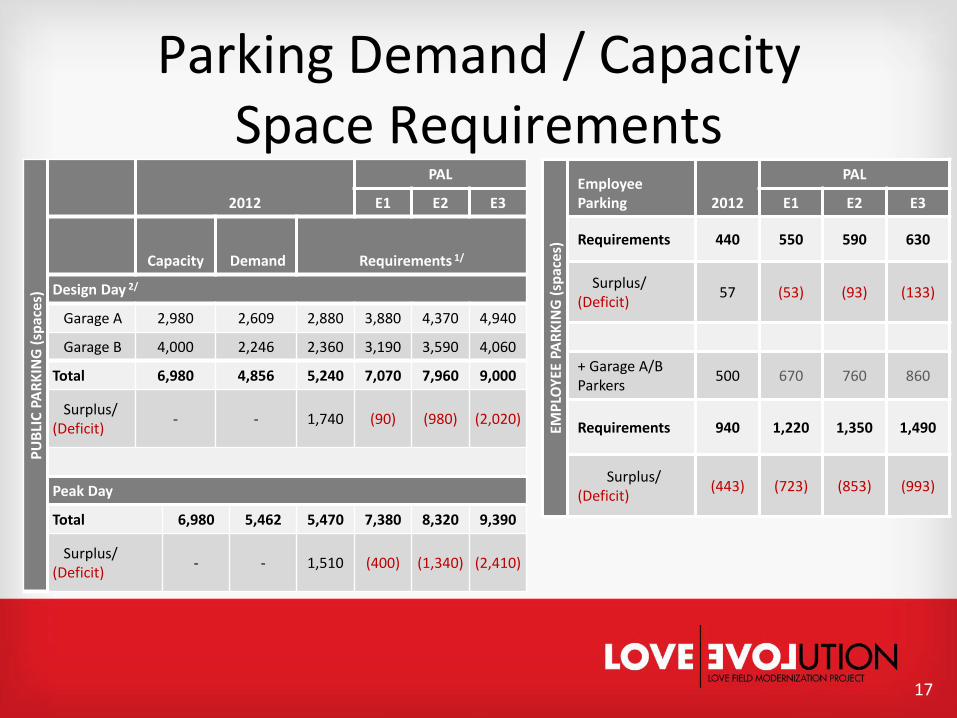
Parking Demand / Capacity Space Requirements
EMP
LOY
EE P
AR
KIN
G (
spac
es)
Employee Parking 2012
PAL
E1 E2 E3
Requirements 440 550 590 630
Surplus/ (Deficit)
57 (53) (93) (133)
+ Garage A/B Parkers
500 670 760 860
Requirements 940 1,220 1,350 1,490
Surplus/ (Deficit)
(443) (723) (853) (993)
PU
BLI
C P
AR
KIN
G (
spac
es)
2012
PAL
E1 E2 E3
Capacity Demand Requirements 1/
Design Day 2/
Garage A 2,980 2,609 2,880 3,880 4,370 4,940
Garage B 4,000 2,246 2,360 3,190 3,590 4,060
Total 6,980 4,856 5,240 7,070 7,960 9,000
Surplus/ (Deficit)
- - 1,740 (90) (980) (2,020)
Peak Day
Total 6,980 5,462 5,470 7,380 8,320 9,390
Surplus/ (Deficit)
- - 1,510 (400) (1,340) (2,410)
17
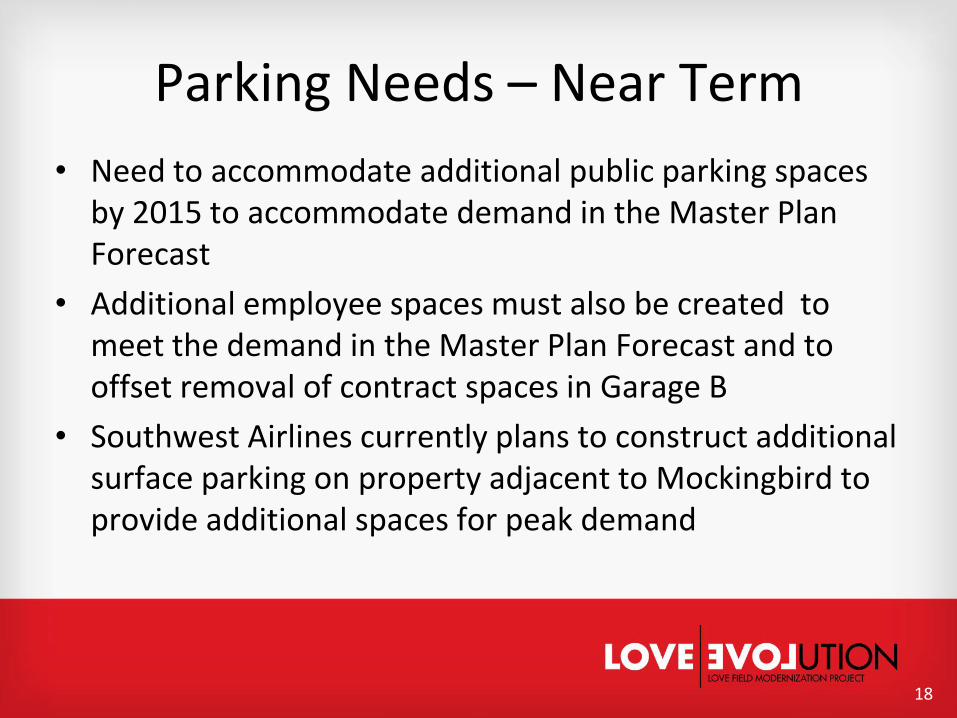
Parking Needs – Near Term
• Need to accommodate additional public parking spaces by 2015 to accommodate demand in the Master Plan Forecast
• Additional employee spaces must also be created to meet the demand in the Master Plan Forecast and to offset removal of contract spaces in Garage B
• Southwest Airlines currently plans to construct additional surface parking on property adjacent to Mockingbird to provide additional spaces for peak demand
18
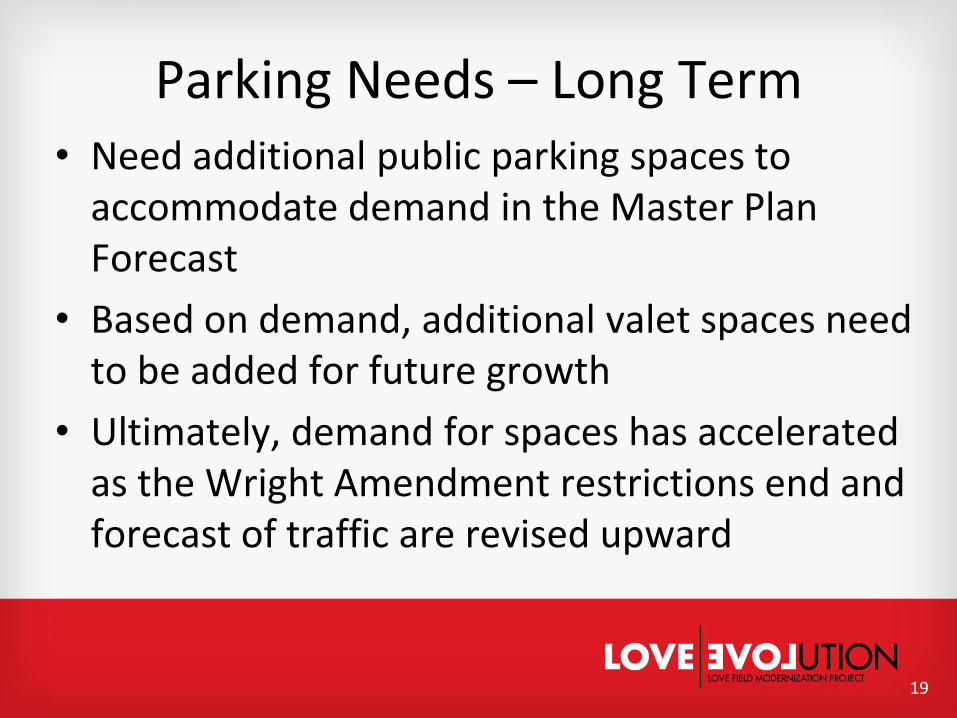
Parking Needs – Long Term • Need additional public parking spaces to
accommodate demand in the Master Plan Forecast
• Based on demand, additional valet spaces need to be added for future growth
• Ultimately, demand for spaces has accelerated as the Wright Amendment restrictions end and forecast of traffic are revised upward
19
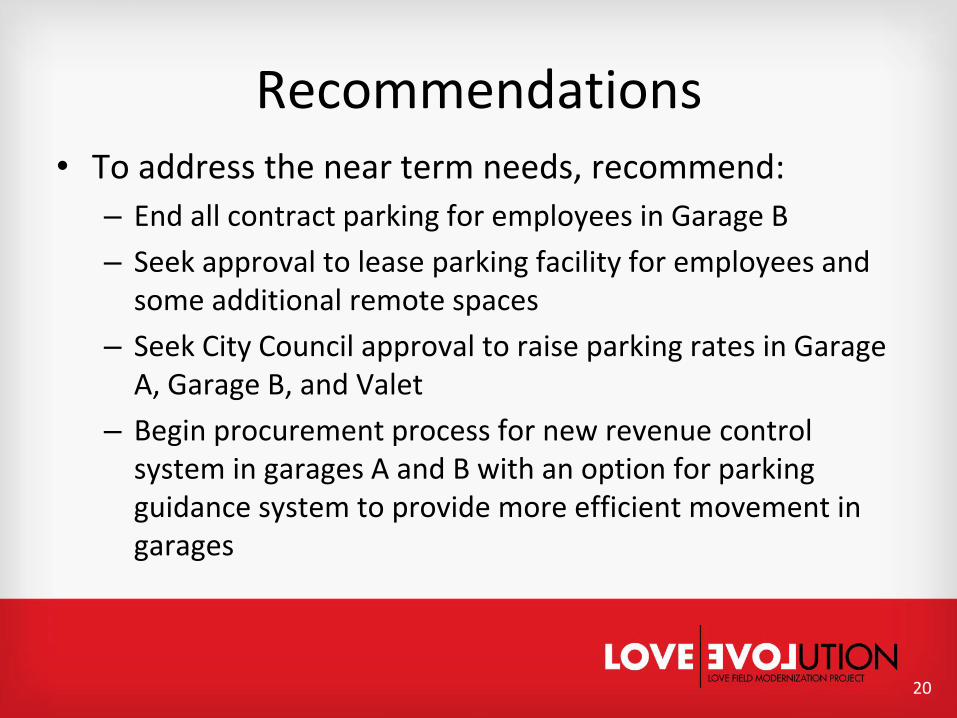
Recommendations • To address the near term needs, recommend:
– End all contract parking for employees in Garage B
– Seek approval to lease parking facility for employees and some additional remote spaces
– Seek City Council approval to raise parking rates in Garage A, Garage B, and Valet
– Begin procurement process for new revenue control system in garages A and B with an option for parking guidance system to provide more efficient movement in garages
20
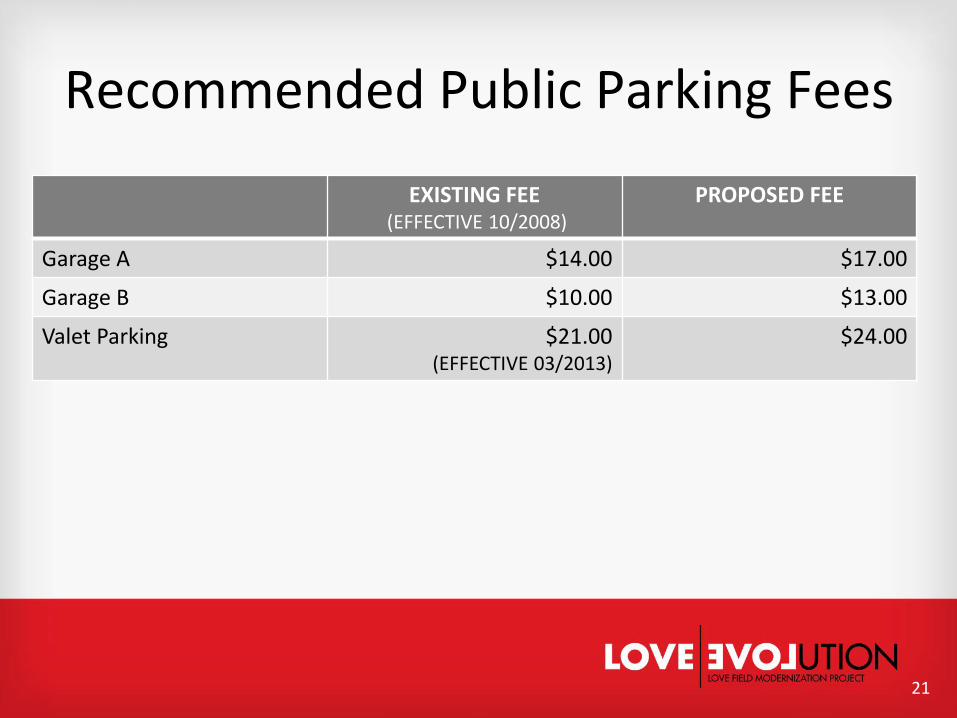
Recommended Public Parking Fees
21
EXISTING FEE (EFFECTIVE 10/2008)
PROPOSED FEE
Garage A $14.00 $17.00
Garage B $10.00 $13.00
Valet Parking $21.00 (EFFECTIVE 03/2013)
$24.00
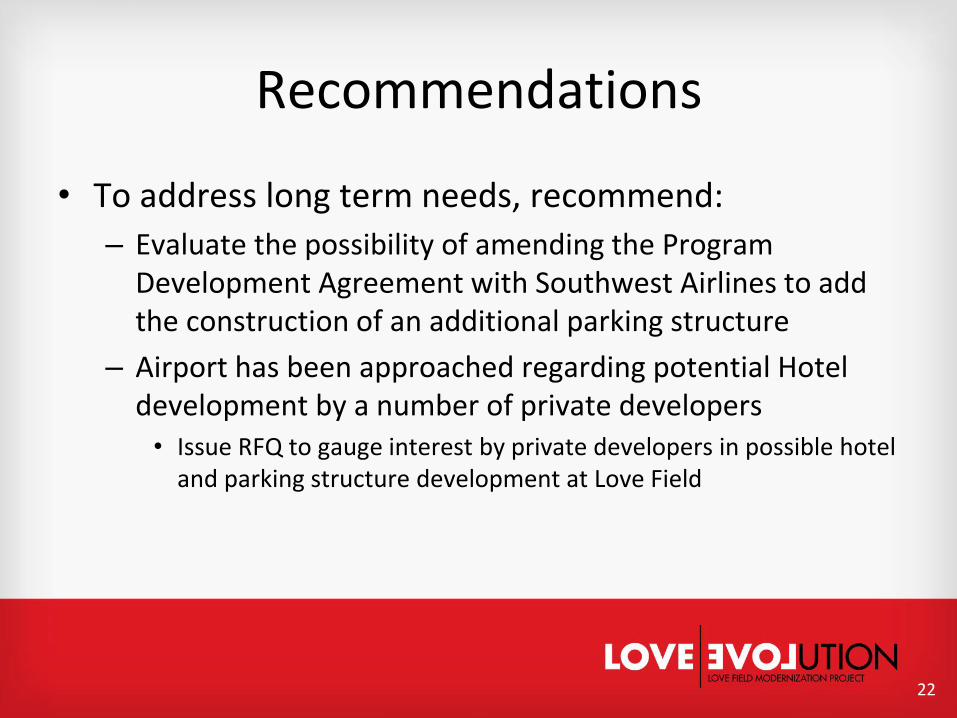
Recommendations
• To address long term needs, recommend:
– Evaluate the possibility of amending the Program Development Agreement with Southwest Airlines to add the construction of an additional parking structure
– Airport has been approached regarding potential Hotel development by a number of private developers • Issue RFQ to gauge interest by private developers in possible hotel
and parking structure development at Love Field
22

Questions
23
Budget, Finance, and Audit Committee
June 2, 2014
2
To brief the committee on the Metro Dallas Homeless Alliance and its work
To recommend support for the efforts of MDHA as the lead agency for the Continuum of Care (CoC) and their partnership with the City of Dallas
3
• MDHA is a 501(c)(3) composed of a broad spectrum of stakeholders committed to ending homelessness • Mike Faenza, President & CEO
• Britton Banosky, Chairman of the Board
• MDHA was recognized in 2006 as the “regional authority on homelessness” by the City Council to develop programs and secure funding to assure services are provided to those experiencing homelessness
• MDHA leads a group of approximately 62 agencies that make up the Continuum of Care (CoC) which meets on a regular basis to collaborate on issues to fight homelessness
4
The Homeless Emergency Assistance and Rapid Transition to Housing Act of 2009 (HEARTH Act) amended the McKinney-Vento Homeless Assistance Act
HEARTH Act codified into law the CoC planning process to assist with homeless coordination of services and addressing the needs of the homeless
CoC must establish performance and outcome measures for both competitive grants and emergency solutions grants
Grantees must consult with their local CoC regarding allocation of funds
The CoC for Dallas includes: Dallas, Dallas County, Plano-Collin County, Irving, and Garland
• Capture and Leverage Federal Funds: MDHA provides data driven stewardship, grant development and submissions for approximately $16M in HUD homeless housing grants annually
• Ensure Homeless Sector Collaboration: 62 agencies make up membership of MDHA’s CoC; develops needs assessments, strategic planning and recommend policies that inform local government’s HUD plans and funding requests
• Ensure Data Driven Solutions: MDHA developed and operates the HUD mandated data management system (HMIS) that enables performance tracking and reporting to HUD and grantees. MDHA uses outcome data to prioritize grant requests, target program performance and provide technical assistance to grantees
• DHA-MDHA PSH Initiative: MDHA partners with Dallas Housing
Authority in developing plans for crucial permanent supportive housing. MDHA focuses on the service organization and tracking of support of services necessary to make the housing placements effective
5
MDHA has been at the center of developing over 2,000 units of permanent supportive housing through the CoC and facilitating partnerships to support those clients
Resultantly, chronic homelessness has decreased by over 50% over the last seven years
MDHA helped develop, fund, and operate the Bridge with continued support planned through a coordinated access system
MDHA developed the first PSH project for children and families
MDHA developed and operates a data system that provides monthly report cards on performance to the agencies ◦ With performance data in hand, MDHA partners have improved performance
towards benchmarks by 30% over two years
6
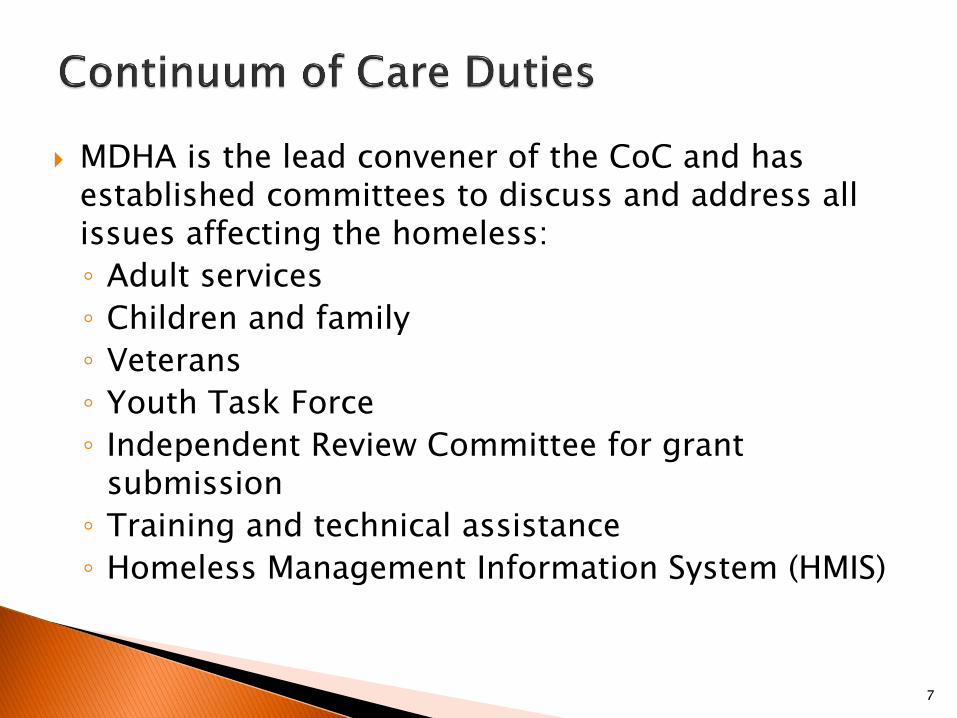
MDHA is the lead convener of the CoC and has established committees to discuss and address all issues affecting the homeless:
◦ Adult services
◦ Children and family
◦ Veterans
◦ Youth Task Force
◦ Independent Review Committee for grant submission
◦ Training and technical assistance
◦ Homeless Management Information System (HMIS)
7
8
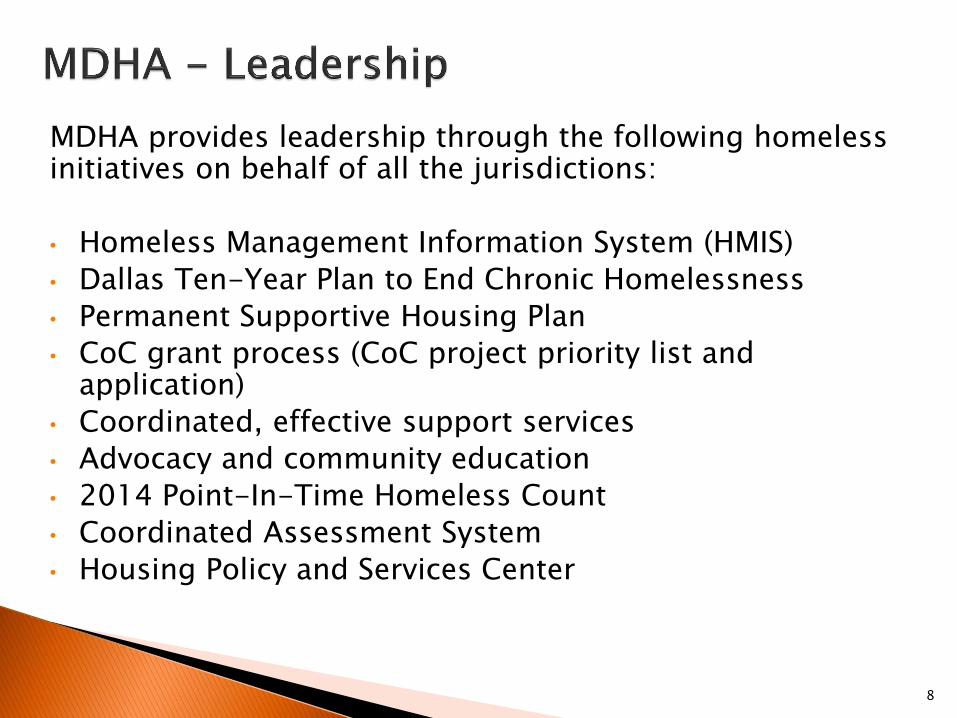
MDHA provides leadership through the following homeless initiatives on behalf of all the jurisdictions:
• Homeless Management Information System (HMIS)
• Dallas Ten-Year Plan to End Chronic Homelessness
• Permanent Supportive Housing Plan
• CoC grant process (CoC project priority list and application)
• Coordinated, effective support services
• Advocacy and community education
• 2014 Point-In-Time Homeless Count
• Coordinated Assessment System
• Housing Policy and Services Center
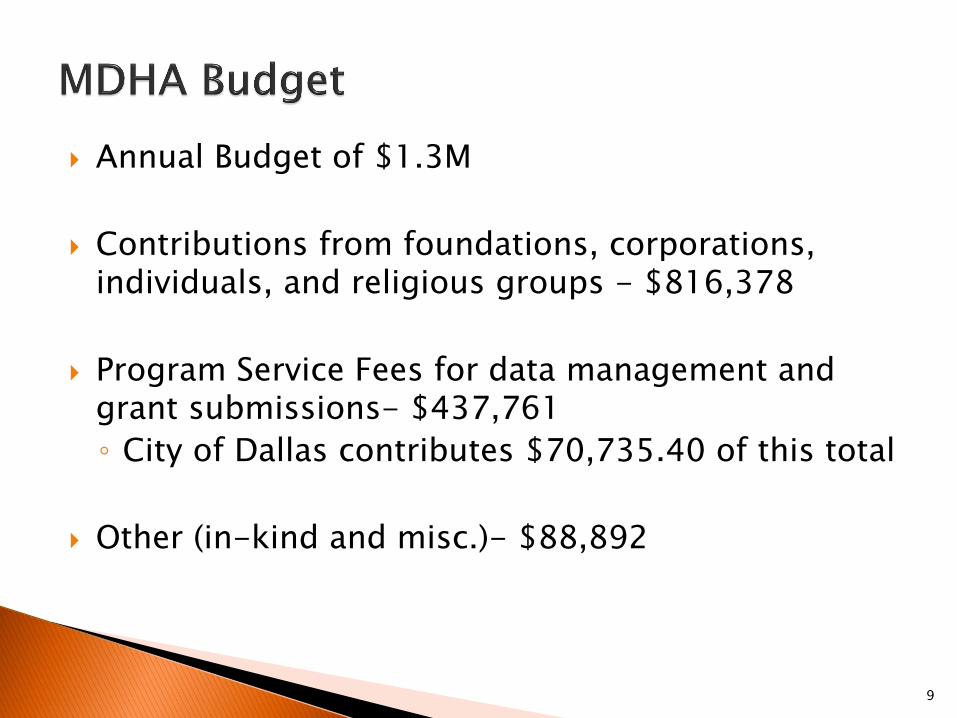
Annual Budget of $1.3M
Contributions from foundations, corporations, individuals, and religious groups - $816,378
Program Service Fees for data management and grant submissions- $437,761
◦ City of Dallas contributes $70,735.40 of this total
Other (in-kind and misc.)- $88,892
9
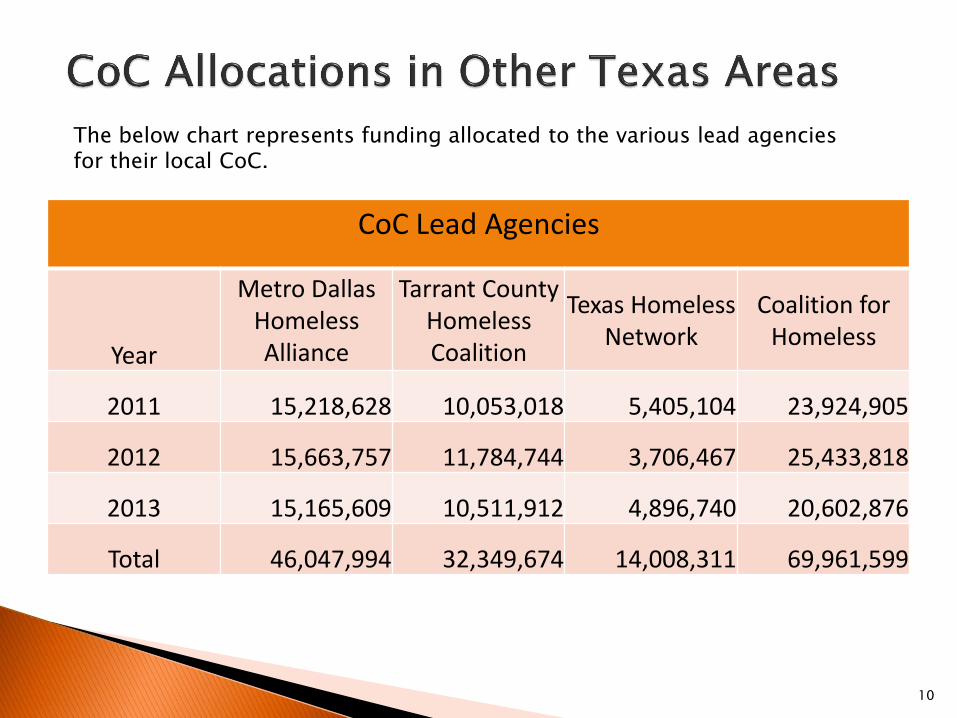
CoC Lead Agencies
Year
Metro Dallas Homeless Alliance
Tarrant County Homeless Coalition
Texas Homeless Network
Coalition for Homeless
2011 15,218,628 10,053,018 5,405,104 23,924,905
2012 15,663,757 11,784,744 3,706,467 25,433,818
2013 15,165,609 10,511,912 4,896,740 20,602,876
Total 46,047,994 32,349,674 14,008,311 69,961,599
10
The below chart represents funding allocated to the various lead agencies for their local CoC.
11
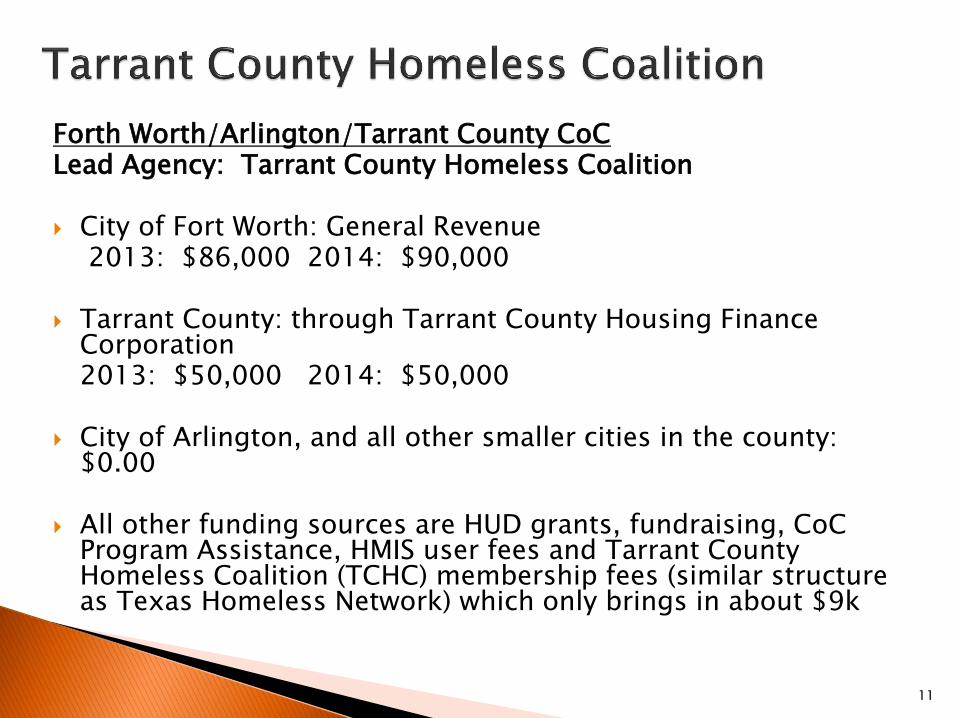
Forth Worth/Arlington/Tarrant County CoC Lead Agency: Tarrant County Homeless Coalition
City of Fort Worth: General Revenue 2013: $86,000 2014: $90,000
Tarrant County: through Tarrant County Housing Finance
Corporation 2013: $50,000 2014: $50,000
City of Arlington, and all other smaller cities in the county:
$0.00
All other funding sources are HUD grants, fundraising, CoC Program Assistance, HMIS user fees and Tarrant County Homeless Coalition (TCHC) membership fees (similar structure as Texas Homeless Network) which only brings in about $9k
12
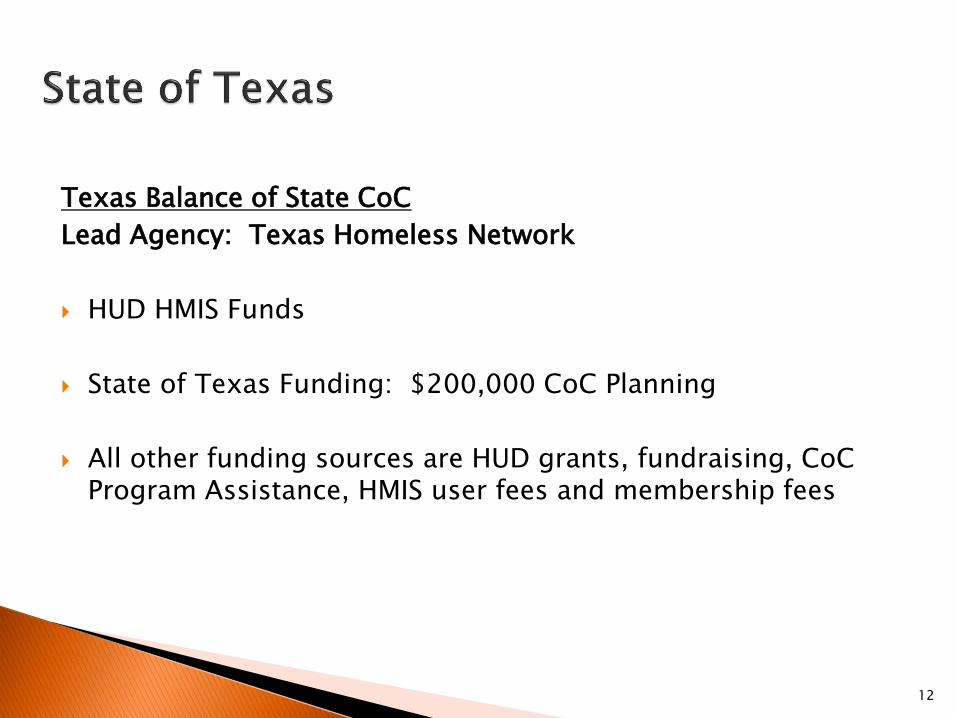
Texas Balance of State CoC
Lead Agency: Texas Homeless Network
HUD HMIS Funds
State of Texas Funding: $200,000 CoC Planning
All other funding sources are HUD grants, fundraising, CoC Program Assistance, HMIS user fees and membership fees
13
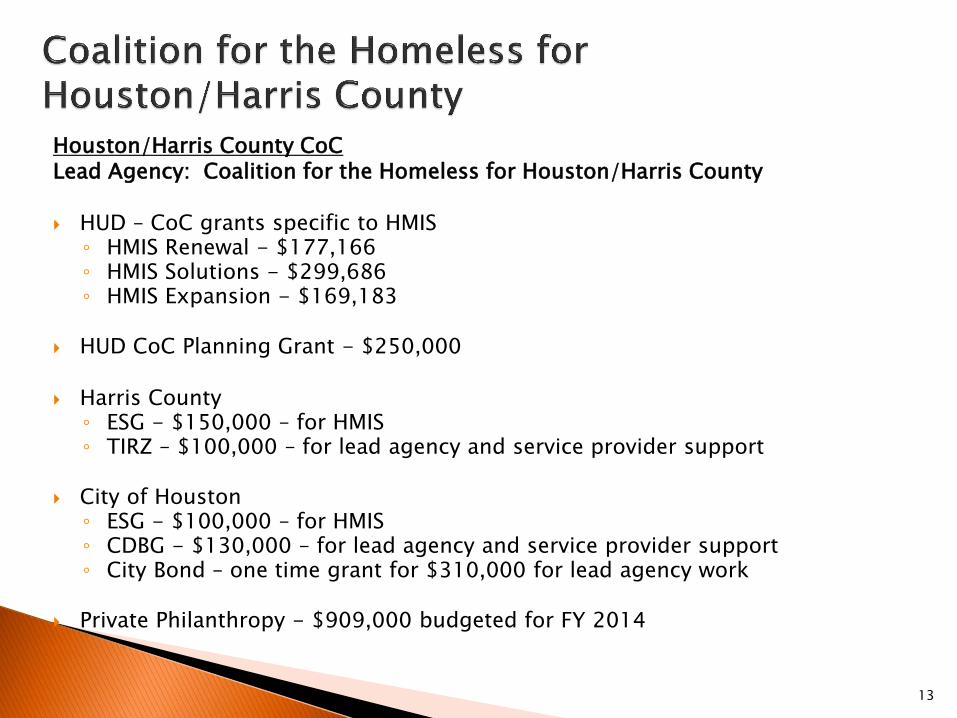
Houston/Harris County CoC Lead Agency: Coalition for the Homeless for Houston/Harris County
HUD – CoC grants specific to HMIS
◦ HMIS Renewal - $177,166 ◦ HMIS Solutions - $299,686 ◦ HMIS Expansion - $169,183
HUD CoC Planning Grant - $250,000
Harris County ◦ ESG - $150,000 – for HMIS ◦ TIRZ – $100,000 – for lead agency and service provider support
City of Houston
◦ ESG - $100,000 – for HMIS ◦ CDBG - $130,000 – for lead agency and service provider support ◦ City Bond – one time grant for $310,000 for lead agency work
Private Philanthropy - $909,000 budgeted for FY 2014
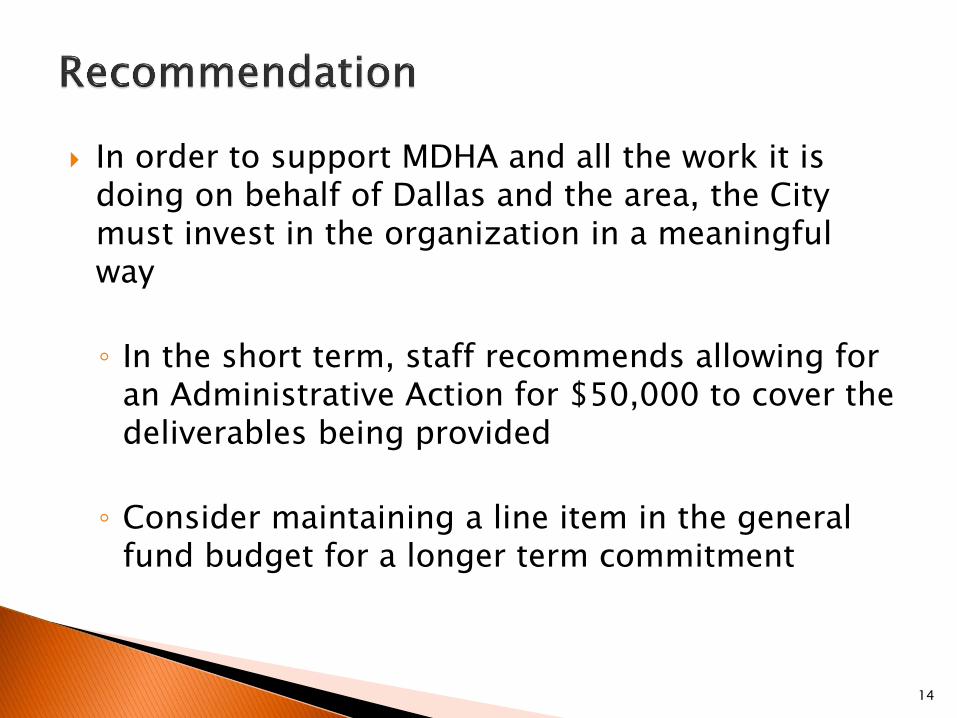
In order to support MDHA and all the work it is doing on behalf of Dallas and the area, the City must invest in the organization in a meaningful way
◦ In the short term, staff recommends allowing for an Administrative Action for $50,000 to cover the deliverables being provided
◦ Consider maintaining a line item in the general fund budget for a longer term commitment
14
15
Challenge other municipalities to join the City of Dallas in financially supporting MDHA’s efforts for advocacy, data management, planning, fund raising, leveraging of funds, providing technical assistance to service agencies, and in the long term, eliminating homelessness.
Memorandum
DATE May 30, 2014 CITY OF DALLAS
TO The Honorable Mayor and Members of the City Council
suBJECT Financial Forecast Report
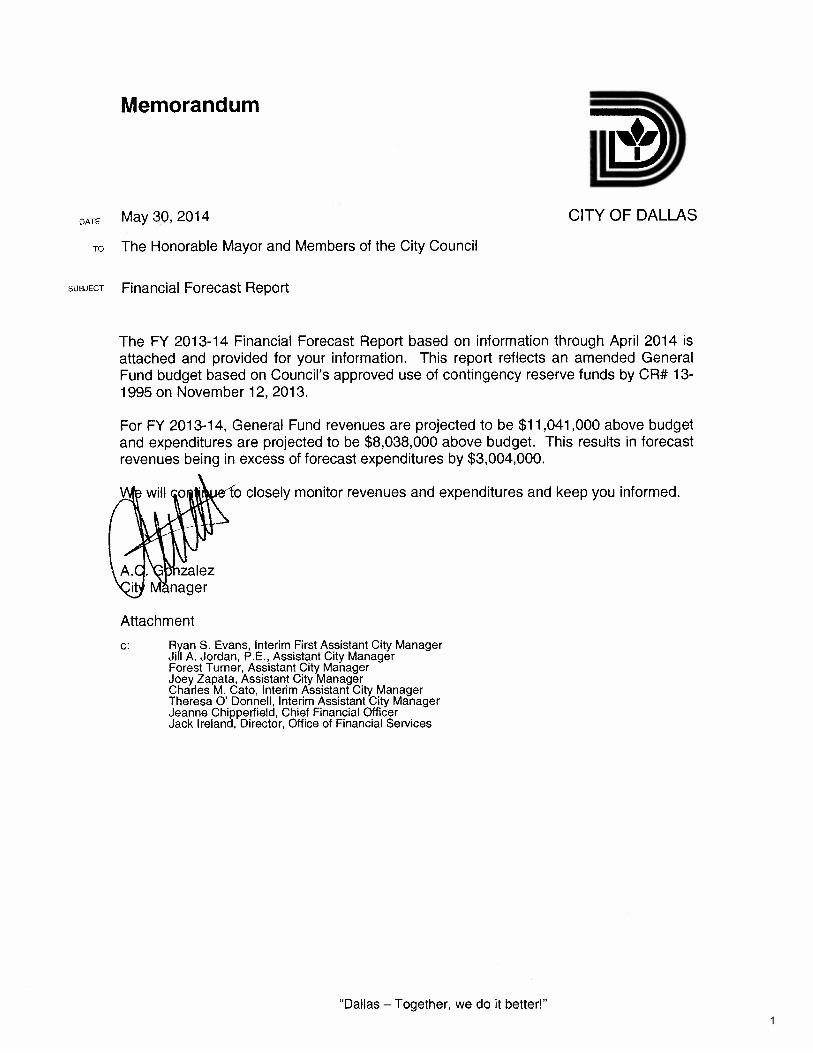
The FY 2013-14 Financial Forecast Report based on information through April 2014 isattached and provided for your information. This report reflects an amended GeneralFund budget based on Council’s approved use of contingency reserve funds by CR# 13-1995 on November 12, 2013.
For FY 2013-14, General Fund revenues are projected to be $1 1,041,000 above budgetand expenditures are projected to be $8,038,000 above budget. This results in forecastrevenues being in excess of forecast expenditures by $3,004,000.
willofo closely monitor revenues and expenditures and keep you informed.
\ A.d’l,alez‘q ivtnager
Attachment
C: Ryan S. Evans, Interim First Assistant City ManagerJill A. Jordan, P.E, Assistant City ManagerForest Turner, Assistant City ManagerJoey Zapata, Assistant City ManagerCharles M. Cato, Interim Assistant City ManagerTheresa 0’ Donnell, Interim Assistant City ManagerJeanne Chipperfield, Chief Financial OfficerJack Ireland, Director, Office of Financial Services
“Dallas — Together, we do it better!”1
BUDGET VSYEAR-END FORECAST
ITEM BUDGET YEAR TO DATE FORECAST VARIANCE
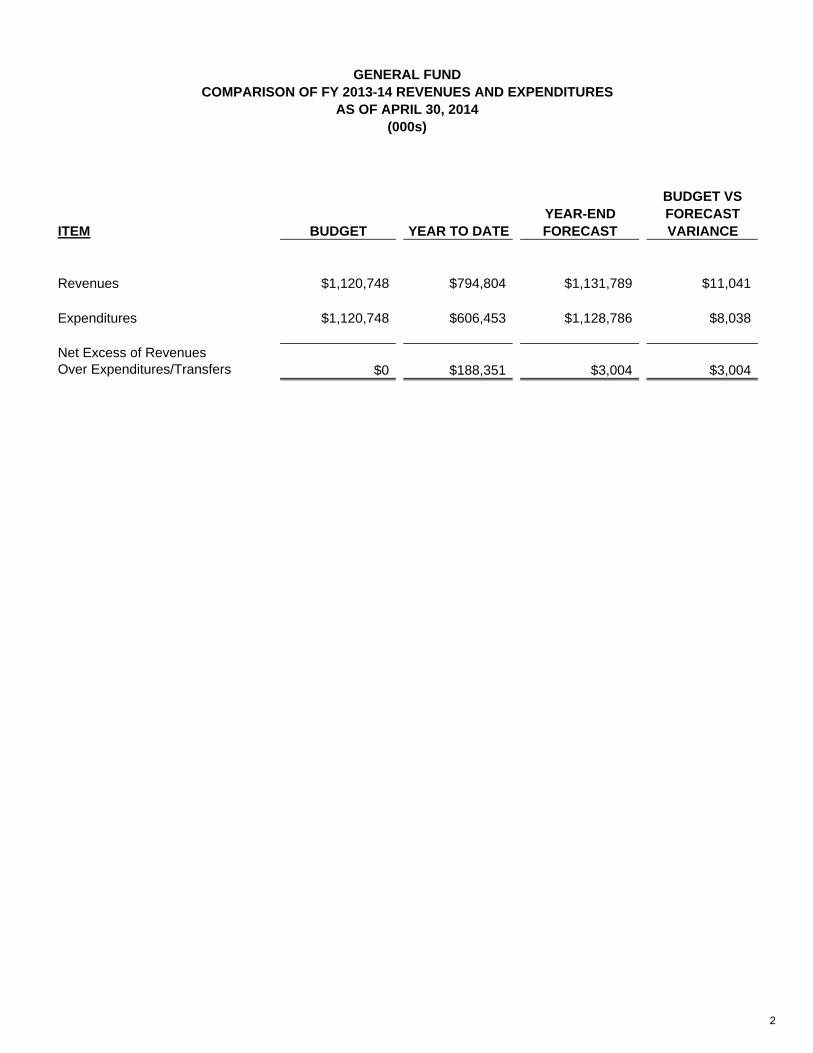
Revenues $1,120,748 $794,804 $1,131,789 $11,041
Expenditures $1,120,748 $606,453 $1,128,786 $8,038
Net Excess of RevenuesOver Expenditures/Transfers $0 $188,351 $3,004 $3,004
GENERAL FUNDCOMPARISON OF FY 2013-14 REVENUES AND EXPENDITURES
AS OF APRIL 30, 2014(000s)
5/29/2014 1:00 PM
2
FINANCIAL FORECAST REPORT
FY 2013-14 AS OF APRIL 30, 2014
GENERAL FUND Revenues
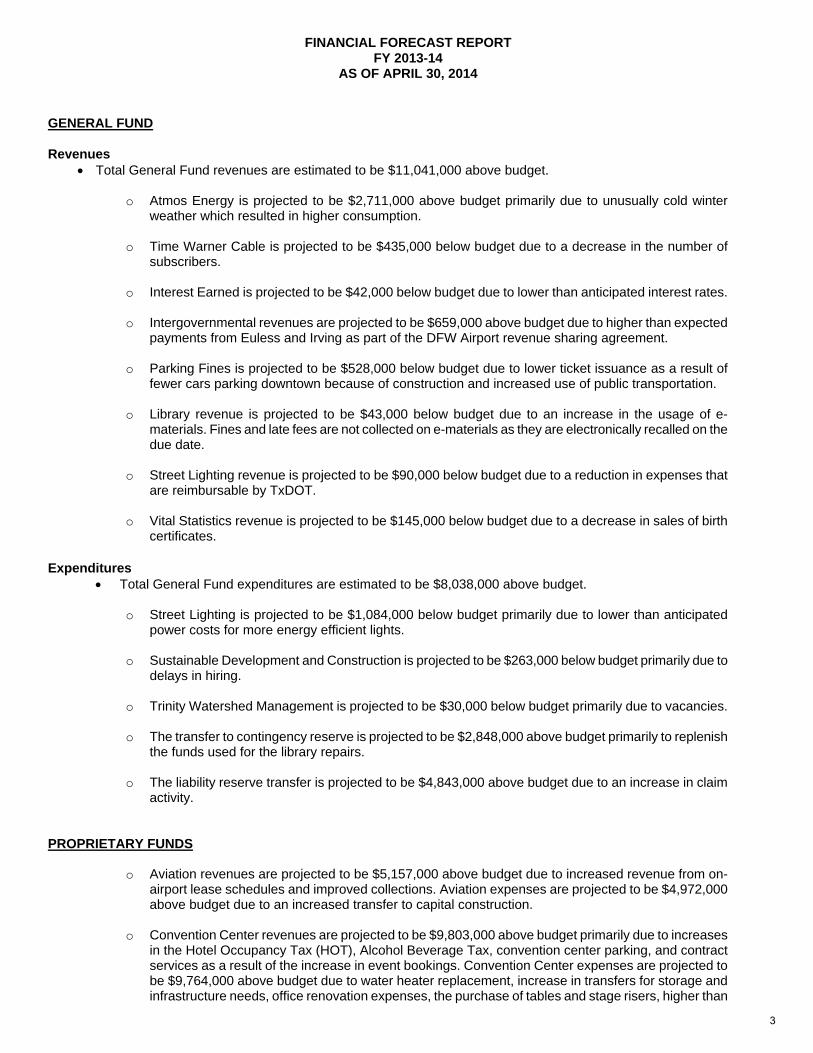
Total General Fund revenues are estimated to be $11,041,000 above budget.
o Atmos Energy is projected to be $2,711,000 above budget primarily due to unusually cold winter weather which resulted in higher consumption.
o Time Warner Cable is projected to be $435,000 below budget due to a decrease in the number of subscribers.
o Interest Earned is projected to be $42,000 below budget due to lower than anticipated interest rates.
o Intergovernmental revenues are projected to be $659,000 above budget due to higher than expected
payments from Euless and Irving as part of the DFW Airport revenue sharing agreement.
o Parking Fines is projected to be $528,000 below budget due to lower ticket issuance as a result of fewer cars parking downtown because of construction and increased use of public transportation.
o Library revenue is projected to be $43,000 below budget due to an increase in the usage of e-materials. Fines and late fees are not collected on e-materials as they are electronically recalled on the due date.
o Street Lighting revenue is projected to be $90,000 below budget due to a reduction in expenses that
are reimbursable by TxDOT.
o Vital Statistics revenue is projected to be $145,000 below budget due to a decrease in sales of birth certificates.
Expenditures
Total General Fund expenditures are estimated to be $8,038,000 above budget.
o Street Lighting is projected to be $1,084,000 below budget primarily due to lower than anticipated power costs for more energy efficient lights.
o Sustainable Development and Construction is projected to be $263,000 below budget primarily due to delays in hiring.
o Trinity Watershed Management is projected to be $30,000 below budget primarily due to vacancies.
o The transfer to contingency reserve is projected to be $2,848,000 above budget primarily to replenish
the funds used for the library repairs.
o The liability reserve transfer is projected to be $4,843,000 above budget due to an increase in claim activity.
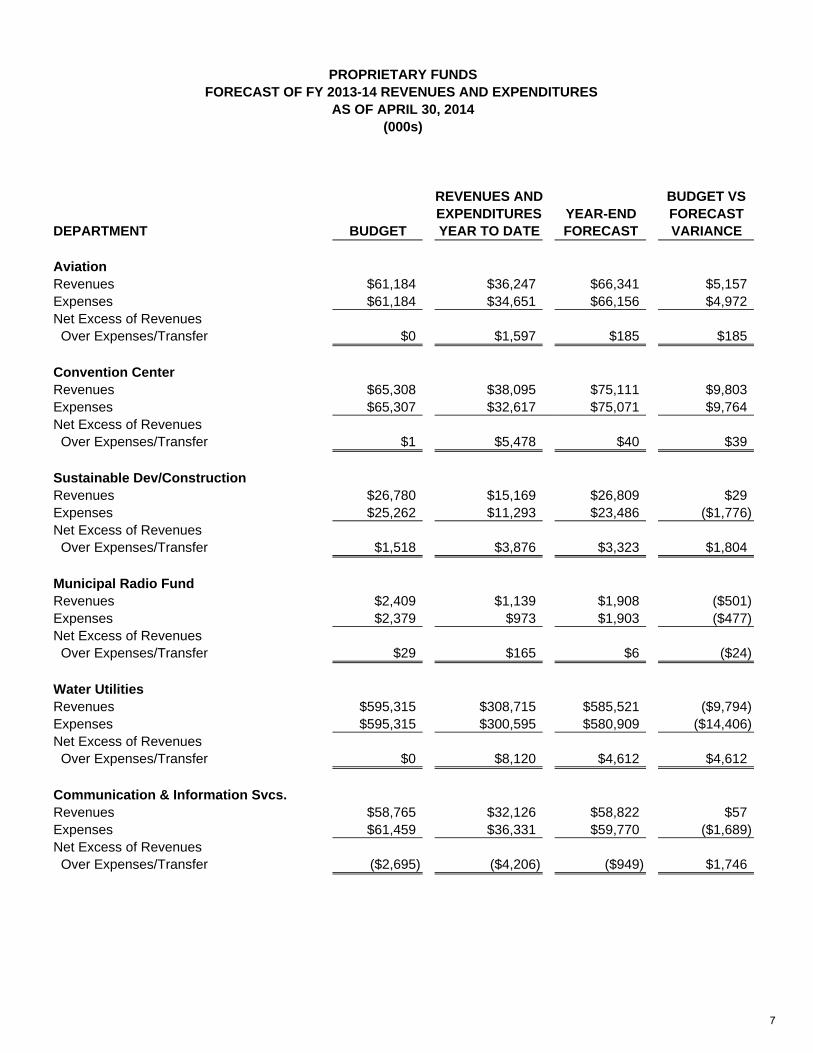
PROPRIETARY FUNDS
o Aviation revenues are projected to be $5,157,000 above budget due to increased revenue from on-
airport lease schedules and improved collections. Aviation expenses are projected to be $4,972,000 above budget due to an increased transfer to capital construction.
o Convention Center revenues are projected to be $9,803,000 above budget primarily due to increases in the Hotel Occupancy Tax (HOT), Alcohol Beverage Tax, convention center parking, and contract services as a result of the increase in event bookings. Convention Center expenses are projected to be $9,764,000 above budget due to water heater replacement, increase in transfers for storage and infrastructure needs, office renovation expenses, the purchase of tables and stage risers, higher than
3
FINANCIAL FORECAST REPORT
FY 2013-14 AS OF APRIL 30, 2014
anticipated costs for a concession contract, and an increase in the payment to DCVB as a result of the increased HOT revenue.
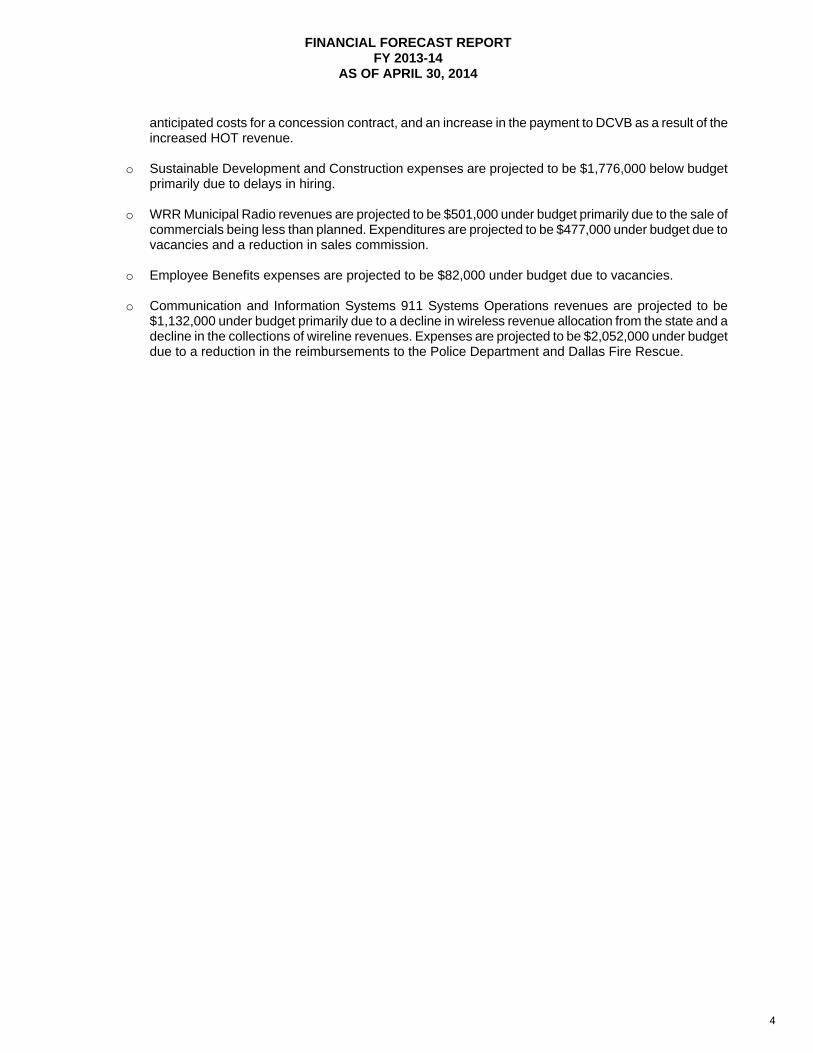
o Sustainable Development and Construction expenses are projected to be $1,776,000 below budget primarily due to delays in hiring.
o WRR Municipal Radio revenues are projected to be $501,000 under budget primarily due to the sale of commercials being less than planned. Expenditures are projected to be $477,000 under budget due to vacancies and a reduction in sales commission.
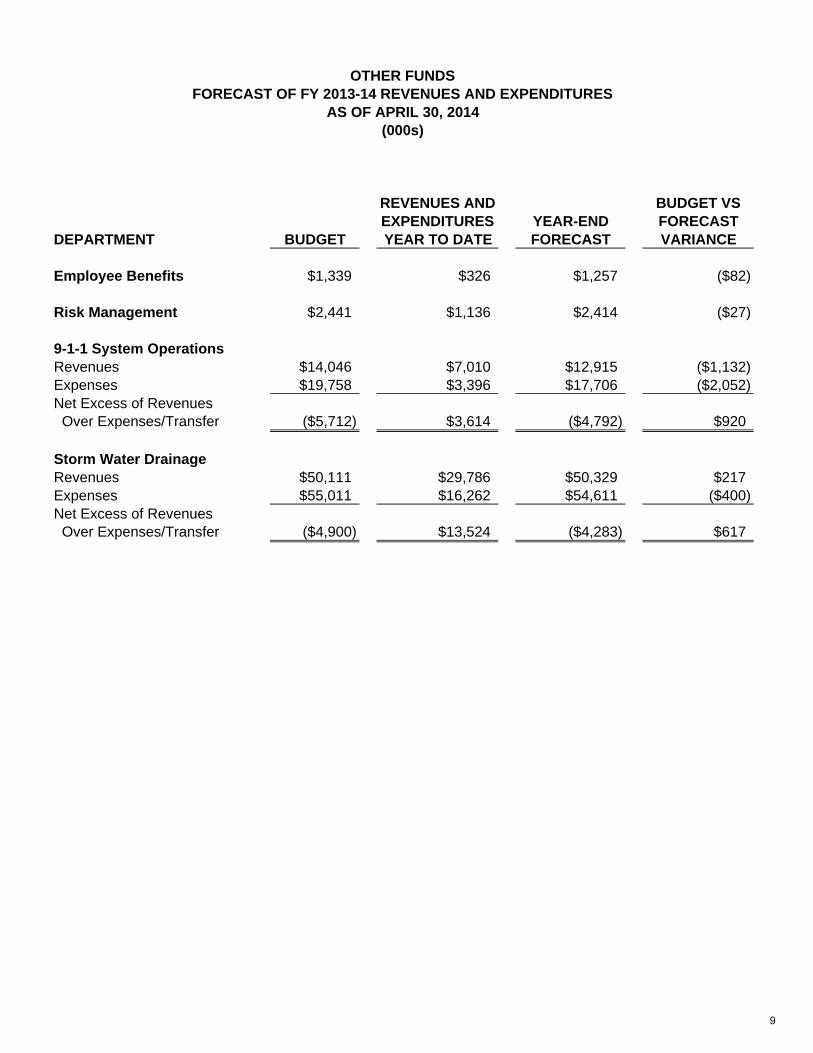
o Employee Benefits expenses are projected to be $82,000 under budget due to vacancies.
o Communication and Information Systems 911 Systems Operations revenues are projected to be
$1,132,000 under budget primarily due to a decline in wireless revenue allocation from the state and a decline in the collections of wireline revenues. Expenses are projected to be $2,052,000 under budget due to a reduction in the reimbursements to the Police Department and Dallas Fire Rescue.
4
BUDGET VSREVENUES YEAR-END FORECAST
BUDGET YEAR TO DATE FORECAST VARIANCE
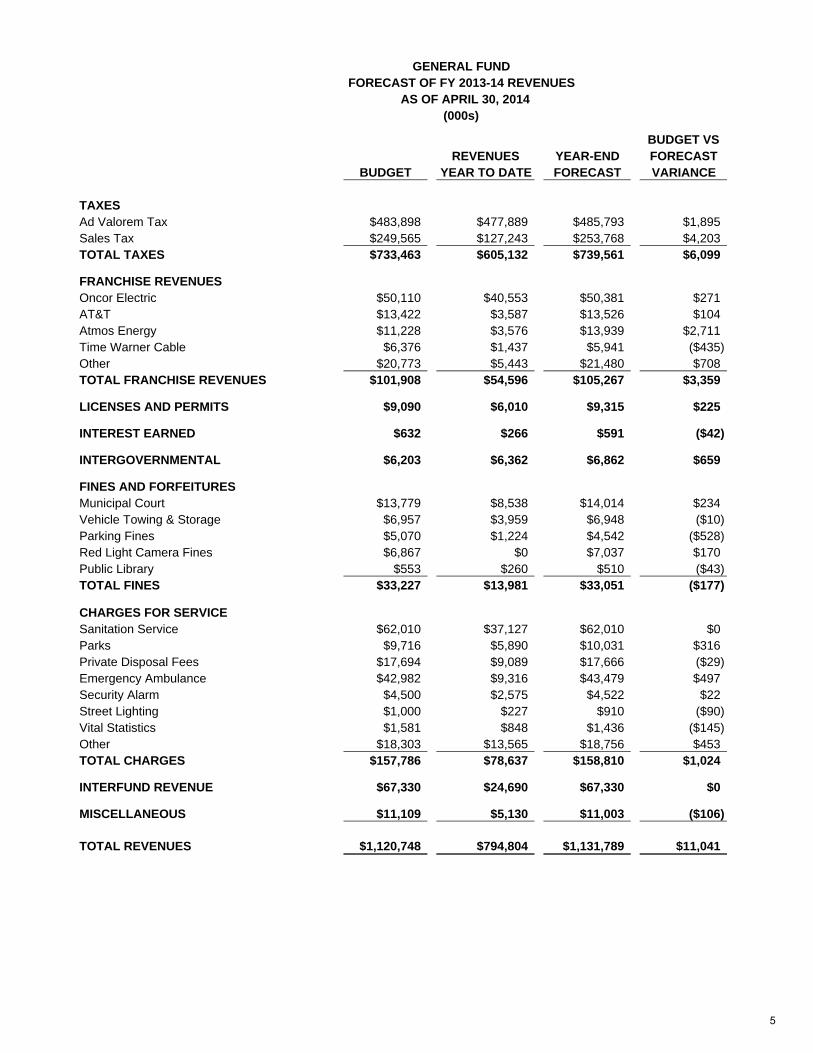
TAXESAd Valorem Tax $483,898 $477,889 $485,793 $1,895Sales Tax $249,565 $127,243 $253,768 $4,203TOTAL TAXES $733,463 $605,132 $739,561 $6,099
FRANCHISE REVENUESOncor Electric $50,110 $40,553 $50,381 $271AT&T $13,422 $3,587 $13,526 $104Atmos Energy $11,228 $3,576 $13,939 $2,711Time Warner Cable $6,376 $1,437 $5,941 ($435)Other $20,773 $5,443 $21,480 $708TOTAL FRANCHISE REVENUES $101,908 $54,596 $105,267 $3,359
LICENSES AND PERMITS $9,090 $6,010 $9,315 $225
INTEREST EARNED $632 $266 $591 ($42)
INTERGOVERNMENTAL $6,203 $6,362 $6,862 $659
FINES AND FORFEITURES Municipal Court $13,779 $8,538 $14,014 $234Vehicle Towing & Storage $6,957 $3,959 $6,948 ($10)Parking Fines $5,070 $1,224 $4,542 ($528)Red Light Camera Fines $6,867 $0 $7,037 $170Public Library $553 $260 $510 ($43)TOTAL FINES $33,227 $13,981 $33,051 ($177)
CHARGES FOR SERVICE Sanitation Service $62,010 $37,127 $62,010 $0Parks $9,716 $5,890 $10,031 $316Private Disposal Fees $17,694 $9,089 $17,666 ($29)Emergency Ambulance $42,982 $9,316 $43,479 $497Security Alarm $4,500 $2,575 $4,522 $22Street Lighting $1,000 $227 $910 ($90)Vital Statistics $1,581 $848 $1,436 ($145)Other $18,303 $13,565 $18,756 $453TOTAL CHARGES $157,786 $78,637 $158,810 $1,024
INTERFUND REVENUE $67,330 $24,690 $67,330 $0
MISCELLANEOUS $11,109 $5,130 $11,003 ($106)TOTAL REVENUE $387,285 $189,672 $392,228 $4,943TOTAL REVENUES $1,120,748 $794,804 $1,131,789 $11,041
(000s)
GENERAL FUNDFORECAST OF FY 2013-14 REVENUES
AS OF APRIL 30, 2014
5
BUDGET VSEXPENDITURES YEAR-END FORECAST
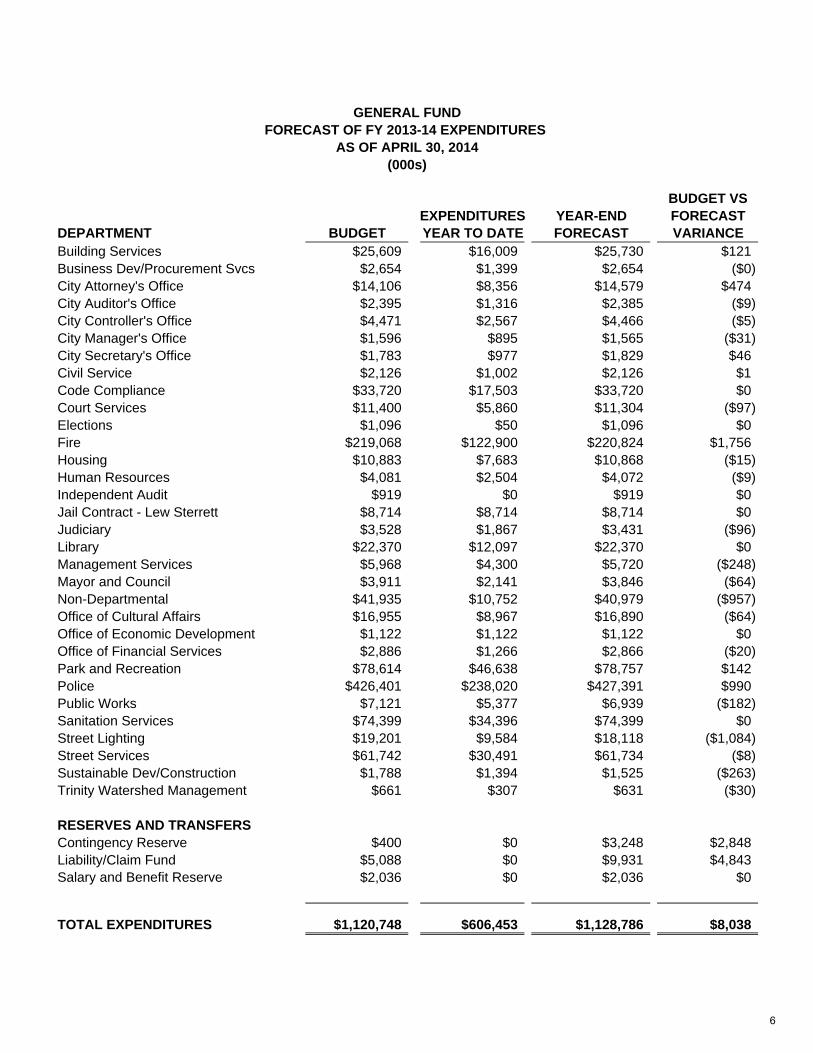
DEPARTMENT BUDGET YEAR TO DATE FORECAST VARIANCEBuilding Services $25,609 $16,009 $25,730 $121Business Dev/Procurement Svcs $2,654 $1,399 $2,654 ($0)City Attorney's Office $14,106 $8,356 $14,579 $474City Auditor's Office $2,395 $1,316 $2,385 ($9)City Controller's Office $4,471 $2,567 $4,466 ($5)City Manager's Office $1,596 $895 $1,565 ($31)City Secretary's Office $1,783 $977 $1,829 $46Civil Service $2,126 $1,002 $2,126 $1Code Compliance $33,720 $17,503 $33,720 $0Court Services $11,400 $5,860 $11,304 ($97)Elections $1,096 $50 $1,096 $0Fire $219,068 $122,900 $220,824 $1,756Housing $10,883 $7,683 $10,868 ($15)Human Resources $4,081 $2,504 $4,072 ($9)Independent Audit $919 $0 $919 $0Jail Contract - Lew Sterrett $8,714 $8,714 $8,714 $0Judiciary $3,528 $1,867 $3,431 ($96)Library $22,370 $12,097 $22,370 $0Management Services $5,968 $4,300 $5,720 ($248)Mayor and Council $3,911 $2,141 $3,846 ($64)Non-Departmental $41,935 $10,752 $40,979 ($957)Office of Cultural Affairs $16,955 $8,967 $16,890 ($64)Office of Economic Development $1,122 $1,122 $1,122 $0Office of Financial Services $2,886 $1,266 $2,866 ($20)Park and Recreation $78,614 $46,638 $78,757 $142Police $426,401 $238,020 $427,391 $990Public Works $7,121 $5,377 $6,939 ($182)Sanitation Services $74,399 $34,396 $74,399 $0Street Lighting $19,201 $9,584 $18,118 ($1,084)Street Services $61,742 $30,491 $61,734 ($8)Sustainable Dev/Construction $1,788 $1,394 $1,525 ($263)Trinity Watershed Management $661 $307 $631 ($30)
RESERVES AND TRANSFERSContingency Reserve $400 $0 $3,248 $2,848Liability/Claim Fund $5,088 $0 $9,931 $4,843Salary and Benefit Reserve $2,036 $0 $2,036 $0
TOTAL EXPENDITURES $1,120,748 $606,453 $1,128,786 $8,038
GENERAL FUNDFORECAST OF FY 2013-14 EXPENDITURES
AS OF APRIL 30, 2014(000s)
6
REVENUES AND BUDGET VSEXPENDITURES YEAR-END FORECAST
DEPARTMENT BUDGET YEAR TO DATE FORECAST VARIANCE
Aviation Revenues $61,184 $36,247 $66,341 $5,157Expenses $61,184 $34,651 $66,156 $4,972Net Excess of Revenues Over Expenses/Transfer $0 $1,597 $185 $185
Convention CenterRevenues $65,308 $38,095 $75,111 $9,803Expenses $65,307 $32,617 $75,071 $9,764Net Excess of Revenues Over Expenses/Transfer $1 $5,478 $40 $39
Sustainable Dev/ConstructionRevenues $26,780 $15,169 $26,809 $29Expenses $25,262 $11,293 $23,486 ($1,776)Net Excess of Revenues Over Expenses/Transfer $1,518 $3,876 $3,323 $1,804
Municipal Radio FundRevenues $2,409 $1,139 $1,908 ($501)Expenses $2,379 $973 $1,903 ($477)Net Excess of Revenues Over Expenses/Transfer $29 $165 $6 ($24)
Water Utilities Revenues $595,315 $308,715 $585,521 ($9,794)Expenses $595,315 $300,595 $580,909 ($14,406)Net Excess of Revenues Over Expenses/Transfer $0 $8,120 $4,612 $4,612
Communication & Information Svcs. Revenues $58,765 $32,126 $58,822 $57Expenses $61,459 $36,331 $59,770 ($1,689)Net Excess of Revenues Over Expenses/Transfer ($2,695) ($4,206) ($949) $1,746
(000s)
FORECAST OF FY 2013-14 REVENUES AND EXPENDITURES PROPRIETARY FUNDS
AS OF APRIL 30, 2014
7
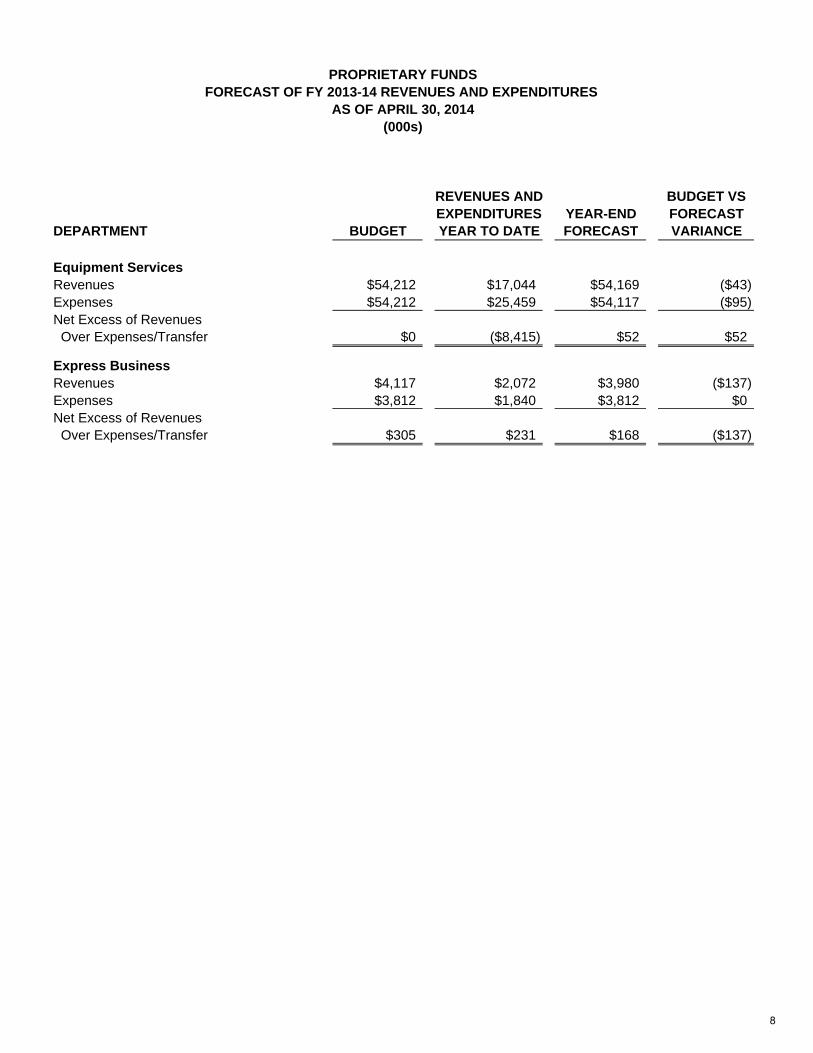
REVENUES AND BUDGET VSEXPENDITURES YEAR-END FORECAST
DEPARTMENT BUDGET YEAR TO DATE FORECAST VARIANCE
(000s)
FORECAST OF FY 2013-14 REVENUES AND EXPENDITURES PROPRIETARY FUNDS
AS OF APRIL 30, 2014
Equipment ServicesRevenues $54,212 $17,044 $54,169 ($43)Expenses $54,212 $25,459 $54,117 ($95)Net Excess of Revenues Over Expenses/Transfer $0 ($8,415) $52 $52
Express Business Revenues $4,117 $2,072 $3,980 ($137)Expenses $3,812 $1,840 $3,812 $0Net Excess of Revenues Over Expenses/Transfer $305 $231 $168 ($137)
8
(000s)
REVENUES AND BUDGET VSEXPENDITURES YEAR-END FORECAST
DEPARTMENT BUDGET YEAR TO DATE FORECAST VARIANCE
Employee Benefits $1,339 $326 $1,257 ($82)
Risk Management $2,441 $1,136 $2,414 ($27)
9-1-1 System OperationsRevenues $14,046 $7,010 $12,915 ($1,132)Expenses $19,758 $3,396 $17,706 ($2,052)Net Excess of Revenues Over Expenses/Transfer ($5,712) $3,614 ($4,792) $920
Storm Water DrainageRevenues $50,111 $29,786 $50,329 $217Expenses $55,011 $16,262 $54,611 ($400)Net Excess of Revenues Over Expenses/Transfer ($4,900) $13,524 ($4,283) $617
AS OF APRIL 30, 2014FORECAST OF FY 2013-14 REVENUES AND EXPENDITURES
OTHER FUNDS
9
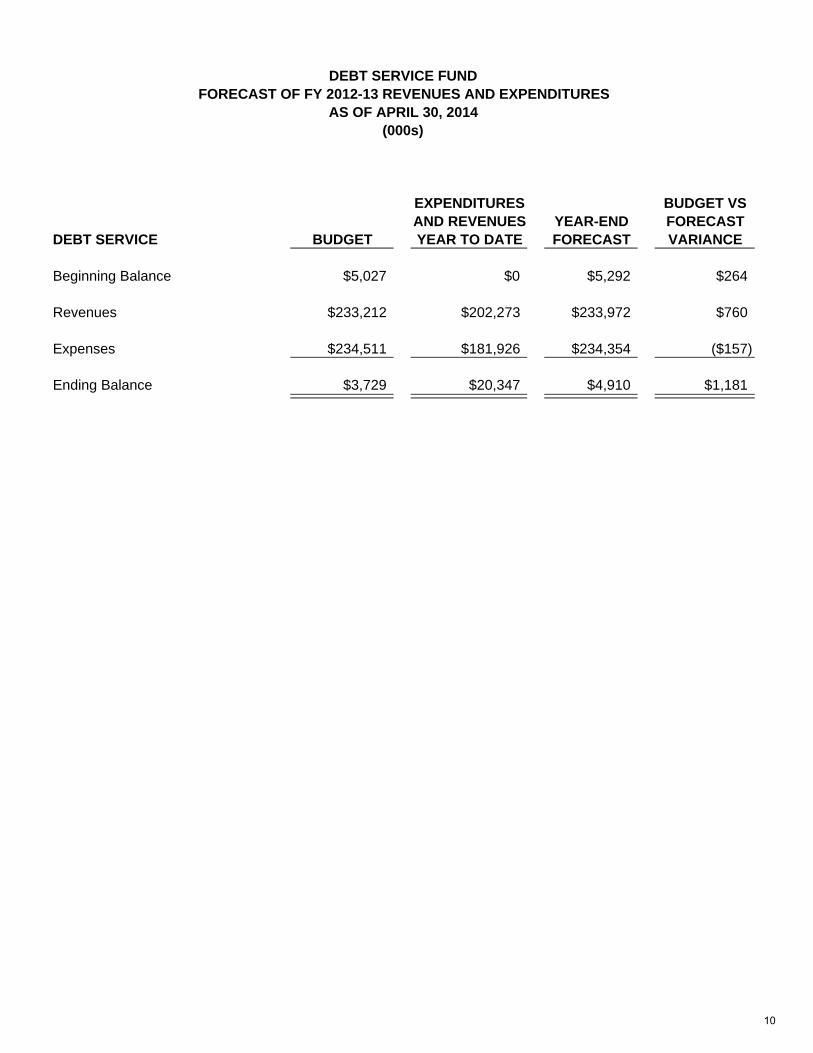
EXPENDITURES BUDGET VSAND REVENUES YEAR-END FORECAST
DEBT SERVICE BUDGET YEAR TO DATE FORECAST VARIANCE
Beginning Balance $5,027 $0 $5,292 $264
Revenues $233,212 $202,273 $233,972 $760
Expenses $234,511 $181,926 $234,354 ($157)
Ending Balance $3,729 $20,347 $4,910 $1,181
DEBT SERVICE FUNDFORECAST OF FY 2012-13 REVENUES AND EXPENDITURES
AS OF APRIL 30, 2014(000s)
10
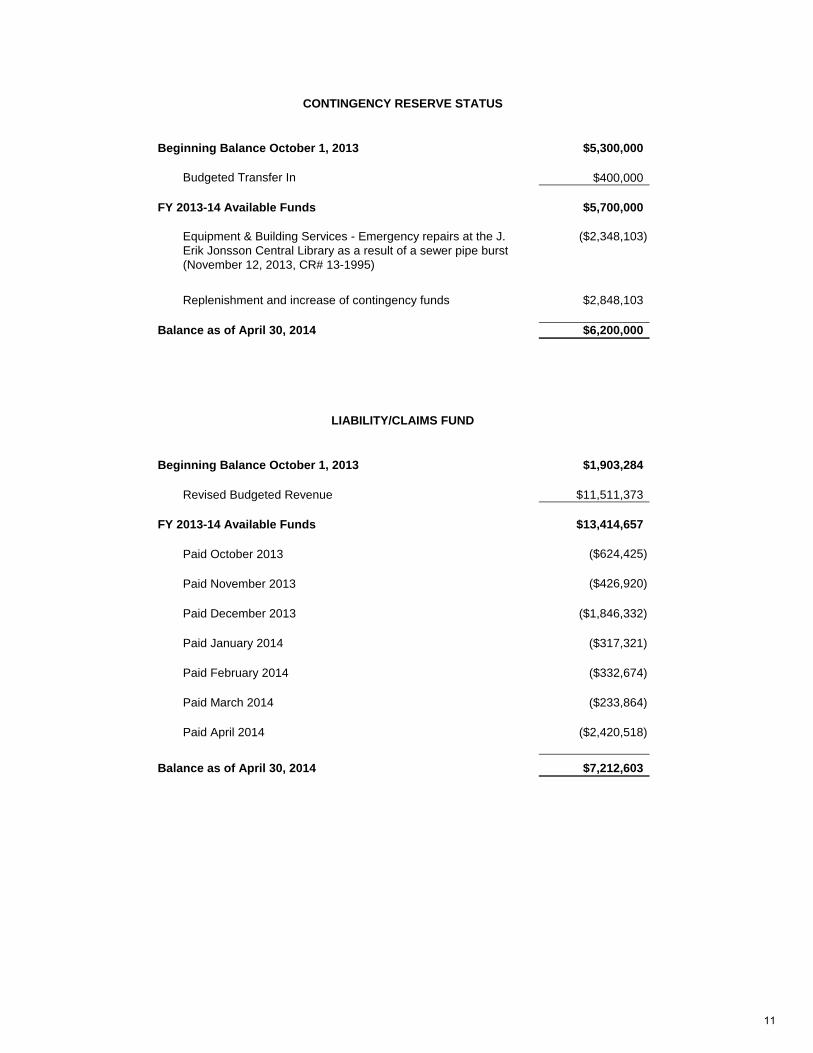
Beginning Balance October 1, 2013 $5,300,000
Budgeted Transfer In $400,000
FY 2013-14 Available Funds $5,700,000
($2,348,103)
$2,848,103
Balance as of April 30, 2014 $6,200,000
Beginning Balance October 1, 2013 $1,903,284
Revised Budgeted Revenue $11,511,373
FY 2013-14 Available Funds $13,414,657
Paid October 2013 ($624,425)
Paid November 2013 ($426,920)
Paid December 2013 ($1,846,332)
Paid January 2014 ($317,321)
Paid February 2014 ($332,674)
Paid March 2014 ($233,864)
Paid April 2014 ($2,420,518)
Balance as of April 30, 2014 $7,212,603
CONTINGENCY RESERVE STATUS
Equipment & Building Services - Emergency repairs at the J. Erik Jonsson Central Library as a result of a sewer pipe burst (November 12, 2013, CR# 13-1995)
Replenishment and increase of contingency funds
LIABILITY/CLAIMS FUND
11
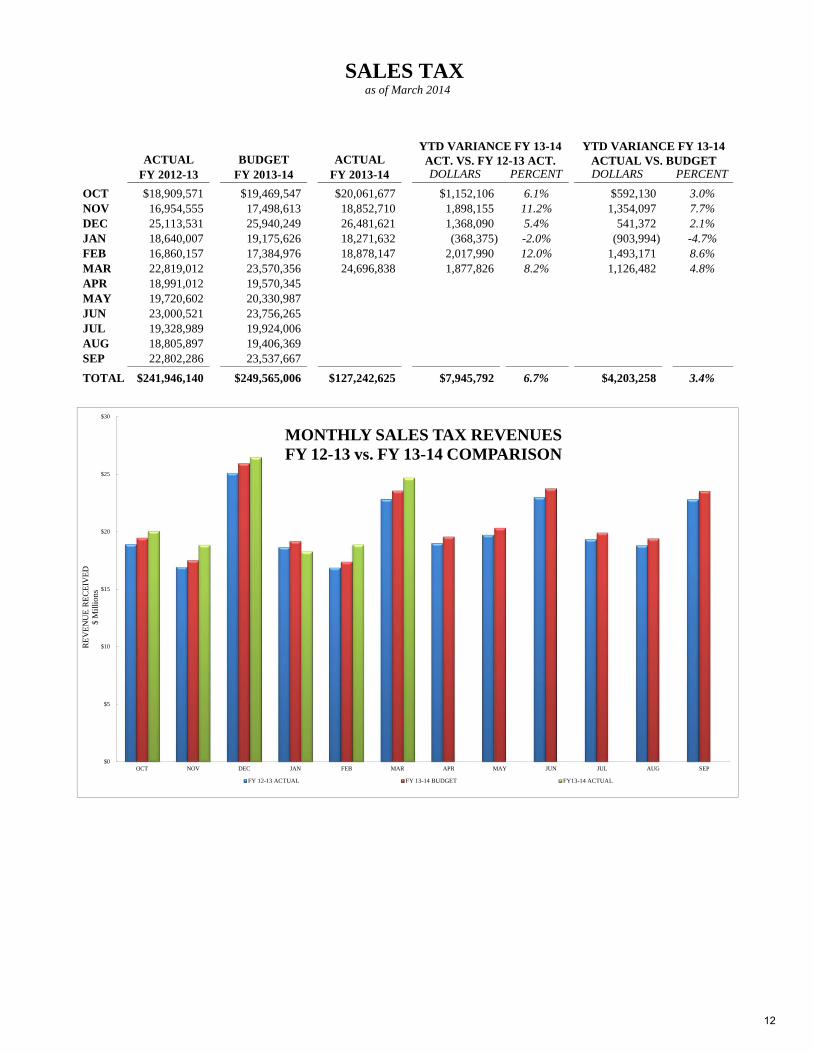
ACTUAL BUDGET ACTUALFY 2012-13 FY 2013-14 FY 2013-14 DOLLARS PERCENT DOLLARS PERCENT
OCT $18,909,571 $19,469,547 $20,061,677 $1,152,106 6.1% $592,130 3.0%NOV 16,954,555 17,498,613 18,852,710 1,898,155 11.2% 1,354,097 7.7%DEC 25,113,531 25,940,249 26,481,621 1,368,090 5.4% 541,372 2.1%JAN 18,640,007 19,175,626 18,271,632 (368,375) -2.0% (903,994) -4.7%FEB 16,860,157 17,384,976 18,878,147 2,017,990 12.0% 1,493,171 8.6%MAR 22,819,012 23,570,356 24,696,838 1,877,826 8.2% 1,126,482 4.8%APR 18,991,012 19,570,345 MAY 19,720,602 20,330,987 JUN 23,000,521 23,756,265 JUL 19,328,989 19,924,006 AUG 18,805,897 19,406,369 SEP 22,802,286 23,537,667
TOTAL $241,946,140 $249,565,006 $127,242,625 $7,945,792 6.7% $4,203,258 3.4%
YTD VARIANCE FY 13-14 ACT. VS. FY 12-13 ACT.
YTD VARIANCE FY 13-14 ACTUAL VS. BUDGET
SALES TAX as of March 2014
$0
$5
$10
$15
$20
$25
$30
OCT NOV DEC JAN FEB MAR APR MAY JUN JUL AUG SEP
RE
VE
NU
E R
EC
EIV
ED
$ M
illio
ns
MONTHLY SALES TAX REVENUESFY 12-13 vs. FY 13-14 COMPARISON
FY 12-13 ACTUAL FY 13-14 BUDGET FY13-14 ACTUAL
12
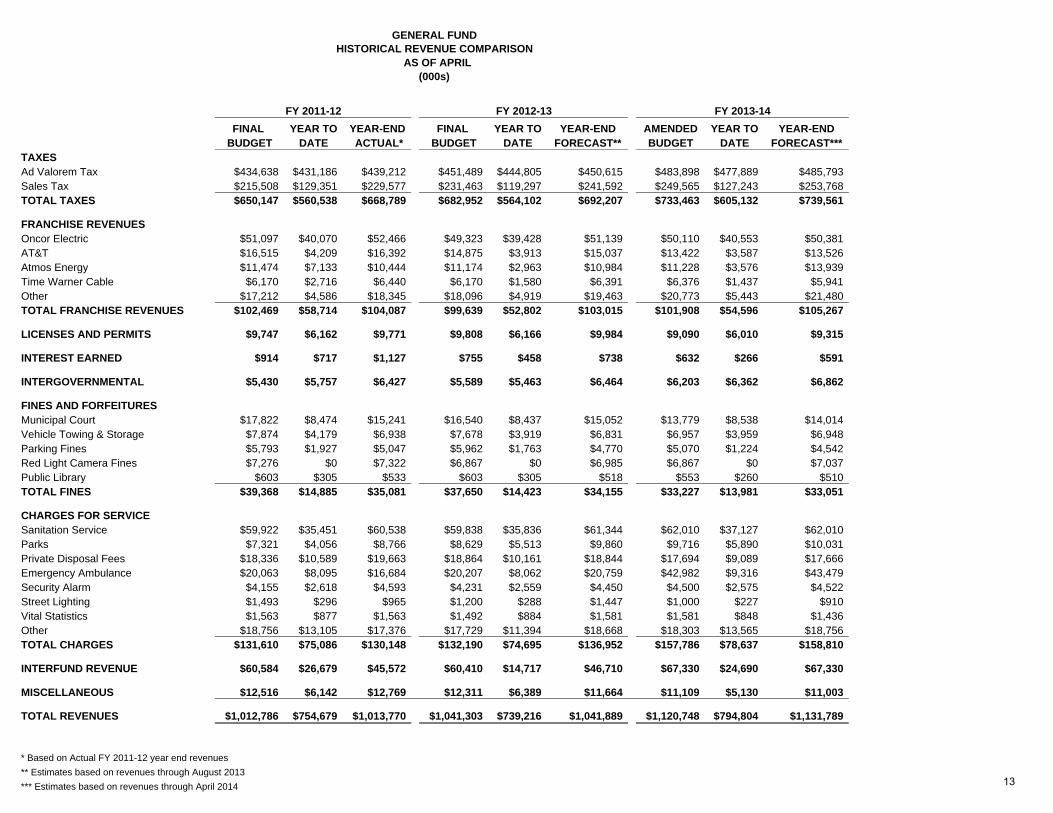
FINAL YEAR TO YEAR-END FINAL YEAR TO YEAR-END AMENDED YEAR TO YEAR-ENDBUDGET DATE ACTUAL* BUDGET DATE FORECAST** BUDGET DATE FORECAST***
TAXESAd Valorem Tax $434,638 $431,186 $439,212 $451,489 $444,805 $450,615 $483,898 $477,889 $485,793Sales Tax $215,508 $129,351 $229,577 $231,463 $119,297 $241,592 $249,565 $127,243 $253,768TOTAL TAXES $650,147 $560,538 $668,789 $682,952 $564,102 $692,207 $733,463 $605,132 $739,561
FRANCHISE REVENUESOncor Electric $51,097 $40,070 $52,466 $49,323 $39,428 $51,139 $50,110 $40,553 $50,381AT&T $16,515 $4,209 $16,392 $14,875 $3,913 $15,037 $13,422 $3,587 $13,526Atmos Energy $11,474 $7,133 $10,444 $11,174 $2,963 $10,984 $11,228 $3,576 $13,939Time Warner Cable $6,170 $2,716 $6,440 $6,170 $1,580 $6,391 $6,376 $1,437 $5,941Other $17,212 $4,586 $18,345 $18,096 $4,919 $19,463 $20,773 $5,443 $21,480TOTAL FRANCHISE REVENUES $102,469 $58,714 $104,087 $99,639 $52,802 $103,015 $101,908 $54,596 $105,267
LICENSES AND PERMITS $9,747 $6,162 $9,771 $9,808 $6,166 $9,984 $9,090 $6,010 $9,315
INTEREST EARNED $914 $717 $1,127 $755 $458 $738 $632 $266 $591
INTERGOVERNMENTAL $5,430 $5,757 $6,427 $5,589 $5,463 $6,464 $6,203 $6,362 $6,862
FINES AND FORFEITURES Municipal Court $17,822 $8,474 $15,241 $16,540 $8,437 $15,052 $13,779 $8,538 $14,014Vehicle Towing & Storage $7,874 $4,179 $6,938 $7,678 $3,919 $6,831 $6,957 $3,959 $6,948Parking Fines $5,793 $1,927 $5,047 $5,962 $1,763 $4,770 $5,070 $1,224 $4,542Red Light Camera Fines $7,276 $0 $7,322 $6,867 $0 $6,985 $6,867 $0 $7,037Public Library $603 $305 $533 $603 $305 $518 $553 $260 $510TOTAL FINES $39,368 $14,885 $35,081 $37,650 $14,423 $34,155 $33,227 $13,981 $33,051
CHARGES FOR SERVICE Sanitation Service $59,922 $35,451 $60,538 $59,838 $35,836 $61,344 $62,010 $37,127 $62,010Parks $7,321 $4,056 $8,766 $8,629 $5,513 $9,860 $9,716 $5,890 $10,031Private Disposal Fees $18,336 $10,589 $19,663 $18,864 $10,161 $18,844 $17,694 $9,089 $17,666Emergency Ambulance $20,063 $8,095 $16,684 $20,207 $8,062 $20,759 $42,982 $9,316 $43,479Security Alarm $4,155 $2,618 $4,593 $4,231 $2,559 $4,450 $4,500 $2,575 $4,522Street Lighting $1,493 $296 $965 $1,200 $288 $1,447 $1,000 $227 $910Vital Statistics $1,563 $877 $1,563 $1,492 $884 $1,581 $1,581 $848 $1,436Other $18,756 $13,105 $17,376 $17,729 $11,394 $18,668 $18,303 $13,565 $18,756TOTAL CHARGES $131,610 $75,086 $130,148 $132,190 $74,695 $136,952 $157,786 $78,637 $158,810
INTERFUND REVENUE $60,584 $26,679 $45,572 $60,410 $14,717 $46,710 $67,330 $24,690 $67,330
MISCELLANEOUS $12,516 $6,142 $12,769 $12,311 $6,389 $11,664 $11,109 $5,130 $11,003TOTAL REVENUE 194,142 $344,981 $349,682 189,672TOTAL REVENUES $1,012,786 $754,679 $1,013,770 $1,041,303 $739,216 $1,041,889 $1,120,748 $794,804 $1,131,789
* Based on Actual FY 2011-12 year end revenues
** Estimates based on revenues through August 2013
*** Estimates based on revenues through April 2014
FY 2011-12 FY 2012-13 FY 2013-14
GENERAL FUNDHISTORICAL REVENUE COMPARISON
AS OF APRIL(000s)
13
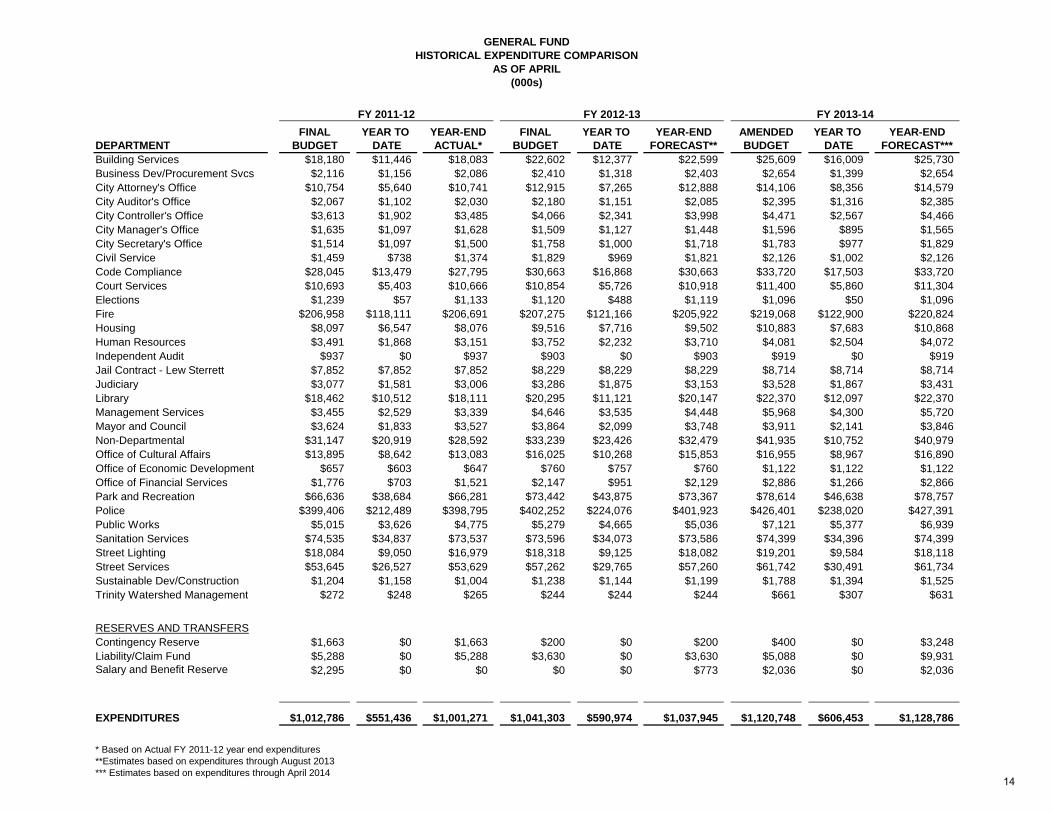
FINAL YEAR TO YEAR-END FINAL YEAR TO YEAR-END AMENDED YEAR TO YEAR-ENDDEPARTMENT BUDGET DATE ACTUAL* BUDGET DATE FORECAST** BUDGET DATE FORECAST***Building Services $18,180 $11,446 $18,083 $22,602 $12,377 $22,599 $25,609 $16,009 $25,730Business Dev/Procurement Svcs $2,116 $1,156 $2,086 $2,410 $1,318 $2,403 $2,654 $1,399 $2,654City Attorney's Office $10,754 $5,640 $10,741 $12,915 $7,265 $12,888 $14,106 $8,356 $14,579City Auditor's Office $2,067 $1,102 $2,030 $2,180 $1,151 $2,085 $2,395 $1,316 $2,385City Controller's Office $3,613 $1,902 $3,485 $4,066 $2,341 $3,998 $4,471 $2,567 $4,466City Manager's Office $1,635 $1,097 $1,628 $1,509 $1,127 $1,448 $1,596 $895 $1,565City Secretary's Office $1,514 $1,097 $1,500 $1,758 $1,000 $1,718 $1,783 $977 $1,829Civil Service $1,459 $738 $1,374 $1,829 $969 $1,821 $2,126 $1,002 $2,126Code Compliance $28,045 $13,479 $27,795 $30,663 $16,868 $30,663 $33,720 $17,503 $33,720Court Services $10,693 $5,403 $10,666 $10,854 $5,726 $10,918 $11,400 $5,860 $11,304Elections $1,239 $57 $1,133 $1,120 $488 $1,119 $1,096 $50 $1,096Fire $206,958 $118,111 $206,691 $207,275 $121,166 $205,922 $219,068 $122,900 $220,824Housing $8,097 $6,547 $8,076 $9,516 $7,716 $9,502 $10,883 $7,683 $10,868Human Resources $3,491 $1,868 $3,151 $3,752 $2,232 $3,710 $4,081 $2,504 $4,072Independent Audit $937 $0 $937 $903 $0 $903 $919 $0 $919Jail Contract - Lew Sterrett $7,852 $7,852 $7,852 $8,229 $8,229 $8,229 $8,714 $8,714 $8,714Judiciary $3,077 $1,581 $3,006 $3,286 $1,875 $3,153 $3,528 $1,867 $3,431Library $18,462 $10,512 $18,111 $20,295 $11,121 $20,147 $22,370 $12,097 $22,370Management Services $3,455 $2,529 $3,339 $4,646 $3,535 $4,448 $5,968 $4,300 $5,720Mayor and Council $3,624 $1,833 $3,527 $3,864 $2,099 $3,748 $3,911 $2,141 $3,846Non-Departmental $31,147 $20,919 $28,592 $33,239 $23,426 $32,479 $41,935 $10,752 $40,979Office of Cultural Affairs $13,895 $8,642 $13,083 $16,025 $10,268 $15,853 $16,955 $8,967 $16,890Office of Economic Development $657 $603 $647 $760 $757 $760 $1,122 $1,122 $1,122Office of Financial Services $1,776 $703 $1,521 $2,147 $951 $2,129 $2,886 $1,266 $2,866Park and Recreation $66,636 $38,684 $66,281 $73,442 $43,875 $73,367 $78,614 $46,638 $78,757Police $399,406 $212,489 $398,795 $402,252 $224,076 $401,923 $426,401 $238,020 $427,391Public Works $5,015 $3,626 $4,775 $5,279 $4,665 $5,036 $7,121 $5,377 $6,939Sanitation Services $74,535 $34,837 $73,537 $73,596 $34,073 $73,586 $74,399 $34,396 $74,399Street Lighting $18,084 $9,050 $16,979 $18,318 $9,125 $18,082 $19,201 $9,584 $18,118Street Services $53,645 $26,527 $53,629 $57,262 $29,765 $57,260 $61,742 $30,491 $61,734Sustainable Dev/Construction $1,204 $1,158 $1,004 $1,238 $1,144 $1,199 $1,788 $1,394 $1,525Trinity Watershed Management $272 $248 $265 $244 $244 $244 $661 $307 $631
RESERVES AND TRANSFERSContingency Reserve $1,663 $0 $1,663 $200 $0 $200 $400 $0 $3,248Liability/Claim Fund $5,288 $0 $5,288 $3,630 $0 $3,630 $5,088 $0 $9,931Salary and Benefit Reserve $2,295 $0 $0 $0 $0 $773 $2,036 $0 $2,036
EXPENDITURES $1,012,786 $551,436 $1,001,271 $1,041,303 $590,974 $1,037,945 $1,120,748 $606,453 $1,128,786
FY 2013-14
GENERAL FUNDHISTORICAL EXPENDITURE COMPARISON
AS OF APRIL
* Based on Actual FY 2011-12 year end expenditures**Estimates based on expenditures through August 2013*** Estimates based on expenditures through April 2014
(000s)
FY 2011-12 FY 2012-13
14