Embed Size (px)
Citation preview

2016FINANCIAL REPORT

TABLE OF CONTENTSThe Michigan Tech Strategic Plan 1
Letter from the President 2
Administrative Officers 3
University Update 4
Management Discussion and Analysis 10
Report of Independent Auditors 23
Statements of Net Position 26
Statements of Revenues, Expenses and Changes in Net Position 27
Statements of Cash Flows 28
Notes to the Financial Statements 30
Required Supplementary Information 57
Supplementary Information 58
2016 Financial Report
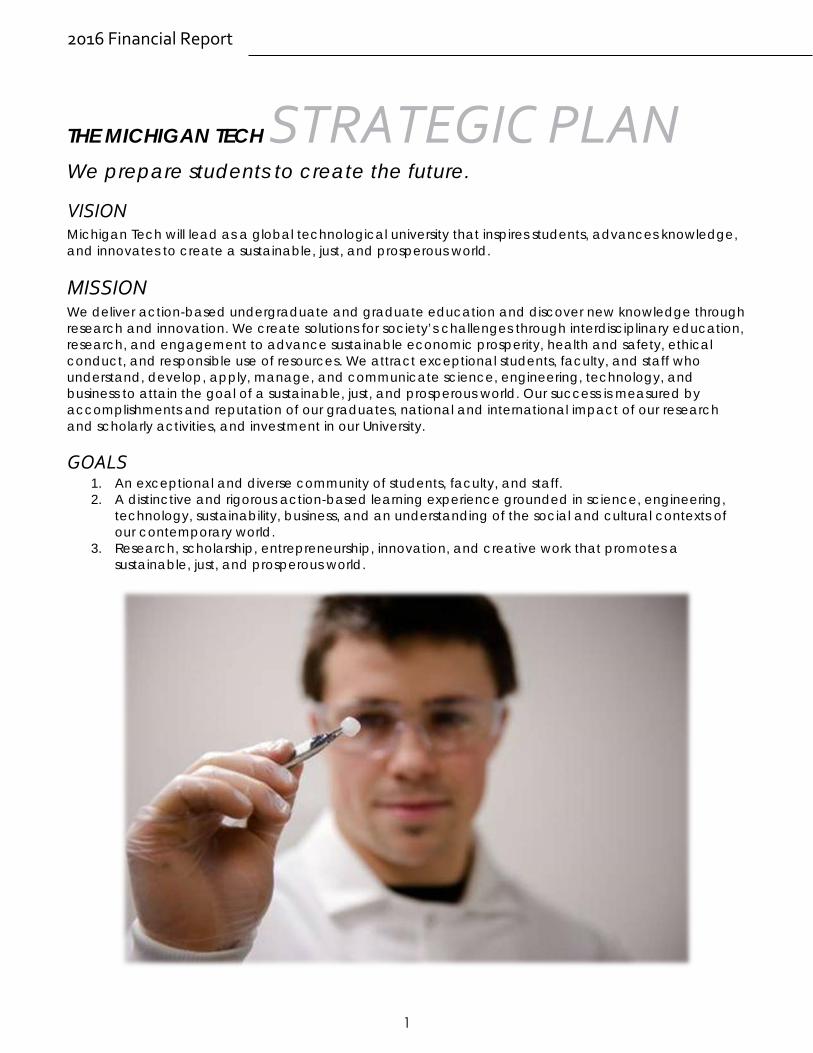
THE MICHIGAN TECH STRATEGIC PLAN We prepare students to create the future.
VISION Michigan Tech will lead as a global technological university that inspires students, advances knowledge, and innovates to create a sustainable, just, and prosperous world.
MISSION We deliver action-based undergraduate and graduate education and discover new knowledge through research and innovation. We create solutions for society’s challenges through interdisciplinary education, research, and engagement to advance sustainable economic prosperity, health and safety, ethical conduct, and responsible use of resources. We attract exceptional students, faculty, and staff who understand, develop, apply, manage, and communicate science, engineering, technology, and business to attain the goal of a sustainable, just, and prosperous world. Our success is measured by accomplishments and reputation of our graduates, national and international impact of our research and scholarly activities, and investment in our University.
GOALS 1. An exceptional and diverse community of students, faculty, and staff.2. A distinctive and rigorous action-based learning experience grounded in science, engineering,
technology, sustainability, business, and an understanding of the social and cultural contexts ofour contemporary world.
3. Research, scholarship, entrepreneurship, innovation, and creative work that promotes asustainable, just, and prosperous world.
1
LETTER FROM THE PRESIDENT Each year we take a moment to reflect on the state of the University. I’m pleased to report that our enrollment is strong, the diversity of our student body is improving, and our faculty continue to help our students create the future.
Our fall 2015 enrollment was 7,238, up from 7,100 in 2014. Graduate school enrollment was 1,521, up from 1,442 in 2014, and there were 1,165 international students—a record high, up from 1,093 in 2014. Our fall Career Fair was one of the largest ever, attracting companies from across the country to recruit our crazy smart students for internships, co-ops, and full-time jobs.
Many of our degree programs continued to see strong growth. Computer science, general engineering, environmental engineering, mechanical engineering technology, and forestry saw some of the largest gains. In addition, the academic profile of this year’s incoming class was high, with an average ACT composite score of 26.8.
While state funding has declined, our budget and finances remained strong. We continue to invest wisely in our faculty, facilities, and staff, constantly striving to be good stewards of our resources. Our 93 percent student placement rate and seventh highest starting salaries for public universities in the US confirm our efforts have been successful.
We continue our vision for 2035 and beyond, increasing graduate student enrollment, continuing our push for a more diverse campus, and increasing our investments in people and technologies to prepare our students for their future careers.
Thank you for sharing our vision and investing in Michigan Tech.
Dr. Glenn D. Mroz President of year shown
2
2016 Financial Report
ADMINISTRATIVE OFFICERSBOARD OF TRUSTEES
TERMS ENDING DECEMBER 31 OF YEAR SHOWN
2016 Thomas L. Baldini Paul G. Ollila, Vice Chair 2018 Julie A. Fream, Chair Terry J. Woychowski 2020 Linda Kennedy Robert Jacquart 2022 William Johnson Brenda Ryan
EXECUTIVE AND BOARD OFFICERS Dr. Glenn D. Mroz Dr. Jacqueline E. Huntoon President Provost and Vice President for Academic Affairs
Dr. David D. Reed Dr. Les P. Cook Vice President for Research Vice President for Student Affairs and Advancement
Dr. Dale R. Tahtinen Julie Seppala Vice President for Governmental Relations Executive Director of Financial Services and Secretary of the Board of Trustees Operations
Treasurer of the Board of Trustees Ellen S. Horsch Vice President for Administration
3
UNIVERSITY UPDATE News and Rankings Fall 2015 enrollment at Michigan Technological University was 7,238, the highest the school has seen in more than 30 years. Female enrollment was also at a record high, with women making up 26.9 percent of the student body. Female enrollment in the College of Engineering rose to 26.7 percent, and the number of women first-year students is at an all-time high.
First-to-second-year retention – the number of first year students who return for their second year – reached a record 87 percent. The statistic is a major predictor of student success.
Michigan Tech’s Graduate School also reported record growth for the seventh year in a row. Graduate enrollment was 1,521, the largest number of graduate students in the University’s history. Driving the growth were 374 new master’s degree students, a 23 percent increase over last year.
Finally, first-year ACT scores were among the highest the school has ever seen at 26.8. Student diversity, including international students, was 23 percent, with domestic diversity at 8.2 percent, up from 7 percent in 2014.
In rankings, Michigan Tech was 59th nationwide, near the top third of 173 public national universities in US News & World Report’s 2015 annual rankings of best undergraduate colleges and universities.
Tech’s undergraduate engineering programs also placed in the top half of the engineering programs ranked by US News, moving up three points from last year to rank No. 70 of 152.
Princeton Review also ranked Michigan Tech among its Best 380 Colleges and recognized it as one of the best Midwestern colleges and green colleges nationwide.
In addition, Michigan Tech ranked first among public universities in Michigan for the mid-career salaries earned by its graduates. In Payscale.com’s 2015 College Salary Report, Michigan Tech was ranked 13th nationwide for mid-career salaries of graduates of public universities and 20th in the nation for mid-career engineering salaries.
The median mid-career salary reported for Michigan Tech was $99,900. The report also listed early-career salaries, defined as earnings by graduates who have been working five years or less in their fields. Michigan Tech graduates’ median early-career salary was $62,800, placing Tech seventh among public universities nationally.
Finally, College Factual, a website member of USA Today’s College Partner Network ranked Michigan Tech in the top 10 in the nation for bachelor’s degree programs in the general area of natural resources and conservation and fifth in the nation for its forestry programs within natural resources and conservation.
Awards and Honors The prestigious Faculty Early Career Development (CAREER) program recognizes junior faculty across the nation. Awardees are the next generation of academic leaders. In 2015, three Michigan Tech faculty—Amy Marcarelli, an associate professor in biological sciences, Caryn Heldt, an assistant professor of chemical engineering, and Nina Mahmoudian, an assistant professor of mechanical engineering-engineering mechanics were honored with the award, which is administered by the National Science Foundation (NSF). Their projects were funded for five years, up to $500,000. For fiscal year 2015, NSF Engineering granted 146 CAREER awards to 81 institutions in 36 states.
4
2016 Financial Report
Michigan Tech researchers Jennifer Becker and Eric Seagren earned a Water Environment Research Foundation (WERF) award for their project: “High-Tech Analysis of Low-Tech Methods for Sustainable Class A Biosolids Production.” Becker, an associate professor of civil and environmental engineering, and Seagren, a professor of civil and environmental engineering, will lead a team to establish a pilot-scale field test at the Portage Lake Water and Sewer Authority (PLWSA) in Houghton.
The Forest Stewards Guild named several Michigan Tech lands a Model Forest. Healthy forests support robust ecosystems across a region, and they are also important spaces for play, research and collaboration. The designated forestlands include 620 acres of the Michigan Tech Trails and Recreation Forest on campus and 3,597 acres of the Ford Center and Research Forest farther south in Alberta, Michigan.
The Biomedical Engineering Society (BMES) recognized Feng Zhao, assistant professor of biomedical engineering, with a Rising Star Award for her heart tissue research. She was one of six researchers in the nation to receive the honor.
Michigan Tech's Concrete Canoe and Steel Bridge teams both took first place in the American Society of Civil Engineers' 2016 North Central student competition at Michigan State University in March.
Les Cook, vice president for student affairs and advancement at Michigan Tech, was named one of the NASPA Foundation’s 2016 Pillars of the Profession.
Diversity in Focus Michigan Tech’s focus on expanding our diverse student body, faculty, and staff is paying dividends.
We are committed to the inclusion of populations in our educational institution who have been traditionally underrepresented or otherwise disadvantaged, whether through economic or structural barriers.
And, a diverse student body is a consummate demand from the employer market. Employers of Michigan Tech students, and students nationwide, want to recruit from a talent pool well versed and experienced with diverse populations.
To them, it's simple business math. A diverse set of employees means a diverse set of solutions to problems. A diverse set of solutions increases the probability in finding the most profitable one.
Many of our programs are run by the Office of Institutional Equity and the Center for Diversity and Inclusion. They support our community through a variety of efforts:
● Promoting "all gender" restroom signs and the gender neutral locker room in the SDC
● High school outreach and education on supporting trans and non-binary students
● Collaborating with GEAR UP to bring social justice speakers to the Dollar Bay School to doworkshops with students
● Supporting diverse students in the classroom: Lunch and Learn with the videos we created andthe presentation on microaggressions
● Promoting Inclusive Classrooms workshops
● Cultural Competency workshops
● Safe Place Training
5

● Social Justice Lecture Series
● CDI Women's Open House and working to more holistically support women students with furtherresources for pregnant/parenting women
● LGBT education will be provided to Corporate Advisory Board
● Sustained dialogue program open to any interested students, focusing on discussingintersecting identities and how it relates to living/learning on the Tech campus
● Developing a 3D's Series: Diversity, Dialogue and Dignity. This will be an interdisciplinary andinterdepartmental program to bring weekly events surrounding diversity to the campus
● Heritage Programming Committee: For 2016-17 the CDI Heritage Programming Committee willtake a different approach to our large-scale campus events. For the next academic year ourheritage events will be co-sponsored by a major college or school at Michigan Tech
● CDI has been collaborating with the Grad School on the AGEP Grant: Underrepresented andMinority students now have monthly socials where a sense of community is fostered
● Collaborating on The Indigenous Peoples’ Day Campaign. The Indigenous Peoples’ DayCampaign committee consists of members of the nearby Keweenaw Bay Indian Community(KBIC), and the Keweenaw Bay Ojibwe Community College (KBOCC), as well as communitymembers from the towns of Houghton and Hancock, the Center for Diversity and Inclusion andstudents and faculty from Michigan Tech. The aim is to promote the cultures of Indigenouspeoples, and the establishment of an Indigenous Peoples' Day locally on the second Mondayof October to promote Native American culture and commemorate the history of NativeAmerican peoples
● Collaborating with Corporate Sponsor to bring support to student organizations
6
2016 Financial Report
Research Alex Mayer, the Charles and Patricia Nelson Presidential Professor in the Department of Civil and Environmental Engineering, studies water resources. His impact in the field earned him Michigan Tech's 2015 Research Award. The Award offers an opportunity for an individual to be recognized for outstanding achievement in research. Noting his dedication to water quality and scarcity research, Mayer’s colleagues nominated him for the award.
Tarun Dam, associate professor of chemistry, and graduate student, Melanie Talaga, won the 2016 Bhakta Rath Award for their glycobiology research. The award is given to an exceptional doctoral student and advisor pair at Michigan Tech making a difference with their research. The award was established in 2010 by an endowment from Bhakta B. Rath and his wife, Sushama Rath, to promote and reward excellence in scientific and engineering research at Michigan Tech.
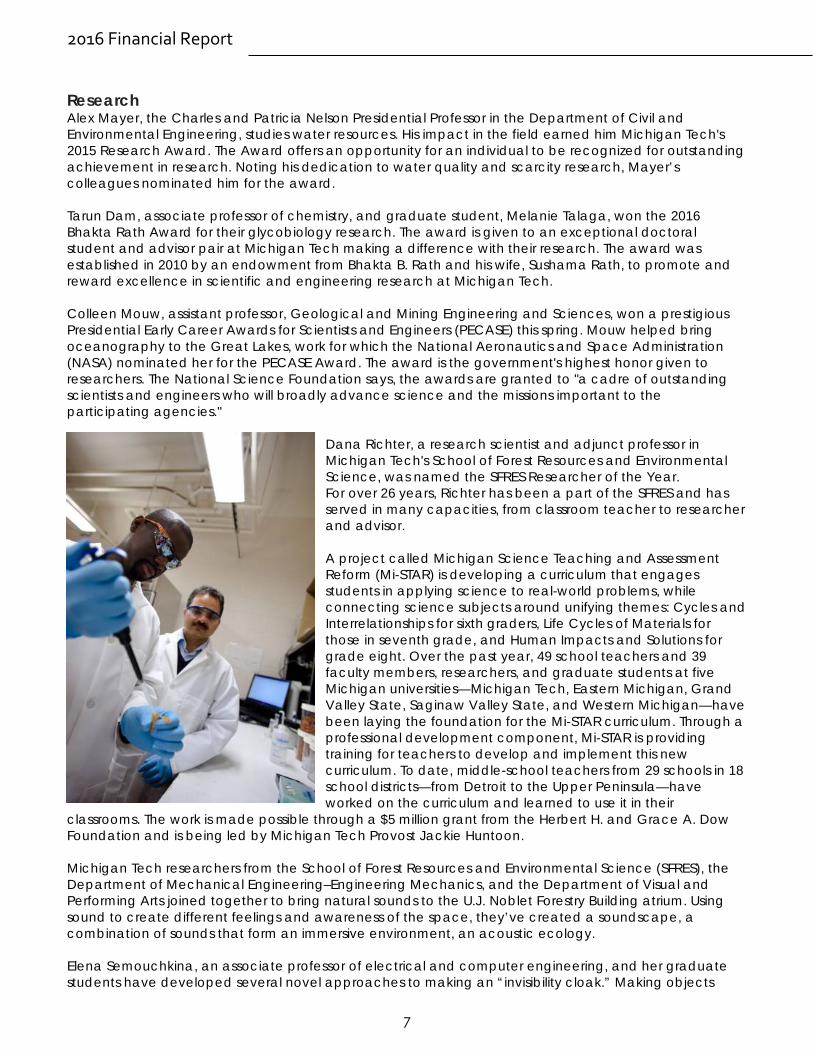
Colleen Mouw, assistant professor, Geological and Mining Engineering and Sciences, won a prestigious Presidential Early Career Awards for Scientists and Engineers (PECASE) this spring. Mouw helped bring oceanography to the Great Lakes, work for which the National Aeronautics and Space Administration (NASA) nominated her for the PECASE Award. The award is the government's highest honor given to researchers. The National Science Foundation says, the awards are granted to "a cadre of outstanding scientists and engineers who will broadly advance science and the missions important to the participating agencies."
Dana Richter, a research scientist and adjunct professor in Michigan Tech's School of Forest Resources and Environmental Science, was named the SFRES Researcher of the Year. For over 26 years, Richter has been a part of the SFRES and has served in many capacities, from classroom teacher to researcher and advisor.
A project called Michigan Science Teaching and Assessment Reform (Mi-STAR) is developing a curriculum that engages students in applying science to real-world problems, while connecting science subjects around unifying themes: Cycles and Interrelationships for sixth graders, Life Cycles of Materials for those in seventh grade, and Human Impacts and Solutions for grade eight. Over the past year, 49 school teachers and 39 faculty members, researchers, and graduate students at five Michigan universities—Michigan Tech, Eastern Michigan, Grand Valley State, Saginaw Valley State, and Western Michigan—have been laying the foundation for the Mi-STAR curriculum. Through a professional development component, Mi-STAR is providing training for teachers to develop and implement this new curriculum. To date, middle-school teachers from 29 schools in 18 school districts—from Detroit to the Upper Peninsula—have worked on the curriculum and learned to use it in their
classrooms. The work is made possible through a $5 million grant from the Herbert H. and Grace A. Dow Foundation and is being led by Michigan Tech Provost Jackie Huntoon.
Michigan Tech researchers from the School of Forest Resources and Environmental Science (SFRES), the Department of Mechanical Engineering–Engineering Mechanics, and the Department of Visual and Performing Arts joined together to bring natural sounds to the U.J. Noblet Forestry Building atrium. Using sound to create different feelings and awareness of the space, they’ve created a soundscape, a combination of sounds that form an immersive environment, an acoustic ecology.
Elena Semouchkina, an associate professor of electrical and computer engineering, and her graduate students have developed several novel approaches to making an “invisibility cloak.” Making objects
7

invisible comes down to manipulating light, in other words, bending beams of light around an area to hide the object. Semouchkina and her team started beam bending with metamaterials—periodic structures comprised of metallic resonators, which can speed up electromagnetic waves.
Wayne Weaver, an associate professor of electrical engineering, is working on smart power systems that use adaptive, predictive, and decision-making algorithms that can learn system behavior. These technologies allow reliable use of energy storage and renewables in small grids, and allow the power grid to grow through the ability to chain multiple microgrids together. This enables distributed control over a larger power network for vastly improved reliability of the power supply and significant fuel consumption reduction.
Athletics Michigan Tech hockey had another successful season, capturing the MacNaughton Cup for the first time since the 1975-76 season. Alex Petan was named the WCHA Player of the Year, while goalie Jamie Phillips was the WCHA Outstanding Student-Athlete of the Year. The Huskies were Desert Hockey Classic champions, made a Final Five appearance, and head coach Mel Pearson was recognized as the WCHA Coach of the Year for the second time. In addition, Tech alumnus and former Husky, John Scott ’10 was named NHL All-Star Game MVP.
The volleyball team started the season with a school-record 10 wins in a row. Jacqueline Aird set Tech’s career digs record, while Rachel Pohlod had 101 assists on the season. The team completed the season with a 19-12 record and an appearance in the GLIAC Tournament.
Tech’s football team finished the season 7-3 after a 5-0 start. Brett Gervais was named to the CoSIDA Academic All-American Second Team, won the GLIAC Commissioner’s Award, and McFarland Award as the top NCAA Division II football scholar-athlete in Michigan. Ryan VanGoethem was named to the CoSIDA Academic All-American First Team, while Paul Kuoppala and Alex Sherbinow were named All-Region. The Huskies played before 3,918 fans in their game against Northern Michigan University—the
8
2016 Financial Report
third biggest crowd in Husky football history—preserving a thrilling 24-23 victory with a blocked field goal attempt as time expired.
Tech’s Nordic teams hosted the US National Cross Country Championships for the second straight year, where Didrik Fjeld Elset placed third in the classic sprint to reach the podium. Elset and three other Huskies—Andrea Lee, Gaspard Cuenot, and Kyle Hanson—also qualified for the NCAA Championships with Cuenot finishing third in the Freestyle.
Michigan Tech’s women’s basketball team enjoyed another successful campaign, capturing their 14th GLIAC title in school history, and finishing 19-8. Danielle Blake and Kylie Moxley were named All-GLIAC First Team. The men’s team finished 11-15. Kyle Monroe started his Husky career in successful fashion, scoring 485 points, the most-ever for a freshman. He was named GLIAC Freshman of the Year, while Kyle Stankowski was named CoSIDA Academic All-District.
9
MANAGEMENT DISCUSSION AND ANALYSIS
This discussion and analysis section of the Michigan Technological University (“University”) annual financial report provides an overview of its financial activities during the fiscal years ended June 30, 2016, 2015, and 2014. University management has prepared the financial statements and the related footnote disclosures along with this discussion and analysis. Responsibility for the completeness and fairness of this information rests with University management.
USING THE ANNUAL REPORT The University’s financial report includes three financial statements: the Statements of Net Position; the Statements of Revenues, Expenses, and Changes in Net Position; and the Statements of Cash Flows. These financial statements are prepared in accordance with accounting principles generally accepted in the United States of America, which establish standards for external financial reporting for public colleges and universities and require that financial statements be presented to focus on the University as a whole. The financial statements report information about the University using accrual accounting methods similar to those used by private-sector companies. All of the current year’s revenues and expenses are taken into account regardless of when cash is received or paid.
REPORTING ENTITY The Michigan Tech Fund (“Fund”) is a component unit of the University and its activity has been blended into the University’s financial statements.
CONDENSED STATEMENTS OF NET POSITION The Statements of Net Position include all assets and liabilities of the University as well as deferred outflows and inflows of resources. Over time, increases and decreases in net position is one indicator of the improvement or erosion of the University’s financial health when considered with operating measures such as enrollment levels, research activities, and the physical condition of facilities.
10
2016 Financial Report
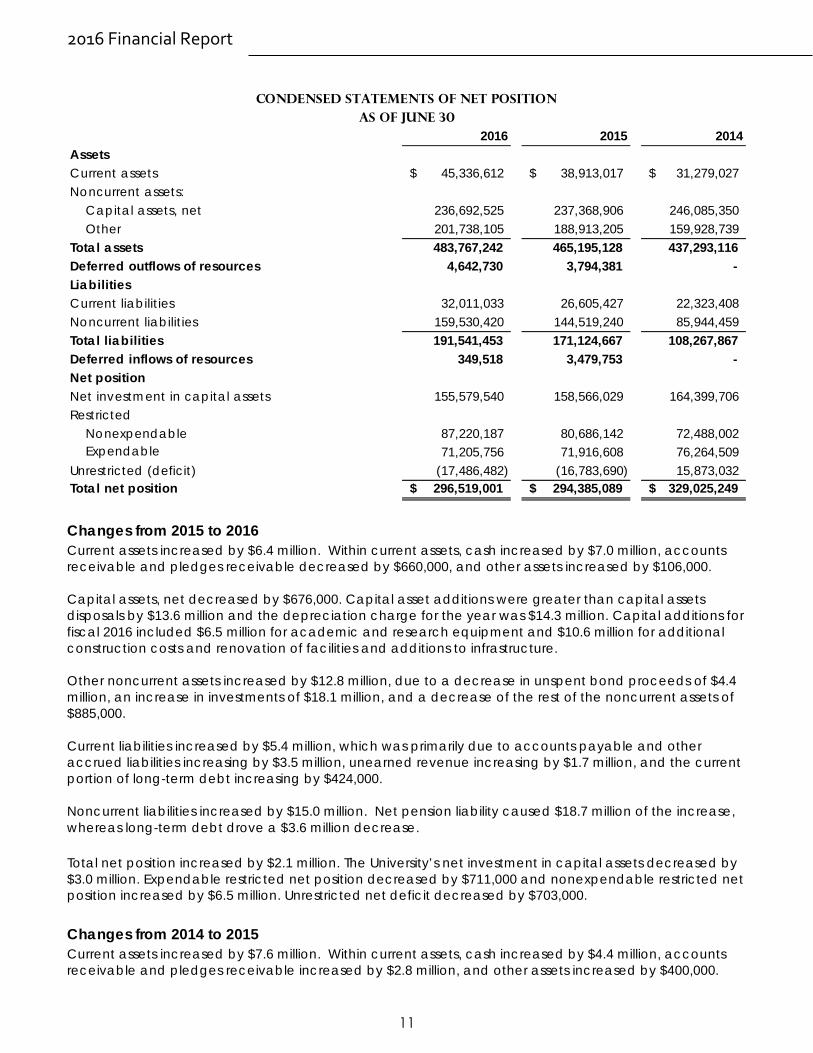
Changes from 2015 to 2016 Current assets increased by $6.4 million. Within current assets, cash increased by $7.0 million, accounts receivable and pledges receivable decreased by $660,000, and other assets increased by $106,000.
Capital assets, net decreased by $676,000. Capital asset additions were greater than capital assets disposals by $13.6 million and the depreciation charge for the year was $14.3 million. Capital additions for fiscal 2016 included $6.5 million for academic and research equipment and $10.6 million for additional construction costs and renovation of facilities and additions to infrastructure.
Other noncurrent assets increased by $12.8 million, due to a decrease in unspent bond proceeds of $4.4 million, an increase in investments of $18.1 million, and a decrease of the rest of the noncurrent assets of $885,000.
Current liabilities increased by $5.4 million, which was primarily due to accounts payable and other accrued liabilities increasing by $3.5 million, unearned revenue increasing by $1.7 million, and the current portion of long-term debt increasing by $424,000.
Noncurrent liabilities increased by $15.0 million. Net pension liability caused $18.7 million of the increase, whereas long-term debt drove a $3.6 million decrease.
Total net position increased by $2.1 million. The University’s net investment in capital assets decreased by $3.0 million. Expendable restricted net position decreased by $711,000 and nonexpendable restricted net position increased by $6.5 million. Unrestricted net deficit decreased by $703,000.
Changes from 2014 to 2015 Current assets increased by $7.6 million. Within current assets, cash increased by $4.4 million, accounts receivable and pledges receivable increased by $2.8 million, and other assets increased by $400,000.
2016 2015 2014AssetsCurrent assets 45,336,612$ 38,913,017$ 31,279,027$ Noncurrent assets:
Capital assets, net 236,692,525 237,368,906 246,085,350 Other 201,738,105 188,913,205 159,928,739
Total assets 483,767,242 465,195,128 437,293,116 Deferred outflows of resources 4,642,730 3,794,381 - LiabilitiesCurrent liabilities 32,011,033 26,605,427 22,323,408 Noncurrent liabilities 159,530,420 144,519,240 85,944,459 Total liabilities 191,541,453 171,124,667 108,267,867 Deferred inflows of resources 349,518 3,479,753 - Net positionNet investment in capital assets 155,579,540 158,566,029 164,399,706 Restricted
Nonexpendable 87,220,187 80,686,142 72,488,002 Expendable 71,205,756 71,916,608 76,264,509
Unrestricted (deficit) (17,486,482) (16,783,690) 15,873,032 Total net position 296,519,001$ 294,385,089$ 329,025,249$
Condensed Statements of Net PositionAs of June 30
11
Capital assets, net decreased by $8.7 million. Capital asset additions ($9.1 million), net of the book value of capital asset disposals ($3.2 million), were $5.9 million, and the depreciation charge for the year was $14.6 million. Capital additions for fiscal 2015 included $4.7 million for academic and research equipment, and mineral collections, and $4.4 million for the additional construction costs and renovation of facilities and additions to infrastructure.
Other noncurrent assets increased by $29.0 million, primarily due to the unspent bond proceeds of $25.1 million, increase in investments of $3.4 million, and an increase of the rest of the noncurrent assets of $500,000.
Current liabilities increased by $4.2 million, which was due to accounts payable and other accrued liabilities increasing by $1.6 million and unearned revenue increasing by $2.6 million.
Noncurrent liabilities increased by $58.6 million. Net pension liability, which is presented for the first time in fiscal year 2015, caused $36.2 million of the increase, and a bond issuance caused $25 million of the increase. Scheduled debt payments of $2.6 million decreased noncurrent liabilities.
Total net position decreased by $34.7 million. The implementation of the new accounting pronouncement regarding net pension liability, which is discussed later in this document in the notes to the financial statements, accounted for a $35.9 million decrease, whereas the net results before any pension adjustments for the fiscal year increased net position by $1.2 million. The University’s net investment in capital assets decreased by $5.8 million. Expendable restricted net position decreased by $4.4 million and nonexpendable restricted net position increased by $8.2 million. Unrestricted net position decreased by $32.7 million, resulting in a net deficit of $16.7 million. The deficit was caused by the aforementioned implementation of the new accounting pronouncement and did not impact the cash position of the University or its ability to repay its obligations.
12
2016 Financial Report
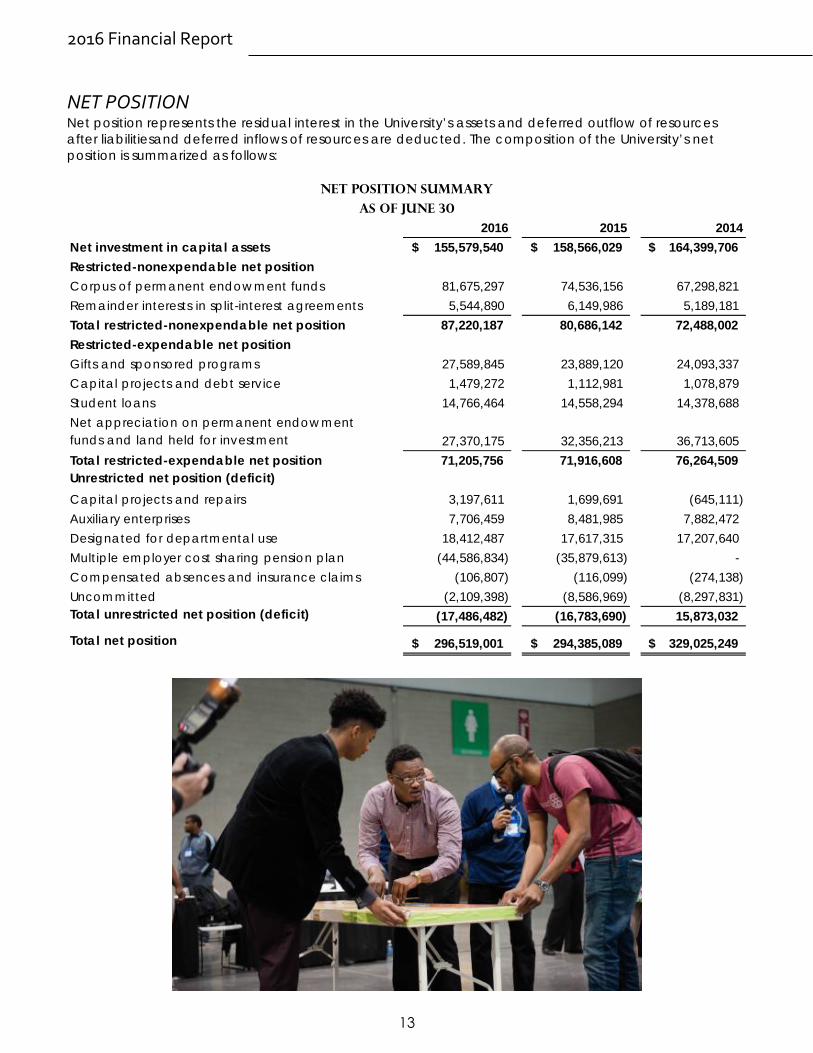
NET POSITION Net position represents the residual interest in the University’s assets and deferred outflow of resources after liabilitiesand deferred inflows of resources are deducted. The composition of the University’s net position is summarized as follows:
2016 2015 2014Net investment in capital assets 155,579,540$ 158,566,029$ 164,399,706$ Restricted-nonexpendable net positionCorpus of permanent endowment funds 81,675,297 74,536,156 67,298,821 Remainder interests in split-interest agreements 5,544,890 6,149,986 5,189,181 Total restricted-nonexpendable net position 87,220,187 80,686,142 72,488,002 Restricted-expendable net positionGifts and sponsored programs 27,589,845 23,889,120 24,093,337 Capital projects and debt service 1,479,272 1,112,981 1,078,879 Student loans 14,766,464 14,558,294 14,378,688 Net appreciation on permanent endowment funds and land held for investment 27,370,175 32,356,213 36,713,605 Total restricted-expendable net position 71,205,756 71,916,608 76,264,509 Unrestricted net position (deficit)Capital projects and repairs 3,197,611 1,699,691 (645,111) Auxiliary enterprises 7,706,459 8,481,985 7,882,472 Designated for departmental use 18,412,487 17,617,315 17,207,640 Multiple employer cost sharing pension plan (44,586,834) (35,879,613) - Compensated absences and insurance claims (106,807) (116,099) (274,138) Uncommitted (2,109,398) (8,586,969) (8,297,831) Total unrestricted net position (deficit) (17,486,482) (16,783,690) 15,873,032
Total net position 296,519,001$ 294,385,089$ 329,025,249$
Net Position Summary
As of June 30
13
Net investment in capital assets represents the University’s capital assets plus unspent bond proceeds net of accumulated depreciation and outstanding principal balances of debt attributable to the acquisition, construction, or improvement of those assets. The net change from year to year reflects the University’s improvement, maintenance, and usage of its capital assets in accordance with its long-range capital plan.
Restricted nonexpendable net position represents the historical value (corpus) of gifts to the University’s permanent endowment funds. Restricted expendable net position is restricted by a party independent of the University or by law. This includes restrictions related to gifts, research contracts, grants, outstanding debt, student-loan programs, and net appreciation of permanent endowments funds.
Unrestricted net position represents those balances from operational activities of the University that have not been restricted by parties independent of the University. This includes designated funds that the Board of Trustees and management have designated for specific purposes, such as public service activities or academic and research initiatives. Unrestricted net position also includes amounts that have been contractually committed for goods and services that have not been received by fiscal year-end.
CONDENSED STATEMENTS OF REVENUES, EXPENSES, AND CHANGES IN NET POSITION The Statements of Revenues, Expenses, and Changes in Net Position present the revenues earned and expenses incurred during the fiscal year. Revenues are reported as either operating or nonoperating. State appropriations and gifts are classified as nonoperating revenues which will always result in operating losses for the University.
14
2016 Financial Report
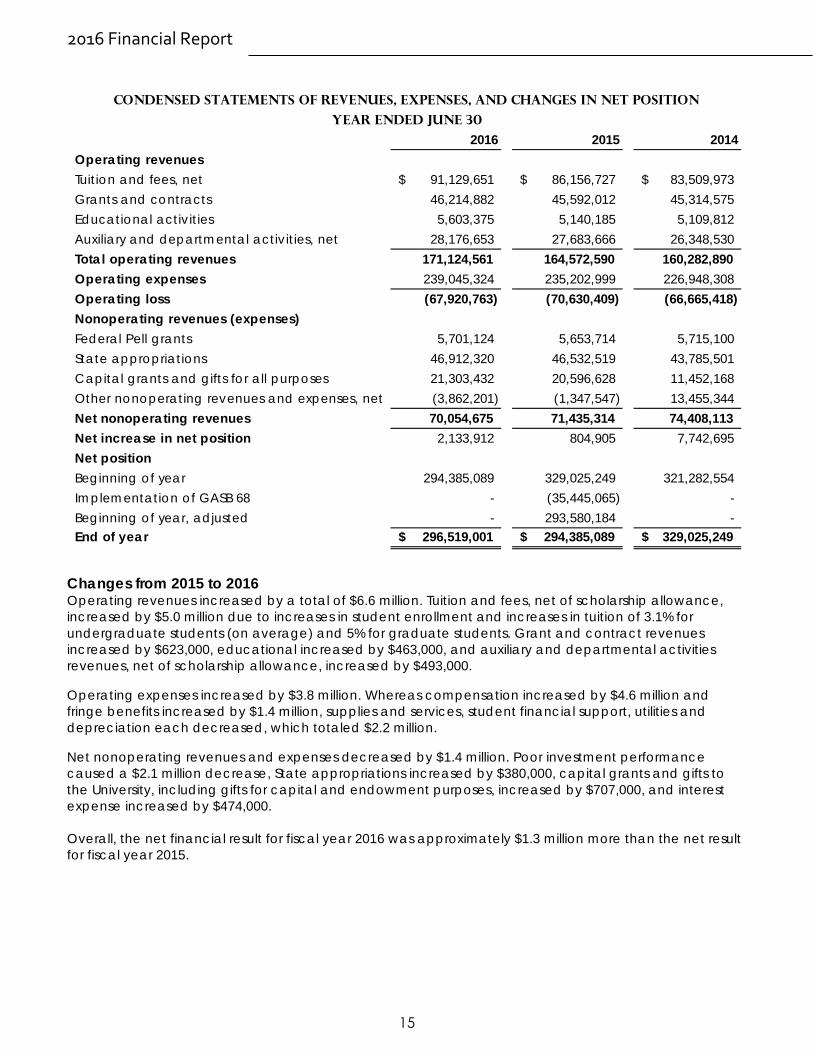
Changes from 2015 to 2016 Operating revenues increased by a total of $6.6 million. Tuition and fees, net of scholarship allowance, increased by $5.0 million due to increases in student enrollment and increases in tuition of 3.1% for undergraduate students (on average) and 5% for graduate students. Grant and contract revenues increased by $623,000, educational increased by $463,000, and auxiliary and departmental activities revenues, net of scholarship allowance, increased by $493,000.
Operating expenses increased by $3.8 million. Whereas compensation increased by $4.6 million and fringe benefits increased by $1.4 million, supplies and services, student financial support, utilities and depreciation each decreased, which totaled $2.2 million.
Net nonoperating revenues and expenses decreased by $1.4 million. Poor investment performance caused a $2.1 million decrease, State appropriations increased by $380,000, capital grants and gifts to the University, including gifts for capital and endowment purposes, increased by $707,000, and interest expense increased by $474,000.
Overall, the net financial result for fiscal year 2016 was approximately $1.3 million more than the net result for fiscal year 2015.
2016 2015 2014Operating revenuesTuition and fees, net 91,129,651$ 86,156,727$ 83,509,973$ Grants and contracts 46,214,882 45,592,012 45,314,575 Educational activities 5,603,375 5,140,185 5,109,812 Auxiliary and departmental activities, net 28,176,653 27,683,666 26,348,530 Total operating revenues 171,124,561 164,572,590 160,282,890 Operating expenses 239,045,324 235,202,999 226,948,308 Operating loss (67,920,763) (70,630,409) (66,665,418) Nonoperating revenues (expenses)Federal Pell grants 5,701,124 5,653,714 5,715,100 State appropriations 46,912,320 46,532,519 43,785,501 Capital grants and gifts for all purposes 21,303,432 20,596,628 11,452,168 Other nonoperating revenues and expenses, net (3,862,201) (1,347,547) 13,455,344 Net nonoperating revenues 70,054,675 71,435,314 74,408,113 Net increase in net position 2,133,912 804,905 7,742,695 Net positionBeginning of year 294,385,089 329,025,249 321,282,554 Implementation of GASB 68 - (35,445,065) - Beginning of year, adjusted - 293,580,184 - End of year 296,519,001$ 294,385,089$ 329,025,249$
Condensed Statements of Revenues, Expenses, and Changes in Net Position
Year ended June 30
15
Changes from 2014 to 2015 Operating revenues increased by a total of $4.3 million. Tuition and fees, net of scholarship allowance, increased by $2.7 million due to an increase in enrollment of around 120 students and to average increases in tuition of 2% for undergraduate students and 4% for graduate students. Grant and contract revenues increased by $277,000, educational activities revenues increased by $30,000, and auxiliary activities revenues, net of scholarship allowance, increased by $1.3 million.
Operating expenses increased by $8.3 million. The major drivers of the increase were a $4 million increase in compensation and a $3.5 million increase in fringe benefits. Supplies and services increased by $1 million, whereas student financial support, utilities and depreciation experienced a decrease of around $200,000.
Net nonoperating revenues decreased by $3.1 million. Poor investment performance for the fiscal year is the primary cause of the decrease. State appropriations increased by $2.7 million, capital grants and gifts to the University, including gifts for capital and endowment purposes, increased by $9.1 million, investment return decreased by $14.7 million and all other net nonoperating revenues decreased by $200,000.
The net financial result for fiscal year 2015 was approximately $6.8 million less than the net result for fiscal year 2014.
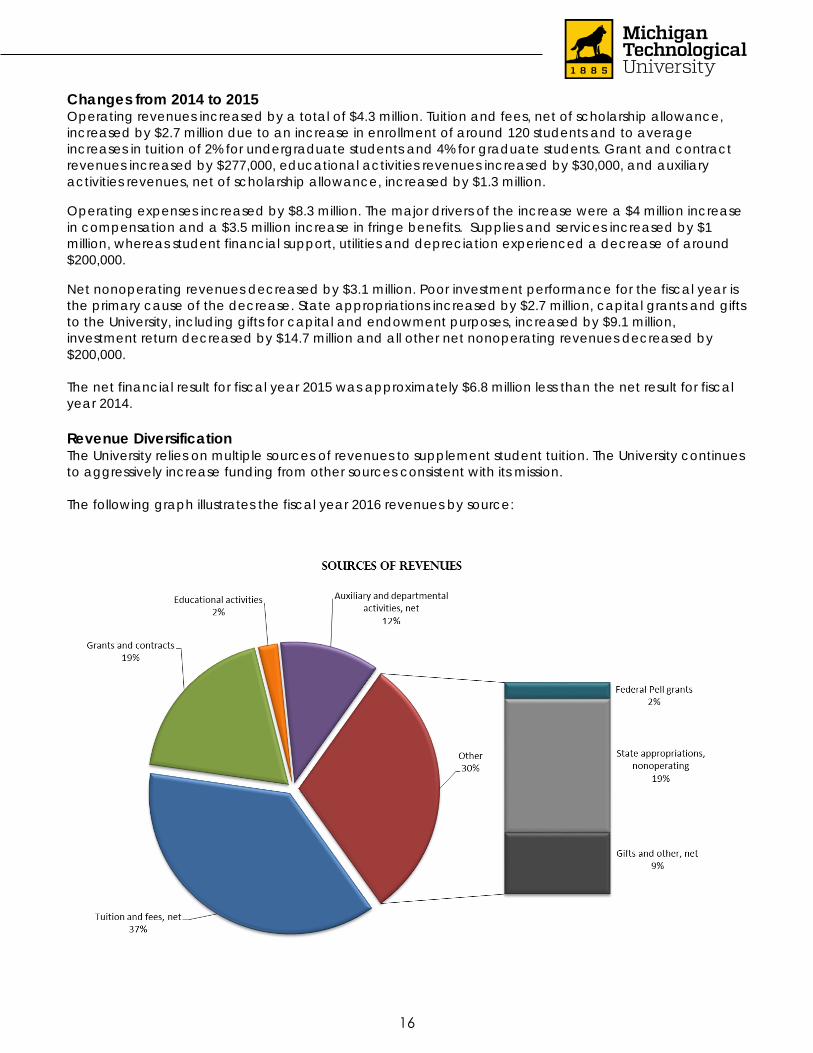
Revenue Diversification The University relies on multiple sources of revenues to supplement student tuition. The University continues to aggressively increase funding from other sources consistent with its mission.
The following graph illustrates the fiscal year 2016 revenues by source:
16
2016 Financial Report
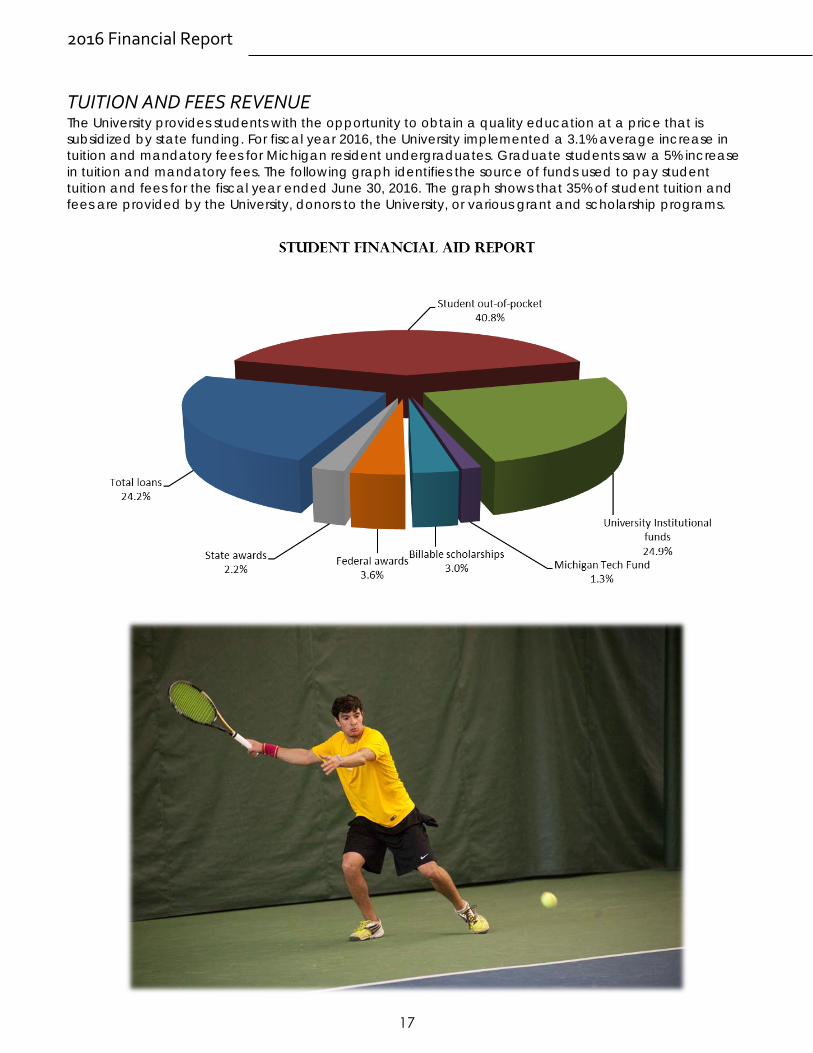
TUITION AND FEES REVENUE The University provides students with the opportunity to obtain a quality education at a price that is subsidized by state funding. For fiscal year 2016, the University implemented a 3.1% average increase in tuition and mandatory fees for Michigan resident undergraduates. Graduate students saw a 5% increase in tuition and mandatory fees. The following graph identifies the source of funds used to pay student tuition and fees for the fiscal year ended June 30, 2016. The graph shows that 35% of student tuition and fees are provided by the University, donors to the University, or various grant and scholarship programs.
17
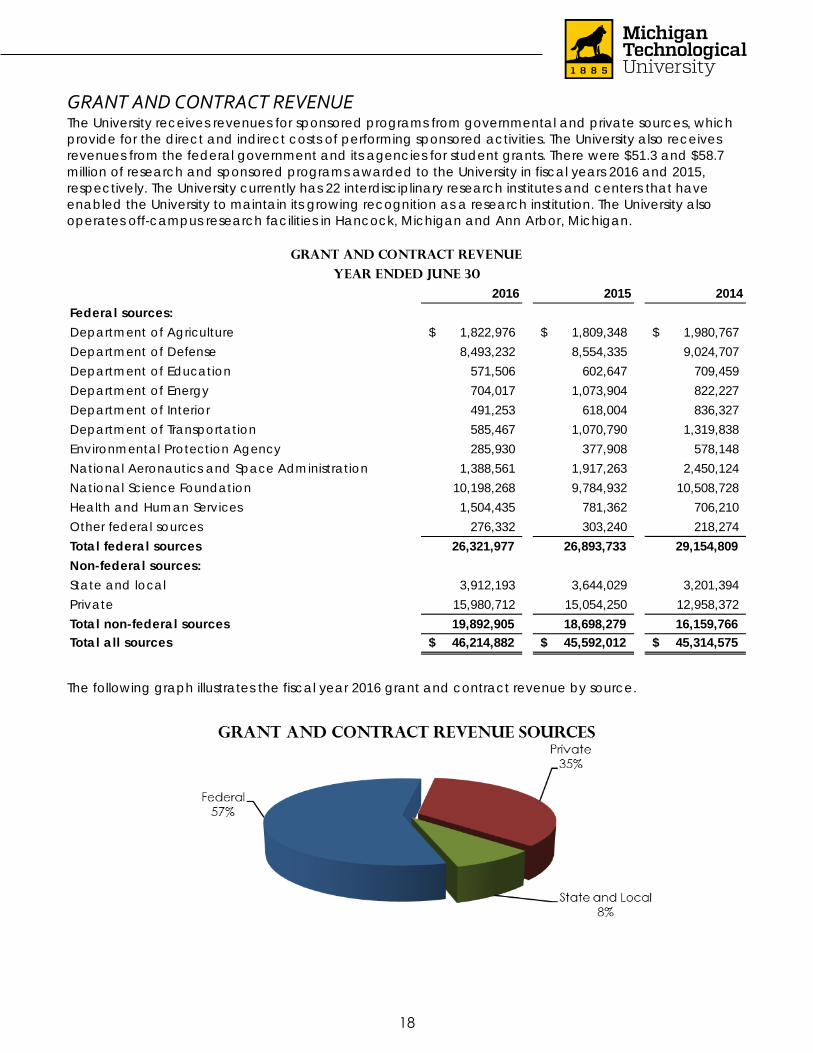
GRANT AND CONTRACT REVENUE The University receives revenues for sponsored programs from governmental and private sources, which provide for the direct and indirect costs of performing sponsored activities. The University also receives revenues from the federal government and its agencies for student grants. There were $51.3 and $58.7 million of research and sponsored programs awarded to the University in fiscal years 2016 and 2015, respectively. The University currently has 22 interdisciplinary research institutes and centers that have enabled the University to maintain its growing recognition as a research institution. The University also operates off-campus research facilities in Hancock, Michigan and Ann Arbor, Michigan.
The following graph illustrates the fiscal year 2016 grant and contract revenue by source.
2016 2015 2014Federal sources:Department of Agriculture 1,822,976$ 1,809,348$ 1,980,767$ Department of Defense 8,493,232 8,554,335 9,024,707 Department of Education 571,506 602,647 709,459 Department of Energy 704,017 1,073,904 822,227 Department of Interior 491,253 618,004 836,327 Department of Transportation 585,467 1,070,790 1,319,838 Environmental Protection Agency 285,930 377,908 578,148 National Aeronautics and Space Administration 1,388,561 1,917,263 2,450,124 National Science Foundation 10,198,268 9,784,932 10,508,728 Health and Human Services 1,504,435 781,362 706,210 Other federal sources 276,332 303,240 218,274 Total federal sources 26,321,977 26,893,733 29,154,809 Non-federal sources:State and local 3,912,193 3,644,029 3,201,394 Private 15,980,712 15,054,250 12,958,372 Total non-federal sources 19,892,905 18,698,279 16,159,766 Total all sources 46,214,882$ 45,592,012$ 45,314,575$
Grant and Contract Revenue
Year Ended June 30
18
2016 Financial Report
CONDENSED STATEMENTS OF CASH FLOWS Another way to assess the financial health of an institution is to look at its Statement of Cash Flows. Its primary purpose is to provide relevant information about sources and uses of cash of an entity during a period. The Statements of Cash Flows also help users assess an entity’s ability to generate future net cash flows, its ability to meet its obligations as they come due, and its needs for external financing. The Statements of Cash Flows present information related to cash inflows and outflows summarized by operating, noncapital financing, capital and related financing, and investing activities.
Changes from 2015 to 2016 Cash from operations increased by $3.4 million. Tuition and student residence fees increased cash provided by operations by $4.7 million, as did an increase of grants and contracts revenue of $936,000. Significant changes in cash used in operations include an increase in payments to employees and for employee benefits of $4.7 million. The other components of operating activities contributed $2.5 million to cash.
Cash from noncapital financing activities increased by $17.2. That was primarily due to a $12.0 million refund received from the State retirement system. Gifts income increased by $4.1 million, State appropriations increased by $1.0 million and other receipts increased by $100,000.
Cash from capital and related financing activities decreased by $36.0 million compared to the previous year. That was mostly due to the $25.3 million bond issuance that was done during fiscal year 2015. During fiscal year 2016, $7.0 million more cash was used to purchase capital assets (net of cash received for disposals) and $2.9 million less was received in capital gifts and grants. Also decreasing cash was the $909,000 more paid for interest on capital debt.
Cash from investing activities decreased by $11.6 million primarily due to the net purchase of investments. The refund received from the State retirement system was invested.
Overall, cash and cash equivalents, including restricted cash, increased by $2.6 million for the fiscal year ended June 30, 2016.
2016 2015 2014Cash (used in) provided byOperating activities (48,740,755)$ (52,152,113)$ (49,004,478)$ Noncapital financing activities 77,512,648 60,311,823 57,319,600 Capital and related financing activities (13,194,009) 22,799,036 (8,871,107) Investing activities (12,978,036) (1,415,400) 5,175,649 Net increase in cash and cash equivalents 2,599,848 29,543,346 4,619,664
Cash and cash equivalents, beginning of the year 41,993,328 12,449,982 7,830,318
Cash and cash equivalents, end of the year 44,593,176$ 41,993,328$ 12,449,982$
Condensed Statements of Cash Flows
Year Ended June 30
19
Changes from 2014 to 2015 Cash from operations increased by $3.2 million. Significant changes in cash used in operations include an increase in payments to employees and for employee benefits of $5.7 million. A decrease in grants and contracts revenue of $1.2 million and a decrease in collections of student loans of $300,000 also contributed to the increase in cash used in operations. Tuition and student residence fees increased cash provided by operations by $3.2 million, as did a reduction of payments to suppliers and payments for utilities of $817,000.
Cash from noncapital financing activities increased by $3.0 million. That was primarily due to an increase in state appropriations of $2.6 million and an increase in gifts of around $400,000.
Cash from capital and related financing activities increased by $31.6 million. During fiscal year 2015, the University received $25.3 million from the issuance of general revenue bonds. In addition, cash gifts received increased by $5.9 million, cash used for the purchase of capital assets decreased by $600,000, and cash received for capital appropriations decreased by $200,000.
Cash from investing activities increased by $6.6 million primarily due to the net purchase of investments, whereas in the prior year, there were net sales of investments.
Overall, cash and cash equivalents, including restricted cash, increased by $29.5 million for the fiscal year ended June 30, 2015.
20
2016 Financial Report
FACTORS IMPACTING FUTURE PERIODS
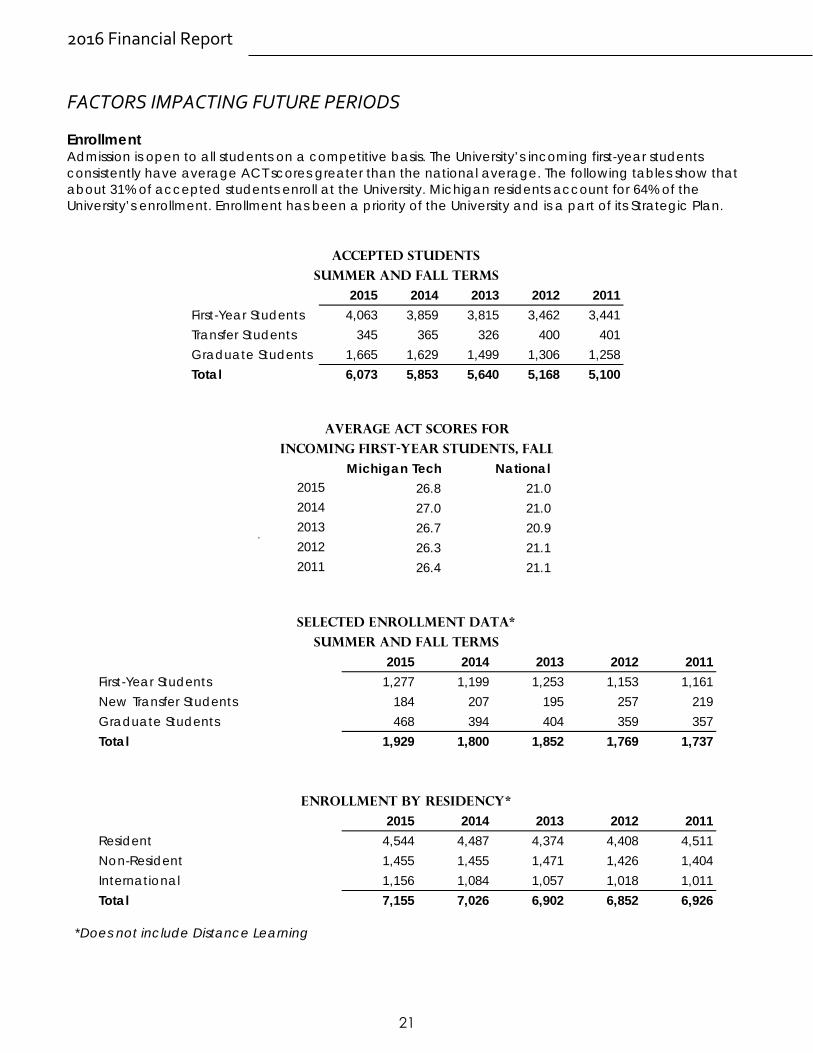
Enrollment Admission is open to all students on a competitive basis. The University’s incoming first-year students consistently have average ACT scores greater than the national average. The following tables show that about 31% of accepted students enroll at the University. Michigan residents account for 64% of the University’s enrollment. Enrollment has been a priority of the University and is a part of its Strategic Plan.
*Does not include Distance Learning
2015 2014 2013 2012 2011First-Year Students 4,063 3,859 3,815 3,462 3,441Transfer Students 345 365 326 400 401Graduate Students 1,665 1,629 1,499 1,306 1,258Total 6,073 5,853 5,640 5,168 5,100
Accepted Students
Summer and Fall Terms
Michigan Tech National2015 26.8 21.02014 27.0 21.02013 26.7 20.92012 26.3 21.12011 26.4 21.1
Average ACT Scores for
Incoming First-Year Students, Fall
2015 2014 2013 2012 2011First-Year Students 1,277 1,199 1,253 1,153 1,161New Transfer Students 184 207 195 257 219Graduate Students 468 394 404 359 357Total 1,929 1,800 1,852 1,769 1,737
2015 2014 2013 2012 2011Resident 4,544 4,487 4,374 4,408 4,511Non-Resident 1,455 1,455 1,471 1,426 1,404International 1,156 1,084 1,057 1,018 1,011Total 7,155 7,026 6,902 6,852 6,926
Enrollment by Residency*
Selected Enrollment Data*
Summer and Fall Terms
21
*Does not include Distance Learning
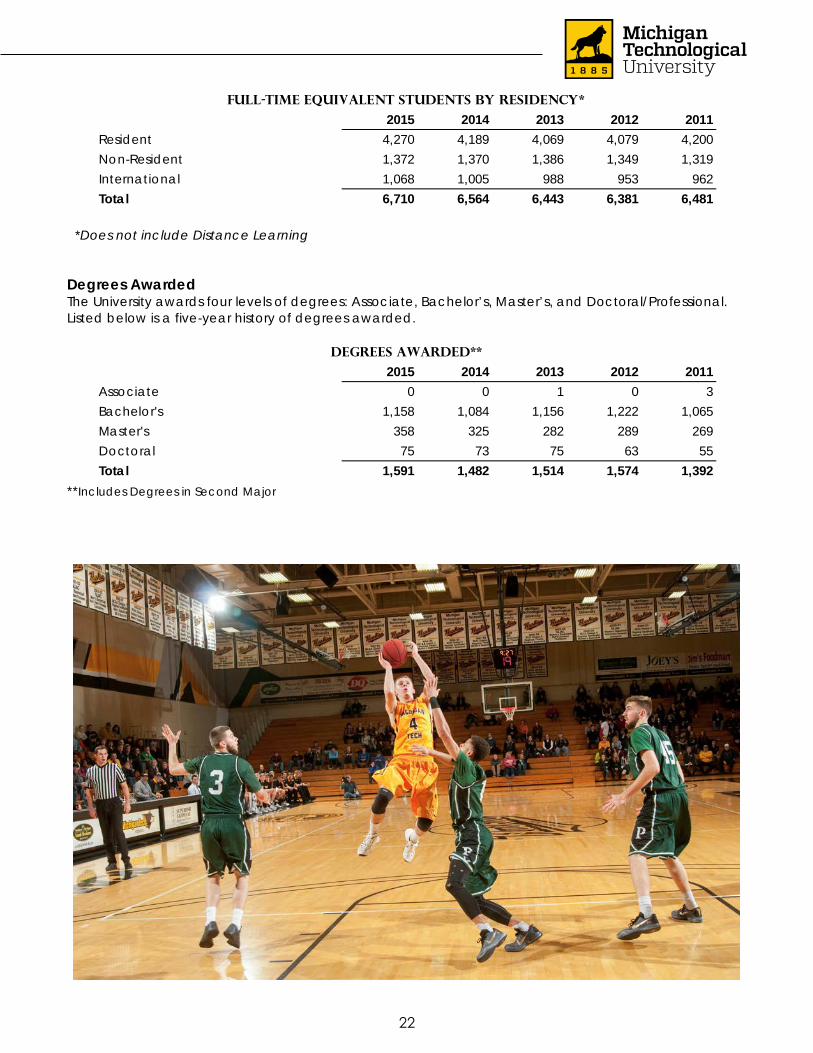
Degrees Awarded The University awards four levels of degrees: Associate, Bachelor’s, Master’s, and Doctoral/Professional. Listed below is a five-year history of degrees awarded.
**Includes Degrees in Second Major
2015 2014 2013 2012 2011Resident 4,270 4,189 4,069 4,079 4,200Non-Resident 1,372 1,370 1,386 1,349 1,319International 1,068 1,005 988 953 962Total 6,710 6,564 6,443 6,381 6,481
Full-Time Equivalent Students by Residency*
Degrees Awarded**
2015 2014 2013 2012 2011Associate 0 0 1 0 3Bachelor's 1,158 1,084 1,156 1,222 1,065Master's 358 325 282 289 269Doctoral 75 73 75 63 55Total 1,591 1,482 1,514 1,574 1,392
22
Report of Independent Auditors
Board of Trustees Michigan Technological University Houghton, Michigan
Report on the Financial Statements
We have audited the accompanying financial statements of Michigan Technological University, a component unit of the State of Michigan, as of and for the year ended June 30, 2016, and the related notes to the financial statements, which collectively comprise the University’s financial statements as listed in the table of contents.
Management’s Responsibility for the Financial Statements
Management is responsible for the preparation and fair presentation of these financial statements in accordance with accounting principles generally accepted in the United States of America; this includes the design, implementation, and maintenance of internal control relevant to the preparation and fair presentation of financial statements that are free from material misstatement, whether due to fraud or error.
Auditors’ Responsibility
Our responsibility is to express an opinion on these financial statements based on our audit. We conducted our audit in accordance with auditing standards generally accepted in the United States of America and the standards applicable to financial audits contained in Government Auditing Standards, issued by the Comptroller General of the United States. Those standards require that we plan and perform the audit to obtain reasonable assurance about whether the financial statements are free of material misstatement.
An audit involves performing procedures to obtain audit evidence about the amounts and disclosures in the financial statements. The procedures selected depend on the auditor’s judgment, including the assessment of the risk of material misstatement of the financial statements, whether due to fraud or error. In making those risk assessments, the auditor considers internal control relevant to the entity’s preparation and fair presentation of the financial statements in order to design audit procedures that are appropriate in the circumstances, but not for the purpose of expressing an opinion on the effectiveness of the entity’s internal control. Accordingly, we express no such opinion. An audit also includes evaluating the appropriateness of accounting policies used and the reasonableness of significant accounting estimates made by management, as well as evaluating the overall presentation of the financial statements.
ANDREWS HOOPER PAVLIK PLC1601 MARQUETTE STREET | SUITE 4 | BAY CITY, MI 48706
p: 989.667.4900 | f: 989.667.4949 | www.ahpplc.com
ANN ARBOR | AUBURN HILLS | BAY CITY | GRAND RAPIDS | GREATER LANSING | MIDLAND | OWOSSO | SAGINAWAndrews Hooper Pavlik PLC is a member of Allinial Global, an association of legally independent firms.
23
We believe that the audit evidence we have obtained is sufficient and appropriate to provide a basis for our audit opinion.
Opinion
In our opinion, the financial statements referred to above present fairly, in all material respects, the financial position of Michigan Technological University as of June 30, 2016, and the changes in its financial position and its cash flows for the year then ended, in accordance with accounting principles generally accepted in the United States of America.
Emphasis of Matter
As discussed in Note 1 and Note 9 to the financial statements, in 2015, the University implemented GASB Statement No. 68, Accounting and Financial Reporting for Pensions and GASB Statement No. 71, Pension Transition for Contributions Made Subsequent to the Measurement Date. These statements require the University to report its net pension obligation and associated deferred outflows of resources, deferred inflows of resources, and pension expense. The University recorded a cumulative effect adjustment to the 2015 financial statements. Our opinion is not modified with respect to these matters.
Prior Period Financial Statements
The financial statements of Michigan Technological University as of and for the year ended June 30, 2015, were audited by other auditors whose report dated November 13, 2015, expressed an unmodified opinion on those statements.
Other Matters
Required Supplementary Information
Accounting principles generally accepted in the United States of America require that the Management’s Discussion and Analysis and the Required Supplementary Information (Schedule of the University’s Proportionate Share of the Net Pension Liability, Schedule of University Contributions, and Notes to Required Supplementary Information) be presented to supplement the financial statements. Such information, although not a part of the financial statements, is required by the Governmental Accounting Standards Board, who considers it to be an essential part of financial reporting for placing the financial statements in an appropriate operational, economic, or historical context. We have applied certain limited procedures to the required supplementary information in accordance with auditing standards generally accepted in the United States of America, which consisted of inquiries of management about the methods of preparing the information and comparing the information for consistency with management’s responses to our inquiries, the financial statements, and other knowledge we obtained during our audit of the financial statements. We do not express an opinion or provide any assurance on the information because the limited procedures do not provide us with sufficient evidence to express an opinion or provide any assurance.
24
Other Supplementary Information
Our audit was conducted for the purposes of forming an opinion on the financial statements as a whole. The Schedule of Net Position by Fund, Schedule of Revenues, Expenses and Changes in Net Position by Fund by Object, and Schedule of Revenues, Expenses and Changes in Net Position by Fund by Function are presented for purposes of additional analysis and are not a required part of the financial statements. Such information is the responsibility of management and was derived from and relates directly to the underlying accounting and other records used to prepare the financial statements. Such information has been subjected to the auditing procedures applied in the audit of the financial statements and certain additional procedures, including comparing and reconciling such information directly to the underlying accounting and other records used to prepare the financial statements or to the financial statements themselves, and other additional procedures in accordance with auditing standards generally accepted in the United States of America. In our opinion, the information is fairly stated in all material respects in relation to the financial statements as a whole.
The introductory section listed in the table of contents on pages 1 through 9 have not been subjected to the auditing procedures applied in the audit of the financial statements and, accordingly, we do not express an opinion or provide any assurance on them.
Other Reporting Required by Government Auditing Standards
In accordance with Government Auditing Standards, we have also issued our report dated October 13, 2016 on our consideration of Michigan Technological University’s internal control over financial reporting and on our tests of its compliance with certain provisions of laws, regulations, contracts, and grant agreements and other matters. The purpose of that report is to describe the scope of our testing of internal control over financial reporting and compliance and the results of that testing, and not to provide an opinion on the internal control over financial reporting or on compliance. That report is an integral part of an audit performed in accordance with Government Auditing Standards in considering Michigan Technological University’s internal control over financial reporting and compliance.
Bay City, Michigan October 13, 2016
25
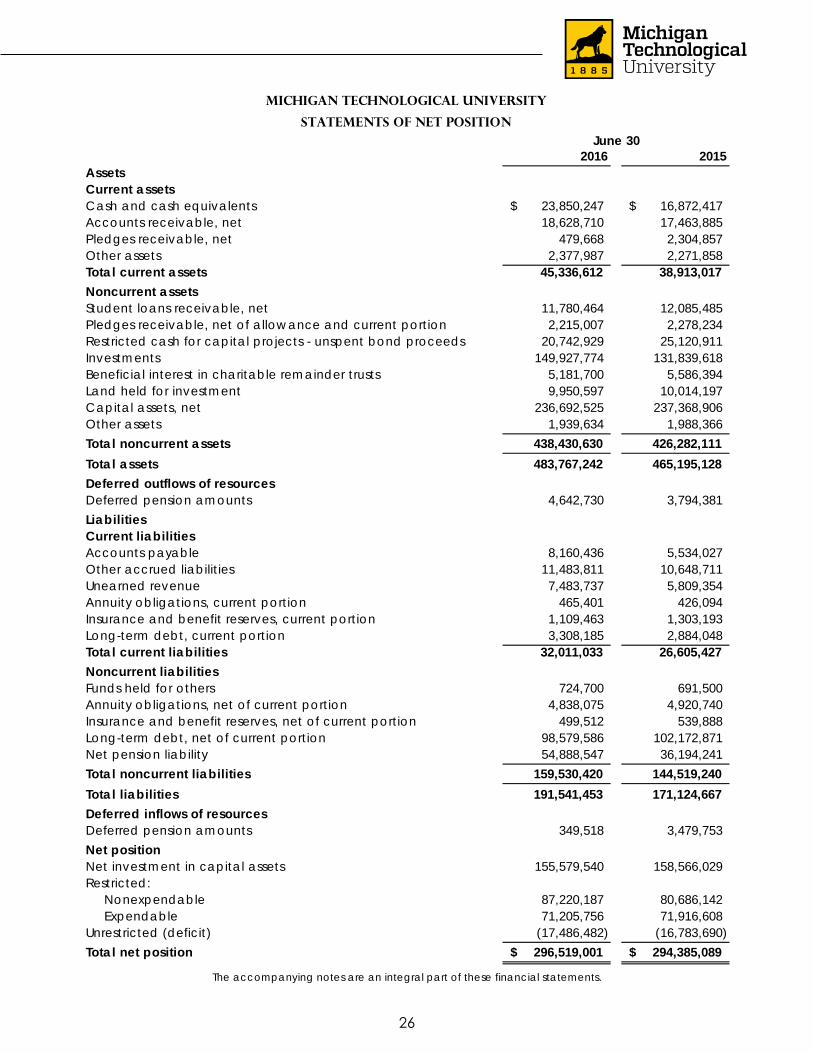
The accompanying notes are an integral part of these financial statements.
2016 2015AssetsCurrent assetsCash and cash equivalents 23,850,247$ 16,872,417$ Accounts receivable, net 18,628,710 17,463,885 Pledges receivable, net 479,668 2,304,857 Other assets 2,377,987 2,271,858 Total current assets 45,336,612 38,913,017 Noncurrent assetsStudent loans receivable, net 11,780,464 12,085,485 Pledges receivable, net of allowance and current portion 2,215,007 2,278,234 Restricted cash for capital projects - unspent bond proceeds 20,742,929 25,120,911 Investments 149,927,774 131,839,618 Beneficial interest in charitable remainder trusts 5,181,700 5,586,394 Land held for investment 9,950,597 10,014,197 Capital assets, net 236,692,525 237,368,906 Other assets 1,939,634 1,988,366 Total noncurrent assets 438,430,630 426,282,111 Total assets 483,767,242 465,195,128 Deferred outflows of resourcesDeferred pension amounts 4,642,730 3,794,381 LiabilitiesCurrent liabilitiesAccounts payable 8,160,436 5,534,027 Other accrued liabilities 11,483,811 10,648,711 Unearned revenue 7,483,737 5,809,354 Annuity obligations, current portion 465,401 426,094 Insurance and benefit reserves, current portion 1,109,463 1,303,193 Long-term debt, current portion 3,308,185 2,884,048 Total current liabilities 32,011,033 26,605,427 Noncurrent liabilitiesFunds held for others 724,700 691,500 Annuity obligations, net of current portion 4,838,075 4,920,740 Insurance and benefit reserves, net of current portion 499,512 539,888 Long-term debt, net of current portion 98,579,586 102,172,871 Net pension liability 54,888,547 36,194,241 Total noncurrent liabilities 159,530,420 144,519,240 Total liabilities 191,541,453 171,124,667 Deferred inflows of resourcesDeferred pension amounts 349,518 3,479,753 Net positionNet investment in capital assets 155,579,540 158,566,029 Restricted:
Nonexpendable 87,220,187 80,686,142 Expendable 71,205,756 71,916,608 Unrestricted (deficit) (17,486,482) (16,783,690) Total net position 296,519,001$ 294,385,089$
Michigan Technological University
Statements of Net PositionJune 30
26
2016 Financial Report
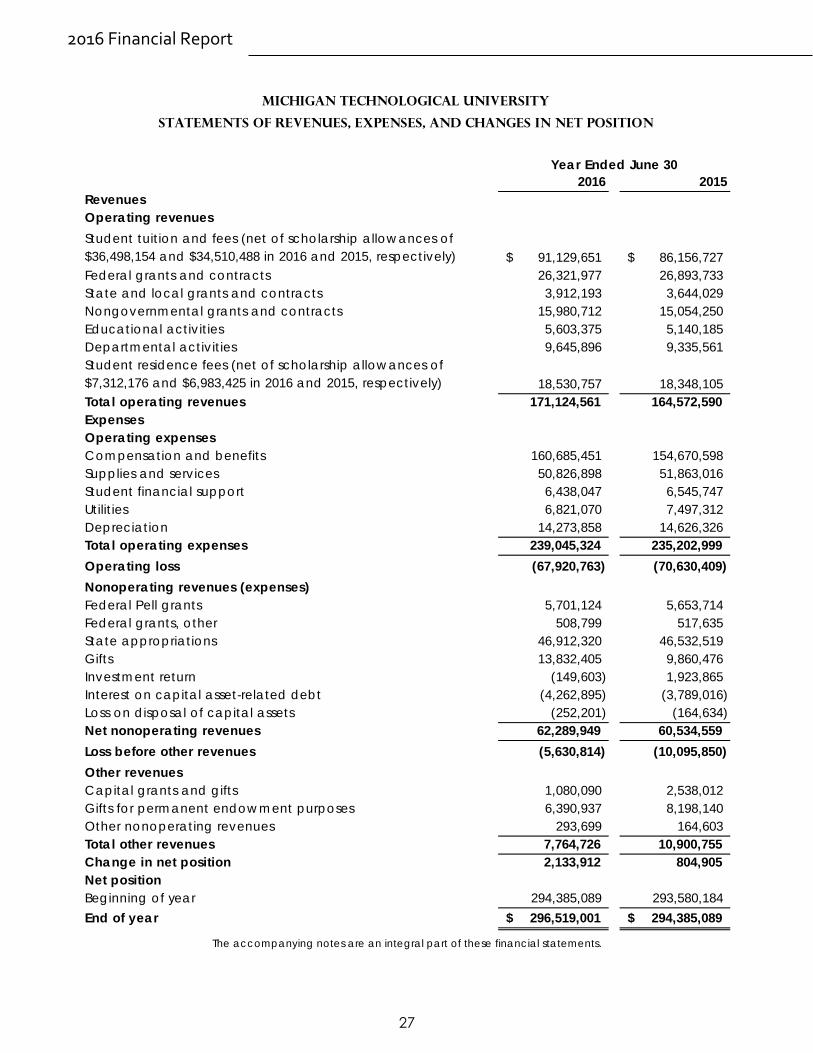
The accompanying notes are an integral part of these financial statements.
2016 2015RevenuesOperating revenuesStudent tuition and fees (net of scholarship allowances of $36,498,154 and $34,510,488 in 2016 and 2015, respectively) 91,129,651$ 86,156,727$ Federal grants and contracts 26,321,977 26,893,733 State and local grants and contracts 3,912,193 3,644,029 Nongovernmental grants and contracts 15,980,712 15,054,250 Educational activities 5,603,375 5,140,185 Departmental activities 9,645,896 9,335,561 Student residence fees (net of scholarship allowances of $7,312,176 and $6,983,425 in 2016 and 2015, respectively) 18,530,757 18,348,105 Total operating revenues 171,124,561 164,572,590 ExpensesOperating expensesCompensation and benefits 160,685,451 154,670,598 Supplies and services 50,826,898 51,863,016 Student financial support 6,438,047 6,545,747 Utilities 6,821,070 7,497,312 Depreciation 14,273,858 14,626,326 Total operating expenses 239,045,324 235,202,999 Operating loss (67,920,763) (70,630,409) Nonoperating revenues (expenses)Federal Pell grants 5,701,124 5,653,714 Federal grants, other 508,799 517,635 State appropriations 46,912,320 46,532,519 Gifts 13,832,405 9,860,476 Investment return (149,603) 1,923,865 Interest on capital asset-related debt (4,262,895) (3,789,016) Loss on disposal of capital assets (252,201) (164,634) Net nonoperating revenues 62,289,949 60,534,559 Loss before other revenues (5,630,814) (10,095,850) Other revenuesCapital grants and gifts 1,080,090 2,538,012 Gifts for permanent endowment purposes 6,390,937 8,198,140 Other nonoperating revenues 293,699 164,603 Total other revenues 7,764,726 10,900,755 Change in net position 2,133,912 804,905 Net positionBeginning of year 294,385,089 293,580,184 End of year 296,519,001$ 294,385,089$
Michigan Technological University
Statements of Revenues, Expenses, and Changes in Net Position
Year Ended June 30
27
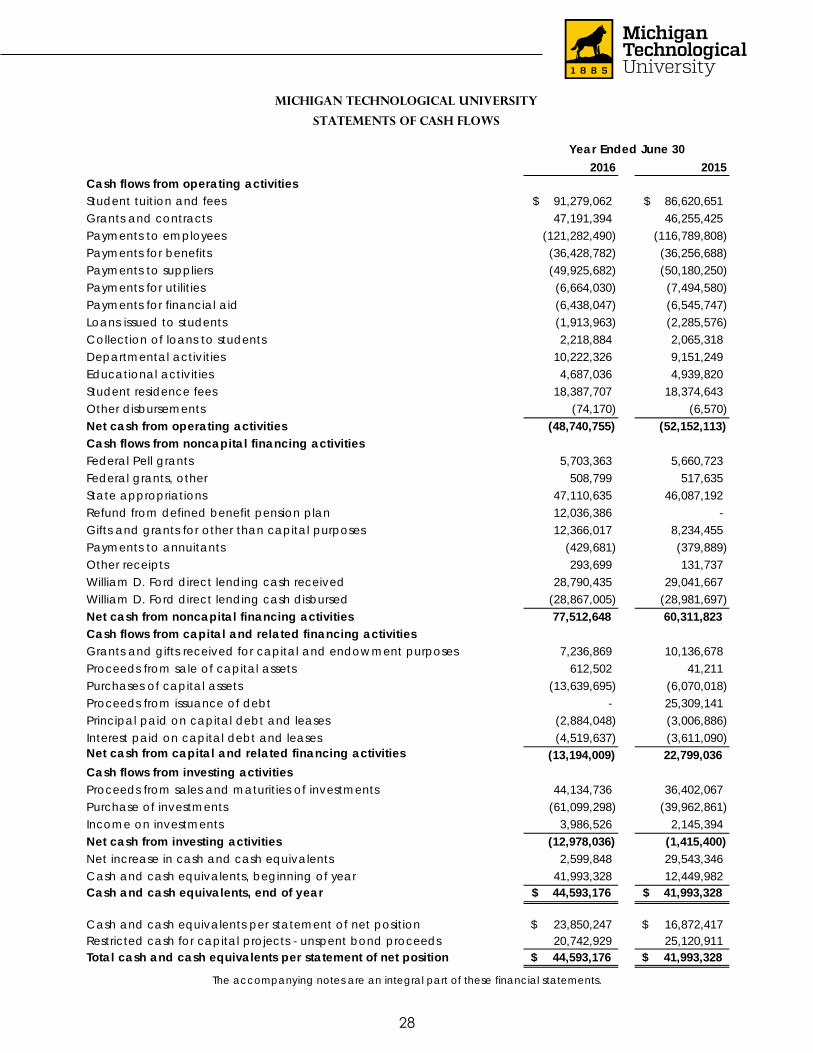
The accompanying notes are an integral part of these financial statements.
2016 2015Cash flows from operating activitiesStudent tuition and fees 91,279,062$ 86,620,651$ Grants and contracts 47,191,394 46,255,425 Payments to employees (121,282,490) (116,789,808) Payments for benefits (36,428,782) (36,256,688) Payments to suppliers (49,925,682) (50,180,250) Payments for utilities (6,664,030) (7,494,580) Payments for financial aid (6,438,047) (6,545,747) Loans issued to students (1,913,963) (2,285,576) Collection of loans to students 2,218,884 2,065,318 Departmental activities 10,222,326 9,151,249 Educational activities 4,687,036 4,939,820 Student residence fees 18,387,707 18,374,643 Other disbursements (74,170) (6,570) Net cash from operating activities (48,740,755) (52,152,113) Cash flows from noncapital financing activitiesFederal Pell grants 5,703,363 5,660,723 Federal grants, other 508,799 517,635 State appropriations 47,110,635 46,087,192 Refund from defined benefit pension plan 12,036,386 - Gifts and grants for other than capital purposes 12,366,017 8,234,455 Payments to annuitants (429,681) (379,889) Other receipts 293,699 131,737 William D. Ford direct lending cash received 28,790,435 29,041,667 William D. Ford direct lending cash disbursed (28,867,005) (28,981,697) Net cash from noncapital financing activities 77,512,648 60,311,823 Cash flows from capital and related financing activitiesGrants and gifts received for capital and endowment purposes 7,236,869 10,136,678 Proceeds from sale of capital assets 612,502 41,211 Purchases of capital assets (13,639,695) (6,070,018) Proceeds from issuance of debt - 25,309,141 Principal paid on capital debt and leases (2,884,048) (3,006,886) Interest paid on capital debt and leases (4,519,637) (3,611,090) Net cash from capital and related financing activities (13,194,009) 22,799,036 Cash flows from investing activitiesProceeds from sales and maturities of investments 44,134,736 36,402,067 Purchase of investments (61,099,298) (39,962,861) Income on investments 3,986,526 2,145,394 Net cash from investing activities (12,978,036) (1,415,400) Net increase in cash and cash equivalents 2,599,848 29,543,346 Cash and cash equivalents, beginning of year 41,993,328 12,449,982 Cash and cash equivalents, end of year 44,593,176$ 41,993,328$
Cash and cash equivalents per statement of net position 23,850,247$ 16,872,417$ Restricted cash for capital projects - unspent bond proceeds 20,742,929 25,120,911 Total cash and cash equivalents per statement of net position 44,593,176$ 41,993,328$
Year Ended June 30
Statements of Cash Flows
Michigan Technological University
28
2016 Financial Report
MICHIGAN TECHNOLOGICAL UNIVERSITY STATEMENTS OF CASH FLOWS (continued)
The accompanying notes are an integral part of these financial statements.
2016 2015
Operating loss (67,920,763)$ (70,630,409)$ Adjustments to reconcile operating loss to net cash from operating activities:
Depreciation expense 14,273,858 14,626,326 Noncash gifts (2,512,824) (205,058)
Changes in operating assets and liabilities:Receivables, net (63,907) 153,950 Other assets (70,461) (652,589) Student loans receivable 305,021 (220,259) Accounts payable 2,609,926 1,053,595 Other accrued liabilities 835,100 749,338 Unearned revenue 1,674,383 2,498,900 Funds held for others 33,200 13,451 Insurance and benefit reserves (234,106) 26,094 Change in net pension liability and deferred amounts 2,329,818 434,548
Net cash from operating activities (48,740,755)$ (52,152,113)$
Reconciliation of operating loss to net cash from operating activities
Year Ended June 30
29
NOTES TO THE FINANCIAL STATEMENTS(1) BASIS OF PRESENTATION AND SUMMARY OF SIGNIFICANT ACCOUNTING POLICIES
BASIS OF PRESENTATION
Reporting Entity Michigan Technological University (“University”) is an institution of higher education and is considered to be a component unit of the State of Michigan because its Board of Trustees is appointed by the Governor of the State of Michigan. Accordingly, the University is included in the State’s financial statements as a discretely presented component unit. Transactions with the State of Michigan relate primarily to appropriations for operations, grants from various state agencies, State Building Authority (SBA) revenues, and payments to the state retirement program for University employees.
The University has two component units which are described below. The descriptions include the impact that each component unit has on the University.
The Michigan Tech Fund (“Fund”) is a legally separate tax-exempt component unit of the University. The primary purpose of the Fund is to receive, invest, and disburse gifts received on behalf of the University. The Fund provides services entirely to the University and has substantially the same governing body. The Fund is blended into the University’s financial statements because management of the University has operational responsibility for the Fund and the Fund exclusively benefits the University. The June 30, 2016, audited financial statements of the Fund can be obtained from its office at 1400 Townsend Drive, Houghton, MI 49931.
The Michigan Tech Entrepreneurial Support Corporation (MTESC) is a legally separate tax-exempt component unit of the University. The primary purpose of the MTESC is to support the entrepreneurial and commercial development efforts of the University. The MTESC meets the criteria for blending its financial activity into the University’s financial statements. The MTESC provides services entirely to the University and has substantially the same governing body. The University, however, has excluded the MTESC’s financial activity from the financial statements due to insignificance.
The financial statements include the operations of the University and the Fund, collectively known as the University’s financial statements. All significant accounts and transactions between the Fund and the University have been eliminated.
30
2016 Financial Report
Condensed financial information for the Michigan Tech Fund is provided below:
2016 2015AssetsCurrent assets 3,180,451$ 4,797,197$ Noncurrent assets:
Investments 122,541,653 117,068,482 Other 8,449,497 9,029,750
Total assets 134,171,601 130,895,429 LiabilitiesCurrent liabilities:
Accounts payable to University 405,092 400,317 Other 521,518 517,605
Noncurrent liabilities 4,838,075 4,920,740 Total liabilities 5,764,685 5,838,662 Net positionRestricted
Nonexpendable 87,220,187 80,686,142 Expendable 41,047,397 42,289,305
Unrestricted 139,332 2,081,320 Total net position 128,406,916$ 125,056,767$
As of June 30
Michigan Tech Fund
Condensed Statements of Net Position
31
Basis of Presentation The accompanying financial statements have been prepared using the economic resource measurement focus and the accrual basis of accounting. In accordance with governmental accounting standards, the University follows all applicable Governmental Accounting Standards Board (GASB) pronouncements. In applying these accounting pronouncements, the University follows the guidance for special-purpose governments engaged only in “business type” activities rather than issuing financial statements that focus on accountability of individual funds.
2016 2015Operating expensesSupplies and services 13,735,318$ 16,125,093$ Student financial support 2,548,167 2,933,865 Total operating expenses 16,283,485 19,058,958
Operating loss (16,283,485) (19,058,958)
Nonoperating revenues and expensesGifts 13,832,155 9,860,476 Investment return (1,220,787) 748,247 Gifts for capital and permanent endowment purposes 6,728,567 10,372,115 Other nonoperating revenues 293,699 131,737 Net nonoperating revenues 19,633,634 21,112,575
Change in net position 3,350,149 2,053,617 Net positionBeginning of year 125,056,767 123,003,150 End of year 128,406,916$ 125,056,767$
Year Ended June 30
Michigan Tech Fund
Condensed Statements of Revenues, Expenses, and Changes in Net Position
2016 2015Cash flows fromOperating activities (19,159,049)$ (17,514,453)$ Noncapital financing activities 13,566,383 7,986,303 Capital and related financing activities 7,218,676 10,058,624 Investing activities (1,434,233) (2,241,415) Net (decrease) increase in cash and cash equivalents 191,777 (1,710,941) Cash and cash equivalents, beginning of year 2,264,109 3,975,050 Cash and cash equivalents, end of year 2,455,886$ 2,264,109$
Year Ended June 30
Michigan Tech Fund
Condensed Statements of Cash Flows
32
2016 Financial Report
Use of Estimates The preparation of the financial statements in conformity with accounting principles generally accepted in the United States of America requires management to make estimates and assumptions that affect the amounts of assets and liabilities and disclosure of contingent assets and liabilities at the date of the financial statements and the reported amounts of revenues and expenses during the reporting period. Actual results could differ from those estimates. Significant estimates include, but are not limited to, the allowance for doubtful accounts and pledges receivable, accrued compensated absences, net pension liability, other postemployment benefit liabilities, insurance claims incurred but not reported, fair value of investments that are not readily marketable, and life expectancies for split-interest gift agreements.
SUMMARY OF SIGNIFICANT ACCOUNTING POLICIES
Cash and Cash Equivalents The University considers all highly liquid investments (including restricted assets) with a maturity of three months or less when purchased to be cash equivalents. On the Statements of Net Position, restricted cash (unspent bond proceeds) is segregated from cash and cash equivalents and included in noncurrent assets. For the Statement of Cash Flows, however, restricted cash is included in the beginning and ending balances of cash and cash equivalents.
Pledges Receivable and Gifts Pledges receivable and gifts are recognized at their fair values as revenues in the periods received. Pledges receivable that are expected to be collected in future years are recorded at the present value of estimated future cash flows. All pledges receivable are recorded at their net realizable values.
Investments The University’s investments in marketable securities are carried at quoted fair market value whenever possible. The University also holds land for investment purposes which functions as an endowment and is recorded at fair value. Fair value is arrived at through independent appraisals of the land and of the timber holdings.
Fund investments in marketable securities including hedge funds are carried at quoted fair market value whenever possible. Hedge funds’ fair values are based on information provided by the administrators of each underlying fund. Real estate and natural resources are accounted for on the equity method. Private equity funds that do not have readily determinable market values as of June 30 are valued based on the most recent available partner capital account balances as reported by the partnerships to the Fund. The partnership valuations involve assumptions and methods that are reviewed by the Fund. Because of the inherent uncertainty of valuations in the absence of a highly liquid market, private equity funds’ estimated values may differ materially from the values that would have been used if a ready market for the securities existed. Gifts of securities are recorded at their fair value based on the mean of the high and low quoted price of stock transactions at the date of the gift. Except for investments that are not readily marketable or where donors specifically provide otherwise, investments are maintained by custodial institutions responsible for consummating investment transactions at the request of the Fund to facilitate cash flow requirements. The Fund employs an asset allocation investment policy and uses the services of an investment advisor to facilitate the implementation of this policy. Asset allocations are reviewed monthly and rebalanced as necessary. The Fund’s Investment Committee of the Board of Directors provides oversight of the investment advisor and makes recommendations to the Board of Directors concerning any changes in the asset allocation. Each month, the Fund allocates and credits investment earnings (including realized and unrealized gains and losses) on nonexpendable restricted, expendable restricted, and unrestricted net position to departmental funds based on an average of each fund’s beginning and ending monthly balances. Any unrealized losses on amounts invested for donor-restricted endowments are recorded as expendable restricted to the extent of unexpended earnings of the respective endowment fund. Any unrealized losses in excess of that amount are charged to unrestricted net position. Subsequent unrealized appreciation on the related investments is recorded as unrestricted up to the amount of losses previously absorbed by unrestricted net position.
33
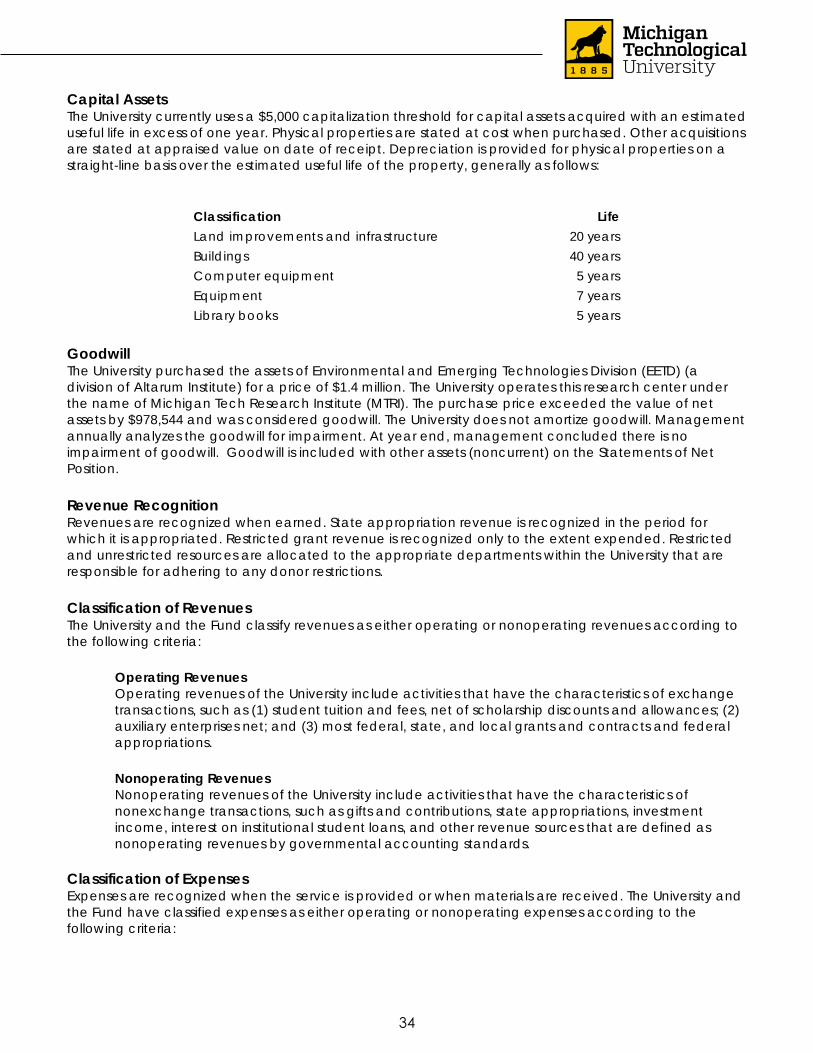
Capital Assets The University currently uses a $5,000 capitalization threshold for capital assets acquired with an estimated useful life in excess of one year. Physical properties are stated at cost when purchased. Other acquisitions are stated at appraised value on date of receipt. Depreciation is provided for physical properties on a straight-line basis over the estimated useful life of the property, generally as follows:
Goodwill The University purchased the assets of Environmental and Emerging Technologies Division (EETD) (a division of Altarum Institute) for a price of $1.4 million. The University operates this research center under the name of Michigan Tech Research Institute (MTRI). The purchase price exceeded the value of net assets by $978,544 and was considered goodwill. The University does not amortize goodwill. Management annually analyzes the goodwill for impairment. At year end, management concluded there is no impairment of goodwill. Goodwill is included with other assets (noncurrent) on the Statements of Net Position.
Revenue Recognition Revenues are recognized when earned. State appropriation revenue is recognized in the period for which it is appropriated. Restricted grant revenue is recognized only to the extent expended. Restricted and unrestricted resources are allocated to the appropriate departments within the University that are responsible for adhering to any donor restrictions.
Classification of Revenues The University and the Fund classify revenues as either operating or nonoperating revenues according to the following criteria:
Operating Revenues Operating revenues of the University include activities that have the characteristics of exchange transactions, such as (1) student tuition and fees, net of scholarship discounts and allowances; (2) auxiliary enterprises net; and (3) most federal, state, and local grants and contracts and federal appropriations.
Nonoperating Revenues Nonoperating revenues of the University include activities that have the characteristics of nonexchange transactions, such as gifts and contributions, state appropriations, investment income, interest on institutional student loans, and other revenue sources that are defined as nonoperating revenues by governmental accounting standards.
Classification of Expenses Expenses are recognized when the service is provided or when materials are received. The University and the Fund have classified expenses as either operating or nonoperating expenses according to the following criteria:
Classification LifeLand improvements and infrastructure 20 yearsBuildings 40 yearsComputer equipment 5 yearsEquipment 7 yearsLibrary books 5 years
34
2016 Financial Report
Operating Expenses Operating expenses include activities that have the characteristics of exchange transactions, such as (1) employee salaries, benefits, and related expenses; (2) scholarships and fellowships, net of scholarship discounts and allowances; (3) utilities, supplies, and other services; (4) professional fees; and (5) depreciation expense related to University capital assets.
Nonoperating Expenses Nonoperating expenses include activities that have the characteristics of nonexchange transactions, such as interest on capital asset-related debt and other expenses that are defined as nonoperating expenses by governmental accounting standards.
Income Taxes The University is classified as a political subdivision of the State of Michigan under Internal Revenue Code Section 115(A) and is, therefore, exempt from federal income taxes. Certain activities of the University, to the extent profitable, may be subject to taxation as unrelated business income under Internal Revenue Code Sections 511 to 514. No such taxes were incurred for either fiscal year presented in this report. The Fund is exempt from federal income taxes under Internal Revenue Code section 501(c)(3).
Net Position The University’s net position is classified as follows:
Net investment in capital assets Capital assets, net of accumulated depreciation, unspent bond proceeds, and outstanding principal balances of debt attributable to the acquisition, construction, or improvement of those assets.
Restricted for nonexpendable purposes Net position from gifts and other inflows of assets that represent permanent endowments. Use of these gifts is limited by donor-imposed stipulations that neither expire by the passage of time nor can be fulfilled or otherwise removed by the University.
Restricted for expendable purposes Net position whose use is subject to externally imposed stipulations that can be fulfilled by actions of the University pursuant to those stipulations or that expire by the passage of time. Such net position includes net appreciation of permanent endowment funds and funds designated for student financial aid and other University programs.
Unrestricted Net position that is not subject to externally imposed stipulations. Unrestricted net position may be designated for specific purposes by action of the University’s Board of Trustees or may otherwise be limited by contractual agreements with outside parties.
Deferred Outflows of Resources In addition to assets, the Statements of Net Position will sometimes report a separate section for deferred outflows of resources. This separate financial statement element represents a consumption of net position that applies to one or more future periods and so will not be recognized as an outflow of resources (expense) until then. The University reports deferred outflows of resources for certain pension-related amounts, such as change in expected and actual experience, changes in assumptions, and certain contributions made to the plan subsequent to the measurement date. More detailed information can be found in Note 9.
35
Deferred Inflows of Resources In addition to liabilities, the Statements of Net Position will sometimes report a separate section for deferred inflows of resources. This separate financial statement element, deferred inflows of resources, represents an acquisition of net position that applies to one or more future periods and so will not be recognized as an inflow of resources (revenue) until that time. The University reports deferred inflows of resources for certain pension-related amounts, such as the difference between projected and actual earnings of the pension plan’s investments. More detailed information can be found in Note 9.
Pension For purposes of measuring the net pension liability, deferred outflows of resources and deferred inflows of resources related to pensions, and pension expense, information about the fiduciary net position of the plan and additions to/deductions from the plan fiduciary net position have been determined on the same basis as they are reported by the plan. For this purpose, benefit payments (including refunds of employee contributions) are recognized when due and payable in accordance with the benefit terms. Investments are reported at fair value.
New Accounting Pronouncements As of July 1, 2014, the University adopted GASB Statement No. 68, Accounting and Financial Reporting for Pensions. This statement requires that the University recognize a net pension liability on the statement of net position, equal to the University’s proportionate share of the net pension liability of the Michigan Public School Employees Retirement System (MPSERS), as defined and calculated in accordance with the new standard. More detailed information can be found in Note 9. As a result of this change, the University recognized a net pension liability of $37,860,467 and deferred outflows of resources of $2,415,402, which resulted in a decrease in net position of $35,455,065 as of July 1, 2014.
Reclassification Certain amounts as reported in the 2015 financial statements have been reclassified to conform to the 2016 presentation.
(2) CASH AND INVESTMENTS
Authorizations The University utilizes the “pooled cash” method of accounting for substantially all of its cash and cash equivalents. The University investment policies are governed and authorized by University Bylaws and the Board of Trustees. The Fund’s investment policies are governed by its Board of Directors and the performance of its investments is monitored by its Investment Committee.
Interest rate risk Neither the University nor the Fund has a formal investment policy that limits investment maturities as a means of managing its exposure to fair value losses arising from increasing interest rates.
Credit risk Credit risk is the risk that an issuer or other counterparty to an investment will not fulfill its obligations. Investment policies for cash and cash equivalents, as set forth by the Board of Trustees, authorize the University to invest, with limitations, in commercial paper rated within the two highest classifications of prime as established by at least one of the standard rating services. Investments may also be made in securities of the US Treasury and federal agencies, or in mutual funds holding securities of the US Treasury and federal agencies, and in time savings accounts. University policies regarding investments and marketable securities, as set forth by the Board of Trustees, authorize the University to invest in US Treasury obligations; commercial paper rated within the two highest classifications of prime as established by at least one of the standard rating services; federal agency securities; certificates of deposit issued by FDIC insured banks or an NCUA credit union member; or Eurodollar time deposits in Tier 1, 2, or 3 banks.
36
2016 Financial Report
Custodial credit risk: deposits For deposits, custodial credit risk is present if the University’s deposits would not be covered by depository insurance or collateralized by the bank. State law does not require, and the University does not have, a policy for deposit custodial credit risk. Deposits were reflected in the accounts of the banks of $45,289,738 and $42,185,728 as of June 30, 2016 and 2015, respectively. The University had $22,964,243 and $27,316,162 exposed to custodial credit risk because the deposits were uninsured or uncollateralized, as of June 30, 2016 and 2015, respectively.
Custodial credit risk: investments For an investment, custodial credit risk is the risk that, in the event of the failure of the counter party, the University will not be able to recover the value of its investments or collateral securities that are in the possession of an outside party. Neither the University nor the Fund has a policy for investment custodial risk. However, all investments are in the name of the University or the Fund, as applicable, and the investments are held in accounts with each financial institution from which they were purchased.
Concentration of credit risk Concentration of credit risk is the risk of loss attributed to the magnitude of investment in a single issuer. Neither the University’s nor the Fund’s investment policy has specific limits on concentration of credit risk. The majority of the University’s and Fund’s investments are in mutual funds; accordingly, concentration of credit risk is considered to be insignificant.
Foreign currency risk Foreign currency risk is the risk that changes in exchange rates will adversely affect the fair value of an investment or deposit. The University and Fund invest in mutual funds whose underlying investments are in foreign currency; however, management of the University and Fund does not believe that there is significant risk as a result of these investments.
37
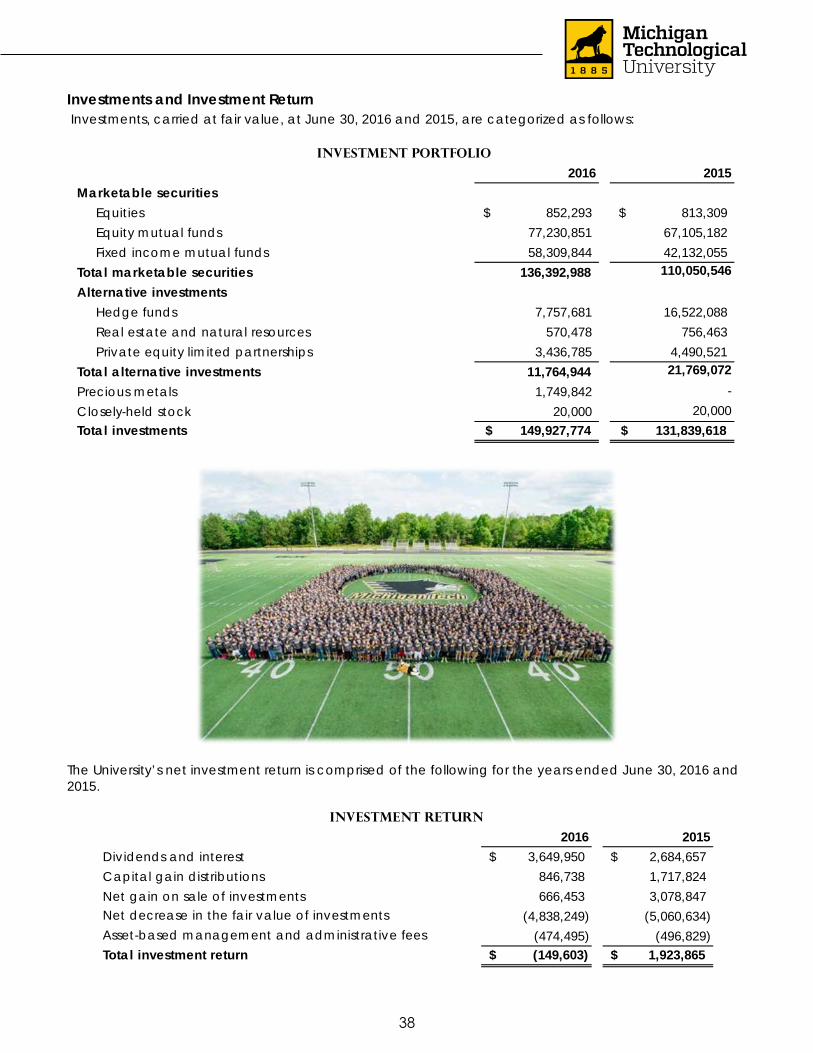
Investments and Investment Return Investments, carried at fair value, at June 30, 2016 and 2015, are categorized as follows:
The University’s net investment return is comprised of the following for the years ended June 30, 2016 and 2015.
2016 2015Marketable securities
Equities 852,293$ 813,309$ Equity mutual funds 77,230,851 67,105,182 Fixed income mutual funds 58,309,844 42,132,055
Total marketable securities 136,392,988 110,050,546 Alternative investments
Hedge funds 7,757,681 16,522,088 Real estate and natural resources 570,478 756,463 Private equity limited partnerships 3,436,785 4,490,521
Total alternative investments 11,764,944 21,769,072 Precious metals 1,749,842 - Closely-held stock 20,000 20,000 Total investments 149,927,774$ 131,839,618$
Investment Portfolio
2016 2015Dividends and interest 3,649,950$ 2,684,657$ Capital gain distributions 846,738 1,717,824 Net gain on sale of investments 666,453 3,078,847 Net decrease in the fair value of investments (4,838,249) (5,060,634) Asset-based management and administrative fees (474,495) (496,829) Total investment return (149,603)$ 1,923,865$
Investment Return
38
2016 Financial Report
The fair values of investments measured on a recurring basis at June 30, 2016 are as follows:
At June 30, 2016, remaining commitments in private equity limited partnerships were $2,459,699.
Quoted Prices in Active
Markets for Identical
Assets
Significant Other
Observable Inputs
Significant Unobservable
Inputs(Level 1) (Level 2) (Level 3)
Equities 852,293$ 852,293$ -$ -$ Equity mutual funds 77,230,851 77,230,851 - - Fixed income mutual funds 58,309,844 44,540,371 13,769,473 - Precious metals 1,749,842 - - 1,749,842 Closely-held stock 20,000 - - 20,000 Total investments by fair value level 138,162,830 122,623,515$ 13,769,473$ 1,769,842$
Investments measured at the net asset value:Hedge funds 7,757,681 Real estate and natural resources 570,478 Private equity limited partnerships 3,436,785
Total investments at the net asset value 11,764,944 Total investments at fair value 149,927,774$
Fair Value
39
(3) RECEIVABLES Accounts receivable of the University are summarized as follows as of June 30, 2016 and 2015.
In addition, the University has student loans receivable in the amount of $11,780,464 and $12,085,485, recorded at June 30, 2016 and 2015, respectively. These amounts are net of an allowance for uncollectible accounts of $169,461 for both years.
Pledges receivable of the University are summarized as follows as of June 30, 2016 and 2015.
The present value of future cash flows were estimated using .25% over the risk-adjusted rate at the date of the gift. Risk-adjusted rates range from .89% to 2.60%.
Accounts Receivable
2016 2015Student tuition and fees 951,340$ 597,002$ State appropriations
Operating 8,500,860 8,349,657 Capital 3,528 -
Grants and contracts 7,675,614 7,151,144 Auxiliary activities 761,950 623,101 Other 841,071 848,634 Less allowance for doubtful accounts (105,653) (105,653)
Accounts receivable, net 18,628,710$ 17,463,885$
2016 2015Pledges receivable in less than one year 3,029,498$ 4,358,710$ Pledges receivable in one to five years 2,295,147 2,408,851 Pledges receivable in more than five years 118,760 112,760 Less:
Allowance for uncollectible pledges (2,549,830) (2,053,853) Present value discount (198,900) (243,377)
Net pledges receivable 2,694,675$ 4,583,091$
Pledges Receivable
40
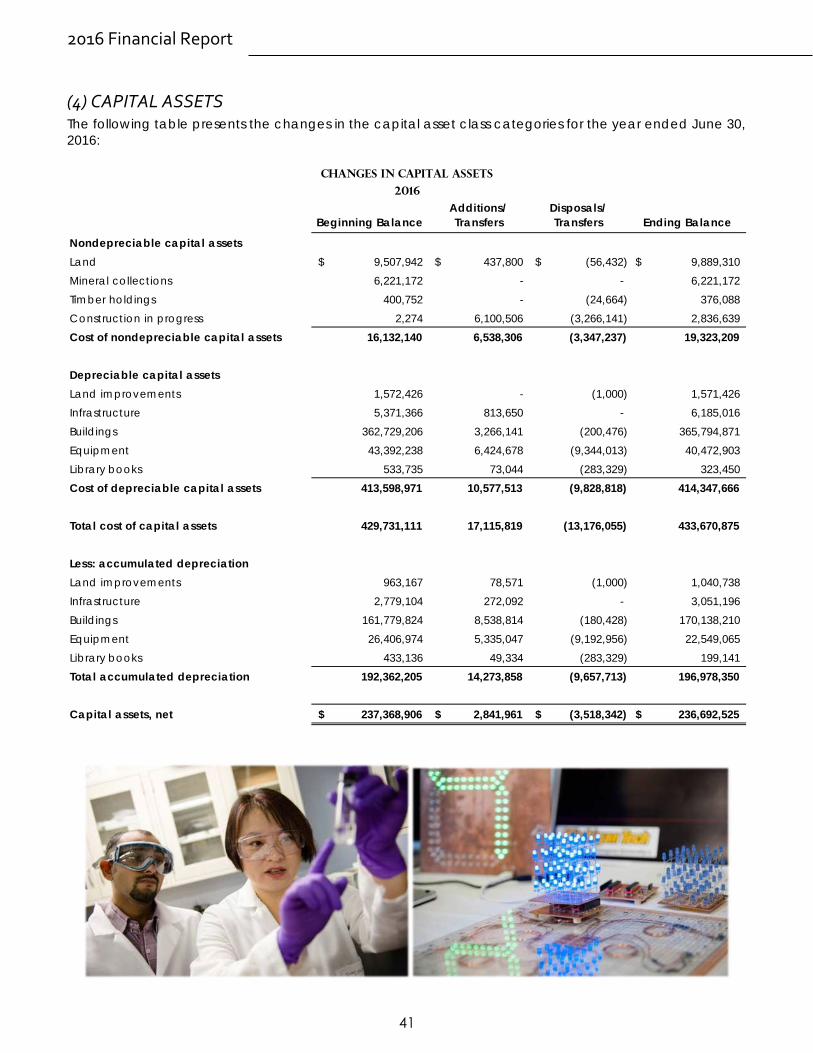
2016 Financial Report
(4) CAPITAL ASSETS The following table presents the changes in the capital asset class categories for the year ended June 30, 2016:
Beginning BalanceAdditions/ Transfers
Disposals/ Transfers Ending Balance
Nondepreciable capital assetsLand 9,507,942$ 437,800$ (56,432)$ 9,889,310$ Mineral collections 6,221,172 - - 6,221,172 Timber holdings 400,752 - (24,664) 376,088 Construction in progress 2,274 6,100,506 (3,266,141) 2,836,639 Cost of nondepreciable capital assets 16,132,140 6,538,306 (3,347,237) 19,323,209
Depreciable capital assetsLand improvements 1,572,426 - (1,000) 1,571,426 Infrastructure 5,371,366 813,650 - 6,185,016 Buildings 362,729,206 3,266,141 (200,476) 365,794,871 Equipment 43,392,238 6,424,678 (9,344,013) 40,472,903 Library books 533,735 73,044 (283,329) 323,450 Cost of depreciable capital assets 413,598,971 10,577,513 (9,828,818) 414,347,666
Total cost of capital assets 429,731,111 17,115,819 (13,176,055) 433,670,875
Less: accumulated depreciationLand improvements 963,167 78,571 (1,000) 1,040,738 Infrastructure 2,779,104 272,092 - 3,051,196 Buildings 161,779,824 8,538,814 (180,428) 170,138,210 Equipment 26,406,974 5,335,047 (9,192,956) 22,549,065 Library books 433,136 49,334 (283,329) 199,141 Total accumulated depreciation 192,362,205 14,273,858 (9,657,713) 196,978,350
Capital assets, net 237,368,906$ 2,841,961$ (3,518,342)$ 236,692,525$
2016
Changes in Capital Assets
41
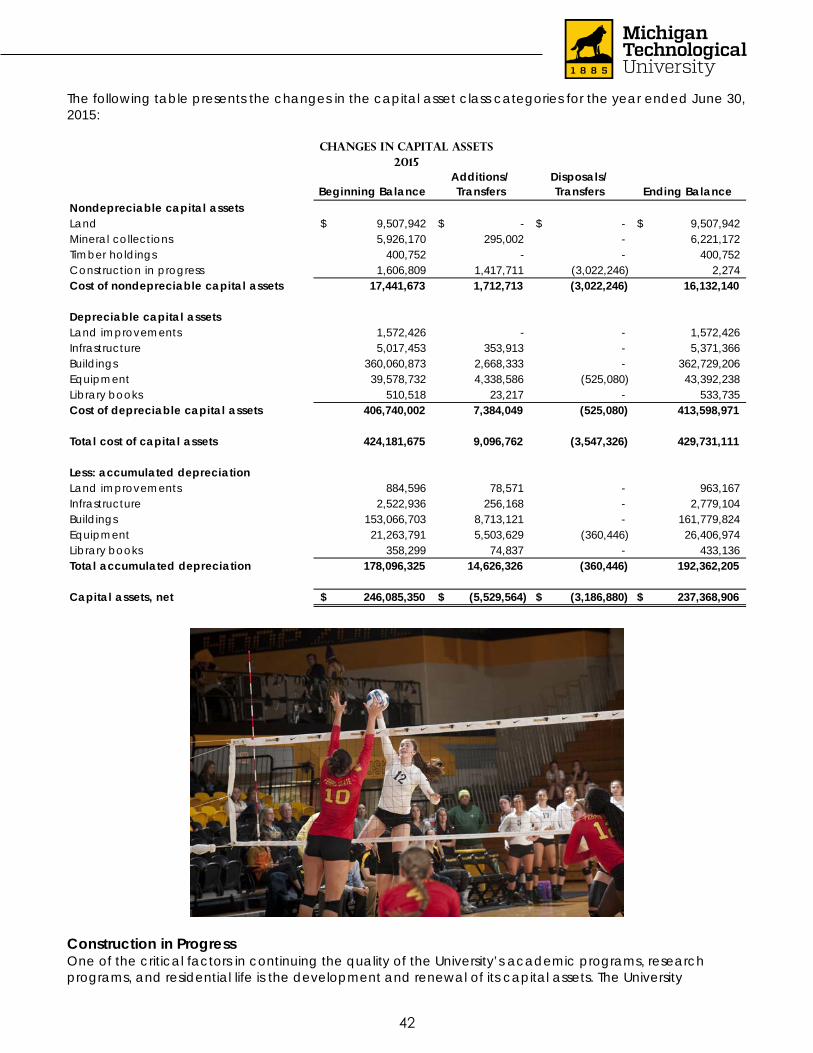
The following table presents the changes in the capital asset class categories for the year ended June 30, 2015:
Construction in Progress One of the critical factors in continuing the quality of the University’s academic programs, research programs, and residential life is the development and renewal of its capital assets. The University
Beginning BalanceAdditions/ Transfers
Disposals/ Transfers Ending Balance
Nondepreciable capital assetsLand 9,507,942$ -$ -$ 9,507,942$ Mineral collections 5,926,170 295,002 - 6,221,172 Timber holdings 400,752 - - 400,752 Construction in progress 1,606,809 1,417,711 (3,022,246) 2,274 Cost of nondepreciable capital assets 17,441,673 1,712,713 (3,022,246) 16,132,140
Depreciable capital assetsLand improvements 1,572,426 - - 1,572,426 Infrastructure 5,017,453 353,913 - 5,371,366 Buildings 360,060,873 2,668,333 - 362,729,206 Equipment 39,578,732 4,338,586 (525,080) 43,392,238 Library books 510,518 23,217 - 533,735 Cost of depreciable capital assets 406,740,002 7,384,049 (525,080) 413,598,971
Total cost of capital assets 424,181,675 9,096,762 (3,547,326) 429,731,111
Less: accumulated depreciationLand improvements 884,596 78,571 - 963,167 Infrastructure 2,522,936 256,168 - 2,779,104 Buildings 153,066,703 8,713,121 - 161,779,824 Equipment 21,263,791 5,503,629 (360,446) 26,406,974 Library books 358,299 74,837 - 433,136 Total accumulated depreciation 178,096,325 14,626,326 (360,446) 192,362,205
Capital assets, net 246,085,350$ (5,529,564)$ (3,186,880)$ 237,368,906$
Changes in Capital Assets2015
42
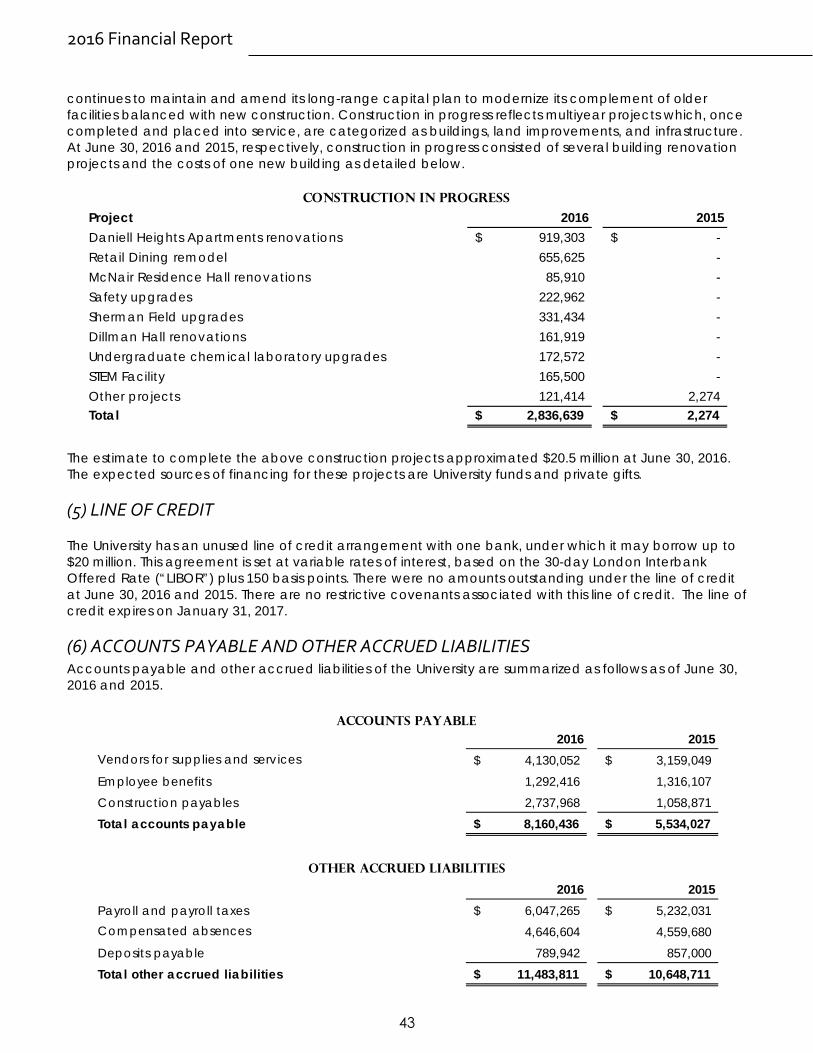
2016 Financial Report
continues to maintain and amend its long-range capital plan to modernize its complement of older facilities balanced with new construction. Construction in progress reflects multiyear projects which, once completed and placed into service, are categorized as buildings, land improvements, and infrastructure. At June 30, 2016 and 2015, respectively, construction in progress consisted of several building renovation projects and the costs of one new building as detailed below.
The estimate to complete the above construction projects approximated $20.5 million at June 30, 2016. The expected sources of financing for these projects are University funds and private gifts.
(5) LINE OF CREDIT
The University has an unused line of credit arrangement with one bank, under which it may borrow up to $20 million. This agreement is set at variable rates of interest, based on the 30-day London Interbank Offered Rate (“LIBOR”) plus 150 basis points. There were no amounts outstanding under the line of credit at June 30, 2016 and 2015. There are no restrictive covenants associated with this line of credit. The line of credit expires on January 31, 2017.
(6) ACCOUNTS PAYABLE AND OTHER ACCRUED LIABILITIES Accounts payable and other accrued liabilities of the University are summarized as follows as of June 30, 2016 and 2015.
Project 2016 2015Daniell Heights Apartments renovations 919,303$ -$ Retail Dining remodel 655,625 - McNair Residence Hall renovations 85,910 - Safety upgrades 222,962 - Sherman Field upgrades 331,434 - Dillman Hall renovations 161,919 - Undergraduate chemical laboratory upgrades 172,572 - STEM Facility 165,500 - Other projects 121,414 2,274 Total 2,836,639$ 2,274$
Construction in Progress
Accounts Payable2016 2015
Vendors for supplies and services 4,130,052$ 3,159,049$ Employee benefits 1,292,416 1,316,107 Construction payables 2,737,968 1,058,871 Total accounts payable 8,160,436$ 5,534,027$
2016 2015Payroll and payroll taxes 6,047,265$ 5,232,031$ Compensated absences 4,646,604 4,559,680 Deposits payable 789,942 857,000 Total other accrued liabilities 11,483,811$ 10,648,711$
Other Accrued Liabilities
43
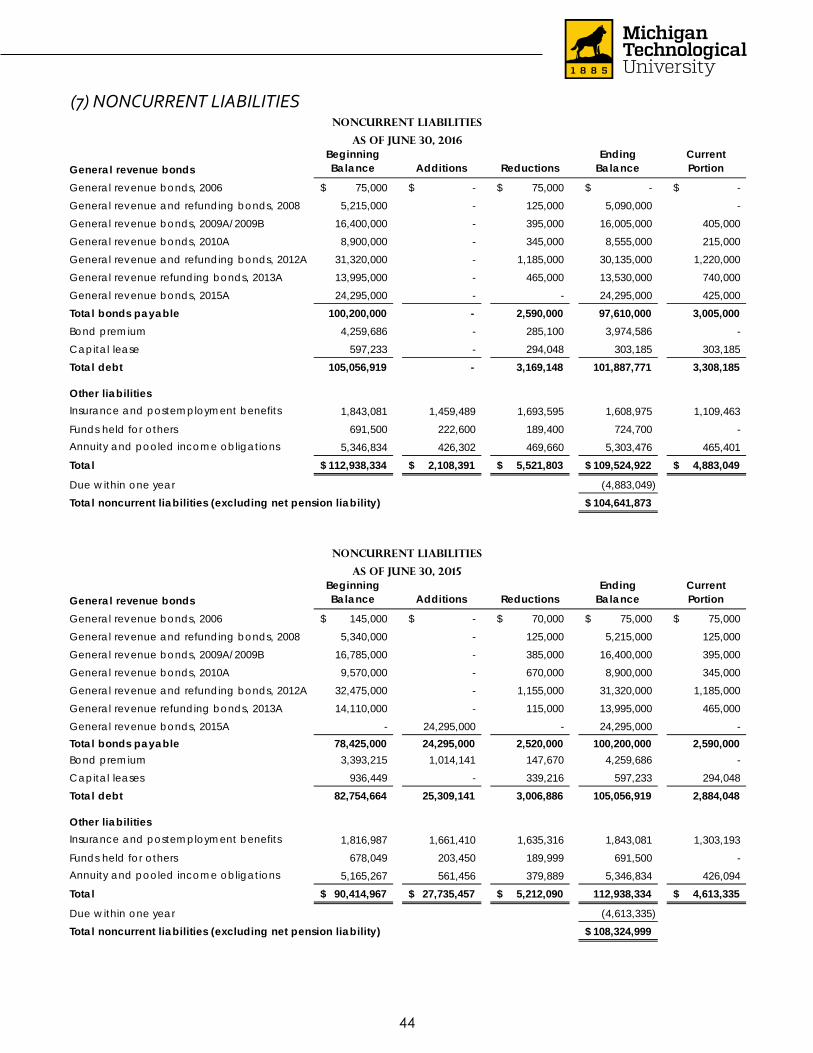
(7) NONCURRENT LIABILITIES
General revenue bondsBeginning Balance Additions Reductions
Ending Balance
Current Portion
General revenue bonds, 2006 75,000$ -$ 75,000$ -$ -$ General revenue and refunding bonds, 2008 5,215,000 - 125,000 5,090,000 - General revenue bonds, 2009A/2009B 16,400,000 - 395,000 16,005,000 405,000 General revenue bonds, 2010A 8,900,000 - 345,000 8,555,000 215,000 General revenue and refunding bonds, 2012A 31,320,000 - 1,185,000 30,135,000 1,220,000 General revenue refunding bonds, 2013A 13,995,000 - 465,000 13,530,000 740,000 General revenue bonds, 2015A 24,295,000 - - 24,295,000 425,000 Total bonds payable 100,200,000 - 2,590,000 97,610,000 3,005,000 Bond premium 4,259,686 - 285,100 3,974,586 - Capital lease 597,233 - 294,048 303,185 303,185 Total debt 105,056,919 - 3,169,148 101,887,771 3,308,185
Other liabilitiesInsurance and postemployment benefits 1,843,081 1,459,489 1,693,595 1,608,975 1,109,463 Funds held for others 691,500 222,600 189,400 724,700 - Annuity and pooled income obligations 5,346,834 426,302 469,660 5,303,476 465,401 Total 112,938,334$ 2,108,391$ 5,521,803$ 109,524,922$ 4,883,049$
Due within one year (4,883,049) Total noncurrent liabilities (excluding net pension liability) 104,641,873$
Noncurrent Liabilities
As of June 30, 2016
General revenue bondsBeginning Balance Additions Reductions
Ending Balance
Current Portion
General revenue bonds, 2006 145,000$ -$ 70,000$ 75,000$ 75,000$ General revenue and refunding bonds, 2008 5,340,000 - 125,000 5,215,000 125,000 General revenue bonds, 2009A/2009B 16,785,000 - 385,000 16,400,000 395,000 General revenue bonds, 2010A 9,570,000 - 670,000 8,900,000 345,000 General revenue and refunding bonds, 2012A 32,475,000 - 1,155,000 31,320,000 1,185,000 General revenue refunding bonds, 2013A 14,110,000 - 115,000 13,995,000 465,000 General revenue bonds, 2015A - 24,295,000 - 24,295,000 - Total bonds payable 78,425,000 24,295,000 2,520,000 100,200,000 2,590,000 Bond premium 3,393,215 1,014,141 147,670 4,259,686 - Capital leases 936,449 - 339,216 597,233 294,048 Total debt 82,754,664 25,309,141 3,006,886 105,056,919 2,884,048
Other liabilitiesInsurance and postemployment benefits 1,816,987 1,661,410 1,635,316 1,843,081 1,303,193 Funds held for others 678,049 203,450 189,999 691,500 - Annuity and pooled income obligations 5,165,267 561,456 379,889 5,346,834 426,094 Total 90,414,967$ 27,735,457$ 5,212,090$ 112,938,334 4,613,335$
Due within one year (4,613,335) Total noncurrent liabilities (excluding net pension liability) 108,324,999$
Noncurrent Liabilities
As of June 30, 2015
44
2016 Financial Report
Bonds The principal and interest on bonds are payable only from certain general revenues. The obligations are generally callable. Premiums on bonds payable are recorded in total and amortized over the life of the bonds using straight line amortization.
All bonds of the University, unless otherwise specified, have received an underlying rating of A1 from Moody’s.
During fiscal year 2006, the University’s Board of Trustees approved the issuance of bonds for the general campus renovation project and the addition of a child care center. On July 19, 2006, the University issued $2.99 million of General Revenue Bonds, Series 2006. These bonds bear interest at an average rate of 4.7% and mature at various dates from October 2007 through October 2036. These General Revenue Bonds are limited obligations of the bond payable from and secured solely by an irrevocable pledge of General Revenues as provided in the indenture. These bonds are rated Aaa by Moody’s due to a municipal bond insurance policy. Outstanding principal of $2.715 million was refunded with the Series 2013A bonds.
During fiscal year 2009, the University’s Board of Trustees approved the issuance of General Revenue Refunding Bonds, Series 2008 in the amount of $15.88 million. The proceeds of this bond issue were used to refund the $10 million of Series 1998 bonds outstanding with the remainder funding the remodeling of the Michigan Tech Lakeshore Center building, remodeling of the Memorial Union ballroom and providing initial construction funds for the Keweenaw Research Center. These bonds bear fixed interest rates at 3.0% to 5.25% and mature at various dates from October 2009 through October 2038. These bonds are secured by an irrevocable pledge of general revenues as provided in the indenture. Outstanding principal of $11.550 million was refunded with the series 2013A bonds.
During fiscal year 2010, the University’s Board of Trustees approved the issuance of General Revenue Bonds, Series 2009A and 2009B. The combined amount of bonds issued was $18.235 million. Series 2009A, in the amount of $17.885 million, was issued as taxable Build America Bonds. Under this federal program, 35% of the interest related to this bond issue in the principal and interest amounts due is anticipated to be paid by the federal government for the life of the Build America Bonds. This bond series consists of serial bonds in the amount of $3.580 million with maturities of October 2011 through October 2019 and interest
45
rates ranging from 2.58% to 5.30%. Two term bonds totaling $14.305 million were also issued in this series. The first term bond in the amount of $5.650 million matures in October 2029 and bears an interest rate of 6.44%. The second term bond in the amount of $8.655 million matures in October 2039 and bears an interest rate of 6.69%. Series 2009B, issued as a tax-exempt bond in the amount of $350,000 matured in October 2010. The proceeds of this bond issue were used to construct a student residential facility and for the construction of a new facility at the Keweenaw Research Center. These bonds are secured by an irrevocable pledge of general revenues as provided in the indenture.
During fiscal year 2011, the University’s Board of Trustees approved the issuance of General Revenue Bonds, Series 2010A in the amount of $10.975 million. The Series 2010A bonds were issued as taxable Build America Bonds. Under this federal program, 35% of the interest related to this bond issue in the principal and interest amounts due is anticipated to be paid by the federal government for the life of the Build America Bonds. This bond series consists of serial bonds in the amount of $2.855 million with maturities of October 2011 through October 2017 and interest rates ranging from 1.37% to 3.84%. Three term bonds totaling $8.12 million were also issued in this series. The first term bond in the amount of $2.085 million matures in October 2025 and bears an interest rate of 5.569%. The second term bond in the amount of $1.66 million matures in October 2030 and bears an interest rate of 6.2%. The third term bond in the amount of $4.375 million matures in October 2040 and bears an interest rate of 6.55%. The proceeds of this bond issue were used to construct, acquire, and equip new research facilities and to construct and equip a new museum building. These bonds are secured by an irrevocable pledge of general revenues as provided in the indenture and have been rated as Aa3 by Moody’s.
During fiscal year 2012, the University’s Board of Trustees approved the issuance of General Revenue and Refunding Bonds, Series 2012A in the amount of $33.070 million. The proceeds of this bond issue were used to partially refund Series 2003 bonds in the amount of $3.965 million, to partially refund Series 2004 bonds in the amount of $27.150 million with the remainder funding the replacement of the ice plant and rink slab in the hockey arena and partial replacement of the roof of the Student Development Center. The Series 2003 bonds refunded were called for redemption on April 1, 2013 and the Series 2004 bonds refunded were called for redemption on October 1, 2013 each at a redemption price equal to 100% of
the principal amount plus accrued interest. The 2012A bond series consists of serial bonds in the amount of $19.75 million with maturities of October 2012 through October 2027 and interest rates ranging from 3.0% to 5.0%. The issue also included two term bonds totaling $13.32 million. The first term bond in the amount of $5.32 million matures in October 2030 and bears an interest rate of 4.0%. The second term bond in the amount of $8.0 million matures in October 2034 and bears an interest rate of 5.0%. These bonds are secured by an irrevocable pledge of general revenues as provided in the indenture and have been rated as Aa3 by Moody’s.
During fiscal year 2013, the University’s Board of Trustees approved the issuance of General Revenue Refunding Bonds, Series 2013A in the amount of $14.265 million. The proceeds of this bond issue were used to refund Series 2006 bonds in the amount of $2.715 million and to partially refund Series 2008 bonds in the amount of $11.550 million. The Series 2006 bonds to be refunded will be called for redemption on April 1, 2016 at a redemption price equal to 100% of the principal amount to be redeemed plus accrued interest to the redemption date. Principal and interest on the Series 2008 bonds will be paid at maturity on October 1, 2016, October 1, 2017, and October 1, 2018, respectively. The advance refunding of the $2.715
million of Series 2006 bonds and the $11.550 million of Series 2008 bonds provided resources to purchase US government securities that were placed in an escrow fund for the purpose of generating resources for all future debt service payments on $14.265 million of refunded debt. The 2013A bond series consists of serial bonds in the amount of $8.325 million with maturities of October 2013 through October 2026 and
46
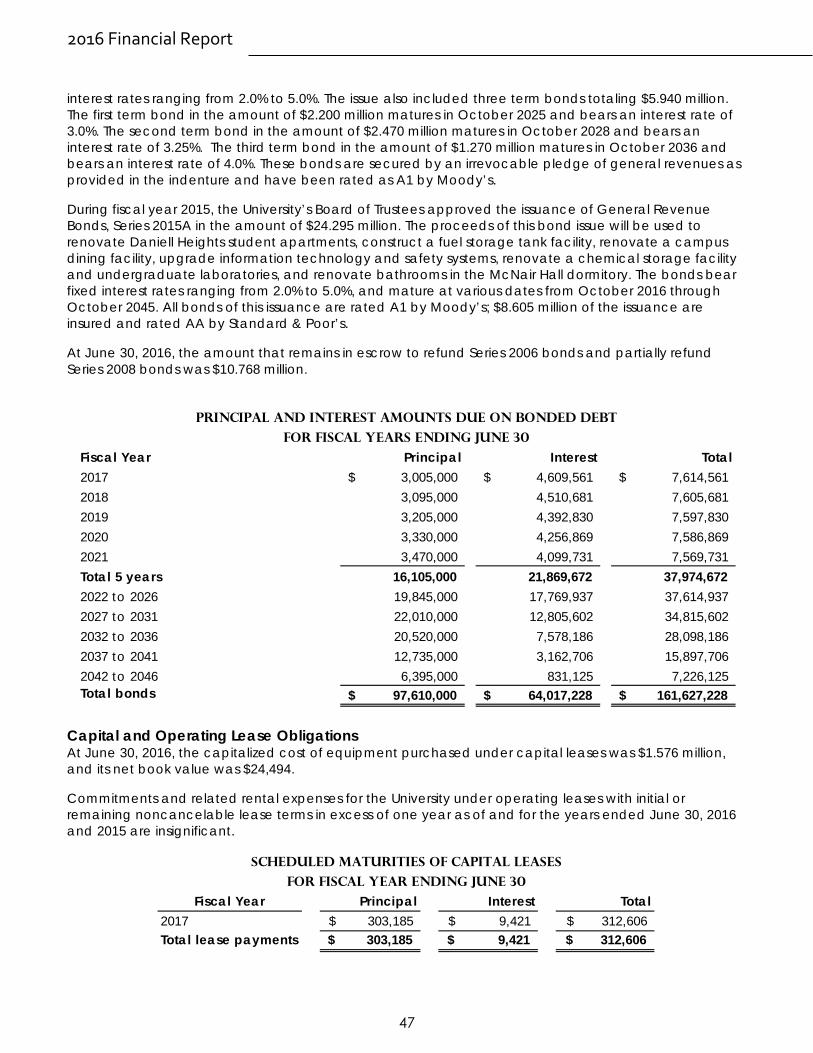
2016 Financial Report
interest rates ranging from 2.0% to 5.0%. The issue also included three term bonds totaling $5.940 million. The first term bond in the amount of $2.200 million matures in October 2025 and bears an interest rate of 3.0%. The second term bond in the amount of $2.470 million matures in October 2028 and bears an interest rate of 3.25%. The third term bond in the amount of $1.270 million matures in October 2036 and bears an interest rate of 4.0%. These bonds are secured by an irrevocable pledge of general revenues as provided in the indenture and have been rated as A1 by Moody’s.
During fiscal year 2015, the University’s Board of Trustees approved the issuance of General Revenue Bonds, Series 2015A in the amount of $24.295 million. The proceeds of this bond issue will be used to renovate Daniell Heights student apartments, construct a fuel storage tank facility, renovate a campus dining facility, upgrade information technology and safety systems, renovate a chemical storage facility and undergraduate laboratories, and renovate bathrooms in the McNair Hall dormitory. The bonds bear fixed interest rates ranging from 2.0% to 5.0%, and mature at various dates from October 2016 through October 2045. All bonds of this issuance are rated A1 by Moody’s; $8.605 million of the issuance are insured and rated AA by Standard & Poor’s.
At June 30, 2016, the amount that remains in escrow to refund Series 2006 bonds and partially refund Series 2008 bonds was $10.768 million.
Capital and Operating Lease Obligations At June 30, 2016, the capitalized cost of equipment purchased under capital leases was $1.576 million, and its net book value was $24,494.
Commitments and related rental expenses for the University under operating leases with initial or remaining noncancelable lease terms in excess of one year as of and for the years ended June 30, 2016 and 2015 are insignificant.
Fiscal Year Principal Interest Total2017 3,005,000$ 4,609,561$ 7,614,561$ 2018 3,095,000 4,510,681 7,605,681 2019 3,205,000 4,392,830 7,597,830 2020 3,330,000 4,256,869 7,586,869 2021 3,470,000 4,099,731 7,569,731 Total 5 years 16,105,000 21,869,672 37,974,672 2022 to 2026 19,845,000 17,769,937 37,614,937 2027 to 2031 22,010,000 12,805,602 34,815,602 2032 to 2036 20,520,000 7,578,186 28,098,186 2037 to 2041 12,735,000 3,162,706 15,897,706 2042 to 2046 6,395,000 831,125 7,226,125 Total bonds 97,610,000$ 64,017,228$ 161,627,228$
Principal and Interest Amounts Due on Bonded Debt
For Fiscal Years Ending June 30
Fiscal Year Principal Interest Total2017 303,185$ 9,421$ 312,606$ Total lease payments 303,185$ 9,421$ 312,606$
Scheduled Maturities of Capital Leases
For Fiscal Year Ending June 30
47
(8) INSURANCE
Self-Insurance The University is essentially self-insured for medical benefits claims, unemployment compensation, and workers’ compensation. Stop-loss coverage has been purchased by the University for its workers’ compensation coverage. Liabilities for estimates of losses retained by the University under self-insurance programs have been determined and accrued for and included in insurance and benefit reserves on the accompanying Statements of Net Position. Changes in the estimated liability for self-insured plans during the past two fiscal years are as follows:
Liability and Property Insurance The University participates with eleven other Michigan universities in the Michigan Universities Self-Insurance Corporation (“MUSIC”). MUSIC’s purpose is to provide indemnity to members against auto, comprehensive general liability, errors and omissions, and property losses commonly covered by insurance. Premiums are assessed annually for (1) insurance risks retained by MUSIC, (2) costs related to excess coverage, and (3) general and administrative expenses. MUSIC also provides risk-management and loss control services and programs.
Loss coverages are structured on a three-layer basis with each member retaining a portion of its losses, MUSIC covering the second layer of losses, and commercial carriers covering the third layer.
Comprehensive general liability coverage is provided on a per-occurrence basis; errors and omissions coverage is provided on a claims-made basis. In the event of excess assets, MUSIC will return the surplus, credit the surplus toward future payments, or provide for increased coverage. Recommended reserves for both MUSIC and each member are actuarially determined on an annual basis. MUSIC will be self-sustaining through member payments and will purchase commercial coverage for claims in excess of established annual limits for each line of coverage. Members may fund their respective reserves as they deem appropriate.
(9) POSTEMPLOYMENT BENEFITS
Retirement Plans The University has a defined contribution retirement plan and a defined benefit retirement plan for qualified employees. The defined benefit plan is closed to new participants, unless they were previously enrolled in the plan at the University or enrolled in the plan at one of the other six participating universities in Michigan.
Defined Contribution Plan The University has a defined contribution plan with Teachers Insurance and Annuities Association College Retirement Equities Fund (TIAA-CREF) and Fidelity. All employees who work at least three-quarter time are eligible to participate in the defined contribution plan.
2016 2015Balance, beginning of year 1,291,953$ 1,251,505$ Claims incurred, including changes in estimates 13,528,874 14,688,085 Less: claims paid (13,711,364) (14,647,637) Balance, end of year 1,109,463$ 1,291,953$
Self-Insured Claims Liability
48
2016 Financial Report
For employees hired between December 31, 1995 and December 31, 2007, employer contributions began two years after date of hire or age 35 whichever was sooner. For employees hired on or after January 1, 2008, employer contributions begin immediately, and employee benefits vest immediately. Plan participants maintain individual investment accounts with TIAA-CREF and/or with Fidelity Investments. At June 30, 2016 and 2015, the University had approximately 3,070 plan participants. Employees may also deposit supplemental retirement funds into 403(b) and/or 457(b) plans up to permissible limits. The University contributes a specified percentage of employee wages and has no liability beyond its own contribution. University contributions to this program are summarized in the Retirement Plan Contributions table.
Prior to January 1, 2010, the University would contribute 10.55% of participating employee’s salary to the employee’s investment account and would then match up to an additional 2.0% of employee’s voluntary contribution. On January 1, 2010, participating employees were given a choice between a 5-5-5 plan and a 0-7.5-7.5 plan. Under the 5-5-5 plan, the University would contribute 5.0% of an employee’s base salary and will then match up to 5.0% of base salary contributed by a participating employee. Employees who chose this plan also received a 2.0% salary increase. Employees who chose the 0-7.5-7.5 plan received no base contribution from the University but received a matching contribution of up to 7.5% of base salary along with a 4.5% increase in base salary. Employees hired after January 1, 2010 will participate in the 0-7.5-7.5 plan.
Defined Benefit Plan The University contributes to the Michigan Public School Employees Retirement System (MPSERS), a cost-sharing multi-employer pension plan administered by the State of Michigan Department of Management and Budget, Office of Retirement Services. Benefit provisions are established and may be amended by state statute. Due to State of Michigan House Bill HB4047, University employees hired after December 31, 1995 can no longer participate in this retirement plan, unless they were previously enrolled in the plan at the University or one of the other six universities that are part of MPSERS. The Office of Retirement Services issues a publicly available financial report that includes financial statements and required supplementary information for MPSERS. That report may be obtained by writing to Michigan Public School Employees’ Retirement System, 7150 Harris Drive, P.O. Box 30171, Lansing, Michigan, 48909 or by calling (517) 322-5103.
University participants are enrolled in one of multiple plans based on date of hire and certain voluntary elections. A summary of the pension plans offered by MPSERS is as follows:
The Member Investment Plan (MIP) includes additional subgroups based on hire date. The MIP Fixed plan includes members hired prior to January 1, 1990. The MIP Graded plan includes members first hired from January 1, 1990 through December 31, 1995. The MIP Plus plan includes members first hired from July 1, 2008 through June 30, 2010. Members who initially enrolled in the MIP plan and made a voluntary election to contribute a higher rate are participants in the MIP 7 % plan.
Members hired between July 1, 2010 and September 3, 2012 were enrolled in the Pension Plus plan. Members hired on or after September 4, 2012 are automatically enrolled in this plan unless an election is
2016 2015 2014University contributions to TIAA-CREF/Fidelity 6,344,926$ 6,004,020$ 5,748,143$ Payroll covered under TIAA-CREF/Fidelity 89,651,072$ 85,173,945$ 81,443,319$
Defined Contribution Retirement Plan Contributions
Plan Name Plan Type Plan StatusMember Investment Plan (MIP) Defined Benefit Closed Basic Defined Benefit Closed Defined Contribution Defined Contribution Open
49
made to participate in the defined contribution plan. The plan includes a pension component as well as a savings component. Member contributions to the savings component are matched at a rate of 50% by the employer (up to a maximum of 1%) and invested in a 401(k) plan.
Effective February 1, 2013, members that initially enrolled in MIP were provided the option to convert to a defined contribution plan (Basic 4%). In these instances, any service credit accumulated under the defined benefit plan before February 1, 2013 is retained. For service performed after this date, the converted plan member receives 4% employer contributions to a personal 401(k) account.
A member first enrolling in MPSERS on or after September 4, 2012 may elect to enroll in the defined contribution plan. Employer and employee contribution rates and vesting requirements are consistent with the defined contribution component of the Pension Plus plan as described above.
Benefits Provided MPSERS provides retirement, death, disability and postemployment benefits to eligible participants. Retirement benefits are calculated as a percentage of the employee's final average compensation multiplied by the employee's years of service. All participants qualify for a benefit multiplier of 1.5% for the first 30 years of service. Certain benefit groups receive a reduced rate of 1.25% for service above 30 years. Disability benefits are calculated the same as regular service retirement. Participants are eligible to receive full retirement benefits upon reaching the age and years of service requirements below. Most plans offer additional options for early retirement if certain stipulations have been met. Voluntary contributions vest immediately.
Contributions Employer contributions to the plans are based on a percentage of covered payroll that has been actuarially determined as an amount that, when combined with employee contributions, is expected to finance the cost of benefits earned by employees during the year, with an additional amount to finance any unfunded accrued liability. Member contributions are determined based on date of hire and the plan selected. During fiscal year 2016, the University was invoiced monthly an amount that approximated 17.73% of covered payroll for "MPSERS UAAL Stabilization." This additional contribution is offset by monthly State aid payments equal to the amounts actually billed by the Office of Retirement Services. Employer contribution requirements for pension and retiree healthcare, inclusive of the MPSERS UAAL Stabilization, ranged from 27.73% to 32.60% of covered payroll. Plan member contributions range from 0.0% to 7.0% of covered payroll.
The University’s contributions to MPSERS under all pension plans as described above for the years ended June 30, 2016, 2015, and 2014 were $4,150,666, $3,395,404, and $2,836,637, respectively, equal to the required contributions for each year.
Plan Name Eligibility Based on Years of Service VestingMember Investment Plan (MIP) Age 46 with 30 years or age 60 with 10 years 10 yearsBasic Age 55 with 30 years or age 60 with 10 years 10 yearsDefined Contribution Age 46 with 30 years or age 60 with 10 years 4 years
50
2016 Financial Report
Pension Liabilities, Pension Expense, and Deferred Outflows of Resources and Deferred Inflows of Resources Related to Pensions At June 30, 2016 and 2015, the University reported a liability of $54.889 million and $36.194 million respectively, for its proportionate share of the net pension liability. The net pension liability was measured as of September 30, 2015 and 2014, and the total pension liability used to calculate the net pension liability was determined by an actuarial valuation as of that date. The University’s proportion of the net pension liability was based on a projection of the University’s long-term share of contributions to the pension plan relative to the projected contributions of all participating universities, actuarially determined. At September 30, 2015 and 2014, the University’s proportion (as calculated by MPSERS) was 10.00520% and 9.64907%, respectively.
For the years ended June 30, 2016 and 2015, the University recognized pension expense of $6.480 million and $3.830 million, respectively. At June 30, 2016 and 2015, the University reported deferred outflows of resources and deferred inflows of resources related to pensions from the following sources:
The amount of deferred outflows of resources related to University contributions subsequent to the measurement date will be recognized as a reduction in the net pension liability for the fiscal year ending June 30, 2016. Other amounts reported as deferred outflows of resources and deferred inflows of resources related to pension will be recognized in pension expense as follows:
Deferred Outflows of Resources
Deferred Inflows of Resources
Net Deferred Outflows of Resources
Differences between expected and actual experience 753,927$ - 753,927$ Contributions subsequent to measurement date 3,315,161 349,518 2,965,643 Changes in proportionate share and differences between contributions and proportionate share of contributions 414,688 - 414,688 Net difference between projected and actual earnings on pension plan contributions 158,954 - 158,954 Total 4,642,730$ 349,518$ 4,293,212$
Deferred Outflows of Resources
Deferred Inflows of Resources
Net Deferred Outflows
(Inflows) of Resources
Changes in assumptions 1,078,301$ - 1,078,301$ Contributions subsequent to measurement date 2,713,238 - 2,713,238 Changes in proportionate share and differences between contributions and proportionate share of contributions 2,842 - 2,842 Net difference between projected and actual earnings on pension plan contributions - 3,479,753 (3,479,753) Total 3,794,381$ 3,479,753$ 314,628$
2016
2015
Fiscal Year Amount2017 982,8422018 (185,773)2019 (185,773)2020 716,273Total 1,327,569$
51
Actuarial Assumptions The total pension liability in the September 30, 2013 actuarial valuation was determined using the following actuarial assumptions, applied to all periods included in the measurement:
Wage inflation 3.5% Salary increases 3.5% to 12.3%, including wage inflation of 3.5% Investment rate of return 8% (7% for the Pension-Plus plan), net of pension plan
investment expenses, including inflation Cost of Living adjustments 3.0% annual, non-compounded for MIP members Healthcare cost trend rate 8.5% year 1 graded to 3.5% year 12
The mortality table used in this valuation was the RP-2000 Male and Female Combined Healthy Life Mortality Table, adjusted for mortality improvements to 2025 using projection Scale BB. For retirees, 100% of the table rates were used. For active members, 80% of the table rates were used for males and 70% of the table rates were used for females.
Assumption changes as a result of an experience study for the periods 2007 through 2012 have been adopted by MPSERS for use in the annual pension valuations beginning with the September 30, 2015 valuation.
The long-term expected rate of return on pension plan investments was determined using a building-block method in which the best-estimate of expected future real rates of return (expected returns, net of pension plan investment expense and inflation) are developed for each major asset class. These ranges are combined to produce the long-term expected rate of return by weighting the expected future real rates of return by the target asset allocation percentage and by adding expected inflation. The target allocation and best estimates of arithmetic real rates of return for each major asset class are summarized in the following table:
Discount Rate The discount rate used to measure the total pension liability is 8.0%. The projection of cash flows used to determine the discount rate assumed that plan member contributions will be made at the current contribution rate and that the University’s contributions will be made at contractually required rates, actuarially determined. Based on those assumptions, the pension plan’s fiduciary net position was projected to be available to make all projected future benefit payments of current active and inactive employees.
Asset ClassTarget
Allocation
Long-Term Expected
Real Rate of Return
Expected Money-
Weighted Rate of Return
Domestic equity pools 28.00% 5.90% 1.65%Alternative investment pools 18.00% 9.20% 1.65%International equity pools 16.00% 7.20% 1.15%Fixed income pools 10.50% 0.90% 0.09%Real estate and infrastructure pools 10.00% 4.30% 0.43%Absolute return pools 15.50% 6.00% 0.93%Short-term investment pools 2.00% 0.00% 0.00%
100.00% 5.90%Inflation 2.10%Investment rate of return 8.00%
52
2016 Financial Report
Therefore, the long-term expected rate of return on pension plan investments was applied to all periods of projected benefit payments to determine the total pension liability.
Sensitivity of the Net Pension Liability to Changes in the Discount Rate The following presents the net pension liability of the University, calculated using the discount rate of 8.0%, as well as what the University’s net pension liability would be if it were calculated using a discount rate that is 1% lower (7.0%) or 1% higher (9.0%) than the current rate:
Pension Plan Fiduciary Net Position Detailed information about the pension plan’s fiduciary net position is available in the separately issued MPSERS financial statements available on the State of Michigan Office of Retirement Services website at www.michigan.gov/orsschools.
Other Postemployment BenefitsRetirees enrolled in MPSERS before December 31, 1995 have the option of participating in the Premium Subsidy plan, a defined benefit postemployment healthcare plan, which is funded by employers on a cash disbursement basis. The State of Michigan has contracted to provide the comprehensive group medical, hearing, dental and vision coverage for retirees and beneficiaries. All health care benefits are on a self-funded basis. A significant portion of the premium is paid by MPSERS with the balance deducted from the monthly pension. Employer contributions range from 2.20% to 2.71% of covered payroll. Plan participants contribute 3.0% of covered payroll to the Retiree Healthcare Fund. At retirement, these individuals receive a subsidy for healthcare premiums that covers up to 80% of cost.
Plan members enrolled on or after September 4, 2012 participate in the Personal Healthcare Fund. This defined contribution other postemployment benefits plan includes a required 2.0% employee contribution into a personal tax-deferred account, which is matched by an additional 2.0% employer contribution. Employees are fully vested in these contributions which can be used, along with earnings thereon, to pay for postemployment healthcare expenses. Plan members working prior to September 4, 2012 were given the option to convert from the Premium Subsidy plan to the Personal Healthcare Fund option. Effective February 1, 2013, these members are no longer required to make the 3.0% employee contribution. Amounts paid into the Retiree Healthcare Fund between September 4, 2012 and February 1, 2013 were credited to each individual’s Personal Healthcare Fund account. Any contributions made prior to September 4, 2012 are pending a Supreme Court resolution.
The University’s contributions to MPSERS for other postemployment benefits amounted to $2.052 million, $2.155 million, and $2.501 million for the years ended June 30, 2016, 2015, and 2014, respectively.
Retirement Supplemental Voluntary Plan The University has a Retirement Supplemental Voluntary Plan (RSVP) to facilitate the voluntary retirement of eligible employees. The RSVP is not an early retirement program. The decision to retire is left to the discretion of the individual employee and remains entirely voluntary. However, if an employee decides to retire, the RSVP provides several options upon retirement: a monetary option; a phased retirement option; a combination of the monetary and phased retirement options; and a program for employment after retirement. The University recognizes the related costs in the year the employee decides to retire. The value of the RSVP liability was approximately $0 and $12,000 at June 30, 2016 and 2015, respectively.
Fiscal Year1% Decrease
(7.0%)
Current Discount Rate
(8.0%)1% Increase
(9.0%)2016 64,402,759$ 54,888,547$ 46,676,338$ 2015 45,298,278$ 36,194,241$ 28,349,389$
NET PENSION LIABILITY
53
Health Care Plan Plan Description The University currently offers retirees a self-funded preferred provider health care plan (MTU-PPO) administered by Blue Cross Blue Shield of Michigan. The University follows the COBRA regulations for its terminated employee’s health care plan. MTU-PPO provides medical, dental, and vision insurance benefits to eligible participants in the TIAA-CREF plan.
Funding Policy The contribution requirements of the plan members are established annually by the University. The required contribution is based on annual projected pay-as-you go financing requirements. Prior to 2007, the University utilized its COBRA rates as the full cost value of early retiree medical and dental benefits. Depending upon specific fiscal years of retirement, these non-Medicare retirees paid a certain percentage of this COBRA rate. Even for those early retirees where their contribution requirement was 100% of the COBRA rate, there was an implied subsidy as the age-adjusted full cost for pre-Medicare eligible retirees is significantly higher. Beginning in 2007, the University began a seven year phase out of the subsidy implied when utilizing the COBRA rates so that starting on January 1, 2014 retiree contributions were established on the expected full cost of the retiree medical and dental plans (pre-Medicare and Medicare eligible populations).
Annual OPEB Cost and Net OPEB Obligation The University’s annual other postemployment benefit (OPEB) cost is calculated based on the annual required contribution (ARC) of the employer, an amount actuarially determined in accordance with the parameters of generally accepted accounting principles. The ARC represents a level of funding that, if paid on an ongoing basis, is projected to cover normal cost each year and amortize any unfunded actuarial liabilities (or funding excess) over a period not to exceed thirty years.
The following table shows the components of the University’s annual OPEB cost, the amount actually contributed to the plan, and changes in the University’s net OPEB obligation for the years ending June 30, 2016 and 2015 respectively:
The University‘s historical annual OPEB cost, the percentage of annual OPEB cost contributed to the plan, and the net OPEB obligation are as follows:
2016 2015Annual required contribution 409,652$ 417,909$ Interest on net OPEB obligation 21,596 21,743 Adjustment to annual required contribution (31,222) (31,435) Annual OPEB cost 400,026 408,217 Contributions made - - Total benefits paid (pay-as-you go) (440,402) (411,910) Decrease in net OPEB obligation (40,376) (3,693) Net OPEB obligation - beginning of year 539,888 543,581 Net OPEB obligation - end of year 499,512$ 539,888$
OPEB Cost and Obligation
Historical Annual OPEB Cost and Net OPEB Obligation
Fiscal Year Ended Annual OPEB Cost
Percentage of Annual OPEB Cost
Contributed Net OPEB ObligationJune 30, 2014 468,098$ 148% 543,581$ June 30, 2015 408,217$ 101% 539,888$ June 30, 2016 400,026$ 110% 499,512$
54
2016 Financial Report
Funded Status and Funding Progress The University has not prefunded any of its OPEB liability, nor does it presently intend to prefund its OPEB liability. Therefore, as of June 30, 2016, the most recent actuarial valuation date, the Plan was 0% funded.
Actuarial valuations of an ongoing plan involve estimates of the value of reported amounts and assumptions about the probability of occurrence of events far into the future. Examples include assumptions about future employment, mortality, and the health care cost trend. Amounts determined regarding the funded status of the plan and annual required contributions of the employer are subject to continual revision as actual results are compared with past expectations and new estimates are made about the future. The schedule of funding progress, as shown above, presents multiyear trend information about whether the actuarial value of plan assets is increasing or decreasing over time relative to the actuarial accrued liabilities for benefits.
Actuarial Methods and Assumptions Projections of benefits for financial reporting purposes are based on the substantive plan (the plan as understood by the employer and the plan members) and include the types of benefits provided at the time of each valuation and the historical pattern of sharing of benefit costs between the employer and plan members to that point. The actuarial methods and assumptions used include techniques that are designed to reduce the effects of short-term volatility in actuarial accrued liabilities and the actuarial value of assets, consistent with the long-term perspective of the calculations. The actuarial valuations performed for the University use the unit credit actuarial cost method. For pre-65 year old retirees, the health care trend assumptions were 7.20% in 2014 grading down by .2% each year to 5.40% in 2022 and then by .4% until 5.0% in year 2023 and each year thereafter. For post-65 year old retirees, the health care trend assumptions were 8.75% in 2014 grading down by .25% each year to 8.0% in 2017 and then by .5% to 5.0% in year 2023 and each year thereafter. The assumptions for dental benefits were 5.0% in 2014 and each year thereafter. The assumptions also included a 4.0% salary scale assumption. The UAAL is being amortized as a level percentage of projected payrolls on an open basis. For actuarial purposes, the University has chosen a thirty year amortization period, so the remaining amortization period at June 30, 2015, was twenty-three years. However, with the implementation of the seven year phased elimination of the retiree health care subsidy, the University’s actual amortization period decreases accordingly.
Actuarial Value of Assets*
Actuarial Accrued
Liability (AAL) Unit Credit
Unfunded AAL (UAAL) Funded Ratio Covered Payroll
UAAL as a Percent of
Covered Payroll
(a) (b) (b)-(a) (a)/(b) (c) ((b)-(a))/(c)June 30, 2014 -$ 8,608,363$ 8,608,363$ 0.0% 73,148,829$ 11.8%June 30, 2015 -$ 7,515,561$ 7,515,561$ 0.0% 118,065,755$ 6.4%June 30, 2016 -$ 7,367,059$ 7,367,059$ 0.0% 121,972,999$ 6.0%
*Actuarial value of assets are $0 because the University has not prefunded this OPEB liability.
Schedule of Funding Progress
Actuarial Valuation Date
55
(10) COMMITMENTS AND CONTINGENCIES
The University has internally funded reserves for certain employee benefits. Accrued liabilities are generally based on actuarial valuations and represent the present value of unpaid expected claims, including estimates of claims incurred but not reported.
The University receives grants and other forms of reimbursement from various federal and state agencies. These activities are subject to audit by agents of the funding authority, the purpose of which is to ensure compliance with conditions precedent to providing such funds. University administration believes there is no liability for reimbursement which may arise as the result of audits.
The University has an arrangement with the State of Michigan and the State Building Authority (the “SBA”) to finance a large portion of the Great Lakes Research Center currently under construction on the campus of the University. The arrangement is based upon a lease agreement that is signed by the University which stipulates that the SBA will hold title to the building and the State will make all the lease payments to the SBA on behalf of the University, and the University will pay all operating and maintenance costs. At the expiration of the lease, the SBA has agreed to sell the building to the University for $1.
In the normal course of its activities, the University is a party in various legal actions. Although some actions have been brought for large amounts, the University has not experienced any significant losses or costs. The University and its legal counsel are of the opinion that the outcome of asserted and unasserted claims outstanding will not have a material effect on the financial statements.
(11) FUNCTIONAL CLASSIFICATION OF OPERATING EXPENSES
The University’s operating expenses by functional classification were as follows for years ended June 30:
Operating Expenses by Functional Classification
2016 2015Instruction 64,625,424$ 65,431,641$ Research 53,941,825 52,321,902 Public service 9,916,188 9,297,856 Academic support 22,082,095 21,025,582 Student services 14,338,179 14,558,486 Institutional support 20,377,479 19,350,779 Operations and maintenance of plant 13,928,124 14,685,916 Student financial support 7,602,180 6,984,531 Departmental activities 6,954,635 5,755,170 Student residents 11,005,337 11,164,810 Depreciation 14,273,858 14,626,326 Total 239,045,324$ 235,202,999$
56
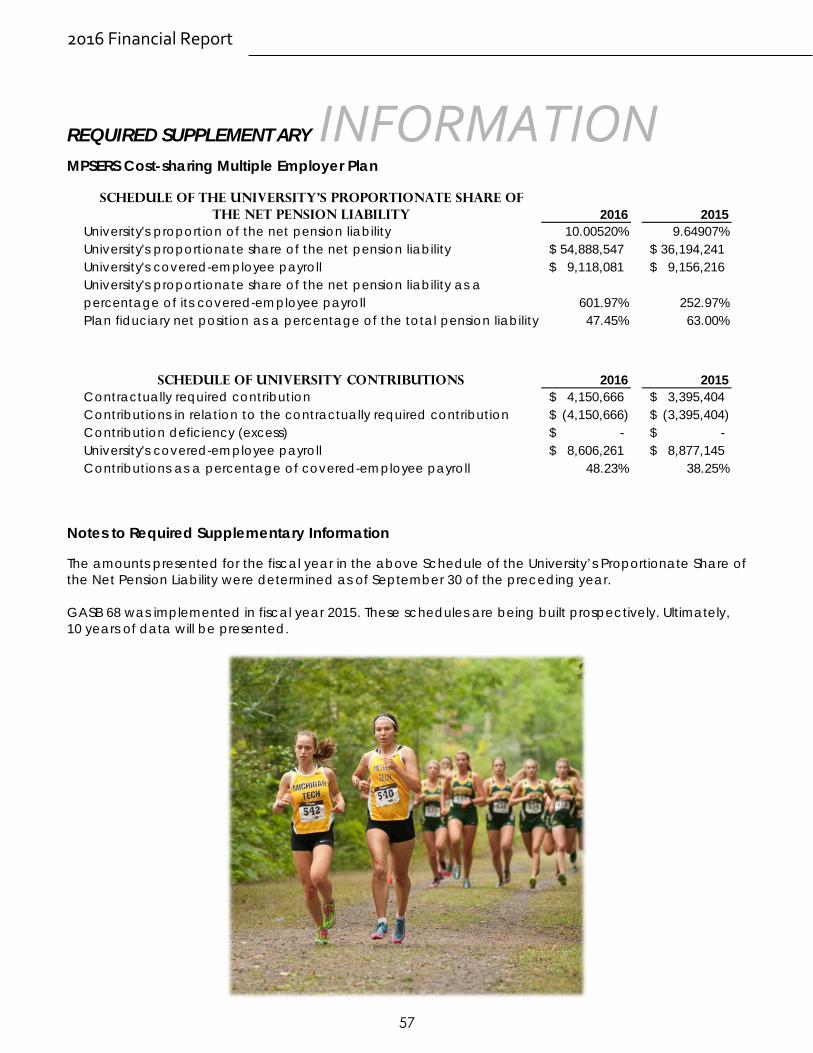
2016 Financial Report
REQUIRED SUPPLEMENTARY INFORMATIONMPSERS Cost-sharing Multiple Employer Plan
Notes to Required Supplementary Information
The amounts presented for the fiscal year in the above Schedule of the University’s Proportionate Share of the Net Pension Liability were determined as of September 30 of the preceding year.
GASB 68 was implemented in fiscal year 2015. These schedules are being built prospectively. Ultimately, 10 years of data will be presented.
Schedule of the University's Proportionate Share of the Net Pension Liability 2016 2015
University's proportion of the net pension liability 10.00520% 9.64907%University's proportionate share of the net pension liability 54,888,547$ 36,194,241$ University's covered-employee payroll 9,118,081$ 9,156,216$ University's proportionate share of the net pension liability as a percentage of its covered-employee payroll 601.97% 252.97%Plan fiduciary net position as a percentage of the total pension liability 47.45% 63.00%
Schedule of University Contributions 2016 2015Contractually required contribution 4,150,666$ 3,395,404$ Contributions in relation to the contractually required contribution (4,150,666)$ (3,395,404)$ Contribution deficiency (excess) -$ -$ University's covered-employee payroll 8,606,261$ 8,877,145$ Contributions as a percentage of covered-employee payroll 48.23% 38.25%
57

SUPPLEMENTARY INFORMATION
58
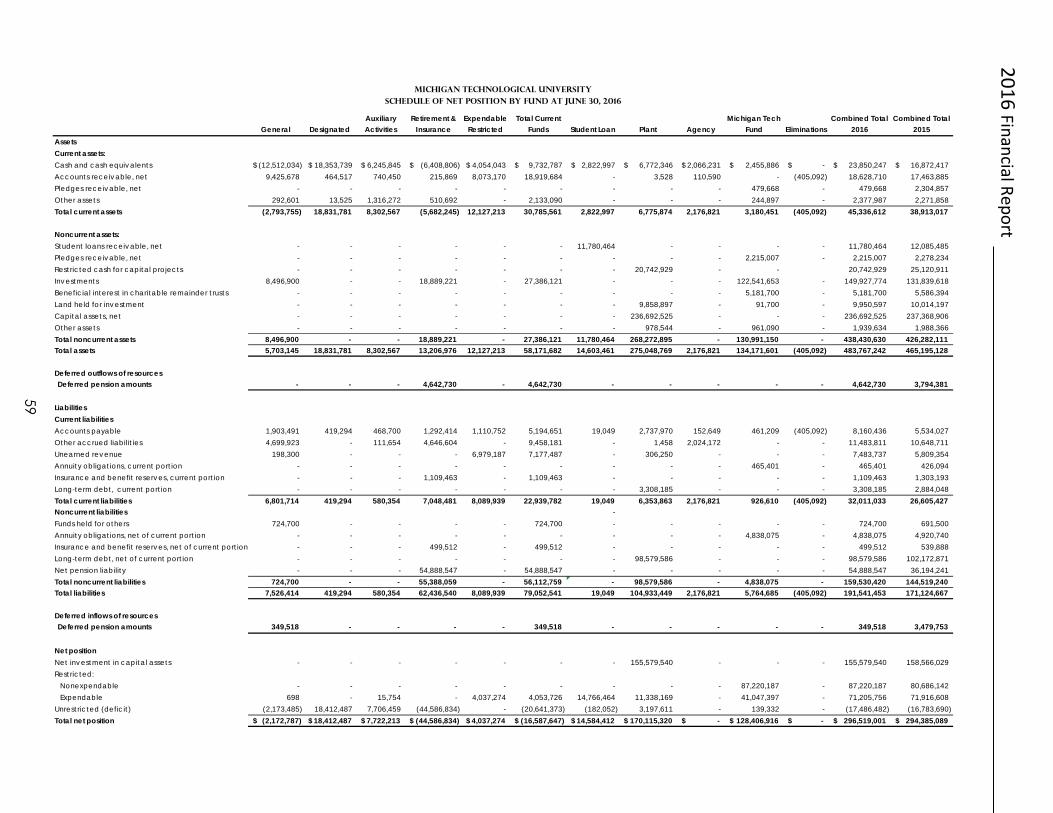
2016 Financial Report
General DesignatedAuxiliary Activities
Retirement & Insurance
Expendable Restricted
Total Current Funds Student Loan Plant Agency
Michigan Tech Fund Eliminations
Combined Total 2016
Combined Total 2015
AssetsCurrent assets:Cash and cash equivalents (12,512,034)$ 18,353,739$ 6,245,845$ (6,408,806)$ 4,054,043$ 9,732,787$ 2,822,997$ 6,772,346$ 2,066,231$ 2,455,886$ -$ 23,850,247$ 16,872,417$ Accounts receivable, net 9,425,678 464,517 740,450 215,869 8,073,170 18,919,684 - 3,528 110,590 - (405,092) 18,628,710 17,463,885 Pledges receivable, net - - - - - - - - - 479,668 - 479,668 2,304,857 Other assets 292,601 13,525 1,316,272 510,692 - 2,133,090 - - - 244,897 - 2,377,987 2,271,858 Total current assets (2,793,755) 18,831,781 8,302,567 (5,682,245) 12,127,213 30,785,561 2,822,997 6,775,874 2,176,821 3,180,451 (405,092) 45,336,612 38,913,017
Noncurrent assets:Student loans receivable, net - - - - - - 11,780,464 - - - - 11,780,464 12,085,485 Pledges receivable, net - - - - - - - - - 2,215,007 - 2,215,007 2,278,234 Restricted cash for capital projects - - - - - - - 20,742,929 - - 20,742,929 25,120,911 Investments 8,496,900 - - 18,889,221 - 27,386,121 - - - 122,541,653 - 149,927,774 131,839,618 Beneficial interest in charitable remainder trusts - - - - - - - - - 5,181,700 - 5,181,700 5,586,394 Land held for investment - - - - - - - 9,858,897 - 91,700 - 9,950,597 10,014,197 Capital assets, net - - - - - - - 236,692,525 - - - 236,692,525 237,368,906 Other assets - - - - - - - 978,544 - 961,090 - 1,939,634 1,988,366 Total noncurrent assets 8,496,900 - - 18,889,221 - 27,386,121 11,780,464 268,272,895 - 130,991,150 - 438,430,630 426,282,111 Total assets 5,703,145 18,831,781 8,302,567 13,206,976 12,127,213 58,171,682 14,603,461 275,048,769 2,176,821 134,171,601 (405,092) 483,767,242 465,195,128
Deferred outflows of resourcesDeferred pension amounts - - - 4,642,730 - 4,642,730 - - - - - 4,642,730 3,794,381
LiabilitiesCurrent liabilitiesAccounts payable 1,903,491 419,294 468,700 1,292,414 1,110,752 5,194,651 19,049 2,737,970 152,649 461,209 (405,092) 8,160,436 5,534,027 Other accrued liabilit ies 4,699,923 - 111,654 4,646,604 - 9,458,181 - 1,458 2,024,172 - - 11,483,811 10,648,711 Unearned revenue 198,300 - - - 6,979,187 7,177,487 - 306,250 - - - 7,483,737 5,809,354 Annuity obligations, current portion - - - - - - - - - 465,401 - 465,401 426,094 Insurance and benefit reserves, current portion - - - 1,109,463 - 1,109,463 - - - - - 1,109,463 1,303,193 Long-term debt, current portion - - - - - - - 3,308,185 - - - 3,308,185 2,884,048 Total current liabilities 6,801,714 419,294 580,354 7,048,481 8,089,939 22,939,782 19,049 6,353,863 2,176,821 926,610 (405,092) 32,011,033 26,605,427 Noncurrent liabilities - Funds held for others 724,700 - - - - 724,700 - - - - - 724,700 691,500 Annuity obligations, net of current portion - - - - - - - - - 4,838,075 - 4,838,075 4,920,740 Insurance and benefit reserves, net of current portion - - - 499,512 - 499,512 - - - - - 499,512 539,888 Long-term debt, net of current portion - - - - - - - 98,579,586 - - - 98,579,586 102,172,871 Net pension liability - - - 54,888,547 - 54,888,547 - - - - - 54,888,547 36,194,241 Total noncurrent liabilities 724,700 - - 55,388,059 - 56,112,759 - 98,579,586 - 4,838,075 - 159,530,420 144,519,240 Total liabilities 7,526,414 419,294 580,354 62,436,540 8,089,939 79,052,541 19,049 104,933,449 2,176,821 5,764,685 (405,092) 191,541,453 171,124,667
Deferred inflows of resourcesDeferred pension amounts 349,518 - - - - 349,518 - - - - - 349,518 3,479,753
Net positionNet investment in capital assets - - - - - - - 155,579,540 - - - 155,579,540 158,566,029 Restricted: Nonexpendable - - - - - - - - - 87,220,187 - 87,220,187 80,686,142 Expendable 698 - 15,754 - 4,037,274 4,053,726 14,766,464 11,338,169 - 41,047,397 - 71,205,756 71,916,608 Unrestricted (deficit) (2,173,485) 18,412,487 7,706,459 (44,586,834) - (20,641,373) (182,052) 3,197,611 - 139,332 - (17,486,482) (16,783,690) Total net position (2,172,787)$ 18,412,487$ 7,722,213$ (44,586,834)$ 4,037,274$ (16,587,647)$ 14,584,412$ 170,115,320$ -$ 128,406,916$ -$ 296,519,001$ 294,385,089$
Michigan Technological UniversitySchedule of Net Position by Fund at June 30, 2016
59
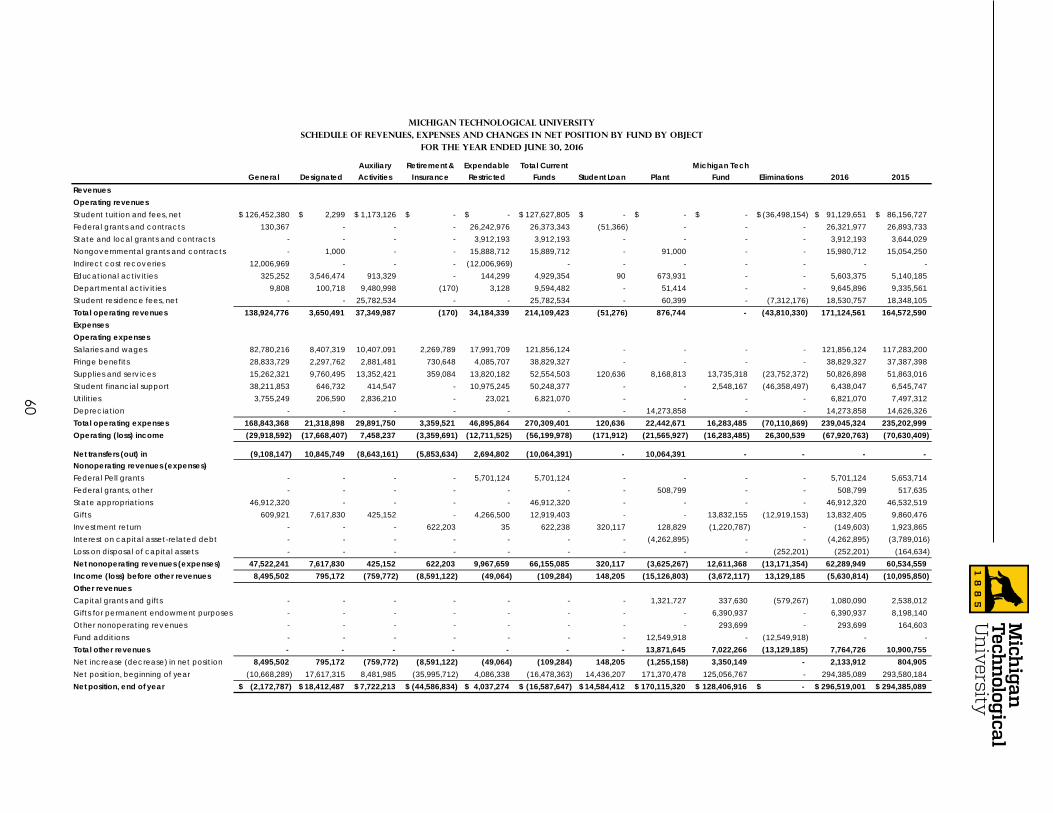
General DesignatedAuxiliary Activities
Retirement & Insurance
Expendable Restricted
Total Current Funds Student Loan Plant
Michigan Tech Fund Eliminations 2016 2015
RevenuesOperating revenuesStudent tuition and fees, net 126,452,380$ 2,299$ 1,173,126$ -$ -$ 127,627,805$ -$ -$ -$ (36,498,154)$ 91,129,651$ 86,156,727$ Federal grants and contracts 130,367 - - - 26,242,976 26,373,343 (51,366) - - - 26,321,977 26,893,733 State and local grants and contracts - - - - 3,912,193 3,912,193 - - - - 3,912,193 3,644,029 Nongovernmental grants and contracts - 1,000 - - 15,888,712 15,889,712 - 91,000 - - 15,980,712 15,054,250 Indirect cost recoveries 12,006,969 - - - (12,006,969) - - - - - - - Educational activ ities 325,252 3,546,474 913,329 - 144,299 4,929,354 90 673,931 - - 5,603,375 5,140,185 Departmental activ ities 9,808 100,718 9,480,998 (170) 3,128 9,594,482 - 51,414 - - 9,645,896 9,335,561 Student residence fees, net - - 25,782,534 - - 25,782,534 - 60,399 - (7,312,176) 18,530,757 18,348,105 Total operating revenues 138,924,776 3,650,491 37,349,987 (170) 34,184,339 214,109,423 (51,276) 876,744 - (43,810,330) 171,124,561 164,572,590 ExpensesOperating expensesSalaries and wages 82,780,216 8,407,319 10,407,091 2,269,789 17,991,709 121,856,124 - - - - 121,856,124 117,283,200 Fringe benefits 28,833,729 2,297,762 2,881,481 730,648 4,085,707 38,829,327 - - - - 38,829,327 37,387,398 Supplies and serv ices 15,262,321 9,760,495 13,352,421 359,084 13,820,182 52,554,503 120,636 8,168,813 13,735,318 (23,752,372) 50,826,898 51,863,016 Student financial support 38,211,853 646,732 414,547 - 10,975,245 50,248,377 - - 2,548,167 (46,358,497) 6,438,047 6,545,747 Utilit ies 3,755,249 206,590 2,836,210 - 23,021 6,821,070 - - - - 6,821,070 7,497,312 Depreciation - - - - - - - 14,273,858 - - 14,273,858 14,626,326 Total operating expenses 168,843,368 21,318,898 29,891,750 3,359,521 46,895,864 270,309,401 120,636 22,442,671 16,283,485 (70,110,869) 239,045,324 235,202,999 Operating (loss) income (29,918,592) (17,668,407) 7,458,237 (3,359,691) (12,711,525) (56,199,978) (171,912) (21,565,927) (16,283,485) 26,300,539 (67,920,763) (70,630,409)
Net transfers (out) in (9,108,147) 10,845,749 (8,643,161) (5,853,634) 2,694,802 (10,064,391) - 10,064,391 - - - - Nonoperating revenues (expenses)Federal Pell grants - - - - 5,701,124 5,701,124 - - - - 5,701,124 5,653,714 Federal grants, other - - - - - - - 508,799 - - 508,799 517,635 State appropriations 46,912,320 - - - - 46,912,320 - - - - 46,912,320 46,532,519 Gifts 609,921 7,617,830 425,152 - 4,266,500 12,919,403 - - 13,832,155 (12,919,153) 13,832,405 9,860,476 Investment return - - - 622,203 35 622,238 320,117 128,829 (1,220,787) - (149,603) 1,923,865 Interest on capital asset-related debt - - - - - - - (4,262,895) - - (4,262,895) (3,789,016) Loss on disposal of capital assets - - - - - - - - - (252,201) (252,201) (164,634) Net nonoperating revenues (expenses) 47,522,241 7,617,830 425,152 622,203 9,967,659 66,155,085 320,117 (3,625,267) 12,611,368 (13,171,354) 62,289,949 60,534,559 Income (loss) before other revenues 8,495,502 795,172 (759,772) (8,591,122) (49,064) (109,284) 148,205 (15,126,803) (3,672,117) 13,129,185 (5,630,814) (10,095,850) Other revenuesCapital grants and gifts - - - - - - - 1,321,727 337,630 (579,267) 1,080,090 2,538,012 Gifts for permanent endowment purposes - - - - - - - - 6,390,937 - 6,390,937 8,198,140 Other nonoperating revenues - - - - - - - - 293,699 - 293,699 164,603 Fund additions - - - - - - - 12,549,918 - (12,549,918) - - Total other revenues - - - - - - - 13,871,645 7,022,266 (13,129,185) 7,764,726 10,900,755 Net increase (decrease) in net position 8,495,502 795,172 (759,772) (8,591,122) (49,064) (109,284) 148,205 (1,255,158) 3,350,149 - 2,133,912 804,905 Net position, beginning of year (10,668,289) 17,617,315 8,481,985 (35,995,712) 4,086,338 (16,478,363) 14,436,207 171,370,478 125,056,767 - 294,385,089 293,580,184 Net position, end of year (2,172,787)$ 18,412,487$ 7,722,213$ (44,586,834)$ 4,037,274$ (16,587,647)$ 14,584,412$ 170,115,320$ 128,406,916$ -$ 296,519,001$ 294,385,089$
Michigan Technological UniversitySchedule of Revenues, Expenses and Changes in Net Position by Fund by Object
For the Year Ended June 30, 2016
60
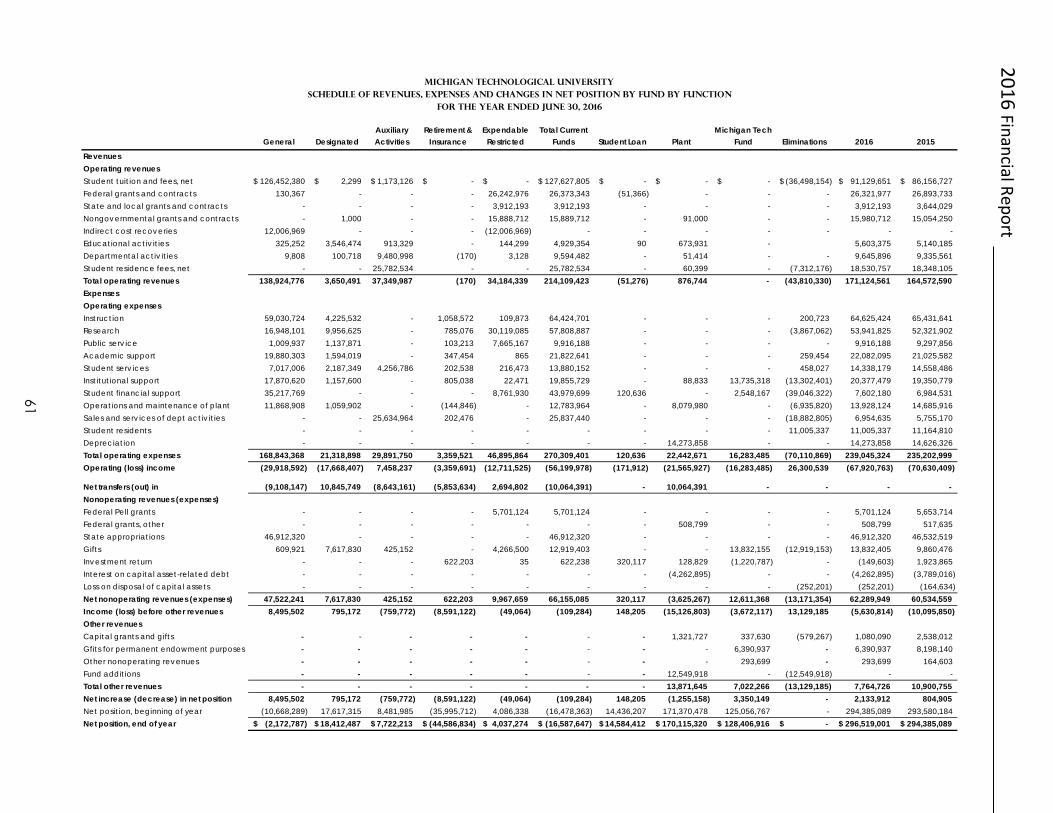
2016 Financial Report
General DesignatedAuxiliary Activities
Retirement & Insurance
Expendable Restricted
Total Current Funds Student Loan Plant
Michigan Tech Fund Eliminations 2016 2015
RevenuesOperating revenuesStudent tuition and fees, net 126,452,380$ 2,299$ 1,173,126$ -$ -$ 127,627,805$ -$ -$ -$ (36,498,154)$ 91,129,651$ 86,156,727$ Federal grants and contracts 130,367 - - - 26,242,976 26,373,343 (51,366) - - - 26,321,977 26,893,733 State and local grants and contracts - - - - 3,912,193 3,912,193 - - - - 3,912,193 3,644,029 Nongovernmental grants and contracts - 1,000 - - 15,888,712 15,889,712 - 91,000 - - 15,980,712 15,054,250 Indirect cost recoveries 12,006,969 - - - (12,006,969) - - - - - - - Educational activ ities 325,252 3,546,474 913,329 - 144,299 4,929,354 90 673,931 - 5,603,375 5,140,185 Departmental activ ities 9,808 100,718 9,480,998 (170) 3,128 9,594,482 - 51,414 - - 9,645,896 9,335,561 Student residence fees, net - - 25,782,534 - - 25,782,534 - 60,399 - (7,312,176) 18,530,757 18,348,105 Total operating revenues 138,924,776 3,650,491 37,349,987 (170) 34,184,339 214,109,423 (51,276) 876,744 - (43,810,330) 171,124,561 164,572,590 ExpensesOperating expensesInstruction 59,030,724 4,225,532 - 1,058,572 109,873 64,424,701 - - - 200,723 64,625,424 65,431,641 Research 16,948,101 9,956,625 - 785,076 30,119,085 57,808,887 - - - (3,867,062) 53,941,825 52,321,902 Public serv ice 1,009,937 1,137,871 - 103,213 7,665,167 9,916,188 - - - - 9,916,188 9,297,856 Academic support 19,880,303 1,594,019 - 347,454 865 21,822,641 - - - 259,454 22,082,095 21,025,582 Student serv ices 7,017,006 2,187,349 4,256,786 202,538 216,473 13,880,152 - - - 458,027 14,338,179 14,558,486 Institutional support 17,870,620 1,157,600 - 805,038 22,471 19,855,729 - 88,833 13,735,318 (13,302,401) 20,377,479 19,350,779 Student financial support 35,217,769 - - - 8,761,930 43,979,699 120,636 - 2,548,167 (39,046,322) 7,602,180 6,984,531 Operations and maintenance of plant 11,868,908 1,059,902 - (144,846) - 12,783,964 - 8,079,980 - (6,935,820) 13,928,124 14,685,916 Sales and serv ices of dept activ ities - - 25,634,964 202,476 - 25,837,440 - - - (18,882,805) 6,954,635 5,755,170 Student residents - - - - - - - - - 11,005,337 11,005,337 11,164,810 Depreciation - - - - - - - 14,273,858 - - 14,273,858 14,626,326 Total operating expenses 168,843,368 21,318,898 29,891,750 3,359,521 46,895,864 270,309,401 120,636 22,442,671 16,283,485 (70,110,869) 239,045,324 235,202,999 Operating (loss) income (29,918,592) (17,668,407) 7,458,237 (3,359,691) (12,711,525) (56,199,978) (171,912) (21,565,927) (16,283,485) 26,300,539 (67,920,763) (70,630,409)
Net transfers (out) in (9,108,147) 10,845,749 (8,643,161) (5,853,634) 2,694,802 (10,064,391) - 10,064,391 - - - - Nonoperating revenues (expenses)Federal Pell grants - - - - 5,701,124 5,701,124 - - - - 5,701,124 5,653,714 Federal grants, other - - - - - - - 508,799 - - 508,799 517,635 State appropriations 46,912,320 - - - - 46,912,320 - - - - 46,912,320 46,532,519 Gifts 609,921 7,617,830 425,152 - 4,266,500 12,919,403 - - 13,832,155 (12,919,153) 13,832,405 9,860,476 Investment return - - - 622,203 35 622,238 320,117 128,829 (1,220,787) - (149,603) 1,923,865 Interest on capital asset-related debt - - - - - - - (4,262,895) - - (4,262,895) (3,789,016) Loss on disposal of capital assets - - - - - - - - - (252,201) (252,201) (164,634) Net nonoperating revenues (expenses) 47,522,241 7,617,830 425,152 622,203 9,967,659 66,155,085 320,117 (3,625,267) 12,611,368 (13,171,354) 62,289,949 60,534,559 Income (loss) before other revenues 8,495,502 795,172 (759,772) (8,591,122) (49,064) (109,284) 148,205 (15,126,803) (3,672,117) 13,129,185 (5,630,814) (10,095,850) Other revenuesCapital grants and gifts - - - - - - - 1,321,727 337,630 (579,267) 1,080,090 2,538,012 Gfits for permanent endowment purposes - - - - - - - - 6,390,937 - 6,390,937 8,198,140 Other nonoperating revenues - - - - - - - - 293,699 - 293,699 164,603 Fund additions - - - - - - - 12,549,918 - (12,549,918) - - Total other revenues - - - - - - - 13,871,645 7,022,266 (13,129,185) 7,764,726 10,900,755 Net increase (decrease) in net position 8,495,502 795,172 (759,772) (8,591,122) (49,064) (109,284) 148,205 (1,255,158) 3,350,149 - 2,133,912 804,905 Net position, beginning of year (10,668,289) 17,617,315 8,481,985 (35,995,712) 4,086,338 (16,478,363) 14,436,207 171,370,478 125,056,767 - 294,385,089 293,580,184 Net position, end of year (2,172,787)$ 18,412,487$ 7,722,213$ (44,586,834)$ 4,037,274$ (16,587,647)$ 14,584,412$ 170,115,320$ 128,406,916$ -$ 296,519,001$ 294,385,089$
Schedule of Revenues, Expenses and Changes in Net Position by Fund by FunctionFor the Year Ended June 30, 2016
Michigan Technological University
61

2016FINANCIAL REPORT
MICHIGAN TECHNOLOGICAL UNIVERSITY1400 TOWNSEND DRIVE
HOUGHTON, MICHIGAN 49931-1295WWW.MTU.EDU
Michigan Technological University is an equal opportunity educational institution/equal opportunity employer, which includes providing equal opportunity for protected veterans and individuals with disabilities. 33997/0914.