Embed Size (px)
Citation preview
200mm Fabs Awaken:
Trends, Status and Forecast
Copyright SEMI, San Jose, USA 2016Christian Gregor Dieseldorff, Sean Nachnani
Industry Research & Statistics Group at SEMI, San Jose, California
TechXPOT South
Semicon West, July 13, 2016

Introduction
Analysts
200mm Fab Trends & Outlook, July 2016. C.G. Dieseldorff & S. Nachnani. Copyright SEMI 2016 2
Worldwide and Dedicated:
Christian G. Dieseldorff (principal), Clark Tseng, Lara Chamness, Dan Tracy, Sean Nachnani (summer 2016)
Utilizing worldwide offices of SEMI in Europe, Korea, China, Taiwan, Singapore
Working with third parties such as in Japan

200mm Fab Trends & Outlook, July 2016. C.G. Dieseldorff & S. Nachnani. Copyright SEMI 20163
The Landscape
Fabs Increasing Capacity
Fabs Losing Capacity
Changes in Capacity: Analysis
Equipment Spending Trends
SEMI’s New Reports
Summary
Outline

200mm Fab Trends & Outlook, July 2016. C.G. Dieseldorff & S. Nachnani. Copyright SEMI 2016 4
Some high level forecasts are done to 2019
More detailed forecasts go to 2018
SEMI will publish an update of the 200mm Fab Outlook report to 2020 in 3Q16

200mm Fab Trends & Outlook, July 2016. C.G. Dieseldorff & S. Nachnani. Copyright SEMI 20165
-7% +8%
200mm Fabs awaken!
From 2015 on
Increase of 200mm:
…Capacity
…Equipment spending
…Fab Count
New equipment being built
Increase for 200mm
Silicon Shipment Fcst

200mm Fab Trends & Outlook, July 2016. C.G. Dieseldorff & S. Nachnani. Copyright SEMI 20166
The Landscape

The Landscape:Fab Count by Wafer Size 1995 to 2018 for 150mm, 200mm, 300mm
200mm Fab Trends & Outlook, July 2016. C.G. Dieseldorff & S. Nachnani. Copyright SEMI 20167
● Count of Front end fabs in operation at the end of each year (excluding LED, EPI, BEOL, R&Ds, Backend).
● 150mm began in 1980 (Intel)
● Dawn of 200mm began in 1990 (IBM Fishkill pilot with Siemens 64Mbit DRAM)
● 300mm began in 2000 (SC300 with Siemens & Motorola). Beta lines in 1998 US (I300I), Japan (Selete)

The Landscape:200mm Fab Count (Volume Fabs)
200mm Fab Trends & Outlook, July 2016. C.G. Dieseldorff & S. Nachnani. Copyright SEMI 20168
● Count of Front end fabs in operation at the end of each year (excluding LED, EPI, BEOL, R&Ds, Backend).
● 200mm fab count increased from 70 fabs in 1995, peak of 200 fabs end of 2007, declined to 180 in 2015
● With the 2008/2009 economic downturn, more 200mm fabs closed and/or transitioned to 300mm (with strongest impact from
2008 to 2010).
● Recent (2015 to 2016) Mergers & Acquistions: most fabs are 200mm for Logic, Foundry, Analog/Mixed Signal and Power
Mergers & Acquisitions
2015 - 2016
Total fabs affected: 57
300mm fabs: 9
200mm fabs: 29 (51%)
150mm fabs: 15
<150mm: 4
Immediate fab
closures: 2 150mm

The Landscape: Fab Capacity by Wafer Size 1995 to 2019 for 150mm, 200mm, 300mm
200mm Fab Trends & Outlook, July 2016. C.G. Dieseldorff & S. Nachnani. Copyright SEMI 20169
● 200mm fab capacity surpassed 150mm capacity in 1998 and peaked in 2007
● In 2008 installed 300mm fab capacity (in 200mm equivalents) surpassed 200mm capacity
● 200mm capacity declined in 2008 to 2009 but has been increasing gradually; by 2018/2019 200mm
capacity estimated to reach level close to 2006
200mm Fab Trends & Outlook, July 2016. C.G. Dieseldorff & S. Nachnani. Copyright SEMI 201610
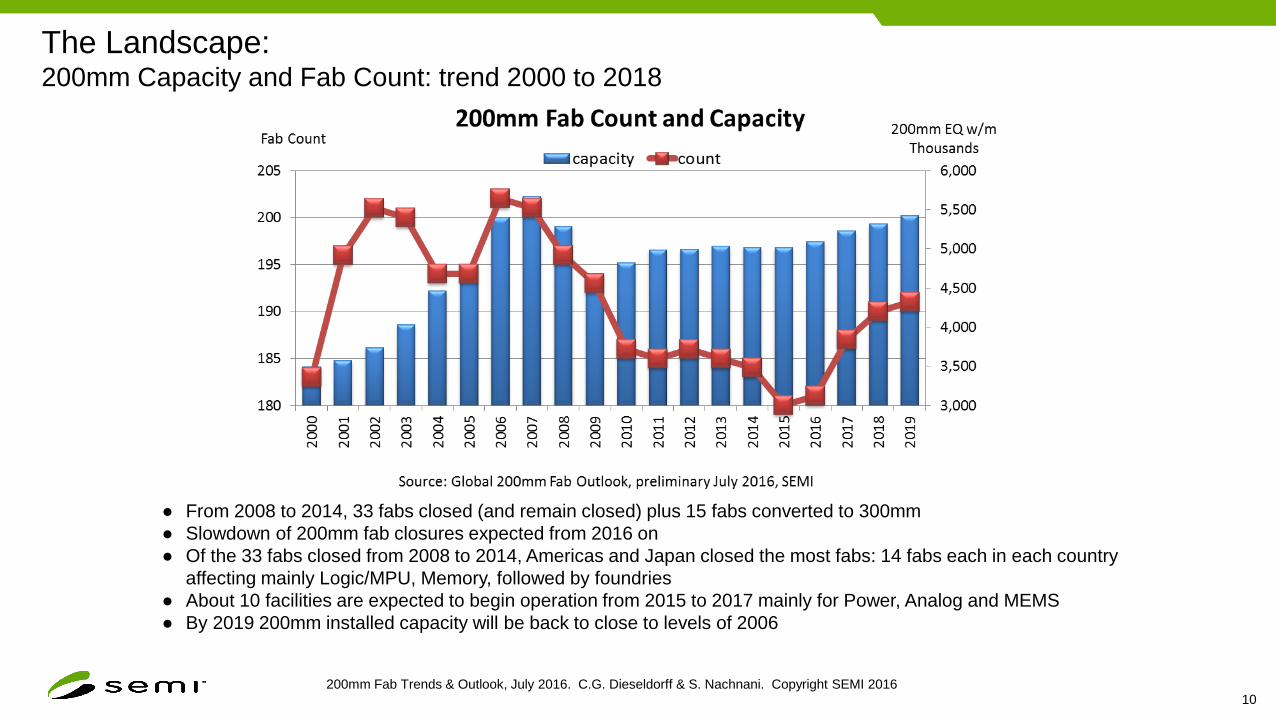
● From 2008 to 2014, 33 fabs closed (and remain closed) plus 15 fabs converted to 300mm
● Slowdown of 200mm fab closures expected from 2016 on
● Of the 33 fabs closed from 2008 to 2014, Americas and Japan closed the most fabs: 14 fabs each in each country
affecting mainly Logic/MPU, Memory, followed by foundries
● About 10 facilities are expected to begin operation from 2015 to 2017 mainly for Power, Analog and MEMS
● By 2019 200mm installed capacity will be back to close to levels of 2006
The Landscape:200mm Capacity and Fab Count: trend 2000 to 2018
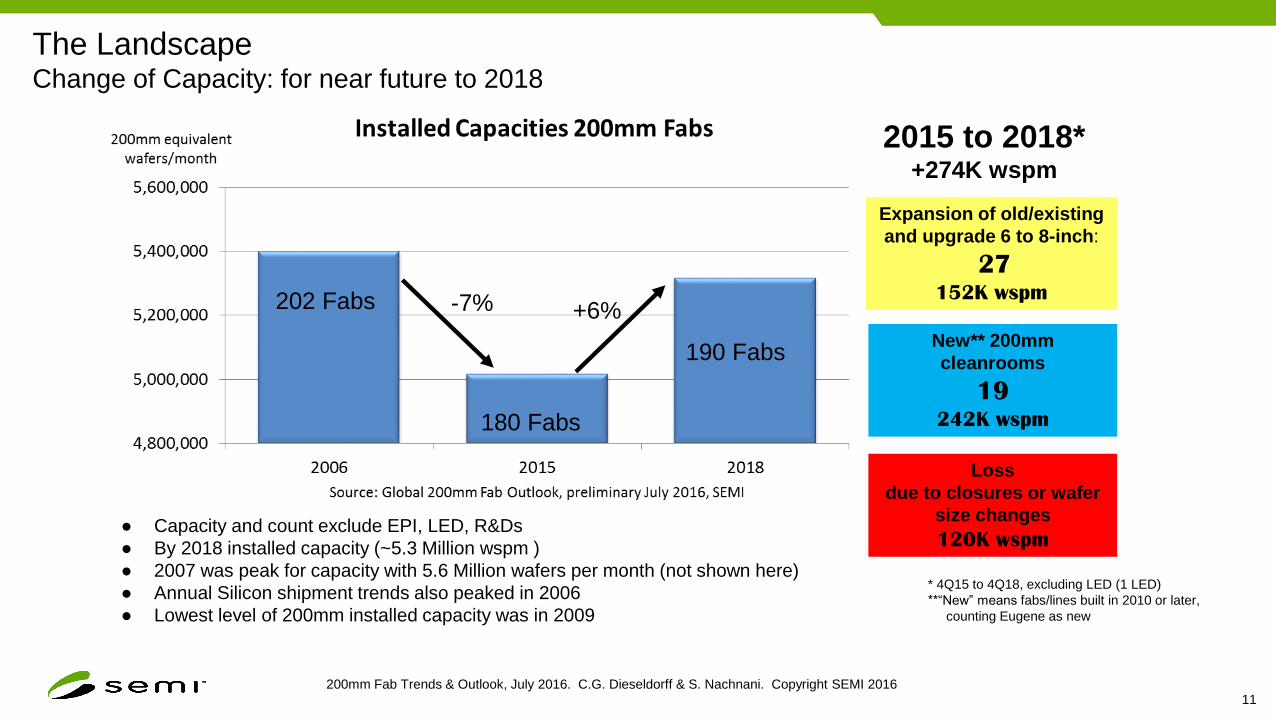
The LandscapeChange of Capacity: for near future to 2018
200mm Fab Trends & Outlook, July 2016. C.G. Dieseldorff & S. Nachnani. Copyright SEMI 201611
● Capacity and count exclude EPI, LED, R&Ds
● By 2018 installed capacity (~5.3 Million wspm )
● 2007 was peak for capacity with 5.6 Million wafers per month (not shown here)
● Annual Silicon shipment trends also peaked in 2006
● Lowest level of 200mm installed capacity was in 2009
Expansion of old/existing
and upgrade 6 to 8-inch:
27152K wspm
New** 200mm
cleanrooms
19242K wspm
2015 to 2018*+274K wspm
* 4Q15 to 4Q18, excluding LED (1 LED)
**“New” means fabs/lines built in 2010 or later,
counting Eugene as new
Loss
due to closures or wafer
size changes
120K wspm
-7% +6%202 Fabs
180 Fabs
190 Fabs

Increasing Capacity
200mm Fab Trends & Outlook, July 2016. C.G. Dieseldorff & S. Nachnani. Copyright SEMI 201612

Increasing Capacity200mm Facilities: All Fabs/Lines Starting Operation
200mm Fab Trends & Outlook, July 2016. C.G. Dieseldorff & S. Nachnani. Copyright SEMI 201613
Starting 2015 2016 2017 2018 2019
Americas 1 1 1
China 4 2
Europe & Mideast 1 1 1
Japan 1 1
Korea
SE Asia 1 1
Taiwan 1
Source: 200mm Fab Outlook report, World Fab Forecast (preliminary July 2016, SEMI)
Starting operation, all probabilities. Excluding EPI, LED, small R&Ds
17 Fabs & Lines are expected to begin operation in 2015 to 2019

Increasing Capacity: New and Existing Fabs from 2013 to 2018
200mm Fab Trends & Outlook, July 2016. C.G. Dieseldorff & S. Nachnani. Copyright SEMI 201614
● Chart shows only fabs which add capacity (excludes fabs with losses)
● Count in each year of 200mm Fabs adding capacity (same fab may show up in 1 or more years)
● “New” refers to fabs that began operation in 2010 and later. “Existing” refers to fabs that began operation before 2010.
A new fab is included in each year’s count if capacity is being added
● For example: in 2013, there were 9 new fabs which added capacity and 22 existing fabs

Losing Capacity
200mm Fab Trends & Outlook, July 2016. C.G. Dieseldorff & S. Nachnani. Copyright SEMI 201615
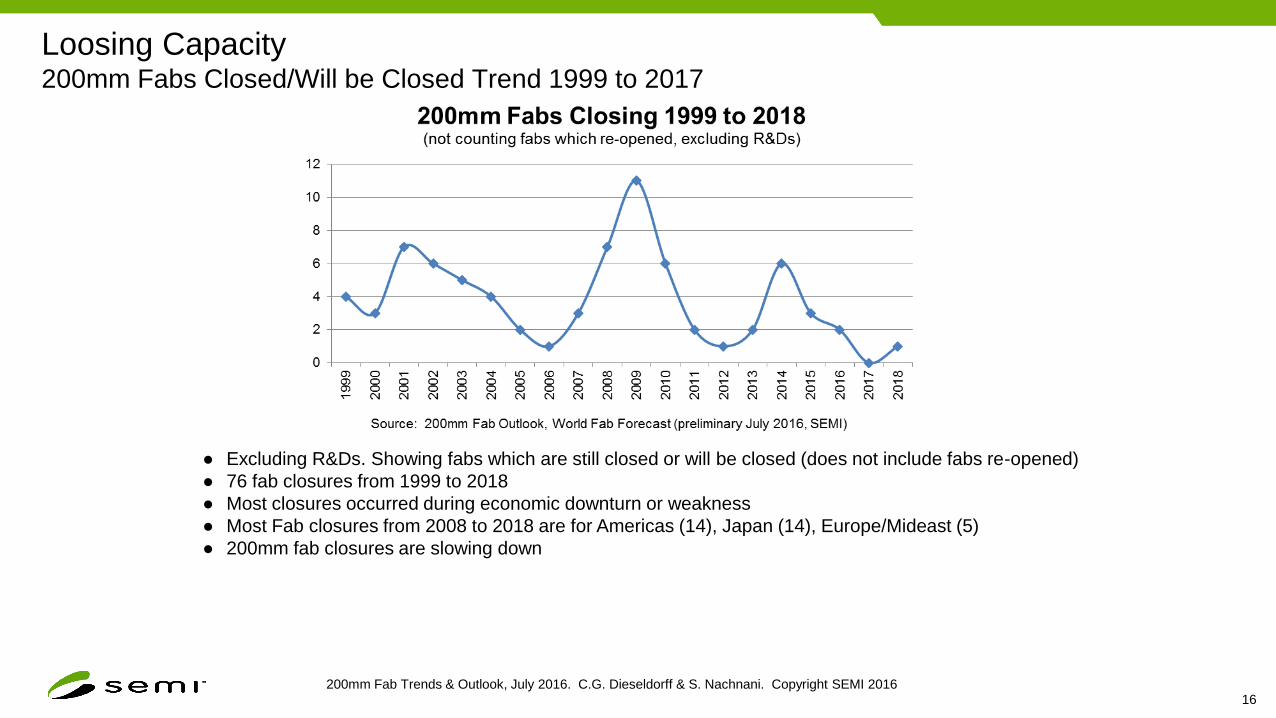
Loosing Capacity200mm Fabs Closed/Will be Closed Trend 1999 to 2017
200mm Fab Trends & Outlook, July 2016. C.G. Dieseldorff & S. Nachnani. Copyright SEMI 201616
● Excluding R&Ds. Showing fabs which are still closed or will be closed (does not include fabs re-opened)
● 76 fab closures from 1999 to 2018
● Most closures occurred during economic downturn or weakness
● Most Fab closures from 2008 to 2018 are for Americas (14), Japan (14), Europe/Mideast (5)
● 200mm fab closures are slowing down
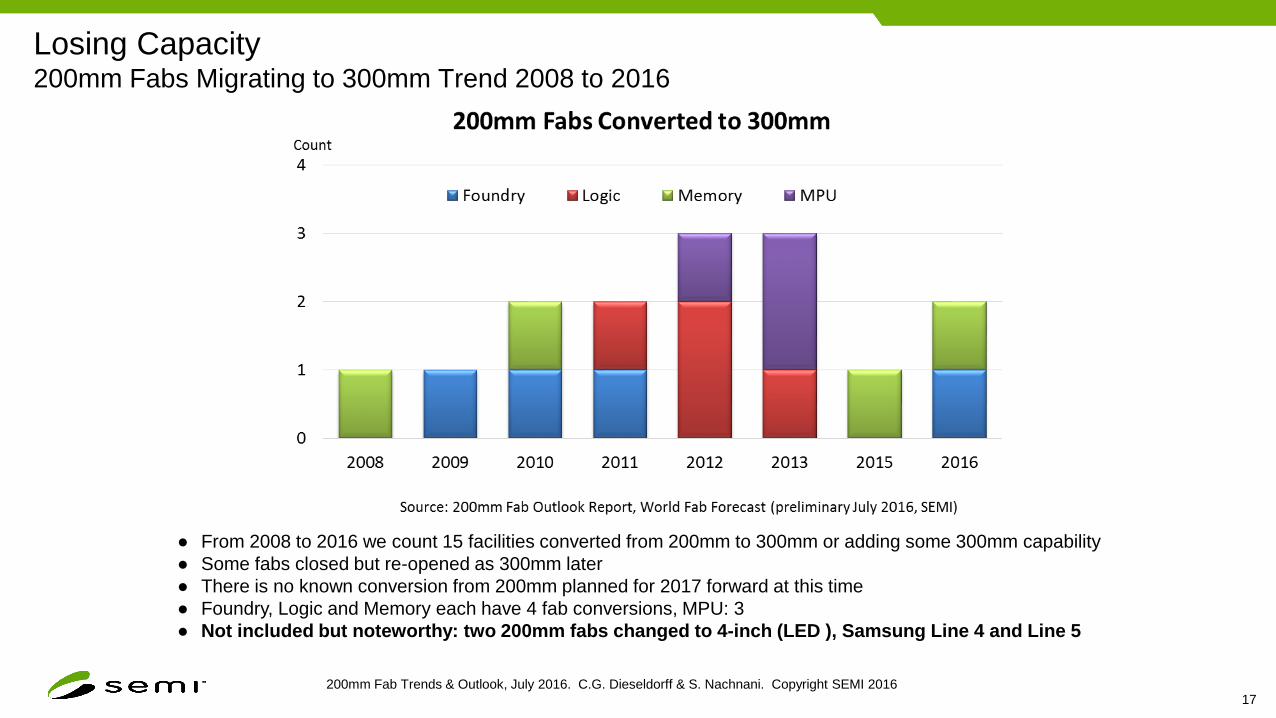
Losing Capacity200mm Fabs Migrating to 300mm Trend 2008 to 2016
200mm Fab Trends & Outlook, July 2016. C.G. Dieseldorff & S. Nachnani. Copyright SEMI 201617
● From 2008 to 2016 we count 15 facilities converted from 200mm to 300mm or adding some 300mm capability
● Some fabs closed but re-opened as 300mm later
● There is no known conversion from 200mm planned for 2017 forward at this time
● Foundry, Logic and Memory each have 4 fab conversions, MPU: 3
● Not included but noteworthy: two 200mm fabs changed to 4-inch (LED ), Samsung Line 4 and Line 5
Losing Capacity200mm Fabs Repurposed Non-Semiconductor 2008 to 2010
200mm Fab Trends & Outlook, July 2016. C.G. Dieseldorff & S. Nachnani. Copyright SEMI 201618
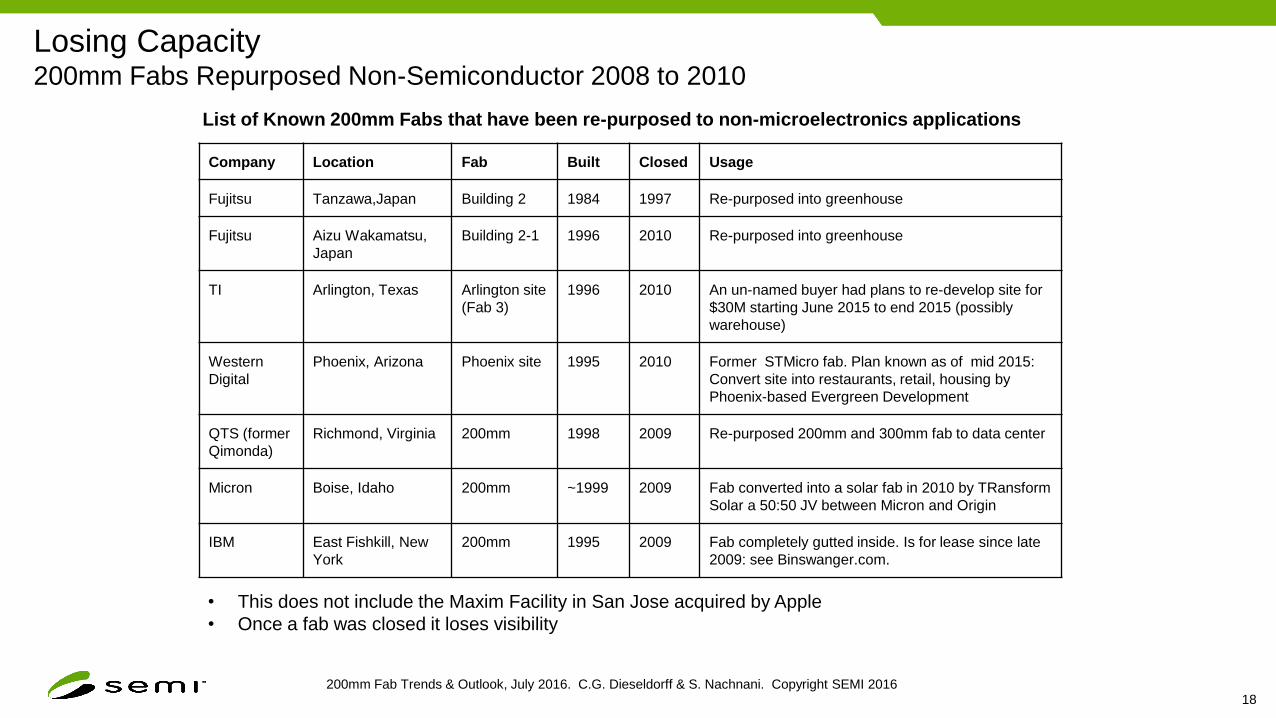
Company Location Fab Built Closed Usage
Fujitsu Tanzawa,Japan Building 2 1984 1997 Re-purposed into greenhouse
Fujitsu Aizu Wakamatsu,
Japan
Building 2-1 1996 2010 Re-purposed into greenhouse
TI Arlington, Texas Arlington site
(Fab 3)
1996 2010 An un-named buyer had plans to re-develop site for
$30M starting June 2015 to end 2015 (possibly
warehouse)
Western
Digital
Phoenix, Arizona Phoenix site 1995 2010 Former STMicro fab. Plan known as of mid 2015:
Convert site into restaurants, retail, housing by
Phoenix-based Evergreen Development
QTS (former
Qimonda)
Richmond, Virginia 200mm 1998 2009 Re-purposed 200mm and 300mm fab to data center
Micron Boise, Idaho 200mm ~1999 2009 Fab converted into a solar fab in 2010 by TRansform
Solar a 50:50 JV between Micron and Origin
IBM East Fishkill, New
York
200mm 1995 2009 Fab completely gutted inside. Is for lease since late
2009: see Binswanger.com.
• This does not include the Maxim Facility in San Jose acquired by Apple
• Once a fab was closed it loses visibility
List of Known 200mm Fabs that have been re-purposed to non-microelectronics applications

Changes in Capacity:
Analysis
200mm Fab Trends & Outlook, July 2016. C.G. Dieseldorff & S. Nachnani. Copyright SEMI 201619

Changes in CapacityChanges by Region 2015 to 2018
200mm Fab Trends & Outlook, July 2016. C.G. Dieseldorff & S. Nachnani. Copyright SEMI 201620
*Existing: all these fabs originally began operation before 2010
*New: all these fabs began operation in 2010 or after
Capacity added from 4Q15 to 4Q18

Change in Capacity 200mm Capacity by Product Type 2006 vs 2018
200mm Fab Trends & Outlook, July 2016. C.G. Dieseldorff & S. Nachnani. Copyright SEMI 201621
● In comparing 2006 versus 2018, memory capacity share of 200mm has declined to just about 2%. Most memory
production has migrated to 300mm fabs
● A similar transition to 300mm has occurred with Logic/MPU production
● On the other hand, we see strong capacity growth from Discrete/Power, MEMS, and Analog segments in part to
the transition from 150mm to 200mm
● Foundry has also been gaining share driven by strong demand for PMIC, Display driver IC, CMOS image
sensor, MCU, MEMS, and other devices requiring >90nm process technology
Source: 200mm Fab Outlook Report, World Fab Forecast (preliminary July 2016, SEMI)
Equipment Spending
Trends
200mm Fab Trends & Outlook, July 2016. C.G. Dieseldorff & S. Nachnani. Copyright SEMI 201622

200mm Fab Trends & Outlook, July 2016. C.G. Dieseldorff & S. Nachnani. Copyright SEMI 201623
• Front End Facilities, new, used, in-house, including LED, EPI
• Count of 200-mm facilities with capex: 2015: 114, 2016: 113, 2017: 109
• Less spending for 2017 and 2018 may be also due to lack of visibility (data are still being gathered)
Equipment SpendingFab Equipment Spending by Wafer Size: 200mm and <200mm
200mm Fab Trends & Outlook, July 2016. C.G. Dieseldorff & S. Nachnani. Copyright SEMI 201624
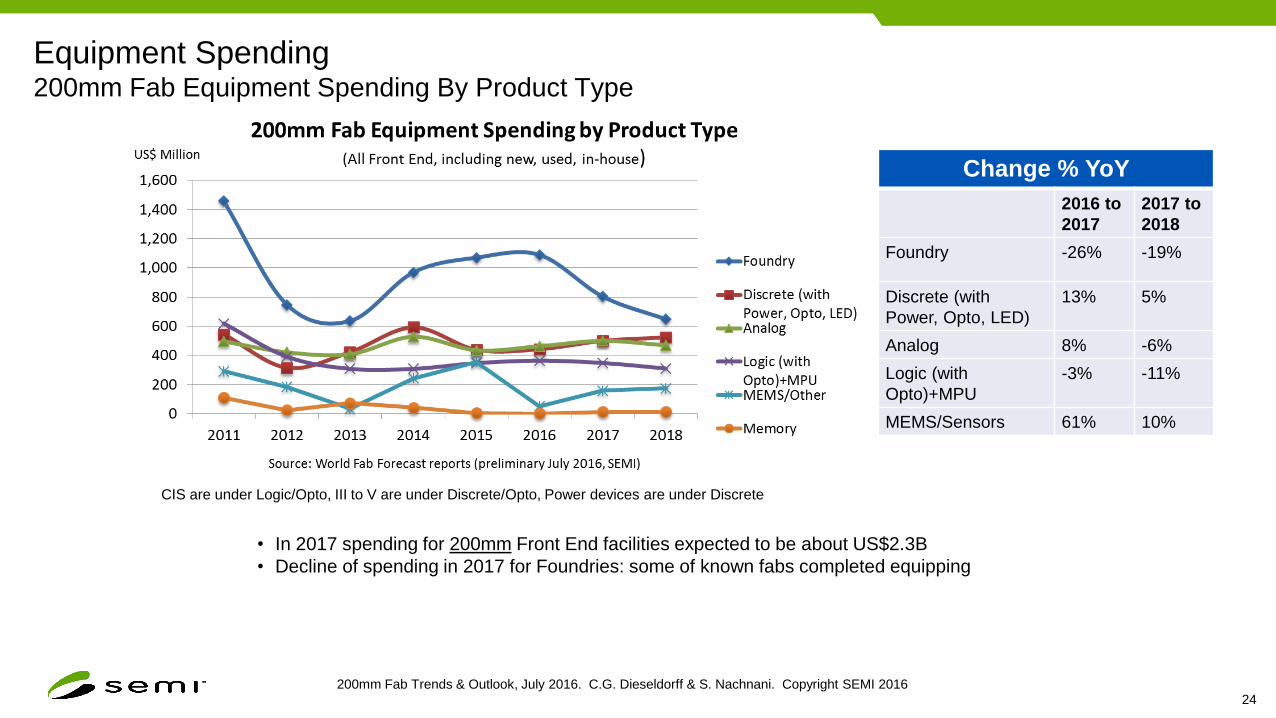
• In 2017 spending for 200mm Front End facilities expected to be about US$2.3B
• Decline of spending in 2017 for Foundries: some of known fabs completed equipping
Equipment Spending200mm Fab Equipment Spending By Product Type
CIS are under Logic/Opto, III to V are under Discrete/Opto, Power devices are under Discrete
Change % YoY
2016 to
2017
2017 to
2018
Foundry -26% -19%
Discrete (with
Power, Opto, LED)
13% 5%
Analog 8% -6%
Logic (with
Opto)+MPU
-3% -11%
MEMS/Sensors 61% 10%
Summary
200mm Fab Trends & Outlook, July 2016. C.G. Dieseldorff & S. Nachnani. Copyright SEMI 201625
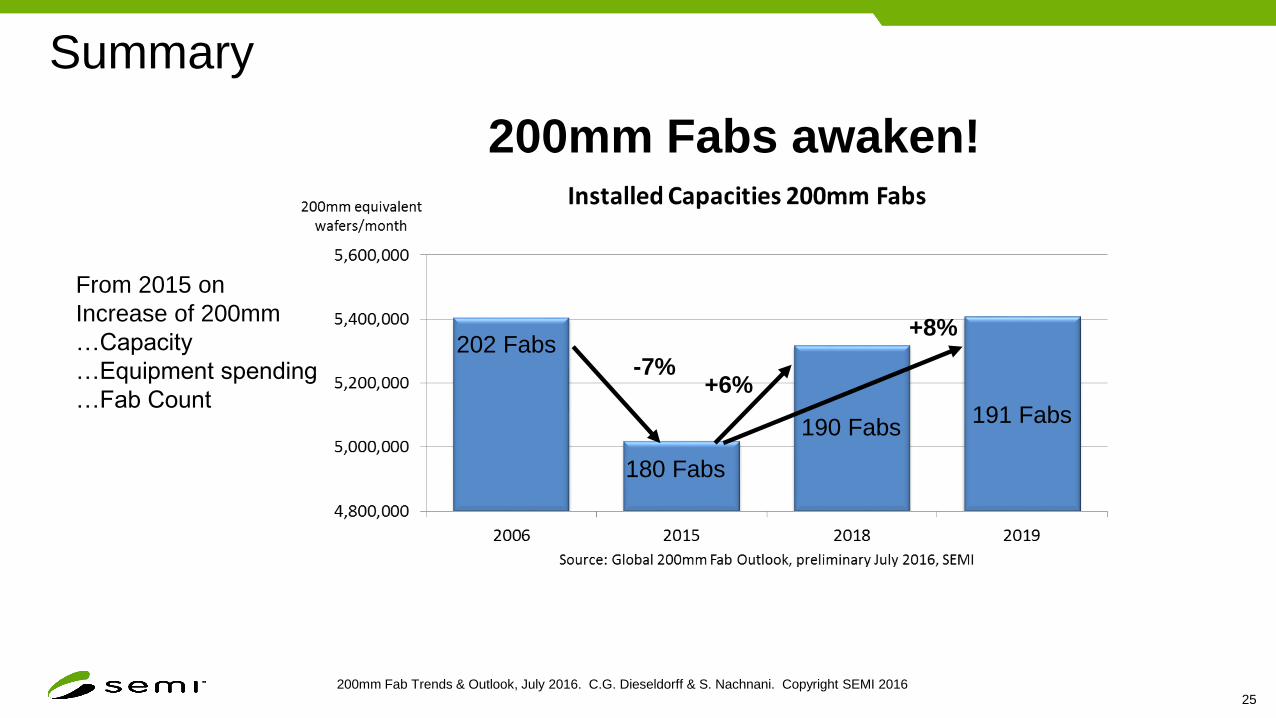
-7%
+8%
+6%
From 2015 on
Increase of 200mm
…Capacity
…Equipment spending
…Fab Count
202 Fabs
180 Fabs
190 Fabs191 Fabs
200mm Fabs awaken!

200mm Fab Trends & Outlook, July 2016. C.G. Dieseldorff & S. Nachnani. Copyright SEMI 201626
SEMI’s Fab report
Update available 3Q 2016:
Forecast to 2020

200mm Fab Trends & Outlook, July 2016. C.G. Dieseldorff & S. Nachnani. Copyright SEMI 201627
SEMI’s Fab report
Fast access to fab information (mobile friendly), easy to use (no Excel)
3 years of data with forecast to next year
Selection on top by: company, country/region, wafer size, product type, geometry, and status
Immediate summaries on top by year for spending (equipment and construction) and capacity
Fab details in grid below including fab type, start year, close year, fab comment, and changes made
Imagine: Fab data at your fingertips:
any time and anywhere
SEMI presents a new report:

200mm Fab Trends & Outlook, July 2016. C.G. Dieseldorff & S. Nachnani. Copyright SEMI 2016 28