Embed Size (px)
DESCRIPTION
VNA ANNuAl Figures 2009 Passenger cars 433,800 408,600 -5.8% Vehicles in RTL** 141,900 134,300 -5.4% 1.2 The VNA vehicle fleet 1.1 The Dutch leased vehicle fleet 1.3 Economic and social significance of vehicle lease 1 VNA members made up 88.7% of the total lease fleet at the end of 2009. Considering the size of the market share of VNA members, it is fair to say that the VNA figures in this publication give a reliable picture of the developments in the Dutch leased vehicle fleet as a whole.
Citation preview
Leased vehicle fleet shrinks due to economic crisisDue to the economic crisis, the Dutch leased vehicle fleet (cars and delivery vans) shrank in 2009 by 3.8%1). The leased fleet of VNA mem-bers in 2009 amounted to 632,300 vehicles, 5.5% less than in 2008. This decline reflects in particular the substantial drop in the number of new lease contracts. The Dutch economy contracted by 4.0% in 2009. The economic crisis also led to more contracts being terminated early compared to 2008. One of the effects of the sharp drop in the number of new contracts in 2009 was that the average age of VNA leased vehicles rose substantially, from 24.0 months in 2008 to 26.4 months in 2009 (+10.0%). The fiscal measures that took effect in 2008 and 2009 to support the environment, along with the continuing public trend of ‘going green’, have led to an increase in the number of small, clean and economical new lease cars. The percentage of new passenger lease cars sporting an ‘A’ energy label thus doubled in 2009 to 30%. The average CO2 emission of new passenger lease cars dropped by 5.2% in 2009 versus 2008.
The number of cars belonging to the VNA vehicle fleet that drive on an alternative fuel grew by no less than 114.7% in 2009, to 20,400.
With this publication VNA aims to provide a good insight into the size and breakdown of the Dutch auto lease market in 2009 and into ma-jor developments affecting it. The results of this study are based on the annual survey held among VNA members and on figures obtained from the RDC Data Centre.
Renate Hemerik, VNA Director
VNA ANNuAl Figures 2009
2 0 0 9
1
1. Market figures: the Dutch leased vehicle fleet
1.1 The Dutch leased vehicle fleetSince 2008 VNA uses figures of the RDC Data Centre to determine the size of the Dutch leased vehicle fleet. A significant share in these figures, which grew disproportionately in 2009, consists of cars financed by private individuals (the RTL base2)). We have excluded this category for purposes of identifying the benchmark of the total Dutch leased vehicle fleet. In this section we therefore compare the VNA fleet figures strictly with the vehicles in the RDC Data Centre database that are registered as leased.
The Dutch leased vehicle fleet, excluding the cars registered in RTL (plus an estimated number of cars in fleet management contracts), shrank in 2009 by 3.75%, coming out at 561,700. The contraction of the Dutch lease fleet in 2009 for cars and delivery vans came to 3.82% and 3.46%, respectively. While not specifically examined, we may assume that this contraction was largely caused by the economic crisis.
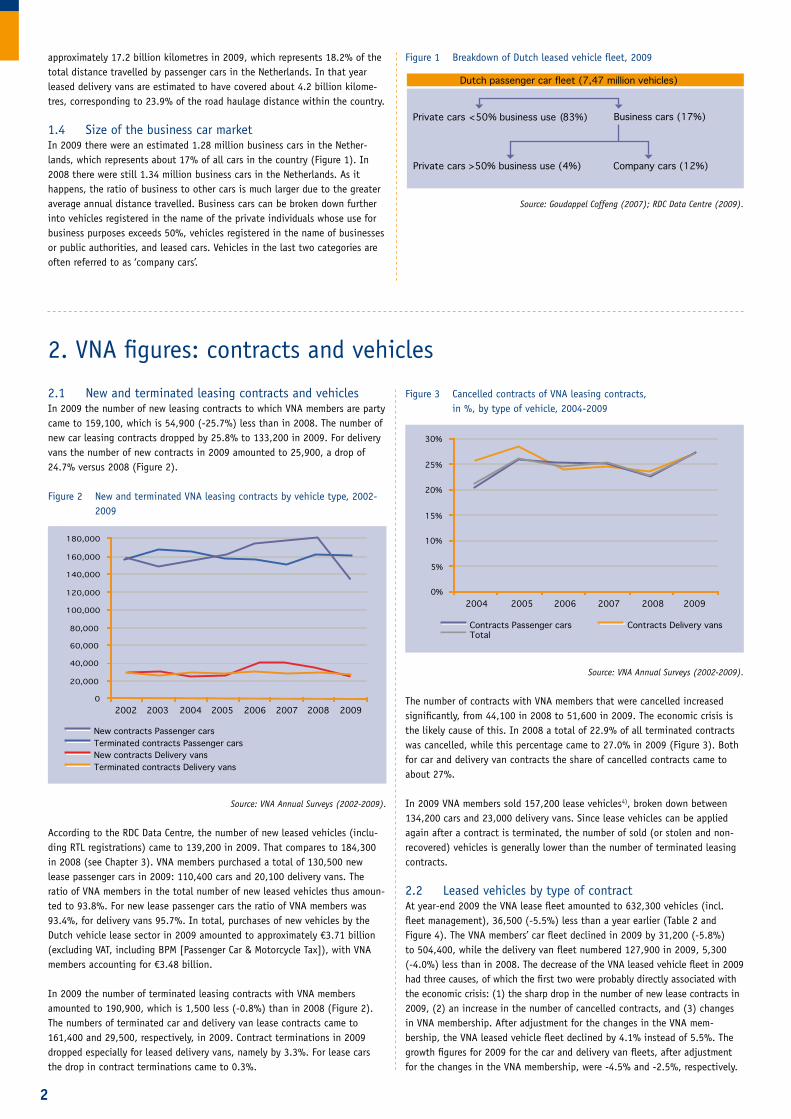
1.2 The VNA vehicle fleetThe vehicle fleet of VNA members amounted at year-end 2009 to 632,300 vehicles, 36,500 less (-5.5%) than a year earlier (table 2). Compared to the total number of vehicles in the Netherlands, the VNA fleet declined more in 2009, largely due to changes in the VNA membership. After adjustment for these changes, the drop of the VNA fleet was 4.1%, very much in line with the decline of the overall Dutch leased vehicle fleet.
VNA members made up 88.7% of the total lease fleet at the end of 2009. Considering the size of the market share of VNA members, it is fair to say that the VNA figures in this publication give a reliable picture of the developments in the Dutch leased vehicle fleet as a whole.
Table 1 VNA leased fleet by vehicle type, 2008-2009
Type of Vehicle 2008 2009 Change ‘08-’09 (in %)
Passenger cars 433,800 408,600 -5.8%
Delivery vans 93,100 89,400 -4.0%
Subtotal* 526,900 498,000 -5.5%
Vehicles in RTL** 141,900 134,300 -5.4%
Total 668,800 632,300 -5.5%
* Including auto fleet management and excluding vehicles registered in RTL.
** Estimated figures for 2008 based on assumption that the RTL share was
identical to 2009. Source: VNA Annual Surveys (2008-2009).
1.3 Economic and social significance of vehicle leaseAccording to VNA estimates, total sales in the Dutch leased vehicle market for 2009 (excluding vehicles in RTL) amounted to over €7.2 billion, an increase of 0.7% versus 2008. VNA members accounted for €6.4 billion of this. Compared to 2008, sales involving VNA members dropped by approximately 1.5%. The lease share of total sales of new vehicles (cars and delivery vans) came to 30.5% in 2009. VNA members accounted for 93.8% of the newly registered leased vehicles (including RTL registrations).
The overall distance travelled by Dutch leased cars and delivery vans (ex-cluding vehicles in RTL) amounted to an estimated 21.4 billion kilometres in 2009. This represents approximately 19.1% of the transport of persons and goods by road in the Netherlands3). Passenger leased cars accounted for
Vehicle Leasing MarketANNUAL FIGURES
2
2. VNA figures: contracts and vehicles
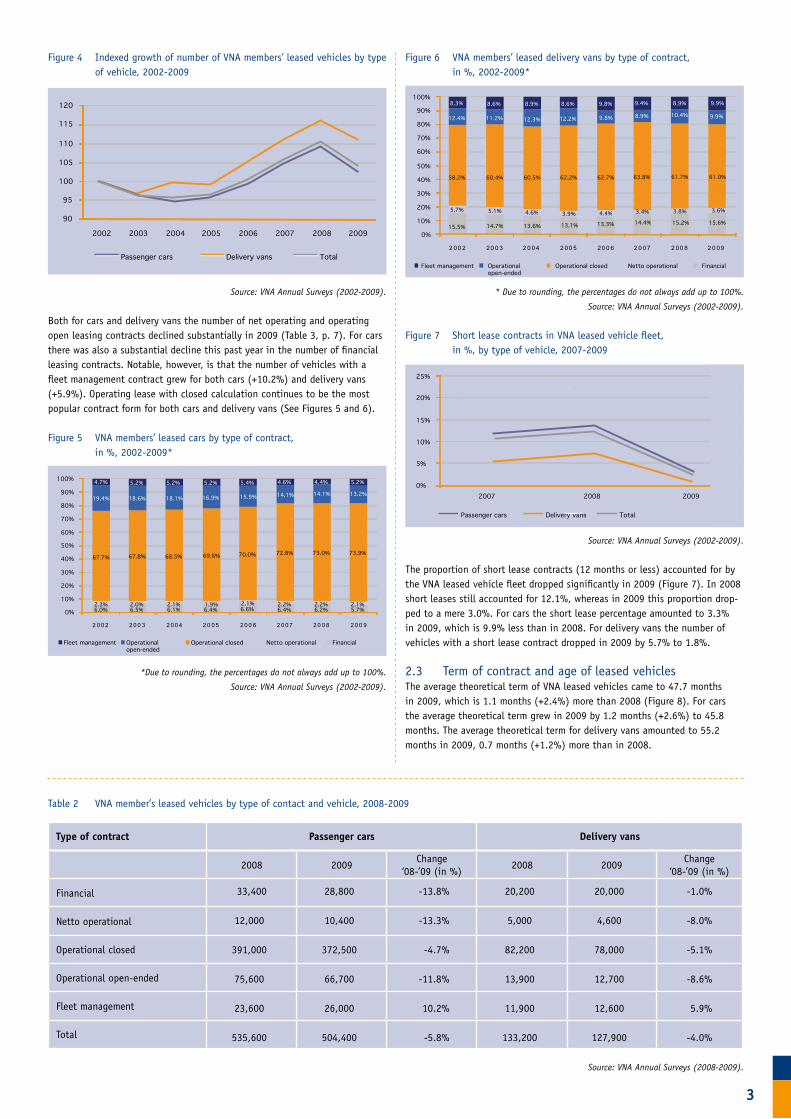
2.1 New and terminated leasing contracts and vehiclesIn 2009 the number of new leasing contracts to which VNA members are party came to 159,100, which is 54,900 (-25.7%) less than in 2008. The number of new car leasing contracts dropped by 25.8% to 133,200 in 2009. For delivery vans the number of new contracts in 2009 amounted to 25,900, a drop of 24.7% versus 2008 (Figure 2).
Figure 2 New and terminated VNA leasing contracts by vehicle type, 2002-2009
Source: VNA Annual Surveys (2002-2009).
According to the RDC Data Centre, the number of new leased vehicles (inclu-ding RTL registrations) came to 139,200 in 2009. That compares to 184,300 in 2008 (see Chapter 3). VNA members purchased a total of 130,500 new lease passenger cars in 2009: 110,400 cars and 20,100 delivery vans. The ratio of VNA members in the total number of new leased vehicles thus amoun-ted to 93.8%. For new lease passenger cars the ratio of VNA members was 93.4%, for delivery vans 95.7%. In total, purchases of new vehicles by the Dutch vehicle lease sector in 2009 amounted to approximately €3.71 billion (excluding VAT, including BPM [Passenger Car & Motorcycle Tax]), with VNA members accounting for €3.48 billion.
In 2009 the number of terminated leasing contracts with VNA members amounted to 190,900, which is 1,500 less (-0.8%) than in 2008 (Figure 2). The numbers of terminated car and delivery van lease contracts came to 161,400 and 29,500, respectively, in 2009. Contract terminations in 2009 dropped especially for leased delivery vans, namely by 3.3%. For lease cars the drop in contract terminations came to 0.3%.
Figure 3 Cancelled contracts of VNA leasing contracts, in %, by type of vehicle, 2004-2009
Source: VNA Annual Surveys (2002-2009).
The number of contracts with VNA members that were cancelled increased significantly, from 44,100 in 2008 to 51,600 in 2009. The economic crisis is the likely cause of this. In 2008 a total of 22.9% of all terminated contracts was cancelled, while this percentage came to 27.0% in 2009 (Figure 3). Both for car and delivery van contracts the share of cancelled contracts came to about 27%.
In 2009 VNA members sold 157,200 lease vehicles4), broken down between 134,200 cars and 23,000 delivery vans. Since lease vehicles can be applied again after a contract is terminated, the number of sold (or stolen and non-recovered) vehicles is generally lower than the number of terminated leasing contracts.
2.2 Leased vehicles by type of contractAt year-end 2009 the VNA lease fleet amounted to 632,300 vehicles (incl. fleet management), 36,500 (-5.5%) less than a year earlier (Table 2 and Figure 4). The VNA members’ car fleet declined in 2009 by 31,200 (-5.8%) to 504,400, while the delivery van fleet numbered 127,900 in 2009, 5,300 (-4.0%) less than in 2008. The decrease of the VNA leased vehicle fleet in 2009 had three causes, of which the first two were probably directly associated with the economic crisis: (1) the sharp drop in the number of new lease contracts in 2009, (2) an increase in the number of cancelled contracts, and (3) changes in VNA membership. After adjustment for the changes in the VNA mem-bership, the VNA leased vehicle fleet declined by 4.1% instead of 5.5%. The growth figures for 2009 for the car and delivery van fleets, after adjustment for the changes in the VNA membership, were -4.5% and -2.5%, respectively.
approximately 17.2 billion kilometres in 2009, which represents 18.2% of the total distance travelled by passenger cars in the Netherlands. In that year leased delivery vans are estimated to have covered about 4.2 billion kilome-tres, corresponding to 23.9% of the road haulage distance within the country.
1.4 Size of the business car marketIn 2009 there were an estimated 1.28 million business cars in the Nether-lands, which represents about 17% of all cars in the country (Figure 1). In 2008 there were still 1.34 million business cars in the Netherlands. As it happens, the ratio of business to other cars is much larger due to the greater average annual distance travelled. Business cars can be broken down further into vehicles registered in the name of the private individuals whose use for business purposes exceeds 50%, vehicles registered in the name of businesses or public authorities, and leased cars. Vehicles in the last two categories are often referred to as ‘company cars’.
Source: Goudappel Coffeng (2007); RDC Data Centre (2009).
Figure 1 Breakdown of Dutch leased vehicle fleet, 2009
Private cars <50% business use (83%) Business cars (17%)
Private cars >50% business use (4%) Company cars (12%)
Dutch passenger car fleet (7,47 million vehicles)
New contracts Passenger carsTerminated contracts Passenger carsNew contracts Delivery vansTerminated contracts Delivery vans
2002 2003 2004 2005 2006 2007 2008 2009
0
20,000
40,000
60,000
80,000
100,000
120,000
140,000
160,000
180,000
2004 2005 2006 2007 2008 2009
Contracts Passenger cars Contracts Delivery vansTotal
0%
5%
10%
15%
20%
25%
30%
3
Figure 4 Indexed growth of number of VNA members’ leased vehicles by type of vehicle, 2002-2009
Source: VNA Annual Surveys (2002-2009).
Both for cars and delivery vans the number of net operating and operating open leasing contracts declined substantially in 2009 (Table 3, p. 7). For cars there was also a substantial decline this past year in the number of financial leasing contracts. Notable, however, is that the number of vehicles with a fleet management contract grew for both cars (+10.2%) and delivery vans (+5.9%). Operating lease with closed calculation continues to be the most popular contract form for both cars and delivery vans (See Figures 5 and 6).
Figure 5 VNA members’ leased cars by type of contract, in %, 2002-2009*
*Due to rounding, the percentages do not always add up to 100%.
Source: VNA Annual Surveys (2002-2009).
Figure 6 VNA members’ leased delivery vans by type of contract, in %, 2002-2009*
* Due to rounding, the percentages do not always add up to 100%.
Source: VNA Annual Surveys (2002-2009).
Figure 7 Short lease contracts in VNA leased vehicle fleet, in %, by type of vehicle, 2007-2009
Source: VNA Annual Surveys (2002-2009).
The proportion of short lease contracts (12 months or less) accounted for by the VNA leased vehicle fleet dropped significantly in 2009 (Figure 7). In 2008 short leases still accounted for 12.1%, whereas in 2009 this proportion drop-ped to a mere 3.0%. For cars the short lease percentage amounted to 3.3% in 2009, which is 9.9% less than in 2008. For delivery vans the number of vehicles with a short lease contract dropped in 2009 by 5.7% to 1.8%.
2.3 Term of contract and age of leased vehiclesThe average theoretical term of VNA leased vehicles came to 47.7 months in 2009, which is 1.1 months (+2.4%) more than 2008 (Figure 8). For cars the average theoretical term grew in 2009 by 1.2 months (+2.6%) to 45.8 months. The average theoretical term for delivery vans amounted to 55.2 months in 2009, 0.7 months (+1.2%) more than in 2008.
Table 2 VNA member’s leased vehicles by type of contact and vehicle, 2008-2009
Source: VNA Annual Surveys (2008-2009).
Type of contract Passenger cars Delivery vans
2008 2009Change
‘08-’09 (in %)2008 2009
Change‘08-’09 (in %)
Financial 33,400 28,800 -13.8% 20,200 20,000 -1.0%
Netto operational 12,000 10,400 -13.3% 5,000 4,600 -8.0%
Operational closed 391,000 372,500 -4.7% 82,200 78,000 -5.1%
Operational open-ended 75,600 66,700 -11.8% 13,900 12,700 -8.6%
Fleet management 23,600 26,000 10.2% 11,900 12,600 5.9%
Total 535,600 504,400 -5.8% 133,200 127,900 -4.0%
Personenauto's Bestelauto's Totaal
Passenger cars Delivery vans Total
90
95
100
105
110
115
120
2002 2003 2004 2005 2006 2007 2008 2009
0%
10%
20%
30%
40%
50%
60%
70%
80%
90%
100%
2 0 0 2 2 0 0 3 2 0 0 4 2 0 0 5 2 0 0 6 2 0 0 7 2 0 0 8 2 0 0 9
Fleet management Operational open-ended
Operational closed Netto operational Financial
6.0% 6.5% 6.1% 6.4% 6.6% 6.4% 6.2%2.3% 2.0% 2.1% 1.9% 2.1% 2.2% 2.2%
67.7% 67.8% 68.5% 69.6% 70.0% 72.8% 73.0%
19.4% 18.6% 18.1% 16.9% 15.9% 14.1% 14.1%
4.7% 5.2% 5.2% 5.2% 5.4% 4.6% 4.4%
5.7%2.1%
73.9%
13.2%
5.2%
0%
10%
20%
30%
40%
50%
60%
70%
80%
90%
100%
2 00 2 20 0 3 2 0 04 2 00 5 20 0 6 2 0 07 2 00 8 2 0 09
5.7% 5.1% 4.6% 3.9% 4.4% 3.4% 3.8%
58.2% 60.4% 60.5% 62.2% 62.7% 63.8%
15.5% 14.7% 13.6% 13.1% 13.3% 14.4%
61.7%
12.4% 11.2% 12.3% 12.2% 9.8% 8.9% 10.4%
8.3% 8.6% 8.9% 8.6% 9.8% 9.4% 8.9%
3.6%
61.0%
15.2% 15.6%
9.9%
9.9%
Fleet management Operational open-ended
Operational closed Netto operational Financial
2007 2008 2009
Passenger cars Delivery vans Total
0%
5%
10%
15%
20%
25%
4
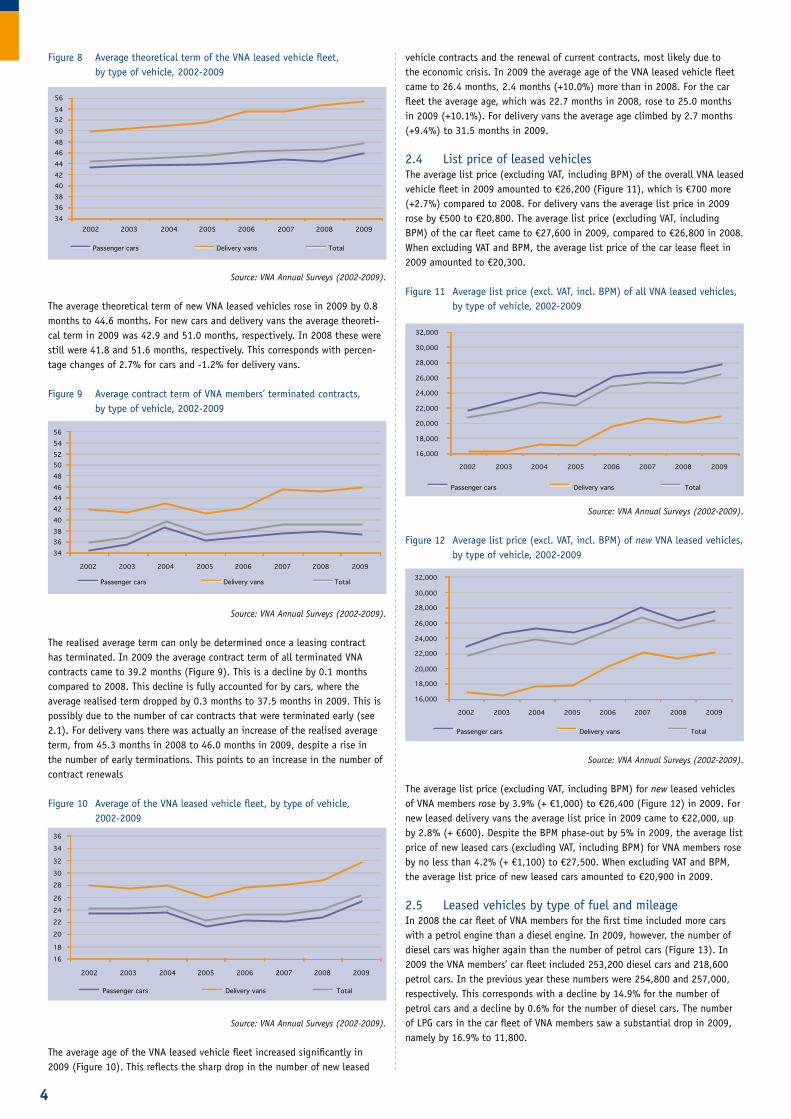
Figure 8 Average theoretical term of the VNA leased vehicle fleet, by type of vehicle, 2002-2009
Source: VNA Annual Surveys (2002-2009).
The average theoretical term of new VNA leased vehicles rose in 2009 by 0.8 months to 44.6 months. For new cars and delivery vans the average theoreti-cal term in 2009 was 42.9 and 51.0 months, respectively. In 2008 these were still were 41.8 and 51.6 months, respectively. This corresponds with percen-tage changes of 2.7% for cars and -1.2% for delivery vans.
Figure 9 Average contract term of VNA members’ terminated contracts, by type of vehicle, 2002-2009
Source: VNA Annual Surveys (2002-2009).
The realised average term can only be determined once a leasing contract has terminated. In 2009 the average contract term of all terminated VNA contracts came to 39.2 months (Figure 9). This is a decline by 0.1 months compared to 2008. This decline is fully accounted for by cars, where the average realised term dropped by 0.3 months to 37.5 months in 2009. This is possibly due to the number of car contracts that were terminated early (see 2.1). For delivery vans there was actually an increase of the realised average term, from 45.3 months in 2008 to 46.0 months in 2009, despite a rise in the number of early terminations. This points to an increase in the number of contract renewals
Figure 10 Average of the VNA leased vehicle fleet, by type of vehicle, 2002-2009
Source: VNA Annual Surveys (2002-2009).
The average age of the VNA leased vehicle fleet increased significantly in 2009 (Figure 10). This reflects the sharp drop in the number of new leased
vehicle contracts and the renewal of current contracts, most likely due to the economic crisis. In 2009 the average age of the VNA leased vehicle fleet came to 26.4 months, 2.4 months (+10.0%) more than in 2008. For the car fleet the average age, which was 22.7 months in 2008, rose to 25.0 months in 2009 (+10.1%). For delivery vans the average age climbed by 2.7 months (+9.4%) to 31.5 months in 2009.
2.4 List price of leased vehiclesThe average list price (excluding VAT, including BPM) of the overall VNA leased vehicle fleet in 2009 amounted to €26,200 (Figure 11), which is €700 more (+2.7%) compared to 2008. For delivery vans the average list price in 2009 rose by €500 to €20,800. The average list price (excluding VAT, including BPM) of the car fleet came to €27,600 in 2009, compared to €26,800 in 2008. When excluding VAT and BPM, the average list price of the car lease fleet in 2009 amounted to €20,300.
Figure 11 Average list price (excl. VAT, incl. BPM) of all VNA leased vehicles, by type of vehicle, 2002-2009
Source: VNA Annual Surveys (2002-2009).
Figure 12 Average list price (excl. VAT, incl. BPM) of new VNA leased vehicles, by type of vehicle, 2002-2009
Source: VNA Annual Surveys (2002-2009).
The average list price (excluding VAT, including BPM) for new leased vehicles of VNA members rose by 3.9% (+ €1,000) to €26,400 (Figure 12) in 2009. For new leased delivery vans the average list price in 2009 came to €22,000, up by 2.8% (+ €600). Despite the BPM phase-out by 5% in 2009, the average list price of new leased cars (excluding VAT, including BPM) for VNA members rose by no less than 4.2% (+ €1,100) to €27,500. When excluding VAT and BPM, the average list price of new leased cars amounted to €20,900 in 2009.
2.5 Leased vehicles by type of fuel and mileageIn 2008 the car fleet of VNA members for the first time included more cars with a petrol engine than a diesel engine. In 2009, however, the number of diesel cars was higher again than the number of petrol cars (Figure 13). In 2009 the VNA members’ car fleet included 253,200 diesel cars and 218,600 petrol cars. In the previous year these numbers were 254,800 and 257,000, respectively. This corresponds with a decline by 14.9% for the number of petrol cars and a decline by 0.6% for the number of diesel cars. The number of LPG cars in the car fleet of VNA members saw a substantial drop in 2009, namely by 16.9% to 11,800.
2002 2003 2004 2005 2006 2007 2008 2009
Passenger cars Delivery vans Total
343638404244464850525456
€ 16,000
€ 18,000
€ 20,000
€ 22,000
€ 24,000
€ 26,000
€ 28,000
€ 30,000
€ 32,000
2002 2003 2004 2005 2006 2007 2008 2009
Passenger cars Delivery vans Total
€ 16,000
€ 18,000
€ 20,000
€ 22,000
€ 24,000
€ 26,000
€ 28,000
€ 30,000
€ 32,000
2002 2003 2004 2005 2006 2007 2008 2009
Passenger cars Delivery vans Total
Passenger cars Delivery vans Total
343638404244464850525456
2002 2003 2004 2005 2006 2007 2008 2009
1618
20
2224
26
2830
32
34
36
2002 2003 2004 2005 2006 2007 2008 2009
Passenger cars Delivery vans Total
5
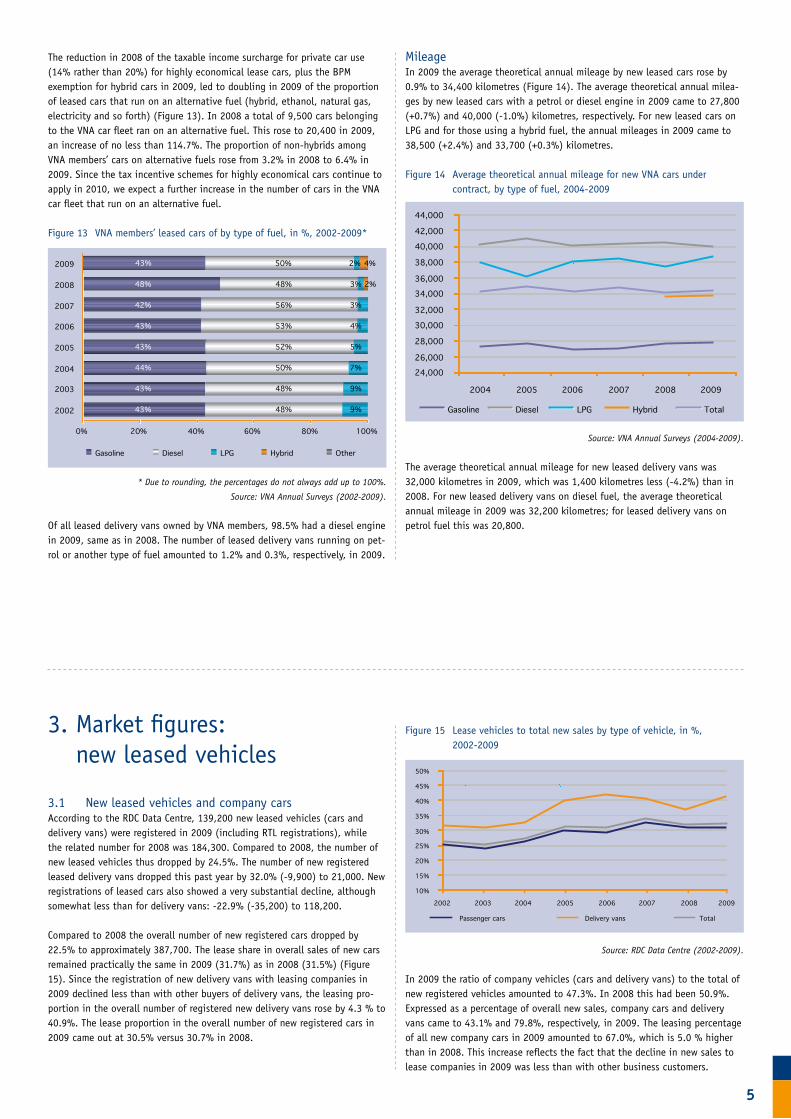
The reduction in 2008 of the taxable income surcharge for private car use (14% rather than 20%) for highly economical lease cars, plus the BPM exemption for hybrid cars in 2009, led to doubling in 2009 of the proportion of leased cars that run on an alternative fuel (hybrid, ethanol, natural gas, electricity and so forth) (Figure 13). In 2008 a total of 9,500 cars belonging to the VNA car fleet ran on an alternative fuel. This rose to 20,400 in 2009, an increase of no less than 114.7%. The proportion of non-hybrids among VNA members’ cars on alternative fuels rose from 3.2% in 2008 to 6.4% in 2009. Since the tax incentive schemes for highly economical cars continue to apply in 2010, we expect a further increase in the number of cars in the VNA car fleet that run on an alternative fuel.
Figure 13 VNA members’ leased cars of by type of fuel, in %, 2002-2009*
* Due to rounding, the percentages do not always add up to 100%.
Source: VNA Annual Surveys (2002-2009).
Of all leased delivery vans owned by VNA members, 98.5% had a diesel engine in 2009, same as in 2008. The number of leased delivery vans running on pet-rol or another type of fuel amounted to 1.2% and 0.3%, respectively, in 2009.
MileageIn 2009 the average theoretical annual mileage by new leased cars rose by 0.9% to 34,400 kilometres (Figure 14). The average theoretical annual milea-ges by new leased cars with a petrol or diesel engine in 2009 came to 27,800 (+0.7%) and 40,000 (-1.0%) kilometres, respectively. For new leased cars on LPG and for those using a hybrid fuel, the annual mileages in 2009 came to 38,500 (+2.4%) and 33,700 (+0.3%) kilometres.
Figure 14 Average theoretical annual mileage for new VNA cars under contract, by type of fuel, 2004-2009
Source: VNA Annual Surveys (2004-2009).
The average theoretical annual mileage for new leased delivery vans was 32,000 kilometres in 2009, which was 1,400 kilometres less (-4.2%) than in 2008. For new leased delivery vans on diesel fuel, the average theoretical annual mileage in 2009 was 32,200 kilometres; for leased delivery vans on petrol fuel this was 20,800.
0% 20% 40% 60% 80% 100%
2002
2003
2004
2005
2006
2007
2008
2009
Gasoline Diesel LPG Hybrid Other
48%
56%
53%
52%
50%
48%
48%
3%
3%
4%
5%
7%
9%
9%
2%48%
42%
43%
43%
44%
43%
43%
43% 50% 2% 4%
Gasoline Diesel LPG Hybrid Total
24,000
26,000
28,000
30,000
32,000
34,000
36,000
38,000
40,000
42,000
44,000
2004 2005 2006 2007 2008 2009
3. Market figures: new leased vehicles 3.1 New leased vehicles and company carsAccording to the RDC Data Centre, 139,200 new leased vehicles (cars and delivery vans) were registered in 2009 (including RTL registrations), while the related number for 2008 was 184,300. Compared to 2008, the number of new leased vehicles thus dropped by 24.5%. The number of new registered leased delivery vans dropped this past year by 32.0% (-9,900) to 21,000. New registrations of leased cars also showed a very substantial decline, although somewhat less than for delivery vans: -22.9% (-35,200) to 118,200.
Compared to 2008 the overall number of new registered cars dropped by 22.5% to approximately 387,700. The lease share in overall sales of new cars remained practically the same in 2009 (31.7%) as in 2008 (31.5%) (Figure 15). Since the registration of new delivery vans with leasing companies in 2009 declined less than with other buyers of delivery vans, the leasing pro-portion in the overall number of registered new delivery vans rose by 4.3 % to 40.9%. The lease proportion in the overall number of new registered cars in 2009 came out at 30.5% versus 30.7% in 2008.
Figure 15 Lease vehicles to total new sales by type of vehicle, in %, 2002-2009
Source: RDC Data Centre (2002-2009).
In 2009 the ratio of company vehicles (cars and delivery vans) to the total of new registered vehicles amounted to 47.3%. In 2008 this had been 50.9%. Expressed as a percentage of overall new sales, company cars and delivery vans came to 43.1% and 79.8%, respectively, in 2009. The leasing percentage of all new company cars in 2009 amounted to 67.0%, which is 5.0 % higher than in 2008. This increase reflects the fact that the decline in new sales to lease companies in 2009 was less than with other business customers.
10%
15%
20%
25%
30%
35%
40%
45%
50%
2002 2003 2004 2005 2006 2007 2008 2009
Passenger cars Delivery vans Total
6
The leased share of new registrations of company cars and delivery vans in 2009 was 70.8% and 51.3%, respectively. For the prior year these percentages came to 66.2% and 47.0%.
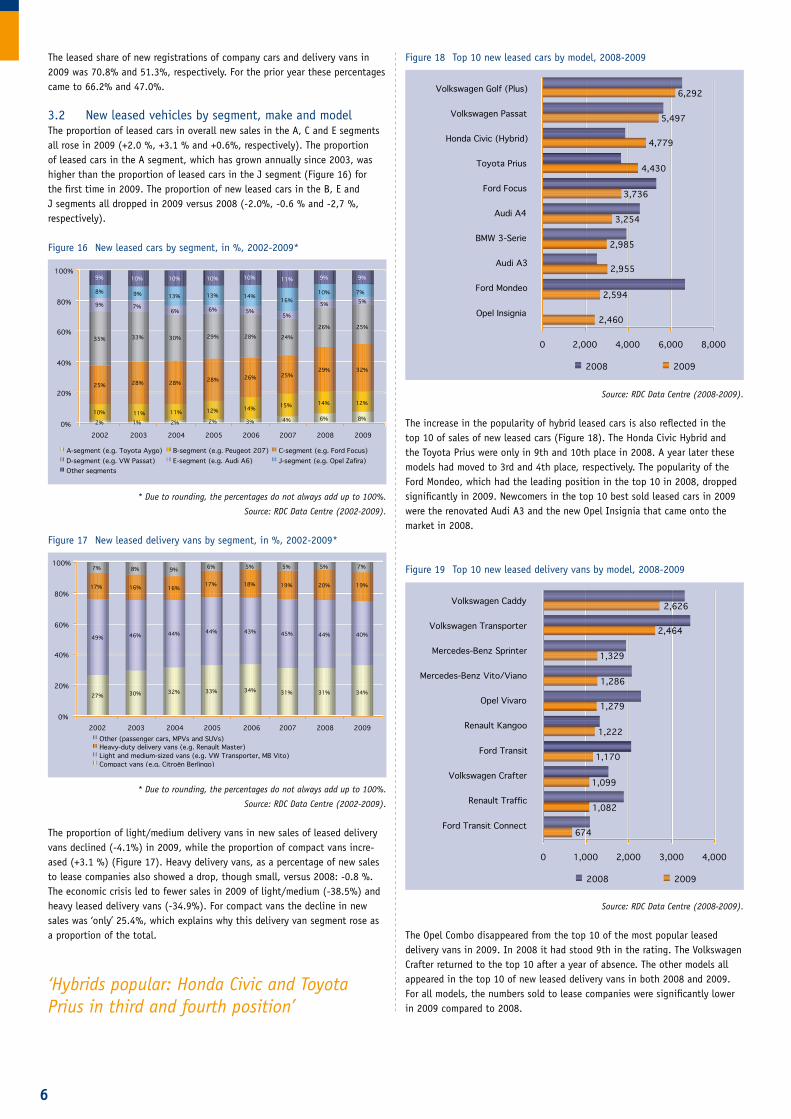
3.2 New leased vehicles by segment, make and modelThe proportion of leased cars in overall new sales in the A, C and E segments all rose in 2009 (+2.0 %, +3.1 % and +0.6%, respectively). The proportion of leased cars in the A segment, which has grown annually since 2003, was higher than the proportion of leased cars in the J segment (Figure 16) for the first time in 2009. The proportion of new leased cars in the B, E and J segments all dropped in 2009 versus 2008 (-2.0%, -0.6 % and -2,7 %, respectively).
Figure 16 New leased cars by segment, in %, 2002-2009*
* Due to rounding, the percentages do not always add up to 100%.
Source: RDC Data Centre (2002-2009).
Figure 17 New leased delivery vans by segment, in %, 2002-2009*
* Due to rounding, the percentages do not always add up to 100%.
Source: RDC Data Centre (2002-2009).
The proportion of light/medium delivery vans in new sales of leased delivery vans declined (-4.1%) in 2009, while the proportion of compact vans incre-ased (+3.1 %) (Figure 17). Heavy delivery vans, as a percentage of new sales to lease companies also showed a drop, though small, versus 2008: -0.8 %. The economic crisis led to fewer sales in 2009 of light/medium (-38.5%) and heavy leased delivery vans (-34.9%). For compact vans the decline in new sales was ‘only’ 25.4%, which explains why this delivery van segment rose as a proportion of the total.
Figure 18 Top 10 new leased cars by model, 2008-2009
Source: RDC Data Centre (2008-2009).
The increase in the popularity of hybrid leased cars is also reflected in the top 10 of sales of new leased cars (Figure 18). The Honda Civic Hybrid and the Toyota Prius were only in 9th and 10th place in 2008. A year later these models had moved to 3rd and 4th place, respectively. The popularity of the Ford Mondeo, which had the leading position in the top 10 in 2008, dropped significantly in 2009. Newcomers in the top 10 best sold leased cars in 2009 were the renovated Audi A3 and the new Opel Insignia that came onto the market in 2008.
Figure 19 Top 10 new leased delivery vans by model, 2008-2009
Source: RDC Data Centre (2008-2009).
The Opel Combo disappeared from the top 10 of the most popular leased delivery vans in 2009. In 2008 it had stood 9th in the rating. The Volkswagen Crafter returned to the top 10 after a year of absence. The other models all appeared in the top 10 of new leased delivery vans in both 2008 and 2009. For all models, the numbers sold to lease companies were significantly lower in 2009 compared to 2008.
4% 6%10% 11% 11% 12% 14% 15% 14%
25% 28% 28% 28% 26% 25%29%
35% 33% 30% 29% 28% 24%
26%
9% 7%6% 6% 5%
5%
5%
8% 9% 13% 13% 14%16%
10%
9% 10% 10% 10% 10% 11% 9%
8%
12%
32%
25%
5%7%
9%
0%
20%
40%
60%
80%
100%
2002 2003 2004 2005 2006 2007 2008 2009
A-segment (e.g. Toyota Aygo) B-segment (e.g. Peugeot 207) C-segment (e.g. Ford Focus)D-segment (e.g. VW Passat) E-segment (e.g. Audi A6) J-segment (e.g. Opel Zafira)Other segments
2% 1% 2% 2% 3%
0 2,000 4,000 6,000 8,000
Opel Insignia
Ford Mondeo
Audi A3
BMW 3-Serie
Audi A4
Ford Focus
Toyota Prius
Honda Civic (Hybrid)
Volkswagen Passat
Volkswagen Golf (Plus)
2008 2009
6,292
5,497
4,779
4,430
3,736
3,254
2,985
2,955
2,594
2,460
0 1,000 2,000 3,000 4,000
Renault Kangoo
Ford Transit Connect
Renault Traffic
Volkswagen Crafter
Ford Transit
Opel Vivaro
Mercedes-Benz Vito/Viano
Mercedes-Benz Sprinter
Volkswagen Transporter
Volkswagen Caddy
2008 2009
2,626
2,464
1,329
1,286
1,279
1,222
1,170
1,099
1,082
674
27% 30% 32% 33% 34% 31% 31%
49% 46% 44% 44% 43% 45% 44%
17% 16% 16% 17% 18% 19% 20%
7% 8% 9% 6% 5% 5% 5%
34%
40%
19%
7%
0%
20%
40%
60%
80%
100%
2002 2003 2004 2005 2006 2007 2008 2009Other (passenger cars, MPVs and SUVs)Heavy-duty delivery vans (e.g. Renault Master)Light and medium-sized vans (e.g. VW Transporter, MB Vito)Compact vans (e.g. Citroën Berlingo)
‘Hybrids popular: Honda Civic and Toyota Prius in third and fourth position’
7
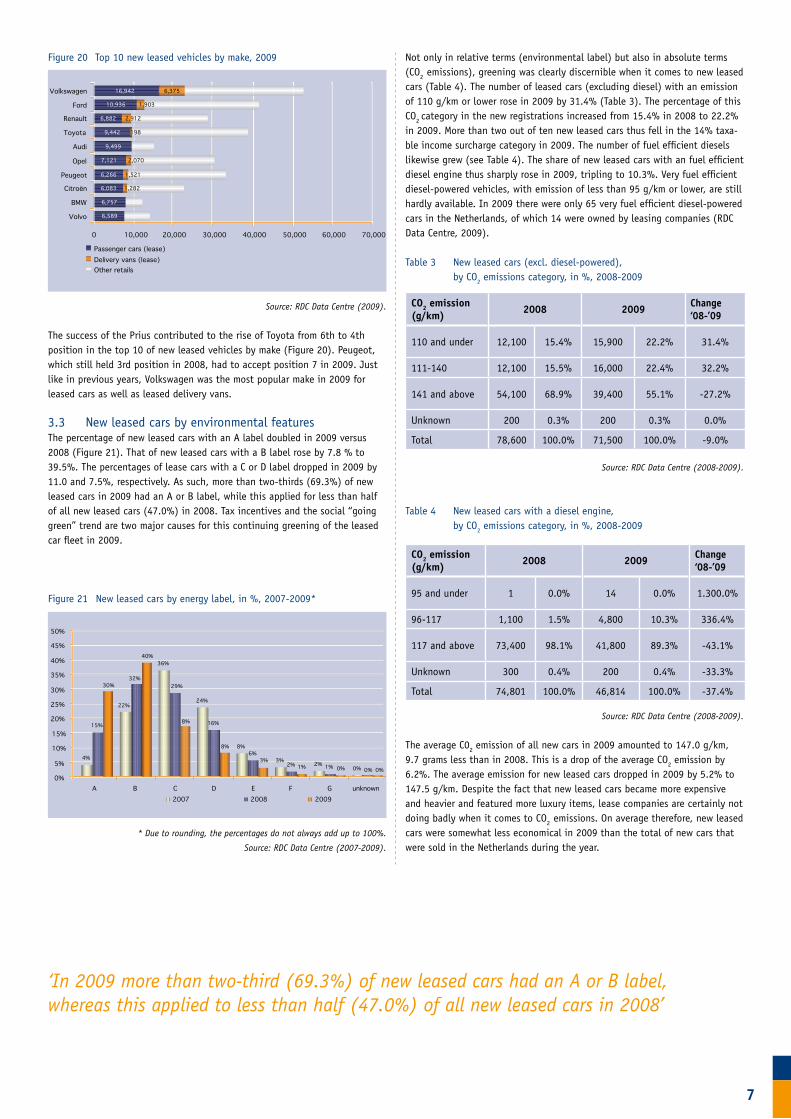
Figure 20 Top 10 new leased vehicles by make, 2009
Source: RDC Data Centre (2009).
The success of the Prius contributed to the rise of Toyota from 6th to 4th position in the top 10 of new leased vehicles by make (Figure 20). Peugeot, which still held 3rd position in 2008, had to accept position 7 in 2009. Just like in previous years, Volkswagen was the most popular make in 2009 for leased cars as well as leased delivery vans.
3.3 New leased cars by environmental featuresThe percentage of new leased cars with an A label doubled in 2009 versus 2008 (Figure 21). That of new leased cars with a B label rose by 7.8 % to 39.5%. The percentages of lease cars with a C or D label dropped in 2009 by 11.0 and 7.5%, respectively. As such, more than two-thirds (69.3%) of new leased cars in 2009 had an A or B label, while this applied for less than half of all new leased cars (47.0%) in 2008. Tax incentives and the social “going green” trend are two major causes for this continuing greening of the leased car fleet in 2009.
Figure 21 New leased cars by energy label, in %, 2007-2009*
* Due to rounding, the percentages do not always add up to 100%.
Source: RDC Data Centre (2007-2009).
Not only in relative terms (environmental label) but also in absolute terms (CO2 emissions), greening was clearly discernible when it comes to new leased cars (Table 4). The number of leased cars (excluding diesel) with an emission of 110 g/km or lower rose in 2009 by 31.4% (Table 3). The percentage of this CO2 category in the new registrations increased from 15.4% in 2008 to 22.2% in 2009. More than two out of ten new leased cars thus fell in the 14% taxa-ble income surcharge category in 2009. The number of fuel efficient diesels likewise grew (see Table 4). The share of new leased cars with an fuel efficient diesel engine thus sharply rose in 2009, tripling to 10.3%. Very fuel efficient diesel-powered vehicles, with emission of less than 95 g/km or lower, are still hardly available. In 2009 there were only 65 very fuel efficient diesel-powered cars in the Netherlands, of which 14 were owned by leasing companies (RDC Data Centre, 2009). Table 3 New leased cars (excl. diesel-powered), by CO2 emissions category, in %, 2008-2009
Source: RDC Data Centre (2008-2009).
Table 4 New leased cars with a diesel engine, by CO2 emissions category, in %, 2008-2009
Source: RDC Data Centre (2008-2009).
The average C02 emission of all new cars in 2009 amounted to 147.0 g/km, 9.7 grams less than in 2008. This is a drop of the average CO2 emission by 6.2%. The average emission for new leased cars dropped in 2009 by 5.2% to 147.5 g/km. Despite the fact that new leased cars became more expensive and heavier and featured more luxury items, lease companies are certainly not doing badly when it comes to CO2 emissions. On average therefore, new leased cars were somewhat less economical in 2009 than the total of new cars that were sold in the Netherlands during the year.
0 10,000 20,000 30,000 40,000 50,000 60,000 70,000
Volvo
BMW
Citroën
Peugeot
Opel
Audi
Toyota
Renault
Ford
Volkswagen
Passenger cars (lease)Delivery vans (lease)Other retails
16,942 6,375
10,936 1,903
6,882 2,912
9,442 198
9,499
7,121 2,070
6,266 1,521
6,083 1,282
6,757
6,589
4%
22%
36%40%
24%
8%8%
8%
3%3% 2%0%0%
15%
32%30% 29%
16%
6%
2% 1%1% 0% 0%0%
5%
10%
15%
20%
25%
30%
35%
40%
45%
50%
A B C D E F G unknown2007 2008 2009
CO2 emission(g/km) 2008 2009 Change
‘08-’09
110 and under 12,100 15.4% 15,900 22.2% 31.4%
111-140 12,100 15.5% 16,000 22.4% 32.2%
141 and above 54,100 68.9% 39,400 55.1% -27.2%
Unknown 200 0.3% 200 0.3% 0.0%
Total 78,600 100.0% 71,500 100.0% -9.0%
CO2 emission(g/km) 2008 2009 Change
‘08-’09
95 and under 1 0.0% 14 0.0% 1.300.0%
96-117 1,100 1.5% 4,800 10.3% 336.4%
117 and above 73,400 98.1% 41,800 89.3% -43.1%
Unknown 300 0.4% 200 0.4% -33.3%
Total 74,801 100.0% 46,814 100.0% -37.4%
‘In 2009 more than two-third (69.3%) of new leased cars had an A or B label, whereas this applied to less than half (47.0%) of all new leased cars in 2008’
8
VNA Annual Figures 2009 is published by the Association of Dutch Vehicle Leasing Companies.Compiled by the VNA Research Department, P.O. Box 42, 3980 CA Bunnik, Netherlands • Telephone (+31) (0)30 659 52 99 [email protected] • www.vna-lease.nl VNA v3
4. Other VNA figures
4.1 Theft of vehicles from VNA membersAccording to the Foundation for Tackling Vehicle Crime (Stichting Aanpak Voertuigcriminaliteit, AVc), 13,400 cars and delivery vans were stolen in the Netherlands in 2009, roughly the same as in 2008. Expressed in percentage terms, the number of stolen vehicles in relation to the overall car and delivery van fleet in the Netherlands amounted to 0.18% in 2009 (AVc, 2009).
Figure 22 Stolen and recovered VNA leased vehicles, in %, 2002-2009
Source: VNA Quarterly Surveys (2002-2003); VNA Annual Surveys (2004-2009).
The number of vehicles stolen from VNA members in 2009 came to 890, same as in 2008. Since the VNA leased vehicle fleet became smaller in size and the number of stolen vehicles remained the same, the number of stolen vehicles as a percentage of the total fleet rose to 0.14% (Figure 22). In 2008 this percentage had been 0.13%. All together, the VNA fleet is thus confronted less often by vehicle theft compared to the overall Dutch vehicle fleet.
The number of recovered vehicles of VNA members amounted to 300 in 2009. That is 30 more than in 2008. The recovery percentage thus came to 33.7%, compared to 30.3% in 2008 (Figure 22). According to AVc, of all stolen cars and delivery vans some 53.4% was recovered in 2009. AVc comments in this regard that older vehicles are recovered more often than newer ones. Since lease vehicles are relatively new (see Figure 10, p. 4), it is logical that the recovery percentage is lower for lease companies.
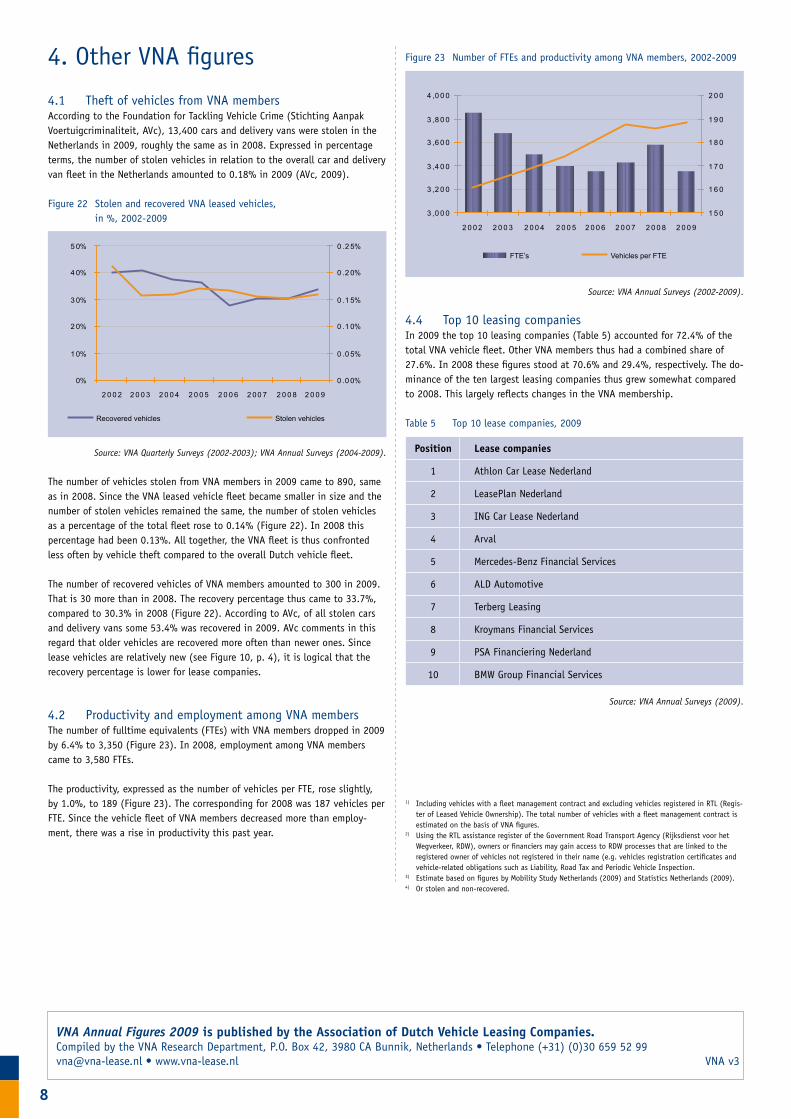
4.2 Productivity and employment among VNA membersThe number of fulltime equivalents (FTEs) with VNA members dropped in 2009 by 6.4% to 3,350 (Figure 23). In 2008, employment among VNA members came to 3,580 FTEs.
The productivity, expressed as the number of vehicles per FTE, rose slightly, by 1.0%, to 189 (Figure 23). The corresponding for 2008 was 187 vehicles per FTE. Since the vehicle fleet of VNA members decreased more than employ-ment, there was a rise in productivity this past year.
Figure 23 Number of FTEs and productivity among VNA members, 2002-2009
Source: VNA Annual Surveys (2002-2009).
4.4 Top 10 leasing companies In 2009 the top 10 leasing companies (Table 5) accounted for 72.4% of the total VNA vehicle fleet. Other VNA members thus had a combined share of 27.6%. In 2008 these figures stood at 70.6% and 29.4%, respectively. The do-minance of the ten largest leasing companies thus grew somewhat compared to 2008. This largely reflects changes in the VNA membership.
Table 5 Top 10 lease companies, 2009
Source: VNA Annual Surveys (2009).
0%
1 0%
2 0%
3 0%
4 0%
5 0%
2 0 0 2 2 0 0 3 2 0 0 4 2 0 0 5 2 0 0 6 2 00 7 2 0 0 8 2 0 0 9
0 .0 0%
0 .0 5%
0 .1 0%
0 .1 5%
0 .2 0%
0 .2 5%
Recovered vehicles Stolen vehicles
3 ,0 0 0
3 ,2 0 0
3 ,4 0 0
3 ,6 0 0
3 ,8 0 0
4 ,0 0 0
2 0 0 2 2 0 0 3 2 0 0 4 2 0 0 5 2 0 0 6 2 0 0 7 2 0 0 8 2 0 0 9
1 5 0
1 6 0
1 7 0
1 8 0
1 9 0
2 0 0
FTE’s Vehicles per FTE
Position Lease companies
1 Athlon Car Lease Nederland
2 LeasePlan Nederland
3 ING Car Lease Nederland
4 Arval
5 Mercedes-Benz Financial Services
6 ALD Automotive
7 Terberg Leasing
8 Kroymans Financial Services
9 PSA Financiering Nederland
10 BMW Group Financial Services
1) Including vehicles with a fleet management contract and excluding vehicles registered in RTL (Regis-ter of Leased Vehicle Ownership). The total number of vehicles with a fleet management contract is estimated on the basis of VNA figures.
2) Using the RTL assistance register of the Government Road Transport Agency (Rijksdienst voor het Wegverkeer, RDW), owners or financiers may gain access to RDW processes that are linked to the registered owner of vehicles not registered in their name (e.g. vehicles registration certificates and vehicle-related obligations such as Liability, Road Tax and Periodic Vehicle Inspection.
3) Estimate based on figures by Mobility Study Netherlands (2009) and Statistics Netherlands (2009).4) Or stolen and non-recovered.