Embed Size (px)
Citation preview


2009 NC Women’s Health Report CardGradingGrades were based primarily on the percentage of change in the indicators from 2003 to 2007. Health disparities across racial subgroups and Healthy People 2010 goals were also considered.
The following guidelines were used:A = > 20% improvement, or current status remains very goodB = 10 – 20% improvement, or current status remains satisfactoryC = no significant change (between 10% improvement and 10% worsening), or current status remains mediocreD = 10 – 20% worse, or current status remains unsatisfactoryF = > 20% worse, or current status remains very poor
Note: Unless otherwise indicated, all data are for women age 15 years and older, and for the years 2003 and 2007.
Reproductive Health
Percentage of women with late (after 1st trimester) or no prenatal care4
ALL White, Non-Hispanic African-American, Non-Hispanic American Indian, Non-Hispanic Hispanic
Percentage of women who smoked during pregnancy4
ALL White, Non-Hispanic African-American, Non-Hispanic American Indian, Non-Hispanic Hispanic
Percentage of births that were of very low birthweight (<1500g)4
ALL White, Non-Hispanic African-American, Non-Hispanic American Indian, Non-Hispanic Hispanic
2003 Grade2007
15.4%9.1%
23.0%19.7%29.9%
18.2%11.0%
24.8%23.4%32.3%
CCDDD
1.8%1.3%3.5%2.2%1.2%
1.8%1.3%3.5%2.5%1.3%
CCDDC
12.7%16.2%10.8%24.0%
1.3%
11.0%14.5%10.3%24.1%
1.1%
BBCCA

2009 NC Women’s Health Report Card Percentage of live births that were unintended (2003,2006)5
ALL White, Non-Hispanic African-American, Non-Hispanic American Indian, Non-Hispanic Hispanic
Percentage of women not breastfeeding at 8 weeks (2003,2006)5
ALL White, Non-Hispanic African-American, Non-Hispanic American Indian, Non-Hispanic Hispanic
42.3%35.5%57.6%65.8%46.8%
47.6%40.8%63.3%59.2%49.6%
DDDCD
Reproductive Health cont.
•North Carolina ranks 44th in the nation on infant mortality6 and this rate is nearly twice the Healthy People 2010 objective.7 The infant mortality rates for African American and American Indian women are more than twice as high as the rates for White and Hispanic women.
•Unintended pregnancies are more likely to result in health problems for the mother and child. This indicator points to the need for available and accessible family planning services.
•Breastfeeding guidelines set forth by UNICEF and other health professional organizations specify exclusive breastfeeding for the first 6 months, with continued breastfeeding through the first year and up to two years or longer along with age-appropriate complimentary feeding.8 Benefits of breastfeeding for the infant are numerous and include lower rates of sudden infant death syndrome, infectious diseases such as ear infections, childhood obesity, type 1 and type 2 diabetes mellitus and leukemia.9 Maternal health benefits include earlier return to prepregnancy weight and decreased risk of breast and ovarian cancer.9
Reproductive Health Notes
Chronic Disease 2003 Grade2007
*Asterisk indicates that numbers were too small (fewer than 10) to calculate reliable estimates.
Heart Disease deaths per 100,000 women ages 15 & over10
ALL White, Non-Hispanic African-American, Non-Hispanic American Indian, Non-Hispanic Hispanic
Stroke deaths per 100,000 women ages 15 & over10
ALL White, Non-Hispanic African-American, Non-Hispanic American Indian, Non-Hispanic Hispanic
Lung Cancer deaths per 100,000 women ages 15 & over10
ALL White, Non-Hispanic African-American, Non-Hispanic American Indian, Non-Hispanic Hispanic
238.4227.0296.0295.156.8
195.3187.2
244.2186.044.3
BBBBA
Percentage of births to women age <18 years4
ALL White, Non-Hispanic African-American, Non-Hispanic American Indian, Non-Hispanic Hispanic
Number of infant deaths per 1,000 live births (infant mortality rate)4
ALL White, Non-Hispanic African-American, Non-Hispanic American Indian, Non-Hispanic Hispanic
3.9%2.5%7.2%6.1%5.1%
3.8%2.4%6.5%6.6%5.1%
CBCCC
2003 Grade2007 2003 Grade2007
Breast cancer deaths per 100,000 women ages 15 & over10
ALL White, Non-Hispanic African-American, Non-Hispanic American Indian, Non-Hispanic Hispanic
Colorectal cancer deaths per 100,000 women ages 15 & over10
ALL White, Non-Hispanic African-American, Non-Hispanic American Indian, Non-Hispanic Hispanic
Hospitalizations among women age 65+ for hip fracture per 100,000 women (2002,2006)11
ALL
31.729.742.330.4
*
31.128.343.936.98.7
CCDF
2003 Grade2007
Note: Racial breakdowns are not possible for hospital discharge data as almost half of all records are missing race.
•Misclassification of race on death certificates may result in understating health problems in some minority populations, particularly American Indians.12
Chronic Disease Notes
8.15.8
14.910.6
7.1
8.46.2
14.317.67.0
CCDFC
53.1%53.3%65.9%64.3%30.4%
49.5%48.3%66.4%57.8%27.7%
CCDCB
81.375.6
108.898.7
*
59.155.676.466.2
*
AAAA
51.955.440.331.9
*
53.356.542.745.3
*
CCBD
19.318.423.4
**
8.718.317.523.5
*
CCC
1076.9 * C

Percentage of women age 18+ with high blood pressure3
ALL White, Non-Hispanic African-American, Non-Hispanic American Indian, Non-Hispanic Hispanic
Percentage of women age 18+ with high cholesterol3 ALL White, Non-Hispanic African-American, Non-Hispanic American Indian, Non-Hispanic Hispanic
30.028.538.546.916.9
29.627.942.830.214.7
CCDBA
Chronic Disease cont. 2003 Grade2007
*Asterisk indicates that numbers were too small (fewer than 10) to calculate reliable estimates.
Infectious Disease 2003 Grade2007
Gonorrhea cases per 100,000 women14 ALL White, Non-Hispanic African-American, Non-Hispanic American Indian, Non-Hispanic Hispanic
Cervical cancer deaths per 100,000 women ages 15 & over10
ALL White, Non-Hispanic African-American, Non-Hispanic American Indian, Non-Hispanic Hispanic
171.646.5
584.2230.668.2
198.057.1
578.0241.165.7
DDFFC
HIV disease cases per 100,000 women14
ALL White, Non-Hispanic African-American, Non-Hispanic American Indian, Non-Hispanic Hispanic
Early latent, primary, and secondary syphilis disease cases per 100,000 women14
ALL White, Non-Hispanic African-American, Non-Hispanic American Indian, Non-Hispanic Hispanic
14.93.4
50.5*
17.4
12.42.8
42.9*
12.2
CBF
C
•Despite improvements for these measures, the rate of deaths due to heart disease is 21% higher and the rate of deaths due to stroke is 18% higher than the Healthy People 2010 objectives.7 Many of these chronic diseases are associated with factors such as tobacco use, diet, and exercise.
•Overall, the percentage of women in North Carolina who are obese increased by 17% and is nearly twice the Healthy People 2010 objective.7 Obesity among Hispanic women increased by 43%. Almost 1 in 2 African American women and 1 in 3 American Indian women are obese. Obesity is an important risk factor for several diseases, including heart disease, stroke, and diabetes.
•Despite a higher incidence of breast cancer among white women, minority women have a higher death rate, primarily due to later diagnosis and treatment among minority women.13
•Because cervical cancer is caused primarily by the human papillomavirus (HPV), we have moved this indicator to the infectious disease section.
•The diabetes deaths indicator was dropped from the 2009 Report Card.
Chronic Disease Notes cont.
Percentage of women age 18+ with diabetes (excluding gestational diabetes)3
ALL White, Non-Hispanic African-American, Non-Hispanic American Indian, Non-Hispanic Hispanic
Percentage of women age 18+ who are obese (BMI 30.0+)3
ALL White, Non-Hispanic African-American, Non-Hispanic American Indian, Non-Hispanic Hispanic
8.17.3
11.819.9
*
8.87.7
14.214.85.8
CCFD
•HIV disease is an ongoing problem and racial and ethnic disparities persist. Although cases among African American and Hispanic women have decreased since 2003, their rates are 14 times and 4 times that of white women, respectively.
Infectious Disease Notes
2003 Grade2007
*Asterisk indicates that numbers were too small (fewer than 10) to calculate reliable estimates.
2003 Grade2007
34.635.830.844.235.6
38.138.738.038.330.3
DDFBB
25.220.942.437.918.7
29.425.745.434.226.7
DFFCF
3.70.711.9
*6.0
3.30.9
10.2*
5.1
BBB
B
2.92.64.6
**
3.02.74.9
**
CCD
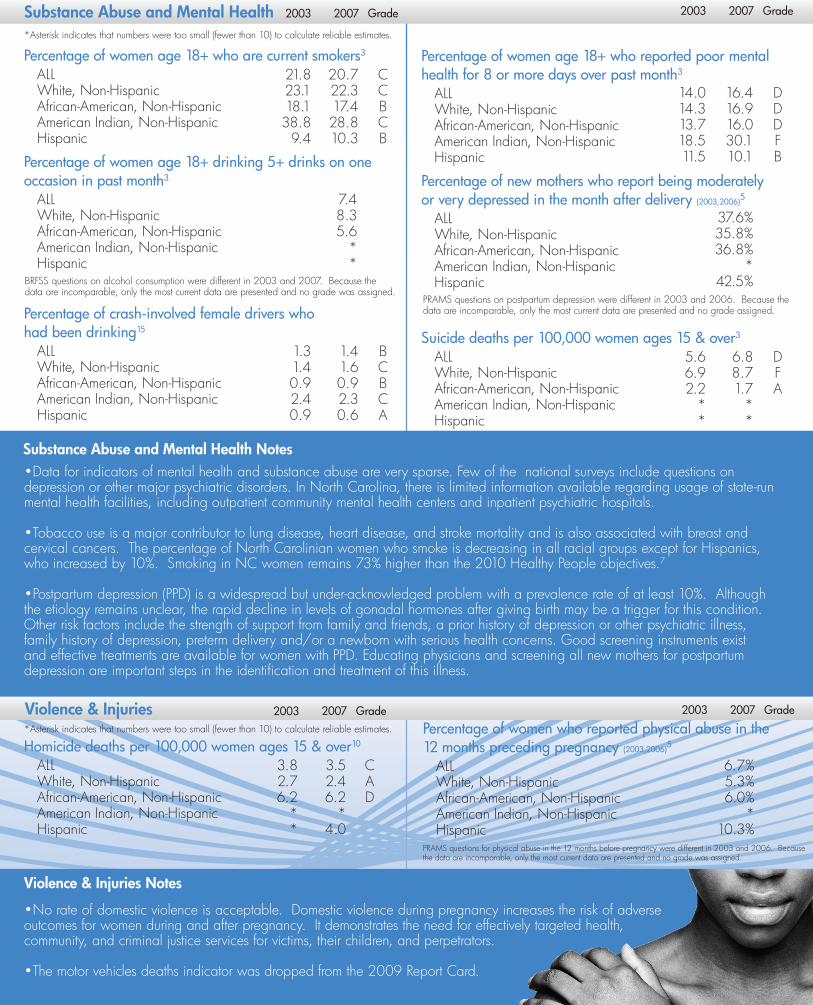
•Data for indicators of mental health and substance abuse are very sparse. Few of the national surveys include questions on depression or other major psychiatric disorders. In North Carolina, there is limited information available regarding usage of state-run mental health facilities, including outpatient community mental health centers and inpatient psychiatric hospitals.
•Tobacco use is a major contributor to lung disease, heart disease, and stroke mortality and is also associated with breast and cervical cancers. The percentage of North Carolinian women who smoke is decreasing in all racial groups except for Hispanics, who increased by 10%. Smoking in NC women remains 73% higher than the 2010 Healthy People objectives.7
•Postpartum depression (PPD) is a widespread but under-acknowledged problem with a prevalence rate of at least 10%. Although the etiology remains unclear, the rapid decline in levels of gonadal hormones after giving birth may be a trigger for this condition. Other risk factors include the strength of support from family and friends, a prior history of depression or other psychiatric illness, family history of depression, preterm delivery and/or a newborn with serious health concerns. Good screening instruments exist and effective treatments are available for women with PPD. Educating physicians and screening all new mothers for postpartum depression are important steps in the identification and treatment of this illness.
Percentage of women age 18+ who are current smokers3
ALL White, Non-Hispanic African-American, Non-Hispanic American Indian, Non-Hispanic Hispanic
Percentage of women age 18+ drinking 5+ drinks on one occasion in past month3
ALL White, Non-Hispanic African-American, Non-Hispanic American Indian, Non-Hispanic Hispanic
Percentage of crash-involved female drivers who had been drinking15
ALL White, Non-Hispanic African-American, Non-Hispanic American Indian, Non-Hispanic Hispanic
21.823.118.138.8
9.4
20.722.317.428.810.3
CCBCB
Substance Abuse and Mental Health 2003 Grade2007
Substance Abuse and Mental Health Notes
Percentage of women age 18+ who reported poor mental health for 8 or more days over past month3
ALL White, Non-Hispanic African-American, Non-Hispanic American Indian, Non-Hispanic Hispanic
Percentage of new mothers who report being moderately or very depressed in the month after delivery (2003,2006)5
ALL White, Non-Hispanic African-American, Non-Hispanic American Indian, Non-Hispanic Hispanic
Suicide deaths per 100,000 women ages 15 & over3
ALL White, Non-Hispanic African-American, Non-Hispanic American Indian, Non-Hispanic Hispanic
14.014.313.718.511.5
16.416.916.030.110.1
DDDFB
*Asterisk indicates that numbers were too small (fewer than 10) to calculate reliable estimates.
BRFSS questions on alcohol consumption were different in 2003 and 2007. Because the data are incomparable, only the most current data are presented and no grade was assigned.
PRAMS questions on postpartum depression were different in 2003 and 2006. Because the data are incomparable, only the most current data are presented and no grade assigned.
7.48.35.6
**
1.31.40.92.40.9
1.41.60.92.30.6
BCBCA
37.6%35.8%36.8%
*42.5%
5.66.92.2
**
6.88.71.7
**
DFA
•No rate of domestic violence is acceptable. Domestic violence during pregnancy increases the risk of adverse outcomes for women during and after pregnancy. It demonstrates the need for effectively targeted health, community, and criminal justice services for victims, their children, and perpetrators.
•The motor vehicles deaths indicator was dropped from the 2009 Report Card.
Violence & Injuries Notes
Homicide deaths per 100,000 women ages 15 & over10
ALL White, Non-Hispanic African-American, Non-Hispanic American Indian, Non-Hispanic Hispanic
3.82.76.2
**
3.52.46.2
*4.0
CAD
Violence & Injuries 2003 Grade2007*Asterisk indicates that numbers were too small (fewer than 10) to calculate reliable estimates. Percentage of women who reported physical abuse in the
12 months preceding pregnancy (2003,2006)5
ALL White, Non-Hispanic African-American, Non-Hispanic American Indian, Non-Hispanic Hispanic
6.7%5.3%6.0%
*10.3%
2003 Grade2007
2003 Grade2007
PRAMS questions for physical abuse in the 12 months before pregnancy were different in 2003 and 2006. Because the data are incomparable, only the most current data are presented and no grade was assigned.

Percentage of women age 18+ with no health insurance coverage3
ALL White, Non-Hispanic African American, Non-Hispanic American Indian, Non-Hispanic Hispanic
15.5%12.2%15.4%22.6%63.1%
16.5%11.4%19.3%24.3%62.4%
CCFDF
Barriers to Health
•White women are 6 times as likely as Hispanic women and about twice as likely as African American and American Indian women to have health insurance coverage.
2003 Grade2007
Barriers to Health Notes
Preventive Health Practices 2003 Grade2007 2003 Grade2007
Preventive Health Practices Notes
•The Pap test is one of the best cervical cancer screenings available. Early detection and treatment can keep most cases of cervical cancer from developing. The percentage of women 18+ who have not had a Pap test in the last two years increased by 40%.
•The BRFSS definition for recommended physical activity level includes: moderate physical activity for 30 or more minutes per day, five or more days per week or vigorous physical activity for 20 or more minutes per day, three or more days per week.3
•Tooth decay and gum disease are responsible not only for oral pain, but if left untreated, abscessed teeth allow infections to spread, which in some cases can be life-threatening. Recent evidence also suggests an association between gum disease and preterm birth.16 For every person in the US over age 19 who has dental insurance, three more lack insurance.17
Percentage of women age 65+ who have never had a pneumonia shot3 ALL White, Non-Hispanic African-American, Non-Hispanic American Indian, Non-Hispanic Hispanic
Percentage of women age 18+ who did not meet the recommended level of physical activity3
ALL White, Non-Hispanic African-American, Non-Hispanic American Indian, Non-Hispanic Hispanic
Percentage of women age 18+ who have not visited a dentist within the past 12 months (2002,2006)3
ALL White, Non-Hispanic African American, Non-Hispanic American Indian, Non-Hispanic Hispanic
34.130.950.442.9
*
30.427.045.446.4
*
BBCD
30.427.136.132.655.8
31.928.239.240.350.7
CCCFD
64.562.171.560.977.9
58.455.467.259.565.9
CCCCC
*Asterisk indicates that numbers were too small (fewer than 10) to calculate reliable estimates.
34.530.257.5
**
29.326.041.841.1
*
BBB
Percentage of women age 65+ who did not have the flu shot in the past 12 months3
ALL White, Non-Hispanic African-American, Non-Hispanic American Indian, Non-Hispanic Hispanic
Percentage of women age 50+ who did not have a mammogram within the past 2 years (2002,2006)3
ALL White, Non-Hispanic African-American, Non-Hispanic American Indian, Non-Hispanic Hispanic
Percentage of women age 18+ who did not have a Pap test within the past 2 years (2002,2006)3
ALL White, Non-Hispanic African-American, Non-Hispanic American Indian, Non-Hispanic Hispanic
Percentage of women age 50+ who have never had a sigmoidoscopy or colonoscopy exam (2002,2006)3
ALL White, Non-Hispanic African-American, Non-Hispanic American Indian, Non-Hispanic Hispanic
16.717.013.219.9
*
17.217.215.919.1
22.8
CCDC
51.549.455.362.564.6
37.836.341.151.752.0
AAABB
13.014.26.7
*15.7
18.118.414.914.420.5
FFF
F

1 Population estimates were compiled by the State Center for Health Statistics based on vintage 2007 estimates produced by the Population Estimates Program of the U.S. Census Bureau in collaboration with the National Center for Health Statistics (NCHS). These bridged-race population files contain estimates of the resident population of the United States as of July 1 of each year by age, sex, bridged-race category, and Hispanic origin. Available at: http://www.cdc.gov/nchs/about/major/dvs/popbridge/datadoc.htm
2 US Census Bureau, American Community Survey.
3 NC Behavioral Risk Factor Surveillance System (BRFSS), State Center for Health Statistics. BRFSS is an ongoing, monthly telephone survey through which data are collected from randomly selected, non-institutionalized NC adults (age 18 and older) in households with telephones. In 2007, over 9,000 women were interviewed for BRFSS; their survey responses were weighted to represent those of all adult women in the state. Available at: http://www.schs.state.nc.us/SCHS/brfss/
4 Live birth certificates for all NC residents. Infant deaths were taken from the matched infant death and birth file, State Center for Health Statistics.
5 Pregnancy Risk Assessment Monitoring System (PRAMS) for North Carolina, State Center for Health Statistics. PRAMS is an ongoing mail/phone survey of women who have recently given birth. Each month, a random sample of mothers are selected from NC birth certificates. Each year, approximately 1,500 NC women are interviewed for PRAMS; their responses are then weighted to represent those of all women giving birth in the state. There is no minimum age specification from PRAMS. Available at: http://www.schs.state.nc.us/SCHS/prams/
6 United Health Foundation. America’s Health Rankings: A Call to Action for People and Their Communities. 2007 Edition. http://www.americashealthrankings.org/2008/pdfs/2007.pdf
7 Healthy People 2010 Database. http://wonder.cdc.gov/data2010/
8 UNICEF, “Nutrition: Infant and Young Child Feeding.” http://www.unicef.org/nutrition/index_breastfeeding.html
9 “American Academy of Pediatrics Policy Statement: Breastfeeding and the Use of Human Milk,” Pediatrics Vol. 115 No.2 February 2005.
10 Death certificates for all NC residents, State Center for Health Statistics. Based on primary cause of death. Age-adjusted by the direct method, using the projected 2000 US total population as the standard.
11 Statewide hospital discharge data reporting system, State Center for Health Statistics. NC hospitals only. Records with a primary diagnosis of hip fracture or mental disease/substance abuse are included.
12 North Carolina State Center for Health Statistics, “Underreporting of American Indian Race on North Carolina Death Certificates” June 2007. http://www.schs.state.nc.us/SCHS/pdf/SB33.pdf
13 Ali, S. 2006. ‘Female Breast Cancer incidence, State at Diagnosis, Treatment, and Mortality in North Carolina.” State Center for Health Statistics, NC Division of Public Health, SCHS Study 150. http://www.schs.state.nc.us/SCHS/pdf/SCHS150.pdf
14 NC Division of Public Health, Epidemiology Section, HIV/STD Prevention and Care Branch.
15 Highway Safety Research Center, University of North Carolina at Chapel Hill. NC Reportable Crash Data.
16 Offenbacher S, Boggess KA, Murtha AP, et al. Progressive periodontal disease and risk of very preterm delivery. Obstet Gynecol Jan 2006; 107: 29-36.
17 Centers for Disease Control and Prevention, “Fact Sheet: Oral Health for Adults. December 2006. http://www.cdc.gov/OralHealth/publications/factsheets/adult.htm
Data Sources & Notes
Reporting data by race and ethnicity: There are advantages to showing data by race and ethnicity for targeting resources and interventions toward populations in need. However, race and ethnicity themselves do not cause a particular health problem. Factors such as income, education, access to health care, and stress are likely among the major causes of the poorer health status of minorities on many health measures compared to whites. Few sources of health data record these types of socio-economic data, although most do collect information on race and ethnicity.

This report card is a result of collaboration between several branches of health services and research. From the NC Department of Health and Human Services: Kathleen Jones-Vessey, Bob Coats and other staff of the State Center for Health Statistics; Sarah McCracken Cobb of the Division of Public Health Women and Children’s Section; and Alvina Long-Valentin of the Division of Women’s Health; Gloria Sanchez from the Office of Public Affairs. From UNC-Chapel Hill, contributors were: Anna Maria Siega-Riz and Carolyn Crump of the School of Public Health; Samantha Meltzer-Brody of the School of Medicine; Pam Dickens from the NC Office on Disability and Health; Priscilla Guild from the Cecil G. Sheps Center for Health Services Research; Clara Sue Kidwell from the American Indian Center; Robert Foss and Eric Rodgman from the Highway Saefty Research Center and Carol Lorenz, Diana Urlaub and Kathryn Salisbury from the Center for Women’s Health Research. From East Carolina University, Ed Newton, Rebecca Bagley, Ruth Little, Dorothy Butler and Stephanie Jilcott. From NC Healthy Start Foundation, Tania Connaughton-Espino. From Wake County Health Services , Maria Ines Robayo. From the Robeson County Healthcare Corporation, Jan Lowry. Report card and insert design were by the Farrelly Group.
Acknowledgments
What We Do: The Center for Women’s Health is at the CORE of women’s health. We serve as a Catalyst by working
across disciplines and schools to facilitate the grant writing process and promote inter-and trans-disciplinary research.
Through the Women’s Health Report Card, we provide Outreach to the community and to healthcare and public health
professionals. We conduct Research in areas of women’s health that are typically overlooked and underfunded and we
Educate new women’s health researchers though career mentoring and the coordination of several epidemiologic and
clinical training grants.
For more information, to download digital versions or request copies of the 2009 Women’s Health Report Card, please visitwww.cwhr.unc.edu
North Carolina Obstetrical and Gynecological Society
The North Carolina Women’s Health Report Card is produced in odd numbered years to provide a snapshot of the health and health care needs of women in our State.
Suggested Citation: North Carolina Women’s Health Report Card, 2009. Center for Women’s Health Research, University of North Carolina at Chapel Hill.