Embed Size (px)
Citation preview
2009 Merritt College Integrated Educational and Facilities Master Plan
February 17, 2009
Acknowledgments
Board of Trustees • President Bill Withrow
• Vice President Abel Guillen
• Cy Gulassa
• Marcie Hodge
• Linda Handy
• Dr. William “Bill” Riley
• Nicky Gonzalez Yuen
• Student Trustees: o Yvonne Thompson o Nicole Tobor
Merritt College • President Robert A. Adams
• Vice President of Instruction Linda C. Berry
Peralta Community College District • Chancellor Elihu Harris
• Vice Chancellor Educational Services Wise Allen
• Vice Chancellor General Services Sadiq Ikharo
• Acting Associate Vice Chancellor Academic Affairs Deborah Budd
Maas Companies, Inc. • Mike Maas
• Jeff Kellogg
• Dan Rosenberg
• John Collins
• Forrest Jung
• Lindsay Maas

2009 Merritt College Integrated Educational and Facilities Master Plan

Table of Contents
LETTER FROM THE PRESIDENT ............................................................... 1
INTRODUCTION TO PROCESS.................................................................. 2
Scope Overview............................................................................ 2
FRAMEWORK FOR THE PLAN ................................................................... 5
Overview....................................................................................... 5 Mission and Values ..................................................................... 5
Mission .................................................................................... 5 Core Values ............................................................................. 5
Strategic Directions 2005-2010 ................................................. 6 Institutional Learning Outcomes (ILOs): 2005-2009 ................ 8 Student Learning Outcomes (SLOs): 2005-2010 ....................... 9 Educational Master Plan ............................................................10
The Process ...........................................................................10
Purpose ......................................................................................10 Planning Integration .............................................................11
Plan Development Process ........................................................11 Plan Implementation .................................................................12 College Vision ............................................................................12 Principles and Goals: .................................................................14 Format of Plan ...........................................................................15 Board of Trustee’s Approval of Plan ........................................15
EXTERNAL ENVIRONMENTAL SCAN ....................................................16
The College in Relationship to the Nation...............................16 The College in Relationship to the State .................................18
Enrollment .............................................................................19 Population Growth ................................................................19 Participation Rate..................................................................19 Economic Conditions ............................................................21
The College in Relationship to the Local Region .................... 21 The Area to be Served............................................................... 22 Snapshot of the Service Area ................................................... 23
Households by Income......................................................... 23 Age Profile............................................................................. 24
Workforce Characteristics of the Local Region ....................... 25 Data References and Resources .......................................... 26
PROGRAM OF INSTRUCTION ................................................................. 27
Overview .................................................................................... 27 Baseline Curriculum ............................................................. 27
The Baseline Program of Instruction by College Department 27 The Baseline Program of Instruction by TOP Code ................. 30 Productivity ................................................................................ 31
INTERNAL ENVIRONMENTAL SCAN .................................................... 35
Local Population Growth........................................................... 35 Student Demographic Profile ................................................... 35
FUTURE CAPACITIES .................................................................................. 38
Key Elements ............................................................................. 38 Capacity for Future Growth ................................................. 38
Existing Curriculum .................................................................. 38 The Internal and External Elements of the College ........... 39 Weekly Student Contact Hours (WSCH) ............................... 39
Growth Rate Targets for WSCH and Enrollment ...................... 40 Profile of the Future Program of Instruction ........................... 40 Measurements for Attaining Growth Goals ............................. 45

DETERMINATION OF FUTURE SPACE NEEDS ..................................46
Space Requirements: Academic Program of Instruction ............46 Cap / Load Analysis ..................................................................46 Academic Space Needs .............................................................46
Academic Space Profile for 2022 ........................................47
Space Requirements: All Programs and Services of the College .......................................................................................49
THE FINANCIAL PLAN ................................................................................51
Proposed Facilities by Site ........................................................51 Financing Options.................................................................52
Suggested Financing Parameters .............................................56
TOTAL COST OF OWNERSHIP ................................................................57
Definition of Total Cost of Ownership (TCO) ..........................57 Purpose of the Process .............................................................57 Objectives to Be Achieved ........................................................58 Approval Process .......................................................................58 Infrastructure / Utility Systems ................................................58 Summary of Planning for Growth and Success .......................59
RECOMMENDATIONS .................................................................................60
ATTACHMENT A: SPACE DETERMINATION METHODOLOGY . 62
Overview .................................................................................... 62 Prescribed State Space Standards ............................................ 62 Standards for Lecture Space ..................................................... 63 Standards for Laboratory Space ............................................... 63 Non-State Space Standards ....................................................... 64
ATTACHMENT B - GLOSSARY OF TERMS ......................................... 65
ATTACHMENT C – TOTAL COST OF OWNERSHIP WORKSHEETS ................................................................................................ 73
Assessment Format................................................................... 73 Implementation Process ........................................................... 74

Maas Companies, Inc. February 2009
Maas Companies, Inc. February 2009
2009 Merritt College Integrated Educational and Facilities Master Plan 1
Letter from the President
The 2009 Merritt College Integrated Educational and Facilities Master Plan is a
document that serves multiple purposes. The plan is an integral component
that will assist the College in planning for its future facilities. It also bridges
two other important documents in the planning process by connecting the
Educational Master Plan to the Facilities Master Plan. The Educational Master
Plan was developed internally over the past year by the Merritt College
community. This undertaking was a critical element in the planning process
and will be the foundation for the college to plan and build what is needed for
the future student population and our facilities. Combining the Educational
Master Plan with the Integrated Educational and Facilities Master Plan will guide the development and
implementation of the Facilities Master Plan. Good planning is the result of engaging everyone in the process
on a constant basis and reviewing the results along with updating the goals and recommendations in a timely
fashion. Merritt College will continue to serve its students in a positive way, and the only way that can be
achieved is by preparing for the future in a proactive manner. A solid planning process that results in
obtainable goals that are reviewed on a timely basis will allow us to support our mission of helping people
help themselves through education. The Integrated Educational and Facilities Master Plan will assist us in
achieving this goal.
Robert A. Adams, Ed.D. President

2 Maas Companies, Inc.
Introduction to Process
SCOPE OVERVIEW
The 2009 Merritt College Integrated Educational and Facilities Master Plan (“Plan”) is a comprehensive plan for the
College, including educational master planning, facilities planning and financial plans input and projections.
This Plan has been developed in support of the 2008 Educational Master Plan prepared by Merritt College.
The 2008 Educational Master Plan was developed over the past twelve months with contributions from the
administration, faculty and staff of Merritt College, and completed independently of this process. The 2009
Merritt College Integrated Educational and Facilities Master Plan provides specific direction and parameters for the
implementation of programs and activities relating to the educational, support service and facility programs of
the College. The Plan is meant to be the “bridging document” between the Educational Master Plan and the
Facilities Master Plan for Merritt College being developed by WLC Architects.
The goal of the 2009 Merritt College Integrated Educational and Facilities Master Plan is to assist the College in
projecting the educational programs, support services and facilities that will be needed through the year 2022.
The Plan provides direction for improving the College’s services to students and the community. It is a
dynamic document, flexible enough to adjust to new issues and needs that may arise, which will guide
decision-making at the institution for years to come.
The 2009 Merritt College Integrated Educational and Facilities Master Plan has its roots in both qualitative input and
quantitative data. Information from inside and outside of the College was used to explain the changes that
occurred in the past, and to forecast the needs for the future. The Plan is to project the future program of
instruction and student services and determine the amount of space that will be required to accommodate
these needs through the year 2022. It will serve as the foundation upon which the Facility Master Plan will be
built.
Maas Companies, Inc. February 2009
2009 Merritt College Integrated Educational and Facilities Master Plan 3
The objectives of the Plan were: • To bring together educational components—the physical, programmatic and human resources of the
College—into a long-range plan that will support facility development and decision-making for the future.
• To identify and allocate academic and support services space through the year 2022.
• To provide the facility master planners with appropriate and quantified space, by category, that meets State educational codes and Title 5 standards.
• To position the College to take the next step in the planning process—forecasting space into the physical dimensions of buildings that meet State criteria and identifying a finance plan and strategy to meet all the facility needs of the institution.
The planning process included the following tasks: • Conducting an overview and assessment of the College and the area it serves.
• Conducting data research on the historic growth of student enrolment and weekly student contact hours (WSCH).
• Completing a physical capacity analysis—determining the viability of the physical space to support the current program of instruction and support services.
• Assessing the internal environment of the College relative to the current composition/profile of the students served.
• Conducting an external environmental scan—viewing the College in relationship to its service area and external environment.

4 Maas Companies, Inc.
The planning process included, but was not limited to, the following areas to create a platform to support the forecast of future needs and directions of the College: • Incorporated the data of the 2008 Educational Master Plan that was developed internally by Merritt
College and verifying the information that was provided to the Peralta Community College District by the independent consultant firm of Chuck McIntyre for that planning process.
• Conducting a section level analysis of the current program of instruction.
• Creating a baseline curriculum that reflects current WSCH values by discipline/program, by school and the College.
• Integrating the qualitative input with quantitative data.
Defining the capacities for WSCH generation in the future and determining the needs for space through year 2022: • Creating a WSCH generation forecast by
discipline/program and school relative to the program of instruction for the future.
• Quantifying the academic space needs in assignable square feet (ASF) for the future.
• Quantifying the College’s total space needs in assignable square feet (ASF) for the future.
• Evaluating space needs for consistency with the Title 5—Administrative Code standards of the State.
• Producing a surplus/deficit analysis for future space requirements.

Maas Companies, Inc. February 2009
2009 Merritt College Integrated Educational and Facilities Master Plan 5
Framework for the Plan
OVERVIEW
The framework for the 2009 Merritt College
Integrated Educational and Facilities Master Plan
commences with an analysis of the students
who attend the College. I covers who they
are, where they live, why they come to
Merritt College, and what College facilities
and services they will utilize during their
enrollment at the College. The students and
their educational needs are the basis for
programs and services provided by the
College. Without students, there would be
no need for the College. Students determine
the future programs and services for the
College and, in turn, the facilities needed to
house those activities. Historically, this
concept of using a student-based model to
generate all future planning efforts has been
difficult to implement at many Colleges.
However, with today’s ever-changing
economic environment and the competition
for students, Colleges must use the student-
based planning model when preparing
master plans for the College.
The framework of the plan also creates
baselines, or reference points from which
future programs, services and facilities are
developed. For the 2009 Merritt College
Integrated Educational and Facilities Master Plan,
baseline references have been established
using fall semester 2007 as the baseline. All
external and internal environmental scan
information included in the Plan is based on
2007-08 information.
MISSION AND VALUES
Mission
The mission of Merritt College is to enhance
the quality of life in the communities we
serve by helping students to attain
knowledge, master skills, and develop the
appreciation, attitudes, and values needed to
succeed and participate responsibly in a
democratic society. To accomplish its
mission, the College provides open access to
excellent instructional programs and
comprehensive support services in a
culturally-rich, caring and supportive
learning environment. The College’s purpose
is to provide opportunities for lifelong
learning, contribute to the economic growth
of our communities while assisting students
to attain degrees and certificates, earn credits
to transfer and develop the skills necessary
to complete their educational goals.
Core Values
Student Success: We provide challenging
and rigorous learning experiences that
support the academic and personal success
of our students.
Caring Spirit: We genuinely care about
every member of our campus community.
6 Maas Companies, Inc.
Teamwork and Inclusion: We encourage
everyone to participate in College
governance and assume responsibility for
acting on our shared commitment to provide
exceptional learning experiences.
Campus Climate: We strive to create a
student-centered learning environment that
leads to student retention, persistence and
success.
Diversity: We honor and respect the
different backgrounds, experiences,
languages, values and cultures of everyone at
the College.
STRATEGIC DIRECTIONS 2005-2010
In 2005, the College’s Integrated Planning
Committee met to draft five-year Strategic
Directions for review and approval by the
College Governance Committees. The agreed-
upon Strategic Directions are as follows.
Strategic Direction I: Student learning Outcomes
Improve the effectiveness of teaching and
learning at Merritt College through the
development and implementation of student
learning outcomes for both instruction and
support services.
Statement of Intent
As reflected in our mission statement,
Merritt College is committed to helping
students attain knowledge, master skills, and
develop the appreciation, attitudes and
values needed to succeed and participate
responsibly in a democratic society. Towards
this end, the College will identify expected
outcomes as to what students should know
and/or be able to do as a consequence of
completing a course program or utilizing a
Maas Companies, Inc. February 2009
2009 Merritt College Integrated Educational and Facilities Master Plan 7
support service. The College should
systematically and routinely measure the
attainment of those outcomes, effectively
communicate the results of this assessment,
utilize the measurement /assessment data to
revise /refine courses, support services, and
to inform allocation of human, fiscal and
physical resources.
Strategic Direction II: Culture of Communication
To have clear communication and listening
be a way of life at Merritt College in order to
arrive at true shared values, and develop an
appreciation of the diverse perspectives in
the College community.
Statement of Intent
Consistent with Merritt’s mission to develop
appreciation and attitudes for success,
provide lifelong learning opportunities, and
foster a caring learning environment. We will
develop a community that excels in the
communication of ideas, values and
decisions among all segments of the Merritt
College community in a timely, efficient and
free flowing manner. Towards this end,
Merritt College will develop mechanisms to
create a shared understanding of how
institutional effectiveness is defined and
measured; provide regular and timely
communication of ideas, information,
decisions, news, priorities, action plans and
progress among College constituencies; and
develop a feedback loop through which
College constituencies can participate.
Strategic Direction III: Technology And Media Resources
Develop and maintain technological,
information and media resources that
support the needs of students, faculty, and
staff and that are consistent with the
College’s mission.
Statement of Intent
An examination of the College technological
infrastructure and media resources suggests
that there are disparities in the technology
and media available to various segments
within the College community. Some of
these disparities exist as a result of resources
managed by the PCCD; while others are
specific to the Merritt College campus.
These disparities impact the ability of the
College to optimize quality education and
opportunities for life-long learning. In order
to enhance student experiences, increase
faculty capacity to support growth, and
improve the College’s ability to provide
effective instruction and College services,
Merritt College will provide technology and
media resources, along with appropriate
infrastructure modifications, and staff
training sufficient to eliminate the current
disparities. The College will develop and
implement its technology and media
standards; and provide training so that
information and learning resources may be
used effectively and efficiently.
Strategic Direction IV: Resource Development
Develop an institutional approach to
optimize the utilization of existing resources
and develop adequate future resources to
support Merritt’s mission.
8 Maas Companies, Inc.
Statement of Intent
To enhance institutional effectiveness, attain
student learning outcomes, implement more
effective communication strategies, and to
provide appropriate technological and media
resources, it is imperative that the College
maximize the utilization of current human,
fiscal and physical resources, invest in
innovation and develop new revenue
streams. Specifically Merritt will pursue
business partnerships that effectively link
our curriculum with industry needs, as well
as service learning opportunities for
students, pursue grants, gifts, donations, and
additional facility rental; provide
faculty/staff training and mentoring as an
investment in our human resources. It also
needs to systematically maintain and upgrade
campus facilities to provide an excellent,
clean, and safe environment for learning.
INSTITUTIONAL LEARNING OUTCOMES (ILOS): 2005-2009
Institutional Learning Outcomes were
drafted late in 2005, and presented to the
College community in 2006. These ILOs
were reviewed, revised, and adopted in
Spring of 2008. ILO’s are defined as “What
students will be able to do out in the world as a
result of their experiences at Merritt College.” The
following are Merritt College’s approved
Institutional Learning Outcomes.
Communication
Communicate with clarity and precision
using oral, nonverbal, and/or written
language, expressing an awareness of
audience, situation, and purpose.
Maas Companies, Inc. February 2009
2009 Merritt College Integrated Educational and Facilities Master Plan 9
Critical thinking
Think critically using appropriate methods
of reasoning to evaluate ideas and identify
and investigate problems; and also to
develop creative and practical solutions to
issues that arise in workplaces, institutions,
and local and global communities.
Quantitative Reasoning
Apply college-level mathematical reasoning
to analyze and explain real world issues, and
to interpret and construct graphs, charts, and
tables.
Information and Computer Literacy
Use appropriate technology to identify,
locate, evaluate and present information for
personal, educational and workplace goals.
Cultural Awareness
Through knowledge of history and cultural
diversity, recognize and value perspectives
and contributions that persons of diverse
backgrounds bring to multicultural settings,
and respond constructively to issues that
arise out of human diversity on both the
local and the global level.
Civic Engagement and Ethics
Internalize and exhibit ethical values and
behaviors that address self respect and
respect for others, with integrity and honesty
that will enable success and participation in
the larger society.
STUDENT LEARNING OUTCOMES (SLOS): 2005-2010
College faculty, staff, administrators and
students have been provided information
and training on Student Learning Outcomes
and Assessment in the context of how SLOs
reveal the student’s journey through the
institution, and the many ways in which a
student’s progress and success can be
measured and demonstrated.
In 2003, the Landscape Horticulture and
Child Development departments were led by
the Vice President of Instruction in a pilot
project to identify program SLOs and to
create a program map in order to elucidate a
student’s progress through the program. In
succeeding years, Dr. Ruth Stiehl has been
invited to present workshops on
identification and assessment of learning
outcomes, as measurements of student
learning and success in the institution. In
Fall 2007, a Student Learning Outcomes and
Assessment Committee (SLOAC) was
created, and the SLOAC Coordinator was
given .5 release time to work with faculty
and staff on developing program outcomes
and drafting program maps.
To date, most of Merritt College’s programs
have identified program outcomes and
created program maps. In 2008-09,
instructional and student services faculty and
staff will create rubrics as assessment tools.
They will continue to articulate outcomes at
the course level, along with communicating
those outcomes through course syllabi, and
begin the work of aligning course outcomes
with program outcomes and ILOs.
10 Maas Companies, Inc.
EDUCATIONAL MASTER PLAN
The Process
The District-Wide Educational Master Plan
is an overall framework for the evolution
and development of the Peralta Community
College District master planning process.
Drawing on environmental scan reports,
program reviews, and unit plans, the plan
establishes a direction for meeting the needs
of students and the community through a
coordinated approach across the four
Colleges and District service centers.
The College Master Plans and the District-
Wide EMP were developed collaboratively
to create an integrated planning framework
linking program review, educational
planning, facilities improvement and
resource allocation. This integrated planning
approach achieves one of the major goals of
the District Wide Strategic Plan and fulfills a
major District-level accreditation
recommendation.
PURPOSE
The purpose of the educational master plan
is to present a shared educational “road
map” for the Colleges and District service
centers for the next several years. This
shared District-wide road map is made up of
the agreed-upon educational principles,
goals, and integrated planning; along with
budgeting processes that provide both a
clear future direction and a set of adaptive
mechanisms to ensure the plan is a living
document. The District Wide EMP is an
umbrella statement of direction for the four
College Educational Master Plans, and
documents the common planning criteria,
methodologies, and agreements that bring
consistency to, and provide a context for,
the College Educational Master Plan.
The 2009 Merritt College Integrated Educational
and Facilities Master Plan is a companion
planning document based on the College’s
Educational Master Plan that focuses
specifically on facilities and funding. All
planning documents are part of the District
and College-wide master planning process.
As such, the framework for all plans have
their origin in the District’s Strategic Plan
and Educational Master Plan. Key planning
parameters or guidelines extracted from the
District-wide process to support the 2009
Merritt College Integrated Educational and
Facilities Master Plan include:
Maas Companies, Inc. February 2009
2009 Merritt College Integrated Educational and Facilities Master Plan 11
Educational Program Framework:
The set of overarching program themes
provide a shared focus for the Colleges and
the unique areas of career-technical focus for
each College.
Integrated Instructional and Student Service Strategies:
The educational strategies for instruction
and student services enable the College to
meet current and anticipated needs of
students.
Shared Decision-Making Criteria and Processes:
The intent is to document the processes
shared across the Colleges on a District-wide
basis that will enable the Colleges and
District, as a whole, to remain flexible and
adaptive to change.
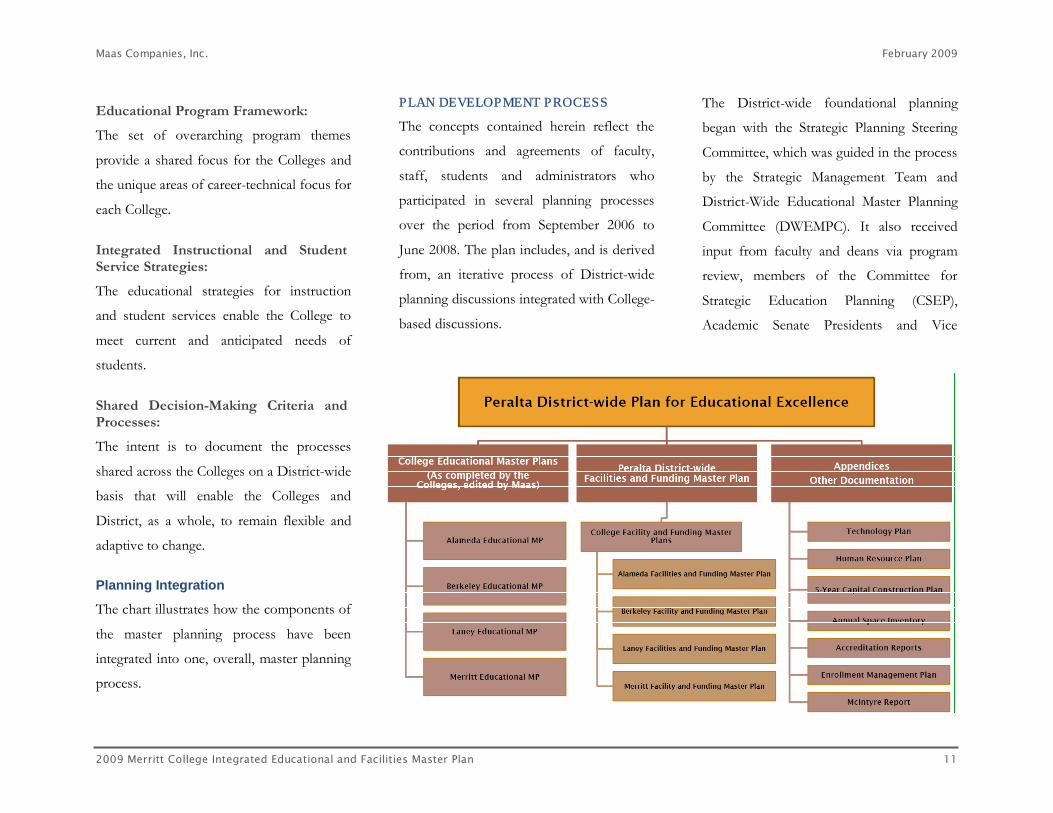
Planning Integration
The chart illustrates how the components of
the master planning process have been
integrated into one, overall, master planning
process.
PLAN DEVELOPMENT PROCESS
The concepts contained herein reflect the
contributions and agreements of faculty,
staff, students and administrators who
participated in several planning processes
over the period from September 2006 to
June 2008. The plan includes, and is derived
from, an iterative process of District-wide
planning discussions integrated with College-
based discussions.
The District-wide foundational planning
began with the Strategic Planning Steering
Committee, which was guided in the process
by the Strategic Management Team and
District-Wide Educational Master Planning
Committee (DWEMPC). It also received
input from faculty and deans via program
review, members of the Committee for
Strategic Education Planning (CSEP),
Academic Senate Presidents and Vice

12 Maas Companies, Inc.
Presidents of Instruction, student services
planning staff, faculty input at the District
August 2007 and College spring 2008 Flex
Days, unit and College planning 2007-2008,
the College educational master planning
committee, department chair planning
sessions, and District-wide plan integration
in spring, 2008.
PLAN IMPLEMENTATION
The implementation of the District and the
various College master plans will require
District-wide collaboration and engagement
of all stakeholders, modeled after the two
year process that resulted in the formal
publishing of the District strategic plan in
June 2006. Merritt College will engage the
following groups in its implementation plan.
The Council of Department Chairs and
Program Directors established in 2001 by
the Academic Senate President and Vice
President of Instruction. The Council is
responsible for making recommendations
regarding budget allocations and faculty
hires, along with participating in peer
evaluations, unit planning, program review
and accreditation self study.
Basic Skills Task Force: The Basic Skills
Task Force works with faculty and staff on
planning for enhanced academic success of
basic skills students. Several projects have
been selected for funding for 2008-09 with
the expressed intent to increase retention,
persistence, and success of basic skills
students.
College Facilities and Budget
Committees: The College’s facilities and
budget committees play an integral role in
planning and implementation of the
College’s ongoing Educational Master Plan.
The College has completed a major
renovation of its Student Center, and next
plans to relocate the Learning Center
programs and to design a new Allied
Health/Sciences building.
The College Council: The Council
provides input and insight into College
issues, and ultimately sends a
recommendation to the College President.
The President’s Three Initiatives: The
three iniatives are an integral part of
planning at the College. Led by the
President’s senior administrative staff, they
focus on Recruitment, Retention, and
Resource Development (the College’s 3 R’s).
COLLEGE VISION
Merritt College’s 2008 Educational Master Plan
and the 2009 Integrated Educational and
Facilities Master Plan share the vision of the
District-wide planning efforts. A successful
College plan will reflect the vision, values
and goals of the District, as represented by
its strategic plan, and the mission, values and
goals of the California Community College
System. The College will implement that
plan through the effective, efficient, and
equitable deployment of available resources
and by identifying the educational,
economic, social and cultural needs and
resources of Merritt College today, and in
the future. The Plan will identify the
available programs and resources of the
Colleges and District; providing an analysis
of capacity to respond to community needs.

Maas Companies, Inc. February 2009
2009 Merritt College Integrated Educational and Facilities Master Plan 13
Additionally, it will articulate the operational
priorities that will allow the College to best
use available and planned future resources
within the context of both the District’s and
the College’s strategic plans.
In 2005-2007 Merritt College engaged in
detailed program reviews, unit reviews, and
CSEP analysis as part of the College’s
strategic planning, its response to ACCJC
recommendations, its preparation for the
accreditation self-study cycle, and its
response to District requests. These reviews
and summaries were used to prioritize
budget, faculty and staff, and Measure A
requests. In addition, they form the basis for
the College’s Educational Master Plan,
which reflects the McIntyre internal and
external scans, and prioritizes allocations for
College facilities, technology, budget and
staffing. A major factor in Merritt College’s
achievement of the educational master plan
goals will be the development of a marketing
strategy that will promote new and ongoing
instructional and student service programs.
Marketing objectives for each program and
discipline need to be articulated, along with
strategies, tasks, and individuals responsible
for each of these. The plan for each
discipline should be derived from market
segmentation research.
The process of formulating Student
Learning Outcomes and designing
assessment tools to measure these outcomes
is ongoing, and much work has already been
completed. All programs at Merritt College
have identified program outcomes and
mapped the students’ journey through the
program. The plan for 2008-2010 is to assess
program outcomes and identify course
outcomes for inclusion on course outlines
and syllabi. A workshop on developing
rubrics was presented on the August 19,
2008 Professional Day. The final work, in
2010-12, will be to align course outcomes
14 Maas Companies, Inc.
with program outcomes and institutional
learning outcomes.
CSEP data was included in Unit Plan
Summaries; the Unit Plan summaries are
presented in Chapter 4 of this document.
PRINCIPLES AND GOALS:
The principles and goals of Merritt College
align with those of the District as a whole.
They are:
• Advance Student Access, Equity, and Success
• Engage our Community and Partners
• Build Programs of Distinction
• Create a Culture of Innovation and Collaboration
• Ensure Financial Health
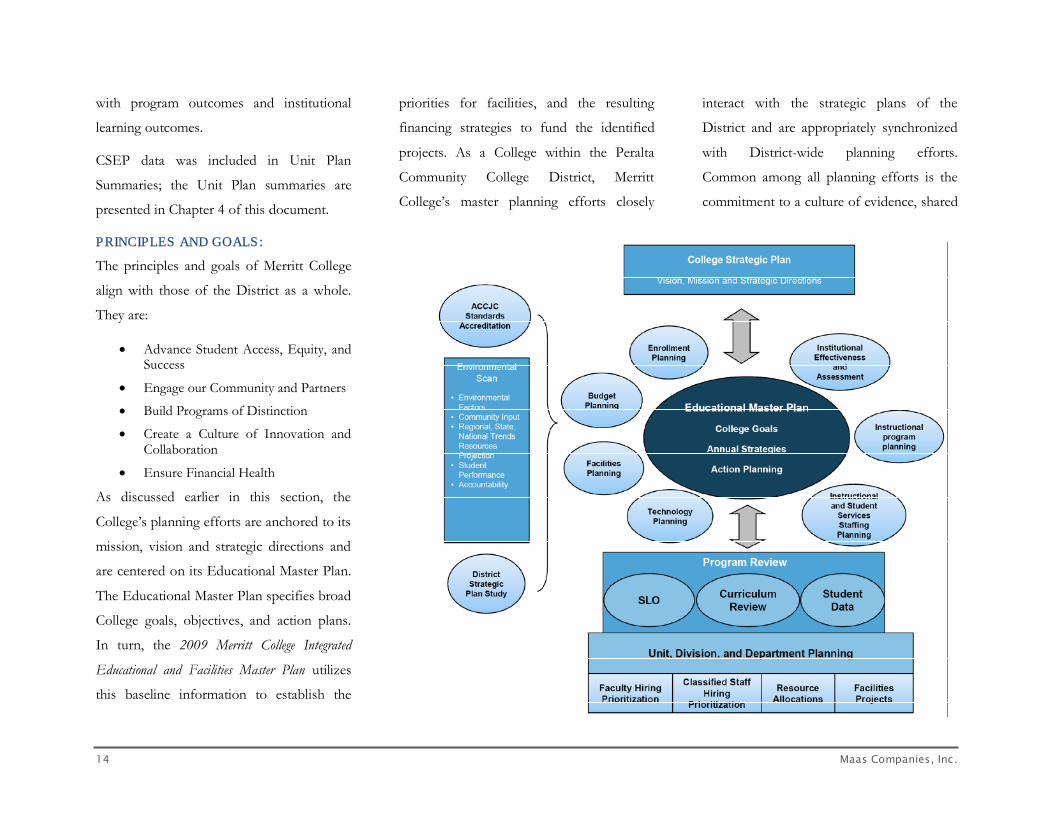
As discussed earlier in this section, the
College’s planning efforts are anchored to its
mission, vision and strategic directions and
are centered on its Educational Master Plan.
The Educational Master Plan specifies broad
College goals, objectives, and action plans.
In turn, the 2009 Merritt College Integrated
Educational and Facilities Master Plan utilizes
this baseline information to establish the
priorities for facilities, and the resulting
financing strategies to fund the identified
projects. As a College within the Peralta
Community College District, Merritt
College’s master planning efforts closely
interact with the strategic plans of the
District and are appropriately synchronized
with District-wide planning efforts.
Common among all planning efforts is the
commitment to a culture of evidence, shared

Maas Companies, Inc. February 2009
2009 Merritt College Integrated Educational and Facilities Master Plan 15
governance, College-wide participation and
leadership transparency. The chart shows the
integration of the District/College planning
components.
FORMAT OF PLAN
In the sections that follow, a detailed analysis
is presented of facility and financial
requirements needed to implement the 2009
Merritt College Integrated Educational and
Facilities Master Plan. All recommendations
and strategies are based on the Strategic and
Educational Master Plan previously
developed by the College.
Included in the 2009 Merritt College Integrated
Educational and Facilities Master Plan are the
following sections:
• External Environmental Scan
• Internal Environmental Scan
• Future Capacities
• Determination of Future Space Needs
• The Financial Plan
• Total Cost of Ownership
• Recommendations
• Glossary of Terms
BOARD OF TRUSTEE’S APPROVAL OF PLAN
As part of the planning approval process,
the 2009 Integrated Educational and Facilities
Master Plan for each College and also the
2009 Peralta District Integrated Educational and
Facilities Master Plan, will be reviewed
utilizing the shared governance process for
the Colleges and the District. Upon approval
of the draft Plans by the constituent shared
governance groups, the College Plans and
the District Plan will be presented to the
Peralta Community College District Board
of Trustees for approval.

16 Maas Companies, Inc.
External Environmental Scan
The external relationships that follow were
identified as important and/or significant in
their potential to have an impact on the
future of Merritt College. While that future
will largely be shaped by the Board of
Trustees, staff, contractors and vendors
operating within the framework of the Plan,
and therefore under close control of College
management, external trends and conditions
will also impact the College’s immediate and
long-term destiny. These trends and
conditions—national, regional or local in
scope – will influence the future direction of
the College, its programs, curriculum,
support services and operation.
THE COLLEGE IN RELATIONSHIP TO THE NATION
Overall, the College forms a part of a vast
nationwide system of higher education. At
any given time, the economic environment
of the United States necessarily affects the
educational community generally and the
College specifically. In addition, federal laws,
regulations and policies can exert direct and
indirect pressures on College leaders, staff
and students. Currently, the state of the
nation’s economy, indeed the state of the
world’s economy, is at risk and will
predictably bring substantial change to the
educational environment for all learning
institutions, including Merritt College.
According to a recent advance estimate by
the Bureau of Economic Analysis (BEA),
the Real Gross Domestic Product—the
output of goods and services produced by
labor and property located in the United
States—decreased at an annual rate of 0.3
percent in the third quarter of 2008. This
follows a weak second quarter report of
annualized Real GDP growth of 2.8 percent.
The BEA may revise the third quarter
estimate after receipt of additional data, but
the outlook has begun to look somewhat
grim.
The Bureau of Labor Statistics (BLS) has
issued some more disturbing news:
“Nonfarm payroll employment fell by
240,000 in October [2008], and the
unemployment rate rose from 6.1 to 6.5
percent….” Unemployment had bottomed
out in early 2007 at approximately 4.4
percent, but has risen lately at an accelerating
rate. The BLS report continues:
“Employment has fallen by 1.2 million in the
first 10 months of 2008; over half of the
decrease has occurred in the past 3 months.
In October, job losses continued in
manufacturing, construction, and several
service-providing industries.” The Labor
Department recently reported that the
516,000 unemployment claims for early
November 2008 almost matches the heavy
layoffs suffered immediately after the 9/11
Maas Companies, Inc. February 2009
2009 Merritt College Integrated Educational and Facilities Master Plan 17
attacks of 2001, and compares to the data
seen during the deep recession of the early
1990’s. In short, the evidence of a weak
economy appears to be worsening, even
accelerating, and indicates the probability of
a deep and lasting recession.
Although the prices in crude oil, gasoline
and diesel fuel have moderated recently,
serious spikes in gasoline and diesel fuel
costs have imposed a heavy toll on
individuals, companies, government
agencies, and other organizations. A return
to higher prices at the pump may affect
students who travel between their jobs, their
homes, and the College. The continuation of
national military deployments will also affect
enrollment at the College.
As a general rule, if the economy flourishes
then community college enrollments
decrease. Conversely, when the economy
flounders then enrollments tend to increase
as more students seek to improve, expand,
or change their job skills. As recently
reported by the Austin Texas American-

18 Maas Companies, Inc.
Statesman, community colleges are “well-
suited to serve the rising number of students
who are older, less affluent, and who work
or have families. The downturn in the
economy could boost enrollment even more
as families try to stretch scarce dollars.” Rey
Garcia, president of the Texas Association
of Community Colleges says, “In tough
economic times, folks tend to lean on
community colleges to retool their skill set.”
THE COLLEGE IN RELATIONSHIP TO THE STATE
The California economy has a direct
influence on Merritt College, both because it
affects jobs and services in the community
and region, and because it impacts resources
available for community college spending.
As with the national economy, California’s
economic prospects have lately shown
serious weakness. The State reported the
unemployment rate for September 2008 was
7.5%, according to the State Employment
Development Department (EDD),
worsening from 5.6% in September 2007.
The EDD estimated the state’s
unemployment rate for October 2008 at
8.2%, an extraordinary increase. The
national rate, previously mentioned, has now
risen to 6.5%.
After steady declines in unemployment since
2003, the last year has seen significant
increases in Californians out of work.
According to the U.S. Bureau of Labor
Statistics, of the 17 metropolitan divisions
that reported employment losses over the
past year in the United States, three of the
five biggest losers were in California,
including Orange County, Los Angeles, and
the Oakland area. The Oakland-Fremont-
Hayward area reported 22,500 lost jobs, a
2.1 percent increase in joblessness.
The State has suffered a series of budget
crises over the past several years. Although
Governor Schwarzenegger has made a
concerted effort to control State spending,
the current challenges appear particularly
daunting. As reported by the Sacramento
Bee on Tuesday, November 12, the non-
partisan Legislative Analyst issued a
statement saying “California will face
massive budget shortfalls through at least
2014 without immediate action by
lawmakers and Gov. Arnold
Schwarzenegger.” The Bee continues, “In
the midst of high unemployment, shaky
consumer confidence and plummeting
investments, the state needs a slew of tax
increases and spending cuts to resolve a
$27.8 billion problem over the next 20
months,” according to this official. Of the
$4.5 billion spending reduction now
proposed by the governor, over half, $2.5
billion, would come from reductions in
education funding. That includes a $322
million cut for community colleges, a cut of
10%. The Bee writes, “While
Schwarzenegger proposed a $2.5 billion mid-
year cut in education spending, the legislative
analyst said the reduction should be just $1
billion because school districts already have
locked in yearlong decisions on staff and
class size. The report suggested eliminating
school cost-of-living adjustments while
suspending professional development fees

Maas Companies, Inc. February 2009
2009 Merritt College Integrated Educational and Facilities Master Plan 19
and raising community college fees.”
Regardless of the specific short term
outcome of the current budget crisis,
community colleges will suffer a significant
impact. Clearly, community college districts
that have built a sizeable reserve fund may
weather the fiscal storm better than those
that have not done so.
Enrollment
The anticipated cuts in community college
budgets will collide with the apparent rise in
enrollment demand. As a rule of thumb, two
main factors traditionally influence
enrollment growth in California’s higher
education system, Population Growth and
Participation Rate (the ratio of the number
of students attending community college to
the population). The current and projected
Economic Conditions will impose some
significant, if not wholly predictable,
negative consequences.
Population Growth
An increase in the state’s college-age
population generally causes a proportional
increase in those who are eligible to attend
postsecondary education. Although
statewide population figures remain
interesting, local trends carry more
relevance. Please see below a discussion of
current and projected data under the
subsection, Local Population Growth.
Participation Rate
The participation rate is the number of
people enrolled at the college per 1,000
people living in the College Service Area.
California maintains one of the highest
participation rates in the nation, primarily

20 Maas Companies, Inc.
because California has a more highly-
developed and extensive system of
community colleges than most other states,
facilitating local accessibility. A number of
factors may influence participation rates in
the future.
• Enrollments have seen a significant and sometimes dramatic increase around the country at community colleges. Increases over a five or six year span that range from 15% to over 40% in some areas have been reported (e.g. 42% increase at a community college campus in Arlington, Texas). Similar increases are generally attributed to the diversion of new students away from more expensive universities during economic downturns and the return of older students for retraining as unemployment rises. California, with an unemployment rate significantly higher than the national figure, will surely experience these same effects.
• Cost. If the cost-per-unit can be kept low, community colleges will continue to attract students and keep the demand for college instruction high. However, State budget cuts will endanger the ability of community colleges to offer classes and services, possibly forcing administrators to impose hard caps on enrollments at each campus. Additionally, community
college districts may require additional student fees. Interestingly, budget cuts and consequential enrollment caps at the two statewide four-year university systems will probably increase the likelihood that students will attend community colleges to take transferable lower division classes, thereby further increasing demand.
• State funding comes in several forms, and financial aid opportunities represent an important part of the package of Sacramento's support. Any cutbacks in the availability of financial aid will probably affect the availability and attractiveness of postsecondary options.
• Historically speaking, the most significant bill passed by the California legislature that affected community college funding was Proposition 13 in 1978. This legislation diminished property tax rates by 57% and resulted in a dramatic reduction in the amount of local property tax revenue available for cities, counties, and especially for schools. In 2000, Proposition 39 amended the California Constitution to allow school and community college districts and county offices of education to issue bonds for construction, reconstruction, rehabilitation or replacement of facilities and to authorize property taxes higher than the existing 1% annual growth rate limit to repay bonds. A major caveat of Proposition 39 was the lowering of the vote requirement on a relative percentage basis. As a result, Proposition 39 allows community college districts to approve bond funding with 55% of the voter consent as opposed to 66.6%. In assessing the future impacts that the State of California could have on Merritt College, funding will be the greatest. Funding formulas for community colleges presently exist in a state of flux. While the mechanisms are in place, escalating costs in construction have caused the State to rethink how the gap can be narrowed between what the State allows and the actual (marketplace) cost of

Maas Companies, Inc. February 2009
2009 Merritt College Integrated Educational and Facilities Master Plan 21
construction. Additionally, the competition for available State dollars through statewide initiatives (bonds) has become very intense. In the 2006 fall election, state voters passed Proposition 1D. This authorized the State to sell bonds totaling $10.4 billion to fund repair and upgrade of educational facilities for K-12 schools, state colleges, universities and community colleges. Of this total, $1.5 billion is designated for the State’s community colleges. The State’s decision to raise and then reduce tuition fees (currently $20/unit) for community colleges created yet another impact and challenge for the District. The overall economic climate of the State of California and the annual budget debate regarding spending priorities make the budget process an annual challenge for all community college districts, especially now and for the next several years.
Economic Conditions
As noted above, pertinent to the
Participation Rate, the current economic and
fiscal challenges bode ill for the state’s
community college system. Community
colleges in many areas of the nation have
reported remarkable increases in enrollments
at a time when they can least afford a flood
of additional students.
The Oakland Tribune very recently quoted
Martha Kanter, chancellor of Foothill-
DeAnza Community College District:
“Many students who planned to attend the
Cal State schools may instead aim for
community colleges.” This comes in
response to a preliminary decision by the
chancellor of the CSU system, Charles Reed,
that his colleges will “no longer [be] able to
accept everyone into next fall's freshman
class,” due to funding cuts by Sacramento.
In addition, he plans to impose a system
whereby admission priority will be given to
freshman applicants from each campus'
“service area.” That is, local students will get
preference over applicants from areas near
other CSU campuses, and most definitely
over international students or people
wishing to enroll for a second bachelor's
degree. In areas where a CSU campus
capacity is tight or capped, some of the
demand for transferable lower division
sections will flow to nearby community
colleges. Increasing on-line opportunities
may offer one of the only ways to quickly
increase service to educational patrons,
whether or not they need transferable
credits.
THE COLLEGE IN RELATIONSHIP TO THE LOCAL REGION
Merritt College lies in Oakland’s foothills,
east of the interchange of Interstate 580 and
State Highway 13, the Warren Freeway. The
city has a population of approximately
400,000. Oakland is the county seat of
Alameda County and ranks as the eighth
largest city in California. It forms part of a
metropolitan district in the heavily populated
East San Francisco Bay Area that employs
well over a million people.
According to the most recent forecast by the
Association of Bay Area Governments
(ABAG), “we expect that between 2005 and
2035 the Bay Area's population will grow by
about 2 million people.” Much of the
population growth will occur in the outlying
suburbs. However even densely populated
western Alameda County will experience
22 Maas Companies, Inc.
some noticeable growth with implications
for community college enrollments.
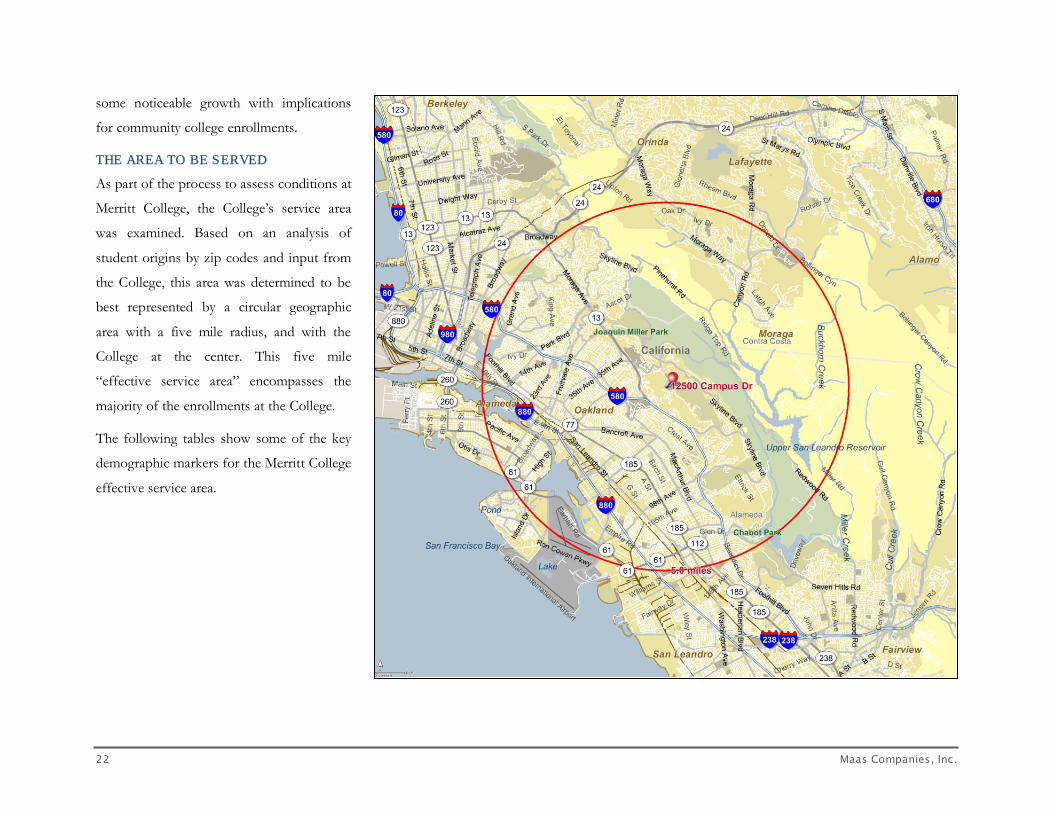
THE AREA TO BE SERVED
As part of the process to assess conditions at
Merritt College, the College’s service area
was examined. Based on an analysis of
student origins by zip codes and input from
the College, this area was determined to be
best represented by a circular geographic
area with a five mile radius, and with the
College at the center. This five mile
“effective service area” encompasses the
majority of the enrollments at the College.
The following tables show some of the key
demographic markers for the Merritt College
effective service area.
Maas Companies, Inc. February 2009
2009 Merritt College Integrated Educational and Facilities Master Plan 23
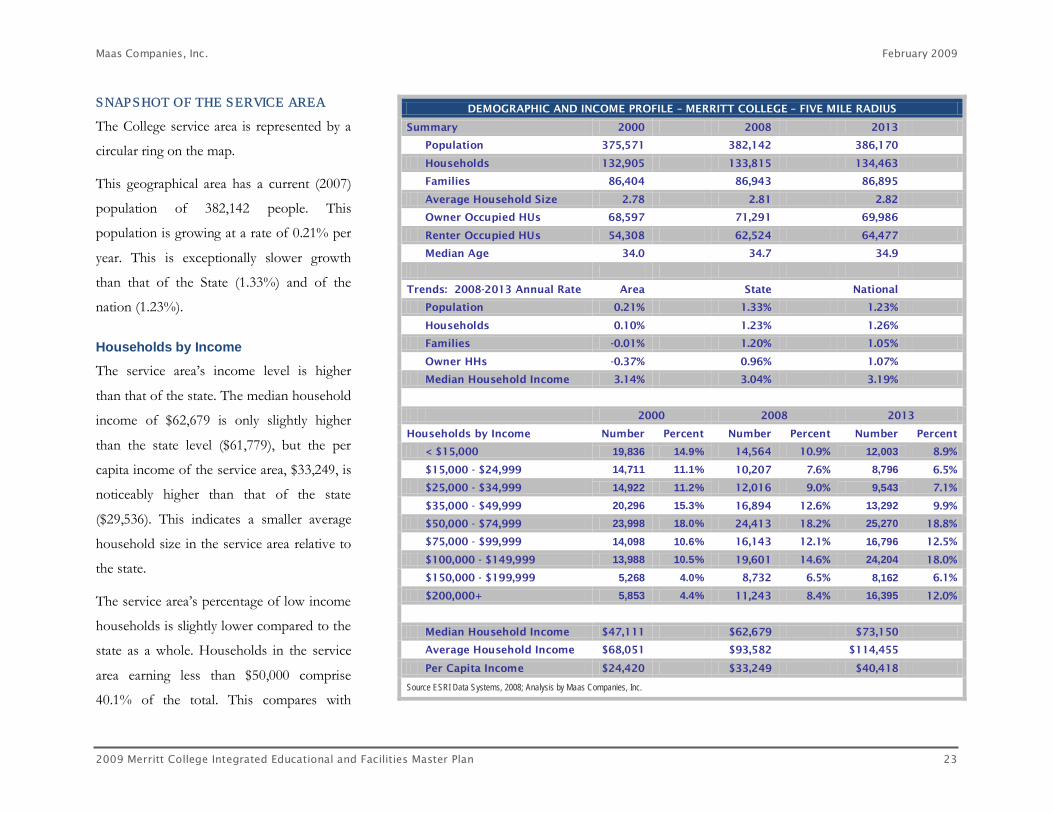
SNAPSHOT OF THE SERVICE AREA
The College service area is represented by a
circular ring on the map.
This geographical area has a current (2007)
population of 382,142 people. This
population is growing at a rate of 0.21% per
year. This is exceptionally slower growth
than that of the State (1.33%) and of the
nation (1.23%).
Households by Income
The service area’s income level is higher
than that of the state. The median household
income of $62,679 is only slightly higher
than the state level ($61,779), but the per
capita income of the service area, $33,249, is
noticeably higher than that of the state
($29,536). This indicates a smaller average
household size in the service area relative to
the state.
The service area’s percentage of low income
households is slightly lower compared to the
state as a whole. Households in the service
area earning less than $50,000 comprise
40.1% of the total. This compares with
DEMOGRAPHIC AND INCOME PROFILE – MERRITT COLLEGE – FIVE MILE RADIUS
Summary 2000 2008 2013
Population 375,571 382,142 386,170
Households 132,905 133,815 134,463
Families 86,404 86,943 86,895
Average Household Size 2.78 2.81 2.82
Owner Occupied HUs 68,597 71,291 69,986
Renter Occupied HUs 54,308 62,524 64,477
Median Age 34.0 34.7 34.9
Trends: 2008-2013 Annual Rate Area State National
Population 0.21% 1.33% 1.23%
Households 0.10% 1.23% 1.26%
Families -0.01% 1.20% 1.05%
Owner HHs -0.37% 0.96% 1.07%
Median Household Income 3.14% 3.04% 3.19%
2000 2008 2013
Households by Income Number Percent Number Percent Number Percent
< $15,000 19,836 14.9% 14,564 10.9% 12,003 8.9%
$15,000 - $24,999 14,711 11.1% 10,207 7.6% 8,796 6.5%
$25,000 - $34,999 14,922 11.2% 12,016 9.0% 9,543 7.1%
$35,000 - $49,999 20,296 15.3% 16,894 12.6% 13,292 9.9%
$50,000 - $74,999 23,998 18.0% 24,413 18.2% 25,270 18.8%
$75,000 - $99,999 14,098 10.6% 16,143 12.1% 16,796 12.5%
$100,000 - $149,999 13,988 10.5% 19,601 14.6% 24,204 18.0%
$150,000 - $199,999 5,268 4.0% 8,732 6.5% 8,162 6.1%
$200,000+ 5,853 4.4% 11,243 8.4% 16,395 12.0%
Median Household Income $47,111 $62,679 $73,150
Average Household Income $68,051 $93,582 $114,455
Per Capita Income $24,420 $33,249 $40,418
Source ESRI Data Systems, 2008; Analysis by Maas Companies, Inc.
24 Maas Companies, Inc.
40.6% for the State of California. Median
household incomes however are growing
faster in the service area—3.14% versus
3.04% for the state.
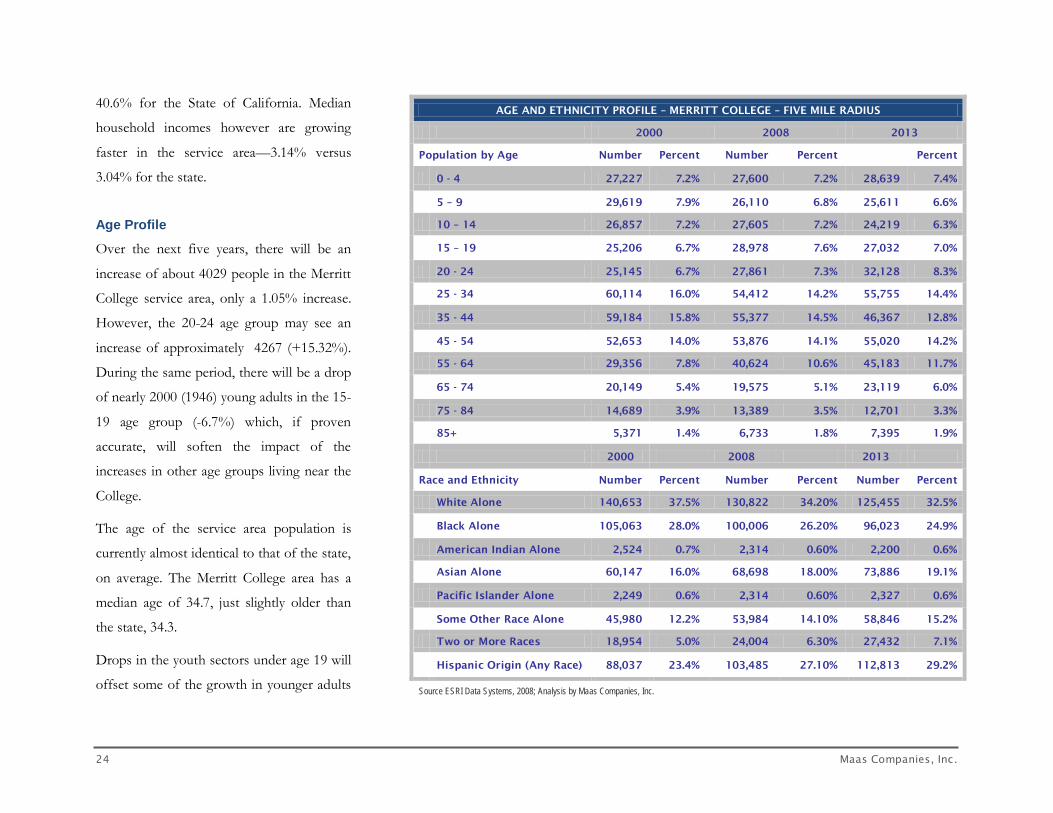
Age Profile
Over the next five years, there will be an
increase of about 4029 people in the Merritt
College service area, only a 1.05% increase.
However, the 20-24 age group may see an
increase of approximately 4267 (+15.32%).
During the same period, there will be a drop
of nearly 2000 (1946) young adults in the 15-
19 age group (-6.7%) which, if proven
accurate, will soften the impact of the
increases in other age groups living near the
College.
The age of the service area population is
currently almost identical to that of the state,
on average. The Merritt College area has a
median age of 34.7, just slightly older than
the state, 34.3.
Drops in the youth sectors under age 19 will
offset some of the growth in younger adults
AGE AND ETHNICITY PROFILE – MERRITT COLLEGE – FIVE MILE RADIUS
2000 2008 2013
Population by Age Number Percent Number Percent Percent
0 - 4 27,227 7.2% 27,600 7.2% 28,639 7.4%
5 – 9 29,619 7.9% 26,110 6.8% 25,611 6.6%
10 – 14 26,857 7.2% 27,605 7.2% 24,219 6.3%
15 – 19 25,206 6.7% 28,978 7.6% 27,032 7.0%
20 - 24 25,145 6.7% 27,861 7.3% 32,128 8.3%
25 - 34 60,114 16.0% 54,412 14.2% 55,755 14.4%
35 - 44 59,184 15.8% 55,377 14.5% 46,367 12.8%
45 - 54 52,653 14.0% 53,876 14.1% 55,020 14.2%
55 - 64 29,356 7.8% 40,624 10.6% 45,183 11.7%
65 - 74 20,149 5.4% 19,575 5.1% 23,119 6.0%
75 - 84 14,689 3.9% 13,389 3.5% 12,701 3.3%
85+ 5,371 1.4% 6,733 1.8% 7,395 1.9%
2000 2008 2013
Race and Ethnicity Number Percent Number Percent Number Percent
White Alone 140,653 37.5% 130,822 34.20% 125,455 32.5%
Black Alone 105,063 28.0% 100,006 26.20% 96,023 24.9%
American Indian Alone 2,524 0.7% 2,314 0.60% 2,200 0.6%
Asian Alone 60,147 16.0% 68,698 18.00% 73,886 19.1%
Pacific Islander Alone 2,249 0.6% 2,314 0.60% 2,327 0.6%
Some Other Race Alone 45,980 12.2% 53,984 14.10% 58,846 15.2%
Two or More Races 18,954 5.0% 24,004 6.30% 27,432 7.1%
Hispanic Origin (Any Race) 88,037 23.4% 103,485 27.10% 112,813 29.2%
Source ESRI Data Systems, 2008; Analysis by Maas Companies, Inc.

Maas Companies, Inc. February 2009
2009 Merritt College Integrated Educational and Facilities Master Plan 25
from 20 to 34. While a drop is anticipated in
the 35 to 44 age group, marked increases in
the 45 to 74 bracket are predicted over the
coming five years.
This period of significant readjustment and
change may provide an opportunity to tailor
new or ongoing programs to accommodate
these demographic shifts.
WORKFORCE CHARACTERISTICS OF THE LOCAL REGION
Rate of Unemployment
Since the Bay Area’s bursting of the “dot
com bubble” several years ago, the region
has rebounded substantially. Today the area
carries an unemployment rate noticeably
lower than other areas of the state.
According to California’s Employment
Development Department (EDD), Alameda
County has suffered an increase in the
unemployment rate from 4.9% in October
2007 to 7.1% in October 2008. However,
that compares to a statewide rate of 8.0%.
Sources of Employment
The service-related employers in the area
provide, by far, the most jobs (884,000)
compared to goods-producing industries
(168,700). However, since construction jobs
suffered the largest losses of any sector, the
goods-producing industries overall took the
largest percentage losses, not the service
providers. In their description of the job
situation in the Oakland-Fremont-Hayward
Metropolitan Statistical Area (MSA), the
EDD says 22,500 jobs
were lost over the last
year since October
2007. That accounts
for a 2.1% increase in
joblessness. The
construction trades
lost 6,100 jobs. Trade,
transportation and
utilities jobs declined
by 5,300, mostly in
retail positions.
Financial jobs fell by
5,300. Not only are
these job losses substantial, but the
economic conditions suggest that the
unemployment rate will continue to increase
in the near term.
Growth Occupations
Since the current economic crisis causes the
risks of forecasting to greatly increase,
prudence dictates that no prognostications
could be responsibly offered. However, the
short-term job loss data suggests that in the
26 Maas Companies, Inc.
upcoming economic turnaround, whenever
it occurs, the region should experience a
rebound in these same job sectors.
Specifically, construction activity should
resume when the consumer credit markets
revive, and the retail jobs sector should
closely match the recovery of the economy.
Data References and Resources
References, resources and sources of
information for the external environmental
scan included the following:
Alameda County
Association of Bay Area Governments
U.S. Department of Commerce, Bureau of Economic Analysis
U.S. Department of Labor
U.S. Department of Education, National Center for Education Statistics
California Department of Education
California Department of Finance, Economic Research Unit
California Employment Development Department, Labor Market Information Division
Center for Continuing Study of the California Economy
California Community College Chancellor’s Office
ESRI BIS Marketing and Data Systems
The Maas Companies Database

Maas Companies, Inc. February 2009
2009 Merritt College Integrated Educational and Facilities Master Plan 27
Program of Instruction
OVERVIEW
Before forecasting future growth, it is
necessary to begin with a benchmark or a
baseline. For the purposes of this Plan, the
fall 2007 semester was used as the baseline.
In the following pages, the fall 2007 program
of instruction is analyzed using several
different metrics. This analysis then serves as
the basis for all future projections regarding
the instructional program.
Baseline Curriculum
The fall 2007 semester was used as a
starting point for determining the College’s
current, “baseline curriculum.” Defining the
current program of instruction served two
primary purposes:
1. It assessed the current condition at the
College from a curricular perspective;
and
2. It provided a foundation from which the
future programs of instruction could be
projected.
THE BASELINE PROGRAM OF INSTRUCTION BY COLLEGE DEPARTMENT
The current program of instruction is
captured in a comprehensive manner in the
table on the following pages. The key
elements of the current program of
instruction have been highlighted in this
assessment. The College’s internal
organizational structure (departments) was
used as the format. The key elements
included the number of net sections offered,
average seats per section, WSCH generated,
the full-time equivalent students (FTES), the
full-time equivalent faculty (FTEF), and the
number of lecture and laboratory hours
produced.
MERRITT COLLEGE PROGRAM OF INSTRUCTION - FALL 2007
NET CLASS SECTIONS OFFERED 493
WEEKLY STUDENT CONTACT HOURS 59,591
FULL-TIME EQUIVALENT STUDENTS PER SEMESTER (FTES)
1,986
FULL-TIME EQUIVALENT FACULTY (FTEF) 137
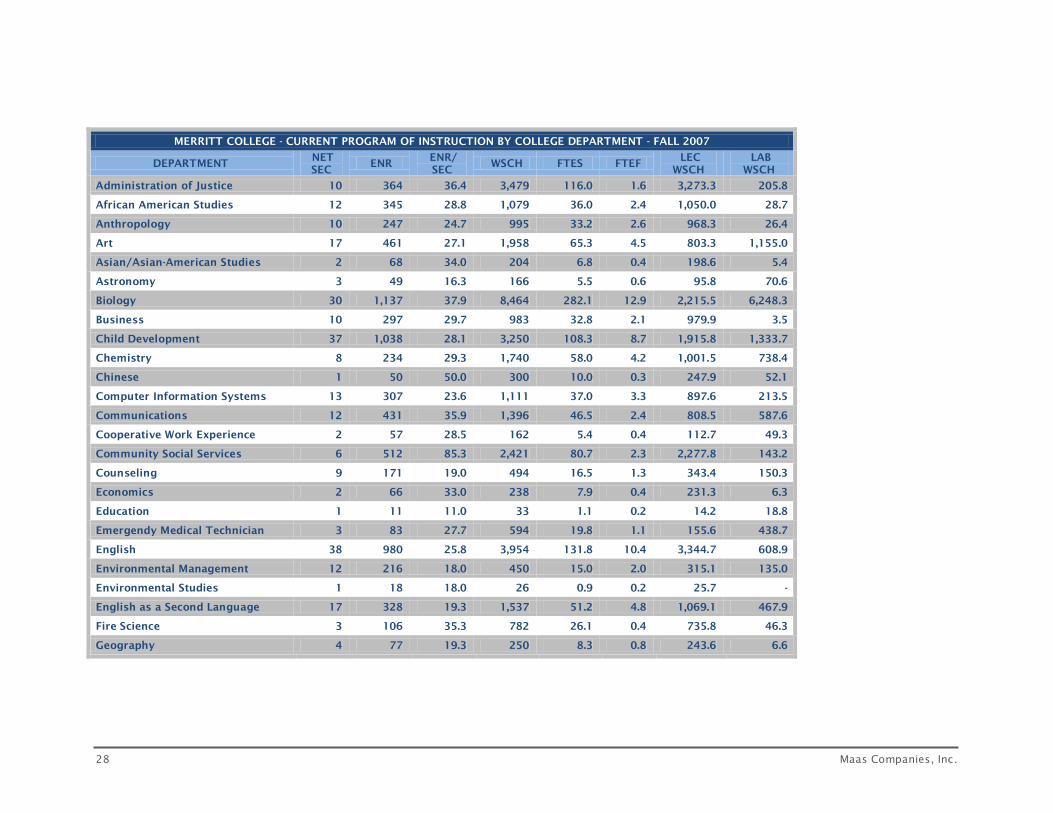
28 Maas Companies, Inc.
MERRITT COLLEGE - CURRENT PROGRAM OF INSTRUCTION BY COLLEGE DEPARTMENT - FALL 2007
DEPARTMENT NET SEC
ENR ENR/ SEC
WSCH FTES FTEF LEC
WSCH LAB
WSCH
Administration of Justice 10 364 36.4 3,479 116.0 1.6 3,273.3 205.8
African American Studies 12 345 28.8 1,079 36.0 2.4 1,050.0 28.7
Anthropology 10 247 24.7 995 33.2 2.6 968.3 26.4
Art 17 461 27.1 1,958 65.3 4.5 803.3 1,155.0
Asian/Asian-American Studies 2 68 34.0 204 6.8 0.4 198.6 5.4
Astronomy 3 49 16.3 166 5.5 0.6 95.8 70.6
Biology 30 1,137 37.9 8,464 282.1 12.9 2,215.5 6,248.3
Business 10 297 29.7 983 32.8 2.1 979.9 3.5
Child Development 37 1,038 28.1 3,250 108.3 8.7 1,915.8 1,333.7
Chemistry 8 234 29.3 1,740 58.0 4.2 1,001.5 738.4
Chinese 1 50 50.0 300 10.0 0.3 247.9 52.1
Computer Information Systems 13 307 23.6 1,111 37.0 3.3 897.6 213.5
Communications 12 431 35.9 1,396 46.5 2.4 808.5 587.6
Cooperative Work Experience 2 57 28.5 162 5.4 0.4 112.7 49.3
Community Social Services 6 512 85.3 2,421 80.7 2.3 2,277.8 143.2
Counseling 9 171 19.0 494 16.5 1.3 343.4 150.3
Economics 2 66 33.0 238 7.9 0.4 231.3 6.3
Education 1 11 11.0 33 1.1 0.2 14.2 18.8
Emergendy Medical Technician 3 83 27.7 594 19.8 1.1 155.6 438.7
English 38 980 25.8 3,954 131.8 10.4 3,344.7 608.9
Environmental Management 12 216 18.0 450 15.0 2.0 315.1 135.0
Environmental Studies 1 18 18.0 26 0.9 0.2 25.7 -
English as a Second Language 17 328 19.3 1,537 51.2 4.8 1,069.1 467.9
Fire Science 3 106 35.3 782 26.1 0.4 735.8 46.3
Geography 4 77 19.3 250 8.3 0.8 243.6 6.6

Maas Companies, Inc. February 2009
2009 Merritt College Integrated Educational and Facilities Master Plan 29
MERRITT COLLEGE - CURRENT PROGRAM OF INSTRUCTION BY COLLEGE DEPARTMENT - FALL 2007
DEPARTMENT NET SEC
ENR ENR/ SEC
WSCH FTES FTEF LEC
WSCH LAB
WSCH
Geology 1 14 14.0 101 3.4 0.4 58.0 42.8
History 3 72 24.0 235 7.8 0.6 228.4 6.2
Health Education 2 68 34.0 245 8.2 0.4 105.3 139.5
Health Professions & Occupations 2 58 29.0 127 4.2 0.4 33.2 93.7
Humanities 4 91 22.8 299 10.0 1.0 252.8 46.0
Human Services 8 137 17.1 381 12.7 1.4 358.4 22.5
Insurance 3 46 15.3 112 3.7 0.5 111.6 0.4
Landscape Horticulture 32 891 27.8 3,049 101.6 6.9 1,524.5 1,524.5
Learning Resources 6 1,857 309.5 303 10.1 2.1 303.3 -
Mathematics 36 1,150 31.9 4,339 144.6 8.3 4,224.2 114.8
Medical Assisting 1 20 20.0 263 8.8 0.8 68.8 194.1
Music 8 240 30.0 845 28.2 1.6 346.7 498.5
Nursing 8 489 61.1 2,618 87.3 12.5 685.3 1,932.7
Nutrition 17 347 20.4 852 28.4 2.5 222.9 628.7
Physical Education 20 1,072 53.6 1,716 57.2 5.6 738.1 978.2
Paralegal Studies 10 243 24.3 742 24.7 1.8 742.0 -
Philosophy 2 44 22.0 143 4.8 0.4 120.8 22.0
Physics 5 67 13.4 394 13.1 1.7 226.8 167.2
Political Science 5 122 24.4 391 13.0 1.0 380.8 10.4
Psychology 11 425 38.6 1,363 45.4 2.2 1,326.5 36.2
Radiologic Technology 10 295 29.5 1,720 57.3 4.1 450.2 1,269.6
Recreation & Leisure Services 1 36 36.0 130 4.3 0.2 76.4 53.2
Real Estate 22 639 29.0 1,374 45.8 4.4 1,368.9 4.9
Sociology 4 139 34.8 450 15.0 0.8 438.0 12.0
Spanish 8 192 24.0 784 26.1 2.1 648.1 136.3
Vocational Nursing 1 19 19.0 551 18.4 2.9 144.3 406.8
TOTAL 493 16,426 33.3 59,591 1,986.4 136.6 38,509.3 21,081.5
Source: Peralta Community College District Office of Institutional Research

30 Maas Companies, Inc.
THE BASELINE PROGRAM OF INSTRUCTION BY TOP CODE
So that community colleges and educational
centers can be evaluated with a common
yardstick, the State has adopted the
Taxonomy of Programs (TOP) Code
instructional division format. This system
assigns standard classifications for each
academic discipline and groups them into
common instructed divisions so that the
institution’s instructional program can be
compared equally and fairly with those
across the state. The TOP Code format is
used by the State to determine space needs.
It is also the format that supports the
District’s 5-Year Capital Construction Plan
from which the capacity-to-load ratios of the
College are derived. The instructional
divisions of the College by TOP Code
classification are translated in the following
table.
MERRITT COLLEGE - CURRENT PROGRAM OF INSTRUCTION BY TOP CODE INSTRUCTIONAL DIVISION - FALL 2007
TOP CODE NET SEC ENR ENR/ SEC WSCH FTES FTEF LEC WSCH LAB WSCH
0100 AGRICULTURE & NATURAL RESOURCES 44 1,107 25.2 3,499 117 9 1,840 1,659
0300 ENVIRONMENTAL SCIANCES & TECH 1 18 18.0 26 1 0 26 -
0500 BUSINESS & MANAGEMENT 35 982 28.1 2,469 82 7 2,460 9
0600 MEDIA & COMMUNICATIONS 12 431 35.9 1,396 47 2 808 588
0700 INFORMATION TECHNOLOGY 13 307 23.6 1,111 37 3 898 214
0800 EDUCATION 23 1,151 50.0 1,994 66 6 858 1,137
1000 FINE & APPLIED ART 25 701 28.0 2,803 93 6 1,150 1,653
1100 FOREIGN LANGUAGE 9 242 26.9 1,084 36 2 896 188
1200 HEALTH 72 2,448 34.0 15,188 506 37 3,976 11,212
1300 FAMILY & CONSUMER SCIENCES 38 1,074 28.3 3,379 113 9 1,992 1,387
1400 LAW 10 243 24.3 742 25 2 742 -
1500 HUMANITIES 44 1,115 25.3 4,395 147 12 3,718 677
1600 LIBRARY SCIENCE 6 1,857 309.5 303 10 2 303 -
1700 MATHEMATICS 36 1,150 31.9 4,339 145 8 4,224 115
1900 PHYSICAL SCIENCES 17 364 21.4 2,401 80 7 1,382 1,019
2100 PUBLIC & PROTECTIVE SERVICES 27 1,119 41.4 7,063 235 6 6,645 418
2200 SOCIAL SCIENCES 53 1,561 29.5 5,204 173 11 5,065 138
4900 INTERDISCIPLINARY STUDIES 28 556 19.9 2,193 73 7 1,525 668
TOTAL 493 16,426 33.3 59,591 1,986 137 38,509 21,081
Source: Peralta Community College District Office of Institutional Research
Maas Companies, Inc. February 2009
2009 Merritt College Integrated Educational and Facilities Master Plan 31
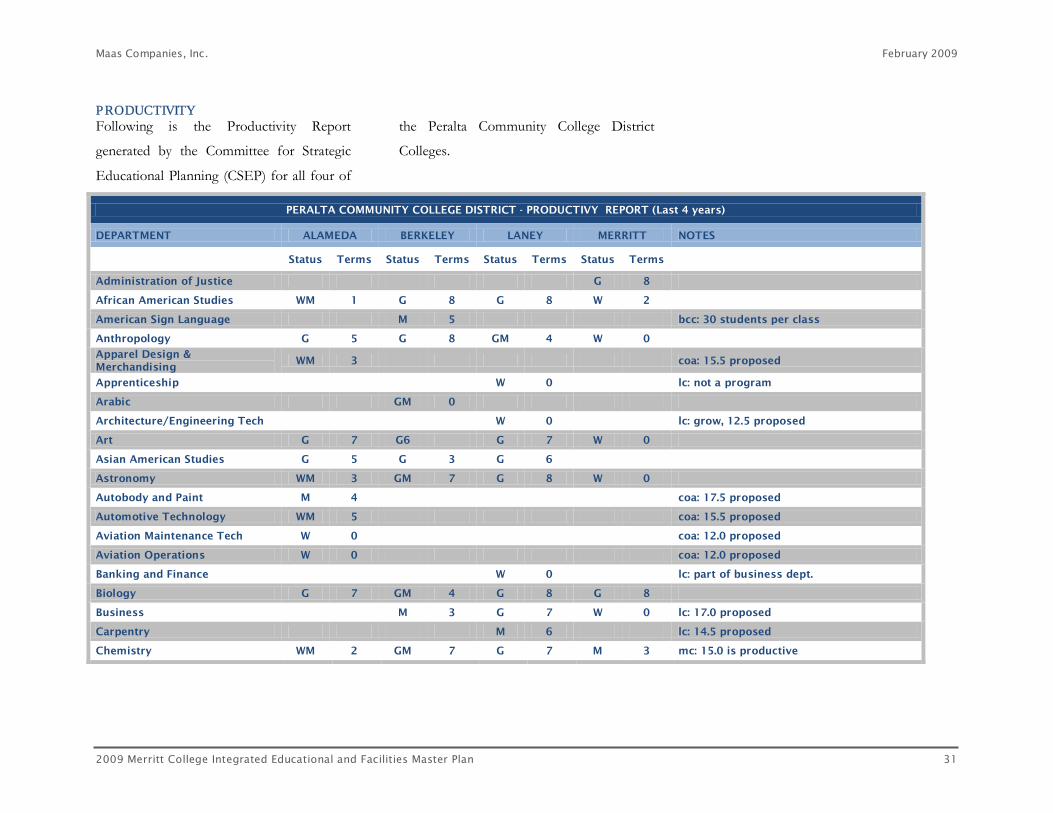
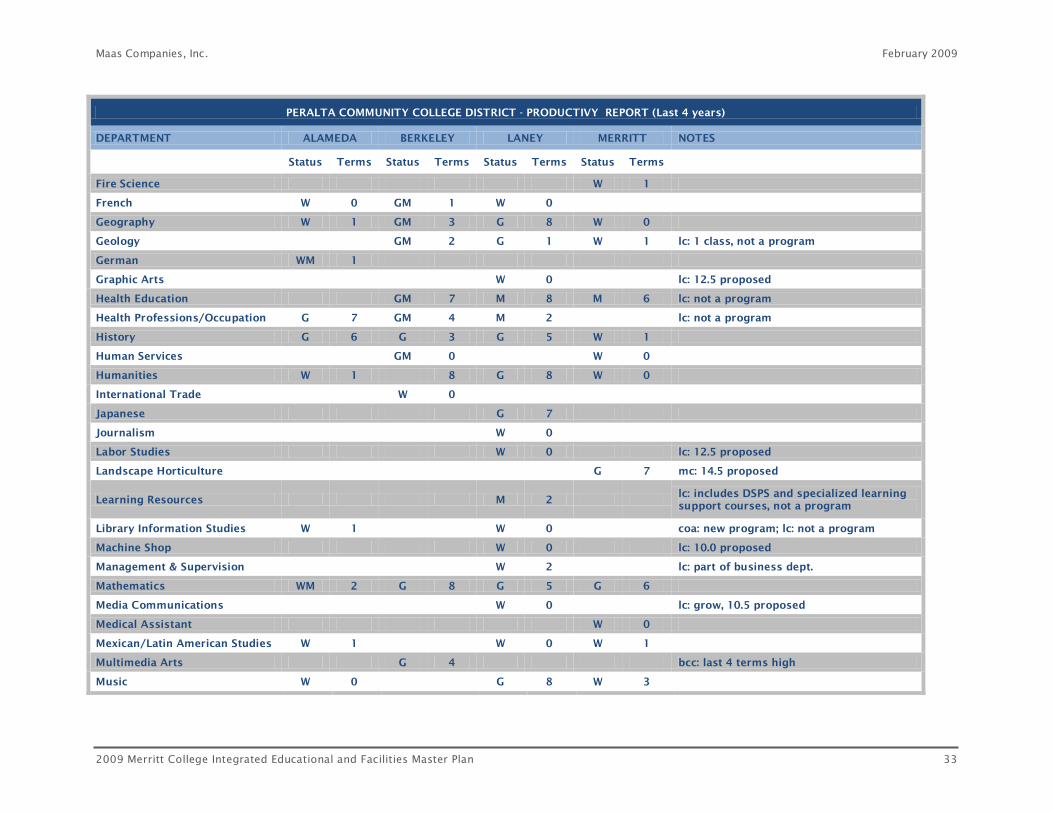
PRODUCTIVITY Following is the Productivity Report
generated by the Committee for Strategic
Educational Planning (CSEP) for all four of
the Peralta Community College District
Colleges.
PERALTA COMMUNITY COLLEGE DISTRICT - PRODUCTIVY REPORT (Last 4 years)
DEPARTMENT ALAMEDA BERKELEY LANEY MERRITT NOTES
Status Terms Status Terms Status Terms Status Terms
Administration of Justice G 8
African American Studies WM 1 G 8 G 8 W 2
American Sign Language M 5 bcc: 30 students per class
Anthropology G 5 G 8 GM 4 W 0
Apparel Design & Merchandising
WM 3 coa: 15.5 proposed
Apprenticeship W 0 lc: not a program
Arabic GM 0
Architecture/Engineering Tech W 0 lc: grow, 12.5 proposed
Art G 7 G6 G 7 W 0
Asian American Studies G 5 G 3 G 6
Astronomy WM 3 GM 7 G 8 W 0
Autobody and Paint M 4 coa: 17.5 proposed
Automotive Technology WM 5 coa: 15.5 proposed
Aviation Maintenance Tech W 0 coa: 12.0 proposed
Aviation Operations W 0 coa: 12.0 proposed
Banking and Finance W 0 lc: part of business dept.
Biology G 7 GM 4 G 8 G 8
Business M 3 G 7 W 0 lc: 17.0 proposed
Carpentry M 6 lc: 14.5 proposed
Chemistry WM 2 GM 7 G 7 M 3 mc: 15.0 is productive

32 Maas Companies, Inc.
PERALTA COMMUNITY COLLEGE DISTRICT - PRODUCTIVY REPORT (Last 4 years)
DEPARTMENT ALAMEDA BERKELEY LANEY MERRITT NOTES
Status Terms Status Terms Status Terms Status Terms
Child Development M 5 mc: 12.5 proposed
Chinese G 5 GM 4 G 4 mc: only offered 4 terms
Communication G 6 G 5 G 7
(Speech) M 2 lc: now communications
Community Social Service M 8
CIS W 0 WM 1 W 2 W 1 coa: 14.0 proposed; bcc: growth in last 2 terms; lc: grow, 15.0 proposed; mc: 15.5 proposed
Construction Management M 8 lc: 17.0 proposed
COPED W 2
Cosmetology G 8 lc: 17.0 proposed
Counseling WM 2 G 6 W 2
Culinary Arts G 5 lc: 13.0 proposed
Dance G 6 G 8
Dental Assisting W 0 coa: 10.0 proposed
Diesel Mechanics W 0 coa: 13.0 proposed
Economics MG 3 M 7 G 8
Education W 0
Electricity/Electronics Tech G 7 lc: 17.0 proposed
Engineering W 0 lc: grow, 11.0 proposed
English W 0 M 0 M 0 W 1 bcc: grow, exception (14.17 avg); lc: grow, 15.0 proposed
ESL W 0 M 4 M 0 W 0 bcc: grow, exception (12.92 avg); lc: grow, 15.0 proposed
Environmental Control Tech M 2 lc: grow, 12.5 proposed
Environmental Science W 1
Maas Companies, Inc. February 2009
2009 Merritt College Integrated Educational and Facilities Master Plan 33
PERALTA COMMUNITY COLLEGE DISTRICT - PRODUCTIVY REPORT (Last 4 years)
DEPARTMENT ALAMEDA BERKELEY LANEY MERRITT NOTES
Status Terms Status Terms Status Terms Status Terms
Fire Science W 1
French W 0 GM 1 W 0
Geography W 1 GM 3 G 8 W 0
Geology GM 2 G 1 W 1 lc: 1 class, not a program
German WM 1
Graphic Arts W 0 lc: 12.5 proposed
Health Education GM 7 M 8 M 6 lc: not a program
Health Professions/Occupation G 7 GM 4 M 2 lc: not a program
History G 6 G 3 G 5 W 1
Human Services GM 0 W 0
Humanities W 1 8 G 8 W 0
International Trade W 0
Japanese G 7
Journalism W 0
Labor Studies W 0 lc: 12.5 proposed
Landscape Horticulture G 7 mc: 14.5 proposed
Learning Resources M 2 lc: includes DSPS and specialized learning support courses, not a program
Library Information Studies W 1 W 0 coa: new program; lc: not a program
Machine Shop W 0 lc: 10.0 proposed
Management & Supervision W 2 lc: part of business dept.
Mathematics WM 2 G 8 G 5 G 6
Media Communications W 0 lc: grow, 10.5 proposed
Medical Assistant W 0
Mexican/Latin American Studies W 1 W 0 W 1
Multimedia Arts G 4 bcc: last 4 terms high
Music W 0 G 8 W 3

34 Maas Companies, Inc.
PERALTA COMMUNITY COLLEGE DISTRICT - PRODUCTIVY REPORT (Last 4 years)
DEPARTMENT ALAMEDA BERKELEY LANEY MERRITT NOTES
Status Terms Status Terms Status Terms Status Terms
Native American Studies W 0 W 0 lc: 1-2 classes, not a program
Nursing (AD) W 0
Nursing (LVN) W 0
Nutrition/Dietetics G 5 mc: 14.5 proposed
Paralegal W 1
Philosophy WM 3 GM 5 G 8 W 0
Photography W 0 lc: 10.6 proposed
Physical Education W 1 M 0 W 0
Physical Science GM 7 W 0 lc: only offered 2 terms
Physics W 0 G 6 W 0
Political Science G 6 M 3 W 1
Psychology G 6 G 8 G 7 M 8
Radiologic Science M 5 mc: 13.5 proposed
Real Estate M 7 W 4 lc: part of business dept., not a program
Recreation/Leisure Services W 2
Sociology G 5 G 7 G 8
Spanish W 1 GM 0 M 3 W 0
Theatre Arts W 1
Travel Industry W 0
Vietnamese G 5
Welding M 4 lc: grow, 12.5 proposed
Wood Technology W 1 lc: 12.5 proposed
Source: Peralta Community College District G – Grow M – Maintain W – Watch
bcc – Berkeley City College coa – College of Alameda lc – Laney College mc – Merritt College

Maas Companies, Inc. February 2009
2009 Merritt College Integrated Educational and Facilities Master Plan 35
Internal Environmental Scan
LOCAL POPULATION GROWTH
Early in this decade, the California
community college student pool was
expected to grow from 1.5% to 2.0%
through the remainder of this decade. Those
estimates were low statewide and Peralta
CCD has grown at a substantially faster rate.
From spring 2006 to spring 2008, statewide
community college enrollment increased by
6.8%. Peralta CCD increased by 14.5% over
the same period.
Ethnically, African-Americans account for
the largest group and they increased their
student population by 7.2%. Asians nearly
caught up with African-Americans by spring
2008 with a 13.0% increase. The third largest
ethnic group, Non-Hispanic Whites, gained
the largest number of additional students, an
increase of 20.4%. Hispanics, a smaller
group and ranking as the fourth largest
ethnicity, did not add as many students, but
still increased by 23.3%. All of these
enrollment increases occurred in the Peralta
District over a two-year period in the
immediate past, as reported by the California
Community Colleges Chancellor’s Office.
STUDENT DEMOGRAPHIC PROFILE
The consulting team relied on data included
in the College’s Educational Master Plan as
well as data in the environmental scan
provided to the District by the McIntyre
Group. The following section contains some
key demographic information that help to
describe who the students are that attend
Merritt College.
Student Origins
The vast majority of students (58%)
attending Merritt College reside in the city of
Oakland. The next three largest places of
origin for students at the College are Contra
Costa County (15%), Peralta Cities (14%)
and Southern Alameda (12%). Together
these four communities account for 99% of
the total student enrollment.
Over the past five years, the student origin
profile has undergone some change. The
most dramatic changes were in student
enrollments from addresses in Contra Costa
County and Soutern Alameda. From 2006 to
2007, Contra Costa County enrollments
jumped from 7% to 15%. Over the same
time period, enrollments from Contra Costa
County fell from 19% to 12%.
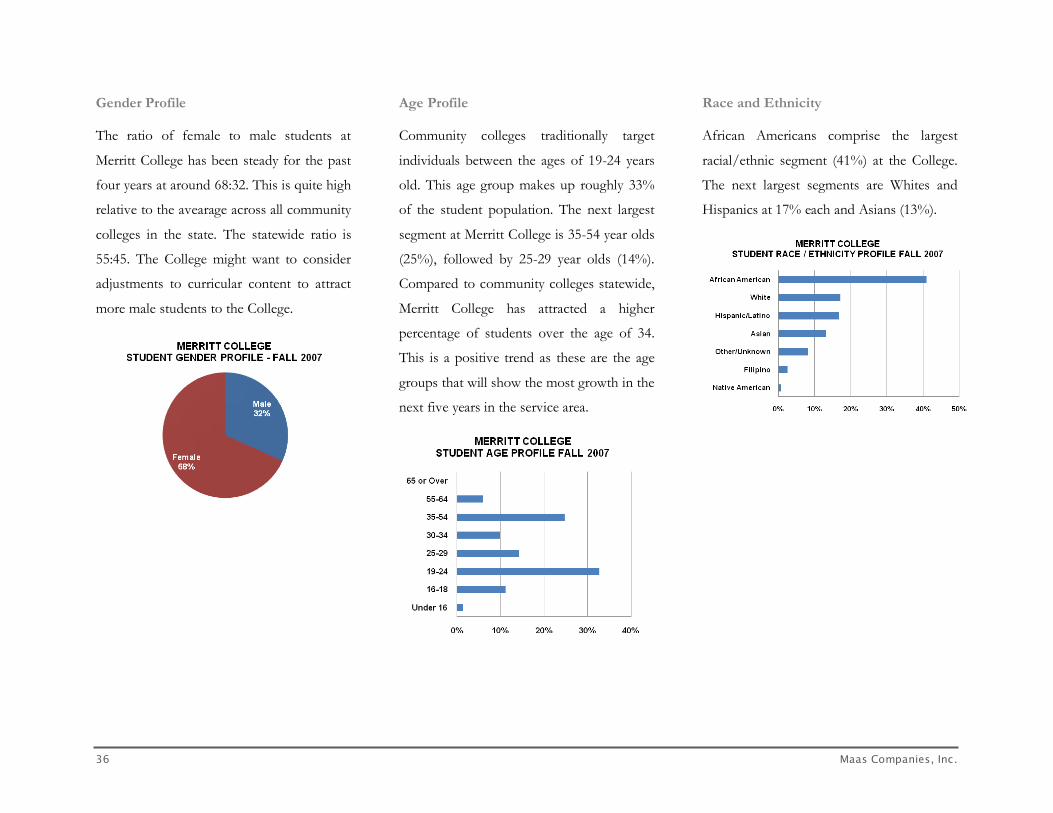
36 Maas Companies, Inc.
Gender Profile
The ratio of female to male students at
Merritt College has been steady for the past
four years at around 68:32. This is quite high
relative to the avearage across all community
colleges in the state. The statewide ratio is
55:45. The College might want to consider
adjustments to curricular content to attract
more male students to the College.
Age Profile
Community colleges traditionally target
individuals between the ages of 19-24 years
old. This age group makes up roughly 33%
of the student population. The next largest
segment at Merritt College is 35-54 year olds
(25%), followed by 25-29 year olds (14%).
Compared to community colleges statewide,
Merritt College has attracted a higher
percentage of students over the age of 34.
This is a positive trend as these are the age
groups that will show the most growth in the
next five years in the service area.
Race and Ethnicity
African Americans comprise the largest
racial/ethnic segment (41%) at the College.
The next largest segments are Whites and
Hispanics at 17% each and Asians (13%).
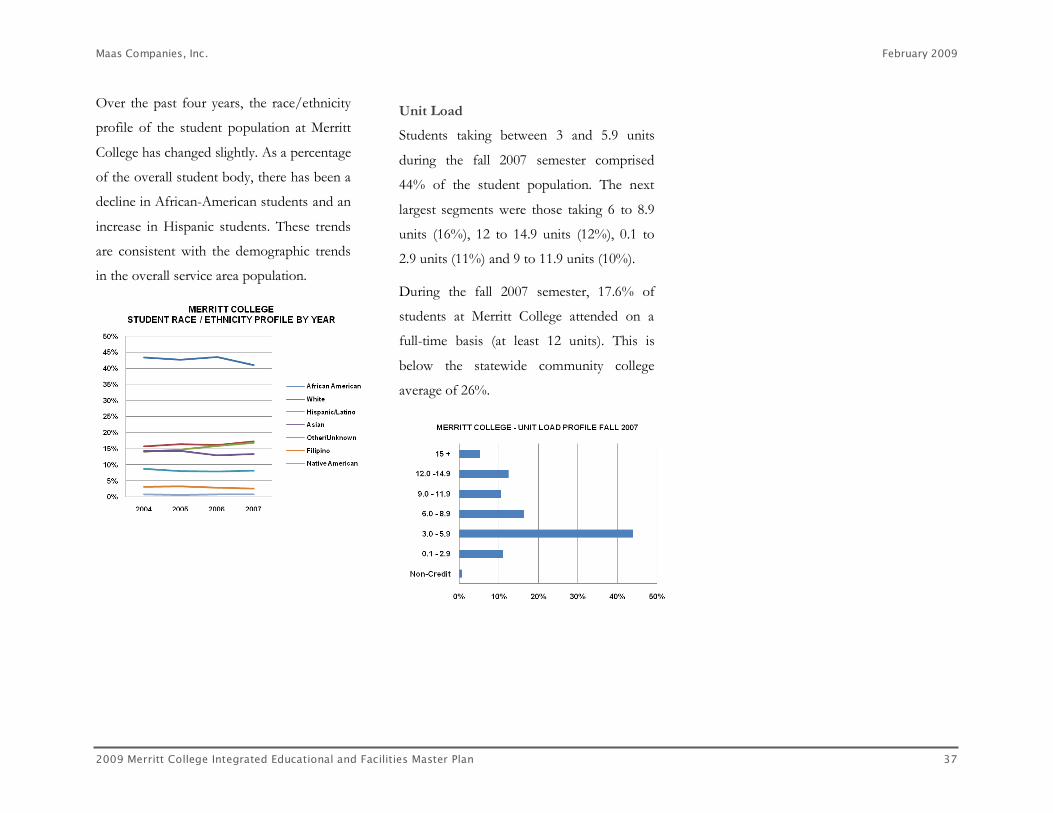
Maas Companies, Inc. February 2009
2009 Merritt College Integrated Educational and Facilities Master Plan 37
Over the past four years, the race/ethnicity
profile of the student population at Merritt
College has changed slightly. As a percentage
of the overall student body, there has been a
decline in African-American students and an
increase in Hispanic students. These trends
are consistent with the demographic trends
in the overall service area population.
Unit Load
Students taking between 3 and 5.9 units
during the fall 2007 semester comprised
44% of the student population. The next
largest segments were those taking 6 to 8.9
units (16%), 12 to 14.9 units (12%), 0.1 to
2.9 units (11%) and 9 to 11.9 units (10%).
During the fall 2007 semester, 17.6% of
students at Merritt College attended on a
full-time basis (at least 12 units). This is
below the statewide community college
average of 26%.
38 Maas Companies, Inc.
Future Capacities
KEY ELEMENTS
Several key elements were referenced in the
process of determining the future capacities
of Merritt College. Those that received the
closest attention included the following.
Capacity for Future Growth
One of the most important elements for
determining future capacity is growth of the
population base, or “natural growth.” The
Merritt College service area will have little
growth over the next five years. The forecast
is for population growth to be 0.21% per
year and growth in households to be a mere
0.10%.
It is also important to look at population
growth by age range. In the Merritt College
service area, the population between 10 and
19 years of age is projected to decrease as a
percentage of the overall service area
population between 2008 and 2013. This will
make “natural growth” even more unlikely
for the College.
The College can expect that there will be an
upward trend for the age group target, 20 to
24 year olds. The demographic data
currently shows an increase in this age group
segment over the next five years. At the
same time, there will be a sizeable increase in
age groups 55 to 74 years of age.
As mentioned in the previous section, the
College has a large number of students
between the ages of 35 and 54 years of age.
The demographic data projects that this
service area population in this age range will
decrease by the year 2013.
Conclusions
In the coming years, the College will need to
become even more creative in its efforts to
attract new students to the campus. One
strategy might be to include more
compacted or accelerated classes, (e.g., 8
week sessions) or weekend class offerings.
Many of these students will probably be
older. Classes for retraining older individuals
and for retirees should also be considered.
EXISTING CURRICULUM
The current programs of instruction (fall
2007) are characterized as follows:
• Unduplicated, credit-enrollments of approximately 7,233 students
• WSCH—Credit weekly student contact hours of 59,591
• FTES—Full-time equivalent students of 1,986 for a given semester.
This “baseline” will be used as the initial
benchmark for forecasting future capacities
of the College.
The existing program of instruction provides
a starting point against which future growth
can be forecast. Looking ahead for the next
five years, curricular content will most likely
not undergo wholesale changes or deviate
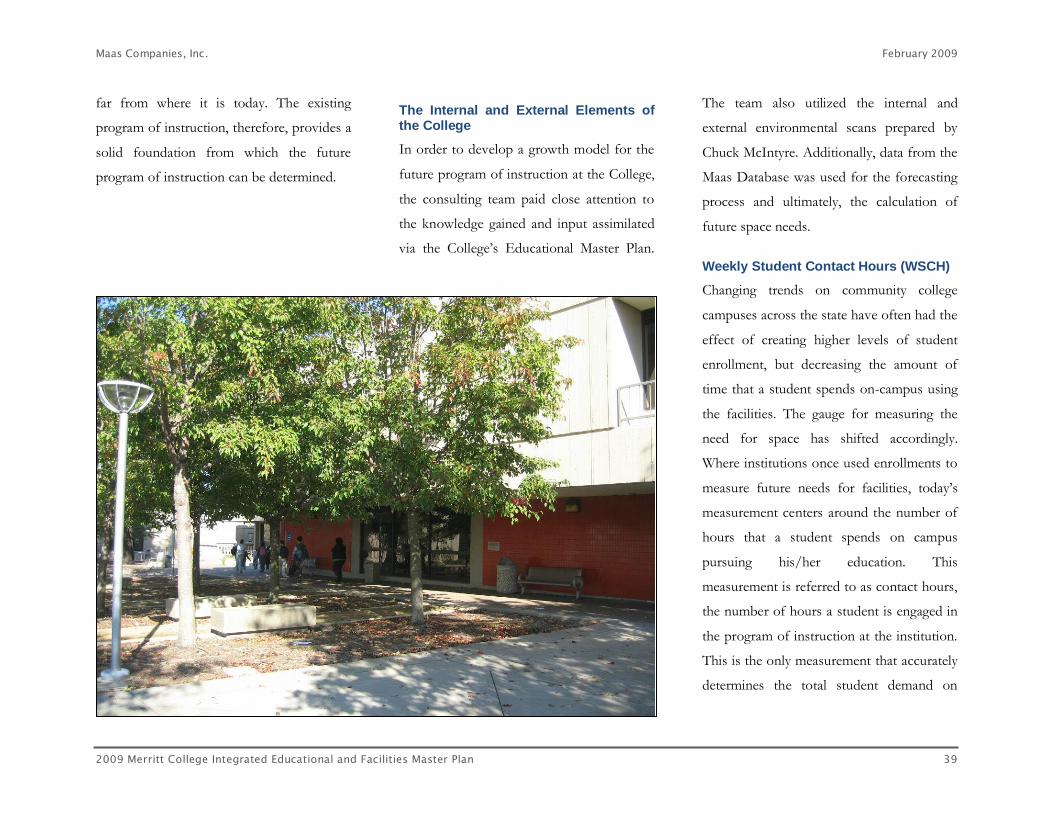
Maas Companies, Inc. February 2009
2009 Merritt College Integrated Educational and Facilities Master Plan 39
far from where it is today. The existing
program of instruction, therefore, provides a
solid foundation from which the future
program of instruction can be determined.
The Internal and External Elements of the College
In order to develop a growth model for the
future program of instruction at the College,
the consulting team paid close attention to
the knowledge gained and input assimilated
via the College’s Educational Master Plan.
The team also utilized the internal and
external environmental scans prepared by
Chuck McIntyre. Additionally, data from the
Maas Database was used for the forecasting
process and ultimately, the calculation of
future space needs.
Weekly Student Contact Hours (WSCH)
Changing trends on community college
campuses across the state have often had the
effect of creating higher levels of student
enrollment, but decreasing the amount of
time that a student spends on-campus using
the facilities. The gauge for measuring the
need for space has shifted accordingly.
Where institutions once used enrollments to
measure future needs for facilities, today’s
measurement centers around the number of
hours that a student spends on campus
pursuing his/her education. This
measurement is referred to as contact hours,
the number of hours a student is engaged in
the program of instruction at the institution.
This is the only measurement that accurately
determines the total student demand on
40 Maas Companies, Inc.
facilities. It is the key to determining the
future program of instruction, and the future
capacities of the District.
GROWTH RATE TARGETS FOR WSCH AND ENROLLMENT
To address the capacities for future WSCH
and enrollment growth, a planning model
was created. The model used, relied on
credit-WSCH as the primary measure for
determining growth. The consulting team
then made projections consistent with the
scope of the Plan, projecting growth out to
the year 2022.
With all of the factors and key planning
elements taken into consideration, credit-
WSCH generation and student headcount is
projected to grow at 2.4% annually. This
growth is not expected to be linear.
Specifically, credit-WSCH generation is
anticipated to grow from the fall 2007 level
of 59,591 to 84,744 by 2022. Student
headcount, over this same period of time, is
projected to grow from the current level of
7,233 at the College to 10,323 by 2022.
The most important outcome of the
forecasting process was to assure that when
a certain level of WSCH was achieved, the
College had designated (or will have
constructed) new or remodeled, facilities in
place to meet the space demands for
academic and support services. Whether that
level of WSCH is reached exactly in the year
2022 is not of utmost importance. What is
key is that to accommodate this future level
of WSCH, the College knows what its space
needs will be and has planned accordingly.
The forecasting model that was used for the
College meets this standard.
PROFILE OF THE FUTURE PROGRAM OF INSTRUCTION
Space needs for the future cannot be
determined without first determining the
capacity of the future program of
instruction. To achieve this, Merritt College’s
fall 2007 program of instruction was used as
the basis for the future forecast.
The projections for the future program of
instruction are not intended to dictate
curricular content but rather to provide a
perspective of what the current curriculum
would look like if extended forward. It is
very likely that the curriculum will change
relative to its content over the next fifteen
years. The more important consideration
and assumption, however, was that there will
be a curriculum of some sort and that it will
have a certain number of class sections,
enrolled students, credit-WSCH, lecture
hours and laboratory hours. While the
program of instruction could be forecast
forward using a generic curriculum and
similar results obtained, the existing program
of instruction at the College offered the
most current and accurate form for the
forecasting process.
The College’s forecast of its future programs
of instruction also relied heavily on several
references and planning documents. Some
of the more critical documents reviewed
include:

Maas Companies, Inc. February 2009
2009 Merritt College Integrated Educational and Facilities Master Plan 41
• The 2008 Peralta Community College District, Report 17 ASF/OGSF Summary and the Capacities Summary, a facilities inventory recorded annually with the State Chancellor’s Office.
• The Peralta Community College District’s 5-Year Construction Plan.
• The 2007 fall semester data reports depicting sections offered, WSCH generated, lecture/lab ratios, seat-count and full-time equivalent faculty loads as provided via Peralta Community College District, Office of Institutional Research.
• The Maas Companies database, containing data and information from 80 community colleges throughout the State of California.
The following chart illustrates the forecast
for WSCH generation by the College
through the year 2022.
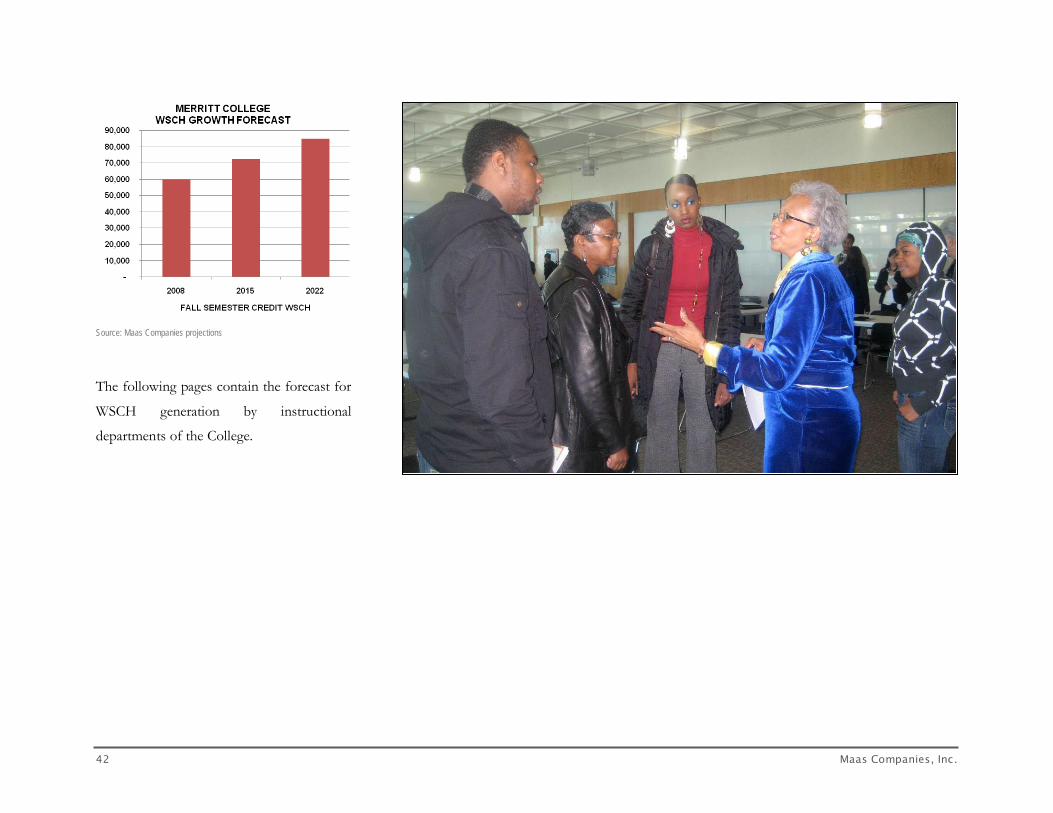
42 Maas Companies, Inc.
Source: Maas Companies projections
The following pages contain the forecast for
WSCH generation by instructional
departments of the College.
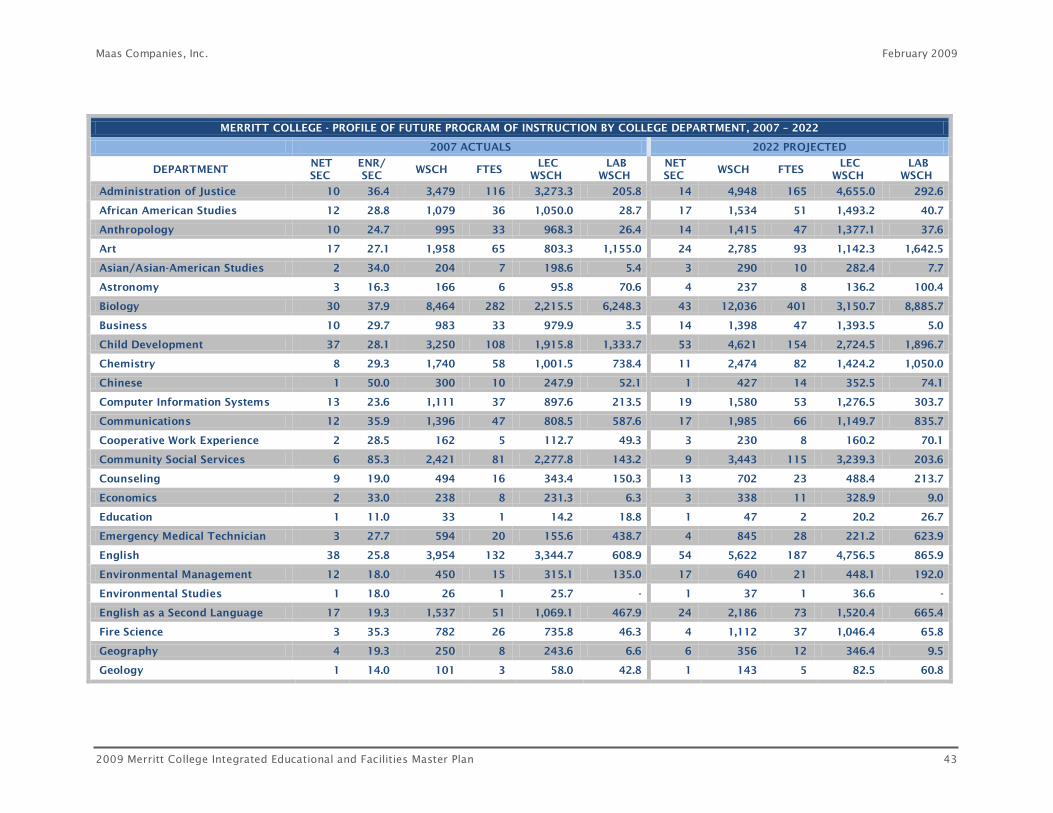
Maas Companies, Inc. February 2009
2009 Merritt College Integrated Educational and Facilities Master Plan 43
MERRITT COLLEGE - PROFILE OF FUTURE PROGRAM OF INSTRUCTION BY COLLEGE DEPARTMENT, 2007 – 2022
2007 ACTUALS 2022 PROJECTED
DEPARTMENT NET SEC
ENR/ SEC
WSCH FTES LEC
WSCH LAB
WSCH NET SEC
WSCH FTES LEC
WSCH LAB
WSCH
Administration of Justice 10 36.4 3,479 116 3,273.3 205.8 14 4,948 165 4,655.0 292.6
African American Studies 12 28.8 1,079 36 1,050.0 28.7 17 1,534 51 1,493.2 40.7
Anthropology 10 24.7 995 33 968.3 26.4 14 1,415 47 1,377.1 37.6
Art 17 27.1 1,958 65 803.3 1,155.0 24 2,785 93 1,142.3 1,642.5
Asian/Asian-American Studies 2 34.0 204 7 198.6 5.4 3 290 10 282.4 7.7
Astronomy 3 16.3 166 6 95.8 70.6 4 237 8 136.2 100.4
Biology 30 37.9 8,464 282 2,215.5 6,248.3 43 12,036 401 3,150.7 8,885.7
Business 10 29.7 983 33 979.9 3.5 14 1,398 47 1,393.5 5.0
Child Development 37 28.1 3,250 108 1,915.8 1,333.7 53 4,621 154 2,724.5 1,896.7
Chemistry 8 29.3 1,740 58 1,001.5 738.4 11 2,474 82 1,424.2 1,050.0
Chinese 1 50.0 300 10 247.9 52.1 1 427 14 352.5 74.1
Computer Information Systems 13 23.6 1,111 37 897.6 213.5 19 1,580 53 1,276.5 303.7
Communications 12 35.9 1,396 47 808.5 587.6 17 1,985 66 1,149.7 835.7
Cooperative Work Experience 2 28.5 162 5 112.7 49.3 3 230 8 160.2 70.1
Community Social Services 6 85.3 2,421 81 2,277.8 143.2 9 3,443 115 3,239.3 203.6
Counseling 9 19.0 494 16 343.4 150.3 13 702 23 488.4 213.7
Economics 2 33.0 238 8 231.3 6.3 3 338 11 328.9 9.0
Education 1 11.0 33 1 14.2 18.8 1 47 2 20.2 26.7
Emergency Medical Technician 3 27.7 594 20 155.6 438.7 4 845 28 221.2 623.9
English 38 25.8 3,954 132 3,344.7 608.9 54 5,622 187 4,756.5 865.9
Environmental Management 12 18.0 450 15 315.1 135.0 17 640 21 448.1 192.0
Environmental Studies 1 18.0 26 1 25.7 - 1 37 1 36.6 -
English as a Second Language 17 19.3 1,537 51 1,069.1 467.9 24 2,186 73 1,520.4 665.4
Fire Science 3 35.3 782 26 735.8 46.3 4 1,112 37 1,046.4 65.8
Geography 4 19.3 250 8 243.6 6.6 6 356 12 346.4 9.5
Geology 1 14.0 101 3 58.0 42.8 1 143 5 82.5 60.8

44 Maas Companies, Inc.
MERRITT COLLEGE - PROFILE OF FUTURE PROGRAM OF INSTRUCTION BY COLLEGE DEPARTMENT, 2007 – 2022
2007 ACTUALS 2022 PROJECTED
DEPARTMENT NET SEC
ENR/ SEC
WSCH FTES LEC
WSCH LAB
WSCH NET SEC
WSCH FTES LEC
WSCH LAB
WSCH
History 3 24.0 235 8 228.4 6.2 4 334 11 324.8 8.9
Health Education 2 34.0 245 8 105.3 139.5 3 348 12 149.7 198.4
Health Professions & Occupations 2 29.0 127 4 33.2 93.7 3 180 6 47.2 133.2
Humanities 4 22.8 299 10 252.8 46.0 6 425 14 359.5 65.4
Human Services 8 17.1 381 13 358.4 22.5 11 542 18 509.6 32.0
Insurance 3 15.3 112 4 111.6 0.4 4 159 5 158.7 0.6
Landscape Horticulture 32 27.8 3,049 102 1,524.5 1,524.5 46 4,336 145 2,167.9 2,167.9
Learning Resources 6 309.5 303 10 303.3 - 9 431 14 431.4 -
Mathematics 36 31.9 4,339 145 4,224.2 114.8 51 6,171 206 6,007.3 163.3
Medical Assisting 1 20.0 263 9 68.8 194.1 1 374 12 97.9 276.0
Music 8 30.0 845 28 346.7 498.5 11 1,202 40 493.0 708.9
Nursing 8 61.1 2,618 87 685.3 1,932.7 11 3,723 124 974.6 2,748.5
Nutrition 17 20.4 852 28 222.9 628.7 24 1,211 40 317.0 894.0
Physical Education 20 53.6 1,716 57 738.1 978.2 29 2,441 81 1,049.7 1,391.1
Paralegal Studies 10 24.3 742 25 742.0 - 14 1,055 35 1,055.2 -
Philosophy 2 22.0 143 5 120.8 22.0 3 203 7 171.8 31.3
Physics 5 13.4 394 13 226.8 167.2 7 560 19 322.5 237.8
Political Science 5 24.4 391 13 380.8 10.4 7 556 19 541.5 14.8
Psychology 11 38.6 1,363 45 1,326.5 36.2 16 1,938 65 1,886.5 51.5
Radiologic Technology 10 29.5 1,720 57 450.2 1,269.6 14 2,446 82 640.2 1,805.4
Recreation & Leisure Services 1 36.0 130 4 76.4 53.2 1 184 6 108.7 75.6
Real Estate 22 29.0 1,374 46 1,368.9 4.9 31 1,954 65 1,946.8 7.0
Sociology 4 34.8 450 15 438.0 12.0 6 640 21 622.9 17.0
Spanish 8 24.0 784 26 648.1 136.3 11 1,116 37 921.7 193.8
Vocational Nursing 1 19.0 551 18 144.3 406.8 1 784 26 205.2 578.6
TOTAL 493 33.3 59,591 1,986 38,509.3 21,081.5 704 84,744 2,825 54,764.0 29,980.0
Source: Peralta Community College District Office of Institutional Research
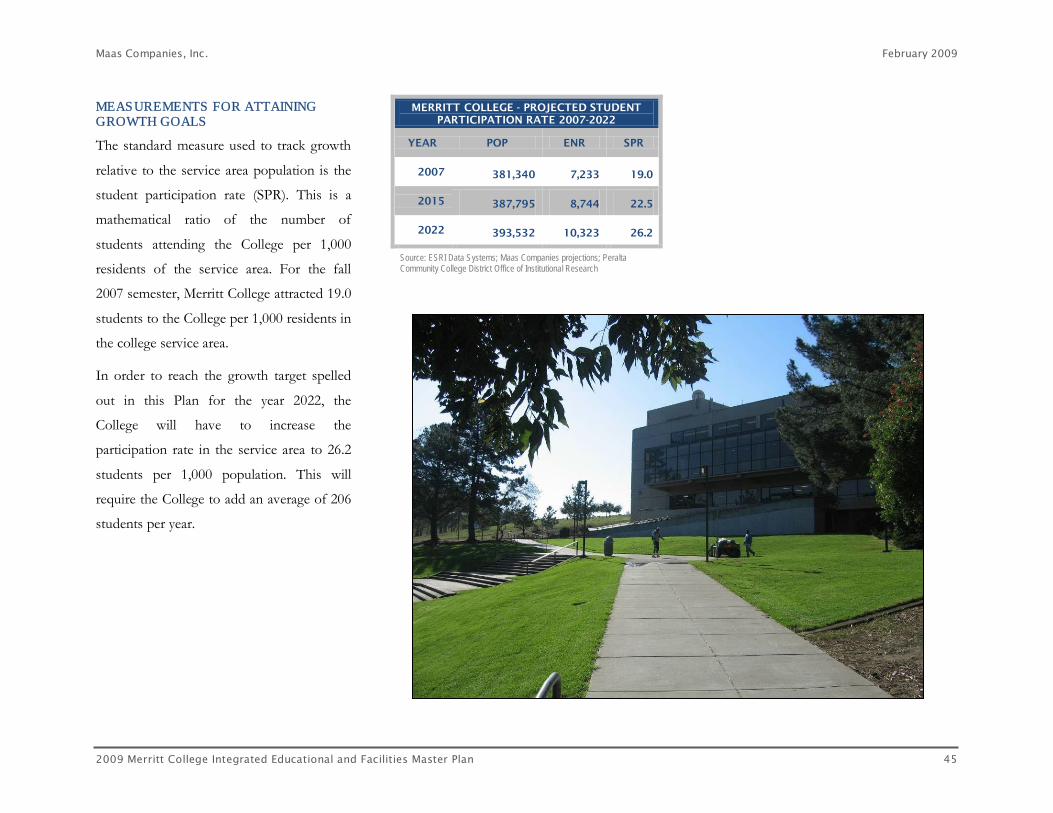
Maas Companies, Inc. February 2009
2009 Merritt College Integrated Educational and Facilities Master Plan 45
MEASUREMENTS FOR ATTAINING GROWTH GOALS
The standard measure used to track growth
relative to the service area population is the
student participation rate (SPR). This is a
mathematical ratio of the number of
students attending the College per 1,000
residents of the service area. For the fall
2007 semester, Merritt College attracted 19.0
students to the College per 1,000 residents in
the college service area.
In order to reach the growth target spelled
out in this Plan for the year 2022, the
College will have to increase the
participation rate in the service area to 26.2
students per 1,000 population. This will
require the College to add an average of 206
students per year.
MERRITT COLLEGE - PROJECTED STUDENT PARTICIPATION RATE 2007-2022
YEAR POP ENR SPR
2007 381,340 7,233 19.0
2015 387,795 8,744 22.5
2022 393,532 10,323 26.2
Source: ESRI Data Systems; Maas Companies projections; Peralta Community College District Office of Institutional Research
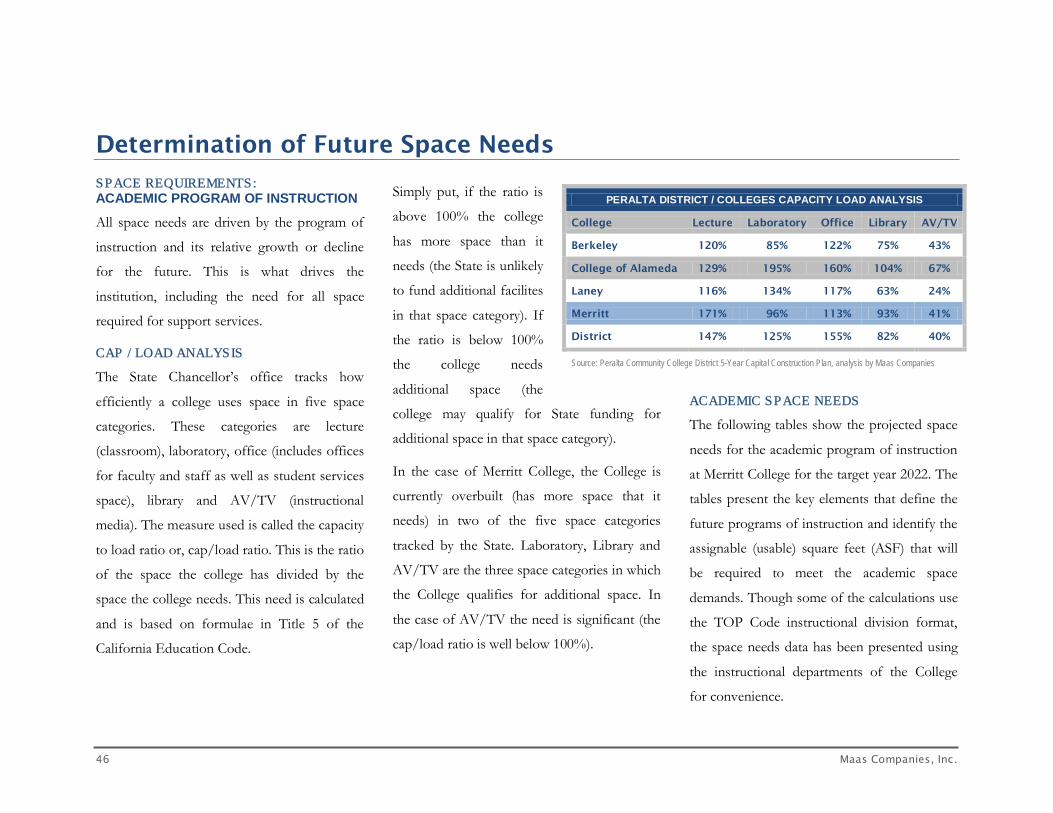
46 Maas Companies, Inc.
Determination of Future Space Needs
SPACE REQUIREMENTS: ACADEMIC PROGRAM OF INSTRUCTION
All space needs are driven by the program of
instruction and its relative growth or decline
for the future. This is what drives the
institution, including the need for all space
required for support services.
CAP / LOAD ANALYSIS
The State Chancellor’s office tracks how
efficiently a college uses space in five space
categories. These categories are lecture
(classroom), laboratory, office (includes offices
for faculty and staff as well as student services
space), library and AV/TV (instructional
media). The measure used is called the capacity
to load ratio or, cap/load ratio. This is the ratio
of the space the college has divided by the
space the college needs. This need is calculated
and is based on formulae in Title 5 of the
California Education Code.
Simply put, if the ratio is
above 100% the college
has more space than it
needs (the State is unlikely
to fund additional facilites
in that space category). If
the ratio is below 100%
the college needs
additional space (the
college may qualify for State funding for
additional space in that space category).
In the case of Merritt College, the College is
currently overbuilt (has more space that it
needs) in two of the five space categories
tracked by the State. Laboratory, Library and
AV/TV are the three space categories in which
the College qualifies for additional space. In
the case of AV/TV the need is significant (the
cap/load ratio is well below 100%).
ACADEMIC SPACE NEEDS
The following tables show the projected space
needs for the academic program of instruction
at Merritt College for the target year 2022. The
tables present the key elements that define the
future programs of instruction and identify the
assignable (usable) square feet (ASF) that will
be required to meet the academic space
demands. Though some of the calculations use
the TOP Code instructional division format,
the space needs data has been presented using
the instructional departments of the College
for convenience.
PERALTA DISTRICT / COLLEGES CAPACITY LOAD ANALYSIS
College Lecture Laboratory Office Library AV/TV
Berkeley 120% 85% 122% 75% 43%
College of Alameda 129% 195% 160% 104% 67%
Laney 116% 134% 117% 63% 24%
Merritt 171% 96% 113% 93% 41%
District 147% 125% 155% 82% 40%
Source: Peralta Community College District 5-Year Capital Construction Plan, analysis by Maas Companies

Maas Companies, Inc. February 2009
2009 Merritt College Integrated Educational and Facilities Master Plan 47
Academic Space Profile for 2022
The following table depicts the program of
instruction when WSCH reaches 84,744 for a
given semester. The table shows the lecture
and laboratory space needs (ASF) for each
department when this level of WSCH is
reached.
MERRITT COLLEGE - PROGRAM OF INSTRUCTION BY COLLEGE DEPARTMENT - FALL 2022
DEPARTMENT NET SEC
WSCH FTES FTEF LEC
WSCH LAB
WSCH LEC ASF
LAB ASF
Administration of Justice 14 4,948 164.9 2 4,655.0 292.6 2,202 626
African American Studies 17 1,534 51.1 3 1,493.2 40.7 706 61
Anthropology 14 1,415 47.2 3 1,377.1 37.6 651 56
Art 24 2,785 92.8 5 1,142.3 1,642.5 540 4,221
Asian/Asian-American Studies 3 290 9.7 0 282.4 7.7 134 12
Astronomy 4 237 7.9 1 136.2 100.4 64 258
Biology 43 12,036 401.2 15 3,150.7 8,885.7 1,490 19,015
Business 14 1,398 46.6 3 1,393.5 5.0 659 6
Child Development 53 4,621 154.0 10 2,724.5 1,896.7 1,289 4,874
Chemistry 11 2,474 82.5 5 1,424.2 1,050.0 674 2,699
Chinese 1 427 14.2 0 352.5 74.1 167 111
Computer Information Systems 19 1,580 52.7 4 1,276.5 303.7 604 519
Communications 17 1,985 66.2 3 1,149.7 835.7 544 1,788
Cooperative Work Experience 3 230 7.7 1 160.2 70.1 76 180
Community Social Services 9 3,443 114.8 3 3,239.3 203.6 1,532 436
Counseling 13 702 23.4 2 488.4 213.7 231 549
Economics 3 338 11.3 0 328.9 9.0 156 13
Education 1 47 1.6 0 20.2 26.7 10 86
Emergendy Medical Technician 4 845 28.2 1 221.2 623.9 105 1,335
English 54 5,622 187.4 12 4,756.5 865.9 2,250 1,853
Environmental Management 17 640 21.3 2 448.1 192.0 212 945
Environmental Studies 1 37 1.2 0 36.6 - 17 -
English as a Second Language 24 2,186 72.9 6 1,520.4 665.4 719 1,710
Fire Science 4 1,112 37.1 0 1,046.4 65.8 495 141
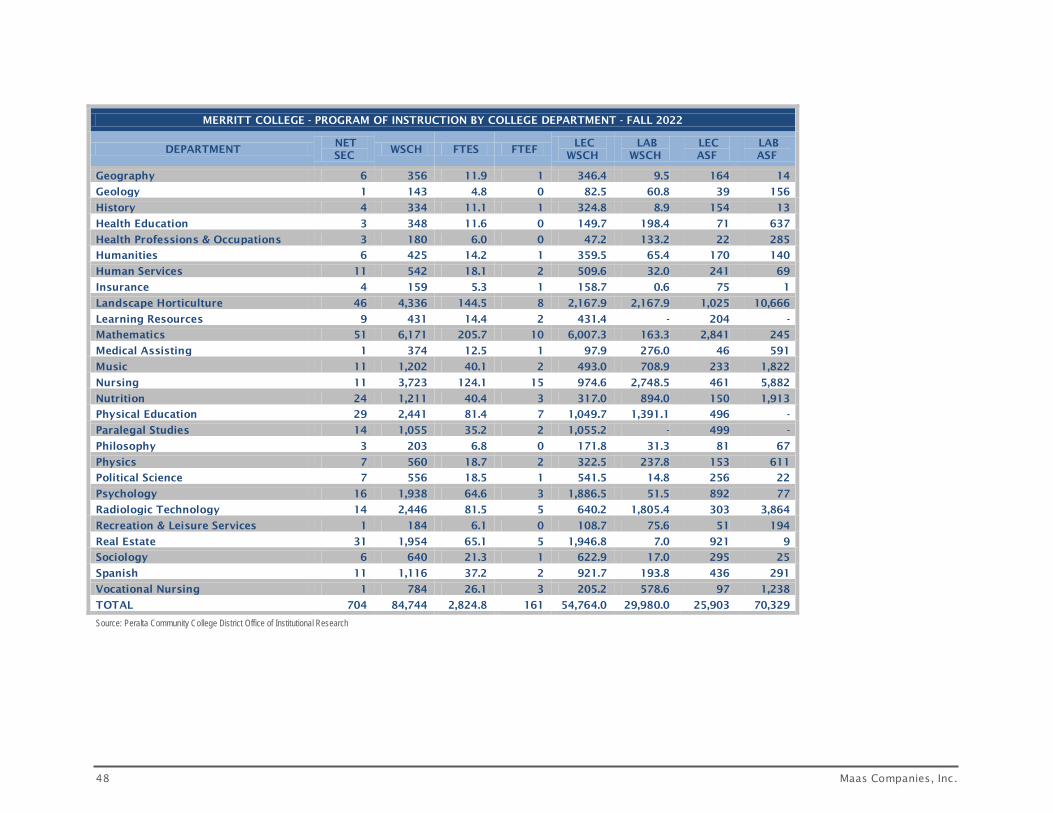
48 Maas Companies, Inc.
MERRITT COLLEGE - PROGRAM OF INSTRUCTION BY COLLEGE DEPARTMENT - FALL 2022
DEPARTMENT NET SEC
WSCH FTES FTEF LEC
WSCH LAB
WSCH LEC ASF
LAB ASF
Geography 6 356 11.9 1 346.4 9.5 164 14
Geology 1 143 4.8 0 82.5 60.8 39 156
History 4 334 11.1 1 324.8 8.9 154 13
Health Education 3 348 11.6 0 149.7 198.4 71 637
Health Professions & Occupations 3 180 6.0 0 47.2 133.2 22 285
Humanities 6 425 14.2 1 359.5 65.4 170 140
Human Services 11 542 18.1 2 509.6 32.0 241 69
Insurance 4 159 5.3 1 158.7 0.6 75 1
Landscape Horticulture 46 4,336 144.5 8 2,167.9 2,167.9 1,025 10,666
Learning Resources 9 431 14.4 2 431.4 - 204 -
Mathematics 51 6,171 205.7 10 6,007.3 163.3 2,841 245
Medical Assisting 1 374 12.5 1 97.9 276.0 46 591
Music 11 1,202 40.1 2 493.0 708.9 233 1,822
Nursing 11 3,723 124.1 15 974.6 2,748.5 461 5,882
Nutrition 24 1,211 40.4 3 317.0 894.0 150 1,913
Physical Education 29 2,441 81.4 7 1,049.7 1,391.1 496 -
Paralegal Studies 14 1,055 35.2 2 1,055.2 - 499 -
Philosophy 3 203 6.8 0 171.8 31.3 81 67
Physics 7 560 18.7 2 322.5 237.8 153 611
Political Science 7 556 18.5 1 541.5 14.8 256 22
Psychology 16 1,938 64.6 3 1,886.5 51.5 892 77
Radiologic Technology 14 2,446 81.5 5 640.2 1,805.4 303 3,864
Recreation & Leisure Services 1 184 6.1 0 108.7 75.6 51 194
Real Estate 31 1,954 65.1 5 1,946.8 7.0 921 9
Sociology 6 640 21.3 1 622.9 17.0 295 25
Spanish 11 1,116 37.2 2 921.7 193.8 436 291
Vocational Nursing 1 784 26.1 3 205.2 578.6 97 1,238
TOTAL 704 84,744 2,824.8 161 54,764.0 29,980.0 25,903 70,329
Source: Peralta Community College District Office of Institutional Research

Maas Companies, Inc. February 2009
2009 Merritt College Integrated Educational and Facilities Master Plan 49
SPACE REQUIREMENTS: ALL PROGRAMS AND SERVICES OF THE COLLEGE
Using the allowable standards referenced in the
California Code of Regulations Title 5 for
calculating space (see Attachment A at the end
of this Plan), and the College’s current space
inventory (the Peralta Community College District
Report 17, ASF/OGSF Summary & Capacities
Summary, October 2008) the future space needs
of the College have been determined for
instructional and support service space
categories.
The table shows the current inventory of
existing facilites at the College, the future space
qualification and the net need by space
catetory. Merritt College currently has 219,030
ASF (assignable or usable square feet of space)
and by the year 2022 (or when WSCH reaches
84,744 for a given semester) the College will
qualify for a total of 261,341 ASF of space.
The total “net need” for space through the
year 2022 is 42,311 ASF.
MERRITT COLLEGE 2022 TARGET YEAR SPACE REQUIREMENTS
SPACE CATEGORY
DESCRIPTION CURRENT
INVENTORY 2022 TITLE 5
QUALIFICATION NET NEED
0 INACTIVE 0 0 -
100 CLASSROOM 39,728 25,903 (13,825)
210-230 LABORATORY 57,120 70,329 13,209
235-255 NON CLASS LABORATORY 0 981 981
300 OFFICE/CONFERENCE 30,305 22,598 (7,707)
400 LIBRARY 21,016 31,612 10,596
520-525 PHYS ED (INDOOR) 31,977 35,000 3,023
530-535 AV/TV 2,000 12,831 10,831
540-555 CLINIC/DEMONSTRATION 6,010 5,436 (574)
580-585 GREENHOUSE 4,581 3,593 (988)
590 OTHER 448 1,633 1,185
610-625 ASSEMBLY/EXHIBITION 1,186 10,323 9,137
630-635 FOOD SERVICE 5,178 6,194 1,016
650-655 LOUNGE/LOUNGE SERVICE 5,940 3,785 (2,155)
660-665 MERCHANDISING 1,786 8,417 6,631
670-690 MEETING/RECREATION 5,350 3,438 (1,912)
710-715 DATA PROCESSING/COMP 3,315 5,000 1,685
720-770 PHYSICAL PLANT 2,695 13,067 10,372
800 HEALTH SERVICES 395 1,200 805
Total 219,030 261,341 42,311
Source: Peralta Community College District Report 17; Maas Companies projections - Calculations based on California Code of Regulations Title 5, Chapter 8, Section 57028
50 Maas Companies, Inc.
The State Chancellor’s Office monitors five
space categories for consideration of funding
support. These categories are classroom,
laboratory, office/conference, library/LRC
and instructional media (AV/TV). An analysis
of the College’s total space needs shows that
by the year 2022 the College will need
additional space in three of these five
categories: laboratory (14,190 ASF—this
combines laboratory and non-class laboratory
categories), library/LRC (10,596 ASF) and
AV/TV–instructional media (10,831 ASF).
The College is currently overbuilt in lecture
(classroom) space by 13,825 ASF. This
indicates that the classroom spaces may not be
configured in the best way to accommodate
the program of instruction. This can be
rectified by renovating some of the existing
classroom facilities, sizing them more
appropriately for the classes being held in
them.
The College and District may also want to
consider a careful re-examination of the space
coding of all campus facilities. There are
additional needs in the discretionary support
service space categories of physical plant,
clinic/demonstration, assembly/exhibition,
data processing and health services.
Maas Companies, Inc. February 2009
2009 Merritt College Integrated Educational and Facilities Master Plan 51
The Financial Plan
The 2009 Merritt College Integrated
Educational and Facilities Master Plan was
developed around the concept of matching
the future space needs of the College with
required funding. The goal has been to
produce a viable building and facilities
program to support the instructional and
support services provided by the College.
Thus, the Plan was developed to first
establish an economically viable and
efficient program of instruction and
support services, and then to determine a
facilities and financing plan that will support
the identified needs.
The Plan forecasts the future program of
instruction and support services through the
year 2022. The need for additional or
remodeled space will occur in a phased manner
over this 15-year period. The time frame for
development will be driven both by growth in
student headcount as well as by the availability
of funds for capital construction.
The priorities and the identified projects do
not change. The variables are time and
funding. The proposed facility program that
follows defines projects by site and location.
The cost estimates for the projects are based
on current construction costs as established by
the State of California pursuant to California
Construction Cost Index (CCI-4593). This
index projects costs for projects that will be
under construction during the 2007-08 fiscal
year. An inflation factor of 3.5% has been
added for each subsequent year of the
Plan.
For renovation projects, it is estimated that
approximately $275/ASF will be required
to achieve the proposed level for
renovation and remodel of existing
buildings. All existing spaces will also need
to be upgraded for technology and
equipment. $85/ASF has been budgeted
for this category. Needed site
improvements include: construction of
parking lots, lighting ADA access routes, and
development of fields and landscaping. The
cost to construct these improvements is
estimated at $25/ASF of building area.
PROPOSED FACILITIES BY SITE
The following table provides a summary of all
proposed projects for the College. These
projects are currently listed on the District
Five-Year Capital Construction Plan.

52 Maas Companies, Inc.
Financing Options
The table to the right provides a summary of
the projected funds needed to fund the
proposed capital construction program. Based
on this information, it is proposed the District
consider the following options to obtain the
necessary funds to implement the capital
development program:
• State of California Capital Outlay Funding
• Scheduled Maintenance Funds from the State1
• Joint Venture programs with Business and Industry
• Joint Venture programs with other Educational Institutions
• Fee Based Instructional Programs
• Private Donations
• Local Bond Issue
1 These funds may be distributed by the State as a “Block
Grant” that also includes funding for instructional equipment.
The District would need to designate these funds for
augmentation of the capital construction program.
A brief description and analysis of each of
these funding options is provided on the
following pages:
MERRITT COLLEGE FUTURE PROJECTS THROUGH THE YEAR 2022
PROJECT PROJECTED COST
Science Complex $45,112,000
Library Renovation $6,000,000
Modernize Trade Technology Building $23,786,000
Child Development Center $16,120,000
Horticulture Building Renovation $7,270,000
Renovation of Building D $24,096,000
TOTAL $122,384,000
Source: Peralta Community College District Five-Year Capital Construction Plan (accessed December 2, 2008)

Maas Companies, Inc. February 2009
2009 Merritt College Integrated Educational and Facilities Master Plan 53
A. State of California Capital Outlay Funding
The California Community College Chancellor’s Office is a long-standing source for funding capital construction
projects. This process requires submission of an Initial Project Proposal (IPP) and a Final Project Proposal (FPP).
Approvals through the State Chancellor’s Office, and ultimately the Department of Finance and the legislature,
typically take three years from application to receiving initial funding of a project, and five years before the project is
completed and ready for occupancy.
A competitive point system drives the process, with all community colleges competing for the same funding that the
State has provided via a statewide bond program. This process generally requires the District to provide a
percentage of its own funds as a “match” while the State provides the balance. In the past, 10-20% District funding
was a norm. Recently, the percentage of local contribution has risen to 30-50% in matching funds as districts that
have passed local bonds are using those funds to gain additional “points” for their projects. Pursuant to State
guidelines, the State will fund a maximum of one project per college per year. In reality, the pattern of funding has
been less than the maximum due to the time it takes to plan and construct a project via this procedure. If the Peralta
District can achieve the necessary “points” for a project to be funded, a reasonable expectation would be to have 4-
5 projects funded by the State per campus over the next 20 years.
B. Scheduled Maintenance Funds from the State
As noted above, the State of California has historically funded local districts to assist in scheduled maintenance of
facilities. Until 2002, funding occurred on a project-by-project basis. Since 2002, scheduled maintenance funding is
included in an annually funded, block grant program that also includes funds for instructional and library
equipment. There is a local match required for the use of these funds. It is not typically a large amount of funding
($300,000-$600,000/district/year) but it is an option to solve minor building renovation or maintenance issues.
54 Maas Companies, Inc.
C. Joint Venture programs with Business and Industry
Joint venture options with business and industry are an option the District needs to consider for job-based,
educational training programs be they on-campus, adjacent to a campus or within the community. The concept
involves educational and training programs jointly developed with private business and industry at a specific site
identified by the joint-venture partner. If the site is owned by the partner, rent-free facilities would be required. If
the College owns the site, the cost of constructing the facility and the repayment of the construction loan for the
building would be part of the joint-use agreement between the parties.
D. Joint Venture programs with other Educational Institutions
Joint venture options with other educational institutions would be similar in format to the joint venture program
discussed in item C. However, rather than having a joint venture partner from business or industry, the District
would have another educational institution as its partner. The education partners, via the joint venture agreement,
would assume responsibility for the repayment of the construction loan, in lieu of land lease payments and rent,
until the building cost is paid.
E. Fee Based Instructional Programs
The District has the option to develop a fee-based curriculum and compete with other public and private
institutions for students who would not typically attend the traditional, State-funded, public instructional program
of a community college. Any excess revenue generated from such activities could be used to fund future capital
construction projects.
Maas Companies, Inc. February 2009
2009 Merritt College Integrated Educational and Facilities Master Plan 55
F. Private Donations
Private colleges and universities have historically created capital campaigns to fund facilities. Unfortunately, the
community colleges have had limited success in such alternative funding efforts. Private businesses or educational
institutions may wish to “partner” with the District. Typically, such donations frequently focus on the development
of technology. In recent years, it has become very popular to develop business incubators with the University of
California campuses. Using this concept, businesses or educational institutions could partner (by providing capital)
with the District to develop advanced technology programs and educational facilities at any site throughout the
District.
G. Local Bond Issue
The District used this option in 2000. Utilization of the funds residual funds needs to be assessed and prioritized. In
developing this Plan, the analysis team has concluded that the remaining funds will not be enough to achieve the
Plan’s objectives. If the Board of Trustees determines that an additional bond is a
viable option, they may wish to once again request voter approval of additional
bond funds. If this decision is made, pursuant to Proposition 39 guidelines, 55%
of the voters must approve the issuance of bonds. There is a maximum limit of
$25/$100,000 of assessed valuation that can be levied. Typically, the length of
repayment of the obligation is 20-30 years. Elections to request voter approval of
a Proposition 39 Bond must be held in conjunction with a general election such as
the statewide primary or general elections. Very specific guidelines and procedures
must be followed by the District if it elects to pursue this option. Finally, a
comprehensive, detailed plan of public information and justification for all
projects that will be funded via the bond program must be shared with all
constituencies.

56 Maas Companies, Inc.
SUGGESTED FINANCING PARAMETERS
The following general guidelines are suggested as the District considers the funding options for implementing the
Integrated Educational and Facilities Master Plan:
1. The Governing Board, in concert with the District staff, should carefully review and assess all funding options.
A series of Board of Trustee workshops specifically designated for this purpose may be necessary.
2. The District must prioritize the projects included in the proposed Plan. This prioritization should be based on
the specific needs as well as the source of potential funding.
3. The District must maximize State funding. This should be a primary criterion for the prioritization of projects.
4. Given that State funding will not meet the total funding needs of the District, consider requesting voter
approval for a local bond to fund the proposed capital construction program.
5. Carefully assess the time line for implementing the plan. Adjustment in the time line may provide additional
funding options.
6. Respect the Plan. Any modifications must be carefully considered as there will likely be unanticipated secondary
effects. Treat the Plan as a “living” document that is used as a decision-making guide. Update the Plan
periodically, as agreed upon, through a thoughtful planning and discussion process with all parties.
7. Assess the impact of inflation on the proposed project budgets. Given the current bidding climate, the
proposed budgets may not be sufficient to cover the scope of work. In all likelihood, the College and District
will need to adjust the prioritization and funding of projects. Accelerating the construction time line for
identified projects will help to reduce the impact of inflation.
Maas Companies, Inc. February 2009
2009 Merritt College Integrated Educational and Facilities Master Plan 57
Total Cost of Ownership
As part of its institutional master planning
process, Merritt College and the Peralta
Community College District (PCCD) are
committed to developing a systematic,
College and District-wide approach for all
planning and budgeting activities. This
approach includes the assessment of all
current functions and activities and the
development of a District-wide process for
the ongoing assessment of future programs,
services and facilities. Preliminary
discussions have suggested that the concept
of “Total Cost of Ownership” (TCO) may
be a viable approach to addressing this
concern.
DEFINITION OF TOTAL COST OF OWNERSHIP (TCO)
Total Cost of Ownership (TCO), as used for
College facilities, is defined for these
purposes as the systematic quantification of
all costs generated over the useful lifespan of
the facility (30-50 years). The goal of TCO is
to determine a value that will reflect the true,
effective cost of the facility, including
planning, design, constructing and equipping
of the facility, and also the recurring costs to
operate the facility over its useful lifespan
(30-50 years). The one-time costs of capital
construction and related costs shall be as
listed on the JCAF-32 report developed by
the California Community College
Chancellor’s Office. The recurring, or
operational costs, shall include staffing,
institutional support services, replaceable
equipment, supplies, maintenance, custodial
services, technological services, utilities and
related day-to-day operating expenses for the
facility.
Green / Sustainable Design
When designing new facilites or renovating
exising ones, the College should consider
“green” building technologies. The College
needs to consider such applications for all
future projects so as to reduce the ongoing
operational costs of the facilities.
PURPOSE OF THE PROCESS
The College and District intend to develop a
standardized procedure for determining the
TCO for existing facilities as well as for
remodeled or new facilities that may be
constructed throughout the District. The
basis for this procedure shall be the concept
of TCO as it is typically used in areas such as
information technology, governmental cost
assessments, and corporate budget analysis.
The purpose of TCO will be to provide an
institutionally agreed upon, systematic
procedure by which each existing facility in
the District is evaluated. This procedure will
establish a quantitative data base to assist the
District and each College in determining the
viability of existing facilities, as well as the
feasibility of remodeling and/or constructing
new facilities.
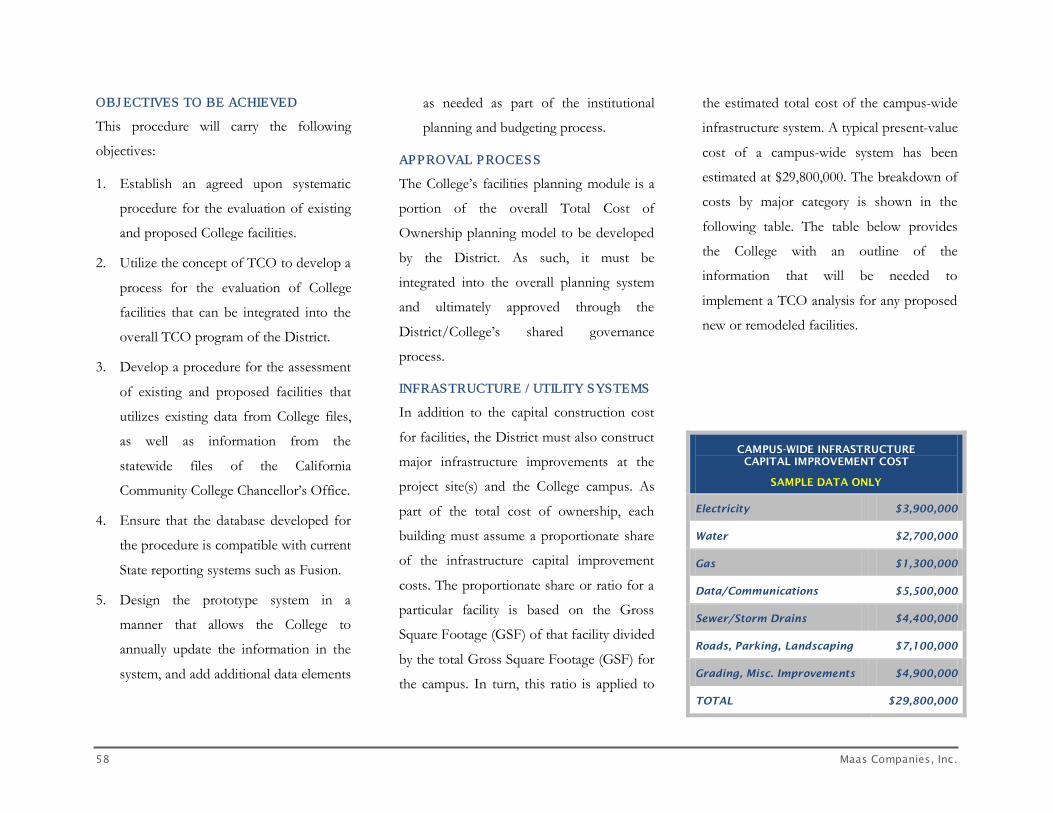
58 Maas Companies, Inc.
OBJ ECTIVES TO BE ACHIEVED
This procedure will carry the following
objectives:
1. Establish an agreed upon systematic
procedure for the evaluation of existing
and proposed College facilities.
2. Utilize the concept of TCO to develop a
process for the evaluation of College
facilities that can be integrated into the
overall TCO program of the District.
3. Develop a procedure for the assessment
of existing and proposed facilities that
utilizes existing data from College files,
as well as information from the
statewide files of the California
Community College Chancellor’s Office.
4. Ensure that the database developed for
the procedure is compatible with current
State reporting systems such as Fusion.
5. Design the prototype system in a
manner that allows the College to
annually update the information in the
system, and add additional data elements
as needed as part of the institutional
planning and budgeting process.
APPROVAL PROCESS
The College’s facilities planning module is a
portion of the overall Total Cost of
Ownership planning model to be developed
by the District. As such, it must be
integrated into the overall planning system
and ultimately approved through the
District/College’s shared governance
process.
INFRASTRUCTURE / UTILITY SYSTEMS
In addition to the capital construction cost
for facilities, the District must also construct
major infrastructure improvements at the
project site(s) and the College campus. As
part of the total cost of ownership, each
building must assume a proportionate share
of the infrastructure capital improvement
costs. The proportionate share or ratio for a
particular facility is based on the Gross
Square Footage (GSF) of that facility divided
by the total Gross Square Footage (GSF) for
the campus. In turn, this ratio is applied to
the estimated total cost of the campus-wide
infrastructure system. A typical present-value
cost of a campus-wide system has been
estimated at $29,800,000. The breakdown of
costs by major category is shown in the
following table. The table below provides
the College with an outline of the
information that will be needed to
implement a TCO analysis for any proposed
new or remodeled facilities.
CAMPUS-WIDE INFRASTRUCTURE CAPITAL IMPROVEMENT COST
SAMPLE DATA ONLY
Electricity $3,900,000
Water $2,700,000
Gas $1,300,000
Data/Communications $5,500,000
Sewer/Storm Drains $4,400,000
Roads, Parking, Landscaping $7,100,000
Grading, Misc. Improvements $4,900,000
TOTAL $29,800,000
Maas Companies, Inc. February 2009
2009 Merritt College Integrated Educational and Facilities Master Plan 59
SUMMARY OF PLANNING FOR GROWTH AND SUCCESS
Vitality and viability, taken together, define
the charted waters of success. For the next
six to twelve years, the College should
consider maintaining the growth
momentum, while carefully adjusting
curriculum and program offerings. Change
in instructional programs needs to be
embraced by faculty and staff, relying upon
trends, projections and other evidence, while
fully utilizing program reviews as their
primary vehicle.
These efforts alone will not guarantee the
completion of planning, implementation and
ultimate success. Many elements affecting
the success of the College must also be
considered. Space utilization and Total Cost
of Ownership, among others, should be
factored into the growth planning equation.
60 Maas Companies, Inc.
Recommendations
The following recommendations have been
developed for Merritt College:
1. Using the previously completed Merritt
College Educational Master Plan and
this Facility Allocation and Financing
Plan as a guide, continue to implement
an ongoing, College-wide master
planning process that will serve as the
basis for recommendations regarding all
future educational programs, support
services, facility and financial decisions
for the College with the intent to
establish an expanded, comprehensive
curriculum for the College.
2. Develop an enrollment management
program that shall include an annual
assessment of the WSCH/FTEF ratio
for all instructional programs with a
2022 College-wide average of 525
WSCH/FTEF. This program shall
include a process for managing the
student enrollment for the College by
establishing the number of net sections
to the College-wide and departmental
targets listed in the educational, facility
and financial master planning
documents.
3. As part of the ongoing, District-wide
process for review and assessment of
the curriculum, determine what unique
and attractive, “magnet” instructional
programs, such as programs for senior
citizens, health occupations and
wellness/fitness programs can be
offered at the campus. Also, evaluate
what programs or courses are not being
successful at this time and whether these
programs or courses should be
eliminated or combined with similar
programs at other Colleges in the
District.
4. Continue to aggressively integrate the
use of alternate delivery systems
including on-line and distance education
programs for the College with special
emphasis on marketing the programs to
senior adults in the College’s service
area. By 2022, a College-wide objective
should be to offer a minimum of 20%
of all course offerings via alternate
delivery systems.
5. Pursue the creation of a public/private
partnership for the development of the
38-acre parcel adjacent to the campus.
The development of the site should be
educationally related with options such
as medical, health, wellness, fitness and
student/faculty/staff housing as
possible joint venture options for the
partnership. Under no circumstances
should the District consider selling the
property, but rather, should develop the
parcel in accordance with the joint-
Maas Companies, Inc. February 2009
2009 Merritt College Integrated Educational and Facilities Master Plan 61
venture guidelines found in the
Education Code of the State of
California.
6. Address the need to provide the
infrastructure and facilities needed to
support a viable student activity and
student support services program for
the College. An outdoor meeting and
activity area including an amphitheater,
recreational/athletic space, meeting
rooms, and a small theater are some
options that should be considered.
7. In building out the remainder of space
at the current site, follow the space
allocation calculations included in this
Facility Allocation and Financing Plan.
Also, consider the financial impact of
any proposed program, including the
joint venture programs and their space
requirements as determined by a Total
Cost of Ownership analysis for the
proposed program or project.
8. In response to the projected cost of the
proposed capital construction program,
the College should maximize the
potential for State funding for future
facilities and programs. The College
currently has a series of projects listed in
the 5-Year Capital Construction
program that can serve as the basis for
initial discussion regarding
implementation of the Facilities Master
Plan for the campus. Pursuant to this
Master Plan, adjustment in this initial list
and augmentation of the list should
occur. In all cases, the timing, feasibility
of State funding along with local bond
funding should be considered when
developing the project’s budget..
9. As part of the Board of Trustees
approval of the Facility Allocation and
Financing Plan, the Board shall approve
a prioritized list of capital construction
projects, the proposed budget for each
project and the funding source(s) for
each project. This Plan shall serve as
the basis for the equitable distribution of
local bond funds and State funds for
each College within the District.
The District may wish to review the
current curriculum at each College with
the intent of consolidating course
offerings at one location within the
District. Potential changes could
include transferring welding courses
from Laney College to the mechanical
technology program at the College of
Alameda. Health occupations and
wellness programs currently at College
of Alameda could be consolidated with
the current programs at Merritt College
and the graphic arts and photography
programs currently housed at Laney
College could be consolidated into the
multimedia center at Berkeley City
College.

62 Maas Companies, Inc.
Attachment A: Space Determination Methodology
OVERVIEW
A combination of factors was used to arrive at
future capacity requirements. These included
identifying a future program of instruction,
determining the amount of credit-WSCH
generated, ascertaining the current space
holdings of the District, and applying
quantification standards outlined in Title 5 of
the California Administrative Code. Title 5
standards define the tolerance thresholds for
space.
PRESCRIBED STATE SPACE STANDARDS
The California Code of Regulations, Title 5
(Sections 57000-57140) establishes standards
for the utilization and planning of most
educational facilities in public community
colleges. These standards, when applied to the
total number of students served (or some
variant thereof, e.g., weekly student contact
hours), produce total capacity requirements
that are expressed in assignable square feet
(space available for assignment to occupants).
The Title 5 space planning standards used to
determine both existing and future capacity
requirements are summarized in the following
tables.
Each component of the standards identified is
mathematically combined with a
commensurate factor (see table below) to
produce a total assignable square foot (ASF)
capacity requirement for each category of
space.
PRESCRIBED SPACE STANDARDS CATEGORY FORMULA RATES / ALLOWANCES
CLASSROOMS ASF/Student Station 15 Station utilization rate 66% Avg hrs room/week 34.98 TEACHING LABS ASF/student station * * Station utilization rate 85% Avg hrs room/week 23.37 OFFICES/CONFERENCE ROOMS ASF per FTEF 140 LIBRARY/LRC Base ASF Allowance 3,795 ASF 1st 3,000 DGE 3.83 ASF/3001-9,000 DGE 3.39 ASF>9,000 2.94 INSTRUCTIONAL MEDIA AV/TV Base ASF Allowance 3,500 ASF 1st 3,000 DGE 1.50 ASF/3001-9,000 DGE 0.75 ASF>9,000 0.25
Source: California Code of Regulations Title 5, Chapter 8
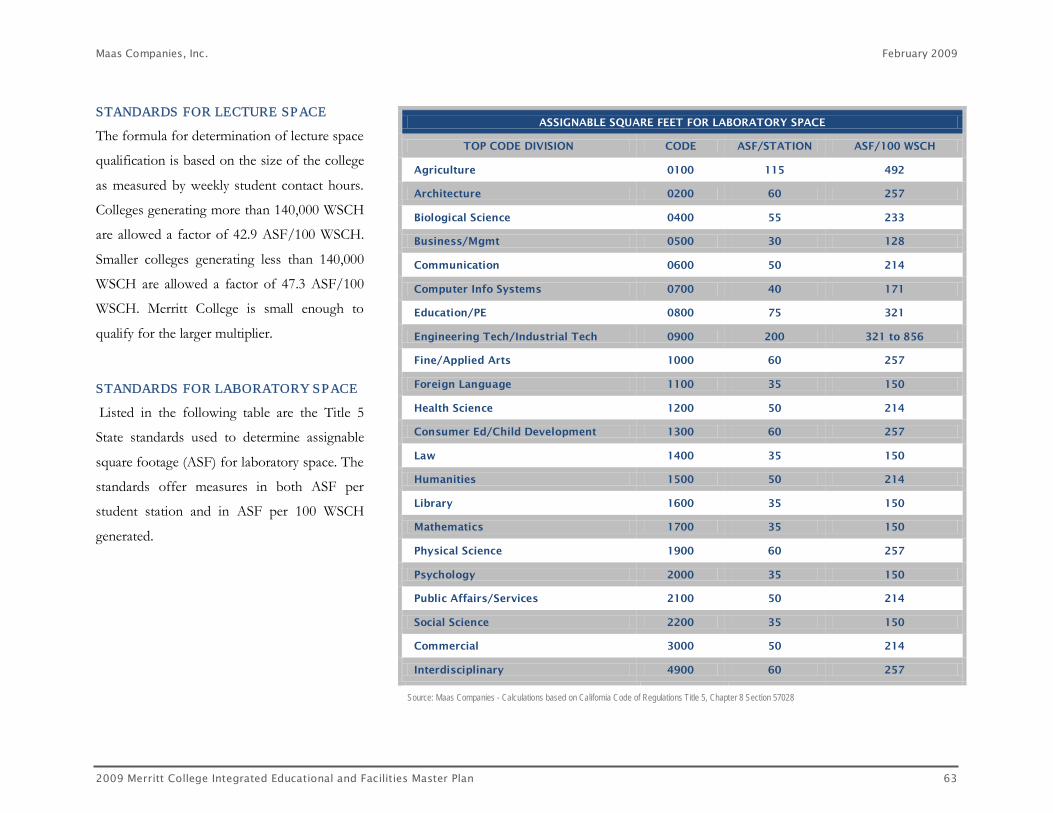
Maas Companies, Inc. February 2009
2009 Merritt College Integrated Educational and Facilities Master Plan 63
STANDARDS FOR LECTURE SPACE
The formula for determination of lecture space
qualification is based on the size of the college
as measured by weekly student contact hours.
Colleges generating more than 140,000 WSCH
are allowed a factor of 42.9 ASF/100 WSCH.
Smaller colleges generating less than 140,000
WSCH are allowed a factor of 47.3 ASF/100
WSCH. Merritt College is small enough to
qualify for the larger multiplier.
STANDARDS FOR LABORATORY SPACE
Listed in the following table are the Title 5
State standards used to determine assignable
square footage (ASF) for laboratory space. The
standards offer measures in both ASF per
student station and in ASF per 100 WSCH
generated.
ASSIGNABLE SQUARE FEET FOR LABORATORY SPACE
TOP CODE DIVISION CODE ASF/STATION ASF/100 WSCH
Agriculture 0100 115 492
Architecture 0200 60 257
Biological Science 0400 55 233
Business/Mgmt 0500 30 128
Communication 0600 50 214
Computer Info Systems 0700 40 171
Education/PE 0800 75 321
Engineering Tech/Industrial Tech 0900 200 321 to 856
Fine/Applied Arts 1000 60 257
Foreign Language 1100 35 150
Health Science 1200 50 214
Consumer Ed/Child Development 1300 60 257
Law 1400 35 150
Humanities 1500 50 214
Library 1600 35 150
Mathematics 1700 35 150
Physical Science 1900 60 257
Psychology 2000 35 150
Public Affairs/Services 2100 50 214
Social Science 2200 35 150
Commercial 3000 50 214
Interdisciplinary 4900 60 257
Source: Maas Companies - Calculations based on California Code of Regulations Title 5, Chapter 8 Section 57028

64 Maas Companies, Inc.
NON-STATE SPACE STANDARDS
The State provides standards for utilization
and planning for more than 60% of all types of
spaces on campus. Capacity estimates for those
remaining spaces, representing approximately
40%, are based on a combination of factors
including the size and/or nature of the
institution. Standards for the remaining types
of spaces are presented in the following table.
These standards were determined based on a
national study of space and on approval of the
State Chancellor's Office.
SPACE DETERMINATION FOR NON-STATE STANDARD FACLITIES
CATEGORY OF SPACE BASIS ASF/ FACTOR
Non-class Laboratory 0.095 ASF per Student Headcount 0.095
Teaching Gym Greater of 2.5 ASF per FTES or 35,000 ASF 2.5—35,000
Assembly/Exhibition ASF Equal to Student Headcount 100%
Food Service 0.60 ASF per Student Headcount 0.60
Lounge 0.67 ASF per FTES 0.67
Bookstore 1,500 ASF plus 0.67 ASF per Student Headcount 0.75
Health Service ASF Allowance 1,200
Meeting Room 0.333 ASF per Student Headcount 0.333
Childcare Greater of 0.4 ASF per Student Headcount or 6,000
ASF (Also, see State Child Care Standards) 0.40—6,000
Data Processing ASF Allowance 5,000
Physical Plant ASF Allowance 5% of Total
All Other Space ASF Allowance 2.5% of Total
Source: Maas Companies & State Chancellor’s Office

Maas Companies, Inc. February 2009
2009 Merritt College Integrated Educational and Facilities Master Plan 65
Attachment B - Glossary of Terms
Academic Calendar Year:
Begins on July 1 of each calendar year and
ends on June 30 of the following calendar
year. There are two primary terms requiring
instruction for 175 days. A day is measured
by being at least 3 hours between 7:00 AM
to 11:00 PM.
Basis/Rationale: 175 days ÷ 5 days per
week = 35 weeks ÷ 2 primary terms = 17.5
week semester.
175 days X 3 hours = 525 hours, which
equals one (1) full-time equivalent student.
Notes: Community colleges in California are
required by code to provide instruction 175
days in an academic calendar year (excluding
summer sessions).
ADA:
Americans with Disabilities Act: Public Law
336 of the 101st Congress, enacted July 26,
1990. The ADA prohibits discrimination and
ensures equal opportunity for persons with
disabilities in employment, State and local
government services, public
accommodations, commercial facilities, and
transportation.
Annual Five-Year Construction Plan:
That part of the Facility Master Plan that
defines the current and proposed capital
improvements the College will need to
undertake over the next five years if it is to
achieve the learning outcomes specified in
its Master Plan.
Annual Space Inventory:
See ‘Space Inventory’
API (Academic Performance Index):
The California's Public Schools
Accountability Act of 1999 (PSAA) resulted
in the development of API for the purpose
of measuring the academic performance and
growth of schools. It is a numeric index (or
scale) that ranges from a low of 200 to a
high of 1000. A school's score on the API is
an indicator of a school's performance level.
The statewide API performance target for all
schools is 800. A school's growth is
measured by how well it is moving toward,
or past that goal. A school's API Base is
subtracted from its API Growth to
determine how much the school improved
in a year. (For details, visit
http://www.cde.ca.gov/ta/ac/ap/).
ASF:
Assignable Square Feet: The sum of the
floor area assigned to, or available to, an
occupant or student station (excludes
circulation, custodial, mechanical and
structural areas, and restrooms).
Budget Change Proposal (BCP):
A document reviewed by the State
Department of Finance and the Office of
66 Maas Companies, Inc.
the Legislative Analyst which recommends
changes in a State agency's budget.
CAD:
Computer Assisted Design
California Community College System Office:
The administrative branch of the California
Community College system. It is a State
agency which provides leadership and
technical assistance to the 110 community
colleges and 72 community college districts
in California. It is located in Sacramento and
allocates State funding to the colleges and
districts.
Capacity:
The amount of enrollment that can be
accommodated by an amount of space given
normal use levels. In terms of facility space
standards, it is defined as the number of
ASF per 100 WSCH.
Capacity/Load Threshold Ratio (aka Cap Load):
The relationship between the space available
for utilization (square footage that is
assignable) and the efficiency level at which
the space is currently being utilized. The
State measures five areas for Capacity Load:
Lecture, Laboratory, Office, Library and
AV/TV. The Space Inventory (Report 17)
provides the basis for this calculation.
Capital Construction Programs:
See ‘Capital Projects’.
Capital Outlay Budget Change Proposal (COBCP):
A type of Budget Change Proposal regarding
the construction of facilities and their related
issues.
Capital Projects:
Construction projects, such as land, utilities,
roads, buildings, and equipment which
involve demolition, alteration, additions, or
new facilities.
Carnegie Unit:
A unit of credit; a student’s time of 3 hours
per week is equivalent to one unit of credit.
CCFS:
320 (“The 320 Report”): One of the primary
apportionment (funding) documents
required by the State. It collects data for
both credit and noncredit attendance. Three
reports are made annually: the First Period
Report (P-1), the Second Period Report (P-
2) and the Annual Report. The importance
of this report is whether the College or
District is meeting its goals for the
generation of full-time equivalent students.
Census:
An attendance accounting procedure that
determines the number of actively enrolled
students at a particular point in the term.
Census is taken on that day nearest to one-
fifth of the number of weeks a course is
scheduled.
Maas Companies, Inc. February 2009
2009 Merritt College Integrated Educational and Facilities Master Plan 67
DSA:
The Division of the State Architect (DSA)
determines California’s policies for building
design and construction. It oversees the
design and construction for K-12 public
schools and community colleges. Its
responsibilities include assuring that all
drawings and specifications meet with codes
and regulations.
EAP (Early Assessment Program):
The Early Assessment Program (EAP) is a
collaborative effort among the State Board
of Education (SBE), the California
Department of Education (CDE), and the
California State University (CSU). The
program was established to provide
opportunities for students to measure their
readiness for college-level English and
mathematics in their junior year of high
school, and to facilitate opportunities for
them to improve their skills during their
senior year. (For details, visit
http://www.calstate.edu/EAP/).
Educational Centers:
A postsecondary institution operating at a
location remote from the campus of the
parent institution which administers it, and
recognized by the Chancellor’s Office as a
Center.
Educational Master Plan:
A part of the College’s Master Plan that
defines the education goals of the College, as
well as the current and future curriculum to
achieve those goals. The Educational Master
Plan precedes and guides the Facilities
Master Plan.
Enrollments (Unduplicated):
A student enrollment count (also referred to
as “Headcount”) based on an Individual
Student Number or Social Security Number
that identifies a student only once in the
system.
Environmental Impact Report:
In accordance with the California
Environmental Quality Act (CEQA), if a
project is known to have a significant effect
on the environment, then an EIR must be
prepared. It provides detailed information
about a project’s environmental effects, ways
to minimize those effects, and alternatives if
reasonable.
Facilities:
All of the capital assets of the College
including the land upon which it is located,
the buildings, systems and equipment.
Faculty Loads:
The amount of “teaching time”
assigned/appropriated to a given
instructional class; i.e. lecture or laboratory,
for a given semester or for an academic year
(two semesters). It is typically defined in
terms of 15 “teaching hours” per week as
being equal to one (1) full-time equivalent
faculty; a “full faculty load.” Actual faculty
loads are generally governed by negotiated
agreements and collective bargaining.
68 Maas Companies, Inc.
Facilities Master Plan:
The Facilities Master Plan is an inventory
and evaluation (condition/life span) of all
owned facilities (the site, buildings,
equipment, systems, etc.). It identifies
regulations impacting those facilities and any
deficiencies; and also defines a plan to
correct those deficiencies. It also identifies
the adequacy, capacity and use of those
facilities, identifies the deficiencies relative to
those criteria, and defines a plan of
correction. It draws on information
contained in the Educational Master Plan.
Final Project Proposal (FPP):
The FPP identifies the project justification,
final scope and estimated costs of all
acquisitions, plus all infrastructure, facility
and systems projects. It contains vital
information including the JCAF 31 and
JCAF 32 reports, the California
Environmental Quality Act (CEQA) Final
Notice of Determination, federal funds
detail, an analysis of future costs, a project
time schedule and an outline of
specifications. It is used by the Chancellor's
Office and the Board of Governors to
determine whether the project has met the
criteria for State funding.
Five-Year Capital Construction Plan (aka 5-YCP):
See Annual Five-Year Construction Plan
FTEF:
An acronym for “full-time equivalent
faculty.” Used as a measure by the State to
calculate the sum total of faculty resources
(full-time and part-time combined) that
equate to measurable units of 15 hours per
week of “teaching time;” i.e. as being equal
to one (1) full-time equivalent faculty. All
academic employees are considered to be
faculty for this purpose including instructors,
librarians and counselors.
FTES:
An acronym for a “full-time equivalent
student.” Used by the State as the measure
for attendance accounting verification. It is
also used as a student workload measure that
represents 525 class (contact) hours in a full
academic year.
GSF:
An acronym for “gross square feet.” The
sum of the floor areas of the building within
the outside faces of the exterior walls; the
“total space” assignable and non assignable
square feet combined.
Hardscape:
Refers to landscaping projects and
components that involve everything but the
plants that will be on the landscape.
Maas Companies, Inc. February 2009
2009 Merritt College Integrated Educational and Facilities Master Plan 69
Initial Project Proposal (IPP):
A document which provides information
such as project costs, type of construction
involved, relevance to master plans,
capacity/load ratio analysis, and project
impact. The IPP identifies the institutional
needs reflected in the Educational and
Facility Master Plans and the 5-YCP. It is
used to determine a project’s eligibility for
State funding before districts make
significant resource commitments into
preparing comprehensive FPPs.
Lecture:
A method of instruction based primarily on
recitation with little or no hands-on
application or laboratory experiences. It is
based on what is called the “Carnegie unit”;
(a student’s time of three hours per week is
equivalent to one unit of credit). For lecture
courses, each hour of instruction is viewed
as one unit of credit (with the expectation of
two hours outside of classroom time for
reading and or writing assignments).
Laboratory:
A method of instruction involving hands-on
or skill development. The application of the
Carnegie unit to this mode of instruction is
the expectation that the student will
complete all assignments within the
classroom hours. Therefore, three hours of
in-class time are usually assumed to
represent one unit of credit.
Master Plan:
An extensive planning document which
covers all functions of the college or district.
Master Plans typically contain a statement of
purpose, an analysis of the community and
its needs, enrollment and economic
projections for the community; current
educational program information and other
services in relation to their future
requirements. It also covers educational
targets and the strategies and current
resources to reach those targets, along with a
comprehensive plan of action and funding.
Middle College:
Middle College High Schools are secondary
schools, authorized to grant diplomas in
their own name, located on college
campuses across the nation. The Middle
Colleges are small, with usually 100 or fewer
students per grade level. They provide a
rigorous academic curriculum within a
supportive and nurturing environment to a
student population that has been historically
under-served and under-represented in
colleges. While at the Middle College,
students have the opportunity to take some
college classes at no cost to themselves. (For
details, visit http://www.mcnc.us/faqs.htm).
Punch List:
The items in a contract that are incomplete.
If a job is designated as substantially
complete for purposes of occupancy, then
those remaining items to be completed or
resolved form the punch list.
Report 17:
See Space Inventory Report.
70 Maas Companies, Inc.
Scheduled Maintenance Plan:
See Annual Five-Year Scheduled
Maintenance Plan.
Service Area:
Any community college’s service area is
usually defined by geography, political
boundaries, commuting distances and the
historical agreements developed with
adjacent community colleges. In most
situations the district boundary is not the
best measure of potential student
participation at a given college, since
students tend to look for options, including
distance education.
SLOAC:
The Student Learning Outcomes and
Assessment Cycle.
Space Inventory Report (aka Report 17):
A record of the gross square footage and the
assignable (i.e. usable) square footage at a
college. Provides information necessary for
Capital Outlay Projects (IPP’s, FPP’s), Five-
Year Construction Plan, space utilization of
the college or district and projecting future
facility needs.
Key Components of Space Inventory:
Room Type (room use category): Identifies room by use or function. ASF (assignable square feet) GSF (gross square feet) Stations
STAR Test:
Standardized Testing and Reporting
developed by the California Department of
Education. Under the STAR program,
California students attain, and are tested for
one of five levels of performance on the
CSTs (California Standards Tests) for each
subject tested: advanced, proficient, basic,
below basic, and far below basic. (For
details, visit http://star.cde.ca.gov/).
Strategic Plan:
Strategic planning is an organization's
process of defining its strategy, or direction,
and making decisions on allocating its
resources to pursue this strategy, including
its capital and people. Various business
analysis techniques can be used in strategic
planning, including SWOT analysis
(Strengths, Weaknesses, Opportunities, and
Threats) and PEST analysis (Political,
Economic, Social, and Technological
analysis). The outcome is normally a
strategic plan which is used as guidance to
define functional and divisional plans,
including Technology, Marketing, etc.
Maas Companies, Inc. February 2009
2009 Merritt College Integrated Educational and Facilities Master Plan 71
Space Utilization:
Rooms, or space, are assigned for a
particular use and function, or a specific
discipline or service. The State has a numeric
code, a four-digit number that identifies the
“type” of use that is supported by a
particular room/space. (see TOP Code)
Space Utilization: assumed by most faculty
and staff on campus to mean the level or
degree to which a room is utilized. It is the
room’s capacity expressed as the percentage
that the room is actually used.
Example: If the lecture weekly student
contact hours were 27,500 and the
classroom capacity for weekly student
contact hours were 35,000, the utilization
would be identified as 78.6%.
Stations: The total space to accommodate a
person at a given task (classroom-
laboratory-office, etc.). The number of
appropriate student work spaces within a
defined area. It generally represents the best
space apportionment for a given educational
program.
TOP Code:
The “Taxonomy of Programs” (TOP) is a
common numeric coding system by which
the College categorizes degree and certificate
programs. Each course or program has a
TOP code. Accountability to the State is
reported through the use of TOP codes. The
taxonomy is most technical in the vocational
programs (0900’s).
Example: The taxonomy uses a standard
format to codify the offerings. The first two-
digits are used for a number of State
purposes. Maas Companies commonly uses
the two-digit designator for educational
master planning purposes. A four-digit code
is necessary for reports in the Five-Year
Capital Outlay Plan.
1500 – Humanities (Letters)
1501 – English
1509 – Philosophy
2200 – Social Sciences
2202 – Anthropology
2205 – History
Total Cost of Ownership (TCO):
Total Cost of Ownership (TCO), as used for
college facilities, is defined for these
purposes as the systematic quantification of
all costs generated over the useful lifespan of
the facility (30-50 years). The goal of TCO is
to determine a value that will reflect the true,
effective cost of the facility including
planning, design, constructing and equipping
of the facility and also the recurring costs to
operate the facility over the useful lifespan
of the facility (30-50 years).
WSCH:
An acronym for “Weekly Student Contact
Hours.” WSCH represents the total hours
per week a student attends a particular class.
WSCH are used to report apportionment
attendance and FTES. One (1) FTES
represents 525 WSCH.

72 Maas Companies, Inc.
WSCH/FTEF:
Represents the ratio between the faculty’s
hours of instruction per week (“faculty
load”) and the weekly hours of enrolled
students in his/her sections. It is the total
weekly student contact hours (WSCH)
divided by the faculty member’s load. The
State productivity/efficiency measure for
which funding is based is 525
WSCH/FTEF.
Examples: A faculty member teaching five
sections of Sociology, each section meeting
for three hours per week with an average per
section enrollment of 30 students, equals
450 WSCH/FTEF. (5 class sections X 3
hours/week X 30 students = 450
WSCH/FTEF). A faculty member teaching
three sections of Biology, each section
meeting for six hours per week with an
average section enrollment of 25 students,
would be teaching 450 WSCH/FTEF. (3
class sections X 6 hours/week X 25 students
= 450 WSCH/FTEF).
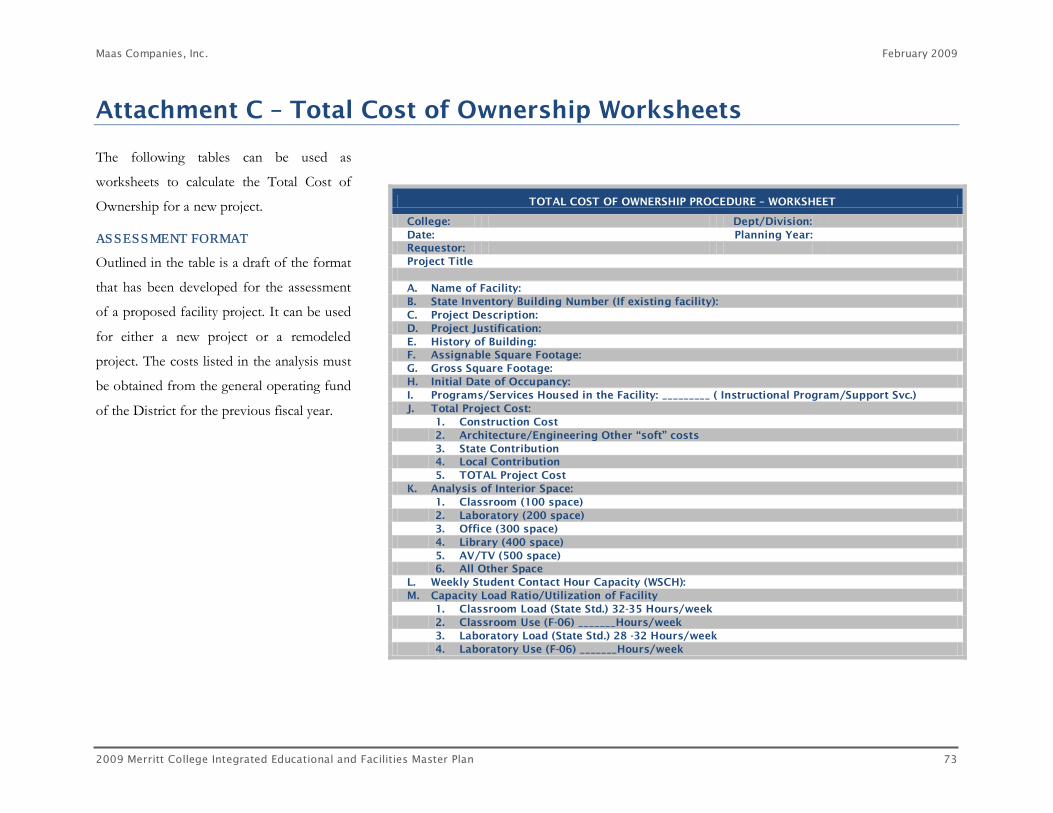
Maas Companies, Inc. February 2009
2009 Merritt College Integrated Educational and Facilities Master Plan 73
Attachment C – Total Cost of Ownership Worksheets
The following tables can be used as
worksheets to calculate the Total Cost of
Ownership for a new project.
ASSESSMENT FORMAT
Outlined in the table is a draft of the format
that has been developed for the assessment
of a proposed facility project. It can be used
for either a new project or a remodeled
project. The costs listed in the analysis must
be obtained from the general operating fund
of the District for the previous fiscal year.
TOTAL COST OF OWNERSHIP PROCEDURE – WORKSHEET
College: Dept/Division: Date: Planning Year: Requestor: Project Title A. Name of Facility: B. State Inventory Building Number (If existing facility): C. Project Description: D. Project Justification: E. History of Building: F. Assignable Square Footage: G. Gross Square Footage: H. Initial Date of Occupancy: I. Programs/Services Housed in the Facility: _________ ( Instructional Program/Support Svc.) J. Total Project Cost: 1. Construction Cost 2. Architecture/Engineering Other “soft” costs 3. State Contribution 4. Local Contribution 5. TOTAL Project Cost K. Analysis of Interior Space: 1. Classroom (100 space) 2. Laboratory (200 space) 3. Office (300 space) 4. Library (400 space) 5. AV/TV (500 space) 6. All Other Space L. Weekly Student Contact Hour Capacity (WSCH): M. Capacity Load Ratio/Utilization of Facility 1. Classroom Load (State Std.) 32-35 Hours/week 2. Classroom Use (F-06) _______Hours/week 3. Laboratory Load (State Std.) 28 -32 Hours/week 4. Laboratory Use (F-06) _______Hours/week
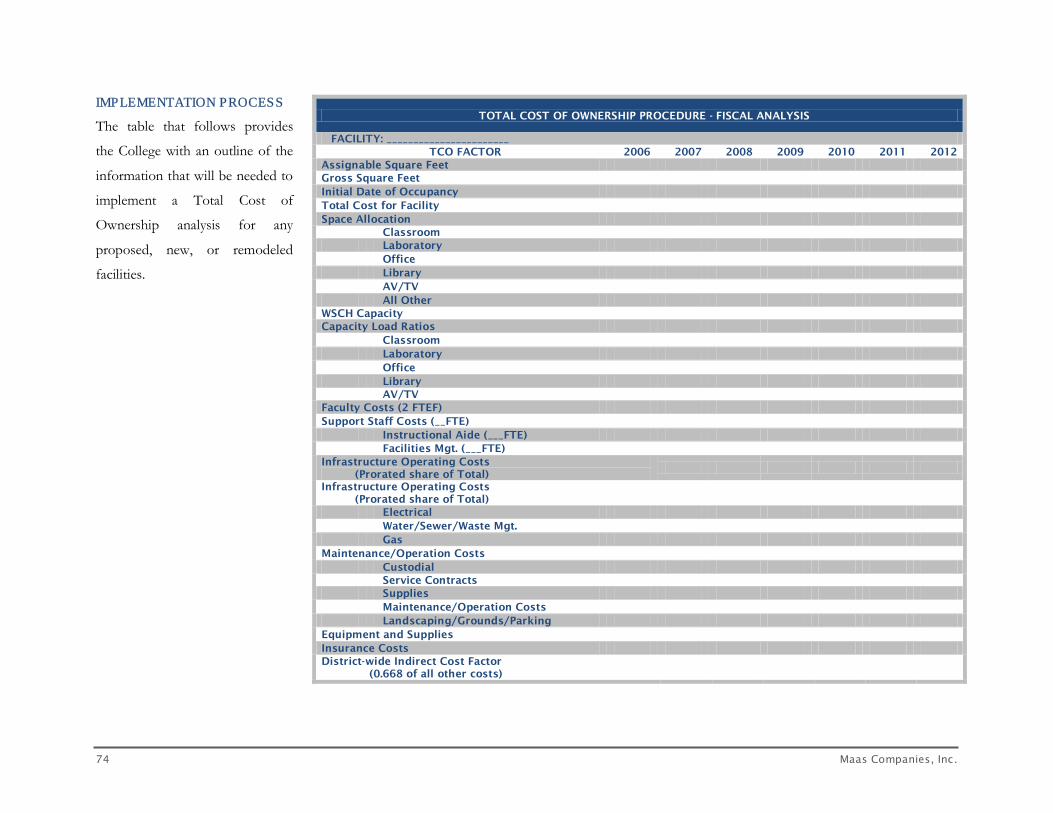
74 Maas Companies, Inc.
IMPLEMENTATION PROCESS
The table that follows provides
the College with an outline of the
information that will be needed to
implement a Total Cost of
Ownership analysis for any
proposed, new, or remodeled
facilities.
TOTAL COST OF OWNERSHIP PROCEDURE - FISCAL ANALYSIS
FACILITY: _______________________ TCO FACTOR 2006 2007 2008 2009 2010 2011 2012
Assignable Square Feet Gross Square Feet Initial Date of Occupancy Total Cost for Facility Space Allocation
Classroom Laboratory Office Library AV/TV All Other
WSCH Capacity Capacity Load Ratios
Classroom Laboratory Office Library AV/TV
Faculty Costs (2 FTEF) Support Staff Costs (__FTE)
Instructional Aide (___FTE) Facilities Mgt. (___FTE)
Infrastructure Operating Costs (Prorated share of Total)
Infrastructure Operating Costs (Prorated share of Total)
Electrical Water/Sewer/Waste Mgt. Gas
Maintenance/Operation Costs Custodial Service Contracts Supplies Maintenance/Operation Costs Landscaping/Grounds/Parking
Equipment and Supplies Insurance Costs District-wide Indirect Cost Factor (0.668 of all other costs)