Embed Size (px)
Citation preview
2009 Budget and Medium Term Plan
Council July 2009
Guiding principles
Set financial targets that are achievable and consistent with the University Plan
Address current challenges Assure robustness Provide a platform for future development
Key Financial Outputs
Operating surplus Trading surplus Operating Cash Flow
Context
Current performance Current and future operating environment University development plans
Current performance
A secure platform for development Operating surplus better than budget Trading result above budget Operating Cash Flow above budget Cash Flow stronger than budget and
borrowing lower than projected
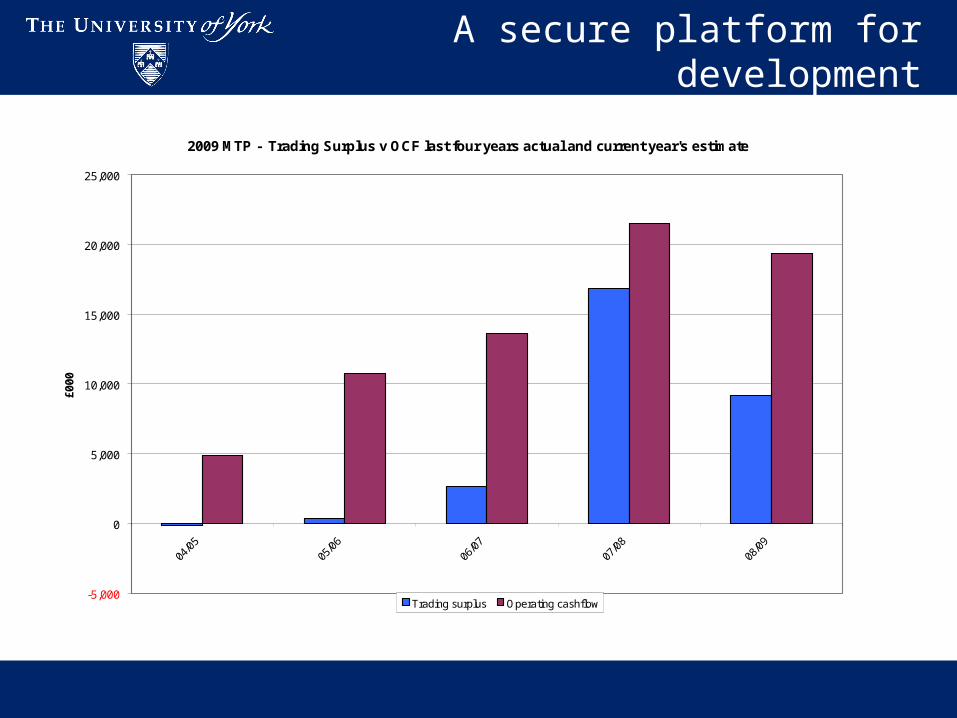
A secure platform for development
2009 MTP - Trading Surplus v OCF last four years actual and current year's estimate
-5,000
0
5,000
10,000
15,000
20,000
25,000
04/0
505
/06
06/0
707
/08
08/0
9
£000
Trading surplus Operating cashflow
Operating environment
Systematic risk Pensions Remuneration Energy
Specific risk Credit crunch
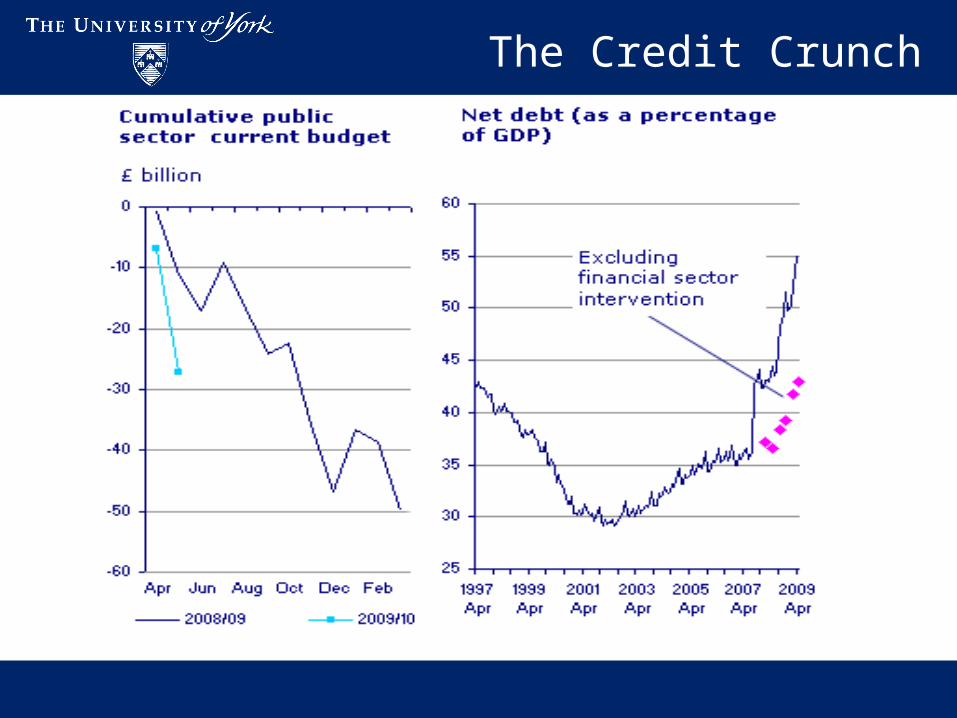
The Credit Crunch
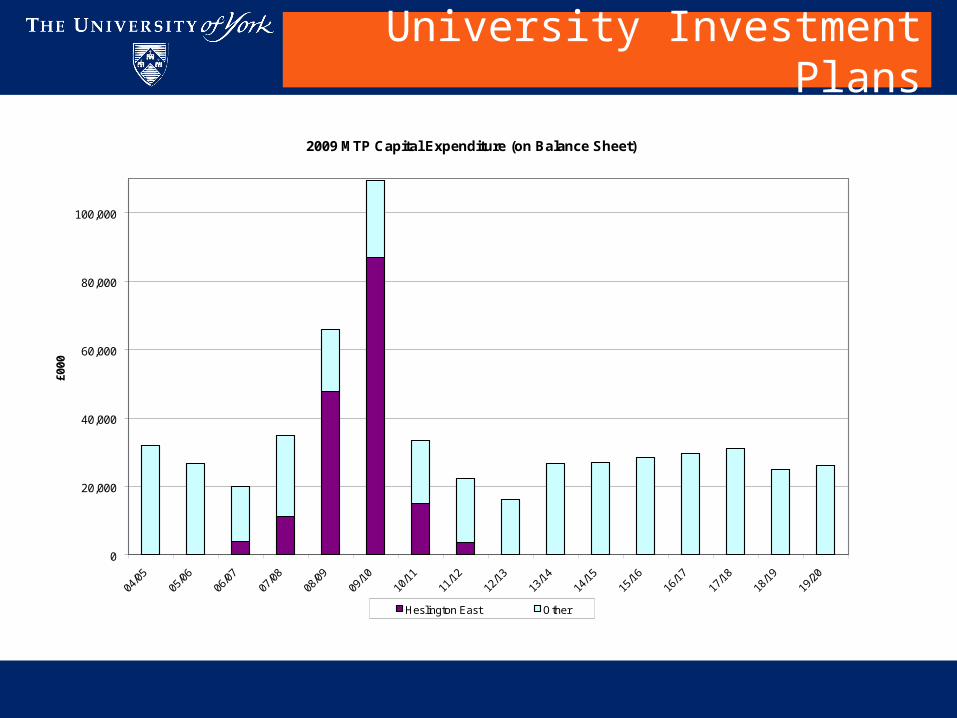
University Investment Plans
2009 MTP Capital Expenditure (on Balance Sheet)
0
20,000
40,000
60,000
80,000
100,000
04/0
505
/06
06/0
707
/08
08/0
909
/10
10/1
111
/12
12/1
313
/14
14/1
515
/16
16/1
717
/18
18/1
919
/20
£000
Heslington East Other
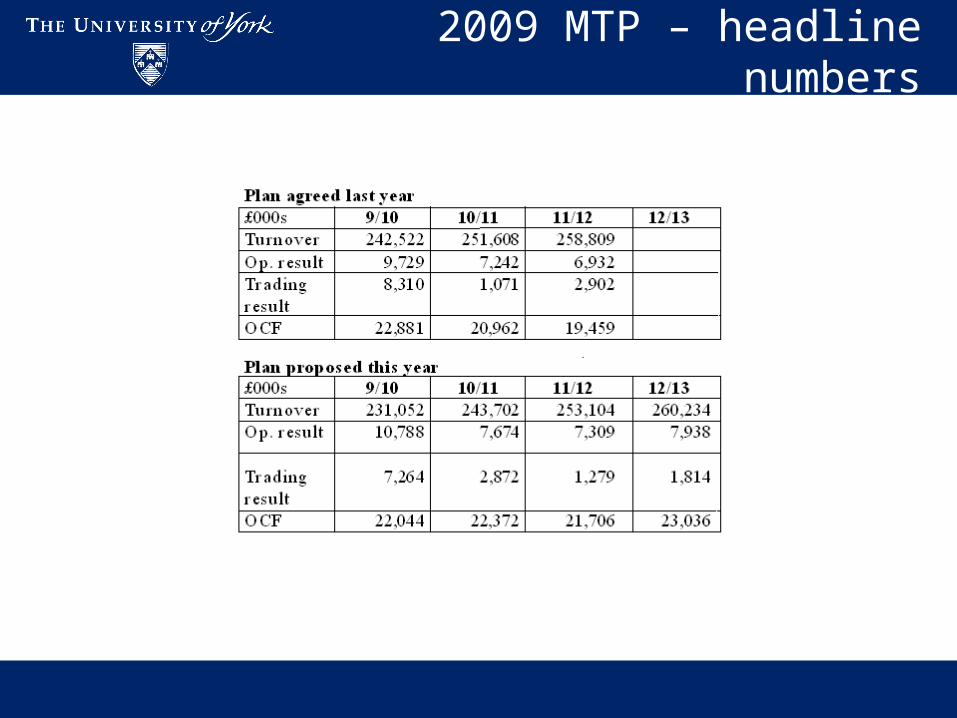
2009 MTP – headline numbers
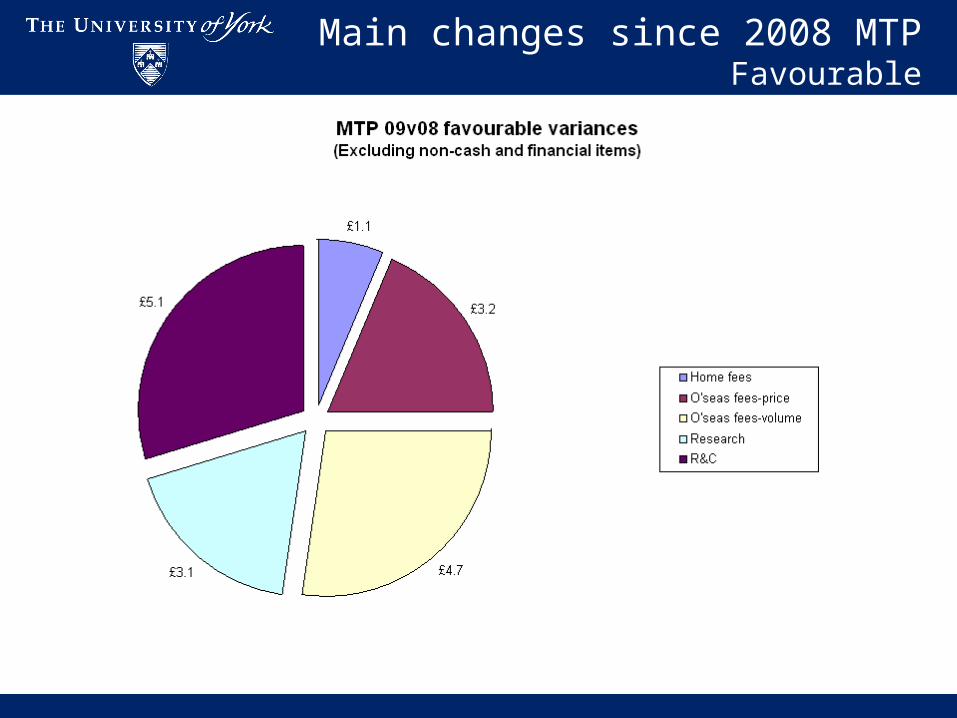
Main changes since 2008 MTP Favourable
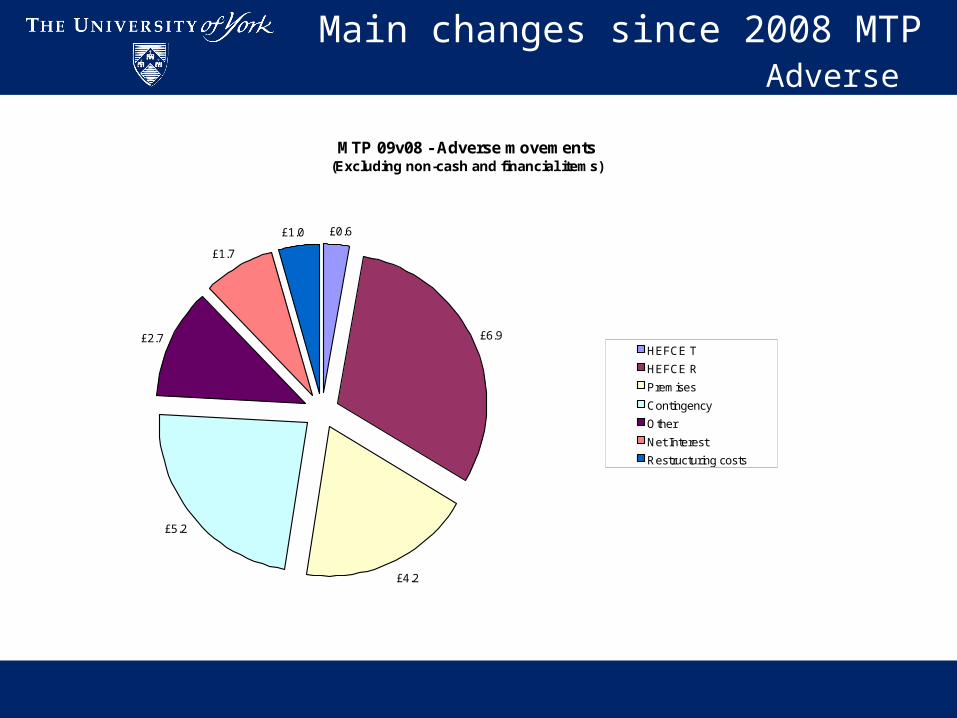
Main changes since 2008 MTPAdverse
MTP 09v08 - Adverse movements(Excluding non-cash and financial items)
£0.6
£6.9
£4.2
£5.2
£2.7
£1.7
£1.0
HEFCE T
HEFCE R
Premises
Contingency
Other
Net Interest
Restructuring costs
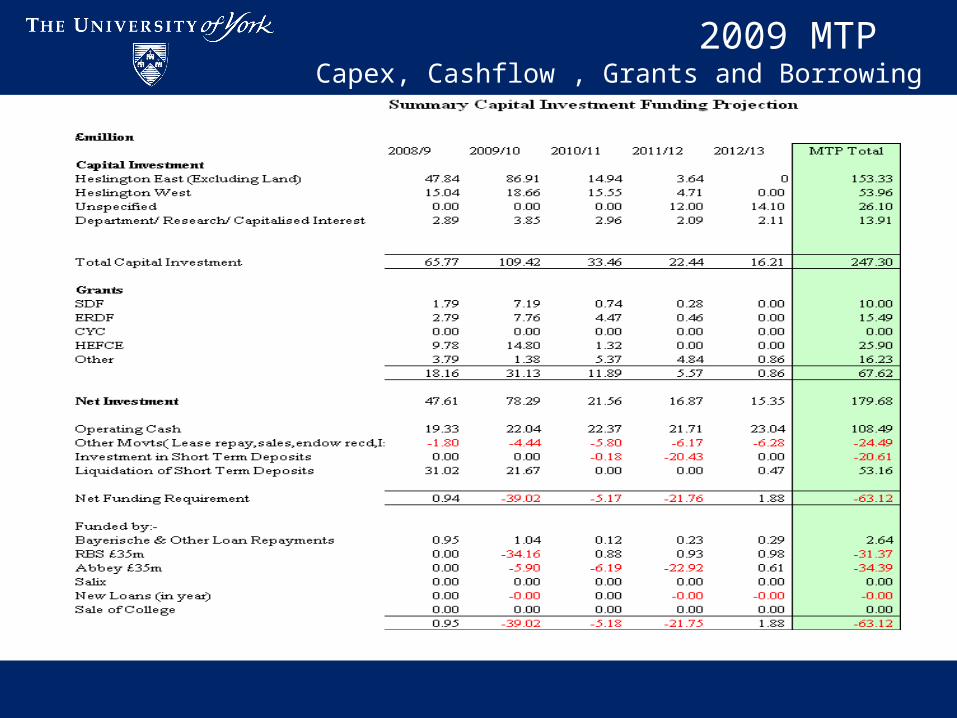
2009 MTP Capex, Cashflow , Grants and Borrowing
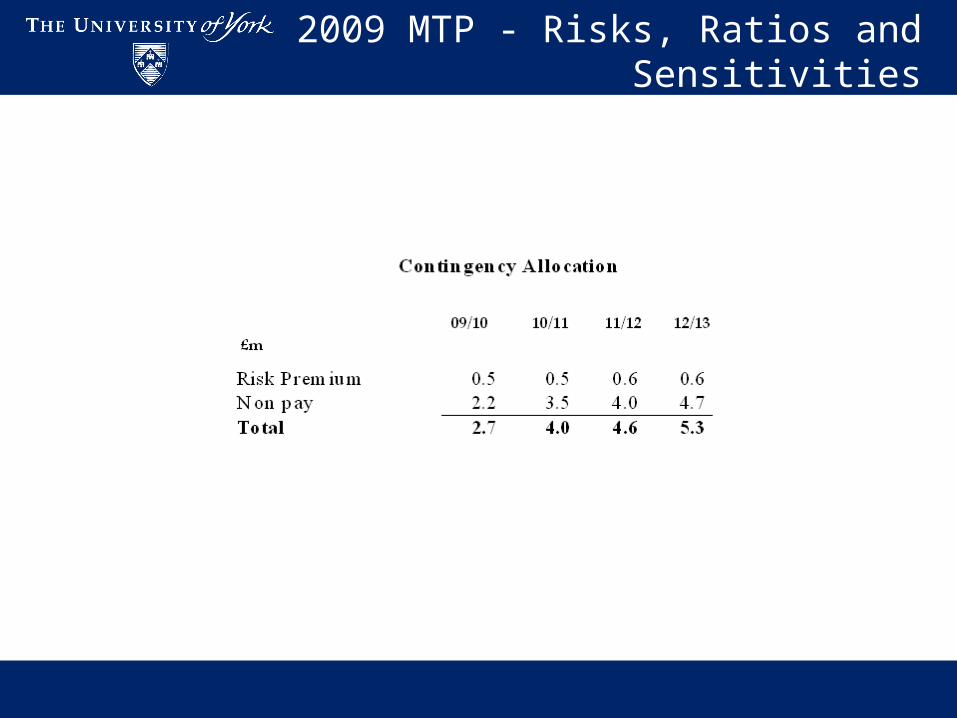
2009 MTP - Risks, Ratios and Sensitivities
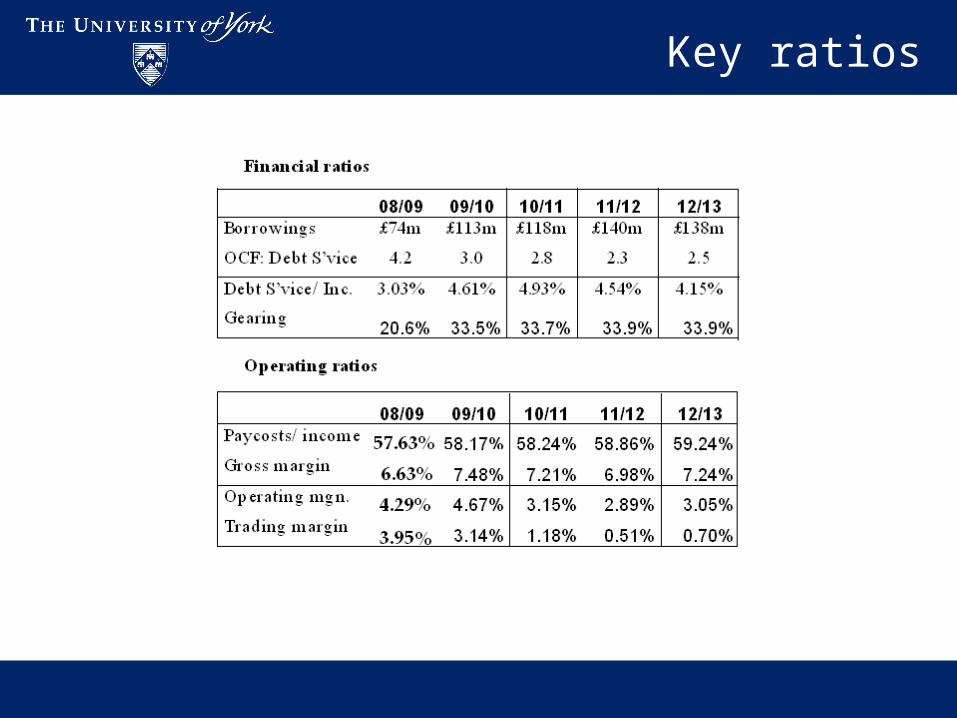
Key ratios
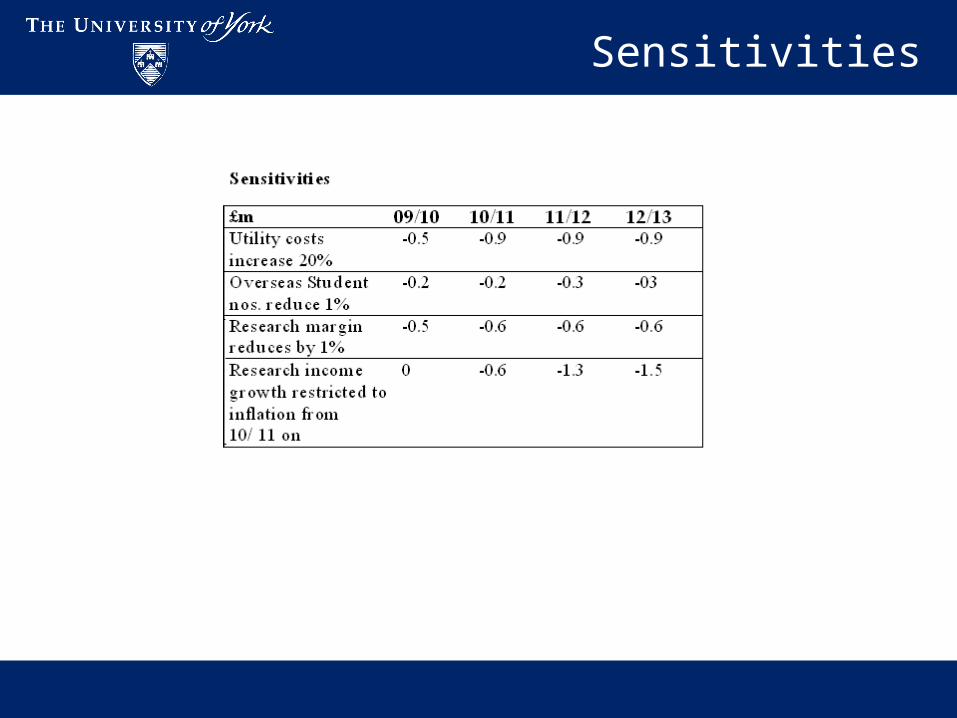
Sensitivities
2009 MTP - Summary
Similar outputs but greater emphasis on income generation and control of key costs
Though Cash Flow similar Borrowing higher
Higher risk strategy in a higher risk environment so greater emphasis on contingency and greater dependence on active performance management
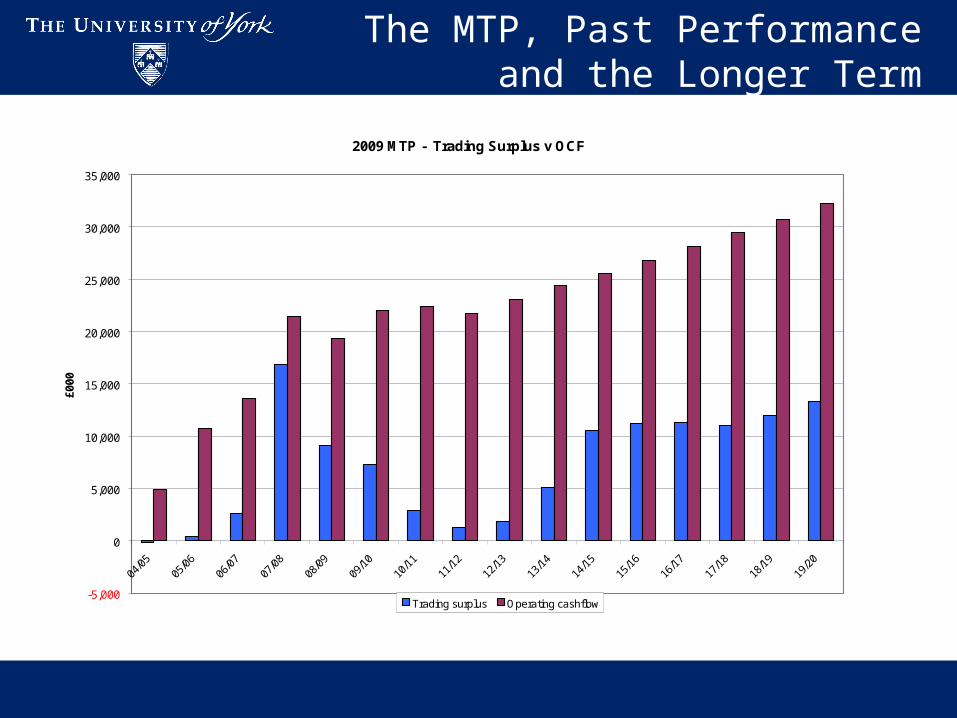
The MTP, Past Performance and the Longer Term
2009 MTP - Trading Surplus v OCF
-5,000
0
5,000
10,000
15,000
20,000
25,000
30,000
35,000
04/0
505
/06
06/0
707
/08
08/0
909
/10
10/1
111
/12
12/1
313
/14
14/1
515
/16
16/1
717
/18
18/1
919
/20
£000
Trading surplus Operating cashflow
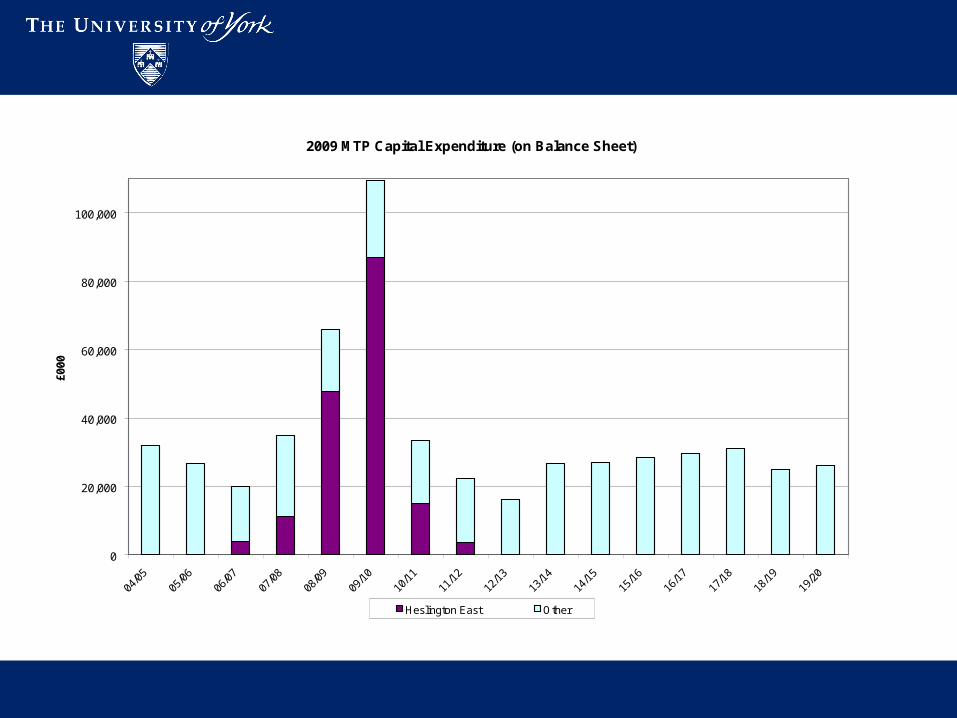
2009 MTP Capital Expenditure (on Balance Sheet)
0
20,000
40,000
60,000
80,000
100,000
04/0
505
/06
06/0
707
/08
08/0
909
/10
10/1
111
/12
12/1
313
/14
14/1
515
/16
16/1
717
/18
18/1
919
/20
£000
Heslington East Other
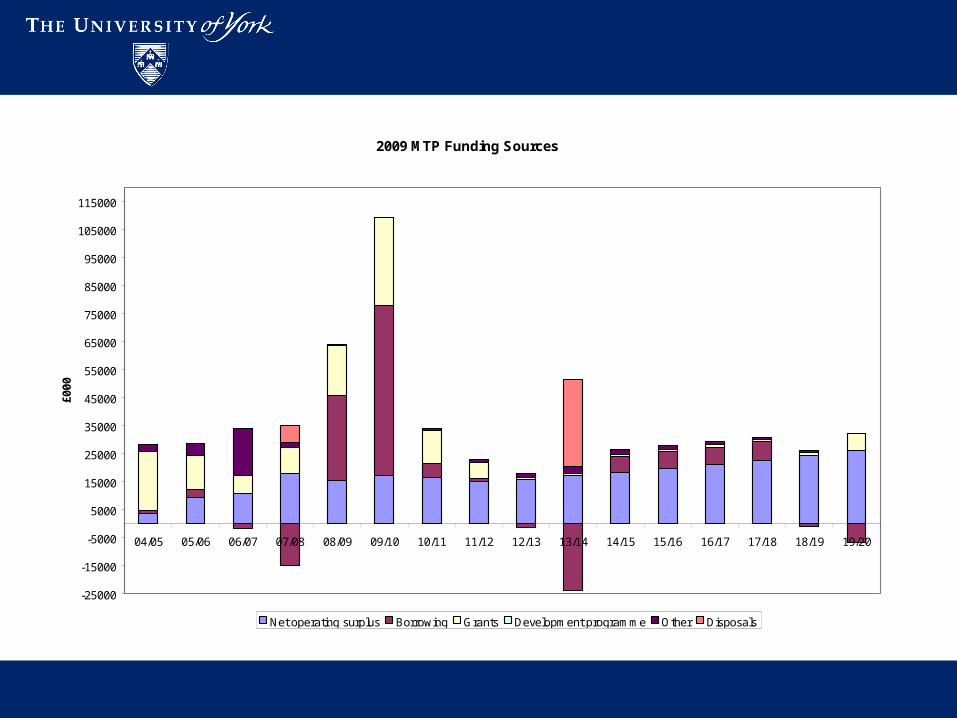
2009 MTP Funding Sources
-25000
-15000
-5000
5000
15000
25000
35000
45000
55000
65000
75000
85000
95000
105000
115000
04/05 05/06 06/07 07/08 08/09 09/10 10/11 11/12 12/13 13/14 14/15 15/16 16/17 17/18 18/19 19/20
£000
Net operating surplus Borrowing Grants Development programme Other Disposals
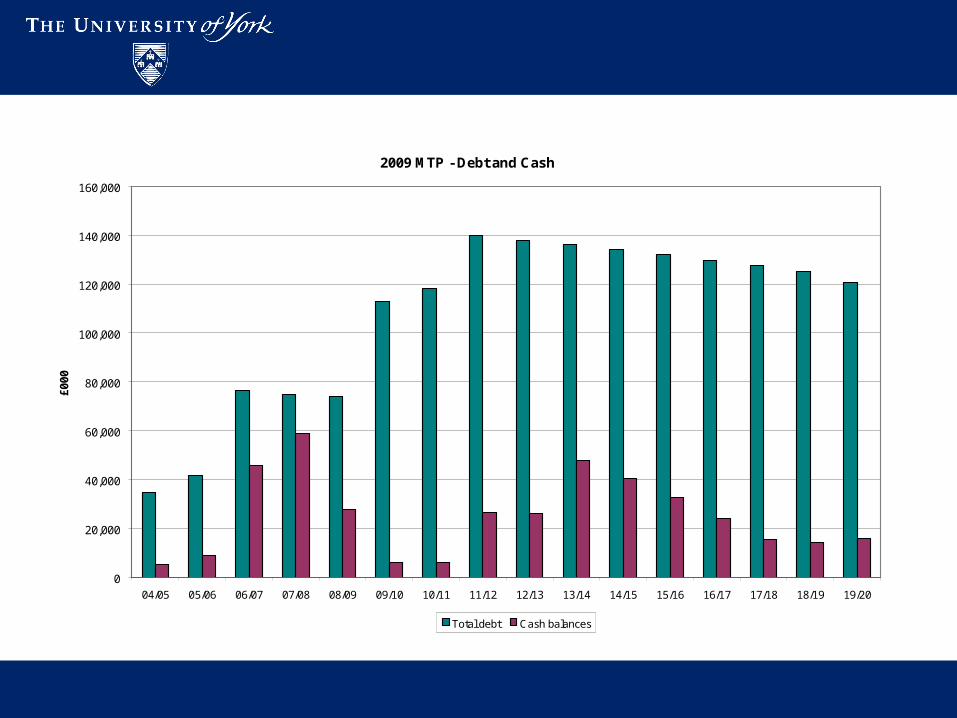
2009 MTP - Debt and Cash
0
20,000
40,000
60,000
80,000
100,000
120,000
140,000
160,000
04/05 05/06 06/07 07/08 08/09 09/10 10/11 11/12 12/13 13/14 14/15 15/16 16/17 17/18 18/19 19/20
£000
Total debt Cash balances

2009 MTP P&L Covenant - Debt service cover including Development Programme
0
5,000
10,000
15,000
20,000
25,000
30,000
35,000
04/05 05/06 06/07 07/08 08/09 09/10 10/11 11/12 12/13 13/14 14/15 15/16 16/17 17/18 18/19 19/20
£000
0.00
0.50
1.00
1.50
2.00
2.50
3.00
3.50
4.00
4.50
5.00
OC
F/D
ebt
serv
ice
cost
Operating cash flow Debt service cost Debt service cover