Embed Size (px)
Citation preview

Toward GrowthEastman Chemical Company
2009 Annual Report

Eastman Chemical Company is a global chemical company which manufactures and sells a broad portfolio of chemicals, plastics, and fibers. Eastman began business in 1920 for the purpose of producing chemicals for Eastman Kodak Company’s photographic business and became a public company, incorporated in Delaware, as of December 31, 1993. Eastman has eleven manufacturing sites in seven countries that supply chemicals, plastics, and fibers products to customers throughout the world. The Company’s headquarters and largest manufacturing site are located in Kingsport, Tennessee. In 2009, the Company had sales revenue of $5.0 billion and operating earnings of $317 million. Earnings per diluted share were $1.85 in 2009. Included in 2009 operating earnings were asset impairments and restructuring charges of $200 million.
The Company’s products and operations are managed and reported in five operating segments: the Coatings, Adhesives, Specialty Polymers, and Inks (“CASPI”) segment, the Fibers segment, the Performance Chemicals and Intermediates (“PCI”) segment, the Performance Polymers segment and the Specialty Plastics segment.
Eastman’s objective is to be an outperforming chemical company by delivering solid financial results from its core businesses and its plans for profitable growth. The Company’s core businesses currently sell differentiated products into diverse markets and geographic regions. Management believes that the Company can increase the revenues from its core businesses with increasing profitability through a balance of new applications for existing products, development of new products, and sales growth in adjacent markets and emerging geographic regions. These revenue and earnings increases are expected to result from organic initiatives and through acquisitions and joint ventures.
The Company benefits from advantaged feedstocks and proprietary technologies, and is focusing on sustainability as a competitive strength for growth. Eastman has developed new products and technologies that enable customers’ development and sales of sustainable products, and has reduced its greenhouse gas emissions and energy consumption. The combination of sustainable profits from the solid core businesses and profitable revenue growth is expected to result in continued solid financial results.
About our business
Non-GAAP Financial Measures, Net Debt, and Free Cash Flow: The CEO letter that begins on the next page of this Annual Report includes non-GAAP earnings per share that exclude asset impairments and restructuring charges and other restructuring-related items. A reconciliation to the most directly comparable GAAP earnings per share for each of the periods referenced in the CEO letter is on the “CEO Letter GAAP Earnings Per Share Reconciliations” page and in the “Management’s Discussion and Analysis of Financial Condition and Results of Operations” section of this Annual Report. Other non-GAAP financial measures and reconciliations to the most directly comparable GAAP financial measures for 2009, 2008, and 2007 for the company and its segments are included in the “Management’s Discussion and Analysis of Financial Condition and Results of Operations” section of this Annual Report. The CEO letter also includes the terms “net debt”, which means long- and short-term debt minus cash and cash equivalents, and “free cash flow”, which for 2009 means cash from operating activities less capital expenditures and dividends and for 2010 means cash from operating activities excluding the $200 million decrease in cash resulting from the increase in accounts receivable due to the adoption of new accounting guidance, less capital expenditures and dividends.
Forward-Looking Statements: This Annual Report includes forward-looking statements concerning plans and expectations for Eastman Chemical Company. Actual results could differ materially from our expectations. See “Forward-Looking Statements and Risk Factors” in the “Management’s Discussion and Analysis of Financial Condition and Results of Operations” section of this Annual Report.

To our stockholders
At Eastman, we see ourselves as an outperforming chemical company. By our definition, that is a company with strong core businesses, solid financial results, and value-creating growth. Our 2009 performance – in the face of significant challenges presented by the severe global recession – is evidence of why we believe this.
Going into the year, we didn’t quite know what to expect. The extraordinary uncertainty and unprecedented drop in demand made it difficult to forecast the depth of the recession. In response, we did a good job of focusing on pricing to offset volatile raw material and energy costs, we focused on strong cash generation, and we took significant measures to reduce our costs by $200 million. By the end of the year, we had exceeded even our own expectations.
Here are a few financial highlights:
• Recorded 2009 earnings per share that were three times higher than the last, considerably milder, recession in 2001. This significantly improved performance was the combined result of our work over the past several years to transform the company and lift the cycle troughs and our recent cost reduction actions.
• Posted record full-year operating earnings in our Fibers segment.
• Set record operating earnings in the Coatings, Adhesives, Specialty Polymers and Inks segment during the third quarter, followed by best-ever fourth-quarter operating earnings.
• Exceeded our cash generation goal by generating over $300 million in free cash flow, which is our best since 2000.
• Reduced net debt by more than $250 million.
Despite headwinds in our PET business, we did make progress toward the end of the year. Following a shutdown in the
fourth quarter to address operational issues, our South Carolina PET manufacturing facility is running at full rates, producing Class I material. With the operational challenges behind us, we are focused on improving our commercial footprint with a more profitable mix of product sales. We expect these no-regrets actions will improve the financial performance of this business.
Financial objectives
We came through the recession in a strong financial position. This and our solid 2009 performance keep us on pace to meet our goals for 2010 through 2012, which we project will be a period of economic recovery. These goals are:
• approximately 20% higher earnings per share in 2010 vs. 2009;
• greater than $100 million of free cash flow in 2010;
• approximately 20% compound annual growth rate for our earnings per share from 2009 through 2012; and,
• 2012 earnings per share of greater than $6, which would exceed our last peak earnings per share.
We have confidence we can achieve these goals. Further, we believe we can meet our earnings goals just on the strength of our core businesses. The mix of these businesses showed incredible resilience in the midst of the worst recession in a generation, and all are positioned to continue to improve as the global economy improves.
Jim RogersPresident and CEO

As I mentioned, an outperforming chemical company also delivers growth, which is why growing our company is our priority. Our plan for delivering growth is simple. We plan to build upon who we are and what we know. First and foremost, we are a chemical company proudly making products that improve our everyday lives. We have a number of growth options on the table, and are considering organic and inorganic opportunities in most of our businesses.
We are taking a balanced and disciplined approach to growth in the four areas of build, joint ventures and acquisitions, equity, and debt.
Let’s look at these in a little more detail.
Build – This starts with optimizing investments that have been completed or are near completion. We made tremendous progress in this area in 2009 with the completion of our Regalite™ adhesives facility in the Netherlands as well as our recently completed Eastman Tritan™ copolyester expansion in Kingsport, Tennessee. Given the specialty nature of these products and expected growth rates, these projects are expected to have returns on capital greater than 15-20%. We should see these benefits starting in 2010 and continuing throughout the recovery period. Our 2008 acetate tow expansion in Europe contributed to 2009 results and will continue to do so going forward.
We are currently evaluating a number of other organic growth options to extend and optimize our core businesses. We expect cash from operations will more than fund organic growth initiatives over the next three years.
Joint ventures and acquisitions – We are also pursuing attractive inorganic joint venture and acquisition opportunities that would be considered bolt-ons to our core businesses or in adjacent product lines or markets.
We are focusing our efforts on opportunities that encompass at least one of these areas of emphasis: serves emerging markets, like our recent acetate tow joint venture with SK Chemicals in Korea; offers differentiated products; provides access to advantaged feedstocks; or takes advantage of mega-trends like consumerism, energy efficiency, and sustainability. We believe that sustainability in particular provides a tailwind for Eastman. Our environmental stewardship was recognized in 2009 by Newsweek magazine which named Eastman as one of the Top 100 Greenest Companies in America. Also in 2009, our Eastman green biocatalytic process was the winner of the EPA’s Presidential Green Chemistry Award. In addition, we have a growing portfolio of sustainably-advantaged products, like our BPA-free Eastman Tritan™ copolyester, our non-phthalate plasticizer Eastman 168™, and our bio-based cellulosics that are made from renewable resources.
Toward growth
2001
$3.63
Company actions contributed to earnings per share more than 3 times higher than last recession
2009 EPS Improvement over 2001
$1.19
2009
-10%
40%
90%
Eastman S&PChemicals
S&PMaterials
S&P 500
Total Stockholder Return vs. Indices12/31/99 - 12/31/09
Total stockholder return is derived by combining share price appreciation and dividends paid assuming reinvestment of dividends
86%
74%
58%
-9%
Equity – We remain committed to returning cash to you, our stockholders. We understand the importance of the dividend, even in the toughest of environments as we demonstrated in 2009. We also remain committed to share repurchases and will be repurchasing shares over the coming quarters primarily to offset dilution.
Debt – We are committed to remain investment grade and we will continue to be opportunistic in the area of managing our debt.
Evaluating our growth efforts through these lenses, we made significant progress toward growth in 2009. I do want to point out, however, that the world hasn’t cooperated on everything. Late last year we announced we were discontinuing our Beaumont, Texas, industrial gasification project due to a number of factors, including high capital costs. It can be difficult to let go of a project that you’ve worked hard on, but we were pragmatic and realized it was the right business decision. It also freed up resources, including cash and energy that can be focused on our other growth projects.
We have a great deal of momentum going into 2010 and a strong balance sheet to achieve our goals. This, along with our disciplined determination, gives me confidence in our ability to profitably grow our company.
Unique culture, unique results
In closing, I want to take a moment to recognize the real heroes of 2009 who in my book are our employees. Last year the recession made it clear to all of us that we were going to have to endure some tough decisions. Our men and women stepped up, stayed focused, and delivered exceptional results. They remained committed to their co-workers and their
communities despite their own personal sacrifices. I have worked several places in my lifetime, and I can say I’ve never experienced the type of unique culture we have at Eastman. I value it, and I know our customers do, too.
I also want to recognize my predecessor, Brian Ferguson. I want to thank him for handing me a strong leadership team which allowed for a smooth transition during what was a very rocky time for the global economy.
Finally I want to thank you, our owners, for recognizing the value of our company and for riding out the storm with us. I am very optimistic about our future, and whatever expectations you have for this company, mine are even higher. I look forward to rewarding your investment by consistently demonstrating that Eastman is truly an outperforming chemical company.
Regards,
Jim Rogers
President and Chief Executive OfficerMarch 19, 2010
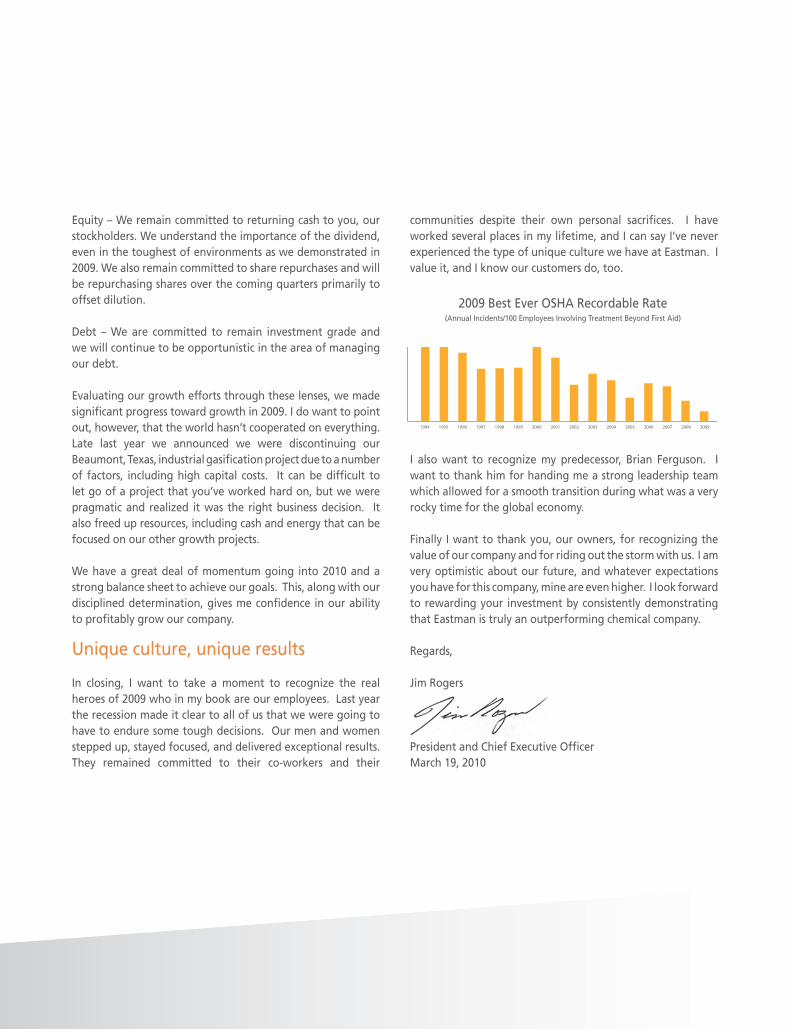
1994 20082007200620052004200320022001200019991998199719961995 2009
2009 Best Ever OSHA Recordable Rate(Annual Incidents/100 Employees Involving Treatment Beyond First Aid)

Table of contents
Selected financial information page 1
Management’s discussion and analysis of financial condition and results of operations page 3
Quantitative and qualitative disclosures about market risk page 41
Financial statements and supplementary data page 42
CEO letter GAAP earnings per share reconciliations page 94
Performance graph page 95
Stockholder information page 96

1
SELECTED FINANCIAL INFORMATION Summary of Operating Data Year Ended December 31, (Dollars in millions, except per share amounts) 2009 2008 2007 2006 2005 Sales $ 5,047 $ 6,726 $ 6,830 $ 6,779 $ 6,460 Operating earnings 317 519 504 654 740 Earnings from continuing operations 136 328 321 427 541 Earnings (loss) from discontinued
operations
--
--
(10)
(18)
16 Gain (loss) from disposal of discontinued
operations
--
18
(11)
--
-- Net earnings $ 136 $ 346 $ 300 $ 409 $ 557 Basic earnings per share
Earnings from continuing operations $ 1.88 $ 4.36 $ 3.89 $ 5.20 $ 6.70 Earnings (loss) from discontinued
operations -- 0.23 (0.26) (0.22) 0.20 Net earnings $ 1.88 $ 4.59 $ 3.63 $ 4.98 $ 6.90
Diluted earnings per share
Earnings from continuing operations $ 1.85 $ 4.31 $ 3.84 $ 5.12 $ 6.61 Earnings (loss) from discontinued
operations -- 0.24 (0.26) (0.21) 0.20 Net earnings $ 1.85 $ 4.55 $ 3.58 $ 4.91 $ 6.81
Statement of Financial Position Data
Current assets $ 1,735 $ 1,423 $ 2,293 $ 2,422 $ 1,924 Net properties 3,110 3,198 2,846 3,069 3,162 Total assets 5,515 5,281 6,009 6,132 5,737 Current liabilities 800 832 1,122 1,059 1,051 Long-term borrowings 1,604 1,442 1,535 1,589 1,621 Total liabilities 4,002 3,728 3,927 4,103 4,125 Total stockholders' equity 1,513 1,553 2,082 2,029 1,612 Dividends declared per share 1.76 1.76 1.76 1.76 1.76 In fourth quarter 2009, the Company announced its decision to discontinue the Beaumont, Texas industrial gasification project. This decision was based on a number of factors, including high capital costs, the current and projected reduced spread between natural gas and oil and petroleum coke prices, and continued uncertainty regarding U.S. energy and environmental public policy. For more information regarding the impact of this impairment on financial results, refer to the segment discussions in "Management's Discussion and Analysis of Financial Condition and Results of Operations" and "Notes to the Audited Consolidated Financial Statements" – Note 2, "Asset Impairments and Restructuring Charges, Net " of this Annual Report. In first quarter 2008, the Company completed the sale of its polyethylene terephthalate ("PET") polymers and purified terephthalic acid ("PTA") manufacturing facilities in Rotterdam, the Netherlands and the PET manufacturing facility in Workington, United Kingdom and related businesses. Results from, charges related to, and gains and losses from disposal of the San Roque, Spain, the Netherlands, and the United Kingdom assets and businesses are presented as discontinued operations. For more information regarding the impact of these divestitures on financial results, refer to the segment discussions in "Management's Discussion and Analysis of Financial Condition and Results of Operations" and "Notes to the Audited Consolidated Financial Statements" – Note 16, "Divestitures" and Note 17, "Discontinued Operations" of this Annual Report.

2
In second quarter 2007, the Company completed the sale of its San Roque, Spain PET manufacturing facility. During fourth quarter 2007, the Company sold its PET polymers production facilities in Cosoleacaque, Mexico and Zarate, Argentina and the related businesses and entered into definitive agreements to sell its PET polymers production facilities in Rotterdam, the Netherlands and Workington, United Kingdom and the related businesses. For more information regarding the impact of these divestitures on financial results, refer to the segment discussions in "Management's Discussion and Analysis of Financial Condition and Results of Operations" and "Notes to the Audited Consolidated Financial Statements" – Note 2, "Discontinued Operations and Assets Held for Sale" and Note 17, "Divestitures" of the 2008 Annual Report on Form 10-K. In fourth quarter 2006, the Company completed the sale of its Batesville, Arkansas manufacturing facility and related assets and specialty organic chemicals product lines in the Performance Chemicals and Intermediates ("PCI") segment and the sale of its polyethylene and EpoleneTM polymer businesses and related assets located at the Longview, Texas site and the Company's ethylene pipeline. The polyethylene assets and product lines were in the Performance Polymers segment, while the EpoleneTM
assets and product lines were in the Coatings, Adhesives, Specialty Polymers and Inks ("CASPI") segment. For more information regarding the impact of these divestitures on financial results, refer to the segment discussions of "Management's Discussion and Analysis of Financial Reporting and Results of Operations" and "Notes to the Audited Consolidated Financial Statements" – Note 17, "Divestitures" of the 2008 Annual Report on Form 10-K.

3
MANAGEMENT'S DISCUSSION AND ANALYSIS OF FINANCIAL CONDITION AND RESULTS OF OPERATIONS
ITEM Page Critical Accounting Estimates 4 Strategic Actions and Related Presentation of Non-GAAP Financial Measures 7 2009 Overview 9 Results of Operations
Summary of Consolidated Results – 2009 Compared with 2008 10 Summary by Operating Segment 14 Summary by Customer Location – 2009 Compared with 2008 20 Summary of Consolidated Results – 2008 Compared with 2007 21 Summary by Operating Segment 24 Summary by Customer Location – 2008 Compared with 2007 30
Liquidity, Capital Resources, and Other Financial Information 31 Environmental 36 Inflation 37 Recently Issued Accounting Standards 37 Outlook 37 Forward-Looking Statements and Risk Factors 38
This Management's Discussion and Analysis of Financial Condition and Results of Operations is based upon the consolidated financial statements for Eastman Chemical Company ("Eastman" or the "Company"), which have been prepared in accordance with accounting principles generally accepted ("GAAP") in the United States, and should be read in conjunction with the Company's consolidated financial statements and related notes included elsewhere in this Annual Report. All references to earnings per share ("EPS") contained in this report are diluted earnings per share unless otherwise noted.

MANAGEMENT'S DISCUSSION AND ANALYSIS OF FINANCIAL CONDITION AND RESULTS OF OPERATIONS
4
CRITICAL ACCOUNTING ESTIMATES In preparing the consolidated financial statements in conformity with GAAP, the Company's management must make decisions which impact the reported amounts and the related disclosures. Such decisions include the selection of the appropriate accounting principles to be applied and assumptions on which to base estimates and judgments that affect the reported amounts of assets, liabilities, sales revenue and expenses, and related disclosure of contingent assets and liabilities. On an ongoing basis, the Company evaluates its estimates, including those related to allowances for doubtful accounts, impairment of long-lived assets, environmental costs, U.S. pension and other post-employment benefits, litigation and contingent liabilities, and income taxes. The Company bases its estimates on historical experience and on various other assumptions that are believed to be reasonable under the circumstances, the results of which form the basis for making judgments about the carrying values of assets and liabilities that are not readily apparent from other sources. Actual results may differ from these estimates under different assumptions or conditions. The Company's management believes the critical accounting estimates described below are the most important to the fair presentation of the Company's financial condition and results. These estimates require management's most significant judgments in the preparation of the Company's consolidated financial statements. Allowances for Doubtful Accounts The Company maintains allowances for doubtful accounts for estimated losses resulting from the inability of its customers to make required payments. The Company believes, based on historical results, the likelihood of actual write-offs having a material impact on financial results is low. However, if one of the Company's key customers was to file for bankruptcy, or otherwise be unable to make its required payments, or there was a significant continued slow-down in the economy, the Company could increase its allowances. This could result in a material charge to earnings. The Company's allowances were $10 million and $8 million at December 31, 2009 and 2008, respectively. Impairment of Long-Lived Assets Long-lived assets and certain identifiable intangibles to be held and used by the Company are reviewed for impairment whenever events or changes in circumstances indicate that the carrying amount of an asset may not be recoverable. If the carrying amount is not considered to be recoverable, an analysis of fair value is triggered. An impairment is recorded for the excess of the carrying amount of the asset over the fair value. The Company conducts its annual testing of goodwill and indefinite-lived intangible assets in third quarter of each year, unless events warrant more frequent testing. Reporting units are identified for the purpose of assessing potential impairments of goodwill. The carrying value of indefinite-lived intangibles is considered impaired when their fair value, as established by appraisal or based on undiscounted future cash flows of certain related products, is less than their carrying value. If the fair value of a reporting unit is less than the carrying value of goodwill, additional steps, including an allocation of the estimated fair value to the assets and liabilities of the reporting unit, would be necessary to determine the amount, if any, of goodwill impairment. Goodwill and indefinite-lived intangibles primarily consist of goodwill in the Coatings, Adhesives, Specialty Polymers and Inks ("CASPI") segment. The Company also had recorded goodwill and other intangibles associated with the Beaumont, Texas industrial gasification project. In fourth quarter 2009, the Company announced the discontinuance of the Beaumont, Texas industrial gasification project, which resulted in an impairment of the Beaumont industrial gasification project goodwill and other intangible assets. As the Company's assumptions related to long-lived assets are subject to change, additional write-downs may be required in the future. If estimates of fair value less costs to sell are revised, the carrying amount of the related asset is adjusted, resulting in a charge to earnings. The Company recognized fixed (tangible) asset impairment costs of $133 million and goodwill and definite-lived intangible asset impairment costs of $46 million in results from continuing operations during 2009, related to the discontinuance of the Beaumont, Texas industrial gasification project. The Company recognized no fixed (tangible) asset impairment costs and no definite-lived intangible asset impairment costs in results from continuing operations during 2008.

MANAGEMENT'S DISCUSSION AND ANALYSIS OF FINANCIAL CONDITION AND RESULTS OF OPERATIONS
5
Environmental Costs The Company accrues environmental remediation costs when it is probable that the Company has incurred a liability at a contaminated site and the amount can be reasonably estimated. When a single amount cannot be reasonably estimated but the cost can be estimated within a range, the Company accrues the minimum amount. This undiscounted accrued amount reflects the Company's assumptions about remediation requirements at the contaminated site, the nature of the remedy, the outcome of discussions with regulatory agencies and other potentially responsible parties at multi-party sites, and the number and financial viability of other potentially responsible parties. Changes in the estimates on which the accruals are based, unanticipated government enforcement action, or changes in health, safety, environmental, and chemical control regulations and testing requirements could result in higher or lower costs. Estimated future environmental expenditures for remediation costs range from the minimum or best estimate of $10 million to the maximum of $20 million at December 31, 2009. In accordance with GAAP, the Company also establishes reserves for closure/postclosure costs associated with the environmental and other assets it maintains. Environmental assets, as defined by GAAP, include but are not limited to waste management units, such as landfills, water treatment facilities, and ash ponds. When these types of assets are constructed or installed, a reserve is established for the future costs anticipated to be associated with the retirement or closure of the asset based on an expected life of the environmental assets and the applicable regulatory closure requirements. These future expenses are charged against earnings over the estimated useful life of the assets. Currently, the Company estimates the useful life of each individual asset is up to 50 years. If the Company changes its estimate of the asset retirement obligation costs or its estimate of the useful lives of these assets, expenses to be charged against earnings could increase or decrease. In accordance with GAAP, the Company also monitors conditional obligations and will record reserves associated with them when and to the extent that more detailed information becomes available concerning applicable retirement costs. The Company's reserve, including the above remediation, was $42 million at December 31, 2009 and $41 million at December 31, 2008, representing the minimum or best estimate for remediation costs and the best estimate of the amount accrued to date over the regulated assets' estimated useful lives for asset retirement obligation costs. Pension and Other Post-employment Benefits The Company maintains defined benefit pension plans that provide eligible employees with retirement benefits. Additionally, Eastman provides life insurance and health care and dental benefits for eligible retirees and health care benefits for retirees' eligible survivors. The costs and obligations related to these benefits reflect the Company's assumptions related to general economic conditions (particularly interest rates) and expected return on plan assets. For the U.S. plans, at December 31, 2009, the Company assumed a discount rate of 5.72 percent on its defined benefit pension plans, 5.79 percent on its other post-employment benefit plan and an expected return on assets of 9 percent. The cost of providing plan benefits also depends on demographic assumptions including retirements, mortality, turnover, and plan participation.

MANAGEMENT'S DISCUSSION AND ANALYSIS OF FINANCIAL CONDITION AND RESULTS OF OPERATIONS
6
The Company expects its 2010 pension expense to be slightly higher than 2009. The December 31, 2009 projected benefit obligation and 2010 expense are affected by year-end 2009 assumptions. The sensitivities below are specific to the time periods noted. They also may not be additive, so the impact of changing multiple factors simultaneously cannot be calculated by combining the individual sensitivities shown. The following table illustrates the sensitivity to changes in the Company's long-term assumptions in the expected return on assets and assumed discount rate for the U.S. pension plans and other postretirement welfare plans:
Change in Assumption
Impact on 2010 Pre-tax U.S. Benefits Expense
Impact on December 31, 2009 Projected Benefit
Obligation for U.S. Pension Plans
Impact on December 31, 2009
Benefit Obligation for Other U.S. Postretirement
Plans
25 basis point decrease in discount
rate
+$5 Million
+$40 Million
+$23 Million
25 basis point increase in discount
rate
-$5 Million
-$38 Million
-$22 Million
25 basis point decrease in expected
return on assets
+$3 Million
No Impact
N/A
25 basis point increase in expected
return on assets
-$3 Million
No Impact
N/A The expected return on assets and assumed discount rate used to calculate the Company's pension and other post-employment benefit obligations are established each December 31. The expected return on assets is based upon the long-term expected returns in the markets in which the pension trust invests its funds, primarily the domestic, international, and private equity markets. Historically, over a ten year period, excluding 2008 which is considered an anomaly due to the global recession, the Company's average achieved actual return has been equal to or greater than the expected return on assets. The assumed discount rate is based upon a portfolio of high-grade corporate bonds, which are used to develop a yield curve. This yield curve is applied to the expected durations of the pension and post-employment benefit obligations. As future benefits under the U.S. benefit plan have been fixed at a certain contribution amount, changes in the health care cost trend assumptions do not have a material impact on the results of operations. The Company uses the market related valuation method to determine the value of plan assets, which recognizes the change of the fair value of the plan assets over five years. If actual experience differs from these long-term assumptions, the difference is recorded as an unrecognized actuarial gain (loss) and then amortized into earnings over a period of time based on the average future service period, which may cause the expense related to providing these benefits to increase or decrease. The charges applied to earnings in 2009, 2008, and 2007 due to the amortization of these unrecognized actuarial losses, largely due to actual experience versus assumptions of discount rates, were $45 million, $37 million, and $47 million, respectively.

MANAGEMENT'S DISCUSSION AND ANALYSIS OF FINANCIAL CONDITION AND RESULTS OF OPERATIONS
7
The Company does not anticipate that a change in pension and other post-employment obligations caused by a change in the assumed discount rate during 2010 will impact the cash contributions to be made to the pension plans during 2010. However, an after-tax charge or credit will be recorded directly to accumulated other comprehensive income (loss), a component of stockholders' equity, as of December 31, 2010 for the impact on the pension's projected benefit obligation of the change in interest rates, if any. While the amount of the change in these obligations does not correspond directly to cash funding requirements, it is an indication of the amount the Company will be required to contribute to the plans in future years. The amount and timing of such cash contributions is dependent upon interest rates, actual returns on plan assets, retirement, attrition rates of employees, and other factors. For further information regarding pension and other post-employment obligations, see Note 10, "Retirement Plans", to the Company's consolidated financial statements in this Annual Report. Litigation and Contingent Liabilities From time to time, the Company and its operations are parties to or targets of lawsuits, claims, investigations and proceedings, including product liability, personal injury, asbestos, patent and intellectual property, commercial, contract, environmental, antitrust, health and safety, and employment matters, which are handled and defended in the ordinary course of business. The Company accrues a liability for such matters when it is probable that a liability has been incurred and the amount can be reasonably estimated. When a single amount cannot be reasonably estimated but the cost can be estimated within a range, the Company accrues the minimum amount. The Company expenses legal costs, including those expected to be incurred in connection with a loss contingency, as incurred. Based upon facts and information currently available, the Company believes the amounts reserved are adequate for such pending matters; however, results of operations could be affected by monetary damages, costs or expenses, and charges against earnings in particular periods. Income Taxes The Company records deferred tax assets and liabilities based on temporary differences between the financial reporting and tax bases of assets and liabilities, applying enacted tax rates expected to be in effect for the year in which the differences are expected to reverse. The ability to realize the deferred tax assets is evaluated through the forecasting of taxable income using historical and projected future operating results, the reversal of existing temporary differences, and the availability of tax planning strategies. Valuation allowances are recorded to reduce deferred tax assets when it is more likely than not that a tax benefit will not be realized. In the event that the actual outcome from future tax consequences differs from our estimates and assumptions, the resulting change to the provision for income taxes could have a material adverse impact on the consolidated results of operations and statement of financial position. As of December 31, 2009, a valuation allowance of $88 million has been provided against the deferred tax assets. The Company recognizes income tax positions that meet the more likely than not threshold and accrues interest related to unrecognized income tax positions, which is recorded as a component of the income tax provision. STRATEGIC ACTIONS AND RELATED PRESENTATION OF NON-GAAP FINANCIAL MEASURES During 2009, the Company recognized $200 million in asset impairment and restructuring charges, primarily consisting of $179 million in asset impairments related to the Company's previously announced discontinuance of its Beaumont, Texas industrial gasification project and $23 million, net, for severance resulting from a reduction in force. The Company's decision to discontinue the industrial gasification project was due to a number of factors, including high capital costs, the current and projected reduced spread between natural gas and oil and petroleum coke prices, and continued uncertainty regarding U.S. energy and environmental public policy.

MANAGEMENT'S DISCUSSION AND ANALYSIS OF FINANCIAL CONDITION AND RESULTS OF OPERATIONS
8
In 2008, the Company sold certain mineral rights at an operating manufacturing site, recognizing $16 million of other operating income. During 2007 and 2008, the Company took certain strategic actions in its Performance Polymers segment to address its underperforming polyethylene terephthalate ("PET") manufacturing facilities outside the United States. In second quarter 2007, the Company completed the sale of its PET manufacturing facility in Spain and in first quarter 2008, the Company completed the sale of its PET polymers and purified terephthalic acid ("PTA") manufacturing facilities in the Netherlands and the PET manufacturing facility in the United Kingdom and related businesses. Results from, charges related to, and gains and losses from disposal of the Spain, the Netherlands, and the United Kingdom assets and businesses are presented as discontinued operations. In fourth quarter 2007, the Company completed the sale of its Mexico and Argentina manufacturing facilities. As part of this divestiture, the Company entered into transition supply agreements for polymer intermediates from which sales revenue and operating results are included in the Performance Polymers segment results in 2008. In fourth quarter 2006, the Company sold its polyethylene ("PE") and EpoleneTM
polymer businesses and related assets of the Performance Polymers and CASPI segments. As part of the PE divestiture, the Company entered into a transition supply agreement for contract ethylene sales, from which sales revenue and operating earnings are included in the Performance Chemicals and Intermediates ("PCI") segment results in 2009, 2008, and 2007.
Also in fourth quarter 2006, the Company made strategic decisions relating to the scheduled shutdown of cracking units in Longview, Texas and a planned shutdown of higher cost PET assets in Columbia, South Carolina. Accelerated depreciation costs resulting from these decisions were $9 million and $49 million in 2008 and 2007, respectively. For more information on accelerated depreciation costs, see "Gross Profit" in the "Results of Operations" section of this Management's Discussion and Analysis of Financial Condition and Results of Operations. This Management's Discussion and Analysis of Financial Condition and Results of Operations includes the following non-GAAP financial measures and accompanying reconciliations to the most directly comparable GAAP financial measures. The non-GAAP financial measures used by the Company may not be comparable to similarly titled measures used by other companies and should not be considered in isolation or as a substitute for measures of performance or liquidity prepared in accordance with GAAP. • Company sales and segment sales and results from continuing operations excluding sales revenue and results
from continuing operations from sales in Latin America of PET products manufactured at the divested Mexico and Argentina PET manufacturing sites;
• Company and segment sales excluding contract ethylene sales under a transition agreement related to the divestiture of the PE product lines;
• Company and segment sales excluding contract polymer intermediates sales under a transition supply agreement related to the divestiture of the PET manufacturing facilities and related businesses in Mexico and Argentina;
• Company and segment gross profit, operating earnings, earnings from continuing operations, and diluted earnings per share excluding accelerated depreciation costs, asset impairments and restructuring charges, and other operating income; and
• Company earnings from continuing operations and diluted earnings per share excluding net deferred tax benefits related to the previous divestiture of businesses.

MANAGEMENT'S DISCUSSION AND ANALYSIS OF FINANCIAL CONDITION AND RESULTS OF OPERATIONS
9
Eastman's management believes that contract ethylene sales under the transition agreement related to the divestiture of the PE product lines, the contract polymer intermediates sales under the transition supply agreement related to the divestiture of the PET manufacturing facilities and related businesses in Mexico and Argentina, and the other operating income from the sale of mineral rights do not reflect the continuing and expected future business of the PCI and Performance Polymers segments or of the Company. In addition, for evaluation and analysis of ongoing business results and the impact on the Company and segments of strategic decisions and actions to reduce costs and to improve the profitability of the Company, management believes that Company and segment earnings from continuing operations should be considered both with and without accelerated depreciation costs, asset impairments and restructuring charges, and deferred tax benefits related to the previous divestiture of businesses, and that Company and segment sales and results from continuing operations should be considered both with and without sales revenue and results from continuing operations from sales in Latin America of PET products manufactured at the divested Mexico and Argentina manufacturing facilities. Management believes that investors can better evaluate and analyze historical and future business trends if they also consider the reported Company and segment results, respectively, without the identified items. Management utilizes Company and segment results including and excluding the identified items in the measures it uses to evaluate business performance and in determining certain performance-based compensation. These measures, excluding the identified items, are not recognized in accordance with GAAP and should not be viewed as alternatives to the GAAP measures of performance. 2009 OVERVIEW The Company generated sales revenue of $5.0 billion and $6.7 billion for 2009 and 2008, respectively. Excluding the results of contract ethylene sales and contract polymer intermediates sales, sales revenue decreased by 20 percent. The sales revenue decrease was due to lower selling prices in response to lower raw material and energy costs and lower sales volume primarily attributed to weakened demand due to the global recession. Operating earnings were $317 million in 2009 compared to $519 million in 2008. Excluding accelerated depreciation costs, asset impairments and restructuring charges, net, and other operating income, operating earnings were $517 million in 2009 compared with $558 million in 2008. Eastman's reduced earnings reflect continued weakness in demand for the Company's products that caused lower sales volume and continued low capacity utilization which resulted in higher unit costs. This weakness in demand, which is attributed to the global recession, moderated throughout 2009 resulting in stronger sales volume and operating earnings in second half of the year. The decline was partially offset by lower raw material and energy costs more than offsetting lower selling prices. Operating earnings also benefited from cost reduction actions which positively impacted results throughout the year. During 2009, operating earnings were negatively impacted by $200 million in asset impairment and restructuring charges, net, primarily consisting of $179 million in asset impairments related to the Company's discontinuance of its Beaumont, Texas industrial gasification project and $23 million, net, for severance resulting from a reduction in force. Primarily as a result of strategic actions related to the Performance Polymers and PCI segments, as well as a corporate severance program, operating earnings in 2008 were negatively impacted by $46 million in asset impairments and restructuring charges and $9 million of accelerated depreciation costs, and were positively impacted by $16 million in other operating income. Earnings from continuing operations were $136 million in 2009 compared to $328 million in 2008. Excluding accelerated depreciation costs, asset impairments and restructuring charges, net, and net deferred tax benefits, earnings from continuing operations were $266 million and $342 million, respectively. Earnings from continuing operations were $1.85 per diluted share in 2009 compared to $4.31 per diluted share in 2008. Excluding accelerated depreciation costs, asset impairments and restructuring charges, net, and net deferred tax benefits, earnings were $3.63 per diluted share and $4.50 per diluted share, respectively.

MANAGEMENT'S DISCUSSION AND ANALYSIS OF FINANCIAL CONDITION AND RESULTS OF OPERATIONS
10
The Company generated $758 million in cash from operating activities during 2009 compared to $653 million generated by operating activities in 2008. The increase was primarily due to cash received from a change in tax accounting method, as well as a reduction in working capital in 2009 as compared to an increase in working capital in 2008. In 2009, the Company received proceeds from a public debt offering of $248 million, contributed $181 million to the U.S. defined benefit pension plan, and repaid $88 million of its euro credit facility and $13 million of short term borrowings. In 2008, the Company received proceeds from sale of assets of $337 million, repurchased shares totaling $501 million, and repaid $175 million of borrowings. The Company continued its growth initiatives in 2009. In the Fibers segment, construction of the Korean acetate tow facility began in first quarter 2009, with the facility expected to be operational in first quarter 2010. In the Specialty Plastics segment, the introduction of its new Eastman TritanTM copolyester progressed with the monomer manufacturing facility and its first TritanTM
copolyester polymer manufacturing facility in Kingsport, Tennessee which were both completed in 2009 and are expected to be operational in early 2010. In the CASPI segment, the 30 percent expansion of the Company's hydrogenated hydrocarbon resins manufacturing capacity in Middelburg, the Netherlands which was completed in 2009 with expected production in 2010 to meet growing demand for specialty hydrocarbon resins.
RESULTS OF OPERATIONS The Company's results of operations as presented in the Company's consolidated financial statements in this Annual Report are summarized and analyzed below. SUMMARY OF CONSOLIDATED RESULTS - 2009 COMPARED WITH 2008
Volume Effect
Price Effect
Product
Mix Effect
Exchange Rate
Effect (Dollars in millions) 2009 2008 Change
Sales $ 5,047 $ 6,726 (25) % (13) % (12) % -- % -- % Sales – contract polymer
intermediates sales (1) -- 138
Sales - contract ethylene
sales (2) 28 314
Sales – excluding listed
items $ 5,019 $ 6,274
(20) % (7) % (12) % (1) % -- % (1) Included in 2008 sales revenue are contract polymer intermediates sales under the transition supply agreement related to the
divestiture of the PET manufacturing facilities and related businesses in Mexico and Argentina in fourth quarter 2007. (2)
Included in 2009 and 2008 sales revenue are contract ethylene sales under the transition supply agreement related to the divestiture of the PE businesses.
Sales revenue for 2009 compared to 2008 decreased $1,679 million. Excluding contract ethylene sales and contract polymer intermediates sales, sales revenue decreased 20 percent due to lower selling prices in response to lower raw material and energy costs, particularly in the PCI and Performance Polymers segments, and lower sales volume primarily attributed to weakened demand due to the global recession.

MANAGEMENT'S DISCUSSION AND ANALYSIS OF FINANCIAL CONDITION AND RESULTS OF OPERATIONS
11
Gross profit for 2009 decreased compared with 2008 in the PCI, Performance Polymers, and Specialty Plastics segments due to continued weakness in demand for the Company's products attributed to the global recession. This weak demand caused lower sales volume and lower capacity utilization which, resulted in higher unit costs. In addition, the Performance Polymers segment was negatively impacted by operational challenges with the South Carolina PET manufacturing facility. Gross profit as a percentage of sales increased due to improved performance in the Fibers and CASPI segments. The Fibers segment benefited from higher selling prices, while the CASPI segment had lower raw material and energy costs more than offsetting lower selling prices. The Company also benefited from cost reduction actions in 2009. In addition, 2009 results included approximately $20 million in costs related to the reconfiguration of the Longview, Texas facility, which impacted the PCI and CASPI segments. Gross profit included accelerated depreciation costs of $9 million in 2008 resulting from the previously reported shutdown of the cracking units in Longview, Texas and higher cost PET polymer assets in Columbia, South Carolina. The Company's 2009 raw material and energy costs decreased by approximately $900 million compared with 2008. (Dollars in millions) 2009 2008 Change Selling, General and Administrative Expenses ("SG&A") $ 399 $ 419 (5) % Research and Development Expenses ("R&D") 137 158 (13) % $ 536 $ 577 (7) % As a percentage of sales 11 % 9 % SG&A expenses decreased for 2009 compared to 2008 primarily due to lower discretionary spending and compensation expense resulting from cost reduction actions partially offset by increased compensation expense linked to the Company's higher stock price. R&D expenses decreased for 2009 compared to 2008 primarily due to lower R&D expenses for corporate growth initiatives, including the industrial gasification project in Beaumont, Texas and the commercialized Eastman TritanTM
copolyester.
Asset Impairments and Restructuring Charges, Net Asset impairments and restructuring charges, net, totaled $200 million and $46 million in 2009 and 2008, respectively. Asset impairments and restructuring charges in 2009 consists primarily of $179 million in asset impairments related to the Company's previously announced discontinuance of its Beaumont, Texas industrial gasification project and $23 million, net for severance resulting from a reduction in force. Asset impairments and restructuring charges in 2008 were primarily for restructuring at the South Carolina facility in the Performance Polymers segment, severance and pension costs from the decision to close a previously impaired site in the United Kingdom in the PCI segment, and severance costs resulting from a corporate severance program. For more information regarding asset impairments and restructuring charges, primarily related to recent strategic decisions and actions, see the Performance Polymers and PCI segments discussion and Note 2, "Asset Impairments and Restructuring Charges, Net", to the Company's consolidated financial statements in this Annual Report.
(Dollars in millions) 2009 2008 Change Gross Profit $ 1,053 $ 1,126 (6) %
As a percentage of sales 21 % 17 % Accelerated depreciation included in cost of sales -- 9
Gross Profit excluding accelerated depreciation costs 1,053 1,135 (7) % As a percentage of sales 21 % 17 %

MANAGEMENT'S DISCUSSION AND ANALYSIS OF FINANCIAL CONDITION AND RESULTS OF OPERATIONS
12
Other Operating Income, Net Other operating income, net for 2008 reflected proceeds of $16 million from the sale of certain mineral rights at an operating manufacturing site. Operating Earnings 2009 2008 Change (Dollars in millions) Operating earnings $ 317 $ 519 (39) % Accelerated depreciation included in cost of sales -- 9 Asset impairments and restructuring charges, net 200 46 Other operating income, net -- (16) Operating earnings excluding accelerated depreciation costs,
asset impairment and restructuring charges, net, and other operating income, net $ 517 $ 558
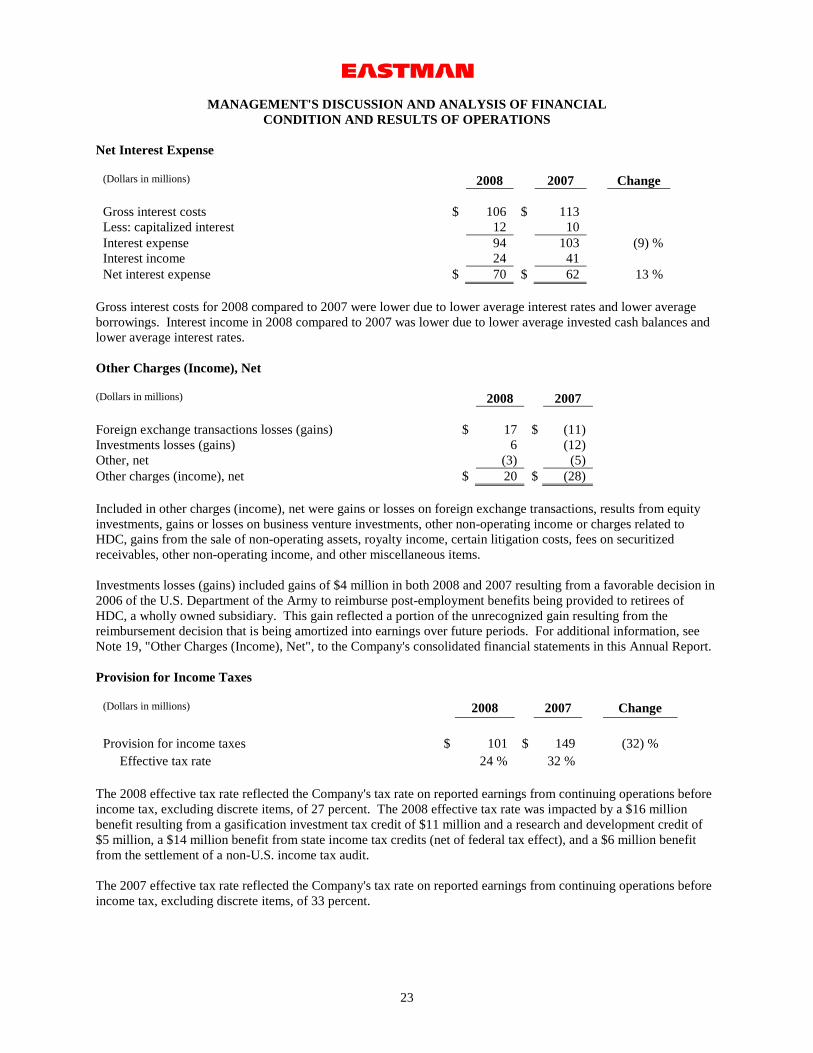
(7) % Net Interest Expense
(Dollars in millions) 2009 2008 Change Gross interest costs $ 99 $ 106 Less: capitalized interest 14 12 Interest expense 85 94 (10) % Interest income 7 24 Net interest expense $ 78 $ 70 11 %
Net interest expense increased $8 million in 2009 compared to 2008. Gross interest costs for 2009 compared to 2008 were lower due to lower average borrowings and lower average interest rates. Interest income in 2009 compared to 2008 was lower due to lower average interest rates and lower average cash balances. For 2010, the Company expects net interest expense to increase compared with 2009 primarily due to lower capitalized interest and higher borrowings. Other Charges (Income), Net (Dollars in millions) 2009 2008 Foreign exchange transactions losses $ 5 $ 17 Investments losses, net 5 6 Other, net 3 (3) Other charges (income), net $ 13 $ 20 Included in other charges (income), net are gains or losses on foreign exchange transactions, results from equity investments, gains or losses on business venture investments, other non-operating income or charges related to Holston Defense Corporation ("HDC"), gains from the sale of non-operating assets, certain litigation costs, fees on securitized receivables, other non-operating income, and other miscellaneous items.

MANAGEMENT'S DISCUSSION AND ANALYSIS OF FINANCIAL CONDITION AND RESULTS OF OPERATIONS
13
Investments losses, net include gains of $4 million in both 2009 and 2008 resulting from a favorable decision in 2006 of the U.S. Department of the Army to reimburse post-employment benefits being provided to retirees of HDC, a wholly owned subsidiary. This gain reflected a portion of the unrecognized gain resulting from the reimbursement decision that will be amortized into earnings over future periods. For additional information, see Note 19, "Other Charges (Income), Net", to the Company's consolidated financial statements in this Annual Report. Provision for Income Taxes
(Dollars in millions) 2009 2008 Change Provision for income taxes $ 90 $ 101 (11) %
Effective tax rate 39 % 24 % The 2009 effective tax rate reflects the Company's tax rate on reported earnings from continuing operations before income tax, excluding discrete items, of 37 percent. The 2009 effective tax rate reflects a $11 million tax charge associated with the recapture of gasification investment tax credits, a $7 million tax charge associated with a change in accounting method for tax purposes to accelerate timing of deductions for manufacturing repairs expense and a $5 million tax benefit from the reversal of tax reserves due to the expiration of the relevant statute of limitations. The 2008 effective tax rate reflects the Company's tax rate on reported earnings from continuing operations before income tax, excluding discrete items, of 27 percent. The 2008 effective tax rate was impacted by a $16 million benefit resulting from a gasification investment tax credit of $11 million and a research and development credit of $5 million, a $14 million benefit from state income tax credits (net of federal tax effect), and a $6 million benefit from the settlement of a non-U.S. income tax audit. The Company expects its effective tax rate in 2010 will be approximately 33 percent. Earnings from Continuing Operations and Diluted Earnings per Share 2009 2008 (Dollars in millions, except diluted EPS) $ EPS $ EPS Earnings from continuing operations $ 136 $ 1.85 $ 328 $ 4.31
Accelerated depreciation included in cost of sales, net of tax --
-- 6
0.08
Asset impairments and restructuring charges, net of tax 130 1.78 32 0.42 Other operating income, net of tax -- -- (10) (0.13) Net deferred tax benefits related to the previous
divestiture of businesses --
-- (14)
(0.18) Earnings from continuing operations excluding accelerated
depreciation costs, net of tax, asset impairments and restructuring charges, net of tax, other operating income, net of tax, and net deferred tax benefits related to the previous divesture of businesses $ 266 $ 3.63 $ 342 $ 4.50
MANAGEMENT'S DISCUSSION AND ANALYSIS OF FINANCIAL CONDITION AND RESULTS OF OPERATIONS
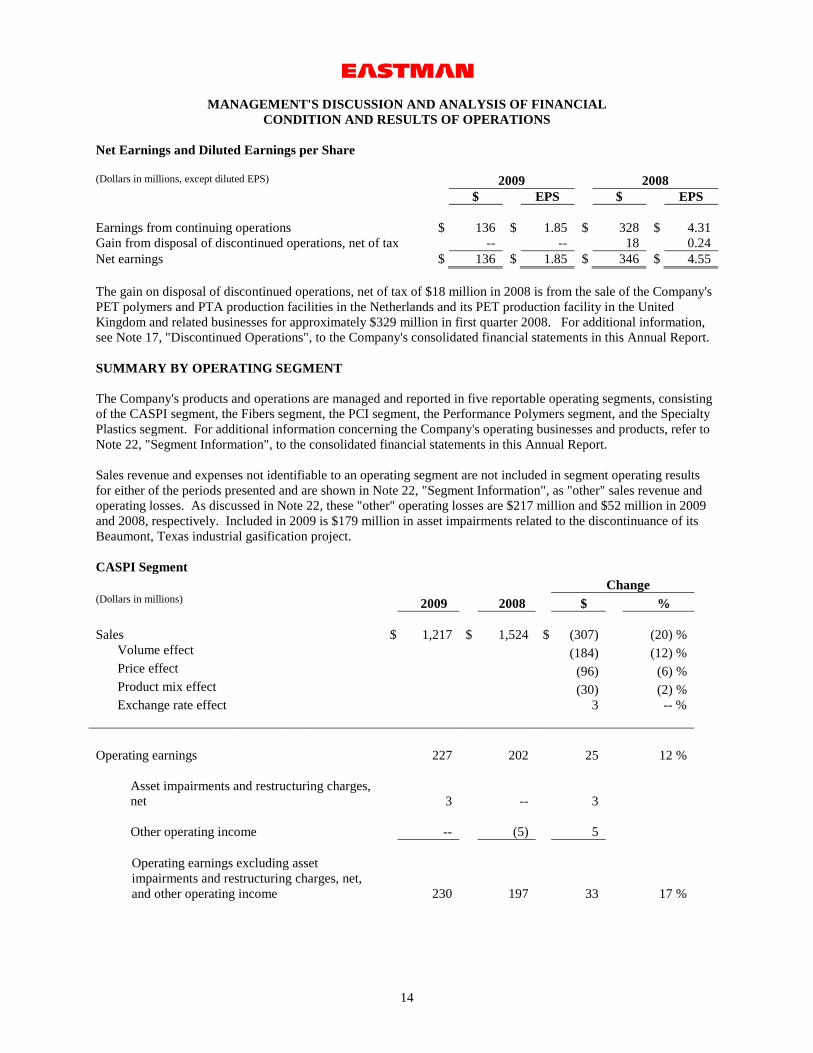
14
Net Earnings and Diluted Earnings per Share (Dollars in millions, except diluted EPS) 2009 2008 $ EPS $ EPS Earnings from continuing operations $ 136 $ 1.85 $ 328 $ 4.31 Gain from disposal of discontinued operations, net of tax -- -- 18 0.24 Net earnings $ 136 $ 1.85 $ 346 $ 4.55 The gain on disposal of discontinued operations, net of tax of $18 million in 2008 is from the sale of the Company's PET polymers and PTA production facilities in the Netherlands and its PET production facility in the United Kingdom and related businesses for approximately $329 million in first quarter 2008. For additional information, see Note 17, "Discontinued Operations", to the Company's consolidated financial statements in this Annual Report. SUMMARY BY OPERATING SEGMENT The Company's products and operations are managed and reported in five reportable operating segments, consisting of the CASPI segment, the Fibers segment, the PCI segment, the Performance Polymers segment, and the Specialty Plastics segment. For additional information concerning the Company's operating businesses and products, refer to Note 22, "Segment Information", to the consolidated financial statements in this Annual Report. Sales revenue and expenses not identifiable to an operating segment are not included in segment operating results for either of the periods presented and are shown in Note 22, "Segment Information", as "other" sales revenue and operating losses. As discussed in Note 22, these "other" operating losses are $217 million and $52 million in 2009 and 2008, respectively. Included in 2009 is $179 million in asset impairments related to the discontinuance of its Beaumont, Texas industrial gasification project. CASPI Segment Change (Dollars in millions) 2009 2008 $ % Sales $ 1,217 $ 1,524 $ (307) (20) % Volume effect (184) (12) % Price effect (96) (6) % Product mix effect (30) (2) % Exchange rate effect 3 -- % Operating earnings 227 202 25 12 %
Asset impairments and restructuring charges, net
3 -- 3
Other operating income -- (5) 5
Operating earnings excluding asset impairments and restructuring charges, net, and other operating income
230 197 33
17 %

MANAGEMENT'S DISCUSSION AND ANALYSIS OF FINANCIAL CONDITION AND RESULTS OF OPERATIONS
15
Sales revenue for 2009 decreased $307 million compared to 2008 due primarily to lower sales volume and lower selling prices. The lower sales volume was due to weak customer demand in all regions except Asia Pacific, attributed to the global recession, particularly for products sold into the building and construction, transportation, and packaging markets. The lower selling prices were primarily due to lower raw material and energy costs. Excluding asset impairments and restructuring charges, net, and other operating income, operating earnings for 2009 increased $33 million compared to 2008 due primarily to lower raw material and energy costs and cost reduction actions partially offset by lower sales volume and approximately $5 million in costs related to the reconfiguration of the Longview, Texas facility. The asset impairments and restructuring charges, net for 2009 reflect the segment's portion of the severance charge for a reduction in force in first quarter 2009 and an adjustment to a reserve for previously divested businesses and product lines. Other operating income for 2008 reflects the segment's allocated portion of proceeds from the sale of certain mineral rights at an operating manufacturing site. Fibers Segment Change (Dollars in millions) 2009 2008 $ % Sales $ 1,032 $ 1,045 $ (13) (1) % Volume effect (88) (8) % Price effect 83 8 % Product mix effect (11) (1) % Exchange rate effect 3 -- % Operating earnings 296 238 58 24 % Asset impairments and restructuring
charges 4 -- 4 Operating earnings excluding asset
impairments and restructuring charges 300 238 62 26 %
Sales revenue for 2009 decreased $13 million compared to 2008 due primarily to lower sales volume mostly offset by higher selling prices. The lower sales volume was primarily for acetyl chemical products. The higher selling prices were in response to higher wood pulp costs. Excluding the segment's portion of the severance charge for a reduction in force in first quarter 2009, operating earnings for 2009 increased $62 million compared to 2008 primarily due to higher selling prices and cost reduction actions, partially offset by lower sales volume. In December 2008, the Company announced an alliance with SK to form a company to acquire and operate a cellulose acetate tow manufacturing facility and related business, with the facility being constructed by SK Chemicals Company Ltd. ("SK") in Korea. Eastman will have majority ownership in the business. Construction began in first quarter 2009 and the facility is expected to be operational in first quarter 2010.

MANAGEMENT'S DISCUSSION AND ANALYSIS OF FINANCIAL CONDITION AND RESULTS OF OPERATIONS
16
PCI Segment Change (Dollars in millions) 2009 2008 $ % Sales $ 1,330 $ 2,160 $ (830) (38) % Volume effect (375) (17) % Price effect (481) (22) % Product mix effect 23 1 % Exchange rate effect 3 -- % Sales – contract ethylene sales (1) 28 314 (286) Sales – excluding listed items 1,302 1,846 (544) (29) %
Volume effect (47) (2) % Price effect (472) (26) % Product mix effect (28) (1) % Exchange rate effect 3 -- %
Operating earnings 63 153 (90) (59) % Accelerated depreciation costs included in
cost of sales
-- 5 (5) Asset impairments and restructuring charges,
net
6 22 (16) Other operating income -- (9) 9 Operating earnings excluding accelerated
depreciation costs, asset impairments and restructuring charges, net, and other operating income
69 171 (102) (60) %
(1) Sales revenue for 2009 and 2008 included contract ethylene sales under the transition supply agreement related to the divestiture of the PE businesses in fourth quarter 2006.
Sales revenue for 2009 decreased $830 million compared to 2008. Excluding contract ethylene sales under the transition agreement resulting from the divestiture of the Performance Polymers segment's PE business in fourth quarter 2006, sales revenue decreased $544 million in 2009 compared to 2008 due to lower selling prices. The lower selling prices were primarily due to lower raw material and energy costs. Excluding accelerated depreciation costs, asset impairments and restructuring charges, net, and other operating income, operating earnings in 2009 decreased $102 million compared to 2008. The decline was primarily due to lower selling prices and lower capacity utilization resulting in higher unit costs, including approximately $15 million in costs related to the reconfiguration of the Longview, Texas facility, partially offset by lower raw material and energy costs and cost reduction actions. A restructuring charge in first quarter 2009 consisted of the segment's portion of the severance charge for a reduction in force. Asset impairments and restructuring charges in 2008 consisted primarily of severance and pension costs from the decision to close a previously impaired site in the United Kingdom. The accelerated depreciation costs for 2008 are related to the continuation of the previously reported planned staged phase-out of older cracking units in 2007 at the Company's Longview, Texas facility.

MANAGEMENT'S DISCUSSION AND ANALYSIS OF FINANCIAL CONDITION AND RESULTS OF OPERATIONS
17
In first quarter 2010, the Company transferred certain intermediates product lines from the Performance Polymers segment to the PCI segment to improve optimization of manufacturing assets supporting the three raw material streams that supply the Company's downstream businesses. The Company also evaluates licensing opportunities for acetic acid and oxo derivatives on a selective basis, and has licensed technology to produce acetyl products to Saudi International Petrochemical Company ("SIPCHEM") in Saudi Arabia and to Chang Chun Petrochemical Company ("Chang Chun") in Taiwan in 2005 and 2007, respectively. SIPCHEM started operations in 2009 at its plant based on this technology and Chang Chun is in the process of building its plant. In first half of 2010, the Company expects to achieve the final milestones under the SIPCHEM agreement and to recognize the remaining revenue related to the license. The Company will also purchase acetic anhydride from the SIPCHEM facility.

MANAGEMENT'S DISCUSSION AND ANALYSIS OF FINANCIAL CONDITION AND RESULTS OF OPERATIONS
18
Performance Polymers Segment Change (Dollars in millions) 2009 2008 $ % Sales $ 719 $ 1,074 $ (355) (33) % Volume effect (137) (13) % Price effect (233) (22) % Product mix effect 15 2 % Exchange rate effect -- -- % Sales – contract polymer intermediates sales (1) -- 138 (138) Sales – U.S. PET manufacturing facilities 719 936 (217) (23) %
Volume effect -- -- % Price effect (233) (25) % Product mix effect 16 2 % Exchange rate effect -- -- %
Operating loss (2) (66) (57) (9) (16) % Operating loss - from sales from Mexico and
Argentina PET manufacturing facilities (2) -- (3) 3 Operating loss - U.S. PET manufacturing
facilities (3) (66) (54) (12) (22) % Operating loss excluding certain items - U.S.
PET manufacturing facilities (3) (62) (29) (33) >(100) %
(1) Sales revenue for 2008 includes contract polymer intermediates sales under the transition supply agreement related to the divestiture of the PET manufacturing facilities and related businesses in Mexico and Argentina in fourth quarter 2007.
(2) Operating results for 2008 include an operating loss from PET manufacturing facilities and related businesses in Cosoleacaque, Mexico and Zarate, Argentina divested in fourth quarter 2007.
(3) Items are accelerated depreciation costs and asset impairments and restructuring charges, net. In 2009, asset impairments and restructuring charges of $4 million consisted of the segment's portion of the severance charge for a reduction in force. In 2008, asset impairments and restructuring charges of $24 million related to restructuring at the South Carolina facility using IntegRexTM technology, the divested PET manufacturing facilities in Mexico and Argentina, and charges related to a corporate severance program, partially offset by a resolution of a contingency from the sale of the Company's PE and EpoleneTM
polymer businesses divested in fourth quarter 2006. Accelerated depreciation costs of $4 million resulted from restructuring actions associated with higher cost PET polymer assets in Columbia, South Carolina.
Excluding contract polymer intermediates sales to the buyer of the divested Mexico and Argentina facilities, sales revenue for 2009 decreased $217 million compared to 2008 due to lower selling prices primarily attributed to lower raw material and energy costs. Excluding accelerated depreciation costs and asset impairments and restructuring charges, net, operating results for 2009 for U.S. PET manufacturing facilities decreased $33 million compared to 2008 due to lower selling prices and the unfavorable impact on sales revenue and manufacturing costs due to operational challenges with the South Carolina PET manufacturing facility partially offset by lower raw material and energy costs.

MANAGEMENT'S DISCUSSION AND ANALYSIS OF FINANCIAL CONDITION AND RESULTS OF OPERATIONS
19
In first quarter 2010, the IntegRexTM-based facility located in Columbia, South Carolina is demonstrating the capability to produce improved quality ParaStar TM
PET products at the facility's nameplate capacity of 525,000 metric tons. The Company expects smaller Performance Polymer segment losses in 2010 based on this improved operational performance and the resulting capability for a more profitable mix of product sales.
In first quarter 2010, the Company transferred certain intermediates product lines from the Performance Polymers segment to the PCI segment to improve optimization of manufacturing assets supporting the three raw material streams that supply the Company's downstream businesses. Specialty Plastics Segment Change (Dollars in millions) 2009 2008 $ % Sales $ 749 $ 923 $ (174) (19) % Volume effect (91) (10) % Price effect (66) (7) % Product mix effect (23) (3) % Exchange rate effect 6 1 % Operating earnings 14 35 (21) (60) % Asset impairments and restructuring
charges, net 4 -- 4 Other operating income -- (2) 2 Operating earnings excluding
accelerated depreciation costs, asset impairments and restructuring charges, net, and other operating income 18 33 (15) (45) %
Sales revenue for 2009 decreased $174 million compared to 2008 due to lower sales volume and lower selling prices. The decline in sales volume was attributed to the global recession which has weakened demand for plastic resins, including copolyester products sold into the consumer and durable goods markets, and for cellulosic plastics sold into various markets. The lower selling prices were a result of lower raw material and energy costs, particularly for paraxylene. Excluding the segment's portion of a severance charge for a reduction in force in first quarter 2009 and other operating income related to the sale of certain mineral rights at an operating manufacturing site in 2008, operating earnings for 2009 decreased $15 million compared to 2008 due to lower sales volume, lower capacity utilization resulting in higher unit costs, an unfavorable shift in product mix with less cellulosic plastics sold into various markets, and lower selling prices, partially offset by lower raw material and energy costs and cost reduction actions. The Specialty Plastics segment is progressing with the introduction of its new Eastman TritanTM copolyester, which it will supply from the monomer manufacturing facility and its first TritanTM
copolyester polymer manufacturing facility in Kingsport, Tennessee which were both completed in 2009 and are expected to be operational in early 2010.

MANAGEMENT'S DISCUSSION AND ANALYSIS OF FINANCIAL CONDITION AND RESULTS OF OPERATIONS
20
SUMMARY BY CUSTOMER LOCATION – 2009 COMPARED WITH 2008 Sales Revenue
(Dollars in millions)
2009
2008
Change
Volume Effect
Price Effect
Product
Mix Effect
Exchange Rate
Effect
United States and Canada $
2,797 $
4,065
(31) %
(16) %
(16) %
1 %
-- %
Asia Pacific 1,062 1,185 (10) % (1) % (5) % (4) % -- % Europe, Middle
East, and Africa
838
977
(14) % (8) % (1) % (6) % 1 % Latin America 350 499 (30) % (22) % (17) % 9 % -- %
$ 5,047 $ 6,726 (25) % (13) % (12) % -- % -- % Sales revenue in the United States and Canada decreased in 2009 compared to 2008 primarily due to lower sales volume and lower selling prices particularly in the PCI segment partially due to contract ethylene sales in the PCI segment. Excluding contract ethylene sales, sales revenue decreased 26 percent primarily due to lower selling prices particularly in the PCI and Performance Polymers segments and lower sales volume particularly in the CASPI and PCI segments.
Sales revenue in Asia Pacific decreased in 2009 compared to 2008 primarily due to lower selling prices in the PCI, Specialty Plastics, and CASPI segments partially offset by higher selling prices in the Fibers segment and an unfavorable shift in product mix, particularly in the CASPI and Specialty Plastics segments. The unfavorable shift in product mix was due to the CASPI segment pursuing favorable market conditions for solvent product lines resulting in a lower average selling price, while the Specialty Plastics segment sold less cellulosic plastics into various markets. The region experienced less of a sales volume decrease as a result of stronger PCI segment volume in 2009 due to raw material supply issues restricting production in 2008 and increased sales volume in the CASPI segment. Sales revenue in Europe, Middle East and Africa decreased in 2009 compared to 2008 primarily due to lower sales volume and an unfavorable shift in product mix in all segments. The region had minimal price effect change compared to significant declines in other regions due to the higher selling prices in the Fibers segment and fewer sales from commodity product lines. Sales revenue in Latin America decreased in 2009 compared to 2008 primarily due to lower sales volume and lower selling prices partially offset by a favorable shift in product mix. Lower selling prices were primarily in the Performance Polymers and PCI segments. Lower sales volume and the favorable shift in product mix were primarily related to contract polymer intermediates sales in 2008 and not in 2009, with the lower sales volume partially offset by increased sales volume in the PCI, Performance Polymers and CASPI segments. Excluding contract polymer intermediates sales, sales revenue decreased 3 percent. With a substantial portion of sales to customers outside the United States, Eastman is subject to the risks associated with operating in international markets. To mitigate its exchange rate risks, the Company frequently seeks to negotiate payment terms in U.S. dollars or euros. In addition, where it deems such actions advisable, the Company engages in foreign currency hedging transactions and requires letters of credit and prepayment for shipments where its assessment of individual customer and country risks indicates their use is appropriate. For more information on these practices see Note 9, "Fair Value of Financial Instruments", to the Company's consolidated financial statements in this Annual Report and "Quantitative and Qualitative Disclosures About Market Risk."

MANAGEMENT'S DISCUSSION AND ANALYSIS OF FINANCIAL CONDITION AND RESULTS OF OPERATIONS
21
SUMMARY OF CONSOLIDATED RESULTS - 2008 COMPARED WITH 2007
Volume Effect
Price Effect
Product
Mix Effect
Exchange Rate
Effect (Dollars in millions) 2008 2007 Change
Sales $ 6,726 $ 6,830 (1) % (11) % 9 % -- % 1 % Sales - sales from
Mexico and Argentina PET manufacturing facilities (1) -- 413
Sales – contract
polymer intermediates sales
(2) 138 15
Sales - contract
ethylene sales (3) 314 314
Sales – excluding listed
items $ 6,274 $ 6,088
3 % (7) % 9 % -- % 1 % (1) Sales revenue for 2007 includes sales revenue from PET manufacturing facilities and related businesses in Cosoleacaque,
Mexico and Zarate, Argentina divested in fourth quarter 2007. (2) Included in 2008 sales revenue are contract polymer intermediates sales under the transition supply agreement related to the
divestiture of the PET manufacturing facilities and related businesses in Mexico and Argentina in fourth quarter 2007. (3)
Included in 2008 and 2007 sales revenue are contract ethylene sales under the transition supply agreement related to the divestiture of the PE businesses.
Sales revenue for 2008 compared to 2007 decreased $104 million. Excluding contract ethylene sales, contract polymer intermediates sales, and sales from Mexico and Argentina PET manufacturing facilities, sales revenue increased 3 percent primarily due to higher selling prices in all segments in response to higher raw material and energy costs more than offsetting lower sales volume, particularly in the Performance Polymers, PCI, and CASPI segments. Although the Company experienced some volume decline through the first nine months 2008 compared to first nine months 2007, the global recession, experienced particularly in fourth quarter 2008, resulted in an unprecedented decrease in sales volume across all segments and all regions in fourth quarter 2008 compared to fourth quarter 2007.
(Dollars in millions) 2008 2007 Change Gross Profit $ 1,126 $ 1,192 (6) %
As a percentage of sales 17 % 17 % Accelerated depreciation included in cost of sales 9 49
Gross Profit excluding accelerated depreciation costs 1,135 1,241 (9) % As a percentage of sales 17 % 18 %

MANAGEMENT'S DISCUSSION AND ANALYSIS OF FINANCIAL CONDITION AND RESULTS OF OPERATIONS
22
Gross profit for 2008 decreased compared with 2007 in the PCI, Specialty Plastics and CASPI segments partially offset by increases in the Performance Polymers and Fibers segments, as higher raw material and energy costs more than offset higher selling prices. Gross profit included accelerated depreciation costs of $9 million and $49 million in 2008 and 2007, respectively, resulting from the previously reported shutdowns of the cracking units in Longview, Texas and of higher cost PET polymer assets in Columbia, South Carolina. The Company's 2008 raw material and energy costs increased by approximately $600 million compared with 2007. An unprecedented decline in demand caused lower sales volume and historically low capacity utilization resulting in higher unit costs in fourth quarter 2008. The historically low capacity utilization rates in the fourth quarter negatively affected the average capacity utilization rate for the full year 2008. (Dollars in millions) 2008 2007 Change Selling, General and Administrative Expenses ("SG&A") $ 419 $ 420 -- % Research and Development Expenses ("R&D") 158 156 1 % $ 577 $ 576 -- % As a percentage of sales 9 % 8 % Asset Impairments and Restructuring Charges, Net Asset impairments and restructuring charges totaled $46 million and $112 million in 2008 and 2007, respectively. Asset impairments and restructuring charges in 2008 were primarily for restructuring at the South Carolina facility in the Performance Polymers segment, severance and pension costs from the decision to close a previously impaired site in the United Kingdom in the PCI segment, and severance costs resulting from a corporate severance program. Asset impairments and restructuring charges in 2007 were primarily costs associated with the PET manufacturing facilities in Mexico and Argentina sold in fourth quarter 2007. For more information regarding asset impairments and restructuring charges, primarily related to strategic decisions and actions, see the Performance Polymers and PCI segments discussion and Note 2, "Asset Impairments and Restructuring Charges, Net", to the Company's consolidated financial statements in this Annual Report. Other Operating Income, Net Other operating income, net for 2008 reflected proceeds of $16 million from the sale of certain mineral rights at an operating manufacturing site. Operating Earnings 2008 2007 Change (Dollars in millions) Operating earnings $ 519 $ 504 3 % Accelerated depreciation included in cost of sales 9 49 Asset impairments and restructuring charges, net 46 112 Other operating income, net (16) -- Operating earnings excluding accelerated depreciation costs,
asset impairment and restructuring charges, net, and other operating income, net $ 558 $ 665
(16) %
MANAGEMENT'S DISCUSSION AND ANALYSIS OF FINANCIAL CONDITION AND RESULTS OF OPERATIONS
23
Net Interest Expense
(Dollars in millions) 2008 2007 Change Gross interest costs $ 106 $ 113 Less: capitalized interest 12 10 Interest expense 94 103 (9) % Interest income 24 41 Net interest expense $ 70 $ 62 13 %
Gross interest costs for 2008 compared to 2007 were lower due to lower average interest rates and lower average borrowings. Interest income in 2008 compared to 2007 was lower due to lower average invested cash balances and lower average interest rates. Other Charges (Income), Net (Dollars in millions) 2008 2007 Foreign exchange transactions losses (gains) $ 17 $ (11) Investments losses (gains) 6 (12) Other, net (3) (5) Other charges (income), net $ 20 $ (28) Included in other charges (income), net were gains or losses on foreign exchange transactions, results from equity investments, gains or losses on business venture investments, other non-operating income or charges related to HDC, gains from the sale of non-operating assets, royalty income, certain litigation costs, fees on securitized receivables, other non-operating income, and other miscellaneous items. Investments losses (gains) included gains of $4 million in both 2008 and 2007 resulting from a favorable decision in 2006 of the U.S. Department of the Army to reimburse post-employment benefits being provided to retirees of HDC, a wholly owned subsidiary. This gain reflected a portion of the unrecognized gain resulting from the reimbursement decision that is being amortized into earnings over future periods. For additional information, see Note 19, "Other Charges (Income), Net", to the Company's consolidated financial statements in this Annual Report. Provision for Income Taxes
(Dollars in millions) 2008 2007 Change Provision for income taxes $ 101 $ 149 (32) %
Effective tax rate 24 % 32 % The 2008 effective tax rate reflected the Company's tax rate on reported earnings from continuing operations before income tax, excluding discrete items, of 27 percent. The 2008 effective tax rate was impacted by a $16 million benefit resulting from a gasification investment tax credit of $11 million and a research and development credit of $5 million, a $14 million benefit from state income tax credits (net of federal tax effect), and a $6 million benefit from the settlement of a non-U.S. income tax audit. The 2007 effective tax rate reflected the Company's tax rate on reported earnings from continuing operations before income tax, excluding discrete items, of 33 percent.

MANAGEMENT'S DISCUSSION AND ANALYSIS OF FINANCIAL CONDITION AND RESULTS OF OPERATIONS
24
Earnings from Continuing Operations and Diluted Earnings per Share 2008 2007 (Dollars in millions, except diluted EPS) $ EPS $ EPS Earnings from continuing operations $ 328 $ 4.31 $ 321 $ 3.84
Accelerated depreciation included in cost of sales, net of tax 6
0.08 31
0.37
Asset impairments and restructuring charges, net of tax 32 0.42 71 0.85 Other operating income, net of tax (10) (0.13) -- -- Net deferred tax benefits related to the previous
divestiture of businesses (14)
(0.18) --
-- Earnings from continuing operations excluding accelerated
depreciation costs, net of tax, asset impairments and restructuring charges, net of tax, other operating income, net of tax, and net deferred tax benefits related to the previous divesture of businesses $ 342 $ 4.50 $ 423 $ 5.06
Net Earnings and Diluted Earnings per Share (Dollars in millions, except diluted EPS) 2008 2007 $ EPS $ EPS Earnings from continuing operations $ 328 $ 4.31 $ 321 $ 3.84 Loss from discontinued operations, net of tax -- -- (10) (0.12) Gain (loss) on disposal of discontinued operations, net of tax 18 0.24 (11) (0.14) Net earnings $ 346 $ 4.55 $ 300 $ 3.58 The gain on disposal of discontinued operations, net of tax of $18 million in 2008 was from the sale of the Company's PET polymers and PTA production facilities in the Netherlands and its PET production facility in the United Kingdom and related businesses for approximately $329 million in first quarter 2008. The loss on disposal of discontinued operations, net of tax of $11 million in 2007 was from the sale of the Company's PET polymers manufacturing facility in Spain for approximately $40 million. During 2007, the Company also recognized site closure costs of $4 million, net of tax, for the San Roque PET site. For additional information, see Note 17, "Discontinued Operations", to the Company's consolidated financial statements in this Annual Report. SUMMARY BY OPERATING SEGMENT The Company's products and operations are managed and reported in five reportable operating segments, consisting of the CASPI segment, the Fibers segment, the PCI segment, the Performance Polymers segment, and the Specialty Plastics segment. For additional information concerning the Company's operating businesses and products, refer to Note 22, "Segment Information", to the consolidated financial statements in this Annual Report. Sales revenue and expenses not identifiable to an operating segment are not included in segment operating results for either of the periods presented and are shown in Note 22, "Segment Information", as "other" sales revenue and operating losses.

MANAGEMENT'S DISCUSSION AND ANALYSIS OF FINANCIAL CONDITION AND RESULTS OF OPERATIONS
25
CASPI Segment Change (Dollars in millions) 2008 2007 $ % Sales $ 1,524 $ 1,451 $ 73 5 % Volume effect (148) (10) % Price effect 167 12 % Product mix effect 34 2 % Exchange rate effect 20 1 % Operating earnings 202 235 (33) (14) % Asset impairments and restructuring gains -- (1) 1 Other operating income (5) -- (5) Operating earnings excluding asset impairments
and restructuring gains and other operating income
197 234 (37)
(16) % Sales revenue for 2008 increased $73 million compared to 2007 due to higher selling prices partially offset by lower sales volume. The higher selling prices were in response to higher raw material and energy costs, particularly for propane, propylene, and adhesives raw materials. Sales volume declined due primarily to the recession in North America and the divestiture of certain adhesives product lines, partially offset by slightly higher sales volume in Asia Pacific. Excluding asset impairments and restructuring gains and other operating income, operating earnings for 2008 decreased $37 million compared to 2007 due primarily to lower sales volume and lower capacity utilization, particularly in fourth quarter, causing higher unit costs. Other operating income for 2008 reflects the segment's allocated portion of proceeds from the sale of certain mineral rights at an operating manufacturing site. Fibers Segment Change (Dollars in millions) 2008 2007 $ % Sales $ 1,045 $ 999 $ 46 5 % Volume effect (11) (1) % Price effect 59 6 % Product mix effect (3) -- % Exchange rate effect 1 -- % Operating earnings 238 238 -- -- % Sales revenue for 2008 increased $46 million compared to 2007 due to higher selling prices. The higher selling prices were in response to higher raw material and energy costs, particularly for wood pulp and coal. An increase in acetate tow sales volume was offset by a decrease in acetyl chemical and acetate yarn sales volume.

MANAGEMENT'S DISCUSSION AND ANALYSIS OF FINANCIAL CONDITION AND RESULTS OF OPERATIONS
26
Operating earnings for 2008 were flat compared to 2007, as an increase in acetate tow sales volume was offset by a decrease in acetyl chemical and acetate yarn sales volume. The capacity expansion of the Company's acetate tow plant in Workington, England was completed in 2008, expanding Eastman's world-wide capacity by five percent, better enabling Eastman to serve existing customers in Western Europe and the growing demand in Eastern Europe.
PCI Segment Change (Dollars in millions) 2008 2007 $ % Sales $ 2,160 $ 2,095 $ 65 3 % Volume effect (219) (10) % Price effect 289 14 % Product mix effect (15) (1) % Exchange rate effect 10 -- % Sales – contract ethylene sales 314 314 -- Sales – excluding listed items 1,846 1,781 65 4 %
Volume effect (135) (8) % Price effect 225 13 % Product mix effect (35) (2) % Exchange rate effect 10 1 %
Operating earnings 153 220 (67) (31) % Accelerated depreciation costs included in
cost of sales
5 19 (14) Asset impairments and restructuring charges
(gains)
22 (1) 23 Other operating income (9) -- (9) Operating earnings excluding accelerated
depreciation costs, asset impairments and restructuring charges (gains), and other operating income
171 238 (67) (28) % Sales revenue for 2008 increased $65 million compared to 2007. Excluding contract ethylene sales under the transition agreement resulting from the divestiture of the Performance Polymers segment's PE business in fourth quarter 2006, sales revenue increased due to higher selling prices in response to higher raw material and energy costs, partially offset by lower sales volume, particularly in fourth quarter 2008. Lower sales volume were primarily in olefin derivative products, particularly for Asia, and bulk olefins product lines related to the previously reported shutdown of a cracking unit in fourth quarter 2007. Contract ethylene sales revenues remained unchanged as higher selling prices offset lower sales volume resulting from the shutdown of one of the Company's cracking units.

MANAGEMENT'S DISCUSSION AND ANALYSIS OF FINANCIAL CONDITION AND RESULTS OF OPERATIONS
27
Excluding accelerated depreciation costs, asset impairments and restructuring charges (gains), and other operating income, operating earnings in 2008 decreased $67 million compared to 2007. The decline was primarily in the Asia Pacific region due to lower sales volume, particularly for olefin derivative product lines, and higher raw material and energy costs partially offset by higher selling prices. Sales revenue and operating earnings for 2007 included $22 million of earnings from the licensing of acetyl technology. In addition, 2007 operating earnings were impacted by favorable market conditions. In 2007, contract ethylene sales had minimal impact on operating earnings. The accelerated depreciation costs were related to the continuation of the previously reported planned staged phase-out of older cracking units at the Company's Longview, Texas facility. Asset impairments and restructuring charges for 2008 consisted primarily of severance and pension costs from the decision to close a previously impaired site in the United Kingdom. Asset impairments and restructuring gains for 2007 were primarily related to severance costs related to a voluntary reduction in force in 2006. Other operating income for 2008 reflects the segment's allocated portion of proceeds from the sale of certain mineral rights at an operating manufacturing site. Performance Polymers Segment Change (Dollars in millions) 2008 2007 $ % Sales $ 1,074 $ 1,413 $ (339) (24) % Volume effect (369) (26) % Price effect 51 4 % Product mix effect (23) (2) % Exchange rate effect 2 -- % Sales from Mexico and Argentina PET
manufacturing facilities (1) -- 413 (413) Sales – contract polymer intermediates sales (2) 138 15 123 Sales – U.S. PET manufacturing facilities 936 985 (49) (5) %
Volume effect (115) (12) % Price effect 47 5 % Product mix effect 17 2 % Exchange rate effect 2 -- %
Operating loss (3) (57) (207) 150 73 % Operating loss - from sales from Mexico and
Argentina PET manufacturing facilities (1)(3) (3) (127) 124 98 % Operating loss - U.S. PET manufacturing
facilities (3) (54) (80) 26 33 %
(1) Sales revenue and operating results for 2007 includes sales revenue from PET manufacturing facilities and related businesses in Cosoleacaque, Mexico and Zarate, Argentina divested in fourth quarter 2007.
(2) Sales revenue for 2008 includes contract polymer intermediates sales under the transition supply agreement related to the divestiture of the PET manufacturing facilities and related businesses in Mexico and Argentina in fourth quarter 2007.
(3)
Includes allocated costs consistent with the Company's historical practices, some of which may remain and could be reallocated to the remainder of the segment and other segments.

MANAGEMENT'S DISCUSSION AND ANALYSIS OF FINANCIAL CONDITION AND RESULTS OF OPERATIONS
28
Performance Polymers Segment Change (Dollars in millions) 2008 2007 $ % Operating loss excluding certain items $ (1)(2) (29) $ (65) $ 36 55 % Operating loss excluding certain items - from
sales from Mexico and Argentina PET manufacturing facilities (1)(3)(4) -- (12) 12 100 %
Operating loss excluding certain items - U.S. PET manufacturing facilities (1)(5) (29) (53) 24 45 % (1) Includes allocated costs consistent with the Company's historical practices, some of which may remain and could be
reallocated to the remainder of the segment and other segments. (2) Items are accelerated depreciation costs and asset impairments and restructuring charges, net. In 2008, asset
impairments and restructuring charges of $24 million related to restructuring at the South Carolina facility using IntegRexTM technology, the divested PET manufacturing facilities in Mexico and Argentina, and charges related to a corporate severance program, partially offset by a resolution of a contingency from the sale of the Company's PE and EpoleneTM
(3) Operating results for 2007 includes sales revenue from PET manufacturing facilities and related businesses in Cosoleacaque, Mexico and Zarate, Argentina divested in fourth quarter 2007.
polymer businesses divested in fourth quarter 2006. Accelerated depreciation costs of $4 million resulted from restructuring actions associated with higher cost PET polymer assets in Columbia, South Carolina. In 2007, asset impairments and restructuring charges of $113 million primarily related to the Mexico and Argentina PET manufacturing facilities sale. Accelerated depreciation costs of $29 million resulted from restructuring actions associated with higher cost PET polymer assets in Columbia, South Carolina.
(4) Items are asset impairments and restructuring charges (gains) relating to the Mexico and Argentina PET manufacturing facilities, and were $3 million and $115 million in 2008 and 2007, respectively.
(5) Items are accelerated depreciation costs and asset impairments and restructuring charges (gains) related to the U.S. PET manufacturing facilities. Asset impairments and restructuring charges (gains) were $21 million and $(2) million in 2008 and 2007, respectively. Accelerated depreciation costs were $4 million and $29 million in 2008 and 2007, respectively.
Sales revenue for 2008 decreased $339 million compared to 2007 due to the divestiture of PET manufacturing facilities and related businesses in Cosoleacaque, Mexico and Zarate, Argentina. For U.S. PET manufacturing facilities, excluding contract polymer intermediates sales to the buyer of the divested Mexico and Argentina facilities and sales from the divested PET facilities in Mexico and Argentina, sales revenue for 2008 decreased $49 million compared to 2007 due to lower sales volume resulting from the shutdown of higher cost PET assets in the first half of 2008, weaker demand for bottled carbonated soft drinks, and lighter-weight water bottles. Excluding accelerated depreciation costs, asset impairments and restructuring charges and other operating expense, operating results for 2008 for U.S. PET manufacturing facilities improved $24 million compared to 2007 due primarily to actions at the Company's South Carolina PET facility, including the PET facility based on IntegRex™ technology and higher selling prices, partially offset by higher raw material and energy costs and higher unit costs due to lower capacity utilization particularly in fourth quarter 2008. Manufacturing ParaStarTM PET resins, the 350,000 metric ton PET manufacturing facility utilizing IntegRexTM technology in Columbia, South Carolina was fully operational in first quarter of 2007. A previously disclosed reduction of $30 million in annual costs at this facility was completed in second quarter 2008. The debottleneck of the PET facility based on IntegRexTM technology was completed in fourth quarter 2008, expanding annual capacity of the plant to 525,000 metric tons of ParaStarTM
PET resins.

MANAGEMENT'S DISCUSSION AND ANALYSIS OF FINANCIAL CONDITION AND RESULTS OF OPERATIONS
29
Specialty Plastics Segment Change (Dollars in millions) 2008 2007 $ % Sales $ 923 $ 872 $ 51 6 % Volume effect (9) (1) % Price effect 28 3 % Product mix effect 16 2 % Exchange rate effect 16 2 % Operating earnings 35 65 (30) (46) % Accelerated depreciation included in
cost of sales -- 1 (1) Asset impairments and restructuring
charges -- 1 (1) Other operating income (2) -- (2) Operating earnings excluding
accelerated depreciation costs, asset impairments and restructuring charges, net, and other operating income 33 67 (34) (51) %
Sales revenue for 2008 increased $51 million compared to 2007 due to higher selling prices, a favorable exchange rate and a favorable shift in product mix. Selling prices increased in response to higher raw material and energy costs, particularly for paraxylene and ethylene glycol. While sales volume in full year 2008 decreased only slightly, increases through nine months 2008 compared to nine months 2007 were more than offset by a sharp decline in sales volume in fourth quarter 2008 attributed to the global recession particularly impacting end-use demand for consumer and durable goods (appliances and electronics), in-store fixtures and displays, and specialty packaging. Excluding accelerated depreciation costs, asset impairments and restructuring charges and other operating income, operating earnings for 2008 decreased $34 million compared to 2007 due to higher raw material and energy costs and lower capacity utilization resulting in higher unit costs, particularly in fourth quarter 2008. The 2008 operating results included $2 million in other operating income related to the segment's allocated portion of proceeds from the sale of certain mineral rights at an operating manufacturing site. The 2007 operating results included $1 million in asset impairment and restructuring costs primarily for the Spain cyclohexane dimethanol ("CHDM") facility and $1 million of accelerated depreciation costs for restructuring actions associated with higher cost PET polymer assets in Columbia, South Carolina.

MANAGEMENT'S DISCUSSION AND ANALYSIS OF FINANCIAL CONDITION AND RESULTS OF OPERATIONS
30
SUMMARY BY CUSTOMER LOCATION – 2008 COMPARED WITH 2007 Sales Revenue
(Dollars in millions)
2008
2007
Change
Volume Effect
Price Effect
Product
Mix Effect
Exchange Rate
Effect
United States and Canada $
4,065 $
4,043
1 %
(12) %
12 %
1 %
-- %
Asia Pacific 1,185 1,103 8 % 1 % 6 % -- % 1 % Europe, Middle
East, and Africa
977
932
5 % (2) % 1 % 2 % 4 % Latin America 499 752 (34) % (33) % 4 % (5) % -- %
$ 6,726 $ 6,830 (1) % (11) % 9 % -- % 1 % Sales revenue in the United States and Canada increased slightly primarily due to higher selling prices in all segments and a favorable shift in product mix, particularly in the CASPI segment, partially offset by lower sales volume in all segments.
Sales revenue in Asia Pacific increased primarily due to higher selling prices in all segments in response to higher raw material and energy costs. Sales volume increased in the CASPI, Fibers, and Specialty Plastics segments, partially offset by lower sales volume primarily in the PCI segment. Sales revenue in Europe, Middle East and Africa increased primarily due to the effect of the foreign currency exchange rates, particularly in the CASPI, Specialty Plastics, and Fibers segments. Sales revenue in Latin America decreased primarily due to lower sales volume, particularly in the Performance Polymers segment. Excluding divested PET manufacturing facilities and related businesses in Cosoleacaque, Mexico and Zarate, Argentina and contract polymer intermediates sales to those facilities, sales revenue increased 12 percent primarily due to higher selling prices in all segments as a result of higher raw material and energy costs and higher sales volume, particularly in the PCI segment. During fourth quarter 2007, the Company sold its PET polymers production facilities in Mexico and Argentina and the related businesses, which is expected to result in significantly lower sales revenue in Latin America in future periods. However, subject to certain product-specific agreements associated with the sale of the manufacturing facilities in Mexico and Argentina, the Company sold a limited set of PET products manufactured in the U.S. in certain Latin American markets through 2008.
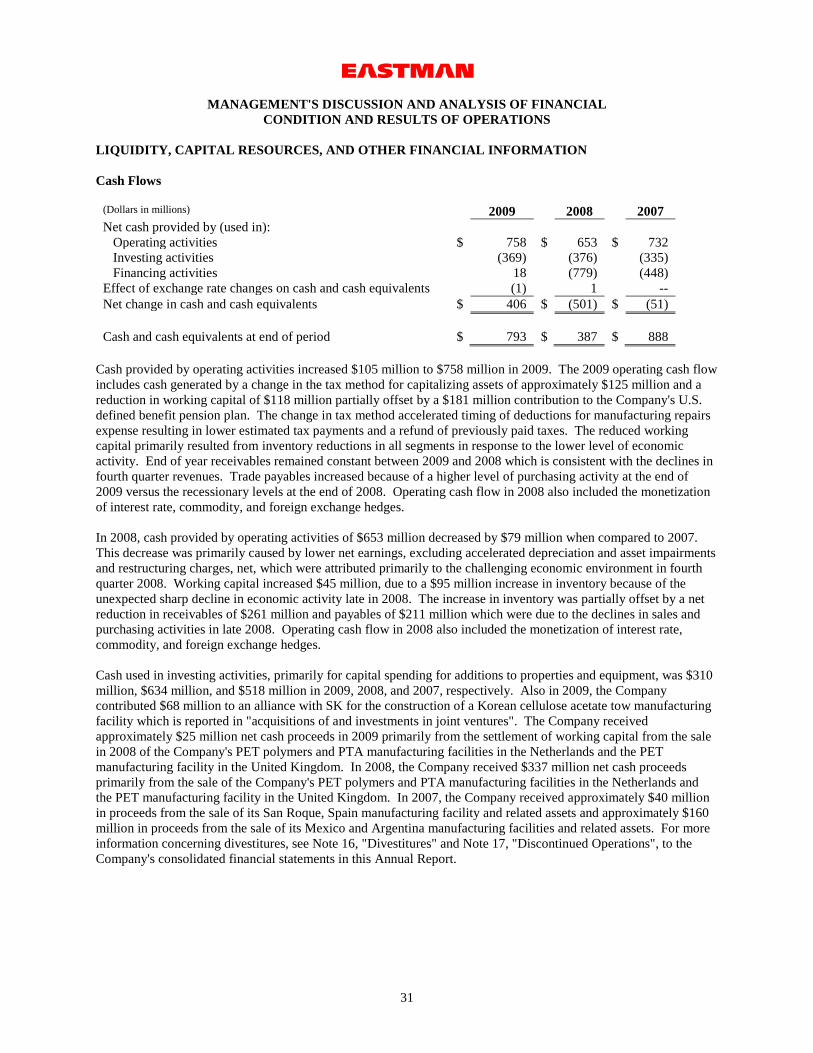
MANAGEMENT'S DISCUSSION AND ANALYSIS OF FINANCIAL CONDITION AND RESULTS OF OPERATIONS
31
LIQUIDITY, CAPITAL RESOURCES, AND OTHER FINANCIAL INFORMATION Cash Flows
(Dollars in millions) 2009 2008 2007 Net cash provided by (used in): Operating activities $ 758 $ 653 $ 732 Investing activities (369) (376) (335) Financing activities 18 (779) (448) Effect of exchange rate changes on cash and cash equivalents (1) 1 -- Net change in cash and cash equivalents $ 406 $ (501) $ (51) Cash and cash equivalents at end of period $ 793 $ 387 $ 888
Cash provided by operating activities increased $105 million to $758 million in 2009. The 2009 operating cash flow includes cash generated by a change in the tax method for capitalizing assets of approximately $125 million and a reduction in working capital of $118 million partially offset by a $181 million contribution to the Company's U.S. defined benefit pension plan. The change in tax method accelerated timing of deductions for manufacturing repairs expense resulting in lower estimated tax payments and a refund of previously paid taxes. The reduced working capital primarily resulted from inventory reductions in all segments in response to the lower level of economic activity. End of year receivables remained constant between 2009 and 2008 which is consistent with the declines in fourth quarter revenues. Trade payables increased because of a higher level of purchasing activity at the end of 2009 versus the recessionary levels at the end of 2008. Operating cash flow in 2008 also included the monetization of interest rate, commodity, and foreign exchange hedges. In 2008, cash provided by operating activities of $653 million decreased by $79 million when compared to 2007. This decrease was primarily caused by lower net earnings, excluding accelerated depreciation and asset impairments and restructuring charges, net, which were attributed primarily to the challenging economic environment in fourth quarter 2008. Working capital increased $45 million, due to a $95 million increase in inventory because of the unexpected sharp decline in economic activity late in 2008. The increase in inventory was partially offset by a net reduction in receivables of $261 million and payables of $211 million which were due to the declines in sales and purchasing activities in late 2008. Operating cash flow in 2008 also included the monetization of interest rate, commodity, and foreign exchange hedges. Cash used in investing activities, primarily for capital spending for additions to properties and equipment, was $310 million, $634 million, and $518 million in 2009, 2008, and 2007, respectively. Also in 2009, the Company contributed $68 million to an alliance with SK for the construction of a Korean cellulose acetate tow manufacturing facility which is reported in "acquisitions of and investments in joint ventures". The Company received approximately $25 million net cash proceeds in 2009 primarily from the settlement of working capital from the sale in 2008 of the Company's PET polymers and PTA manufacturing facilities in the Netherlands and the PET manufacturing facility in the United Kingdom. In 2008, the Company received $337 million net cash proceeds primarily from the sale of the Company's PET polymers and PTA manufacturing facilities in the Netherlands and the PET manufacturing facility in the United Kingdom. In 2007, the Company received approximately $40 million in proceeds from the sale of its San Roque, Spain manufacturing facility and related assets and approximately $160 million in proceeds from the sale of its Mexico and Argentina manufacturing facilities and related assets. For more information concerning divestitures, see Note 16, "Divestitures" and Note 17, "Discontinued Operations", to the Company's consolidated financial statements in this Annual Report.

MANAGEMENT'S DISCUSSION AND ANALYSIS OF FINANCIAL CONDITION AND RESULTS OF OPERATIONS
32
Cash provided by financing activities totaled $18 million in 2009. Cash used in financing activities totaled $779 million and $448 million in 2008 and 2007, respectively. Financing activities in 2009 included $248 million of net proceeds from the issuance of notes due 2019, a repayment of $88 million of the Company's euro credit facility, and a repayment of $13 million of short term borrowings. The Company also repurchased stock totaling $21 million offset by cash received from stock option exercises and other items of $17 million. Financing activities in 2008 included the Company's repayment of $72 million of notes that matured in 2008, a repayment of $103 million of the euro credit facility, a decrease in credit facility and other borrowings, including bank overdrafts, of $7 million, and repurchases of stock totaling $501 million offset by cash received from stock option exercises and other items of $39 million. In 2007, financing activities included a decrease in credit facility and other borrowings, including bank overdrafts, of $22 million and repurchases of stock totaling $382 million offset by cash received from stock option exercises and other items of $103 million. The payment of dividends is also reflected in financing activities in all periods. The Company expects to generate positive free cash flow (operating cash flow excluding the $200 million decrease in cash resulting from the increase in accounts receivable due to the adoption of new accounting guidance, less capital expenditures and dividends) in 2010 of greater than $100 million, assuming capital expenditures of between $250 million and $275 million and U.S. defined benefit pension plan funding of less than $25 million. The priorities for uses of available cash in 2010 are payment of the quarterly cash dividend, funding targeted growth initiatives, including organic initiatives, joint ventures and acquisitions, and repurchasing shares. Liquidity At December 31, 2009, the Company had a $700 million revolving credit facility ("Credit Facility") in two tranches, with $125 million expiring in 2012 and $575 million expiring in 2013. Borrowings under the Credit Facility are subject to interest at varying spreads above quoted market rates and a facility fee is paid on the total commitment. In addition, the Credit Facility contains a number of customary covenants and events of default, including the maintenance of certain financial ratios. The Company was in compliance with all such covenants for all periods presented. At December 31, 2009, the Company had no outstanding borrowings under the Credit Facility. At December 31, 2008, the Company had both the Credit Facility and a 60 million euro credit facility ("Euro Facility"), with borrowings totaling $84 million at an effective interest rate of 3.74 percent. On November 2, 2009, the Company issued notes in the principal amount of $250 million due 2019 and bearing interest at 5.50% per annum. Proceeds from the sale of notes, net of approximately $2 million in transaction fees, were $248 million. The Company used part of the proceeds from the sale of its PET polymers and PTA production facilities in the Netherlands and its PET production facility in the United Kingdom and related businesses to reduce the balance outstanding on its Euro Facility by $103 million in second quarter 2008. The Credit Facility provides liquidity support for commercial paper borrowings and general corporate purposes. Accordingly, any outstanding commercial paper borrowings reduce borrowings available under the Credit Facility. Given the expiration dates of the Credit Facility, any commercial paper borrowings supported by the Credit Facility are classified as long-term borrowings because the Company has the ability to refinance such borrowings on a long-term basis. Additionally, the Company maintains a $200 million accounts receivable securitization program
that is available to provide liquidity through the sale of receivables and was fully drawn at December 31, 2009 and 2008. For more information, see "Off Balance Sheet and Other Financing Arrangements" below and Note 11, "Commitments", to the Company's consolidated financial statements in this Annual Report.
For more information regarding interest rates, see Note 8, "Borrowings", to the Company's consolidated financial statements in this Annual Report.

MANAGEMENT'S DISCUSSION AND ANALYSIS OF FINANCIAL CONDITION AND RESULTS OF OPERATIONS
33
In 2009, the Company made $181 million in contributions to its U.S. defined benefit pension plan, and made no contribution in 2008. Cash flows from operations and the other sources of liquidity described above are expected to be available and sufficient to meet foreseeable cash flow requirements. However, the Company's cash flows from operations can be affected by numerous factors including risks associated with global operations, raw material availability and cost, demand for and pricing of Eastman's products, capacity utilization, and other factors described under "Forward-Looking Statements and Risk Factors" below. The Company believes maintaining a financial profile consistent with an investment grade company is important to its long term strategic and financial flexibility. Capital Expenditures Capital expenditures were $310 million, $634 million, and $518 million for 2009, 2008, and 2007, respectively. The decrease of $324 million in 2009 compared with 2008 was primarily due to a decrease in spending on capital projects as a response to a more challenging economic environment. The Company expects that 2010 capital spending will be $250 million to $275 million, which is sufficient for required maintenance and certain strategic growth initiatives. The Company expects 2010 depreciation and amortization to be slightly higher than 2009 expenses of approximately $274 million, primarily due to the start-up of new manufacturing facilities in 2010. Other Commitments At December 31, 2009, the Company's obligations related to notes and debentures totaled approximately $1.6 billion to be paid over a period of approximately 20 years. The Company had various purchase obligations at December 31, 2009 totaling approximately $1.1 billion over a period of approximately 15 years for materials, supplies and energy incident to the ordinary conduct of business. The Company also had various lease commitments for property and equipment under cancelable, noncancelable, and month-to-month operating leases totaling $104 million over a period of several years. Of the total lease commitments, approximately 15 percent relate to machinery and equipment, including computer and communications equipment and production equipment; approximately 45 percent relate to real property, including office space, storage facilities, and land; and approximately 40 percent relate to railcars. In addition, the Company had other liabilities at December 31, 2009 totaling approximately $1.4 billion related primarily to pension, retiree medical, other post-employment obligations, and environmental reserves.
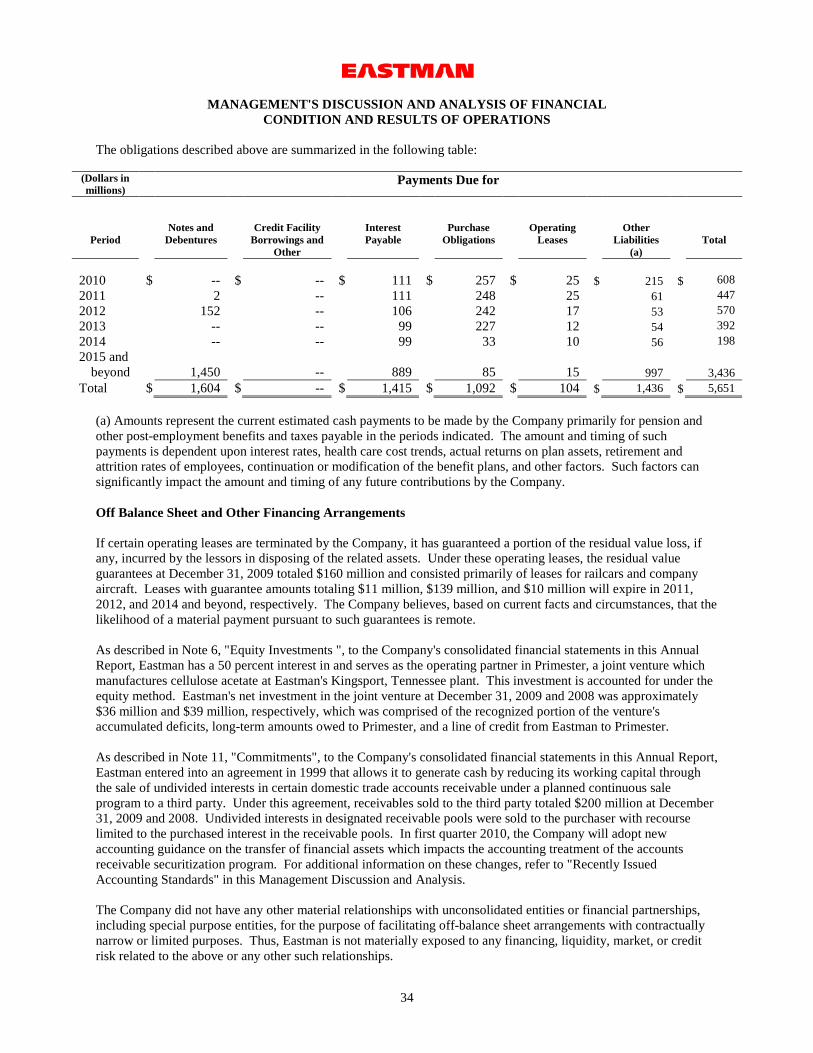
MANAGEMENT'S DISCUSSION AND ANALYSIS OF FINANCIAL CONDITION AND RESULTS OF OPERATIONS
34
The obligations described above are summarized in the following table:
(Dollars in millions)
Payments Due for
Period
Notes and Debentures
Credit Facility Borrowings and
Other
Interest Payable
Purchase Obligations
Operating Leases
Other Liabilities
(a)
Total
2010 $ -- $ -- $ 111 $ 257 $ 25 $ 215 $ 608 2011 2 -- 111 248 25 61 447 2012 152 -- 106 242 17 53 570 2013 -- -- 99 227 12 54 392 2014 -- -- 99 33 10 56 198 2015 and
beyond
1,450
--
889
85 15 997 3,436 Total $ 1,604 $ -- $ 1,415 $ 1,092 $ 104 $ 1,436 $ 5,651
(a) Amounts represent the current estimated cash payments to be made by the Company primarily for pension and other post-employment benefits and taxes payable in the periods indicated. The amount and timing of such payments is dependent upon interest rates, health care cost trends, actual returns on plan assets, retirement and attrition rates of employees, continuation or modification of the benefit plans, and other factors. Such factors can significantly impact the amount and timing of any future contributions by the Company. Off Balance Sheet and Other Financing Arrangements If certain operating leases are terminated by the Company, it has guaranteed a portion of the residual value loss, if any, incurred by the lessors in disposing of the related assets. Under these operating leases, the residual value guarantees at December 31, 2009 totaled $160 million and consisted primarily of leases for railcars and company aircraft. Leases with guarantee amounts totaling $11 million, $139 million, and $10 million will expire in 2011, 2012, and 2014 and beyond, respectively. The Company believes, based on current facts and circumstances, that the likelihood of a material payment pursuant to such guarantees is remote. As described in Note 6, "Equity Investments ", to the Company's consolidated financial statements in this Annual Report, Eastman has a 50 percent interest in and serves as the operating partner in Primester, a joint venture which manufactures cellulose acetate at Eastman's Kingsport, Tennessee plant. This investment is accounted for under the equity method. Eastman's net investment in the joint venture at December 31, 2009 and 2008 was approximately $36 million and $39 million, respectively, which was comprised of the recognized portion of the venture's accumulated deficits, long-term amounts owed to Primester, and a line of credit from Eastman to Primester. As described in Note 11, "Commitments", to the Company's consolidated financial statements in this Annual Report, Eastman entered into an agreement in 1999 that allows it to generate cash by reducing its working capital through the sale of undivided interests in certain domestic trade accounts receivable under a planned continuous sale program to a third party. Under this agreement, receivables sold to the third party totaled $200 million at December 31, 2009 and 2008. Undivided interests in designated receivable pools were sold to the purchaser with recourse limited to the purchased interest in the receivable pools. In first quarter 2010, the Company will adopt new accounting guidance on the transfer of financial assets which impacts the accounting treatment of the accounts receivable securitization program. For additional information on these changes, refer to "Recently Issued Accounting Standards" in this Management Discussion and Analysis. The Company did not have any other material relationships with unconsolidated entities or financial partnerships, including special purpose entities, for the purpose of facilitating off-balance sheet arrangements with contractually narrow or limited purposes. Thus, Eastman is not materially exposed to any financing, liquidity, market, or credit risk related to the above or any other such relationships.

MANAGEMENT'S DISCUSSION AND ANALYSIS OF FINANCIAL CONDITION AND RESULTS OF OPERATIONS
35
The Company has evaluated its material contractual relationships and has concluded that the entities involved in these relationships are not Variable Interest Entities ("VIE's") or, in the case of Primester, a joint venture that manufactures cellulose acetate at the Company's Kingsport, Tennessee plant, the Company is not the primary beneficiary of the VIE. As such, in accordance with GAAP, the Company is not required to consolidate these entities. In addition, the Company has evaluated long-term purchase obligations with an entity that may be a VIE at December 31, 2009. This potential VIE is a joint venture from which the Company has purchased raw materials and utilities for several years. The Company purchased approximately $40 million and $50 million of raw materials and utilities in 2009 and 2008, respectively, and expects to purchase approximately $50 million of raw materials and utilities in 2010. The Company has no equity interest in this entity and has confirmed that one party to this joint venture does consolidate the potential VIE. However, due to competitive and other reasons, the Company has not been able to obtain the necessary financial information to determine whether the entity is a VIE, and whether or not the Company is the primary beneficiary. Guarantees and claims also arise during the ordinary course of business from relationships with suppliers, customers, and other parties when the Company undertakes an obligation to guarantee the performance of others, if specified triggering events occur. Non-performance under a contract could trigger an obligation of the Company. These potential claims include actions based upon alleged exposures to products, intellectual property and environmental matters, and other indemnifications. The ultimate effect on future financial results is not subject to reasonable estimation because considerable uncertainty exists as to the final outcome of these claims. However, while the ultimate liabilities resulting from such claims may be significant to results of operations in the period recognized, management does not anticipate they will have a material adverse effect on the Company's consolidated financial position or liquidity. Treasury Stock Transactions On February 4, 1999, the Company was authorized by its Board of Directors to repurchase up to $400 million of its common stock. Through January 2007, a total of 2.7 million shares of common stock were repurchased under the authorization at a cost of approximately $112 million. On February 20, 2007, the Board of Directors cancelled its prior authorization and approved a new authorization for the repurchase of up to $300 million of the Company's outstanding common stock. The Company completed the $300 million repurchase authorization in September 2007, acquiring a total of 4.6 million shares. In October 2007, the Board of Directors authorized an additional $700 million for repurchase of the Company's outstanding common shares at such times, in such amounts, and on such terms, as determined to be in the best interests of the Company. As of December 31, 2009, a total of 9.7 million shares have been repurchased under this authorization for a total amount of approximately $604 million. Dividends The Company declared quarterly cash dividends of $0.44 per share for a total of $1.76 per share in 2009, 2008, and 2007. The Company has declared a cash dividend of $0.44 per share during the first quarter of 2010, payable on April 1, 2010 to stockholders of record on March 15, 2010.

MANAGEMENT'S DISCUSSION AND ANALYSIS OF FINANCIAL CONDITION AND RESULTS OF OPERATIONS
36
ENVIRONMENTAL Certain Eastman manufacturing sites generate hazardous and nonhazardous wastes of which the treatment, storage, transportation, and disposal are regulated by various governmental agencies. In connection with the cleanup of various hazardous waste sites, the Company, along with many other entities, has been designated a potentially responsible party ("PRP") by the U.S. Environmental Protection Agency under the Comprehensive Environmental Response, Compensation and Liability Act, which potentially subjects PRPs to joint and several liability for such cleanup costs. In addition, the Company will be required to incur costs for environmental remediation and closure and postclosure under the Federal Resource Conservation and Recovery Act. Reserves for environmental contingencies have been established in accordance with Eastman's policies as described in Note 1, "Significant Accounting Policies", to the Company's consolidated financial statements in this Annual Report. Because of expected sharing of costs, the availability of legal defenses, and the Company's preliminary assessment of actions that may be required, it does not believe its liability for these environmental matters, individually or in the aggregate, will be material to the Company's consolidated financial position, results of operations, or cash flows. The Company accrues environmental remediation costs when it is probable that the Company has incurred a liability at a contaminated site and the amount can be reasonably estimated. When a single amount cannot be reasonably estimated but the cost can be estimated within a range, the Company accrues the minimum amount. This undiscounted accrued amount reflects the Company's assumptions about remediation requirements at the contaminated site, the nature of the remedy, the outcome of discussions with regulatory agencies and other potentially responsible parties at multi-party sites, and the number and financial viability of other potentially responsible parties. Changes in the estimates on which the accruals are based, unanticipated government enforcement action, or changes in health, safety, environmental, and chemical control regulations and testing requirements could result in higher or lower costs. Estimated future environmental expenditures for remediation costs range from the minimum or best estimate of $10 million to the maximum of $20 million at December 31, 2009. In addition to remediation activities, the Company establishes reserves for closure and postclosure costs associated with the environmental assets it maintains. Environmental assets include but are not limited to waste management units, such as landfills, water treatment facilities, and ash ponds. When these types of assets are constructed or installed, a reserve is established for the anticipated future costs associated with the closure of the asset based on its expected life and the applicable regulatory closure requirements. These future expenses are charged into earnings over the estimated useful life of the assets. The best estimate accrued to date over the facilities' estimated useful lives for asset retirement obligation costs is $32 million at December 31, 2009. GAAP requires an entity to recognize a liability for a conditional asset retirement obligation ("CARO") when incurred if the liability can be reasonably estimated. The Company has performed a thorough examination of various asset categories as of December 31, 2009. Although it may have CAROs at certain of its facilities, including, but not limited to, the potential for asbestos abatement activities, the Company is unable to determine potential settlement dates to be used in fair value calculations for estimating these obligations as a result of an absence of plans or expectations to undertake a major renovation or demolition project that would require the removal of asbestos. The Company continues to monitor these conditional obligations, as well as any new ones that may develop, and will record reserves associated with them when and to the extent that more detailed information becomes available concerning applicable retirement costs. The recorded obligations did not have a material impact on its consolidated financial position, results of operations and cash flows. Reserves related to environmental assets accounted for approximately 75 percent of the total environmental reserve at December 31, 2009. Currently, the Company's environmental assets are expected to reach the end of their useful lives at different times over the next 50 years. If the Company was to invest in numerous new environmental assets, or, these assets were to require closure a significant number of years before the Company anticipated they would, the amortization on them would increase, and could have a material negative impact on the Company's financial condition and results of operations. The Company views the likelihood of this occurrence to be remote, and does not anticipate, based on its past experience with this type of planned remediation, that an additional accrual related to environmental assets will be necessary.

MANAGEMENT'S DISCUSSION AND ANALYSIS OF FINANCIAL CONDITION AND RESULTS OF OPERATIONS
37
The Company's cash expenditures related to environmental protection and improvement were approximately $173 million, $218 million, and $209 million in 2009, 2008, and 2007, respectively. These amounts were primarily for operating costs associated with environmental protection equipment and facilities, but also included expenditures for construction and development. The Company does not expect future environmental capital expenditures arising from requirements of recently promulgated environmental laws and regulations to materially increase the Company's planned level of annual capital expenditures for environmental control facilities. INFLATION In recent years, general economic inflation has not had a material adverse impact on Eastman's costs. The cost of raw materials is generally based on market price, although derivative financial instruments were utilized, as appropriate, to mitigate short-term market price fluctuations. The volatility of raw material and energy costs will continue and the Company will continue to pursue pricing and hedging strategies and ongoing cost control initiatives to offset the effects on gross profit. For additional information see Note 9, "Fair Value of Financial Instruments", to the Company's consolidated financial statements in this Annual Report. RECENTLY ISSUED ACCOUNTING STANDARDS In June 2009, the Financial Accounting Standards Board ("FASB") issued new guidance related to the transfers of financial assets. The new guidance addresses the relevance, representational faithfulness, and comparability of the information that a reporting entity provides in its financial reports about a transfer of financial assets; the effects of a transfer on its financial position, financial performance, and cash flows; and a transferor's continuing involvement in transferred financial assets. This statement is effective for all Company financial asset transfers occurring on or after January 1, 2010. The Company has concluded that this new guidance will impact the Company's consolidated financial position and cash flows upon adoption in first quarter 2010. Prior to adoption of the new accounting guidance, the transfer of accounts receivable under the accounts receivable securitization program was accounted for as a sale which resulted in increased cash from operations at inception of the program in 1999. The program has been consistently utilized every year since 2000 and, therefore, has had no impact on cash from operations since that time. Going forward, any future transfers of accounts receivable will be treated as secured borrowings in the Statements of Financial Position. These secured borrowings will be reflected as cash from financing activities in the Statements of Cash Flows. The adoption of the new guidance, regardless of whether the Company continues to transfer accounts receivable subsequent to December 31, 2009, will result in an increase in accounts receivable of $200 million in the Statements of Financial Position and a corresponding decrease in cash flows from operations in the Statements of Cash Flows for the quarter ending March 31, 2010. In June 2009, the FASB issued new guidance on the consolidation of variable interest entities. The new guidance addresses improvements to financial reporting by enterprises involved with variable interest entities and to provide more relevant and reliable information to users of financial statements. This statement is effective for all variable interest entities the Company is involved with on or after January 1, 2010. The Company has concluded that this new guidance will not have a material impact on the Company's consolidated financial position, liquidity, or results of operations upon adoption in first quarter 2010. OUTLOOK For 2010, the Company expects: • increases in volume due to the expected recovery from the global recession and continued substitution of
Eastman products for other materials and new applications for existing products;
• the volatility of market prices for raw materials and energy to continue and that the Company will continue to use pricing and hedging strategies to offset this volatility and for raw material and energy costs to be higher than 2009;
MANAGEMENT'S DISCUSSION AND ANALYSIS OF FINANCIAL CONDITION AND RESULTS OF OPERATIONS
38
• to acquire and operate a cellulose acetate tow manufacturing facility and related business in Korea, with the facility to be operational in first quarter 2010 and fully integrated into the Fibers segment's production and sales processes in 2011;
• to continue to progress with the introduction of its new Eastman TritanTM copolyester, which it will supply from
the monomer manufacturing facility and its first TritanTM
copolyester polymer manufacturing facility in Kingsport, Tennessee which were both completed in 2009 and are expected to be operational in early 2010;
• to improve the profitability of its PET product lines in the Performance Polymers segment as a result of improved operational performance of the South Carolina facility and more profitable mix of PET product sales, and to continue to pursue licensing opportunities;
• depreciation and amortization to be slightly higher than 2009 primarily due to expected completion of
manufacturing facilities in 2010;
• pension expense to be slightly higher than 2009, and to fund the U.S. defined benefit pension plan in an amount less than $25 million;
• net interest expense to increase compared with 2009 primarily due to lower capitalized interest and higher
borrowings;
• the effective tax rate to be approximately 33 percent;
• capital spending to be between $250 million and $275 million for required maintenance and certain strategic growth initiatives;
• to generate more than $100 million of positive free cash flow (operating cash flow excluding the $200 million
decrease in cash resulting from the increase in accounts receivable due to the adoption of new accounting guidance, less capital expenditures and dividends);
• priorities
• earnings per share to be 20 percent above 2009 earnings per share excluding charges related to asset impairments, restructuring, and cost reduction actions.
for uses of available cash to be payment of the quarterly cash dividend, funding targeted growth initiatives, including organic initiatives, joint ventures and acquisitions, and repurchasing shares; and
See "Forward-Looking Statements and Risk Factors below." FORWARD-LOOKING STATEMENTS AND RISK FACTORS
The expectations under "Outlook" and certain other statements in this Annual Report which are not statements of historical fact may be "forward-looking statements" as defined in the Private Securities Litigation Reform Act of 1995 and other federal securities laws. These statements, and other written and oral forward-looking statements made by the Company from time to time may relate to, among other things, such matters as planned and expected capacity increases and utilization; anticipated capital spending; expected depreciation and amortization; environmental matters; legal proceedings; exposure to, and effects of hedging of, raw material and energy costs, foreign currencies and interest rates; global and regional economic, political, and business conditions; competition; growth opportunities; supply and demand, volume, price, cost, margin, and sales; earnings, cash flow, dividends and other expected financial results and conditions; expectations, strategies, and plans for individual assets and products, businesses and segments as well as for the whole of Eastman; cash requirements and uses of available cash; financing plans; pension expenses and funding; credit ratings; anticipated restructuring, divestiture, and consolidation activities; cost reduction and control efforts and targets; integration of any acquired businesses; strategic initiatives and development, production, commercialization, and acceptance of new products, services and technologies and related costs; asset, business and product portfolio changes; and expected tax rates and net interest costs.

MANAGEMENT'S DISCUSSION AND ANALYSIS OF FINANCIAL CONDITION AND RESULTS OF OPERATIONS
39
These plans and expectations are based upon certain underlying assumptions, including those mentioned with the specific statements. Such assumptions are based upon internal estimates and analyses of current market conditions and trends, management plans and strategies, economic conditions and other factors. These plans and expectations and the underlying assumptions are necessarily subject to risks and uncertainties inherent in projecting future conditions and results. Actual results could differ materially from expectations expressed in any forward-looking statement if one or more of the underlying assumptions or expectations proves to be inaccurate or is unrealized. In addition to the factors described elsewhere in this Annual Report, the following are the most significant known factors that could cause the Company's actual results to differ materially from those in any such forward-looking statement. Additional factors not presently known to the Company, or that the Company does not currently believe to be material, may also cause actual results to differ materially from expectations: Continued adverse and uncertain conditions in the global economy and the financial markets could continue to negatively impact the Company. Conditions in the global economy and global capital markets may continue to adversely affect the Company's results of operations, financial condition, and cash flows. The Company's business and operating results have been and are expected to continue to be affected by the impact of the recent global recession, including the credit market crisis, declining consumer and business confidence, fluctuating commodity prices, volatile exchange rates, and other challenges currently affecting the global economy. The Company's customers may experience deterioration of their businesses, cash flow shortages, and difficulty obtaining financing. As a result, existing or potential customers may delay or cancel plans to purchase products and may not be able to, or may be unwilling to, fulfill their obligations in a timely fashion. Further, suppliers may be experiencing similar conditions, which could impact their ability to fulfill their obligations to the Company. If weakness in the global economy continues for significant future periods or if the global economy further deteriorates, the Company's results of operations, financial condition and cash flows could be materially adversely affected. If weakness in the global economy continues for significant future periods, or if the global economy or financial markets experience significant new disruptions or deterioration, the Company's ability to access the credit and capital markets under attractive rates and terms could be constrained, which may negatively impact the Company's liquidity or ability to pursue certain growth initiatives.
Volatility in costs for strategic raw material and energy commodities or disruption in the supply of these commodities could adversely affect our financial results. The Company is reliant on certain strategic raw material and energy commodities for its operations and utilizes risk management tools, including hedging, as appropriate, to mitigate short-term market fluctuations in raw material and energy costs. It is unlikely, however, that these risk mitigation measures will eliminate all exposure to market fluctuations. In addition, natural disasters, plant interruptions, changes in laws or regulations, war or other outbreak of hostilities or terrorism, and breakdown or degradation of transportation infrastructure used for delivery of strategic raw material and energy commodities, could adversely impact both the cost and availability of these commodities. The Company could be materially adversely affected by disruptions to manufacturing operations or related infrastructure. Significant limitation of the Company's ability to manufacture products due to disruption of manufacturing operations or related infrastructure could have a material adverse affect on sales revenue, costs, results of operations, and financial condition. Disruptions could occur due to internal factors such as computer or equipment malfunction, operator error, or process failures; or external factors such as natural disasters, pandemic illness, changes in laws or regulations, war or other outbreak of hostilities or terrorism, or breakdown or degradation of transportation infrastructure used for delivery of supplies to the Company or for delivery of products to customers.

MANAGEMENT'S DISCUSSION AND ANALYSIS OF FINANCIAL CONDITION AND RESULTS OF OPERATIONS
40
Loss or financial weakness of the Company's largest customers could adversely affect our financial results. The Company has an extensive customer base; however, loss of, or material financial weakness of, certain of the largest customers could adversely affect the Company's financial condition and results of operations until such business is replaced and no assurances can be made that the Company would be able to regain or replace any lost customers. Growth initiatives may not achieve desired business or financial objectives and may require a significant use of resources.
The Company continues to identify and pursue growth opportunities through both internal development and acquisitions and joint ventures to diversify and extend the portfolio of our businesses. These growth opportunities include development and commercialization of new products and technologies, expansion into new markets and geographic regions, and alliances, ventures, and acquisitions that complement and extend the Company's portfolio of businesses and capabilities. There can be no assurance that such efforts, investments, or acquisitions and alliances will result in financially successful commercialization of products or acceptance by existing or new customers or new markets or achieve their underlying strategic business objectives or that they will be beneficial to the Company's results of operations. There also can be no assurance that capital projects for such growth efforts can be completed within the time or at the costs projected due, among other things, to demand for and availability of construction materials and labor and obtaining regulatory approvals and operating permits and reaching agreement on terms of key agreements and arrangements with potential suppliers and customers. Any such delays or cost overruns or the inability to obtain such approvals or to reach such agreements on acceptable terms could negatively affect the returns from any proposed investments and projects. Legislative and regulatory actions could increase the Company's future compliance costs. The Company's facilities and businesses are subject to complex health, safety and environmental laws and regulations, which require and will continue to require significant expenditures to remain in compliance with such laws and regulations currently and in the future. The Company's accruals for such costs and associated liabilities are subject to changes in estimates on which the accruals are based. The amount accrued reflects the Company's assumptions about remediation requirements at the contaminated site, the nature of the remedy, the outcome of discussions with regulatory agencies and other potentially responsible parties at multi-party sites, and the number and financial viability of other potentially responsible parties. Changes in the estimates on which the accruals are based, unanticipated government enforcement action, or changes in health, safety, environmental, chemical control regulations, and testing requirements could result in higher costs. Pending and proposed U.S. Federal legislation and regulation increase the likelihood that the Company's manufacturing sites will in the future be impacted by regulation or taxation of greenhouse gas emissions, which legislation and regulation, if enacted, may result in capital expenditures, increases in costs for raw materials and energy, limitations on raw material and energy source and supply choices, and other direct compliance costs. In addition to the foregoing most significant known risk factors to the Company, there may be other factors, not currently known to the Company, which could, in the future, materially adversely affect the Company, its business, financial condition, or results of operations. The foregoing discussion of the most significant risk factors to the Company does not necessarily present them in order of importance. This disclosure, including that under "Outlook" and "Forward-Looking Statements and Risk Factors," and other forward-looking statements and related disclosures made by the Company in this Annual Report and elsewhere from time to time, represents management's best judgment as of the date the information is given. The Company does not undertake responsibility for updating any of such information, whether as a result of new information, future events, or otherwise, except as required by law. Investors are advised, however, to consult any further public Company disclosures (such as in filings with the Securities and Exchange Commission or in Company press releases) on related subjects.

41
QUANTITATIVE AND QUALITATIVE DISCLOSURES ABOUT MARKET RISK Eastman Chemical Company and subsidiaries ("Eastman" or the "Company") are exposed to changes in financial market conditions in the normal course of its business due to its use of certain financial instruments as well as transacting in various foreign currencies and funding foreign operations. To mitigate the Company's exposure to these market risks, Eastman has established policies, procedures, and internal processes governing its management of financial market risks and the use of financial instruments to manage its exposure to such risks. The Company determines its market risk utilizing sensitivity analyses, which measure the potential losses in fair value resulting from one or more selected hypothetical changes in interest rates, foreign currency exchange rates, and/or commodity prices. The Company is exposed to changes in interest rates primarily as a result of its borrowing and investing activities, which include long-term borrowings used to maintain liquidity and to fund its business operations and capital requirements. Currently, these borrowings and investments are predominately U.S. dollar denominated. The nature and amount of the Company's long-term and short-term debt may vary as a result of future business requirements, market conditions, and other factors. For purposes of calculating the market risks associated with the fair value of interest-rate-sensitive instruments, the Company uses a one percent or less absolute shift in interest rates. For 2009 and 2008, the market risks associated with the fair value of interest-rate-sensitive instruments, assuming an instantaneous absolute shift in interest rates of one percent or less were approximately $120 million and $107 million, respectively. This exposure is primarily related to long-term debt with fixed interest rates. The Company's operating cash flows and borrowings denominated in foreign currencies are exposed to changes in foreign currency exchange rates. The Company continually evaluates its foreign currency exposure based on current market conditions and the locations in which the Company conducts business. In order to mitigate the effect of foreign currency risk, the Company enters into currency options to hedge probable anticipated, but not yet committed, export sales and purchase transactions expected within no more than five years and denominated in foreign currencies; and forward exchange contracts to hedge certain firm commitments denominated in foreign currencies. The gains and losses on these contracts offset changes in the value of related exposures. It is the Company's policy to enter into foreign currency derivative financial instruments only to the extent considered necessary to meet its objectives as stated above. The Company does not enter into foreign currency derivative financial instruments for speculative purposes. For 2009, the market risks associated with borrowings denominated in foreign currencies assuming a 10 percent adverse move in the U.S. dollar relative to each foreign currency was approximately $51 million and an additional $5 million for each additional one percentage point adverse change in foreign currency rates. For 2008, the market risks associated with borrowings denominated in foreign currencies assuming a 10 percent adverse move in the U.S. dollar relative to each foreign currency was approximately $39 million and an additional $4 million for each additional one percentage point adverse change in foreign currency rates. Furthermore, since the Company utilizes currency-sensitive derivative instruments for hedging anticipated foreign currency transactions, a loss in fair value for those instruments is generally offset by increases in the value of the underlying anticipated transactions. The Company is exposed to fluctuations in market prices for certain of its major raw materials and energy. To mitigate short-term fluctuations in market prices for certain commodities, principally propane, natural gas, and ethane, the Company enters into option and forward contracts. For 2009, the market risk associated with forwards and options for feedstock and natural gas, assuming an instantaneous parallel shift in the underlying commodity price of 10 percent, was $4 million and less than an additional $1 million for each one percentage point move in closing price thereafter. For 2008, there was limited market risk associated with options and forwards for these same commodities.

42
FINANCIAL STATEMENTS AND SUPPLEMENTARY DATA
ITEM Page Management's Responsibility for Financial Statements 43 Report of Independent Registered Public Accounting Firm 44 Consolidated Statements of Earnings, Comprehensive Income and Retained Earnings 45 Consolidated Statements of Financial Position 46 Consolidated Statements of Cash Flows 47 Notes to Consolidated Financial Statements
Note 1. Significant Accounting Policies 48 Note 2. Asset Impairments and Restructuring Charges, Net 52 Note 3. Inventories 56 Note 4. Properties and Accumulated Depreciation 56 Note 5. Goodwill and Other Intangible Assets 57 Note 6. Equity Investments 57 Note 7. Payables and Other Current Liabilities 58 Note 8. Borrowings 58 Note 9. Fair Value of Financial Instruments 59 Note 10. Retirement Plans 62 Note 11. Commitments 70 Note 12. Environmental Matters 72 Note 13. Legal Matters 72 Note 14. Stockholders' Equity 73 Note 15. Share-Based Compensation Plans and Awards 75 Note 16. Divestitures 78 Note 17. Discontinued Operations 78 Note 18. Other Operating Income, Net 79 Note 19. Other Charges (Income), Net 79 Note 20. Income Taxes 80 Note 21. Supplemental Cash Flow Information 84 Note 22. Segment Information 84 Note 23. Quarterly Sales and Earnings Data - Unaudited 88 Note 24. Recently Issued Accounting Standards 90 Note 25. Reserve Rollforwards 91
43
MANAGEMENT'S RESPONSIBILITY FOR FINANCIAL STATEMENTS Management is responsible for the preparation and integrity of the accompanying consolidated financial statements of Eastman appearing on pages 45 through 91. Eastman has prepared these consolidated financial statements in accordance with accounting principles generally accepted in the United States, and the statements of necessity include some amounts that are based on management's best estimates and judgments. Eastman's accounting systems include extensive internal controls designed to provide reasonable assurance of the reliability of its financial records and the proper safeguarding and use of its assets. Such controls are based on established policies and procedures, are implemented by trained, skilled personnel with an appropriate segregation of duties, and are monitored through a comprehensive internal audit program. The Company's policies and procedures prescribe that the Company and all employees are to maintain the highest ethical standards and that its business practices throughout the world are to be conducted in a manner that is above reproach. The consolidated financial statements have been audited by PricewaterhouseCoopers LLP, an independent registered public accounting firm, who were responsible for conducting their audit in accordance with the standards of the Public Company Accounting Oversight Board (United States). Their report is included herein. The Board of Directors exercises its responsibility for these financial statements through its Audit Committee, which consists entirely of non-management Board members. The independent registered public accounting firm and internal auditors have full and free access to the Audit Committee. The Audit Committee meets periodically with PricewaterhouseCoopers LLP and Eastman's director of internal auditing, both privately and with management present, to discuss accounting, auditing, policies and procedures, internal controls, and financial reporting matters.
/s/James P. Rogers
/s/Curtis E. Espeland James P. Rogers Curtis E. Espeland
President and Senior Vice President and Chief Executive Officer Chief Financial Officer
February 24, 2010
44
Report of Independent Registered Public Accounting Firm To the Board of Directors and Stockholders of Eastman Chemical Company In our opinion, the consolidated financial statements present fairly, in all material respects, the financial position of Eastman Chemical Company and its subsidiaries at December 31, 2009 and 2008, and the results of their operations and their cash flows for each of the three years in the period ended December 31, 2009 in conformity with accounting principles generally accepted in the United States of America. Also in our opinion, the Company maintained, in all material respects, effective internal control over financial reporting as of December 31, 2009, based on criteria established in Internal Control - Integrated Framework issued by the Committee of Sponsoring Organizations of the Treadway Commission (COSO). The Company's management is responsible for these financial statements, for maintaining effective internal control over financial reporting and for its assessment of the effectiveness of internal control over financial reporting, included in Management's Report on Internal Control Over Financial Reporting. Our responsibility is to express opinions on these financial statements and on the Company's internal control over financial reporting based on our integrated audits. We conducted our audits in accordance with the standards of the Public Company Accounting Oversight Board (United States). Those standards require that we plan and perform the audits to obtain reasonable assurance about whether the financial statements are free of material misstatement and whether effective internal control over financial reporting was maintained in all material respects. Our audits of the financial statements included examining, on a test basis, evidence supporting the amounts and disclosures in the financial statements, assessing the accounting principles used and significant estimates made by management, and evaluating the overall financial statement presentation. Our audit of internal control over financial reporting included obtaining an understanding of internal control over financial reporting, assessing the risk that a material weakness exists, and testing and evaluating the design and operating effectiveness of internal control based on the assessed risk. Our audits also included performing such other procedures as we considered necessary in the circumstances. We believe that our audits provide a reasonable basis for our opinions. A company's internal control over financial reporting is a process designed to provide reasonable assurance regarding the reliability of financial reporting and the preparation of financial statements for external purposes in accordance with generally accepted accounting principles. A company's internal control over financial reporting includes those policies and procedures that (i) pertain to the maintenance of records that, in reasonable detail, accurately and fairly reflect the transactions and dispositions of the assets of the company; (ii) provide reasonable assurance that transactions are recorded as necessary to permit preparation of financial statements in accordance with generally accepted accounting principles, and that receipts and expenditures of the company are being made only in accordance with authorizations of management and directors of the company; and (iii) provide reasonable assurance regarding prevention or timely detection of unauthorized acquisition, use, or disposition of the company's assets that could have a material effect on the financial statements. Because of its inherent limitations, internal control over financial reporting may not prevent or detect misstatements. Also, projections of any evaluation of effectiveness to future periods are subject to the risk that controls may become inadequate because of changes in conditions, or that the degree of compliance with the policies or procedures may deteriorate. /s/PricewaterhouseCoopers LLP . PricewaterhouseCoopers LLP Cincinnati, Ohio
February 24, 2010

45
CONSOLIDATED STATEMENTS OF EARNINGS, COMPREHENSIVE INCOME and RETAINED EARNINGS
For years ended December 31, (Dollars in millions, except per share amounts) 2009 2008 2007 Sales $ 5,047 $ 6,726 $ 6,830 Cost of sales 3,994 5,600 5,638 Gross profit 1,053 1,126 1,192 Selling, general and administrative expenses 399 419 420 Research and development expenses 137 158 156 Asset impairments and restructuring charges, net 200 46 112 Other operating income, net -- (16) -- Operating earnings 317 519 504 Net interest expense 78 70 62 Other charges (income), net 13 20 (28) Earnings from continuing operations before income taxes 226 429 470 Provision for income taxes from continuing operations 90 101 149
Earnings from continuing operations 136 328 321 Loss from discontinued operations, net of tax -- -- (10) Gain (loss) from disposal of discontinued operations, net of tax -- 18 (11)
Net earnings $ 136 $ 346 $ 300 Basic earnings per share
Earnings from continuing operations $ 1.88 $ 4.36 $ 3.89 Earnings (loss) from discontinued operations -- 0.23 (0.26)
Basic earnings per share $ 1.88 $ 4.59 $ 3.63
Diluted earnings per share Earnings from continuing operations $ 1.85 $ 4.31 $ 3.84 Earnings (loss) from discontinued operations -- 0.24 (0.26)
Diluted earnings per share $ 1.85 $ 4.55 $ 3.58 Comprehensive Income Net earnings $ 136 $ 346 $ 300 Other comprehensive income (loss), net of tax
Change in cumulative translation adjustment 17 (97) 36 Change in unrecognized gains (losses) and prior service credits for benefit
plans (74) (232) 106 Change in unrealized gains on derivative instruments 7 23 3 Change in unrealized gains (losses) on investments -- (1) 1
Total other comprehensive income (loss), net of tax (50) (307) 146 Comprehensive income $ 86 $ 39 $ 446 Retained Earnings Retained earnings at beginning of period $ 2,563 $ 2,349 $ 2,186 Net earnings 136 346 300 Cash dividends declared (128) (132) (145) Effect of adoption of accounting for uncertain income tax positions -- -- 8 Retained earnings at end of period $ 2,571 $ 2,563 $ 2,349
The accompanying notes are an integral part of these consolidated financial statements.

46
CONSOLIDATED STATEMENTS OF FINANCIAL POSITION
The accompanying notes are an integral part of these consolidated financial statements.
December 31, December 31, (Dollars in millions, except per share amounts) 2009 2008 Assets Current assets
Cash and cash equivalents $ 793 $ 387 Trade receivables, net 277 275 Miscellaneous receivables 102 79 Inventories 531 637 Other current assets 32 45
Total current assets 1,735 1,423 Properties
Properties and equipment at cost 8,525 8,527 Less: Accumulated depreciation 5,415 5,329
Net properties 3,110 3,198 Goodwill 315 325 Other noncurrent assets 355 335 Total assets $ 5,515 $ 5,281 Liabilities and Stockholders' Equity Current liabilities
Payables and other current liabilities $ 800 $ 819 Borrowings due within one year -- 13
Total current liabilities 800 832 Long-term borrowings 1,604 1,442 Deferred income tax liabilities 258 106 Post-employment obligations 1,221 1,246 Other long-term liabilities 119 102
Total liabilities 4,002 3,728 Commitments and contingencies (Note 12) Stockholders' equity
Common stock ($0.01 par value – 350,000,000 shares authorized; shares issued – 94,775,064 and 94,495,860 for 2009 and 2008, respectively) 1 1
Additional paid-in capital 661 638 Retained earnings 2,571 2,563 Accumulated other comprehensive loss (385) (335)
2,848 2,867 Less: Treasury stock at cost (22,389,696 shares for 2009 and
22,031,357 shares for 2008 ) 1,335 1,314
Total stockholders' equity 1,513 1,553 Total liabilities and stockholders' equity $ 5,515 $ 5,281

47
CONSOLIDATED STATEMENTS OF CASH FLOWS For years ended December 31, (Dollars in millions) 2009 2008 2007
Cash flows from operating activities Net earnings $ 136 $ 346 $ 300
Adjustments to reconcile net earnings to net cash provided by operating activities:
Depreciation and amortization 274 267 327 Asset impairments charges 179 1 138 Gains on sale of assets -- (14) (8) Provision (benefit) for deferred income taxes 185 (71) (9)
Changes in operating assets and liabilities, net of effect of acquisitions and divestitures:
(Increase) decrease in trade receivables 2 261 (28) (Increase) decrease in inventories 100 (95) 66 Increase (decrease) in trade payables 16 (211) 48 Increase (decrease) in liabilities for employee benefits and
incentive pay
(141)
7 (55) Other items, net 7 162 (47)
Net cash provided by operating activities 758 653 732
Cash flows from investing activities Additions to properties and equipment (310) (634) (518) Proceeds from sale of assets and investments 30 337 202 Acquisitions of and investments in joint ventures (68) (38) (40) Additions to capitalized software (8) (10) (11) Other items, net (13) (31) 32
Net cash used in investing activities (369) (376) (335)
Cash flows from financing activities Net increase (decrease) in commercial paper, credit facility,
and other borrowings
3
(7) (5) Proceeds from borrowings 248 -- -- Repayment of borrowings (101) (175) (17) Dividends paid to stockholders (128) (135) (147) Treasury stock purchases (21) (501) (382) Proceeds from stock option exercises and other items 17 39 103
Net cash provided by (used in) financing activities 18 (779) (448)
Effect of exchange rate changes on cash and cash equivalents (1) 1 --
Net change in cash and cash equivalents 406 (501) (51)
Cash and cash equivalents at beginning of period 387 888 939 Cash and cash equivalents at end of period $ 793 $ 387 $ 888
The accompanying notes are an integral part of these consolidated financial statements.

NOTES TO THE AUDITED CONSOLIDATED FINANCIAL STATEMENTS
48
1. SIGNIFICANT ACCOUNTING POLICIES Financial Statement Presentation The consolidated financial statements of Eastman Chemical Company and subsidiaries ("Eastman" or the "Company") are prepared in conformity with accounting principles generally accepted in the United States and of necessity include some amounts that are based upon management estimates and judgments. Future actual results could differ from such current estimates. The consolidated financial statements include assets, liabilities, sales revenue, and expenses of all majority-owned subsidiaries and joint ventures. Eastman accounts for other joint ventures and investments in minority-owned companies where it exercises significant influence on the equity basis. Intercompany transactions and balances are eliminated in consolidation. Certain prior period data has been reclassified in the Consolidated Financial Statements and accompanying footnotes to conform to current period presentation. The Company has evaluated the period from December 31, 2009, the date of the financial statements, through February 24, 2010, the date of the issuance and filing of the financial statements and has determined that no material subsequent events have occurred that would affect the information presented in these financial statements or require additional disclosure. Cash and Cash Equivalents Cash and cash equivalents include cash, time deposits, and readily marketable securities with maturities of three months or less at the purchase date. Fair Value Measurements On January 1, 2008, the Company began recording financial assets and liabilities subject to recurring fair value measurement at the price that would be received to sell an asset or paid to transfer a liability in an orderly transaction between market participants. On January 1, 2009 the Company began recording non-recurring financial as well as all non-financial assets and liabilities subject to fair value measurement under the same principles. These fair value principles prioritize valuation inputs across three broad levels. Level 1 inputs are quoted prices (unadjusted) in active markets for identical assets or liabilities. Level 2 inputs are quoted prices for similar assets and liabilities in active markets or inputs that are observable for the asset or liability, either directly or indirectly through market corroboration, for substantially the full term of the financial instrument. Level 3 inputs are unobservable inputs based on the Company's assumptions used to measure assets and liabilities at fair value. An asset or liability's classification within the various levels is determined based on the lowest level input that is significant to the fair value measurement. Accounts Receivable and Allowance for Doubtful Accounts Trade accounts receivable are recorded at the invoiced amount and do not bear interest. The Company maintains allowances for doubtful accounts for estimated losses resulting from the inability of its customers to make required payments. The allowances are based on the number of days an individual receivable is delinquent and management's regular assessment of the financial condition of the Company's customers. The Company considers that a receivable is delinquent if it is unpaid after the terms of the related invoice have expired. The Company evaluates the allowance based on a monthly assessment of the aged receivables. Write-offs are recorded at the time a customer receivable is deemed uncollectible. Allowance for doubtful accounts was $10 million and $8 million at December 31, 2009 and 2008, respectively. Inventories Inventories are valued at the lower of cost or market. The Company determines the cost of most raw materials, work in process, and finished goods inventories in the United States by the last-in, first-out ("LIFO") method. The cost of all other inventories, including inventories outside the United States, is determined by the average cost method, which approximates the first-in, first-out ("FIFO") method. The Company writes-down its inventories for estimated obsolescence or unmarketable inventory equal to the difference between the carrying value of inventory and the estimated market value based upon assumptions about future demand and market conditions.

NOTES TO THE AUDITED CONSOLIDATED FINANCIAL STATEMENTS
49
Properties The Company records properties at cost. Maintenance and repairs are charged to earnings; replacements and betterments are capitalized. When Eastman retires or otherwise disposes of assets, it removes the cost of such assets and related accumulated depreciation from the accounts. The Company records any profit or loss on retirement or other disposition in earnings. Asset impairments are reflected as increases in accumulated depreciation for properties that have been placed in service. In instances when an asset has not been placed in service and is impaired, the associated costs are removed from the appropriate property accounts. Depreciation Depreciation expense is calculated based on historical cost and the estimated useful lives of the assets (buildings and building equipment 20 to 50 years; machinery and equipment 3 to 33 years), generally using the straight-line method. Accelerated depreciation is reported when the estimated useful life is shortened and continues to be reported in Cost of Sales. Computer Software Costs Capitalized software costs are amortized primarily on a straight-line basis over three years, the expected useful life of such assets, beginning when the software project is substantially complete and placed in service. Capitalized software in 2009, 2008, and 2007 was approximately $8 million, $10 million, and $11 million, respectively. During those same periods, approximately $11 million, $11 million, and $13 million, respectively, of previously capitalized costs were amortized. At December 31, 2009 and 2008, the unamortized capitalized software costs were $21 million and $24 million, respectively. Capitalized software costs are reflected in other noncurrent assets. Impairment of Long Lived Assets Long-lived assets and certain identifiable intangibles to be held and used by the Company are reviewed for impairment whenever events or changes in circumstances indicate that the carrying amount of an asset may not be recoverable. If the carrying amount is not considered to be recoverable, an analysis of fair value is triggered. An impairment is recorded for the excess of the carrying amount of the asset over the fair value. The Company conducts its annual testing of goodwill and indefinite-lived intangible assets in third quarter of each year, unless events warrant more frequent testing. Reporting units are identified for the purpose of assessing potential impairments of goodwill. The carrying value of indefinite-lived intangibles is considered impaired when their fair value, as established by appraisal or based on undiscounted future cash flows of certain related products, is less than their carrying value. If the fair value of a reporting unit is less than the carrying value of goodwill, additional steps, including an allocation of the estimated fair value to the assets and liabilities of the reporting unit, would be necessary to determine the amount, if any, of goodwill impairment. Investments The consolidated financial statements include the accounts of the Company and all its subsidiaries in which a controlling interest is maintained. Investments in affiliates over which the Company has significant influence but not a controlling interest are carried on the equity basis. Under the equity method of accounting, these investments are included in other noncurrent assets. The Company includes its share of earnings and losses of such investments in other charges (income), net and its share of other comprehensive income (loss) in the appropriate component of other accumulated comprehensive income (loss) in stockholders' equity.

NOTES TO THE AUDITED CONSOLIDATED FINANCIAL STATEMENTS
50
Pension and Other Post-employment Benefits The Company maintains defined benefit pension plans that provide eligible employees with retirement benefits. Additionally, Eastman provides life insurance and health care and dental benefits for eligible retirees and health care benefits for retirees' eligible survivors. The costs and obligations related to these benefits reflect the Company's assumptions related to general economic conditions (particularly interest rates), expected return on plan assets, rate of compensation increase for employees, and health care cost trends. The cost of providing plan benefits depends on demographic assumptions including retirements, mortality, turnover, and plan participation. For additional information, see Note 10, "Retirement Plans." Environmental Costs The Company accrues environmental remediation costs when it is probable that the Company has incurred a liability at a contaminated site and the amount can be reasonably estimated. When a single amount cannot be reasonably estimated but the cost can be estimated within a range, the Company accrues the minimum amount. This undiscounted accrued amount reflects the Company's assumptions about remediation requirements at the contaminated site, the nature of the remedy, the outcome of discussions with regulatory agencies and other potentially responsible parties at multi-party sites, and the number and financial viability of other potentially responsible parties. Changes in the estimates on which the accruals are based, unanticipated government enforcement action, or changes in health, safety, environmental, and chemical control regulations and testing requirements could result in higher or lower costs. The Company also establishes reserves for closure/postclosure costs associated with the environmental and other assets it maintains. Environmental assets include but are not limited to waste management units, such as landfills, water treatment facilities, and ash ponds. When these types of assets are constructed or installed, a reserve is established for the future costs anticipated to be associated with the closure of the site based on an expected life of the environmental assets and the applicable regulatory closure requirements. These expenses are charged into earnings over the estimated useful life of the assets. Currently, the Company estimates the useful life of each individual asset up to 50 years. If the Company changes its estimate of the asset retirement obligation costs or its estimate of the useful lives of these assets, the expenses to be charged into earnings could increase or decrease. The Company also monitors conditional obligations and will record reserves associated with them when and to the extent that more detailed information becomes available concerning applicable retirement costs. Accruals for environmental liabilities are included in other long-term liabilities and exclude claims for recoveries from insurance companies or other third parties. Environmental costs are capitalized if they extend the life of the related property, increase its capacity, and/or mitigate or prevent future contamination. The cost of operating and maintaining environmental control facilities is charged to expense. The Company's cash expenditures related to environmental protection and improvement were approximately $173 million, $218 million, and $209 million in 2009, 2008, and 2007, respectively. These amounts were primarily for operating costs associated with environmental protection equipment and facilities, but also included expenditures for construction and development. The Company does not expect future environmental capital expenditures arising from requirements of recently promulgated environmental laws and regulations to materially increase the Company's planned level of annual capital expenditures for environmental control facilities. For additional information see Note 12, "Environmental Matters" and Note 25, "Reserve Rollforwards". Derivative Financial Instruments Derivative financial instruments are used by the Company in the management of its exposures to fluctuations in foreign currency, raw material and energy costs, and interest rates. Such instruments are used to mitigate the risk that changes in exchange rates, interest rates or raw material and energy costs will adversely affect the eventual dollar cash flows resulting from the hedged transactions.

NOTES TO THE AUDITED CONSOLIDATED FINANCIAL STATEMENTS
51
The Company enters into currency option and forward contracts to hedge anticipated, but not yet committed, export sales and purchase transactions expected within no more than five years and denominated in foreign currencies (principally the euro, British pound and the Japanese yen); and forward exchange contracts to hedge certain firm commitments denominated in foreign currencies. To mitigate short-term fluctuations in market prices for propane, ethane, and natural gas (major raw material and energy used in the manufacturing process), the Company enters into option and forward contracts. From time to time, the Company also utilizes interest rate derivative instruments, primarily swaps, to hedge the Company's exposure to movements in interest rates. The Company's qualifying option and forward contracts are accounted for as hedges because the derivative instruments are designated and effective as hedges and reduce the Company's exposure to identified risks. Gains and losses resulting from effective hedges of existing liabilities, firm commitments, or anticipated transactions are deferred and recognized when the offsetting gains and losses are recognized on the related hedged items and are reported as a component of operating earnings. Derivative assets and liabilities are recorded at fair value. Deferred currency option premiums are included in the fair market value of the hedges. The related obligation for payment is generally included in other liabilities and is paid in the period in which the options are exercised or expire. For additional information see Note 9, "Fair Value of Financial Instruments". Litigation and Contingent Liabilities The Company and its operations from time to time are parties to or targets of lawsuits, claims, investigations, and proceedings, including product liability, personal injury, asbestos, patent and intellectual property, commercial, contract, environmental, antitrust, health and safety, and employment matters, which are handled and defended in the ordinary course of business. The Company accrues a liability for such matters when it is probable that a liability has been incurred and the amount can be reasonably estimated. When a single amount cannot be reasonably estimated but the cost can be estimated within a range, the Company accrues the minimum amount. The Company expenses legal costs, including those expected to be incurred in connection with a loss contingency, as incurred. Revenue Recognition and Customer Incentives The Company recognizes revenue when persuasive evidence of an arrangement exists, delivery has occurred or services have been rendered, the price to the customer is fixed or determinable, and collectability is reasonably assured. The Company records estimated obligations for customer programs and incentive offerings, which consist primarily of revenue or volume-based amounts that a customer must achieve over a specified period of time, as a reduction of revenue to each underlying revenue transaction as the customer progresses toward reaching goals specified in incentive agreements. These estimates are based on a combination of forecast of customer sales and actual sales volume and revenues against established goals, the customer's current level of purchases, Eastman's knowledge of customer purchasing habits, and industry pricing practice. The incentive payment rate may be variable, based upon the customer reaching higher sales volume or revenue levels over a specified period of time in order to receive an agreed upon incentive payment. Shipping and Handling Fees and Costs Shipping and handling fees related to sales transactions are billed to customers and are recorded as sales revenue. Shipping and handling costs incurred are recorded in cost of sales.

NOTES TO THE AUDITED CONSOLIDATED FINANCIAL STATEMENTS
52
Restructuring of Operations The Company records restructuring charges incurred in connection with consolidation of operations, exited business lines, or shutdowns of specific sites that are expected to be substantially completed within twelve months. These restructuring charges are recorded as incurred, and are associated with site closures, legal and environmental matters, demolition, contract terminations, or other costs directly related to the restructuring. The Company records severance charges for involuntary employee separations when the separation is probable and reasonably estimable. The Company records severance charges for voluntary employee separations ratably over the remaining service period of those employees.
Share-based Compensation The Company recognizes compensation expense in the financial statements for stock options and other share-based compensation awards based upon the grant-date fair value over the substantive vesting period. For additional information, see Note 15, "Share-Based Compensation Plans and Awards."
Compensated Absences The Company accrues compensated absences and related benefits as current charges to earnings in the period earned. Research and Development All costs identified as research and development costs are charged to expense when incurred with the exception of third-party reimbursed and government-funded research and development. Expenses for third-party reimbursed and government-funded research and development are deferred until reimbursement is received to ensure appropriate matching of revenue and expense, provided specific criteria are met. Income Taxes The provision for income taxes has been determined using the asset and liability approach of accounting for income taxes. Under this approach, deferred taxes represent the future tax consequences expected to occur when the reported amounts of assets and liabilities are recovered or paid. The provision for income taxes represents income taxes paid or payable for the current year plus the change in deferred taxes during the year. Deferred taxes result from differences between the financial and tax bases of the Company's assets and liabilities and are adjusted for changes in tax rates and tax laws when changes are enacted. Valuation allowances are recorded to reduce deferred tax assets when it is more likely than not that a tax benefit will not be realized. Provision has been made for income taxes on unremitted earnings of subsidiaries and affiliates, except for subsidiaries in which earnings are deemed to be permanently reinvested. The Company recognizes income tax positions that meet the more likely than not threshold and accrues interest related to unrecognized income tax positions which is recorded as a component of the income tax provision. 2. ASSET IMPAIRMENTS AND RESTRUCTURING CHARGES, NET Asset impairment and restructuring charges totaled $200 million during 2009, consisting primarily of $179 million in asset impairments related to the discontinuance of the Beaumont, Texas industrial gasification project and $23 million, net, for severance resulting from a reduction in force. Restructuring charges totaled $46 million during 2008. Impairments and restructuring charges totaled $112 million during 2007.

NOTES TO THE AUDITED CONSOLIDATED FINANCIAL STATEMENTS
53
The following table summarizes the 2009, 2008, and 2007 charges by segment:
(Dollars in millions) 2009 2008 2007 CASPI:
Severance charges $ 5 $ -- $ (1) Site closure and restructuring costs (2) -- --
Fibers:
Severance charges 4 -- -- PCI:
Severance charges 6 8 (1) Site closure and restructuring costs -- 14 --
Performance Polymers:
Fixed asset impairments -- -- 118 Severance charges 4 2 (5) Site closure and restructuring costs -- 22 --
Specialty Plastics:
Fixed asset impairments -- -- 2 Severance charges 4 -- (2) Site closure and restructuring costs -- -- 1
Other:
Fixed asset impairments 133 -- -- Intangible asset and goodwill impairments 46 -- 2 Site closure and restructuring costs -- -- (2)
Total Eastman Chemical Company
Fixed asset impairments $ 133 $ -- $ 120 Intangible asset and goodwill impairments 46 -- 2 Severance charges 23 10 (9) Site closure and restructuring costs (2) 36 (1)
Total Eastman Chemical Company $ 200 $ 46 $ 112 2009 The Company announced during fourth quarter 2009, its decision to discontinue the Beaumont, Texas industrial gasification project due to a number of factors, including high capital costs, the current and projected reduced spread between natural gas and oil and petroleum coke prices, and continued uncertainty regarding U.S. energy and environmental public policy. As a result of this decision the Company recorded an asset impairment of $179 million in fourth quarter 2009, reducing the project's book value to $56 million for assets the Company expects to recover. For the purpose of calculating an impairment, the fair value of these assets was determined using Level 2 and Level 3 inputs as defined in the fair value hierarchy. Of the $56 million, $8 million related to certain environmental credits classified as a Level 2, using observable prices for similar assets, and $48 million related to land and tangible assets is classified as a Level 3, based on various inputs, including real estate appraisals and unobservable market information for similar assets based on management's experience, including the evaluation of assumptions that market participants would use in pricing similar assets. For additional information on fair value measurement, see Note 1, "Significant Accounting Policies". In first quarter 2009, the Company announced a reduction in force of approximately 300 employees, resulting in restructuring charges of $23 million, net for related severance.
NOTES TO THE AUDITED CONSOLIDATED FINANCIAL STATEMENTS
54
2008 During 2008, the Company recorded $46 million in restructuring charges. These charges consist of approximately $24 million in the Performance Polymers segment for restructuring at the South Carolina facility and $22 million in asset impairments and restructuring charges primarily for severance and pension charges in the Performance Chemicals and Intermediates ("PCI") segment resulting from the decision to close a previously impaired site in the United Kingdom. 2007 In fourth quarter 2007 asset impairments and restructuring gains totaled $4 million related primarily to the adjustments to previously recorded charges for Cendian Corporation, the Company's logistics subsidiary, and the polyethylene terephthalate ("PET") manufacturing facilities in Latin America which were sold in third quarter 2007. In third quarter 2007 asset impairments and restructuring charges totaled $114 million were primarily the impairment of assets of Eastman's PET manufacturing facilities in Cosoleacaque, Mexico, and Zarate, Argentina which were classified as held for sale as of September 30, 2007. The Company wrote down the value of the assets of these facilities in third quarter 2007 to the expected sales proceeds less cost to sell. These charges were in the Performance Polymers segment. Also in third quarter 2007, the Company adjusted the severance accrual recorded in fourth quarter 2006 which resulted in a reversal of approximately $5 million, which was reflected in all segments. In first and second quarter 2007, the Company recorded $2 million in charges related primarily to the site closure and asset removal related to the shutdown of the Company's Spanish cyclohexane dimethanol ("CHDM") manufacturing facility, located adjacent to the PET manufacturing facility. These charges were offset by the reversal of fourth quarter 2006 severance accrual at the same site, as the employees included in the CHDM severance accrual were employed by the purchaser of the San Roque, Spain PET manufacturing facility, relieving the Company of the severance obligation. These charges were reflected in the Performance Polymers and Specialty Plastics segments.

NOTES TO THE AUDITED CONSOLIDATED FINANCIAL STATEMENTS
55
The following table summarizes the charges and changes in estimates described above, other asset impairments and restructuring charges, the non-cash reductions attributable to asset impairments, and the cash reductions in shutdown reserves for severance costs and site closure costs paid:
(Dollars in millions)
Balance at January 1,
2007 Provision/
Adjustments Non-cash
Reductions Cash
Reductions
Balance at December 31,
2007 Noncash charges $ -- $ 122 $ (122) $ -- $ -- Severance costs 34 (9) -- (18) 7 Site closure and restructuring costs
14
(1)
--
(2)
11
Total $ 48 $ 112 $ (122) $ (20) $ 18
Balance at January 1,
2008 Provision/
Adjustments Non-cash
Reductions Cash
Reductions
Balance at December 31,
2008 Noncash charges $ -- $ 2 $ (2) $ -- $ -- Severance costs 7 10 -- (12) 5 Site closure and restructuring costs
11
34
--
(20)
25
Total $ 18 $ 46 $ (2) $ (32) $ 30
Balance at January 1,
2009 Provision/
Adjustments Non-cash
Reductions Cash
Reductions
Balance at December 31,
2009 Noncash charges $ -- $ 179 $ (179) $ -- $ -- Severance costs 5 23 -- (23) 5 Site closure and restructuring costs
25
(2)
--
(18)
5
Total $ 30 $ 200 $ (179) $ (41) $ 10 A majority of costs remaining for severance is expected to be applied to the reserves within one year. During 2009, the Company accrued for approximately 300 employee separations. As of the end of 2009, approximately 120 separations for the 2009 accrual were completed and all of the 2008 and 2007 separations were completed. During 2008 and 2007, the Company accrued for approximately 40 and 25 employee separations, respectively.

NOTES TO THE AUDITED CONSOLIDATED FINANCIAL STATEMENTS
56
3. INVENTORIES December 31, (Dollars in millions) 2009 2008 At FIFO or average cost (approximates current cost)
Finished goods $ 547 $ 634 Work in process 168 200 Raw materials and supplies 262 328
Total inventories 977 1,162 LIFO Reserve (446) (525)
Total inventories $ 531 $ 637 Inventories valued on the LIFO method were approximately 75 percent of total inventories for 2009 and 2008, respectively. 4. PROPERTIES AND ACCUMULATED DEPRECIATION December 31, (Dollars in millions) 2009 2008 Properties
Land $ 78 $ 79 Buildings and building equipment 849 803 Machinery and equipment 7,456 7,190 Construction in progress 142 455
Properties and equipment at cost $ 8,525 $ 8,527 Less: Accumulated depreciation 5,415 5,329 Net properties $ 3,110 $ 3,198 Cumulative construction-period interest of $208 million and $204 million, reduced by accumulated depreciation of $127 million and $130 million, is included in net properties at December 31, 2009 and 2008, respectively. During fourth quarter 2009, the Company recognized asset impairments of $133 million related to the Beaumont, Texas industrial gasification project. For additional information see Note 2, "Asset Impairments and Restructuring Charges, Net". Interest capitalized during 2009, 2008, and 2007 was $14 million, $12 million, and $10 million, respectively. Depreciation expense related to continuing operations was $262 million, $256 million, and $313 million for 2009, 2008, and 2007, respectively. Depreciation expense for the year ended December 31, 2008 included $9 million of accelerated depreciation costs related to restructuring decisions in association with cracking units in Longview, Texas, and higher cost PET polymer intermediates assets in Columbia, South Carolina. The accelerated depreciation at Longview, Texas and the transformation at Columbia, South Carolina were completed in 2008. The Company shut down the first of three cracking units as part of the stage phase-out of its three oldest cracking units in Longview, Texas in fourth quarter 2007. Shutdown timing for the remaining two units will depend on feedstock and olefin market conditions.

NOTES TO THE AUDITED CONSOLIDATED FINANCIAL STATEMENTS
57
5. GOODWILL AND OTHER INTANGIBLE ASSETS
Changes in the carrying amount of goodwill follow: (Dollars in millions)
CASPI Segment
Other Segments Total
Reported balance at December 31, 2007 $ 310 $ 6 $ 316 Additions -- 10 10 Currency translation adjustments (1) -- (1) Reported balance at December 31, 2008 $ 309 $ 16 $ 325 Impairment -- (10) (10) Reported balance at December 31, 2009 $ 309 $ 6 $ 315 Goodwill and indefinite-lived intangibles primarily consist of goodwill in the Coatings, Adhesives, Specialty Polymers and Inks ("CASPI") segment. The Company also had recorded goodwill and other intangibles associated with the Beaumont, Texas industrial gasification project. In fourth quarter 2009, the Company announced the discontinuance of the Beaumont, Texas industrial gasification project, which resulted in an impairment of the Beaumont industrial gasification project goodwill and other intangible assets. Included in the reported balance for goodwill are accumulated impairment losses of $44 million at December 31, 2009 and $34 million at December 31, 2008 and 2007. Intangible assets include developed technology, customer lists, patents and patent licenses, and trademarks with a net book value of $43 million in 2009 and $79 million in 2008. Other intangible assets are included in other noncurrent assets on the balance sheet. 6. EQUITY INVESTMENTS Eastman has a 50 percent interest in and serves as the operating partner in Primester, a joint venture which manufactures cellulose acetate at Eastman's Kingsport, Tennessee plant. This investment is accounted for under the equity method. Eastman's net investment in the joint venture at December 31, 2009 and 2008 was approximately $36 million and $39 million, respectively, which was comprised of the recognized portion of the venture's accumulated deficits, long-term amounts owed to Primester, and a line of credit from Eastman to Primester. Such amounts are included in other noncurrent assets. Eastman owns a 50 percent interest in Nanjing Yangzi Eastman Chemical Ltd. ("Nanjing"), a company which manufactures EastotacTM
hydrocarbon tackifying resins for the adhesives market. This joint venture is accounted for under the equity method and is included in other noncurrent assets. At December 31, 2009 and 2008, the Company's investment in Nanjing was approximately $6 million and $5 million, respectively.

NOTES TO THE AUDITED CONSOLIDATED FINANCIAL STATEMENTS
58
7. PAYABLES AND OTHER CURRENT LIABILITIES December 31, (Dollars in millions) 2009 2008 Trade creditors $ 427 $ 390 Accrued payrolls, vacation, and variable-incentive compensation 125 129 Accrued taxes 33 41 Post-employment obligations 61 60 Interest payable 32 30 Bank overdrafts 6 4 Other 116 165 Total payables and other current liabilities $ 800 $ 819 The current portion of post-employment obligations is an estimate of current year payments in excess of plan assets.
8. BORROWINGS December 31, (Dollars in millions) 2009 2008 Borrowings consisted of:
7% notes due 2012 $ 152 $ 154 6.30% notes due 2018 205 207 5.5% notes due 2019 250 -- 7 1/4% debentures due 2024 497 497 7 5/8% debentures due 2024 200 200 7.60% debentures due 2027 298 298 Credit facility borrowings -- 84 Other 2 15
Total borrowings 1,604 1,455 Borrowings due within one year -- (13) Long-term borrowings $ 1,604 $ 1,442
At December 31, 2009, the Company had a $700 million revolving credit facility (the "Credit Facility") in two tranches, with $125 million expiring in 2012 and $575 million expiring in 2013. Borrowings under the Credit Facility are subject to interest at varying spreads above quoted market rates and a facility fee is paid on the total commitment. In addition, the Credit Facility contains a number of customary covenants and events of default, including the maintenance of certain financial ratios. The Company was in compliance with all such covenants for all periods presented. At December 31, 2009, the Company had no outstanding borrowings under the Credit Facility. At December 31, 2008, the Company had both the Credit Facility and a 60 million euro credit facility, with borrowings totaling $84 million at an effective interest rate of 3.74 percent. On November 2, 2009, the Company issued notes in the principal amount of $250 million due 2019 and bearing interest at 5.50% per annum. Proceeds from the sale of notes, net of approximately $2 million in transaction fees, were $248 million. At December 31, 2009 the Company had no outstanding interest rate swaps. In December 2008, outstanding interest rate swaps were settled with an unrecognized gain of $36 million which will be amortized into interest expense over the remaining term of the respective bonds resulting in effective interest rates of 5.22 percent for the 7% notes due in 2012 and 4.14 percent for the 6.30% notes due in 2018.

NOTES TO THE AUDITED CONSOLIDATED FINANCIAL STATEMENTS
59
9. FAIR VALUE OF FINANCIAL INSTRUMENTS Fair Value of Borrowings
The fair value for fixed-rate borrowings is based on current interest rates for comparable securities. The Company's floating-rate borrowings approximate fair value.
December 31, 2009 December 31, 2008
(Dollars in millions) Recorded
Amount Fair
Value Recorded
Amount Fair
Value Long-term borrowings $ 1,604 $ 1,656 $ 1,442 $ 1,369
Fair Value Measurements For additional information on fair value measurement, see Note 1, "Significant Accounting Policies". The following chart shows the financial assets and liabilities valued on a recurring basis. (Dollars in millions) Fair Value Measurements at December 31, 2009
Description December 31,
2009
Quoted Prices in Active Markets for Identical
Assets (Level 1)
Significant Other Observable Inputs
(Level 2)
Significant Unobservable
Inputs (Level 3) Derivative Assets $ 52 $ -- $ 52 $ -- Derivative Liabilities (21) -- (21) -- $ 31 $ -- $ 31 $ -- (Dollars in millions) Fair Value Measurements at December 31, 2008
Description December 31,
2008
Quoted Prices in Active Markets for Identical
Assets (Level 1)
Significant Other Observable Inputs
(Level 2)
Significant Unobservable
Inputs (Level 3) Derivative Assets $ 16 $ -- $ 16 $ -- Derivative Liabilities (14) -- (14) -- $ 2 $ -- $ 2 $ -- Hedging Programs The Company is exposed to market risk, such as changes in currency exchange rates, raw material and energy costs, and interest rates. The Company uses various derivative financial instruments pursuant to the Company's hedging policies to mitigate these market risk factors and their effect on the cash flows of the underlying transactions. Designation is performed on a specific exposure basis to support hedge accounting. The changes in fair value of these hedging instruments are offset in part or in whole by corresponding changes in the cash flows of the underlying exposures being hedged. The Company does not hold or issue derivative financial instruments for trading purposes. Fair Value Hedges Fair value hedges are defined by accounting principles generally accepted in the U.S. ("GAAP") as derivative or non-derivative instruments designated as and used to hedge the exposure to changes in the fair value of an asset or a liability or an identified portion thereof that is attributable to a particular risk. For derivative instruments that are designated and qualify as a fair value hedge, the gain or loss on the derivative as well as the offsetting loss or gain on the hedged item attributable to the hedged risk are recognized in current earnings. As of December 31, 2009, the Company had no active fair value hedges.

NOTES TO THE AUDITED CONSOLIDATED FINANCIAL STATEMENTS
60
Cash Flow Hedges Cash flow hedges are defined by GAAP as derivative instruments designated as and used to hedge the exposure to variability in expected future cash flows that is attributable to a particular risk. For derivative instruments that are designated and qualify as a cash flow hedge, the effective portion of the gain or loss on the derivative is reported as a component of other comprehensive income, net of income taxes and reclassified into earnings in the same period or periods during which the hedged transaction affects earnings. Gains and losses on the derivatives representing either hedge ineffectiveness or hedge components excluded from the assessment of effectiveness are recognized in current earnings. As of December 31, 2009, the total amount of the Company's foreign exchange forward and option contracts was a $25 million asset. As of December 31, 2009, the total amount of the Company's feedstock/energy forward and option contracts was a $6 million net asset.
Fair Value of Derivatives Designated as Cash Flow Hedging Instruments
(Dollars in millions) December 31, 2009 Asset Derivatives Balance Sheet Location Fair Value Commodity contract Other current assets $ 7 Foreign exchange contracts Other current assets 14 Foreign exchange contracts Other noncurrent assets 11 $ 32 (Dollars in millions) December 31, 2009 Liability Derivatives Balance Sheet Location Fair Value Commodity contract Payables and other current liabilities $ 1 $ 1
Derivatives' Cash Flow Hedging Relationships
(Dollars in millions) Twelve Months 2009
Derivatives Cash Flow Hedging Relationships
Amount after tax of gain/ (loss) recognized
in Other Comprehensive
Income on derivatives (effective portion) December 31, 2009
Location of gain/(loss)
reclassified from Accumulated Other
Comprehensive Income into income (effective portion)
Pre-tax amount of gain/(loss) reclassified
from Accumulated Other Comprehensive
Income into income (effective portion) December 31, 2009
Commodity contract $ 9 Cost of sales $ (6) Foreign exchange contracts (2) Sales 23 $ 7 $ 17
For twelve months ended December 31, 2009, there was no material ineffectiveness with regard to the Company's cash flow hedges. Nondesignated / Nonqualifying Derivative Instruments The gains or losses on nonqualifying derivatives or derivatives that are not designated as hedges are marked to market in the line item "Other charges (income), net" of the Statements of Earnings. The Company recognized approximately $1 million net loss on nonqualifying derivatives during 2009.

NOTES TO THE AUDITED CONSOLIDATED FINANCIAL STATEMENTS
61
Currency Rate Hedging
The Company manufactures and sells its products in a number of countries throughout the world and, as a result, is exposed to movements in foreign currency exchange rates. To manage the volatility relating to these exposures, the Company nets the exposures on a consolidated basis to take advantage of natural offsets. To manage the remaining exposure, the Company enters into currency options and forwards to hedge probable anticipated, but not yet committed, export sales and purchase transactions expected within no more than five years and denominated in foreign currencies (principally the euro, British pound, and the Japanese yen) and forward exchange contracts to hedge certain firm commitments denominated in foreign currencies. These contracts are designated as cash flow hedges. The mark-to-market gains or losses on qualifying hedges are included in accumulated other comprehensive income (loss) to the extent effective, and reclassified into sales in the period during which the hedged transaction affects earnings. Raw Material and Energy Hedging Raw material and energy sources used by the Company are subject to price volatility caused by weather, supply conditions, economic variables and other unpredictable factors. To mitigate short-term fluctuations in market prices for propane, ethane, and natural gas, the Company enters into option and forward contracts. These contracts are designated as cash flow hedges. The mark-to-market gains or losses on qualifying hedges are included in accumulated other comprehensive income (loss) to the extent effective, and reclassified into cost of sales in the period during which the hedged transaction affects earnings. Interest Rate Hedging
The Company's policy is to manage interest expense using a mix of fixed and variable rate debt. To manage this mix effectively, the Company enters into interest rate swaps in which the Company agrees to exchange the difference between fixed and variable interest amounts calculated by reference to an agreed upon notional principal amount. These swaps are designated as hedges of the fair value of the underlying debt obligations and the interest rate differential is reflected as an adjustment to interest expense over the life of the swaps. As these instruments are 100 percent effective, there is no impact on earnings due to hedge ineffectiveness. From time to time, the Company also utilizes interest rate derivative instruments, primarily forwards, to hedge the Company's exposure to movements in interest rates prior to anticipated debt offerings. These instruments are designated as cash flow hedges and are typically 100 percent effective. As a result, there is no current impact on earnings due to hedge ineffectiveness. The mark-to-market gains or losses on these hedges are included in accumulated other comprehensive income (loss) to the extent effective, and are reclassified into interest expense over the term of the related debt instruments. Hedging Summary At December 31, 2009 and 2008, monetized positions and mark-to-market gains from raw materials and energy, currency, and certain interest rate hedges that were included in accumulated other comprehensive income totaled approximately $27 million and $20 million, respectively. If realized, approximately $20 million in gains will be reclassified into earnings during the next 12 months. The mark-to-market gains or losses on non-qualifying, excluded and ineffective portions of hedges are immediately recognized in cost of sales or other charges (income), net. There were no material gains or losses recognized in 2009 or 2008.

NOTES TO THE AUDITED CONSOLIDATED FINANCIAL STATEMENTS
62
10. RETIREMENT PLANS Eastman maintains defined benefit pension plans that provide eligible employees with retirement benefits. Prior to 2000, benefits were calculated using a defined benefit formula based on age, years of service, and the employee's final average compensation as defined in the plans. Effective January 1, 2000, the Company's U.S. defined benefit pension plan, the Eastman Retirement Assistance Plan, was amended. Employees' accrued pension benefits earned prior to January 1, 2000 are calculated based on previous plan provisions using the employee's age, years of service, and final average compensation as defined in the plans. The amended defined benefit pension plan uses a pension equity formula based on age, years of service, and final average compensation to calculate an employee's retirement benefits from January 1, 2000 forward. Benefits payable will be the combined pre-2000 and post-1999 benefits. Employees hired on or after January 1, 2007 are not eligible to participate in the U.S. defined benefit pension plans. Benefits are paid to employees from trust funds. Contributions to the plan are made as permitted by laws and regulations. The pension trust fund does not directly own any of the Company's common stock. Pension coverage for employees of Eastman's non-U.S. operations is provided, to the extent deemed appropriate, through separate plans. The Company systematically provides for obligations under such plans by depositing funds with trustees, under insurance policies, or by book reserves. Below is a summary balance sheet of the change in plan assets during 2009 and 2008, the funded status of the plans, amounts recognized in the Consolidated Statements of Financial Position, and a summary of amounts recognized in accumulated other comprehensive income.

NOTES TO THE AUDITED CONSOLIDATED FINANCIAL STATEMENTS
63
The assumptions used to develop the projected benefit obligation for the Company's significant U.S. and non-U.S. defined benefit pension plans are also provided in the following tables. Summary Balance Sheet (Dollars in millions) 2009 2008 Change in projected benefit obligation: Benefit obligation, beginning of year $ 1,423 $ 1,470 Service cost 42 46 Interest cost 87 88 Actuarial loss 72 -- Plan amendments and other -- (22) Effect of currency exchange 17 (53) Benefits paid (133) (106) Benefit obligation, end of year $ 1,508 $ 1,423 Change in plan assets:
Fair value of plan assets, beginning of year $ 930 $ 1,346 Actual return on plan assets 76 (290) Effect of currency exchange 14 (41) Company contributions 200 21 Benefits paid (133) (106) Fair value of plan assets, end of year $ 1,087 $ 930 Funded Status at end of year $ (421) $ (493) Amounts recognized in the Consolidated Statements of Financial Position consist of:
Current liability $ (4) $ (3) Noncurrent liability (417) (490) Net amount recognized, end of year $ (421) $ (493) Amounts recognized in accumulated other comprehensive income consist of: Net actuarial loss $ 779 $ 712 Prior service credit
(54) (70)
Accumulated other comprehensive loss $ 725 $ 642 The accumulated benefit obligation basis at the end of 2009 and 2008 was $1,415 million and $1,345 million, respectively.

NOTES TO THE AUDITED CONSOLIDATED FINANCIAL STATEMENTS
64
A summary of the components of net periodic benefit cost recognized for Eastman's significant U.S. and non-U.S. defined benefit pension plans follows: Summary of Benefit Costs and Other Amounts Recognized in Other Comprehensive Income (Dollars in millions) 2009 2008 2007 Components of net periodic benefit cost: Service cost $ 42 $ 46 $ 48 Interest cost 87 88 90 Expected return on assets (100) (105) (105) Curtailment charge -- 9 4 Amortization of: Prior service credit (16) (16) (9) Actuarial loss 32 27 35 Net periodic benefit cost $ 45 $ 49 $ 63 Other changes in plan assets and benefit obligations recognized in other comprehensive income:
Curtailment effect $ -- $ 15 $ 10 Current year actuarial (loss) gain (96) (395) 68 Current year prior service credit -- 16 49 Amortization of:
Prior service credit (16) (16) (9) Actuarial loss 32 27 35
Effect of currency exchange (3) 13 (3) Total $ (83) $ (340) $ 150 2009 2008 2007 Weighted-average assumptions used to determine benefit
obligations for years ended December 31:
Discount rate 5.73% 6.05% 6.03% Expected return on assets 8.44% 8.47% 8.54% Rate of compensation increase 3.53% 3.57% 3.83%
Weighted-average assumptions used to determine net
periodic pension cost for years ended December 31:
Discount rate 6.05% 6.03% 5.66% Expected return on assets 8.47% 8.54% 8.57% Rate of compensation increase 3.57% 3.83% 3.78%
The fair value of plan assets for domestic plans at December 31, 2009 and 2008 was $854 million and $739 million, respectively, while the fair value of plan assets at December 31, 2009 and 2008 for non-U.S. plans was $233 million and $191 million, respectively. At December 31, 2009 and 2008, the expected long-term rate of return on the U.S. plan assets was 9 percent, while the expected weighted-average long-term rate of return on non-U.S. plan assets was 6.41 percent and 6.40 percent at December 31, 2009 and 2008, respectively.

NOTES TO THE AUDITED CONSOLIDATED FINANCIAL STATEMENTS
65
The following chart reflects the fair value of the defined pension plans assets as of December 31, 2009: (Dollars in millions) Fair Value Measurements at December 31, 2009
Description December 31,
2009
Quoted Prices in Active Markets
for Identical Assets (Level 1)
Significant Other
Observable Inputs (Level 2)
Significant
Unobservable Inputs (Level 3)
Cash $ 18 $ 18 $ -- $ -- Fixed Income 186 -- 186 -- Public Equity Funds 569 -- 569 -- Private Equity, Real Estate
Funds, and Other Alternative Investments 314 -- 10 304
Total $ 1,087 $ 18 $ 765 $ 304 The Company valued assets with unobservable inputs (Level 3), alternative investments, in private equity and real estate and other funds under the practical expedient method. The practical expedient method allows reporting entities to use the most recently reported net asset value ("NAV") of qualifying investment companies provided it is not probable that the investment will be sold by the reporting entity at an amount different from the most recently reported NAV. (Dollars in millions) Fair Value Measurements Using Significant Unobservable Inputs (Level 3)
Private Equity
Real Estate
Other Alternative
Investments
(1) Total Beginning balance at December 31, 2008 $ 106 $ 113 $ 101 $ 320 Return (loss) on plan assets (9) (30) (3) (42) Purchases, sales, and settlements, net 10 9 7 26 Ending balance at December 31, 2009 $ 107 $ 92 $ 105 $ 304
(1)
Primarily consists of natural resource and energy related limited partnership investments.
The target allocation for the Company's U.S. pension plan for 2010 and the asset allocation at December 31, 2009 and 2008, by asset category, is as follows:
Target
Allocation
Plan Assets at December 31,
2009
Plan Assets at December 31,
2008 Asset category Equity securities 59% 58% 50% Debt securities 12% 7% 6% Real estate 9% 11% 16% Other investments 20% (1) 24% 28%
Total 100% 100% 100% (1)
Primarily consists of private equity and natural resource and energy related limited partnership investments.

NOTES TO THE AUDITED CONSOLIDATED FINANCIAL STATEMENTS
66
The asset allocation for the Company's non-U.S. pension plans at December 31, 2009 and 2008, and the target allocation for 2010, by asset category, is as follows:
Target
Allocation
Plan Assets at December 31,
2009
Plan Assets at December 31,
2008 Asset category Equity securities 33 % 33 % 31 % Debt securities 50 % 53 % 54 % Other investments 17 % (1) 14 % 15 %
Total 100 % 100 % 100 % (1)
Primarily consists of an annuity contract and alternative investments.
The Company's investment strategy for its defined benefit pension plans is to maximize long-term rate of return on plan assets within an acceptable level of risk in order to minimize the cost of providing pension benefits. A periodic asset/liability study is conducted in order to assist in the modification of the Company's long-term investment policy for the plan. The investment policy establishes a target allocation range for each asset class and the fund is managed within those ranges. The plans use a number of investment approaches including equity, real estate, and fixed income funds in which the underlying securities are marketable in order to achieve this target allocation. The U.S. plan also invests in private equity and other funds. This investment process provides for a well diversified portfolio which results in a portfolio of investments with no significant concentration of risk. This diversification is created through investment across various asset classes, geographies, fund managers and individual securities. The investment process is monitored by an investment committee comprised of various senior executives from within Eastman. The expected rate of return for the portfolio was determined by modeling the expected long-term rates of return for the categories of investments held by the plan and the targeted allocation percentage against a number of various potential economic scenarios.
The Company funded its U.S. defined benefit pension plan by $181 million in 2009 and $100 million in 2007. Benefits expected to be paid from pension plans are as follows: (Dollars in millions) 2010 2011 2012 2013 2014 2015-2019 U.S. plans $111 $117 $117 $122 $124 $635 Non U.S. plans $6 $7 $7 $8 $8 $51 The estimated net actuarial loss and prior service credit for the pension plans that will be amortized from accumulated other comprehensive income into net periodic cost in 2010 are $42 million and $16 million, respectively.
DEFINED CONTRIBUTION PLANS
The Company sponsors a defined contribution employee stock ownership plan (the "ESOP"), a qualified plan under Section 401(a) of the Internal Revenue Code, which is a component of the Eastman Investment Plan and Employee Stock Ownership Plan ("EIP/ESOP"). Eastman anticipates that it will make annual contributions for substantially all U.S. employees equal to 5 percent of eligible compensation to the ESOP, or for employees who have five or more prior ESOP contributions, to other investment options within the EIP including the Eastman Stock Fund. Employees may diversify to other investment funds within the EIP from the ESOP at any time without restrictions. Allocated shares in the ESOP totaled 1,508,712; 1,465,656; and 1,540,303 shares as of December 31, 2009, 2008, and 2007, respectively. Dividends on shares held by the EIP/ESOP are charged to retained earnings. All shares held by the EIP/ESOP are treated as outstanding in computing earnings per share.
NOTES TO THE AUDITED CONSOLIDATED FINANCIAL STATEMENTS
67
In July 2006, the Company amended its EIP/ESOP to provide a company match of 50 percent of the first 7 percent of an employee's compensation contributed to the plan for employees who are hired on or after January 1, 2007. Employees who are hired on or after January 1, 2007, will also be eligible for the 5 percent contribution to the ESOP as described above. Charges for domestic contributions to the EIP/ESOP were $34 million, $37 million, and $34 million for 2009, 2008, and 2007, respectively.
POSTRETIREMENT WELFARE PLANS
Eastman provides a subsidy toward life insurance and health care and dental benefits for eligible retirees hired prior to January 1, 2007, and a subsidy toward health care benefits for retirees' eligible survivors. In general, Eastman provides those benefits to retirees eligible under the Company's U.S. plans. Similar benefits are also made available to retirees of Holston Defense Corporation ("HDC"), a wholly-owned subsidiary of the Company that, prior to January 1, 1999, operated a government-owned ammunition plant. For additional information on HDC, see Note 19, "Other Charges (Income), Net". Eligible employees hired on or after January 1, 2007 have access to postretirement health care benefits, but Eastman does not provide a subsidy toward the premium cost of postretirement benefits for those employees. A few of the Company's non-U.S. operations have supplemental health benefit plans for certain retirees, the cost of which is not significant to the Company.

NOTES TO THE AUDITED CONSOLIDATED FINANCIAL STATEMENTS
68
Below is a summary balance sheet of the change in plan assets during 2009 and 2008, the funded status of the plans, amounts recognized in the Consolidated Statements of Financial Position, and a summary of amounts recognized in accumulated other comprehensive income. Summary Balance Sheet (Dollars in millions) 2009 2008 Change in benefit obligation:
Benefit obligation, beginning of year $ 746 $ 716
Service cost 8 7 Interest cost 45 43 Plan participants' contributions 12 18 Actuarial loss 24 26 Benefits paid (58) (64)
Benefit obligation, end of year $ 777 $ 746 Change in plan assets: Fair value of plan assets, beginning of year $ 55 $ 56
Actual return on plan assets 13 (19) Company contributions 40 39 Reserve for third party contributions (11) 25 Plan participants' contributions 12 18 Benefits paid (58) (64)
Fair value of plan assets, end of year $ 51 $ 55 Funded status $ (726) $ (691) Amounts recognized in the Consolidated Statements of Financial Position consist of:
Current liabilities $ (40) $ (40) Non-current liabilities (686) (651) Net amount recognized, end of year $ (726) $ (691) Amounts recognized in accumulated other comprehensive income consist of:
Actuarial loss $ 203 $ 191 Prior service credit (148) (172) Accumulated other comprehensive loss $ 55 $ 19

NOTES TO THE AUDITED CONSOLIDATED FINANCIAL STATEMENTS
69
A summary of the components of net periodic benefit cost recognized for Eastman's postretirement benefit cost follows: Summary of Benefit Costs (Dollars in millions) 2009 2008 2007 Components of net periodic benefit cost: Service cost $ 8 $ 6 $ 7 Interest cost 45 43 43 Expected return on assets (3) (4) (3) Amortization of:
Prior service credit (23) (23) (23) Actuarial loss 13 10 12
Net periodic benefit cost $ 40 $ 32 $ 36 Weighted-average assumptions used to determine end of year benefit obligations: 2009 2008
2007
Discount rate 5.76% 6.08% 6.19% Rate of compensation increase 3.50% 3.50% 3.75% Health care cost trend
Initial 8.00% 8.00% 9.00% Decreasing to ultimate trend of 5.00% 5.00% 5.00%
in year 2016 2015 2012 Weighted-average assumptions used to determine end of year net benefit cost: 2009 2008 2007 Discount rate 6.08% 6.19% 5.86% Rate of compensation increase 3.50% 3.75% 3.75% Health care cost trend
Initial 8.00% 9.00% 9.00% Decreasing to ultimate trend of 5.00% 5.00% 5.00%
in year 2015 2012 2011 Benefits, net of participant contributions, expected to be paid for post-employment obligations are as follows: (Dollars in millions) 2010 2011 2012 2013 2014 2015-2019
U.S. plans $44 $45 $46 $47 $49 $271
An 8 percent rate of increase in per capita cost of covered health care benefits is assumed for 2010. The rate is assumed to decrease gradually to 5 percent for 2016 and remain at that level thereafter. A 1 percent increase or decrease in health care cost trend would have had no material impact on the 2009 service and interest costs or the 2009 benefit obligation, because the Company's contributions for benefits are fixed. The estimated net actuarial loss and prior service credit for the postretirement benefit plans that will be amortized from accumulated other comprehensive income into net periodic cost in 2010 are $12 million and $23 million, respectively.

NOTES TO THE AUDITED CONSOLIDATED FINANCIAL STATEMENTS
70
11. COMMITMENTS
Purchase Obligations and Lease Commitments
At December 31, 2009, the Company had various purchase obligations totaling approximately $1.1 billion over a period of approximately 15 years for materials, supplies, and energy incident to the ordinary conduct of business. The Company also had various lease commitments for property and equipment under cancelable, noncancelable, and month-to-month operating leases totaling $104 million over a period of several years. Of the total lease commitments, approximately 15 percent relate to machinery and equipment, including computer and communications equipment and production equipment; approximately 45 percent relate to real property, including office space, storage facilities and land; and approximately 40 percent relate to railcars. Rental expense, net of sublease income, was approximately $35 million, $44 million, and $56 million in 2009, 2008, and 2007, respectively. The obligations described above are summarized in the following table: (Dollars in millions) Payments Due For
Period Notes and
Debentures
Credit Facility
Borrowings and Other
Interest Payable
Purchase Obligations
Operating Leases Total
2010 $ -- $ -- $ 111 $ 257 $ 25 $ 393 2011 2 -- 111 248 25 386 2012 152 -- 106 242 17 517 2013 -- -- 99 227 12 338 2014 -- -- 99 33 10 142 2015 and
beyond
1,450
--
889
85 15
2,439 Total $ 1,604 $ -- $ 1,415 $ 1,092 $ 104 $ 4,215
Accounts Receivable Securitization Program
In 1999, the Company entered into an agreement that allows the Company to sell certain trade receivables on a non-recourse basis to a consolidated special purpose entity which in turn may sell interests in those receivables to a third party purchaser which generally funds its purchases via the issuance of commercial paper backed by the receivables interests. The annually renewable agreement permits the sale of undivided interests in domestic trade accounts receivable. The assets of the special purpose entity are not available to satisfy the Company's general obligations. Receivables sold to the third party totaled $200 million at December 31, 2009 and December 31, 2008. Undivided interests in designated receivable pools were sold to the purchaser with recourse limited to the purchased interest in the receivable pools. Average monthly proceeds from collections reinvested in the continuous sale program were approximately $228 million and $339 million in 2009 and 2008, respectively. The securitization program was fully drawn at December 31, 2009 and renewed in July 2009. In first quarter 2010, the Company will adopt new accounting guidance on the transfer of financial assets. Outstanding accounts receivable that were previously treated as sold and removed from the balance sheet will be included in trade receivables, net on the balance sheet. Going forward, any amounts outstanding under the accounts receivable securitization program will be accounted for as a secured borrowing and reflected on the Statements of Financial Position. In addition, the adoption of this new guidance will be reflected on the Statements of Cash Flows in first quarter 2010 as an increase in trade receivables which will reduce cash flows from operations by $200 million.

NOTES TO THE AUDITED CONSOLIDATED FINANCIAL STATEMENTS
71
Guarantees The Company has operating leases with terms that require the Company to guarantee a portion of the residual value of the leased assets upon termination of the lease. Disclosures about each group of similar guarantees are provided below.
Residual Value Guarantees
If certain operating leases are terminated by the Company, it has agreed to guarantee a portion of the residual value loss, if any, incurred by the lessors in disposing of the related assets. Under these operating leases, the residual value guarantees at December 31, 2009 totaled $160 million and consisted primarily of leases for railcars and company aircraft. Leases with guarantee amounts totaling $11 million, $139 million, and $10 million will expire in 2011, 2012, and 2014 and beyond, respectively. The Company believes, based on current facts and circumstances, that the likelihood of a material payment pursuant to such guarantees is remote. Other Guarantees Guarantees and claims also arise during the ordinary course of business from relationships with suppliers, customers, and other parties when the Company undertakes an obligation to guarantee the performance of others if specified triggering events occur. Non-performance under a contract could trigger an obligation of the Company. These potential claims include actions based upon alleged exposures to products, intellectual property and environmental matters, and other indemnifications. The ultimate effect on future financial results is not subject to reasonable estimation because considerable uncertainty exists as to the final outcome of these claims. However, while the ultimate liabilities resulting from such claims may be significant to results of operations in the period recognized, management does not anticipate they will have a material adverse effect on the Company's consolidated financial position or liquidity.
Variable Interest Entities
The Company has evaluated its material contractual relationships and has concluded that the entities involved in these relationships are not VIEs or, in the case of Primester, a joint venture that manufactures cellulose acetate at the Company's Kingsport, Tennessee plant, the Company is not the primary beneficiary of the VIE. As such, in accordance with consolidations rules included in GAAP, the Company is not required to consolidate these entities. In addition, the Company has evaluated long-term purchase obligations with an entity that may be a VIE at December 31, 2009. This potential VIE is a joint venture from which the Company has purchased raw materials and utilities for several years. The Company purchased approximately $40 million and $50 million of raw materials and utilities in 2009 and 2008, respectively. The Company has no equity interest in this entity and has confirmed that one party to this joint venture does consolidate the potential VIE. However, due to competitive and other reasons, the Company has not been able to obtain the necessary financial information to determine whether the entity is a VIE, and whether or not the Company is the primary beneficiary.

NOTES TO THE AUDITED CONSOLIDATED FINANCIAL STATEMENTS
72
12. ENVIRONMENTAL MATTERS Certain Eastman manufacturing sites generate hazardous and nonhazardous wastes, the treatment, storage, transportation, and disposal of which are regulated by various governmental agencies. In connection with the cleanup of various hazardous waste sites, the Company, along with many other entities, has been designated a potentially responsible party ("PRP"), by the U.S. Environmental Protection Agency under the Comprehensive Environmental Response, Compensation and Liability Act, which potentially subjects PRPs to joint and several liability for such cleanup costs. In addition, the Company will be required to incur costs for environmental remediation and closure and postclosure under the federal Resource Conservation and Recovery Act. Reserves for environmental contingencies have been established in accordance with Eastman's policies described in Note 1, "Significant Accounting Policies." Because of expected sharing of costs, the availability of legal defenses, and the Company's preliminary assessment of actions that may be required, management does not believe that the Company's liability for these environmental matters, individually or in the aggregate, will be material to the Company's consolidated financial position, results of operations or cash flows. The Company's total reserve for environmental contingencies was $42 million and $41 million at December 31, 2009 and 2008, respectively. Estimated future environmental expenditures for remediation costs range from the minimum or best estimate of $10 million to the maximum of $20 million at December 31, 2009. The best estimate accrued to date over the facilities' estimated useful lives for asset retirement obligation costs is $32 million at December 31, 2009. For additional information, refer to Note 25, "Reserve Rollforwards." 13. LEGAL MATTERS General From time to time, the Company and its operations are parties to, or targets of, lawsuits, claims, investigations and proceedings, including product liability, personal injury, asbestos, patent and intellectual property, commercial, contract, environmental, antitrust, health and safety, and employment matters, which are being handled and defended in the ordinary course of business. While the Company is unable to predict the outcome of these matters, it does not believe, based upon currently available facts, that the ultimate resolution of any such pending matters will have a material adverse effect on its overall financial condition, results of operations or cash flows. However, adverse developments could negatively impact earnings or cash flows in a particular future period.

NOTES TO THE AUDITED CONSOLIDATED FINANCIAL STATEMENTS
73
14. STOCKHOLDERS' EQUITY A reconciliation of the changes in stockholders' equity for 2007, 2008, and 2009 is provided below:
(Dollars in millions)
Common Stock at
Par Value
$
Paid-in Capital
$
Retained Earnings
$
Accumulated Other
Comprehensive Income (Loss)
$
Treasury Stock at
Cost $
Total Stockholders'
Equity $
Balance at December 31, 2006 1 448 2,186 (174) (432) 2,029 Net Earnings -- -- 300 -- -- 300 Effect of adoption of
accounting for uncertain income tax positions -- -- 8 -- -- 8
Cash Dividends Declared (1) -- -- (145) -- -- (145) Other Comprehensive Income -- -- -- 146 -- 146 Share-based Compensation
Costs (2) -- 18 -- -- -- 18 Stock Option Exercises -- 91 -- -- -- 91 Other (3) -- 16 -- -- 1 17 Stock Repurchases -- -- -- -- (382) (382) Balance at December 31, 2007 1 573 2,349 (28) (813) 2,082 Net Earnings -- -- 346 -- -- 346 Cash Dividends Declared (1) -- -- (132) -- -- (132) Other Comprehensive Loss -- -- -- (307) -- (307) Share-based Compensation
Costs (2) -- 25 -- -- -- 25 Stock Option Exercises -- 35 -- -- -- 35 Other (3) -- 5 -- -- -- 5 Stock Repurchases -- -- -- -- (501) (501) Balance at December 31, 2008 1 638 2,563 (335) (1,314) 1,553 Net Earnings -- -- 136 -- -- 136 Cash Dividends Declared (1) -- -- (128) -- -- (128) Other Comprehensive Loss -- -- -- (50) -- (50) Share-based Compensation
Costs(2) -- 19 -- -- -- 19 Stock Option Exercises -- 7 -- -- -- 7 Other (3) -- (3) -- -- -- (3) Stock Repurchases -- -- -- -- (21) (21) Balance at December 31, 2009 1 661 2,571 (385) (1,335) 1,513
(1) Includes cash dividends paid and dividends declared, but unpaid. Also, includes the redemption of the outstanding
preferred stock purchase rights. (2) Includes the fair value of equity share-based awards recognized for share-based compensation. (3) Includes tax benefits relating to the difference between the amounts deductible for federal income taxes over the
amounts charged to income for book value purposes have been credited to paid-in capital and other items. The Company is authorized to issue 400 million shares of all classes of stock, of which 50 million may be preferred stock, par value $0.01 per share, and 350 million may be common stock, par value $0.01 per share. The Company declared dividends of $1.76 per share in each of 2009, 2008, and 2007.

NOTES TO THE AUDITED CONSOLIDATED FINANCIAL STATEMENTS
74
The Company established a benefit security trust in 1997 to provide a degree of financial security for unfunded obligations under certain plans and contributed to the trust a warrant to purchase up to 1 million shares of common stock of the Company for par value. The warrant, which remains outstanding, is exercisable by the trustee if the Company does not meet certain funding obligations, which obligations would be triggered by certain occurrences, including a change in control or potential change in control, as defined, or failure by the Company to meet its payment obligations under covered unfunded plans. Such warrant is excluded from the computation of diluted earnings per share because the conditions upon which the warrant becomes exercisable have not been met. The additions to paid-in capital for 2009, 2008, and 2007 are primarily the result of employee stock option exercises and compensation expense of equity awards. On February 4, 1999, the Company was authorized by its Board of Directors to repurchase up to $400 million of its common stock. Through January 2007, a total of 2.7 million shares of common stock was repurchased under the authorization at a cost of approximately $112 million. On February 20, 2007, the Board of Directors cancelled its prior authorization for stock repurchases and approved a new authorization for the repurchase of up to $300 million of the Company's outstanding common stock. The Company completed the $300 million repurchase authorization in September 2007 acquiring a total of 4.6 million shares. In October 2007, the Board of Directors authorized an additional $700 million for repurchase of the Company's outstanding common shares at such times, in such amounts, and on such terms, as determined to be in the best interests of the Company. As of December 31, 2009, a total of 9.7 million shares have been repurchased under this authorization for a total amount of approximately $604 million. The Company's charitable foundation held 82,674 shares of the Company's common stock at December 31, 2009, 2008, and 2007 which are reflected in treasury stock. For 2009, 2008, and 2007, the weighted average number of common shares outstanding used to compute basic earnings per share was 72.5 million, 75.2 million, and 82.8 million, respectively, and for diluted earnings per share was 73.4 million, 76.0 million, and 83.9 million, respectively, reflecting the effect of dilutive share-based equity awards outstanding. Stock options excluded from the 2009, 2008, and 2007 calculation of diluted earnings per share were 3,498,489; 2,355,954; and 1,026,284, respectively, because the total market value of option exercises for these awards was less than the total cash proceeds that would be received from these exercises. Shares of common stock issued (1) 2009 2008 2007
Balance at beginning of year 94,495,860 93,630,292 91,579,441 Issued for employee compensation and benefit
plans
279,204 865,568 2,050,851 Balance at end of year 94,775,064 94,495,860 93,630,292
(1) Includes shares held in treasury.

NOTES TO THE AUDITED CONSOLIDATED FINANCIAL STATEMENTS
75
ACCUMULATED OTHER COMPREHENSIVE INCOME (LOSS)
(Dollars in millions)
Cumulative Translation Adjustment
$
Benefit Plans Unrecognized
Losses and Prior Service
Credits $
Unrealized Gains (Losses) on Cash Flow
Hedges $
Unrealized Losses on
Investments $
Accumulated Other
Comprehensive Income (Loss)
$ Balance at December 31, 2007 157 (182) (3) -- (28)
Period change (97) (232) 23 (1) (307) Balance at December 31, 2008 60 (414) 20 (1) (335)
Period change 17 (74) 7 -- (50) Balance at December 31, 2009 77 (488) 27 (1) (385)
Amounts of other comprehensive income (loss) are presented net of applicable taxes. The Company records deferred income taxes on the cumulative translation adjustment related to branch operations and other entities included in the Company's consolidated U.S. tax return. No deferred income taxes are provided on the cumulative translation adjustment of subsidiaries outside the United States, as such cumulative translation adjustment is considered to be a component of permanently invested, unremitted earnings of these foreign subsidiaries. 15. SHARE-BASED COMPENSATION PLANS AND AWARDS 2007 Omnibus Long-Term Compensation Plan Eastman's 2007 Omnibus Long-Term Compensation Plan ("2007 Omnibus Plan") was approved by stockholders at the May 3, 2007 Annual Meeting of Stockholders and shall remain in effect until its fifth anniversary. The 2007 Omnibus Plan authorizes the Compensation and Management Development Committee of the Board of Directors to: grant awards, designate participants, determine the types and numbers of awards, determine the terms and conditions of awards and determine the form of award settlement. Under the 2007 Omnibus Plan, the aggregate number of shares reserved and available for issuance is 4.1 million. Any stock distributed pursuant to an award may consist of, in whole or in part, authorized and unissued stock, treasury stock, or stock purchased on the open market. Under the 2007 Omnibus Plan and previous plans, the form of awards have included: restricted stock and restricted stock units, stock options, stock appreciation rights ("SARs"), and performance shares. The 2007 Omnibus Plan is flexible as to the number of specific forms of awards, but provides that stock options and SARs are to be granted at an exercise price not less than 100 percent of the per share fair market value on the date of the grant. 2008 Director Long-Term Compensation Subplan Eastman's 2008 Director Long-Term Compensation Subplan ("2008 Directors' Subplan"), a component of the 2007 Omnibus Plan, remains in effect until terminated by the Board of Directors or the earlier termination of the 2007 Omnibus Plan. The 2008 Directors' Subplan provides for structured awards of restricted shares to non-employee members of the Board of Directors. Restricted shares awarded under the 2008 Directors' Subplan are subject to the same terms and conditions of the 2007 Omnibus Plan. The 2008 Directors' Subplan does not constitute a separate source of shares for grant of equity awards and all shares awarded are part of the 4.1 million shares authorized by the 2007 Omnibus Plan. Shares of restricted stock are granted upon the first day of a non-employee director's initial term of service and shares of restricted stock are granted each year to each non-employee director on the date of the annual meeting of stockholders.

NOTES TO THE AUDITED CONSOLIDATED FINANCIAL STATEMENTS
76
The Company is authorized by the Board of Directors under the 2007 Omnibus Plan and 2008 Directors' Subplan to provide grants to employees and non-employee members of the Board of Directors. It has been the Company's practice to issue new shares rather than treasury shares for equity awards that require payment by the issuance of common stock and to withhold or accept back shares awarded to cover the income taxes of employee participants. Shares of non-employee directors are not withheld or acquired for the withholding of their income taxes. Shares of unrestricted common stock owned by specified senior management level employees are accepted by the Company to pay for the exercise price of stock options in accordance with the terms and conditions of their awards.
For 2009, 2008, and 2007, total share-based compensation expense (before tax) of approximately $20 million, $21 million, and $26 million, respectively, was recognized in selling, general and administrative expense in the consolidated statement of earnings for all share-based awards of which approximately $5 million, $9 million, and $13 million, respectively, related to stock options. The compensation expense is recognized over the substantive vesting period, which may be a shorter time period than the stated vesting period for retirement-eligible employees. For 2009, 2008, and 2007, approximately $2 million, $2 million and $3 million, respectively, of stock option compensation expense was recognized due to retirement eligibility preceding the requisite vesting period. Stock Option Awards Options have been granted on an annual basis to non-employee directors under predecessor plans to the 2008 Directors' Subplan and by the Compensation and Management Development Committee of the Board of Directors under the 2007 Omnibus Plan and predecessor plans to employees. Option awards have an exercise price equal to the closing price of the Company's stock on the date of grant. The term life of options is ten years with vesting periods that vary up to three years. Vesting usually occurs ratably over the vesting period or at the end of the vesting period. The Company utilizes the Black Scholes Merton option valuation model which relies on certain assumptions to estimate an option's fair value. The weighted average assumptions used in the determination of fair value for stock options awarded in 2009, 2008, and 2007 are provided in the table below:
Assumptions 2009 2008 2007 Expected volatility rate 31.69 % 21.96 % 20.80 % Expected dividend yield 4.84 % 2.66 % 2.92 % Average risk-free interest rate 2.47 % 2.76 % 4.24 % Expected forfeiture rate 0.75 % 0.75 % 0.75 % Expected term years 5.20 5.00 4.40 The volatility rate of grants is derived from historical Company common stock price volatility over the same time period as the expected term of each stock option award. The volatility rate is derived by mathematical formula utilizing the weekly high closing stock price data over the expected term. The expected dividend yield is calculated using the Company's average of the last four quarterly dividend yields. The average risk-free interest rate is derived from United States Department of Treasury published interest rates of daily yield curves for the same time period as the expected term. GAAP specifies only share-based awards expected to vest be included in share-based compensation expense. Estimated forfeiture rates are determined using historical forfeiture experience for each type of award and are excluded from the quantity of awards included in share-based compensation expense. The weighted average expected term reflects the analysis of historical share-based award transactions and includes option swap and reload grants which may have much shorter remaining expected terms than new option grants.

NOTES TO THE AUDITED CONSOLIDATED FINANCIAL STATEMENTS
77
A summary of the activity of the Company's stock option awards for 2009, 2008, and 2007 are presented below: 2009 2008 2007
Options
Weighted-Average Exercise
Price
Options
Weighted-Average Exercise
Price
Options
Weighted-Average Exercise
Price Outstanding at
beginning of year
4,217,700 $
54
4,481,300 $
55
5,866,900 $
52 Granted 355,300 56 445,700 38 643,000 65 Exercised (167,600) 41 (691,500) 51 (2,010,100) 50 Cancelled, forfeited, or expired (64,000)
46
(17,800)
55
(18,500)
59 Outstanding at end
of year 4,341,400 $ 55
4,217,700 $ 54
4,481,300 $ 55 Options exercisable
at year-end
3,493,800
2,980,100
2,686,800
Available for grant
at end of year
1,899,323
2,545,400
3,379,200 The following table provides the remaining contractual term and weighted average exercise prices of stock options outstanding and exercisable at December 31, 2009:
Options Outstanding Options Exercisable
Range of Exercise Prices
Number
Outstanding at 12/31/09
Weighted-Average
Remaining Contractual Life (Years)
Weighted-Average
Exercise Price
Number
Exercisable at 12/31/09
Weighted-Average Exercise
Price
$30-45 576,800 7.2 $ 37 293,100 $ 37 $46-52 568,400 2.8 48 568,400 48 $53-59 1,360,000 6.8 55 945,600 54 $60-64 1,239,900 6.5 61 1,239,700 61 $65-74 596,300 6.5 66 447,000 66
4,341,400 6.2 $ 55 3,493,800 $ 56 The range of exercise prices of options outstanding at December 31, 2009 is approximately $30 to $74 per share. The aggregate intrinsic value of total options outstanding and total options exercisable at December 31, 2009 is $28 million and $20 million, respectively. Intrinsic value is the amount by which the closing market price of the stock at December 31, 2009 exceeds the exercise price of the option grants. The weighted average remaining contractual life of all exercisable options at December 31, 2009 is 5.6 years. The weighted average fair value of options granted during 2009, 2008, and 2007 was $10.48, $6.59, and $11.12, respectively. The total intrinsic value of options exercised during the years ended December 31, 2009, 2008, and 2007, was $2 million, $15 million, and $30 million, respectively. Cash proceeds received by the Company from option exercises and the related tax benefit totals $7 million and $0.5 million, respectively for 2009, $35 million and $4 million, respectively, for 2008, and $91 million and $10 million, respectively, for 2007. The total fair value of shares vested during the years ended December 31, 2009, 2008, and 2007 was $8 million, $11 million, and $13 million, respectively.
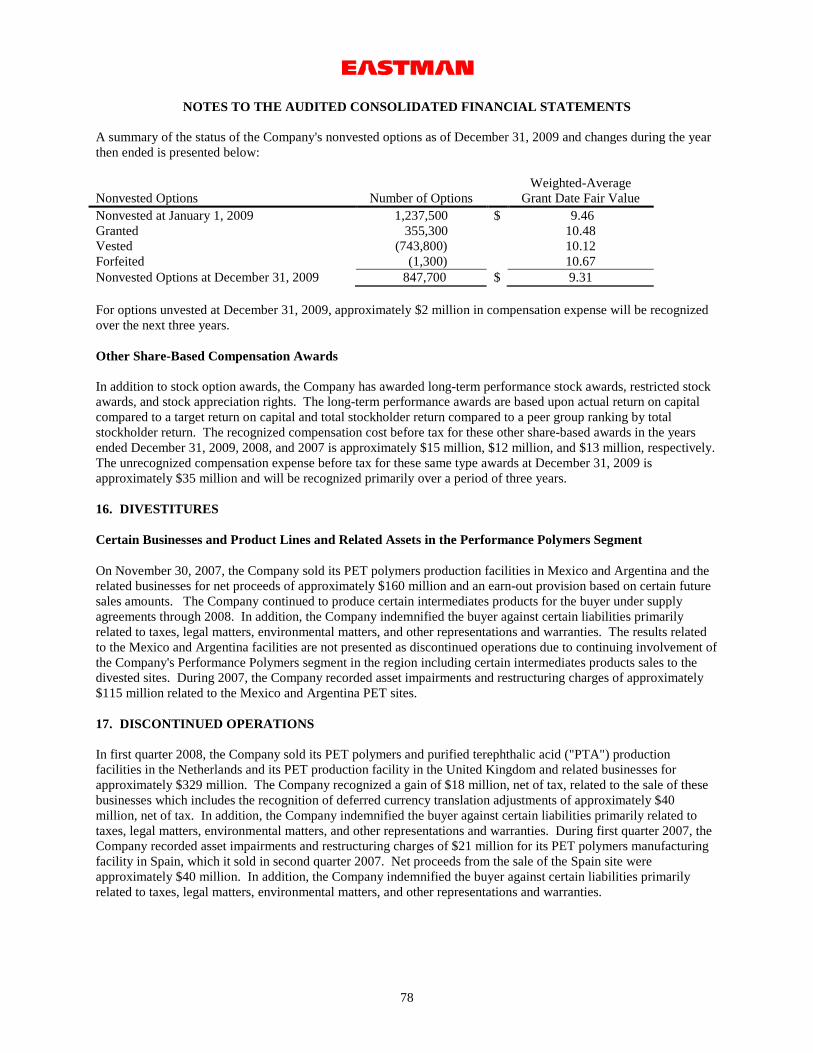
NOTES TO THE AUDITED CONSOLIDATED FINANCIAL STATEMENTS
78
A summary of the status of the Company's nonvested options as of December 31, 2009 and changes during the year then ended is presented below:
Nonvested Options Number of Options Weighted-Average
Grant Date Fair Value Nonvested at January 1, 2009 1,237,500 $ 9.46 Granted 355,300 10.48 Vested (743,800) 10.12 Forfeited (1,300) 10.67 Nonvested Options at December 31, 2009 847,700 $ 9.31 For options unvested at December 31, 2009, approximately $2 million in compensation expense will be recognized over the next three years. Other Share-Based Compensation Awards
In addition to stock option awards, the Company has awarded long-term performance stock awards, restricted stock awards, and stock appreciation rights. The long-term performance awards are based upon actual return on capital compared to a target return on capital and total stockholder return compared to a peer group ranking by total stockholder return. The recognized compensation cost before tax for these other share-based awards in the years ended December 31, 2009, 2008, and 2007 is approximately $15 million, $12 million, and $13 million, respectively. The unrecognized compensation expense before tax for these same type awards at December 31, 2009 is approximately $35 million and will be recognized primarily over a period of three years. 16. DIVESTITURES Certain Businesses and Product Lines and Related Assets in the Performance Polymers Segment
On November 30, 2007, the Company sold its PET polymers production facilities in Mexico and Argentina and the related businesses for net proceeds of approximately $160 million and an earn-out provision based on certain future sales amounts. The Company continued to produce certain intermediates products for the buyer under supply agreements through 2008. In addition, the Company indemnified the buyer against certain liabilities primarily related to taxes, legal matters, environmental matters, and other representations and warranties. The results related to the Mexico and Argentina facilities are not presented as discontinued operations due to continuing involvement of the Company's Performance Polymers segment in the region including certain intermediates products sales to the divested sites. During 2007, the Company recorded asset impairments and restructuring charges of approximately $115 million related to the Mexico and Argentina PET sites. 17. DISCONTINUED OPERATIONS In first quarter 2008, the Company sold its PET polymers and purified terephthalic acid ("PTA") production facilities in the Netherlands and its PET production facility in the United Kingdom and related businesses for approximately $329 million. The Company recognized a gain of $18 million, net of tax, related to the sale of these businesses which includes the recognition of deferred currency translation adjustments of approximately $40 million, net of tax. In addition, the Company indemnified the buyer against certain liabilities primarily related to taxes, legal matters, environmental matters, and other representations and warranties. During first quarter 2007, the Company recorded asset impairments and restructuring charges of $21 million for its PET polymers manufacturing facility in Spain, which it sold in second quarter 2007. Net proceeds from the sale of the Spain site were approximately $40 million. In addition, the Company indemnified the buyer against certain liabilities primarily related to taxes, legal matters, environmental matters, and other representations and warranties.

NOTES TO THE AUDITED CONSOLIDATED FINANCIAL STATEMENTS
79
The manufacturing facilities in the Netherlands, United Kingdom, and Spain, and related businesses represent the Company's European PET business and qualify as a component of an entity under GAAP for the impairment or disposal of long-lived assets, and accordingly their results are presented as discontinued operations and are not included in the results from continuing operations for all periods presented in the Company's unaudited consolidated financial statements. In fourth quarter 2007, the Company sold its PET polymers production facilities in Mexico and Argentina and the related businesses. The results related to the Mexico and Argentina facilities are not presented as discontinued operations due to continuing involvement of the Company's Performance Polymers segment in the region including contract polymer intermediates sales under a transition supply agreement to the divested sites through 2008. Operating results of the discontinued operations which were formerly included in the Performance Polymers segment are summarized below:
For years ended December 31, (Dollars in millions) 2009 2008 2007 Sales $ -- $ 169 $ 542 Earnings (loss) before income taxes -- 6 (9) Loss from discontinued operations, net of tax -- -- (10) Gain (loss) on disposal, net of tax -- 18 (11)
18. OTHER OPERATING INCOME, NET (Dollars in millions) 2009 2008 2007 Other operating income, net $ -- $ (16) $ -- Other operating income, net for 2008 reflected a gain of $16 million from the sale of certain mineral rights at an operating manufacturing site. 19. OTHER CHARGES (INCOME), NET (Dollars in millions) 2009 2008 2007 Foreign exchange transactions losses (gains) $ 5 $ 17 $ (11) Investments losses (gains) 5 6 (12) Other, net 3 (3) (5) Other charges (income), net $ 13 $ 20 $ (28) Included in other charges (income), net are gains or losses on foreign exchange transactions, results from equity investments, gains or losses on business venture investments, other non-operating income or charges related to HDC, gains from the sale of non-operating assets, certain litigation costs, fees on securitized receivables, other non-operating income, and other miscellaneous items. Investment losses (gains) for 2009, 2008, and 2007 included gains of $4 million in each year resulting from a favorable decision in 2006 of the U.S. Department of the Army to reimburse post-employment benefits being provided to retirees of HDC, a wholly owned subsidiary. This gain reflected a portion of the unrecognized gain resulting from the reimbursement decision that will be amortized into earnings over future periods.
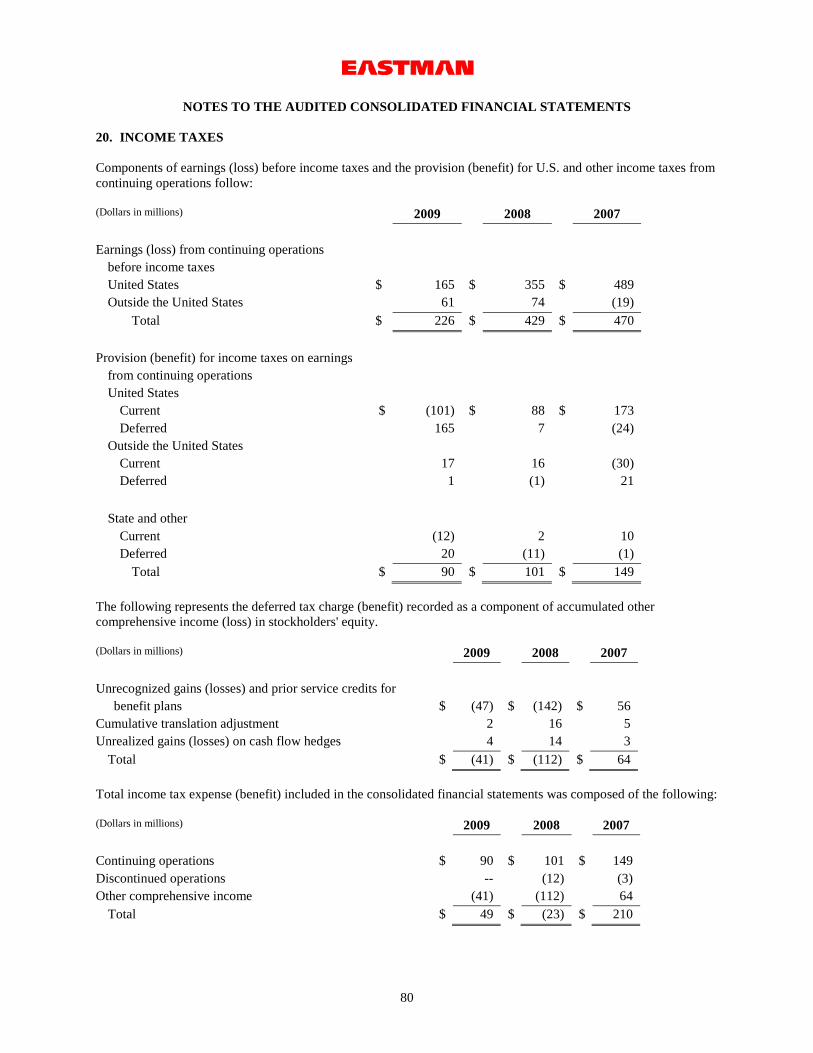
NOTES TO THE AUDITED CONSOLIDATED FINANCIAL STATEMENTS
80
20. INCOME TAXES
Components of earnings (loss) before income taxes and the provision (benefit) for U.S. and other income taxes from continuing operations follow: (Dollars in millions) 2009 2008 2007 Earnings (loss) from continuing operations
before income taxes
United States $ 165 $ 355 $ 489 Outside the United States 61 74 (19)
Total $ 226 $ 429 $ 470 Provision (benefit) for income taxes on earnings
from continuing operations
United States Current $ (101) $ 88 $ 173 Deferred 165 7 (24)
Outside the United States Current 17 16 (30) Deferred 1 (1) 21
State and other Current (12) 2 10 Deferred 20 (11) (1)
Total $ 90 $ 101 $ 149 The following represents the deferred tax charge (benefit) recorded as a component of accumulated other comprehensive income (loss) in stockholders' equity. (Dollars in millions) 2009 2008 2007 Unrecognized gains (losses) and prior service credits for
benefit plans $ (47) $ (142) $ 56 Cumulative translation adjustment 2 16 5 Unrealized gains (losses) on cash flow hedges 4 14 3
Total $ (41) $ (112) $ 64 Total income tax expense (benefit) included in the consolidated financial statements was composed of the following: (Dollars in millions) 2009 2008 2007 Continuing operations $ 90 $ 101 $ 149 Discontinued operations -- (12) (3) Other comprehensive income (41) (112) 64
Total $ 49 $ (23) $ 210

NOTES TO THE AUDITED CONSOLIDATED FINANCIAL STATEMENTS
81
Differences between the provision for income taxes on earnings from continuing operations and income taxes computed using the U.S. federal statutory income tax rate follow: (Dollars in millions) 2009 2008 2007 Amount computed using the statutory rate $ 79 $ 150 $ 165 State income taxes, net 5 (6) 8 Foreign rate variance (2) (4) (3) Domestic manufacturing deduction 5 (7) (11) ESOP dividend payout (1) (1) (1) Capital loss benefits -- (12) (3) Change in reserves for tax contingencies (5) (8) (2) General business credits 7 (16) (5) Other 2 5 1 Provision for income taxes $ 90 $ 101 $ 149 The 2009 effective tax rate reflects a $11 million tax charge associated with the recapture of gasification investment tax credits and a $7 million tax charge associated with a change in accounting method for tax purposes to accelerate timing of deductions for manufacturing repairs expense and a $5 million tax benefit from the reversal of tax reserves due to the expiration of the relevant statute of limitations. The 2008 effective tax rate was impacted by a $16 million benefit resulting from a gasification investment tax credit of $11 million and a research and development tax credit of $5 million, a $14 million benefit from state income tax credits (net of federal effect), a $12 million benefit from the reversal of a U.S. capital loss valuation allowance associated with the sale of businesses, and a $6 million benefit from the settlement of a non-U.S. income tax audit.

NOTES TO THE AUDITED CONSOLIDATED FINANCIAL STATEMENTS
82
The significant components of deferred tax assets and liabilities follow: December 31, (Dollars in millions) 2009 2008 Deferred tax assets
Post-employment obligations $ 496 $ 491 Net operating loss carry forwards 97 113 Capital loss carry forwards -- 33 Other 70 37
Total deferred tax assets 663 674 Less valuation allowance (88) (131) Deferred tax assets less valuation allowance $ 575 $ 543 Deferred tax liabilities
Depreciation $ (771) $ (599) Inventory reserves (26) (23)
Total deferred tax liabilities $ (797) $ (622) Net deferred tax liabilities $ (222) $ (79) As recorded in the Consolidated Statements of
Financial Position:
Other current assets $ 11 $ 2 Other noncurrent assets 30 28 Payables and other current liabilities (5) (3) Deferred income tax liabilities (258) (106)
Net deferred tax liabilities $ (222) $ (79) Unremitted earnings of subsidiaries outside the United States, considered to be reinvested indefinitely, totaled $310 million at December 31, 2009. It is not practicable to determine the deferred tax liability for temporary differences related to those unremitted earnings. For certain consolidated foreign subsidiaries, income and losses directly flow through to taxable income in the United States. These entities are also subject to taxation in the foreign tax jurisdictions. Net operating loss carryforwards exist to offset future taxable income in foreign tax jurisdictions and valuation allowances are provided to reduce deferred related tax assets if it is more likely than not that this benefit will not be realized. Changes in the estimated realizable amount of deferred tax assets associated with net operating losses for these entities could result in changes in the deferred tax asset valuation allowance in the foreign tax jurisdiction. At the same time, because these entities are also subject to tax in the United States, a deferred tax liability for the expected future taxable income will be established concurrently. Therefore, the impact of any reversal of valuation allowances on consolidated income tax expense will only be to the extent that there are differences between the United States statutory tax rate and the tax rate in the foreign jurisdiction. A valuation allowance of $73 million at December 31, 2009, has been provided against the deferred tax asset resulting from these operating loss carryforwards. At December 31, 2009, foreign net operating loss carryforwards totaled $346 million. Of this total, $238 million will expire in 3 to 15 years; and $108 million has no expiration date.

NOTES TO THE AUDITED CONSOLIDATED FINANCIAL STATEMENTS
83
Amounts due to and from tax authorities as recorded in the Consolidated Statements of Financial Position:
December 31, (Dollars in millions) 2009 2008 Miscellaneous receivables $ 23 $ 10
Payables and other current liabilities 2 11 Other long-term liabilities 6 11 Total income taxes payable $ 8 $ 22
A reconciliation of the beginning and ending amounts of unrecognized tax benefits is as follows:
December 31, 2009 2008 2007 (Dollars in millions) Balance at January 1 $ 11 $ 24 $ 28 Additions based on tax positions related to current
year
--
--
1 Reductions for tax positions of prior years -- (4) (3) Settlements -- (7) -- Lapse of statute of limitations (5) (2) (2) Balance at December 31 $ 6 $ 11 $ 24
As of December 31, 2009, 2008, and 2007, $6 million, $11 million, and $24 million, respectively, of unrecognized tax benefits would, if recognized, impact the Company's effective tax rate. Interest, net of tax, related to unrecognized tax benefits are recorded as a component of income tax expense. As of January 1, 2009 and 2008, the Company had accrued a liability of approximately $2 million and $4 million, respectively, for interest, net of tax and had no accrual for tax penalties. During 2009, the Company recognized income of $1 million for interest, net of tax and no penalties associated with unrecognized tax benefits, resulting in an accrued balance of $1 million for interest, net of tax benefit and no amount of penalties as of December 31, 2009. During 2008, the Company recognized income of $2 million for interest, net of tax and no penalties associated with unrecognized tax benefits, resulting in an accrued balance of $2 million for interest, net of tax benefit and no amount of penalties as of December 31, 2008. The Company or one of its subsidiaries files tax returns in the U.S. federal jurisdiction, and various states and foreign jurisdictions. With few exceptions, the Company is no longer subject to U.S. federal, state and local, or non-U.S. income tax examinations by tax authorities for years before 2005. It is reasonably possible that within the next 12 months the Company will recognize approximately $2 million of unrecognized tax benefits as a result of the expiration of relevant statutes of limitations.

NOTES TO THE AUDITED CONSOLIDATED FINANCIAL STATEMENTS
84
21. SUPPLEMENTAL CASH FLOW INFORMATION Included in the line item "Other items, net" of the "Cash flows from operating activities" section of the Consolidated Statements of Cash Flows are specific changes to certain balance sheet accounts as follows:
(Dollars in millions) 2009 2008 2007 Current assets $ (2) $ 113 $ (29) Other assets 27 18 10 Current liabilities (23) 10 (33) Long-term liabilities and equity 5 21 5 Total $ 7 $ 162 $ (47)
The above changes included transactions such as monetized positions from raw material and energy, currency, and certain interest rate hedges, prepaid insurance, miscellaneous deferrals, accrued taxes, and value-added taxes. The 2008 changes in current assets were primarily related to the monetization of interest rate, commodity, and foreign exchange hedges during 2008. Monetizations in 2009 and 2007 were significantly less than in 2008. Derivative financial instruments treated as hedges and related gains and losses are included in cash flows from operating activities. Non-cash portion of losses from the Company's equity investments was $5 million and $9 million for 2009 and 2008, respectively. Non-cash portions of earnings from the Company's equity investments in 2007 were $3 million.
(Dollars in millions) 2009 2008 2007 Cash paid for interest and income taxes is as follows:
Interest, net of amounts capitalized $ 82 $ 96 $ 108 Income taxes paid (refunded) (71) 150 173
22. SEGMENT INFORMATION The Company's products and operations are managed and reported in five reportable operating segments, consisting of the CASPI segment, the Fibers segment, the PCI segment, the Performance Polymers segment, and the Specialty Plastics segment. The CASPI segment manufactures raw materials, additives, and specialty polymers, primarily for the paints and coatings, inks, and adhesives markets. The CASPI segment's products consist of liquid vehicles, coatings additives, and hydrocarbon resins and rosins and rosin esters. Liquid vehicles, such as ester, ketone and alcohol solvents, maintain the binders in liquid form for ease of application. Coatings additives, such as cellulosic polymers, TexanolTM ester alcohol and chlorinated polyolefins, enhance the rheological, film formation and adhesion properties of paints, coatings, and inks. Hydrocarbon resins and rosins and rosin esters are used in adhesive, ink, and polymers compounding applications. Additional products are developed in response to, or in anticipation of, new applications where the Company believes significant value can be achieved. The Fibers segment manufactures EstronTM acetate tow and EstrobondTM triacetin plasticizers which are used primarily in cigarette filters; EstronTM and ChromspunTM acetate yarns for use in apparel, home furnishings and industrial fabrics; acetate flake for use by other acetate tow producers; and acetyl chemicals.

NOTES TO THE AUDITED CONSOLIDATED FINANCIAL STATEMENTS
85
The PCI segment manufactures diversified products that are used in a variety of markets and industrial and consumer applications, including chemicals for agricultural intermediates, fibers, food and beverage ingredients, photographic chemicals, pharmaceutical intermediates, polymer compounding, and chemical manufacturing intermediates. As part of the sale of the Performance Polymers segment's polyethylene business, the Company has agreed to supply ethylene to the buyer. These sales of ethylene, previously used internally as a raw material, are reported in the PCI segment. The Performance Polymers segment manufactures and supplies PET intermediates and polymers for use primarily in beverage and food packaging, including carbonated soft drinks, water, juices, sports drinks, beer, and food containers that are suitable for both conventional and microwave oven use. Other end-uses for PET packaging include bottles for non-food items such as household cleaners and clear, disposable clamshell trays such as those used in delis and salad bars. In 2007, the Company's PET manufacturing facility based on IntegRexTM technology became fully operational and produces ParaStarTM, the next generation PET resins. During fourth quarter 2007, the Company sold its Mexico and Argentina PET manufacturing sites. The Specialty Plastics segment's key products include engineering and specialty polymers, specialty film and sheet products, and packaging film and fiber products. Included in these are highly specialized copolyesters and cellulosic plastics that possess unique performance properties for value-added end uses such as appliances, store fixtures and displays, building and construction, electronic packaging, medical packaging, personal care and cosmetics, performance films, tape and labels, fiber, photographic and optical film, graphic arts, and general packaging. In fourth quarter 2007, Eastman commercialized a new family of high-temperature copolyester products, Eastman TritanTM copolyester. Research and development and other expenses not identifiable to an operating segment are not included in segment operating results for either of the periods presented and are shown in the tables below as "other" operating losses. (Dollars in millions) 2009 2008 2007 Sales by Segment
CASPI $ 1,217 $ 1,524 $ 1,451 Fibers 1,032 1,045 999 PCI 1,330 2,160 2,095 Performance Polymers 719 1,074 1,413 Specialty Plastics 749 923 872
Total Sales by Segment 5,047 6,726 6,830 Other -- -- -- Total Sales $ 5,047 $ 6,726 $ 6,830

NOTES TO THE AUDITED CONSOLIDATED FINANCIAL STATEMENTS
86
(Dollars in millions) 2009 2008 2007 Operating Earnings (Loss)
CASPI (1) $ 227 $ 202 $ 235 Fibers (2) 296 238 238 PCI (3) 63 153 220 Performance Polymers (4) (66) (57) (207) Specialty Plastics (5) 14 35 65
Total Operating Earnings by Segment 534 571 551 Other (6) (217) (52) (47) Total Operating Earnings $ 317 $ 519 $ 504
(1) CASPI includes $3 million and $(1) million in 2009 and 2007, respectively, in asset impairments and restructuring charges (gains) for the segment's portion of severance costs of a reduction in force and previously closed manufacturing facilities and $5 million in 2008 in other operating income related to the sale of certain mineral rights at an operating manufacturing site.
(2) Fibers includes $4 million in 2009 in asset impairments and restructuring charges related to severance cost of a reduction in force.
(3) PCI includes $6 million, $22 million, and $(1) million in 2009, 2008, and 2007, respectively, in asset impairments and restructuring charges (gains) related to severance costs of a reduction in force and the divestiture of the Batesville, Arkansas facility, manufacturing facilities outside the U.S., $5 million and $19 million in 2008 and 2007, respectively, in accelerated depreciation related to crackers at the Company's Longview, Texas facility, and other operating income of $9 million in 2008 related to the sale of certain mineral rights at an operating manufacturing site.
(4) Performance Polymers includes $4 million, $24 million, and $113 million in 2009, 2008, and 2007, respectively, in asset impairments and restructuring charges related to severance costs related to a reduction in force, restructuring at the South Carolina facility, partially offset by a resolution of a contingency from the sale of the Company's PE and EpoleneTM polymer businesses divested in fourth quarter 2006, the PET divestitures in Mexico and Argentina, and the shutdown of a research and development pilot plant in Kingsport, Tennessee and $4 million and $29 million in 2008 and 2007, respectively, of accelerated depreciation related to assets in Columbia, South Carolina.
(5) Specialty Plastics includes $4 million and $1 million in 2009 and 2007, respectively, in asset impairments and restructuring charges related to severance costs for a reduction in force, $1 million in 2007 of accelerated depreciation related to assets in Columbia, South Carolina, and $2 million in 2008 in other operating income related to the sale of certain mineral rights at an operating manufacturing site.
(6) Other includes $179 million in 2009 in asset impairments and restructuring charges related to the discontinued industrial gasification project in Beaumont, Texas.

NOTES TO THE AUDITED CONSOLIDATED FINANCIAL STATEMENTS
87
(Dollars in millions) 2009 2008 2007
Assets by Segment (1) CASPI $ 1,113 $ 1,160 $ 1,114 Fibers 726 758 692 PCI 784 844 1,062 Performance Polymers (2) 635 606 727 Specialty Plastics 910 828 622
Total Assets by Segment 4,168 4,196 4,217 Corporate Assets (4) 1,347 1,085 1,417 Assets Held for Sale (2)(3) -- -- 375 Total Assets $ 5,515 $ 5,281 $ 6,009
(1) The chief operating decision maker holds segment management accountable for accounts receivable, inventory, fixed assets, and goodwill.
(2) The Performance Polymers assets have decreased as a result of asset impairments, divestitures in Spain and Latin America, and classification of European assets as assets held for sale as of December 31, 2007.
(3) For more information regarding assets held for sale, see Note 17, "Discontinued Operations." (4) For more information regarding the impairment of Beaumont, Texas industrial gasification project, see Note 2 "Asset
Impairments and Restructuring Charges, Net".
(Dollars in millions) 2009 2008 2007 Depreciation Expense by Segment (1)
CASPI $ 56 $ 50 $ 53 Fibers 59 50 57 PCI 53 53 70 Performance Polymers 39 49 81 Specialty Plastics 53 53 50
Total Depreciation Expense by Segment 260 255 311 Other 2 1 2 Total Depreciation Expense $ 262 $ 256 $ 313
(1) In the fourth quarter 2006, the Company made strategic decisions relating to the scheduled shutdown of cracking units in Longview, Texas and a planned shutdown of higher cost PET assets in Columbia, South Carolina. In 2008, accelerated depreciation costs resulting from these decisions were $5 million and $4 million in PCI and Performance Polymers, respectively. In 2007, accelerated depreciation costs were $19 million, $29 million, and $1 million in PCI, Performance Polymers, and Specialty Plastics segments, respectively. In 2006, accelerated depreciation costs were $2 million, $7 million, and $1 million in PCI, Performance Polymers, and Specialty Plastics segments, respectively.
(Dollars in millions) 2009 2008 2007 Capital Expenditures by Segment
CASPI $ 42 $ 69 $ 73 Fibers 29 87 87 PCI 49 126 104 Performance Polymers 27 126 126 Specialty Plastics 125 152 111
Total Capital Expenditures by Segment 272 560 501 Other 38 74 17 Total Capital Expenditures $ 310 $ 634 $ 518

NOTES TO THE AUDITED CONSOLIDATED FINANCIAL STATEMENTS
88
Sales are attributed to geographic areas based on customer location; long-lived assets are attributed to geographic areas based on asset location. (Dollars in millions) 2009 2008 2007 Geographic Information
Sales United States $ 2,716 $ 3,965 $ 3,959 All foreign countries 2,331 2,761 2,871
Total $ 5,047 $ 6,726 $ 6,830
Long-Lived Assets, Net United States $ 2,789 $ 2,794 $ 2,564 All foreign countries 321 404 518
Total $ 3,110 $ 3,198 $ 3,082 23. QUARTERLY SALES AND EARNINGS DATA – UNAUDITED (Dollars in millions, except per share amounts)
First Quarter
Second Quarter
Third Quarter
Fourth Quarter
2009 Sales $ 1,129 $ 1,253 $ 1,337 $ 1,328 Gross profit 179 260 328 286 Asset impairment and restructuring charges, net
26 (3) -- 177
Earnings (loss) from continuing operations 2 65 101 (32) Net earnings (loss) 2 65 101 (32) Earnings (loss) from continuing operations per share (1)
Basic $ 0.03 $ 0.89 $ 1.40 $ (0.44) Diluted $ 0.03 $ 0.89 $ 1.38 $ (0.44)
Net earnings (loss) per share (1)
Basic $ 0.03 $ 0.89 $ 1.40 $ (0.44) Diluted $ 0.03 $ 0.89 $ 1.38 $ (0.44)
(1) Each quarter is calculated as a discrete period; the sum of the four quarters may not equal the calculated full year
amount.

NOTES TO THE AUDITED CONSOLIDATED FINANCIAL STATEMENTS
89
(Dollars in millions, except per share amounts)
First Quarter
Second Quarter
Third Quarter
Fourth Quarter
2008 Sales $ 1,727 $ 1,834 $ 1,819 $ 1,346 Gross profit 337 321 322 146 Asset impairment and restructuring charges, net
17 3 2 24
Other operating income -- -- -- (16) Earnings (loss) from continuing operations 115 115 100 (2) Gain from disposal of discontinued
operations, net of tax
18 -- -- -- Net earnings (loss) 133 115 100 (2) Earnings (loss) from continuing operations per share (1)
Basic $ 1.47 $ 1.51 $ 1.35 $ (0.03) Diluted $ 1.46 $ 1.48 $ 1.33 $ (0.03)
Earnings from discontinued operations per
share (1)(2)
Basic $ 0.23 $ -- $ -- $ -- Diluted $ 0.22 $ -- $ -- $ --
Net earnings (loss) per share (1)
Basic $ 1.70 $ 1.51 $ 1.35 $ (0.03) Diluted $ 1.68 $ 1.48 $ 1.33 $ (0.03)
(1) Each quarter is calculated as a discrete period; the sum of the four quarters may not equal the calculated full year
amount. (2) In first quarter 2008, the Company sold its PET polymers and PTA production facilities in the Netherlands and its PET
production facility in the United Kingdom and related businesses.

NOTES TO THE AUDITED CONSOLIDATED FINANCIAL STATEMENTS
90
24. RECENTLY ISSUED ACCOUNTING STANDARDS In June 2009, the Financial Accounting Standards Board ("FASB") issued new guidance related to the transfers of financial assets. The new guidance addresses the relevance, representational faithfulness, and comparability of the information that a reporting entity provides in its financial reports about a transfer of financial assets; the effects of a transfer on its financial position, financial performance, and cash flows; and a transferor's continuing involvement in transferred financial assets. This statement is effective for all Company financial asset transfers occurring on or after January 1, 2010. The Company has concluded that this new guidance will impact the Company's consolidated financial position and cash flows upon adoption in first quarter 2010. Prior to adoption of the new accounting guidance, the transfer of accounts receivable under the accounts receivable securitization program was accounted for as a sale which resulted in increased cash from operations at inception of the program in 1999. The program has been consistently utilized every year since 2000 and, therefore, has had no impact on cash from operations since that time. Going forward, any future transfers of accounts receivable will be treated as secured borrowings in the Statements of Financial Position. These secured borrowings will be reflected as cash from financing activities in the Statements of Cash Flows. The adoption of the new guidance, regardless of whether the Company continues to transfer accounts receivable subsequent to December 31, 2009, will result in an increase in accounts receivable of $200 million in the Statements of Financial Position and a corresponding decrease in cash flows from operations in the Statements of Cash Flows for the quarter ending March 31, 2010. In June 2009, the FASB issued new guidance on the consolidation of variable interest entities. The new guidance addresses improvements to financial reporting by enterprises involved with variable interest entities and to provide more relevant and reliable information to users of financial statements. This statement is effective for all variable interest entities the Company is involved with on or after January 1, 2010. The Company has concluded that this new guidance will not have a material impact on the Company's consolidated financial position, liquidity, or results of operations upon adoption.

NOTES TO THE AUDITED CONSOLIDATED FINANCIAL STATEMENTS
91
25. RESERVE ROLLFORWARDS Valuation and Qualifying Accounts
Additions
Balance at January 1,
2007
Charged to Cost
and Expense
Charged to Other Accounts
Deductions
Balance at December 31, 2007
Reserve for:
Doubtful accounts and returns $ 15 $ (1) $ -- $ 8 $ 6
LIFO Inventory 464 46 -- -- 510 Environmental
contingencies 47 3 -- 8 42 Deferred tax valuation
allowance 130 8 8 -- 146 $ 656 $ 56 $ 8 $ 16 $ 704
Balance at January 1,
2008
Charged to Cost
and Expense
Charged to Other Accounts
Deductions
Balance at December 31, 2008
Reserve for:
Doubtful accounts and returns $ 6 $ 6 $ -- $ 4 $ 8
LIFO Inventory 510 15 -- -- 525 Environmental
contingencies 42 5 -- 6 41 Deferred tax valuation
allowance 146 (10) (5) -- 131 $ 704 $ 16 $ (5) $ 10 $ 705
Balance at January 1,
2009
Charged to Cost
and Expense
Charged to Other Accounts
Deductions
Balance at December 31, 2009
Reserve for:
Doubtful accounts and returns $ 8 $ 3 $ -- $ 1 $ 10
LIFO Inventory 525 (79) -- -- 446 Environmental
contingencies 41 3 -- 2 42 Deferred tax valuation
allowance 131 (45) 2 -- 88 $ 705 $ (118) $ 2 $ 3 $ 586

92
CEO LETTER GAAP EARNINGS PER SHARE RECONCILIATIONS Earnings (loss) per diluted share reconciliation
2001 2005 2009 As reported
($2.28) $6.81 $1.85
Certain items: Asset impairments and restructuring charges, net
$3.21 $0.27 $1.78 Other operating expense (income)
$0.26 ($0.01) -
Net deferred tax benefits related to the divestiture of businesses
- ($0.14) -
Early extinguishment of debt costs
- $0.35 - Gain on sale of investment in Genencor
- ($1.35) -
Excluding items
$1.19 $5.93 $3.63

93
PERFORMANCE GRAPH The following graph compares the cumulative total return on Eastman Chemical Company common stock from December 31, 2004 through December 31, 2009 to that of the Standard & Poor’s ("S&P") 500 Stock Index and a group of peer issuers in the chemical industry. The peer group consists of the eight chemical companies which meet three objective criteria: (i) common shares traded on a major trading market; (ii) similar lines of business to those of the Company; and (iii) more than $1 billion in annual sales. Cumulative total return represents the change in stock price and the amount of dividends received during the indicated period, assuming reinvestment of dividends. The graph assumes an investment of $100 on December 31, 2004. All data in the graph have been provided by Standard & Poor’s Institutional Market Services. The stock performance shown in the graph is included in response to Securities and Exchange Commission ("SEC") requirements and is not intended to forecast or to be indicative of future performance.
Company Name / Index 12/31/2004 12/31/2005 12/31/2006 12/31/2007 12/31/2008 12/31/2009 EASTMAN CHEMICAL COMPANY
100 92.38 109.70 116.14 62.44 123.86
S&P 500 INDEX 100 104.91 121.48 128.16 80.74 102.11 PEER GROUP (1) 100 91.58 102.30 104.84 53.32 86.87
(1) The peer group for 2009 consists of the following issuers: Albemarle Corporation; Ashland Inc.; Celanese Corporation; Cytec Industries, Inc.; The Dow Chemical Company; E.I. du Pont de Nemours and Company; FMC Corporation; and PPG Industries Inc. Air Products & Chemicals, Inc., Chemtura Corporation, H.B. Fuller Company, Georgia Gulf Corporation, Huntsman Corporation, Nova Chemicals Corporation, PolyOne Corporation, Rohm & Haas Co, and Westlake Chemical Corporation, which were included in the peer group last year, have been excluded from the Company’s peer comparison group. Albemarle Corporation, Ashland Inc., and FMC Corporation, which were not included in last year’s peer group, are included in the peer comparison group. In accordance with SEC requirements, the return for each issuer has been weighted according to the respective issuer’s stock market capitalization at the beginning of each period for which a return is indicated.
0
50
100
150
200
12/31/04 12/31/05 12/31/06 12/31/07 12/31/08 12/31/09
DO
LLAR
S
COMPARISON OF CUMULATIVE FIVE YEAR TOTAL RETURN
Eastman Chemical CompanyS&P 500 IndexPeer Group

94
Stockholder Information Eastman Chemical Company and Subsidiaries
Corporate Offices Eastman Chemical Company 200 S. Wilcox Drive P. O. Box 431 Kingsport, TN 37662-5280 U.S.A. http://www.eastman.com
Stock Transfer Agent and Registrar Inquiries and changes to stockholder accounts should be directed to our transfer agent:
American Stock Transfer & Trust Company 59 Maiden Lane New York, NY 10038 In the United States: 800-937-5449 Outside the United States: (1) 212-936-5100 or (1) 718-921-8200 http://www.amstock.com
Annual Meeting Toy F. Reid Employee Center Kingsport, Tennessee Thursday, May 6, 2010 11:30 a.m. (ET)
Eastman Stockholder Information 877-EMN-INFO (877-366-4636) http://www.eastman.com
Annual Report on Form 10-K Eastman's Annual Report on Form 10-K for the year ended December 31, 2009, as filed with the Securities and Exchange Commission, is available upon written request of any stockholder to Eastman Chemical Company, P.O. Box 431, Kingsport, Tennessee 37662-5280, Attention: Investor Relations. This information is also available via the Internet at Eastman's Web site (www.eastman.com) in the investor information section, and on the SEC's website (www.sec.gov).
Stock Exchange Listing Eastman Chemical Company common stock is listed and traded on the New York Stock Exchange under the ticker symbol EMN.
Dividends Quarterly dividends on common stock, if declared by the Board of Directors, are usually paid on or about the first business day of the month following the end of each quarter. Dividends declared were $1.76 in 2009, 2008 and 2007.
Stockholders of record at year-end 2009: 23,712 Shares outstanding at year-end 2009: 72,468,042 Employees at year-end 2009: approximately 10,000
Stock Price
High Low
Cash Dividends Declared
2009 First Quarter $34.15 $17.76 $0.44 Second Quarter $45.85 $26.14 $0.44 Third Quarter $55.88 $34.57 $0.44 Fourth Quarter $61.95 $49.85 $0.44 2008 First Quarter $67.77 $56.31 $0.44 Second Quarter $78.29 $62.16 $0.44 Third Quarter $69.45 $52.91 $0.44 Fourth Quarter $55.22 $25.87 $0.44
Forward-Looking Statements Certain statements in this Annual Report which are not statements of historical fact may be “forward-looking statements” as defined in the Private Securities Litigation Reform Act of 1995 and other federal securities laws. These statements, and other written and oral forward-looking statements made by the Company from time to time may relate to, among other things, such matters as planned and expected capacity increases and utilization; anticipated capital spending; expected depreciation and amortization; environmental matters; legal proceedings; exposure to, and effects of hedging of, raw material and energy costs, foreign currencies and interest rates; global and regional economic, political, and business conditions; competition; growth opportunities; supply and demand, volume, price, cost, margin, and sales; earnings, cash flow, dividends and other expected financial results and conditions; expectations, strategies, and plans for individual assets and products, businesses and segments as well as for the whole of Eastman; cash requirements and uses of available cash; financing plans and activities; pension expenses and funding; credit ratings; anticipated restructuring, divestiture, and consolidation activities; cost reduction and control efforts and targets; integration of any acquired businesses; strategic initiatives and development, production, commercialization, and acceptance of new products, services and technologies and related costs; asset, business and product portfolio changes; and expected tax rates and net interest costs. These plans and expectations are based upon certain underlying assumptions, including those mentioned with the specific statements. Such assumptions are based upon internal estimates and other analyses of current market conditions and trends, management plans and strategies, economic conditions, and other factors. These plans and expectations and the underlying assumptions are necessarily subject to risks and uncertainties inherent in projecting future conditions and results. Actual results could differ materially from expectations expressed in any forward-looking statements if one or more of the underlying assumptions or expectations proves to be inaccurate or is unrealized. The most significant known factors that could cause actual results to differ materially from those in the forward-looking statements are identified and discussed in "Management's Discussion and Analysis of Financial Condition and Results of Operations—Forward-Looking Statements and Risk Factors" in this Annual Report.

Gary E. AndersonRetired Chairman of the Board, Dow Corning Corporation
Michael P. ConnorsChairman of the Board and Chief Executive Officer, Information Services Group, Inc.
Stephen R. DemerittRetired Vice Chairman of the Board, General Mills, Inc.
J. Brian FergusonExecutive Chairman of the Board,Eastman Chemical Company
Robert M. HernandezRetired Vice Chairman of the Board and Chief Financial Officer, USX Corporation
Renée J. HornbakerChief Financial Officer, Shared Technologies, Inc.
Lewis M. KlingRetired Executive Vice Chairman of the Board, President and Chief Executive Officer, Flowserve Corporation
Howard L. LanceChairman of the Board, President and Chief Executive Officer, Harris Corporation
Thomas H. McLainChief Executive Officer,Claro Scientific, LLC
David W. RaisbeckRetired Vice Chairman of the Board,Cargill, Incorporated
James P. RogersPresident and Chief Executive Officer, Eastman Chemical Company
Peter M. WoodRetired Managing Director, J.P. Morgan & Company
Board of Directors
Executive Officers
L-R: Howard Lance, Lewis Kling, Robert Hernandez, Thomas McLain, James Rogers, Stephen Demeritt, Brian Ferguson, Gary Anderson, David Raisbeck, Peter Wood, Renée Hornbaker, Michael Connors
J. Brian FergusonExecutive Chairman of the Board
James P. RogersPresident and Chief Executive Officer
Mark J. CostaExecutive Vice President, Specialty Polymers, Coatings and Adhesives, and Chief Marketing Officer
Ronald C. LindsayExecutive Vice President, Performance Polymers and Chemical Intermediates Curtis E. EspelandSenior Vice President and Chief Financial Officer
Richard L. JohnsonSenior Vice President, Fibers and Global Supply Chain
Theresa K. LeeSenior Vice President, Chief Legal Officer and Corporate Secretary
Greg W. NelsonSenior Vice President and Chief Technology Officer
Norris P. SneedSenior Vice President, Manufacturing Support and Chief Administrative Officer
Scott V. KingVice President, Controller and Chief Accounting Officer

Eastman Chemical CompanyKingsport, Tennessee, U.S.A.
423.229.2000www.eastman.com
Photography: Ben Dowdy & Carla Olson, Eastman Chemical CompanyDesign: Jeannie Miller Design • Shutterstock 2010 - cover concept


![REVISION FURTHER - Lakewood€¦ · [1]Debt to EBITDA (2014) 1.4x Total Cash & LT Investments (2014) $54.5 million . Cash & LT Investments to [1]Debt (2014) 434.9% [1] Debt includes](https://img.pdfslide.us/doc/110x75/5f660906a1917d28de740fff/revision-further-1debt-to-ebitda-2014-14x-total-cash-lt-investments.jpg)