Embed Size (px)
Citation preview

al
ex
an
dr
ia r
ea
l e
sta
te
eq
uit
ies
, inc
.2009 a
nn
ua
l r
ep
or
t

AlexAndriA reAl estAte equities, inc. (nYse:Are), landlord of choice to the life science industry®, is the largest owner and preeminent real estate investment trust (“reit”) focused principally on cluster development through the ownership, operation, management, selective redevelopment, development, and acquisition of properties containing life science laboratory space. Alexandria has a stellar twelve-year operating and financial track record as a nYse-listed company, ranking fifth out of all publicly traded equity reits in total return performance, and had an approximate $5.8 billion total market capitalization as of december 31, 2009. Alexandria is the leading provider of high-quality, environmentally sustainable real estate, technical infrastructure, and services to the broad and diverse life science industry. client tenants include institutional (universities and independent not-for-profit institutions), pharmaceutical, biotechnology, medical device, product, service, and translational entities, as well as government agencies. Alexandria’s operating platform is based on the principle of “clustering,” with assets and operations located in key life science markets.
As the illuMinAtinG BeAcOn to the life science industry, Alexandria has pioneered its unique niche with unmatched leadership and ingenuity as the first and best-in-class REIT focused on providing high-quality, sustainable scientific research environments to this broad and diverse sector. Since its founding in 1994, Alexandria has demonstrated consistent and solid operating performance as a result of its commitment to six fundamental principles: leAdershiP, Business, science, relAtiOnshiPs, huMAnitY, and stABilitY. Adherence to these principles has guided Alexandria from its inception through varying economic cycles, and will enable the Company to sustain its leadership position.

tO fellOw AlexAndriA reAl estAte equities, inc. Owners
1 AlexAndriA reAl estAte equities, inc.
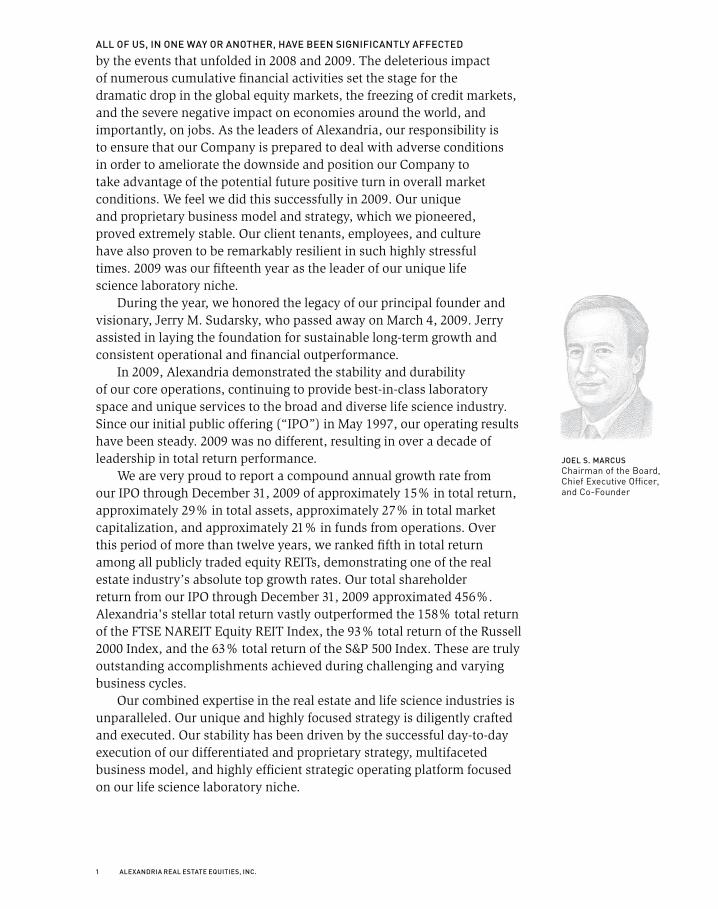
jOel s. MArcusChairman of the Board,Chief Executive Officer,and Co-Founder
All Of us, in One wAY Or AnOther, hAve Been siGnificAntlY Affected by the events that unfolded in 2008 and 2009. The deleterious impact of numerous cumulative financial activities set the stage for the dramatic drop in the global equity markets, the freezing of credit markets, and the severe negative impact on economies around the world, and importantly, on jobs. As the leaders of Alexandria, our responsibility is to ensure that our Company is prepared to deal with adverse conditions in order to ameliorate the downside and position our Company to take advantage of the potential future positive turn in overall market conditions. We feel we did this successfully in 2009. Our unique and proprietary business model and strategy, which we pioneered, proved extremely stable. Our client tenants, employees, and culture have also proven to be remarkably resilient in such highly stressful times. 2009 was our fifteenth year as the leader of our unique life science laboratory niche. During the year, we honored the legacy of our principal founder and visionary, Jerry M. Sudarsky, who passed away on March 4, 2009. Jerry assisted in laying the foundation for sustainable long-term growth and consistent operational and financial outperformance. In 2009, Alexandria demonstrated the stability and durability of our core operations, continuing to provide best-in-class laboratory space and unique services to the broad and diverse life science industry. Since our initial public offering (“IPO”) in May 1997, our operating results have been steady. 2009 was no different, resulting in over a decade of leadership in total return performance. We are very proud to report a compound annual growth rate from our IPO through December 31, 2009 of approximately 15% in total return, approximately 29% in total assets, approximately 27% in total market capitalization, and approximately 21% in funds from operations. Over this period of more than twelve years, we ranked fifth in total return among all publicly traded equity REITs, demonstrating one of the real estate industry’s absolute top growth rates. Our total shareholder return from our IPO through December 31, 2009 approximated 456%. Alexandria's stellar total return vastly outperformed the 158% total return of the FTSE NAREIT Equity REIT Index, the 93% total return of the Russell 2000 Index, and the 63% total return of the S&P 500 Index. These are truly outstanding accomplishments achieved during challenging and varying business cycles. Our combined expertise in the real estate and life science industries is unparalleled. Our unique and highly focused strategy is diligently crafted and executed. Our stability has been driven by the successful day-to-day execution of our differentiated and proprietary strategy, multifaceted business model, and highly efficient strategic operating platform focused on our life science laboratory niche.

2 2009 AnnuAl rePOrt
the life science industrY And Our client tenAnts
The quality, diversity, breadth, and depth of our significant relationships with our life science client tenants provide Alexandria with consistent and solid cash flows. As of December 31, 2009, Alexandria’s multinational pharmaceutical client tenants represented approximately 28% of our annualized base rent, led by Novartis AG, Roche Holding Ltd, GlaxoSmithKline plc, Pfizer Inc., Johnson & Johnson, and Merck & Co., Inc.; revenue-producing life science product and service companies represented approximately 20%, led by Quest Diagnostics Incorporated, Qiagen N.V., Laboratory Corporation of America Holdings, and Monsanto Company; public biotechnology companies represented approximately 17% and included the three largest in the sector, Amgen Inc., Gilead Sciences, Inc., and Celgene Corporation; government agencies and renowned medical and research institutions represented approximately 15% and included The Scripps Research Institute, Massachusetts Institute of Technology, Fred Hutchinson Cancer Research Center, University of Washington, Sanford-Burnham Medical Research Institute, and the United States Government; private biotechnology companies represented approximately 13% and included high-quality, leading-edge companies with blue-chip venture and institutional investors, including Ambrx, Inc., Intellikine, Inc., MacroGenics, Inc., and Tolerx, Inc.; and the remaining approximately 7% consisted of traditional office tenants. Two of the fastest-growing client tenant sectors by revenue currently include leading institutional and multinational pharmaceutical entities. Alexandria's strong life science underwriting skills, long-term life science industry relationships, and sophisticated management with both real estate and life science operating expertise set the Company apart from all other publicly traded REITs and real estate companies. The life science industry fared better than many other sectors in 2009 due to the continuous demand for existing and new medical products and services coupled with increased federal funding for scientific research. The life science industry offers a critical solution to rising health care expenditures in the United States, which are estimated to reach $4.5 trillion, or 19% of GDP, by 2019. Through the development and commercialization of novel therapeutics and diagnostics, the life science industry will enable significant cost containment by providing new products to detect, prevent, treat, manage, and ultimately cure a wide range of diseases. Additionally, the vitality of the life science industry has been further enhanced by the expanded federal funding for scientific research institutions and government agencies included in the federal economic stimulus bill as well as by increasing annual budgets for the National Institutes of Health and the National Science Foundation. Substantial public and private funding is also flowing to the renewable energy sector. With strong balance sheets, strategic commitments to investing in
3 AlexAndriA reAl estAte equities, inc.
research and development, and the urgency to access innovation, the pharmaceutical industry is adapting and reinventing its business models in ways that directly benefit Alexandria. Acquisitions and partnering activities among pharmaceutical companies and biotechnology companies reached record levels in 2009 as the pharmaceutical industry sought to boost its drug development pipeline. These substantial acquisition and partnering activities have enhanced the credit quality of numerous Alexandria client tenants. We also witnessed the completion of the mega mergers of Pfizer Inc. and Wyeth; Roche Holding AG and Genentech, Inc.; and Merck & Co., Inc. and Schering-Plough Corporation. While the pharmaceutical industry’s strategic commitment to investing in innovative research and development remains strong, it is rapidly adapting its business model to create more focused, innovative, and productive companies positioned to maintain global competitiveness. To achieve these goals, the pharmaceutical industry is becoming laser focused on key strategic areas of science while reducing non-core research and development efforts. Multinational pharmaceutical companies are also seeking to capture revenue growth in fast-growing emerging markets and through expansion in consumer medicines, vaccines, and generic drugs. Importantly, multinational pharmaceutical companies are strategically migrating to the key adjacency touch points of innovation in tight infill life science cluster submarkets while scaling back and decentralizing remote, large campus locations. These adjacency cluster locations, which are dominated by Alexandria, provide the entrepreneurial and collaborative environments needed to advance scientific discoveries from the laboratory bench to the marketplace. Alexandria’s unique cluster business model continues to drive its consistent performance in these unprecedented economic times. In 2009, the successful nature of this model was once again demonstrated as leading life science companies continued to strategically locate in Alexandria’s world-class cluster submarkets adjacent to premier scientific research institutions. A testament to our successful business model, each one of the world’s fifteen largest pharmaceutical and biotechnology companies has strategic research units in Alexandria properties in our key cluster submarkets. Top pharmaceutical companies, including affiliates of GlaxoSmithKline plc, Pfizer Inc., and Novartis AG, signed new leases in 2009 at Alexandria’s Technology Square at MIT in Cambridge, adjacent to the MIT campus, to encourage a more collaborative, innovative, and productive model for drug discovery. An affiliate of Eli Lilly and Company signed a significant lease in 2009 at Alexandria Center™ for Life Science - New York City for its new oncology headquarters to collaborate with the numerous neighboring world-renowned scientific research institutions. Additionally, Gilead Sciences, Inc. and Celgene Corporation affiliates recently expanded through new leases with Alexandria in Seattle and Mission Bay, respectively. The clustering of multinational
Each one of the world’s fifteenlargest pharma-ceutical and biotechnology companies has strategic research units in Alexandria properties in our key cluster submarkets.
4 2009 AnnuAl rePOrt
pharmaceutical companies, world-renowned academic researchers, and leading biotechnology companies creates the highly collaborative and innovative atmosphere necessary for the development of future medical breakthroughs and contributes to the overall long-term sustainability of the life science industry.
OPerAtiOnAl review And finAnciAl hiGhliGhts
2009 will be long remembered as a historic year where during the first quarter, the financial and credit systems were on the precipice of collapse. The markets were extremely volatile, with fears of a complete global financial and economic breakdown at the forefront of world leaders’ concerns. In the face of these monumental challenges, Alexandria successfully raised capital to strengthen our balance sheet, deleverage, and position ourselves to take advantage of the significant opportunities existing in our value-added development and redevelopment pipeline in San Francisco, New York City, and Cambridge. In total, we raised nearly $850 million through four transactions over the course of the year. In March, we were the first REIT to lead the market in raising common equity. While a very difficult decision, particularly given where the stock was trading at the time, we believed this decision was prudent given the real possibility of a banking collapse or a contagion further spreading throughout the financial system, which effectively would have closed any window for raising capital. This decisive move was followed by many other REITs. In addition to this equity offering, we raised approximately $233 million through the private offering of our 8.00% unsecured convertible notes and $120 million in a secured loan with a significant life insurance company. Importantly, this debt investor had previously never financed property in the life science sector. We believe these financing activities represent a significant validation of Alexandria, our business, and the unique niche asset class that we pioneered. With these capital raises, we also reduced principal balances of secured loans by approximately $267 million and repurchased, in privately negotiated transactions, approximately $75 million of our 3.70% unsecured convertible notes. We also extended maturities and refinanced secured loans totaling approximately $159 million. During 2009, we sold four properties aggregating approximately 112,000 rentable square feet to life science users. These sales reflect our ongoing program to continually and critically evaluate the strategic value of all of our properties and sell certain properties when appropriate to prudently repay debt or accretively recycle capital. Given these efforts, we are satisfied with our current liquidity position. As of December 31, 2009, we had approximately $95 million of cash on hand, including approximately $24 million of cash restricted for use in
5 AlexAndriA reAl estAte equities, inc.
construction projects. Additional liquidity of approximately $674 million is available on our $1.15 billion unsecured line of credit and our $750 million unsecured term loan. Once again in 2009, full-year growth in U.S. generally accepted accounting principles (“GAAP”) net operating income for our pool of same properties was positive, approximating 2.8%, and cash net operating income for these properties grew approximately 4.7%. Our same property growth, which has been positive for 46 consecutive quarters, represents broad-based, long-term, and continuing stable performance in our markets. Contributing to this growth, approximately 93% of our leases have annual rental rate increases, generally with minimum annual increases of at least 3%. Rental rate increases for lease rollovers in our asset base, which have been positive every year since our IPO, approximated 3.5% on a GAAP basis for 2009, driving our internal core growth. 2009 was one of the most active leasing years in the Company’s history. We signed a total of 142 leases for approximately 1,864,000 rentable square feet of space, which represented a record year for Alexandria. As of December 31, 2009, we reported a total occupancy rate of approximately 94.1%. Additionally, our average occupancy rate as of December 31 of each year from 1998 through 2009 was approximately 95.3%. In a very cost-conscious environment, we have continued to focus on controlling the costs of our operations, to both maintain our high operating margins, which approximated a healthy 74% during 2009, and sustain strong year end interest and fixed charge coverage ratios of 4.2 and 2.8 times, respectively. As of December 31, 2009, as at all times during our existence, we were in compliance with our financial covenants under our unsecured line of credit and unsecured term loan. Additionally, we believe our capital and business plan will allow us to continue to remain in compliance with these covenants. Our dividend payout ratio remained among the industry’s lowest, at approximately 28.5% for the quarter ended December 31, 2009.
the lessOns And Our teAM
2009 will be defined as a very tough year focused on risk management. We decisively managed our liquidity and leverage positions as well as our capital, operating, and administrative expenditures. We also preserved and protected our invaluable human capital base. I was the first (and maybe only) CEO to voluntarily reduce my base salary by one-third to demonstrate top-level commitment to very stringent cost controls. Our team, client tenants, shareholders, and the world at large faced one of the most difficult economic periods in history. Through it all, our people
Our same property growth, which has been positive for 46 consecutive quarters, represents broad-based, long-term, and continuing stable performance.
6 2009 AnnuAl rePOrt
maintained a rigorous focus. It is the unparalleled strength and experience of our employees that drive our continued success. Our team members bring an impressive breadth of knowledge, understanding, and expertise in both the life science and real estate industries, and are hand-picked from the top of their respective fields. We are extremely proud of our long-tenured team, which brings an unrivaled level of leadership and on-point experience. Fifteen of these superb individuals are featured in this annual report. These individuals are representative of the capabilities, strength, and depth of our best-in-class leadership.
A trAditiOn Of service And sOciAl resPOnsiBilitY
Good citizenship remains integral to the fabric of Alexandria’s mission: Landlord of Choice to the Life Science Industry®. Just as our business practices enable science to advance the human condition through discovery, our community relationships seek to improve the quality of life of those around us through outreach, smart partnering, and responsible operations. Our collaboration between company and community achieved meaningful success in 2009. We continue to expand the breadth of Operation Outreach in our local communities. Since its inception in 2003, this program has served the needs of military service members and their families. This commitment continued in 2009 as we provided financial assistance to individual families in our community and partnered with the Armed Services YMCA to augment specific, requested needs of multiple families. Alexandria also increased community engagement through employee volunteerism with organized activities at local non-profit service providers, including food banks and family rehabilitation centers. We also launched a national campaign across nine regions to partner our employees, our client tenants, and third-party service providers to collect food, clothing, and toys during the November and December holiday seasons. Alexandria encouraged participation by matching the value of all proceeds received. These collection drives contributed much-needed supplies to eighteen non-profit organizations who then distributed the proceeds to hundreds of people in need within our local communities. Alexandria received strong philanthropic recognition when the City of Hope, a leading research and treatment center for cancer, diabetes, and other life-threatening diseases, honored Alexandria, as well as bestowed the Lifetime Achievement Award to Alexandria’s principal founder, the late Jerry M. Sudarsky, in recognition of his significant philanthropic and business accomplishments. Our alignment with the City of Hope’s scientific research and critical treatment of patients exemplifies Alexandria’s strong relationship as an industry partner.
7 AlexAndriA reAl estAte equities, inc.
To further advance our commitment to improve the world around us, we developed a multifaceted framework for corporate social responsibility, defined by four pillars:
BEST-IN-CLASS SUPPORT TO THE LIFE SCIENCE INDUSTRY We make every effort to optimize the working environment of our client tenants so they can improve lives around the globe through scientific discovery.
SUSTAINABLE BUILDING PRACTICES Our buildings provide world-class facilities and cutting-edge equipment that also set the standard for Leadership in Energy and Environmental Design (LEED®) laboratory projects.
CORPORATE GIVING THROUGH OPERATION OUTREACH Alexandria dedicates resources to support our local communities through, among other activities, science education for youth and much needed assistance to military service members and their families.
EMPLOYEE VOLUNTEERISM Our employees strengthen our relationships with our communities and the programs that serve them through personal stewardship and the dedication of their own time and talents.
We at Alexandria are proudly devoted to making a difference in our communities by contributing time, effort, and philanthropic support to our environment and its natural resources, the people that surround us, and those that we faithfully serve.
sustAinABle BuildinG And OPerAtiOnAl PrActices
With environmental concerns remaining at the forefront of our global awareness and the ever-increasing need for operating efficiency, Alexandria continues advancing green practices in all aspects of its operations. At the leading edge of sustainable building practices, our initiatives include addressing utility consumption, incorporating environmentally friendly materials, and educational outreach to our client tenants and our employees. Our dedication and commitment to incorporating environmental best practices into our projects continues to be rewarded, with many of our cutting-edge life science laboratory properties receiving LEED® certification (four Silver Certifications and two Gold Certifications), including the first LEED® Silver Certification in California for a core and shell office/laboratory project. In addition to our achievements to date, we are currently pursuing no less than LEED® Silver Certification, or its equivalent, at eighteen additional properties located in key cluster submarkets. Finally, Alexandria has embarked on a number of fronts to lower overall operating costs for our client tenants, including central plant optimization projects, renewable energy initiatives, and
We at Alexandria are proudly devoted to making a difference in our communities by contributing time, effort, and philanthropic support.
8 2009 AnnuAl rePOrt
green housekeeping practices. From our Company's inception, Alexandria has led the development of laboratory space for the life science sector, and we remain dedicated to maintaining our leadership position as pioneers of a forward-thinking, green initiative to build upon our specialized and sustainable niche.
lOOKinG tO the future
The past two years have been historic and unprecedented. Our goals for 2010 and beyond are simple: (i) maintain a solid and flexible balance sheet with adequate liquidity, near-term obligations that are modest, together with multiple sources of stable earnings and cash flows; (ii) continue operational leadership that ensures our durable and distinctive competitive advantage; and (iii) nurture our outstanding operating managers who over the years have been invaluable in contributing to Alexandria's exceptional results. We manage Alexandria with a long-term focus to create value for long-term total return investors and our owner employees. We are convinced that this is the best way to run our business. The integration of our business model and differentiated strategy is powerful and unique. We have a proven brand that is relevant and impactful to our broad and diverse life science constituency, whom we deeply respect and consider an integral part of our team. As we have stated before, our culture is defined by unparalleled excellence, earnest service, cutting-edge creativity and innovation, interdependent teamwork, mutual respect, responsibility, and unwavering integrity. At Alexandria, our mandate is to preserve, protect, and grow our leadership position. We are well positioned to do so and look forward to consistently delivering, once again, on our promise.
jOel s. MArcuschAirMAn Of the BOArd, chief executive Officer, And cO-fOunder
We have a proven brand that is relevant and impactful to our broad and diverse life science constituency.

9 AlexAndriA reAl estAte equities, inc.
Our fOundinG PrinciPles


BACK ROW:STUARTJACKIEJOSEPHTIM W.EDDIETIM M.KRISTINAJAY
FRONT ROW:DINHTEREZIAAMANDAJENIKRUPALLUCINDATODD
leAdershiP is deMOnstrAted BY the extrAOrdinArY PeOPle at all levels of Alexandria. Human capital has been and always will be the Company’s most important asset, the “DNA” from which its business and success are built. Alexandria’s team of passionate, diligent, and experienced professionals is comprised of uniquely skilled experts in laboratory operations, building engineering, leasing, asset management, life science, financial analysis, and real estate capital markets, among numerous other diverse fields. They demonstrate remarkable leadership in their areas of expertise, excelling with utmost professionalism, integrity, grace, and humility. They are trusted advisors to Alexandria’s sophisticated network of client tenants. Together, Alexandria’s people form the core component that has fueled its vision and steady growth over the years. As the Company marks its fifteenth anniversary, it celebrates from among all of the outstanding people at Alexandria, fifteen of its leaders. These individuals exemplify the deep and diverse talent that defines Alexandria.
leAd
ersh
iP
01

As a trained benchtop scientist with over 30 years of life science experience, stuArt BerrY translates his comprehensive industry knowledge and expertise into meeting the technical de-mands of laboratory operations and facility design requirements for Alexandria’s client tenants.
jAcKie cleM is an experienced transactional real estate attorney with a unique background in acquisitions and leasing. Her in-depth legal expertise, combined with her business acumen and tenant service perspective, shape her forward-thinking handling of legal matters.
jOsePh MAGuire joined Alexandria following a 20-year career in real estate development and asset management with the investment arm of Massachu-setts Institute of Technology. He leads a diverse team of consul-tants, designers, and planners in procuring entitlements for Alexandria’s development efforts in East Cambridge.
tiM white is a licensed profes-sional mechanical engineer with 25 years of laboratory facilities experience. He is a technical expert in building operations, mechanical design, labora-tory conversions, leasing, and construction.
eddie rOse is an expert in real estate research with outstanding financial and leasing experience. He manages numerous proper-ties and infrastructure improve-ments and is heavily involved with some of the most important leasing functions at Alexandria.
Trained as a research scientist, tiM McBride has unique experience in laboratory design, programming, operations, construction, tenant services, and acquisitions. His expertise has played a significant role in attracting numerous client tenants.
KristinA cArlsOn is respon-sible for leading global efforts associated with Alexandria’s human resources vision, initiatives, and programs. She develops and implements leadership and organizational priorities, ensures the integrity and synergy of the Company’s hu-man resources operations, and effectively cultivates Alexandria’s human capital.
As a LEED® accredited profes-sional with over a decade of experience in building laboratory facilities, jAY inGrAM is actively involved in Alexandria’s green initiatives. He is responsible for managing construction and development activities in several of Alexandria’s life science cluster markets.
dinh hAn is a certified public ac-countant with more than a decade of public accounting and private industry accounting experience in the real estate, high technology, and manufacturing industries. He is responsible for the leader-ship of Alexandria’s dedicated and diligent accounting team and the management of account-ing, Sarbanes-Oxley, and GAAP compliance matters.
tereziA neMeth is an accom-plished real estate developer with experience overseeing numerous high-profile private and public development projects. Her re-sponsibilities include securing all necessary entitlements for the 2.7 million square foot life science and technology research cluster at Mission Bay.
AMAndA cAshin earned her Ph.D. in Chemical Biology from the California Institute of Tech-nology. Her scientific expertise and experience enable her to lead the Company’s life science research team, enhance tenant underwriting capability, and strengthen research of and com-munications with Alexandria’s global life science network.
Proficient in commercial real estate operations and manage-ment, jeni schriMsher leads the asset services and engineer-ing functions at Alexandria’s newest life science cluster. She created an operations model focused on exceptional tenant re-lationships, outstanding service, and alert responsiveness that has become the five-star standard for Alexandria’s regions.
KruPAl rAvAl joined Alexandria with a notable track record as a respected research analyst at Fidelity Management & Research Company. He was also a REIT analyst at Citigroup Investment Research, Institutional Investor’s top-ranked team for the duration of his tenure. Krupal is focused on the capital markets function at Alexandria.
As an Alexandria team member since 1994, lucindA wOnG was integral to the creation of the Company’s initial accoun- ting department and system infrastructure, and demonstrates the long-term stability of Alexandria’s employee base. She currently oversees certain business development and accounting activities in Asia.
With an extensive background in real estate research and financial analysis, tOdd Miller has developed significant expertise and experience in critical leasing activities for Alexandria. He stra-tegically balances the complexity of leasing transactions with the importance of tenant relations.

BACK ROW:STUARTJACKIEJOSEPHTIM W.EDDIETIM M.KRISTINAJAY
FRONT ROW:DINHTEREZIAAMANDAJENIKRUPALLUCINDATODD

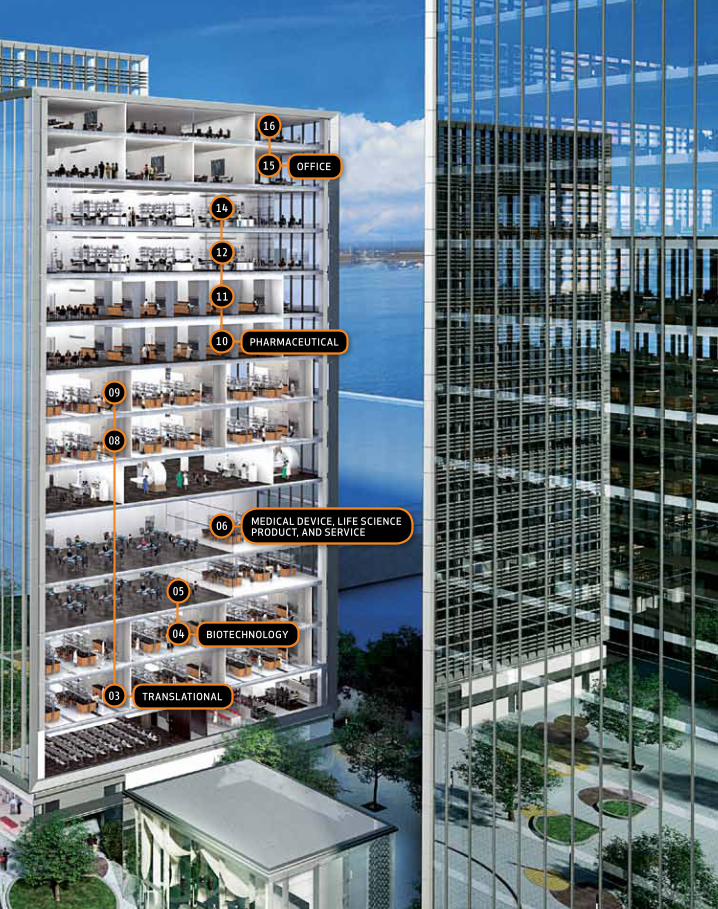
conference center 02
restaurant 01
MeDIcaL DeVIce, LIfe scIence ProDuct, anD serVIce06
BIotecHnoLoGY04
05
transLatIonaL03
08
09
PHarMaceutIcaL10
14
offIce 15
16
11
12
Bu
siness
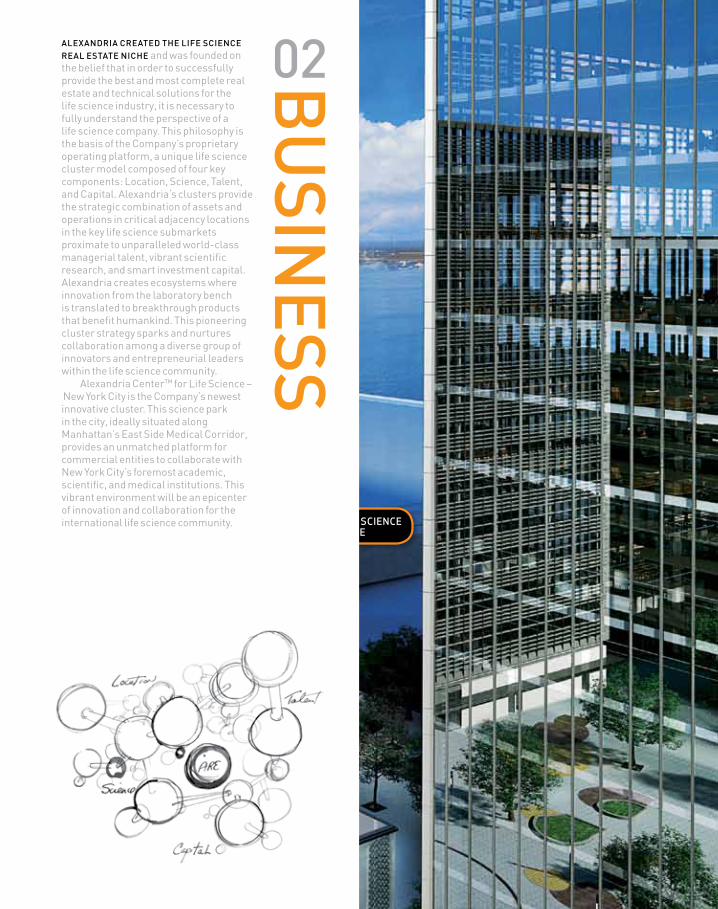
02AlexAndriA creAted the life science reAl estAte niche and was founded on the belief that in order to successfully provide the best and most complete real estate and technical solutions for the life science industry, it is necessary to fully understand the perspective of a life science company. This philosophy is the basis of the Company’s proprietary operating platform, a unique life science cluster model composed of four key components: Location, Science, Talent, and Capital. Alexandria‘s clusters provide the strategic combination of assets and operations in critical adjacency locations in the key life science submarkets proximate to unparalleled world-class managerial talent, vibrant scientific research, and smart investment capital. Alexandria creates ecosystems where innovation from the laboratory bench is translated to breakthrough products that benefit humankind. This pioneering cluster strategy sparks and nurtures collaboration among a diverse group of innovators and entrepreneurial leaders within the life science community. Alexandria Center™ for Life Science – New York City is the Company’s newest innovative cluster. This science park in the city, ideally situated along Manhattan’s East Side Medical Corridor, provides an unmatched platform for commercial entities to collaborate with New York City’s foremost academic, scientific, and medical institutions. This vibrant environment will be an epicenter of innovation and collaboration for the international life science community.

conference center 02
restaurant 01
Abbott LaboratoriesAstellas Pharma Inc.AstraZeneca PLCBaxter International Inc.Bayer AGBristol-Myers Squibb CompanyEisai Co., Ltd.Eli Lilly and CompanyGlaxoSmithKline plcJohnson & JohnsonMerck & Co., Inc.Novartis AGPfizer Inc.Roche Holding LtdSanofi-Aventis
Bill & Melinda Gates FoundationDuke UniversityEnvironmental Protection AgencyFred Hutchinson Cancer Research CenterMassachusetts Institute of TechnologyNational Institutes of HealthSanford-Burnham Medical Research InstituteThe Scripps Research InstituteUniversity of California, San FranciscoUniversity of MassachusettsUMass Memorial Medical CenterUniversity of Washington
Alnylam Pharmaceuticals, Inc.Amgen Inc.Amylin Pharmaceuticals, Inc.Biogen Idec Inc.Celgene CorporationGilead Sciences, Inc.Intercell AGTheravance, Inc.ZymoGenetics, Inc.
Ambrx, Inc.Anaphore, Inc.Avila Therapeutics, Inc.BrainCells Inc.Fate Therapeutics, Inc.Ikaria Holdings, Inc.Intellikine, Inc.MacroGenics, Inc.Presidio Pharmaceuticals, Inc.Proteostasis Therapeutics, Inc.Tolerx, Inc.
Bio-Rad Laboratories, Inc.Becton, Dickinson and CompanyCanon U.S. Life Sciences, Inc.Laboratory Corporation of America HoldingsLife Technologies CorporationMonsanto CompanyPharmaceutical Product Development, Inc.Qiagen N.V.Quest Diagnostics IncorporatedSapphire Energy, Inc.
MultinAtiOnAl PhArMAceuticAl
institutiOnAl: indePendent,nOt-fOr-PrOfit,universities, & GOvernMent
BiOtechnOlOGY: PuBlic & PrivAte
MedicAl device, life science PrOduct, service, & BiOfuels
AlexAndriA’s cluster lOcAtiOns provide an entrepreneurial campus environment for the broad and diverse life science industry.
Alexandria’s world-class client tenant base (partial list):
MeDIcaL DeVIce, LIfe scIence ProDuct, anD serVIce06
BIotecHnoLoGY04
05
transLatIonaL03
08
09
PHarMaceutIcaL10
14
offIce 15
16
11
12


scien
ce
03AlexAndriA’s fOunders recOGnized A strOnG, lOnG-terM deMAnd for scientific and medical innovations to treat rising unmet medical needs. Today, our aging population, increasing health care expenditures, and the global economic demands for advances in science and technology intensify the need for new medical breakthroughs. The life science industry offers a unique, cost-effective solution to these challenges through the development and commercialization of novel products and services to prevent, detect, treat, and ultimately cure diseases facing the world’s growing population. Increased investment in science and technology research through expanded federal funding demonstrates the government’s commitment to research and enables fundamental scientific discoveries that fuel the continued growth of the life science industry. In addition, highly collaborative and entrepreneurial environments in key cluster locations adjacent to world-renowned academic institutions are vital for the life science industry to efficiently translate scientific discoveries into innovative biomedical products. Specifically, large biopharmaceutical companies are migrating to these touch points of innovation to increase productivity and maintain global competitiveness. Alexandria is the leading provider of mission-critical real estate to the life science industry, strategically positioning itself and its client tenants for success in the global economy.

lArGe PhArMAceuticAl And BiOtechnOlOGY cOMPAnies, AcAdeMiA, And GOvernMent are among the key industry drivers and important client tenants that consistently propel Alexandria’s growth. In 2009, the pharmaceutical industry continued to adapt in order to maintain global competitiveness, as seen through the mergers of Pfizer Inc. and Wyeth; Roche Holding Ltd and Genentech, Inc.; and Merck & Co., Inc. and Schering-Plough Corporation. Pharmaceutical companies are seeking to capture the entrepreneurial spirit and scientific talent in key cluster submarket locations. In 2009, Pfizer Inc., Novartis AG, and GlaxoSmithKline plc affiliates each signed new leases at Alexandria’s Technology Square at MIT. In addition, Eli Lilly and Company is establishing its oncology headquarters at Alexandria Center™ for Life Science – New York City to collaborate with neighboring, world-renowned academic institutions. Alexandria also recently signed new leases with affiliates of Roche Holding Ltd in South San Francisco, Celgene Corporation in Mission Bay, San Francisco, and Gilead Sciences, Inc. in Seattle, Washington. Also key to Alexandria’s life science clusters, its prolific academic and research institutional client tenants continue to directly benefit from and secure top levels of federal funding to support fundamental science and technology research. Alexandria’s client tenants received approximately 9% of National Institutes of Health (“NIH”) stimulus awards in 2009 and received approximately 10% of 2009 annual NIH funding. For example, the University of California, San Francisco, an Alexandria client tenant, is the second-largest recipient of annual NIH funding among all organizations, and client tenants Fred Hutchinson Cancer Research Center and The Scripps Research Institute are the two largest recipients of annual NIH funding among all research institutes.
in this iMAGe Alexandria’s client tenant BrainCells Inc. uses its proprietary neurogenesis platform to identify clinical-stage compounds and novel targets for central nervous system indications, including depression, post-traumatic stress disorder, anxiety, and cognition.
Image provided by BrainCells Inc.

SF
SF
SF

SF
the success Of AlexAndriA’s Business MOdel is largely based on exceptional relationships with client tenants and the broad and diverse life science industry. Alexandria has pioneered its niche, positioning the Company as a neutral partner and collaborator. This distinguishing role allows Alexandria to promote, foster, and participate in long-standing industry relationships that constitute a multifaceted network of the world’s foremost scientific and entrepreneurial minds. Alexandria facilitates mutually beneficial introductions among companies, investors, entrepreneurs, and academic institutions with a thorough and seasoned understanding of the needs and aspirations of all parties. Alexandria is dedicated to creating meaningful partnerships that go beyond the role of a traditional landlord by providing not only environments of unparalleled quality and cutting-edge design, but also comprehensive infrastructure, support, and access to an expansive network of valuable relationships that cater to the unique needs of the life science industry.
relAtiO
nsh
iPs
04
SF
SF
SF
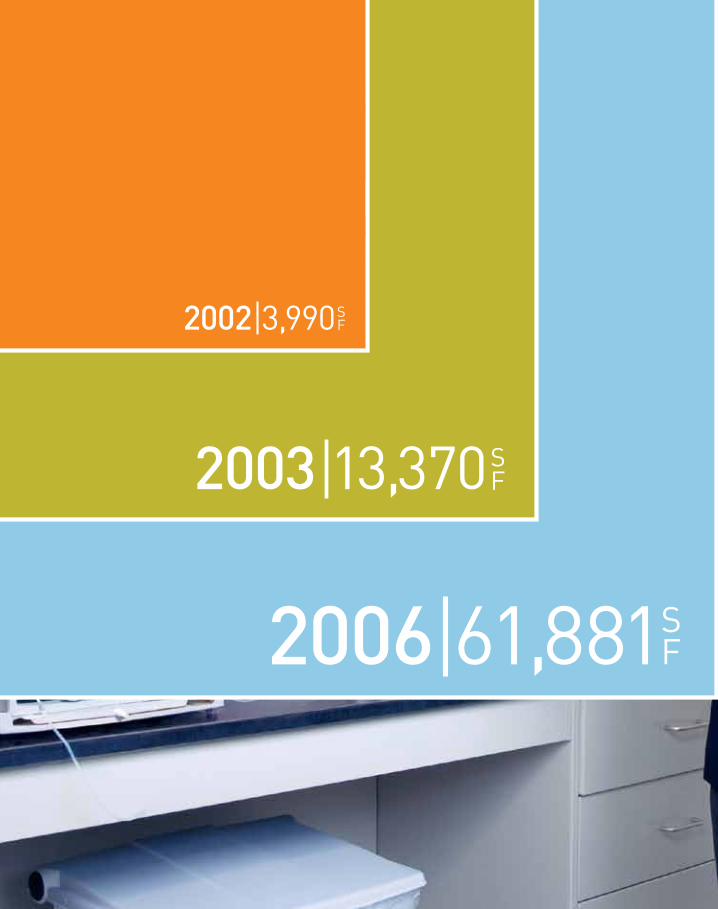
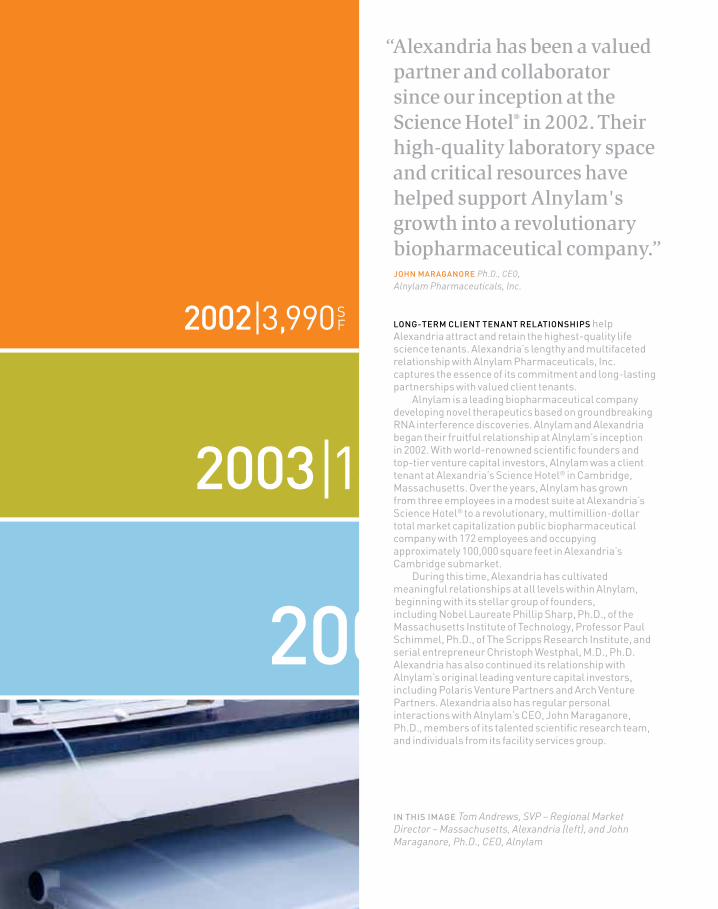
“Alexandria has been a valued partner and collaborator since our inception at the Science Hotel® in 2002. Their high-quality laboratory space and critical resources have helped support Alnylam's growth into a revolutionary biopharmaceutical company.”
lOnG-terM client tenAnt relAtiOnshiPs help Alexandria attract and retain the highest-quality life science tenants. Alexandria’s lengthy and multifaceted relationship with Alnylam Pharmaceuticals, Inc. captures the essence of its commitment and long-lasting partnerships with valued client tenants. Alnylam is a leading biopharmaceutical company developing novel therapeutics based on groundbreaking RNA interference discoveries. Alnylam and Alexandria began their fruitful relationship at Alnylam’s inception in 2002. With world-renowned scientific founders and top-tier venture capital investors, Alnylam was a client tenant at Alexandria’s Science Hotel® in Cambridge, Massachusetts. Over the years, Alnylam has grown from three employees in a modest suite at Alexandria’s Science Hotel® to a revolutionary, multimillion-dollar total market capitalization public biopharmaceutical company with 172 employees and occupying approximately 100,000 square feet in Alexandria’s Cambridge submarket. During this time, Alexandria has cultivated meaningful relationships at all levels within Alnylam, beginning with its stellar group of founders, including Nobel Laureate Phillip Sharp, Ph.D., of the Massachusetts Institute of Technology, Professor Paul Schimmel, Ph.D., of The Scripps Research Institute, and serial entrepreneur Christoph Westphal, M.D., Ph.D. Alexandria has also continued its relationship with Alnylam’s original leading venture capital investors, including Polaris Venture Partners and Arch Venture Partners. Alexandria also has regular personal interactions with Alnylam’s CEO, John Maraganore, Ph.D., members of its talented scientific research team, and individuals from its facility services group.
in this iMAGe Tom Andrews, SVP – Regional Market Director – Massachusetts, Alexandria (left), and John Maraganore, Ph.D., CEO, Alnylam
jOhn MArAGAnOre Ph.D., CEO,Alnylam Pharmaceuticals, Inc.

SF


hu
MA
nitY
05At the heArt Of AlexAndriA is its fOcus On huMAnitY. Importantly, Alexandria creates environments that enable its client tenants to discover and launch effective products that improve the human condition. This core principle compels Alexandria to operate conscientiously as it strives to improve our environment through sustainable building and operating practices and integrated community outreach. Alexandria is a responsible steward of capital and is proudly devoted to making a difference in the community by contributing time, effort, and financial support to the environment, its natural resources, and the people whom the Company faithfully serves.

AlexAndriA cOMMits itself to an integrated framework for corporate social responsibility, defined by four pillars:
sustAinABilitY Alexandria is dedicated to sustainable building and operating practices. Its buildings provide world-class facilities and cutting-edge equipment that have set the standard for LEED® development of laboratory facilities. Alexandria received the first LEED® Silver Certification for a core and shell office/laboratory building in California. Current and future projects seek to utilize the latest green technologies as the Company aims to minimize its carbon footprint, reduce waste, and incorporate clean energy production systems throughout its asset base.
tenAnt science A best-in-class partner to the lifescience industry, Alexandria provides optimal laboratory working environments that enable its client tenants to improve the quality of life through scientific discovery.
cOMMunitY Through volunteerism, Alexandria employees dedicate their personal time and talents in the service of local communities and the not-for-profit programs that serve them.
OPerAtiOn OutreAch Founded in 2003, Alexandria’s Operation Outreach program is built upon corporate and employee giving and community involvement. Alexandria dedicates resources to support local communities through science education for youth and provides much needed assistance to members of our armed forces and their families.

08 09
STABLE OPERATING MARGINS
55
50
60
65
70
75
80
85
98 99 00 01 02 03 04 05 06 07
IN PERCENT
OCCUPANCY
65
60
70
75
80
85
90
95
98 99 00 01 02 03 04 05 06 07 08 09
IN PERCENT
SQUARE FOOTAGE LEASEDIN MILLIONS
FAVORABLE LEASE STRUCTURE
4% GROSS LEASES
8% TENANT PAYS MAJORITY OF OPERATING EXPENSES 91%
93%
88% TRIPLE NET LEASES
SAME PROPERTY NET OPERATING INCOME PERFORMANCE
3.73.0
8.1
0.6
1.9
3.7
0.8
1.5
6.1
4.1
8.4
7.1
9.7
0.8
5.8
8.2
1.3
5.6
0.9
4.6
2.3
0% 98 00 0299 01 03 04 05 06 07 08 092Q 4Q 2Q 4Q 2Q 4Q 2Q 4Q 2Q 4Q 2Q 4Q 2Q 4Q 2Q 4Q 2Q 4Q 2Q 4Q 2Q 4Q 2Q 4Q
99 00 01 02 03 04 05 06 07 08 09
POSITIVE LEASE RENEWALIN PERCENT
TOTAL RETURN FROM IPO TO 2009 OUTPERFORMANCEOUT OF ALL PUBLICLY TRADED EQUITY REITS TOTAL RETURN FROM IPO TO 2009 (IN PERCENT)
S&P 500 Index
FTSE NAREIT Equity REIT Index
ALEXANDRIA REAL ESTATE EQUITIES, INC.
0.3
3.9 3.8
0.6
th
ALEXANDRIA REAL ESTATE EQUITIES, INC. MIXED OFFICE/INDUSTRIAL AVERAGE
Source: Citigroup Investment Research
0.5
0.0
1.0
1.5
2.0
2.5
05 06 07 08 09
EVOLUTION OF LEASE STRUCTUREIN PERCENT
IN PERCENT
% TRIPLE NET LEASES % RENT ESCALATION % CAPEX RECAPTURE TENANT PAYS MAJORITY OF OPERATING EXPENSES
85
80
75
70
65
60
90
95
1998 2009
7878 79 79 79 79 7977 77 75 75 74
95.796.298.4 99.0
96.393.9
95.293.2 93.1 93.8 94.8 94.1
1.51.6 1.6
2.2
1.9
78 7883 88 93 91
96
456
158
63
1.51.6 1.6
2.2
1.926.6 15.9 15.3 12.9 8.75.8 3.4 3.514.1 9.8 15.0
7878 79 79 79 79 7977 77 75 75 74
95.796.298.4 99.0
96.393.9
95.293.2 93.1 93.8 94.8 94.1
7.67.77.67.7
7.17.17.3
8.1
0.6
5.8
4.3
5.8
4.3
5.8
7.6
5.8
7.6
4.5
11.2
4.5
11.2
7.2
8.3
7.2
8.3
6.4
9.0
6.4
4.84.0
6.8
1.1
6.8
1.11.9
4.44.4
3.7
0.8
1.5
0.70.60.1
3.73.0
9.19.1
6.1
4.1
8.4
7.1
9.7
0.8
5.8
8.2
1.3
5.6
0.9
4.6
2.3
0.3
3.9 3.8
1.8
LEASES CONTAIN ANNUAL RENT ESCALATIONS (GENERALLY 3% PLUS)
LEASES PROVIDE FOR RECOVERY OF CAPITAL EXPENDITURES
stAB
ilitY
06AlexAndriA’s sOlid OPerAtinG PerfOrMAnce highlights the strength of its business model, particularly in the context of the 2009 financial crisis, which presented the single most challenging global economic environment in generations. Despite extremely unsettled market conditions, Alexandria raised significant capital, thereby positioning itself with stability and strength. The Company is poised to take advantage of significant opportunities existing in its value-added development pipeline. Alexandria now possesses the capacity for future growth at a time when many other companies do not. Through the years, Alexandria’s capital plan has been stable and consistent, with equity and debt partners that understand the Company’s objectives and are willing to provide the capital that serves as a cornerstone for Alexandria’s business.
08 09
STABLE OPERATING MARGINS
55
50
60
65
70
75
80
85
98 99 00 01 02 03 04 05 06 07
IN PERCENT
OCCUPANCY
65
60
70
75
80
85
90
95
98 99 00 01 02 03 04 05 06 07 08 09
IN PERCENT
SQUARE FOOTAGE LEASEDIN MILLIONS
FAVORABLE LEASE STRUCTURE
4% GROSS LEASES
8% TENANT PAYS MAJORITY OF OPERATING EXPENSES 91%
93%
88% TRIPLE NET LEASES
SAME PROPERTY NET OPERATING INCOME PERFORMANCE
3.73.0
8.1
0.6
1.9
3.7
0.8
1.5
6.1
4.1
8.4
7.1
9.7
0.8
5.8
8.2
1.3
5.6
0.9
4.6
2.3
0% 98 00 0299 01 03 04 05 06 07 08 092Q 4Q 2Q 4Q 2Q 4Q 2Q 4Q 2Q 4Q 2Q 4Q 2Q 4Q 2Q 4Q 2Q 4Q 2Q 4Q 2Q 4Q 2Q 4Q
99 00 01 02 03 04 05 06 07 08 09
POSITIVE LEASE RENEWALIN PERCENT
TOTAL RETURN FROM IPO TO 2009 OUTPERFORMANCEOUT OF ALL PUBLICLY TRADED EQUITY REITS TOTAL RETURN FROM IPO TO 2009 (IN PERCENT)
S&P 500 Index
FTSE NAREIT Equity REIT Index
ALEXANDRIA REAL ESTATE EQUITIES, INC.
0.3
3.9 3.8
0.6
th
ALEXANDRIA REAL ESTATE EQUITIES, INC. MIXED OFFICE/INDUSTRIAL AVERAGE
Source: Citigroup Investment Research
0.5
0.0
1.0
1.5
2.0
2.5
05 06 07 08 09
EVOLUTION OF LEASE STRUCTUREIN PERCENT
IN PERCENT
% TRIPLE NET LEASES % RENT ESCALATION % CAPEX RECAPTURE TENANT PAYS MAJORITY OF OPERATING EXPENSES
85
80
75
70
65
60
90
95
1998 2009
7878 79 79 79 79 7977 77 75 75 74
95.796.298.4 99.0
96.393.9
95.293.2 93.1 93.8 94.8 94.1
1.51.6 1.6
2.2
1.9
78 7883 88 93 91
96
456
158
63
1.51.6 1.6
2.2
1.926.6 15.9 15.3 12.9 8.75.8 3.4 3.514.1 9.8 15.0
7878 79 79 79 79 7977 77 75 75 74
95.796.298.4 99.0
96.393.9
95.293.2 93.1 93.8 94.8 94.1
7.67.77.67.7
7.17.17.3
8.1
0.6
5.8
4.3
5.8
4.3
5.8
7.6
5.8
7.6
4.5
11.2
4.5
11.2
7.2
8.3
7.2
8.3
6.4
9.0
6.4
4.84.0
6.8
1.1
6.8
1.11.9
4.44.4
3.7
0.8
1.5
0.70.60.1
3.73.0
9.19.1
6.1
4.1
8.4
7.1
9.7
0.8
5.8
8.2
1.3
5.6
0.9
4.6
2.3
0.3
3.9 3.8
1.8
LEASES CONTAIN ANNUAL RENT ESCALATIONS (GENERALLY 3% PLUS)
LEASES PROVIDE FOR RECOVERY OF CAPITAL EXPENDITURES
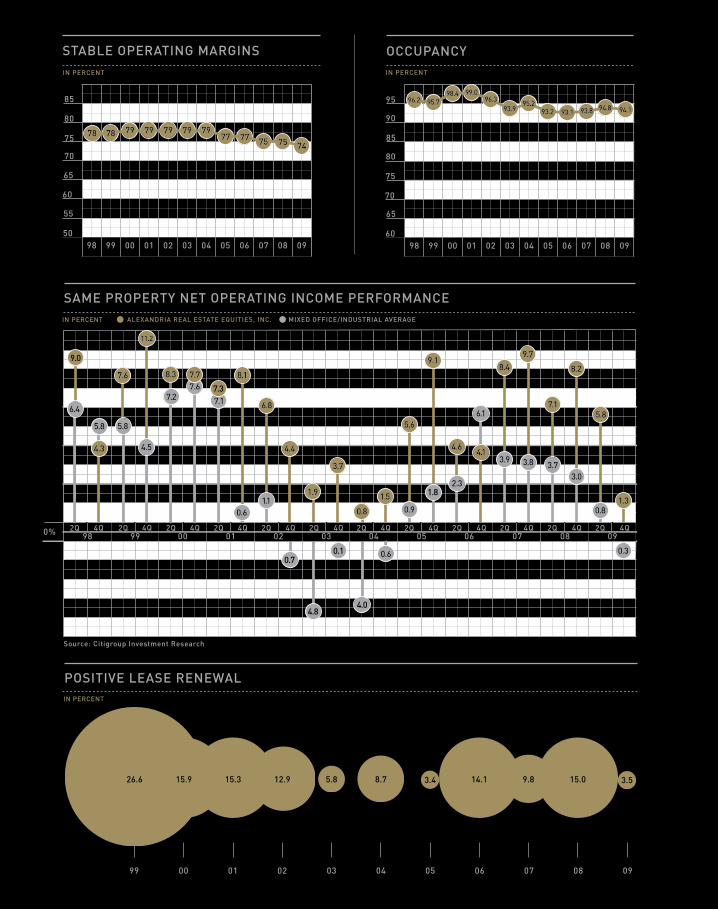
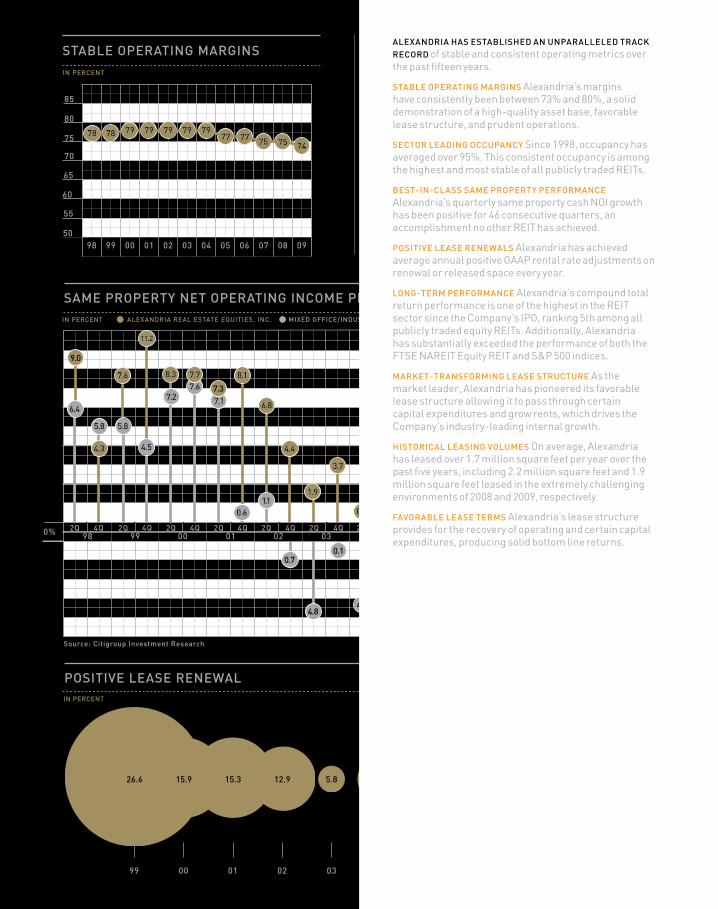
AlexAndriA hAs estABlished An unPArAlleled trAcK recOrd of stable and consistent operating metrics over the past fifteen years.
stABle OPerAtinG MArGins Alexandria’s margins have consistently been between 73% and 80%, a solid demonstration of a high-quality asset base, favorable lease structure, and prudent operations.
sectOr leAdinG OccuPAncY Since 1998, occupancy has averaged over 95%. This consistent occupancy is among the highest and most stable of all publicly traded REITs.
Best-in-clAss sAMe PrOPertY PerfOrMAnce
Alexandria’s quarterly same property cash NOI growth has been positive for 46 consecutive quarters, an accomplishment no other REIT has achieved.
POsitive leAse renewAls Alexandria has achieved average annual positive GAAP rental rate adjustments on renewal or released space every year.
lOnG-terM PerfOrMAnce Alexandria’s compound total return performance is one of the highest in the REIT sector since the Company’s IPO, ranking 5th among all publicly traded equity REITs. Additionally, Alexandria has substantially exceeded the performance of both the FTSE NAREIT Equity REIT and S&P 500 indices.
MArKet-trAnsfOrMinG leAse structure As the market leader, Alexandria has pioneered its favorable lease structure allowing it to pass through certain capital expenditures and grow rents, which drives the Company’s industry-leading internal growth.
histOricAl leAsinG vOluMes On average, Alexandria has leased over 1.7 million square feet per year over the past five years, including 2.2 million square feet and 1.9 million square feet leased in the extremely challenging environments of 2008 and 2009, respectively.
fAvOrABle leAse terMs Alexandria’s lease structure provides for the recovery of operating and certain capital expenditures, producing solid bottom line returns.

08 09
STABLE OPERATING MARGINS
55
50
60
65
70
75
80
85
98 99 00 01 02 03 04 05 06 07
IN PERCENT
OCCUPANCY
65
60
70
75
80
85
90
95
98 99 00 01 02 03 04 05 06 07 08 09
IN PERCENT
SQUARE FOOTAGE LEASEDIN MILLIONS
FAVORABLE LEASE STRUCTURE
4% GROSS LEASES
8% TENANT PAYS MAJORITY OF OPERATING EXPENSES 91%
93%
88% TRIPLE NET LEASES
SAME PROPERTY NET OPERATING INCOME PERFORMANCE
3.73.0
8.1
0.6
1.9
3.7
0.8
1.5
6.1
4.1
8.4
7.1
9.7
0.8
5.8
8.2
1.3
5.6
0.9
4.6
2.3
0% 98 00 0299 01 03 04 05 06 07 08 092Q 4Q 2Q 4Q 2Q 4Q 2Q 4Q 2Q 4Q 2Q 4Q 2Q 4Q 2Q 4Q 2Q 4Q 2Q 4Q 2Q 4Q 2Q 4Q
99 00 01 02 03 04 05 06 07 08 09
POSITIVE LEASE RENEWALIN PERCENT
TOTAL RETURN FROM IPO TO 2009 OUTPERFORMANCEOUT OF ALL PUBLICLY TRADED EQUITY REITS TOTAL RETURN FROM IPO TO 2009 (IN PERCENT)
S&P 500 Index
FTSE NAREIT Equity REIT Index
ALEXANDRIA REAL ESTATE EQUITIES, INC.
0.3
3.9 3.8
0.6
th
ALEXANDRIA REAL ESTATE EQUITIES, INC. MIXED OFFICE/INDUSTRIAL AVERAGE
Source: Citigroup Investment Research
0.5
0.0
1.0
1.5
2.0
2.5
05 06 07 08 09
EVOLUTION OF LEASE STRUCTUREIN PERCENT
IN PERCENT
% TRIPLE NET LEASES % RENT ESCALATION % CAPEX RECAPTURE TENANT PAYS MAJORITY OF OPERATING EXPENSES
85
80
75
70
65
60
90
95
1998 2009
7878 79 79 79 79 7977 77 75 75 74
95.796.298.4 99.0
96.393.9
95.293.2 93.1 93.8 94.8 94.1
1.51.6 1.6
2.2
1.9
78 7883 88 93 91
96
456
158
63
1.51.6 1.6
2.2
1.926.6 15.9 15.3 12.9 8.75.8 3.4 3.514.1 9.8 15.0
7878 79 79 79 79 7977 77 75 75 74
95.796.298.4 99.0
96.393.9
95.293.2 93.1 93.8 94.8 94.1
7.67.77.67.7
7.17.17.3
8.1
0.6
5.8
4.3
5.8
4.3
5.8
7.6
5.8
7.6
4.5
11.2
4.5
11.2
7.2
8.3
7.2
8.3
6.4
9.0
6.4
4.84.0
6.8
1.1
6.8
1.11.9
4.44.4
3.7
0.8
1.5
0.70.60.1
3.73.0
9.19.1
6.1
4.1
8.4
7.1
9.7
0.8
5.8
8.2
1.3
5.6
0.9
4.6
2.3
0.3
3.9 3.8
1.8
LEASES CONTAIN ANNUAL RENT ESCALATIONS (GENERALLY 3% PLUS)
LEASES PROVIDE FOR RECOVERY OF CAPITAL EXPENDITURES

2 2009annualreport
2009Financials

23 alexandriarealestateequities,inc.
FORWARD-LOOKINg STATEMENTS
Certain information and statements included in this annual report, including, without limitation, statements containing
the words “believes,” “expects,” “may,” “will,” “should,” “seeks,” “approximately,” “intends,” “plans,” “estimates,” or “an-
ticipates,” or the negative of these words or similar words, constitute “forward-looking statements” within the meaning of sec-
tion 27a of the securities act of 1933, as amended, and section 21e of the securities exchange act of 1934, as amended. such
forward-looking statements involve known and unknown risks, uncertainties, and other factors that may cause our actual results,
performance or achievements, or industry results, to be materially different from any future results, performance or achievements
expressed or implied by such forward-looking statements. Given these uncertainties, prospective and current investors are cau-
tioned not to place undue reliance on such forward-looking statements. a number of important factors could cause actual results
to differ materially from those set forth or contemplated in the forward-looking statements, including, but not limited to, our fail-
ure to obtain capital (debt, construction financing, or equity) or refinance debt maturities, increased interest rates and operating
costs, adverse economic or real estate developments in our markets, our failure to successfully complete and lease our existing
space held for redevelopment and new properties acquired for that purpose and any properties undergoing development, our
failure to successfully operate or lease acquired properties, decreased rental rates or increased vacancy rates or failure to renew or
replace expiring leases, defaults on or non-renewal of leases by tenants, general and local economic conditions, and other factors
described in our annual report on form 10-K for the fiscal year ended december 31, 2009 and our other reports that are publicly
filed with the securities and exchange Commission (“seC”). We disclaim any obligation to update such factors or publicly an-
nounce the result of any revisions to any of the forward-looking statements contained in this or any other document. readers of
this annual report should also read our reports that are publicly filed with the seC for further discussion.
ForWard-looKingstateMentsAlexandria Real Estate Equities, Inc.
24 2009annualreport
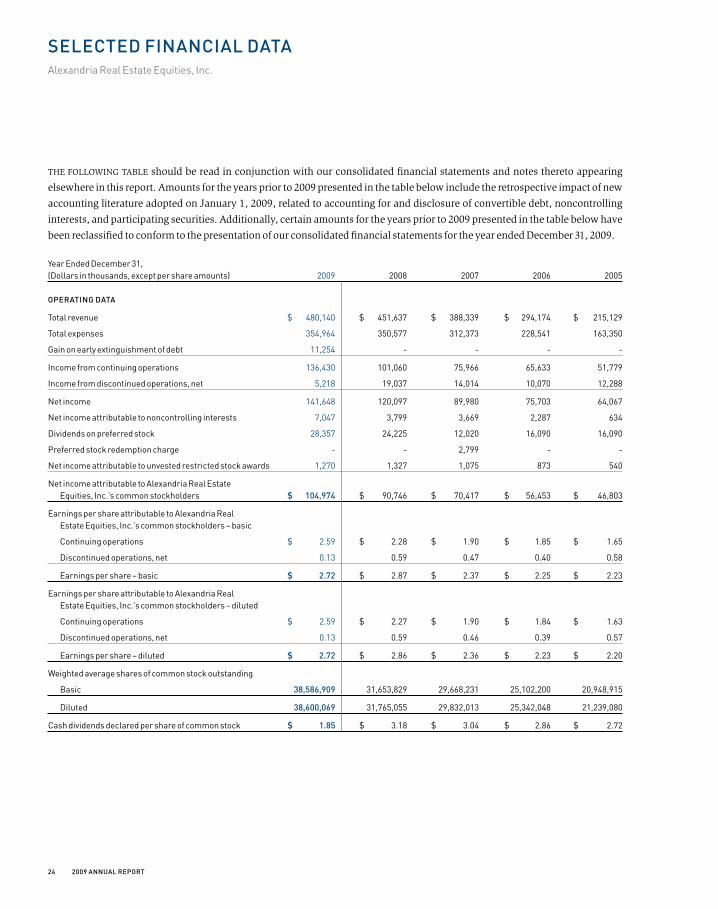
the folloWinG table should be read in conjunction with our consolidated financial statements and notes thereto appearing
elsewhere in this report. amounts for the years prior to 2009 presented in the table below include the retrospective impact of new
accounting literature adopted on January 1, 2009, related to accounting for and disclosure of convertible debt, noncontrolling
interests, and participating securities. additionally, certain amounts for the years prior to 2009 presented in the table below have
been reclassified to conform to the presentation of our consolidated financial statements for the year ended december 31, 2009.
Year Ended December 31, (Dollars in thousands, except per share amounts) 2009 2008 2007 2006 2005
operatingdata
Total revenue $ 480,140 $ 451,637 $ 388,339 $ 294,174 $ 215,129
Total expenses 354,964 350,577 312,373 228,541 163,350
Gain on early extinguishment of debt 11,254 - - - -
Income from continuing operations 136,430 101,060 75,966 65,633 51,779
Income from discontinued operations, net 5,218 19,037 14,014 10,070 12,288
Net income 141,648 120,097 89,980 75,703 64,067
Net income attributable to noncontrolling interests 7,047 3,799 3,669 2,287 634
Dividends on preferred stock 28,357 24,225 12,020 16,090 16,090
Preferred stock redemption charge - - 2,799 - -
Net income attributable to unvested restricted stock awards 1,270 1,327 1,075 873 540
Net income attributable to Alexandria Real Estate Equities, Inc.’s common stockholders $ 104,974 $ 90,746 $ 70,417 $ 56,453 $ 46,803
Earnings per share attributable to Alexandria Real Estate Equities, Inc.’s common stockholders – basic
Continuing operations $ 2.59 $ 2.28 $ 1.90 $ 1.85 $ 1.65
Discontinued operations, net 0.13 0.59 0.47 0.40 0.58
Earnings per share – basic $ 2.72 $ 2.87 $ 2.37 $ 2.25 $ 2.23
Earnings per share attributable to Alexandria Real Estate Equities, Inc.’s common stockholders – diluted
Continuing operations $ 2.59 $ 2.27 $ 1.90 $ 1.84 $ 1.63
Discontinued operations, net 0.13 0.59 0.46 0.39 0.57
Earnings per share – diluted $ 2.72 $ 2.86 $ 2.36 $ 2.23 $ 2.20
Weighted average shares of common stock outstanding
Basic 38,586,909 31,653,829 29,668,231 25,102,200 20,948,915
Diluted 38,600,069 31,765,055 29,832,013 25,342,048 21,239,080
Cash dividends declared per share of common stock $ 1.85 $ 3.18 $ 3.04 $ 2.86 $ 2.72
selectedFinancialdataAlexandria Real Estate Equities, Inc.

25 alexandriarealestateequities,inc.
Year Ended December 31, (Dollars in thousands) 2009 2008 2007 2006 2005
Balancesheetdata(atyearend)
Rental properties, net $ 3,383,308 $ 3,215,723 $ 3,057,294 $ 2,663,088 $ 1,662,905
Land held for future development $ 255,025 $ 109,478 $ 89,621 $ 63,163 $ 12,615
Construction in progress $ 1,400,795 $ 1,398,895 $ 1,143,314 $ 596,331 $ 442,636
Total assets $ 5,457,227 $ 5,132,077 $ 4,641,245 $ 3,617,477 $ 2,362,450
Total debt $ 2,746,946 $ 2,938,108 $ 2,750,648 $ 2,024,866 $ 1,406,666
Total liabilities $ 3,051,148 $ 3,357,014 $ 3,025,502 $ 2,208,348 $ 1,512,535
Redeemable noncontrolling interests $ 41,441 $ 33,963 $ 35,342 $ 20,132 $ 20,115
Alexandria Real Estate Equities, Inc.’s stockholders’ equity $ 2,323,408 $ 1,700,010 $ 1,540,219 $ 1,351,652 $ 829,800
Noncontrolling interests $ 41,230 $ 41,090 $ 40,182 $ 37,345 $ –
Total equity $ 2,364,638 $ 1,741,100 $ 1,580,401 $ 1,388,997 $ 829,800
reconciliationoFnetincoMeattriButaBleto alexandriarealestateequities,inc.’scoMMon stocKholderstoFundsFroMoperations attriButaBletoalexandriarealestateequities, inc.’scoMMonstocKholders
Net income attributable to Alexandria Real Estate Equities, Inc.’s common stockholders $ 104,974 $ 90,746 $ 70,417 $ 56,453 $ 46,803
Add:
Depreciation and amortization (1) 118,508 108,743 97,335 74,039 55,416
Net income attributable to noncontrolling interests 7,047 3,799 3,669 2,287 634
Net income attributable to unvested restricted stock awards 1,270 1,327 1,075 873 540
Subtract:
Gain on sales of property (2) (2,627) (20,401) (7,976) (59) (36)
FFO attributable to noncontrolling interests (3,843) (4,108) (3,733) (1,928) (668)
FFO attributable to unvested restricted stock awards (2,694) (2,596) (2,418) (2,006) (1,171)
FFO attributable to Alexandria Real Estate Equities, Inc.’s common stockholders (3) $ 222,635 $ 177,510 $ 158,369 $ 129,659 $ 101,518
otherdata
Cash provided by operating activities $ 205,950 $ 255,837 $ 188,031 $ 125,641 $ 123,970
Cash used in investing activities $ (409,923) $ (494,933) $ (949,253) $ (961,636) $ (433,645)
Cash provided by financing activities $ 203,440 $ 302,227 $ 766,304 $ 835,032 $ 310,428
Number of properties at year end 156 159 166 158 132
Rentable square feet of properties at year end 11,759,643 11,769,136 12,259,416 11,338,060 8,922,856
Occupancy of properties at year end 89% 90% 88% 88% 88%
Occupancy of properties at year end, excluding properties undergoing redevelopment and properties “held for sale” 94% 95% 94% 93% 93%
(1) Includes depreciation and amortization on assets “held for sale” reflected as discontinued operations for the periods prior to when such assets were classified as “held for sale.”
(2) Gain on sales of property is classified in the consolidated statements of income as income from discontinued operations, net.
(3) United States generally accepted accounting principles (“GAAP”) basis accounting for real estate assets utilizes historical cost accounting and assumes real estate values diminish over time. In an effort to overcome the difference between real estate values and historical cost accounting for real estate assets, the Board of Governors of the National Association of Real Estate Investment Trusts ("NAREIT") established the measurement tool of Funds from Operations (“FFO”). Since its introduction, FFO has become a widely used non-GAAP financial measure by real estate investment trusts ("REITs"). We believe that FFO is helpful to investors as an additional measure of the performance of an equity REIT. We compute FFO in accordance with standards established by the Board of Governors of NAREIT in its April 2002 White Paper (the "White Paper") and related implementation guidance, which may differ from the methodology for calculating FFO utilized by other equity REITs, and, accordingly, may not be comparable to such other REITs. The White Paper defines FFO as net income (loss) (computed in accordance with GAAP), excluding gains (or losses) from sales, plus real estate related depreciation and amortization, and after adjustments for unconsolidated partnerships and joint ventures. While FFO is a relevant and widely used measure of operating performance for REITs, it should not be considered as an alternative to net income (determined in accordance with GAAP) as an indication of financial performance, or to cash flows from operating activities (determined in accordance with GAAP) as a measure of our liquidity, nor is it indicative of funds available to fund our cash needs, including our ability to make distributions. For a more detailed discussion of FFO, see "Management's Discussion and Analysis of Financial Condition and Results of Operations - Funds From Operations.”

26 2009annualreport
the folloWinG disCussion should be read in conjunction with our consolidated financial statements and notes thereto appearing
elsewhere in this report. forward-looking statements involve inherent risks and uncertainties regarding events, conditions, and
financial trends that may affect our future plans of operation, business strategy, results of operations, and financial position.
a number of important factors could cause actual results to differ materially from those included within or contemplated by
such forward-looking statements, including, but not limited to, those described below in this report. We do not undertake any
responsibility to update any of these factors or to announce publicly any revisions to any of the forward-looking statements
contained in this or any other document, whether as a result of new information, future events, or otherwise.
OvERvIEW
We are a publicly traded reit focused principally on science-driven cluster formation. We are the leading provider of high-quality
environmentally sustainable real estate, technical infrastructure services, and capital to the broad and diverse life science industry.
Client tenants include institutional (universities and independent not-for-profit institutions), pharmaceutical, biotechnology,
medical device, product, service and translational entities, as well as government agencies. our operating platform is based on the
principle of “clustering,” with assets and operations located in key life science markets.
in 2009, we:
• Executed142leasesfor1,864,000rentablesquarefeet.
• Reportedoccupancyat94%asofDecember31,2009.
• Enteredintoa15-yearleasewithanaffiliateofEliLillyandCompanyasananchortenantatAlexandriaCenter™for
life science – new York City.
• Leased310,000rentablesquarefeetofredevelopmentanddevelopmentspace.
• Completedground-updevelopmentofonepropertyatMissionBay,SanFrancisco,aggregating102,000rentable
squarefeetpursuanttoa15-yearleasewithPfizerInc.
• Reducedprincipalbalancesofsecurednotespayableby$267million.
• Completedredevelopmentofmultiplespacesat10propertiesaggregating227,000rentablesquarefeet,of
whichapproximately72%wasleased.
• Closed10-yearsecuredloanfor$120million.
• Soldfourpropertiesforapproximately$21million.
• Closedtwofollow-oncommonstockofferingswithaggregatenetproceedsof$488million.
• Closedprivateofferingof8.00%unsecuredconvertiblenoteswithnetproceedsof$233million.
• Repurchased,inprivatelynegotiatedtransactions,approximately$75million(parvalue)ofour3.70%
unsecured convertible notes.
• ReceivedLEED®GoldCertificationforabuildingintheSanDiegomarket.
2009 demonstrated the strength and durability of our core operations providing life science laboratory space to the broad
and diverse life science industry. our core operating results were relatively steady for the year ended december 31, 2009, during
the continuing extraordinary and unprecedented worldwide economic, financial, banking and credit market crisis, significant
worldwide economic recession, and drastic decline in consumer confidence and the consumer-driven economy. financial
systems throughout the world have recently experienced significant periods of illiquidity with banks much less willing to lend
substantial amounts to other banks and borrowers.
the economic, financial and banking environment, and consumer confidence have improved since the depth of the crisis in the
fourthquarterof2008andfirstquarterof2009.Evenwiththerecentimprovements,weremaincautiousregardingtheeconomic,
financial, and banking environment. We intend to continue to focus on the completion of our existing active redevelopment
projectsaggregatingapproximately575,152rentablesquarefeetandourexistingactivedevelopmentprojectsaggregating
ManageMent'sdiscussionandanalysisoFFinancialconditionandresultsoFoperationsAlexandria Real Estate Equities, Inc.
27 alexandriarealestateequities,inc.
approximatelyanadditional980,000rentablesquarefeet.Additionally,weintendtocontinuewithpreconstructionactivities
for certain land parcels for future ground-up/vertical aboveground development in order to preserve and create value for these
projects. these important preconstruction activities add significant value to our land for future ground-up development and are
required for the ultimate vertical construction of the buildings. We also intend to be very careful and prudent with any future
decisions to add new projects to our active ground-up/vertical developments. future ground-up/vertical development projects
will likely require significant pre-leasing from high-quality and/or credit entities. We also intend to continue to reduce debt as
a percentage of our overall capital structure over a multi-year period. during this period, we may also extend and/or refinance
certain debt maturities. We expect the source of funds for construction activities and repayment of outstanding debt to be provided
over several years by opportunistic sales of real estate, joint ventures, cash flows from operations, new secured or unsecured debt,
and the issuance of additional equity securities, as appropriate. as of december 31, 2009, we had identified three assets as “held
for sale,” which have been classified in discontinued operations.
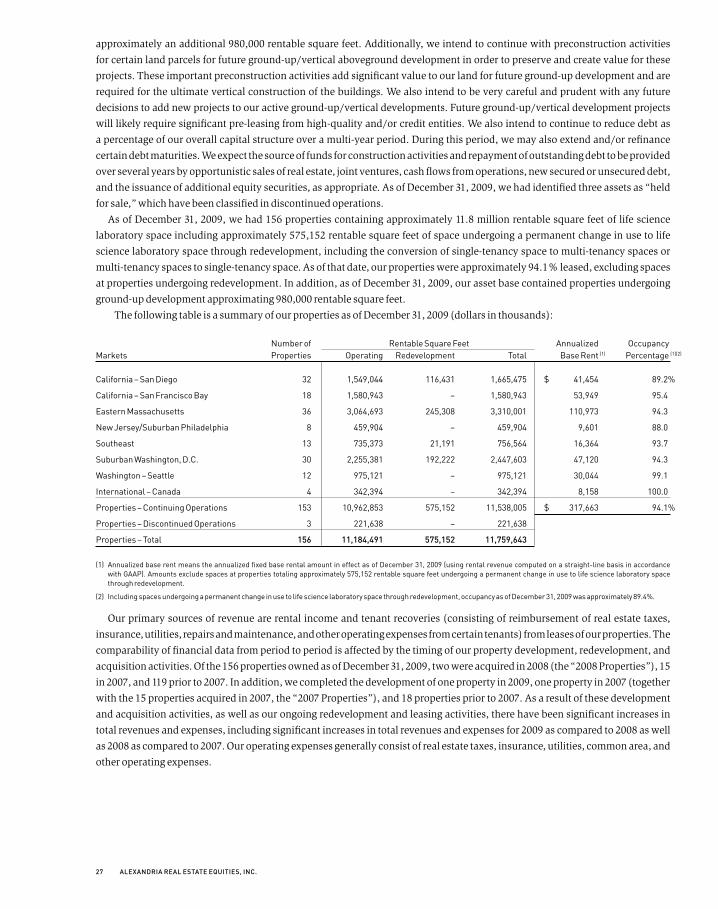
AsofDecember31,2009,wehad156propertiescontainingapproximately11.8millionrentablesquarefeetoflifescience
laboratoryspaceincludingapproximately575,152rentablesquarefeetofspaceundergoingapermanentchangeinusetolife
science laboratory space through redevelopment, including the conversion of single-tenancy space to multi-tenancy spaces or
multi-tenancyspacestosingle-tenancyspace.Asofthatdate,ourpropertieswereapproximately94.1%leased,excludingspaces
at properties undergoing redevelopment. in addition, as of december 31, 2009, our asset base contained properties undergoing
ground-updevelopmentapproximating980,000rentablesquarefeet.
the following table is a summary of our properties as of december 31, 2009 (dollars in thousands):
Number of Rentable Square Feet Annualized OccupancyMarkets Properties Operating Redevelopment Total Base Rent (1) Percentage (1)(2)
California – San Diego 32 1,549,044 116,431 1,665,475 $ 41,454 89.2%
California – San Francisco Bay 18 1,580,943 – 1,580,943 53,949 95.4
Eastern Massachusetts 36 3,064,693 245,308 3,310,001 110,973 94.3
New Jersey/Suburban Philadelphia 8 459,904 – 459,904 9,601 88.0
Southeast 13 735,373 21,191 756,564 16,364 93.7
Suburban Washington, D.C. 30 2,255,381 192,222 2,447,603 47,120 94.3
Washington – Seattle 12 975,121 – 975,121 30,044 99.1
International – Canada 4 342,394 – 342,394 8,158 100.0
Properties – Continuing Operations 153 10,962,853 575,152 11,538,005 $ 317,663 94.1%
Properties – Discontinued Operations 3 221,638 – 221,638
Properties – Total 156 11,184,491 575,152 11,759,643
(1) Annualized base rent means the annualized fixed base rental amount in effect as of December 31, 2009 (using rental revenue computed on a straight-line basis in accordance with GAAP). Amounts exclude spaces at properties totaling approximately 575,152 rentable square feet undergoing a permanent change in use to life science laboratory space through redevelopment.
(2) Including spaces undergoing a permanent change in use to life science laboratory space through redevelopment, occupancy as of December 31, 2009 was approximately 89.4%.
our primary sources of revenue are rental income and tenant recoveries (consisting of reimbursement of real estate taxes,
insurance, utilities, repairs and maintenance, and other operating expenses from certain tenants) from leases of our properties. the
comparability of financial data from period to period is affected by the timing of our property development, redevelopment, and
acquisitionactivities.Ofthe156propertiesownedasofDecember31,2009,twowereacquiredin2008(the“2008Properties”),15
in 2007, and 119 prior to 2007. in addition, we completed the development of one property in 2009, one property in 2007 (together
withthe15propertiesacquiredin2007,the“2007Properties”),and18propertiespriorto2007.Asaresultofthesedevelopment
and acquisition activities, as well as our ongoing redevelopment and leasing activities, there have been significant increases in
totalrevenuesandexpenses,includingsignificantincreasesintotalrevenuesandexpensesfor2009ascomparedto2008aswell
as2008ascomparedto2007.Ouroperatingexpensesgenerallyconsistofrealestatetaxes,insurance,utilities,commonarea,and
other operating expenses.
28 2009annualreport
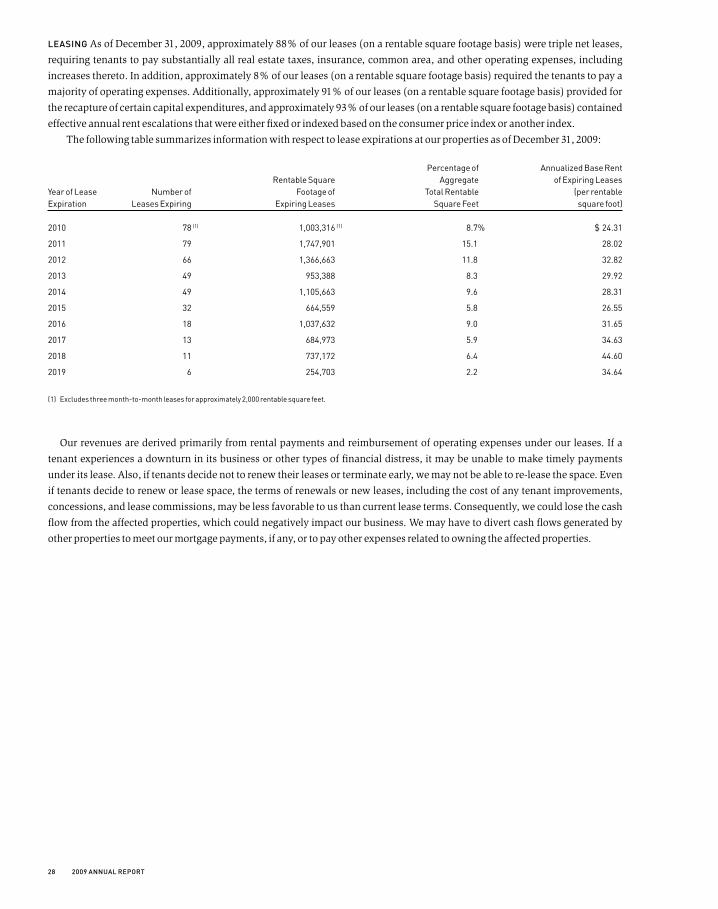
leasingAsofDecember31,2009,approximately88%ofourleases(onarentablesquarefootagebasis)weretriplenetleases,
requiring tenants to pay substantially all real estate taxes, insurance, common area, and other operating expenses, including
increasesthereto.Inaddition,approximately8%ofourleases(onarentablesquarefootagebasis)requiredthetenantstopaya
majorityofoperatingexpenses.Additionally,approximately91%ofourleases(onarentablesquarefootagebasis)providedfor
therecaptureofcertaincapitalexpenditures,andapproximately93%ofourleases(onarentablesquarefootagebasis)contained
effective annual rent escalations that were either fixed or indexed based on the consumer price index or another index.
ThefollowingtablesummarizesinformationwithrespecttoleaseexpirationsatourpropertiesasofDecember31,2009:
Percentage of Annualized Base Rent Rentable Square Aggregate of Expiring Leases Year of Lease Number of Footage of Total Rentable (per rentable Expiration Leases Expiring Expiring Leases Square Feet square foot)
2010 78 (1) 1,003,316 (1) 8.7% $ 24.31
2011 79 1,747,901 15.1 28.02
2012 66 1,366,663 11.8 32.82
2013 49 953,388 8.3 29.92
2014 49 1,105,663 9.6 28.31
2015 32 664,559 5.8 26.55
2016 18 1,037,632 9.0 31.65
2017 13 684,973 5.9 34.63
2018 11 737,172 6.4 44.60
2019 6 254,703 2.2 34.64
(1) Excludes three month-to-month leases for approximately 2,000 rentable square feet.
our revenues are derived primarily from rental payments and reimbursement of operating expenses under our leases. if a
tenant experiences a downturn in its business or other types of financial distress, it may be unable to make timely payments
under its lease. also, if tenants decide not to renew their leases or terminate early, we may not be able to re-lease the space. even
if tenants decide to renew or lease space, the terms of renewals or new leases, including the cost of any tenant improvements,
concessions, and lease commissions, may be less favorable to us than current lease terms. Consequently, we could lose the cash
flow from the affected properties, which could negatively impact our business. We may have to divert cash flows generated by
other properties to meet our mortgage payments, if any, or to pay other expenses related to owning the affected properties.

29 alexandriarealestateequities,inc.
Value-addedactiVities Construction in progress includes the following value-added activities as of december 31, 2009 (dollars
in thousands):
Square Value-Added Activities Amount Feet
Redevelopment projects $ 135,521 575,152
Development projects 407,084 980,000
Preconstruction projects 617,964 5,229,000
New markets and other projects 240,226 1,057,000
Total $1,400,795 7,841,152
AmountsareclassifiedasconstructioninprogressasrequiredunderGAAPwhileconstructionactivitiesareongoingtobring
the asset to its intended use. When construction activities cease, the asset is transferred out of construction in progress and
classified as rental properties, net or land held for future development.
a key component of our business model is our value-added redevelopment and development programs. these programs are
focused on providing high-quality generic life science laboratory space that is reusable by various life science industry tenants.
upon completion, each value-added project is expected to generate significant revenues and cash flows. our redevelopment
and development projects are generally in locations highly desirable by life science entities, which we believe results in higher
occupancy levels, longer lease terms, and higher rental income and returns. redevelopment projects consist of the permanent
change in use of office, warehouse, and shell space into generic life science laboratory space, including the conversion of single-
tenancy space to multi-tenancy spaces or multi-tenancy spaces to single-tenancy space. our investment in redevelopment projects
generallyrangesfrom$75to$150persquarefootdependingonthenatureoftheexistingbuildingimprovements.Development
projects consist of the ground-up development of generic life science laboratory facilities. We also have certain significant value-
added projects undergoing important and substantial preconstruction activities to bring these assets to their intended use. these
critical activities add significant value for future ground-up development and are required for the ultimate vertical construction
of buildings. ultimately, these land parcels will provide valuable opportunities for new ground-up construction projects. the
projects will provide high-quality facilities for the life science industry and will generate significant revenues and cash flows for
the Company.
a component of our business model also includes ground-up development projects in new markets and other unique projects.
We have two development parcels in China. one development parcel is located in south China, where a two-building project
aggregatingapproximately275,000rentablesquarefeetisunderconstruction.TheseconddevelopmentparcelislocatedinNorth
China, where a two-building project aggregating approximately 272,000 rentable square feet is under construction. additional
projectsincludeconstructionrelatedtositework,plaza,park,andundergroundparkingatAlexandriaCentertm for life science –
new York City, a unique state-of-the-art urban science park in the city, and in the adjoining future building approximating 410,000
rentable square feet.
our success with our redevelopment, development, and preconstruction projects depends on many risks that may adversely
affect our business, including those associated with the following:
• negativeworldwideeconomic,financial,andbankingconditions;
• worldwideeconomicrecessionandlackofconfidence;
• financingavailability;
• national,local,andworldwideeconomicconditions;
• delaysinconstruction;
• budgetoverruns;
• lackofavailabilityand/orincreasingcostsofmaterials;
• commoditypricingofbuildingmaterialsandsupplies;
• changesinthelifesciences,financial,andbankingindustries;
• volatilityininterestrates;
• laboravailabilityand/orstrikes;
• uncertaintyofleasing;
30 2009annualreport
• timingofthecommencementofrentalpayments;
• changesinlocalsubmarketconditions;
• delaysordenialsofentitlementsorpermits;and
• otherpropertydevelopmentuncertainties.
in addition, redevelopment, development, and preconstruction activities, regardless of whether they are ultimately successful,
typically require a substantial portion of management's time and attention. this may distract management from focusing on other
operational activities. if we are unable to complete redevelopment, development, and preconstruction projects successfully, our
business may be adversely affected.
CRITICAL ACCOuNTINg pOLICIES
our discussion and analysis of our financial condition and results of operations are based upon our consolidated financial
statements,whichhavebeenpreparedinaccordancewithGAAP.Oursignificantaccountingpoliciesaredescribedinthenotes
to our consolidated financial statements appearing elsewhere in this report. the preparation of these financial statements in
conformitywithGAAPrequiresustomakeestimates,judgments,andassumptionsthataffectthereportedamountsofassets,
liabilities, revenues, and expenses. We base these estimates, judgments, and assumptions on historical experience and on various
other factors that we believe to be reasonable under the circumstances. Changes in estimates could affect our financial position
and specific items in our results of operations that are used by our stockholders, potential investors, industry analysts, and lenders
in their evaluation of our performance. actual results may differ from these estimates under different assumptions or conditions.
reitcoMpliance We have elected to be taxed as a reit under the internal revenue Code. Qualification as a reit involves the
application of highly technical and complex provisions of the internal revenue Code to our operations and financial results,
and the determination of various factual matters and circumstances not entirely within our control. We believe that our current
organizationandmethodofoperationcomplywiththerulesandregulationspromulgatedundertheInternalRevenueCodeto
enableustoqualify,andcontinuetoqualify,asaREIT.However,itispossiblethatwehavebeenorganizedorhaveoperatedina
manner that would not allow us to qualify as a reit, or that our future operations could cause us to fail to qualify.
if we fail to qualify as a reit in any taxable year, then we will be required to pay federal income tax (including any applicable
alternative minimum tax) on our taxable income at regular corporate rates. if we lose our reit status, then our net earnings
available for investment or distribution to our stockholders will be significantly reduced for each of the years involved and we will
no longer be required to make distributions to our stockholders.
rentalproperties,net,landheldForFuturedeVelopMent,andconstructioninprogress in december 2007, the
financial accounting standards board (“fasb”) issued new accounting literature with respect to business combinations. We
prospectivelyadoptedthenewguidanceonJanuary1,2009.Inaccordancewiththenewguidance,werecognizeassetsacquired
(including the intangible value to above- or below-market leases, acquired in-place leases, tenant relationships, and other
intangible assets or liabilities), liabilities assumed, and any noncontrolling interests in an acquired entity at their fair values as of
the acquisition date. the value of tangible assets acquired is based upon our estimation of value on an “as if vacant” basis. the
value of acquired in-place leases includes the estimated carrying costs during the hypothetical lease-up period and other costs
that would have been incurred to execute similar leases, considering market conditions at the acquisition date of the acquired
in-place lease. We assess the fair values of tangible and intangible assets based on numerous factors, including estimated cash
flowprojectionsthatutilizeappropriatediscount,capitalizationrates,andavailablemarketinformation.Estimatesoffuturecash
flows are based on a number of factors, including the historical operating results, known trends, and market/economic conditions
thatmayaffecttheproperty.Wealsorecognizethefairvaluesofassetsacquired,theliabilitiesassumed,andanynoncontrolling
interestsinacquisitionsoflessthana100%interestwhentheacquisitionconstitutesachangeincontroloftheacquiredentity.
Inaddition,acquisition-relatedcostsandrestructuringcostsareexpensedasincurred.Priortotheadoptionofthenewguidance
related to business combinations, the purchase price was allocated based upon relative fair values, and acquisition-related costs
onsuccessfulacquisitionswerecapitalizedandamortizedovertheestimatedusefullivesoftheassetsacquired.
the values allocated to land improvements, buildings, building improvements, tenant improvements, and equipment are
depreciated on a straight-line basis using an estimated life of 20 years for land improvements, the shorter of the term of the
respective ground lease or 40 years for buildings and building improvements, the respective lease term for tenant improvements,
andtheestimatedusefullifeforequipment.Thevaluesofacquiredabove-andbelow-marketleasesareamortizedoverthelives
31 alexandriarealestateequities,inc.
of the related leases and recorded as either an increase (for below-market leases) or a decrease (for above-market leases) to
rental income. the values of acquired in-place leases are classified as leasing costs, included in other assets in the accompanying
consolidatedbalancesheets,andamortizedovertheremainingtermsoftherelatedleases.
rental properties, land held for future development, construction in progress, and intangibles are individually evaluated
for impairment when conditions exist that may indicate that it is probable that the sum of expected future undiscounted cash
flows is less than the carrying amount. impairment indicators for our rental properties, land held for future development, and
construction in progress are assessed by project and include, but are not limited to, significant fluctuations in estimated net
operating income, occupancy changes, construction costs, estimated completion dates, rental rates, and other market factors.
We assess the expected undiscounted cash flows based upon numerous factors, including, but not limited to, construction costs,
available market information, historical operating results, known trends, and market/economic conditions that may affect the
property and our assumptions about the use of the asset, including, if necessary, a probability-weighted approach if multiple
outcomes are under consideration. upon determination that an impairment has occurred, a write-down is recorded to reduce the
carrying amount to its estimated fair value.
capitalizationoFcostsWearerequiredtocapitalizedirectconstructionanddevelopmentcosts,includingpreconstruction
costs, interest, property taxes, insurance, and other costs directly related and essential to the acquisition, development,
redevelopment,orconstructionofaproject.Capitalizationofconstruction,development,andredevelopmentcostsisrequired
while activities are ongoing to prepare an asset for its intended use. Costs incurred after a project is substantially complete and
ready for its intended use are expensed as incurred. should development, redevelopment, or construction activity cease, interest,
propertytaxes,insurance,andcertainothercostswouldnolongerbeeligibleforcapitalizationandwouldbeexpensedas
incurred. expenditures for repairs and maintenance are expensed as incurred.
Wealsocapitalizecostsdirectlyrelatedandessentialtoourleasingactivities.Thesecostsareamortizedonastraight-linebasis
over the terms of the related leases. Costs related to unsuccessful leasing opportunities are expensed.
accountingForinVestMents We hold equity investments in certain publicly traded companies and privately held entities
primarily involved in the life science industry. all of our investments in publicly traded companies are considered "available
for sale" and are recorded at fair value. fair value has been determined based upon the closing price as of each balance sheet
date,withunrealizedgainsandlossesshownasaseparatecomponentoftotalequity.Theclassificationofeachinvestmentis
determined at the time each investment is made, and such determination is reevaluated at each balance sheet date. the cost of
eachinvestmentsoldisdeterminedbythespecificidentificationmethod,withnetrealizedgainsincludedinotherincome.
investments in privately held entities are generally accounted for under the cost method when our interest in the entity is so
minor that we have virtually no influence over such entity's operating and financial policies. Certain investments in privately held
entities are accounted for under the equity method when our interest in the entity is not deemed so minor that we have virtually
no influence over such entity's operating and financial policies. under the equity method of accounting, we record our investment
initiallyatcostandadjustthecarryingamountoftheinvestmenttorecognizeourshareoftheearningsorlossesoftheinvestee
subsequent to the date of our investment. additionally, we limit our ownership percentage in the voting stock of each individual
entitytolessthan10%.
individual investments are evaluated for impairment when changes in conditions may indicate an impairment exists. the
factors that we consider in making these assessments include, but are not limited to, market prices, market conditions, available
financing, prospects for favorable or unfavorable clinical trial results, new product initiatives, and new collaborative agreements.
if there are no identified events or changes in circumstances that would have an adverse effect on our cost method investments,
we do not estimate its fair value. for all of our investments, if a decline in the fair value of an investment below the carrying value
is determined to be other-than-temporary, such investment is written down to its estimated fair value with a non-cash charge to
current earnings. We use “significant other observable inputs” and “significant unobservable inputs” to determine the fair value
of privately held entities.
32 2009annualreport
interestratehedgeagreeMents We are exposed to certain risks arising from both our business operations and economic
conditions. We principally manage our exposures to a wide variety of business and operational risks through management of
our core business activities. We manage economic risks, including interest rate, liquidity, and credit risk primarily by managing
the amount, sources, duration of our debt funding, and the use of interest rate hedge agreements. specifically, we enter into
interest rate hedge agreements to manage exposures that arise from business activities that result in the payment of future
known and uncertain cash amounts, the value of which are determined by interest rates. our interest rate hedge agreements are
used to manage differences in the amount, timing, and duration of our known or expected cash payments principally related to
our borrowings based on the london interbank offered rate (“libor”). We do not use derivatives for trading or speculative
purposes, and currently all of our derivatives are designated as hedges. our objectives in using interest rate hedge agreements are
to add stability to interest expense and to manage our exposure to interest rate movements in accordance with our interest rate risk
management strategy. interest rate swap agreements designated as cash flow hedges involve the receipt of variable rate amounts
from a counterparty in exchange for the Company making fixed rate payments over the life of the interest rate swap agreements
without exchange of the underlying notional amount. interest rate cap agreements designated as cash flow hedges involve the
receipt of variable rate amounts from a counterparty if interest rates rise above the strike rate on the contract in exchange for an
up-front premium.
We record our interest rate hedge agreements in the consolidated balance sheets at their estimated fair values with an offsetting
adjustmentreflectedasunrealizedgains/lossesinaccumulatedothercomprehensiveincomeintotalequity.Theaccountingfor
changes in fair value (i.e., gains or losses) of a derivative instrument depends on whether it has been designated and qualifies
as part of a hedging relationship and further, on the type of hedging relationship. for those derivative instruments that are
designated and qualify as hedging instruments, a company must designate the hedging instrument, based upon the exposure
being hedged, as a fair value hedge, a cash flow hedge, or a hedge of a net investment in a foreign operation. our interest rate hedge
agreements are considered cash flow hedges as they are designated and qualify as hedges of the exposure to variability in expected
future cash flows. hedge accounting generally provides for the matching of the timing of gain or loss recognition on the hedging
instrument with the recognition of the changes in the earnings effect of the hedged forecasted transactions in a cash flow hedge.
all of our interest rate hedge agreements meet the criteria to be deemed “highly effective” in reducing our exposure to variable
interest rates. We formally document all relationships between interest rate hedge agreements and hedged items, including the
method for evaluating effectiveness and the risk strategy. We make an assessment at the inception of each interest rate hedge
agreement and on an ongoing basis to determine whether these instruments are “highly effective” in offsetting changes in cash
flowsassociatedwiththehedgeditems.Theineffectiveportionofeachinterestratehedgeagreementisimmediatelyrecognized
in earnings. While we intend to continue to meet the conditions for such hedge accounting, if hedges did not qualify as “highly
effective,” the changes in the fair values of the derivatives used as hedges would be reflected in earnings.
the fair values of our interest rate hedge agreements are determined using widely accepted valuation techniques, including
discounted cash flow analyses on the expected cash flows of each derivative. these analyses reflect the contractual terms of the
derivatives, including the period to maturity, and use observable market-based inputs, including interest rate curves and implied
volatilities (also referred to as “significant other observable inputs”). the fair values of our interest rate swap agreements are
determined using the market standard methodology of netting the discounted future fixed cash payments and the discounted
expected variable cash receipts. the variable cash receipts are based on an expectation of future interest rates (forward curves)
derived from observable market interest rate curves. the fair value of our interest rate cap agreement is determined using the
market standard methodology of discounting the future expected cash receipts that would occur if variable interest rates rise
above the strike rate of the interest rate cap agreement. the variable interest rate used in the calculation of projected receipts
on the interest rate cap agreement is based on an expectation of future interest rates derived from observable market interest
rate curves and volatilities. the fair value calculation also includes an amount for risk of non-performance using “significant
unobservable inputs” such as estimates of current credit spreads to evaluate the likelihood of default, which we have determined
to be insignificant to the overall fair value of our interest rate hedge agreements. in adjusting the fair value of our interest rate
hedge agreements for the risk of non-performance, we have considered any applicable credit enhancements such as collateral
postings, thresholds, mutual puts, and guarantees. these methods of assessing fair value result in a general approximation of
value,andsuchvaluemayneverberealized.
33 alexandriarealestateequities,inc.
recognitionoFrentalincoMeandtenantrecoVeries rental income from leases with scheduled rent increases, free rent,
incentives,orotherrentadjustmentsisrecognizedonastraight-linebasisovertherespectiveleaseterms.Weincludeamounts
currentlyrecognizedasincome,andexpectedtobereceivedinlateryears,indeferredrentintheaccompanyingconsolidated
balancesheets.Amountsreceivedcurrently,butrecognizedasincomeinfutureyears,areincludedasunearnedrentinaccounts
payable, accrued expenses, and tenant security deposits in our consolidated balance sheets. We commence recognition of rental
income at the date the property is ready for its intended use and the tenant takes possession of or controls the physical use of
the property.
tenant recoveries related to reimbursement of real estate taxes, insurance, utilities, repairs and maintenance, and other
operatingexpensesarerecognizedasrevenueintheperiodtheapplicableexpensesareincurred.
if necessary, we maintain an allowance for estimated losses that may result from the inability of our tenants to make payments
requiredunderthetermsofthelease.Ifatenantfailstomakecontractualpaymentsbeyondanyallowance,wemayrecognize
additionalbaddebtexpenseinfutureperiodsequaltotheamountofunpaidrentandunrealizeddeferredrent.AsofDecember31,
2009and2008,wehadnoallowancefordoubtfulaccounts.
discontinuedoperations a property is classified as “held for sale” when all of the following criteria for a plan of sale have
beenmet:(1)management,havingtheauthoritytoapprovetheaction,commitstoaplantoselltheproperty;(2)thepropertyis
availableforimmediatesaleinitspresentcondition,subjectonlytotermsthatareusualandcustomary;(3)anactiveprogramto
locateabuyer,andotheractionsrequiredtocompletetheplantosell,havebeeninitiated;(4)thesaleofthepropertyisprobable
andisexpectedtobecompletedwithinoneyear;(5)thepropertyisbeingactivelymarketedforsaleatapricethatisreasonable
inrelationtoitscurrentfairvalue;and(6)actionsnecessarytocompletetheplanofsaleindicatethatitisunlikelythatsignificant
changes to the plan will be made or that the plan will be withdrawn. When all of these criteria have been met, the property is
classified as “held for sale,” its operations, including any interest expense directly attributable to it, are classified as discontinued
operations in our consolidated statements of income, and amounts for all prior periods presented are reclassified from continuing
operationstodiscontinuedoperations.Alossisrecognizedforanyinitialadjustmentoftheasset’scarryingamounttofairvalue
less costs to sell in the period the asset qualifies as “held for sale.” depreciation of assets ceases upon designation of a property as
“held for sale.”
iMpactoFrecentlyissuedaccountingstandards in January 2010, the fasb issued an accounting standard update (“asu”)
to address implementation issues associated with the accounting for decreases in the ownership of a subsidiary. the new guidance
clarified the scope of the entities covered by the guidance related to accounting for decreases in the ownership of a subsidiary
and specifically excluded in-substance real estate or conveyances of oil and gas mineral rights from the scope. additionally, the
new guidance expands the disclosures required for a business combination achieved in stages and deconsolidation of a business
or nonprofit activity. the new guidance became effective for interim and annual periods ending on or after december 31, 2009
and must be applied on a retrospective basis to the first period that an entity adopted the new guidance related to noncontrolling
interests. the adoption of this new guidance did not have an impact on our consolidated financial statements.
in January 2010, the fasb issued an asu to address diversity in practice related to the accounting for a distribution to
shareholders that offers them the ability to elect to receive their entire distribution in cash or shares of equivalent value with a
potential limitation on the total amount of cash that shareholders can elect to receive in the aggregate. the new guidance clarifies
that the stock portion of a distribution to shareholders that allows them to elect to receive cash or shares with a potential limitation
on the total amount of cash that all shareholders can elect to receive in the aggregate is considered a share issuance that is reflected
in earnings per share prospectively as opposed to a stock dividend that is retroactively applied by restating shares outstanding and
earnings per share for all periods presented. the new guidance became effective for interim and annual periods ending on or after
december 31, 2009, and must be applied on a retrospective basis. the adoption of this new guidance did not have an impact on our
consolidated financial statements.
in June 2009, the fasb established the fasb accounting standards Codification (the “Codification”) as the source of
authoritativeaccountingprinciplesrecognizedbytheFASBtobeappliedbynongovernmentalentitiesinthepreparationof
financialstatementsinconformitywithGAAP.RulesandinterpretivereleasesoftheSECunderauthorityoffederalsecurities
lawsarealsosourcesofauthoritativeGAAPforSECregistrants.AllguidancecontainedintheCodificationcarriesanequallevel
ofauthority.TheCodificationbecameeffectiveforinterimorannualfinancialperiodsendingafterSeptember15,2009.The
adoption of the Codification did not have an impact on our consolidated financial statements.
34 2009annualreport
in June 2009, the fasb issued new accounting literature with respect to the consolidation of variable interest entities (“Vies”).
the new guidance impacts the consolidation guidance applicable to Vies and among other things requires a qualitative rather
than a quantitative analysis to determine the primary beneficiary of a Vie, continuous assessments of whether a company is the
primarybeneficiaryofaVIE,andenhanceddisclosuresaboutacompany’sinvolvementwithaVIE.Thenewguidanceappliesto
our fiscal year beginning on January 1, 2010, and early adoption is prohibited. We are currently evaluating the impact of the new
guidance on our consolidated financial statements.
in may 2009, the fasb issued new accounting literature with respect to subsequent events. the new guidance, among other
things, clarifies accounting for and disclosure of events that occur after the balance sheet date but before financial statements are
issued or available to be issued. We adopted the new guidance effective april 1, 2009, and the adoption did not have an impact on
our consolidated financial statements.
RESuLTS OF OpERATIONS
coMparisonoFtheyearendeddeceMBer31,2009totheyearendeddeceMBer31,2008 rental revenues increased by
$25.1million,or7%,to$366.2millionfortheyearendedDecember31,2009,comparedto$341.1millionfortheyearended
December31,2008.Theincreaseresultedfromrentalrevenuefrompropertiesplacedinserviceorredevelopedduringtheperiods
afterJanuary1,2008,andincreasesinrentalratesrelatedtorenewedand/orreleasablespaceleased.Additionally,in2009and
2008,werecognizedadditionalrentalincomeaggregating$18.5millionand$11.3million,respectively,primarilyrelatedtoa
modification of a lease for a property in south san francisco, California.
Tenantrecoveriesincreasedby$2.8million,or3%,to$102.1millionfortheyearendedDecember31,2009,comparedto$99.4
millionfortheyearendedDecember31,2008.Theincreaseresultedprimarilyfrompropertiesplacedinserviceorredeveloped
duringtheperiodsafterJanuary1,2008.AsofDecember31,2009and2008,approximately88%and89%,respectively,ofour
leases (on a rentable square footage basis) were triple net leases, requiring tenants to pay substantially all real estate taxes,
insurance, common area, and other operating expenses, including increases thereto.
OtherincomefortheyearsendedDecember31,2009and2008,of$11.8millionand$11.2million,respectively,represents
construction management fees, interest, investment income, and storage income. other income for the year ended december 31,
2009,alsoincludesa$7.2millioncashpaymentrelatedtorealestateacquiredinNovember2007.Excludingthiscashpayment,
the decrease in other income is primarily due to decreases in investment income for the year ended december 31, 2009, as
comparedtotheyearendedDecember31,2008.
Rentaloperatingexpensesincreasedby$8.5million,or8%,to$120.5millionfortheyearendedDecember31,2009,compared
to$112.0millionfortheyearendedDecember31,2008.Theincreaseresultedprimarilyfromincreasesinrentaloperating
expenses (primarily payroll, property taxes, and insurance) from properties placed in service or redeveloped during the periods
afterJanuary1,2008.Themajorityoftheincreaseinrentaloperatingexpenseswasrecoverablefromourtenants.
Generalandadministrativeexpensesincreasedby$1.5million,or4%,to$36.3millionfortheyearendedDecember31,2009,
comparedto$34.8millionfortheyearendedDecember31,2008.Asapercentageoftotalrevenues,generalandadministrative
expensesfor2009remainedconsistentwith2008atapproximately8%.
Interestexpensedecreasedby$2.8million,or3%,to$81.3millionfortheyearendedDecember31,2009,comparedto
$84.1millionfortheyearendedDecember31,2008.ThedecreaseresultedfromadecreaseinLIBORratesandadecreaseinthe
outstandingbalanceonourunsecuredlineofcreditpartiallyoffsetbytheissuanceofour8%unsecuredconvertiblenotes.The
weighted average interest rate on our unsecured line of credit and unsecured term loan, including the impact of our interest rate
hedgeagreements,decreasedfromapproximately4.30%asofDecember31,2008,toapproximately4.10%asofDecember31,
2009. We have entered into certain interest rate hedge agreements to hedge a portion of our exposure to variable interest rates
primarily associated with our unsecured line of credit and unsecured term loan (see "liquidity and Capital resources – interest
rate hedge agreements").
Depreciationandamortizationincreasedby$10.5million,or10%,to$116.9millionfortheyearendedDecember31,2009,
comparedto$106.4millionfortheyearendedDecember31,2008.Theincreaseresultedprimarilyfromdepreciationassociated
withtheimprovementsandpropertiesplacedinserviceorredevelopedduringtheperiodsafterJanuary1,2008.
During2009,werecognizedagainonearlyextinguishmentofdebtofapproximately$11.3millionrelatedtotherepurchase,in
privatelynegotiatedtransactions,ofapproximately$75million(parvalue)ofcertainofour3.70%UnsecuredConvertibleNotes.
During2008,werecognizedaggregatenon-cashimpairmentchargesof$13.3millionassociatedwithother-than-temporary
declines in the value of certain investments below their carrying value.
35 alexandriarealestateequities,inc.
Incomefromdiscontinuedoperations,netofapproximately$5.2millionfortheyearendedDecember31,2009,reflectsthe
results of operations of three properties that were classified as “held for sale” as of december 31, 2009 and four properties
soldduring2009.Inconnectionwiththepropertiessoldin2009,werecordedagainofapproximately$2.6million.Income
fromdiscontinuedoperations,netofapproximately$19.0millionfortheyearendedDecember31,2008,reflectstheresultsof
operations of three properties that were classified as “held for sale” as of december 31, 2009, four properties sold during 2009,
andeightpropertiessoldduring2008.Inconnectionwiththepropertiessoldin2008,werecordedagainofapproximately$20.4
million.Wealsorecordedanon-cashimpairmentchargeof$4.7millioninMarch2008relatedtoanindustrialbuildinglocatedin
a suburban submarket south of boston and an office building located in the san diego market which has been included in income
fromdiscontinuedoperations,net.Thesepropertiesweresoldlaterin2008.
coMparisonoFtheyearendeddeceMBer31,2008totheyearendeddeceMBer31,2007 rental revenues increased by
$47.6million,or16%,to$341.1millionfortheyearendedDecember31,2008comparedto$293.4millionfortheyearended
december 31, 2007. the increase resulted from rental revenue from properties acquired, placed in service, or redeveloped during
the periods after January 1, 2007 and increases in rental rates related to renewed and/or re-leasable space leased. additionally,
duringtheyearendedDecember31,2008,werecognizedadditionalrentalincomeaggregating$11.3millionprimarilyrelatedtoa
modification of a lease for a property in south san francisco, California.
Tenantrecoveriesincreasedby$19.1million,or24%,to$99.4millionfortheyearendedDecember31,2008comparedto
$80.2millionfortheyearendedDecember31,2007.Theincreaseresultedprimarilyfrompropertiesacquired,placedinservice,
orredevelopedduringtheperiodsafterJanuary1,2007.AsofDecember31,2008and2007,approximately89%and88%,
respectively, of our leases (on a rentable square footage basis) were triple net leases, requiring tenants to pay substantially all real
estate taxes, insurance, common area, and other operating expenses, including increases thereto.
OtherincomefortheyearsendedDecember31,2008and2007of$11.2millionand$14.7million,respectively,represents
construction management fees, interest, investment income, and storage income. as a percentage of total revenues, other income
fortheyearsendedDecember31,2008and2007remainedrelativelyconsistentatapproximately2%to4%oftotalrevenues.
Rentaloperatingexpensesincreasedby$17.1million,or18%,to$112.0millionfortheyearendedDecember31,2008compared
to$94.9millionfortheyearendedDecember31,2007.Theincreaseresultedprimarilyfromincreasesinrentaloperatingexpenses
(primarily property taxes and utilities) from properties acquired, placed in service, or redeveloped during the periods after
January 1, 2007. the majority of the increase in rental operating expenses was recoverable from our tenants.
Generalandadministrativeexpensesincreasedby$2.5million,or8%,to$34.8millionfortheyearendedDecember31,2008
comparedto$32.3millionfortheyearendedDecember31,2007,primarilyduetothegrowthinboththedepthandbreadthofour
operations in multiple markets, including internationally. as a percentage of total revenues, general and administrative expenses
fortheyearendedDecember31,2008remainedconsistentwiththeyearendedDecember31,2007atapproximately8%.
Interestexpensedecreasedby$8.2million,or9%,to$84.1millionfortheyearendedDecember31,2008comparedto$92.3
million for the year ended december 31, 2007. the decrease resulted primarily from a decrease in outstanding borrowings on our
unsecuredlineofcreditduetotheissuanceof10.0millionsharesofour7.00%seriesDcumulativeconvertiblepreferredstock
("SeriesDConvertiblePreferredStock")inMarchandApril2008.Additionally,thedecreaseresultedfromadecreaseinLIBOR
rates. these decreases were partially offset by increases in indebtedness on our unsecured line of credit. these borrowings were
utilizedtofinancethedevelopment,redevelopment,andacquisitionofthe2007Propertiesand2008Properties.Theweighted
average interest rate on our unsecured line of credit and unsecured term loan, including the impact of our interest rate hedge
agreements,decreasedfromapproximately5.85%asofDecember31,2007toapproximately4.30%asofDecember31,2008.
We have entered into certain interest rate hedge agreements to hedge a portion of our exposure to variable interest rates primarily
associated with our unsecured line of credit and unsecured term loan (see "liquidity and Capital resources – interest rate
hedge agreements").
Depreciationandamortizationincreasedby$13.5million,or15%,to$106.4millionfortheyearendedDecember31,2008,
comparedto$92.9millionfortheyearendedDecember31,2007.Theincreaseresultedprimarilyfromdepreciationassociated
with the improvements and properties acquired, placed in service, or redeveloped during the period after January 1, 2007.
During2008,werecognizedaggregatenon-cashimpairmentchargesof$13.3millionassociatedwithother-than-temporary
declines in the value of certain investments below their carrying value.
Incomefromdiscontinuedoperations,netof$19.0millionfortheyearendedDecember31,2008,reflectstheresultsof
operations of three properties that were classified as “held for sale” as of december 31, 2009, four properties sold in 2009, and
eightpropertiessoldduring2008.Inconnectionwiththepropertiessoldin2008,werecordedagainofapproximately$20.4
36 2009annualreport
million.Wealsorecordedanon-cashimpairmentchargeof$4.7millioninMarch2008relatedtoanindustrialbuildinglocatedin
a suburban submarket south of boston and an office building located in the san diego market that has been included in income
fromdiscontinuedoperations,net.Thesepropertiesweresoldlaterin2008.Incomefromdiscontinuedoperations,netof$14.0
million for the year ended december 31, 2007, reflects the results of operations of three properties that were classified as “held for
sale”asofDecember31,2009,fourpropertiessoldin2009,eightpropertiessoldduring2008,andfourpropertiesandfourland
parcels sold during 2007. in connection with the properties sold during the year ended december 31, 2007, we recorded a gain of
approximately$8.0million.
LIquIDITy AND CApITAL RESOuRCES
oVerVieW We expect to continue meeting our short-term liquidity and capital requirements generally through our working capital
and net cash provided by operating activities. We believe that the net cash provided by operating activities will continue to be
sufficient to enable us to make the distributions necessary to continue qualifying as a reit. We also believe that net cash provided
by operating activities will be sufficient to fund recurring non-revenue-enhancing capital expenditures, tenant improvements,
and leasing commissions.
We expect to meet certain long-term liquidity requirements, such as for property development, redevelopment, other
construction projects, scheduled debt maturities, and non-recurring capital improvements, through net cash provided by
operating activities, periodic asset sales, and long-term secured and unsecured indebtedness, including borrowings under the
unsecured line of credit and unsecured term loan, and the issuance of additional debt and/or equity securities.
notwithstanding our expectations, financial markets have recently experienced unusual volatility and uncertainty. While this
condition had occurred initially within the "subprime" mortgage lending sector of the credit market, financial systems throughout
the world have recently experienced significant periods of illiquidity with banks much less willing to lend substantial amounts to
other banks and borrowers. Consequently, there is greater uncertainty regarding our ability to access the credit markets in order
to attract financing or capital on reasonable terms or on any terms. our ability to finance our development and redevelopment
projects and pending or new acquisitions, as well as our ability to refinance debt maturities, could be adversely affected by our
inability to secure capital on reasonable terms, if at all.
the current economic, financial, and banking environment, worldwide economic recession, and lack of consumer confidence
haveimprovedsincethefourthquarterof2008andfirstquarterof2009.Evenwiththerecentimprovements,weremaincautious
over the economic, financial, and banking environment. We intend to continue to focus on the completion of our existing active
redevelopmentprojectsaggregatingapproximately575,152rentablesquarefeetandourexistingactivedevelopmentprojects
aggregatinganadditionalapproximately980,000rentablesquarefeet.Additionally,weintendtocontinuewithpreconstruction
activities for certain land parcels for future ground-up/vertical aboveground development in order to preserve and create value
for these projects. these important preconstruction activities add significant value to our land for future ground-up development
and are required for the ultimate vertical construction of the buildings. We also intend to be very careful and prudent with any
future decisions to add new projects to our active ground-up/vertical developments. future ground-up/vertical development
projects will likely require significant pre-leasing from high-quality and/or credit entities. We also intend to continue to reduce
debt as a percentage of our overall capital structure over a multi-year period. during this period, we may also extend and/or
refinance certain debt maturities. We expect the source of funds for construction activities and repayment of outstanding debt
to be provided over several years by cash flows from operations, opportunistic sales of real estate, joint ventures, new secured or
unsecured debt, and the issuance of additional equity securities, as appropriate. as of december 31, 2009, we had identified three
assets as “held for sale” that have been classified in discontinued operations.
as further discussed below, our principal liquidity needs are to fund the following:
• normalrecurringexpenses;
• currentdevelopmentandredevelopmentcosts;
• capitalexpenditures,includingtenantimprovementsandleasingcosts;
• principalandinterestpaymentsdueunderourdebtobligations,includingballoonpaymentsofprincipal;and
• dividenddistributionsinordertomaintainourREITqualificationundertheInternalRevenueCode.
We believe that our sources of capital for our principal liquidity needs will be satisfied by the following:
• cashonhandofapproximately$70.6millionasofDecember31,2009;
• restrictedcashofapproximately$24.1millionasofDecember31,2009,tofundcertainconstructioncosts;
• cashflowsgeneratedbyoperatingactivities(fortheyearendedDecember31,2009,wegeneratedapproximately
$206.0millionofcashflowsfromoperatingactivities);

37 alexandriarealestateequities,inc.
• availabilityunderour$1.9billionunsecuredlineofcreditandunsecuredtermloan(approximately$1.2billion
outstandingasofDecember31,2009);
• cashproceedsfromnewsecuredorunsecuredfinancings;
• cashproceedsgeneratedfrompotentialassetsalesincludingthreepropertiesthatwereclassifiedas“heldforsale”
asofDecember31,2009;
• cashproceedsfromtheissuanceofcommonorpreferredequityordebtsecurities;and
• cashproceedsfromjointventures.
pRINCIpAL LIquIDITy NEEDS
contractualoBligationsandcoMMitMentsContractual obligations as of december 31, 2009, consisted of the following (in
thousands):
Payments by Period
Total 2010 2011-2012 2013-2014 Thereafter
Secured notes payable (1) $ 937,017 $ 35,982 $ 176,191 $ 308,096 $ 416,748
Unsecured line of credit (2) 476,000 – 476,000 – –
Unsecured term loan (2) 750,000 – 750,000 – –
Unsecured convertible notes 624,700 – 384,700 240,000 –
Estimated interest payments 598,252 120,955 193,638 113,605 170,054
Ground lease obligations 611,440 6,558 15,831 17,079 571,972
Other obligations 3,288 1,357 1,931 – –
Total $4,000,697 $164,852 $1,998,291 $678,780 $1,158,774
(1) Assumes we exercise our sole right to extend the maturity dates of a secured note payable of approximately $28.5 million from January 1, 2011, to January 1, 2012, and a secured note payable of approximately $38.4 million from January 2, 2012, to April 6, 2013. Amounts include noncontrolling interests’ share of scheduled principal maturities of approximately $39.3 million, of which approximately $17.6 million and $20.8 million mature in 2013 and 2014, respectively. Also, amounts are net of unamortized discounts of approximately $2.1 million.
(2) Assumes we exercise our sole right to extend the maturity date of our unsecured line of credit from October 2010 to October 2011 and our unsecured term loan from October 2011 to October 2012.
SecurednotespayableasofDecember31,2009,consistedof26notessecuredby57propertiesandonelanddevelopment
parcel. our secured notes payable require monthly payments of principal and interest and had weighted average interest rates of
approximately5.83%atDecember31,2009.Noncontrollinginterests’shareofsecurednotespayableaggregatedapproximately
$39.3millionasofDecember31,2009.Thetotalbookvaluesofrentalproperties,net,landheldforfuturedevelopment,and
constructioninprogresssecuringdebtwereapproximately$1.4billionatDecember31,2009.AtDecember31,2009,oursecured
notespayablewerecomprisedofapproximately$831.5millionand$105.5millionoffixedandvariableratedebt,respectively.
our unsecured line of credit matures in october 2010 and may be extended at our sole option for an additional one-year period
to october 2011. our unsecured term loan matures in october 2011 and may be extended at our sole option for an additional one-
year period to october 2012.
InApril2009,wecompletedaprivateofferingof$240millionunsecuredconvertiblenoteswithacouponof8.00%(the"8.00%
UnsecuredConvertibleNotes").InJanuary2007,wecompletedaprivateofferingof$460millionunsecuredconvertiblenotes
withacouponof3.70%(the"3.70%UnsecuredConvertibleNotes").InApril2009,werepurchased,inprivatelynegotiated
transactions,approximately$75million(parvalue)ofcertainofour3.70%UnsecuredConvertibleNotes.Seeadditional
information under note 7 to our consolidated financial statements regarding our ability to redeem the notes, the ability of the
holders to require us to repurchase the notes, and circumstances under which the holders may convert the notes.
estimated interest payments on our fixed rate debt and hedged variable rate debt were calculated based upon contractual
interest rates, including the impact of interest rate swap agreements, interest payment dates, and scheduled maturity dates.
AsofDecember31,2009,approximately83%ofourdebtwasfixedratedebtorvariableratedebtsubjecttointerestratehedge
agreements. see additional information regarding our interest rate hedge agreements under “liquidity and Capital resources
–InterestRateHedgeAgreements.”Theremaining17%ofourdebtisunhedgedvariableratedebtbasedprimarilyonLIBOR.
interest payments on our unhedged variable rate debt have been excluded from the table above because we cannot reasonably
determine the future interest obligations on variable rate debt as we cannot predict the applicable variable interest rates in the
future.SeeadditionalinformationregardingourdebtunderNotes5,6,7,and8toourconsolidatedfinancialstatements.

38 2009annualreport
Ground lease obligations as of december 31, 2009, included leases for 19 of our properties and three land development parcels.
these lease obligations have remaining lease terms from 23 to 97 years, excluding extension options.
in addition, as of december 31, 2009, remaining aggregate costs under contracts for the construction of properties undergoing
development, redevelopment, and life science laboratory infrastructure improvements under the terms of leases approximated
$186.8million.Weexpectpaymentsfortheseobligationstooccuroveronetothreeyears,subjecttocapitalplanningadjustments
fromtimetotime.Wearealsocommittedtofundapproximately$48.3millionforcertaininvestmentsoverthenextsixyears.
capital expenditures, tenant iMproVeMents, and leasing costs as of december 31, 2009, we had an aggregate of
approximately980,000rentablesquarefeetundergoingverticalground-upconstructionandanaggregateofapproximately
575,152rentablesquarefeetundergoingapermanentchangeinusetolifesciencelaboratoryspacethroughredevelopment
including the conversion of single-tenancy space to multi-tenancy spaces or multi-tenancy spaces to single-tenancy space.
For the years ended December 31, 2009, 2008, and 2007, we paid property-related capital expenditures and tenant
improvements related to our properties, including expenditures related to our development and redevelopment projects,
aggregatingapproximately$446.1million,$542.5million,and$589.7million,respectively.Theseamountsincludepaymentsfor
property-related capital expenditures and tenant improvements presented in the table below, including non-revenue-enhancing
capital expenditures and tenant improvement and leasing costs related to re-tenanted and renewal space. We expect our future
property-related capital expenditures and tenant improvements related to our life science properties to decrease in 2010 as
compared to 2009.
the following table shows five-year average per square foot property-related capital expenditures, tenant improvements and
leasing costs (excluding capital expenditures and tenant improvements that are recoverable from tenants, revenue-enhancing,
orrelatedtopropertiesthathaveundergoneredevelopment)fortheyearsendedDecember31,2009,2008,2007,2006,and2005:
Five-Year Year Ended December 31, Average 2009 2008 2007 2006 2005
capitalexpenditures(1)
Major capital expenditures $ 772,000 $ 529,000 $ 405,000 $ 1,379,000 $ 575,000 $ 972,000
Recurring capital expenditures $ 985,000 $ 1,405,000 $ 955,000 $ 648,000 $ 639,000 $ 1,278,000
Square feet in portfolio 10,581,399 11,740,993 11,770,769 11,476,217 9,790,326 8,128,690
Per square foot:
Major capital expenditures $ 0.07 $ 0.05 $ 0.03 $ 0.12 $ 0.06 $ 0.12
Recurring capital expenditures $ 0.09 $ 0.12 $ 0.08 $ 0.06 $ 0.07 $ 0.16
tenantiMproVeMentsandleasingcosts
re-tenantedspace(2)
Tenant improvements and leasing costs $ 1,619,000 $ 1,475,000 $ 3,481,000 $ 1,446,000 $ 1,370,000 $ 324,000
Re-tenanted square feet 264,382 211,638 505,773 224,767 248,846 130,887
Per square foot $ 6.12 $ 6.97 $ 6.88 $ 6.43 $ 5.51 $ 2.48
renewalspace
Tenant improvements and leasing costs $ 1,861,000 $ 3,263,000 $ 2,364,000 $ 1,942,000 $ 957,000 $ 778,000
Renewal square feet 703,645 976,546 748,512 671,127 455,980 666,058
Per square foot $ 2.64 $ 3.34 $ 3.16 $ 2.89 $ 2.10 $ 1.17
(1) Property-related capital expenditures include all major capital and recurring capital expenditures except capital expenditures that are recoverable from tenants, revenue-enhancing
capital expenditures, or costs related to the redevelopment of a property. Major capital expenditures consist of roof replacements and heavy-duty heating, ventilation and air-conditioning ("HVAC") systems that are typically identified and considered at the time a property is acquired.
(2) Excludes space that has undergone redevelopment before re-tenanting.
39 alexandriarealestateequities,inc.
Capital expenditures fluctuate in any given period due to the nature, extent, and timing of improvements required and the
extenttowhichtheyarerecoverablefromourtenants.AsofDecember31,2009,approximately91%(onarentablesquare
footage basis) of our leases provide for the recapture of certain capital expenditures (such as hVaC systems maintenance and/or
replacement, roof replacement, and parking lot resurfacing). in addition, we maintain an active preventive maintenance program
ateachofourpropertiestominimizecapitalexpenditures.
tenant improvements and leasing costs also fluctuate in any given year depending upon factors such as the timing and extent
of vacancies, property age, location, characteristics, the type of lease (renewal tenant or re-tenanted space), the involvement of
external leasing agents, and overall competitive market conditions.
We expect our future capital expenditures, tenant improvements, and leasing costs (excluding capital expenditures and tenant
improvements that are recoverable from tenants, revenue-enhancing or related to properties that have undergone redevelopment)
to be approximately in the range as shown in the table on the previous page.
unsecuredlineoFcreditandunsecuredterMloan We use our unsecured line of credit and unsecured term loan to fund
workingcapital,constructionactivities,and,fromtimetotime,acquisitionofproperties.Our$1.9billionunsecuredcredit
facilitiesconsistofa$1.15billionunsecuredlineofcreditanda$750millionunsecuredtermloan.Wemayinthefutureelect
toincreasecommitmentsunderourunsecuredcreditfacilitiesbyuptoanadditional$500million.AsofDecember31,2009,
wehadborrowingsof$476millionand$750millionoutstandingunderourunsecuredlineofcreditandunsecuredtermloan,
respectively, with a weighted average interest rate, including the impact of our interest rate swap agreements, of approximately
4.10%.
our unsecured line of credit and unsecured term loan, as amended, bear interest at a floating rate based on our election of either
(1)aLIBOR-basedrateplus1.00%to1.45%dependingonourleverageor(2)thehigherofaratebaseduponBankofAmerica’s
primerateplus0.0%to0.25%dependingonourleverageandtheFederalFundsrateplus0.50%.ForeachLIBOR-basedadvance,
we must elect a libor period of one, two, three, or six months. our unsecured line of credit matures in october 2010 and may be
extended at our sole option for an additional one-year period to october 2011. our unsecured term loan matures in october 2011
and may be extended at our sole option for an additional one-year period to october 2012.
our unsecured line of credit and unsecured term loan contain financial covenants, including, among others, the following (as
defined under the terms of the agreement):
• leverageratiolessthan65.0%;
• fixedchargecoverageratiogreaterthan1.40;
• minimumbookvalueof$1.6billion;and
• secureddebtratiolessthan55.0%.
as of december 31, 2009, we believe our two most restrictive financial covenants under our unsecured line of credit and
unsecured term loan were the leverage and fixed charge ratios. future changes in interest rates, our outstanding debt balances, and
other changes in our business, operations, or financial statements may result in a default of these and other financial covenants
under our unsecured line of credit and unsecured term loan.
in addition, the terms of the unsecured line of credit and unsecured term loan restrict, among other things, certain investments,
indebtedness, distributions, mergers, developments, land, and borrowings available under our unsecured line of credit and
unsecuredtermloanfordevelopments,land,andencumberedassets.AsofDecember31,2009and2008,wewereincompliance
withallsuchcovenants.ManagementcontinuouslymonitorstheCompany’scomplianceandprojectedcompliancewiththe
covenants. our current expectation is that we will continue to meet the requirements of our debt covenants in the short and long
term. however, in the event of a continued economic down-turn, continued crisis in the credit markets, or rising cost of capital,
there is no certainty that we will be able to continue to satisfy all of the covenant requirements.
aggregate unsecured borrowings may be limited to an amount based primarily on the net operating income derived from a
pool of unencumbered and encumbered properties and our cost basis of development assets and land. aggregate unsecured
borrowings may increase as we complete the development, redevelopment, or acquisition of additional unencumbered properties.
AsofDecember31,2009,aggregateunsecuredborrowingswerelimitedtoapproximately$2.8billion.Ifnetoperatingincome
from properties supporting our borrowing capacity under our unsecured credit facilities decreases, our borrowing capacity under
our credit facilities will also decrease. additionally, we may be required to reduce our outstanding borrowings under our credit
facilities in order to maintain compliance with one or more covenants under our credit facilities.
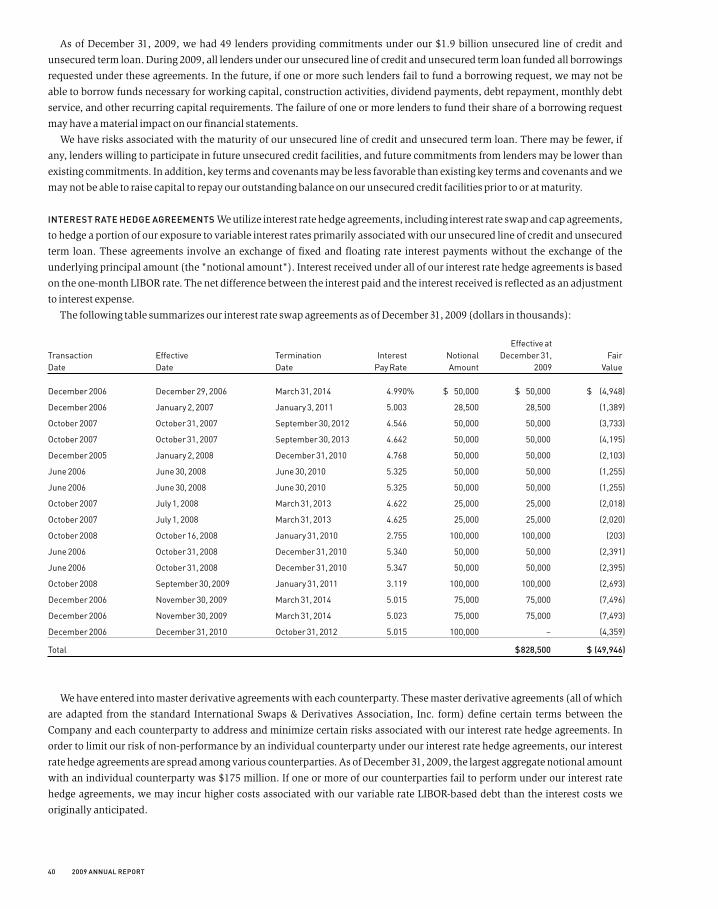
40 2009annualreport
AsofDecember31,2009,wehad49lendersprovidingcommitmentsunderour$1.9billionunsecuredlineofcreditand
unsecured term loan. during 2009, all lenders under our unsecured line of credit and unsecured term loan funded all borrowings
requested under these agreements. in the future, if one or more such lenders fail to fund a borrowing request, we may not be
able to borrow funds necessary for working capital, construction activities, dividend payments, debt repayment, monthly debt
service, and other recurring capital requirements. the failure of one or more lenders to fund their share of a borrowing request
may have a material impact on our financial statements.
We have risks associated with the maturity of our unsecured line of credit and unsecured term loan. there may be fewer, if
any, lenders willing to participate in future unsecured credit facilities, and future commitments from lenders may be lower than
existing commitments. in addition, key terms and covenants may be less favorable than existing key terms and covenants and we
may not be able to raise capital to repay our outstanding balance on our unsecured credit facilities prior to or at maturity.
interestratehedgeagreeMentsWeutilizeinterestratehedgeagreements,includinginterestrateswapandcapagreements,
to hedge a portion of our exposure to variable interest rates primarily associated with our unsecured line of credit and unsecured
term loan. these agreements involve an exchange of fixed and floating rate interest payments without the exchange of the
underlying principal amount (the "notional amount"). interest received under all of our interest rate hedge agreements is based
on the one-month libor rate. the net difference between the interest paid and the interest received is reflected as an adjustment
to interest expense.
ThefollowingtablesummarizesourinterestrateswapagreementsasofDecember31,2009(dollarsinthousands):
Effective at Transaction Effective Termination Interest Notional December 31, Fair Date Date Date Pay Rate Amount 2009 Value
December 2006 December 29, 2006 March 31, 2014 4.990% $ 50,000 $ 50,000 $ (4,948)
December 2006 January 2, 2007 January 3, 2011 5.003 28,500 28,500 (1,389)
October 2007 October 31, 2007 September 30, 2012 4.546 50,000 50,000 (3,733)
October 2007 October 31, 2007 September 30, 2013 4.642 50,000 50,000 (4,195)
December 2005 January 2, 2008 December 31, 2010 4.768 50,000 50,000 (2,103)
June 2006 June 30, 2008 June 30, 2010 5.325 50,000 50,000 (1,255)
June 2006 June 30, 2008 June 30, 2010 5.325 50,000 50,000 (1,255)
October 2007 July 1, 2008 March 31, 2013 4.622 25,000 25,000 (2,018)
October 2007 July 1, 2008 March 31, 2013 4.625 25,000 25,000 (2,020)
October 2008 October 16, 2008 January 31, 2010 2.755 100,000 100,000 (203)
June 2006 October 31, 2008 December 31, 2010 5.340 50,000 50,000 (2,391)
June 2006 October 31, 2008 December 31, 2010 5.347 50,000 50,000 (2,395)
October 2008 September 30, 2009 January 31, 2011 3.119 100,000 100,000 (2,693)
December 2006 November 30, 2009 March 31, 2014 5.015 75,000 75,000 (7,496)
December 2006 November 30, 2009 March 31, 2014 5.023 75,000 75,000 (7,493)
December 2006 December 31, 2010 October 31, 2012 5.015 100,000 – (4,359)
Total $828,500 $(49,946)
We have entered into master derivative agreements with each counterparty. these master derivative agreements (all of which
are adapted from the standard international swaps & derivatives association, inc. form) define certain terms between the
Companyandeachcounterpartytoaddressandminimizecertainrisksassociatedwithourinterestratehedgeagreements.In
order to limit our risk of non-performance by an individual counterparty under our interest rate hedge agreements, our interest
rate hedge agreements are spread among various counterparties. as of december 31, 2009, the largest aggregate notional amount
withanindividualcounterpartywas$175million.Ifoneormoreofourcounterpartiesfailtoperformunderourinterestrate
hedge agreements, we may incur higher costs associated with our variable rate libor-based debt than the interest costs we
originally anticipated.

41 alexandriarealestateequities,inc.
as of december 31, 2009, our interest rate swap agreements were classified in accounts payable, accrued expenses, and
tenantsecuritydepositsbasedupontheirrespectivefairvalues,aggregatingaliabilitybalanceofapproximately$49.9million
withtheoffsettingadjustmentreflectedasunrealizedlossesinaccumulatedothercomprehensivelossintotalequity.Balances
inaccumulatedothercomprehensivelossarerecognizedinearningsintheperiodthattheforecastedhedgetransactionsaffect
earnings. also, during the year ended december 31, 2009, we entered into an interest rate cap agreement with a notional amount
approximating$38.4millioneffectiveMay15,2009,andterminatingonJanuary3,2012.Thisagreementsetsaceilingonone-
monthLIBORat2.50%relatedtoonesecurednote.Theinterestratecapagreementwasclassifiedinotherassetsbasedupon
itsfairvalueaggregatinganassetbalanceofapproximately$189,000.Wehavenotpostedanycollateralrelatedtoourinterest
ratehedgeagreements.FortheyearendedDecember31,2009,approximately$37.5millionwasreclassifiedfromaccumulated
other comprehensive income to interest expense as an increase to interest expense. during the next twelve months, we expect
toreclassifyapproximately$28.6millionfromaccumulatedothercomprehensivelosstointerestexpenseasanincreaseto
interest expense.
securednotespayaBleAsofDecember31,2009,wehadaggregatesecurednotespayableofapproximately$937.0million.
if we are unable to refinance, extend principal payments due at maturity, or pay principal maturities with proceeds from other
capital sources, then our cash flows may be insufficient to pay dividends to our stockholders and to repay debt upon maturity.
furthermore, even if we are able to refinance debt prior to maturity, the interest rate, loan to value, and other key loan terms may
be less favorable than existing loan terms. less favorable loan terms, assuming we are able to refinance our secured notes payable,
may result in higher interest costs, additional required capital as a result of less proceeds or lower loan to value upon refinancing,
or new or more restrictive covenants or loan terms.
diVidendsWearerequiredtodistribute90%ofourREITtaxableincomeonanannualbasisinordertocontinuetoqualifyasa
reit for federal income tax purposes. accordingly, we intend to make, but are not contractually bound to make, regular quarterly
distributions to preferred and common stockholders from cash flows from operating activities. all such distributions are at the
discretion of our board of directors. We may be required to use borrowings under our unsecured line of credit, if necessary, to
meet reit distribution requirements and maintain our reit status. We consider market factors and our performance, in addition
to reit requirements, in determining distribution levels. during the year ended december 31, 2009, we paid dividends on our
commonstockaggregatingapproximately$86.7million.Also,duringtheyearendedDecember31,2009,wepaiddividendson
our8.375%seriesCcumulativeredeemablepreferredstock("SeriesCPreferredStock")andSeriesDConvertiblePreferredStock
aggregatingapproximately$10.9millionand$17.5million,respectively.

42 2009annualreport
SOuRCES OF CApITAL
cashandcashequiValentsAsofDecember31,2009,wehadapproximately$70.6millionofcashandcashequivalents.
tenantsecuritydepositsandotherrestrictedcashtenant security deposits and other restricted cash consisted of the
following (in thousands):
December 31, 2009 2008
Funds held in trust under the terms of certain secured notes payable $ 19,340 $ 16,118
Funds held in escrow related to construction projects 24,054 49,499
Other restricted funds 3,897 2,165
Total $47,291 $ 67,782
the funds held in escrow related to construction projects will be used to pay for certain construction costs.
cashFloWsNetcashprovidedbyoperatingactivitiesfortheyearendedDecember31,2009decreasedby$49.9millionto$206.0
millioncomparedto$255.8millionfortheyearendedDecember31,2008.Thedecreaseresultedprimarilyfromadecreasein
cash flows from overall changes in operating assets and liabilities partially offset by an increase in net income. Cash flows from
operations are primarily dependent upon the occupancy level of our portfolio, the net effective rental rates achieved on our
leases, the collectability of rent, operating escalations and recoveries from our tenants, and the level of operating, and other
costs. We believe our cash flows from operating activities provide a stable source of cash to fund operating expenses. in addition,
asofDecember31,2009,approximately88%ofourleases(onarentablesquarefootagebasis)weretriplenetleases,requiring
tenants to pay substantially all real estate taxes, insurance, utilities, common area, and other operating expenses, including
increasesthereto,andapproximately8%ofourleases(onarentablesquarefootagebasis)requiredthetenantstopayamajority
of operating expenses.
We are largely dependent on the life science industry for revenues due under lease agreements. our business could be adversely
affected if the life science industry is impacted by the current economic downturn and financial and banking crisis or if the life
science industry migrates from the united states to other countries. our tenants may not be able to pay amounts due under their
lease agreements if they are unsuccessful in discovering, developing, making, or selling their products or technologies.
the bankruptcy or insolvency of a major tenant may also adversely affect the income produced by a property. if any of our
tenants become a debtor in a case under the united states bankruptcy Code, the bankruptcy court must approve any eviction. the
bankruptcycourtmayauthorizethetenanttorejectandterminateitsleasewithus.Ourclaimagainstsuchatenantforunpaid
future rent would be subject to a statutory limitation that might be substantially less than the remaining rent actually owed to us
under the tenant's lease. any shortfall in rent payments could adversely affect our cash flow and our ability to make distributions
to our stockholders.
NetcashusedininvestingactivitiesfortheyearendedDecember31,2009,was$409.9millioncomparedto$494.9millionfor
theyearendedDecember31,2008.Thedecreaseinnetcashusedininvestingactivitiesreflectslowerproceedsfromdispositions
aswellasloweradditionstopropertiesduetoourstrategytoreducecapitalspendingin2009,ascomparedto2008.
NetcashprovidedbyfinancingactivitiesfortheyearendedDecember31,2009,decreasedby$98.8millionto$203.4
millioncomparedto$302.2millionfortheyearendedDecember31,2008.FortheyearendedDecember31,2009,proceedsof
approximately$1.5billionfromtheissuanceofcommonstock,theissuanceofour8.00%UnsecuredConvertibleNotes,and
borrowingsfromsecurednotespayableandourunsecuredlineofcreditwerepartiallyoffsetbyapproximately$1.2billion
relatedtotherepurchasesofcertainofour3.70%UnsecuredConvertibleNotes,principalreductionsrelatedtorepayments
of outstanding principal on our secured notes payable, and repayments of borrowings from our unsecured line of credit.
additionally, for the year ended december 31, 2009, we paid dividends on our common and preferred stock of approximately
$115.0million.FortheyearendedDecember31,2008,proceedsofapproximately$1.3billionfromtheissuanceofSeriesD
ConvertiblePreferredStockandborrowingsfromsecurednotespayableandourunsecuredlineofcreditwerepartiallyoffsetby
principalrepaymentsofapproximately$0.9billionrelatedtooutstandingamountsonoursecurednotespayableandunsecured
lineofcredit.Additionally,wepaiddividendsonourcommonandpreferredstockofapproximately$122.0millionduringtheyear
endedDecember31,2008.

43 alexandriarealestateequities,inc.
unsecuredlineoFcreditandunsecuredterMloan We use our unsecured line of credit and unsecured term loan to
fundworkingcapital,constructionactivities,and,fromtimetotime,acquisitionofproperties.Our$1.9billionunsecuredcredit
facilitiesconsistofa$1.15billionunsecuredlineofcreditanda$750millionunsecuredtermloan.Wemayinthefutureelectto
increasecommitmentsunderourunsecuredcreditfacilitiesbyuptoanadditional$500million.AsofDecember31,2009,wehad
borrowingsof$476millionand$750millionoutstandingunderourunsecuredlineofcreditandunsecuredtermloan,respectively,
withaweightedaverageinterestrate,includingtheimpactofourinterestrateswapagreements,ofapproximately4.10%.
propertydispositions during the year ended december 31, 2009, we sold four properties at an aggregate contract price of
approximately$20.9million.Thenetsalesproceedswereinitiallyusedtorepayoutstandingsecureddebtrelatedtotheproperties
sold or outstanding debt on our unsecured line of credit. as of december 31, 2009, we had three properties classified as “held
for sale.”
otherresourcesandliquidityrequireMents under our current shelf registration statement filed with the securities and
exchange Commission, we may offer common stock, preferred stock, debt, and other securities. these securities may be issued
from time to time at our discretion based on our needs and market conditions.
InSeptember2009,wesold4,600,000sharesofourcommonstockinafollow-onoffering(includingsharesissueduponfull
exerciseoftheunderwriters’over-allotmentoption).Theshareswereissuedatapriceof$53.25pershare,resultinginaggregate
proceedsofapproximately$233.5million(afterdeductingunderwriters’discountsandotherofferingcosts).
InApril2009,wecompletedaprivateofferingofthe8.00%UnsecuredConvertibleNotes.Thenetproceedsfromthisoffering,
afterinitialpurchasers’feesandotherofferingcosts,wereapproximately$233.0million.PriortoApril20,2014,wewillnot
havetherighttoredeemthe8.00%UnsecuredConvertibleNotes,excepttopreserveourqualificationasaREIT.Onandafter
thatdate,wehavetherighttoredeemthe8.00%UnsecuredConvertibleNotes,inwholeorinpart,atanytimeandfromtimeto
time,forcashequalto100%oftheprincipalamountofthenotestoberedeemed,plusanyaccruedandunpaidinterestto,but
excluding,theredemptiondate.Holdersofthe8.00%UnsecuredConvertibleNotesmayrequireustorepurchasetheirnotes,in
wholeorinpart,onApril15,2014,2019,and2024forcashequalto100%oftheprincipalamountofthenotestobepurchased
plusanyaccruedandunpaidinterestto,butexcluding,therepurchasedate.Holdersofthe8.00%UnsecuredConvertibleNotes
may require us to repurchase all or a portion of their notes upon the occurrence of specified corporate transactions, including
a change in control, certain merger or consolidation transactions, or the liquidation of the Company (each, a "fundamental
Change"),atarepurchasepriceincashequalto100%oftheprincipalamountofthenotestoberepurchased,plusanyaccrued
andunpaidinterestto,butexcluding,thefundamentalchangerepurchasedate.Atissuance,the8.00%UnsecuredConvertible
Noteshadaninitialconversionrateofapproximately24.1546sharesofcommonstockper$1,000principalamountofthe8.00%
UnsecuredConvertibleNotes,representingaconversionpriceofapproximately$41.40pershareofourcommonstock.Thisinitial
conversionpricerepresentedapremiumof15%basedonthelastreportedsalepriceof$36.00pershareofourcommonstock
onApril21,2009.Theconversionrateofthe8.00%UnsecuredConvertibleNotesissubjecttoadjustmentsforcertainevents,
including,butnotlimitedto,certaincashdividendsonourcommonstockinexcessof$0.35pershareperquarteranddividends
on our common stock payable in shares of our common stock. as of december 31, 2009, there was no change from the initial
conversionrateofour8.00%UnsecuredConvertibleNotes.Holdersofthe8.00%UnsecuredConvertibleNotesmayconverttheir
notespriortothestatedmaturitydateofApril15,2029,onlyunderthefollowingcircumstances:(1)duringanycalendarquarter
after the calendar quarter ending June 30, 2009, if the closing sale price of our common stock for each of 20 or more trading days
in a period of 30 consecutive trading days ending on the last trading day of the immediately preceding calendar quarter exceeds or
isequalto130%oftheconversionpriceineffectonthelasttradingdayoftheimmediatelyprecedingcalendarquarter;(2)during
thefiveconsecutivebusinessdaysimmediatelyafteranyfiveconsecutivetradingdayperiod(the“8.00%UnsecuredConvertible
NoteMeasurementPeriod”)inwhichtheaveragetradingpriceper$1,000principalamountofthe8.00%UnsecuredConvertible
Noteswasequaltoorlessthan98%oftheaverageconversionvalueofthe8.00%UnsecuredConvertibleNotesduringthe8.00%
UnsecuredConvertibleNoteMeasurementPeriod;(3)upontheoccurrenceofaFundamentalChange;(4)ifwecallthe8.00%
UnsecuredConvertibleNotesforredemption;and(5)atanytimefromandincludingMarch15,2029,untilthecloseofbusiness
onthebusinessdayimmediatelyprecedingApril15,2029,orearlierredemptionorrepurchase.Uponconversion,holdersofthe
8.00%UnsecuredConvertibleNoteswillreceivecash,sharesofourcommonstock,oracombinationthereof,asthecasemaybe,
atourelection.Pursuanttotheaccountingliteraturerelatedtoconvertibledebt,atissuanceofthe8.00%UnsecuredConvertible
Notes,wedeterminedtheeffectiveinterestrateofthenotestobe11.0%.
44 2009annualreport
in march 2009, we sold 7,000,000 shares of our common stock in a follow-on offering. the shares were issued at a price of
$38.25pershare,resultinginaggregateproceedsofapproximately$254.6million(afterdeductingunderwriters’discountsand
other offering costs).
InMarchandApril2008,wecompletedapublicofferingof10,000,000sharesofSeriesDConvertiblePreferredStock.The
shareswereissuedatapriceof$25.00pershare,resultinginaggregateproceedsofapproximately$242million(afterdeducting
underwriters' discounts and other offering costs). the proceeds from this offering were used to pay down outstanding borrowings
onourunsecuredlineofcredit.ThedividendsonourSeriesDConvertiblePreferredStockarecumulativeandaccruefromthedate
oforiginalissuance.Wepaydividendsquarterlyinarrearsatanannualrateof$1.75pershare.OurSeriesDConvertiblePreferred
stock has no stated maturity and is not subject to any sinking fund or mandatory redemption provisions, and we are not allowed
toredeemourSeriesDConvertiblePreferredStock,excepttopreserveourstatusasaREIT.InvestorsinourSeriesDConvertible
PreferredStockgenerallyhavenovotingrights.OnorafterApril20,2013,wemay,atouroption,beabletocausesomeorallofour
SeriesDConvertiblePreferredStocktobeautomaticallyconvertediftheclosingsalepricepershareofourcommonstockequals
orexceeds150%ofthethen-applicableconversionpriceoftheSeriesDConvertiblePreferredStockforatleast20tradingdaysin
a period of 30 consecutive trading days ending on the trading day immediately prior to our issuance of a press release announcing
theexerciseofourconversionoption.HoldersofourSeriesDConvertiblePreferredStock,attheiroption,may,atanytimeand
from time to time, convert some or all of their outstanding shares initially at a conversion rate of 0.2477 shares of common stock
per$25.00liquidationpreference,whichwasequivalenttoaninitialconversionpriceofapproximately$100.93pershareof
commonstock.TheconversionratefortheSeriesDConvertiblePreferredStockissubjecttoadjustmentsforcertainevents,
including,butnotlimitedto,certaindividendsonourcommonstockinexcessof$0.78pershareperquarteranddividendson
ourcommonstockpayableinsharesofourcommonstock.AsofDecember31,2009,theSeriesDConvertiblePreferredStockhad
aconversionrateofapproximately0.2480sharesofcommonstockper$25.00liquidationpreference,whichisequivalenttoa
conversionpriceofapproximately$100.81pershareofcommonstock.
InJanuary2007,wecompletedaprivateofferingofthe3.70%UnsecuredConvertibleNotes.Thenetproceedsfromthis
offering,afterunderwriters’discount,wereapproximately$450.8million.PriortoJanuary15,2012,wewillnothavetherightto
redeemthe3.70%UnsecuredConvertibleNotes,excepttopreserveourqualificationasaREIT.Onandafterthatdate,wehavethe
righttoredeemthe3.70%UnsecuredConvertibleNotes,inwholeorinpart,atanytimeandfromtimetotime,forcashequalto
100%oftheprincipalamountofthenotestoberedeemed,plusanyaccruedandunpaidinterestto,butexcluding,theredemption
date.Holdersofthe3.70%UnsecuredConvertibleNotesmayrequireustorepurchasetheirnotes,inwholeorinpart,onJanuary
15,2012,2017,and2022forcashequalto100%oftheprincipalamountofthenotestobepurchasedplusanyaccruedandunpaid
interesttobutexcludingtherepurchasedate.Holdersofthe3.70%UnsecuredConvertibleNotesmayrequireustorepurchase
alloraportionoftheirnotesupontheoccurrenceofaFundamentalChange,atarepurchasepriceincashequalto100%of
the principal amount of the notes to be repurchased, plus any accrued and unpaid interest to, but excluding, the fundamental
changerepurchasedate.Atissuance,the3.70%UnsecuredConvertibleNoteshadaninitialconversionrateofapproximately
8.4774commonsharesper$1,000principalamountofthe3.70%UnsecuredConvertibleNotesrepresentingaconversionprice
ofapproximately$117.96pershareofourcommonstock.Thisinitialconversionpricerepresentedapremiumof20%based
onthelastreportedsalepriceof$98.30pershareofourcommonstockonJanuary10,2007.Theconversionrateofthe3.70%
unsecured Convertible notes is subject to adjustments for certain events, including, but not limited to, certain dividends on our
commonstockinexcessof$0.74pershareperquarteranddividendsonourcommonstockpayableinsharesofourcommon
stock.AsofDecember31,2009,the3.70%UnsecuredConvertibleNoteshadaconversionrateofapproximately8.5207common
sharesper$1,000principalamountofthe3.70%UnsecuredConvertibleNotes,whichisequivalenttoaconversionpriceof
approximately$117.36pershareofourcommonstock.Holdersofthe3.70%UnsecuredConvertibleNotesmayconverttheir
notes into cash and, if applicable, shares of our common stock prior to the stated maturity of the notes only under the following
circumstances: (1) during any calendar quarter after the calendar quarter ending march 31, 2007, if the closing sale price of our
common stock for each of 20 or more trading days in a period of 30 consecutive trading days ending on the last trading day of the
immediatelyprecedingcalendarquarterexceeds120%oftheconversionpriceineffectonthelasttradingdayoftheimmediately
precedingcalendarquarter;(2)duringthefiveconsecutivebusinessdaysimmediatelyafteranyfiveconsecutivetradingday
period(the“3.70%UnsecuredConvertibleNoteMeasurementPeriod”)inwhichtheaveragetradingpriceper$1,000principal
amountof3.70%UnsecuredConvertibleNoteswasequaltoorlessthan98%oftheaverageconversionvalueofthe3.70%
UnsecuredConvertibleNotesduringthe3.70%UnsecuredConvertibleNoteMeasurementPeriod;(3)upontheoccurrenceof
specified corporate transactions, including a change in control, certain merger or consolidation transactions, or the liquidation
45 alexandriarealestateequities,inc.
oftheCompany;(4)ifwecallthe3.70%UnsecuredConvertibleNotesforredemption;and(5)atanytimefromandincluding
December15,2026,untilthecloseofbusinessonthebusinessdayimmediatelyprecedingJanuary15,2027,orearlierredemption
orrepurchase.The3.70%UnsecuredConvertibleNoteMeasurementPeriodisthefiveconsecutivetradingdayperiodfollowing
arequestbyaholderofthe3.70%UnsecuredConvertibleNotestoconverthisorhernotes.Pursuanttotheaccountingliterature
relatedtoconvertibledebt,atissuanceofthe3.70%UnsecuredConvertibleNotes,wedeterminedtheeffectiveinterestrateofthe
notestobe5.96%.
We hold interests, together with certain third parties, in a limited partnership and in limited liability companies which we
consolidate in our financial statements. these third parties may contribute equity into these entities primarily related to their
share of funds for construction and financing-related activities.
oFF-BalancesheetarrangeMentsas of december 31, 2009, we had no off-balance sheet arrangements.
exposuretoenVironMentalliaBilitiesInconnectionwiththeacquisitionofallofourproperties,wehaveobtainedPhase
Ienvironmentalassessmentstoascertaintheexistenceofanyenvironmentalliabilitiesorotherrelatedissues.ThePhaseI
environmental assessments of our properties have not revealed any environmental liabilities that we believe would have a
material adverse effect on our financial condition or results of operations taken as a whole, nor are we aware of any material
environmentalliabilitiesthathaveoccurredsincethePhaseIenvironmentalassessmentswerecompleted.Inaddition,wecarrya
policy of pollution legal liability insurance covering exposure to certain environmental losses at substantially all of our properties.
inFlationAsofDecember31,2009,approximately88%ofourleases(onarentablesquarefootagebasis)weretriplenetleases,
requiring tenants to pay substantially all real estate taxes, insurance, utilities, common area, and other operating expenses,
includingincreasesthereto.Inaddition,approximately8%ofourleases(onarentablesquarefootagebasis)requiredthetenants
topayamajorityofoperatingexpenses.Approximately93%ofourleases(onarentablesquarefootagebasis)containedeffective
annualrentescalationsthatwereeitherfixed(generallyrangingfrom3.0%to3.5%)orindexedbasedontheconsumerprice
index or another index. accordingly, we do not believe that our earnings or cash flow from real estate operations are subject to
any significant risk from inflation. an increase in inflation, however, could result in an increase in the cost of our variable rate
borrowings, including borrowings related to our unsecured line of credit and unsecured term loan.
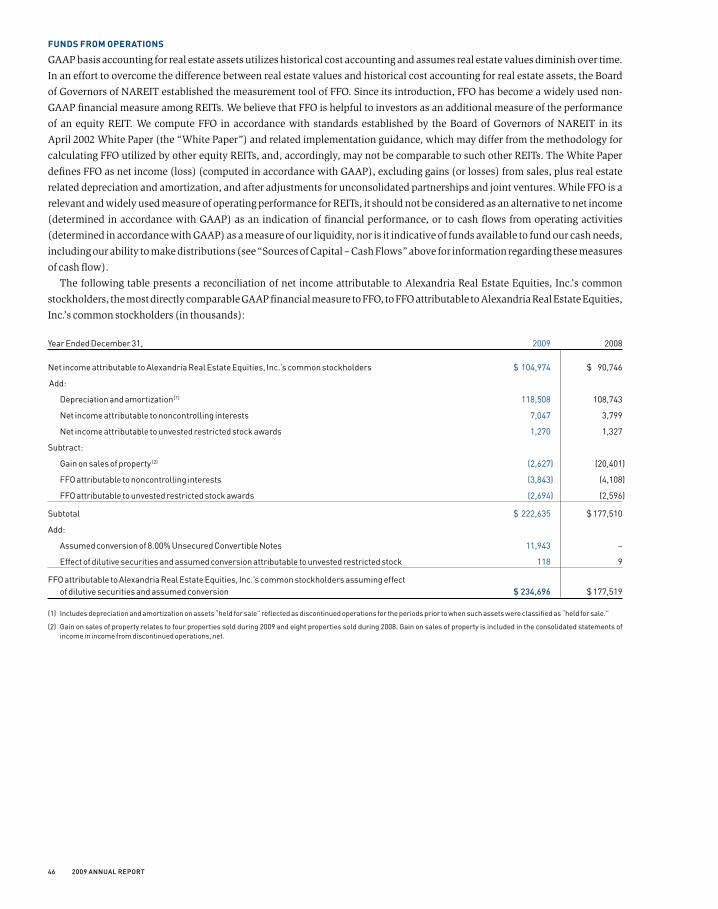
46 2009annualreport
FuNDS FROM OpERATIONS
GAAPbasisaccountingforrealestateassetsutilizeshistoricalcostaccountingandassumesrealestatevaluesdiminishovertime.
in an effort to overcome the difference between real estate values and historical cost accounting for real estate assets, the board
of Governors of nareit established the measurement tool of ffo. since its introduction, ffo has become a widely used non-
GAAPfinancialmeasureamongREITs.WebelievethatFFOishelpfultoinvestorsasanadditionalmeasureoftheperformance
of an equity reit. We compute ffo in accordance with standards established by the board of Governors of nareit in its
April2002WhitePaper(the“WhitePaper”)andrelatedimplementationguidance,whichmaydifferfromthemethodologyfor
calculatingFFOutilizedbyotherequityREITs,and,accordingly,maynotbecomparabletosuchotherREITs.TheWhitePaper
definesFFOasnetincome(loss)(computedinaccordancewithGAAP),excludinggains(orlosses)fromsales,plusrealestate
relateddepreciationandamortization,andafteradjustmentsforunconsolidatedpartnershipsandjointventures.WhileFFOisa
relevant and widely used measure of operating performance for reits, it should not be considered as an alternative to net income
(determinedinaccordancewithGAAP)asanindicationoffinancialperformance,ortocashflowsfromoperatingactivities
(determinedinaccordancewithGAAP)asameasureofourliquidity,norisitindicativeoffundsavailabletofundourcashneeds,
including our ability to make distributions (see “sources of Capital – Cash flows” above for information regarding these measures
of cash flow).
ThefollowingtablepresentsareconciliationofnetincomeattributabletoAlexandriaRealEstateEquities,Inc.’scommon
stockholders,themostdirectlycomparableGAAPfinancialmeasuretoFFO,toFFOattributabletoAlexandriaRealEstateEquities,
Inc.’scommonstockholders(inthousands):
Year Ended December 31, 2009 2008
Net income attributable to Alexandria Real Estate Equities, Inc.’s common stockholders $ 104,974 $ 90,746
Add:
Depreciation and amortization (1) 118,508 108,743
Net income attributable to noncontrolling interests 7,047 3,799
Net income attributable to unvested restricted stock awards 1,270 1,327
Subtract:
Gain on sales of property (2) (2,627) (20,401)
FFO attributable to noncontrolling interests (3,843) (4,108)
FFO attributable to unvested restricted stock awards (2,694) (2,596)
Subtotal $ 222,635 $ 177,510
Add:
Assumed conversion of 8.00% Unsecured Convertible Notes 11,943 –
Effect of dilutive securities and assumed conversion attributable to unvested restricted stock 118 9
FFO attributable to Alexandria Real Estate Equities, Inc.’s common stockholders assuming effect of dilutive securities and assumed conversion $234,696 $ 177,519
(1) Includes depreciation and amortization on assets “held for sale” reflected as discontinued operations for the periods prior to when such assets were classified as “held for sale.”
(2) Gain on sales of property relates to four properties sold during 2009 and eight properties sold during 2008. Gain on sales of property is included in the consolidated statements of income in income from discontinued operations, net.

47 alexandriarealestateequities,inc.
quANTITATIvE AND quALITATIvE DISCLOSuRES ABOuT MARKET RISK
market risk is the exposure to loss resulting from changes in interest rates, equity prices, and foreign currency exchange rates.
interestraterisKthe primary market risk to which we believe we are exposed is interest rate risk, which may result from many
factors, including government monetary and tax policies, domestic and international economic and political considerations, and
other factors that are beyond our control.
in order to modify and manage the interest rate characteristics of our outstanding debt and to limit the effects of interest rate
risksonouroperations,wemayutilizeavarietyoffinancialinstruments,includinginterestrateswaps,caps,floors,andother
interest rate exchange contracts. the use of these types of instruments to hedge a portion of our exposure to changes in interest
rates carries additional risks, such as counterparty credit risk and the legal enforceability of hedging contracts.
our future earnings and fair values relating to financial instruments are primarily dependent upon prevalent market rates of
interest, such as libor. however, our interest rate hedge agreements are intended to reduce the effects of interest rate changes.
Basedoninterestratesat,andourinterestratehedgeagreementsineffectonDecember31,2009and2008,weestimatethata
1%increaseininterestratesonourvariableratedebt,includingourunsecuredlineofcreditandunsecuredtermloan,after
consideringtheeffectofourinterestratehedgeagreements,woulddecreaseannualfutureearningsbyapproximately$2.4
millionand$3.6million,respectively.Wefurtherestimatethata1%decreaseininterestratesonourvariableratedebt,including
our unsecured line of credit and unsecured term loan, after considering the effect of our interest rate hedge agreements in effect on
December31,2009and2008,wouldincreaseannualfutureearningsbyapproximately$2.4millionand$3.6million,respectively.
A1%increaseininterestratesonoursecureddebt,unsecuredconvertiblenotes,andinterestratehedgeagreementswould
decreasetheiraggregatefairvaluesbyapproximately$67.8millionand$60.9millionatDecember31,2009and2008,respectively.
A1%decreaseininterestratesonoursecureddebt,unsecuredconvertiblenotes,andinterestratehedgeagreementswould
increasetheiraggregatefairvaluesbyapproximately$57.5millionand$63.0millionatDecember31,2009and2008,respectively.
these amounts were determined by considering the impact of the hypothetical interest rates on our borrowing cost and our
interestratehedgeagreementsineffectonDecember31,2009and2008.Theseanalysesdonotconsidertheeffectsofthereduced
level of overall economic activity that could exist in such an environment. further, in the event of a change of such magnitude,
we would consider taking actions to further mitigate our exposure to the change. however, due to the uncertainty of the specific
actions that would be taken and their possible effects, the sensitivity analysis assumes no changes in our capital structure.
equity price risK We have exposure to equity price market risk because of our equity investments in certain publicly
traded companies and privately held entities. We classify investments in publicly traded companies as “available for sale”
and,consequently,recordthemonourconsolidatedbalancesheetsatfairvaluewithunrealizedgainsorlossesreportedasa
component of accumulated other comprehensive income or loss. investments in privately held entities are generally accounted
for under the cost method because we do not influence any of the operating or financial policies of the entities in which we invest.
Forallinvestments,werecognizeother-than-temporarydeclinesinvalueagainstearningsinthesameperiodthedeclineinvalue
was deemed to have occurred. there is no assurance that future declines in value will not have a material adverse impact on our
futureresultsofoperations.Bywayofexample,a10%decreaseinthefairvalueofourequityinvestmentsasofDecember31,2009
and2008,woulddecreasetheirfairvaluesbyapproximately$7.3millionand$6.2million,respectively.
ForeigncurrencyexchangeraterisK We have exposure to foreign currency exchange rate risk related to our subsidiaries
operating in Canada and China. the functional currencies of our foreign subsidiaries operating in Canada and China are the
respective local currencies. Gains or losses resulting from the translation of our foreign subsidiaries' balance sheets and income
statements are included in accumulated other comprehensive income as a separate component of total equity. Gains or losses
will be reflected in our income statement when there is a sale or partial sale of our investment in these operations or upon a
complete or substantially complete liquidation of the investment. based on our current operating assets outside the united states
asofDecember31,2009,weestimatethata10%increaseinforeigncurrencyexchangeratesrelativetotheUnitedStatesdollar
wouldincreaseannualfutureearningsbyapproximately$746,000.Wefurtherestimatethata10%decreaseinforeigncurrency
exchangeratesrelativetotheUnitedStatesdollarwoulddecreaseannualfutureearningsbyapproximately$746,000.
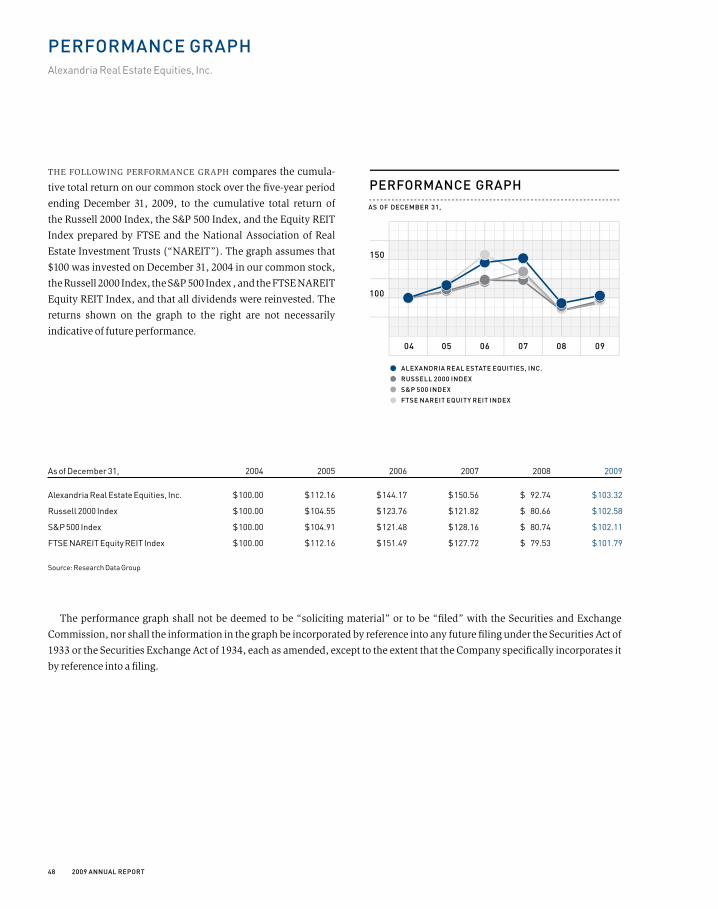
48 2009annualreport
perForMancegraphAlexandria Real Estate Equities, Inc.
The following performance graph compares the cumula-
tive total return on our common stock over the five-year period
ending december 31, 2009, to the cumulative total return of
theRussell2000Index,theS&P500Index,andtheEquityREIT
index prepared by ftse and the national association of real
estate investment trusts (“nareit”). the graph assumes that
$100wasinvestedonDecember31,2004inourcommonstock,
theRussell2000Index,theS&P500Index,andtheFTSENAREIT
equity reit index, and that all dividends were reinvested. the
returns shown on the graph to the right are not necessarily
indicative of future performance.
As of December 31, 2004 2005 2006 2007 2008 2009
Alexandria Real Estate Equities, Inc. $ 100.00 $ 112.16 $ 144.17 $ 150.56 $ 92.74 $ 103.32
Russell 2000 Index $ 100.00 $ 104.55 $ 123.76 $ 121.82 $ 80.66 $ 102.58
S&P 500 Index $ 100.00 $ 104.91 $ 121.48 $ 128.16 $ 80.74 $ 102.11
FTSE NAREIT Equity REIT Index $ 100.00 $ 112.16 $ 151.49 $ 127.72 $ 79.53 $ 101.79
Source: Research Data Group
the performance graph shall not be deemed to be “soliciting material” or to be “filed” with the securities and exchange
Commission, nor shall the information in the graph be incorporated by reference into any future filing under the securities act of
1933 or the securities exchange act of 1934, each as amended, except to the extent that the Company specifically incorporates it
by reference into a filing.
PERFORMANCE GRAPH
100
150
04
ALEXANDRIA REAL ESTATE EQUITIES, INC.
RUSSELL 2000 INDEX
S&P 500 INDEX
FTSE NAREIT EQUITY REIT INDEX
05 06 07 08 09
AS OF DECEMBER 31,
ALEXANDRIA REALESTATE EQUITIES, INC.
NAREIT EQUITY REITRUSSELL 2000S&P 500
AS OF DECEMBER 31,
$100
$150
$200
2003 2004 2005 2006 2007 2008 2009

49 alexandriarealestateequities,inc.
ManageMent'sannualreportoninternalcontroloVerFinancialreportingAlexandria Real Estate Equities, Inc.
the manaGement of alexandria real estate equities, inc. (the “Company”) is responsible for establishing and maintaining
adequateinternalcontroloverfinancialreporting.InternalcontroloverfinancialreportingisdefinedinRule13a-15(f)and
15d-15(f)promulgatedundertheSecuritiesExchangeActof1934,asamended,andisaprocessdesignedby,orunderthe
supervisionof, theCompany’sChiefExecutiveOfficer (“CEO”)andChiefFinancialOfficer (“CFO”)andeffectedby the
Company’sboardofdirectors,management,andotherpersonnel,toprovidereasonableassuranceregardingthereliabilityof
financialreportingandthepreparationoffinancialstatementsforexternalreportingpurposesinaccordancewithGAAP.The
Company's internal control over financial reporting includes those policies and procedures that (1) pertain to the maintenance of
recordsthat,inreasonabledetail,accuratelyandfairlyreflectthetransactionsanddispositionsofassets;(2)providereasonable
assurancethattransactionsarerecordedasnecessarytopermitpreparationoffinancialstatementsinaccordancewithGAAP,
andthatreceiptsandexpendituresarebeingmadeonlyinaccordancewiththeauthorizationsoftheCompany'smanagement
anddirectors;and(3)providereasonableassuranceregardingpreventionortimelydetectionofunauthorizedacquisition,use,or
disposition of assets that could have a material effect on the financial statements.
because of its inherent limitations, internal control over financial reporting may not prevent or detect misstatements.
Projectionsofanyevaluationofeffectivenesstofutureperiodsaresubjecttotheriskthatcontrolsmaybecomeinadequate
because of changes in conditions, or that the degree of compliance with the policies or procedures may deteriorate.
management has assessed the effectiveness of the Company's internal control over financial reporting as of december 31,
2009.Inmakingitsassessment,managementhasutilizedthecriteriasetforthbytheCommitteeofSponsoringOrganizations
(“Coso”) of the treadway Commission in “internal Control – integrated framework.” management concluded that based on its
assessment, the Company's internal control over financial reporting was effective as of december 31, 2009. the effectiveness of
ourinternalcontroloverfinancialreportingasofDecember31,2009,hasbeenauditedbyErnst&YoungLLP,anindependent
registered accounting firm, as stated in their report which is included herein.
50 2009annualreport
TO ThE BOARD OF DIRECTORS AND STOCKhOLDERS OF ALExANDRIA REAL ESTATE EquITIES, INC.
We haVe auditedAlexandriaRealEstateEquities,Inc.’s(the“Company”)internalcontroloverfinancialreportingasofDecember
31, 2009, based on criteria established in internal Control–integrated framework issued by the Committee of sponsoring
OrganizationsoftheTreadwayCommission(theCOSOcriteria).TheCompany’smanagementisresponsibleformaintaining
effective internal control over financial reporting, and for its assessment of the effectiveness of internal control over financial
reportingincludedinManagement’sannualreportoninternalcontroloverfinancialreporting.Ourresponsibilityistoexpressan
opinionontheCompany’sinternalcontroloverfinancialreportingbasedonouraudit.
WeconductedourauditinaccordancewiththestandardsofthePublicCompanyAccountingOversightBoard(UnitedStates).
those standards require that we plan and perform the audit to obtain reasonable assurance about whether effective internal
control over financial reporting was maintained in all material respects. our audit included obtaining an understanding of internal
control over financial reporting, assessing the risk that a material weakness exists, testing and evaluating the design and operating
effectiveness of internal control based on the assessed risk, and performing such other procedures as we considered necessary in
the circumstances. We believe that our audit provides a reasonable basis for our opinion.
Acompany’sinternalcontroloverfinancialreportingisaprocessdesignedtoprovidereasonableassuranceregardingthe
reliability of financial reporting and the preparation of financial statements for external purposes in accordance with generally
acceptedaccountingprinciples.Acompany’sinternalcontroloverfinancialreportingincludesthosepoliciesandproceduresthat
(1) pertain to the maintenance of records that, in reasonable detail, accurately and fairly reflect the transactions and dispositions
oftheassetsofthecompany;(2)providereasonableassurancethattransactionsarerecordedasnecessarytopermitpreparation
of financial statements in accordance with generally accepted accounting principles, and that receipts and expenditures of the
companyarebeingmadeonlyinaccordancewithauthorizationsofmanagementanddirectorsofthecompany;and(3)provide
reasonableassuranceregardingpreventionortimelydetectionofunauthorizedacquisition,use,ordispositionofthecompany’s
assets that could have a material effect on the financial statements.
because of its inherent limitations, internal control over financial reporting may not prevent or detect misstatements. also,
projections of any evaluation of effectiveness to future periods are subject to the risk that controls may become inadequate
because of changes in conditions, or that the degree of compliance with the policies or procedures may deteriorate.
in our opinion, the Company maintained, in all material respects, effective internal control over financial reporting as of
december 31, 2009, based on the Coso criteria.
Wealsohaveaudited,inaccordancewiththestandardsofthePublicCompanyAccountingOversightBoard(UnitedStates),
theaccompanyingconsolidatedbalancesheetsoftheCompanyasofDecember31,2009and2008,andtherelatedconsolidated
statements of income, changes in stockholders' equity and noncontrolling interests, and cash flows for each of the three years in the
period ended december 31, 2009, of the Company, and in our report dated march 1, 2010, expressed an unqualified opinion thereon.
los angeles, California
march 1, 2010
reportoFindependentregisteredpuBlicaccountingFirMAlexandria Real Estate Equities, Inc.
51 alexandriarealestateequities,inc.
reportoFindependentregisteredpuBlicaccountingFirMAlexandria Real Estate Equities, Inc.
TO ThE BOARD OF DIRECTORS AND STOCKhOLDERS OF ALExANDRIA REAL ESTATE EquITIES, INC.
we have audiTed the accompanying consolidated balance sheets of alexandria real estate equities, inc. (the “Company”)
asofDecember31,2009and2008,andtherelatedconsolidatedstatementsofincome,changesinstockholders'equityand
noncontrolling interests, and cash flows for each of the three years in the period ended december 31, 2009. these financial
statements are the responsibility of the Company's management. our responsibility is to express an opinion on these financial
statements based on our audits.
WeconductedourauditsinaccordancewiththestandardsofthePublicCompanyAccountingOversightBoard(United
states). those standards require that we plan and perform the audit to obtain reasonable assurance about whether the financial
statements are free of material misstatements. an audit includes examining, on a test basis, evidence supporting the amounts and
disclosures in the financial statements. an audit also includes assessing the accounting principles used and significant estimates
made by management, as well as evaluating the overall financial statement presentation. We believe that our audits provide a
reasonable basis for our opinion.
in our opinion, the financial statements referred to above present fairly, in all material respects, the consolidated financial
positionofAlexandriaRealEstateEquities,Inc.atDecember31,2009and2008,andtheconsolidatedresultsoftheiroperations
and their cash flows for each of the three years in the period ended december 31, 2009, in conformity with u.s. generally accepted
accounting principles.
as discussed in note 2 to the consolidated financial statements, effective January 1, 2009, the Company adopted fasb staff
PositionNo.APB14-1Accounting for Convertible Debt Instruments That May Be Settled in Cash upon Conversion (Including
Partial Cash Settlement) (codified in fasb asC 470-20 Debt with Conversion and Other Options),FAS160Noncontrolling Interest
in Consolidated Financial Statements(codifiedinFASBASC810Consolidation),andFASBStaffPositionNo.EITF03-06-1
Determining Whether Instruments Granted in Share-Based Payment Transactions Are Participating Securities (codified in fasb
ASC260EarningsPerShare).Allyearsandperiodspresentedhavebeenreclassifiedtoconformtotheadoptedaccounting
standards.
Wealsohaveaudited,inaccordancewiththestandardsofthePublicCompanyAccountingOversightBoard(UnitedStates),
the Company's internal control over financial reporting as of december 31, 2009, based on criteria established in internal Control–
IntegratedFrameworkissuedbytheCommitteeofSponsoringOrganizationsoftheTreadwayCommission,andinourreport
dated march 1, 2010, expressed an unqualified opinion thereon.
los angeles, California
march 1, 2010
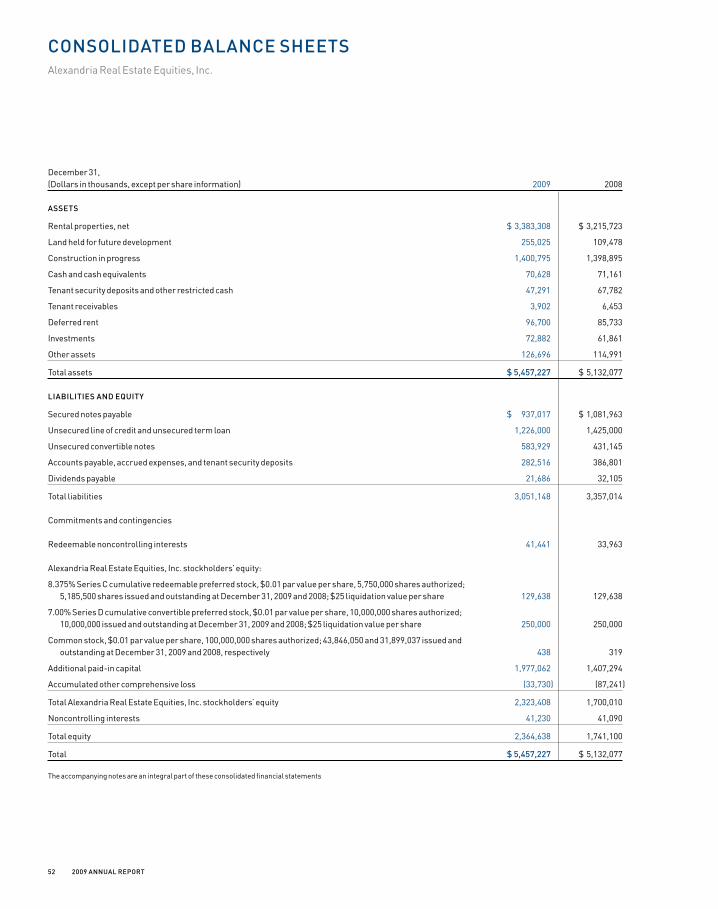
52 2009annualreport
consolidatedBalancesheetsAlexandria Real Estate Equities, Inc.
December 31, (Dollars in thousands, except per share information) 2009 2008
assets
Rental properties, net $ 3,383,308 $ 3,215,723
Land held for future development 255,025 109,478
Construction in progress 1,400,795 1,398,895
Cash and cash equivalents 70,628 71,161
Tenant security deposits and other restricted cash 47,291 67,782
Tenant receivables 3,902 6,453
Deferred rent 96,700 85,733
Investments 72,882 61,861
Other assets 126,696 114,991
Total assets $5,457,227 $ 5,132,077
liaBilitiesandequity
Secured notes payable $ 937,017 $ 1,081,963
Unsecured line of credit and unsecured term loan 1,226,000 1,425,000
Unsecured convertible notes 583,929 431,145
Accounts payable, accrued expenses, and tenant security deposits 282,516 386,801
Dividends payable 21,686 32,105
Total liabilities 3,051,148 3,357,014
Commitments and contingencies
Redeemable noncontrolling interests 41,441 33,963
Alexandria Real Estate Equities, Inc. stockholders’ equity:
8.375% Series C cumulative redeemable preferred stock, $0.01 par value per share, 5,750,000 shares authorized; 5,185,500 shares issued and outstanding at December 31, 2009 and 2008; $25 liquidation value per share 129,638 129,638
7.00% Series D cumulative convertible preferred stock, $0.01 par value per share, 10,000,000 shares authorized; 10,000,000 issued and outstanding at December 31, 2009 and 2008; $25 liquidation value per share 250,000 250,000
Common stock, $0.01 par value per share, 100,000,000 shares authorized; 43,846,050 and 31,899,037 issued and outstanding at December 31, 2009 and 2008, respectively 438 319
Additional paid-in capital 1,977,062 1,407,294
Accumulated other comprehensive loss (33,730) (87,241)
Total Alexandria Real Estate Equities, Inc. stockholders’ equity 2,323,408 1,700,010
Noncontrolling interests 41,230 41,090
Total equity 2,364,638 1,741,100
Total $5,457,227 $ 5,132,077
The accompanying notes are an integral part of these consolidated financial statements
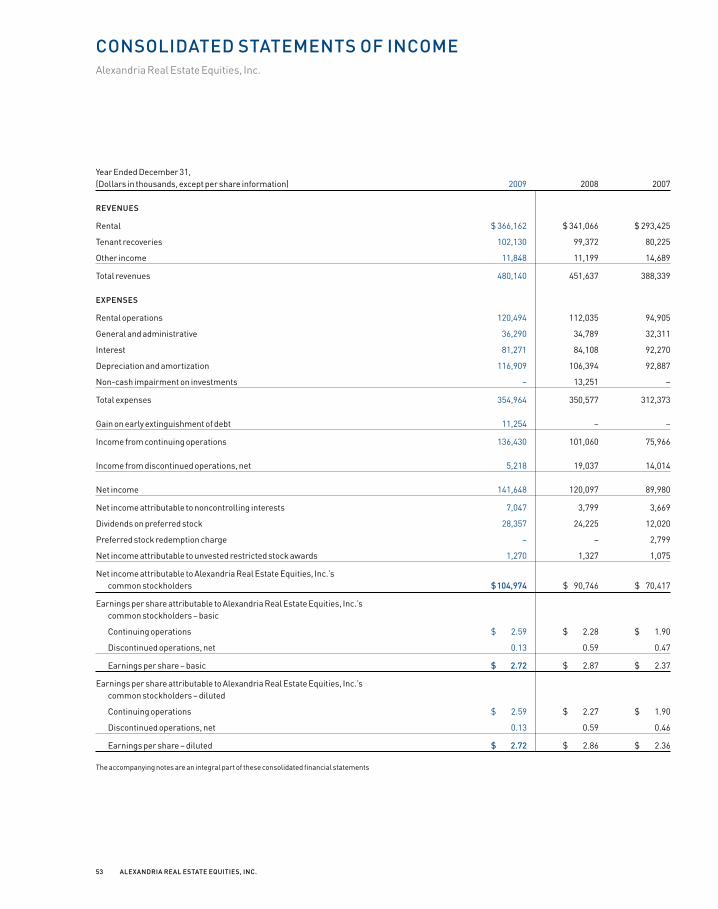
53 alexandriarealestateequities,inc.
consolidatedstateMentsoFincoMeAlexandria Real Estate Equities, Inc.
Year Ended December 31, (Dollars in thousands, except per share information) 2009 2008 2007
reVenues
Rental $ 366,162 $ 341,066 $ 293,425
Tenant recoveries 102,130 99,372 80,225
Other income 11,848 11,199 14,689
Total revenues 480,140 451,637 388,339
expenses
Rental operations 120,494 112,035 94,905
General and administrative 36,290 34,789 32,311
Interest 81,271 84,108 92,270
Depreciation and amortization 116,909 106,394 92,887
Non-cash impairment on investments – 13,251 –
Total expenses 354,964 350,577 312,373
Gain on early extinguishment of debt 11,254 – –
Income from continuing operations 136,430 101,060 75,966
Income from discontinued operations, net 5,218 19,037 14,014
Net income 141,648 120,097 89,980
Net income attributable to noncontrolling interests 7,047 3,799 3,669
Dividends on preferred stock 28,357 24,225 12,020
Preferred stock redemption charge – – 2,799
Net income attributable to unvested restricted stock awards 1,270 1,327 1,075
Net income attributable to Alexandria Real Estate Equities, Inc.’s common stockholders $104,974 $ 90,746 $ 70,417
Earnings per share attributable to Alexandria Real Estate Equities, Inc.’s common stockholders – basic
Continuing operations $ 2.59 $ 2.28 $ 1.90
Discontinued operations, net 0.13 0.59 0.47
Earnings per share – basic $ 2.72 $ 2.87 $ 2.37
Earnings per share attributable to Alexandria Real Estate Equities, Inc.’s common stockholders – diluted
Continuing operations $ 2.59 $ 2.27 $ 1.90
Discontinued operations, net 0.13 0.59 0.46
Earnings per share – diluted $ 2.72 $ 2.86 $ 2.36
The accompanying notes are an integral part of these consolidated financial statements
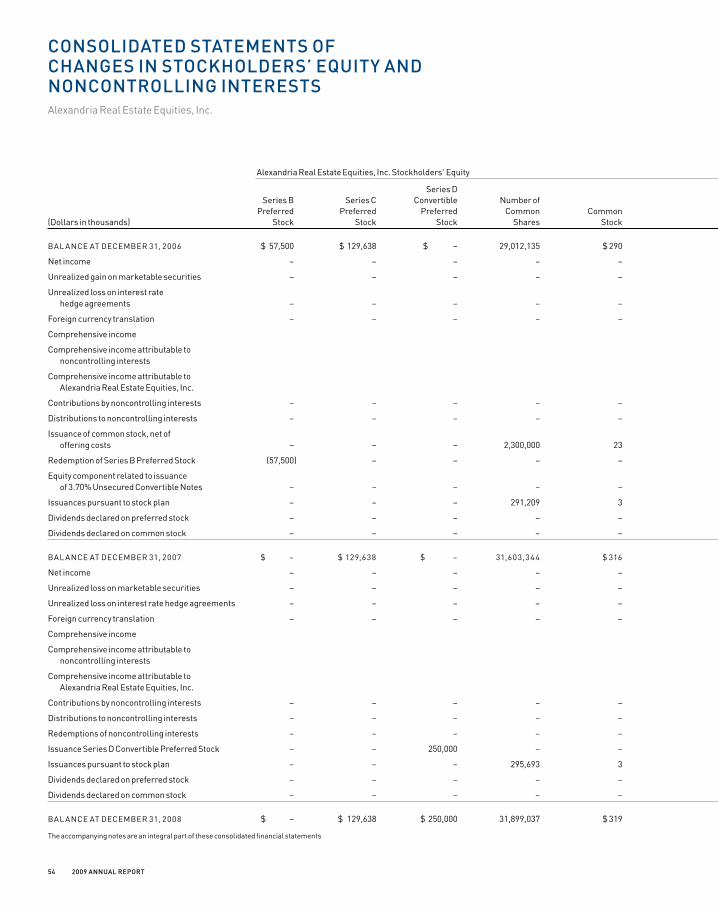
54 2009annualreport
consolidatedstateMentsoFchangesinstocKholders’equityandnoncontrollinginterestsAlexandria Real Estate Equities, Inc.
Alexandria Real Estate Equities, Inc. Stockholders' Equity
Series D Accumulated Series B Series C Convertible Number of Additional Other Redeemable Preferred Preferred Preferred Common Common Paid-In Retained Comprehensive Noncontrolling Total Noncontrolling Comprehensive (Dollars in thousands) Stock Stock Stock Shares Stock Capital Earnings Income (loss) Interests Equity Interests Income
BAL ANCE AT DECEMBER 31, 2006 $ 57,500 $ 129,638 $ – 29,012,135 $ 290 $ 1,139,629 $ – $ 24,595 $ 37,345 $ 1,388,997 $ 20,132
Net income – – – – – – 86,311 – 2,184 88,495 1,485 $ 89,980
Unrealized gain on marketable securities – – – – – – – 833 – 833 – 833
Unrealized loss on interest rate hedge agreements – – – – – – – (27,892) – (27,892) – (27,892)
Foreign currency translation – – – – – – – 10,539 18 10,557 – 10,557
Comprehensive income 73,478
Comprehensive income attributable to noncontrolling interests 3,687
Comprehensive income attributable to Alexandria Real Estate Equities, Inc. $ 69,791
Contributions by noncontrolling interests – – – – – – – – 2,795 2,795 15,298
Distributions to noncontrolling interests – – – – – – – – (2,160) (2,160) (1,573)
Issuance of common stock, net of offering costs – – – 2,300,000 23 215,169 – – – 215,192 –
Redemption of Series B Preferred Stock (57,500) – – – – 2,799 (2,799) – – (57,500) –
Equity component related to issuance of 3.70% Unsecured Convertible Notes – – – – – 43,830 – – – 43,830 –
Issuances pursuant to stock plan – – – 291,209 3 22,524 – – – 22,527 –
Dividends declared on preferred stock – – – – – – (12,020) – – (12,020) –
Dividends declared on common stock – – – – – (21,761) (71,492) – – (93,253) –
BAL ANCE AT DECEMBER 31, 2007 $ – $ 129,638 $ – 31,603,344 $ 316 $ 1,402,190 $ – $ 8,075 $ 40,182 $ 1,580,401 $ 35,342
Net income – – – – – – 116,298 – 2,416 118,714 1,383 $ 120,097
Unrealized loss on marketable securities – – – – – – – (16,910) – (16,910) – (16,910)
Unrealized loss on interest rate hedge agreements – – – – – – – (53,623) – (53,623) – (53,623)
Foreign currency translation – – – – – – – (24,783) 14 (24,769) – (24,769)
Comprehensive income 24,795
Comprehensive income attributable to noncontrolling interests 3,813
Comprehensive income attributable to Alexandria Real Estate Equities, Inc. $ 20,982
Contributions by noncontrolling interests – – – – – – – – 1,106 1,106 –
Distributions to noncontrolling interests – – – – – – – – (2,628) (2,628) (1,480)
Redemptions of noncontrolling interests – – – – – – – – – – (1,282)
Issuance Series D Convertible Preferred Stock – – 250,000 – – (7,814) – – – 242,186 –
Issuances pursuant to stock plan – – – 295,693 3 23,124 – – – 23,127 –
Dividends declared on preferred stock – – – – – – (24,225) – – (24,225) –
Dividends declared on common stock – – – – – (10,206) (92,073) – – (102,279) –
BAL ANCE AT DECEMBER 31, 2008 $ – $ 129,638 $ 250,000 31,899,037 $ 319 $ 1,407,294 $ – $ (87,241) $ 41,090 $ 1,741,100 $ 33,963
The accompanying notes are an integral part of these consolidated financial statements
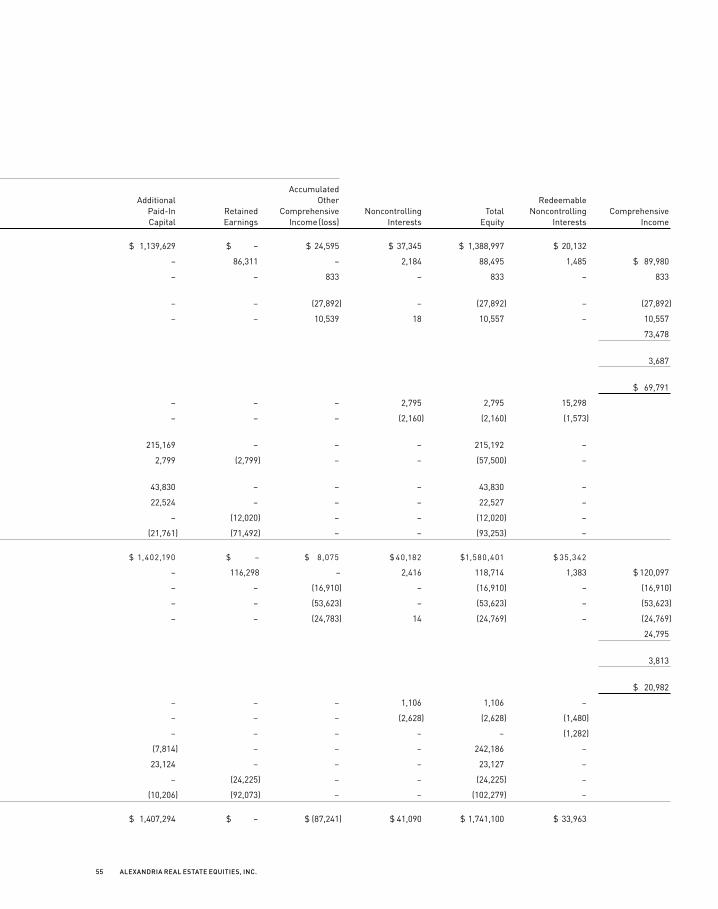
55 alexandriarealestateequities,inc.
Alexandria Real Estate Equities, Inc. Stockholders' Equity
Series D Accumulated Series B Series C Convertible Number of Additional Other Redeemable Preferred Preferred Preferred Common Common Paid-In Retained Comprehensive Noncontrolling Total Noncontrolling Comprehensive (Dollars in thousands) Stock Stock Stock Shares Stock Capital Earnings Income (loss) Interests Equity Interests Income
BAL ANCE AT DECEMBER 31, 2006 $ 57,500 $ 129,638 $ – 29,012,135 $ 290 $ 1,139,629 $ – $ 24,595 $ 37,345 $ 1,388,997 $ 20,132
Net income – – – – – – 86,311 – 2,184 88,495 1,485 $ 89,980
Unrealized gain on marketable securities – – – – – – – 833 – 833 – 833
Unrealized loss on interest rate hedge agreements – – – – – – – (27,892) – (27,892) – (27,892)
Foreign currency translation – – – – – – – 10,539 18 10,557 – 10,557
Comprehensive income 73,478
Comprehensive income attributable to noncontrolling interests 3,687
Comprehensive income attributable to Alexandria Real Estate Equities, Inc. $ 69,791
Contributions by noncontrolling interests – – – – – – – – 2,795 2,795 15,298
Distributions to noncontrolling interests – – – – – – – – (2,160) (2,160) (1,573)
Issuance of common stock, net of offering costs – – – 2,300,000 23 215,169 – – – 215,192 –
Redemption of Series B Preferred Stock (57,500) – – – – 2,799 (2,799) – – (57,500) –
Equity component related to issuance of 3.70% Unsecured Convertible Notes – – – – – 43,830 – – – 43,830 –
Issuances pursuant to stock plan – – – 291,209 3 22,524 – – – 22,527 –
Dividends declared on preferred stock – – – – – – (12,020) – – (12,020) –
Dividends declared on common stock – – – – – (21,761) (71,492) – – (93,253) –
BAL ANCE AT DECEMBER 31, 2007 $ – $ 129,638 $ – 31,603,344 $ 316 $ 1,402,190 $ – $ 8,075 $ 40,182 $ 1,580,401 $ 35,342
Net income – – – – – – 116,298 – 2,416 118,714 1,383 $ 120,097
Unrealized loss on marketable securities – – – – – – – (16,910) – (16,910) – (16,910)
Unrealized loss on interest rate hedge agreements – – – – – – – (53,623) – (53,623) – (53,623)
Foreign currency translation – – – – – – – (24,783) 14 (24,769) – (24,769)
Comprehensive income 24,795
Comprehensive income attributable to noncontrolling interests 3,813
Comprehensive income attributable to Alexandria Real Estate Equities, Inc. $ 20,982
Contributions by noncontrolling interests – – – – – – – – 1,106 1,106 –
Distributions to noncontrolling interests – – – – – – – – (2,628) (2,628) (1,480)
Redemptions of noncontrolling interests – – – – – – – – – – (1,282)
Issuance Series D Convertible Preferred Stock – – 250,000 – – (7,814) – – – 242,186 –
Issuances pursuant to stock plan – – – 295,693 3 23,124 – – – 23,127 –
Dividends declared on preferred stock – – – – – – (24,225) – – (24,225) –
Dividends declared on common stock – – – – – (10,206) (92,073) – – (102,279) –
BAL ANCE AT DECEMBER 31, 2008 $ – $ 129,638 $ 250,000 31,899,037 $ 319 $ 1,407,294 $ – $ (87,241) $ 41,090 $ 1,741,100 $ 33,963
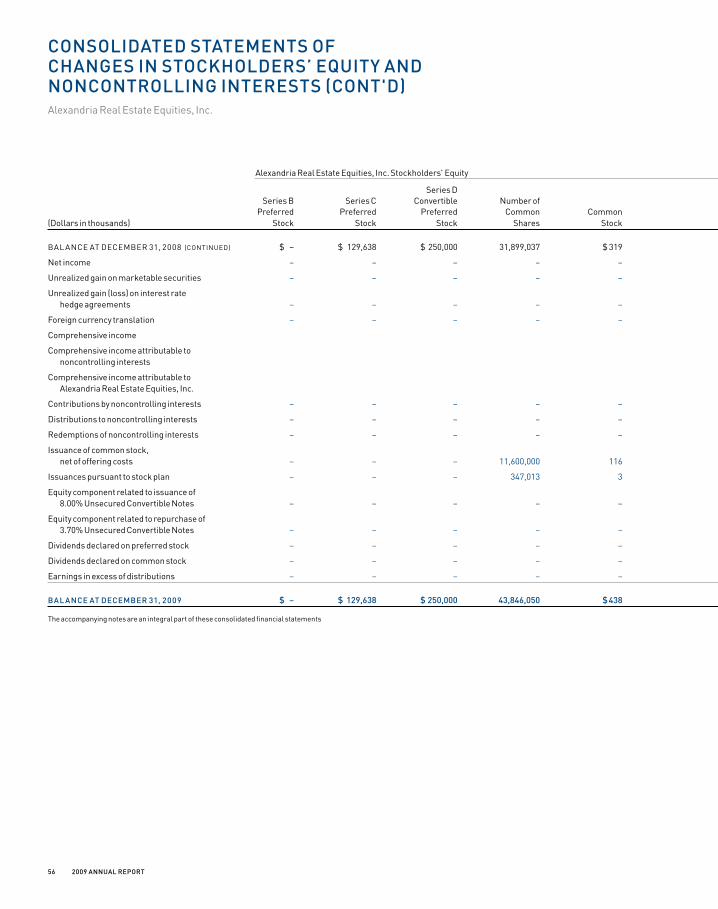
56 2009annualreport
consolidatedstateMentsoFchangesinstocKholders’equityandnoncontrollinginterests(cont'd)Alexandria Real Estate Equities, Inc.
Alexandria Real Estate Equities, Inc. Stockholders' Equity
Series D Accumulated Series B Series C Convertible Number of Additional Other Redeemable Preferred Preferred Preferred Common Common Paid–In Retained Comprehensive Noncontrolling Total Noncontrolling Comprehensive (Dollars in thousands) Stock Stock Stock Shares Stock Capital Earnings Income (loss) Interests Equity Interests Income
BAL ANCE AT DECEMBER 31, 2008 (CONTINUED) $ – $ 129,638 $ 250,000 31,899,037 $ 319 $ 1,407,294 $ – $ (87,241) $ 41,090 $ 1,741,100 $ 33,963
Net income – – – – – – 134,601 – 2,299 136,900 4,748 $ 141,648
Unrealized gain on marketable securities – – – – – – – 1,620 – 1,620 – 1,620
Unrealized gain (loss) on interest rate hedge agreements – – – – – – – 30,499 – 30,499 (80) 30,419
Foreign currency translation – – – – – – – 21,392 (9) 21,383 – 21,383
Comprehensive income 195,070
Comprehensive income attributable to noncontrolling interests 6,958
Comprehensive income attributable to Alexandria Real Estate Equities, Inc. $ 188,112
Contributions by noncontrolling interests – – – – – – – – 300 300 5,255
Distributions to noncontrolling interests – – – – – – – – (2,450) (2,450) (1,393)
Redemptions of noncontrolling interests – – – – – – – – – – (1,052)
Issuance of common stock, net of offering costs – – – 11,600,000 116 488,047 – – – 488,163 –
Issuances pursuant to stock plan – – – 347,013 3 25,786 – – – 25,789 –
Equity component related to issuance of 8.00% Unsecured Convertible Notes – – – – – 26,216 – – – 26,216 –
Equity component related to repurchase of 3.70% Unsecured Convertible Notes – – – – – (292) – – – (292) –
Dividends declared on preferred stock – – – – – – (28,357) – – (28,357) –
Dividends declared on common stock – – – – – – (76,233) – – (76,233) –
Earnings in excess of distributions – – – – – 30,011 (30,011) – – – –
Bal anceatdeceMBer31,2009 $ – $ 129,638 $250,000 43,846,050 $438 $1,977,062 $ – $(33,730) $41,230 $2,364,638 $41,441
The accompanying notes are an integral part of these consolidated financial statements
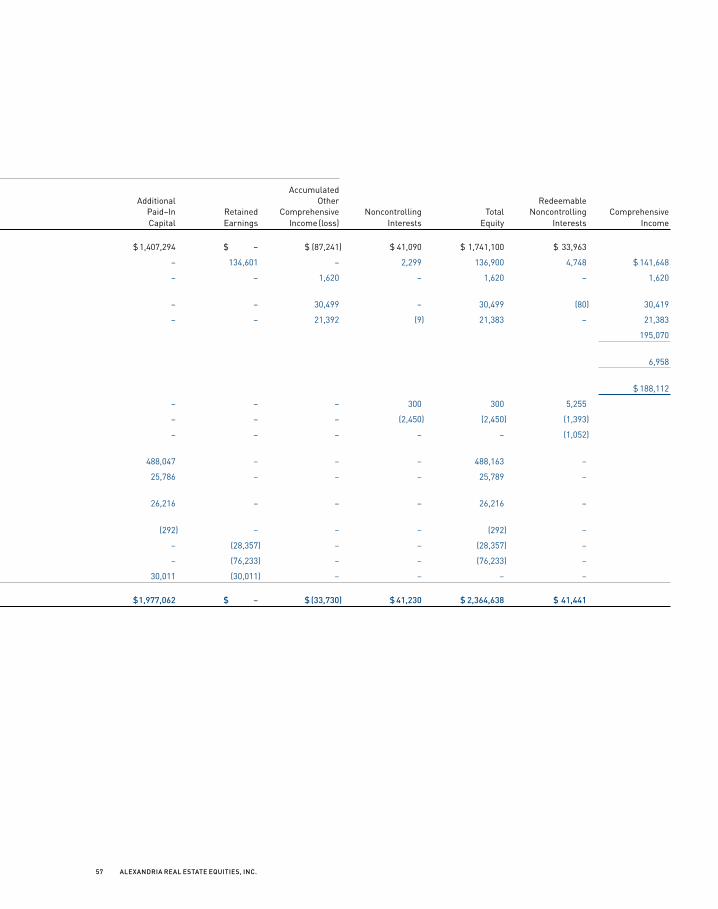
57 alexandriarealestateequities,inc.
Alexandria Real Estate Equities, Inc. Stockholders' Equity
Series D Accumulated Series B Series C Convertible Number of Additional Other Redeemable Preferred Preferred Preferred Common Common Paid–In Retained Comprehensive Noncontrolling Total Noncontrolling Comprehensive (Dollars in thousands) Stock Stock Stock Shares Stock Capital Earnings Income (loss) Interests Equity Interests Income
BAL ANCE AT DECEMBER 31, 2008 (CONTINUED) $ – $ 129,638 $ 250,000 31,899,037 $ 319 $ 1,407,294 $ – $ (87,241) $ 41,090 $ 1,741,100 $ 33,963
Net income – – – – – – 134,601 – 2,299 136,900 4,748 $ 141,648
Unrealized gain on marketable securities – – – – – – – 1,620 – 1,620 – 1,620
Unrealized gain (loss) on interest rate hedge agreements – – – – – – – 30,499 – 30,499 (80) 30,419
Foreign currency translation – – – – – – – 21,392 (9) 21,383 – 21,383
Comprehensive income 195,070
Comprehensive income attributable to noncontrolling interests 6,958
Comprehensive income attributable to Alexandria Real Estate Equities, Inc. $ 188,112
Contributions by noncontrolling interests – – – – – – – – 300 300 5,255
Distributions to noncontrolling interests – – – – – – – – (2,450) (2,450) (1,393)
Redemptions of noncontrolling interests – – – – – – – – – – (1,052)
Issuance of common stock, net of offering costs – – – 11,600,000 116 488,047 – – – 488,163 –
Issuances pursuant to stock plan – – – 347,013 3 25,786 – – – 25,789 –
Equity component related to issuance of 8.00% Unsecured Convertible Notes – – – – – 26,216 – – – 26,216 –
Equity component related to repurchase of 3.70% Unsecured Convertible Notes – – – – – (292) – – – (292) –
Dividends declared on preferred stock – – – – – – (28,357) – – (28,357) –
Dividends declared on common stock – – – – – – (76,233) – – (76,233) –
Earnings in excess of distributions – – – – – 30,011 (30,011) – – – –
Bal anceatdeceMBer31,2009 $ – $ 129,638 $250,000 43,846,050 $438 $1,977,062 $ – $(33,730) $41,230 $2,364,638 $41,441

58 2009annualreport
consolidatedstateMentsoFcashFloWsAlexandria Real Estate Equities, Inc.
Year Ended December 31, (In thousands) 2009 2008 2007
operatingactiVities
Net income $ 141,648 $ 120,097 $ 89,980
Adjustments to reconcile net income to net cash provided by operating activities
Depreciation and amortization 118,508 108,743 97,335
Gain on early extinguishment of debt (11,254) – –
Amortization of loan fees and costs 7,958 6,774 5,988
Amortization of debt premiums/discounts 10,788 7,973 6,955
Amortization of acquired above- and below-market leases (9,448) (9,509) (7,572)
Deferred rent (14,379) (12,273) (15,755)
Stock compensation expense 14,051 13,677 11,176
Equity in (income) loss related to investments (39) 173 330
Gain on sales of investments (3,442) (8,841) (12,216)
Loss on sales of investments 1,342 663 186
Gain/loss on properties “held for sale” and sales of properties (2,627) (15,751) (7,976)
Non-cash impairment on investments – 13,251 –
Changes in operating assets and liabilities
Tenant security deposits and other restricted cash (1,732) 5,644 744
Tenant receivables 2,551 306 (432)
Other assets (28,734) (21,842) (14,705)
Accounts payable, accrued expenses, and tenant security deposits (19,241) 46,752 33,993
Net cash provided by operating activities 205,950 255,837 188,031
inVestingactiVities
Additions to properties (446,127) (542,460) (589,661)
Purchase of properties – (7,915) (415,601)
Proceeds from sales of properties 18,021 80,909 70,889
Change in restricted cash related to construction projects 25,445 (25,772) (17,913)
Additions to investments (12,895) (13,006) (16,618)
Proceeds from investments 5,633 13,311 19,651
Net cash used in investing activities (409,923) (494,933) (949,253)
The accompanying notes are an integral part of these consolidated financial statements
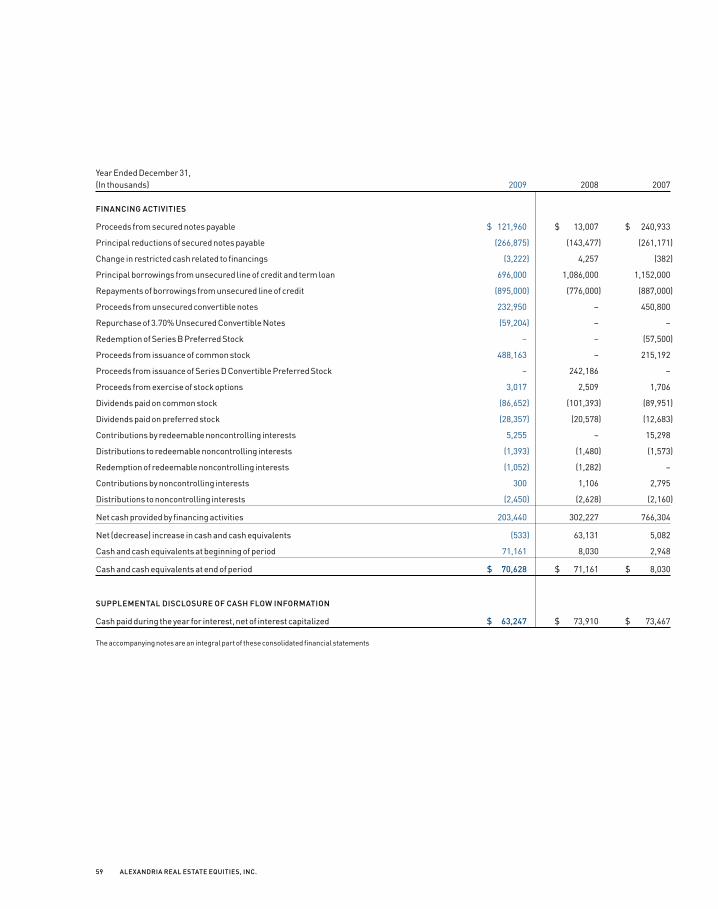
59 alexandriarealestateequities,inc.
Year Ended December 31, (In thousands) 2009 2008 2007
FinancingactiVities
Proceeds from secured notes payable $ 121,960 $ 13,007 $ 240,933
Principal reductions of secured notes payable (266,875) (143,477) (261,171)
Change in restricted cash related to financings (3,222) 4,257 (382)
Principal borrowings from unsecured line of credit and term loan 696,000 1,086,000 1,152,000
Repayments of borrowings from unsecured line of credit (895,000) (776,000) (887,000)
Proceeds from unsecured convertible notes 232,950 – 450,800
Repurchase of 3.70% Unsecured Convertible Notes (59,204) – –
Redemption of Series B Preferred Stock – – (57,500)
Proceeds from issuance of common stock 488,163 – 215,192
Proceeds from issuance of Series D Convertible Preferred Stock – 242,186 –
Proceeds from exercise of stock options 3,017 2,509 1,706
Dividends paid on common stock (86,652) (101,393) (89,951)
Dividends paid on preferred stock (28,357) (20,578) (12,683)
Contributions by redeemable noncontrolling interests 5,255 – 15,298
Distributions to redeemable noncontrolling interests (1,393) (1,480) (1,573)
Redemption of redeemable noncontrolling interests (1,052) (1,282) –
Contributions by noncontrolling interests 300 1,106 2,795
Distributions to noncontrolling interests (2,450) (2,628) (2,160)
Net cash provided by financing activities 203,440 302,227 766,304
Net (decrease) increase in cash and cash equivalents (533) 63,131 5,082
Cash and cash equivalents at beginning of period 71,161 8,030 2,948
Cash and cash equivalents at end of period $ 70,628 $ 71,161 $ 8,030
suppleMentaldisclosureoFcashFloWinForMation
Cash paid during the year for interest, net of interest capitalized $ 63,247 $ 73,910 $ 73,467
The accompanying notes are an integral part of these consolidated financial statements
60 2009annualreport
notestoconsolidatedFinancialstateMentsAlexandria Real Estate Equities, Inc.
NOTE 1. BACKgROuND
references to the "Company,” "we,” "our," and "us" refer to alexandria real estate equities, inc. and its subsidiaries.
alexandria real estate equities, inc. is a real estate investment trust ("reit") formed in 1994. We are focused principally on
science-driven cluster formation through the ownership, operation, management, selective redevelopment, development, and
acquisition of properties containing life science laboratory space. our properties are designed and improved for lease primarily to
institutional (universities and independent not-for-profit institutions), pharmaceutical, biotechnology, medical device, product,
service,andtranslationalentities,aswellasgovernmentagencies.AsofDecember31,2009,wehad156properties(152properties
locatedintenstatesintheUnitedStatesandfourpropertieslocatedinCanada)containingapproximately11.8millionrentable
squarefeet(includingspacesundergoingactiveredevelopment),comparedto159properties(155propertieslocatedintenstates
intheUnitedStatesandfourpropertieslocatedinCanada)withapproximately11.8millionrentablesquarefeet(includingspaces
undergoingactiveredevelopment)asofDecember31,2008.
AsofDecember31,2009,approximately88%ofourleases(onarentablesquarefootagebasis)weretriplenetleases,requiring
tenants to pay substantially all real estate taxes and insurance, common area, and other operating expenses, including increases
thereto.Inaddition,approximately8%ofourleases(onarentablesquarefootagebasis)requiredthetenantstopayamajority
ofoperatingexpenses.Additionally,approximately91%ofourleases(onarentablesquarefootagebasis)providedforthe
recaptureofcertaincapitalexpendituresandapproximately93%ofourleases(onarentablesquarefootagebasis)contained
effective annual rent escalations that were either fixed or based on the consumer price index or another index. any references
tothenumberofbuildings,squarefootage,numberofleases,occupancy,andannualizedbaserentpercentagesinthenotesto
consolidated financial statements are unaudited.
NOTE 2. BASIS OF pRESENTATION AND SuMMARy OF SIgNIFICANT ACCOuNTINg pOLICIES
BasisoFpresentationthe accompanying consolidated financial statements include the accounts of alexandria real estate
equities, inc. and its subsidiaries. all significant intercompany balances and transactions have been eliminated.
We hold interests, together with certain third parties, in a limited partnership and in limited liability companies which we
consolidate in our financial statements. We consolidate the limited partnership and limited liability companies because we
exercise significant control over major decisions by these entities, such as investment activity and changes in financing.
for entities that are variable interest entities (“Vies”), we consolidate the entity if it is determined that we are the primary
beneficiary at either the creation of the Vie or upon occurrence of a qualifying reconsideration event. a Vie is broadly defined
as an entity where either (i) the equity investors as a group, if any, do not have a controlling financial interest, or (ii) the equity
investmentatriskisinsufficienttofinancethatentity’sactivitieswithoutadditionalsubordinatedfinancialsupport.Qualifying
reconsideration events include, but are not limited to, the modification of contractual agreements that affect the characteristics or
adequacyoftheentity’sequityinvestmentsatriskandthedisposalofalloraportionofaninterestheldbytheprimarybeneficiary.
61 alexandriarealestateequities,inc.
We use qualitative and quantitative approaches when determining whether we are (or are not) the primary beneficiary of a Vie.
Consideration of various factors includes, but is not limited to, the form of our ownership interest, our representation of the
entity’sgoverningbody,thesizeandseniorityofourinvestment,variouscashflowscenariosrelatedtotheVIE,ourabilityto
participate in policy-making decisions, and the rights of the other investors to participate in the decision-making process and to
replace us as manager and/or liquidate the venture, if applicable. our ability to correctly assess our influence or control over an
entity at inception of our involvement or upon a reconsideration event and determine the primary beneficiary of a Vie affects the
presentation of these entities in our consolidated financial statements. if we were to perform a primary beneficiary analysis upon
the occurrence of a future reconsideration event, our assumptions may be different, which could result in the identification of a
different primary beneficiary. see note 13, noncontrolling interests.
useoFestiMatesthe preparation of financial statements in conformity with united states generally accepted accounting
principles(“GAAP”)requiresustomakeestimatesandassumptionsthataffectthereportedamountsofassets,liabilities,and
equity, the disclosure of contingent assets and liabilities as of the date of the consolidated financial statements, and the amounts of
revenues and expenses during the reporting period. actual results could materially differ from those estimates.
reclassiFications Certain prior year amounts have been reclassified to conform to the current year presentation.
retrospectiVeadjustMentsFroMadoptionoFaccountingpronounceMentsInJune2008,theFinancialAccounting
standards board (the “fasb”) issued new accounting literature with respect to determining whether instruments granted in share-
based payment transactions are participating securities. the new guidance clarifies that unvested share-based payment awards
that contain nonforfeitable rights to dividends or dividend equivalents (whether paid or unpaid) are participating securities and
should be included in the computation of earnings per share pursuant to the two-class method. the new guidance was adopted
onJanuary1,2009.Asaresult,netincomeattributabletoAlexandriaRealEstateEquities,Inc.’scommonstockholdersand
earnings per share (basic and diluted) are adjusted for an allocation of net income to unvested restricted stock awards, including
retrospectiveapplicationtopriorperiods.FortheyearsendedDecember31,2009,2008,and2007,approximately$1.3million,
$1.3million,and$1.1million,respectively,ofnetincomewasattributabletounvestedrestrictedstockawards.
InMay2008,theFASBissuednewaccountingliteraturewithrespecttotheaccountingforconvertibledebtinstrumentsthat
may be settled in cash upon conversion, including partial cash settlement. on January 1, 2009, we adopted the new guidance,
whichaffectsouroutstanding3.70%unsecuredconvertiblenotes(“3.70%UnsecuredConvertibleNotes”),whichmaybesettled
wholly or partially in cash. the new guidance, among other things, requires that instruments within its scope be separated
into their liability and equity components as of the issuance date of the instrument by recording the liability component at the
fair value of a similar liability that does not have an associated equity component and attributing the remaining proceeds from
issuance to the equity component. the excess of the principal amount of the liability component over its initial fair value will
beamortizedtointerestexpenseusingtheeffectiveinterestmethodoveraperiodoffiveyearsthroughJanuary2012(thefirst
datetheholdersofthe3.70%UnsecuredConvertibleNotesmayrequireustorepurchasetheirnotes).Asoftheissuancedateof
the3.70%UnsecuredConvertibleNotes,wedeterminedtheeffectiveinterestrateofthenotestobe5.96%andapproximately
$43.8millionofthe3.70%UnsecuredConvertibleNoteswasclassifiedasequity.Thenewguidancealsorequiresretrospective
applicationtopriorperiods.FortheyearsendedDecember31,2009,2008,and2007,weincurredadditionalnon-cashinterest
expenserelatedtoour3.70%UnsecuredConvertibleNotes,netofamountscapitalized,ofapproximately$3.5million,$6.6
million,and$7.4million,respectively,asaresultofadoptingthenewguidance.
in december 2007, the fasb issued new accounting literature with respect to the accounting for noncontrolling interests in
consolidated financial statements. the new guidance, among other things, requires all entities to report noncontrolling interests
insubsidiarieswithinequityintheconsolidatedfinancialstatements,butseparatefromtheparentstockholders’equity.If
noncontrolling interests are determined to be redeemable, they are classified as temporary equity, and reported at an amount
no less than the redemption value at each balance sheet date. the new guidance also requires any acquisitions or dispositions
of noncontrolling interests that do not result in a change of control to be accounted for as equity transactions. in addition, the
newguidancerequiresthataparentcompanyrecognizeagainorlossinnetincomewhenasubsidiaryisdeconsolidatedupon
achangeincontrol.Purchasesorsalesofaninterestinanentitythatresultinachangeofcontrolisrecognizedatfairvalue
with gains or losses included in net income. the new guidance was adopted on January 1, 2009, and applied retrospectively
to prior periods. the retrospective application of the presentation and disclosure requirements resulted in a reclassification of
noncontrolling interests determined not to be redeemable to a separate component of total equity (including an allocation of

62 2009annualreport
accumulated other comprehensive income to noncontrolling interests), and net income attributable to noncontrolling interests
isshownasareductionfromnetincomeincalculatingnetincomeattributabletoAlexandriaRealEstateEquities,Inc.’scommon
stockholders. the retrospective application of the presentation and disclosure requirements of the new guidance did not impact
netincomeattributabletoAlexandriaRealEstateEquities,Inc.’scommonstockholdersorearningspersharefortheyearsended
December31,2009,2008,and2007.
the following financial statement line items were affected by the adoption of the new accounting literature related to convertible
notes, noncontrolling interests, and participating securities (dollars in thousands, except per share data):
Year Ended Year Ended December 31, 2009 December 31, 2008 After Before After Before Adoption Adoption Adoption Adoption
incoMestateMentdata
Interest expense $ 81,271 $ 77,723 $ 84,108 $ 77,537
Income from continuing operations $ 136,430 $ 132,931 $ 101,060 $ 103,832
Net income $ 141,648 $ 138,149 $ 120,097 $ 122,869
Net income attributable to Alexandria Real Estate Equities, Inc.’s common stockholders $ 104,974 $ 109,792 $ 90,746 $ 98,644
Earnings per share attributable to Alexandria Real Estate Equities, Inc.’s common stockholders
Basic $ 2.72 $ 2.85 $ 2.87 $ 3.12
Diluted $ 2.72 $ 2.84 $ 2.86 $ 3.09
Year Ended December 31, 2007 After Before Adoption Adoption
incoMestateMentdata
Interest expense $ 92,270 $ 84,857
Income from continuing operations $ 75,966 $ 79,710
Net income $ 89,980 $ 93,724
Net income attributable to Alexandria Real Estate Equities, Inc.’s common stockholders $ 70,417 $ 78,905
Earnings per share attributable to Alexandria Real Estate Equities, Inc.’s common stockholders
Basic $ 2.37 $ 2.66
Diluted $ 2.36 $ 2.63
December 31, 2009 December 31, 2008 After Before After Before Adoption Adoption Adoption Adoption
Balancesheetdata
Construction in progress $ 1,400,795 $ 1,395,879 $ 1,398,895 $ 1,397,423
Other assets $ 126,696 $ 127,053 $ 114,991 $ 115,636
3.70% Unsecured Convertible Notes $ 368,027 $ 384,700 $ 431,145 $ 460,000
Minority interest $ – $ 82,728 $ – $ 75,021
Redeemable noncontrolling interests $ 41,441 $ – $ 33,963 $ –
Additional paid-in capital $ 1,977,062 $ 1,954,934 $ 1,407,294 $ 1,377,448
Noncontrolling interests $ 41,230 $ – $ 41,090 $ –

63 alexandriarealestateequities,inc.
FairValueWearerequiredtodisclosefairvalueinformationaboutallfinancialinstruments,whetherornotrecognizedinthe
balance sheet, for which it is practicable to estimate fair value. We measure and disclose the estimated fair value of financial
assetsandliabilitiesutilizingafairvaluehierarchythatdistinguishesbetweendataobtainedfromsourcesindependentofthe
reportingentityandthereportingentity’sownassumptionsaboutmarketparticipantassumptions.Thishierarchyconsistsof
three broad levels as follows: (1) using quoted prices in active markets for identical assets or liabilities, (2) “significant other
observable inputs,” and (3) “significant unobservable inputs.” “significant other observable inputs” can include quoted prices
for similar assets or liabilities in active markets, as well as inputs that are observable for the asset or liability, such as interest rates,
foreign exchange rates, and yield curves that are observable at commonly quoted intervals. “significant unobservable inputs”
aretypicallybasedonanentity’sownassumptions,sincethereislittle,ifany,relatedmarketactivity.Ininstanceswherethe
determination of the fair value measurement is based on inputs from different levels of the fair value hierarchy, the level in the fair
value hierarchy within which the entire fair value measurement falls is based on the lowest level input that is significant to the
fair value measurement in its entirety. our assessment of the significance of a particular input to the fair value measurement in its
entirety requires judgment, and considers factors specific to the asset or liability.
the carrying amounts of cash and cash equivalents, tenant security deposits and other restricted cash, tenant receivables,
otherassets,accountspayable,andaccruedexpensesapproximatefairvalue.AsdescribedinNote8,ourinterestratehedge
agreements have been recorded at fair value. the fair values of our secured notes payable, unsecured line of credit, unsecured
term loan, and unsecured convertible notes were estimated using “significant other observable inputs” such as available market
information and discounted cash flows analyses based on borrowing rates we believe we could obtain with similar terms and
maturities. because the valuations of our financial instruments are based on these types of estimates, the actual fair value of our
financial instruments may differ materially if our estimates do not prove to be accurate. additionally, the use of different market
assumptions or estimation methods may have a material effect on the estimated fair value amounts. as of december 31, 2009
and2008,thebookandfairvaluesofoursecurednotespayable,unsecuredlineofcredit,unsecuredtermloan,andunsecured
convertible notes were as follows (in thousands):
December 31, 2009 2008
Book Value Fair Value Book Value Fair Value
Secured notes payable $ 937,017 $ 909,367 $ 1,081,963 $ 1,050,551
Unsecured line of credit and unsecured term loan 1,226,000 1,175,512 1,425,000 1,333,215
Unsecured convertible notes 583,929 615,572 431,145 312,800
operatingsegMent We are engaged in the business of providing life science laboratory space for lease to the life science
industry. our properties are similar in that they provide space for lease to the life science industry, consist of life science laboratory
improvements that are generic and reusable for the life science industry, are located in key life science cluster markets, and have
similar economic characteristics. our chief operating decision maker reviews financial information for our entire consolidated
operations when making decisions on how to allocate resources and in assessing our operating performance. the financial
information disclosed herein represents all of the financial information related to our principal operating segment.
internationaloperations the functional currency for our subsidiaries operating in the united states is the united states
dollar. We have four operating properties and one development parcel in Canada and two development parcels in China. the
functional currency for our foreign subsidiaries operating in Canada and China is the local currency. the assets and liabilities of
our foreign subsidiaries are translated into united states dollars at the exchange rate in effect as of the financial statement date.
income statement accounts of our foreign subsidiaries are translated using the average exchange rate for the periods presented.
Gains or losses resulting from the translation are included in accumulated other comprehensive income (loss) as a separate
component of total equity.
the appropriate amounts of foreign exchange rate gains or losses included in accumulated other comprehensive income
(loss) will be reflected in income when there is a sale or partial sale of our investment in these operations or upon a complete or
substantially complete liquidation of the investment.
rentalproperties,net,landheldForFuturedeVelopMent,constructioninprogress,anddiscontinuedopera-
tions in december 2007, the fasb issued new accounting literature with respect to business combinations. this new accounting

64 2009annualreport
literaturewasadoptedprospectivelybeginningonJanuary1,2009.Inaccordancewiththenewguidance,werecognizeassets
acquired (including the intangible values to above- or below-market leases, acquired in-place leases, tenant relationships, and
other intangible assets or liabilities), liabilities assumed, and any noncontrolling interests in an acquired entity at their fair values
as of the acquisition date. the value of tangible assets acquired is based upon our estimation of value on an “as if vacant” basis. the
values of acquired in-place leases includes the estimated carrying costs during the hypothetical lease-up period and other costs
that would have been incurred to execute similar leases, considering market conditions at the acquisition date of the acquired
in-place lease. the values of acquired in-place leases are classified as leasing costs, included in other assets in the accompanying
consolidatedbalancesheets,andamortizedovertheremainingtermsoftherelatedleases.Weassessthefairvalueoftangible
andintangibleassetsbasedonnumerousfactors,includingestimatedcashflowprojectionsthatutilizeappropriatediscountand
capitalizationratesandavailablemarketinformation.Estimatesoffuturecashflowsarebasedonanumberoffactors,historical
operatingresults,knowntrends,andmarket/economicconditionsthatmayaffecttheproperty.Wealsorecognizethefairvalues
ofassetsacquired,theliabilitiesassumed,andanynoncontrollinginterestsinacquisitionsoflessthana100%interestwhenthe
acquisition constitutes a change in control of the acquired entity. in addition, acquisition-related costs and restructuring costs
areexpensedasincurred.Priortotheadoptionofthenewguidancerelatedtobusinesscombinations,thepurchasepricewas
allocatedbaseduponrelativefairvalues,andacquisition-relatedcostsonsuccessfulacquisitionswerecapitalizedandamortized
over the estimated useful lives of the assets acquired.
the values allocated to land improvements, buildings, building improvements, tenant improvements, and equipment are
depreciated on a straight-line basis using an estimated life of 20 years for land improvements, the shorter of the term of the
respective ground lease or 40 years for buildings and building improvements, the respective lease term for tenant improvements,
and the estimated useful life for equipment.
Thevaluesofacquiredabove-andbelow-marketleasesareamortizedoverthetermsoftherelatedleasesandrecordedaseither
an increase (for below-market leases) or a decrease (for above-market leases) to rental income. for the years ended december 31,
2009,2008,and2007,werecognizedanetincreaseinrentalincomeofapproximately$9,448,000,$9,509,000,and$7,572,000,
respectively,fortheamortizationofacquiredabove-andbelow-marketleases.Thevalueofacquiredabove-andbelow-market
leases,lessaccumulatedamortization,wasapproximately$27,746,000and$37,194,000asofDecember31,2009and2008,
respectively.Theweightedaverageamortizationperiodofacquiredleaseswasapproximately4.0yearsasofDecember31,2009.
Theestimatedaggregateannualamortizationofacquiredleasesforeachofthefivesucceedingyearsisapproximately$5,264,000
for2010,$4,009,000for2011,$3,467,000for2012,$3,415,000for2013,and$3,323,000for2014.
DuringtheyearendedDecember31,2009,werecognizedincomeofapproximately$7,242,000foracashpaymentrelatedto
real estate acquired in november 2007. this amount is classified in other income in the accompanying consolidated statements
of income.
Wearerequiredtocapitalizeconstruction,redevelopment,anddevelopmentcosts,includingpreconstructioncosts,interest,
property taxes, insurance, and other costs directly related and essential to the project while activities are ongoing to prepare an
asset for its intended use. Costs incurred after a project is substantially complete and ready for its intended use are expensed as
incurred. should development, redevelopment, or construction activity cease, interest, property taxes, insurance, and other costs
wouldnolongerbeeligibleforcapitalizationandwouldbeexpensedasincurred.Expendituresforrepairsandmaintenanceare
expensed as incurred.
We classify a property as “held for sale” when all of the following criteria for a plan of sale have been met: (1) management,
havingtheauthoritytoapprovetheaction,commitstoaplantoselltheproperty;(2)thepropertyisavailableforimmediatesalein
itspresentcondition,subjectonlytotermsthatareusualandcustomary;(3)anactiveprogramtolocateabuyerandotheractions
requiredtocompletetheplantosellhavebeeninitiated;(4)thesaleofthepropertyisprobableandisexpectedtobecompleted
withinoneyear;(5)thepropertyisbeingactivelymarketedforsaleatapricethatisreasonableinrelationtoitscurrentfair
value;and(6)actionsnecessarytocompletetheplanofsaleindicatethatitisunlikelythatsignificantchangestotheplanwillbe
madeorthattheplanwillbewithdrawn.Whenallofthesecriteriahavebeenmet,thepropertyisclassifiedas“heldforsale”;its
operations, including any interest expense directly attributable to it, are classified as discontinued operations in our consolidated
statementsofincome;andamountsforallpriorperiodspresentedarereclassifiedfromcontinuingoperationstodiscontinued
operations.Alossisrecognizedforanyinitialadjustmentoftheasset’scarryingamounttofairvaluelesscoststosellintheperiod
the asset qualifies as “held for sale.” depreciation of assets ceases upon designation of a property as “held for sale.”
rental properties, net, land held for future development, construction in progress, and intangibles are individually evaluated
for impairment when conditions exist that may indicate that it is probable that the sum of expected future undiscounted cash
flows is less than the carrying amount. impairment indicators for our rental properties, land held for future development, and

65 alexandriarealestateequities,inc.
construction in progress are assessed by project and include, but are not limited to, significant fluctuations in estimated net
operating income, occupancy changes, construction costs, estimated completion dates, rental rates, and other market factors.
We assess the expected undiscounted cash flows based upon numerous factors, including, but not limited to, construction
costs, available market information, historical operating results, known trends, market/economic conditions that may affect the
property, and our assumptions about the use of the asset, including, if necessary, a probability-weighted approach if multiple
outcomes are under consideration. upon determination that an impairment has occurred, a write-down is recorded to reduce
thecarryingamounttoitsestimatedfairvalue.Baseduponourevaluation,werecognizedanon-cashimpairmentchargeof
approximately$4,650,000duringtheyearendedDecember31,2008relatedtoanindustrialbuildinglocatedinasuburban
submarket south of boston and an office building located in the san diego market. this non-cash impairment charge is classified
in income from discontinued operations, net, in the accompanying consolidated statements of income.
conditionalassetretireMentoBligations some of our properties may contain asbestos, which, under certain conditions,
requires remediation. although we believe that the asbestos is appropriately contained in accordance with environmental
regulations,ourpracticeistoremediatetheasbestosuponthedevelopmentorredevelopmentoftheaffectedproperty.Werecognize
a liability for the fair value of a conditional asset retirement obligation (including asbestos) when the fair value of the liability can
bereasonablyestimated.Inaddition,forcertainproperties,wehavenotrecognizedanassetretirementobligationwhenthere
is an indeterminate settlement date for the obligation because the period in which we may remediate the obligation may not be
estimated with any level of precision to provide for a meaningful estimate of the retirement obligation. Conditional asset retirement
obligationstotaledapproximately$10.6millionand$10.9millionasofDecember31,2009and2008,respectively,andareincluded
in accounts payable, accrued expenses, and tenant security deposits in the accompanying consolidated balance sheets.
cashandcashequiValents We consider all highly liquid investments with original maturities of three months or less when
purchased to be cash and cash equivalents. the majority of our cash and cash equivalents are held at major commercial banks in
accounts that may at times exceed the federal deposit insurance Corporation (“fdiC”) limit. We have not experienced any losses
to date on our invested cash.
tenantsecuritydepositsandotherrestrictedcash tenant security deposits and other restricted cash consisted of the
following (in thousands):
December 31, 2009 2008
Funds held in trust under the terms of certain secured notes payable $ 19,340 $ 16,118
Funds held in escrow related to construction projects 24,054 49,499
Other restricted funds 3,897 2,165
Total $47,291 $ 67,782
inVestMents We hold equity investments in certain publicly traded companies and privately held entities primarily involved
in the life science industry. all of our investments in publicly traded companies are considered “available for sale” and are
recordedatfairvalue.Fairvaluehasbeendeterminedbasedupontheclosingpriceasofeachbalancesheetdate,withunrealized
gains and losses shown as a separate component of total equity. the classification of each investment is determined at the time
each investment is made, and such determination is reevaluated at each balance sheet date. the cost of each investment sold is
determinedbythespecificidentificationmethod,withnetrealizedgainsincludedinotherincome.Investmentsinprivatelyheld
entities are generally accounted for under the cost method when our interest in the entity is so minor that we have virtually no
influenceovertheentities’operatingandfinancialpolicies.Certaininvestmentsinprivatelyheldentitiesareaccountedforunder
theequitymethodwhenourinterestintheentityisnotdeemedsominorandwearedeemedtohaveinfluenceovertheentities’
operating and financial policies. under the equity method of accounting, we record our investment initially at cost and adjust the
carryingamountoftheinvestmenttorecognizeourshareoftheearningsorlossesoftheinvesteesubsequenttothedateofour
investment.AsofDecember31,2009and2008,ourownershippercentagesinthevotingstockofeachindividualprivatelyheld
entitywereunder10%.
individual investments are evaluated for impairment when changes in conditions may indicate an impairment exist. the
factors that we consider in making these assessments include, but are not limited to, market prices, market conditions, available

66 2009annualreport
financing, prospects for favorable or unfavorable clinical trial results, new product initiatives, and new collaboration agreements.
if there are no identified events or changes in circumstances that would have an adverse effect on our cost method investments,
we do not estimate its fair value. for all of our investments, if a decline in the fair value of an investment below the carrying value
is determined to be other-than-temporary, such investment is written down to its estimated fair value with a non-cash charge to
current earnings. We use “significant other observable inputs” and “significant unobservable inputs” to determine the fair value
of privately held entities.
leasingcostsCostsdirectlyrelatedandessentialtoourleasingactivitiesarecapitalizedandamortizedonastraight-line
basis over the term of the related lease. Costs related to unsuccessful leasing opportunities are expensed. leasing costs, net of
relatedamortization,totaledapproximately$70,209,000and$60,147,000asofDecember31,2009and2008,respectively,and
are included in other assets in the accompanying consolidated balance sheets. the value of acquired in-place leases is included
in the amounts immediately above, classified as leasing costs, included in other assets in the accompanying consolidated
balancesheets,andamortizedovertheremainingtermoftherelatedlease.Thevalueofacquiredin-placeleases,netofrelated
amortization,wasapproximately$8,177,000and$12,184,000asofDecember31,2009and2008,respectively.Theestimated
annualamortizationofthevalueofacquiredin-placeleasesforeachofthefivesucceedingyearsisapproximately$2,528,000for
2010,$1,689,000for2011,$1,101,000for2012,$925,000for2013,and$667,000for2014.
loanFeesandcostsFeesandcostsincurredinobtaininglong-termfinancingareamortizedoverthetermsoftherelated
loans and included in interest expense in the accompanying consolidated statements of income. loan fees and costs, net of
relatedamortization,totaledapproximately$23,706,000and$21,018,000asofDecember31,2009and2008,respectively,andare
included in other assets in the accompanying consolidated balance sheets.
interestratehedgeagreeMentsWeutilizeinterestratehedgeagreements,includinginterestrateswapandcapagreements,
to hedge a portion of our exposure to variable interest rates primarily associated with our unsecured line of credit and unsecured
termloan.Werecognizeourinterestratehedgeagreementsaseitherassetsorliabilitiesonthebalancesheetatfairvalue.The
accounting for changes in fair value (i.e., gains or losses) of a derivative instrument depends on whether it has been designated
and qualifies as part of a hedging relationship and further, on the type of hedging relationship. for those derivative instruments
that are designated and qualify as hedging instruments, a company must designate the hedging instrument, based upon the
hedged exposure, as a fair value hedge, cash flow hedge, or a hedge of a net investment in a foreign operation. our interest rate
hedge agreements are considered cash flow hedges as they are designated and qualify as hedges of the exposure to variability
in expected future cash flows. hedge accounting generally provides for the matching of the timing of gain or loss recognition on
the hedging instrument with the recognition of the changes in the earnings effect of the hedged forecasted transactions in a cash
flow hedge.
accountspayaBle,accruedexpenses,andtenantsecuritydeposits as of december 31, 2009, accounts payable, accrued
expenses,andtenantsecuritydepositsincludedinterestrateswapliabilitiesofapproximately$49,946,000,accountspayable
andaccruedexpensesofapproximately$48,866,000,accruedconstructioncostsofapproximately$36,856,000,andacquired
below-marketleasesofapproximately$27,746,000.AsofDecember31,2008,accountspayable,accruedexpenses,andtenant
securitydepositsincludedinterestrateswapliabilitiesofapproximately$80,542,000,accountspayableandaccruedexpenses
ofapproximately$86,161,000,accruedconstructioncostsof$73,470,000,andacquiredbelow-marketleasesofapproximately
$37,194,000.
accuMulated other coMprehensiVe (loss) incoMe accumulated other comprehensive (loss) income attributable to
alexandria real estate equities, inc. consists of the following (in thousands):
December 31, 2009 2008
Unrealized gain on marketable securities $ 7,280 $ 5,660
Unrealized loss on interest rate hedge agreements (50,043) (80,542)
Unrealized gain (loss) on foreign currency translation 9,033 (12,359)
Total $(33,730) $ (87,241)

67 alexandriarealestateequities,inc.
rentalincoMeandtenantrecoVeries rental income from leases with scheduled rent increases, free rent, incentives, or
otherrentadjustmentsisrecognizedonastraight-linebasisovertherespectiveleaseterms.Weincludeamountscurrently
recognizedasincome,andexpectedtobereceivedinlateryears,indeferredrentintheaccompanyingconsolidatedbalance
sheets.Amountsreceivedcurrently,butrecognizedasincomeinfutureyears,areincludedasunearnedrentinaccountspayable,
accrued expenses, and tenant security deposits in our consolidated balance sheets. We commence recognition of rental income
at the date the property is ready for its intended use and the tenant takes possession of or controls the physical use of the property.
tenant recoveries related to reimbursement of real estate taxes, insurance, utilities, repairs and maintenance, and other
operatingexpensesarerecognizedasrevenueintheperiodtheapplicableexpensesareincurred.
if necessary, we maintain an allowance for estimated losses that may result from the inability of our tenants to make payments
requiredunderthetermsofthelease.Ifatenantfailstomakecontractualpaymentsbeyondanyallowance,wemayrecognize
additionalbaddebtexpenseinfutureperiodsequaltotheamountofunpaidrentandunrealizeddeferredrent.AsofDecember31,
2009and2008,wehadnoallowancefordoubtfulaccounts.
interestincoMeInterestincomewasapproximately$1,503,000,$1,763,000,and$1,916,000in2009,2008,and2007,
respectively, and is included in other income in the accompanying consolidated statements of income.
incoMetaxesWeareorganizedandqualifyasaREITpursuanttotheInternalRevenueCodeof1986,asamended(the“Code”).
UndertheCode,aREITthatdistributes100%ofitstaxableincometoitsshareholderseachyearandthatmeetscertainother
conditionsisnotsubjecttofederalincometaxes,butcouldbesubjecttocertainstateandlocaltaxes.Wegenerallydistribute100%
or more of our taxable income. therefore, no provision for federal income taxes is required. We file tax returns, including returns
for our subsidiaries, with federal, state, and local jurisdictions, including jurisdictions located in the united states, Canada,
China, and other international locations. our tax returns are subject to examination in various jurisdictions for the calendar years
2005through2009.
Werecognizetaxbenefitsofuncertaintaxpositionsonlyifitismorelikelythannotthatthetaxpositionwillbesustained,based
solely on its technical merits, with the taxing authority having full knowledge of all relevant information. the measurement of
a tax benefit for an uncertain tax position that meets the “more likely than not” threshold is based on a cumulative probability
modelunderwhichthelargestamountoftaxbenefitrecognizedistheamountwithagreaterthan50%likelihoodofbeing
realizeduponultimatesettlementwiththetaxingauthorityhavingfullknowledgeofalltherelevantinformation.AsofDecember
31,2009,therewerenounrecognizedtaxbenefits.Wedonotanticipateasignificantchangetothetotalamountofunrecognized
tax benefits within the next twelve months.
Interestexpenseandpenalties,ifany,wouldberecognizedinthefirstperiodtheinterestorpenaltywouldbeginaccruing
according to the provisions of the relevant tax law at the applicable statutory rate of interest. We did not incur any tax-related
interestexpenseorpenaltiesfortheyearsendedDecember31,2009,2008,or2007.
DuringtheyearsendedDecember31,2009,2008,and2007,wedeclareddividendsonourcommonstockof$1.85,$3.18,and
$3.04pershare,respectively.DuringtheyearendedDecember31,2007,wedeclareddividendsonour9.10%seriesBcumulative
redeemablepreferredstock(“SeriesBPreferredStock”)of$0.4108pershare.DuringtheyearsendedDecember31,2009,2008,
and2007,wedeclareddividendsonour8.375%seriesCcumulativeredeemablepreferredstock(“SeriesCPreferredStock”)
of$2.09375pershare.DuringtheyearsendedDecember31,2009and2008,wedeclareddividendsonour7.00%seriesD
cumulativeconvertiblepreferredstock(“SeriesDConvertiblePreferredStock”)of$1.75and$1.409722pershare,respectively.
SeeNote11,PreferredStockandExcessStock.
Thetaxtreatmentofdistributionsoncommonstockpaidin2009wasasfollows:(1)98.8%ordinarydividendand(2)1.2%
returnofcapital.Ourtaxreturnfor2009isdueonorbeforeSeptember15,2010,assumingwefileforanextensionofthedue
date.Thetaxtreatmentofdistributionsoncommonstockpaidin2008wasasfollows:(1)81.1%ordinarydividend;(2)6.6%
capitalgainat15%;and(3)12.3%returnofcapital.Thetaxabilityinformationpresentedforourdividendspaidin2009isbased
uponmanagement’sestimate.OurtaxreturnsforprevioustaxyearshavenotbeenexaminedbytheInternalRevenueService.
Consequently, the taxability of distributions and dividends is subject to change. the information provided in this paragraph
is unaudited.

68 2009annualreport
netincoMeattriButaBletoalexandriarealestateequities,inc. the following table shows net income attributable to
alexandria real estate equities, inc. (in thousands):
Year Ended December 31, 2009 2008 2007
Income from continuing operations $ 129,383 $ 97,261 $ 72,297
Income from discontinued operations, net 5,218 19,037 14,014
Net income attributable to Alexandria Real Estate Equities, Inc. $134,601 $ 116,298 $ 86,311
earnings per share, diVidends declared, and preFerred stocK redeMption charge We account for unvested
restricted stock awards that contain nonforfeitable rights to dividends as participating securities and include these securities
in the computation of earnings per share using the two-class method. under the two-class method, we allocate net income after
preferred stock dividends and amounts attributable to noncontrolling interests to common stockholders and unvested restricted
stock awards based on their respective participation rights to dividends declared (or accumulated) and undistributed earnings.
diluted earnings per share is computed using the weighted average shares of common stock outstanding determined for the basic
earnings per share computation plus the effect of any dilutive securities, including the dilutive effect of stock options using the
treasury stock method.
Weappliedtheif-convertedmethodforour8.00%unsecuredseniorconvertiblenotes(“8.00%UnsecuredConvertible
notes”). in applying the if-converted method, conversion is assumed for purposes of calculating diluted earnings per share if the
effect would be dilutive to earnings per share. if the assumed conversion pursuant to the if-converted method is dilutive, diluted
earningspersharewouldbecalculatedbyaddingbackinterestchargesapplicabletoour8.00%UnsecuredConvertibleNotes
tothenumeratorandour8.00%UnsecuredConvertibleNoteswouldbeassumedtohavebeenconvertedatthebeginningofthe
period presented (or from the date of issuance, if occurring on a date later than the date that the period begins), and the resulting
incremental shares associated with the assumed conversion would be included in the denominator. for purposes of calculating
dilutedearningspershare,wedidnotassumeconversionofour8.00%UnsecuredConvertibleNotessincetheywereanti-dilutive
to earnings per share for the year ended december 31, 2009.
the following table shows the computation of earnings per share and dividends declared per common share (dollars in
thousands, except per share amounts):
Year Ended December 31, 2009 2008 2007
nuMerator
Net income attributable to Alexandria Real Estate Equities, Inc.’s common stockholders – numerator for basic earnings per share $ 104,974 $ 90,746 $ 70,417
Assumed conversion of 8.00% Unsecured Convertible Notes – – –
Effect of dilutive securities and assumed conversion attributable to unvested restricted stock awards – 5 6
Net income attributable to Alexandria Real Estate Equities, Inc.’s common stockholders – numerator for diluted earnings per share $ 104,974 $ 90,751 $ 70,423
denoMinator
Weighted average shares of common stock outstanding – basic 38,586,909 31,653,829 29,668,231
Effect of dilutive securities
Dilutive effect of stock options 13,160 111,226 163,782
Assumed conversion of 8.00% Unsecured Convertible Notes – – –
Weighted average shares of common stock outstanding – diluted 38,600,069 31,765,055 29,832,013
Earnings per share attributable to Alexandria Real Estate Equities, Inc.’s common stockholders
Basic $ 2.72 $ 2.87 $ 2.37
Diluted $ 2.72 $ 2.86 $ 2.36
Dividends declared per common share $ 1.85 $ 3.18 $ 3.04

69 alexandriarealestateequities,inc.
Ourcalculationofweightedaveragedilutedshareswillincludeadditionalsharesrelatedtoour3.70%UnsecuredConvertible
Noteswhentheaveragemarketpriceofourcommonstockishigherthantheconversionprice($117.36asofDecember31,2009).
the number of additional shares that will be included in the weighted average diluted shares is equal to the number of shares that
wouldbeissueduponthesettlementofthe3.70%UnsecuredConvertibleNotesassumingthesettlementoccurredattheendof
thereportingperiodpursuanttothetreasurystockmethod.FortheyearsendedDecember31,2009,2008,and2007,theweighted
averagesharesofcommonstock,relatedtoour3.70%UnsecuredConvertibleNoteshavebeenexcludedfromdilutedweighted
average shares of common stock, as the average market price of our common stock was lower than the conversion price of
$117.36asofDecember31,2009relatedtoour3.70%UnsecuredConvertibleNotes,andtheimpactofconversionwouldhave
been anti-dilutive.
ThedilutiveeffectofourSeriesDConvertiblePreferredStockwillbereflectedindilutedearningspersharebyapplicationof
theif-convertedmethod.FortheyearsendedDecember31,2009,2008,and2007,theweightedaveragesharesofcommonstock
relatedtoourSeriesDConvertiblePreferredStockhavebeenexcludedfromdilutedweightedaveragesharesofcommonstock,as
the impact on diluted earnings per share was anti-dilutive.
During2007,werecordedachargeofapproximately$2,799,000forcostsrelatedtotheredemptionofourSeriesBPreferred
Stock.ThisamountrepresentstheexcessofthefairvalueoftheconsiderationtransferredtotheholdersofourSeriesBPreferred
StockredeemedoverthecarryingamountofourSeriesBPreferredStockandissubtractedfromnetearningstodeterminenet
incomeattributabletoAlexandriaRealEstateEquities,Inc.’scommonstockholdersinthecalculationofearningspershare
attributabletoAlexandriaRealEstateEquities,Inc.’scommonstockholders.ThecosttoissueourSeriesBPreferredStockwas
recorded as a reduction to additional paid-in capital in the period that the preferred stock was issued. upon any redemption of
our preferred stock, the respective offering costs, representing the excess of the fair value of the consideration transferred to the
holdersoverthecarryingamountofthepreferredstock,willberecognizedasadividendtopreferredstockholders.Additionally,
dividends on preferred stock are deducted from net income to arrive at net income attributable to alexandria real estate equities,
Inc.’scommonstockholders.
stocK-BasedcoMpensationexpense We have historically issued two forms of stock-based compensation under our equity
incentive plan: options to purchase common stock (“options”) and restricted stock awards. We have not granted any options
since2002.Werecognizeallstock-basedcompensationintheincomestatementbasedonthegrantdatefairvalue.Thefairvalue
isrecordedbasedonthemarketvalueofthecommonstockonthegrantdateandsuchcostisthenrecognizedonastraight-line
basis over the period during which the employee is required to provide services in exchange for the award (the vesting period).
We are required to compute stock-based compensation based on awards that are ultimately expected to vest and as a result,
future forfeitures of awards are estimated at the time of grant and revised, if necessary, in subsequent periods if actual forfeitures
differfromthoseestimates.Nocompensationcostisrecognizedforequityinstrumentsthatareforfeitedorareanticipated
to be forfeited.
iMpactoFrecentlyissuedaccountingstandardsin January 2010, the fasb issued an accounting standard update (“asu”)
to address implementation issues associated with the accounting for decreases in the ownership of a subsidiary. the new guidance
clarified the scope of the entities covered by the guidance related to accounting for decreases in the ownership of a subsidiary
and specifically excluded in-substance real estate or conveyances of oil and gas mineral rights from the scope. additionally, the
new guidance expands the disclosures required for a business combination achieved in stages and deconsolidation of a business
or nonprofit activity. the new guidance became effective for interim and annual periods ending on or after december 31, 2009,
and must be applied on a retrospective basis to the first period that an entity adopted the new guidance related to noncontrolling
interests. the adoption of this new guidance did not have an impact on our consolidated financial statements.
in January 2010, the fasb issued an asu to address diversity in practice related to the accounting for a distribution to
shareholders that offers them the ability to elect to receive their entire distribution in cash or shares of equivalent value with a
potential limitation on the total amount of cash that shareholders can elect to receive in the aggregate. the new guidance clarifies
that the stock portion of a distribution to shareholders that allows them to elect to receive cash or shares with a potential limitation
on the total amount of cash that all shareholders can elect to receive in the aggregate is considered a share issuance that is reflected
in earnings per share prospectively as opposed to a stock dividend that is retroactively applied by restating shares outstanding and
earnings per share for all periods presented. the new guidance became effective for interim and annual periods ending on or after
december 31, 2009, and must be applied on a retrospective basis. the adoption of this new guidance did not have an impact on our
consolidated financial statements.
70 2009annualreport
in June 2009, the fasb established the fasb accounting standards Codification (the “Codification”) as the source of
authoritativeaccountingprinciplesrecognizedbytheFASBtobeappliedbynongovernmentalentitiesinthepreparationof
financialstatementsinconformitywithGAAP.RulesandinterpretivereleasesoftheSecuritiesandExchangeCommission(“SEC”)
underauthorityoffederalsecuritieslawsarealsosourcesofauthoritativeGAAPforSECregistrants.Allguidancecontainedinthe
Codification carries an equal level of authority. the Codification became effective for interim or annual financial periods ending
afterSeptember15,2009.TheadoptionoftheCodificationdidnothaveanimpactonourconsolidatedfinancialstatements.
in June 2009, the fasb issued new accounting literature with respect to the consolidation of Vies. the new guidance impacts
the consolidation guidance applicable to Vies and, among other things, requires a qualitative rather than a quantitative analysis
to determine the primary beneficiary of a Vie, continuous assessments of whether a company is the primary beneficiary of a Vie,
andenhanceddisclosuresaboutacompany’sinvolvementwithaVIE.Thenewguidanceappliestoourfiscalyearbeginningon
January 1, 2010, and early adoption is prohibited. We are currently evaluating the impact of the new guidance on our consolidated
financial statements.
in may 2009, the fasb issued new accounting literature with respect to subsequent events. the new guidance, among other
things, clarifies accounting for and disclosure of events that occur after the balance sheet date but before financial statements are
issued or available to be issued. We adopted the new guidance effective april 1, 2009, and the adoption did not have an impact on
our consolidated financial statements.
NOTE 3. RENTAL pROpERTIES, NET, LAND hELD FOR FuTuRE DEvELOpMENT, AND CONSTRuCTION IN pROgRESS
our real estate consisted of the following (in thousands):
December 31, 2009 2008
Land $ 474,859 $ 450,812
Buildings and building improvements 3,249,866 3,013,315
Other improvements 179,230 180,286
Gross book value of real estate – operating properties 3,903,955 3,644,413
Less: accumulated depreciation (520,647) (428,690)
Rental properties, net 3,383,308 3,215,723
Land held for future development 255,025 109,478
Construction in progress 1,400,795 1,398,895
Real estate investments, net $5,039,128 $ 4,724,096
AsofDecember31,2009and2008,certainofourrentalpropertieswereencumberedbydeedsoftrustandassignmentsof
rentsandleasesassociatedwiththeproperties.SeeNote5,SecuredNotesPayable.Thenetbookvaluesofencumberedrental
properties,netasofDecember31,2009and2008,wereapproximately$1,304,235,000and$1,324,011,000,respectively.
AsofDecember31,2009and2008,wehadapproximately$3.4billionand$3.2billion,respectively,ofrentalproperties,net
aggregating11.2millionand11.1millionrentablesquarefeet,respectively.Additionally,asofDecember31,2009and2008,we
hadapproximately$255.0millionand$109.5million,respectively,oflandheldforfuturedevelopmentaggregating4.8million
and 2.9 million rentable square feet, respectively. land held for future development represents real estate we plan to develop in
the future but as of each period presented, no construction activities were ongoing. as a result, interest, property taxes, insurance,
and other costs are expensed as incurred.
71 alexandriarealestateequities,inc.
AsofDecember31,2009and2008,wehadapproximately$1.4billionundergoingpreconstructionandconstructionactivities,
including development and redevelopment. these projects are classified in the accompanying consolidated balance sheets as
constructioninprogress.AsofDecember31,2009and2008,wehad575,152and590,057rentablesquarefeet,respectively,
undergoing active redevelopment through a permanent change in use to life science laboratory space, including conversion of
single- tenancy to multi-tenancy spaces or multi-tenancy spaces to single-tenancy space. in addition, as of december 31, 2009 and
2008,wehad980,000and875,000rentablesquarefeet,respectively,undergoingactiveground-updevelopmentconsistingof
verticalabovegroundconstructionoflifesciencelaboratoryproperties.Additionally,asofDecember31,2009and2008,wehad
anaggregateof6.3millionand7.6millionrentablesquarefeet,respectively,undergoingpreconstructionactivities(entitlements,
permitting, design, site work, and activities prior to commencement of vertical construction of aboveground core and shell),
andnewmarketsandotherprojects.Wearerequiredtocapitalizeinterestduringtheperiodanassetisundergoingactivitiesto
prepareitforitsintendeduse.Capitalizationofinterestceasesafteraprojectissubstantiallycompleteandreadyforitsintended
use.Inaddition,shouldconstructionactivitycease,interestwouldbeexpensedasincurred.Totalinterestcapitalizedfortheyears
endedDecember31,2009,2008,and2007,wasapproximately$76,884,000,$74,194,000,and$56,057,000,respectively.Total
interestincurredfortheyearsendedDecember31,2009,2008,and2007,wasapproximately$148,370,000,$152,765,000,and,
$144,898,000,respectively.
Weleasespaceundernoncancellableleaseswithremainingtermsofupto15years.Minimumleasepaymentstobereceived
under the terms of the operating lease agreements, excluding expense reimbursements, as of december 31, 2009, are as follows
(in thousands):
Year Amount
2010 $ 319,794
2011 314,394
2012 260,268
2013 226,355
2014 196,786
Thereafter 675,473
$1,993,070
NOTE 4. INvESTMENTS
We hold equity investments in certain publicly traded companies and privately held entities primarily involved in the life science
industry. all of our investments in publicly traded companies are considered “available for sale” and are recorded at fair value.
fair value of our investments in publicly traded companies has been determined based upon the closing price as of the balance
sheetdate,withunrealizedgainsandlossesshownasaseparatecomponentoftotalequity.Theclassificationofeachinvestment
is determined at the time each investment is made, and such determination is reevaluated at each balance sheet date. the cost
ofeachinvestmentsoldisdeterminedbythespecificidentificationmethod,withnetrealizedgainsandlossesincludedin
other income. investments in privately held entities are generally accounted for under the cost method when our interest in the
entityissominorthatwehavevirtuallynoinfluenceovertheentities’operatingandfinancialpolicies.Additionally,welimit
ourownershippercentageinthevotingstockofeachindividualentitytolessthan10%.AsofDecember31,2009and2008,our
ownershippercentageinthevotingstockofeachindividualentitywaslessthan10%.
individual investments are evaluated for impairment when changes in conditions may indicate an impairment exists. the
factors that we consider in making these assessments include, but are not limited to, market prices, market conditions, available
financing, prospects for favorable or unfavorable clinical trial results, new product initiatives, and new collaboration agreements.
if there are no identified events or changes in circumstances that would have an adverse effect on our cost method investments,
we do not estimate their fair value. for all of our investments, if a decline in the fair value of an investment below the carrying
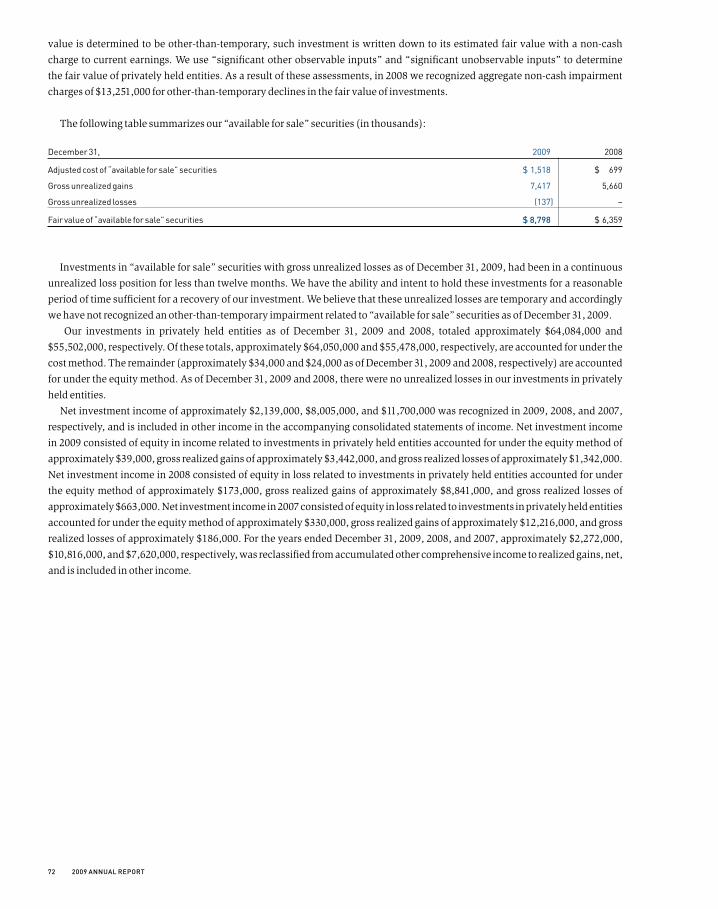
72 2009annualreport
value is determined to be other-than-temporary, such investment is written down to its estimated fair value with a non-cash
charge to current earnings. We use “significant other observable inputs” and “significant unobservable inputs” to determine
thefairvalueofprivatelyheldentities.Asaresultoftheseassessments,in2008werecognizedaggregatenon-cashimpairment
chargesof$13,251,000forother-than-temporarydeclinesinthefairvalueofinvestments.
Thefollowingtablesummarizesour“availableforsale”securities(inthousands):
December 31, 2009 2008
Adjusted cost of “available for sale” securities $ 1,518 $ 699
Gross unrealized gains 7,417 5,660
Gross unrealized losses (137) –
Fair value of “available for sale” securities $8,798 $ 6,359
Investmentsin“availableforsale”securitieswithgrossunrealizedlossesasofDecember31,2009,hadbeeninacontinuous
unrealizedlosspositionforlessthantwelvemonths.Wehavetheabilityandintenttoholdtheseinvestmentsforareasonable
periodoftimesufficientforarecoveryofourinvestment.Webelievethattheseunrealizedlossesaretemporaryandaccordingly
wehavenotrecognizedanother-than-temporaryimpairmentrelatedto“availableforsale”securitiesasofDecember31,2009.
Our investments inprivatelyheldentitiesasofDecember31,2009and2008, totaledapproximately$64,084,000and
$55,502,000,respectively.Ofthesetotals,approximately$64,050,000and$55,478,000,respectively,areaccountedforunderthe
costmethod.Theremainder(approximately$34,000and$24,000asofDecember31,2009and2008,respectively)areaccounted
forundertheequitymethod.AsofDecember31,2009and2008,therewerenounrealizedlossesinourinvestmentsinprivately
held entities.
Netinvestmentincomeofapproximately$2,139,000,$8,005,000,and$11,700,000wasrecognizedin2009,2008,and2007,
respectively, and is included in other income in the accompanying consolidated statements of income. net investment income
in 2009 consisted of equity in income related to investments in privately held entities accounted for under the equity method of
approximately$39,000,grossrealizedgainsofapproximately$3,442,000,andgrossrealizedlossesofapproximately$1,342,000.
Netinvestmentincomein2008consistedofequityinlossrelatedtoinvestmentsinprivatelyheldentitiesaccountedforunder
theequitymethodofapproximately$173,000,grossrealizedgainsofapproximately$8,841,000,andgrossrealizedlossesof
approximately$663,000.Netinvestmentincomein2007consistedofequityinlossrelatedtoinvestmentsinprivatelyheldentities
accountedforundertheequitymethodofapproximately$330,000,grossrealizedgainsofapproximately$12,216,000,andgross
realizedlossesofapproximately$186,000.FortheyearsendedDecember31,2009,2008,and2007,approximately$2,272,000,
$10,816,000,and$7,620,000,respectively,wasreclassifiedfromaccumulatedothercomprehensiveincometorealizedgains,net,
and is included in other income.
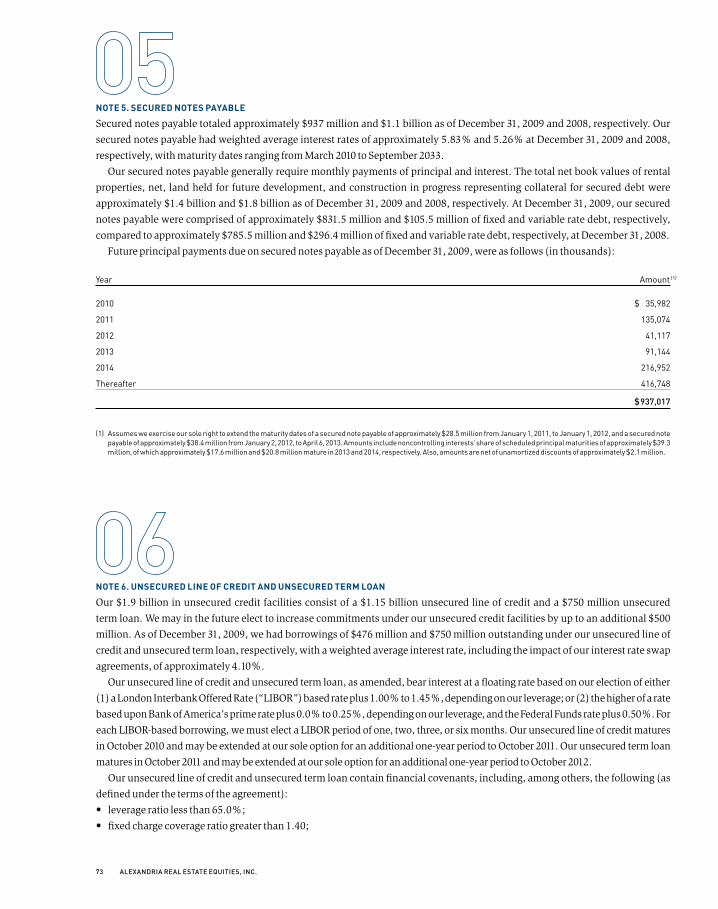
73 alexandriarealestateequities,inc.
NOTE 5. SECuRED NOTES pAyABLE
Securednotespayabletotaledapproximately$937millionand$1.1billionasofDecember31,2009and2008,respectively.Our
securednotespayablehadweightedaverageinterestratesofapproximately5.83%and5.26%atDecember31,2009and2008,
respectively, with maturity dates ranging from march 2010 to september 2033.
our secured notes payable generally require monthly payments of principal and interest. the total net book values of rental
properties, net, land held for future development, and construction in progress representing collateral for secured debt were
approximately$1.4billionand$1.8billionasofDecember31,2009and2008,respectively.AtDecember31,2009,oursecured
notespayablewerecomprisedofapproximately$831.5millionand$105.5millionoffixedandvariableratedebt,respectively,
comparedtoapproximately$785.5millionand$296.4millionoffixedandvariableratedebt,respectively,atDecember31,2008.
future principal payments due on secured notes payable as of december 31, 2009, were as follows (in thousands):
Year Amount (1)
2010 $ 35,982
2011 135,074
2012 41,117
2013 91,144
2014 216,952
Thereafter 416,748
$937,017
(1) Assumes we exercise our sole right to extend the maturity dates of a secured note payable of approximately $28.5 million from January 1, 2011, to January 1, 2012, and a secured note payable of approximately $38.4 million from January 2, 2012, to April 6, 2013. Amounts include noncontrolling interests’ share of scheduled principal maturities of approximately $39.3 million, of which approximately $17.6 million and $20.8 million mature in 2013 and 2014, respectively. Also, amounts are net of unamortized discounts of approximately $2.1 million.
NOTE 6. uNSECuRED LINE OF CREDIT AND uNSECuRED TERM LOAN
Our$1.9billioninunsecuredcreditfacilitiesconsistofa$1.15billionunsecuredlineofcreditanda$750millionunsecured
termloan.Wemayinthefutureelecttoincreasecommitmentsunderourunsecuredcreditfacilitiesbyuptoanadditional$500
million.AsofDecember31,2009,wehadborrowingsof$476millionand$750millionoutstandingunderourunsecuredlineof
credit and unsecured term loan, respectively, with a weighted average interest rate, including the impact of our interest rate swap
agreements,ofapproximately4.10%.
our unsecured line of credit and unsecured term loan, as amended, bear interest at a floating rate based on our election of either
(1)aLondonInterbankOfferedRate(“LIBOR”)basedrateplus1.00%to1.45%,dependingonourleverage;or(2)thehigherofarate
baseduponBankofAmerica’sprimerateplus0.0%to0.25%,dependingonourleverage,andtheFederalFundsrateplus0.50%.For
each libor-based borrowing, we must elect a libor period of one, two, three, or six months. our unsecured line of credit matures
in october 2010 and may be extended at our sole option for an additional one-year period to october 2011. our unsecured term loan
matures in october 2011 and may be extended at our sole option for an additional one-year period to october 2012.
our unsecured line of credit and unsecured term loan contain financial covenants, including, among others, the following (as
defined under the terms of the agreement):
• leverageratiolessthan65.0%;
• fixedchargecoverageratiogreaterthan1.40;

74 2009annualreport
• minimumbookvalueof$1.6billion;and
• secureddebtratiolessthan55.0%.
in addition, the terms of the unsecured line of credit and unsecured term loan restrict, among other things, certain investments,
indebtedness, distributions, mergers, developments, land, and borrowings available under our unsecured line of credit and
unsecuredtermloanfordevelopments,land,andencumberedassets.AsofDecember31,2009and2008,wewereincompliance
with all such covenants.
aggregate unsecured borrowings may be limited to an amount based primarily on the net operating income derived from a
pool of unencumbered and encumbered properties and our cost basis of development assets and land. aggregate unsecured
borrowings may increase as we complete the development, redevelopment, or acquisition of additional unencumbered
properties.AsofDecember31,2009,aggregateunsecuredborrowingswerelimitedtoapproximately$2.8billion.
NOTE 7. uNSECuRED CONvERTIBLE NOTES
8.00%unsecuredconVertiBlenotesInApril2009,wecompletedaprivateofferingofthe8.00%UnsecuredConvertible
Notes.Thenetproceedsfromthisoffering,afterinitialpurchasers’feesandotherofferingcosts,wereapproximately$233.0
million.PriortoApril20,2014,wewillnothavetherighttoredeemthe8.00%UnsecuredConvertibleNotes,excepttopreserve
ourqualificationasaREIT.Onandafterthatdate,wehavetherighttoredeemthe8.00%UnsecuredConvertibleNotes,inwhole
orinpart,atanytimeandfromtimetotime,forcashequalto100%oftheprincipalamountofthenotestoberedeemed,plus
anyaccruedandunpaidinterestto,butexcluding,theredemptiondate.Holdersofthe8.00%UnsecuredConvertibleNotesmay
requireustorepurchasetheirnotes,inwholeorinpart,onApril15,2014,2019,and2024,forcashequalto100%oftheprincipal
amount of the notes to be purchased plus any accrued and unpaid interest to, but excluding, the repurchase date. holders of the
8.00%UnsecuredConvertibleNotesmayrequireustorepurchasealloraportionoftheirnotesupontheoccurrenceofspecified
corporatetransactions(each,a“FundamentalChange”),atarepurchasepriceincashequalto100%oftheprincipalamountof
the notes to be repurchased, plus any accrued and unpaid interest to, but excluding, the fundamental change repurchase date.
Atissuance,the8.00%UnsecuredConvertibleNoteshadaninitialconversionrateofapproximately24.1546sharesofcommon
stockper$1,000principalamountofthe8.00%UnsecuredConvertibleNotes,representingaconversionpriceofapproximately
$41.40pershareofourcommonstock.Thisinitialconversionpricerepresentedapremiumof15%basedonthelastreported
salepriceof$36.00pershareofourcommonstockonApril21,2009.Theconversionrateofthe8.00%UnsecuredConvertible
notes is subject to adjustments for certain events, including, but not limited to, certain cash dividends on our common stock in
excessof$0.35pershareperquarteranddividendsonourcommonstockpayableinsharesofourcommonstock.AsofDecember
31,2009,therewasnochangefromtheinitialconversionrateofour8.00%UnsecuredConvertibleNotes.Theaggregatenumber
of shares that would have been issued assuming conversion of the notes occured on december 31, 2009, was approximately
5,797,000shares.
Holdersofthe8.00%UnsecuredConvertibleNotesmayconverttheirnotespriortothestatedmaturitydateofApril15,2029
only under the following circumstances: (1) during any calendar quarter after the calendar quarter ending June 30, 2009, if the
closing sale price of our common stock for each of 20 or more trading days in a period of 30 consecutive trading days ending on the
lasttradingdayoftheimmediatelyprecedingcalendarquarterexceedsorisequalto130%oftheconversionpriceineffectonthe
lasttradingdayoftheimmediatelyprecedingcalendarquarter;(2)duringthefiveconsecutivebusinessdaysimmediatelyafter
anyfiveconsecutivetradingdayperiod(the“8.00%UnsecuredConvertibleNoteMeasurementPeriod”)inwhichtheaverage
tradingpriceper$1,000principalamountofthe8.00%UnsecuredConvertibleNoteswasequaltoorlessthan98%oftheaverage
conversionvalueofthe8.00%UnsecuredConvertibleNotesduringthe8.00%UnsecuredConvertibleNoteMeasurementPeriod;
(3)upontheoccurrenceofaFundamentalChange;(4)ifwecallthe8.00%UnsecuredConvertibleNotesforredemption;and(5)
atanytimefrom,andincluding,March15,2029,untilthecloseofbusinessonthebusinessdayimmediatelyprecedingApril15,
2029,orearlierredemptionorrepurchase.Uponconversion,holdersofthe8.00%UnsecuredConvertibleNoteswillreceivecash,
shares of our common stock, or a combination thereof, as the case may be, at our election.
75 alexandriarealestateequities,inc.
Our8.00%UnsecuredConvertibleNoteshavebeenseparatedintotheirliabilityandequitycomponentsasoftheissuancedate
by recording the liability component at the fair value of a similar liability that does not have an associated equity component and
attributing the remaining proceeds from issuance to the equity component. the excess of the principal amount of the liability
componentoveritsinitialfairvaluewillbeamortizedtointerestexpenseusingtheeffectiveinterestmethodoveraperiodoffive
yearsthroughApril2014(thefirstdatetheholdersofthe8.00%UnsecuredConvertibleNotesmayrequireustorepurchasetheir
notes).Asoftheissuancedateofthe8.00%UnsecuredConvertibleNotes,wedeterminedtheeffectiveinterestrateofthenotesto
be11.0%,andapproximately$26.2millionofthe8.00%UnsecuredConvertibleNoteswasclassifiedasequity.AsofDecember
31,2009,thecarryingamountoftheequitycomponentwasapproximately$26.2million.FortheyearendedDecember31,2009,
theamountofinterestcostrecognizedfortheperiod,beforetheimpactofcapitalizedinterest,relatingtothecontractualinterest
couponwasapproximately$13.0millionandamortizationofthediscountontheliabilitycomponentwasapproximately$2.9
million.AsofDecember31,2009,thebookvalueofthe8.00%UnsecuredConvertibleNoteswasapproximately$215.9million,
netofanunamortizeddiscountofapproximately$24.1million.BasedontheDecember31,2009closingstockpriceofour
commonstockandtheDecember31,2009conversionpriceofthe8.00%UnsecuredConvertibleNotes,theif-convertedvalueof
thenotesexceededtheprincipalamountbyapproximately$132.7millionasofDecember31,2009.
3.70%unsecuredconVertiBlenotesInJanuary2007,wecompletedaprivateofferingof$460millionprincipalamount
of3.70%UnsecuredConvertibleNotes.Thenetproceedsfromthisoffering,afterinitialpurchasers’feesandotheroffering
costs,wereapproximately$450.8million.PriortoJanuary15,2012,wewillnothavetherighttoredeemthe3.70%Unsecured
ConvertibleNotes,excepttopreserveourqualificationasaREIT.Onandafterthatdate,wehavetherighttoredeemthe3.70%
UnsecuredConvertibleNotes,inwholeorinpart,atanytimeandfromtimetotime,forcashequalto100%oftheprincipal
amountofthe3.70%UnsecuredConvertibleNotestoberedeemed,plusanyaccruedandunpaidinterestto,butexcluding,the
redemptiondate.Holdersofthe3.70%UnsecuredConvertibleNotesmayrequireustorepurchasetheirnotes,inwholeorinpart,
onJanuary15,2012,2017,and2022,forcashequalto100%oftheprincipalamountofthenotestobepurchasedplusanyaccrued
andunpaidinterestto,butexcluding,therepurchasedate.Holdersofthe3.70%UnsecuredConvertibleNotesmayrequireusto
repurchase all or a portion of their notes upon the occurrence of a fundamental Change, including a change in control, certain
mergerorconsolidationtransactions,ortheliquidationoftheCompany,atarepurchasepriceincashequalto100%ofthe
principal amount of the notes to be repurchased, plus any accrued and unpaid interest to, but excluding, the fundamental change
repurchase date.
Atissuance,the3.70%UnsecuredConvertibleNoteshadaninitialconversionrateofapproximately8.4774sharesofcommon
stockper$1,000principalamountofthe3.70%UnsecuredConvertibleNotes,representingaconversionpriceofapproximately
$117.96pershareofourcommonstock.Thisinitialconversionpricerepresentedapremiumof20%basedonthelastreported
salepriceof$98.30pershareofourcommonstockonJanuary10,2007.Theconversionrateofthe3.70%UnsecuredConvertible
notes is subject to adjustments for certain events, including, but not limited to, certain cash dividends on our common stock in
excessof$0.74pershareperquarteranddividendsonourcommonstockpayableinsharesofourcommonstock.AsofDecember
31,2009,the3.70%UnsecuredConvertibleNoteshadaconversionrateofapproximately8.5207sharesofcommonstockper
$1,000principalamountofthe3.70%UnsecuredConvertibleNotes,whichisequivalenttoaconversionpriceofapproximately
$117.36pershareofourcommonstock.
Holdersofthe3.70%UnsecuredConvertibleNotesmayconverttheirnotesintocashand,ifapplicable,sharesofourcommon
stockpriortothestatedmaturityofJanuary15,2027,onlyunderthefollowingcircumstances:(1)duringanycalendarquarter
after the calendar quarter ending march 31, 2007, if the closing sale price of our common stock for each of 20 or more trading days
in a period of 30 consecutive trading days ending on the last trading day of the immediately preceding calendar quarter exceeds
120%oftheconversionpriceineffectonthelasttradingdayoftheimmediatelyprecedingcalendarquarter;(2)duringthefive
consecutivebusinessdaysimmediatelyafteranyfiveconsecutivetradingdayperiod(the“3.70%UnsecuredConvertibleNote
MeasurementPeriod”)inwhichtheaveragetradingpriceper$1,000principalamountof3.70%UnsecuredConvertibleNotes
wasequaltoorlessthan98%oftheaverageconversionvalueofthe3.70%UnsecuredConvertibleNotesduringthe3.70%
UnsecuredConvertibleNoteMeasurementPeriod;(3)upontheoccurrenceofaFundamentalChange;(4)ifwecallthe3.70%
UnsecuredConvertibleNotesforredemption;and(5)atanytimefromandincludingDecember15,2026,untilthecloseof
businessonthebusinessdayimmediatelyprecedingJanuary15,2027,orearlierredemptionorrepurchase.
InApril2009,werepurchased,inprivatelynegotiatedtransactions,certainofour3.70%UnsecuredConvertibleNotes
aggregatingapproximately$75million(parvalue)atanaggregatecashpriceofapproximately$59.2million.Asaresultofthe
76 2009annualreport
repurchases,werecognizedagainonearlyextinguishmentofdebtofapproximately$11.3million,netofapproximately$860,000
inunamortizedissuancecosts.Thegainisclassifiedasgainonearlyextinguishmentofdebtintheaccompanyingconsolidated
incomestatements.AsofDecember31,2009and2008,thecarryingvalueoftheequitycomponentofthe3.70%Unsecured
ConvertibleNoteswasapproximately$43.5millionand$43.8million,respectively.
FortheyearsendedDecember31,2009,2008,and2007,theamountofinterestcostrecognized,beforetheimpactofcapitalized
interest, relating to thecontractual interestcouponofour3.70%UnsecuredConvertibleNoteswasapproximately$15.1
million,$17.0,millionand$15.3million,respectively.Additionally,fortheyearsendedDecember31,2009,2008,and2007,the
amountofinterestcostrecognized,beforetheimpactofcapitalizedinterest,relatingtotheamortizationofthediscountonthe
liabilitycomponentofour3.70%UnsecuredConvertibleNoteswasapproximately$7.9million,$8.4million,and$7.6million,
respectively.AsofDecember31,2009and2008,thebookvalueofthe3.70%UnsecuredConvertibleNoteswasapproximately
$368.0millionand$431.1million,respectively,netofanunamortizeddiscountofapproximately$16.7millionand$28.9million,
respectively.Our3.70%UnsecuredConvertibleNotesrequirethatuponconversion,theentireprincipalamountbesettledin
cash, and any excess value above the principal amount, if applicable, in shares of our common stock. based on the december 31,
2009closingstockpriceofourcommonstockandtheDecember31,2009conversionpriceofthe3.70%UnsecuredConvertible
notes, the if-converted value of the notes did not exceed the principal amount as of december 31, 2009, and accordingly, no shares
of our common stock would be issued if the notes were settled on december 31, 2009.
NOTE 8. INTEREST RATE hEDgE AgREEMENTS
We are exposed to certain risks arising from both our business operations and economic conditions. We principally manage our
exposures to a wide variety of business and operational risks through management of our core business activities. We manage
economic risks, including interest rate, liquidity, and credit risk primarily by managing the amount, sources, and duration of
our debt funding and the use of interest rate hedge agreements. specifically, we enter into interest rate hedge agreements to
manage exposures that arise from business activities that result in the payment of future known and uncertain cash amounts,
the value of which are determined by interest rates. our interest rate hedge agreements are used to manage differences in the
amount, timing, and duration of our known or expected cash payments principally related to our libor-based borrowings.
We do not use derivatives for trading or speculative purposes, and currently all of our derivatives are designated as hedges. our
objectives in using interest rate hedge agreements are to add stability to interest expense and to manage our exposure to interest
rate movements in accordance with our interest rate risk management strategy. interest rate swap agreements designated as cash
flow hedges involve the receipt of variable rate amounts from a counterparty in exchange for the Company making fixed rate
payments over the life of the interest rate swap agreements without exchange of the underlying notional amount. interest rate cap
agreements designated as cash flow hedges involve the receipt of variable rate amounts from a counterparty if interest rates rise
above the strike rate on the contract in exchange for an up-front premium.
the effective portion of changes in the fair value of our interest rate hedge agreements designated and that qualify as cash flow
hedges is recorded in accumulated other comprehensive income. the amount is subsequently reclassified into earnings in the
periodthatthehedgedforecastedtransactionsaffectearnings.DuringtheyearsendedDecember31,2009and2008,ourinterest
rate hedge agreements were used to hedge the variable cash flows associated with certain of our existing libor-based variable
rate debt, including our unsecured line of credit and unsecured term loan. the ineffective portion of the change in fair value of our
interestratehedgeagreementsisrecognizeddirectlyinearnings.DuringtheyearsendedDecember31,2009,2008,and2007,our
interestratehedgeagreementswere100%effective,thuswedidnotrecognizeanyofthechangeinfairvalueofourinterestrate
hedge agreements directly into earnings.
AsofDecember31,2009and2008,ourinterestrateswapagreementswereclassifiedinaccountspayable,accruedexpenses,
andtenantsecuritydepositsbasedupontheirrespectivefairvaluesaggregatingaliabilitybalanceofapproximately$49.9million
and$80.5million,respectively,whichincludesaccruedinterestandadjustmentsforriskofnon-performance,withtheoffsetting
adjustmentreflectedasunrealizedgain(loss)inaccumulatedothercomprehensivelossintotalequity.Also,duringtheyear
endedDecember31,2009,weenteredintoaninterestratecapagreementwithanotionalamountapproximating$38.4million
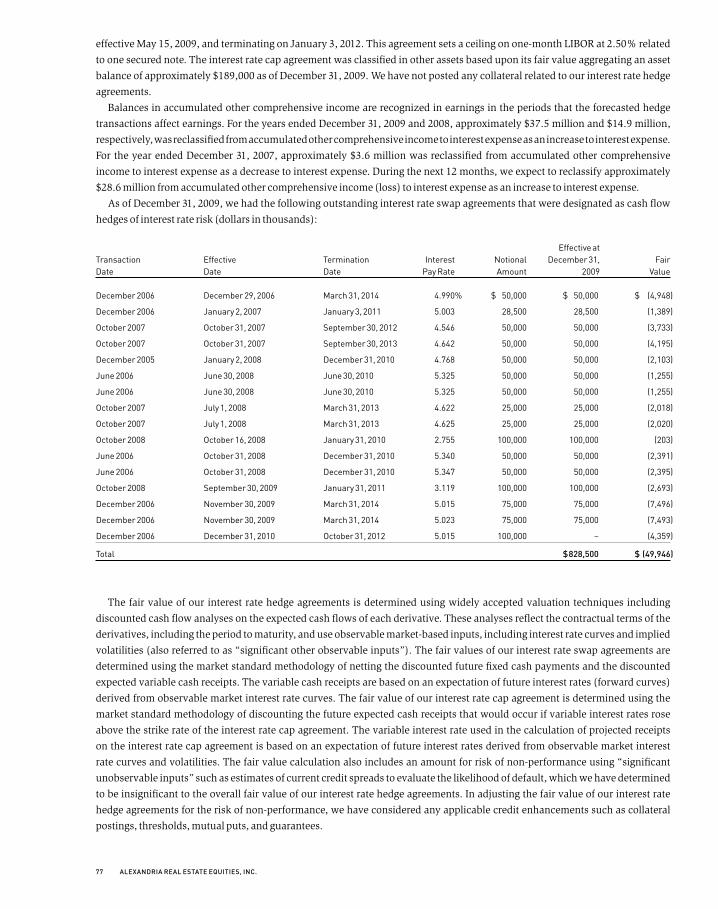
77 alexandriarealestateequities,inc.
effectiveMay15,2009,andterminatingonJanuary3,2012.Thisagreementsetsaceilingonone-monthLIBORat2.50%related
to one secured note. the interest rate cap agreement was classified in other assets based upon its fair value aggregating an asset
balanceofapproximately$189,000asofDecember31,2009.Wehavenotpostedanycollateralrelatedtoourinterestratehedge
agreements.
Balancesinaccumulatedothercomprehensiveincomearerecognizedinearningsintheperiodsthattheforecastedhedge
transactionsaffectearnings.FortheyearsendedDecember31,2009and2008,approximately$37.5millionand$14.9million,
respectively, was reclassified from accumulated other comprehensive income to interest expense as an increase to interest expense.
FortheyearendedDecember31,2007,approximately$3.6millionwasreclassifiedfromaccumulatedothercomprehensive
income to interest expense as a decrease to interest expense. during the next 12 months, we expect to reclassify approximately
$28.6millionfromaccumulatedothercomprehensiveincome(loss)tointerestexpenseasanincreasetointerestexpense.
as of december 31, 2009, we had the following outstanding interest rate swap agreements that were designated as cash flow
hedges of interest rate risk (dollars in thousands):
Effective at Transaction Effective Termination Interest Notional December 31, Fair Date Date Date Pay Rate Amount 2009 Value
December 2006 December 29, 2006 March 31, 2014 4.990% $ 50,000 $ 50,000 $ (4,948)
December 2006 January 2, 2007 January 3, 2011 5.003 28,500 28,500 (1,389)
October 2007 October 31, 2007 September 30, 2012 4.546 50,000 50,000 (3,733)
October 2007 October 31, 2007 September 30, 2013 4.642 50,000 50,000 (4,195)
December 2005 January 2, 2008 December 31, 2010 4.768 50,000 50,000 (2,103)
June 2006 June 30, 2008 June 30, 2010 5.325 50,000 50,000 (1,255)
June 2006 June 30, 2008 June 30, 2010 5.325 50,000 50,000 (1,255)
October 2007 July 1, 2008 March 31, 2013 4.622 25,000 25,000 (2,018)
October 2007 July 1, 2008 March 31, 2013 4.625 25,000 25,000 (2,020)
October 2008 October 16, 2008 January 31, 2010 2.755 100,000 100,000 (203)
June 2006 October 31, 2008 December 31, 2010 5.340 50,000 50,000 (2,391)
June 2006 October 31, 2008 December 31, 2010 5.347 50,000 50,000 (2,395)
October 2008 September 30, 2009 January 31, 2011 3.119 100,000 100,000 (2,693)
December 2006 November 30, 2009 March 31, 2014 5.015 75,000 75,000 (7,496)
December 2006 November 30, 2009 March 31, 2014 5.023 75,000 75,000 (7,493)
December 2006 December 31, 2010 October 31, 2012 5.015 100,000 – (4,359)
Total $828,500 $(49,946)
the fair value of our interest rate hedge agreements is determined using widely accepted valuation techniques including
discounted cash flow analyses on the expected cash flows of each derivative. these analyses reflect the contractual terms of the
derivatives, including the period to maturity, and use observable market-based inputs, including interest rate curves and implied
volatilities (also referred to as “significant other observable inputs”). the fair values of our interest rate swap agreements are
determined using the market standard methodology of netting the discounted future fixed cash payments and the discounted
expected variable cash receipts. the variable cash receipts are based on an expectation of future interest rates (forward curves)
derived from observable market interest rate curves. the fair value of our interest rate cap agreement is determined using the
market standard methodology of discounting the future expected cash receipts that would occur if variable interest rates rose
above the strike rate of the interest rate cap agreement. the variable interest rate used in the calculation of projected receipts
on the interest rate cap agreement is based on an expectation of future interest rates derived from observable market interest
rate curves and volatilities. the fair value calculation also includes an amount for risk of non-performance using “significant
unobservable inputs” such as estimates of current credit spreads to evaluate the likelihood of default, which we have determined
to be insignificant to the overall fair value of our interest rate hedge agreements. in adjusting the fair value of our interest rate
hedge agreements for the risk of non-performance, we have considered any applicable credit enhancements such as collateral
postings, thresholds, mutual puts, and guarantees.

78 2009annualreport
NOTE 9. COMMITMENTS AND CONTINgENCIES
eMployeeretireMentsaVingsplan We have a retirement savings plan pursuant to section 401(k) of the internal revenue
Code whereby our employees may contribute a portion of their compensation to their respective retirement accounts in an
amount not to exceed the maximum allowed under the internal revenue Code. in addition to employee contributions, we have
elected to provide discretionary profit sharing contributions (subject to statutory limitations), which amounted to approximately
$809,000,$1,289,000,and$941,000,respectively,fortheyearsendedDecember31,2009,2008,and2007.Employeeswho
participate in the plan are immediately vested in their contributions and in the contributions by the Company.
concentrationoFcreditrisK We maintain our cash and cash equivalents at insured financial institutions. the combined
account balances at each institution periodically exceed fdiC insurance coverage, and, as a result, there is a concentration of credit
risk related to amounts in excess of fdiC insurance coverage. We have not experienced any losses to date on our invested cash.
We are dependent on rental income from relatively few tenants in the life science industry. the inability of any single tenant
to make its lease payments could adversely affect our operations. as of december 31, 2009, we held 417 leases with a total of
342tenants,and74ofour156propertieswereeachleasedtoasingletenant.AtDecember31,2009,ourthreelargesttenants
accountedforapproximately17.1%ofouraggregateannualizedbaserent.
We generally do not require collateral or other security from our tenants, other than security deposits. in addition to security
depositsheldincash,weheldapproximately$40.9millioninirrevocablelettersofcreditavailablefromcertaintenantsassecurity
depositsfor156leasesasofDecember31,2009.
coMMitMents as of december 31, 2009, remaining aggregate costs under contracts for the construction of properties undergoing
development, redevelopment and generic life science laboratory infrastructure improvements under the terms of leases
approximated$186.8million.Weexpectpaymentsfortheseobligationstooccuroverthenextonetothreeyears,subjecttocapital
planningadjustmentsfromtimetotime.Wewerealsocommittedtofundapproximately$48.3millionforcertaininvestments
over the next six years.
as of december 31, 2009, we were committed under the terms of ground leases for 19 of our properties and three land
developmentparcels.Thesegroundleaseobligationsaggregateapproximately$6.6millionin2010,$7.6millionin2011,$8.2
millionin2012,$8.6millionin2013,$8.4millionin2014,and$572.0millionthereafter,andhaveremainingleasetermsfrom23
to 97 years, exclusive of extension options. in addition, as of december 31, 2009, we were committed under the terms of certain
operatingleasesforourheadquartersandfieldoffices.Theseleaseobligationstotaledapproximately$3.3millionasofDecember
31, 2009, and have remaining lease terms of less than one year up to three years, exclusive of extension options.
NOTE 10. ISSuANCES OF COMMON STOCK
InSeptember2009,wesold4,600,000sharesofourcommonstockinafollow-onoffering(includingsharesissueduponfull
exerciseoftheunderwriters’over-allotmentoption).Theshareswereissuedatapriceof$53.25pershare,resultinginaggregate
proceedsofapproximately$233.5million(afterdeductingunderwriters’discountsandotherofferingcosts).
in march 2009, we sold 7,000,000 shares of our common stock in a follow-on offering. the shares were issued at a price of
$38.25pershare,resultinginaggregateproceedsofapproximately$254.6million(afterdeductingunderwriters’discountsand
other offering costs).
in september 2007, we sold 2,300,000 shares of our common stock in a follow-on offering (including the shares issued upon
exerciseoftheunderwriters’over-allotmentoption).Theshareswereissuedatapriceof$96.00pershare,resultinginaggregate
proceedsofapproximately$215million(afterdeductingunderwritingdiscountsandotherofferingcosts).
79 alexandriarealestateequities,inc.
NOTE 11. pREFERRED STOCK AND ExCESS STOCK
seriesBpreFerredstocKInJanuary2002,wecompletedapublicofferingof2,300,000sharesofourSeriesBPreferredStock
(includingthesharesissueduponexerciseoftheunderwriters’over-allotmentoption).Theshareswereissuedatapriceof
$25.00pershare,resultinginaggregateproceedsofapproximately$55.1million(afterdeductingunderwriters’discountsand
otherofferingcosts).ThedividendsonourSeriesBPreferredStockwerecumulativeandaccruedfromthedateofissuance.We
paiddividendsquarterlyinarrearsatanannualrateof$2.275pershare.OurSeriesBPreferredStockhadnostatedmaturity,were
not subject to any sinking fund or mandatory redemption and were not redeemable prior to January 22, 2007, except in order to
preserveourstatusasaREIT.InvestorsinourSeriesBPreferredStockgenerallyhadnovotingrights.
InFebruary2007,wecalledforredemptionofourSeriesBPreferredStock.TheSeriesBPreferredStockwasredeemedin
March2007ataredemptionpriceequalto$25.00pershareplus$0.4107639persharerepresentingaccumulatedandunpaid
dividendstotheredemptiondate.AsdiscussedinNote2,werecordedachargeofapproximately$2.8millionforcostsrelatedto
theredemptionoftheSeriesBPreferredStock.
seriescpreFerredstocKInJune2004,wecompletedapublicofferingof5,185,500sharesofourSeriesCPreferredStock
(includingthesharesissueduponexerciseoftheunderwriters’over-allotmentoption).Theshareswereissuedatapriceof$25.00
pershare,resultinginaggregateproceedsofapproximately$124.0million(afterdeductingunderwriters’discountsandother
offeringcosts).ThedividendsonourSeriesCPreferredStockarecumulativeandaccruefromthedateoforiginalissuance.We
paydividendsquarterlyinarrearsatanannualrateof$2.09375pershare.OurSeriesCPreferredStockhasnostatedmaturity,
is not subject to any sinking fund or mandatory redemption and was not redeemable prior to June 29, 2009, except in order to
preserveourstatusasaREIT.InvestorsinourSeriesCPreferredStockgenerallyhavenovotingrights.OnorafterJune29,2009,
wemay,atouroption,redeemourSeriesCPreferredStock,inwholeorinpart,atanytimeforcashataredemptionpriceof$25.00
per share, plus accrued and unpaid dividends.
seriesdconVertiBlepreFerredstocKInMarchandApril2008,wecompletedapublicofferingof10,000,000sharesof
SeriesDConvertiblePreferredStock.Theshareswereissuedatapriceof$25.00pershare,resultinginaggregateproceedsof
approximately$242million(afterdeductingunderwriters'discountsandotherofferingcosts).Theproceedsfromthisoffering
were used to pay down outstanding borrowings on our unsecured line of credit. the dividends on our series d Convertible
PreferredStockarecumulativeandaccruefromthedateoforiginalissuance.Wepaydividendsquarterlyinarrearsatanannual
rateof$1.75pershare.OurSeriesDConvertiblePreferredStockhasnostatedmaturity,isnotsubjecttoanysinkingfundor
mandatoryredemptionprovisionsandwearenotallowedtoredeemourSeriesDConvertiblePreferredStock,excepttopreserve
ourstatusasaREIT.InvestorsinourSeriesDConvertiblePreferredStockgenerallyhavenovotingrights.OnorafterApril20,
2013,wemay,atouroption,beabletocausesomeorallofourSeriesDConvertiblePreferredStocktobeautomaticallyconverted
iftheclosingsalepricepershareofourcommonstockequalsorexceeds150%ofthethen-applicableconversionpriceofthe
SeriesDConvertiblePreferredStockforatleast20tradingdaysinaperiodof30consecutivetradingdaysendingonthetrading
day immediately prior to our issuance of a press release announcing the exercise of our conversion option. holders of our series
DConvertiblePreferredStock,attheiroption,may,atanytimeandfromtimetotime,convertsomeoralloftheiroutstanding
sharesinitiallyataconversionrateof0.2477sharesofcommonstockper$25.00liquidationpreference,whichwasequivalent
toaninitialconversionpriceofapproximately$100.93pershareofcommonstock.TheconversionratefortheSeriesDConvertible
PreferredStockissubjecttoadjustmentsforcertainevents,including,butnotlimitedto,certaindividendsonourcommon
stockinexcessof$0.78pershareperquarteranddividendsonourcommonstockpayableinsharesofourcommonstock.
AsofDecember31,2009,theSeriesDConvertiblePreferredStockhadaconversionrateofapproximately0.2480sharesof
commonstockper$25.00liquidationpreference,whichisequivalenttoaconversionpriceofapproximately$100.81pershareof
common stock.
preFerredstocKandexcessstocKauthorizationsOurcharterauthorizestheissuanceofupto100,000,000sharesof
preferredstock,ofwhich15,185,500shareswereissuedandoutstandingasofDecember31,2009.Inaddition,200,000,000
sharesof"excessstock"(asdefined)areauthorized,noneofwhichwereissuedandoutstandingatDecember31,2009.
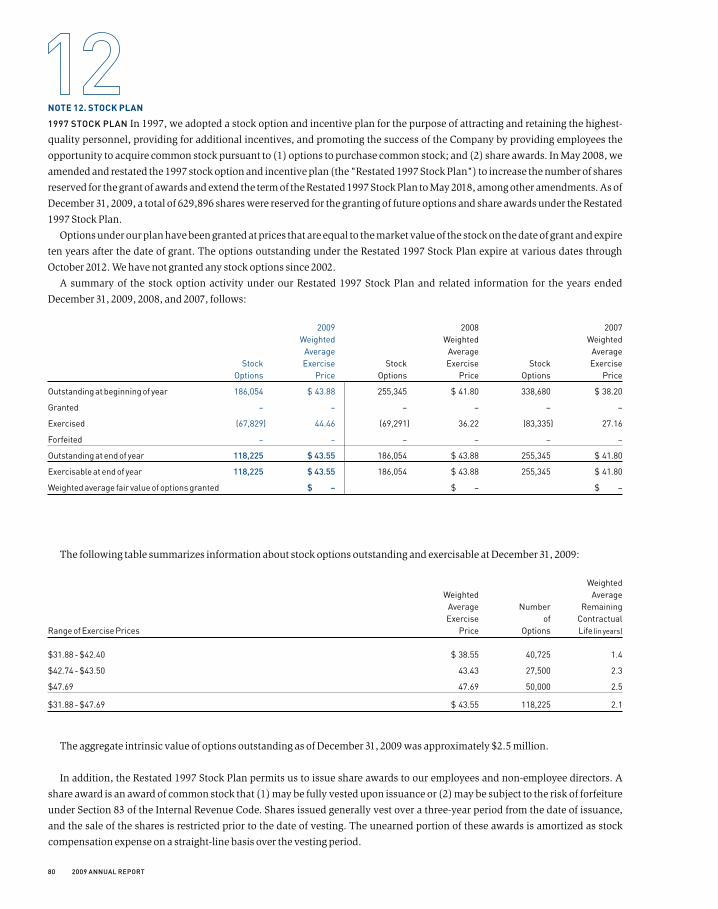
80 2009annualreport
NOTE 12. STOCK pLAN
1997stocKplan in 1997, we adopted a stock option and incentive plan for the purpose of attracting and retaining the highest-
quality personnel, providing for additional incentives, and promoting the success of the Company by providing employees the
opportunitytoacquirecommonstockpursuantto(1)optionstopurchasecommonstock;and(2)shareawards.InMay2008,we
amendedandrestatedthe1997stockoptionandincentiveplan(the"Restated1997StockPlan")toincreasethenumberofshares
reservedforthegrantofawardsandextendthetermoftheRestated1997StockPlantoMay2018,amongotheramendments.Asof
December31,2009,atotalof629,896shareswerereservedforthegrantingoffutureoptionsandshareawardsundertheRestated
1997StockPlan.
options under our plan have been granted at prices that are equal to the market value of the stock on the date of grant and expire
tenyearsafterthedateofgrant.TheoptionsoutstandingundertheRestated1997StockPlanexpireatvariousdatesthrough
october 2012. We have not granted any stock options since 2002.
AsummaryofthestockoptionactivityunderourRestated1997StockPlanandrelatedinformationfortheyearsended
December31,2009,2008,and2007,follows:
2009 2008 2007 Weighted Weighted Weighted Average Average Average Stock Exercise Stock Exercise Stock Exercise Options Price Options Price Options Price
Outstanding at beginning of year 186,054 $ 43.88 255,345 $ 41.80 338,680 $ 38.20
Granted – – – – – –
Exercised (67,829) 44.46 (69,291) 36.22 (83,335) 27.16
Forfeited – – – – – –
Outstanding at end of year 118,225 $43.55 186,054 $ 43.88 255,345 $ 41.80
Exercisable at end of year 118,225 $43.55 186,054 $ 43.88 255,345 $ 41.80
Weighted average fair value of options granted $ – $ – $ –
ThefollowingtablesummarizesinformationaboutstockoptionsoutstandingandexercisableatDecember31,2009:
Weighted Weighted Average Average Number Remaining Exercise of Contractual Range of Exercise Prices Price Options Life (in years)
$31.88 - $42.40 $ 38.55 40,725 1.4
$42.74 - $43.50 43.43 27,500 2.3
$47.69 47.69 50,000 2.5
$31.88 - $47.69 $ 43.55 118,225 2.1
TheaggregateintrinsicvalueofoptionsoutstandingasofDecember31,2009wasapproximately$2.5million.
Inaddition,theRestated1997StockPlanpermitsustoissueshareawardstoouremployeesandnon-employeedirectors.A
share award is an award of common stock that (1) may be fully vested upon issuance or (2) may be subject to the risk of forfeiture
underSection83oftheInternalRevenueCode.Sharesissuedgenerallyvestoverathree-yearperiodfromthedateofissuance,
andthesaleofthesharesisrestrictedpriortothedateofvesting.Theunearnedportionoftheseawardsisamortizedasstock
compensation expense on a straight-line basis over the vesting period.
81 alexandriarealestateequities,inc.
AsofDecember31,2009and2008,therewere455,182and475,421shares,respectively,ofnonvestedawardsoutstanding.
During2009,wegranted312,661sharesofcommonstock,331,650shareawardsvested,and1,250shareswereforfeited.During
2008,wegranted230,663sharesofcommonstock,209,523shareawardsvested,and3,675shareswereforfeited.During2007,
wegranted294,376sharesofcommonstock,275,487shareawardsvested,and5,282shareswereforfeited.Theweighted
averagegrant-datefairvalueofshareawardsgrantedduring2009wasapproximately$53.14pershare,andthetotalfairvalueof
shareawardsvested,basedonthemarketpriceonthevestingdate,wasapproximately$16.4million.AsofDecember31,2009,
therewas$26.7millionofunrecognizedcompensationrelatedtononvestedshareawardsundertheRestated1997StockPlan,
whichisexpectedtoberecognizedoverthenextthreeyearsandhasaweightedaverageperiodofapproximatelytwelvemonths.
Capitalizedstockcompensationwasapproximately$8,774,000,$7,019,000,and$8,677,000in2009,2008,and2007,respectively,
and is treated as a reduction of general and administrative costs in the accompanying consolidated statements of income.
NOTE 13. NONCONTROLLINg INTERESTS
noncontrolling interests represent the third-party interests in certain entities in which we have a controlling interest and a third-
party interest in a variable interest entity in which we are the primary beneficiary. these entities own eight properties and three
development parcels and are included in our consolidated financial statements. noncontrolling interests is adjusted for additional
contributions and distributions, the proportionate share of the net earnings or losses, and other comprehensive income or loss.
distributions, profits, and losses related to these entities are allocated in accordance with the respective operating agreements.
Certain of our noncontrolling interests have the right to require us to redeem their ownership interests in the respective
entities. We classify these ownership interests in the entities as redeemable noncontrolling interests outside of total equity in
the accompanying consolidated balance sheets. redeemable noncontrolling interests is adjusted for additional contributions
and distributions, the proportionate share of the net earnings or losses, and other comprehensive income or loss. distributions,
profits and losses related to these entities are allocated in accordance with the respective operating agreements. if the carrying
amount of redeemable noncontrolling interests is less than the maximum redemption value at the balance sheet date, such
amountisadjustedtothemaximumredemptionvalue.Subsequentdeclinesintheredemptionvaluearerecognizedonlyto
the extent previously recorded increases have been recorded pursuant to the preceding sentence. as of december 31, 2009 and
2008,theredeemablenoncontrollinginterestbalanceswereapproximately$41.4millionand$34.0million,respectively.The
remainingnoncontrollinginterestsaggregatingapproximately$41.2millionand$41.1millionasofDecember31,2009and
2008,respectively,donothaverightstorequireustopurchasetheirownershipinterestsandareclassifiedintotalequityinthe
accompanying consolidated balance sheets.
AsofDecember31,2009and2008,weweretheprimarybeneficiaryofaVIEthatownsadevelopmentparcelwithacarrying
valueofapproximately$92.3millionand$88.0million,respectively.Thedevelopmentparcelservesascollateralforanon-
recoursesecuredloanthathadbalancesofapproximately$38.4millionand$50.7millionatDecember31,2009and2008,
respectively, and matures in april 2013, assuming we exercise our sole right to extend the maturity date from the original maturity
date of January 2012. We may, in certain circumstances, be obligated to provide additional capital to the Vie in accordance
withtheoperatingagreement.AsofDecember31,2009and2008,thenoncontrollinginterestsbalancerelatedtothisentity
wasapproximately$23.9millionand$15.3million,respectively,andisreflectedinredeemablenoncontrollinginterestsinthe
accompanying consolidated balance sheets.
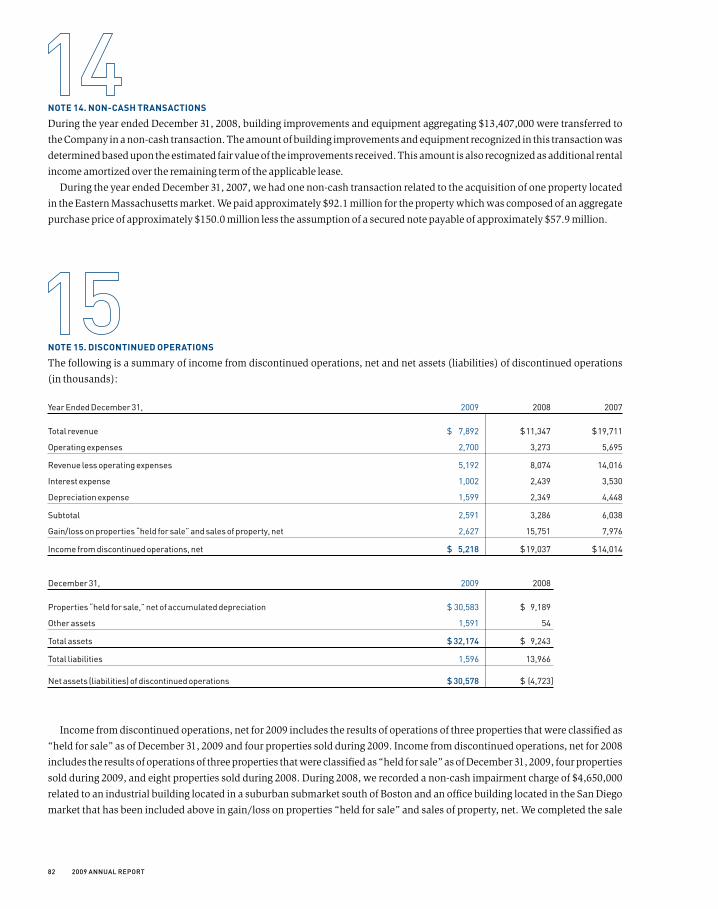
82 2009annualreport
NOTE 14. NON-CASh TRANSACTIONS
DuringtheyearendedDecember31,2008,buildingimprovementsandequipmentaggregating$13,407,000weretransferredto
theCompanyinanon-cashtransaction.Theamountofbuildingimprovementsandequipmentrecognizedinthistransactionwas
determinedbasedupontheestimatedfairvalueoftheimprovementsreceived.Thisamountisalsorecognizedasadditionalrental
incomeamortizedovertheremainingtermoftheapplicablelease.
during the year ended december 31, 2007, we had one non-cash transaction related to the acquisition of one property located
intheEasternMassachusettsmarket.Wepaidapproximately$92.1millionforthepropertywhichwascomposedofanaggregate
purchasepriceofapproximately$150.0millionlesstheassumptionofasecurednotepayableofapproximately$57.9million.
NOTE 15. DISCONTINuED OpERATIONS
the following is a summary of income from discontinued operations, net and net assets (liabilities) of discontinued operations
(in thousands):
Year Ended December 31, 2009 2008 2007
Total revenue $ 7,892 $ 11,347 $ 19,711
Operating expenses 2,700 3,273 5,695
Revenue less operating expenses 5,192 8,074 14,016
Interest expense 1,002 2,439 3,530
Depreciation expense 1,599 2,349 4,448
Subtotal 2,591 3,286 6,038
Gain/loss on properties “held for sale” and sales of property, net 2,627 15,751 7,976
Income from discontinued operations, net $ 5,218 $ 19,037 $ 14,014
December 31, 2009 2008
Properties “held for sale,” net of accumulated depreciation $ 30,583 $ 9,189
Other assets 1,591 54
Total assets $32,174 $ 9,243
Total liabilities 1,596 13,966
Net assets (liabilities) of discontinued operations $30,578 $ (4,723]
income from discontinued operations, net for 2009 includes the results of operations of three properties that were classified as
“heldforsale”asofDecember31,2009andfourpropertiessoldduring2009.Incomefromdiscontinuedoperations,netfor2008
includes the results of operations of three properties that were classified as “held for sale” as of december 31, 2009, four properties
soldduring2009,andeightpropertiessoldduring2008.During2008,werecordedanon-cashimpairmentchargeof$4,650,000
related to an industrial building located in a suburban submarket south of boston and an office building located in the san diego
market that has been included above in gain/loss on properties “held for sale” and sales of property, net. We completed the sale
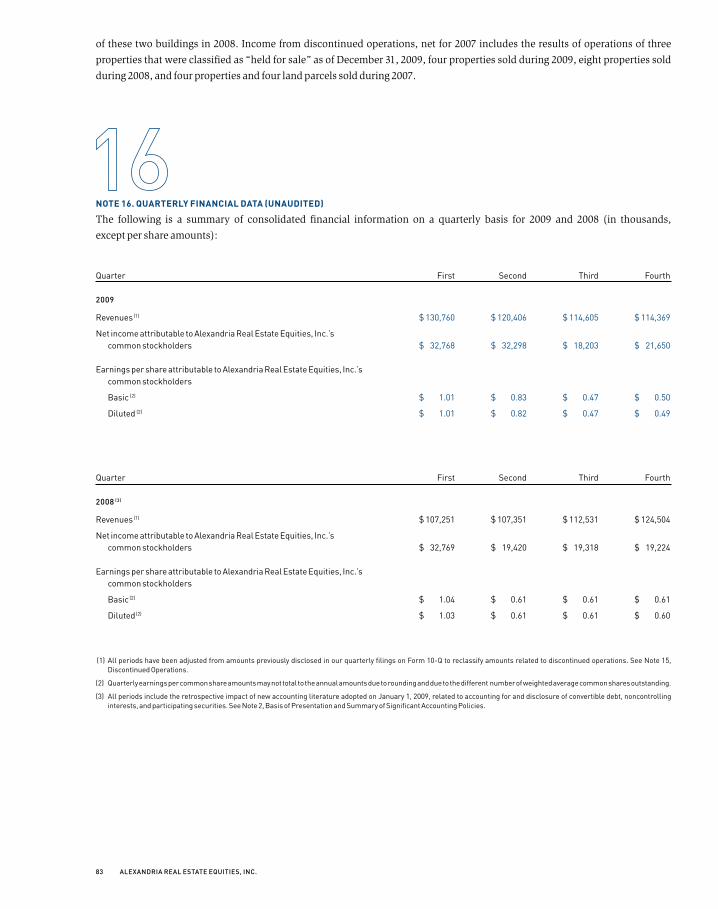
83 alexandriarealestateequities,inc.
ofthesetwobuildingsin2008.Incomefromdiscontinuedoperations,netfor2007includestheresultsofoperationsofthree
properties that were classified as “held for sale” as of december 31, 2009, four properties sold during 2009, eight properties sold
during2008,andfourpropertiesandfourlandparcelssoldduring2007.
NOTE 16. quARTERLy FINANCIAL DATA (uNAuDITED)
Thefollowingisasummaryofconsolidatedfinancial informationonaquarterlybasis for2009and2008(inthousands,
except per share amounts):
Quarter First Second Third Fourth
2009
Revenues (1) $ 130,760 $ 120,406 $ 114,605 $ 114,369
Net income attributable to Alexandria Real Estate Equities, Inc.’s common stockholders $ 32,768 $ 32,298 $ 18,203 $ 21,650
Earnings per share attributable to Alexandria Real Estate Equities, Inc.’s common stockholders
Basic (2) $ 1.01 $ 0.83 $ 0.47 $ 0.50
Diluted (2) $ 1.01 $ 0.82 $ 0.47 $ 0.49
Quarter First Second Third Fourth
2008(3)
Revenues (1) $ 107,251 $ 107,351 $ 112,531 $ 124,504
Net income attributable to Alexandria Real Estate Equities, Inc.’s common stockholders $ 32,769 $ 19,420 $ 19,318 $ 19,224
Earnings per share attributable to Alexandria Real Estate Equities, Inc.’s common stockholders
Basic (2) $ 1.04 $ 0.61 $ 0.61 $ 0.61
Diluted (2) $ 1.03 $ 0.61 $ 0.61 $ 0.60
(1) All periods have been adjusted from amounts previously disclosed in our quarterly filings on Form 10-Q to reclassify amounts related to discontinued operations. See Note 15, Discontinued Operations.
(2) Quarterly earnings per common share amounts may not total to the annual amounts due to rounding and due to the different number of weighted average common shares outstanding.
(3) All periods include the retrospective impact of new accounting literature adopted on January 1, 2009, related to accounting for and disclosure of convertible debt, noncontrolling interests, and participating securities. See Note 2, Basis of Presentation and Summary of Significant Accounting Policies.
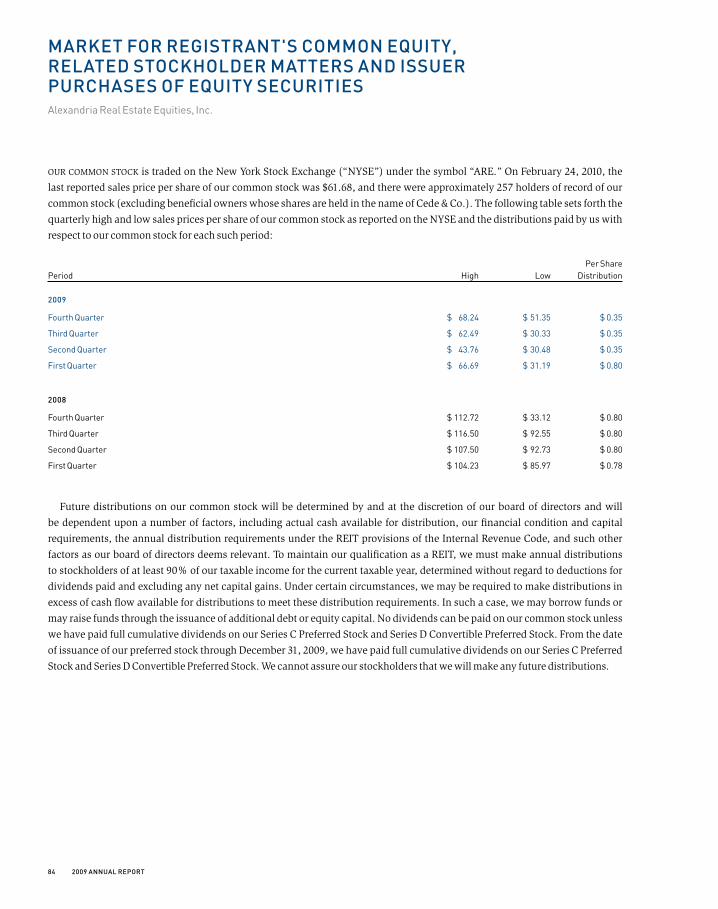
84 2009annualreport
MarKetForregistrant'scoMMonequity,relatedstocKholderMattersandissuerpurchasesoFequitysecuritiesAlexandria Real Estate Equities, Inc.
our Common stoCK is traded on the new York stock exchange (“nYse”) under the symbol “are.” on february 24, 2010, the
lastreportedsalespricepershareofourcommonstockwas$61.68,andtherewereapproximately257holdersofrecordofour
common stock (excluding beneficial owners whose shares are held in the name of Cede & Co.). the following table sets forth the
quarterly high and low sales prices per share of our common stock as reported on the nYse and the distributions paid by us with
respect to our common stock for each such period:
Per Share Period High Low Distribution
2009
Fourth Quarter $ 68.24 $ 51.35 $ 0.35
Third Quarter $ 62.49 $ 30.33 $ 0.35
Second Quarter $ 43.76 $ 30.48 $ 0.35
First Quarter $ 66.69 $ 31.19 $ 0.80
2008
Fourth Quarter $ 112.72 $ 33.12 $ 0.80
Third Quarter $ 116.50 $ 92.55 $ 0.80
Second Quarter $ 107.50 $ 92.73 $ 0.80
First Quarter $ 104.23 $ 85.97 $ 0.78
future distributions on our common stock will be determined by and at the discretion of our board of directors and will
be dependent upon a number of factors, including actual cash available for distribution, our financial condition and capital
requirements, the annual distribution requirements under the reit provisions of the internal revenue Code, and such other
factors as our board of directors deems relevant. to maintain our qualification as a reit, we must make annual distributions
tostockholdersofatleast90%ofourtaxableincomeforthecurrenttaxableyear,determinedwithoutregardtodeductionsfor
dividends paid and excluding any net capital gains. under certain circumstances, we may be required to make distributions in
excess of cash flow available for distributions to meet these distribution requirements. in such a case, we may borrow funds or
may raise funds through the issuance of additional debt or equity capital. no dividends can be paid on our common stock unless
wehavepaidfullcumulativedividendsonourSeriesCPreferredStockandSeriesDConvertiblePreferredStock.Fromthedate
ofissuanceofourpreferredstockthroughDecember31,2009,wehavepaidfullcumulativedividendsonourSeriesCPreferred
StockandSeriesDConvertiblePreferredStock.Wecannotassureourstockholdersthatwewillmakeanyfuturedistributions.

85 alexandriarealestateequities,inc.
directorsandoFFicersAlexandria Real Estate Equities, Inc.
BOARD OF DIRECTORS
Joel s. marcus
Chairman of the board and
Chief executive officer
alexandria real estate equities, inc.
richard b. Jennings
President
realty Capital international llC
John l. atkins iii
Chairman and Chief executive officer
O’Brien/AtkinsAssociates,PA
RichardH.Klein,CPA
founder and Chief executive officer
Chefmakers Cooking academy llC
James h. richardson
senior management Consultant
martin a. simonetti
PresidentandChiefExecutiveOfficer
Vlst Corporation
AlanG.Walton,Ph.D.,D.Sc.
SeniorGeneralPartner
OxfordBioSciencePartners
ExECuTIvE OFFICERS
Joel s. marcus
Chief executive officer
dean a. shigenaga
Chief financial officer
PeterJ.Nelson
secretary
SENIOR OFFICERS
thomas J. andrews
VincentR.Ciruzzi,Jr.
John J. Cox
John h. Cunningham
lawrence J. diamond
PeterM.Moglia
JenniferJ.Pappas
stephen a. richardson
Jeffrey J. ryan

86 2009annualreport
COMMON STOCK
listed on the new York stock exchange
symbol "are"
CORpORATE OFFICES
385E.ColoradoBoulevard,Suite299
Pasadena,CA91101
(626)578-0777
TRANSFER AgENT
american stock transfer &
trust Company, llC
59MaidenLane
NewYork,NY10038
(212)936-5100
LEgAL COuNSEL
Morrison&FoersterLLP
los angeles, California
INDEpENDENT REgISTERED
puBLIC ACCOuNTINg FIRM
Ernst&YoungLLP
los angeles, California
ANNuAL MEETINg
the annual meeting will be held at 11 am,
PacificDaylightTime,May27,2010,at
the langham huntington
1401 s. oak Knoll avenue
Pasadena,California
SEC FORM 10-K
AcopyoftheCompany’sAnnualReport
on form 10-K, as filed with the securities
and exchange Commission, is available
without charge, upon written request to:
alexandria real estate equities, inc.
385E.ColoradoBoulevard,Suite299
Pasadena,CA91101
(626)396-4828
www.labspace.com
corporateinForMationAlexandria Real Estate Equities, Inc.

Des
ign:
Opt
o D
esig
n / C
onsu
ltin
g D
esig
ners
: Kel
ly A
tkin
s, C
amill
a R
. Mar
cus
/ Ill
ustr
atio
n: V
eron
ica
Law
lor /
Por
trai
t Illu
stra
tion:
Kev
in S
prou
ls /
Pho
togr
aphy
: P
eter
Gre
goir
e, V
ern
Evan
s / S
cien
ce Im
ager
y: C
ourt
esy o
f Bra
in C
ells
Inc.
/ A
rchi
tect
ural
rend
erin
g: N
eosc
ape
/ Sto
ck p
hoto
grap
hy: B
ruce
Fos
ter,
Com
stoc
k, C
orbi
s Im
ages
/ P
rint
ing:
Lith
ogra
phix
, Inc
.
This
ann
ual r
epor
t is
prin
ted
on a
com
bina
tion
of
recy
cled
and
For
est S
tew
ards
hip
Cou
ncil
(FSC
) cer
tified
pa
pers
usi
ng ve
geta
ble
base
d in
ks. P
rint
ed b
y Li
thog
raph
ix, I
nc.,
who
se s
olar
pan
els
are
expe
cted
to
off
set t
he C
ompa
ny’s
ene
rgy d
eman
ds b
y 30
perc
ent.

la
nd
lor
d o
f c
ho
ice
to t
he
lif
e s
cie
nc
e in
du
st
ry
®