Embed Size (px)
Citation preview
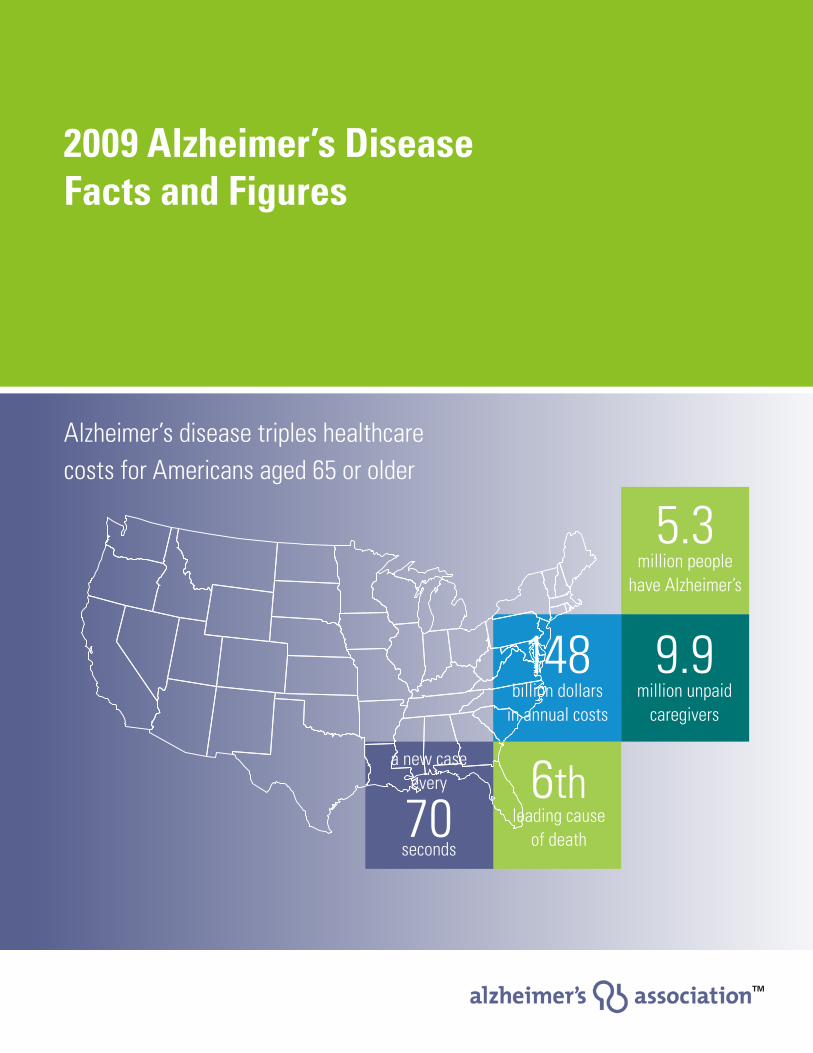
Alzheimer’s disease triples healthcare costs for Americans aged 65 or older
2009 Alzheimer’s Disease Facts and Figures
a new case every
70 seconds
9.9 million unpaid
caregivers
6th leading cause
of death
148 billion dollars
in annual costs
5.3 million people
have Alzheimer’s
TM

About This Report
2009 Alzheimer’s Disease Facts and Figures provides a statistical resource for U.S. data related to Alzheimer’s disease, the most common type of dementia, as well as other dementias. Background and context for interpretation of the data are contained in the Overview. This includes definitions of the types of dementias and a summary of current knowledge about Alzheimer’s disease. Additional sections address prevalence, mortality and lifetime risk of Alzheimer’s disease and other dementias, as well as paid and family caregiving and use and costs of care and services. The Special Report for 2009 focuses on the emerging issue of mild cognitive impairment (MCI).
Specific information in this year’s Alzheimer’s Disease Facts and Figures includes:
•OverallnumberofAmericanswithAlzheimer’sdisease nationally and for each state
•ProportionofwomenandmenwithAlzheimer’sandotherdementias
•Estimatesforshort-termandlifetimeriskfordeveloping Alzheimer’s disease and other dementias at age 65, 75 and 85, as well as estimates for lifetime risks at age 55
•Numberoffamilycaregivers,hoursofcareprovided,economicvalue of unpaid care nationally and for each state, and the impact of caregiving on caregivers
•Newdataonfamilycaregivingfromstateandlocalpublic health surveys
•Useandcostsofhealthcare,long-termcareandhospicecarefor people with Alzheimer’s disease and other dementias
•ImpactofAlzheimer’sdiseaseonMedicare,Medicaid,U.S.businesses, and individuals and their families
•NumberofdeathsduetoAlzheimer’sdiseasenationallyandfor each state, and death rates by age, gender and ethnicity
•Emergingimportanceofunderstandingthehealthycognition-to-dementia continuum, particularly relationships between MCI and subsequent risk for Alzheimer’s disease and other dementias
The Appendix details sources and methods used to derive data presented in this document. Definitions of terms and an extensive reference list are also provided in the Appendix.
This report frequently cites statistics that apply to individuals with all types of dementia. When possible, specific information about Alzheimer’s disease is provided; in other cases, the reference may be a more general one of “Alzheimer’s disease and other dementias.”
Alzheimer’s Association, 2009 Alzheimer’s Disease Facts and Figures, to be published in Alzheimer’s & Dementia, Volume 5, Issue 3.
1
Contents
Overview of Alzheimer’s DiseaseDementia: Definition and Specific Types 5
More about Alzheimer’s Disease 7
Symptoms of Alzheimer’s Disease 7
Risk Factors for Alzheimer’s Disease 7
TreatmentandPreventionofAlzheimer’sDisease 8
PrevalencePrevalenceofAlzheimer’sDiseaseandOtherDementias 10
PrevalenceofAlzheimer’sDiseaseandOtherDementiasinWomenandMen 10
PrevalenceofAlzheimer’sDiseaseandOtherDementiasbyYearsofEducation 11
PrevalenceofAlzheimer’sDiseaseandOtherDementiasinAfrican-AmericansandWhites 11
LifetimeRiskEstimatesforAlzheimer’sDiseaseandOtherDementias 11
EstimatesfortheNumbersofPeoplewithAlzheimer’sDisease,byState 14
Causes of Dementia 18
Looking to the Future 19
MortalityDeaths From Alzheimer’s Disease 27
State-by-State Deaths from Alzheimer’s Disease 28
DeathRatesbyAge,GenderandEthnicity 30
Location of Death 31
CaregivingPaidCaregivers 33
Family Caregiving 33
NumberofCaregivers 33
Hours of Unpaid Care 34
EconomicValueofCaregiving 34
Who Are the Caregivers? 34
Long-distance Caregivers 35
Caregiving Tasks 36
Duration of Caregiving 37
Impact of Caregiving on the Caregiver 37
ImpactontheCaregiver’sEmotionalWell-being 38
Impact on the Caregiver’s Health 38
ImpactontheCaregiver’sEmployment 38
Impact on the Caregiver’s Income and Financial Security 39
EmergingTrendsandIssuesfromNewData 39
2009 Alzheimer’s Disease Facts and Figures Contents
2 Contents 2009 Alzheimer’s Disease Facts and Figures
Use and Costs of Health Care, Long-term Care and HospiceUse and Costs of Healthcare Services 48
Use of Healthcare Services by Setting 48
Impact of Coexisting Medical Conditions 49
Costs of Healthcare Services by Setting 51
Costs of Coexisting Medical Conditions 52
Use and Costs of Long-term Care Services 53
Use of Long-term Care Services by Setting 54
Costs of Long-term Care Services by Setting 57
Affordability of Long-term Care Services 57
Long-term Care Insurance 57
Medicaid Costs 58
Out-of-PocketCostsforHealthcareandLong-termCareServices 58
Use and Costs of Hospice Care 59
Use of Hospice Services 59
Costs of Hospice Services 59
Special Report: Mild Cognitive Impairment and Early-Stage Alzheimer’s DiseaseAssessing Memory Loss 62
Frequency 62
Outcome 62
PredictorsofProgressionfromMCItoDementia 63
Treatment 63
The Future 64
AppendixEndNotes 65
References 68
Definitions 73
Tables Table 1: Common Types of Dementia and Their Typical Characteristics 5
Table2:ProjectionsbyRegionandStateforTotalNumbersofAmericansAged65andOlderwithAlzheimer’s 20
Table3:PercentageChangesinSelectedCausesofDeath,2000and2006 27
Table4:NumberofDeathsDuetoAlzheimer’sandAge-AdjustedRatesper100,000PopulationbyState,2005 29
Table 5: U.S. Alzheimer Death Rates (per 100,000) by Age, 2000, 2004 and 2005 30

3 2009 Alzheimer’s Disease Facts and Figures Contents
Table6:U.S.AlzheimerDeathRates(per100,000)byRace/EthnicityandGender,2005 30
Table7:LocationofDeathforPeopleAged65andOlder,2001 31
Table8:NumberofAlzheimerandOtherDementiaCaregivers,HoursofUnpaidCareand EconomicValueoftheCarebyState,2008 42
Table9:FamilyandOtherUnpaidCaregiversofPeoplewithAlzheimer’s,OtherDementias and/or Memory Loss, Washington State, 2007 44
Table10:AverageperPersonPaymentsbySourceforHealthcareandLong-termCareServices, Medicare Beneficiaries Aged 65 and Older, with and without Alzheimer’s and Other Dementias, 2004 47
Table11:PercentagesofMedicareBeneficiariesAged65andOlderwithAlzheimer’sand Other Dementias, by Specified Coexisting Medical Conditions, 2004 49
Table12:AverageperPersonPaymentsforHealthcareServices,MedicareBeneficiariesAged65and Older with and without Alzheimer’s and Other Dementias, 2004 52
Table13:AveragePerPersonPaymentsbyTypeofServiceandMedicalCondition,MedicareBeneficiaries with and without Alzheimer’s and Other Dementias, 2006 53
Table14:CognitiveImpairmentinNursingHomeResidentsbyState,2007 55
FiguresFigure1:EstimatedPercentageofAmericansAged71+withDementiabyGender,ADAMS,2002 10
Figure2:FraminghamEstimatedRisksforDementia(AllTypes)byAgeandSex 12
Figure3:FraminghamEstimatedRisksforAlzheimer’sbyAgeandSex 12
Figure4:FraminghamEstimatedLifetimeRisksforDementia(AllTypes)byAgeandSex 13
Figure5:FraminghamEstimatedLifetimeRisksforAlzheimer’sbyAgeandSex 13
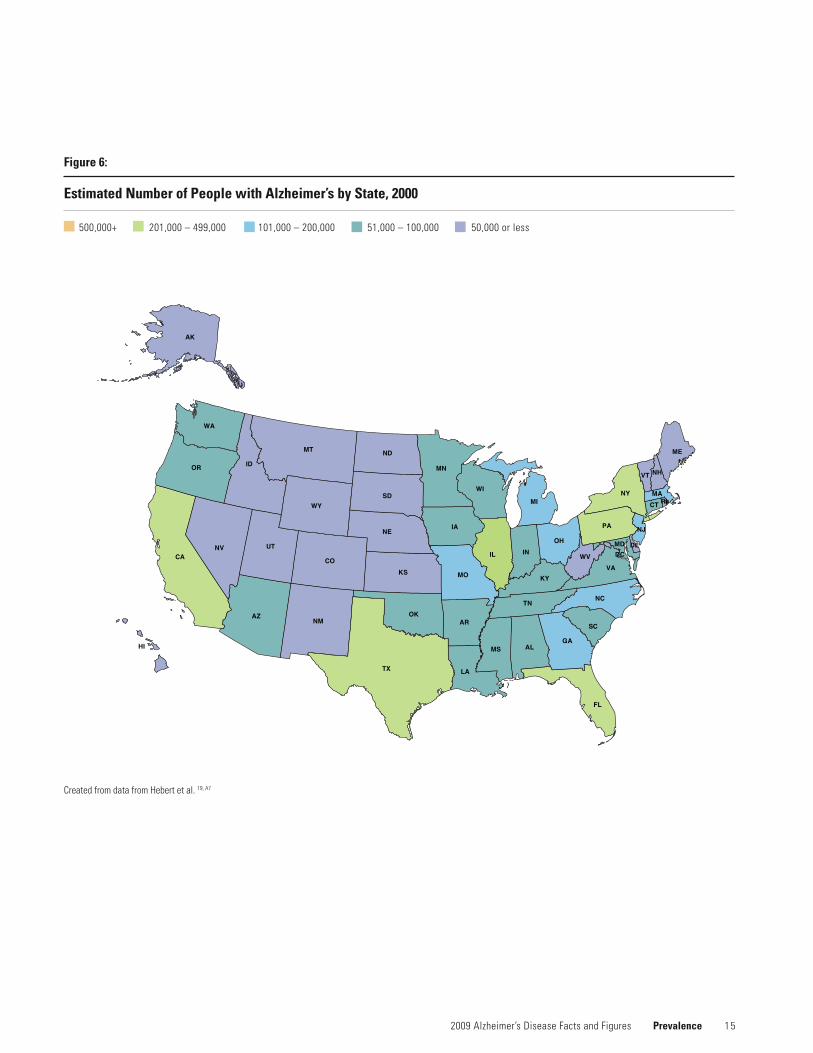
Figure6:EstimatedNumberofPeoplewithAlzheimer’sbyState,2000 15
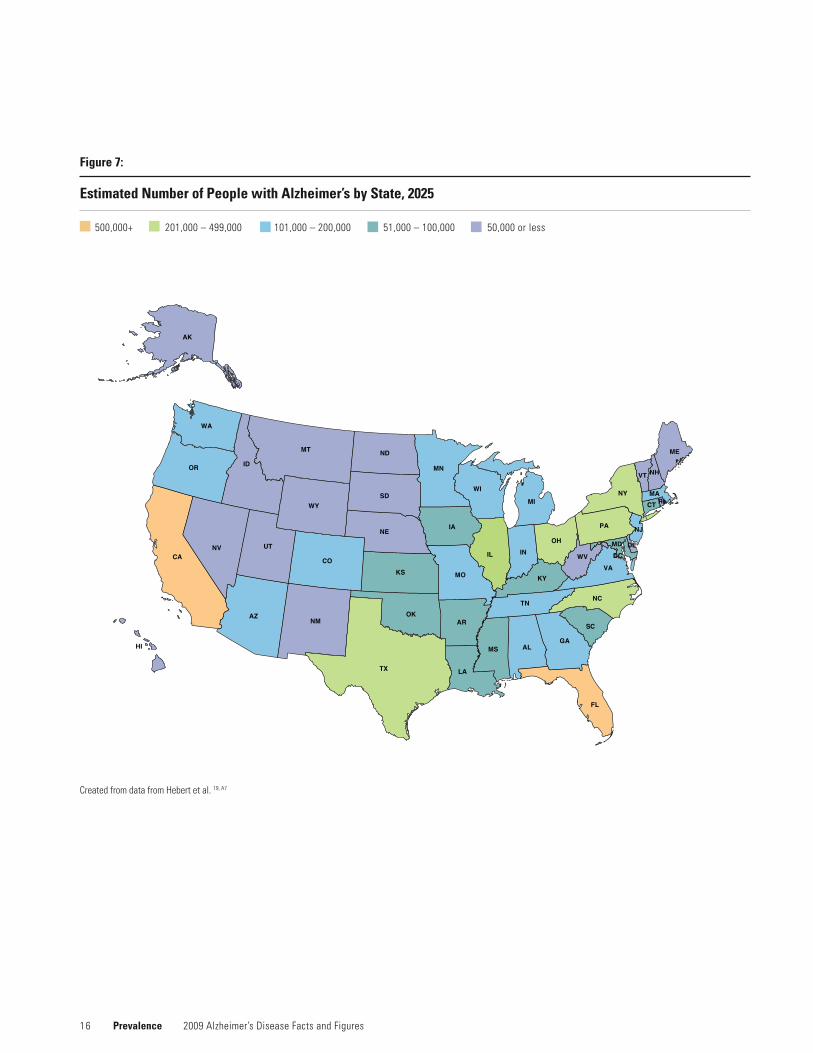
Figure7:EstimatedNumberofPeoplewithAlzheimer’sbyState,2025 16
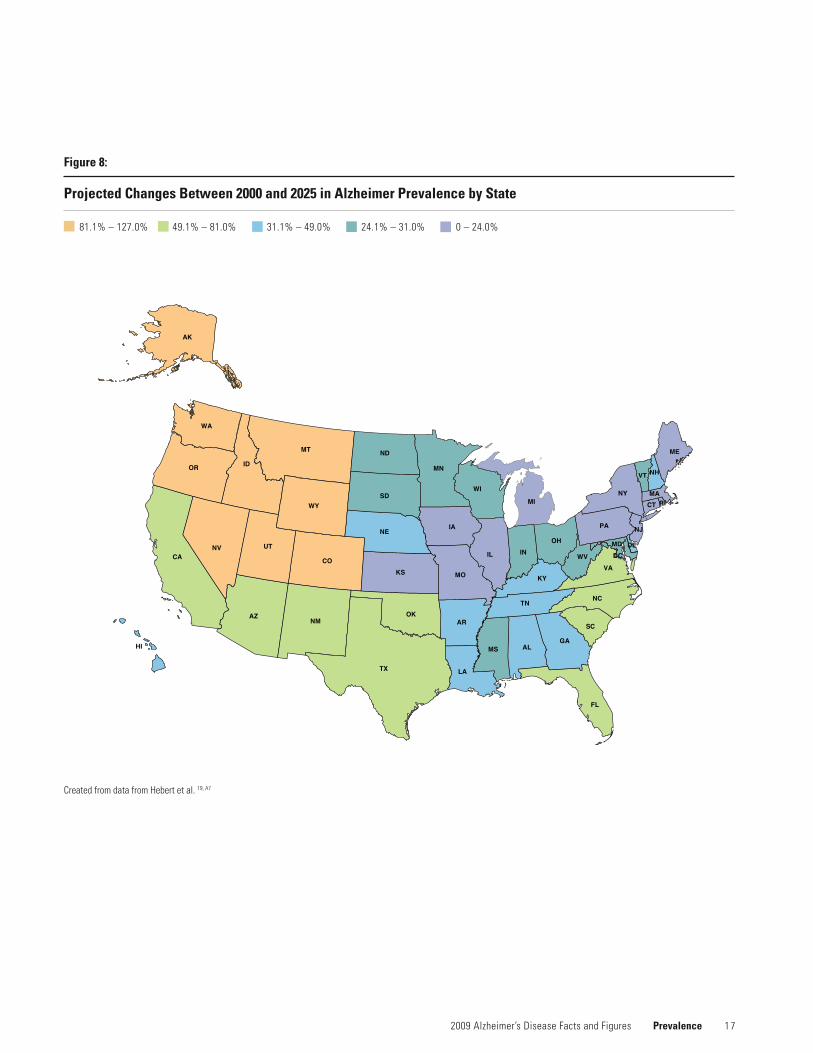
Figure8:ProjectedChangesbetween2000and2025inAlzheimerPrevalencebyState 17
Figure9:CausesofDementiainPeopleAged71+,ADAMS,2002 18
Figure10:PercentageChangesinSelectedCausesofDeathBetween2000and2006 28
Figure 11: Ages of Alzheimer and Other Dementia Caregivers, 2003 35
Figure12:PercentageofAlzheimerandOtherDementiaCaregiversvs.CaregiversofOtherOlderPeople WhoProvideHelpwithSpecificDailyTasks,2003 36
Figure 13: Duration of Caregiving, 2003 37
Figure 14: Hospital Stays for Medicare Beneficiaries Aged 65 and Older with and without Alzheimer’s and Other Dementias, 2004 48
Figure15:AveragePerPersonPaymentsforHospitalCareforMedicareBeneficiariesAged65andOlder Who Have Alzheimer’s and Other Dementias Compared with Other Medicare Beneficiaries, 2004 51
Figure 16: Healthy Cognition-to-Dementia Continuum 61
Alzheimer’s disease is the most common cause of dementia.
Overview of Alzheimer’s Disease
This section provides information about the definition of dementia, the characteristics of specific types of dementia and the symptoms of, risk factors for and treatment of Alzheimer’s disease. More detailed information on these topics is available at www.alz.org.

5
Table 1:
Common Types of Dementia and Their Typical Characteristics
Alzheimer’s disease
Vascular dementia(also known as multi-infarct or post-stroke dementia or vascular cognitive impairment)
Mixed dementia
Most common type of dementia; accounts for 60 to 80 percent of cases.
Difficulty remembering names and recent events is often an early clinical symptom; apathy anddepressionarealsooftenearlysymptoms.Latersymptomsincludeimpairedjudgment,disorientation, confusion, behavior changes, and trouble speaking, swallowing and walking.
Hallmark abnormalities are deposits of the protein fragment beta-amyloid (plaques) and twisted strands of the protein tau (tangles).
Considered the second most common type of dementia.
Impairment is caused by decreased blood flow to parts of the brain, often due to a series of small strokes that block arteries.
Symptoms often overlap with those of Alzheimer’s, although memory may not be as seriously affected.
Characterized by the presence of the hallmark abnormalities of Alzheimer’s and another type of dementia, most commonly vascular dementia, but also other types, such as dementia with Lewy bodies.
Type of Dementia Characteristics
2009 Alzheimer’s Disease Facts and Figures Overview of Alzheimer’s Disease
Dementia is characterized by loss of or decline in memory and other cognitive abilities. It is caused by various diseases and conditions that result in damaged brain cells. To be classified as dementia, the following criteria must be met:
•Itmustincludedeclineinmemoryandinatleastoneofthe following cognitive abilities: 1) Ability to generate coherent speech or understand spoken or written language; 2)Abilitytorecognizeoridentifyobjects,assumingintact sensory function; 3) Ability to execute motor activities, assuming intact motor abilities, sensory function and comprehension of the required task; and
4)Abilitytothinkabstractly,makesoundjudgmentsand plan and carry out complex tasks.•Thedeclineincognitiveabilitiesmustbesevereenoughto interfere with daily life.
Different types of dementia have been associated with distinct symptom patterns and distinguishing microscopic brain abnormalities. Increasing evidence from long-term epidemio-logical observation and autopsy studies suggests that many people have microscopic brain abnormalities associated with more than one type of dementia. The symptoms of different types of dementia also overlap and can be further complicated by coexisting medical conditions. Table 1 provides information about the most common types of dementia.
Dementia: Definition and Specific Types
6 Overview of Alzheimer’s Disease 2009 Alzheimer’s Disease Facts and Figures
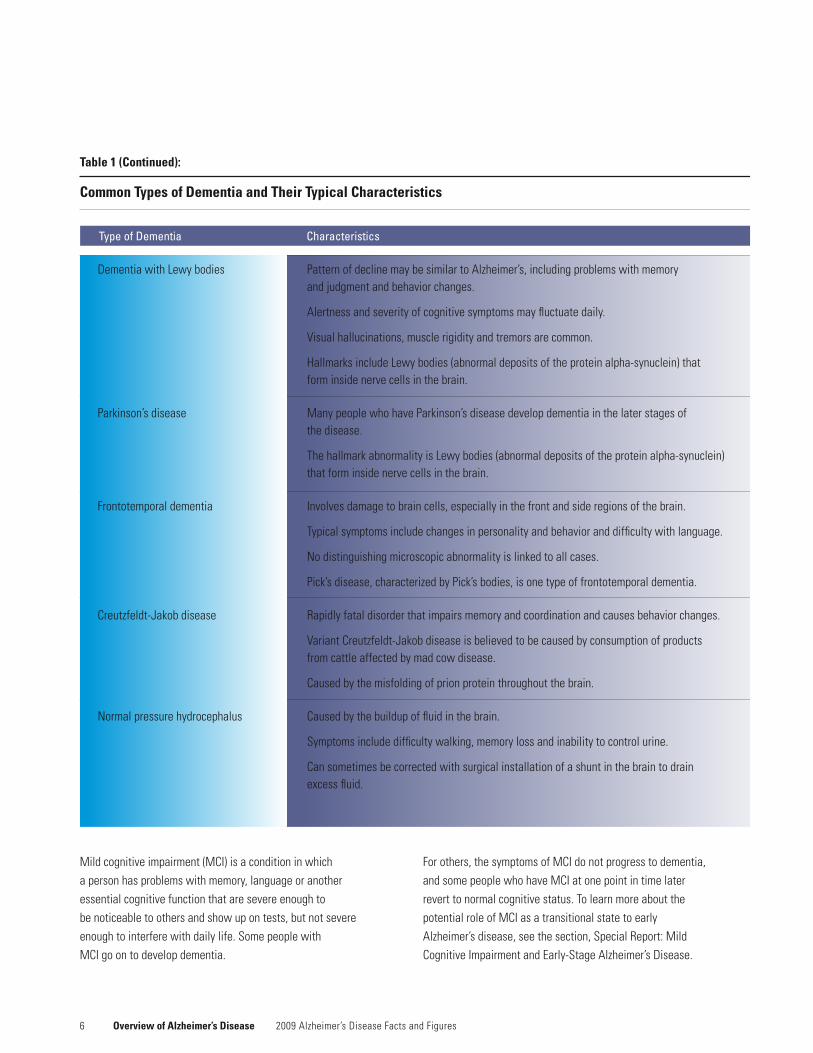
Mild cognitive impairment (MCI) is a condition in which a person has problems with memory, language or another essential cognitive function that are severe enough to be noticeable to others and show up on tests, but not severe enough to interfere with daily life. Some people with MCI go on to develop dementia.
Table 1 (Continued):
Common Types of Dementia and Their Typical Characteristics
Type of Dementia Characteristics
PatternofdeclinemaybesimilartoAlzheimer’s,includingproblemswithmemory andjudgmentandbehaviorchanges.
Alertness and severity of cognitive symptoms may fluctuate daily.
Visual hallucinations, muscle rigidity and tremors are common.
Hallmarks include Lewy bodies (abnormal deposits of the protein alpha-synuclein) that form inside nerve cells in the brain.
ManypeoplewhohaveParkinson’sdiseasedevelopdementiainthelaterstagesof the disease.
The hallmark abnormality is Lewy bodies (abnormal deposits of the protein alpha-synuclein) that form inside nerve cells in the brain.
Involves damage to brain cells, especially in the front and side regions of the brain.
Typical symptoms include changes in personality and behavior and difficulty with language.
Nodistinguishingmicroscopicabnormalityislinkedtoallcases.
Pick’sdisease,characterizedbyPick’sbodies,isonetypeoffrontotemporaldementia.
Rapidly fatal disorder that impairs memory and coordination and causes behavior changes.
Variant Creutzfeldt-Jakob disease is believed to be caused by consumption of products from cattle affected by mad cow disease.
Caused by the misfolding of prion protein throughout the brain.
Caused by the buildup of fluid in the brain.
Symptoms include difficulty walking, memory loss and inability to control urine.
Can sometimes be corrected with surgical installation of a shunt in the brain to drain excess fluid.
Dementia with Lewy bodies
Parkinson’sdisease
Frontotemporal dementia
Creutzfeldt-Jakob disease
Normalpressurehydrocephalus
For others, the symptoms of MCI do not progress to dementia, and some people who have MCI at one point in time later revert to normal cognitive status. To learn more about the potential role of MCI as a transitional state to early Alzheimer’s disease, see the section, Special Report: Mild CognitiveImpairmentandEarly-StageAlzheimer’sDisease.
72009 Alzheimer’s Disease Facts and Figures Overview of Alzheimer’s Disease
More about Alzheimer’s Disease
In Alzheimer’s disease, as in other types of dementia, increasing numbers of nerve cells deteriorate and die. A healthy adult brain has 100 billion nerve cells, or neurons, with long branching extensions connected at 100 trillion points. At these connections, called synapses, information flows in tiny chemical pulses released by one neuron and taken up by the receiving cell. Different strengths and patterns of signals move constantly through the brain’s circuits, creating the cellular basis of memories, thoughts and skills.
In Alzheimer’s disease, information transfer at the synapses begins to fail, the number of synapses declines and eventually cells die. Brains with advanced Alzheimer’s show dramatic shrinkage from cell loss and widespread debris from dead and dying neurons.
Symptoms of Alzheimer’s Disease
Alzheimer’s disease can affect different people in different ways, but the most common symptom pattern begins with gradually worsening difficulty in remembering new informa-tion. This is because disruption of brain cells usually begins in regions involved in forming new memories. As damage spreads, individuals also experience confusion, disorganized thinking,impairedjudgment,troubleexpressingthemselvesand disorientation to time, space and location, which may lead to unsafe wandering and socially inappropriate behavior. In advanced Alzheimer’s, people need help with bathing, dressing, using the bathroom, eating and other daily activities. Those in the final stages of the disease lose their ability to communicate, fail to recognize loved ones and become bed-bound and reliant on 24/7 care. Alzheimer’s disease is ultimately fatal.
Although families generally prefer to keep the person with Alzheimer’s at home as long as possible, most people with the disease eventually need more assistance than families can provide, and they move into a nursing home or another residence where professional care is available.
Risk Factors for Alzheimer’s Disease
Although the cause or causes of Alzheimer’s disease are not yet known, most experts agree that Alzheimer’s, like other common chronic conditions, probably develops as a result of multiple factors rather than a single cause.
The greatest risk factor for Alzheimer’s disease is advancing age. Most Americans with Alzheimer’s disease are aged 65 or older, although individuals younger than age 65 can also develop the disease.
When Alzheimer’s or other dementia is recognized in a person under age 65, these conditions are referred to as “younger-onset” or “early-onset” Alzheimer’s or “younger-onset” or “early-onset” dementia.
A small percentage of Alzheimer’s disease cases, probably less than 5 percent, is caused by rare genetic variations found in a small number of families worldwide. In these inherited forms of Alzheimer’s, the disease tends to develop before age 65, sometimes in individuals as young as 30.
A genetic factor in late-onset Alzheimer’s disease (Alzheimer’s diseasedevelopingatage65orolder)isapolipoproteinE-e4 (APOE-e4).APOE-e4isoneofthreecommonformsoftheAPOEgene,whichprovidestheblueprintforaproteinthatcarriescholesterolinthebloodstream.Everyoneinherits oneformoftheAPOEgenefromeachofhisorherparents.ThosewhoinheritoneAPOE-e4genehaveincreasedriskofdeveloping Alzheimer’s disease. Those who inherit two APOE-e4geneshaveanevenhigherrisk.However,inheritingone or two copies of the gene does not guarantee that the individual will develop Alzheimer’s.
8
Treatment and Prevention of Alzheimer’s Disease
Notreatmentisavailabletosloworstopthedeterioration of brain cells in Alzheimer’s disease. The U.S. Food and Drug Administration has approved five drugs that temporarily slow worsening of symptoms for about six to 12 months, on average, for about half of the individuals who take them. Based on deepening insight into the underlying biology of Alzheimer’s and emerging conceptual frameworks for understanding the disease, researchers have identified treatment strategies that may have the potential to change its course. A number of experimental therapies are in clinical testing in human volunteers.
Despite the current lack of disease-modifying therapies, studies have consistently shown that active medical management of Alzheimer’s and other dementias can significantly improve quality of life through all stages of the disease for diagnosed individuals and their caregivers. Active management includes appropriate use of available treatment options, effective integration of coexisting conditions into the treatment plan, and use of supportive services such as counseling, activity and support groups and adult day center programs.
Many scientists consider the emerging field of prevention one of the most exciting recent developments in the dementia research arena. A growing body of evidence suggests that the health of the brain—one of the body’s most highly vascular organs—is closely linked to the overall health of the heart and blood vessels. Some data indicate that management of cardiovascular risk factors, such as high cholesterol, Type 2 diabetes, high blood pressure and overweight, may help avoid or delay cognitive decline. Additional evidence points to a significant role for regular physical exercise in maintaining lifelong cognitive health. More limited data suggest that a low-fat diet rich in fruits and vegetables may support brain health, as may a robust social network and a lifetime of intellectual curiosity and mental stimulation.
Overview of Alzheimer’s Disease 2009 Alzheimer’s Disease Facts and Figures
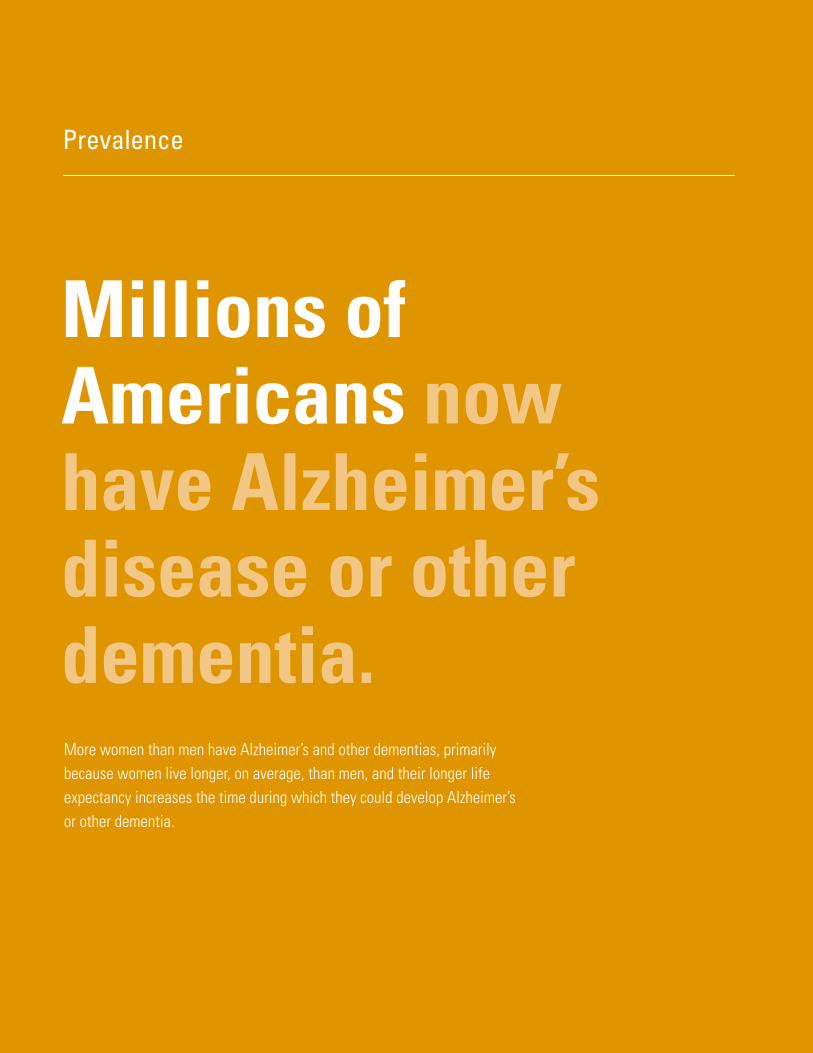
Millions of Americans now have Alzheimer’s disease or other dementia.
Prevalence
More women than men have Alzheimer’s and other dementias, primarily because women live longer, on average, than men, and their longer life expectancy increases the time during which they could develop Alzheimer’s or other dementia.
1 0 Prevalence 2009 Alzheimer’s Disease Facts and Figures
The prevalence of Alzheimer’s and other dementias also differs by education; those with fewer years of education appear to have higher rates of Alzheimer’s and other dementias. Some researchers believe that having more years of education (compared with those with fewer years) provides a “cognitive reserve” that allows individuals to compensate for symptoms of Alzheimer’s or other dementia. However, it is generally believed that these differences reflect socioeconomic factors such as higher rates of disease and less access to medical care in lower socioeconomic groups. Racial and ethnic differences in rates of Alzheimer’s disease and other dementias have also been reported, although differences have not been consistently found.
The number of Americans with Alzheimer’s and other dementias is increasing every year because of the steady growth in the older population. The number will continue to increase and escalate rapidly in the coming years as the baby boom generation ages.
Figures from different studies on the prevalence and charac-teristics of people with Alzheimer’s and other dementias vary, depending on how each study was conducted. Data from several studies are used in this section to describe the prevalence of these conditions and the proportion of people with the conditions by gender, years of education, race and cause of dementia. Data sources and methodologies are described, and more detailed information is contained in theEndNotessectionintheAppendix.Estimatesoflifetimerisk of Alzheimer’s disease and other dementias are also briefly discussed.
Prevalence of Alzheimer’s Disease and Other Dementias
Currently, an estimated 5.3 million Americans of all ages have Alzheimer’s disease. This figure includes 5.1 million people aged 65 and olderA1 and 200,000 individuals under age 65 who have younger-onset Alzheimer’s.1 Based on these estimates, approximately 500,000 Americans under age 65 have Alzheimer’s or other dementia. Of these, about 40 percent are estimated to have Alzheimer’s disease.
•Oneineightpersonsaged65andolder(13percent)haveAlzheimer’s disease.A2
•Every70seconds,someoneinAmericadevelopsAlzheimer’s disease. By mid-century, someone will develop Alzheimer’s every 33 seconds.A3
Prevalence of Alzheimer’s Disease and Other Dementias in Women and Men
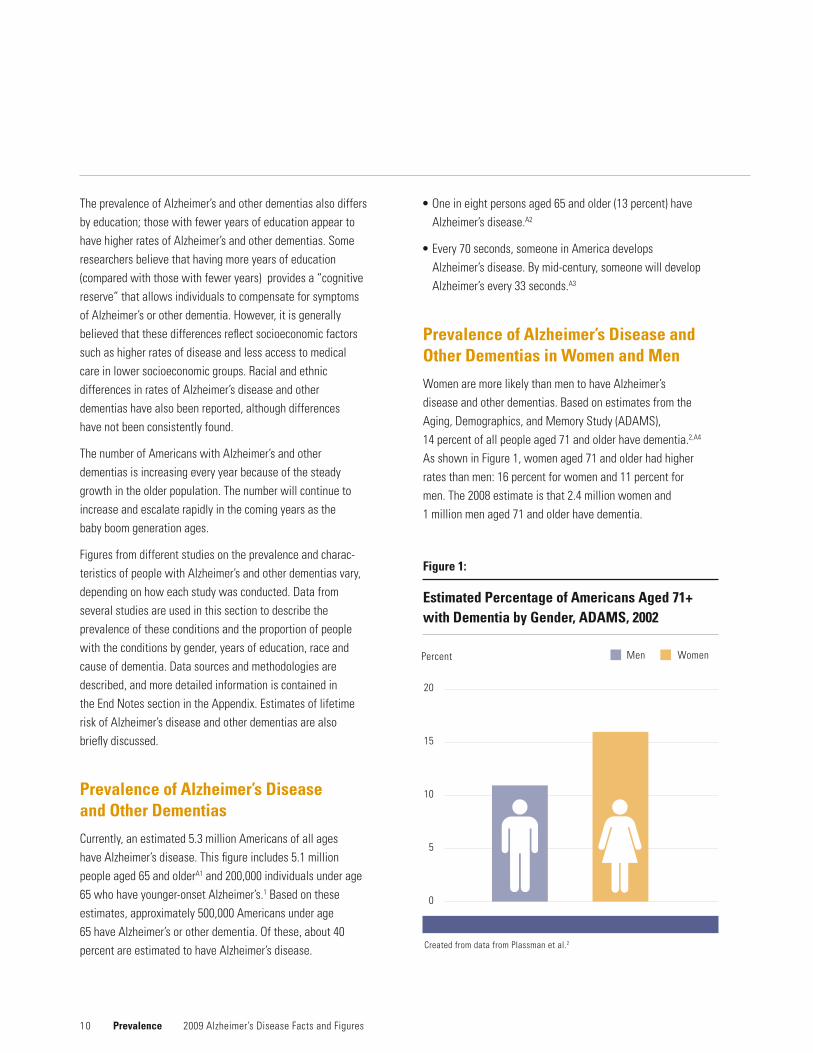
Women are more likely than men to have Alzheimer’s disease and other dementias. Based on estimates from the Aging, Demographics, and Memory Study (ADAMS), 14 percent of all people aged 71 and older have dementia.2,A4 As shown in Figure 1, women aged 71 and older had higher rates than men: 16 percent for women and 11 percent for men. The 2008 estimate is that 2.4 million women and 1 million men aged 71 and older have dementia.
Men Women
Figure 1:
Estimated Percentage of Americans Aged 71+ with Dementia by Gender, ADAMS, 2002
20
15
10
5
0
CreatedfromdatafromPlassmanetal.2
Percent
1 1 2009 Alzheimer’s Disease Facts and Figures Prevalence
Further analysis of these data shows that the larger proportion of older women than men who have dementia is primarily explained by the fact that women live longer, on average, than men.2 Likewise, many studies of the age-specific incidence (new cases) of dementia have found no significant difference by gender.3,4,5,6,7
The same is true for Alzheimer’s disease. The larger proportion of older women than men who have Alzheimer’s disease is believed to be explained by the fact that women live longer.2 Again, many studies of the age-specific incidence of Alzheimer’s disease show no significant difference for women and men.3,6,7,8,9,10,11 Thus, it appears that gender is not a risk factor for Alzheimer’s disease or other dementia once age is takenintoaccount.Essentially,womenaremorelikelytohaveAlzheimer’s disease and other dementias because they live long enough to develop these conditions and generally live longer than men.
Prevalence of Alzheimer’s Disease and Other Dementias by Years of Education
Peoplewithfeweryearsofeducationappeartobeathigherrisk for Alzheimer’s and other dementias than those with more years of education. Studies of the prevalence of dementia show that having fewer years of education is associated with greater likelihood of having dementia,2,12 and incidence studies show that having fewer years of education is associated with a greater risk of developing dementia.5,6,13 One study found, for example, that people with less than 12 years of education had a 15 percent greater risk of developing dementia than people with 12 to 15 years of education and a 35 percent greater risk of developing dementia than people with more than 15 years of education.6
Similar findings have been reported for Alzheimer’s disease. Studies of the prevalence of Alzheimer’s disease show that having fewer years of education is associated with higher likelihood of having Alzheimer’s disease,2,12 and incidence studies show that having fewer years of education is associated with greater risk of developing Alzheimer’s disease.6,9,13,14
A number of researchers have noted that years of education may be a surrogate marker for factors that affect access to education, such as socioeconomic status and where one lived as a child.14,15 Attaining fewer years of education is generally related to additional factors, such as lower levels of occupa-tional attainment and higher prevalence of physical health conditions in adulthood, that are also associated with the development of dementia.
Prevalence of Alzheimer’s Disease and Other Dementias in African-Americans and Whites
African-Americans are frequently reported to be more likely than whites to have Alzheimer’s disease and other dementias. However, more detailed analysis of these relationships indicates that the differences may be largely explained by factors other than race. Most analyses that examined racial differences in Alzheimer’s and other dementias, and have simultaneously looked at age, gender, years of education and comorbid conditions, report significant differences on the basis of race do not persist.2,4,5,6,12,16
Researchers examining racial differences in risk factors for Alzheimer’s disease only have reported similar findings. Most analyses that have combined age, gender, years of education, African-American versus white race, and apolipo-proteinE(APOE)statushavefoundthatthehigherprevalenceof Alzheimer’s disease in African-Americans is primarily explained by these other factors, or that their increased risk is greatly reduced once these factors are taken into account.2,4,5,6,9,12
Lifetime Risk Estimates for Alzheimer’s and Other Dementias
The Framingham original study population was used to estimate short-term (10-year), intermediate (20- and 30-year) and lifetime risks for Alzheimer’s disease, as well as overall risk for any dementia.17,A5Nearly2,800persons65yearsofageand free of dementia were identified in 1975 and provided the
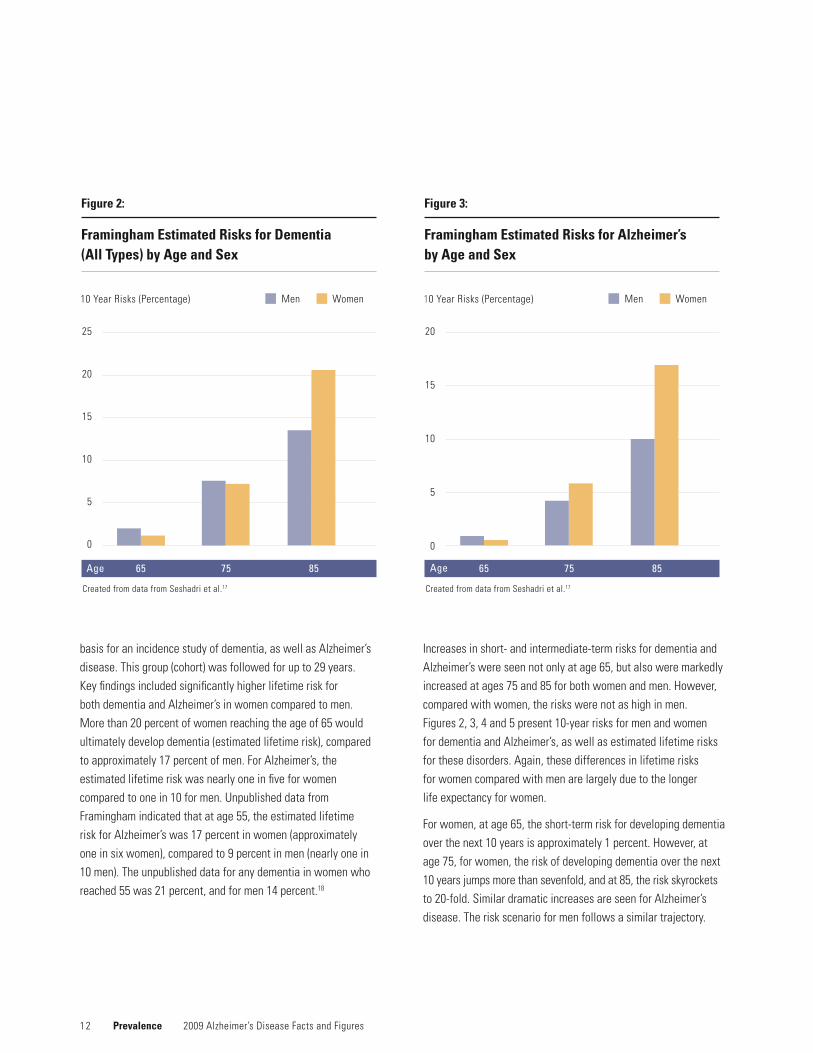
1 2
basis for an incidence study of dementia, as well as Alzheimer’s disease. This group (cohort) was followed for up to 29 years. Key findings included significantly higher lifetime risk for both dementia and Alzheimer’s in women compared to men. More than 20 percent of women reaching the age of 65 would ultimately develop dementia (estimated lifetime risk), compared to approximately 17 percent of men. For Alzheimer’s, the estimated lifetime risk was nearly one in five for women compared to one in 10 for men. Unpublished data from Framingham indicated that at age 55, the estimated lifetime risk for Alzheimer’s was 17 percent in women (approximately one in six women), compared to 9 percent in men (nearly one in 10 men). The unpublished data for any dementia in women who reached 55 was 21 percent, and for men 14 percent.18
Increases in short- and intermediate-term risks for dementia and Alzheimer’s were seen not only at age 65, but also were markedly increased at ages 75 and 85 for both women and men. However, compared with women, the risks were not as high in men. Figures 2, 3, 4 and 5 present 10-year risks for men and women for dementia and Alzheimer’s, as well as estimated lifetime risks for these disorders. Again, these differences in lifetime risks for women compared with men are largely due to the longer life expectancy for women.
For women, at age 65, the short-term risk for developing dementia over the next 10 years is approximately 1 percent. However, at age 75, for women, the risk of developing dementia over the next 10yearsjumpsmorethansevenfold,andat85,theriskskyrocketsto 20-fold. Similar dramatic increases are seen for Alzheimer’s disease.Theriskscenarioformenfollowsasimilartrajectory.
Prevalence 2009 Alzheimer’s Disease Facts and Figures
Figure 2:
Framingham Estimated Risks for Dementia (All Types) by Age and Sex
25
20
15
10
5
0
Created from data from Seshadri et al.17
65 75 85 Age
Men Women10YearRisks(Percentage)
Figure 3:
Framingham Estimated Risks for Alzheimer’s by Age and Sex
20
15
10
5
0
Created from data from Seshadri et al.17
65 75 85
Men Women10YearRisks(Percentage)
Age
1 3
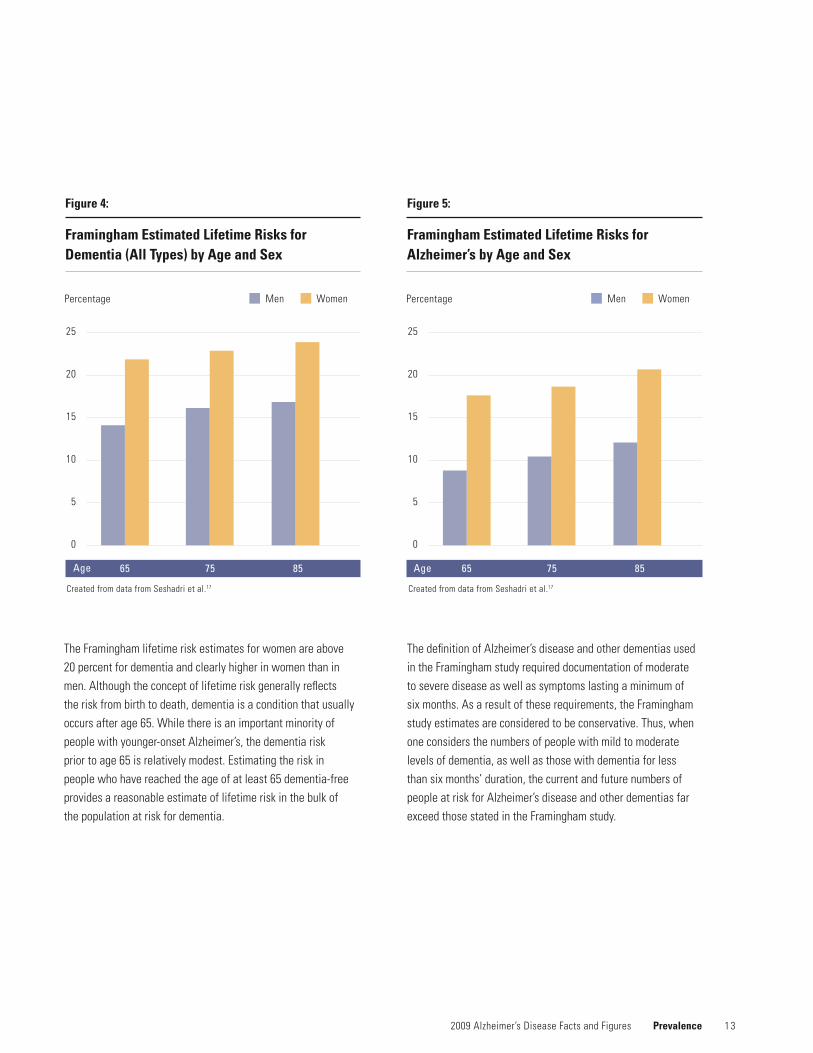
The Framingham lifetime risk estimates for women are above 20 percent for dementia and clearly higher in women than in men. Although the concept of lifetime risk generally reflects the risk from birth to death, dementia is a condition that usually occurs after age 65. While there is an important minority of people with younger-onset Alzheimer’s, the dementia risk priortoage65isrelativelymodest.Estimatingtheriskinpeople who have reached the age of at least 65 dementia-free provides a reasonable estimate of lifetime risk in the bulk of the population at risk for dementia.
The definition of Alzheimer’s disease and other dementias used in the Framingham study required documentation of moderate to severe disease as well as symptoms lasting a minimum of six months. As a result of these requirements, the Framingham study estimates are considered to be conservative. Thus, when one considers the numbers of people with mild to moderate levels of dementia, as well as those with dementia for less than six months’ duration, the current and future numbers of people at risk for Alzheimer’s disease and other dementias far exceed those stated in the Framingham study.
2009 Alzheimer’s Disease Facts and Figures Prevalence
Figure 4:
Framingham Estimated Lifetime Risks for Dementia (All Types) by Age and Sex
25
20
15
10
5
0
Created from data from Seshadri et al.17
65 75 85
Men WomenPercentage
Figure 5:
Framingham Estimated Lifetime Risks for Alzheimer’s by Age and Sex
25
20
15
10
5
0
Created from data from Seshadri et al.17
65 75 85
Men WomenPercentage
Age Age
1 4
Estimates for the Numbers of People with Alzheimer’s Disease, by State
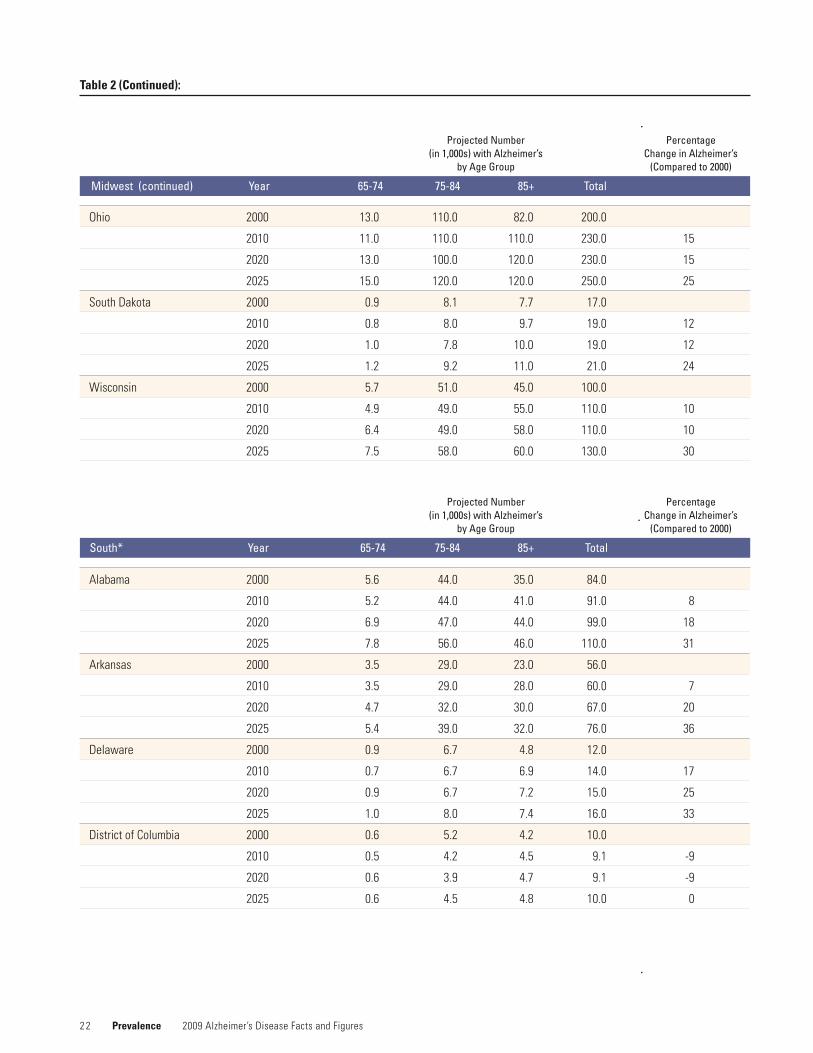
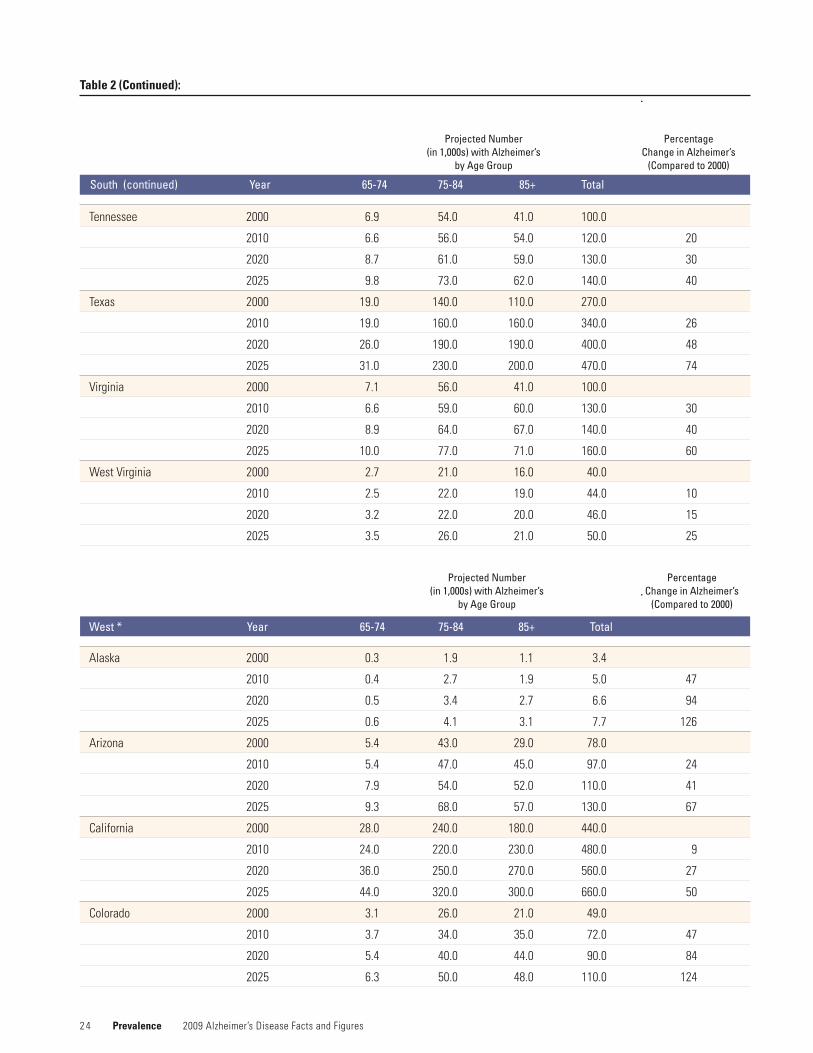
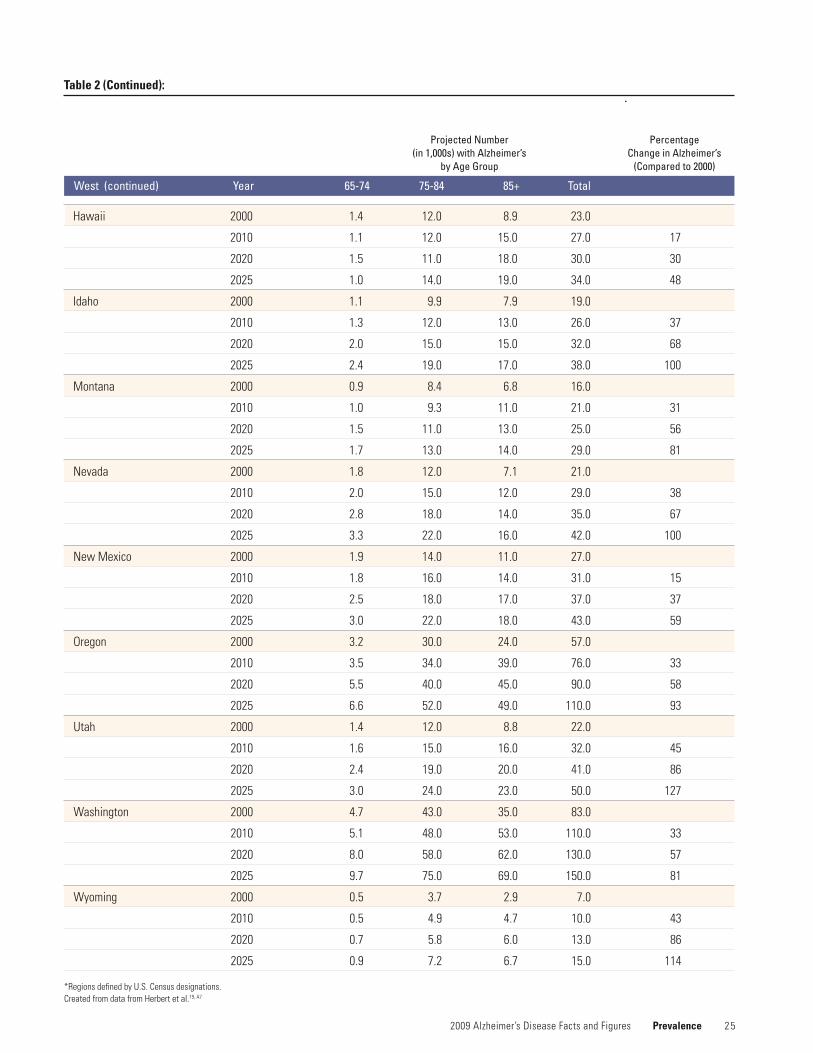
AsreflectedinTable2,theprojectednumberofpeople aged 65 and older with Alzheimer’s disease varies by region of the country, as well as by state. The table presents the estimated numbers of people with Alzheimer’s disease by age groups65yearsandolder.Theprojectionsarepresentedbyregion and state for the years 2000, 2010, 2020 and 2025. The percentage change in Alzheimer’s between 2000 and each of the subsequent time periods is also shown. Comparableprojectionsforprevalencedataondementia by state are not available.
NotonlyistheresubstantialvariabilitybystateintheprojectednumbersofpeoplewithAlzheimer’s,butthisvariability is also reflected between regions of the country. (See Figures 6 and 7 for estimated numbers of people with Alzheimer’s in 2000 and 2025.) Some of the difference is clearly due to where the 65-and-older population resides within the United States. However, between 2000 and 2025, it also is clear that across the country, states and regions are expected to experience double-digit percentage increases overall in the numbers of people with Alzheimer’s. Compared with the numbers of people with Alzheimer’s estimated for 2000, the South, Midwest and West are expected to experi-ence increases that will result in 30–50 percent (and greater) increases over the 25-year period. Some states in the West (Alaska,Colorado,Idaho,Nevada,UtahandWyoming) areprojectedtoexperienceadoubling(ormore)oftheir populations aged 65 and older with Alzheimer’s.
The increased numbers of people with Alzheimer’s will have a marked impact on states’ infrastructures and health-care systems, not to mention on families and caregivers. AlthoughtheprojectedincreasesintheNortheastarenotnearly as marked as those in other regions of the United States, it should be noted that this section of the country is the residence of a large proportion of people aged 65 and older with Alzheimer’s.
This table also underscores the fact that the impact of Alzheimer’s is not equal across the age groups constituting people aged 65 and older. Although there are dramatic increases in Alzheimer’s disease across the elderly age groups, an especially significant impact is expected to occur in the 85 and older age groups.
The final color-coded map of the United States in this section (Figure 8) provides an overview of the amount of change in the proportion of the U.S. population that is expected to be aged 65 and older between 2000 and 2025. Of particular note are the states that are anticipated to experience growth exceeding 80 percent.
Prevalence 2009 Alzheimer’s Disease Facts and Figures
1 5 2009 Alzheimer’s Disease Facts and Figures Prevalence
Figure 6:
Estimated Number of People with Alzheimer’s by State, 2000
500,000+201,000–499,000101,000–200,00051,000–100,00050,000orless
Created from data from Hebert et al. 19, A7
1 6 Prevalence 2009 Alzheimer’s Disease Facts and Figures
Figure 7:
Estimated Number of People with Alzheimer’s by State, 2025
500,000+201,000–499,000101,000–200,00051,000–100,00050,000orless
Created from data from Hebert et al. 19, A7
1 7 2009 Alzheimer’s Disease Facts and Figures Prevalence
Figure 8:
Projected Changes Between 2000 and 2025 in Alzheimer Prevalence by State
81.1% – 127.0% 49.1% – 81.0% 31.1% – 49.0% 24.1% – 31.0% 0 – 24.0%
Created from data from Hebert et al. 19, A7

1 8
Causes of Dementia
Alzheimer’s disease is the most frequent cause of dementia. As shown in Figure 9, Alzheimer’s accounts for 70 percent of all cases of dementia in Americans aged 71 and older.2
Vascular dementia accounts for 17 percent of cases of dementia, and other diseases and conditions, including Parkinson’sdisease,Lewybodydisease,frontotemporaldementia and normal pressure hydrocephalus, account for the remaining 13 percent.*
The proportion of cases of dementia attributable to Alzheimer’s disease increases with age. In people aged 90 and older, Alzheimer’s disease accounts for 80 percent of all dementias compared with 47 percent for people aged 71–79.
However, data are beginning to emerge to suggest that attribution of dementia to specific types may not be as clear cut as previously believed. The study by Schneider and colleagues reports that most older community-dwelling residents (mean age at death, approximately 88 years) have changes in the brain suggestive of disease, and that those with dementia often have evidence of multiple types of brain disease.20
Of the first 141 autopsies, 80 examined brain tissue from people with intermediate or high likelihood of having Alzheimer’s based on clinical evaluation, which included medical history, neuropsychological tests and physical examination with an emphasis on neurologic function.
Figure 9:
Causes of Dementia in People Aged 71+, ADAMS, 2002
13% Other Dementia
17% Vascular Dementia
70% Alzheimer’s
Less than half of the 80 autopsies showed evidence of Alzheimer’salone.NearlyathirdshowedevidenceofAlzheimer’s and infarcts; 15 percent showed evidence of Alzheimer’sandParkinson’sdisease/Lewybodydisease; 5 percent showed evidence of all three diseases; and 2.5 percent showed evidence of Alzheimer’s and brain disease otherthaninfarctsandParkinson’sdisease/Lewybodydisease. Although 50 percent of participants with no or low likelihood of having Alzheimer’s disease based on clinical evaluation also had no evidence of dementia on autopsy, approximately one-third showed evidence of brain infarcts. Thus, there is reason to believe that the causes of dementia may be much more complicated than originally believed.
Prevalence 2009 Alzheimer’s Disease Facts and Figures
*Thesedatareflecttheconclusionsofanexpertpanelofphysiciansandpsychologistsabouttheprimarycauseofdementiaineachsubjectfoundtohavedementiainthe Aging, Demographics, and Memory Study (ADAMS).2Somesubjectswerealsogivensecondarydiagnosesinrecognitionofthegrowingawarenessthatdementiaisoftenassociated with more than one disease or condition. See Table 1 in the section Overview of Alzheimer’s Disease for a brief explanation of “mixed dementia,” that is, dementia with symptoms and brain abnormalities associated with two or more diseases and conditions, for example, Alzheimer’s disease and vascular dementia.
CreatedfromdatafromPlassmanetal.2

1 9
Looking to the Future
The number of Americans surviving into their 80s and 90s and beyond is expected to grow because of advances in medicine and medical technology, as well as social and environmental conditions. Since the incidence and prevalence of Alzheimer’s disease and other dementias increase with age, the number of people with these conditions will also grow rapidly.
•In2000,therewereanestimated411,000new(incident)cases of Alzheimer’s disease. By 2010, that number is expected to increase to 454,000 new cases per year; by 2029, to 615,000; and by 2050, to 959,000.21
•In2011,thefirstbabyboomerswillturn65.By2029,allbabyboomers will be at least 65 years old.
•The85yearsandolderpopulationcurrentlycomprises nearly 50 percent of the individuals with Alzheimer’s disease, or about 2.7 million people. By the time the first wave of baby boomers reaches age 85 years (2031), there will be an estimated 3.5 million people aged 85 and older with Alzheimer’s.22,A6
•Thenumberofpeopleaged65andolderwithAlzheimer’sdisease is estimated to reach 7.7 million in 2030, more than a 50 percent increase from the 5.1 million aged 65 and older who are currently affected.22
•By2050,thenumberofindividualsaged65andolderwithAlzheimer’sisprojectedtonumberbetween11millionand 16 million—unless medical breakthroughs identify ways to prevent or more effectively treat the disease. Barring such developments, by that date, more than 60 percent of people with Alzheimer’s disease will be aged 85 or older.22
2009 Alzheimer’s Disease Facts and Figures Prevalence

2 0 Prevalence 2009 Alzheimer’s Disease Facts and Figures
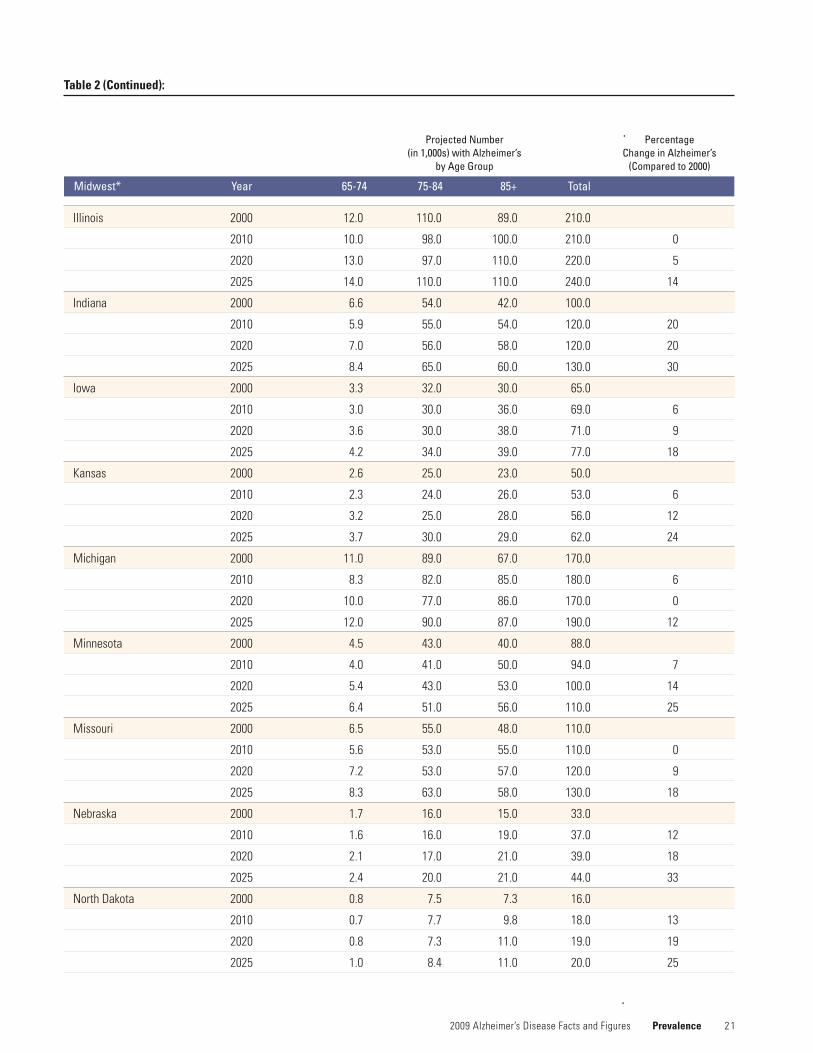
Table 2:
Projections by Region and State for Total Numbers of Americans Aged 65 and Older with Alzheimer’s
Connecticut 2000 3.6 35.0 30.0 68.0
2010 2.8 30.0 37.0 70.0 3
2020 3.6 29.0 38.0 70.0 3
2025 3.9 34.0 38.0 76.0 12
Maine 2000 1.6 13.0 10.0 25.0
2010 1.2 12.0 12.0 25.0 0
2020 1.7 12.0 12.0 25.0 0
2025 2.0 14.0 12.0 28.0 12
Massachusetts 2000 6.6 61.0 52.0 120.0
2010 5.1 54.0 64.0 120.0 0
2020 6.8 51.0 66.0 120.0 0
2025 7.5 61.0 67.0 140.0 17
NewHampshire 2000 1.2 9.8 8.0 19.0
2010 1.0 9.9 11.0 22.0 16
2020 1.4 10.0 12.0 23.0 21
2025 1.7 13.0 12.0 26.0 37
NewJersey 2000 9.1 80.0 63.0 150.0
2010 7.5 73.0 74.0 150.0 0
2020 9.4 71.0 77.0 160.0 7
2025 10.0 83.0 79.0 170.0 13
NewYork 2000 20.0 170.0 140.0 330.0
2010 16.0 150.0 150.0 320.0 -3
2020 20.0 150.0 160.0 330.0 0
2025 21.0 170.0 160.0 350.0 6
Pennsylvania 2000 17.0 150.0 110.0 280.0
2010 12.0 130.0 140.0 280.0 0
2020 15.0 120.0 130.0 260.0 -7
2025 17.0 140.0 130.0 280.0 0
Rhode Island 2000 1.3 12.0 10.0 24.0
2010 0.9 10.0 13.0 24.0 0
2020 1.2 9.1 12.0 23.0 -4
2025 1.4 11.0 12.0 24.0 0
Vermont 2000 0.6 5.2 4.4 10.0
2010 0.5 5.1 5.3 11.0 10
2020 0.8 5.2 5.5 12.0 20
2025 0.9 6.5 5.6 13.0 30
Northeast* Year 65-74 75-84 85+ Total
Percentage Change in Alzheimer’s
(Compared to 2000)
Projected Number (in 1,000s) with Alzheimer’s
by Age Group
2 1 2009 Alzheimer’s Disease Facts and Figures Prevalence
Table 2 (Continued):
Percentage Change in Alzheimer’s
(Compared to 2000)
Projected Number (in 1,000s) with Alzheimer’s
by Age Group
Illinois 2000 12.0 110.0 89.0 210.0
2010 10.0 98.0 100.0 210.0 0
2020 13.0 97.0 110.0 220.0 5
2025 14.0 110.0 110.0 240.0 14
Indiana 2000 6.6 54.0 42.0 100.0
2010 5.9 55.0 54.0 120.0 20
2020 7.0 56.0 58.0 120.0 20
2025 8.4 65.0 60.0 130.0 30
Iowa 2000 3.3 32.0 30.0 65.0
2010 3.0 30.0 36.0 69.0 6
2020 3.6 30.0 38.0 71.0 9
2025 4.2 34.0 39.0 77.0 18
Kansas 2000 2.6 25.0 23.0 50.0
2010 2.3 24.0 26.0 53.0 6
2020 3.2 25.0 28.0 56.0 12
2025 3.7 30.0 29.0 62.0 24
Michigan 2000 11.0 89.0 67.0 170.0
2010 8.3 82.0 85.0 180.0 6
2020 10.0 77.0 86.0 170.0 0
2025 12.0 90.0 87.0 190.0 12
Minnesota 2000 4.5 43.0 40.0 88.0
2010 4.0 41.0 50.0 94.0 7
2020 5.4 43.0 53.0 100.0 14
2025 6.4 51.0 56.0 110.0 25
Missouri 2000 6.5 55.0 48.0 110.0
2010 5.6 53.0 55.0 110.0 0
2020 7.2 53.0 57.0 120.0 9
2025 8.3 63.0 58.0 130.0 18
Nebraska 2000 1.7 16.0 15.0 33.0
2010 1.6 16.0 19.0 37.0 12
2020 2.1 17.0 21.0 39.0 18
2025 2.4 20.0 21.0 44.0 33
NorthDakota 2000 0.8 7.5 7.3 16.0
2010 0.7 7.7 9.8 18.0 13
2020 0.8 7.3 11.0 19.0 19
2025 1.0 8.4 11.0 20.0 25
Midwest* Year 65-74 75-84 85+ Total Midwest*
2 2 Prevalence 2009 Alzheimer’s Disease Facts and Figures
Midwest (continued) Year 65-74 75-84 85+ Total
Ohio 2000 13.0 110.0 82.0 200.0
2010 11.0 110.0 110.0 230.0 15
2020 13.0 100.0 120.0 230.0 15
2025 15.0 120.0 120.0 250.0 25
South Dakota 2000 0.9 8.1 7.7 17.0
2010 0.8 8.0 9.7 19.0 12
2020 1.0 7.8 10.0 19.0 12
2025 1.2 9.2 11.0 21.0 24
Wisconsin 2000 5.7 51.0 45.0 100.0
2010 4.9 49.0 55.0 110.0 10
2020 6.4 49.0 58.0 110.0 10
2025 7.5 58.0 60.0 130.0 30
Percentage Change in Alzheimer’s
(Compared to 2000)
Projected Number (in 1,000s) with Alzheimer’s
by Age Group
South* Year 65-74 75-84 85+ Total
Alabama 2000 5.6 44.0 35.0 84.0
2010 5.2 44.0 41.0 91.0 8
2020 6.9 47.0 44.0 99.0 18
2025 7.8 56.0 46.0 110.0 31
Arkansas 2000 3.5 29.0 23.0 56.0
2010 3.5 29.0 28.0 60.0 7
2020 4.7 32.0 30.0 67.0 20
2025 5.4 39.0 32.0 76.0 36
Delaware 2000 0.9 6.7 4.8 12.0
2010 0.7 6.7 6.9 14.0 17
2020 0.9 6.7 7.2 15.0 25
2025 1.0 8.0 7.4 16.0 33
District of Columbia 2000 0.6 5.2 4.2 10.0
2010 0.5 4.2 4.5 9.1 -9
2020 0.6 3.9 4.7 9.1 -9
2025 0.6 4.5 4.8 10.0 0
Percentage Change in Alzheimer’s
(Compared to 2000)
Projected Number (in 1,000s) with Alzheimer’s
by Age Group
Table 2 (Continued):

2 3 2009 Alzheimer’s Disease Facts and Figures Prevalence
Florida 2000 23.0 200.0 150.0 360.0
2010 22.0 210.0 220.0 450.0 25
2020 32.0 230.0 250.0 510.0 42
2025 37.0 290.0 270.0 590.0 64
Georgia 2000 7.5 58.0 44.0 110.0
2010 7.4 60.0 57.0 120.0 9
2020 10.0 68.0 64.0 140.0 27
2025 12.0 84.0 68.0 160.0 45
Kentucky 2000 5.1 39.0 30.0 74.0
2010 4.9 41.0 35.0 80.0 8
2020 6.3 43.0 38.0 87.0 18
2025 7.0 50.0 39.0 97.0 31
Louisiana 2000 5.1 38.0 30.0 73.0
2010 4.7 41.0 37.0 83.0 14
2020 6.0 43.0 43.0 92.0 26
2025 7.0 51.0 46.0 100.0 37
Maryland 2000 5.1 42.0 31.0 78.0
2010 4.4 40.0 41.0 86.0 10
2020 5.8 41.0 44.0 90.0 15
2025 6.6 49.0 45.0 100.0 28
Mississippi 2000 3.4 26.0 22.0 51.0
2010 3.2 26.0 24.0 53.0 4
2020 4.1 28.0 26.0 58.0 14
2025 4.7 33.0 27.0 65.0 27
NorthCarolina 2000 9.4 72.0 53.0 130.0
2010 9.2 80.0 78.0 170.0 31
2020 12.0 88.0 89.0 190.0 46
2025 14.0 110.0 94.0 210.0 62
Oklahoma 2000 3.8 31.0 27.0 62.0
2010 3.7 34.0 37.0 74.0 19
2020 5.0 37.0 42.0 85.0 37
2025 5.8 45.0 45.0 96.0 55
South Carolina 2000 4.8 36.0 25.0 67.0
2010 4.5 38.0 37.0 80.0 19
2020 6.2 42.0 43.0 91.0 36
2025 7.0 51.0 45.0 100.0 49
South (continued) Year 65-74 75-84 85+ Total
Percentage Change in Alzheimer’s
(Compared to 2000)
Projected Number (in 1,000s) with Alzheimer’s
by Age Group
Table 2 (Continued):
2 4 Prevalence 2009 Alzheimer’s Disease Facts and Figures
South (continued) Year 65-74 75-84 85+ Total
Tennessee 2000 6.9 54.0 41.0 100.0
2010 6.6 56.0 54.0 120.0 20
2020 8.7 61.0 59.0 130.0 30
2025 9.8 73.0 62.0 140.0 40
Texas 2000 19.0 140.0 110.0 270.0
2010 19.0 160.0 160.0 340.0 26
2020 26.0 190.0 190.0 400.0 48
2025 31.0 230.0 200.0 470.0 74
Virginia 2000 7.1 56.0 41.0 100.0
2010 6.6 59.0 60.0 130.0 30
2020 8.9 64.0 67.0 140.0 40
2025 10.0 77.0 71.0 160.0 60
West Virginia 2000 2.7 21.0 16.0 40.0
2010 2.5 22.0 19.0 44.0 10
2020 3.2 22.0 20.0 46.0 15
2025 3.5 26.0 21.0 50.0 25
Alaska 2000 0.3 1.9 1.1 3.4
2010 0.4 2.7 1.9 5.0 47
2020 0.5 3.4 2.7 6.6 94
2025 0.6 4.1 3.1 7.7 126
Arizona 2000 5.4 43.0 29.0 78.0
2010 5.4 47.0 45.0 97.0 24
2020 7.9 54.0 52.0 110.0 41
2025 9.3 68.0 57.0 130.0 67
California 2000 28.0 240.0 180.0 440.0
2010 24.0 220.0 230.0 480.0 9
2020 36.0 250.0 270.0 560.0 27
2025 44.0 320.0 300.0 660.0 50
Colorado 2000 3.1 26.0 21.0 49.0
2010 3.7 34.0 35.0 72.0 47
2020 5.4 40.0 44.0 90.0 84
2025 6.3 50.0 48.0 110.0 124
Percentage Change in Alzheimer’s
(Compared to 2000)
Projected Number (in 1,000s) with Alzheimer’s
by Age Group
Percentage Change in Alzheimer’s
(Compared to 2000)
Projected Number (in 1,000s) with Alzheimer’s
by Age Group
Table 2 (Continued):
West * Year 65-74 75-84 85+ Total
2 5 2009 Alzheimer’s Disease Facts and Figures Prevalence
West (continued) Year 65-74 75-84 85+ Total
Hawaii 2000 1.4 12.0 8.9 23.0
2010 1.1 12.0 15.0 27.0 17
2020 1.5 11.0 18.0 30.0 30
2025 1.0 14.0 19.0 34.0 48
Idaho 2000 1.1 9.9 7.9 19.0
2010 1.3 12.0 13.0 26.0 37
2020 2.0 15.0 15.0 32.0 68
2025 2.4 19.0 17.0 38.0 100
Montana 2000 0.9 8.4 6.8 16.0
2010 1.0 9.3 11.0 21.0 31
2020 1.5 11.0 13.0 25.0 56
2025 1.7 13.0 14.0 29.0 81
Nevada 2000 1.8 12.0 7.1 21.0
2010 2.0 15.0 12.0 29.0 38
2020 2.8 18.0 14.0 35.0 67
2025 3.3 22.0 16.0 42.0 100
NewMexico 2000 1.9 14.0 11.0 27.0
2010 1.8 16.0 14.0 31.0 15
2020 2.5 18.0 17.0 37.0 37
2025 3.0 22.0 18.0 43.0 59
Oregon 2000 3.2 30.0 24.0 57.0
2010 3.5 34.0 39.0 76.0 33
2020 5.5 40.0 45.0 90.0 58
2025 6.6 52.0 49.0 110.0 93
Utah 2000 1.4 12.0 8.8 22.0
2010 1.6 15.0 16.0 32.0 45
2020 2.4 19.0 20.0 41.0 86
2025 3.0 24.0 23.0 50.0 127
Washington 2000 4.7 43.0 35.0 83.0
2010 5.1 48.0 53.0 110.0 33
2020 8.0 58.0 62.0 130.0 57
2025 9.7 75.0 69.0 150.0 81
Wyoming 2000 0.5 3.7 2.9 7.0
2010 0.5 4.9 4.7 10.0 43
2020 0.7 5.8 6.0 13.0 86
2025 0.9 7.2 6.7 15.0 114
*Regions defined by U.S. Census designations. Created from data from Herbert et al.19, A7
Percentage Change in Alzheimer’s
(Compared to 2000)
Projected Number (in 1,000s) with Alzheimer’s
by Age Group
Table 2 (Continued):
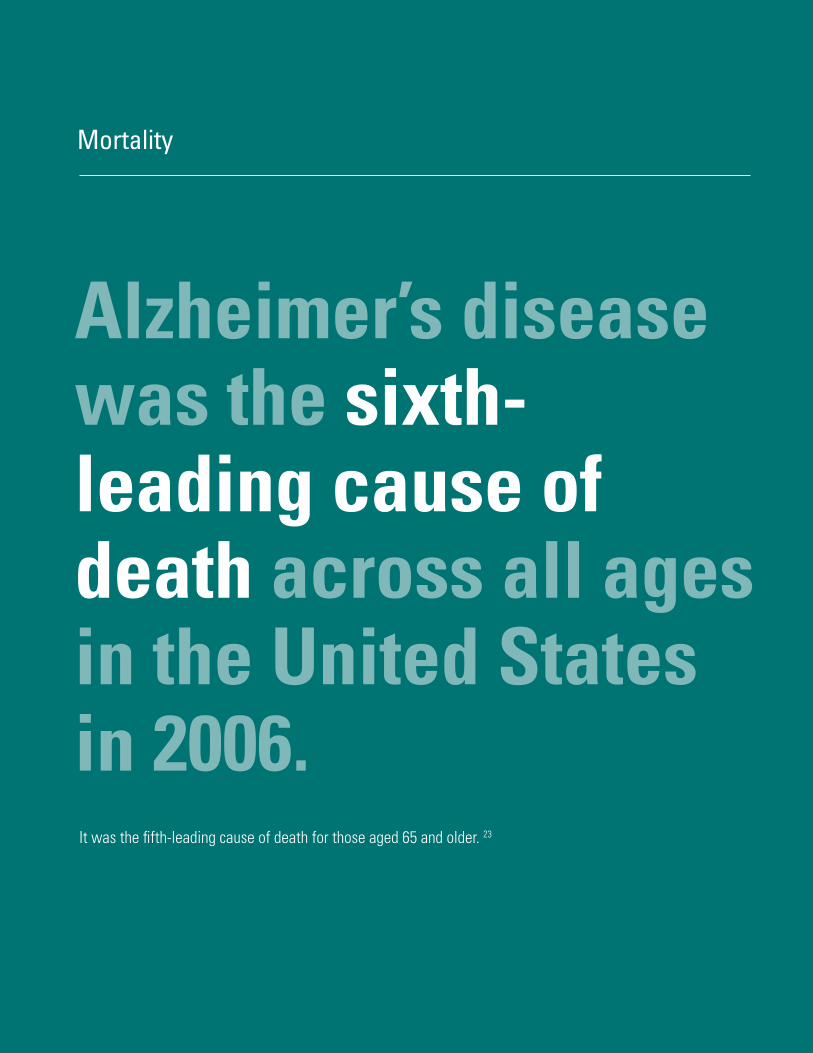
Alzheimer’s disease was the sixth- leading cause of death across all ages in the United States in 2006.
Mortality
It was the fifth-leading cause of death for those aged 65 and older. 23

2 7 2009 Alzheimer’s Disease Facts and Figures Mortality
In 2006, Alzheimer’s disease was reported as the underlying cause of death for 72,914 people. However, underreporting of Alzheimer’s disease as an underlying cause of death has been well documented.24,25,26,27 Death rates from the disease can vary a great deal across states and result from differences in state demographics and reporting practices. On the other hand, death rates among people with Alzheimer’s disease dramatically increase with age. From one community-based, 15-year prospective study, the mortality rate for people aged 75–84 with Alzheimer’s was nearly 2.5 times greater than for those aged 55–74 with the disease. At age 85 and older, the rate was nearly twice that of those with Alzheimer’s aged 75–84.28 Two-thirds of those dying of dementia did so in nursing homes, compared with 20 percent of cancer patients and 28 percent of people dying from all other conditions.
Deaths from Alzheimer’s Disease
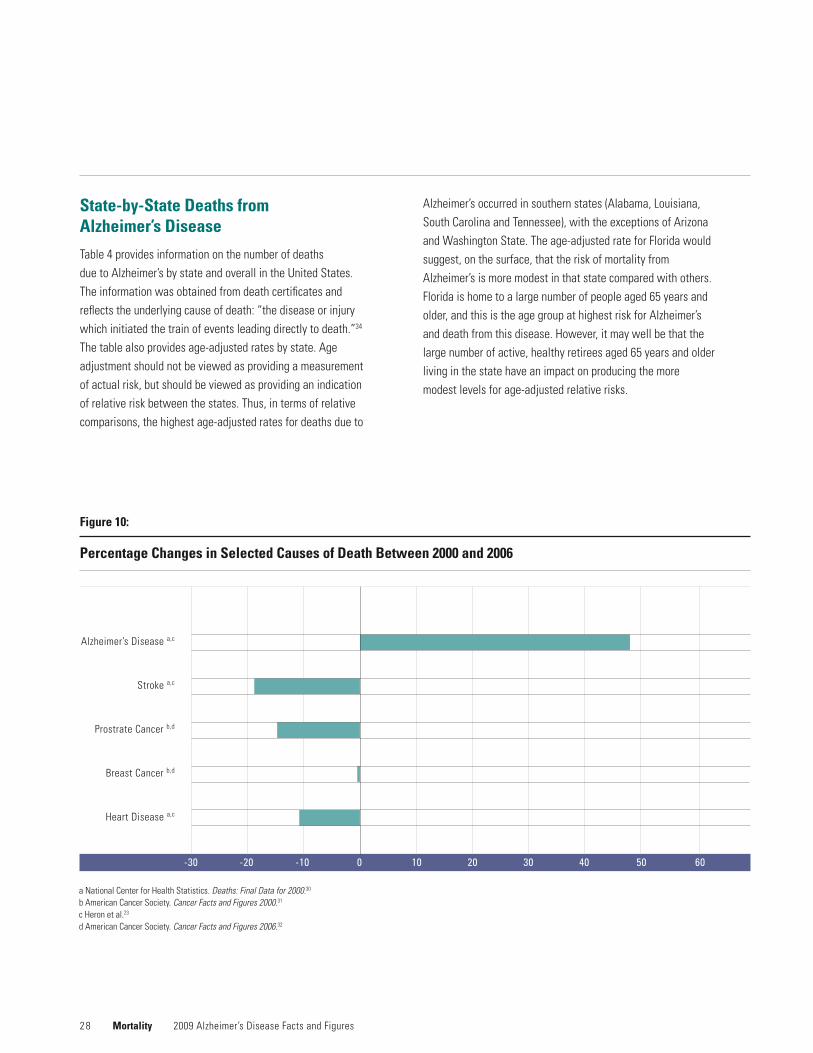
Whilethetotalnumberofdeathsattributedtoothermajorcauses of deaths has been decreasing, those due to Alzheimer’s have continued to increase. In 1991, only 14,112 death certificates recorded Alzheimer’s disease as the underlying cause.29 Comparing changes in selected causes of death between 2000 and 2006 (Figure 10), deaths attributed to Alzheimer’s disease increased 47.1 percent, while those attributed to the number one cause of death, heart disease, decreased 11.5 percent. Table 3 compares the number of deaths and percentage change for selected causes of deaths in 2000 and 2006.
Although deaths attributed to Alzheimer’s are increasing, underreporting of this condition on death certificates results in significant underestimates of the public health impact of Alzheimer’s. A number of studies have documented substantial underreporting of Alzheimer’s disease on death certificates as an underlying or contributory cause of death. Underreporting Alzheimer’s disease as the cause of death occurs in the community, as well as in nursing homes.25, 26, 27
An increased risk of death may also apply to people newly diagnosed with Alzheimer’s. One 2004 study noted that people newly diagnosed with Alzheimer’s survived about half as long as those of similar age who did not have the disease.33 In this study, average survival time was four to six years after diagnosis, but survival can be as long as 20 years from the first symptoms (although these early symptoms may be fairly subtle and not immediately recognized).
The mechanisms by which dementia leads to death may create ambiguity about the underlying cause of death. Severe dementia frequently causes such complications as immobility, swallowing disorders or malnutrition. These complications can significantly increase the risk of developing pneumonia, which has been found in several studies to be the most commonly identified cause of death among elderly people with Alzheimer’s disease and other dementias. One researcher described the situation as a “blurred distinction between death with dementia and death from dementia.”28
aNationalCenterforHealthStatistics.Deaths: Final Data for 2000.30 b American Cancer Society. Cancer Facts and Figures 2000.31 c Heron et al.23 d American Cancer Society. Cancer Facts and Figures 2006.32
Table 3:
Percentage Changes in Selected Causes of Death, 2000 and 2006
Cause 2000 2006 Percentage Change
Heart disease 710,760a 629,191c -11.5
Breast cancer 41,200b 40,970d -0.6
Prostatecancer 31,900b 27,350d -14.3
Stroke 167,661a 137,265c -18.1
Alzheimer’s disease 49,558a 72,914c +47.1
2 8
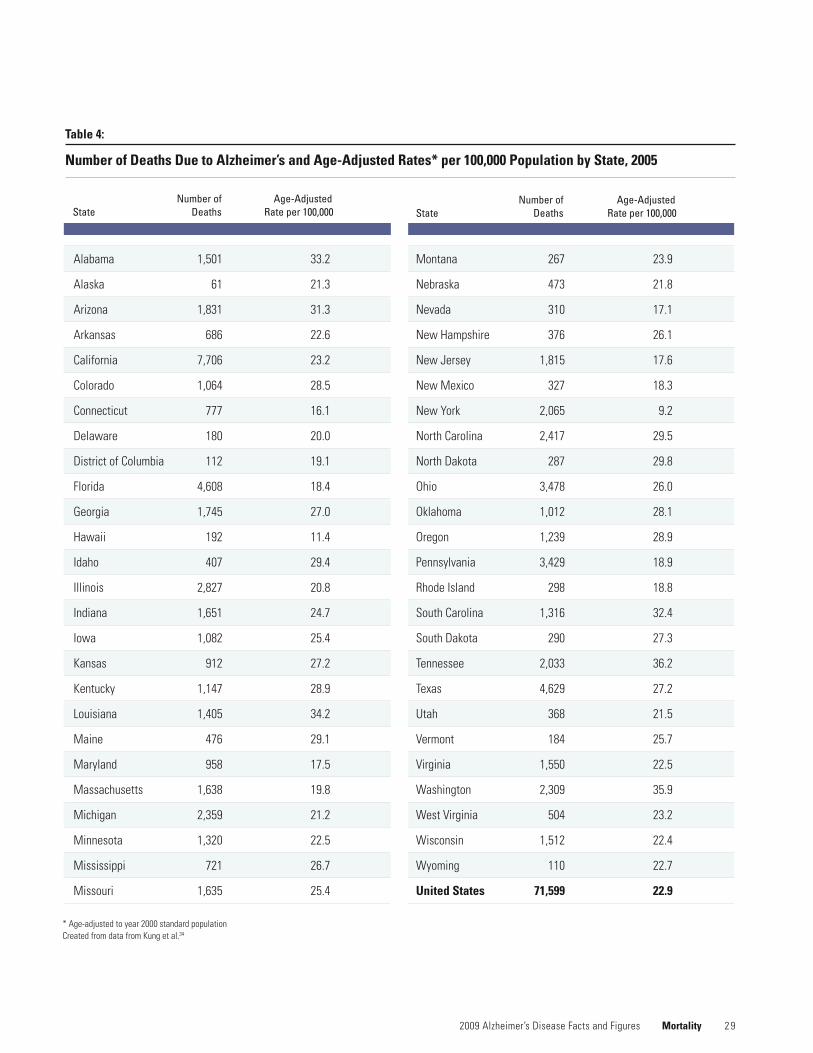
State-by-State Deaths from Alzheimer’s Disease
Table 4 provides information on the number of deaths due to Alzheimer’s by state and overall in the United States. The information was obtained from death certificates and reflectstheunderlyingcauseofdeath:“thediseaseorinjurywhich initiated the train of events leading directly to death.”34 Thetablealsoprovidesage-adjustedratesbystate.Ageadjustmentshouldnotbeviewedasprovidingameasurementof actual risk, but should be viewed as providing an indication of relative risk between the states. Thus, in terms of relative comparisons,thehighestage-adjustedratesfordeathsdueto
Alzheimer’s occurred in southern states (Alabama, Louisiana, South Carolina and Tennessee), with the exceptions of Arizona andWashingtonState.Theage-adjustedrateforFloridawouldsuggest, on the surface, that the risk of mortality from Alzheimer’s is more modest in that state compared with others. Florida is home to a large number of people aged 65 years and older, and this is the age group at highest risk for Alzheimer’s and death from this disease. However, it may well be that the large number of active, healthy retirees aged 65 years and older living in the state have an impact on producing the more modestlevelsforage-adjustedrelativerisks.
Mortality 2009 Alzheimer’s Disease Facts and Figures
-30 -20 -10 0 10 20 30 40 50 60
Figure 10:
Percentage Changes in Selected Causes of Death Between 2000 and 2006
Alzheimer’s Disease a,c
Stroke a,c
ProstrateCancerb,d
Breast Cancer b,d
Heart Disease a,c
aNationalCenterforHealthStatistics.Deaths: Final Data for 2000.30 b American Cancer Society. Cancer Facts and Figures 2000.31 c Heron et al.23 d American Cancer Society. Cancer Facts and Figures 2006.32
2 9 2009 Alzheimer’s Disease Facts and Figures Mortality
*Age-adjustedtoyear2000standardpopulation Created from data from Kung et al.34
Number of Age-Adjusted State Deaths Rate per 100,000
Number of Age-Adjusted State Deaths Rate per 100,000
Table 4:
Number of Deaths Due to Alzheimer’s and Age-Adjusted Rates* per 100,000 Population by State, 2005
Alabama 1,501 33.2
Alaska 61 21.3
Arizona 1,831 31.3
Arkansas 686 22.6
California 7,706 23.2
Colorado 1,064 28.5
Connecticut 777 16.1
Delaware 180 20.0
District of Columbia 112 19.1
Florida 4,608 18.4
Georgia 1,745 27.0
Hawaii 192 11.4
Idaho 407 29.4
Illinois 2,827 20.8
Indiana 1,651 24.7
Iowa 1,082 25.4
Kansas 912 27.2
Kentucky 1,147 28.9
Louisiana 1,405 34.2
Maine 476 29.1
Maryland 958 17.5
Massachusetts 1,638 19.8
Michigan 2,359 21.2
Minnesota 1,320 22.5
Mississippi 721 26.7
Missouri 1,635 25.4
Montana 267 23.9
Nebraska 473 21.8
Nevada 310 17.1
NewHampshire 376 26.1
NewJersey 1,815 17.6
NewMexico 327 18.3
NewYork 2,065 9.2
NorthCarolina 2,417 29.5
NorthDakota 287 29.8
Ohio 3,478 26.0
Oklahoma 1,012 28.1
Oregon 1,239 28.9
Pennsylvania 3,429 18.9
Rhode Island 298 18.8
South Carolina 1,316 32.4
South Dakota 290 27.3
Tennessee 2,033 36.2
Texas 4,629 27.2
Utah 368 21.5
Vermont 184 25.7
Virginia 1,550 22.5
Washington 2,309 35.9
West Virginia 504 23.2
Wisconsin 1,512 22.4
Wyoming 110 22.7
United States 71,599 22.9
3 0
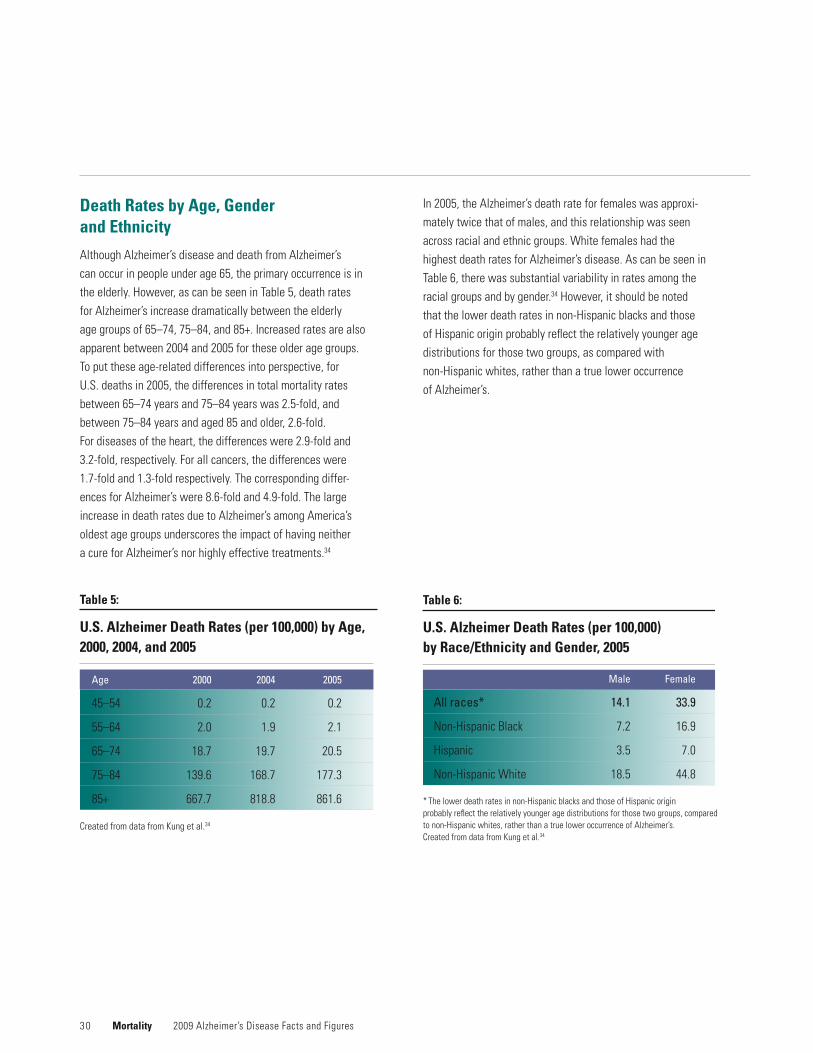
Death Rates by Age, Gender and Ethnicity
Although Alzheimer’s disease and death from Alzheimer’s can occur in people under age 65, the primary occurrence is in the elderly. However, as can be seen in Table 5, death rates for Alzheimer’s increase dramatically between the elderly agegroupsof65–74,75–84,and85+.Increasedratesarealsoapparent between 2004 and 2005 for these older age groups. To put these age-related differences into perspective, for U.S. deaths in 2005, the differences in total mortality rates between 65–74 years and 75–84 years was 2.5-fold, and between 75–84 years and aged 85 and older, 2.6-fold. For diseases of the heart, the differences were 2.9-fold and 3.2-fold, respectively. For all cancers, the differences were 1.7-fold and 1.3-fold respectively. The corresponding differ-ences for Alzheimer’s were 8.6-fold and 4.9-fold. The large increase in death rates due to Alzheimer’s among America’s oldest age groups underscores the impact of having neither a cure for Alzheimer’s nor highly effective treatments.34
In 2005, the Alzheimer’s death rate for females was approxi-mately twice that of males, and this relationship was seen across racial and ethnic groups. White females had the highest death rates for Alzheimer’s disease. As can be seen in Table 6, there was substantial variability in rates among the racial groups and by gender.34 However, it should be noted that the lower death rates in non-Hispanic blacks and those of Hispanic origin probably reflect the relatively younger age distributions for those two groups, as compared with non-Hispanic whites, rather than a true lower occurrence of Alzheimer’s.
Mortality 2009 Alzheimer’s Disease Facts and Figures
* The lower death rates in non-Hispanic blacks and those of Hispanic origin probably reflect the relatively younger age distributions for those two groups, compared to non-Hispanic whites, rather than a true lower occurrence of Alzheimer’s. Created from data from Kung et al.34
Table 6:
U.S. Alzheimer Death Rates (per 100,000) by Race/Ethnicity and Gender, 2005
Male Female
All races* 14.1 33.9
Non-HispanicBlack 7.2 16.9
Hispanic 3.5 7.0
Non-HispanicWhite 18.5 44.8
Created from data from Kung et al.34
Age 2000 2004 2005
45–54 0.2 0.2 0.2
55–64 2.0 1.9 2.1
65–74 18.7 19.7 20.5
75–84 139.6 168.7 177.3
85+ 667.7 818.8 861.6
Table 5:
U.S. Alzheimer Death Rates (per 100,000) by Age, 2000, 2004, and 2005
3 1
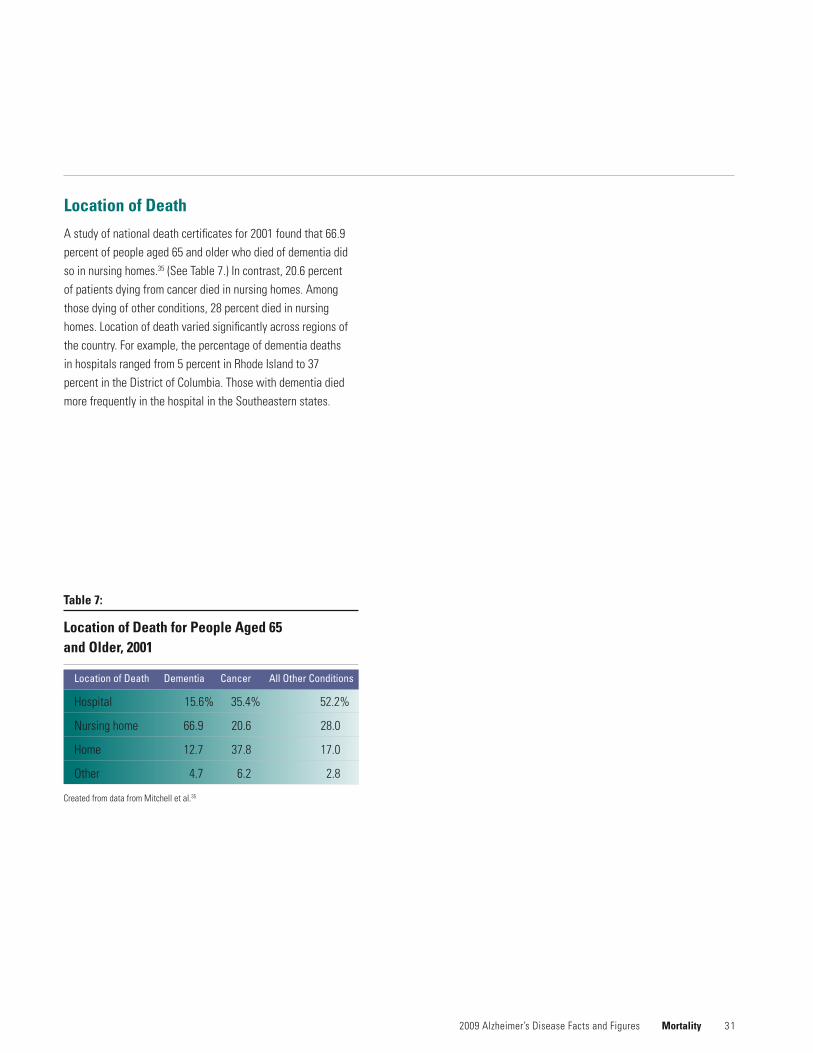
Location of Death
A study of national death certificates for 2001 found that 66.9 percent of people aged 65 and older who died of dementia did so in nursing homes.35 (See Table 7.) In contrast, 20.6 percent of patients dying from cancer died in nursing homes. Among those dying of other conditions, 28 percent died in nursing homes. Location of death varied significantly across regions of the country. For example, the percentage of dementia deaths in hospitals ranged from 5 percent in Rhode Island to 37 percent in the District of Columbia. Those with dementia died more frequently in the hospital in the Southeastern states.
2009 Alzheimer’s Disease Facts and Figures Mortality
Created from data from Mitchell et al.35
Location of Death Dementia Cancer All Other Conditions
Hospital 15.6% 35.4% 52.2%
Nursinghome 66.9 20.6 28.0
Home 12.7 37.8 17.0
Other 4.7 6.2 2.8
Table 7:
Location of Death for People Aged 65 and Older, 2001
2008 Alzheimer’s Disease
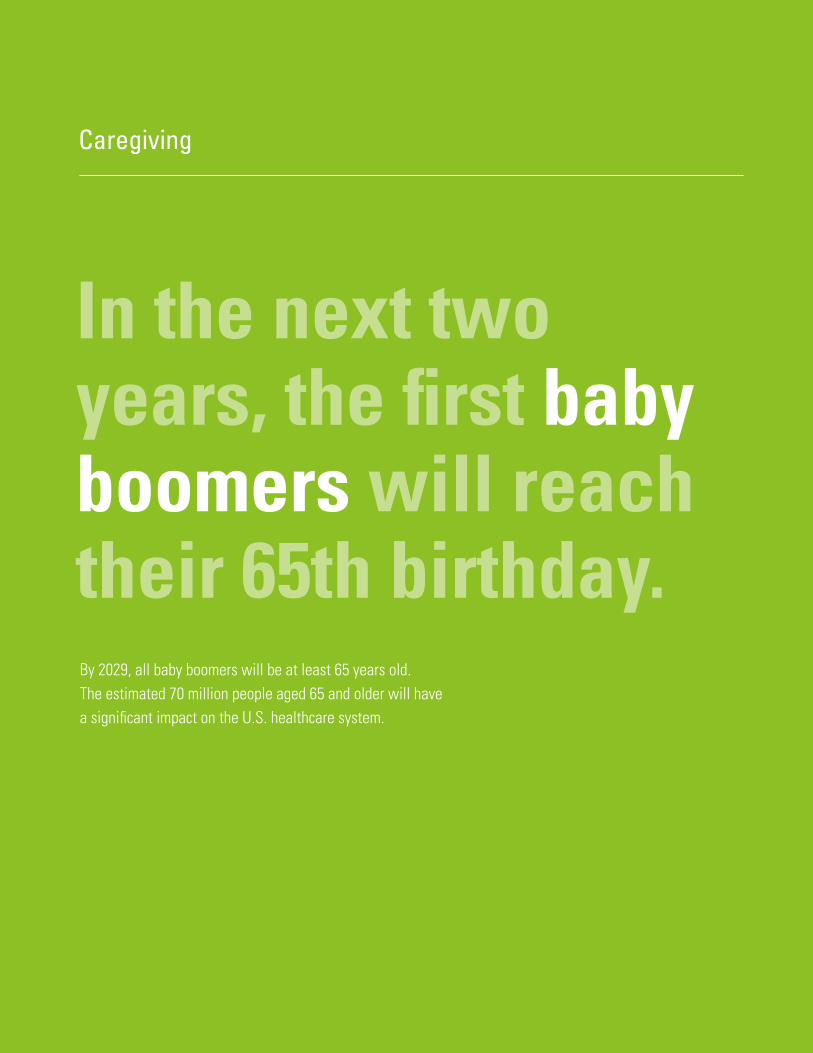
In the next two years, the first baby boomers will reach their 65th birthday.
Caregiving
By 2029, all baby boomers will be at least 65 years old. The estimated 70 million people aged 65 and older will have a significant impact on the U.S. healthcare system.
3 3 2009 Alzheimer’s Disease Facts and Figures Caregiving
Paid Caregivers
Older Americans represent approximately 12 percent of the population. However, they comprise 26 percent of physician office visits, approximately a third of all hospital stays, a third of all prescriptions, nearly 40 percent of all medical emergency responses and 90 percent of nursing home residents, accordingtotheNationalAcademyofSciences.36 Alzheimer’s disease will clearly require a significant portion of future healthcare workforce needs.
InitsExecutiveSummary,theNationalAcademyof Sciences states that an estimated 3.5 million additional formally trained healthcare providers will be required by 2030—more than a one-third increase in the current ratio of providerstothetotalpopulation—justtomaintaincurrentlevelsofstaffing.TheExecutiveSummaryalsodocuments thatthevastmajorityofhealthcareworkerswhoprovidethebulk of services to the elderly do not have training in geriat-rics. Currently, less than 1 percent of physician assistants specialize in geriatrics. A similar percentage of pharmacists and registered nurses are certified in geriatrics. It’s estimated that only about 4 percent of social workers—33 percent of what’s needed—specialize in geriatrics.
As of 2007, the number of physicians certified in geriatric medicine totaled 7,128; those certified in geriatric psychiatry equaled 1,596. By 2030, the need for geriatricians is estimated to number approximately 36,000. Some have estimated that the increase from current levels will amount to less than 10 percent, while others believe there will be a net loss of physicians for geriatric patients.
Thus, significant formal healthcare staffing needs are anticipated to be unmet or underserved as America approaches unparalleled demands for these services in its elderlypopulationgroups.ItshouldbenotedthattheNationalAcademy of Sciences report only provides a snapshot of the health worker needs and the shortages thereof impacting people with Alzheimer’s and other dementias and their
families. Increased staffing to meet the needs of the dementia population must include not only increased numbers of staff, but also specific dementia-care training of physicians, nurses, social workers and other healthcare providers working in these settings.
Family Caregiving
Almost 10 million Americans provide unpaid care for a person with Alzheimer’s disease or other dementia. These unpaid caregivers are primarily family members but also include friends and neighbors. In 2008, they provided 8.5 billion hours of unpaid care, a contribution to the nation valued at $94 billion.
Caring for a person with Alzheimer’s or other dementia is often very difficult, and many family and other unpaid caregivers experience high levels of emotional stress and depression as a result. Caregiving also has a negative impact on the health, employment, income and financial security of many caregivers.
NumberofCaregivers
In 2008, 9.9 million family members, friends and neighbors provided unpaid care for a person with Alzheimer’s disease or other dementia.A8 Table 8 on page 42 shows the number of family and other unpaid caregivers for the United States and each state. The number of caregivers by state ranges from about 15,000 in Alaska to 1.1 million in California.
Some people with Alzheimer’s and other dementias have more than one unpaid caregiver, for example, people who live with their primary caregiver and also receive help from another relative, friend or neighbor.37
Many people with Alzheimer’s or other dementia also have other serious medical conditions such as diabetes and congestive heart failure.38 Their family and other unpaid
3 4
caregivers often help to manage the other medical conditions in addition to the person’s Alzheimer’s or other dementia. Some of these caregivers say that the person’s Alzheimer’s or other dementia is his or her main health problem, and others say that one of the person’s other serious medical conditions is his or her main health problem.37 On average, about 29 percent of all unpaid caregivers of older people in the United States say that they are caring for a person with Alzheimer’s or other dementia, and one-quarter to one-third of these caregivers say that the person’s Alzheimer’s or other dementia is his or her main health problem.A8
Hours of Unpaid Care
In 2008, the 9.9 million family and other unpaid caregivers of people with Alzheimer’s and other dementias provided 8.5 billion hours of care. This number represents an average of 16.6 hours of care per caregiver per week, or 863 hours of care per caregiver per year.A9 Table 8 shows the total hours of unpaid care provided for the United States and each state. EveninasmallstatesuchasRhodeIsland,caregiversofpeople with Alzheimer’s and other dementias provided 30 million hours of unpaid care in 2008.
Caregivers of people with Alzheimer’s and other dementias provide more hours of help, on average, than caregivers of other older people. The number of hours varies in findings from different studies. One study found that 23 percent of caregivers of people with Alzheimer’s and other dementias provided more than 40 hours a week, compared with 16 percent of caregivers of other older people.37 Another study found that 40 percent of caregivers of people with Alzheimer’s and other dementias provided more than 40 hours a week of help, compared with 28 percent of caregivers of other older people.39
The average number of hours of unpaid care provided for people with Alzheimer’s and other dementias increases as the person’s disease worsens.40 The number of hours of unpaid care is also greater, on average, for people with co-existing medical conditions in addition to Alzheimer’s or another dementia.40
Caregiving 2009 Alzheimer’s Disease Facts and Figures
Some family and other unpaid caregivers who live with a person who has Alzheimer’s or other dementia provide supervi-sion and help 24 hours a day, 7 days a week, getting up with the person at night and assisting with all daily activities.41,42 Such around-the-clock care is needed when the person cannot be left alone because of risk of wandering, getting lost and other unsafe activities.
EconomicValueofCaregiving
In 2008, the economic value of the care provided by family and other unpaid caregivers of people with Alzheimer’s and other dementias was $94 billion. This number represents 8.5 billion hours of care valued at $11.10 per hour, which is the average of the minimum wage ($5.85 per hour) and the average wage of a home health aide in July 2008 ($16.35 per hour).A10 Table 8 shows the value of the care provided by family and other unpaid caregivers for the United States and each state.
Unpaid caregivers of people with Alzheimer’s and other dementias provided care valued at more than $1 billion in each of 31 states. Unpaid caregivers in each of five states, California,Florida,NewYork,PennsylvaniaandTexas,provided care valued at more than $4 billion.
Who Are the Caregivers?
About 60 percent of family and other unpaid caregivers of people with Alzheimer’s disease and other dementias are women.37,39,43 These caregivers provide assistance for various relatives and non-relatives. One study found that 87 percent of caregivers of people with Alzheimer’s and other dementias were taking care of a relative, including a parent or parent-in-law (57 percent), a grandparent (11 percent), or a spouse (6 percent). The remaining 13 percent of caregivers were taking care of a non-relative, including a friend or neighbor.37

3 5 2009 Alzheimer’s Disease Facts and Figures Caregiving
Some caregivers live with the people for whom they are providing care, and other caregivers do not. One study found that 23 percent of caregivers of people with Alzheimer’s and other dementias lived in the same household as the person for whom they were providing care.37 The proportion varies in different studies, however, depending on how caregivers were recruited for the study. Another study of caregivers of people with Alzheimer’s and other dementias who were receiving long-term care insurance benefits found that two-thirds of caregivers lived in the same household as the person for whom they were providing care.39
Caregivers range in age from very young to very old. One study found that 19 percent of caregivers of people with Alzheimer’s and other dementias were under age 35; 29 percent were age 35–49; 37 percent were age 50–64; and 14 percent were age 65 and older (see Figure 11).37 Their average age was 48.
In addition, a 2003 survey found that about 250,000 American children age 8 to 18 are unpaid caregivers for a person with Alzheimer’s or another dementia.44 These children represent 18 percent of the 1.4 million American children age 8 to 18 who provide unpaid help for any person.44
Long-distance Caregivers
Ten percent of the 9.9 million family and other unpaid care-givers of people with Alzheimer’s and other dementias live more than two hours from the person for whom they provide care, and another 4 percent live one to two hours away.37 Depending on the definition of “long-distance caregiving,” these numbers indicate that 990,000 to 1.4 million caregivers of people with Alzheimer’s and other dementias are “long-distance caregivers.”
Figure 11:
Ages of Alzheimer and Other Dementia Caregivers, 2003
Under3535–4950–6465+
40
35
30
25
20
15
10
5
0
Percent
Created from data from Families Care: Alzheimer’s Caregiving in the United States.37

3 6 Caregiving 2009 Alzheimer’s Disease Facts and Figures
Caregiving Tasks
The kinds of help provided by family and other unpaid caregivers depend on the needs of the person with Alzheimer’s or other dementia and change as the disease worsens. Caregiving tasks can include:37,39
•Shoppingforgroceries,preparingmealsandprovidingtransportation;
•Helpingthepersontakemedicationscorrectlyandfollowtreatment recommendations for his or her dementia and other medical conditions;
•Managingfinancesandlegalaffairs;
•Supervisingthepersontoavoidunsafeactivities,suchaswandering and getting lost;
•Bathing,dressing,feedingandhelpingthepersonusethe toilet or providing incontinence care;
•Makingarrangementsformedicalcareandpaidin-home,assisted living or nursing home care; and
•Managingbehavioralsymptoms.
As shown in Figure 12, family and other unpaid caregivers of people with Alzheimer’s and other dementias are more likely than caregivers of other older people to assist with all kinds of personal care, for example, bathing the person (35 percent of Alzheimer and dementia caregivers versus 25 percent of other caregivers) and dealing with bladder and bowel incontinence (32 percent of Alzheimer and dementia caregivers versus 13 percent of other caregivers).37 These tasks are often made more difficult by the confusion, disorientation and agitation of the person with dementia, who may be unable to cooperate and may even resist care.
Figure 12:
Percentage of Alzheimer and Other Dementia Caregivers vs. Caregivers of Other Older People Who Provide Help with Specific Daily Tasks, 2003
Caregivers of people with Alzheimer’s and other dementias Caregivers of other older people
45
40
35
30
25
20
15
10
5
0
Getting dressed Bathing Dealing with incontinence
Percent
Created from data from Families Care: Alzheimer’s Caregiving in the United States.37

3 7 2009 Alzheimer’s Disease Facts and Figures Caregiving
When a person with Alzheimer’s or other dementia moves to an assisted living facility or nursing home, the kinds of help provided by his or her family and other unpaid caregivers usually change, but many caregivers continue to assist with financial and legal affairs and arrangements for medical care and to provide emotional support. Some also continue to help with bathing, dressing and other personal care needs.45,46
Duration of Caregiving
Because Alzheimer’s and other dementias usually progress slowly, most caregivers spend many years in the caregiving role. At any one time, 32 percent of family and other unpaid caregivers of people with Alzheimer’s and other dementias have been providing help for five years or longer, and 39 percent have been providing care for one to four years.37
In contrast, 27 percent of caregivers of other older people have been providing help for five years or longer, and 32 percent have been providing care for one to four years. Figure 13 shows the percentage of Alzheimer and other dementia caregivers versus caregivers of other older people who have provided care for various lengths of time.
Impact of Caregiving on the Caregiver
Caring for a person with Alzheimer’s or other dementia poses special challenges. Although memory loss is the best-known symptom, these diseases also cause loss of judgment,orientation,andabilitytounderstandandcommuni-cate effectively and, frequently, changes in personality and behavior. Individuals require increasing levels of supervision and personal care, and many caregivers experience high levels of stress and negative effects on their health, employment, income and financial security.
40
35
30
25
20
15
10
5
0
Percent
Caregivers of people with Alzheimer’s and other dementias Caregivers of other older people
Figure 13:
Duration of Caregiving, 2003
5+ years 1-4 years Less than 1 year Occasionally
Created from data from Families Care: Alzheimer’s Caregiving in the United States.37
3 8
Impact on the Caregiver’s Emotional Well-Being
Most family and other unpaid caregivers are proud of the help they provide, and some manage caregiving tasks with little difficulty.47,48Yetmanycaregiversexperiencehighlevelsofstressand depression associated with caregiving.
•Morethan40percentoffamilyandotherunpaidcaregiversofpeople with Alzheimer’s and other dementias rate the emotional stress of caregiving as high or very high.37
•Aboutone-thirdoffamilycaregiversofpeoplewithAlzheimer’sand other dementias have symptoms of depression.49,50
•Onestudyoffamilycareprovidedforpeoplewithdementia in the year before the person’s death found that half the caregivers spent at least 46 hours a week assisting the person; 59 percent felt that they were “on duty” 24 hours a day; and many felt that caregiving in this end-of-life period was extremely stressful.42 The stress of caregiving was so great that 72 percent of the family caregivers said they experienced relief when the person died.
•Caregiverstress,especiallystressrelatedtotheirlovedone’sbehavioral symptoms, is associated with nursing home placement.51,52 One study found, however, that family caregiver stresswasjustashighafterthepersonwasplacedina nursing home as before placement.45
Impact on the Caregiver’s Health
Many caregivers of people with Alzheimer’s and other dementias experience negative health outcomes associated with caregiving.
•FamilyandotherunpaidcaregiversofpeoplewithAlzheimer’sand other dementias are more likely than non-caregivers to report that their health is fair or poor.53,54 They are also more likely than unpaid caregivers of other older people to say that caregiving made their health worse.37,39
•FamilyandotherunpaidcaregiversofpeoplewithAlzheimer’sor other dementia are more likely than non-caregivers to have high levels of stress hormones,55,56,57 reduced immune function,55,58 slow wound healing,59 new hypertension60 and new coronary heart disease.61
•OnestudyofspousecaregiversofpeoplewithAlzheimer’sorother dementia found that 24 percent of the caregivers had an emergency department visit or hospitalization in the previous six months; caregivers who were more depressed and those who were taking care of individuals who needed more help with daily activities and had more behavioral symptoms were more likely to have an emergency department visit or hospitalization.62
•Onestudyofspousecaregiversofpeoplewhowerehospital-ized for various diseases and conditions found that caregivers of people who were hospitalized for dementia were more likely than caregivers of people who were hospitalized for other diseases and conditions to die in the following year.63 (These findingswereadjustedfortheageofthespousecaregiver.)Among male caregivers, 9 percent died in the year after their wife’s hospitalization for dementia, compared with 6 percent who died in the year after the wife’s hospitalization for colon cancer and 7 percent who died in the year after the wife’s hospitalization for stroke. Among female caregivers, 5 percent died in the year after their husband’s hospitalization for dementia, compared with 3 percent who died in the year after the husband’s hospitalization for colon cancer and 4 percent who died in the year after the husband’s hospitalization for stroke.
Impact on the Caregiver’s Employment
Many caregivers of people with Alzheimer’s and other dementias have to quit work, reduce their work hours or take time off because of caregiving responsibilities.
•OnestudyoffamilyandotherunpaidcaregiversofpeoplewithAlzheimer’s and other dementias found that 57 percent were employed full time or part time. Of those who were employed,
Caregiving 2009 Alzheimer’s Disease Facts and Figures
3 9
two-thirds said they had to go in late, leave early or take time off because of caregiving; 18 percent had to take a leave of absence; 13 percent had reduced their hours; and 8 percent had turned down promotions.37Eightpercentofcaregiversinthe study had to quit work entirely because of caregiving.
•Anotherstudyoffamilyandotherunpaidcaregiversofmorethan 2,000 older people found that caregivers of people who had Alzheimer’s or other dementia without behavioral symptoms were 31 percent more likely than caregivers of other older people to have reduced their hours or quit work.64 Caregivers of people who had Alzheimer’s or other dementia with behavioral symptoms were 68 percent more likely than caregivers of other older people to have reduced their hours or quit work.
Impact on the Caregiver’s Income and Financial Security
Family and other unpaid caregivers who turn down promotions, reducetheirworkhoursandquitworklosejob-relatedincomeand benefits, including employer contributions to their own retirement savings. In addition, people with Alzheimer’s and other dementias use substantial amounts of paid care. Some of this care is covered for some people by public programs and private insurance, but the person and family must pay out-of-pocket for much of the care.
•Onestudyfoundthat49percentoffamilyandotherunpaidcaregivers of people with Alzheimer’s and other dementias (not including spouse caregivers) had caregiving-related out-of-pocket expenditures that averaged $219 a month.37
•Anotherstudyoffamilycaregiversofpeopleaged50andolder, including people with Alzheimer’s and other dementias, found that long-distance caregivers had higher caregiving-related out-of-pocket expenditures than other caregivers. 65
EmergingTrendsandIssuesfrom NewData
Since 2003, a few states have added questions about family caregiving for people with Alzheimer’s and other dementias to their Behavioral Risk Factors Surveillance System (BRFSS) survey. The BRFSS fields an annual telephone survey of a large, representative sample of each state’s residents that is conducted by states with assistance from the U.S. Centers forDiseaseControlandPrevention(CDC).66 BRFSS survey findings on family caregiving for people with Alzheimer’s and other dementias are now available for Washington State and NorthCarolina.Inaddition,in2007,LosAngelesCountyaddedquestions about caregiving for people with these conditions to its public health survey, and findings are available from that survey. The findings from these three surveys generally support the national level data presented earlier in this section, but they also suggest some important differences among states and localities in the number of family and other unpaid care-givers of people with Alzheimer’s disease and other dementias.
•WashingtonStateadded18questionsaboutcaregivingtoits 2007 BRFSS survey, including questions about caregiving for people with Alzheimer’s and other dementias. Findings from the survey show that 15 percent of state residents aged 18 and older identified themselves as caregivers, and 31 percent of these caregivers, equivalent to 199,900 Washington State residents, said that the person for whom they provided care had “a problem with memory loss or a condition like Alzheimer’s disease or a related dementia.”67
•NorthCarolinaaddedquestionsaboutcaregiving,includingquestions about caregiving for people with Alzheimer’s and other dementias, to its BRFSS survey starting in 2003.68 In 2003 and 2004, the caregiving questions asked about care provided for a family member or friend aged 60 or older. Findings for those years show that about one-quarter of state residents aged 18 and older identified themselves as caregivers, and 43 percent of these caregivers said the person for whom they provided care had “a problem with memory loss or confusion or a disorder like Alzheimer’s
2009 Alzheimer’s Disease Facts and Figures Caregiving

4 0
disease.”69 In 2005, the state changed the wording of the question about caregiving to include care provided for a family member or friend of any age. Findings from the 2005 survey show that 16 percent of state residents aged 18 and older identified themselves as caregivers. The question about “memory loss or confusion or a disorder like Alzheimer’s disease” was only asked of caregivers who said the person for whom they provided care was aged 60 or older, and 42 percent of those caregivers said the person for whom they provided care had “a problem with memory loss or confusion or a disorder like Alzheimer’s disease.”70
•In2007,LosAngelesCountyaddedquestionsaboutcaregiving, including questions about caregiving for people with Alzheimer’s and other dementias, to its annual public health survey.71 Findings from this survey show that 25 percent of county residents aged 18 and older who identified themselves as caregivers said that the person for whom they provided care had “Alzheimer’s or a related form of memory impairment.”72 This is equivalent to 310,000 Los Angeles County residents aged 18 and older.
ThesurveyfindingsfromWashingtonState,NorthCarolina and Los Angeles County differ in the proportion of family and other unpaid caregivers who say they provide help to a person with Alzheimer’s disease, dementia, memory loss or memory impairment. These differences may reflect variations in the wording of the survey questions or real differences in the prevalence of caregiving for people with Alzheimer’s and other dementias by state and locality.
In2008,Florida,NewYorkandTexasaddedquestionsaboutcaregiving, including caregiving for people with Alzheimer’s and other dementias, to their BRFSS surveys. Once available, the findings from these surveys will help to clarify the extent of variation in the proportion of family and other unpaid caregivers who provide care for people with Alzheimer’s and other dementias across states.
In addition to information about the number and proportion of caregivers for people with Alzheimer’s and other dementias, theWashingtonState,NorthCarolinaandLosAngelesCountysurveys provide extensive information about the characteristics of these caregivers. As noted earlier, 31 percent of people who identified themselves as caregivers in the 2007 Washington State survey said that the person for whom they provided care had “a problem with memory loss or a condition like Alzheimer’s disease or a related dementia.” Of these caregivers, 36 percent said that Alzheimer’s or other dementia was the person’s main health problem, and the other 64 percent said the person had another main health problem, such as heart disease, diabetes, cancer, stroke or arthritis, in addition to his or her memory loss, Alzheimer’s or other dementia.67
Table 9 shows selected findings from the Washington State survey for caregivers who said that the person for whom they provided care had “a problem with memory loss or a condition like Alzheimer’s disease or a related dementia.” Since the questions about caregiving were embedded in the state’s BRFSS survey, the findings include responses to the caregiving questions and responses to other survey questions that can be analyzed for caregivers of people with Alzheimer’s and other dementias because these caregivers are identified in the survey. As noted in the table:
•53percentofthecaregiverswereaged45–64;30percent were under age 45; and 16 percent were aged 65 or older;
•59percentwerefemale;
•26percentwerelivingwiththepersonforwhomthey provided care;
•25percentwereproviding40ormorehoursofcareaweek;
•13percentwerelong-distancecaregivers;thatis,theylived one or more hours away from the person for whom they provided care; and
•27percenthadchildrenunderage18livingintheirhouse-hold, including 12 percent with one child and 15 percent with two or more children (data not shown).67
Caregiving 2009 Alzheimer’s Disease Facts and Figures

4 1
The findings from Washington State show that stress is the greatest difficulty faced by caregivers of people with Alzheimer’s and other dementias. In addition, 18 percent of caregivers say they do not have enough time for themselves; 14 percent say they do not have enough time for their families; and 13 percent answer that caregiving creates a financial burden for them. More than one-third say that information about local programs would help with caregiving; 30 percent respond that money for additional resources would benefit them; one-quarter select respite care as an important need; and 22 percent say that family consultation or counseling would help.67
InNorthCarolina,42percentofpeoplewhoidentifiedthem-selvesascaregiversinthe2005NorthCarolinasurveysaidthat the person for whom they provided care had “a problem with memory loss or confusion or a disorder like Alzheimer’s disease.”70 Information is available about caregiver gender, race, age, education and household income for caregivers who do and do not say the person for whom they provided care had memory loss or confusion or a disorder like Alzheimer’s disease.
In Los Angeles County, 25 percent of people who identified themselves as caregivers in the 2007 survey said that the person for whom they provided care had “Alzheimer’s or a related form of memory impairment.”72 The survey data show that:
•57percentofthecaregiverswereaged40–64;31percentwere under age 40; and 12 percent were aged 65 or older;
•77percentofthecaregiverswereprovidingcareforarelative,including 49 percent who were providing care for a parent or parent-in-law;
•58percentwerefemale;
•37percentwerespending20ormorehoursaweekoncaregiving;
•48percentwereemployed35ormorehoursperweek,andthose working caregivers reported providing an average of 18 additional hours per week of care, including 17 percent who provided 10–19 hours of care, 36 percent who provided 20+hoursofcare,and47percentwhoprovidedlessthan 10 hours of care;
•20percenthadincomebelowthepovertylevel.72
In 2009, all states will include the following question about caregiving in their BRFSS surveys:
“Peoplemayprovideregularcareorassistancetoafriendorfamily member who has a health problem, long-term illness or disability. During the past month, did you provide any such care or assistance to a friend or family member?”
The CDC has also released an approved set of nine questions about caregiving that states could add to their BRFSS surveys beginning in 2009. This set of questions includes the question, “During the past year, has the person you care for experienced changes in thinking or remembering?” which can be further clarified by the interviewer to mean that the person “had more difficulty remembering people, places or things, or under-standing or making decisions as easily as they once did.”
2009 Alzheimer’s Disease Facts and Figures Caregiving
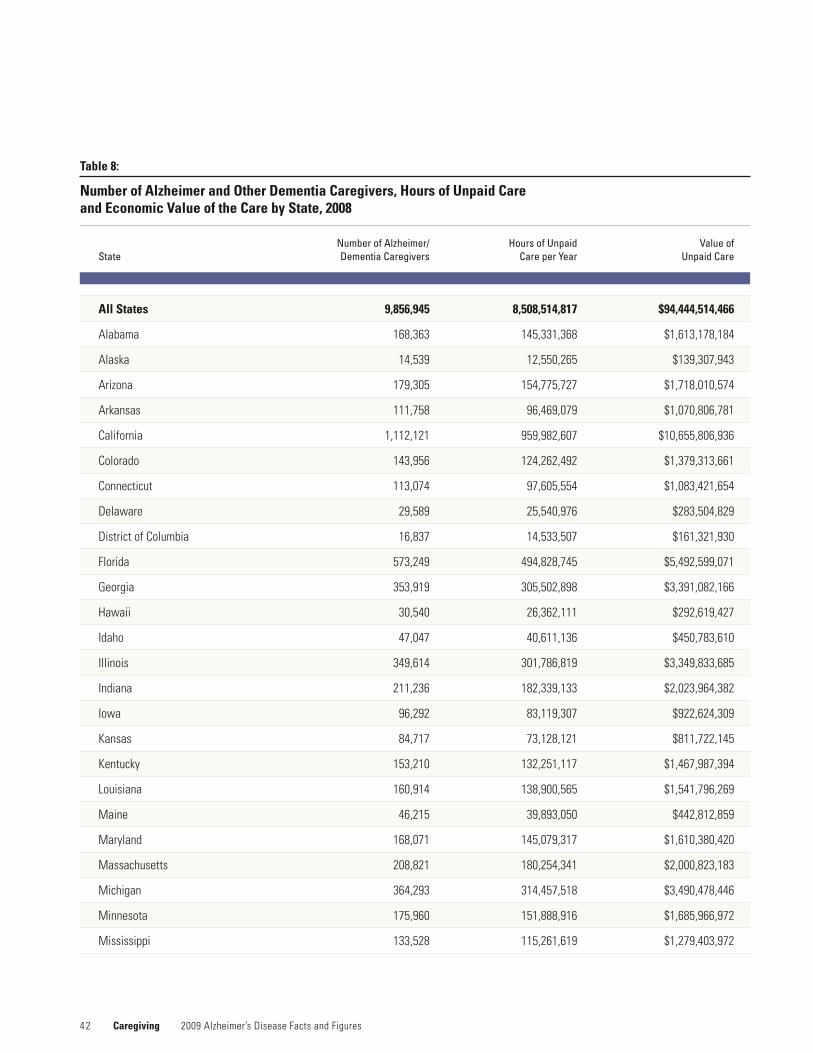
4 2 Caregiving 2009 Alzheimer’s Disease Facts and Figures
Number of Alzheimer/ Hours of Unpaid Value of State Dementia Caregivers Care per Year Unpaid Care
All States 9,856,945 8,508,514,817 $94,444,514,466
Alabama 168,363 145,331,368 $1,613,178,184
Alaska 14,539 12,550,265 $139,307,943
Arizona 179,305 154,775,727 $1,718,010,574
Arkansas 111,758 96,469,079 $1,070,806,781
California 1,112,121 959,982,607 $10,655,806,936
Colorado 143,956 124,262,492 $1,379,313,661
Connecticut 113,074 97,605,554 $1,083,421,654
Delaware 29,589 25,540,976 $283,504,829
District of Columbia 16,837 14,533,507 $161,321,930
Florida 573,249 494,828,745 $5,492,599,071
Georgia 353,919 305,502,898 $3,391,082,166
Hawaii 30,540 26,362,111 $292,619,427
Idaho 47,047 40,611,136 $450,783,610
Illinois 349,614 301,786,819 $3,349,833,685
Indiana 211,236 182,339,133 $2,023,964,382
Iowa 96,292 83,119,307 $922,624,309
Kansas 84,717 73,128,121 $811,722,145
Kentucky 153,210 132,251,117 $1,467,987,394
Louisiana 160,914 138,900,565 $1,541,796,269
Maine 46,215 39,893,050 $442,812,859
Maryland 168,071 145,079,317 $1,610,380,420
Massachusetts 208,821 180,254,341 $2,000,823,183
Michigan 364,293 314,457,518 $3,490,478,446
Minnesota 175,960 151,888,916 $1,685,966,972
Mississippi 133,528 115,261,619 $1,279,403,972
Table 8:
Number of Alzheimer and Other Dementia Caregivers, Hours of Unpaid Care and Economic Value of the Care by State, 2008
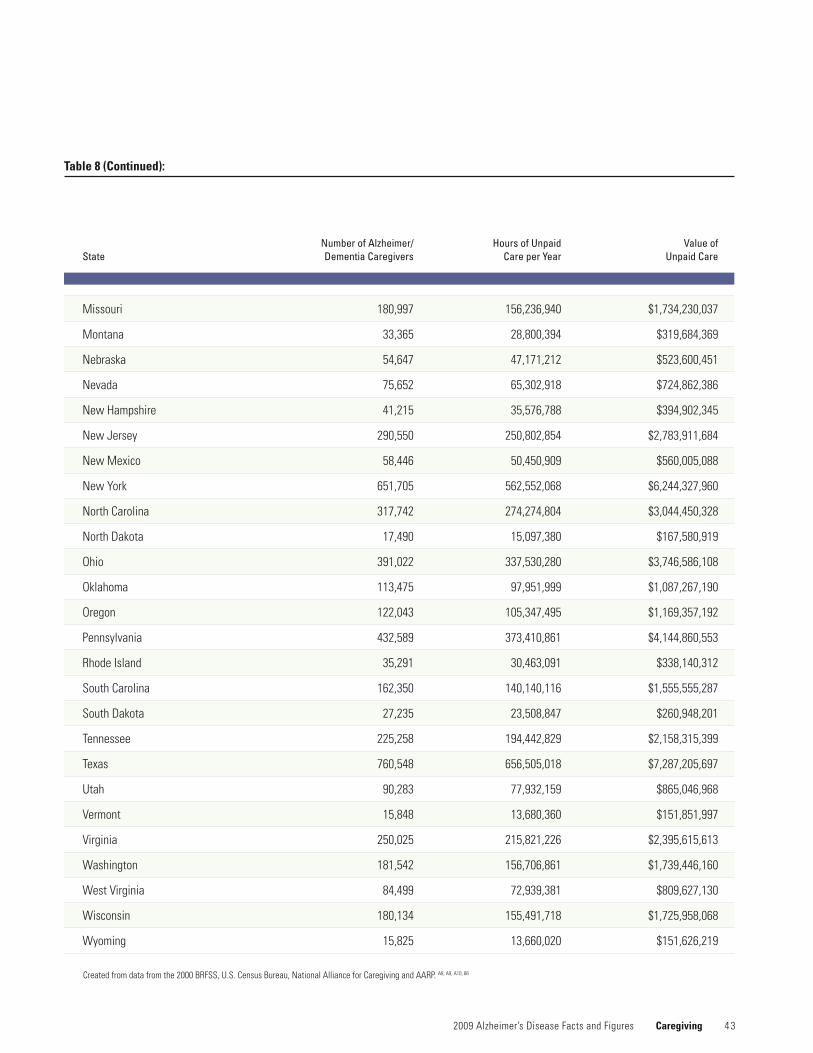
4 3 2009 Alzheimer’s Disease Facts and Figures Caregiving
Createdfromdatafromthe2000BRFSS,U.S.CensusBureau,NationalAllianceforCaregivingandAARP.A8, A9, A10, 66
Number of Alzheimer/ Hours of Unpaid Value of State Dementia Caregivers Care per Year Unpaid Care
Missouri 180,997 156,236,940 $1,734,230,037
Montana 33,365 28,800,394 $319,684,369
Nebraska 54,647 47,171,212 $523,600,451
Nevada 75,652 65,302,918 $724,862,386
NewHampshire 41,215 35,576,788 $394,902,345
NewJersey 290,550 250,802,854 $2,783,911,684
NewMexico 58,446 50,450,909 $560,005,088
NewYork 651,705 562,552,068 $6,244,327,960
NorthCarolina 317,742 274,274,804 $3,044,450,328
NorthDakota 17,490 15,097,380 $167,580,919
Ohio 391,022 337,530,280 $3,746,586,108
Oklahoma 113,475 97,951,999 $1,087,267,190
Oregon 122,043 105,347,495 $1,169,357,192
Pennsylvania 432,589 373,410,861 $4,144,860,553
Rhode Island 35,291 30,463,091 $338,140,312
South Carolina 162,350 140,140,116 $1,555,555,287
South Dakota 27,235 23,508,847 $260,948,201
Tennessee 225,258 194,442,829 $2,158,315,399
Texas 760,548 656,505,018 $7,287,205,697
Utah 90,283 77,932,159 $865,046,968
Vermont 15,848 13,680,360 $151,851,997
Virginia 250,025 215,821,226 $2,395,615,613
Washington 181,542 156,706,861 $1,739,446,160
West Virginia 84,499 72,939,381 $809,627,130
Wisconsin 180,134 155,491,718 $1,725,958,068
Wyoming 15,825 13,660,020 $151,626,219
Table 8 (Continued):
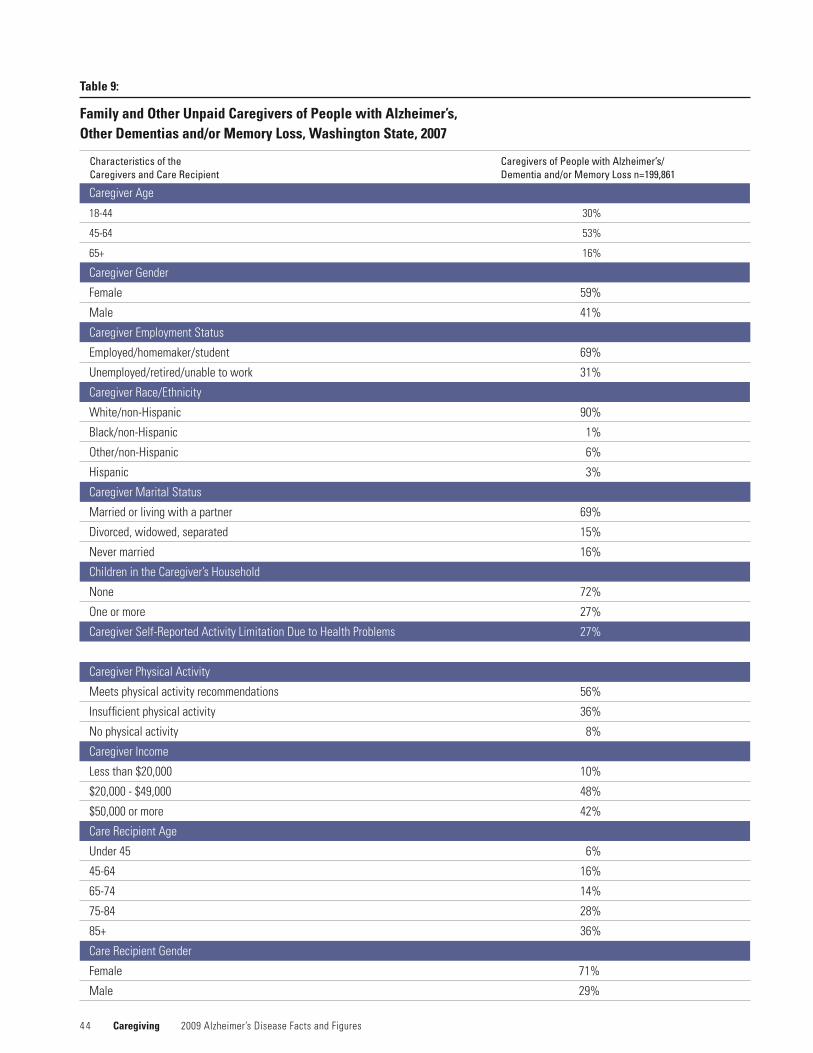
4 4 Caregiving 2009 Alzheimer’s Disease Facts and Figures
Table 9:
Family and Other Unpaid Caregivers of People with Alzheimer’s, Other Dementias and/or Memory Loss, Washington State, 2007
Characteristics of the Caregivers and Care Recipient
Caregivers of People with Alzheimer’s/ Dementia and/or Memory Loss n=199,861
Caregiver Age
18-44 30%
45-64 53%
65+ 16%
Caregiver Gender
Female 59%
Male 41%
CaregiverEmploymentStatus
Employed/homemaker/student 69%
Unemployed/retired/unable to work 31%
CaregiverRace/Ethnicity
White/non-Hispanic 90%
Black/non-Hispanic 1%
Other/non-Hispanic 6%
Hispanic 3%
Caregiver Marital Status
Married or living with a partner 69%
Divorced, widowed, separated 15%
Nevermarried 16%
Children in the Caregiver’s Household
None 72%
One or more 27%
CaregiverSelf-ReportedActivityLimitationDuetoHealthProblems 27%
CaregiverPhysicalActivity
Meets physical activity recommendations 56%
Insufficient physical activity 36%
Nophysicalactivity 8%
Caregiver Income
Less than $20,000 10%
$20,000 - $49,000 48%
$50,000 or more 42%
Care Recipient Age
Under 45 6%
45-64 16%
65-74 14%
75-84 28%
85+ 36%
Care Recipient Gender
Female 71%
Male 29%
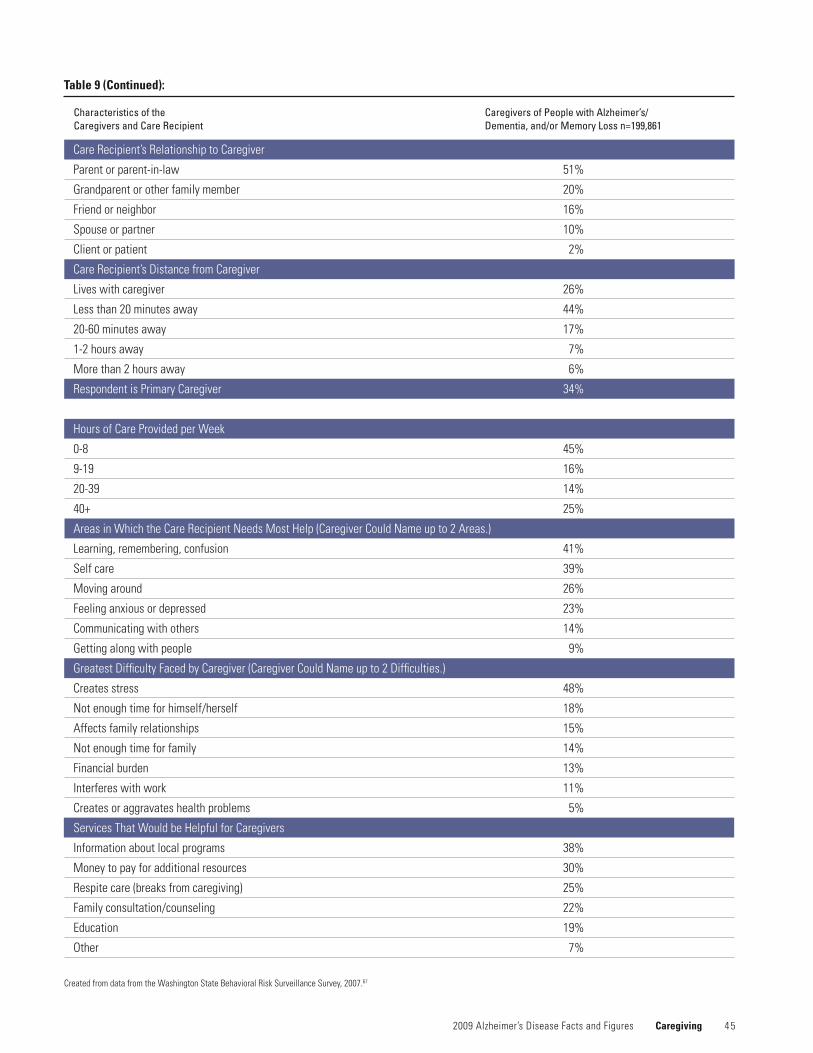
4 5 2009 Alzheimer’s Disease Facts and Figures Caregiving
Table 9 (Continued):
Care Recipient’s Relationship to Caregiver
Parentorparent-in-law 51%
Grandparent or other family member 20%
Friend or neighbor 16%
Spouse or partner 10%
Client or patient 2%
Care Recipient’s Distance from Caregiver
Lives with caregiver 26%
Less than 20 minutes away 44%
20-60 minutes away 17%
1-2 hours away 7%
More than 2 hours away 6%
RespondentisPrimaryCaregiver 34%
HoursofCareProvidedperWeek
0-8 45%
9-19 16%
20-39 14%
40+ 25%
AreasinWhichtheCareRecipientNeedsMostHelp(CaregiverCouldNameupto2Areas.)
Learning, remembering, confusion 41%
Self care 39%
Moving around 26%
Feeling anxious or depressed 23%
Communicating with others 14%
Getting along with people 9%
GreatestDifficultyFacedbyCaregiver(CaregiverCouldNameupto2Difficulties.)
Creates stress 48%
Notenoughtimeforhimself/herself 18%
Affects family relationships 15%
Notenoughtimeforfamily 14%
Financial burden 13%
Interferes with work 11%
Creates or aggravates health problems 5%
Services That Would be Helpful for Caregivers
Information about local programs 38%
Money to pay for additional resources 30%
Respite care (breaks from caregiving) 25%
Family consultation/counseling 22%
Education 19%
Other 7%
Created from data from the Washington State Behavioral Risk Surveillance Survey, 2007.67
Characteristics of the Caregivers and Care Recipient
Caregivers of People with Alzheimer’s/ Dementia, and/or Memory Loss n=199,861

2008 Alzheimer’s Disease
People with Alzheimer’s disease and other dementias are high users of healthcare and long-term care services.
Use and Cost of Health Care, Long-term Care and Hospice Care
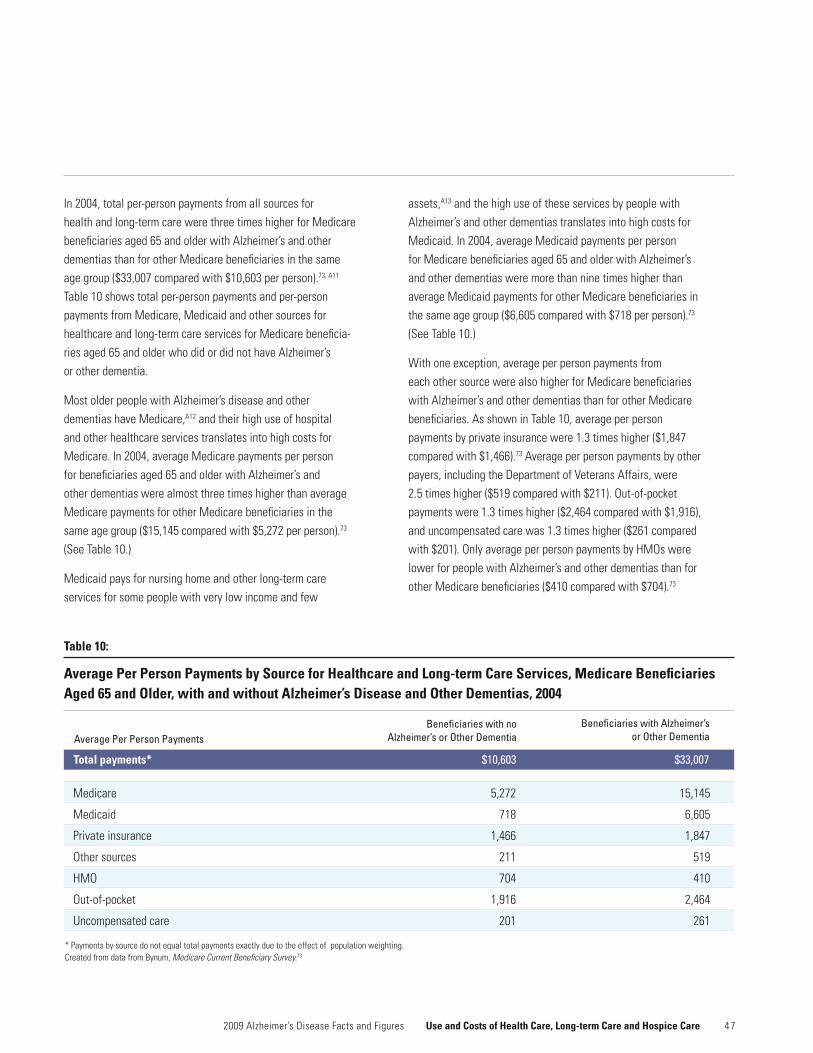
4 7
People with Alzheimer’s disease and other dementias are high users of healthcare and long-term care services.
In 2004, total per-person payments from all sources for health and long-term care were three times higher for Medicare beneficiaries aged 65 and older with Alzheimer’s and other dementias than for other Medicare beneficiaries in the same age group ($33,007 compared with $10,603 per person).73, A11 Table 10 shows total per-person payments and per-person payments from Medicare, Medicaid and other sources for healthcare and long-term care services for Medicare beneficia-ries aged 65 and older who did or did not have Alzheimer’s or other dementia.
Most older people with Alzheimer’s disease and other dementias have Medicare,A12 and their high use of hospital and other healthcare services translates into high costs for Medicare. In 2004, average Medicare payments per person for beneficiaries aged 65 and older with Alzheimer’s and other dementias were almost three times higher than average Medicare payments for other Medicare beneficiaries in the same age group ($15,145 compared with $5,272 per person).73 (See Table 10.)
Medicaid pays for nursing home and other long-term care services for some people with very low income and few
assets,A13 and the high use of these services by people with Alzheimer’s and other dementias translates into high costs for Medicaid. In 2004, average Medicaid payments per person for Medicare beneficiaries aged 65 and older with Alzheimer’s and other dementias were more than nine times higher than average Medicaid payments for other Medicare beneficiaries in the same age group ($6,605 compared with $718 per person).73 (See Table 10.)
With one exception, average per person payments from each other source were also higher for Medicare beneficiaries with Alzheimer’s and other dementias than for other Medicare beneficiaries. As shown in Table 10, average per person payments by private insurance were 1.3 times higher ($1,847 compared with $1,466).73 Average per person payments by other payers, including the Department of Veterans Affairs, were 2.5 times higher ($519 compared with $211). Out-of-pocket payments were 1.3 times higher ($2,464 compared with $1,916), and uncompensated care was 1.3 times higher ($261 compared with $201). Only average per person payments by HMOs were lower for people with Alzheimer’s and other dementias than for other Medicare beneficiaries ($410 compared with $704).73
*Paymentsbysourcedonotequaltotalpaymentsexactlyduetotheeffectofpopulationweighting. Created from data from Bynum, Medicare Current Beneficiary Survey.73
Medicare 5,272 15,145
Medicaid 718 6,605
Privateinsurance 1,466 1,847
Other sources 211 519
HMO 704 410
Out-of-pocket 1,916 2,464
Uncompensated care 201 261
Total payments* $10,603 $33,007
Table 10:
Average Per Person Payments by Source for Healthcare and Long-term Care Services, Medicare Beneficiaries Aged 65 and Older, with and without Alzheimer’s Disease and Other Dementias, 2004
Average Per Person PaymentsBeneficiaries with no
Alzheimer’s or Other DementiaBeneficiaries with Alzheimer’s
or Other Dementia
2009 Alzheimer’s Disease Facts and Figures Use and Costs of Health Care, Long-term Care and Hospice Care
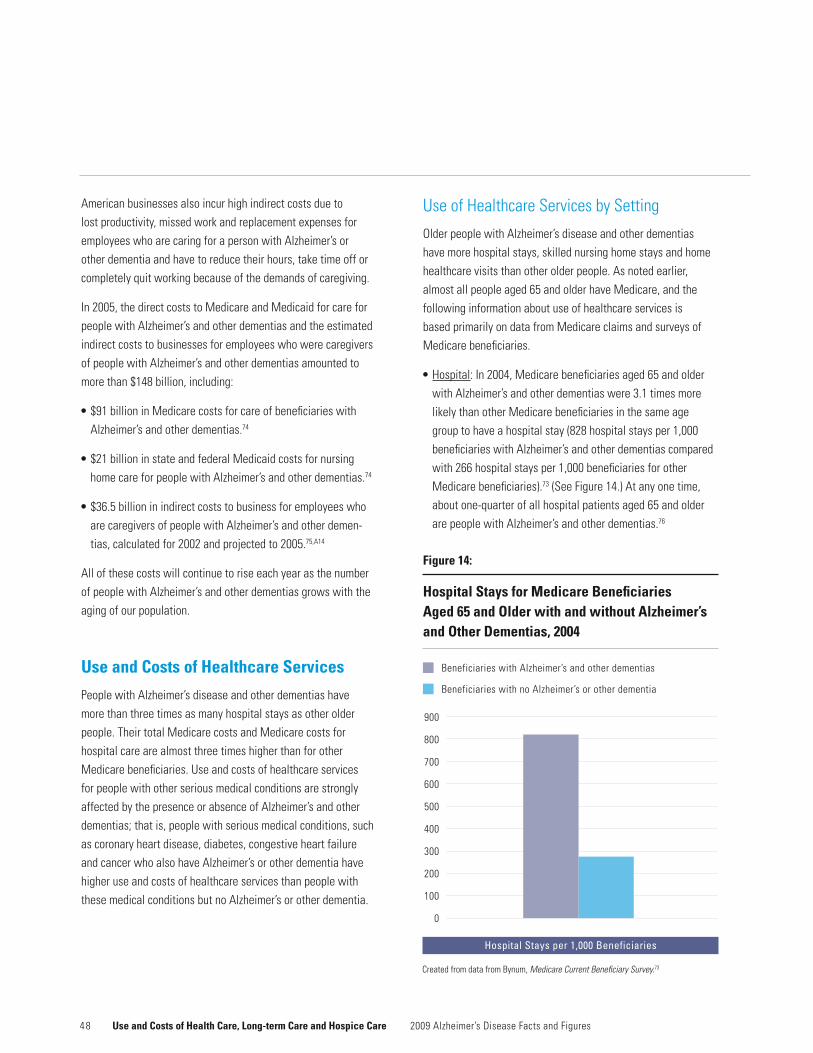
4 8
American businesses also incur high indirect costs due to lost productivity, missed work and replacement expenses for employees who are caring for a person with Alzheimer’s or other dementia and have to reduce their hours, take time off or completely quit working because of the demands of caregiving.
In 2005, the direct costs to Medicare and Medicaid for care for people with Alzheimer’s and other dementias and the estimated indirect costs to businesses for employees who were caregivers of people with Alzheimer’s and other dementias amounted to more than $148 billion, including:
•$91billioninMedicarecostsforcareofbeneficiarieswithAlzheimer’s and other dementias.74
•$21billioninstateandfederalMedicaidcostsfornursinghome care for people with Alzheimer’s and other dementias.74
•$36.5billioninindirectcoststobusinessforemployeeswhoare caregivers of people with Alzheimer’s and other demen-tias,calculatedfor2002andprojectedto2005.75,A14
All of these costs will continue to rise each year as the number of people with Alzheimer’s and other dementias grows with the aging of our population.
Use and Costs of Healthcare Services
PeoplewithAlzheimer’sdiseaseandotherdementiashavemore than three times as many hospital stays as other older people. Their total Medicare costs and Medicare costs for hospital care are almost three times higher than for other Medicare beneficiaries. Use and costs of healthcare services for people with other serious medical conditions are strongly affected by the presence or absence of Alzheimer’s and other dementias; that is, people with serious medical conditions, such as coronary heart disease, diabetes, congestive heart failure and cancer who also have Alzheimer’s or other dementia have higher use and costs of healthcare services than people with these medical conditions but no Alzheimer’s or other dementia.
Use of Healthcare Services by Setting
Older people with Alzheimer’s disease and other dementias have more hospital stays, skilled nursing home stays and home healthcare visits than other older people. As noted earlier, almost all people aged 65 and older have Medicare, and the following information about use of healthcare services is based primarily on data from Medicare claims and surveys of Medicare beneficiaries.
•Hospital: In 2004, Medicare beneficiaries aged 65 and older with Alzheimer’s and other dementias were 3.1 times more likely than other Medicare beneficiaries in the same age group to have a hospital stay (828 hospital stays per 1,000 beneficiaries with Alzheimer’s and other dementias compared with 266 hospital stays per 1,000 beneficiaries for other Medicare beneficiaries).73 (See Figure 14.) At any one time, about one-quarter of all hospital patients aged 65 and older are people with Alzheimer’s and other dementias.76
Beneficiaries with Alzheimer’s and other dementias
Beneficiaries with no Alzheimer’s or other dementia
900
800
700
600
500
400
300
200
100
0
Figure 14:
Hospital Stays for Medicare Beneficiaries Aged 65 and Older with and without Alzheimer’s and Other Dementias, 2004
Hospital Stays per 1,000 Beneficiaries
??%
Use and Costs of Health Care, Long-term Care and Hospice Care 2009 Alzheimer’s Disease Facts and Figures
Created from data from Bynum, Medicare Current Beneficiary Survey.73

4 9
•Skillednursingfacility(SNF): In 2004, Medicare beneficiaries aged 65 and older with Alzheimer’s and other dementias were eight times more likely than other Medicare beneficiaries in the sameagegrouptohaveaMedicare-coveredstayinanSNF(319 stays per 1,000 beneficiaries with Alzheimer’s and other dementias compared with 39 stays per 1,000 beneficiaries for other beneficiaries).73
•Home health care: In 2004, one-quarter of Medicare beneficia-ries aged 65 and older who received Medicare-covered home health care services were people with Alzheimer’s and other dementias,77 about twice as many as one would expect given the proportion of Medicare beneficiaries with Alzheimer’s and other dementias among all Medicare beneficiaries.
Impact of Coexisting Medical Conditions
Most people with Alzheimer’s and other dementias have one or more other serious medical conditions. For example, in 2004, 26 percent of Medicare beneficiaries aged 65 and older with Alzheimer’s and other dementias also had coronary heart disease;
23 percent also had diabetes; 16 percent also had congestive heart failure; and 13 percent also had cancer.73 (See Table 11.)
As shown in Table 11, the percentages of Medicare beneficia-ries with Alzheimer’s disease and other dementias who also have various coexisting medical conditions clearly sums to more than 100 percent. This means that many Medicare beneficiaries with Alzheimer’s and other dementias have more than one other serious medical condition.
PeoplewithseriousmedicalconditionsandAlzheimer’sorotherdementia are more likely to be hospitalized and to stay in the hospital longer than people with the same serious medical conditions but no Alzheimer’s or other dementia.
•Coronary heart disease: In 2006, Medicare beneficiaries with coronary heart disease and Alzheimer’s or other dementia had 946 hospital discharges per 1,000 beneficiaries, compared with 668 hospital discharges per 1,000 for beneficiaries with coronary heart disease and no Alzheimer’s or other dementia.78,A15 The average number of hospital days was also greater for beneficiaries with coronary heart disease
Created from data from Bynum, Medicare Current Beneficiary Survey.73
Hypertension 60
Coronary heart disease 26
Stroke – late effects 25
Diabetes 23
Osteoporosis 18
Congestive heart failure 16
Chronic obstructive pulmonary disease 15
Cancer 13
Parkinson’sdisease 8
Coexisting Condition Percentage With Alzheimer’s or Other Dementia and the Coexisting Condition
Table 11:
Percentages of Medicare Beneficiaries Aged 65 and Older with Alzheimer’s and Other Dementias by Specified Coexisting Medical Conditions, 2004
2009 Alzheimer’s Disease Facts and Figures Use and Costs of Health Care, Long-term Care and Hospice Care
5 0
and Alzheimer’s or other dementia (6.2 days per person compared with 3.7 days for beneficiaries with coronary heart disease but no Alzheimer’s or other dementia).78
•Diabetes: In 2006, Medicare beneficiaries with diabetes and Alzheimer’s or other dementia had 902 hospital discharges per 1,000 beneficiaries, compared with 550 hospital discharges per 1,000 for beneficiaries with diabetes and no Alzheimer’s or other dementia.78 The average number of hospital days was also greater for beneficiaries with diabetes and Alzheimer’s or other dementia (6 days per person compared with 3.2 days for beneficiaries with diabetes but no Alzheimer’s or other dementia).78
•Congestive heart failure: In 2006, Medicare beneficiaries with congestive heart failure and Alzheimer’s or other dementia had 976 hospital discharges per 1,000 beneficiaries, compared with 822 hospital discharges per 1,000 for beneficiaries with congestive heart failure and no Alzheimer’s or another dementia.78 The average number of hospital days was also greater for beneficiaries with congestive heart failure and Alzheimer’s or other dementia (6.4 days per person compared with 4.8 days for beneficiaries with congestive heart failure but no Alzheimer’s or other dementia).78
•Cancer: In 2006, Medicare beneficiaries with cancer and Alzheimer’s or other dementia had 791 hospital discharges per 1,000 beneficiaries, compared with 490 hospital discharges per 1,000 for beneficiaries with cancer and no Alzheimer’s or other dementia.78 The average number of hospital days was also greater for beneficiaries with cancer and Alzheimer’s or other dementia (5.1 days per person compared with 2.8 days for beneficiaries with cancer but no Alzheimer’s or other dementia).78
PeoplewithAlzheimer’sandotherdementiasaremost often hospitalized for treatment of their coexisting medical conditions,79,80 and data from an analysis of 1999 Medicare claims suggest that some of these hospitalizations are potentially preventable.38 A potentially preventable hospitalization is defined as a hospitalization for a condition that can be prevented altogether or whose course can be mitigated with optimum outpatient management, thus preventing the hospitalization. In 1999, Medicare beneficiaries aged 65 and older with Alzheimer’s disease and other dementias were 2.4 times more likely than other Medicare beneficiaries in that age group to have a potentially preventable hospitalization.38
One study of a large, nationally representative sample ofpeople aged 70 and older found that those with cognitive impairment who said (or their proxy respondent said) that a doctor had told them they had Alzheimer’s disease or other dementia had significantly more physician contacts (including both in-person and telephone contacts) and significantly fewer hospital days than a comparison group of people with cognitive impairment who said (or their proxy respondent said) that a doctor had not told them they had Alzheimer’s disease or other dementia.81 This finding suggests that recognition of Alzheimer’s or other dementia by the doctor, the person with the condition and/or the family may increase optimum outpatient management and reduce hospital days.
Use and Costs of Health Care, Long-term Care and Hospice Care 2009 Alzheimer’s Disease Facts and Figures
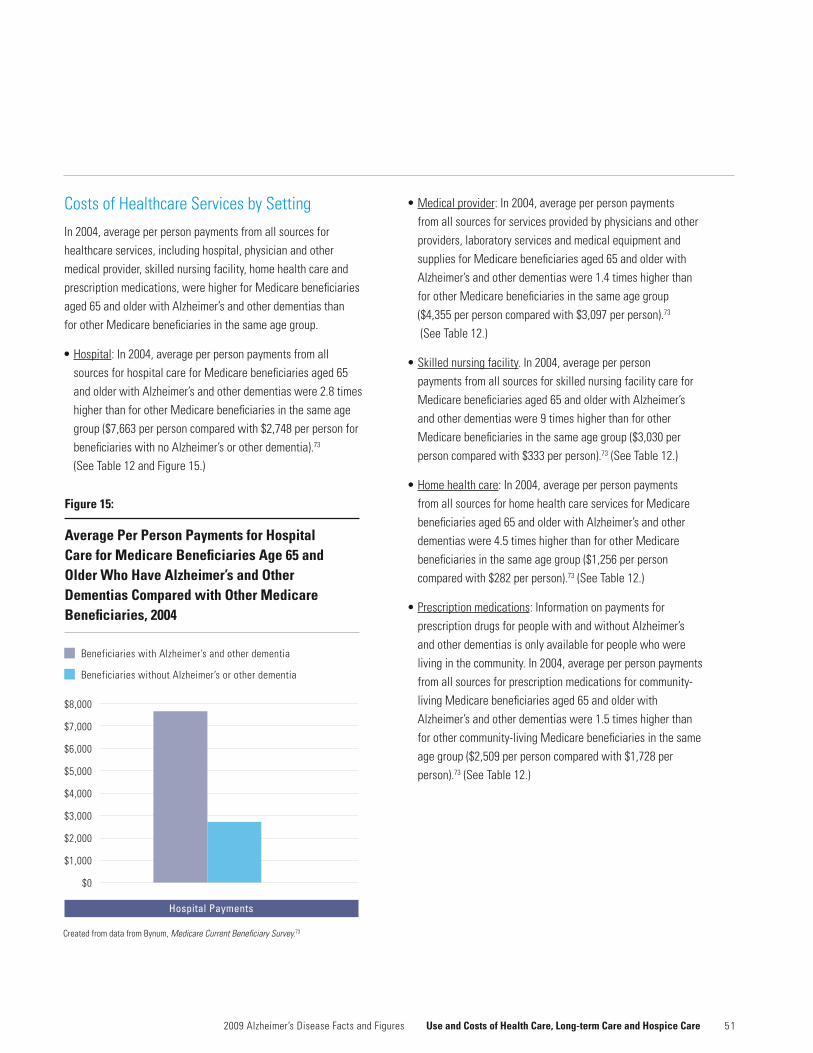
5 1
Costs of Healthcare Services by Setting
In 2004, average per person payments from all sources for healthcare services, including hospital, physician and other medical provider, skilled nursing facility, home health care and prescription medications, were higher for Medicare beneficiaries aged 65 and older with Alzheimer’s and other dementias than for other Medicare beneficiaries in the same age group.
•Hospital: In 2004, average per person payments from all sources for hospital care for Medicare beneficiaries aged 65 and older with Alzheimer’s and other dementias were 2.8 times higher than for other Medicare beneficiaries in the same age group ($7,663 per person compared with $2,748 per person for beneficiaries with no Alzheimer’s or other dementia).73 (See Table 12 and Figure 15.)
•Medical provider: In 2004, average per person payments from all sources for services provided by physicians and other providers, laboratory services and medical equipment and supplies for Medicare beneficiaries aged 65 and older with Alzheimer’s and other dementias were 1.4 times higher than for other Medicare beneficiaries in the same age group ($4,355 per person compared with $3,097 per person).73
(See Table 12.)
•Skilled nursing facility. In 2004, average per person payments from all sources for skilled nursing facility care for Medicare beneficiaries aged 65 and older with Alzheimer’s and other dementias were 9 times higher than for other Medicare beneficiaries in the same age group ($3,030 per person compared with $333 per person).73 (See Table 12.)
•Home health care: In 2004, average per person payments from all sources for home health care services for Medicare beneficiaries aged 65 and older with Alzheimer’s and other dementias were 4.5 times higher than for other Medicare beneficiaries in the same age group ($1,256 per person compared with $282 per person).73 (See Table 12.)
•Prescriptionmedications: Information on payments for prescription drugs for people with and without Alzheimer’s and other dementias is only available for people who were living in the community. In 2004, average per person payments from all sources for prescription medications for community-living Medicare beneficiaries aged 65 and older with Alzheimer’s and other dementias were 1.5 times higher than for other community-living Medicare beneficiaries in the same age group ($2,509 per person compared with $1,728 per person).73 (See Table 12.)
2009 Alzheimer’s Disease Facts and Figures Use and Costs of Health Care, Long-term Care and Hospice Care
Beneficiaries with Alzheimer’s and other dementia
Beneficiaries without Alzheimer’s or other dementia
Figure 15:
Average Per Person Payments for Hospital Care for Medicare Beneficiaries Age 65 and Older Who Have Alzheimer’s and Other Dementias Compared with Other Medicare Beneficiaries, 2004
$8,000
$7,000
$6,000
$5,000
$4,000
$3,000
$2,000
$1,000
$0
??%
Hospital Payments
Created from data from Bynum, Medicare Current Beneficiary Survey.73

5 2
Costs of Coexisting Medical Conditions
Average per person payments for many healthcare services are higher for people who have other serious medical condi-tions and Alzheimer’s or other dementia than for people who have the other serious medical conditions but no Alzheimer’s or other dementia. Table 13 shows total average per person Medicare payments and average per person Medicare payments for selected services for Medicare beneficiaries with other serious medical condition who either do or do not have Alzheimer’s or other dementia.78 With one exception, Medicare beneficiaries with a serious medical condition and
Alzheimer’s or other dementia had higher average per person payments than Medicare beneficiaries with the same medical conditions but no Alzheimer’s or other dementia. The one exception is average per person payments for physician visits for people with congestive heart failure, where the average per person payment is $29 lower for Medicare beneficiaries with congestive heart failure and Alzheimer’s or other dementia than for Medicare beneficiaries with congestive heart failure and no Alzheimer’s or other dementia ($1,470 per person compared with $1,499 per person).78
Use and Costs of Health Care, Long-term Care and Hospice Care 2009 Alzheimer’s Disease Facts and Figures
* “Medical provider” includes physician, other medical provider, laboratory services and medical equipment and supplies. Created from data from Bynum, Medicare Current Beneficiary Survey.73
Hospital $2,748 $7,663
Medical provider* 3,097 4,355
Skilled nursing facility 333 3,030
Home health care 282 1,256
Prescriptionmedications 1,728 2,509
Table 12:
Average Per Person Payments for Healthcare Services, Medicare Beneficiaries Aged 65 and Older with and without Alzheimer’s and Other Dementias, 2004
Healthcare ServiceAverage Per Person Payment for Those With No Alzheimer’s or Other Dementia
Average Per Person Payment for Those With Alzheimer’s or Other Dementia
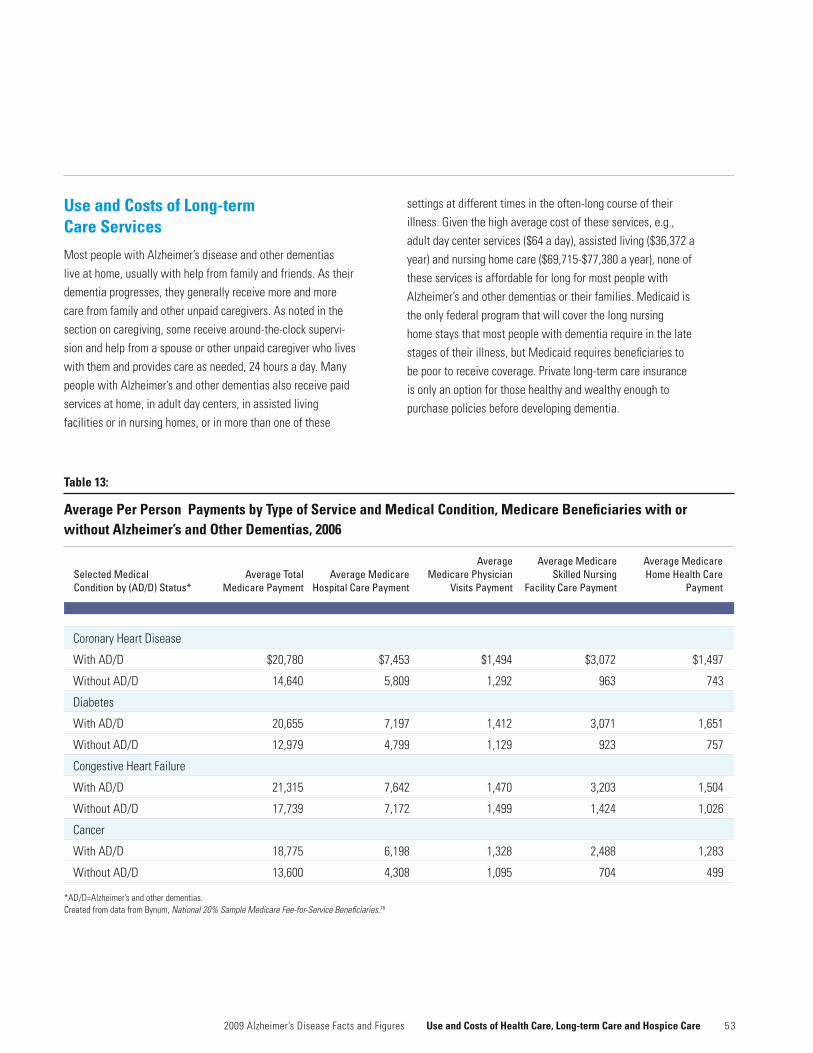
5 3
Table 13:
Average Per Person Payments by Type of Service and Medical Condition, Medicare Beneficiaries with or without Alzheimer’s and Other Dementias, 2006
Coronary Heart Disease
With AD/D $20,780 $7,453 $1,494 $3,072 $1,497
Without AD/D 14,640 5,809 1,292 963 743
Diabetes
With AD/D 20,655 7,197 1,412 3,071 1,651
Without AD/D 12,979 4,799 1,129 923 757
Congestive Heart Failure
With AD/D 21,315 7,642 1,470 3,203 1,504
Without AD/D 17,739 7,172 1,499 1,424 1,026
Cancer
With AD/D 18,775 6,198 1,328 2,488 1,283
Without AD/D 13,600 4,308 1,095 704 499
*AD/D=Alzheimer’s and other dementias. Created from data from Bynum, National 20% Sample Medicare Fee-for-Service Beneficiaries.78
Selected Medical Condition by (AD/D) Status*
Average Total Medicare Payment
Average Medicare Hospital Care Payment
Average Medicare Physician
Visits Payment
Average Medicare Skilled Nursing
Facility Care Payment
Average Medicare Home Health Care
Payment
Use and Costs of Long-term Care Services
Most people with Alzheimer’s disease and other dementias live at home, usually with help from family and friends. As their dementia progresses, they generally receive more and more care from family and other unpaid caregivers. As noted in the section on caregiving, some receive around-the-clock supervi-sion and help from a spouse or other unpaid caregiver who lives with them and provides care as needed, 24 hours a day. Many people with Alzheimer’s and other dementias also receive paid services at home, in adult day centers, in assisted living facilities or in nursing homes, or in more than one of these
settings at different times in the often-long course of their illness. Given the high average cost of these services, e.g., adult day center services ($64 a day), assisted living ($36,372 a year) and nursing home care ($69,715-$77,380 a year), none of these services is affordable for long for most people with Alzheimer’s and other dementias or their families. Medicaid is the only federal program that will cover the long nursing home stays that most people with dementia require in the late stages of their illness, but Medicaid requires beneficiaries to bepoortoreceivecoverage.Privatelong-termcareinsurance is only an option for those healthy and wealthy enough to purchase policies before developing dementia.
2009 Alzheimer’s Disease Facts and Figures Use and Costs of Health Care, Long-term Care and Hospice Care
5 4
Use of Long-term Care Services by Setting
At any one time, about 70 percent of people with Alzheimer’s and other dementias are living at home.82 Most of these people receive unpaid help from family members and friends, but some also receive paid home and community-based services, such as personal care and adult day center care. A study of older people who needed help to perform daily activities, such as dressing, bathing, shopping and managing money, found that those who also had cognitive impairment were more than twice as likely as those who did not have cognitive impairment to receive paid home care (29 percent of those with cognitive impairment received paid services compared with 12 percent of those who did not have cognitive impairment).83 In addition, those who had cognitive impairment and received paid services used almost twice as many hours of care monthly as those who did not have cognitive impairment (206 hours compared with 108 hours).
PeoplewithAlzheimer’sandotherdementiasmakeupa large proportion of all elderly people who receive non-medical home care, adult day center services, assisted living care and nursing home care.
•Home care: More than one-third (about 37 percent) of older people who received primarily non-medical home care services, such as personal care and homemaker services, through state home care programs in Connecticut, Florida and Michigan had cognitive impairment consistent with dementia.84,85,86
•Adult day center services: At least half of all elderly adult day center participants have Alzheimer’s disease or other dementia.87,88
•Assisted living care:Estimatesfromvariousstudiesindicatethat 45–67 percent of residents of assisted living facilities have Alzheimer’s disease or other dementia.73,89
•Nursinghomecare: In 2007, 69 percent of all nursing home residents had some degree of cognitive impairment, including 27 percent who had mild cognitive impairment and 42 percent who had moderate to severe cognitive impair-ment.90 (See Table 14.) In June 2008, 47 percent of all nursing home residents had a diagnosis of Alzheimer’s or other dementia in their nursing home records.91
•Alzheimer’s special care unit:Nursinghomeshadatotalof86,669 beds in Alzheimer’s special care units in June 2008,92 accounting for 5 percent of all nursing home beds at that time. The total number of nursing home beds in Alzheimer’s special care units increased in the 1980s but has decreased since 2004, when there were 93,763 beds in such units.93 Since almost half of nursing home residents have Alzheimer’s or other dementia, and only 5 percent of nursing home beds are in Alzheimer’s special care units, it is clear that the great majorityofnursinghomeresidentswithAlzheimer’sandotherdementias are not in Alzheimer’s special care units.
Use and Costs of Health Care, Long-term Care and Hospice Care 2009 Alzheimer’s Disease Facts and Figures
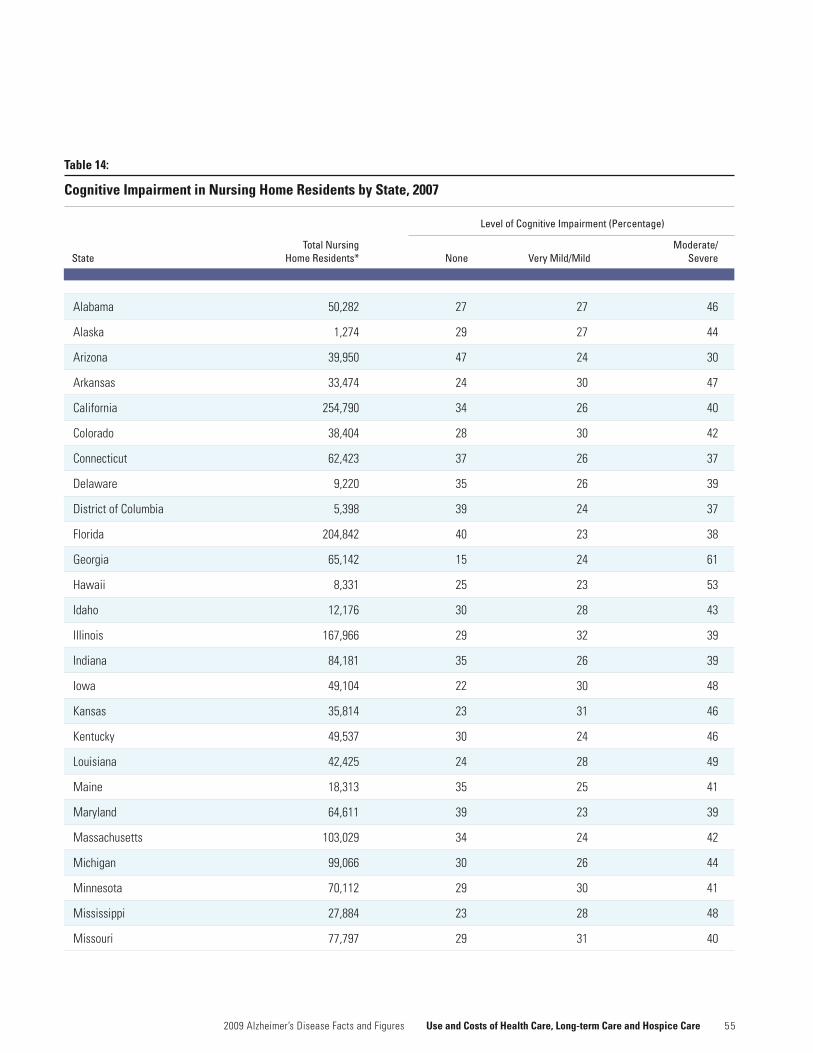
5 52009 Alzheimer’s Disease Facts and Figures Use and Costs of Health Care, Long-term Care and Hospice Care
Total Nursing Moderate/State Home Residents* None Very Mild/Mild Severe
Alabama 50,282 27 27 46
Alaska 1,274 29 27 44
Arizona 39,950 47 24 30
Arkansas 33,474 24 30 47
California 254,790 34 26 40
Colorado 38,404 28 30 42
Connecticut 62,423 37 26 37
Delaware 9,220 35 26 39
District of Columbia 5,398 39 24 37
Florida 204,842 40 23 38
Georgia 65,142 15 24 61
Hawaii 8,331 25 23 53
Idaho 12,176 30 28 43
Illinois 167,966 29 32 39
Indiana 84,181 35 26 39
Iowa 49,104 22 30 48
Kansas 35,814 23 31 46
Kentucky 49,537 30 24 46
Louisiana 42,425 24 28 49
Maine 18,313 35 25 41
Maryland 64,611 39 23 39
Massachusetts 103,029 34 24 42
Michigan 99,066 30 26 44
Minnesota 70,112 29 30 41
Mississippi 27,884 23 28 48
Missouri 77,797 29 31 40
Table 14:
Cognitive Impairment in Nursing Home Residents by State, 2007
Level of Cognitive Impairment (Percentage)
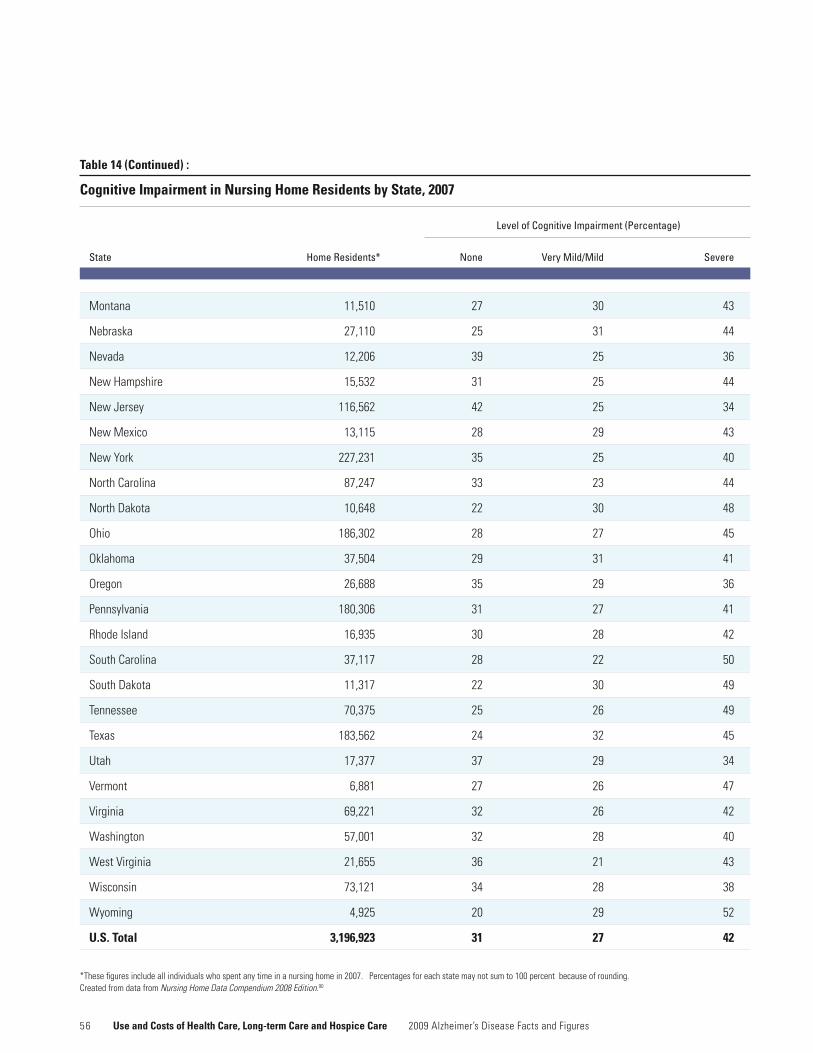
5 6 Use and Costs of Health Care, Long-term Care and Hospice Care 2009 Alzheimer’s Disease Facts and Figures
Table 14 (Continued) :
Cognitive Impairment in Nursing Home Residents by State, 2007
State Home Residents* None Very Mild/Mild Severe
Montana 11,510 27 30 43
Nebraska 27,110 25 31 44
Nevada 12,206 39 25 36
NewHampshire 15,532 31 25 44
NewJersey 116,562 42 25 34
NewMexico 13,115 28 29 43
NewYork 227,231 35 25 40
NorthCarolina 87,247 33 23 44
NorthDakota 10,648 22 30 48
Ohio 186,302 28 27 45
Oklahoma 37,504 29 31 41
Oregon 26,688 35 29 36
Pennsylvania 180,306 31 27 41
Rhode Island 16,935 30 28 42
South Carolina 37,117 28 22 50
South Dakota 11,317 22 30 49
Tennessee 70,375 25 26 49
Texas 183,562 24 32 45
Utah 17,377 37 29 34
Vermont 6,881 27 26 47
Virginia 69,221 32 26 42
Washington 57,001 32 28 40
West Virginia 21,655 36 21 43
Wisconsin 73,121 34 28 38
Wyoming 4,925 20 29 52
U.S. Total 3,196,923 31 27 42
*Thesefiguresincludeallindividualswhospentanytimeinanursinghomein2007.Percentagesforeachstatemaynotsumto100percentbecauseofrounding. Created from data from Nursing Home Data Compendium 2008 Edition.90
Level of Cognitive Impairment (Percentage)

5 7
Costs of Long-term Care Services by Setting
Costs are high for care at home or in an adult day center, assistedlivingfacilityornursinghome.Exceptwhereotherwise specified, the cost figures in the following bullets areforallserviceusers,notjustthosewithAlzheimer’s and other dementias.
•Home care: In 2008, the average hourly rate for non-medical home care, including personal care and home-maker services, was $18, or $144 for an eight-hour day.94
•Adult day center services: In 2008, the average cost of adult day center services was $64 per day.94Ninety-fivepercent of adult day centers provided care for people with Alzheimer’s disease and other dementias, and 2 percent of these centers charged additional fees for these clients.
•Assisted living facility: In 2008, the average cost for basic services in an assisted living facility was $3,031 a month, or $36,372 a year.95 Fifty-two percent of assisted living facilities provided specialized Alzheimer’s and other dementia care and charged an average of $4,267 a month, or $51,204 a year for this care.
•Nursinghome: In 2008, the average cost for a private room in a nursing home was $212 a day, or $77,380 a year. The average cost of a semi-private room in a nursing home was $191 a day, or $69,715 a year.95 In Alzheimer’s special care units, the average cost for a private room was $219 a day, or $79,935 a year, and the average cost for a semi- private room was $198 a day, or $72,270 a year.
Affordability of Long-term Care Services
Few individuals with Alzheimer’s disease or other dementia and their families can afford to pay for long-term care services for as long as the services are needed.
•IncomeandassetdataarenotavailableforpeoplewithAlzheimer’s or other dementia, but the median income for people aged 65 and older was $17,382 in 2007.96 The median income for households headed by an older person was $29,730.Evenforolderpeoplewhoseincomesfallcomfort-ably above the median, the costs of home care, adult day center services, assisted living care or nursing home care can quickly exceed their incomes.
•In2005,65percentofolderpeoplelivinginthecommunityand 84 percent of those at high risk of needing nursing home care had assets that would pay for less than a year in a nursing home.97 Fifty-seven percent of older people in the community and 75 percent of those at high risk of needing nursing home care did not have enough assets to cover even a month in a nursing home.
Long-term Care Insurance
In 2002, about 6 million people had long-term care insurance policies, which paid out $1.4 billion for services for those who filed claims in that year.98Privatehealthandlong-termcareinsurance policies funded only about 7.2 percent of national long-term care spending in 2005.99 However, long-term care insurance plays a significant role in paying for the care of people with dementia who purchase policies before developing the disease.
A study of people filing claims on their long-term care insurance policies for the first time during 2003, 2004 and 2005 shows that about two-thirds of those filing claims for care in assisted living residences (63 percent) and nursing homes (64 percent) had cognitive impairment.100 The figure was 28 percent for those filing claims for paid home care.
2009 Alzheimer’s Disease Facts and Figures Use and Costs of Health Care, Long-term Care and Hospice Care
5 8
Medicaid Costs
Medicaid covers nursing home care and other long-term care services in the community for individuals who meet program requirements for level of care, income and assets. To receive coverage, beneficiaries must have low incomes or be poor due to their expenditures on these services. The federal government and states share in managing and funding the program, and states differ greatly in the services covered by their Medicaid programs.
Medicaid plays a critical role for people with dementia who can no longer afford to pay for their long-term care expenses on their own.
•In2004,28percentofMedicarebeneficiariesaged65andolder with Alzheimer’s disease or other dementia were also Medicaid beneficiaries.73
•AbouthalfofallMedicaidbeneficiarieswithAlzheimer’sorother dementia are nursing home residents, and the rest live in the community.82
•AmongnursinghomeresidentswithAlzheimer’sdiseaseandother dementias, 51 percent relied on Medicaid to help pay for their nursing home care in 2000.82
•MostnursinghomeresidentswhoqualifyforMedicaidmustspend all their Social Security income and any other monthly income, except for a very small personal needs allowance, to pay for nursing home care. Medicaid only makes up the difference if the resident cannot pay the full cost of care or has a financially dependent spouse.
•AmongolderpeoplewithAlzheimer’sdiseaseandotherdementias who were living in the community in 2000, 18 percent relied on Medicaid to help pay for their care.82 Depending on which home and community-based services are covered by Medicaid in their state, these people could receive personal care, which provides assistance with daily activities like bathing and dressing; homemaker services; adult day care; respite care or other services.
•In2004,totalperpersonMedicaidpaymentsforMedicaidbeneficiaries aged 65 and older with Alzheimer’s and other dementias were 3.8 times higher than Medicaid payments for other Medicaid beneficiaries in the same age group ($23,631 per Medicaid beneficiary with Alzheimer’s or other dementia compared with $6,236 per Medicaid beneficiary with no Alzheimer’s or other dementia).73
Much of the difference in Medicaid payments for beneficia-ries with Alzheimer’s and other dementias compared with other Medicaid beneficiaries is due to Medicaid payments for beneficiaries with Alzheimer’s and other dementias who live in nursing homes and other residential care facilities, such as assisted living facilities. Including the large Medicaid payments for Medicaid beneficiaries with Alzheimer’s and other demen-tias in nursing homes and other residential care facilities, total Medicaid payments for beneficiaries aged 65 and older with Alzheimer’s and other dementias were almost as high in 2004 as total Medicaid payments for all other Medicaid beneficiaries in that age group combined ($19 billion compared with $22.6 billion);73 this was true even though Medicaid beneficiaries aged 65 and older with Alzheimer’s and other dementias accounted for only 18 percent of all Medicaid beneficiaries aged 65 and older in that year.
Out-of-pocket Costs for Healthcare and Long-term Care Services
Although Medicare, Medicaid, and other sources such as the Veterans Health Administration and private insurance pay for most hospital and other healthcare services, and some long-term care services, for older people with Alzheimer’s and other dementias, individuals and their families still incur high out-of-pocket costs. These costs are for Medicare and other health insurance premiums, deductibles and co-payments and healthcare and long-term care services that are not covered by Medicare, Medicaid or other sources.
In 2004, Medicare beneficiaries aged 65 and older with Alzheimer’s disease and other dementias had average per person out-of-pocket costs amounting to $2,464 for healthcare
Use and Costs of Health Care, Long-term Care and Hospice Care 2009 Alzheimer’s Disease Facts and Figures
5 9
and long-term care services that were not covered by other sources.73 (See Table 10 at the beginning of this section.) Average per person out-of-pocket costs for people with Alzheimer’s and other dementias were highest for those who were living in nursing homes and assisted living facilities ($16,689 per person). Out-of-pocket costs for people aged 65 and older with Alzheimer’s and other dementias who were living in the community were 1.2 times higher than the average for all other Medicare beneficiaries in that age group ($2,298 per person for people with Alzheimer’s and other dementias compared with $1,916 per person for all other Medicare beneficiaries).73
BeforetheimplementationoftheMedicarePartDPrescriptionDrug Benefit in 2006, out-of pocket expenses were increasing annually for Medicare beneficiaries.101 In 2003, out-of-pocket costs for prescription medications accounted for about one-quarter of total out-of-pocket costs for all Medicare benefi-ciaries aged 65 and older.102 Other important components of out-of-pocket costs were premiums for Medicare and private insurance (45 percent) and payments for hospital, physi-cian and other healthcare services that were not covered by other sources (31 percent). With the implementation of the MedicarePartDPrescriptionDrugBenefit,out-of-pocketcostsfor prescription drugs are expected to drop, and this change will benefit Medicare beneficiaries with Alzheimer’s and other dementias. Clearly, however, the biggest component of out-of-pocket costs for people with Alzheimer’s and other dementias is nursing home and other residential care, and out-of-pocket costs for these services are likely to continue to grow over time.
Use and Costs of Hospice Care
Hospices provide medical care, pain management, and emotional and spiritual support for people who are dying, including people with Alzheimer’s disease and other dementias. Hospices also provide emotional and spiritual support and bereavement services for families of people who are dying. The main purpose of hospice care is to allow individuals to die with dignity and without pain and other distressing symptoms that often accompany terminal illness. Individuals can receive hospice care in their homes, assisted living residences or
nursing homes. Medicare is the primary source of payment for hospice care, but private insurance, Medicaid and other sources also pay for hospice care.
Use of Hospice Services
TheNationalHospiceandPalliativeCareOrganization estimates that in 2007 about 10 percent of all people admitted to hospices in the United States had a primary hospice diagnosis of Alzheimer’s disease or other dementia.103 Likewise, an extensive review of Medicare hospice records found that in 2005, 9.8 percent of people who received Medicare-covered hospice benefits were people with a primary hospice diagnosis of Alzheimer’s disease or other dementia, including 5.7 percent (43,000 people) with a primary hospice diagnosis of Alzheimer’s disease and 4.1 percent (31,000 people) with a primary hospice diagnosis of other dementia.104
The number of people with Alzheimer’s and other dementias who receive hospice care has increased in recent years. In 2001, only 6.8 percent of all hospice admissions were people with a primary hospice diagnosis of Alzheimer’s or other dementia, compared to 10.1 percent in 2007.103,105
Hospice length of stay has also increased in recent years. The average length of stay for hospice beneficiaries with a primary hospice diagnosis of Alzheimer’s disease increased from 66 days in 2000 to 99 days in 2005; likewise, the average length of stay for hospice beneficiaries with a primary hospice diagnosis of dementia increased from 57 days in 2000 to 85 days in 2005.104
Costs of Hospice Services
In 2004, total payments from all sources for hospice care for Medicare beneficiaries aged 65 and older with Alzheimer’s and other dementias amounted to $2.8 billion.73 Average per person payments for hospice care for beneficiaries aged 65 and older with Alzheimer’s or other dementia were eight times higher than for other Medicare beneficiaries in the same age group ($976 per person compared with $120 per person).73
2009 Alzheimer’s Disease Facts and Figures Use and Costs of Health Care, Long-term Care and Hospice Care
2008 Alzheimer’s Disease
Mild Cognitive Impairment and Early-Stage Alzheimer’s Disease
Special Report:
This special section of 2009 Alzheimer’s Disease Facts and Figures highlights what is known about MCI and identifies implications and opportunities for advancing Alzheimer research.
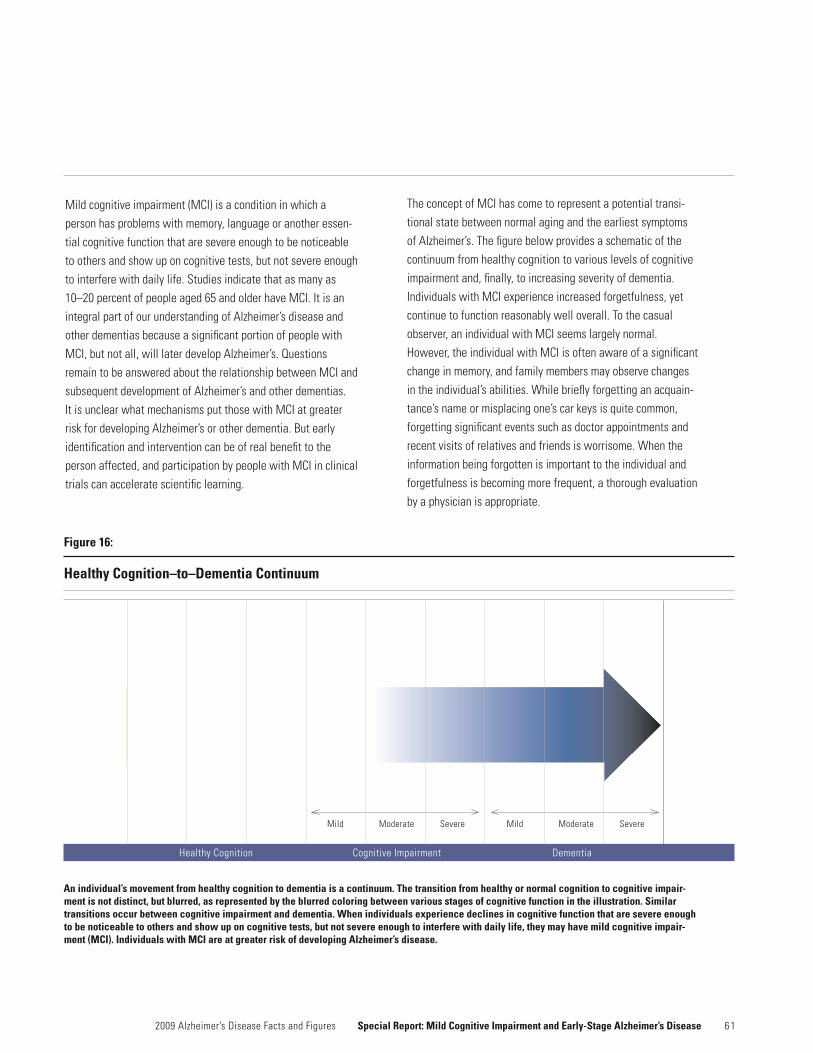
6 1
Mild cognitive impairment (MCI) is a condition in which a person has problems with memory, language or another essen-tial cognitive function that are severe enough to be noticeable to others and show up on cognitive tests, but not severe enough to interfere with daily life. Studies indicate that as many as 10–20 percent of people aged 65 and older have MCI. It is an integral part of our understanding of Alzheimer’s disease and other dementias because a significant portion of people with MCI, but not all, will later develop Alzheimer’s. Questions remain to be answered about the relationship between MCI and subsequent development of Alzheimer’s and other dementias. It is unclear what mechanisms put those with MCI at greater risk for developing Alzheimer’s or other dementia. But early identification and intervention can be of real benefit to the person affected, and participation by people with MCI in clinical trials can accelerate scientific learning.
The concept of MCI has come to represent a potential transi-tional state between normal aging and the earliest symptoms of Alzheimer’s. The figure below provides a schematic of the continuum from healthy cognition to various levels of cognitive impairment and, finally, to increasing severity of dementia. Individuals with MCI experience increased forgetfulness, yet continue to function reasonably well overall. To the casual observer, an individual with MCI seems largely normal. However, the individual with MCI is often aware of a significant change in memory, and family members may observe changes in the individual’s abilities. While briefly forgetting an acquain-tance’s name or misplacing one’s car keys is quite common, forgetting significant events such as doctor appointments and recent visits of relatives and friends is worrisome. When the information being forgotten is important to the individual and forgetfulness is becoming more frequent, a thorough evaluation by a physician is appropriate.
Figure 16:
Healthy Cognition–to–Dementia Continuum
Mild Moderate Severe Mild Moderate Severe
Healthy Cognition Cognitive Impairment Dementia
2009 Alzheimer’s Disease Facts and Figures Special Report: Mild Cognitive Impairment and Early-Stage Alzheimer’s Disease
An individual’s movement from healthy cognition to dementia is a continuum. The transition from healthy or normal cognition to cognitive impair-ment is not distinct, but blurred, as represented by the blurred coloring between various stages of cognitive function in the illustration. Similar transitions occur between cognitive impairment and dementia. When individuals experience declines in cognitive function that are severe enough to be noticeable to others and show up on cognitive tests, but not severe enough to interfere with daily life, they may have mild cognitive impair-ment (MCI). Individuals with MCI are at greater risk of developing Alzheimer’s disease.
6 2
Assessing Memory Loss
Memory concerns are a common reason for physician visits. Typically, the physician will obtain a health history from the person and someone who knows the individual well. If a pattern of increasing forgetfulness of important information emerges, the physician will perform a mental status examination as well as a general medical examination. If the physician is concerned about the degree of forgetfulness, additional testing might be undertaken, such as a neuropsychological examination, which is an inventory of a person’s cognitive abilities—memory, language function, problem solving and visuospatial skill—to help determine if the memory and thinking concerns are beyond what would be expected for the individual’s age, and the extent to which other abilities beyond memory are impaired. Magnetic resonance imaging (MRI) scans of the brain and tests for treatable causes of cognitive impairment, such as a thyroid abnormality or a vitamin B12 deficiency, are examples of the kinds of evaluations a physician might make to better under-stand the reason for the cognitive impairment. If forgetfulness is becoming increasingly severe yet has developed gradually and no other obvious explanations such as medication side effects, coexisting illnesses, anxiety or depression exist, the physician might conclude that a neurodegenerative process, such as MCI, is a possibility.
Individuals with MCI, however, are quite functional. They are still driving, paying bills and interacting in society in a relatively normal way. Difficulties only become apparent when their memories are stressed or they are required to multi-task. Individuals with this degree of memory impairment but intact cognitive functions such as language skills, attention, executive function (the ability to plan, reason, solve problems and focus on a task) and visuospatial skills (the ability to understand and use symbols and maps, for example, and the ability to translate visualsignalsintoacorrectimpressionofwhereobjectsareinspace) are considered to have MCI. With the aging of society, MCI is becoming an increasingly important condition to recognize since it can represent the earliest stages of Alzheimer’s disease, may be treatable and is important for counseling, planning and educational purposes.
Frequency
Several recent epidemiologic studies have been completed assessing the frequency of MCI in the general population.106,107,108,109 The Mayo Clinic Study of Aging has estimated the prevalence of MCI to be between 13 percent and 16 percent of individuals aged 70 to 89 years old.110 Several international studies have indicated a prevalence of between 10 percent and 20 percent in individuals aged 65 and older.109,111 This is a significant proportion of the population considering that baby boomers are now aging into the period of highest risk for cognitive disorders and dementia. As a result of the baby boomer impact, the Alzheimer’s Association estimates that if nothing is done to delay the onset or slow the progression of Alzheimer’s disease, this single entity will bankrupt the healthcare system as we know it.
Outcome
While some individuals with MCI ultimately revert to normal cognitive status or do not go on to develop dementia, individuals with MCI develop dementia, most commonly Alzheimer’s, at a higher rate than individuals without MCI. PeoplewhoseMCIsymptomscausethemenoughconcerntovisit a physician appear to have a higher risk of developing dementia. It’s estimated that as many as 15 percent of these individuals progress from MCI to dementia each year. From this estimate, nearly half of all people who have visited a physician about MCI symptoms will develop dementia in three or four years.112 This estimate is somewhat higher than for individuals whose MCI is identified through assessments of community residents. When individuals are identified as having MCI through community sampling (and not as a result of visits to physicians because of cognitive concerns), their rate of progression is as high as 10 percent per year.107 This may reflect that symptoms among those identified through community sampling are generally less severe than symptoms among those who seek medical care. Thus, if a person already is concerned about his or her memory and meets criteria for MCI, he or she is more likely to progress to dementia at a higher rate.
Special Report: Mild Cognitive Impairment and Early-Stage Alzheimer’s Disease 2009 Alzheimer’s Disease Facts and Figures
6 3
Predictors of Progression from MCI to Dementia
Some individuals with MCI may develop dementia at a higher rate than other individuals with MCI, depending on certain characteristics. For example, if a person with MCI also has brain atrophy as shown on an MRI scan—meaning that the brain regions involved with memory are smaller than those in individuals without memory impairments—the person is more likely to rapidly progress to dementia.113,114,115,116,117 Other factors also predict who might progress more rapidly to dementia, such as severity of memory impairment, a certain pattern of glucose metabolism in the brain that is characteristic of Alzheimer’s and levels of particular proteins in cerebrospinal fluid that are consistent with Alzheimer’s.118,119
Biomarkers such as these are an area of active investigation by researchers. Clinical trials investigating new therapeutic agents for Alzheimer’s are increasingly incorporating imaging techniques as well as biomarkers. Ultimately, it is hoped that these studies will provide clearer answers about which individuals with MCI are more likely to develop Alzheimer’s and when it is likely to happen. In addition, these individuals will be very important to identify, as they possess the characteristics of early Alzheimer’s and may be the best candidates for inclusion in clinical trials to try to understand how to prevent Alzheimer’s.
One large study of this nature co-sponsored by the Alzheimer’s AssociationistheAlzheimer’sDiseaseNeuroimagingInitiative(ADNI).Thisstudyinvolves800individuals:200whoarecognitively normal, 400 with MCI and 200 with mild Alzheimer’s. All participants undergo a variety of brain imaging techniques such as MRI scans or positron emission tomography (PET)scanstomeasureglucosemetabolisminthebrain. AsubsetalsoreceivesPETscansofthebraintoidentify beta-amyloid, a protein that is a hallmark of Alzheimer’s.120 About 50 percent of the participants undergo lumbar punctures, which enable measurement of cerebrospinal fluid biomarkers. These biomarkers are being assessed to determine their utility in predicting who is more likely to progress to Alzheimer’s in the near future.120
Most investigators believe that the earlier interventions occur in the Alzheimer’s disease process, the greater the chances of delayingorstoppingadditionaldamagetothebrain.Extensiveresearch efforts are under way to detect Alzheimer’s at its earliest stage. Ideally, physicians would intervene even before the development of overt symptoms.
Treatment
NodrugshavebeenapprovedbytheFDAforthetreatmentofMCI.Several large international clinical trials of drug interventions for MCI have been completed. Unfortunately, virtually none of these trials have shown the intervention to slow the rate of progression from MCI to Alzheimer’s.121,122,123 One clinical trial cosponsored bytheNationalInstituteonAging,Pfizer,Inc.andEisai,Inc.,documented a reduced risk of progressing from MCI to Alzheimer’s for the first 12 months of the trial for individuals who had been treatedwithdonepezil.AsubsetofsubjectsinthestudywiththeAPOE-4genewhoweretreatedwithdonepezilhadareducedriskof developing Alzheimer’s for the first 24 months. However, the study lasted 36 months, and by that time, neither of the interven-tions,donepezilandhigh-dosevitaminE,demonstratedalastingeffect.Nevertheless,thistrialwasthefirsttoindicatethatanintervention could reduce the risk of developing Alzheimer’s in the short term and suggested that patients with MCI might be important to study in the search for therapies. That is, presumably the earlier people at risk for developing Alzheimer’s are identified, the earlier interventions can occur and hopefully prevent continuing damage to the brain.
2009 Alzheimer’s Disease Facts and Figures Special Report: Mild Cognitive Impairment and Early-Stage Alzheimer’s Disease
6 4
The Future
The field of Alzheimer’s disease research is evolving rapidly. We are learning a great deal about the early symptoms of individuals who will go on to develop Alzheimer’s. It is important to not ignore these early warning features because, as discussed above, the earlier we intervene, the better. At present this “intervention” might include education and knowledge about the course of the disease. With more research, recommendations may include information about lifestyle and even pharmacological interventions. Although not all individuals with MCI develop Alzheimer’s, for those who do, MCI represents an earlier stage in Alzheimer symptoms and is receiving increasing attention by both researchers and physicians. Memory impairment is a common complaint among older patients, and much has been learned about which types of memory complaints may increase Alzheimer’s risk. Studying individuals with MCI helps identify those individuals at higher risk for developing Alzheimer’s.124,125,126 At the same time, not all concerns about memory are problematic. With aging, minor forgetfulness does occur and should not be interpreted to mean that Alzheimer’s disease is inevitable.
With more information from longitudinal studies of aging and dementia, researchers will be able to further characterize the earlyfeaturesofAlzheimer’s.Neuroimagingtechniquesandbiomarker studies will help identify the severity of disease in these individuals with early signs of Alzheimer’s. If interventions are successful in individuals showing early symptoms of MCI, they may also be helpful for individuals who have yet to develop symptoms but are considered to be at high risk of developing Alzheimer’s based on neuroimaging and biomarker studies. Those individuals then may be candidates for intervention even before the development of symptoms. This would represent attainment of the ultimate goal: prevention of Alzheimer’s disease.
Special Report: Mild Cognitive Impairment and Early-Stage Alzheimer’s Disease 2009 Alzheimer’s Disease Facts and Figures
6 5
A1. NumberofAmericansaged65andolderwithAlzheimer’sdisease: DenisEvans,MD,andcolleaguescomputedthe5millionnumberinearly2007, at the request of the Alzheimer’s Association. The number is based on linear extrapolation from their previously published prevalence estimatesfor2000(4.5million)and2010(5.1million).See,Hebert,LE;Scherr,PA;Bienias,JL;Bennett,DA;andEvans,DA.“Alzheimer’sdiseaseintheU.S.population:Prevalenceestimatesusingthe2000census.”Archives of Neurology 2003;60:1119-1122. These prevalence numbers are basedonincidencedatafromtheChicagoHealthandAgingProject(CHAP).
A2. ProportionofAmericanswithAlzheimer’sdisease: The 13 percent, is calculated by dividing the number of people aged 65 and older with Alzheimer’s disease (5.1 million) by the U.S. population aged 65 and older in 2008, the latest available data from the U.S. Census Bureau (38 million) = 13 percent. Thirteen percent is the same as 1 in 8.
A3. NumberofsecondsfordevelopmentofanewcaseofAlzheimer’sdisease: The 70 seconds number is calculated by dividing the number of seconds in a year (31,536,000) by the number of new cases in a year. Hebert et al. (2001) estimated that there would be 411,000 new cases in 2000,and454,000newcasesin2010.See,Hebert,LE;Beckett,LA;Scherr,PA;andEvans,DA.“AnnualincidenceofAlzheimerdiseasein theUnitedStatesprojectedtotheyears2000through2050.”Alzheimer Disease and Associated Disorders 2001;15:169-173. The Alzheimer’s Association calculated that the incidence of new cases in 2009 would be 449,700 by multiplying the 10-year change from 411,000 to 454,000 (43,000) by 0.9 (for the number of years from 2000 to 2009 divided by the number of years from 2000 to 2010), adding that result (38,700) to the Hebert et al. (2001) estimate for 2000 (411,000) = 449,700. 31,536,000 divided by 449,700=70.1 seconds, rounded to 70 seconds. Using the same method of calculation for 2050, 31,536,000 divided by 959,000 (from Hebert et al. (2001) = 32.8 seconds, rounded to 33 seconds.
A4. The Aging, Demographics, and Memory Study (ADAMS): ADAMS provides estimates of the number of Americans aged 71 and older who hadAlzheimer’sdiseaseandotherdementiasin2002.SeePlassman,BL;Langa, KM; Fisher, GG; Heeringa, SG; Weir, DR; Ofstedal, MB; et al. “PrevalenceofDementiaintheUnitedStates:TheAging,Demographics,and Memory Study.” Neuroepidemiology 2007; 29:125–132. Updated to 2008, ADAMS data indicate that there are now about 3.7 million Americans aged 71 and older who have dementia, including about 2.6 million people in that age group who have Alzheimer’s disease. These figures do not include Americans under age 71 who have Alzheimer’s and other dementias—an estimated 1 million people in 2008. Analysis of the reasonsforthedifferenceinprevalenceestimatesfromtheCHAPstudy(Hebert et al., 2003) and the ADAMS study is ongoing. Conclusions from this analysis, which are not available at the time this Alzheimer’s Association report is being published, will help to clarify the difference in estimates from the two studies.
A5. CriteriaforidentifyingsubjectswithAlzheimer’sdiseaseandotherdementias in the Framingham study: Standard diagnostic criteria (DSM IV criteria) were used to diagnose dementia in the Framingham study, but, in addition,thesubjectshadtohaveatleast“moderate”dementiaaccordingto the Framingham criteria, which is equivalent to a score of 1 or more on the Clinical Dementia Rating Scale (CDR), and they had to have symptoms forsixmonthsormore.Standarddiagnosticcriteria(theNINCDS-ADRDAcriteria) were used to diagnose Alzheimer’s disease. The examination for dementia and Alzheimer’s disease is described in detail in Seshadri, S; Wolf,PA;Beiser,A;Au,R;McNulty,K;White,R;etal.“Lifetimeriskofdementia and Alzheimer’s disease: The impact of mortality on risk estimates in the Framingham Study.” Neurology 1997; 49:1498–1504.
A6. NumberofbabyboomerswhowilldevelopAlzheimer’sdiseaseandother dementias: The numbers for remaining lifetime risk of Alzheimer’s disease and other dementias for baby boomers were developed by the Alzheimer’s Association by applying the data provided to the Association onremaininglifetimeriskbyAlexaBeiser,Ph.D.;SudhaSeshadri,M.D.;RhodaAu,Ph.D.;andPhilipA.Wolf,M.D.,fromtheDepartmentsofNeurologyandBiostatistics,BostonUniversitySchoolsofMedicineandPublicHealthtoU.S.Censusdataforthenumberofwomenandmenaged43to61inNovember2007,usedheretoestimatethenumberofwomenand men who will be aged 44 to 62.
A7. State-by-state prevalence of Alzheimer’s disease: These state-by- state prevalence numbers are based on incidence data from the Chicago HealthandAgingProject(CHAP),projectedtoeachstate’spopulation,withadjustmentsforstate-specificgender,yearsofeducation,race,andmortality.SeeHebert,LE;Scherr,PA;Bienias,JL;Bennett,DA;andEvansDA.“State-specificprojectionsthrough2025ofAlzheimerdiseaseprevalence.” Neurology 2004; 62:1645. The numbers in Table 2 are found in online material related to this article at www.neurology.org.
A8. NumberoffamilyandotherunpaidcaregiversofpeoplewithAlzheimer’s and other dementias: To calculate this number, the Alzheimer’s Association started with data from the Behavioral Risk Factor Surveillance System (BRFSS). In 2000, the BRFSS survey asked respondents aged 18 and older whether they had provided any regular care or assistance during the past month to a family member or friend aged 60 or older who had a long-term illness or disability. To determine the number of family and other unpaid caregivers by state, we applied the proportion of caregivers for each state from the 2000 BRFSS (as reported in McKune, SL; Andresen, EM;Zhang,J;Neugaard,B.Caregiving: A National Profile and Assessment of Caregiver Services and Needs. University of Florida and Rosalynn Carter Institute, 2006) to the number of people aged 18 and older in each state from the U.S. Census Bureau report for July 2008 accessed at http://www.census.gov/popest/national/files/NST-EST2008-alldata.csvonDec.27,2008. To calculate the proportion of family and other unpaid caregivers that provides care for a person with Alzheimer’s or other dementia, we used data from a national telephone survey conducted in 2003, for the NationalAllianceforCaregiving(NAC)andAARP(seeNationalAllianceforCaregivingandAARP.Caregiving in the U.S. (Bethesda, Md., February 2004). This survey asked respondents aged 18 and older whether they
End Notes
2009 Alzheimer’s Disease Facts and Figures Appendix
6 6
were providing unpaid care for a relative or friend aged 18 or older or had provided such care during the past 12 months. Respondents who answered affirmatively were then asked about the health problems of the person for whom they provided care. In response, 23 percent of caregivers said that: 1) Alzheimer’s or other dementia was the main problem of the person for whom they provided care; or 2) the person had Alzheimer’s or other mental confusion in addition to his or her main problem. The 23 percent figure pertains to caregivers of people aged 18 and older, but almost all people with Alzheimer’s and other dementias are at least 50 years old, and we needed a percentage figure to use with the BRFSS state numbers for caregivers of people aged 60 and older. To estimate that percentage, we divided the proportion of caregivers of people with Alzheimer’sandotherdementiasfromtheNAC/AARPsurvey(23percent)by the proportion of caregivers of people aged 50 and older with any healthproblemfromtheNAC/AARPsurvey(79percent),andestimatedthat 29 percent of caregivers aged 18 and older are taking care of a person aged 50 or older with Alzheimer’s or other dementia. We applied the 29 percent figure to the total number of caregivers of people aged 60 and older in each state.
A9. Numberofhoursofunpaidcare: To calculate this number, the Alzheimer’s Association used data from a follow-up analysis based on the2003NAC/AARPsurvey(seeAlzheimer’sAssociationandNationalAlliance for Caregiving. Families Care: Alzheimer’s Caregiving in the United States, 2004, accessible at www.alz.org). This analysis showed that 23 percent of caregivers of people with Alzheimer’s and other dementias provided 40 or more hours of care a week; 8 percent provided an average of 30 hours per week; 21 percent provided an average of 15 hours a week; 47 percent provided an average of 4 hours a week; and 1 percent did not report their hours of care. Based on these proportions, the average hours of care provided per week is 16.6, or 863 hours per year. We multiplied the number of family and other unpaid caregivers (9,856,945) by the average hours of care per year (863) = 8,506,543,535 hours, rounded to 8.5 billion hours.
A10. Value of unpaid caregiving: To calculate this number, the Alzheimer’s AssociationusedthemethodofArnoetal.(seeArno,PS;Levine,C;andMemmott, MM. “The economic value of informal caregiving.” Health Affairs. 1999; 18:182–188). This method uses the average of the minimum wage ($5.85 in July 2008) and the mean wage of home health aides ($16.35 in July 2008) (see U.S. Department of Labor, Bureau of Labor Statistics.“Employment,HoursandEarningsfromCurrentEmploymentStatisticsSurvey,”Series10-CEU6562160008,HomeHealthCareServices[NAICScode6216],AverageHourlyEarnings,July2008,accessedat ftp://ftp.bls.gov/pub/suppl/empsit.edseeb16.txt,Nov.4,2008.)Wemultiplied the total number of hours of unpaid care (8,506,543,535 hours) by $11.10 = $94,422,633,239, rounded to $94 billion.
A11. Medicare Current Beneficiary Survey Report: These data come from an analysis of findings from the 2004 Medicare Current Beneficiary Survey (MCBS). The analysis was conducted for the Alzheimer’s Association by JulieBynum,M.D.,M.P.H.,DartmouthInstituteforHealthPolicyand
ClinicalCare,CenterforHealthPolicyResearch.TheMCBSisacontinuoussurvey of a nationally representative sample of about 16,000 Medicare beneficiarieswhoarelinkedtoMedicarePartBclaims.Thesurveyissupported by the U.S. Centers for Medicare and Medicaid Services (CMS). For community-dwelling survey participants, MCBS interviews are conducted in person three times a year with the Medicare beneficiary or a proxy respondent if the beneficiary is not able to respond for himself or herself. For survey participants who are living in a nursing home or another residential care facility, such as an assisted living residence, retirement home, or a long-term care unit in a hospital or mental health facility. MCBS interviews are conducted with a nurse who is familiar with the survey participant and his or her medical record. Data from the MCBS analysis that are included in 2009 Alzheimer’s Disease Facts and Figures pertain only to Medicare beneficiaries aged 65 and older. For this MCBS analysis, people with dementia are defined as:
1) Community-dwelling survey participants who answered yes to the MCBS question, “Has a doctor ever told you that you had Alzheimer’s diseaseordementia?”Proxyresponsestothisquestionwereaccepted.
2) Survey participants who were living in a nursing home or other residential care facility and had a diagnosis of Alzheimer’s disease or other dementia in their medical records
3) Survey participants who had at least one Medicare claim with a diagnostic code for Alzheimer’s disease or other dementia in 2004. The claim could be for any Medicare service, including hospital, skilled nursing facility, outpatient medical care, home health care, hospice, or physician or other healthcare provider visit. The diagnostic codes used to identify survey participants with Alzheimer’s disease and other dementias are 331.0, 331.1, 331.11, 331.19, 331.2, 331.7, 331.82, 290.0, 290.1, 290.10, 290.11, 290.12, 290.13, 290.20, 290.21, 290.3, 290.40, 290.41, 290.42, 290.43, 291.2, 294.0, 294.1, 294.10 and 290.11.
A12. Medicare: Medicare is a medical insurance program available to all Americans aged 65 and older and to a limited number of younger individuals who meet the requirements for Social Security Disability Insurance (SSDI). In 2007, 95 percent of people aged 65 and older had Medicare (see U.S. Department of Health and Human Services, Health Care Financing Review: Medicare and Medicaid Statistical Supplement, Brief Summaries of Medicare and Medicaid,Nov.1,2008).Original,fee-for-service Medicare covers hospital care; physician services; home health care; laboratory and imaging tests; physical, occupational, and speech therapies; hospice; and other medical services. Medicare beneficiaries can choose to enroll in a Medicare health maintenance organization (HMO) as an alternative to original fee-for-service Medicare. Medicare does not cover long-term care in a nursing home, but it does cover short stays in skilled nursing facilities when the stay follows within 30 days of a hospitalization of three or more days for an acute illness such as a heart attack or broken hip. Medicare beneficiaries pay premiums for coverage and generally also pay deductibles and co-payments for particular services. Medicare premiums, deductibles and co-payments do not cover the full cost of services to beneficiaries, and the program is also tax supported.
Appendix 2009 Alzheimer’s Disease Facts and Figures
6 7
A13. Medicaid: Medicaid is a publicly funded health services program forlow-incomeAmericans.Itisjointlyfundedbythefederalgovernmentand the states according to a complex formula. In addition to basic health services, Medicaid covers nursing home care and various home- and community-based long-term care services for individuals who meet program requirements for level of care, income and assets. States have considerable flexibility about which services are covered in their Medicaid programs, and covered services vary greatly in different states.
A14. Cost to businesses of Alzheimer’s disease: This number comes from an analysis by Koppel, 2002. See Koppel, R. Alzheimer’s Disease: The Costs to U.S. Businesses in 2002 (Washington, D.C.: Alzheimer’s Association, June 2002), accessible at www.alz.org, search “Alzheimer’s Disease: The Costs to U.S. Businesses in 2002.” The total cost to businesses from this analysis includes an additional $24.6 billion for the costs to businesses of healthcare and long-term care services for people with Alzheimer’s and other dementias. The $24.6 billion consists primarily of government taxes that are used for publicly funded services. That amount is not included here because, to a great extent, it overlaps with the $91 billion for Medicare and $21 billion for Medicaid.
A15. National20%SampleMedicareFee-for-ServiceBeneficiariesReport: These data come from an analysis of Medicare claims data for 2005–2006. The analysis was conducted for the Alzheimer’s Association by Julie Bynum,M.D.,M.P.H.,DartmouthInstituteforHealthPolicyandClinicalCare,CenterforHealthPolicy.ThedatacomefromMedparfiles(hospitalandSNFservices)Outpatientfiles(outpatienthospitalservices),Carrierfiles (physician and supplier services), Hospice files (hospice services), DMEfiles(durablemedicalequipment),andHomeHealthfiles(homehealth services). Data from the analysis that are included in 2009 Alzheimer’s Disease Facts and Figures pertain only to Medicare beneficiaries aged 65 and older. For this analysis, people with dementia are defined as those who have at least one claim with a diagnostic code forAlzheimer’sdiseaseorotherdementiainMedparMedicarePartB,Hospice, or Home Health files in 2005. The diagnostic codes used to identify survey participants with Alzheimer’s disease and other dementias are 331.0, 331.1, 331.11, 331.19, 331.2, 331.7, 331.82, 290.0, 290.1, 290.10, 290.11, 290.12, 290.13, 290.20, 290.21, 290.3, 290.40, 290.41, 290.42,290.43,291.2,294.0,294.1,294.10and290.11.Peoplewithotherchronic conditions (identified using ICD-9 codes from the Clinical Classification Software produced by AHRQ) are defined as those who had atleastoneMedicarePartAclaimortwoPartBclaimsoccurringatleastseven days apart, with a diagnostic code for the condition. Medicare beneficiaries with Alzheimer’s disease, other dementias and other chronic conditions were identified in 2005 Medicare claims, and outcomes (use and costs of services) were taken from 2006 Medicare claims. This prospective method decreases the influence of people with a new diagnosis, which is usually associated with higher use and costs of services compared with ongoing management of the condition.
2009 Alzheimer’s Disease Facts and Figures Appendix
6 8
13. Stern,Y;Gurland,B;Tatemichi,TK;Tang,MX;Wilder,D;Mayeux,R.“Influence of education and occupation on the incidence of Alzheimer’s disease.” Journal of the American Medical Association 1994; 271(13):1004–1010.
14. Evans,DA;Hebert,LE;Beckett,LA;Scherr,PA;Albert,MS;Chown,MJ;etal.“Educationandothermeasuresofsocioeconomicstatusand risk of incident Alzheimer disease in a defined population of older persons.” Archives of Neurology 1997; 54(11):1399–1405
15. Hall, KS; Gao, S; Unverzagt, FW; and Hendrie, HC. “Low education and childhood rural residence: Risk for Alzheimer’s disease in African Americans.” Neurology 2000; 54(1):95–99.
16. Shadlen, M-F; Siscovick, D; Fitzpatrick, AL; Dulberg, C; Kuller, LH; andJackson,S.“Education,cognitivetestscores,andblack-whitedifferences in dementia risk.” Journal of the American Geriatrics Society 2006; 54(6):898–905.
17. Seshadri, S; Beiser, A; Kelly-Hayes, M; et al. “The lifetime risk of stroke:EstimatesfromtheFraminghamStudy.”Stroke 2006; 37:345–350.
18. Beiser,A;Seshadri,S;Au,R;andWolf,PA.DepartmentsofNeurologyandBiostatistics,BostonUniversitySchoolsofMedicineandPublicHealth. Unpublished data from Framingham Heart Study, 2008.
19. Hebert,LE;Scherr,PA;Bienias,JL;etal.“State-specificprojectionsthrough 2025 of Alzheimer’s disease prevalence.” Neurology 2004; 62:1645.
20. Schneider,JA;Arvanitakis,Z;BangW;Bennett,DA.“Mixedbrainpathologies account for most dementia cases in community-dwelling older persons.” Neurology 2007; 69:2197–2204.
21. Hebert,LE;Beckett,LA;Scherr,PA;andEvans,DA.“AnnualincidenceofAlzheimerdiseaseintheUnitedStatesprojectedtotheyears2000through 2050.” Alzheimer Disease and Associated Disorders 2001; 15:169–173.
22. Hebert,LE;Scherr,PA;Bienias,JL;Bennett,DA;andEvans,DA.“Alzheimer’sdiseaseintheU.S.population:Prevalenceestimatesusing the 2000 census.” Archives of Neurology 2003; 60:1119–1122.
23. Heron,MP;Hoyer,DL;Xu,J;Scott,C;Tejada-Vera,B.Deaths: Preliminary Data for 2006.Nationalvitalstatisticsreports.Vol.56, no.16.Hyattsville,Md.:NationalCenterforHealthStatistics;2008.
24. Ives,DG;Samuel,P;Psaty,BM;Kuller,LH.“Agreementbetweennosologist and Cardiovascular Health Study review of deaths: Implications of coding differences.” Journal of the American Geriatrics Society 2009; 57:133–139.
References
Appendix 2009 Alzheimer’s Disease Facts and Figures
1. Alzheimer’s Association. Early Onset Dementia: A National Challenge, A Future Crisis. (Washington, D.C.: Alzheimer’s Association, June 2006) Accessible at www.alz.org.
2. Plassman,BL;Langa,KM;Fisher,GG;Heeringa,SG;Weir,DR;Ofstedal,MB;etal.“PrevalenceofDementiaintheUnitedStates: The Aging, Demographics, and Memory Study.” Neuroepidemiology 2007; 29:125–132.
3. Bachman,DL;Wolf,PA;Linn,RT;Knoefel,JE;Cobb,J;Belanger,AJ;etal. “Incidence of dementia and probable Alzheimer’s disease in a general population.” Neurology 1993; 43:515–519.
4. Fillenbaum, GG; Heyman, A; Huber, MS; Woodbury, MA, Leiss, J; Schmader,KE;etal.“Theprevalenceand3-yearincidenceofdementia in older black and white community residents.” Journal of Clinical Epidemiology 1998; 51(7):587–595.
5. Fitzpatrick, AL; Kuller, LH; Ives, DG; Lopez, OL; Jagust, W; Breitner, JCS; et al. “Incidence and prevalence of dementia in the Cardiovascular Health Study.” Journal of the American Geriatrics Society 2004; 52:195–204.
6. Kukull, WA; Higdon, R; Bowen, JD; McCormick, WC; Teri, L; Shellenberg, GD; et al. “Dementia and Alzheimer’s disease incidence: A prospective cohort study.” Archives of Neurology 2002; 59;1737–1746.
7. Rocca,WA;Cha,RH;Waring,SC;andKokmen,E.“Incidenceofdementia and Alzheimer’s disease: A reanalysis of data from Rochester, Minnesota, 1975–1984.” American Journal of Epidemiology 1998; 148(1):51–62.
8. Barnes,LL;Wilson,RS;Schneider,JA;Bienias,JL;Evans,DA;andBennett, DA. “Gender, cognitive decline, and risk of AD in older persons.” Neurology 2003; 60:1777–1781.
9. Evans,DA;Bennett,DA;Wilson,RS;Bienias,JL;Morris,LA;Scherr,PA;etal.“IncidenceofAlzheimerdiseaseinabiracialurbancommunity:RelationtoApolipoproteinEAllelestatus.”Archives of Neurology 2003; 60:185–189.
10. Hebert,LE;Scherr,PA;McCann,JJ;Becket,LA;Evans,DA.“Istheriskof developing Alzheimer’s disease greater for women than for men?” American Journal of Epidemiology 2001; 153(2):132–136.
11.Miech,RA;Breitner,JCS;Zandi,PP;Khachaturian,AS;Anthony,JC;Mayer, L. “Incidence of AD may decline in the early 90s for men, later for women.” Neurology 2002; 58:209-218.
12. Gurland,BJ;Wilder,DE;Lantigua,R;Stern,Y;Chen,J;Killeffer,EHP;et al. “Rates of dementia in three ethnoracial groups.” International Journal of Geriatric Psychiatry 1999; 14:481–493.
6 9
25. Wachterman, M; Kiely, DK; Mitchell, SL. “Reporting dementia on the death certificates of nursing home residents dying with end-stage dementia.” Journal of the American Medical Association 2008; 300:2608–2610.
26. Olichney, JM; Hofstetter, CR; Galasko, D; Thal, LJ; Katzman R. “Death certificate reporting of dementia and mortality in an Alzheimer’s disease research center cohort.” Journal of the American Geriatrics Society 1995; 43:890–893.
27. Macera,CA;Sun,RKP;Yeager,KK;BrandesDA.“Sensitivityandspecificityof death certificate diagnoses for dementing illnesses, 1988–1990.” Journal of the American Geriatrics Society 1992; 40:479–481.
28. Ganguli,M;andRodriguez,EG.“Reportingofdementiaondeathcertificates. A community study.” Journal of the American Geriatrics Society 1999; 47:842–849.
29. Hoyert, DL. Mortality Trends for Alzheimer’s Disease,1979–91.NationalCenter for Health Statistics. Vital and Health Statistics 1996; 20 (28):1–23.
30. NationalCenterforHealthStatistics.Deaths:Final Data for 2000,Nationalvitalstatisticsreports.Vol.50,no.15.Hyattsville,Md.:NationalCenterforHealth Statistics; 2002.
31. American Cancer Society. Cancer Facts and Figures 2000. Atlanta: American Cancer Society; 2000.
32. American Cancer Society. Cancer Facts and Figures 2006. Atlanta: American Cancer Society; 2006.
33. Larson,EB;Shadlen,M;Wang,L;McCormick,WC;Bowen,JD;Teri,L;etal. “Survival after initial diagnosis of Alzheimer disease.” Annals of Internal Medicine 2004; 140:501–509.
34. Kung,HC;Hoyert,DL;Xu,JQ;Murphy,SL.“Deaths: Final Data for 2005” Nationalvitalstatisticsreports.Vol.56,no.10.Hyattsville,Md.:NationalCenter for Health Statistics; 2008.
35. Mitchell, SL; Teno, JM; Miller, SC; and Mor, V. “A national study of the location of death for older persons with dementia.” Journal of the American Geriatrics Society 2005; 53:299–305.
36. Institute of Medicine report, “Retooling for an Aging America: Building the HealthCareWorkforceforOlderAmericans,”ExecutiveSummary2008.
37. Alzheimer’sAssociationandNationalAllianceforCaregiving.Families Care: Alzheimer’s Caregiving in the United States, 2004, accessible at www.alz.org.
38. Bynum,JPW;Rabins,PV;Weller,W;Niefeld,M;Anderson,GF;andWu,AW. “The relationship between a dementia diagnosis, chronic illness, Medicare expenditures and hospital use.” Journal of the American Geriatrics Society 2004; 52:187–194.
39. MetLife Mature Market Institute, The MetLife Study of Alzheimer’s Disease: The Caregiving Experience, August 2006, accessible at www.maturemarketinstitute.com.
40. Zhu,CW;Scarmeas,N;Torgan,R;Albert,M;Brandt,J;Blacker,D;etal.“Clinical characteristics and longitudinal changes of informal cost of Alzheimer’s disease in the community.” Journal of the American Geriatrics Society 2006; 54(10):1596–1602.
41. Mahoney,DF.“Vigilance:Evolutionanddefinitionforcaregiversoffamilymembers with Alzheimer’s disease.” Journal of Gerontological Nursing 2003; 29(8):24–30.
42. Schulz,R;Mendelsohn,AB;Haley,WE;Mahoney,D;Allen,RS;Zhang,S;etal.“End-of-lifecareandtheeffectsofbereavementonfamilycaregivers of persons with dementia.” New England Journal of Medicine 2003; 349(20):1936–1942.
43. Newcomer,RN;Yordi,C;DuNah,R;Fox,P;andWilkinson,A.“Effectsofthe Medicare Alzheimer’s Disease Demonstration on Caregiver Burden and Depression.” Health Services Research 1999; 34(3):669–689.
44. NationalAllianceforCaregivingandUnitedHospitalFund.Young Caregivers in the U.S.: Report of Findings, September 2005, accessible at www.caregiving.org.
45. Schulz,R;Belle,SH;Czaja,SJ;McGinnis,KA;Stevens,A;andZhang, S. “Long-term care placement of dementia patients and caregiver health and well-being.” Journal of the American Medical Association 2004; 292(8):961–967.
46. Port,CL;Zimmerman,S;Williams,CS;Dobbs,D;Preisser,JS;andWilliams, SW. “Families filling the gap: Comparing family involvement for assisted living and nursing home residents with dementia.” Gerontologist 2005; 45 (Special Issue 1):87–95.
47. Cohen,CA;Colantonio,A;andVernich,L.“Positiveaspectsofcaregiving:Rounding out the caregiver experience.” International Journal of Geriatric Psychiatry 2002; 17(7):184–188.
48. Farran,CJ;Miller,BH;Kaufman,JE;Donner,E;andFogg,L.“Findingmeaning through caregiving: Development of an instrument for family caregivers of persons with Alzheimer’s disease.” Journal of Clinical Psychology. 1999; 55(9):1107–1125.
49. Yaffe,K;Fox,P;Newcomer,R;Sands,L;Lindquist,K;Dane,K;etal.“Patientandcaregivercharacteristicsandnursinghomeplacementinpatients with dementia.” Journal of the American Medical Association 2002; 287:2090–2097.
50. Taylor,DH;Ezell,M;Kuchibhatla,M;Ostbye,T;Clipp,EC.“Identifyingthetrajectoriesofdepressivesymptomsforwomencaringfortheirhusbandswith dementia.” Journal of the American Geriatrics Society 2008; 56(2):322–327.
2009 Alzheimer’s Disease Facts and Figures Appendix
7 0
63. Christakis,NA;andAllison,PD.“Mortalityafterthehospitalizationofaspouse.” New England Journal of Medicine 2006; 354:719–730.
64. Covinsky,KI;Eng,C;Liu,L-Y;Sands,LP;Sehgal,AR;Walter,LC;etal.“Reduced employment in caregivers of frail elders: Impact of ethnicity, patient clinical characteristics and caregiver characteristics.” Journal of Gerontology: Medical Sciences 2001; 56A(11):M707–713.
65. NationalAllianceforCaregivingandEvercare.Evercare Study of Family Caregivers – What They Spend, What They Sacrifice,November2007,accessibleatwww.EvercareHealthPlans.com.
66. General information about the Behavioral Risk Factors Surveillance System is available at www.cdc.gov/brfss.
67. The results of Washington state’s 2007 survey were provided to the Alzheimer’s Association by Hilari Hauptman, Aging and Disability Services Administration, Washington State, Oct. 31, 2008.
68. GeneralinformationaboutNorthCarolina’sBRFSSsurveyisavailableatwww.schs.state.nc.us/SCHS/brfss. To view the BRFSS questionnaires by year, click on “questionnaires.”
69. Results for 2003 are available at www.schs.state.nc.us/SCHS/brfss/2003/nc/all/NC02Q03.htmlforcaregivingingeneralandatwww.schs.state.nc.us/SCHS/brfss/2003/nc/all/NC02Q04.htmlforcaregivingforapersonwith“a problem with memory loss or confusion or a disorder like Alzheimer’s disease.” Results for 2004 are available at www.schs.state.nc.us/SCHS/brfss/2004/nc/all/nc07q03.html for caregiving in general and at www.schs.state.nc.us/SCHS/brfss/2004/nc/all/nc07q04.html for caregiving for a person with “a problem with memory loss or confusion or a disorder like Alzheimer’s disease.”
70. Resultsfor2005forcaregivingingeneralarefromNeugaard,B;Andresen,EM;DeFries,EL;Talley,RC;andCrews,JE.“CharacteristicsandHealthofCaregiversandCareRecipients–NorthCarolina2005.”MMWR Weekly 2007;56(21):529-532. Results for 2005 for caregiving for a person with “a problem with memory loss or confusion or a disorder like Alzheimer’s disease”are available at www.schs.state.nc.us/SCHS/brfss/2005/nc/all/nc19q03.html.
71. A description of the 2007 survey is available at publichealth.lacounty.gov/ha/docs/2007%20LACHS/2007%20LA%20Health%20Survey%20Methods%20(amended).pdf.
72. LosAngelesCountyDepartmentofPublicHealth,OfficeofHealthAssessmentandEpidemiology, Alzheimer’s Disease: An Emerging Public Health Concern, LA Health. October 2008, accessible at www.publichealth.lacounty.gov/ha/reports/LAHealthBrief_2007/Alzheimer’s_Disease.pdf.
73. Bynum, J. Characteristics, Costs, and Health Service Use for Medicare Beneficiaries with a Dementia Diagnosis: Report 1: Medicare Current Beneficiary Survey(Lebanon,N.H.:DartmouthInstituteforHealthPolicyandClinicalCare,CenterforHealthPolicyResearch,January2009).
Appendix 2009 Alzheimer’s Disease Facts and Figures
51. Cohen,CA;Gold,DP;Shulman,KI;Wortley,JT;McDonald,G;andWargon,M. “Factors determining the decision to institutionalize dementing individuals: A prospective study.” Gerontologist 1993; 33(6):714–720.
52. Buhr,GT;Kuchibhatla,M;andClipp,EC.“Caregivers’reasonsfornursinghome placement: Clues for improving discussions with families prior to the transition.” Gerontologist 2006; 46(1):52–61.
53. Schulz,R;O’Brien,AT;Bookwala,J;andFleissner,K.“Psychiatricandphysicalmorbidityeffectsofdementiacaregiving:Prevalence,correlates,and causes.” Gerontologist 1995; 35(6):771–791.
54. Vitaliano,PP;Zhang,J;Scanlan,JM.“Iscaregivinghazardoustoone’sphysical health? A meta-analysis.” Psychological Bulletin; 2003; 129(6):946–972.
55. Lutgendorf,SK;Garand,L;Buckwalter,KC;Reimer,TT;Hong,S-Y;Lubaroff,DM. “Life stress, mood disturbance, and elevated Interleukin-6 in healthy older women.” Journal of Gerontology: Medical Sciences 1999; 54A(9):M434–439.
56. VonKanel,R;Dimsdale,JE;Mills,PJ;Ancoli-Israel,S;Patterson,TL;Mausback,BT;etal.“EffectofAlzheimercaregivingstressandageonfrailtymarkersInterleukin-6,C-ReactiveProtein,andD-Diner.”Journal of Gerontology: Medical Sciences 2006; 61A(9):963–969.
57. Kiecolt-Glaser, JK; Glaser, R; Gravenstein, S; Malarkey, WB; Sheridan, J. “Chronic stress alters the immune response to influenza virus vaccine in older adults.” Proceedings of the National Academy of Sciences 1996; 93:3043–3047.
58. Kiecolt-Glaser,JK;Dura,JR;Speicher,CE;Trask,OJ;Galser,R.“Spousalcaregivers of dementia victims: Longitudinal changes in immunity and health.” Psychosomatic Medicine 1991; 53:345–362.
59. Kiecolt-Glaser,JK;Marucha,PT;Mercado,AM;Malarkey,WB;Glaser,R.“Slowing of wound healing by psychological stress.” Lancet 1995; 346(8984):1194–1196.
60. Shaw,WS;Patterson,TL;Ziegler,MG;Dimsdale,JE;Semple,SJ;Grant,I.“Accelerated risk of hypertensive blood pressure recordings among Alzheimer caregivers.” Journal of Psychosomatic Research 1999; 46(3):215–227.
61. Vitaliano,PP;Scanlan,JM;Zhang,J;Savage,MV;Hirsch,IB;Siegler,I.“APathModelofChronicStress,theMetabolicSyndrome,andCoronaryHeart Disease.” Psychosomatic Medicine 2002; 64:418–435.
62. Schubert,CC;Boustani,M;Callahan,CM;Perkins,AJ;Hui,S;andHendrie,HC. “Acute care utilization by dementia caregivers within urban primary care practices.” Journal of General Internal Medicine 2008; 23(11):1736–1740.
7 1
74. Lewin Group. Saving Lives. Saving Money: Dividends for Americans Investing in Alzheimer Research (Washington, D.C.: Alzheimer’s Association, 2004), accessible at www.alz.org, search “Saving Lives, Saving Money.”
75. Koppel, R. Alzheimer’s Disease: The Costs to U.S. Businesses in 2002 (Washington, D.C.: Alzheimer’s Association, June 2002), accessible at www.alz.org, search “Alzheimer’s Disease: The Costs to U.S. Businesses in 2002.”
76. Maslow,K.“Howmanyhospitalpatientshavedementia?”inN.Silversteinand K. Maslow (eds.) Improving Hospital Care for People with Dementia (NewYork,N.Y.:SpringerPublishingCo.,2006).
77. U.S. Centers for Medicare and Medicaid Services, “Chronic Condition Data Warehouse, Data from OASIS Assessments,” prepared by Jennifer Wolff, Ph.D.,JohnsHopkinsUniversitySchoolofPublicHealth,fortheAlzheimer’s Association, Apr. 11, 2008.
78. Bynum, J. Characteristics, Costs, and Health Service Use for Medicare Beneficiaries with a Dementia Diagnosis: Report 2: National 20% Sample Medicare Fee-for-Service Beneficiaries(Lebanon,N.H.:DartmouthInstituteforHealthPolicyandClinicalCare,CenterforHealthPolicyResearch,January 2009).
79. Naylor,MD;Stephens,C;Bowles,KH;Bixby,MB.“Cognitivelyimpairedolder adults: From hospital to home.” American Journal of Nursing 2005; 105:52–61.
80. Torian,L;Davidson,E;Fulop,G;Fillit,H.“Theeffectofdementiaonacutecare in a geriatric medical unit.” International Psychogeriatrics. 1992; 4(2):231-239.
81. Caspi,E;Silverstein,NM;Porell,F;Kwan,N.“Physicianoutpatientcontacts and hospitalizations among cognitively impaired elderly.” Alzheimer’s and Dementia 2009; 5:30–42.
82. Unpublished tabulations developed by the Urban Institute for the Alzheimer’s Association based on data from the 2000 Medicare Current Beneficiary Survey and Medicare claims for 2000.
83. Johnson, RW; and Wiener, JM. A Profile of Frail Older Americans and Their Caregivers. Washington, D.C.: Urban Institute, February 2006.
84. Fortinsky, RH; Fenster, JR; and Judge, JO. “Medicare and Medicaid home health and Medicaid waiver services for dually eligible older adults: Risk factors for use and correlates of expenditures.” Gerontologist 2004; 44(6):739–749. The data come from assessments of 5,232 elderly people served by Connecticut’s Medicaid home and community-based waiver program.
85. Hirdes,JP;Fries,BE;Morris,JN;etal.,“HomeCareQualityIndicators(HCQIs) Based on the MDS-HC.” Gerontologist. 2004; 44(5):665–679. The data come from assessments of 11,252 low-income adults served by a Michigan home and community-based waiver program and a state-funded case management program.
86. Mitchell,G;Salmon,JR;Polivka,L;Soberon-Ferrer,H.“TheRelativeBenefits and Cost of Medicaid Home- and Community-Based Services in Florida.” Gerontologist. 2006; 46(4):483–494. The data come from assessmentsof6,014adultsaged60+servedbyanyoffiveFloridaMedicaid home and community-based waiver programs.
87. PartnersinCaregiving.A National Study of Adult Day Services 2001–2002. Winston-Salem,N.C.:WakeForestUniversitySchoolofMedicine,2002.
88. O’Keeffe, J; and Siebenaler, K. Adult Day Services: A Key Community Service for Older Adults. (Washington, D.C., U.S. Department of Health andHumanServices,OfficeoftheAssistantSecretaryforPlanningandEvaluation,July2006).
89. Hyde,J;Perez,R;Forester,B.“DementiaandAssistedLiving.”The Gerontologist 2007; vol. 47, Special Issue III: 51-67.
90. U. S. Department of Health and Human Services, Centers for Medicare and Medicaid Services, Nursing Home Data Compendium2008Edition.
91. American Health Care Association, Medical Condition–Mental Status CMS OSCAR Data Current Surveys, June 2008.
92. American Health Care Association, Nursing Facility Beds in Dedicated Special Care Units CMS OSCAR Data Current Surveys, June 2008.
93. American Health Care Association, Nursing Facility Beds in Dedicated Special Care Units CMS OSCAR Data Current Surveys, June 2004.
94. MetLifeMatureMarketInstitute&LifePlans,Inc.The MetLife Market Survey of Adult Day Services and Home Care Costs, September 2008.
95. MetLifeMatureMarketInstitute&LifePlans,Inc.The MetLife Market Survey of Nursing Home and Assisted Living Costs, October 2008.
96. Purcell,P.CRS Report for Congress: Income and Poverty Among Older Americans in 2007. U.S. Congress, Congressional Research Service, Oct. 3, 2008.
97. Kaiser Commission on Medicaid and the Uninsured. The Distribution of Assets in the Elderly Population Living in the Community. Washington, D.C.: Henry A Kaiser Family Foundation, 2005.
98. Coronel S. Long Term Care Insurance in 2002. America’s Health Insurance Plans,2004.
99. GeorgetownUniversityLong-TermCareFinancingProject.FactSheet:National Spending for Long-Term Care, January 2007.
2009 Alzheimer’s Disease Facts and Figures Appendix
7 2
113. JackJr.,CR;Petersen,RC;Xu,YC;etal.“PredictionofADwithMRI-basedhippocampal volume in mild cognitive impairment.” Neurology 1999;52:1397–1403.
114. JackJr.,CR;Petersen,RC;Xu,Y;etal.“Ratesofhippocampalatrophycorrelate with change in clinical status in aging and AD.” Neurology 2000;55:484–489.
115. Killiany, RJ ; Gomez-Isla, T ; Moss, M ; et al. “Use of structural magnetic resonance imaging to predict who will get Alzheimer’s disease.” Annals of Neurology 2000; 47:430–439.
116. DeCarli,C.“Mildcognitiveimpairment:Prevalence,prognosis,aetiologyand treatment.” Lancet Neurology 2003; 2:15–21.
117. Fox,NC;Crum,WR;Scahill,RI;Stevens,JM;Janssen,JC;Rossor,MN.“Imaging of onset and progression of Alzheimer’s disease with voxel-compression mapping of serial magnetic resonance images.” Lancet 2001; 358:201–205.
118. Hansson,O;Zetterberg,H;Buchhave,P;Londos,E;Blennow,K;Minthon,L. “Association between CSF biomarkers and incipient Alzheimer’s disease in patients with mild cognitive impairment: A follow-up study.” Lancet Neurology 2006; 5:228–234.
119. Jagust, W. “Is amnestic mild cognitive impairment always AD?” Neurology 2008; 70:502–503.
120. Mueller, SG; Weiner, MW; Thal, LJ; et al. “The Alzheimer’s Disease NeuroimagingInitiative.”InPettrella,JR;Doraiswamy,PM;eds.“NeuroimagingClinicsofNorthAmerica:Alzheimer’sdisease:100yearsofprogress.”Philadelphia:ElsevierSaunders,2005:869–877.
121. Petersen,RC;Thomas,RG;Grundman,M;etal.“DonepezilandvitaminEin the treatment of mild cognitive impairment.” New England Journal of Medicine 2005; 352:2379–2388.
122. Goldstein,MK;Gwyther,LP;Lazaroff,AE;Thal,LJ.“ManagingearlyAlzheimer’s disease.” Patient Care1991;November15:44–70.
123. Thal, LJ; Ferris, SH; Kirby, L; et al. “A randomized, double-blind study of rofecoxib in patients with mild cognitive impairment.” Neuropsychopharmacology 2005; 30:1204–1215.
124. Gauthier,S;Reisberg,B;Zaudig,M;etal.“Mildcognitiveimpairment.”Lancet 2006; 367:1262–1270.
125. Petersen,RC.“Mildcognitiveimpairment:Usefulornot?”Alzheimer’s & Dementia 2005; 1:5–10.
126. Petersen,RC.“Mildcognitiveimpairment.”Continuum 2007; 13:15–38.
Appendix 2009 Alzheimer’s Disease Facts and Figures
100. Cohen,MA;Miller,JS;ShiX.Service Use and Transitions: Decisions, Choices and Care Management Among an Admissions Cohort of Privately Insured Disabled Elders, U.S. Department of Health and Human ServicesassistantsecretaryforPlanningandEvaluationOfficeofDisability,AgingandLong-TermCarePolicy,December2006.
101. Neuman,P;Cubanski,J;Desmond,Ka;Rice,TH.“Howmuch‘skininthegame’ do Medicare beneficiaries have? The increasing financial burden of health care spending, 1997–2003.” Health Affairs 2007; 26(6):1692–1701.
102. Caplan,C;andBrangan,N.Out-of-Pocket Spending on Health Care by Medicare Beneficiaries Age 65 and Older in 2003.AARPPublicPolicyInstitute, September 2004.
103. NationalHospiceandPalliativeCareOrganization,NHPCO’s Facts and Figures: Hospice Care in America, October 2008.
104. Medpac.“EvaluatingMedicare’sHospiceBenefit,”inReport to the Congress: Reforming the Delivery System, June 2008.
105. NationalHospiceandPalliativeCareOrganization,2004 National Summary Statistics and Trends.
106. Palmer,K;Backman,L;Winblad,B;Fratiglioni,L.“Mildcognitiveimpairment in the general population: Occurrence and progression to Alzheimer disease.” American Journal of Geriatric Psychiatry 2008;16:603–611.
107. Manly,JJ;Tang,MX;Schupf,N;Stern,Y;Vonsattel,JP;Mayeux,R.“Frequency and course of mild cognitive impairment in a multiethnic community.” Annals of Neurology 2008; 63:494–506.
108. Fischer,P;Jungwirth,S;Zehetmayer,S;etal.“Conversionfromsubtypesof mild cognitive impairment to Alzheimer dementia.” Neurology 2007; 68:288–291.
109. Lopez,OL;Jagust,WJ;DeKosky,ST;etal.“Prevalenceandclassificationof mild cognitive impairment in the cardiovascular health study cognition study.” Archives of Neurology 2003;60:1385–1389.
110. Roberts,RO;Geda,YE;Knopman,DS;etal.“TheMayoClinicStudyofAging: Design and sampling, participation, baseline measures and sample characteristics.” Neuroepidemiology 2008; 30:58–69.
111. Hanninen, T; Hallikainen, M; Tuomainen, S; Vanhanen, M; Soininen, H. “Prevalenceofmildcognitiveimpairment:Apopulation-basedstudyinelderlysubjects.”Acta Neurologica Scandinavica 2002; 106:148–154.
112. Petersen,RC;Smith,GE;Waring,SC;Ivnik,RJ;Tangalos,EG;Kokmen,E.“Mild cognitive impairment: clinical characterization and outcome.” Archives of Neurology 1999;56:303–308.

7 3
Adult day center A center providing social, medical and/or specialized services during the day for functionally or cognitively impaired adults needing supervised care in a safe setting. Services may include social activities, meals, exercise, transportation, mental stimulation and personal care such as bathing.
Age-adjusted rates Ratescalculatedafteradjustingfortheeffectofagedisparitiesinthepopulations being examined. This enables reliable population comparisons that are not skewed by age disparities.
Alzheimer’s disease A form of dementia in which physical changes in the brain cause early symptoms such as difficulty in remembering names and recent events. Apathy and depression may also be early symptoms. Later symptoms include impaired judgment,disorientation,confusionandbehaviorchanges.Initslateststages,the brain changes of Alzheimer’s cause difficulty with eating and drinking. Alzheimer’s is ultimately fatal.
Alzheimer’s special care unit A unit in a long-term care facility that provides specialized services for individuals with Alzheimer’s disease.
APOE-e4 ApolipoproteinE(APOE)-e4,oneofthreecommonformsoftheAPOEgene. TheAPOEgeneprovidestheblueprintforaproteinthatcarriescholesterolinthebloodstream.EveryoneinheritsoneformoftheAPOEgenefromeachparent.ThosewhoinheritoneAPOE-e4genehaveincreasedriskofdevelopingAlzheimer’sdisease.ThosewhoinherittwoAPOE-e4genesareatevenhigherrisk.However,inheritingoneortwoAPOE-e4genesdoesnotguaranteethatanindividual will develop Alzheimer’s.
Assisted living residence Assisted living residences generally provide 24-hour staffing, recreational activities, meals, housekeeping, laundry and transportation to their residents, who typically need help with some but not all activities of daily living.
Beta-amyloid A protein fragment that accumulates into the amyloid plaques in the brain that areonehallmarkofAlzheimer’sdisease.Elevatedlevelsofbeta-amyloid(causedby overproduction of beta-amyloid or the body’s reduced ability to remove beta-amyloid) are believed to interfere with brain cells’ ability to communicate with each other, leading to a cascade of damaging events ending in cell death.
Caregiver A person who provides care for an individual needing help due to illness or injury.Acaregivermaybeafamilymember,friendorpaidhealthprofessional.
Clinical trials Medical studies involving human volunteers. Before approving a drug for use, the U.S. Food and Drug Administration (FDA) requires that the drug first be shown successful in laboratory or animal studies. Only then can clinical trials involving human volunteers begin.
Phase I clinical trials typically enroll fewer than 100 individuals and are primarily concerned with assessing risks and side effects associated with a drug.
Phase II clinical trials typically enroll up to a few hundred volunteers and focus on showing whether the drug is safe and determining the best dose of the drug.
Phase III clinical trials enroll several hundred to thousands of volunteers, often at multiple study sites in the United States and sometimes abroad. They provide the chief evidence for safety and effectiveness that the FDA will consider in deciding whether to approve a drug.
Phase IV clinical studies, also called post-marketing studies, are often required by the FDA after a drug is approved. The study sponsor must monitor the health of individuals taking the drug to gain further insight into its long-term safety and effectiveness and the best way to use it.
Coexisting condition A health condition that already exists when another health condition develops. Since most cases of Alzheimer’s disease develop at age 65 or older, individuals with Alzheimer’s commonly have other age-related health issues, such as heart disease, hypertension or diabetes. Alzheimer’s may affect management of coexisting conditions.
Comorbidity See Coexisting condition.
Dementia To be classified as dementia, the condition must include a decline in memory and in at least one of four specific cognitive abilities. The decline in cognitive ability must be severe enough to interfere with daily life. Dementia is caused by various diseases that result in damaged brain cells. Alzheimer’s disease is one form of dementia.
Direct costs of care Costs such as hospital stays, emergency room visits, physician visits, medications, services of paid caregivers and assisted living, adult day care, home healthcare and nursing home expenses that are associated with caring for an individual with a given health condition.
2009 Alzheimer’s Disease Facts and Figures Appendix
Definitions
7 4
Disease-modifying therapies Therapies designed to slow or stop the progression of a disease. Many disease-modifyingtherapiesforAlzheimer’sareinclinicaltrials.Existingtherapies for Alzheimer’s are symptomatic, improving the symptoms of Alzheimer’s but doing nothing to stop the brain cell death of Alzheimer’s that is ultimately fatal.
Early-onset Alzheimer’s disease SeeYounger-onsetAlzheimer’sdisease.
Early-stage Alzheimer’s disease Alzheimer’s in which the symptoms are relatively mild, allowing most individuals to continue to do simple daily routines.
FDA The mission of the U.S. Food and Drug Administration (www.fda.gov) is to “protect the public health by assuring the safety, efficacy and security of human and veterinary drugs, biological products, medical devices, the nation’s food supply, cosmetics and products that emit radiation. The FDA is also responsible for advancing the public health by helping to speed innovations that make medicines and foods more effective, safer and more affordable and for helping the public get the accurate, science-based information they need to use medicines and foods to improve their health.” The FDA has approved five drugs for the treatment of Alzheimer’s diseasesymptoms:galantamine(Razadyne™),rivastigmine(Exelon™),donepezil (Aricept™), tacrine (Cognex™, now rarely used) and memantine (Namenda™).
Home health care Health care in which the provider comes to the individual’s home. Services might include companion services; personal care such as assistance with bathing, dressing, toileting and exercising; homemaker or maid services such as help with laundry, shopping, and preparing meals; and skilled care services including helping with medication.
Hospice A service that provides pain management, comfort care and other end-of-life services. Hospice is covered by Medicare if a physician certifies that the individual is likely to die within six months.
Incidence The number of new cases of a condition among the population at risk (those able to develop the condition) in a given period.
Indirect costs of care Costs to businesses such as missed work and decreased productivity that are associated with medical illness.
Infarct Dead tissue caused by an obstructed blood supply. One type of dementia is multi-infarct dementia, which can be caused by a series of small strokes that block arteries and decrease blood flow to parts of the brain.
Late-onset Alzheimer’s disease Alzheimer’s disease developing at or after age 65.
Long-distance caregiver AsdefinedbytheNationalInstituteonAging,acaregiverlivingmorethanonehour away from the individual (usually a parent) needing help with care.
Long-term care AccordingtoMedicare.gov,“a‘variety’ofservicesthathelppeoplewithhealth or personal needs and activities of daily living over a period of time. Long-term care can be provided at home, in the community or in various types of facilities, including nursing homes and assisted living facilities. Most long-term care services help with activities of daily living, such as eating, bathing, dressing or moving about. Medicare doesn’t pay for such care unless it’s part of certain short-term stays following hospitalization.”
Medicaid A program that covers nursing home care and various long-term care services for people with low income and few assets. The federal government and states share in managing and funding Medicaid. Medicaid programs vary from state to state, but most healthcare costs are covered for those who qualify for both Medicare and Medicaid.
Medicare A federal health insurance program that covers most hospital and other healthcare services for people aged 65 and older and younger people with disabilities. Individuals may still incur significant out-of-pocket expenses for Medicare premiums, deductibles and copayments, as well as for other healthcare costs not covered by Medicare.
Medicare beneficiary An individual receiving Medicare benefits.
Mild cognitive impairment (MCI) A condition in which an individual has problems with memory, language or another essential cognitive function that are severe enough to be noticeable to others and show up on tests, but not severe enough to interfere with daily life. Those with MCI are at greater risk of developing Alzheimer’s disease than those without MCI.
Mortality rate Death rate.
Nursing home AccordingtoMedicare.gov,“Nursinghomeisatermthatincludesboth skilled nursing facilities and nursing facilities. Skilled nursing facilities are thosethatparticipateinbothMedicareandMedicaid.NursingfacilitiesarethosethatparticipateinMedicaidonly.Nursinghomesprimarilyengageinproviding residents skilled nursing care and related services for residents who require medical or nursing care and rehabilitation services for the rehabilitationofinjured,disabledorsickpersons.”
Appendix 2009 Alzheimer’s Disease Facts and Figures
7 5
Potential preventable hospitalization A hospitalization for a condition that can be prevented altogether or whose course can be mitigated with optimum outpatient management, thus preventing the hospitalization.
Prevalence The number of existing cases of a condition among the population at risk (those able to develop the condition) in a given period.
Skilled nursing facility A health care facility participating in both Medicaid and Medicare that provides for needs including rehabilitation, intravenous care and high level/high acuity nursing care. Skilled nursing care is available 24 hours a day. Services are provided under the full-time supervision of a physician or registered nurse. Most nursing homes provide both skilled nursing care and custodial care (care for personal needs such as bathing and eating). The Medicare skilled nursing care benefit is time limited and usually goes into effect after hospitalization.
Synapse Ajuncturebetweenbrainnervecells(neurons)wheremessagesfrom one cell are communicated to neighboring cells. In Alzheimer’s disease, information transfer at the synapses begins to fail, the number of synapses declines and neurons eventually die. On autopsy, the brains of individuals with advanced Alzheimer’s show dramatic shrinkage from cell loss and widespread debris from dead and dying neurons.
Tau A protein that helps brain nerve cells (neurons) maintain their physical structure, including the structure of microtubules through which cells are nourished. In Alzheimer’s disease, tau protein accumulates into twisted strands called tangles that interrupt the flow of nutrients and ultimately cause cell death. Tau tangles are a hallmark of Alzheimer’s disease.
Younger-onset Alzheimer’s disease Alzheimer’s disease in which symptoms appear before age 65.
2009 Alzheimer’s Disease Facts and Figures Appendix

7 6
Notes

The Alzheimer’s Association is the leading voluntary health organization
in Alzheimer care, support and research.
Our mission is to eliminate Alzheimer’s disease through the advancement
of research; to provide and enhance care and support for all affected; and to
reduce the risk of dementia through the promotion of brain health.
Our vision is a world without Alzheimer’s disease.
Alzheimer’s Association National Office 225 N. Michigan Ave., Fl. 17 Chicago, IL 60601-7633
Alzheimer’s Association Public Policy Office 1319 F. Street N.W. Suite 500 Washington, D.C. 20004-1106 1.800.272.3900www.alz.org
021209.01 500-60-0001TM
Cert no. SCS-COC-001528