Embed Size (px)
Citation preview
Production Planning Process Optimization -
A multi agent and layer based simulator design
MAGISTERARBEIT
zur Erlangung des akademischen Grades
Magister der Sozial- und Wirtschaftswissenschaften (Mag.rer.soc.oec)
im Rahmen des Studiums
Wirtschaftsinformatik
ausgeführt von
Uwe Pascal Szabo Matrikelnummer 0203043
an der: Fakultät für Informatik der Technischen Universität Wien
Betreuerin/Betreuer: ao. Univ. Prof. Dipl.-Ing. Dr. techn. Mag. Stefan Biffl Mitwirkung: Univ.-Ass. Mag. Thomas Moser
Wien, April 2009 _______________________ ______________________ (Unterschrift Verfasser/in) (Unterschrift Betreuer/in)
Technische Universität Wien
A-1040 Wien ▪ Karlsplatz 13 ▪ Tel. +43/(0)1/58801-0 ▪ http://www.tuwien.ac.at

Acknowledgement
I would like to thank the IFS institute for providing me the possibility to write this thesis to a project concerning both technical and economical topics meeting my interest. Especially I want to thank Mag. Thomas Moser and Dipl.-Ing. Dr. Stefan Biffl for supporting me at any time they could during the elaboration of this document. Furthermore I want to show gratitude to my colleagues Clemens Gondowidjaja, Dindin Wahyudin, and Klemens Kunz for their time and ideas during many discussions which gave me great input for my master thesis. Last but not least I would like to thank my family and all my friends for supporting me during my study period and especially during the elaboration of my diploma thesis.

Erklärung / Affirmation
Deutsch
Hiermit erkläre ich, dass ich diese Arbeit selbständig verfasst habe, dass ich die verwendeten Quellen und Hilfsmittel vollständig angegeben habe und dass ich die Stellen der Arbeit – einschließlich Tabellen, Karten und Abbildungen –, die anderen Werken oder dem Internet im Wortlaut oder dem Sinn nach entnommen sind, auf jeden Fall unter Angabe der Quelle als Entlehnung kenntlich gemacht habe. Weiters bestätige ich, dass diese Ausarbeitung bisher noch nirgends veröffentlicht oder anderweitig eingereicht wurde!
English
I declare that I have elaborated this thesis by myself without using of other support than the devices mentioned in the elaboration. These parts are marked as citations. I also confirm that this thesis was not yet published and submitted to other examination boards!
__________________________ Wien, April 2009 Uwe Szabo (Matr.Nr.: 0203043)
Curriculum Vitæ
Uwe Pascal Szabo, Bakk. Geboren am 14.Mai 1982 Familienstand ledig Staatsbürgerschaft Osterreich Wohnadresse A-7501 Unterwart, HNr. 235 Führerschein A, B Fremdsprachen • Englisch (verhandlungssicher) • Ungarisch (Maturaniveau) Spezielle fachliche Interessen
• Prozessanalyse und –optimierung, Produktion & Logistik • Softwaredesign, Modellierung, Datenbanken • Knowledge-, Kompetenz- und Projektmanagement • Persönlichkeitsentwicklung, Personalentwicklung • Softskilltraining, Organisationsentwicklung
Schulische Ausbildung und Studium 10/2002 – 02/2006 Magisterstudium Wirtschaftsinformatik (Studienplan 2001) Interuniversitär an der Universität Wien und TU Wien Kernfächer
- Strukturwissenschaften - Wirtschaftswissenschaften - Informationstechnologie - Wirtschaftsinformatik
Fachspezifische Ausbildung - themenübergreifende Kernfachkombinationen
• Projekt- und Qualitätsmanagement � Magisterarbeit: Production Planning Process
Optimization - a multi agent and layer based simulator design
• Projektmanagement und Informations-Kommunikations-Technologie
- freie Wahlfächer 10/2002 – 02/2006 Bakkalaureatsstudium Wirtschaftsinformatik (Studienplan 2001) Interuniversitär an der Universität Wien und TU Wien Kernfächer
- Strukturwissenschaften - Wirtschaftswissenschaften - Informationstechnologie - Wirtschaftsinformatik
Fachspezifische Ausbildung - themenübergreifende Kernfachkombinationen
• Entscheidungsunterstützung im öffentlichen Sektor � (1) Bakkalaureatsarbeit: Exekutive im Web –
Bewertung des behördenexternen Informationsangebotes
� (2) Bakkalaureatsarbeit: Enterprise Resource Planning Systeme
• Projekt- und Qualitätsmanagement • ICT- Projektmanagement und
Organisationsentwicklung - freie Wahlfächer
09/1995 – 06/2000 Bundeshandelsakademie Oberwart
Kaufmännische Ausbildung mit Kernfächern wie - Projektmanagement und Organisation, - Präsentationstechnik & Persönlichkeitsbildung - Natur- und Geisteswissenschaften (Biologie, Geographie, - Chemie, Physik, Geschichte)
und fachspezifischer Ausbildung in - Wirtschaftsinformatik - Betriebswirtschaft & Marketing - Rechnungswesen & Controlling - Textverarbeitung - Businesstraining und Übungsfirmen
09/1987 – 06/1995 Volksschule Unterwart / Hauptschule Oberwart Grundschulausbildung (Geistes- und naturwissenschaftlicher Unterricht, Deutsch, Englisch, Ungarisch, Mathematik) Praktika und Berufserfahrung 03/2008 – 10/2008 befristetes Dienstverhältnis als Entwickler sIT Solutions AT Spardat GmbH Deployment von SAS-Programmen zur Risikobewertung in unterschiedlichen Entwicklungsumgebungen bzw. neuer Hardwareumgebung 07/2005 – 09/2005 befristetes Dienstverhältnis als Urlaubsvertretung und etwaigen 07/2004 – 09/2004 Engpässen durch Personalfluktuation oder Krankenständen 07/2003 – 09/2003 bei der LCP GmbH bzw. Spedition Ludwig Pall GmbH 06/2001 – 09/2002 Fixanstellung als Büroangestellter Lagerverwaltung, Sachbearbeiter, IT-Mitarbeiter Logistik Center Pall GmbH, A-7503 Großpetersdorf 09/2000 – 05/2001 Präsenzdienst Fernmeldezug der Stabskompanie des Jägerbataillon 19 Turba-Kaserne Pinkafeld, A-7423 08/1999 Ferialpraxis Burgenländische Gebietskrankenkasse BGKK Oberwart, A-7400 administrative Tätigkeiten zur Unterstützung der Angestellten Wien, April 2009
i
Kurzfassung
Produktionsautomationssysteme sind komplexe Systeme mit viele Entitäten (Roboter, Transportsysteme usw.) die mannigfaltig aufeinander einwirken und zusammenspielen um das Ziel einer Produktendfertigung zu ermöglichen. Multiagenten-Systeme basierend auf verteilter Kontrolle sind der praktikabelste Ansatz die ansteigende Kompliziertheit solcher Systeme in den Griff zu bekommen und gleichzeitig eine flexible Anpassung des Produktionsautomationssystems an variable Rahmenbedingungen zu gewährleisten (z.B. Änderung von Produktionsstrassen oder die Koordination von Transportelementen). Für solch kritische Produktionsautomationssysteme ist eine Überprüfung aller Schritte im Entwicklungsprozess erforderlich um ein sicher funktionierendes System zu gewährleisten. Qualitätsmessungen zur Sicherstellung der Korrektheit von Systemelemente stellen bei der Zielerreichung daher einen wichtigen Schritt dar. Die Softwaresimulation des Werkstatt-Systems erlaubt sowohl Leistungsmessung einer Systemkonfiguration als auch schnellere und preiswertere Reaktion auf sich ändernde Voraussetzungen. Hinzu kommt, dass die Softwaresimulation von Produktionsautomationssystemen immer mehr einen praktikable Möglichkeit darstellt, um Produktionsvorgänge zu planen und/oder zu optimieren. Entwickler von Simulationen für ein Produktionsautomationssystem brauchen Datenmodelle, die sowohl das Modellieren von abstrakten Klassendefinitionen als auch die konkreten Beispiele unterstützen, um vorgeschlagene Anlagenkonfigurationen gültig abbilden zu können. Weiters würde ein durchgehendes Datenmodell die nahtlose Transformation von Datenmodellen zwischen allen relevanten Schritten im Technikprozess (vertikale Transformation und Überprüfung von relevanten Daten von allgemeinen Information und Prozess-Beschreibung zur Beziehung zwischen Klassen, Attributen und ihren Beispielen) unterstützen. Während der Konstruktion eines auf mehreren Agenten basierenden Simulators können Definitionen von Design- und der Koordinationsmuster helfen, die optimale Lösung zu finden und Durchführungsprobleme im Vorhinein vermeiden. Gleichzeitig dienen sie als Beschreibung für Entwickler während des Implementierung. Diese Muster sind relevante Koordinations- und Zusammenarbeitsbeschreibungen von Rollen und Agenten, die erfasst und dem Systemanalytiker mitgeteilt werden müssen. Diese Arbeit sieht als Ansatz zur Definition und Konfiguration des Datenmodells für den geschaffenen Simulator des Produktionsautomationssystems eine Ontologie vor. Besonderer Fokus liegt dabei auf der Entwicklung und Konfigurierbarkeit von unterschiedlichen Systemvarianten sowie die Möglichkeit das Simulationssystem in die Produktionsplanung und Optimierung einfließen zu lassen. Die praktische Anwendung des Ontologieansatzes bezieht sich im Projekt auf die Generation von Testdaten für Testfälle. Außerdem erlaubt die Simulation dem Benutzer, als Auftragsverteiler zu handeln, um verschiedene Strategien für die Produktionsreihenfolge zu testen, den Prozess zu optimieren und so mögliche Misserfolge zu erkennen um die Ausfallzeit des gesamten Systems zu minimieren. Der Simulator soll Information für die Ressourcenplanung der Unternehmung sammeln und den Produktionsplanungsprozess unterstützen um einen entscheidenden Beitrag zur erfolgreichen Produktionszielerreichung leisten. Zusammenarbeit aller beteiligten Rollen des Fertigungsprozesses leisten. Dadurch sollen Systemrekonfigurationen ermöglicht werden, um vorhandenes Einsparungspotential zu erkennen und eine möglichst optimale Lösung des Produktionsproblems mit möglichst geringem Aufwand zu erreichen. Die Evaluierung des Konzepts für die Datenmodellierung unter Verwendung einer Ontologie sowie des Ansatzes der Produktfamilien zur Softwareentwicklung im Bereich der Fertigungsstrassenproduktion findet durch einen abschließenden Vergleich des gewählten Prinzips mit jenem der traditionellen UML-Modellierung statt. Ein Modell der mit der Simulation nachempfundenen Fertigungsstrasse wurde am Odo Struger Laboratorium des ACIN-Instituts an der Technischen Universität Wien errichtet. Der implementierte Softwaresimulator basiert auf dem Produktionssystemsimulierungsbausatz der Firma Rockwell Automation International aus Prag. Damit liegen die Hauptforschungsbeiträge der Ausarbeitung auf dem Prozessentwurf für die Auftragsabwicklung, der Simulationsunterstützung zur Optimierung der Produktionsplanung sowie dem Designprozess des Simulationssystems mit Ontologieansatz als Wissensbasis für den Simulator.
ii
Abstract
Production Automation Systems are complex systems. They typically have many entities like robots, transport systems, etc. that interact in complex ways to provide production automation functions like assembly of products. The increasing complexity of these systems makes central control more and more difficult. Therefore systems with distributed control are areas of intense research such as multi-agent systems. Moreover, changing requirements for production automation systems require better system and model flexibility for e.g. easy-to-change workshop layouts or coordination of transportation elements. Meeting all this tasks makes the design of a production automation system a challenge hard to solve for designers and system engineers. For safety-critical systems like production automation systems, verification is required for all steps in the development process. Testing aims at measuring the quality of executable system elements, especially the validity of a configuration and correctness of calculated results. A particular challenge is measurement of non-functional quality requirements such as system performance before the actual hardware system is built. Software simulation of the workshop system would allow both performance measurement of a configuration and faster, cheaper reaction to changing requirements, however the validity of the simulation has to be assured. On top of this, software simulation of production automation systems can get more and more a sufficient part during the production planning and optimization process. Designers of a simulation for a production automation system need data models which support both the modelling of abstract class definitions and concrete instances to validate proposed system configurations. Further, a continuous data model would support seamless transformation of data models between all relevant steps in the engineering process (vertical transformation and verification of relevant data from general information and process description towards relation between classes, attributes and their instances). During the construction of a multi agent based simulator, definitions of design and coordination patterns can help to find the optimal solution to solve implementation problems. At the same time they serve as description for engineers during the construction. These patterns are relevant coordination and cooperation descriptions of roles and agents which have to be captured and communicated for the system engineers. In this work, we propose an ontology approach for the definition and configuration of the data model for the created simulation of production automation system. Particular focus is on the development and configuration of system variants and how the designed simulation system can help in production planning and optimization. The practical application of the ontology approach in the project is to automatically generate test cases for test suites and the automatic building and testing of system variants and data analysis of test runs. Furthermore the simulation allows user to act as dispatcher to test different assembly strategies to optimize the process and handle unforeseeable failures to minimize the downtime of the whole system. The designed simulator should gather important information for the resource planning of a company which is a crucial part for a successful cooperation between all involved roles of the production process and help to re-define it if there are existing saving potentials to get closer to an optimal solution with minimal increasing efforts. The evaluation of the data model concept using an ontology and product line configuration approach in the context of an assembly workshop takes places by a comparison with traditional modelling approaches using UML. A model of the assembly workshop is situated at Odo Struger Lab of the ACIN institute of TU Vienna. The software simulator has been implemented based on a production system simulation kit from Rockwell Automation International, Prague. So, the main research contributions of this elaboration are focused on a process design for order management, the simulation support to optimize the production planning as well as the design process of the simulation system with ontology support as knowledge base for the simulator.
iii
Table of contents
(1) INTRODUCTION ....................................................................................................................................... 1
1.1 RESEARCH PROJECT DESCRIPTION......................................................................................................... 3 1.2 THESIS TOPIC PREAMBLES..................................................................................................................... 7
1.2.1 Mass Customization ........................................................................................................................ 7 1.2.2 Information systems in production process..................................................................................... 8 1.2.3 Production simulation................................................................................................................... 15 1.2.4 Ontology support for production simulation................................................................................. 16 1.2.5 Production planning and control .................................................................................................. 16 1.2.6 Optimization.................................................................................................................................. 18
1.3 STRUCTURE OF THE THESIS ................................................................................................................. 19
(2) RELATED WORK.................................................................................................................................... 20
2.1 PRODUCTION SCHEDULING ................................................................................................................. 20 2.1.1 Principles ...................................................................................................................................... 20 2.1.2 Scheduling strategies for assemble production............................................................................. 29 2.1.3 Advanced planning systems (APS) ................................................................................................ 32 2.1.4 Simulation ..................................................................................................................................... 35
2.2 ENTERPRISE RESOURCE PLANNING (ERP).......................................................................................... 36 2.2.1 Definition ...................................................................................................................................... 37 2.2.2 Special requirements regarding a modern ERP-software-solution............................................... 37 2.2.3 Characterization of an ERP system............................................................................................... 39 2.2.4 Risk of the integration of ERP-systems ......................................................................................... 39
2.3 SOFTWARE ENGINEERING ................................................................................................................... 41 2.3.1 Unified Modelling Language (UML) ............................................................................................ 41 2.3.2 Development Process .................................................................................................................... 43
2.4 ONTOLOGY ......................................................................................................................................... 54 2.4.1 Definition ...................................................................................................................................... 54 2.4.2 How can we use ontologies for the project of production simulation? ......................................... 56 2.4.3 Components of an ontology........................................................................................................... 57 2.4.4 Description of an ontology............................................................................................................ 59 2.4.5 OWL language synopsis ................................................................................................................ 60 2.4.6 What are the advantages of ontologies and their separation into areas? ..................................... 60 2.4.7 Architecture of the designed ontology for the production simulation project ............................... 62
2.5 PATTERNS ........................................................................................................................................... 64 2.5.1 What are patterns and why are they useful? ................................................................................. 64 2.5.2 How to describe design pattern..................................................................................................... 65 2.5.3 Categorization of design patterns ................................................................................................. 65
2.6 PRINCIPLES OF MULTI AGENT SYSTEMS (MAS) ................................................................................. 66 2.6.1 Agent-oriented software engineering ............................................................................................ 67 2.6.2 Acting cycle of intelligent agents................................................................................................... 68 2.6.3 Related Fields of MAS in Computer Science................................................................................. 69 2.6.4 Areas of application for MAS........................................................................................................ 70 2.6.5 FIPA-Standard .............................................................................................................................. 72
iv
2.6.6 Communication between agents.................................................................................................... 73
(3) RESEARCH ISSUES AND RESEARCH METHOD ............................................................................ 76
3.1 PROBLEM STATEMENT ........................................................................................................................ 76 3.2 RESEARCH METHOD ............................................................................................................................ 76 3.3 RESEARCH ISSUES ............................................................................................................................... 77
3.3.1 Production planning process design with simulation support ...................................................... 77 3.3.2 SAW demonstrator simulator design and development process.................................................... 78 3.3.3 Knowledge management for production planning simulator ........................................................ 78
3.4 GOALS AND RESEARCH CONTRIBUTION............................................................................................... 78 3.4.1 Production process cycle and simulation design .......................................................................... 79 3.4.2 Ontology area approach for data model ....................................................................................... 80
(4) PRACTICAL PART ................................................................................................................................. 82
4.1 ORDER MANAGEMENT........................................................................................................................ 82 4.2 MANUFACTURING AGENT SIMULATION TOOL (MAST) ..................................................................... 84 4.3 SIMULATION OF ASSEMBLY WORKSHOP (SAW) ................................................................................ 87
4.3.1 Production process cycle – economic process of order fulfilment ................................................ 88 4.3.2 Decision of software system design............................................................................................... 93 4.3.3 Design techniques and implementation technologies.................................................................... 96 4.3.4 Prototype of the SAW demonstrator ............................................................................................ 115 4.3.5 Work order scheduling strategies implemented in SAW project ................................................. 125 4.3.6 Summary...................................................................................................................................... 127
(5) DISCUSSION OF RESULTS ................................................................................................................. 128
5.1 EVALUATION OF THE SAW DEMONSTRATOR .................................................................................... 128 5.1.1 SAW Test Management System (SAW TMS)................................................................................ 128 5.1.2 Simulation input parameters ....................................................................................................... 129 5.1.3 Test run results ............................................................................................................................ 135
5.2 OPTIMIZATION POTENTIALS .............................................................................................................. 139 5.3 COMPARISON OF UML- & ONTOLOGY PROCESSES APPROACHES...................................................... 141
5.3.1 Reconfiguration Process in the system based on UML ............................................................... 141 5.3.2 Reconfiguration process in the system based on ontology .......................................................... 142 5.3.3 Comparison of UML- & ontology processes for reconfiguration ............................................... 143 5.3.4 Further differences between approaches .................................................................................... 144
5.4 SAW PROJECT RECOGNITIONS .......................................................................................................... 145
(6) CONCLUSION AND FURTHER WORK............................................................................................ 147
6.1 RESEARCH RESULTS.......................................................................................................................... 147 6.2 FURTHER WORK IN SAW PROJECT .................................................................................................... 149
6.2.1 Coordination of message traffic .................................................................................................. 149 6.2.2 Fault tolerance ............................................................................................................................ 149 6.2.3 Shop layout.................................................................................................................................. 150 6.2.4 Input parameters ......................................................................................................................... 150 6.2.5 Workflow scheduling strategies................................................................................................... 151
v
6.2.6 Dynamic dispatching................................................................................................................... 151 6.2.7 Integration of Naiad.................................................................................................................... 151
REFERENCES.................................................................................................................................................. 153
BOOKS ............................................................................................................................................................ 153 SCIENTIFIC PAPERS & TECHNICAL REPORTS .................................................................................................... 154 WEB RESOURCES............................................................................................................................................. 156
APPENDIX........................................................................................................................................................ 158
UML DIAGRAM TYPES [A10] [C20] ................................................................................................................ 158 CATALOGUE OF DESIGN PATTERNS [A7] ......................................................................................................... 160 OWL LANGUAGE SYNOPSIS ............................................................................................................................ 162 ABBREVIATIONS OF PRODUCTION SCHEDULING STRATEGIES .......................................................................... 167 DESCRIPTION OF PRODUCTION SCHEDULING STRATEGIES ............................................................................... 168
vi
Index of tables
TABLE 1: MAIN TARGET (ROLES/TASKS) AUDIENCE FOR THE THESIS ........................................................................ 2 TABLE 2: LAYER TRANSITION WITHIN THE PROJECT ................................................................................................. 6 TABLE 3: REASONS FOR USING (NOT USING) AUTOMATED SYSTEMS [B11]............................................................... 9 TABLE 4: COMMON PARTS OF COMPUTER AIDED MANUFACTURING ....................................................................... 11 TABLE 5: GOALS OF DISTRIBUTED SYSTEMS [A14]................................................................................................. 12 TABLE 6: PLANNING STEPS AT PUSH PRINCIPLE ...................................................................................................... 22 TABLE 7: GUIDELINES FOR A CAPACITY ORIENTED PPC SYSTEM [B4] ................................................................... 23 TABLE 8: GENERAL PRODUCTION FLOW OF THE PULL PRINCIPLE............................................................................ 28 TABLE 9: CLASSIFICATION OF DISPATCH PRIORITY INDEX [B10A].......................................................................... 31 TABLE 10: CLASSIFICATION OF DISPATCHING RULES/PRODUCTION SCHEDULING STRATEGIES [B10B] ................... 32 TABLE 11: THE ORIGINAL AND SECONDARY RESULTS WHICH LEAD TO SUBOPTIMAL AND PROBLEMATIC IT
SOLUTIONS [C19] ......................................................................................................................................... 41 TABLE 12: FEEDBACK-LOOPS IN EXTREME PROGRAMMING .................................................................................... 52 TABLE 13: CONFRONTATION UML AND ONTOLOGY VISUALIZATION .................................................................... 56 TABLE 14: ADVANTAGES OF USING ONTOLOGIES [C18] [B26] ............................................................................... 62 TABLE 15: DISADVANTAGES OF USING ONTOLOGIES [B1]...................................................................................... 62 TABLE 16: DESIGN PATTERN SPACE [A7] ............................................................................................................... 66 TABLE 17: MAPPING OOP TO AOP [A12C] ............................................................................................................ 68 TABLE 18: ADVANTAGES AND DISADVANTAGES OF PPC SYSTEM SOLUTION WITH SIMULATION SUPPORT ............. 93 TABLE 19: DESCRIPTION OF BUSINESS DATA FOR THE PRODUCTION SIMULATION SYSTEM ..................................... 99 TABLE 20: DESCRIPTION OF SHIFT LAYER FOR PRODUCTION SIMULATION SYSTEM .............................................. 100 TABLE 21: DESCRIPTION OF JOB SHOP LAYER FOR THE PRODUCTION SIMULATION SYSTEM.................................. 101 TABLE 22: DESCRIPTION OF OPERATION LAYER FOR THE PRODUCTION SIMULATION SYSTEM .............................. 101 TABLE 23: DESCRIPTION OF MASTER DATA LAYER FOR THE PRODUCTION SIMULATION SYSTEM.......................... 102 TABLE 24: REQUIRED FUNCTION IMPLEMENTATION (DISPATCHING FUNCTIONS FOR THE COORDINATION ROLES
REPRESENTING A DISPATCHER) FOR THE SAW PROJECT SIMULATOR VARIANTS......................................... 104 TABLE 25: TASKS/ROLES OF THE AGENT SYSTEM ................................................................................................. 105 TABLE 26: VISUALIZATION OF DEFINED “BILLY001” PRODUCT (MEDIUM COMPLEXITY) IN THE SAW PROJECT... 131 TABLE 27: VISUALIZATION OF DEFINED “BILLY002” PRODUCT (HIGH COMPLEXITY) IN THE SAW PROJECT ........ 132 TABLE 28: VISUALIZATION OF DEFINED “BILLY003” PRODUCT (SIMPLE COMPLEXITY) IN THE SAW PROJECT..... 132 TABLE 29: LEGEND FOR PRODUCT TREE SYMBOLS AND XML ELEMENT NOTATION ............................................... 133 TABLE 30: COMPARISON OF NUMBER OF PALLETS AND NUMBER OF FINISHED PRODUCTS [B13] .......................... 136 TABLE 31: COMPARISON OF SCHEDULING STRATEGY AND MACHINE UTILIZATION RATE [B13]............................ 139 TABLE 32: IDENTIFIED OPTIMIZATION POTENTIALS USING SIMULATOR AS PRODUCTION PLAN OPTIMIZATION TOOL
................................................................................................................................................................... 140 TABLE 33: IDENTIFIED OPTIMIZATION POTENTIALS USING SIMULATOR FOR MANUFACTURING UNIT DESIGN........ 141 TABLE 34: COMPARISON OF UML- AND ONTOLOGY-BASED APPROACHES (TIMES IN MINUTES) [B15] ................. 144 TABLE 35: DIAGRAM TYPES OF UML 2.X [A10] & [C20]..................................................................................... 160 TABLE 36: OWL LANGUAGE SYNOPSIS [C22]...................................................................................................... 166 TABLE 37: ABBREVIATIONS OF PRODUCTION SCHEDULING STRATEGIES [B10C].................................................. 167 TABLE 38: DESCRIPTION OF PRODUCTION SCHEDULING STRATEGIES [B10D] ...................................................... 169
vii
Index of figures
FIGURE 1: ABSTRACT LAYER MODEL FOR PRODUCTION PROCESS [B24] ................................................................... 5 FIGURE 2: CIM & PRODUCTION CONTROL SYSTEM [B23] ...................................................................................... 10 FIGURE 3: PRODUCT ORIENTED PPC SYSTEM (BASED ON [B4]).............................................................................. 17 FIGURE 4: ARCHITECTURE OF A CAPACITY ORIENTED PPC SYSTEM [A15B]........................................................... 24 FIGURE 5: CROSS-LOCATION PLANNING SYSTEM [A15C] ....................................................................................... 26 FIGURE 6: CAPACITY ORIENTED PPC SYSTEM WITHIN A SUPPLY NETWORK [A15D].............................................. 27 FIGURE 7: ARCHITECTURE OF AN ADVANCED PLANNING SYSTEM [A15G] .............................................................. 33 FIGURE 8: HARMONY FOR THE ROLLOUT OF ERP-SYSTEMS [C19] ......................................................................... 40 FIGURE 9: THE BASIC ENGINEERING CYCLE [A12A] .............................................................................................. 43 FIGURE 10: GENERAL N-ARY TREE OF WORKING PACKAGES [A12B] ...................................................................... 44 FIGURE 11: WATERFALL PROCESS MODEL [A2]...................................................................................................... 47 FIGURE 12: PROTOTYPING PROCESS MODEL [A2]................................................................................................... 48 FIGURE 13: EVOLUTIONARY PROCESS MODEL [A2]................................................................................................ 48 FIGURE 14: V-PROCESS MODEL [A1] ...................................................................................................................... 49 FIGURE 15: SPIRAL MODEL AS PROCESS MODEL [B2] ............................................................................................. 50 FIGURE 16: UNIFIED PROCESS MODEL – PHASES AND EFFORTS [C21] ..................................................................... 51 FIGURE 17: PLANNING/FEEDBACK LOOPS [C23] .................................................................................................... 52 FIGURE 18: SOFTWARE PRODUCT LINE PROCESS MODEL [A16] .............................................................................. 53 FIGURE 19: CATEGORIZATION OF ONTOLOGIES [B18] ............................................................................................ 55 FIGURE 20: SCREENSHOT OF THE "BILLY_LOW"-INSTANCE CREATED VIA PROTÉGÉ [C14].................................... 57 FIGURE 21: EXAMPLE FOR HIERARCHICAL ORDERED CLASSES ............................................................................... 58 FIGURE 22: SNAPSHOOT OF THE EER DATA MODEL SHOWING THE "PRODUCT" ENTITY ......................................... 58 FIGURE 23: ONTOLOGY PYRAMID [B14]................................................................................................................. 61 FIGURE 24: INTERCONNECTIVITY BETWEEN LEVELS IN A FAULT TOLERANT MULTI AGENT SYSTEM FOR PRODUCTION
AUTOMATION [B6] ....................................................................................................................................... 63 FIGURE 25: PERCEIVE-REASON-ACT-CYCLE (COMPARE [A12D]).......................................................................... 69 FIGURE 26: MAS-RELATED FIELDS IN COMPUTER SCIENCE [A12E] ....................................................................... 69 FIGURE 27: CLASSIFICATION OF THE VARIOUS TYPES OF APPLICATION FOR MULTI-AGENT SYSTEMS [A6B] ........... 70 FIGURE 28: SPECIFICATION CIRCLE OF FIPA [C6] ................................................................................................. 72 FIGURE 29: AGENT MANAGEMENT REFERENCE MODEL [C2]................................................................................ 73 FIGURE 30: GENERAL EXECUTION HANDLING FOR INCOMING ORDERS ................................................................... 79 FIGURE 31: TRANSITION OF A GENERIC ORDER MANAGEMENT MODEL INTO THE CONCRETE BUSINESS PROCESS
CYCLE FOR THE PROJECT TO USE SIMULATORS AS OPTIMIZATION AND PLANNING TOOL ............................... 83 FIGURE 32: SIMULATION COMPONENTS.................................................................................................................. 85 FIGURE 33: POSSIBLE THREE TYPES OF CROSSINGS IN THE SIMULATION ................................................................. 86 FIGURE 34: PRODUCTION PROCESS CYCLE - “BIG PICTURE” OF A PRACTICABLE ORDER EXECUTION....................... 88 FIGURE 35: TASK ALLOCATION CONSIDERING THE LAYER MODEL.......................................................................... 91 FIGURE 36: "BIG PICTURE" OF PLANNING BEHAVIOUR - CHANGEOVER BETWEEN REAL AND SYSTEM WORLD ........ 92 FIGURE 37: FIRST CONCEPT DRAFT OF THE SAW PROJECT COMPONENTS............................................................... 95 FIGURE 38: DISTRIBUTED ARCHITECTURE OF JADE [B21]..................................................................................... 96 FIGURE 39: OVERVIEW OF JADE TOOLS [A17B] .................................................................................................... 98 FIGURE 40: GRAPHICAL VISUALIZATION OF THE INPUT-OUTPUT-FEEDBACK-LAYER-CONCEPT............................... 99 FIGURE 41: VISUALIZATION OF THE DISPATCHER AND AGENT SYSTEM INTERACTION CONCEPT ........................... 106
viii
FIGURE 42: DISPATCHER/AGENT SYSTEM CONCEPT TRANSFORMATION FOR PRODUCTION SIMULATION ............... 106 FIGURE 43: SEQUENCE DIAGRAM FOR AGENT SYSTEM FOR PRODUCTION SIMULATION......................................... 107 FIGURE 44: COMPLETE EER DATA MODEL WITH DESIGNED PROJECT LAYERS ...................................................... 109 FIGURE 45: BUSINESS LAYER OF THE DATA MODEL ............................................................................................. 110 FIGURE 46: SHIFT LAYER OF THE DATA MODEL ................................................................................................... 110 FIGURE 47: JOB SHOP LAYER OF THE DATA MODEL ............................................................................................. 111 FIGURE 48: OPERATION LAYER OF THE DATA MODEL .......................................................................................... 111 FIGURE 49: MASTER DATA LAYER OF THE DATA MODEL..................................................................................... 112 FIGURE 50: EXCHANGE OF SHIFT LAYER IN DATA MODEL..................................................................................... 113 FIGURE 51: MAIN COMPONENTS OF PROTÉGÉ ....................................................................................................... 114 FIGURE 52: VIEW OF THE PROTÉGÉ-EDITOR WITH DEFINED CLASS(ES) ................................................................. 115 FIGURE 53: VIEW TO ADD INSTANCES (TEST DATA) INTO THE ONTOLOGY ............................................................ 115 FIGURE 54: GRAPHICAL VISUALISATION OF THE SIMULATOR ARCHITECTURE [B6] .............................................. 117 FIGURE 55: FINAL APPLICATION DESIGN OF THE SAW DEMONSTRATOR COMPONENTS ARCHITECTURE ............... 118 FIGURE 56: MAS OVERVIEW – COORDINATION AGENTS OF SAW DEMONSTRATOR (CEBIT PROJECT) [B6] ....... 119 FIGURE 57: CEBIT APPLICATION – SIMULATION PROGRESS VISUALIZATION DURING SIMULATION RUN .............. 121 FIGURE 58: CEBIT DEMONSTRATOR - INTERFACE FOR INPUT PARAMETER .......................................................... 122 FIGURE 59: ASSEMBLE LINE SHOP LAYOUT - CEBIT DEMONSTRATOR ................................................................. 123 FIGURE 60: NUMBER OF FINISHED PRODUCTS COMPARED WITH THE NUMBER OF PALLETS IN THE SHIFT [B13].... 136 FIGURE 61: MACHINE USAGE TIME DURING A SHIFT ............................................................................................. 138 FIGURE 62: MACHINE UTILIZATION RATE LEVEL FOR 600 TEST CASES [B13] ....................................................... 138 FIGURE 63: UML RECONFIGURATION LIFECYCLE WITH QUALITY ASSURANCE [B15] .......................................... 142 FIGURE 64: ONTOLOGY-BASED RECONFIGURATION LIFECYCLE WITH QUALITY ASSURANCE [B15]...................... 143 FIGURE 65: NEW SHOP LAYOUT (EXTENDED ASSEMBLE LINE) AS FURTHER WORK ............................................... 150 FIGURE 66: DESIGN PATTERN RELATIONSHIPS [A7].............................................................................................. 162

ix
Index of listings
LISTING 1: CALCULATION OF CRITICAL RATIO...................................................................................................... 126 LISTING 2: CUT OUT OF A XML FILE TO CONFIGURE THE ASSEMBLE LINE LAYOUT IN THE SIMULATION .............. 130 LISTING 3: TEST CASE EXAMPLE WITH INPUT PARAMETER FOR EVALUATION OF SAW PROJECT TMS ................. 135 LISTING 4: CALCULATION OF MACHINE UTILIZATION RATE [B13]........................................................................ 137 LISTING 5: FAILURE ENTRY IN THE INPUT PARAMETER FILE ................................................................................. 151
-1-
(1) Introduction
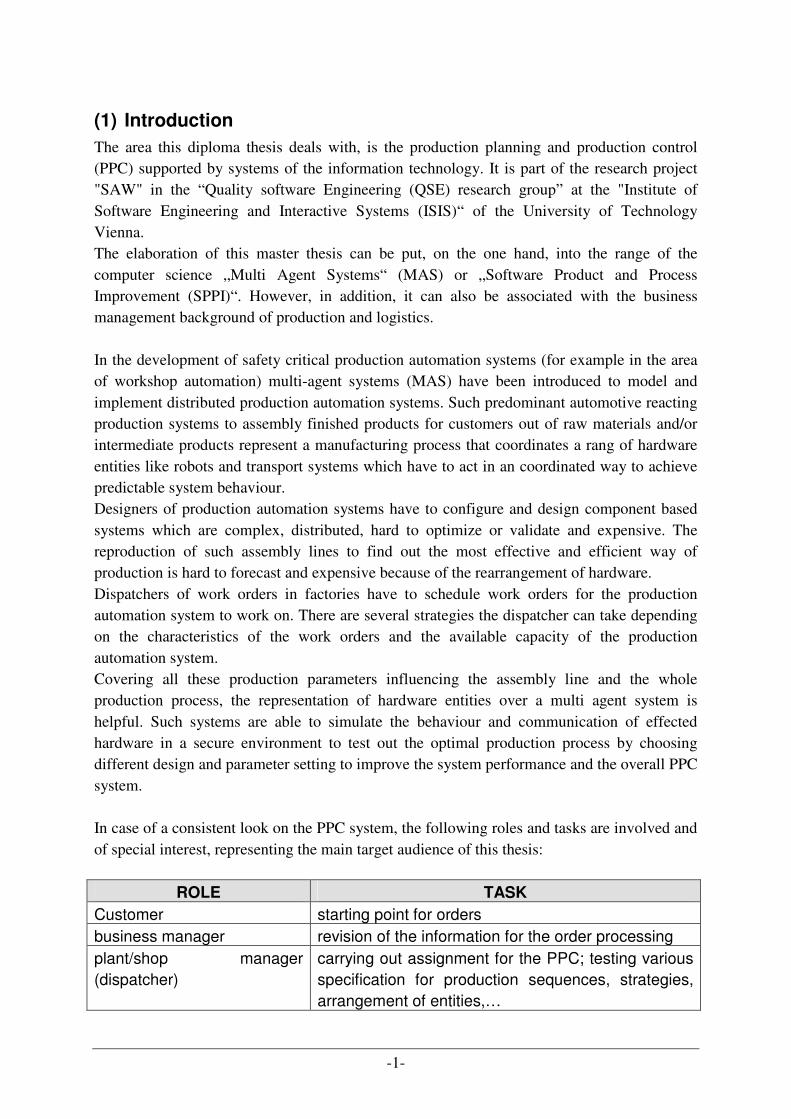
The area this diploma thesis deals with, is the production planning and production control (PPC) supported by systems of the information technology. It is part of the research project "SAW" in the “Quality software Engineering (QSE) research group” at the "Institute of Software Engineering and Interactive Systems (ISIS)“ of the University of Technology Vienna. The elaboration of this master thesis can be put, on the one hand, into the range of the computer science „Multi Agent Systems“ (MAS) or „Software Product and Process Improvement (SPPI)“. However, in addition, it can also be associated with the business management background of production and logistics. In the development of safety critical production automation systems (for example in the area of workshop automation) multi-agent systems (MAS) have been introduced to model and implement distributed production automation systems. Such predominant automotive reacting production systems to assembly finished products for customers out of raw materials and/or intermediate products represent a manufacturing process that coordinates a rang of hardware entities like robots and transport systems which have to act in an coordinated way to achieve predictable system behaviour. Designers of production automation systems have to configure and design component based systems which are complex, distributed, hard to optimize or validate and expensive. The reproduction of such assembly lines to find out the most effective and efficient way of production is hard to forecast and expensive because of the rearrangement of hardware. Dispatchers of work orders in factories have to schedule work orders for the production automation system to work on. There are several strategies the dispatcher can take depending on the characteristics of the work orders and the available capacity of the production automation system. Covering all these production parameters influencing the assembly line and the whole production process, the representation of hardware entities over a multi agent system is helpful. Such systems are able to simulate the behaviour and communication of effected hardware in a secure environment to test out the optimal production process by choosing different design and parameter setting to improve the system performance and the overall PPC system. In case of a consistent look on the PPC system, the following roles and tasks are involved and of special interest, representing the main target audience of this thesis:
ROLE TASK
Customer starting point for orders business manager revision of the information for the order processing plant/shop manager (dispatcher)
carrying out assignment for the PPC; testing various specification for production sequences, strategies, arrangement of entities,…
-2-
operator employee/unit/machine/agent which fulfils the transmitted working tasks by the dispatcher of the system
system developer / designer creator of the production simulation system for the PPC system; transformation of typical coordination problems in the implementation as well as the support of the PPC by the simulation of production alternatives
Table 1: main target (roles/tasks) audience for the thesis
The project is based on a multi agent system consisting of different layers. One focus of this work lies on the description on a higher level of the process planning and process handling. The second important part includes the steps to set up a production automation system based on reusable components (agents) following a software product line-based process. In further steps it is described, how strategies can be used to optimize the output of the real system by simulating them. Also the handling of unforeseeable failures can be simulated to find adequate solving strategies. Furthermore, the efficiency and resulting advantages and problems of the design arbitration to use an ontology and the concept of ontology areas to realize a knowledge base for the simulator are discussed. The current tendency in the economic shows one thing clearly: The demand for simulation systems to record the production planning process and the control of it - in particular the flow of information - increases. The possibility to simulate alternative solutions can be an important part for production planning in order to design systems efficient and anticipate problems. And in case of this, the importance of MAS increases accordingly because it is a very suitable approach to create simulation systems. The MAS layer concept allows a vertical and horizontal view on the data model (implemented by an ontology) needed to describe the system. By using design and coordination patterns, it is possible to describe the dependencies within the system in a formal way. According to that, the elaboration will describe, how to realize, use and optimize a multi agent based system like the production simulation described in this work to create the maximum gain. The intention behind using an ontology concept instead of traditional data models is on the one hand the research towards this rather new technology, and on the other hand the expectable advantages which will be tried to approved or disproved by the project. The step towards the decision in favour of an ontology were furthermore the possibility to design it by using the Uniform Modelling Language well known by all participants of the project. The different involved roles lead to a fast growing amount of data and complex data structures which was a further reason for using ontologies because the layer concept to structure the sum of information could be a promise to be easy transferable into the area concept of ontologies. The area concept for areas means nothing other that for each field of interest which is concerned with the topic and needs a possibility to store information and data an own ontology is created. The several emerging ontology areas describe the whole research field or
-3-
in the case of the simulation project the complete system with the different layers. All data used or produced during the production process life cycle with the simulation possibility is stored in the continuous model of the engineered ontology. This allows the optimization of future run troughs and facilitates the data analysis using reasoning techniques. By using of the ontology area concept several advantages are expected which will be approved or disproved by the results of this diploma thesis. These anticipated advantages could be:
- a concentrated view only on areas of certain interest to generate and extract exactly the needed information by setting queries according to a special task
- ontology areas help the different roles involved in the production process life cycle to view only the data they are interested in
- different versions of ontology areas can be used in order to model different strategies for finding an optimized production process
- ontology areas of the same kind can be combined in order to allow comparisons - the storing of relevant archive data can be clearly arranged stored by archive complete
areas by time slides (especially for volatile data like order or shift information but also for rather stable data like information about product trees or infrastructure data)
- the consistency of the engineered ontology for the production process cycle can easier be checked in contrast to traditional UML data models
After all, the practical use of MAS for simulation is the goal of the master thesis. The efficiency of the introduced capacity oriented PPC system can be ascertained by the comparison with conventional (production oriented) PPC systems used nowadays in the industry. The evaluation of the project will take place by a validation of these concepts in a case study. So different work order scheduling strategies get simulated by the designed production automation system and allow an interpretation of the measured data in a cheap way.
1.1 Research project description
The major task during the project on which this master thesis bases on was to design and implement a simulator that uses a multi-agent system to represent an automated production system able to carry out specified production sequences. These assemble tasks are bedded into a production planning process which allows to generate a complete production planning and control process cycle beginning from the request of goods by a customer towards the delivery at the end of the assembly line out of the inventory. The use of a simulator provides the advantage to find a nearly optimal solution to arrange entities like machines, transport systems and robots or to try out different production strategies to fulfil incoming orders to reach the production goals. The simulator usage allows an easy entrance to verify all thinkable production sequences by changing the different production parameters influencing the process. Basing on the results various decisions can be made to optimize the calculated production plan.
-4-
The simulator realized in this project of this thesis bases on MAS and has its roots in the Distributed Artificial Intelligence (DAI) domain. The various agents of the system act as community to solve the production problem handed over to the production simulator. The simulated system represented through several agents facilitates an efficient evaluation and optimization of the production system performance. The agents act autonomous and heterogeneous taking their own knowledge and the received knowledge out of the communication with other agents in the environment and manage his next actions due to this information. So all agents in the system try to solve their own local task but always keep their common goal to achieve the production process also in focus. This is one of the core abilities of a MAS but also needs the easy getting complicated coordination and communication between the different agents. The information transition between these agents is essential for the correct function of the system. For example a machine has to inform its logical predecessor in the production sequence, for example the crossing redirecting the goods to the transport system leading to the machine, that it is not reachable because of a damage to prevent the whole system for overall breakdowns. This interaction is realized using the Agent Communication Language of the Foundation for Intelligent Physical Agents (FIPA-ACL) [C4]. The chosen assembly workshop for the project is based on a model situated at the Odo Struger lab of the ACIN, TU Vienna [C1]. The software simulator to build up the assemble line bases on the production system simulation kit origins from Rockwell Automation International Research situated in Prague. During the project this tool to create assembly lines out of agents like docking stations, machines, conveyor belts, crossings and sensors was enhanced with further intelligence to be able to simulate more complex behaviours, e.g. sorting machines and waiting loops, which are needed to simulate the production of more complicated products consisting of parts where the assembly sequence is important. Furthermore the simulator of Rockwell is extended with coordination agents that represent the interface between the more business-oriented layers which are responsible for the order dispatching and the rather technical layer responsible for the workshop floor simulation. By feeding this simulation system with different parameter settings, it can be used as a test system for various possible scheduling strategies on an assembly line with redundant machines. This parallel machine scheduling problem is defined as a production system that has to fulfil the outlined tasks on the available machines with the constraints of a number of underlying conditions. The simulator tries to find out the obvious production sequence for the tasks. Taking all these facts into consideration the production system represented by the simulator can be defined as a closed-queuing transfer network with redundant paths through the different lines and nodes. The focus of this thesis lies on the design process of the described simulator. Therefore the whole production process beginning on the business layer down to the technical execution layer with the in between lying simulation possibility to optimize the production planning has to be analyzed and represented. A central coordination component needs a global view onto the system to make proper decision which management and production steps are useful to be done next. This coordination is done by a so called “dispatcher” who interprets all available information in the system to calculate an adequate solution or tries out different possibilities
-5-
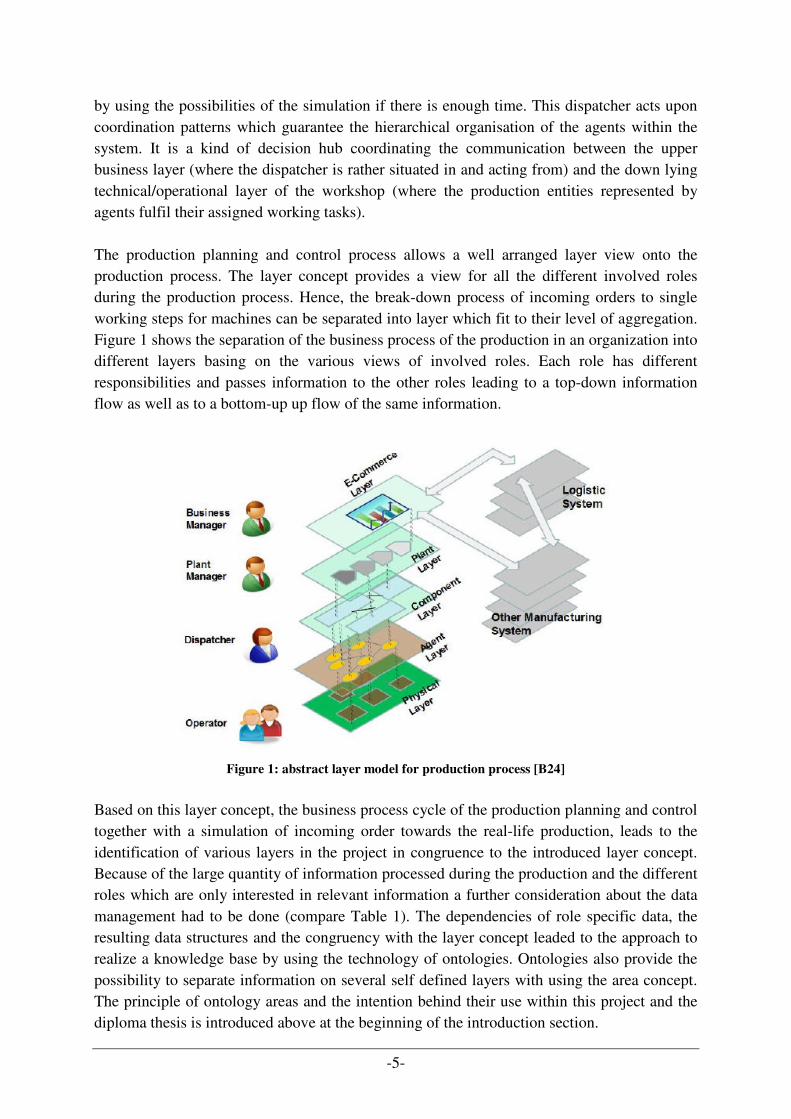
by using the possibilities of the simulation if there is enough time. This dispatcher acts upon coordination patterns which guarantee the hierarchical organisation of the agents within the system. It is a kind of decision hub coordinating the communication between the upper business layer (where the dispatcher is rather situated in and acting from) and the down lying technical/operational layer of the workshop (where the production entities represented by agents fulfil their assigned working tasks). The production planning and control process allows a well arranged layer view onto the production process. The layer concept provides a view for all the different involved roles during the production process. Hence, the break-down process of incoming orders to single working steps for machines can be separated into layer which fit to their level of aggregation. Figure 1 shows the separation of the business process of the production in an organization into different layers basing on the various views of involved roles. Each role has different responsibilities and passes information to the other roles leading to a top-down information flow as well as to a bottom-up up flow of the same information.
Figure 1: abstract layer model for production process [B24]
Based on this layer concept, the business process cycle of the production planning and control together with a simulation of incoming order towards the real-life production, leads to the identification of various layers in the project in congruence to the introduced layer concept. Because of the large quantity of information processed during the production and the different roles which are only interested in relevant information a further consideration about the data management had to be done (compare Table 1). The dependencies of role specific data, the resulting data structures and the congruency with the layer concept leaded to the approach to realize a knowledge base by using the technology of ontologies. Ontologies also provide the possibility to separate information on several self defined layers with using the area concept. The principle of ontology areas and the intention behind their use within this project and the diploma thesis is introduced above at the beginning of the introduction section.
-6-
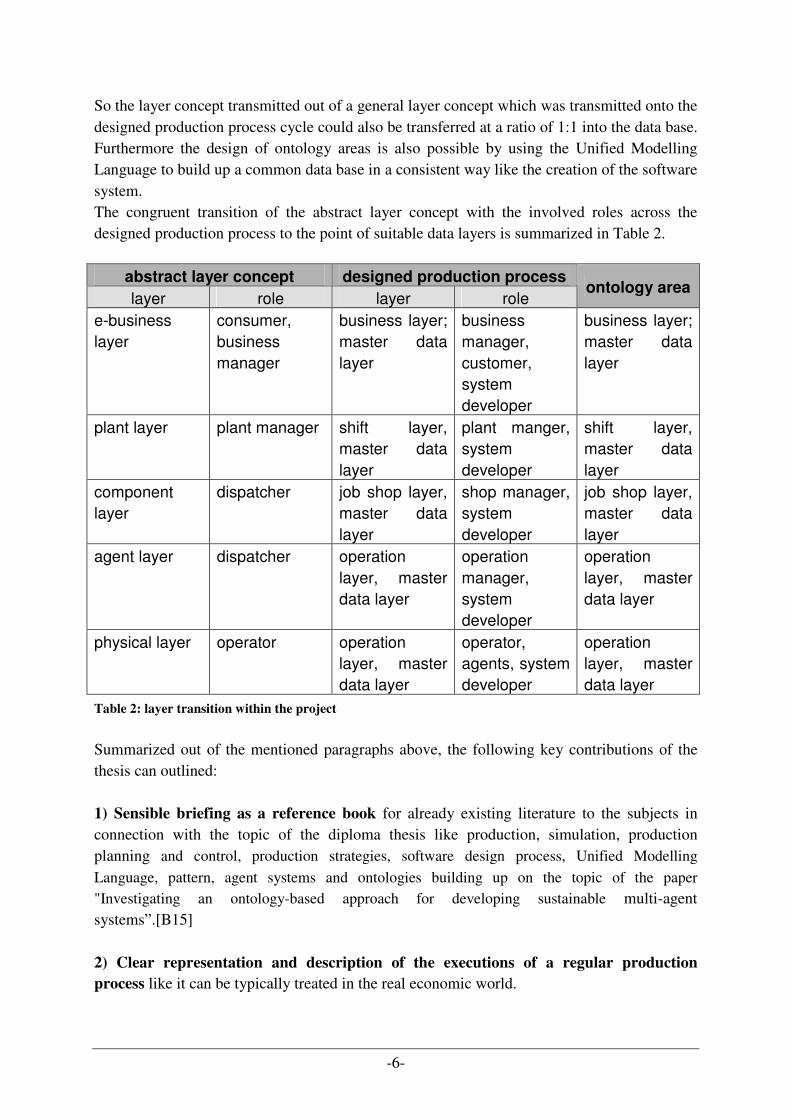
So the layer concept transmitted out of a general layer concept which was transmitted onto the designed production process cycle could also be transferred at a ratio of 1:1 into the data base. Furthermore the design of ontology areas is also possible by using the Unified Modelling Language to build up a common data base in a consistent way like the creation of the software system. The congruent transition of the abstract layer concept with the involved roles across the designed production process to the point of suitable data layers is summarized in Table 2.
abstract layer concept designed production process
layer role layer role ontology area
e-business layer
consumer, business manager
business layer; master data layer
business manager, customer, system developer
business layer; master data layer
plant layer plant manager shift layer, master data layer
plant manger, system developer
shift layer, master data layer
component layer
dispatcher job shop layer, master data layer
shop manager, system developer
job shop layer, master data layer
agent layer dispatcher operation layer, master data layer
operation manager, system developer
operation layer, master data layer
physical layer operator operation layer, master data layer
operator, agents, system developer
operation layer, master data layer
Table 2: layer transition within the project
Summarized out of the mentioned paragraphs above, the following key contributions of the thesis can outlined: 1) Sensible briefing as a reference book for already existing literature to the subjects in connection with the topic of the diploma thesis like production, simulation, production planning and control, production strategies, software design process, Unified Modelling
Language, pattern, agent systems and ontologies building up on the topic of the paper "Investigating an ontology-based approach for developing sustainable multi-agent systems”.[B15] 2) Clear representation and description of the executions of a regular production
process like it can be typically treated in the real economic world.
-7-
3) Development of system architecture by the transition of the process execution of the production process into a system design taking a simulator as a useful supplement for the planning and control process of the manufacturing in consideration. 4) Description of the modelling processes for the creation of the necessary data basis as a knowledge base for the agents used in the simulator on base of an ontology following the area concept as well as the design process of the simulation system for the automated assembly line embedded into the whole production system. 5) Description of the created simulator based on the layer-concept which turned out during the design process as well as the sensible possibility to use the application for the production planning 6) Evaluation of the performance differences with the help of the simulation of production processes by test runs of the exemplarily created automated assembly line with different input parameter. The interpreted results of simulation output be used for the optimisation of the processes and order execution as well as to improve the manufacturing arrangement itself. 7) reflective discussion regarding to the system development process as well as the design decision in favour of an ontology by comparing the effort with conventional data bank methods as well as the elaboration of advantages and disadvantages of ontologies especially in this project.
1.2 Thesis topic preambles
The following chapters in this introduction should act as brief guideline to the topics which are on closer interest in the thesis. Detailed information about their contribution to the project of production simulation by using multi agent systems and an ontology approach for system design are described in other chapters of the thesis as eluded in section 1.3.
1.2.1 Mass Customization
“Enterprises orientate themselves more and more by the principles of the
customer-individual mass manufacturing. The purpose of mass
customization is to serve customers individually and to increase their
satisfaction without giving up the advantage of mass manufacturing.
Therefore beside a clear strategy a consistent adjustment of the whole
value added chain is necessary.“ [C13] In economy there exist different principles to manufacture products. Two of these are: the single-unit production – where the commodity is made with special modifications for the customer – and the mass production – where the product gets manufactured a variation that meets most of the common requirements in huge numbers. Both of them have their advantages referring to their trade off. The mass production gets cheaper in the production but eventually does not fully meet the requirement of the customer. Whereas by using a the
-8-
single-unit production, the producer can be sure to satisfy his customer to 100% but the production costs for a larger number of products is significantly higher. The challenge today is to merge these strategies to gain the advantages of both. This is called “Mass Customization (MC)”. First of all one has to understand that all of the power belongs to the customer. He decides if he feels up to spend his money on something. The producer is forced to present the goods in the needed variations. Additionally the price to produce something increases when decisions for the design are outsourced to the customer. Of course, these costs depend on the point of time and the scope of the product attributes determined through the recipient. So, MC seems to provide only advantages: the customer gets exactly the variation of the goods he wants and the producer can be sure to sell the manufactured good which saves him storage costs (and eventually design, market survey and merchandising costs, etc.). Because of this, companies which want to establish the principle of MC, have to deal with this kind of trade off: the more the customer gets involved into the production process the more advantages of mass production get lost. For the producer it is important to identify the key attributes the buyer would like to manipulate. In a second step he has to analyse them, how efficient and profitable he can offer this to his customers. Further it has to be considered, if the customers enjoy the process of product configuration or if the process means additional effort for the customers. Also the higher level of interaction and the subsequent cost has to be handled and calculated in an appropriate way. All these circumstances have to be taken into consideration for adopting MC for a company in the production area.
1.2.2 Information systems in production process
Production processes are getting more and more complex during the last decades. Beginning from simple step-by-step manufacturing the companies today use giant plants to operate all these procedures in shorter time and larger numbers. The technical advances allow handling these processes. Today’s production processes could not be controlled without information technology. The sum of the needed information flow at many stations of the process for different persons or roles involved with the tasks makes the support by actual workflow management tools essential. Workflow management seem to provide the needed support. Tools supporting workflow management use the powerful capacities of information technology. The expression “workflow management” stands for an electronically executed business process and belongs to the area of “Computer Supported Cooperative Work” (CSCW). Growing knowledge in computer science allows an increasing assistance for routine and special processes in companies today. This begins with rather easier office automation ranging to more complex support of production processes by simulation or control of manufacturing procedures. The affinity between common workflow management systems in office/business automation and systems to coordinate and control industrial production processes is highly visible.
-9-
Digital data processing gets more and more integrated into industrial production processes. Activities directly connected with the process are controlled by information systems - for example: ordering of needed raw materials, drawing of technical documentations or the regulation and supervision of manufacturing robots. Since the 1980 the term “Computer Integrated Manufacturing” (CIM) is used for concepts in the area of continuous deployment of information technology for industrial production.
1.2.2.1 Production automation
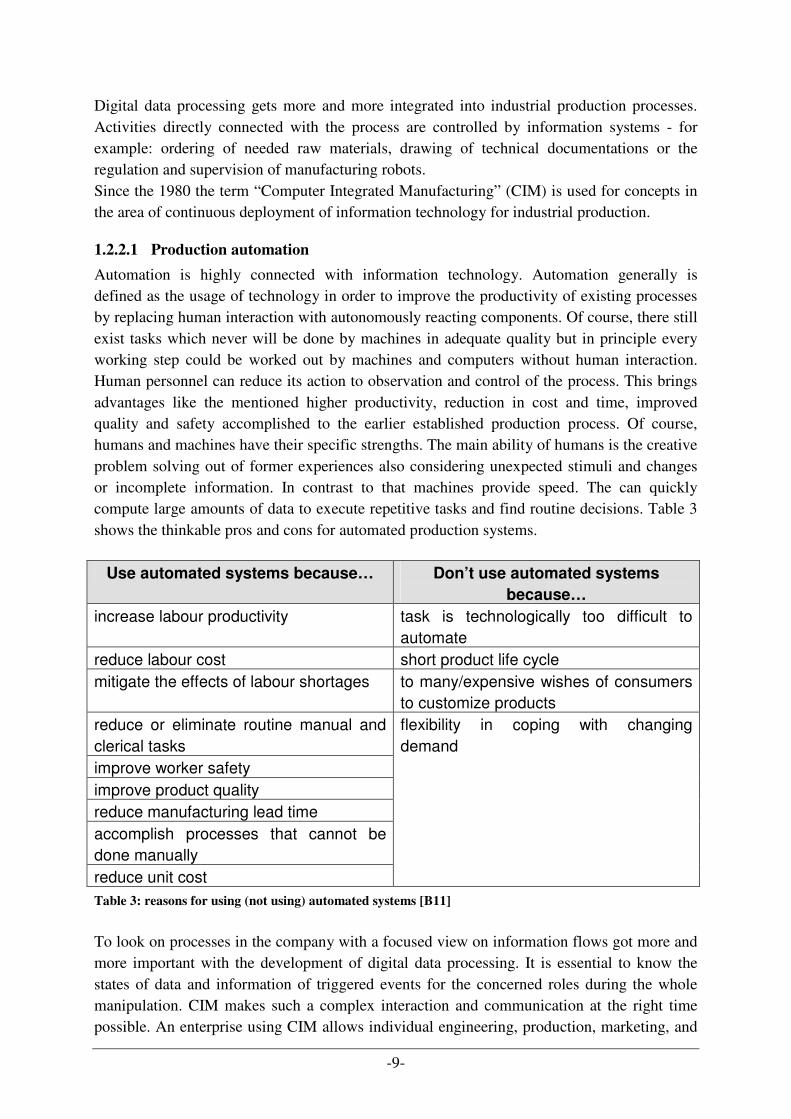
Automation is highly connected with information technology. Automation generally is defined as the usage of technology in order to improve the productivity of existing processes by replacing human interaction with autonomously reacting components. Of course, there still exist tasks which never will be done by machines in adequate quality but in principle every working step could be worked out by machines and computers without human interaction. Human personnel can reduce its action to observation and control of the process. This brings advantages like the mentioned higher productivity, reduction in cost and time, improved quality and safety accomplished to the earlier established production process. Of course, humans and machines have their specific strengths. The main ability of humans is the creative problem solving out of former experiences also considering unexpected stimuli and changes or incomplete information. In contrast to that machines provide speed. The can quickly compute large amounts of data to execute repetitive tasks and find routine decisions. Table 3 shows the thinkable pros and cons for automated production systems.
Use automated systems because… Don’t use automated systems
because…
increase labour productivity task is technologically too difficult to automate
reduce labour cost short product life cycle mitigate the effects of labour shortages to many/expensive wishes of consumers
to customize products reduce or eliminate routine manual and clerical tasks improve worker safety improve product quality reduce manufacturing lead time accomplish processes that cannot be done manually reduce unit cost
flexibility in coping with changing demand
Table 3: reasons for using (not using) automated systems [B11]
To look on processes in the company with a focused view on information flows got more and more important with the development of digital data processing. It is essential to know the states of data and information of triggered events for the concerned roles during the whole manipulation. CIM makes such a complex interaction and communication at the right time possible. An enterprise using CIM allows individual engineering, production, marketing, and
-10-
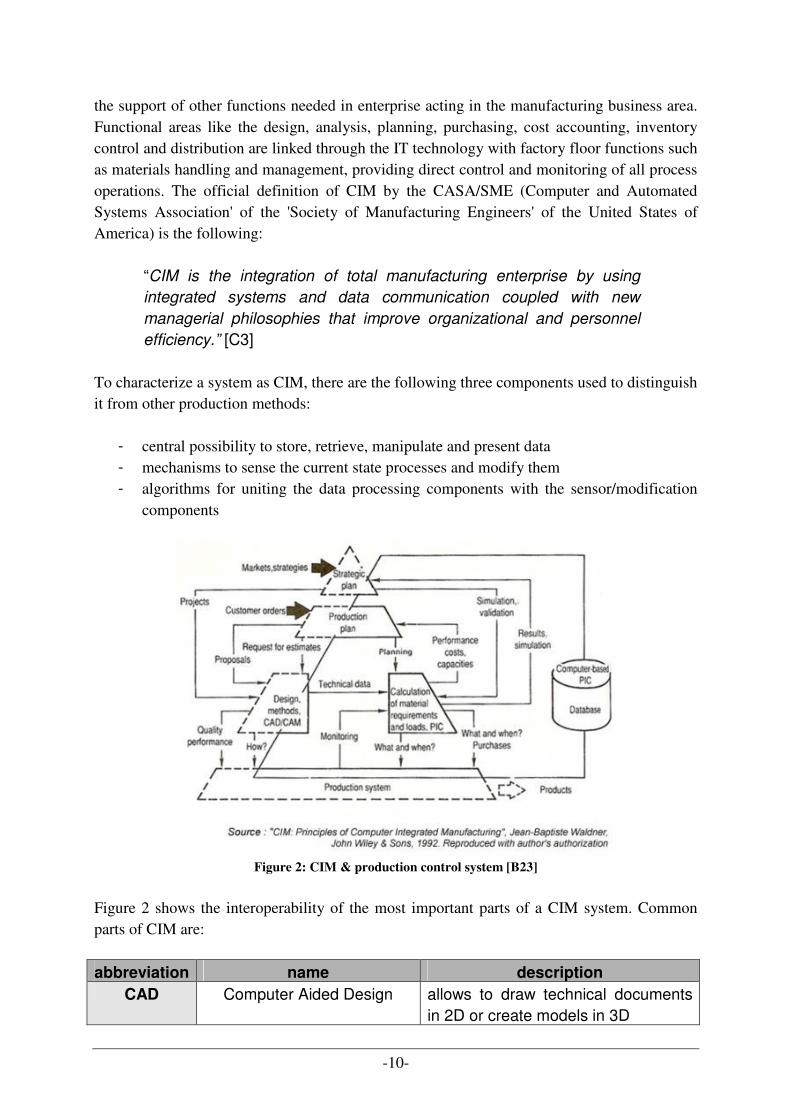
the support of other functions needed in enterprise acting in the manufacturing business area. Functional areas like the design, analysis, planning, purchasing, cost accounting, inventory control and distribution are linked through the IT technology with factory floor functions such as materials handling and management, providing direct control and monitoring of all process operations. The official definition of CIM by the CASA/SME (Computer and Automated Systems Association' of the 'Society of Manufacturing Engineers' of the United States of America) is the following:
“CIM is the integration of total manufacturing enterprise by using
integrated systems and data communication coupled with new
managerial philosophies that improve organizational and personnel
efficiency.” [C3] To characterize a system as CIM, there are the following three components used to distinguish it from other production methods:
- central possibility to store, retrieve, manipulate and present data - mechanisms to sense the current state processes and modify them - algorithms for uniting the data processing components with the sensor/modification
components
Figure 2: CIM & production control system [B23]
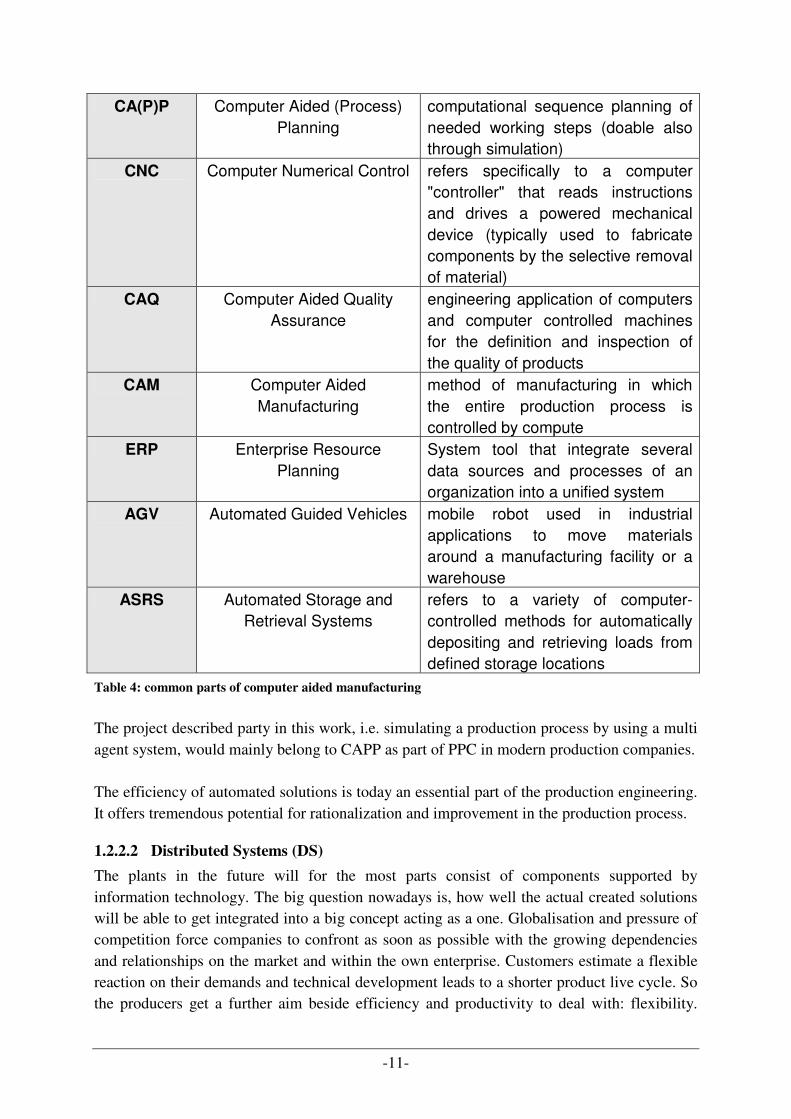
Figure 2 shows the interoperability of the most important parts of a CIM system. Common parts of CIM are:
abbreviation name description CAD Computer Aided Design allows to draw technical documents
in 2D or create models in 3D
-11-
CA(P)P Computer Aided (Process) Planning
computational sequence planning of needed working steps (doable also through simulation)
CNC Computer Numerical Control refers specifically to a computer "controller" that reads instructions and drives a powered mechanical device (typically used to fabricate components by the selective removal of material)
CAQ Computer Aided Quality Assurance
engineering application of computers and computer controlled machines for the definition and inspection of the quality of products
CAM Computer Aided Manufacturing
method of manufacturing in which the entire production process is controlled by compute
ERP Enterprise Resource Planning
System tool that integrate several data sources and processes of an organization into a unified system
AGV Automated Guided Vehicles mobile robot used in industrial applications to move materials around a manufacturing facility or a warehouse
ASRS Automated Storage and Retrieval Systems
refers to a variety of computer-controlled methods for automatically depositing and retrieving loads from defined storage locations
Table 4: common parts of computer aided manufacturing
The project described party in this work, i.e. simulating a production process by using a multi agent system, would mainly belong to CAPP as part of PPC in modern production companies. The efficiency of automated solutions is today an essential part of the production engineering. It offers tremendous potential for rationalization and improvement in the production process.
1.2.2.2 Distributed Systems (DS)
The plants in the future will for the most parts consist of components supported by information technology. The big question nowadays is, how well the actual created solutions will be able to get integrated into a big concept acting as a one. Globalisation and pressure of competition force companies to confront as soon as possible with the growing dependencies and relationships on the market and within the own enterprise. Customers estimate a flexible reaction on their demands and technical development leads to a shorter product live cycle. So the producers get a further aim beside efficiency and productivity to deal with: flexibility.
-12-
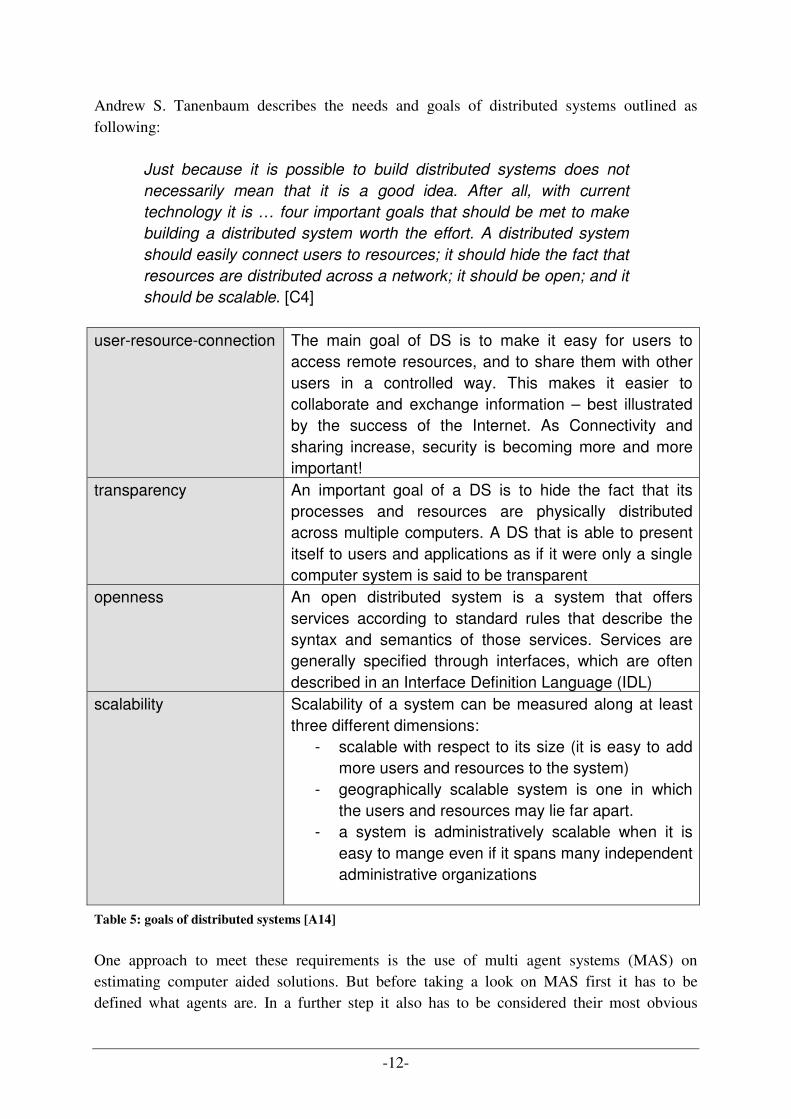
Andrew S. Tanenbaum describes the needs and goals of distributed systems outlined as following:
Just because it is possible to build distributed systems does not
necessarily mean that it is a good idea. After all, with current
technology it is … four important goals that should be met to make
building a distributed system worth the effort. A distributed system
should easily connect users to resources; it should hide the fact that
resources are distributed across a network; it should be open; and it
should be scalable. [C4]
user-resource-connection The main goal of DS is to make it easy for users to access remote resources, and to share them with other users in a controlled way. This makes it easier to collaborate and exchange information – best illustrated by the success of the Internet. As Connectivity and sharing increase, security is becoming more and more important!
transparency An important goal of a DS is to hide the fact that its processes and resources are physically distributed across multiple computers. A DS that is able to present itself to users and applications as if it were only a single computer system is said to be transparent
openness An open distributed system is a system that offers services according to standard rules that describe the syntax and semantics of those services. Services are generally specified through interfaces, which are often described in an Interface Definition Language (IDL)
scalability Scalability of a system can be measured along at least three different dimensions:
- scalable with respect to its size (it is easy to add more users and resources to the system)
- geographically scalable system is one in which the users and resources may lie far apart.
- a system is administratively scalable when it is easy to mange even if it spans many independent administrative organizations
Table 5: goals of distributed systems [A14]
One approach to meet these requirements is the use of multi agent systems (MAS) on estimating computer aided solutions. But before taking a look on MAS first it has to be defined what agents are. In a further step it also has to be considered their most obvious
-13-
alternative: centralized, single-agent systems. It would be much too easy to say that for all situations, multi agent systems are the better solution in compare to single agent systems. Agents
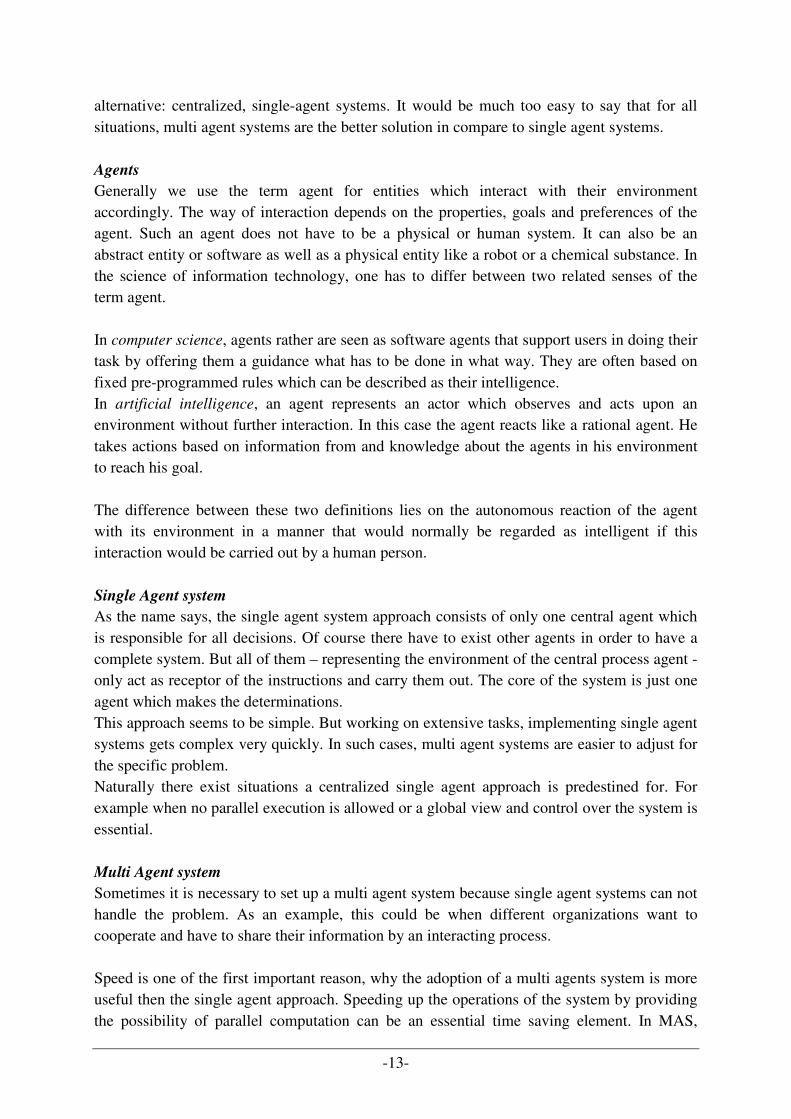
Generally we use the term agent for entities which interact with their environment accordingly. The way of interaction depends on the properties, goals and preferences of the agent. Such an agent does not have to be a physical or human system. It can also be an abstract entity or software as well as a physical entity like a robot or a chemical substance. In the science of information technology, one has to differ between two related senses of the term agent. In computer science, agents rather are seen as software agents that support users in doing their task by offering them a guidance what has to be done in what way. They are often based on fixed pre-programmed rules which can be described as their intelligence. In artificial intelligence, an agent represents an actor which observes and acts upon an environment without further interaction. In this case the agent reacts like a rational agent. He takes actions based on information from and knowledge about the agents in his environment to reach his goal. The difference between these two definitions lies on the autonomous reaction of the agent with its environment in a manner that would normally be regarded as intelligent if this interaction would be carried out by a human person. Single Agent system
As the name says, the single agent system approach consists of only one central agent which is responsible for all decisions. Of course there have to exist other agents in order to have a complete system. But all of them – representing the environment of the central process agent - only act as receptor of the instructions and carry them out. The core of the system is just one agent which makes the determinations. This approach seems to be simple. But working on extensive tasks, implementing single agent systems gets complex very quickly. In such cases, multi agent systems are easier to adjust for the specific problem. Naturally there exist situations a centralized single agent approach is predestined for. For example when no parallel execution is allowed or a global view and control over the system is essential. Multi Agent system
Sometimes it is necessary to set up a multi agent system because single agent systems can not handle the problem. As an example, this could be when different organizations want to cooperate and have to share their information by an interacting process. Speed is one of the first important reason, why the adoption of a multi agents system is more useful then the single agent approach. Speeding up the operations of the system by providing the possibility of parallel computation can be an essential time saving element. In MAS,
-14-
independent tasks can be executed at the same time by different agents of the system. But on the other side, this multi taking ability implies more coordination effort. But anyway, the advantage of parallelism can be very important for time-bounded execution of tasks. The second reason to use multi agent systems is the possibility to increase robustness by using more redundant agents. This gets highly relevant when failures within the system will happen relatively often or have expensive impacts. In this case the higher numbers of agents, which are able to execute redundant tasks, compensates the breakdown of single agents in the system. If only one single agent would be able to fulfil the execution of a task, the whole system can break down. A further advantage of multi agent system is their scalability. If it necessary to customize the system to meet new requirements, it is easier to reconfigure the system or add new agents because of the modular architecture of a MAS. In course of that programmers have to take special attention on the modular implementation of the components/agents. Normally this gets to an easier implementation task then creating a centralized single agent system. To create a MAS tasks have to be broken down into easier subtask which can be handled by on of the agents. The implementation gets easier by focusing on smaller requirements and providing the necessary interfaces to other agents. [B19]
1.2.2.3 Production automation systems by MAS
“The ever fast changes of customers’ needs and demands ask for
reconfigurable and adaptive production systems, which can provide
companies with the proper level of agility and effectiveness, without
disregarding at the same time cost factors. … research works on the
adoption of MAS in several industrial environments has flourished. This
approach … assumes the presence of several decision-making
entities, distributed inside the manufacturing system, interacting and
cooperating each other in order to achieve optimal global
performance.” [B3] The simulation of a production assembly line is one of the best examples to show the efficiency of MAS on solving distributed problems. The project this work is part of, focuses on a production automation simulation by using a multi agent system. To create a suitable simulation, autonomous acting agents for all possible elements in a real production cycle have to be implemented. They must interpret their own state and communicate with concerned agents in their environment to fulfil their common goal. The simulation is based on the model established by the ACIN (Automation and Control Institute) Laboratory of the Vienna University of Technology. This model consists of different machines or groups of them which have do work out their instructions to reach the common goal of producing goods. This starting point is predestined for a realization by simulation created on MAS. The components like working machines, conveyor belts, sensors, stoppers, junctions, diverter, stoppers and storages can all be implemented as agents to act
-15-
autonomously on communication and coordination with other agents in their environment. The behaviour of the agents always depends on the information retrieved from other agents involved in the sequence of working steps. The simulation itself has been realized by a production automation system simulation kit provided by Rockwell Automation International from Prague. Their simulation kit gives the possibility to assemble a production assembly workshop with the different needed agents. So the coordination among the agents already existed. The goal of the project this work is part of was to add other needed agents and integrate their communication into the existing messaging between the components represented by agents.
1.2.3 Production simulation
The VDI (“Verein Deutscher Ingenieure” in english approximately „Association of German Engineers) defined in their directive 3633 as following.
“The simulation is a replication of a system with its dynamic processes in
a model to get knowledge which can be transferred into the reality.”
[B17a] Simulations contain huge potentials to improve current situations in different areas. The costs of simulating a problem depend in the first row on the level of detail it should describe. So it should be possible to create suitable simulation for nearly all demands in the business without horrendous budgets and the advantages of operating with simulation should quickly reinvestigate the spent money. Simulation is a supporting tool for decisions in planning, design, evaluation, deployment and monitoring. It allows the identification of possible solutions for problems in logistic and production. The most common reasons why simulations are not as often used as they would be useful are the high initial investments, the complexity of needed simulations, the learning effort to use the new tools, difficult acquisition of data and the fact, that the profit of using simulations often arrives far in the future. The biggest advantage in using simulation is the possibility to save costs. By simulating difficult situations of problem, failures on planning the manufacturing plant, production assembly line layout and procedures in the manufacturing process can be anticipated and avoided. Furthermore simulation can be used to optimize the next production process by finding out the best way to arrange the production sequence through setting trying adjusting various parameters. By comparing the results among themselves and with the current situation, the best solution can be chosen. As one can imagine, this example shows the wide range of thinkable use for simulations. For this thesis, one of the goals was to find out ways to optimize an existing production process. Therefore a simulation of a production assembly workshop was used to figure out the reaction of different situations. On creating situations of incoming business orders the reactions of the system were tested. By setting different parameters like scheduling strategies, available pallets and speed of the conveyor belts the simulation worked out the needed
-16-
working steps in different sequences. According to that, the simulation produced a variety of measurable results which allows comparing the simulation runs and finding out the optimal solution for the current circumstances.
1.2.4 Ontology support for production simulation
The origin of the term ontology lies in the philosophy where it is used as a term to describe the conceptions of objects of the real world. Derived from this the term ontology can also be used in the area of computer and information science. In this area instances, classes, attributes and relations are used to build up a kind of data base for a specific problem. A closer description of what ontologies are and how they can be used can be found in chapter 2.4. Within this work the data model for the MAS is defined by using ontologies. In a first step, the important parts of a simulation run are identified and arranged using an EER diagram. Through the powerful UML notation it is easier to keep the overview on the whole data. Especially by dividing the system into different layers, which is common for ontologies, the needed data for different roles gets additionally increased. As mentioned at the beginning of the introduction section the use of ontologies as knowledge base are alluded by several research issues for this data model concept which will be answered by the experiences of the project team (consult concerned paragraphs on pages 2 and 3). To set up and use simulations various data are required. In this project ontologies are used to provide the data variations. Out of the ontology areas, information in xml-format is generated and extracted by queries, which can be interpreted by the software agents to build up and configure the needed simulation. To sum up the use of ontologies and the concept of ontology areas should expect a more flexible handling of storable information and a consistent process for data model design according to the design layer concept for the system with different views at it from the point of several involved roles.
1.2.5 Production planning and control
To be competitive on nowadays markets, enterprises have to deal with a dynamic business environment. They must provide goods with high quality at the right time where the customers need them. Various production parameters which can not or just partly be influenced by the company (for example increasing costs for material, personal and energy or stagnating/falling demand because of economic crisis, etc) tightens this situation. To cope with these problems it is important to make accessible potential cost saving positions within the company. All enterprises rely on a division on labour to maximize the existing capacity for production. Normally the tasks for planning and controlling are separated from the executing part of the production process. But this caused more and more effort to manage the processes and created a lot of interfaces for the information flow between the linked departments which are always introducing additional risks. This coordination effort increases more and more whereas the
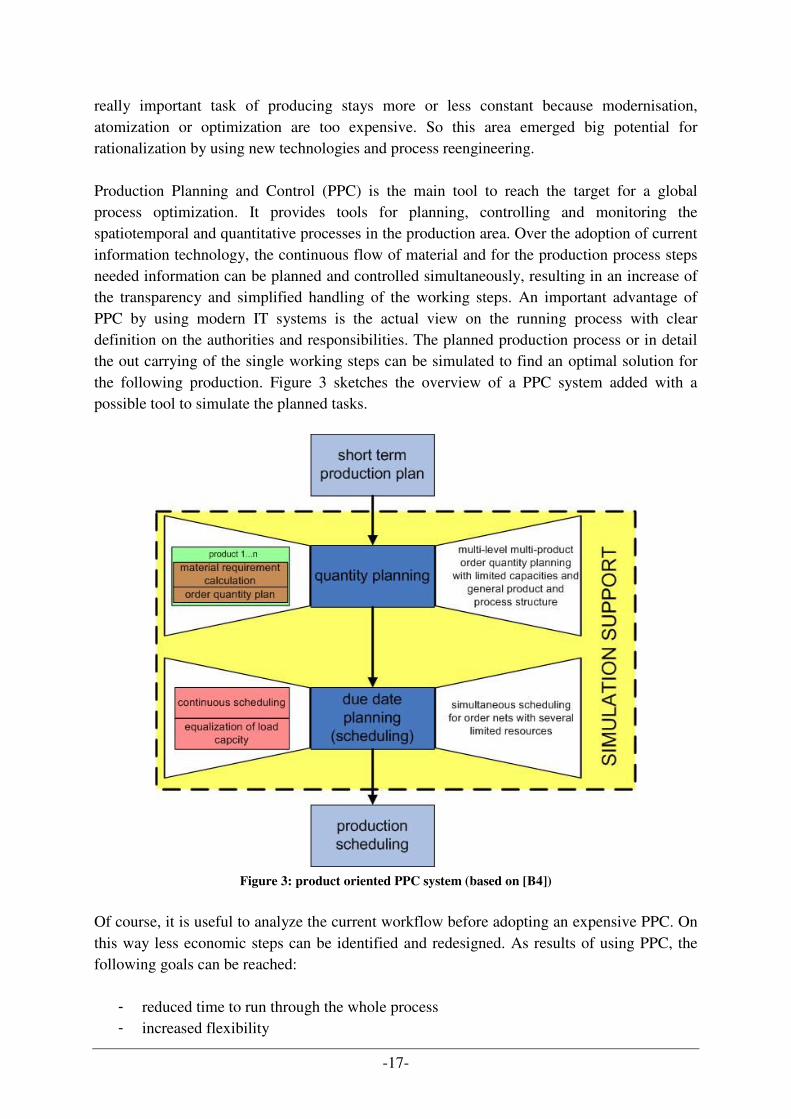
-17-
really important task of producing stays more or less constant because modernisation, atomization or optimization are too expensive. So this area emerged big potential for rationalization by using new technologies and process reengineering. Production Planning and Control (PPC) is the main tool to reach the target for a global process optimization. It provides tools for planning, controlling and monitoring the spatiotemporal and quantitative processes in the production area. Over the adoption of current information technology, the continuous flow of material and for the production process steps needed information can be planned and controlled simultaneously, resulting in an increase of the transparency and simplified handling of the working steps. An important advantage of PPC by using modern IT systems is the actual view on the running process with clear definition on the authorities and responsibilities. The planned production process or in detail the out carrying of the single working steps can be simulated to find an optimal solution for the following production. Figure 3 sketches the overview of a PPC system added with a possible tool to simulate the planned tasks.
Figure 3: product oriented PPC system (based on [B4])
Of course, it is useful to analyze the current workflow before adopting an expensive PPC. On this way less economic steps can be identified and redesigned. As results of using PPC, the following goals can be reached:
- reduced time to run through the whole process - increased flexibility
-18-
- lowered storage cost because of efficient material coordination - higher efficiency through higher machine load - increased adherence to delivery dates
To be sure to reach these goals the existing process has to be adapted to be able to use information technology by PPC efficient. The costs for the realization of a PPC system are often underestimated in enterprises. Most of the companies think that purchasing a PPC system solution is enough. But this is wrong. Rather is the construction of such a system a complex operation which has to be individually done for each manufacturer. A standard software solution can only be seen as a first step or a support in the scope of the conversion. Further detailed information about PPC systems is described in chapter 2.1.
1.2.6 Optimization
Optimization in general is defined as the practice to analyze the current situation of a process and improve it by several adjustments to get a better result. Which processes are needed to get optimized is a decision affected by different reasons. In most of the cases the process is ineffective to stay competitive on the market or the current process is simple too expensive. But of course a company can also try to optimize established processes to get a better market position by developing a new, better working sequence than competitors. Anyway, optimization is getting important in the next few years in all branches to save cost and increase profit. The first step of optimization focuses on improvement of the equipment. To be able to manufacture goods efficient, a company has to invest money into modern machines and technologies. This is the basic to be competitive. In a second step, the optimization of processes is taken into consideration. In this case nowadays automation systems and information technology are used in order to speed up and improve working steps significantly. But in most cases optimization is just a new setting of priorities. By analyzing the parts of the production process, the most interesting steps which provide the biggest potential for optimization are getting focused. The optimization process often leads to a trade off, by giving special work steps a higher priority then other because this results in an advantage for the enterprise in this situation. Before starting with optimizing all processes in a company, the current situation has to be analyzed in order to have a comparable value which has to be improved after an optimization. At this investigation the “Pareto principle” [C12] has to be considered to find out the right process which should be the point of interest for optimization. The Pareto principle (also known as the 80-20 rule) states, that the biggest part (80%) of effects causes a small part (20%) of causes. This is a common rule of thumb in all business areas. That means it is better to optimize a process when it seems to cause bigger problems then optimizing a – properly more complex - process which does not improve the situation of the production process as much as expected.
-19-
In this work, we focused on the optimization of a concrete production assembly line by using MAS to simulate the production of incoming orders. Every run of the simulation calculates the results using different input parameters. The measured output is the needed knowledge base for further production decisions on the real assembly workshop. But the last step of analyzing and making a decision up on the simulated results is the most important step and still requires human personnel. Automated systems can only provide a set of possible solutions over a simulation for the judgment of the optimal solution for the current problem.
1.3 Structure of the thesis
This work is structured into five correlative parts. The Introduction in chapter (1) is divided into two sections. The first tries to give a shortened overview about the content of the master thesis. The second part is the attempt to guide the reader closer to the core topics of the work by introducing them to essential background information of them. The second chapter (2) “related work” summarizes available relevant related work to give all necessary information which can be useful to understand the project and the thesis on which the elaboration bases on. Chapter (3) concretizes the research issues derived out of the project. The main parts of the diploma thesis are chapter (4) and (5). The practical part in chapter (4) records the work which has been done during the project. This concerns at a major point the design process of the simulation system together with the knowledge base basing on a designed ontology. Also the architecture for the agent system used to create a sensible simulator is introduced. Chapter (5) takes a closer look onto the results of the thesis by evaluation the output of simulator test runs with different input parameters and compares these results with the appointed research issues of chapter three. At the same time it should constitute a reflecting discussion due to the experiences done during the software design process and the creation of an ontology for the project as well as presenting ideas to use the designed simulator of the SAW project as optimization tool for production processes. The last chapter (6) concludes by trying to sum up major points and possible cognitions of the master thesis by answering the research issues of chapter (3) briefly while a detailed description is given in the chapters (4) and (5). Furthermore it gives a short idea about further work in the SAW project done by other students to make the SAW demonstrator more suitable for practical use in daily business in production plants.
-20-
(2) Related work
Before continuing the explanation of the implemented MAS for productions simulation project, a closer look on several theoretical business and technical issues is required to build up a common understanding for the basics of essential topics. Therefore a first look on established principles in production planning and controlling is useful to understand the existing difficulties. These problems are the core reason for implementing the proposed production simulation approach, because this approach can be useful in solving the mentioned problems. To implement our solution, we choose a rather classical software development process by using the approach of software product lines (SPL). Explanations and definitions of the SPL approach are provided in this section. The further sections about ontologies, patterns, MAS and ERP-systems (enterprise resource planning systems - as bridge from the business area to the technical part of our project for a better understanding of necessary interfaces towards them) primarily include general explanations and definitions of these techniques to communicate their strength and weaknesses.
2.1 Production scheduling
The production of goods is the core of our industrial consumer society. The whole economy is built up on the principle of supply and demand vice versa the production and consummation of goods and services which shows the necessary value adding through different companies. The focus of this diploma thesis lies on the manufacturing of goods by a mainly automated system. Such an industrial production is the generation of physically existing goods by following a specific technical procedural method. The factors of production are on the one hand material or other components needed for the construction of a consumer good and on the other hand stocks and machines to manipulate them to a good with higher value for the customer. All these economical, technological and societal influencing factors make it explainable why production scheduling containing the planning and controlling of various processes is of major interest for companies. The possibility to test and forecast production activities by simulating the properties of an assembly line is a most welcome tool to support the process of production planning and controlling.
2.1.1 Principles
Business informatics addresses their attention since years to problems of integrated information systems to support daily work in all economical areas, because every development of a software tool or system has its origin in a managerial-economics problem. Basing on the business processes the developers and designers have to create a software system regarding the economical knowledge of dependencies with the adequate technologies which is able to support and/or to carry out the reproduced processes by the implemented functionalities. Therefore it is essential to have enough knowledge of the possible workflows and their relationships. Due to that circumstance the following paragraphs will familiarise the reader with basic concepts and expressions to plan and control production processes.
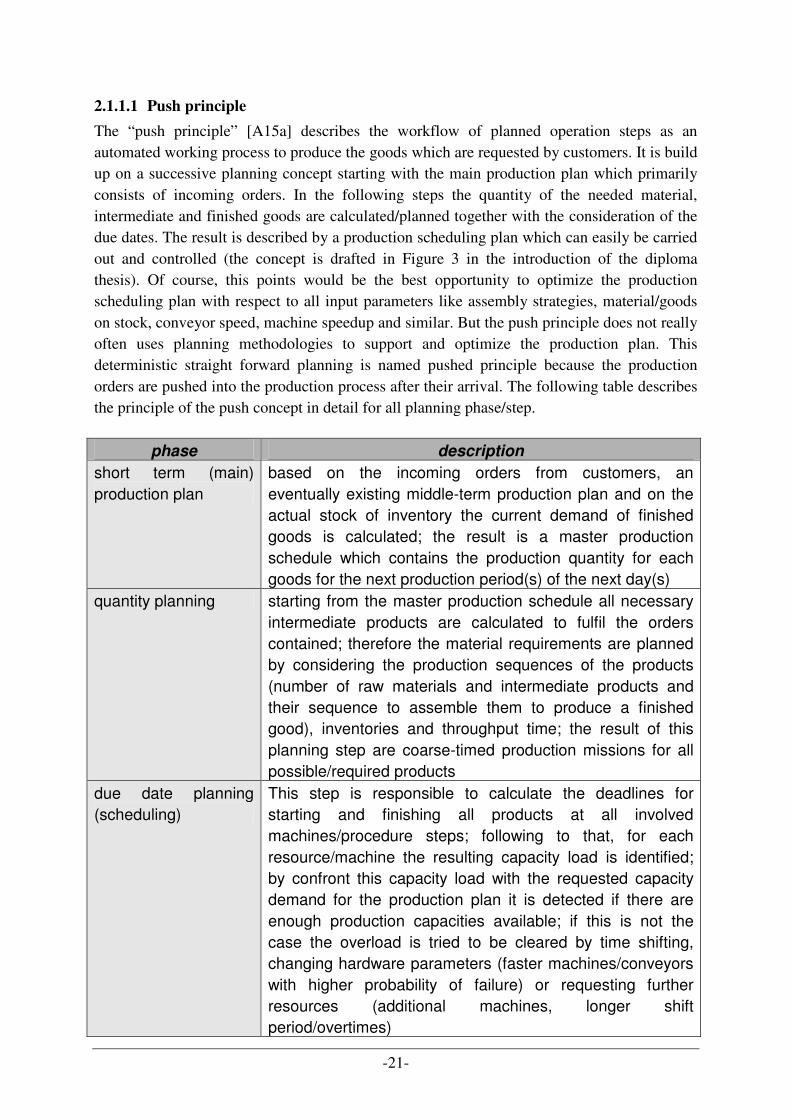
-21-
2.1.1.1 Push principle
The “push principle” [A15a] describes the workflow of planned operation steps as an automated working process to produce the goods which are requested by customers. It is build up on a successive planning concept starting with the main production plan which primarily consists of incoming orders. In the following steps the quantity of the needed material, intermediate and finished goods are calculated/planned together with the consideration of the due dates. The result is described by a production scheduling plan which can easily be carried out and controlled (the concept is drafted in Figure 3 in the introduction of the diploma thesis). Of course, this points would be the best opportunity to optimize the production scheduling plan with respect to all input parameters like assembly strategies, material/goods on stock, conveyor speed, machine speedup and similar. But the push principle does not really often uses planning methodologies to support and optimize the production plan. This deterministic straight forward planning is named pushed principle because the production orders are pushed into the production process after their arrival. The following table describes the principle of the push concept in detail for all planning phase/step.
phase description
short term (main) production plan
based on the incoming orders from customers, an eventually existing middle-term production plan and on the actual stock of inventory the current demand of finished goods is calculated; the result is a master production schedule which contains the production quantity for each goods for the next production period(s) of the next day(s)
quantity planning starting from the master production schedule all necessary intermediate products are calculated to fulfil the orders contained; therefore the material requirements are planned by considering the production sequences of the products (number of raw materials and intermediate products and their sequence to assemble them to produce a finished good), inventories and throughput time; the result of this planning step are coarse-timed production missions for all possible/required products
due date planning (scheduling)
This step is responsible to calculate the deadlines for starting and finishing all products at all involved machines/procedure steps; following to that, for each resource/machine the resulting capacity load is identified; by confront this capacity load with the requested capacity demand for the production plan it is detected if there are enough production capacities available; if this is not the case the overload is tried to be cleared by time shifting, changing hardware parameters (faster machines/conveyors with higher probability of failure) or requesting further resources (additional machines, longer shift period/overtimes)
-22-
production scheduling Here production orders are aggregated to a queue of working steps and matched to the required resources in the right sequence (for this sequencing priority rules are used)
Table 6: planning steps at push principle
Unfortunately the push concept contains several deficiencies which are inherent to the system and so the use of modern information technology cannot help to eliminate them but can help to accelerate the processes and simplify the handling and control for the employees. The created production plan of the push concept bases on statistically measured or calculated average/standard historical production data and actual states of resources. This top-down planning by using start- and finishing times of goods leads to under utilization of resources and high inventory costs because of longer throughput times for the materials goods (waiting time in front of needed resource because the machine is still working on another material/good). To solve these problem two approaches are realized in practice. The first is rather an improvement and complementation to a PPC system basing on a push principle. The second is the attempt to avoid the problems through a hierarchical structure for a capacity-oriented PPC with a modular builds up of different organizational principles in the same production system Utilization oriented order/work step release
Due to the low prediction precision of the throughput time by the production of a number of good varieties many orders or production steps are not approved at the right moment. Because of too early or too late clearing of the single work steps in the queue of the production scheduling plan there are often long waiting times at machines which lead to higher inventories on stock and problems in meeting deadlines. The reason for this fact is that many parameters in the planning calculation are seen as constant but they are more likely variable and inconsistent. To solve this problem the utilization oriented work step release tries to adapt the interface between due date planning and production scheduling. The idea of this improvement is to regulate the supply to a constant material flow to the machines/resources reachable on the current assembly line. This means that the sequence of working steps is not given free in regular time periods but when the needed machine is available or the waiting position/queue – depending on the arrangement and design of the assembly line - in front of this machine is getting empty. Utilization oriented order/work step release
Due to the low prediction precision of the throughput time by the production of a number of good varieties many orders or production steps are not approved at the right moment. Because of too early or too late clearing of the single work steps in the queue of the production scheduling plan there are often long waiting times at machines which lead to higher inventories on stock and problems in holding deadlines. The reason for this fact is that many parameters in the planning calculation are seen as constant but they are more likely variable and inconsistent.
-23-
To solve this problem the utilization oriented work step release tries to adapt the interface between due date planning and production scheduling. The idea of this improvement is to regulate the supply to a constant material flow to the machines/resources reachable on the current assembly line. This means that the sequence of working steps is not given free in regular time periods but when the needed machine is available or the waiting position/queue – depending on the arrangement and design of the assembly line - in front of this machine is getting empty. Capacity oriented PPC system
As described before, the push principle in practice has the weakness that it does not take into consideration the availability of resources. The production plan is created on the assumption that the machines are available if they are needed for a production step. But of course this element should be one of the core things a PPC system has to deal with since the capacity and availability of the resources are the bottleneck of each production system. A capacity oriented PPC system has to comply with the following seven guidelines:
1 The complete production system should base on linked production segments which are organized decentralized for planning purposes.
2 The single production segments are organized differently allowing flexible disposition of orders to the most suitable executing module by a superior planning, coordination and control instance
3 The functional orientation of PPC systems is replaced by a vertical arrangement by the central coordination instance towards the decentralized executing modules
4 The level of detail for the requested elements and the time planning interval decreases from the hierarchical top planning towards the executing modules. The planning decisions are substantiated downwards to working steps for short production intervals of a continuous planning (in German called “rollende/rollierende Planung”)
5 The calculation of the production plan has to be seen as interactive process to reach a nearly optimal solving for the requested working steps to fulfil orders. Modern information technology can help through simulation techniques to find the best possible solution in adequate time by changing possible parameters and restriction of the production process.
6 The system architecture has to be open to use other planning heuristics and adaptable for actual production and information techniques.
7 Because of the insecurity of relevant production data (requested goods, available raw materials …) it is useful to establish reasonable safety stocks for important resources. Also a continuous actualization of the calculated production plan is needed (with respect to the first planning � because an often changed production plan interferes the current production; so it must not reach the optimal result)
Table 7: guidelines for a capacity oriented PPC system [B4]
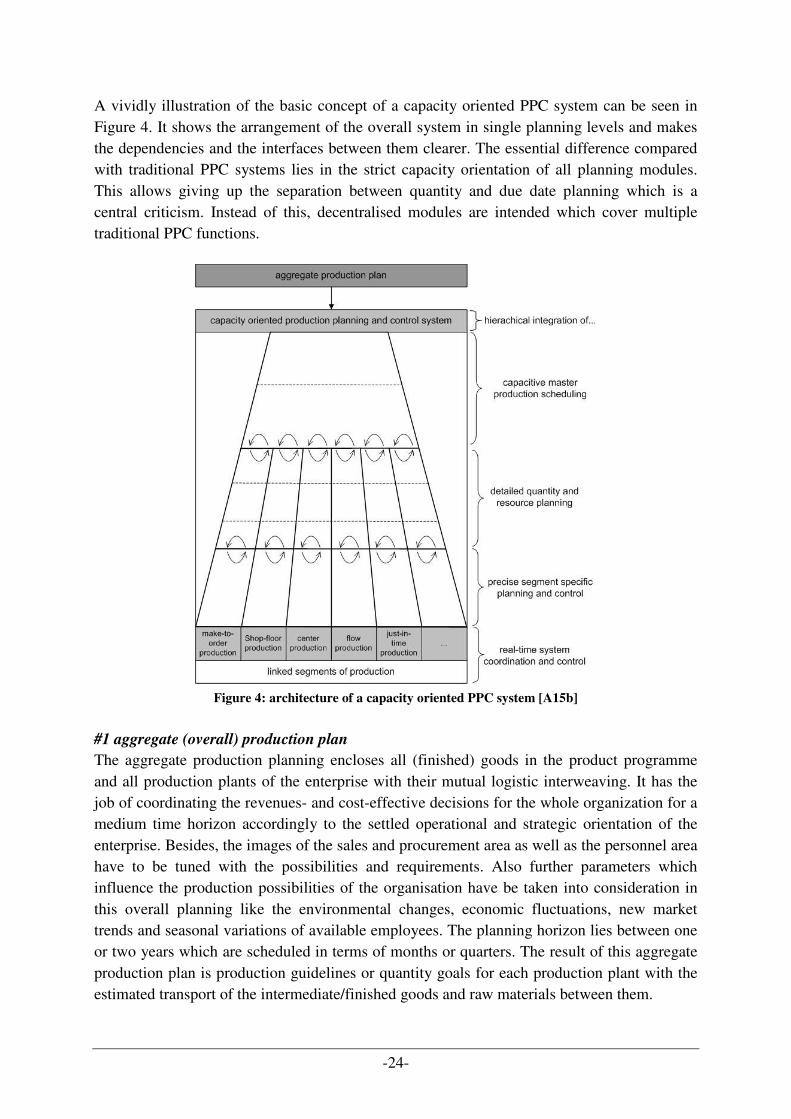
-24-
A vividly illustration of the basic concept of a capacity oriented PPC system can be seen in Figure 4. It shows the arrangement of the overall system in single planning levels and makes the dependencies and the interfaces between them clearer. The essential difference compared with traditional PPC systems lies in the strict capacity orientation of all planning modules. This allows giving up the separation between quantity and due date planning which is a central criticism. Instead of this, decentralised modules are intended which cover multiple traditional PPC functions.
Figure 4: architecture of a capacity oriented PPC system [A15b]
#1 aggregate (overall) production plan
The aggregate production planning encloses all (finished) goods in the product programme and all production plants of the enterprise with their mutual logistic interweaving. It has the job of coordinating the revenues- and cost-effective decisions for the whole organization for a medium time horizon accordingly to the settled operational and strategic orientation of the enterprise. Besides, the images of the sales and procurement area as well as the personnel area have to be tuned with the possibilities and requirements. Also further parameters which influence the production possibilities of the organisation have be taken into consideration in this overall planning like the environmental changes, economic fluctuations, new market trends and seasonal variations of available employees. The planning horizon lies between one or two years which are scheduled in terms of months or quarters. The result of this aggregate production plan is production guidelines or quantity goals for each production plant with the estimated transport of the intermediate/finished goods and raw materials between them.
-25-
#2 capacitive master production scheduling
Traditional PPC systems use the main production planning only as accumulation of the incoming orders without using the possibility of supporting the decision making useful in production to optimize the revenues with the available resources. The capacitive master production planning uses this opportunity of a central horizontal planning possibility of different production segments. This coordinates and utilizes the best matching decentralised organised production possibility. The goal of this planning step is the calibration of availably production capacities in the whole production system of the organisation with the actual arrived orders of customers. The objective is to minimize the costs for production, inventory and providing production possibilities (like machines and personal) by simultaneous completion of the customer orders to the requested due dates. The planning result of this step are concrete work orders for a special product and quantity with realistic due dates. #3 detailed quantity and resource planning
The detailed quantity and resource planning is the first decentral executed planning instance in a capacity oriented PPC system. It focuses on the transferred production quantities according to the available production resources. Now it is necessary to identify the quantities of components, materials and intermediate goods to reach the goal to produce the requested number of finished goods. The two overtaken parameter of “what” and “when” the production process has to be finished is arranged to a an optimal utilization of the resources with a minimal set-up and change-over cost for the assembly line and low inventory costs during the production process. If there are various problems to fulfil the work orders, these problems have to be balanced with other production segments through a feedback to the main production planning. #4 precise segment specific planning and control
This is the lowest layer where planning takes place in a capacity oriented PPC system because of the granularity of the action to plan the organisational principle of the specific production segment has major impact. The detailed planning of single process and working steps reflects the actual situation and arrangement of the production segments organizational, work shop layout, material flow and hardware/machine configurations conditions. The time horizon focuses on days or rather on shift durations. Economical targets are substituted by nonmonetary objectives like minimal throughput for goods are minimal tolerances to the requested production deadlines. #5 real-time system coordination and control
The system coordination and control is directly combined with the precise segment specific planning and control. Depending on the automation level the scheduled working steps are executed in real-time. Feedback about the production status concerning the single products or the state of machines in the assembly line allows high level on control and (re-)routing for optimization. To guarantee this high performance interaction information technology is needed.
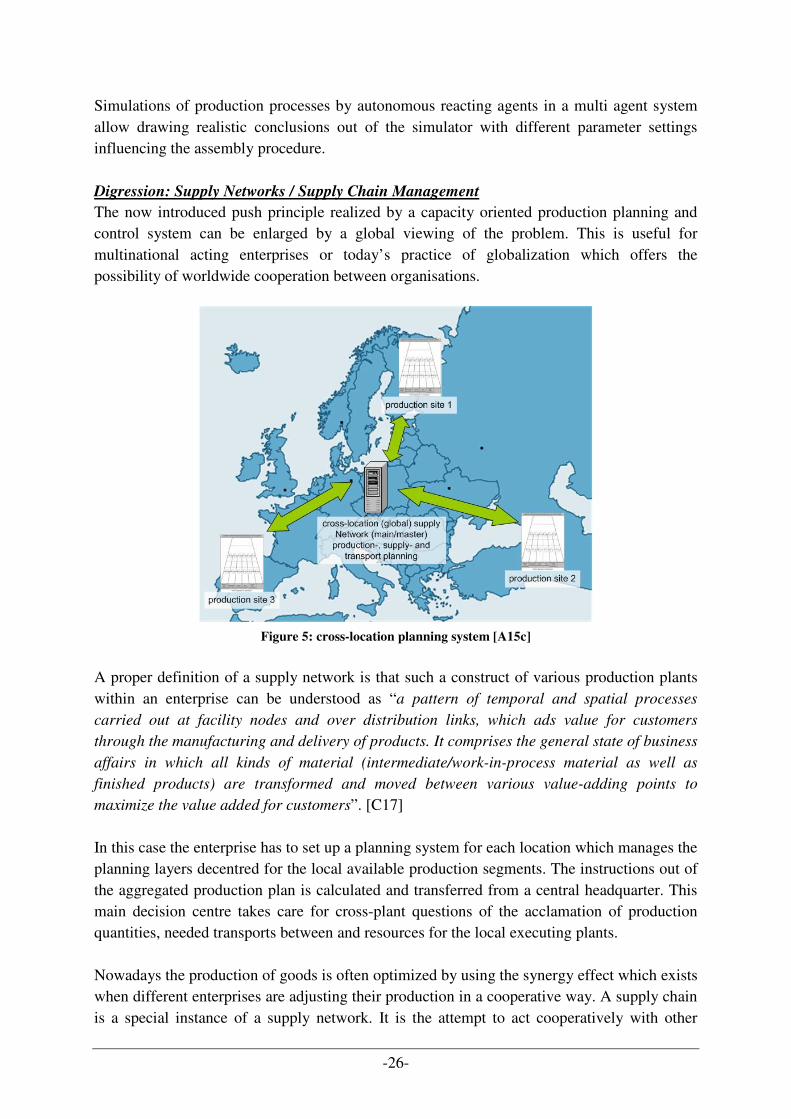
-26-
Simulations of production processes by autonomous reacting agents in a multi agent system allow drawing realistic conclusions out of the simulator with different parameter settings influencing the assembly procedure. Digression: Supply Networks / Supply Chain Management
The now introduced push principle realized by a capacity oriented production planning and control system can be enlarged by a global viewing of the problem. This is useful for multinational acting enterprises or today’s practice of globalization which offers the possibility of worldwide cooperation between organisations.
Figure 5: cross-location planning system [A15c]
A proper definition of a supply network is that such a construct of various production plants within an enterprise can be understood as “a pattern of temporal and spatial processes
carried out at facility nodes and over distribution links, which ads value for customers
through the manufacturing and delivery of products. It comprises the general state of business
affairs in which all kinds of material (intermediate/work-in-process material as well as
finished products) are transformed and moved between various value-adding points to
maximize the value added for customers”. [C17] In this case the enterprise has to set up a planning system for each location which manages the planning layers decentred for the local available production segments. The instructions out of the aggregated production plan is calculated and transferred from a central headquarter. This main decision centre takes care for cross-plant questions of the acclamation of production quantities, needed transports between and resources for the local executing plants. Nowadays the production of goods is often optimized by using the synergy effect which exists when different enterprises are adjusting their production in a cooperative way. A supply chain is a special instance of a supply network. It is the attempt to act cooperatively with other
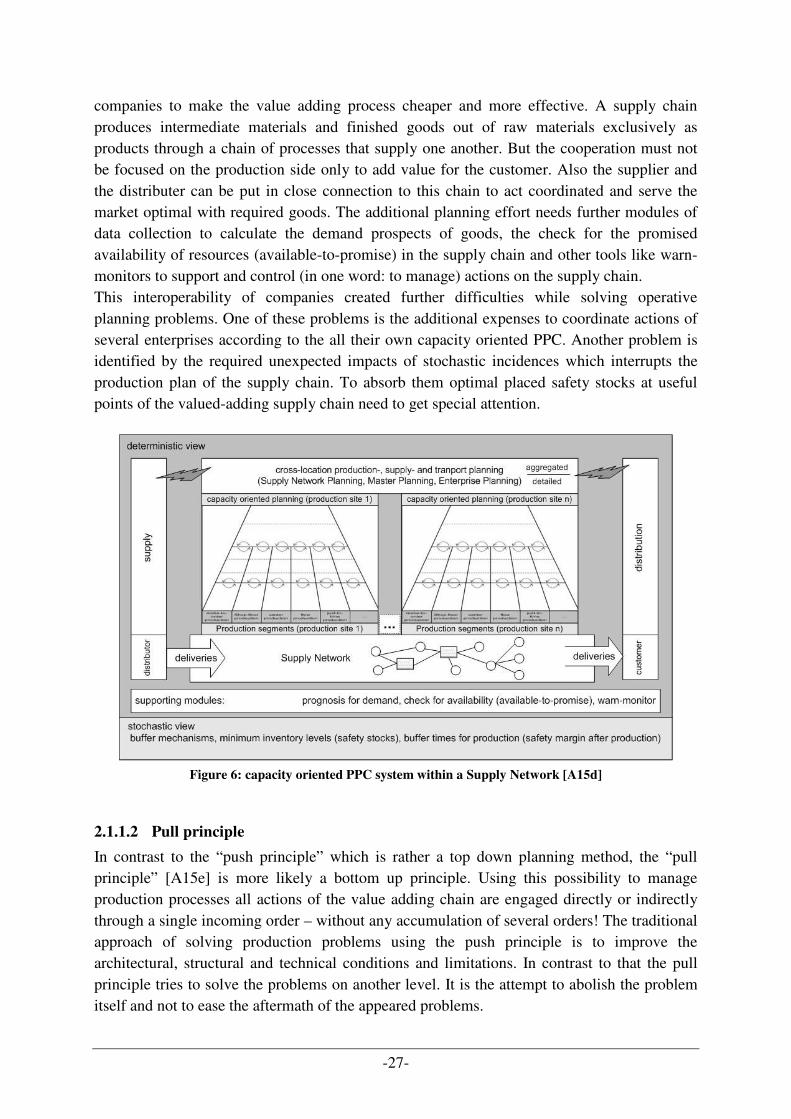
-27-
companies to make the value adding process cheaper and more effective. A supply chain produces intermediate materials and finished goods out of raw materials exclusively as products through a chain of processes that supply one another. But the cooperation must not be focused on the production side only to add value for the customer. Also the supplier and the distributer can be put in close connection to this chain to act coordinated and serve the market optimal with required goods. The additional planning effort needs further modules of data collection to calculate the demand prospects of goods, the check for the promised availability of resources (available-to-promise) in the supply chain and other tools like warn-monitors to support and control (in one word: to manage) actions on the supply chain. This interoperability of companies created further difficulties while solving operative planning problems. One of these problems is the additional expenses to coordinate actions of several enterprises according to the all their own capacity oriented PPC. Another problem is identified by the required unexpected impacts of stochastic incidences which interrupts the production plan of the supply chain. To absorb them optimal placed safety stocks at useful points of the valued-adding supply chain need to get special attention.
Figure 6: capacity oriented PPC system within a Supply Network [A15d]
2.1.1.2 Pull principle
In contrast to the “push principle” which is rather a top down planning method, the “pull principle” [A15e] is more likely a bottom up principle. Using this possibility to manage production processes all actions of the value adding chain are engaged directly or indirectly through a single incoming order – without any accumulation of several orders! The traditional approach of solving production problems using the push principle is to improve the architectural, structural and technical conditions and limitations. In contrast to that the pull principle tries to solve the problems on another level. It is the attempt to abolish the problem itself and not to ease the aftermath of the appeared problems.
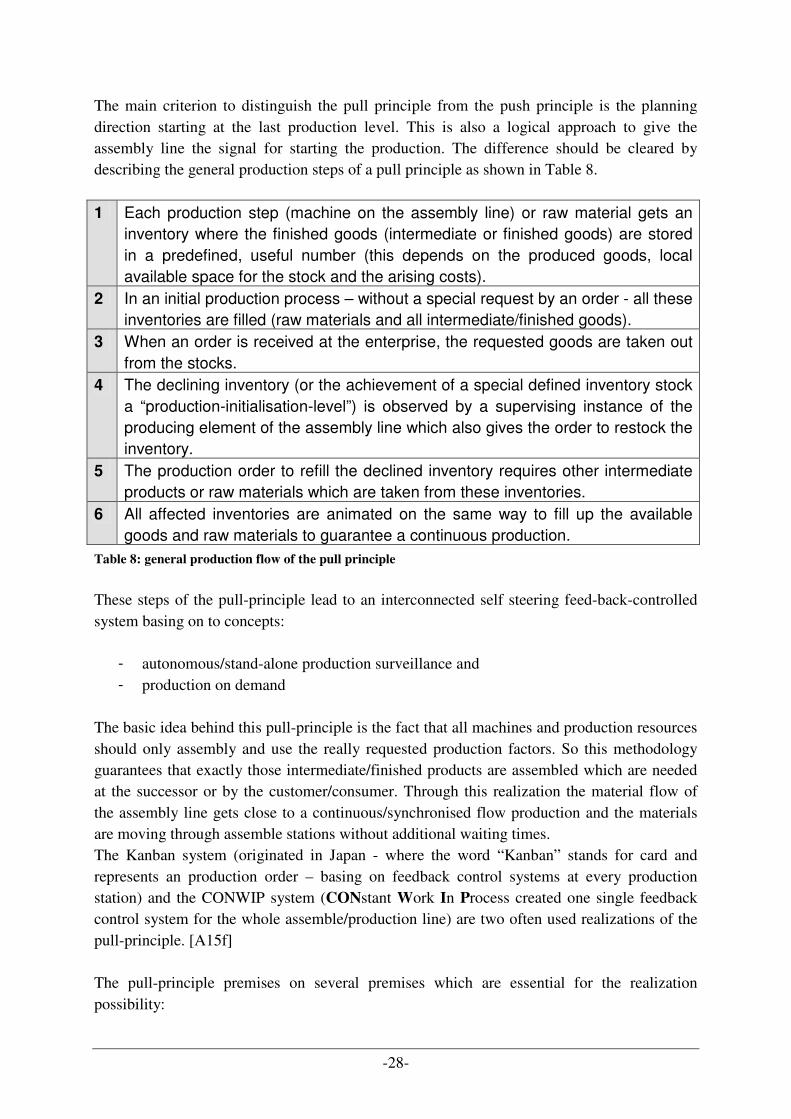
-28-
The main criterion to distinguish the pull principle from the push principle is the planning direction starting at the last production level. This is also a logical approach to give the assembly line the signal for starting the production. The difference should be cleared by describing the general production steps of a pull principle as shown in Table 8.
1 Each production step (machine on the assembly line) or raw material gets an inventory where the finished goods (intermediate or finished goods) are stored in a predefined, useful number (this depends on the produced goods, local available space for the stock and the arising costs).
2 In an initial production process – without a special request by an order - all these inventories are filled (raw materials and all intermediate/finished goods).
3 When an order is received at the enterprise, the requested goods are taken out from the stocks.
4 The declining inventory (or the achievement of a special defined inventory stock a “production-initialisation-level”) is observed by a supervising instance of the producing element of the assembly line which also gives the order to restock the inventory.
5 The production order to refill the declined inventory requires other intermediate products or raw materials which are taken from these inventories.
6 All affected inventories are animated on the same way to fill up the available goods and raw materials to guarantee a continuous production.
Table 8: general production flow of the pull principle
These steps of the pull-principle lead to an interconnected self steering feed-back-controlled system basing on to concepts:
- autonomous/stand-alone production surveillance and - production on demand
The basic idea behind this pull-principle is the fact that all machines and production resources should only assembly and use the really requested production factors. So this methodology guarantees that exactly those intermediate/finished products are assembled which are needed at the successor or by the customer/consumer. Through this realization the material flow of the assembly line gets close to a continuous/synchronised flow production and the materials are moving through assemble stations without additional waiting times. The Kanban system (originated in Japan - where the word “Kanban” stands for card and represents an production order – basing on feedback control systems at every production station) and the CONWIP system (CONstant Work In Process created one single feedback control system for the whole assemble/production line) are two often used realizations of the pull-principle. [A15f] The pull-principle premises on several premises which are essential for the realization possibility:
-29-
- small fluctuations of work pieces for the containers (e.g. pallets) on the assembly line to be able to react flexible in case of unforeseeable production disturbances to keep costs low for necessary personnel qualifications an preparation times
- absolute adherence to the daily output quantity (planned quantity overrules the daily work time if necessary)
- layout must be oriented on the material flow to keep transport quick and easy - high production quality to handover faultless products - capable transport system to balance out necessary inadequacies or tradeoffs created in
the assembly line/work shop layout
2.1.2 Scheduling strategies for assemble production
Scheduling is one of the most important questions to solve for manufacturing since it has a major impact on the productivity of a process and out of this for the complete organization. It decides between success and failure of the market competitiveness of the company. The main goal by using scheduling as a kind of tool to support and optimize production is the minimization of production time and emerging costs. The purpose of production scheduling is to manage the production facilities of all production plants to create an effective and efficient coordinated production flow. All available resources should be scheduled for the production. The scheduled plan contains detailed advising for each material what production steps have to be done in which sequence, at which machine together with which equipment. This allows finding out an optimal solution for the single working steps of the process and assembling sequence to reach the goal of efficiency maximization with a simultaneous reduction of production costs. Actual software to automate manual scheduling methods is a powerful tool to visually optimize real-time work loads in various stages of production. In combination with a simulator to identify possible bottlenecks of the production system these tools provide the optimal test suite to find the best way to solve actual production problems with the currently available resources and capacities. When the production scheduling is planned carefully and used sensible, it can provide several benefits like the reduction of preproduction costs for change-over times of the assembly line set-up, reduced scheduling effort and saving for inventory costs which is desirable for all companies. In one word: the whole production process gets organized better, allows a higher output performance and leads to a higher efficiency of the company. Generally there exist two ways to organize the production on an assembly plant. The manufacturer can plan his production on the arriving orders by his customers respectively on the orders getting really into the assembly line determined on the basis of the level of finished goods in the inventory. Companies serving their customers with finished products out of their inventories are known as make-to-stock manufacturers. In contrast, production strategy companies reacting on the incoming production request by their customers are called make-to-order manufacturers. Of course there also exist hybrid manufacturers gearing onto both orientations which come along with a higher coordination effort to maximize the utilization by to planning all operations. Another aspect of scheduling deals with the carrying out of the received orders. They can be pushed into the production system immediately (to be sure to reach the due-date) or with
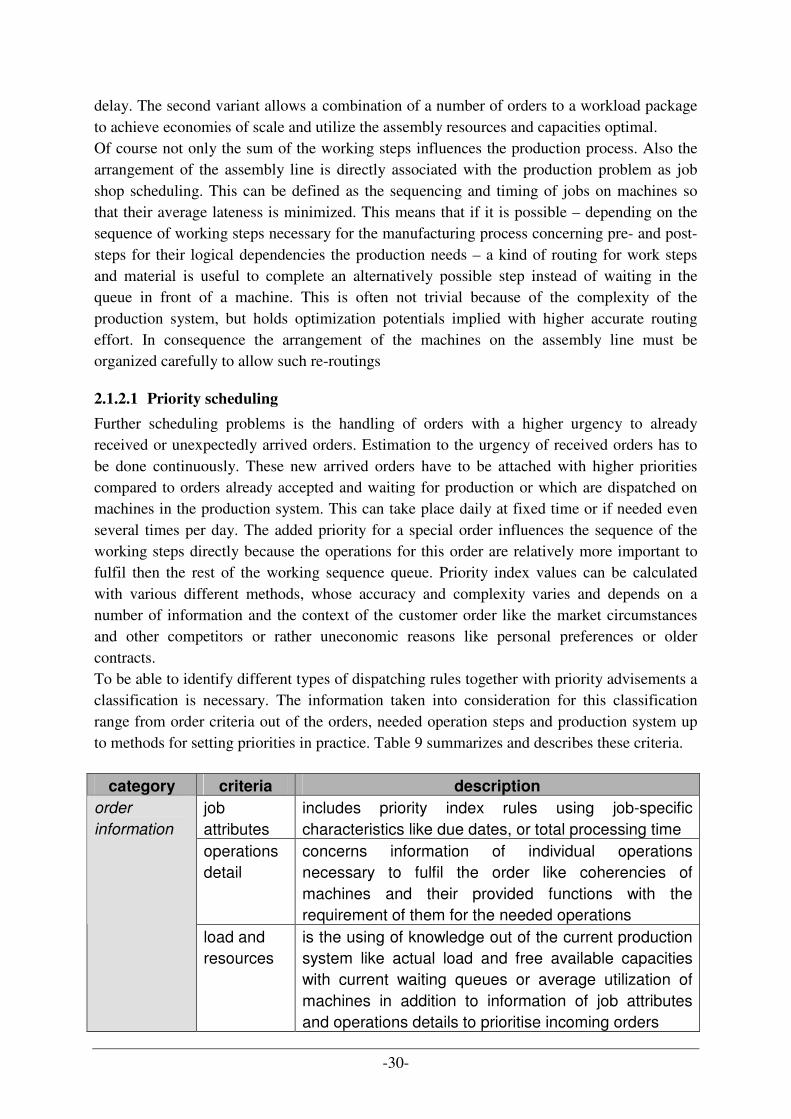
-30-
delay. The second variant allows a combination of a number of orders to a workload package to achieve economies of scale and utilize the assembly resources and capacities optimal. Of course not only the sum of the working steps influences the production process. Also the arrangement of the assembly line is directly associated with the production problem as job shop scheduling. This can be defined as the sequencing and timing of jobs on machines so that their average lateness is minimized. This means that if it is possible – depending on the sequence of working steps necessary for the manufacturing process concerning pre- and post-steps for their logical dependencies the production needs – a kind of routing for work steps and material is useful to complete an alternatively possible step instead of waiting in the queue in front of a machine. This is often not trivial because of the complexity of the production system, but holds optimization potentials implied with higher accurate routing effort. In consequence the arrangement of the machines on the assembly line must be organized carefully to allow such re-routings
2.1.2.1 Priority scheduling
Further scheduling problems is the handling of orders with a higher urgency to already received or unexpectedly arrived orders. Estimation to the urgency of received orders has to be done continuously. These new arrived orders have to be attached with higher priorities compared to orders already accepted and waiting for production or which are dispatched on machines in the production system. This can take place daily at fixed time or if needed even several times per day. The added priority for a special order influences the sequence of the working steps directly because the operations for this order are relatively more important to fulfil then the rest of the working sequence queue. Priority index values can be calculated with various different methods, whose accuracy and complexity varies and depends on a number of information and the context of the customer order like the market circumstances and other competitors or rather uneconomic reasons like personal preferences or older contracts. To be able to identify different types of dispatching rules together with priority advisements a classification is necessary. The information taken into consideration for this classification range from order criteria out of the orders, needed operation steps and production system up to methods for setting priorities in practice. Table 9 summarizes and describes these criteria.
category criteria description
job attributes
includes priority index rules using job-specific characteristics like due dates, or total processing time
operations detail
concerns information of individual operations necessary to fulfil the order like coherencies of machines and their provided functions with the requirement of them for the needed operations
order
information
load and resources
is the using of knowledge out of the current production system like actual load and free available capacities with current waiting queues or average utilization of machines in addition to information of job attributes and operations details to prioritise incoming orders
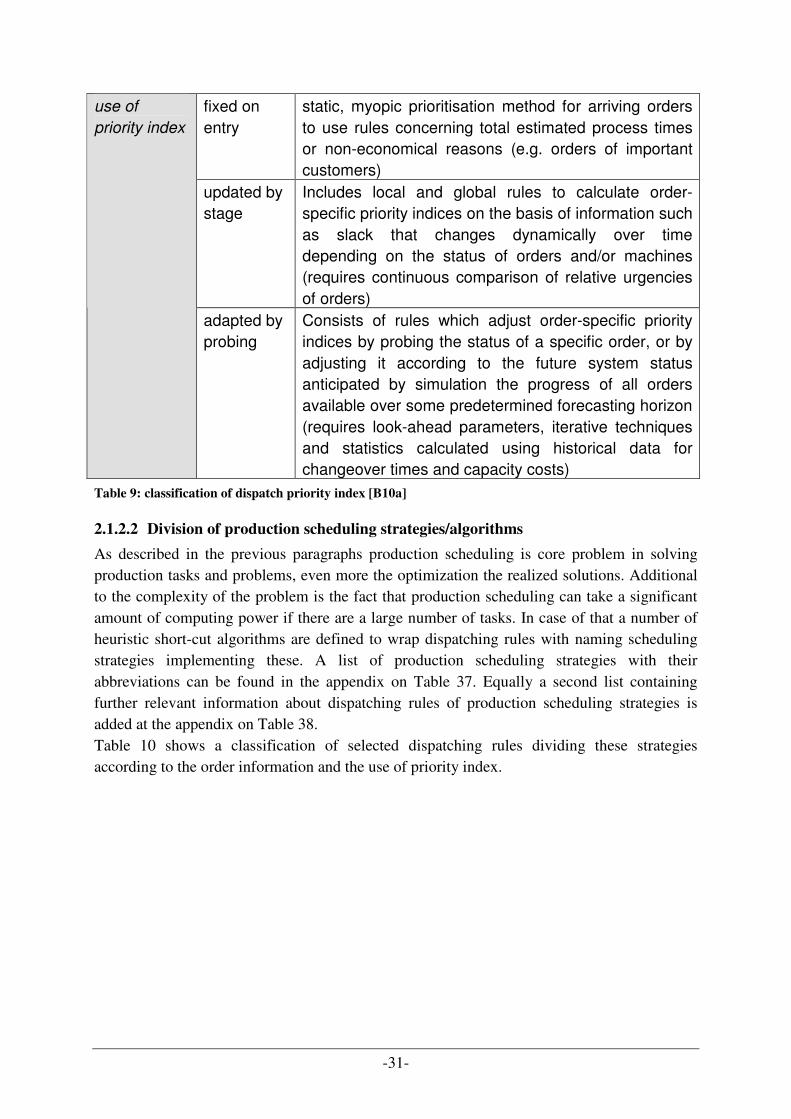
-31-
fixed on entry
static, myopic prioritisation method for arriving orders to use rules concerning total estimated process times or non-economical reasons (e.g. orders of important customers)
updated by stage
Includes local and global rules to calculate order-specific priority indices on the basis of information such as slack that changes dynamically over time depending on the status of orders and/or machines (requires continuous comparison of relative urgencies of orders)
use of
priority index
adapted by probing
Consists of rules which adjust order-specific priority indices by probing the status of a specific order, or by adjusting it according to the future system status anticipated by simulation the progress of all orders available over some predetermined forecasting horizon (requires look-ahead parameters, iterative techniques and statistics calculated using historical data for changeover times and capacity costs)
Table 9: classification of dispatch priority index [B10a]
2.1.2.2 Division of production scheduling strategies/algorithms
As described in the previous paragraphs production scheduling is core problem in solving production tasks and problems, even more the optimization the realized solutions. Additional to the complexity of the problem is the fact that production scheduling can take a significant amount of computing power if there are a large number of tasks. In case of that a number of heuristic short-cut algorithms are defined to wrap dispatching rules with naming scheduling strategies implementing these. A list of production scheduling strategies with their abbreviations can be found in the appendix on Table 37. Equally a second list containing further relevant information about dispatching rules of production scheduling strategies is added at the appendix on Table 38. Table 10 shows a classification of selected dispatching rules dividing these strategies according to the order information and the use of priority index.
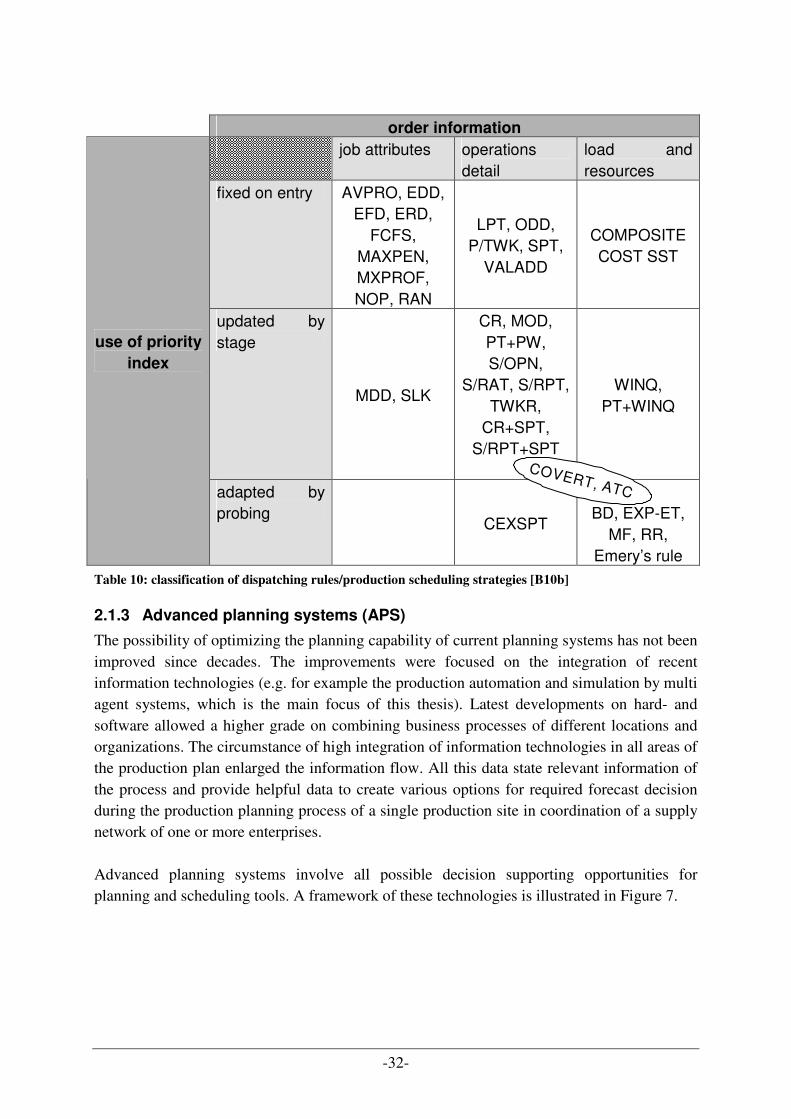
-32-
order information
job attributes operations detail
load and resources
fixed on entry AVPRO, EDD, EFD, ERD,
FCFS, MAXPEN, MXPROF, NOP, RAN
LPT, ODD, P/TWK, SPT,
VALADD
COMPOSITE COST SST
updated by stage
MDD, SLK
CR, MOD, PT+PW, S/OPN,
S/RAT, S/RPT, TWKR,
CR+SPT, S/RPT+SPT
WINQ, PT+WINQ
use of priority
index
adapted by probing
CEXSPT
BD, EXP-ET,
MF, RR, Emery’s rule
Table 10: classification of dispatching rules/production scheduling strategies [B10b]
2.1.3 Advanced planning systems (APS)
The possibility of optimizing the planning capability of current planning systems has not been improved since decades. The improvements were focused on the integration of recent information technologies (e.g. for example the production automation and simulation by multi agent systems, which is the main focus of this thesis). Latest developments on hard- and software allowed a higher grade on combining business processes of different locations and organizations. The circumstance of high integration of information technologies in all areas of the production plan enlarged the information flow. All this data state relevant information of the process and provide helpful data to create various options for required forecast decision during the production planning process of a single production site in coordination of a supply network of one or more enterprises. Advanced planning systems involve all possible decision supporting opportunities for planning and scheduling tools. A framework of these technologies is illustrated in Figure 7.
COVERT, ATC
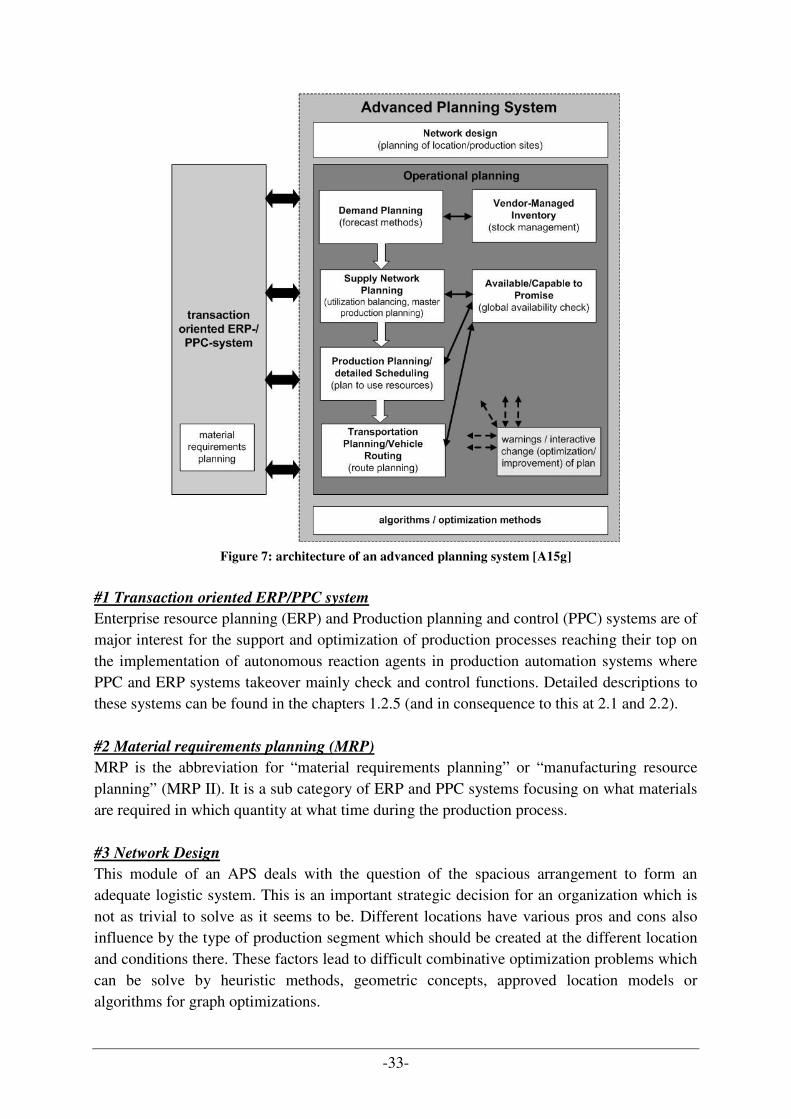
-33-
Figure 7: architecture of an advanced planning system [A15g]
#1 Transaction oriented ERP/PPC system
Enterprise resource planning (ERP) and Production planning and control (PPC) systems are of major interest for the support and optimization of production processes reaching their top on the implementation of autonomous reaction agents in production automation systems where PPC and ERP systems takeover mainly check and control functions. Detailed descriptions to these systems can be found in the chapters 1.2.5 (and in consequence to this at 2.1 and 2.2). #2 Material requirements planning (MRP)
MRP is the abbreviation for “material requirements planning” or “manufacturing resource planning” (MRP II). It is a sub category of ERP and PPC systems focusing on what materials are required in which quantity at what time during the production process. #3 Network Design
This module of an APS deals with the question of the spacious arrangement to form an adequate logistic system. This is an important strategic decision for an organization which is not as trivial to solve as it seems to be. Different locations have various pros and cons also influence by the type of production segment which should be created at the different location and conditions there. These factors lead to difficult combinative optimization problems which can be solve by heuristic methods, geometric concepts, approved location models or algorithms for graph optimizations.
-34-
#4 Demand Planning
The demand planning module within an APS is realized by forecasting methods. The task to calculate and prognosis getting easier and more precise as more information can be taken into consideration out of market situation and previous comparable demand. #5 Supply Network Planning
This module focuses on the balancing of available resources of hardware, material and employees in the operational master planning to avoid underemployment as well as system overloads which are awaited through seasonal fluctuations. It is the attempt to utilize the available capacities of all locations of the company in an optimal way. More information to this topic is recorded at the digression at the end of chapter 2.1.1.1 Push principle. #6 Production Planning
The main task of the production planning is the detailed scheduling and the allocation of arrived orders with their quantities and due dates to the available production factors and resources. Also the sequence to execute the orders is arranged by the production planning for each production resource and the therefore necessary transports within and between the production plant(s).Of course the free capacities for production and transportation are the limiting factors for the production. Modern palling, optimization, simulation, controlling and monitoring tools provide the possibility for the dispatcher to identify static and dynamic problems and concretize or avoid their causes by manual and/or automated by test, simulate, reorganize and improve plans. All these questions with their dependencies are the core element described by the sections 2.1 Production scheduling and 2.2 Enterprise Resource Planning (ERP) in this related work. #7 Transportation Planning/Vehicle Routing
The transportation planning or vehicle routing module takes care of an optimal solution by solving planning problems for transportation of goods between nodes/production sites on logistic networks. Therefore the planer/distributor can choose different means of transport, define various routes between nodes needed to visit for a transport vehicle, the frequency of transport and of course the combination of the cargos needed to be forwarded. #8 Vendor-Managed Inventory
Stocks which are underlying stochastic demand and replacement times can be controlled using intelligent warehousing policy. The integration of modern information technology which surveillances the actual inventories and transmit this information into a central information system, it is possibly to forward these information directly to the supplier. On this way the order process to refill the stock is accelerated and even gets more economic when the relevant safety levels for the required goods are chosen right. #9 Available-to-Promise
A global check for the availability of resources realized by the available-to-promise principle means that incoming orders for the requested goods are confronted with the relevant inventories. Available-to-promise calls the economic question whether a certain amount of a
-35-
material or product is available for a needed appointment or whether the material can be provided at a later time or in a smaller quantity if it is necessary or useful – depending on the circumstances and/or customer and the importance of the arrived order. For this statement, whether a material or product is available, other soon arriving accesses to stocks can be also considered, like orders and manufacturing missions. It must also be checked if available goods are already assured for other accepted orders. #10 Capable-to-Promise
Like the available-to-Promise approach the capable-to-promise principle focuses also on the economic question whether a certain amount of a product is available by a desired need appointment. In contrast to an available-to-promise check of the actual stocks (which can be seen as a current extrapolation of the inventory changes) the capable-to-promise approach also takes additional repositories for fulfilment of demand into consideration like free production capacities or external suppliers.
2.1.4 Simulation
Simulation is the description of a real system to try out various impacts of possible solutions for a designed problem. As mentioned in the introduction, the use of simulation can offer many possibilities to save cost and optimize processes simultaneously. The fast growing evolution of information technology makes simulations more effective and suitable across all business branches. Faster processor chips and cheaper memory allows the calculation of problems through mathematical calculations and simulation models. Ten years ago, these possibilities were not practical for the daily business because they lead to high costs and needed to long to earn the Return-on-Investment. Only accordingly important projects were a reason for establishing a simulation to solve big design or process problems. Recent developments on this sector allow a practically adoption of simulations suitable for different ranges and volumes of problems. In this project the optimization of a predefined production automation process through a simulation, based on a tool provided by Rockwell Automation. This Manufacturing Agent Simulation Tool (MAST) has been developed by Pavel Vrba [B22] in corporation with Rockwell Automation and provides an agent-based simulation support for building assembly lines and investigates scheduling strategies on hardware manufacturing components and realistic transport information. [B13] Used in this way, simulations can help to design new production plants or layouts of assembling lines in order to meet a set of given requirements. An optimal positioning of machines, junctions, sensors and stoppers is essential for preventing problems like traffic jams or finding the best route to reach a destination. The earlier simulations are used in the planning phase of a project, the more failures in planning and resulting consequential costs can be avoided. A further benefit of the simulation is the dynamical and visual demonstration of occurring problems which can be used as argument for higher investment costs. The designed workshop layout can be used to simulate the behaviour of the assembling line by deploying the work orders with different assembly strategies. This concept of production
-36-
control is suitable to answer the following important questions using the simulator before starting the real construction of the production plant:
- Is it possible to produce the requested quantity of goods before the shipment deadline with the planned shop layout?
- How do failures (machine or conveyor breakdowns) influence the production? - Which assembling strategy fits best to current requirements and situations? - How does the machine utilization differ on using different assemble strategies? - How many pallets are reasonable?
So the simulation allows identifying problems in machine utilization and material flow, which would lead to additional cost in real life. It is one of the best approaches to test out the optimal way to prevent the company from these problems in production. This all are reasons why the simulation approach in industry gets more and more important. Nowadays user-friendly, flexible simulation tools and software are available to achievable prices for computing power of common computers. But to keep the expenses for simulations in calculable regions, the following points should be kept in mind [B17b]:
- A clear demarcation of the production area and relevant products has to be done for the examination.
- The simulation model should be kept as simple as possible for an efficient examination.
- The correct implementation of the simulation model has to be checked by specialists who know the production process well.
- The data for the test runs must be checked and analysed for consistency. - To avoid misinterpretations all involved roles have to know the restrictions and
simplifications implemented in the simulation. When these points are considered, simulation can be seen as a kind of game to find out the optimal solution for a special problem. The major advantage of a simulation is the possibility to try out scenarios and analyze and visualize the impacts of different parameter settings before the actual runtime. In this case, simulators can be used prior to the solving of a special problem or project in real life in order to prevent the investor from wrong decision. As well in case of short-term production planning, a simulation can help to find an optimized production sequence as basic for decision making by the production manager. The findings of the optimal production sequence for the current situation gets a quick “try and error”-game for the decision maker without the fear of making failures and creating additional costs.
2.2 Enterprise Resource Planning (ERP)
One of the most important trends in current IT development for companies is the trend to support and optimize the daily business in all areas of the business. Primary goal when deploying and using an ERP-System in a company is to increase the efficiency of established processes by supporting them through information technology. If the adaption of this system is a success and it supports the daily to-dos of the employees, it is over all a big opportunity to
-37-
save time and money for the company. Of course, the first problem of establishing the new system and major investments has to be carefully planned. ERP-software involves the business task to plan the resources of a company like money, personal or equipment persistently, carefully and in an efficient form during the whole production process. Therefore companies need more and more IT infrastructure which gets even more complex and so harder to maintain. The simulation of the production flow by multi agent system tools also belongs to this package of planning software. Furthermore it can be an essential part of it and complete the functionality of standard ERP-software by providing further information about the production process and add important data into the central available data source. In this case, the ERP-software acts as media, which transports this information towards all roles that need the data.
2.2.1 Definition
The term “Enterprise Resource Planning” covers the attempt to provide a central point to organize actions within a company by using information technology and software to control information flows and evaluate them. In the book “Wirtschaftsinformatik 1 – Grundlagen und Anwendungen” [A8] the following translated definition of ERP systems can be found:
The term ERP (enterprise resource planning) stands for a complex
application package consisting of more components, which together
support operational processes in all crucial business areas. The
integration of these systems is build up on a central data base which
avoids redundancy of data and allows a continuously build up of
necessary business processes. [A8] This means that ERP programs are working process-oriented and take into consideration the construction and expiration of the organisations and responsibilities of an enterprise in the IT infrastructure. An ERP solution tries to grasp and illustrate the flow of information in the company as a whole.
2.2.2 Special requirements regarding a modern ERP-software-solution
The definition of ERP systems concretizes the following important points for requirements which have to be covered by these solutions: Platform independency
It is important for companies that all bigger investments are in operational use over a long time – this applies in particular for IT systems. But if reorganisation can not be avoided, the additional effort should be as small as possible. Therefore it is useful to take special care on platform independency covering the hardware and operation-system when a new business application will be bought (e.g. switch from Windows to Linux, open-source-software, etc.) Open system architecture
-38-
Actual ERP-systems have to provide the opportunity for the customer to use them over the border of the own company away. In time of globalisation modern business scenarios do not end at the area of the own manufacturing plant. It is necessary to involve pre and post processes of suppliers and customers. Integration of supply chain management (SCM) and customer relationship management
(CRM)
SCM- and CRM-solutions can be also used as stand-alone software but they are useful complementary elements to an ERP-software-solution. As mentioned before, by integrating such tools into a single application, the boundaries and interfaces to other needed elements as customers and suppliers are softened but well controlled. SCM � supply chain management (= delivery chain, added value chain) is the definition
and management of business processes, which arise along the supply chain from the first raw material supplier to the final consumer; they are arranged economical and efficiently as possible; intensive co-operation between involved enterprises involved is necessary for an optimum organization of all concerned material, information and funds flows
CRM � customer relationship management (= customer relations management); CRM covers methods and applications, which serve a systematic support of the customer relations; it bases on a data base providing information about customers like personal data, preferences or past sales – this allows an individual contact to each customer of the company
Simultaneous use by a larger number of users
ERP systems are used frequently in very large enterprises or the public administration. Therefore a simultaneous access by a multiplicity of users must be ensured by as small hardware costs as possible. This requirement is best convertible with a multi-level Client/Server architecture, which permits an appropriate load distribution during the program execution. Assignment of person specific access options
This issue primarily covers the personal and roll-specific authentication of a system user by means of user names and password. That means that each employee of the enterprise can access only those services of the system, which are necessary for his role in order to fulfil the given tasks (e.g.: a department manager can look at personal data of all employees but the secretary can only look at the personal address and internal call number to pick up a contact possibility). Beyond this access right administration, an ERP system should include mechanisms that allow each employee to individualise his working interface to his special demands (individually arranged workplace). Workplace technologies supply the employees using the ERP system through their working station at their desktop in their offices with the power to build up his own personal package of the offered information, applications and services. Thus an efficient working environment is made available to the employee, which is oriented on its
-39-
respective habits, activity and authority so that he feels also still well in the practice of its work doing.
2.2.3 Characterization of an ERP system
In order to be able to differentiate between ERP systems and other, functionally oriented software by definition, there are certain characteristics, which distinguish an ERP program. One speaks of ERP-systems if in the following described characteristics are given:
1) Integration
With the integration of ERP-systems the widely cover of the administrative functions of the organization and orientation at constant business processes is expressed. In order to prevent redundant data and guarantee a high level of data consistency at the same time, always the same data source – a central data base – is accessed.
2) Flexibility
Covers the adaptability of an ERP system to the different requirements on technical and economical level.
- Technical � deployment of different operating systems, hardware platforms, client/server architecture, support of open standards (communication protocols, Interfaces, etc.) - Economical � Configuration by adjusting different system internal parameter (customizing), interface configuration
3) Internationality
The increasing market globalization and world-wide acting of many organizations requires the availability of ERP systems in several languages. Additionally, the ERP system has to take into consideration differences in the country-specific legislation (e.g.: tax rates, revisions, etc.)
2.2.4 Risk of the integration of ERP-systems
Actually, computer science (and especially ERP software) is no longer only an auxiliary means to a more efficient work organization, but rather became a central nervous system of the enterprise. If problems arise here, the entire enterprise is concerned. Each data input at one point is taken up to real time and immediately changes all information concerned in the system. Thus for example an order by a customer releases a chain of further actions, like material order, supplier payment, delivery note and account creation, etc. Errors, which need to be corrected afterwards, can have serious effects on procedures linked with it. Therefore the expiration or framework organization has to be usually adapted to the actual process logic. If the integration is not executed in an adequate quality the danger exists that the individual elements of the enterprise work against each other. A frequently made mistake of enterprises is that the implementation of an integrated application system is dismissed as purely technical affair. But this is not true! The consideration of the single specialist areas into the implementation project is essential for the success. A careful planning is still necessary in order to judge the chances and risks of a software introduction exactly from the deployment and to provide product requirement specifications with consideration of the business processes.
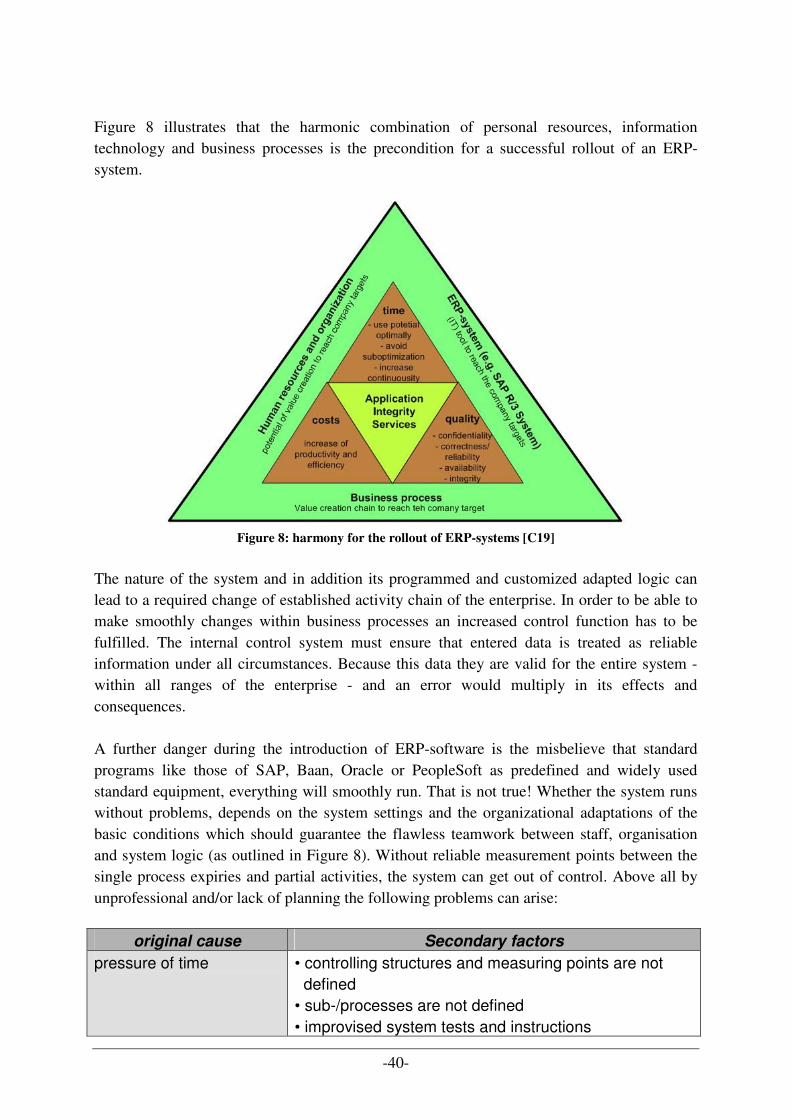
-40-
Figure 8 illustrates that the harmonic combination of personal resources, information technology and business processes is the precondition for a successful rollout of an ERP-system.
Figure 8: harmony for the rollout of ERP-systems [C19]
The nature of the system and in addition its programmed and customized adapted logic can lead to a required change of established activity chain of the enterprise. In order to be able to make smoothly changes within business processes an increased control function has to be fulfilled. The internal control system must ensure that entered data is treated as reliable information under all circumstances. Because this data they are valid for the entire system - within all ranges of the enterprise - and an error would multiply in its effects and consequences. A further danger during the introduction of ERP-software is the misbelieve that standard programs like those of SAP, Baan, Oracle or PeopleSoft as predefined and widely used standard equipment, everything will smoothly run. That is not true! Whether the system runs without problems, depends on the system settings and the organizational adaptations of the basic conditions which should guarantee the flawless teamwork between staff, organisation and system logic (as outlined in Figure 8). Without reliable measurement points between the single process expiries and partial activities, the system can get out of control. Above all by unprofessional and/or lack of planning the following problems can arise:
original cause Secondary factors
pressure of time • controlling structures and measuring points are not defined • sub-/processes are not defined • improvised system tests and instructions
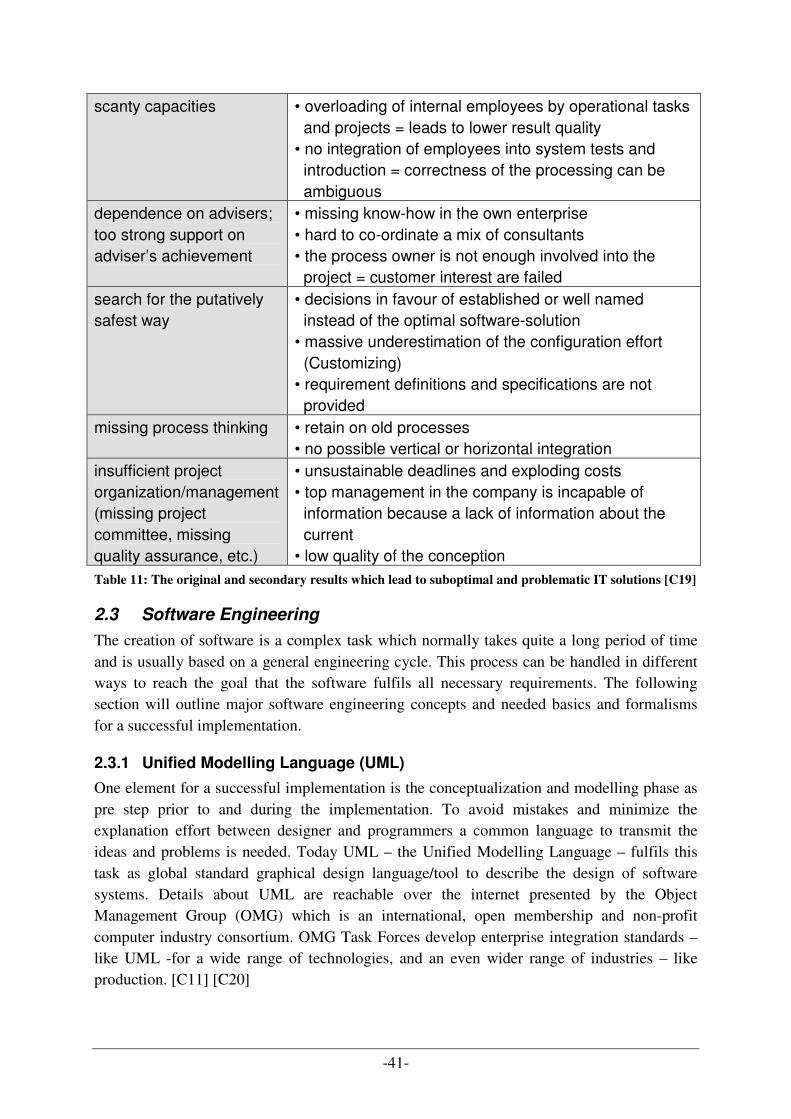
-41-
scanty capacities • overloading of internal employees by operational tasks and projects = leads to lower result quality • no integration of employees into system tests and introduction = correctness of the processing can be ambiguous
dependence on advisers; too strong support on adviser’s achievement
• missing know-how in the own enterprise • hard to co-ordinate a mix of consultants • the process owner is not enough involved into the project = customer interest are failed
search for the putatively safest way
• decisions in favour of established or well named instead of the optimal software-solution • massive underestimation of the configuration effort (Customizing) • requirement definitions and specifications are not provided
missing process thinking • retain on old processes • no possible vertical or horizontal integration
insufficient project organization/management (missing project committee, missing quality assurance, etc.)
• unsustainable deadlines and exploding costs • top management in the company is incapable of information because a lack of information about the current • low quality of the conception
Table 11: The original and secondary results which lead to suboptimal and problematic IT solutions [C19]
2.3 Software Engineering
The creation of software is a complex task which normally takes quite a long period of time and is usually based on a general engineering cycle. This process can be handled in different ways to reach the goal that the software fulfils all necessary requirements. The following section will outline major software engineering concepts and needed basics and formalisms for a successful implementation.
2.3.1 Unified Modelling Language (UML)
One element for a successful implementation is the conceptualization and modelling phase as pre step prior to and during the implementation. To avoid mistakes and minimize the explanation effort between designer and programmers a common language to transmit the ideas and problems is needed. Today UML – the Unified Modelling Language – fulfils this task as global standard graphical design language/tool to describe the design of software systems. Details about UML are reachable over the internet presented by the Object Management Group (OMG) which is an international, open membership and non-profit computer industry consortium. OMG Task Forces develop enterprise integration standards – like UML -for a wide range of technologies, and an even wider range of industries – like production. [C11] [C20]
-42-
UML at itself is not a method. It was designed to be compatible with the leading object-oriented software development methods basing on the iterative project lifecycle described in the Rational Unified Process maintained by IBM [B9]:
1) inception phase (establishing a baseline by which to compare actual expenditures versus planned expenditures)
2) elaboration phase (this is where the project starts to take shape. In this phase the problem domain analysis is made and the architecture of the project gets its basic form.)
3) construction phase (in this phase, the main focus lies on the development of components and other features of the system being designed. This is the phase when the bulk of the coding takes place. In larger projects, several construction iterations may be developed in an effort to divide the use cases into manageable segments that produce demonstrable prototypes.)
4) transition phase (here the product moves from the development organization to the end user. The activities of this phase include training of the end users and maintainers and beta testing of the system to validate it against the end users' expectations. The product is also checked against the quality level set in the Inception phase. If it does not meet this level, or the standards of the end users, another iteration of the phase begins.)
The advantage of a common language consisting of well known symbols and mechanisms with well defined semantics to outline a software system is that it enables software designers to express, exchange and work on their ideas without the need for a complicated translation process which was necessary in historical projects in which they ideas needed to be transmitted to the programmer who had to implement them. UML provides a ready-to-use expressive visual modelling language that is widely accepted and thus allows the users to exchange design models without loss of information or excessive work to map their models onto each other. Furthermore UML provides the advantage of independency towards any programming language, i.e. the UML should support all reasonable programming languages as well as most existing process models. Another important fact of created UML models during the inception and elaboration phase is that the formal semantics of the language constructs are not too complicated so that it can be applied by the average user. This is one of the main powers of a graphical visualization language. UML is in the position to express the operational meanings of most constructs in precise natural language and thus avoids operational definitions that are equivalent to implementation specifications. Extensibility and specialization mechanisms are another useful way to extend the core concepts as far it is needed for a special task (e.g. for a conversation with the customer an easier visualization of a design problem is needed then it is necessary for a developer to implement the same problem. The description of software systems with UML bases on the interconnection of things and relationships. Things are an abstraction in the defined models to describe entities. The Relationships between the different entities tie these things (entities) together by modelling
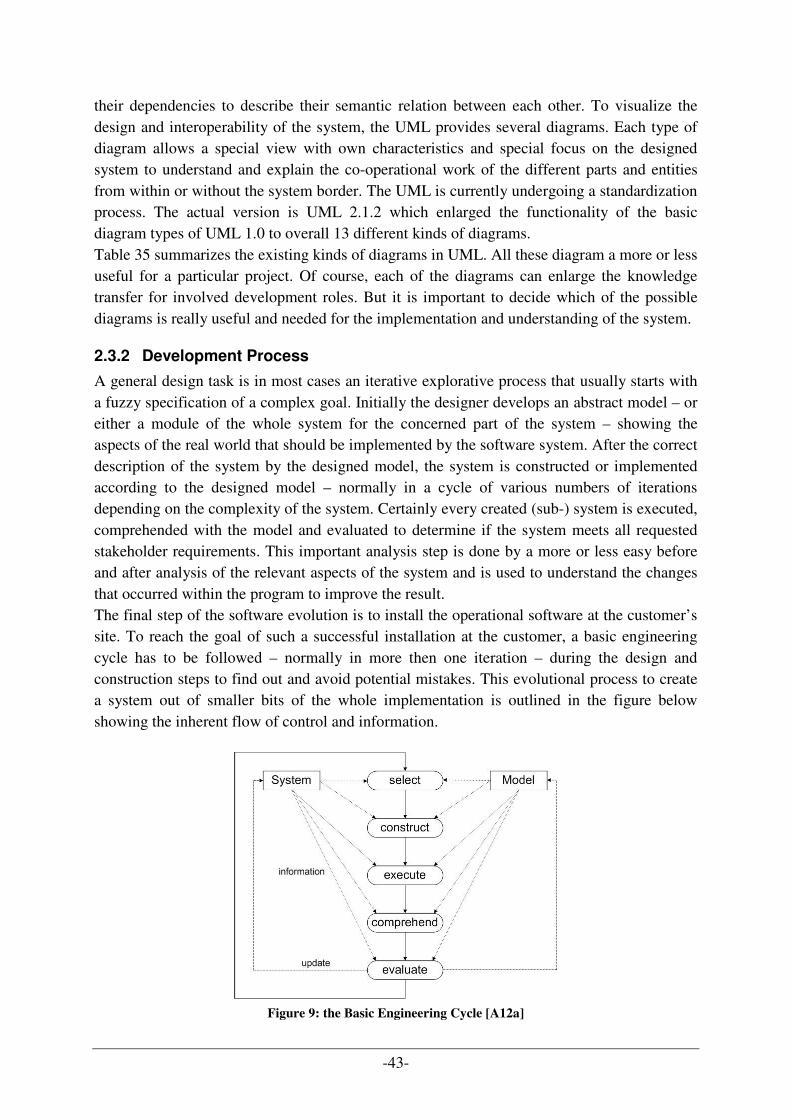
-43-
their dependencies to describe their semantic relation between each other. To visualize the design and interoperability of the system, the UML provides several diagrams. Each type of diagram allows a special view with own characteristics and special focus on the designed system to understand and explain the co-operational work of the different parts and entities from within or without the system border. The UML is currently undergoing a standardization process. The actual version is UML 2.1.2 which enlarged the functionality of the basic diagram types of UML 1.0 to overall 13 different kinds of diagrams. Table 35 summarizes the existing kinds of diagrams in UML. All these diagram a more or less useful for a particular project. Of course, each of the diagrams can enlarge the knowledge transfer for involved development roles. But it is important to decide which of the possible diagrams is really useful and needed for the implementation and understanding of the system.
2.3.2 Development Process
A general design task is in most cases an iterative explorative process that usually starts with a fuzzy specification of a complex goal. Initially the designer develops an abstract model – or either a module of the whole system for the concerned part of the system – showing the aspects of the real world that should be implemented by the software system. After the correct description of the system by the designed model, the system is constructed or implemented according to the designed model – normally in a cycle of various numbers of iterations depending on the complexity of the system. Certainly every created (sub-) system is executed, comprehended with the model and evaluated to determine if the system meets all requested stakeholder requirements. This important analysis step is done by a more or less easy before and after analysis of the relevant aspects of the system and is used to understand the changes that occurred within the program to improve the result. The final step of the software evolution is to install the operational software at the customer’s site. To reach the goal of such a successful installation at the customer, a basic engineering cycle has to be followed – normally in more then one iteration – during the design and construction steps to find out and avoid potential mistakes. This evolutional process to create a system out of smaller bits of the whole implementation is outlined in the figure below showing the inherent flow of control and information.
Figure 9: the Basic Engineering Cycle [A12a]
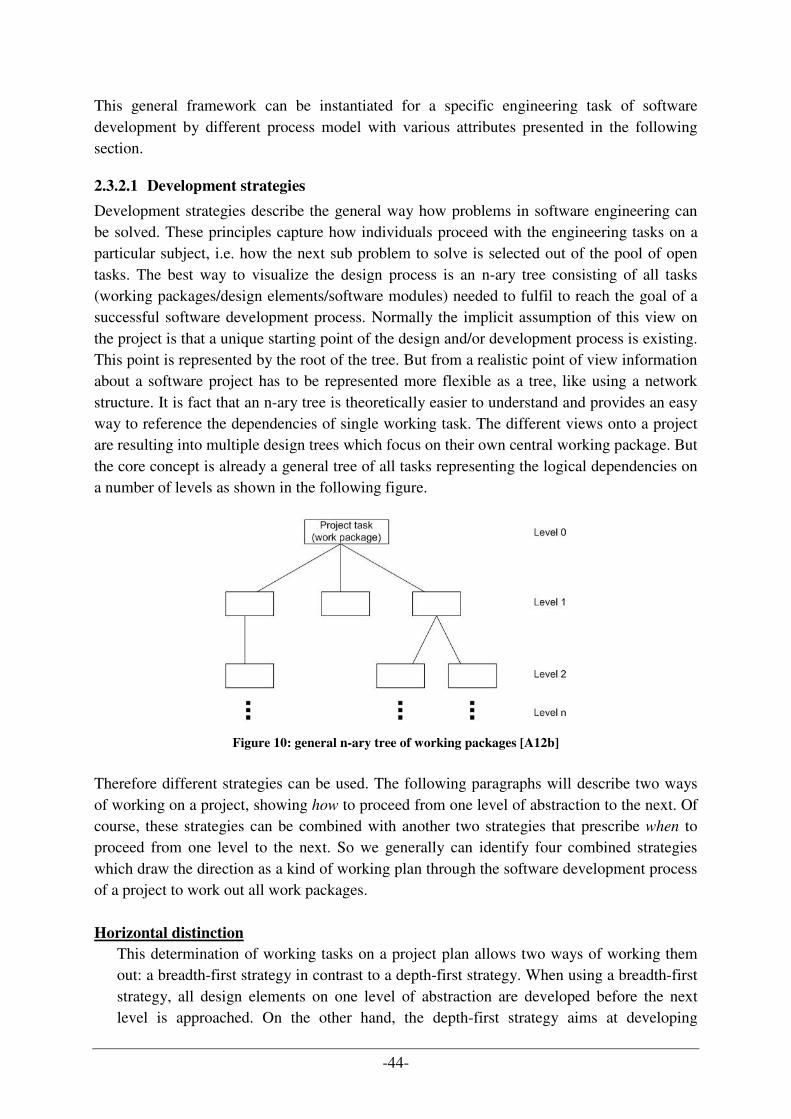
-44-
This general framework can be instantiated for a specific engineering task of software development by different process model with various attributes presented in the following section.
2.3.2.1 Development strategies
Development strategies describe the general way how problems in software engineering can be solved. These principles capture how individuals proceed with the engineering tasks on a particular subject, i.e. how the next sub problem to solve is selected out of the pool of open tasks. The best way to visualize the design process is an n-ary tree consisting of all tasks (working packages/design elements/software modules) needed to fulfil to reach the goal of a successful software development process. Normally the implicit assumption of this view on the project is that a unique starting point of the design and/or development process is existing. This point is represented by the root of the tree. But from a realistic point of view information about a software project has to be represented more flexible as a tree, like using a network structure. It is fact that an n-ary tree is theoretically easier to understand and provides an easy way to reference the dependencies of single working task. The different views onto a project are resulting into multiple design trees which focus on their own central working package. But the core concept is already a general tree of all tasks representing the logical dependencies on a number of levels as shown in the following figure.
Figure 10: general n-ary tree of working packages [A12b]
Therefore different strategies can be used. The following paragraphs will describe two ways of working on a project, showing how to proceed from one level of abstraction to the next. Of course, these strategies can be combined with another two strategies that prescribe when to proceed from one level to the next. So we generally can identify four combined strategies which draw the direction as a kind of working plan through the software development process of a project to work out all work packages. Horizontal distinction
This determination of working tasks on a project plan allows two ways of working them out: a breadth-first strategy in contrast to a depth-first strategy. When using a breadth-first strategy, all design elements on one level of abstraction are developed before the next level is approached. On the other hand, the depth-first strategy aims at developing
-45-
components of one or few branch to start with their full depth and then going back to the highest level of abstraction to start with the next branch.
Vertical distinction
These two strategies (the bottom-up-approach versus the top-down-approach) differ on the granularity of the problem description for the various tasks to be done. By using a top-down strategy, the designer proceeds from the structural elements on the most abstract level to more concrete elements until finally the code level is reached. On the other hand, the bottom-up strategy goes exactly the other way. It starts with a collection of low level design elements that are subsequently assembled into bigger units.
In realistic projects this introduced strategies are rather abstracted and an idealized workflow. In practice none of these strategies is applied throughout the full development process. It is more practicable for developers who are working on the whole project to choose the best strategy for the next few steps according to logical dependencies and other limitations and advantages which can influence the development process, like e.g. the available capacity of developers for the outstanding tasks and the personal preferences and skills of available developer. This behaviour is called opportunistic strategy where the next sub-task is selected due to its utility and its cognitive costs.
2.3.2.2 Software Engineering Process Models
Basically the development of software systems is achieved in three steps.
1. The first point is the development of an abstract model for the aspects of the real world that should be implemented by the needed software by a system designer.
2. This designed system has to be constructed and implemented according to this model and finally
3. the operational system has to be installed at the customers site This ideal process is not as realistic as it seems. The development process contains numerous difficulties that often cannot be solved in an ad-hoc manner. So the need of a pre-defined plan of how to execute the activities that are involved in the software development process and also plans of how to handle difficulties that arise in the course of these activities is clear. A general definition for process model can be merged out of Jalote Pankej’s paper as following:
A Software Engineering process model is the formalization of the software
design and implementation activities and of the products that are
connected with these activities. [A9] Normally a process model consists of phases (e.g. like listed below) which will be worked out sequentially one after the other. Depending on the chosen model, they may be performed in more than one iteration and/or back step into prep-phases allow by quality control steps at the end of the phase or beginning of the following phase to discover potential problems to guarantee the needed quality of the created results:
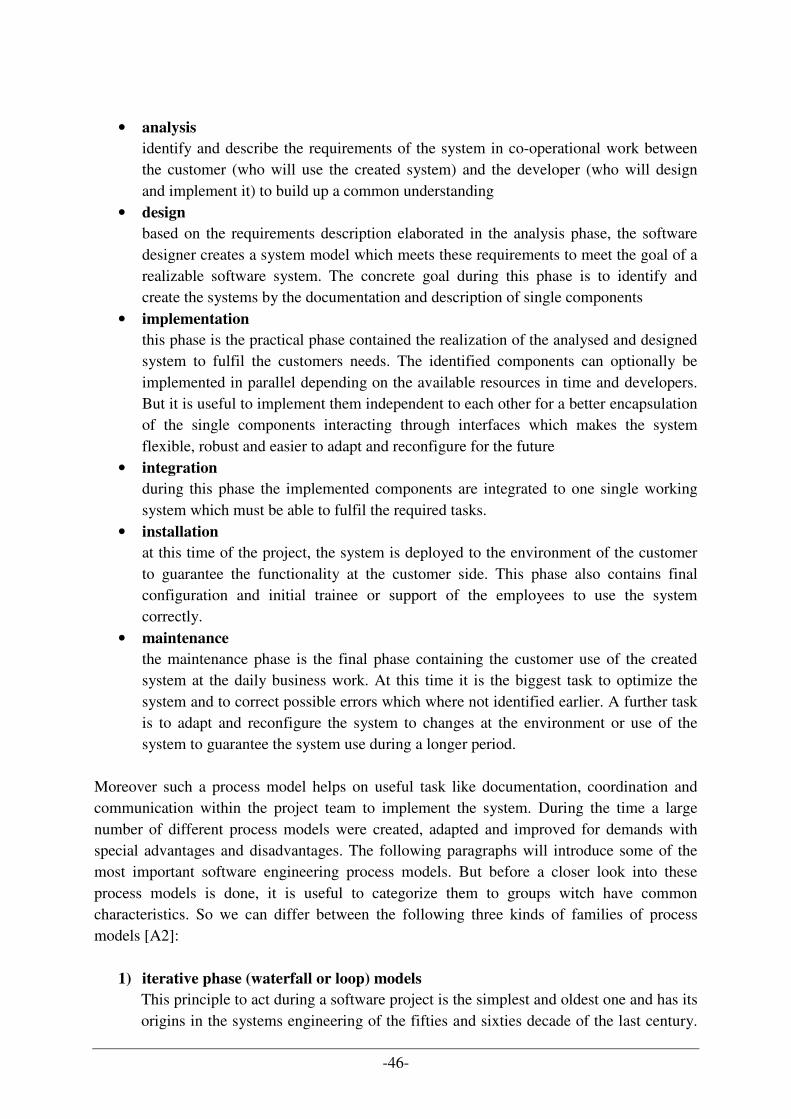
-46-
• analysis
identify and describe the requirements of the system in co-operational work between the customer (who will use the created system) and the developer (who will design and implement it) to build up a common understanding
• design
based on the requirements description elaborated in the analysis phase, the software designer creates a system model which meets these requirements to meet the goal of a realizable software system. The concrete goal during this phase is to identify and create the systems by the documentation and description of single components
• implementation
this phase is the practical phase contained the realization of the analysed and designed system to fulfil the customers needs. The identified components can optionally be implemented in parallel depending on the available resources in time and developers. But it is useful to implement them independent to each other for a better encapsulation of the single components interacting through interfaces which makes the system flexible, robust and easier to adapt and reconfigure for the future
• integration
during this phase the implemented components are integrated to one single working system which must be able to fulfil the required tasks.
• installation
at this time of the project, the system is deployed to the environment of the customer to guarantee the functionality at the customer side. This phase also contains final configuration and initial trainee or support of the employees to use the system correctly.
• maintenance
the maintenance phase is the final phase containing the customer use of the created system at the daily business work. At this time it is the biggest task to optimize the system and to correct possible errors which where not identified earlier. A further task is to adapt and reconfigure the system to changes at the environment or use of the system to guarantee the system use during a longer period.
Moreover such a process model helps on useful task like documentation, coordination and communication within the project team to implement the system. During the time a large number of different process models were created, adapted and improved for demands with special advantages and disadvantages. The following paragraphs will introduce some of the most important software engineering process models. But before a closer look into these process models is done, it is useful to categorize them to groups witch have common characteristics. So we can differ between the following three kinds of families of process models [A2]:
1) iterative phase (waterfall or loop) models
This principle to act during a software project is the simplest and oldest one and has its origins in the systems engineering of the fifties and sixties decade of the last century.
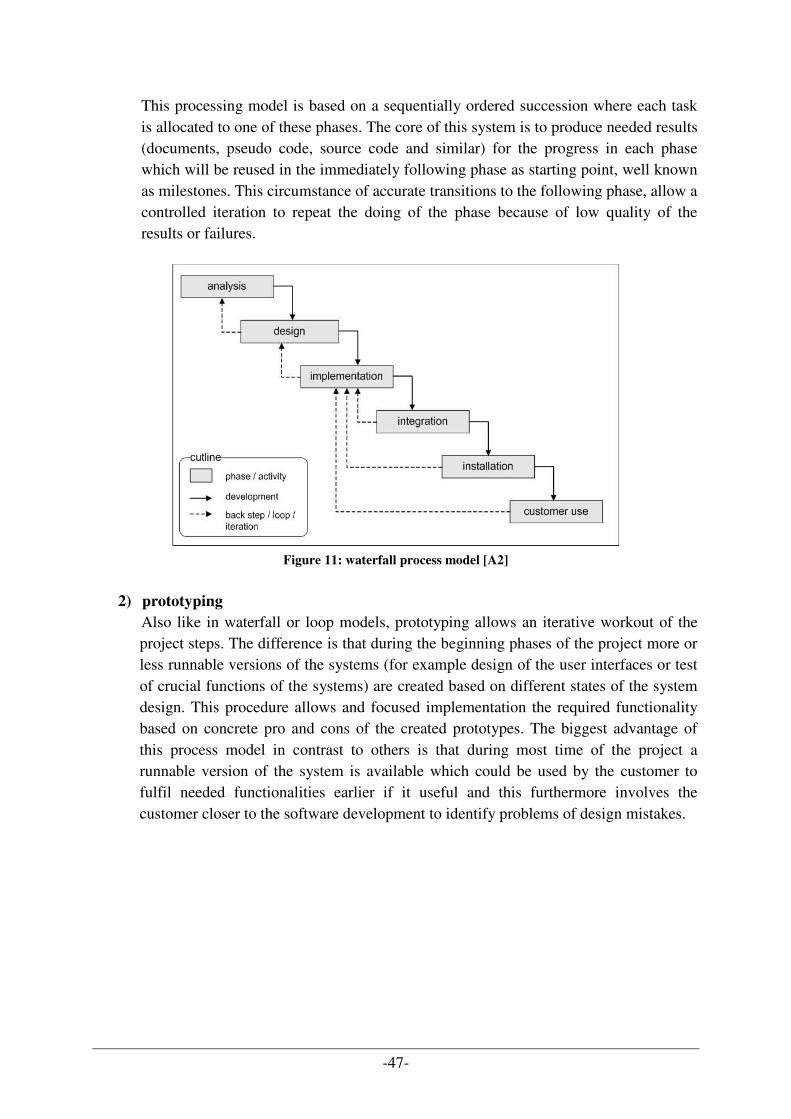
-47-
This processing model is based on a sequentially ordered succession where each task is allocated to one of these phases. The core of this system is to produce needed results (documents, pseudo code, source code and similar) for the progress in each phase which will be reused in the immediately following phase as starting point, well known as milestones. This circumstance of accurate transitions to the following phase, allow a controlled iteration to repeat the doing of the phase because of low quality of the results or failures.
Figure 11: waterfall process model [A2]
2) prototyping
Also like in waterfall or loop models, prototyping allows an iterative workout of the project steps. The difference is that during the beginning phases of the project more or less runnable versions of the systems (for example design of the user interfaces or test of crucial functions of the systems) are created based on different states of the system design. This procedure allows and focused implementation the required functionality based on concrete pro and cons of the created prototypes. The biggest advantage of this process model in contrast to others is that during most time of the project a runnable version of the system is available which could be used by the customer to fulfil needed functionalities earlier if it useful and this furthermore involves the customer closer to the software development to identify problems of design mistakes.
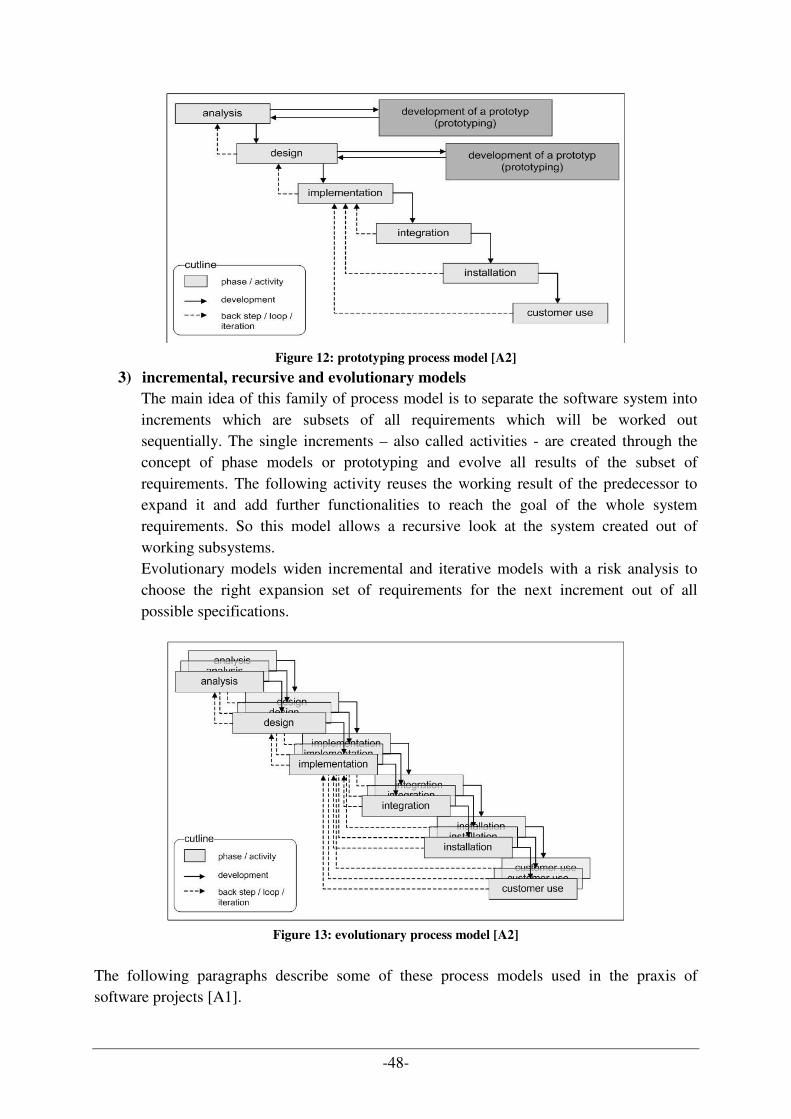
-48-
Figure 12: prototyping process model [A2]
3) incremental, recursive and evolutionary models
The main idea of this family of process model is to separate the software system into increments which are subsets of all requirements which will be worked out sequentially. The single increments – also called activities - are created through the concept of phase models or prototyping and evolve all results of the subset of requirements. The following activity reuses the working result of the predecessor to expand it and add further functionalities to reach the goal of the whole system requirements. So this model allows a recursive look at the system created out of working subsystems. Evolutionary models widen incremental and iterative models with a risk analysis to choose the right expansion set of requirements for the next increment out of all possible specifications.
Figure 13: evolutionary process model [A2]
The following paragraphs describe some of these process models used in the praxis of software projects [A1].
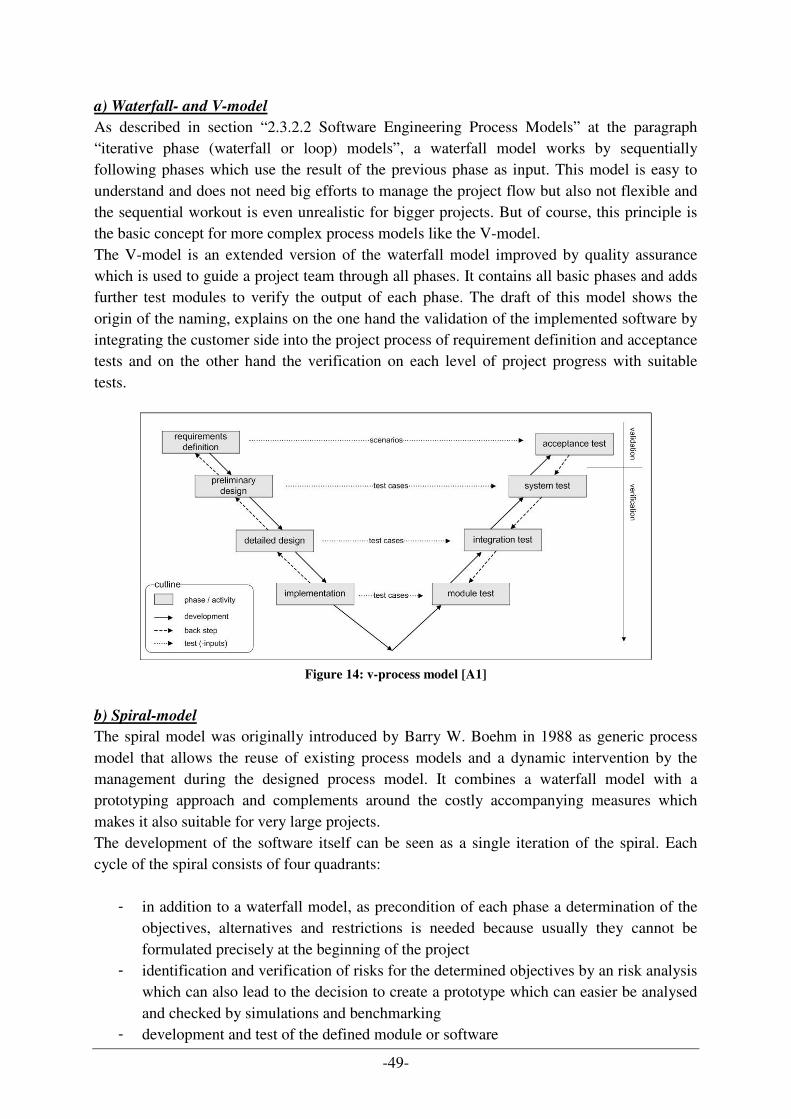
-49-
a) Waterfall- and V-model
As described in section “2.3.2.2 Software Engineering Process Models” at the paragraph “iterative phase (waterfall or loop) models”, a waterfall model works by sequentially following phases which use the result of the previous phase as input. This model is easy to understand and does not need big efforts to manage the project flow but also not flexible and the sequential workout is even unrealistic for bigger projects. But of course, this principle is the basic concept for more complex process models like the V-model. The V-model is an extended version of the waterfall model improved by quality assurance which is used to guide a project team through all phases. It contains all basic phases and adds further test modules to verify the output of each phase. The draft of this model shows the origin of the naming, explains on the one hand the validation of the implemented software by integrating the customer side into the project process of requirement definition and acceptance tests and on the other hand the verification on each level of project progress with suitable tests.
Figure 14: v-process model [A1]
b) Spiral-model
The spiral model was originally introduced by Barry W. Boehm in 1988 as generic process model that allows the reuse of existing process models and a dynamic intervention by the management during the designed process model. It combines a waterfall model with a prototyping approach and complements around the costly accompanying measures which makes it also suitable for very large projects. The development of the software itself can be seen as a single iteration of the spiral. Each cycle of the spiral consists of four quadrants:
- in addition to a waterfall model, as precondition of each phase a determination of the objectives, alternatives and restrictions is needed because usually they cannot be formulated precisely at the beginning of the project
- identification and verification of risks for the determined objectives by an risk analysis which can also lead to the decision to create a prototype which can easier be analysed and checked by simulations and benchmarking
- development and test of the defined module or software
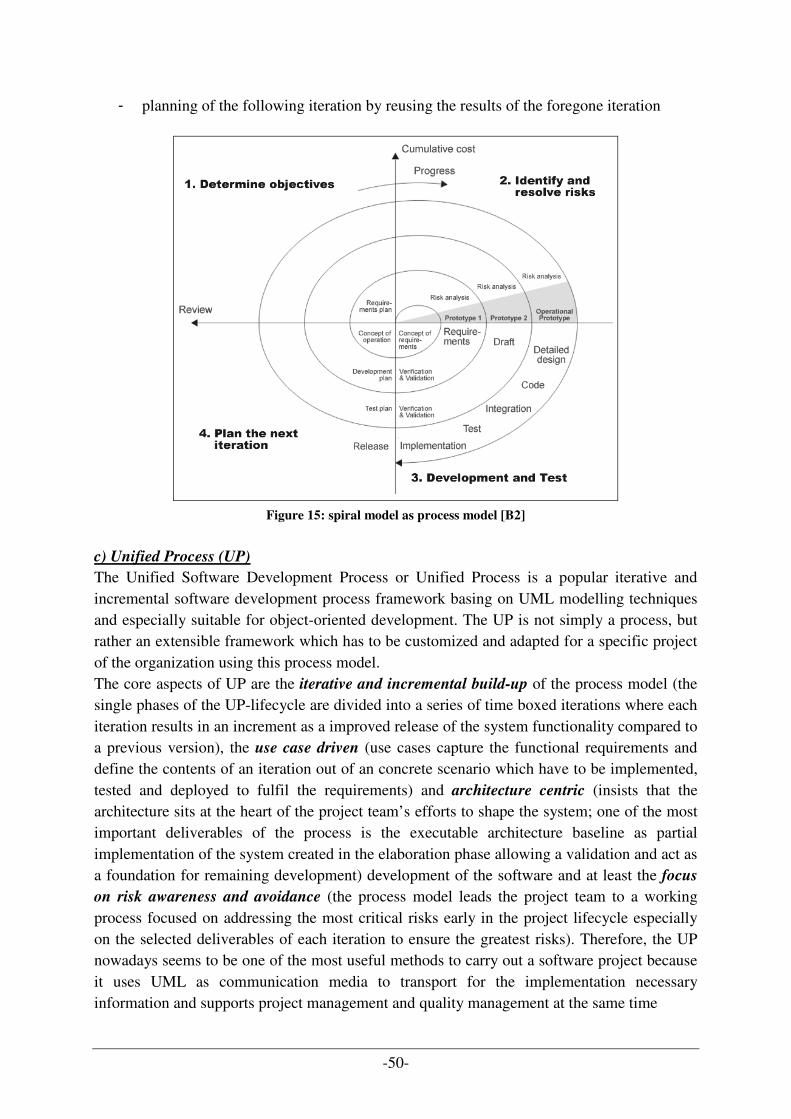
-50-
- planning of the following iteration by reusing the results of the foregone iteration
Figure 15: spiral model as process model [B2]
c) Unified Process (UP)
The Unified Software Development Process or Unified Process is a popular iterative and incremental software development process framework basing on UML modelling techniques and especially suitable for object-oriented development. The UP is not simply a process, but rather an extensible framework which has to be customized and adapted for a specific project of the organization using this process model. The core aspects of UP are the iterative and incremental build-up of the process model (the single phases of the UP-lifecycle are divided into a series of time boxed iterations where each iteration results in an increment as a improved release of the system functionality compared to a previous version), the use case driven (use cases capture the functional requirements and define the contents of an iteration out of an concrete scenario which have to be implemented, tested and deployed to fulfil the requirements) and architecture centric (insists that the architecture sits at the heart of the project team’s efforts to shape the system; one of the most important deliverables of the process is the executable architecture baseline as partial implementation of the system created in the elaboration phase allowing a validation and act as a foundation for remaining development) development of the software and at least the focus
on risk awareness and avoidance (the process model leads the project team to a working process focused on addressing the most critical risks early in the project lifecycle especially on the selected deliverables of each iteration to ensure the greatest risks). Therefore, the UP nowadays seems to be one of the most useful methods to carry out a software project because it uses UML as communication media to transport for the implementation necessary information and supports project management and quality management at the same time
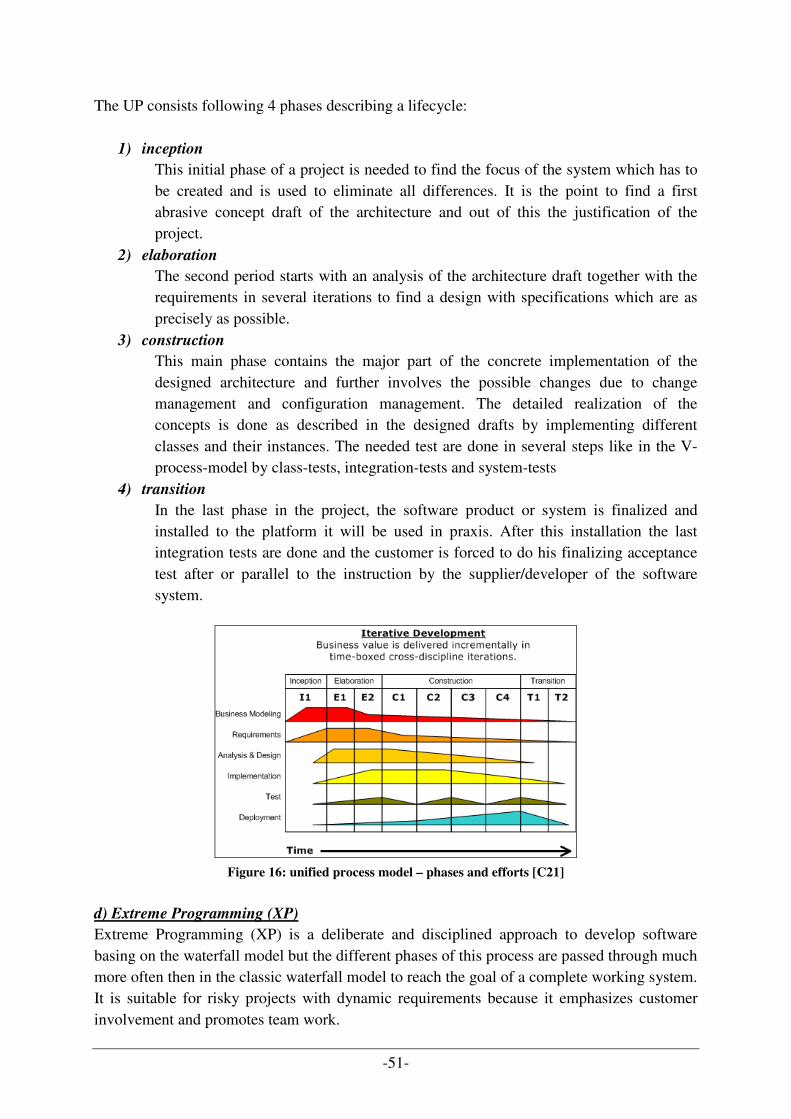
-51-
The UP consists following 4 phases describing a lifecycle:
1) inception
This initial phase of a project is needed to find the focus of the system which has to be created and is used to eliminate all differences. It is the point to find a first abrasive concept draft of the architecture and out of this the justification of the project.
2) elaboration
The second period starts with an analysis of the architecture draft together with the requirements in several iterations to find a design with specifications which are as precisely as possible.
3) construction
This main phase contains the major part of the concrete implementation of the designed architecture and further involves the possible changes due to change management and configuration management. The detailed realization of the concepts is done as described in the designed drafts by implementing different classes and their instances. The needed test are done in several steps like in the V-process-model by class-tests, integration-tests and system-tests
4) transition
In the last phase in the project, the software product or system is finalized and installed to the platform it will be used in praxis. After this installation the last integration tests are done and the customer is forced to do his finalizing acceptance test after or parallel to the instruction by the supplier/developer of the software system.
Figure 16: unified process model – phases and efforts [C21]
d) Extreme Programming (XP)
Extreme Programming (XP) is a deliberate and disciplined approach to develop software basing on the waterfall model but the different phases of this process are passed through much more often then in the classic waterfall model to reach the goal of a complete working system. It is suitable for risky projects with dynamic requirements because it emphasizes customer involvement and promotes team work.
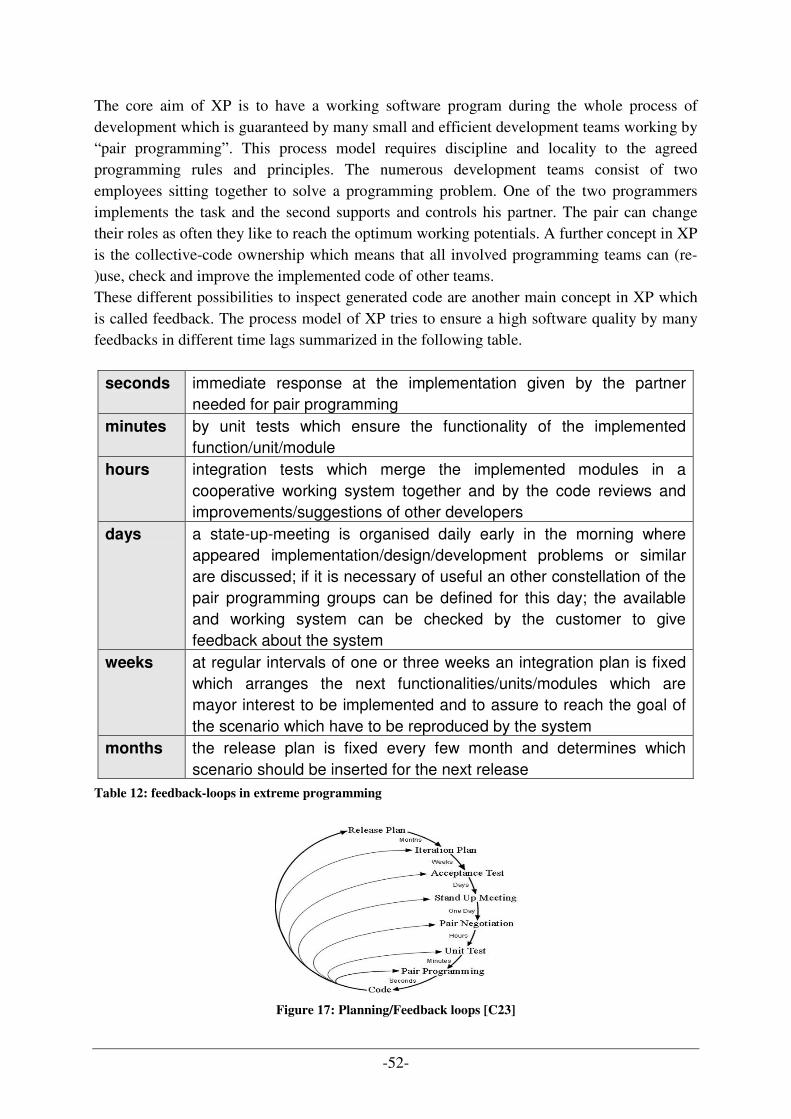
-52-
The core aim of XP is to have a working software program during the whole process of development which is guaranteed by many small and efficient development teams working by “pair programming”. This process model requires discipline and locality to the agreed programming rules and principles. The numerous development teams consist of two employees sitting together to solve a programming problem. One of the two programmers implements the task and the second supports and controls his partner. The pair can change their roles as often they like to reach the optimum working potentials. A further concept in XP is the collective-code ownership which means that all involved programming teams can (re-)use, check and improve the implemented code of other teams. These different possibilities to inspect generated code are another main concept in XP which is called feedback. The process model of XP tries to ensure a high software quality by many feedbacks in different time lags summarized in the following table.
seconds immediate response at the implementation given by the partner needed for pair programming
minutes by unit tests which ensure the functionality of the implemented function/unit/module
hours integration tests which merge the implemented modules in a cooperative working system together and by the code reviews and improvements/suggestions of other developers
days a state-up-meeting is organised daily early in the morning where appeared implementation/design/development problems or similar are discussed; if it is necessary of useful an other constellation of the pair programming groups can be defined for this day; the available and working system can be checked by the customer to give feedback about the system
weeks at regular intervals of one or three weeks an integration plan is fixed which arranges the next functionalities/units/modules which are mayor interest to be implemented and to assure to reach the goal of the scenario which have to be reproduced by the system
months the release plan is fixed every few month and determines which scenario should be inserted for the next release
Table 12: feedback-loops in extreme programming
Figure 17: Planning/Feedback loops [C23]
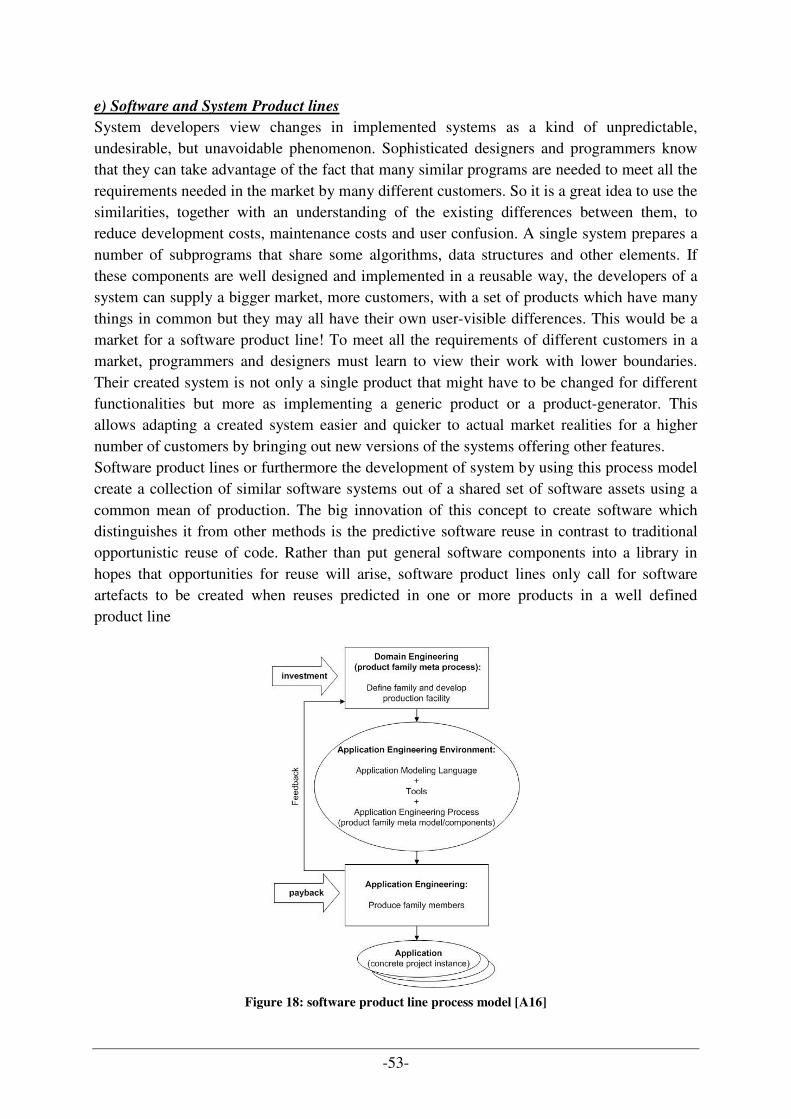
-53-
e) Software and System Product lines
System developers view changes in implemented systems as a kind of unpredictable, undesirable, but unavoidable phenomenon. Sophisticated designers and programmers know that they can take advantage of the fact that many similar programs are needed to meet all the requirements needed in the market by many different customers. So it is a great idea to use the similarities, together with an understanding of the existing differences between them, to reduce development costs, maintenance costs and user confusion. A single system prepares a number of subprograms that share some algorithms, data structures and other elements. If these components are well designed and implemented in a reusable way, the developers of a system can supply a bigger market, more customers, with a set of products which have many things in common but they may all have their own user-visible differences. This would be a market for a software product line! To meet all the requirements of different customers in a market, programmers and designers must learn to view their work with lower boundaries. Their created system is not only a single product that might have to be changed for different functionalities but more as implementing a generic product or a product-generator. This allows adapting a created system easier and quicker to actual market realities for a higher number of customers by bringing out new versions of the systems offering other features. Software product lines or furthermore the development of system by using this process model create a collection of similar software systems out of a shared set of software assets using a common mean of production. The big innovation of this concept to create software which distinguishes it from other methods is the predictive software reuse in contrast to traditional opportunistic reuse of code. Rather than put general software components into a library in hopes that opportunities for reuse will arise, software product lines only call for software artefacts to be created when reuses predicted in one or more products in a well defined product line
Figure 18: software product line process model [A16]
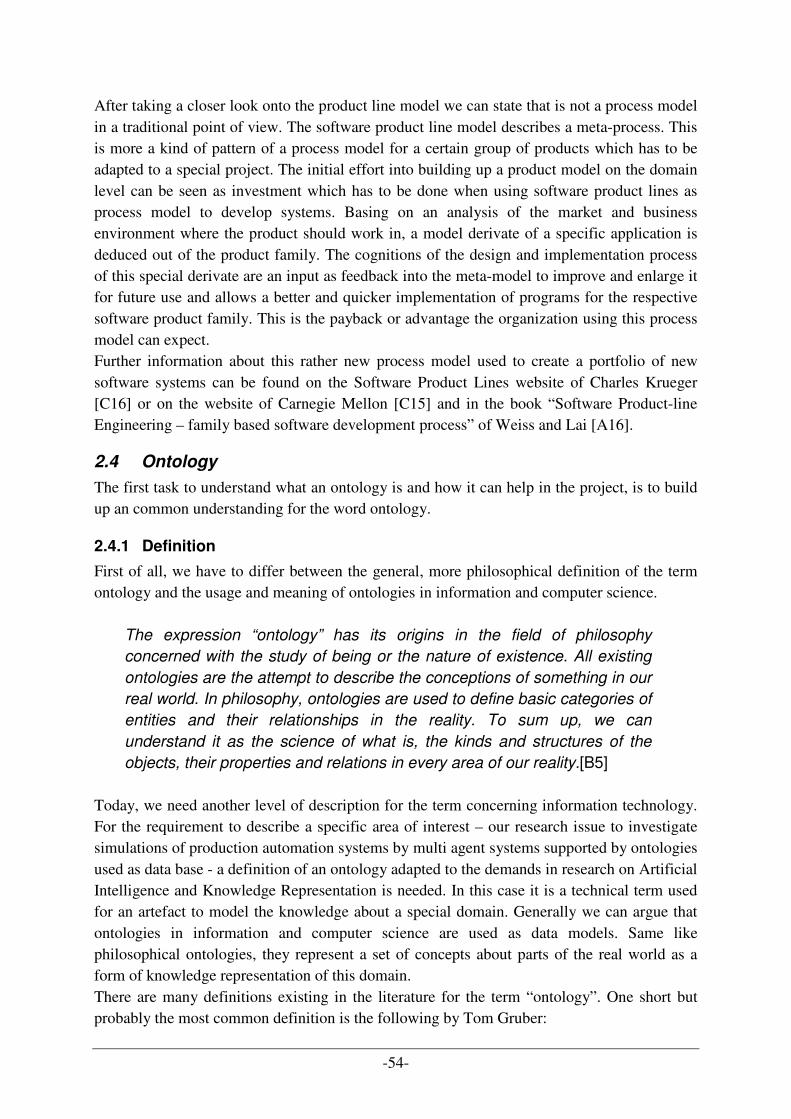
-54-
After taking a closer look onto the product line model we can state that is not a process model in a traditional point of view. The software product line model describes a meta-process. This is more a kind of pattern of a process model for a certain group of products which has to be adapted to a special project. The initial effort into building up a product model on the domain level can be seen as investment which has to be done when using software product lines as process model to develop systems. Basing on an analysis of the market and business environment where the product should work in, a model derivate of a specific application is deduced out of the product family. The cognitions of the design and implementation process of this special derivate are an input as feedback into the meta-model to improve and enlarge it for future use and allows a better and quicker implementation of programs for the respective software product family. This is the payback or advantage the organization using this process model can expect. Further information about this rather new process model used to create a portfolio of new software systems can be found on the Software Product Lines website of Charles Krueger [C16] or on the website of Carnegie Mellon [C15] and in the book “Software Product-line Engineering – family based software development process” of Weiss and Lai [A16].
2.4 Ontology
The first task to understand what an ontology is and how it can help in the project, is to build up an common understanding for the word ontology.
2.4.1 Definition
First of all, we have to differ between the general, more philosophical definition of the term ontology and the usage and meaning of ontologies in information and computer science.
The expression “ontology” has its origins in the field of philosophy
concerned with the study of being or the nature of existence. All existing
ontologies are the attempt to describe the conceptions of something in our
real world. In philosophy, ontologies are used to define basic categories of
entities and their relationships in the reality. To sum up, we can
understand it as the science of what is, the kinds and structures of the
objects, their properties and relations in every area of our reality.[B5] Today, we need another level of description for the term concerning information technology. For the requirement to describe a specific area of interest – our research issue to investigate simulations of production automation systems by multi agent systems supported by ontologies used as data base - a definition of an ontology adapted to the demands in research on Artificial Intelligence and Knowledge Representation is needed. In this case it is a technical term used for an artefact to model the knowledge about a special domain. Generally we can argue that ontologies in information and computer science are used as data models. Same like philosophical ontologies, they represent a set of concepts about parts of the real world as a form of knowledge representation of this domain. There are many definitions existing in the literature for the term “ontology”. One short but probably the most common definition is the following by Tom Gruber:
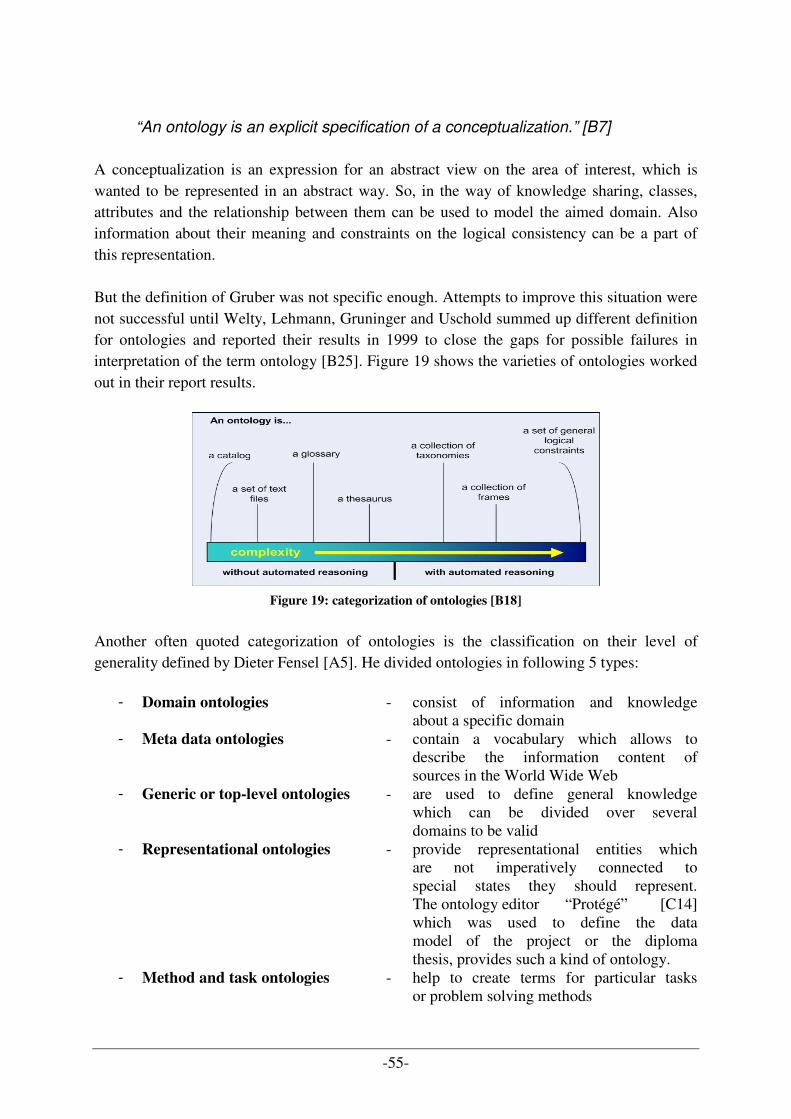
-55-
“An ontology is an explicit specification of a conceptualization.” [B7]
A conceptualization is an expression for an abstract view on the area of interest, which is wanted to be represented in an abstract way. So, in the way of knowledge sharing, classes, attributes and the relationship between them can be used to model the aimed domain. Also information about their meaning and constraints on the logical consistency can be a part of this representation. But the definition of Gruber was not specific enough. Attempts to improve this situation were not successful until Welty, Lehmann, Gruninger and Uschold summed up different definition for ontologies and reported their results in 1999 to close the gaps for possible failures in interpretation of the term ontology [B25]. Figure 19 shows the varieties of ontologies worked out in their report results.
Figure 19: categorization of ontologies [B18]
Another often quoted categorization of ontologies is the classification on their level of generality defined by Dieter Fensel [A5]. He divided ontologies in following 5 types:
- Domain ontologies - consist of information and knowledge about a specific domain
- Meta data ontologies - contain a vocabulary which allows to describe the information content of sources in the World Wide Web
- Generic or top-level ontologies - are used to define general knowledge which can be divided over several domains to be valid
- Representational ontologies - provide representational entities which are not imperatively connected to special states they should represent. The ontology editor “Protégé” [C14] which was used to define the data model of the project or the diploma thesis, provides such a kind of ontology.
- Method and task ontologies - help to create terms for particular tasks or problem solving methods
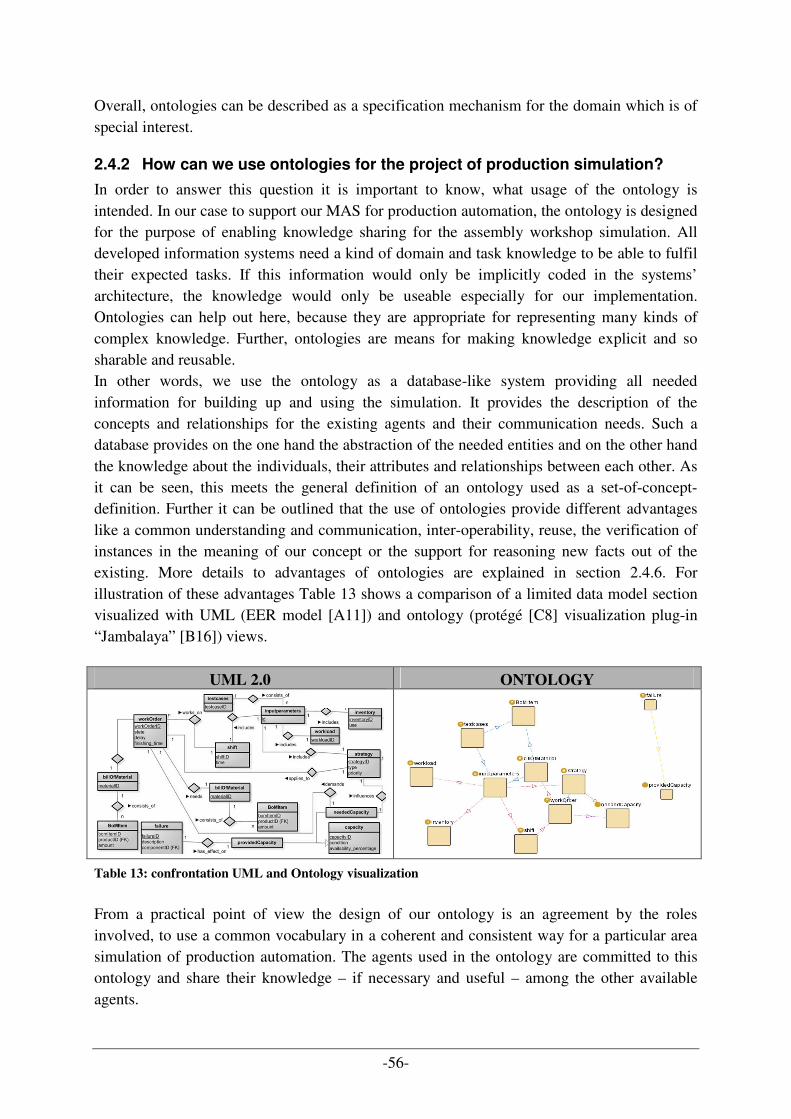
-56-
Overall, ontologies can be described as a specification mechanism for the domain which is of special interest.
2.4.2 How can we use ontologies for the project of production simulation?
In order to answer this question it is important to know, what usage of the ontology is intended. In our case to support our MAS for production automation, the ontology is designed for the purpose of enabling knowledge sharing for the assembly workshop simulation. All developed information systems need a kind of domain and task knowledge to be able to fulfil their expected tasks. If this information would only be implicitly coded in the systems’ architecture, the knowledge would only be useable especially for our implementation. Ontologies can help out here, because they are appropriate for representing many kinds of complex knowledge. Further, ontologies are means for making knowledge explicit and so sharable and reusable. In other words, we use the ontology as a database-like system providing all needed information for building up and using the simulation. It provides the description of the concepts and relationships for the existing agents and their communication needs. Such a database provides on the one hand the abstraction of the needed entities and on the other hand the knowledge about the individuals, their attributes and relationships between each other. As it can be seen, this meets the general definition of an ontology used as a set-of-concept-definition. Further it can be outlined that the use of ontologies provide different advantages like a common understanding and communication, inter-operability, reuse, the verification of instances in the meaning of our concept or the support for reasoning new facts out of the existing. More details to advantages of ontologies are explained in section 2.4.6. For illustration of these advantages Table 13 shows a comparison of a limited data model section visualized with UML (EER model [A11]) and ontology (protégé [C8] visualization plug-in “Jambalaya” [B16]) views.
UML 2.0 ONTOLOGY
Table 13: confrontation UML and Ontology visualization
From a practical point of view the design of our ontology is an agreement by the roles involved, to use a common vocabulary in a coherent and consistent way for a particular area simulation of production automation. The agents used in the ontology are committed to this ontology and share their knowledge – if necessary and useful – among the other available agents.
-57-
2.4.3 Components of an ontology
Today used ontologies share structural similarities, regardless of the language used to express their definitions. Therefore, contemporary ontologies consist of following four basic components: instances, classes, attributes and relations. The next sections describe them in a short way.
2.4.3.1 Instances
Instance, which often also are called Individuals, are the main component of any ontology. Over individuals the Ontology gets its main purpose to describe the needed object – even if they are concrete (like people, machine, product,…) or abstract (like numbers, strategies, routes). For example “Billy_low” is an instance of “product” or “First In First Out” is an instance of “strategy” in the context of our production simulation.
Figure 20: screenshot of the "Billy_low"-Instance created via Protégé [C14]
2.4.3.2 Classes
Classes are often also called type, concept or category and cover one sort of the before mentioned instances into an abstract group of these objects. They can contain individuals but also other classes. The concept of classes can be seen as generalization. That means that classes can be a subset of other classes. Normally the most general class is on top of this hierarchical view and is called “thing”. Vice versa the most specified class is the last item of the created tree containing all available classes. But of course, such structures are not forced to be build up as a hierarchical ordered tree. It is also possible to see the classes as a network. Figure 21 presents an easy example for such a hierarchical ordered tree of classes.
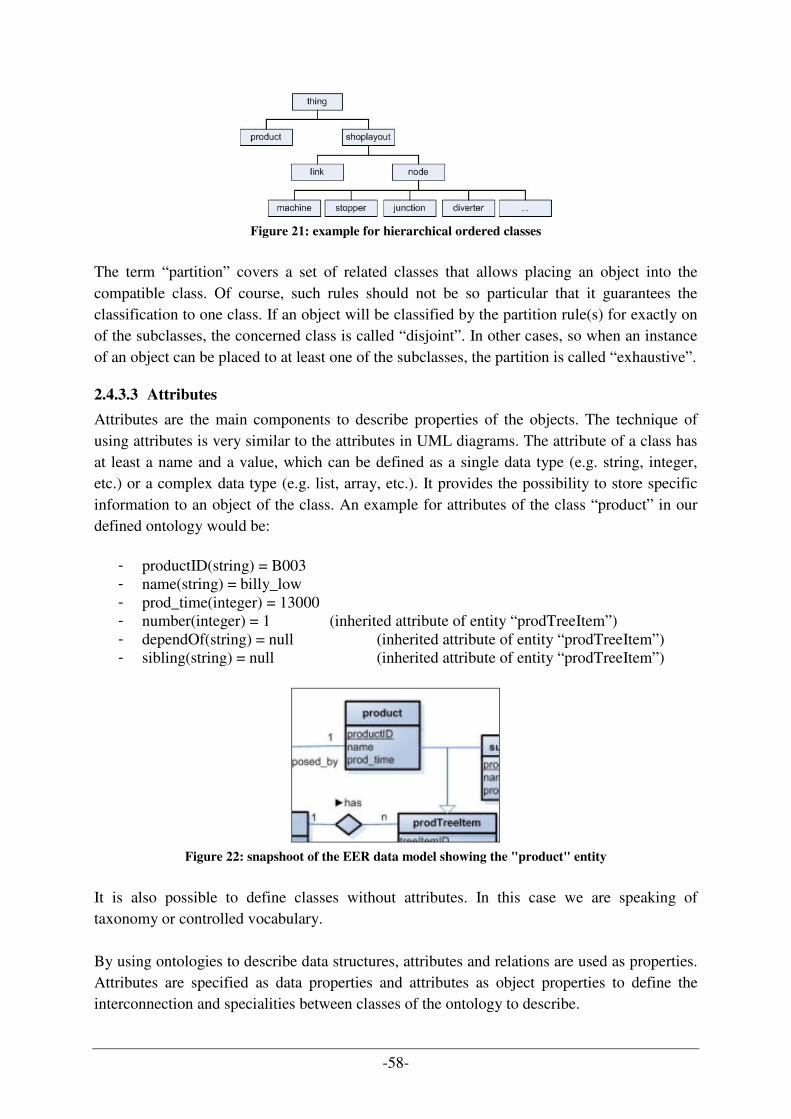
-58-
Figure 21: example for hierarchical ordered classes
The term “partition” covers a set of related classes that allows placing an object into the compatible class. Of course, such rules should not be so particular that it guarantees the classification to one class. If an object will be classified by the partition rule(s) for exactly on of the subclasses, the concerned class is called “disjoint”. In other cases, so when an instance of an object can be placed to at least one of the subclasses, the partition is called “exhaustive”.
2.4.3.3 Attributes
Attributes are the main components to describe properties of the objects. The technique of using attributes is very similar to the attributes in UML diagrams. The attribute of a class has at least a name and a value, which can be defined as a single data type (e.g. string, integer, etc.) or a complex data type (e.g. list, array, etc.). It provides the possibility to store specific information to an object of the class. An example for attributes of the class “product” in our defined ontology would be:
- productID(string) = B003 - name(string) = billy_low - prod_time(integer) = 13000 - number(integer) = 1 (inherited attribute of entity “prodTreeItem”) - dependOf(string) = null (inherited attribute of entity “prodTreeItem”) - sibling(string) = null (inherited attribute of entity “prodTreeItem”)
Figure 22: snapshoot of the EER data model showing the "product" entity
It is also possible to define classes without attributes. In this case we are speaking of taxonomy or controlled vocabulary. By using ontologies to describe data structures, attributes and relations are used as properties. Attributes are specified as data properties and attributes as object properties to define the interconnection and specialities between classes of the ontology to describe.
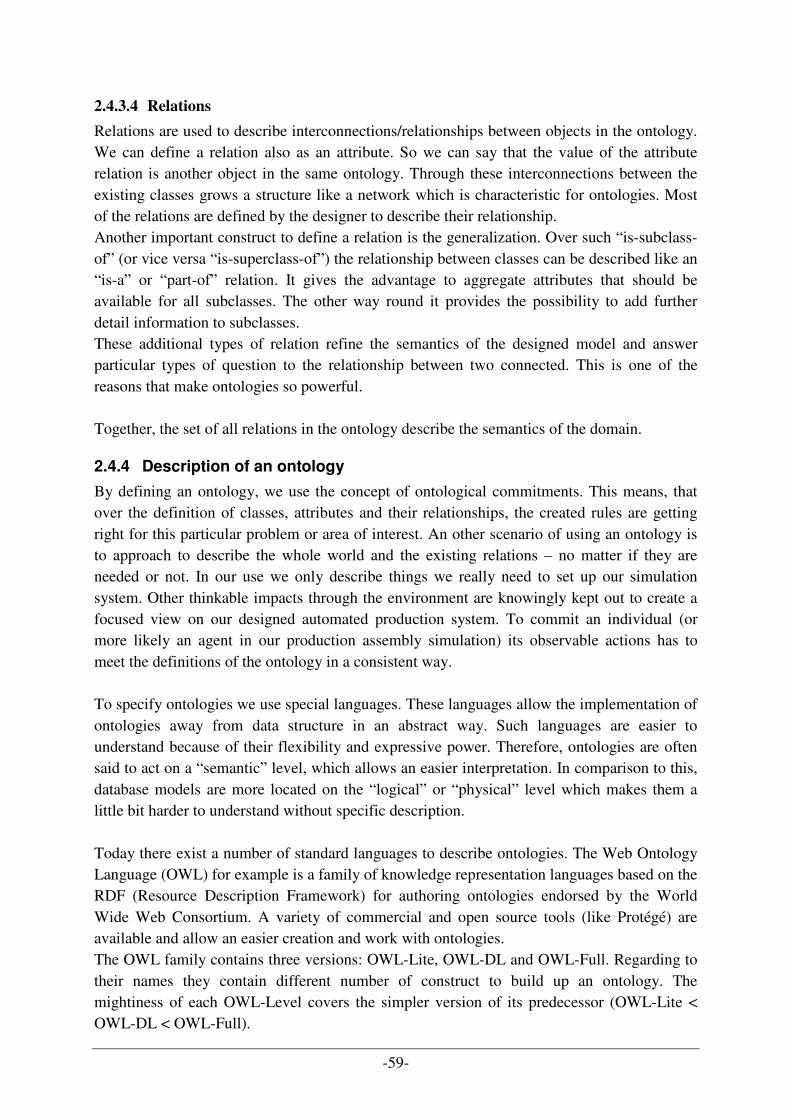
-59-
2.4.3.4 Relations
Relations are used to describe interconnections/relationships between objects in the ontology. We can define a relation also as an attribute. So we can say that the value of the attribute relation is another object in the same ontology. Through these interconnections between the existing classes grows a structure like a network which is characteristic for ontologies. Most of the relations are defined by the designer to describe their relationship. Another important construct to define a relation is the generalization. Over such “is-subclass-of” (or vice versa “is-superclass-of”) the relationship between classes can be described like an “is-a” or “part-of” relation. It gives the advantage to aggregate attributes that should be available for all subclasses. The other way round it provides the possibility to add further detail information to subclasses. These additional types of relation refine the semantics of the designed model and answer particular types of question to the relationship between two connected. This is one of the reasons that make ontologies so powerful. Together, the set of all relations in the ontology describe the semantics of the domain.
2.4.4 Description of an ontology
By defining an ontology, we use the concept of ontological commitments. This means, that over the definition of classes, attributes and their relationships, the created rules are getting right for this particular problem or area of interest. An other scenario of using an ontology is to approach to describe the whole world and the existing relations – no matter if they are needed or not. In our use we only describe things we really need to set up our simulation system. Other thinkable impacts through the environment are knowingly kept out to create a focused view on our designed automated production system. To commit an individual (or more likely an agent in our production assembly simulation) its observable actions has to meet the definitions of the ontology in a consistent way. To specify ontologies we use special languages. These languages allow the implementation of ontologies away from data structure in an abstract way. Such languages are easier to understand because of their flexibility and expressive power. Therefore, ontologies are often said to act on a “semantic” level, which allows an easier interpretation. In comparison to this, database models are more located on the “logical” or “physical” level which makes them a little bit harder to understand without specific description. Today there exist a number of standard languages to describe ontologies. The Web Ontology Language (OWL) for example is a family of knowledge representation languages based on the RDF (Resource Description Framework) for authoring ontologies endorsed by the World Wide Web Consortium. A variety of commercial and open source tools (like Protégé) are available and allow an easier creation and work with ontologies. The OWL family contains three versions: OWL-Lite, OWL-DL and OWL-Full. Regarding to their names they contain different number of construct to build up an ontology. The mightiness of each OWL-Level covers the simpler version of its predecessor (OWL-Lite < OWL-DL < OWL-Full).
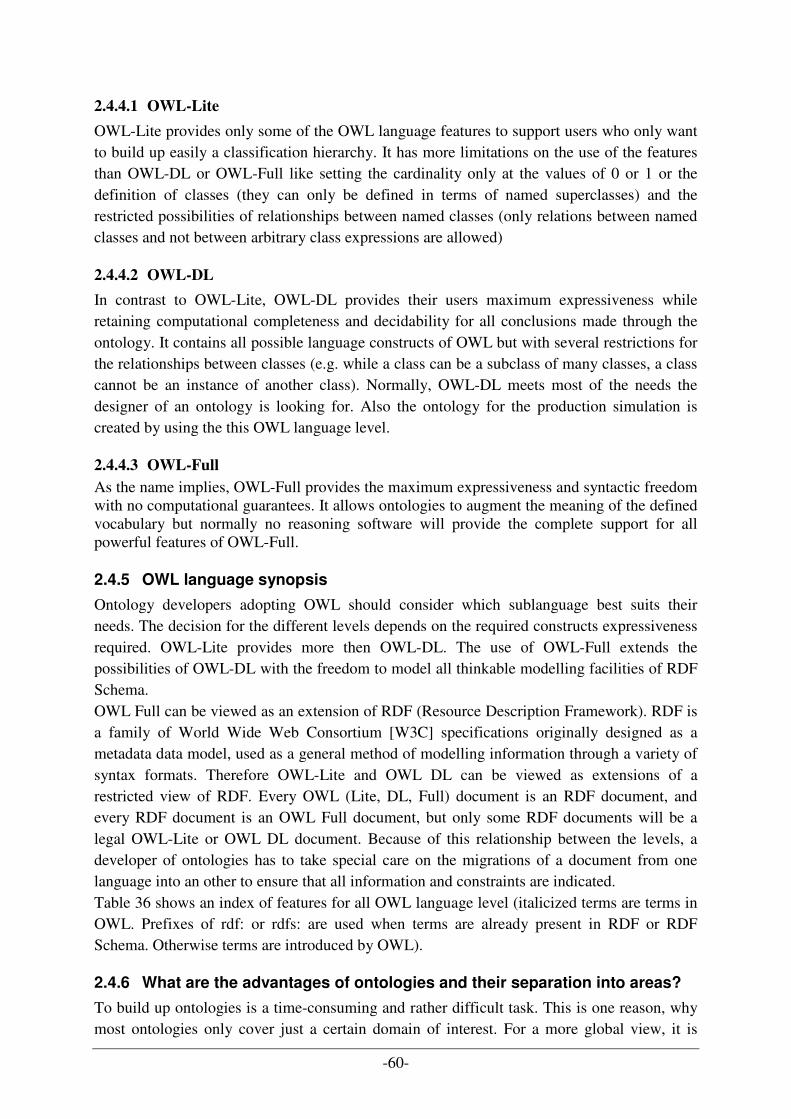
-60-
2.4.4.1 OWL-Lite
OWL-Lite provides only some of the OWL language features to support users who only want to build up easily a classification hierarchy. It has more limitations on the use of the features than OWL-DL or OWL-Full like setting the cardinality only at the values of 0 or 1 or the definition of classes (they can only be defined in terms of named superclasses) and the restricted possibilities of relationships between named classes (only relations between named classes and not between arbitrary class expressions are allowed)
2.4.4.2 OWL-DL
In contrast to OWL-Lite, OWL-DL provides their users maximum expressiveness while retaining computational completeness and decidability for all conclusions made through the ontology. It contains all possible language constructs of OWL but with several restrictions for the relationships between classes (e.g. while a class can be a subclass of many classes, a class cannot be an instance of another class). Normally, OWL-DL meets most of the needs the designer of an ontology is looking for. Also the ontology for the production simulation is created by using the this OWL language level.
2.4.4.3 OWL-Full
As the name implies, OWL-Full provides the maximum expressiveness and syntactic freedom with no computational guarantees. It allows ontologies to augment the meaning of the defined vocabulary but normally no reasoning software will provide the complete support for all powerful features of OWL-Full.
2.4.5 OWL language synopsis
Ontology developers adopting OWL should consider which sublanguage best suits their needs. The decision for the different levels depends on the required constructs expressiveness required. OWL-Lite provides more then OWL-DL. The use of OWL-Full extends the possibilities of OWL-DL with the freedom to model all thinkable modelling facilities of RDF Schema. OWL Full can be viewed as an extension of RDF (Resource Description Framework). RDF is a family of World Wide Web Consortium [W3C] specifications originally designed as a metadata data model, used as a general method of modelling information through a variety of syntax formats. Therefore OWL-Lite and OWL DL can be viewed as extensions of a restricted view of RDF. Every OWL (Lite, DL, Full) document is an RDF document, and every RDF document is an OWL Full document, but only some RDF documents will be a legal OWL-Lite or OWL DL document. Because of this relationship between the levels, a developer of ontologies has to take special care on the migrations of a document from one language into an other to ensure that all information and constraints are indicated. Table 36 shows an index of features for all OWL language level (italicized terms are terms in OWL. Prefixes of rdf: or rdfs: are used when terms are already present in RDF or RDF Schema. Otherwise terms are introduced by OWL).
2.4.6 What are the advantages of ontologies and their separation into areas?
To build up ontologies is a time-consuming and rather difficult task. This is one reason, why most ontologies only cover just a certain domain of interest. For a more global view, it is
-61-
possible to integrate or add further parts of ontologies. In this way you can compare ontologies with a puzzle. So first of all it is important to know exactly what information is needed. After this you have to decide, which parts (or areas) of the ontology are useful to get out the required specification – like puzzling. The second approach to look on the separation of ontologies is a “vertical” one. The complexity of the designed ontology can differ. Sometimes it can be useful to create a “top-level-ontology” to handle the problem in a rather abstract way. Starting from this point of “key concepts”, the ontology can be grained top down into more detailed ontology-levels with special views on the specific problem. The major problem here is to avoid inconsistencies, which are common with very detailed ontologies.
Figure 23: ontology pyramid [B14]
Figure 23 shows the principle of upper-, middle- and low-ontologies on growing complexity. Upper ontologies are helpful to convey basic concepts. Middle- and low-ontologies can consist of hundred or thousands of relations to describe to represent specific domains in a granularity for complete understanding. Generally, as explained so far, there seem to be many advantages of ontology usage. But of course, also some disadvantages make the commitment of ontologies difficult.
2.4.6.1 Advantages
For companies it is most important to stay competitive. Therefore it is necessary to guarantee a consistent information flow beside the value chain. Ontologies are one approach to handle this situation and meet the dynamic task to keep in touch with the essentials. Ontologies represent a language and the common understanding for complex information structures employees are concerned with. So, they are the basic for good working communication. They are a kind of agreement on the meaning of things between interaction partners, either humans or computers. By committing to an ontology, an interaction partner declares that it is aware of and will refer to the meaning of the vocabulary. This is important to guarantee consistency. Theoretically the use of ontologies is beneficial wherever an agreement on the meaning of things is important. The main advantages provide through an ontology are the following one:
Understanding an ontology can serve as a documentation, which using human beings can understand the underlying conceptualisation of a domain and structure of information better
Communication Ontologies can help interaction partners to communicate
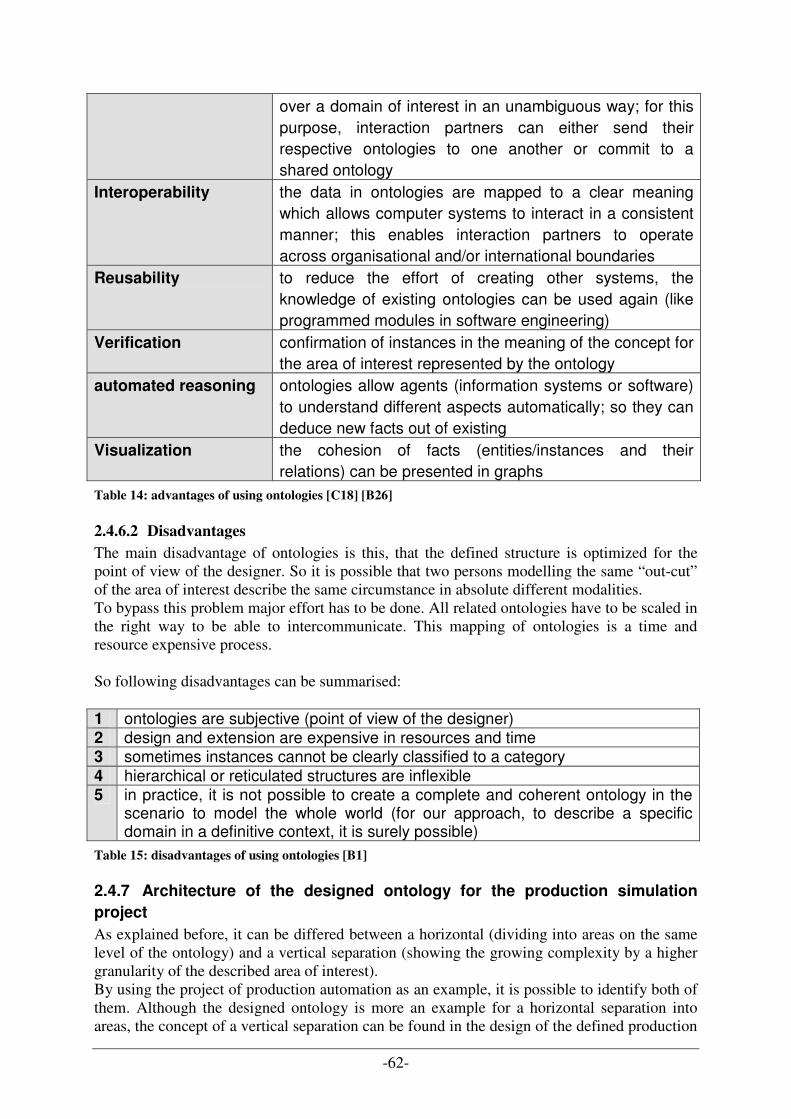
-62-
over a domain of interest in an unambiguous way; for this purpose, interaction partners can either send their respective ontologies to one another or commit to a shared ontology
Interoperability the data in ontologies are mapped to a clear meaning which allows computer systems to interact in a consistent manner; this enables interaction partners to operate across organisational and/or international boundaries
Reusability to reduce the effort of creating other systems, the knowledge of existing ontologies can be used again (like programmed modules in software engineering)
Verification confirmation of instances in the meaning of the concept for the area of interest represented by the ontology
automated reasoning ontologies allow agents (information systems or software) to understand different aspects automatically; so they can deduce new facts out of existing
Visualization the cohesion of facts (entities/instances and their relations) can be presented in graphs
Table 14: advantages of using ontologies [C18] [B26]
2.4.6.2 Disadvantages
The main disadvantage of ontologies is this, that the defined structure is optimized for the point of view of the designer. So it is possible that two persons modelling the same “out-cut” of the area of interest describe the same circumstance in absolute different modalities. To bypass this problem major effort has to be done. All related ontologies have to be scaled in the right way to be able to intercommunicate. This mapping of ontologies is a time and resource expensive process. So following disadvantages can be summarised: 1 ontologies are subjective (point of view of the designer) 2 design and extension are expensive in resources and time 3 sometimes instances cannot be clearly classified to a category 4 hierarchical or reticulated structures are inflexible 5 in practice, it is not possible to create a complete and coherent ontology in the
scenario to model the whole world (for our approach, to describe a specific domain in a definitive context, it is surely possible)
Table 15: disadvantages of using ontologies [B1]
2.4.7 Architecture of the designed ontology for the production simulation
project
As explained before, it can be differed between a horizontal (dividing into areas on the same level of the ontology) and a vertical separation (showing the growing complexity by a higher granularity of the described area of interest). By using the project of production automation as an example, it is possible to identify both of them. Although the designed ontology is more an example for a horizontal separation into areas, the concept of a vertical separation can be found in the design of the defined production
-63-
process involving different roles on different abstraction levels. Figure 24 sketches this interconnectivity between levels of granularity in a fault tolerant multi agent system used for the production automation system in the SAW project. The role of the work order dispatcher is in charge of the business processes aggregated on the first layer to offer working instructions for among lying layers with general work order scheduling information. The workshop layer is symbolized by the developed simulator and is responsible for the fulfilment of the various needed tasks receiving from the business layer. This layer also has to report about the different status, capacities, failures and the measurements of the represented production system. The simulation results are forwarded to the third layer which is represented by the “real” hardware like assemble machines and conveyor belts..
Figure 24: interconnectivity between levels in a fault tolerant multi agent system for production
automation [B6]
A very common usage of ontologies is the approach to use them as knowledge base approach to model “cut-outs” of the worlds. This makes it very useful for research fields of today because this fact of modelling a world with well defined boundaries makes it flexible and easily compatible (with the use common semantics and definitions without special interfaces to translate them) with other ontologies if necessary. This provides the possibility to merge them to a consistent ontology representing relations between different areas of the real world and can serve as common basis for the exchange of information. In case of the ontology for the master thesis project case, the ontology is used to describe a self-created production process in a particular domain. It describes a specific area through defined classes and relationships to get a common view at the situation of our problem. The assembly model constructed by the Odo Struger laboratory at the Automation and Control Institute (ACIN) at the technical university of Vienna served as a starting point to create our simulator. The creation of the ontology oriented on this model, turned into an evolutionary process. Starting from the easy example to store basic information of products an their assembly process, a more complex ontology has been developed to be able to save information concerning the whole production automation simulation process – beginning with the products, shop-layout, process steps, measurements and so on. On this way the created ontology (shown in the practical part in Figure 44) also represents the areas of interest for
-64-
different roles in the production process. As mentioned before, the classification by roles and layers to subsume information for a special point of decision was one focus of the created concept. It should be representative for most common production processes in the economy. But surely, there can be differences according to special operation methods and reliabilities to real work plans in special production plants. Further details to the defined ontology can be found in the description at chapter 4.3.3.3.
2.5 Patterns
The following sections are formulated to transmit what patterns are and how they can be used in software system development. Therefore it is explained how patterns are described and categorized to use them sensible.
2.5.1 What are patterns and why are they useful?
The development of software is not as easy as it often seems to be. Furthermore designing object-oriented software is hard, and designing reusable object-oriented software is even harder. So developing software for agent system is on the same level. You have to find pertinent objects, factor them into classes at the right granularity and define interfaces, hierarchies and relations between objects to guarantee a coordinated interaction between all agents – like software components. Erich Gamma, Richard Helm, Ralph Johnson and John Vlissides describe a design pattern in their book “Design Patterns – Elements of Reusable Object-Oriented Software” as following:
“Design patterns are descriptions of communicating objects and classes
that are customized to solve a general design problem in a particular
context.
This means in particular that a design pattern names, abstracts, and
identifies the key aspects of a common design structure that make it useful
for creating a reusable object-oriented design. The design pattern identifies
the participating classes and instances, their roles and collaborations, and
the distribution of responsibilities. Each pattern focuses on a particular
object-oriented design problem or issue and describes when it applies,
whether it can be applied in view of other design constraints, and the
consequences and trade-offs of its use. Since design patterns also have to
be implemented, they often contain a sample implementation as illustration
for the programmer.” [A7] So the use of design patterns is one powerful possibility to facilitate the work of developers and designers of software solutions. Patterns help to solve often returning problems by summarizing the design- and architectural knowledge in a compact and reusable way. This offers an important support for developers to create their own software by showing tips, like how to make the solution more adaptable, more understandable or even reach a higher performance. Because one thing is clear for everyone: a professional worker in information technology development should reuse solutions from the past. It is not necessary to solve every problem from first principles if a good solution in earlier developments can be reused or
-65-
even adapted to fit for the actual problem. In addition, the adequate use of design patterns can lower the risk of design mistakes in bigger projects.
2.5.2 How to describe design pattern
Patterns are suitable outstanding for communication over draft decisions. They can help to arrange the necessary draft more flexible. However, frequently additional classes or interfaces because of the pattern-usage swell the system unnecessarily. Because of this fact, one of the most important rules with the software design is: “Keep your drafts as simple as possible!” It is important to keep in mind that simplicity makes the comprehensibility and clarity easier! It is valid to confront the increase in value by the pattern application to the original draft and to weigh up their pros and cons against each other. To make this easier some essential elements are necessary to describe patterns in general to look at them from a comparable point of view:
- pattern name � is the highest abstraction of the pattern which describes the design problem and the possible solution in one or two words
- problem � describes situations where it is useful to apply the pattern by explaining the problem and its context
- solution � describes the needed elements to make up the design, their relationships, responsibilities and collaborations; it is no concrete explanation of the design or implementation – a pattern is more a template that can be applied in different situations
- consequences � describes the expectable results and possible trade-offs of applying the pattern
Of course, patterns can be described in many ways, e.g. more or less detailed. It depends on the complexity of the pattern and the goodwill of the developer who sets up the design pattern. Actually, there exists no standard vocabulary for needed descriptions for patterns. Karl Eilebrecht and Gernot Starke choose in their book “Patterns kompakt” a more flexible template to amend the problem with further information like intention, scenario, pros and cons, possible deployment, variants and references [A3]. Also in the widely known as “Gang-of-four-book” by Erich Gamma [A7] a template consisting of following parts is used to have a structure to transfer the needed information about the described pattern: pattern name and classification, intent, “also known as” (other well-known names for the pattern), motivation, applicability, structure, participants, collaborations, consequences, implementation, sample code, known uses and related patterns.
2.5.3 Categorization of design patterns
There are a number of patterns which are well described and used in praxis in a broad way. A catalogue of design patterns has been taken from the book “Design Patterns” arranged and described by Erich Gamma, Richard Helm, Ralph Johnson and John Vlissides. The list can be
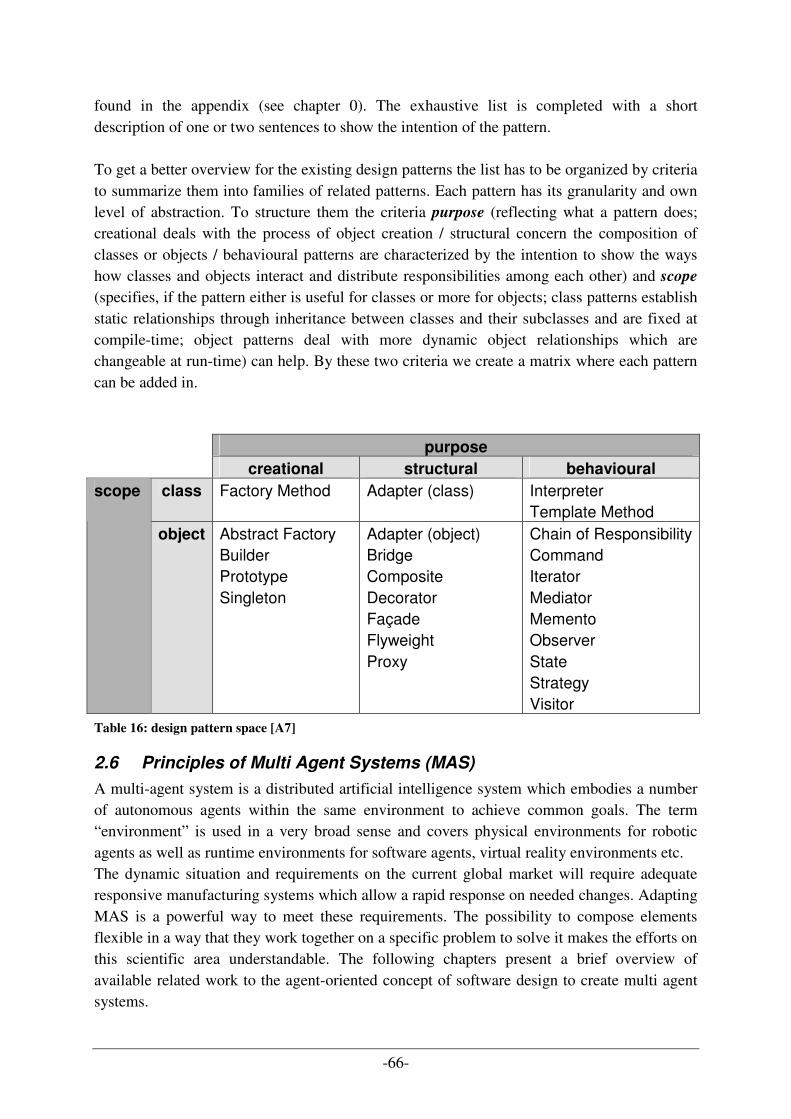
-66-
found in the appendix (see chapter 0). The exhaustive list is completed with a short description of one or two sentences to show the intention of the pattern. To get a better overview for the existing design patterns the list has to be organized by criteria to summarize them into families of related patterns. Each pattern has its granularity and own level of abstraction. To structure them the criteria purpose (reflecting what a pattern does; creational deals with the process of object creation / structural concern the composition of classes or objects / behavioural patterns are characterized by the intention to show the ways how classes and objects interact and distribute responsibilities among each other) and scope (specifies, if the pattern either is useful for classes or more for objects; class patterns establish static relationships through inheritance between classes and their subclasses and are fixed at compile-time; object patterns deal with more dynamic object relationships which are changeable at run-time) can help. By these two criteria we create a matrix where each pattern can be added in.
purpose creational structural behavioural
class Factory Method Adapter (class) Interpreter Template Method
scope
object Abstract Factory Builder Prototype Singleton
Adapter (object) Bridge Composite Decorator Façade Flyweight Proxy
Chain of Responsibility Command Iterator Mediator Memento Observer State Strategy Visitor
Table 16: design pattern space [A7]
2.6 Principles of Multi Agent Systems (MAS)
A multi-agent system is a distributed artificial intelligence system which embodies a number of autonomous agents within the same environment to achieve common goals. The term “environment” is used in a very broad sense and covers physical environments for robotic agents as well as runtime environments for software agents, virtual reality environments etc. The dynamic situation and requirements on the current global market will require adequate responsive manufacturing systems which allow a rapid response on needed changes. Adapting MAS is a powerful way to meet these requirements. The possibility to compose elements flexible in a way that they work together on a specific problem to solve it makes the efforts on this scientific area understandable. The following chapters present a brief overview of available related work to the agent-oriented concept of software design to create multi agent systems.
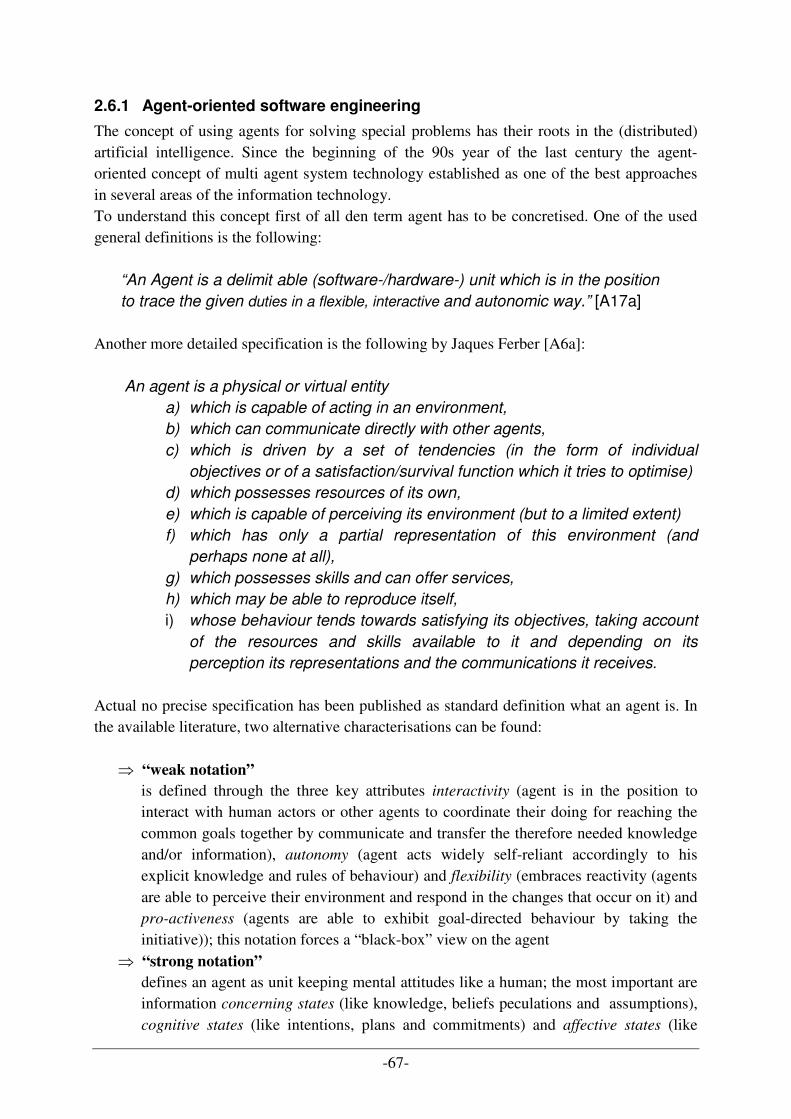
-67-
2.6.1 Agent-oriented software engineering
The concept of using agents for solving special problems has their roots in the (distributed) artificial intelligence. Since the beginning of the 90s year of the last century the agent-oriented concept of multi agent system technology established as one of the best approaches in several areas of the information technology. To understand this concept first of all den term agent has to be concretised. One of the used general definitions is the following:
“An Agent is a delimit able (software-/hardware-) unit which is in the position
to trace the given duties in a flexible, interactive and autonomic way.” [A17a] Another more detailed specification is the following by Jaques Ferber [A6a]:
An agent is a physical or virtual entity
a) which is capable of acting in an environment,
b) which can communicate directly with other agents,
c) which is driven by a set of tendencies (in the form of individual
objectives or of a satisfaction/survival function which it tries to optimise)
d) which possesses resources of its own,
e) which is capable of perceiving its environment (but to a limited extent)
f) which has only a partial representation of this environment (and
perhaps none at all),
g) which possesses skills and can offer services,
h) which may be able to reproduce itself,
i) whose behaviour tends towards satisfying its objectives, taking account
of the resources and skills available to it and depending on its
perception its representations and the communications it receives. Actual no precise specification has been published as standard definition what an agent is. In the available literature, two alternative characterisations can be found:
⇒ “weak notation”
is defined through the three key attributes interactivity (agent is in the position to interact with human actors or other agents to coordinate their doing for reaching the common goals together by communicate and transfer the therefore needed knowledge and/or information), autonomy (agent acts widely self-reliant accordingly to his explicit knowledge and rules of behaviour) and flexibility (embraces reactivity (agents are able to perceive their environment and respond in the changes that occur on it) and pro-activeness (agents are able to exhibit goal-directed behaviour by taking the initiative)); this notation forces a “black-box” view on the agent
⇒ “strong notation”
defines an agent as unit keeping mental attitudes like a human; the most important are information concerning states (like knowledge, beliefs peculations and assumptions), cognitive states (like intentions, plans and commitments) and affective states (like
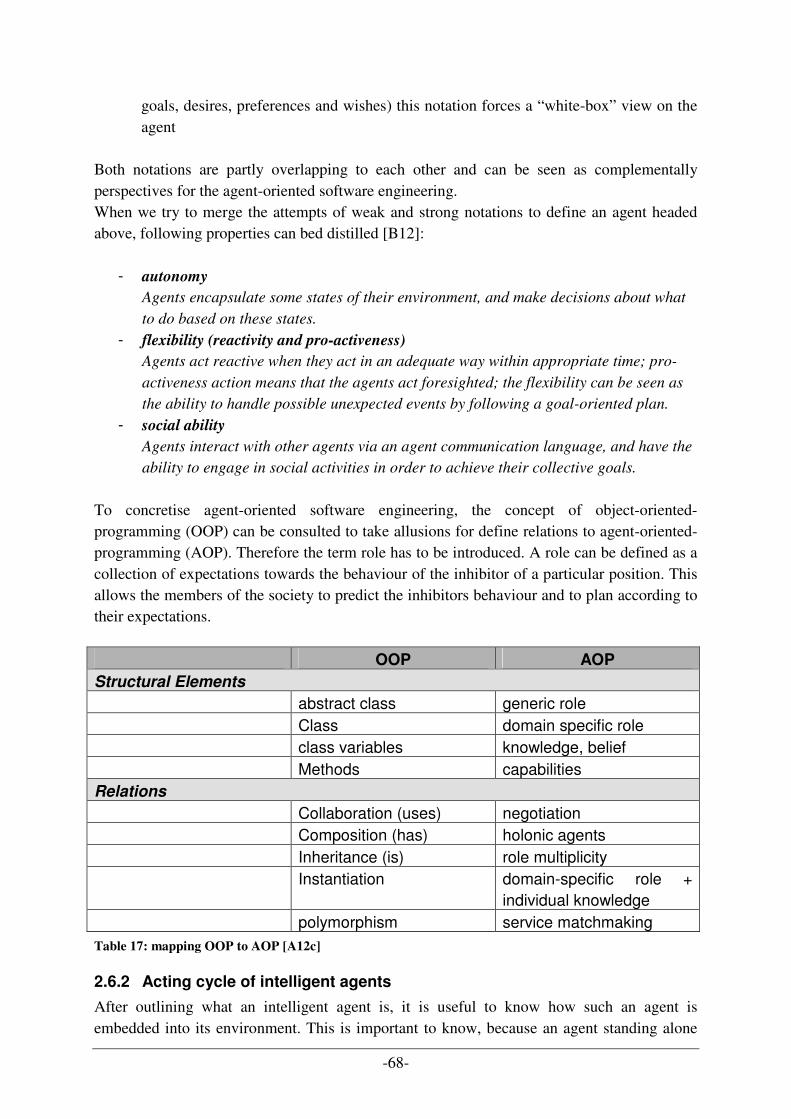
-68-
goals, desires, preferences and wishes) this notation forces a “white-box” view on the agent
Both notations are partly overlapping to each other and can be seen as complementally perspectives for the agent-oriented software engineering. When we try to merge the attempts of weak and strong notations to define an agent headed above, following properties can bed distilled [B12]:
- autonomy
Agents encapsulate some states of their environment, and make decisions about what
to do based on these states.
- flexibility (reactivity and pro-activeness)
Agents act reactive when they act in an adequate way within appropriate time; pro-
activeness action means that the agents act foresighted; the flexibility can be seen as
the ability to handle possible unexpected events by following a goal-oriented plan.
- social ability
Agents interact with other agents via an agent communication language, and have the
ability to engage in social activities in order to achieve their collective goals.
To concretise agent-oriented software engineering, the concept of object-oriented-programming (OOP) can be consulted to take allusions for define relations to agent-oriented-programming (AOP). Therefore the term role has to be introduced. A role can be defined as a collection of expectations towards the behaviour of the inhibitor of a particular position. This allows the members of the society to predict the inhibitors behaviour and to plan according to their expectations.
OOP AOP
Structural Elements
abstract class generic role Class domain specific role class variables knowledge, belief Methods capabilities Relations
Collaboration (uses) negotiation Composition (has) holonic agents Inheritance (is) role multiplicity Instantiation domain-specific role +
individual knowledge polymorphism service matchmaking
Table 17: mapping OOP to AOP [A12c]
2.6.2 Acting cycle of intelligent agents
After outlining what an intelligent agent is, it is useful to know how such an agent is embedded into its environment. This is important to know, because an agent standing alone
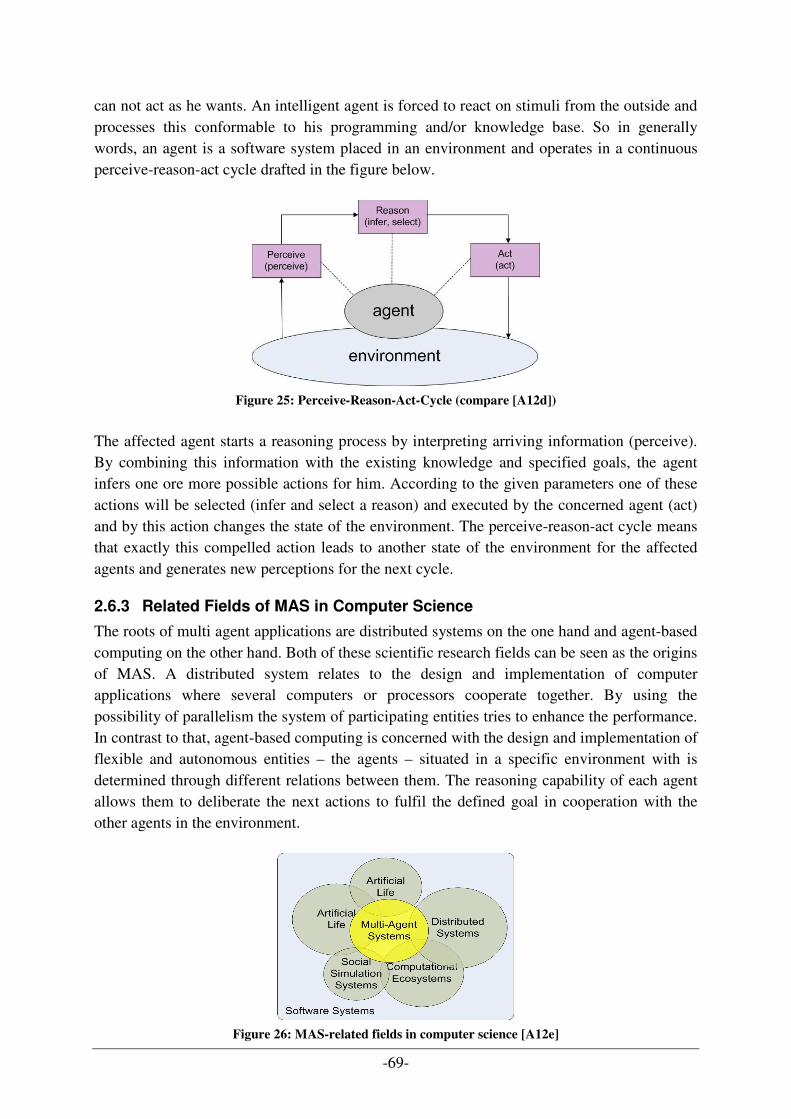
-69-
can not act as he wants. An intelligent agent is forced to react on stimuli from the outside and processes this conformable to his programming and/or knowledge base. So in generally words, an agent is a software system placed in an environment and operates in a continuous perceive-reason-act cycle drafted in the figure below.
Figure 25: Perceive-Reason-Act-Cycle (compare [A12d])
The affected agent starts a reasoning process by interpreting arriving information (perceive). By combining this information with the existing knowledge and specified goals, the agent infers one ore more possible actions for him. According to the given parameters one of these actions will be selected (infer and select a reason) and executed by the concerned agent (act) and by this action changes the state of the environment. The perceive-reason-act cycle means that exactly this compelled action leads to another state of the environment for the affected agents and generates new perceptions for the next cycle.
2.6.3 Related Fields of MAS in Computer Science
The roots of multi agent applications are distributed systems on the one hand and agent-based computing on the other hand. Both of these scientific research fields can be seen as the origins of MAS. A distributed system relates to the design and implementation of computer applications where several computers or processors cooperate together. By using the possibility of parallelism the system of participating entities tries to enhance the performance. In contrast to that, agent-based computing is concerned with the design and implementation of flexible and autonomous entities – the agents – situated in a specific environment with is determined through different relations between them. The reasoning capability of each agent allows them to deliberate the next actions to fulfil the defined goal in cooperation with the other agents in the environment.
Figure 26: MAS-related fields in computer science [A12e]
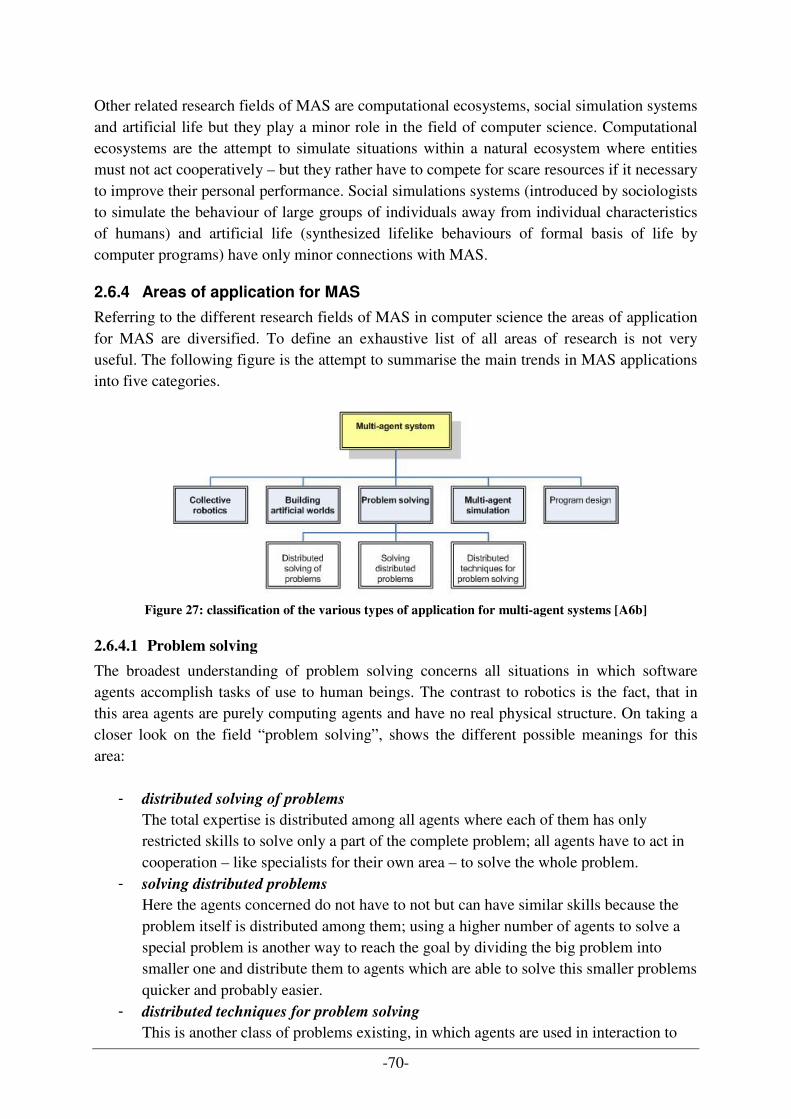
-70-
Other related research fields of MAS are computational ecosystems, social simulation systems and artificial life but they play a minor role in the field of computer science. Computational ecosystems are the attempt to simulate situations within a natural ecosystem where entities must not act cooperatively – but they rather have to compete for scare resources if it necessary to improve their personal performance. Social simulations systems (introduced by sociologists to simulate the behaviour of large groups of individuals away from individual characteristics of humans) and artificial life (synthesized lifelike behaviours of formal basis of life by computer programs) have only minor connections with MAS.
2.6.4 Areas of application for MAS
Referring to the different research fields of MAS in computer science the areas of application for MAS are diversified. To define an exhaustive list of all areas of research is not very useful. The following figure is the attempt to summarise the main trends in MAS applications into five categories.
Figure 27: classification of the various types of application for multi-agent systems [A6b]
2.6.4.1 Problem solving
The broadest understanding of problem solving concerns all situations in which software agents accomplish tasks of use to human beings. The contrast to robotics is the fact, that in this area agents are purely computing agents and have no real physical structure. On taking a closer look on the field “problem solving”, shows the different possible meanings for this area:
- distributed solving of problems
The total expertise is distributed among all agents where each of them has only restricted skills to solve only a part of the complete problem; all agents have to act in cooperation – like specialists for their own area – to solve the whole problem.
- solving distributed problems
Here the agents concerned do not have to not but can have similar skills because the problem itself is distributed among them; using a higher number of agents to solve a special problem is another way to reach the goal by dividing the big problem into smaller one and distribute them to agents which are able to solve this smaller problems quicker and probably easier.
- distributed techniques for problem solving
This is another class of problems existing, in which agents are used in interaction to
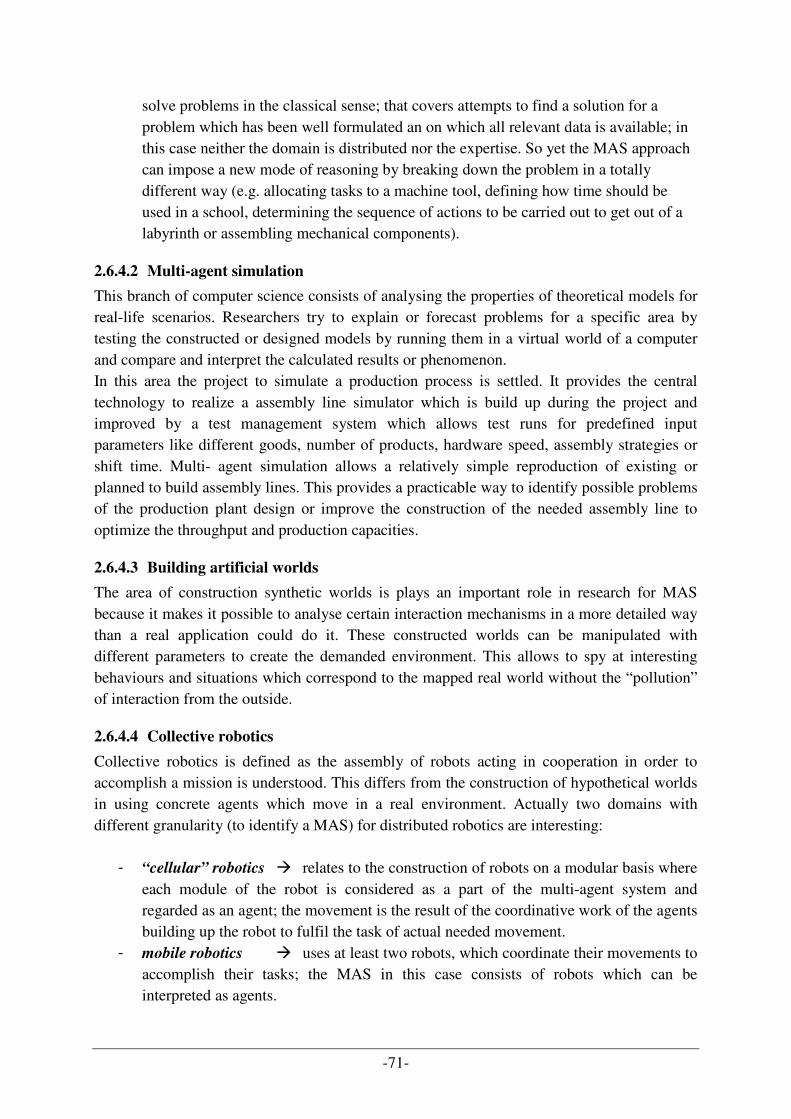
-71-
solve problems in the classical sense; that covers attempts to find a solution for a problem which has been well formulated an on which all relevant data is available; in this case neither the domain is distributed nor the expertise. So yet the MAS approach can impose a new mode of reasoning by breaking down the problem in a totally different way (e.g. allocating tasks to a machine tool, defining how time should be used in a school, determining the sequence of actions to be carried out to get out of a labyrinth or assembling mechanical components).
2.6.4.2 Multi-agent simulation
This branch of computer science consists of analysing the properties of theoretical models for real-life scenarios. Researchers try to explain or forecast problems for a specific area by testing the constructed or designed models by running them in a virtual world of a computer and compare and interpret the calculated results or phenomenon. In this area the project to simulate a production process is settled. It provides the central technology to realize a assembly line simulator which is build up during the project and improved by a test management system which allows test runs for predefined input parameters like different goods, number of products, hardware speed, assembly strategies or shift time. Multi- agent simulation allows a relatively simple reproduction of existing or planned to build assembly lines. This provides a practicable way to identify possible problems of the production plant design or improve the construction of the needed assembly line to optimize the throughput and production capacities.
2.6.4.3 Building artificial worlds
The area of construction synthetic worlds is plays an important role in research for MAS because it makes it possible to analyse certain interaction mechanisms in a more detailed way than a real application could do it. These constructed worlds can be manipulated with different parameters to create the demanded environment. This allows to spy at interesting behaviours and situations which correspond to the mapped real world without the “pollution” of interaction from the outside.
2.6.4.4 Collective robotics
Collective robotics is defined as the assembly of robots acting in cooperation in order to accomplish a mission is understood. This differs from the construction of hypothetical worlds in using concrete agents which move in a real environment. Actually two domains with different granularity (to identify a MAS) for distributed robotics are interesting:
- “cellular” robotics � relates to the construction of robots on a modular basis where each module of the robot is considered as a part of the multi-agent system and regarded as an agent; the movement is the result of the coordinative work of the agents building up the robot to fulfil the task of actual needed movement.
- mobile robotics � uses at least two robots, which coordinate their movements to accomplish their tasks; the MAS in this case consists of robots which can be interpreted as agents.
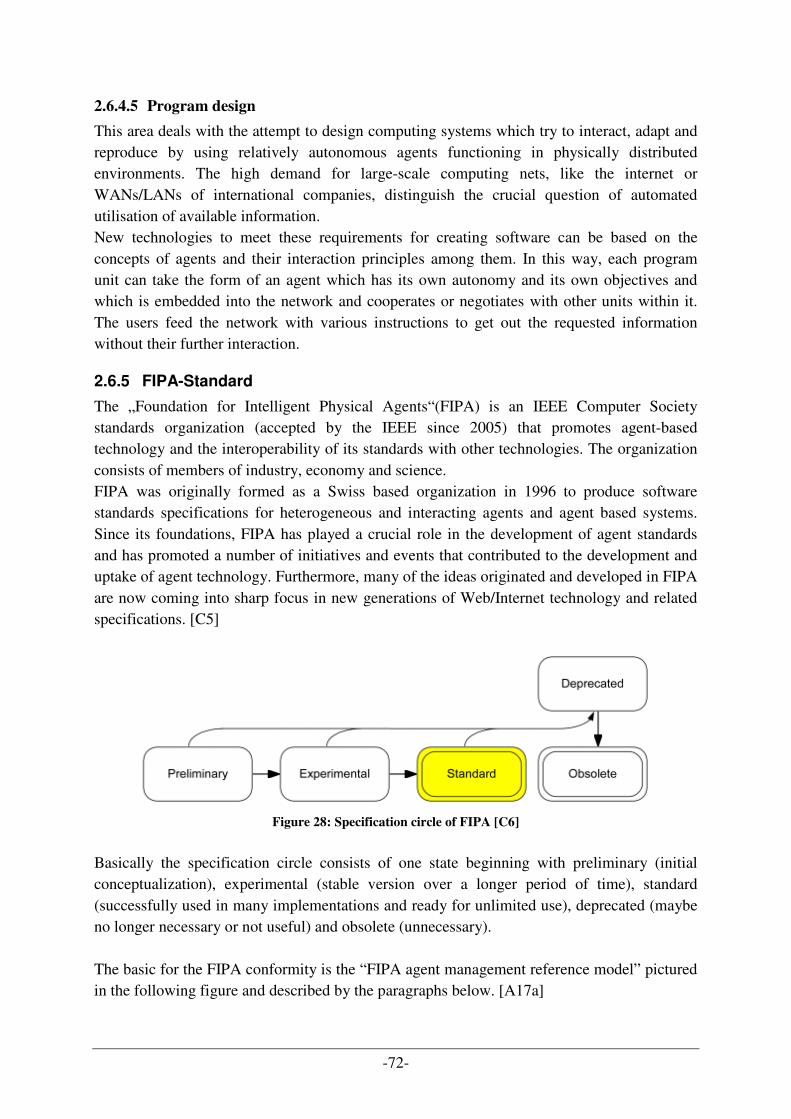
-72-
2.6.4.5 Program design
This area deals with the attempt to design computing systems which try to interact, adapt and reproduce by using relatively autonomous agents functioning in physically distributed environments. The high demand for large-scale computing nets, like the internet or WANs/LANs of international companies, distinguish the crucial question of automated utilisation of available information. New technologies to meet these requirements for creating software can be based on the concepts of agents and their interaction principles among them. In this way, each program unit can take the form of an agent which has its own autonomy and its own objectives and which is embedded into the network and cooperates or negotiates with other units within it. The users feed the network with various instructions to get out the requested information without their further interaction.
2.6.5 FIPA-Standard
The „Foundation for Intelligent Physical Agents“(FIPA) is an IEEE Computer Society standards organization (accepted by the IEEE since 2005) that promotes agent-based technology and the interoperability of its standards with other technologies. The organization consists of members of industry, economy and science. FIPA was originally formed as a Swiss based organization in 1996 to produce software standards specifications for heterogeneous and interacting agents and agent based systems. Since its foundations, FIPA has played a crucial role in the development of agent standards and has promoted a number of initiatives and events that contributed to the development and uptake of agent technology. Furthermore, many of the ideas originated and developed in FIPA are now coming into sharp focus in new generations of Web/Internet technology and related specifications. [C5]
Figure 28: Specification circle of FIPA [C6]
Basically the specification circle consists of one state beginning with preliminary (initial conceptualization), experimental (stable version over a longer period of time), standard (successfully used in many implementations and ready for unlimited use), deprecated (maybe no longer necessary or not useful) and obsolete (unnecessary). The basic for the FIPA conformity is the “FIPA agent management reference model” pictured in the following figure and described by the paragraphs below. [A17a]
-73-
Figure 29: Agent Management Reference Model [C2]
- Agent management system (AMS)
is responsible for the administration of all agents; every new arriving agent on the platform has to register here to get an explicit identifier and the AMS monitors their lifecycle
- Message Transport System (MTS)
is responsible for the transport of an agent communication language (ACL) message; an “Agent Communication Channel” is established between the agents and transmitted through the “Message Transport Protocol”; for communication between agent on different platforms other protocols have to be used (e.g. HTTP)
- Directory Facilitator (DF)
is responsible administration for the administration of available services; comparable to a “look-up-registry” all agents register their offered agents and can vice versa search for needed services offered by other agents
2.6.6 Communication between agents
Agents in Multi Agent Systems need more then just communication to transmit information. They furthermore interact with each other to be able to act collectively. In the research area of agent technology this means that an agent achieves an action or makes a decision which is affected by the attendance or the knowledge of another agent. The resultant step is to interpret the semantics of the transmitted information over the communication. This theory is called “act of speech theory” (in German: Sprechakttheorie) as bases on the fact that one describes with linguistic statements not only circumstances and vouches for their existence, but in addition carries out actions. For example Levinson described the principle of an act of speech as following (quoted by Dr. Torsten Eymann out of Levinson S.C. paper of pragmatics in the Cambrigde Univ. Press of 1983 on page 241):
-74-
While he makes this declaration, the speaker says not only something, but
he does at the same time also something. The world changes with this
statement, as for example “I christen this ship with the name Queen
Mary”.[A4a] The usages of agent technology to realize the speech act theory knows two different implementations of communication languages between agents. These alternative languages are described in a short way in the following two chapters 2.6.6.1 Knowledge Query and Manipulation Language (KQML) and 2.6.6.2 FIPA-Agent Communication Language (ACL). The KQML and the FIPA-ACL are mutual exchangeable but the variant of the ACL is documented better and is in the focus of active for further development in the multi agent system theory.
2.6.6.1 Knowledge Query and Manipulation Language (KQML)
KQML is a language and protocol for communication among software agents and knowledge-based systems. It specifies both, the message format as well as the message-handling protocol to support run-time knowledge sharing among agents. KQML can be used as a language for an application program to interact with an intelligent system or for two or more intelligent systems to share knowledge in support of cooperative problem solving. This communication protocol was originally developed as an interface for knowledge based systems in the early 1990’s year as part of the DARPA knowledge Sharing Effort aimed to develop techniques to build large-scale knowledge bases which can be shared and reused, it was soon repurposed as an agent communication language.
KQML focuses on an extensible set of performatives, which defines the
permissible operations that agents may attempt on each other's knowledge
and goal stores. The performatives comprise a substrate on which to
develop higher-level models of inter-agent interaction such as contract nets
and negotiation. In addition, KQML provides a basic architecture for
knowledge sharing through a special class of agent called communication
facilitators which coordinate the interactions of other agents The ideas
which underlie the evolving design of KQML are currently being explored
through experimental prototype systems which are being used to support
several test beds in such areas as concurrent engineering, intelligent
design and intelligent planning and scheduling. [C9]
2.6.6.2 FIPA-Agent Communication Language (ACL)
The ACL is another proposed standard language for agent communication relying on the act of speech theory which is realized by a set of performatives and their meaning. The content of the performative is not standardized, but varies from system to system to be able to fulfil the specialized tasks for which the system was built for. The mechanism to execute an act of speech is like the sending of a message coding this act of speech. The receiver of the message can use the message together with his knowledge to interpret the transmission and act due to it. That agents are in the position to understand each

-75-
other they have not only to speak the same language, but also they have to have the common ontology which represents their specific knowledge and the required semantics combined with messages leading to forced reaction.
The performative admits conclusions on the state of the internal model of the
transmitter agent and the consequences expected by sender on the state of the
internal model of the receiver's agent. Because both agents are autonomous,
there is no guarantee that the expected consequences really arrive. [A4b] Further information about the Agent Communication Language can be found on the internet for example on the website of infoloom. [C7]
-76-
(3) Research issues and research method
The topic of this master thesis deals with production automation and takes special care on the following two research fields. The first research field is situated more on the economical area and investigates appearing problems in production planning and optimization using predominant automated production systems. The second research field concentrates on a rather technical part which is the approach to adapt production automation software simulator based on a multi agent system with support of ontologies as data base.
3.1 Problem statement
The basic idea of the thesis is to examine the possibilities of using a multi-agent system (MAS) to create a software simulator for automated production assembly lines. By implementing and investigating such a system, a closer look into the IT system can be done which should justify this system as component to provide information to plan and optimize production processes of the enterprise. The continuous concept of the thesis is to describe how simulation can support the processes of production planning. Of course the gathered information can be used in a further step to optimize the established production processes in order to create a higher output. The connection between this rather economical task and the more technical part to sketch architectural concepts (together with the design and implementation of such a simulator) is the assignment of multi-agent systems. This agent technology is a common approach for building complex and automotive reacting utilities because it allows breaking up big tasks into smaller one which are easier to handle by a number of single agents to solve the whole problem by the result of all involved entities. So, MAS distribute computational resources and capabilities across a network of interconnected agents. A centralized system may be restricted by resource limitations, performance bottlenecks or critical failures whereas MAS are organized decentralized and thus do not suffer from the “single point of failure” problem associated with centralized systems. Finally, it can be summarized that a MAS is in the position to enhance overall system performance, specifically along the dimensions of computational efficiency, reliability, extensibility, robustness, maintainability, responsiveness, flexibility and reuse which makes it very useful for our problem to simulate complex production processes. In order to create an adequate simulator with a set of agents, a large number of information is needed. This information has to be available at the initial phase to create the simulator and also during the working process to react on actual situations which are communicated directly between the involved agents. In order to structure this large information a sophisticated data model has to be created to subsume all relevant information in a suitable way. The designed data model is realized by an ontology approach to identify potential advantages and disadvantages and compare the design efforts to traditional ways, e.g. to use data bases as information backbone.
3.2 Research method
The core of this master thesis is the usage MAS for the simulation of product assembly lines. The goal to develop an automated production process based on a simulation should support the practical utilization of optimizing the planning process for production plants. The project
-77-
group has to do both research and design/implementation work to create a suitable simulator to test production scenarios with realistic assembly strategies. The simulation itself is based on Java-Technology and uses the JADE [C8] (Java Agent Development Framework using the Agent Communication Language (ACL) for communication between the agents) for coordination of the single agents. The simulator technology was provided by Rockwell Automation Systems in Prague and developed by Pavel Vrba. [B22] The task of the project team composed of Clemens Gondowidjaja, Klemens Kunz and me, Uwe Szabo, within the project was to adapt the basic functionalities of the existing tool to create simple assembly lines with more practicable methods to simulate more complex assembly strategies of the manufacturing industry. During regular meetings the studied literature and research work was discussed by the participants of the project group and transformed into concepts which are possible to realize. The results of the conceptualization, design and implementation steps were also reviewed and discussed iteratively by the project group to keep the focus of the realized simulator exactly on the arranged goals. As evaluation concept for the research contributions interrogated with the research issues are primarily comparisons of traditional processes, design and implementation with the solutions and realization approaches selected for the SAW project. The conclusions out of the experiences during the project are summarized with the identified benefits and limitations.
3.3 Research issues
This section introduces the major research issues covered in this thesis. They were formulated and completed by questions to define the concrete field of interest and catch the intention of research in this elaboration to operationalize the research contributions.
3.3.1 Production planning process design with simulation support
To be able to work on optimization of established production processes it is necessary to define a practicable execution process. This production cycle has to be adapted by the integration of a simulator to optimize the manufacturing process as well as the planning process with tool support. To determine how the simulation of manufacturing can support production processes it is essential to analyze business processes to see how information flow works and interconnectivity and cooperation between different entities and roles looks like. MAS representing these complex systems have to be carefully implemented and arranged to get useful output from the simulation. The planning process of the dispatcher by trying different input parameters provides the results which have to be carefully analyzed and interpreted to take out conclusions for production optimization. The development und usage of simulators in daily business is a rather new approach. But today’s IT performance and cheaper powerful computer hardware makes this evolution in business processes much more interesting. The design of a simulation tool supported production planning process can be used to draw conclusions about the integrated simulation support in testing different scheduled production plans and manufacturing strategies. The task is to integrate simulations into daily business to create saving potentials and improve business processes by optimizing the hardware and information flow. To estimate the profitableness and the saving potentials of a simulation supported production planning process, a traditional
-78-
planning procedure and a simulation supported production planning process are faced together to identify expected efforts to establish optimization by simulation. This view allows conclusions about the usability of simulations for various sizes of companies, their production processes and their intentions of using simulations.
3.3.2 SAW demonstrator simulator design and development process
In practice it is hard to follow traditional software development processes to reach the goal of a working system because of various problems like observance of deadlines or budget restrictions. Of course UML is still the communication language between designers and programmers, as well as the interface to the customer with adequate explanation if necessary to transmit information. The description of the chosen development strategy shows an iterative product-line approach to realize the required simulator. It constitutes the proof of concept that the design process works and familiarizes the layer concept to create the system. By using a rather complex new product-line approach together with UML processes to design features and the structure of the system, the aim during the project was to determine the usability and dis-/advantages of this iterative approach together with the members of the project team. The evaluation of the SAW demonstrator itself accents the functionality of the simulator and attests the operation of the chosen design process.
3.3.3 Knowledge management for production planning simulator
One important decision for all software development is the conceptual design of and decision to create an adequate knowledge base. It is important to store all relevant data for the entire system as well as needed information to create a simulation of the assembly process as close to the real world as possible. Normally there would be the possibility to create a data base, out of which the different system parts could take the relevant data through queries and store calculated results and data by inserting them. But in contrast to that possibility, there exists a rather new approach to create and use an ontology as knowledge base where all relevant data get their semantics in context of the production simulation system of the production process. Together with the layer concept, the area concept of ontologies provides various advantages during the design and implementation period, as well as during the customer usage and support phase to get easy access to data the developer is already interested in. These facts seem to make clear that the usage of an ontology as knowledge base could be a practicable way for providing data for a software simulation system using a layer based area concept. The advantages or disadvantages implied by the use of ontologies are summarized in this diploma thesis. In addition, the facilitations or problems of ontology approaches compared to traditional UML approaches during the design and development process are determined by estimating efforts for possible change management of system requirements. This proves the advantages of ontology support during the design of an automated production system simulator and records expectable consequences using ontology area-concept basing on a layer concept for the system design of the SAW demonstrator.
3.4 Goals and research contribution
The main goals of the elaboration covered in this master thesis are focused on two research contributions. The first intention was a suitable process design for order management,
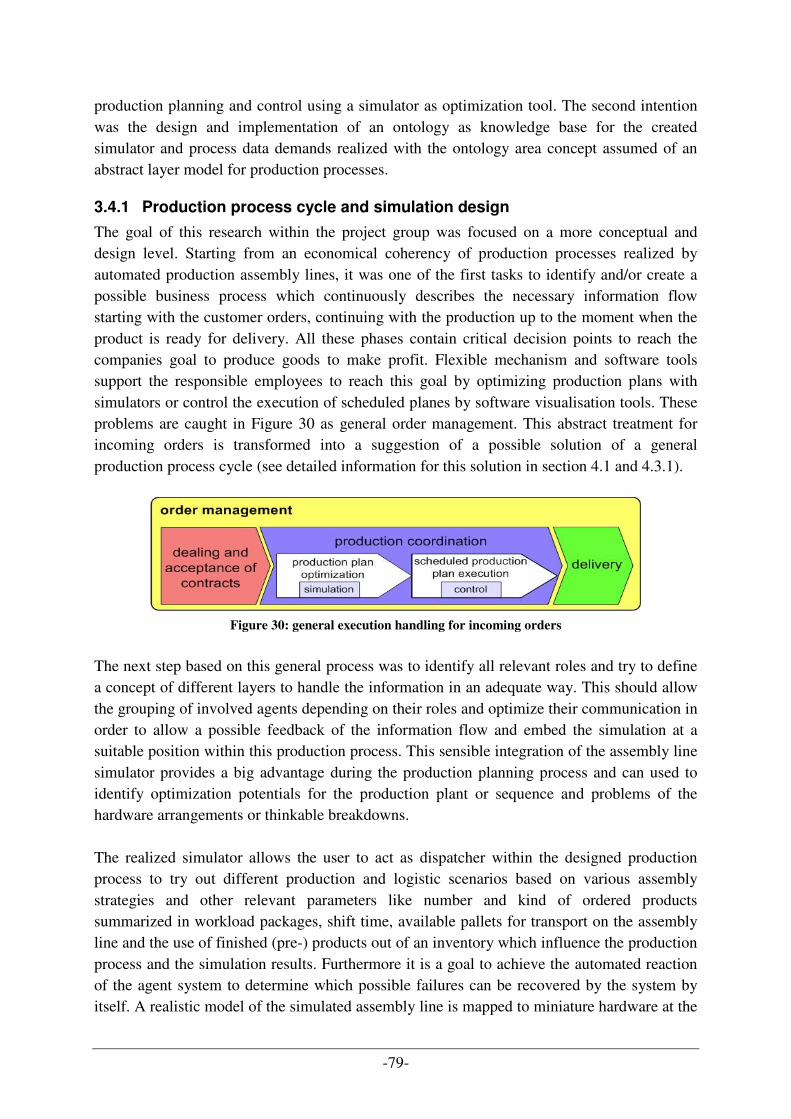
-79-
production planning and control using a simulator as optimization tool. The second intention was the design and implementation of an ontology as knowledge base for the created simulator and process data demands realized with the ontology area concept assumed of an abstract layer model for production processes.
3.4.1 Production process cycle and simulation design
The goal of this research within the project group was focused on a more conceptual and design level. Starting from an economical coherency of production processes realized by automated production assembly lines, it was one of the first tasks to identify and/or create a possible business process which continuously describes the necessary information flow starting with the customer orders, continuing with the production up to the moment when the product is ready for delivery. All these phases contain critical decision points to reach the companies goal to produce goods to make profit. Flexible mechanism and software tools support the responsible employees to reach this goal by optimizing production plans with simulators or control the execution of scheduled planes by software visualisation tools. These problems are caught in Figure 30 as general order management. This abstract treatment for incoming orders is transformed into a suggestion of a possible solution of a general production process cycle (see detailed information for this solution in section 4.1 and 4.3.1).
Figure 30: general execution handling for incoming orders
The next step based on this general process was to identify all relevant roles and try to define a concept of different layers to handle the information in an adequate way. This should allow the grouping of involved agents depending on their roles and optimize their communication in order to allow a possible feedback of the information flow and embed the simulation at a suitable position within this production process. This sensible integration of the assembly line simulator provides a big advantage during the production planning process and can used to identify optimization potentials for the production plant or sequence and problems of the hardware arrangements or thinkable breakdowns. The realized simulator allows the user to act as dispatcher within the designed production process to try out different production and logistic scenarios based on various assembly strategies and other relevant parameters like number and kind of ordered products summarized in workload packages, shift time, available pallets for transport on the assembly line and the use of finished (pre-) products out of an inventory which influence the production process and the simulation results. Furthermore it is a goal to achieve the automated reaction of the agent system to determine which possible failures can be recovered by the system by itself. A realistic model of the simulated assembly line is mapped to miniature hardware at the
-80-
Odo Struger lab at the Automation and Control Institute (ACIN) at the Technical University of Vienna. [C10] The measurable results of simulation runs and their comparisons can be used as input for optimization processes within the production process or to optimize the design of the assembly lines itself. To make this data analysis part of the thesis easier to handle, a test management system was created to work with a larger number of data and test runs to try out all possible input parameter settings of the simulator. This helped to create more knowledge about the efficiency and effectiveness of various workshop scheduling strategies for the assembly line. Above all, the thesis gives a short overview about the technical implementation of MAS for simulations of manufacturing plants. The task to convert problems of the real world into patterns and the attempt to translate them for the implementation and simulation depicts a core part of this thesis. Together with the economical background of production, simulation and production planning and optimization process the interrelation focus of this thesis get clear. Looking at the whole concept and the mentioned topics of this diploma thesis the co operational need between simulation system engineering for specialized production problems and the optimization of beneath lying business processes should get clarified. Finally, the implemented simulator together with the examined production process can help to find proper ways to optimize production plants in real business life. And above all by involving the results of the simulation runs into our research work, the thesis can help to enlarge the trust into the outcome of simulations.
3.4.2 Ontology area approach for data model
To meet the requirement of saving and accessing data a new approach was chosen. The use of ontology technologies and the area concept for ontologies could provide several advantages in contrast to traditional data model design methods. In contrast to traditional databases, ontologies could provide various advantages, providing another research field investigated with this thesis. On top of this advantages like a more flexible handling of storable information and the area concept provides a consistent process to transfer the designed layer concept of the system into the data models with ontology areas to simplify the different information extraction for involved roles. Ontologies are a possible way to describe problems in a conceptual way and within this project ontologies are used as data model. The designed data model bases on layers according to relevant roles. These layers are realized by the ontology area concept, allowing a separated view on isolated problems but creating at the same time a complete overview of the system showing its dependencies by combining different areas/layers. Furthermore, the ontology area concept guarantees an easy change of constrained data which leads to the aim of a reconfigurable simulator using ontologies as data storage. The use of ontology allows more complex queries like a normal database. For example the reasoning for redundancy, consistency and integrity of the designed model can be checked which can state a problem in UML. Starting from the defined production process concerning all relevant roles, the designed layer model is visualized using classic UML models. For the data model an EER (Extended Entity
-81-
Relation) model was used. Each layer is designed by an own EER model which can be combined by further relations to get a complete model containing all relevant data of entities, their attributes and relations for the system. Based on this model, the instance data base can be developed by an ontology-editor (like the open source tool Protégé). The output of the implemented ontology are different configuration files representing the needed data (workshop layout of the simulation, assembly plan for products and data for the test management system) to create a workshop layout and run the test cases using the simulator. The files are defined in XML (Extensible Markup Language) and contain all components of the simulation, their attributes and relations to other components.
-82-
(4) Practical part
This chapter deals with the practical part of the thesis. Main focus of this section of the diploma thesis lies on the annotation of various to dos during the project of the design and implementation of a simulator to reproduce production assemble lines by using multi agent systems and ontologies. It describes the handling of the order management within the created production and order fulfilment process. In consequence it deals with the process and decision to design and implement the created simulation system by using an existing multi agent simulation tool of Rockwell Automation System. It also takes a closer look onto the used technologies to describe the architecture and the functionality of the prototype.
4.1 Order Management
One of the central elements of this thesis is the handling of incoming orders for a company. Therefore basing on some general existing key decision concerning order management, production planning and operations scheduling an example of a production-process-cycle was designed to visualize the dependencies and interoperation between roles and their various tasks. There exist two different ways to solve production planning and scheduling problems to maintain order management. On the one hand, there is highly developed software with algorithms designed for optimizing the use of production capacity. On the other hand, management concepts such as just-in-time- and lean manufacturing with the emphasis on the role of process standardization which were a great deal in shaping the development of order management. But of course there still exist production environments for which neither the mathematical methods nor the pragmatic management approaches are the best way for managing and scheduling customer orders. Based on this, we created a generous possible production cycle containing all relevant decision which influences the effective out carrying of incoming orders to satisfy the market demands and in especially the customer needs as quick and well as possible. This designed production cycle is created in coherence to the illustrated process to plan capacities, schedule and dispatch activities to manage a shop floor production by Pinedo [A13]. His process description focuses on information flows and is extended by specifying key decision for each stage of the order management, production planning and operations scheduling (OMPPOS) process. Figure 31 visualizes the OMPPOS process of Pinedo and depicts the extracted layers, use cases and roles for the production-process-cycle (see Figure 34). This cycle is introduced later in a second part of this chapter and constitutes the core element for the design process exemplified by this thesis.
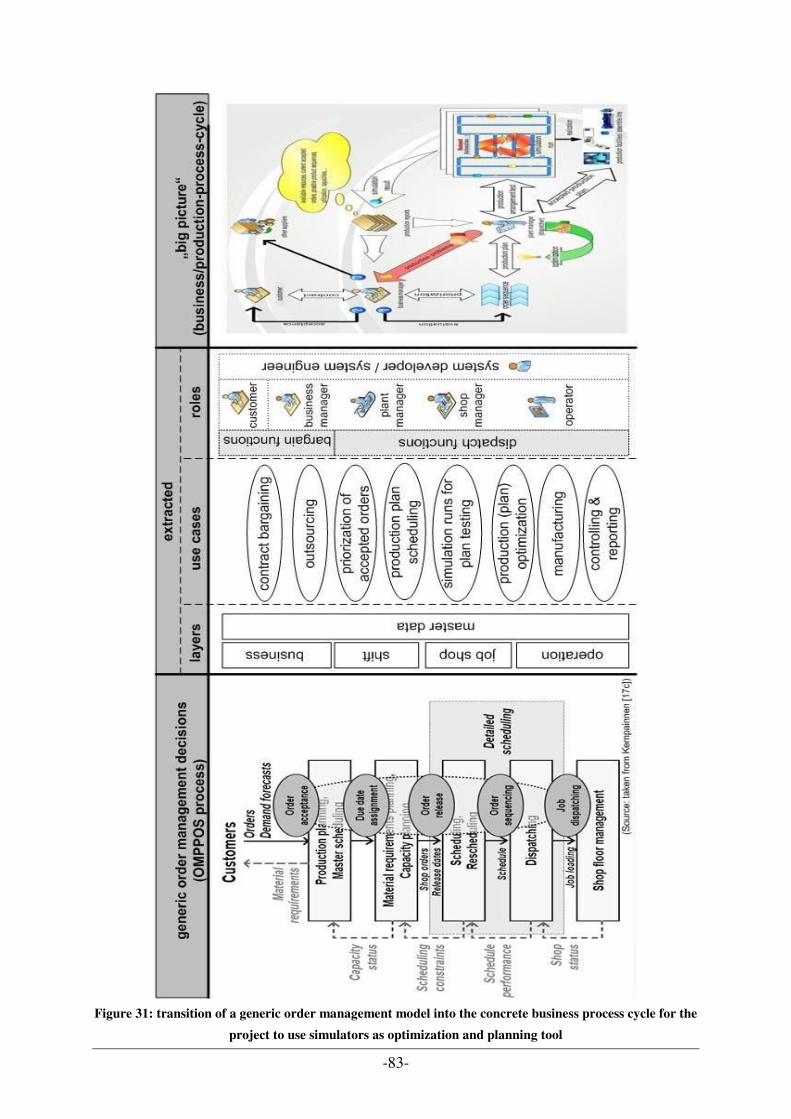
-83-
Figure 31: transition of a generic order management model into the concrete business process cycle for the
project to use simulators as optimization and planning tool
-84-
As result of this design process to transit the generic order management model into a particular production cycle different layer, use cases and roles could be extracted, identified, analysed/summarized and assigned. The various views and the different roles with their variable needs for data and information automatically leaded to the designed layer concept to allow focused information sharing for the emerging complex data structures. The summarization by layers and the roles guarantees the separation of information values for their special use by taking their requirements into consideration.
4.2 Manufacturing Agent Simulation Tool (MAST)
Starting point for the implementation of the simulator for the project is an existing simulator called MAST (manufacturing agent simulation tool) and was developed by Rockwell Automation Research Center situated in Prague, Czech Republic. It is programmed in Java and is based on the JADE platform [C8]. The purpose behind this tool was to provide an easy possibility to build typical assemble lines and simulate typical manufacturing task like transportation of products on conveyor belts and junctions to manufacturing cells and imitate a material handling system.
“The GUI part of the MAST provides the graphical representation of the
simulation as well as the means to design user-specific material handling
systems. Once the simulation is started, the agents carry out the
transportation of products among user-requested manufacturing cells while
cooperating with each other via message sending. Main stress is put on the
failure detection and recovery and the dynamic reconfiguration capabilities.
The user can simulate a failure of any component and trace the reaction of
agents looking for another delivery routes while avoiding the broken
component. The configuration of the system can also be re-designed at
runtime – any component can be removed from the system or a new one
can be interconnected while the simulation is still running.
Originally, the RIPA-OS platform has been chosen, but due to the
performance and memory consumption issues the JADE platform has been
used instead. (…)
In the MAST the XML is used as a general language for the content of
messages (indicated by the language attribute). (…)
…type of manufacturing tasks that can be simulated in the MAST is the
assembly. A special assembly-cell agent has been derived from the
workcell agent allowing to simulate a simple assembly operation. Basically,
two or more input workpieces received from input conveyors are mounted
together resulting in one output workpiece sent out by the output conveyor.
(…)” [B22] The ability of the simulator to simulate breakdowns of machines or conveyor belts is important for the simulation of failure detection and recovery. The reaction of agents in the simulation caused by various simulation failures like stopping a conveyor belt or making a
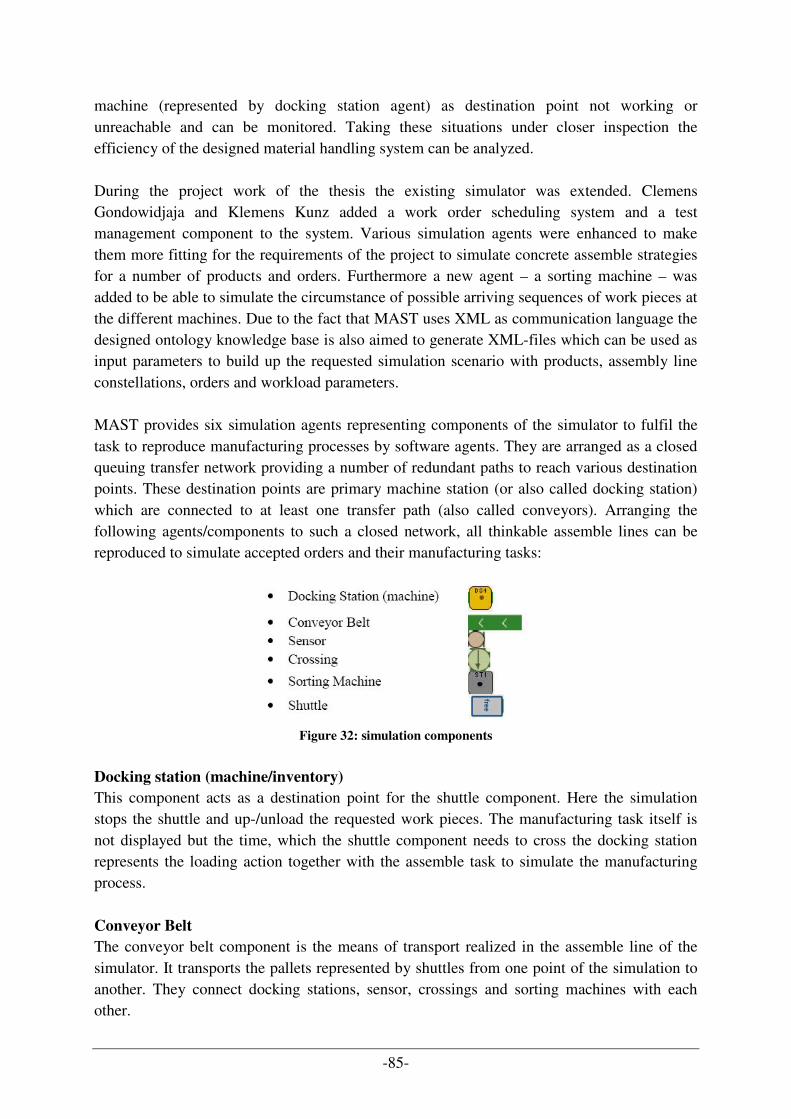
-85-
machine (represented by docking station agent) as destination point not working or unreachable and can be monitored. Taking these situations under closer inspection the efficiency of the designed material handling system can be analyzed. During the project work of the thesis the existing simulator was extended. Clemens Gondowidjaja and Klemens Kunz added a work order scheduling system and a test management component to the system. Various simulation agents were enhanced to make them more fitting for the requirements of the project to simulate concrete assemble strategies for a number of products and orders. Furthermore a new agent – a sorting machine – was added to be able to simulate the circumstance of possible arriving sequences of work pieces at the different machines. Due to the fact that MAST uses XML as communication language the designed ontology knowledge base is also aimed to generate XML-files which can be used as input parameters to build up the requested simulation scenario with products, assembly line constellations, orders and workload parameters. MAST provides six simulation agents representing components of the simulator to fulfil the task to reproduce manufacturing processes by software agents. They are arranged as a closed queuing transfer network providing a number of redundant paths to reach various destination points. These destination points are primary machine station (or also called docking station) which are connected to at least one transfer path (also called conveyors). Arranging the following agents/components to such a closed network, all thinkable assemble lines can be reproduced to simulate accepted orders and their manufacturing tasks:
Figure 32: simulation components
Docking station (machine/inventory)
This component acts as a destination point for the shuttle component. Here the simulation stops the shuttle and up-/unload the requested work pieces. The manufacturing task itself is not displayed but the time, which the shuttle component needs to cross the docking station represents the loading action together with the assemble task to simulate the manufacturing process. Conveyor Belt
The conveyor belt component is the means of transport realized in the assemble line of the simulator. It transports the pallets represented by shuttles from one point of the simulation to another. They connect docking stations, sensor, crossings and sorting machines with each other.
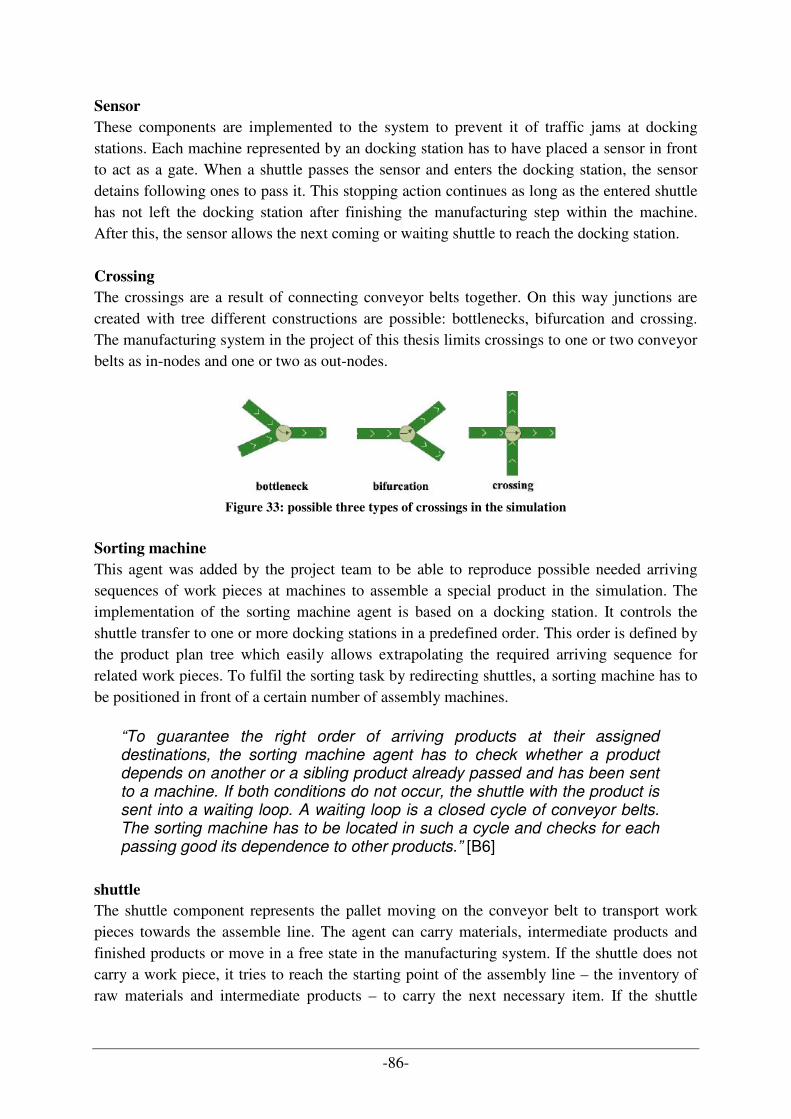
-86-
Sensor
These components are implemented to the system to prevent it of traffic jams at docking stations. Each machine represented by an docking station has to have placed a sensor in front to act as a gate. When a shuttle passes the sensor and enters the docking station, the sensor detains following ones to pass it. This stopping action continues as long as the entered shuttle has not left the docking station after finishing the manufacturing step within the machine. After this, the sensor allows the next coming or waiting shuttle to reach the docking station. Crossing
The crossings are a result of connecting conveyor belts together. On this way junctions are created with tree different constructions are possible: bottlenecks, bifurcation and crossing. The manufacturing system in the project of this thesis limits crossings to one or two conveyor belts as in-nodes and one or two as out-nodes.
Figure 33: possible three types of crossings in the simulation
Sorting machine
This agent was added by the project team to be able to reproduce possible needed arriving sequences of work pieces at machines to assemble a special product in the simulation. The implementation of the sorting machine agent is based on a docking station. It controls the shuttle transfer to one or more docking stations in a predefined order. This order is defined by the product plan tree which easily allows extrapolating the required arriving sequence for related work pieces. To fulfil the sorting task by redirecting shuttles, a sorting machine has to be positioned in front of a certain number of assembly machines.
“To guarantee the right order of arriving products at their assigned destinations, the sorting machine agent has to check whether a product depends on another or a sibling product already passed and has been sent to a machine. If both conditions do not occur, the shuttle with the product is sent into a waiting loop. A waiting loop is a closed cycle of conveyor belts. The sorting machine has to be located in such a cycle and checks for each passing good its dependence to other products.” [B6]
shuttle
The shuttle component represents the pallet moving on the conveyor belt to transport work pieces towards the assemble line. The agent can carry materials, intermediate products and finished products or move in a free state in the manufacturing system. If the shuttle does not carry a work piece, it tries to reach the starting point of the assembly line – the inventory of raw materials and intermediate products – to carry the next necessary item. If the shuttle
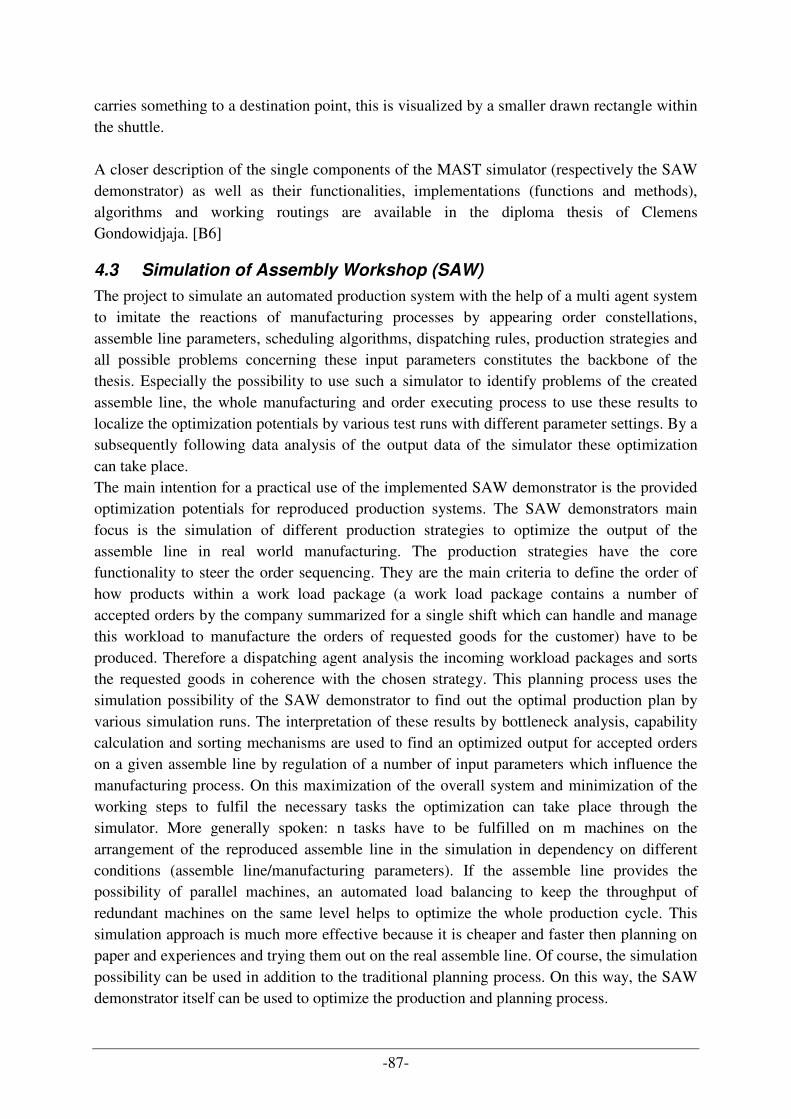
-87-
carries something to a destination point, this is visualized by a smaller drawn rectangle within the shuttle. A closer description of the single components of the MAST simulator (respectively the SAW demonstrator) as well as their functionalities, implementations (functions and methods), algorithms and working routings are available in the diploma thesis of Clemens Gondowidjaja. [B6]
4.3 Simulation of Assembly Workshop (SAW)
The project to simulate an automated production system with the help of a multi agent system to imitate the reactions of manufacturing processes by appearing order constellations, assemble line parameters, scheduling algorithms, dispatching rules, production strategies and all possible problems concerning these input parameters constitutes the backbone of the thesis. Especially the possibility to use such a simulator to identify problems of the created assemble line, the whole manufacturing and order executing process to use these results to localize the optimization potentials by various test runs with different parameter settings. By a subsequently following data analysis of the output data of the simulator these optimization can take place. The main intention for a practical use of the implemented SAW demonstrator is the provided optimization potentials for reproduced production systems. The SAW demonstrators main focus is the simulation of different production strategies to optimize the output of the assemble line in real world manufacturing. The production strategies have the core functionality to steer the order sequencing. They are the main criteria to define the order of how products within a work load package (a work load package contains a number of accepted orders by the company summarized for a single shift which can handle and manage this workload to manufacture the orders of requested goods for the customer) have to be produced. Therefore a dispatching agent analysis the incoming workload packages and sorts the requested goods in coherence with the chosen strategy. This planning process uses the simulation possibility of the SAW demonstrator to find out the optimal production plan by various simulation runs. The interpretation of these results by bottleneck analysis, capability calculation and sorting mechanisms are used to find an optimized output for accepted orders on a given assemble line by regulation of a number of input parameters which influence the manufacturing process. On this maximization of the overall system and minimization of the working steps to fulfil the necessary tasks the optimization can take place through the simulator. More generally spoken: n tasks have to be fulfilled on m machines on the arrangement of the reproduced assemble line in the simulation in dependency on different conditions (assemble line/manufacturing parameters). If the assemble line provides the possibility of parallel machines, an automated load balancing to keep the throughput of redundant machines on the same level helps to optimize the whole production cycle. This simulation approach is much more effective because it is cheaper and faster then planning on paper and experiences and trying them out on the real assemble line. Of course, the simulation possibility can be used in addition to the traditional planning process. On this way, the SAW demonstrator itself can be used to optimize the production and planning process.
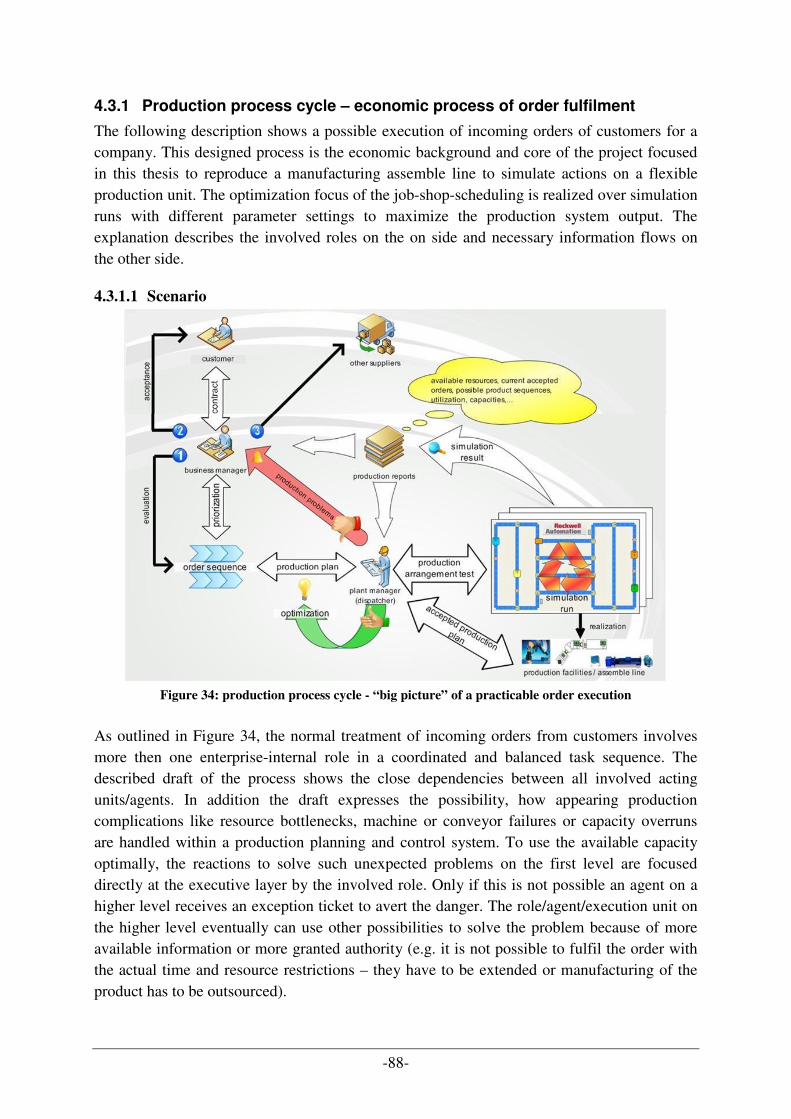
-88-
4.3.1 Production process cycle – economic process of order fulfilment
The following description shows a possible execution of incoming orders of customers for a company. This designed process is the economic background and core of the project focused in this thesis to reproduce a manufacturing assemble line to simulate actions on a flexible production unit. The optimization focus of the job-shop-scheduling is realized over simulation runs with different parameter settings to maximize the production system output. The explanation describes the involved roles on the on side and necessary information flows on the other side.
4.3.1.1 Scenario
Figure 34: production process cycle - “big picture” of a practicable order execution
As outlined in Figure 34, the normal treatment of incoming orders from customers involves more then one enterprise-internal role in a coordinated and balanced task sequence. The described draft of the process shows the close dependencies between all involved acting units/agents. In addition the draft expresses the possibility, how appearing production complications like resource bottlenecks, machine or conveyor failures or capacity overruns are handled within a production planning and control system. To use the available capacity optimally, the reactions to solve such unexpected problems on the first level are focused directly at the executive layer by the involved role. Only if this is not possible an agent on a higher level receives an exception ticket to avert the danger. The role/agent/execution unit on the higher level eventually can use other possibilities to solve the problem because of more available information or more granted authority (e.g. it is not possible to fulfil the order with the actual time and resource restrictions – they have to be extended or manufacturing of the product has to be outsourced).
-89-
4.3.1.2 Production process cycle - workflow description
1) Starting point for all production planning actions is the incoming detailed order of the customer. The assumption of the order can take place on several ways: personally at negotiations (completion of contracts at large orders) written by letters or forms, by telephone or on new media like the internet (online orders via E-commerce-trading, web-shops, etc.). In the optimal case, the orders arrive already in digital form on prepared web forms at the responsible person which acts in the role of a customer adviser. In this manner media breaks are eliminated as a source of error and the passing-on/takeover of the order into the system used in the company for the order management as well as the PPC is accelerated immensely.
2) Then the business manager takes over the order winding by making a first optimisation as a next step. Therefore he lines up the received orders to produce the requested quantity of goods in time according to certain criteria which are actually decisive for the enterprise success. It would be conceivable on this occasion:
- sequence of the incoming orders - dates of delivery - meaning of the customer - urgency of the ordered goods for the customer - image build up compared to competitors on the market - etc.
In this manner the first order sequence arises considering certain priority criteria and thus serves as an input for the production planning of the plant manager.
3) The job of the plant managers is to distribute the order list transmitted to him efficiently to the available capacities and resources. However, besides he should be anxious to keep the predefined sequence to avoid unnecessary difficulties. His concrete job is to compile an efficiently allocation plan for the available production lines under the current time, capacity and resources restrictions. Available simulation tools like the developed SAW demonstrator can be used by the plant manager to complete this job. By defining the available orders by configuration of input parameters (e.g. number and kind of products) as well as different settings of factors which influence the production process (e.g. speed of conveyor belts, available free pallets, shift duration, assemble line arrangement) the expected production process can be predicted to find out the best production sequence. This simulated and tested production order can be transmitted to the physically existent production units as an optimized production plan.
4) The assemble lines should preferably act automated to carry out the transmitted production instructions to fulfil their manufacturing task. During the whole production process data of the current state (order, product sequence, number of pieces, order status, utilisation, …) is collected and made available on the information system to the different roles of the working on unities and employees.
5) If failures occur during the production, the units/agents of the assemble line automatically react to the resulted failure to compensate (compensation at operation
-90-
layer) without further intervention. Only if this is not possible any more, i.e. the entire processing by resource lack, machine failure, overload, etc. can not be executed in the planned time, a suitable announcement about the production report is done.
6) Possible reaction: A1) compensation on planning level
By analysing the current manufacturing and system report the plant manager has the possibility to influence the actual production plan during the running production allocation plan. So he is able optimise the production plan with regard to the current situation by a skilful restacking of the allocation plan or a new distribution of the assigned resources. If the plant manager is not in the position to clear the problem, he only can make a feedback of the complication to the responsible business manager. A2) compensation on business level
At this level a reaction to production difficulties occurs only in those cases where the lowest layers (operational level or planning level) could not solve the problem on their own. Nevertheless the business manager has overall three possibilities to "save" the order for the company:
- New evaluation of the production sequence � due to current situations a changed production order sequence could arise which enable the lower layers to fulfil the orders in spite of current problems and restrictions.
- Over the consultation of the affected customer new negotiations of the basic conditions (scope of supply, quantity, date of delivery, etc.) for the order can loosen the restrictions for the executing layers.
- Also the additional purchase of necessary intermediate products or even end products by alternative foreign suppliers accepted orders can be fulfilled. But on taking this way to get alternative goods from other suppliers further logistics problems can arrive. Of course, the concurrency product also probably does not provide the same quality. The customer has to be informed about such situations in any way!
It cannot be said globally, which of these 3 possibilities should be taken first into consideration in problem cases to provide the best solution. For this decision some factors have to be considered which are depending on the customer or the actual situation.
4.3.1.3 Problem
Nowadays enterprises must be able to react flexible to often changing requirements. The aim is to be able to satisfy the individual consumption wishes faster and, however, still under minimisation of the costs. The biggest challenge for production planning and control (PPC) systems is the consistent information supply information and to be able to affect actively the processes at every time during the planning phase, implementation phase and control/supervision phase of the
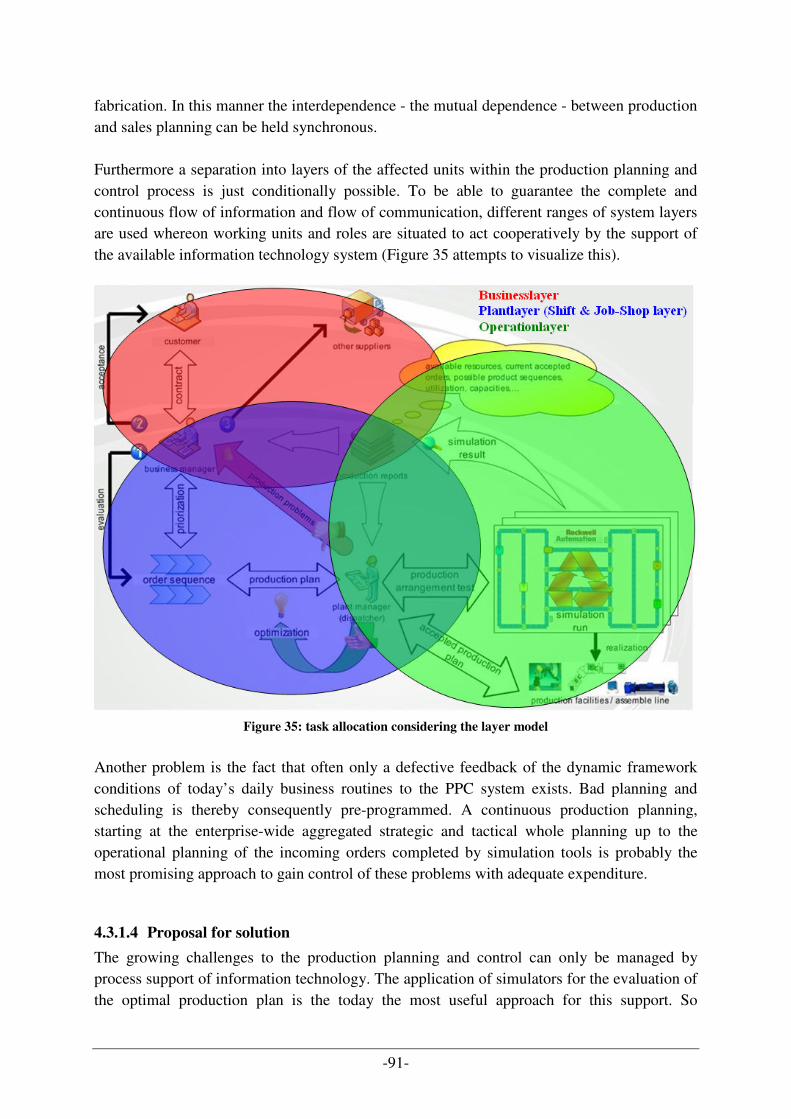
-91-
fabrication. In this manner the interdependence - the mutual dependence - between production and sales planning can be held synchronous. Furthermore a separation into layers of the affected units within the production planning and control process is just conditionally possible. To be able to guarantee the complete and continuous flow of information and flow of communication, different ranges of system layers are used whereon working units and roles are situated to act cooperatively by the support of the available information technology system (Figure 35 attempts to visualize this).
Figure 35: task allocation considering the layer model
Another problem is the fact that often only a defective feedback of the dynamic framework conditions of today’s daily business routines to the PPC system exists. Bad planning and scheduling is thereby consequently pre-programmed. A continuous production planning, starting at the enterprise-wide aggregated strategic and tactical whole planning up to the operational planning of the incoming orders completed by simulation tools is probably the most promising approach to gain control of these problems with adequate expenditure.
4.3.1.4 Proposal for solution
The growing challenges to the production planning and control can only be managed by process support of information technology. The application of simulators for the evaluation of the optimal production plan is the today the most useful approach for this support. So
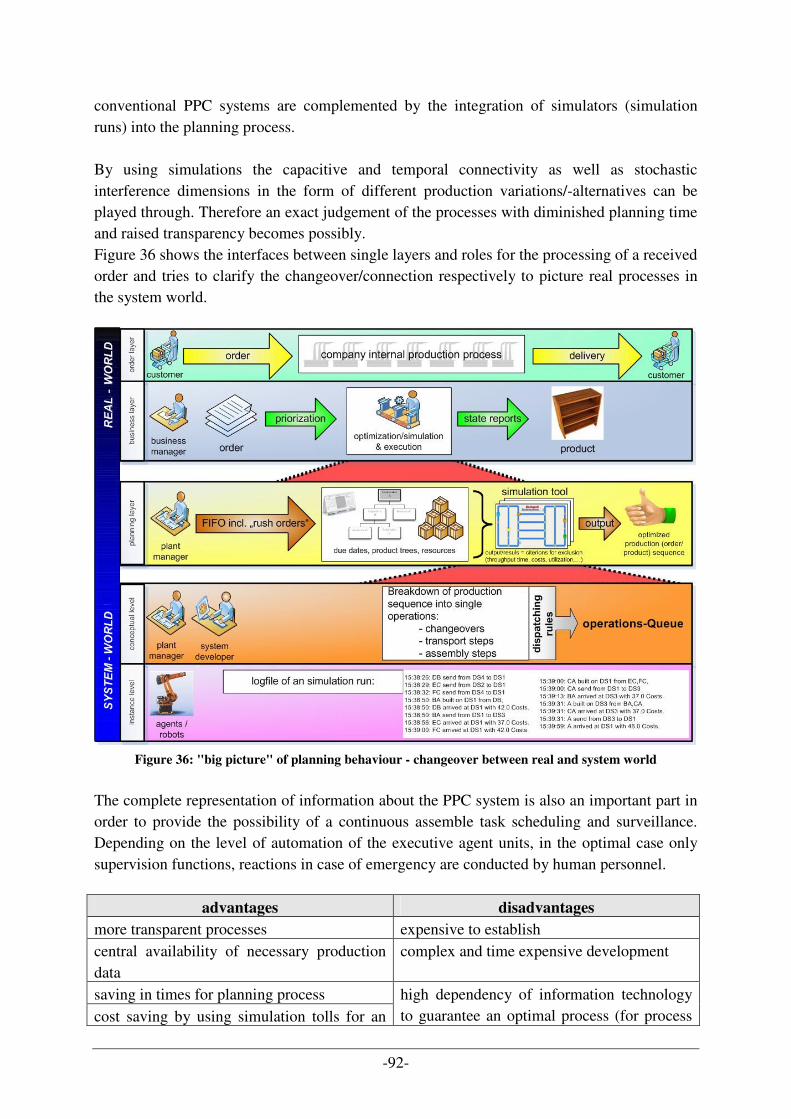
-92-
conventional PPC systems are complemented by the integration of simulators (simulation runs) into the planning process. By using simulations the capacitive and temporal connectivity as well as stochastic interference dimensions in the form of different production variations/-alternatives can be played through. Therefore an exact judgement of the processes with diminished planning time and raised transparency becomes possibly. Figure 36 shows the interfaces between single layers and roles for the processing of a received order and tries to clarify the changeover/connection respectively to picture real processes in the system world.
Figure 36: "big picture" of planning behaviour - changeover between real and system world
The complete representation of information about the PPC system is also an important part in order to provide the possibility of a continuous assemble task scheduling and surveillance. Depending on the level of automation of the executive agent units, in the optimal case only supervision functions, reactions in case of emergency are conducted by human personnel.
advantages disadvantages
more transparent processes expensive to establish central availability of necessary production data
complex and time expensive development
saving in times for planning process cost saving by using simulation tolls for an
high dependency of information technology to guarantee an optimal process (for process
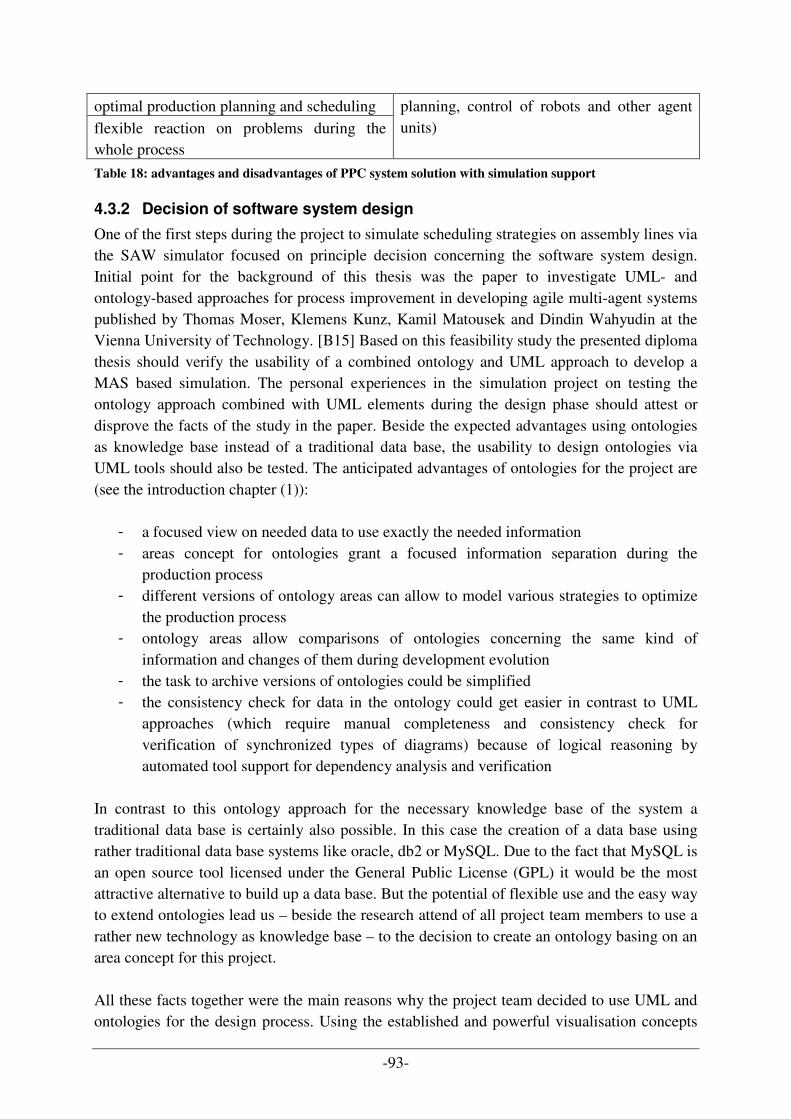
-93-
optimal production planning and scheduling flexible reaction on problems during the whole process
planning, control of robots and other agent units)
Table 18: advantages and disadvantages of PPC system solution with simulation support
4.3.2 Decision of software system design
One of the first steps during the project to simulate scheduling strategies on assembly lines via the SAW simulator focused on principle decision concerning the software system design. Initial point for the background of this thesis was the paper to investigate UML- and ontology-based approaches for process improvement in developing agile multi-agent systems published by Thomas Moser, Klemens Kunz, Kamil Matousek and Dindin Wahyudin at the Vienna University of Technology. [B15] Based on this feasibility study the presented diploma thesis should verify the usability of a combined ontology and UML approach to develop a MAS based simulation. The personal experiences in the simulation project on testing the ontology approach combined with UML elements during the design phase should attest or disprove the facts of the study in the paper. Beside the expected advantages using ontologies as knowledge base instead of a traditional data base, the usability to design ontologies via UML tools should also be tested. The anticipated advantages of ontologies for the project are (see the introduction chapter (1)):
- a focused view on needed data to use exactly the needed information - areas concept for ontologies grant a focused information separation during the
production process - different versions of ontology areas can allow to model various strategies to optimize
the production process - ontology areas allow comparisons of ontologies concerning the same kind of
information and changes of them during development evolution - the task to archive versions of ontologies could be simplified - the consistency check for data in the ontology could get easier in contrast to UML
approaches (which require manual completeness and consistency check for verification of synchronized types of diagrams) because of logical reasoning by automated tool support for dependency analysis and verification
In contrast to this ontology approach for the necessary knowledge base of the system a traditional data base is certainly also possible. In this case the creation of a data base using rather traditional data base systems like oracle, db2 or MySQL. Due to the fact that MySQL is an open source tool licensed under the General Public License (GPL) it would be the most attractive alternative to build up a data base. But the potential of flexible use and the easy way to extend ontologies lead us – beside the research attend of all project team members to use a rather new technology as knowledge base – to the decision to create an ontology basing on an area concept for this project. All these facts together were the main reasons why the project team decided to use UML and ontologies for the design process. Using the established and powerful visualisation concepts
-94-
of UML diagrams, the design process following traditional phase models in dependence of a product line approach, the design process get more familiar for the participants of the project. On top of this, a higher flexibility for necessary reconfiguration after design reviews of the system solution was achieved because the design process was primarily done through UML diagrams completed by drafts and sketches to visualize components, roles, acting units and agents and their interconnectivity. The SAW (Simulation of Assembly Workshops) project is a research tool for simulation, measurement and data analysis. The goal of the project team was - beside the construction of the SAW demonstrator for the reproduction of manufacturing processes on assembly lines based on the MAST simulator - the development of a test management system to evaluate the implementation. The created simulator was developed in two evolution steps. The prototype was implemented as CeBIT-demonstrator. This was presented on the fair trade "CeBIT" (acronym for the German words "Centrum for Büroautomation, Informationstechnologie und Telekommunikation") – the worldwide biggest fair for information technology – in Hanover by project team member Thomas Moser. There the production simulator was published as "a game" to test selected strategies for the manufacturing of certain goods. This had the aim to highlight the advantages of a simulation application in the course of the production planning. Basing on this version a second version with various extensions and refinements was implemented. The advancement focused on the goal to use the SAW as a core element for the optimisation of production planning processes. Therefore other, more complicated production strategies were added to have a bigger number in workflow scheduling strategies for choice. This allowed to generate a higher number of test cases with the available products, assembly line layout and production process influencing parameter options. This was necessary for an efficiency test of the simulator with a sensible amount in data volume to be sure if the simulator can manipulate data volumes close to real production data. In addition, the extension of the SAW demonstrator allows the interpretation of results with regard to redundant machines to simulate load balancing for whole system as well as alternative production routes in the case possible failures. These conclusions can be consulted for suitable evaluation and data analysis and used as input for optimisation processes.
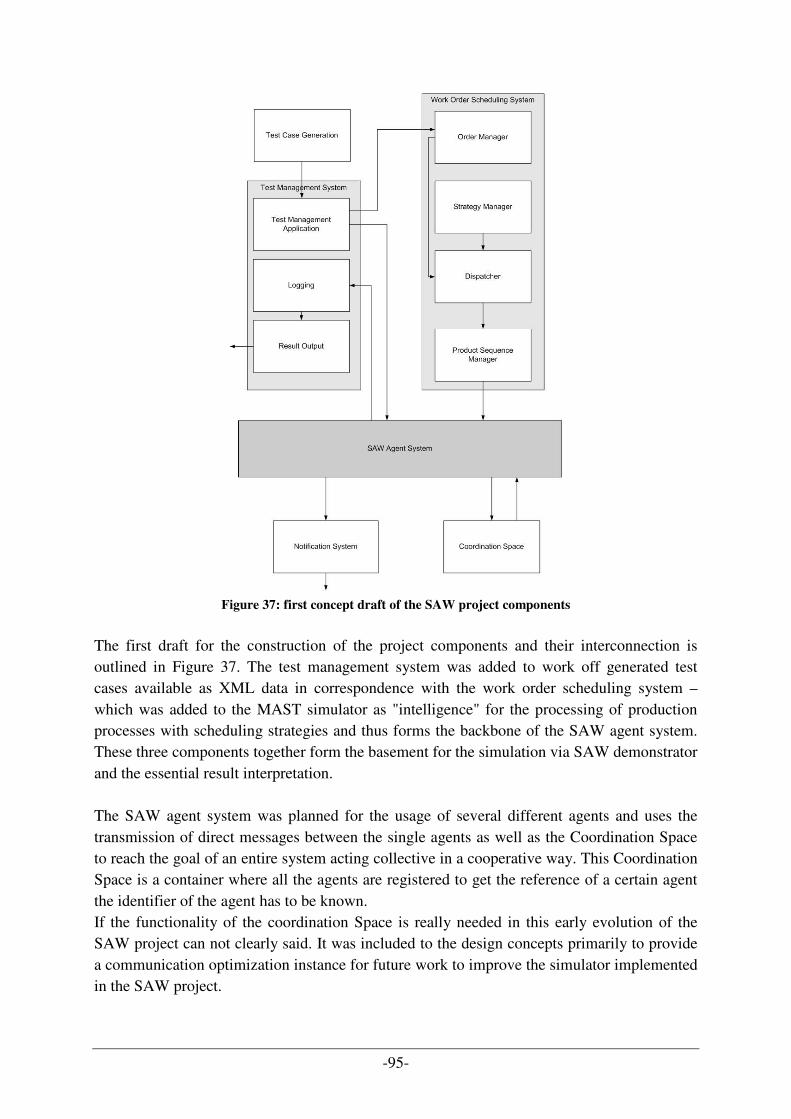
-95-
Figure 37: first concept draft of the SAW project components
The first draft for the construction of the project components and their interconnection is outlined in Figure 37. The test management system was added to work off generated test cases available as XML data in correspondence with the work order scheduling system – which was added to the MAST simulator as "intelligence" for the processing of production processes with scheduling strategies and thus forms the backbone of the SAW agent system. These three components together form the basement for the simulation via SAW demonstrator and the essential result interpretation. The SAW agent system was planned for the usage of several different agents and uses the transmission of direct messages between the single agents as well as the Coordination Space to reach the goal of an entire system acting collective in a cooperative way. This Coordination Space is a container where all the agents are registered to get the reference of a certain agent the identifier of the agent has to be known. If the functionality of the coordination Space is really needed in this early evolution of the SAW project can not clearly said. It was included to the design concepts primarily to provide a communication optimization instance for future work to improve the simulator implemented in the SAW project.
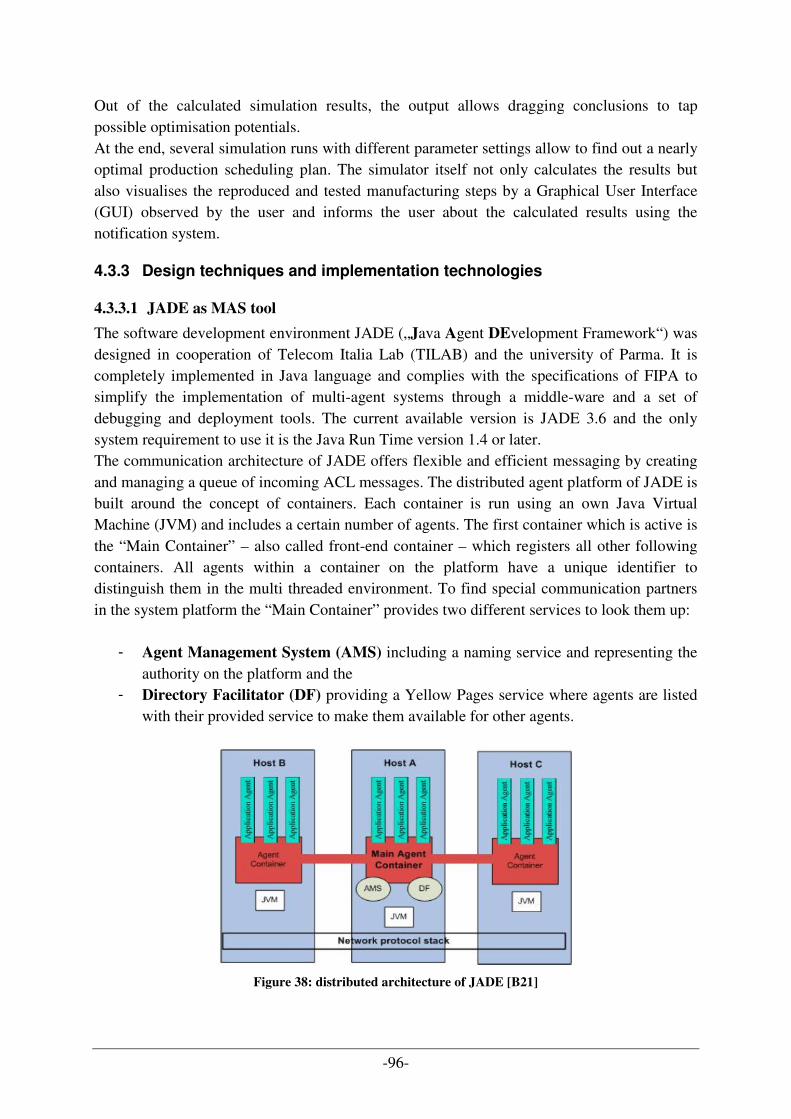
-96-
Out of the calculated simulation results, the output allows dragging conclusions to tap possible optimisation potentials. At the end, several simulation runs with different parameter settings allow to find out a nearly optimal production scheduling plan. The simulator itself not only calculates the results but also visualises the reproduced and tested manufacturing steps by a Graphical User Interface (GUI) observed by the user and informs the user about the calculated results using the notification system.
4.3.3 Design techniques and implementation technologies
4.3.3.1 JADE as MAS tool
The software development environment JADE („Java Agent DEvelopment Framework“) was designed in cooperation of Telecom Italia Lab (TILAB) and the university of Parma. It is completely implemented in Java language and complies with the specifications of FIPA to simplify the implementation of multi-agent systems through a middle-ware and a set of debugging and deployment tools. The current available version is JADE 3.6 and the only system requirement to use it is the Java Run Time version 1.4 or later. The communication architecture of JADE offers flexible and efficient messaging by creating and managing a queue of incoming ACL messages. The distributed agent platform of JADE is built around the concept of containers. Each container is run using an own Java Virtual Machine (JVM) and includes a certain number of agents. The first container which is active is the “Main Container” – also called front-end container – which registers all other following containers. All agents within a container on the platform have a unique identifier to distinguish them in the multi threaded environment. To find special communication partners in the system platform the “Main Container” provides two different services to look them up:
- Agent Management System (AMS) including a naming service and representing the authority on the platform and the
- Directory Facilitator (DF) providing a Yellow Pages service where agents are listed with their provided service to make them available for other agents.
Figure 38: distributed architecture of JADE [B21]
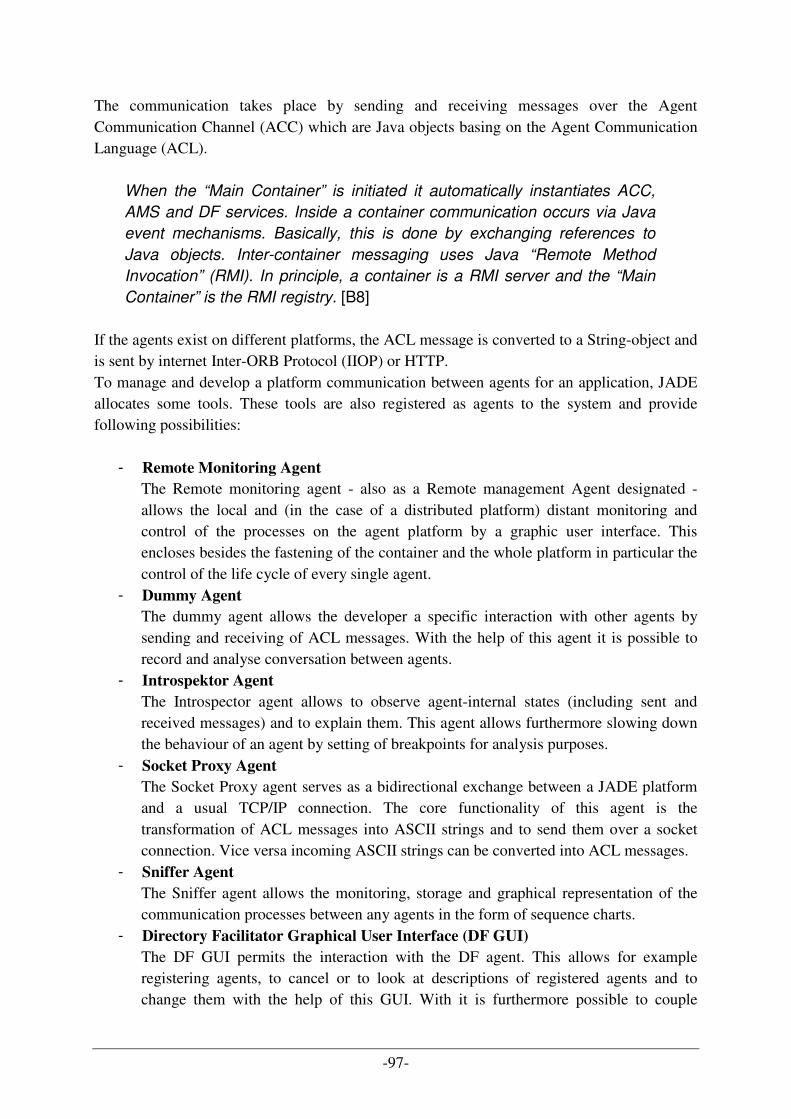
-97-
The communication takes place by sending and receiving messages over the Agent Communication Channel (ACC) which are Java objects basing on the Agent Communication Language (ACL).
When the “Main Container” is initiated it automatically instantiates ACC,
AMS and DF services. Inside a container communication occurs via Java
event mechanisms. Basically, this is done by exchanging references to
Java objects. Inter-container messaging uses Java “Remote Method
Invocation” (RMI). In principle, a container is a RMI server and the “Main
Container” is the RMI registry. [B8] If the agents exist on different platforms, the ACL message is converted to a String-object and is sent by internet Inter-ORB Protocol (IIOP) or HTTP. To manage and develop a platform communication between agents for an application, JADE allocates some tools. These tools are also registered as agents to the system and provide following possibilities:
- Remote Monitoring Agent
The Remote monitoring agent - also as a Remote management Agent designated - allows the local and (in the case of a distributed platform) distant monitoring and control of the processes on the agent platform by a graphic user interface. This encloses besides the fastening of the container and the whole platform in particular the control of the life cycle of every single agent.
- Dummy Agent
The dummy agent allows the developer a specific interaction with other agents by sending and receiving of ACL messages. With the help of this agent it is possible to record and analyse conversation between agents.
- Introspektor Agent
The Introspector agent allows to observe agent-internal states (including sent and received messages) and to explain them. This agent allows furthermore slowing down the behaviour of an agent by setting of breakpoints for analysis purposes.
- Socket Proxy Agent
The Socket Proxy agent serves as a bidirectional exchange between a JADE platform and a usual TCP/IP connection. The core functionality of this agent is the transformation of ACL messages into ASCII strings and to send them over a socket connection. Vice versa incoming ASCII strings can be converted into ACL messages.
- Sniffer Agent
The Sniffer agent allows the monitoring, storage and graphical representation of the communication processes between any agents in the form of sequence charts.
- Directory Facilitator Graphical User Interface (DF GUI)
The DF GUI permits the interaction with the DF agent. This allows for example registering agents, to cancel or to look at descriptions of registered agents and to change them with the help of this GUI. With it is furthermore possible to couple
-98-
different DF agents to create a complex network of yellow pages for the look up service to find a special agent (functionality).
Figure 39: overview of JADE tools [A17b]
Of course, because JADE also uses the internet for communication, it also has to provide at least some basic security mechanisms. Using the Java Authentication and Authorization Service API (JAAS) the access to the platform can be limited by rules defined using a policy model. The integrity of the messages and the sender is proved using signatures. Encryption methods guarantee the confidentiality of sent messages. This means that trespassing is avoided. Further details and documentation to the JADE technology can be found at http://jade.tilab.com/. [C8]
4.3.3.2 Software system design and development process
The design of the SAW demonstrator software system is based on a traditional development process. On the one hand it was the aim to follow the product line approach to realize the project but on the other hand it was easier for the participants to follow a sequential phase model because of the rather small project team. So the project team followed a mix of these two approaches to minimize the effort and maximize the usability during the different development phases. The software to reproduce a production system as simulation based on a layer concept which was extracted out of generic order management decisions (compare Figure 31). This designed
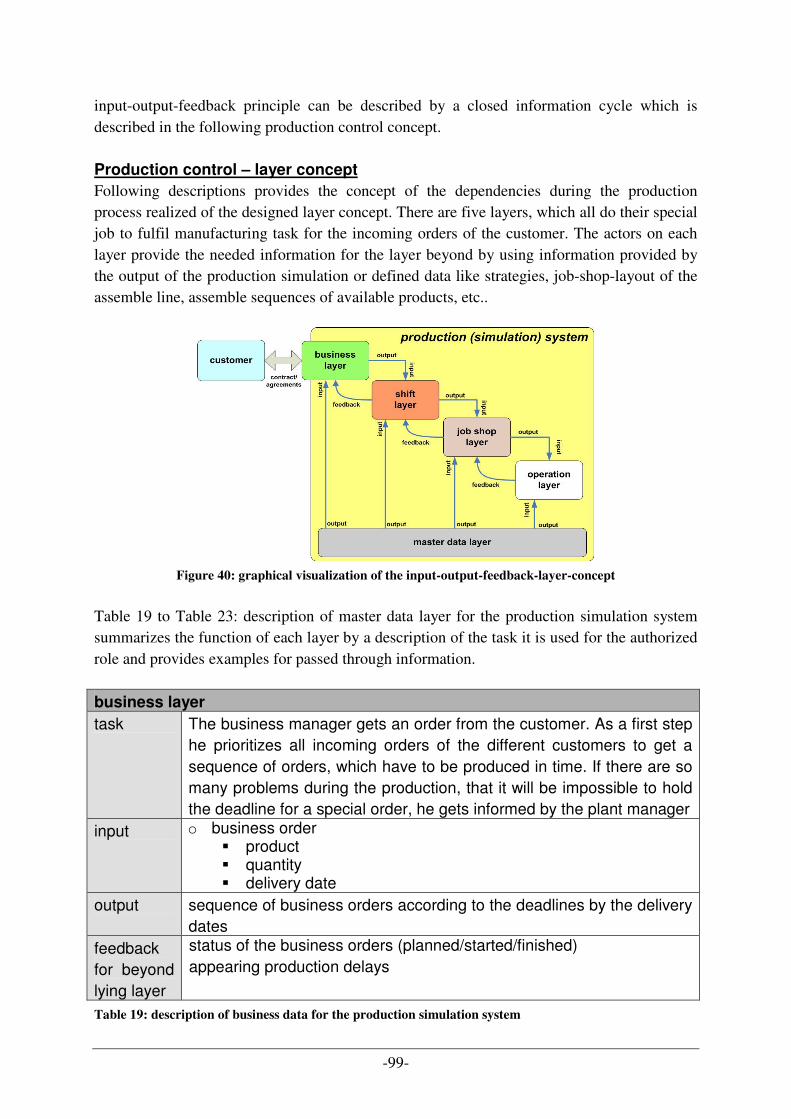
-99-
input-output-feedback principle can be described by a closed information cycle which is described in the following production control concept. Production control – layer concept
Following descriptions provides the concept of the dependencies during the production process realized of the designed layer concept. There are five layers, which all do their special job to fulfil manufacturing task for the incoming orders of the customer. The actors on each layer provide the needed information for the layer beyond by using information provided by the output of the production simulation or defined data like strategies, job-shop-layout of the assemble line, assemble sequences of available products, etc..
Figure 40: graphical visualization of the input-output-feedback-layer-concept
Table 19 to Table 23: description of master data layer for the production simulation system summarizes the function of each layer by a description of the task it is used for the authorized role and provides examples for passed through information.
business layer
task The business manager gets an order from the customer. As a first step he prioritizes all incoming orders of the different customers to get a sequence of orders, which have to be produced in time. If there are so many problems during the production, that it will be impossible to hold the deadline for a special order, he gets informed by the plant manager
input o business order � product � quantity � delivery date
output sequence of business orders according to the deadlines by the delivery dates
feedback for beyond lying layer
status of the business orders (planned/started/finished) appearing production delays
Table 19: description of business data for the production simulation system
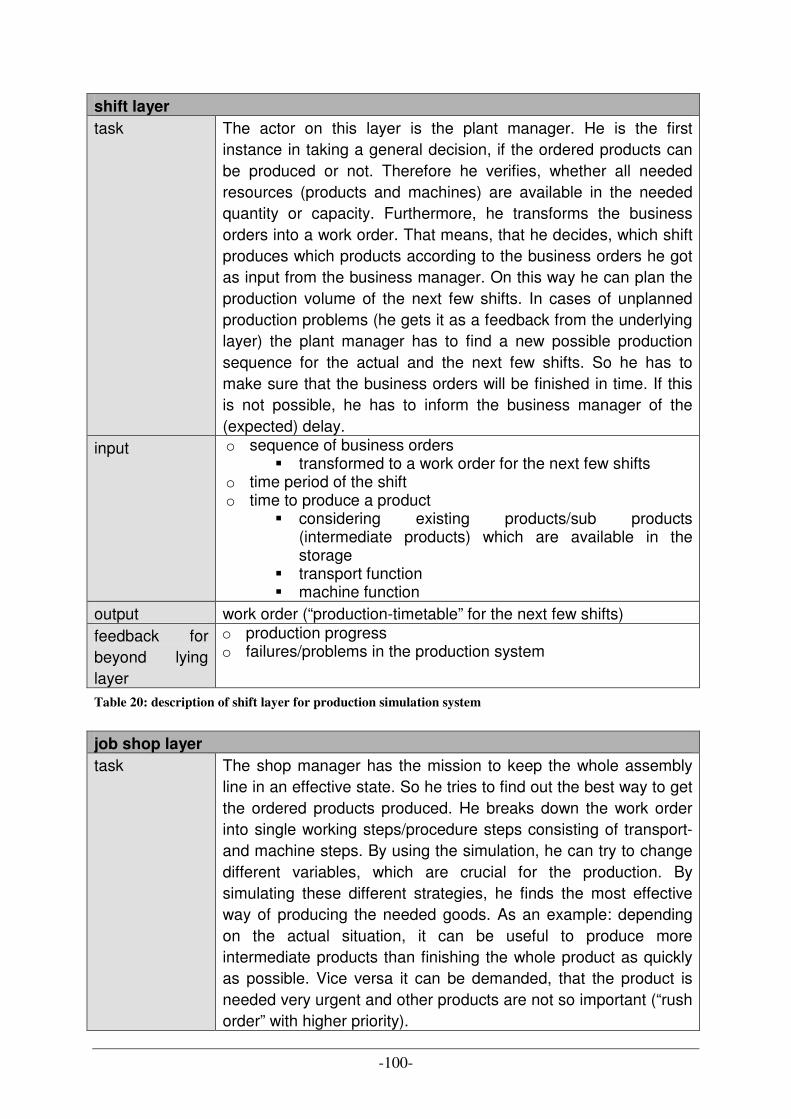
-100-
shift layer
task The actor on this layer is the plant manager. He is the first instance in taking a general decision, if the ordered products can be produced or not. Therefore he verifies, whether all needed resources (products and machines) are available in the needed quantity or capacity. Furthermore, he transforms the business orders into a work order. That means, that he decides, which shift produces which products according to the business orders he got as input from the business manager. On this way he can plan the production volume of the next few shifts. In cases of unplanned production problems (he gets it as a feedback from the underlying layer) the plant manager has to find a new possible production sequence for the actual and the next few shifts. So he has to make sure that the business orders will be finished in time. If this is not possible, he has to inform the business manager of the (expected) delay.
input o sequence of business orders � transformed to a work order for the next few shifts
o time period of the shift o time to produce a product
� considering existing products/sub products (intermediate products) which are available in the storage
� transport function � machine function
output work order (“production-timetable” for the next few shifts) feedback for beyond lying layer
o production progress o failures/problems in the production system
Table 20: description of shift layer for production simulation system
job shop layer
task The shop manager has the mission to keep the whole assembly line in an effective state. So he tries to find out the best way to get the ordered products produced. He breaks down the work order into single working steps/procedure steps consisting of transport- and machine steps. By using the simulation, he can try to change different variables, which are crucial for the production. By simulating these different strategies, he finds the most effective way of producing the needed goods. As an example: depending on the actual situation, it can be useful to produce more intermediate products than finishing the whole product as quickly as possible. Vice versa it can be demanded, that the product is needed very urgent and other products are not so important (“rush order” with higher priority).
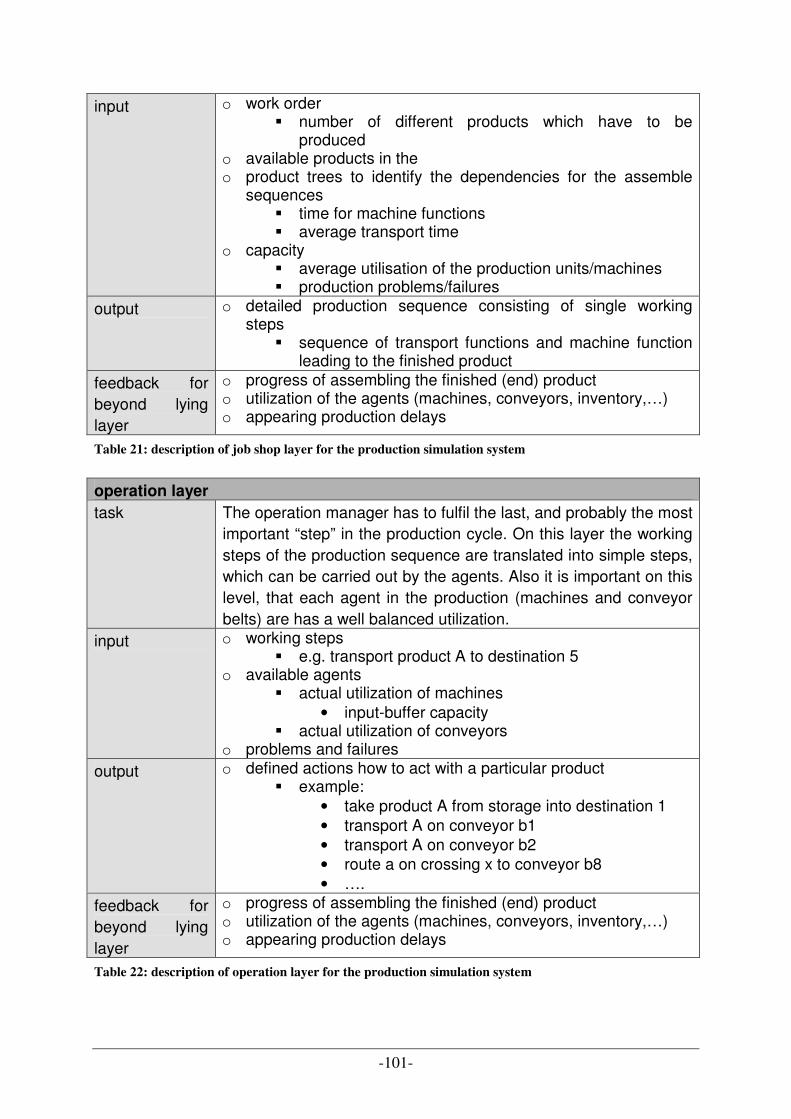
-101-
input o work order � number of different products which have to be
produced o available products in the o product trees to identify the dependencies for the assemble
sequences � time for machine functions � average transport time
o capacity � average utilisation of the production units/machines � production problems/failures
output o detailed production sequence consisting of single working steps
� sequence of transport functions and machine function leading to the finished product
feedback for beyond lying layer
o progress of assembling the finished (end) product o utilization of the agents (machines, conveyors, inventory,…) o appearing production delays
Table 21: description of job shop layer for the production simulation system
operation layer
task The operation manager has to fulfil the last, and probably the most important “step” in the production cycle. On this layer the working steps of the production sequence are translated into simple steps, which can be carried out by the agents. Also it is important on this level, that each agent in the production (machines and conveyor belts) are has a well balanced utilization.
input o working steps � e.g. transport product A to destination 5
o available agents � actual utilization of machines
• input-buffer capacity � actual utilization of conveyors
o problems and failures output o defined actions how to act with a particular product
� example: • take product A from storage into destination 1 • transport A on conveyor b1 • transport A on conveyor b2 • route a on crossing x to conveyor b8 • ….
feedback for beyond lying layer
o progress of assembling the finished (end) product o utilization of the agents (machines, conveyors, inventory,…) o appearing production delays
Table 22: description of operation layer for the production simulation system
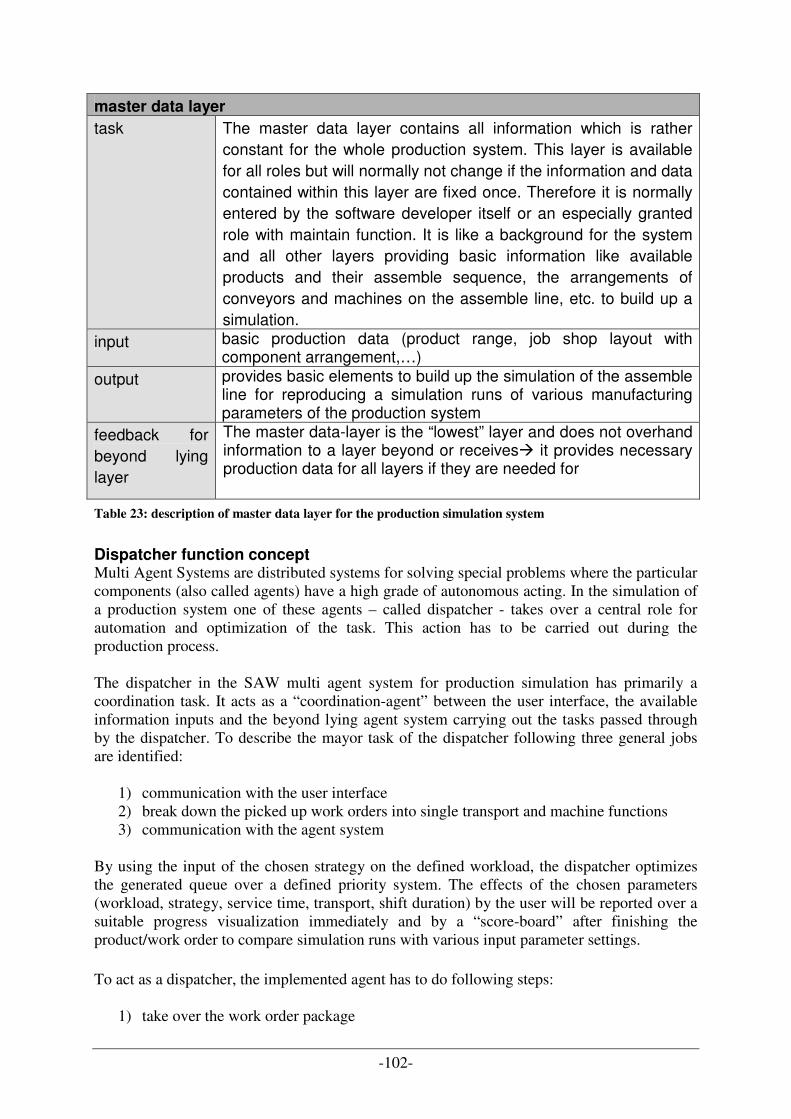
-102-
master data layer
task The master data layer contains all information which is rather constant for the whole production system. This layer is available for all roles but will normally not change if the information and data contained within this layer are fixed once. Therefore it is normally entered by the software developer itself or an especially granted role with maintain function. It is like a background for the system and all other layers providing basic information like available products and their assemble sequence, the arrangements of conveyors and machines on the assemble line, etc. to build up a simulation.
input basic production data (product range, job shop layout with component arrangement,…)
output provides basic elements to build up the simulation of the assemble line for reproducing a simulation runs of various manufacturing parameters of the production system
feedback for beyond lying layer
The master data-layer is the “lowest” layer and does not overhand information to a layer beyond or receives� it provides necessary production data for all layers if they are needed for
Table 23: description of master data layer for the production simulation system
Dispatcher function concept Multi Agent Systems are distributed systems for solving special problems where the particular components (also called agents) have a high grade of autonomous acting. In the simulation of a production system one of these agents – called dispatcher - takes over a central role for automation and optimization of the task. This action has to be carried out during the production process. The dispatcher in the SAW multi agent system for production simulation has primarily a coordination task. It acts as a “coordination-agent” between the user interface, the available information inputs and the beyond lying agent system carrying out the tasks passed through by the dispatcher. To describe the mayor task of the dispatcher following three general jobs are identified:
1) communication with the user interface 2) break down the picked up work orders into single transport and machine functions 3) communication with the agent system
By using the input of the chosen strategy on the defined workload, the dispatcher optimizes the generated queue over a defined priority system. The effects of the chosen parameters (workload, strategy, service time, transport, shift duration) by the user will be reported over a suitable progress visualization immediately and by a “score-board” after finishing the product/work order to compare simulation runs with various input parameter settings. To act as a dispatcher, the implemented agent has to do following steps:
1) take over the work order package
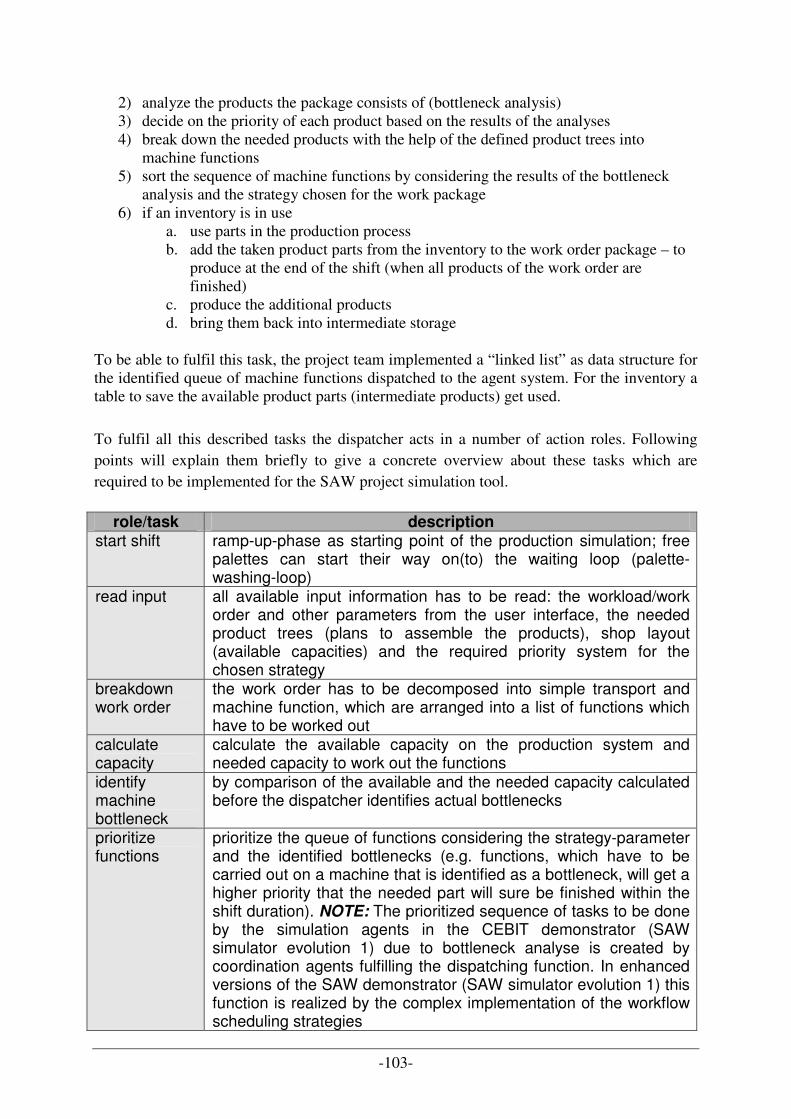
-103-
2) analyze the products the package consists of (bottleneck analysis) 3) decide on the priority of each product based on the results of the analyses 4) break down the needed products with the help of the defined product trees into
machine functions 5) sort the sequence of machine functions by considering the results of the bottleneck
analysis and the strategy chosen for the work package 6) if an inventory is in use
a. use parts in the production process b. add the taken product parts from the inventory to the work order package – to
produce at the end of the shift (when all products of the work order are finished)
c. produce the additional products d. bring them back into intermediate storage
To be able to fulfil this task, the project team implemented a “linked list” as data structure for the identified queue of machine functions dispatched to the agent system. For the inventory a table to save the available product parts (intermediate products) get used. To fulfil all this described tasks the dispatcher acts in a number of action roles. Following points will explain them briefly to give a concrete overview about these tasks which are required to be implemented for the SAW project simulation tool.
role/task description start shift ramp-up-phase as starting point of the production simulation; free
palettes can start their way on(to) the waiting loop (palette-washing-loop)
read input all available input information has to be read: the workload/work order and other parameters from the user interface, the needed product trees (plans to assemble the products), shop layout (available capacities) and the required priority system for the chosen strategy
breakdown work order
the work order has to be decomposed into simple transport and machine function, which are arranged into a list of functions which have to be worked out
calculate capacity
calculate the available capacity on the production system and needed capacity to work out the functions
identify machine bottleneck
by comparison of the available and the needed capacity calculated before the dispatcher identifies actual bottlenecks
prioritize functions
prioritize the queue of functions considering the strategy-parameter and the identified bottlenecks (e.g. functions, which have to be carried out on a machine that is identified as a bottleneck, will get a higher priority that the needed part will sure be finished within the shift duration). NOTE: The prioritized sequence of tasks to be done by the simulation agents in the CEBIT demonstrator (SAW simulator evolution 1) due to bottleneck analyse is created by coordination agents fulfilling the dispatching function. In enhanced versions of the SAW demonstrator (SAW simulator evolution 1) this function is realized by the complex implementation of the workflow scheduling strategies
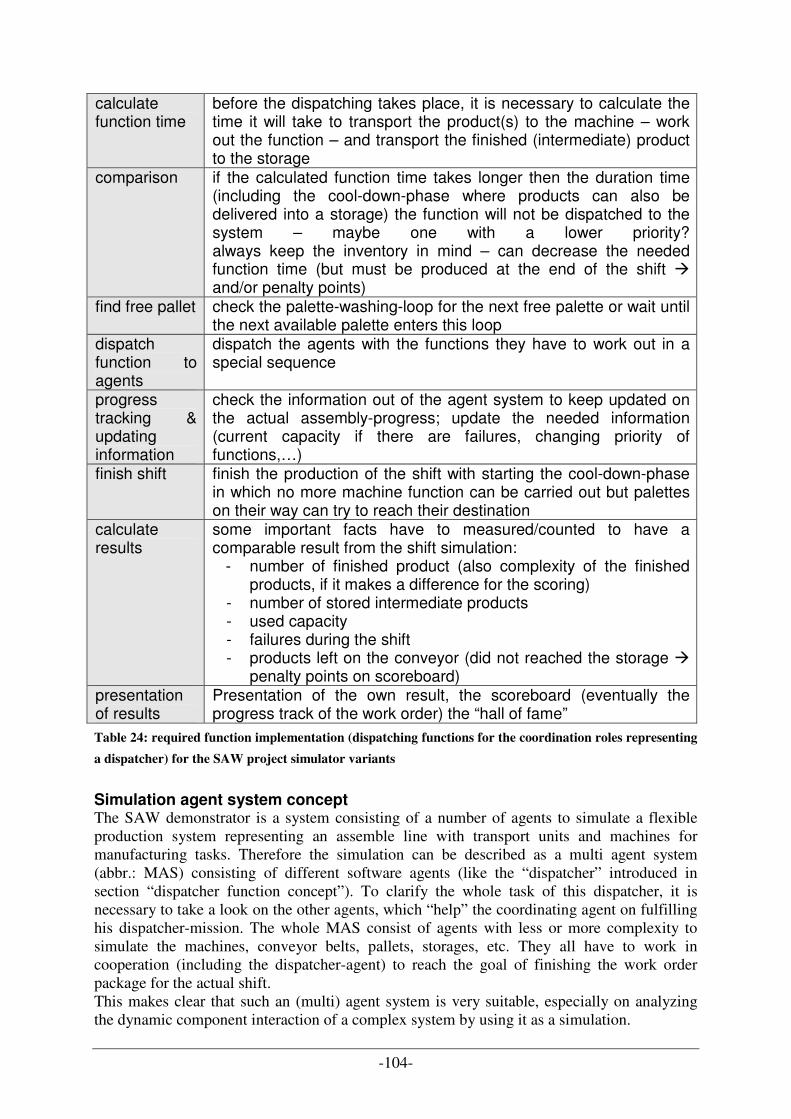
-104-
calculate function time
before the dispatching takes place, it is necessary to calculate the time it will take to transport the product(s) to the machine – work out the function – and transport the finished (intermediate) product to the storage
comparison if the calculated function time takes longer then the duration time (including the cool-down-phase where products can also be delivered into a storage) the function will not be dispatched to the system – maybe one with a lower priority? always keep the inventory in mind – can decrease the needed function time (but must be produced at the end of the shift � and/or penalty points)
find free pallet check the palette-washing-loop for the next free palette or wait until the next available palette enters this loop
dispatch function to agents
dispatch the agents with the functions they have to work out in a special sequence
progress tracking & updating information
check the information out of the agent system to keep updated on the actual assembly-progress; update the needed information (current capacity if there are failures, changing priority of functions,…)
finish shift finish the production of the shift with starting the cool-down-phase in which no more machine function can be carried out but palettes on their way can try to reach their destination
calculate results
some important facts have to measured/counted to have a comparable result from the shift simulation:
- number of finished product (also complexity of the finished products, if it makes a difference for the scoring)
- number of stored intermediate products - used capacity - failures during the shift - products left on the conveyor (did not reached the storage �
penalty points on scoreboard) presentation of results
Presentation of the own result, the scoreboard (eventually the progress track of the work order) the “hall of fame”
Table 24: required function implementation (dispatching functions for the coordination roles representing
a dispatcher) for the SAW project simulator variants
Simulation agent system concept The SAW demonstrator is a system consisting of a number of agents to simulate a flexible production system representing an assemble line with transport units and machines for manufacturing tasks. Therefore the simulation can be described as a multi agent system (abbr.: MAS) consisting of different software agents (like the “dispatcher” introduced in section “dispatcher function concept”). To clarify the whole task of this dispatcher, it is necessary to take a look on the other agents, which “help” the coordinating agent on fulfilling his dispatcher-mission. The whole MAS consist of agents with less or more complexity to simulate the machines, conveyor belts, pallets, storages, etc. They all have to work in cooperation (including the dispatcher-agent) to reach the goal of finishing the work order package for the actual shift. This makes clear that such an (multi) agent system is very suitable, especially on analyzing the dynamic component interaction of a complex system by using it as a simulation.
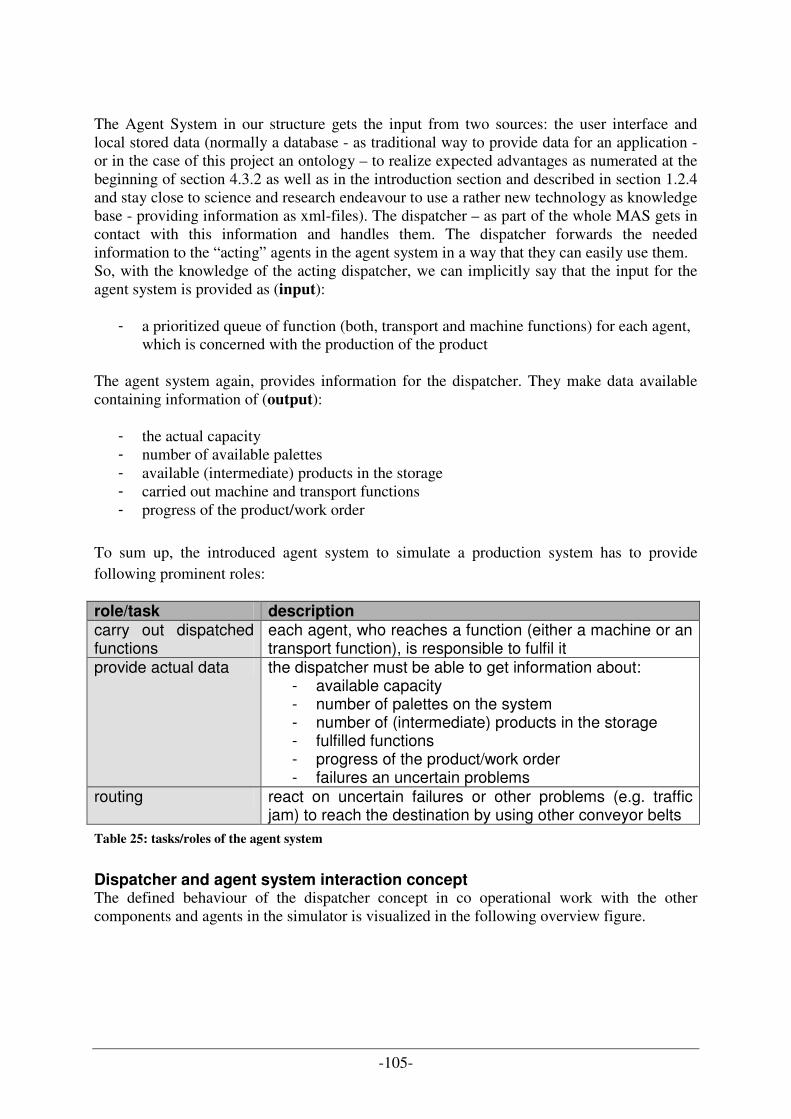
-105-
The Agent System in our structure gets the input from two sources: the user interface and local stored data (normally a database - as traditional way to provide data for an application -or in the case of this project an ontology – to realize expected advantages as numerated at the beginning of section 4.3.2 as well as in the introduction section and described in section 1.2.4 and stay close to science and research endeavour to use a rather new technology as knowledge base - providing information as xml-files). The dispatcher – as part of the whole MAS gets in contact with this information and handles them. The dispatcher forwards the needed information to the “acting” agents in the agent system in a way that they can easily use them. So, with the knowledge of the acting dispatcher, we can implicitly say that the input for the agent system is provided as (input):
- a prioritized queue of function (both, transport and machine functions) for each agent, which is concerned with the production of the product
The agent system again, provides information for the dispatcher. They make data available containing information of (output):
- the actual capacity - number of available palettes - available (intermediate) products in the storage - carried out machine and transport functions - progress of the product/work order
To sum up, the introduced agent system to simulate a production system has to provide following prominent roles: role/task description carry out dispatched functions
each agent, who reaches a function (either a machine or an transport function), is responsible to fulfil it
provide actual data the dispatcher must be able to get information about: - available capacity - number of palettes on the system - number of (intermediate) products in the storage - fulfilled functions - progress of the product/work order - failures an uncertain problems
routing react on uncertain failures or other problems (e.g. traffic jam) to reach the destination by using other conveyor belts
Table 25: tasks/roles of the agent system
Dispatcher and agent system interaction concept The defined behaviour of the dispatcher concept in co operational work with the other components and agents in the simulator is visualized in the following overview figure.
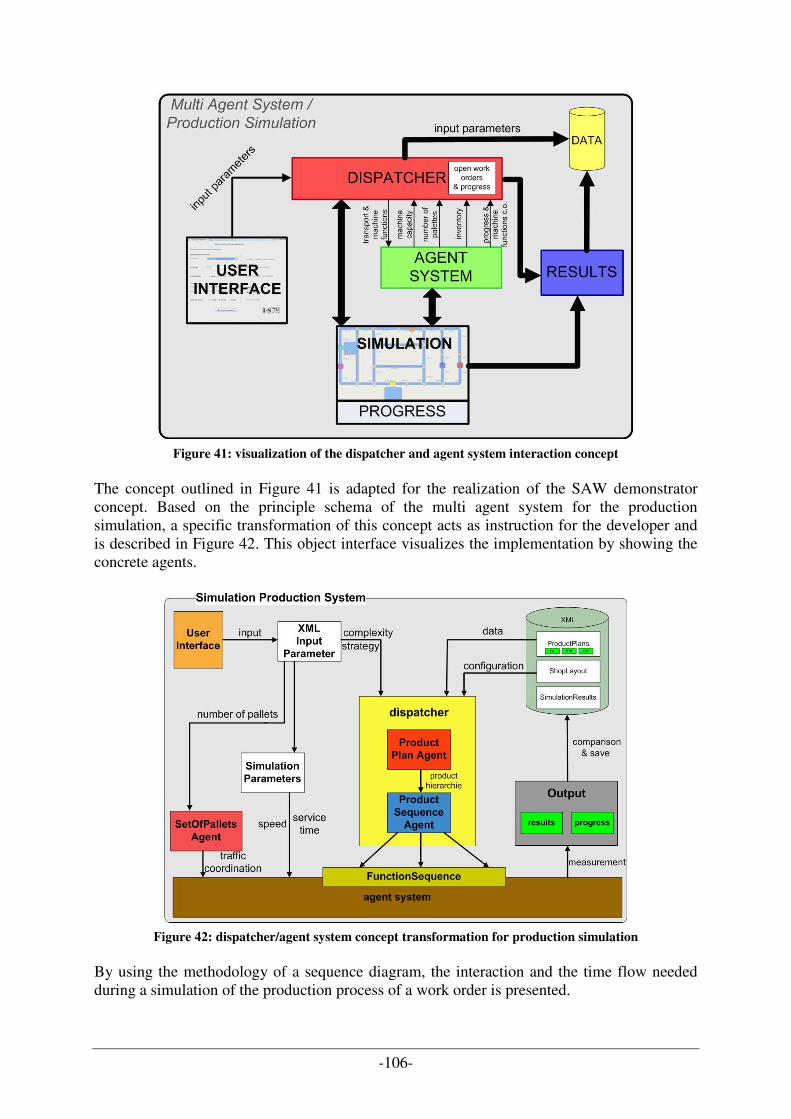
-106-
Figure 41: visualization of the dispatcher and agent system interaction concept
The concept outlined in Figure 41 is adapted for the realization of the SAW demonstrator concept. Based on the principle schema of the multi agent system for the production simulation, a specific transformation of this concept acts as instruction for the developer and is described in Figure 42. This object interface visualizes the implementation by showing the concrete agents.
Figure 42: dispatcher/agent system concept transformation for production simulation
By using the methodology of a sequence diagram, the interaction and the time flow needed during a simulation of the production process of a work order is presented.
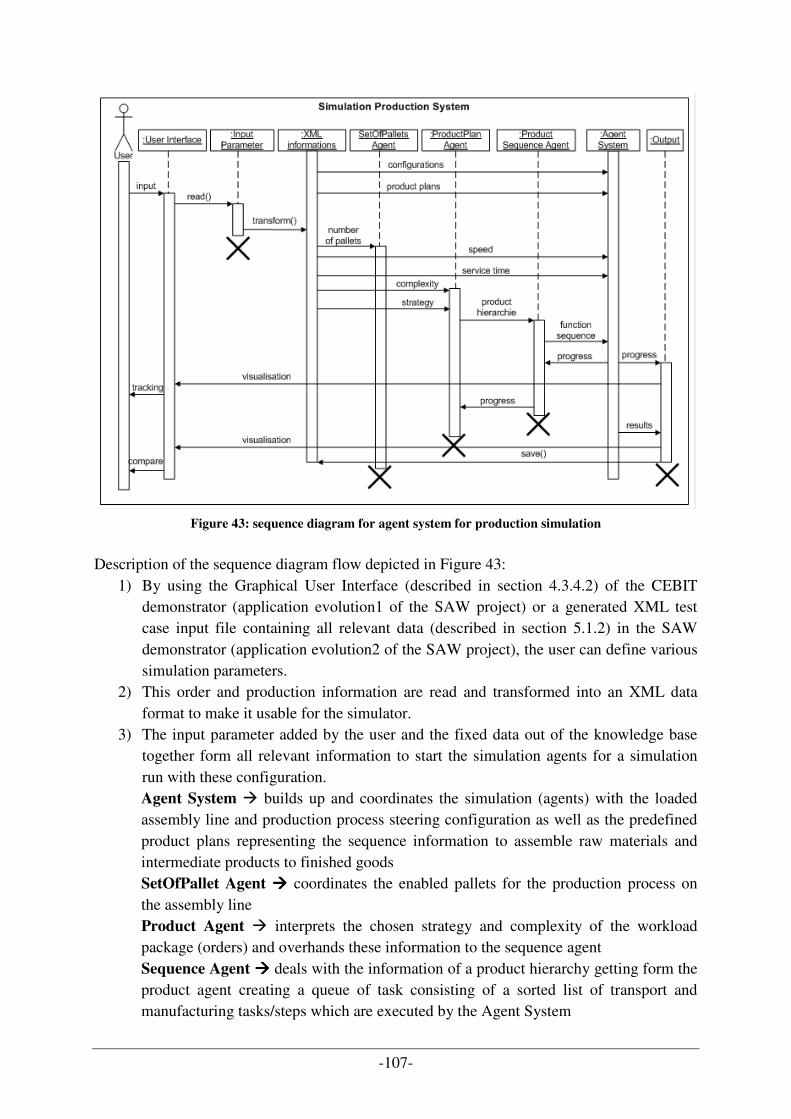
-107-
Figure 43: sequence diagram for agent system for production simulation
Description of the sequence diagram flow depicted in Figure 43:
1) By using the Graphical User Interface (described in section 4.3.4.2) of the CEBIT demonstrator (application evolution1 of the SAW project) or a generated XML test case input file containing all relevant data (described in section 5.1.2) in the SAW demonstrator (application evolution2 of the SAW project), the user can define various simulation parameters.
2) This order and production information are read and transformed into an XML data format to make it usable for the simulator.
3) The input parameter added by the user and the fixed data out of the knowledge base together form all relevant information to start the simulation agents for a simulation run with these configuration. Agent System � builds up and coordinates the simulation (agents) with the loaded assembly line and production process steering configuration as well as the predefined product plans representing the sequence information to assemble raw materials and intermediate products to finished goods SetOfPallet Agent ���� coordinates the enabled pallets for the production process on the assembly line Product Agent � interprets the chosen strategy and complexity of the workload package (orders) and overhands these information to the sequence agent Sequence Agent ���� deals with the information of a product hierarchy getting form the product agent creating a queue of task consisting of a sorted list of transport and manufacturing tasks/steps which are executed by the Agent System
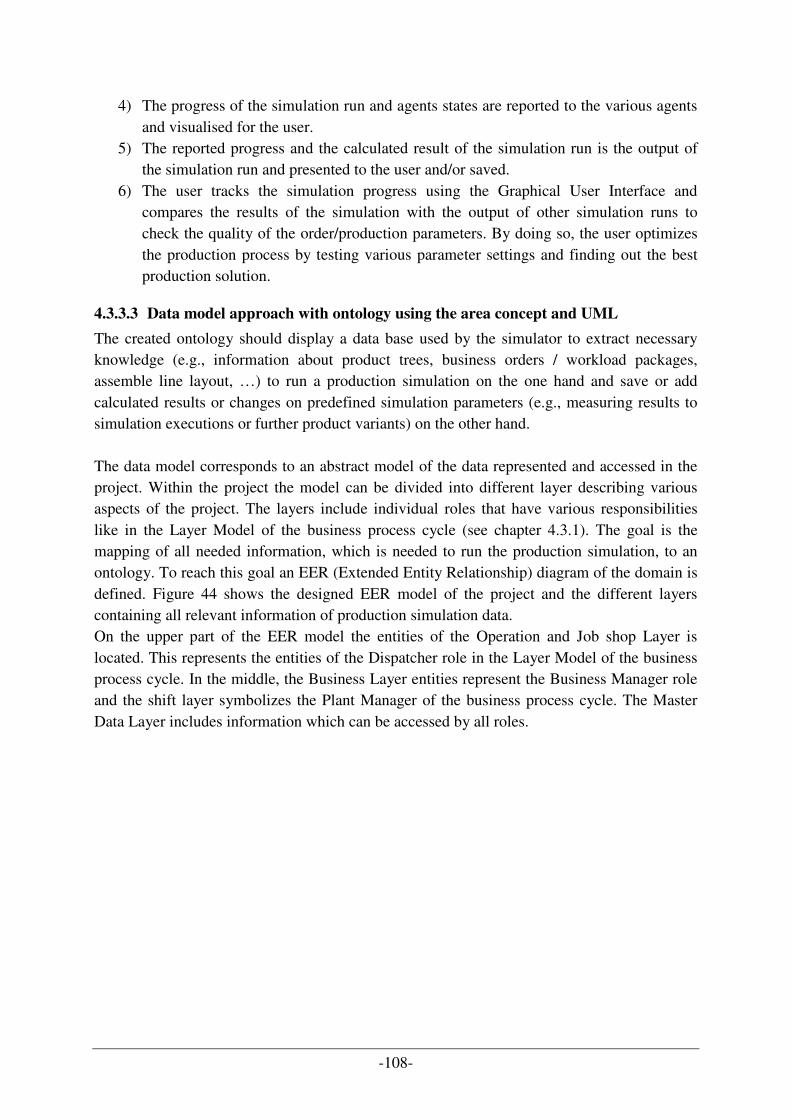
-108-
4) The progress of the simulation run and agents states are reported to the various agents and visualised for the user.
5) The reported progress and the calculated result of the simulation run is the output of the simulation run and presented to the user and/or saved.
6) The user tracks the simulation progress using the Graphical User Interface and compares the results of the simulation with the output of other simulation runs to check the quality of the order/production parameters. By doing so, the user optimizes the production process by testing various parameter settings and finding out the best production solution.
4.3.3.3 Data model approach with ontology using the area concept and UML
The created ontology should display a data base used by the simulator to extract necessary knowledge (e.g., information about product trees, business orders / workload packages, assemble line layout, …) to run a production simulation on the one hand and save or add calculated results or changes on predefined simulation parameters (e.g., measuring results to simulation executions or further product variants) on the other hand. The data model corresponds to an abstract model of the data represented and accessed in the project. Within the project the model can be divided into different layer describing various aspects of the project. The layers include individual roles that have various responsibilities like in the Layer Model of the business process cycle (see chapter 4.3.1). The goal is the mapping of all needed information, which is needed to run the production simulation, to an ontology. To reach this goal an EER (Extended Entity Relationship) diagram of the domain is defined. Figure 44 shows the designed EER model of the project and the different layers containing all relevant information of production simulation data. On the upper part of the EER model the entities of the Operation and Job shop Layer is located. This represents the entities of the Dispatcher role in the Layer Model of the business process cycle. In the middle, the Business Layer entities represent the Business Manager role and the shift layer symbolizes the Plant Manager of the business process cycle. The Master Data Layer includes information which can be accessed by all roles.
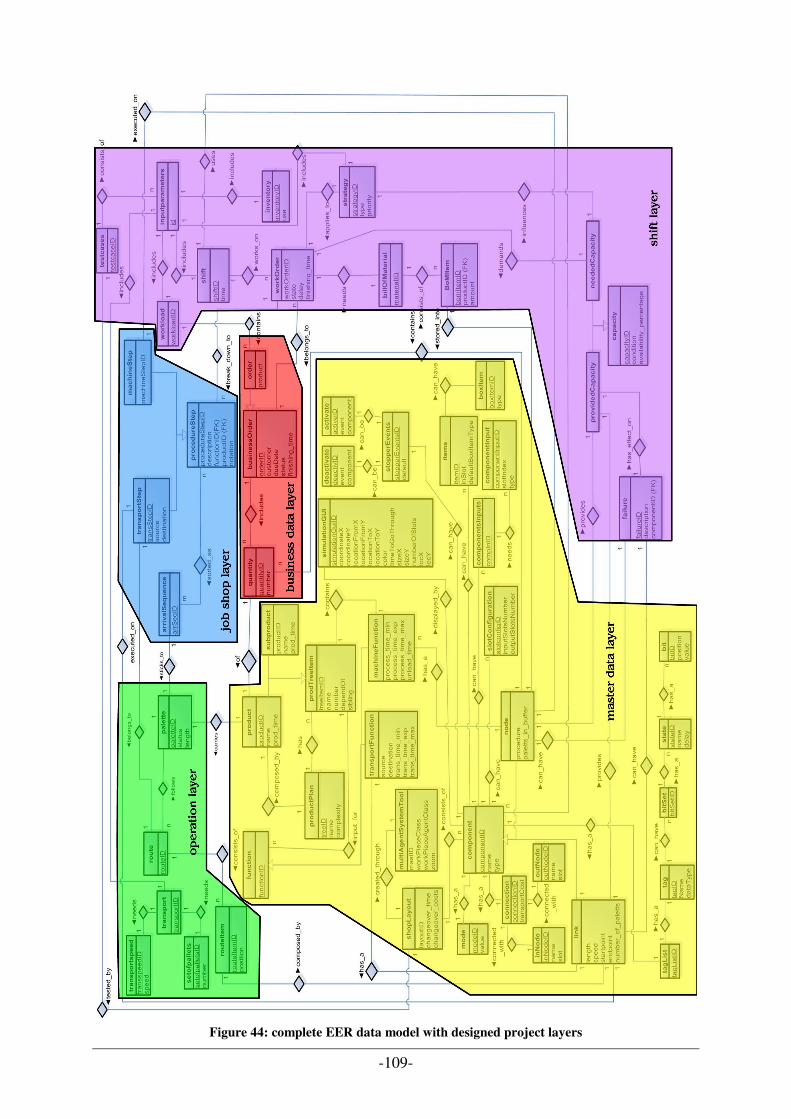
-109-
Figure 44: complete EER data model with designed project layers
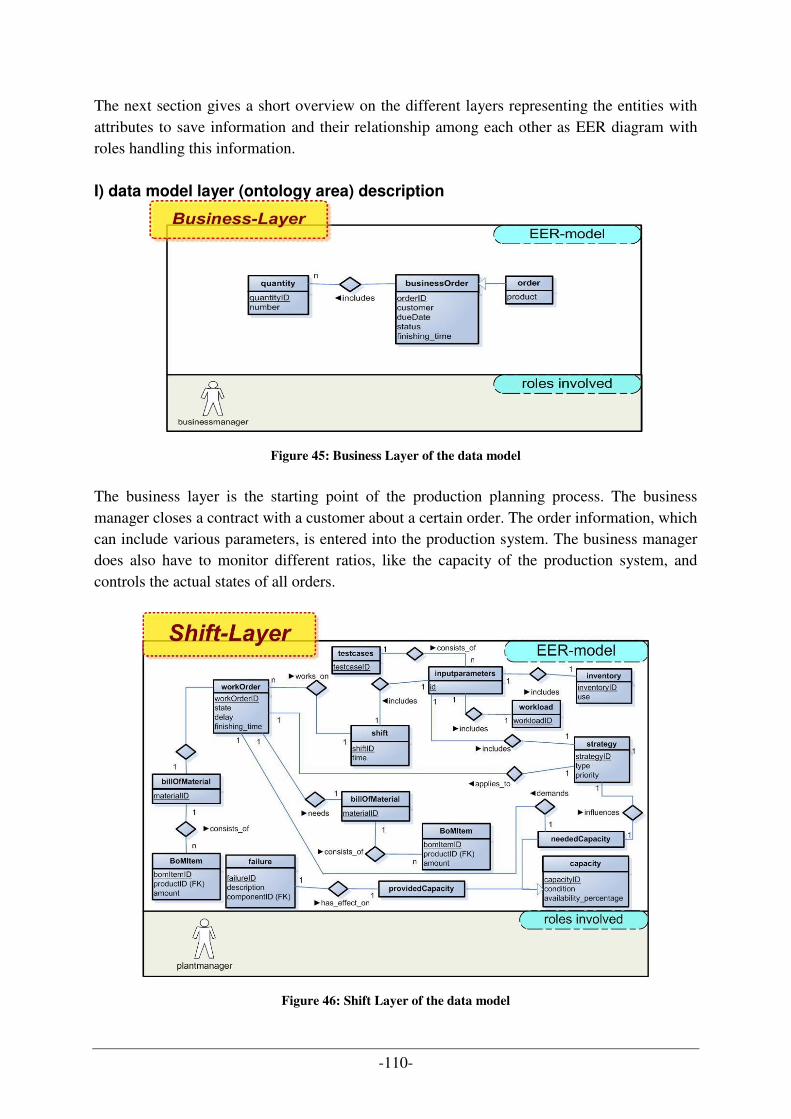
-110-
The next section gives a short overview on the different layers representing the entities with attributes to save information and their relationship among each other as EER diagram with roles handling this information. I) data model layer (ontology area) description
Figure 45: Business Layer of the data model
The business layer is the starting point of the production planning process. The business manager closes a contract with a customer about a certain order. The order information, which can include various parameters, is entered into the production system. The business manager does also have to monitor different ratios, like the capacity of the production system, and controls the actual states of all orders.
Figure 46: Shift Layer of the data model

-111-
The shift layer is monitored by the plant manager(s), who gets orders from the business manager. The layer includes the first calculations about the availability of resources and sub products. Therefore all information about the inventory stock and the production capacity needs to be analysed. Besides, the capacity of the production system is compared with the production steps that have to be done to fulfil the orders. If any bottleneck occurs the plant manager has to inform the business manager.
Figure 47: Job Shop Layer of the data model
The job shop layer is monitored by the shop manager(s), who is responsible to analyse the product plans which are included in an order. The product plans are divided into different production steps. A production step is subdivided into a machine step, which represents an activity on a machine, and a transport step, which is the transportation of a good from one point to another. The shop manager forwards these steps to the next layer, which is the operation layer.
Figure 48: Operation Layer of the data model
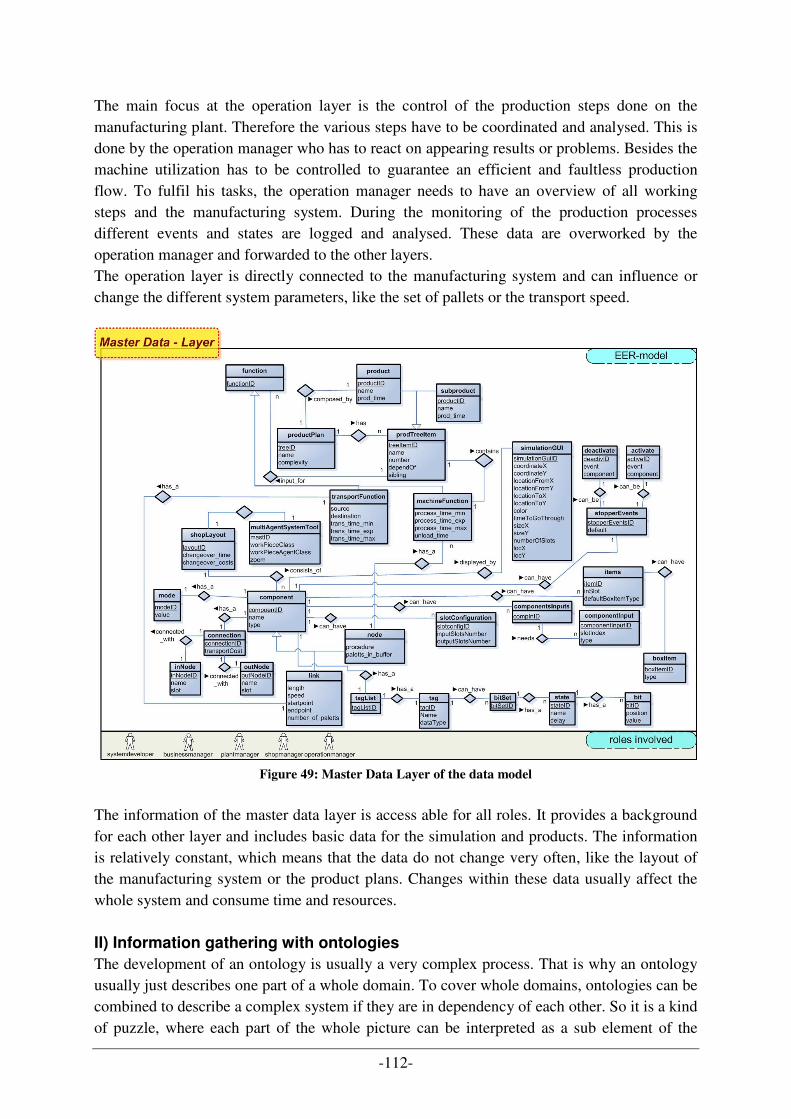
-112-
The main focus at the operation layer is the control of the production steps done on the manufacturing plant. Therefore the various steps have to be coordinated and analysed. This is done by the operation manager who has to react on appearing results or problems. Besides the machine utilization has to be controlled to guarantee an efficient and faultless production flow. To fulfil his tasks, the operation manager needs to have an overview of all working steps and the manufacturing system. During the monitoring of the production processes different events and states are logged and analysed. These data are overworked by the operation manager and forwarded to the other layers. The operation layer is directly connected to the manufacturing system and can influence or change the different system parameters, like the set of pallets or the transport speed.
Figure 49: Master Data Layer of the data model
The information of the master data layer is access able for all roles. It provides a background for each other layer and includes basic data for the simulation and products. The information is relatively constant, which means that the data do not change very often, like the layout of the manufacturing system or the product plans. Changes within these data usually affect the whole system and consume time and resources. II) Information gathering with ontologies
The development of an ontology is usually a very complex process. That is why an ontology usually just describes one part of a whole domain. To cover whole domains, ontologies can be combined to describe a complex system if they are in dependency of each other. So it is a kind of puzzle, where each part of the whole picture can be interpreted as a sub element of the
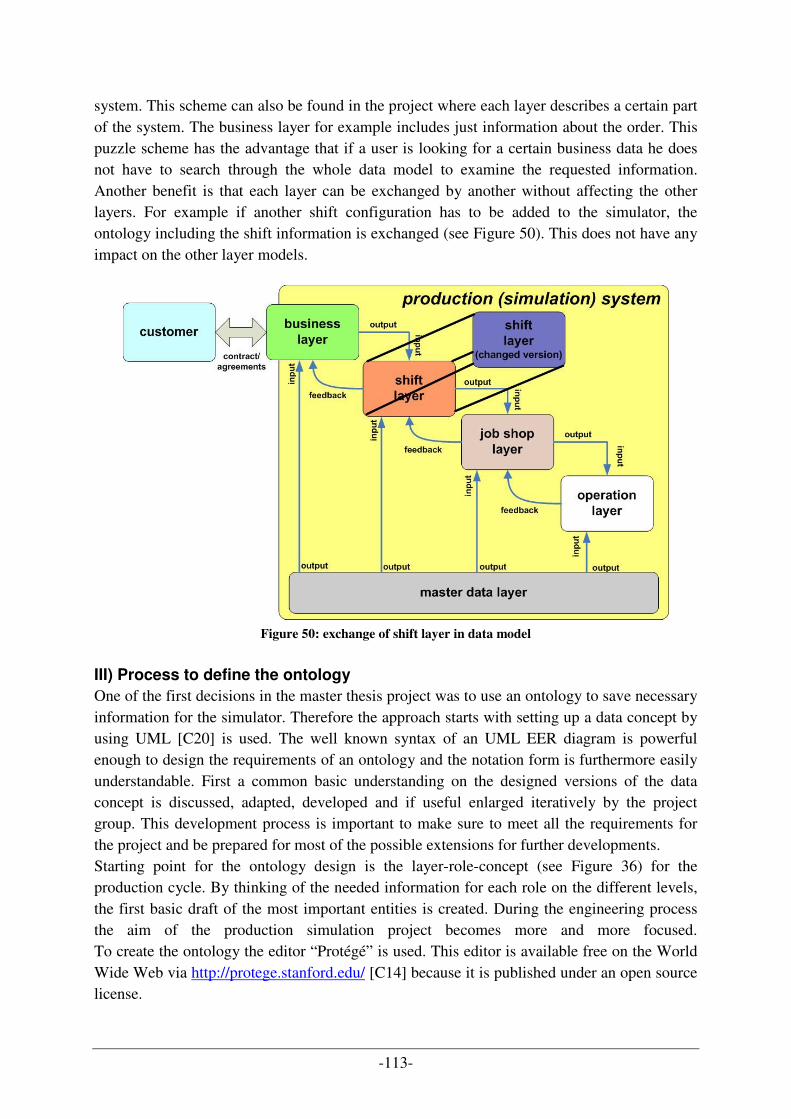
-113-
system. This scheme can also be found in the project where each layer describes a certain part of the system. The business layer for example includes just information about the order. This puzzle scheme has the advantage that if a user is looking for a certain business data he does not have to search through the whole data model to examine the requested information. Another benefit is that each layer can be exchanged by another without affecting the other layers. For example if another shift configuration has to be added to the simulator, the ontology including the shift information is exchanged (see Figure 50). This does not have any impact on the other layer models.
Figure 50: exchange of shift layer in data model
III) Process to define the ontology
One of the first decisions in the master thesis project was to use an ontology to save necessary information for the simulator. Therefore the approach starts with setting up a data concept by using UML [C20] is used. The well known syntax of an UML EER diagram is powerful enough to design the requirements of an ontology and the notation form is furthermore easily understandable. First a common basic understanding on the designed versions of the data concept is discussed, adapted, developed and if useful enlarged iteratively by the project group. This development process is important to make sure to meet all the requirements for the project and be prepared for most of the possible extensions for further developments. Starting point for the ontology design is the layer-role-concept (see Figure 36) for the production cycle. By thinking of the needed information for each role on the different levels, the first basic draft of the most important entities is created. During the engineering process the aim of the production simulation project becomes more and more focused. To create the ontology the editor “Protégé” is used. This editor is available free on the World Wide Web via http://protege.stanford.edu/ [C14] because it is published under an open source license.
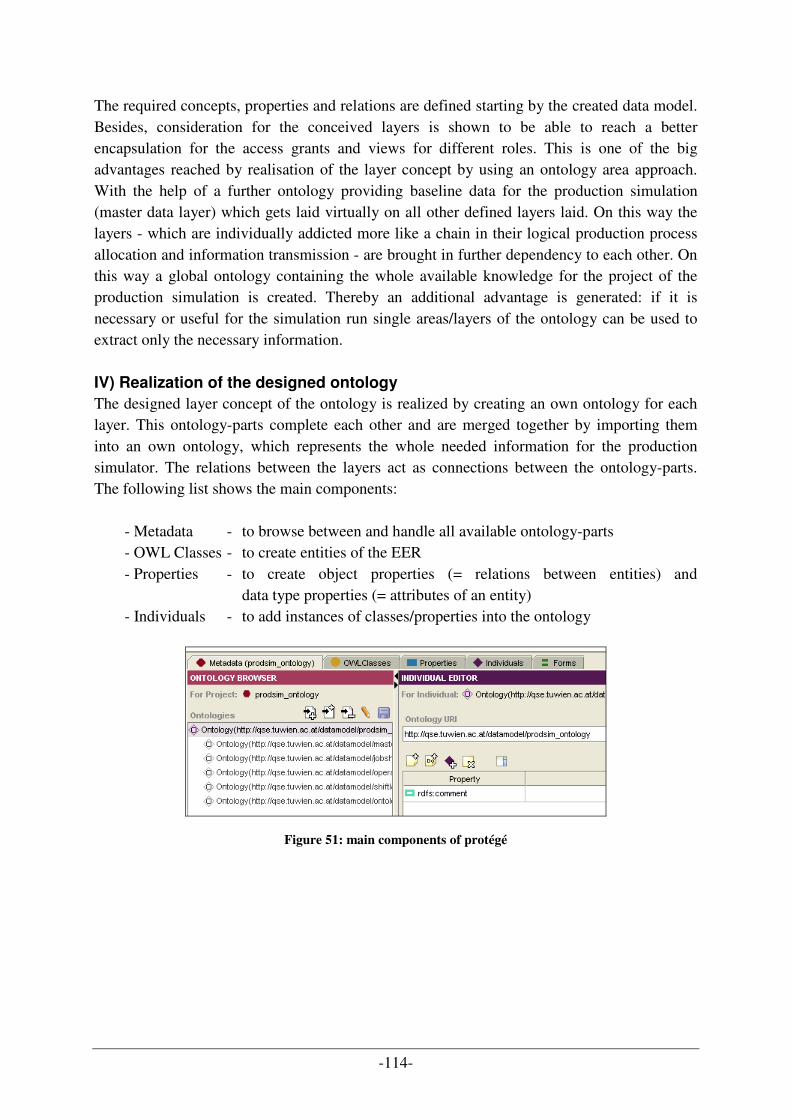
-114-
The required concepts, properties and relations are defined starting by the created data model. Besides, consideration for the conceived layers is shown to be able to reach a better encapsulation for the access grants and views for different roles. This is one of the big advantages reached by realisation of the layer concept by using an ontology area approach. With the help of a further ontology providing baseline data for the production simulation (master data layer) which gets laid virtually on all other defined layers laid. On this way the layers - which are individually addicted more like a chain in their logical production process allocation and information transmission - are brought in further dependency to each other. On this way a global ontology containing the whole available knowledge for the project of the production simulation is created. Thereby an additional advantage is generated: if it is necessary or useful for the simulation run single areas/layers of the ontology can be used to extract only the necessary information. IV) Realization of the designed ontology
The designed layer concept of the ontology is realized by creating an own ontology for each layer. This ontology-parts complete each other and are merged together by importing them into an own ontology, which represents the whole needed information for the production simulator. The relations between the layers act as connections between the ontology-parts. The following list shows the main components:
- Metadata - to browse between and handle all available ontology-parts - OWL Classes - to create entities of the EER - Properties - to create object properties (= relations between entities) and data type properties (= attributes of an entity) - Individuals - to add instances of classes/properties into the ontology
Figure 51: main components of protégé
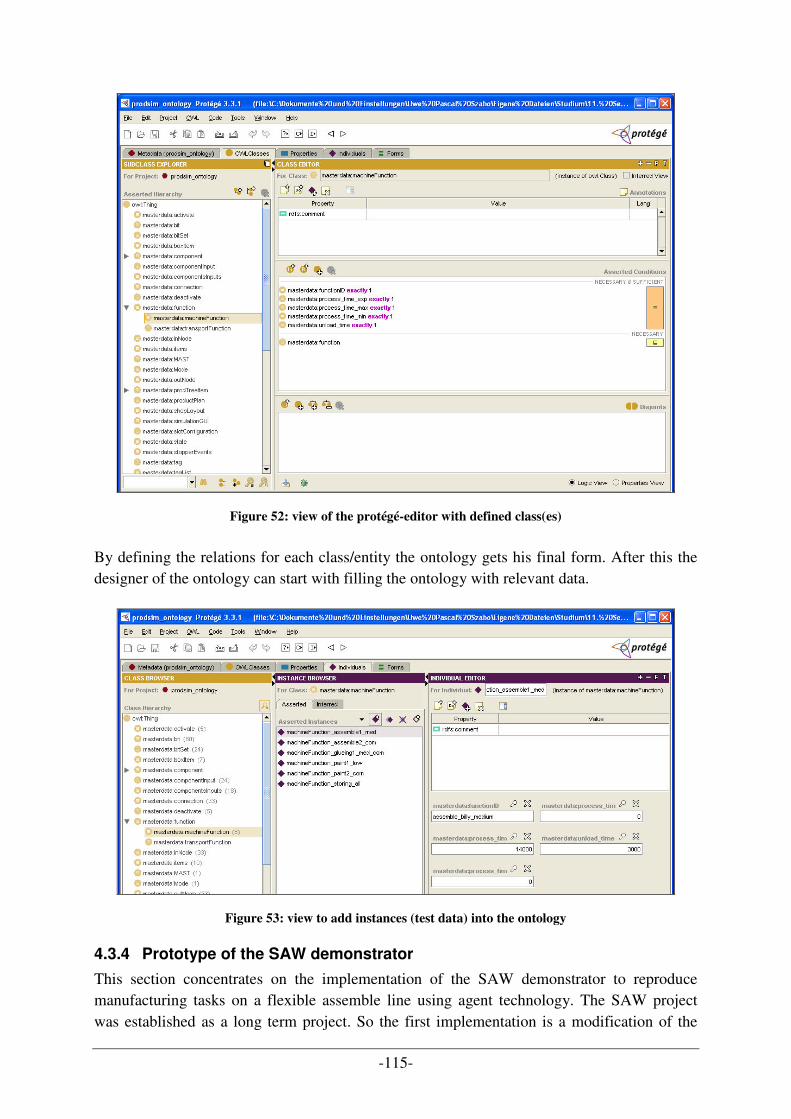
-115-
Figure 52: view of the protégé-editor with defined class(es)
By defining the relations for each class/entity the ontology gets his final form. After this the designer of the ontology can start with filling the ontology with relevant data.
Figure 53: view to add instances (test data) into the ontology
4.3.4 Prototype of the SAW demonstrator
This section concentrates on the implementation of the SAW demonstrator to reproduce manufacturing tasks on a flexible assemble line using agent technology. The SAW project was established as a long term project. So the first implementation is a modification of the
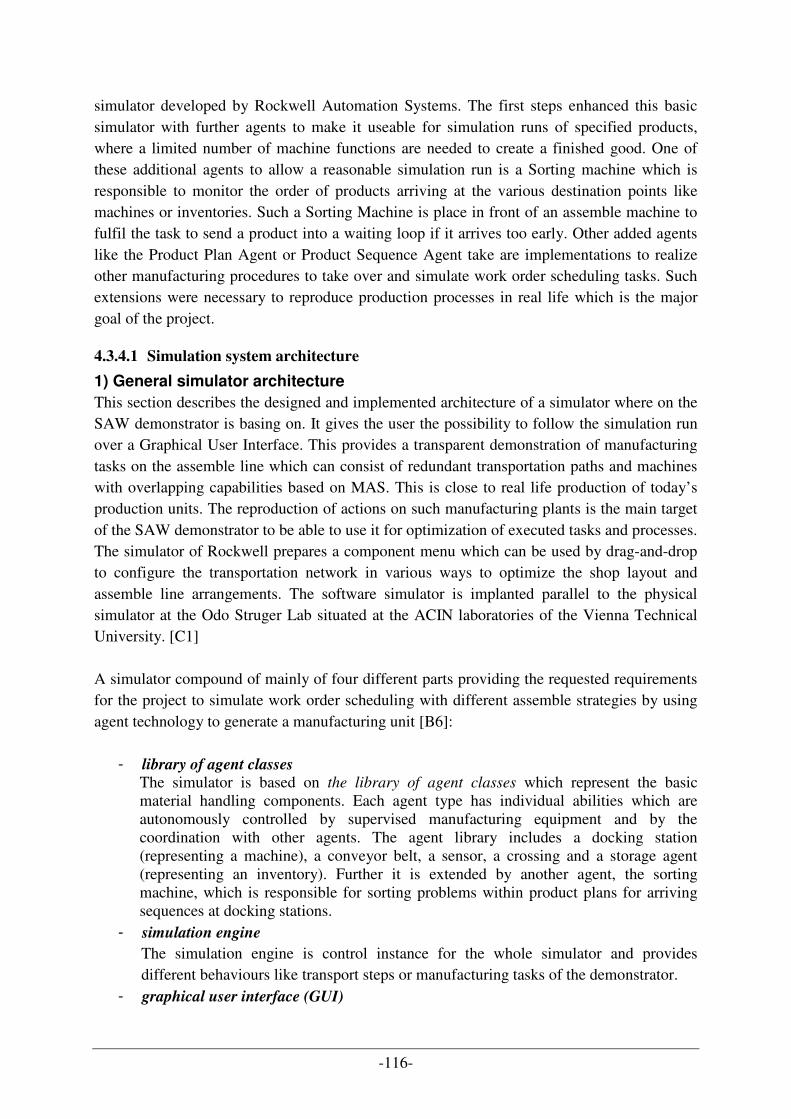
-116-
simulator developed by Rockwell Automation Systems. The first steps enhanced this basic simulator with further agents to make it useable for simulation runs of specified products, where a limited number of machine functions are needed to create a finished good. One of these additional agents to allow a reasonable simulation run is a Sorting machine which is responsible to monitor the order of products arriving at the various destination points like machines or inventories. Such a Sorting Machine is place in front of an assemble machine to fulfil the task to send a product into a waiting loop if it arrives too early. Other added agents like the Product Plan Agent or Product Sequence Agent take are implementations to realize other manufacturing procedures to take over and simulate work order scheduling tasks. Such extensions were necessary to reproduce production processes in real life which is the major goal of the project.
4.3.4.1 Simulation system architecture
1) General simulator architecture
This section describes the designed and implemented architecture of a simulator where on the SAW demonstrator is basing on. It gives the user the possibility to follow the simulation run over a Graphical User Interface. This provides a transparent demonstration of manufacturing tasks on the assemble line which can consist of redundant transportation paths and machines with overlapping capabilities based on MAS. This is close to real life production of today’s production units. The reproduction of actions on such manufacturing plants is the main target of the SAW demonstrator to be able to use it for optimization of executed tasks and processes. The simulator of Rockwell prepares a component menu which can be used by drag-and-drop to configure the transportation network in various ways to optimize the shop layout and assemble line arrangements. The software simulator is implanted parallel to the physical simulator at the Odo Struger Lab situated at the ACIN laboratories of the Vienna Technical University. [C1] A simulator compound of mainly of four different parts providing the requested requirements for the project to simulate work order scheduling with different assemble strategies by using agent technology to generate a manufacturing unit [B6]:
- library of agent classes The simulator is based on the library of agent classes which represent the basic material handling components. Each agent type has individual abilities which are autonomously controlled by supervised manufacturing equipment and by the coordination with other agents. The agent library includes a docking station (representing a machine), a conveyor belt, a sensor, a crossing and a storage agent (representing an inventory). Further it is extended by another agent, the sorting machine, which is responsible for sorting problems within product plans for arriving sequences at docking stations.
- simulation engine
The simulation engine is control instance for the whole simulator and provides different behaviours like transport steps or manufacturing tasks of the demonstrator.
- graphical user interface (GUI)
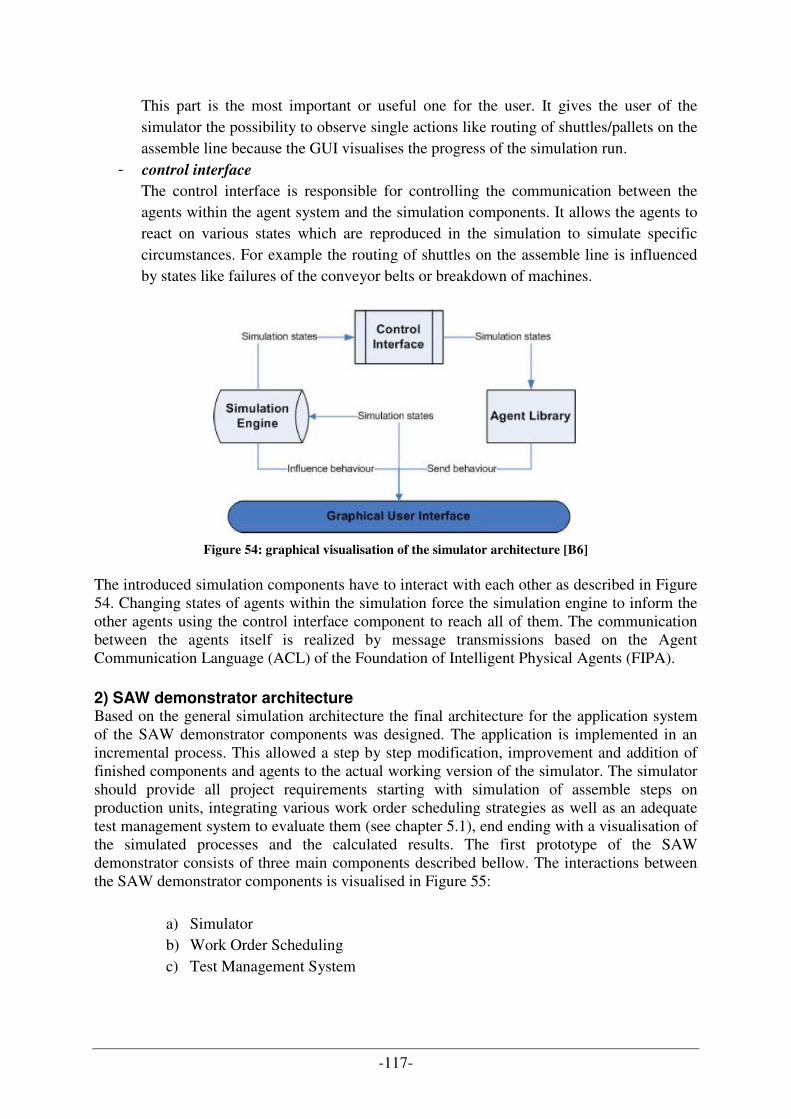
-117-
This part is the most important or useful one for the user. It gives the user of the simulator the possibility to observe single actions like routing of shuttles/pallets on the assemble line because the GUI visualises the progress of the simulation run.
- control interface
The control interface is responsible for controlling the communication between the agents within the agent system and the simulation components. It allows the agents to react on various states which are reproduced in the simulation to simulate specific circumstances. For example the routing of shuttles on the assemble line is influenced by states like failures of the conveyor belts or breakdown of machines.
Figure 54: graphical visualisation of the simulator architecture [B6]
The introduced simulation components have to interact with each other as described in Figure 54. Changing states of agents within the simulation force the simulation engine to inform the other agents using the control interface component to reach all of them. The communication between the agents itself is realized by message transmissions based on the Agent Communication Language (ACL) of the Foundation of Intelligent Physical Agents (FIPA). 2) SAW demonstrator architecture Based on the general simulation architecture the final architecture for the application system of the SAW demonstrator components was designed. The application is implemented in an incremental process. This allowed a step by step modification, improvement and addition of finished components and agents to the actual working version of the simulator. The simulator should provide all project requirements starting with simulation of assemble steps on production units, integrating various work order scheduling strategies as well as an adequate test management system to evaluate them (see chapter 5.1), end ending with a visualisation of the simulated processes and the calculated results. The first prototype of the SAW demonstrator consists of three main components described bellow. The interactions between the SAW demonstrator components is visualised in Figure 55:
a) Simulator b) Work Order Scheduling c) Test Management System
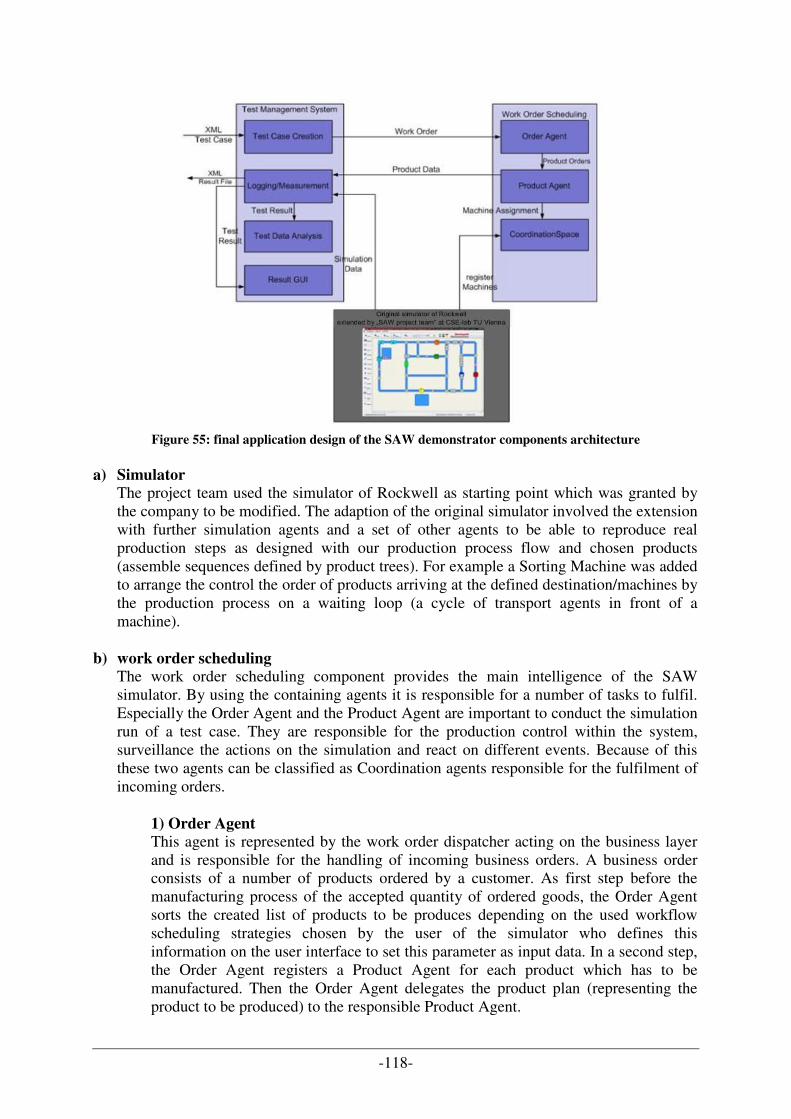
-118-
Figure 55: final application design of the SAW demonstrator components architecture
a) Simulator
The project team used the simulator of Rockwell as starting point which was granted by the company to be modified. The adaption of the original simulator involved the extension with further simulation agents and a set of other agents to be able to reproduce real production steps as designed with our production process flow and chosen products (assemble sequences defined by product trees). For example a Sorting Machine was added to arrange the control the order of products arriving at the defined destination/machines by the production process on a waiting loop (a cycle of transport agents in front of a machine).
b) work order scheduling The work order scheduling component provides the main intelligence of the SAW simulator. By using the containing agents it is responsible for a number of tasks to fulfil. Especially the Order Agent and the Product Agent are important to conduct the simulation run of a test case. They are responsible for the production control within the system, surveillance the actions on the simulation and react on different events. Because of this these two agents can be classified as Coordination agents responsible for the fulfilment of incoming orders.
1) Order Agent This agent is represented by the work order dispatcher acting on the business layer and is responsible for the handling of incoming business orders. A business order consists of a number of products ordered by a customer. As first step before the manufacturing process of the accepted quantity of ordered goods, the Order Agent sorts the created list of products to be produces depending on the used workflow scheduling strategies chosen by the user of the simulator who defines this information on the user interface to set this parameter as input data. In a second step, the Order Agent registers a Product Agent for each product which has to be manufactured. Then the Order Agent delegates the product plan (representing the product to be produced) to the responsible Product Agent.
-119-
2) Product Agent One of the most important extensions of the Rockwell simulator to realize the requirements of the project is the Product Agent which is responsible for the manufacturing of a single product. The Product Agent receives a product plan created by the Order Agent as an ArrayList. To fulfil his task of producing a finished good, the Product Agent has to communicate with the simulation agents carrying out single assembly and transport tasks and needs to decide which of these steps has to be done next. This ability makes this component very important for the simulation and allows identifying it as main coordination component. The Product Agent acts as interface between the Order Agent acting on the business layer and the simulator (which actions are distributed on lower layers of shift, job shop, operation and master data layer). The Product Agent handles production information which is transmitted to him as the so called “product plan”. It analysis these information closer and splits them – by taking fixed simulation data like assemble sequences out of product trees of the master data layer into consideration – into single working steps like assembly and transport tasks. These work step sequence is delegated to simulation agents who take care of their completion. During this time shift of the simulation run, the Product Agents monitors the production process of the product and signals the accomplishment of the finished product after fulfilling all production steps. After each status change or event which influences the Product Agent, this action and surveillance cycle starts again by analysing the product plan and discover the next step to be done.
Figure 56: MAS overview – coordination agents of SAW demonstrator (CEBIT Project) [B6]
3) Coordination Space The Coordination Space is a support to the agent system. It allows the registration of all available agents on the simulation system to simplify reaching their provided functionalities. The Coordination Space is working like a yellow-page-service acting as a container where all agents are registered in. To get the reference of a certain agent the identifier of the agent has to be known.
A further important part of the SAW production simulation system is the Product Plan Agent. In cooperation with the Product Sequence Agent they overtake the functionality of a dispatcher (see Figure 42 and consult chapter 4.3.3.2 subsection “dispatcher function concept”).
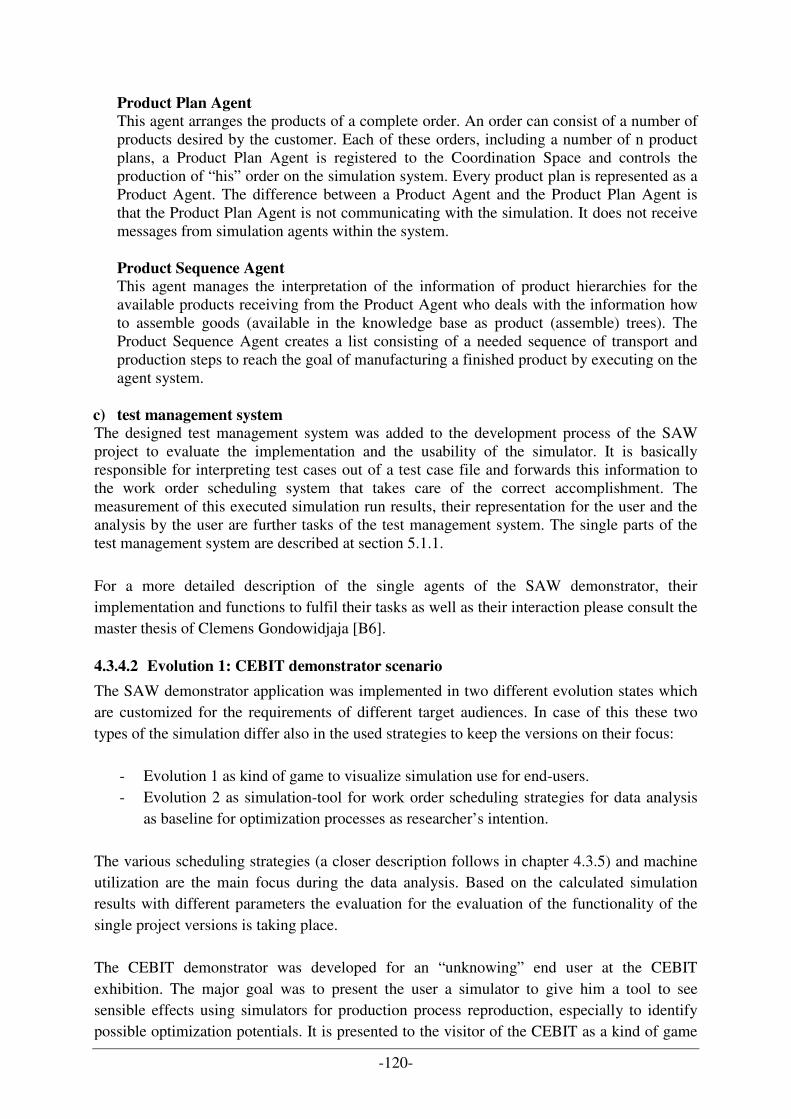
-120-
Product Plan Agent This agent arranges the products of a complete order. An order can consist of a number of products desired by the customer. Each of these orders, including a number of n product plans, a Product Plan Agent is registered to the Coordination Space and controls the production of “his” order on the simulation system. Every product plan is represented as a Product Agent. The difference between a Product Agent and the Product Plan Agent is that the Product Plan Agent is not communicating with the simulation. It does not receive messages from simulation agents within the system. Product Sequence Agent This agent manages the interpretation of the information of product hierarchies for the available products receiving from the Product Agent who deals with the information how to assemble goods (available in the knowledge base as product (assemble) trees). The Product Sequence Agent creates a list consisting of a needed sequence of transport and production steps to reach the goal of manufacturing a finished product by executing on the agent system.
c) test management system The designed test management system was added to the development process of the SAW project to evaluate the implementation and the usability of the simulator. It is basically responsible for interpreting test cases out of a test case file and forwards this information to the work order scheduling system that takes care of the correct accomplishment. The measurement of this executed simulation run results, their representation for the user and the analysis by the user are further tasks of the test management system. The single parts of the test management system are described at section 5.1.1. For a more detailed description of the single agents of the SAW demonstrator, their implementation and functions to fulfil their tasks as well as their interaction please consult the master thesis of Clemens Gondowidjaja [B6].
4.3.4.2 Evolution 1: CEBIT demonstrator scenario
The SAW demonstrator application was implemented in two different evolution states which are customized for the requirements of different target audiences. In case of this these two types of the simulation differ also in the used strategies to keep the versions on their focus:
- Evolution 1 as kind of game to visualize simulation use for end-users. - Evolution 2 as simulation-tool for work order scheduling strategies for data analysis
as baseline for optimization processes as researcher’s intention. The various scheduling strategies (a closer description follows in chapter 4.3.5) and machine utilization are the main focus during the data analysis. Based on the calculated simulation results with different parameters the evaluation for the evaluation of the functionality of the single project versions is taking place. The CEBIT demonstrator was developed for an “unknowing” end user at the CEBIT exhibition. The major goal was to present the user a simulator to give him a tool to see sensible effects using simulators for production process reproduction, especially to identify possible optimization potentials. It is presented to the visitor of the CEBIT as a kind of game
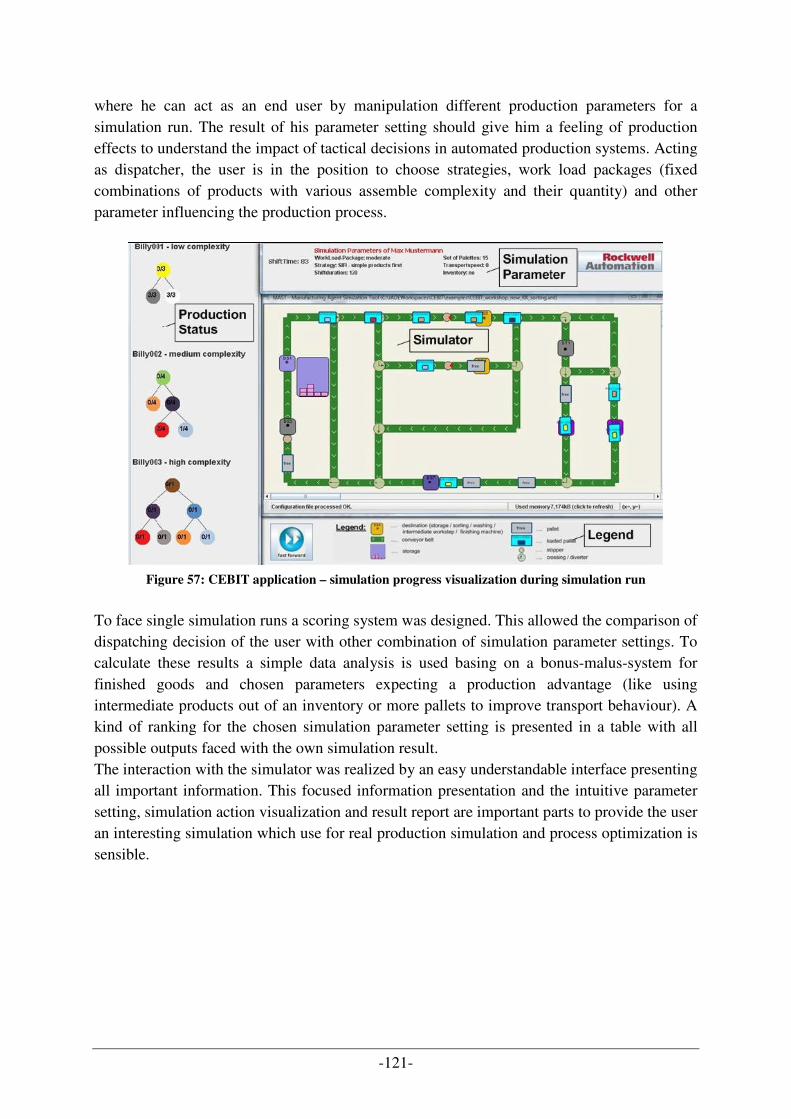
-121-
where he can act as an end user by manipulation different production parameters for a simulation run. The result of his parameter setting should give him a feeling of production effects to understand the impact of tactical decisions in automated production systems. Acting as dispatcher, the user is in the position to choose strategies, work load packages (fixed combinations of products with various assemble complexity and their quantity) and other parameter influencing the production process.
Figure 57: CEBIT application – simulation progress visualization during simulation run
To face single simulation runs a scoring system was designed. This allowed the comparison of dispatching decision of the user with other combination of simulation parameter settings. To calculate these results a simple data analysis is used basing on a bonus-malus-system for finished goods and chosen parameters expecting a production advantage (like using intermediate products out of an inventory or more pallets to improve transport behaviour). A kind of ranking for the chosen simulation parameter setting is presented in a table with all possible outputs faced with the own simulation result. The interaction with the simulator was realized by an easy understandable interface presenting all important information. This focused information presentation and the intuitive parameter setting, simulation action visualization and result report are important parts to provide the user an interesting simulation which use for real production simulation and process optimization is sensible.
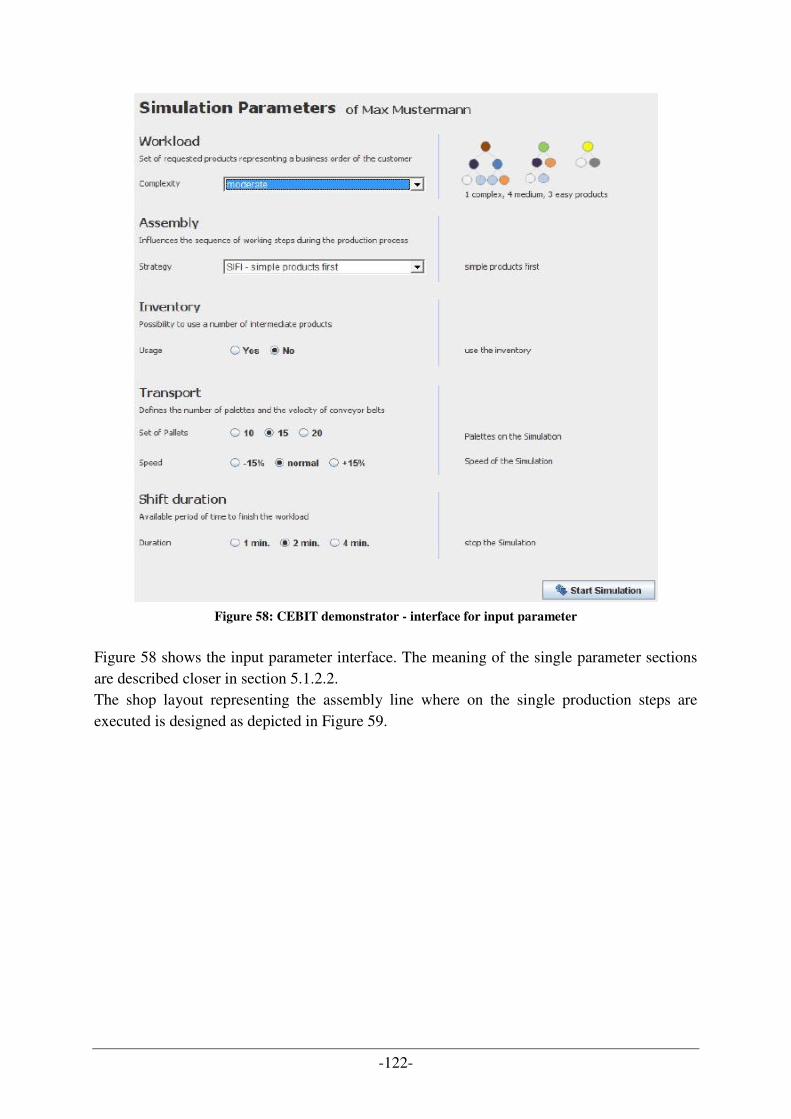
-122-
Figure 58: CEBIT demonstrator - interface for input parameter
Figure 58 shows the input parameter interface. The meaning of the single parameter sections are described closer in section 5.1.2.2. The shop layout representing the assembly line where on the single production steps are executed is designed as depicted in Figure 59.
-123-
Figure 59: assemble line shop layout - CEBIT demonstrator
The arrangement of machines and conveyor belt for the CEBIT demonstrator is based on the real life model situated at the ACIN laboratories. It was modified in single points to make some project assumptions for the simulation reasonable, e.g. the setting of a sorting machine which was only implemented as software agent at this time or the positioning of conveyor belts to simplify routing on unnecessary transport units. In the first considerations of the project design, all machines available in the simulation of the assemble line should provide the same functionalities. However, because of their positioning in the production simulation they are grouped to the processing of certain tasks (product release, assembly of intermediate products, final manufacturing, and storage). Therefore following machines fulfill outlined tasks:
- machine DS1 releases the necessary products (or intermediate products if such are available from earlier shifts, respectively if their use is desired) from the storage and [product release – marked red]
- machine DS2 is used as starting point where free shuttles representing pallets can enter the assemble line (DS2 is the destination point for all free pallets if their has no specific task to fulfil – together with the conveyor belts in the close surrounding, it provides a kind of waiting loop for free transport capacities [waiting loop - marked brown])
- machines DS3 and DS4 are responsible for manufacturing the intermediate products [assembly of intermediate products – marked black]
- machines DS5 and DS6 take over the manufacturing of the end product [product final manufacturing – marked violet] and
- machine DS7 is responsible for removing the finished products into the storage of the finished [end product storage – marked orange]
- machine ST1 represents the sorting machine on a sorting loop in front of finishing assemble steps which is in charge of the right arriving sequence of production parts at the machines DS5 and DS6 to finish the products [sorting machine – marked
gray]
-124-
In the left area of the production unity, additional conveyor belts are established as a waiting loop. On this conveyor belts the empty palettes available to fulfill transport tasks for the production are positioned when they do not have any other instruction. When required by production orders, these palettes are routed to the destinations/machines where they are needed. After completion of the transport order, the empty palettes go back on direct way to the waiting loop. Actually, the defined shop layout only needs free pallets near destination1 (starting point of the production flow), because the other machines are using the last palettes - transporting the needed product for the assemble task - to transport the assembled good immediately to the next machine/inventory.
4.3.4.3 Evolution 2: SAW project scenario
As mentioned before, the SAW demonstrator application was implemented for two various project targets. The second evolution step based on the first evolution step. So the CEBIT demonstrator was the starting point for SAW simulation project scenario. In other words: the simulator of the SAW project is an extension of the CEBIT demonstrator. There were several more strategies implemented to provide a higher number of possible test case scenarios to reach the goal of practise near production simulation which is a precondition for a reasonable data analysis for identifying best production solutions and optimization potentials. Simplified it can outlined that the CEBIT demonstrator was focused as presentation object to visualize simulation advantages for end-users. The SAW demonstrator aimed rather at researchers for providing an adequate tool for test scenario simulation with sensible data analysis of production parameter settings and their consequences on the overall system performance like machine utilization or finishing rates of requested goods during a certain shift as basis for process decisions and optimization. First test runs to simulate scenarios could be done soon after the CEBIT because the were just a few modifications like adding further, more complicated but closer to real world production strategies to be implemented. These added scheduling strategies were “First Come First Serve (FCFS)”, “Critical Ratio (CR)”, “Earliest Due Date (EDD)” and “Shortest Processing Time (SPT)” and are closer described in section 4.3.5. The SAW demonstrator can be used as research tool to study dynamic scheduling strategies with attention on parallel machine scheduling as described in the following citation out of the diploma thesis of Clemens Gondowidjaja.
“…It is used to study dynamic scheduling strategies with the attention on
parallel machine scheduling. This means that n tasks depending on
different constraints, like capacity, are accomplished on m machines. The
parallel arrangement of machines provides a better overall system
throughput and an alternative production flow if a machine failure occurs.
In contrast to the CEBIT project it is not implemented for an “end user”.
Therefore visualization, like the process status, is not a key factor. The
application is used to test the effects of different workflow scheduling
strategies and input parameters. Especially the simulation throughput and
-125-
the machine utilization are analysed. The input parameters differ from the
ones in the CEBIT project. The workload parameter is extended. It has a
set of 40 products where each product has a due date given in seconds.
To test the efficiency of the simulator a case study with 600 test cases is
done. The test cases are a composition of the different input parameters.
The results showed that the choice of the strategy has a significant impact
on the test rates.
Strategies can also be defined as dispatching rules, which means
sequencing the tasks that have to be done next. These rules are given in
the input parameters of the test cases. …” [B6]
This master thesis bases on the first phases of the SAW project focusing on the conceptual design of the SAW simulation system and the use of the simulator for business process flow and optimization. Currently the application is being extended by other students outlined as “further steps” in the closing chapter 6.2.
4.3.5 Work order scheduling strategies implemented in SAW project
The SAW demonstrator allows the simulation of various scenarios described by a number of defined input parameters to reproduce production processes with different workflow scheduling strategies and other different workload and production influencing parameters. This information to build up and execute the simulation process are included in the test cases which are handed over to the processing system in XML format by an user-interface (at the CEBIT demonstrator) or a formatted XML-file (at the SAW demonstrator). All these input parameters are described in section 5.1.2. The choice of the workflow scheduling strategy is the most important and influencing input parameter regarding the results of the simulation. The dispatcher who uses the simulator to find out the best production solution, can easily change this parameter in the simulator as well as (at least in most cases) in the real production world. Other changes for production influencing parameters require more or less changes for the production process flow or the units executing manufacturing steps (e.g. raise or limit production capacities or collective work agreements) as well as the consideration of external influences (e.g. competitors, mandatory legislations, economic situation)
A) CEBIT-demonstrator
A1) Simple First (SIFI)
This production scheduling strategy takes the complete workload package into consideration and sorts the products by their complexity. The production starts with the simplest product in the package and continues with the medium. The complex products get the lowest priority and will be produced as last items. A2) Complex First (COFI)
The COFI strategy works exactly the other way round as the SIFI strategy. They work both the same way but use inverted priority rating. The production starts with the most complex product in the workload package, continues with the products of medium complexity and gives the products with the lowest complexity the lowest priority.
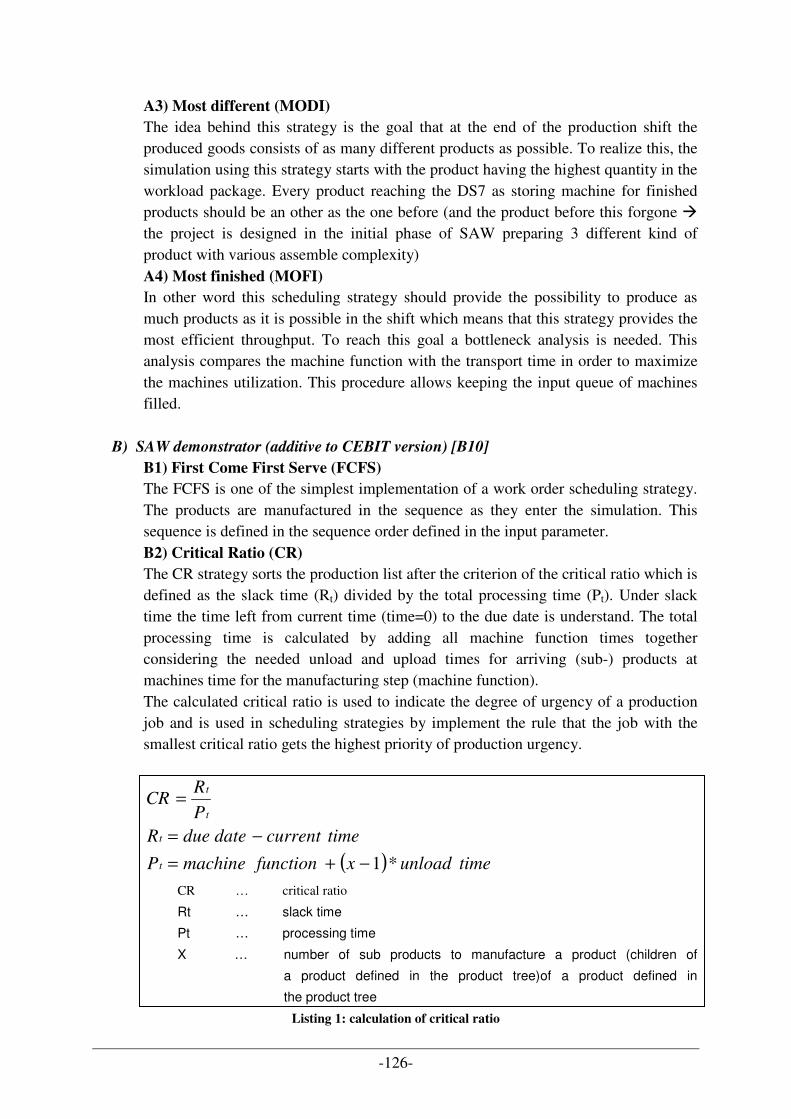
-126-
A3) Most different (MODI)
The idea behind this strategy is the goal that at the end of the production shift the produced goods consists of as many different products as possible. To realize this, the simulation using this strategy starts with the product having the highest quantity in the workload package. Every product reaching the DS7 as storing machine for finished products should be an other as the one before (and the product before this forgone � the project is designed in the initial phase of SAW preparing 3 different kind of product with various assemble complexity) A4) Most finished (MOFI)
In other word this scheduling strategy should provide the possibility to produce as much products as it is possible in the shift which means that this strategy provides the most efficient throughput. To reach this goal a bottleneck analysis is needed. This analysis compares the machine function with the transport time in order to maximize the machines utilization. This procedure allows keeping the input queue of machines filled.
B) SAW demonstrator (additive to CEBIT version) [B10]
B1) First Come First Serve (FCFS)
The FCFS is one of the simplest implementation of a work order scheduling strategy. The products are manufactured in the sequence as they enter the simulation. This sequence is defined in the sequence order defined in the input parameter. B2) Critical Ratio (CR)
The CR strategy sorts the production list after the criterion of the critical ratio which is defined as the slack time (Rt) divided by the total processing time (Pt). Under slack time the time left from current time (time=0) to the due date is understand. The total processing time is calculated by adding all machine function times together considering the needed unload and upload times for arriving (sub-) products at machines time for the manufacturing step (machine function). The calculated critical ratio is used to indicate the degree of urgency of a production job and is used in scheduling strategies by implement the rule that the job with the smallest critical ratio gets the highest priority of production urgency.
( ) timeunloadxfunctionmachineP
timecurrentdatedueR
P
RCR
t
t
t
t
*1−+=
−=
=
CR … critical ratio
Rt … slack time
Pt … processing time
X … number of sub products to manufacture a product (children of
a product defined in the product tree)of a product defined in
the product tree
Listing 1: calculation of critical ratio
-127-
B3) Earliest Due Date (EDD)
The EDD scheduling strategy is a rather simple algorithm to sort the list of products to be manufactured on a single criterion. This criterion is the due date of each product of the order. The due date represents the time when the production should be finished at the latest. Sorting them in an adequate way important productions are manufactured earlier then those where the time horizon for finishing is longer. B4) Shortest Processing Time (SPT)
This scheduling strategy arranges the production product list on taking the processing time of the products into consideration. The processing time of a product is the sum of all machine functions needed to produce a single product of each different variations of available products. Therefore the processing time of all products within an order are calculated and build the criterion to sort the production list. The product with the shortest processing time is produced first. The productions of goods with the longest processing time are simulated as last.
A further more precise description of the implemented scheduling strategies and used calculation algorithms can be found in the diploma thesis of Clemens Gondowidjaja [B6].
4.3.6 Summary
Chapter (4) contains the mayor works during the SAW project. It illustrates all done task to reach the goal to design and implement a suitable simulator for production automation systems. In a first step the practical part focuses on the handling of incoming orders to inherit them into the production system and simulate possible assemble strategies. The use case identification and transformation into a practicable order management process solution was one of the major contributions of my working part in the SAW project and my diploma thesis elaboration. After this, the section provides a description about design steps for the MAST system in the project variations of the CEBIT and the SAW demonstrator together with the used approaches and technologies. The MAST system where on the implementation of the software simulator for the SAW project bases on, was developed by Pavel Vrba [B22] and provided by Rockwell Automation System, Prague. The production process cycle which should be improved using the developed SAW demonstrator to simulate assemble line productions with different manufacturing strategies, was created by myself. Necessary software system design decision where done in cooperation of the SAW project team members Clemens Gondowidjaja, Klemens Kunz and Uwe Szabo in assistance of Thomas Moser, Dindin Wahyudin and Stefan Biffl. The data model design for the necessary knowledge base of the simulator as well as the creation and implementation of the ontology was again done by me in assistance of Clemens Gondowidjaja. This was helpful to prevent problems of data inconsistency and interface implementation and guarantee the compatibility of the data information stored in the ontology with the software application
-128-
(5) Discussion of results
This section gives an overview of the SAW project results by discussing concrete results and taking conclusions out of test runs of the designed and implemented production automation system simulator. The result discussion part of the thesis acts as necessary logical sequel to interpret the output of the calculated simulation results and presents these results regarding to the research issues introduced in section (3). It describes the evaluation methods of the SAW demonstrator by using the designed test management system. The core elements are a number of various simulation runs with different input parameters to find a nearly optimal production configuration for the real world manufacturing units, which has to be achieved by interpreting the simulation output results. A summary of the optimization potentials and the experiences during the development process with the UML and ontology process completes the results discussion of the project and the main part of the diploma thesis.
5.1 Evaluation of the SAW demonstrator
An important step in all software system development projects is the evaluation of the designed and implemented application. This is necessary to make sure that the program reaches the goals set in early phases of the project. The same careful look is needed regarding the SAW demonstrator. It is part of the project itself to analyse the output and calculated results of the simulation, as well as to ensure that the application works correct. The output and the interpretation of the results is important as base for comparison to be able to find a suitable production plan and of course to optimize processes. Therefore the SAW project team added a Test Management System to evaluate the results of the simulation. It gives the possibility to investigate the used input parameters of various scenarios for production optimization to verify an optimal production sequence for facility entities in the real world. These optimization potentials could also cover the possibility to rearrange production units on the real manufacturing plant if the simulation results attest a better production result. Of course, these changes must be well planned because of big change efforts and capital investment which are only useful and manageable if the needed resources and space is available.
5.1.1 SAW Test Management System (SAW TMS)
The Test Management System (TMS) of the SAW demonstrator was designed and implemented for reading test cases out of a test case file in XML format. It is in charge of forwarding the test cases to the work order scheduling system and for the measurement and representation of the simulation results. To fulfil this aspects it consists of the following four parts (see Figure 55):
a) Test Case Creation b) Logging/Measurement c) Test Data Analysis d) Result GUI
-129-
These elements of the SAW demonstrator system building up the TMS are described more detailed in the following paragraphs. a) Test Case Creation
All needed information to represent an incoming order is defined in files using XML syntax. The contained data is interpreted by an interface which extracts all relevant input parameters. These parameters set the simulation into a defined state ready to execute the defined simulation run. For running a test suite containing a number of test cases, the SAW demonstrator is reset into a starting state, the XML file with the parameter setting information is parsed and the test cases are consecutively injected into the agent-based simulation and control system. All parameters represent various production circumstances and several constraints of the manufacturing unit, except the workload package (see 5.1.2.2). The workload package represents the order containing the products and their quantity which are requested to produce on the assemble line. It is forwarded to the work order scheduling system where the manufacturing takes place.
b) Logging/Measurement The result of the simulation actions and calculations has to be recorded. Therefore the TMS of the SAW demonstrator logs different events and states that occur during a simulation run. A defined scoring system defining more or less important situations or results of the simulation measurement allows comparisons of the results. Another advantage of logging is the possibility to reproduce a certain simulation state when an unexpected failure occurred and stopped the simulation run.
c) Test Data Analysis All test data calculated in the simulation has to be analysed. This is important to compare different results for evaluation of the best production configuration setting. The interpretation of the result is of course important for identification of optimization potentials by creating knowledge of how different input parameter setting affects the simulation results. Algorithms are implemented to extract significant information and data volumes which are important for the person who gets the results presented and is in charge of their interpretation.
d) Result GUI The presentation of the simulation result is important for the user. The result GUI shows the information available on the calculated results of the test data analysis in an easy understandable and possible self-explanatory way. The decision to find out the best production configuration is a process of comparing simulation run results. A defined scoring system and ranking mechanism is implemented to show the current test result compared to other simulation run results and allows a comprehendible evaluation.
5.1.2 Simulation input parameters
The following sections represent all needed data and information to simulate a particular production process on the multi agent simulation system of the SAW project. The introduced ontology (see chapter 4.3.3.3) is prepared to store all these information in adequate layers.
5.1.2.1 General defined data for production simulation
The simulator of the SAW project uses data to build up the simulation which do not change. This general information is predefined by the system developer in this project state. In further works the simulator could also be adapted to make this input creation or change suitable for common users. In most of the cases this would effect data on lower levels of the layer concept
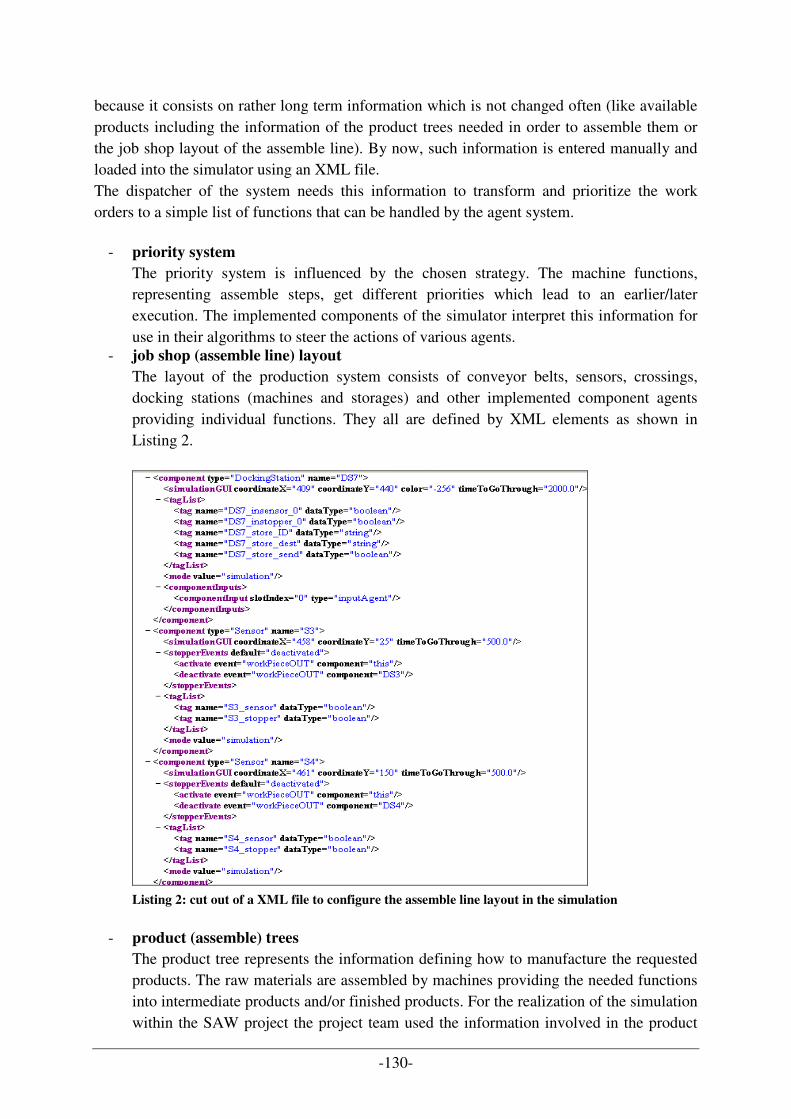
-130-
because it consists on rather long term information which is not changed often (like available products including the information of the product trees needed in order to assemble them or the job shop layout of the assemble line). By now, such information is entered manually and loaded into the simulator using an XML file. The dispatcher of the system needs this information to transform and prioritize the work orders to a simple list of functions that can be handled by the agent system.
- priority system
The priority system is influenced by the chosen strategy. The machine functions, representing assemble steps, get different priorities which lead to an earlier/later execution. The implemented components of the simulator interpret this information for use in their algorithms to steer the actions of various agents.
- job shop (assemble line) layout
The layout of the production system consists of conveyor belts, sensors, crossings, docking stations (machines and storages) and other implemented component agents providing individual functions. They all are defined by XML elements as shown in Listing 2.
Listing 2: cut out of a XML file to configure the assemble line layout in the simulation
- product (assemble) trees
The product tree represents the information defining how to manufacture the requested products. The raw materials are assembled by machines providing the needed functions into intermediate products and/or finished products. For the realization of the simulation within the SAW project the project team used the information involved in the product

-131-
trees. The product tree provides the information to create the sequence to produce a simple/medium/high complexity product by using the correct order of transport and machine functions. Of course, this solution to provide the correct assemble sequence for the simulation, for a limited number of products for early phases of the SAW projects, is just one possibility. More generally all kinds of combinations of products are possible in other information representation are possible. Table 26 shows the three defined products called “billy00x”. They all have different complexity levels (“billy001” = medium complexity / “billy002” = high complexity / “billy003” = simple complexity). Table 26, Table 27 and Table 28 represent a visualized version implemented product trees which are used to find out and plan a sequence to assemble the product in the simulation. Furthermore these tables show the notation of the xml files defining these products. Table 29 acts as legend to elucidate the symbols on the product trees and explain the functions of different xml element notations.
product tree xml notation
Table 26: visualization of defined “Billy001” product (medium complexity) in the SAW project
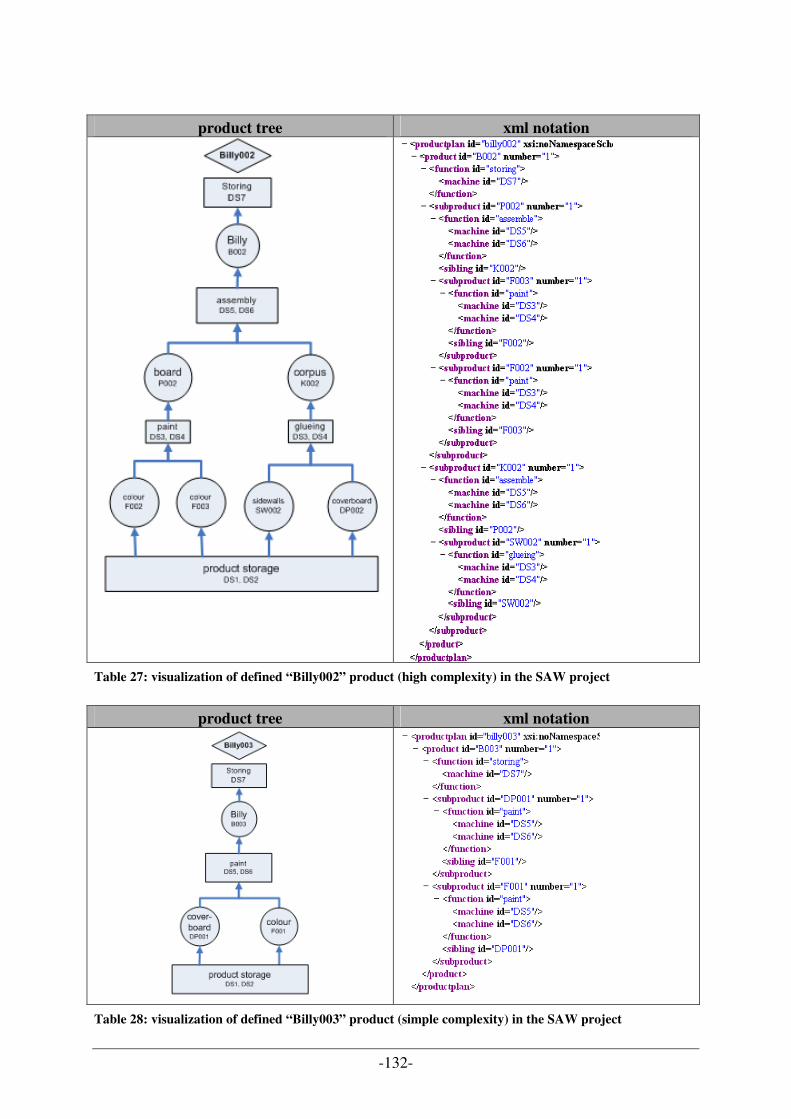
-132-
product tree xml notation
Table 27: visualization of defined “Billy002” product (high complexity) in the SAW project
product tree xml notation
Table 28: visualization of defined “Billy003” product (simple complexity) in the SAW project
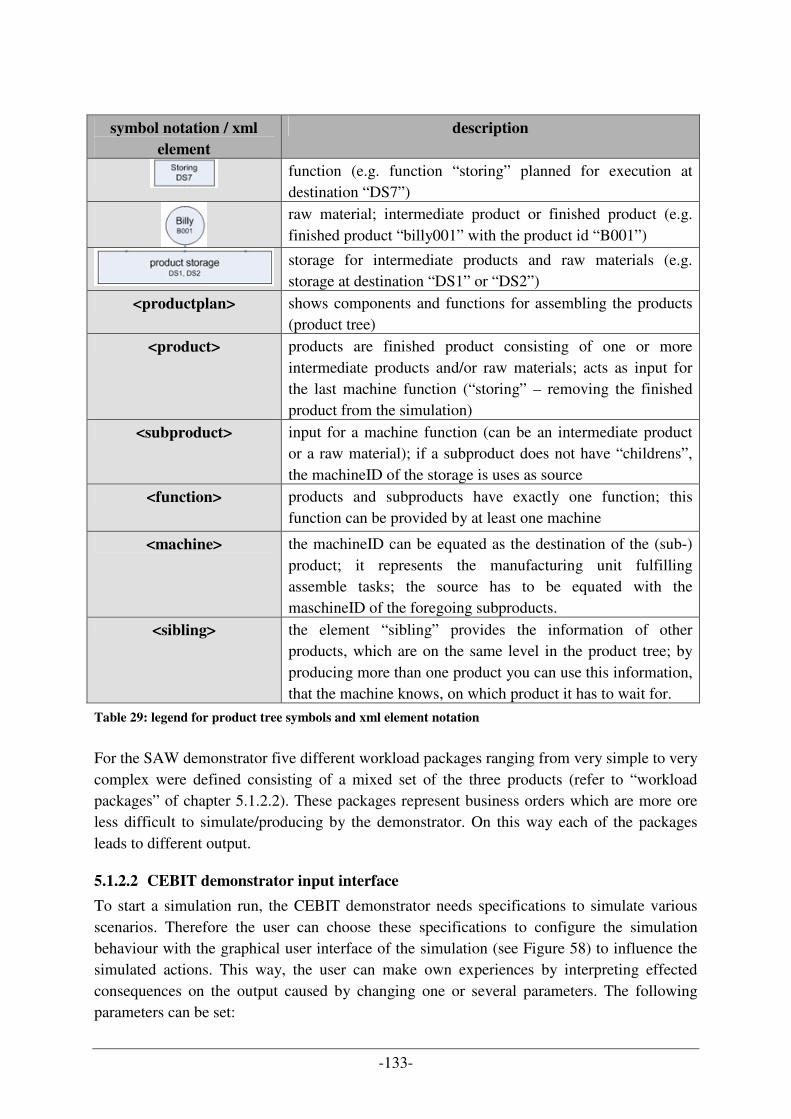
-133-
symbol notation / xml
element
description
function (e.g. function “storing” planned for execution at destination “DS7”)
raw material; intermediate product or finished product (e.g. finished product “billy001” with the product id “B001”)
storage for intermediate products and raw materials (e.g. storage at destination “DS1” or “DS2”)
<productplan> shows components and functions for assembling the products (product tree)
<product> products are finished product consisting of one or more intermediate products and/or raw materials; acts as input for the last machine function (“storing” – removing the finished product from the simulation)
<subproduct> input for a machine function (can be an intermediate product or a raw material); if a subproduct does not have “childrens”, the machineID of the storage is uses as source
<function> products and subproducts have exactly one function; this function can be provided by at least one machine
<machine> the machineID can be equated as the destination of the (sub-) product; it represents the manufacturing unit fulfilling assemble tasks; the source has to be equated with the maschineID of the foregoing subproducts.
<sibling> the element “sibling” provides the information of other products, which are on the same level in the product tree; by producing more than one product you can use this information, that the machine knows, on which product it has to wait for.
Table 29: legend for product tree symbols and xml element notation
For the SAW demonstrator five different workload packages ranging from very simple to very complex were defined consisting of a mixed set of the three products (refer to “workload packages” of chapter 5.1.2.2). These packages represent business orders which are more ore less difficult to simulate/producing by the demonstrator. On this way each of the packages leads to different output.
5.1.2.2 CEBIT demonstrator input interface
To start a simulation run, the CEBIT demonstrator needs specifications to simulate various scenarios. Therefore the user can choose these specifications to configure the simulation behaviour with the graphical user interface of the simulation (see Figure 58) to influence the simulated actions. This way, the user can make own experiences by interpreting effected consequences on the output caused by changing one or several parameters. The following parameters can be set:
-134-
- workload package represents a (business) work order consisting of a predefined mixed set of products with various level of complexities ranging from very simple to very complex (very low, low, moderate, high, very high � mixture of quantities of simple, medium or complex products) to create a list of products to be produced; the workload package also includes product type and due dates for all products
- workflow scheduling (assemble) strategy defines the behaviour of the simulation by considering the strategy influencing the sequence of working steps to assemble a product; different strategies have effects on the priority of functions to be fulfilled next by the machines on the assembly line to follow the desire of the dispatcher
- transport regulates the speed of the conveyor belts in the simulated assemble line and the available pallets to fulfil transport steps on the conveyors
- inventory allows the dispatcher to use some predefined (intermediate and/or finished) products out of an inventory which were manufactured in earlier shifts
- shift duration of a shift representing the time when simulation run will be stopped – even all of the ordered products are finished or not
5.1.2.3 SAW project XML input file
Instead of the information out of the user interface as used for the CEBIT demonstrator, the final SAW project uses XML files preparing to extract all necessary data to automatically simulate a large number of test cases within one test suite. These test cases are generated to verify and describe only one simplified production scenario defined by several input parameter. The following paragraph specifies the verification of the first scenario chosen for early design and implementation as well as evaluation phase of the SAW project. Using the designed Test Management System (TMS) of the SAW project a total number of 600 test cases were generated. These test cases are especially created for the test requirements to verify the functionality and usability of the SAW project simulator to reproduce assemble strategy behaviour on a production unit created by a multi agent system. The parameters where sensible chosen in a limited way to describe only simplified production scenarios. Further enhancement of the SAW project simulator (as described in 6.2) auf allows further example scenarios for behaviour simulation to identify real production process optimization potentials. Each test case consist of a mixture of all possible variants to arrange the needed values of the xml elements: a workflow scheduling strategy (FCFS, CR, EDD, SPT), a certain number of pallets on the simulation (5, 10, 15 or 20) and a workload of 40 orders. Such an order consists of a product type which has to be manufactured and a randomly generated due date in seconds. To simplify the simulation process only tree products (see “product trees” in chapter 5.1.2.1) with different complexity (various number of sub products (raw material or intermediate product) and machine functions needed to assemble the product) were predefined. The duration of the simulation run is defined by the shift time which was set to 10 minutes (600 second) for each test case. The reason why the shift time was chosen with 10 minutes was to ensure that all 40 orders in each test case can be surely fulfilled. The simulator parses the information for the input parameters out of an XML file where the data are hold as attributes of the xml elements as shown in Listing 3. An interface reads and saves them into
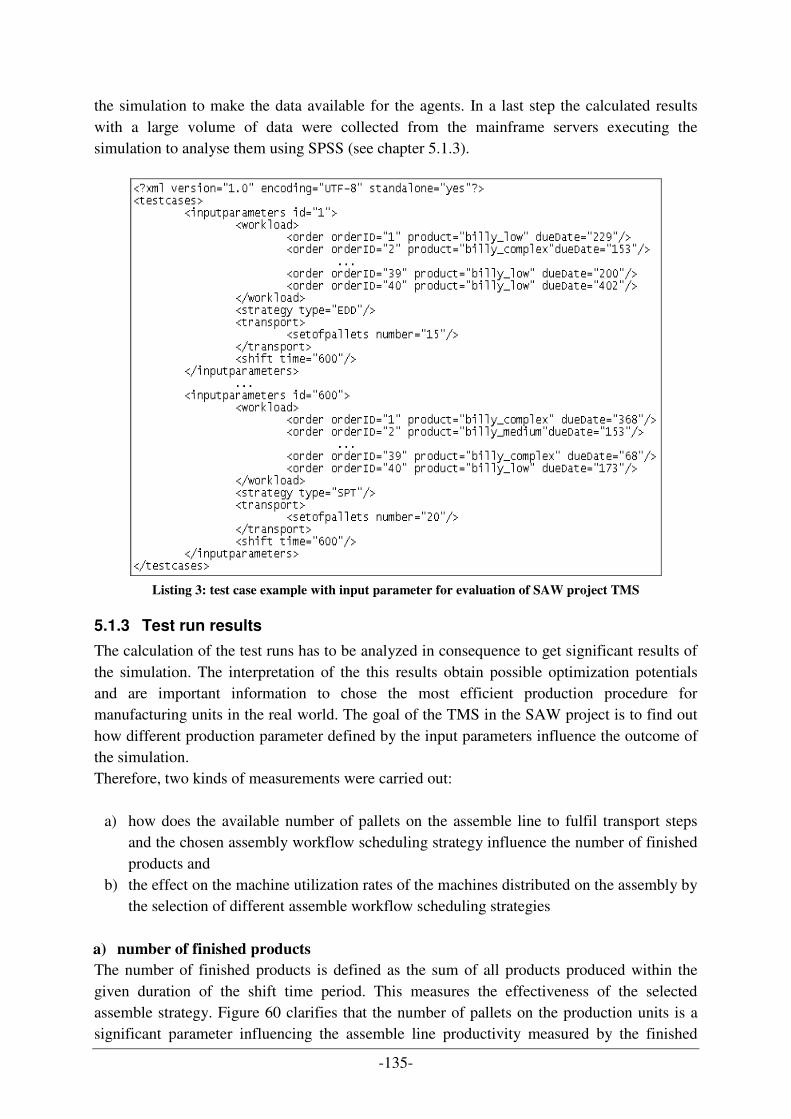
-135-
the simulation to make the data available for the agents. In a last step the calculated results with a large volume of data were collected from the mainframe servers executing the simulation to analyse them using SPSS (see chapter 5.1.3).
Listing 3: test case example with input parameter for evaluation of SAW project TMS
5.1.3 Test run results
The calculation of the test runs has to be analyzed in consequence to get significant results of the simulation. The interpretation of the this results obtain possible optimization potentials and are important information to chose the most efficient production procedure for manufacturing units in the real world. The goal of the TMS in the SAW project is to find out how different production parameter defined by the input parameters influence the outcome of the simulation. Therefore, two kinds of measurements were carried out:
a) how does the available number of pallets on the assemble line to fulfil transport steps and the chosen assembly workflow scheduling strategy influence the number of finished products and
b) the effect on the machine utilization rates of the machines distributed on the assembly by the selection of different assemble workflow scheduling strategies
a) number of finished products
The number of finished products is defined as the sum of all products produced within the given duration of the shift time period. This measures the effectiveness of the selected assemble strategy. Figure 60 clarifies that the number of pallets on the production units is a significant parameter influencing the assemble line productivity measured by the finished
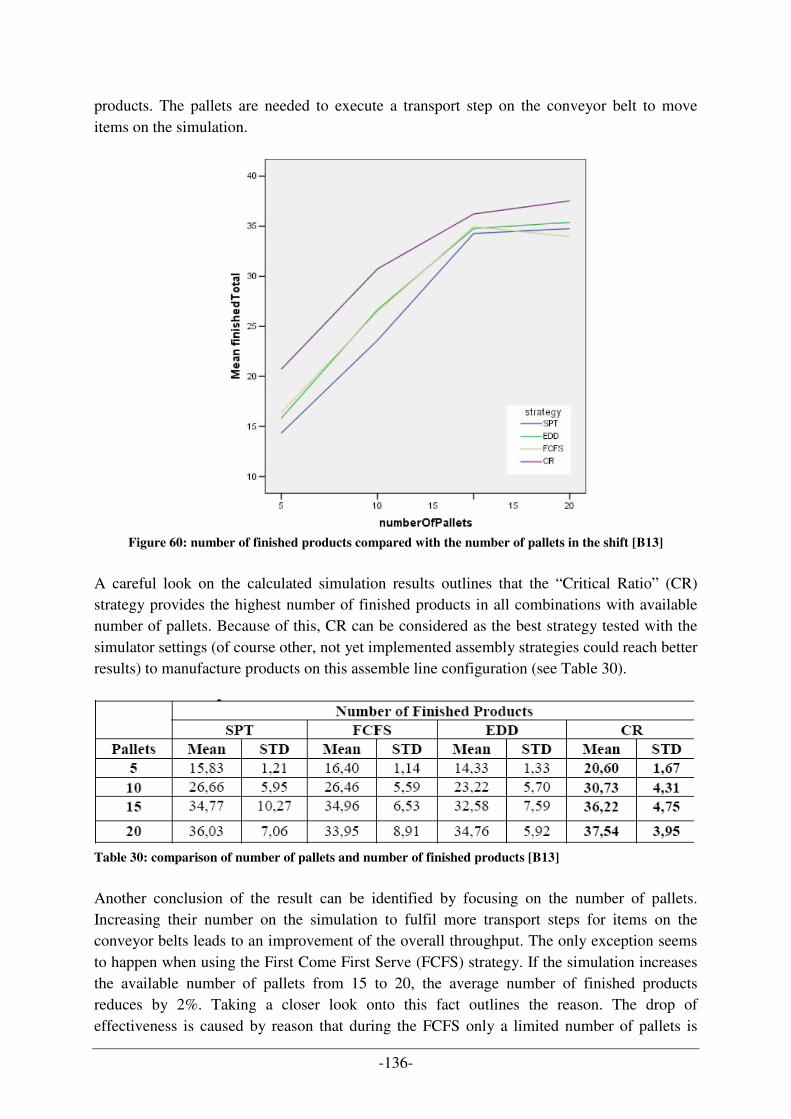
-136-
products. The pallets are needed to execute a transport step on the conveyor belt to move items on the simulation.
Figure 60: number of finished products compared with the number of pallets in the shift [B13]
A careful look on the calculated simulation results outlines that the “Critical Ratio” (CR) strategy provides the highest number of finished products in all combinations with available number of pallets. Because of this, CR can be considered as the best strategy tested with the simulator settings (of course other, not yet implemented assembly strategies could reach better results) to manufacture products on this assemble line configuration (see Table 30).
Table 30: comparison of number of pallets and number of finished products [B13]
Another conclusion of the result can be identified by focusing on the number of pallets. Increasing their number on the simulation to fulfil more transport steps for items on the conveyor belts leads to an improvement of the overall throughput. The only exception seems to happen when using the First Come First Serve (FCFS) strategy. If the simulation increases the available number of pallets from 15 to 20, the average number of finished products reduces by 2%. Taking a closer look onto this fact outlines the reason. The drop of effectiveness is caused by reason that during the FCFS only a limited number of pallets is
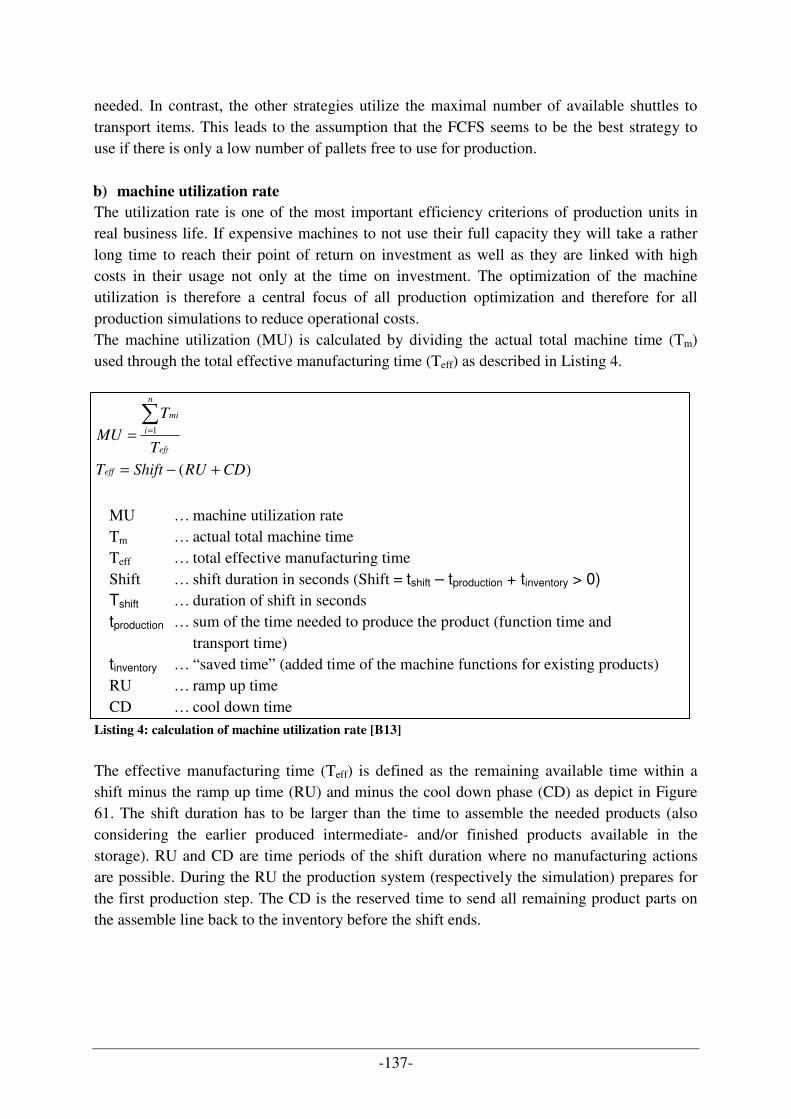
-137-
needed. In contrast, the other strategies utilize the maximal number of available shuttles to transport items. This leads to the assumption that the FCFS seems to be the best strategy to use if there is only a low number of pallets free to use for production. b) machine utilization rate
The utilization rate is one of the most important efficiency criterions of production units in real business life. If expensive machines to not use their full capacity they will take a rather long time to reach their point of return on investment as well as they are linked with high costs in their usage not only at the time on investment. The optimization of the machine utilization is therefore a central focus of all production optimization and therefore for all production simulations to reduce operational costs. The machine utilization (MU) is calculated by dividing the actual total machine time (Tm) used through the total effective manufacturing time (Teff) as described in Listing 4.
)(
1
CDRUShiftT
T
T
MU
eff
ef
n
i
mi
f
+−=
=
∑=
MU … machine utilization rate Tm … actual total machine time Teff … total effective manufacturing time Shift … shift duration in seconds (Shift = tshift – tproduction + tinventory > 0) Tshift … duration of shift in seconds
tproduction … sum of the time needed to produce the product (function time and transport time)
tinventory … “saved time” (added time of the machine functions for existing products) RU … ramp up time CD … cool down time
Listing 4: calculation of machine utilization rate [B13]
The effective manufacturing time (Teff) is defined as the remaining available time within a shift minus the ramp up time (RU) and minus the cool down phase (CD) as depict in Figure 61. The shift duration has to be larger than the time to assemble the needed products (also considering the earlier produced intermediate- and/or finished products available in the storage). RU and CD are time periods of the shift duration where no manufacturing actions are possible. During the RU the production system (respectively the simulation) prepares for the first production step. The CD is the reserved time to send all remaining product parts on the assemble line back to the inventory before the shift ends.
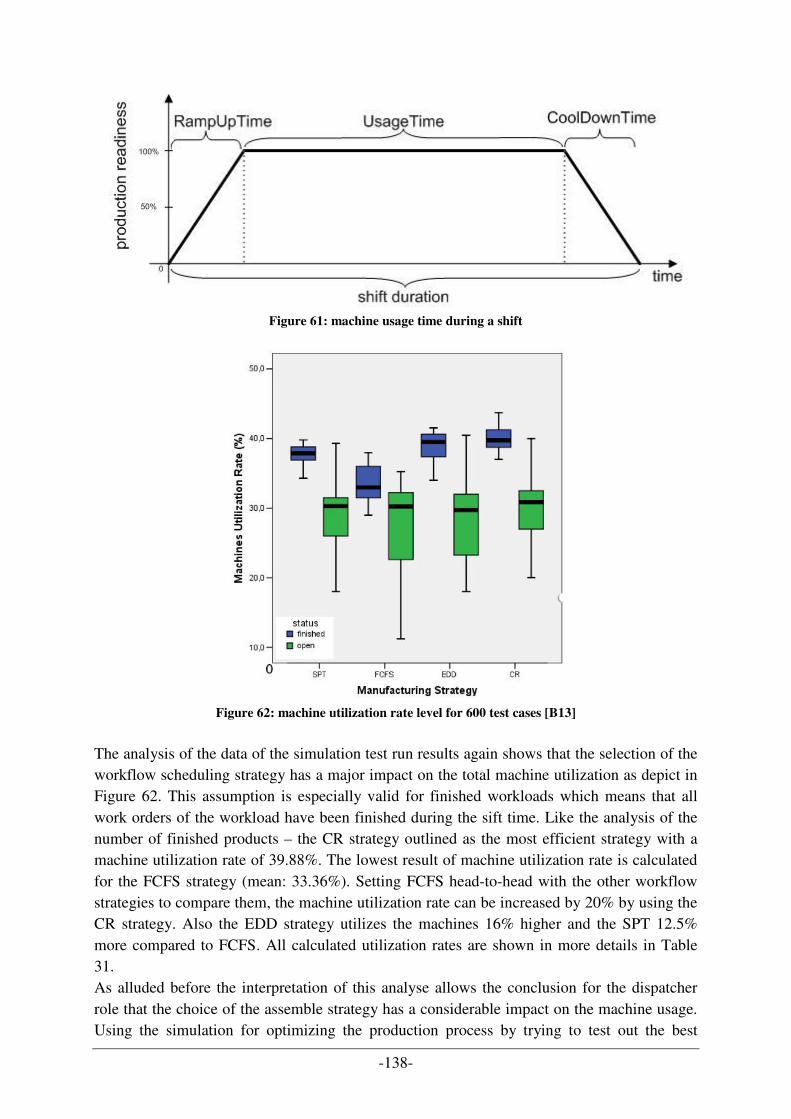
-138-
Figure 61: machine usage time during a shift
Figure 62: machine utilization rate level for 600 test cases [B13]
The analysis of the data of the simulation test run results again shows that the selection of the workflow scheduling strategy has a major impact on the total machine utilization as depict in Figure 62. This assumption is especially valid for finished workloads which means that all work orders of the workload have been finished during the sift time. Like the analysis of the number of finished products – the CR strategy outlined as the most efficient strategy with a machine utilization rate of 39.88%. The lowest result of machine utilization rate is calculated for the FCFS strategy (mean: 33.36%). Setting FCFS head-to-head with the other workflow strategies to compare them, the machine utilization rate can be increased by 20% by using the CR strategy. Also the EDD strategy utilizes the machines 16% higher and the SPT 12.5% more compared to FCFS. All calculated utilization rates are shown in more details in Table 31. As alluded before the interpretation of this analyse allows the conclusion for the dispatcher role that the choice of the assemble strategy has a considerable impact on the machine usage. Using the simulation for optimizing the production process by trying to test out the best
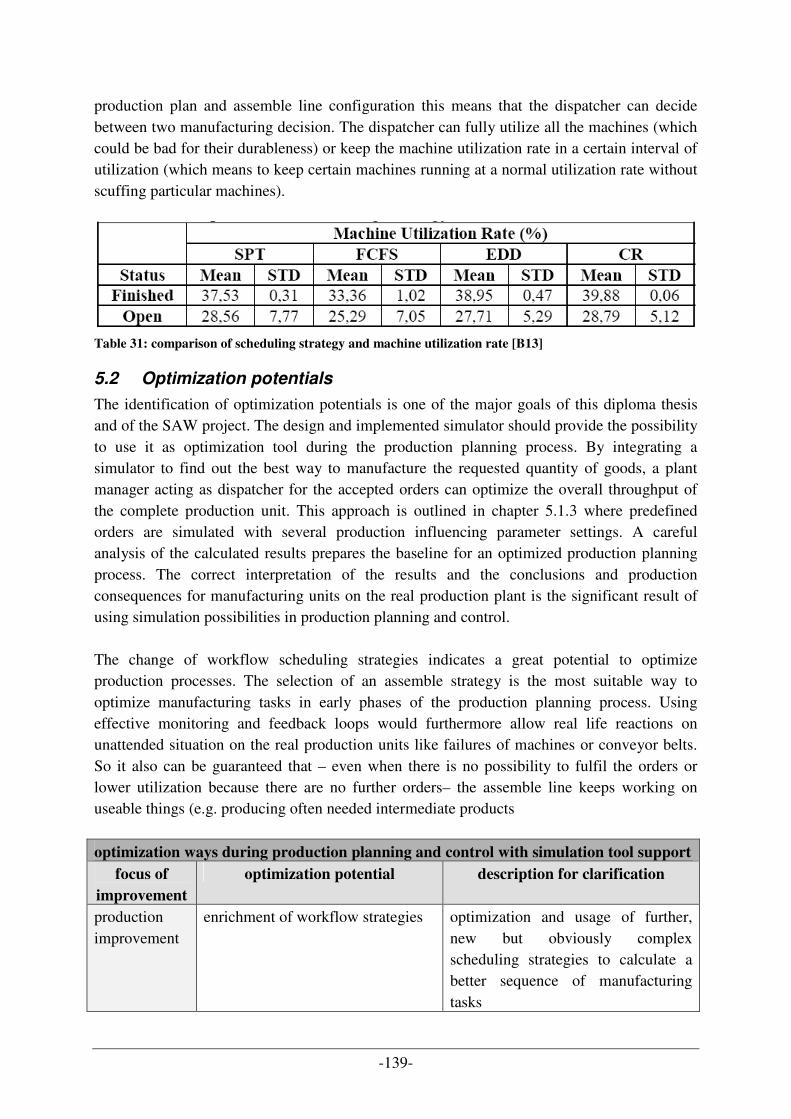
-139-
production plan and assemble line configuration this means that the dispatcher can decide between two manufacturing decision. The dispatcher can fully utilize all the machines (which could be bad for their durableness) or keep the machine utilization rate in a certain interval of utilization (which means to keep certain machines running at a normal utilization rate without scuffing particular machines).
Table 31: comparison of scheduling strategy and machine utilization rate [B13]
5.2 Optimization potentials
The identification of optimization potentials is one of the major goals of this diploma thesis and of the SAW project. The design and implemented simulator should provide the possibility to use it as optimization tool during the production planning process. By integrating a simulator to find out the best way to manufacture the requested quantity of goods, a plant manager acting as dispatcher for the accepted orders can optimize the overall throughput of the complete production unit. This approach is outlined in chapter 5.1.3 where predefined orders are simulated with several production influencing parameter settings. A careful analysis of the calculated results prepares the baseline for an optimized production planning process. The correct interpretation of the results and the conclusions and production consequences for manufacturing units on the real production plant is the significant result of using simulation possibilities in production planning and control. The change of workflow scheduling strategies indicates a great potential to optimize production processes. The selection of an assemble strategy is the most suitable way to optimize manufacturing tasks in early phases of the production planning process. Using effective monitoring and feedback loops would furthermore allow real life reactions on unattended situation on the real production units like failures of machines or conveyor belts. So it also can be guaranteed that – even when there is no possibility to fulfil the orders or lower utilization because there are no further orders– the assemble line keeps working on useable things (e.g. producing often needed intermediate products
optimization ways during production planning and control with simulation tool support
focus of
improvement
optimization potential description for clarification
production improvement
enrichment of workflow strategies optimization and usage of further, new but obviously complex scheduling strategies to calculate a better sequence of manufacturing tasks
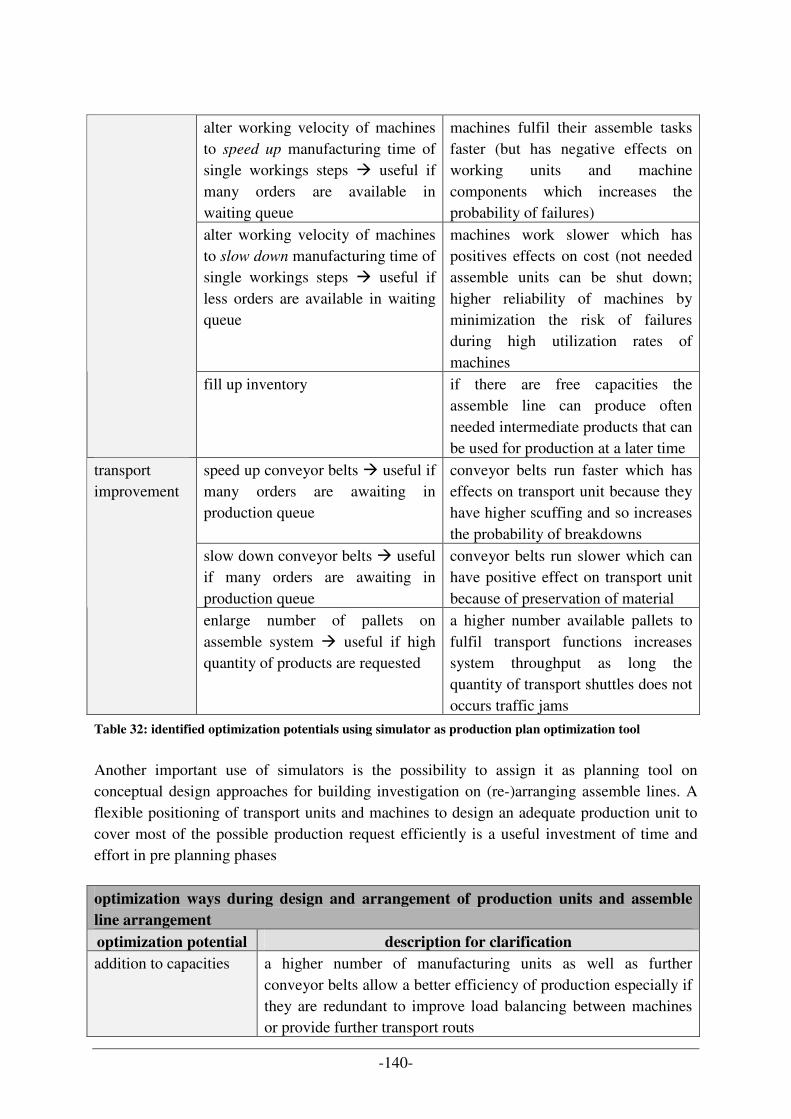
-140-
alter working velocity of machines to speed up manufacturing time of single workings steps � useful if many orders are available in waiting queue
machines fulfil their assemble tasks faster (but has negative effects on working units and machine components which increases the probability of failures)
alter working velocity of machines to slow down manufacturing time of single workings steps � useful if less orders are available in waiting queue
machines work slower which has positives effects on cost (not needed assemble units can be shut down; higher reliability of machines by minimization the risk of failures during high utilization rates of machines
fill up inventory if there are free capacities the assemble line can produce often needed intermediate products that can be used for production at a later time
speed up conveyor belts � useful if many orders are awaiting in production queue
conveyor belts run faster which has effects on transport unit because they have higher scuffing and so increases the probability of breakdowns
slow down conveyor belts � useful if many orders are awaiting in production queue
conveyor belts run slower which can have positive effect on transport unit because of preservation of material
transport improvement
enlarge number of pallets on assemble system � useful if high quantity of products are requested
a higher number available pallets to fulfil transport functions increases system throughput as long the quantity of transport shuttles does not occurs traffic jams
Table 32: identified optimization potentials using simulator as production plan optimization tool
Another important use of simulators is the possibility to assign it as planning tool on conceptual design approaches for building investigation on (re-)arranging assemble lines. A flexible positioning of transport units and machines to design an adequate production unit to cover most of the possible production request efficiently is a useful investment of time and effort in pre planning phases
optimization ways during design and arrangement of production units and assemble
line arrangement
optimization potential description for clarification addition to capacities a higher number of manufacturing units as well as further
conveyor belts allow a better efficiency of production especially if they are redundant to improve load balancing between machines or provide further transport routs
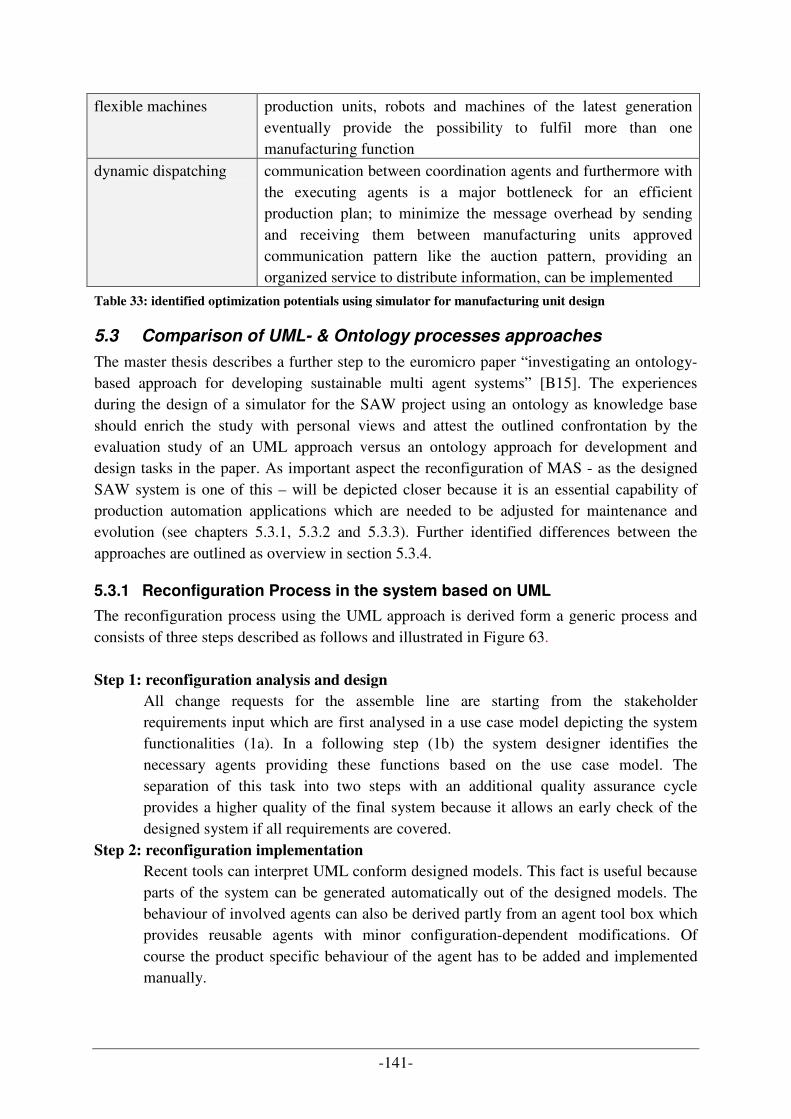
-141-
flexible machines production units, robots and machines of the latest generation eventually provide the possibility to fulfil more than one manufacturing function
dynamic dispatching communication between coordination agents and furthermore with the executing agents is a major bottleneck for an efficient production plan; to minimize the message overhead by sending and receiving them between manufacturing units approved communication pattern like the auction pattern, providing an organized service to distribute information, can be implemented
Table 33: identified optimization potentials using simulator for manufacturing unit design
5.3 Comparison of UML- & Ontology processes approaches
The master thesis describes a further step to the euromicro paper “investigating an ontology-based approach for developing sustainable multi agent systems” [B15]. The experiences during the design of a simulator for the SAW project using an ontology as knowledge base should enrich the study with personal views and attest the outlined confrontation by the evaluation study of an UML approach versus an ontology approach for development and design tasks in the paper. As important aspect the reconfiguration of MAS - as the designed SAW system is one of this – will be depicted closer because it is an essential capability of production automation applications which are needed to be adjusted for maintenance and evolution (see chapters 5.3.1, 5.3.2 and 5.3.3). Further identified differences between the approaches are outlined as overview in section 5.3.4.
5.3.1 Reconfiguration Process in the system based on UML
The reconfiguration process using the UML approach is derived form a generic process and consists of three steps described as follows and illustrated in Figure 63. Step 1: reconfiguration analysis and design
All change requests for the assemble line are starting from the stakeholder requirements input which are first analysed in a use case model depicting the system functionalities (1a). In a following step (1b) the system designer identifies the necessary agents providing these functions based on the use case model. The separation of this task into two steps with an additional quality assurance cycle provides a higher quality of the final system because it allows an early check of the designed system if all requirements are covered.
Step 2: reconfiguration implementation
Recent tools can interpret UML conform designed models. This fact is useful because parts of the system can be generated automatically out of the designed models. The behaviour of involved agents can also be derived partly from an agent tool box which provides reusable agents with minor configuration-dependent modifications. Of course the product specific behaviour of the agent has to be added and implemented manually.
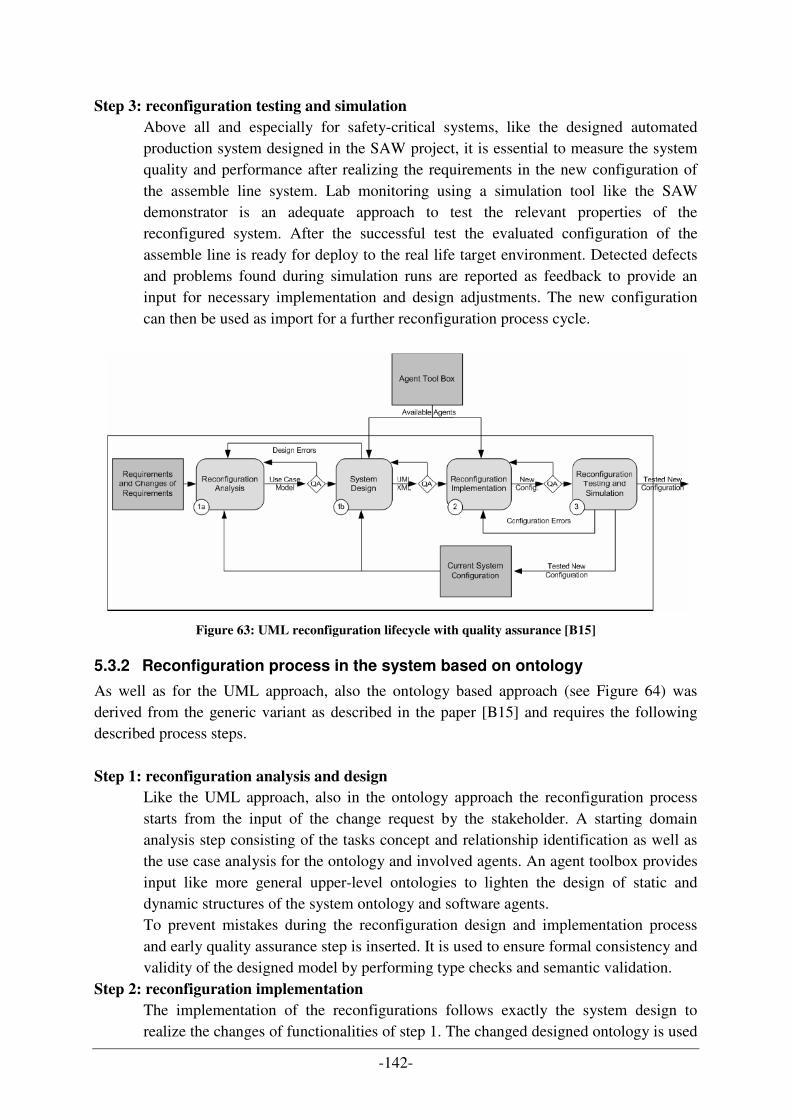
-142-
Step 3: reconfiguration testing and simulation
Above all and especially for safety-critical systems, like the designed automated production system designed in the SAW project, it is essential to measure the system quality and performance after realizing the requirements in the new configuration of the assemble line system. Lab monitoring using a simulation tool like the SAW demonstrator is an adequate approach to test the relevant properties of the reconfigured system. After the successful test the evaluated configuration of the assemble line is ready for deploy to the real life target environment. Detected defects and problems found during simulation runs are reported as feedback to provide an input for necessary implementation and design adjustments. The new configuration can then be used as import for a further reconfiguration process cycle.
Figure 63: UML reconfiguration lifecycle with quality assurance [B15]
5.3.2 Reconfiguration process in the system based on ontology
As well as for the UML approach, also the ontology based approach (see Figure 64) was derived from the generic variant as described in the paper [B15] and requires the following described process steps. Step 1: reconfiguration analysis and design
Like the UML approach, also in the ontology approach the reconfiguration process starts from the input of the change request by the stakeholder. A starting domain analysis step consisting of the tasks concept and relationship identification as well as the use case analysis for the ontology and involved agents. An agent toolbox provides input like more general upper-level ontologies to lighten the design of static and dynamic structures of the system ontology and software agents. To prevent mistakes during the reconfiguration design and implementation process and early quality assurance step is inserted. It is used to ensure formal consistency and validity of the designed model by performing type checks and semantic validation.
Step 2: reconfiguration implementation
The implementation of the reconfigurations follows exactly the system design to realize the changes of functionalities of step 1. The changed designed ontology is used
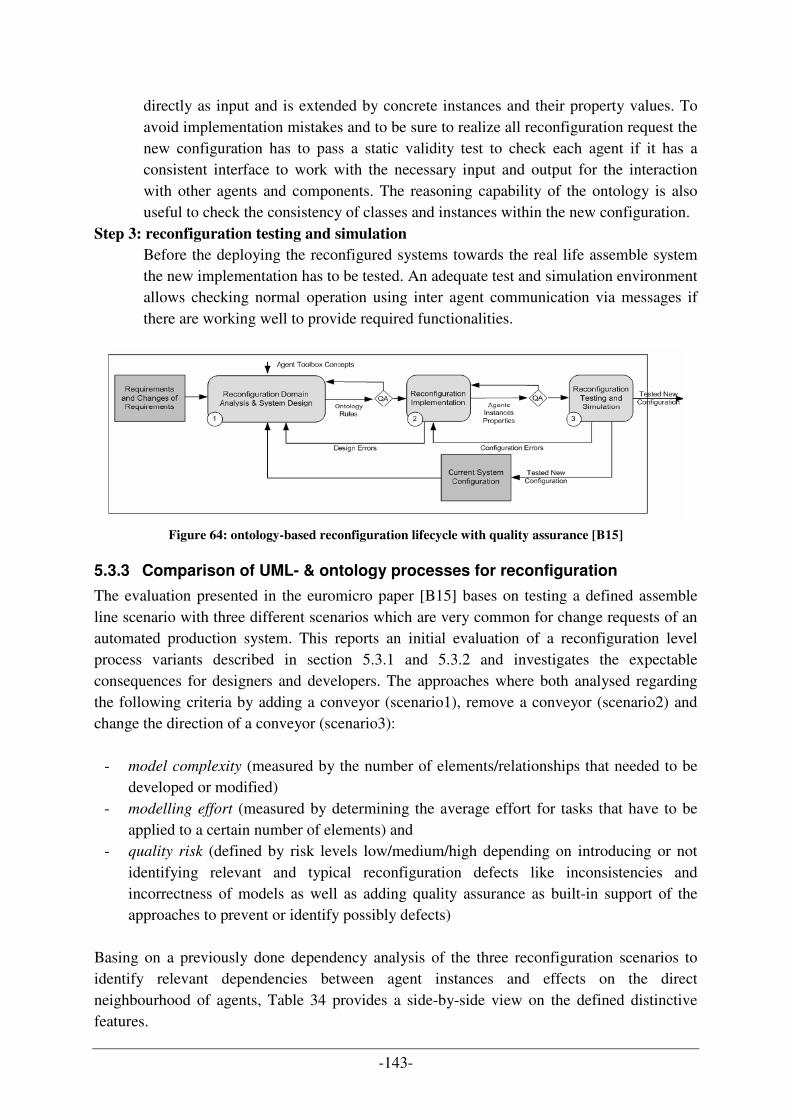
-143-
directly as input and is extended by concrete instances and their property values. To avoid implementation mistakes and to be sure to realize all reconfiguration request the new configuration has to pass a static validity test to check each agent if it has a consistent interface to work with the necessary input and output for the interaction with other agents and components. The reasoning capability of the ontology is also useful to check the consistency of classes and instances within the new configuration.
Step 3: reconfiguration testing and simulation
Before the deploying the reconfigured systems towards the real life assemble system the new implementation has to be tested. An adequate test and simulation environment allows checking normal operation using inter agent communication via messages if there are working well to provide required functionalities.
Figure 64: ontology-based reconfiguration lifecycle with quality assurance [B15]
5.3.3 Comparison of UML- & ontology processes for reconfiguration
The evaluation presented in the euromicro paper [B15] bases on testing a defined assemble line scenario with three different scenarios which are very common for change requests of an automated production system. This reports an initial evaluation of a reconfiguration level process variants described in section 5.3.1 and 5.3.2 and investigates the expectable consequences for designers and developers. The approaches where both analysed regarding the following criteria by adding a conveyor (scenario1), remove a conveyor (scenario2) and change the direction of a conveyor (scenario3):
- model complexity (measured by the number of elements/relationships that needed to be developed or modified)
- modelling effort (measured by determining the average effort for tasks that have to be applied to a certain number of elements) and
- quality risk (defined by risk levels low/medium/high depending on introducing or not identifying relevant and typical reconfiguration defects like inconsistencies and incorrectness of models as well as adding quality assurance as built-in support of the approaches to prevent or identify possibly defects)
Basing on a previously done dependency analysis of the three reconfiguration scenarios to identify relevant dependencies between agent instances and effects on the direct neighbourhood of agents, Table 34 provides a side-by-side view on the defined distinctive features.
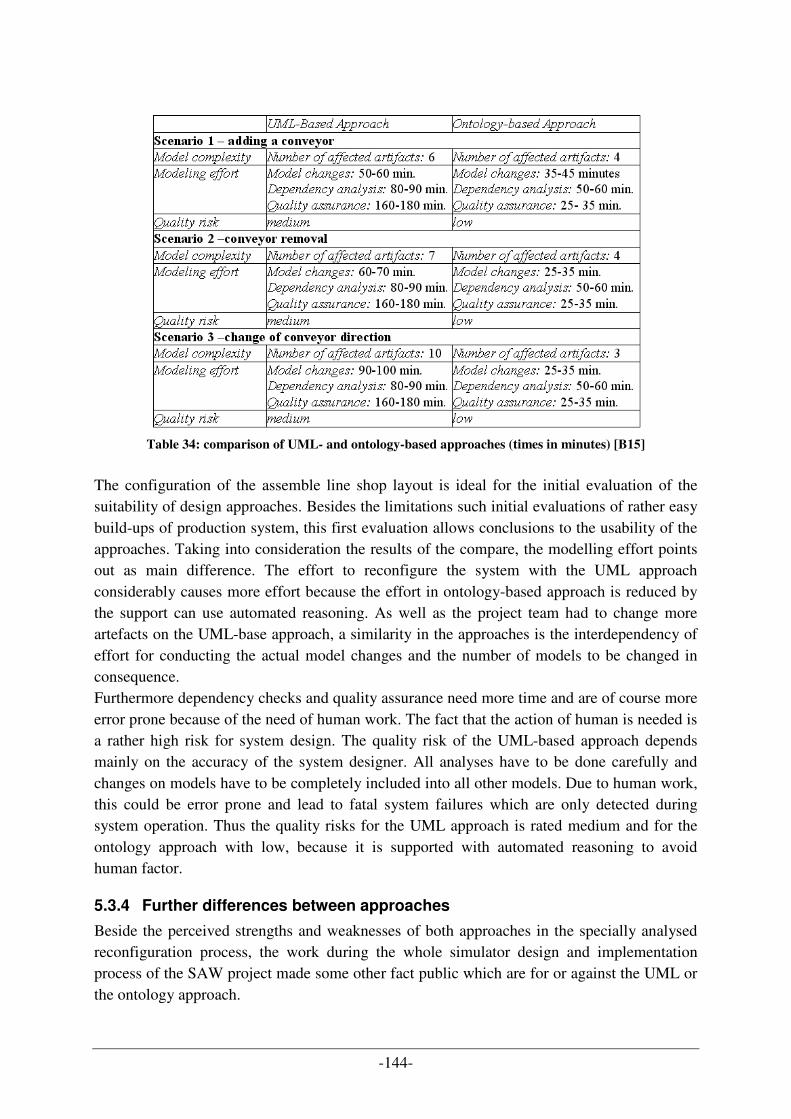
-144-
Table 34: comparison of UML- and ontology-based approaches (times in minutes) [B15]
The configuration of the assemble line shop layout is ideal for the initial evaluation of the suitability of design approaches. Besides the limitations such initial evaluations of rather easy build-ups of production system, this first evaluation allows conclusions to the usability of the approaches. Taking into consideration the results of the compare, the modelling effort points out as main difference. The effort to reconfigure the system with the UML approach considerably causes more effort because the effort in ontology-based approach is reduced by the support can use automated reasoning. As well as the project team had to change more artefacts on the UML-base approach, a similarity in the approaches is the interdependency of effort for conducting the actual model changes and the number of models to be changed in consequence. Furthermore dependency checks and quality assurance need more time and are of course more error prone because of the need of human work. The fact that the action of human is needed is a rather high risk for system design. The quality risk of the UML-based approach depends mainly on the accuracy of the system designer. All analyses have to be done carefully and changes on models have to be completely included into all other models. Due to human work, this could be error prone and lead to fatal system failures which are only detected during system operation. Thus the quality risks for the UML approach is rated medium and for the ontology approach with low, because it is supported with automated reasoning to avoid human factor.
5.3.4 Further differences between approaches
Beside the perceived strengths and weaknesses of both approaches in the specially analysed reconfiguration process, the work during the whole simulator design and implementation process of the SAW project made some other fact public which are for or against the UML or the ontology approach.
-145-
The most important advantage of the UML approach is the fact that UML is a common understood language to illustrate software design and implementation. It constitutes the perfect tool to help designer to get an overview of the domain and identify components to work with and furthermore make requirements readable and understandable in the visualization for developers of the system. But of course this advantage also entails a disadvantage. Very often there are a number of various diagrams with possible extensions needed to be able to map all system characteristics which quickly raise the number of models and diagrams. Consequently this raises the difficulty to understand all requirements and boosts the error proneness due to the need for manual model reviews and completeness and consistency checks. In contrast, the ontology-based approach is more powerful to depict and keep the overview on all relevant detailed information and dependencies on agents and instances during several design and implementation phases and iterations. It provides the advantage to define all information and data at one point to keep a well-defined big picture without the need of abstraction to make information representation easier. On top of this, there exists tool support for quality assurance checks for reasoning to conduct consistency and plausibility checks within the model aspects. Due to the construction of the ontology, the ontology editors provide the advantage to explore the system structure and architecture. But unfortunately the ontology has a cognitional problem due to the UML approach: to cover all information the ontology model gets quickly more complex. This fact makes the ontology again hard to understand which is enforced by the problem that relationships among entities and a general overview on a domain is hard to visualize with generic standard tools. Furthermore it is a challenge for all project participants to understand the contribution of an ontology element without good understanding of the domain because it is compared to traditional software engineering qualifications like data modelling using UML a rather new topic. Obviously the project team was promising some advantage in the use of ontologies for the SAW project simulator. To enlarge the probability of success, the project team tried to use the strength of both approaches by using an ontology but design it on using UML tools. This enabled the designers to design the ontology areas basing on the layer concept with fair effort due to their existing knowledge of data modelling. The implementation of the ontology gets well supported by using the open source ontology editor “Protégé“[C14]. This tool well supports the realization of single ontology areas and their merging to a complete knowledge base covering all relevant data for a production automation system simulation as well it was easier for designers in review phases to check the consistency and plausibility of the ontology through reasoning.
5.4 SAW project recognitions
As conclusion of the SAW project results one important fact can be outlined. The process support with an adequate simulation tool for production planning and scheduling control can get an essential part to manufacture efficient, economical and stay competitive. The investment to adapt established processes can surely get high, but will improve the companies output at least after a certain time period when the return on investment for financial efforts is
-146-
reached. The simulation support for production processes allow respectable cost reductions and savings in time for planning and optimization processes. Of course, the needed effort or expenses to design implement and/or adapt available software solutions has to be alluded. But using adequate design and development approaches to use the advantages of UML design, layer concepts and strength of ontology-based approaches for flexible data management. Especially the ontology approach with ontology area concept (as adapted layer model) allows a flexible change modulation of information and large data volumes for variable conditions with relative low expenditure. In addition, the use of ontologies (in contrast to traditional database design by UML modelling to visualize the data concept) also allows an easy consistency check for used data. Therefore automated reasoning with tool support can be used which makes design and implementation saver, easier and faster. The improvement reached by the chosen approaches in SAW project can be detected in the effort (number of work steps and needed time) to design, implement and change the software simulator. Furthermore the financial retrenchment can be caught in time and cost savings for process planning tasks and optimizing scheduled production plans.
-147-
(6) Conclusion and further work
This closing section of the master thesis briefly summarizes the encountered answers of research isuess of chapter 3.3 which were illustrated in chapter (4) and (5).Additionally, it depicts ideas for further work to enhance the simulator created in the SAW project which will done by other students.
6.1 Research results
An essential part of all master theses are research issues the students wants to work on in their scientific elaboration. The research issues of this elaboration were introduced in chapter (3). In this section the goal is to shortly point out the handled research contributions due to these research issues gathered during the SAW project and described during the single chapters of this master thesis. Therefore these items are summarized to research questions. The main research contributions and results of this elaboration are focused on the process flow for order management with simulation support to optimize the production as well as on the design and implementation of the ontology approach to prepare a possibility to store process information as data for the simulator. To operationalize this research contributions research questions were formulated out of the research issues to catch the intention and goals of the elaboration. To complete the thesis these questions given to repeat the research issues and briefly recapitulated by answers acquired and introduced in detail before. How could a sensible execution process for a production cycle integrating a simulator to
optimize manufacturing processes look like? Which sensible conclusions about establishing
a simulation possibility into the production planning process can be drawn out of the
integrated support in course of this?
From a rather technical and software system development point of view, the use of simulation is the most promising approach to simplify optimization of production processes in daily production business. Of course, the establishment of simulators and their integration into the existing process require rather high investments and efforts to adapt well known enterprise wide used process knowledge. But the expectable optimization potential and consequently the saving potentials in costs over a long time period makes such a modernization step nearly unavoidable for big companies especially if they use automated production units. If the simulation is used at the right time to test dispatching decision like scheduling algorithms choices, it provides the advantage to avoid possible defects in assemble line arrangement or production planning by simulating the results with various parameter setting. The interpretation of the output can become a familiar optimization step in an adapted production planning cycle of the business which avoids tremendous losses with rather small effort. One possible approach of such simulation integration production planning and control processes is depicted in general in section 4.1 and allocated for the designed production process of the SAW project with the design and implementation of an adequate simulator in section 4.3. How does the usage of ontologies support the design of an automated production system
simulator?
-148-
In the course of this ontology support it is interesting to record expectable dis-/advantages
using ontologies as knowledge base (using ontology area-concept together with layer
concept in the system design)?
The fact of realizing a layer concept simplified the decision to use ontologies as knowledge base. The required layers were rather easy to transform into ontology areas preparing all required data to reproduce an automated production system simulation. Furthermore such multi-agent systems in production automation need a flexible development strategy to reconfigure the beneath lying data information correctly, efficiently and consistently to adapt current version with new requirements, new behaviour and new support technology. Current standard development strategies basing on UML notation only partly support capturing agent system. The modelling tasks lead to a large number of various diagrams even for relatively simple scenarios. Of course, UML is easy to understand and provides a suitable tool to represent dependencies and interaction between agents and components but keeping several types of UML diagrams synchronized with each other and the actual system configuration is a considerable effort. In contrast to that, ontologies allow the modelling of all aspects of a multi-agent system design in one common model. Even because the ontology contains the system architecture and the system configuration as well as instances of these, the synchronization risk is lowered. The disadvantage is that it therefore contains more entities and relationships to represent all information. The visualization of ontologies is a major challenge while logical reasoning supports for dependency analysis and consistency checks. Of course, the creation of the ontology using an ontology editor was rather time consuming, also because the experience of the project team for usage of ontologies were not well developed. But because ontologies are logical text-based constructs it can also be created and manipulated using scripts. The SAW project tried to combine both approaches during the design and implementation of the system as well as the ontology as knowledge base. The strength of ontologies was enhanced by its design using the power of UML. Detailed information to the chosen approach are described in chapter 4.3.2 and especially 4.3.3.3. Is the chosen development strategy (design through an iterative product-line approach)
basing on a layer concept feasible to create a simulation system with an ontology as
knowledge base?
The aim to use a defined development strategy to identify requirements, design the system characteristics and implement the simulation system behaviors was only playing a subordinate role during the SAW project. Of course, the guidance through an approved software development process with cleared phases helps on reaching the project goals. But fact is that the rather small project team consisting of three to five members made a consequently usage of specified phase directives not as important as it would be for large projects with a participating team of a large number of persons. Because of this the defined product-line approach was rather adapted toward an iterative phase basing development strategy well known by all team members. The precise work partitioning among the team members lightened the task to develop an adequate simulator meeting all requirements following an iterative approach using important review steps to keep the focus and identify problems of the design and implementation decisions.
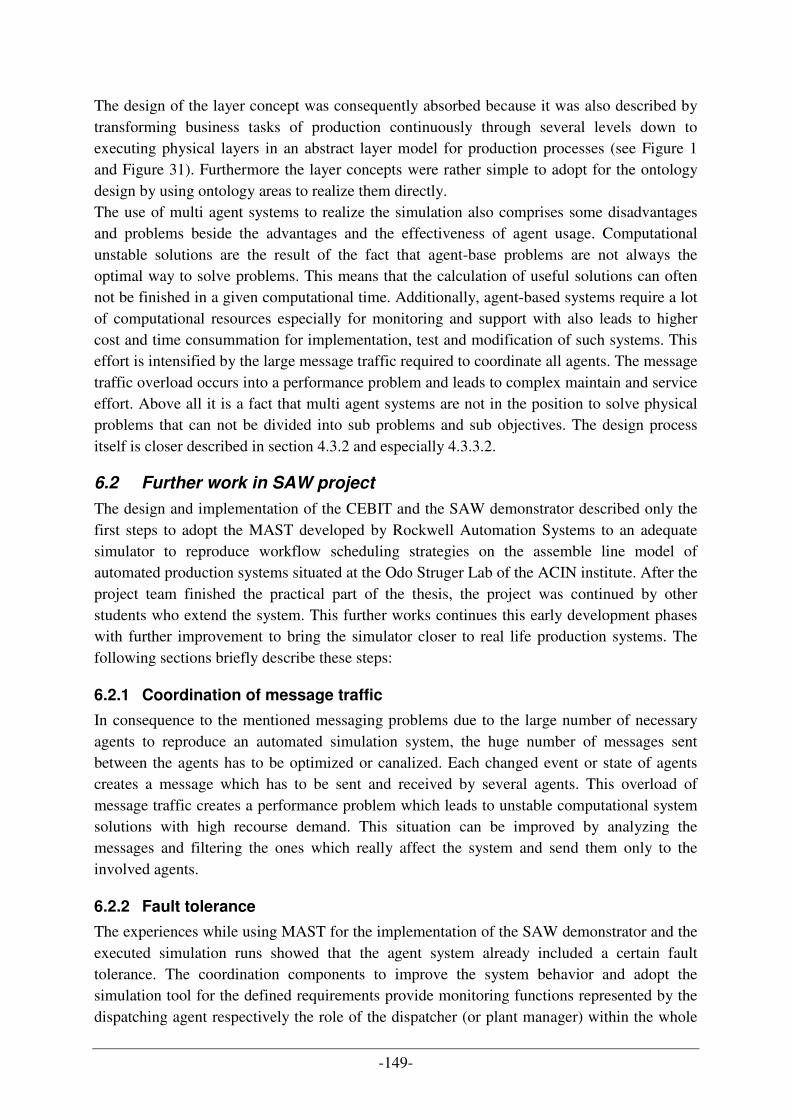
-149-
The design of the layer concept was consequently absorbed because it was also described by transforming business tasks of production continuously through several levels down to executing physical layers in an abstract layer model for production processes (see Figure 1 and Figure 31). Furthermore the layer concepts were rather simple to adopt for the ontology design by using ontology areas to realize them directly. The use of multi agent systems to realize the simulation also comprises some disadvantages and problems beside the advantages and the effectiveness of agent usage. Computational unstable solutions are the result of the fact that agent-base problems are not always the optimal way to solve problems. This means that the calculation of useful solutions can often not be finished in a given computational time. Additionally, agent-based systems require a lot of computational resources especially for monitoring and support with also leads to higher cost and time consummation for implementation, test and modification of such systems. This effort is intensified by the large message traffic required to coordinate all agents. The message traffic overload occurs into a performance problem and leads to complex maintain and service effort. Above all it is a fact that multi agent systems are not in the position to solve physical problems that can not be divided into sub problems and sub objectives. The design process itself is closer described in section 4.3.2 and especially 4.3.3.2.
6.2 Further work in SAW project
The design and implementation of the CEBIT and the SAW demonstrator described only the first steps to adopt the MAST developed by Rockwell Automation Systems to an adequate simulator to reproduce workflow scheduling strategies on the assemble line model of automated production systems situated at the Odo Struger Lab of the ACIN institute. After the project team finished the practical part of the thesis, the project was continued by other students who extend the system. This further works continues this early development phases with further improvement to bring the simulator closer to real life production systems. The following sections briefly describe these steps:
6.2.1 Coordination of message traffic
In consequence to the mentioned messaging problems due to the large number of necessary agents to reproduce an automated simulation system, the huge number of messages sent between the agents has to be optimized or canalized. Each changed event or state of agents creates a message which has to be sent and received by several agents. This overload of message traffic creates a performance problem which leads to unstable computational system solutions with high recourse demand. This situation can be improved by analyzing the messages and filtering the ones which really affect the system and send them only to the involved agents.
6.2.2 Fault tolerance
The experiences while using MAST for the implementation of the SAW demonstrator and the executed simulation runs showed that the agent system already included a certain fault tolerance. The coordination components to improve the system behavior and adopt the simulation tool for the defined requirements provide monitoring functions represented by the dispatching agent respectively the role of the dispatcher (or plant manager) within the whole
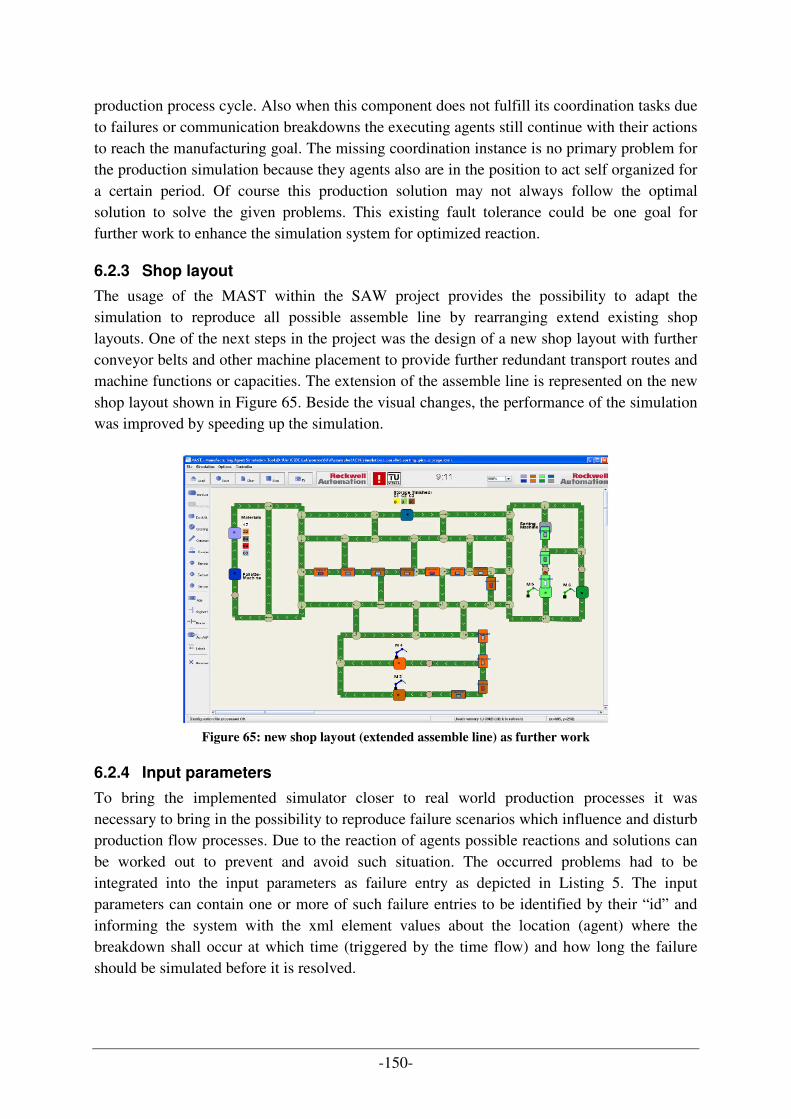
-150-
production process cycle. Also when this component does not fulfill its coordination tasks due to failures or communication breakdowns the executing agents still continue with their actions to reach the manufacturing goal. The missing coordination instance is no primary problem for the production simulation because they agents also are in the position to act self organized for a certain period. Of course this production solution may not always follow the optimal solution to solve the given problems. This existing fault tolerance could be one goal for further work to enhance the simulation system for optimized reaction.
6.2.3 Shop layout
The usage of the MAST within the SAW project provides the possibility to adapt the simulation to reproduce all possible assemble line by rearranging extend existing shop layouts. One of the next steps in the project was the design of a new shop layout with further conveyor belts and other machine placement to provide further redundant transport routes and machine functions or capacities. The extension of the assemble line is represented on the new shop layout shown in Figure 65. Beside the visual changes, the performance of the simulation was improved by speeding up the simulation.
Figure 65: new shop layout (extended assemble line) as further work
6.2.4 Input parameters
To bring the implemented simulator closer to real world production processes it was necessary to bring in the possibility to reproduce failure scenarios which influence and disturb production flow processes. Due to the reaction of agents possible reactions and solutions can be worked out to prevent and avoid such situation. The occurred problems had to be integrated into the input parameters as failure entry as depicted in Listing 5. The input parameters can contain one or more of such failure entries to be identified by their “id” and informing the system with the xml element values about the location (agent) where the breakdown shall occur at which time (triggered by the time flow) and how long the failure should be simulated before it is resolved.
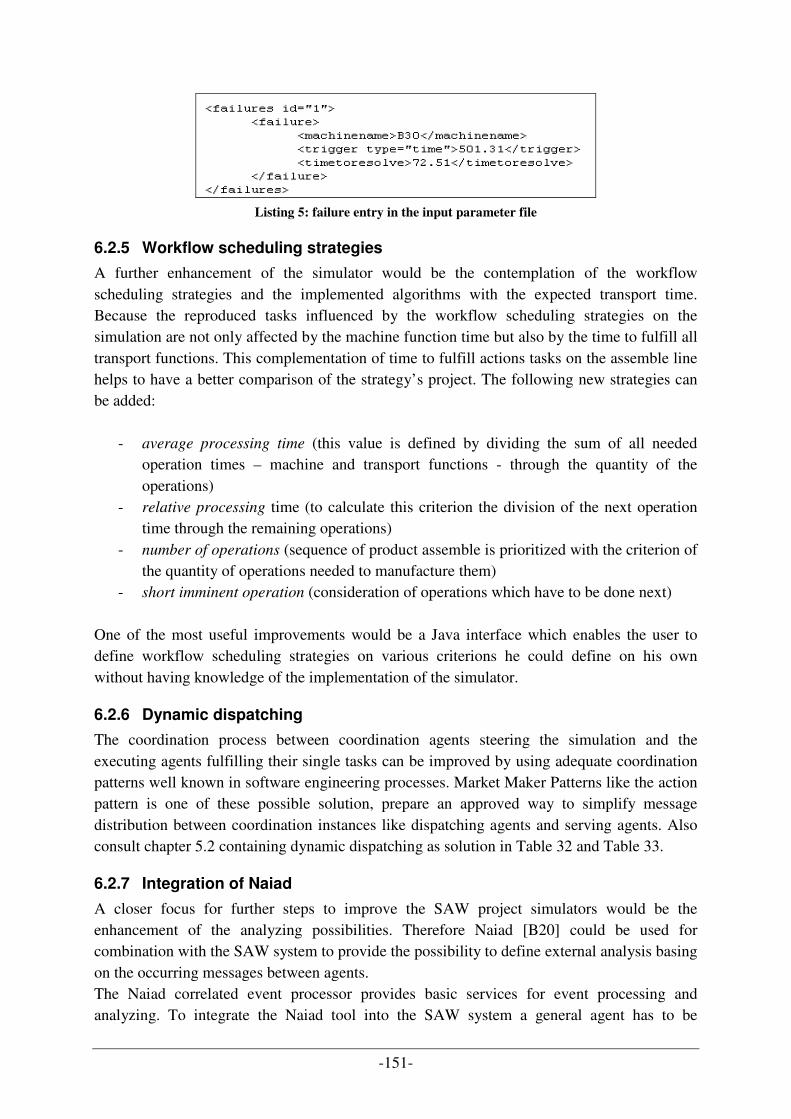
-151-
Listing 5: failure entry in the input parameter file
6.2.5 Workflow scheduling strategies
A further enhancement of the simulator would be the contemplation of the workflow scheduling strategies and the implemented algorithms with the expected transport time. Because the reproduced tasks influenced by the workflow scheduling strategies on the simulation are not only affected by the machine function time but also by the time to fulfill all transport functions. This complementation of time to fulfill actions tasks on the assemble line helps to have a better comparison of the strategy’s project. The following new strategies can be added:
- average processing time (this value is defined by dividing the sum of all needed operation times – machine and transport functions - through the quantity of the operations)
- relative processing time (to calculate this criterion the division of the next operation time through the remaining operations)
- number of operations (sequence of product assemble is prioritized with the criterion of the quantity of operations needed to manufacture them)
- short imminent operation (consideration of operations which have to be done next) One of the most useful improvements would be a Java interface which enables the user to define workflow scheduling strategies on various criterions he could define on his own without having knowledge of the implementation of the simulator.
6.2.6 Dynamic dispatching
The coordination process between coordination agents steering the simulation and the executing agents fulfilling their single tasks can be improved by using adequate coordination patterns well known in software engineering processes. Market Maker Patterns like the action pattern is one of these possible solution, prepare an approved way to simplify message distribution between coordination instances like dispatching agents and serving agents. Also consult chapter 5.2 containing dynamic dispatching as solution in Table 32 and Table 33.
6.2.7 Integration of Naiad
A closer focus for further steps to improve the SAW project simulators would be the enhancement of the analyzing possibilities. Therefore Naiad [B20] could be used for combination with the SAW system to provide the possibility to define external analysis basing on the occurring messages between agents. The Naiad correlated event processor provides basic services for event processing and analyzing. To integrate the Naiad tool into the SAW system a general agent has to be
-152-
implemented for subscribing all message types and agents. This new agent acts as interface between the agents steering the manufacturing process and the Naiad application. On this way the general agent improves the SAW simulation system message flow by having a central control system forwarding occurring messages from the SAW system towards the Naiad components as soon a message is sent. For the communication with the Naiad tool a special format for the exchange protocol has to be defined and messages have to be extended by timestamps.
-153-
References
Books
[A1] Edward Bernroider, Volker Stix; “Grundzüge der Modellierung – Anwendungen in der
Softwareentwicklung“ (2. erweiterte und überarbeitet Auflage); Institut für Informationswirtschaft am
Department für Informationsverarbeitung und Informationswirtschaft – Wirtschaftsuniversität Wien;
Facultas Verlags- und Buchhandels AG; pages 127-132 ISBN 3-85114-931-9; 2006
[A2] Christian Bunse / Antje von Knethen; Vorgehensmodelle kompakt, Spektrum Akademischer Verlag
GmbH; p. 3-15; ISBN 3-8274-1203-X; 2002
[A3] Karl Eilebrecht, Gernot Starke; „Patterns kompakt – Entwurfsmuster für effektive Software-
Entwicklung“, 2. Auflage; Spektrum Akademischer Verlag; p.3; ISBN-10: 3-8274-1591-8
[A4*] Dr. Torsten Eymann; Institut für Informatik und Gesellschaft – Abteilung Telematik; Albert-Ludwigs-
Universität Freiburg; „Digitale Geschäftsagenten“; Springer Verlag; pages: [A4a] 59 [A4b] 60; ISBN
3-540-44019-4; 2003
[A5] Dieter Fensel; “Ontologies: A Silver Bullet for Knowledge Management and Electronic Commerce”;
Springer Verlag, ; pages 5-6, ISBN 3-540-00302; 2004
[A6*] Jaques Ferber; Multi-Agent Systems – An Introduction to Distributed Artificial Intelligence; Addison-
Wesley Longman; pages: [A6a] 9 [A6b] 31; ISBN 0-201-36048-9; 1999
[A7] Erich Gamma, Richard Helm, Ralph Johnson, John Vlissides, „Design Patterns – Elements of
Reusable Object-Oriented Software“; Addison-Wesley professional computing series; pages 1-12;
ISBN 0-201-63361-2; 1998
[A8] Hansen, Neumann; „Wirtschaftsinformatik 1 - Grundlagen und Anwendungen“ (9. Auflage); Lucius
& Lucius Verlagsgesellschaft mbH; page 523; ISBN 3-8252-2670-0; 2005
[A9] Pankey Jalote, „An integrated approach to software engineering”, 2nd edition; New York; Springer,
XIV, Undergraduate texts in computer science; pages 1-70; ISBN 0-387-94899-6; 1997
[A10] Gerti Kappel, Martin Hitz; UML@Work – von der Analyse zur Realisierung (2. Auflage); pages. 7 et
seq.;; ISBN 3-89864-194-5; dpunkt.verlag, 2003
[A11] Georg Lausen; Datenbanken – Grundlagen und XML-Technologien; 1. Auflage; Elsevier GmbH,
München – Spektrum Akademischer Verlag; pages 105-125; ISBN 3-8274-1488-1; 2005
[A12*] Jürgen Lind; Iterative Software Engineering for Multiagent Systems – The MASSIVE Method;
Lecture Notes in Artificial Intelligence; pages: [A12a] 44/45 [A12b] 46 [A12c] 26 [A12d] 10 [A12e]
19/20 Springer Verlag; ISBN 3540421661 1994
[A13] M. Pinedo; „Scheduling: theory, algorithms and systems“ Prentice-Hall, Englewood Cliffs; New
Jersey; p. 378; 1995; Springer Verlag; ISBN 0387789340 ;2008
[A14] Andrew S. Tanenbaum – “Distributed systems: principles and paradigms”; Maarten van Steen. -
Internat. ed. . - Upper Saddle River, NJ: Prentice Hall; pages 4ff; ISBN 0-13-121786-0; 2002
[A15*] Prof. Dr. Horst Tempelmeier (Universität zu Köln – Seminar für Allgemeine Betriebswirtschaftslehre
und Produktionswirtschaft); Prof. Dr. Hans-Otto Günther (Technische Universität Berlin – Fachgebiet
Betriebswirtschaftslehre / Produktionsmanagement), Produktion und Logistik; fünfte verbesserte
Auflage, Springer Verlag; pages: [A15a] 301-310 [A15b] 307 [A15c] 308 [A15d] 310 [A15e] 311-
325 [A15f] 315 – 319 [A15g] 327, ISBN 3-540-66518-8; 2003
[A16] David M. Weiss, Chi Tau Robert Lai; Software Product-line Engineering – a family based software
development process; Addison Wesley Longman, Inc.; page: 15; ISBN 0-201-69438-7; 1999
-154-
[A17*] Gerhard Weiß, Ralf Jakob; „Agentenorientierte Softwareentwicklung“, Institut für Informatik –
Technische Universität München; Springer Verlag; pages: [A17a] 4 [A17b] 202; ISBN 3-540-00062-
3; 2005
Scientific papers & technical reports
[B1] Christine Albrecht; diploma thesis TU Vienna; “Folksonomy”; “Institut für Gestaltungs- und
Wirkungsforschung” (Prof. Purgathofer); 2006
[B2] Boehm B; "A Spiral Model of Software Development and Enhancement", "Computer", "IEEE",
21(5):61-72; (picture taken from: http://en.wikipedia.org/wiki/Spiral_model (15.07.2008)); May 1988
[B3] Maria Caridi and Sergio Cavalieri; “Multi-agent systems in production planning and control: an
overview”; Production Planning & Control; Department of Management, Economics and Industrial
Engineering, Università degli Studi di Bergamo Milano, Italy; published in: International Journal of
Production Economics; 2004
[B4] Prof. Dr. Andreas Drexl – Lehrstuhl für Produktion und Logistik, Christian-Albrechts-Universität zu
Kiel; Prof. Dr. Bernhard Fleischmann – Lehrstuhl für Produktion und Logistik, Universität Augsburg,
Prof. Dr. Hans-Otto Günther, Fachgebiet Betriebswirtschaflehre-Produktionsmanagement, TU Berlin;
Prof. Dr. Hartmut Stadtler – Fachgebiet Fertigungs- und Materialwirtschaft, TU Darmstadt; Prof. Dr.
Horst Tempelmeier - Seminar für Industriebetriebslehre und Produktionswirtschaft, Universität zu
Köln; „Konzeptionelle Grundlagen kapazitätsorientierter PPS-Systeme“; Zeitschrift für
betriebswirtschaftliche Forschung 46, 1022–1045; 12/1994
[B5] L. Floridi (ed); Preprint version of chapter „Ontology“, Blackwell Guide to the Philosophy of
Computing and Information, Oxford: Blackwell, pages 155-166.
http://ontology.buffalo.edu/smith/articles/ontologies.htm; 2003
[B6] Clemens Gondowidjaja, diploma thesis “Implementation and Coordination of Multi Agent Systems
for Production Automation Simulation using Coordination Patterns”; Faculty of informatics of the
Vienna technical university; 2008
[B7] Gruber, T. R., “A Translation Approach to Portable Ontology Specifications”, Knowledge Acquisition,
5(2):199-220, See also “What is an Ontology?“ (http://www-ksl.stanford.edu/kst/what-is-an-
ontology.html) 1993
[B8] Christoph David Hermann; Masterarbeit “Criteria-Driven Scheduling in an IEEE-FIPA Compliant
Multi-Agent Infrastructure”; p 22; TU Vienna; 2007
[B9] IBM’s Rational Unified Process – Best Practices for Software Development Teams; A Rational
software Corporation White Paper;
http://www.augustana.ab.ca/~mohrj/courses/2000.winter/csc220/papers/
rup_best_practices/rup_bestpractices.html (25.11.2008)
[B10*] Katariina Kemppainen; PhD Thesis: Priority Scheduling revisited – Dominant rules, open protocols,
and integrated order management; Helsinki school of economics; ISBN 951-791-968-9 (e-version:
951-791-969-7); pages: [B10a] 21 [B10b] 64 [B10c] 23 [B10d] Appendix 2, page b [B10e] Appendix
2, page c; HSE Print 2005
[B11] LeMaster, R.A., Automated Production Systems; The University of Tennessee at Martin - School of
Engineering (Tennessee, USA);powerpoint presentation for lecture: “Introdution to Automation –
lecture 1 / engineering 475 – automated production system” pages: 22 and 23; 2001 (available on
http://www.utm.edu/departments/engin/lemaster/Auto%20Prod%20Sys/Lecture%2001.pdf (01.04.2009))
-155-
[B12] M.K. Lim, Z. Zhang; A multi-agent based manufacturing control strategy for responsive
manufacturing; Journal of Materials Processing Technology 139; pages 379-384; School of
Engineering and Computer Science, University of Exeter, UK; 2003
[B13] M. Merdan, T. Moser, D. Wahyudin, S. Biffl, P. Vrba; "Simulation of workflow scheduling strategies
using the MAST test management system," Control, Automation, Robotics and Vision, 2008. ICARCV
2008. 10th International Conference on , vol., no., pp.1172-1177, 17-20 Dec. 2008
URL: http://ieeexplore.ieee.org/stamp/stamp.jsp?arnumber=4795687&isnumber=4795481 (01.04.2009)
[B14] M. Missikoff, R. Navigli and P. Velardi. The usable ontology: An environment for building and
assessing a domain ontology; Lecture Notes in Computer Science; Volume 2342/2002; Springer
Verlag; Buchkapitel (ISBN 978-3-540-43760-4) 2002
[B15] Moser, T.; Kunz, K.; Matousek, K.; Wahyudin, D., "Investigating UML- and Ontology-Based
Approaches for Process Improvement in Developing Agile Multi-Agent Systems," Software
Engineering and Advanced Applications, 2008. SEAA '08. 34th Euromicro Conference , vol., no.,
pp.224-231, 3-5 Sept. 2008
URL: http://ieeexplore.ieee.org/stamp/stamp.jsp?arnumber=4725726&isnumber=4725678 (01.04.2009)
[B16] Storey, Musen, Silva, Best, Ernst, Fergerson, Noy; Jambalaya: Interactive visualization to enhance
ontology authoring and knowledge acquisition in Protégé; workshop on Interactive Tolls for
Knowledge Capture (K-CAP-2001 http://www.csr.uvic.ca/~mstorey/research/../papers/kcap2001.pdf)
Jambalaya introduction website: http://www.thechiselgroup.org/jambalaya (20.01.2009);
[B17*] phi – Produktionstechnik Hannover informiert; Print-Ausgabe - Seiten: [B17a] 3 [B17b] 15; ISSN
1616-2757 Ausgabe 2 / April 2001 (see also online on http://www.phi-hannover.de/)
[B18] Barry Smith (Department of Philosophy, University at Buffalo, Buffalo (NY), USA) and Christopher
Welty, (Computer Science Dept. Vassar College, Poughkeepsie (NY), USA); “Ontology: Towards a
New Synthesis”, 2001
[B19] Peter Stone and Manuela Veloso; “Multiagent Systems: A survey from a Machine Learning
Perspective”; Peter Stone and Manuela Veloso; 1997; Carnegie Mellon University – Computer
Science Department; Pittsburgh (USA); seen on
http://www.cs.cmu.edu/afs/cs/usr/pstone/public/papers/97MAS-survey/revised-survey.html (17.4.2008)
[B20] R.V. Szabolcs Rozsnyai, Josef Schiefer, Alexander Schatten, “Event cloud – Searching for Correlated
Business Events”, in Proceedings of the 4th IEEE Conference on Enterprise Computing, E-Commerce
and E-Services (EEE ’07): IEEE, pp. 409-420; 2007
[B21] Telecom-Italia, “Java Agent Development Framework” vol. 2008, 2008
[B22] Vrba,P. MAST: Manufacturing Agent Simulation Tool in Proceedings of IEEE Conference on
Emerging Technologies and Factory Automation, Lisbon, Portugal, pp.282-287; Volume 1;
September 2003
[B23] Jean-Baptiste Waldner; CIM – principles of computer integrated manufacturing; John Willey & Sons
(picture taken from http://en.wikipedia.org/wiki/Computer_Integrated_Manufacturing) 1992
[B24] Dindin Wahyudin; presentation to topics of diploma thesis, “agile and safe multi agent system
development”,page 4; TU Vienna, Faculty of Informatics; 2007
[B25] C. Welty, F. Lehmann, G. Gruninger, and M. Uschold; 1000. Ontology: Expert Systems All Over
Again? Invited panel at AAAI-999: The National Conference on Artificial Intelligence. Austin, Texas
[B26] Burcu Yildiz, “Ontology-Driven Information Extraction“; Ph.D. Thesis; Institute of Software
Technology & Interactive Systems, TU Vienna; 2007
-156-
Web resources
[C1] ACIN - online reference to the website of ACIN laboratories of the TU Vienna
http://www.acin.tuwien.ac.at (15.1.2009)
[C2] Agent Management Reference Model of the Foundation for Intelligent Physical Agents;
http://www.fipa.org/specs/fipa00023/SC00023K.html (11.1.2009)
[C3] CASA SME – ‘Computer and Automated Systems Association' of the 'Society of Manufacturing
Engineers' of the United States of America; www.sme.org/casa (3.12.2008)
[C4] FIPA - available online reference for the FIPA ACL specification
http://www.fipa.org/specs/fipa00061/ (10.2.2009)
[C5] FIPA website - The Foundation for Intelligent Physical Agents; http://www.fipa.org/ (11.11.2008)
[C6] FIPA Specification - The Foundation for Intelligent Physical Agents;
http://www.fipa.org/repository/standardspecs.html (11.11.2008)
[C7] INFOLOOM - website of infoloom.Inc (http://www.infoloom.com);created by Michel Biezunski -
internationally recognized expert in the field of information management);
http://www.infoloom.com/gcaconfs/WEB/ts1273/tp1273.HTM (30.11.2008)
[C8] JADE - website of JADE; http://jade.tilab.com/ (20.12.2008)
[C9] KQML - public directory for information and software related to the design, development and use of
the Knowledge Query and Manipulation Language (KQML); http://www.cs.umbc.edu/kqml/
(28.11.2008)
[C10] Odo Struger Lab at ACIN Institute (TU Vienna);
http://www.acin.tuwien.ac.at/forschung/Projekte/255/ (18.08.2008)
[C11] OMG - website of the “Object Modelling Group”; http://www.omg.org/ (13.07.2008)
[C12] Pareto-Principle (confer to http://www.4whatitis.ch/index.php?page=1309) – named after Vilfredo
Federico Damaso Pareto, an Italian sociologist, economist and philosopher (for further detailed
description, please consult wikipedia or other common encyclopedias) (24.4.2008)
[C13] perspektive:blau - Wirtschaftsmagazin; Artikel: „Mass Customization: Maßgeschneidert vom
Fließband“ (seen on http://www.perspektive-blau.de/wissen/0703a/0703a.htm (15.4.2008))
[C14] Protégé is a free, open source ontology editor and knowledge-base framework;
http://protege.stanford.edu/ (25.11.2008)
[C15] SEI - Carnegie Mellon® Software Engineering Institute (SEI), federally funded research and
development centre since 1984; http://www.sei.cmu.edu/productlines/ (10.10.2008)
[C16] SPL - The Software Product Lines site; coordinated and moderated by Charles Krueger;
http://www.softwareproductlines.com/ (20.10.2008)
[C17] Supply network; taken from Wikipedia - free, multilingual, open content encyclopaedia project
supported by the United States-based non-profit Wikimedia Foundation;
http://en.wikipedia.org/wiki/Supply_network (05.11.2008)
[C18] Swiss Knowledge Management Forum; confer to: page 2
http://www.skmf.net/fileadmin/redaktion/aktiver_content/Ontos_WP_Ontologie_V_3.0__D_.pdf; (10.04.2008)
[C19] Trend, Thesen, Strategien – Netzguide ERP/Extended Enterprise 2003 - “Integrierte ERP-Systeme
bergen auch Risiken“ (pdf paper) http://www2.eycom.ch/library/items/tts_030801/de.pdf,©
Netzmedien AG, 2003; Stand: Juni 2007; (10.01.2009)
[C20] UML - website of Unified Modelling Language presented by the OMG;
http://www.uml.org/#UML2.0 (13.07.2008)

-157-
[C21] Unified Process – Wikipedia: free, multilingual, open content encyclopaedia project supported by the
United States-based non-profit Wikimedia Foundation; http://en.wikipedia.org/wiki/Unified_Process
(20.08.2008)
[C22] World Wide Web Consortium (W3C); main international standards organization for the World Wide
Web; 434 members; founded 1994 by Tim Berners-Lee; USA (see http://www.w3.org/TR/2004/REC-
owl-features-20040210/#s2) (04.11.2008)
[C23] XP extreme programming – a gentle introduction; website of “lessons learned”;
http://www.extremeprogramming.org/ (02.11.2008)
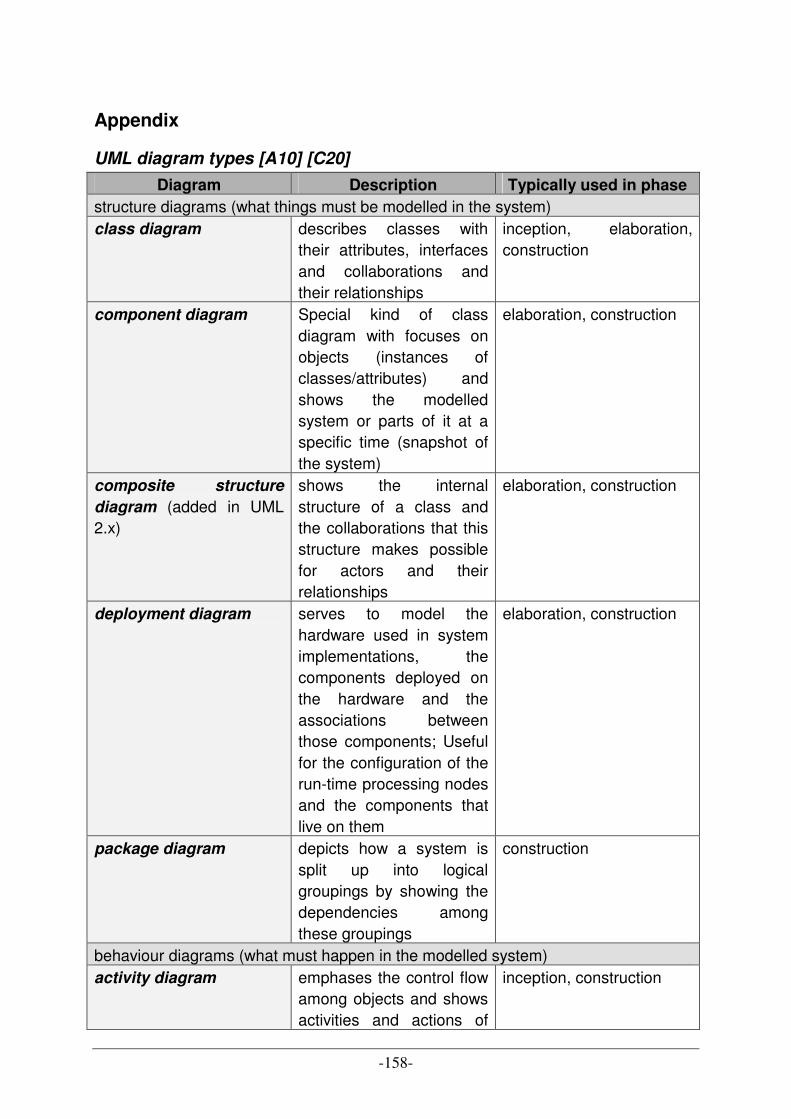
-158-
Appendix
UML diagram types [A10] [C20]
Diagram Description Typically used in phase
structure diagrams (what things must be modelled in the system) class diagram describes classes with
their attributes, interfaces and collaborations and their relationships
inception, elaboration, construction
component diagram Special kind of class diagram with focuses on objects (instances of classes/attributes) and shows the modelled system or parts of it at a specific time (snapshot of the system)
elaboration, construction
composite structure
diagram (added in UML 2.x)
shows the internal structure of a class and the collaborations that this structure makes possible for actors and their relationships
elaboration, construction
deployment diagram serves to model the hardware used in system implementations, the components deployed on the hardware and the associations between those components; Useful for the configuration of the run-time processing nodes and the components that live on them
elaboration, construction
package diagram depicts how a system is split up into logical groupings by showing the dependencies among these groupings
construction
behaviour diagrams (what must happen in the modelled system) activity diagram emphases the control flow
among objects and shows activities and actions of
inception, construction
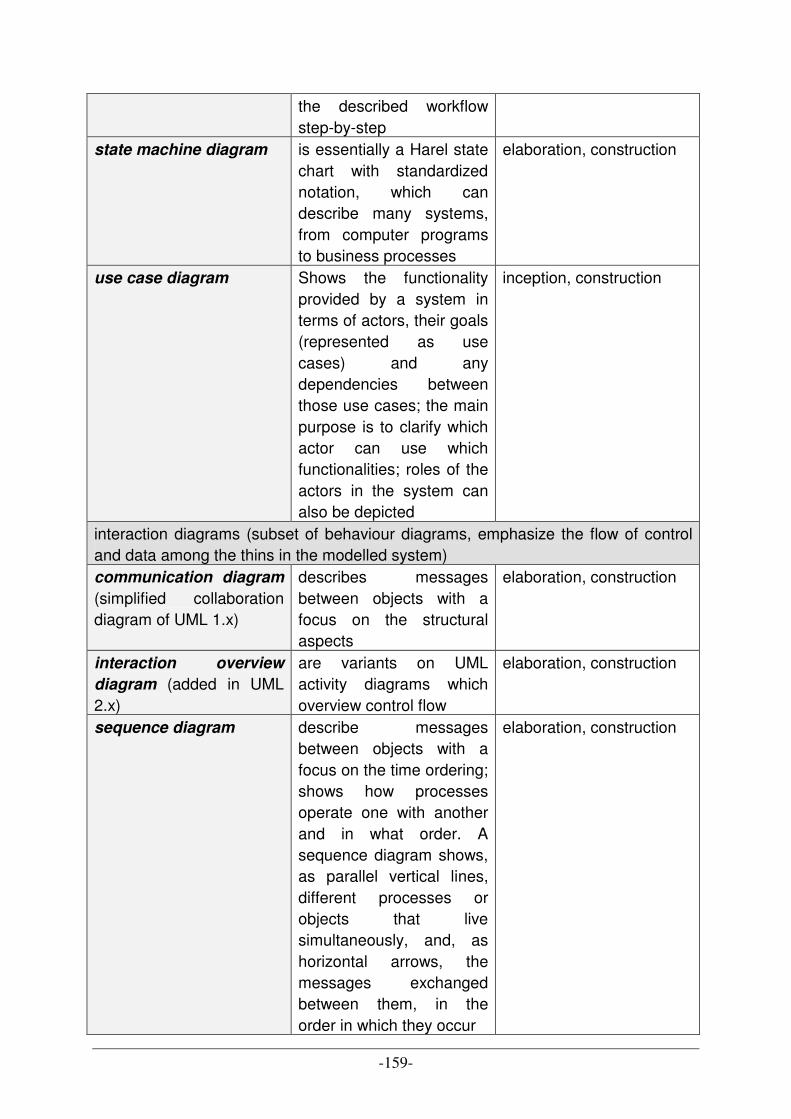
-159-
the described workflow step-by-step
state machine diagram is essentially a Harel state chart with standardized notation, which can describe many systems, from computer programs to business processes
elaboration, construction
use case diagram Shows the functionality provided by a system in terms of actors, their goals (represented as use cases) and any dependencies between those use cases; the main purpose is to clarify which actor can use which functionalities; roles of the actors in the system can also be depicted
inception, construction
interaction diagrams (subset of behaviour diagrams, emphasize the flow of control and data among the thins in the modelled system) communication diagram
(simplified collaboration diagram of UML 1.x)
describes messages between objects with a focus on the structural aspects
elaboration, construction
interaction overview
diagram (added in UML 2.x)
are variants on UML activity diagrams which overview control flow
elaboration, construction
sequence diagram describe messages between objects with a focus on the time ordering; shows how processes operate one with another and in what order. A sequence diagram shows, as parallel vertical lines, different processes or objects that live simultaneously, and, as horizontal arrows, the messages exchanged between them, in the order in which they occur
elaboration, construction
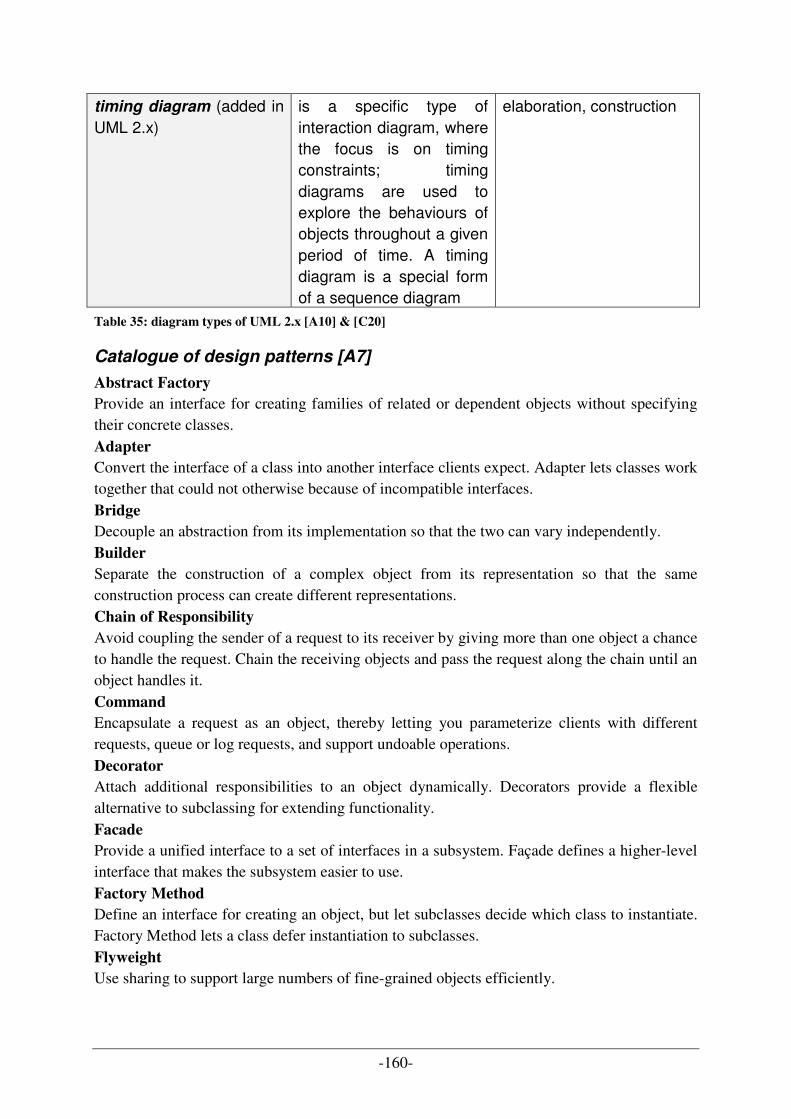
-160-
timing diagram (added in UML 2.x)
is a specific type of interaction diagram, where the focus is on timing constraints; timing diagrams are used to explore the behaviours of objects throughout a given period of time. A timing diagram is a special form of a sequence diagram
elaboration, construction
Table 35: diagram types of UML 2.x [A10] & [C20]
Catalogue of design patterns [A7]
Abstract Factory
Provide an interface for creating families of related or dependent objects without specifying their concrete classes. Adapter
Convert the interface of a class into another interface clients expect. Adapter lets classes work together that could not otherwise because of incompatible interfaces. Bridge
Decouple an abstraction from its implementation so that the two can vary independently. Builder
Separate the construction of a complex object from its representation so that the same construction process can create different representations. Chain of Responsibility
Avoid coupling the sender of a request to its receiver by giving more than one object a chance to handle the request. Chain the receiving objects and pass the request along the chain until an object handles it. Command
Encapsulate a request as an object, thereby letting you parameterize clients with different requests, queue or log requests, and support undoable operations. Decorator
Attach additional responsibilities to an object dynamically. Decorators provide a flexible alternative to subclassing for extending functionality. Facade
Provide a unified interface to a set of interfaces in a subsystem. Façade defines a higher-level interface that makes the subsystem easier to use. Factory Method
Define an interface for creating an object, but let subclasses decide which class to instantiate. Factory Method lets a class defer instantiation to subclasses. Flyweight
Use sharing to support large numbers of fine-grained objects efficiently.
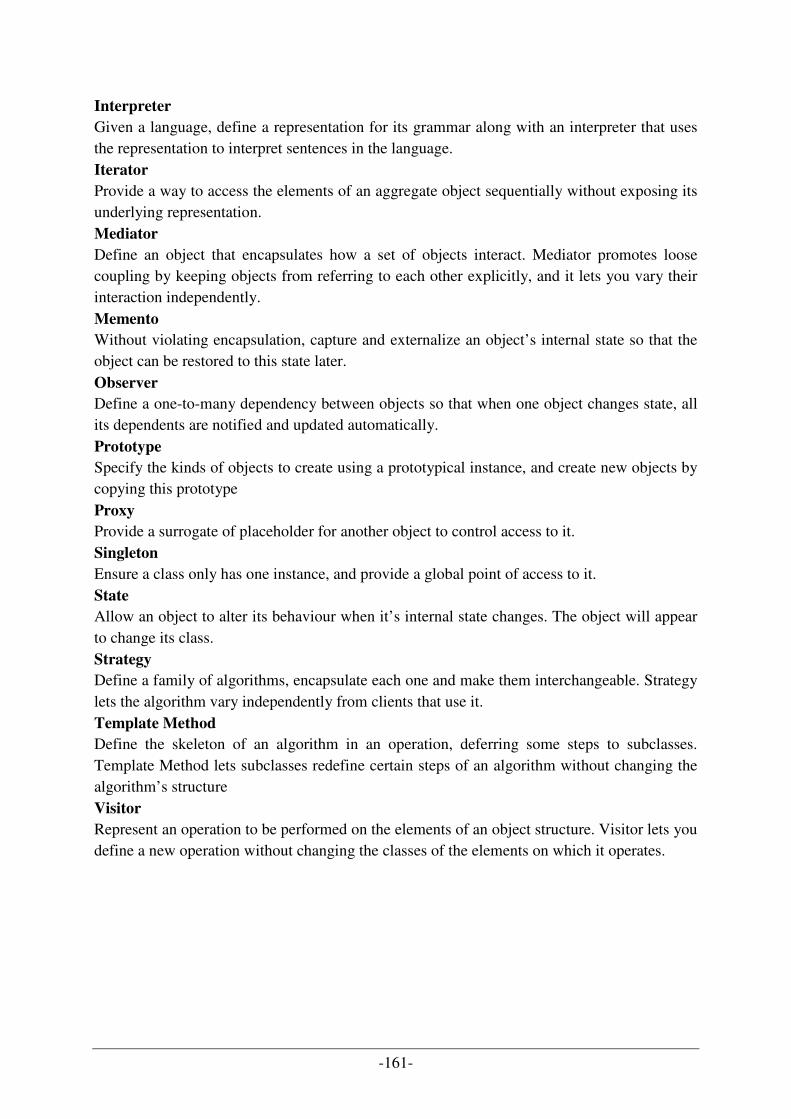
-161-
Interpreter
Given a language, define a representation for its grammar along with an interpreter that uses the representation to interpret sentences in the language. Iterator
Provide a way to access the elements of an aggregate object sequentially without exposing its underlying representation. Mediator
Define an object that encapsulates how a set of objects interact. Mediator promotes loose coupling by keeping objects from referring to each other explicitly, and it lets you vary their interaction independently. Memento
Without violating encapsulation, capture and externalize an object’s internal state so that the object can be restored to this state later. Observer
Define a one-to-many dependency between objects so that when one object changes state, all its dependents are notified and updated automatically. Prototype
Specify the kinds of objects to create using a prototypical instance, and create new objects by copying this prototype Proxy
Provide a surrogate of placeholder for another object to control access to it. Singleton
Ensure a class only has one instance, and provide a global point of access to it. State
Allow an object to alter its behaviour when it’s internal state changes. The object will appear to change its class. Strategy
Define a family of algorithms, encapsulate each one and make them interchangeable. Strategy lets the algorithm vary independently from clients that use it. Template Method
Define the skeleton of an algorithm in an operation, deferring some steps to subclasses. Template Method lets subclasses redefine certain steps of an algorithm without changing the algorithm’s structure Visitor
Represent an operation to be performed on the elements of an object structure. Visitor lets you define a new operation without changing the classes of the elements on which it operates.
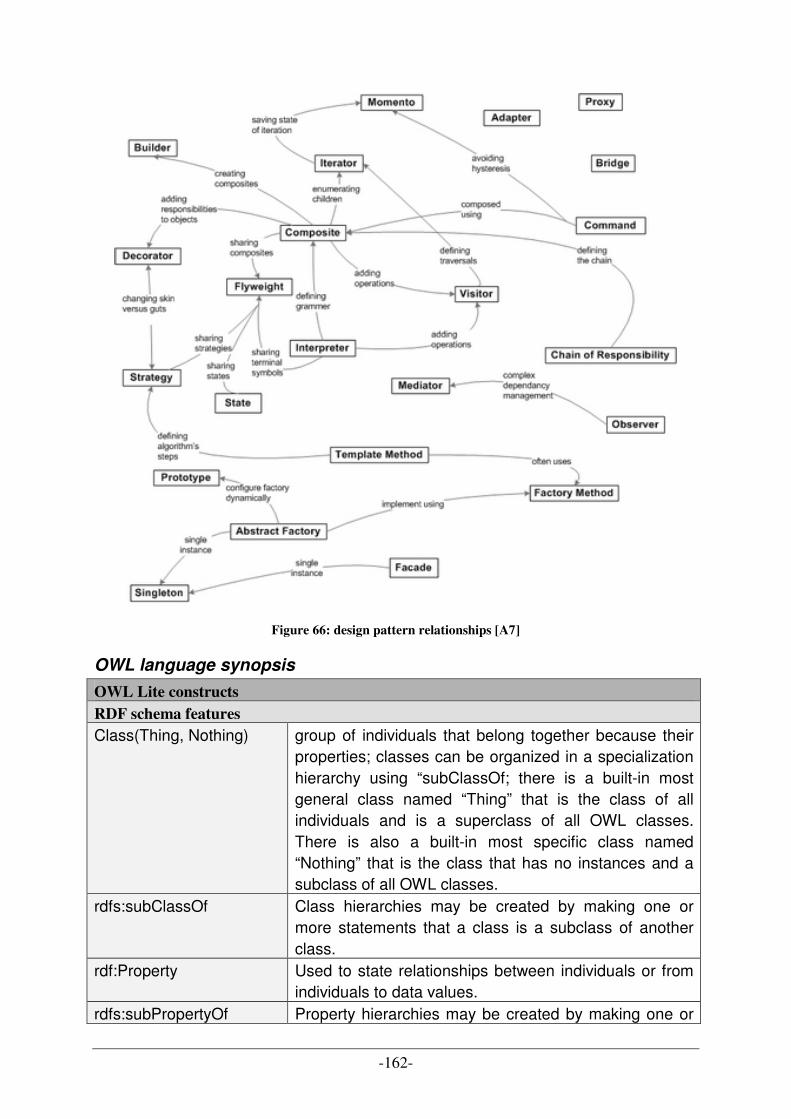
-162-
Figure 66: design pattern relationships [A7]
OWL language synopsis
OWL Lite constructs
RDF schema features Class(Thing, Nothing) group of individuals that belong together because their
properties; classes can be organized in a specialization hierarchy using “subClassOf; there is a built-in most general class named “Thing” that is the class of all individuals and is a superclass of all OWL classes. There is also a built-in most specific class named “Nothing” that is the class that has no instances and a subclass of all OWL classes.
rdfs:subClassOf Class hierarchies may be created by making one or more statements that a class is a subclass of another class.
rdf:Property Used to state relationships between individuals or from individuals to data values.
rdfs:subPropertyOf Property hierarchies may be created by making one or
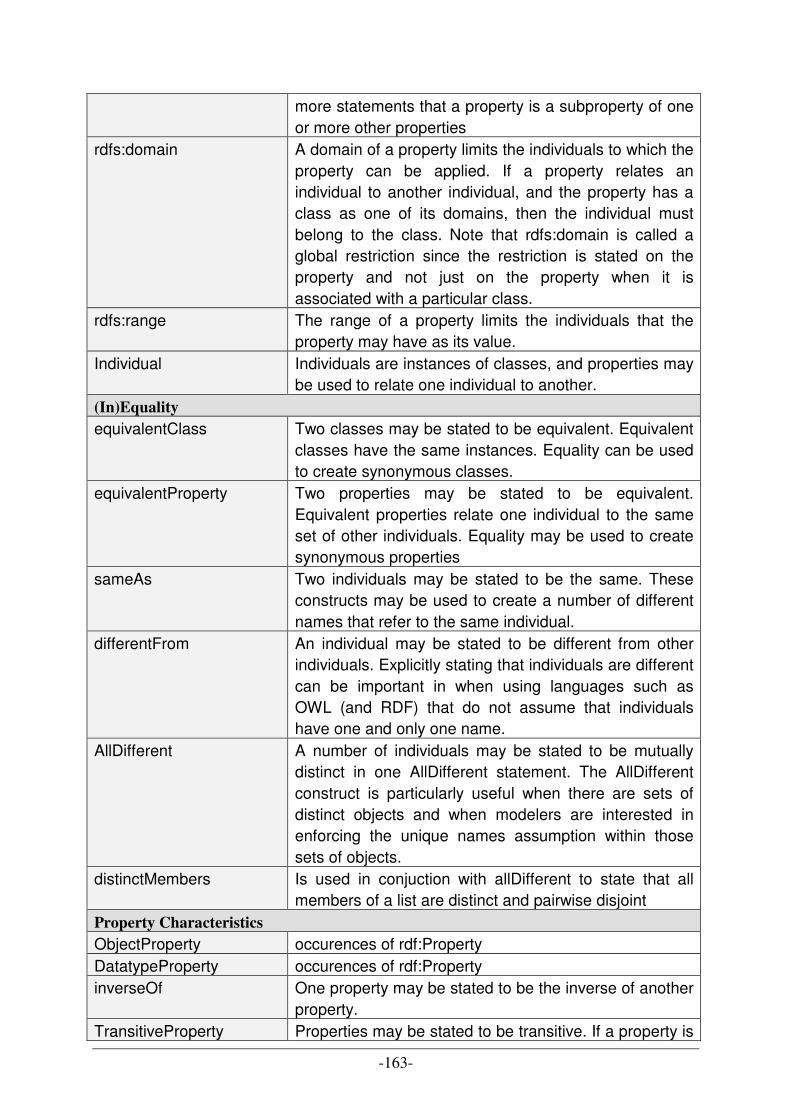
-163-
more statements that a property is a subproperty of one or more other properties
rdfs:domain A domain of a property limits the individuals to which the property can be applied. If a property relates an individual to another individual, and the property has a class as one of its domains, then the individual must belong to the class. Note that rdfs:domain is called a global restriction since the restriction is stated on the property and not just on the property when it is associated with a particular class.
rdfs:range The range of a property limits the individuals that the property may have as its value.
Individual Individuals are instances of classes, and properties may be used to relate one individual to another.
(In)Equality equivalentClass Two classes may be stated to be equivalent. Equivalent
classes have the same instances. Equality can be used to create synonymous classes.
equivalentProperty Two properties may be stated to be equivalent. Equivalent properties relate one individual to the same set of other individuals. Equality may be used to create synonymous properties
sameAs Two individuals may be stated to be the same. These constructs may be used to create a number of different names that refer to the same individual.
differentFrom An individual may be stated to be different from other individuals. Explicitly stating that individuals are different can be important in when using languages such as OWL (and RDF) that do not assume that individuals have one and only one name.
AllDifferent A number of individuals may be stated to be mutually distinct in one AllDifferent statement. The AllDifferent construct is particularly useful when there are sets of distinct objects and when modelers are interested in enforcing the unique names assumption within those sets of objects.
distinctMembers Is used in conjuction with allDifferent to state that all members of a list are distinct and pairwise disjoint
Property Characteristics ObjectProperty occurences of rdf:Property DatatypeProperty occurences of rdf:Property inverseOf One property may be stated to be the inverse of another
property. TransitiveProperty Properties may be stated to be transitive. If a property is
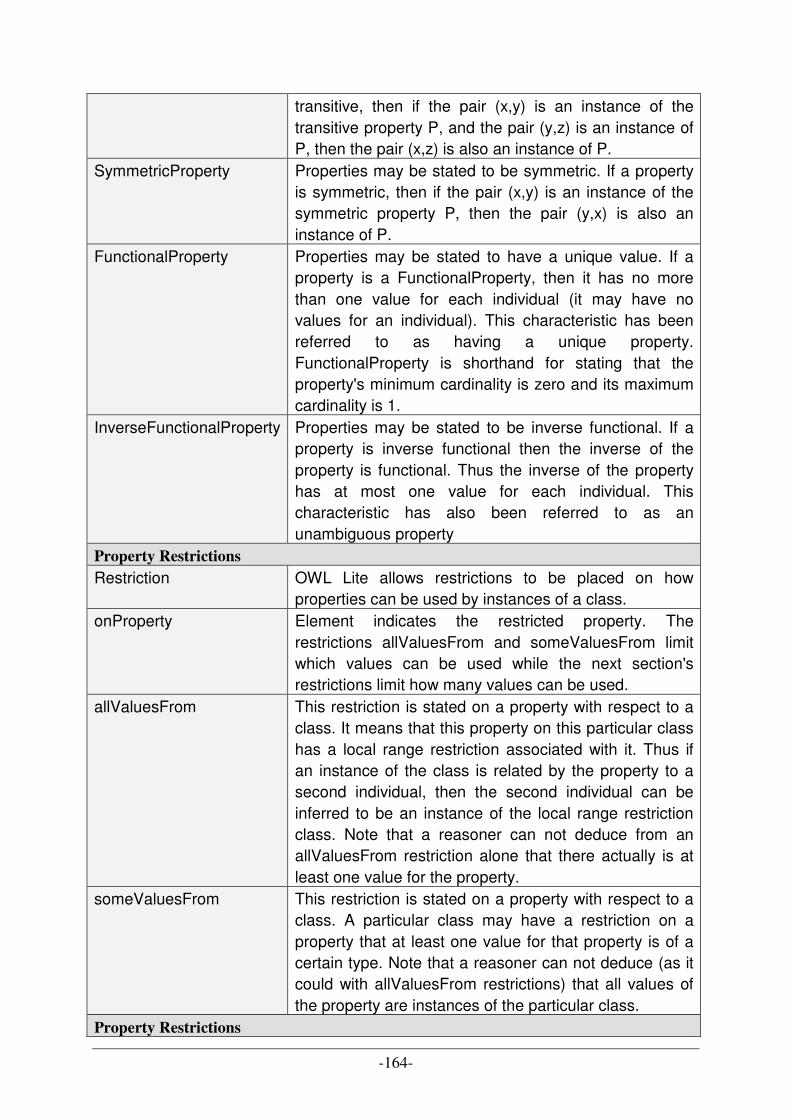
-164-
transitive, then if the pair (x,y) is an instance of the transitive property P, and the pair (y,z) is an instance of P, then the pair (x,z) is also an instance of P.
SymmetricProperty Properties may be stated to be symmetric. If a property is symmetric, then if the pair (x,y) is an instance of the symmetric property P, then the pair (y,x) is also an instance of P.
FunctionalProperty Properties may be stated to have a unique value. If a property is a FunctionalProperty, then it has no more than one value for each individual (it may have no values for an individual). This characteristic has been referred to as having a unique property. FunctionalProperty is shorthand for stating that the property's minimum cardinality is zero and its maximum cardinality is 1.
InverseFunctionalProperty Properties may be stated to be inverse functional. If a property is inverse functional then the inverse of the property is functional. Thus the inverse of the property has at most one value for each individual. This characteristic has also been referred to as an unambiguous property
Property Restrictions Restriction OWL Lite allows restrictions to be placed on how
properties can be used by instances of a class. onProperty Element indicates the restricted property. The
restrictions allValuesFrom and someValuesFrom limit which values can be used while the next section's restrictions limit how many values can be used.
allValuesFrom This restriction is stated on a property with respect to a class. It means that this property on this particular class has a local range restriction associated with it. Thus if an instance of the class is related by the property to a second individual, then the second individual can be inferred to be an instance of the local range restriction class. Note that a reasoner can not deduce from an allValuesFrom restriction alone that there actually is at least one value for the property.
someValuesFrom This restriction is stated on a property with respect to a class. A particular class may have a restriction on a property that at least one value for that property is of a certain type. Note that a reasoner can not deduce (as it could with allValuesFrom restrictions) that all values of the property are instances of the particular class.
Property Restrictions
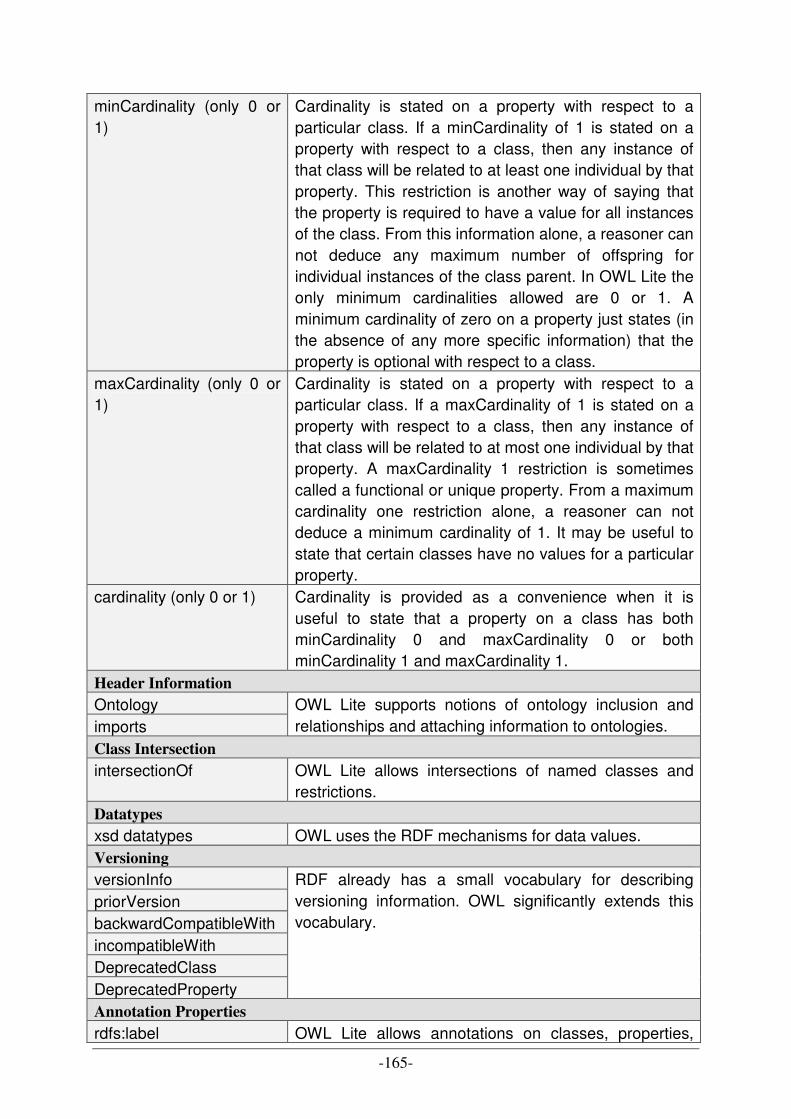
-165-
minCardinality (only 0 or 1)
Cardinality is stated on a property with respect to a particular class. If a minCardinality of 1 is stated on a property with respect to a class, then any instance of that class will be related to at least one individual by that property. This restriction is another way of saying that the property is required to have a value for all instances of the class. From this information alone, a reasoner can not deduce any maximum number of offspring for individual instances of the class parent. In OWL Lite the only minimum cardinalities allowed are 0 or 1. A minimum cardinality of zero on a property just states (in the absence of any more specific information) that the property is optional with respect to a class.
maxCardinality (only 0 or 1)
Cardinality is stated on a property with respect to a particular class. If a maxCardinality of 1 is stated on a property with respect to a class, then any instance of that class will be related to at most one individual by that property. A maxCardinality 1 restriction is sometimes called a functional or unique property. From a maximum cardinality one restriction alone, a reasoner can not deduce a minimum cardinality of 1. It may be useful to state that certain classes have no values for a particular property.
cardinality (only 0 or 1) Cardinality is provided as a convenience when it is useful to state that a property on a class has both minCardinality 0 and maxCardinality 0 or both minCardinality 1 and maxCardinality 1.
Header Information Ontology imports
OWL Lite supports notions of ontology inclusion and relationships and attaching information to ontologies.
Class Intersection intersectionOf OWL Lite allows intersections of named classes and
restrictions. Datatypes xsd datatypes OWL uses the RDF mechanisms for data values. Versioning versionInfo priorVersion backwardCompatibleWith incompatibleWith DeprecatedClass DeprecatedProperty
RDF already has a small vocabulary for describing versioning information. OWL significantly extends this vocabulary.
Annotation Properties rdfs:label OWL Lite allows annotations on classes, properties,
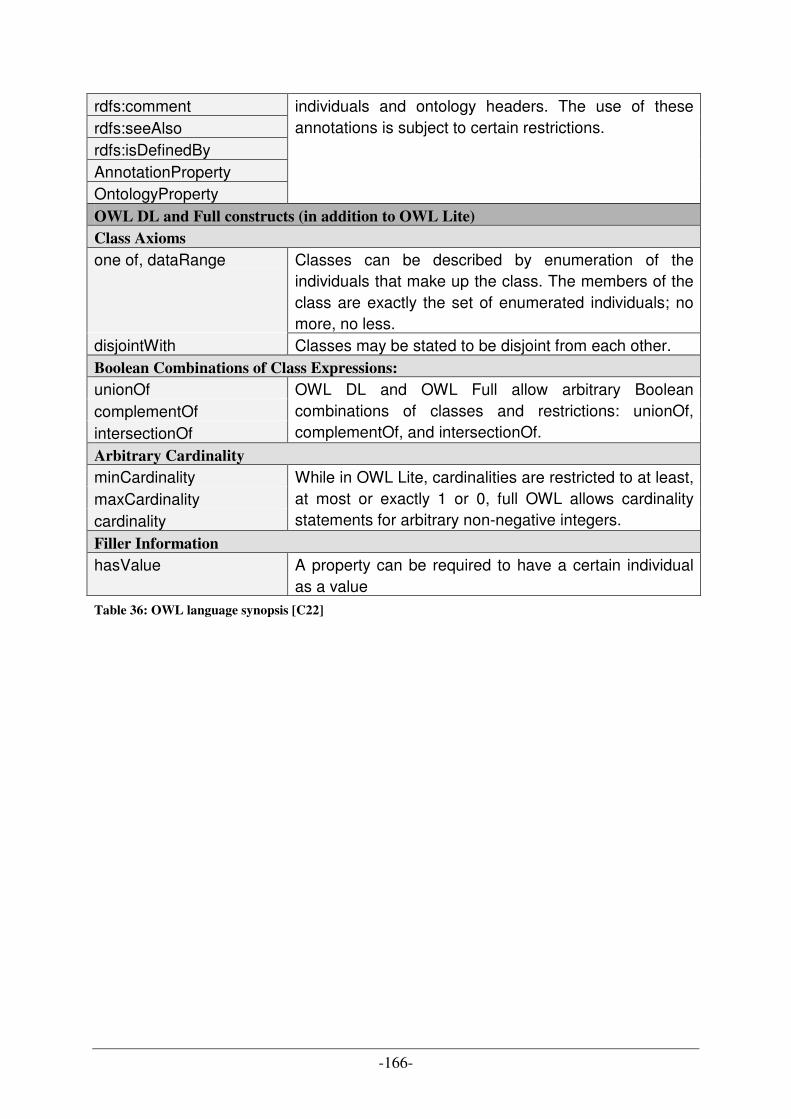
-166-
rdfs:comment rdfs:seeAlso rdfs:isDefinedBy AnnotationProperty OntologyProperty
individuals and ontology headers. The use of these annotations is subject to certain restrictions.
OWL DL and Full constructs (in addition to OWL Lite)
Class Axioms one of, dataRange Classes can be described by enumeration of the
individuals that make up the class. The members of the class are exactly the set of enumerated individuals; no more, no less.
disjointWith Classes may be stated to be disjoint from each other. Boolean Combinations of Class Expressions: unionOf complementOf intersectionOf
OWL DL and OWL Full allow arbitrary Boolean combinations of classes and restrictions: unionOf, complementOf, and intersectionOf.
Arbitrary Cardinality minCardinality maxCardinality cardinality
While in OWL Lite, cardinalities are restricted to at least, at most or exactly 1 or 0, full OWL allows cardinality statements for arbitrary non-negative integers.
Filler Information hasValue A property can be required to have a certain individual
as a value Table 36: OWL language synopsis [C22]
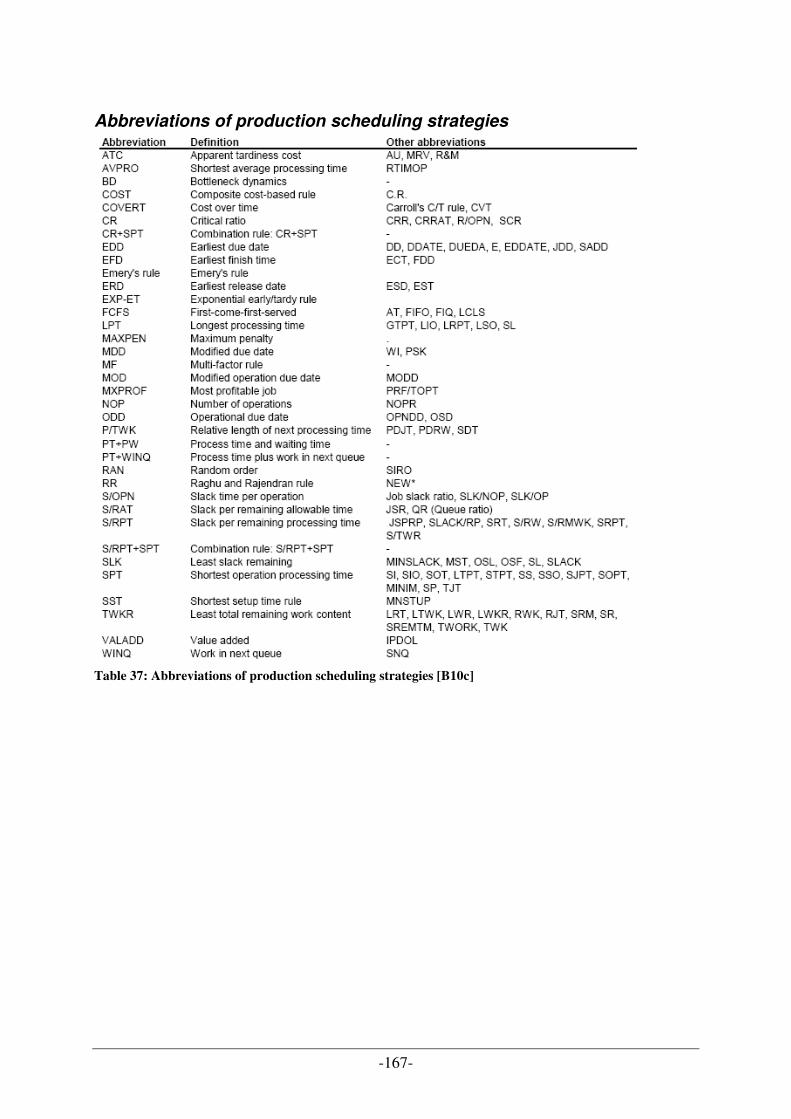
-167-
Abbreviations of production scheduling strategies
Table 37: Abbreviations of production scheduling strategies [B10c]
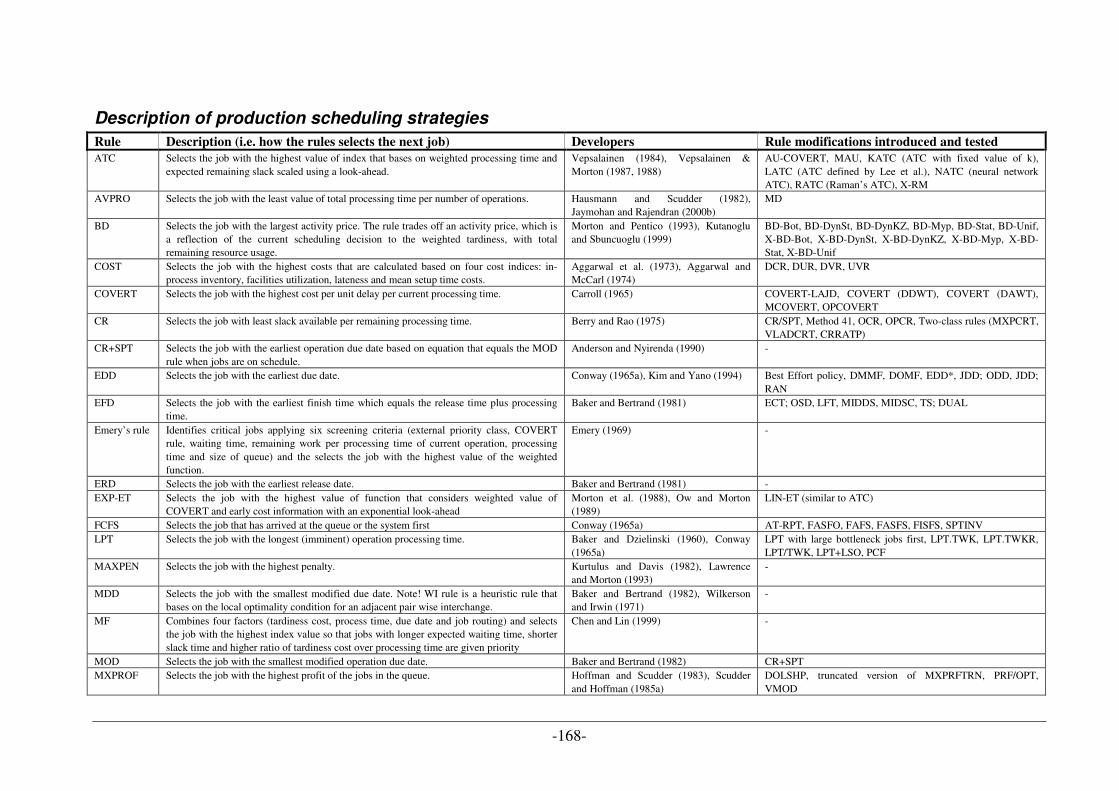
-168-
Description of production scheduling strategies
Rule Description (i.e. how the rules selects the next job) Developers Rule modifications introduced and tested
ATC Selects the job with the highest value of index that bases on weighted processing time and expected remaining slack scaled using a look-ahead.
Vepsalainen (1984), Vepsalainen & Morton (1987, 1988)
AU-COVERT, MAU, KATC (ATC with fixed value of k), LATC (ATC defined by Lee et al.), NATC (neural network ATC), RATC (Raman’s ATC), X-RM
AVPRO Selects the job with the least value of total processing time per number of operations. Hausmann and Scudder (1982), Jaymohan and Rajendran (2000b)
MD
BD Selects the job with the largest activity price. The rule trades off an activity price, which is a reflection of the current scheduling decision to the weighted tardiness, with total remaining resource usage.
Morton and Pentico (1993), Kutanoglu and Sbuncuoglu (1999)
BD-Bot, BD-DynSt, BD-DynKZ, BD-Myp, BD-Stat, BD-Unif, X-BD-Bot, X-BD-DynSt, X-BD-DynKZ, X-BD-Myp, X-BD-Stat, X-BD-Unif
COST Selects the job with the highest costs that are calculated based on four cost indices: in-process inventory, facilities utilization, lateness and mean setup time costs.
Aggarwal et al. (1973), Aggarwal and McCarl (1974)
DCR, DUR, DVR, UVR
COVERT Selects the job with the highest cost per unit delay per current processing time. Carroll (1965) COVERT-LAJD, COVERT (DDWT), COVERT (DAWT), MCOVERT, OPCOVERT
CR Selects the job with least slack available per remaining processing time. Berry and Rao (1975) CR/SPT, Method 41, OCR, OPCR, Two-class rules (MXPCRT, VLADCRT, CRRATP)
CR+SPT Selects the job with the earliest operation due date based on equation that equals the MOD rule when jobs are on schedule.
Anderson and Nyirenda (1990) -
EDD Selects the job with the earliest due date. Conway (1965a), Kim and Yano (1994) Best Effort policy, DMMF, DOMF, EDD*, JDD; ODD, JDD; RAN
EFD Selects the job with the earliest finish time which equals the release time plus processing time.
Baker and Bertrand (1981) ECT; OSD, LFT, MIDDS, MIDSC, TS; DUAL
Emery’s rule Identifies critical jobs applying six screening criteria (external priority class, COVERT rule, waiting time, remaining work per processing time of current operation, processing time and size of queue) and the selects the job with the highest value of the weighted function.
Emery (1969) -
ERD Selects the job with the earliest release date. Baker and Bertrand (1981) - EXP-ET Selects the job with the highest value of function that considers weighted value of
COVERT and early cost information with an exponential look-ahead Morton et al. (1988), Ow and Morton (1989)
LIN-ET (similar to ATC)
FCFS Selects the job that has arrived at the queue or the system first Conway (1965a) AT-RPT, FASFO, FAFS, FASFS, FISFS, SPTINV LPT Selects the job with the longest (imminent) operation processing time. Baker and Dzielinski (1960), Conway
(1965a) LPT with large bottleneck jobs first, LPT.TWK, LPT.TWKR, LPT/TWK, LPT+LSO, PCF
MAXPEN Selects the job with the highest penalty. Kurtulus and Davis (1982), Lawrence and Morton (1993)
-
MDD Selects the job with the smallest modified due date. Note! WI rule is a heuristic rule that bases on the local optimality condition for an adjacent pair wise interchange.
Baker and Bertrand (1982), Wilkerson and Irwin (1971)
-
MF Combines four factors (tardiness cost, process time, due date and job routing) and selects the job with the highest index value so that jobs with longer expected waiting time, shorter slack time and higher ratio of tardiness cost over processing time are given priority
Chen and Lin (1999) -
MOD Selects the job with the smallest modified operation due date. Baker and Bertrand (1982) CR+SPT MXPROF Selects the job with the highest profit of the jobs in the queue. Hoffman and Scudder (1983), Scudder
and Hoffman (1985a) DOLSHP, truncated version of MXPRFTRN, PRF/OPT, VMOD
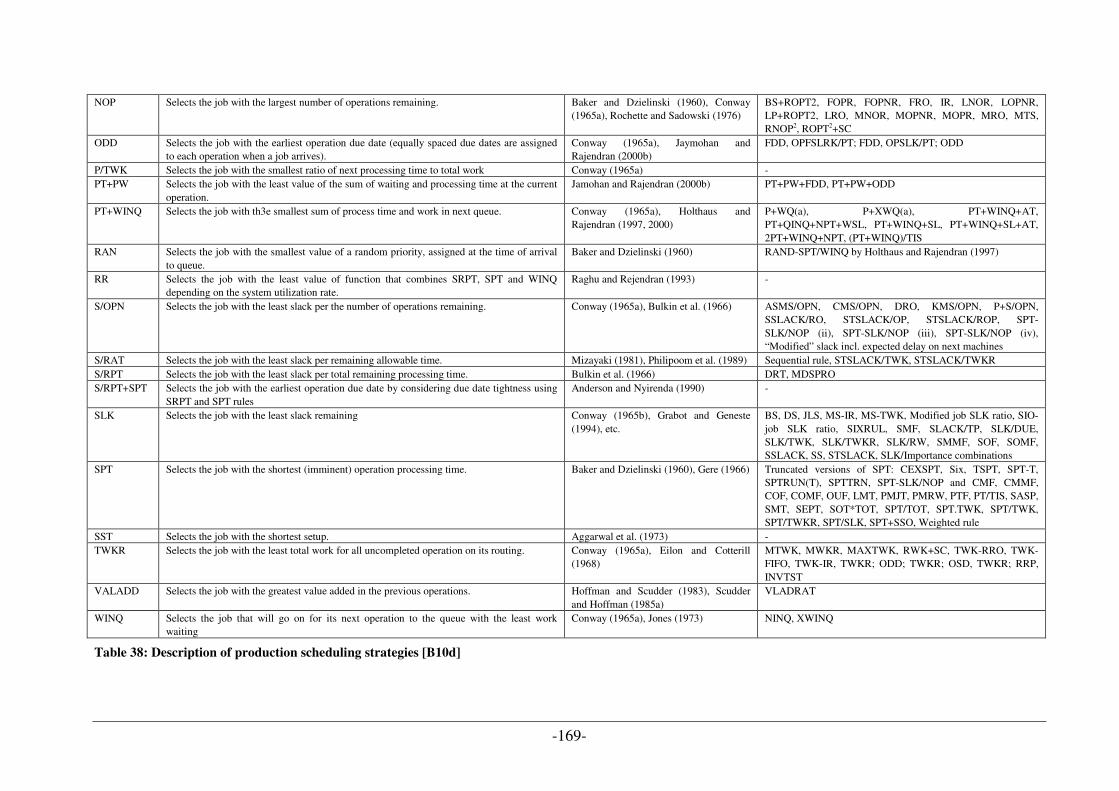
-169-
NOP Selects the job with the largest number of operations remaining. Baker and Dzielinski (1960), Conway (1965a), Rochette and Sadowski (1976)
BS+ROPT2, FOPR, FOPNR, FRO, IR, LNOR, LOPNR, LP+ROPT2, LRO, MNOR, MOPNR, MOPR, MRO, MTS, RNOP2, ROPT2+SC
ODD Selects the job with the earliest operation due date (equally spaced due dates are assigned to each operation when a job arrives).
Conway (1965a), Jaymohan and Rajendran (2000b)
FDD, OPFSLRK/PT; FDD, OPSLK/PT; ODD
P/TWK Selects the job with the smallest ratio of next processing time to total work Conway (1965a) - PT+PW Selects the job with the least value of the sum of waiting and processing time at the current
operation. Jamohan and Rajendran (2000b) PT+PW+FDD, PT+PW+ODD
PT+WINQ Selects the job with th3e smallest sum of process time and work in next queue. Conway (1965a), Holthaus and Rajendran (1997, 2000)
P+WQ(a), P+XWQ(a), PT+WINQ+AT, PT+QINQ+NPT+WSL, PT+WINQ+SL, PT+WINQ+SL+AT, 2PT+WINQ+NPT, (PT+WINQ)/TIS
RAN Selects the job with the smallest value of a random priority, assigned at the time of arrival to queue.
Baker and Dzielinski (1960) RAND-SPT/WINQ by Holthaus and Rajendran (1997)
RR Selects the job with the least value of function that combines SRPT, SPT and WINQ depending on the system utilization rate.
Raghu and Rejendran (1993) -
S/OPN Selects the job with the least slack per the number of operations remaining. Conway (1965a), Bulkin et al. (1966) ASMS/OPN, CMS/OPN, DRO, KMS/OPN, P+S/OPN, SSLACK/RO, STSLACK/OP, STSLACK/ROP, SPT-SLK/NOP (ii), SPT-SLK/NOP (iii), SPT-SLK/NOP (iv), “Modified” slack incl. expected delay on next machines
S/RAT Selects the job with the least slack per remaining allowable time. Mizayaki (1981), Philipoom et al. (1989) Sequential rule, STSLACK/TWK, STSLACK/TWKR S/RPT Selects the job with the least slack per total remaining processing time. Bulkin et al. (1966) DRT, MDSPRO S/RPT+SPT Selects the job with the earliest operation due date by considering due date tightness using
SRPT and SPT rules Anderson and Nyirenda (1990) -
SLK Selects the job with the least slack remaining Conway (1965b), Grabot and Geneste (1994), etc.
BS, DS, JLS, MS-IR, MS-TWK, Modified job SLK ratio, SIO-job SLK ratio, SIXRUL, SMF, SLACK/TP, SLK/DUE, SLK/TWK, SLK/TWKR, SLK/RW, SMMF, SOF, SOMF, SSLACK, SS, STSLACK, SLK/Importance combinations
SPT Selects the job with the shortest (imminent) operation processing time. Baker and Dzielinski (1960), Gere (1966) Truncated versions of SPT: CEXSPT, Six, TSPT, SPT-T, SPTRUN(T), SPTTRN, SPT-SLK/NOP and CMF, CMMF, COF, COMF, OUF, LMT, PMJT, PMRW, PTF, PT/TIS, SASP, SMT, SEPT, SOT*TOT, SPT/TOT, SPT.TWK, SPT/TWK, SPT/TWKR, SPT/SLK, SPT+SSO, Weighted rule
SST Selects the job with the shortest setup. Aggarwal et al. (1973) - TWKR Selects the job with the least total work for all uncompleted operation on its routing. Conway (1965a), Eilon and Cotterill
(1968) MTWK, MWKR, MAXTWK, RWK+SC, TWK-RRO, TWK-FIFO, TWK-IR, TWKR; ODD; TWKR; OSD, TWKR; RRP, INVTST
VALADD Selects the job with the greatest value added in the previous operations. Hoffman and Scudder (1983), Scudder and Hoffman (1985a)
VLADRAT
WINQ Selects the job that will go on for its next operation to the queue with the least work waiting
Conway (1965a), Jones (1973) NINQ, XWINQ
Table 38: Description of production scheduling strategies [B10d]