Embed Size (px)
Citation preview
2008T Debug Screens
Part Number 490139 Rev. G
Fresenius Medical Care North America 920 Winter St.
Waltham, MA 02451
Manufactured by: Fresenius USA, Inc. 4040 Nelson Avenue Concord, CA 94520
Copyright 2010 - 2019 Fresenius Medical Care North America, All Rights Reserved
2008®T Debug Screens This document contains proprietary information of Fresenius USA, Inc. d/b/a Fresenius Medical Care North America and its affiliates (“Fresenius Medical Care”). The contents of this document may not be disclosed to third parties, copied, or duplicated in any form, in whole or in part, without the prior written permission of Fresenius Medical Care.
Fresenius Medical Care, the triangle logo, 2008, bibag and DIASAFE are trademarks of Fresenius Medical Care Holdings, Inc., or its affiliated companies. All other trademarks are the property of their respective owners.
Caution: US Federal law restricts this device to sale only by or on the order of a physician. Frequency, duration, and parameters of treatment are to be determined by the prescribing physician.
Installation, maintenance, calibration and other technical information may be found in the 2008T Technician’s Manual, P/N 490130.
Contact Fresenius Medical Care Technical Support for applicable Field Service Bulletins. The spare parts manual for the model 2008T and other information may be found on our web site at www.fmcna.com
Indications for Use: The 2008T hemodialysis machine is indicated for acute and chronic dialysis therapy.
TABLE OF CONTENT DEBUG SCREEN 0 - HYDRAULIC FLOW ...................................................................... 1
DEBUG SCREEN 1 - HYDRAULICS .............................................................................. 5
DEBUG SCREEN 2 - INPUTS / OUTPUTS .................................................................. 10
DEBUG SCREEN 3 - ACTUATOR ................................................................................ 15
DEBUG SCREEN 4 - ELECTRONICS .......................................................................... 18
DEBUG SCREEN 5 - ON-LINE CLEARANCE .............................................................. 21
DEBUG SCREEN 6 - ON-LINE CLEARANCE 2 ........................................................... 25
DEBUG SCREEN 7 - BP HISTORY .............................................................................. 29
DEBUG SCREEN 8 - UF EVENTS ............................................................................... 30
DEBUG SCREEN 9 - BTM EVENTS ............................................................................. 32
DEBUG SCREEN 10 - ADC HI LO ................................................................................ 34
DEBUG SCREEN 11 - BIT HI LO.................................................................................. 38
DEBUG SCREEN 12 - BATRAM DATA ........................................................................ 42
DEBUG SCREEN 13 - TEMP CONTROL ..................................................................... 43
DEBUG SCREEN 14 - BIBAG ...................................................................................... 46
DEBUG SCREEN 15 - BIC MON & ACT. REG ............................................................. 52
Accessing Debug Screens
The Debug Screens can be accessed in both Dialysis mode and Rinse Mode by pressing and holding the CTRL key and then pressing the up and down arrow keys at the same time on the keyboard. Use the up and down arrow keys individually to scroll through each Debug Screen.
Note
This document is written for the 2008T Hemodialysis System using functional software version 2.71. Older software versions may not have all Debug Screens illustrated in this document and some may look different and have different or missing data boxes.
Debug Screen 0 – Hydraulic Flow
P/N 490139 Rev. G Page 1
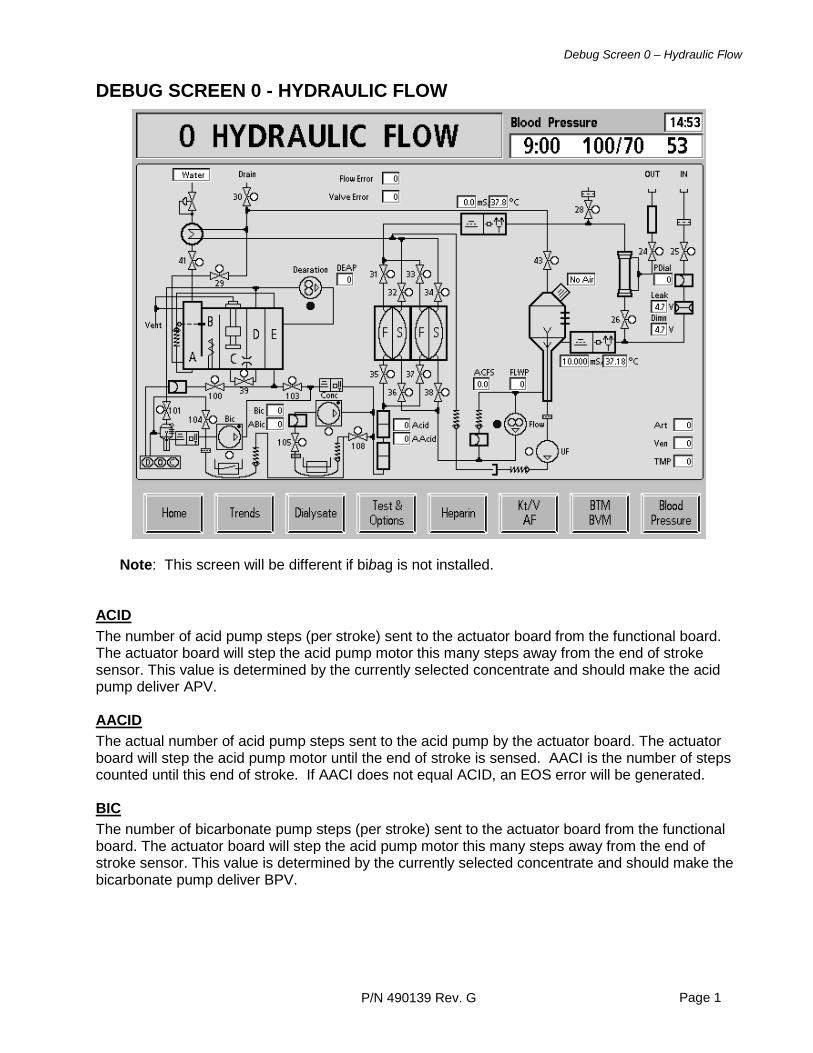
DEBUG SCREEN 0 - HYDRAULIC FLOW
Note: This screen will be different if bibag is not installed.
ACID The number of acid pump steps (per stroke) sent to the actuator board from the functional board. The actuator board will step the acid pump motor this many steps away from the end of stroke sensor. This value is determined by the currently selected concentrate and should make the acid pump deliver APV. AACID The actual number of acid pump steps sent to the acid pump by the actuator board. The actuator board will step the acid pump motor until the end of stroke is sensed. AACI is the number of steps counted until this end of stroke. If AACI does not equal ACID, an EOS error will be generated. BIC The number of bicarbonate pump steps (per stroke) sent to the actuator board from the functional board. The actuator board will step the acid pump motor this many steps away from the end of stroke sensor. This value is determined by the currently selected concentrate and should make the bicarbonate pump deliver BPV.
Debug Screen 0 – Hydraulic Flow
P/N 490139 Rev. G Page 2
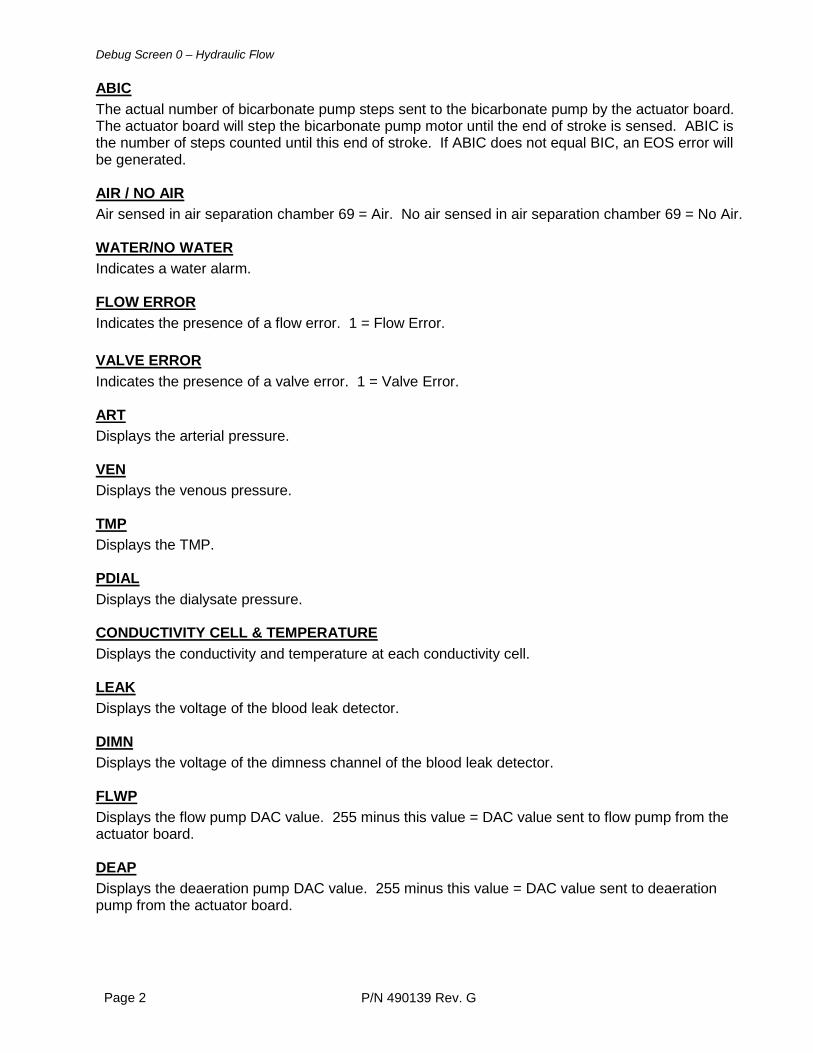
ABIC The actual number of bicarbonate pump steps sent to the bicarbonate pump by the actuator board. The actuator board will step the bicarbonate pump motor until the end of stroke is sensed. ABIC is the number of steps counted until this end of stroke. If ABIC does not equal BIC, an EOS error will be generated. AIR / NO AIR Air sensed in air separation chamber 69 = Air. No air sensed in air separation chamber 69 = No Air. WATER/NO WATER Indicates a water alarm. FLOW ERROR Indicates the presence of a flow error. 1 = Flow Error. VALVE ERROR Indicates the presence of a valve error. 1 = Valve Error. ART Displays the arterial pressure. VEN Displays the venous pressure. TMP Displays the TMP. PDIAL Displays the dialysate pressure. CONDUCTIVITY CELL & TEMPERATURE Displays the conductivity and temperature at each conductivity cell. LEAK Displays the voltage of the blood leak detector. DIMN Displays the voltage of the dimness channel of the blood leak detector. FLWP Displays the flow pump DAC value. 255 minus this value = DAC value sent to flow pump from the actuator board. DEAP Displays the deaeration pump DAC value. 255 minus this value = DAC value sent to deaeration pump from the actuator board.
Debug Screen 0 – Hydraulic Flow
P/N 490139 Rev. G Page 3
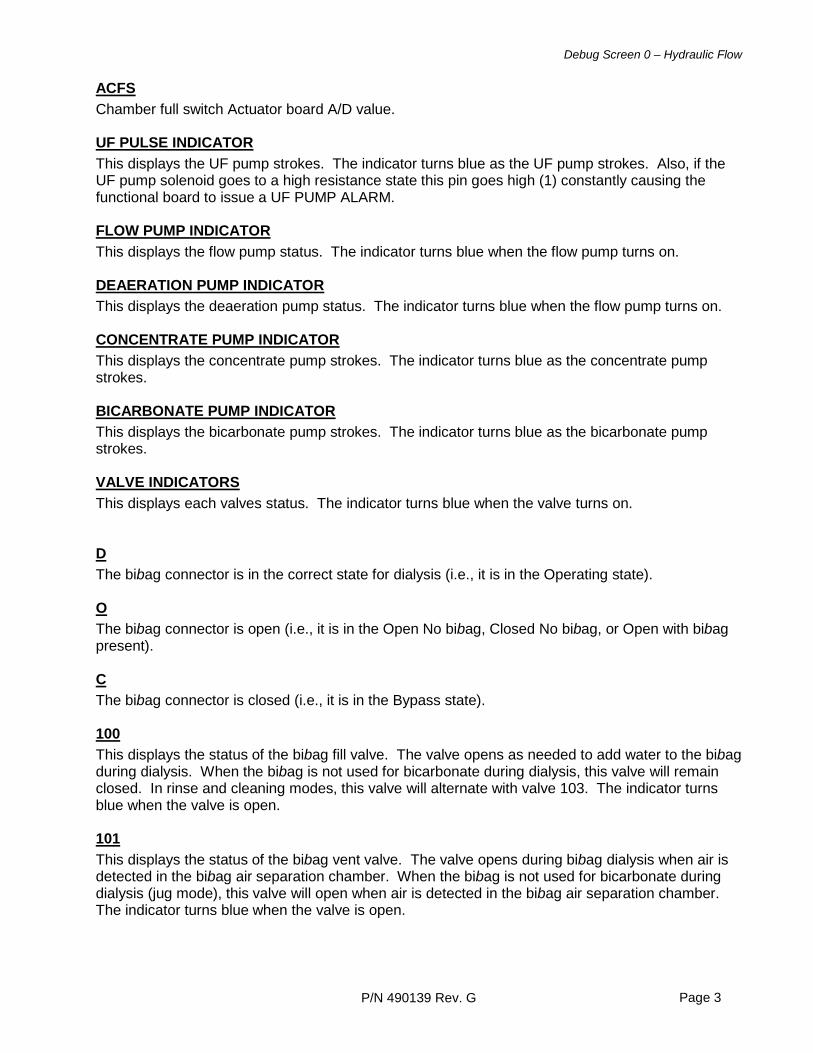
ACFS Chamber full switch Actuator board A/D value. UF PULSE INDICATOR This displays the UF pump strokes. The indicator turns blue as the UF pump strokes. Also, if the UF pump solenoid goes to a high resistance state this pin goes high (1) constantly causing the functional board to issue a UF PUMP ALARM. FLOW PUMP INDICATOR This displays the flow pump status. The indicator turns blue when the flow pump turns on. DEAERATION PUMP INDICATOR This displays the deaeration pump status. The indicator turns blue when the flow pump turns on. CONCENTRATE PUMP INDICATOR This displays the concentrate pump strokes. The indicator turns blue as the concentrate pump strokes. BICARBONATE PUMP INDICATOR This displays the bicarbonate pump strokes. The indicator turns blue as the bicarbonate pump strokes. VALVE INDICATORS This displays each valves status. The indicator turns blue when the valve turns on. D The bibag connector is in the correct state for dialysis (i.e., it is in the Operating state). O The bibag connector is open (i.e., it is in the Open No bibag, Closed No bibag, or Open with bibag present). C The bibag connector is closed (i.e., it is in the Bypass state). 100 This displays the status of the bibag fill valve. The valve opens as needed to add water to the bibag during dialysis. When the bibag is not used for bicarbonate during dialysis, this valve will remain closed. In rinse and cleaning modes, this valve will alternate with valve 103. The indicator turns blue when the valve is open. 101 This displays the status of the bibag vent valve. The valve opens during bibag dialysis when air is detected in the bibag air separation chamber. When the bibag is not used for bicarbonate during dialysis (jug mode), this valve will open when air is detected in the bibag air separation chamber. The indicator turns blue when the valve is open.
Debug Screen 0 – Hydraulic Flow
P/N 490139 Rev. G Page 4
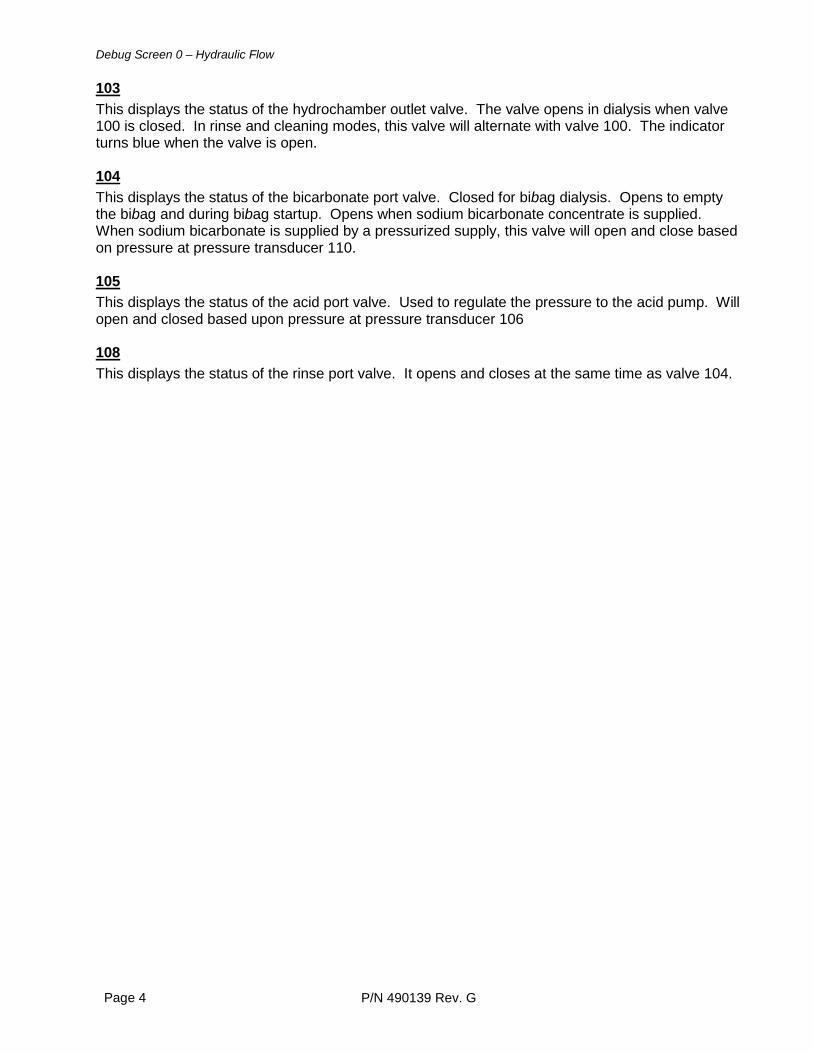
103 This displays the status of the hydrochamber outlet valve. The valve opens in dialysis when valve 100 is closed. In rinse and cleaning modes, this valve will alternate with valve 100. The indicator turns blue when the valve is open. 104 This displays the status of the bicarbonate port valve. Closed for bibag dialysis. Opens to empty the bibag and during bibag startup. Opens when sodium bicarbonate concentrate is supplied. When sodium bicarbonate is supplied by a pressurized supply, this valve will open and close based on pressure at pressure transducer 110. 105 This displays the status of the acid port valve. Used to regulate the pressure to the acid pump. Will open and closed based upon pressure at pressure transducer 106 108 This displays the status of the rinse port valve. It opens and closes at the same time as valve 104.
Debug Screen 1 – Hydraulics
P/N 490139 Rev. G Page 5
DEBUG SCREEN 1 - HYDRAULICS
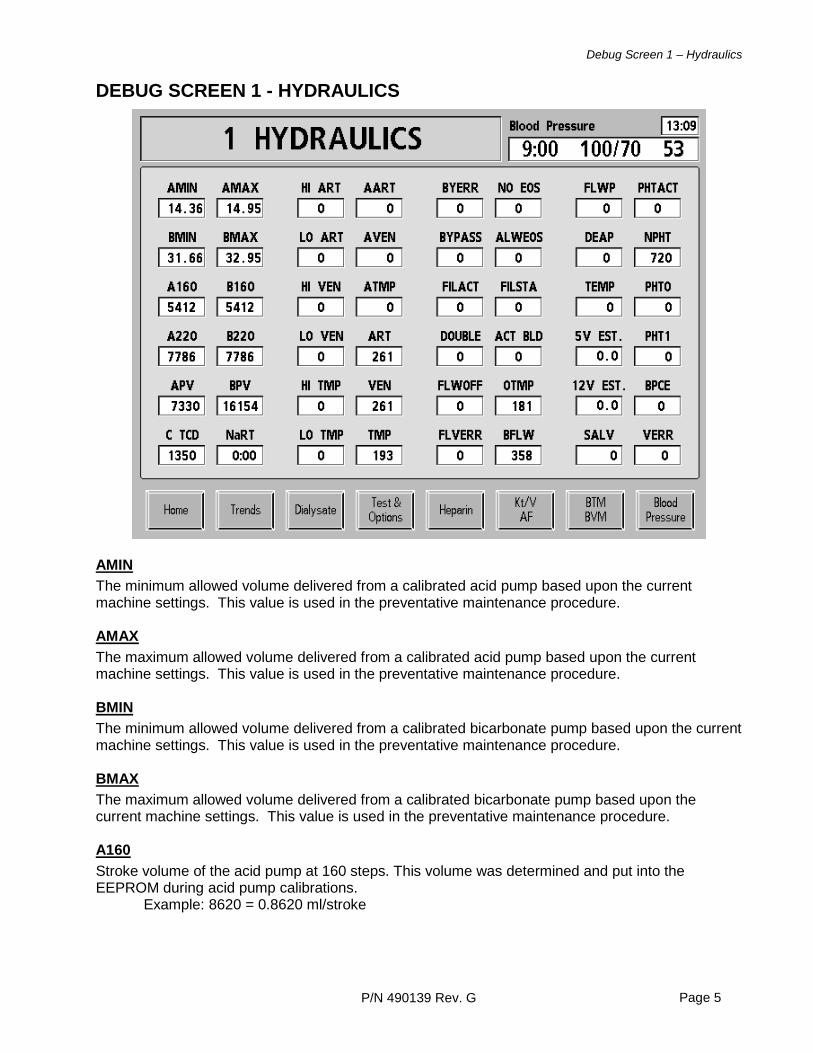
AMIN The minimum allowed volume delivered from a calibrated acid pump based upon the current machine settings. This value is used in the preventative maintenance procedure. AMAX The maximum allowed volume delivered from a calibrated acid pump based upon the current machine settings. This value is used in the preventative maintenance procedure. BMIN The minimum allowed volume delivered from a calibrated bicarbonate pump based upon the current machine settings. This value is used in the preventative maintenance procedure. BMAX The maximum allowed volume delivered from a calibrated bicarbonate pump based upon the current machine settings. This value is used in the preventative maintenance procedure. A160 Stroke volume of the acid pump at 160 steps. This volume was determined and put into the EEPROM during acid pump calibrations. Example: 8620 = 0.8620 ml/stroke
Debug Screen 1 – Hydraulics
P/N 490139 Rev. G Page 6
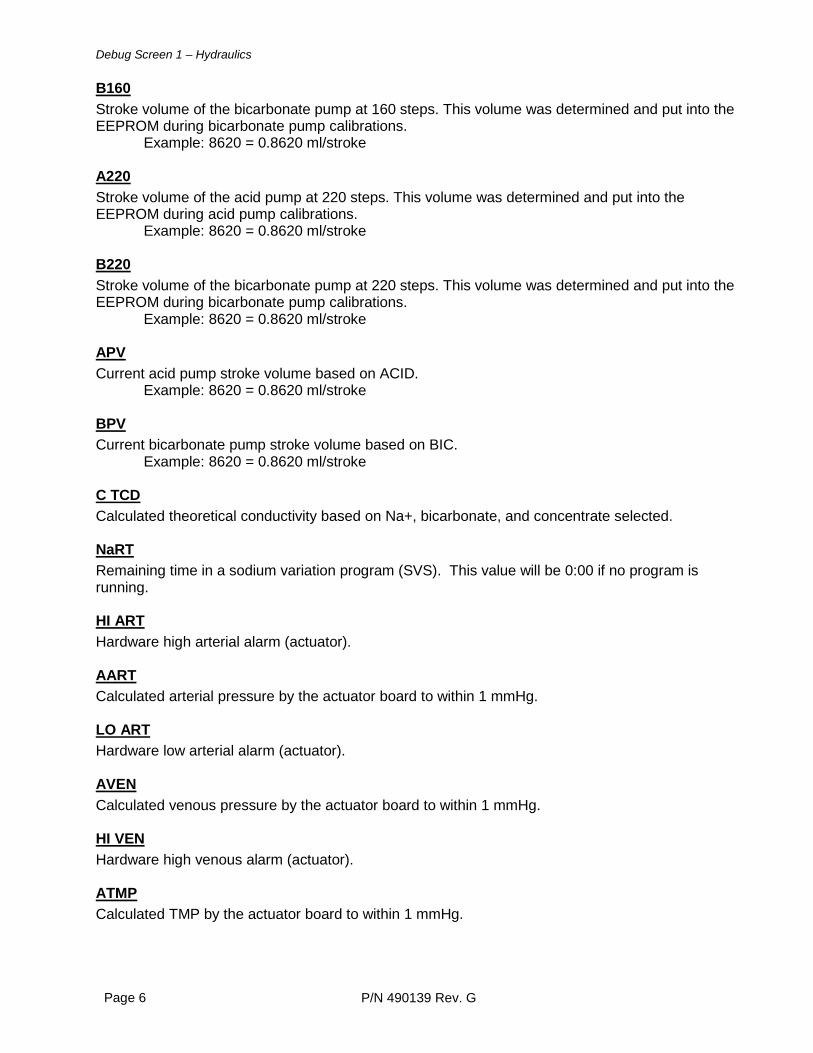
B160 Stroke volume of the bicarbonate pump at 160 steps. This volume was determined and put into the EEPROM during bicarbonate pump calibrations. Example: 8620 = 0.8620 ml/stroke A220 Stroke volume of the acid pump at 220 steps. This volume was determined and put into the EEPROM during acid pump calibrations. Example: 8620 = 0.8620 ml/stroke B220 Stroke volume of the bicarbonate pump at 220 steps. This volume was determined and put into the EEPROM during bicarbonate pump calibrations. Example: 8620 = 0.8620 ml/stroke APV Current acid pump stroke volume based on ACID. Example: 8620 = 0.8620 ml/stroke BPV Current bicarbonate pump stroke volume based on BIC. Example: 8620 = 0.8620 ml/stroke C TCD Calculated theoretical conductivity based on Na+, bicarbonate, and concentrate selected. NaRT Remaining time in a sodium variation program (SVS). This value will be 0:00 if no program is running. HI ART Hardware high arterial alarm (actuator). AART Calculated arterial pressure by the actuator board to within 1 mmHg. LO ART Hardware low arterial alarm (actuator). AVEN Calculated venous pressure by the actuator board to within 1 mmHg. HI VEN Hardware high venous alarm (actuator). ATMP Calculated TMP by the actuator board to within 1 mmHg.
Debug Screen 1 – Hydraulics
P/N 490139 Rev. G Page 7
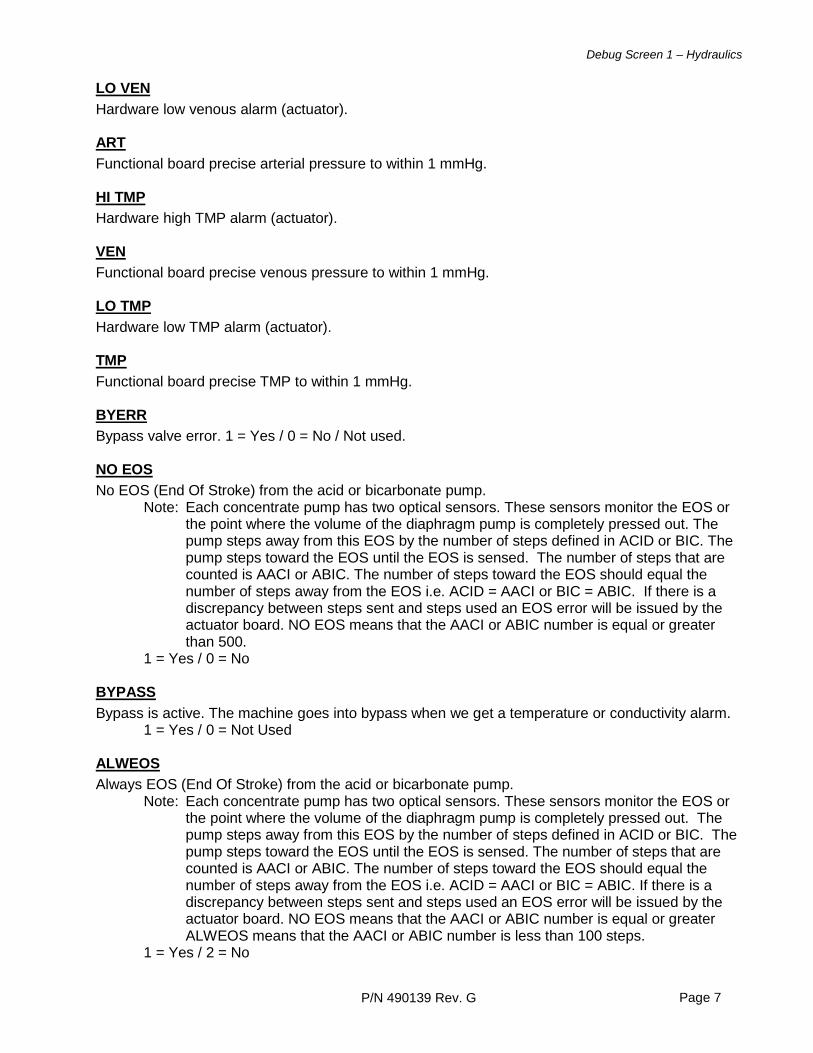
LO VEN Hardware low venous alarm (actuator). ART Functional board precise arterial pressure to within 1 mmHg. HI TMP Hardware high TMP alarm (actuator). VEN Functional board precise venous pressure to within 1 mmHg. LO TMP Hardware low TMP alarm (actuator). TMP Functional board precise TMP to within 1 mmHg. BYERR Bypass valve error. 1 = Yes / 0 = No / Not used. NO EOS No EOS (End Of Stroke) from the acid or bicarbonate pump. Note: Each concentrate pump has two optical sensors. These sensors monitor the EOS or
the point where the volume of the diaphragm pump is completely pressed out. The pump steps away from this EOS by the number of steps defined in ACID or BIC. The pump steps toward the EOS until the EOS is sensed. The number of steps that are counted is AACI or ABIC. The number of steps toward the EOS should equal the number of steps away from the EOS i.e. ACID = AACI or BIC = ABIC. If there is a discrepancy between steps sent and steps used an EOS error will be issued by the actuator board. NO EOS means that the AACI or ABIC number is equal or greater than 500.
1 = Yes / 0 = No BYPASS Bypass is active. The machine goes into bypass when we get a temperature or conductivity alarm. 1 = Yes / 0 = Not Used ALWEOS Always EOS (End Of Stroke) from the acid or bicarbonate pump. Note: Each concentrate pump has two optical sensors. These sensors monitor the EOS or
the point where the volume of the diaphragm pump is completely pressed out. The pump steps away from this EOS by the number of steps defined in ACID or BIC. The pump steps toward the EOS until the EOS is sensed. The number of steps that are counted is AACI or ABIC. The number of steps toward the EOS should equal the number of steps away from the EOS i.e. ACID = AACI or BIC = ABIC. If there is a discrepancy between steps sent and steps used an EOS error will be issued by the actuator board. NO EOS means that the AACI or ABIC number is equal or greater ALWEOS means that the AACI or ABIC number is less than 100 steps.
1 = Yes / 2 = No
Debug Screen 1 – Hydraulics
P/N 490139 Rev. G Page 8
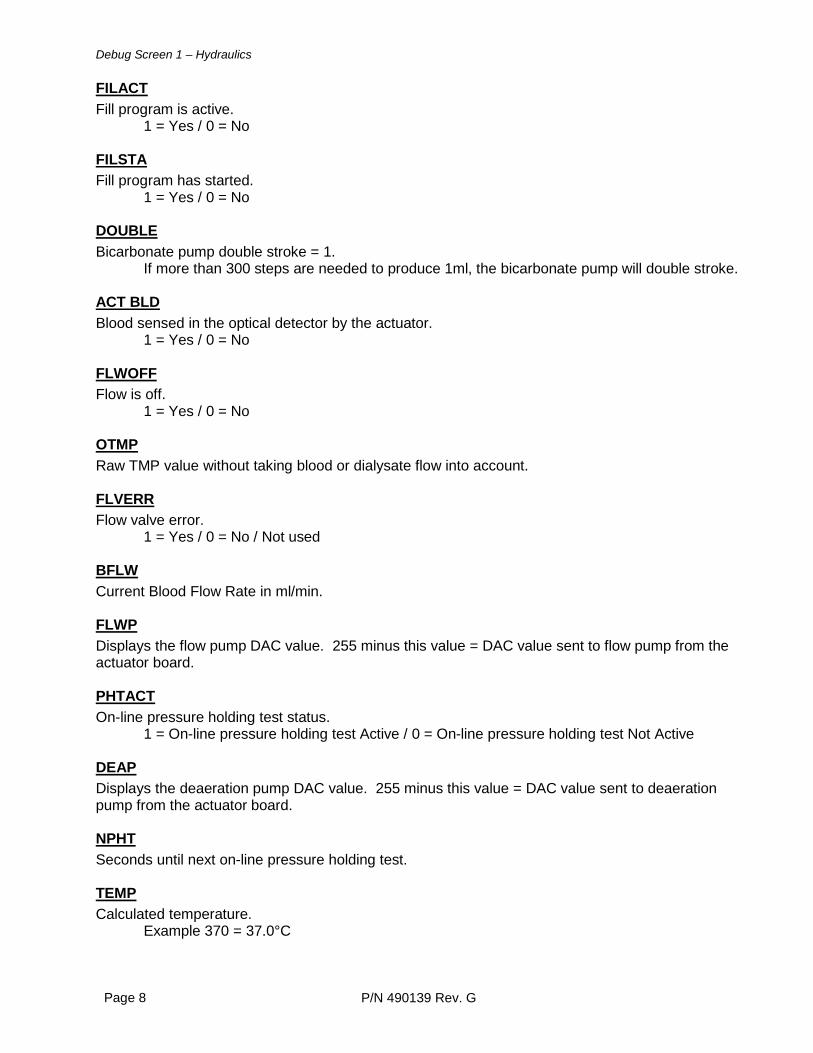
FILACT Fill program is active. 1 = Yes / 0 = No FILSTA Fill program has started. 1 = Yes / 0 = No DOUBLE Bicarbonate pump double stroke = 1. If more than 300 steps are needed to produce 1ml, the bicarbonate pump will double stroke. ACT BLD Blood sensed in the optical detector by the actuator. 1 = Yes / 0 = No FLWOFF Flow is off. 1 = Yes / 0 = No OTMP Raw TMP value without taking blood or dialysate flow into account. FLVERR Flow valve error. 1 = Yes / 0 = No / Not used BFLW Current Blood Flow Rate in ml/min. FLWP Displays the flow pump DAC value. 255 minus this value = DAC value sent to flow pump from the actuator board. PHTACT On-line pressure holding test status. 1 = On-line pressure holding test Active / 0 = On-line pressure holding test Not Active DEAP Displays the deaeration pump DAC value. 255 minus this value = DAC value sent to deaeration pump from the actuator board. NPHT Seconds until next on-line pressure holding test. TEMP Calculated temperature. Example 370 = 37.0°C
Debug Screen 1 – Hydraulics
P/N 490139 Rev. G Page 9
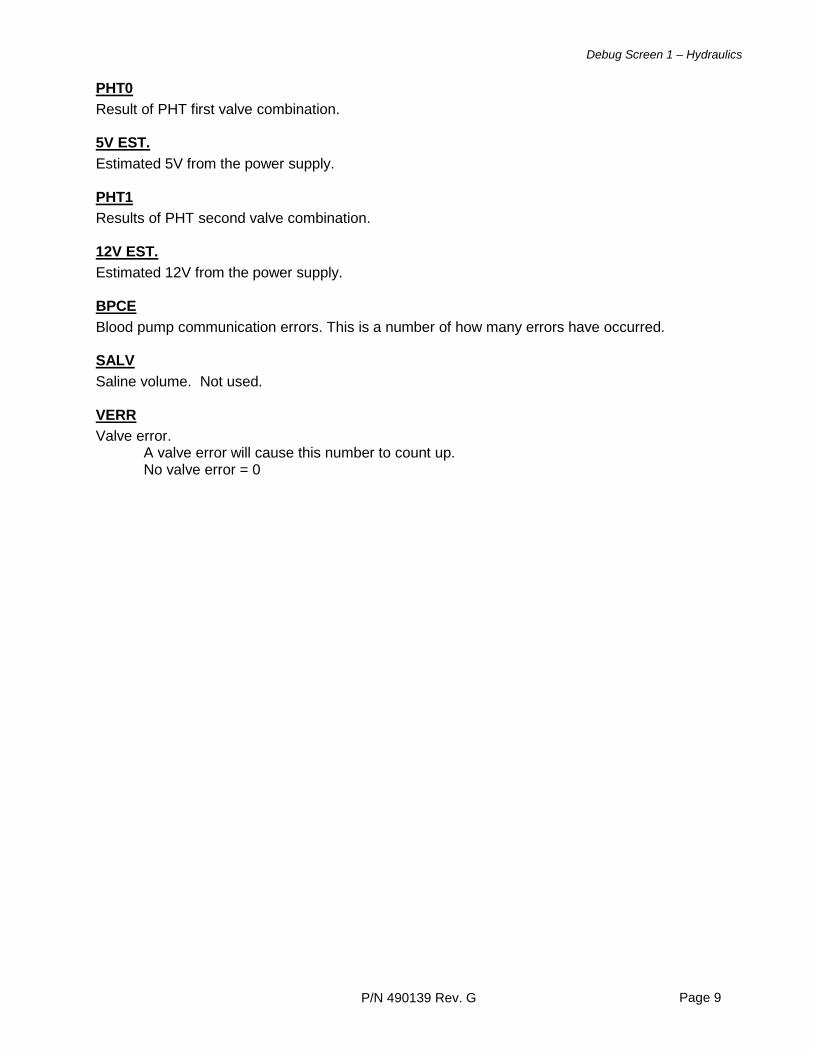
PHT0 Result of PHT first valve combination. 5V EST. Estimated 5V from the power supply. PHT1 Results of PHT second valve combination. 12V EST. Estimated 12V from the power supply. BPCE Blood pump communication errors. This is a number of how many errors have occurred. SALV Saline volume. Not used. VERR Valve error. A valve error will cause this number to count up. No valve error = 0
Debug Screen 2 – Inputs / Outputs
P/N 490139 Rev. G Page 10
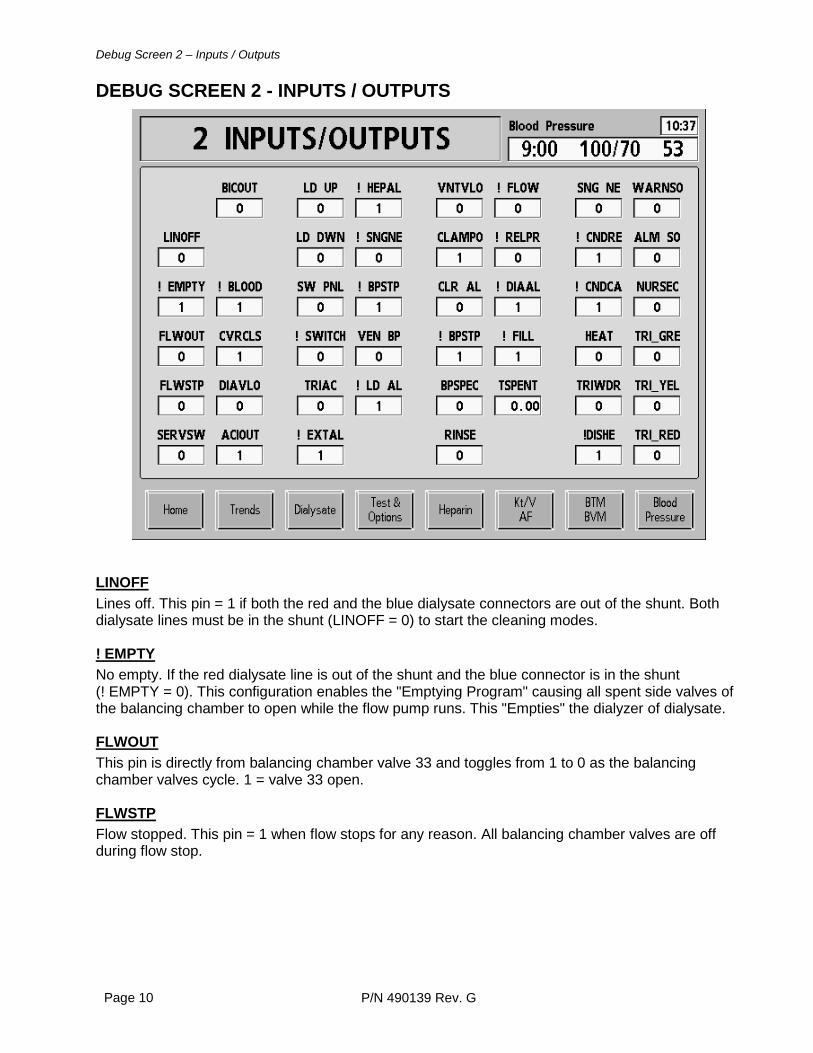
DEBUG SCREEN 2 - INPUTS / OUTPUTS
LINOFF Lines off. This pin = 1 if both the red and the blue dialysate connectors are out of the shunt. Both dialysate lines must be in the shunt (LINOFF = 0) to start the cleaning modes. ! EMPTY No empty. If the red dialysate line is out of the shunt and the blue connector is in the shunt (! EMPTY = 0). This configuration enables the "Emptying Program" causing all spent side valves of the balancing chamber to open while the flow pump runs. This "Empties" the dialyzer of dialysate. FLWOUT This pin is directly from balancing chamber valve 33 and toggles from 1 to 0 as the balancing chamber valves cycle. 1 = valve 33 open. FLWSTP Flow stopped. This pin = 1 when flow stops for any reason. All balancing chamber valves are off during flow stop.
Debug Screen 2 – Inputs / Outputs
P/N 490139 Rev. G Page 11
SERVSW Unused. BICOUT Bicarbonate connector out. Bicarbonate connector not plugged into machine = 1 (reed switch K12 in the "open" state). ! BLOOD No Blood. Blood sensed in the optical detector = 0. CVRCLS Shunt door closed. Shunt door closed = 1. DIAVLO Dialyze valve 24 open. Valve 24 open = 1 i.e. machine is not in bypass. This pin must = 0 if a bypass alarm becomes present. ACIOUT Acid connector out. Acid connector not plugged into machine = 1 (reed switch K11 in the "open" state). LD UP Level detector switch up. Venous chamber level up switch pressed = 1. The level adjust switch is used to raise the level in the venous drip chamber. LD DWN This pin is always = 0 (unused). SW PNL This pin is always = 1. ! SWITCH Power button not pushed. Pushed = 0. TRIAC If the triac is this pin = 0. In the first 10 seconds, after entering dialysis mode, the heater relay (RL 3) is turned off so that no voltage is available to the triac while the temperature control circuit, on the sensor board, is fully on. This pin should be = 1 since there is no voltage available to the triac. If the pin goes low (TRIAC = 0) during this time a “HEATER RELAY TEST FAIL” will be issued by the functional board. Pin A10 on the motherboard connector P1.
Debug Screen 2 – Inputs / Outputs
P/N 490139 Rev. G Page 12
! EXTAL Unused. ! HEPAL No heparin pump alarm. No alarm = 1. ! SNGNE Single needle (venous) blood pump not running. Venous blood pump running = 0. During single needle operation, when the arterial blood pump runs, the venous blood pump does not and vise versa. This pin monitors the blood pump during so that the functional board can control the venous clamp. When the arterial blood pump runs, in single needle operation, the venous clamp is closed. ! BPSTP No blood pump(s) stopped alarm. Blood pump (arterial or venous) stopped alarm = 0 (low). If the blood pump(s) are turned on this pin will = 0 15 or 30 seconds after the blood pump(s) stopped stop for any reason. VEN BP Operational venous (single needle) blood pump present. Pump present = 1. This pin must = 1 in order to turn single needle function on. ! LD AL No level detector alarm. No level detector alarm = 1. VNTVLO Vent valve open. Open vent valve in self prime = 1. The vent valve is located inside the level detector module and vents the venous drip chamber to atmosphere when open. This pin does not go high when manually raising the venous level. CLAMPO Venous bloodline clamp open. Open clamp = 1. CLR AL Clear alarms. Reset alarms to modules = 1. Note: This occurs too quickly to be seen in DEBUG. ! BPSTP No blood pump stopped. Stop blood pump(s) = 0. BPSPEC Blood pump special. Special blood pump control = 1. This pin inputs the blood pump module and controls the blood pump to a maximum speed of 150 ml/min. This occurs whenever the venous level switch is held up to raise the venous drip chamber level.
Debug Screen 2 – Inputs / Outputs
P/N 490139 Rev. G Page 13
RINSE In rinse. In rinse program = 1. ! FLOW No flow. Flow off = 1 with no water alarm. ! RELPR No release pressure. Release dialysate pressure = 0. This occurs when resetting a TMP alarm. ! DIAAL No dialysate alarms. Dialysate alarms = conductivity or temperature alarm or shunt door open = machine in bypass = 0 (i.e. valve 24 closed, valve 26 open). ! FILL No fill. Not in fill program = 1. TSPENT For development use only. SNG NE Single needle. Turn single needle on = 1. ! CNDRE No conductivity resistor. Normally = 1. During conductivity cell calibrations the functional board takes this pin low (! CNDRE= 0) and turns on the sensor board relay (RL2). This puts a fixed resistor (R6) into the sensor board conductivity counter circuit. ! CNDCA No conductivity calibration. Normally = 1. During conductivity cell calibrations the functional board takes this pin low (!CNDCA = 0) and turns on the sensor board relay (RL1). This removes the conductivity cell from the conductivity counting circuit. HEAT Heat relay on. On = 1. The heater relay (RL3), located in the power supply on the power control board, supplies 120 Vac to the triac. The functional board keeps RL3 on as long as temperature remains below 41.5ºC in dialyze mode or 90ºC in heat disinfect. TRIWDR Triac watchdog reset. Normally = 0. During power up the functional board tests the heater relay (RL 3), located in the upper power supply on the power control board, for proper function. Reset = 1.
Debug Screen 2 – Inputs / Outputs
P/N 490139 Rev. G Page 14
! DISHE No heat disinfect. Machine in heat disinfect = 0. Generates high temperature for heat disinfect. WARNSO Warning sound on. Sound on = 1. ALM SO Alarm sound on. Sound on = 1. NURSEC Nurse call on. ON = 1. TRI_GRE Green traffic light on. Green traffic light on = 1. Traffic lights are optional and hang on the IV pole. Since they hang on the IV pole they can be seen from across the unit. TRI_YEL Yellow traffic light on. Yellow traffic light on = 1. TRI_RED Red traffic light on. Red traffic light on = 1.
Debug Screen 3 – Actuator
P/N 490139 Rev. G Page 15
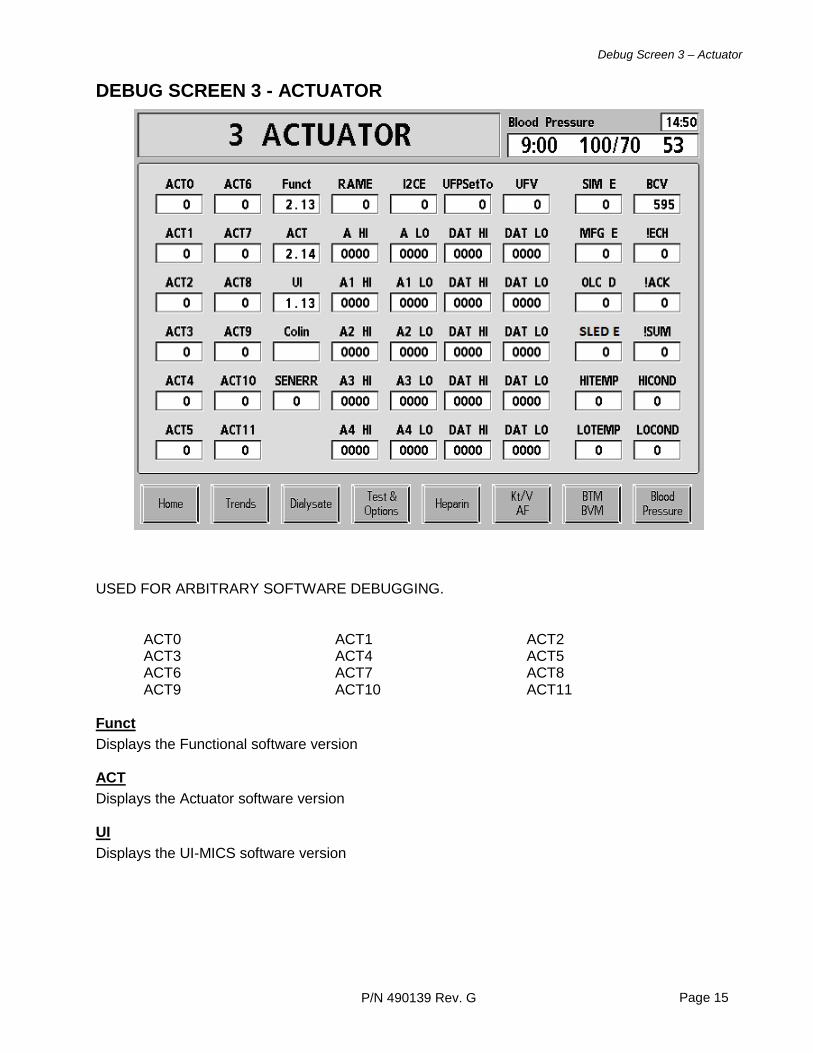
DEBUG SCREEN 3 - ACTUATOR
USED FOR ARBITRARY SOFTWARE DEBUGGING.
ACT0 ACT1 ACT2 ACT3 ACT4 ACT5 ACT6 ACT7 ACT8 ACT9 ACT10 ACT11
Funct Displays the Functional software version ACT Displays the Actuator software version UI Displays the UI-MICS software version
Debug Screen 3 – Actuator
P/N 490139 Rev. G Page 16
Colin For Future Use. SENERR The status of communication errors with the sensor board. RAME This is the number of errors in the comparison of RAM to Flash since the machine was turned on. I2CE This is the total number of comparison errors in when the I2C is read at power up. UFPSetTo For development use only. UFV For development use only. A (A1-A2-A3-A4) HI & A (A1-A2-A3-A4) LO These are the addresses of the last 5 RAM/Flash comparison errors. DAT? HI This is the total number of comparison errors since the board was initialized. DAT? LO Unused. SIM E Special Idle Mode for DSD enable. MFG E Special options for DSD enable. OLC D OLC disabled. SLED E SLED enabled. BCV Actual balancing chamber volume as per two strokes. Example: 609 = 60.9 ml
Debug Screen 3 – Actuator
P/N 490139 Rev. G Page 17
!ECH Number of times no echo signal was received. This is a communication signal between actuator board and functional board. !ACK Number of times no acknowledge signal was received. This is a communication signal between actuator board and functional board. !SUM Number of bad check sums. This is a communication signal between actuator board and functional board. HITEMP/LOTEMP This is the temperature alarm status from the actuator board. Above or below 30- 41 HICOND/LOCOND This is the conductivity alarm status from the actuator board. Above or below 12.5 – 16.0
Debug Screen 4 – Electronics
P/N 490139 Rev. G Page 18
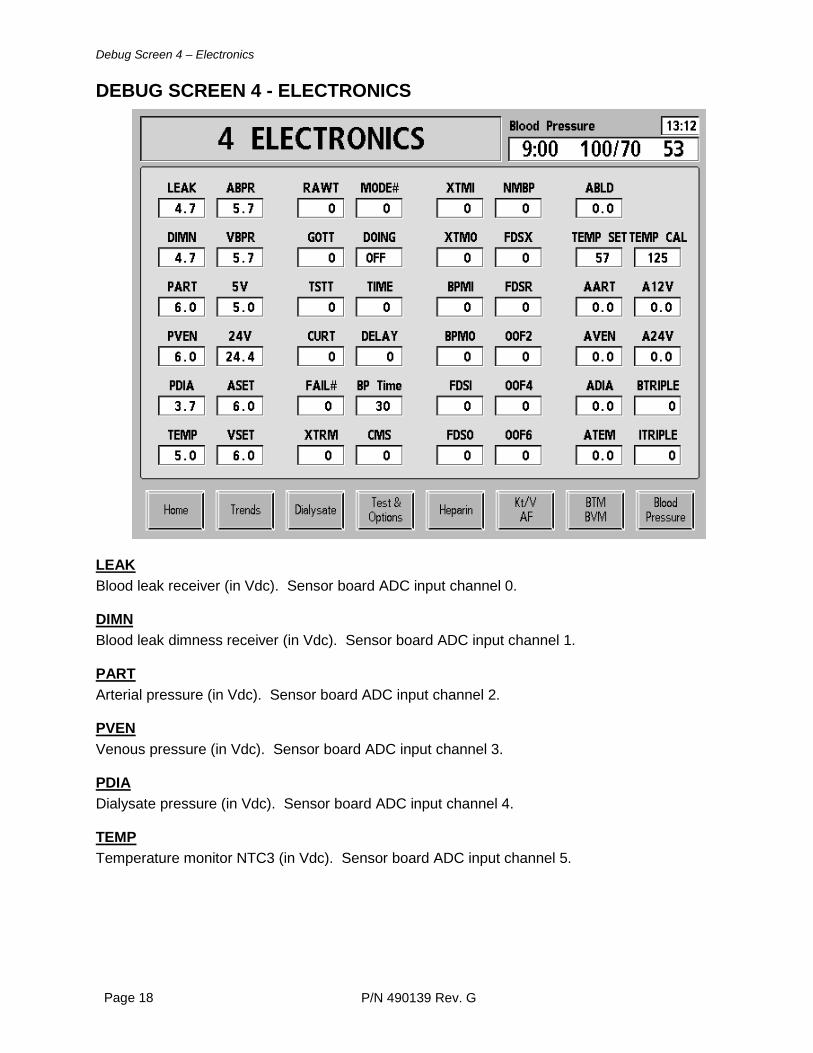
DEBUG SCREEN 4 - ELECTRONICS
LEAK Blood leak receiver (in Vdc). Sensor board ADC input channel 0. DIMN Blood leak dimness receiver (in Vdc). Sensor board ADC input channel 1. PART Arterial pressure (in Vdc). Sensor board ADC input channel 2. PVEN Venous pressure (in Vdc). Sensor board ADC input channel 3. PDIA Dialysate pressure (in Vdc). Sensor board ADC input channel 4. TEMP Temperature monitor NTC3 (in Vdc). Sensor board ADC input channel 5.
Debug Screen 4 – Electronics
P/N 490139 Rev. G Page 19
ABPR Arterial blood pump rate (in Vdc). Sensor board ADC input channel 6. VBPR Venous (single needle) blood pump rate (in Vdc). Sensor board ADC input channel 7. 5V 5V power supply (in Vdc). Sensor board ADC input channel 8. 24V 24V power supply (in Vdc). Sensor board ADC input channel 9. ASET Arterial blood pump set (in Vdc). Sensor board ADC input channel 10. VSET Venous (single needle) blood pump set (in Vdc). Sensor board ADC input channel 11. SELF-TEST SIGNALS RAWT: Raw TMP. MODE#: Test Mode. GOTT: Achieved Dialysate Pressure in Pressure Holding Test. DOING: Type of Test. TSTT: Test TMP. TIME: Test Timeout. CURT: Current TMP. DELAY: Stabilization Time Delay. FAIL#: Number of Self Test Failures. XTRM Last byte received from Transterm (actuator board). BPTIME Count down timer for Blood Pressure interval. CMS Undefined. NMBP Number of blood pressure measurements sent to FDS08 since last New Tx key press or long power down.
Debug Screen 4 – Electronics
P/N 490139 Rev. G Page 20
FUNCTIONAL BOARD COMMUNICATION DATA USED IN SOFTWARE DEVELOPMENT XTMI: Not Used. XTMO: Not Used. BPMI: Not Used. BPMO: Not Used. FDSI: Not Used. FDSO: Not Used. FDSX: FDS08 Option Set ON or OFF. FDSR: Interval Time (seconds) for Sending Data to FDS08. 00F2: Not Used. 00F4: Not Used. 00F6: Not Used. TEMP SET DAC value for calibration. TEMP CAL DAC value for calibration. ACTUATOR BOARD VALUES ABLD: Blood Leak Detector. AART: Arterial Pressure. AVEN: Venous Pressure. ADIA: Dialysate Pressure. ATEM: Temperature. A12V: 12 Volt Supply. A24V: 24 Volt Supply. BTRIPLE Number of failure locations of battery RAM triple check. ITRIPLE Number of failure locations of I2C triple check.
Debug Screen 5 – On-line Clearance
P/N 490139 Rev. G Page 21
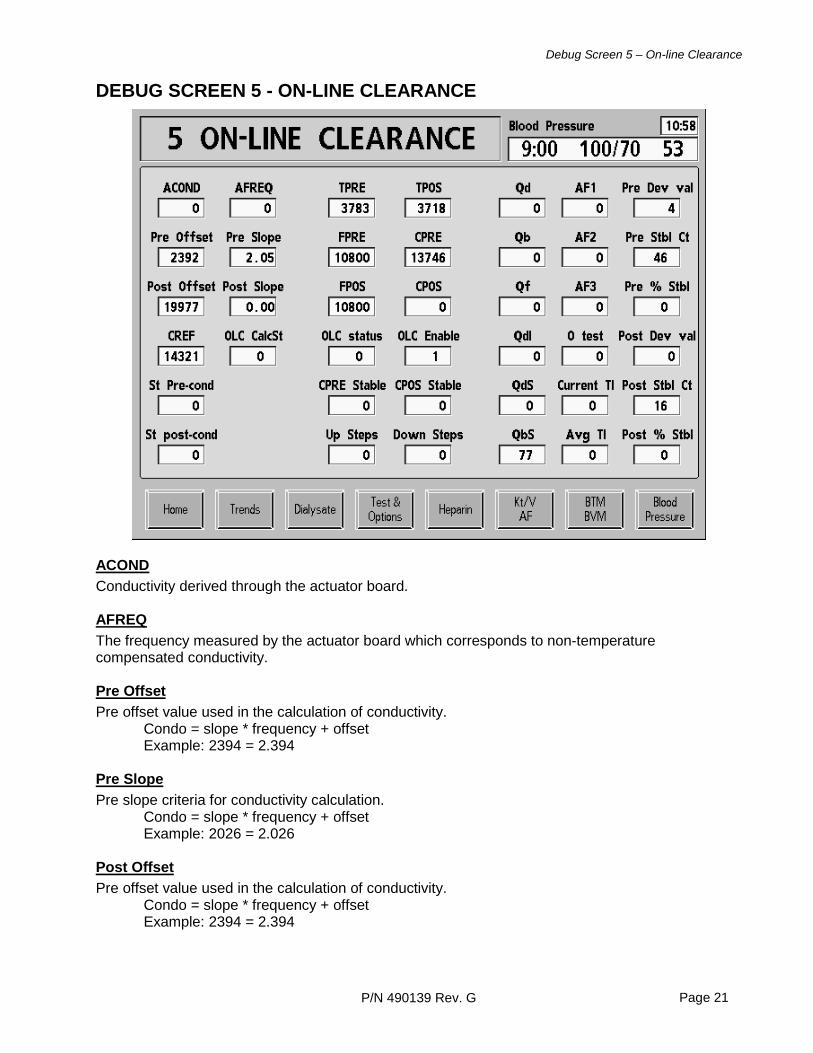
DEBUG SCREEN 5 - ON-LINE CLEARANCE
ACOND Conductivity derived through the actuator board. AFREQ The frequency measured by the actuator board which corresponds to non-temperature compensated conductivity. Pre Offset Pre offset value used in the calculation of conductivity. Condo = slope * frequency + offset Example: 2394 = 2.394 Pre Slope Pre slope criteria for conductivity calculation. Condo = slope * frequency + offset Example: 2026 = 2.026 Post Offset Pre offset value used in the calculation of conductivity. Condo = slope * frequency + offset Example: 2394 = 2.394
Debug Screen 5 – On-line Clearance
P/N 490139 Rev. G Page 22
Post Slope Post slope criteria for conductivity calculation. Condo = slope * frequency + offset Example: 2026 = 2.026 CREF Frequency measurement of the reference resistor done during conductivity calibration. OLC CalcSt This parameter indicates if the calculation for the steps is complete. 6 if complete, 0 if in process. St Pre-cond For development use only. St post-cond For development use only. TPRE Temperature pre-dialyzer. Example: 3710 = 37.10ºC TPOS Temperature post-dialyzer. Example: 3710 = 37.10ºC FPRE Frequency pre-dialyzer. This value is used in calculating pre-dialyzer conductivity. Note: Frequency is read as cycles per second, but this value is read as cycles per 2 seconds or twice the frequency Example: 11290 = 5645 hertz CPRE Conductivity pre-dialyzer. Example: 14184 = 14.184 mS FPOS Offset Frequency post-dialyzer. This value is used in calculating post-dialyzer conductivity, but is offset so it does not interfere with the CPRE frequency. Note: Frequency is read as cycles per second, but this value is read as cycles per 2
seconds or twice the frequency Example: 14290 = 7145 hertz CPOS Conductivity post-dialyzer. Example: 14184 = 14.184 mS
Debug Screen 5 – On-line Clearance
P/N 490139 Rev. G Page 23
OLC status The status of on-line clearance. 1 = top point of conductivity 2 = bottom point of conductivity 0 = not running OLC Enable The status of the OLC Enable/Disable codes in EEPROM memory. Cpre Stable Conductivity value of pre-dialyzer sensor when it stabilizes. Example: 15800 = 15.800 mS, this is the pre-conductivity value used in calculating KEU CPOS Stable Conductivity value of post-dialyzer sensor when it stabilizes. Example: 15466 = 15.466 mS, this is the post-conductivity value used in calculating KEU Up Steps The calculated acid pump step rate for the upper OLC level. Down Steps The calculated acid pump step rate for the lower OLC level. Qd Actual dialysate flow during on-line clearance. Taken when pre and post conductivity is at upper and lower point of conductivity. Qb Actual blood flow during on-line clearance. Taken when pre and post conductivity is at upper and lower point of conductivity. Qf Actual UF rate during on-line clearance. Taken when pre and post conductivity is at upper and lower point of conductivity. Qdl Actual dialysate flow currently. QdS Is dialysate flow stable. 1 = Yes / 0 = No. QbS Blood flow stability. Must be below 10 to run on-line clearance / 0 is stable. AF1 First access flow result.
Debug Screen 5 – On-line Clearance
P/N 490139 Rev. G Page 24
AF2 Second access flow result. AF3 Third access flow result. 0 test Results from 0 on-line clearance test. Less than 25 is needed for the test to pass. Current TI Temperature stability index value. Example: X180 sec = [T180 – avg(T1:T180)]2 Avg TI = 110 – X, averaged over the last 12 minutes. Example: Index is limited to 0 – 100 Pre Dev val How much the pre-conductivity has deviated from the previous value. The closer to 0 the least amount of deviation. Sum of the squares – square of the sums over the last 31 counts. Pre Stbl Ct Counter that decrements to 0 when the pre deviation value is less that the allowed limit. Pre % Stbl Percent of time over the last 12 minutes that the pre conductivity stability value has been less than the limit (135). Post Dev val How much the post-conductivity has deviated from the previous value. The closer to 0 the least amount of deviation. Sum of the squares – square of the sums over the last 31 counts. Post Stbl Ct Counter that decrements to 0 when the pre deviation value is less that the allowed limit. Post % Stbl Percent of time over the last 12 minutes that the post conductivity stability value has been less than the limit (70).
Debug Screen 6 – On-line Clearance 2
P/N 490139 Rev. G Page 25
DEBUG SCREEN 6 - ON-LINE CLEARANCE 2
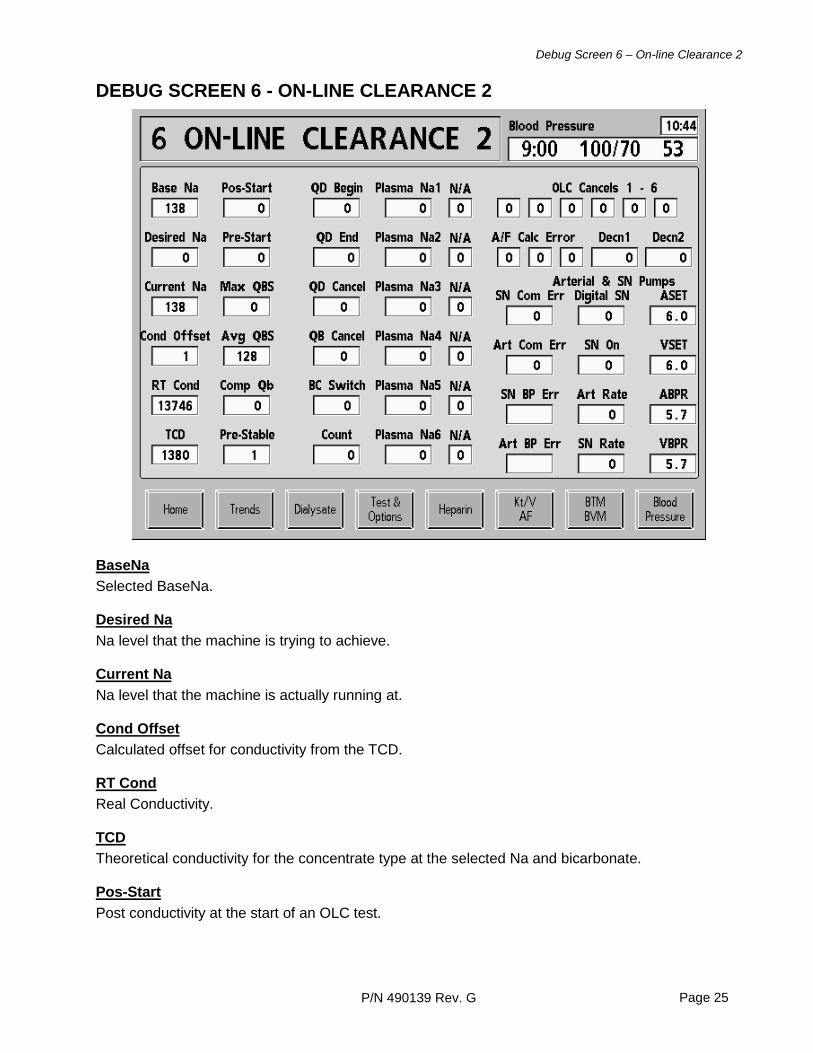
BaseNa Selected BaseNa. Desired Na Na level that the machine is trying to achieve. Current Na Na level that the machine is actually running at. Cond Offset Calculated offset for conductivity from the TCD. RT Cond Real Conductivity. TCD Theoretical conductivity for the concentrate type at the selected Na and bicarbonate. Pos-Start Post conductivity at the start of an OLC test.
Debug Screen 6 – On-line Clearance 2
P/N 490139 Rev. G Page 26
Pre-Start Pre conductivity at the start of an OLC test. Max QBS Maximum Qbs value during an OLC test. Avg QBS Average Qb DAC value. Comp Qb Arterial pressure compensated blood flow rate. Pre Stable A bit that shows if the pre conductivity is stable or not. 1 = Stable 0 = Not Stable QD Begin Dialysate flow rate at the beginning of the OLC test. QD End Dialysate flow rate at the end of the OLC test. QD Cancel Dialysate flow rate when the OLC test is cancelled. QB Cancel Blood flow rate when the OLC test is cancelled. BC Switch Balancing chamber switching time. Example: 3.57 seconds = 357 Count Counter for the delay of OLC steps calculation. Plasma Na1 Plasma Na at beginning of treatment. Plasma Na2 Plasma Na at second OLC test. Plasma Na3 Plasma Na at third OLC test. Plasma Na4 Plasma Na at fourth OLC test.
Debug Screen 6 – On-line Clearance 2
P/N 490139 Rev. G Page 27
Plasma Na5 Plasma Na at fifth OLC test. Plasma Na6 Plasma Na at sixth OLC test. N/A (next to Plasma Na, 6 places)
0 = OLC test not yet done or Plasma Na calculated 1 = OLC test result = 0 2 = Pre conductivity not stable (before first test or after subsequent tests). 3 = Post conductivity not stable (before first test or after subsequent tests). 4 = Plasma Na > 170 5 = Plasma Na < 100 6 = RTD not counting down
OLC Test Cancel reasons (six total)
0 = No cancellation 1 = Time out at upper step 2= Time out at lower step 3 = QbS > 20 when blood sensed 4 = Dialysate flow unstable (3/10 balance chamber times >10% from average value). 5 = OLC disabled 6 = Dialysate flow stopped 7 = Test program start
Access Flow Calculation Errors (three total) ; Note Decn is the Kecn1 recalculated at the same Qb and Qd as the second OLC test for AF.
0 - No error 1 - Kecn1 = 0 2 - Qd = 0 3 - Qb = 0 4 - Special case that would cause an illegal divide by zero:
0.85*Qb = Qd 5 - Special case that would cause an illegal divide by zero:
0.85*Qb = Kecn 6 - Special case that would cause an illegal divide by zero:
(exp[(1 – Qb/Qd)* KoA/Qb] – Qb/Qd) = 0 7 - Decn1 = 0 8 - Special case that would cause an illegal divide by zero:
Decn1 = Kecn2 Decn1 & Decn2 The first OLC test is recalculated at the same Qb & Qd as the second OLC test for Access Flow. These are the recalculated Kecn1 values (Decn1) from Access Flow test 1 and 2.
Debug Screen 6 – On-line Clearance 2
P/N 490139 Rev. G Page 28
ARTERIAL & SN PUMPS SN Com Err Single Needle Comm Error State: 1 = Error is Present 2 = Error is Reset 0 = No Error Art Com Err Arterial Blood Pump Communication Error State: 1 = Error is Present 2 = Error is Reset 0 = No Error SN BP Err Error number reported from single needle blood pump. Example: A.16. Art BP Err Error number reported from Arterial blood pump. Example: A.16 Digital SN 1 if Digital SN Blood pump is selected in service mode. 0 is it is not. SN On 1 If the SN Blood Pump is on. 0 is it is not. Art Rate Arterial blood pump rate sent from the arterial blood pump to the functional board. SN Rate Single needle blood pump rate sent from the functional board to the single needle blood pump. ASET Arterial blood pump set (in Vdc). Sensor board input pin A12. Sensor board ADC input channel 10. VSET Venous (single needle) blood pump set (in Vdc). Sensor board input pin A11. Sensor board ADC input channel 11. ABPR Arterial Blood Pump Rate voltage from the sensor board. VBPR Venous (SN) Blood Pump Rate voltage from the sensor board.
Debug Screen 7 – BP History
P/N 490139 Rev. G Page 29
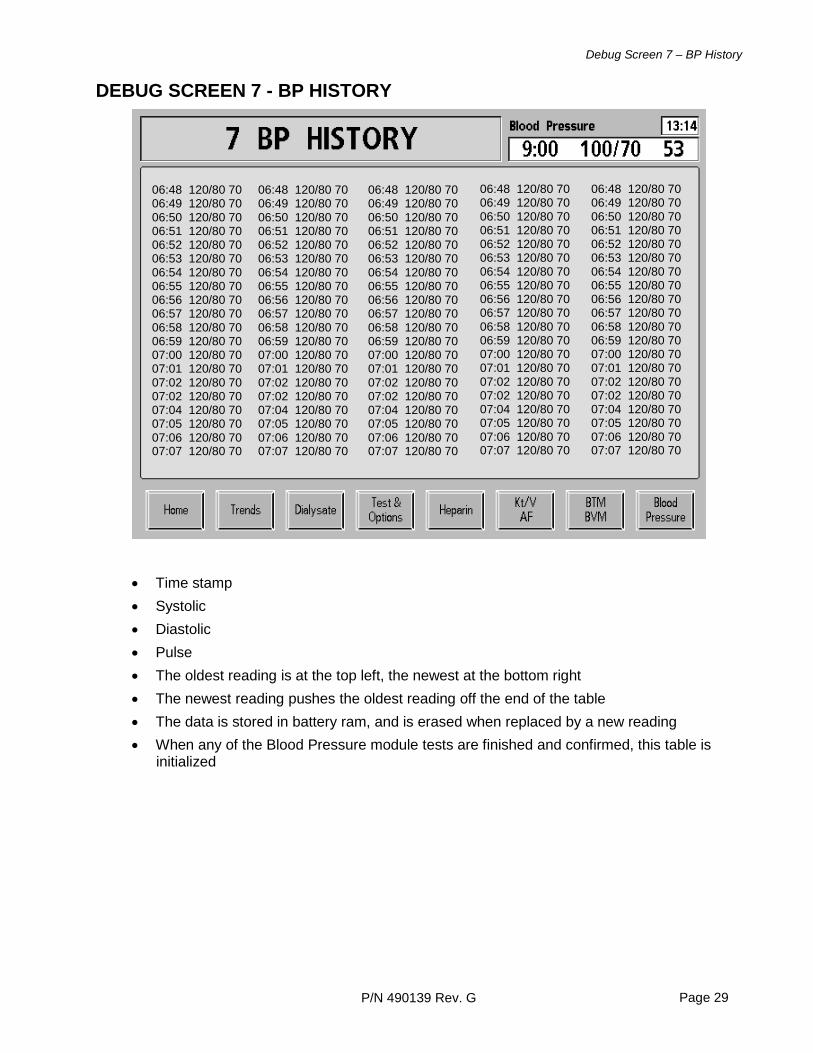
DEBUG SCREEN 7 - BP HISTORY
• Time stamp • Systolic • Diastolic • Pulse • The oldest reading is at the top left, the newest at the bottom right • The newest reading pushes the oldest reading off the end of the table • The data is stored in battery ram, and is erased when replaced by a new reading • When any of the Blood Pressure module tests are finished and confirmed, this table is
initialized
06:48 120/80 70 06:49 120/80 70 06:50 120/80 70 06:51 120/80 70 06:52 120/80 70 06:53 120/80 70 06:54 120/80 70 06:55 120/80 70 06:56 120/80 70 06:57 120/80 70 06:58 120/80 70 06:59 120/80 70 07:00 120/80 70 07:01 120/80 70 07:02 120/80 70 07:02 120/80 70 07:04 120/80 70 07:05 120/80 70 07:06 120/80 70 07:07 120/80 70
06:48 120/80 70 06:49 120/80 70 06:50 120/80 70 06:51 120/80 70 06:52 120/80 70 06:53 120/80 70 06:54 120/80 70 06:55 120/80 70 06:56 120/80 70 06:57 120/80 70 06:58 120/80 70 06:59 120/80 70 07:00 120/80 70 07:01 120/80 70 07:02 120/80 70 07:02 120/80 70 07:04 120/80 70 07:05 120/80 70 07:06 120/80 70 07:07 120/80 70
06:48 120/80 70 06:49 120/80 70 06:50 120/80 70 06:51 120/80 70 06:52 120/80 70 06:53 120/80 70 06:54 120/80 70 06:55 120/80 70 06:56 120/80 70 06:57 120/80 70 06:58 120/80 70 06:59 120/80 70 07:00 120/80 70 07:01 120/80 70 07:02 120/80 70 07:02 120/80 70 07:04 120/80 70 07:05 120/80 70 07:06 120/80 70 07:07 120/80 70
06:48 120/80 70 06:49 120/80 70 06:50 120/80 70 06:51 120/80 70 06:52 120/80 70 06:53 120/80 70 06:54 120/80 70 06:55 120/80 70 06:56 120/80 70 06:57 120/80 70 06:58 120/80 70 06:59 120/80 70 07:00 120/80 70 07:01 120/80 70 07:02 120/80 70 07:02 120/80 70 07:04 120/80 70 07:05 120/80 70 07:06 120/80 70 07:07 120/80 70
06:48 120/80 70 06:49 120/80 70 06:50 120/80 70 06:51 120/80 70 06:52 120/80 70 06:53 120/80 70 06:54 120/80 70 06:55 120/80 70 06:56 120/80 70 06:57 120/80 70 06:58 120/80 70 06:59 120/80 70 07:00 120/80 70 07:01 120/80 70 07:02 120/80 70 07:02 120/80 70 07:04 120/80 70 07:05 120/80 70 07:06 120/80 70 07:07 120/80 70
Debug Screen 8 – UF Events
P/N 490139 Rev. G Page 30
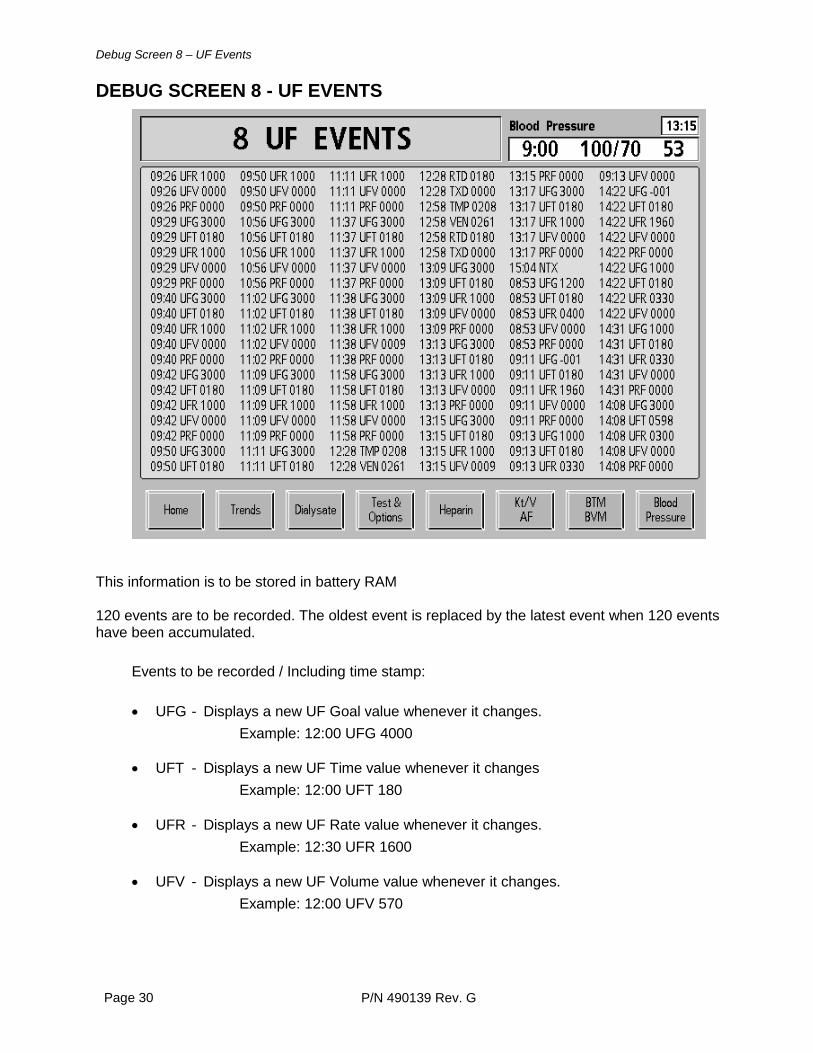
DEBUG SCREEN 8 - UF EVENTS
This information is to be stored in battery RAM 120 events are to be recorded. The oldest event is replaced by the latest event when 120 events have been accumulated.
Events to be recorded / Including time stamp:
• UFG - Displays a new UF Goal value whenever it changes. Example: 12:00 UFG 4000
• UFT - Displays a new UF Time value whenever it changes
Example: 12:00 UFT 180
• UFR - Displays a new UF Rate value whenever it changes. Example: 12:30 UFR 1600
• UFV - Displays a new UF Volume value whenever it changes.
Example: 12:00 UFV 570
Debug Screen 8 – UF Events
P/N 490139 Rev. G Page 31
• PRF - Displays a new UF Profile number whenever it changes. Example: 12:00 PRF 0002
• AUF - Displays an Average UF Rate at the beginning if a UF profile is active and at each
profile segment change. Example: 12:30 AUF 1500
• CUG - Displays a Calculated UF Goal at the beginning if a UF profile is active and at each
profile segment change. Example: 12:30 CUG 5000
• TXD - Displays the Tx Clock, every 30 minutes when the Tx Clock is running.
Example: 12:51 TXD 0180
• RTD - Displays the Remaining Time of Dialysis every 30 minutes when the Tx Clock is running.
Example: 12:51 RTD 0120
• TMP - Displays the TMP value every 30 minutes when the Tx Clock is running. Example: 12:30 TMP 120
• VEN - Displays the Venous pressure value every 30 minutes when the Tx Clock is
running. Example: 12:30 VEN 200
• TMA - Displays a TMP alarm whenever it occurs and value.
Example: 12:30 TMA 120
• PHT - Displays online PHT results whenever the test is run (two results are shown, one for each half of the balancing chamber)
Example: 12:45 PHT 00 10
• UFE - Displays any UF Error along with the calculated UF Goal. Example: 12:45 UFE 4500
• FIL - Displays each occurrence of a Fill program.
Example: 12:50 FIL
• NTX - Displays whenever the new Tx key is pressed. Example: 12:50 NTX
Debug Screen 9 – BTM Events
P/N 490139 Rev. G Page 32
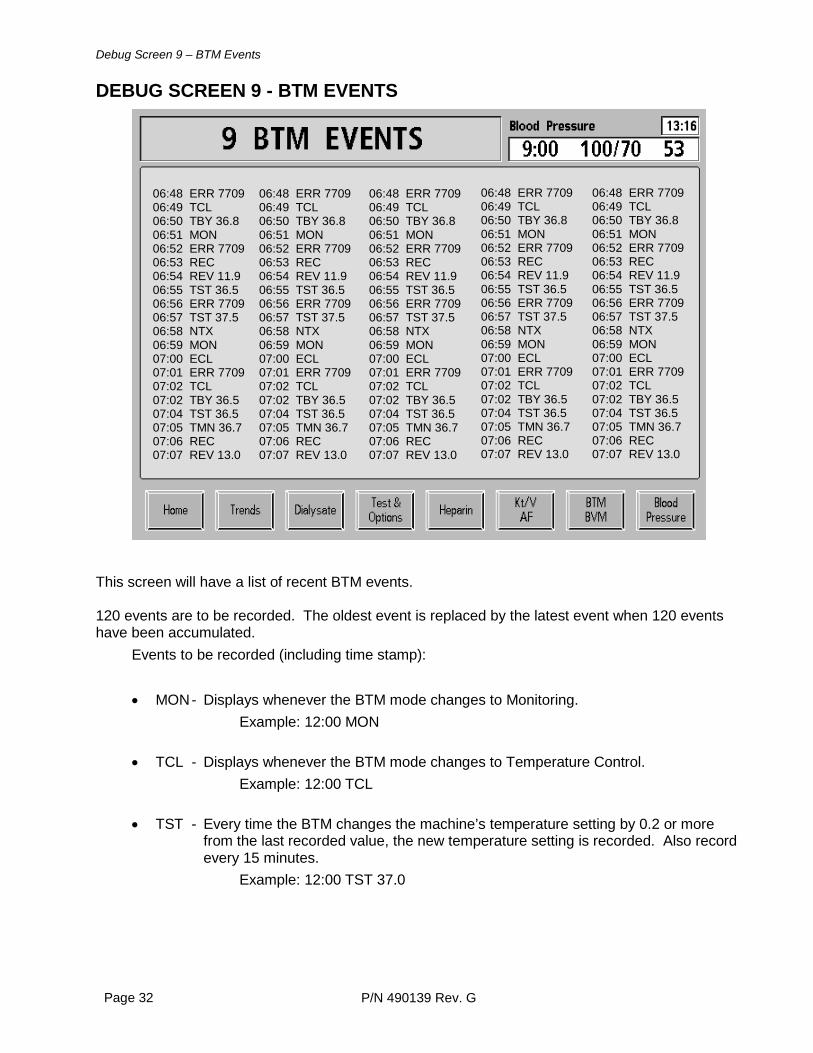
DEBUG SCREEN 9 - BTM EVENTS
This screen will have a list of recent BTM events. 120 events are to be recorded. The oldest event is replaced by the latest event when 120 events have been accumulated.
Events to be recorded (including time stamp): • MON - Displays whenever the BTM mode changes to Monitoring.
Example: 12:00 MON • TCL - Displays whenever the BTM mode changes to Temperature Control.
Example: 12:00 TCL • TST - Every time the BTM changes the machine’s temperature setting by 0.2 or more
from the last recorded value, the new temperature setting is recorded. Also record every 15 minutes.
Example: 12:00 TST 37.0
06:48 ERR 7709 06:49 TCL 06:50 TBY 36.8 06:51 MON 06:52 ERR 7709 06:53 REC 06:54 REV 11.9 06:55 TST 36.5 06:56 ERR 7709 06:57 TST 37.5 06:58 NTX 06:59 MON 07:00 ECL 07:01 ERR 7709 07:02 TCL 07:02 TBY 36.5 07:04 TST 36.5 07:05 TMN 36.7 07:06 REC 07:07 REV 13.0
06:48 ERR 7709 06:49 TCL 06:50 TBY 36.8 06:51 MON 06:52 ERR 7709 06:53 REC 06:54 REV 11.9 06:55 TST 36.5 06:56 ERR 7709 06:57 TST 37.5 06:58 NTX 06:59 MON 07:00 ECL 07:01 ERR 7709 07:02 TCL 07:02 TBY 36.5 07:04 TST 36.5 07:05 TMN 36.7 07:06 REC 07:07 REV 13.0
06:48 ERR 7709 06:49 TCL 06:50 TBY 36.8 06:51 MON 06:52 ERR 7709 06:53 REC 06:54 REV 11.9 06:55 TST 36.5 06:56 ERR 7709 06:57 TST 37.5 06:58 NTX 06:59 MON 07:00 ECL 07:01 ERR 7709 07:02 TCL 07:02 TBY 36.5 07:04 TST 36.5 07:05 TMN 36.7 07:06 REC 07:07 REV 13.0
06:48 ERR 7709 06:49 TCL 06:50 TBY 36.8 06:51 MON 06:52 ERR 7709 06:53 REC 06:54 REV 11.9 06:55 TST 36.5 06:56 ERR 7709 06:57 TST 37.5 06:58 NTX 06:59 MON 07:00 ECL 07:01 ERR 7709 07:02 TCL 07:02 TBY 36.5 07:04 TST 36.5 07:05 TMN 36.7 07:06 REC 07:07 REV 13.0
06:48 ERR 7709 06:49 TCL 06:50 TBY 36.8 06:51 MON 06:52 ERR 7709 06:53 REC 06:54 REV 11.9 06:55 TST 36.5 06:56 ERR 7709 06:57 TST 37.5 06:58 NTX 06:59 MON 07:00 ECL 07:01 ERR 7709 07:02 TCL 07:02 TBY 36.5 07:04 TST 36.5 07:05 TMN 36.7 07:06 REC 07:07 REV 13.0
Debug Screen 9 – BTM Events
P/N 490139 Rev. G Page 33
• TBY - Every time that a recirculation measurement is made and every time TST is displayed, the body temperature is recorded.
Example: 12:00 TBY 36.50
• ECL - Displays whenever the BTM mode changes to Energy Mode. Example: 12:00 ECL
• EGY - Display Energy Flux during energy mode at initiation and with each change.
Example: 12:00 EGY 1000
• REC - Displays whenever the BTM mode changes to Recirculation Mode. Example: 12:00 12:30 REC
• REV - Displays the recirculation value every time that a Recirculation Measurement is
available. Example: 12:00 REV 11.7
• TMN - Displays temperature on monitor every 15 minutes.
Example: 12:45 TMN 37.5
• QD - Displays the Dialysate Flow every time it changes. Example: 12:45 QD 800
• QB - Displays the Blood Flow every time Qd is displayed and each time REV is
displayed. Example: 12:45 QB 300
• ERR - Displays an error with the error code every time an error occurs.
Example: 12:00 ERR 1107
• NTX - Displays whenever the new Tx key is pressed. Example: 12:50 NTX
Debug Screen 10 – ADC HI LO
P/N 490139 Rev. G Page 34
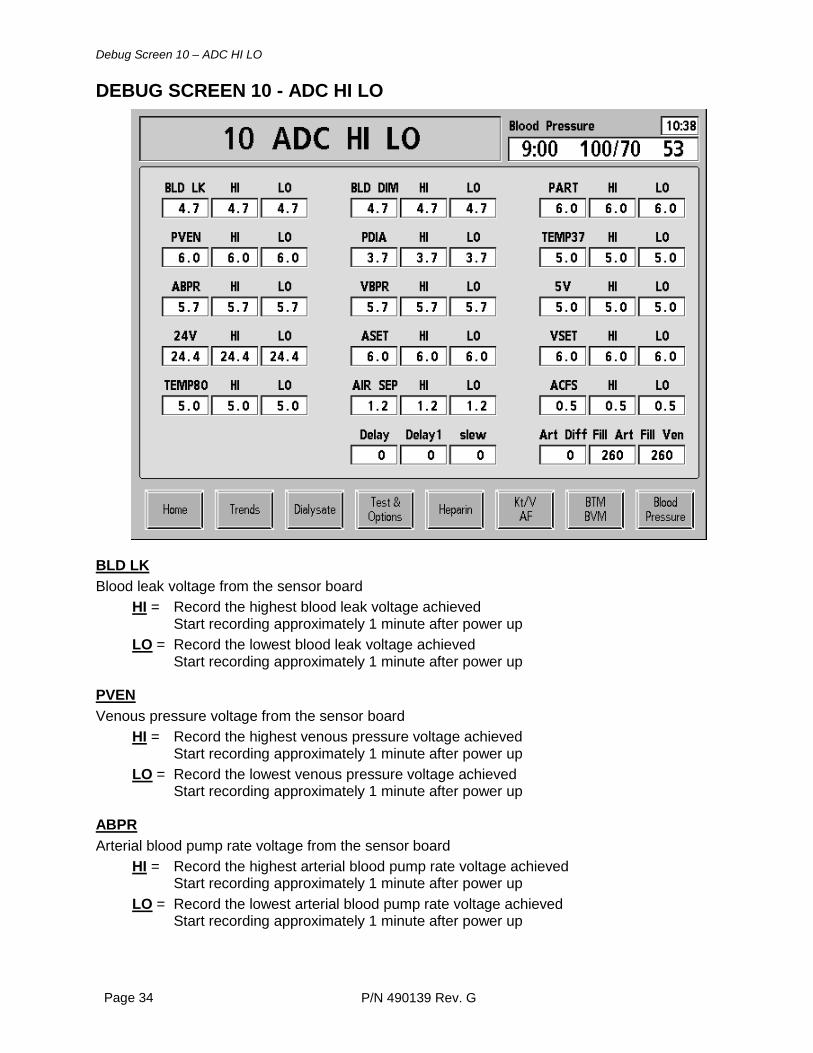
DEBUG SCREEN 10 - ADC HI LO
BLD LK Blood leak voltage from the sensor board
HI = Record the highest blood leak voltage achieved Start recording approximately 1 minute after power up LO = Record the lowest blood leak voltage achieved Start recording approximately 1 minute after power up
PVEN Venous pressure voltage from the sensor board
HI = Record the highest venous pressure voltage achieved Start recording approximately 1 minute after power up LO = Record the lowest venous pressure voltage achieved Start recording approximately 1 minute after power up
ABPR Arterial blood pump rate voltage from the sensor board
HI = Record the highest arterial blood pump rate voltage achieved Start recording approximately 1 minute after power up LO = Record the lowest arterial blood pump rate voltage achieved Start recording approximately 1 minute after power up
Debug Screen 10 – ADC HI LO
P/N 490139 Rev. G Page 35
24V 24 volts from the sensor board
HI = Record the highest 24 volts achieved Start recording approximately 1 minute after power up LO = Record the lowest 24 volts achieved Start recording approximately 1 minute after power up
TEMP80 80°C temperature channel voltage from the sensor board
HI = Record the highest 80°C temperature channel voltage achieved Start recording approximately 1 minute after power up LO = Record the lowest 80°C temperature channel voltage achieved Start recording approximately 1 minute after power up
BLD DIM Blood dimness voltage from the sensor board
HI = Record the highest blood dimness voltage achieved Start recording approximately 1 minute after power up LO = Record the lowest blood dimness voltage achieved Start recording approximately 1 minute after power up
PDIA Dialysate pressure transducer voltage from the sensor board
HI = Record the highest dialysate pressure transducer voltage achieved Start recording approximately 1 minute after power up LO = Record the lowest dialysate pressure transducer voltage achieved Start recording approximately 1 minute after power up
VBPR Venous blood pump rate voltage from the sensor board
HI = Record the highest venous blood pump rate voltage achieved Start recording approximately 1 minute after power up LO = Record the lowest venous blood pump rate voltage achieved Start recording approximately 1 minute after power up
ASET Arterial blood pump knob voltage from the sensor board
HI = Record the highest arterial blood pump knob voltage achieved Start recording approximately 1 minute after power up LO = Record the lowest arterial blood pump knob voltage achieved Start recording approximately 1 minute after power up
Debug Screen 10 – ADC HI LO
P/N 490139 Rev. G Page 36
AIR SEP Air separation chamber sensors voltage from the sensor board
HI = Record the highest air separation chamber sensors voltage achieved Start recording approximately 1 minute after power up LO = Record the lowest air separation chamber sensors voltage achieved Start recording approximately 1 minute after power up
Delay For development use only. Delay1 For development use only. slew For development use only. PART Arterial pressure voltage from the sensor board
HI = Record the highest arterial pressure voltage achieved Start recording approximately 1 minute after power up LO = Record the lowest arterial pressure voltage achieved Start recording approximately 1 minute after power up
TEMP37 37°C temperature channel voltage from the sensor board
HI = Record the highest 37°C temperature channel voltage achieved Start recording approximately 1 minute after power up
LO = Record the lowest 37°C temperature channel voltage achieved Start recording approximately 1 minute after power up
5V V5 volts from the sensor board
HI = Record the highest 5 volts achieved Start recording approximately 1 minute after power up
LO = Record the lowest 5 volts achieved Start recording approximately 1 minute after power up
VSET Venous blood pump knob voltage from the sensor board
HI = Record the highest venous blood pump knob voltage achieved Start recording approximately 1 minute after power up
LO = Record the lowest venous blood pump knob voltage achieved Start recording approximately 1 minute after power up
Debug Screen 10 – ADC HI LO
P/N 490139 Rev. G Page 37
ACFS Chamber full switch voltage from the actuator board
HI = Record the highest chamber full switch voltage achieved Start recording approximately 1 minute after power up
LO = Record the lowest chamber full switch voltage achieved Start recording approximately 1 minute after power up
Art Diff For development use only. Fill Art For development use only. Fill Ven For development use only.
Debug Screen 11 – BIT HI LO
P/N 490139 Rev. G Page 38
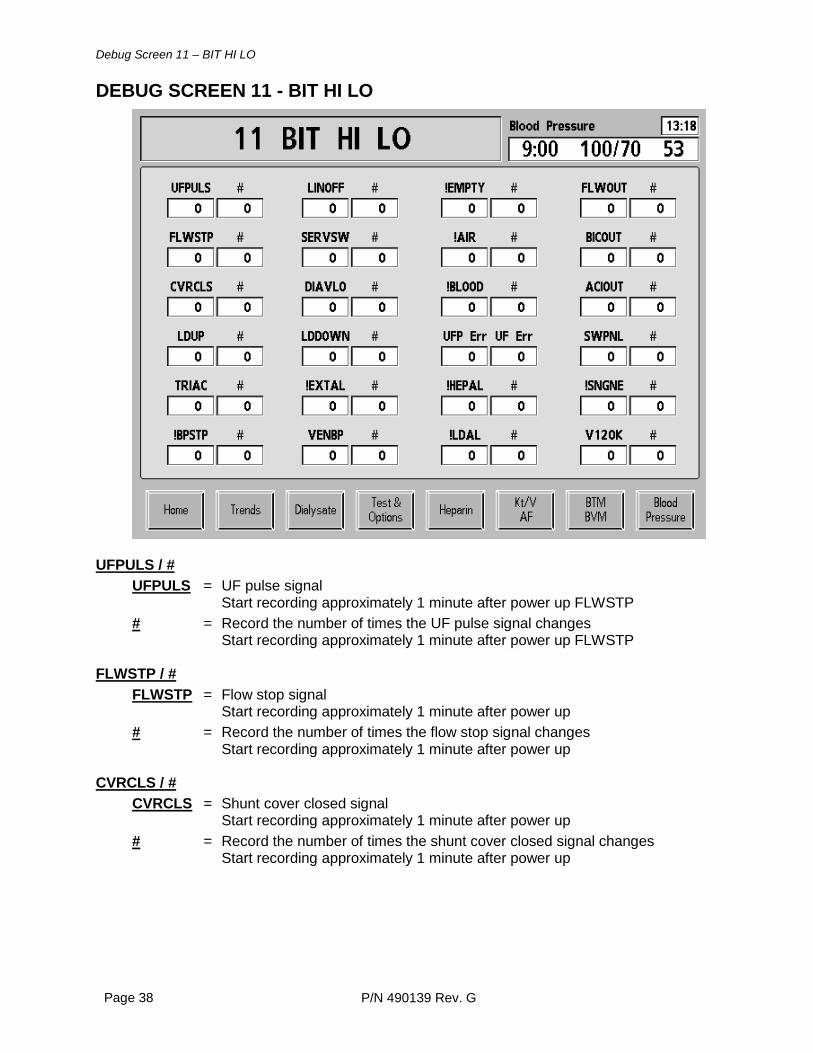
DEBUG SCREEN 11 - BIT HI LO
UFPULS / #
UFPULS = UF pulse signal Start recording approximately 1 minute after power up FLWSTP # = Record the number of times the UF pulse signal changes Start recording approximately 1 minute after power up FLWSTP
FLWSTP / #
FLWSTP = Flow stop signal Start recording approximately 1 minute after power up # = Record the number of times the flow stop signal changes Start recording approximately 1 minute after power up
CVRCLS / #
CVRCLS = Shunt cover closed signal Start recording approximately 1 minute after power up # = Record the number of times the shunt cover closed signal changes Start recording approximately 1 minute after power up
Debug Screen 11 – BIT HI LO
P/N 490139 Rev. G Page 39
LDUP / # LDUP = Level adjust up signal Start recording approximately 1 minute after power up # = Record the number of times the level adjust up signal changes Start recording approximately 1 minute after power up
TRIAC / #
TRIAC = Triac signal Start recording approximately 1 minute after power up # = Record the number of times the triac signal changes Start recording approximately 1 minute after power up
!BPSTP / #
!BPSTP = Blood pump stopped signal Start recording approximately 1 minute after power up # = Record the number of times the blood pump stopped signal changes Start recording approximately 1 minute after power up
LINOFF / #
LINOFF = Lines off the shunt signal Start recording approximately 1 minute after power up # = Record the number of times the lines off the shunt signal changes Start recording approximately 1 minute after power up
SERVSW / #
SERVSW = Service switch signal Start recording approximately 1 minute after power up # = Record the number of times the service switch signal changes Start recording approximately 1 minute after power up
DIAVLO / #
DIAVLO = Dialysis valve open signal Start recording approximately 1 minute after power up # = Record the number of times the dialysis valve open signal changes Start recording approximately 1 minute after power up
LDDOWN / #
LDDOWN = Not Used # = Not Used
Debug Screen 11 – BIT HI LO
P/N 490139 Rev. G Page 40
!EXTAL / # !EXTAL = No external alarm signal Start recording approximately 1 minute after power up # = Record the number of times the no external alarm signal changes Start recording approximately 1 minute after power up
VENBP / #
VENBP = Venous blood pump connected signal Start recording approximately 1 minute after power up # = Record the number of times the venous blood pump connected signal changes Start recording approximately 1 minute after power up
!EMPTY / #
!EMPTY = Not emptying signal Start recording approximately 1 minute after power up # = Record the number of times the not emptying signal changes Start recording approximately 1 minute after power up
!AIR / #
!AIR = No air sensed signal Start recording approximately 1 minute after power up # = Record the number of times the no air sensed signal changes Start recording approximately 1 minute after power up
!BLOOD / #
!BLOOD = No blood sensed signal Start recording approximately 1 minute after power up # = Record the number of times the no blood sensed signal changes Start recording approximately 1 minute after power up
UFP Err / UF Err
UFP Err = Total number of UF Profile alarms
UF Err = Total number of UF Rate alarms
!HEPAL / #
!HEPAL = No heparin pump alarm signal Start recording approximately 1 minute after power up # = Record the number of times the no heparin pump alarm signal changes Start recording approximately 1 minute after power up
Debug Screen 11 – BIT HI LO
P/N 490139 Rev. G Page 41
!LDAL / # !LDAL = No level detector alarm signal Start recording approximately 1 minute after power up # = Record the number of times the no level detector alarm signal changes Start recording approximately 1 minute after power up
FLWOUT / #
FLWOUT = Flow out signal Start recording approximately 1 minute after power up # = Record the number of times the flow out signal changes Start recording approximately 1 minute after power up
BICOUT / #
BICOUT = Bicarb wand out signal Start recording approximately 1 minute after power up # = Record the number of times the bicarb wand out signal changes Start recording approximately 1 minute after power up
ACIOUT / #
ACIOUT = Acid wand out signal Start recording approximately 1 minute after power up # = Record the number of times the acid wand out signal changes Start recording approximately 1 minute after power up
SWPNL / #
SWPNL = Power switch activated signal Start recording approximately 1 minute after power up # = Record the number of times the power switch activated signal changes Start recording approximately 1 minute after power up
!SNGNE / #
!SNGNE = No single needle signal Start recording approximately 1 minute after power up # = Record the number of times the no single needle signal changes. Start recording approximately 1 minute after power up
V12OK / #
V12OK = 12 volts OK signal Start recording approximately 1 minute after power up # = Record the number of times the 12 volts OK signal changes Start recording approximately 1 minute after power up
Debug Screen 12 – BATRAM Data
P/N 490139 Rev. G Page 42
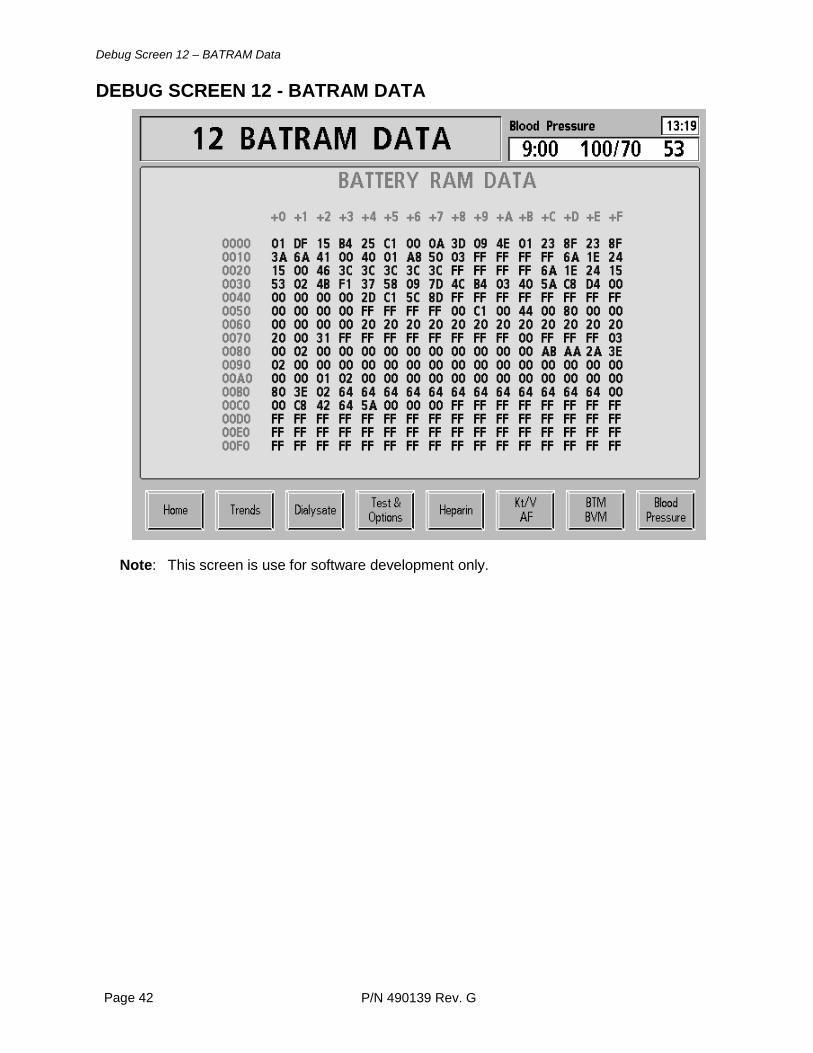
DEBUG SCREEN 12 - BATRAM DATA
Note: This screen is use for software development only.
Debug Screen 13 – Temp Control
P/N 490139 Rev. G Page 43
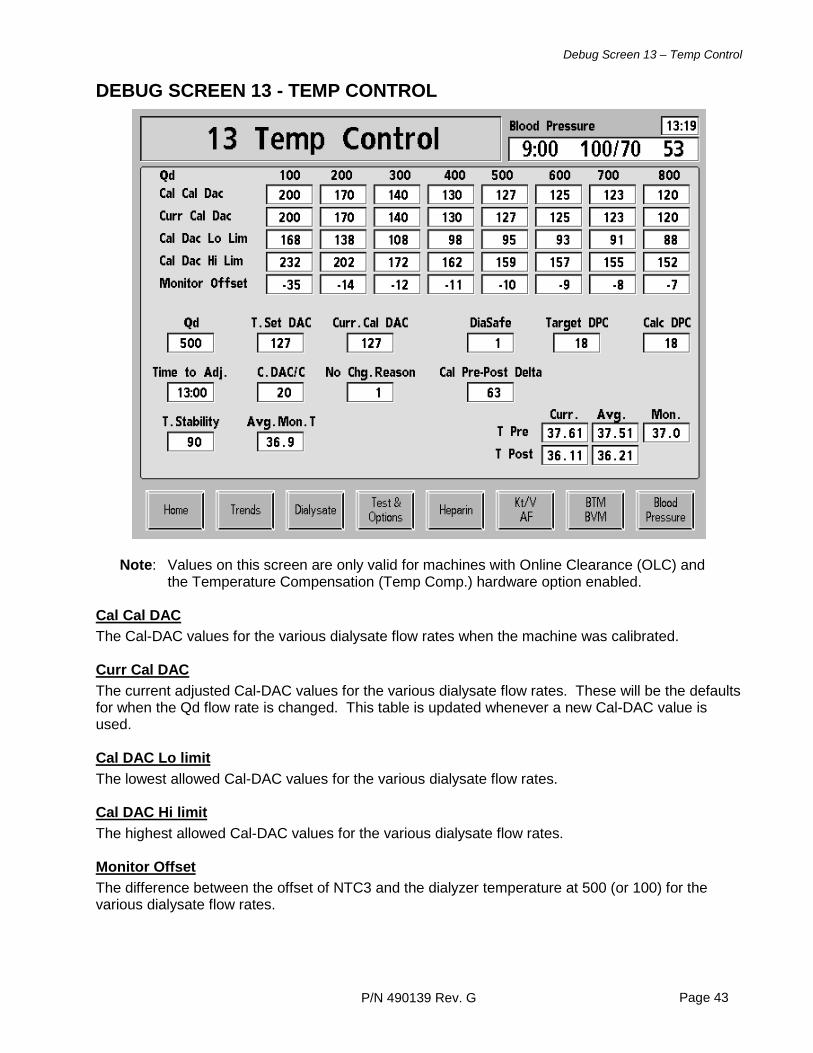
DEBUG SCREEN 13 - TEMP CONTROL
Note: Values on this screen are only valid for machines with Online Clearance (OLC) and
the Temperature Compensation (Temp Comp.) hardware option enabled.
Cal Cal DAC The Cal-DAC values for the various dialysate flow rates when the machine was calibrated. Curr Cal DAC The current adjusted Cal-DAC values for the various dialysate flow rates. These will be the defaults for when the Qd flow rate is changed. This table is updated whenever a new Cal-DAC value is used. Cal DAC Lo limit The lowest allowed Cal-DAC values for the various dialysate flow rates. Cal DAC Hi limit The highest allowed Cal-DAC values for the various dialysate flow rates. Monitor Offset The difference between the offset of NTC3 and the dialyzer temperature at 500 (or 100) for the various dialysate flow rates.
Debug Screen 13 – Temp Control
P/N 490139 Rev. G Page 44
Qd Current dialysate flow rate, ml/min. Time to Adj. The time (min:sec) until the next time a new Cal-DAC value will be calculated. T.Stability The temperature stability value:
• Note: T is the average temperature sample over 2 seconds • X180 = ((Avg (T1 to T180)) - (Avg (T121 to T180)) )2 • Tiinst180 = 110 – X180 (Limit to 0 - 100) • Tiavg210 = Avg (Tiinst 181 to Tiinst210)
T.Set DAC The temperature set DAC value: C.DAC/C The calibration DAC change necessary to get a 1°C change in monitor temperature at Qd 500: Avg.Mon.T This is the average monitor temperature (6 min avg.) Curr.Cal DAC The is the Cal DAC being used by the machine (same as the table value for the current Qd). No Chg.Reason The reason that the Cal-DAC was not adjusted at the last opportunity.
0- Monitor temp at 37, no change necessary or adjusted at the last opportunity. Message: Not necessary 1- Not yet time for first adjustment after startup. Message: Too early 2- Temp Stability not > 70. Message: Temp Stability < 70 3- Dialysate flow rate change delayed adjustment. Message: Qd adjusted 4- Fill Program delayed adjustment. Message: Fill program 5- Heater off condition delayed adjustment. Message: Heater off condition 6- Cal-DAC is at lower limit of allowed adjustment. Message: Cal-DAC at low limit 7- Cal-DAC is at upper limit of allowed adjustment. Message: Cal-DAC at high limit
Debug Screen 13 – Temp Control
P/N 490139 Rev. G Page 45
DiaSafe The setting for the DiaSafe option. Cal Pre-Post Delta The difference between the Pre and Post temperature sensors at 500 ml/min when the machine is in bypass (during a calibration step). Target DPC This is the target DAC counts per degree C. This is shown only during the test. Calc DPC This is the calculated DAC counts per degree C determined by the test. Temp Control - Continued T Pre
Curr. = The current NTC3 (pre) or NTC4 (post) reading (2 sec avg.) Avg. = The current NTC3 (pre) or NTC4 (post) average reading (6 min. avg.) Mon. = The current monitor reading (NTC3 + monitor offset)
T Post
Curr. = The current NTC3 (pre) or NTC4 (post) reading (2 sec avg.) Avg. = The current NTC3 (pre) or NTC4 (post) average reading (6 min. avg.)
Debug Screen 14 – bibag
P/N 490139 Rev. G Page 46
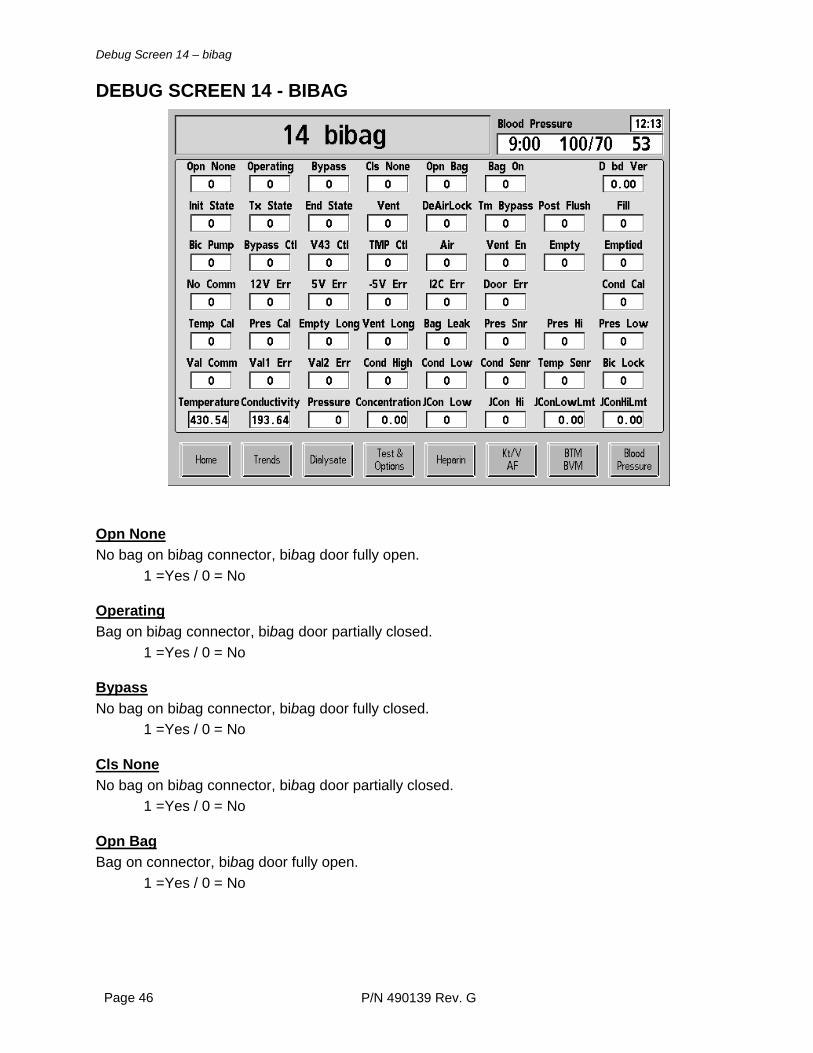
DEBUG SCREEN 14 - BIBAG
Opn None No bag on bibag connector, bibag door fully open.
1 =Yes / 0 = No Operating Bag on bibag connector, bibag door partially closed.
1 =Yes / 0 = No Bypass No bag on bibag connector, bibag door fully closed.
1 =Yes / 0 = No Cls None No bag on bibag connector, bibag door partially closed.
1 =Yes / 0 = No Opn Bag Bag on connector, bibag door fully open.
1 =Yes / 0 = No
Debug Screen 14 – bibag
P/N 490139 Rev. G Page 47
Bag On Bag on bibag connector.
1 =Yes / 0 = No D bd Ver bibag interface board (daughter board) software version. Init State System is in the bibag Initial state.
1 =Yes / 0 = No Tx State System is in the bibag Treatment state.
1 =Yes / 0 = No End State System is in the bibag End state.
1 =Yes / 0 = No Vent System is running the chamber vent, bibag initial flush or bibag vent process.
1 =Yes / 0 = No DeAirLock System is running the bibag deairlock (air lock removal) process.
1 =Yes / 0 = No Tm Bypass System is running the bibag timed bypass process.
1 =Yes / 0 = No Post Flush System is running the bibag post empty flush process.
1 =Yes / 0 = No Fill System is running the bibag fill process (Initial state).
1 =Yes / 0 = No Bic Pump System requests the bicarbonate pump to be on for a bibag process.
1 =Yes / 0 = No
Debug Screen 14 – bibag
P/N 490139 Rev. G Page 48
Bypass Ctl System requests bypass of the dialyzer for a bibag process.
1 =Yes / 0 = No V43 Ctl System is suppressing the “Valve 43 Failure” error for a bibag process.
1 =Yes / 0 = No TMP Ctl System requests TMP control, which isolates the dialyzer and freezes dialysate pressure for a bibag process.
1 =Yes / 0 = No Air Air is detected by the bibag air separation chamber air sensor.
1 =Yes / 0 = No Vent En System indicates that it is enabled to do the bibag vent process.
1 =Yes / 0 = No Empty System is running the bibag empty process.
1 =Yes / 0 = No Emptied System indicates that the bag is emptied.
1 =Yes / 0 = No No Comm Indicates a bibag No Communication error.
1 =Yes / 0 = No 12V Err Indicates a bibag +12 V error.
1 =Yes / 0 = No 5V Err Indicates a bibag +5 V error.
1 =Yes / 0 = No -5V Err Indicates a bibag -5 V error.
1 =Yes / 0 = No
Debug Screen 14 – bibag
P/N 490139 Rev. G Page 49
I2C Err Indicates a bibag I2C error.
1 =Yes / 0 = No Door Err Indicates a bibag Door error.
1 =Yes / 0 = No Cond Cal Indicates a bibag Conductivity Calibration error.
1 =Yes / 0 = No Temp Cal Indicates a bibag Temperature Calibration error.
1 =Yes / 0 = No Pres Cal Indicates a bibag Pressure Calibration error.
1 =Yes / 0 = No Empty Long Indicates a bibag Emptying Too Long error.
1 =Yes / 0 = No Vent Long Indicates a bibag Venting Too Long error.
1 =Yes / 0 = No Bag Leak Indicates a bibag Bag Leak error.
1 =Yes / 0 = No Pres Snr Indicates a bibag Pressure Sensor error.
1 =Yes / 0 = No Pres Hi Indicates a bibag Pressure Too High error.
1 =Yes / 0 = No
Debug Screen 14 – bibag
P/N 490139 Rev. G Page 50
Pres Low Indicates a bibag Pressure Too Low error.
1 =Yes / 0 = No Val Comm Indicates a bibag Valve Communication error.
1 =Yes / 0 = No Val1 Err Indicates a bibag Valve 1 error.
1 =Yes / 0 = No Val2 Err Indicates a bibag Valve 2 error.
1 =Yes / 0 = No Cond High Indicates a bibag Conductivity High error.
1 =Yes / 0 = No Cond Low Indicates a bibag Conductivity Low error.
1 =Yes / 0 = No Cond Senr Indicates a bibag Conductivity Sensor error. This bit is only set in the Rinse program.
1 =Yes / 0 = No Temp Senr Indicates a bibag Temperature Sensor error. This bit is only set in the Rinse program.
1 =Yes / 0 = No Bic Lock Indicates a bibag Bicarbonate Pump Air Locked error.
1 =Yes / 0 = No Temperature Displays the bibag temperature in °C of the sodium bicarbonate concentrate from either the bibag or a jug. Conductivity Displays the bibag conductivity in mS/cm of the sodium bicarbonate concentrate from either the bibag or a jug. This value is temperature compensated.
Debug Screen 14 – bibag
P/N 490139 Rev. G Page 51
Pressure Displays the bibag pressure in mmHg. Concentration Displays the bibag concentration in g/L during bibag dialysis. JCon Low Indicates a bicarbonate (jug) conductivity low error.
1 =Yes / 0 = No JCon Hi Indicates a bicarbonate (jug) conductivity high error.
1 =Yes / 0 = No JConLowLmt Displays the bicarbonate (jug) conductivity lower limit in mS/cm. JConHiLmt Displays the bicarbonate (jug) conductivity higher limit in mS/cm.
Debug Screen 15 – Bic Mon & Act. Reg
P/N 490139 Rev. G Page 52
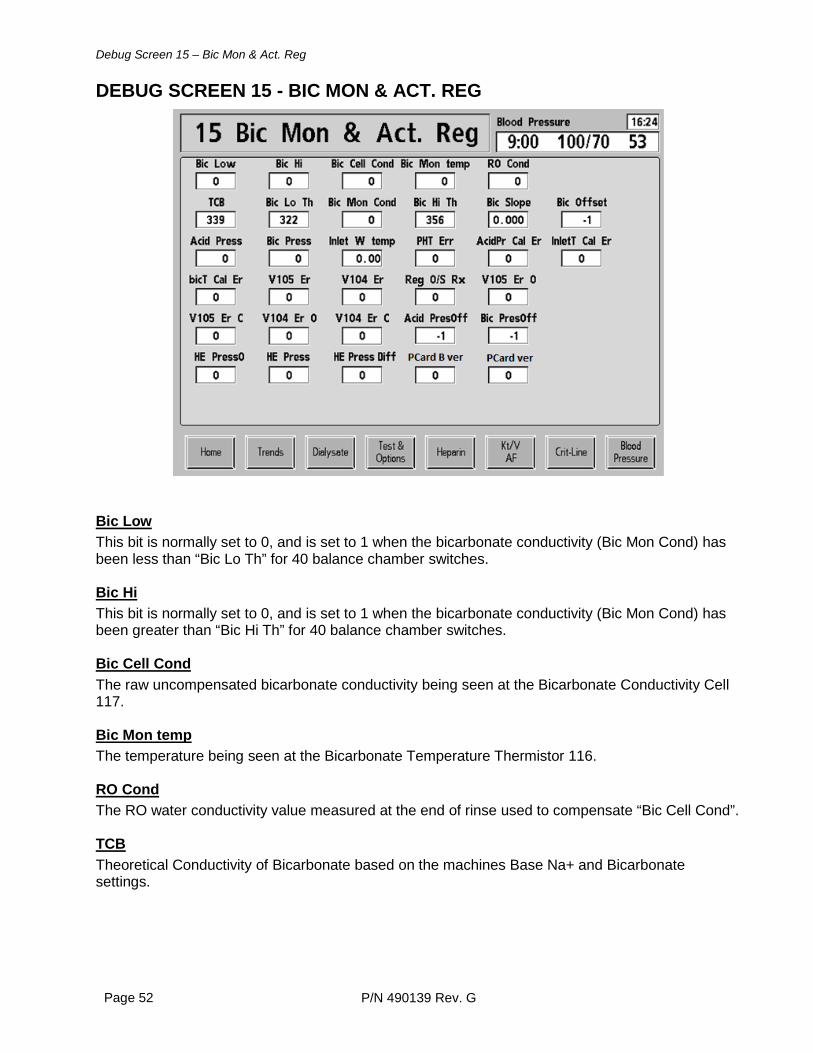
DEBUG SCREEN 15 - BIC MON & ACT. REG
Bic Low This bit is normally set to 0, and is set to 1 when the bicarbonate conductivity (Bic Mon Cond) has been less than “Bic Lo Th” for 40 balance chamber switches. Bic Hi This bit is normally set to 0, and is set to 1 when the bicarbonate conductivity (Bic Mon Cond) has been greater than “Bic Hi Th” for 40 balance chamber switches. Bic Cell Cond The raw uncompensated bicarbonate conductivity being seen at the Bicarbonate Conductivity Cell 117. Bic Mon temp The temperature being seen at the Bicarbonate Temperature Thermistor 116. RO Cond The RO water conductivity value measured at the end of rinse used to compensate “Bic Cell Cond”. TCB Theoretical Conductivity of Bicarbonate based on the machines Base Na+ and Bicarbonate settings.
Debug Screen 15 – Bic Mon & Act. Reg
P/N 490139 Rev. G Page 53
Bic Lo Th The lower threshold for compensated bicarbonate conductivity (Bic Mon Cond),
• 5% below TCB in Functional board software version less than 2.71 • 15% below TCB in Functional board software version 2.71 or greater
Bic Mon Cond The compensated bicarbonate conductivity based on Bic Cell Cond, Bic Mon temp, Bic Slope, Bic Offset, and RO Cond. Bic Hi Th The upper threshold for compensated bicarbonate conductivity (Bic Mon Cond),
• 5% above TCB in Functional board software version less than 2.71 • 15% above TCB in Functional board software version 2.71 or greater.
Bic Slope The slope value of the bicarbonate conductivity calculated from the bicarbonate conductivity cell calibration. Bic Offset The offset value of the bicarbonate conductivity calculated from the bicarbonate conductivity cell calibration. Acid Press The compensated pressure seen at the Acid Port Pressure Transducer 106. Bic Press The compensated pressure seen by the bibag Pressure Transducer 110 (bibag machine). Inlet W temp – (Not used) PHT Err Indicates a bibag Pressure Holding Test failure.
1 =Yes / 0 = No AcidPr Cal Er Indicates an Acid Pressure Calibration Error.
1 =Yes / 0 = No InletT Cal Er – (Not Used) BicT Cal Er Indicates a Bicarb Temperature Calibration Error.
1 =Yes / 0 = No V105 Er Indicates a Valve 105 Error.
1 =Yes / 0 = No V104 Er Indicates a Valve 104 Error.
1 =Yes / 0 = No
Debug Screen 15 – Bic Mon & Act. Reg
P/N 490139 Rev. G Page 54
Reg O/S Rx Indicates the bibag interface board has received the Regulator Pressure service mode calibration data.
1 = Data Received / 0 = Data not Received. V105 Er O Indicates Valve 105 is Stuck Open.
1 =Yes / 0 = No V105 Er C Indicates Valve 105 is Stuck Closed.
1 =Yes / 0 = No V104 Er O Indicates Valve 104 is Stuck Open.
1 =Yes / 0 = No V104 Er C Indicates Valve 104 is Stuck Closed.
1 =Yes / 0 = No Acid PresOff The compensation value for Acid Port Pressure Transducer 106 based on the Regulator Pressure service mode calibration.
Bic PresOff The compensation value for bibag Pressure Transducer 110 (bibag machine) based on the Regulator Pressure service mode calibration. HE Press0 The starting pressure value in mmHg for the Heat Exchanger Leak Test.
HE Press The most recent pressure value in mmHg for the Heat Exchanger Leak Test.
HE Press Diff The difference in mmHg between the most recent pressure value and the starting pressure value (HE Press0) for the Heat Exchanger Leak Test. PCard B ver Displays the patient card board software version PCard ver Displays the patient card reader software version
Notes
P/N 490139 Rev. G Page 55
NOTES:
_______________________________________________________________________________________
_______________________________________________________________________________________
_______________________________________________________________________________________
_______________________________________________________________________________________
_______________________________________________________________________________________
_______________________________________________________________________________________
_______________________________________________________________________________________
_______________________________________________________________________________________
_______________________________________________________________________________________
_______________________________________________________________________________________
_______________________________________________________________________________________
_______________________________________________________________________________________
_______________________________________________________________________________________
_______________________________________________________________________________________
_______________________________________________________________________________________
_______________________________________________________________________________________
_______________________________________________________________________________________
_______________________________________________________________________________________
_______________________________________________________________________________________
_______________________________________________________________________________________
_______________________________________________________________________________________
_______________________________________________________________________________________
_______________________________________________________________________________________
_______________________________________________________________________________________
_______________________________________________________________________________________
_______________________________________________________________________________________

Fresenius Medical Care North America
Manufactured by: Fresenius USA, Inc. 4040 Nelson Avenue Concord, CA 94520 800 227-2572