Embed Size (px)
Citation preview

2008–2009professional servicesutilization Trends Among Privately Insured Patients

The Maryland Health Care Commission (MHCC) is a public,
regulatory commission established in 1999 by the Maryland
General Assembly through a merger of the Health Care Access
and Cost Commission and the Maryland Health Resources
Planning Commission. The MHCC mission is to plan for health
system needs, promote informed decisionmaking, increase
accountability, and improve access in a rapidly changing health
care environment by providing timely and accurate information
on availability, cost, and quality of services to policymakers,
purchasers, providers, and the public. The Commission is
administratively located within the Maryland Department of
Health and Mental Hygiene, and is composed of 15 members
appointed by the Governor, with advice and consent of the
Senate, for a term of four years.
The MHCC is required under Health-General Ar t icle
§19-133(g)(2-4) to issue a report describing the level of
payments to physicians and other health care practitioners.
Each year since 1996, the MHCC has published a professional
health services report that provides a detailed analysis of
payments to physicians and other health care professionals
for the care of privately insured Maryland residents under
age 65. The reports are based on health care claims and
encounter data that most health insurance plans serving
Maryland residents submit annually to the MHCC.
Marilyn Moon, Ph.D. Chair
Garret A. Falcone Vice Chair
Reverend Robert L. Conway
John E. Fleig, Jr.
Kenny W. Kan
Sharon Krumm, R.N., Ph.D.
Robert Lyles, Jr., M.D.
Barbara Gill McLean, M.A.
Tekedra N. Mawakana, Esq.
Kurt B. Olsen, Esq.
Sylvia Ontaneda-Bernales, Esq.
Darren W. Petty
Adam Weinstein, M.D.
Randall P. Worthington

Released July 2011
Center for Information Services and Analysis
2008–2009
professional servicesutilization Trends Among Privately Insured Patients
AcknowledgmentsThis report would not have been possible without the assistance of private health insurance companies and health maintenance organizations (HMOs) that provided information (identified in Appendix C). The Maryland Health Care Commission is grateful to these organizations, which dedi-cated considerable staff time and computer resources, and to the many individuals who answered questions and reviewed results.
The development of the Medical Care Data Base (MCDB) and the preparation of this report were conducted under contract with Social & Scientific Systems, Inc. (SSS), of Silver Spring, Maryland, with assistance from Avar Consulting of Rockville, Maryland, and Data and Analytic Solutions, Inc. (DAS), of Fairfax, Virginia. The overall effort at SSS was under the direction of Dr. Claudia Schur and Mr. Adrien Ndikumwami.
Dr. Lan Zhao of SSS’s Center for Health Research and Policy conducted the analyses described in this report. The programming effort at SSS was led by Mr. Adrien Ndikumwami with assistance from Ms. Sanee Maphungphong (SSS), Ms. Kasey Chen (Avar), Ms. Doreen Xu (DAS), and Ms. Ling Wu (DAS). They edited the payer data submissions, organized the MCDB, and completed the numerous data analyses in this report. Also at SSS, Ms. Joan Holleman and Ms. Bonnie Belkin edited the report, and Ms. Laura Spofford assisted in the graphic design and production of the report. The Commission thanks the SSS team.
Contents
Report Highlights . . . . . . . . . . . . . . . . . . . . . . . . . . . . . . . . . . . . . . . . . . . . . . . . . . . . . . . . . . . . . . . . . . . . . . . . . . . . . . . . . . . . 1
Growth in Per-User Spending . . . . . . . . . . . . . . . . . . . . . . . . . . . . . . . . . . . . . . . . . . . . . . . . . . . . . . . . . . . . . . . . . . . . . . . . . 1
Level and Determinants of Per-User Spending . . . . . . . . . . . . . . . . . . . . . . . . . . . . . . . . . . . . . . . . . . . . . . . . . . . . . . . . . . 1
Payment Rate for Professional Services . . . . . . . . . . . . . . . . . . . . . . . . . . . . . . . . . . . . . . . . . . . . . . . . . . . . . . . . . . . . . . . . 2
1. Introduction . . . . . . . . . . . . . . . . . . . . . . . . . . . . . . . . . . . . . . . . . . . . . . . . . . . . . . . . . . . . . . . . . . . . . . . . . . . . . . . . . . . . . . . 3
Study Populations: All Users Versus Full-Year Enrollees . . . . . . . . . . . . . . . . . . . . . . . . . . . . . . . . . . . . . . . . . . . . . . . 3
Key Terms . . . . . . . . . . . . . . . . . . . . . . . . . . . . . . . . . . . . . . . . . . . . . . . . . . . . . . . . . . . . . . . . . . . . . . . . . . . . . . . . . . . . . . . . . 5
User, Insurance Plan, Payer, and Provider Characteristics . . . . . . . . . . . . . . . . . . . . . . . . . . . . . . . . . . . . . . . . . . . . . 6
Methodological Changes: Imputation of Payments for Capitated Services . . . . . . . . . . . . . . . . . . . . . . . . . . . . . . 7
Caveats . . . . . . . . . . . . . . . . . . . . . . . . . . . . . . . . . . . . . . . . . . . . . . . . . . . . . . . . . . . . . . . . . . . . . . . . . . . . . . . . . . . . . . . . . . . 8
2. Decomposition of Spending on Professional Services: Volume, Complexity, and Price . . . . . . . . . . . . . . 9
2.1 Overview . . . . . . . . . . . . . . . . . . . . . . . . . . . . . . . . . . . . . . . . . . . . . . . . . . . . . . . . . . . . . . . . . . . . . . . . . . . . . . . . . . . . . 9
2.2 Summary of Main Findings . . . . . . . . . . . . . . . . . . . . . . . . . . . . . . . . . . . . . . . . . . . . . . . . . . . . . . . . . . . . . . . . . . . . . 9
2.3 Level of Per-User Spending on Professional Services and Underlying Factors . . . . . . . . . . . . . . . . . . . . . 9
2.4 Growth in Per-User Spending on Professional Services and Role of Service Volume,
Service Complexity, and Payment Rate . . . . . . . . . . . . . . . . . . . . . . . . . . . . . . . . . . . . . . . . . . . . . . . . . . . . . . . . . 14
2.5 Some Details About Per-User Spending . . . . . . . . . . . . . . . . . . . . . . . . . . . . . . . . . . . . . . . . . . . . . . . . . . . . . . . . 15
3. Payment Rates for Professional Services . . . . . . . . . . . . . . . . . . . . . . . . . . . . . . . . . . . . . . . . . . . . . . . . . . . . . . . . . 19
3.1 Overview . . . . . . . . . . . . . . . . . . . . . . . . . . . . . . . . . . . . . . . . . . . . . . . . . . . . . . . . . . . . . . . . . . . . . . . . . . . . . . . . . . . . 19
3.2 Differences in Payment Rate by Payer Market Share . . . . . . . . . . . . . . . . . . . . . . . . . . . . . . . . . . . . . . . . . . . . 19
3.3 Contributors to the Differences in Payment Rate by Payer Market Share . . . . . . . . . . . . . . . . . . . . . . . . . . 20
Appendix A: Technical Background: Summary of Data and Methods for This Report . . . . . . . . . . . . . . . . . . . . . 27
Appendix B: Supplemental Tables . . . . . . . . . . . . . . . . . . . . . . . . . . . . . . . . . . . . . . . . . . . . . . . . . . . . . . . . . . . . . . . . . . . . 29
Appendix C: Payers Contributing Data to This Report . . . . . . . . . . . . . . . . . . . . . . . . . . . . . . . . . . . . . . . . . . . . . . . . . . 34

TAble 1-1: Count of All and Full-Year Users and Distribution of Users by Coverage Type, 2009 . . . . . . . . . . 4
TAble 1-2: Impact of Imputation of Capitated Services on the Number of Full-Year Users and Expenditure Per User, 2008 and 2009 . . . . . . . . . . . . . . . . . . . . . . . . . . . . . . . . . . . . . . . . . . . . . . . . . . . 7
TAble 2-1: Distribution of Full-Year Users and Expenditure Per User in Expenditure Risk Categories by Coverage Type, Network Type, Region, and Payer Market Share, 2008–2009 . . . . . . . . . . 10
TAble 2-2: Distribution of Full-Year Users, Mean, Median, and 90th Percentile of Expenditure Risk Score by Coverage Type, Network Type, Region, and Payer Market Share, 2008–2009 . . . . . . . . . . . . . . 11
TAble 2-3: Number of Services Per User in Expenditure Risk Categories by Coverage Type, Network Type, Region, and Payer Market Share, 2008–2009 . . . . . . . . . . . . . . . . . . . . . . . . . . . . . . . . . . . 12
FiguRe 2-1A: Distribution of Coverage Type by Payer Market Share, 2009 . . . . . . . . . . . . . . . . . . . . . . . 15
FiguRe 2-1b: Distribution of Region by Payer Market Share, 2009 . . . . . . . . . . . . . . . . . . . . . . . . . . . . . . . 16
TAble 2-4: Decomposition of Expenditure Per User by Market Share and Network Type, 2009 . . . . . . . . . 17
FiguRe 2-2A: Percentage Paid Out-of-Pocket by Non-CDHP Coverage Type and Network Type, 2009 . . 18
FiguRe 2-2b: Components of Out-of-Pocket Expenditures, 2009 . . . . . . . . . . . . . . . . . . . . . . . . . . . . . . . . 18
TAble 3-1: Distribution of Number of Services, Total RVUs, and Total Payment by Payer Market Share Within Coverage Type, Network Type, and User Region, 2009 . . . . . . . . . . . . . . . . . . . . . . . 20
TAble 3-2A: Payment Rates and Service Complexity by Provider Region, Service Type, and Payer Market Share, 2008–2009 . . . . . . . . . . . . . . . . . . . . . . . . . . . . . . . . . . . . . . . . . . . . . . . . . . . . . . . . . 21
TAble 3-2b: Payment Rates and Distribution of RVUs for Participating Provider Services by Provider Region, Service Type, and Payer Market Share, 2008–2009 . . . . . . . . . . . . . . . . . . . . . . . . . . . . 23
TAble 3-2C: Payment Rates and Share of all RVUs for Nonparticipating Provider Services by Provider Region, Service Type, and Payer Market Share, 2008–2009 . . . . . . . . . . . . . . . . . . . . . . . . . . . 25
TAble b-1: Distribution of Payments by Coverage Type and User Risk Status Within Coverage Type, 2008–2009 . . . . . . . . . . . . . . . . . . . . . . . . . . . . . . . . . . . . . . . . . . . . . . . . . . . . . . . . . . . . 29
TAble b-2: RVUs Per Service in Expenditure Risk Categories by Coverage Type, Network Type, Region, and Payer Market Share, 2008–2009 . . . . . . . . . . . . . . . . . . . . . . . . . . . . . . . . . . . . . . . . . . . 30
TAble b-3: Percentage Change in Payment Per RVU in Expenditure Risk Categories by User, Coverage Type, Network Type, Region, and Payer Market Share, 2008–2009 . . . . . . . . . . . . . . . . . . 31
TAble b-4: Expenditure Per User by Coverage Type, Network Type, Region, and Payer Market Share, 2008 . . . . . . . . . . . . . . . . . . . . . . . . . . . . . . . . . . . . . . . . . . . . . . . . . . . . . . . . . . . . . . . . . . . . 32
TAble b-5: Distribution of Expenditure Risk Scores, 2009 . . . . . . . . . . . . . . . . . . . . . . . . . . . . . . . . . . . . . 33
TAble b-6: Comparison of Median CDPS for Each Coverage Type with the Overall Median Score, 2009 . . 33
TAble C-1: Payers Contributing Data to This Report . . . . . . . . . . . . . . . . . . . . . . . . . . . . . . . . . . . . . . . . . . 34
Tables and Figures
Report Highlights
This report describes the use of professional health care services by privately insured Maryland resi-dents less than 65 years of age, during calendar year 2009, and the payments made to practitio-ners for these services by insurance companies and service users. Unless otherwise noted, the data source for all analyses in the report is the Maryland Medical Care Data Base (MCDB), which contains information on privately insured profes-sional services used by Maryland residents.1 As in the 2008 Practitioner Utilization report, the analysis includes capitated services; while these services lack payment information, improvements in data quality allowed imputation of payment amounts so that a fuller picture of all services and payments can be provided.2
Professional service use is characterized by three key measures: (a) the average annual expenditure per user; (b) the average number of professional services obtained during the year; and (c) the average complexity of these services, with complexity defined by the number of rela-tive value units3 (RVUs) per service. Payments to health care professionals are described using the average payment per RVU and the ratio of the actual expenditure per user to the payment that would have resulted if the Medicare fee schedule had been applied.
HigHligHTS FROM THe RePORTgrowth in Per-user SpendingBetween 2008 and 2009 the average expenditure per user for professional services among users insured for the entire year4 grew by 2 percent, lower than the 5 percent increase in the prior year. Nationally, the average spending on office-based medical provider visits for a nonelderly, privately insured, full-year user increased by 3 percent from
1 A detailed description of the MCDB is included in Appendix A, and the list of insurers who submitted 2009 insurance claim data to the MCDB is located in Appendix C.
2 These changes are described in detail in Chapter 1 under Methodological Changes: Imputation of Payments for Capitated Services.
3 See Key Terms in Chapter 1 for the definition of relative value unit.
4 See Chapter 1 for the definition of a full-year user.
2007 to 2008.5 The main driver for the 2008–2009 growth was a 2 percent increase in the average payment rate for the mix of services obtained by users—as measured by the average payment per RVU. In contrast, the main driver for the 2007–2008 growth was a 3 percent increase in average volume, as measured by the number of professional services per user. The growth in per-user spending from 2008 to 2009 varied by coverage type and was especially large, at 8 percent, in the individual market. By network type, the growth was concentrated almost exclusively among users enrolled in HMO plans (4 percent), while users in non-HMO plans exhibited no increase in per-user spending in 2009.
Per-capita personal income in Maryland has continued to keep pace with the growth in spending for professional services, with the result that, since 2004, per-user spending continues to account for slightly more than 2 percent of per-capita personal income.
level and Determinants of Per-user SpendingIn 2009, the average expenditure on profes-sional services for a full-year user in Maryland was $1,238. User risk status, as measured by an expenditure risk score, is an important determinant of the level of average spending on professional services. An expenditure risk score—which is a measure of a person’s need for medical care—was calculated for each full-year user, and users were assigned to one of three categories: low-risk, medium-risk, or high-risk.6 In 2009, the annual expenditure for a user with medium-risk was about twice that of a low-risk user, and the annual expen-diture for a high-risk user was about five times that of a low-risk user. The average expenditure per user in different coverage types is strongly influenced by the risk mix of the users. Users in the Maryland Health Insurance Plan (MHIP), the
5 Data source: Medical Expenditure Panel Survey (MEPS), 2007 and 2008. The 2008 data are from the most recent MEPS available at the time this report was prepared.
6 See Chapter 1 for a description of the expenditure risk score and category assignment.
2008–2009 PROFESSIONAL SERVICES UTILIZATION: Trends Among Privately Insured Patients 1

state’s high-risk pool, had the highest average risk score and the highest average expenditure per user of all coverage types.7 At the other end of the risk-score distribution, users enrolled in plans in the individual market had the lowest risk scores and ranked at the bottom in average spending per user.
The overall patient cost-sharing burden, measured by the share of total spending paid out-of-pocket, for full-year users was 21 percent in 2009, but the patient’s share of payment obligations varied significantly by network type. Users in consumer-directed health plans (CDHPs) that allow members to use personal Health Savings Accounts (HSAs), Health Reimbursement Arrangements (HRAs), or similar medical payment products to pay routine health care expenses on a pre-tax basis paid 36 percent of their expenditures out-of-pocket in 2009. In comparison, among non-CDHP users, the out-of-pocket cost was 21 percent and 14 percent, respectively, for non-HMO users and HMO users.
Payment Rate for Professional ServicesThe two largest payers in Maryland accounted for about 70 percent of the market, whether measured by number of services, total resources (RVUs), or total payments. In 2009, the overall average payment rate was $36.70, 2 percent higher than in 2008. As in previous years, payment per RVU across all professional services was lower among the largest payers than among the other payers, $35.30 versus $40.30. However, their difference in payment rates may be narrowing as the increase in the overall average payment rate from 2008 to 2009 was mainly due to a 2 percent increase among the largest payers, while the payment rate increase among the other payers was lower, at 1 percent. Among the largest payers, the average payment rate for services from participating providers grew by 2 percent, while the average rate for services from nonparticipating providers grew considerably more, by 9 percent. Services covered by the largest payers were more likely to be delivered by participating providers than services covered by the other payers. Among the other payers, the average rates for services from participating and nonparticipating providers both grew by 1 percent. Overall, the average rate for
7 2008 was the first year that data on full-year users in the Maryland Health Insurance Plan (MHIP) were included in the MCDB.
participating provider services grew by 2 percent, and the average rate for non-participating provider services grew by 7 percent.
Across Maryland regions, the largest payers had a lower payment rate for services delivered by participating providers than the other payers; both payer groups paid their highest rate to participating providers in the National Capital Area. The largest payers also paid a lower rate across all types of services provided by participating providers than the other payers; for both groups of payers, the lowest average payment per RVU was for evalua-tion and management (E/M) services delivered by mental health professionals. Mental-health-related E/M services were most likely to be provided by nonparticipating providers regardless of payer market share; about one-quarter of these E/M services covered by the largest payers was deliv-ered by nonparticipating providers, and that ratio was almost one-third for the smaller payers.
2 2008–2009 PROFESSIONAL SERVICES UTILIZATION: Trends Among Privately Insured Patients
1. Introduction
As required by Maryland Health-General Article §19 -133(g)(2-4), the Maryland Health Care Commission (MHCC) has published annually, since 1996, a report on the use of and spending on professional medical services by state residents with private health insurance. The main purpose of the professional services report series8 is:
n To describe the use of—and trends in the use of—professional medical services covered by private health insurance by nonelderly Maryland residents;
n To analyze spending on these services by user, provider, and market characteristics;
n To examine the payments made by insurance companies for these services; and
n To provide timely analytic evidence on issues related to professional medical services for state policymakers and other interested parties when data permit.
As with all previous professional services reports, the Maryland Medical Care Data Base (MCDB) is the main data source for this 2009 Professional Services Utilization report. The MCDB includes information for individuals covered by private insur-ance who used insured professional services during each year. Private health insurance plans that serve Maryland residents, with the exception of a number of small payers, have been submitting data for inclu-sion in the MCDB annually since 1996.9
This introductory chapter explains key concepts used in the report and describes methodological changes and caveats in this year’s data analyses. Chapter 2 examines professional services from the users’ perspective. It analyzes the relation-ship between price, volume, service complexity, and total per-user spending. Chapter 3 analyzes professional services from the payers’ perspective. It examines whether payment rates for professional services differ by payer market share. Payment rates are also compared for services provided
8 Between 1996 and 2008, the report was titled Practitioner Utilization. Beginning with this 2008–2009 report, the title has been changed to Professional Services Utilization.
9 A detailed description of the MCDB is included in Appendix A, and the list of insurers who submitted 2009 insurance claims data to the MCDB is located in Appendix C.
by participating and nonparticipating providers between the largest payers and the other payers. Appendix A provides a technical background, including a summary of data and methods for this report. Appendix B contains supplemental data on per-user expenditures and the relative value units (RVUs) for privately insured professional services. It also includes tables that summarize the distribution of full-year users’ expenditures for professional services in 2009 by user health status, as measured by expenditure risk scores, and coverage type; changes in RVUs per service and payment rate in expenditure risk categories by coverage type, network type, region, and payer market share; the decomposition of per-user expen-diture by user, plan, and payer characteristics in 2008; the value of risk scores at various percen-tiles; and the distribution of expenditure risk scores by user characteristics. Appendix C lists the payers contributing data to this report.
Key COnCePTSStudy Populations: All users Versus Full-year enrolleesFindings in this report pertain only to the nonelderly privately insured who used one or more profes-sional services (i.e., the users) rather than the whole nonelderly, privately insured population. The MHCC’s professional medical services reports are based on information from private insurers in Maryland for covered (insured) services used by nonelderly Maryland residents. If a privately insured nonelderly person did not use any covered professional services, and thus had no claim or encounter10 in a particular year, this individual will not appear in the MCDB and, therefore, will not be part of the analyses for that year.
Among all users, some were enrolled in the same insurance plan for the entire year of 2009. These full-year users, identified using enrollment and disenrollment dates, are the study population in
10 Claims are records of health care services paid on a service-by-service basis and include the associated payment information. Encounters are records of services paid on a capitation basis or through a global contract with an intermediary organization, and do not include payment information.
2008–2009 PROFESSIONAL SERVICES UTILIZATION: Trends Among Privately Insured Patients 3

Chapter 2 when professional services are exam-ined from the users’ perspective. Focusing on full-year users provides a more accurate estima-tion of annual service use and spending and better understanding of how price, volume, and service complexity contribute to changes in spending on privately insured professional services in Maryland.
In 2009, there were about 2.7 mill ion users, 1 percent fewer than in 2008 (data not shown).11 Non-consumer-directed health plan (non-CDHP) private employer plans and public employer plans continued to be the two major sources of private health insurance for users of professional services, accounting for more than one-third each and almost three-quarters combined, of all users in 2009 (Table 1-1). Consumer-directed health plans (CDHPs) of any coverage type and the non-CDHP Maryland Comprehensive Standard Health Benefit Plan (CSHBP) for small busi-nesses covered 10 percent and 8 percent of users, respectively. Another 5 percent of users were covered through the individual market. The Maryland Health Insurance Plan (MHIP), the high-risk pool for individuals who are unable to obtain health insurance in the nongroup market due to medical underwriting, covered about 1 percent of all users, exclusively through non-CDHP plans. Among CDHPs, all coverage types except for the
11 Changes in the number of users between years may reflect several factors, including the completeness of the data submitted by the payers, and changes in the number of individuals covered by private insurance and in the share of the privately insured who used professional medical services.
MHIP gained users in 2009 (data not shown). In contrast, all non-CDHPs except those provided through public employers and the MHIP lost users. As a result, the share of users covered by non-CDHP private employer plans and the non-CDHP CSHBP shrank slightly, by 1 and 2 percentage points, respectively, while the share of users in non-CDHP public employer plans and CDHPs each increased by 1 percentage point in 2009 (data not shown). Changes in the distribution of all users by coverage type possibly reflect the prolonged effect of the economic downturn on the job market and its ripple effect on the availability and affordability of health insurance, including the decision by some employers to limit coverage to employees only (no family members).
A little less than three-quarters of users in 2009 were enrolled in the same plan for the entire calendar year (Table 1-1). As seen in previous years, individuals insured through public employers are most likely to remain enrolled in the same plan. This is not surprising given that public-sector employment tends to be more stable than private-sector employment. The vast majority of users in public employer plans (83 percent in 2009) were full-year enrollees. As a result, users in public employer plans accounted for a higher share among full-year users than among all users: 43 percent versus 37 percent in 2009. In contrast, users in the non-CDHP CSHBP were much less likely to hold insurance with the same plan throughout the calendar year—in 2009, just under one-half of the non-CDHP CSHBP enrollees
TABle 1-1: Count of All and Full-Year Users and Distribution of Users by Coverage Type, 2009
All users Full-year users Proportion of Full-year users to All users
All 2,713,856 1,942,491 72%
COVeRAge TyPe
non-CDHP 90% 92% 73%
1: Public Employer Plan 37 43 83
2: Private Employer Plan 37 36 70
3: CSHBP 8 6 49
4: Individual Plan 5 5 69
5: MHIP 1 1 62
CDHP 10 8 57
NoTeS: 1. CDHP = consumer-directed health plan; CSHBP = Comprehensive Standard Health Benefit Plan; MHIP = Maryland Health Insurance Plan.
2. Full-year users are those enrolled in the same insurance plan for the entire year. Enrollees who have more than one coverage type are assigned the coverage type associated with the highest total RVUs, payment, number of services, or the most recent recorded coverage type if the coverage types are tied to total RVUs, payment, and number of services.
3. Detail may not add to total due to rounding.
4 2008–2009 PROFESSIONAL SERVICES UTILIZATION: Trends Among Privately Insured Patients

were full-year users. This may be the result of two factors: job turnover and the stability of plan offerings. The turnover rate of employees in small business and the turnover rate of small busi-nesses themselves tend to be higher than their larger counterparts. In addition, the contract year for small employers often does not coincide with the calendar year. When employers in the CSHBP change plans or initiate or drop health insurance coverage during the calendar year, their employees become part-year enrollees in one or more plans.
Users in the MHIP were about 10 percentage points less likely to be full-year users than the average of all users. The low ratio of full-year users to all users in the MHIP is in part due to the fact that MHIP enrollees can enroll at any time during a year. Many eligible individuals enroll in MHIP when they have a break in employment and have either exhausted or are not eligible for COBRA benefits. Once they find new employment with
insurance coverage in which their employers pay 50 percent or more of the premiums, they are not eligible for MHIP.12
Users in CDHP plans were also less likely to be full-year users than average. In 2009, 57 percent of CDHP users were full-year users. As in the previous couple of years, the lower share of full-year users in CDHPs in 2009 reflects the continued growth in CDHP enrollment in 2009. Because this enrollment occurred throughout the year, it produced a relatively large share of users who were covered for less than a year. Among non-CDHP CSHBP users, compared with 2008, the share of full-year users dropped by 9 percentage points in 2009. This is due, in part, to a switch of CSHBP users from non-CDHPs to CDHPs
12 Individuals may be eligible for subsidized premiums under MHIP, if the family income falls below thresholds established by the MHIP board.
Key TeRMS
TOTAl PAyMenTS FOR PROFeSSiOnAl SeRViCeS Sum of payments from the insurer and patient, including the deductible, copay-ment or coinsurance, and balance bill ing amounts to be paid directly out-of-pocket by the patient, as reported on the claims data.
COunT OF SeRViCeS A simple count of the number of services provided to patients (as listed on the bills), without regard to the cost or complexity of those services. The average number of services per user is used to capture the volume of professional services in this report.
RelATiVe VAlue uniTS (RVus) OF CARe A measure of the quantity of care, in which more complex, resource-intensive (and typically more costly) services have a higher number of RVUs. A more sophisticated measure of the quantity of care than a simple count of services, RVUs measure the level of resources used to produce a particular service. RVUs are used to define both service complexity and payment rate in this report. The complexity of a group of services is defined by the average
number of RVUs per service. The average unit price, or payment rate, is measured by the average payment per RVU. Medicare’s physi-cian payment system was used as the source of information on the number of RVUs for each service. For this report, RVUs from the 2009 Medicare fee schedule were applied to both 2008 and 2009 data.
COunT OF SeRViCe uSeRS A count of the encrypted patient identifiers reported by payers. Because payers may use different encryption systems for their different insur-ance products (plans), the count is made within each specific plan. Counts of users may over-state the actual number of users of practitioner services, because individuals who are insured under more than one product during a year will be counted separately under each.
PAyMenT AT MeDiCARe PAyMenT leVel Medicare RVUs are added to each service in the MCDB by Current Procedural Terminology (CPT) code, and the Medicare conversion factor is applied to calculate payment for the service at the Medicare payment level.
2008–2009 PROFESSIONAL SERVICES UTILIZATION: Trends Among Privately Insured Patients 5

during 2009,13 which led to a lower share of full-year users in both the non-CDHP CSHBP group and the CDHP group.
user, insurance Plan, Payer, and Provider CharacteristicsUsers, providers, and payers and the insurance plans they offer all play a role in determining the use and cost of professional services. In this report, we examine: (a) how the level of and the annual change in per-user expenditures and service utilization vary by user, plan, and payer characteris-tics, and (b) how payments per RVU vary by payer and provider characteristics.
uSeR CHARACTeRiSTiCS: Health status and geographic location are two main user character-istics that affect the use of professional services. Health status determines the type and amount of professional services needed, while geographic location captures factors such as cost of living that affect expenditures on professional services.
n Geographic region divides the state into three areas: Balt imore Metropol i tan Area (BMA), National Capital Area (NCA, including Montgomery and Prince George’s counties), and Other Maryland Areas.
n expenditure risk score measures the need for medical care. The healthier a person, the less medical care is needed, regardless of the person’s demographic and socioeconomic char-acteristics. We report utilization and spending for full-year users grouped by a measure of their need for medical care, defined by the Chronic Illness and Disability Payment System (CDPS). The CDPS, developed by researchers at the University of California, San Diego, categorizes an individual’s risk of having significant medical expenditures from the number and mix of diag-noses recorded on his or her insurance claims.
A risk score was calculated for each user enrolled for the entire year in the same data reporting plan using only professional service records. The resulting distribution of scores was divided into
13 Of all CDHP users, the share of CSHBP users increased from 26 percent in 2008 to 34 percent in 2009; meanwhile, the share of CSHBP users among all non-CDHP users dropped from 10 percent in 2008 to 8 percent in 2009.
three groups of approximately the same size,14 and individuals were assigned to one of three categories—“low-risk,” “medium-risk,” or “high-risk”—based on their position in the distribution.
Pl An An D PAye R CHAR AC Te Ri S TiC S: Throughout this report, insurance plans and payers are categorized along the following dimensions:
n Coverage type differentiates between CDHPs and non-CDHPs, and among non-CDHPs, whether the private insurance is purchased on an individual basis or through an employer. Among employer-sponsored plans, there are three groups—private employers, public employers, and the CSHBP for small businesses. There are two groups for plans purchased individually—those through the regular individual market and those through the MHIP. This is the second year since the creation of the MHIP by the Maryland legislature in 2002 in which data submission allows the reporting of MHIP as a separate coverage type.
n Network type distinguishes between health maintenance organizations (HMOs) and non-HMOs—typically preferred provider organizations (PPOs). HMOs and non-HMOs differ in the breadth of their provider networks, whether a referral from a primary care physician is required to see a specialist, and the extent to which the use of nonparticipating providers’ services (out-of-network services) is reimbursed. PPOs have larger networks and offer more generous reimbursement for out-of-network services, while HMOs limit their reimbursement for out-of-network services to emergency care only.
n Market share separates the two largest payers from all other payers, because they may differ in their ability to lead rather than follow market trends.
PROViDeR CHARACTeRiSTiCS: A provider’s reimbursement for a service generally reflects the number of RVUs associated with the service— although other factors are involved—and differs by payer. Even for the same service within the same payer, the average price per unit of service—here measured as average payment per RVU—can vary
14 Users were not grouped evenly in thirds due to ties in risk scores around the cutoff points.
6 2008–2009 PROFESSIONAL SERVICES UTILIZATION: Trends Among Privately Insured Patients

based on geographic location of the provider and whether the provider and payer have a payment agreement.15
n Geographic region divides the providers into four categories based on their geographic location, which may be outside of Maryland. Providers in locations with higher resource costs tend to receive higher average payment per RVU. The provider regions include the Baltimore Metropolitan Area (BMA); the NCA (Montgomery and Prince George’s counties, and locations in Northern Virginia); other areas in Maryland or in adjacent states (excluding Virginia); and providers in more distant or unknown locations.
n Participation status indicates whether or not the provider who rendered a service had a payment agreement with the payer responsible for the reimbursement of the service. A service obtained from a nonparticipating provider is considered out-of-network.16
15 A provider who has a payment agreement with a payer is a participating provider; a provider without a payment agreement is a nonparticipating provider.
16 Another scenario in which a service is considered out-of-network is when the user was required to, but did not, obtain a referral for the service.
Methodological Changes: imputation of Payments for Capitated ServicesThe MCDB’s information on professional services includes both health care claims—with payment information—and encounter records, which do not have payment data.17 Because they lack payment information and reliable procedure codes, encounter records were not included in the anal-yses in professional services reports prior to 2008. The exclusion of encounter records resulted in an underestimation of the utilization of and spending on professional services in users with one or more capitated services.
Starting with the 2008 MCDB, improvement in data quality, particularly in the procedure code field, allowed the imputation of payments for capi-tated services. In 2009, 14 percent of all services were capitated, the same as in 2008 (data not shown). These services accounted for 7 percent of total RVUs in both years, reflecting the rela-tively low resource intensity in capitated services. Capitated services were provided mainly by HMO plans, accounting for 40 percent of the number of all HMO services, or 21 percent of the total RVUs embodied in HMO services in 2009.
17 Encounter records include both capitated services and services reimbursed through a global contract with an intermediary organization. For simplicity, this report refers to services recorded in encounter records as “capitated services.”
TABle 1-2: Impact of Imputation of Capitated Services on the Number of Full-Year Users and expenditure Per User, 2008 and 2009
2008 2009
Without
ImputationWith
Imputation
Percentage Change
After Imputation
Without Imputation
With Imputation
Percentage Change
After Imputation
nuMbeR OF Full-yeAR uSeRS 1,907,827 2,060,039 8% 1,790,737 1,941,520 8%
PeR-uSeR exPenDiTuRe
All Full-Year Users $1,099 $1,209 10 $1,126 $1,237 10
Full-Year Users with Some Capitated Services 1,279 1,563 22 1,310 1,639 25
Full-Year Users with Only Capitated Services n/a 414 n/a n/a 487 n/a
NoTeS: 1. Full-year users are those enrolled in the same insurance plan for the entire year. 2. Capitated services include both services paid on a capitation basis and services reimbursed through a global contract with an
intermediary organization.
2008–2009 PROFESSIONAL SERVICES UTILIZATION: Trends Among Privately Insured Patients 7

Using payment information on noncapitated services within the same payer, we imputed payment for capitated services based on the Current Procedural Terminology (CPT) code associated with a service. The imputation affects two groups of users—those with only capitated services and those with certain services paid through capitation during a plan year. Without imputation, the first group of users would have been excluded from the analyses; the second group of users would have been included but would be associated with an underestimated utili-zation of services and per-user spending. In both 2008 and 2009, the number of full-year users who are included in the report analyses increased by 8 percent with imputation (Table 1-2). These full-year users spent on average $414 and $487 on profes-sional services in 2008 and 2009, respectively. For full-year users with some but not all capitated services, per-user expenditure was 22 percent and 25 percent higher after imputation in 2008 and 2009, respectively. Overall, the inclusion of imputed payments for capitated services led to a 10 percent increase in reported per-user spending among all full-year users in both 2008 and 2009.
CaveatsIn previous years, payment for a service was defined as the sum of reimbursed amount from the insurer and the amount paid out-of-pocket (OOP) by the patient. Our examination of the data shows that patient liability does not always capture balance billing for non-HMO out-of-network (OON) services.18 In this report, we differentiate between non-HMO OON services and all other services when defining payment. For all other services, the definition of payment remains the same as in previous reports while for non-HMO OON services, payment is set to billed charge to reflect the full extent of balance billing. Patient OOP cost for non-HMO OON services is set to the difference between billed charge and the amount reimbursed by the payer; for all other services it is set to the patient liability reported on the claim, as in previous reports.
18 Balance billing entails billing the patient for the difference between the provider’s actual charge and the amount covered by insurance. In non-HMO plans, patients using OON services may be responsible for this amount.
Measures related to RVUs for 2008 may differ slightly from what was reported in the 2008 Practitioner Utilization report. In the 2008 report, RVUs from the 2008 Medicare fee schedule were used for the 2008 services, while in this report, RVUs from the 2009 Medicare fee schedule were used. In each year’s report, we apply the same set of RVUs to both the reporting year and comparison year’s data in order to eliminate the reevaluation of resource use for different services from calcu-lations of the annual changes in payment rates (payment per RVU) and service complexity (RVUs per service). In other words, holding the number of RVUs constant by CPT code allows us to more correctly determine the impact of annual changes in the use of services and changes in payment rates on spending for professional services.
The 2009 data provided by one of the major insurers in Maryland did not pass quality checks. There appeared to be errors in the user identi-fication encryption algorithm used in its data.19 As a result, the count of this insurer’s users is not reliable. However, without this payer’s data, the annual report on utilization and cost of profes-sional health care services by privately insured, nonelderly residents in Maryland would present a skewed picture of utilization, especially with regard to distribution of patients and payments across the largest payers and the other carriers. Consequently, the 2009 MCDB was augmented with this payer’s 2008 data, adjusted to approxi-mate 2009 utilization and costs using parameters from the 2009 data submission that have been determined to be credible. The MCDB shows that the use of and payment for professional services by other payers was fairly stable from 2008 to 2009, and there is no anecdotal evidence that this particular payer was an anomaly. Therefore, our approach allows us to present a more accurate picture of the use of and payments for professional services by privately insured nonelderly Maryland residents while keeping the bias in the analyses to a minimum.
19 This insurer had successfully submitted data in prior years.
8 2008–2009 PROFESSIONAL SERVICES UTILIZATION: Trends Among Privately Insured Patients

2. Decomposition of Spending on Professional Services: Volume, Complexity, and Price
This chapter provides an in-depth examination of the level of, and growth in, per-user expenditures on professional services. Spending is decomposed in order to understand the contributions of service volume, service complexity, and price in deter-mining the level of spending as well as changes over time. This chapter also examines the variation in per-user expenditures by a number of user and market characteristics. The analyses are based on data for full-year users—users who were enrolled in the same plan for the entire calendar year. Following MHCC’s convention for decomposing spending, service volume is captured through the number of services per user; complexity is measured by the average number of RVUs per service; and price is estimated through payment per RVU, with payment including both payer and user cost-sharing (out-of-pocket) amounts.
2.1 OverviewIn 2009, the average expenditure on professional services for a full-year user in Maryland was $1,238, 2 percent higher than in 2008 (Table 2-1). Nationally, the average spending on office-based medical provider visits for a nonelderly, privately insured, full-year user increased by 3 percent from 2007 to 2008.20 As a share of the average annual per-capita income for state residents, per-user spending has been stable for the past few years and remained so between 2008 and 2009. In both years, the average expenditure on professional services for a full-year user accounted for a little more than 2.5 percent of per-capita income (data not shown).
20 Data source: Medical Expenditure Panel Survey (MEPS), 2007 and 2008. The 2008 data are from the most recent MEPS available at the time this report was prepared.
2.2 Summary of Main Findings n User risk status, as measured by an expendi-ture risk score, is an important determinant of the level of average spending on professional services. The annual expenditure for a user with medium-risk is about twice that of a low-risk user, and the annual expenditure for a high-risk user is about five times that of a low-risk user.
n The growth in the average expenditure on professional services between 2008 and 2009 was lower than in the 2007 to 2008 period— 2 percent versus 5 percent.
n The main driver for the 2008–2009 growth was a 2 percent increase in the average payment rate for the mix of services obtained by users—as measured by the average payment per relative value unit (RVU). In contrast, the main driver for the 2007–2008 growth was a 3 percent increase in average volume, as measured by the number of professional services per user.
n The growth in per-user spending was concen-trated almost exclusively among users enrolled in HMO plans (4 percent), while users in non-HMO plans exhibited no increase in per-user spending in 2009.
n The growth in per-user spending from 2008 to 2009 varied by coverage type and was especially large, at 8 percent, in the individual market.
2.3 level of Per-user Spending on Professional Services and underlying Factors2.3.1 uSeR RiSK STATuS User risk status varies by plan, payer, and other user characteristics. Table 2-1 shows the distribution of users across expenditure risk categories for different coverage and network types. In the non-CDHP market, individuals who did not have employer-sponsored
2008–2009 PROFESSIONAL SERVICES UTILIZATION: Trends Among Privately Insured Patients 9

TAB
le 2
-1: D
istr
ibut
ion
of F
ull-Y
ear
Use
rs a
nd e
xpen
ditu
re P
er U
ser
in e
xpen
ditu
re R
isk
Cat
egor
ies
by C
over
age
Type
, Net
wor
k Ty
pe, R
egio
n,
and
Pay
er M
arke
t S
hare
, 20
08–2
009 P
eR
Ce
nTA
ge
OF
uS
eR
S,
20
09
ex
Pe
nD
iTu
Re
Pe
R u
Se
R
All
u
sers
l
ow
-Ris
k
use
rsM
ed
ium
-Ris
k u
sers
Hig
h-R
isk
u
sers
Lo
w-R
isk
Use
rsM
ediu
m-
Ris
k U
sers
Hig
h-R
isk
Use
rs2
00
9
Per
cent
age
Cha
nge
from
20
08
20
09
Per
cent
age
Cha
nge
from
20
08
20
09
Per
cent
age
Cha
nge
from
20
08
20
09
Per
cent
age
Cha
nge
from
20
08
All
100%
35%
32%
33%
$1,2
38
2%$
45
63%
$9
23
1%$
2,3
750%
CO
Ve
RA
ge
Ty
Pe
no
n-C
DH
P10
03
531
33
1,24
82
45
83
927
12
,38
90
1: P
ublic
Em
plo
yer
Pla
n10
03
43
23
51,
23
83
441
48
97
22
,327
0
2:
Pri
vate
Em
plo
yer
Pla
n10
03
63
23
21,
270
34
85
49
68
22
,442
0
3:
CS
HB
P10
03
631
33
1,2
62
-34
45
-89
33
-52
,44
50
4: I
ndiv
idua
l Pla
n10
042
3127
1,16
98
46
65
977
62
,50
57
5:
MH
IP10
015
26
59
2,2
08
-26
40
91,
103
-23
,101
-3
CD
HP
100
373
231
1,12
82
43
53
873
22
,20
9-1
ne
Tw
OR
K T
yP
e
Non
-HM
O10
03
531
34
1,3
03
047
01
96
2-1
2,4
62
-1
HM
O10
037
32
311,
113
44
30
48
473
2,1
93
2
Re
giO
n
Bal
timor
e M
etro
pol
itan
Are
a10
03
431
34
1,2
33
24
521
90
81
2,3
160
Nat
iona
l Cap
ital A
rea
100
3731
32
1,2
64
347
03
96
91
2,4
92
0
Oth
er M
aryl
and
Are
as10
03
53
23
31,
20
23
437
587
11
2,3
06
1
PA
ye
R M
AR
Ke
T S
HA
Re
Lar
ges
t P
ayer
s10
03
431
34
1,2
36
14
39
19
04
02
,33
90
Oth
er P
ayer
s10
03
83
231
1,24
34
48
85
961
32
,461
0
No
TeS
: 1.
CD
HP
= c
onsu
mer
-dire
cted
hea
lth p
lan;
CS
HB
P =
Com
preh
ensi
ve S
tand
ard
Hea
lth B
enefi
t P
lan;
MH
IP =
Mar
ylan
d H
ealth
Ins
uran
ce P
lan;
HM
O =
hea
lth m
aint
enan
ce o
rgan
izat
ion.
2
. D
etai
l may
not
ad
d to
tot
al d
ue t
o ro
und
ing.
3
. 0%
ind
icat
es <
0.5%
.
10 2008–2009 PROFESSIONAL SERVICES UTILIZATION: Trends Among Privately Insured Patients

health insurance are sorted by the market into two groups—those who purchased insurance in the individual market and those who acquired insur-ance through the MHIP. These two groups of users are at opposite ends of the distribution of user expenditure risk. Users in the individual market are the healthiest among all users—42 percent of them were low risk and only 27 percent of them were high risk. The MHIP enrollees, on the other hand, are much more likely to have high expendi-ture risk scores—almost 60 percent of them were high risk in 2009, while only 15 percent of them were low risk. CDHP users had a slightly higher proportion in the low-risk category and a lower proportion in the high-risk category than the overall average. HMO users, users residing in the NCA, and users insured by payers other than the two largest payers also appear to be slightly healthier than their counterparts.
Table 2-2 shows the average, median, and 90th percentile expenditure risk scores21 for full-year users in 2009 by plan, user, and payer charac-teristics and confirms the relative risks shown in Table 2-1. Variations in user risk status across different plan and payer characteristics reflect how the insurance market functions. Market selection and self-selection of healthier users into individual market plans and CDHPs underlie the lower-than-average average risk scores in these markets. Non-CDHP individual plan users in Maryland are subject to individual medical under writing and preexisting condition restrictions,22 while the benefit structure (e.g., high deductibles) of CDHPs tends to attract users who expect to incur lower
21 See page 6 for a definition of expenditure risk score.22 A significant number of individuals are denied coverage in this
market and purchase coverage through Maryland’s high-risk pool, the MHIP.
TABle 2-2: Distribution of Full-Year Users, Mean, Median, and 90th Percentile of expenditure Risk Score by Coverage Type, Network Type, Region, and Payer Market Share, 2008–2009
MeAn MeDiAn 90th PeRCenTile
All Full-
year users 2009
Percentage Change
From 2008 2009
Percentage Change
From 2008 2009
Percentage Change
From 2008
All 1,942,491 1.26 1% 0.78 1% 2.98 1%
COVeRAge TyPe
non-CDHP 92% 1.27 1% 0.78 0% 2.99 1%
1: Public Employer Plan 43 1.31 0 0.81 0 3.09 0
2: Private Employer Plan 36 1.23 2 0.76 3 2.91 3
3: CSHBP 6 1.27 -2 0.78 -3 3.00 -1
4: Individual Plan 5 1.05 1 0.58 0 2.43 1
5: MHIP 1 2.17 0 1.66 0 4.50 0
CDHP 8 1.20 1 0.71 -2 2.83 1
neTwORK TyPe
Non-HMO 66 1.29 0 0.79 -2 3.05 0
HMO 34 1.20 1 0.69 1 2.82 2
RegiOn
Baltimore Metropolitan Area 44 1.29 0 0.79 -2 3.05 1
National Capital Area 37 1.21 2 0.71 4 2.86 2
Other Maryland Areas 20 1.27 0 0.78 0 3.01 0
PAyeR MARKeT SHARe
Largest Payers 68 1.29 0 0.81 0 3.06 0
Other Payers 32 1.19 2 0.64 0 2.79 3
NoTeS: 1. CDHP = consumer-directed health plan; CSHBP = Comprehensive Standard Health Benefit Plan; MHIP = Maryland Health Insurance Plan; HMO = health maintenance organization.
2. Detail may not add to total due to rounding. 3. 0% indicates <0.5%.
2008–2009 PROFESSIONAL SERVICES UTILIZATION: Trends Among Privately Insured Patients 11

health expenses. The skewed distribution toward high-risk users for MHIP users reflects its role as a safety net for people who have been denied health insurance coverage in the private market or suffer from particular health conditions that make them automatically eligible (e.g., cancer). The fact that HMO users appear to be healthier than their non-HMO counterparts may reflect the need of less healthy users for a wider range of services, which are more easily accessible through non-HMO products. The higher average risk score for users covered by the largest payers than that for users covered by the other payers is likely the result of the mix of user risk scores in the markets where these payers operate—almost one-half of the full-year users covered by the other payers were from the NCA where users appeared to be
healthier on average, while only about one-third of the users covered by the largest payers were from the NCA (Figure 2-1B).
User risk status is an important determinant of per-user expenditures, regardless of plan, payer, and other user characteristics. On average, the annual expenditure for a medium-risk user is twice that of a low-risk user, and the annual expenditure for a high-risk user is five times that of a low-risk user (Table 2-1). These ratios hold without excep-tion within each coverage type, network type, user geographic region, and payer market share.
The markedly higher per-user expenditures for higher-risk users lead to two interesting find-ings. First, the mix of users by risk category can
TABle 2-3: Number of Services Per User in expenditure Risk Categories by Coverage Type, Network Type, Region, and Payer Market Share, 2008–2009
nuMbeR OF SeRViCeS PeR uSeR
All users low-Risk users Medium-Risk users High-Risk users
2009
Percentage Change
from 2008 2009
Percentage Change
from 2008 2009
Percentage Change
from 2008 2009
Percentage Change
from 2008
All 21.0 1% 9.3 2% 17.5 1% 36.8 -1%
COVeRAge TyPe
non-CDHP 21.1 1 9.3 2 17.6 1 36.9 -1
1: Public Employer Plan 21.5 2 9.2 3 17.6 2 37.1 -1
2: Private Employer Plan 20.6 2 9.4 2 17.5 1 36.2 0
3: CSHBP 22.0 -6 9.6 -7 18.4 -5 38.5 -4
4: Individual Plan 18.9 1 9.1 0 17.4 0 36.1 0
5: MHIP 33.9 -8 12.0 -8 19.3 -7 45.9 -9
CDHP 19.6 1 9.1 2 17.1 1 34.7 -1
neTwORK TyPe
Non-HMO 21.7 0 9.4 1 17.9 0 37.6 -2
HMO 19.7 2 9.1 2 16.8 1 35.0 0
RegiOn
Baltimore Metropolitan Area 21.6 1 9.4 1 17.9 0 37.1 -1
National Capital Area 20.8 1 9.5 2 17.7 1 37.4 -1
Other Maryland Areas 20.0 1 8.7 2 16.5 0 34.9 -1
PAyeR MARKeT SHARe
Largest Payers 21.5 0 9.4 1 17.8 0 37.2 -1
Other Payers 19.8 4 9.1 3 17.0 3 35.8 0
NoTeS: 1. CDHP = consumer-directed health plan; CSHBP = Comprehensive Standard Health Benefit Plan; MHIP = Maryland Health Insurance Plan; HMO = health maintenance organization.
2. Detail may not add to total due to rounding. 3. 0% indicates <0.5%.
12 2008–2009 PROFESSIONAL SERVICES UTILIZATION: Trends Among Privately Insured Patients
change the overall ranking of per-user spending for a given group, even when a particular coverage type, network type, payer market share, or user geographic region is associated with higher per-user spending. For example, within each risk group, per-user spending in individual plans was 6 percent, 9 percent, and 8 percent higher than that for users in public employer plans for low-, medium-, and high-risk groups, respectively. However, the significantly healthier user mix in individual plans produced an average expendi-ture for individual plan users that was 6 percent lower than the average for those in public employer plans when looking at all risk groups combined. For the largest payers, their low-, medium-, and high-risk users on average had an expenditure that was 10 percent, 6 percent, and 5 percent lower than the expenditure for users in each respective risk category covered by the other payers, yet the overall per-user expenditure for the largest payers was less than 1 percent lower than that for the other payers as a result of their less healthy mix of users. A similar pattern can be observed by user region—the high proportion of full-year users in the low-risk group in the NCA relative to the BMA leads to a noticeably smaller difference in overall per-user spending between these two regions than the differences within each risk group.
Secondly, the share of spending on professional services generated by high-risk users exceeds their share of users by a considerable margin, while the low-risk users have lower expenditures than their patient share would predict; this pattern holds for both 2008 and 2009, and the respective shares changed little between the 2 years (Appendix B, Table B-1). In 2009, excluding users in individual plans and the MHIP, high-risk users comprised 31 percent to 35 percent of the users in each coverage type but were responsible for 61 percent to 65 percent of expenditures for professional services (Appendix B, Table B-1); in contrast, low-risk users were 34 percent to 37 percent of the users, but accounted for just 12 percent to 14 percent of the payments within each coverage type (again, excluding the individual market and the MHIP).
2.3.2 neTwORK TyPe, PAyeR MARKeT SHARe, AnD uSeR geOgRAPHiC lOCATiOn When user risk status is controlled for (i.e., within each risk group), plan and payer characteristics and user geographic location have their own effects on per-user expenditure. Within each risk group, per-user
expenditure varied by plan and by payer charac-teristics and user geographic region (Table 2-1). Among all non-CDHPs, per-user spending was lowest for those enrolled in public employer plans across all three risk categories; in contrast, per-user spending for MHIP users was the highest and was substantially higher than that of users in public employer plans (by 45 percent, 23 percent, and 33 percent for low-, medium-, and high-risk users, respectively). These within-risk-category differences, together with the much skewed distri-bution of full-year users toward the high-risk end in the MHIP group, led to an average expenditure per user that was 78 percent higher than that for full-year users enrolled in public employer plans. The high per-user expenditure for MHIP users is primarily the result of higher service volume, but higher service complexity also contributed. In 2009, the average number of services used by MHIP users was 62 percent higher than that of all full-year users (Table 2-3), while their service complexity was 13 percent higher (Appendix B, Table B-2). The average payment rate of the MHIP users—as measured by payment per RVU—was 3 percent lower than the overall average (Appendix B, Table B-3). HMO users in the low-, medium-, and high-risk groups had an average annual spending on professional services that was from 8 percent to 12 percent lower than that of their non-HMO counterparts in 2009. Users insured by the largest payers had a lower average expenditure on professional services than those insured by the other payers, regardless of their risk status. Despite their healthier mix, users living in the NCA had a per-user expenditure that was 3 percent and 5 percent higher than those in BMA and Other Maryland Areas, respectively, in 2009. Low-, medium-, and high-risk users in the NCA on average had expenditures that were 4 percent, 7 percent, and 8 percent higher, respec-tively, more than their counterparts from the BMA, and 8 percent, 11 percent, and 8 percent higher, respectively, than their counterparts in Other Maryland Areas. The higher per-user spending for each risk category of NCA residents probably reflects the high proportion of NCA users enrolled in non-HMO products (data not shown).
2008–2009 PROFESSIONAL SERVICES UTILIZATION: Trends Among Privately Insured Patients 13
2.4 growth in Per-user Spending on Professional Services and Role of Service Volume, Service Complexity, and Payment RateSpending on professional services per user grew by 2 percent for full-year users from 2008 to 2009. This growth was principally due to a 2 percent increase in the average payment rate for the mix of services obtained by the users—as measured by the average payment per RVU. A 1 percent increase in the average number of professional services per user also contributed to the growth in average spending. Service complexity (number of RVUs per service) was unchanged from 2008. The growth in average expenditure per user from 2008 to 2009 differed from that from 2007 to 2008 in two notable ways. The increase in per-user spending from 2008 to 2009 is lower than in the 2007–2008 period (5 percent), and the primary driver of the 2007–2008 increase was an increase in the average volume of professional services per user, which grew by 3 percent. The average payment rate did not change in the 2007–2008 period, but service complexity increased by 1 percent, contributing to the increase in per-user expenditures in that time period.
2.4.1 gROwTH in PeR-uSeR SPenDing by uSeR RiSK STATuS The 2008-to-2009 growth in average expenditure per user varied by user risk status, as shown in Table 2-1. Overall, the low-risk users had the highest rate of growth in per-user spending, at close to 3 percent in 2009, followed by 1 percent for the medium-risk users and virtu-ally no change for the high-risk users. The growth pattern in service volume by user risk status is similar to that in per-user spending (Table 2-3). The growth rate in service complexity and average payment per RVU, on the other hand, was similar across all three risk categories.
2.4.2 gROwTH in PeR-uSeR SPenDing by COVeRAge TyPe The overall growth in expen-ditures per user varied noticeably by coverage type, and so did the growth in service volume, service complexity, and payment rate. From 2008 to 2009, changes in per-user spending ranged from a drop of 3 percent for non-CDHP CSHBP users to an increase of 8 percent for non-CDHP individual plans (Table 2-1). While most coverage types had similar growth rates across user risk categories, the non-CDHP CSHBPs and the MHIP had uneven growth in per-user spending in
different risk groups. Low-risk users enrolled in non-CDHP CSHBPs experienced an 8 percent drop in average spending, while high-risk users saw little change in average spending. Low-risk users in the MHIP on average had a 9 percent increase in their spending on professional services, even though the medium- and high-risk users had a 3 percent and a 2 percent drop in their average spending, respectively.
The decomposition of per-user spending reveals a wide range of growth rates in service volume (Table 2-3), service complexity (Appendix B, Table B-2), and payment rate (as measured by payment per RVU, Appendix B, Table B-3) by coverage type. While service volume grew by 1 percent to 2 percent for all other coverage types, it fell by 6 percent and 8 percent, respectively, for the non-CDHP CSHBPs and the MHIP. The growth rate of service complexity fluctuated by coverage type also, ranging from -2 percent for the non-CDHP CSHBPs to 3 percent for the MHIP. The payment rate grew the fastest among full-year users insured in the non-CDHP individual market (6 percent) followed by the non-CDHP CSHBPs (5 percent) and the MHIP (4 percent).
Different components made varied contributions to the changes in the growth of per-user spending by coverage type. For example, it appears that the fast growth in per-user spending among full-year users in non-CDHP individual plans is mainly attributable to a hike in payment per RVU (6 percent). In contrast, the significant drop of 6 percent and 8 percent in service volume for the non-CDHP CSHBPs and the MHIP, respectively, more than offset the increase in payment rate and led to a drop in the average per-user spending in those groups. Public employer plans and private employer plans both had modest growth of 2 percent in per-user spending. The growth rate in service volume was similar for the two different coverage types. However, public employer plans experienced almost no change in both service complexity and payment rate, while the growth in service complexity and payment rate went in opposite directions for the private employer plans. As observed in 2008, growth in per-user expen-diture and its decomposition for CDHPs seem to be in line with non-CDHPs in 2009, suggesting that spending patterns among those covered by CDHP products more closely resemble the non-CDHP market as the number of CDHP enrollees continues to grow.
14 2008–2009 PROFESSIONAL SERVICES UTILIZATION: Trends Among Privately Insured Patients

2.4.3 gROwTH in PeR-uSeR SPenDing by neTwORK TyPe The growth in per-user spending was concentrated almost exclusively among users enrolled in HMO plans, while users in non-HMO plans exhibited no increase in per-user spending. In 2009, per-user spending grew by 4 percent for HMO plans (Table 2-1). The main driver was a 3 percent increase in the average payment rate (Appendix B, Table B-3) and a 2 percent increase in service volume (Table 2-3), which together more than offset the slight drop (a little less than 2 percent) in service complexity (Appendix B, Table B-2). Growth in the components of spending displayed a very different pattern for non-HMO products. There was almost no change in service volume; changes in service complexity and payment rate were both small (1 percent) and went in oppo-site directions.
2.4.4 gROwTH in PeR-uSeR SPenDing by uSeR geOgRAPHiC lOCATiOn The growth rate in per-user expenditure on professional services was almost identical in the NCA and Other Maryland Areas but slightly lower in the BMA. Users residing in the NCA and Other Maryland Areas on average had expenditures that were 3 percent higher in 2009 than in 2008, while expenditures for those in the BMA were 2 percent higher. The main contributor to the growth in per-user spending in Other Maryland Areas was a 3 percent increase in the payment rate, while in the other two regions, a small increase in both service volume and payment rate contributed to the growth in per-user spending. The payment rate grew faster in Other Maryland Areas than in the two metropolitan regions for users across all three risk categories.
2.4.5 gROwTH in PeR-uSeR SPenDing by PAyeR MARKeT SHARe Per-user expen-ditures grew faster for users insured by payers other than the two largest payers. In 2009, per-user expenditures grew by 4 percent for users covered by the other payers, compared with just a 1 percent increase among those covered by the largest payers. As a result, the relative size of the per-user expenditure between the two groups is reversed from 2008, with that for the other payers slightly higher than that for the largest payers, though the difference is quite small. The differ-ence in the growth rate in per-user expenditures mainly comes from the different growth rates in service volume—users covered by the two largest payers used about the same number of services on average between 2008 and 2009, while those
covered by the other payers used 4 percent more services in 2009. The payment rate increased by 2 percent for services covered by the largest payers, 1 percentage point faster than the growth in the payment rate for services covered by the other payers. Service complexity dropped slightly (1 percent) for the largest payers while remaining the same for the other payers.
2.5 Some Details About Per-user Spending2.5.1 beHinD PAyeR MARKeT SHARe The different levels of and growth rates in per-user spending by payer market share may reflect the different user mix in terms of coverage type, network type, risk category, and user geographic location. The distribution of full-year users by payer market share remained stable between 2008 and 2009—in both years slightly more than two-thirds of full-year users (68 percent) were covered by the largest
FIGURe 2-1A: Distribution of Coverage Type by Payer Market Share, 2009
Other PayersLargest Payers
Individual PlanMHIPCDHP
Private Employer PlanCSHBP
Public Employer Plan
0%
20%
40%
60%
80%
100%
6%7%
1%
24%
50%
2%10%
29%
63%
3%
PAYER MARKET SHARE
0%
3%
2008–2009 PROFESSIONAL SERVICES UTILIZATION: Trends Among Privately Insured Patients 15
payers (Table 2-2). As in previous years, full-year users insured by payers other than the two largest payers in the state were highly concentrated in non-CDHP private employer plans (63 percent) and public employer plans (29 percent) (Figure 2-1A). The distribution by coverage type is more dispersed for full-year users insured by the two largest payers in the state—about one-half were enrolled in non-CDHP public employer plans, followed by 24 percent in non-CDHP private employer plans, and 7 percent in non-CDHP CSHBPs. The largest payers also have a much higher share of full-year users in CDHPs compared with the other payers (10 percent versus 3 percent). Compared with 2008, the share of non-CDHP CSHBPs for the two largest payers dropped by 4 percentage points while the share of non-CDHP public employer plans and private employer plans increased by 2 percentage points and 1 percentage point, respectively.
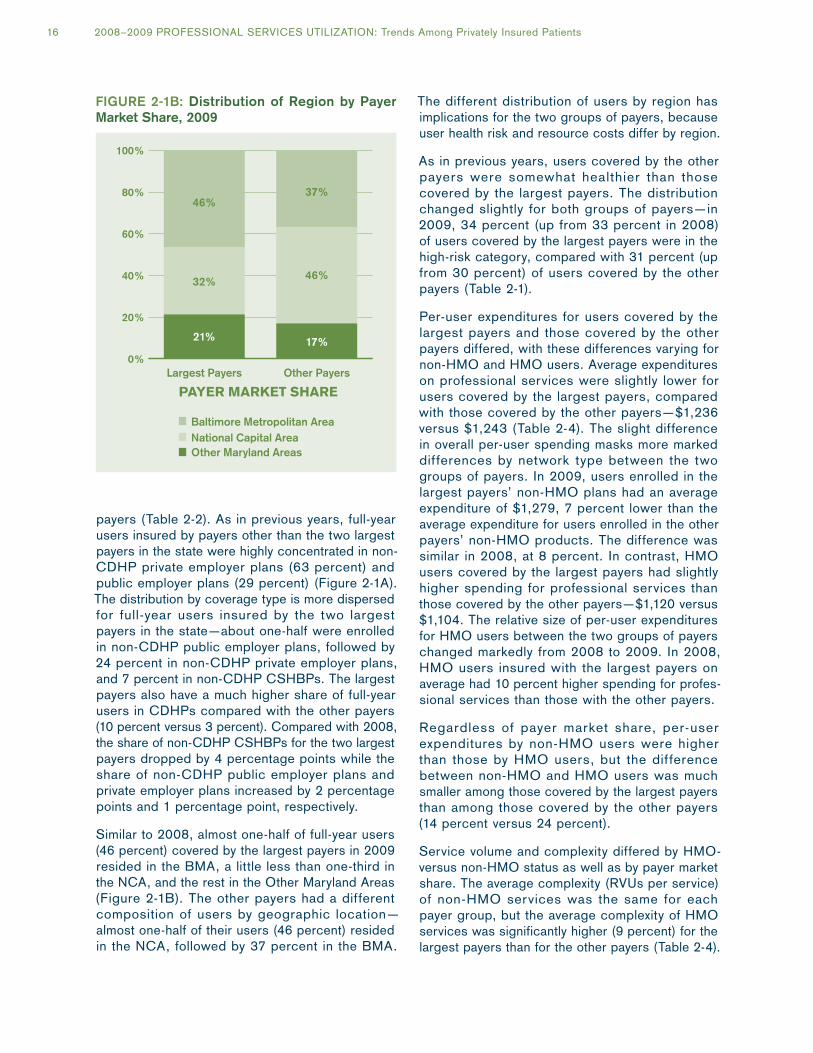
Similar to 2008, almost one-half of full-year users (46 percent) covered by the largest payers in 2009 resided in the BMA, a little less than one-third in the NCA, and the rest in the Other Maryland Areas (Figure 2-1B). The other payers had a different composition of users by geographic location—almost one-half of their users (46 percent) resided in the NCA, followed by 37 percent in the BMA.
The different distribution of users by region has implications for the two groups of payers, because user health risk and resource costs differ by region.
As in previous years, users covered by the other payers were somewhat healthier than those covered by the largest payers. The distribution changed slightly for both groups of payers—in 2009, 34 percent (up from 33 percent in 2008) of users covered by the largest payers were in the high-risk category, compared with 31 percent (up from 30 percent) of users covered by the other payers (Table 2-1).
Per-user expenditures for users covered by the largest payers and those covered by the other payers differed, with these differences varying for non-HMO and HMO users. Average expenditures on professional services were slightly lower for users covered by the largest payers, compared with those covered by the other payers—$1,236 versus $1,243 (Table 2-4). The slight difference in overall per-user spending masks more marked differences by network type between the two groups of payers. In 2009, users enrolled in the largest payers’ non-HMO plans had an average expenditure of $1,279, 7 percent lower than the average expenditure for users enrolled in the other payers’ non-HMO products. The difference was similar in 2008, at 8 percent. In contrast, HMO users covered by the largest payers had slightly higher spending for professional services than those covered by the other payers—$1,120 versus $1,104. The relative size of per-user expenditures for HMO users between the two groups of payers changed markedly from 2008 to 2009. In 2008, HMO users insured with the largest payers on average had 10 percent higher spending for profes-sional services than those with the other payers.
Regardless of payer market share, per-user expenditures by non-HMO users were higher than those by HMO users, but the difference between non-HMO and HMO users was much smaller among those covered by the largest payers than among those covered by the other payers (14 percent versus 24 percent).
Service volume and complexity differed by HMO- versus non-HMO status as well as by payer market share. The average complexity (RVUs per service) of non-HMO services was the same for each payer group, but the average complexity of HMO services was significantly higher (9 percent) for the largest payers than for the other payers (Table 2-4).
FIGURe 2-1B: Distribution of Region by Payer Market Share, 2009
0%
20%
40%
60%
80%
100%
Other PayersLargest Payers
Other Maryland Areas
Baltimore Metropolitan Area
17%
46%
37%
21%
32%
46%
PAYER MARKET SHARE
National Capital Area
16 2008–2009 PROFESSIONAL SERVICES UTILIZATION: Trends Among Privately Insured Patients
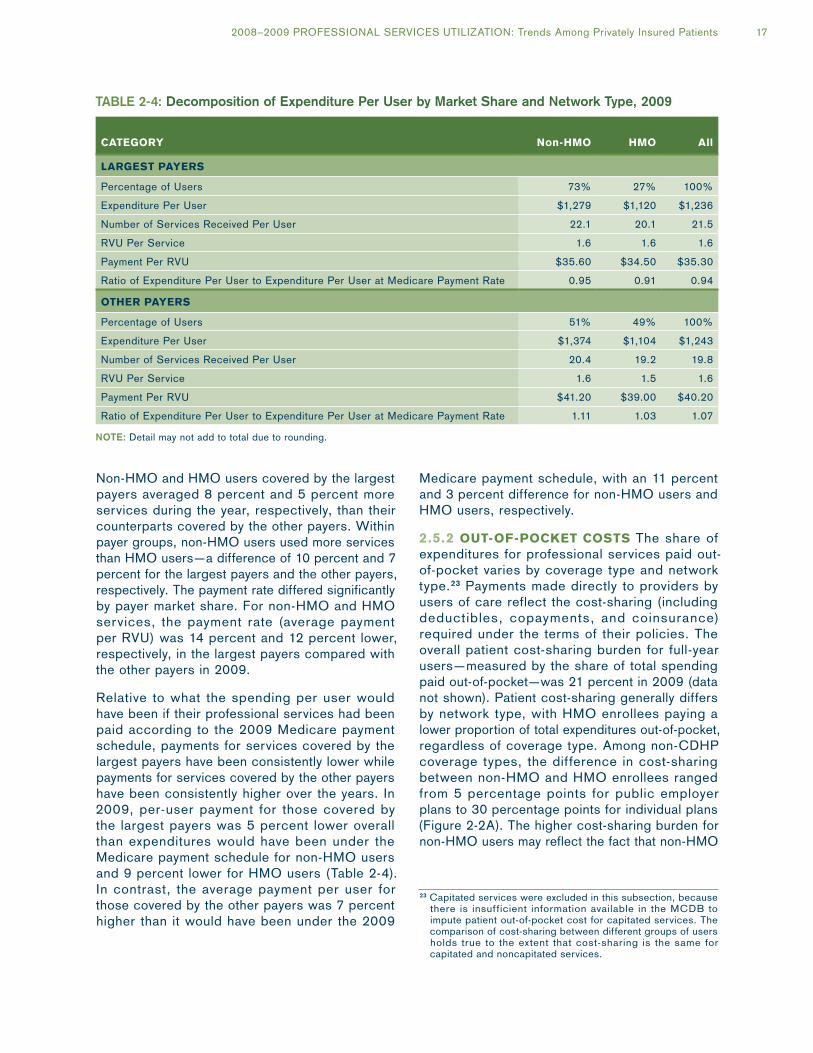
Non-HMO and HMO users covered by the largest payers averaged 8 percent and 5 percent more services during the year, respectively, than their counterparts covered by the other payers. Within payer groups, non-HMO users used more services than HMO users—a difference of 10 percent and 7 percent for the largest payers and the other payers, respectively. The payment rate differed significantly by payer market share. For non-HMO and HMO services, the payment rate (average payment per RVU) was 14 percent and 12 percent lower, respectively, in the largest payers compared with the other payers in 2009.
Relative to what the spending per user would have been if their professional services had been paid according to the 2009 Medicare payment schedule, payments for services covered by the largest payers have been consistently lower while payments for services covered by the other payers have been consistently higher over the years. In 2009, per-user payment for those covered by the largest payers was 5 percent lower overall than expenditures would have been under the Medicare payment schedule for non-HMO users and 9 percent lower for HMO users (Table 2-4). In contrast, the average payment per user for those covered by the other payers was 7 percent higher than it would have been under the 2009
Medicare payment schedule, with an 11 percent and 3 percent difference for non-HMO users and HMO users, respectively.
2.5.2 OuT-OF-POCKeT COSTS The share of expenditures for professional services paid out-of-pocket varies by coverage type and network type.23 Payments made directly to providers by users of care reflect the cost-sharing (including deductibles, copayments, and coinsurance) required under the terms of their policies. The overall patient cost-sharing burden for full-year users—measured by the share of total spending paid out-of-pocket—was 21 percent in 2009 (data not shown). Patient cost-sharing generally differs by network type, with HMO enrollees paying a lower proportion of total expenditures out-of-pocket, regardless of coverage type. Among non-CDHP coverage types, the difference in cost-sharing between non-HMO and HMO enrollees ranged from 5 percentage points for public employer plans to 30 percentage points for individual plans (Figure 2-2A). The higher cost-sharing burden for non-HMO users may reflect the fact that non-HMO
23 Capitated services were excluded in this subsection, because there is insufficient information available in the MCDB to impute patient out-of-pocket cost for capitated services. The comparison of cost-sharing between different groups of users holds true to the extent that cost-sharing is the same for capitated and noncapitated services.
TABle 2-4: Decomposition of expenditure Per User by Market Share and Network Type, 2009
CATegORy non-HMO HMO All
lARgeST PAyeRS
Percentage of Users 73% 27% 100%
Expenditure Per User $1,279 $1,120 $1,236
Number of Services Received Per User 22.1 20.1 21.5
RVU Per Service 1.6 1.6 1.6
Payment Per RVU $35.60 $34.50 $35.30
Ratio of Expenditure Per User to Expenditure Per User at Medicare Payment Rate 0.95 0.91 0.94
OTHeR PAyeRS
Percentage of Users 51% 49% 100%
Expenditure Per User $1,374 $1,104 $1,243
Number of Services Received Per User 20.4 19.2 19.8
RVU Per Service 1.6 1.5 1.6
Payment Per RVU $41.20 $39.00 $40.20
Ratio of Expenditure Per User to Expenditure Per User at Medicare Payment Rate 1.11 1.03 1.07
NoTe: Detail may not add to total due to rounding.
2008–2009 PROFESSIONAL SERVICES UTILIZATION: Trends Among Privately Insured Patients 17

FIGURe 2-2A: Percentage Paid out-of-Pocket by Non-CDHP Coverage Type and Network Type, 2009
0%
10%
20%
30%
40%
50%
MHIPIndividual Plan
CSHBPPrivate Employer Plan
Public Employer Plan
48%
18%13%20% 20%
12%
29%17% 17%
37%
Non-HMO HMO
users—unlike those in HMOs—have coverage for out-of-network services, which require higher out-of-pocket payments (i.e., balance billing) compared with in-network services.
Across the coverage types, non-CDHP public employer plans were associated with the lowest cost-sharing percentages in either non-HMO (17 percent ) o r HMO (12 percent ) p l ans (Figure 2-2A). As expected, due to the benefit structure of CDHPs, CDHP users paid a rela-tively high share of their expenditures out-of-pocket, 35 percent in 2009 (Figure 2-2B). However, the highest cost-sharing in 2009, at 48 percent, was still borne by full-year users in non-HMO, non-CDHPs purchased in the individual market (Figure 2-2A). The MHIP users also had relatively high cost-sharing: 37 percent was paid out-of-pocket by MHIP non-HMO users and 17 percent by MHIP HMO users.
Figure 2-2B shows that cost-sharing differed not only by level but also by composition between CDHP users and non-CDHP users. Overall, CDHP users’ average out-of-pocket costs, measured as a share of the average expenditure per user, were 15 percentage points and 22 percentage points higher than those of non-CDHP non-HMO users and non-CDHP HMO users, respectively, in 2009. Most (63 percent) of the cost-sharing by CDHP users was due to deductibles, with copayments/coinsurance accounting for one-third of their out-of-pocket payments. For non-CDHP non-HMO users, the majority of their out-of-pocket costs (58 percent) were for copayments or coinsurance, with deductibles accounting for one-third of their cost-sharing. For non-CDHP HMO users, copayment/coinsurance payments accounted for 87 percent of their out-of-pocket
costs. The differences in the distribution of cost-sharing among deductibles, copayments, and coinsurance payments between CDHP and non-CDHP users reflect the special benefit design of CDHPs. The relatively high deductibles of CDHPs are designed as a cost-control tool; when facing high deductibles, CDHP enrollees are expected to make more informed decisions with regard to their medical care.
FIGURe 2-2B: Components of out-of-Pocket expenditures, 2009
0%
10%
20%
30%
40%
Non-CDHP HMO
Non-CDHP Non-HMO
All CDHP
DeductiblesCopayments/Coinsurance
Other
12% 11% 12%
1%
22%
2%
6%1%
1%
18 2008–2009 PROFESSIONAL SERVICES UTILIZATION: Trends Among Privately Insured Patients
3. Payment Rates for Professional Services
This chapter examines differences in payment rates by payer market share. Payment rates for professional services—defined as the payment per RVU at the service level—are primarily based on negotiations between insurers and health care providers. When market share is concentrated in a small number of payers, they may hold price-setting power that conveys leverage in those negotiations and thus in setting lower payment rates. Unlike in Chapter 2 where only services rendered to full-year users are included, the analyses in this chapter are based on all services, whether delivered to full-year or part-year users, in order to draw a full picture of payers’ practices with regard to payment rates.
3.1 OverviewIn the Maryland commercial market for insured health benefit plans, the distribution of market share is markedly skewed.24 Overall, the two largest payers account for about 70 percent of the business, whether measured by number of services, total resources (RVUs), or total payments (Table 3-1). The remaining 30 percent of the market is shared by more than 20 payers. When examined by coverage type, the two largest payers appear to have an even more dominant presence in most markets, with the exception of the private employer market. Within the private employer market, payers other than the two largest covered a relatively higher share of services—more than one-half in 2009. As shown by their shares of services, total RVUs and total payments in Table 3-1, these other payers were also relatively more likely to serve residents of the National Capital Area (NCA) than residents in other parts of Maryland and to provide HMO products rather than non-HMO products.
The division of the market between the two largest and all other payers mostly remained stable between 2008 and 2009 and only changed slightly in some segments of the market. The two largest payers lost between 2 and 3 percentage points of share in the non-CDHP CSHBP market, depending on the measure of market share. This
24 Most, if not all, states have a similarly skewed distribution of market share in the commercial market for insured health benefit plans.
loss was accompanied by a gain of similar size in the CDHP market. As mentioned in the previous chapter, it appears that some non-CDHP CSHBP enrollees covered by the largest payers switched to CDHP products in 2009, accounting for the change in market share in corresponding markets. The share of the largest payers also shrank by 2 to 3 percentage points in the HMO market.
In 2009, the average payment rate was $36.70, 2 percent higher than in 2008. The increase in the average payment rate from 2008 to 2009 was mainly due to a 2 percent increase among the largest payers; the payment rate increase among the other payers was lower, at 1 percent. Among the largest payers, the average payment rate for services from participating providers grew by 2 percent, while the average rate for services from nonparticipating providers grew considerably more, by 9 percent. Among the other payers, the average rates for services from participating and nonparticipating providers both grew by 1 percent. Overall, the average rate for participating provider services grew by 2 percent, and the average rate for nonparticipating provider services grew by 7 percent.
3.2 Differences in Payment Rate by Payer Market Share Payment per RVU across all professional services was lower among the largest payers than among the other payers: $35.30 versus $40.30, a differ-ence of 14 percent (Table 3-2A). The difference in the payment rate between the two groups of payers shrank from 16 percent (data not shown) in 2008 as the rate paid by the largest payers increased faster than that paid by the other payers.
3.2.1 by PROViDeR RegiOn By provider region, payment rates were lower for services covered by the largest payers than for those covered by the other payers in all Maryland regions and neighboring states. As shown in Table 3-2A, within each region, the average payment rate for services covered by the largest payers was below the average payment rate of the other payers, with the differences ranging from a low of 10 percent
2008–2009 PROFESSIONAL SERVICES UTILIZATION: Trends Among Privately Insured Patients 19
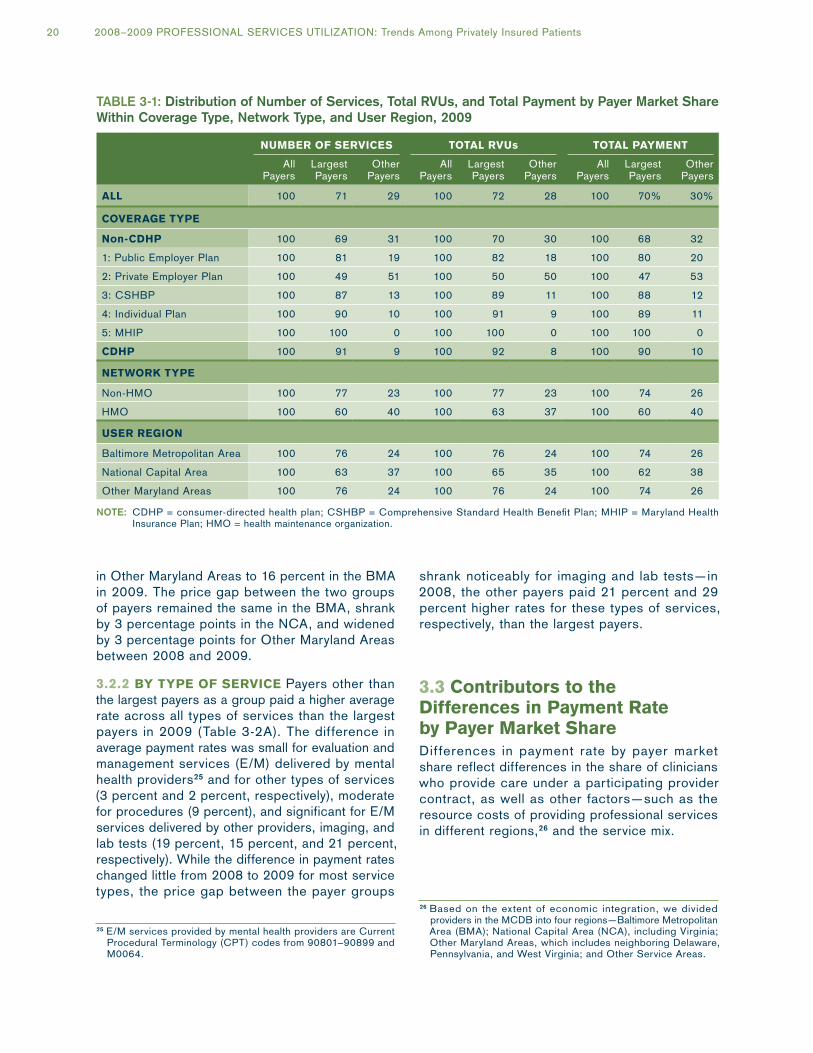
in Other Maryland Areas to 16 percent in the BMA in 2009. The price gap between the two groups of payers remained the same in the BMA, shrank by 3 percentage points in the NCA, and widened by 3 percentage points for Other Maryland Areas between 2008 and 2009.
3.2.2 by TyPe OF SeRViCe Payers other than the largest payers as a group paid a higher average rate across all types of services than the largest payers in 2009 (Table 3-2A). The difference in average payment rates was small for evaluation and management services (E/M) delivered by mental health providers25 and for other types of services (3 percent and 2 percent, respectively), moderate for procedures (9 percent), and significant for E/M services delivered by other providers, imaging, and lab tests (19 percent, 15 percent, and 21 percent, respectively). While the difference in payment rates changed little from 2008 to 2009 for most service types, the price gap between the payer groups
25 E/M services provided by mental health providers are Current Procedural Terminology (CPT) codes from 90801–90899 and M0064.
shrank noticeably for imaging and lab tests—in 2008, the other payers paid 21 percent and 29 percent higher rates for these types of services, respectively, than the largest payers.
3.3 Contributors to the Differences in Payment Rate by Payer Market ShareDifferences in payment rate by payer market share reflect differences in the share of clinicians who provide care under a participating provider contract, as well as other factors—such as the resource costs of providing professional services in different regions,26 and the service mix.
26 Based on the extent of economic integration, we divided providers in the MCDB into four regions—Baltimore Metropolitan Area (BMA); National Capital Area (NCA), including Virginia; Other Maryland Areas, which includes neighboring Delaware, Pennsylvania, and West Virginia; and Other Service Areas.
TABle 3-1: Distribution of Number of Services, Total RVUs, and Total Payment by Payer Market Share Within Coverage Type, Network Type, and User Region, 2009
nuMbeR OF SeRViCeS TOTAl RVus TOTAl PAyMenT
All Payers
Largest Payers
Other Payers
All Payers
Largest Payers
Other Payers
All Payers
Largest Payers
Other Payers
All 100 71 29 100 72 28 100 70% 30%
COVeRAge TyPe
non-CDHP 100 69 31 100 70 30 100 68 32
1: Public Employer Plan 100 81 19 100 82 18 100 80 20
2: Private Employer Plan 100 49 51 100 50 50 100 47 53
3: CSHBP 100 87 13 100 89 11 100 88 12
4: Individual Plan 100 90 10 100 91 9 100 89 11
5: MHIP 100 100 0 100 100 0 100 100 0
CDHP 100 91 9 100 92 8 100 90 10
neTwORK TyPe
Non-HMO 100 77 23 100 77 23 100 74 26
HMO 100 60 40 100 63 37 100 60 40
uSeR RegiOn
Baltimore Metropolitan Area 100 76 24 100 76 24 100 74 26
National Capital Area 100 63 37 100 65 35 100 62 38
Other Maryland Areas 100 76 24 100 76 24 100 74 26
NoTe: CDHP = consumer-directed health plan; CSHBP = Comprehensive Standard Health Benefit Plan; MHIP = Maryland Health Insurance Plan; HMO = health maintenance organization.
20 2008–2009 PROFESSIONAL SERVICES UTILIZATION: Trends Among Privately Insured Patients
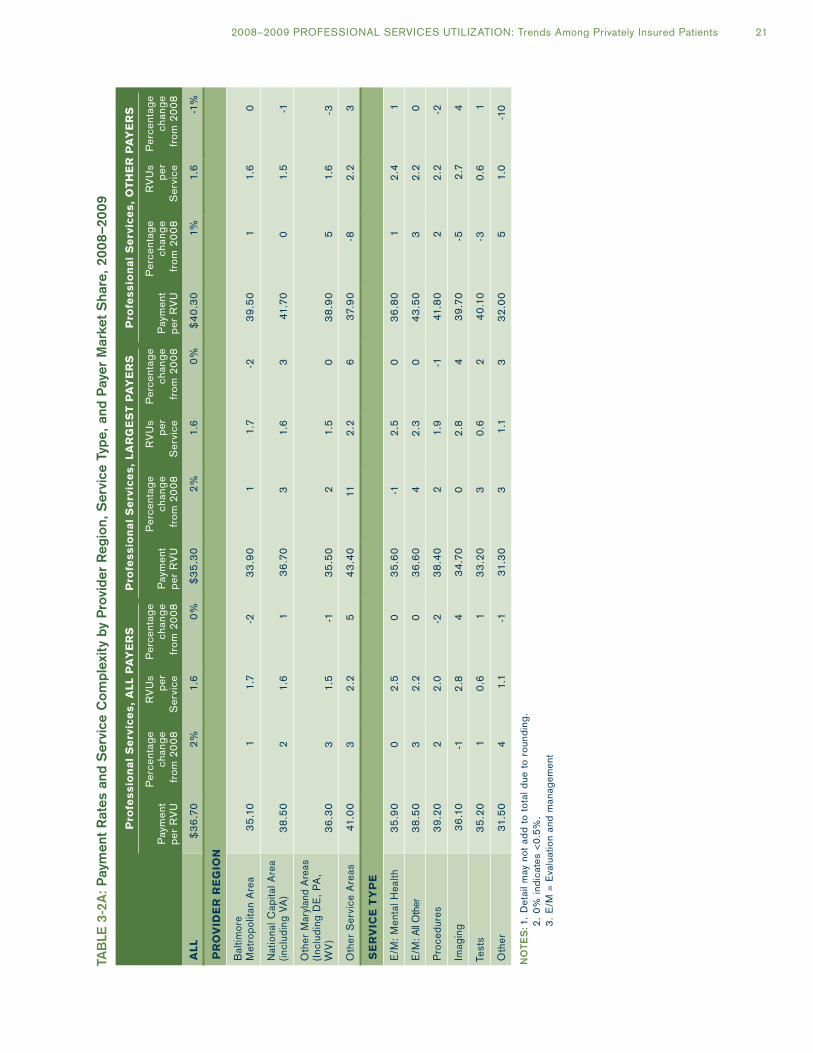
TAB
le 3
-2A
: P
aym
ent
Rat
es a
nd S
ervi
ce C
ompl
exit
y by
Pro
vide
r R
egio
n, S
ervi
ce T
ype,
and
Pay
er M
arke
t S
hare
, 20
08–2
009
Pro
fes
sio
na
l S
erv
ice
s,
All
PA
ye
RS
Pro
fes
sio
na
l S
erv
ice
s,
lA
Rg
eS
T P
Ay
eR
SP
rofe
ss
ion
al
Se
rvic
es
, O
TH
eR
PA
ye
RS
Pay
men
t p
er R
VU
Per
cent
age
chan
ge
from
20
08
RV
Us
per
S
ervi
ce
Per
cent
age
chan
ge
from
20
08
Pay
men
t p
er R
VU
Per
cent
age
chan
ge
from
20
08
RV
Us
per
S
ervi
ce
Per
cent
age
chan
ge
from
20
08
Pay
men
t p
er R
VU
Per
cent
age
chan
ge
from
20
08
RV
Us
per
S
ervi
ce
Per
cent
age
chan
ge
from
20
08
All
$3
6.7
02%
1.6
0%$
35
.30
2%1.
60%
$4
0.3
01%
1.6
-1%
PR
OV
iDe
R R
eg
iOn
Bal
timor
e M
etro
polit
an A
rea
35
.10
11.
7-2
33
.90
11.
7-2
39
.50
11.
60
Nat
iona
l Cap
ital A
rea
(incl
udin
g VA
)3
8.5
02
1.6
13
6.7
03
1.6
341
.70
01.
5-1
Oth
er M
aryl
and
Are
as
(Inc
ludi
ng D
E,
PA
, W
V)
36
.30
31.
5-1
35
.50
21.
50
38
.90
51.
6-3
Oth
er S
ervi
ce A
reas
41.0
03
2.2
54
3.4
011
2.2
63
7.9
0-8
2.2
3
Se
RV
iCe
Ty
Pe
E/M
: M
enta
l Hea
lth3
5.9
00
2.5
03
5.6
0-1
2.5
03
6.8
01
2.4
1
E/M
: All
Oth
er3
8.5
03
2.2
03
6.6
04
2.3
04
3.5
03
2.2
0
Pro
cedu
res
39
.20
22
.0-2
38
.40
21.
9-1
41.8
02
2.2
-2
Imag
ing
36
.10
-12
.84
34
.70
02
.84
39
.70
-52
.74
Test
s3
5.2
01
0.6
13
3.2
03
0.6
24
0.1
0-3
0.6
1
Oth
er31
.50
41.
1-1
31.3
03
1.1
33
2.0
05
1.0
-10
No
TeS
: 1.
Det
ail m
ay n
ot a
dd
to t
otal
due
to
roun
din
g.
2
. 0%
ind
icat
es <
0.5%
.
3.
E/M
= E
valu
atio
n an
d m
anag
emen
t
2008–2009 PROFESSIONAL SERVICES UTILIZATION: Trends Among Privately Insured Patients 21
3.3.1 PARTiCiPATiOn PROViDeR COnTRACTS Overall, the largest payers paid lower average rates for participating providers’ services than did their smaller counterparts. This was true in all regions and across all types of services except for E/M delivered by mental health providers, indicating the price-setting advantage that the largest payers have in the market for professional services (Table 3-2B). The average payment rates for services provided by participating providers reflect the amount of rela-tive leverage a payer has in the market due to the payer’s volume of enrollees. A provider is generally willing to accept a lower negotiated payment rate from a very large payer than from a smaller payer because participation with the larger payer gives the provider access to a larger volume of poten-tial patients. The largest payers’ 2009 average payment rate (measured by payment per RVU) for participating providers’ services was 13 percent lower than the average rate paid by the other payers, $33.60 versus $38.50. This rate gap is smaller than the payer gap that existed in 2008 because the largest payers raised their average payment rates for participating provider services by 2 percent over those in 2008, while the other payers raised their average rates by just 1 percent.
The difference in 2009 payment rates for partici-pating providers’ services by payer market share varied slightly across provider regions, from 11 percent lower for the largest payers in Other Maryland Areas to 13 percent in both the BMA and the NCA. The payment rate gap by type of service exhibited greater variation. The largest payers’ average rates ranged from 2 percent lower for other services to 22 percent lower for lab tests. For E/M services delivered by mental health providers, however, the largest payers paid a slightly higher average rate (1 percent) compared with the other payers.
3.3.2 ReSOuRCe COSTS Payment rates for participating providers’ services varied among regions regardless of payer market share, in part because carriers recognize differences in resource costs associated with the provider’s location. Participating providers in locations with higher resource costs tend to receive higher rates from payers. In keeping with their rela-tively higher resource costs, providers located in the NCA received a higher average payment rate compared with other providers located in Maryland or other states, regardless of payer market share (Table 3-2B). The average payment
rate for participating providers’ services rendered by providers in the BMA and Other Maryland Areas was similar, around 5 percent lower than the rate in the NCA for both groups of payers. The NCA rate was much higher than the average payment rate for services rendered in Other Service Areas—more than 10 percent for both the largest payers and all other payers.
The difference in the distribution of services by provider region for the largest payers versus the distribution for the other payers also contributed to the difference in their average payment rates. Among participating providers’ services covered by the other payers, almost one-half (44 percent) was rendered by providers in the NCA, the region with the highest resource costs. In contrast, less than one-third of participating provider services covered by the largest payers was provided in the NCA.
3.3.3 TyPe OF SeRViCe Payment rates for different types of services reflect many different factors such as the mix of providers, the range in skills and training, and the legacy of the payment policies of both private and public insurers. In 2009, procedures provided by participating providers received a higher average payment rate than other types of services. The premium paid ranged from 2 percent and 6 percent over the average rate for E/M delivered by non-mental-health providers and imaging, respectively, to 15 percent over the payment rate for lab tests, to 28 percent and 36 percent over the rate for other types of services and E/M from mental health providers, respec-tively (Table 3-2B). The overall ranking of average payment rate by type of service holds true for the two groups of payers with one exception—among payers other than the two largest ones, E/M from non-mental-health providers was paid slightly higher (3 percent) than procedures.
The mix of participating providers’ services paid for by the two largest payers was very similar to that paid for by the other payers except for proce-dures. In 2009, the share of RVUs embedded in procedures paid for by the largest payers was 4 percentage points higher than the share of RVUs embedded in procedures paid for by their smaller counterparts. Since procedures are on average the most expensive type of service, this difference in service mix also contributed to the price gap between the two groups of payers.
22 2008–2009 PROFESSIONAL SERVICES UTILIZATION: Trends Among Privately Insured Patients
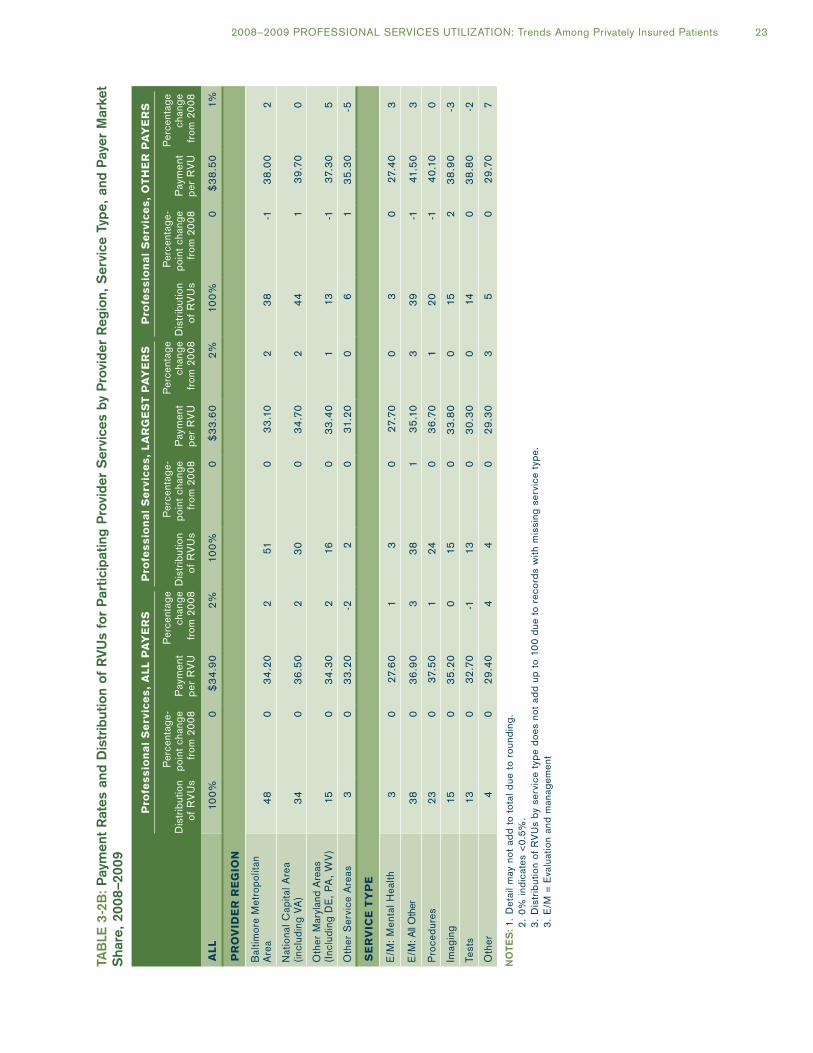
TAB
le 3
-2B
: P
aym
ent
Rat
es a
nd D
istr
ibut
ion
of R
VU
s fo
r P
artic
ipat
ing
Pro
vide
r S
ervi
ces
by P
rovi
der
Reg
ion,
Ser
vice
Typ
e, a
nd P
ayer
Mar
ket
Sha
re,
2008
–20
09
Pro
fes
sio
na
l S
erv
ice
s,
All
PA
ye
RS
Pro
fes
sio
na
l S
erv
ice
s,
lA
Rg
eS
T P
Ay
eR
SP
rofe
ss
ion
al
Se
rvic
es
, O
TH
eR
PA
ye
RS
Dis
trib
utio
n of
RV
Us
Per
cent
age-
po
int
chan
ge
from
20
08P
aym
ent
per
RV
U
Per
cent
age
chan
ge
from
20
08D
istr
ibut
ion
of R
VU
s
Per
cent
age-
po
int
chan
ge
from
20
08P
aym
ent
per
RV
U
Per
cent
age
chan
ge
from
20
08D
istr
ibut
ion
of R
VU
s
Per
cent
age-
po
int
chan
ge
from
20
08P
aym
ent
per
RV
U
Per
cent
age
chan
ge
from
20
08
All
100%
0$
34
.90
2%10
0%0
$3
3.6
02%
100%
0$
38
.50
1%
PR
OV
iDe
R R
eg
iOn
Bal
timor
e M
etro
polit
an
Are
a4
80
34
.20
251
03
3.1
02
38
-13
8.0
02
Nat
iona
l Cap
ital A
rea
(incl
udin
g VA
)3
40
36
.50
23
00
34
.70
24
41
39
.70
0
Oth
er M
aryl
and
Are
as
(Inc
ludi
ng D
E,
PA
, W
V)
150
34
.30
216
03
3.4
01
13-1
37.
30
5
Oth
er S
ervi
ce A
reas
30
33
.20
-22
031
.20
06
13
5.3
0-5
Se
RV
iCe
Ty
Pe
E/M
: M
enta
l Hea
lth3
02
7.6
01
30
27.
70
03
02
7.4
03
E/M
: All
Oth
er3
80
36
.90
33
81
35
.10
33
9-1
41.5
03
Pro
cedu
res
23
03
7.5
01
240
36
.70
12
0-1
40
.10
0
Imag
ing
150
35
.20
015
03
3.8
00
152
38
.90
-3
Test
s13
03
2.7
0-1
130
30
.30
014
03
8.8
0-2
Oth
er4
02
9.4
04
40
29
.30
35
02
9.7
07
No
TeS
: 1.
Det
ail m
ay n
ot a
dd
to t
otal
due
to
roun
din
g.
2
. 0%
ind
icat
es <
0.5%
.
3.
Dis
trib
utio
n of
RV
Us
by s
ervi
ce t
ype
doe
s no
t ad
d up
to
100
due
to
reco
rds
with
mis
sing
ser
vice
typ
e.
3.
E/M
= E
valu
atio
n an
d m
anag
emen
t
2008–2009 PROFESSIONAL SERVICES UTILIZATION: Trends Among Privately Insured Patients 23
3.3.4 SeRViCeS RenDeReD by nOnPARTiCi-PATing PROViDeRS Services covered by the largest payers were more likely to be provided by participating providers. Table 3-2C shows the share of nonparticipating providers’ services—measured as the proportion of RVUs accounted for by nonparticipating providers—covered by the largest versus the other payers. Nonparticipating providers’ services comprised about 8 percent of the professional services covered by the other payers in 2009, compared with 5 percent of services reimbursed by the largest payers. This difference in the share of nonparticipating providers’ services between the largest and the other payers is likely attributable to the smaller provider networks of the other payers.27
Across provider regions, both groups of payers had the lowest share of nonparticipating providers’ services in the BMA and the highest in the Other Service Areas (Table 3-2C). However, nonpartici-pating providers’ services rendered in the NCA tend to be less complex than services provided in most other areas, with the average RVU per service in the NCA lower than that in all other regions for the smaller payers and in all but the Other Service Areas for the largest payers (data not shown).
E/M services delivered by mental health providers are by far the most likely to be provided by nonpar-ticipating providers among all types of services. One-quarter of mental health E/M, measured by total RVUs paid for by the two largest payers in 2009, was rendered by nonparticipating providers, and that share was even higher for smaller payers, at almost one-third. In contrast, none of the other types of services had more than 10 percent that was provided by nonparticipating providers, whether examined as a whole or by payer market share.
Nonparticipating providers’ services were paid at a higher rate than participating providers’ services. This is not surprising, as providers in general accept reduced payment rates in exchange for a steadier source of patients when they elect to participate in a payer’s network. In 2009, the overall average payment rate paid
27 A provider’s decision to participate with a payer is influenced by the number of patients insured by any given payer; payers with more enrollees are likely to generate more patients for a provider than payers with fewer enrollees. Users in general incur higher out-of-pocket costs when using nonparticipating providers’ services.
to nonparticipating providers was $64.30 per RVU (Table 3-2C), 84 percent higher than the average payment rate for participating providers’ services in the same year. The higher payment rates reflect payment rules for covered services rendered by nonparticipating providers, referred to as “balance billing.” These rules generally require non-HMO enrollees to pay a nonparticipating provider the difference between the provider’s billed amount and the amount a payer would reimburse participating providers for the same service. The balance billing of non-HMO users translates into significantly higher cost-sharing for users of nonparticipating providers’ services and (potentially) higher average payment rates for the nonparticipating provider.
Nonparticipating providers’ services were paid at a higher rate regardless of provider region, type of service, or payer market share. The differ-ence in payment rates for participating providers’ services and nonparticipating providers’ services varied markedly by payer market share—payment rates for nonparticipating providers’ services were 96 percent higher for the largest payers and 60 percent higher for the other payers (Table 3-2B and Table 3-2C). The difference among providers located in Maryland and neighboring states also varied greatly by region, with overall differences ranging from 76 percent higher in the BMA to 94 percent in Other Maryland Areas. The regional difference for Maryland-based providers is espe-cially prominent for the largest payers—in the BMA, services provided by nonparticipating providers were on average paid about 81 higher than participating providers’ services, while in Other Maryland Areas, the payment rate for nonpartici-pating providers’ services was more than double that for participating providers’ services. The differ-ence in payment rates varied much less by provider region for services covered by the other payers—the regional difference ranged from 50 percent in Other Maryland Areas to 63 percent in the NCA. This partly reflects the fact that the largest payers had a greater share of non-HMO users—who can be affected by provider balance billing—than did the other payers (73 percent versus 51 percent, Table 2-4).
For E/M delivered by mental health providers, imaging, and lab tests, nonparticipating providers were on average paid more than double the rate at which participating providers were paid. The payment rate for non-mental-health E/M and
24 2008–2009 PROFESSIONAL SERVICES UTILIZATION: Trends Among Privately Insured Patients
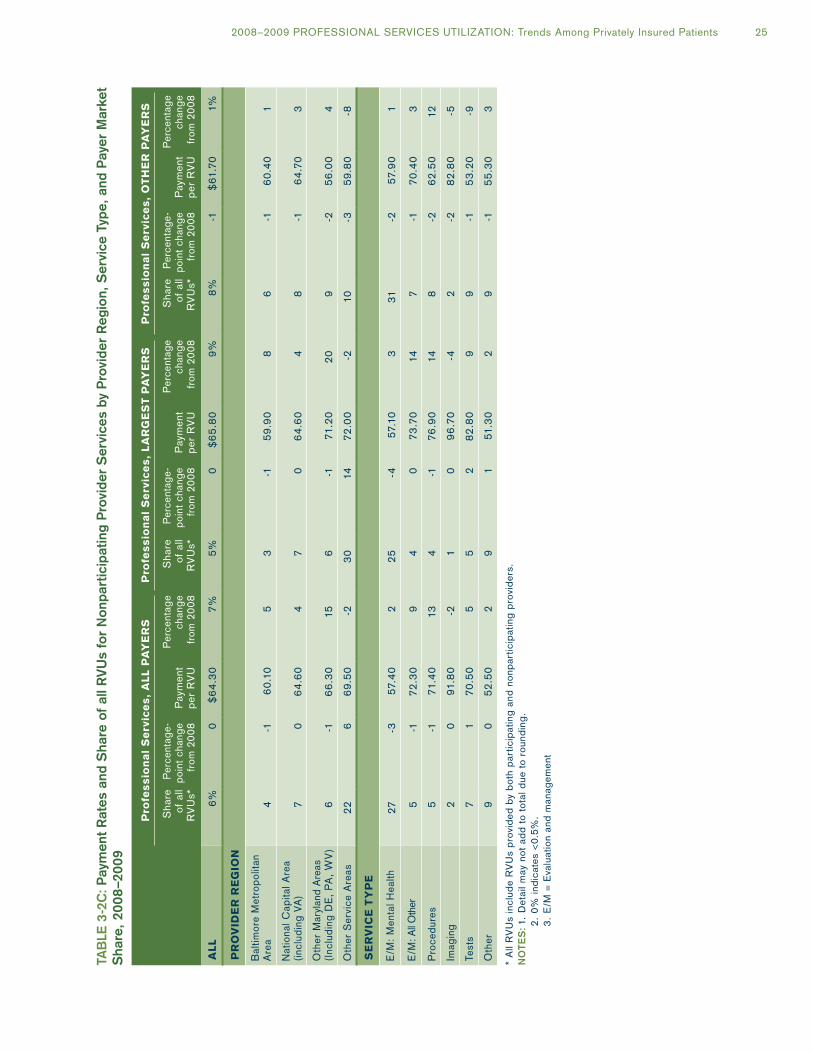
TAB
le 3
-2C
: Pay
men
t R
ates
and
Sha
re o
f al
l RV
Us
for
Non
part
icip
atin
g P
rovi
der
Ser
vice
s by
Pro
vide
r R
egio
n, S
ervi
ce T
ype,
and
Pay
er M
arke
t S
hare
, 20
08–2
009
Pro
fes
sio
na
l S
erv
ice
s,
All
PA
ye
RS
Pro
fes
sio
na
l S
erv
ice
s,
lA
Rg
eS
T P
Ay
eR
SP
rofe
ss
ion
al
Se
rvic
es
, O
TH
eR
PA
ye
RS
Sha
re
of
all
RV
Us*
Per
cent
age-
po
int
chan
ge
from
20
08P
aym
ent
per
RV
U
Per
cent
age
chan
ge
from
20
08
Sha
re
of
all
RV
Us*
Per
cent
age-
po
int
chan
ge
from
20
08P
aym
ent
per
RV
U
Per
cent
age
chan
ge
from
20
08
Sha
re
of
all
RV
Us*
Per
cent
age-
po
int
chan
ge
from
20
08P
aym
ent
per
RV
U
Per
cent
age
chan
ge
from
20
08
All
6%0
$6
4.3
07%
5%0
$6
5.8
09%
8%-1
$61
.70
1%
PR
OV
iDe
R R
eg
iOn
Bal
timor
e M
etro
polit
an
Are
a4
-16
0.1
05
3-1
59
.90
86
-16
0.4
01
Nat
iona
l Cap
ital A
rea
(incl
udin
g VA
)7
06
4.6
04
70
64
.60
48
-16
4.7
03
Oth
er M
aryl
and
Are
as
(Inc
ludi
ng D
E,
PA
, W
V)
6-1
66
.30
156
-171
.20
20
9-2
56
.00
4
Oth
er S
ervi
ce A
reas
22
66
9.5
0-2
30
1472
.00
-210
-35
9.8
0-8
Se
RV
iCe
Ty
Pe
E/M
: M
enta
l Hea
lth2
7-3
57.4
02
25
-457
.10
331
-257
.90
1
E/M
: All
Oth
er5
-172
.30
94
07
3.7
014
7-1
70
.40
3
Pro
cedu
res
5-1
71.4
013
4-1
76.9
014
8-2
62
.50
12
Imag
ing
20
91.8
0-2
10
96
.70
-42
-28
2.8
0-5
Test
s7
17
0.5
05
52
82
.80
99
-15
3.2
0-9
Oth
er9
05
2.5
02
91
51.3
02
9-1
55
.30
3
* A
ll R
VU
s in
clud
e R
VU
s p
rovi
ded
by
bot
h p
artic
ipat
ing
and
nonp
artic
ipat
ing
pro
vid
ers.
No
TeS
: 1.
Det
ail m
ay n
ot a
dd
to t
otal
due
to
roun
din
g.
2
. 0%
ind
icat
es <
0.5%
.
3.
E/M
= E
valu
atio
n an
d m
anag
emen
t
2008–2009 PROFESSIONAL SERVICES UTILIZATION: Trends Among Privately Insured Patients 25

procedures provided by nonparticipating providers were nearly double the rate for the same type of service provided by participating providers. Within each type of service, especially for non-mental-health E/M, procedures, and lab tests, the price gap differed markedly between the two groups of payers. In 2009, nonparticipating providers received 110 percent more for non-mental-health E/M or procedures covered by the largest payers than did participating providers; the difference was only 70 percent and 56 percent, respectively, if the services were covered by the smaller payers. For lab tests covered by the largest payers, nonpar-ticipating providers received 174 percent more than participating providers; the difference was only 37 percent if the tests were covered by the other payers.
26 2008–2009 PROFESSIONAL SERVICES UTILIZATION: Trends Among Privately Insured Patients
2008–2009 PROFESSIONAL SERVICES UTILIZATION: Trends Among Privately Insured Patients 27
APPenDix A:
Technical Background: Summary of Data and Methods for This Report
Tables and figures in this report are based on services and payments captured in the MCDB. The MCDB contains extracts of insurance claims28 for the services of physicians and other medical prac-titioners such as podiatrists, nurse practitioners, and therapists. Insurance companies and HMOs meeting certain criteria29 are required to submit these data to MHCC under the Code of Maryland Regulations (COMAR) 10.25.06 on health care practitioner services provided to Maryland resi-dents. For calendar year 2009, the Commission received usable data from 21 payers, including all major health insurance companies.30 Data from Assurant Health (Time Insurance Company) were excluded this year for consistent comparison with 2008. A list of these 21 payers is included in Appendix C.
Each practitioner service generates a separate record in the MCDB. Patients are identified by concatenating the payer ID, plan-specific user ID (an encrypted number generated by each payer), the birth year and month of the user, and the user’s gender. Insurers use a standard format for reporting the data. Each data record identifies the service provided; payments from the insurer and patient (for noncapitated care); practitioner specialty; user characteristics such as age, gender, and ZIP code of user residence; clinical diagnosis codes; and other attributes of care such as site of service and type of insurance coverage.
This report uses categories and definitions for region, coverage type, and market share compa-rable to those in previous reports. However, the distinction between HMO and non-HMO services, which was referred to as plan type in previous reports, is categorized as network type in this report.31 The definition of network type (HMO
28 The MCDB also includes information on capitated services, but some capitated primary care is not submitted to MHCC.
29 The companies are licensed in the State of Maryland and collect more than $1 million in health insurance premiums.
30 A number of small payers received waivers from contributing data, but these payers together account for less than 1 percent of total health insurance premiums reported in Maryland.
31 “Plan” is used in a general sense in this report (e.g., plan characteristics include coverage type and network type).
versus non-HMO) remains the same as in the 2008 report. In reports prior to the 2008 Practitioner Utilization report, network type was assigned based on the network and coverage type associated with the user as reported by the payer. Starting in the 2008 report, network type is based on the type of business that provided the plan, regardless of the reported network type. In other words, all users enrolled in plans provided by licensed HMOs are defined as HMO users and those enrolled in plans provided by life and health insurers are defined as non-HMO users. Users who were enrolled in more than one plan in a year or who moved from one region to another are assigned to the region or network type that is associated with the majority of their total payments. If two regions or both network types tie in terms of total payment, we assign the user to the region or network type with the higher number of services. This methodological change mainly affects part-year users.
This report continues to employ two analytic tools that were introduced in the 2005 Practitioner Utilization report: risk status and enrollment period. Users have been grouped into low-risk, medium-risk, and high-risk groups based on their scores from the Chronic Illness and Disability Payment System (CDPS). This algorithm, developed by researchers at the University of California, San Diego, creates person-level risk scores from the service utilization data of the MCDB. It has been applied only to users who were enrolled in reporting plans for the entire year, to avoid devel-oping biased scores based on partial-year data. Resulting scores were used to categorize users as “low-risk,” “medium-risk,” or “high-risk,” based on the scores of the top one-third and bottom one-third of the distribution.32 Plans reported enrollment data for the first time in 2005, making it possible to analyze those users who were enrolled all year. As a result, the decomposition of spending
32 The resulting risk status groups do not each include exactly one-third of the population, since the cutoff score values applied to many users. Overall, about 35 percent of users were in the low-risk group, while about 32 percent and 33 percent fell in the medium- and high-risk groups, respectively.

28 2008–2009 PROFESSIONAL SERVICES UTILIZATION: Trends Among Privately Insured Patients
into volume, complexity, and payment level reported in Chapter 2 is not distorted by the anomalies introduced by including part-year enrollees.
As in last year’s report, prices for capitated services were imputed in this report. The imputa-tion made it possible to include capitated services in the analyses. Previous Practitioner Utilization reports excluded capitated services due to their lack of payment information. The exclusion of capi-tated services resulted in an undercount of users of professional services—those who obtained only capitated services—and understated total per-user values in HMO plans. In this report, we imputed payment for capitated services based on the Current Procedure Terminology (CPT) code asso-ciated with a service, using payment information on noncapitated services within the same payer. As in 2008, the number of full-year users included in the report analyses increased by 8 percent with imputation in 2009 (Table 1-2). Full-year users with only capitated services spent on average $414 and $487 on professional services in 2008 and 2009, respectively. For full-year users with some but not all capitated services, the average per-user expen-diture is 22 percent and 25 percent higher after imputation in 2008 and 2009, respectively. Overall, the inclusion of imputed payments for capitated services led to a 10 percent increase in per-user spending among all full-year users in both 2008 and 2009.
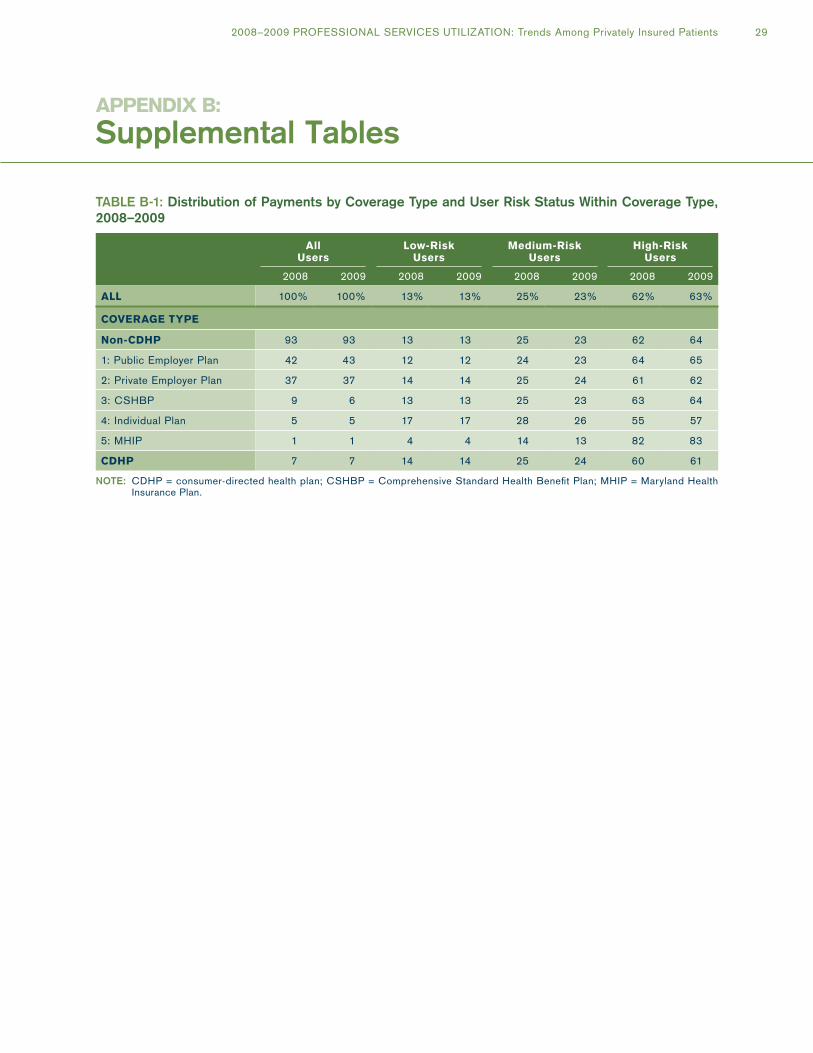
APPenDix b:
Supplemental Tables
TABle B-1: Distribution of Payments by Coverage Type and User Risk Status Within Coverage Type, 2008–2009
All users
low-Risk users
Medium-Risk users
High-Risk users
2008 2009 2008 2009 2008 2009 2008 2009
All 100% 100% 13% 13% 25% 23% 62% 63%
COVeRAge TyPe
non-CDHP 93 93 13 13 25 23 62 64
1: Public Employer Plan 42 43 12 12 24 23 64 65
2: Private Employer Plan 37 37 14 14 25 24 61 62
3: CSHBP 9 6 13 13 25 23 63 64
4: Individual Plan 5 5 17 17 28 26 55 57
5: MHIP 1 1 4 4 14 13 82 83
CDHP 7 7 14 14 25 24 60 61
NoTe: CDHP = consumer-directed health plan; CSHBP = Comprehensive Standard Health Benefit Plan; MHIP = Maryland Health Insurance Plan.
2008–2009 PROFESSIONAL SERVICES UTILIZATION: Trends Among Privately Insured Patients 29

TABle B-2: RVUs Per Service in expenditure Risk Categories by Coverage Type, Network Type, Region, and Payer Market Share, 2008–2009
RVus PeR SeRViCe
All users low-Risk users Medium-Risk users High-Risk users
2009
Percentage Change
from 2008 2009
Percentage Change
from 2008 2009
Percentage Change
from 2008 2009
Percentage Change
from 2008
All 1.6 0% 1.3 -1% 1.4 -1% 1.8 -1%
COVeRAge TyPe
non-CDHP 1.6 0 1.3 -1 1.4 -1 1.8 0
1: Public Employer Plan 1.6 0 1.4 0 1.4 0 1.7 1
2: Private Employer Plan 1.6 -1 1.4 0 1.5 -1 1.8 -2
3: CSHBP 1.6 -2 1.3 -6 1.4 -3 1.8 -1
4: Individual Plan 1.6 1 1.4 1 1.5 1 1.8 0
5: MHIP 1.8 3 1.5 11 1.6 1 1.9 3
CDHP 1.6 -1 1.4 -1 1.5 -1 1.8 -1
neTwORK TyPe
Non-HMO 1.6 0 1.4 -1 1.5 -1 1.8 0
HMO 1.6 -1 1.3 -2 1.4 -2 1.7 -1
RegiOn
Baltimore Metropolitan Area 1.6 0 1.4 -1 1.4 -1 1.8 0
National Capital Area 1.6 0 1.3 0 1.4 -1 1.7 0
Other Maryland Areas 1.6 -1 1.4 -2 1.5 -2 1.8 -1
PAyeR MARKeT SHARe
Largest Payers 1.6 -1 1.4 -2 1.5 -1 1.8 0
Other Payers 1.6 0 1.3 1 1.4 0 1.7 -1
NoTeS: 1. CDHP = consumer-directed health plan; CSHBP = Comprehensive Standard Health Benefit Plan; MHIP = Maryland Health Insurance Plan; HMO = health maintenance organization.
2. Detail may not add to total due to rounding. 3. 0% indicates <0.5%. 4. 2009 RVUs were applied to both 2008 and 2009 data when calculating RVUs per service.
30 2008–2009 PROFESSIONAL SERVICES UTILIZATION: Trends Among Privately Insured Patients

TABle B-3: Percentage Change in Payment Per RVU in expenditure Risk Categories by User, Coverage Type, Network Type, Region, and Payer Market Share, 2008–2009
PeRCenTAge CHAnge in PAyMenT PeR RVu FROM 2008
All Users Low-Risk Users Medium-Risk Users High-Risk Users
All 2% 2% 2% 2%
COVeRAge TyPe
non-CDHP 2 2 2 2
1: Public Employer Plan 0 1 0 0
2: Private Employer Plan 2 2 2 2
3: CSHBP 5 4 3 5
4: Individual Plan 6 4 5 7
5: MHIP 4 7 3 4
CDHP 2 2 2 1
neTwORK TyPe
Non-HMO 1 1 0 1
HMO 3 3 3 3
RegiOn
Baltimore Metropolitan Area 1 1 1 2
National Capital Area 1 1 1 2
Other Maryland Areas 3 4 3 3
PAyeR MARKeT SHARe
Largest Payers 2 2 2 2
Other Payers 1 1 0 1
NoTeS: 1. CDHP = consumer-directed health plan; CSHBP = Comprehensive Standard Health Benefit Plan; MHIP = Maryland Health Insurance Plan; HMO = health maintenance organization.
2. Detail may not add to total due to rounding. 3. 0% indicates <0.5%. 4. 2009 RVUs were applied to both 2008 and 2009 data when calculating RVUs per service.
2008–2009 PROFESSIONAL SERVICES UTILIZATION: Trends Among Privately Insured Patients 31

TABle B-4: expenditure Per User by Coverage Type, Network Type, Region, and Payer Market Share, 2008
Percentage of Users
Number of Users
Expenditure per User
Number of Services
per UserRVUs per
Service
All 100% 2,061,075 $1,186 20.8 1.6
COVeRAge TyPe
non-CDHP 92 1,905,537 1,193 20.9 1.6
1: Public Employer Plan 42 858,632 1,176 21.2 1.6
2: Private Employer Plan 36 743,503 1,205 20.1 1.6
3: CSHBP 8 173,635 1,293 23.3 1.6
4: Individual Plan 5 105,478 1,049 18.6 1.6
5: MHIP 0 8,064 2,205 36.8 1.8
CDHP 8 155,538 1,103 19.5 1.6
neTwORK TyPe
Non-HMO 61 1,258,182 1,262 21.7 1.6
HMO 39 802,893 1,067 19.3 1.6
RegiOn
Baltimore Metropolitan Area 44 901,958 1,188 21.4 1.6
National Capital Area 36 736,281 1,210 20.5 1.6
Other Maryland Areas 21 422,836 1,140 19.8 1.6
PAyeR MARKeT SHARe
Largest Payers 68 1,410,122 1,193 21.5 1.6
Other Payers 32 650,953 1,170 19.1 1.6
NoTe: CDHP = consumer-directed health plan; CSHBP = Comprehensive Standard Health Benefit Plan; MHIP = Maryland Health Insurance Plan; HMO = health maintenance organization.
32 2008–2009 PROFESSIONAL SERVICES UTILIZATION: Trends Among Privately Insured Patients

TABle B-5: Distribution of expenditure Risk Scores, 2009
RiSK SCORe PeRCenTile Risk Score
01 0.20
05 0.20
10 0.23
25 0.26
50 0.78
75 1.67
90 2.98
95 3.87
99 7.08
NoTe: Risk scores were generated using the Chronic Illness and Disability Payment System (CDPS), which takes into account the impact of both the number and the mix of diagnoses on health care expenditures.
TABle B-6: Comparison of Median CDPS for each Coverage Type with the overall Median Score, 2009
ClASSiFiCATiOn Median CDPS Ratio
All uSeRS 0.78 1.00
COVeRAge TyPe
non-CDHP 0.78 1.00
1: Public Employer Plan 0.80 1.03
2: Private Employer Plan 0.76 0.97
3: CSHBP 0.78 1.00
4: Individual Plan 0.58 0.74
5: MHIP 1.66 2.12
CDHP 0.71 0.91
NoTeS: 1. CDHP = consumer-directed health plan; CSHBP = Comprehensive Standard Health Benefit Plan; CDPS = Chronic Illness and Disability Payment System; MHIP = Maryland Health Insurance Plan.
2. Risk scores were generated using the CDPS, which takes into account the impact of both the number and the mix of diagnoses on health care expenditures.
2008–2009 PROFESSIONAL SERVICES UTILIZATION: Trends Among Privately Insured Patients 33

APPenDix C:
Payers Contributing Data to This Report
TABle C-1: Payers Contributing Data to This Report
PAyeR Payer Identification Number
Aetna Life and Health Insurance Company P020
Aetna U.S. Healthcare P030
American Republic Insurance Company P070
CareFirst BlueChoice, Inc. P130
CareFirst of MD, Inc. P131
CIGNA Healthcare Mid-Atlantic Inc. P160
Golden Rule Insurance Company P320
Graphic Arts Benefit Corporation P325
Guardian Life Insurance Company of America P350
Unicare Life & Health Insurance Company P471
Kaiser Foundation Health Plan of the Mid-Atlantic States, Inc. P480
MAMSI Life and Health Insurance Co. P500
MD-Individual Practice Association, Inc. P520
The MEGA Life & Health Insurance Company P530
Optimum Choice Inc. P620
Coventry Healthcare of Delaware, Inc. P680
State Farm Mutual Automobile Insurance Company P760
United Healthcare Corporation P820
Trustmark Insurance Company P830
Union Labor Life Insurance Company P850
United Healthcare of the Mid-Atlantic, Inc. P870
34 2008–2009 PROFESSIONAL SERVICES UTILIZATION: Trends Among Privately Insured Patients


4160 Patterson AvenueBaltimore, Maryland 21215
Telephone: 410-764-3570Fax: 410-358-1236mhcc.maryland.gov