Embed Size (px)
Citation preview
2008/09 UFV Fact Book
Prepared by:
Email: [email protected]
V2S 7M8
33844 King RoadUFV Office of Institutional Research
Abbotsford, British Columbia
Please note that archived Fact Books prior to 2005/06 used a different methodology and sourced an internal student record system. Consequently, those particular archives are not directly comparable with more recent UCFV/UFV Fact Books.
The 2008/09 UFV Fact Book utilizes data derived from the provincial Central Data Warehouse (CDW). Using standardized definitions, the CDW stores data from all British
Columbia public post-secondary colleges, university-colleges, special purpose universities, and institutes.
URL: www.ufv.ca/irp
Tel: (604) 504-7441
INSTITUTIONAL OVERVIEWUFV Timeline 2Vision, Mission, and Values 3
ENROLMENT (2003-2009)UFV Student Headcount 6Registration by Term (2003/2004 - 2008/2009) 7
Summer Registrations by Course Level 8Fall Registrations by Course Level 9Winter Registrations by Course Level 10
FULL TIME EQUIVALENTS (FTE)Audited FTE Report (2008/09) 11Historic FTE Enrolments (1990-2008) 12
GRADUATES, GRADES, & STUDENT OUTCOMES Credentials Awarded (2004-2009) 13
Diplomas by Program 14Bachelor Degrees by Program 15
Student Outcomes - A Summary of Survey Results (2008)Diploma, Associate Degree, and Certificate Student Outcomes 16Baccalaureate Graduate Survey 20Apprenticeship Survey 22
STUDENT DEMOGRAPHICSGender and Age Distributions
All Programs 26Demographic Trends 27Degree and Diploma Programs 28Development Programs 29ELTT/Apprenticeship 30Certificate Programs 31
Bachelor Degree Students by ProgramFull/Part-time Distribution 32Gender Distribution 33
Associate Degree and Diploma Students by ProgramFull/Part-time Distribution 34Gender Distribution 35
General and Degree Studies Students by ProgramFull/Part-time Distribution 36Gender Distribution 37
Aboriginal Student Headcount 38Students by Home Location 39International Students 40Continuing Education (CE) 41CE Students by Home Location 42GIS Maps of UFV Student Spatial Distribution 43-46
EMPLOYEES & SERVICESFaculty and Staff Age Distribution 47Library Services 48
APPENDIX 49
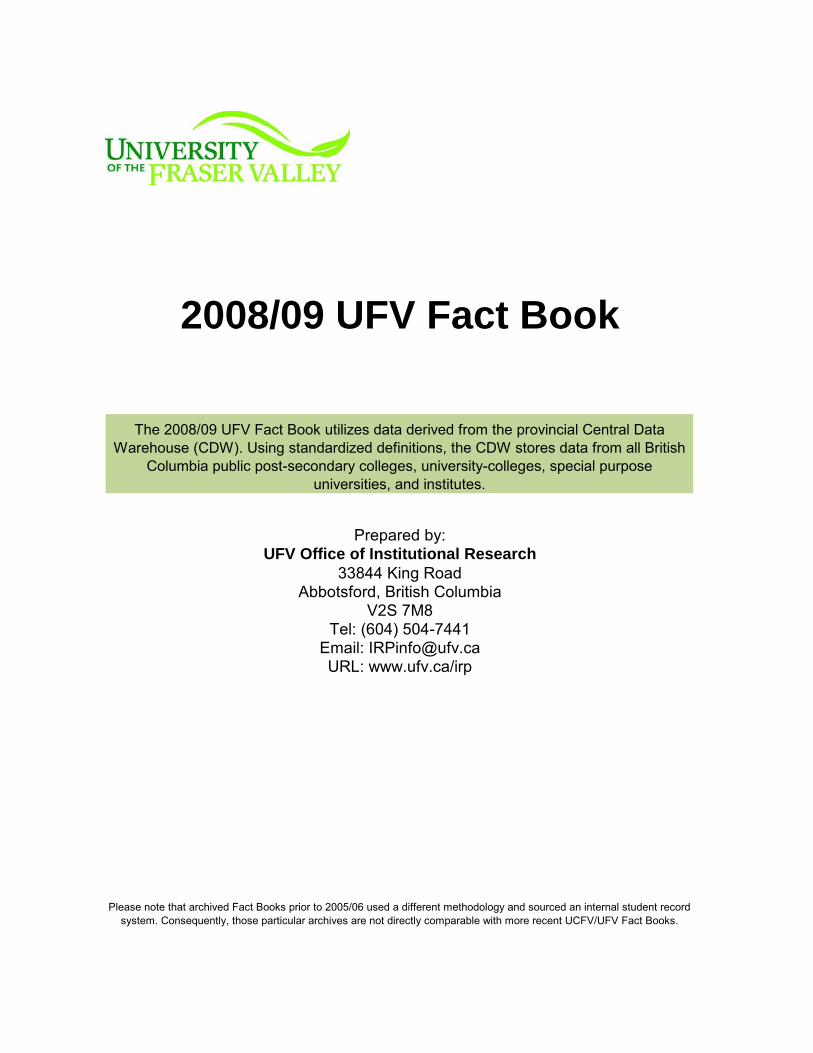
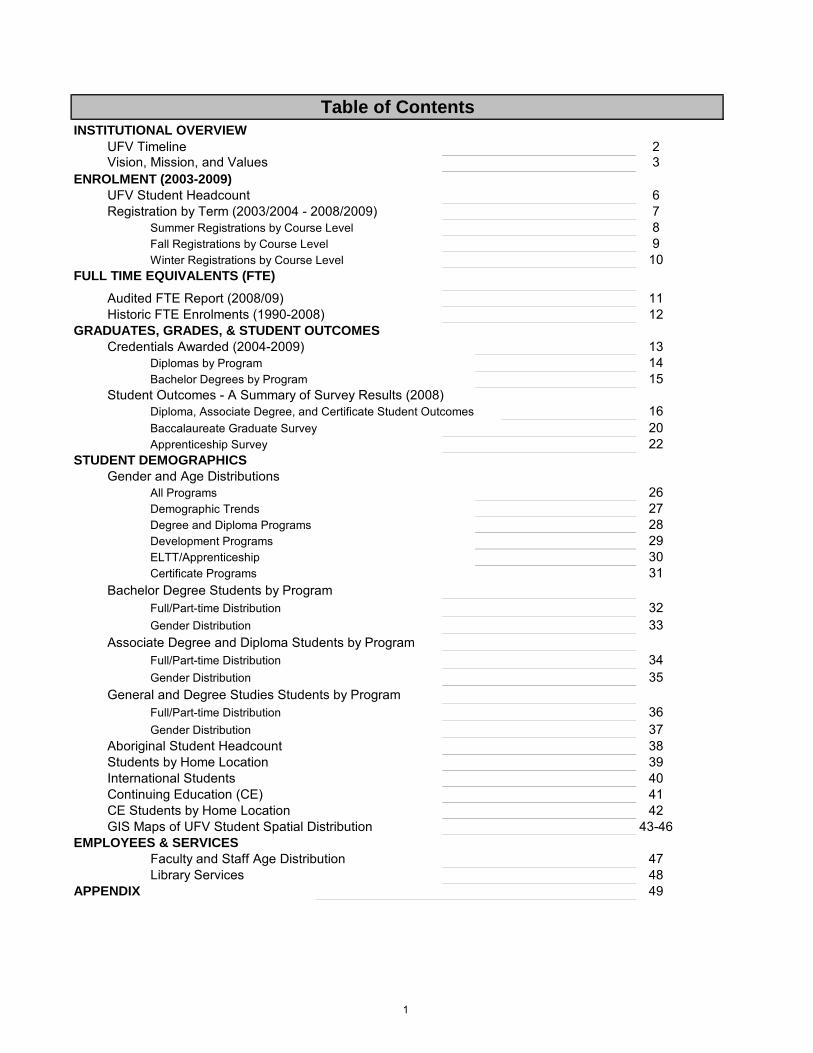
Table of Contents
1
TIMELINE AT A GLANCE1974 • Fraser Valley College (FVC) founded
1975 • Over 2300 students attending FVC in Chilliwack, Abbotsford, and Mission campuses
1978 • FVC Chilliwack campus Trades programming
1983 • FVC establishes permanent campus in Abbotsford
1986 • FVC opens Agriculture Centre in Chilliwack
1991 • Fraser Valley College gains university-college status and becomes University College of the Fraser Valley (UCFV)
1992• UCFV its Baccalaureate degrees
• UCFV Health Sciences Centre opens in Chilliwack
1995• UCFV Heritage Park Centre campus opens in Mission
1996• UCFV and Coastal Aviation (CPA) launch the four-year aviation degree in Canada
2001 • Founding of UCFV Alumni Association
2004• UCFV awarded Federal Tier 1 Canadian Research Chair
in Aboriginal Studies
2005 • Solicitor General establishes UCFV Research Chair in Criminal Justice
2006 • Over 11,000 students now attending UCFV
• UCFV Cascades basketball and soccer teams enter Canadian Interuniversity Sports league
• Centre for Indo-Canadian Studies opens
• First BBA cohort begins study in Chandigarh, India
2007
• First master degrees awarded at UCFV
• Launch of BBA (Trades Management) and Teacher Education program
• Appointment of BC Regional Innovation Chair on Canada-India Business and Economic Development
• Baker House, UCFV’s on-campus student residence,
welcomes students
• Trades and Technology Centre opens at Canada Education Park campus
2008• UCFV becomes the University of the Fraser Valley
2009
• UFV installs first Chancellor
• First graduates from the Teacher Education and Bachelor of Fine Arts programs
Marked the 35th anniversary of the founding of FVC• 2
VISION The UFV vision is to maintain its heritage of building community learning capacity through a comprehensive range of programs from trades training to graduate degrees, while developing selected high-growth, world-demand areas of study based on competitive advantages and critical strengths. UFV is recognized for its students’ success, excellent learning environment, creative integration of programming, and its work with the region’s communities.
MISSION
The fundamental purpose of UFV is to provide a superb learning experience for our students. We provide our students and the rapidly growing Fraser Valley region with:
Excellence in teaching and research A supportive, professional, and respectful learning environment Innovative, distinctive, and comprehensive programming Education directed towards both personal and career development Beneficial local, national, and international partnerships
VALUES
At UFV the paramount priority is placed on our students and responding to their learning goals. We are committed to excellence in post-secondary education through programs that serve the diverse needs of the Fraser Valley region. We view education as an ongoing process essential for both career progress and actualizing human potential. We make the university accessible to students with diverse backgrounds and goals, while rewarding academic success and maintaining high standards. We value and treat students as mature individuals, and encourage intellectual, cultural, creative, ethical and social development in order to prepare our graduates for their roles as productive citizens of an increasingly complex and pluralistic society. We place a high value on environmental, social and economic sustainability in all our endeavours. Visit the link below for more details: http://www.ufv.ca/Assets/IRP/Institutional+Accountablity+Report+$!26+Plan+2009-10_to_2011-12.pdf
3
INSTITUTIONAL OVERVIEW
In 1974, Fraser Valley College (FVC) opened its doors to the community. As a two-year vocational college, FVC provided public access to post-secondary education in the Fraser Valley of British Columbia. By 1975, a permanent campus in Chilliwack had been established and was soon followed by the Marshall Rd. Annex in Abbotsford. In 1991, FVC was granted university-college status and renamed University College of the Fraser Valley (UCFV). In March 2006, UCFV presented its university status application to the Ministry of Advanced Education1 and on April 21, 2008 was awarded university status and a new title: the University of the Fraser Valley (UFV). On September 1, 2008 UFV began fall semester classes under its new name and status. In the midst of these exciting changes, in 2007, UFV also attained a new campus at the Canada Education Park (CEP) in Chilliwack (located on the former Canadian Forces Base Chilliwack) and offered its first classes on this campus in the fall of 2007.
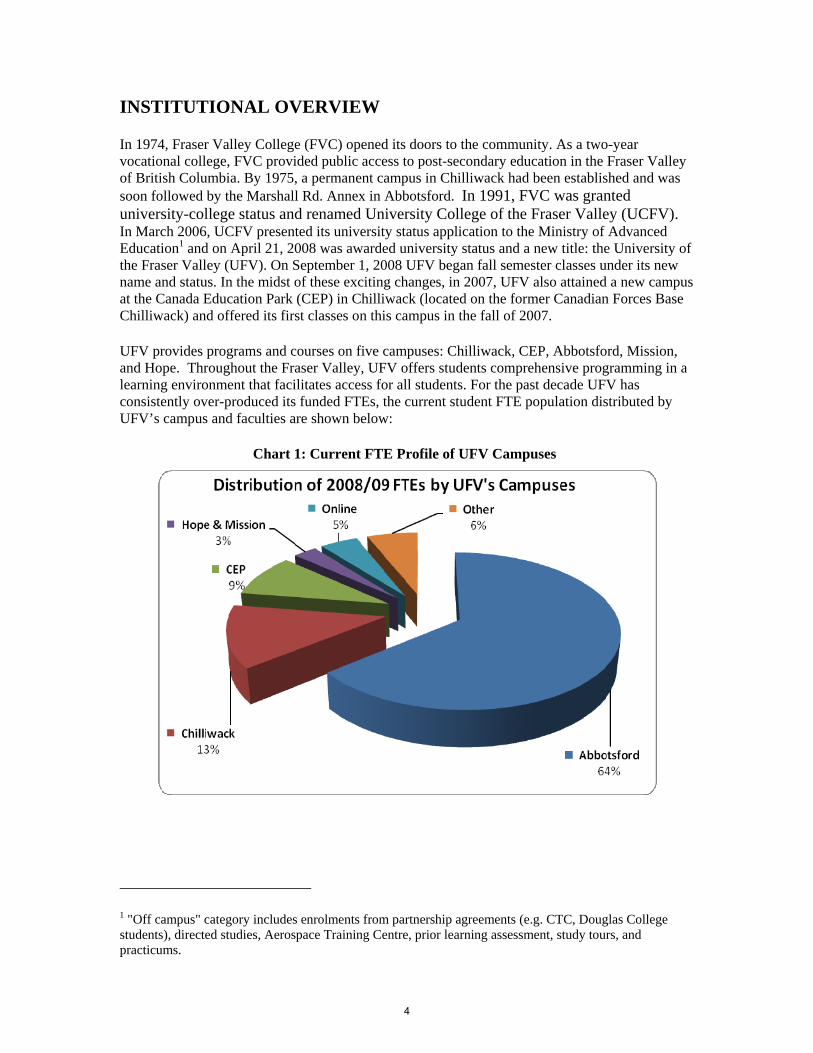
UFV provides programs and courses on five campuses: Chilliwack, CEP, Abbotsford, Mission, and Hope. Throughout the Fraser Valley, UFV offers students comprehensive programming in a learning environment that facilitates access for all students. For the past decade UFV has consistently over-produced its funded FTEs, the current student FTE population distributed by UFV’s campus and faculties are shown below:
Chart 1: Current FTE Profile of UFV Campuses2
1 "Off campus" category includes enrolments from partnership agreements (e.g. CTC, Douglas College students), directed studies, Aerospace Training Centre, prior learning assessment, study tours, and practicums.
4
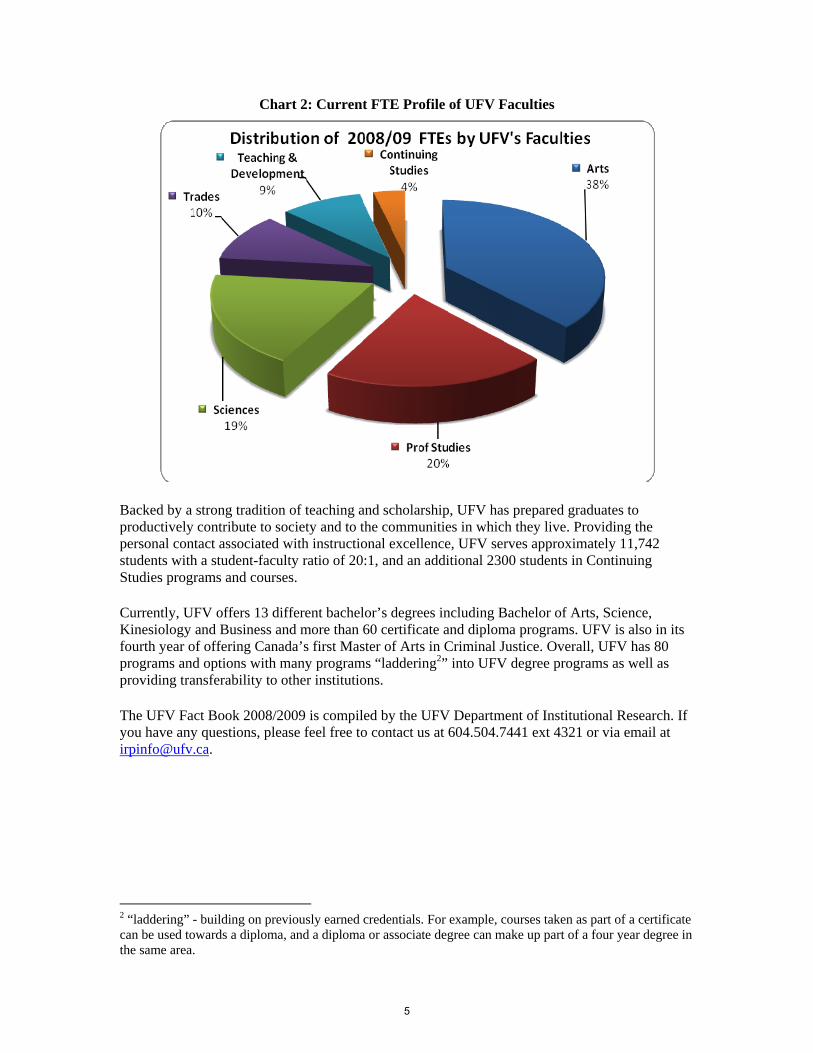
Chart 2: Current FTE Profile of UFV Faculties
Backed by a strong tradition of teaching and scholarship, UFV has prepared graduates to productively contribute to society and to the communities in which they live. Providing the personal contact associated with instructional excellence, UFV serves approximately 11,742 students with a student-faculty ratio of 20:1, and an additional 2300 students in Continuing Studies programs and courses.
Currently, UFV offers 13 different bachelor’s degrees including Bachelor of Arts, Science, Kinesiology and Business and more than 60 certificate and diploma programs. UFV is also in its fourth year of offering Canada’s first Master of Arts in Criminal Justice. Overall, UFV has 80 programs and options with many programs “laddering2” into UFV degree programs as well as providing transferability to other institutions. 3
The UFV Fact Book 2008/2009 is compiled by the UFV Department of Institutional Research. If you have any questions, please feel free to contact us at 604.504.7441 ext 4321 or via email at [email protected].
2 “laddering” - building on previously earned credentials. For example, courses taken as part of a certificate can be used towards a diploma, and a diploma or associate degree can make up part of a four year degree in the same area.
5
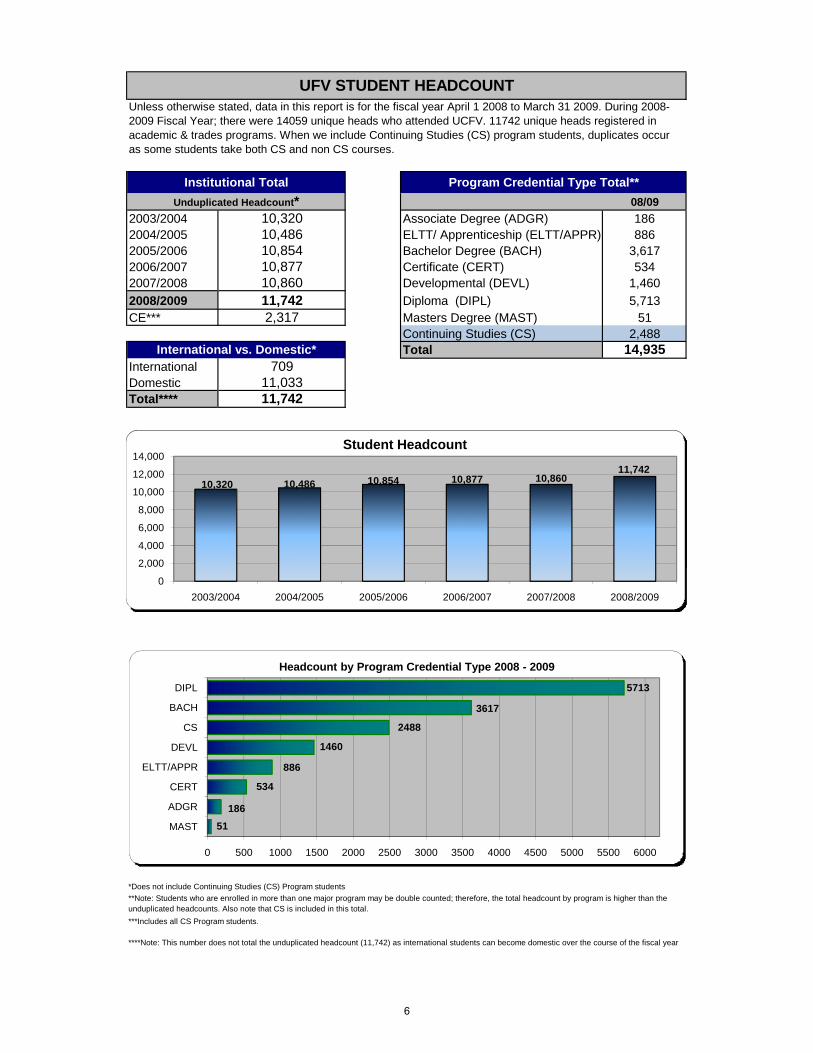
08/09
2003/2004 10,320 Associate Degree (ADGR) 1862004/2005 10,486 ELTT/ Apprenticeship (ELTT/APPR) 8862005/2006 10,854 Bachelor Degree (BACH) 3,6172006/2007 10,877 Certificate (CERT) 5342007/2008 10,860 Developmental (DEVL) 1,460
2008/2009 11,742 Diploma (DIPL) 5,713CE*** 2,317 Masters Degree (MAST) 51
Continuing Studies (CS) 2,488Total 14,935
International 709Domestic 11,033Total**** 11,742
UFV STUDENT HEADCOUNT
Institutional Total Program Credential Type Total**
Unduplicated Headcount*
International vs. Domestic*
Unless otherwise stated, data in this report is for the fiscal year April 1 2008 to March 31 2009. During 2008-2009 Fiscal Year; there were 14059 unique heads who attended UCFV. 11742 unique heads registered in academic & trades programs. When we include Continuing Studies (CS) program students, duplicates occur as some students take both CS and non CS courses.
10,320 10,486 10,854 10,877 10,86011,742
2,000
4,000
6,000
8,000
10,000
12,000
14,000Student Headcount
*Does not include Continuing Studies (CS) Program students
****Note: This number does not total the unduplicated headcount (11,742) as international students can become domestic over the course of the fiscal year
***Includes all CS Program students.
**Note: Students who are enrolled in more than one major program may be double counted; therefore, the total headcount by program is higher than the unduplicated headcounts. Also note that CS is included in this total.
10,320 10,486 10,854 10,877 10,86011,742
0
2,000
4,000
6,000
8,000
10,000
12,000
14,000
2003/2004 2004/2005 2005/2006 2006/2007 2007/2008 2008/2009
Student Headcount
51
186
534
886
1460
2488
3617
5713
0 500 1000 1500 2000 2500 3000 3500 4000 4500 5000 5500 6000
MAST
ADGR
CERT
ELTT/APPR
DEVL
CS
BACH
DIPL
Headcount by Program Credential Type 2008 - 2009
6
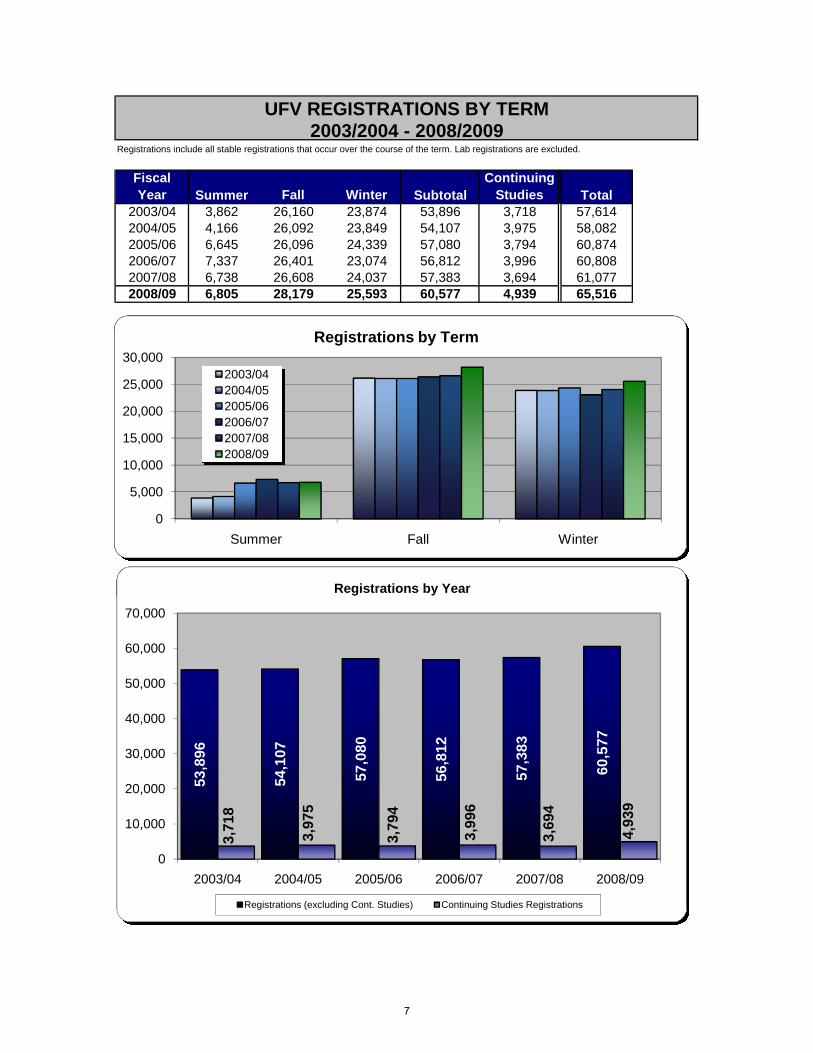
Registrations include all stable registrations that occur over the course of the term. Lab registrations are excluded.
Fiscal Year Summer Fall Winter Subtotal
Continuing Studies Total
2003/04 3,862 26,160 23,874 53,896 3,718 57,6142004/05 4,166 26,092 23,849 54,107 3,975 58,0822005/06 6,645 26,096 24,339 57,080 3,794 60,8742006/07 7,337 26,401 23,074 56,812 3,996 60,8082007/08 6,738 26,608 24,037 57,383 3,694 61,0772008/09 6,805 28,179 25,593 60,577 4,939 65,516
UFV REGISTRATIONS BY TERM2003/2004 - 2008/2009
0
5,000
10,000
15,000
20,000
25,000
30,000
Summer Fall Winter
Registrations by Term
2003/042004/052005/062006/072007/082008/09
Registrations by Year
0
5,000
10,000
15,000
20,000
25,000
30,000
Summer Fall Winter
Registrations by Term
2003/042004/052005/062006/072007/082008/09
53,8
96
54,1
07
57,0
80
56,8
12
57,3
83
60,5
77
3,71
8
3,97
5
3,79
4
3,99
6
3,69
4
4,93
9
0
10,000
20,000
30,000
40,000
50,000
60,000
70,000
2003/04 2004/05 2005/06 2006/07 2007/08 2008/09
Registrations by Year
Registrations (excluding Cont. Studies) Continuing Studies Registrations
7
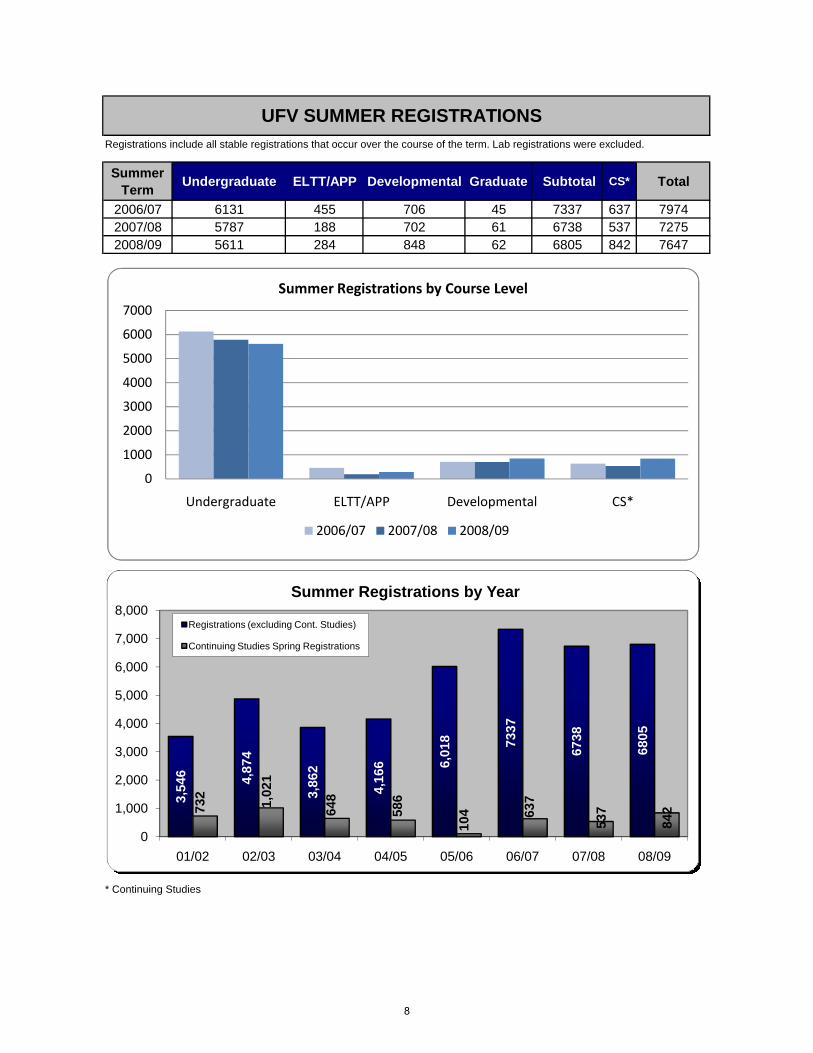
Registrations include all stable registrations that occur over the course of the term. Lab registrations were excluded.
Summer Term
Undergraduate ELTT/APP Developmental Graduate Subtotal CS* Total
2006/07 6131 455 706 45 7337 637 79742007/08 5787 188 702 61 6738 537 72752008/09 5611 284 848 62 6805 842 7647
UFV SUMMER REGISTRATIONS
0
1000
2000
3000
4000
5000
6000
7000
Undergraduate ELTT/APP Developmental CS*
Summer Registrations by Course Level
2006/07 2007/08 2008/09
Summer Registrations by Year
* Continuing Studies
0
1000
2000
3000
4000
5000
6000
7000
Undergraduate ELTT/APP Developmental CS*
Summer Registrations by Course Level
2006/07 2007/08 2008/09
3,54
6 4,87
4
3,86
2
4,16
6 6,01
8 7337
6738
6805
732
1,02
1
648
586
104 63
7
537
842
0
1,000
2,000
3,000
4,000
5,000
6,000
7,000
8,000
01/02 02/03 03/04 04/05 05/06 06/07 07/08 08/09
Summer Registrations by Year
Registrations (excluding Cont. Studies)
Continuing Studies Spring Registrations
8
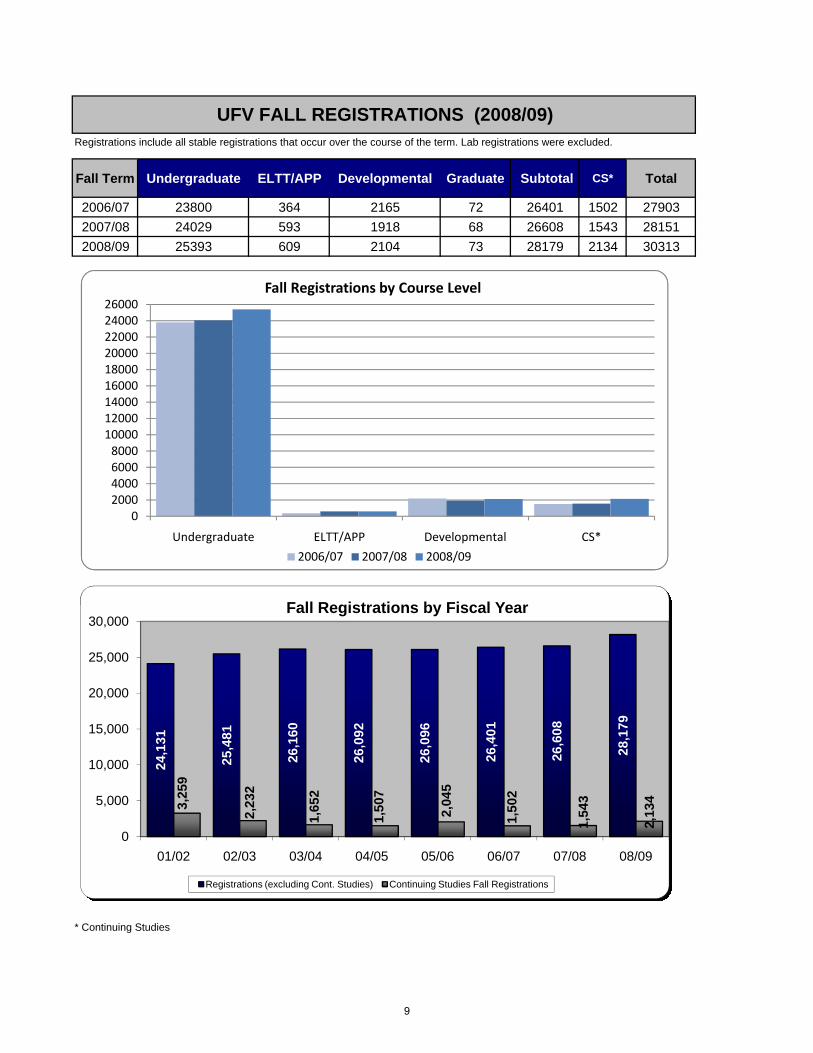
Registrations include all stable registrations that occur over the course of the term. Lab registrations were excluded.
Fall Term Undergraduate ELTT/APP Developmental Graduate Subtotal CS* Total
2006/07 23800 364 2165 72 26401 1502 27903
2007/08 24029 593 1918 68 26608 1543 28151
2008/09 25393 609 2104 73 28179 2134 30313
UFV FALL REGISTRATIONS (2008/09)
02000400060008000100001200014000160001800020000220002400026000
Undergraduate ELTT/APP Developmental CS*
Fall Registrations by Course Level
2006/07 2007/08 2008/09
Fall Registrations by Fiscal Year
* Continuing Studies
02000400060008000100001200014000160001800020000220002400026000
Undergraduate ELTT/APP Developmental CS*
Fall Registrations by Course Level
2006/07 2007/08 2008/09
24,1
31
25,4
81
26,1
60
26,0
92
26,0
96
26,4
01
26,6
08
28,1
79
3,25
9
2,23
2
1,65
2
1,50
7
2,04
5
1,50
2
1,54
3
2,13
4
0
5,000
10,000
15,000
20,000
25,000
30,000
01/02 02/03 03/04 04/05 05/06 06/07 07/08 08/09
Fall Registrations by Fiscal Year
Registrations (excluding Cont. Studies) Continuing Studies Fall Registrations
9
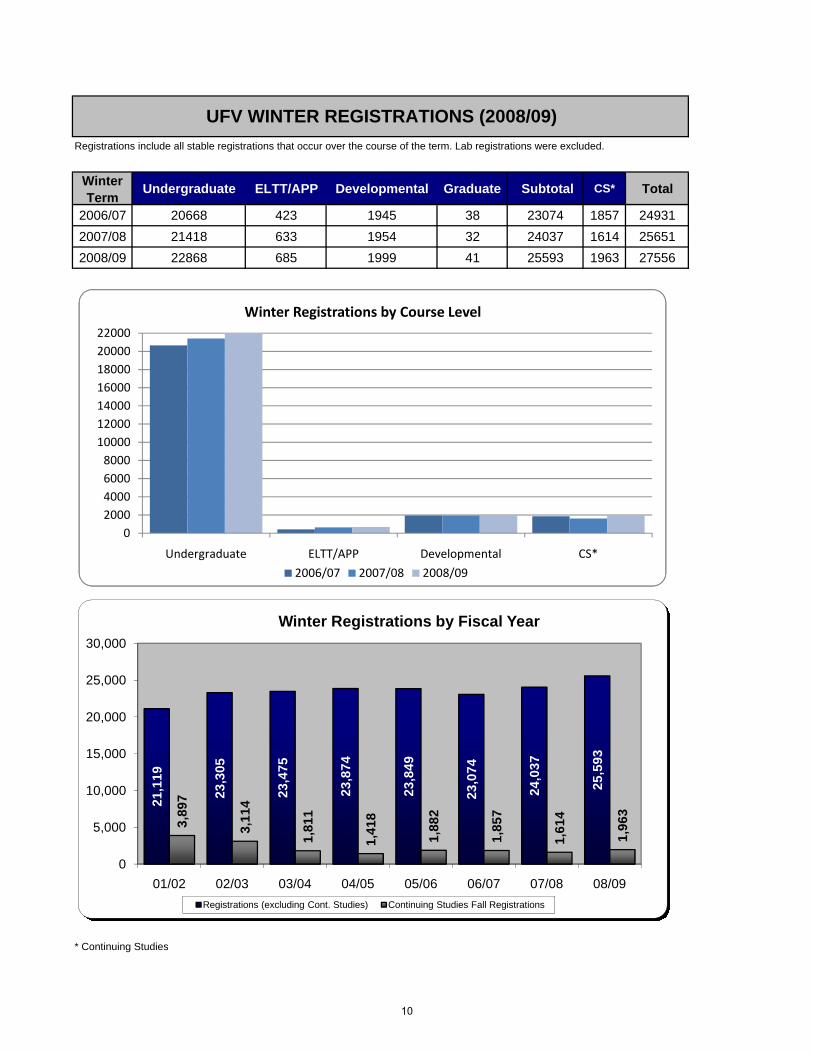
Registrations include all stable registrations that occur over the course of the term. Lab registrations were excluded.
Winter Term
Undergraduate ELTT/APP Developmental Graduate Subtotal CS* Total
2006/07 20668 423 1945 38 23074 1857 24931
2007/08 21418 633 1954 32 24037 1614 25651
2008/09 22868 685 1999 41 25593 1963 27556
UFV WINTER REGISTRATIONS (2008/09)
0
2000
4000
6000
8000
10000
12000
14000
16000
18000
20000
22000
Undergraduate ELTT/APP Developmental CS*
Winter Registrations by Course Level
2006/07 2007/08 2008/09
* Continuing Studies
0
2000
4000
6000
8000
10000
12000
14000
16000
18000
20000
22000
Undergraduate ELTT/APP Developmental CS*
Winter Registrations by Course Level
2006/07 2007/08 2008/09
21
,11
9
23
,30
5
23
,47
5
23
,87
4
23
,84
9
23
,07
4
24
,03
7
25
,59
3
3,8
97
3,1
14
1,8
11
1,4
18
1,8
82
1,8
57
1,6
14
1,9
63
0
5,000
10,000
15,000
20,000
25,000
30,000
01/02 02/03 03/04 04/05 05/06 06/07 07/08 08/09
Winter Registrations by Fiscal Year
Registrations (excluding Cont. Studies) Continuing Studies Fall Registrations
10
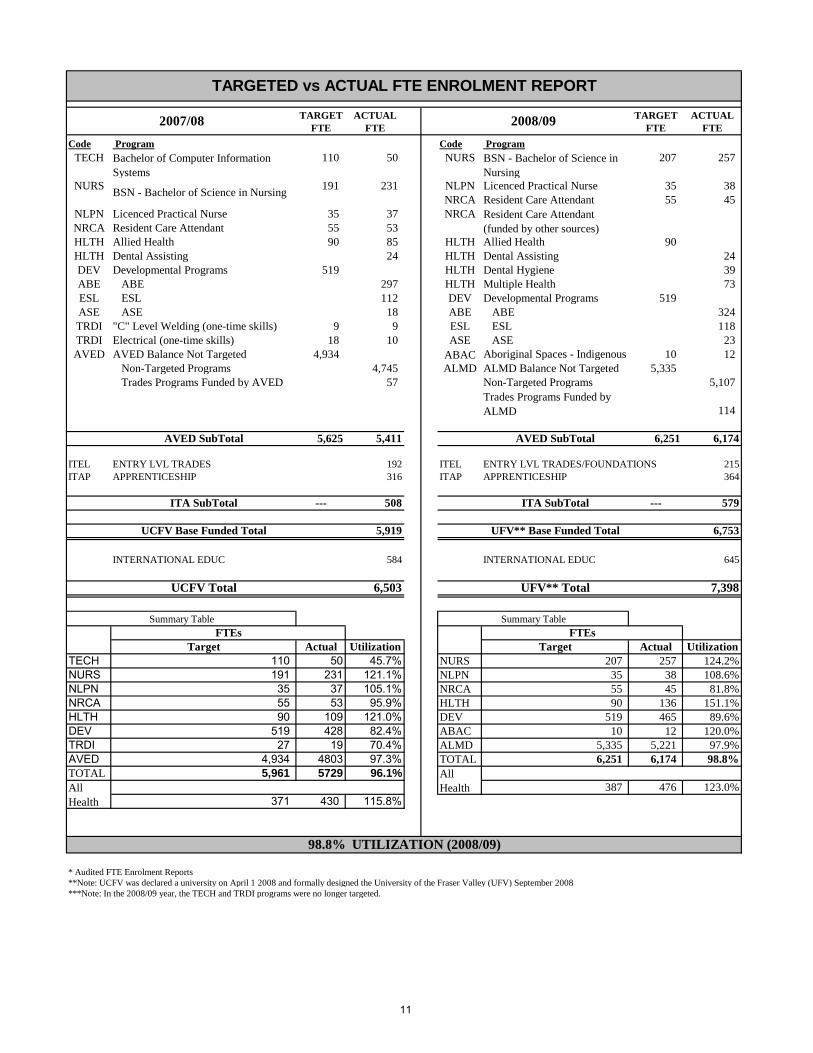
TARGET ACTUAL TARGET ACTUALFTE FTE FTE FTE
Code Program Code ProgramTECH 110 50 NURS 207 257
NURS 191 231 NLPN Licenced Practical Nurse 35 38 NRCA Resident Care Attendant 55 45
NLPN Licenced Practical Nurse 35 37 NRCANRCA Resident Care Attendant 55 53 HLTH Allied Health 90 85 HLTH Allied Health 90 HLTH Dental Assisting 24 HLTH Dental Assisting 24 DEV Developmental Programs 519 HLTH Dental Hygiene 39 ABE ABE 297 HLTH Multiple Health 73 ESL ESL 112 DEV Developmental Programs 519 ASE ASE 18 ABE ABE 324 TRDI "C" Level Welding (one-time skills) 9 9 ESL ESL 118 TRDI Electrical (one-time skills) 18 10 ASE ASE 23 AVED AVED Balance Not Targeted 4,934 ABAC Aboriginal Spaces - Indigenous 10 12
Non-Targeted Programs 4,745 ALMD ALMD Balance Not Targeted 5,335 Trades Programs Funded by AVED 57 Non-Targeted Programs 5,107
114
AVED SubTotal 5,625 5,411 AVED SubTotal 6,251 6,174
ITEL ENTRY LVL TRADES 192 ITEL ENTRY LVL TRADES/FOUNDATIONS 215ITAP APPRENTICESHIP 316 ITAP APPRENTICESHIP 364
ITA SubTotal --- 508 ITA SubTotal --- 579
UCFV Base Funded Total 5,919 UFV** Base Funded Total 6,753
INTERNATIONAL EDUC 584 INTERNATIONAL EDUC 645
UCFV Total 6,503 UFV** Total 7,398
FTEs FTEsTarget Actual Utilization Target Actual Utilization
TECH 110 50 45.7% NURS 207 257 124.2%NURS 191 231 121.1% NLPN 35 38 108.6%NLPN 35 37 105.1% NRCA 55 45 81.8%NRCA 55 53 95.9% HLTH 90 136 151.1%HLTH 90 109 121.0% DEV 519 465 89.6%DEV 519 428 82.4% ABAC 10 12 120.0%TRDI 27 19 70.4% ALMD 5,335 5,221 97.9%AVED 4,934 4803 97.3% TOTAL 6,251 6,174 98.8%TOTAL 5,961 5729 96.1%
387 476 123.0%371 430 115.8%
* Audited FTE Enrolment Reports**Note: UCFV was declared a university on April 1 2008 and formally designed the University of the Fraser Valley (UFV) September 2008***Note: In the 2008/09 year, the TECH and TRDI programs were no longer targeted.
98.8% UTILIZATION (2008/09)
Summary Table Summary Table
All Health
TARGETED vs ACTUAL FTE ENROLMENT REPORT
2007/08 2008/09
All Health
Bachelor of Computer Information Systems
Resident Care Attendant (funded by other sources)
Trades Programs Funded by ALMD
BSN - Bachelor of Science in Nursing
BSN - Bachelor of Science in Nursing
11
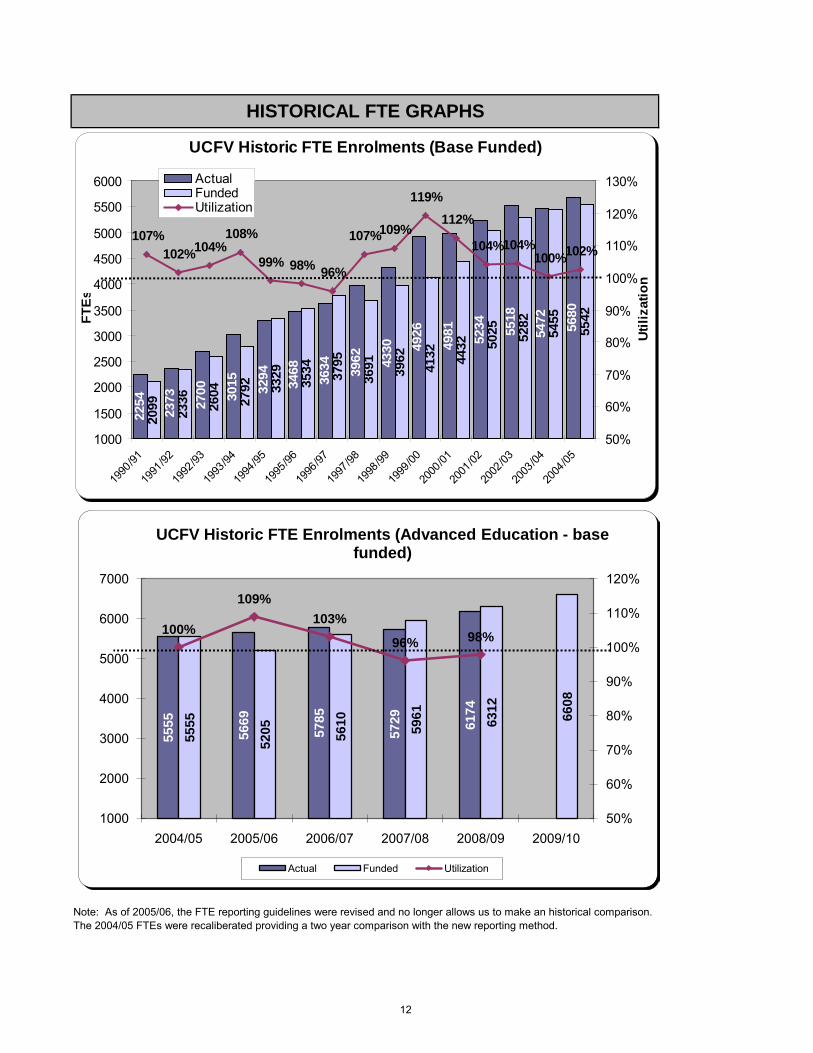
Note: As of 2005/06, the FTE reporting guidelines were revised and no longer allows us to make an historical comparison. The 2004/05 FTEs were recaliberated providing a two year comparison with the new reporting method.
HISTORICAL FTE GRAPHS
UCFV Historic FTE Enrolments (Base Funded)22
54
2373 27
00 3015 3294
3468
3634 39
62 4330 49
26
4981 5234 55
18
5472 5680
2099 2336 2604
2792 33
29
3534 3795
3691 3962
4132 44
32 5025 5282
5455
5542
107%102%104%
108%
99% 98% 96%
107%109%
119%112%
104%104%100%102%
1000
1500
2000
2500
3000
3500
4000
4500
5000
5500
6000
1990
/91
1991
/92
1992
/93
1993
/94
1994
/95
1995
/96
1996
/97
1997
/98
1998
/99
1999
/00
2000
/01
2001
/02
2002
/03
2003
/04
2004
/05
FTE
s
50%
60%
70%
80%
90%
100%
110%
120%
130%
Util
izat
ion
ActualFundedUtilization
5555
5669
5785
5729 61
74
5555
5205 56
10 5961 6312 6608
100%
109%103%
96% 98%
50%
60%
70%
80%
90%
100%
110%
120%
1000
2000
3000
4000
5000
6000
7000
2004/05 2005/06 2006/07 2007/08 2008/09 2009/10
UCFV Historic FTE Enrolments (Advanced Education - base funded)
Actual Funded Utilization
12
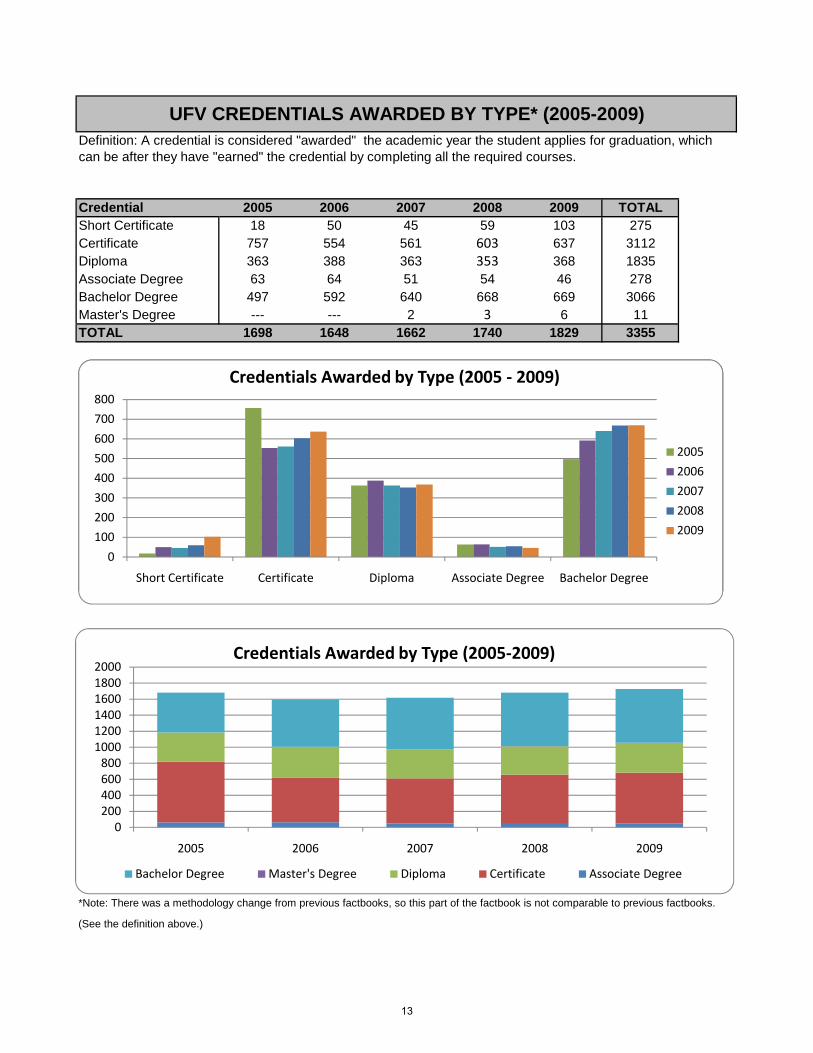
Credential 2005 2006 2007 2008 2009 TOTALShort Certificate 18 50 45 59 103 275Certificate 757 554 561 603 637 3112Diploma 363 388 363 353 368 1835Associate Degree 63 64 51 54 46 278Bachelor Degree 497 592 640 668 669 3066Master's Degree --- --- 2 3 6 11TOTAL 1698 1648 1662 1740 1829 3355
UFV CREDENTIALS AWARDED BY TYPE* (2005-2009)Definition: A credential is considered "awarded" the academic year the student applies for graduation, which can be after they have "earned" the credential by completing all the required courses.
0
100
200
300
400
500
600
700
800
Short Certificate Certificate Diploma Associate Degree Bachelor Degree
Credentials Awarded by Type (2005 ‐ 2009)
2005
2006
2007
2008
2009
*Note: There was a methodology change from previous factbooks, so this part of the factbook is not comparable to previous factbooks.
(See the definition above.)
0
100
200
300
400
500
600
700
800
Short Certificate Certificate Diploma Associate Degree Bachelor Degree
Credentials Awarded by Type (2005 ‐ 2009)
2005
2006
2007
2008
2009
0200400600800100012001400160018002000
2005 2006 2007 2008 2009
Credentials Awarded by Type (2005‐2009)
Bachelor Degree Master's Degree Diploma Certificate Associate Degree
13
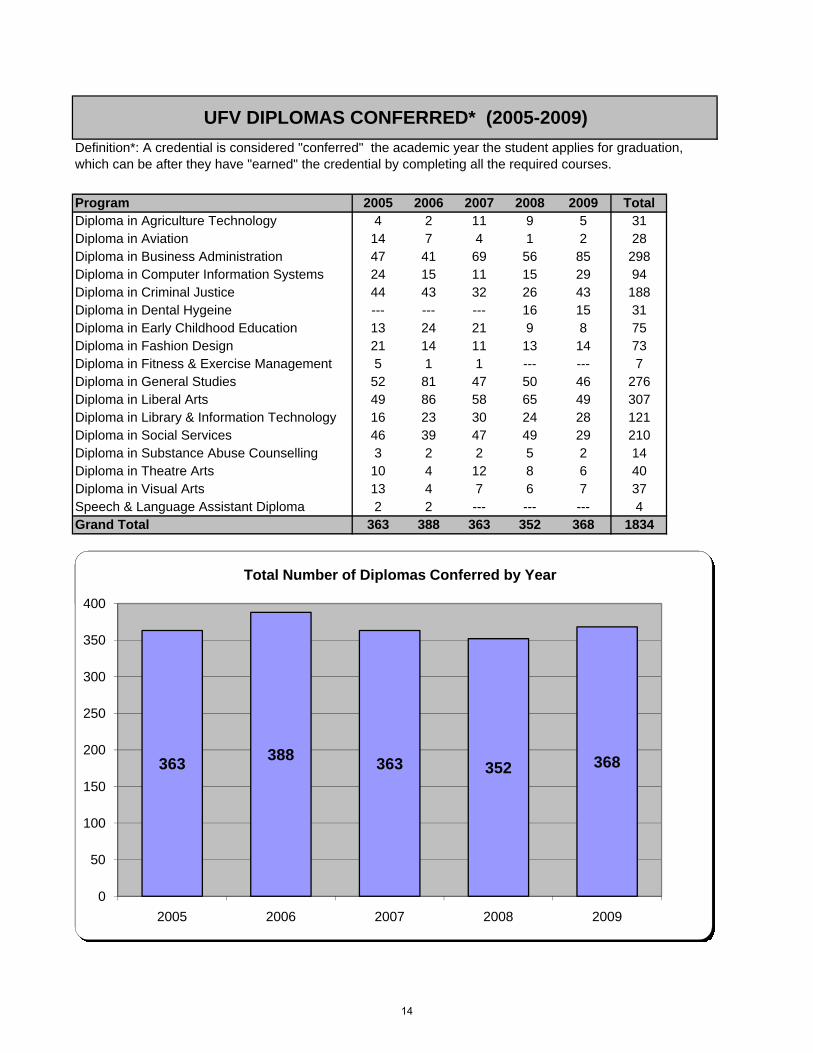
Program 2005 2006 2007 2008 2009 TotalDiploma in Agriculture Technology 4 2 11 9 5 31Diploma in Aviation 14 7 4 1 2 28Diploma in Business Administration 47 41 69 56 85 298Diploma in Computer Information Systems 24 15 11 15 29 94Diploma in Criminal Justice 44 43 32 26 43 188Diploma in Dental Hygeine --- --- --- 16 15 31Diploma in Early Childhood Education 13 24 21 9 8 75Diploma in Fashion Design 21 14 11 13 14 73Diploma in Fitness & Exercise Management 5 1 1 --- --- 7Diploma in General Studies 52 81 47 50 46 276Diploma in Liberal Arts 49 86 58 65 49 307Diploma in Library & Information Technology 16 23 30 24 28 121Diploma in Social Services 46 39 47 49 29 210Diploma in Substance Abuse Counselling 3 2 2 5 2 14Diploma in Theatre Arts 10 4 12 8 6 40Diploma in Visual Arts 13 4 7 6 7 37Speech & Language Assistant Diploma 2 2 --- --- --- 4Grand Total 363 388 363 352 368 1834
UFV DIPLOMAS CONFERRED* (2005-2009)
Definition*: A credential is considered "conferred" the academic year the student applies for graduation, which can be after they have "earned" the credential by completing all the required courses.
400
Total Number of Diplomas Conferred by Year
363388
363 352 368
0
50
100
150
200
250
300
350
400
2005 2006 2007 2008 2009
Total Number of Diplomas Conferred by Year
14
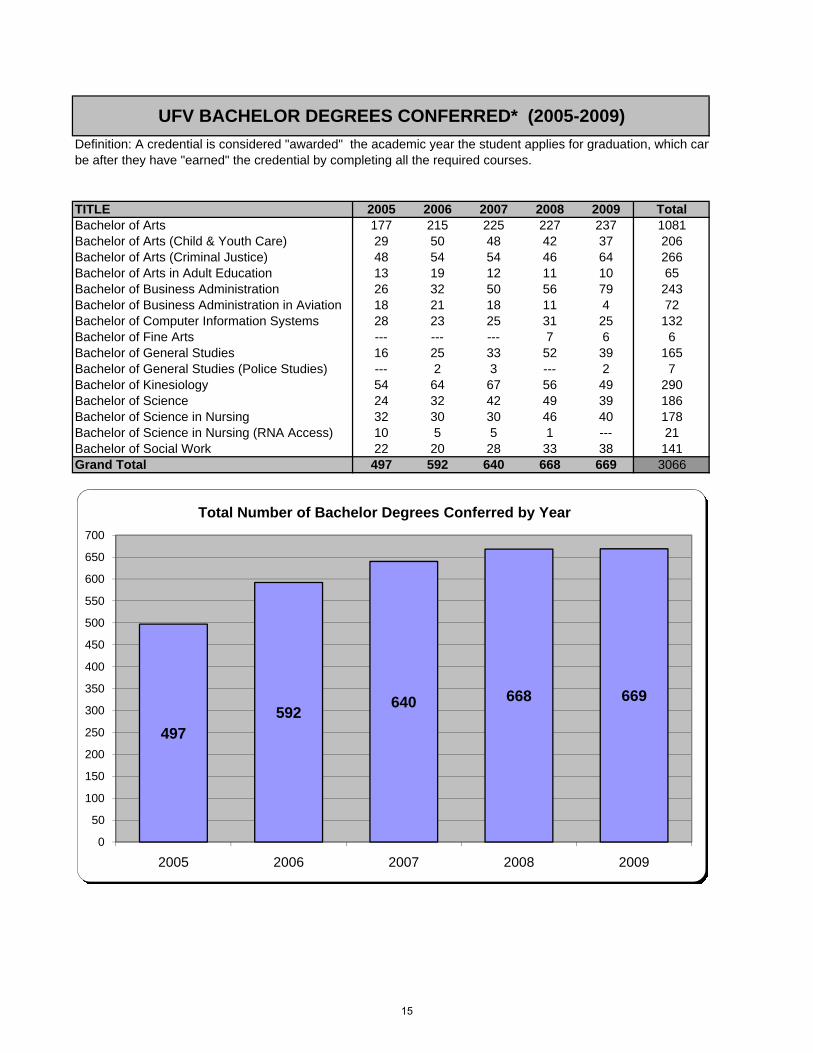
TITLE 2005 2006 2007 2008 2009 TotalBachelor of Arts 177 215 225 227 237 1081Bachelor of Arts (Child & Youth Care) 29 50 48 42 37 206Bachelor of Arts (Criminal Justice) 48 54 54 46 64 266Bachelor of Arts in Adult Education 13 19 12 11 10 65Bachelor of Business Administration 26 32 50 56 79 243Bachelor of Business Administration in Aviation 18 21 18 11 4 72Bachelor of Computer Information Systems 28 23 25 31 25 132Bachelor of Fine Arts --- --- --- 7 6 6Bachelor of General Studies 16 25 33 52 39 165Bachelor of General Studies (Police Studies) --- 2 3 --- 2 7Bachelor of Kinesiology 54 64 67 56 49 290Bachelor of Science 24 32 42 49 39 186Bachelor of Science in Nursing 32 30 30 46 40 178Bachelor of Science in Nursing (RNA Access) 10 5 5 1 --- 21Bachelor of Social Work 22 20 28 33 38 141Grand Total 497 592 640 668 669 3066
UFV BACHELOR DEGREES CONFERRED* (2005-2009)
Definition: A credential is considered "awarded" the academic year the student applies for graduation, which canbe after they have "earned" the credential by completing all the required courses.
550
600
650
700
Total Number of Bachelor Degrees Conferred by Year
497592
640 668 669
0
50
100
150
200
250
300
350
400
450
500
550
600
650
700
2005 2006 2007 2008 2009
Total Number of Bachelor Degrees Conferred by Year
15
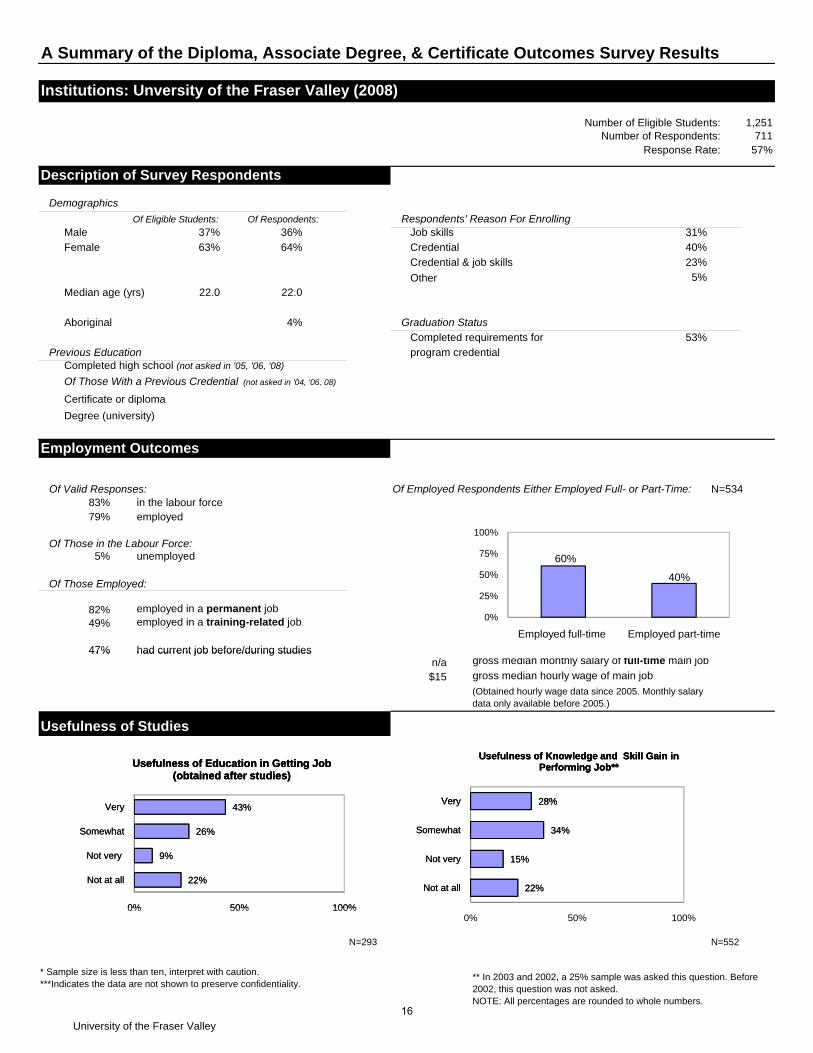
A Summary of the Diploma, Associate Degree, & Certificate Outcomes Survey Results
Institutions: Unversity of the Fraser Valley (2008)
Number of Eligible Students:Number of Respondents:
Response Rate:
1,251711
57%
Description of Survey Respondents
Demographics
Of Eligible Students: Of Respondents: Respondents' Reason For EnrollingMale 37% 36% 31%
Female 63% 64% Credential 40%
Credential & job skills 23%
5%Other
Job skills
22.0 22.0
4% Graduation Status
Completed requirements for 53%
Previous Education program credentialCompleted high school (not asked in '05, '06, '08)
Certificate or diploma
Median age (yrs)
Aboriginal
Of Those With a Previous Credential (not asked in '04, '06, 08)
Degree (university)
Employment Outcomes
Of Valid Responses:83% in the labour force79% employed
N=534Of Employed Respondents Either Employed Full- or Part-Time:
100%Of Those in the Labour Force: 60% Empl
5% unemployed 40% Empl
82% employed in a permanent job49% employed in a training-related job
47% had current job before/during studies
Of Those Employed:
60%
40%
0%
25%
50%
75%
100%
Employed full-time Employed part-time
47% had current job before/during studiesn/a gross median monthly salary of full-time main job
$15 gross median hourly wage of main job
Usefulness of Studies
(Obtained hourly wage data since 2005. Monthly salary data only available before 2005.)
60%
40%
0%
25%
50%
75%
100%
Employed full-time Employed part-time
Usefulness of Education in Getting Job (obtained after studies)
28%Very
Usefulness of Knowledge and Skill Gain inPerforming Job**
22% Not at all
9% Not very 22% Not at all
26% Somewhat 15% Not very
43% Very 34% Somewhat
28% Very
60%
40%
0%
25%
50%
75%
100%
Employed full-time Employed part-time
22%
9%
26%
43%
0% 50% 100%
Not at all
Not very
Somewhat
Very
Usefulness of Education in Getting Job (obtained after studies)
22%
15%
34%
28%
Not at all
Not very
Somewhat
Very
Usefulness of Knowledge and Skill Gain inPerforming Job**
N=293
* Sample size is less than ten, interpret with caution.***Indicates the data are not shown to preserve confidentiality.
N=552
** In 2003 and 2002, a 25% sample was asked this question. Before 2002, this question was not asked. NOTE: All percentages are rounded to whole numbers.
60%
40%
0%
25%
50%
75%
100%
Employed full-time Employed part-time
22%
9%
26%
43%
0% 50% 100%
Not at all
Not very
Somewhat
Very
Usefulness of Education in Getting Job (obtained after studies)
22%
15%
34%
28%
0% 50% 100%
Not at all
Not very
Somewhat
Very
Usefulness of Knowledge and Skill Gain inPerforming Job**
University of the Fraser Valley
16
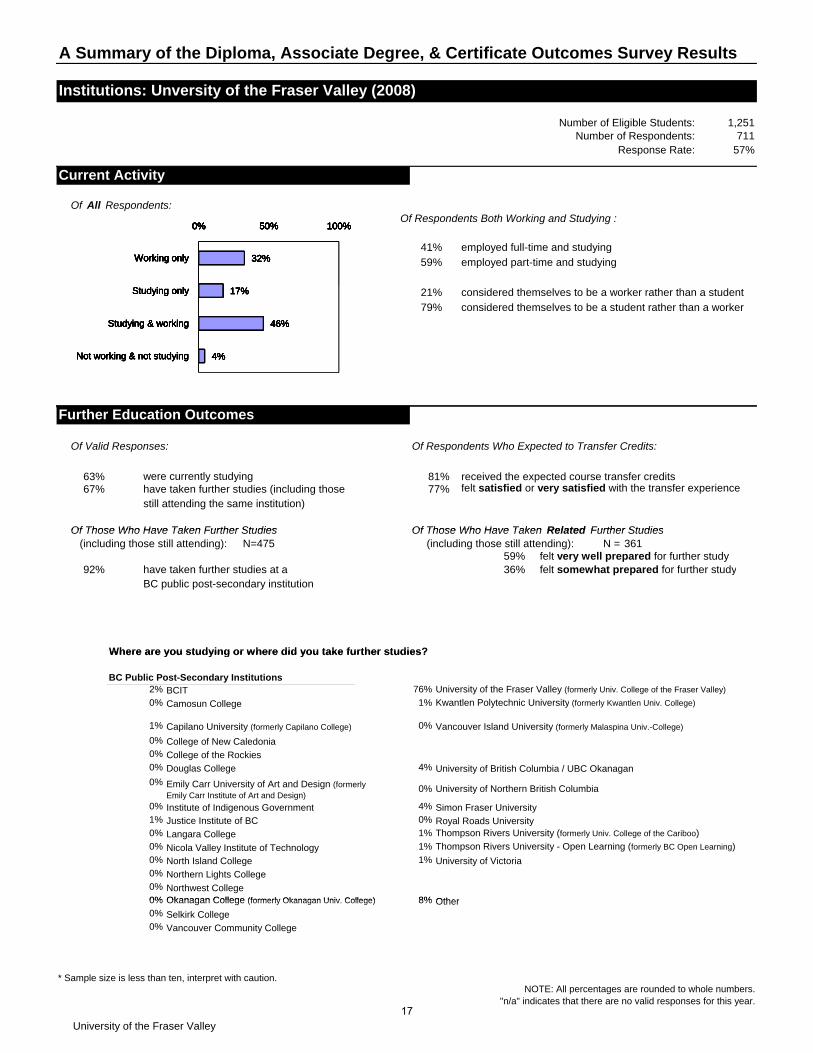
A Summary of the Diploma, Associate Degree, & Certificate Outcomes Survey Results
Institutions: Unversity of the Fraser Valley (2008)
Number of Eligible Students:Number of Respondents:
Response Rate:
1,251711
57%
Current Activity
Of Respondents Both Working and Studying :
employed full-time and studying
employed part-time and studying
Working only 32%
Of All Respondents:
41%
59%32%
0% 50% 100%
Working only
g y
Studying only 17% considered themselves to be a worker rather than a student
Studying & working 46% considered themselves to be a student rather than a worker
Not working & not studying 4%
79%
21%
32%
17%
46%
4%
0% 50% 100%
Working only
Studying only
Studying & working
Not working & not studying
Further Education Outcomes
Of Valid Responses: Of Respondents Who Expected to Transfer Credits:
63% were currently studying received the expected course transfer credits67% have taken further studies (including those felt satisfied or very satisfied with the transfer experience
still attending the same institution)
Of Those Who Have Taken Related Further StudiesOf Those Who Have Taken Further Studies
81%77%
32%
17%
46%
4%
0% 50% 100%
Working only
Studying only
Studying & working
Not working & not studying
(including those still attending): (including those still attending): N =59%
92% have taken further studies at a 36%BC public post-secondary institution
Where are you studying or where did you take further studies?
felt very well prepared for further study
Of Those Who Have Taken Related Further StudiesOf Those Who Have Taken Further StudiesN=475
felt somewhat prepared for further study
361
32%
17%
46%
4%
0% 50% 100%
Working only
Studying only
Studying & working
Not working & not studying
Where are you studying or where did you take further studies?
BC Public Post-Secondary Institutions2% 76% University of the Fraser Valley (formerly Univ. College of the Fraser Valley)
0% 1% Kwantlen Polytechnic University (formerly Kwantlen Univ. College)
1% 0%
0%
0%
0% 4% University of British Columbia / UBC Okanagan
BCIT
Camosun College
College of the Rockies
Douglas College
Capilano University (formerly Capilano College) Vancouver Island University (formerly Malaspina Univ.-College)
College of New Caledonia
32%
17%
46%
4%
0% 50% 100%
Working only
Studying only
Studying & working
Not working & not studying
0%0% University of Northern British Columbia
0% 4%
1% 0%
0% 1% Thompson Rivers University (formerly Univ. College of the Cariboo)
0% 1% Thompson Rivers University - Open Learning (formerly BC Open Learning)
0% 1%
0%
0%
0% Okanagan College (formerly Okanagan Univ College) 8% Other
University of VictoriaNorth Island College
Institute of Indigenous Government
Northwest College
Nicola Valley Institute of Technology
Northern Lights College
Emily Carr University of Art and Design (formerly Emily Carr Institute of Art and Design)
Langara College
Justice Institute of BCSimon Fraser University
Royal Roads University
32%
17%
46%
4%
0% 50% 100%
Working only
Studying only
Studying & working
Not working & not studying
0% Okanagan College (formerly Okanagan Univ. College) 8% Other0% Selkirk College0%
##
NOTE: All percentages are rounded to whole numbers. "n/a" indicates that there are no valid responses for this year.
* Sample size is less than ten, interpret with caution.
Vancouver Community College
32%
17%
46%
4%
0% 50% 100%
Working only
Studying only
Studying & working
Not working & not studying
University of the Fraser Valley
17
A Summary of the Diploma, Associate Degree, & Certificate Outcomes Survey Results
Institutions: Unversity of the Fraser Valley (2008)
Number of Eligible Students: 1,251Number of Respondents: 711
57%Response Rate:
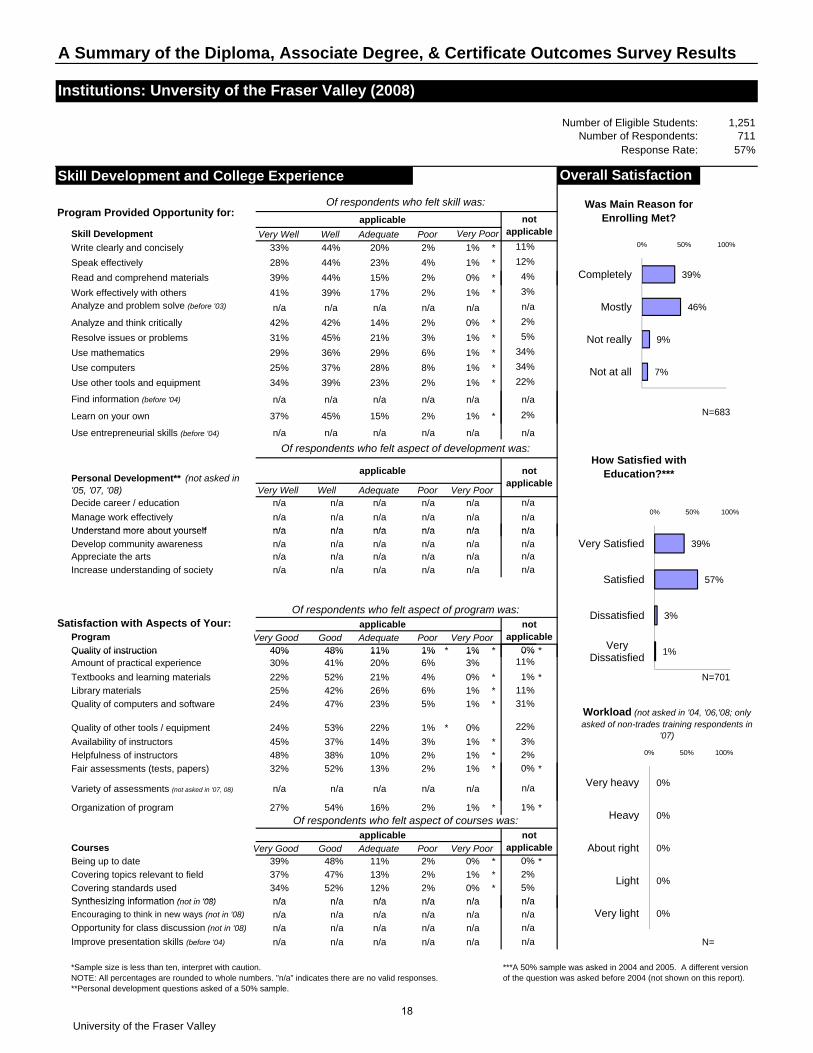
Skill Development and College Experience Overall Satisfaction
applicable
Very Well Well Adequate Poor
Write clearly and concisely 33% 44% 20% 2% 1% *
Speak effectively 28% 44% 23% 4% 1% * Completely 39%
Read and comprehend materials 39% 44% 15% 2% 0% * Mostly 46%
Skill Development
4%
not applicableVery Poor
Was Main Reason for Enrolling Met?
11%
Program Provided Opportunity for:Of respondents who felt skill was:
12%39%
0% 50% 100%
Completelyp y
Work effectively with others 41% 39% 17% 2% 1% * Not really 9%Analyze and problem solve (before '03) n/a n/a n/a n/a n/a Not at all 7%
Analyze and think critically 42% 42% 14% 2% 0% *
Resolve issues or problems 31% 45% 21% 3% 1% *
Use mathematics 29% 36% 29% 6% 1% *
Use computers 25% 37% 28% 8% 1% *
Use other tools and equipment 34% 39% 23% 2% 1% *
Find information (before '04) n/a n/a n/a n/a n/a n/a
5%
n/a
22%
34%
3%
2%
34%
39%
46%
9%
7%
0% 50% 100%
Completely
Mostly
Not really
Not at all
Learn on your own 37% 45% 15% 2% 1% * N=683
n/a n/a n/a n/a n/a
applicable
Very Well Well Adequate Poor Very PoorDecide career / education n/a n/a n/a n/a n/a
Manage work effectively n/a n/a n/a n/a n/a
Understand more about yourself n/a n/a n/a n/a n/a n/a
n/a
Personal Development** (not asked in '05, '07, '08)
n/a
not applicable
n/a
Of respondents who felt aspect of development was:How Satisfied with
Education?***
Use entrepreneurial skills (before '04)
2%
39%
46%
9%
7%
0% 50% 100%
Completely
Mostly
Not really
Not at all
0% 50% 100%
Understand more about yourself n/a n/a n/a n/a n/a
Develop community awareness n/a n/a n/a n/a n/aAppreciate the arts n/a n/a n/a n/a n/a
Increase understanding of society n/a n/a n/a n/a n/a Very Satisfi 39%Satisfied 57%Dissatisfied 3%Very Dissat 1%
applicableProgram Very Good Good Adequate Poor Very PoorQuality of instruction 40% 48% 11% 1% * 1% * *
n/a
n/a
n/a
Of respondents who felt aspect of program was:Satisfaction with Aspects of Your:
0%
not applicable
n/a
39%
46%
9%
7%
0% 50% 100%
Completely
Mostly
Not really
Not at all
39%
57%
3%
1%
0% 50% 100%
Very Satisfied
Satisfied
Dissatisfied
Very Dissatisfied
Quality of instruction 40% 48% 11% 1% 1%Amount of practical experience 30% 41% 20% 6% 3%
Textbooks and learning materials 22% 52% 21% 4% 0% * * N=701
Library materials 25% 42% 26% 6% 1% *
Quality of computers and software 24% 47% 23% 5% 1% *
Quality of other tools / equipment 24% 53% 22% 1% * 0%
Availability of instructors 45% 37% 14% 3% 1% *
Helpfulness of instructors 48% 38% 10% 2% 1% *
Fair assessments (tests, papers) 32% 52% 13% 2% 1% * *0%
1%
22%
3%
0%11%
Workload (not asked in '04, '06,'08; only asked of non-trades training respondents in
'07)
2%
31%
11%
39%
46%
9%
7%
0% 50% 100%
Completely
Mostly
Not really
Not at all
39%
57%
3%
1%
0% 50% 100%
Very Satisfied
Satisfied
Dissatisfied
Very Dissatisfied
0%
0% 50% 100%
Very heavyVariety of assessments (not asked in '07, 08) n/a n/a n/a n/a n/a
Organization of program 27% 54% 16% 2% 1% * *
applicableCourses Very Good Good Adequate Poor Very Poor Very heavy n/a
39% 48% 11% 2% 0% * * Heavy n/a37% 47% 13% 2% 1% * About right n/a34% 52% 12% 2% 0% * Light n/an/a n/a n/a n/a n/a Very light n/an/a
1%
Of respondents who felt aspect of courses was:
Synthesizing information ( t i '08)
5%
not applicable
2%
0%
Covering standards used
Covering topics relevant to field
n/a
Being up to date
39%
46%
9%
7%
0% 50% 100%
Completely
Mostly
Not really
Not at all
39%
57%
3%
1%
0% 50% 100%
Very Satisfied
Satisfied
Dissatisfied
Very Dissatisfied
0%
0%
0%
0%
0% 50% 100%
Very heavy
Heavy
About right
Light
n/a n/a n/a n/a n/a Very light n/an/a n/a n/a n/a n/a
n/a n/a n/a n/a n/a
n/a n/a n/a n/a n/a N=
***A 50% sample was asked in 2004 and 2005. A different version of the question was asked before 2004 (not shown on this report).
n/an/a
*Sample size is less than ten, interpret with caution.NOTE: All percentages are rounded to whole numbers. "n/a" indicates there are no valid responses.**Personal development questions asked of a 50% sample.
Synthesizing information (not in '08)
n/a
n/aImprove presentation skills (before '04)
Opportunity for class discussion (not in '08)
Encouraging to think in new ways (not in '08)
39%
46%
9%
7%
0% 50% 100%
Completely
Mostly
Not really
Not at all
39%
57%
3%
1%
0% 50% 100%
Very Satisfied
Satisfied
Dissatisfied
Very Dissatisfied
0%
0%
0%
0%
0%
0% 50% 100%
Very heavy
Heavy
About right
Light
Very light
University of the Fraser Valley
18
A Summary of the Diploma, Associate Degree, & Certificate Outcomes Survey Results
Institutions: Unversity of the Fraser Valley (2008)
Number of Eligible Students: 1,251Number of Respondents: 711
Response Rate: 57%
Reasons for choosing the institution
More than 6 months
0% It is in the region where I live Length of program / convenient schedule
0% Availability of program Small institution or class size
0% Program unique to this institution Other
0% Reputation of institution / went there before
0%
0%
0%
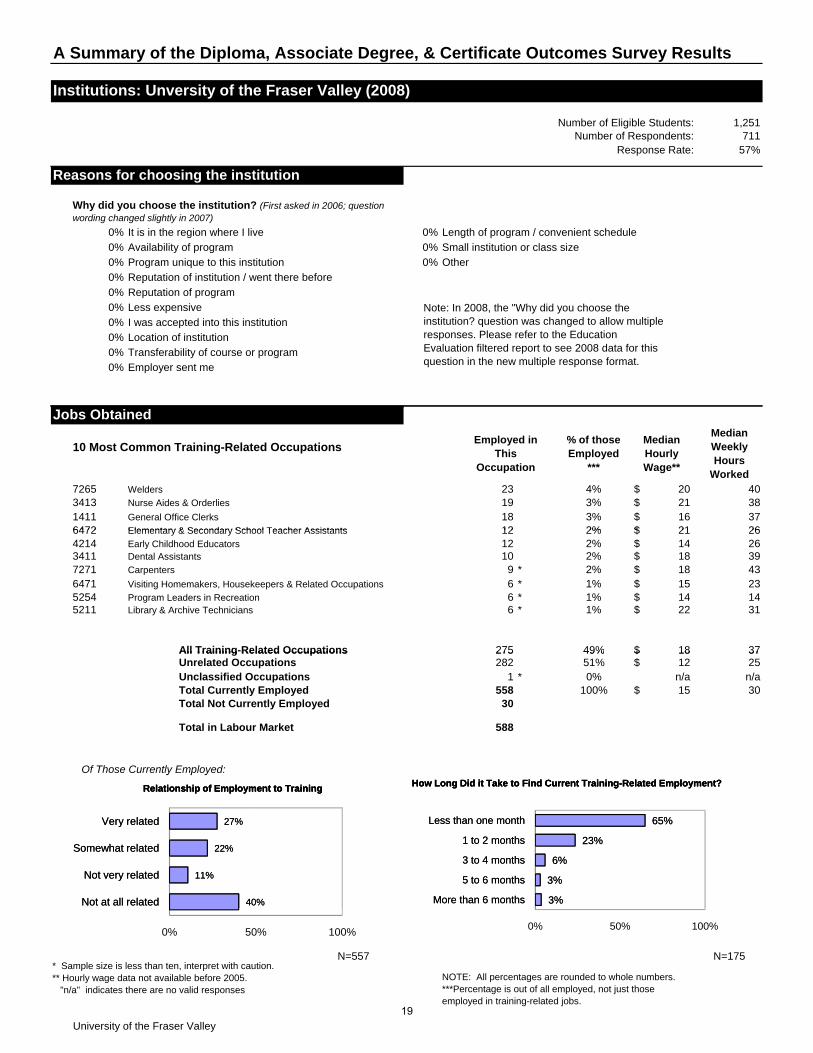
Why did you choose the institution? (First asked in 2006; question wording changed slightly in 2007)
p
0% Reputation of program
0% Less expensive
0% I was accepted into this institution
0% Location of institution
0% Transferability of course or program
0% Employer sent me
Note: In 2008, the "Why did you choose the institution? question was changed to allow multiple responses. Please refer to the Education Evaluation filtered report to see 2008 data for this question in the new multiple response format.
Jobs Obtained
10 Most Common Training-Related Occupations
Welders 40Nurse Aides & Orderlies 38General Office Clerks 37Elementary & Secondary School Teacher Assistants 26
Median Hourly Wage**
16$
Employed in This
Occupation
6472
Median Weekly Hours
Worked7265 23
191812
34131411
21$3%2%
3%20$ 21$
4%
% of those Employed
***
Elementary & Secondary School Teacher Assistants 26Early Childhood Educators 26Dental Assistants 39Carpenters * 43Visiting Homemakers, Housekeepers & Related Occupations * 23
* 14* 31
37
Library & Archive Technicians52115254
64724214
22$
15$
18$
9
275
2%2%
1210
14$
18$
14$
1%
49%
1%1%
18$
All Training-Related Occupations
72716471 6
2%
12 21$ 2%
66
Program Leaders in Recreation
3411
3725
* n/a30
Of Those Currently Employed:
0%100%
1558
588
3015$ n/a
18$ 12$
27551%49%All Training Related Occupations
Unrelated OccupationsUnclassified OccupationsTotal Currently EmployedTotal Not Currently Employed
Total in Labour Market
282
How Long Did it Take to Find Current Training-Related Employment?Relationship of Employment to Training
y p y
3% More than 6 months3% 5 to 6 months
6% 3 to 4 months
27% Very related 23% 1 to 2 months
22% Somewhat related 65% Less than one month
11% Not very related40% Not at all related
3%
3%
6%
23%
65%
More than 6 months
5 to 6 months
3 to 4 months
1 to 2 months
Less than one month
How Long Did it Take to Find Current Training-Related Employment?
27%
22%
11%
40%
Very related
Somewhat related
Not very related
Not at all related
Relationship of Employment to Training
N=557 N=175* Sample size is less than ten, interpret with caution. ** Hourly wage data not available before 2005. "n/a" indicates there are no valid responses
NOTE: All percentages are rounded to whole numbers. ***Percentage is out of all employed, not just those employed in training-related jobs.
3%
3%
6%
23%
65%
0% 50% 100%
More than 6 months
5 to 6 months
3 to 4 months
1 to 2 months
Less than one month
How Long Did it Take to Find Current Training-Related Employment?
27%
22%
11%
40%
0% 50% 100%
Very related
Somewhat related
Not very related
Not at all related
Relationship of Employment to Training
University of the Fraser Valley
19
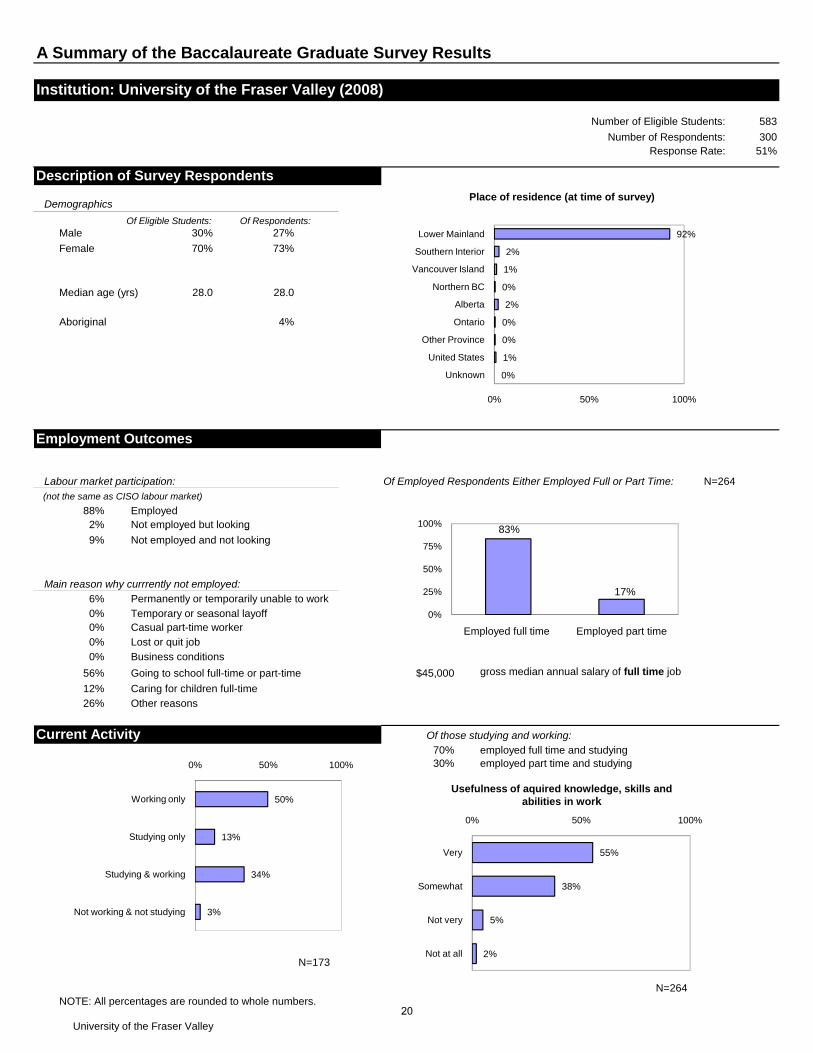
A Summary of the Baccalaureate Graduate Survey Results
Institution: University of the Fraser Valley (2008)
Number of Eligible Students:
Number of Respondents:Response Rate:
Description of Survey Respondents
Demographics 0% Unknown
Of Eligible Students: Of Respondents: 1% United StatesMale 30% 27% 0% Other Province
Female 70% 73% 0% Ontario
2% Alberta0% Northern BC
28.0 28.0 1% Vancouver Island
2% Southern Interior
4% ### Lower Mainland
Employment Outcomes
(not the same as CISO labour market)
88% Employed2% Not employed but looking
30051%
583
N=264Of Employed Respondents Either Employed Full or Part Time:
Median age (yrs)
Aboriginal
Labour market participation:
83%100%
0%
1%
0%
0%
2%
0%
1%
2%
92%
0% 50% 100%
Unknown
United States
Other Province
Ontario
Alberta
Northern BC
Vancouver Island
Southern Interior
Lower Mainland
Place of residence (at time of survey)
% p y g
9% Not employed and not looking 83% Employed full time 17% Employed part time
6% Permanently or temporarily unable to work0% Temporary or seasonal layoff0% Casual part-time worker0% Lost or quit job0% Business conditions
56% $45,000 gross median annual salary of full time job
12% Caring for children full-time26% Other reasons
Of those studying and working:70% employed full time and studying30% employed part time and studying
Working only 50%Studying only 13%
Studying & working 34%
Not working & not studying 3% 55% Very
38% Somewhat
5% Not very
2% Not at all
N=173
Main reason why currrently not employed:
Going to school full-time or part-time
Current Activity
N=264NOTE: All percentages are rounded to whole numbers.
83%
17%
0%
25%
50%
75%
100%
Employed full time Employed part time
55%
38%
5%
2%
0% 50% 100%
Very
Somewhat
Not very
Not at all
Usefulness of aquired knowledge, skills and abilities in work
0%
1%
0%
0%
2%
0%
1%
2%
92%
0% 50% 100%
Unknown
United States
Other Province
Ontario
Alberta
Northern BC
Vancouver Island
Southern Interior
Lower Mainland
Place of residence (at time of survey)
50%
13%
34%
3%
0% 50% 100%
Working only
Studying only
Studying & working
Not working & not studying
University of the Fraser Valley
20
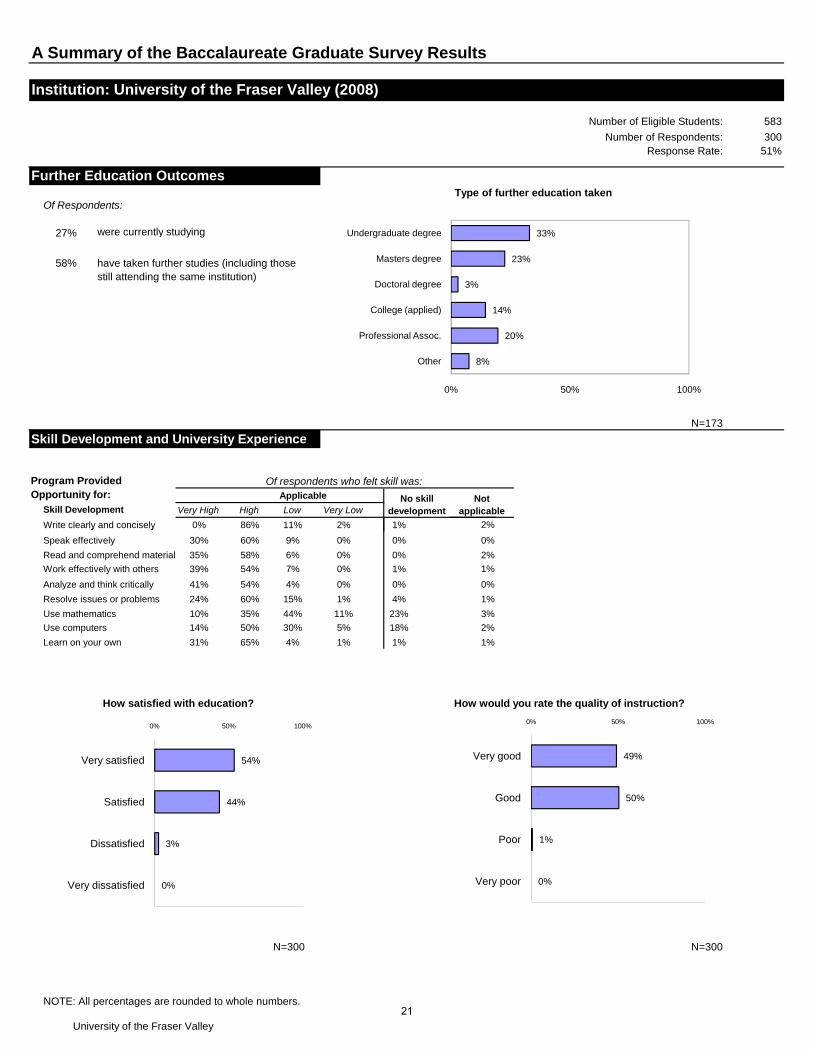
A Summary of the Baccalaureate Graduate Survey Results
Institution: University of the Fraser Valley (2008)
Number of Eligible Students:
Number of Respondents:Response Rate:
Further Education Outcomes
8% Other27% were currently studying 20% Professional Assoc.
14% College (applied)
58% have taken further studies (including those 3% Doctoral degree
still attending the same institution) 23% Masters degree
33% Undergraduate degree
N=173
Skill Development and University Experience
Applicable
Very High High Low Very Low
Write clearly and concisely 0% 86% 11% 2% 1%
No skill development
Program Provided Opportunity for:
Of respondents who felt skill was:
Of Respondents:
Not applicable
583
30051%
2%
Skill Development
8%
20%
14%
3%
23%
33%
0% 50% 100%
Other
Professional Assoc.
College (applied)
Doctoral degree
Masters degree
Undergraduate degree
Type of further education taken
y y % % % % %
Speak effectively 30% 60% 9% 0% 0%
Read and comprehend material 35% 58% 6% 0% 0%
Work effectively with others 39% 54% 7% 0% 1%
Analyze and think critically 41% 54% 4% 0% 0%
Resolve issues or problems 24% 60% 15% 1% 4%
Use mathematics 10% 35% 44% 11% 23%
Use computers 14% 50% 30% 5% 18%
Learn on your own 31% 65% 4% 1% 1%
Very satisfied 54%Satisfied 44% ## Very good
Dissatisfied 3% ## Good
Very dissatisfied 0% ## Poor
## Very poor
N=300
1%
3%
2%
0%
0%
2%
1%
1%
N=300
How would you rate the quality of instruction?How satisfied with education?
NOTE: All percentages are rounded to whole numbers.
8%
20%
14%
3%
23%
33%
0% 50% 100%
Other
Professional Assoc.
College (applied)
Doctoral degree
Masters degree
Undergraduate degree
Type of further education taken
54%
44%
3%
0%
0% 50% 100%
Very satisfied
Satisfied
Dissatisfied
Very dissatisfied
49%
50%
1%
0%
0% 50% 100%
Very good
Good
Poor
Very poor
University of the Fraser Valley
21
A Summary of the Apprenticeship Survey Results
Institution: University of the Fraser Valley (2008)Number of Eligible Students:
Number of Respondents:
Response Rate:
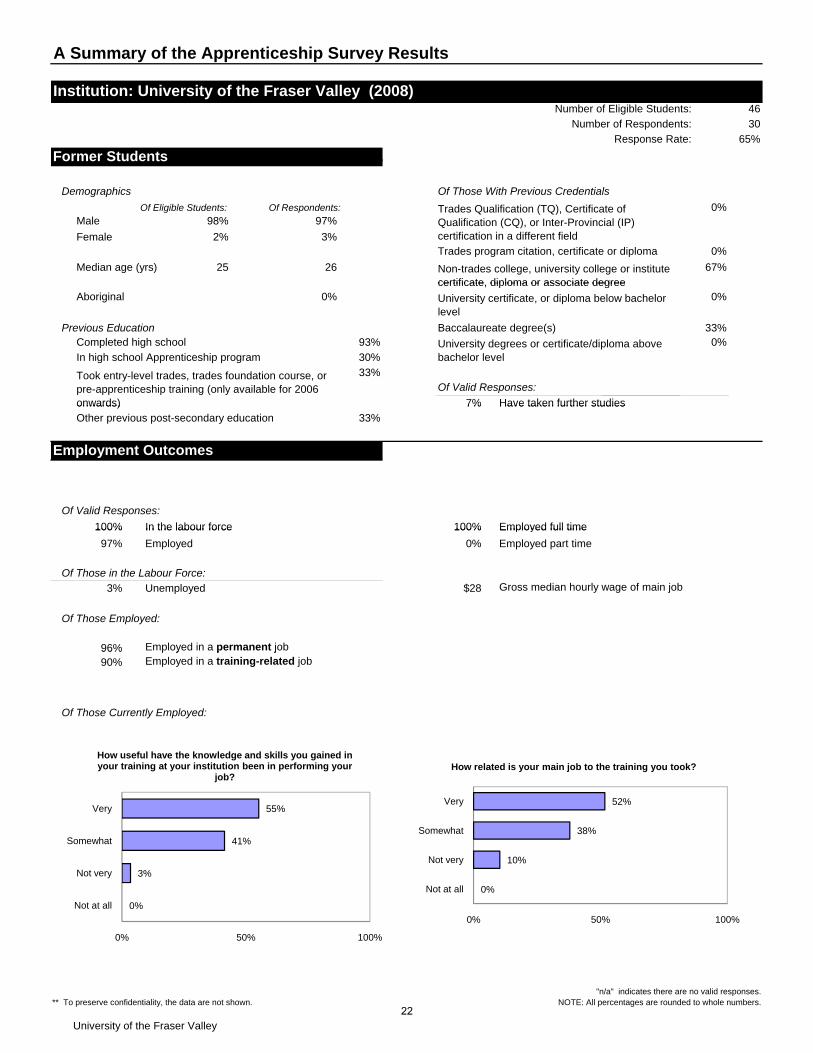
Former Students
46
30
65%
Former Students
Demographics Of Those With Previous Credentials
Of Eligible Students: Of Respondents:
Male 98% 97%
Female 2% 3%
25 26Median age (yrs)
0%
0%Trades Qualification (TQ), Certificate of Qualification (CQ), or Inter-Provincial (IP) certification in a different field
Non-trades college, university college or institute certificate diploma or associate degree
Trades program citation, certificate or diploma
67%
0%
Previous Education Completed high school 93%
In high school Apprenticeship program 30%
33%Of Valid Responses:
7% Have taken further studies
33%
Aboriginal
Took entry-level trades, trades foundation course, or pre-apprenticeship training (only available for 2006 onwards)
University certificate, or diploma below bachelor level
0%
0%
Baccalaureate degree(s)
University degrees or certificate/diploma above bachelor level
certificate, diploma or associate degree
7% Have taken further studies
Other previous post-secondary education 33%
Of Valid Responses:
100% In the labour force 100% Employed full time
Employment Outcomes
onwards)
100% In the labour force 100% Employed full time
97% Employed 0%
Of Those in the Labour Force:
3% Unemployed $28 Gross median hourly wage of main job
96% Employed in a permanent job
Of Those Employed:
Employed part time
96% p y p j
90% Employed in a training-related job
Of Those Currently Employed:
How related is your main job to the training you took?How useful have the knowledge and skills you gained in your training at your institution been in performing your
job?
Not at all
Not at all 0% Not veryNot very 3% SomewhatSomewhat ## Very
Very ## 0%
10%
38%
52%
Not at all
Not very
Somewhat
Very
How related is your main job to the training you took?
0%
3%
41%
55%
Not at all
Not very
Somewhat
Very
How useful have the knowledge and skills you gained in your training at your institution been in performing your
job?
** To preserve confidentiality, the data are not shown. "n/a" indicates there are no valid responses.
NOTE: All percentages are rounded to whole numbers.
0%
10%
38%
52%
0% 50% 100%
Not at all
Not very
Somewhat
Very
How related is your main job to the training you took?
0%
3%
41%
55%
0% 50% 100%
Not at all
Not very
Somewhat
Very
How useful have the knowledge and skills you gained in your training at your institution been in performing your
job?
University of the Fraser Valley22
A Summary of the Apprenticeship Survey Results
Institution: University of the Fraser Valley (2008) Number of Eligible Students:
Number of Respondents:
Response Rate:
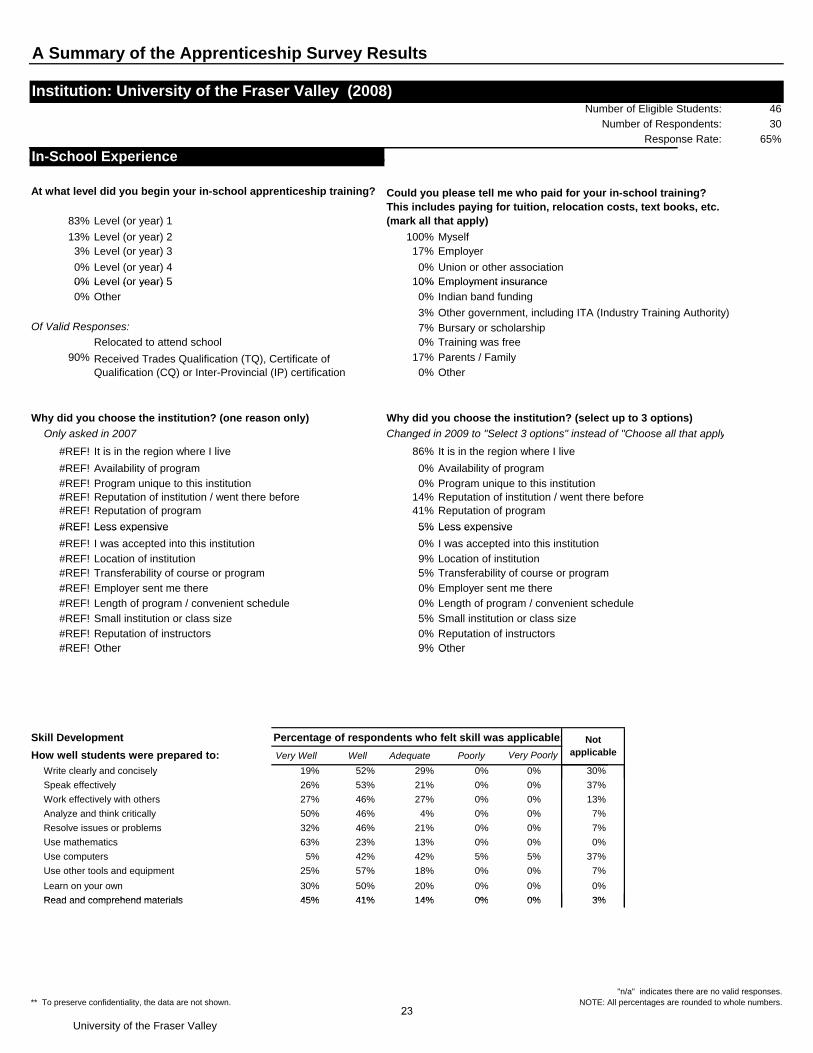
In-School Experience
46
30
65%
In School Experience
At what level did you begin your in-school apprenticeship training?
83% Level (or year) 1
13% Level (or year) 2 100% Myself3% Level (or year) 3 17% Employer
0% Level (or year) 4 0% Union or other association0% Level (or year) 5 10% Employment insurance
Could you please tell me who paid for your in-school training? This includes paying for tuition, relocation costs, text books, etc. (mark all that apply)
0% Level (or year) 5 10% Employment insurance
0% Other 0% Indian band funding
3% Other government, including ITA (Industry Training Authority)Of Valid Responses: 7% Bursary or scholarship
Relocated to attend school 0% Training was free
90% 17% Parents / Family
0% OtherReceived Trades Qualification (TQ), Certificate of Qualification (CQ) or Inter-Provincial (IP) certification
Why did you choose the institution? (one reason only) Why did you choose the institution? (select up to 3 options)
Only asked in 2007
#REF! It is in the region where I live 86% It is in the region where I live
#REF! Availability of program 0% Availability of program
#REF! Program unique to this institution 0% Program unique to this institution#REF! Reputation of institution / went there before 14% Reputation of institution / went there before#REF! Reputation of program 41% Reputation of program
#REF! Less expensive 5% Less expensive
Changed in 2009 to "Select 3 options" instead of "Choose all that apply
#REF! Less expensive 5% Less expensive
#REF! I was accepted into this institution 0% I was accepted into this institution
#REF! Location of institution 9% Location of institution#REF! Transferability of course or program 5% Transferability of course or program
#REF! Employer sent me there 0% Employer sent me there
#REF! Length of program / convenient schedule 0% Length of program / convenient schedule
#REF! Small institution or class size 5% Small institution or class size
#REF! Reputation of instructors 0% Reputation of instructors#REF! Other 9% Other#REF! Other 9% Other
Percentage of respondents who felt skill was applicable:
Very Well Well Adequate Poorly
Write clearly and concisely 19% 52% 29% 0% 0% 30%
Skill Development
How well students were prepared to:
Not applicableVery Poorly
y y
Speak effectively 26% 53% 21% 0% 0% 37%
Work effectively with others 27% 46% 27% 0% 0% 13%
Analyze and think critically 50% 46% 4% 0% 0% 7%
Resolve issues or problems 32% 46% 21% 0% 0% 7%
Use mathematics 63% 23% 13% 0% 0% 0%
Use computers 5% 42% 42% 5% 5% 37%
Use other tools and equipment 25% 57% 18% 0% 0% 7%
Learn on your own 30% 50% 20% 0% 0% 0%
45% 41% 14% 0% 0% 3%Read and comprehend materials 45% 41% 14% 0% 0% 3%
"n/a" indicates there are no valid responses. NOTE: All percentages are rounded to whole numbers. ** To preserve confidentiality, the data are not shown.
Read and comprehend materials
University of the Fraser Valley23
A Summary of the Apprenticeship Survey Results
Institution: University of the Fraser Valley (2008) Number of Eligible Students: 46
Number of Respondents: 30
65%
In-School Experience, continuedResponse Rate:
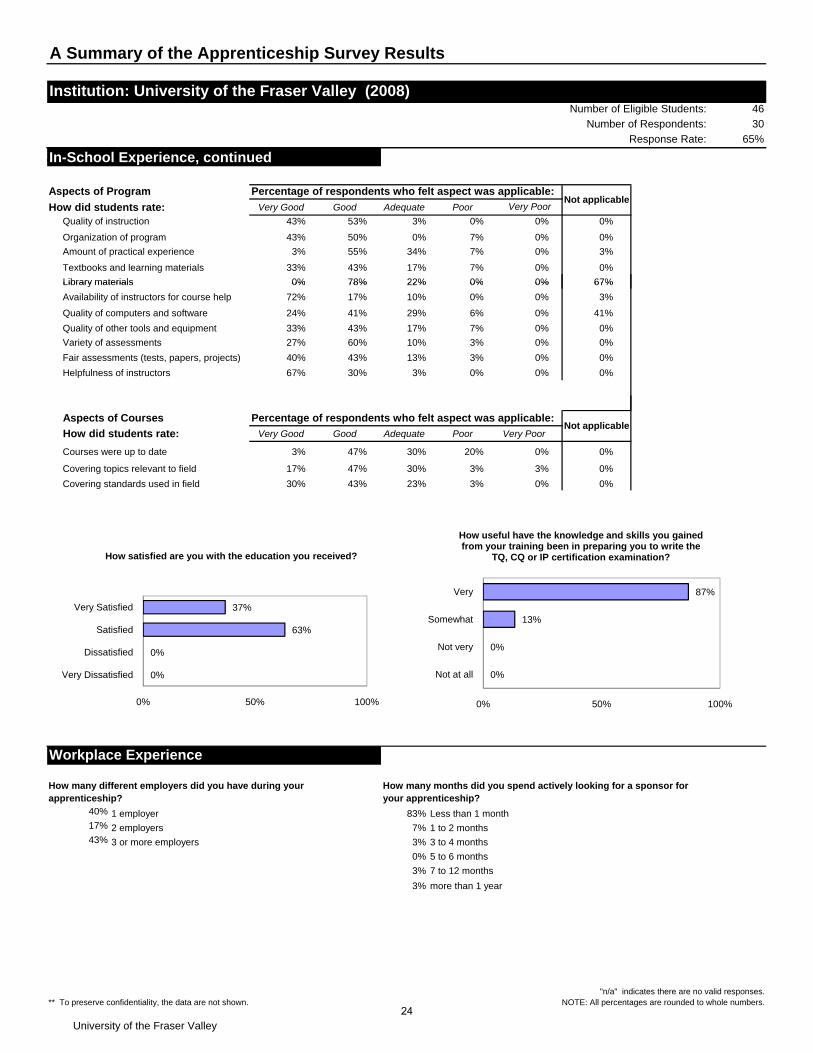
In-School Experience, continued
Percentage of respondents who felt aspect was applicable:
Very Good Good Adequate Poor
Quality of instruction 43% 53% 3% 0% 0% 0%
Organization of program 43% 50% 0% 7% 0% 0%
Amount of practical experience 3% 55% 34% 7% 0% 3%
Textbooks and learning materials 33% 43% 17% 7% 0% 0%
Library materials 0% 78% 22% 0% 0% 67%
Aspects of ProgramNot applicable
Very PoorHow did students rate:
Library materials 0% 78% 22% 0% 0% 67%
Availability of instructors for course help 72% 17% 10% 0% 0% 3%
Quality of computers and software 24% 41% 29% 6% 0% 41%
Quality of other tools and equipment 33% 43% 17% 7% 0% 0%
Variety of assessments 27% 60% 10% 3% 0% 0%
Fair assessments (tests, papers, projects) 40% 43% 13% 3% 0% 0%
Helpfulness of instructors 67% 30% 3% 0% 0% 0%
Percentage of respondents who felt aspect was applicable:
Very Good Good Adequate Poor Very Poor
Courses were up to date 3% 47% 30% 20% 0% 0%
Covering topics relevant to field 17% 47% 30% 3% 3% 0%
Covering standards used in field 30% 43% 23% 3% 0% 0%
Aspects of Courses
How did students rate:Not applicable
How useful have the knowledge and skills you gained
Dissatisfied 0% Not at all #
Dissatisfied 0% Not very #
Satisfied 63% Somewhat #0%
63%
37%
Dissatisfied
Satisfied
Very Satisfied
How satisfied are you with the education you received?
0%
13%
87%
Not very
Somewhat
Very
How useful have the knowledge and skills you gained from your training been in preparing you to write the
TQ, CQ or IP certification examination?
Satisfied 63% Somewhat #
Very Satisfied 37% Very #
Workplace Experience
0%
0%
63%
37%
0% 50% 100%
Very Dissatisfied
Dissatisfied
Satisfied
Very Satisfied
How satisfied are you with the education you received?
0%
0%
13%
87%
0% 50% 100%
Not at all
Not very
Somewhat
Very
How useful have the knowledge and skills you gained from your training been in preparing you to write the
TQ, CQ or IP certification examination?
40% 1 employer 83%17% 2 employers 7%43% 3 or more employers 3%
0%
3%
3%
How many different employers did you have during your apprenticeship?
more than 1 year
How many months did you spend actively looking for a sponsor for your apprenticeship?
1 to 2 months
Less than 1 month
7 to 12 months
5 to 6 months
3 to 4 months
0%
0%
63%
37%
0% 50% 100%
Very Dissatisfied
Dissatisfied
Satisfied
Very Satisfied
How satisfied are you with the education you received?
0%
0%
13%
87%
0% 50% 100%
Not at all
Not very
Somewhat
Very
How useful have the knowledge and skills you gained from your training been in preparing you to write the
TQ, CQ or IP certification examination?
** To preserve confidentiality, the data are not shown. "n/a" indicates there are no valid responses.
NOTE: All percentages are rounded to whole numbers.
0%
0%
63%
37%
0% 50% 100%
Very Dissatisfied
Dissatisfied
Satisfied
Very Satisfied
How satisfied are you with the education you received?
0%
0%
13%
87%
0% 50% 100%
Not at all
Not very
Somewhat
Very
How useful have the knowledge and skills you gained from your training been in preparing you to write the
TQ, CQ or IP certification examination?
University of the Fraser Valley24
A Summary of the Apprenticeship Survey Results
Institution: University of the Fraser Valley (2008)Number of Eligible Students: 46
Number of Respondents: 30
Response Rate: 65%
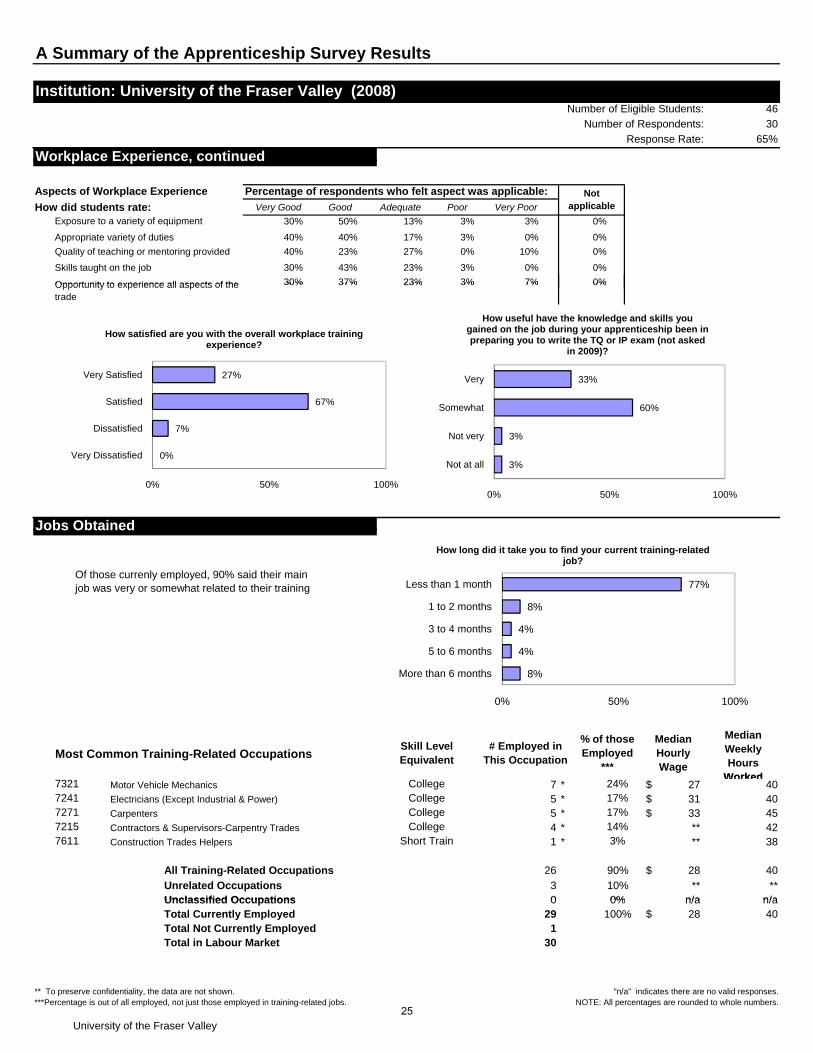
Workplace Experience, continued
Percentage of respondents who felt aspect was applicable:
Very Good Good Adequate Poor Very Poor
30% 50% 13% 3% 3%
40% 40% 17% 3% 0%
Quality of teaching or mentoring provided 40% 23% 27% 0% 10%
30% 43% 23% 3% 0%
30% 37% 23% 3% 7%
Appropriate variety of duties
How did students rate:
Opportunity to experience all aspects of the
Workplace Experience, continued
0%
Not applicable
Skills taught on the job
Aspects of Workplace Experience
0%
Exposure to a variety of equipment 0%
0%
0%
30% 37% 23% 3% 7%
Very Dissatisfied 0% Not 3%
Dissatisfied 7% Not 3%
Opportunity to experience all aspects of the trade
0%
67%
27%
Satisfied
Very Satisfied
How satisfied are you with the overall workplace training experience?
60%
33%
Somewhat
Very
How useful have the knowledge and skills you gained on the job during your apprenticeship been in preparing you to write the TQ or IP exam (not asked
in 2009)?
Dissatisfied 7% Not 3%
Satisfied 67% Som###
Very Satisfied 27% Very###
Jobs Obtained
0%
7%
67%
27%
0% 50% 100%
Very Dissatisfied
Dissatisfied
Satisfied
Very Satisfied
How satisfied are you with the overall workplace training experience?
3%
3%
60%
33%
0% 50% 100%
Not at all
Not very
Somewhat
Very
How useful have the knowledge and skills you gained on the job during your apprenticeship been in preparing you to write the TQ or IP exam (not asked
in 2009)?
Jobs Obtained
8% More than 6 months
4% 5 to 6 months
4% 3 to 4 months
8% 1 to 2 months
Of those currenly employed, 90% said their main job was very or somewhat related to their training
0%
7%
67%
27%
0% 50% 100%
Very Dissatisfied
Dissatisfied
Satisfied
Very Satisfied
How satisfied are you with the overall workplace training experience?
3%
3%
60%
33%
0% 50% 100%
Not at all
Not very
Somewhat
Very
How useful have the knowledge and skills you gained on the job during your apprenticeship been in preparing you to write the TQ or IP exam (not asked
in 2009)?
4%
4%
8%
77%
5 to 6 months
3 to 4 months
1 to 2 months
Less than 1 month
How long did it take you to find your current training-related job?
8% 1 to 2 months
## Less than 1 month
Most Common Training-Related Occupations
Median Weekly Hours
Worked
# Employed in This Occupation
Skill Level Equivalent
Median Hourly Wage
% of those Employed
***
0%
7%
67%
27%
0% 50% 100%
Very Dissatisfied
Dissatisfied
Satisfied
Very Satisfied
How satisfied are you with the overall workplace training experience?
3%
3%
60%
33%
0% 50% 100%
Not at all
Not very
Somewhat
Very
How useful have the knowledge and skills you gained on the job during your apprenticeship been in preparing you to write the TQ or IP exam (not asked
in 2009)?
8%
4%
4%
8%
77%
0% 50% 100%
More than 6 months
5 to 6 months
3 to 4 months
1 to 2 months
Less than 1 month
How long did it take you to find your current training-related job?
Motor Vehicle Mechanics * 40Electricians (Except Industrial & Power) * 40Carpenters * 45Contractors & Supervisors-Carpentry Trades * 42Construction Trades Helpers * 38
40
**n/a
College
26
10%3
4 **
Worked
517% 33$
1
17%
Unrelated Occupations **0%Unclassified Occupations 0 n/a
14%
90%
**
28$
3%
31$ 5
7611College
Short Train7215
7321 CollegeCollege
72717241
All Training-Related Occupations
7 24% 27$
0%
7%
67%
27%
0% 50% 100%
Very Dissatisfied
Dissatisfied
Satisfied
Very Satisfied
How satisfied are you with the overall workplace training experience?
3%
3%
60%
33%
0% 50% 100%
Not at all
Not very
Somewhat
Very
How useful have the knowledge and skills you gained on the job during your apprenticeship been in preparing you to write the TQ or IP exam (not asked
in 2009)?
8%
4%
4%
8%
77%
0% 50% 100%
More than 6 months
5 to 6 months
3 to 4 months
1 to 2 months
Less than 1 month
How long did it take you to find your current training-related job?
n/a40Total Currently Employed
Total Not Currently Employed
** To preserve confidentiality, the data are not shown. ***Percentage is out of all employed, not just those employed in training-related jobs.
"n/a" indicates there are no valid responses. NOTE: All percentages are rounded to whole numbers.
28$ 0%
100%
Total in Labour Market
Unclassified Occupations
30
290
1
n/a
0%
7%
67%
27%
0% 50% 100%
Very Dissatisfied
Dissatisfied
Satisfied
Very Satisfied
How satisfied are you with the overall workplace training experience?
3%
3%
60%
33%
0% 50% 100%
Not at all
Not very
Somewhat
Very
How useful have the knowledge and skills you gained on the job during your apprenticeship been in preparing you to write the TQ or IP exam (not asked
in 2009)?
8%
4%
4%
8%
77%
0% 50% 100%
More than 6 months
5 to 6 months
3 to 4 months
1 to 2 months
Less than 1 month
How long did it take you to find your current training-related job?
University of the Fraser Valley25
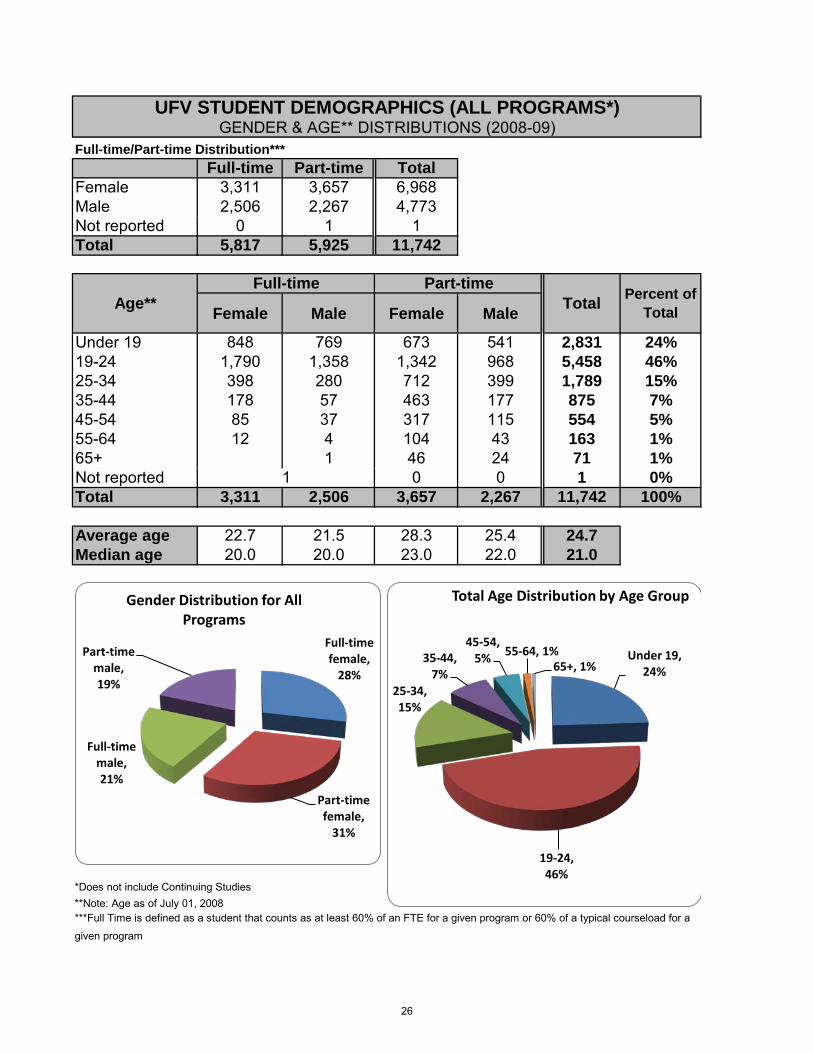
Full-time/Part-time Distribution***Full-time Part-time Total
Female 3,311 3,657 6,968Male 2,506 2,267 4,773Not reported 0 1 1Total 5,817 5,925 11,742
Female Male Female Male
Under 19 848 769 673 541 2,831 24%19-24 1,790 1,358 1,342 968 5,458 46%25-34 398 280 712 399 1,789 15%35-44 178 57 463 177 875 7%45-54 85 37 317 115 554 5%55-64 12 4 104 43 163 1%65+ 1 46 24 71 1%Not reported 0 0 1 0%Total 3,311 2,506 3,657 2,267 11,742 100%
Average age 22.7 21.5 28.3 25.4 24.7Median age 20.0 20.0 23.0 22.0 21.0
*Does not include Continuing Studies**Note: Age as of July 01, 2008***Full Time is defined as a student that counts as at least 60% of an FTE for a given program or 60% of a typical courseload for a
given program
1
UFV STUDENT DEMOGRAPHICS (ALL PROGRAMS*)GENDER & AGE** DISTRIBUTIONS (2008-09)
Total Percent of Total
Full-time Part-timeAge**
Full-time female,
28%
Part-time female,
31%
Full-time male, 21%
Part-time male, 19%
Gender Distribution for All Programs
Under 19, 24%
19-24, 46%
25-34, 15%
35-44, 7%
45-54, 5% 55-64, 1%
65+, 1%
Total Age Distribution by Age Group
26
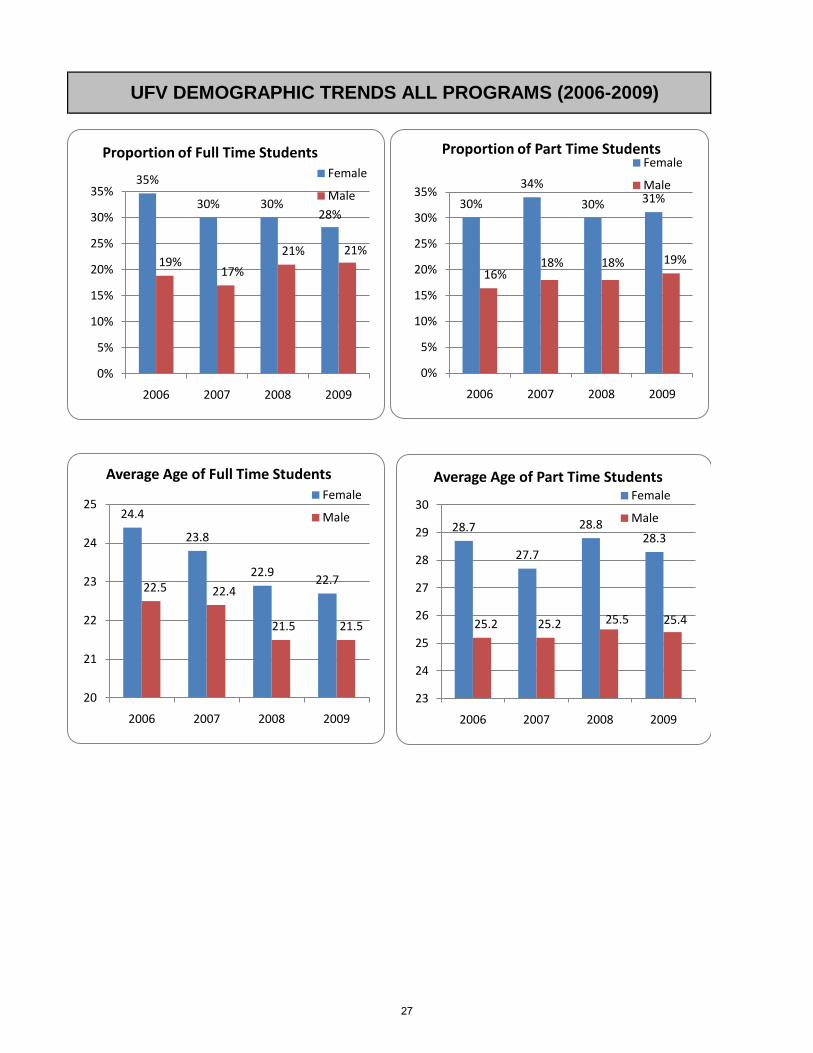
UFV DEMOGRAPHIC TRENDS ALL PROGRAMS (2006-2009)
35%
30% 30%28%
19%17%
21% 21%
0%
5%
10%
15%
20%
25%
30%
35%
2006 2007 2008 2009
Proportion of Full Time StudentsFemale
Male30%
34%
30% 31%
16%18% 18% 19%
0%
5%
10%
15%
20%
25%
30%
35%
2006 2007 2008 2009
Proportion of Part Time StudentsFemale
Male
28.7
27.7
28.828.3
25.2 25.2 25.5 25.4
23
24
25
26
27
28
29
30
2006 2007 2008 2009
Average Age of Part Time StudentsFemale
Male24.4
23.8
22.922.7
22.5 22.4
21.5 21.5
20
21
22
23
24
25
2006 2007 2008 2009
Average Age of Full Time StudentsFemale
Male
27
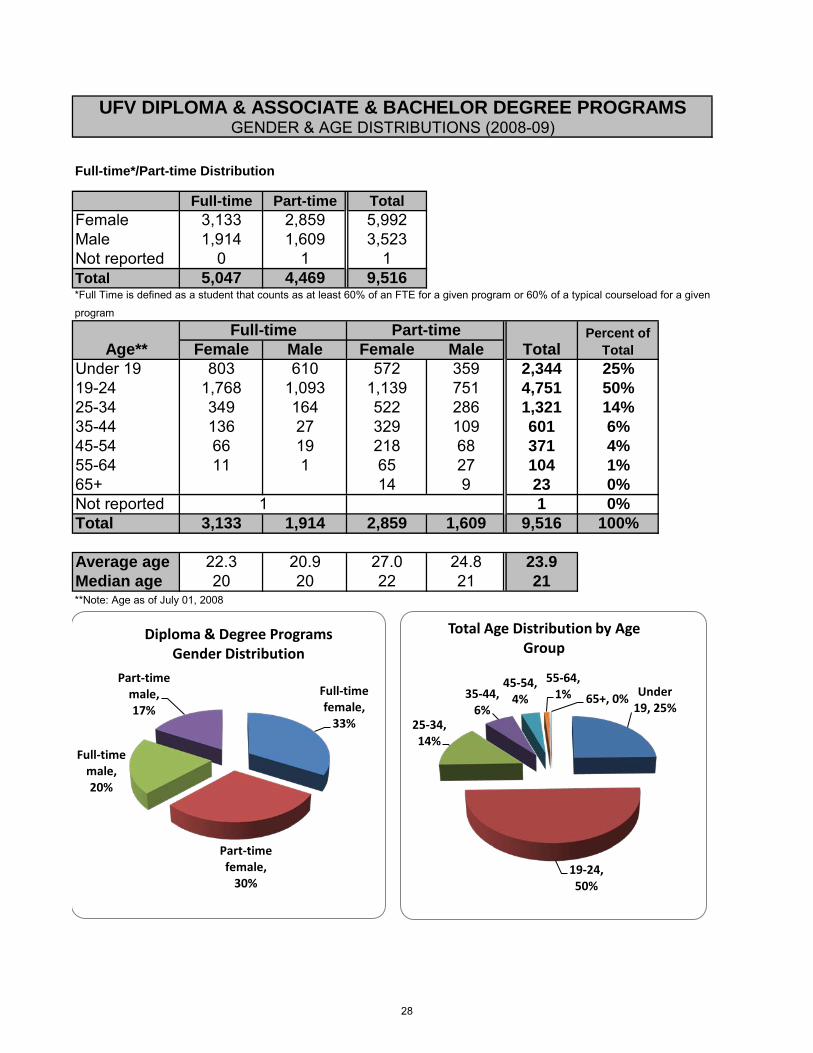
Full-time*/Part-time Distribution
Full-time Part-time TotalFemale 3,133 2,859 5,992Male 1,914 1,609 3,523Not reported 0 1 1Total 5,047 4,469 9,516
Female Male Female MaleUnder 19 803 610 572 359 2,344 25%19-24 1,768 1,093 1,139 751 4,751 50%25-34 349 164 522 286 1,321 14%35-44 136 27 329 109 601 6%45-54 66 19 218 68 371 4%55-64 11 1 65 27 104 1%65+ 14 9 23 0%Not reported 1 0%Total 3,133 1,914 2,859 1,609 9,516 100%
Average age 22.3 20.9 27.0 24.8 23.9Median age 20 20 22 21 21**Note: Age as of July 01, 2008
1
UFV DIPLOMA & ASSOCIATE & BACHELOR DEGREE PROGRAMS
TotalPercent of
TotalFull-time Part-time
Age**
GENDER & AGE DISTRIBUTIONS (2008-09)
*Full Time is defined as a student that counts as at least 60% of an FTE for a given program or 60% of a typical courseload for a given
program
Full-time female,
33%
Part-time female,
30%
Full-time male, 20%
Part-time male, 17%
Diploma & Degree ProgramsGender Distribution
Under 19, 25%
19-24, 50%
25-34, 14%
35-44, 6%
45-54, 4%
55-64, 1% 65+, 0%
Total Age Distribution by Age Group
28
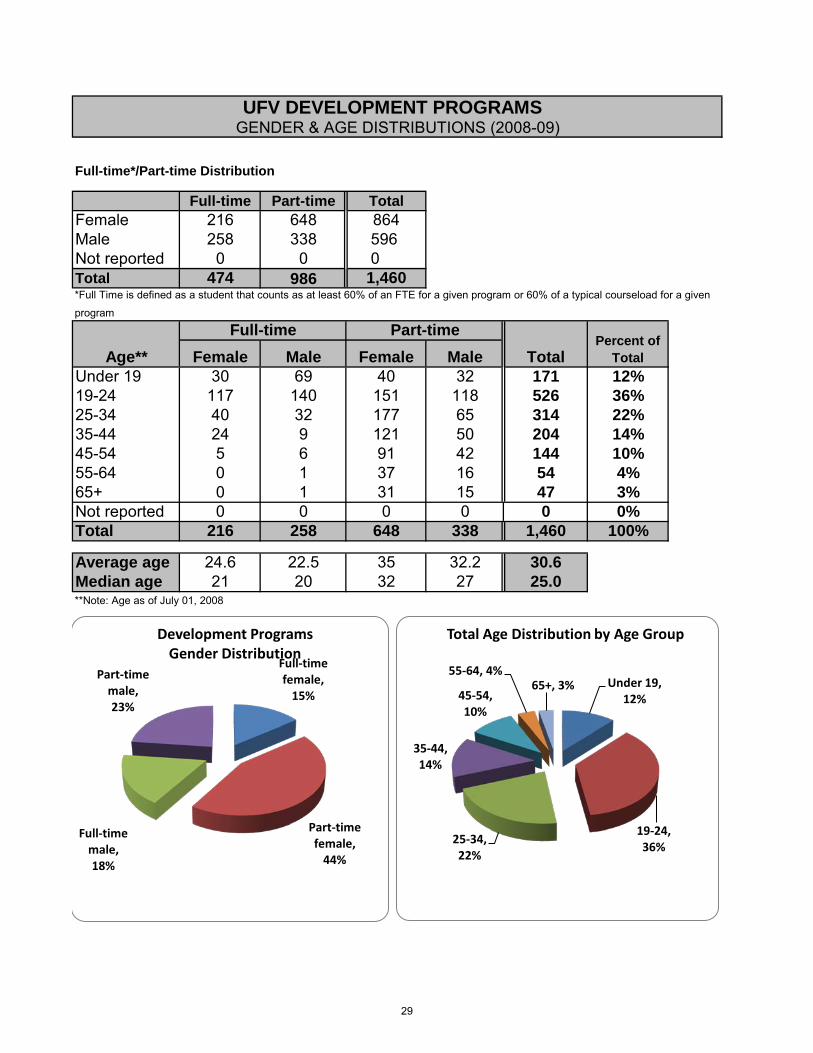
Full-time*/Part-time Distribution
Full-time Part-time TotalFemale 216 648 864Male 258 338 596Not reported 0 0 0Total 474 986 1,460
Female Male Female MaleUnder 19 30 69 40 32 171 12%19-24 117 140 151 118 526 36%25-34 40 32 177 65 314 22%35-44 24 9 121 50 204 14%45-54 5 6 91 42 144 10%55-64 0 1 37 16 54 4%65+ 0 1 31 15 47 3%Not reported 0 0 0 0 0 0%Total 216 258 648 338 1,460 100%
Average age 24.6 22.5 35 32.2 30.6Median age 21 20 32 27 25.0**Note: Age as of July 01, 2008
UFV DEVELOPMENT PROGRAMS
TotalPercent of
Total
Full-time Part-timeAge**
GENDER & AGE DISTRIBUTIONS (2008-09)
*Full Time is defined as a student that counts as at least 60% of an FTE for a given program or 60% of a typical courseload for a given
program
Full-time female,
15%
Part-time female,
44%
Full-time male, 18%
Part-time male, 23%
Development ProgramsGender Distribution
Under 19, 12%
19-24, 36%
25-34, 22%
35-44, 14%
45-54, 10%
55-64, 4%65+, 3%
Total Age Distribution by Age Group
29
Full-time*/Part-time Distribution
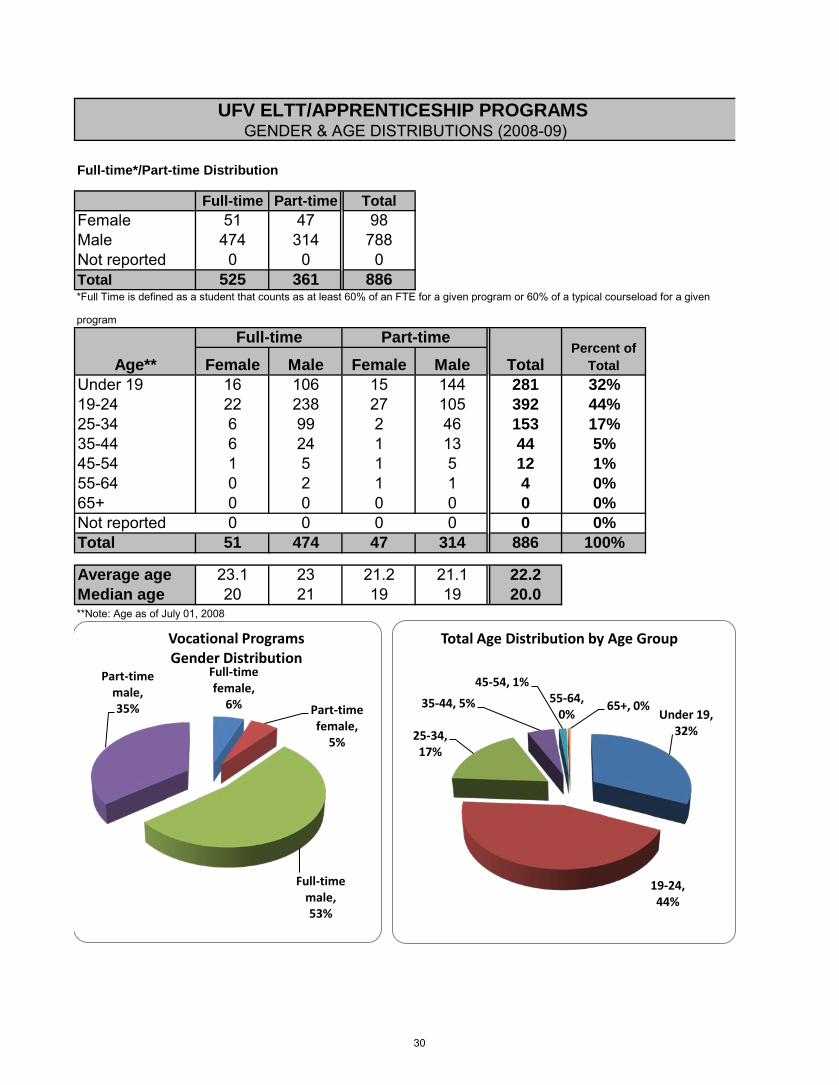
Full-time Part-time TotalFemale 51 47 98Male 474 314 788Not reported 0 0 0Total 525 361 886
Female Male Female MaleUnder 19 16 106 15 144 281 32%19-24 22 238 27 105 392 44%25-34 6 99 2 46 153 17%35-44 6 24 1 13 44 5%45-54 1 5 1 5 12 1%55-64 0 2 1 1 4 0%65+ 0 0 0 0 0 0%Not reported 0 0 0 0 0 0%Total 51 474 47 314 886 100%
Average age 23.1 23 21.2 21.1 22.2Median age 20 21 19 19 20.0**Note: Age as of July 01, 2008
UFV ELTT/APPRENTICESHIP PROGRAMS
TotalPercent of
Total
Full-timeAge**
GENDER & AGE DISTRIBUTIONS (2008-09)
*Full Time is defined as a student that counts as at least 60% of an FTE for a given program or 60% of a typical courseload for a given
program
Part-time
Full-time female,
6% Part-time female,
5%
Full-time male, 53%
Part-time male, 35%
Vocational ProgramsGender Distribution
Under 19, 32%
19-24, 44%
25-34, 17%
35-44, 5%
45-54, 1%55-64,
0%65+, 0%
Total Age Distribution by Age Group
30
Full-time*/Part-time Distribution
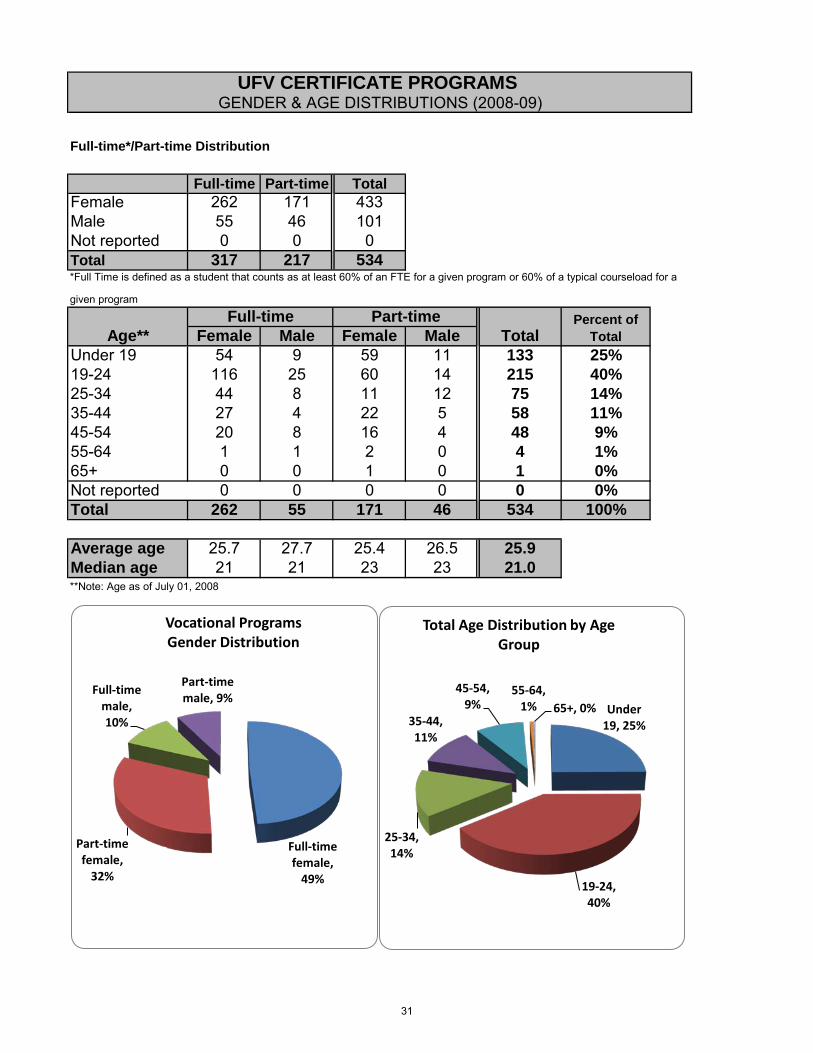
Full-time Part-time TotalFemale 262 171 433Male 55 46 101Not reported 0 0 0Total 317 217 534
Female Male Female MaleUnder 19 54 9 59 11 133 25%19-24 116 25 60 14 215 40%25-34 44 8 11 12 75 14%35-44 27 4 22 5 58 11%45-54 20 8 16 4 48 9%55-64 1 1 2 0 4 1%65+ 0 0 1 0 1 0%Not reported 0 0 0 0 0 0%Total 262 55 171 46 534 100%
Average age 25.7 27.7 25.4 26.5 25.9Median age 21 21 23 23 21.0**Note: Age as of July 01, 2008
UFV CERTIFICATE PROGRAMS GENDER & AGE DISTRIBUTIONS (2008-09)
Age**Full-time Part-time
TotalPercent of
Total
*Full Time is defined as a student that counts as at least 60% of an FTE for a given program or 60% of a typical courseload for a
given program
Full-time female,
49%
Part-time female,
32%
Full-time male, 10%
Part-time male, 9%
Vocational ProgramsGender Distribution
Under 19, 25%
19-24, 40%
25-34, 14%
35-44, 11%
45-54, 9%
55-64, 1% 65+, 0%
Total Age Distribution by Age Group
31
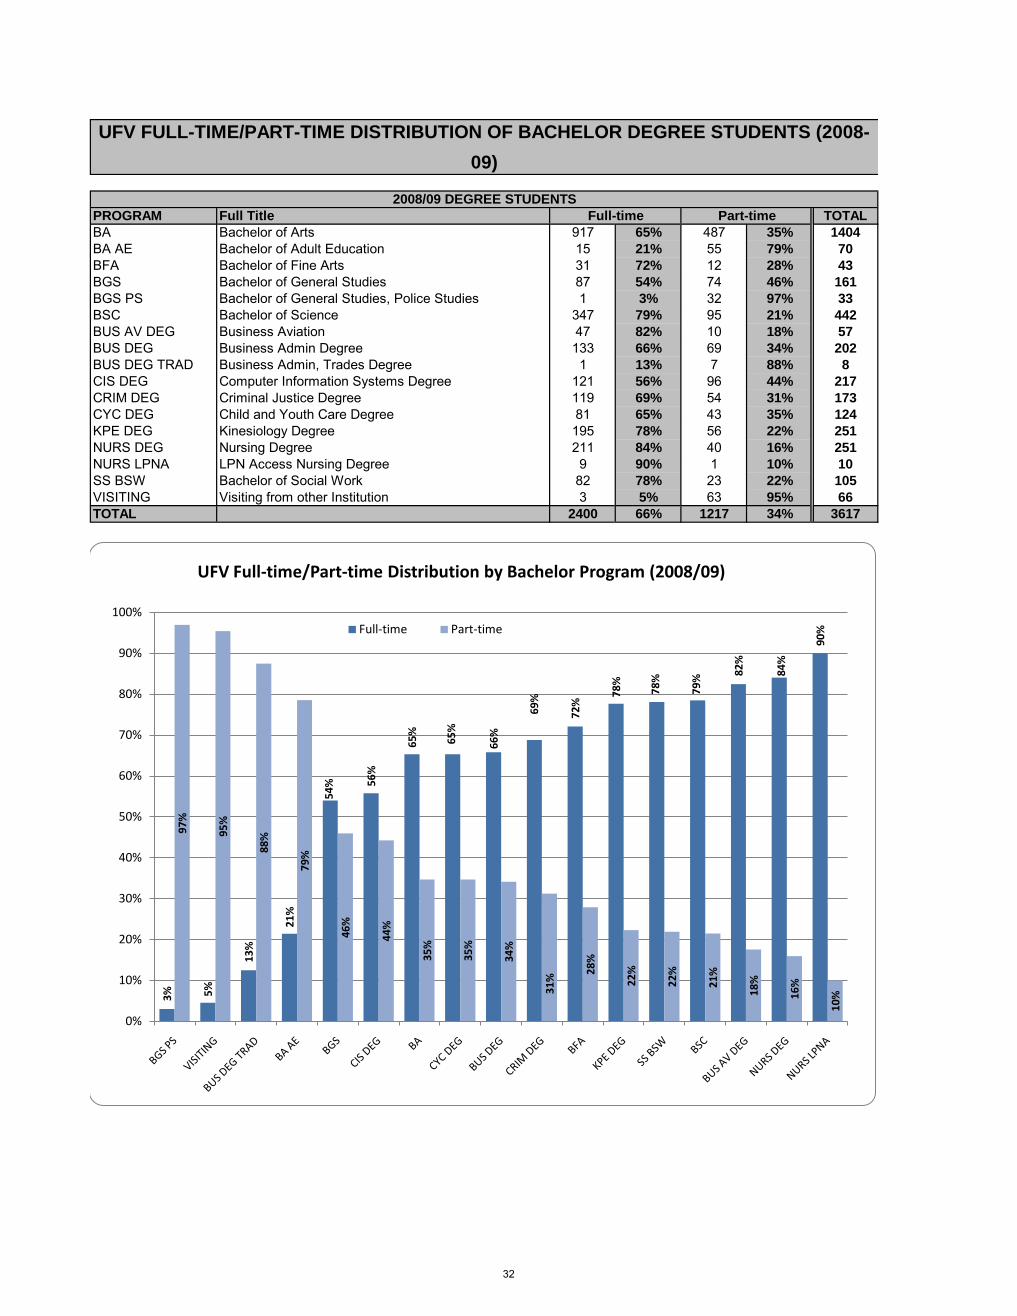
PROGRAM Full Title TOTALBA Bachelor of Arts 917 65% 487 35% 1404BA AE Bachelor of Adult Education 15 21% 55 79% 70BFA Bachelor of Fine Arts 31 72% 12 28% 43BGS Bachelor of General Studies 87 54% 74 46% 161BGS PS Bachelor of General Studies, Police Studies 1 3% 32 97% 33BSC Bachelor of Science 347 79% 95 21% 442BUS AV DEG Business Aviation 47 82% 10 18% 57BUS DEG Business Admin Degree 133 66% 69 34% 202BUS DEG TRAD Business Admin, Trades Degree 1 13% 7 88% 8CIS DEG Computer Information Systems Degree 121 56% 96 44% 217CRIM DEG Criminal Justice Degree 119 69% 54 31% 173CYC DEG Child and Youth Care Degree 81 65% 43 35% 124KPE DEG Kinesiology Degree 195 78% 56 22% 251NURS DEG Nursing Degree 211 84% 40 16% 251NURS LPNA LPN Access Nursing Degree 9 90% 1 10% 10SS BSW Bachelor of Social Work 82 78% 23 22% 105VISITING Visiting from other Institution 3 5% 63 95% 66TOTAL 2400 66% 1217 34% 3617
Full-time Part-time2008/09 DEGREE STUDENTS
UFV FULL-TIME/PART-TIME DISTRIBUTION OF BACHELOR DEGREE STUDENTS (2008-09)
3% 5%
13%
21%
54% 56
%
65%
65%
66%
69%
72%
78%
78%
79% 82
%
84%
90%
97%
95%
88%
79%
46%
44%
35%
35%
34%
31%
28%
22%
22%
21%
18%
16%
10%
0%
10%
20%
30%
40%
50%
60%
70%
80%
90%
100%
UFV Full-time/Part-time Distribution by Bachelor Program (2008/09)
Full-time Part-time
32
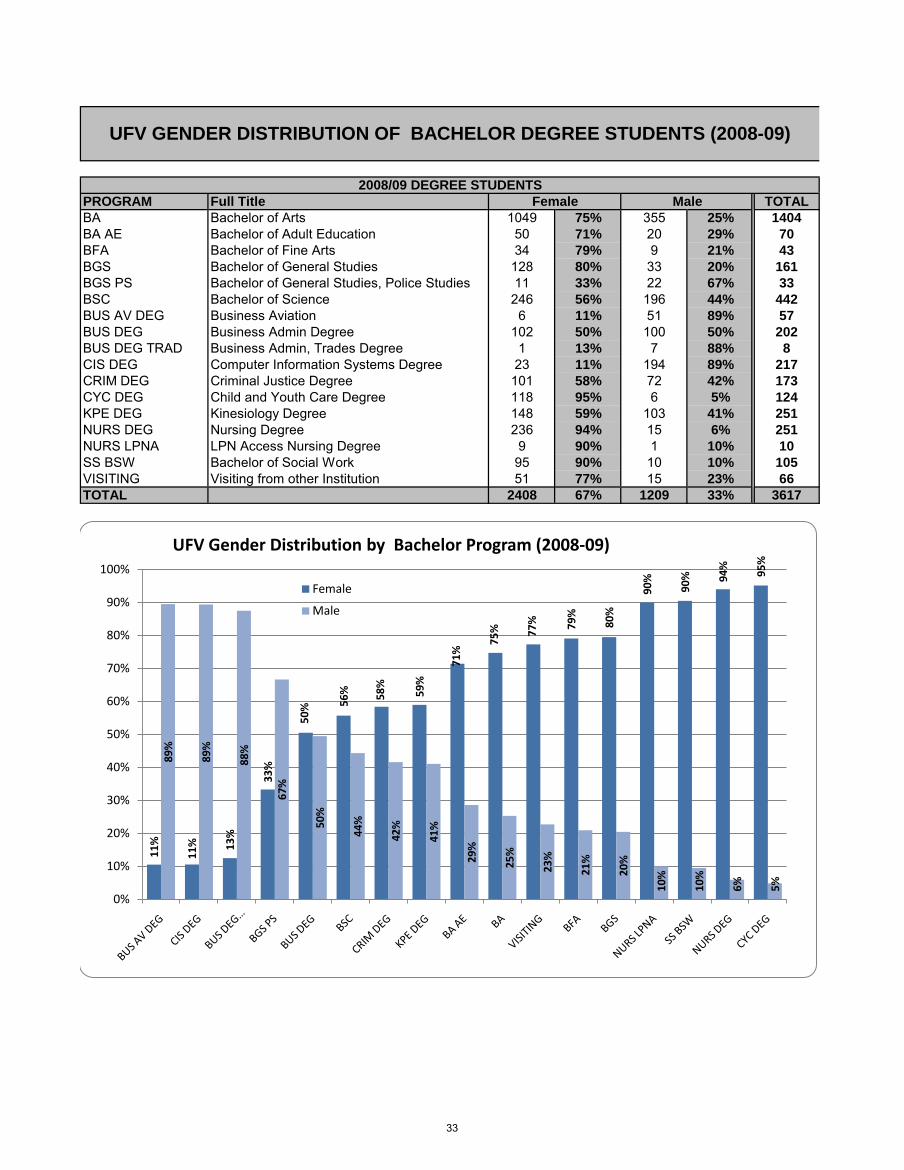
PROGRAM Full Title TOTALBA Bachelor of Arts 1049 75% 355 25% 1404BA AE Bachelor of Adult Education 50 71% 20 29% 70BFA Bachelor of Fine Arts 34 79% 9 21% 43BGS Bachelor of General Studies 128 80% 33 20% 161BGS PS Bachelor of General Studies, Police Studies 11 33% 22 67% 33BSC Bachelor of Science 246 56% 196 44% 442BUS AV DEG Business Aviation 6 11% 51 89% 57BUS DEG Business Admin Degree 102 50% 100 50% 202BUS DEG TRAD Business Admin, Trades Degree 1 13% 7 88% 8CIS DEG Computer Information Systems Degree 23 11% 194 89% 217CRIM DEG Criminal Justice Degree 101 58% 72 42% 173CYC DEG Child and Youth Care Degree 118 95% 6 5% 124KPE DEG Kinesiology Degree 148 59% 103 41% 251NURS DEG Nursing Degree 236 94% 15 6% 251NURS LPNA LPN Access Nursing Degree 9 90% 1 10% 10SS BSW Bachelor of Social Work 95 90% 10 10% 105VISITING Visiting from other Institution 51 77% 15 23% 66TOTAL 2408 67% 1209 33% 3617
UFV GENDER DISTRIBUTION OF BACHELOR DEGREE STUDENTS (2008-09)
2008/09 DEGREE STUDENTSFemale Male
11%
11% 13
%
33%
50% 56
% 58%
59%
71%
75% 77
% 79%
80%
90%
90% 94
%
95%
89%
89%
88%
67%
50%
44%
42%
41%
29%
25%
23%
21%
20%
10%
10%
6% 5%
0%
10%
20%
30%
40%
50%
60%
70%
80%
90%
100%
UFV Gender Distribution by Bachelor Program (2008-09)
Female
Male
33
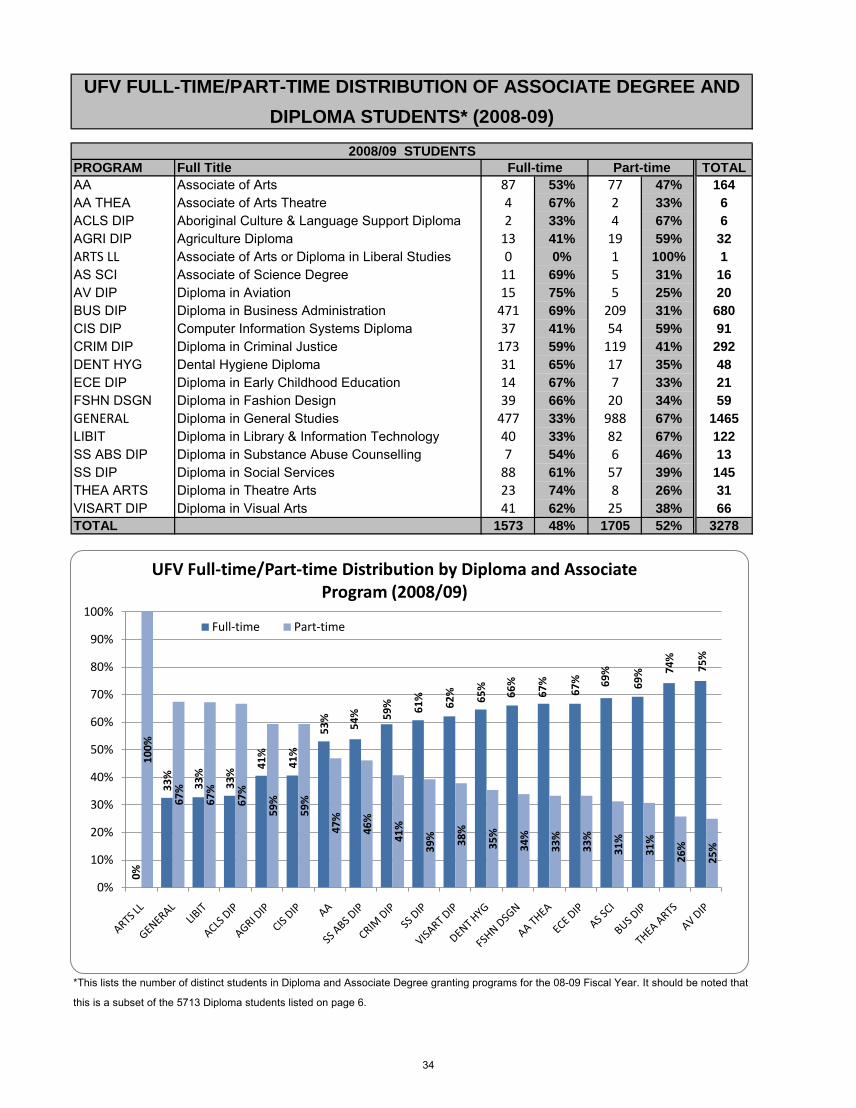
PROGRAM Full Title TOTALAA Associate of Arts 87 53% 77 47% 164AA THEA Associate of Arts Theatre 4 67% 2 33% 6ACLS DIP Aboriginal Culture & Language Support Diploma 2 33% 4 67% 6AGRI DIP Agriculture Diploma 13 41% 19 59% 32ARTS LL Associate of Arts or Diploma in Liberal Studies 0 0% 1 100% 1AS SCI Associate of Science Degree 11 69% 5 31% 16AV DIP Diploma in Aviation 15 75% 5 25% 20BUS DIP Diploma in Business Administration 471 69% 209 31% 680CIS DIP Computer Information Systems Diploma 37 41% 54 59% 91CRIM DIP Diploma in Criminal Justice 173 59% 119 41% 292DENT HYG Dental Hygiene Diploma 31 65% 17 35% 48ECE DIP Diploma in Early Childhood Education 14 67% 7 33% 21FSHN DSGN Diploma in Fashion Design 39 66% 20 34% 59GENERAL Diploma in General Studies 477 33% 988 67% 1465LIBIT Diploma in Library & Information Technology 40 33% 82 67% 122SS ABS DIP Diploma in Substance Abuse Counselling 7 54% 6 46% 13SS DIP Diploma in Social Services 88 61% 57 39% 145THEA ARTS Diploma in Theatre Arts 23 74% 8 26% 31VISART DIP Diploma in Visual Arts 41 62% 25 38% 66TOTAL 1573 48% 1705 52% 3278
UFV FULL-TIME/PART-TIME DISTRIBUTION OF ASSOCIATE DEGREE AND DIPLOMA STUDENTS* (2008-09)
*This lists the number of distinct students in Diploma and Associate Degree granting programs for the 08-09 Fiscal Year. It should be noted that
this is a subset of the 5713 Diploma students listed on page 6.
2008/09 STUDENTSFull-time Part-time
0%
33%
33%
33%
41%
41%
53%
54% 59
% 61%
62% 65
%
66%
67%
67% 69
%
69% 74
%
75%
100%
67%
67%
67%
59%
59%
47%
46%
41%
39% 38
%
35%
34%
33%
33%
31%
31%
26%
25%
0%
10%
20%
30%
40%
50%
60%
70%
80%
90%
100%
UFV Full-time/Part-time Distribution by Diploma and Associate Program (2008/09)
Full-time Part-time
34
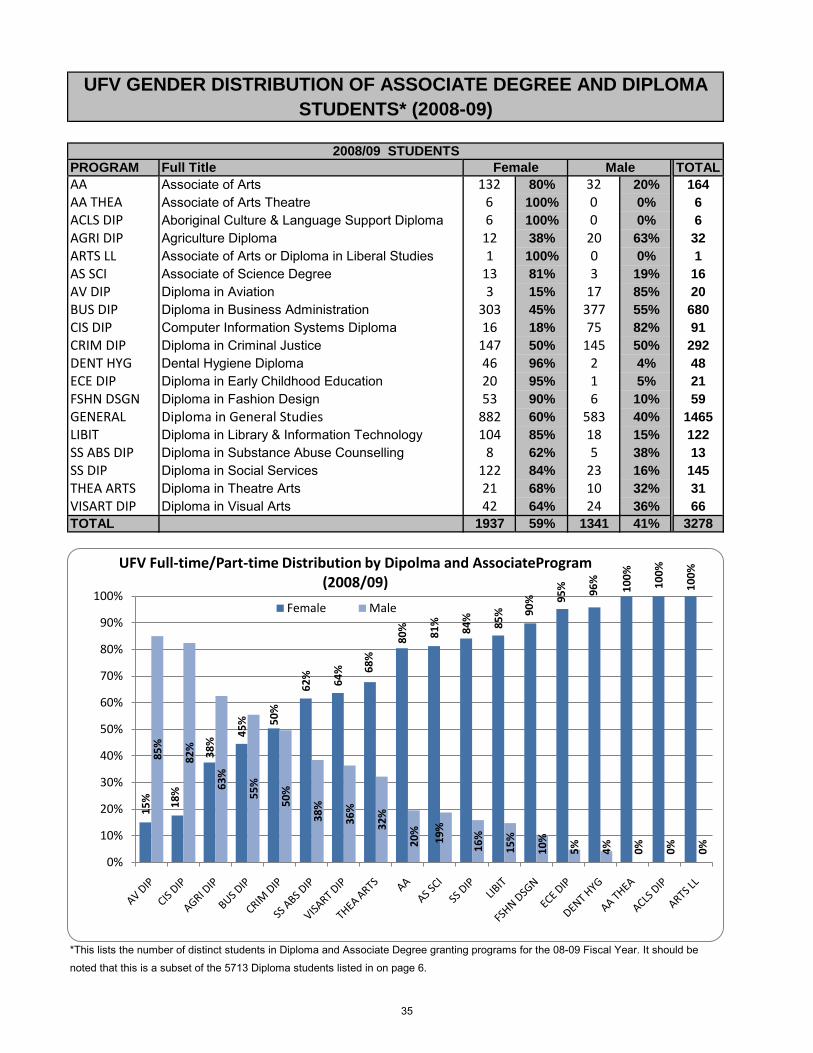
PROGRAM Full Title TOTALAA Associate of Arts 132 80% 32 20% 164AA THEA Associate of Arts Theatre 6 100% 0 0% 6ACLS DIP Aboriginal Culture & Language Support Diploma 6 100% 0 0% 6AGRI DIP Agriculture Diploma 12 38% 20 63% 32ARTS LL Associate of Arts or Diploma in Liberal Studies 1 100% 0 0% 1AS SCI Associate of Science Degree 13 81% 3 19% 16AV DIP Diploma in Aviation 3 15% 17 85% 20BUS DIP Diploma in Business Administration 303 45% 377 55% 680CIS DIP Computer Information Systems Diploma 16 18% 75 82% 91CRIM DIP Diploma in Criminal Justice 147 50% 145 50% 292DENT HYG Dental Hygiene Diploma 46 96% 2 4% 48ECE DIP Diploma in Early Childhood Education 20 95% 1 5% 21FSHN DSGN Diploma in Fashion Design 53 90% 6 10% 59GENERAL Diploma in General Studies 882 60% 583 40% 1465LIBIT Diploma in Library & Information Technology 104 85% 18 15% 122SS ABS DIP Diploma in Substance Abuse Counselling 8 62% 5 38% 13SS DIP Diploma in Social Services 122 84% 23 16% 145THEA ARTS Diploma in Theatre Arts 21 68% 10 32% 31VISART DIP Diploma in Visual Arts 42 64% 24 36% 66TOTAL 1937 59% 1341 41% 3278
UFV GENDER DISTRIBUTION OF ASSOCIATE DEGREE AND DIPLOMA STUDENTS* (2008-09)
*This lists the number of distinct students in Diploma and Associate Degree granting programs for the 08-09 Fiscal Year. It should be
noted that this is a subset of the 5713 Diploma students listed in on page 6.
2008/09 STUDENTSFemale Male
15% 18
%
38%
45% 50
%
62% 64% 68
%
80% 81%
84%
85% 90
% 95% 96
%
100%
100%
100%
85%
82%
63%
55%
50%
38%
36%
32%
20%
19%
16%
15%
10%
5% 4% 0% 0% 0%
0%
10%
20%
30%
40%
50%
60%
70%
80%
90%
100%
UFV Full-time/Part-time Distribution by Dipolma and AssociateProgram (2008/09)
Female Male
35
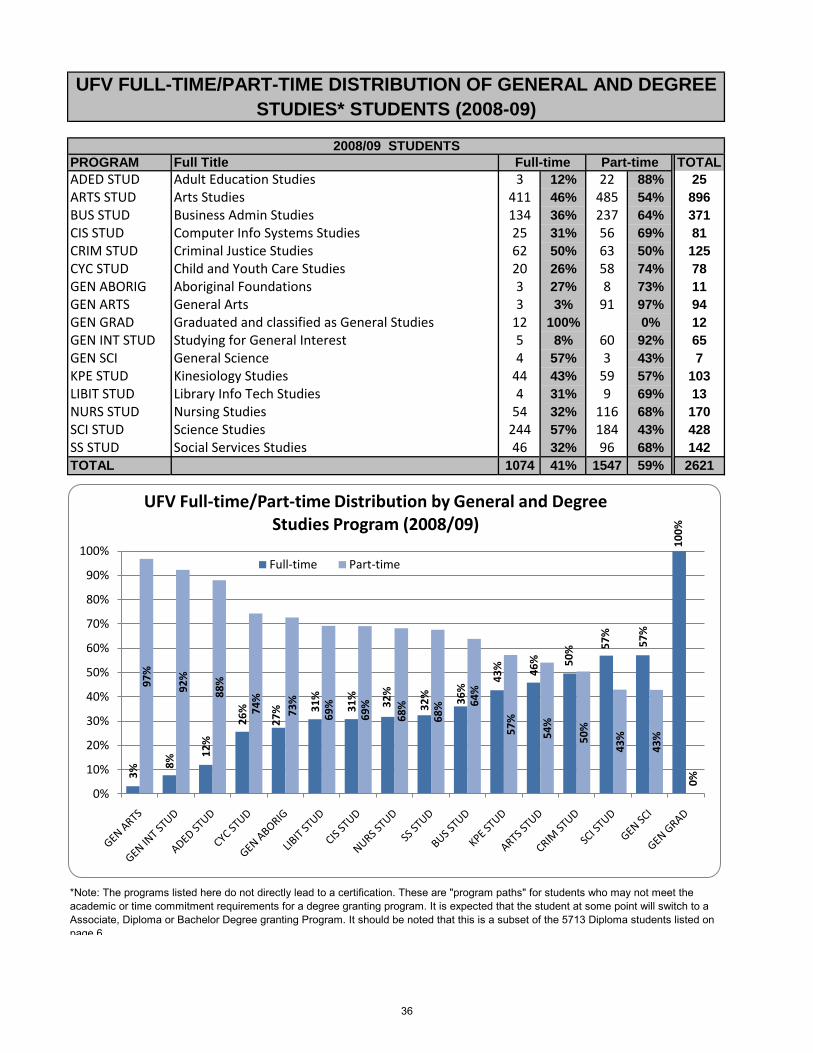
PROGRAM Full Title TOTALADED STUD Adult Education Studies 3 12% 22 88% 25ARTS STUD Arts Studies 411 46% 485 54% 896BUS STUD Business Admin Studies 134 36% 237 64% 371CIS STUD Computer Info Systems Studies 25 31% 56 69% 81CRIM STUD Criminal Justice Studies 62 50% 63 50% 125CYC STUD Child and Youth Care Studies 20 26% 58 74% 78GEN ABORIG Aboriginal Foundations 3 27% 8 73% 11GEN ARTS General Arts 3 3% 91 97% 94GEN GRAD Graduated and classified as General Studies 12 100% 0% 12GEN INT STUD Studying for General Interest 5 8% 60 92% 65GEN SCI General Science 4 57% 3 43% 7KPE STUD Kinesiology Studies 44 43% 59 57% 103LIBIT STUD Library Info Tech Studies 4 31% 9 69% 13NURS STUD Nursing Studies 54 32% 116 68% 170SCI STUD Science Studies 244 57% 184 43% 428SS STUD Social Services Studies 46 32% 96 68% 142TOTAL 1074 41% 1547 59% 2621
*Note: The programs listed here do not directly lead to a certification. These are "program paths" for students who may not meet the academic or time commitment requirements for a degree granting program. It is expected that the student at some point will switch to a Associate, Diploma or Bachelor Degree granting Program. It should be noted that this is a subset of the 5713 Diploma students listed on page 6
UFV FULL-TIME/PART-TIME DISTRIBUTION OF GENERAL AND DEGREE STUDIES* STUDENTS (2008-09)
2008/09 STUDENTSFull-time Part-time
3%
8%
12%
26%
27% 31
%
31%
32%
32% 36
%
43% 46
% 50% 57
%
57%
100%
97%
92%
88%
74%
73%
69%
69%
68%
68% 64
%
57%
54%
50%
43%
43%
0%
0%
10%
20%
30%
40%
50%
60%
70%
80%
90%
100%
UFV Full-time/Part-time Distribution by General and Degree Studies Program (2008/09)
Full-time Part-time
36
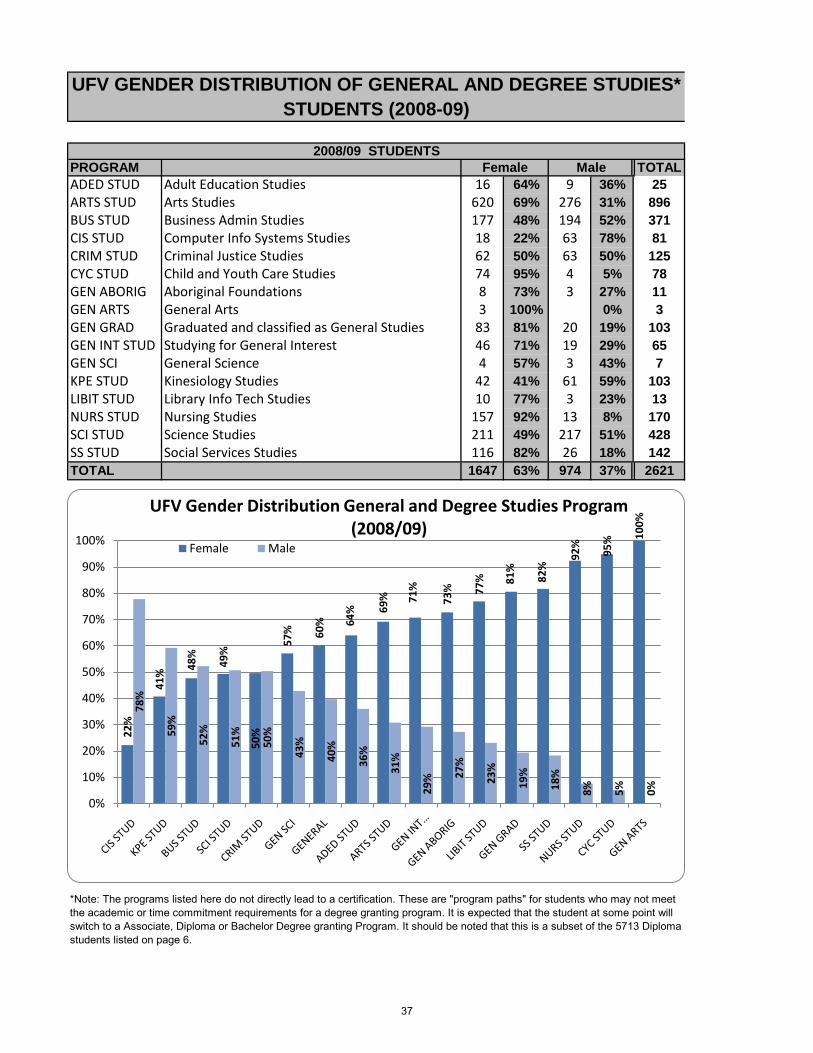
PROGRAM TOTALADED STUD Adult Education Studies 16 64% 9 36% 25ARTS STUD Arts Studies 620 69% 276 31% 896BUS STUD Business Admin Studies 177 48% 194 52% 371CIS STUD Computer Info Systems Studies 18 22% 63 78% 81CRIM STUD Criminal Justice Studies 62 50% 63 50% 125CYC STUD Child and Youth Care Studies 74 95% 4 5% 78GEN ABORIG Aboriginal Foundations 8 73% 3 27% 11GEN ARTS General Arts 3 100% 0% 3GEN GRAD Graduated and classified as General Studies 83 81% 20 19% 103GEN INT STUD Studying for General Interest 46 71% 19 29% 65GEN SCI General Science 4 57% 3 43% 7KPE STUD Kinesiology Studies 42 41% 61 59% 103LIBIT STUD Library Info Tech Studies 10 77% 3 23% 13NURS STUD Nursing Studies 157 92% 13 8% 170SCI STUD Science Studies 211 49% 217 51% 428SS STUD Social Services Studies 116 82% 26 18% 142TOTAL 1647 63% 974 37% 2621
*Note: The programs listed here do not directly lead to a certification. These are "program paths" for students who may not meet the academic or time commitment requirements for a degree granting program. It is expected that the student at some point will switch to a Associate, Diploma or Bachelor Degree granting Program. It should be noted that this is a subset of the 5713 Diploma students listed on page 6.
UFV GENDER DISTRIBUTION OF GENERAL AND DEGREE STUDIES* STUDENTS (2008-09)
2008/09 STUDENTSFemale Male
22%
41%
48%
49%
50%
57% 60
% 64% 69
% 71%
73% 77
% 81%
82%
92%
95% 10
0%
78%
59%
52%
51%
50%
43%
40%
36%
31%
29% 27
%
23%
19%
18%
8% 5% 0%
0%
10%
20%
30%
40%
50%
60%
70%
80%
90%
100%
UFV Gender Distribution General and Degree Studies Program (2008/09)
Female Male
37
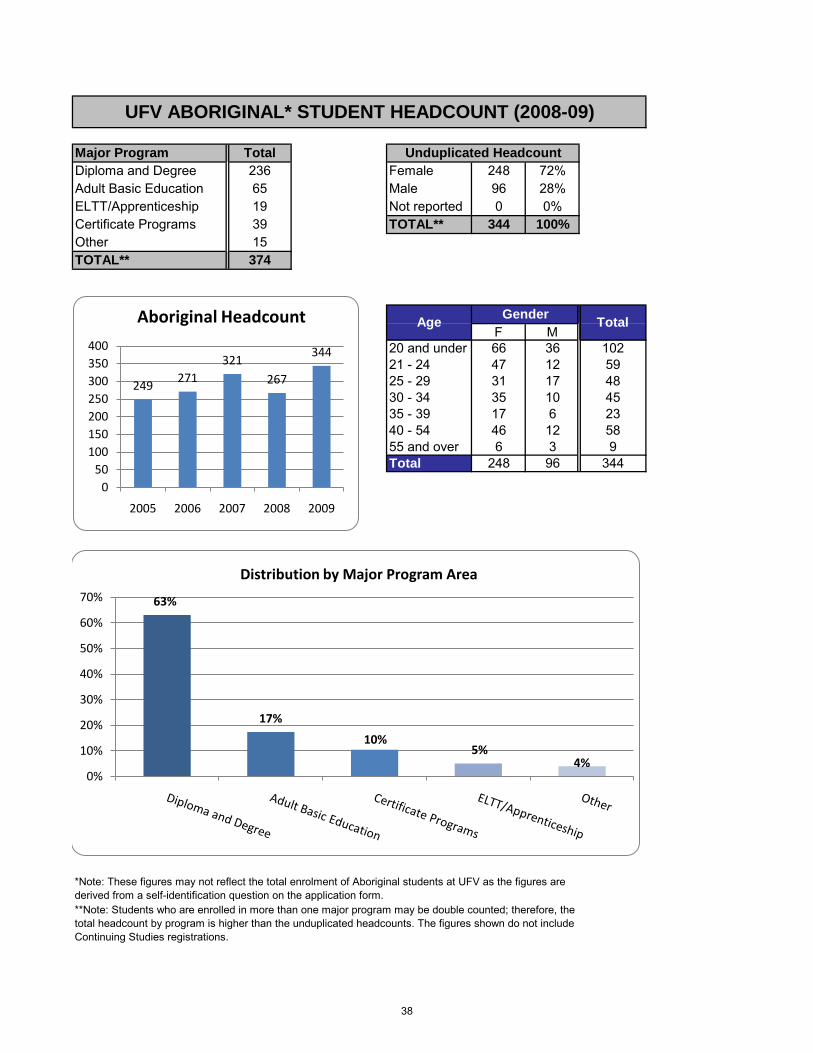
Major Program TotalDiploma and Degree 236 Female 248 72%Adult Basic Education 65 Male 96 28%ELTT/Apprenticeship 19 Not reported 0 0%Certificate Programs 39 TOTAL** 344 100%Other 15TOTAL** 374
F M20 and under 66 36 10221 - 24 47 12 5925 - 29 31 17 4830 - 34 35 10 4535 - 39 17 6 2340 - 54 46 12 5855 and over 6 3 9Total 248 96 344
**Note: Students who are enrolled in more than one major program may be double counted; therefore, the total headcount by program is higher than the unduplicated headcounts. The figures shown do not include Continuing Studies registrations.
TotalAge
UFV ABORIGINAL* STUDENT HEADCOUNT (2008-09)
*Note: These figures may not reflect the total enrolment of Aboriginal students at UFV as the figures are derived from a self-identification question on the application form.
Gender
Unduplicated Headcount
63%
17%
10%5%
4%0%
10%
20%
30%
40%
50%
60%
70%
Distribution by Major Program Area
249271
321
267
344
050
100150200250300350400
2005 2006 2007 2008 2009
Aboriginal Headcount
38
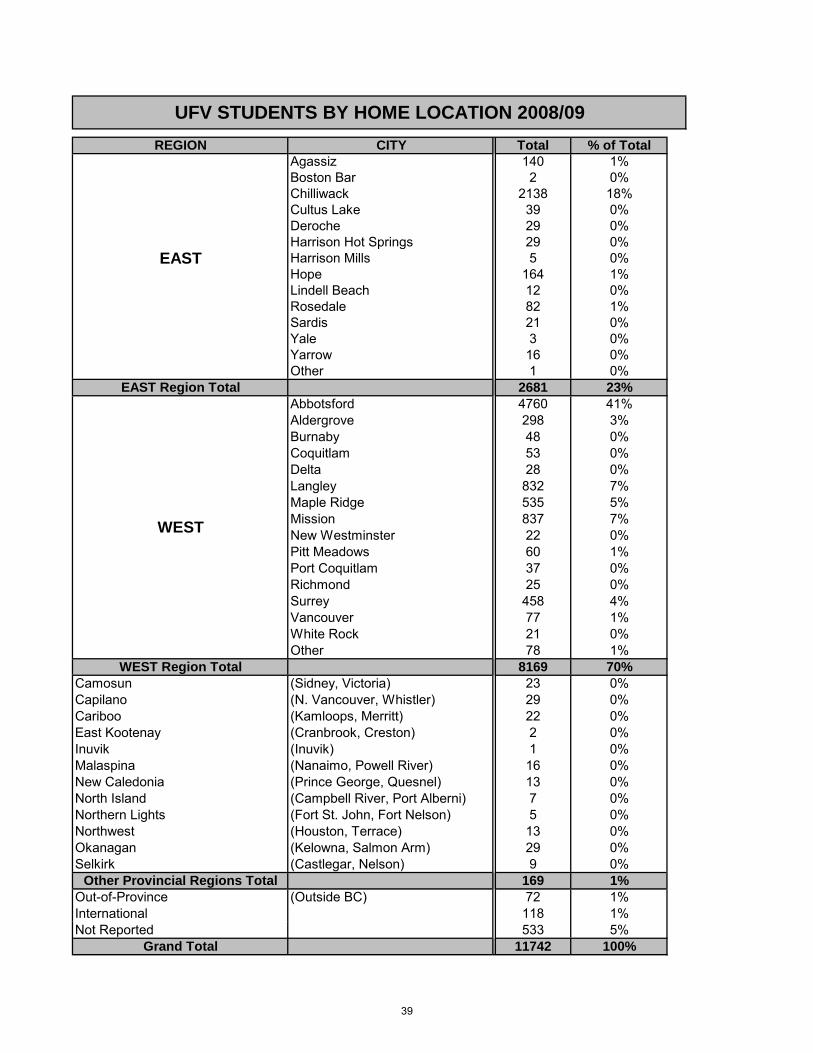
REGION CITY Total % of TotalAgassiz 140 1%Boston Bar 2 0%Chilliwack 2138 18%Cultus Lake 39 0%Deroche 29 0%Harrison Hot Springs 29 0%Harrison Mills 5 0%Hope 164 1%Lindell Beach 12 0%Rosedale 82 1%Sardis 21 0%Yale 3 0%Yarrow 16 0%Other 1 0%
EAST Region Total 2681 23%Abbotsford 4760 41%Aldergrove 298 3%Burnaby 48 0%Coquitlam 53 0%Delta 28 0%Langley 832 7%Maple Ridge 535 5%Mission 837 7%New Westminster 22 0%Pitt Meadows 60 1%Port Coquitlam 37 0%Richmond 25 0%Surrey 458 4%Vancouver 77 1%White Rock 21 0%Other 78 1%
WEST Region Total 8169 70%Camosun (Sidney, Victoria) 23 0%Capilano (N. Vancouver, Whistler) 29 0%Cariboo (Kamloops, Merritt) 22 0%East Kootenay (Cranbrook, Creston) 2 0%Inuvik (Inuvik) 1 0%Malaspina (Nanaimo, Powell River) 16 0%New Caledonia (Prince George, Quesnel) 13 0%North Island (Campbell River, Port Alberni) 7 0%Northern Lights (Fort St. John, Fort Nelson) 5 0%Northwest (Houston, Terrace) 13 0%Okanagan (Kelowna, Salmon Arm) 29 0%Selkirk (Castlegar, Nelson) 9 0%
Other Provincial Regions Total 169 1%Out-of-Province (Outside BC) 72 1%International 118 1%Not Reported 533 5%
Grand Total 11742 100%
UFV STUDENTS BY HOME LOCATION 2008/09
EAST
WEST
39
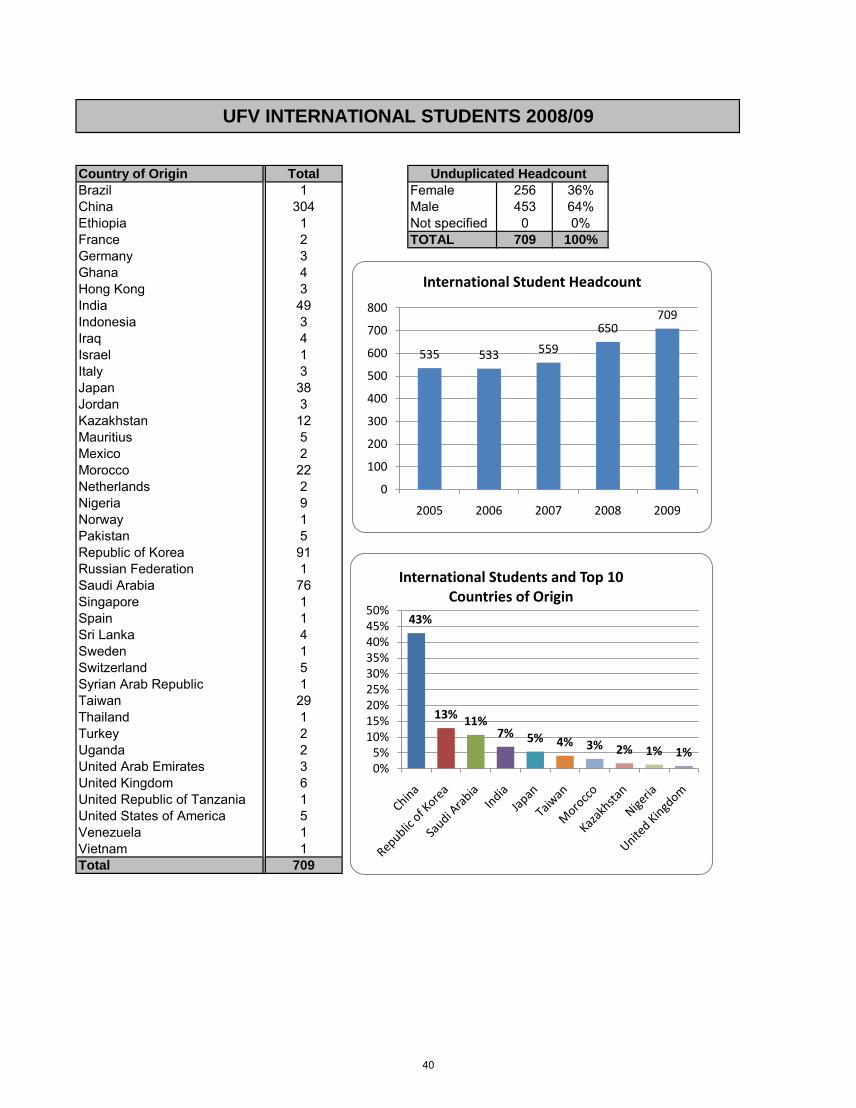
Country of Origin TotalBrazil 1 Female 256 36%China 304 Male 453 64%Ethiopia 1 Not specified 0 0%France 2 TOTAL 709 100%Germany 3Ghana 4Hong Kong 3India 49Indonesia 3Iraq 4Israel 1Italy 3Japan 38Jordan 3Kazakhstan 12Mauritius 5Mexico 2Morocco 22Netherlands 2Nigeria 9Norway 1Pakistan 5Republic of Korea 91Russian Federation 1Saudi Arabia 76Singapore 1Spain 1Sri Lanka 4Sweden 1Switzerland 5Syrian Arab Republic 1Taiwan 29Thailand 1Turkey 2Uganda 2United Arab Emirates 3United Kingdom 6United Republic of Tanzania 1United States of America 5Venezuela 1Vietnam 1Total 709
UFV INTERNATIONAL STUDENTS 2008/09
Unduplicated Headcount
43%
13% 11%7% 5% 4% 3% 2% 1% 1%
0%5%
10%15%20%25%30%35%40%45%50%
International Students and Top 10 Countries of Origin
535 533 559
650709
0
100
200
300
400
500
600
700
800
2005 2006 2007 2008 2009
International Student Headcount
40
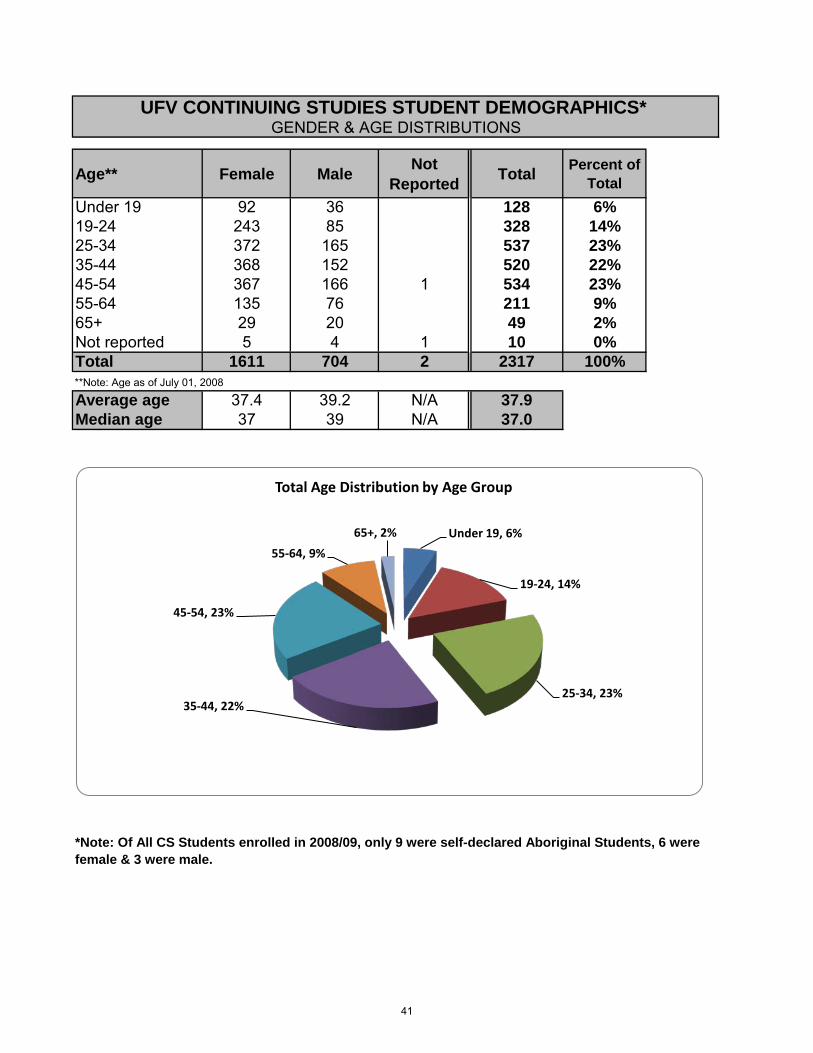
Age** Female Male Not Reported Total Percent of
TotalUnder 19 92 36 128 6%19-24 243 85 328 14%25-34 372 165 537 23%35-44 368 152 520 22%45-54 367 166 1 534 23%55-64 135 76 211 9%65+ 29 20 49 2%Not reported 5 4 1 10 0%Total 1611 704 2 2317 100%**Note: Age as of July 01, 2008
Average age 37.4 39.2 N/A 37.9Median age 37 39 N/A 37.0
UFV CONTINUING STUDIES STUDENT DEMOGRAPHICS* GENDER & AGE DISTRIBUTIONS
*Note: Of All CS Students enrolled in 2008/09, only 9 were self-declared Aboriginal Students, 6 were female & 3 were male.
Under 19, 6%
19-24, 14%
25-34, 23%35-44, 22%
45-54, 23%
55-64, 9%
65+, 2%
Total Age Distribution by Age Group
41
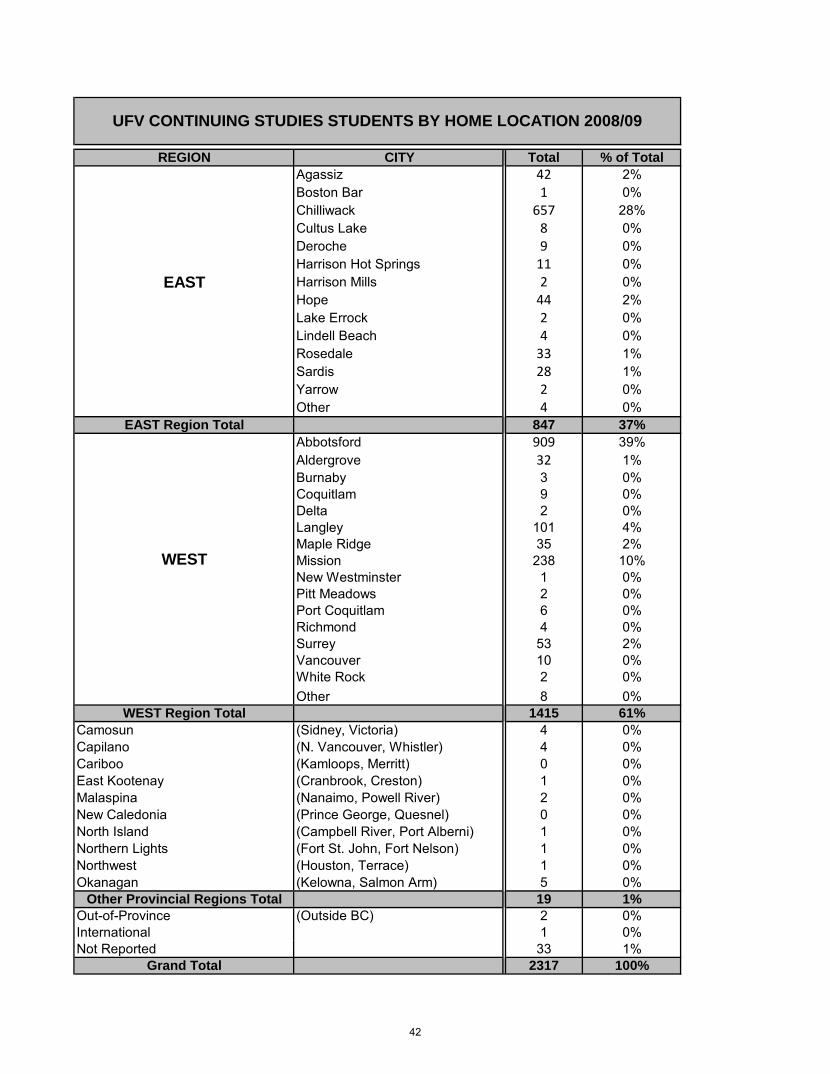
REGION CITY Total % of TotalAgassiz 42 2%Boston Bar 1 0%Chilliwack 657 28%Cultus Lake 8 0%Deroche 9 0%Harrison Hot Springs 11 0%Harrison Mills 2 0%Hope 44 2%Lake Errock 2 0%Lindell Beach 4 0%Rosedale 33 1%Sardis 28 1%Yarrow 2 0%Other 4 0%
EAST Region Total 847 37%Abbotsford 909 39%Aldergrove 32 1%Burnaby 3 0%Coquitlam 9 0%Delta 2 0%Langley 101 4%Maple Ridge 35 2%Mission 238 10%New Westminster 1 0%Pitt Meadows 2 0%Port Coquitlam 6 0%Richmond 4 0%Surrey 53 2%Vancouver 10 0%White Rock 2 0%Other 8 0%
WEST Region Total 1415 61%Camosun (Sidney, Victoria) 4 0%Capilano (N. Vancouver, Whistler) 4 0%Cariboo (Kamloops, Merritt) 0 0%East Kootenay (Cranbrook, Creston) 1 0%Malaspina (Nanaimo, Powell River) 2 0%New Caledonia (Prince George, Quesnel) 0 0%North Island (Campbell River, Port Alberni) 1 0%Northern Lights (Fort St. John, Fort Nelson) 1 0%Northwest (Houston, Terrace) 1 0%Okanagan (Kelowna, Salmon Arm) 5 0%
Other Provincial Regions Total 19 1%Out-of-Province (Outside BC) 2 0%International 1 0%Not Reported 33 1%
Grand Total 2317 100%
EAST
WEST
UFV CONTINUING STUDIES STUDENTS BY HOME LOCATION 2008/09
42
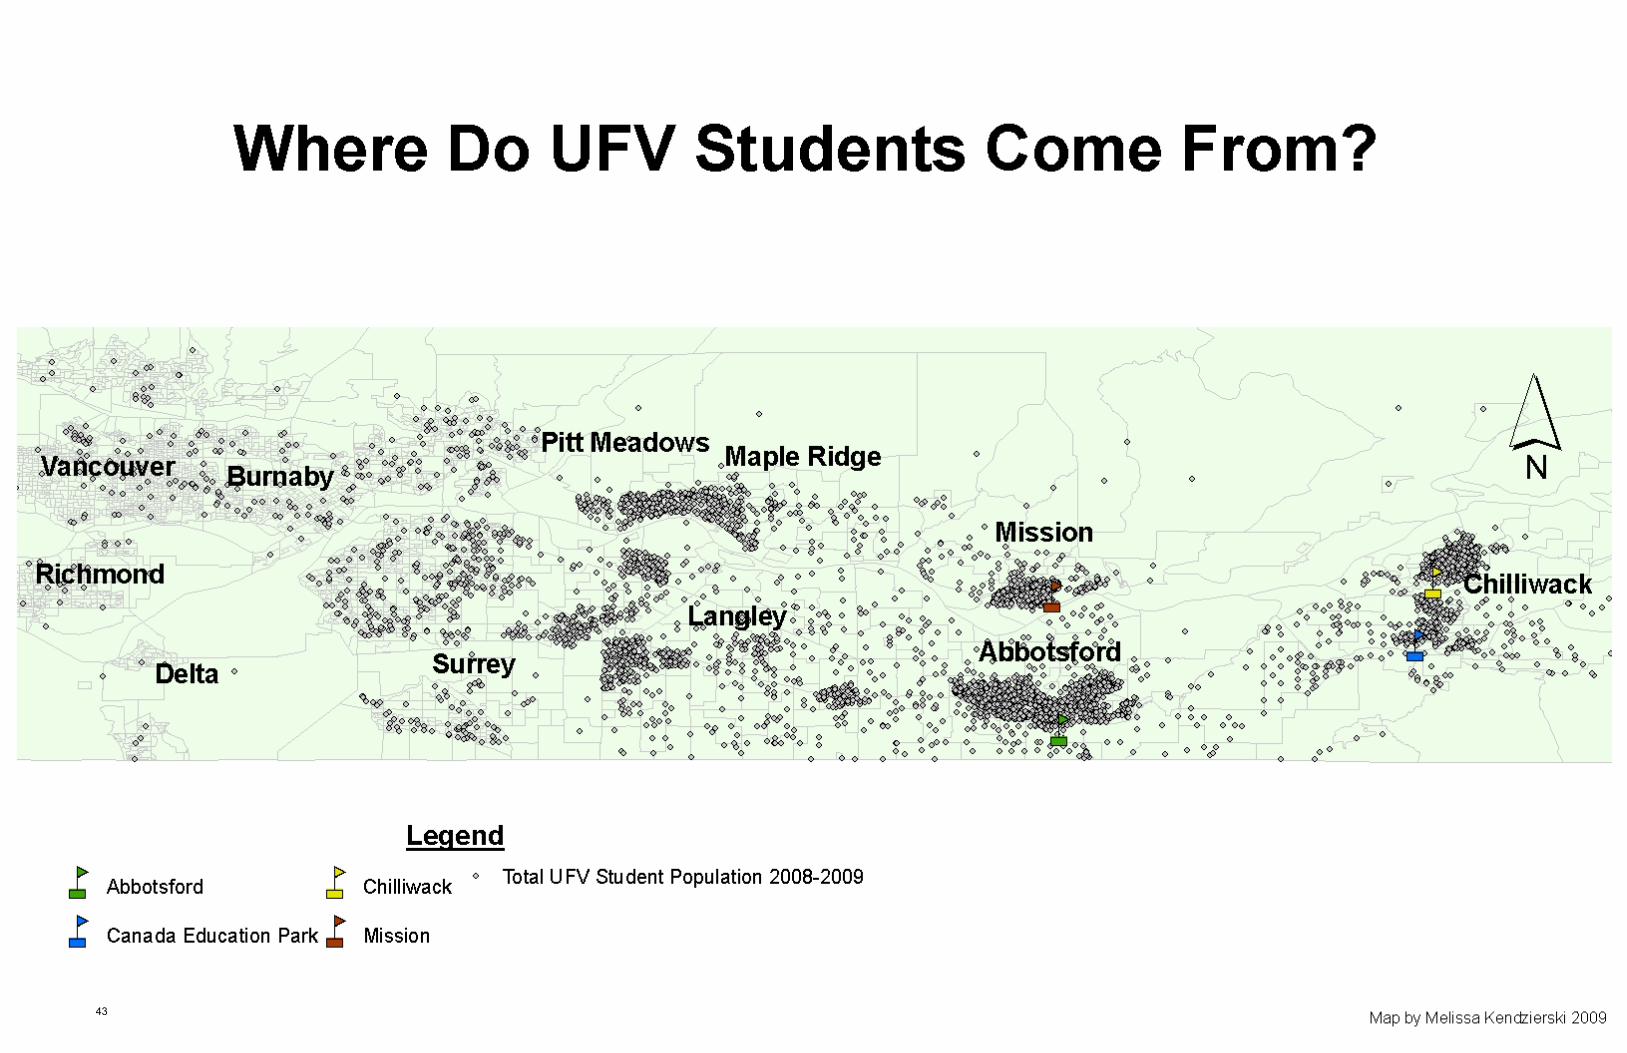
43
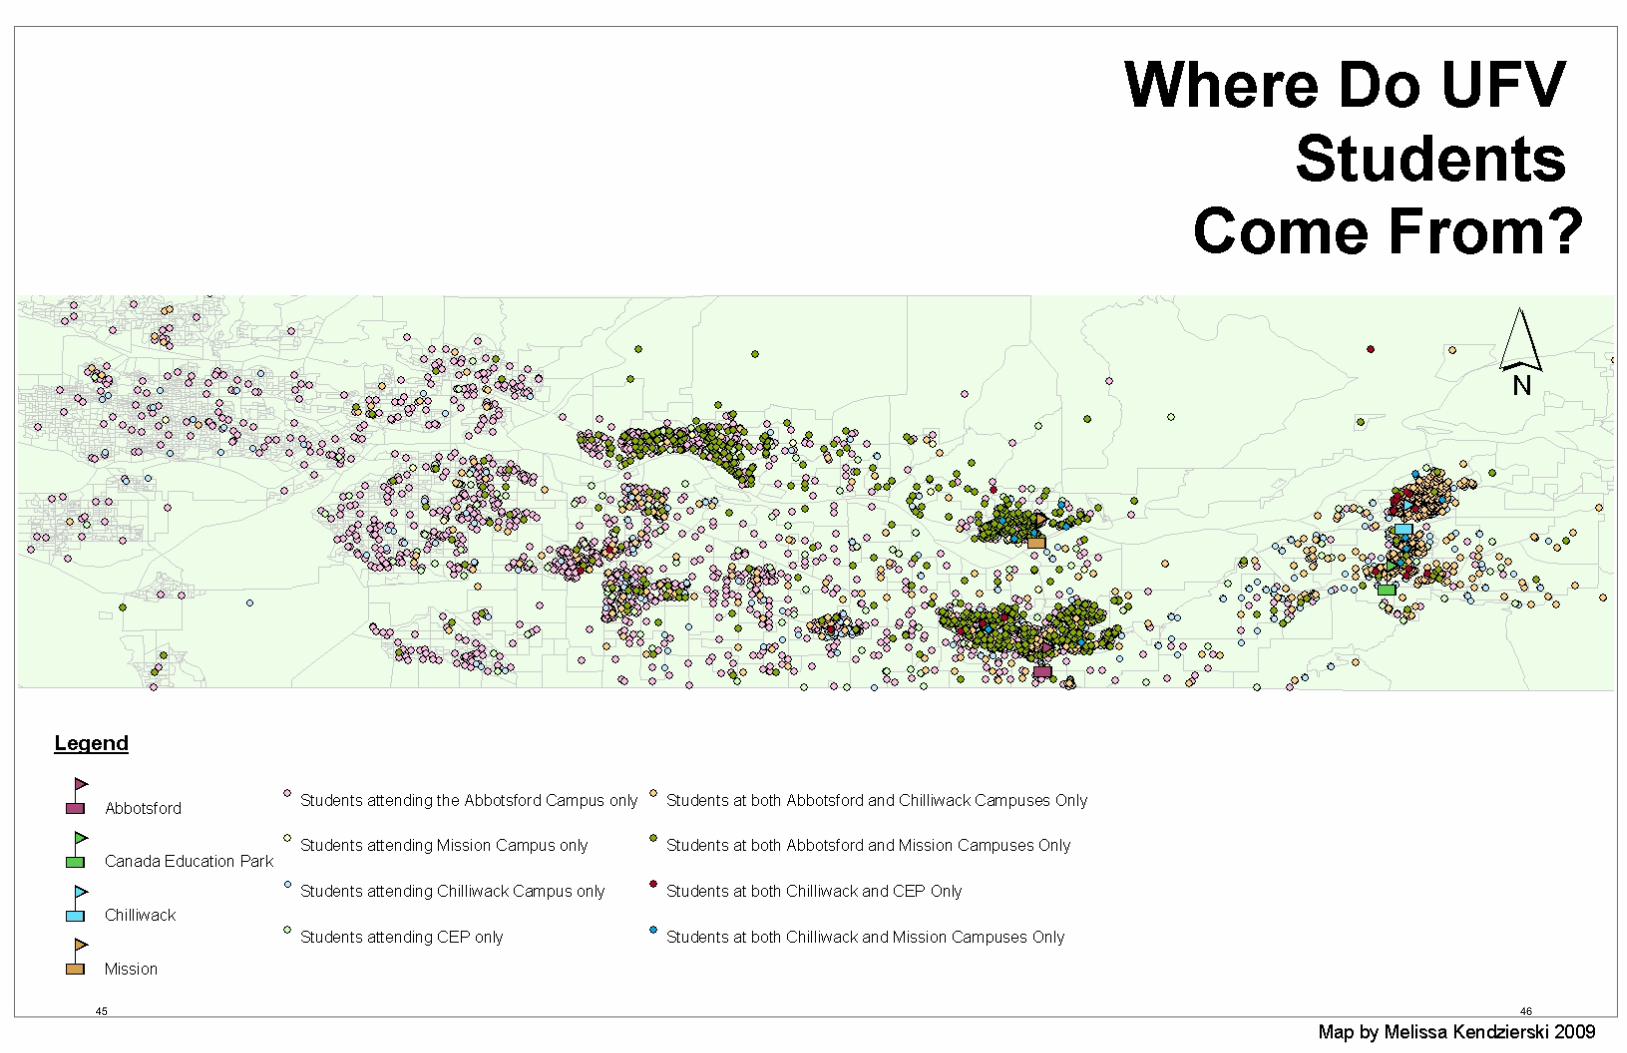
45 46
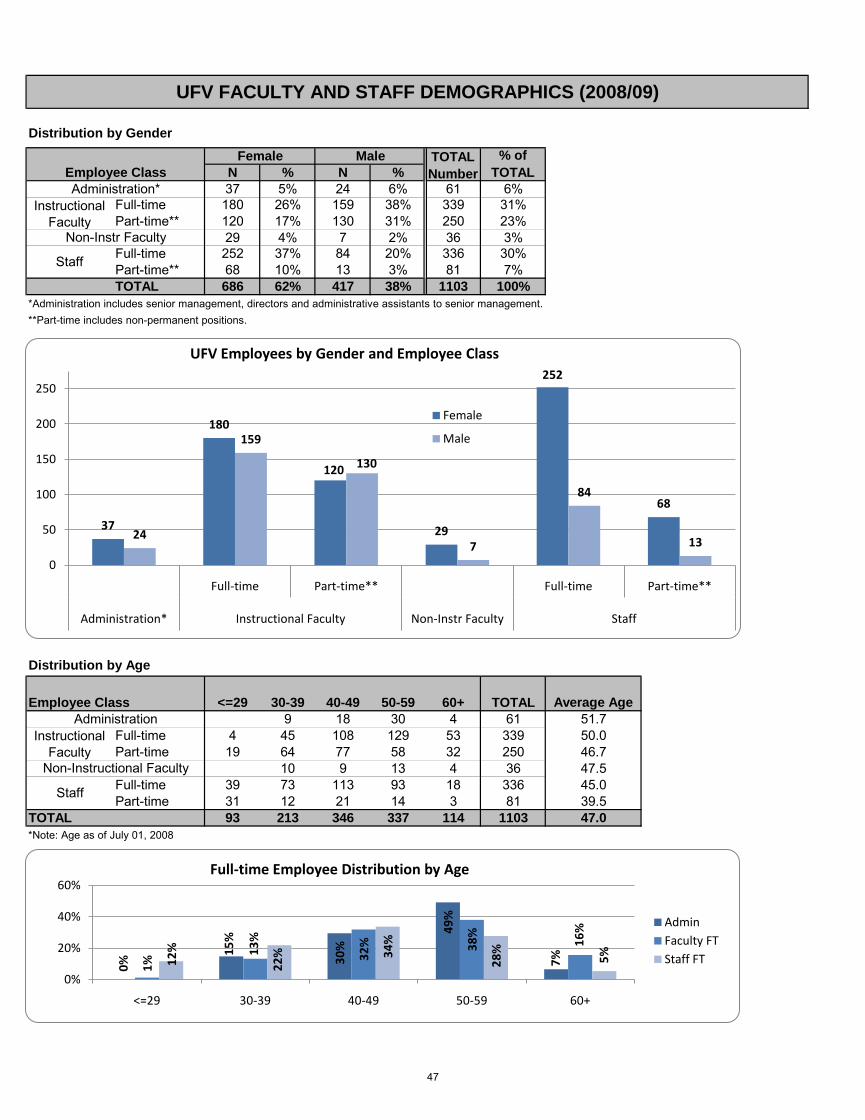
Distribution by Gender
N % N %37 5% 24 6% 61 6%
Full-time 180 26% 159 38% 339 31%Part-time** 120 17% 130 31% 250 23%
29 4% 7 2% 36 3%Full-time 252 37% 84 20% 336 30%Part-time** 68 10% 13 3% 81 7%TOTAL 686 62% 417 38% 1103 100%
*Administration includes senior management, directors and administrative assistants to senior management.**Part-time includes non-permanent positions.
Distribution by Age
Employee Class <=29 30-39 40-49 50-59 60+ TOTAL Average Age9 18 30 4 61 51.7
Full-time 4 45 108 129 53 339 50.0Part-time 19 64 77 58 32 250 46.7
10 9 13 4 36 47.5Full-time 39 73 113 93 18 336 45.0Part-time 31 12 21 14 3 81 39.5
TOTAL 93 213 346 337 114 1103 47.0*Note: Age as of July 01, 2008
% of TOTAL
Instructional Faculty
Staff
Administration*
UFV FACULTY AND STAFF DEMOGRAPHICS (2008/09)
Instructional Faculty
Staff
TOTAL NumberEmployee Class
Female Male
Administration
Non-Instr Faculty
Non-Instructional Faculty
37
180
120
29
252
68
24
159
130
7
84
13
0
50
100
150
200
250
Full-time Part-time** Full-time Part-time**
Administration* Instructional Faculty Non-Instr Faculty Staff
UFV Employees by Gender and Employee Class
Female
Male
0%
15%
30%
49%
7%1%
13%
32% 38
%
16%
12%
22% 34
%
28%
5%
0%
20%
40%
60%
<=29 30-39 40-49 50-59 60+
Full-time Employee Distribution by Age
AdminFaculty FTStaff FT
47
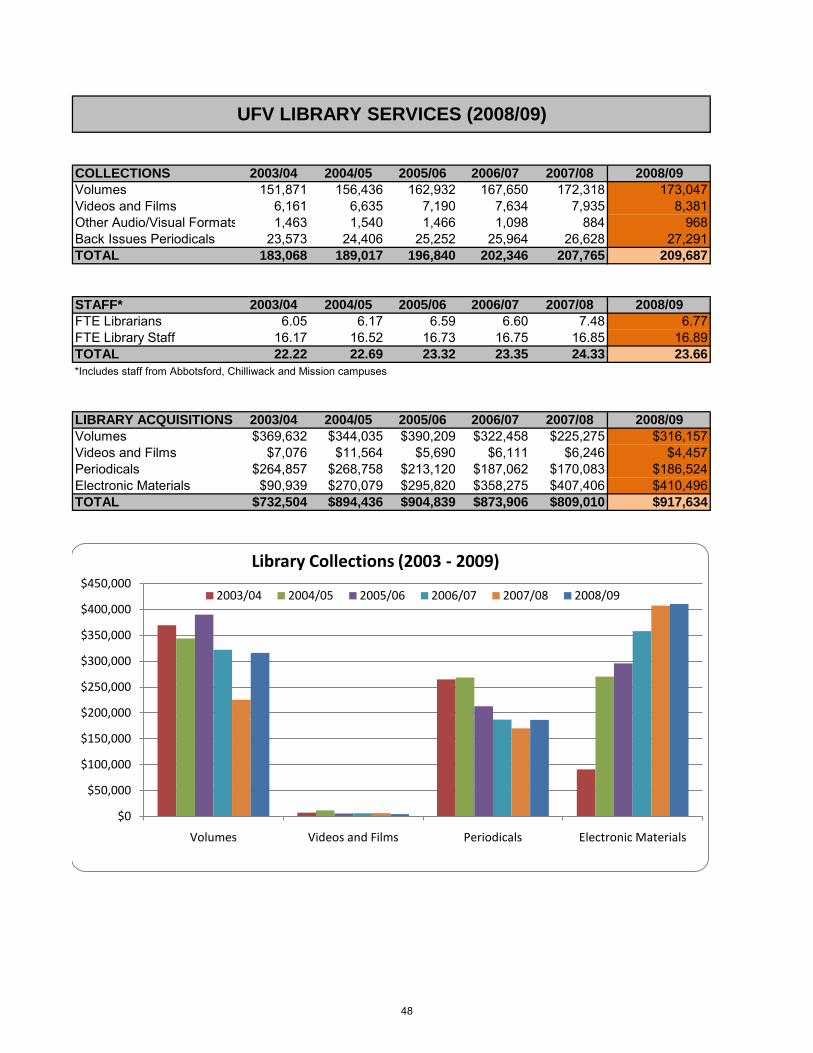
COLLECTIONS 2003/04 2004/05 2005/06 2006/07 2007/08 2008/09Volumes 151,871 156,436 162,932 167,650 172,318 173,047Videos and Films 6,161 6,635 7,190 7,634 7,935 8,381Other Audio/Visual Formats 1,463 1,540 1,466 1,098 884 968Back Issues Periodicals 23,573 24,406 25,252 25,964 26,628 27,291TOTAL 183,068 189,017 196,840 202,346 207,765 209,687
STAFF* 2003/04 2004/05 2005/06 2006/07 2007/08 2008/09FTE Librarians 6.05 6.17 6.59 6.60 7.48 6.77FTE Library Staff 16.17 16.52 16.73 16.75 16.85 16.89TOTAL 22.22 22.69 23.32 23.35 24.33 23.66*Includes staff from Abbotsford, Chilliwack and Mission campuses
LIBRARY ACQUISITIONS 2003/04 2004/05 2005/06 2006/07 2007/08 2008/09Volumes $369,632 $344,035 $390,209 $322,458 $225,275 $316,157Videos and Films $7,076 $11,564 $5,690 $6,111 $6,246 $4,457Periodicals $264,857 $268,758 $213,120 $187,062 $170,083 $186,524Electronic Materials $90,939 $270,079 $295,820 $358,275 $407,406 $410,496TOTAL $732,504 $894,436 $904,839 $873,906 $809,010 $917,634
UFV LIBRARY SERVICES (2008/09)
$0
$50,000
$100,000
$150,000
$200,000
$250,000
$300,000
$350,000
$400,000
$450,000
Volumes Videos and Films Periodicals Electronic Materials
Library Collections (2003 - 2009)
2003/04 2004/05 2005/06 2006/07 2007/08 2008/09
48
Appendix Data Definitions • 2008-2009 Fact Book – includes all stable enrolment from the fiscal year (Summer
2008, Fall 2008 and Winter 2009 terms). • Full-time Undergraduate Student – a student enrolled in 60% or more of the
standard course load.
• Full-time Graduate Student - a student who is admitted to a graduate program and enrolled in a minimum of six credits during a single semester for two or more semesters.
• Home Location – a student’s home location is determined by their mailing address.
• DASCO - Diploma, Associate Degree, and Certificate Student Outcomes (formerly
College and Institute Student Outcomes (CISO))
• BGS – Baccalaureate Graduate Survey
49