Embed Size (px)
Citation preview
8/3/2019 2008 Vienna Ifa Summary
http://slidepdf.com/reader/full/2008-vienna-ifa-summary 1/11
A/08/87bJuly 2008
76th IFA Annual ConferenceVienna (Austria), 19-21 May 2008
Medium-Term Outlookfor Global Fertilizer Demand,Supply and Trade
2008 – 2012
Summary Report
Patrick Heffer and Michel Prud’hommeInternational Fertilizer Industry Association (IFA)
International Fertilizer Industry Association (IFA) – 28, rue Marbeuf – 75008 Paris – FranceTel. +33 1 53 93 05 00 – Fax +33 1 53 93 05 45/47 – [email protected] – www.fertilizer.org
Copyright © 2008 International Fertilizer Industry Association – All Rights Reserved
8/3/2019 2008 Vienna Ifa Summary
http://slidepdf.com/reader/full/2008-vienna-ifa-summary 2/11
This public Summary Report was prepared by Patrick Heffer, Executive Secretary of theIFA Agriculture Committee, and Michel Prud’homme, Executive Secretary of the IFAProduction and International Trade Committee. The first part looks at the global contextand agricultural situation. The second part provides global and regional fertilizerconsumption projections for the period 2007/08 to 2012/13. The third part provides IFAprojections of fertilizer supply and supply/demand balances for the period 2008 to 2012.
This report is available to the general public on the IFA web site or by request to the IFASecretariat.
The Summary Report draws on the revised versions of two reports presented at the 76th
IFA Annual Conference held in Vienna in May 2008: the IFA report Medium-Term Outlook for World Agriculture and Fertilizer Demand: 2007/08 – 2012/13 (A/08/85), and the IFAreport Global Fertilizers and Raw Materials Supply and Supply/Demand Balances: 2008 – 2012 (A/08/73b). These two comprehensive reports are strictly reserved for IFAmembers.
Copyright © 2008 International Fertilizer Industry Association - All Rights Reserved
8/3/2019 2008 Vienna Ifa Summary
http://slidepdf.com/reader/full/2008-vienna-ifa-summary 3/11
76th
IFA Annual Conference, Vienna, May 2008Summary Report “Medium-Term Outlook for Global Fertilizer Demand, Supply and Trade: 2008-2012”, P. Heffer and M. Prud’homme, IFA
PART 1 – GLOBAL ECONOMIC CONTEXTAND AGRICULTURAL SITUATION
1.1. Global Context
1.1.1. Economic Situation
In 2007, the global economy remained strongwith, however, a marked slowdown during thelast quarter. Growth of the world grossdomestic product (GDP) is assessed at 4.9%,as buoyant economic growth in emerging Asiahas offset the deceleration registered in theUSA. Global expansion is losing speed in 2008,with GDP growth forecast at some 3.7% by theInternational Monetary Fund (IMF). This declineis driven by the current crisis in the US housingand financial sectors, which is partly
counterbalanced by continuous robustdevelopment in most developing countries. Theoutlook for the global economy might berevised down further if the situation in the USAcontinues to deteriorate. Under a pessimisticscenario, the United Nations projects a drop inworld economic growth to 1.6%. The beneficialimpact of GDP growth could be mitigated byfast-increasing inflation in a number ofdeveloping countries, including China.
Income growth in emerging economies triggersfood diversification towards more meat, fish,fruits, vegetables, sugar and vegetable oils andfewer cereals and pulses per capita. More meatproduction requires greater amounts of feedingredients (feed cereals, oilseed meals,distillers’ grain, etc.). Furthermore, productionof oilseeds, fruits, vegetables and other cashcrops strongly competes with that of cereals forland.
Crude oil prices surged in 2007 and continuedto rise during the first half of 2008, to reachmore than US$ 135 per barrel. Theseunprecedented levels impact fertilizerproduction and trade and, therefore, fertilizer
prices. In addition, they provide a strongrationale for developing biofuel production.
1.1.2. Policies and Regulations
Food inflation and food security are currentlyvery high on the policy agenda. Prices of mostagricultural commodities have soared over thepast 12 months, leading to unrest in a numberof low-income and food-deficit countries.
With the objective of improving food availabilityand affordability, the Food and AgricultureOrganization of the United Nations (FAO), theWorld Bank and many other bodies areconsidering options for easing current very tightmarket conditions in respect to virtually allcereal and oilseed crops.
In the short term, many countries have takenunilateral actions to keep domestic foodinflation under control and to ensure adequatefood supply. Thus, a number of major grainproducers have recently imposed various formsof export restrictions (taxes, quotas, bans, etc.),which result in even higher grain prices on theinternational market.
In that context, environmental objectives aretemporarily lower on the agenda of manycountries and international organizations, withthe notable exception of objectives related to
greenhouse gas emissions and climate change.
Despite the food vs. fuel debate, biofuelproduction has been increasing rapidly.Decision makers in the USA and in theEuropean Union (EU) have recently adoptednew policies on renewable energies. Thesepolicies set new mandates for biofuels that aremore ambitious than previous ones. Whetherthe mandates can be achieved, and whetherthey will be maintained in the current policycontext, is questionable.
In any case, over the next five years the pace
of biofuel expansion is expected to slow,according to the United States Department ofAgriculture (USDA) and the Food andAgricultural Policy Research Institute (FAPRI).For instance, from 2008/09 there will be littlepotential for increasing the share of US maizebeing converted to ethanol. Future expansion ofbiofuel production in the USA would have tocome from other technologies, such asbiodiesel and cellulosic ethanol. Similarly, in theEU the expansion of biofuel production wouldhave to come mostly from ethanol productionusing cereals and sugar beet as feedstocks,rather than from further growth in theproduction of rapeseed-based biodiesel. Incontrast, Brazil has much greater potential inthe short term, as land and water availability inthat country is less limiting.
Environmental concerns have a much greaterimpact on agriculture and fertilizer demand indeveloped countries than in developing ones.Increasingly, farmers in developed countriesare being requested to reduce nitrogen andphosphorus losses in order to preserve orimprove water and air quality.
8/3/2019 2008 Vienna Ifa Summary
http://slidepdf.com/reader/full/2008-vienna-ifa-summary 4/11
76th IFA Annual Conference, Vienna, May 2008
Summary Report “Medium-Term Outlook for Global Fertilizer Demand, Supply and Trade: 2008-2012”, P. Heffer and M. Prud’homme, IFA
- 2 -
At the same time, increasing emphasis is beingput on soil fertility. Optimizing the recycling oforganic nutrient sources and producing nutrientbudgets are common requirements in manydeveloped countries. A growing number ofdeveloping countries are also paying dueattention to better management of
manufactured fertilizers and other nutrientsources, with the objective of preserving theenvironment, finding alternatives to tightfertilizer supply and enhancing farmers’ income.The impact of soil nutrient mining due tounderuse of fertilizers in Sub-Saharan Africa isattracting increasing interest; urgent action isneeded to prevent further soil fertilitydegradation and make it possible to raiseproductivity in the region.
Increasing fertilizer prices influence fertilizerapplication rates and nutrient ratios. Countries
with fertilizer subsidy schemes are in generalless impacted. Currently, out of the 25 largestfertilizer-consuming countries, ten (mostlydeveloping Asian countries) implement someform of fertilizer subsidisation.
1.1.3. Weather Conditions
Weather conditions in the northern hemispherehave been favourable overall during the winterand spring. The main concern relates to wetconditions in the US Corn Belt, which aresignificantly delaying maize planting operations.
This could result in a smaller area planted tomaize, to the benefit of soybean, or in yieldpotential losses. Cyclone Nargis has floodedone of the key rice producing regions ofMyanmar; it is too soon to estimate the impactof this flooding on the 2008 rice harvest.
1.2. Agricultural Situation
1.2.1. Short-term Prospects
Despite a record world cereal output, estimatedat 2.1 billion metric tonnes (Bt) sharp in 2007, asmall deficit is anticipated at the end of the2007/08 marketing campaign. This would resultin a contraction of world inventories, and in anaggregate stock-to-use ratio for cerealsreaching record lows for at least two decades.In this context, prices for most cerealsstrengthened in 2007 and have continued to doso during the first half of 2008, with theexception of wheat prices, which peaked duringthe first quarter of 2008.
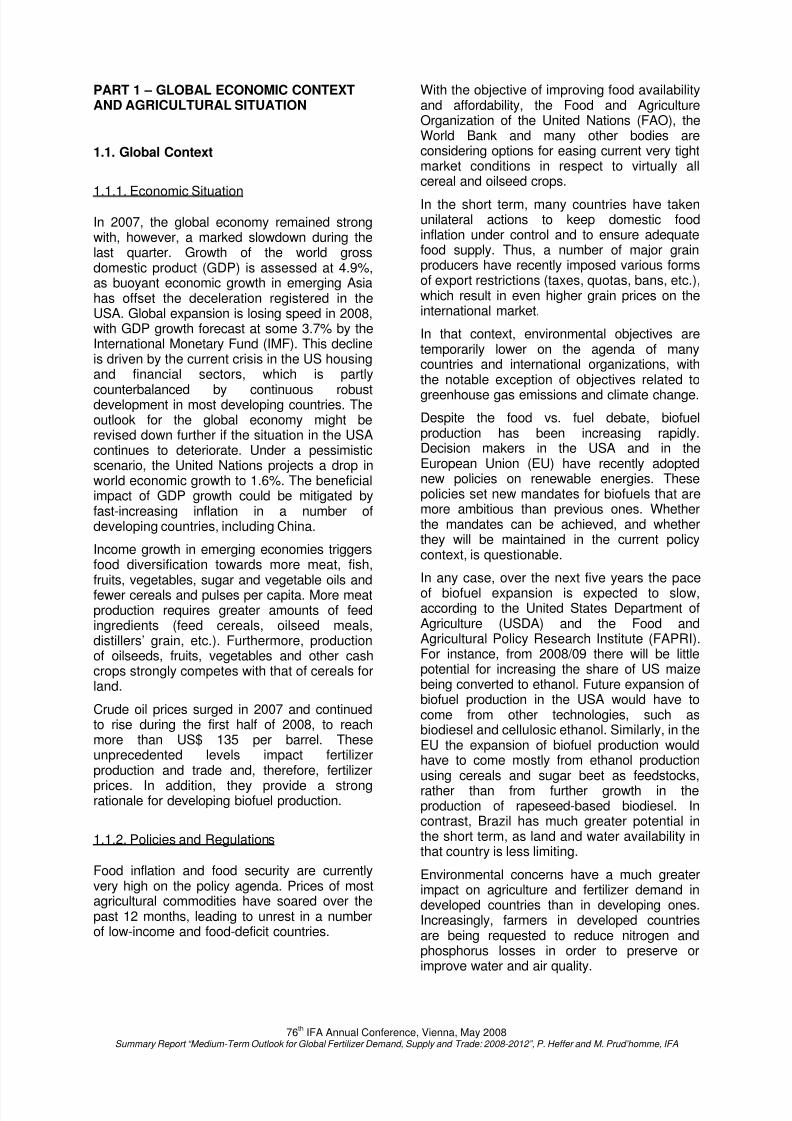
Preliminary forecasts for the 2008 harvest pointto a new record cereal crop, up 2.8% from theprevious year to 2.16 Bt.
World Cereal Production and Utilization (Mt)
Source: FAO
The wheat output is seen as strongly
rebounding (+8.2%) after two consecutivedisappointing harvests. Coarse grain productionwould only increase marginally (+0.3%) fromthe previous year’s record, and the rice crop isprojected to increase by 1.1%. Oilseedproduction is seen as rising sharply (+8.2%),while sugar and cotton crops would contract by2% each.
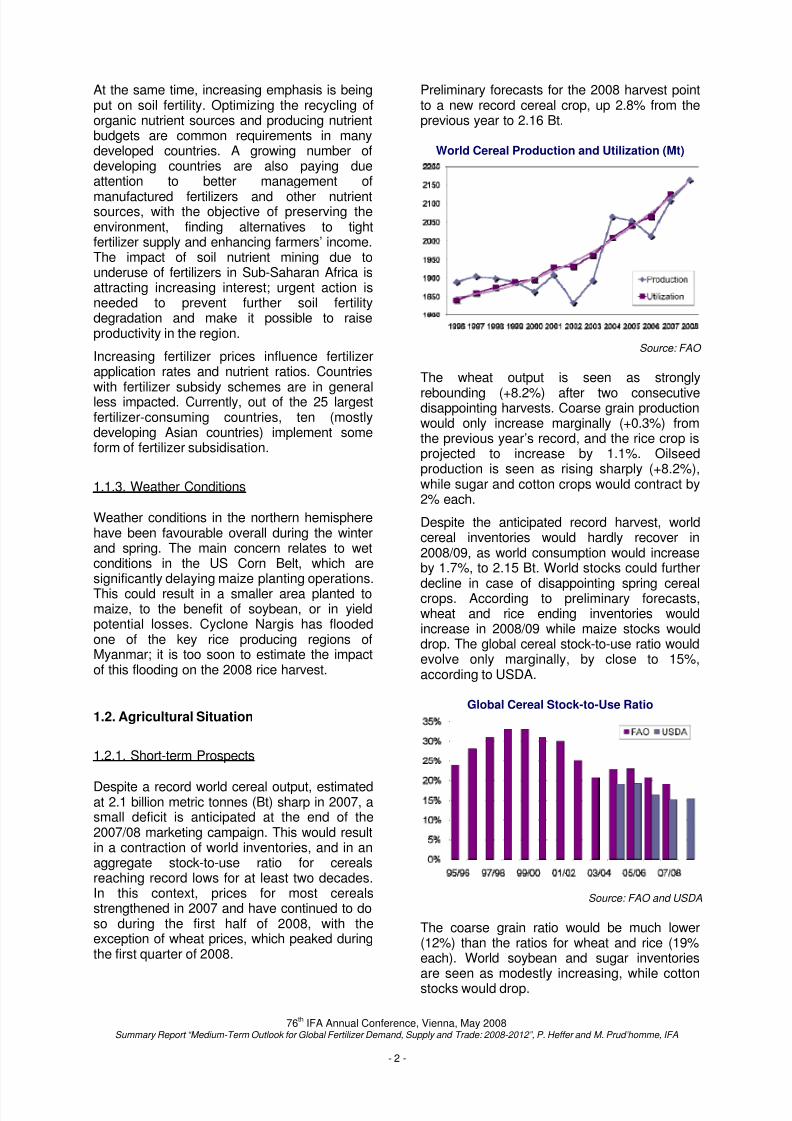
Despite the anticipated record harvest, worldcereal inventories would hardly recover in2008/09, as world consumption would increaseby 1.7%, to 2.15 Bt. World stocks could further
decline in case of disappointing spring cerealcrops. According to preliminary forecasts,wheat and rice ending inventories wouldincrease in 2008/09 while maize stocks woulddrop. The global cereal stock-to-use ratio wouldevolve only marginally, by close to 15%,according to USDA.
Global Cereal Stock-to-Use Ratio
Source: FAO and USDA
The coarse grain ratio would be much lower(12%) than the ratios for wheat and rice (19%each). World soybean and sugar inventoriesare seen as modestly increasing, while cottonstocks would drop.
8/3/2019 2008 Vienna Ifa Summary
http://slidepdf.com/reader/full/2008-vienna-ifa-summary 5/11
76th IFA Annual Conference, Vienna, May 2008
Summary Report “Medium-Term Outlook for Global Fertilizer Demand, Supply and Trade: 2008-2012”, P. Heffer and M. Prud’homme, IFA
- 3 -
Because tight market conditions are expectedto prevail in 2008/09, cereal and oilseed pricesare likely to remain high. Sugar and cottonprices are not as firm, but are still attractivecompared to some years ago.
1.2.2. Medium-term Agricultural Outlook
In a medium-term perspective, there is a needto quickly increase agricultural production inorder to meet the food, feed, fiber and biofuelrequirements of the world population. It isanticipated that the expansion of biofuelproduction will decelerate until newtechnologies such as cellulosic ethanolproduction are commercially competitive. Thisis projected to result in a progressive slowdownof world grain consumption.
Nevertheless, supply/demand balances for
most agricultural commodities are seen asremaining tight, and crop prices are notexpected to evolve dramatically from currentlevels.
With increasing food diversification, productionof meat, dairy products, fruits and vegetableswould also increase steadily, in particular inemerging Asia where average income issteadily rising.
At the country level, the following changes areanticipated: a large maize area to the detrimentof other crops in the USA; more soybean, sugarcane and maize in Brazil; more soybean andcereals in Argentina; the end of the mandatoryset-aside in the EU; more cereals, oilseeds andsugar beet in the Commonwealth ofIndependent States (CIS); more cash crops inIndia; more maize, fruits and vegetables andless wheat and rice in China; more oil palm inIndonesia and Malaysia.
Few changes are anticipated in Sub-SaharanAfrica, despite the huge untapped potential ofthis region.
Output gains are anticipated to come fromincreases in cropped area and yields. Thecultivated area is seen as essentially increasingin Argentina, Brazil, Indonesia, Malaysia,Russia and Ukraine.
Abolition of the mandatory set-aside in the EUand release of Conservation Reserve Program(CRP) land in the USA are also expected toopen additional areas for cropping.
PART 2 – GLOBAL FERTILIZER DEMAND
2.1. Short-term Prospects
In response to very attractive agriculturalcommodity prices in 2007 and the first half of
2008, as well as to policies promoting fertilizeruse in many Asian countries and favourableweather conditions in the northern hemisphereover the past few months, global fertilizerdemand is seen as up 4.1% in 2007/08. Worlddemand would reach 169.4 million metrictonnes (Mt) nutrients, compared to 162.7 Mt theyear before. Potash consumption wouldincrease by 6%, compared to 4% for nitrogenand 3% for phosphate. At the regional level,demand is seen as surging in Latin America(+12.8%) in response to very favourable cropprices. It is also projected to rise in Eastern
Europe and Central Asia (+6.3%), East Asia(+6.1%), South Asia (+3.4%) and Western andCentral Europe (+2.0%). Consumption wouldstagnate in Africa, and drops are anticipated inWest Asia (-6.3%), North America (-1.3%) andOceania (-0.5%).
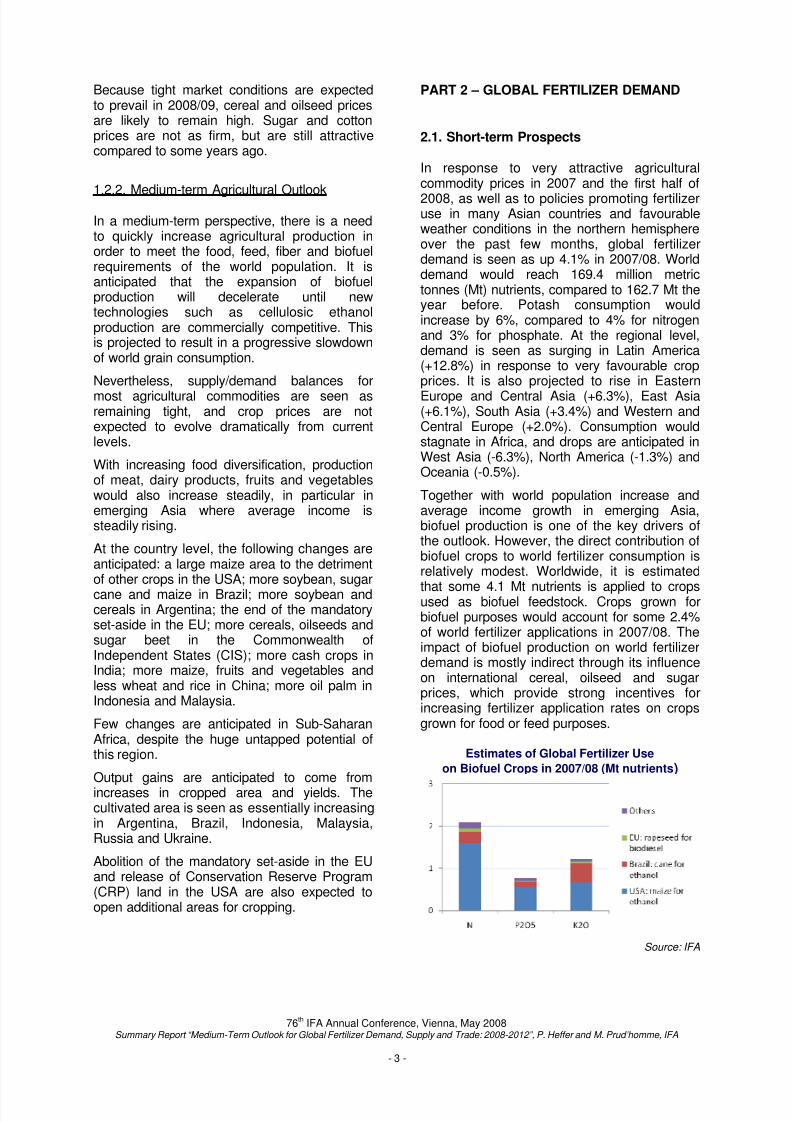
Together with world population increase andaverage income growth in emerging Asia,biofuel production is one of the key drivers ofthe outlook. However, the direct contribution ofbiofuel crops to world fertilizer consumption isrelatively modest. Worldwide, it is estimated
that some 4.1 Mt nutrients is applied to cropsused as biofuel feedstock. Crops grown forbiofuel purposes would account for some 2.4%of world fertilizer applications in 2007/08. Theimpact of biofuel production on world fertilizerdemand is mostly indirect through its influenceon international cereal, oilseed and sugarprices, which provide strong incentives forincreasing fertilizer application rates on cropsgrown for food or feed purposes.
Estimates of Global Fertilizer Use
on Biofuel Crops in 2007/08 (Mt nutrients)
Source: IFA
8/3/2019 2008 Vienna Ifa Summary
http://slidepdf.com/reader/full/2008-vienna-ifa-summary 6/11
76th IFA Annual Conference, Vienna, May 2008
Summary Report “Medium-Term Outlook for Global Fertilizer Demand, Supply and Trade: 2008-2012”, P. Heffer and M. Prud’homme, IFA
- 4 -
With market conditions expected to remainexceptionally favourable in the coming months,global fertilizer demand is projected to furthergrow in 2008/09 by some 3.1%, to reach 174.7Mt. Contrary to the previous year, growth indemand is forecast to be stronger for nitrogen(+3.6%) than for phosphate (+2.7%) and potash
(+2.2%). The fertilizer market is anticipated toexpand in all the regions but West Asia (-0.5%),with Oceania (+5.0%) and Eastern Europe andCentral Asia (+4.9%) recording the highestyear-on-year growth rates. Consumption growthwould be modest in Western and CentralEurope (+0.6%). In all the other regions,demand is seen as up by 3 to 4% from theprevious year.
2.2. Medium-term Fertilizer Demand Outlook
In the medium term, world fertilizer demand isprojected to grow steadily. Compared toaverage consumption between 2005/06 and2007/08, global demand in 2012/13 is seen asincreasing by 3.1% annually on average, toreach 194.3 Mt. In view of anticipated tightermarket conditions for phosphate and potash vs.nitrogen, as well as the need to boost yields tomeet world food, feed, fiber and biofuelrequirements, nitrogen demand is seen asrising slightly faster (+3.2% p.a.) thanconsumption of potash (+3.0% p.a.) andphosphate (+2.8% p.a.).
Global Fertilizer Consumption(Mt nutrients)
2007/08(e)
2008/09(f)
Change 2012/13
(f)
Average Annual
Change* N 100.0 103.5 +3.6% 115.6 +3.2%
P2O5 40.1 41.2 +2.7% 45.7 +2.8%
K2O 29.3 30.0 +2.2% 33.0 +3.0%
Total 169.4 174.7 +3.1% 194.3 +3.1%
(e) estimated; (f) forecast * Compared to the average 2005/06 to 2007/08
Source: IFA
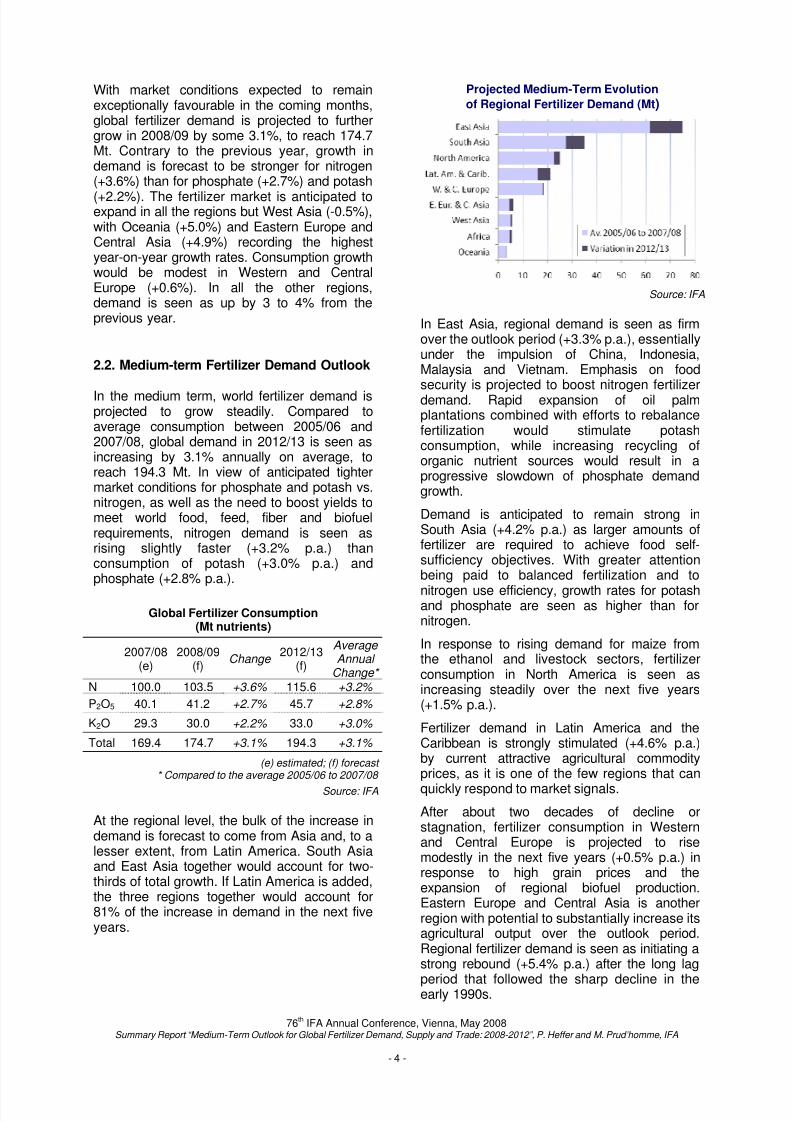
At the regional level, the bulk of the increase indemand is forecast to come from Asia and, to alesser extent, from Latin America. South Asiaand East Asia together would account for two-thirds of total growth. If Latin America is added,the three regions together would account for81% of the increase in demand in the next fiveyears.
Projected Medium-Term Evolution
of Regional Fertilizer Demand (Mt)
Source: IFA
In East Asia, regional demand is seen as firmover the outlook period (+3.3% p.a.), essentiallyunder the impulsion of China, Indonesia,Malaysia and Vietnam. Emphasis on foodsecurity is projected to boost nitrogen fertilizerdemand. Rapid expansion of oil palmplantations combined with efforts to rebalancefertilization would stimulate potashconsumption, while increasing recycling oforganic nutrient sources would result in aprogressive slowdown of phosphate demandgrowth.
Demand is anticipated to remain strong inSouth Asia (+4.2% p.a.) as larger amounts offertilizer are required to achieve food self-sufficiency objectives. With greater attentionbeing paid to balanced fertilization and to
nitrogen use efficiency, growth rates for potashand phosphate are seen as higher than fornitrogen.
In response to rising demand for maize fromthe ethanol and livestock sectors, fertilizerconsumption in North America is seen asincreasing steadily over the next five years(+1.5% p.a.).
Fertilizer demand in Latin America and theCaribbean is strongly stimulated (+4.6% p.a.)by current attractive agricultural commodityprices, as it is one of the few regions that can
quickly respond to market signals.
After about two decades of decline orstagnation, fertilizer consumption in Westernand Central Europe is projected to risemodestly in the next five years (+0.5% p.a.) inresponse to high grain prices and theexpansion of regional biofuel production.Eastern Europe and Central Asia is anotherregion with potential to substantially increase itsagricultural output over the outlook period.Regional fertilizer demand is seen as initiating astrong rebound (+5.4% p.a.) after the long lag
period that followed the sharp decline in theearly 1990s.
8/3/2019 2008 Vienna Ifa Summary
http://slidepdf.com/reader/full/2008-vienna-ifa-summary 7/11
76th IFA Annual Conference, Vienna, May 2008
Summary Report “Medium-Term Outlook for Global Fertilizer Demand, Supply and Trade: 2008-2012”, P. Heffer and M. Prud’homme, IFA
- 5 -
Fertilizer demand in West Asia would increaseby 2.1% p.a., as limiting the food import bill is akey issue for many countries in the region. Mostof the increase would be in demand for nitrogenfertilizers.
Fertilizer consumption in Africa is projected to
increase by only 3.2% p.a. from its current verylow base, despite the huge untapped potentialof Sub-Saharan Africa. High agriculturalcommodity prices are likely to benefit onlythose farmers who are well connected to theinput and output markets.
Fertilizer consumption in Oceania is seen asrecovering slowly (+1.4% p.a.) from the twoconsecutive droughts that have severelyimpacted Australian agriculture.
PART 3 – GLOBAL FERTILIZER SUPPLY
Since early 2007, the global fertilizer markethas entered a new demand-pull cycle, driven bya surge in overall consumption and a shortageof available supply. Indeed, 2007 was a recordproduction year for most products, as buoyantdemand stretched the fertilizer industry’scapability to meet global plant nutrientsrequirements. The prices of fertilizer productshave reached record levels in the past tenyears. Global supply/demand balances for mostfertilizers, intermediates and raw materials weretight during 2007 and entering 2008.
Demand prospects in the medium term lookbullish, with global consumption expanding atan annual rate of 2.7 per cent between 2008and 2012, which is above the five-year averagegrowth rate of the past decade. World fertilizerconsumption is projected at 173.5 Mt nutrientsin 2008, reaching 193.1 Mt in 2012.
Global Fertilizer ConsumptionCalendar Year Basis
Mt
nutrients 2007(e)
2008(f)
2012(f)
Annual Change
Over 2008*
N 99.4 102.9 114.9 +2.8%
P 2 O 5 40.2 40.8 45.4 +2.7%
K 2 O 29.1 29.8 32.8 +2.4%
Total 168.7 173.5 193.1 +2.7%
(e) estimated; (f) forecast * Based on estimates of future demand in 2008 and 2012
Source: IFA, June 2008
The supply of raw materials has become tight,boosting production rates and resulting inhigher prices for intermediates and finishedfertilizers.
In early 2008, several exporting countriesimplemented export taxes on fertilizers,
exacerbating the prevailing tight supplysituation and adding upward pressures onprices.
Fertilizer prices have increased dramaticallysince the beginning of 2008, generatingconcerns over possible demand destruction inthe short term. A combination of factors explainthe rapid increase in fertilizer prices. The mainones are a surge in agri-commodity demandand prices, resulting in a major increase infertilizer demand over the past two years; risingenergy costs and ocean freight rates; highersteel and equipment prices; a shortage of
specialized labour; a historical lack ofinvestments in the fertilizer industry; and therecent devaluation of the US dollar.
Since 1985, the global fertilizer market hasexperienced moderate demand growth, largecapacity surpluses and few positive prospectsfor a favourable investment climate. Similarly tothe metal mining sector, the mineral fertilizerindustry has been confronted with rising costsand more stringent regulatory processes, whichare associated with societal and environmentalconsiderations. Meanwhile, the nitrogen sector
has faced various constraints such as risingenergy prices, ageing equipment andcompeting supply from low-cost natural gasregions.
A more positive outlook since 2004 has led tocapacity investments in the fertilizer sector,albeit at different levels for the three majornutrients. However, the very rapid changes inmarket conditions since 2006 have not leftenough time for the industry to react on thesupply side given the timeline required fordeveloping greenfield operations, which couldtake from three to ten years depending onproducts and processes.
A shortage of available supply does notnecessarily translate into scarcity of resources.There are sufficient raw material resources tomeet, for several generations, the needs of thefertilizer industry and the nutrient requirementsof farmers and breeders worldwide, usingcurrent production technology and advancedexploration and extraction technologies.However, these resources are not immediatelyavailable, as considerable time and largeinvestments are required in order to access and
develop economic reserves.

8/3/2019 2008 Vienna Ifa Summary
http://slidepdf.com/reader/full/2008-vienna-ifa-summary 8/11
76th IFA Annual Conference, Vienna, May 2008
Summary Report “Medium-Term Outlook for Global Fertilizer Demand, Supply and Trade: 2008-2012”, P. Heffer and M. Prud’homme, IFA
- 6 -
3.1. Nitrogen Outlook
3.1.1. World Nitrogen Situation in 2007
Nitrogen supply/demand conditions in 2007remained very tight, driven by strong nitrogen
fertilizer demand worldwide. Productionoutages in exporting countries and delays in thecommissioning of new capacity furthertightened supply availability, as most producersoperated at close to capacity. Ammonia importsrose moderately, but much of the growth inimport demand concerned urea.
World ammonia production in 2007 was closeto 154.4 Mt NH3, a 4.5 per cent increase over2006. On a global basis, ammonia producersoperated at an average of 88 per cent ofcapacity during 2007. Global ammonia tradewas close to 19.2 Mt NH3, while world seaborne
trade was stable at 16.6 Mt NH3.
3.1.2. Global Nitrogen Capacity and Balance
During the period 2007 to 2012, nitrogencapacity developments will be shaped by thecost differential of feedstock between regions,governments’ policies fostering downstreamdevelopments from the hydrocarbon sector,industry’s desire to improve factories’ energyefficiency and, more recently, strong demandprojections.
According to the IFA 2008 world capacitysurvey, global ammonia capacity will increasefrom 176.3 Mt NH3 in 2007 to 210.3 Mt NH3 in2012. One-third of this increase will come fromrevamping activities. The remaining two-thirdswill be generated from the commissioning ofclose to 50 units worldwide, of which half will belocated in China.
In terms of regional distribution, the bulk ofcapacity growth will occur in East Asia (mostlyChina), West Asia, EECA, Africa (Egypt andAlgeria) and South Asia (India and Pakistan).
Ammonia capacity is tentatively projected toincrease in North America by 2013 and wouldbe relatively static in Europe and Oceania.
Between 2007 and 2012, world nitrogen supplyis projected to expand from 134.4 Mt N in 2008and 156.2 Mt N in 2012. Taking into accountnitrogen fertilizer uses, industrial uses anddistribution losses, global nitrogen demandwould reach 131.4 Mt N and 146.7 Mt N in2008 and 2012, respectively.
Global Nitrogen Supply/Demand2008-2012
Mt N 2008 2012
Nitrogen Supply 134.4 156.2
Nitrogen Demand 131.4 146.7
Global Balance +3.0 +9.5
Source: IFA, June 2008
IFA estimates that the global nitrogensupply/demand balance will show a surplus of3.0 Mt N in 2008, rising to 9.5 Mt N in 2012.However, the potential surpluses in 2008 and2009 are equivalent to 3 per cent of globalsupply, a level which could be considered asmarginal when taking into account idle capacityand unexpected plant outages.
3.1.3. World Urea Situation in 2007
With the increasing share of urea in thenitrogen fertilizer mix, overall urea use reacheda record level in 2007, driven by firmconsumption in the agricultural and industrialsectors.
The positive tone of the fertilizer market since2006 has led to rising production and exports.At the same time, longer turnarounds andwidespread production outages, combined with
delays in the commissioning of new export-oriented facilities, has tightened overall supplyavailability.
World urea production in 2007 rose by6.6 per cent to 144 Mt. China contributed two-thirds of the global increase. On a global basis,the industry ran at 91 per cent of capacity.Global trade was very robust, increasing by 15per cent over 2006 to 36.4 Mt.

8/3/2019 2008 Vienna Ifa Summary
http://slidepdf.com/reader/full/2008-vienna-ifa-summary 9/11
76th IFA Annual Conference, Vienna, May 2008
Summary Report “Medium-Term Outlook for Global Fertilizer Demand, Supply and Trade: 2008-2012”, P. Heffer and M. Prud’homme, IFA
- 7 -
3.1.4. Global Urea Capacity and Balance
IFA’s 2008 global capacity survey shows thatthe world urea capacity is forecast to reach200 Mt in 2012. This corresponds to acompound annual growth rate of 5.5 per centover 2007.
New units will add about 30 Mt of capacity,while revamping and debottleneckingprogrammes will add another 13 Mt of capacity.Due to slippage in the completion of severalprojects, limited capacity will be added in 2008,2010 and 2012, and significant export tonnagewill emerge in 2009 and 2011. World ureasupply is estimated at 150.6 Mt in 2008 and184.3 Mt in 2012.
The global demand for urea is forecast toincrease from 150 Mt in 2008 to 180.2 Mt in2012, representing a net growth of 30.2 Mt.
Global Urea Supply/Demand2008-2012
Mt urea 2008 2012
Urea Supply 150.6 184.3
Urea Demand 150.0 180.2
Global Balance +0.6 +4.1
Source: IFA, June 2008
IFA estimates of the urea supply/demandbalance show a tight market situation from
2008 to 2010. A growing surplus will emerge by2011, averaging 4.3 Mt/a, assuming that allannounced projects proceed as planned andthat urea uses attain a 64% share of alldemand for nitrogen nutrient fertilizers.
It can already be assumed that some projectsplanned during the period 2008 to 2012 wouldbe delayed or even cancelled in the near term,and that some further rationalization couldoccur in Europe and South Asia.
3.2. Potash Outlook
3.2.1. World Potash Situation in 2007
The global potash market became very tight in2007, in the light of stronger than anticipated
demand for potassium fertilizers and logisticalconstraints in a few exporting countries.Importers’ potash stocks were at very lowlevels. Most producers operated at close tocapacity, and several customers were notifiedof the availability of supply on sales allocation.
Global potash production in 2007 was 55.4 MtMOP eq., increasing by 14 per cent over 2006.In K 2 O terms, world total production wasestimated at 34.1 Mt (including all primaryoutput of MOP, SOP and KMgSOP). Globalpotash exports accounted for 80 per cent oftotal deliveries and domestic sales for the
remaining 20 per cent. Potash exports in 2007totalled 45.2 Mt MOP eq ., representing an18 per cent increase over 2006.
3.2.2. Global Potash Capacity and Balance
During the period 2007 to 2012, potashcapacity will expand in virtually all producingcountries. IFA forecasts that global potashcapacity will increase by 22 per cent over 2007,to 50.3 Mt in 2012. Expansion will mostly occurin Canada, China and Russia, along with a
greenfield operation in Argentina. On an annualbasis, capacity addition will be very limited in2008 but will accelerate thereafter at anaverage of 1.2 Mt/a K20 between 2009 and2011. However, close to 5.0 Mt would be addedbetween 2011 and 2012. The bulk of theaddition to capacity will be for potassiumchloride (MOP), especially granular grades.
Global Potash Supply/Demand2008-2012
Mt K 2 O 2008 2012
Potash Supply 35.5 43.7
Potash Demand 33.3 36.6
Global Balance +2.2 +7.1
Source: IFA, June 2008
IFA estimates that the world potash supply willincrease from 35.5 Mt K20 in 2008 to43.7 Mt K20 in 2012. The global demand forpotash is estimated at 33.3 Mt K 2 O in 2008 and36.6 Mt K 2 O in 2012. The global potashsupply/demand balance will remain tightthrough 2011. During this period, all capacityincreases will be absorbed by the growth indemand.
8/3/2019 2008 Vienna Ifa Summary
http://slidepdf.com/reader/full/2008-vienna-ifa-summary 10/11
76th IFA Annual Conference, Vienna, May 2008
Summary Report “Medium-Term Outlook for Global Fertilizer Demand, Supply and Trade: 2008-2012”, P. Heffer and M. Prud’homme, IFA
- 8 -
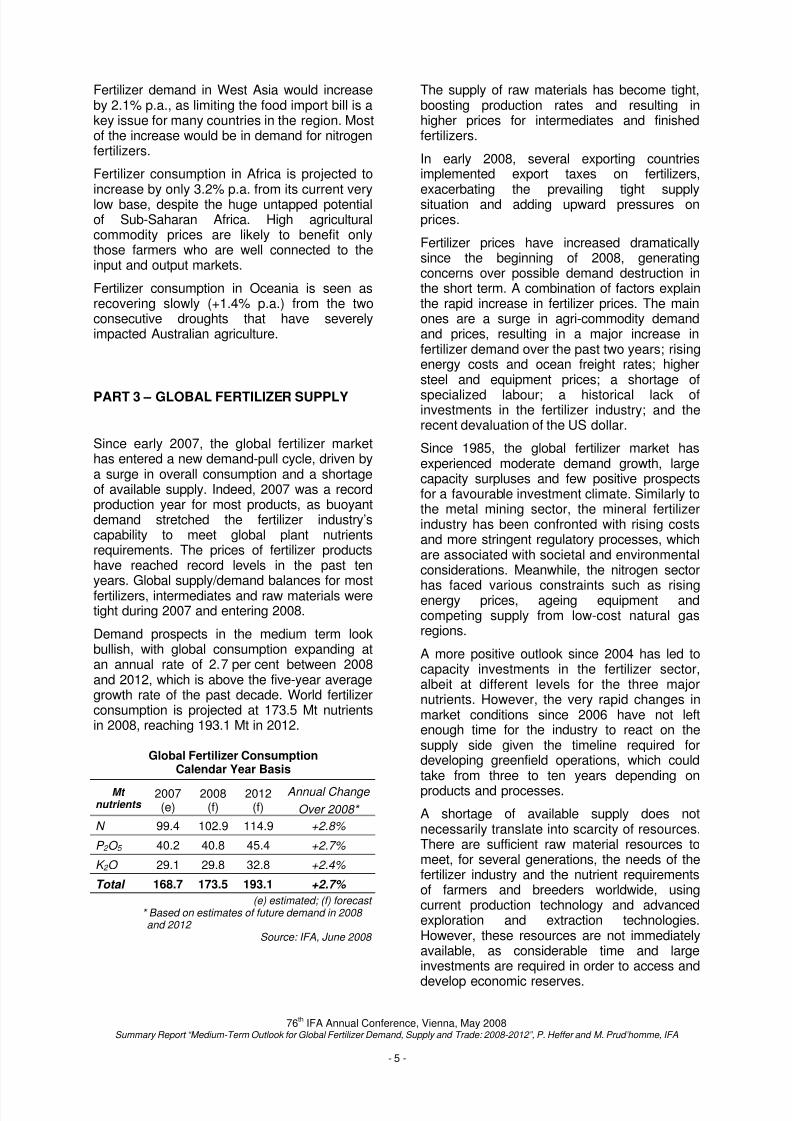
The prospects for firmer demand thanprojected, or delays in the commissioning ofnew capacity, could lead to a tighter balance.By 2012, large capacity additions will exceeddemand growth if all projects proceed asplanned.
3.3. Phosphate Outlook
The world demand for phosphate fertilizers in2007 grew by 4.5 per cent over 2006,pressuring the industry to operate at high ratesduring the whole year. Production of rawmaterials, intermediates and processedphosphate fertilizers rose to near record levelswhile input costs started to escalate, notably forsulphur and phosphate rock.
The global production of processed phosphates(MAP, DAP and TSP) grew by 5.5 per cent over2006, to 25 Mt P 2 O 5 . MAP productionaccounted for all of the increase.
3.3.1. World Phosphate Rock Outlook
World production of phosphate rock in 2007was estimated at 176.1 Mt, growing by4.6 per cent over 2006. Most producersincreased output, but China alone contributed
three-quarters of the net increase. Global traderecovered in 2007, after registering two years ofdecline, and reached 31.4 Mt, representing anincrease of 5.7 per cent over 2006.
Based on the IFA 2008 survey of futurephosphate rock supply, world phosphate rockcapacity is expected to reach 242 Mt in 2012,representing an overall 28 per cent growth over2007. On a regional basis, future rock supply isprojected to grow in West Asia, Africa, EastAsia (China) and Latin America (Brazil, Peruand Venezuela). As a single country, China willaccount for one-fifth of the increase during this
period.
While the international supply of phosphateconcentrates is considered tight in the short tomedium term, upcoming capacity projects andthe availability of resources are more thanadequate to meet growing demand in thelonger term.
3.3.2. World Phosphoric Acid Outlook
Global production of phosphoric acid in 2007was estimated at 36 Mt P 2 O 5 , representing a5.6 per cent increase over 2006. For the sixthconsecutive year, China accounted for most ofthe increase. The global trade of phosphoricacid declined for the third consecutive year.Much of the reduction was caused by lowerimports into India.
According to the IFA 2008 capacity survey,global phosphoric acid capacity is forecast to
increase by 10.2 Mt to 53.1 Mt P 2 O 5 between2007 and 2012. Close to three-quarters of thisnet expansion will be dedicated to domesticdownstream processing. The main additions todomestic capacity will occur in China, SaudiArabia and India. Very little tonnage of non-committed merchant phosphoric acid capacityis expected to be available before 2012.
3.3.3. Global Phosphoric Acid Balance
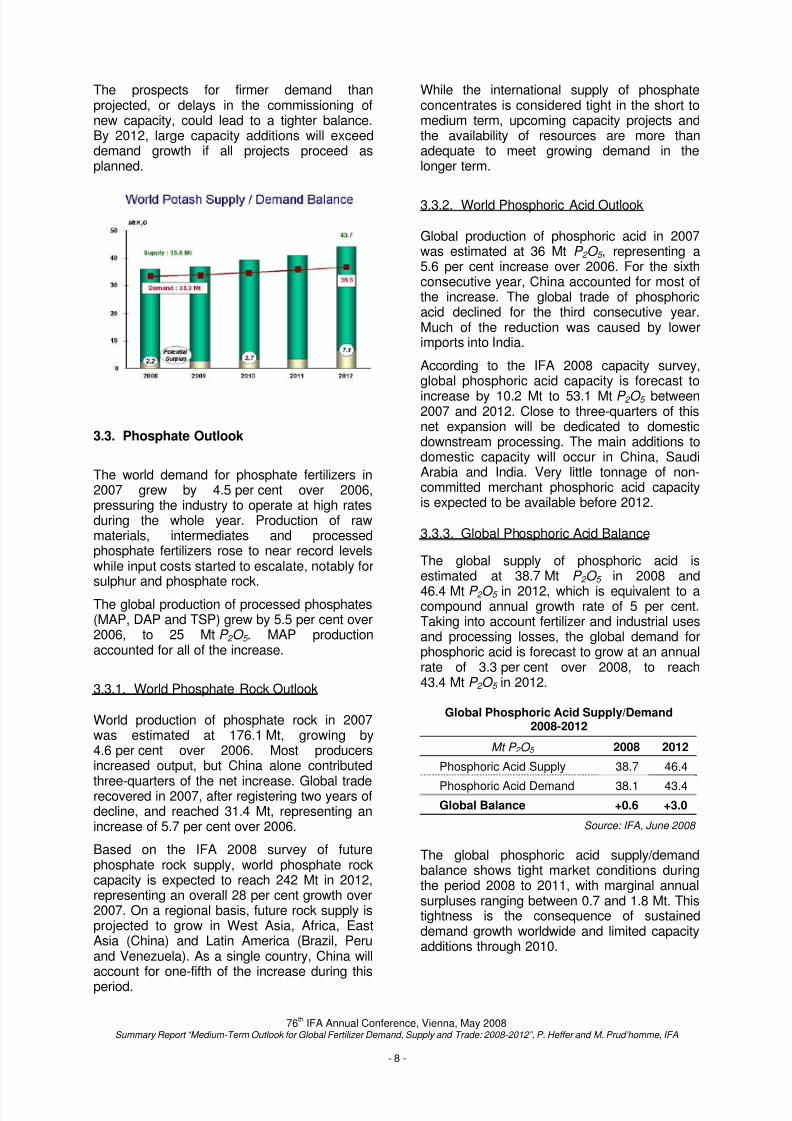
The global supply of phosphoric acid isestimated at 38.7 Mt P 2 O 5 in 2008 and
46.4 Mt P 2 O 5 in 2012, which is equivalent to acompound annual growth rate of 5 per cent.Taking into account fertilizer and industrial usesand processing losses, the global demand forphosphoric acid is forecast to grow at an annualrate of 3.3 per cent over 2008, to reach43.4 Mt P 2 O 5 in 2012.
Global Phosphoric Acid Supply/Demand2008-2012
Mt P 2 O 5 2008 2012
Phosphoric Acid Supply 38.7 46.4
Phosphoric Acid Demand 38.1 43.4Global Balance +0.6 +3.0
Source: IFA, June 2008
The global phosphoric acid supply/demandbalance shows tight market conditions duringthe period 2008 to 2011, with marginal annualsurpluses ranging between 0.7 and 1.8 Mt. Thistightness is the consequence of sustaineddemand growth worldwide and limited capacityadditions through 2010.
8/3/2019 2008 Vienna Ifa Summary
http://slidepdf.com/reader/full/2008-vienna-ifa-summary 11/11
76th IFA Annual Conference, Vienna, May 2008
Summary Report “Medium-Term Outlook for Global Fertilizer Demand, Supply and Trade: 2008-2012”, P. Heffer and M. Prud’homme, IFA
- 9 -
However, a larger surplus may emerge in 2012as a result of new capacity coming on stream in2011/12.
3.4. Elemental Sulphur Outlook
3.4.1. World Sulphur Situation in 2007
In 2007, the global sulphur market showedremarkable strength in the light of strongdemand in the fertilizer and industrial sectorscombined with lower than anticipated growth ofworld production. World elemental sulphurconsumption grew by 6 per cent over 2006, to49.2 Mt S , while production rose to 47.9 Mt S .
3.4.2. Global Sulphur Supply/Demand Balance
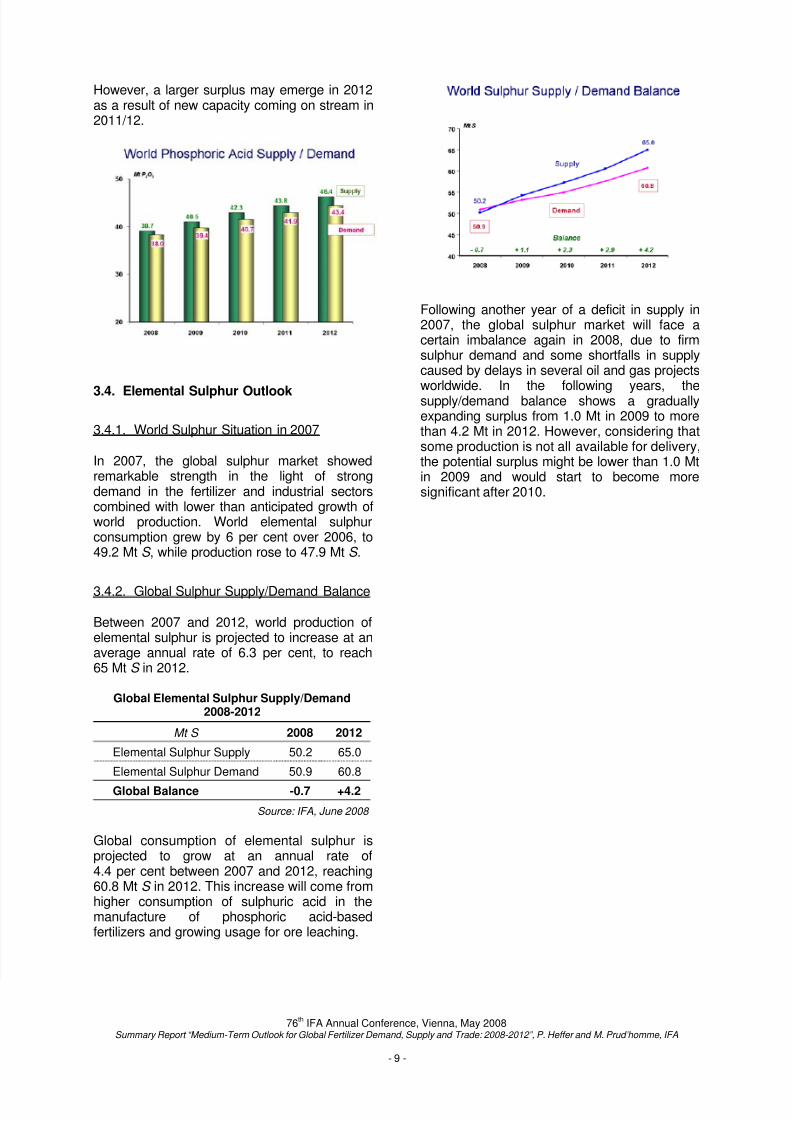
Between 2007 and 2012, world production ofelemental sulphur is projected to increase at anaverage annual rate of 6.3 per cent, to reach65 Mt S in 2012.
Global Elemental Sulphur Supply/Demand2008-2012
Mt S 2008 2012
Elemental Sulphur Supply 50.2 65.0
Elemental Sulphur Demand 50.9 60.8
Global Balance -0.7 +4.2
Source: IFA, June 2008
Global consumption of elemental sulphur isprojected to grow at an annual rate of4.4 per cent between 2007 and 2012, reaching60.8 Mt S in 2012. This increase will come fromhigher consumption of sulphuric acid in themanufacture of phosphoric acid-basedfertilizers and growing usage for ore leaching.
Following another year of a deficit in supply in2007, the global sulphur market will face acertain imbalance again in 2008, due to firmsulphur demand and some shortfalls in supplycaused by delays in several oil and gas projects
worldwide. In the following years, thesupply/demand balance shows a graduallyexpanding surplus from 1.0 Mt in 2009 to morethan 4.2 Mt in 2012. However, considering thatsome production is not all available for delivery,the potential surplus might be lower than 1.0 Mtin 2009 and would start to become moresignificant after 2010.