Embed Size (px)
Citation preview
22000088
EENNVVIIRROONNMMEENNTTAALL
SSCCAANN
JULY 2008

22000088 EEnnvviirroonnmmeennttaall SSccaann
Table of Contents i
TABLE OF CONTENTS PAGE
I. Demographic Trends Highlights.............................................................................................................1 A. Toronto Population ..........................................................................................2 B. Age Structure of the Population.......................................................................4 C. Population Composition ..................................................................................8
Immigration..............................................................................................8 Diversity ...................................................................................................11 Language..................................................................................................14 Religion ....................................................................................................16 Income......................................................................................................17
D. Homelessness...................................................................................................21 e. Divisional Profiles............................................................................................22 Recommendations for Police Service ..................................................................23 Chapter Appendix (Divisional Demographics) ...................................................25
II. Crime Trends Highlights.............................................................................................................37 A. National Crime Trends ....................................................................................39 B. Interpretation of Police-Reported Crime Data.................................................39 C. Contemporary Policing Framework & Confronting Issues .............................40 D. Number of Crimes in Toronto .........................................................................44 E. Rates for Comparisons .....................................................................................46 F. Changes in Proportion of Major Offence Groups ............................................47 G. Crimes of Violence ..........................................................................................48 H. Use of Weapons & Injury of Crime Victims...................................................49
Use of Weapons........................................................................................49 Injury of Victims.......................................................................................51
I. Theft of Motor Vehicles and Break & Enter ....................................................51 Theft of Motor Vehicles............................................................................51 Break & Enter ..........................................................................................52
J. Drug-Related Crimes ........................................................................................53 K. Organized Crime..............................................................................................55 L. Hi-Tech Crime & Identity Theft ......................................................................57 M. Persons Arrested & Charged...........................................................................59 N. Trends Across Police Divisions.......................................................................63 O. Comparison with Other Canadian Cities .........................................................66 Recommendations for Police Service ..................................................................69 Chapter Appendix (Divisional Statistics) ............................................................71
III. Youth Crime Highlights.............................................................................................................77 A. A Perspective on Youth Crime........................................................................78 B. Youth Criminal Justice Act..............................................................................79 C. Youth Crime in Canada ...................................................................................80
22000088 EEnnvviirroonnmmeennttaall SSccaann
Table of Contents ii
PAGE
III. Youth Crime (cont’d) D. Youth Crime in Toronto ..................................................................................83
Number of Youths Arrested ......................................................................83 Number of Youths Arrested – By Gender & Major Offence
Categories .............................................................................................85 Arrest Rates..............................................................................................88
E. Crimes Occurring on School Premises ............................................................90 Students’ Perceptions of Safety................................................................91 School Community Safety Advisory Panel ...............................................91 Bullying ....................................................................................................93
F. Drug Use by Youths.........................................................................................95 G. Youth Gangs ....................................................................................................96 Recommendations for Police Service ..................................................................100 Chapter Appendix (Persons Arrested/Charged by Age and Offence) .................102
IV. Victims & Witnesses Highlights.............................................................................................................105 A. Victimization in Canada ..................................................................................107 B. Reporting Victimization to the Police .............................................................109 C. Witnesses of Crime..........................................................................................110 D. Victimization – Total and By Gender..............................................................113 E. Victimisation – By Age ...................................................................................116 F. Groups at Risk..................................................................................................120
Children and Youth – Violent Crime & Abuse.........................................120 Elderly – Violent Crime & Abuse ............................................................123 Domestic Violence ...................................................................................124 Domestic Violence – Calls for Service & Occurrences ...........................128 Criminal Harassment (Stalking) ..............................................................129 Life on the Streets & Victimization ..........................................................131
G. Victimization in the Workplace.......................................................................132 H. Hate/Bias Crime ..............................................................................................134 I. Victim Resources ..............................................................................................137
Victim Services.........................................................................................138 Recommendations for Police Service ..................................................................139
V. Traffic Highlights.............................................................................................................141 A. The Global Traffic Safety Paradigm ...............................................................142
Traffic Safety Models ...............................................................................143 B. Canada’s National Road Safety Plan ...............................................................145 C. Toronto – Transportation Infrastructure Overview .........................................146 D. Traffic Congestion...........................................................................................147 E. Transportation Planning...................................................................................148
Active Transportation ..............................................................................148 Transportation Demand Management .....................................................149
22000088 EEnnvviirroonnmmeennttaall SSccaann
Table of Contents iii
PAGE
V. Traffic (cont’d) Roadway & Congestion Management .....................................................149
F. Best Practices – Roads & Highways................................................................151 G. City of Toronto – Volume Counts...................................................................152 H. Traffic Collisions.............................................................................................153
Safety Systems for Pedestrians.................................................................159 I. Public Perceptions of Traffic ............................................................................161 J. Highway Traffic Act.........................................................................................162
Red Light Cameras ..................................................................................163 K. Aggressive & Distracted Drivers.....................................................................165 L. Impaired Driving..............................................................................................166
Campaigns ...............................................................................................166 Drinking & Driving Enforcement ............................................................169 Drug-Impaired Driving............................................................................170
Recommendations for Police Service ..................................................................171
VI. Calls for Service Highlights.............................................................................................................173 A. Calls Received and Method of Response ........................................................174 B. Response Times ...............................................................................................175 C. Service Times ..................................................................................................178 Recommendations for Police Service ..................................................................181
VII. Technology & Policing Highlights.............................................................................................................183 A. Internet Use......................................................................................................184
On-line Society & Generation ‘C’ ...........................................................186 Cyber-bullying .........................................................................................187
B. Policing Technological Crimes........................................................................188 C. Digital Crimes..................................................................................................190
Organized Cyber-crime ...........................................................................190 Cyber-terrorism .......................................................................................190 Critical Infrastructure Vulnerabilities .....................................................190 World-wide Hackers ................................................................................191 Networked Computers & Cyber-crime ....................................................191 Computer-facilitated Identity Theft & Frauds .........................................192 Cyberhate .................................................................................................196
D. Child Exploitation............................................................................................197 E. Criminal Justice Technology ...........................................................................199
Communication ........................................................................................201 Biometrics ................................................................................................202 Police Equipment & Software..................................................................203 Green Policing .........................................................................................204
Recommendations for Police Service ..................................................................205
22000088 EEnnvviirroonnmmeennttaall SSccaann
Table of Contents iv
VIII. Police Resources Highlights.............................................................................................................207 A. Workforce Demographics................................................................................208
Officer to Population Ratio......................................................................209 Age & Length of Service of Uniform Members........................................210 Retirements & Resignations.....................................................................214 Workload..................................................................................................216 Resource Deployment ..............................................................................217
B. Workforce Diversity ........................................................................................218 Uniform Composition...............................................................................219 Uniform Equity Hiring .............................................................................221
C. Resource Challenges........................................................................................221 Recruiting.................................................................................................222 Retention ..................................................................................................225 Training & Development .........................................................................227
D. Work Environment ..........................................................................................228 Recommendations for Police Service ..................................................................229
IX. Urban Trends Highlights.............................................................................................................231 A. National Urban Trends & Challenges .............................................................233 B. Understanding Urban Thinking .......................................................................234 C. Toronto: A Place to Work & Live ...................................................................235 D. Toronto’s Urban Strategy ................................................................................236 E. Growth & Development...................................................................................238 F. Community Revitalization Projects .................................................................239
Regent Park..............................................................................................240 Lawrence Heights ....................................................................................240
G. Crime Prevention Through Environmental Design (CPTED).........................240 H. Street Life ........................................................................................................241
Homelessness ...........................................................................................241 Harm Reduction .......................................................................................243
I. Public Transportation........................................................................................243 Toronto Transit Commission – Expansion & Development ....................245 Toronto Transit Commission – Safety......................................................246 GO Transit ...............................................................................................248
J. Special Constable Services ...............................................................................249 TTC Special Constables...........................................................................249 Toronto Community Housing Corporation..............................................250 University of Toronto Police....................................................................250
K. Private Security................................................................................................251 L. Tourism & Travel to Toronto ..........................................................................253
Lester B. Pearson Airport ........................................................................255 Toronto City Centre Airport ....................................................................256 Toronto Port Terminal.............................................................................256
M. Emergency Preparedness ................................................................................257
22000088 EEnnvviirroonnmmeennttaall SSccaann
Table of Contents v
PAGE
IX. Urban Trends (cont’d) N. Special Events..................................................................................................259 Recommendations for Police Service ..................................................................260
X. Public Perceptions Highlights.............................................................................................................263 A. National Perceptions of Safety and Police ......................................................264
Perceptions of Safety................................................................................264 Perceptions of Police/Policing ................................................................266
B. General Community.........................................................................................267 Perceptions of Safety................................................................................267 Perceptions of Police/Policing ................................................................271 General Community Respondents who had Contact with
Police during Past Year ........................................................................274 C. High School Students.......................................................................................276
Perceptions of Safety................................................................................276 Perceptions of Police/Policing ................................................................279
D. Victims of Domestic Violence ........................................................................281 Perceptions of Safety................................................................................281 Perceptions of Police/Policing ................................................................281
Recommendations for Police Service ..................................................................283
XI. Legislative Impacts Highlights.............................................................................................................285 A. Criminal Code..................................................................................................285
An Act to amend the Criminal Code (Tackling Violent Crime
Act) and to make consequential amendment to other Acts ...................285 An Act to amend the Criminal Code (identity theft and
related misconduct)...............................................................................287 An Act to amend the Criminal Code (street racing) and to make
consequential amendment to the Corrections and Criminal
Release Act............................................................................................288 An Act to amend the Criminal Code and the Firearms Act
(non-registration of firearms that are neither prohibited nor
restricted) ..............................................................................................288 Hill v. Hamilton-Wentworth Police Services Board ................................288
B. Controlled Drugs and Substances Act .............................................................288 C. Copyright Act ..................................................................................................289 D. Ontario Police Services Act.............................................................................289 E. Christopher’s Law (Sex Offender Registry), 2000 ..........................................290 F. Highway Traffic Act ........................................................................................290 G. Child Pornography Reporting Act ...................................................................291 H. Labour Related Legislation .............................................................................291 Recommendations for Police Service ..................................................................292
22000088 EEnnvviirroonnmmeennttaall SSccaann
Table of Contents vi
PAGE
Appendices Appendix A: External Consultations & Public Meetings – Summary .........293 Municipal Councillors .....................................................................................295 Community Police Liaison Committees ..........................................................299 Criminal Justice System...................................................................................303 Public & Private Sector Agencies....................................................................307 Chief’s Advisory and Youth Advisory Councils ............................................315 Public Forums .................................................................................................319 Youth in Policing Initiative Students ..............................................................331 Appendix B: Internal Consultations – Summary ...........................................339
Senior Officer Forum....................................................................................341 Officer Forum ...............................................................................................345 Civilian Forum..............................................................................................349 Specialized Operations Command................................................................351 Executive, Administrative, & Human Resources Commands ......................361 Divisional Policing Command......................................................................369 Senior Officers ..............................................................................................379
22000088 EEnnvviirroonnmmeennttaall SSccaann
Demographic Trends 1
I. DEMOGRAPHIC TRENDS
Information based on demographic and social trends provides a basis for good planning,
identifying areas where changes are likely to occur. The task is then to relate the
population and social changes to possible service needs: what are the implications for
current and future decisions regarding the delivery of police service, provisions of
programs, allocations of resources, and so on.
HIGHLIGHTS
• Toronto’s population continues to grow at a slower pace than the populations of the other
regions of the Greater Toronto Area (GTA). According to Statistics Canada census data, the population of Toronto increased 10.0% between 1991 and 2006, from 2,275,771 to 2,503,281. The population is expected to grow about 20% from the 2006 level, bringing Toronto’s population to about 3 million people in 2031.
• Within the GTA in 2006, the median age in City of Toronto was the same as that in Halton
(38.4 years), but older than the median ages in Durham (37.7), Peel (35.6), and York (37.5). Toronto had the smallest proportion of children aged 15 or younger and the largest proportion of seniors aged 65 or older.
• Over the past decade, the proportions of very young and school-age children (0-14 years)
decreased, while the proportion of teens and young adults (15-24 years) increased. The proportion of seniors 65 years and over also increased slightly, but all the increase occurred in the older senior age group.
• According to the 2006 census, 1 in 2 Toronto residents (50%) were born outside of Canada,
up from 48% in 1996 and 49% in 2001. In 2006, of those born outside of Canada, 22% were recent arrivals, having immigrated in the past five years.
• Southern Asia, Eastern Asia, and West Central Asia & the Middle East were the largest
sources of newcomers, representing 77% of total immigrants during 2001-2006. Newcomers from Southern and Eastern Asia were predominantly from India and China.
• The growth of the visible minority population has largely been due to the shift in sources of
immigration to Canada. Within Toronto, the total visible minority population increased 32% between 1996 and 2006, representing almost half the population in 2006 (47%). South Asians are now the largest visible minority group in Toronto, followed by the Chinese and Black populations.
• Although the numbers were still relatively small, the Korean, Filipino, and Latin American
communities also increased significantly between 1996 and 2006. • While almost half (48%) of the population in the 2006 census said they had a mother tongue
other than just English or French, up slightly from 46% in 2001, only 5% of Toronto’s
22000088 EEnnvviirroonnmmeennttaall SSccaann
Demographic Trends 2
population in 2006 said they were not able to carry out a conversation in either French or English.
• Mirroring the growing diversity of Toronto’s population was a growing diversity in the
religious make up of the City. Much of the change in Toronto’s religious profile was the result of the changing sources of immigration.
• According to the 2006 census, median household income in the City of Toronto increased to
$52,833 in 2005, up from $42,752 in 1995, however Toronto’s median household income was lower than the median household income in each of the four outer GTA regions. Toronto also had the highest incidence of low income: 24%, compared to 9% in Durham, 8% in Halton, 14% in Peel, and 13% in York.
• Census income data for Toronto households reflected a growing income inequality: in 2005,
while 21% of Toronto’s households had an income of over $100,000, up from 12% ten years previously, almost half (47%) had an income under $50,000.
• A ‘snapshot’ completed by the City of Toronto on the night of April 19th, 2006, estimated that
there were a minimum of 5,052 people homeless. Those who live on the streets of Toronto typically face a greater risk of harm than those who have a home to return to for security, and, given their situation, are relatively likely to come into contact with police.
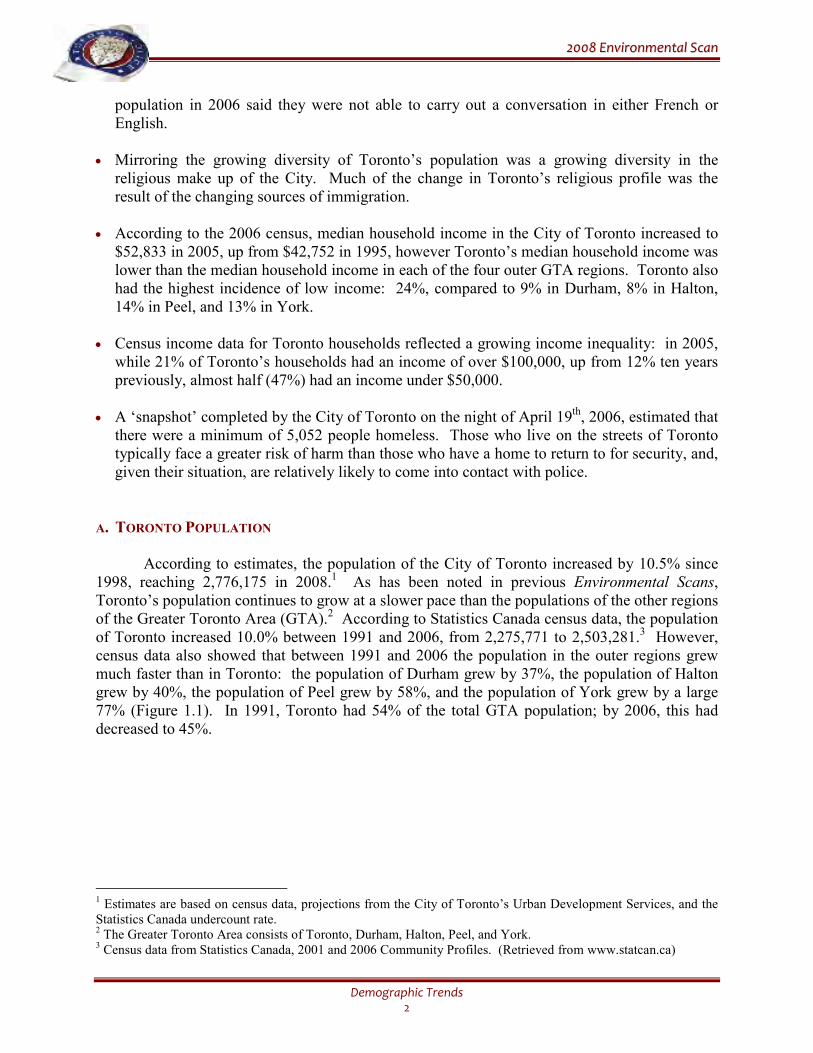
A. TORONTO POPULATION According to estimates, the population of the City of Toronto increased by 10.5% since 1998, reaching 2,776,175 in 2008.1 As has been noted in previous Environmental Scans, Toronto’s population continues to grow at a slower pace than the populations of the other regions of the Greater Toronto Area (GTA).2 According to Statistics Canada census data, the population of Toronto increased 10.0% between 1991 and 2006, from 2,275,771 to 2,503,281.3 However, census data also showed that between 1991 and 2006 the population in the outer regions grew much faster than in Toronto: the population of Durham grew by 37%, the population of Halton grew by 40%, the population of Peel grew by 58%, and the population of York grew by a large 77% (Figure 1.1). In 1991, Toronto had 54% of the total GTA population; by 2006, this had decreased to 45%.
1 Estimates are based on census data, projections from the City of Toronto’s Urban Development Services, and the Statistics Canada undercount rate. 2 The Greater Toronto Area consists of Toronto, Durham, Halton, Peel, and York. 3 Census data from Statistics Canada, 2001 and 2006 Community Profiles. (Retrieved from www.statcan.ca)
22000088 EEnnvviirroonnmmeennttaall SSccaann
Demographic Trends 3
0
1000000
2000000
3000000
Toronto Durham Halton Peel York
1991
1996
2001
2006
2031(est)
Population & Projected Growth 1991-2031
Figure 1.1 Source: Statistics Canada/ Toronto City Planning Div.
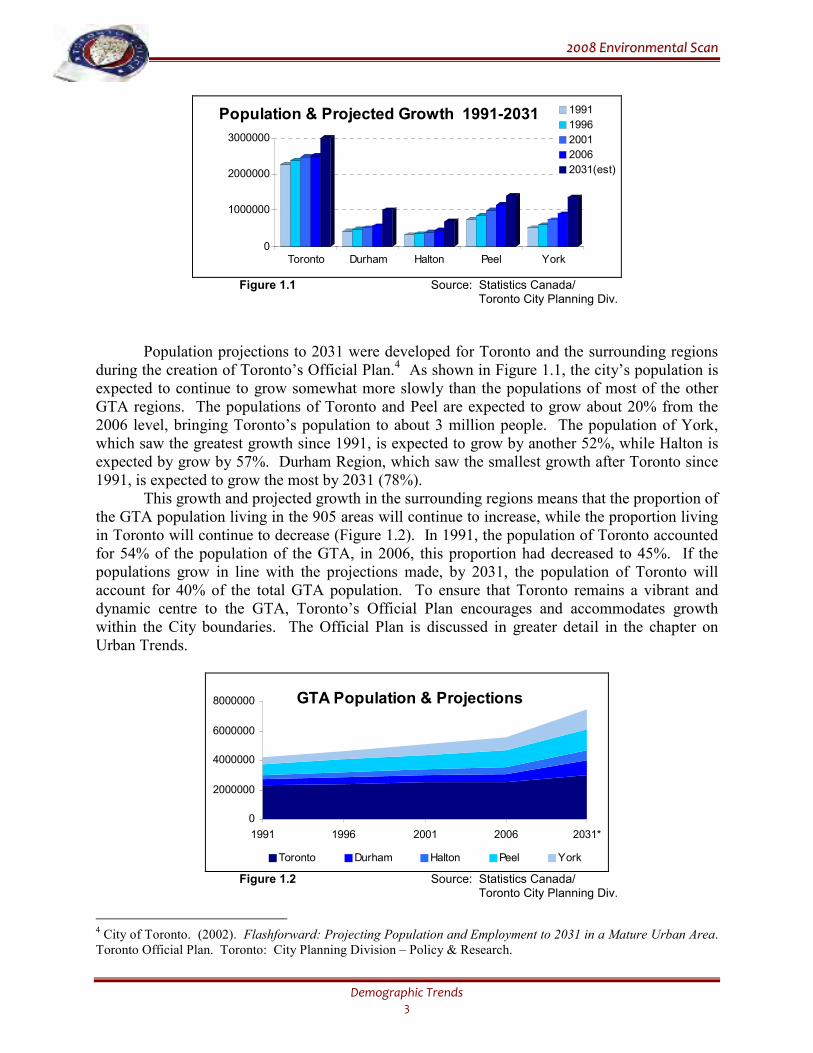
Population projections to 2031 were developed for Toronto and the surrounding regions during the creation of Toronto’s Official Plan.4 As shown in Figure 1.1, the city’s population is expected to continue to grow somewhat more slowly than the populations of most of the other GTA regions. The populations of Toronto and Peel are expected to grow about 20% from the 2006 level, bringing Toronto’s population to about 3 million people. The population of York, which saw the greatest growth since 1991, is expected to grow by another 52%, while Halton is expected by grow by 57%. Durham Region, which saw the smallest growth after Toronto since 1991, is expected to grow the most by 2031 (78%). This growth and projected growth in the surrounding regions means that the proportion of the GTA population living in the 905 areas will continue to increase, while the proportion living in Toronto will continue to decrease (Figure 1.2). In 1991, the population of Toronto accounted for 54% of the population of the GTA, in 2006, this proportion had decreased to 45%. If the populations grow in line with the projections made, by 2031, the population of Toronto will account for 40% of the total GTA population. To ensure that Toronto remains a vibrant and dynamic centre to the GTA, Toronto’s Official Plan encourages and accommodates growth within the City boundaries. The Official Plan is discussed in greater detail in the chapter on Urban Trends.
GTA Population & Projections
0
2000000
4000000
6000000
8000000
1991 1996 2001 2006 2031*
Toronto Durham Halton Peel York
Figure 1.2 Source: Statistics Canada/ Toronto City Planning Div.
4 City of Toronto. (2002). Flashforward: Projecting Population and Employment to 2031 in a Mature Urban Area. Toronto Official Plan. Toronto: City Planning Division – Policy & Research.
22000088 EEnnvviirroonnmmeennttaall SSccaann
Demographic Trends 4
The changing industrial profile of the city and the growing population will likely mean that more people will be employed in other areas of the GTA, even if they live in Toronto. This will have implications for traffic, commuting patterns, and public transit.5 In addition, while the growing communities surrounding Toronto are quite self-contained, as discussed in the Urban Trends chapter, there is still significant commuter and visitor travel into the city for employment, entertainment, and education. This will continue to put substantial pressure on transportation networks, contributing to greater congestion, diminishing air quality, parking problems, and so on, for the foreseeable future, affecting quality of life within the city. Further, as the populations of the surrounding areas grow, the transient daytime population (commuters, tourists, visitors for entertainment purposes, etc.) can be expected to grow as well, and points to the need for an efficient, effective, and integrated public transit system for the GTA. It should be noted that this transient population also makes use of police services but is not captured in resident population statistics used in crime rate and workload analyses.
B. AGE STRUCTURE OF THE POPULATION Age is a strong predictor of human behaviour and awareness of the age structure of the population not only provides context for current behaviours and trends, but also allows some forecast of future behaviours and trends. The median age of Canada’s population, which has been rising steadily, reached an all-time high of 39.5 years in 2006, increasing 1.9 years from the previous census. The median age is expected to continue to rise, possibly exceeding 44 years by 2031.6 Seniors aged 65 years or older increased to a record 13.7% of the population – representing 1 in 7 Canadians – and is projected to nearly double by 2031. In particular, those aged 80 and older showed the largest increase. In contrast, children aged 15 and younger decreased to 17.7% of the population, its lowest level. Statistics Canada also found that the census metropolitan areas (CMAs), while still aging, generally had a smaller proportion of seniors and a larger proportion of children than at the national level. There were some differences, however, between the central municipality of the CMAs and the surrounding municipalities: the peripheral or suburban areas were younger than the central urban areas, with more children and fewer seniors. The urban areas tended to have larger proportions of those aged 20-34 years. It was suggested that this pattern, which was also evident in the Toronto CMA, was due to larger proportions of working-age young adults moving to the urban centre, larger proportions of international immigrants (who tend to be about 30 years old on average when they arrive), and more senior residences and health care services for the elderly.7,8
5 Heisz, A. (2006). Canada’s Global Cities: Socio-economic Conditions in Montréal, Toronto and Vancouver. (Catalogue No. 89-613-MIE, No. 010) Statistics Canada, Business and Labour Market Analysis Division. 6 Statistics Canada. (2007). Portrait of the Canadian Population in 2006, by Age and Sex, 2006 Census. (Catalogue no. 97-551-XIE) Statistics Canada. 7 Ibid. 8 The Toronto Census Metropolitan Area extends from Ajax to Oakville, and north to Newmarket, and includes the following municipalities: Ajax, Aurora, Bradford, West Gwillimbury, Brampton, Caledon, East Gwillimbury, Georgina, Halton Hills, King, Markham, Milton, Mississauga, Mono, New Tecumseh, Newmarket, Oakville, Orangeville, Pickering, Richmond Hill, Toronto, Uxbridge, Vaughan, and Whitchurch-Stouffville.
22000088 EEnnvviirroonnmmeennttaall SSccaann
Demographic Trends 5
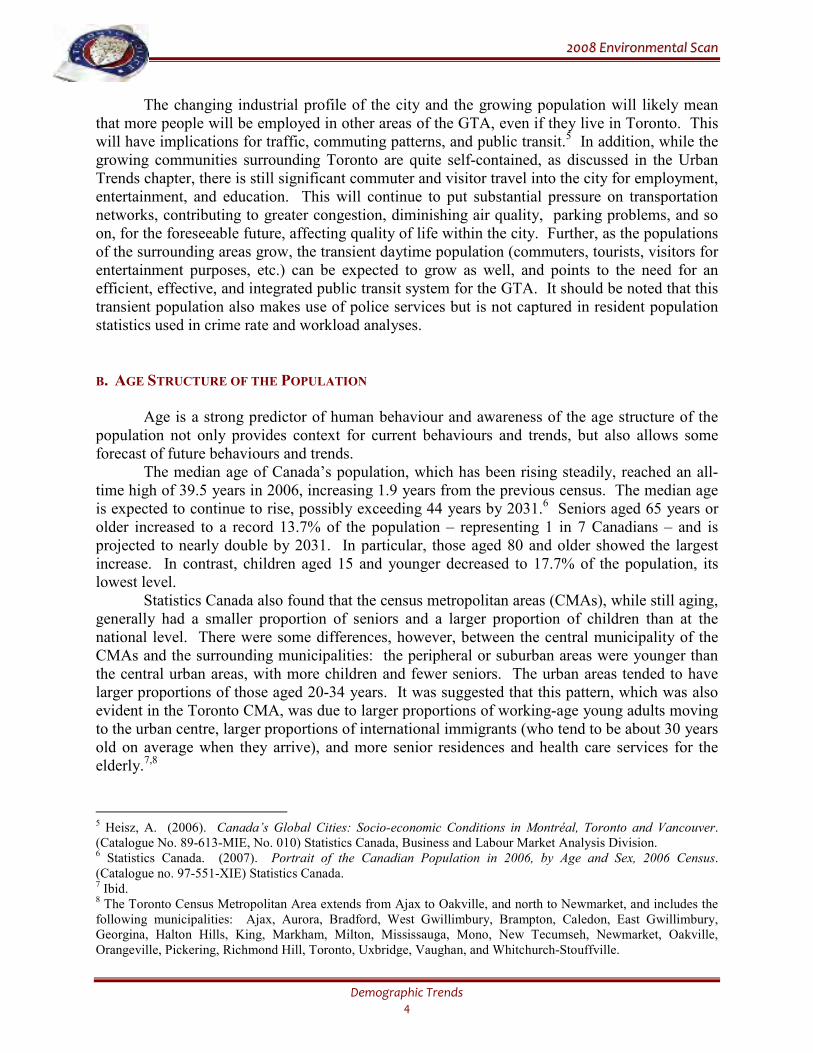
Within the GTA in 2006, the median age in City of Toronto was the same as the median age in Halton (38.4 years), but older than the median ages in Durham (37.7), Peel (35.6), and York (37.5).9 Toronto had the smallest proportion of children aged 15 or younger (16%) and the largest proportion of seniors aged 65 or older (14%). Peel Region had both the largest proportion of children (21%) and the smallest proportion of seniors (9%). As shown in Figure 1.3, Toronto had a smaller proportions of young people 5 to 14 years and 15 to 19 years than any of the outer regions. Toronto also had larger proportions of the population who were between 25 and 44 years of age, and 65 years or older.
0
5
10
15
20
25
30
35
0-4 5-14 15-19 20-24 25-44 45-54 55-64 65 +
GTA - Proportion of Population by Age 2006 Toronto
Durham
Halton
Peel
York
%
Figure 1.3 Source: Statistics Canada
This age distribution pattern is consistent with the general pattern noted above in CMAs, with fewer children, more working age adults, and more seniors living in the urban centre than in the surrounding areas or ‘suburbs’.
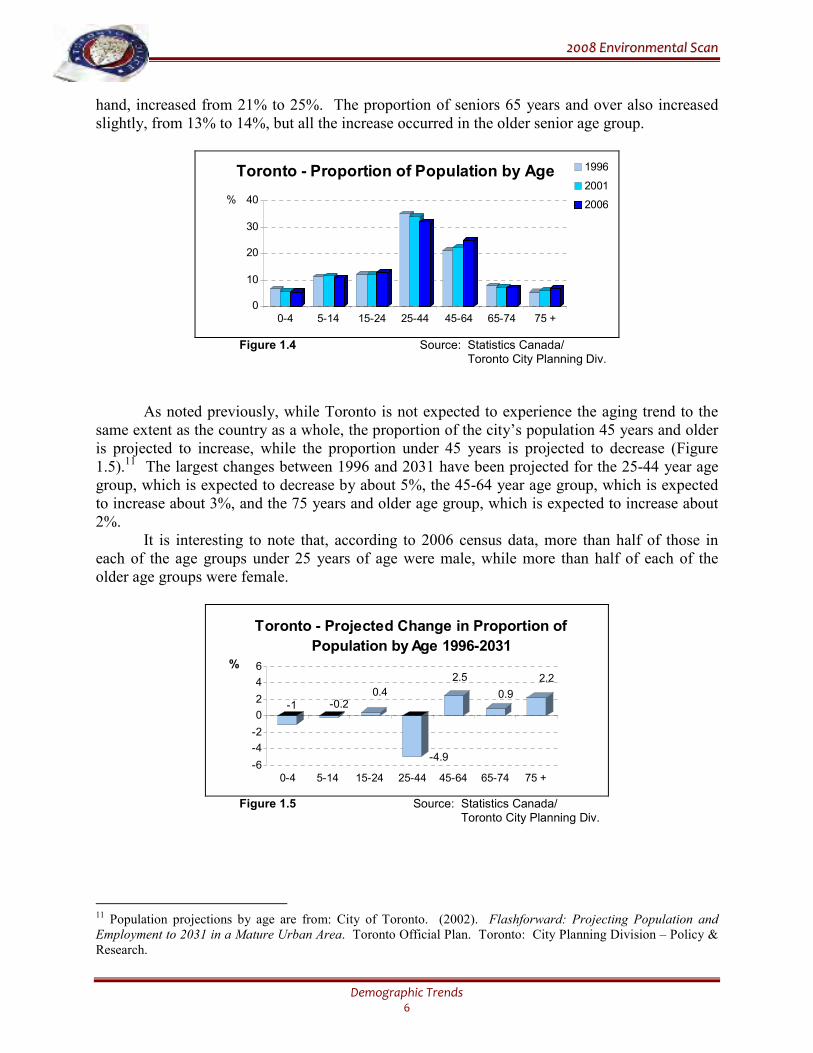
This age distribution pattern in the GTA is also not unexpected, given changes in housing preferences as people age. In general, young people typically occupy apartments or apartment-type units. As they age through their 20s and 30s, the peak years for the formation of families, people tend to prefer ground-related dwellings (e.g. single or semi-detached houses, etc.). Most families remain in the home until late in life when property upkeep becomes too difficult or a spouse dies; seniors then show an increased preference for apartment or apartment-type units.10 With high house prices and space at a premium in Toronto, many of those in their child-bearing years have moved to the outer regions. Consistent with the above, according to the 2006 census, between 38% and 46% of all households in the outer regions of the GTA were households containing a couple (married or common-law) with children, compared to 25% in Toronto. On the other hand, 30% of Toronto’s households were one-person households, compared to 13%-19% in the regions. Figure 1.4 shows how the age profile of Toronto has changed over the past decade. The proportions of very young and school-age children decreased, while the proportion of teens and young adults increased. The overall proportion of children 0-14 years in the city decreased from 18% in 1996 to 16% in 2006; the proportion of youth 15-24 years increased slightly from 12% to 13%. The proportion of younger working age adults decreased from just over one-third of the population (35%) to just under (32%). The proportion of older working age adults, on the other
9 The median age is the age at which one half of the population is older and one half is younger. 10 Foot, D. & Stoffman, D. (1996). Boom, Bust, & Echo. Toronto: Mcfarlane Walter & Ross.
22000088 EEnnvviirroonnmmeennttaall SSccaann
Demographic Trends 6
hand, increased from 21% to 25%. The proportion of seniors 65 years and over also increased slightly, from 13% to 14%, but all the increase occurred in the older senior age group.
0
10
20
30
40
0-4 5-14 15-24 25-44 45-64 65-74 75 +
Toronto - Proportion of Population by Age 1996
2001
2006%
Figure 1.4 Source: Statistics Canada/ Toronto City Planning Div.
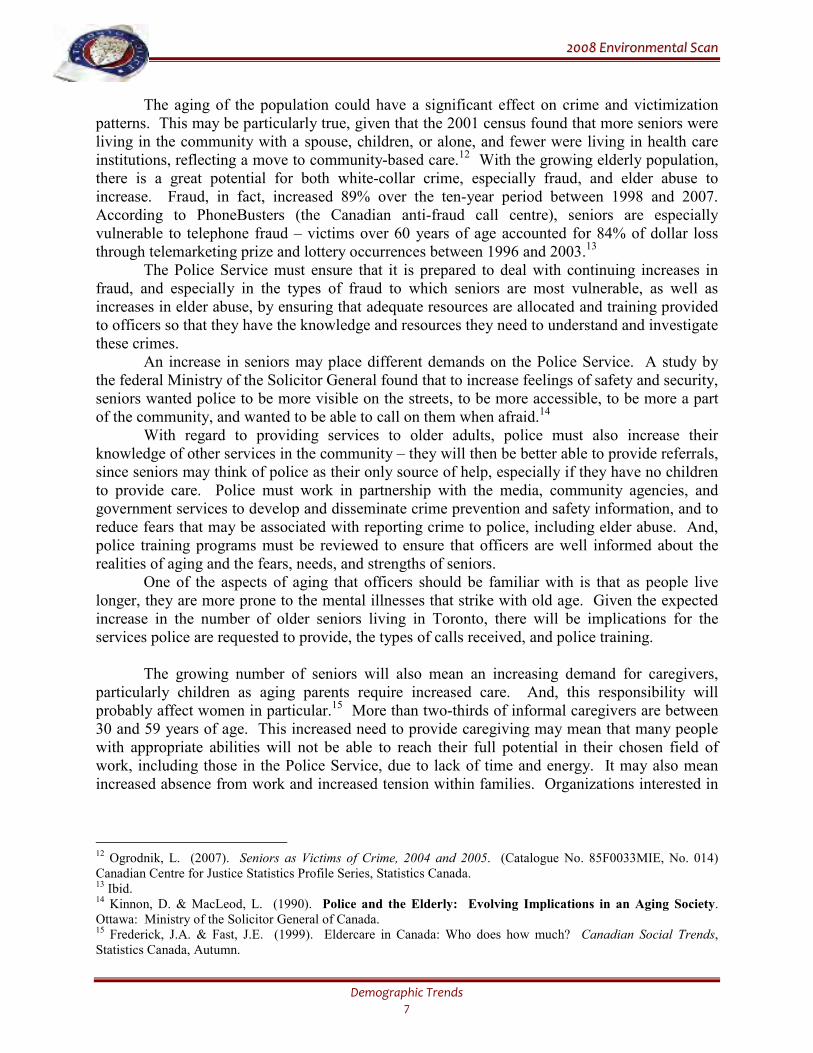
As noted previously, while Toronto is not expected to experience the aging trend to the same extent as the country as a whole, the proportion of the city’s population 45 years and older is projected to increase, while the proportion under 45 years is projected to decrease (Figure 1.5).11 The largest changes between 1996 and 2031 have been projected for the 25-44 year age group, which is expected to decrease by about 5%, the 45-64 year age group, which is expected to increase about 3%, and the 75 years and older age group, which is expected to increase about 2%.
It is interesting to note that, according to 2006 census data, more than half of those in each of the age groups under 25 years of age were male, while more than half of each of the older age groups were female.
-1 -0.20.4
-4.9
2.5
0.9
2.2
-6
-4
-2
0
2
4
6
0-4 5-14 15-24 25-44 45-64 65-74 75 +
%
Toronto - Projected Change in Proportion of
Population by Age 1996-2031
Figure 1.5 Source: Statistics Canada/ Toronto City Planning Div.
11 Population projections by age are from: City of Toronto. (2002). Flashforward: Projecting Population and Employment to 2031 in a Mature Urban Area. Toronto Official Plan. Toronto: City Planning Division – Policy & Research.
22000088 EEnnvviirroonnmmeennttaall SSccaann
Demographic Trends 7
The aging of the population could have a significant effect on crime and victimization patterns. This may be particularly true, given that the 2001 census found that more seniors were living in the community with a spouse, children, or alone, and fewer were living in health care institutions, reflecting a move to community-based care.12 With the growing elderly population, there is a great potential for both white-collar crime, especially fraud, and elder abuse to increase. Fraud, in fact, increased 89% over the ten-year period between 1998 and 2007. According to PhoneBusters (the Canadian anti-fraud call centre), seniors are especially vulnerable to telephone fraud – victims over 60 years of age accounted for 84% of dollar loss through telemarketing prize and lottery occurrences between 1996 and 2003.13
The Police Service must ensure that it is prepared to deal with continuing increases in fraud, and especially in the types of fraud to which seniors are most vulnerable, as well as increases in elder abuse, by ensuring that adequate resources are allocated and training provided to officers so that they have the knowledge and resources they need to understand and investigate these crimes. An increase in seniors may place different demands on the Police Service. A study by the federal Ministry of the Solicitor General found that to increase feelings of safety and security, seniors wanted police to be more visible on the streets, to be more accessible, to be more a part of the community, and wanted to be able to call on them when afraid.14 With regard to providing services to older adults, police must also increase their knowledge of other services in the community – they will then be better able to provide referrals, since seniors may think of police as their only source of help, especially if they have no children to provide care. Police must work in partnership with the media, community agencies, and government services to develop and disseminate crime prevention and safety information, and to reduce fears that may be associated with reporting crime to police, including elder abuse. And, police training programs must be reviewed to ensure that officers are well informed about the realities of aging and the fears, needs, and strengths of seniors. One of the aspects of aging that officers should be familiar with is that as people live longer, they are more prone to the mental illnesses that strike with old age. Given the expected increase in the number of older seniors living in Toronto, there will be implications for the services police are requested to provide, the types of calls received, and police training.
The growing number of seniors will also mean an increasing demand for caregivers, particularly children as aging parents require increased care. And, this responsibility will probably affect women in particular.15 More than two-thirds of informal caregivers are between 30 and 59 years of age. This increased need to provide caregiving may mean that many people with appropriate abilities will not be able to reach their full potential in their chosen field of work, including those in the Police Service, due to lack of time and energy. It may also mean increased absence from work and increased tension within families. Organizations interested in
12 Ogrodnik, L. (2007). Seniors as Victims of Crime, 2004 and 2005. (Catalogue No. 85F0033MIE, No. 014) Canadian Centre for Justice Statistics Profile Series, Statistics Canada. 13 Ibid. 14 Kinnon, D. & MacLeod, L. (1990). Police and the Elderly: Evolving Implications in an Aging Society. Ottawa: Ministry of the Solicitor General of Canada. 15 Frederick, J.A. & Fast, J.E. (1999). Eldercare in Canada: Who does how much? Canadian Social Trends, Statistics Canada, Autumn.
22000088 EEnnvviirroonnmmeennttaall SSccaann
Demographic Trends 8
promoting employee wellness will have to consider innovative ways of assisting with the care for aging parents; one possibility is the provision of eldercare facilities, similar to childcare.16
With the potential for increased family stress and tension, the Service must be prepared for a potential increase in elder abuse, and, internally, must ensure that support and systems are available for Service members caring for elderly parents. The population projections in Figure 1.5 have implications for the recruitment and retention of Service members, as well. Aging Service members are and will continue to be eligible for retirement in increasing numbers, and with the relatively stable projections for the younger age groups probably due at least in part to the large numbers of young immigrants to Toronto, the Service will need to ensure continued recruitment outreach to the various diverse communities of Toronto. Recruitment and retention issues are discussed in detail in the Police Resources chapter. It should be noted that in addition to the projected aging of the population of Toronto over the next few decades, Figures 1.4 and 1.5 also show the slight increase that has occurred, and that is projected to continue, in the proportion of young people in their late ’teens and early twenties. Studies have consistently indicated that this group of young people, males in particular, are at comparatively higher risk of being offenders, and victims, of crime, especially ‘street’ crime.17 This pattern is also evident in the data outlined in the Youth Crime chapter discussing youth involvement in crime in Toronto in recent years. Although slight, any increase in the proportion of this population may contribute to a future increase in criminal offences. The Service, governments, and community agencies must enhance efforts to ensure these young people have access to education and employment opportunities to prevent marginalization and disengagement from society.
C. POPULATION COMPOSITION
Immigration:
Immigration is the main force driving population growth in the Toronto CMA.18 Almost
two-thirds (60%) of recent immigrants to the CMA settled in the city of Toronto. According to the 2006 census, 1 in 2 Toronto residents (50%) were born outside of Canada, up from 48% in 1996 and 49% in 2001. In 2006, of those born outside of Canada, 22% were recent arrivals, having immigrated in the past five years, while almost half (48%) arrived before 1991.
Immigration is changing the outer regions of the GTA as well as Toronto. While Toronto had 58% of the GTA’s foreign-born population in 2001, this decreased to 53% in 2006. Both Peel and York had large immigrant populations in 2006: almost half (49%) of Peel’s population were foreign-born, followed by 43% in York. Around 20% of Durham residents were foreign-born, as were 25% of Halton residents. As in Toronto, all proportions increased from 2001. Peel
16 Kressley, K.M. (2005). Aging and Public Institutions. The Futurist, 39(5), 28-32. 17 South, S.J. & Messner, S.F. (2000). Crime and Demography: Multiple Linkages, Reciprocal Relations, Annual Review of Sociology, v. 26. 18 Heisz (2006).
22000088 EEnnvviirroonnmmeennttaall SSccaann
Demographic Trends 9
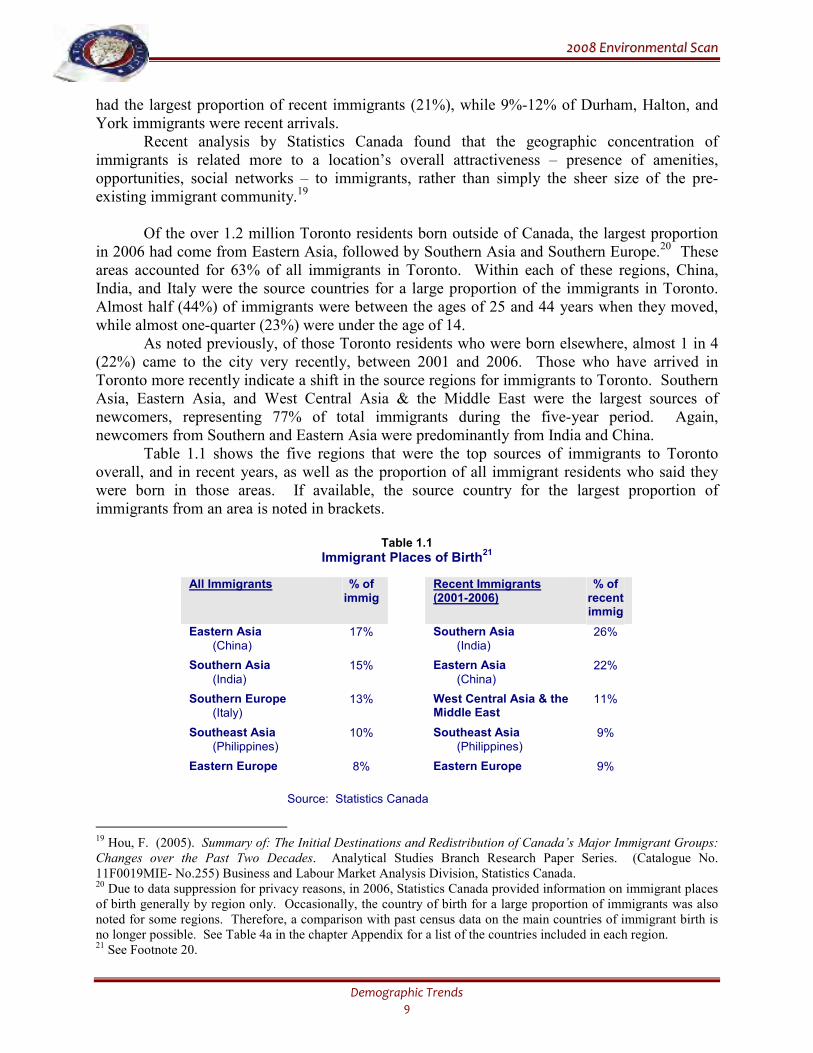
had the largest proportion of recent immigrants (21%), while 9%-12% of Durham, Halton, and York immigrants were recent arrivals. Recent analysis by Statistics Canada found that the geographic concentration of immigrants is related more to a location’s overall attractiveness – presence of amenities, opportunities, social networks – to immigrants, rather than simply the sheer size of the pre-existing immigrant community.19 Of the over 1.2 million Toronto residents born outside of Canada, the largest proportion in 2006 had come from Eastern Asia, followed by Southern Asia and Southern Europe.20 These areas accounted for 63% of all immigrants in Toronto. Within each of these regions, China, India, and Italy were the source countries for a large proportion of the immigrants in Toronto. Almost half (44%) of immigrants were between the ages of 25 and 44 years when they moved, while almost one-quarter (23%) were under the age of 14. As noted previously, of those Toronto residents who were born elsewhere, almost 1 in 4 (22%) came to the city very recently, between 2001 and 2006. Those who have arrived in Toronto more recently indicate a shift in the source regions for immigrants to Toronto. Southern Asia, Eastern Asia, and West Central Asia & the Middle East were the largest sources of newcomers, representing 77% of total immigrants during the five-year period. Again, newcomers from Southern and Eastern Asia were predominantly from India and China. Table 1.1 shows the five regions that were the top sources of immigrants to Toronto overall, and in recent years, as well as the proportion of all immigrant residents who said they were born in those areas. If available, the source country for the largest proportion of immigrants from an area is noted in brackets.
Table 1.1
Immigrant Places of Birth21
All Immigrants % of immig
Recent Immigrants (2001-2006)
% of recent immig
Eastern Asia (China)
17% Southern Asia (India)
26%
Southern Asia (India)
15% Eastern Asia (China)
22%
Southern Europe (Italy)
13% West Central Asia & the Middle East
11%
Southeast Asia (Philippines)
10% Southeast Asia (Philippines)
9%
Eastern Europe 8% Eastern Europe 9%
Source: Statistics Canada
19 Hou, F. (2005). Summary of: The Initial Destinations and Redistribution of Canada’s Major Immigrant Groups: Changes over the Past Two Decades. Analytical Studies Branch Research Paper Series. (Catalogue No. 11F0019MIE- No.255) Business and Labour Market Analysis Division, Statistics Canada. 20 Due to data suppression for privacy reasons, in 2006, Statistics Canada provided information on immigrant places of birth generally by region only. Occasionally, the country of birth for a large proportion of immigrants was also noted for some regions. Therefore, a comparison with past census data on the main countries of immigrant birth is no longer possible. See Table 4a in the chapter Appendix for a list of the countries included in each region. 21 See Footnote 20.
22000088 EEnnvviirroonnmmeennttaall SSccaann
Demographic Trends 10
While India and China have for some time been the two main sources of immigration to Toronto, the growing economies in both these countries and improving standards of living may possibly result in somewhat lower levels of immigration in the future. Immigrants to Canada, and Toronto, face a number of challenges, with a main one being employment. In 2007, the employment rate for immigrants to Canada was well below the employment rate for those born in Canada, despite the fact that employment among working-age (25-54) immigrants increased faster between 2006 and 2007 than employment among the same-age Canadian-born.22 Further, almost all immigrant employment growth was for established rather than recent immigrants, and the employment rate for immigrant youth (15-24) was half that for Canadian-born youth. Similarly, the Statistics Canada Longitudinal Survey of Immigrants, which asked new immigrants about their experiences since coming to Canada, found that when asked about the difficulties they had encountered, almost half (46%) cited finding an adequate job.23 When asked about barriers to employment, most cited multiple obstacles, including lack of Canadian work experience and lack of recognition of foreign experience or foreign qualifications. Linguistic and cultural issues were also cited when people were asked about their difficulties since coming to Canada: 26% said they had difficulty learning a new language, while 13% said they had difficulty adapting to a new culture and values. Despite these challenges, two-thirds said that their material well-being was better or the same as before they arrived, and 84% or more (depending on admission category) said their quality of life was better than before coming to Canada. A large international study, including Canada, of immigrant youth found substantial relationships between how well youth acculturate and how well they adapted.24 Those youth who integrated well (had a strong sense of their heritage as well as close ties to their new society), had the best psychological and socio-cultural outcomes (felt better about themselves and had fewer social or academic problems). These youth had better outcomes than did those who assimilated (adopted their new culture while leaving behind their old) or those who stayed separate (maintained their old culture and avoided the new). In Canada, 50% of the youth involved in the study were considered integrated. Given the results of this study, the authors suggested that immigrant youth should be encouraged to keep a sense of their heritage and cultural identity while also participating in the larger, new society; policies should promote pluralism and diversity. Finally, there has been some debate, particularly in the United States (US), as to whether immigrants are responsible for a disproportionate amount of crime. Recent research from the US suggests this is not the case. A 2008 study using data from the California state prison system and census, found that immigrant adults were considerably less likely than US-born to be in a California prison or jail:
22 Gilmore, J. (2008). The Canadian Immigrant Labour Market in 2007. The Immigrant Labour Force Analysis Series. (Catalogue no. 71-606-X2008003) Labour Statistics Division, Statistics Canada. 23 Schellenberg, G. & Maheux, H. (2007). Immigrants’ Perspectives on their First Four Years in Canada: Highlights from Three Waves of the Longitudinal Survey of Immigrants to Canada. Canadian Social Trends, Special Edition. (Statistics Canada) 24 Berry, J.W., Phinney, J.S., Sam, D.L., & Vedder, P. (2006). Immigrant Youth: Acculturation, Identity, and Adaptation (Abstract). Applied Psychology, 55(3), 303-332.
22000088 EEnnvviirroonnmmeennttaall SSccaann
Demographic Trends 11
the incarceration rate for US-born men was 3.3 times higher than for immigrant men.25 The study also examined the belief that immigrants take away jobs, perhaps causing native-born people to turn to illegal opportunities; they found that between 2000 and 2005, California cities with a larger share of immigrants saw their crime rates, particularly for violent crime, fall more than cities with fewer immigrants. Further review found continued low levels of criminal activity in the children of immigrants. A second US study found that first generation immigrants (those born outside the US) were 45% less likely, and second generation immigrants were 22% less likely, to commit violence than third generation Americans, adjusting for individual, family, and neighbourhood background.26
Diversity:
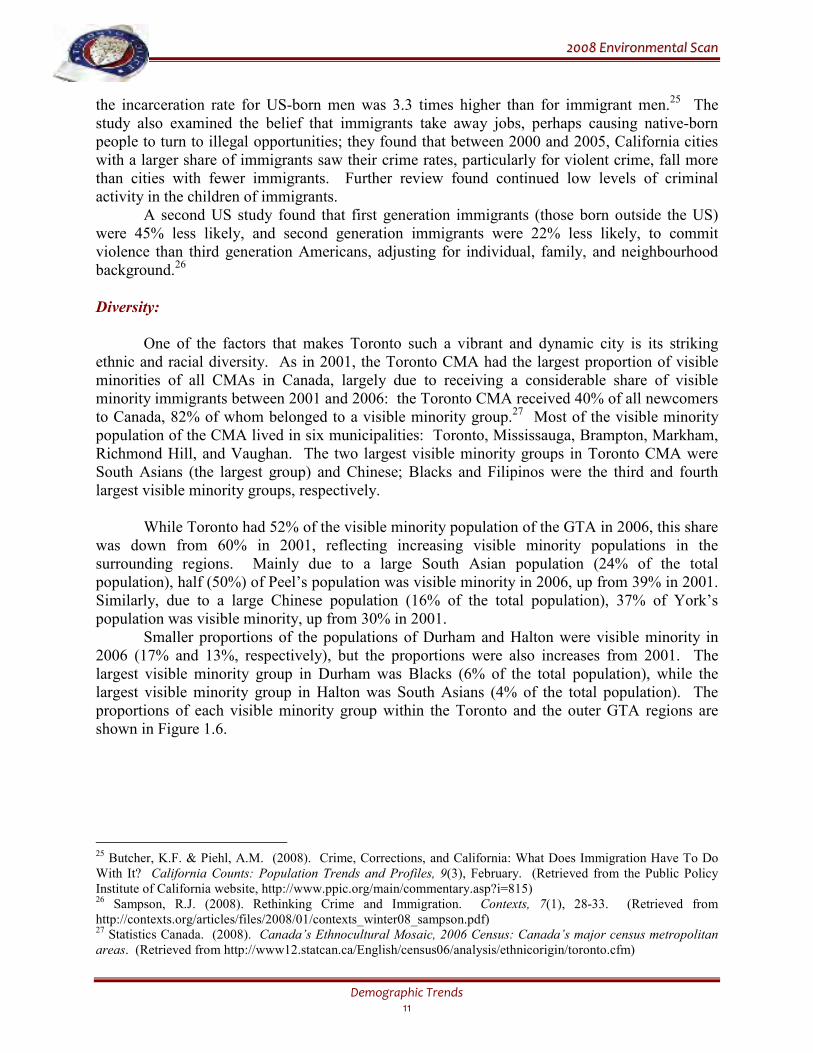
One of the factors that makes Toronto such a vibrant and dynamic city is its striking ethnic and racial diversity. As in 2001, the Toronto CMA had the largest proportion of visible minorities of all CMAs in Canada, largely due to receiving a considerable share of visible minority immigrants between 2001 and 2006: the Toronto CMA received 40% of all newcomers to Canada, 82% of whom belonged to a visible minority group.27 Most of the visible minority population of the CMA lived in six municipalities: Toronto, Mississauga, Brampton, Markham, Richmond Hill, and Vaughan. The two largest visible minority groups in Toronto CMA were South Asians (the largest group) and Chinese; Blacks and Filipinos were the third and fourth largest visible minority groups, respectively. While Toronto had 52% of the visible minority population of the GTA in 2006, this share was down from 60% in 2001, reflecting increasing visible minority populations in the surrounding regions. Mainly due to a large South Asian population (24% of the total population), half (50%) of Peel’s population was visible minority in 2006, up from 39% in 2001. Similarly, due to a large Chinese population (16% of the total population), 37% of York’s population was visible minority, up from 30% in 2001.
Smaller proportions of the populations of Durham and Halton were visible minority in 2006 (17% and 13%, respectively), but the proportions were also increases from 2001. The largest visible minority group in Durham was Blacks (6% of the total population), while the largest visible minority group in Halton was South Asians (4% of the total population). The proportions of each visible minority group within the Toronto and the outer GTA regions are shown in Figure 1.6.
25 Butcher, K.F. & Piehl, A.M. (2008). Crime, Corrections, and California: What Does Immigration Have To Do With It? California Counts: Population Trends and Profiles, 9(3), February. (Retrieved from the Public Policy Institute of California website, http://www.ppic.org/main/commentary.asp?i=815) 26 Sampson, R.J. (2008). Rethinking Crime and Immigration. Contexts, 7(1), 28-33. (Retrieved from http://contexts.org/articles/files/2008/01/contexts_winter08_sampson.pdf) 27 Statistics Canada. (2008). Canada’s Ethnocultural Mosaic, 2006 Census: Canada’s major census metropolitan areas. (Retrieved from http://www12.statcan.ca/English/census06/analysis/ethnicorigin/toronto.cfm)
22000088 EEnnvviirroonnmmeennttaall SSccaann
Demographic Trends 12
0
5
10
15
20
25
Toronto Durham Halton Peel York
GTA - Visible Minorities - Proportion of PopulationChinese
S.Asian
Black
Filipino
Lat.Amer.
SE.Asian
Arab
W.Asian
Korean
Japan.
Other
%
Figure 1.6 Source: Statistics Canada
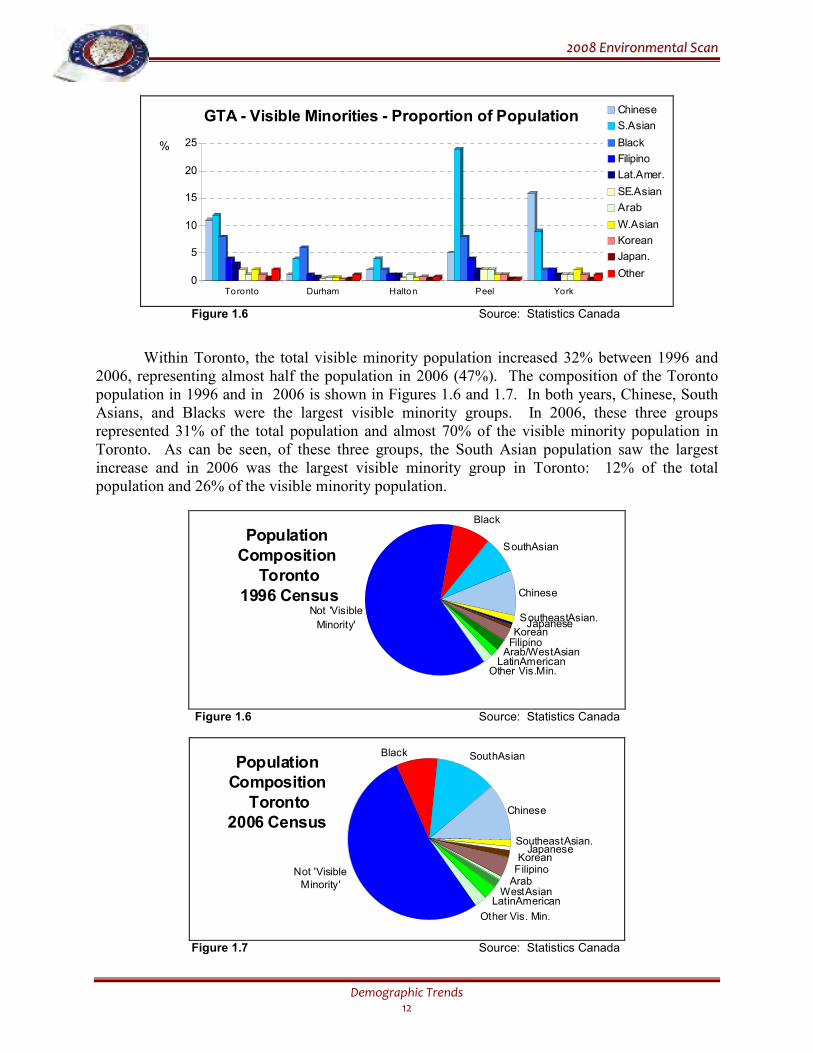
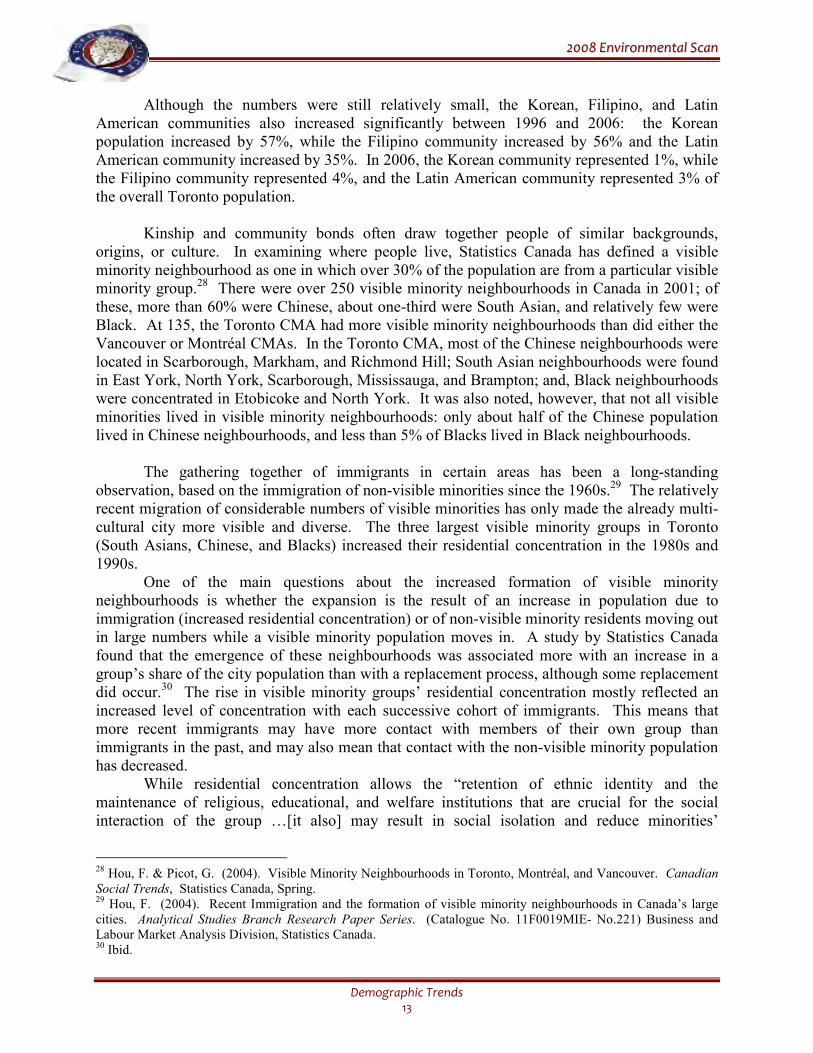
Within Toronto, the total visible minority population increased 32% between 1996 and 2006, representing almost half the population in 2006 (47%). The composition of the Toronto population in 1996 and in 2006 is shown in Figures 1.6 and 1.7. In both years, Chinese, South Asians, and Blacks were the largest visible minority groups. In 2006, these three groups represented 31% of the total population and almost 70% of the visible minority population in Toronto. As can be seen, of these three groups, the South Asian population saw the largest increase and in 2006 was the largest visible minority group in Toronto: 12% of the total population and 26% of the visible minority population.
Not 'Visible
Minority'
Black
SouthAsian
Chinese
Arab/WestAsianLatinAmerican
Other Vis.Min.
JapaneseSoutheastAsian.
KoreanFilipino
Population Composition
Toronto 1996 Census
Figure 1.6 Source: Statistics Canada
SouthAsian
WestAsian
Japanese
Not 'Visible Minority'
Black
Other Vis. Min.
Chinese
SoutheastAsian.
LatinAmerican
Korean
ArabFilipino
Population Composition
Toronto 2006 Census
Figure 1.7 Source: Statistics Canada
22000088 EEnnvviirroonnmmeennttaall SSccaann
Demographic Trends 13
Although the numbers were still relatively small, the Korean, Filipino, and Latin American communities also increased significantly between 1996 and 2006: the Korean population increased by 57%, while the Filipino community increased by 56% and the Latin American community increased by 35%. In 2006, the Korean community represented 1%, while the Filipino community represented 4%, and the Latin American community represented 3% of the overall Toronto population. Kinship and community bonds often draw together people of similar backgrounds, origins, or culture. In examining where people live, Statistics Canada has defined a visible minority neighbourhood as one in which over 30% of the population are from a particular visible minority group.28 There were over 250 visible minority neighbourhoods in Canada in 2001; of these, more than 60% were Chinese, about one-third were South Asian, and relatively few were Black. At 135, the Toronto CMA had more visible minority neighbourhoods than did either the Vancouver or Montréal CMAs. In the Toronto CMA, most of the Chinese neighbourhoods were located in Scarborough, Markham, and Richmond Hill; South Asian neighbourhoods were found in East York, North York, Scarborough, Mississauga, and Brampton; and, Black neighbourhoods were concentrated in Etobicoke and North York. It was also noted, however, that not all visible minorities lived in visible minority neighbourhoods: only about half of the Chinese population lived in Chinese neighbourhoods, and less than 5% of Blacks lived in Black neighbourhoods. The gathering together of immigrants in certain areas has been a long-standing observation, based on the immigration of non-visible minorities since the 1960s.29 The relatively recent migration of considerable numbers of visible minorities has only made the already multi-cultural city more visible and diverse. The three largest visible minority groups in Toronto (South Asians, Chinese, and Blacks) increased their residential concentration in the 1980s and 1990s. One of the main questions about the increased formation of visible minority neighbourhoods is whether the expansion is the result of an increase in population due to immigration (increased residential concentration) or of non-visible minority residents moving out in large numbers while a visible minority population moves in. A study by Statistics Canada found that the emergence of these neighbourhoods was associated more with an increase in a group’s share of the city population than with a replacement process, although some replacement did occur.30 The rise in visible minority groups’ residential concentration mostly reflected an increased level of concentration with each successive cohort of immigrants. This means that more recent immigrants may have more contact with members of their own group than immigrants in the past, and may also mean that contact with the non-visible minority population has decreased. While residential concentration allows the “retention of ethnic identity and the maintenance of religious, educational, and welfare institutions that are crucial for the social interaction of the group …[it also] may result in social isolation and reduce minorities’
28 Hou, F. & Picot, G. (2004). Visible Minority Neighbourhoods in Toronto, Montréal, and Vancouver. Canadian Social Trends, Statistics Canada, Spring. 29 Hou, F. (2004). Recent Immigration and the formation of visible minority neighbourhoods in Canada’s large cities. Analytical Studies Branch Research Paper Series. (Catalogue No. 11F0019MIE- No.221) Business and Labour Market Analysis Division, Statistics Canada. 30 Ibid.

22000088 EEnnvviirroonnmmeennttaall SSccaann
Demographic Trends 14
incentives to acquire the host-country language or to gain work experience and educational qualifications.”31 The visible minority population is expected to continue to grow over the next few decades, as a result of the high levels of immigration from non-European regions noted previously and a relatively young visible minority population.32 With the majority of this visible minority population expected to continue to live in Ontario, Toronto “will likely become increasingly differentiated from other regions of Canada in terms of cultural diversity and the presence of visible minorities.”33 Such diversity within the population being served presents both opportunities and challenges for the Toronto Police Service. Opportunities, for example, relating to the potential for recruitment, volunteers, and community partnerships. And, challenges such as the need to ensure that officers are aware of different cultures and sensitivities, and language barriers which could hinder crime prevention, information dissemination, and ability to access services. According to the 2004 Statistics Canada General Social Survey, 28% of visible minorities in Canada (compared to 13% of non-visible minorities) said they had experienced discrimination – most of these (81%) believed it was because of their race or ethnic origin.34 Blacks and Latin Americans were the most likely visible minority groups to say they’d experienced discrimination (36% both groups). And, 14% of visible minorities said they’d experienced discrimination when dealing with the police or courts, compared to 8% of non-visible minorities. The Police Service must work to ensure that members of all communities in Toronto feel they are treated professionally, respectfully, and fairly.
Language:
Toronto is also a city of diverse languages. Almost half (48%) of the population in the 2006 census said they had a mother tongue (the first language they learned at home and still understood) other than just English or French, up slightly from 46% in 2001 (single responses). Only 5% of Toronto’s population in 2006 said they were not able to carry out a conversation in either French or English. Home language is defined by Statistics Canada as being the language spoken most often or on a regular basis at home, or if the respondent lives alone, the language he/she is most comfortable with. In 2006, just under one-third of Toronto’s population (31%) said they spoke only a language other than English or French at home. This was up from 19% in 2001, but similar to the 29% in 1996. The number of those who said they spoke English and another non-official language at home was around 4% in both 1996 and 2006. Table 1.2 shows the top ten (by proportion) single response, non-official home languages in Toronto (i.e. respondent spoke this language and no other most often at home) in 1996 and 2006, as well as the proportion of Toronto’s population who said they spoke this language at home.
31 Hou & Picot (2004), p.13. 32 Chard, J. & Renaud, V. (1999) Visible Minorities in Toronto, Vancouver and Montréal. Canadian Social Trends, Statistics Canada, Autumn. 33 Ibid., p.25. 34 Perreault, S. (2004). Visible Minorities and Victimization. (Catalogue No. 85F0033MIE – No. 015) Canadian Centre for Justice Statistics Profile Series, Statistics Canada.
22000088 EEnnvviirroonnmmeennttaall SSccaann
Demographic Trends 15
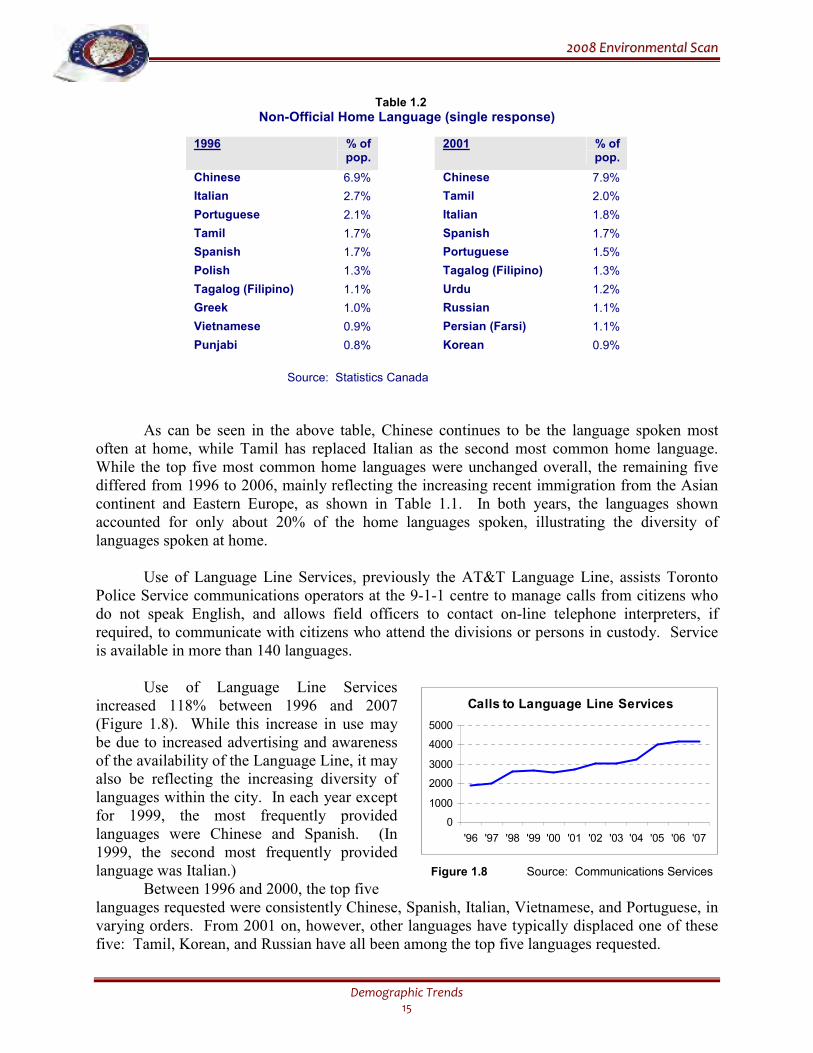
Table 1.2
Non-Official Home Language (single response)
1996 % of pop.
2001 % of pop.
Chinese 6.9% Chinese 7.9%
Italian 2.7% Tamil 2.0%
Portuguese 2.1% Italian 1.8%
Tamil 1.7% Spanish 1.7%
Spanish 1.7% Portuguese 1.5%
Polish 1.3% Tagalog (Filipino) 1.3%
Tagalog (Filipino) 1.1% Urdu 1.2%
Greek 1.0% Russian 1.1%
Vietnamese 0.9% Persian (Farsi) 1.1%
Punjabi 0.8% Korean 0.9%
Source: Statistics Canada
As can be seen in the above table, Chinese continues to be the language spoken most often at home, while Tamil has replaced Italian as the second most common home language. While the top five most common home languages were unchanged overall, the remaining five differed from 1996 to 2006, mainly reflecting the increasing recent immigration from the Asian continent and Eastern Europe, as shown in Table 1.1. In both years, the languages shown accounted for only about 20% of the home languages spoken, illustrating the diversity of languages spoken at home. Use of Language Line Services, previously the AT&T Language Line, assists Toronto Police Service communications operators at the 9-1-1 centre to manage calls from citizens who do not speak English, and allows field officers to contact on-line telephone interpreters, if required, to communicate with citizens who attend the divisions or persons in custody. Service is available in more than 140 languages.
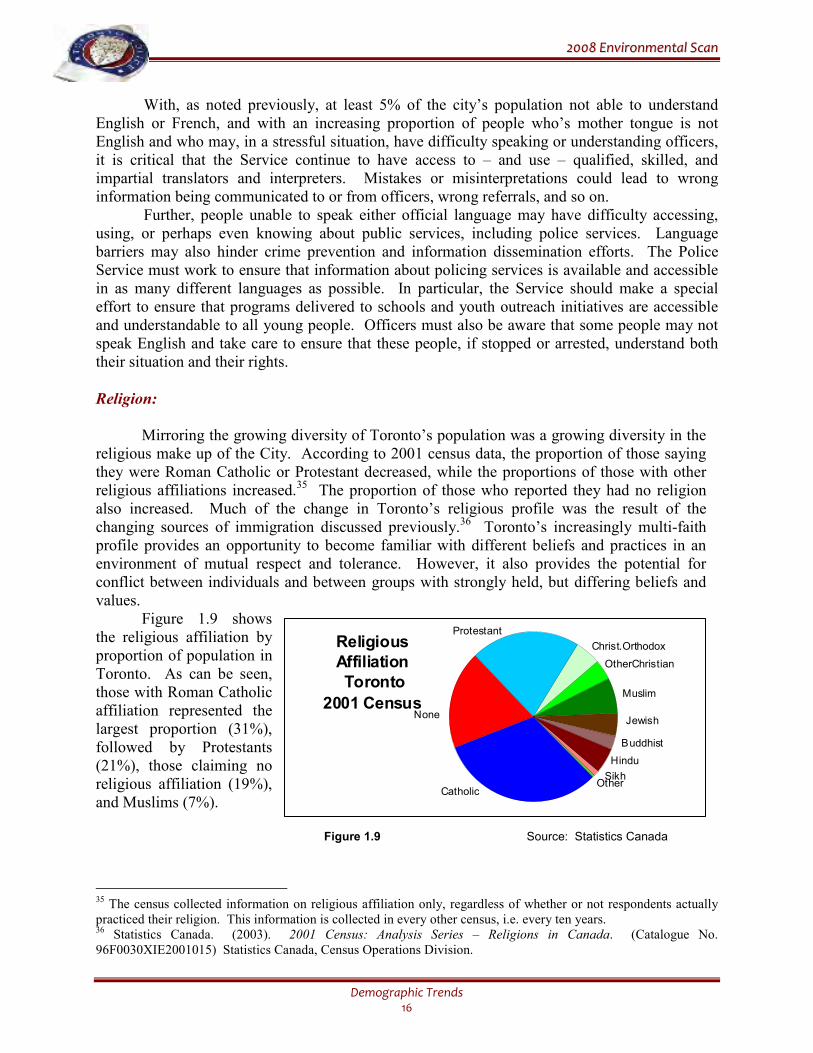
Use of Language Line Services increased 118% between 1996 and 2007 (Figure 1.8). While this increase in use may be due to increased advertising and awareness of the availability of the Language Line, it may also be reflecting the increasing diversity of languages within the city. In each year except for 1999, the most frequently provided languages were Chinese and Spanish. (In 1999, the second most frequently provided language was Italian.) Figure 1.8 Source: Communications Services
Between 1996 and 2000, the top five languages requested were consistently Chinese, Spanish, Italian, Vietnamese, and Portuguese, in varying orders. From 2001 on, however, other languages have typically displaced one of these five: Tamil, Korean, and Russian have all been among the top five languages requested.
0
1000
2000
3000
4000
5000
'96 '97 '98 '99 '00 '01 '02 '03 '04 '05 '06 '07
Calls to Language Line Services
22000088 EEnnvviirroonnmmeennttaall SSccaann
Demographic Trends 16
With, as noted previously, at least 5% of the city’s population not able to understand English or French, and with an increasing proportion of people who’s mother tongue is not English and who may, in a stressful situation, have difficulty speaking or understanding officers, it is critical that the Service continue to have access to – and use – qualified, skilled, and impartial translators and interpreters. Mistakes or misinterpretations could lead to wrong information being communicated to or from officers, wrong referrals, and so on. Further, people unable to speak either official language may have difficulty accessing, using, or perhaps even knowing about public services, including police services. Language barriers may also hinder crime prevention and information dissemination efforts. The Police Service must work to ensure that information about policing services is available and accessible in as many different languages as possible. In particular, the Service should make a special effort to ensure that programs delivered to schools and youth outreach initiatives are accessible and understandable to all young people. Officers must also be aware that some people may not speak English and take care to ensure that these people, if stopped or arrested, understand both their situation and their rights.
Religion:
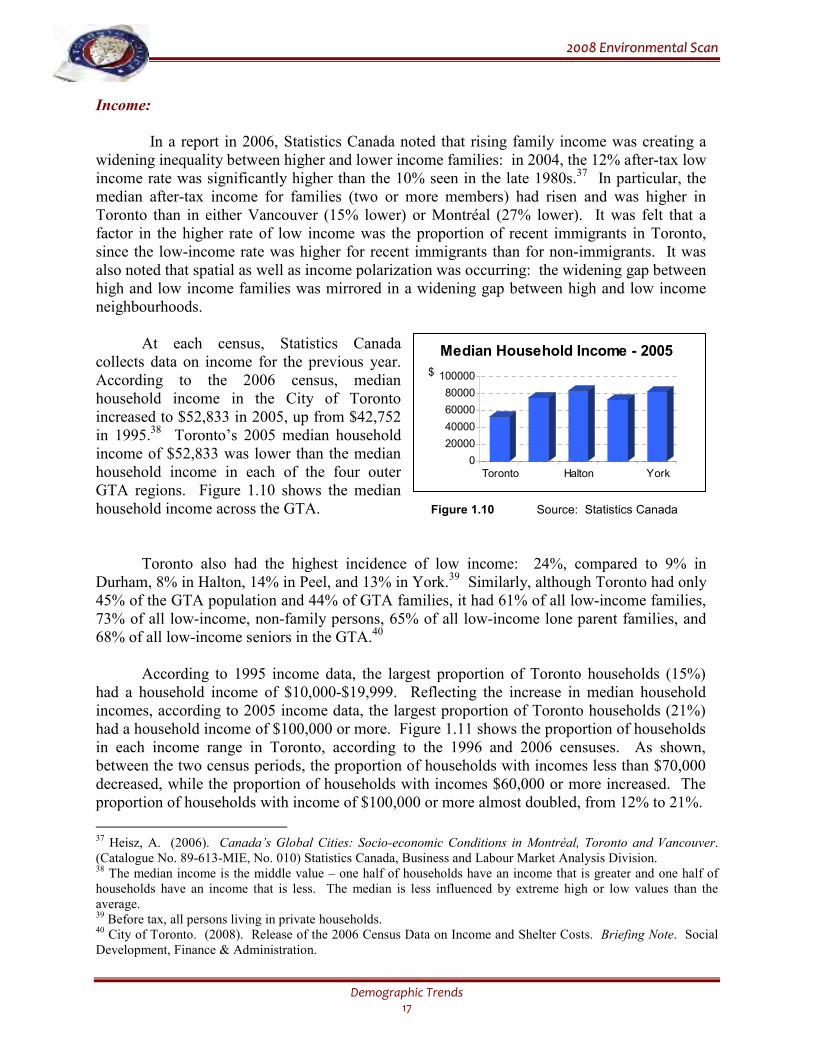
Mirroring the growing diversity of Toronto’s population was a growing diversity in the religious make up of the City. According to 2001 census data, the proportion of those saying they were Roman Catholic or Protestant decreased, while the proportions of those with other religious affiliations increased.35 The proportion of those who reported they had no religion also increased. Much of the change in Toronto’s religious profile was the result of the changing sources of immigration discussed previously.36 Toronto’s increasingly multi-faith profile provides an opportunity to become familiar with different beliefs and practices in an environment of mutual respect and tolerance. However, it also provides the potential for conflict between individuals and between groups with strongly held, but differing beliefs and values. Figure 1.9 shows the religious affiliation by proportion of population in Toronto. As can be seen, those with Roman Catholic affiliation represented the largest proportion (31%), followed by Protestants (21%), those claiming no religious affiliation (19%), and Muslims (7%).
Figure 1.9 Source: Statistics Canada
35 The census collected information on religious affiliation only, regardless of whether or not respondents actually practiced their religion. This information is collected in every other census, i.e. every ten years. 36 Statistics Canada. (2003). 2001 Census: Analysis Series – Religions in Canada. (Catalogue No. 96F0030XIE2001015) Statistics Canada, Census Operations Division.
Protestant
Sikh
Muslim
Catholic
None
Christ.Orthodox
OtherChristian
Other
Jewish
Hindu
Buddhist
ReligiousAffiliation Toronto
2001 Census
22000088 EEnnvviirroonnmmeennttaall SSccaann
Demographic Trends 17
Income:
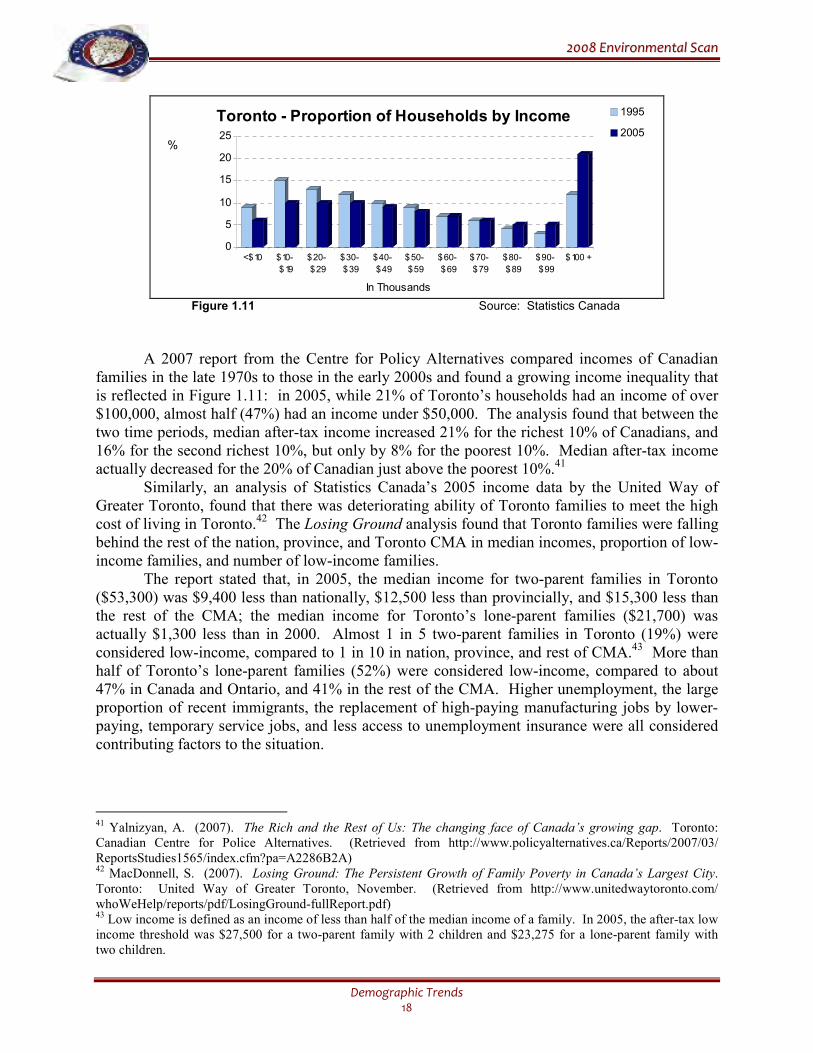
In a report in 2006, Statistics Canada noted that rising family income was creating a widening inequality between higher and lower income families: in 2004, the 12% after-tax low income rate was significantly higher than the 10% seen in the late 1980s.37 In particular, the median after-tax income for families (two or more members) had risen and was higher in Toronto than in either Vancouver (15% lower) or Montréal (27% lower). It was felt that a factor in the higher rate of low income was the proportion of recent immigrants in Toronto, since the low-income rate was higher for recent immigrants than for non-immigrants. It was also noted that spatial as well as income polarization was occurring: the widening gap between high and low income families was mirrored in a widening gap between high and low income neighbourhoods. At each census, Statistics Canada collects data on income for the previous year. According to the 2006 census, median household income in the City of Toronto increased to $52,833 in 2005, up from $42,752 in 1995.38 Toronto’s 2005 median household income of $52,833 was lower than the median household income in each of the four outer GTA regions. Figure 1.10 shows the median household income across the GTA. Figure 1.10 Source: Statistics Canada Toronto also had the highest incidence of low income: 24%, compared to 9% in Durham, 8% in Halton, 14% in Peel, and 13% in York.39 Similarly, although Toronto had only 45% of the GTA population and 44% of GTA families, it had 61% of all low-income families, 73% of all low-income, non-family persons, 65% of all low-income lone parent families, and 68% of all low-income seniors in the GTA.40 According to 1995 income data, the largest proportion of Toronto households (15%) had a household income of $10,000-$19,999. Reflecting the increase in median household incomes, according to 2005 income data, the largest proportion of Toronto households (21%) had a household income of $100,000 or more. Figure 1.11 shows the proportion of households in each income range in Toronto, according to the 1996 and 2006 censuses. As shown, between the two census periods, the proportion of households with incomes less than $70,000 decreased, while the proportion of households with incomes $60,000 or more increased. The proportion of households with income of $100,000 or more almost doubled, from 12% to 21%.
37 Heisz, A. (2006). Canada’s Global Cities: Socio-economic Conditions in Montréal, Toronto and Vancouver. (Catalogue No. 89-613-MIE, No. 010) Statistics Canada, Business and Labour Market Analysis Division. 38 The median income is the middle value – one half of households have an income that is greater and one half of households have an income that is less. The median is less influenced by extreme high or low values than the average. 39 Before tax, all persons living in private households. 40 City of Toronto. (2008). Release of the 2006 Census Data on Income and Shelter Costs. Briefing Note. Social Development, Finance & Administration.
0
20000
40000
60000
80000
100000
Toronto Halton York
Median Household Income - 2005
$
22000088 EEnnvviirroonnmmeennttaall SSccaann
Demographic Trends 18
0
5
10
15
20
25
<$10 $10-
$19
$20-
$29
$30-
$39
$40-
$49
$50-
$59
$60-
$69
$70-
$79
$80-
$89
$90-
$99
$100 +
Toronto - Proportion of Households by Income 1995
2005%
In Thousands
Figure 1.11 Source: Statistics Canada
A 2007 report from the Centre for Policy Alternatives compared incomes of Canadian families in the late 1970s to those in the early 2000s and found a growing income inequality that is reflected in Figure 1.11: in 2005, while 21% of Toronto’s households had an income of over $100,000, almost half (47%) had an income under $50,000. The analysis found that between the two time periods, median after-tax income increased 21% for the richest 10% of Canadians, and 16% for the second richest 10%, but only by 8% for the poorest 10%. Median after-tax income actually decreased for the 20% of Canadian just above the poorest 10%.41 Similarly, an analysis of Statistics Canada’s 2005 income data by the United Way of Greater Toronto, found that there was deteriorating ability of Toronto families to meet the high cost of living in Toronto.42 The Losing Ground analysis found that Toronto families were falling behind the rest of the nation, province, and Toronto CMA in median incomes, proportion of low- income families, and number of low-income families. The report stated that, in 2005, the median income for two-parent families in Toronto ($53,300) was $9,400 less than nationally, $12,500 less than provincially, and $15,300 less than the rest of the CMA; the median income for Toronto’s lone-parent families ($21,700) was actually $1,300 less than in 2000. Almost 1 in 5 two-parent families in Toronto (19%) were considered low-income, compared to 1 in 10 in nation, province, and rest of CMA.43 More than half of Toronto’s lone-parent families (52%) were considered low-income, compared to about 47% in Canada and Ontario, and 41% in the rest of the CMA. Higher unemployment, the large proportion of recent immigrants, the replacement of high-paying manufacturing jobs by lower-paying, temporary service jobs, and less access to unemployment insurance were all considered contributing factors to the situation.
41 Yalnizyan, A. (2007). The Rich and the Rest of Us: The changing face of Canada’s growing gap. Toronto: Canadian Centre for Police Alternatives. (Retrieved from http://www.policyalternatives.ca/Reports/2007/03/ ReportsStudies1565/index.cfm?pa=A2286B2A) 42 MacDonnell, S. (2007). Losing Ground: The Persistent Growth of Family Poverty in Canada’s Largest City. Toronto: United Way of Greater Toronto, November. (Retrieved from http://www.unitedwaytoronto.com/ whoWeHelp/reports/pdf/LosingGround-fullReport.pdf) 43 Low income is defined as an income of less than half of the median income of a family. In 2005, the after-tax low income threshold was $27,500 for a two-parent family with 2 children and $23,275 for a lone-parent family with two children.
22000088 EEnnvviirroonnmmeennttaall SSccaann
Demographic Trends 19
Income level can have a significant effect on many aspects of life. Research has found that higher incomes are almost always associated with cognitive, behavioural, physical, and social/emotional outcomes for children.44 While outcomes generally improved more quickly with increases in incomes at lower levels than at higher levels, there was no ceiling above which income no longer mattered for child outcomes. Increases in income at very low-income levels were found to be particularly important for young children (4-7 year olds). Other research has found that youth from lower income families are less likely than youth from higher income families to attend university.45 In addition to financial reasons for not attending, youth from lower income families did not perform as well on standardized tests, had lower marks in high school, and were less likely to have parents that expected them to complete a university degree – all of which were found to exert a strong influence on the probability of going to university. Not attending university means not gaining the benefits of a university education that accrue over a lifetime. The relationship between income inequality and crime has been the subject of study for many years, and the “notion that income inequality and crime rates are positively related is considered as conventional wisdom in the literature of both economics and criminology.”46 However, empirical support for such a relationship, when available, tends to involve correlation or association rather than a causal/cause-and-effect link. In an analysis of 34 data studies reporting on violent crime, poverty, and income inequality, Hsieh and Pugh (1993) concluded that poverty and income equality were each positively correlated with violent crime, possibly homicide and assault in particular.47 Similarly, Kennedy et al (1998) found a strong, positive correlation between income inequality and firearm violent crime, that held even when poverty and firearm availability were controlled for.48 In contrast, Doyle et al (1999) found that income inequality had no significant effect on property or violent crime.49 This study did find, however, that an increase in wages predicted a decrease in crime. Lee (2002) found evidence for a relationship between income inequality and robbery and theft, but not murder.50 However, they found no support for a causal link between income inequality and crime.
44 Phipps, S. & Lethbridge, L. (2006). Income and the Outcomes of Children. Analytical Studies Branch Research Paper Series. (Catalogue No. 11F0019MIE- No.281). Ottawa: Business and Labour Market Analysis Division, Statistics Canada. 45 Frenette, M. (2007). Why Are Youth from Lower-income Families Less Likely to Attend University? Evidence from Academic Abilities, Parental Influences, and Financial Constraints. Analytical Studies Branch Research Paper Series. (Catalogue No. 11F0019MIE- No.295). Ottawa: Business and Labour Market Analysis Division, Statistics Canada. 46 Lee, D.Y. (2002). Income Inequality and Crime: Cointegration Analyses and Causality Tests, Working Paper, Shippensburg University (PA). (www.grove.ship.edu/research/wp/02dlee.pdf). 47 Hsieh, C.C. & Pugh, M.D. (1993). Poverty, Income Inequality, and Violent Crime: A Meta-analysis of Recent Aggregate Data Studies. Criminal Justice Review, vol. 18. 48 Kennedy, B.P., Kawachi, I., Prothrow-Stith, D., Lochner, K., & Gupta, V. (1998). Social Capital, Income Inequality, and Firearm Violent Crime. Social Science and Medicine, 47(1). 49 Doyle, J.M., Ahmed, E., & Horn, R.N. (1999). The Effects of Labour Markets and Income Inequality on Crime: Evidence from Panel Data. Southern Economic Journal, 65(4),. 50 Lee (2002).
22000088 EEnnvviirroonnmmeennttaall SSccaann
Demographic Trends 20
Fajnzylber et al (2002), on the other hand, concluded that an increase in income inequality had the significant, causal effect of raising rates of both homicide and robbery.51 To address the criticism that such a relationship may have resulted from other factors affecting both income inequality and crime, the authors also examined the effects of average national income, adult education, economic/employment opportunities as measured by the gross domestic product (GDP) growth rate, degree of urbanisation, ethnic diversity, share of young males in the population, and the number of police per capita. No factor showed a significant effect except the GDP growth rate. Since the GDP growth rate and income inequality were significant determinants of homicide and robbery rates, results indicated that changes in the rate of poverty were related to the incidence of crime. Many of the authors of these studies suggested that efforts to address violent crime should consider addressing broader social and economic issues, rather than only targeting individuals at high-risk. They also discussed the need to further explore crime reduction strategies that involved poverty alleviation, acknowledging that policies to reduce crime may be more effective if they can include measures to address income inequality. In Canada, with a time series analysis of data from 1962 to 2003, Pottie Bunge et al (2005) found that increased unemployment rates were associated with increased homicide rates.52 However, inflation, not unemployment rates, was found to be associated with ‘financially-motivated’ crimes (robbery, motor vehicle theft, and break & enter). During periods of high inflation, the price of goods relative to wages increases. This results in a reduction of real income, which can have a significant effect on people with fixed or minimum wage incomes. High inflation can also create a general climate of uncertainty, resulting in higher interest rates for loans and mortgages, higher unemployment rates, and so on. The authors suggested that “…in times of high inflation when there is a significant differential between the price of goods and wages and uncertainty about one’s economic future is high, those located at or near the motivational margin of legality may be more likely to cross the threshold into criminality.”53 Researchers have also examined other types of violence. Benson and Litton Fox (2004) looked at connections between self-reported intimate violence and personal and economic well-being, and at how the type of neighbourhood the women lived in influenced their decision to leave or stay in abusive relationships.54 They found that violence against women by intimate partners occurred more often and was more severe in economically disadvantaged neighbourhoods; they also found that women struggling with money in their relationships (unemployment, not enough money to make ends meet, worrying about finances) had a higher risk of intimate violence. The authors felt the findings suggested that strategies to prevent and
51 Fajnzylber, P., Lederman, D., & Loayza, N. (2002). Inequality and Violent Crime. World Bank Research Working Paper, June 2002 (Retrieved from econ.worldbank.org/programs/conflict/topic/12197/library/ doc?id=15757); also in The Journal of Law and Economics, 45(1). 52 Pottie Bunge, V., Johnson, H. & Baldé, T.A. (2005). Exploring Crime Patterns in Canada. Crime and Justice Research Paper Series. (Catalogue No. 85-561-MIE - No.005). Ottawa: Canadian Centre for Justice Statistics and Time Series Research and Analysis Centre, Statistics Canada. 53 Ibid., p. 53. 54 Benson, M.L. & Litton Fox, G. (2004). When Violence Hits Home: How Economics and Neighbourhood Play a Role. Research in Brief. US National Institute of Justice, Office of Justice Programs.
22000088 EEnnvviirroonnmmeennttaall SSccaann
Demographic Trends 21
detect violence in domestic relationships should give greater attention and priority to disadvantaged neighbourhoods. In early 2006, a British epidemiologist noted that people who live in unequal societies trust each other less and that social status contributes to good feelings – people feel good if they feel they measure well against others around them.55 With greater inequality, people have no or bad jobs, lower incomes, and feel deprived of material goods that others have and that mark status. Vulnerable to the perceived indignity of relative rather than absolute poverty, they may be less willing to overlook incidents that they feel cause them to lose ‘face’. With the increasing income disparity, lower median household income, and a relatively large proportion of low-income in Toronto, the Service should explore the possibility of developing crime prevention/reduction strategies specifically in partnership with agencies or government departments responsible for the economic support of residents in disadvantaged areas. The Service should also support, where it can, initiatives of other agencies that provide job training, mentoring, education, and so on. D. HOMELESSNESS
56 A ‘snapshot’ completed by the City of Toronto on the night of April 19th, 2006, estimated that there were a minimum of 5,052 people homeless.57 While about 72% were in homeless shelters, 16% were on the street. Those on the street had been homeless longer (an average of 6 compared to 3.4 years overall), and were mostly men. The average age was 39 years for homeless men and 36 years for homeless women. Aboriginal people represented about 16% of the homeless population. While 86% said they would like permanent housing, those in men’s shelters, those over 50 years of age, or those homeless for a longer period of time were least likely to want such housing. For those who did not want housing, the most common answer why was that they preferred being homeless. Those not in shelters were asked where they would be staying that night – the most common answers were sidewalk/grate/doorway and ravine/park. Panhandling was a source of income for 57% of the outdoor population. Drop-in centres were the most frequently used service by the homeless: 60% had used drop-ins, 41% had used Out of the Cold meals, 31% had used Out of the Cold beds, 24% had used employment/job training, 19% had used detox, and 18% had used harm reduction. Given their situation, the homeless population are also relatively likely to come into contact with police, as victims, as witnesses, through enforcement activities, and just in general communication. Over one-third (37%) of the homeless (excluding those in corrections) interviewed by the City said they had interacted with the police in the past six months; younger homeless people were more likely than older to have interacted with police.58
55 Scrivener, L. (2006, January 15). Guns, crime and income disparity. Toronto Star. 56 The homeless population is also discussed in the Victims & Witnesses chapter and the Urban Trends chapter. 57 City of Toronto. (2006). Street Needs Assessment: Results and Key Findings. Toronto: Shelter, Support & Administration, Staff Report. 58 Ibid.
22000088 EEnnvviirroonnmmeennttaall SSccaann
Demographic Trends 22
Those who live on the streets of Toronto typically face a greater risk of harm than those who have a home to return to for security. A survey of homeless adults in November 2006 to February 2007 by Street Health found that 35% had been assaulted or beaten up in the past year – of these, more than two-thirds had been assaulted more than once.59 For those who had been assaulted, the most common assailants were a stranger (56%), an acquaintance (38%), police (35%), or another shelter resident (27%). In contrast to these overall results, women who’d been assaulted were more likely to say they’d been assaulted by an acquaintance (60%) than by a stranger (48%). Homeless women also experienced more sexual violence than homeless men: 21% said they had been sexually assaulted in the past year. Just over 1 in 10 (12%) of those surveyed reported being physically assaulted by police; three-quarters of these people said they did not make a formal complaint because they were afraid of repercussions or they felt it wouldn’t accomplish anything. Over half of the homeless people surveyed (59%) said they used illicit drugs three or more times a week, most likely crack, marijuana, and cocaine, while of the 77% who said they drank, 1 in 4 said they drank four or more times a week. Just under one-quarter (23%) said they had seriously considered suicide in the past year, while 10% said they had attempted it. To address concerns around the homeless population and the desire of many homeless people for permanent housing, the City of Toronto implemented the Streets to Homes program in 2005. With one-on-one outreach assistance and follow-up, the program has assisted about 1,800 people to find permanent housing directly from the streets; as of May 2008, the city reported that 88% have remained in their housing.60 Interviews in late 2006, early 2007 with 88 people housed through Streets to Homes found that almost all (91%) said their life had improved since moving into housing.61 Alcohol and other drug use was reduced once in housing and there was a 75% decrease in the number of individuals using police detox (‘drunk tank’) and a 56% decrease in the number of individuals arrested. There was also a 56% decrease in the number of people reporting income from panhandling, and only 9 % of those who reported panhandling while homeless said they continued to panhandle the same amount once in housing. In May 2008, the mandate of Streets to Homes was expanded to include not only those living outside, but all street-involved people, regardless of where they sleep. The goal is to reduce street homelessness as well as panhandling.
E. DIVISIONAL PROFILES With regard to divisional population, 42 Division in the east end of the city had the largest population in both 2001 and 2006.62 As can be seen in Figure 1.12, the population of most divisions showed relatively little change over the five-year period. Two divisions, 52 and 32, had relatively large increases in population, 27% and 11%, respectively, while 42 Division’s population increased by 7%. The largest population decrease – 5% – was seen in 54 Division.
59 Street Health. (2007). The Street Health Report 2007. (Retrieved from http://www.streethealth.ca/home.htm) 60 City of Toronto. (2008, May 26th). City Council approves enhanced services for panhandlers and others who are street involved. News Release. (Retrieved from http://wx.toronto.ca/inter/it/newsrel.nsf/7017df2f20edbe288525661 9004e428e/3b113230d1e723cb852574560051544d?OpenDocument) 61 City of Toronto. (2007) What Housing First Means For People: Results of Streets to Homes 2007 Post-Occupancy Research. (Retrieved April 14th, 2008, from http://www.toronto.ca/housing/pdf/results07postocc.pdf ) 62 Due to changes in divisional boundaries, comparable data for 1996 are not available.
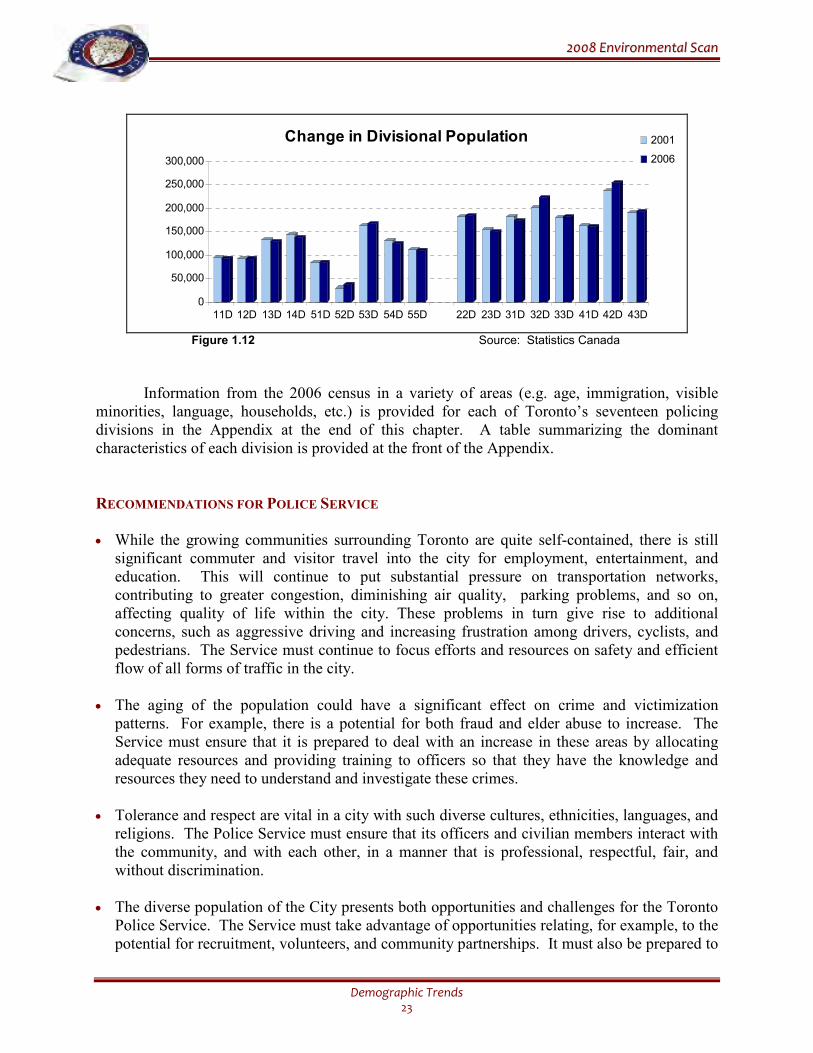
22000088 EEnnvviirroonnmmeennttaall SSccaann
Demographic Trends 23
0
50,000
100,000
150,000
200,000
250,000
300,000
11D 12D 13D 14D 51D 52D 53D 54D 55D 22D 23D 31D 32D 33D 41D 42D 43D
2001
2006
Change in Divisional Population
Figure 1.12 Source: Statistics Canada
Information from the 2006 census in a variety of areas (e.g. age, immigration, visible minorities, language, households, etc.) is provided for each of Toronto’s seventeen policing divisions in the Appendix at the end of this chapter. A table summarizing the dominant characteristics of each division is provided at the front of the Appendix.
RECOMMENDATIONS FOR POLICE SERVICE
• While the growing communities surrounding Toronto are quite self-contained, there is still
significant commuter and visitor travel into the city for employment, entertainment, and education. This will continue to put substantial pressure on transportation networks, contributing to greater congestion, diminishing air quality, parking problems, and so on, affecting quality of life within the city. These problems in turn give rise to additional concerns, such as aggressive driving and increasing frustration among drivers, cyclists, and pedestrians. The Service must continue to focus efforts and resources on safety and efficient flow of all forms of traffic in the city.
• The aging of the population could have a significant effect on crime and victimization
patterns. For example, there is a potential for both fraud and elder abuse to increase. The Service must ensure that it is prepared to deal with an increase in these areas by allocating adequate resources and providing training to officers so that they have the knowledge and resources they need to understand and investigate these crimes.
• Tolerance and respect are vital in a city with such diverse cultures, ethnicities, languages, and
religions. The Police Service must ensure that its officers and civilian members interact with the community, and with each other, in a manner that is professional, respectful, fair, and without discrimination.
• The diverse population of the City presents both opportunities and challenges for the Toronto
Police Service. The Service must take advantage of opportunities relating, for example, to the potential for recruitment, volunteers, and community partnerships. It must also be prepared to
22000088 EEnnvviirroonnmmeennttaall SSccaann
Demographic Trends 24
meet challenges such as the need to ensure that officers are aware of different cultures and sensitivities, and language barriers that could hinder crime prevention, information dissemination, and ability to access services.
• Values and culture from immigrant home countries may be different from Canadian values
and culture, especially teen culture, potentially creating clashes between immigrant parents and their children, particularly if the children are expected to act socially as if they were in the home country. The Service should consider initiatives to encourage children, including the children of immigrants, to speak to someone if clashes with parents involve abuse or violence.
• The Service must ensure that information about policing services and crime prevention is
available and accessible in as many different languages as possible. Officers must also be aware that some people may not speak English and take care to ensure that these people, if stopped or arrested, understand both their situation and their rights. In particular, the Service should make a special effort to ensure that programs delivered to schools and youth outreach initiatives are accessible and understandable to all young people.
• The Service must ensure that officers have an understanding and awareness of the differing
sensitivities of the growing diversity of religions in the City. • With the increasing income disparity in Toronto, and the results of recent studies regarding
possible links between income inequality and crime, the Service should look at exploring the possibility of developing crime prevention/reduction strategies, including strategies to address domestic violence, in partnership with agencies or government services responsible for the economic support of residents in disadvantaged areas.
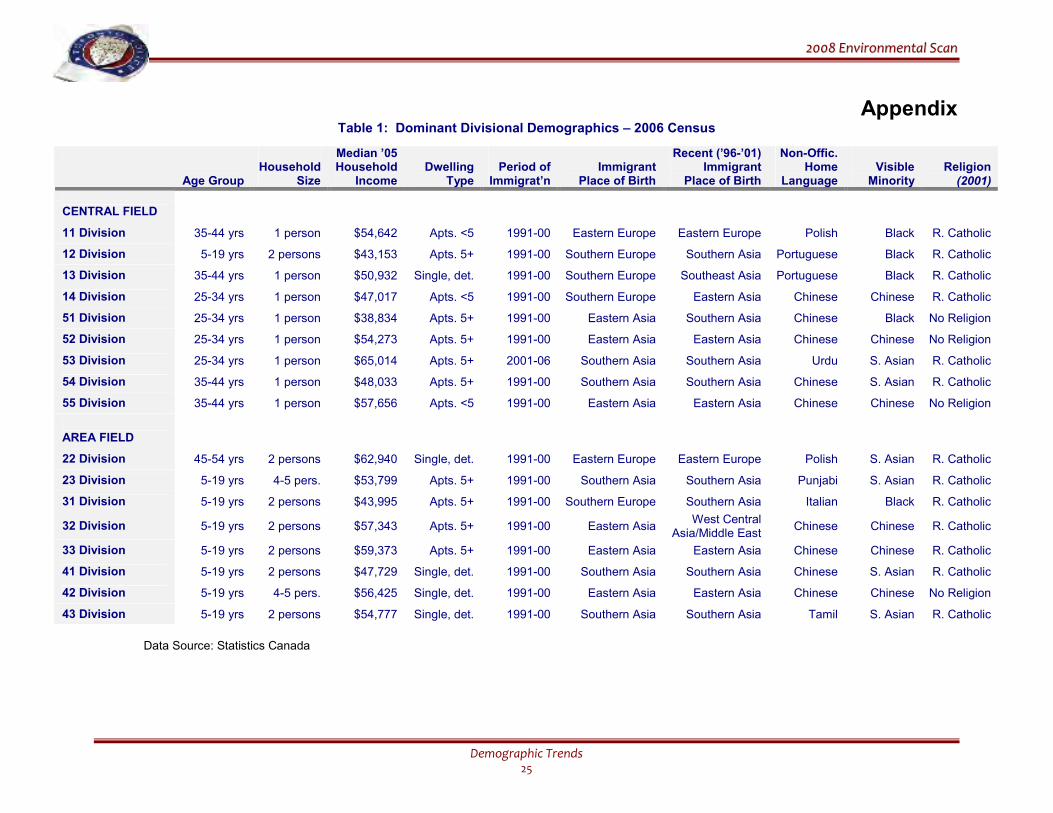
22000088 EEnnvviirroonnmmeennttaall SSccaann
Demographic Trends 25
Appendix Table 1: Dominant Divisional Demographics – 2006 Census
Age Group
Household
Size
Median ’05 Household
Income
Dwelling
Type
Period of
Immigrat’n
Immigrant
Place of Birth
Recent (’96-’01) Immigrant
Place of Birth
Non-Offic. Home
Language
Visible
Minority
Religion
(2001)
CENTRAL FIELD
11 Division 35-44 yrs 1 person $54,642 Apts. <5 1991-00 Eastern Europe Eastern Europe Polish Black R. Catholic
12 Division 5-19 yrs 2 persons $43,153 Apts. 5+ 1991-00 Southern Europe Southern Asia Portuguese Black R. Catholic
13 Division 35-44 yrs 1 person $50,932 Single, det. 1991-00 Southern Europe Southeast Asia Portuguese Black R. Catholic
14 Division 25-34 yrs 1 person $47,017 Apts. <5 1991-00 Southern Europe Eastern Asia Chinese Chinese R. Catholic
51 Division 25-34 yrs 1 person $38,834 Apts. 5+ 1991-00 Eastern Asia Southern Asia Chinese Black No Religion
52 Division 25-34 yrs 1 person $54,273 Apts. 5+ 1991-00 Eastern Asia Eastern Asia Chinese Chinese No Religion
53 Division 25-34 yrs 1 person $65,014 Apts. 5+ 2001-06 Southern Asia Southern Asia Urdu S. Asian R. Catholic
54 Division 35-44 yrs 1 person $48,033 Apts. 5+ 1991-00 Southern Asia Southern Asia Chinese S. Asian R. Catholic
55 Division 35-44 yrs 1 person $57,656 Apts. <5 1991-00 Eastern Asia Eastern Asia Chinese Chinese No Religion
AREA FIELD
22 Division 45-54 yrs 2 persons $62,940 Single, det. 1991-00 Eastern Europe Eastern Europe Polish S. Asian R. Catholic
23 Division 5-19 yrs 4-5 pers. $53,799 Apts. 5+ 1991-00 Southern Asia Southern Asia Punjabi S. Asian R. Catholic
31 Division 5-19 yrs 2 persons $43,995 Apts. 5+ 1991-00 Southern Europe Southern Asia Italian Black R. Catholic
32 Division 5-19 yrs 2 persons $57,343 Apts. 5+ 1991-00 Eastern Asia West Central
Asia/Middle East Chinese Chinese R. Catholic
33 Division 5-19 yrs 2 persons $59,373 Apts. 5+ 1991-00 Eastern Asia Eastern Asia Chinese Chinese R. Catholic
41 Division 5-19 yrs 2 persons $47,729 Single, det. 1991-00 Southern Asia Southern Asia Chinese S. Asian R. Catholic
42 Division 5-19 yrs 4-5 pers. $56,425 Single, det. 1991-00 Eastern Asia Eastern Asia Chinese Chinese No Religion
43 Division 5-19 yrs 2 persons $54,777 Single, det. 1991-00 Southern Asia Southern Asia Tamil S. Asian R. Catholic
Data Source: Statistics Canada
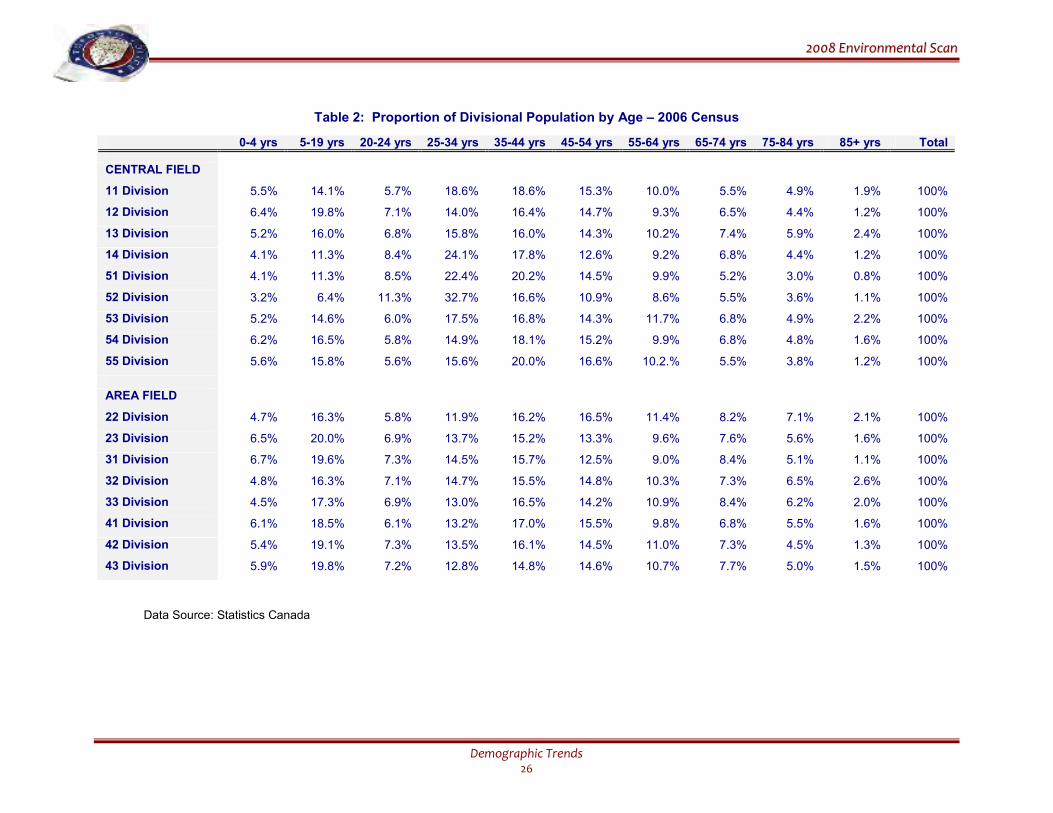
22000088 EEnnvviirroonnmmeennttaall SSccaann
Demographic Trends 26
Table 2: Proportion of Divisional Population by Age – 2006 Census
0-4 yrs 5-19 yrs 20-24 yrs 25-34 yrs 35-44 yrs 45-54 yrs 55-64 yrs 65-74 yrs 75-84 yrs 85+ yrs Total
CENTRAL FIELD
11 Division 5.5% 14.1% 5.7% 18.6% 18.6% 15.3% 10.0% 5.5% 4.9% 1.9% 100%
12 Division 6.4% 19.8% 7.1% 14.0% 16.4% 14.7% 9.3% 6.5% 4.4% 1.2% 100%
13 Division 5.2% 16.0% 6.8% 15.8% 16.0% 14.3% 10.2% 7.4% 5.9% 2.4% 100%
14 Division 4.1% 11.3% 8.4% 24.1% 17.8% 12.6% 9.2% 6.8% 4.4% 1.2% 100%
51 Division 4.1% 11.3% 8.5% 22.4% 20.2% 14.5% 9.9% 5.2% 3.0% 0.8% 100%
52 Division 3.2% 6.4% 11.3% 32.7% 16.6% 10.9% 8.6% 5.5% 3.6% 1.1% 100%
53 Division 5.2% 14.6% 6.0% 17.5% 16.8% 14.3% 11.7% 6.8% 4.9% 2.2% 100%
54 Division 6.2% 16.5% 5.8% 14.9% 18.1% 15.2% 9.9% 6.8% 4.8% 1.6% 100%
55 Division 5.6% 15.8% 5.6% 15.6% 20.0% 16.6% 10.2.% 5.5% 3.8% 1.2% 100%
AREA FIELD
22 Division 4.7% 16.3% 5.8% 11.9% 16.2% 16.5% 11.4% 8.2% 7.1% 2.1% 100%
23 Division 6.5% 20.0% 6.9% 13.7% 15.2% 13.3% 9.6% 7.6% 5.6% 1.6% 100%
31 Division 6.7% 19.6% 7.3% 14.5% 15.7% 12.5% 9.0% 8.4% 5.1% 1.1% 100%
32 Division 4.8% 16.3% 7.1% 14.7% 15.5% 14.8% 10.3% 7.3% 6.5% 2.6% 100%
33 Division 4.5% 17.3% 6.9% 13.0% 16.5% 14.2% 10.9% 8.4% 6.2% 2.0% 100%
41 Division 6.1% 18.5% 6.1% 13.2% 17.0% 15.5% 9.8% 6.8% 5.5% 1.6% 100%
42 Division 5.4% 19.1% 7.3% 13.5% 16.1% 14.5% 11.0% 7.3% 4.5% 1.3% 100%
43 Division 5.9% 19.8% 7.2% 12.8% 14.8% 14.6% 10.7% 7.7% 5.0% 1.5% 100%
Data Source: Statistics Canada
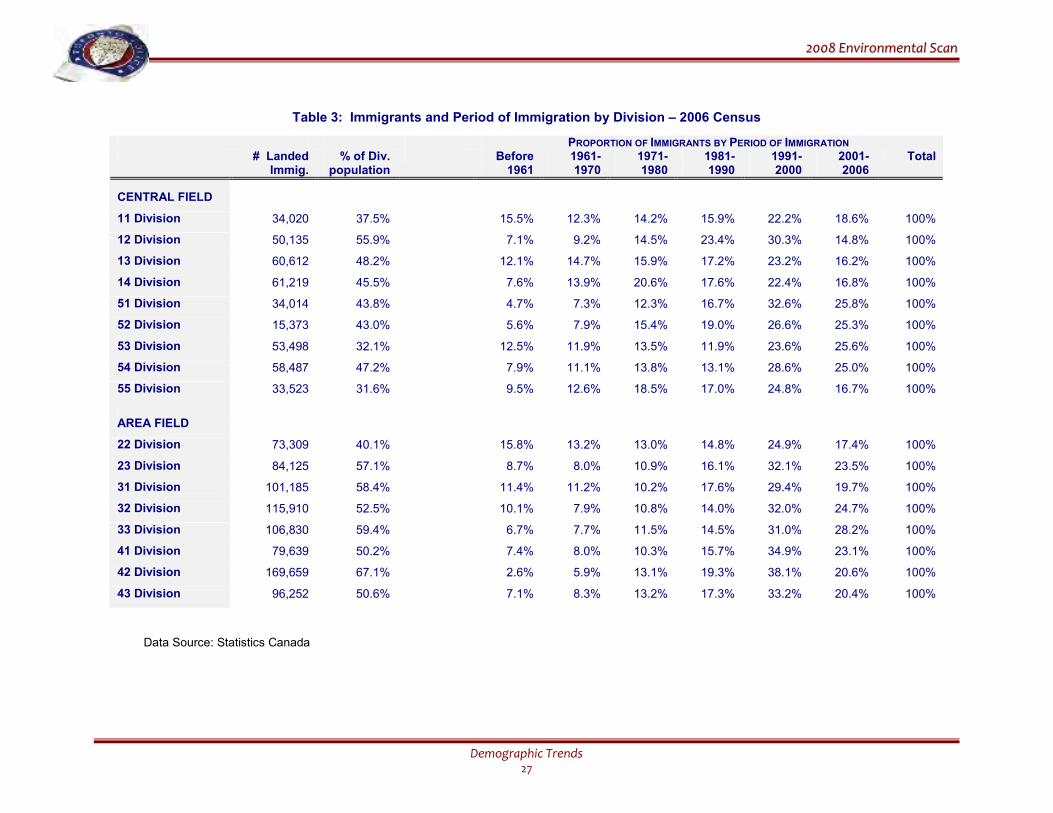
22000088 EEnnvviirroonnmmeennttaall SSccaann
Demographic Trends 27
Table 3: Immigrants and Period of Immigration by Division – 2006 Census
PROPORTION OF IMMIGRANTS BY PERIOD OF IMMIGRATION # Landed
Immig. % of Div.
population Before
1961 1961-1970
1971-1980
1981-1990
1991-2000
2001-2006
Total
CENTRAL FIELD
11 Division 34,020 37.5% 15.5% 12.3% 14.2% 15.9% 22.2% 18.6% 100%
12 Division 50,135 55.9% 7.1% 9.2% 14.5% 23.4% 30.3% 14.8% 100%
13 Division 60,612 48.2% 12.1% 14.7% 15.9% 17.2% 23.2% 16.2% 100%
14 Division 61,219 45.5% 7.6% 13.9% 20.6% 17.6% 22.4% 16.8% 100%
51 Division 34,014 43.8% 4.7% 7.3% 12.3% 16.7% 32.6% 25.8% 100%
52 Division 15,373 43.0% 5.6% 7.9% 15.4% 19.0% 26.6% 25.3% 100%
53 Division 53,498 32.1% 12.5% 11.9% 13.5% 11.9% 23.6% 25.6% 100%
54 Division 58,487 47.2% 7.9% 11.1% 13.8% 13.1% 28.6% 25.0% 100%
55 Division 33,523 31.6% 9.5% 12.6% 18.5% 17.0% 24.8% 16.7% 100%
AREA FIELD
22 Division 73,309 40.1% 15.8% 13.2% 13.0% 14.8% 24.9% 17.4% 100%
23 Division 84,125 57.1% 8.7% 8.0% 10.9% 16.1% 32.1% 23.5% 100%
31 Division 101,185 58.4% 11.4% 11.2% 10.2% 17.6% 29.4% 19.7% 100%
32 Division 115,910 52.5% 10.1% 7.9% 10.8% 14.0% 32.0% 24.7% 100%
33 Division 106,830 59.4% 6.7% 7.7% 11.5% 14.5% 31.0% 28.2% 100%
41 Division 79,639 50.2% 7.4% 8.0% 10.3% 15.7% 34.9% 23.1% 100%
42 Division 169,659 67.1% 2.6% 5.9% 13.1% 19.3% 38.1% 20.6% 100%
43 Division 96,252 50.6% 7.1% 8.3% 13.2% 17.3% 33.2% 20.4% 100%
Data Source: Statistics Canada
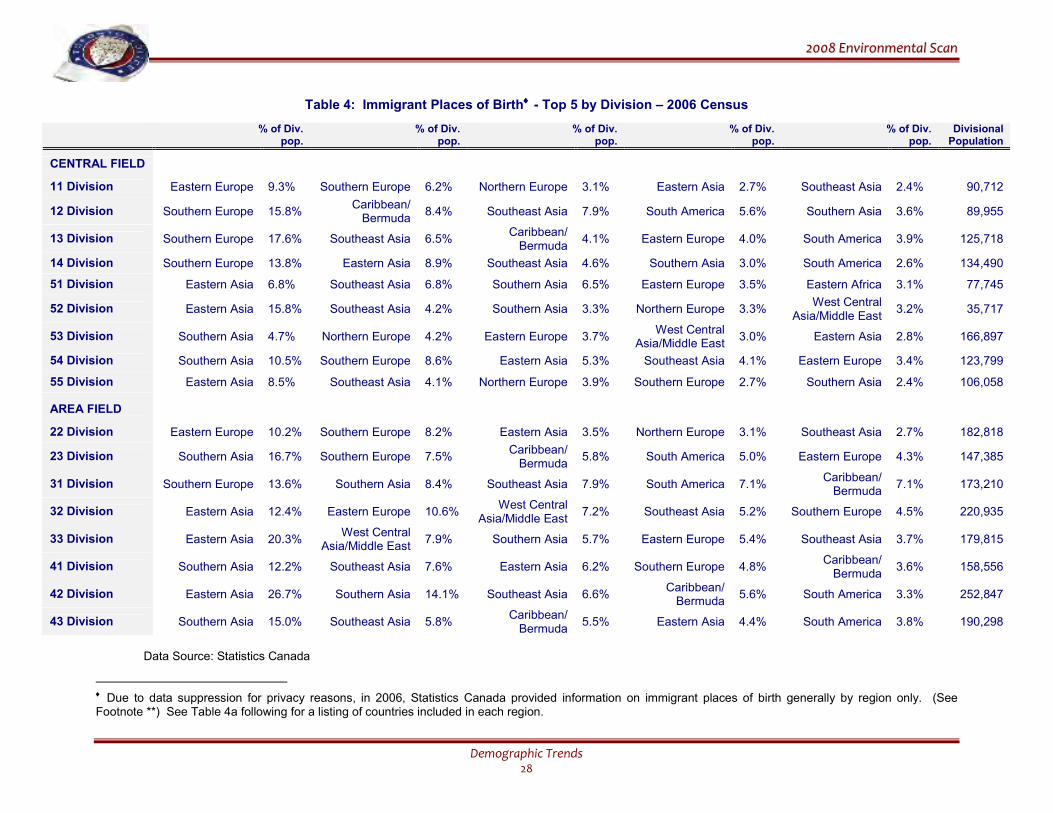
22000088 EEnnvviirroonnmmeennttaall SSccaann
Demographic Trends 28
Table 4: Immigrant Places of Birth♦♦♦♦ - Top 5 by Division – 2006 Census
% of Div. pop.
% of Div. pop.
% of Div. pop.
% of Div. pop.
% of Div. pop.
Divisional Population
CENTRAL FIELD
11 Division Eastern Europe 9.3% Southern Europe 6.2% Northern Europe 3.1% Eastern Asia 2.7% Southeast Asia 2.4% 90,712
12 Division Southern Europe 15.8% Caribbean/ Bermuda
8.4% Southeast Asia 7.9% South America 5.6% Southern Asia 3.6% 89,955
13 Division Southern Europe 17.6% Southeast Asia 6.5% Caribbean/ Bermuda
4.1% Eastern Europe 4.0% South America 3.9% 125,718
14 Division Southern Europe 13.8% Eastern Asia 8.9% Southeast Asia 4.6% Southern Asia 3.0% South America 2.6% 134,490
51 Division Eastern Asia 6.8% Southeast Asia 6.8% Southern Asia 6.5% Eastern Europe 3.5% Eastern Africa 3.1% 77,745
52 Division Eastern Asia 15.8% Southeast Asia 4.2% Southern Asia 3.3% Northern Europe 3.3% West Central
Asia/Middle East 3.2% 35,717
53 Division Southern Asia 4.7% Northern Europe 4.2% Eastern Europe 3.7% West Central
Asia/Middle East 3.0% Eastern Asia 2.8% 166,897
54 Division Southern Asia 10.5% Southern Europe 8.6% Eastern Asia 5.3% Southeast Asia 4.1% Eastern Europe 3.4% 123,799
55 Division Eastern Asia 8.5% Southeast Asia 4.1% Northern Europe 3.9% Southern Europe 2.7% Southern Asia 2.4% 106,058
AREA FIELD
22 Division Eastern Europe 10.2% Southern Europe 8.2% Eastern Asia 3.5% Northern Europe 3.1% Southeast Asia 2.7% 182,818
23 Division Southern Asia 16.7% Southern Europe 7.5% Caribbean/ Bermuda
5.8% South America 5.0% Eastern Europe 4.3% 147,385
31 Division Southern Europe 13.6% Southern Asia 8.4% Southeast Asia 7.9% South America 7.1% Caribbean/ Bermuda
7.1% 173,210
32 Division Eastern Asia 12.4% Eastern Europe 10.6% West Central
Asia/Middle East 7.2% Southeast Asia 5.2% Southern Europe 4.5% 220,935
33 Division Eastern Asia 20.3% West Central
Asia/Middle East 7.9% Southern Asia 5.7% Eastern Europe 5.4% Southeast Asia 3.7% 179,815
41 Division Southern Asia 12.2% Southeast Asia 7.6% Eastern Asia 6.2% Southern Europe 4.8% Caribbean/ Bermuda
3.6% 158,556
42 Division Eastern Asia 26.7% Southern Asia 14.1% Southeast Asia 6.6% Caribbean/ Bermuda
5.6% South America 3.3% 252,847
43 Division Southern Asia 15.0% Southeast Asia 5.8% Caribbean/ Bermuda
5.5% Eastern Asia 4.4% South America 3.8% 190,298
Data Source: Statistics Canada
♦ Due to data suppression for privacy reasons, in 2006, Statistics Canada provided information on immigrant places of birth generally by region only. (See Footnote **) See Table 4a following for a listing of countries included in each region.
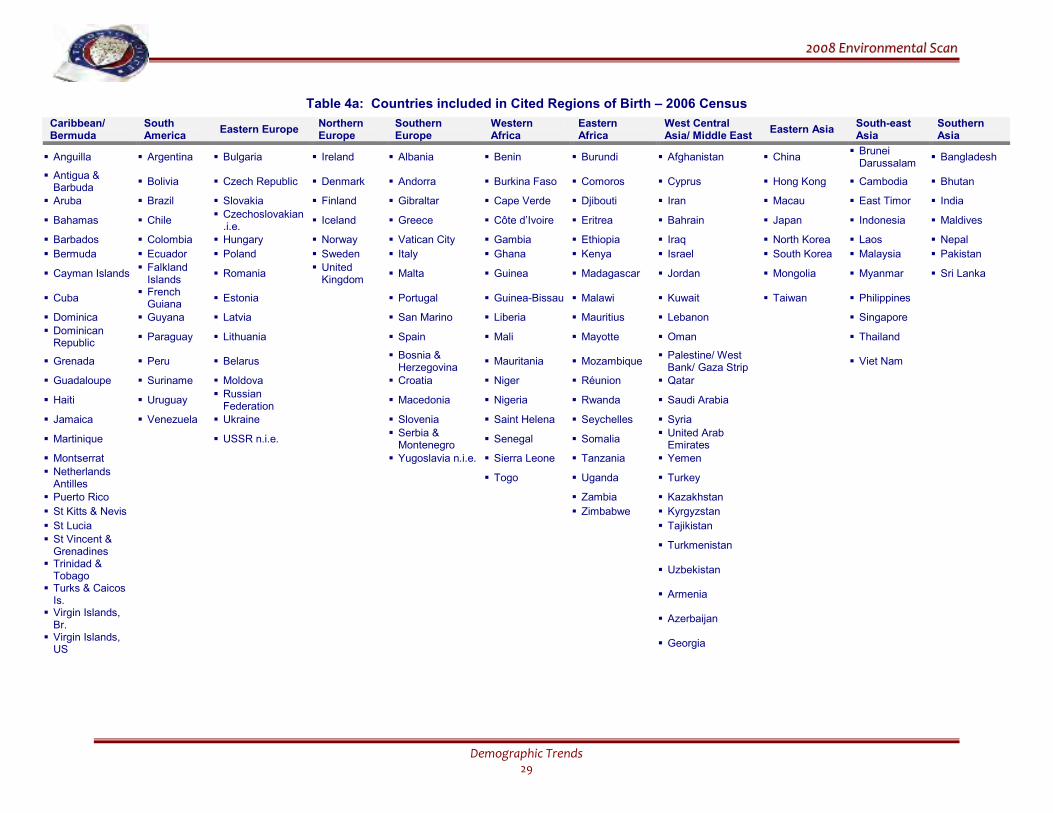
22000088 EEnnvviirroonnmmeennttaall SSccaann
Demographic Trends 29
Table 4a: Countries included in Cited Regions of Birth – 2006 Census
Caribbean/ Bermuda
South America
Eastern Europe Northern Europe
Southern Europe
Western Africa
Eastern Africa
West Central Asia/ Middle East
Eastern Asia South-east Asia
Southern Asia
� Anguilla � Argentina � Bulgaria � Ireland � Albania � Benin � Burundi � Afghanistan � China � Brunei Darussalam
� Bangladesh
� Antigua & Barbuda
� Bolivia � Czech Republic � Denmark � Andorra � Burkina Faso � Comoros � Cyprus � Hong Kong � Cambodia � Bhutan
� Aruba � Brazil � Slovakia � Finland � Gibraltar � Cape Verde � Djibouti � Iran � Macau � East Timor � India
� Bahamas � Chile � Czechoslovakian.i.e.
� Iceland � Greece � Côte d’Ivoire � Eritrea � Bahrain � Japan � Indonesia � Maldives
� Barbados � Colombia � Hungary � Norway � Vatican City � Gambia � Ethiopia � Iraq � North Korea � Laos � Nepal
� Bermuda � Ecuador � Poland � Sweden � Italy � Ghana � Kenya � Israel � South Korea � Malaysia � Pakistan
� Cayman Islands � Falkland Islands
� Romania � United Kingdom
� Malta � Guinea � Madagascar � Jordan � Mongolia � Myanmar � Sri Lanka
� Cuba � French Guiana
� Estonia � Portugal � Guinea-Bissau � Malawi � Kuwait � Taiwan � Philippines
� Dominica � Guyana � Latvia � San Marino � Liberia � Mauritius � Lebanon � Singapore
� Dominican Republic
� Paraguay � Lithuania � Spain � Mali � Mayotte � Oman � Thailand
� Grenada � Peru � Belarus � Bosnia & Herzegovina
� Mauritania � Mozambique � Palestine/ West Bank/ Gaza Strip
� Viet Nam
� Guadaloupe � Suriname � Moldova � Croatia � Niger � Réunion � Qatar
� Haiti � Uruguay � Russian Federation
� Macedonia � Nigeria � Rwanda � Saudi Arabia
� Jamaica � Venezuela � Ukraine � Slovenia � Saint Helena � Seychelles � Syria
� Martinique � USSR n.i.e. � Serbia & Montenegro
� Senegal � Somalia � United Arab Emirates
� Montserrat � Yugoslavia n.i.e. � Sierra Leone � Tanzania � Yemen
� Netherlands Antilles
� Togo � Uganda � Turkey
� Puerto Rico � Zambia � Kazakhstan
� St Kitts & Nevis � Zimbabwe � Kyrgyzstan
� St Lucia � Tajikistan
� St Vincent & Grenadines
� Turkmenistan
� Trinidad & Tobago
� Uzbekistan
� Turks & Caicos Is.
� Armenia
� Virgin Islands, Br.
� Azerbaijan
� Virgin Islands, US
� Georgia
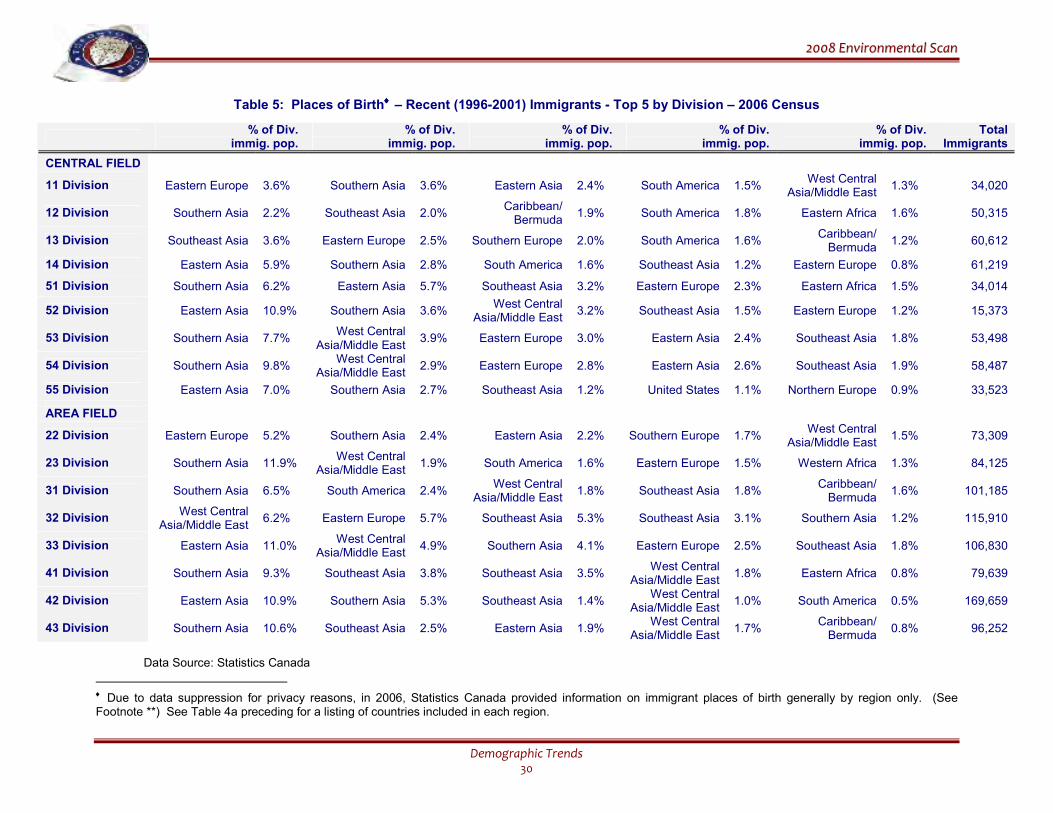
22000088 EEnnvviirroonnmmeennttaall SSccaann
Demographic Trends 30
Table 5: Places of Birth♦♦♦♦ – Recent (1996-2001) Immigrants - Top 5 by Division – 2006 Census
% of Div.
immig. pop. % of Div.
immig. pop. % of Div.
immig. pop. % of Div.
immig. pop. % of Div.
immig. pop. Total
Immigrants
CENTRAL FIELD
11 Division Eastern Europe 3.6% Southern Asia 3.6% Eastern Asia 2.4% South America 1.5% West Central
Asia/Middle East 1.3% 34,020
12 Division Southern Asia 2.2% Southeast Asia 2.0% Caribbean/ Bermuda
1.9% South America 1.8% Eastern Africa 1.6% 50,315
13 Division Southeast Asia 3.6% Eastern Europe 2.5% Southern Europe 2.0% South America 1.6% Caribbean/ Bermuda
1.2% 60,612
14 Division Eastern Asia 5.9% Southern Asia 2.8% South America 1.6% Southeast Asia 1.2% Eastern Europe 0.8% 61,219
51 Division Southern Asia 6.2% Eastern Asia 5.7% Southeast Asia 3.2% Eastern Europe 2.3% Eastern Africa 1.5% 34,014
52 Division Eastern Asia 10.9% Southern Asia 3.6% West Central
Asia/Middle East 3.2% Southeast Asia 1.5% Eastern Europe 1.2% 15,373
53 Division Southern Asia 7.7% West Central
Asia/Middle East 3.9% Eastern Europe 3.0% Eastern Asia 2.4% Southeast Asia 1.8% 53,498
54 Division Southern Asia 9.8% West Central
Asia/Middle East 2.9% Eastern Europe 2.8% Eastern Asia 2.6% Southeast Asia 1.9% 58,487
55 Division Eastern Asia 7.0% Southern Asia 2.7% Southeast Asia 1.2% United States 1.1% Northern Europe 0.9% 33,523
AREA FIELD
22 Division Eastern Europe 5.2% Southern Asia 2.4% Eastern Asia 2.2% Southern Europe 1.7% West Central
Asia/Middle East 1.5% 73,309
23 Division Southern Asia 11.9% West Central
Asia/Middle East 1.9% South America 1.6% Eastern Europe 1.5% Western Africa 1.3% 84,125
31 Division Southern Asia 6.5% South America 2.4% West Central
Asia/Middle East 1.8% Southeast Asia 1.8%
Caribbean/ Bermuda
1.6% 101,185
32 Division West Central
Asia/Middle East 6.2% Eastern Europe 5.7% Southeast Asia 5.3% Southeast Asia 3.1% Southern Asia 1.2% 115,910
33 Division Eastern Asia 11.0% West Central
Asia/Middle East 4.9% Southern Asia 4.1% Eastern Europe 2.5% Southeast Asia 1.8% 106,830
41 Division Southern Asia 9.3% Southeast Asia 3.8% Southeast Asia 3.5% West Central
Asia/Middle East 1.8% Eastern Africa 0.8% 79,639
42 Division Eastern Asia 10.9% Southern Asia 5.3% Southeast Asia 1.4% West Central
Asia/Middle East 1.0% South America 0.5% 169,659
43 Division Southern Asia 10.6% Southeast Asia 2.5% Eastern Asia 1.9% West Central
Asia/Middle East 1.7%
Caribbean/ Bermuda
0.8% 96,252
Data Source: Statistics Canada
♦ Due to data suppression for privacy reasons, in 2006, Statistics Canada provided information on immigrant places of birth generally by region only. (See Footnote **) See Table 4a preceding for a listing of countries included in each region.
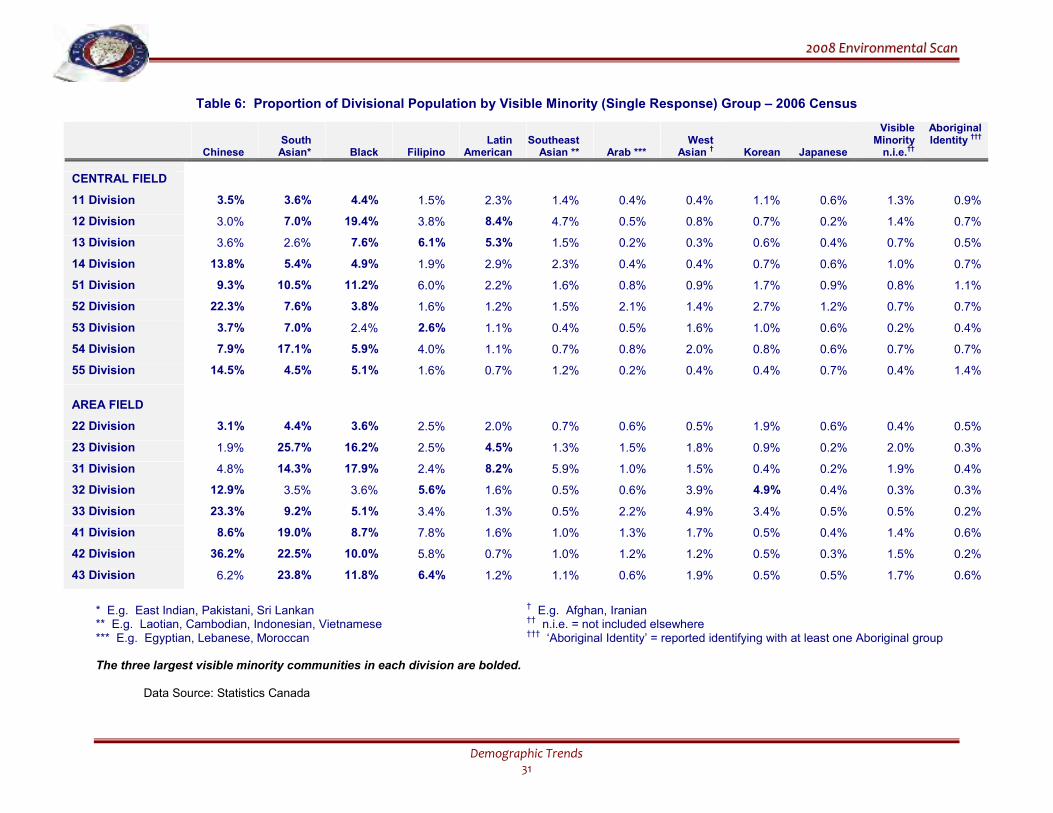
22000088 EEnnvviirroonnmmeennttaall SSccaann
Demographic Trends 31
Table 6: Proportion of Divisional Population by Visible Minority (Single Response) Group – 2006 Census
Chinese
South Asian*
Black
Filipino
Latin
American
Southeast
Asian **
Arab ***
West
Asian †
Korean
Japanese
Visible Minority
n.i.e.††
Aboriginal Identity
†††
CENTRAL FIELD
11 Division 3.5% 3.6% 4.4% 1.5% 2.3% 1.4% 0.4% 0.4% 1.1% 0.6% 1.3% 0.9%
12 Division 3.0% 7.0% 19.4% 3.8% 8.4% 4.7% 0.5% 0.8% 0.7% 0.2% 1.4% 0.7%
13 Division 3.6% 2.6% 7.6% 6.1% 5.3% 1.5% 0.2% 0.3% 0.6% 0.4% 0.7% 0.5%
14 Division 13.8% 5.4% 4.9% 1.9% 2.9% 2.3% 0.4% 0.4% 0.7% 0.6% 1.0% 0.7%
51 Division 9.3% 10.5% 11.2% 6.0% 2.2% 1.6% 0.8% 0.9% 1.7% 0.9% 0.8% 1.1%
52 Division 22.3% 7.6% 3.8% 1.6% 1.2% 1.5% 2.1% 1.4% 2.7% 1.2% 0.7% 0.7%
53 Division 3.7% 7.0% 2.4% 2.6% 1.1% 0.4% 0.5% 1.6% 1.0% 0.6% 0.2% 0.4%
54 Division 7.9% 17.1% 5.9% 4.0% 1.1% 0.7% 0.8% 2.0% 0.8% 0.6% 0.7% 0.7%
55 Division 14.5% 4.5% 5.1% 1.6% 0.7% 1.2% 0.2% 0.4% 0.4% 0.7% 0.4% 1.4%
AREA FIELD
22 Division 3.1% 4.4% 3.6% 2.5% 2.0% 0.7% 0.6% 0.5% 1.9% 0.6% 0.4% 0.5%
23 Division 1.9% 25.7% 16.2% 2.5% 4.5% 1.3% 1.5% 1.8% 0.9% 0.2% 2.0% 0.3%
31 Division 4.8% 14.3% 17.9% 2.4% 8.2% 5.9% 1.0% 1.5% 0.4% 0.2% 1.9% 0.4%
32 Division 12.9% 3.5% 3.6% 5.6% 1.6% 0.5% 0.6% 3.9% 4.9% 0.4% 0.3% 0.3%
33 Division 23.3% 9.2% 5.1% 3.4% 1.3% 0.5% 2.2% 4.9% 3.4% 0.5% 0.5% 0.2%
41 Division 8.6% 19.0% 8.7% 7.8% 1.6% 1.0% 1.3% 1.7% 0.5% 0.4% 1.4% 0.6%
42 Division 36.2% 22.5% 10.0% 5.8% 0.7% 1.0% 1.2% 1.2% 0.5% 0.3% 1.5% 0.2%
43 Division 6.2% 23.8% 11.8% 6.4% 1.2% 1.1% 0.6% 1.9% 0.5% 0.5% 1.7% 0.6%
* E.g. East Indian, Pakistani, Sri Lankan
† E.g. Afghan, Iranian
** E.g. Laotian, Cambodian, Indonesian, Vietnamese †† n.i.e. = not included elsewhere
*** E.g. Egyptian, Lebanese, Moroccan †††
‘Aboriginal Identity’ = reported identifying with at least one Aboriginal group The three largest visible minority communities in each division are bolded.
Data Source: Statistics Canada
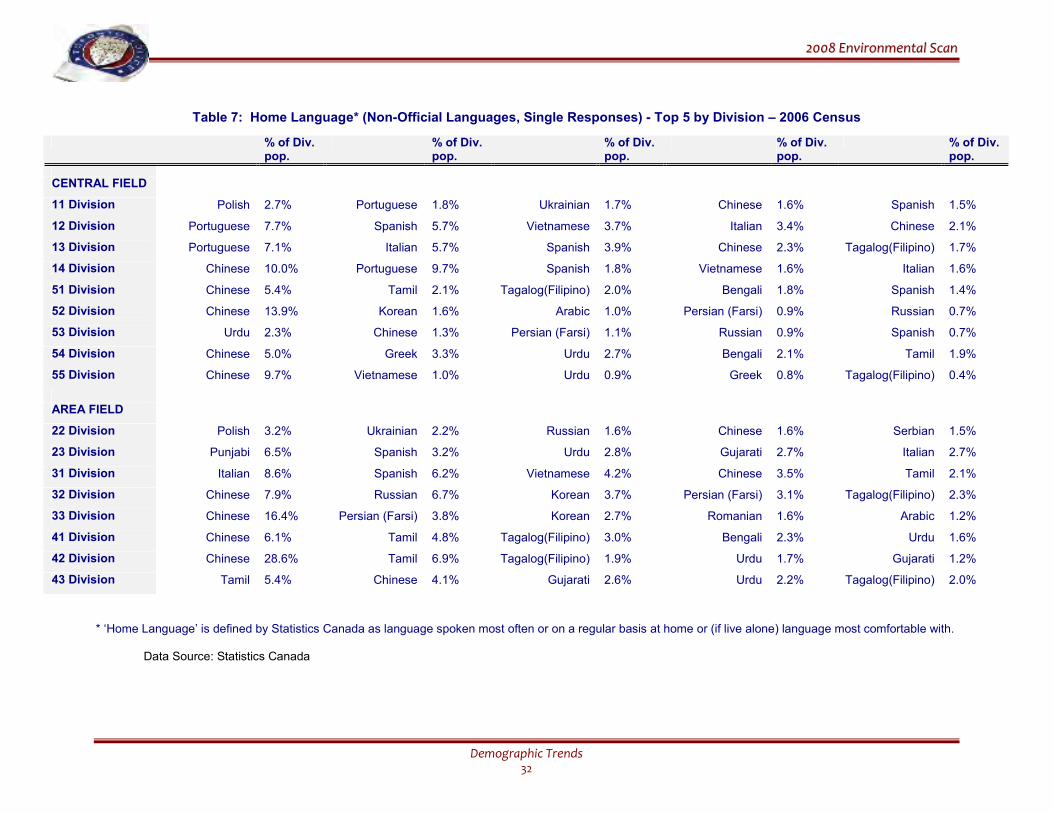
22000088 EEnnvviirroonnmmeennttaall SSccaann
Demographic Trends 32
Table 7: Home Language* (Non-Official Languages, Single Responses) - Top 5 by Division – 2006 Census
% of Div. pop.
% of Div. pop.
% of Div. pop.
% of Div. pop.
% of Div. pop.
CENTRAL FIELD
11 Division Polish 2.7% Portuguese 1.8% Ukrainian 1.7% Chinese 1.6% Spanish 1.5%
12 Division Portuguese 7.7% Spanish 5.7% Vietnamese 3.7% Italian 3.4% Chinese 2.1%
13 Division Portuguese 7.1% Italian 5.7% Spanish 3.9% Chinese 2.3% Tagalog(Filipino) 1.7%
14 Division Chinese 10.0% Portuguese 9.7% Spanish 1.8% Vietnamese 1.6% Italian 1.6%
51 Division Chinese 5.4% Tamil 2.1% Tagalog(Filipino) 2.0% Bengali 1.8% Spanish 1.4%
52 Division Chinese 13.9% Korean 1.6% Arabic 1.0% Persian (Farsi) 0.9% Russian 0.7%
53 Division Urdu 2.3% Chinese 1.3% Persian (Farsi) 1.1% Russian 0.9% Spanish 0.7%
54 Division Chinese 5.0% Greek 3.3% Urdu 2.7% Bengali 2.1% Tamil 1.9%
55 Division Chinese 9.7% Vietnamese 1.0% Urdu 0.9% Greek 0.8% Tagalog(Filipino) 0.4%
AREA FIELD
22 Division Polish 3.2% Ukrainian 2.2% Russian 1.6% Chinese 1.6% Serbian 1.5%
23 Division Punjabi 6.5% Spanish 3.2% Urdu 2.8% Gujarati 2.7% Italian 2.7%
31 Division Italian 8.6% Spanish 6.2% Vietnamese 4.2% Chinese 3.5% Tamil 2.1%
32 Division Chinese 7.9% Russian 6.7% Korean 3.7% Persian (Farsi) 3.1% Tagalog(Filipino) 2.3%
33 Division Chinese 16.4% Persian (Farsi) 3.8% Korean 2.7% Romanian 1.6% Arabic 1.2%
41 Division Chinese 6.1% Tamil 4.8% Tagalog(Filipino) 3.0% Bengali 2.3% Urdu 1.6%
42 Division Chinese 28.6% Tamil 6.9% Tagalog(Filipino) 1.9% Urdu 1.7% Gujarati 1.2%
43 Division Tamil 5.4% Chinese 4.1% Gujarati 2.6% Urdu 2.2% Tagalog(Filipino) 2.0%
* ‘Home Language’ is defined by Statistics Canada as language spoken most often or on a regular basis at home or (if live alone) language most comfortable with. Data Source: Statistics Canada
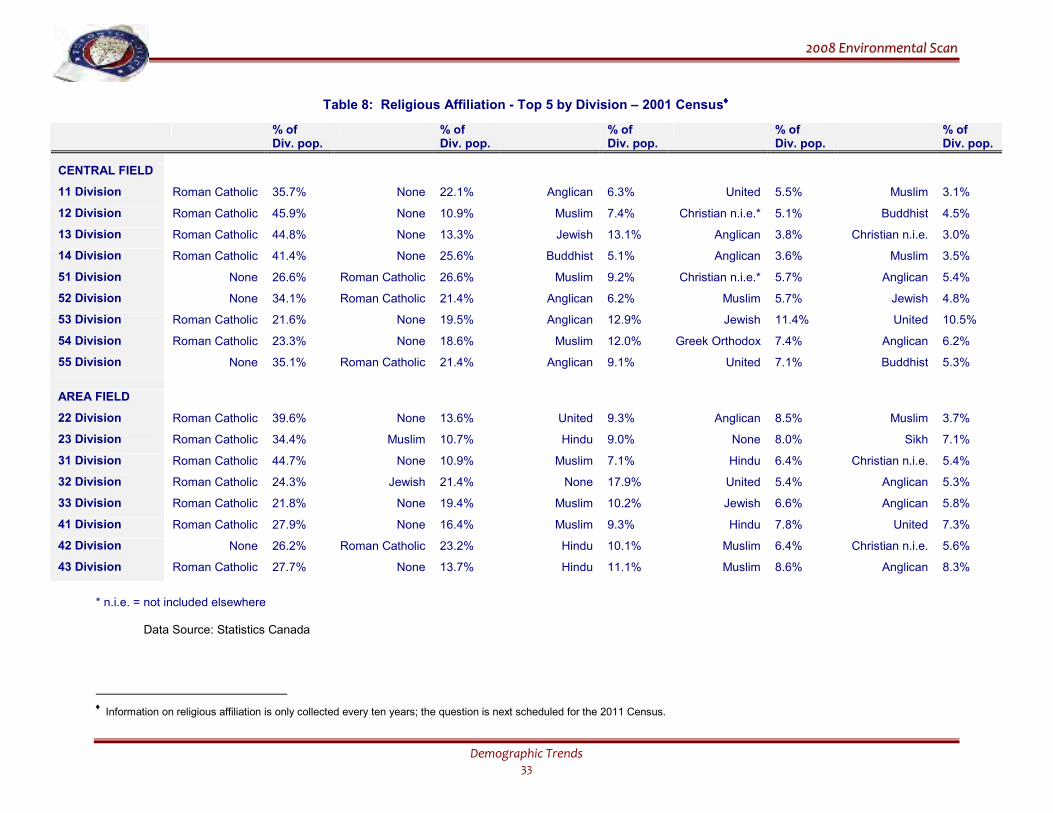
22000088 EEnnvviirroonnmmeennttaall SSccaann
Demographic Trends 33
Table 8: Religious Affiliation - Top 5 by Division – 2001 Census♦♦♦♦
% of Div. pop.
% of Div. pop.
% of Div. pop.
% of Div. pop.
% of Div. pop.
CENTRAL FIELD
11 Division Roman Catholic 35.7% None 22.1% Anglican 6.3% United 5.5% Muslim 3.1%
12 Division Roman Catholic 45.9% None 10.9% Muslim 7.4% Christian n.i.e.* 5.1% Buddhist 4.5%
13 Division Roman Catholic 44.8% None 13.3% Jewish 13.1% Anglican 3.8% Christian n.i.e. 3.0%
14 Division Roman Catholic 41.4% None 25.6% Buddhist 5.1% Anglican 3.6% Muslim 3.5%
51 Division None 26.6% Roman Catholic 26.6% Muslim 9.2% Christian n.i.e.* 5.7% Anglican 5.4%
52 Division None 34.1% Roman Catholic 21.4% Anglican 6.2% Muslim 5.7% Jewish 4.8%
53 Division Roman Catholic 21.6% None 19.5% Anglican 12.9% Jewish 11.4% United 10.5%
54 Division Roman Catholic 23.3% None 18.6% Muslim 12.0% Greek Orthodox 7.4% Anglican 6.2%
55 Division None 35.1% Roman Catholic 21.4% Anglican 9.1% United 7.1% Buddhist 5.3%
AREA FIELD
22 Division Roman Catholic 39.6% None 13.6% United 9.3% Anglican 8.5% Muslim 3.7%
23 Division Roman Catholic 34.4% Muslim 10.7% Hindu 9.0% None 8.0% Sikh 7.1%
31 Division Roman Catholic 44.7% None 10.9% Muslim 7.1% Hindu 6.4% Christian n.i.e. 5.4%
32 Division Roman Catholic 24.3% Jewish 21.4% None 17.9% United 5.4% Anglican 5.3%
33 Division Roman Catholic 21.8% None 19.4% Muslim 10.2% Jewish 6.6% Anglican 5.8%
41 Division Roman Catholic 27.9% None 16.4% Muslim 9.3% Hindu 7.8% United 7.3%
42 Division None 26.2% Roman Catholic 23.2% Hindu 10.1% Muslim 6.4% Christian n.i.e. 5.6%
43 Division Roman Catholic 27.7% None 13.7% Hindu 11.1% Muslim 8.6% Anglican 8.3%
* n.i.e. = not included elsewhere Data Source: Statistics Canada
♦ Information on religious affiliation is only collected every ten years; the question is next scheduled for the 2011 Census.
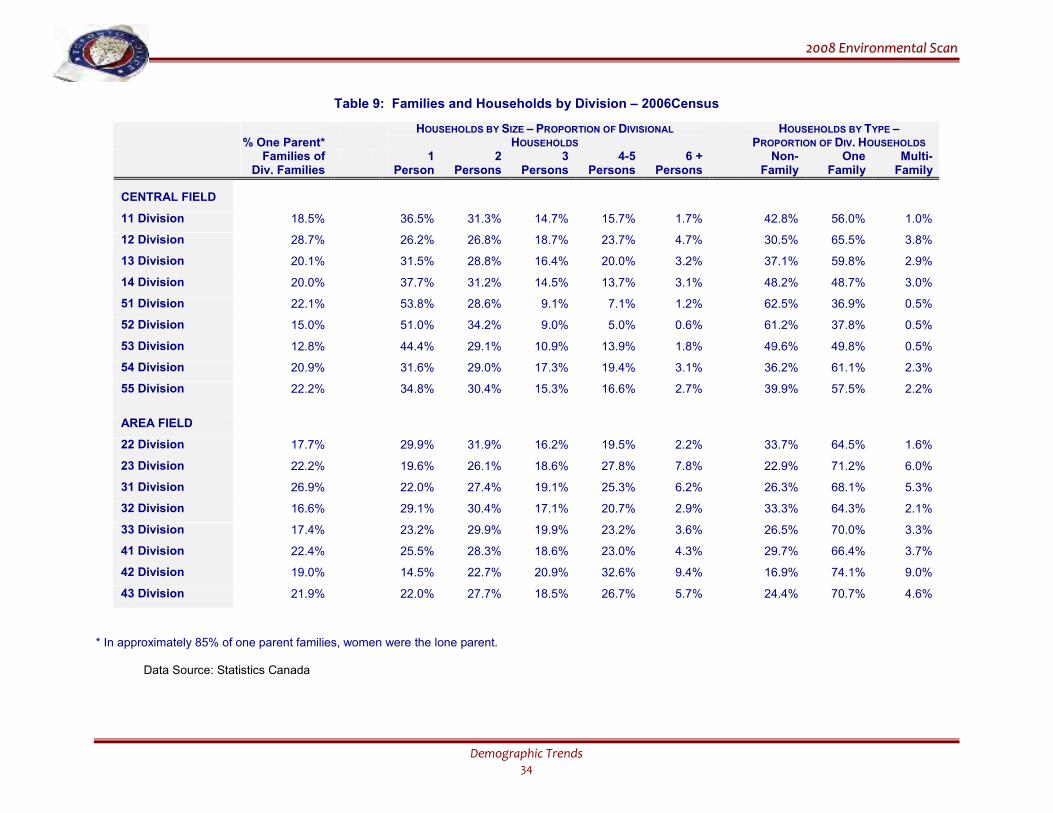
22000088 EEnnvviirroonnmmeennttaall SSccaann
Demographic Trends 34
Table 9: Families and Households by Division – 2006Census
% One Parent*
HOUSEHOLDS BY SIZE – PROPORTION OF DIVISIONAL
HOUSEHOLDS HOUSEHOLDS BY TYPE –
PROPORTION OF DIV. HOUSEHOLDS Families of
Div. Families 1
Person 2
Persons 3
Persons 4-5
Persons 6 +
Persons Non-
Family One
Family Multi-
Family
CENTRAL FIELD
11 Division 18.5% 36.5% 31.3% 14.7% 15.7% 1.7% 42.8% 56.0% 1.0%
12 Division 28.7% 26.2% 26.8% 18.7% 23.7% 4.7% 30.5% 65.5% 3.8%
13 Division 20.1% 31.5% 28.8% 16.4% 20.0% 3.2% 37.1% 59.8% 2.9%
14 Division 20.0% 37.7% 31.2% 14.5% 13.7% 3.1% 48.2% 48.7% 3.0%
51 Division 22.1% 53.8% 28.6% 9.1% 7.1% 1.2% 62.5% 36.9% 0.5%
52 Division 15.0% 51.0% 34.2% 9.0% 5.0% 0.6% 61.2% 37.8% 0.5%
53 Division 12.8% 44.4% 29.1% 10.9% 13.9% 1.8% 49.6% 49.8% 0.5%
54 Division 20.9% 31.6% 29.0% 17.3% 19.4% 3.1% 36.2% 61.1% 2.3%
55 Division 22.2% 34.8% 30.4% 15.3% 16.6% 2.7% 39.9% 57.5% 2.2%
AREA FIELD
22 Division 17.7% 29.9% 31.9% 16.2% 19.5% 2.2% 33.7% 64.5% 1.6%
23 Division 22.2% 19.6% 26.1% 18.6% 27.8% 7.8% 22.9% 71.2% 6.0%
31 Division 26.9% 22.0% 27.4% 19.1% 25.3% 6.2% 26.3% 68.1% 5.3%
32 Division 16.6% 29.1% 30.4% 17.1% 20.7% 2.9% 33.3% 64.3% 2.1%
33 Division 17.4% 23.2% 29.9% 19.9% 23.2% 3.6% 26.5% 70.0% 3.3%
41 Division 22.4% 25.5% 28.3% 18.6% 23.0% 4.3% 29.7% 66.4% 3.7%
42 Division 19.0% 14.5% 22.7% 20.9% 32.6% 9.4% 16.9% 74.1% 9.0%
43 Division 21.9% 22.0% 27.7% 18.5% 26.7% 5.7% 24.4% 70.7% 4.6%
* In approximately 85% of one parent families, women were the lone parent. Data Source: Statistics Canada
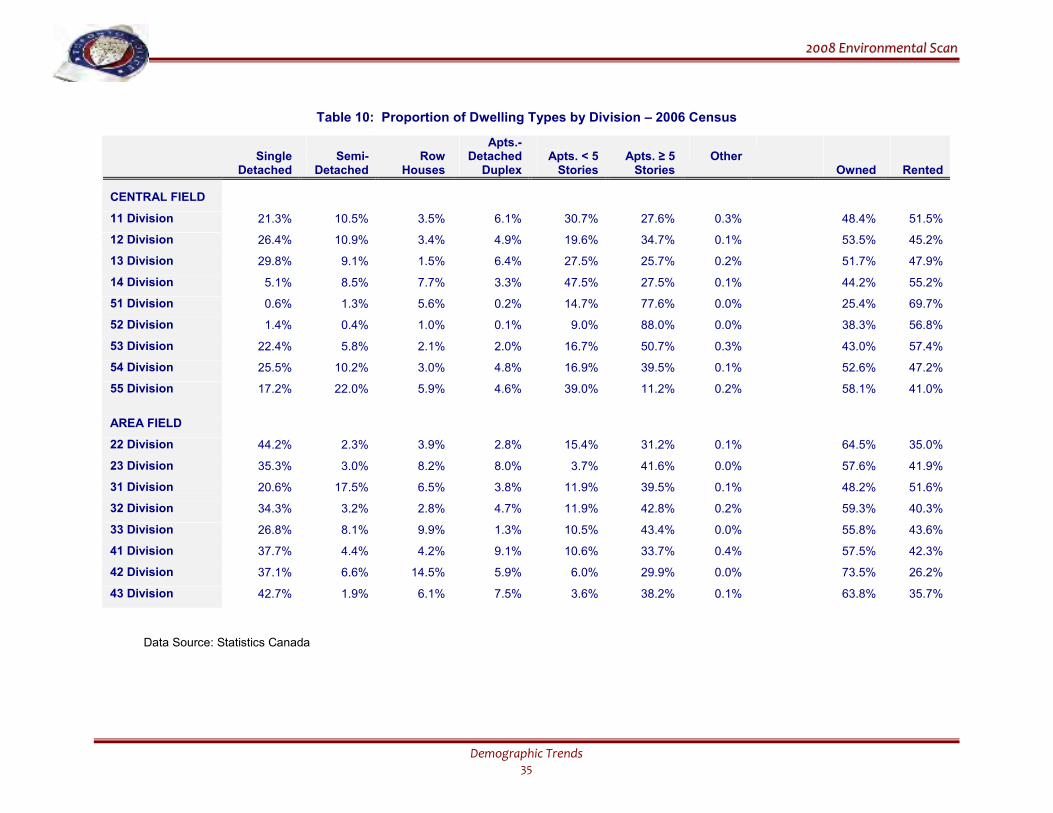
22000088 EEnnvviirroonnmmeennttaall SSccaann
Demographic Trends 35
Table 10: Proportion of Dwelling Types by Division – 2006 Census
Single
Detached
Semi-
Detached
Row
Houses
Apts.-Detached
Duplex
Apts. < 5
Stories
Apts. ≥ 5
Stories
Other
Owned
Rented
CENTRAL FIELD
11 Division 21.3% 10.5% 3.5% 6.1% 30.7% 27.6% 0.3% 48.4% 51.5%
12 Division 26.4% 10.9% 3.4% 4.9% 19.6% 34.7% 0.1% 53.5% 45.2%
13 Division 29.8% 9.1% 1.5% 6.4% 27.5% 25.7% 0.2% 51.7% 47.9%
14 Division 5.1% 8.5% 7.7% 3.3% 47.5% 27.5% 0.1% 44.2% 55.2%
51 Division 0.6% 1.3% 5.6% 0.2% 14.7% 77.6% 0.0% 25.4% 69.7%
52 Division 1.4% 0.4% 1.0% 0.1% 9.0% 88.0% 0.0% 38.3% 56.8%
53 Division 22.4% 5.8% 2.1% 2.0% 16.7% 50.7% 0.3% 43.0% 57.4%
54 Division 25.5% 10.2% 3.0% 4.8% 16.9% 39.5% 0.1% 52.6% 47.2%
55 Division 17.2% 22.0% 5.9% 4.6% 39.0% 11.2% 0.2% 58.1% 41.0%
AREA FIELD
22 Division 44.2% 2.3% 3.9% 2.8% 15.4% 31.2% 0.1% 64.5% 35.0%
23 Division 35.3% 3.0% 8.2% 8.0% 3.7% 41.6% 0.0% 57.6% 41.9%
31 Division 20.6% 17.5% 6.5% 3.8% 11.9% 39.5% 0.1% 48.2% 51.6%
32 Division 34.3% 3.2% 2.8% 4.7% 11.9% 42.8% 0.2% 59.3% 40.3%
33 Division 26.8% 8.1% 9.9% 1.3% 10.5% 43.4% 0.0% 55.8% 43.6%
41 Division 37.7% 4.4% 4.2% 9.1% 10.6% 33.7% 0.4% 57.5% 42.3%
42 Division 37.1% 6.6% 14.5% 5.9% 6.0% 29.9% 0.0% 73.5% 26.2%
43 Division 42.7% 1.9% 6.1% 7.5% 3.6% 38.2% 0.1% 63.8% 35.7%
Data Source: Statistics Canada
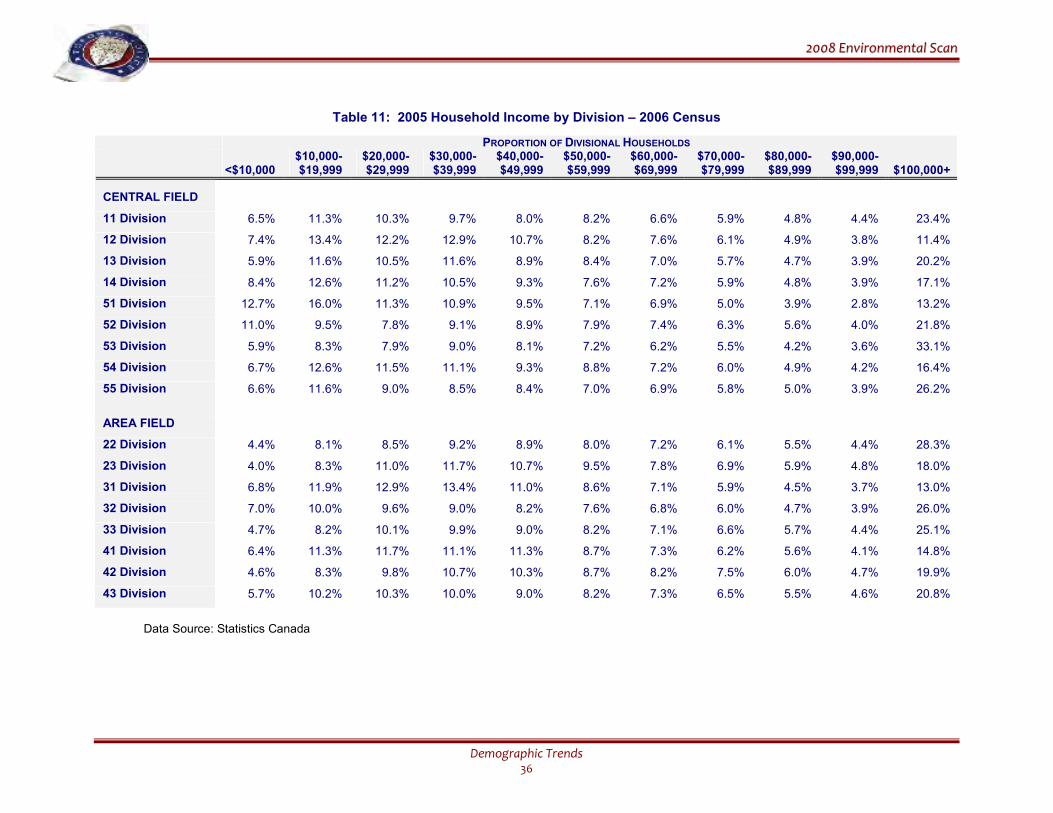
22000088 EEnnvviirroonnmmeennttaall SSccaann
Demographic Trends 36
Table 11: 2005 Household Income by Division – 2006 Census
PROPORTION OF DIVISIONAL HOUSEHOLDS
<$10,000 $10,000-$19,999
$20,000-$29,999
$30,000-$39,999
$40,000-$49,999
$50,000-$59,999
$60,000-$69,999
$70,000-$79,999
$80,000-$89,999
$90,000-$99,999
$100,000+
CENTRAL FIELD
11 Division 6.5% 11.3% 10.3% 9.7% 8.0% 8.2% 6.6% 5.9% 4.8% 4.4% 23.4%
12 Division 7.4% 13.4% 12.2% 12.9% 10.7% 8.2% 7.6% 6.1% 4.9% 3.8% 11.4%
13 Division 5.9% 11.6% 10.5% 11.6% 8.9% 8.4% 7.0% 5.7% 4.7% 3.9% 20.2%
14 Division 8.4% 12.6% 11.2% 10.5% 9.3% 7.6% 7.2% 5.9% 4.8% 3.9% 17.1%
51 Division 12.7% 16.0% 11.3% 10.9% 9.5% 7.1% 6.9% 5.0% 3.9% 2.8% 13.2%
52 Division 11.0% 9.5% 7.8% 9.1% 8.9% 7.9% 7.4% 6.3% 5.6% 4.0% 21.8%
53 Division 5.9% 8.3% 7.9% 9.0% 8.1% 7.2% 6.2% 5.5% 4.2% 3.6% 33.1%
54 Division 6.7% 12.6% 11.5% 11.1% 9.3% 8.8% 7.2% 6.0% 4.9% 4.2% 16.4%
55 Division 6.6% 11.6% 9.0% 8.5% 8.4% 7.0% 6.9% 5.8% 5.0% 3.9% 26.2%
AREA FIELD
22 Division 4.4% 8.1% 8.5% 9.2% 8.9% 8.0% 7.2% 6.1% 5.5% 4.4% 28.3%
23 Division 4.0% 8.3% 11.0% 11.7% 10.7% 9.5% 7.8% 6.9% 5.9% 4.8% 18.0%
31 Division 6.8% 11.9% 12.9% 13.4% 11.0% 8.6% 7.1% 5.9% 4.5% 3.7% 13.0%
32 Division 7.0% 10.0% 9.6% 9.0% 8.2% 7.6% 6.8% 6.0% 4.7% 3.9% 26.0%
33 Division 4.7% 8.2% 10.1% 9.9% 9.0% 8.2% 7.1% 6.6% 5.7% 4.4% 25.1%
41 Division 6.4% 11.3% 11.7% 11.1% 11.3% 8.7% 7.3% 6.2% 5.6% 4.1% 14.8%
42 Division 4.6% 8.3% 9.8% 10.7% 10.3% 8.7% 8.2% 7.5% 6.0% 4.7% 19.9%
43 Division 5.7% 10.2% 10.3% 10.0% 9.0% 8.2% 7.3% 6.5% 5.5% 4.6% 20.8%
Data Source: Statistics Canada
22000088 EEnnvviirroonnmmeennttaall SSccaann
Crime Trends 37
II. CRIME TRENDS63
The nature and extent of crime are social indicators of the safety and security of the public
and are often used for the evaluation of effectiveness of policies and programs to reduce
crime. In policing, a significant portion of police activity is spent in the prevention and
detection of crime and the apprehension of offenders. Information about changing crime
patterns or types of offenders allows the Police Service to develop strategies to address
changing problems, make rational decisions, and plan activities according to, or in
anticipation of, crime-related trends.
HIGHLIGHTS • In 2007, a total of 194,151 non-traffic Criminal Code offences occurred in Toronto,
representing a 5.0% decrease from 2006, a 3.7% decrease from five years ago, and a 7.5% decrease from ten years ago in 1998. In general, crime decreased between 1998 and 2000, and then remained relatively stable for five years before a slight increase in 2006 and a decrease in 2007.
• Between 2006 and 2007, decreases were noted for all major categories of crimes, including a
2.5% decrease for violent crime, a 4.1% decrease for property crime, and a 9.0% decrease for other non-traffic Criminal Code offences.
• The specific crimes that decreased between 2007 and 2006 included assault (-2.0%), sexual
assault (-0.9%), robbery (-3.6%), break and enter (-8.3%), auto theft (-6.4%), theft from auto (-6.4%), fraud (-4.8%), offensive weapons (-17.8%) and drugs (-6.7%). The only offences that showed an increase were homicide (19.2%) and other theft (1.6%).
• The decrease in crime between 2007 and 1998 was driven mainly by a drop in the number of
property crimes (-16.3%); the number of violent crimes remained relatively the same, while the number of other Criminal Code offences increased (16.2%).
• While overall crime decreased over ten years ago, specific crimes increased. These included
homicide (64.2%), robbery (8.7%), fraud (89.1%), offensive weapons (62.9%), and drugs (57.7%).
• The number of robberies recorded in 2007 was a drop from the peak seen in 2006, but it was
still a 4.3% and an 8.7% increase over five years ago and ten years ago, respectively. With regard to types of robberies, while the number of home invasions showed a large increase (21.2%), robberies involving financial institutions/businesses decreased (-8.8%).
• In terms of the total number of crimes per 1,000 population, a trend of decrease was seen over
the past ten years. The overall rate of non-traffic Criminal Code offences decreased from 83.5 offences in 1998 to 75 offences in 2006, and dropped further to 70.6 offences in 2007.
63 Due to different counting methods and/or different data sources, numbers in this chapter may differ slightly from those in other Toronto Police Service publications. For example, in the Annual Statistical Report, number of sexual assaults also includes non-assaultive sexual offences.
22000088 EEnnvviirroonnmmeennttaall SSccaann
Crime Trends 38
• Of the average 70.6 non-traffic Criminal Code offences that occurred per 1,000 population in
2007, 12.2 were violent crimes, 41.4 were property crimes, and 17 were other non-traffic Criminal Code offences.
• The overall crime clearance rate improved over the past ten years. Just over half (51.2%) of
crimes were cleared in 2007, compared to 48.4% in 2003 and 44.9% in 1998. In particular, while the clearance rate for violent crime remained at about 70%, the clearance rate for both property crime (32.2%) and other Criminal Code offences (83.7%) represented an improvement over ten years ago.
• In 2007, 25.9% of non-sexual assaults, 37.0% of robberies, and 6.8% of sexual assaults
involved the use of weapons. In 2007, weapons were used more frequently in robberies and non-sexual assaults than five years ago, but less frequently than ten years ago. In contrast, weapons were used less frequently in sexual assaults than five years ago, but more frequently than ten years ago.
• In the past three years, about one-quarter of robberies have involved the use of firearms. The
2007 proportion was a slight drop from the peak (26.0%) in 2006. Fewer than 2.0% of sexual and non-sexual assaults involved firearms.
• The number of marijuana grow-operations investigated by the police and the number of
persons charged for such operations in 2007 decreased from the record highs in 2005. • The number of persons arrested and charged for Criminal Code offences in 2007 was a 4.1%
decrease from 2006, but a 3.3% increase over 2003. Over the past five years, the charge rates decreased for violent crime (-4.3%), property crime (-1.5%) and traffic offences (-12.1%), while charge rates for other Criminal Code (5.5%) and drug offences (42.3%) increased. Males in the younger age groups continued to have the highest arrest rates.
• In 2007, 31, 52, and 14 Divisions were the busiest stations in terms of number of crimes. In
terms of calls for service, 14, 51, and 31 Divisions had the largest proportion of dispatched calls serviced. Divisions 52, 51, and 14 continued to have the highest overall crime rates per 1,000 population.
• Relative to eighteen other Canadian cities of ‘comparable’ population size, in 2006, the crime
rate in Toronto ranked eighth for overall crime, fourth for violent crime, and thirteenth for property crime. Between 2002 and 2006, Toronto was one of the four cities that had an increase in the overall crime rate, but was one of the cities that had a decrease in both the violent crime rate and the property crime rate. All the cities in the comparison had an increase in the per capita cost of policing; Toronto had the seventh largest increase of 31.9%, compared to the largest increase of 47.3%.
22000088 EEnnvviirroonnmmeennttaall SSccaann
Crime Trends 39
A. NATIONAL CRIME TRENDS64
In 2006, the national crime rate reached its lowest point in over 25 years after increasing steadily throughout the 1960s, 70s, and 80s. After peaking in 1991, the overall crime rate fell throughout the rest of the 1990s and stabilized in the early 2000s. Although there were slight increases in 2003 and 2004, the overall crime rate dropped by 5% in 2005 and by 6% in 2006. Compared with the peak in 1991, the 2006 crime rate was about 30% lower.
The drop in 2006 was driven by declines in non-violent crimes, primarily counterfeiting, thefts under $5,000, and break-ins. Following a 5% decrease in 2006, the rate for break-ins was, in fact, at its lowest in over 30 years. While the overall violent crime rate remained stable and the homicide rate dropped 10% in 2006, increases were noted in attempted murder, aggravated assaults, assaults with a weapon or causing bodily harm, robberies, and kidnapping/forcible confinement. Total drug crimes increased slightly (2%) in 2006, with cannabis offences forming the majority (60%) of all drug offences.
Of the total crimes recorded in 2006, most were property crimes (48%), followed by other Criminal Code (39%), and then violent crime (13%). Among the various provinces and territories, in 2006, Ontario had the lowest overall crime rate (non-traffic), the second lowest rate for both violent crime and other Criminal Code offences, and the third lowest rate for property crime
B. INTERPRETATION OF POLICE-REPORTED CRIME DATA
There is a general understanding that official crime statistics do not cover all the crimes that have occurred and that the decline in number of police-reported crimes may not be indicative of the real crime picture. The 2004 General Social Survey by Statistics Canada found that only about 34% of criminal victimizations were reported to police.65 Reporting of crime by the public to the police is affected by a number of factors, including: perceived seriousness of the incident; readiness to involve the police; fear of reprisal from the aggressor or other negative consequences of criminal justice intervention; desire to bring justice to the offender; social obligation to report criminal behaviour; and, the need to obtain a police report for insurance purposes. Changes in law that limit or broaden the definition of an existing offence will also influence the number of incidents reported to the police. And, proactive policing initiatives targeting specific types of crime, such as prostitution and drugs, will affect official crime statistics as well.
64 Silver, W. (2007 July). Crime Statistics in Canada 2006. Juristat (Canadian Centre for Justice Statistics, Statistics Canada), 27(5). 65 Gannon, M. and Mihorean, K. (2005 November). Criminal Victimization in Canada 2004. Juristat (Canadian Centre for Justice Statistics, Statistics Canada), 25(7).
22000088 EEnnvviirroonnmmeennttaall SSccaann
Crime Trends 40
In addition to the dynamics that determine the level of criminal activities, such as social, economic, and demographic changes, the following factors can influence official crime statistics:66, 67
• reporting by the public to the police; • reporting by police to the CCJS; • changes in legislation; and/or • changes in policies or enforcement practices.
Other exogenous and endogenous factors, such as the need to address the issue of terrorism after the September 11th, 2001, attacks, and the diminishing ability of police to detect, investigate, and take reports of less serious crimes due to changing service priorities and dwindling resources resulting from persistent budget constraints, also have an impact on official crime statistics.68
C. CONTEMPORARY POLICING FRAMEWORK & CONFRONTING ISSUES
Police are often regarded as the primary agent in the control of crime, although in reality
the number of crime-related factors that police have a direct impact on may be limited.69 Starting from the traditional reactive service delivery model, with specific policing programs geared towards enforcement and responding to crime and emergencies, contemporary policing has moved towards a reactive-proactive model focusing more on the risk factors for crime. This shift from the ‘professional’ model of police as force to fight crime to police as risk-minimizing agents is in response to a changing external environment marked by various crime-related social disorder problems. This changing environment makes the traditional strategies of crime control, which focus on crime only, increasingly ineffective. The common understanding is that, without a clear focus on crime risk factors, policing will have little effect on crime. The correct identification of these risk factors will provide focus for police to direct their resources to attack
66 A 2005 study by Statistics Canada revealed that financially-motivated crimes such as robbery, break-ins, and motor vehicle thefts were positively correlated with shifts in inflation rates and shifts in the population of persons aged 15 to 24 years, and that changes in unemployment rates and alcohol consumption were associated with the changes in the prevalence of homicides. (Pottie Bunge, V., Johnson, H., & Balde, T.A. (2005). Exploring Crime Trends in Canada. (Statistics Canada, Catalogue 85-561), no. 5). Statistics Canada’s studies on geocoding also found that higher levels of crime occurred in neighbourhoods with lower levels of income: Winnipeg: Catalogue no. 85-561-MIE – No. 4, Montreal: Catalogue no. 85-561-MIE – No. 7, and Regina: Catalogue no. 85-561-MIE – No. 8. 67 Wallace, M. (2003 July). Crime Statistics in Canada 2002. Juristat (Canadian Centre for Justice Statistics, Statistics Canada), 23(5). 68 The violent crime rate was reportedly up in the United States in 2006. One of the suggested reasons for the increase was the government’s emphasis on the war on terror instead of fighting crime. It was reported that the government’s proposed 2008 budget will cut more than $1.7 billion from existing enforcement assistance and other anti-crime programs. (Fisher, L. Why is the violent crime rate up? Retrieved February 23rd, 2007, from http://www.gainesville.com). 69 As pointed out in the report, police make only minimal contributions to crime prevention in the context of far more powerful social institutions, like the family and labour markets. (Sherman, L.W., Gottfredson, D., MacKenzie, D., Eck, J., Reuter, P., & Bushway, S. (1997). Preventing Crime: What Works, What Doesn’t, What’s Promising – A report to the United States Congress, Chapter 8 (p. 8-195), Washington, DC: U.S. Dept. of Justice. (Retrieved from http://www.ncjrs.gov/works) )
22000088 EEnnvviirroonnmmeennttaall SSccaann
Crime Trends 41
the proximate causes of public safety problems. The use of problem-oriented policing and community mobilization strategies are an indication of this focus on risk factors. It is now also recognized that there is no one best method or panacea to fight crime, and police can only prevent certain crime by using certain methods under certain conditions.
In the debate on police accountability in the control of crime, police performance or the effectiveness of police programs in preventing crime is at the centre of discussion. There has been criticism that policing strategies are frequently launched and maintained without any empirical understanding of their success or failure. This can perpetuate a ‘myth’ about a program’s success and waste money and effort. A study, mandated by Congress and commissioned by the United States (US) National Institute of Justice, resulted in one of the most compelling pieces of research on promising, and not so promising, policing strategies and programs.70 The analysis, based on available evidence, supported two major conclusions about policing for crime prevention:71
• The effects of police on crime are complex, and often surprising (e.g. arrests can sometimes increase crime, and traffic enforcement may reduce robbery and gun crime).
• The more focused the police strategy is on risk factors, the more likely it is to prevent crime (e.g. the mere addition of officers or shortening response time without clear focuses have little effect on crime prevention).
The following summarizes the report’s findings on policing programs with regard to what works, what doesn’t, and what is promising. What works:
• increased directed patrols in street-corner ‘hot spots’ of crime • proactive arrests of serious repeat offenders • proactive drunk driving arrests • arrests of employed suspects for domestic violence
What doesn’t work:
• neighbourhood block watch • arrests of some juveniles for minor offences • arrests of unemployed suspects for domestic assault • drug market arrests • community policing with no clear crime-risk factor focus
What’s promising:72
• police traffic enforcement patrols against illegally carried handguns
70 Ibid. It should be noted, however, that the report’s analysis covered only those programs and initiatives that were known and amenable to evaluation based on the criteria established for scientific evaluation and data availability. Those that did not meet the laid down criteria or were too costly to further pursue were dropped from the evaluation. 71 Ibid. See section on Conclusions under Chapter 8 (Policing for Crime Prevention), pp.8-219. 72 Ibid. This refers to those programs/initiatives that are found to yield encouraging findings in the initial research, but require much more research to confirm the real impact.
22000088 EEnnvviirroonnmmeennttaall SSccaann
Crime Trends 42
• community policing with community participation in priority setting • community policing focused on improving police legitimacy • zero tolerance of disorder, if legitimacy issues can be addressed • problem-oriented policing generally • adding extra police to cities, regardless of assignments • warrants for arrest of suspect absent when police respond to domestic violence
There were also studies which found that closed-circuit television (CCTV) surveillance and improved street lighting were effective in deterring crime. Violent crime is often regarded as a priority issue in policing. Different police services may adopt different strategies and initiatives in addressing violent crime. A 2007 survey by the Police Executive Research Forum (PERF) to police services in the US yielded the following on factors perceived to contribute to violent crime, as well as police responses in combating violent crime.73 Factors identified as contributing to violent crime:
i. gangs (77%) ii. juvenile/youth crime (74%) iii. impulsive violence / ‘disrespect’ issues (66%) iv. economy / poverty / unemployment (63%) v. release of offenders from correctional institutions back into the community (63%) vi. cocaine (61%) vii. poor parenting (58%) viii. increased availability of guns (56%) ix. methamphetamines (38%) x. insufficient prison / jail space (38%)
Programs/policies implemented in response to violent crime included:74
i. hot spot enforcement (63%) ii. community-oriented initiatives (44%) iii. problem-solving policing (37%) iv. co-operation with other departments (e.g. drug task forces) (37%) v. gang suppression (enforcement) (37%) vi. shifts in police resources (moving desk officers to patrol, or reassigning employees
based on changes in crime) (28%) vii. drug enforcement, such as crackdowns on open-air drug markets (23%) viii. targeting enforcement on repeat offenders (22%) ix. hiring / recruiting more officers (20%) x. federal grant programs (e.g. Weed & Seed, Project Safe Neighborhoods) (17%) xi. technology (e.g. cameras, radios, computer systems, CEDs) (15%)
73 Police Executive Research Forum. (2007) Violent Crime in America: “A Tale of Two Cities”. (Retrieved from http://www.policeforum.org/upload/VC%20Summit%2007_full_148192123_1272007111812.pdf) 74 Ibid. It is believed that these new programs and policies may have helped to reduce crime in some of the US cities.
22000088 EEnnvviirroonnmmeennttaall SSccaann
Crime Trends 43
xii. school resource officers (12%) xiii. policies for ‘zero tolerance’ of low-level disorder (12%) xiv. juvenile crime programs (10%) xv. creation of a gang unit (9%)
Capacities and constraints on policing are imposed by the legal/justice system, political and community expectations, knowledge about what works in policing, technology, labour laws, militant police unionism, available resources, and accountability requirements. These provide the context within which police strive to control crime through initiatives that maximize their impact on a limited number of crime-related factors. Providing adequate and effective services within this context presents definite challenges to police services. Some of the current, specific challenges confronting policing include:75
• Problems posed by the highly inter-related issues of gangs, drugs and violence. • The disparity between public perception of safety and actual risk of criminal
victimization (as indicated by crime statistics). • Globalization and co-operation of organized crime groups. • Proliferation of criminal opportunities due to advance in technology and the need for
police to keep up and remain effective. • The culture of silence and ‘anti-snitching’ encountered in crime investigations. • The media’s disproportional interest in reporting on violent crimes and crime-related
issues and the subsequent impact on public perception of safety. • Increased public scrutiny and emphasis on police accountability. • Policing an ethnically diverse population • Continuation of neighbourhood-oriented policing and maintaining a balance between
police priorities and the public’s priorities, and the sharing of power and responsibilities in addressing local public safety concerns.
• Maintaining police legitimacy in proactive and targeted enforcement, often practiced to control gangs, drugs, and violent crime.
• Maintaining an appropriate balance between reactive and proactive policing. • Need for information, storage, retrieval, analysis, and technology to enable intelligence-
led policing, particularly for crime solving and prevention, as well as for efficient administration.
• The burden of evidence/information disclosure imposed on police in criminal prosecutions and civil actions.
• Need for co-operation and information sharing among police services. • Provision of general and specialized training (including e-training) to maintain/promote
police employees’ effectiveness at work, and the need to promote the value of learning and ongoing education.
• Need for a management policy/strategy to better manage human resources, particularly to cope with the rising expectations of the more recently recruited and better educated employees.
75 Opinions collected from internal and external consultations in 2008 are incorporated. See document Appendix for summaries of all consultation presentations.
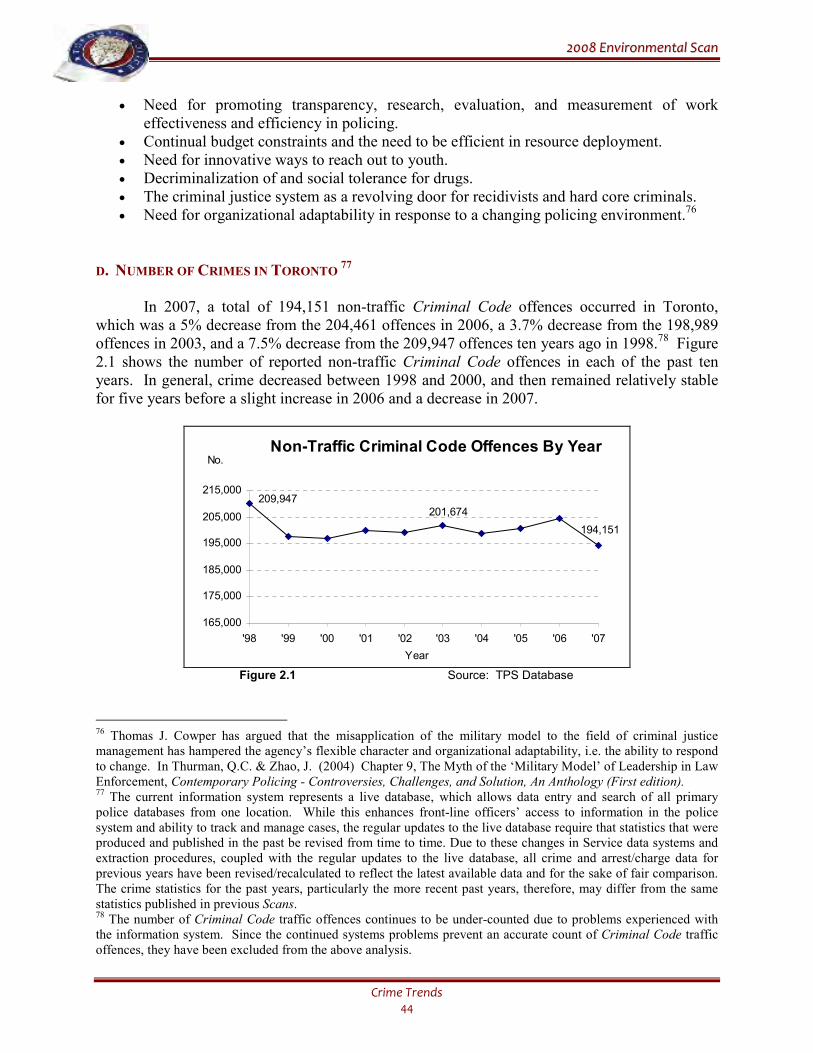
22000088 EEnnvviirroonnmmeennttaall SSccaann
Crime Trends 44
• Need for promoting transparency, research, evaluation, and measurement of work effectiveness and efficiency in policing.
• Continual budget constraints and the need to be efficient in resource deployment. • Need for innovative ways to reach out to youth. • Decriminalization of and social tolerance for drugs. • The criminal justice system as a revolving door for recidivists and hard core criminals. • Need for organizational adaptability in response to a changing policing environment.76
D. NUMBER OF CRIMES IN TORONTO 77
In 2007, a total of 194,151 non-traffic Criminal Code offences occurred in Toronto,
which was a 5% decrease from the 204,461 offences in 2006, a 3.7% decrease from the 198,989 offences in 2003, and a 7.5% decrease from the 209,947 offences ten years ago in 1998.78 Figure 2.1 shows the number of reported non-traffic Criminal Code offences in each of the past ten years. In general, crime decreased between 1998 and 2000, and then remained relatively stable for five years before a slight increase in 2006 and a decrease in 2007.
194,151
201,674209,947
165,000
175,000
185,000
195,000
205,000
215,000
'98 '99 '00 '01 '02 '03 '04 '05 '06 '07
Non-Traffic Criminal Code Offences By Year
Year
No.
Figure 2.1 Source: TPS Database
76 Thomas J. Cowper has argued that the misapplication of the military model to the field of criminal justice management has hampered the agency’s flexible character and organizational adaptability, i.e. the ability to respond to change. In Thurman, Q.C. & Zhao, J. (2004) Chapter 9, The Myth of the ‘Military Model’ of Leadership in Law Enforcement, Contemporary Policing - Controversies, Challenges, and Solution, An Anthology (First edition). 77 The current information system represents a live database, which allows data entry and search of all primary police databases from one location. While this enhances front-line officers’ access to information in the police system and ability to track and manage cases, the regular updates to the live database require that statistics that were produced and published in the past be revised from time to time. Due to these changes in Service data systems and extraction procedures, coupled with the regular updates to the live database, all crime and arrest/charge data for previous years have been revised/recalculated to reflect the latest available data and for the sake of fair comparison. The crime statistics for the past years, particularly the more recent past years, therefore, may differ from the same statistics published in previous Scans. 78 The number of Criminal Code traffic offences continues to be under-counted due to problems experienced with the information system. Since the continued systems problems prevent an accurate count of Criminal Code traffic offences, they have been excluded from the above analysis.
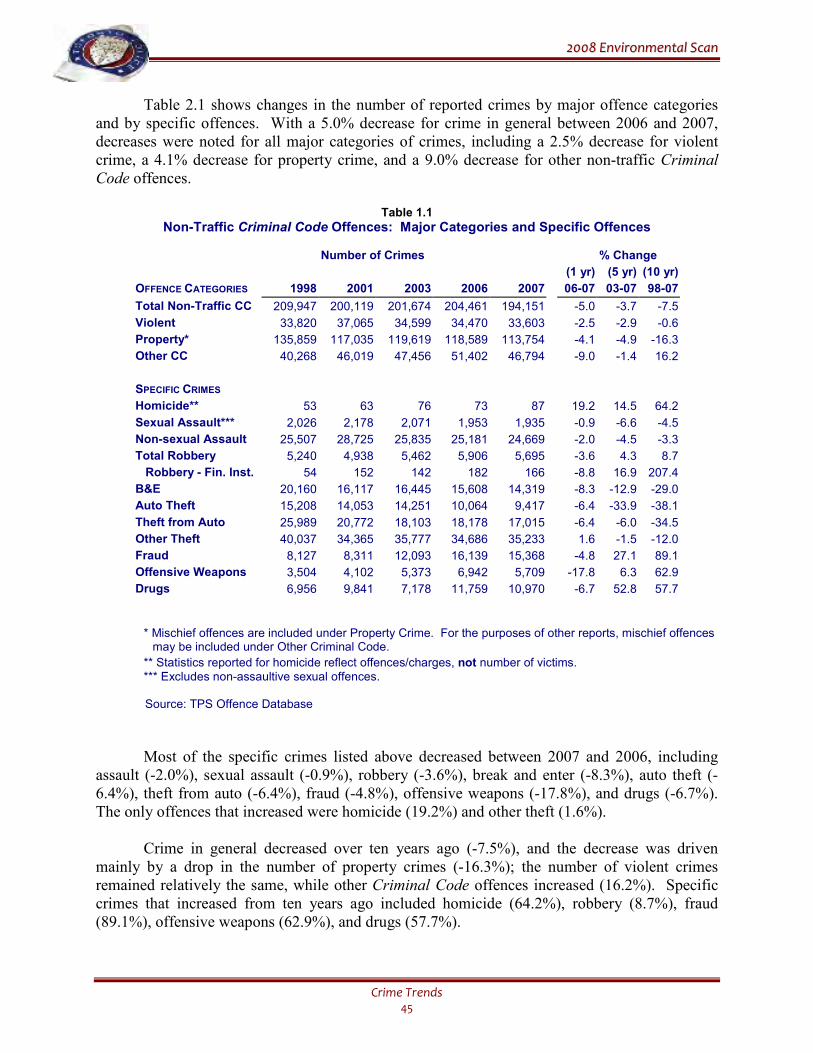
22000088 EEnnvviirroonnmmeennttaall SSccaann
Crime Trends 45
Table 2.1 shows changes in the number of reported crimes by major offence categories and by specific offences. With a 5.0% decrease for crime in general between 2006 and 2007, decreases were noted for all major categories of crimes, including a 2.5% decrease for violent crime, a 4.1% decrease for property crime, and a 9.0% decrease for other non-traffic Criminal Code offences.
Table 1.1
Non-Traffic Criminal Code Offences: Major Categories and Specific Offences
Number of Crimes % Change
(1 yr) (5 yr) (10 yr)
OFFENCE CATEGORIES 1998 2001 2003 2006 2007 06-07 03-07 98-07
Total Non-Traffic CC 209,947 200,119 201,674 204,461 194,151 -5.0 -3.7 -7.5
Violent 33,820 37,065 34,599 34,470 33,603 -2.5 -2.9 -0.6
Property* 135,859 117,035 119,619 118,589 113,754 -4.1 -4.9 -16.3
Other CC 40,268 46,019 47,456 51,402 46,794 -9.0 -1.4 16.2
SPECIFIC CRIMES
Homicide** 53 63 76 73 87 19.2 14.5 64.2
Sexual Assault*** 2,026 2,178 2,071 1,953 1,935 -0.9 -6.6 -4.5
Non-sexual Assault 25,507 28,725 25,835 25,181 24,669 -2.0 -4.5 -3.3
Total Robbery 5,240 4,938 5,462 5,906 5,695 -3.6 4.3 8.7
Robbery - Fin. Inst. 54 152 142 182 166 -8.8 16.9 207.4
B&E 20,160 16,117 16,445 15,608 14,319 -8.3 -12.9 -29.0
Auto Theft 15,208 14,053 14,251 10,064 9,417 -6.4 -33.9 -38.1
Theft from Auto 25,989 20,772 18,103 18,178 17,015 -6.4 -6.0 -34.5
Other Theft 40,037 34,365 35,777 34,686 35,233 1.6 -1.5 -12.0
Fraud 8,127 8,311 12,093 16,139 15,368 -4.8 27.1 89.1
Offensive Weapons 3,504 4,102 5,373 6,942 5,709 -17.8 6.3 62.9
Drugs 6,956 9,841 7,178 11,759 10,970 -6.7 52.8 57.7
* Mischief offences are included under Property Crime. For the purposes of other reports, mischief offences may be included under Other Criminal Code.
** Statistics reported for homicide reflect offences/charges, not number of victims. *** Excludes non-assaultive sexual offences. Source: TPS Offence Database
Most of the specific crimes listed above decreased between 2007 and 2006, including assault (-2.0%), sexual assault (-0.9%), robbery (-3.6%), break and enter (-8.3%), auto theft (-6.4%), theft from auto (-6.4%), fraud (-4.8%), offensive weapons (-17.8%), and drugs (-6.7%). The only offences that increased were homicide (19.2%) and other theft (1.6%).
Crime in general decreased over ten years ago (-7.5%), and the decrease was driven mainly by a drop in the number of property crimes (-16.3%); the number of violent crimes remained relatively the same, while other Criminal Code offences increased (16.2%). Specific crimes that increased from ten years ago included homicide (64.2%), robbery (8.7%), fraud (89.1%), offensive weapons (62.9%), and drugs (57.7%).
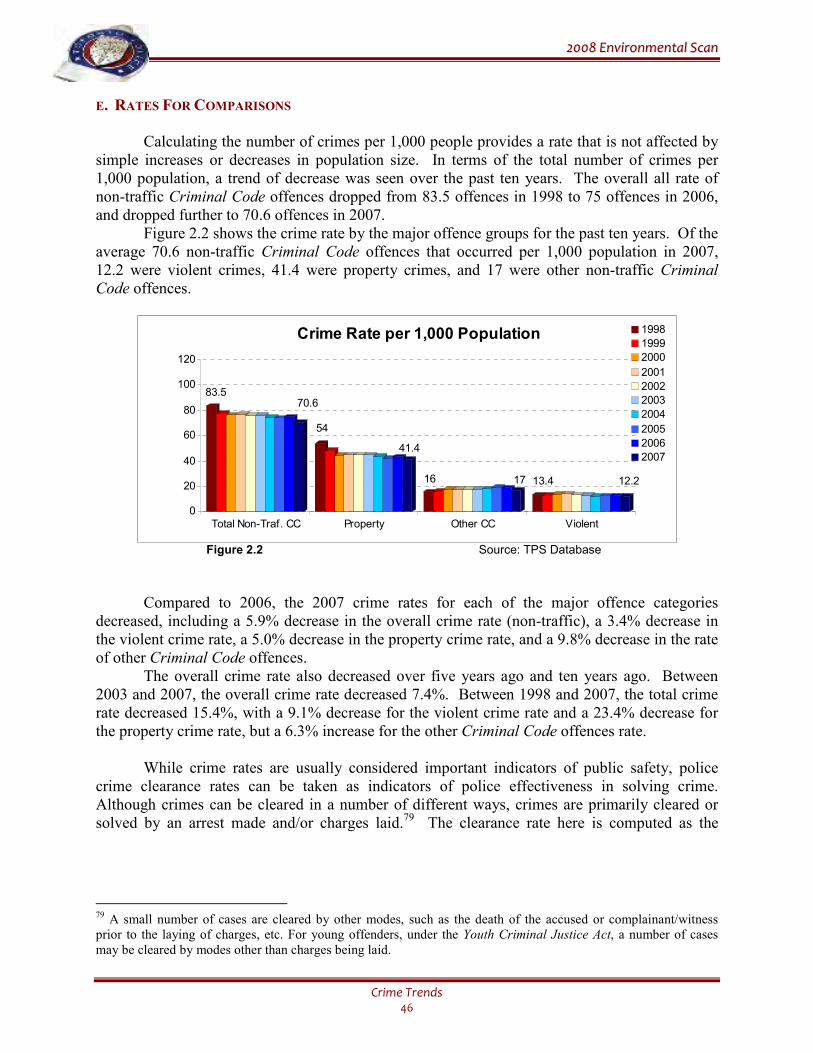
22000088 EEnnvviirroonnmmeennttaall SSccaann
Crime Trends 46
E. RATES FOR COMPARISONS
Calculating the number of crimes per 1,000 people provides a rate that is not affected by simple increases or decreases in population size. In terms of the total number of crimes per 1,000 population, a trend of decrease was seen over the past ten years. The overall all rate of non-traffic Criminal Code offences dropped from 83.5 offences in 1998 to 75 offences in 2006, and dropped further to 70.6 offences in 2007.
Figure 2.2 shows the crime rate by the major offence groups for the past ten years. Of the average 70.6 non-traffic Criminal Code offences that occurred per 1,000 population in 2007, 12.2 were violent crimes, 41.4 were property crimes, and 17 were other non-traffic Criminal Code offences.
83.570.6
54
41.4
16 17 13.4 12.2
0
20
40
60
80
100
120
Total Non-Traf. CC Property Other CC Violent
1998
1999
2000
2001
2002
2003
2004
2005
2006
2007
Crime Rate per 1,000 Population
Figure 2.2 Source: TPS Database
Compared to 2006, the 2007 crime rates for each of the major offence categories decreased, including a 5.9% decrease in the overall crime rate (non-traffic), a 3.4% decrease in the violent crime rate, a 5.0% decrease in the property crime rate, and a 9.8% decrease in the rate of other Criminal Code offences.
The overall crime rate also decreased over five years ago and ten years ago. Between 2003 and 2007, the overall crime rate decreased 7.4%. Between 1998 and 2007, the total crime rate decreased 15.4%, with a 9.1% decrease for the violent crime rate and a 23.4% decrease for the property crime rate, but a 6.3% increase for the other Criminal Code offences rate. While crime rates are usually considered important indicators of public safety, police crime clearance rates can be taken as indicators of police effectiveness in solving crime. Although crimes can be cleared in a number of different ways, crimes are primarily cleared or solved by an arrest made and/or charges laid.79 The clearance rate here is computed as the
79 A small number of cases are cleared by other modes, such as the death of the accused or complainant/witness prior to the laying of charges, etc. For young offenders, under the Youth Criminal Justice Act, a number of cases may be cleared by modes other than charges being laid.
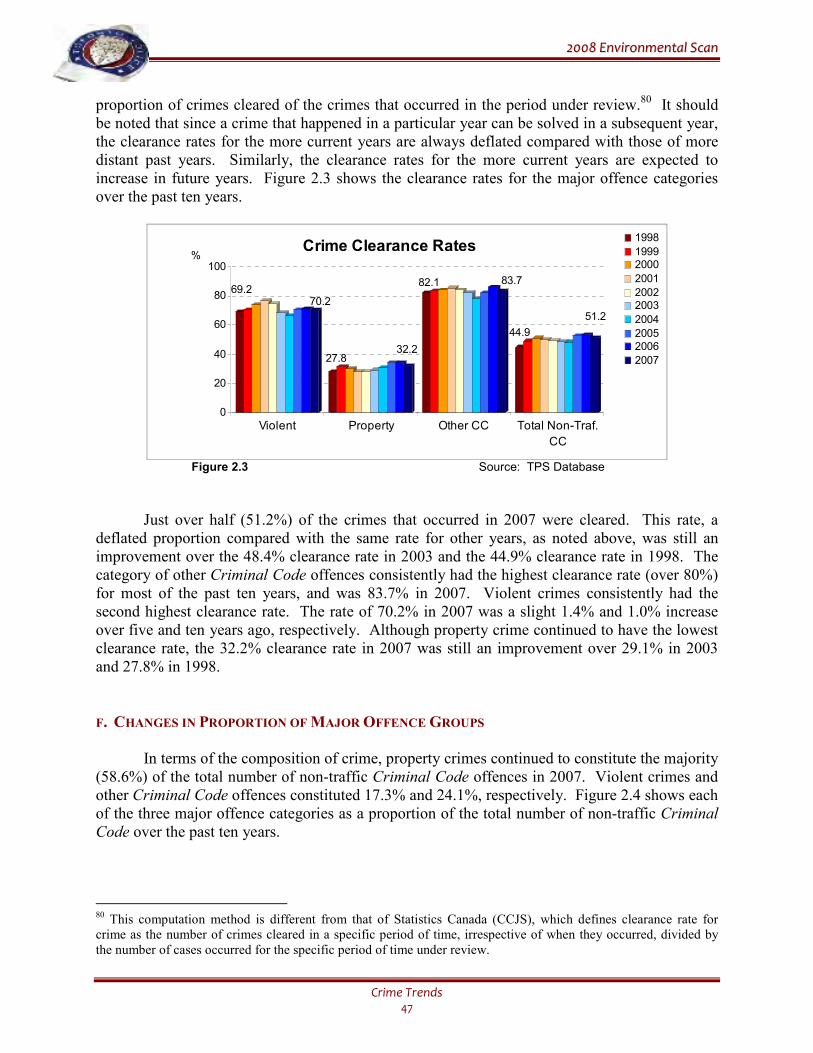
22000088 EEnnvviirroonnmmeennttaall SSccaann
Crime Trends 47
proportion of crimes cleared of the crimes that occurred in the period under review.80 It should be noted that since a crime that happened in a particular year can be solved in a subsequent year, the clearance rates for the more current years are always deflated compared with those of more distant past years. Similarly, the clearance rates for the more current years are expected to increase in future years. Figure 2.3 shows the clearance rates for the major offence categories over the past ten years.
69.270.2
27.832.2
82.1 83.7
44.9
51.2
0
20
40
60
80
100
Violent Property Other CC Total Non-Traf.
CC
1998
19992000
2001
20022003
2004
20052006
2007
Crime Clearance Rates%
Figure 2.3 Source: TPS Database
Just over half (51.2%) of the crimes that occurred in 2007 were cleared. This rate, a deflated proportion compared with the same rate for other years, as noted above, was still an improvement over the 48.4% clearance rate in 2003 and the 44.9% clearance rate in 1998. The category of other Criminal Code offences consistently had the highest clearance rate (over 80%) for most of the past ten years, and was 83.7% in 2007. Violent crimes consistently had the second highest clearance rate. The rate of 70.2% in 2007 was a slight 1.4% and 1.0% increase over five and ten years ago, respectively. Although property crime continued to have the lowest clearance rate, the 32.2% clearance rate in 2007 was still an improvement over 29.1% in 2003 and 27.8% in 1998.
F. CHANGES IN PROPORTION OF MAJOR OFFENCE GROUPS In terms of the composition of crime, property crimes continued to constitute the majority (58.6%) of the total number of non-traffic Criminal Code offences in 2007. Violent crimes and other Criminal Code offences constituted 17.3% and 24.1%, respectively. Figure 2.4 shows each of the three major offence categories as a proportion of the total number of non-traffic Criminal Code over the past ten years.
80 This computation method is different from that of Statistics Canada (CCJS), which defines clearance rate for crime as the number of crimes cleared in a specific period of time, irrespective of when they occurred, divided by the number of cases occurred for the specific period of time under review.
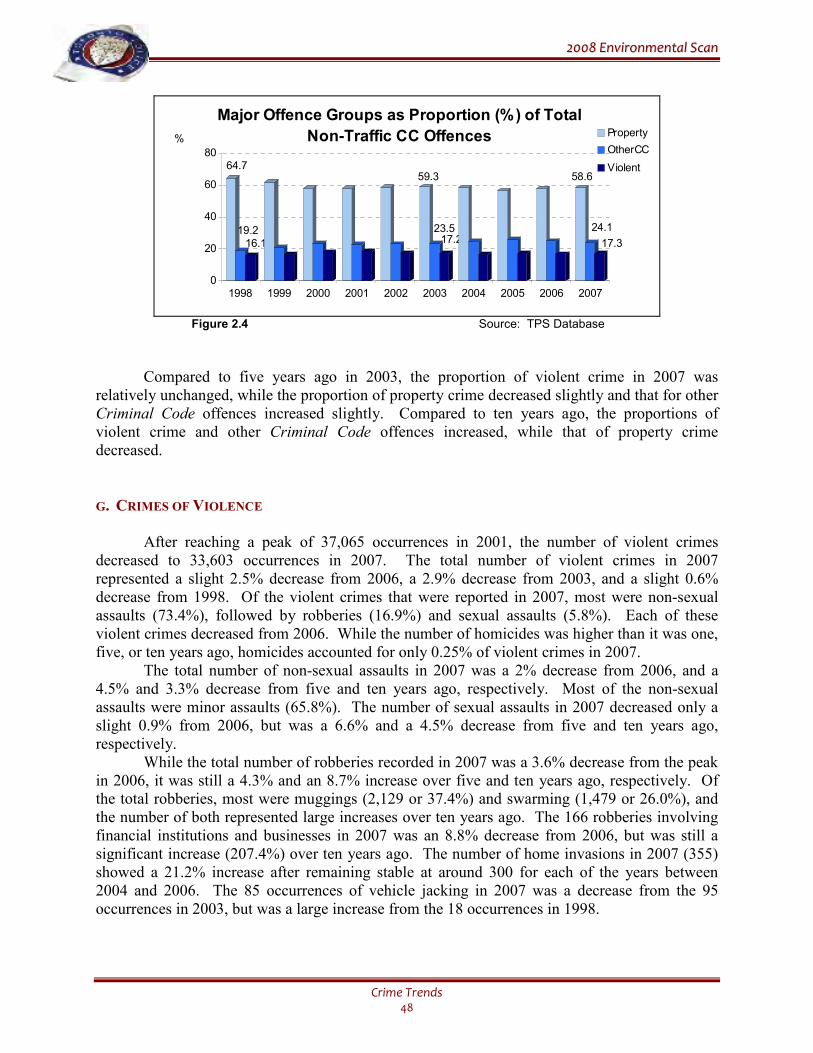
22000088 EEnnvviirroonnmmeennttaall SSccaann
Crime Trends 48
64.7
19.216.1
59.3
23.517.2
58.6
24.1
17.3
0
20
40
60
80
1998 1999 2000 2001 2002 2003 2004 2005 2006 2007
Property
OtherCC
Violent
Major Offence Groups as Proportion (%) of Total
Non-Traffic CC Offences%
Figure 2.4 Source: TPS Database
Compared to five years ago in 2003, the proportion of violent crime in 2007 was relatively unchanged, while the proportion of property crime decreased slightly and that for other Criminal Code offences increased slightly. Compared to ten years ago, the proportions of violent crime and other Criminal Code offences increased, while that of property crime decreased.
G. CRIMES OF VIOLENCE
After reaching a peak of 37,065 occurrences in 2001, the number of violent crimes
decreased to 33,603 occurrences in 2007. The total number of violent crimes in 2007 represented a slight 2.5% decrease from 2006, a 2.9% decrease from 2003, and a slight 0.6% decrease from 1998. Of the violent crimes that were reported in 2007, most were non-sexual assaults (73.4%), followed by robberies (16.9%) and sexual assaults (5.8%). Each of these violent crimes decreased from 2006. While the number of homicides was higher than it was one, five, or ten years ago, homicides accounted for only 0.25% of violent crimes in 2007.
The total number of non-sexual assaults in 2007 was a 2% decrease from 2006, and a 4.5% and 3.3% decrease from five and ten years ago, respectively. Most of the non-sexual assaults were minor assaults (65.8%). The number of sexual assaults in 2007 decreased only a slight 0.9% from 2006, but was a 6.6% and a 4.5% decrease from five and ten years ago, respectively.
While the total number of robberies recorded in 2007 was a 3.6% decrease from the peak in 2006, it was still a 4.3% and an 8.7% increase over five and ten years ago, respectively. Of the total robberies, most were muggings (2,129 or 37.4%) and swarming (1,479 or 26.0%), and the number of both represented large increases over ten years ago. The 166 robberies involving financial institutions and businesses in 2007 was an 8.8% decrease from 2006, but was still a significant increase (207.4%) over ten years ago. The number of home invasions in 2007 (355) showed a 21.2% increase after remaining stable at around 300 for each of the years between 2004 and 2006. The 85 occurrences of vehicle jacking in 2007 was a decrease from the 95 occurrences in 2003, but was a large increase from the 18 occurrences in 1998.
22000088 EEnnvviirroonnmmeennttaall SSccaann
Crime Trends 49
H. USE OF WEAPONS & INJURY OF CRIME VICTIMS
Use of Weapons:
In response to a wave of gun violence in 2005, the Toronto Police implemented a number of initiatives, including the Toronto Anti-Violence Intervention Strategy (TAVIS) to target areas of the city particularly affected by violent crime. The overall goals of TAVIS are the reduction of violence, the enhancement of community safety, and the improvement of quality of life in the community. It has four specific objectives: a reduction in the number of offenders engaged in violent crime, a reduction in opportunities for crime in specific neighbourhoods deemed to be at risk, a reduction in victimization by violent crime, and an enhancement of the community’s capacity to reduce crime and improve community safety. Based on intelligence and crime-risk factors, TAVIS focuses on high-risk persons and areas, and partnerships with the community to prevent crime and enhance public safety. Rapid Response Teams, Specialized Operations units, and the Community Mobilization Unit support the divisions in a collaborative effort to enhance local anti-violence strategies by targeting violence and those who perpetuate it.
Table 2.2 shows the proportion of robberies, assaults, and sexual assaults by type of weapon involved over the past ten years. In all years, weapons were more likely used in robberies than in sexual assaults or non-sexual assaults. In 2007, 37.0% of robberies, 25.9% of non-sexual assaults, and 6.8% of sexual assaults involved the use of weapons. Compared to five years ago, the proportions for non-sexual assaults and robbery increased, although they were still both lower than ten years ago. In contrast, compared to five years ago, the proportion of sexual assaults where a weapon was used decreased in 2007, but was an increase compared to ten years ago.
Given the recent focus on gun violence, the use of firearms in committing violent crimes is a major public safety concern. While the proportions of assaults and robberies involving any type of weapon were both lower in 2007 than in 1998, all three of these violent crimes showed an increase in the proportion involving firearms over the ten year period.
It should be noted, however, that the proportions of these violent crimes involving firearms all decreased between 2006 and 2007. In 2007, the proportion of robberies involving the use of firearms dropped to 24.3% from the ten-year high of 26.0% in 2006. Although only relatively small proportions of assaults and sexual assaults involved the use of firearms, drops were also noted between 2007 and 2006. As noted earlier, the number of homicides in Toronto is very small compared to the number of other violent crimes. Although not shown in Table 2.2, the use of firearms in homicides was more frequent each year than in robberies. As with the crimes shown, the proportion of homicides that involved firearms also increased over the ten year period, from 23% in 1998 to 51% in 2007. Unlike assaults, robberies, and sexual assaults, however, the proportion in 2007 was an increase over 2006. While the 2007 proportion of homicides involving firearms was a decrease from the high of 65% seen in 2005, it was an increase from 41% in 2006.
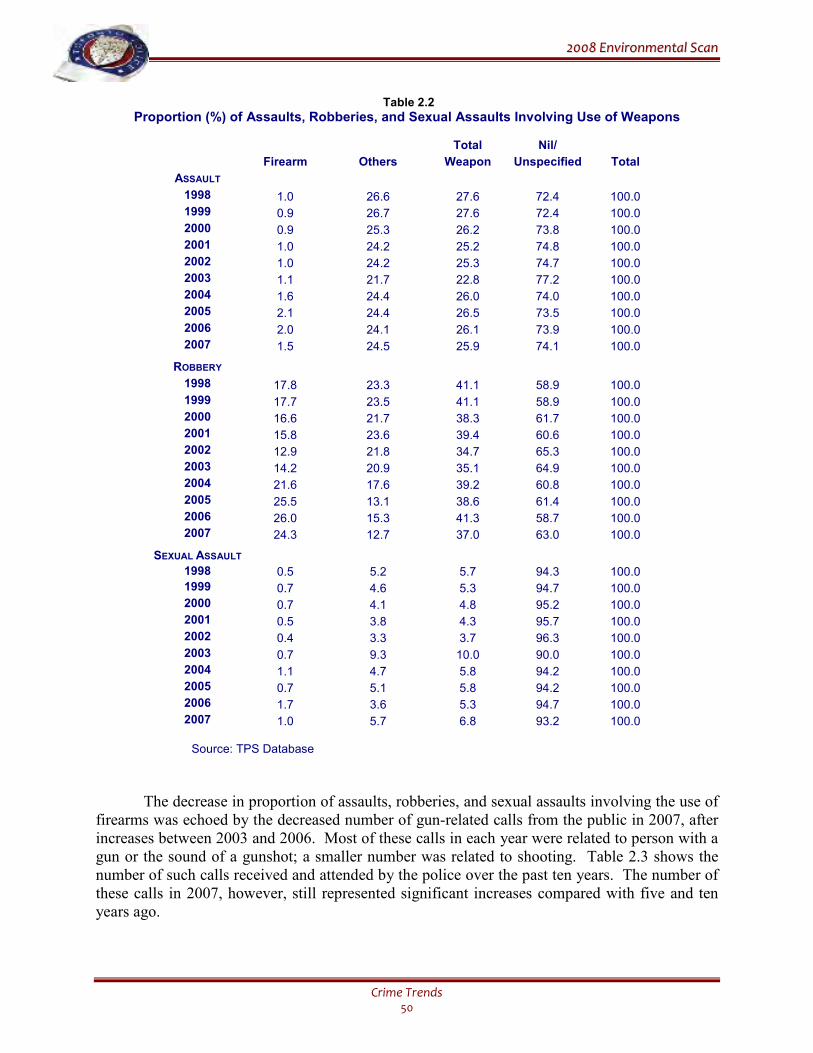
22000088 EEnnvviirroonnmmeennttaall SSccaann
Crime Trends 50
Table 2.2
Proportion (%) of Assaults, Robberies, and Sexual Assaults Involving Use of Weapons
Total Nil/
Firearm Others Weapon Unspecified Total
ASSAULT
1998 1.0 26.6 27.6 72.4 100.0
1999 0.9 26.7 27.6 72.4 100.0
2000 0.9 25.3 26.2 73.8 100.0
2001 1.0 24.2 25.2 74.8 100.0
2002 1.0 24.2 25.3 74.7 100.0
2003 1.1 21.7 22.8 77.2 100.0
2004 1.6 24.4 26.0 74.0 100.0
2005 2.1 24.4 26.5 73.5 100.0
2006 2.0 24.1 26.1 73.9 100.0
2007 1.5 24.5 25.9 74.1 100.0
ROBBERY
1998 17.8 23.3 41.1 58.9 100.0
1999 17.7 23.5 41.1 58.9 100.0
2000 16.6 21.7 38.3 61.7 100.0
2001 15.8 23.6 39.4 60.6 100.0
2002 12.9 21.8 34.7 65.3 100.0
2003 14.2 20.9 35.1 64.9 100.0
2004 21.6 17.6 39.2 60.8 100.0
2005 25.5 13.1 38.6 61.4 100.0
2006 26.0 15.3 41.3 58.7 100.0
2007 24.3 12.7 37.0 63.0 100.0
SEXUAL ASSAULT
1998 0.5 5.2 5.7 94.3 100.0
1999 0.7 4.6 5.3 94.7 100.0
2000 0.7 4.1 4.8 95.2 100.0
2001 0.5 3.8 4.3 95.7 100.0
2002 0.4 3.3 3.7 96.3 100.0
2003 0.7 9.3 10.0 90.0 100.0
2004 1.1 4.7 5.8 94.2 100.0
2005 0.7 5.1 5.8 94.2 100.0
2006 1.7 3.6 5.3 94.7 100.0
2007 1.0 5.7 6.8 93.2 100.0 Source: TPS Database
The decrease in proportion of assaults, robberies, and sexual assaults involving the use of firearms was echoed by the decreased number of gun-related calls from the public in 2007, after increases between 2003 and 2006. Most of these calls in each year were related to person with a gun or the sound of a gunshot; a smaller number was related to shooting. Table 2.3 shows the number of such calls received and attended by the police over the past ten years. The number of these calls in 2007, however, still represented significant increases compared with five and ten years ago.
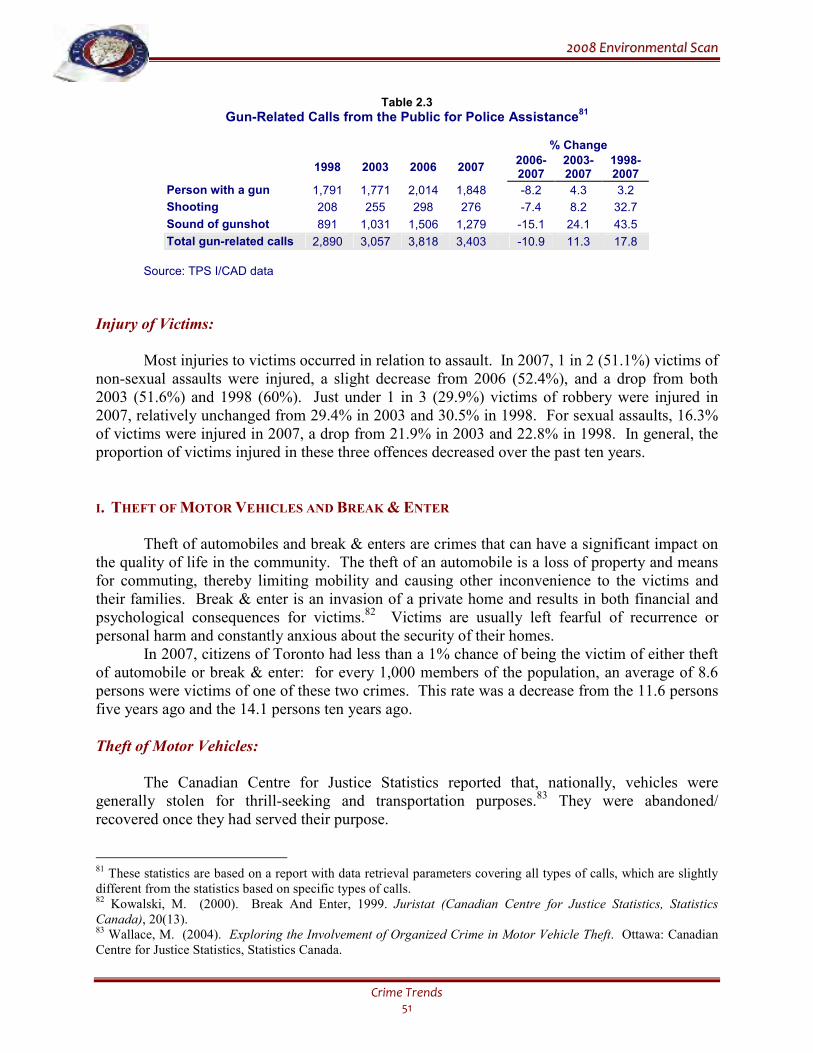
22000088 EEnnvviirroonnmmeennttaall SSccaann
Crime Trends 51
Table 2.3
Gun-Related Calls from the Public for Police Assistance81
% Change
1998 2003 2006 2007 2006-2007
2003-2007
1998-2007
Person with a gun 1,791 1,771 2,014 1,848 -8.2 4.3 3.2
Shooting 208 255 298 276 -7.4 8.2 32.7
Sound of gunshot 891 1,031 1,506 1,279 -15.1 24.1 43.5
Total gun-related calls 2,890 3,057 3,818 3,403 -10.9 11.3 17.8
Source: TPS I/CAD data
Injury of Victims:
Most injuries to victims occurred in relation to assault. In 2007, 1 in 2 (51.1%) victims of
non-sexual assaults were injured, a slight decrease from 2006 (52.4%), and a drop from both 2003 (51.6%) and 1998 (60%). Just under 1 in 3 (29.9%) victims of robbery were injured in 2007, relatively unchanged from 29.4% in 2003 and 30.5% in 1998. For sexual assaults, 16.3% of victims were injured in 2007, a drop from 21.9% in 2003 and 22.8% in 1998. In general, the proportion of victims injured in these three offences decreased over the past ten years.
I. THEFT OF MOTOR VEHICLES AND BREAK & ENTER
Theft of automobiles and break & enters are crimes that can have a significant impact on the quality of life in the community. The theft of an automobile is a loss of property and means for commuting, thereby limiting mobility and causing other inconvenience to the victims and their families. Break & enter is an invasion of a private home and results in both financial and psychological consequences for victims.82 Victims are usually left fearful of recurrence or personal harm and constantly anxious about the security of their homes.
In 2007, citizens of Toronto had less than a 1% chance of being the victim of either theft of automobile or break & enter: for every 1,000 members of the population, an average of 8.6 persons were victims of one of these two crimes. This rate was a decrease from the 11.6 persons five years ago and the 14.1 persons ten years ago.
Theft of Motor Vehicles:
The Canadian Centre for Justice Statistics reported that, nationally, vehicles were
generally stolen for thrill-seeking and transportation purposes.83 They were abandoned/ recovered once they had served their purpose.
81 These statistics are based on a report with data retrieval parameters covering all types of calls, which are slightly different from the statistics based on specific types of calls. 82 Kowalski, M. (2000). Break And Enter, 1999. Juristat (Canadian Centre for Justice Statistics, Statistics Canada), 20(13). 83 Wallace, M. (2004). Exploring the Involvement of Organized Crime in Motor Vehicle Theft. Ottawa: Canadian Centre for Justice Statistics, Statistics Canada.
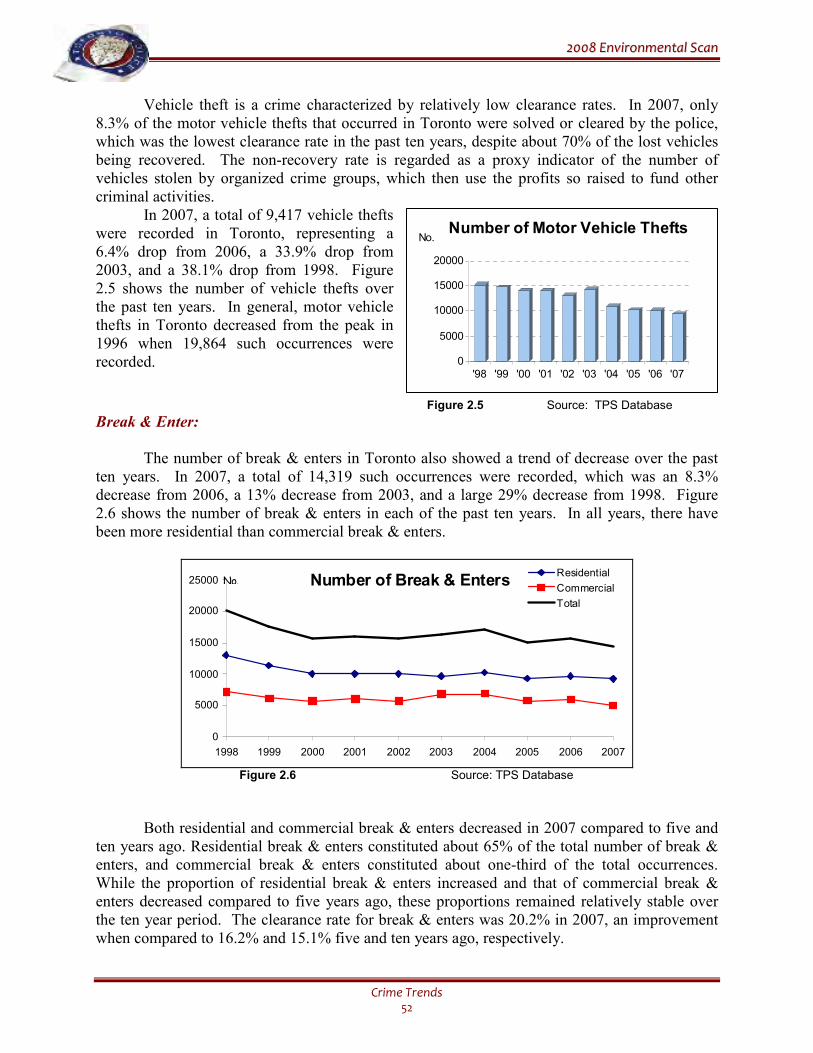
22000088 EEnnvviirroonnmmeennttaall SSccaann
Crime Trends 52
Vehicle theft is a crime characterized by relatively low clearance rates. In 2007, only 8.3% of the motor vehicle thefts that occurred in Toronto were solved or cleared by the police, which was the lowest clearance rate in the past ten years, despite about 70% of the lost vehicles being recovered. The non-recovery rate is regarded as a proxy indicator of the number of vehicles stolen by organized crime groups, which then use the profits so raised to fund other criminal activities. In 2007, a total of 9,417 vehicle thefts were recorded in Toronto, representing a 6.4% drop from 2006, a 33.9% drop from 2003, and a 38.1% drop from 1998. Figure 2.5 shows the number of vehicle thefts over the past ten years. In general, motor vehicle thefts in Toronto decreased from the peak in 1996 when 19,864 such occurrences were recorded. Figure 2.5 Source: TPS Database
Break & Enter:
The number of break & enters in Toronto also showed a trend of decrease over the past
ten years. In 2007, a total of 14,319 such occurrences were recorded, which was an 8.3% decrease from 2006, a 13% decrease from 2003, and a large 29% decrease from 1998. Figure 2.6 shows the number of break & enters in each of the past ten years. In all years, there have been more residential than commercial break & enters.
0
5000
10000
15000
20000
25000
1998 1999 2000 2001 2002 2003 2004 2005 2006 2007
Residential
Commercial
Total
Number of Break & Enters No.
Figure 2.6 Source: TPS Database
Both residential and commercial break & enters decreased in 2007 compared to five and ten years ago. Residential break & enters constituted about 65% of the total number of break & enters, and commercial break & enters constituted about one-third of the total occurrences. While the proportion of residential break & enters increased and that of commercial break & enters decreased compared to five years ago, these proportions remained relatively stable over the ten year period. The clearance rate for break & enters was 20.2% in 2007, an improvement when compared to 16.2% and 15.1% five and ten years ago, respectively.
0
5000
10000
15000
20000
'98 '99 '00 '01 '02 '03 '04 '05 '06 '07
No.Number of Motor Vehicle Thefts
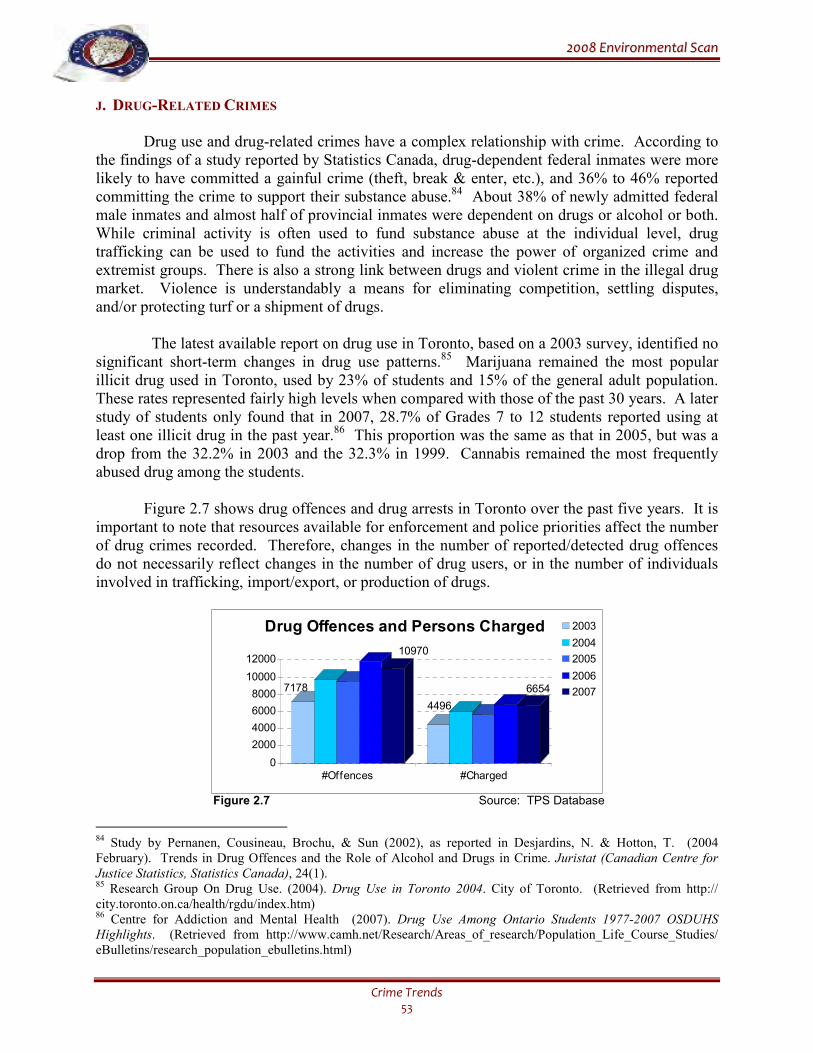
22000088 EEnnvviirroonnmmeennttaall SSccaann
Crime Trends 53
J. DRUG-RELATED CRIMES
Drug use and drug-related crimes have a complex relationship with crime. According to
the findings of a study reported by Statistics Canada, drug-dependent federal inmates were more likely to have committed a gainful crime (theft, break & enter, etc.), and 36% to 46% reported committing the crime to support their substance abuse.84 About 38% of newly admitted federal male inmates and almost half of provincial inmates were dependent on drugs or alcohol or both. While criminal activity is often used to fund substance abuse at the individual level, drug trafficking can be used to fund the activities and increase the power of organized crime and extremist groups. There is also a strong link between drugs and violent crime in the illegal drug market. Violence is understandably a means for eliminating competition, settling disputes, and/or protecting turf or a shipment of drugs.
The latest available report on drug use in Toronto, based on a 2003 survey, identified no significant short-term changes in drug use patterns.85 Marijuana remained the most popular illicit drug used in Toronto, used by 23% of students and 15% of the general adult population. These rates represented fairly high levels when compared with those of the past 30 years. A later study of students only found that in 2007, 28.7% of Grades 7 to 12 students reported using at least one illicit drug in the past year.86 This proportion was the same as that in 2005, but was a drop from the 32.2% in 2003 and the 32.3% in 1999. Cannabis remained the most frequently abused drug among the students.
Figure 2.7 shows drug offences and drug arrests in Toronto over the past five years. It is important to note that resources available for enforcement and police priorities affect the number of drug crimes recorded. Therefore, changes in the number of reported/detected drug offences do not necessarily reflect changes in the number of drug users, or in the number of individuals involved in trafficking, import/export, or production of drugs.
7178
10970
4496
6654
0
2000
4000
6000
8000
10000
12000
#Offences #Charged
2003
2004
2005
2006
2007
Drug Offences and Persons Charged
Figure 2.7 Source: TPS Database
84 Study by Pernanen, Cousineau, Brochu, & Sun (2002), as reported in Desjardins, N. & Hotton, T. (2004 February). Trends in Drug Offences and the Role of Alcohol and Drugs in Crime. Juristat (Canadian Centre for Justice Statistics, Statistics Canada), 24(1). 85 Research Group On Drug Use. (2004). Drug Use in Toronto 2004. City of Toronto. (Retrieved from http://
city.toronto.on.ca/health/rgdu/index.htm) 86 Centre for Addiction and Mental Health (2007). Drug Use Among Ontario Students 1977-2007 OSDUHS Highlights. (Retrieved from http://www.camh.net/Research/Areas_of_research/Population_Life_Course_Studies/ eBulletins/research_population_ebulletins.html)
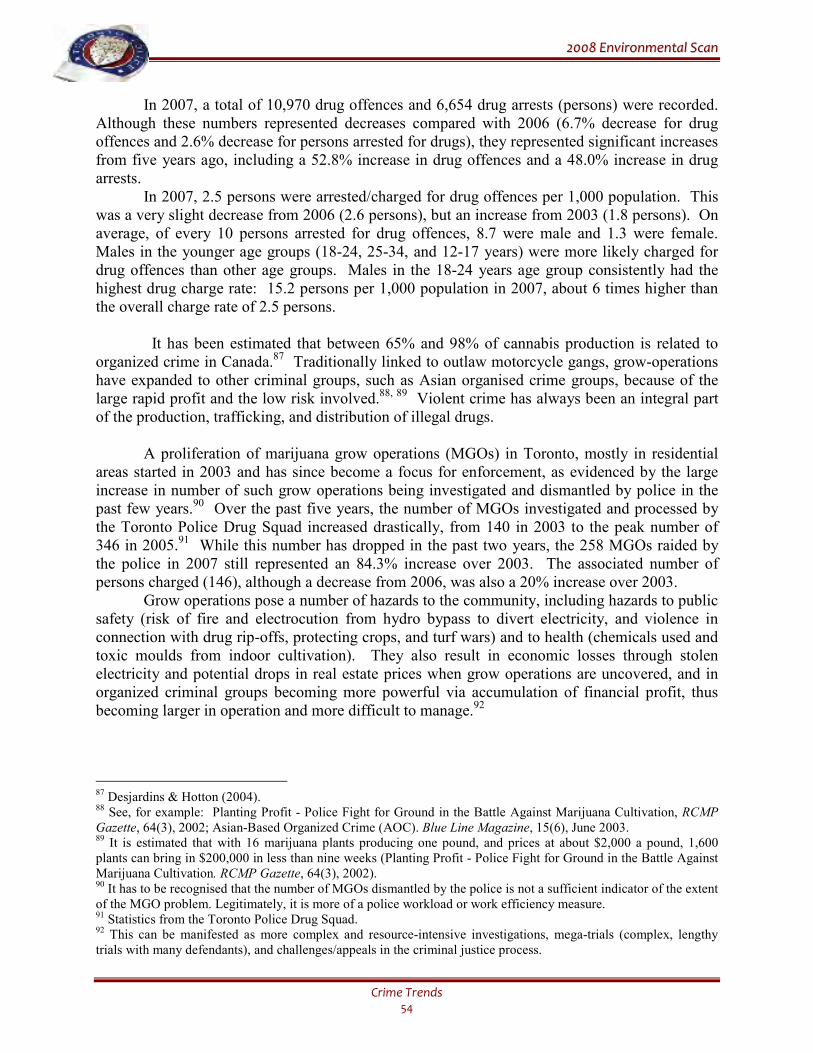
22000088 EEnnvviirroonnmmeennttaall SSccaann
Crime Trends 54
In 2007, a total of 10,970 drug offences and 6,654 drug arrests (persons) were recorded. Although these numbers represented decreases compared with 2006 (6.7% decrease for drug offences and 2.6% decrease for persons arrested for drugs), they represented significant increases from five years ago, including a 52.8% increase in drug offences and a 48.0% increase in drug arrests. In 2007, 2.5 persons were arrested/charged for drug offences per 1,000 population. This was a very slight decrease from 2006 (2.6 persons), but an increase from 2003 (1.8 persons). On average, of every 10 persons arrested for drug offences, 8.7 were male and 1.3 were female. Males in the younger age groups (18-24, 25-34, and 12-17 years) were more likely charged for drug offences than other age groups. Males in the 18-24 years age group consistently had the highest drug charge rate: 15.2 persons per 1,000 population in 2007, about 6 times higher than the overall charge rate of 2.5 persons.
It has been estimated that between 65% and 98% of cannabis production is related to organized crime in Canada.87 Traditionally linked to outlaw motorcycle gangs, grow-operations have expanded to other criminal groups, such as Asian organised crime groups, because of the large rapid profit and the low risk involved.88, 89 Violent crime has always been an integral part of the production, trafficking, and distribution of illegal drugs.
A proliferation of marijuana grow operations (MGOs) in Toronto, mostly in residential areas started in 2003 and has since become a focus for enforcement, as evidenced by the large increase in number of such grow operations being investigated and dismantled by police in the past few years.90 Over the past five years, the number of MGOs investigated and processed by the Toronto Police Drug Squad increased drastically, from 140 in 2003 to the peak number of 346 in 2005.91 While this number has dropped in the past two years, the 258 MGOs raided by the police in 2007 still represented an 84.3% increase over 2003. The associated number of persons charged (146), although a decrease from 2006, was also a 20% increase over 2003.
Grow operations pose a number of hazards to the community, including hazards to public safety (risk of fire and electrocution from hydro bypass to divert electricity, and violence in connection with drug rip-offs, protecting crops, and turf wars) and to health (chemicals used and toxic moulds from indoor cultivation). They also result in economic losses through stolen electricity and potential drops in real estate prices when grow operations are uncovered, and in organized criminal groups becoming more powerful via accumulation of financial profit, thus becoming larger in operation and more difficult to manage.92
87 Desjardins & Hotton (2004). 88 See, for example: Planting Profit - Police Fight for Ground in the Battle Against Marijuana Cultivation, RCMP Gazette, 64(3), 2002; Asian-Based Organized Crime (AOC). Blue Line Magazine, 15(6), June 2003. 89 It is estimated that with 16 marijuana plants producing one pound, and prices at about $2,000 a pound, 1,600 plants can bring in $200,000 in less than nine weeks (Planting Profit - Police Fight for Ground in the Battle Against Marijuana Cultivation. RCMP Gazette, 64(3), 2002). 90 It has to be recognised that the number of MGOs dismantled by the police is not a sufficient indicator of the extent of the MGO problem. Legitimately, it is more of a police workload or work efficiency measure. 91 Statistics from the Toronto Police Drug Squad. 92 This can be manifested as more complex and resource-intensive investigations, mega-trials (complex, lengthy trials with many defendants), and challenges/appeals in the criminal justice process.
22000088 EEnnvviirroonnmmeennttaall SSccaann
Crime Trends 55
The detection, investigation, and dismantling of the large number of MGOs have proven to be very time-consuming tasks for police. The legal requirements for obtaining search warrants and the procedures to comply with in addressing the health and safety risks associated with the raid, seizure, preparation, and storage of the plants and other properties all place heavy demands on police resources. Combating the problem of the large increase in MGOs is a difficult task and requires more dedicated and specialized enforcement, as well as legislative support in terms of police discretion to lay criminal charges in aggravating circumstances of drug possession. The lack of reliable and consistently captured data, and co-ordination between different drug-related work units are among the current challenges to making strategic decisions to address the drug problem, as well as to the evaluation of the impact of enforcement in combating MGOs. K. ORGANIZED CRIME
Organized crime can be found wherever there is profit to be made. On the demand side are the markets for the goods and services produced by such groups. Across Canada, established and emerging organized crime groups undertake a complex range of criminal activities ranging from street level distribution of illicit drugs to international production and distribution of counterfeit goods. According to the Canadian Intelligence Service Canada (CISC), the Canadian criminal intelligence community has identified approximately 950 organized crime groups in 2007, compared to an estimated 800 groups in 2006.93 While the existence of organized crime is undeniable, the definition of an organized criminal group under Canadian law is relatively vague for the purpose of quantifying the problem itself. According to the Criminal Code of Canada (s467.1), a criminal organization is defined as a group, however organized, that is composed of three or more persons in or outside of Canada, and has as one of its main purposes or main activities the facilitation or commission of one or more serious offences that, if committed, would likely result in the direct or indirect receipt of a material benefit, including a financial benefit, by the group or by any of the persons who constitute the group. It does not include a group of persons that forms randomly for the immediate commission of a single crime.94
While organized crime groups vary widely in organizational structure and criminal capabilities, they can be classified into three main categories:
• Groups capable of operating elaborate criminal operations, such as complex frauds, money laundering or financial schemes, and/or the distribution of a wide range of illicit commodities. These groups are fewer in number compared with those in other categories and are not visible to the public because of their level of sophistication and nature of their operations.
• Groups with a lower level of sophistication and criminal capability. They form a larger
proportion of the crime groups compared to the first category. They are involved in more
93 Analysis under this section is largely based on: Criminal Intelligence Service Canada (CISC). 2007 Annual Report 2007 – Organized Crime in Canada. (Retrieved from http://www.cisc.gc.ca/annual_reports/ annual_report_ 2007/frontpage_2007_e.html) 94 Definition for organized criminal group is from Department of Justice Canada website (http://laws.justice.gc) (under Criminal Code C46).
22000088 EEnnvviirroonnmmeennttaall SSccaann
Crime Trends 56
visible criminal activities, such as the distribution of contraband, drug trafficking, prostitution, vehicle theft, violence, and intimidation.
• Street level criminal groups. These groups form the largest number of organized crime
groups. They usually are formed to facilitate criminal activities for more capable groups. A number of them exist for limited periods of time, co-operate for specific criminal activities, and then disband. They are highly visible to the public because of their activities and their tendency to use violence and intimidation, and thus have a direct impact on public safety.
Almost all organized crime groups network or collaborate with other groups to facilitate their own criminal activities. They may use or exploit the legitimate economy to some degree to hide or insulate their activities, launder proceeds of crime, and/or commit financial crimes through a legitimate front, sometimes by corrupting public officials and professionals. The advance in technology has provided opportunities for these groups to commit crimes through the Internet or other communication interception devices, and to facilitate identity theft, theft of financial information, and large scale frauds and thefts.
Organized criminal activity has serious and complex social and economic ramifications, regionally, nationally, and internationally. The serious socio-economic harms and threats to the society posed by organized crime groups, though well documented, are not readily known to the public. These harms can be direct and tangible, such as fraud or thefts, the consequences of which can be quantified as monetary loss, or they can be intangible adverse effects, such as the loss of quality of life through victimization. Violence is frequently used by organized groups to intimidate individuals or the community, to promote and protect their criminal interests, and to settle conflicts with other groups, leading to a diminished sense of public safety. It is also recognized that there is increasing risk that organized criminal groups will become involved in facilitating the movement/smuggling of chemical, biological, radiological, and/or nuclear weapons, posing a serious threat to national and public safety.
Financial crimes, including money laundering and manipulation of financial systems and institutions, usually committed by the more sophisticated and powerful organized crime groups, can make an otherwise healthy market distorted, resulting in loss of investor and public confidence. Other crimes perpetuated by organized criminal groups, such as insurance frauds, mortgage frauds, mass marketing frauds, vehicle thefts, contraband, counterfeit goods, intellectual property theft, payment card fraud, small arms trade, and human smuggling can result in rise of insurance costs, in financial loss to victims, in loss of government tax revenue and profits of legitimate industries, and in physical and mental suffering of victims.
There is also a huge social cost from the illegal activities of these criminal groups, which can not readily be quantified. They include the ruining effect on life, health, and personal development as a result of addiction to drugs made available by the illicit drug trade, the breakdown of family and marriages as a result of addiction, and the deprivations imposed on children in such broken families. Marijuana grow operations, in which organized criminal groups are heavily involved, also pose serious health and safety risks to the community involved.
22000088 EEnnvviirroonnmmeennttaall SSccaann
Crime Trends 57
Due to the nature and financial resources of organised criminal organisations, fighting organized crime is beyond the ability of any single police service.95 Successes against organized crime require continual, co-ordinated, joint efforts by law enforcement agencies that recognize its global networks, complex social milieu, and use of technology. The importance of integrated, intelligence-led policing through intelligence sharing among law enforcement partners to enable multi-agency and multi-jurisdictional responses is well recognized. Strategic co-ordination, commitment to intelligence, and communication are all considered integral to the fight against organized crime. Integrated approaches are essential, particularly for those organized criminal activities that reach beyond organisational, jurisdictional, and national boundaries.
On June 12th, 2007, the Ontario government announced the new strategy of fighting organized crime with organized justice, through the establishment of a Special Advisory Group to the Attorney General. It is intended that this Group will bring the best and brightest together to combat organized crime, enhance investigation and prosecution of identity theft and counterfeiting, mobilize experts and researchers in the field, and provide training and educational materials to be used by Crown prosecutors and other law enforcement agencies.96
L. HI-TECH CRIME & IDENTITY THEFT
High-tech crimes, largely computer-related crimes, are characterized by their high level
of sophistication, effectiveness in terms of furthering criminal objectives, and the potentially more serious damage to the victim(s).97, 98 The most common purpose of high-tech crimes is the unauthorized tapping of personal, organizational, and financial information for financial gain or other criminal purposes. The increase in the number and variety of crimes that capitalize on the advancement of technology is proportionate to the rapid increase in the number of Internet users and the expansion of e-commerce globally. Other contributing factors include the rapid growth of credit, debit, and banking cards; careless consumer behaviour; easy availability of personal-financial information and consumer data; escalating on-line opportunities for theft and fraud; lax business and government security practices in protecting information; the low risk of being caught for perpetrators; and, the easy availability of automated hacking tools.99
There are a variety of crimes that exploit the advancement of technology: new crimes committed with and born out of new technology, and traditional crimes committed with new technology. The newer crimes include hacking and ‘spoofing’ websites, while the traditional
95 The then-RCMP Commissioner G. Zaccardelli was reported to have made these remarks in his address to the Senate Committee on National Security and Defence on May 8th, 2006 (Terrorists work with gangs: RCMP. (2006 May). Toronto Star.) 96 Government of Ontario. (2007) McGuinty Government Protecting Ontarians From Organized Crime. News Release. (Retrieved on June 12th, 2007, from http://www.attorneygeneral.jus.gov.on.ca/english/news/2007/ 20070612-orrgcrim-nr-asp) 97 Computer crime generally refers to criminal activity that involves a computer or network as the source, tool, target, or place of a crime. It can broadly be defined as criminal activity involving an information technology infrastructure, including unauthorized access, illegal interception, data interference, systems interference, misuse of devices, forgery, and electronic fraud. 98 Some of the following discussion is based on: Criminal Intelligence Service Canada (CISC). 2005 Annual Report – Organized Crime in Canada. (Retrieved from http://www.cisc.gc.ca/annual_reports/annual_report_2005/ frontpage_2005_e.html) 99 Public Safety Canada. Fact Sheet: High-tech Crime. (Retrieved from http://ww2.ps-sp.gc.ca/policing/ organized_crime/FactSheets/high_tech_crime_e.asp)
22000088 EEnnvviirroonnmmeennttaall SSccaann
Crime Trends 58
crimes using technology include identity theft, extortion, and fraud, mostly committed through the Internet. The use by criminals of technology that facilitates increasingly secure, anonymous, and rapid communication (via tools like encryption software, wireless devices, disposable cell phones and anonymous re-mailers) also makes these crimes less detectable and helps to conceal the perpetrators’ identities.
Identity theft (ID theft) involves stealing, misrepresenting, or hijacking the identity of another person or business and provides an effective means to commit other crimes.100 Identity theft enables criminals to use stolen personal information to drain individuals’ bank accounts and obtain fraudulent documentation for the commission of other crimes. The unauthorized collection of personal information can occur in a number of ways, including: hacking into computer databases or ‘colonizing’ computers by virus infection via the Internet; obtaining of personal information through bribery of database administrators; theft of personal information records or computer hard drives from businesses or government; digging up information from publicly available sources (such as the Internet); dumpster diving (garbage sieving); theft or diversion of mail; payment card fraud; card skimming; or posing as a potential employer, Internet service provider, market researcher, or other service provider to solicit personal information for seemingly legitimate purposes.101 There is indication that more Internet viruses are being designed to steal financial data, user names, and passwords for profit motives.102
Identity theft, particularly of financial data via the Internet, is committed mostly through phishing, pharming, and, most recently, vishing.103 Both pharming and phishing involve deceptively redirecting Internet users from legitimate financial sites to targeted websites via the Internet for the purpose of scam, while vishing involves the use of Voice-over-Internet Protocol (VoIP) phones. More detailed analysis of crimes based on advancement in technology is provided in the chapter on Technology & Policing. Identity theft is increasingly a global problem, beyond the constraints of physical geographical boundaries and political jurisdictions, and the perpetrators of identity theft include organized criminal groups, individual criminals, and terrorists. Victims of such thefts may be unaware for long periods of time that their identity information has been wrongfully used, and the full extent of losses from identity theft are not usually known when the crime is first discovered. As a consequence, victims suffer financial loss, damage to their reputation, and emotional distress, and are left with the complicated and sometimes arduous task of clearing their names.
Currently, there is no separate federal or provincial offence for identity theft. The Canadian Criminal Code provisions in relation to fraud, forgery, unauthorized use of computer, and theft are generally used to prosecute such crimes. However, most of these applicable Criminal Code offences require proof of the accused’s intent to gain advantage or cause
100 From the Identity Theft page on the RCMP website (rcmp-grc.gc.ca). 101 There is the analogy that “People…now understand that it is the databases that carry the goldmines and criminals are mining them.” Credit Agency Reports Security Breach. (2004, March 17). (Retrieved from www.computerworld.com/printthis/2004/0,4814,91319,00.html) 102 There are computer viruses, such as Sobig.F, specifically designed to enable the perpetrator to have control of the infected computer and thus have access to sensitive information, or enabling marketers to disguise bulk messages or spam. It is also mentioned in the Metro, March 15, 2004, that the Symantec Engineering Director remarked on the trend of Internet viruses designed for profit-motivated purposes. 103 It can also be done via other means, such as skimming, which involves stealing personal information from the magnetic strip on debit and credit cards through the use of small electronic devices called skimmers or wedges.
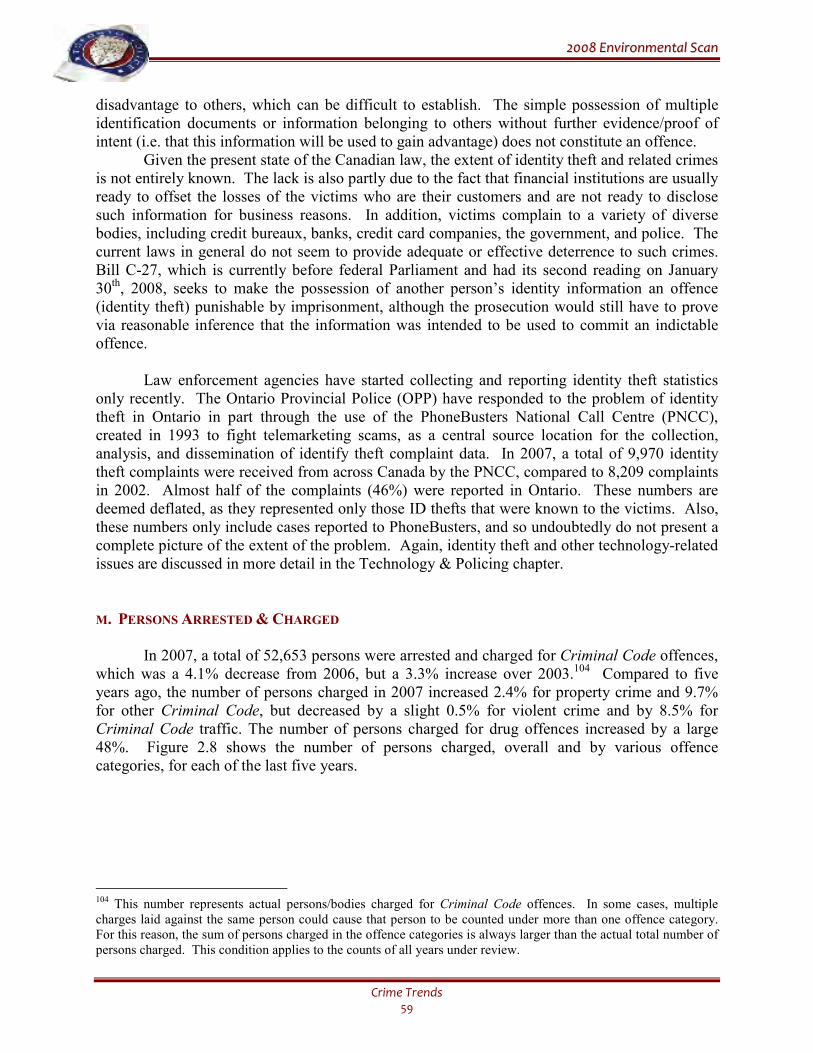
22000088 EEnnvviirroonnmmeennttaall SSccaann
Crime Trends 59
disadvantage to others, which can be difficult to establish. The simple possession of multiple identification documents or information belonging to others without further evidence/proof of intent (i.e. that this information will be used to gain advantage) does not constitute an offence.
Given the present state of the Canadian law, the extent of identity theft and related crimes is not entirely known. The lack is also partly due to the fact that financial institutions are usually ready to offset the losses of the victims who are their customers and are not ready to disclose such information for business reasons. In addition, victims complain to a variety of diverse bodies, including credit bureaux, banks, credit card companies, the government, and police. The current laws in general do not seem to provide adequate or effective deterrence to such crimes. Bill C-27, which is currently before federal Parliament and had its second reading on January 30th, 2008, seeks to make the possession of another person’s identity information an offence (identity theft) punishable by imprisonment, although the prosecution would still have to prove via reasonable inference that the information was intended to be used to commit an indictable offence.
Law enforcement agencies have started collecting and reporting identity theft statistics only recently. The Ontario Provincial Police (OPP) have responded to the problem of identity theft in Ontario in part through the use of the PhoneBusters National Call Centre (PNCC), created in 1993 to fight telemarketing scams, as a central source location for the collection, analysis, and dissemination of identify theft complaint data. In 2007, a total of 9,970 identity theft complaints were received from across Canada by the PNCC, compared to 8,209 complaints in 2002. Almost half of the complaints (46%) were reported in Ontario. These numbers are deemed deflated, as they represented only those ID thefts that were known to the victims. Also, these numbers only include cases reported to PhoneBusters, and so undoubtedly do not present a complete picture of the extent of the problem. Again, identity theft and other technology-related issues are discussed in more detail in the Technology & Policing chapter.
M. PERSONS ARRESTED & CHARGED
In 2007, a total of 52,653 persons were arrested and charged for Criminal Code offences, which was a 4.1% decrease from 2006, but a 3.3% increase over 2003.104 Compared to five years ago, the number of persons charged in 2007 increased 2.4% for property crime and 9.7% for other Criminal Code, but decreased by a slight 0.5% for violent crime and by 8.5% for Criminal Code traffic. The number of persons charged for drug offences increased by a large 48%. Figure 2.8 shows the number of persons charged, overall and by various offence categories, for each of the last five years.
104 This number represents actual persons/bodies charged for Criminal Code offences. In some cases, multiple charges laid against the same person could cause that person to be counted under more than one offence category. For this reason, the sum of persons charged in the offence categories is always larger than the actual total number of persons charged. This condition applies to the counts of all years under review.
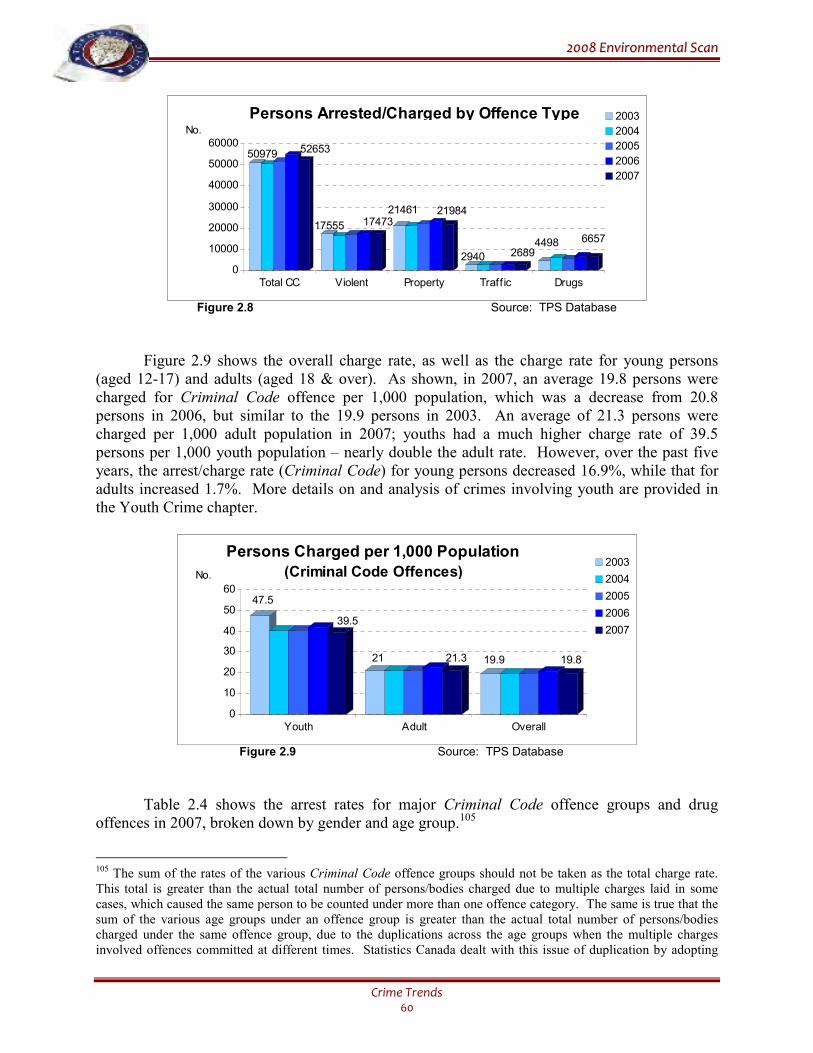
22000088 EEnnvviirroonnmmeennttaall SSccaann
Crime Trends 60
50979 52653
17555 1747321461 21984
2940 26894498 6657
0
10000
20000
30000
40000
50000
60000
Total CC Violent Property Traff ic Drugs
2003
2004
2005
2006
2007
Persons Arrested/Charged by Offence TypeNo.
Figure 2.8 Source: TPS Database
Figure 2.9 shows the overall charge rate, as well as the charge rate for young persons (aged 12-17) and adults (aged 18 & over). As shown, in 2007, an average 19.8 persons were charged for Criminal Code offence per 1,000 population, which was a decrease from 20.8 persons in 2006, but similar to the 19.9 persons in 2003. An average of 21.3 persons were charged per 1,000 adult population in 2007; youths had a much higher charge rate of 39.5 persons per 1,000 youth population – nearly double the adult rate. However, over the past five years, the arrest/charge rate (Criminal Code) for young persons decreased 16.9%, while that for adults increased 1.7%. More details on and analysis of crimes involving youth are provided in the Youth Crime chapter.
47.5
39.5
21 21.3 19.9 19.8
0
10
20
30
40
50
60
Youth Adult Overall
2003
2004
2005
2006
2007
Persons Charged per 1,000 Population
(Criminal Code Offences)No.
Figure 2.9 Source: TPS Database
Table 2.4 shows the arrest rates for major Criminal Code offence groups and drug offences in 2007, broken down by gender and age group.105
105 The sum of the rates of the various Criminal Code offence groups should not be taken as the total charge rate. This total is greater than the actual total number of persons/bodies charged due to multiple charges laid in some cases, which caused the same person to be counted under more than one offence category. The same is true that the sum of the various age groups under an offence group is greater than the actual total number of persons/bodies charged under the same offence group, due to the duplications across the age groups when the multiple charges involved offences committed at different times. Statistics Canada dealt with this issue of duplication by adopting
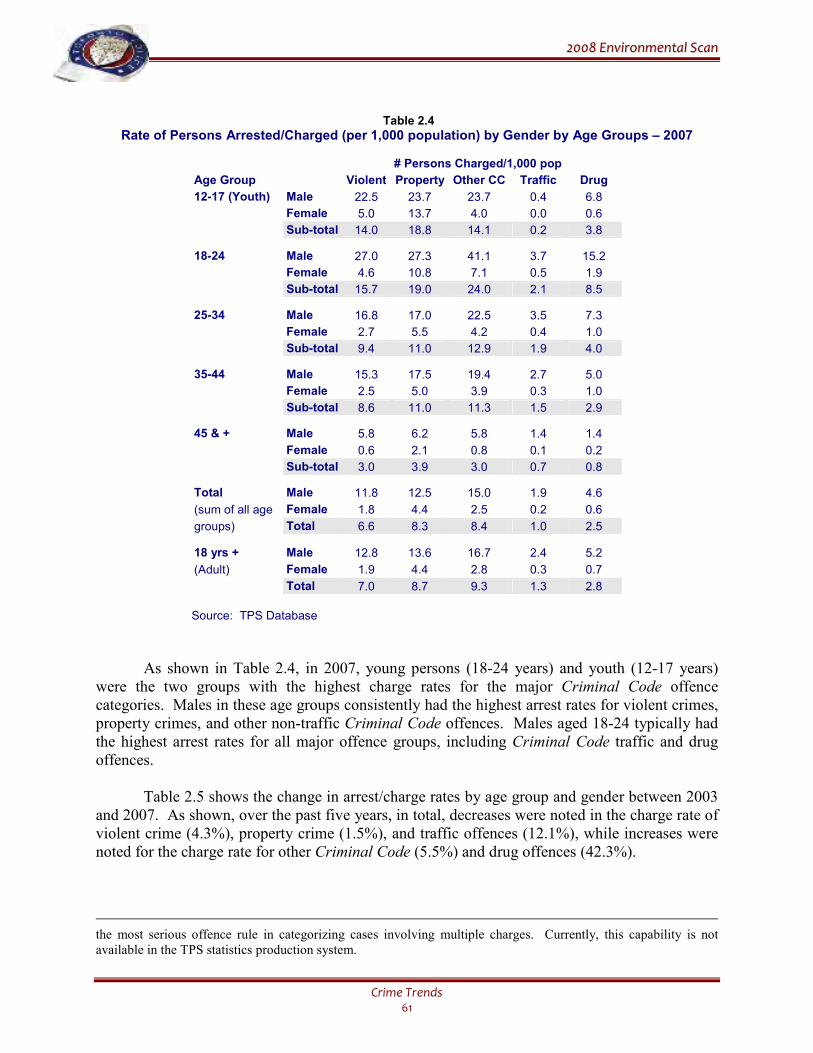
22000088 EEnnvviirroonnmmeennttaall SSccaann
Crime Trends 61
Table 2.4
Rate of Persons Arrested/Charged (per 1,000 population) by Gender by Age Groups – 2007
# Persons Charged/1,000 pop
Age Group Violent Property Other CC Traffic Drug
12-17 (Youth) Male 22.5 23.7 23.7 0.4 6.8
Female 5.0 13.7 4.0 0.0 0.6
Sub-total 14.0 18.8 14.1 0.2 3.8
18-24 Male 27.0 27.3 41.1 3.7 15.2
Female 4.6 10.8 7.1 0.5 1.9
Sub-total 15.7 19.0 24.0 2.1 8.5
25-34 Male 16.8 17.0 22.5 3.5 7.3
Female 2.7 5.5 4.2 0.4 1.0
Sub-total 9.4 11.0 12.9 1.9 4.0
35-44 Male 15.3 17.5 19.4 2.7 5.0
Female 2.5 5.0 3.9 0.3 1.0
Sub-total 8.6 11.0 11.3 1.5 2.9
45 & + Male 5.8 6.2 5.8 1.4 1.4
Female 0.6 2.1 0.8 0.1 0.2
Sub-total 3.0 3.9 3.0 0.7 0.8
Total Male 11.8 12.5 15.0 1.9 4.6
(sum of all age Female 1.8 4.4 2.5 0.2 0.6
groups) Total 6.6 8.3 8.4 1.0 2.5
18 yrs + Male 12.8 13.6 16.7 2.4 5.2
(Adult) Female 1.9 4.4 2.8 0.3 0.7
Total 7.0 8.7 9.3 1.3 2.8
Source: TPS Database
As shown in Table 2.4, in 2007, young persons (18-24 years) and youth (12-17 years) were the two groups with the highest charge rates for the major Criminal Code offence categories. Males in these age groups consistently had the highest arrest rates for violent crimes, property crimes, and other non-traffic Criminal Code offences. Males aged 18-24 typically had the highest arrest rates for all major offence groups, including Criminal Code traffic and drug offences.
Table 2.5 shows the change in arrest/charge rates by age group and gender between 2003 and 2007. As shown, over the past five years, in total, decreases were noted in the charge rate of violent crime (4.3%), property crime (1.5%), and traffic offences (12.1%), while increases were noted for the charge rate for other Criminal Code (5.5%) and drug offences (42.3%).
the most serious offence rule in categorizing cases involving multiple charges. Currently, this capability is not available in the TPS statistics production system.
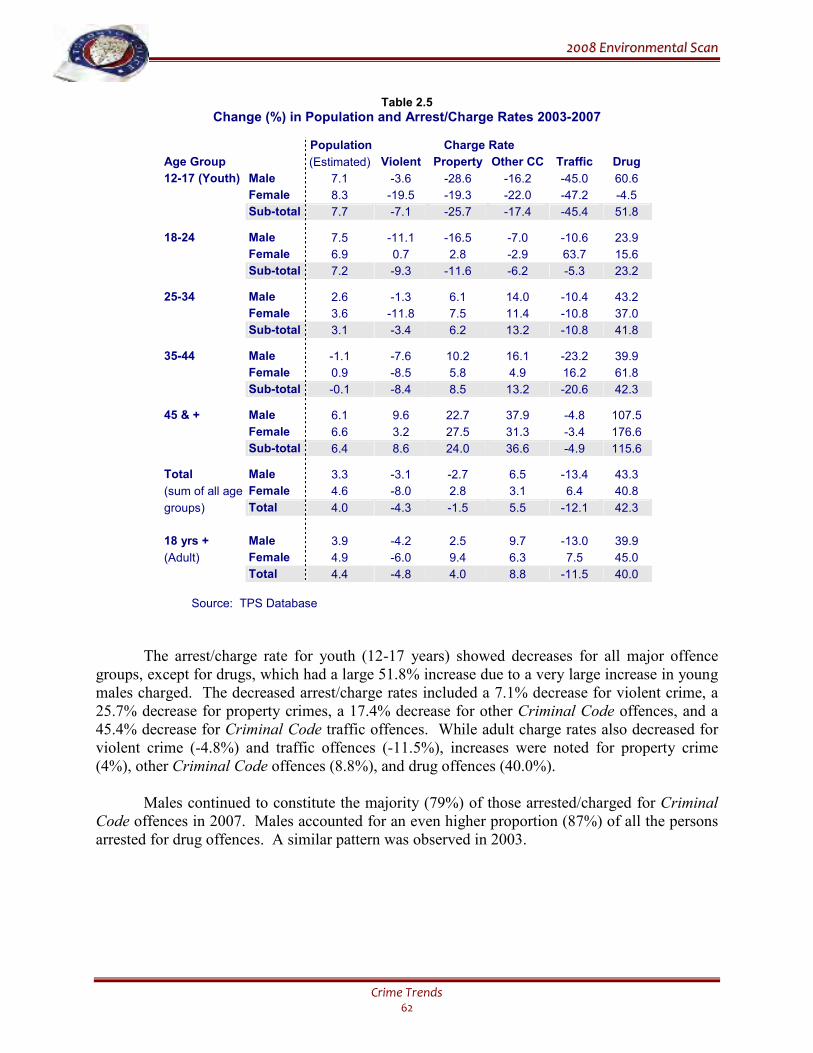
22000088 EEnnvviirroonnmmeennttaall SSccaann
Crime Trends 62
Table 2.5
Change (%) in Population and Arrest/Charge Rates 2003-2007
Population Charge Rate
Age Group (Estimated) Violent Property Other CC Traffic Drug
12-17 (Youth) Male 7.1 -3.6 -28.6 -16.2 -45.0 60.6
Female 8.3 -19.5 -19.3 -22.0 -47.2 -4.5
Sub-total 7.7 -7.1 -25.7 -17.4 -45.4 51.8
18-24 Male 7.5 -11.1 -16.5 -7.0 -10.6 23.9
Female 6.9 0.7 2.8 -2.9 63.7 15.6
Sub-total 7.2 -9.3 -11.6 -6.2 -5.3 23.2
25-34 Male 2.6 -1.3 6.1 14.0 -10.4 43.2
Female 3.6 -11.8 7.5 11.4 -10.8 37.0
Sub-total 3.1 -3.4 6.2 13.2 -10.8 41.8
35-44 Male -1.1 -7.6 10.2 16.1 -23.2 39.9
Female 0.9 -8.5 5.8 4.9 16.2 61.8
Sub-total -0.1 -8.4 8.5 13.2 -20.6 42.3
45 & + Male 6.1 9.6 22.7 37.9 -4.8 107.5
Female 6.6 3.2 27.5 31.3 -3.4 176.6
Sub-total 6.4 8.6 24.0 36.6 -4.9 115.6
Total Male 3.3 -3.1 -2.7 6.5 -13.4 43.3
(sum of all age Female 4.6 -8.0 2.8 3.1 6.4 40.8
groups) Total 4.0 -4.3 -1.5 5.5 -12.1 42.3
18 yrs + Male 3.9 -4.2 2.5 9.7 -13.0 39.9
(Adult) Female 4.9 -6.0 9.4 6.3 7.5 45.0
Total 4.4 -4.8 4.0 8.8 -11.5 40.0
Source: TPS Database
The arrest/charge rate for youth (12-17 years) showed decreases for all major offence groups, except for drugs, which had a large 51.8% increase due to a very large increase in young males charged. The decreased arrest/charge rates included a 7.1% decrease for violent crime, a 25.7% decrease for property crimes, a 17.4% decrease for other Criminal Code offences, and a 45.4% decrease for Criminal Code traffic offences. While adult charge rates also decreased for violent crime (-4.8%) and traffic offences (-11.5%), increases were noted for property crime (4%), other Criminal Code offences (8.8%), and drug offences (40.0%). Males continued to constitute the majority (79%) of those arrested/charged for Criminal Code offences in 2007. Males accounted for an even higher proportion (87%) of all the persons arrested for drug offences. A similar pattern was observed in 2003.
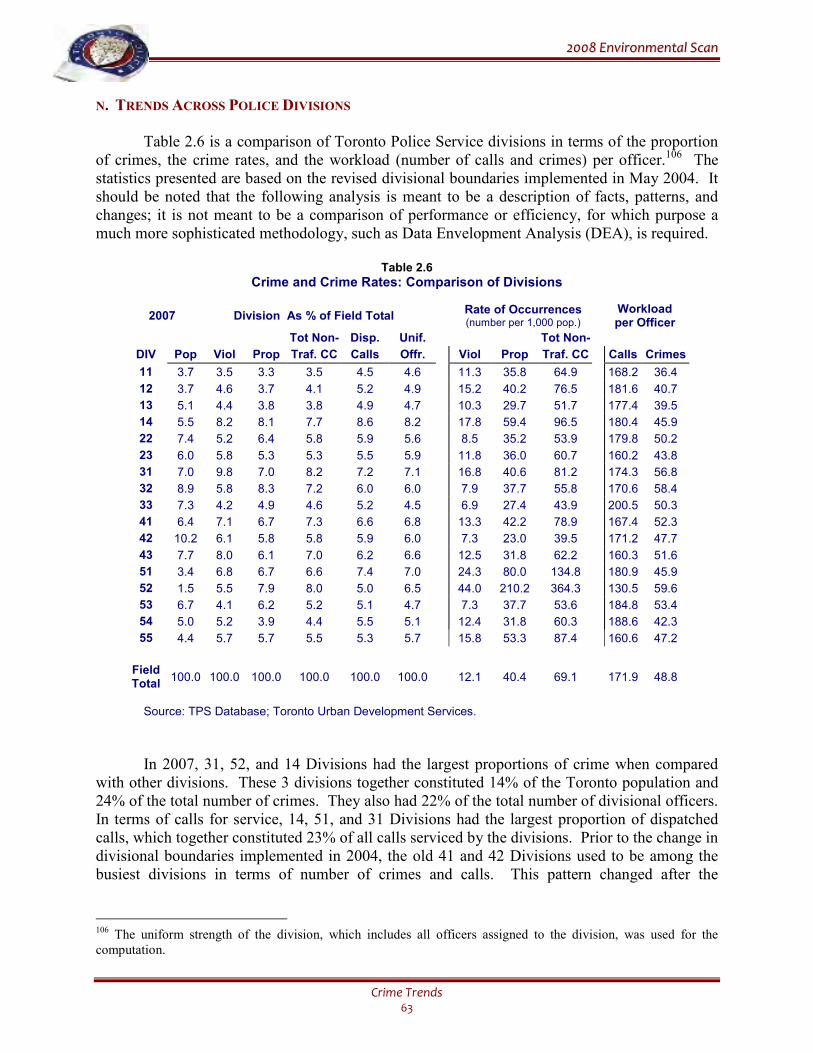
22000088 EEnnvviirroonnmmeennttaall SSccaann
Crime Trends 63
N. TRENDS ACROSS POLICE DIVISIONS
Table 2.6 is a comparison of Toronto Police Service divisions in terms of the proportion of crimes, the crime rates, and the workload (number of calls and crimes) per officer.106 The statistics presented are based on the revised divisional boundaries implemented in May 2004. It should be noted that the following analysis is meant to be a description of facts, patterns, and changes; it is not meant to be a comparison of performance or efficiency, for which purpose a much more sophisticated methodology, such as Data Envelopment Analysis (DEA), is required.
Table 2.6
Crime and Crime Rates: Comparison of Divisions
2007 Division As % of Field Total Rate of Occurrences (number per 1,000 pop.)
Workload per Officer
Tot Non- Disp. Unif. Tot Non-
DIV Pop Viol Prop Traf. CC Calls Offr. Viol Prop Traf. CC Calls Crimes
11 3.7 3.5 3.3 3.5 4.5 4.6 11.3 35.8 64.9 168.2 36.4
12 3.7 4.6 3.7 4.1 5.2 4.9 15.2 40.2 76.5 181.6 40.7
13 5.1 4.4 3.8 3.8 4.9 4.7 10.3 29.7 51.7 177.4 39.5
14 5.5 8.2 8.1 7.7 8.6 8.2 17.8 59.4 96.5 180.4 45.9
22 7.4 5.2 6.4 5.8 5.9 5.6 8.5 35.2 53.9 179.8 50.2
23 6.0 5.8 5.3 5.3 5.5 5.9 11.8 36.0 60.7 160.2 43.8
31 7.0 9.8 7.0 8.2 7.2 7.1 16.8 40.6 81.2 174.3 56.8
32 8.9 5.8 8.3 7.2 6.0 6.0 7.9 37.7 55.8 170.6 58.4
33 7.3 4.2 4.9 4.6 5.2 4.5 6.9 27.4 43.9 200.5 50.3
41 6.4 7.1 6.7 7.3 6.6 6.8 13.3 42.2 78.9 167.4 52.3
42 10.2 6.1 5.8 5.8 5.9 6.0 7.3 23.0 39.5 171.2 47.7
43 7.7 8.0 6.1 7.0 6.2 6.6 12.5 31.8 62.2 160.3 51.6
51 3.4 6.8 6.7 6.6 7.4 7.0 24.3 80.0 134.8 180.9 45.9
52 1.5 5.5 7.9 8.0 5.0 6.5 44.0 210.2 364.3 130.5 59.6
53 6.7 4.1 6.2 5.2 5.1 4.7 7.3 37.7 53.6 184.8 53.4
54 5.0 5.2 3.9 4.4 5.5 5.1 12.4 31.8 60.3 188.6 42.3
55 4.4 5.7 5.7 5.5 5.3 5.7 15.8 53.3 87.4 160.6 47.2
Field Total
100.0 100.0 100.0 100.0 100.0 100.0 12.1 40.4 69.1 171.9 48.8
Source: TPS Database; Toronto Urban Development Services.
In 2007, 31, 52, and 14 Divisions had the largest proportions of crime when compared with other divisions. These 3 divisions together constituted 14% of the Toronto population and 24% of the total number of crimes. They also had 22% of the total number of divisional officers. In terms of calls for service, 14, 51, and 31 Divisions had the largest proportion of dispatched calls, which together constituted 23% of all calls serviced by the divisions. Prior to the change in divisional boundaries implemented in 2004, the old 41 and 42 Divisions used to be among the busiest divisions in terms of number of crimes and calls. This pattern changed after the
106 The uniform strength of the division, which includes all officers assigned to the division, was used for the computation.
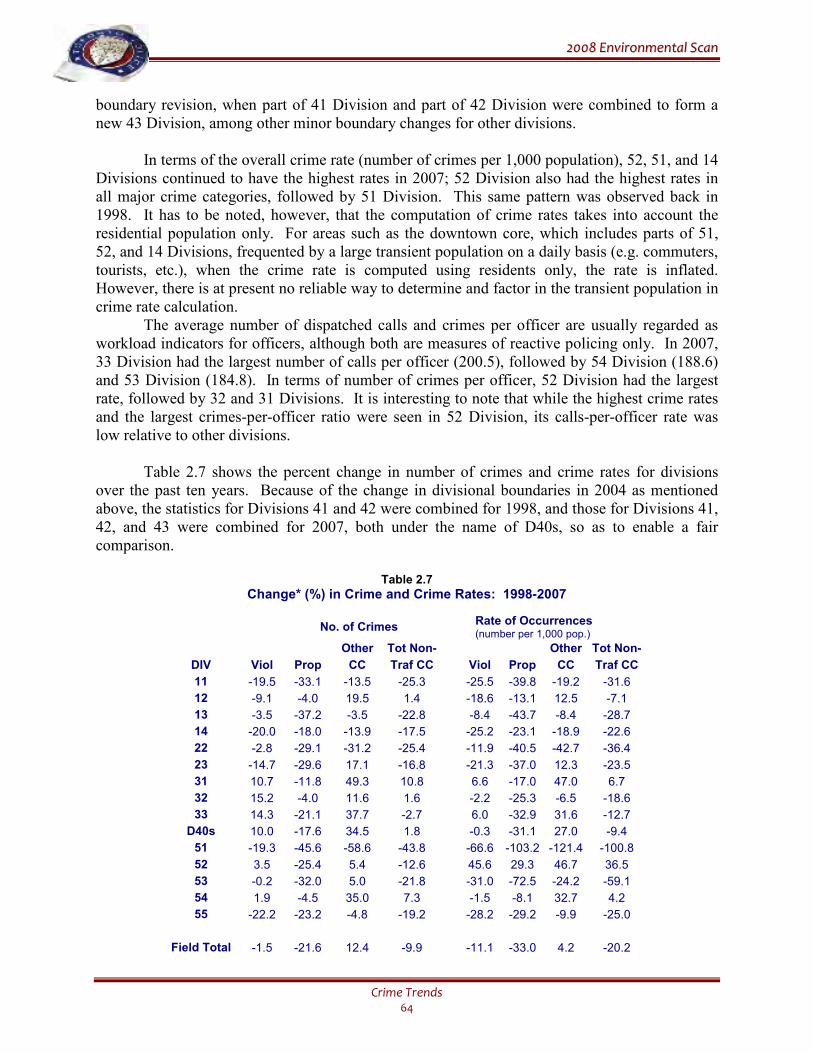
22000088 EEnnvviirroonnmmeennttaall SSccaann
Crime Trends 64
boundary revision, when part of 41 Division and part of 42 Division were combined to form a new 43 Division, among other minor boundary changes for other divisions. In terms of the overall crime rate (number of crimes per 1,000 population), 52, 51, and 14 Divisions continued to have the highest rates in 2007; 52 Division also had the highest rates in all major crime categories, followed by 51 Division. This same pattern was observed back in 1998. It has to be noted, however, that the computation of crime rates takes into account the residential population only. For areas such as the downtown core, which includes parts of 51, 52, and 14 Divisions, frequented by a large transient population on a daily basis (e.g. commuters, tourists, etc.), when the crime rate is computed using residents only, the rate is inflated. However, there is at present no reliable way to determine and factor in the transient population in crime rate calculation. The average number of dispatched calls and crimes per officer are usually regarded as workload indicators for officers, although both are measures of reactive policing only. In 2007, 33 Division had the largest number of calls per officer (200.5), followed by 54 Division (188.6) and 53 Division (184.8). In terms of number of crimes per officer, 52 Division had the largest rate, followed by 32 and 31 Divisions. It is interesting to note that while the highest crime rates and the largest crimes-per-officer ratio were seen in 52 Division, its calls-per-officer rate was low relative to other divisions. Table 2.7 shows the percent change in number of crimes and crime rates for divisions over the past ten years. Because of the change in divisional boundaries in 2004 as mentioned above, the statistics for Divisions 41 and 42 were combined for 1998, and those for Divisions 41, 42, and 43 were combined for 2007, both under the name of D40s, so as to enable a fair comparison.
Table 2.7
Change* (%) in Crime and Crime Rates: 1998-2007
No. of Crimes Rate of Occurrences (number per 1,000 pop.)
Other Tot Non- Other Tot Non-
DIV Viol Prop CC Traf CC Viol Prop CC Traf CC
11 -19.5 -33.1 -13.5 -25.3 -25.5 -39.8 -19.2 -31.6
12 -9.1 -4.0 19.5 1.4 -18.6 -13.1 12.5 -7.1
13 -3.5 -37.2 -3.5 -22.8 -8.4 -43.7 -8.4 -28.7
14 -20.0 -18.0 -13.9 -17.5 -25.2 -23.1 -18.9 -22.6
22 -2.8 -29.1 -31.2 -25.4 -11.9 -40.5 -42.7 -36.4
23 -14.7 -29.6 17.1 -16.8 -21.3 -37.0 12.3 -23.5
31 10.7 -11.8 49.3 10.8 6.6 -17.0 47.0 6.7
32 15.2 -4.0 11.6 1.6 -2.2 -25.3 -6.5 -18.6
33 14.3 -21.1 37.7 -2.7 6.0 -32.9 31.6 -12.7
D40s 10.0 -17.6 34.5 1.8 -0.3 -31.1 27.0 -9.4
51 -19.3 -45.6 -58.6 -43.8 -66.6 -103.2 -121.4 -100.8
52 3.5 -25.4 5.4 -12.6 45.6 29.3 46.7 36.5
53 -0.2 -32.0 5.0 -21.8 -31.0 -72.5 -24.2 -59.1
54 1.9 -4.5 35.0 7.3 -1.5 -8.1 32.7 4.2
55 -22.2 -23.2 -4.8 -19.2 -28.2 -29.2 -9.9 -25.0
Field Total -1.5 -21.6 12.4 -9.9 -11.1 -33.0 4.2 -20.2
22000088 EEnnvviirroonnmmeennttaall SSccaann
Crime Trends 65
*For the sake of fair comparison, statistics for 41 and 42 Divisions were combined for 1998 and those for 41, 42, and 43 Divisions were combined for 2007, both under the label of D40s, so as to enable a 10-year comparison. Division 43, opened in 2004, was formed from part of 41 Division and part of 42 Division. Therefore, the ‘old’ 41 and 42 Divisions together are equal to the ‘new’ 41, 42, and 43 Divisions combined.
Source: TPS Database; Toronto Urban Development Services.
Between 1998 and 2007, there was a 10% decrease in non-traffic Criminal Code offences for all the divisions, including a 21.6% decrease in property crimes, a 1.5% decrease in violent crimes, and a 12.4% increase in other Criminal Code offences. In other words, the decrease in crime over the past ten years was mainly driven by the decrease in property crimes. Overall crimes decreased in most divisions, with the largest decrease (-43.8%) in 51 Division and the smallest decrease (-2.7%) in 33 Division. Only two divisions showed significant increases over the past ten years – a 10.8% increase in 31 Division and a 7.3% increase in 54 Division. Three other divisions showed slight increases. A drop in property crime was seen in all divisions, with decreases ranging from 4.0% (12 and 32 Divisions) to 45.6% (51 Division). There was a mixed picture in terms of the change in violent crimes in divisions, with 9 showing a decrease and the rest showing an increase. The largest decrease in violent crime was in 55 Division (-22.2%) and the largest increase was in 32 Division (15.2%). Only 6 divisions showed decreases in other Criminal Code offences, while others had increases, with the largest increase (49.3%) in 31 Division.
As previously noted, calculating the number of crimes per 1,000 people provides a rate that is not affected by simple increases or decreases in population size. There was a large 20.2% drop in the overall crime rate per 1,000 population for the divisions, with the largest decreases noted in 51, 53, and 22 Divisions. The property crime rate dropped 33.0% for the divisions over the past ten years, and a decrease in the property crime rate was noted for all divisions except 52. The decrease ranged from 8.1% to 103.2%. In terms of the violent crime rate, the overall divisional rate dropped 11.1%, but 3 divisions had an increase. Division 51 had the largest decrease (-66.6%), while 52 Division had the largest increase (45.6%). Division 52, in fact, had the largest increase in the crime rate for all major crime categories over the past ten years, against a drop in these rates in most of the other divisions.
The diminishing number of crimes and calls serviced by the police over the past years may paint a picture of a diminishing workload per officer in the divisions. However, this is not necessarily the case for a number of reasons. First, contemporary policing is no longer confined to reacting/responding to crimes and calls. Currently, there are policing programs that focus on crime prevention and problem solving at the neighbourhood level, which have become a regular part of policing. These proactive programs in turn have an impact on reducing criminal occurrences and calls for service. Secondly, changes in the way that calls were managed/dispatched might have reduced the number of calls assigned directly to the divisions. In 2007, about 9% of the total dispatched calls were dealt with by the Central Alternate Response. These calls were not reflected in the divisional workload. Thirdly, as discussed in the chapter on Calls for Service, over the past few years, there has been a considerable increase in time required for servicing calls. This increase in servicing time for calls, which has continued
22000088 EEnnvviirroonnmmeennttaall SSccaann
Crime Trends 66
in the past five years, amounts to an increase in workload and will continue to be a drain on existing police resources, if unchanged. Statistics regarding number of crimes, crime clearance, and crime rates by division for selected years over the past ten years are shown in the Appendix at the end of this chapter.
O. COMPARISON WITH OTHER CANADIAN CITIES
This section compares the crime rates of Toronto to those of other large Canadian cities. Crime statistics from Statistics Canada are usually delayed by one year and so only 2006 crime statistics were available at the time of writing. The crime statistics reviewed under this section are incident-based. These statistics are different from those compiled by the Toronto Police Service, which are based on offences or violations of the law.107 It should be noted that, in the past, counts based on offences have always been larger than the counts based on incidents. In 2006, the incident-based number of crimes (non-traffic) for Toronto was 167,660, compared with the offence-based count of 204,461 crimes. The two sets of crime statistics are useful for different purposes.
In 2006, of the 19 police services serving a population of more than 250,000, Toronto had the second largest per capita cost for policing, after Vancouver, and Toronto had the third smallest number of population per police officer (Table 2.8).108 The factors associated with high policing cost in Toronto are many and varied. It has to be noted that per capita cost and the population-police ratio are based on residential population. For Toronto, due to various constraints, the computation of these ratios cannot take into account the large transient population (e.g. visitors, commuters, tourists, etc.) also served by the Toronto Police, and thus results in an inflation of these ratios. This, together with other factors such as the city’s ethnically and culturally diverse populations and its position as the centre of business, cultural, entertainment, and sporting activities in the Greater Toronto Area, all pose special demands on the Police Service, which certainly impact on the per capita cost but can not easily be quantified.
107 In offence-based statistics, all offences involved in an incident are counted. This differs from incident-based statistics where more than one offence may have occurred in the incident, but only the most serious offence is counted in the crime statistics. 108 Data from CCJS, Statistics Canada.
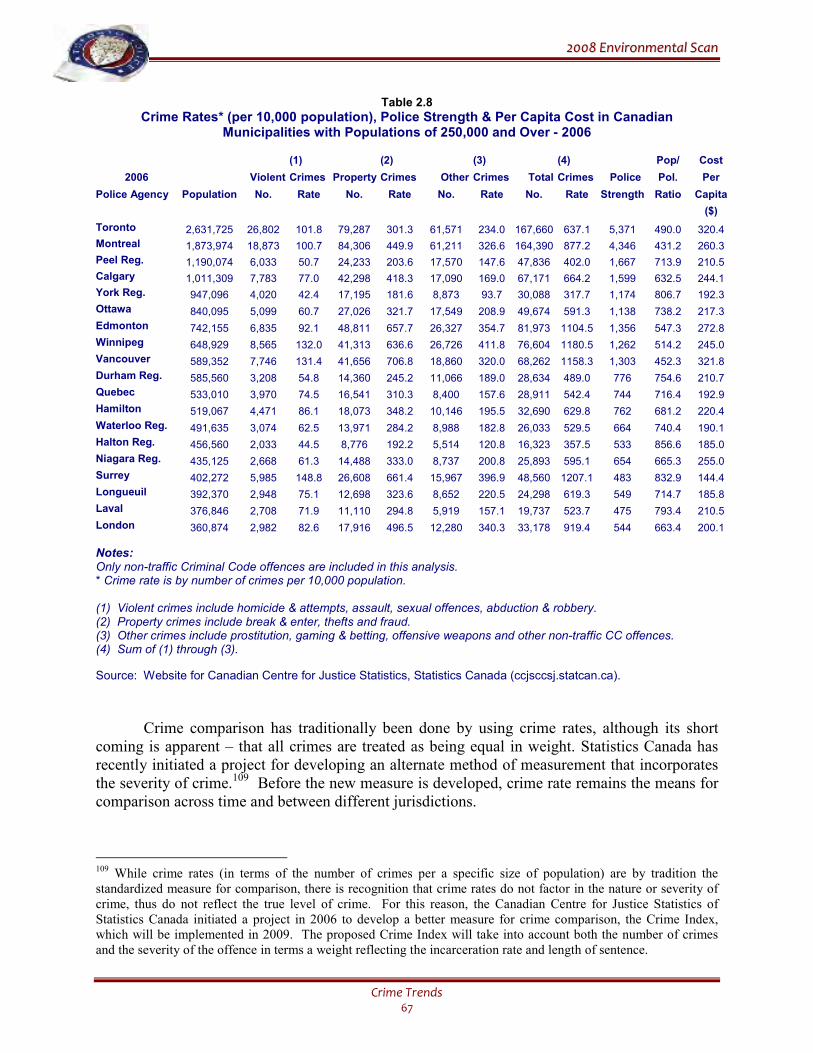
22000088 EEnnvviirroonnmmeennttaall SSccaann
Crime Trends 67
Table 2.8
Crime Rates* (per 10,000 population), Police Strength & Per Capita Cost in Canadian Municipalities with Populations of 250,000 and Over - 2006
(1) (2) (3) (4) Pop/ Cost
2006 Violent Crimes Property Crimes Other Crimes Total Crimes Police Pol. Per
Police Agency Population No. Rate No. Rate No. Rate No. Rate Strength Ratio Capita
($)
Toronto 2,631,725 26,802 101.8 79,287 301.3 61,571 234.0 167,660 637.1 5,371 490.0 320.4
Montreal 1,873,974 18,873 100.7 84,306 449.9 61,211 326.6 164,390 877.2 4,346 431.2 260.3
Peel Reg. 1,190,074 6,033 50.7 24,233 203.6 17,570 147.6 47,836 402.0 1,667 713.9 210.5
Calgary 1,011,309 7,783 77.0 42,298 418.3 17,090 169.0 67,171 664.2 1,599 632.5 244.1
York Reg. 947,096 4,020 42.4 17,195 181.6 8,873 93.7 30,088 317.7 1,174 806.7 192.3
Ottawa 840,095 5,099 60.7 27,026 321.7 17,549 208.9 49,674 591.3 1,138 738.2 217.3
Edmonton 742,155 6,835 92.1 48,811 657.7 26,327 354.7 81,973 1104.5 1,356 547.3 272.8
Winnipeg 648,929 8,565 132.0 41,313 636.6 26,726 411.8 76,604 1180.5 1,262 514.2 245.0
Vancouver 589,352 7,746 131.4 41,656 706.8 18,860 320.0 68,262 1158.3 1,303 452.3 321.8
Durham Reg. 585,560 3,208 54.8 14,360 245.2 11,066 189.0 28,634 489.0 776 754.6 210.7
Quebec 533,010 3,970 74.5 16,541 310.3 8,400 157.6 28,911 542.4 744 716.4 192.9
Hamilton 519,067 4,471 86.1 18,073 348.2 10,146 195.5 32,690 629.8 762 681.2 220.4
Waterloo Reg. 491,635 3,074 62.5 13,971 284.2 8,988 182.8 26,033 529.5 664 740.4 190.1
Halton Reg. 456,560 2,033 44.5 8,776 192.2 5,514 120.8 16,323 357.5 533 856.6 185.0
Niagara Reg. 435,125 2,668 61.3 14,488 333.0 8,737 200.8 25,893 595.1 654 665.3 255.0
Surrey 402,272 5,985 148.8 26,608 661.4 15,967 396.9 48,560 1207.1 483 832.9 144.4
Longueuil 392,370 2,948 75.1 12,698 323.6 8,652 220.5 24,298 619.3 549 714.7 185.8
Laval 376,846 2,708 71.9 11,110 294.8 5,919 157.1 19,737 523.7 475 793.4 210.5
London 360,874 2,982 82.6 17,916 496.5 12,280 340.3 33,178 919.4 544 663.4 200.1
Notes: Only non-traffic Criminal Code offences are included in this analysis. * Crime rate is by number of crimes per 10,000 population. (1) Violent crimes include homicide & attempts, assault, sexual offences, abduction & robbery. (2) Property crimes include break & enter, thefts and fraud. (3) Other crimes include prostitution, gaming & betting, offensive weapons and other non-traffic CC offences. (4) Sum of (1) through (3).
Source: Website for Canadian Centre for Justice Statistics, Statistics Canada (ccjsccsj.statcan.ca).
Crime comparison has traditionally been done by using crime rates, although its short coming is apparent – that all crimes are treated as being equal in weight. Statistics Canada has recently initiated a project for developing an alternate method of measurement that incorporates the severity of crime.109 Before the new measure is developed, crime rate remains the means for comparison across time and between different jurisdictions.
109 While crime rates (in terms of the number of crimes per a specific size of population) are by tradition the standardized measure for comparison, there is recognition that crime rates do not factor in the nature or severity of crime, thus do not reflect the true level of crime. For this reason, the Canadian Centre for Justice Statistics of Statistics Canada initiated a project in 2006 to develop a better measure for crime comparison, the Crime Index, which will be implemented in 2009. The proposed Crime Index will take into account both the number of crimes and the severity of the offence in terms a weight reflecting the incarceration rate and length of sentence.
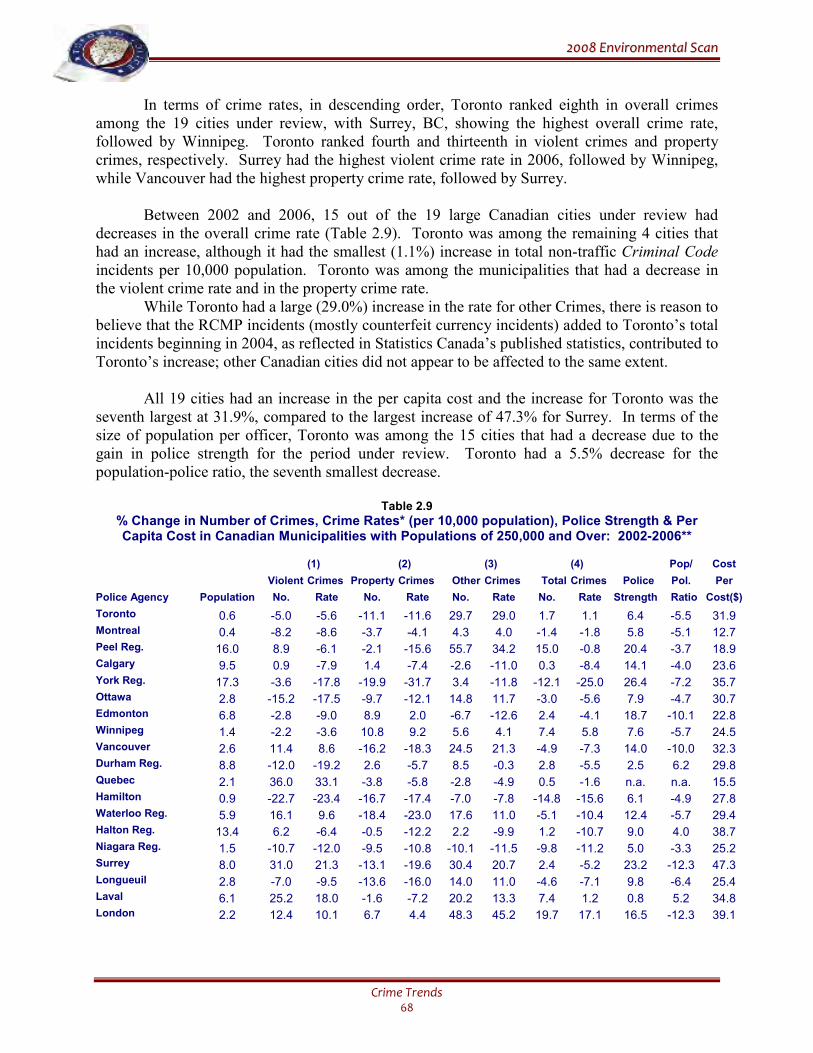
22000088 EEnnvviirroonnmmeennttaall SSccaann
Crime Trends 68
In terms of crime rates, in descending order, Toronto ranked eighth in overall crimes among the 19 cities under review, with Surrey, BC, showing the highest overall crime rate, followed by Winnipeg. Toronto ranked fourth and thirteenth in violent crimes and property crimes, respectively. Surrey had the highest violent crime rate in 2006, followed by Winnipeg, while Vancouver had the highest property crime rate, followed by Surrey. Between 2002 and 2006, 15 out of the 19 large Canadian cities under review had decreases in the overall crime rate (Table 2.9). Toronto was among the remaining 4 cities that had an increase, although it had the smallest (1.1%) increase in total non-traffic Criminal Code incidents per 10,000 population. Toronto was among the municipalities that had a decrease in the violent crime rate and in the property crime rate. While Toronto had a large (29.0%) increase in the rate for other Crimes, there is reason to believe that the RCMP incidents (mostly counterfeit currency incidents) added to Toronto’s total incidents beginning in 2004, as reflected in Statistics Canada’s published statistics, contributed to Toronto’s increase; other Canadian cities did not appear to be affected to the same extent.
All 19 cities had an increase in the per capita cost and the increase for Toronto was the seventh largest at 31.9%, compared to the largest increase of 47.3% for Surrey. In terms of the size of population per officer, Toronto was among the 15 cities that had a decrease due to the gain in police strength for the period under review. Toronto had a 5.5% decrease for the population-police ratio, the seventh smallest decrease.
Table 2.9
% Change in Number of Crimes, Crime Rates* (per 10,000 population), Police Strength & Per Capita Cost in Canadian Municipalities with Populations of 250,000 and Over: 2002-2006**
(1) (2) (3) (4) Pop/ Cost
Violent Crimes Property Crimes Other Crimes Total Crimes Police Pol. Per
Police Agency Population No. Rate No. Rate No. Rate No. Rate Strength Ratio Cost($)
Toronto 0.6 -5.0 -5.6 -11.1 -11.6 29.7 29.0 1.7 1.1 6.4 -5.5 31.9 Montreal 0.4 -8.2 -8.6 -3.7 -4.1 4.3 4.0 -1.4 -1.8 5.8 -5.1 12.7 Peel Reg. 16.0 8.9 -6.1 -2.1 -15.6 55.7 34.2 15.0 -0.8 20.4 -3.7 18.9 Calgary 9.5 0.9 -7.9 1.4 -7.4 -2.6 -11.0 0.3 -8.4 14.1 -4.0 23.6 York Reg. 17.3 -3.6 -17.8 -19.9 -31.7 3.4 -11.8 -12.1 -25.0 26.4 -7.2 35.7 Ottawa 2.8 -15.2 -17.5 -9.7 -12.1 14.8 11.7 -3.0 -5.6 7.9 -4.7 30.7 Edmonton 6.8 -2.8 -9.0 8.9 2.0 -6.7 -12.6 2.4 -4.1 18.7 -10.1 22.8 Winnipeg 1.4 -2.2 -3.6 10.8 9.2 5.6 4.1 7.4 5.8 7.6 -5.7 24.5 Vancouver 2.6 11.4 8.6 -16.2 -18.3 24.5 21.3 -4.9 -7.3 14.0 -10.0 32.3 Durham Reg. 8.8 -12.0 -19.2 2.6 -5.7 8.5 -0.3 2.8 -5.5 2.5 6.2 29.8 Quebec 2.1 36.0 33.1 -3.8 -5.8 -2.8 -4.9 0.5 -1.6 n.a. n.a. 15.5 Hamilton 0.9 -22.7 -23.4 -16.7 -17.4 -7.0 -7.8 -14.8 -15.6 6.1 -4.9 27.8 Waterloo Reg. 5.9 16.1 9.6 -18.4 -23.0 17.6 11.0 -5.1 -10.4 12.4 -5.7 29.4 Halton Reg. 13.4 6.2 -6.4 -0.5 -12.2 2.2 -9.9 1.2 -10.7 9.0 4.0 38.7 Niagara Reg. 1.5 -10.7 -12.0 -9.5 -10.8 -10.1 -11.5 -9.8 -11.2 5.0 -3.3 25.2 Surrey 8.0 31.0 21.3 -13.1 -19.6 30.4 20.7 2.4 -5.2 23.2 -12.3 47.3 Longueuil 2.8 -7.0 -9.5 -13.6 -16.0 14.0 11.0 -4.6 -7.1 9.8 -6.4 25.4 Laval 6.1 25.2 18.0 -1.6 -7.2 20.2 13.3 7.4 1.2 0.8 5.2 34.8 London 2.2 12.4 10.1 6.7 4.4 48.3 45.2 19.7 17.1 16.5 -12.3 39.1
22000088 EEnnvviirroonnmmeennttaall SSccaann
Crime Trends 69
Notes: Only non-traffic Criminal Code offences are included in this analysis. * Crime rate is by number of crimes per 10,000 population. ** Due to changes in jurisdiction of some police services prior to 2002, a 5-year (2002-2006) comparison, instead of a 10-year comparison, was done, for the sake of fair comparison. (1) Violent crimes include homicide & attempts, assault, sexual offences, abduction & robbery. (2) Property crimes include break & enter, thefts and fraud. (3) Other crimes include prostitution, gaming & betting, offensive weapons and other non-traffic CC offences. (4) Sum of (1) through (3).
Source: Website for Canadian Centre for Justice Statistics, Statistics Canada (ccjsccsj.statcan.ca).
RECOMMENDATIONS FOR POLICE SERVICE
• One of the major challenges in contemporary policing is to deal with public safety issues on a
broader spectrum in order to address the ‘root causes’ of crime and be effective in crime control. This, coupled with the need for efficiency and accountability, often require the police to go beyond the traditional police practices for more effective ways of doing business. Continual effort should be made to identify and develop innovative methods in order to deliver police services in a cost-effective manner.
• Contemporary policing is geared more towards results (in controlling crime) than the
maintenance of policing programs for their own sake, largely as a result of the emphasis on accountability. For this reason, there is a need to conduct evaluation on both regular programs and innovative strategies in terms of their impact on crime and the community so as to identify those that are effective. Resources should only be directed to those police programs that are demonstrated to work or are promising in terms of its effect on preventing crime. The evaluation function should, therefore, be built into policing programs.
• Policing that focuses on crime risk factors (e.g. hard-core criminals or crime hot-spots) has
been found to produce more promising results in controlling crime than other traditional policing programs, such as random patrol. Proactive policing strategies to neutralize risk factors are likely more invasive to the public, which requires more community support to minimize any possible backlash. Building police-community partnerships and rapport is essential in winning support from communities that are more affected by the focused or ‘aggressive’ enforcement. Maintaining a delicate balance between proactive, targeted policing and police legitimacy remains a challenge to police, that can and should be supported by community mobilization.
• Appropriate support should continue to be given to police-community partnerships and
mobilization efforts to address community concerns.110 The community often pays more attention to safety, visible public disorder, and quality of life issues that may not necessarily
110 It has been pointed out that it is the procedures and manner of criminal justice officials, rather than the fairness or effectiveness of decisions made by them, that is more important in determining public trust in criminal justice. (Sherman, L.W. (2002). Trust and Confidence in Criminal Justice. NIJ Journal, No. 248. (Retrieved from www.ncjrs.gov/pdffiles1/jr000248e.pdf)
22000088 EEnnvviirroonnmmeennttaall SSccaann
Crime Trends 70
be in line with policing priorities, but which may be instrumental in controlling crime and enhancing quality of life within the community.
• To maintain community-oriented policing, continued support should be given to the
infrastructure for local problem solving, crime prevention, and community partnerships: the Community Police Liaison Committees, the divisional crime management teams, and the field crime analysis capability are currently the main components of the local problem solving process. Continued support should also be given to the research and development of tools and methodologies that will enhance crime analysis, prediction, and management functions towards intelligence-led policing.
• Another challenge for municipal polices services is to contain their budgets while trying to
meet the changing public demands for police services. Continual effort should be made to enhance the efficiency of police resource deployment so that the use of available resources is optimized. An example is the matching of the supply of service to the demand for such service.
• There is indication that organized crime groups are involved in an increasing number and
types of crimes, such as computer crimes, identity theft, vehicle theft, drug and human trafficking, and marijuana grow-operations. Police initiatives to address the issue of organized crime, including intelligence-driven enforcement and partnerships with regional, national, and international enforcement agencies, should be maintained and enhanced as necessary.
• The proliferation of marijuana grow-operations requires continual effort from the Service to
strengthen partnerships with local, regional, and national police services and other government agencies, to effectively check the supply side of the drug issue. There is a need for police organisations to improve their ability to detect, dismantle, and prosecute such operations. In addition, continued and new partnerships with local agencies and services, such as public utilities and real estate representatives, are required to provide a multi-faceted response to this particular issue.
• Despite a moderate decrease in crime over the past ten years, violent crime remained
relatively stable. Specific crimes, including robbery, fraud, offensive weapons, and drugs increased over the past five and ten years. Appropriate police initiatives should be maintained and new initiatives developed to address these crimes.
• While clearance rates for crimes have generally improved over the past ten years, the
clearance rate for property crimes remained low. The clearance rates for specific property crimes that affect the community’s perception of safety, such as break & enter and theft of auto, were even lower. Innovative methods need to be constantly developed to deal with these crimes in a more effective manner.
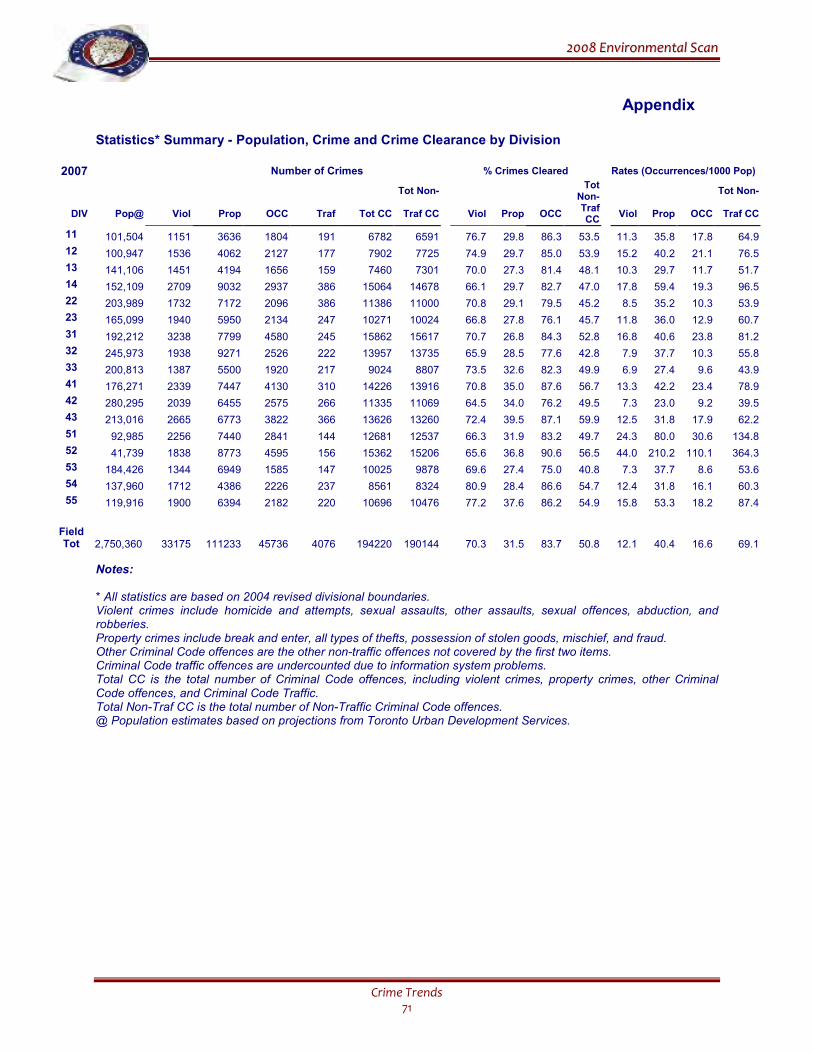
22000088 EEnnvviirroonnmmeennttaall SSccaann
Crime Trends 71
Appendix Statistics* Summary - Population, Crime and Crime Clearance by Division
2007 Number of Crimes % Crimes Cleared Rates (Occurrences/1000 Pop)
Tot Non- Tot
Non- Tot Non-
DIV Pop@ Viol Prop OCC Traf Tot CC Traf CC Viol Prop OCC Traf CC
Viol Prop OCC Traf CC
11 101,504 1151 3636 1804 191 6782 6591 76.7 29.8 86.3 53.5 11.3 35.8 17.8 64.9
12 100,947 1536 4062 2127 177 7902 7725 74.9 29.7 85.0 53.9 15.2 40.2 21.1 76.5
13 141,106 1451 4194 1656 159 7460 7301 70.0 27.3 81.4 48.1 10.3 29.7 11.7 51.7
14 152,109 2709 9032 2937 386 15064 14678 66.1 29.7 82.7 47.0 17.8 59.4 19.3 96.5
22 203,989 1732 7172 2096 386 11386 11000 70.8 29.1 79.5 45.2 8.5 35.2 10.3 53.9
23 165,099 1940 5950 2134 247 10271 10024 66.8 27.8 76.1 45.7 11.8 36.0 12.9 60.7
31 192,212 3238 7799 4580 245 15862 15617 70.7 26.8 84.3 52.8 16.8 40.6 23.8 81.2
32 245,973 1938 9271 2526 222 13957 13735 65.9 28.5 77.6 42.8 7.9 37.7 10.3 55.8
33 200,813 1387 5500 1920 217 9024 8807 73.5 32.6 82.3 49.9 6.9 27.4 9.6 43.9
41 176,271 2339 7447 4130 310 14226 13916 70.8 35.0 87.6 56.7 13.3 42.2 23.4 78.9
42 280,295 2039 6455 2575 266 11335 11069 64.5 34.0 76.2 49.5 7.3 23.0 9.2 39.5
43 213,016 2665 6773 3822 366 13626 13260 72.4 39.5 87.1 59.9 12.5 31.8 17.9 62.2
51 92,985 2256 7440 2841 144 12681 12537 66.3 31.9 83.2 49.7 24.3 80.0 30.6 134.8
52 41,739 1838 8773 4595 156 15362 15206 65.6 36.8 90.6 56.5 44.0 210.2 110.1 364.3
53 184,426 1344 6949 1585 147 10025 9878 69.6 27.4 75.0 40.8 7.3 37.7 8.6 53.6
54 137,960 1712 4386 2226 237 8561 8324 80.9 28.4 86.6 54.7 12.4 31.8 16.1 60.3
55 119,916 1900 6394 2182 220 10696 10476 77.2 37.6 86.2 54.9 15.8 53.3 18.2 87.4
Field Tot 2,750,360 33175 111233 45736 4076 194220 190144 70.3 31.5 83.7 50.8 12.1 40.4 16.6 69.1
Notes: * All statistics are based on 2004 revised divisional boundaries. Violent crimes include homicide and attempts, sexual assaults, other assaults, sexual offences, abduction, and robberies. Property crimes include break and enter, all types of thefts, possession of stolen goods, mischief, and fraud. Other Criminal Code offences are the other non-traffic offences not covered by the first two items. Criminal Code traffic offences are undercounted due to information system problems. Total CC is the total number of Criminal Code offences, including violent crimes, property crimes, other Criminal Code offences, and Criminal Code Traffic. Total Non-Traf CC is the total number of Non-Traffic Criminal Code offences. @ Population estimates based on projections from Toronto Urban Development Services.
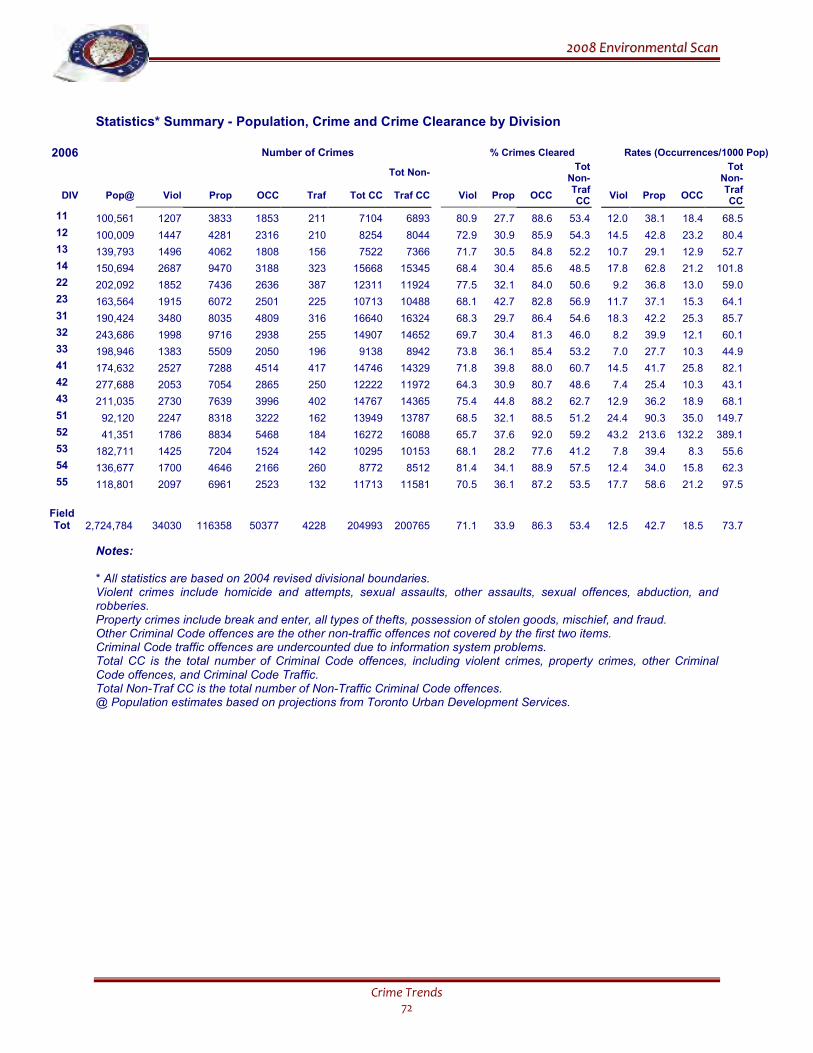
22000088 EEnnvviirroonnmmeennttaall SSccaann
Crime Trends 72
Statistics* Summary - Population, Crime and Crime Clearance by Division
2006 Number of Crimes % Crimes Cleared Rates (Occurrences/1000 Pop)
Tot Non- Tot
Non-
Tot Non-
DIV Pop@ Viol Prop OCC Traf Tot CC Traf CC Viol Prop OCC Traf CC
Viol Prop OCC Traf CC
11 100,561 1207 3833 1853 211 7104 6893 80.9 27.7 88.6 53.4 12.0 38.1 18.4 68.5
12 100,009 1447 4281 2316 210 8254 8044 72.9 30.9 85.9 54.3 14.5 42.8 23.2 80.4
13 139,793 1496 4062 1808 156 7522 7366 71.7 30.5 84.8 52.2 10.7 29.1 12.9 52.7
14 150,694 2687 9470 3188 323 15668 15345 68.4 30.4 85.6 48.5 17.8 62.8 21.2 101.8
22 202,092 1852 7436 2636 387 12311 11924 77.5 32.1 84.0 50.6 9.2 36.8 13.0 59.0
23 163,564 1915 6072 2501 225 10713 10488 68.1 42.7 82.8 56.9 11.7 37.1 15.3 64.1
31 190,424 3480 8035 4809 316 16640 16324 68.3 29.7 86.4 54.6 18.3 42.2 25.3 85.7
32 243,686 1998 9716 2938 255 14907 14652 69.7 30.4 81.3 46.0 8.2 39.9 12.1 60.1
33 198,946 1383 5509 2050 196 9138 8942 73.8 36.1 85.4 53.2 7.0 27.7 10.3 44.9
41 174,632 2527 7288 4514 417 14746 14329 71.8 39.8 88.0 60.7 14.5 41.7 25.8 82.1
42 277,688 2053 7054 2865 250 12222 11972 64.3 30.9 80.7 48.6 7.4 25.4 10.3 43.1
43 211,035 2730 7639 3996 402 14767 14365 75.4 44.8 88.2 62.7 12.9 36.2 18.9 68.1
51 92,120 2247 8318 3222 162 13949 13787 68.5 32.1 88.5 51.2 24.4 90.3 35.0 149.7
52 41,351 1786 8834 5468 184 16272 16088 65.7 37.6 92.0 59.2 43.2 213.6 132.2 389.1
53 182,711 1425 7204 1524 142 10295 10153 68.1 28.2 77.6 41.2 7.8 39.4 8.3 55.6
54 136,677 1700 4646 2166 260 8772 8512 81.4 34.1 88.9 57.5 12.4 34.0 15.8 62.3
55 118,801 2097 6961 2523 132 11713 11581 70.5 36.1 87.2 53.5 17.7 58.6 21.2 97.5
Field Tot 2,724,784 34030 116358 50377 4228 204993 200765 71.1 33.9 86.3 53.4 12.5 42.7 18.5 73.7
Notes: * All statistics are based on 2004 revised divisional boundaries. Violent crimes include homicide and attempts, sexual assaults, other assaults, sexual offences, abduction, and robberies. Property crimes include break and enter, all types of thefts, possession of stolen goods, mischief, and fraud. Other Criminal Code offences are the other non-traffic offences not covered by the first two items. Criminal Code traffic offences are undercounted due to information system problems. Total CC is the total number of Criminal Code offences, including violent crimes, property crimes, other Criminal Code offences, and Criminal Code Traffic. Total Non-Traf CC is the total number of Non-Traffic Criminal Code offences. @ Population estimates based on projections from Toronto Urban Development Services.
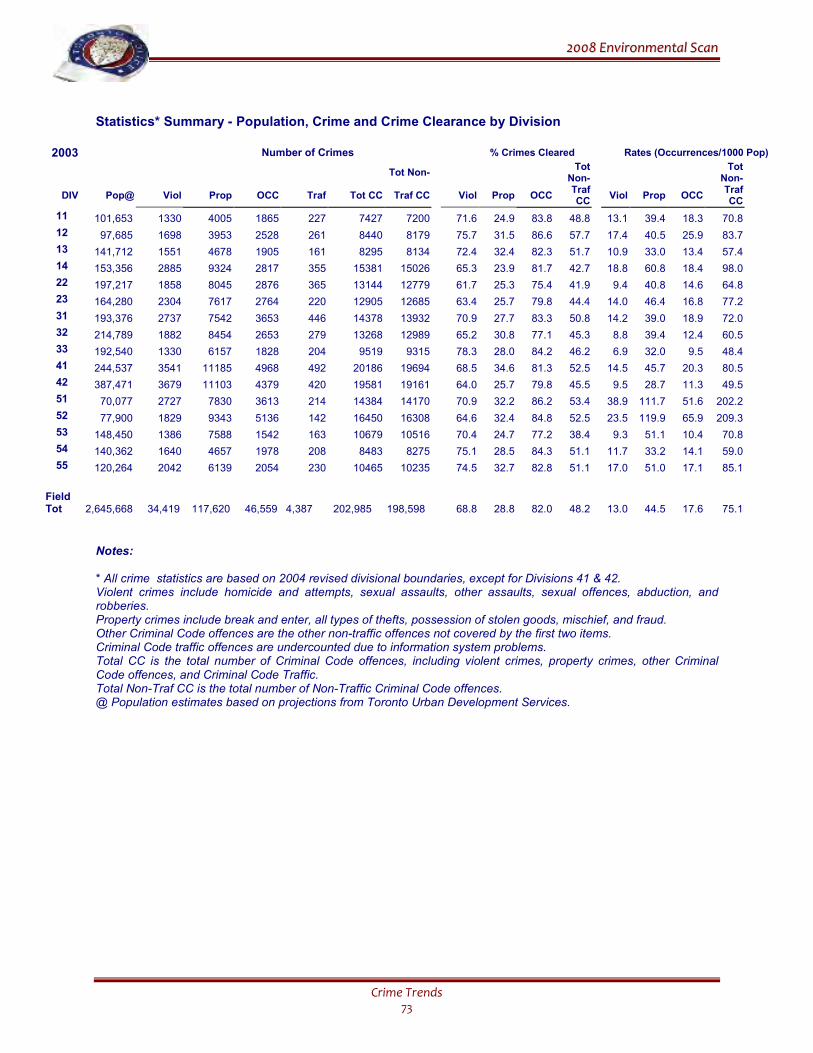
22000088 EEnnvviirroonnmmeennttaall SSccaann
Crime Trends 73
Statistics* Summary - Population, Crime and Crime Clearance by Division
2003 Number of Crimes % Crimes Cleared Rates (Occurrences/1000 Pop)
Tot Non- Tot
Non-
Tot Non-
DIV Pop@ Viol Prop OCC Traf Tot CC Traf CC Viol Prop OCC Traf CC
Viol Prop OCC Traf CC
11 101,653 1330 4005 1865 227 7427 7200 71.6 24.9 83.8 48.8 13.1 39.4 18.3 70.8
12 97,685 1698 3953 2528 261 8440 8179 75.7 31.5 86.6 57.7 17.4 40.5 25.9 83.7
13 141,712 1551 4678 1905 161 8295 8134 72.4 32.4 82.3 51.7 10.9 33.0 13.4 57.4
14 153,356 2885 9324 2817 355 15381 15026 65.3 23.9 81.7 42.7 18.8 60.8 18.4 98.0
22 197,217 1858 8045 2876 365 13144 12779 61.7 25.3 75.4 41.9 9.4 40.8 14.6 64.8
23 164,280 2304 7617 2764 220 12905 12685 63.4 25.7 79.8 44.4 14.0 46.4 16.8 77.2
31 193,376 2737 7542 3653 446 14378 13932 70.9 27.7 83.3 50.8 14.2 39.0 18.9 72.0
32 214,789 1882 8454 2653 279 13268 12989 65.2 30.8 77.1 45.3 8.8 39.4 12.4 60.5
33 192,540 1330 6157 1828 204 9519 9315 78.3 28.0 84.2 46.2 6.9 32.0 9.5 48.4
41 244,537 3541 11185 4968 492 20186 19694 68.5 34.6 81.3 52.5 14.5 45.7 20.3 80.5
42 387,471 3679 11103 4379 420 19581 19161 64.0 25.7 79.8 45.5 9.5 28.7 11.3 49.5
51 70,077 2727 7830 3613 214 14384 14170 70.9 32.2 86.2 53.4 38.9 111.7 51.6 202.2
52 77,900 1829 9343 5136 142 16450 16308 64.6 32.4 84.8 52.5 23.5 119.9 65.9 209.3
53 148,450 1386 7588 1542 163 10679 10516 70.4 24.7 77.2 38.4 9.3 51.1 10.4 70.8
54 140,362 1640 4657 1978 208 8483 8275 75.1 28.5 84.3 51.1 11.7 33.2 14.1 59.0
55 120,264 2042 6139 2054 230 10465 10235 74.5 32.7 82.8 51.1 17.0 51.0 17.1 85.1
Field Tot 2,645,668 34,419 117,620 46,559 4,387 202,985
198,598 68.8 28.8 82.0 48.2 13.0 44.5 17.6 75.1
Notes: * All crime statistics are based on 2004 revised divisional boundaries, except for Divisions 41 & 42. Violent crimes include homicide and attempts, sexual assaults, other assaults, sexual offences, abduction, and robberies. Property crimes include break and enter, all types of thefts, possession of stolen goods, mischief, and fraud. Other Criminal Code offences are the other non-traffic offences not covered by the first two items. Criminal Code traffic offences are undercounted due to information system problems. Total CC is the total number of Criminal Code offences, including violent crimes, property crimes, other Criminal Code offences, and Criminal Code Traffic. Total Non-Traf CC is the total number of Non-Traffic Criminal Code offences. @ Population estimates based on projections from Toronto Urban Development Services.
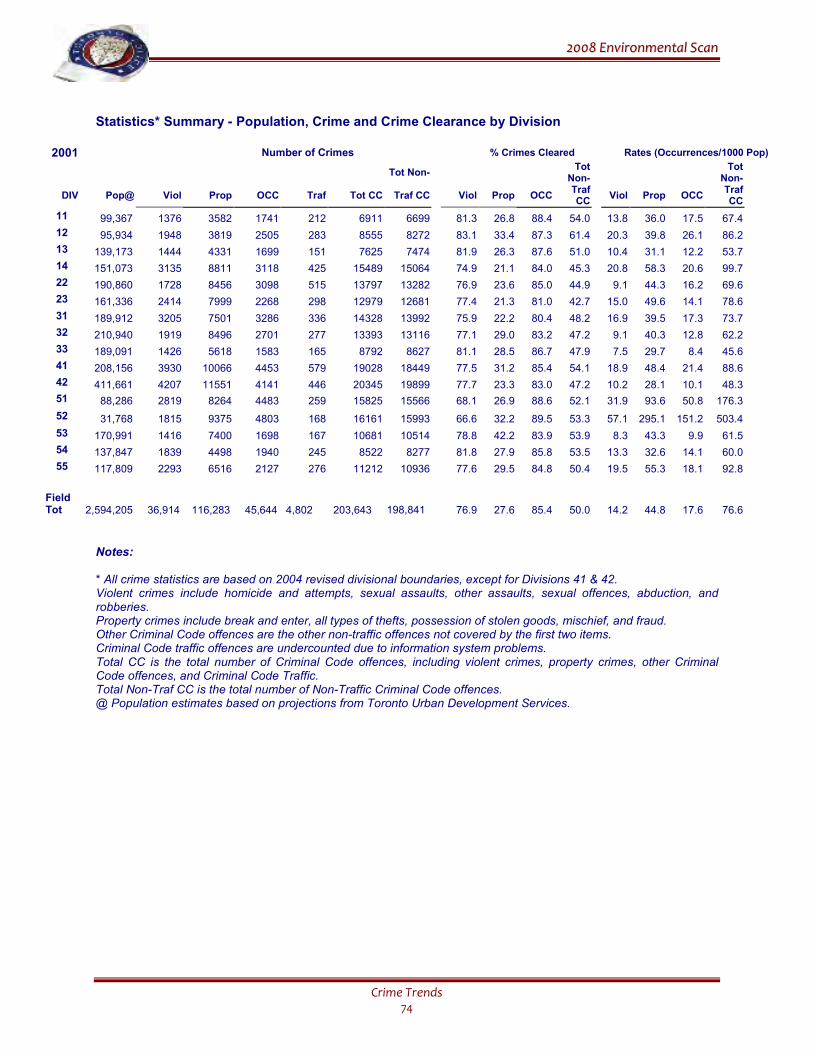
22000088 EEnnvviirroonnmmeennttaall SSccaann
Crime Trends 74
Statistics* Summary - Population, Crime and Crime Clearance by Division
2001 Number of Crimes % Crimes Cleared Rates (Occurrences/1000 Pop)
Tot Non- Tot
Non-
Tot Non-
DIV Pop@ Viol Prop OCC Traf Tot CC Traf CC Viol Prop OCC Traf CC
Viol Prop OCC Traf CC
11 99,367 1376 3582 1741 212 6911 6699 81.3 26.8 88.4 54.0 13.8 36.0 17.5 67.4
12 95,934 1948 3819 2505 283 8555 8272 83.1 33.4 87.3 61.4 20.3 39.8 26.1 86.2
13 139,173 1444 4331 1699 151 7625 7474 81.9 26.3 87.6 51.0 10.4 31.1 12.2 53.7
14 151,073 3135 8811 3118 425 15489 15064 74.9 21.1 84.0 45.3 20.8 58.3 20.6 99.7
22 190,860 1728 8456 3098 515 13797 13282 76.9 23.6 85.0 44.9 9.1 44.3 16.2 69.6
23 161,336 2414 7999 2268 298 12979 12681 77.4 21.3 81.0 42.7 15.0 49.6 14.1 78.6
31 189,912 3205 7501 3286 336 14328 13992 75.9 22.2 80.4 48.2 16.9 39.5 17.3 73.7
32 210,940 1919 8496 2701 277 13393 13116 77.1 29.0 83.2 47.2 9.1 40.3 12.8 62.2
33 189,091 1426 5618 1583 165 8792 8627 81.1 28.5 86.7 47.9 7.5 29.7 8.4 45.6
41 208,156 3930 10066 4453 579 19028 18449 77.5 31.2 85.4 54.1 18.9 48.4 21.4 88.6
42 411,661 4207 11551 4141 446 20345 19899 77.7 23.3 83.0 47.2 10.2 28.1 10.1 48.3
51 88,286 2819 8264 4483 259 15825 15566 68.1 26.9 88.6 52.1 31.9 93.6 50.8 176.3
52 31,768 1815 9375 4803 168 16161 15993 66.6 32.2 89.5 53.3 57.1 295.1 151.2 503.4
53 170,991 1416 7400 1698 167 10681 10514 78.8 42.2 83.9 53.9 8.3 43.3 9.9 61.5
54 137,847 1839 4498 1940 245 8522 8277 81.8 27.9 85.8 53.5 13.3 32.6 14.1 60.0
55 117,809 2293 6516 2127 276 11212 10936 77.6 29.5 84.8 50.4 19.5 55.3 18.1 92.8
Field Tot 2,594,205 36,914 116,283 45,644 4,802 203,643
198,841 76.9 27.6 85.4 50.0 14.2 44.8 17.6 76.6
Notes: * All crime statistics are based on 2004 revised divisional boundaries, except for Divisions 41 & 42. Violent crimes include homicide and attempts, sexual assaults, other assaults, sexual offences, abduction, and robberies. Property crimes include break and enter, all types of thefts, possession of stolen goods, mischief, and fraud. Other Criminal Code offences are the other non-traffic offences not covered by the first two items. Criminal Code traffic offences are undercounted due to information system problems. Total CC is the total number of Criminal Code offences, including violent crimes, property crimes, other Criminal Code offences, and Criminal Code Traffic. Total Non-Traf CC is the total number of Non-Traffic Criminal Code offences. @ Population estimates based on projections from Toronto Urban Development Services.
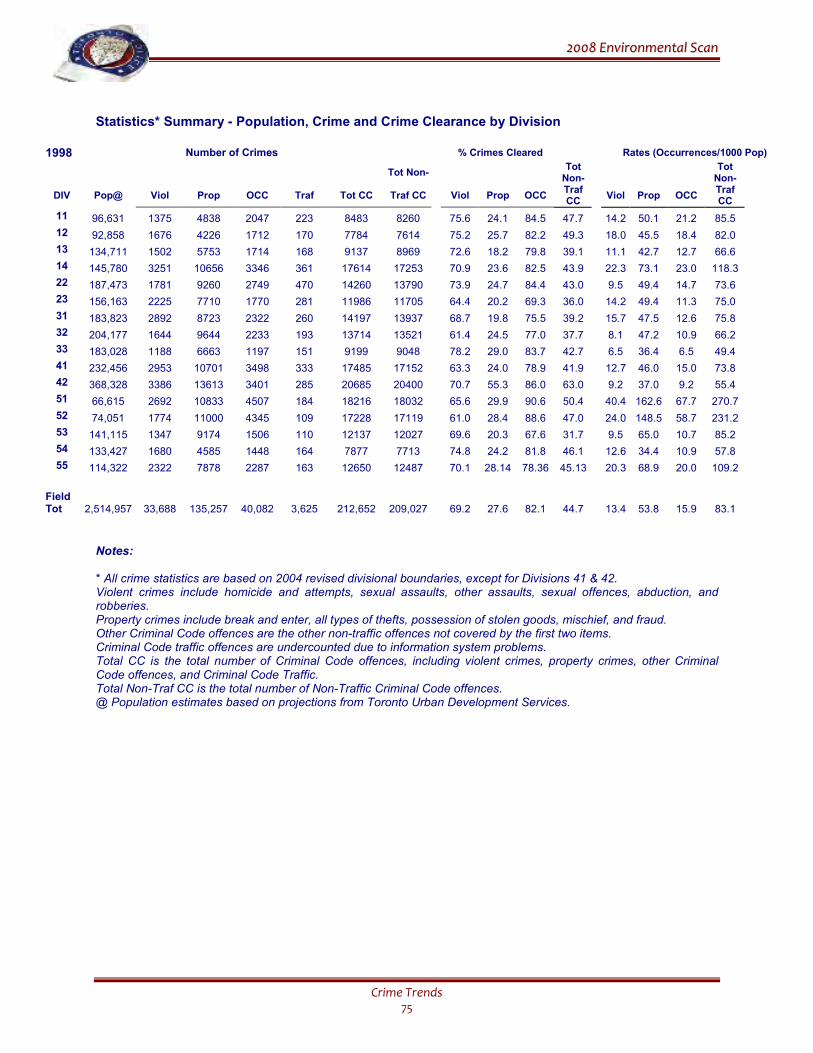
22000088 EEnnvviirroonnmmeennttaall SSccaann
Crime Trends 75
Statistics* Summary - Population, Crime and Crime Clearance by Division
1998 Number of Crimes % Crimes Cleared Rates (Occurrences/1000 Pop)
Tot Non- Tot
Non-
Tot Non-
DIV Pop@ Viol Prop OCC Traf Tot CC Traf CC Viol Prop OCC Traf CC
Viol Prop OCC Traf CC
11 96,631 1375 4838 2047 223 8483 8260 75.6 24.1 84.5 47.7 14.2 50.1 21.2 85.5
12 92,858 1676 4226 1712 170 7784 7614 75.2 25.7 82.2 49.3 18.0 45.5 18.4 82.0
13 134,711 1502 5753 1714 168 9137 8969 72.6 18.2 79.8 39.1 11.1 42.7 12.7 66.6
14 145,780 3251 10656 3346 361 17614 17253 70.9 23.6 82.5 43.9 22.3 73.1 23.0 118.3
22 187,473 1781 9260 2749 470 14260 13790 73.9 24.7 84.4 43.0 9.5 49.4 14.7 73.6
23 156,163 2225 7710 1770 281 11986 11705 64.4 20.2 69.3 36.0 14.2 49.4 11.3 75.0
31 183,823 2892 8723 2322 260 14197 13937 68.7 19.8 75.5 39.2 15.7 47.5 12.6 75.8
32 204,177 1644 9644 2233 193 13714 13521 61.4 24.5 77.0 37.7 8.1 47.2 10.9 66.2
33 183,028 1188 6663 1197 151 9199 9048 78.2 29.0 83.7 42.7 6.5 36.4 6.5 49.4
41 232,456 2953 10701 3498 333 17485 17152 63.3 24.0 78.9 41.9 12.7 46.0 15.0 73.8
42 368,328 3386 13613 3401 285 20685 20400 70.7 55.3 86.0 63.0 9.2 37.0 9.2 55.4
51 66,615 2692 10833 4507 184 18216 18032 65.6 29.9 90.6 50.4 40.4 162.6 67.7 270.7
52 74,051 1774 11000 4345 109 17228 17119 61.0 28.4 88.6 47.0 24.0 148.5 58.7 231.2
53 141,115 1347 9174 1506 110 12137 12027 69.6 20.3 67.6 31.7 9.5 65.0 10.7 85.2
54 133,427 1680 4585 1448 164 7877 7713 74.8 24.2 81.8 46.1 12.6 34.4 10.9 57.8
55 114,322 2322 7878 2287 163 12650 12487 70.1 28.14 78.36 45.13 20.3 68.9 20.0 109.2
Field Tot 2,514,957 33,688 135,257 40,082 3,625 212,652 209,027 69.2 27.6 82.1 44.7 13.4 53.8 15.9 83.1
Notes: * All crime statistics are based on 2004 revised divisional boundaries, except for Divisions 41 & 42. Violent crimes include homicide and attempts, sexual assaults, other assaults, sexual offences, abduction, and robberies. Property crimes include break and enter, all types of thefts, possession of stolen goods, mischief, and fraud. Other Criminal Code offences are the other non-traffic offences not covered by the first two items. Criminal Code traffic offences are undercounted due to information system problems. Total CC is the total number of Criminal Code offences, including violent crimes, property crimes, other Criminal Code offences, and Criminal Code Traffic. Total Non-Traf CC is the total number of Non-Traffic Criminal Code offences. @ Population estimates based on projections from Toronto Urban Development Services.

22000088 EEnnvviirroonnmmeennttaall SSccaann
Crime Trends 76
22000088 EEnnvviirroonnmmeennttaall SSccaann
Youth Crime 77
III. YOUTH CRIME
Concern about youth, crime, and ‘disrespectful’ attitudes has been common throughout
history. Nevertheless, this should not minimise the concern and effects of violence and
crime by youth in our society nor should it be allowed to act as an easy response and
explanation for not taking action. The search for solutions to this social problem demands
a commitment to develop a comprehensive response strategy that will address both the
individual and systemic factors contributing to this phenomenon. The Service’s community
policing and community mobilization provides the necessary approach for reaching
creative and effective solutions to youth violence.
HIGHLIGHTS
• To put youth crime in perspective, three issues must be noted. First, a very small proportion
of young persons aged 12 to 17 years are involved in criminal activity, and even fewer are involved in violent crimes. Second, youth crime statistics reflect the number of youths arrested for criminal offences, not the actual level of crime involving young offenders. Third, it is believed that only a portion of youth crime is actually reported to police.
• In recognition of the strong provisions for alternative measures contained in the Youth Criminal Justice Act (YCJA), proclaimed in April 2003, Statistics Canada revised their reporting of youth criminal activity in Canada to include both youths charged with a criminal offence and youths accused of, but not charged with, a criminal offence.
• National youth crime statistics showed that, in 2006, 73,941 Canadian youths were charged
with a non-traffic criminal incident and a further 103,924 youths were arrested and cleared otherwise (that is, not by charge). The overall total youth crime rate was 68.9 per 1,000 youths, a decrease of 5.7% from 73.1 in 1997. The 2006 national youth charge rate was 28.6, down 37.0% from 45.4 in 1997.
• In Toronto in 2007, 7,828 young persons were arrested for all types of Criminal Code
offences, down 5.6% from 2006 and 10.6% from 2003. • Compared to five years ago in 2003, the number of youths arrested in 2007 for a violent
offence remained the same; however, the number of youths arrested for a property crime or other Criminal Code offence decreased 19.9% and 11.0%, respectively.
• For every 100 youths arrested for Criminal Code offences in 2007, on average, 75 were male
and 25 were female, compared to 2003 when 74 were male and 26 were female. Notwithstanding year-to-year variation, the number of youths arrested over the past five years, indicates an overall decreasing trend for both male and female youths.
• In 2007, on average, 46.8 of every 1,000 young persons in Toronto were arrested for a Criminal Code offence, including 14.0 arrested for a violent crime, 18.8 for a property crime, and 14.1 for other Criminal Code offences. Male youths had an arrest rate of more than three times that of female youths, and the overall charge rate for youths was almost double that for adults.
22000088 EEnnvviirroonnmmeennttaall SSccaann
Youth Crime 78
• The total number of crimes reported as occurring on school premises in 2007 decreased 8.1%
from 2006 due to decreases in weapons offences, break & enters, and robberies. Crimes occurring on school premises increased 10.0% from five years ago in 2003, but decreased 11.8% from ten years ago in 1998. Thefts and non-sexual assaults were generally the most frequently occurring offences.
• In 2007, a total of 755 youths were charged with drug-related offences, compared to 852
youths in 2006 and 462 youths in 2003. The youth charge rate for drug offences was 3.8 per 1,000 youths in 2007, compared to 4.3 in 2006 and 2.5 in 2003.
A. A PERSPECTIVE ON YOUTH CRIME
Community perception of youth crime and, in particular, youth violence, is largely
influenced by the media saturation of the violent actions of often only a very few young persons. The actual extent of youth crime in Canada and Toronto – historically defined by the number of Criminal Code charges laid against young people aged 12-17 years and, more recently, defined as the number of youths accused of a crime – is discussed later in this chapter.
To put youth crime in perspective, three things must be clearly noted in advance. First, as revealed by police statistics, only a small proportion of youths are involved in criminal activity, and even fewer are involved in violent crimes. Second, youth crime statistics reflect the number of youths accused of criminal activities, not the actual level of crime involving young offenders. Third, it is generally believed that only a portion of youth crime is actually reported to police. Overall, it is believed that youth crime statistics are most likely understated. Most experts on the subject of youth crime, however, strongly caution against viewing all youth as potential criminals. In 2007, the 7,828 youths arrested for Criminal Code offences in Toronto represented about 3.9% of the youth population. Assuming that every youth arrested was a different individual (i.e. no one was arrested more than once), which was very unlikely, on average, only about 39 out of every 1,000 youths in Toronto were arrested for a Criminal Code offence in 2007; about a third of these (14 per 1,000 youths) were arrested for a violent criminal offence.
Perhaps the single greatest impediment to developing a clear picture of youth crime is the basis for the enumeration of youth crimes. As was noted above, 3.9% of young people in Toronto were accused of a Criminal Code offence in 2007; however, self-reported delinquency is substantially higher. Of the Toronto students who responded to the 2006 International Youth Survey, 20% reported committing at least one delinquent act in the year preceding the survey and 13% reported committing at least one violent act in the year preceding the survey.111 Similarly, the Centre for Addiction and Mental Health’s 2007 Ontario Student Drug Use Survey (OSDUS) found that during the 12 months before the survey, 13% of students engaged in delinquent behaviour (defined as 3 or more of 11 possible acts), 11% had assaulted someone at least once,
111 Savoie, J. (2007). Youth Self-Reported Delinquency, Toronto, 2006. Juristat (Canadian Centre for Justice Statistics, Statistics Canada), Catalogue no. 85-002-XPE, Vol. 27, no.6. p. 13-14.
22000088 EEnnvviirroonnmmeennttaall SSccaann
Youth Crime 79
and 9% carried a weapon (such as a knife or gun).112 Unlike general crime statistics that count the actual number of Criminal Code incidents (or offences) reported to police, youth crime statistics reflect the number of youths arrested for or, more recently, accused of a Criminal Code offence. This method counts the number of Criminal Code offences that result in the arrest/accusation of a young person, rather than the number of Criminal Code offences actually committed by a young person or group of young persons. Counting youths accused of a criminal offence, whether charged or cleared otherwise, is used because it is the most accurate way to categorise an offence as a youth crime.
The use of statistics on youths accused of a Criminal Code offence, including both youths charged and youths not charged, may still fail to present a full picture of the youth crime problem. First, increases and decreases in the number of youths accused may reflect the performance of the police, rather than the actual level of youth criminal activity. Second, the increasing use of alternative measures, specifically police discretion and pre-charge disposition, will cause youth crime based on charges to be understated, particularly for minor crimes committed by first-time offenders. Statistics Canada’s inclusion of youths not charged in the determination of youth crime has, to some extent, addressed this shortcoming in the enumeration of youth crime. In the absence of a more exact system of enumeration, this method is the most reliable indicator for the volume of youth crime and trend analysis.
As with general crime statistics, the issue of reported vs. non-reported crime is also a concern in determining the level of youth crime. According to the 2004 General Social Survey (GSS), only about 33% of violent victimization was reported to police in 2004.113 Young victims (15-25 years of age) were the most likely to be a victim of a violent crime and the least likely to report to police (only 24% of young people reported violent victimization).114 If youth are most often victimised by other youths – in their own age group or slightly older – as is reported by Statistics Canada and the Centre for Research on Youth at Risk, the actual level of crime and, in particular, violent crime involving young offenders, is likely to be undercounted.
B. YOUTH CRIMINAL JUSTICE ACT
The Youth Criminal Justice Act (YCJA), which came into effect on April 1st, 2003,
provides a clear distinction between violent and non-violent crimes, and between first-time and repeat young offenders. For youths who commit violent crimes or are repeat offenders, the Act prescribes more severe consequences. However, for youths who commit non-violent crimes, the Act promotes rehabilitation through diversion programs. It accomplishes this by creating the presumption that extrajudicial sanctions, rather than court proceedings, will be used for non-violent first offenders by requiring police officers to consider alternate measures – taking no further action, issuing a warning, administering a caution, or referring the youth to a community-based program – before a charge is laid. The Act establishes the principle that extrajudicial
112 Adlaf, E., Paglia-Boak, A., Deitchman, J. H. & Wolfe, D. (2007). OSDUHS Highlights - The Mental Health and Well-Being of Ontario Students 1991 – 2007, Centre for Addiction and Mental Health Research Document Series No. 23. p. 12. 113 Gannon, M. & Mihorean K. (2006). Criminal Victimization in Canada, 2004. Juristat (Canadian Centre for Justice Statistics, Statistics Canada), Catalogue no. 85-002-XPE, Vol. 25, no.7. 114 Ibid.
22000088 EEnnvviirroonnmmeennttaall SSccaann
Youth Crime 80
measures are often the most appropriate approach to rehabilitate young offenders, and provides that non-judicial measures are not restricted to first-time offenders.
C. YOUTH CRIME IN CANADA
Because the YCJA requires police to first consider the use of extrajudicial measures
when dealing with young persons, Statistics Canada considers the total of youths formally charged with a criminal offence(s) and youths ‘cleared otherwise’ to measure and report youth criminal activity in Canada.115,116,117 Statistics from the Canadian Centre for Justice Statistics showed that, in 2006, 73,941 Canadian youths, aged 12-17 years, were charged with a non-traffic criminal incident and a further 103,924 youths were accused but not charged.118,119 In total, 177,865 youths were accused of a non-traffic Criminal Code offence, an overall increase of 3.4% from the 172,047 accused in 2005.
This one-year increase in the total number of accused youths reflected a 0.9% decrease in the number of youths charged (from 74,595 in 2005 to 73,941 in 2006) and a 6.6% increase in the number of youths cleared otherwise (from 97,452 in 2005 to 103,924 in 2006).120 It is interesting to note that this increase in the number of youths cleared otherwise follows a general increasing trend, including a 34.0% increase between 2002 and 2003 when the Youth Criminal Justice Act came into effect and when, for the first time, the number of youths cleared otherwise exceed the number of youths charged.
Compared to 1997, the number of youths accused in 2006 was a slight drop from the 178,529 in 1997.121 What was more interesting, however, was the reversal of the relative use of charges and pre-charge dispositions over the past decade; in 1997, 62.1% of youths accused of a crime were charged with a non-traffic Criminal Code offence, compared to only 41.6% of youths accused in 2006. The number of youths not charged increased 53.6%, from 67,679 in 1997 to 103,924 in 2006.
As would be expected given the provisions of the YCJA, the proportion of young persons accused and dealt with other than by Criminal Code charge increased significantly in all categories over the past decade, although the increase in violent offences cleared otherwise was somewhat less than in other categories (Table 3.1).
115 Due to changes in the measuring and reporting of youth crime activity by Statistics Canada, national youth crime data for 1997 to 2006 have been restated to include both youths charged and youths ‘cleared otherwise’ or ‘not charged’ to allow for a more comprehensive representation of youth criminal activity in Canada. National youth crime data therefore differs from data in previous Scans. 116 An incident is ‘cleared otherwise’ or ‘not charged’ when police have identified at least one accused and sufficient evidence exists to lay a charge, but the accused is processed by other means including formal measures (e.g. extrajudicial sanctions or Crown caution) or less formal alternative measures (e.g. community referral program). 117
According to Statistics Canada, youth crime is likely still understated, as some Canadian police services do not
maintain records for all youths cleared otherwise. 118 Silver, W. (2007). Crime Statistics in Canada 2006. Juristat (Canadian Centre for Justice Statistics, Statistics Canada), Catalogue no. 85-002-XIE, Vol. 27, no. 5. p. 14. 119 Crime statistics from Statistics Canada are usually delayed by one year; 2006 crime statistics were the most recent available at the time of writing. 120 Ibid. 121 Crime Statistics, Canada, Provinces and Territories, 1977 to 2005. Statistics Canada. (Retrieved from www.ccjsccsj.statcan.ca)
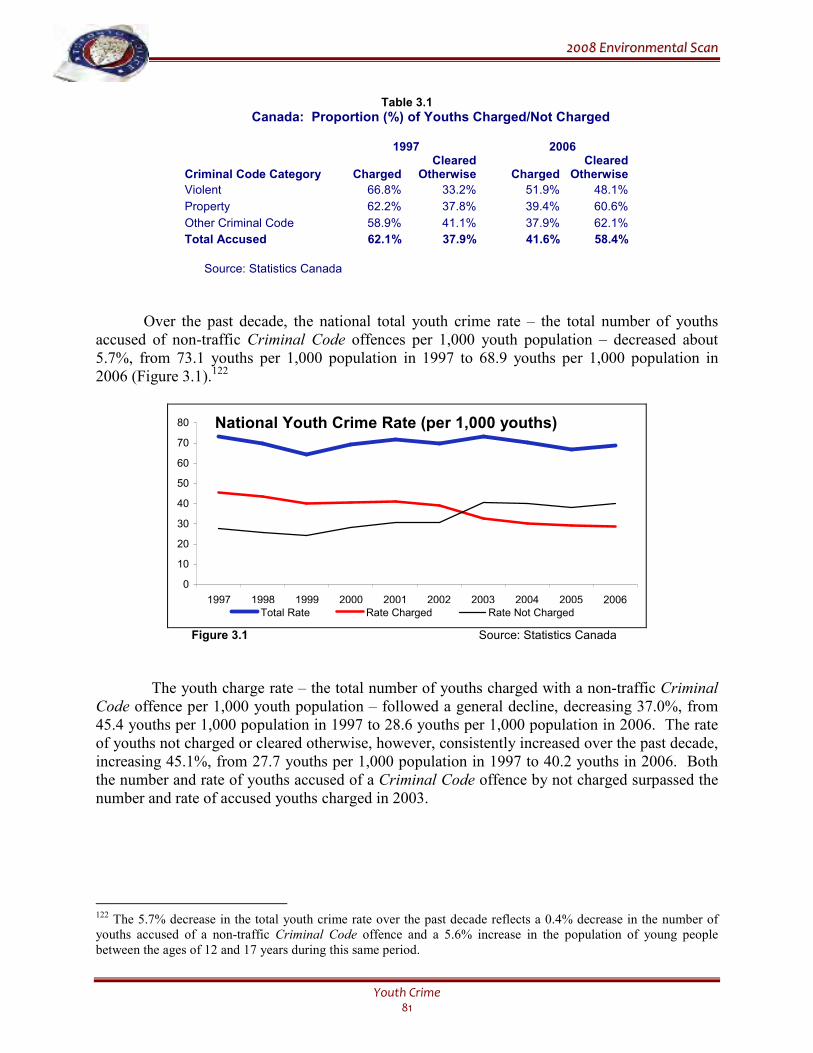
22000088 EEnnvviirroonnmmeennttaall SSccaann
Youth Crime 81
Table 3.1
Canada: Proportion (%) of Youths Charged/Not Charged
1997 2006
Criminal Code Category
Charged Cleared
Otherwise
Charged Cleared
Otherwise
Violent 66.8% 33.2% 51.9% 48.1%
Property 62.2% 37.8% 39.4% 60.6%
Other Criminal Code 58.9% 41.1% 37.9% 62.1%
Total Accused 62.1% 37.9% 41.6% 58.4%
Source: Statistics Canada
Over the past decade, the national total youth crime rate – the total number of youths accused of non-traffic Criminal Code offences per 1,000 youth population – decreased about 5.7%, from 73.1 youths per 1,000 population in 1997 to 68.9 youths per 1,000 population in 2006 (Figure 3.1).122
0
10
20
30
40
50
60
70
80
1997 1998 1999 2000 2001 2002 2003 2004 2005 2006Total Rate Rate Charged Rate Not Charged
National Youth Crime Rate (per 1,000 youths)
Figure 3.1 Source: Statistics Canada
The youth charge rate – the total number of youths charged with a non-traffic Criminal Code offence per 1,000 youth population – followed a general decline, decreasing 37.0%, from 45.4 youths per 1,000 population in 1997 to 28.6 youths per 1,000 population in 2006. The rate of youths not charged or cleared otherwise, however, consistently increased over the past decade, increasing 45.1%, from 27.7 youths per 1,000 population in 1997 to 40.2 youths in 2006. Both the number and rate of youths accused of a Criminal Code offence by not charged surpassed the number and rate of accused youths charged in 2003.
122 The 5.7% decrease in the total youth crime rate over the past decade reflects a 0.4% decrease in the number of youths accused of a non-traffic Criminal Code offence and a 5.6% increase in the population of young people between the ages of 12 and 17 years during this same period.
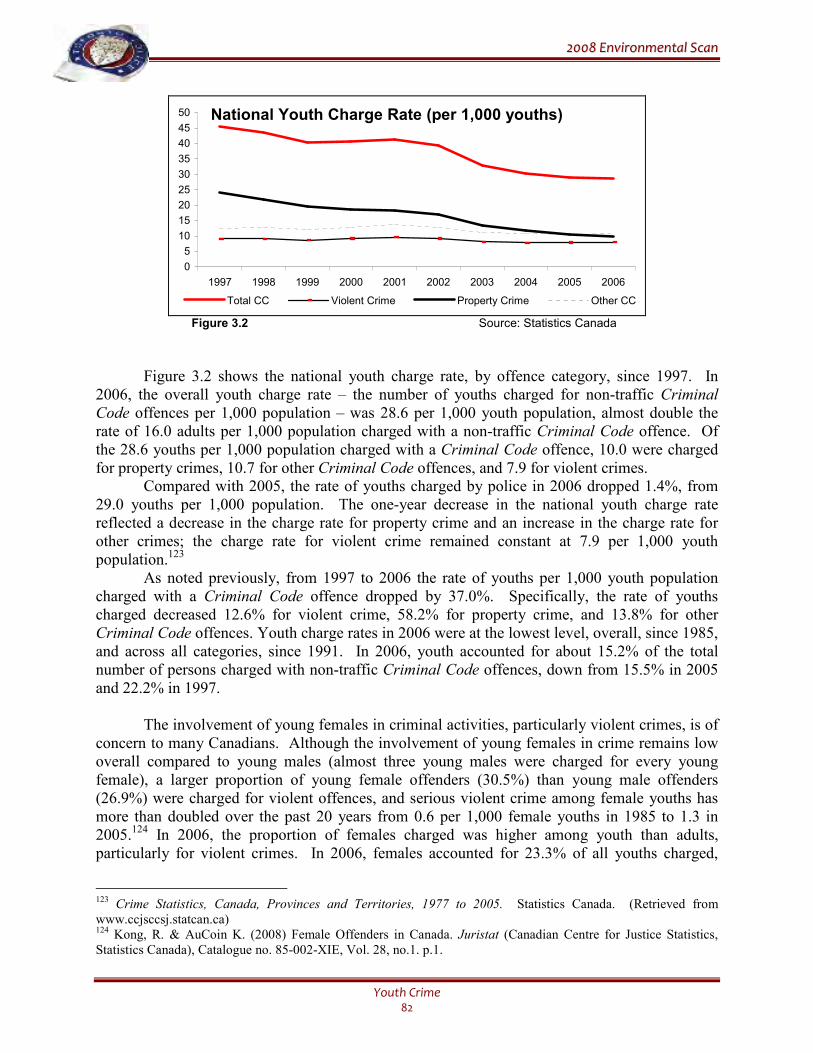
22000088 EEnnvviirroonnmmeennttaall SSccaann
Youth Crime 82
0
5
10
15
20
25
30
35
40
45
50
1997 1998 1999 2000 2001 2002 2003 2004 2005 2006
Total CC Violent Crime Property Crime Other CC
National Youth Charge Rate (per 1,000 youths)
Figure 3.2 Source: Statistics Canada
Figure 3.2 shows the national youth charge rate, by offence category, since 1997. In 2006, the overall youth charge rate – the number of youths charged for non-traffic Criminal Code offences per 1,000 population – was 28.6 per 1,000 youth population, almost double the rate of 16.0 adults per 1,000 population charged with a non-traffic Criminal Code offence. Of the 28.6 youths per 1,000 population charged with a Criminal Code offence, 10.0 were charged for property crimes, 10.7 for other Criminal Code offences, and 7.9 for violent crimes.
Compared with 2005, the rate of youths charged by police in 2006 dropped 1.4%, from 29.0 youths per 1,000 population. The one-year decrease in the national youth charge rate reflected a decrease in the charge rate for property crime and an increase in the charge rate for other crimes; the charge rate for violent crime remained constant at 7.9 per 1,000 youth population.123
As noted previously, from 1997 to 2006 the rate of youths per 1,000 youth population charged with a Criminal Code offence dropped by 37.0%. Specifically, the rate of youths charged decreased 12.6% for violent crime, 58.2% for property crime, and 13.8% for other Criminal Code offences. Youth charge rates in 2006 were at the lowest level, overall, since 1985, and across all categories, since 1991. In 2006, youth accounted for about 15.2% of the total number of persons charged with non-traffic Criminal Code offences, down from 15.5% in 2005 and 22.2% in 1997.
The involvement of young females in criminal activities, particularly violent crimes, is of concern to many Canadians. Although the involvement of young females in crime remains low overall compared to young males (almost three young males were charged for every young female), a larger proportion of young female offenders (30.5%) than young male offenders (26.9%) were charged for violent offences, and serious violent crime among female youths has more than doubled over the past 20 years from 0.6 per 1,000 female youths in 1985 to 1.3 in 2005.124 In 2006, the proportion of females charged was higher among youth than adults, particularly for violent crimes. In 2006, females accounted for 23.3% of all youths charged,
123 Crime Statistics, Canada, Provinces and Territories, 1977 to 2005. Statistics Canada. (Retrieved from www.ccjsccsj.statcan.ca) 124 Kong, R. & AuCoin K. (2008) Female Offenders in Canada. Juristat (Canadian Centre for Justice Statistics, Statistics Canada), Catalogue no. 85-002-XIE, Vol. 28, no.1. p.1.
22000088 EEnnvviirroonnmmeennttaall SSccaann
Youth Crime 83
compared to 19.2% for adults; however, the rate at which female youths (31.8 per 1,000 population) were accused – charged or cleared otherwise – of committing a non-traffic Criminal Code offence in 2005 was more than three and a half times that of female adults (8.9 per 1,000 population).125 Female youths accounted for about one-quarter (25.6%) of youths charged with a violent offence. It is interesting to note, however, the Ontario School Drug Use and Health Survey found that males (14%) were only twice as likely as females (7%) to report having assaulted someone in the 12 months before the survey.126
Overall, the number of young females charged with a non-traffic Criminal Code offence in 2006 was the lowest since 1995, and some researchers suggest that previous increases could be attributed, at least in part, to changes in societal response – a stricter approach – to school-yard fights and bullying, behaviour which may have, in the past, been considered bad as opposed to criminal.127,128
Between 2002/2003 and 2006/2007, the number of cases processed in the youth courts decreased by 25.9%, largely due a 16.0% decrease in 2003/04 from 2002/2003.129 As noted in previous Scans, the youth court caseload has gradually decreased over the past decade due to a steady decline in the number of crimes against property. However, the decreases over the past five years reflect the impact of the Youth Criminal Justice Act enacted in April 2003 – fewer charges were laid by police. Since 2002/2003 there were decreases in youth court cases in all offence categories, including a 32.1% decrease in the number of cases involving crimes against property and an 18.0% decrease in the number of cases involving crimes against the person. The three most common types of cases processed in the youth courts in 2006/2007 included theft (13.6%), common assault (10.1%), and break & enter (9.0%). D. YOUTH CRIME IN TORONTO
130, 131
Number of Youths Arrested:
During 2006, a total of 52,653 persons were arrested for non-traffic Criminal Code
offences in Toronto, including 7,828 young persons aged 12-17 years and 44,825 adults. Youths accounted for about 14.9% of the total number of persons arrested in 2007, but represented only 8.6% of the population 12 years of age and older. The total number of youths arrested for Criminal Code offences in 2007 decreased 5.6% from the 8,295 youths arrested in 2006 and 10.6% from the 8,753 youths arrested 2003. In comparison, the total number of adults arrested
125 Ibid. p.17. 126 Adlaf, et al. (2007). p. 13. 127 Health Canada. Aggressive Girls – Overview Paper. (Retrieved from www.phac.gc.ca) 128 Flores, J. R. (2008). Girls Study Group, Understanding and Responding to Girl’s Delinquency. Office of Juvenile Justice and Delinquency Prevention. (Retrieved from www.ojp.usdoj.gov) 129 Thomas, J. (2008). Youth Court Statistics, 2006/2007. Juristat (Canadian Centre for Justice Statistics, Statistics Canada), Catalogue no. 85-002-XPE, vol. 8, no. 4. p.13. 130 Due to changes in Service data systems and extraction procedures, all arrest data for 2001 to 2005 have been recalculated to allow fair comparison and may differ from data in previous Scans. Examination of arrest data is based on five years. 131 The use of the term ‘arrested’ in this section means all persons arrested for a criminal offence and/or charged with a criminal offence but not formally arrested (e.g. charged by Summons).
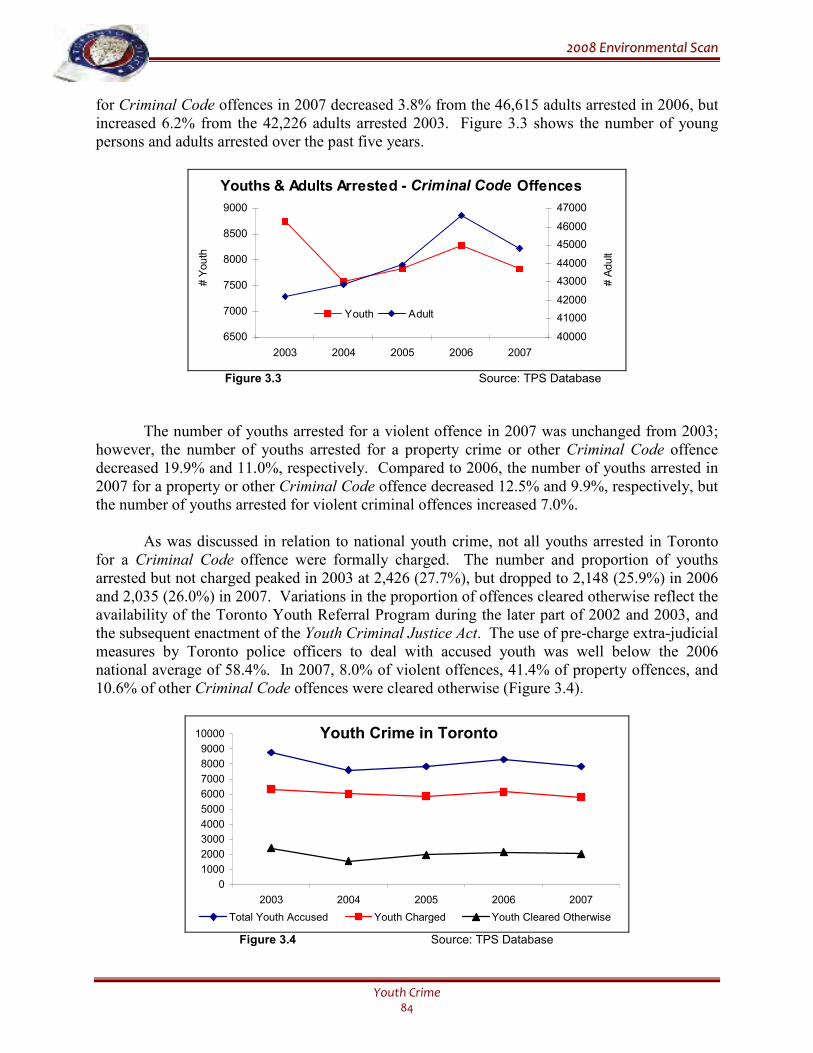
22000088 EEnnvviirroonnmmeennttaall SSccaann
Youth Crime 84
for Criminal Code offences in 2007 decreased 3.8% from the 46,615 adults arrested in 2006, but increased 6.2% from the 42,226 adults arrested 2003. Figure 3.3 shows the number of young persons and adults arrested over the past five years.
6500
7000
7500
8000
8500
9000
2003 2004 2005 2006 2007
# Youth
40000
41000
42000
43000
44000
45000
46000
47000
# Adult
Youth Adult
Youths & Adults Arrested - Criminal Code Offences
Figure 3.3 Source: TPS Database
The number of youths arrested for a violent offence in 2007 was unchanged from 2003; however, the number of youths arrested for a property crime or other Criminal Code offence decreased 19.9% and 11.0%, respectively. Compared to 2006, the number of youths arrested in 2007 for a property or other Criminal Code offence decreased 12.5% and 9.9%, respectively, but the number of youths arrested for violent criminal offences increased 7.0%.
As was discussed in relation to national youth crime, not all youths arrested in Toronto for a Criminal Code offence were formally charged. The number and proportion of youths arrested but not charged peaked in 2003 at 2,426 (27.7%), but dropped to 2,148 (25.9%) in 2006 and 2,035 (26.0%) in 2007. Variations in the proportion of offences cleared otherwise reflect the availability of the Toronto Youth Referral Program during the later part of 2002 and 2003, and the subsequent enactment of the Youth Criminal Justice Act. The use of pre-charge extra-judicial measures by Toronto police officers to deal with accused youth was well below the 2006 national average of 58.4%. In 2007, 8.0% of violent offences, 41.4% of property offences, and 10.6% of other Criminal Code offences were cleared otherwise (Figure 3.4).
0
1000
2000
3000
4000
5000
6000
7000
8000
9000
10000
2003 2004 2005 2006 2007
Total Youth Accused Youth Charged Youth Cleared Otherwise
Youth Crime in Toronto
Figure 3.4 Source: TPS Database
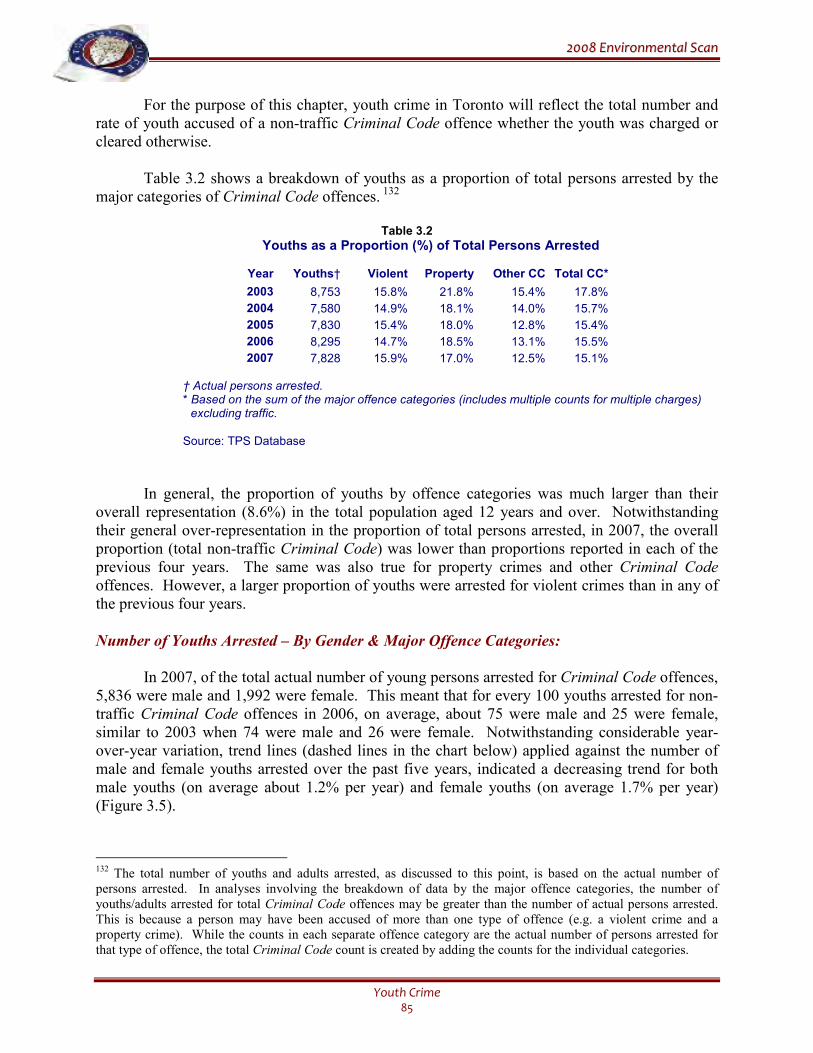
22000088 EEnnvviirroonnmmeennttaall SSccaann
Youth Crime 85
For the purpose of this chapter, youth crime in Toronto will reflect the total number and rate of youth accused of a non-traffic Criminal Code offence whether the youth was charged or cleared otherwise.
Table 3.2 shows a breakdown of youths as a proportion of total persons arrested by the major categories of Criminal Code offences. 132
Table 3.2
Youths as a Proportion (%) of Total Persons Arrested
Year Youths† Violent Property Other CC Total CC*
2003 8,753 15.8% 21.8% 15.4% 17.8%
2004 7,580 14.9% 18.1% 14.0% 15.7%
2005 7,830 15.4% 18.0% 12.8% 15.4%
2006 8,295 14.7% 18.5% 13.1% 15.5%
2007 7,828 15.9% 17.0% 12.5% 15.1% † Actual persons arrested. * Based on the sum of the major offence categories (includes multiple counts for multiple charges) excluding traffic.
Source: TPS Database
In general, the proportion of youths by offence categories was much larger than their overall representation (8.6%) in the total population aged 12 years and over. Notwithstanding their general over-representation in the proportion of total persons arrested, in 2007, the overall proportion (total non-traffic Criminal Code) was lower than proportions reported in each of the previous four years. The same was also true for property crimes and other Criminal Code offences. However, a larger proportion of youths were arrested for violent crimes than in any of the previous four years.
Number of Youths Arrested – By Gender & Major Offence Categories:
In 2007, of the total actual number of young persons arrested for Criminal Code offences,
5,836 were male and 1,992 were female. This meant that for every 100 youths arrested for non-traffic Criminal Code offences in 2006, on average, about 75 were male and 25 were female, similar to 2003 when 74 were male and 26 were female. Notwithstanding considerable year-over-year variation, trend lines (dashed lines in the chart below) applied against the number of male and female youths arrested over the past five years, indicated a decreasing trend for both male youths (on average about 1.2% per year) and female youths (on average 1.7% per year) (Figure 3.5).
132 The total number of youths and adults arrested, as discussed to this point, is based on the actual number of persons arrested. In analyses involving the breakdown of data by the major offence categories, the number of youths/adults arrested for total Criminal Code offences may be greater than the number of actual persons arrested. This is because a person may have been accused of more than one type of offence (e.g. a violent crime and a property crime). While the counts in each separate offence category are the actual number of persons arrested for that type of offence, the total Criminal Code count is created by adding the counts for the individual categories.
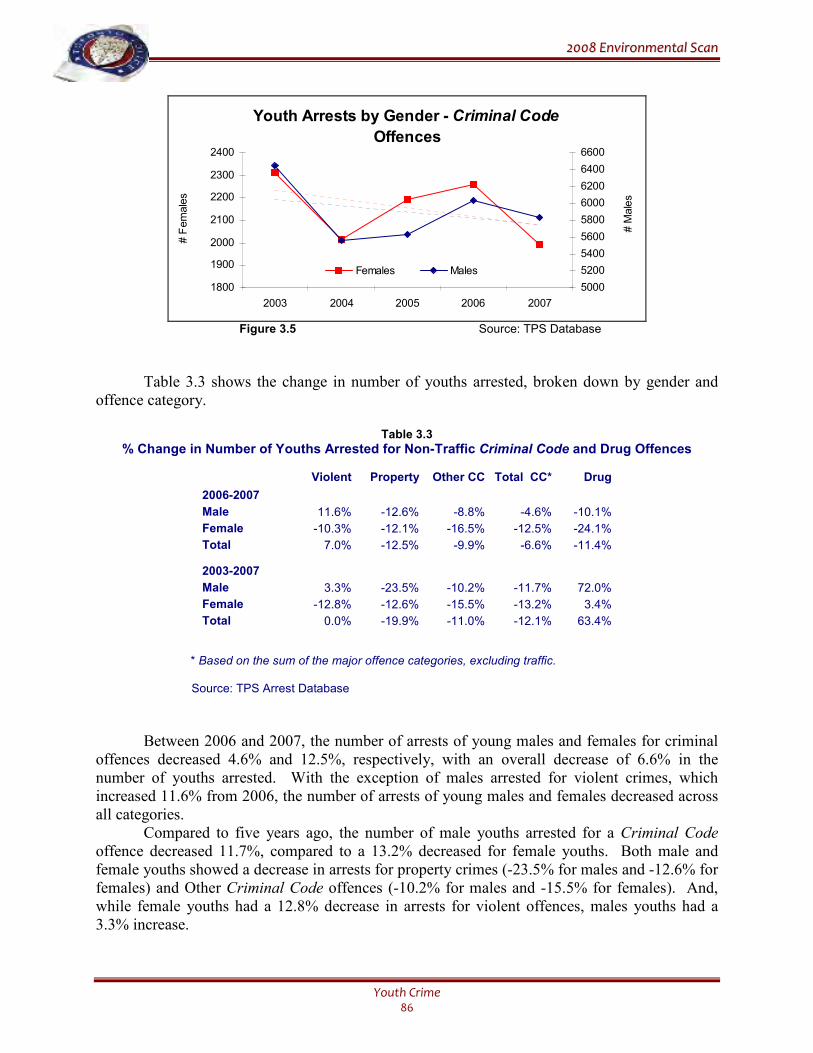
22000088 EEnnvviirroonnmmeennttaall SSccaann
Youth Crime 86
Youth Arrests by Gender - Criminal Code
Offences
1800
1900
2000
2100
2200
2300
2400
2003 2004 2005 2006 2007
# Females
5000
5200
5400
5600
5800
6000
6200
6400
6600
# Males
Females Males
Figure 3.5 Source: TPS Database
Table 3.3 shows the change in number of youths arrested, broken down by gender and offence category.
Table 3.3
% Change in Number of Youths Arrested for Non-Traffic Criminal Code and Drug Offences
Violent Property Other CC Total CC* Drug
2006-2007
Male 11.6% -12.6% -8.8% -4.6% -10.1%
Female -10.3% -12.1% -16.5% -12.5% -24.1%
Total 7.0% -12.5% -9.9% -6.6% -11.4% 2003-2007
Male 3.3% -23.5% -10.2% -11.7% 72.0%
Female -12.8% -12.6% -15.5% -13.2% 3.4%
Total 0.0% -19.9% -11.0% -12.1% 63.4%
* Based on the sum of the major offence categories, excluding traffic.
Source: TPS Arrest Database
Between 2006 and 2007, the number of arrests of young males and females for criminal offences decreased 4.6% and 12.5%, respectively, with an overall decrease of 6.6% in the number of youths arrested. With the exception of males arrested for violent crimes, which increased 11.6% from 2006, the number of arrests of young males and females decreased across all categories.
Compared to five years ago, the number of male youths arrested for a Criminal Code offence decreased 11.7%, compared to a 13.2% decreased for female youths. Both male and female youths showed a decrease in arrests for property crimes (-23.5% for males and -12.6% for females) and Other Criminal Code offences (-10.2% for males and -15.5% for females). And, while female youths had a 12.8% decrease in arrests for violent offences, males youths had a 3.3% increase.
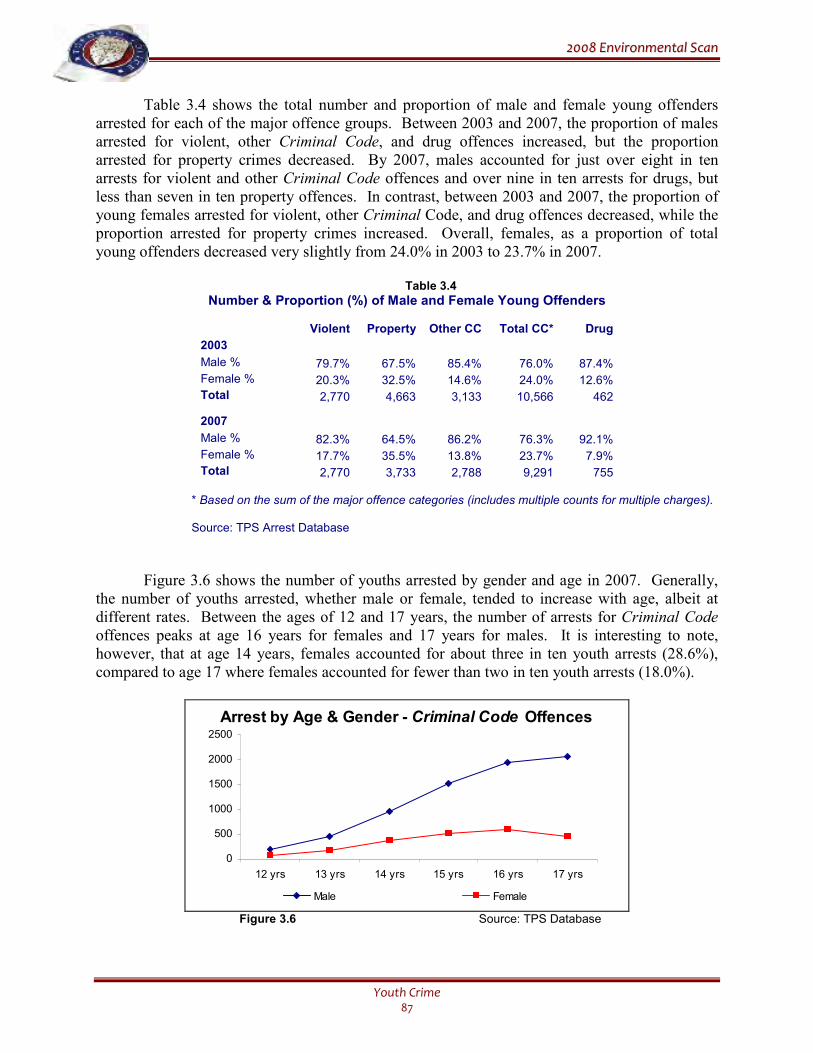
22000088 EEnnvviirroonnmmeennttaall SSccaann
Youth Crime 87
Table 3.4 shows the total number and proportion of male and female young offenders arrested for each of the major offence groups. Between 2003 and 2007, the proportion of males arrested for violent, other Criminal Code, and drug offences increased, but the proportion arrested for property crimes decreased. By 2007, males accounted for just over eight in ten arrests for violent and other Criminal Code offences and over nine in ten arrests for drugs, but less than seven in ten property offences. In contrast, between 2003 and 2007, the proportion of young females arrested for violent, other Criminal Code, and drug offences decreased, while the proportion arrested for property crimes increased. Overall, females, as a proportion of total young offenders decreased very slightly from 24.0% in 2003 to 23.7% in 2007.
Table 3.4
Number & Proportion (%) of Male and Female Young Offenders
Violent Property Other CC Total CC* Drug
2003
Male % 79.7% 67.5% 85.4% 76.0% 87.4%
Female % 20.3% 32.5% 14.6% 24.0% 12.6%
Total 2,770 4,663 3,133 10,566 462 2007
Male % 82.3% 64.5% 86.2% 76.3% 92.1%
Female % 17.7% 35.5% 13.8% 23.7% 7.9%
Total 2,770 3,733 2,788 9,291 755 * Based on the sum of the major offence categories (includes multiple counts for multiple charges). Source: TPS Arrest Database
Figure 3.6 shows the number of youths arrested by gender and age in 2007. Generally, the number of youths arrested, whether male or female, tended to increase with age, albeit at different rates. Between the ages of 12 and 17 years, the number of arrests for Criminal Code offences peaks at age 16 years for females and 17 years for males. It is interesting to note, however, that at age 14 years, females accounted for about three in ten youth arrests (28.6%), compared to age 17 where females accounted for fewer than two in ten youth arrests (18.0%).
0
500
1000
1500
2000
2500
12 yrs 13 yrs 14 yrs 15 yrs 16 yrs 17 yrs
Male Female
Arrest by Age & Gender - Criminal Code Offences
Figure 3.6 Source: TPS Database
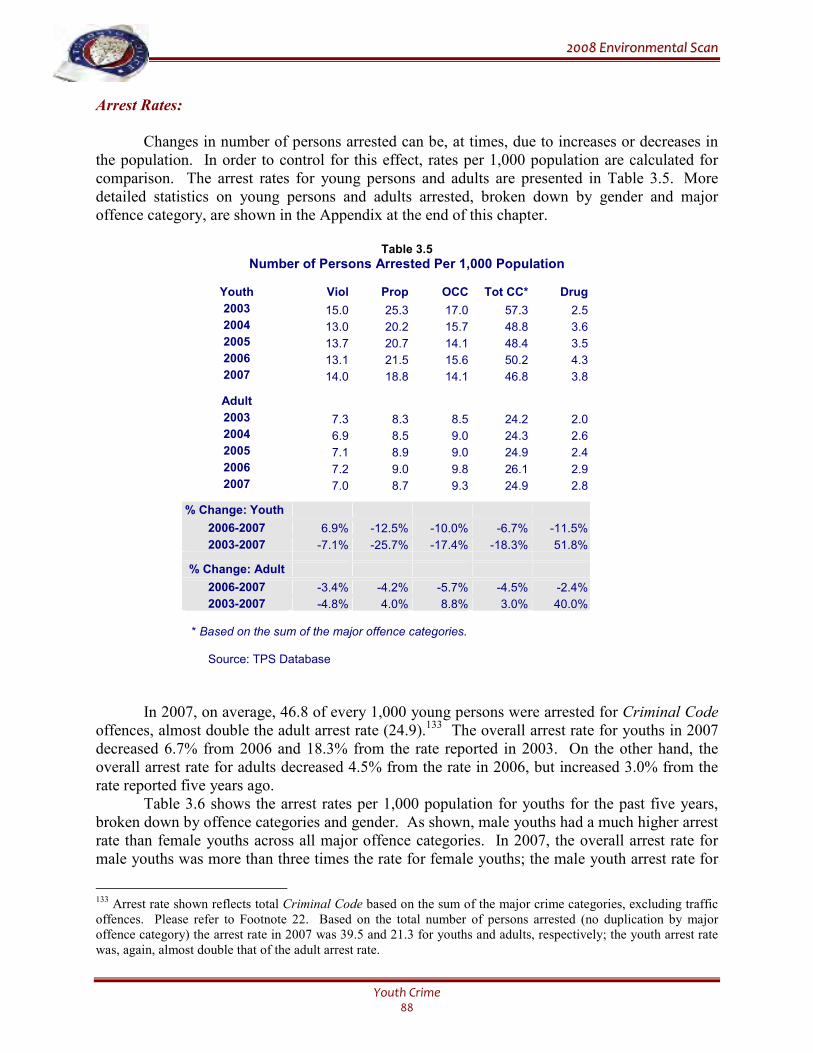
22000088 EEnnvviirroonnmmeennttaall SSccaann
Youth Crime 88
Arrest Rates:
Changes in number of persons arrested can be, at times, due to increases or decreases in
the population. In order to control for this effect, rates per 1,000 population are calculated for comparison. The arrest rates for young persons and adults are presented in Table 3.5. More detailed statistics on young persons and adults arrested, broken down by gender and major offence category, are shown in the Appendix at the end of this chapter.
Table 3.5
Number of Persons Arrested Per 1,000 Population
Youth Viol Prop OCC Tot CC* Drug
2003 15.0 25.3 17.0 57.3 2.5
2004 13.0 20.2 15.7 48.8 3.6
2005 13.7 20.7 14.1 48.4 3.5
2006 13.1 21.5 15.6 50.2 4.3
2007 14.0 18.8 14.1 46.8 3.8
Adult
2003 7.3 8.3 8.5 24.2 2.0
2004 6.9 8.5 9.0 24.3 2.6
2005 7.1 8.9 9.0 24.9 2.4
2006 7.2 9.0 9.8 26.1 2.9
2007 7.0 8.7 9.3 24.9 2.8
% Change: Youth
2006-2007 6.9% -12.5% -10.0% -6.7% -11.5%
2003-2007 -7.1% -25.7% -17.4% -18.3% 51.8%
% Change: Adult
2006-2007 -3.4% -4.2% -5.7% -4.5% -2.4%
2003-2007 -4.8% 4.0% 8.8% 3.0% 40.0%
* Based on the sum of the major offence categories. Source: TPS Database
In 2007, on average, 46.8 of every 1,000 young persons were arrested for Criminal Code offences, almost double the adult arrest rate (24.9).133 The overall arrest rate for youths in 2007 decreased 6.7% from 2006 and 18.3% from the rate reported in 2003. On the other hand, the overall arrest rate for adults decreased 4.5% from the rate in 2006, but increased 3.0% from the rate reported five years ago. Table 3.6 shows the arrest rates per 1,000 population for youths for the past five years, broken down by offence categories and gender. As shown, male youths had a much higher arrest rate than female youths across all major offence categories. In 2007, the overall arrest rate for male youths was more than three times the rate for female youths; the male youth arrest rate for
133 Arrest rate shown reflects total Criminal Code based on the sum of the major crime categories, excluding traffic offences. Please refer to Footnote 22. Based on the total number of persons arrested (no duplication by major offence category) the arrest rate in 2007 was 39.5 and 21.3 for youths and adults, respectively; the youth arrest rate was, again, almost double that of the adult arrest rate.
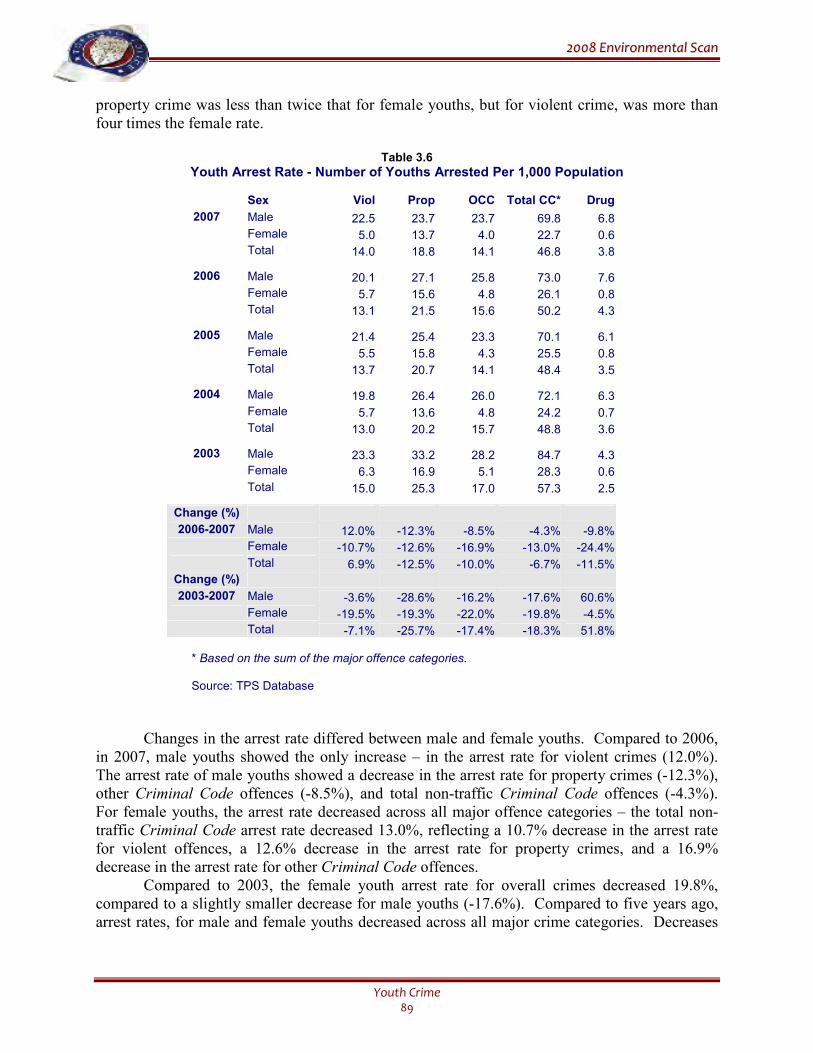
22000088 EEnnvviirroonnmmeennttaall SSccaann
Youth Crime 89
property crime was less than twice that for female youths, but for violent crime, was more than four times the female rate.
Table 3.6
Youth Arrest Rate - Number of Youths Arrested Per 1,000 Population
Sex Viol Prop OCC Total CC* Drug
2007 Male 22.5 23.7 23.7 69.8 6.8
Female 5.0 13.7 4.0 22.7 0.6
Total 14.0 18.8 14.1 46.8 3.8
2006 Male 20.1 27.1 25.8 73.0 7.6
Female 5.7 15.6 4.8 26.1 0.8
Total 13.1 21.5 15.6 50.2 4.3
2005 Male 21.4 25.4 23.3 70.1 6.1
Female 5.5 15.8 4.3 25.5 0.8
Total 13.7 20.7 14.1 48.4 3.5
2004 Male 19.8 26.4 26.0 72.1 6.3
Female 5.7 13.6 4.8 24.2 0.7
Total 13.0 20.2 15.7 48.8 3.6
2003 Male 23.3 33.2 28.2 84.7 4.3
Female 6.3 16.9 5.1 28.3 0.6
Total 15.0 25.3 17.0 57.3 2.5
Change (%)
2006-2007 Male 12.0% -12.3% -8.5% -4.3% -9.8%
Female -10.7% -12.6% -16.9% -13.0% -24.4%
Total 6.9% -12.5% -10.0% -6.7% -11.5%
Change (%)
2003-2007 Male -3.6% -28.6% -16.2% -17.6% 60.6%
Female -19.5% -19.3% -22.0% -19.8% -4.5%
Total -7.1% -25.7% -17.4% -18.3% 51.8% * Based on the sum of the major offence categories.
Source: TPS Database
Changes in the arrest rate differed between male and female youths. Compared to 2006, in 2007, male youths showed the only increase – in the arrest rate for violent crimes (12.0%). The arrest rate of male youths showed a decrease in the arrest rate for property crimes (-12.3%), other Criminal Code offences (-8.5%), and total non-traffic Criminal Code offences (-4.3%). For female youths, the arrest rate decreased across all major offence categories – the total non-traffic Criminal Code arrest rate decreased 13.0%, reflecting a 10.7% decrease in the arrest rate for violent offences, a 12.6% decrease in the arrest rate for property crimes, and a 16.9% decrease in the arrest rate for other Criminal Code offences.
Compared to 2003, the female youth arrest rate for overall crimes decreased 19.8%, compared to a slightly smaller decrease for male youths (-17.6%). Compared to five years ago, arrest rates, for male and female youths decreased across all major crime categories. Decreases
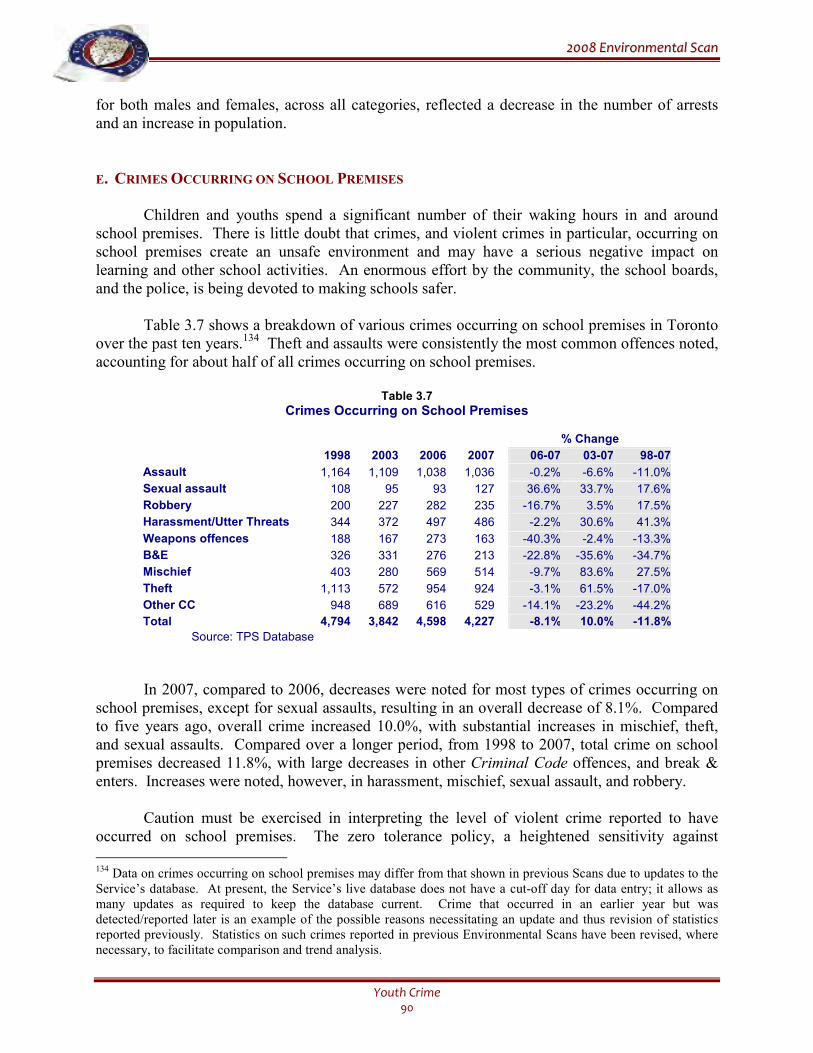
22000088 EEnnvviirroonnmmeennttaall SSccaann
Youth Crime 90
for both males and females, across all categories, reflected a decrease in the number of arrests and an increase in population.
E. CRIMES OCCURRING ON SCHOOL PREMISES
Children and youths spend a significant number of their waking hours in and around school premises. There is little doubt that crimes, and violent crimes in particular, occurring on school premises create an unsafe environment and may have a serious negative impact on learning and other school activities. An enormous effort by the community, the school boards, and the police, is being devoted to making schools safer.
Table 3.7 shows a breakdown of various crimes occurring on school premises in Toronto over the past ten years.134 Theft and assaults were consistently the most common offences noted, accounting for about half of all crimes occurring on school premises.
Table 3.7
Crimes Occurring on School Premises
% Change
1998 2003 2006 2007 06-07 03-07 98-07
Assault 1,164 1,109 1,038 1,036 -0.2% -6.6% -11.0%
Sexual assault 108 95 93 127 36.6% 33.7% 17.6%
Robbery 200 227 282 235 -16.7% 3.5% 17.5%
Harassment/Utter Threats 344 372 497 486 -2.2% 30.6% 41.3%
Weapons offences 188 167 273 163 -40.3% -2.4% -13.3%
B&E 326 331 276 213 -22.8% -35.6% -34.7%
Mischief 403 280 569 514 -9.7% 83.6% 27.5%
Theft 1,113 572 954 924 -3.1% 61.5% -17.0%
Other CC 948 689 616 529 -14.1% -23.2% -44.2%
Total 4,794 3,842 4,598 4,227 -8.1% 10.0% -11.8%
Source: TPS Database
In 2007, compared to 2006, decreases were noted for most types of crimes occurring on school premises, except for sexual assaults, resulting in an overall decrease of 8.1%. Compared to five years ago, overall crime increased 10.0%, with substantial increases in mischief, theft, and sexual assaults. Compared over a longer period, from 1998 to 2007, total crime on school premises decreased 11.8%, with large decreases in other Criminal Code offences, and break & enters. Increases were noted, however, in harassment, mischief, sexual assault, and robbery. Caution must be exercised in interpreting the level of violent crime reported to have occurred on school premises. The zero tolerance policy, a heightened sensitivity against
134 Data on crimes occurring on school premises may differ from that shown in previous Scans due to updates to the Service’s database. At present, the Service’s live database does not have a cut-off day for data entry; it allows as many updates as required to keep the database current. Crime that occurred in an earlier year but was detected/reported later is an example of the possible reasons necessitating an update and thus revision of statistics reported previously. Statistics on such crimes reported in previous Environmental Scans have been revised, where necessary, to facilitate comparison and trend analysis.
22000088 EEnnvviirroonnmmeennttaall SSccaann
Youth Crime 91
violence, the legislated Safe Schools Act, and Code of Conduct adopted by the school boards may have resulted in more incidents being reported to police, thus giving a ‘distorted’ picture about the prevalence of the problem.
Students’ Perception of Safety:
Perhaps the best indicator of school safety is students’ perception of safety in and around the school – between seven and nine in ten students reported feeling safe in and around their schools:
• the 2007 Toronto Police Service school survey, discussed more fully in the Public Perceptions chapter, found that 86% of Toronto students in Grades 7 through 12 felt very or reasonably safe in and around their school at any time of day;
• a Toronto District School Board survey of over 100,000 students in Grades 7 through 12 found that 89% of students felt safe inside their classrooms and 69% felt safe outside on school property; 135 and,
• the Centre for Addiction and Mental Health’s 2007 Ontario Student Drug Use and Health Survey (OSDUHS), administered to more than 6,300 students in Grades 7 through 12, found that 93% of students felt safe in their schools.136
While a large majority of students felt safe in schools, there is certainly cause for concern. The OSDUHS also found that of the students surveyed, 12% reported worried about being harmed or threatened; further, 16% reported fighting (representing about 166,000 students in Ontario), 9% reported having been threatened or injured with a weapon, and 30% reported being bullied (about 315,000 students) on school property at least once during the 12 months before the survey. On a national level, Statistics Canada reported that in 2006 about one in ten youth Criminal Code and drug violations (13%) occurred on school property – mostly assaults (27%) and drug-offences (18%) – and most occurred (73%) during school hours; while weapons were in involved in about 7% of school crimes, less than 1% involved firearms.137
School Community Safety Advisory Panel:
In response to an in-school shooting death of a 15-year old student in May 2007, the
Toronto District School Board (TDSB) established the School Community Safety Advisory Panel (SCSAP) to complete a comprehensive review of school safety. The Panel interpreted the scope of their review to go beyond physical security measures – metal detectors, identification tags, etc. – to promote safety, and to encompass all that is inherent in a healthy learning environment. The Road to Health, the Panel’s final report, was released in January 2008.
135 Yau, M. & O’Reilly, J. (2007). 2006 Student Census, Grade 7-12: System Overview, TDSB Research Report 07/08-1. October 2007. p. 20. 136 Adlaf, et al. (2007). p. 3. 137 Taylor, A. & Bressan, A. (2008). Youth Crime in Canada, 2006. Juristat (Canadian Centre for Justice Statistics, Statistics Canada), Catalogue No. 85-002-XIE, Vol. 28 no.3. p. 4.

22000088 EEnnvviirroonnmmeennttaall SSccaann
Youth Crime 92
The report addressed a dozen issues which, according to the Panel, fundamentally reflected and had an impact on the health of school environments generally and school safety in particular:
• gender, • barriers to reporting school safety issues, • tracking violent incidents at schools across TDSB, • the breakdown in the relationship between students and teachers, • the lack of youth initiatives, • inadequate funding, • lack of clarity concerning the role of Trustees, • discipline measures in schools, • strategies for detecting and deterring safety threats, • missing supports for complex needs students, • school safety concerns specific to Aboriginal students, and • the relationship between safety and equity.
The Panel’s 126 recommendations prescribed an inclusive approach to school safety “which recognizes a different and inclusive concept of safety – an approach which includes discipline but is capable of operating beyond straight enforcement, …. identifying and employing key strategies aimed at re-engaging youth.”138 The Panel specifically addressed almost all its recommendations to the TDSB, the Ministry of Education and/or the Ministry of Training, Colleges and University. However, the following two recommendations were specifically addressed to the Toronto Police Service:
74. The Toronto Police Service should create a position of Staff Superintendent – Executive
School Safety, with the responsibility for liaising and working with the Toronto Police Service with respect to policing issues that affect students.
92. The Toronto Police Service should ensure that its data recording systems can categorize
incidents by school name to allow for ease of extraction and analysis of trends at individual schools.
The Toronto District School Board created the Leadership Action Team, comprised of TDSB staff, to develop a comprehensive analysis of the School Community Safety Advisory Panel’s report and implement an overall strategy to address the Panel’s recommendations. In May 2008, the Leadership Action Team presented their response to the School Board. The Team outlined the initiatives implemented and actions taken to date (e.g. Student Safety Line, Safe and Caring Schools Alternative Programs – Sisterhood Media, Habitat for Humanity, Business of Sport, resource inventory, policy reviews, action plans, etc.), and had six recommendations:
138 School Community Safety Advisory Panel. (2008). The Road to Health: A Final Report on School Safety. p.5. (Retrieved from www.schoolsafetypanel.com)
22000088 EEnnvviirroonnmmeennttaall SSccaann
Youth Crime 93
1. Equity – ensure programs and support for a culture of inclusion, respect, and regard in all schools and workplaces;
2. Support for Marginalized and Vulnerable Youth – through programs and professional supports that improve outcomes for marginalized and vulnerable youth;
3. Partnerships & Integrated Services – by establishing the internal and external coordination and integration of supports;
4. Gender-based Harassment and Violence – improve the culture of respect in all schools; 5. Safety – to reduce risk of violence and other crime in schools, and to foster a culture of
kindness and caring in all schools; and, 6. Culture of Silence – reduce barriers to reporting violence or other crime in schools and
foster a culture of open and honest communication.
The Leadership Action Team’s recommendations, including detailed, time-specific actions, activities, and responsibilities, mirrored the Panel’s more inclusive approach to school safety, that of a healthy learning environment. For the most part, the Team’s action plans centered on staff development (e.g. race relations, equity, multiculturalism, leadership, mentoring, etc.), policy/protocol review and revision (e.g. peer sexual assault/harassment, progressive discipline, school safety, safe school transfer, etc.), equity hiring, identification of new and enhancement of existing partnerships, focused resource allocation (e.g. students who are at-risk, marginalized, ESL, etc.), and curriculum review. While the Service could reasonably be expected to participate in almost all areas and many of the recommended action plans, the Toronto Police Service was only specifically included in one action plan within Culture of Silence. The Leadership Action Team recommended that the TDSB liaise with Toronto Police Service leaders to enhance student-police interaction in the schools and promote positive engagement with police and school.
The action plan, under the heading of Safety, spoke to lockdown procedures in the schools; the Toronto Police Service and both Toronto school boards are currently finalizing a joint procedure for school lockdowns and emergency response, an integrated police/school response to maximize the safety of the school community.
Bullying:
Although once looked upon as a rite of passage or an inevitable part of growing up,
bullying is now recognized as a form of violence among children, often occurring in the presence of or in front of adults who fail to intercede. According to a United States (US) Department of Justice (USDOJ) study, bullying is perhaps the most widespread, under-reported, and potentially harmful school safety problem.139 Recently, the Centre for Disease Control reported that an estimated 30% of 6th to 9th graders in the US were either a bully, a target of bullying, or both.140
Although there is no widely agreed definition of bullying, two components are consistently present – repeated harmful acts (physical, verbal and psychological in nature) and an imbalance of power. The Ontario Student Drug Use and Health Survey (OSDUHS) questionnaire explained bullying to respondents as: “…when one or more people tease, hurt, or
139 Sampson, R. (2004). Bullying in Schools. Problem-Oriented Guides for Police Services No. 12. U.S. Department of Justice. (Retrieved from www.cops.usdoj.gov/files/ric/CDROMs/GangCrime/pubs/BullyinginSchools.pdf) 140 Centre for Disease Control. (2008) Youth Violence Facts at a Glance. (Retrieved from www.cdc.gov/inquiry)
22000088 EEnnvviirroonnmmeennttaall SSccaann
Youth Crime 94
upset a weaker person on purpose, again and again. It is also bullying when someone is left out
of things on purpose.”141
In the 2007 Toronto Police Service school surveys, almost three in four school administrators (73.8%) and almost half (47.3%) of the students in Toronto reported that they were concerned or very concerned about bullying in their schools; almost six in ten school administrators (58.9%) said that cyber-bullying was a problem for students in their school, and almost one in four students (23.9%) reported having experienced cyber-bullying.
The Mental Health and Well-Being of Ontario Students 1991-2007 study, based on the OSDUHS, found that 30% of Ontario students (about 315,000 students in Grades 7 though 12) reported having been bullied since September – 23% reported verbal/non-physical bullying, 4% reported physical bullying, and 3% reported theft or vandalism; almost one in ten Grade 7 through 12 students in Ontario said that they were bullied on a daily or weekly basis. Females (32%) were significantly more likely than males (28%) to be bullied and more likely to be bullied verbally; however, males were three times more likely than females to be physically bullied (6% vs. 2%, respectively). The study also found significant variation in the prevalence of bullying by grade – one-third of students in Grades 7 through 10 as compared to about one-fifth (19%) of students in Grade 12 reported being bullied, and younger students were more likely to be bullied on a daily/weekly basis. Specific to the bully, the study found that 25% of students (representing about 261,000 students in Ontario) reported bullying others at school; most (20%) reported verbal or non-physical bullying, followed by physical bullying (4%), and stealing or damaging another’s property (1%). Girls and boys were equally likely to report bullying others and students in Grade 8 (30%) were most likely to bully others.
A study conducted by the Toronto District School Board (TDSB) found that, by grade, between 50% and 60% of students reported having never or rarely experienced bullying in school.142 Students who reported being bullied all the time, often, or sometimes were most likely to report insults or name calling and least likely to report physical bullying; these students reported body image, grades or marks, and cultural or racial background as the reason for being bullied.
A survey of nearly 2,500 youths by the Kids Help Phone found that 70% of kids reported having been bullied online, 38% reported having been bullied online in the past three months, and 44% said they had bullied someone else.143 Those who had taken part in cyber-bulling were between 13 and 15 years of age and three-quarters of them were female. The study found that the effects of cyber-bullying were real, devastating, and long-lasting. The survey found that victims did not report bullying to parents for fear of losing their electronic devices.
According to the USDOJ study, most students – victims or witnesses – did not report bullying to an adult, thereby concealing the extent of the bullying in schools. The report cited poor response by adults who actually witness bullying behaviour as one reason that victims do not report – two-thirds of victims (66%) believed school professionals responded poorly to the bullying problems that they observed.144 Some of the other reasons given by victims for not reporting included fear of retaliation, feeling shame, fear they will not be believed, not wanting to worry parents, and having no confidence that anything would change as a result.
141 Adlaf, et al. (2007). p. 15. 142 Yau, M. & O’Reilly, J. (2007). P 21. 143 Lines, E. (2007). Cyber-bullying: Our Kids’ New Reality. A Kid’s Help Phone Research Study of Kids On-line. (Retrieved from http://org.kidshelpphone.ca/media/21704/2007_cyber_bullying_report.pdf) 144 Sampson, R. (2004). p. 5.
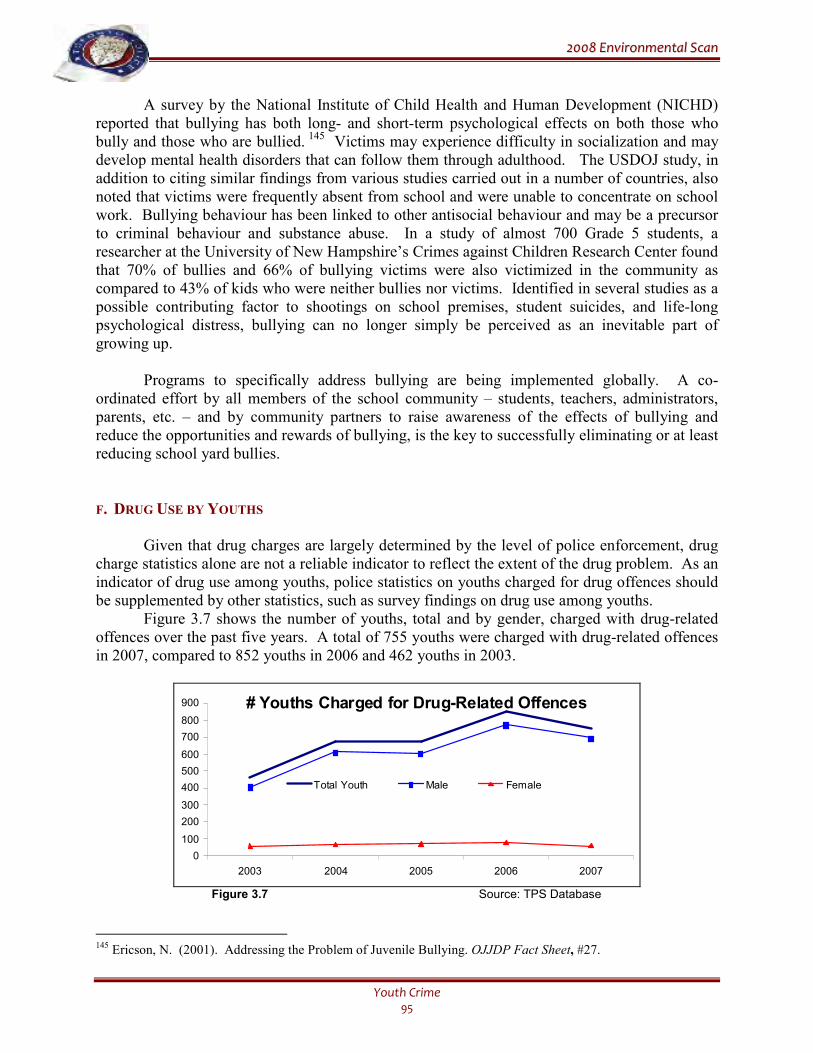
22000088 EEnnvviirroonnmmeennttaall SSccaann
Youth Crime 95
A survey by the National Institute of Child Health and Human Development (NICHD) reported that bullying has both long- and short-term psychological effects on both those who bully and those who are bullied. 145 Victims may experience difficulty in socialization and may develop mental health disorders that can follow them through adulthood. The USDOJ study, in addition to citing similar findings from various studies carried out in a number of countries, also noted that victims were frequently absent from school and were unable to concentrate on school work. Bullying behaviour has been linked to other antisocial behaviour and may be a precursor to criminal behaviour and substance abuse. In a study of almost 700 Grade 5 students, a researcher at the University of New Hampshire’s Crimes against Children Research Center found that 70% of bullies and 66% of bullying victims were also victimized in the community as compared to 43% of kids who were neither bullies nor victims. Identified in several studies as a possible contributing factor to shootings on school premises, student suicides, and life-long psychological distress, bullying can no longer simply be perceived as an inevitable part of growing up.
Programs to specifically address bullying are being implemented globally. A co-ordinated effort by all members of the school community – students, teachers, administrators, parents, etc. – and by community partners to raise awareness of the effects of bullying and reduce the opportunities and rewards of bullying, is the key to successfully eliminating or at least reducing school yard bullies.
F. DRUG USE BY YOUTHS
Given that drug charges are largely determined by the level of police enforcement, drug
charge statistics alone are not a reliable indicator to reflect the extent of the drug problem. As an indicator of drug use among youths, police statistics on youths charged for drug offences should be supplemented by other statistics, such as survey findings on drug use among youths.
Figure 3.7 shows the number of youths, total and by gender, charged with drug-related offences over the past five years. A total of 755 youths were charged with drug-related offences in 2007, compared to 852 youths in 2006 and 462 youths in 2003.
# Youths Charged for Drug-Related Offences
0
100
200
300
400
500
600
700
800
900
2003 2004 2005 2006 2007
Total Youth Male Female
Figure 3.7 Source: TPS Database
145 Ericson, N. (2001). Addressing the Problem of Juvenile Bullying. OJJDP Fact Sheet, #27.
22000088 EEnnvviirroonnmmeennttaall SSccaann
Youth Crime 96
In 2007, the number of youths charged with drug-related offences decreased from a five-
year high reported in 2006 – an 11.4% decrease from the number of youths charged with a drug-related offence in 2006 but was a 63.4% increase from the number charged in 2003. Females accounted for about 7.9% of the youths arrested charged for drug offences in 2007 – down from 12.6% in 2003 – and the number of youths arrested for drugs, whether male or female, tended to increase with age. Interestingly, the number of adults charged with drug-related offences echoed the annual increases and decreases in youths charged over the past five years. The youth charge rate for drug offences was 3.8 per 1,000 youths in 2007, compared to 4.3 in 2006 and 2.5 in 2003.
Findings from the Centre for Addiction and Mental Health’s 2007 Ontario Student Drug Use Survey (OSDUS) indicated that while alcohol, cannabis and other drug use among Ontario students decreased or stayed stable, the misuse of prescription drugs may be a cause for concern. The survey found that more than one in five Ontario students reported using prescription opioid pain relievers for non-medical reasons and almost three in four (72%) reported obtaining the drugs from home. Other survey findings included:
• Slightly more than one in four students (28%) reported no substance use (including alcohol and tobacco). Another one in four students (25%) reported using only alcohol in the previous twelve months.
• Alcohol is the drug of choice for students; more than six in ten students (representing about 616,300 Ontario students) reported drinking alcohol over the past 12 months. Use of alcohol by students increased by grade, from 28% of Grade 7 students to 83% of Grade 12 students. Just over half (55%) of Toronto students reported drinking alcohol.
• About one in four (26%) students reported using cannabis and 10% of those students reported using it every day. Similar to alcohol, use increased by grade, from 4% of students in Grade 7 to 45% of students in Grade 12.
• About one in six students with a drivers licence reported driving after using cannabis as compared to one in eight (12%) that reported driving within one hour after drinking alcohol.
• Although males (29.3%) and females (28.1%) were equally likely to report using illicit drugs, young females accounted for only about one in ten drug-related youth arrests in Toronto.
• In relation to drugs at school, about 15% of students reported being drunk or high at school (representing 141,800 students) at least once in the past twelve months; one in five (21%) reported having been offered, sold, or given drugs at school; almost half (49%) of students reported that drug use in their school was higher than in the past few years; and, three-quarters of students said that drugs were a problem in their school.
G. YOUTH GANGS
Youth gangs are a problem across Canada. According to a study prepared for Public
Safety and Preparedness Canada, almost six in ten (59%) Canadians are served by law
22000088 EEnnvviirroonnmmeennttaall SSccaann
Youth Crime 97
enforcement agencies that report active youth gangs within their jurisdiction. 146 According to the 2002 Canadian Police Survey on Youth Gangs, there were about 216 youth gangs and 3,320 youth gang members in Ontario, about half of the estimated 434 youth gangs and 7,071 youth gang members across Canada.147, 148 In the 2007 OSDUHS, 4% of students (representing about 41,000 Ontario students) responded yes to “Do you belong to a gang right now?”; boys (6%) and Grade 9 students (7%) were significantly more likely to report that they belonged to a gang, but there was no significant difference among geographical regions.149
Toronto Police Service Intelligence officers estimate that between 100 and 160 youth gangs currently exist across the city of Toronto, both in urban and suburban areas – a sizeable increase from the 60 to 80 youth gangs estimated in 2000. It is important to note that the number of youth gangs is highly variable – gangs form, splinter, and dissolve with regular frequency. For the most part, active recruiting is directed at high school, however, some recruiting is done at the middle school level. Membership in Toronto area youth gangs is estimated, on average, at between 10 and 100 members; members tend to be quite young – between the age of 13 and 30 years, and there has been no significant increase in female membership. The ethnic composition of the gangs tends to vary; because gangs recruit from within schools, they generally reflect the multicultural environment in which they operate.
Beyond the presence of and membership in youth gangs is the social impact of gang
activities. The activities of youth gangs and their likelihood of criminal behaviour is a subject of much research. The question as to whether gang members contribute to delinquency above and beyond the influences of delinquent peers was explored in Gang Membership, Delinquent Peers, and Delinquent Behaviour by the USDOJ.150 The study found that the involvement in violent crime for gang members was, overall, twice that of the youth who associated with delinquent peers. Further studies conducted by the Office of Justice Programs, Comparing the Criminal Behaviour of Youth Gangs and At-Risk Youths and Early Precursors of Gang Membership: A Study of Seattle Youth, reported much the same findings based on self-reported crime by youth gang members and at-risk youths. Youth gang members engaged in more delinquent behaviour than their peers who were not in gangs, were twice as likely to commit a crime, and two to seven times more likely to commit serious violent crimes than at-risk youths.151,152 While the majority of at-risk youths denied selling drugs, most youth gang members reported selling on a regular basis. Youth gang members were much more likely to possess powerful and lethal weapons –
146 Mellor, B., MacRae, L., Pauls, M. & Hornick, J. (2005) Youth Gangs in Canada: A Preliminary Review of Programs and Services. Canadian Research Institute for Law and the Family (CLIRF). (Retrieved from http://www.ucalgary.ca/~ crilf/publications/Youth_Gang_Report.pdf)) 147 Public Safety Canada. (2007). Youth Gangs in Canada: What do we know? 2007-YG-1, p. 4. (Retrieved from www.publicsafety.gc.ca/ncpc) 148 Much of the difficulty in measuring the nature and extent of youth crimes is the on-going debate how to define youth gangs. Although a widely accepted definition has not been developed, there exist some consistent elements: size, age of members, sense of identity, stability over time, and involvement in criminal activity. 149 Adlaf, et al. (2007). p. 14. 150 Gang Membership, Delinquent Peers, and Delinquent Behavior, National Institute of Justice Research in Brief, US Department of Justice, Office of Juvenile Justice and Delinquency Prevention. 151 Huff, R. C. (1998) Comparing the Criminal Behaviour of Youth Gangs and At-Risk Youths, National Institute of Justice Research in Brief, US Department of Justice, Office of Juvenile Justice and Delinquency Prevention. 152 Hill, K.G., Lui, C. & Hawkins. (2001) Early Precursors of Gang Membership: A Study of Seattle Youth. National Institute of Justice Juvenile Justice Bulletin, US Department of Justice, Office of Juvenile Justice and Delinquency Prevention.
22000088 EEnnvviirroonnmmeennttaall SSccaann
Youth Crime 98
nearly 75% of gang members reported that nearly all fellow gang members owned guns, and 90% said gang members prefer powerful, lethal weapons over smaller-calibre handguns.153
In general, cross-sectional and longitudinal studies in Canada and the US have found a strong relationship between levels of offending and gang membership. These findings are based on the disproportionate number of crimes committed by individuals while in the gang, as compared to before and after gang membership, and the on-going influence after separating from the gang.154 “The conclusion drawn most frequently is that the observed positive relationship between gang membership and offending levels cannot be explained through a simple process of self-selection, wherein only highly delinquent youths join gangs. Instead, there are additional influences that gang membership brings to bear in facilitating higher levels of offending among individuals who join. This is especially true for behaviours related to guns and violence.”155
The propensity of youth involved in youth gangs to commit criminal acts is a concern for other members of the community. In the Toronto Police Service 2007 survey of 8th to 12th graders, almost half (47%) said they were very or somewhat concerned about gangs in their schools; of those who indicated concern about gangs, more than one-third (34%) said their personal safety was specifically what caused the concern. While six in ten Canadians (57%) believed that the youth gang problem was getting worse, a 2007 Toronto Police Service survey of residents and business owners in the 13 city-defined priority areas in Toronto found that about one in three respondents (32%) thought that gangs in their neighbourhood had increased over the past year and a half, while almost half said they did not know. 156
The keys to addressing youth gangs, according to law enforcement agencies and researchers, are to curtail membership in the first instance, assist youth to leave gangs, and increase reporting of youth gang criminal activities. The vast majority of youth do not get involved in criminal activities or join gangs and although studies have found that youths can resist overtures to join youth gangs without serious consequences, some youths choose not to resist.157 Most of the research centred on the reasons for youth gang involvement suggests that these youths tend to have specific risk factors that may influence their decision to join a youth gang. Major long-term studies of youth in large urban centres in Canada and the US suggest that the following are the most significant risk factors for youth gang involvement:
• negative influences in the youth’s life, • limited attachment to the community, • over-reliance on anti-social peers, • poor parental supervision, • alcohol and drug abuse, • poor educational or employment potential, and • a need for recognition and belonging.158
153 Huff, R. C. (1998) 154 Howell, J. C. (1998). Youth Gangs. Gazette (Royal Canadian Mounted Police Magazine). 155 Tita, G. (2007). Strategies for Reducing Gun Violence: The Role of Gangs, Drugs and Firearm Accessibility. National Crime Prevention Centre Research Report, p. 4. (Retrieved from www.publicsafety.gc.ca/ncpc) 156 Mellor, et al. (2005) 157 Howell (1998) 158 Public Safety Canada. (2007). Youth Gang Involvement: What are the Risk Factors? 2007-YG-2. (Retrieved from www.publicsafety.gc.ca/ncpc)
22000088 EEnnvviirroonnmmeennttaall SSccaann
Youth Crime 99
The Seattle Social Development Project found that the odds of a youth joining a gang between the ages of 13 to 18 years were three times higher than average with two to three risk factors present and thirteen times higher than average with seven or more risk factors present.159
Youth gangs rely heavily on the silence of their victims – if the crime is not reported by the victim there can be no consequences, and their power, based on intimidation, is thereby strengthened. Although it is likely that youths victimised by youth gang members are able to identify the offender, they fail to do so for fear of reprisal. The development and implementation of programs which encourage crime reporting, provide protection for young victims, and ensure consequences for offenders, are required to address the current activities of youth gang.
More recent studies of youth gangs have focused on the effectiveness of programs to address youth gang problems in the community. Public Safety Canada conducted an extensive literary review and discussion of youth gang research, to develop a comprehensive understanding of what doesn’t work, what does work, and what is promising in addressing youth gang problems.160 The report cited, for the most part, the findings of American studies and, while supporting the work of American researchers, cautioned against the direct application to the Canadian situation.
Over the past thirty years, responses to the youth gang problem in the United States can be categorized into three distinct strategies – prevention, intervention, and suppression. Gang prevention programs generally focus on discouraging youth from joining gangs – primary prevention targets all youth, secondary prevention targets identified at-risk youth, and tertiary prevention targets youth involved in criminal activities and/or currently a member of a youth gang. Gang intervention programs specifically target active gangs and gang members. Finally suppression programs, usually through specialized gang enforcement units, target gang members and their criminal activities with aggressive enforcement of laws.
Based on available gang research and program evaluation, the Public Safety Canada report concluded that suppression strategies in isolation, incarceration of youth gang members, Gang Resistance Education and Training (G.R.E.A.T) Program – a primary prevention program, and detached worker programs do not work. On the other hand, specific programs such as the Office of Juvenile Justice and Delinquency Prevention Comprehensive Gang Model, Boston Gun Project and Operation Ceasefire, Philadelphia’s Youth Violence Reduction Partnership (YVRP) were found to be promising. The report summarized the key ingredients of promising strategies – the program-related elements that would likely contribute to the effectiveness of gang-related programs:
• Strategic Planning – Clearly define the goals and objectives of the program to improve co-ordination and co-operation of multi-agency and multi-disciplinary resources; effective allocation of resources.
• Accurate and Thorough Diagnosis of the Problem – Supplement a general knowledge of
the nature and scope of youth gangs with information on crime, victimization, and gang-related social problems specific the community.
159 Hill, et al. (2001) 160 Public Safety Canada. (2007). Addressing Youth Crime Problems: An Overview of Programs and Practices. 2007-YG-3. (Retrieved from www.publicsafety.gc.ca/ncpc)
22000088 EEnnvviirroonnmmeennttaall SSccaann
Youth Crime 100
• Comprehensive and Integrated Approach – The most effective approach to addressing youth gangs incorporates multi-sectoral and multi-agency involvement in a combination of prevention, intervention, and suppression.
• Multi-Sectoral and Multi-Agency Approach – Based on identified risk- and protective-
factors in gang involvement that cut across all social systems and services; the approach to the youth gang problem must recognize the contribution of all key community sectors – criminal justice, housing, recreation, social services, child welfare, education, community groups, church groups, etc.
• Establishing a Lead Agency and Co-ordination – A central lead agency should be
identified to co-ordinate the program components and monitoring.
• Proper Targeting and Different Levels of Intervention – The targets, youth involved in gangs and specific gangs as a unit, should be specifically identified early in the program; the less defined the target, the less effective the project.
In essence, the report recommended a well planned, comprehensive, and multi-agency approach to address the full range of risk-factors identified in gang-involved youth – factors specific to individual characteristics of the youth, peer group, school, family, and community. It is interesting to note that similar recommendations were raised in an Environmental Scan consultation held with a group of Toronto students in the Youth in Policing Initiative (YIPI). A summary of the YIPI consultation is included in the Appendix at the end of this document.
The Toronto Police Service has initiated and participated in a wide range of enforcement and community partnership programs that directly and indirectly have an impact on enforcement, gang membership, and reporting of youth gang activities, for example, the Toronto Anti-Violence Intervention Strategy, the Youth in Policing Initiative (YIPI), School Resource Officers, the Gun and Gang Task Force, Student Crime Stoppers, Student Watch, etc.
RECOMMENDATIONS FOR POLICE SERVICE
• It is essential that commitment to the youth community remains a priority for the Toronto
Police Service and is clearly reflected in resource allocation and in the development and application of effective youth service initiatives and programs.
• While it is understood that juvenile delinquency in general and youth crime specifically have
a complicated network of root causes embedded in the family and other social institutions, it is also clear that no one agency alone can effectively deal with the problem. The need for a multi-disciplinary approach requires the police, schools, other government departments, and community agencies to work in partnership, each delivering service in their area of specialization that matches the needs of specific young offenders at different stages of delinquency. It is essential that the infrastructure for such partnerships continue to be developed and maintained.
22000088 EEnnvviirroonnmmeennttaall SSccaann
Youth Crime 101
• The Youth Referral Program funded by the Justice Department provided much flexibility in
terms of alternatives other than court proceedings to address the different needs of specific young offenders before the laying of charges by the police. With the expiration of the funding at the end of 2003, the Referral Program ceased. It is essential that resources are sought and allocated to maintain this or a similar pre-charge diversion program to benefit young offenders appropriate for such mode of intervention.
• A clear understanding of the nature and extent of youth crime, youth violence, and youth
gangs is essential for the development of effective initiatives to address such issues. It is important that resources continue to be deployed to enable the development and maintenance of an information system that allows detailed analysis of police arrest and related data for understanding the nature of youth crime. There is a need for analysis that will consistently and reliably answer basic questions about youth crime – who the young offenders are, who they victimized, the circumstances under which the crime occurred, and common factors among young offenders in connection with their delinquency.
• There is an identified need to encourage the reporting of youth violence and, in particular,
gang-related violence. The Toronto Police Service must continue to encourage and expand anonymous, low-risk reporting mechanisms across the city.
• Police must continue to address the behaviour of repeat and persistent offenders through
programs such as the Serious Teen Offender Program (STOP). This program, by monitoring the activities of youth at high risk of re-offending and providing comprehensive case information to assist in developing intervention and supervision activities, helps to prevent high-risk youth from ‘falling through the cracks’.
• There is the need to collect and maintain data to enable evaluation of the Service’s youth
initiatives and specific programs, such as diversion, with regard to their effectiveness in addressing crime and recidivism.
• The police must undertake, in conjunction with other stakeholders, a comprehensive
communication program aimed at educating the community about youth issues – the positive contribution of youth to our community, the challenges youth face, the community’s responsibility to youth, and stressing, in particular, the relatively few youths that are involved in crime and the even fewer youths that are involved in violent crime. The community’s perception of youth must be changed to more closely reflect the majority of youths rather than the minority of youths who are responsible for youth crime.
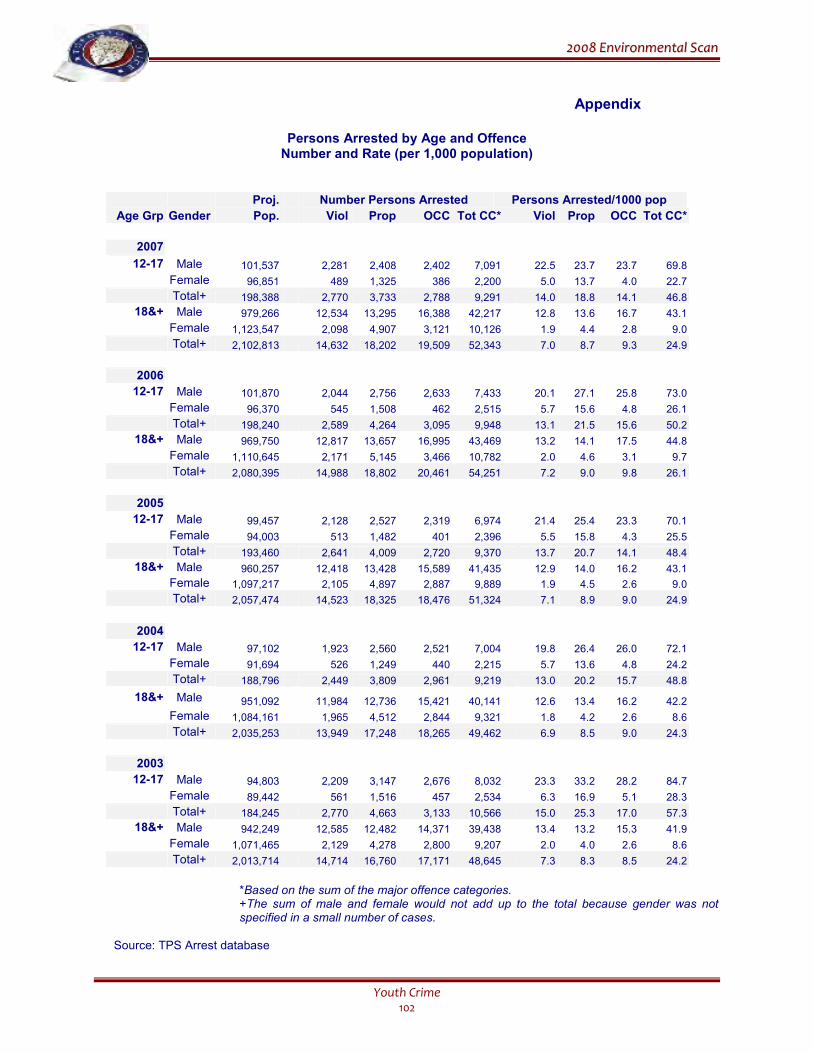
22000088 EEnnvviirroonnmmeennttaall SSccaann
Youth Crime 102
Appendix
Persons Arrested by Age and Offence Number and Rate (per 1,000 population)
Proj. Number Persons Arrested Persons Arrested/1000 pop
Age Grp Gender Pop. Viol Prop OCC Tot CC* Viol Prop OCC Tot CC*
2007
12-17 Male 101,537 2,281 2,408 2,402 7,091 22.5 23.7 23.7 69.8
Female 96,851 489 1,325 386 2,200 5.0 13.7 4.0 22.7
Total+ 198,388 2,770 3,733 2,788 9,291 14.0 18.8 14.1 46.8
18&+ Male 979,266 12,534 13,295 16,388 42,217 12.8 13.6 16.7 43.1
Female 1,123,547 2,098 4,907 3,121 10,126 1.9 4.4 2.8 9.0
Total+ 2,102,813 14,632 18,202 19,509 52,343 7.0 8.7 9.3 24.9
2006
12-17 Male 101,870 2,044 2,756 2,633 7,433 20.1 27.1 25.8 73.0
Female 96,370 545 1,508 462 2,515 5.7 15.6 4.8 26.1
Total+ 198,240 2,589 4,264 3,095 9,948 13.1 21.5 15.6 50.2
18&+ Male 969,750 12,817 13,657 16,995 43,469 13.2 14.1 17.5 44.8
Female 1,110,645 2,171 5,145 3,466 10,782 2.0 4.6 3.1 9.7
Total+ 2,080,395 14,988 18,802 20,461 54,251 7.2 9.0 9.8 26.1
2005
12-17 Male 99,457 2,128 2,527 2,319 6,974 21.4 25.4 23.3 70.1
Female 94,003 513 1,482 401 2,396 5.5 15.8 4.3 25.5
Total+ 193,460 2,641 4,009 2,720 9,370 13.7 20.7 14.1 48.4
18&+ Male 960,257 12,418 13,428 15,589 41,435 12.9 14.0 16.2 43.1
Female 1,097,217 2,105 4,897 2,887 9,889 1.9 4.5 2.6 9.0
Total+ 2,057,474 14,523 18,325 18,476 51,324 7.1 8.9 9.0 24.9
2004
12-17 Male 97,102 1,923 2,560 2,521 7,004 19.8 26.4 26.0 72.1
Female 91,694 526 1,249 440 2,215 5.7 13.6 4.8 24.2
Total+ 188,796 2,449 3,809 2,961 9,219 13.0 20.2 15.7 48.8
18&+ Male 951,092 11,984 12,736 15,421 40,141 12.6 13.4 16.2 42.2
Female 1,084,161 1,965 4,512 2,844 9,321 1.8 4.2 2.6 8.6
Total+ 2,035,253 13,949 17,248 18,265 49,462 6.9 8.5 9.0 24.3
2003
12-17 Male 94,803 2,209 3,147 2,676 8,032 23.3 33.2 28.2 84.7
Female 89,442 561 1,516 457 2,534 6.3 16.9 5.1 28.3
Total+ 184,245 2,770 4,663 3,133 10,566 15.0 25.3 17.0 57.3
18&+ Male 942,249 12,585 12,482 14,371 39,438 13.4 13.2 15.3 41.9
Female 1,071,465 2,129 4,278 2,800 9,207 2.0 4.0 2.6 8.6
Total+ 2,013,714 14,714 16,760 17,171 48,645 7.3 8.3 8.5 24.2
*Based on the sum of the major offence categories. +The sum of male and female would not add up to the total because gender was not specified in a small number of cases.
Source: TPS Arrest database
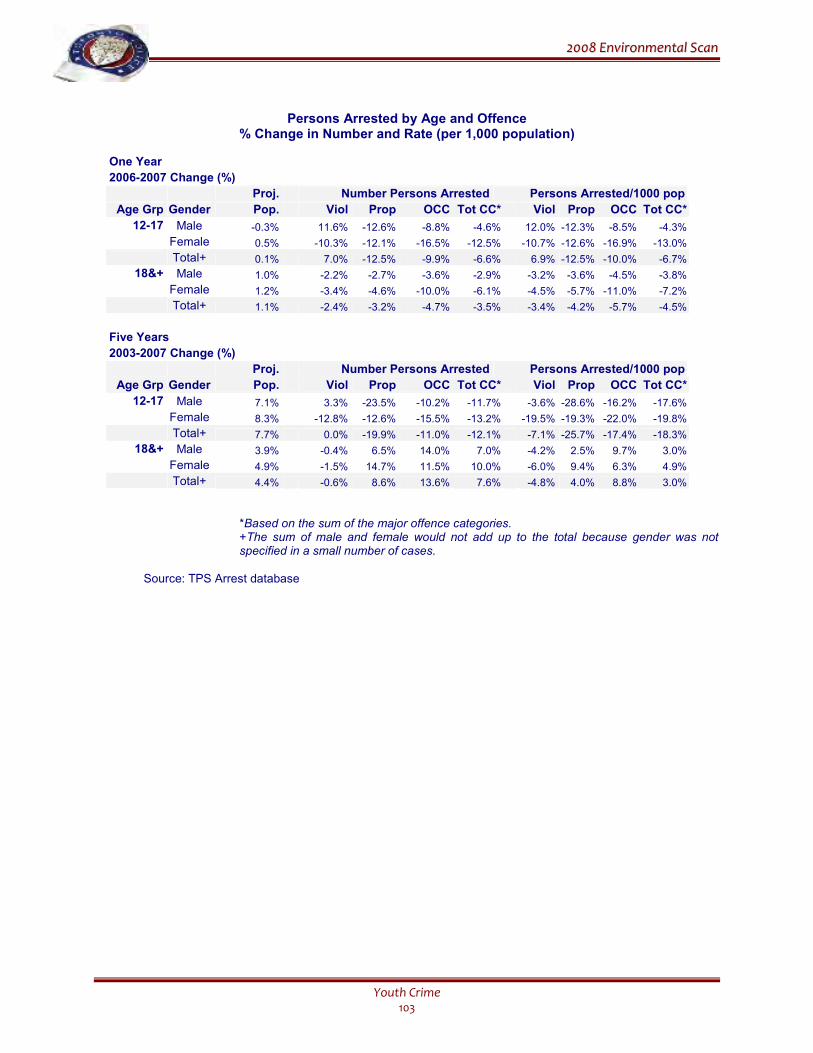
22000088 EEnnvviirroonnmmeennttaall SSccaann
Youth Crime 103
Persons Arrested by Age and Offence
% Change in Number and Rate (per 1,000 population)
One Year
2006-2007 Change (%)
Proj. Number Persons Arrested Persons Arrested/1000 pop
Age Grp Gender Pop. Viol Prop OCC Tot CC* Viol Prop OCC Tot CC*
12-17 Male -0.3% 11.6% -12.6% -8.8% -4.6% 12.0% -12.3% -8.5% -4.3%
Female 0.5% -10.3% -12.1% -16.5% -12.5% -10.7% -12.6% -16.9% -13.0%
Total+ 0.1% 7.0% -12.5% -9.9% -6.6% 6.9% -12.5% -10.0% -6.7%
18&+ Male 1.0% -2.2% -2.7% -3.6% -2.9% -3.2% -3.6% -4.5% -3.8%
Female 1.2% -3.4% -4.6% -10.0% -6.1% -4.5% -5.7% -11.0% -7.2%
Total+ 1.1% -2.4% -3.2% -4.7% -3.5% -3.4% -4.2% -5.7% -4.5%
Five Years
2003-2007 Change (%)
Proj. Number Persons Arrested Persons Arrested/1000 pop
Age Grp Gender Pop. Viol Prop OCC Tot CC* Viol Prop OCC Tot CC*
12-17 Male 7.1% 3.3% -23.5% -10.2% -11.7% -3.6% -28.6% -16.2% -17.6%
Female 8.3% -12.8% -12.6% -15.5% -13.2% -19.5% -19.3% -22.0% -19.8%
Total+ 7.7% 0.0% -19.9% -11.0% -12.1% -7.1% -25.7% -17.4% -18.3%
18&+ Male 3.9% -0.4% 6.5% 14.0% 7.0% -4.2% 2.5% 9.7% 3.0%
Female 4.9% -1.5% 14.7% 11.5% 10.0% -6.0% 9.4% 6.3% 4.9%
Total+ 4.4% -0.6% 8.6% 13.6% 7.6% -4.8% 4.0% 8.8% 3.0%
*Based on the sum of the major offence categories. +The sum of male and female would not add up to the total because gender was not specified in a small number of cases.
Source: TPS Arrest database

22000088 EEnnvviirroonnmmeennttaall SSccaann
Youth Crime 104
22000088 EEnnvviirroonnmmeennttaall SSccaann
Victims & Witnesses 105
IV. VICTIMS & WITNESSES
Understanding trends in victimization is important to effective proactive policing.
Examining issues such as risk and vulnerability to crime can aid in understanding
victimization trends, reducing crime, and easing the fear of crime. Supporting an
environment that eases the fear and pressures that victims and witnesses face is critical to
reducing crime and to maximising the effects of policing and the justice system. Patterns of
victimization have implications for the protection of and services provided to victims, for
the allocation of police resources, and for the success of initiatives directed at reducing
crime.
HIGHLIGHTS • Of seventeen Census Metropolitan Areas (CMAs) studied by Statistics Canada in the 2004
General Social Survey (GSS), the Toronto CMA had the fourth lowest total victimization rate, equal to Vancouver, but higher than St. Johns, Montreal, and Quebec. The highest victimizations rates occurred in Halifax and Edmonton.
• The GSS found that men and women experienced comparable overall violent victimization
rates in Canada. In 2004, there were 111 violent incidents per 1,000 men, compared to 102 per 1,000 for women. However, the rate of sexual assault was five times higher for women than for men, while the rates of both assault and robbery were higher for men than for women.
• According to the 2004 GSS, the proportion of victimization incidents reported to the police
was lowest in Ontario and highest in Quebec. Those aged 15 to 24 years were the least likely age group to report victimization to the police. With regard specifically to the reporting of violent victimization, robbery and assault were most likely to be reported (46% for robbery and 39% for assault), while sexual assaults were the least likely at 8%.
• According to research in the US, youth were willing to report crimes if an injured victim
needed help, when the crime was intended for themselves or a family member, or if they felt there was little chance for the offenders to identify them.
• Toronto Police Service data indicate that the overall number of victims of selected violent
crimes decreased 2.4%, to 32,903 victims in 2007 from 33,707 in 2006, and decreased 1.1% from 1998 when there were 33,269 victims.
• When examining the rate of victimization, it was found that overall victimization by the
selected violent crimes decreased 3.2%, to 12.0 victims per 1,000 people in 2007 from 12.4 victims per 1,000 in 2006. The rate per 1,000 population in 2007 was the lowest rate in 10 years.
• The rate of assault against women in 2007 was 8.4 per 1,000, 10.6% lower than the 9.4 in
1998. The rate of assault against men in 2007 was 9.9 per 1,000, 14.7% lower than the 11.6 in 1998.
22000088 EEnnvviirroonnmmeennttaall SSccaann
Victims & Witnesses 106
• In contrast, the rate of robberies against men increased 6.7% between 1998 and 2007, from 3.0 to 3.2 per 1,000. The rate of robberies against women, however, decreased 14.3%, from 1.4 in 1998 to 1.1 per 1,000 in 2007.
• In Toronto, 18-24 year olds had the highest rates of violent victimization for the past four
years. • Focus groups with domestic violence survivors conducted for the TPS found that reasons for
not calling the police included: fear that the situation would escalate if there was outside intervention; belief that the incident was an isolated one; preference in seeking support and assistance from religious leaders; concerns that the survivor was somehow responsible for the situation; and, concerns that family and community members would judge the survivor and his or her partner harshly.
• According to the Service’s communications (I/CAD) database, the number of calls for
domestics attended by officers in 2007 decreased 1.2% from 2006 and 16.0% from 1998. The average time spent by officers at these types of calls, however, continued to increase from 2.3 hours in 1998 to 4.7 hours in 2007.
• According to I/CAD, the number of calls for domestic assaults attended by officers in 2007,
also decreased, 5.2% from 2006 and 45.1% from 1998. The average amount of time spent by officers at these calls also increased, from 3.5 hours in 1998 to 7.4 hours in 2007.
• Total harassment (stalking) incidents reported to the Toronto Police Service increased 120%
from 1998 to 2007, from 1,183 to 2,599 incidents. While most victims in each of the past ten years were female, this proportion decreased over the ten-year period, from 83.1% in 1998, to 76.0% in 2007.
• Those living on the street do not have permanent housing, which is an important feature of
protection from crime. Their exposure to victimization is enhanced by their concentration in highly populated urban areas, and many homeless occupy unsafe places that attract motivated offenders and offer little guardianship. The homeless are also more likely to be in positions where they witness crimes, and their direct and indirect contact with crime makes the homeless more fearful of crime and concerned about their vulnerability.
• In Toronto, there were a total of 130 hate/bias occurrences reported in 2007, the lowest of the
past decade. The number in 2007 was 19.7% lower than 162 hate crimes in 2006, and 43.0% lower than the 228 hate crimes in 1998. In 2007, the single communities most targeted in 2007 were the Black and Jewish communities.
• In 2007, the Victim Services Program assisted 15,872 victims by telephone, an increase of
4.0% compared to 2006. On-scene assistance was provided in 20.2% of cases.
22000088 EEnnvviirroonnmmeennttaall SSccaann
Victims & Witnesses 107
A. VICTIMIZATION IN CANADA
Canada and its cities, such as Toronto, are true multicultural societies. People of all
backgrounds, from different continents, cultures, and religions have settled in and call Canada home. Different countries have different crime concerns and different views of the justice system and policing, and as a result many newcomers to Canada may have predetermined views of victimization, crime, and police. As the Service strives to continue to provide equitable and respectful service to people of all backgrounds, it is important to understand victimization in Canada and how it is similar to and differs from other countries.
In 2005, the International Crime Victims Survey (ICVS) was completed for the fifth time; in 15 years, more than 300,000 people have been interviewed about property and personal victimization. The 2004/2005 study involved a survey of 30 countries including Canada, and 33 capital or main cities, comparing the results with those from 1989, 1992, 1996, and 2000.161
With regard to overall victimization levels in 2004/05, about 16% of the population of the 30 participating countries had been a victim of crime in the past year. Canada, along with the United States (US), Australia, and Sweden, had rates near the average (16%), and all dropped several places in the overall rankings, showing lower victimization rates compared to earlier surveys. The highest victimization rates occurred in Ireland, England & Wales, New Zealand, and Iceland. Spain, Japan, Hungary, and Portugal had the lowest rates.162
Over the past ten years, the differences between Canada, the US, Australia, and Western and Central Europe with regard to the levels of victimization have narrowed, and have dropped. Although not attributable to a single factor, it is generally believed that changing demographics, among other factors, have played a causal role in the decreases. The majority of common crime involves young males, and the proportion of this demographic (15 to 24 years) has decreased in a number of the countries studied.163
Also in 2004, Statistics Canada conducted its fourth Canada-wide survey on victimization, interviewing approximately 24,000 people living in the ten provinces. According to the 2004 General Social Survey (GSS), 28% of Canadians aged 15 and older reported being victimized by crime one or more times in the previous year.164 This represented an increase of 2% from the 1999 GSS. Approximately 40% of the victims indicated they were victimized multiple times: 19% were victimized twice over the previous year, while 20% were victimized three or more times. Violent offences represented 29% of the victimization incidents. For every 1,000 Canadians 15 years old or over, there were about 106 violent victimizations, which was slightly lower than the rate of 111 per 1,000 in 1999.
Rates of violent victimization differed across Canada, with the two highest violent victimization rates in 2004 occurring in Alberta and Nova Scotia (160 per 1,000 and 157 per 1,000, respectively). The remaining western provinces accounted for the next highest rates,
161 Van Dijk, S., Van Kesteren, J., & Smit, P. (2007). Criminal Victimization in International Perspective: Key findings from the 2004-2005 ICVS and EU ICS. (Retrieved May 12th, 2008, from http://www.unicri.it/wwd/ analysis/icvs/pdf_files/ICVS2004_05report.pdf) 162 Ibid. 163 Ibid. 164 Gannon, M. & Mihorean, K. (2005). Criminal Victimization in Canada, 2004. Juristat (Canadian Centre for Justice Statistics, Statistics Canada), 25(7).
22000088 EEnnvviirroonnmmeennttaall SSccaann
Victims & Witnesses 108
while Quebec (59 per 1,000) had the lowest violent victimization rate. Ontario ranked 6th with 112 violent incidents per 1,000 people.165
Of seventeen Census Metropolitan Areas (CMAs) studied by Statistics Canada, the Toronto CMA had the fourth lowest violent victimization rate at 107 incidents per 1,000, equal to Vancouver, but higher than St. Johns (70 per 1,000), Montreal (64 per 1,000), and Quebec (55 per 1,000)166. The highest violent victimization rates for CMAs occurred in Halifax (229 per 1,000) and Edmonton (191 per 1,000), illustrating the effect that urban rates of victimization have on the overall provincial rates.167
A number of personal and lifestyle characteristics can contribute to an increased risk of victimization, including: gender, age, marital status, frequency of night-time activities, household income, and location of residence.168 In 2004, as in the 1999 GSS, men and women experienced comparable overall violent victimization rates in Canada. In 2004, there were 111 violent incidents per 1,000 men, compared to 102 per 1,000 for women. There were some differences, however. The rate of sexual assault was five times higher for women than for men (35 per 1,000 women compared to 7 per 1,000 men), while the rates for assault and robbery were both higher for men than for women (assault: 91 compared to 59 per 1,000; robbery: 13 compared to 8 per 1,000). Compared to previous GSS results, the only significant change occurred in assaults: the rate for women decreased from 70 per 1,000 in 1999 to 59 per 1,000 in 2004.
Rates of victimization in Canada continued to be highest among young people (15-24 years old). At 226 per 1,000, their violent victimization rate was one and a half to nineteen times greater than the rates for other age groups. Victimization steadily declined as age increased, and rates were lowest for those 65 years and older (12 per 1,000).
With regard to lifestyle characteristics, those who reported being involved in 30 or more evening activities in a given month were most likely to be victimized by a violent crime, and their rate was four times higher than those who participated in less than 10 evening activities in a month. Furthermore, those who were single were more likely to be victimized than married people; those who were looking for work and student were more likely to be victimized than retired people; those who lived in households with incomes less than $15,000 were at least one and a half times more likely than those in higher income brackets to be victims of violent crime; and, those who living in urban areas had higher violent victimization rates than those in rural areas.
The GSS also looked at violence among diverse populations by examining the rates of victimization experienced by visible minorities, immigrants (including recent immigrants), and Aboriginal people. Aboriginal people were found most likely to be victimized: they were three times more likely than non-Aboriginal people to be victims of a violent incident (319 per 1,000 compared to 101 per 1,000). The risk of violent victimization for visible minorities did not significantly differ from that of non-visible minority people (98 per 1,000 for visible minorities compared to 107 per 1,000 for non-visible minority people). The victimization rate for immigrants was lower than that for non-immigrants (68 per 1,000 compared to 116 per 1,000),
165 Ibid. 166 The Toronto CMA extends from Ajax to Oakville, and north to Newmarket, and includes the following municipalities: Ajax, Aurora, Bradford, West Gwillimbury, Brampton, Caledon, East Gwillimbury, Georgina, Halton Hills, King, Markham, Milton, Mississauga, Mono, New Tecumseh, Newmarket, Oakville, Orangeville, Pickering, Richmond Hill, Toronto, Uxbridge, Vaughan, and Whitchurch-Stouffville. 167 Gannon & Mihorean (2005). 168 Ibid.
22000088 EEnnvviirroonnmmeennttaall SSccaann
Victims & Witnesses 109
and the reduction was even more pronounced for those who had recently immigrated to Canada (since 1999): for immigrants who arrive before 1999, the rate was 71 per 1,000 population compared to 53 per 1,000 for those arriving since 1999. One possible reason for the lower rate for immigrants may have been that the immigrant population tended to be older, which is a factor associated with less victimization.169
Further to Canada-wide studies, and in keeping with the diverse population within the city, it may be beneficial for the Service to consider a more comprehensive collection of victimization information, examining backgrounds and personal characteristics. Findings of variations in victimization rates for diverse communities could yield information that could help to guide prevention and education programs, enforcement, and mobilization efforts in the city.
B. REPORTING VICTIMIZATION TO THE POLICE
In addition to the importance of reporting crimes to the police for safety and for justice, reporting rates can be an important measure of the quality of the community’s relationship with the police, and can be an objective, behavioural measure of public confidence and trust in a police service.
On a world-wide scale, reporting rates continue to be a challenge for many countries, including Canada. According to the latest International Crime Victims Survey (ICVS), reporting rates have gone down in Canada, Belgium, Scotland, England & Wales, the Netherlands, France, New Zealand, and the US in recent years. The ICVS found that in Canada, an average of 48% of property crime was reported, down from 55% in 1988. The highest reporting rates were found in Austria (70%), Belgium (68%), Sweden (64%) and Switzerland (63%).170
The most important reason given by respondents to the ICVS survey for not reporting (specific to burglary) was that the incident was not serious enough (34%). An additional 21% said that the police couldn’t do anything, and 20% said that the police wouldn’t do anything.
The 2004 GSS indicated that, in Canada, only about 34% of criminal victimization was reported to police, down from 37% in 1999. The GSS found regional variations in the decision to contact police; differences in the amount of time required to report and in the ease of reporting may be considered by victims and could have affected the differing reporting rates across the provinces. In 2004, the proportion of victimization incidents reported to the police was highest in Quebec and lowest in Ontario: 40% of victimization incidents were reported to police in Quebec in 2004, 10% more than 30% in Ontario. The average rate for the provinces was 34%.171
With regard specifically to the reporting of violent victimization, 33% of incidents were reported to police in Canada in 2004, slightly higher than the 31% in 1999. Robbery and assault were most likely to be reported (46% for robbery and 39% for assault), while sexual assaults were the least likely at 8%. The reason most often sited for reporting a violent victimization to the police was that the victim felt it was their duty (83% of incidents). Other common reasons were that the victim wanted the offender arrested or punished (74%), and that the person wanted the violence to stop or wanted protection (70%).
169 Ibid. 170 Van Dijk, et al. (2007). 171 Gannon & Mihorean (2005).
22000088 EEnnvviirroonnmmeennttaall SSccaann
Victims & Witnesses 110
Incidents where the victim was injured were about one and a half times more likely to be reported to police than incidents that did not involve injuries (47% compared to 28%). Young victims were found to be the least likely to report victimization to the police (24% of those 15-24 years old), and men reported more often than women (38% compared to 26%).172
Of the 66% of violent victimizations that were not reported to the police, most (60%) indicated they’d not reported because they’d dealt with the incident in another way. Other common reasons included: the victim didn’t feel the incident was important enough (53%); they didn’t want police involved (42%); they felt it was a personal matter (39%); or, they didn’t think the police could do anything about it (29%).173
Although a number of victims did not report violent incidents to police or other formal agencies, the GSS found that the majority of victims (90%) turned to informal supports to deal with their victimization. In about 75% of incidents, victims told a friend or neighbour, in 60% they told family, and in about 47% of incidents they told a co-worker.
The Service’s 2007 survey of Toronto residents, presented in more detail in the Public Perceptions chapter, found that 6% of respondents said they’d been the victim of crime in Toronto in the past year, down from 8% in 2006 and 11% in 2005.
In 2007, most of the respondents who were victimized said they’d been victims of ‘home broken into’ or ‘assault’, while in 2006 respondents said they were victims of ‘robbery’ or ‘home broken into’. In 2005, respondents said they were victims of ‘home broken into’ or ‘damage to car/vehicle’. About one-third (34%) of these respondents in 2007 said they did not report the crime to police, up from 28% in 2006 and from 30% in 2005. The most common reason for not reporting in 2007 was ‘sorted things out myself/dealt with it myself’, while in previous years the main reason for not reporting the crime was ‘not serious enough/minor incident’.
Building on the research into trends and attitudes associated with reporting victimization, it is important that the Service work towards making the reporting of crime an easier process, where possible, perhaps through technology such as Internet reporting, and through Service efficiencies. Education efforts must also continue to encourage individuals and communities to report crimes and victimization, especially those who may be particularly reluctant to do so. Community mobilization efforts may also play a part, as the duty to report a crime may move from beyond the individual to include a sense of responsibility to their neighbours.
C. WITNESSES OF CRIME
Supporting victims of crime requires the concerted effort of police, the justice system,
formal and informal agencies, and members of the community. Witnesses to crime play an essential role in the protection of victims, the capture of offenders, and the prosecution of crime.
A witness’s role can often be very stressful and demanding. Research has found that witnesses seldom find giving evidence a positive experience.174 In addition, witnesses may not
172 Ibid. 173 Ibid. 174 Moody, S. (2005). Vulnerable Witnesses: Rights and Responsibilities. Paper presented at the 19th
International Conference of the International Society for the Reform of Criminal Law, June 2005, Edinburgh. (Retrieved May 22nd, 2008, from http://www.isrcl.org/Papers/2005/Moody.pdf)
22000088 EEnnvviirroonnmmeennttaall SSccaann
Victims & Witnesses 111
understand the laws of evidence, procedure, and what is expected of them. They sometimes have to wait for extended periods in uncomfortable surroundings and may have the added pressures of fear of retaliation, and of themselves being penalized for not testifying.
Traditionally, child witnesses are those most associated with being ‘vulnerable’ witnesses, and special procedures such as CCTV have been employed to assist in the stresses of testimony. According to research on vulnerable victims and witnesses presented at the 19th International Conference of the International Society for the Reform of Criminal Law, new definitions with regard to vulnerable witnesses that acknowledge the witnesses’ personal characteristics, vulnerability arising from the nature or circumstance of the offence, and the exposure to intimidation regardless of the age or mental capacity of a person, may enable witnesses to give evidence who might otherwise not do so. It may even be the process itself that renders them vulnerable and in need of special measures.175
A 2006 study by the Home Office in the United Kingdom (UK), found that with regard to the identification of vulnerable and intimidated witnesses, early identification by the police was vital but that police had difficulty in identifying witnesses with learning disabilities, mental disorders, or those who were intimidated.176 Many of these vulnerable witnesses were identified for the first time by Witness Services when they arrived at court, which was often too late for them to benefit from special measures. Once again, there was a hierarchy of identification where children and victims of sexual offenders were more likely identified as vulnerable.
The research identified three problems. First was the failure to identify large numbers of witnesses as vulnerable and intimidated. Second, even among those who were identified, there was an unmet need for special measures or the wrong measures were provided, largely due to lack of resources and/or poor advice given to witnesses by police and prosecutors who lacked the necessary knowledge or understanding. And third, pre-trial stages tended to be neglected, with the focus more on court, affecting mainly the learning disabled, physically disabled, mentally ill, intimidated adults, and many older children; pre-court visits would have help to improve identification of vulnerable/intimidated witnesses and correct misinformation. Some of the report’s recommendations aimed at police included the need for better training in the recognition of vulnerable and intimidated witnesses, monitoring of witnesses by police, a more sophisticated inter-agency monitoring and feedback system, and more use made of Witness Services as a point of contact for witnesses, relieving pressure on police at an earlier stage.177
In 2007, the National Center For Victims of Crime in the US released a report called Snitches Get Stitches, which discussed the results of a study aimed at better understanding the intimidation of teen and young adult witnesses in gang-related cases.178 The researchers gathered information through an on-line survey of 641 youth aged 12-20 years, in-person interviews with 39 youth aged 13-21 years, and interviews with 7 public officials. The study gathered information that included the prevalence and effect of gangs in the youths’
175 Ibid. 176 Burton, M., Evans, R. & Sanders, A. (2006). Are Special Measures for Vulnerable and Intimidated Witnesses Working? Evidence from the Criminal Justice Agencies. Home Office Online Report 01/06. (Retrieved May 27th, 2008, from http://www.homeoffice.gov.uk/rds/pdfs06/rdsolr0106.pdf) 177 Ibid. 178 Whitman, J.L. & Davis, R.C. (2007). Snitches Get Stitches: Youth, Gangs, and Witness Intimidation in Massachusetts. National Center for Victims of Crime. (Retrieved May 28th, 2008, from http://www.ncvc.org/tvp/ AGP.Net/Components/DocumentViewer/Download.aspxnz?DocumentID=43495)
22000088 EEnnvviirroonnmmeennttaall SSccaann
Victims & Witnesses 112
communities, the critical factors that deterred youth witnesses from reporting gang crimes and testifying against offenders, their relationship with police, and the types of policies and programs they thought would encourage witness and victim co-operation.
Key findings suggested that youth had a high rate of exposure to crimes through direct victimization, the victimization of friends or family, and through witnessing crimes. The three most common crimes experienced by youth were serious threats (20% directly and 44% witnessed), assaults (26% directly and 39% witnessed), and drug activity (16% experienced and 40% witnessed). In addition, youth were most likely to tell a parent or family member about witnessing a crime, and less likely to report it to authorities or police. Only about half of the youth who’d witnessed or experienced gang-related crime told anyone. The most common reasons for not-reporting was that they were concerned about not be seen as a ‘snitch’, that it was not their business, or they were afraid of being assaulted or killed.
Although community norms against ‘snitching’ were strong, youth were still willing to report crimes if an injured victim needed help, when the crime was intended for themselves or a family member, or if youth felt there was little chance of retaliation (i.e. there was no way for the offenders to identify them). Indirect knowledge of witness intimidation was far more common than direct experience, as one in three youth said they had heard about someone being threatened or harmed after reporting or considering reporting a crime. About 12% of the respondents who’d reported gang crimes said they had been threatened or harmed for reporting; none of them reported these threats or harm.
The youth generally expressed great faith in the ability of police to deal with crime, but showed little awareness about their own potential role as a witness in reducing crime. The youth also had suggestions for making crime reporting safer, including: building better relationships between the police and the community; providing confidentiality to witnesses and/or anonymous crime reporting; protecting of witnesses after they report; and dealing with the roots of gang-involvement such as those relating to economics, education, and society.
Although there were tools available to criminal justice officials to reduce or mitigate threats against witnesses, they were found to seldom be used. The tools included charging offenders with witness tampering, revoking bail when threats were made, expediting cases, and capturing witness testimony at early stages to reduce the opportunity for witnesses to become unavailable or unwilling to testify.
The study made several recommendations aimed at criminal justice authorities, to improve the participation of young witnesses in the criminal justice system. These recommendations included: increasing efforts to build trust between the police, youth, and their parents in high-crime neighbourhoods; increasing the safety of crime reporting through anonymity/confidentiality when possible; creating social marketing campaigns to counter ‘stop snitching’ norms, through partnership with youth, parents, and credible spokespeople (e.g. youth, faith leaders, trusted youth workers, etc.); reaching out to parents so they will be convinced that reporting will not harm their children; keeping in touch with witnesses while they are involved in the justice process; and, making more aggressive use of legal tools to protect witnesses.179
Legislative mandates and/or new funding streams can assist local criminal justice agencies, including the Service, to increase collaboration and to shift focus to more strongly emphasize witness safety and protection. The Service will continue to face challenges in the area of witness co-operation. It is important that the Service work with communities, and especially
179 Ibid.
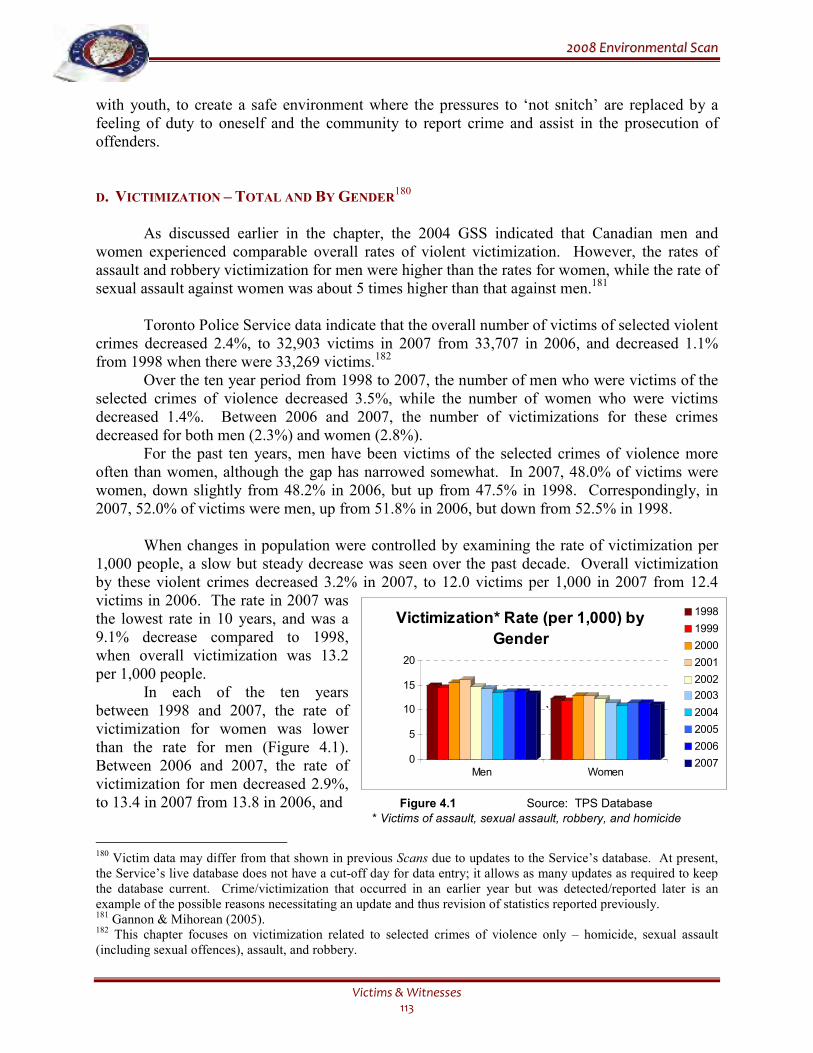
22000088 EEnnvviirroonnmmeennttaall SSccaann
Victims & Witnesses 113
with youth, to create a safe environment where the pressures to ‘not snitch’ are replaced by a feeling of duty to oneself and the community to report crime and assist in the prosecution of offenders. D. VICTIMIZATION – TOTAL AND BY GENDER
180
As discussed earlier in the chapter, the 2004 GSS indicated that Canadian men and
women experienced comparable overall rates of violent victimization. However, the rates of assault and robbery victimization for men were higher than the rates for women, while the rate of sexual assault against women was about 5 times higher than that against men.181
Toronto Police Service data indicate that the overall number of victims of selected violent crimes decreased 2.4%, to 32,903 victims in 2007 from 33,707 in 2006, and decreased 1.1% from 1998 when there were 33,269 victims.182
Over the ten year period from 1998 to 2007, the number of men who were victims of the selected crimes of violence decreased 3.5%, while the number of women who were victims decreased 1.4%. Between 2006 and 2007, the number of victimizations for these crimes decreased for both men (2.3%) and women (2.8%).
For the past ten years, men have been victims of the selected crimes of violence more often than women, although the gap has narrowed somewhat. In 2007, 48.0% of victims were women, down slightly from 48.2% in 2006, but up from 47.5% in 1998. Correspondingly, in 2007, 52.0% of victims were men, up from 51.8% in 2006, but down from 52.5% in 1998.
When changes in population were controlled by examining the rate of victimization per 1,000 people, a slow but steady decrease was seen over the past decade. Overall victimization by these violent crimes decreased 3.2% in 2007, to 12.0 victims per 1,000 in 2007 from 12.4 victims in 2006. The rate in 2007 was the lowest rate in 10 years, and was a 9.1% decrease compared to 1998, when overall victimization was 13.2 per 1,000 people.
In each of the ten years between 1998 and 2007, the rate of victimization for women was lower than the rate for men (Figure 4.1). Between 2006 and 2007, the rate of victimization for men decreased 2.9%, to 13.4 in 2007 from 13.8 in 2006, and Figure 4.1 Source: TPS Database
* Victims of assault, sexual assault, robbery, and homicide
180 Victim data may differ from that shown in previous Scans due to updates to the Service’s database. At present, the Service’s live database does not have a cut-off day for data entry; it allows as many updates as required to keep the database current. Crime/victimization that occurred in an earlier year but was detected/reported later is an example of the possible reasons necessitating an update and thus revision of statistics reported previously. 181 Gannon & Mihorean (2005). 182 This chapter focuses on victimization related to selected crimes of violence only – homicide, sexual assault (including sexual offences), assault, and robbery.
0
5
10
15
20
Men Women
Victimization* Rate (per 1,000) by
Gender
1998
1999
2000
2001
2002
2003
2004
2005
2006
2007
`
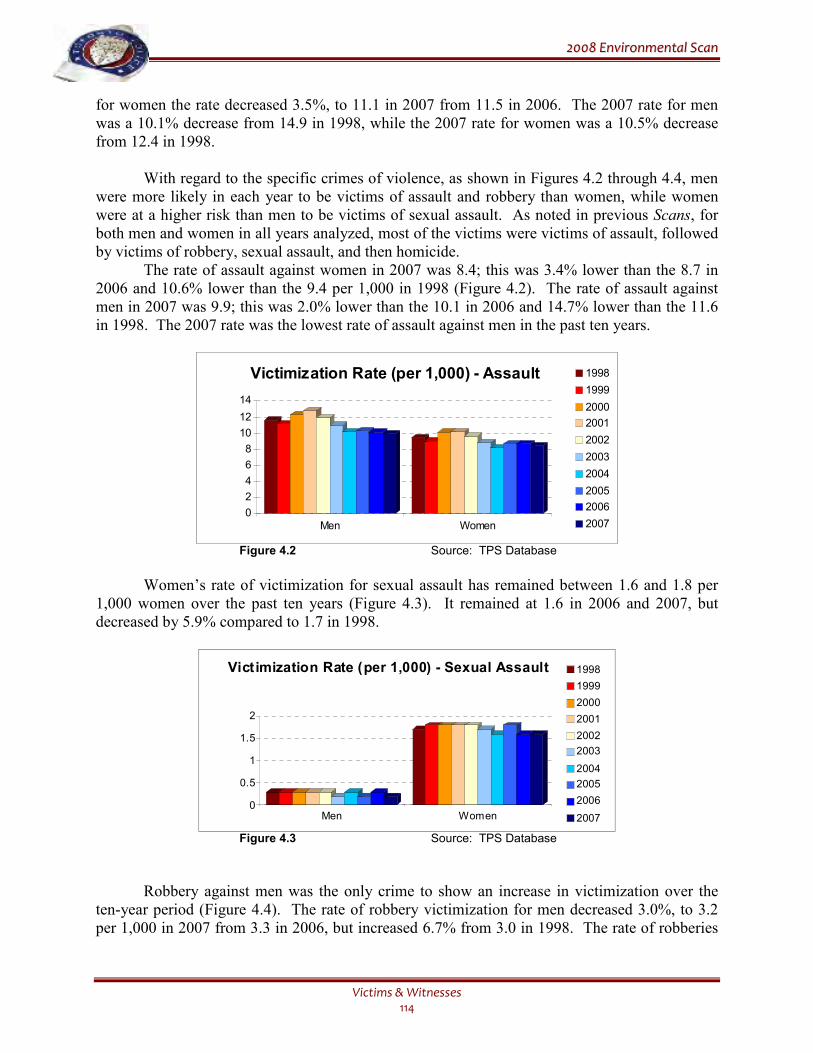
22000088 EEnnvviirroonnmmeennttaall SSccaann
Victims & Witnesses 114
for women the rate decreased 3.5%, to 11.1 in 2007 from 11.5 in 2006. The 2007 rate for men was a 10.1% decrease from 14.9 in 1998, while the 2007 rate for women was a 10.5% decrease from 12.4 in 1998.
With regard to the specific crimes of violence, as shown in Figures 4.2 through 4.4, men were more likely in each year to be victims of assault and robbery than women, while women were at a higher risk than men to be victims of sexual assault. As noted in previous Scans, for both men and women in all years analyzed, most of the victims were victims of assault, followed by victims of robbery, sexual assault, and then homicide.
The rate of assault against women in 2007 was 8.4; this was 3.4% lower than the 8.7 in 2006 and 10.6% lower than the 9.4 per 1,000 in 1998 (Figure 4.2). The rate of assault against men in 2007 was 9.9; this was 2.0% lower than the 10.1 in 2006 and 14.7% lower than the 11.6 in 1998. The 2007 rate was the lowest rate of assault against men in the past ten years.
0
2
4
6
8
10
12
14
Men Women
Victimization Rate (per 1,000) - Assault 1998
1999
2000
2001
2002
2003
2004
2005
2006
2007
Figure 4.2 Source: TPS Database
Women’s rate of victimization for sexual assault has remained between 1.6 and 1.8 per
1,000 women over the past ten years (Figure 4.3). It remained at 1.6 in 2006 and 2007, but decreased by 5.9% compared to 1.7 in 1998.
0
0.5
1
1.5
2
Men Women
Victimization Rate (per 1,000) - Sexual Assault 1998
1999
2000
2001
2002
2003
2004
2005
2006
2007
Figure 4.3 Source: TPS Database
Robbery against men was the only crime to show an increase in victimization over the ten-year period (Figure 4.4). The rate of robbery victimization for men decreased 3.0%, to 3.2 per 1,000 in 2007 from 3.3 in 2006, but increased 6.7% from 3.0 in 1998. The rate of robberies
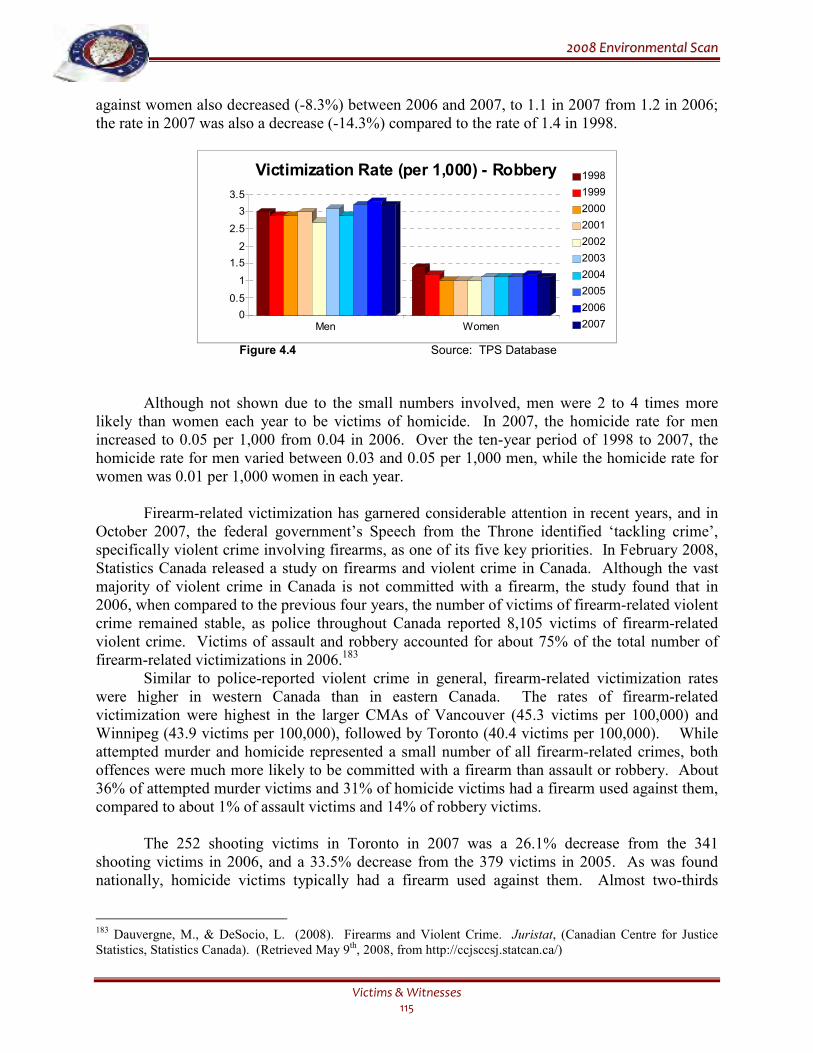
22000088 EEnnvviirroonnmmeennttaall SSccaann
Victims & Witnesses 115
against women also decreased (-8.3%) between 2006 and 2007, to 1.1 in 2007 from 1.2 in 2006; the rate in 2007 was also a decrease (-14.3%) compared to the rate of 1.4 in 1998.
0
0.5
1
1.5
2
2.5
3
3.5
Men Women
Victimization Rate (per 1,000) - Robbery 1998
1999
2000
2001
2002
2003
2004
2005
2006
2007
Figure 4.4 Source: TPS Database
Although not shown due to the small numbers involved, men were 2 to 4 times more likely than women each year to be victims of homicide. In 2007, the homicide rate for men increased to 0.05 per 1,000 from 0.04 in 2006. Over the ten-year period of 1998 to 2007, the homicide rate for men varied between 0.03 and 0.05 per 1,000 men, while the homicide rate for women was 0.01 per 1,000 women in each year.
Firearm-related victimization has garnered considerable attention in recent years, and in October 2007, the federal government’s Speech from the Throne identified ‘tackling crime’, specifically violent crime involving firearms, as one of its five key priorities. In February 2008, Statistics Canada released a study on firearms and violent crime in Canada. Although the vast majority of violent crime in Canada is not committed with a firearm, the study found that in 2006, when compared to the previous four years, the number of victims of firearm-related violent crime remained stable, as police throughout Canada reported 8,105 victims of firearm-related violent crime. Victims of assault and robbery accounted for about 75% of the total number of firearm-related victimizations in 2006.183
Similar to police-reported violent crime in general, firearm-related victimization rates were higher in western Canada than in eastern Canada. The rates of firearm-related victimization were highest in the larger CMAs of Vancouver (45.3 victims per 100,000) and Winnipeg (43.9 victims per 100,000), followed by Toronto (40.4 victims per 100,000). While attempted murder and homicide represented a small number of all firearm-related crimes, both offences were much more likely to be committed with a firearm than assault or robbery. About 36% of attempted murder victims and 31% of homicide victims had a firearm used against them, compared to about 1% of assault victims and 14% of robbery victims. The 252 shooting victims in Toronto in 2007 was a 26.1% decrease from the 341 shooting victims in 2006, and a 33.5% decrease from the 379 victims in 2005. As was found nationally, homicide victims typically had a firearm used against them. Almost two-thirds
183 Dauvergne, M., & DeSocio, L. (2008). Firearms and Violent Crime. Juristat, (Canadian Centre for Justice Statistics, Statistics Canada). (Retrieved May 9th, 2008, from http://ccjsccsj.statcan.ca/)
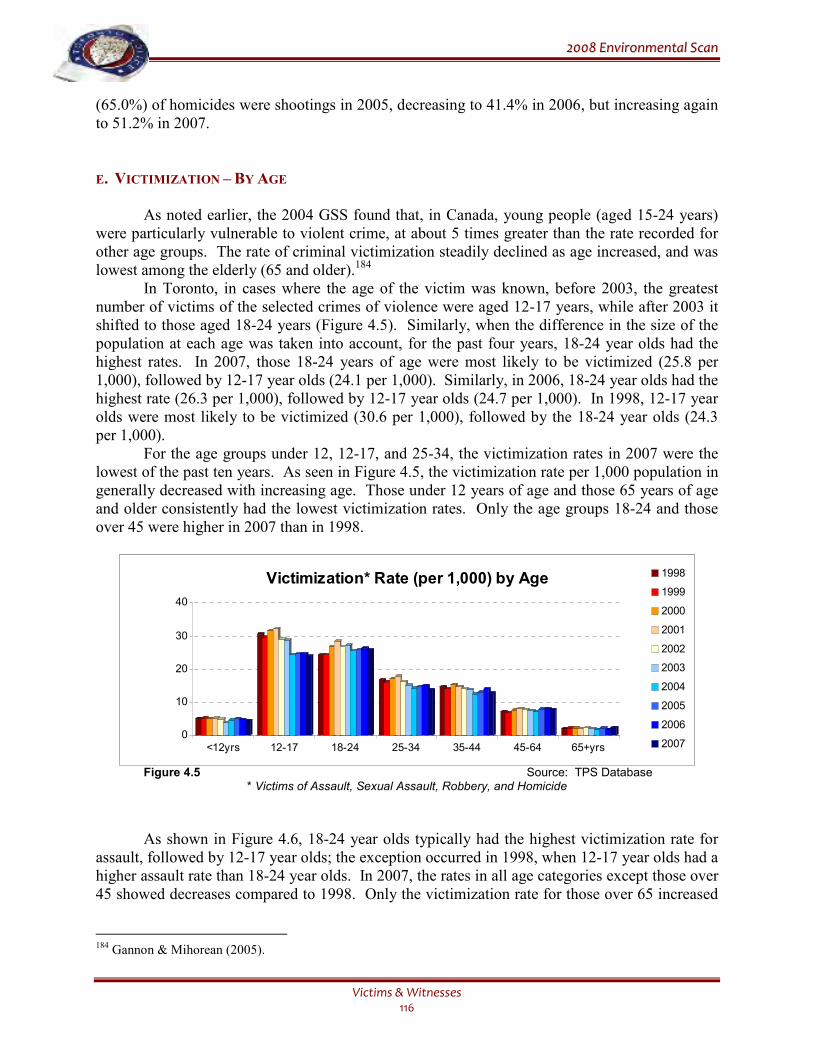
22000088 EEnnvviirroonnmmeennttaall SSccaann
Victims & Witnesses 116
(65.0%) of homicides were shootings in 2005, decreasing to 41.4% in 2006, but increasing again to 51.2% in 2007.
E. VICTIMIZATION – BY AGE
As noted earlier, the 2004 GSS found that, in Canada, young people (aged 15-24 years) were particularly vulnerable to violent crime, at about 5 times greater than the rate recorded for other age groups. The rate of criminal victimization steadily declined as age increased, and was lowest among the elderly (65 and older).184
In Toronto, in cases where the age of the victim was known, before 2003, the greatest number of victims of the selected crimes of violence were aged 12-17 years, while after 2003 it shifted to those aged 18-24 years (Figure 4.5). Similarly, when the difference in the size of the population at each age was taken into account, for the past four years, 18-24 year olds had the highest rates. In 2007, those 18-24 years of age were most likely to be victimized (25.8 per 1,000), followed by 12-17 year olds (24.1 per 1,000). Similarly, in 2006, 18-24 year olds had the highest rate (26.3 per 1,000), followed by 12-17 year olds (24.7 per 1,000). In 1998, 12-17 year olds were most likely to be victimized (30.6 per 1,000), followed by the 18-24 year olds (24.3 per 1,000).
For the age groups under 12, 12-17, and 25-34, the victimization rates in 2007 were the lowest of the past ten years. As seen in Figure 4.5, the victimization rate per 1,000 population in generally decreased with increasing age. Those under 12 years of age and those 65 years of age and older consistently had the lowest victimization rates. Only the age groups 18-24 and those over 45 were higher in 2007 than in 1998.
0
10
20
30
40
<12yrs 12-17 18-24 25-34 35-44 45-64 65+yrs
Victimization* Rate (per 1,000) by Age 1998
1999
2000
2001
2002
2003
2004
2005
2006
2007
Figure 4.5 Source: TPS Database
* Victims of Assault, Sexual Assault, Robbery, and Homicide
As shown in Figure 4.6, 18-24 year olds typically had the highest victimization rate for assault, followed by 12-17 year olds; the exception occurred in 1998, when 12-17 year olds had a higher assault rate than 18-24 year olds. In 2007, the rates in all age categories except those over 45 showed decreases compared to 1998. Only the victimization rate for those over 65 increased
184 Gannon & Mihorean (2005).
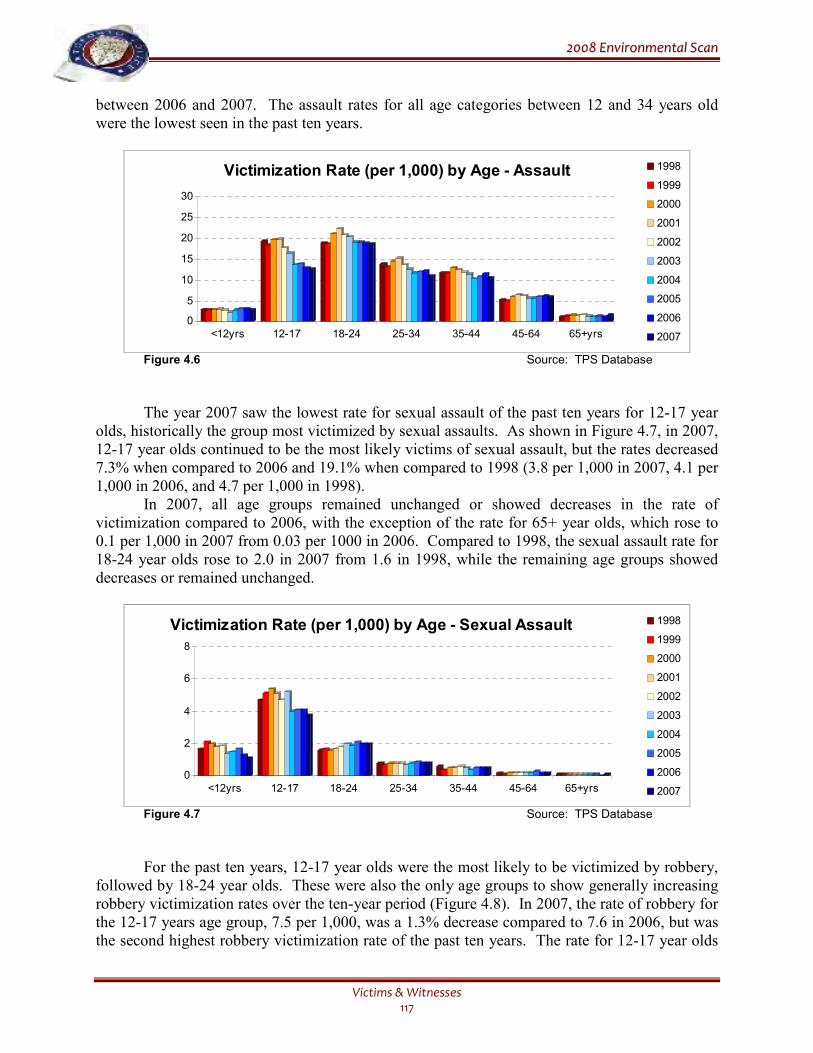
22000088 EEnnvviirroonnmmeennttaall SSccaann
Victims & Witnesses 117
between 2006 and 2007. The assault rates for all age categories between 12 and 34 years old were the lowest seen in the past ten years.
0
5
10
15
20
25
30
<12yrs 12-17 18-24 25-34 35-44 45-64 65+yrs
Victimization Rate (per 1,000) by Age - Assault 1998
1999
2000
2001
2002
2003
2004
2005
2006
2007
Figure 4.6 Source: TPS Database
The year 2007 saw the lowest rate for sexual assault of the past ten years for 12-17 year olds, historically the group most victimized by sexual assaults. As shown in Figure 4.7, in 2007, 12-17 year olds continued to be the most likely victims of sexual assault, but the rates decreased 7.3% when compared to 2006 and 19.1% when compared to 1998 (3.8 per 1,000 in 2007, 4.1 per 1,000 in 2006, and 4.7 per 1,000 in 1998). In 2007, all age groups remained unchanged or showed decreases in the rate of victimization compared to 2006, with the exception of the rate for 65+ year olds, which rose to 0.1 per 1,000 in 2007 from 0.03 per 1000 in 2006. Compared to 1998, the sexual assault rate for 18-24 year olds rose to 2.0 in 2007 from 1.6 in 1998, while the remaining age groups showed decreases or remained unchanged.
0
2
4
6
8
<12yrs 12-17 18-24 25-34 35-44 45-64 65+yrs
Victimization Rate (per 1,000) by Age - Sexual Assault 1998
1999
2000
2001
2002
2003
2004
2005
2006
2007
Figure 4.7 Source: TPS Database
For the past ten years, 12-17 year olds were the most likely to be victimized by robbery, followed by 18-24 year olds. These were also the only age groups to show generally increasing robbery victimization rates over the ten-year period (Figure 4.8). In 2007, the rate of robbery for the 12-17 years age group, 7.5 per 1,000, was a 1.3% decrease compared to 7.6 in 2006, but was the second highest robbery victimization rate of the past ten years. The rate for 12-17 year olds
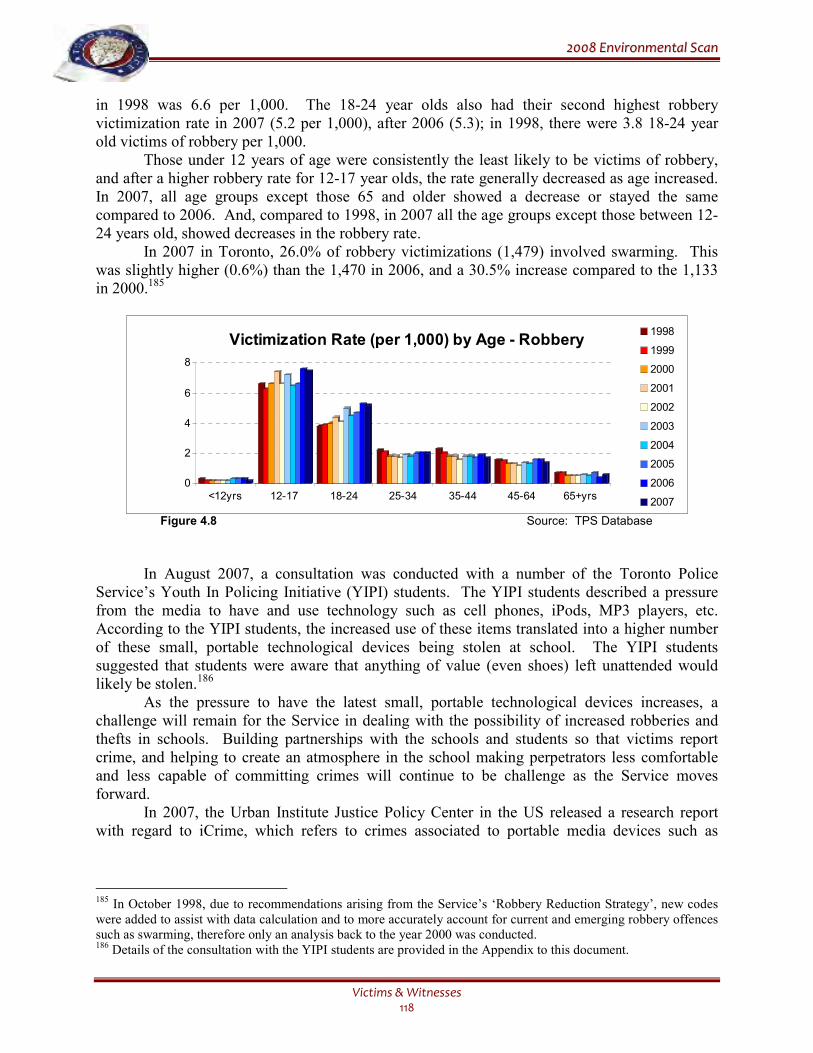
22000088 EEnnvviirroonnmmeennttaall SSccaann
Victims & Witnesses 118
in 1998 was 6.6 per 1,000. The 18-24 year olds also had their second highest robbery victimization rate in 2007 (5.2 per 1,000), after 2006 (5.3); in 1998, there were 3.8 18-24 year old victims of robbery per 1,000. Those under 12 years of age were consistently the least likely to be victims of robbery, and after a higher robbery rate for 12-17 year olds, the rate generally decreased as age increased. In 2007, all age groups except those 65 and older showed a decrease or stayed the same compared to 2006. And, compared to 1998, in 2007 all the age groups except those between 12-24 years old, showed decreases in the robbery rate. In 2007 in Toronto, 26.0% of robbery victimizations (1,479) involved swarming. This was slightly higher (0.6%) than the 1,470 in 2006, and a 30.5% increase compared to the 1,133 in 2000.185
0
2
4
6
8
<12yrs 12-17 18-24 25-34 35-44 45-64 65+yrs
Victimization Rate (per 1,000) by Age - Robbery1998
1999
2000
2001
2002
2003
2004
2005
2006
2007
Figure 4.8 Source: TPS Database
In August 2007, a consultation was conducted with a number of the Toronto Police Service’s Youth In Policing Initiative (YIPI) students. The YIPI students described a pressure from the media to have and use technology such as cell phones, iPods, MP3 players, etc. According to the YIPI students, the increased use of these items translated into a higher number of these small, portable technological devices being stolen at school. The YIPI students suggested that students were aware that anything of value (even shoes) left unattended would likely be stolen.186
As the pressure to have the latest small, portable technological devices increases, a challenge will remain for the Service in dealing with the possibility of increased robberies and thefts in schools. Building partnerships with the schools and students so that victims report crime, and helping to create an atmosphere in the school making perpetrators less comfortable and less capable of committing crimes will continue to be challenge as the Service moves forward.
In 2007, the Urban Institute Justice Policy Center in the US released a research report with regard to iCrime, which refers to crimes associated to portable media devices such as
185 In October 1998, due to recommendations arising from the Service’s ‘Robbery Reduction Strategy’, new codes were added to assist with data calculation and to more accurately account for current and emerging robbery offences such as swarming, therefore only an analysis back to the year 2000 was conducted. 186 Details of the consultation with the YIPI students are provided in the Appendix to this document.
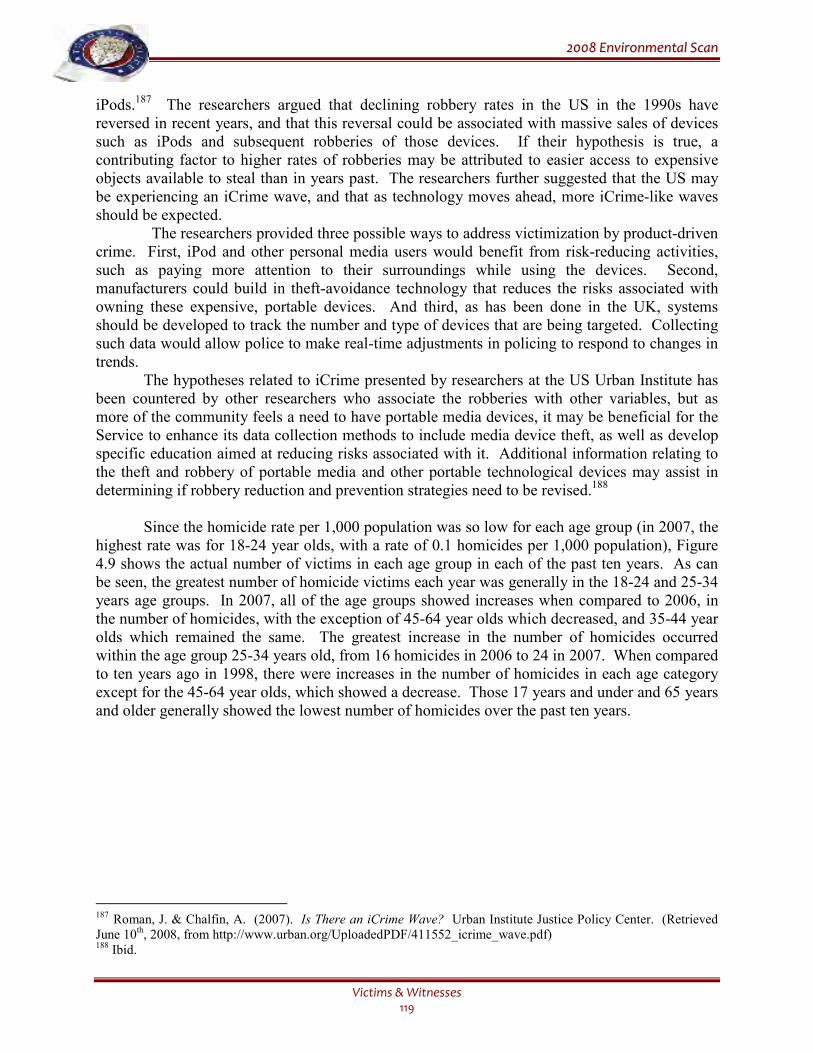
22000088 EEnnvviirroonnmmeennttaall SSccaann
Victims & Witnesses 119
iPods.187 The researchers argued that declining robbery rates in the US in the 1990s have reversed in recent years, and that this reversal could be associated with massive sales of devices such as iPods and subsequent robberies of those devices. If their hypothesis is true, a contributing factor to higher rates of robberies may be attributed to easier access to expensive objects available to steal than in years past. The researchers further suggested that the US may be experiencing an iCrime wave, and that as technology moves ahead, more iCrime-like waves should be expected.
The researchers provided three possible ways to address victimization by product-driven crime. First, iPod and other personal media users would benefit from risk-reducing activities, such as paying more attention to their surroundings while using the devices. Second, manufacturers could build in theft-avoidance technology that reduces the risks associated with owning these expensive, portable devices. And third, as has been done in the UK, systems should be developed to track the number and type of devices that are being targeted. Collecting such data would allow police to make real-time adjustments in policing to respond to changes in trends.
The hypotheses related to iCrime presented by researchers at the US Urban Institute has been countered by other researchers who associate the robberies with other variables, but as more of the community feels a need to have portable media devices, it may be beneficial for the Service to enhance its data collection methods to include media device theft, as well as develop specific education aimed at reducing risks associated with it. Additional information relating to the theft and robbery of portable media and other portable technological devices may assist in determining if robbery reduction and prevention strategies need to be revised.188
Since the homicide rate per 1,000 population was so low for each age group (in 2007, the highest rate was for 18-24 year olds, with a rate of 0.1 homicides per 1,000 population), Figure 4.9 shows the actual number of victims in each age group in each of the past ten years. As can be seen, the greatest number of homicide victims each year was generally in the 18-24 and 25-34 years age groups. In 2007, all of the age groups showed increases when compared to 2006, in the number of homicides, with the exception of 45-64 year olds which decreased, and 35-44 year olds which remained the same. The greatest increase in the number of homicides occurred within the age group 25-34 years old, from 16 homicides in 2006 to 24 in 2007. When compared to ten years ago in 1998, there were increases in the number of homicides in each age category except for the 45-64 year olds, which showed a decrease. Those 17 years and under and 65 years and older generally showed the lowest number of homicides over the past ten years.
187 Roman, J. & Chalfin, A. (2007). Is There an iCrime Wave? Urban Institute Justice Policy Center. (Retrieved June 10th, 2008, from http://www.urban.org/UploadedPDF/411552_icrime_wave.pdf) 188 Ibid.
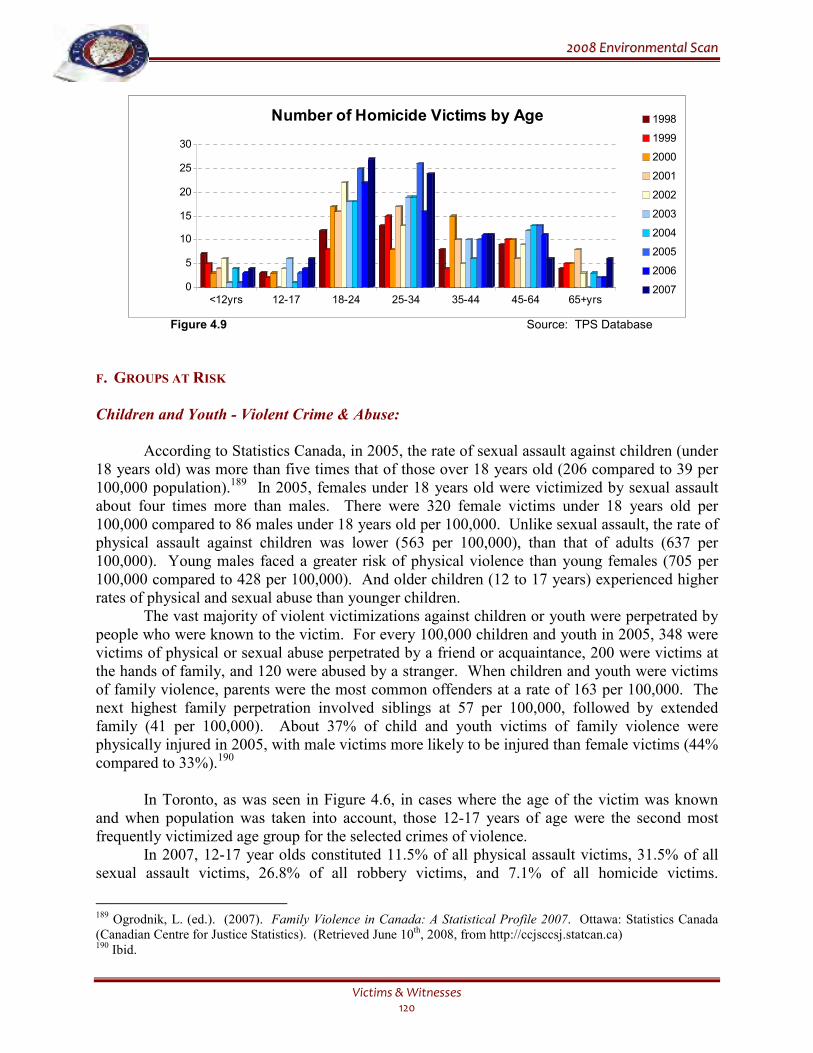
22000088 EEnnvviirroonnmmeennttaall SSccaann
Victims & Witnesses 120
0
5
10
15
20
25
30
<12yrs 12-17 18-24 25-34 35-44 45-64 65+yrs
Number of Homicide Victims by Age 1998
1999
2000
2001
2002
2003
2004
2005
2006
2007
Figure 4.9 Source: TPS Database
F. GROUPS AT RISK
Children and Youth - Violent Crime & Abuse:
According to Statistics Canada, in 2005, the rate of sexual assault against children (under 18 years old) was more than five times that of those over 18 years old (206 compared to 39 per 100,000 population).189 In 2005, females under 18 years old were victimized by sexual assault about four times more than males. There were 320 female victims under 18 years old per 100,000 compared to 86 males under 18 years old per 100,000. Unlike sexual assault, the rate of physical assault against children was lower (563 per 100,000), than that of adults (637 per 100,000). Young males faced a greater risk of physical violence than young females (705 per 100,000 compared to 428 per 100,000). And older children (12 to 17 years) experienced higher rates of physical and sexual abuse than younger children.
The vast majority of violent victimizations against children or youth were perpetrated by people who were known to the victim. For every 100,000 children and youth in 2005, 348 were victims of physical or sexual abuse perpetrated by a friend or acquaintance, 200 were victims at the hands of family, and 120 were abused by a stranger. When children and youth were victims of family violence, parents were the most common offenders at a rate of 163 per 100,000. The next highest family perpetration involved siblings at 57 per 100,000, followed by extended family (41 per 100,000). About 37% of child and youth victims of family violence were physically injured in 2005, with male victims more likely to be injured than female victims (44% compared to 33%).190
In Toronto, as was seen in Figure 4.6, in cases where the age of the victim was known and when population was taken into account, those 12-17 years of age were the second most frequently victimized age group for the selected crimes of violence.
In 2007, 12-17 year olds constituted 11.5% of all physical assault victims, 31.5% of all sexual assault victims, 26.8% of all robbery victims, and 7.1% of all homicide victims.
189 Ogrodnik, L. (ed.). (2007). Family Violence in Canada: A Statistical Profile 2007. Ottawa: Statistics Canada (Canadian Centre for Justice Statistics). (Retrieved June 10th, 2008, from http://ccjsccsj.statcan.ca) 190 Ibid.
22000088 EEnnvviirroonnmmeennttaall SSccaann
Victims & Witnesses 121
Compared to 1998, there were decreased proportions of 12-17 year old assault and sexual assault victims, and increased proportions of robbery and homicide victims. In 1998, 12-17 year olds represented 14.1% of all physical assault victims, 32.2% of all sexual assault victims, 21.8% of all robbery victims, and 5.4% of all homicide victims.
In each of the ten years under review, of all the selected violent victimizations against 12-17 year olds, most were physical assaults, although this proportion decreased from 63.0% in 1998 to 53.0% in 2007, a slight increase from 52.6% in 2006. After physical assaults, 12-17 year olds were most likely victimized by robbery, followed by sexual assault; they were rarely victims of homicide.
Those under 12 years old continued to be less likely than older children to be victimized. In 2007, those under 12 constituted a lower proportion of total victims than 12-17 year olds for each of the violent crimes considered. They constituted 4.8% of all physical assault victims, 16.7% of all sexual assault victims, 1.3% of all robbery victims, and 4.8% of all homicide victims. In 1998, those under 12 constituted 4.7% of all assault victims, 24.8% of all sexual assault victims, 2.5% of all robbery victims, and 12.5% of homicide victims. In 2007 compared to 1998, only the proportion of assault victims under 12 showed a slight increase. In particular, these very young children went from representing one-quarter of all sexual assault victims in 1998 to one-sixth in 2007.
It should be noted that figures related to this age group may be influenced by under-reporting, given the vulnerability of young children and the possibility that those committing the offences may be family members.
In each of the ten years under review, of all violent victimizations against children under 12 years of age, most were physical assaults; this proportion increased from 59.5% in 1998 to 66.9% in 2006, and to 68.8% in 2007. Until 1998, the proportions of victimized children under 12 who were physically assaulted or who were sexually assaulted did not differ greatly; from 1998 on, the proportion of those physically assaulted generally increased, while the proportion of those sexually assaulted generally decreased. In all years, of those victimized in this young age group, few were victims of robbery and homicide.
The Canadian Incident Study of Reported Child Abuse and Neglect in 2003 (CIS) was the second nation-wide study to examine the incidence of child abuse, tracking 14,200 child maltreatment investigations conducted in a sample of 63 Child Welfare Service Areas across Canada.191 When compared to the first study in 1998, the rate of substantiated maltreatment of children in the main sample (excluding Quebec) increased 125%, from 9.6 per 1,000 children in 1998, to 21.7 per 1,000 in 2003. According to the report, some of the reasons for the increase may have been: changes in case substantiation practices, a shift in the way that child abuse agencies classify cases (smaller proportion classified as suspected), better identification of siblings who are victimized, and the large increase in the number of cases of exposure to domestic violence and emotional maltreatment (the rate of exposure to domestic violence
191 Trocme, N., Fallon, B., et al. (2005). Canadian Incidence Study of Reported Child Abuse and Neglect – 2003. Public Health Agency of Canada (Retrieved from http://www.phac-aspc.gc.ca/cm-vee/csca-ecve/pdf/childabuse_ final_e.pdf)
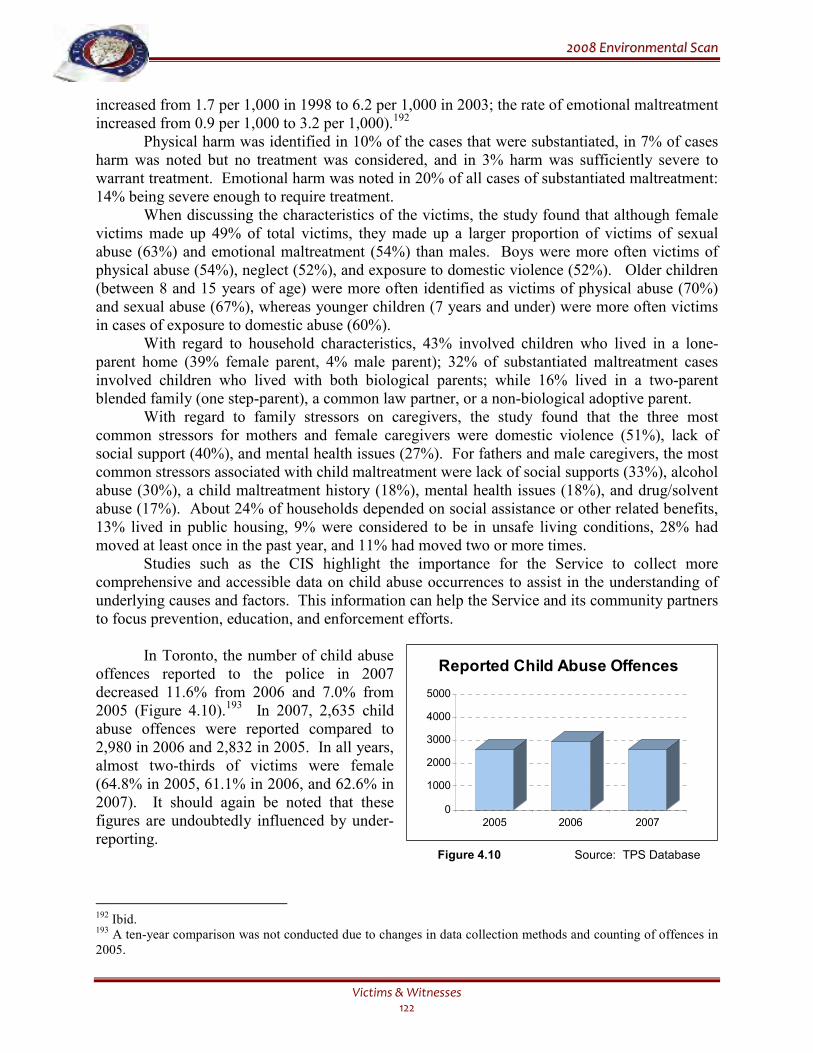
22000088 EEnnvviirroonnmmeennttaall SSccaann
Victims & Witnesses 122
increased from 1.7 per 1,000 in 1998 to 6.2 per 1,000 in 2003; the rate of emotional maltreatment increased from 0.9 per 1,000 to 3.2 per 1,000).192 Physical harm was identified in 10% of the cases that were substantiated, in 7% of cases harm was noted but no treatment was considered, and in 3% harm was sufficiently severe to warrant treatment. Emotional harm was noted in 20% of all cases of substantiated maltreatment: 14% being severe enough to require treatment.
When discussing the characteristics of the victims, the study found that although female victims made up 49% of total victims, they made up a larger proportion of victims of sexual abuse (63%) and emotional maltreatment (54%) than males. Boys were more often victims of physical abuse (54%), neglect (52%), and exposure to domestic violence (52%). Older children (between 8 and 15 years of age) were more often identified as victims of physical abuse (70%) and sexual abuse (67%), whereas younger children (7 years and under) were more often victims in cases of exposure to domestic abuse (60%).
With regard to household characteristics, 43% involved children who lived in a lone-parent home (39% female parent, 4% male parent); 32% of substantiated maltreatment cases involved children who lived with both biological parents; while 16% lived in a two-parent blended family (one step-parent), a common law partner, or a non-biological adoptive parent.
With regard to family stressors on caregivers, the study found that the three most common stressors for mothers and female caregivers were domestic violence (51%), lack of social support (40%), and mental health issues (27%). For fathers and male caregivers, the most common stressors associated with child maltreatment were lack of social supports (33%), alcohol abuse (30%), a child maltreatment history (18%), mental health issues (18%), and drug/solvent abuse (17%). About 24% of households depended on social assistance or other related benefits, 13% lived in public housing, 9% were considered to be in unsafe living conditions, 28% had moved at least once in the past year, and 11% had moved two or more times.
Studies such as the CIS highlight the importance for the Service to collect more comprehensive and accessible data on child abuse occurrences to assist in the understanding of underlying causes and factors. This information can help the Service and its community partners to focus prevention, education, and enforcement efforts.
In Toronto, the number of child abuse offences reported to the police in 2007 decreased 11.6% from 2006 and 7.0% from 2005 (Figure 4.10).193 In 2007, 2,635 child abuse offences were reported compared to 2,980 in 2006 and 2,832 in 2005. In all years, almost two-thirds of victims were female (64.8% in 2005, 61.1% in 2006, and 62.6% in 2007). It should again be noted that these figures are undoubtedly influenced by under-reporting. Figure 4.10 Source: TPS Database
192 Ibid. 193 A ten-year comparison was not conducted due to changes in data collection methods and counting of offences in 2005.
0
1000
2000
3000
4000
5000
2005 2006 2007
Reported Child Abuse Offences
22000088 EEnnvviirroonnmmeennttaall SSccaann
Victims & Witnesses 123
The Service must understand and assist victims in matters relating to the underlying causes of violence against youth, including child abuse. A future challenge will be to understand and deal with indirect causes associated to the environment and history in which the children live in. Violence and child abuse involve a number of variables, and effective enforcement, understanding, support and education can help to break the cycle of violence in the home, and will assist in the upbringing of children in a happy, thriving and safe environment.
Elderly – Violent Crime & Abuse:
The reality of large increases in the elderly population in coming years has heightened the
concern for the victimization of, and the importance of understanding the needs of, the elderly community. Projections reveal that by 2031, seniors will account for between 23% and 25% of the entire population of Canada. The aging baby boomers, low fertility rates, and increased life expectancy will all contribute to an expected doubling of the proportion of seniors over the next quarter century.194
Seniors in Canada are much less likely to experience an assault, sexual assault, or robbery than other age groups. According to Statistics Canada’s GSS in 2004, there were about 12 violent victimizations per 1,000 seniors (aged 65 years and over), which was four times lower than for those aged 55-64 (45 per 1,000), and about 20 times lower than for 15-24 year olds (226 per 1,000).195
Among police-reported violent crimes in Canada, seniors were most frequently the victims of common assault (61 per 100,000), followed by robbery (32 per 100,000).196 Furthermore, senior males were more likely to be victimized by violent crimes than senior females (200 per 100,000 compared to 131 per 100,000). The most notable differences between the genders were in the rates for major assaults (26 per 100,000 for males compared to 12 per 100,000 for female seniors), uttering threats (42 compared to 22 per 100,000), and common assault (77 compared to 48 per 100,000). Sexual assault was the only offence with a higher rate for senior women than for senior men (6 compared to 1 per 100,000 for men).
Seniors were unlikely to report many of the crimes committed against them, as according to Canada-wide self-reported victimization data, only slightly more than half (51%), of all violent victimizations against seniors were reported to police. In addition, most senior victims knew their offender. Those 65 and older were most likely to experience victimization by a family member, a friend, or acquaintance. The most common perpetrators of family violence against seniors were adult children (35%) followed by a current or previous spouse (31%).197
Similar to the whole of Canada, in Toronto, as was seen in Figure 4.6, seniors were the age group least likely to be victimized in each of the past ten years. In Toronto in 2007, those 65 years and older constituted 2.5% of all physical assault victims, 1.1% of all sexual assault victims, 3.7% of all robbery victims and 7.1% of homicide victims. Compared to 1998, in 2007 there were greater proportions of senior physical and sexual assault victims, but a smaller proportion of senior robbery victims. In 1998, persons 65 years and older constituted 1.8% of all
194 Ogrodnik, L. (2007). Seniors as Victims of Crime: 2004-2005. Ottawa: Statistics Canada (Canadian Centre for
Justice Statistics). (Retrieved June 10th , 2008, from http://ccjsccsj.statcan.ca) 195 Ibid. 196 Ibid. 197 Ibid.
22000088 EEnnvviirroonnmmeennttaall SSccaann
Victims & Witnesses 124
physical assault victims, 0.7% of all sexual assault victims, 4.3% of all robbery victims, and 7.1% of all homicide victims.
In each of the ten years under review, of all violent victimizations against those 65 years of age and older, most were physical assaults; this proportion increased from 63.1% in 1998 to 73.4% in 2006, but dropped to 70.5% in 2007. After physical assaults, older adults were most likely victimized by robbery in all years; they were rarely victims of sexual assault or homicide.
Toronto Police Service data show that 590 people 65 years or older were victims of assault or sexual assault in 2007, which was a 25.0% increase from the 472 in 2006, and a 38.8% increase from the 425 in 1998.
As discussed in previous Scans, many older adults have to contend with various health problems that can limit their physical or mental functioning. Such limitations can leave many of these older people vulnerable to various types of abuse, which they may not report to police due to a number of factors, including embarrassment, fear, guilt, love of and/or dependency on the perpetrator, family pressures, cultural background, distrust of police and the court system, denial of the abuse, or lack of awareness that an offence has taken place.
As our elderly population increases and grows, it will be important to enhance our programs aimed at seniors, including components relating to elderly abuse, traffic safety, frauds, and other crimes and incidents that more specifically effect seniors.
Domestic Violence:
Domestic violence is an unacceptable crime that has physical, psychological, social and economic effects on the victim, their family, and society. According to Statistics Canada, victimization data have shown a decline in domestic victimization in Canada since 1993, when about 12% of women reported being assaulted in the preceding five years.198 About 7% of women who were living in a marital or common-law relationship reported in the 2004 GSS that they’d been physically or sexually assaulted by a partner on at least one occasion in the previous five years, compared to about 8% in 1999. The percentages represented approximately 653,000 women in 2004 and 690,000 in 1999. In the 12 months preceding the GSS interviews, about 2% of women said they had been physically or sexually assaulted by a partner. The most significant change in domestic violence for women between 1999 and 2004 was that it involved relationships that had ended at the time of the interview: women reported higher rates of violence by previous partners compared to current ones.
With regard to men, the 2004 GSS found that 6% of men said they had experienced domestic violence in the past five years from their previous or current partner/common-law, compared to the 1999 GSS in which 7% of men reported some type of violence by their common-law or marital partner in the five years preceding the survey.199
Some possible reasons for the decline in domestic violence include: improved training for police officers and Crown attorneys, pro-charging and pro-prosecution policies, increased use of services by abused women, increased public awareness, co-ordinated inter-agency referrals, growth of provincial legislation, increased number of treatment programs for violent men, and
198 Statistics Canada. (2006). Measuring Violence Against Women: Statistical Trends 2006. Ottawa: Statistics Canada (Canadian Centre for Justice Statistics). (Retrieved June 10th, 2008, from http://ccjsccsj.statcan.ca) 199 Ibid.
22000088 EEnnvviirroonnmmeennttaall SSccaann
Victims & Witnesses 125
positive changes in women’s socioeconomic status that may have enabled them to flee from abusive relationships at earlier stages.200
When looking nationally, between 1999 and 2004, Newfoundland/Labrador was the only jurisdiction to show a rise in domestic violence against women (prevalence rate from 4% in 1999 to 6% in 2004), while in Ontario rates were unchanged (prevalence rate of 7% both years). Prince Edward Island saw the largest drop between 1999 and 2004, from 12% to 6%. The highest prevalence rate in 2004 was in Alberta at 10% for women (9% when men are included).
Generally, women were victimized by severe forms of domestic violence more often than men. In 2004, twice as many women as men were beaten by their partners. In addition, 16% of women who were victimized were sexually assaulted, and twice as many women reported chronic, ongoing assaults (10 or more) compared to men. Since the GSS data did not indicate the degree of force, the findings suggest that even though women and men have similar prevalence rates, assaults on women tended to be more serious.
A comparison of data from the GSS in 1993, 1999, and 2004 suggested some evidence that the severity of domestic assaults diminished slightly.201 The surveys indicate a reduction across the three time points in the percentage of women victims subjected to the most severe violence (being beaten, choked, threatened with a gun or knife, or sexually assaulted), from 50% of all victims in 1993 to 39% in 2004. However, the percentage of victims who’d suffered physical injury increased slightly during this period. The shifts in severity may be due in part to improved societal interventions that help to reduce the escalation of violence that are consistent with a decline in domestic homicide. However, the observed declined in the prevalence and severity of domestic victimization have not resulted in a decrease in the use of women abuse shelters.
According to police-reported data for the period 1998 to 2004, women represented 87% of victims of domestic assault.202 In 2004, 14,597 cases of domestic violence involving female victims were reported to the contributing police services, compared to 2,413 cases involving male victims. This finding supported the suggestion that domestic victimizations involving females were more likely to reach a level of severity that required police intervention.
Current and former husbands made up the largest number of intimate partner assault offenders, although this number declined since 2001. Although significantly smaller, the number of current and former boyfriends reported to the police for domestic violence increased since 1998, surpassing assaults by wives and former wives, to become the second highest category. Pro-charging policies have led to the unexpected result that, in some cases, both the victim and the offender are charged. A number of jurisdictions in the US have adopted ‘primary aggressor’ models, which require police to identify the primary aggressor based on the history of violence between the parties and evidence that one person may have been defending him or herself.
In Canada, about one in five homicides involves the killing of an intimate partner, and although rates have fluctuated over the past 30 years, they generally show an overall decline.203 The rate of women victimized by domestic homicide decreased by 39% between 1991 and 2004, from 1.16 to 0.71 per 100,000 couples. The rate for men also decreased in the same period, by 59%, from 0.34 to 0.14 per 100,000 couples. In 41% of domestic homicides of men in which
200 Ibid. 201 Ibid. 202 Ibid. 203 Ibid.
22000088 EEnnvviirroonnmmeennttaall SSccaann
Victims & Witnesses 126
police had the requisite information, the police determined that the male victim was the first to use or threaten to use force or violence, which suggests that a large percentage of the persons in these cases accused of spousal homicide were acting in self defence. Conversely, with regard to the killing of women, police indicated that the victim initiated the violence in only 5% of the homicides.
In a majority of the domestic homicides, there is a history of violence between the victims and offender. Between 1991 and 2004, there was a history of violence reported in 59% of domestic homicides against women and 70% of domestic homicides against men by female partners. A history of violence was not as common for legally married couples as it was for common-law, separated, and divorced victims.
The decreased national domestic homicide rate in recent years may be due to a number of factors including mandatory charging policies, improved training of police officers, and increased community support. Researchers in North America studied the relationships between the above factors and changes in domestic homicide rates over the years and found that the decline in domestic homicide was also linked to a combination of increased availability of resources and improvements in women’s socioeconomic status, including:
• delayed marriage, which means exposure to violence in the high-risk age group is reduced, and may also reflect increased selectivity in the choice of a partner;
• delayed childbirth which gives women greater opportunity for education, employment advancement, and economic independence;
• rising income levels and workforce participation rates for women, which provide more options in the event of violence; and,
• increasing availability of domestic violence services, including shelters which may also help to reduce the opportunities for violence.204
Emotional and psychological abuse is one of the most important predictors of physical and sexual violence in spousal relationships. In 2004, according to Statistics Canada, when women experienced psychological abuse in the form of damage to their property, 61% were also assaulted.205 The knowledge that the risk of domestic violence is heightened among those who demonstrate certain behaviours and attitudes towards their partners may assist the Service in the development of proactive interventions for victims, offenders, and the community in general.
According to the GSS, visible minority status did not increase the risk for domestic violence. Visible minority women in fact reported lower five year rates of spousal violence than other women (4% compared to 8%). In addition, rates of domestic violence also declined for visible minority women between 1999 and 2004, whereas they remained more stable for other women. Since the GSS is conducted in only English or French, the actual rates for minority women may under-represented because some women may have not been able to participate in the survey.206
204 Ibid. 205 Ibid. 206 Ibid.
22000088 EEnnvviirroonnmmeennttaall SSccaann
Victims & Witnesses 127
In December 2007, six 2-hour focus group discussions were held for the Toronto Police Service with individuals who had been involved in incidents of domestic violence – either themselves or through a family member or close friend. The groups included respondents from designated geographic areas within Toronto and three groups of respondents from ethnic communities: Chinese, South Asian, and Black.207
There were a number of common themes that emerged from the focus groups including a general lack of awareness of social services and community programs available to aid survivors of domestic violence, and victim interest in counselling sessions, self-esteem classes, and meetings with other survivors of domestic violence in order to share stories and draw strength from others.208 It also emerged that the main reasons that respondents did not call the police when domestic violence occurred were not based on concerns regarding how the police would handle the situation but, rather, on other factors, such as:
• fear that the situation would escalate if there was any outside intervention, • belief that the incident was an isolated one that would not continue, • preferring to seek support and assistance from religious leaders, usually in one’s own
religious community but sometimes in areas where the survivor was not known (this feeling was more prevalent with the Black and South Asian communities),
• concerns that the survivor was somehow responsible for the situation, • and concerns that family and community members would judge the survivor and his/her
partner harshly.
Furthermore, focus group participants were generally unaware of community resources available to assist them in dealing with domestic violence. In some cases, although victims believed resources might be available at a neighbourhood community centre, they were reluctant to visit the centres because of the fear that they would be recognized by others within the community.
Despite these concerns, the focus group participants wanted access to services such as counselling (both for the victim and the offender), group-support sessions, job training, self-esteem classes, and educational training. The participants also suggested that resources should be publicized at schools, libraries, places of worship, and on bulletin boards at grocery stores. In addition, a suggestion was also made that a ‘Neighbourhood Watch’ system be implemented whereby a victim could go to a safe-home in the neighbourhood to escape the violent situation temporarily and then determine the next steps to take (call the police, go to a shelter, etc.) in a neutral and supportive setting.
As research and the focus groups illustrated, an essential aspect of proactive domestic violence prevention includes timely and effective follow-up with the victim. In an effort to assist victims and reduce the risk to victims of crime, the Service has undertaken to replace the method of notifying victims of domestic violence of bail conditions by facsimile, with a method involving the current e-mail system. During the development and research of the Ontario Ministry of the Attorney General’s MAG1 disclosure project, a need was recognized to update
207 Muldoon, P. (2007). Toronto Police Service: Survivors of Domestic Violence, Research Findings. Commissioned by Toronto Police Service. 208 Note: Findings from the focus groups are not conclusive and may not reflect the thoughts and impressions of survivors of domestic violence or friends and family of victims of such violence in general.
22000088 EEnnvviirroonnmmeennttaall SSccaann
Victims & Witnesses 128
the notification system for victims of domestic violence. The project recommended a number of systemic changes aimed at reducing the risk to victims of crime, and has the potential to not only assist victims of domestic violence, but, as discussed further in the Victim Resources section, many victims of other crimes can benefit from efficiencies in the process of victim notification.
Domestic Violence – Calls for Service & Occurrences: The Toronto Police Service receives a large number of calls each year for incidents that are initially reported to be domestics or domestic assaults. According to the Service’s communications (I/CAD) database, in 2007, officers attended 15,738 calls for domestics, which was a 1.2% decrease from the 15,924 calls in 2006 and a 16.0% decrease from the 18,747 calls in 1998. However, even though the number of domestics attended decreased compared to 2006 and 1998, the average time spent by officers at these types of calls increased, from 140.2 minutes (2.3 hours) in 1998 to 260.0 (4.3 hours) in 2006, and to 280.8 minutes (4.7 hours) in 2007.
In 2007, according to I/CAD, the number of calls for domestic assaults attended by officers also decreased, dropping 5.2% to 4,744 in 2007 from 5,007 in 2006. The number of domestic assault calls in 2007 was 45.1% lower than 1998, when there were 8,642 domestic assault calls. Again, though the number of calls decreased over the ten-year period, the average amount of time spent by officers at these calls increased, from 209.3 minutes (3.5 hours) in 1998 to 405.0 minutes (6.7 hours) in 2006, and to 443.7 minutes (7.4 hours) in 2007.
Not all domestic calls attended by police involve criminal offences. In 2007, there were 7,004 domestic violence occurrences and charges were laid in 83.4% of these occurrences (5839). In 2006, there were 7,297 domestic violence occurrences and charges were laid in 86% of these occurrences (6,162).209
Similar to trends seen in previous years, in 2007, assault level 1 charges accounted for the majority of domestic violence charges, followed by uttering threats, and assault with a weapon/causing bodily harm. In 2007, there were 4,266 charges for assault level 1, representing 73.1% of all domestic violence charges. The 1,437 charges for uttering threats represented 24.6% of the total, and the 1,068 charges for assault with a weapon/causing bodily harm with represented 18.3% of the total. Similar to previous years, men represented the majority of those charged (86.5% in 2007).
In 2006, there were 4,451 charges for assault level 1 (72.2% of domestic all violence charges), followed by uttering threats with 1,460 charges (23.7%) and assault with a weapon/causing bodily harm with 1,091 charges (17.7%).
It will continue to be a challenge for the Service to effectively investigate domestic violence in an efficient and timely manner. It would be beneficial for the Service to evaluate its current domestic violence practices, specifically in the area of time spent on domestic violence investigations, to ensure that victims are well protected, investigations are well managed, and that partners such as Victim Services, Children’s Aid, shelters, community services, etc., are used appropriately and effectively.
209 The Province changed the domestic reporting practices for 2006. The number of domestics in 2006 and 2007 is, therefore, not comparable with the numbers reported for earlier years in previous Scans.
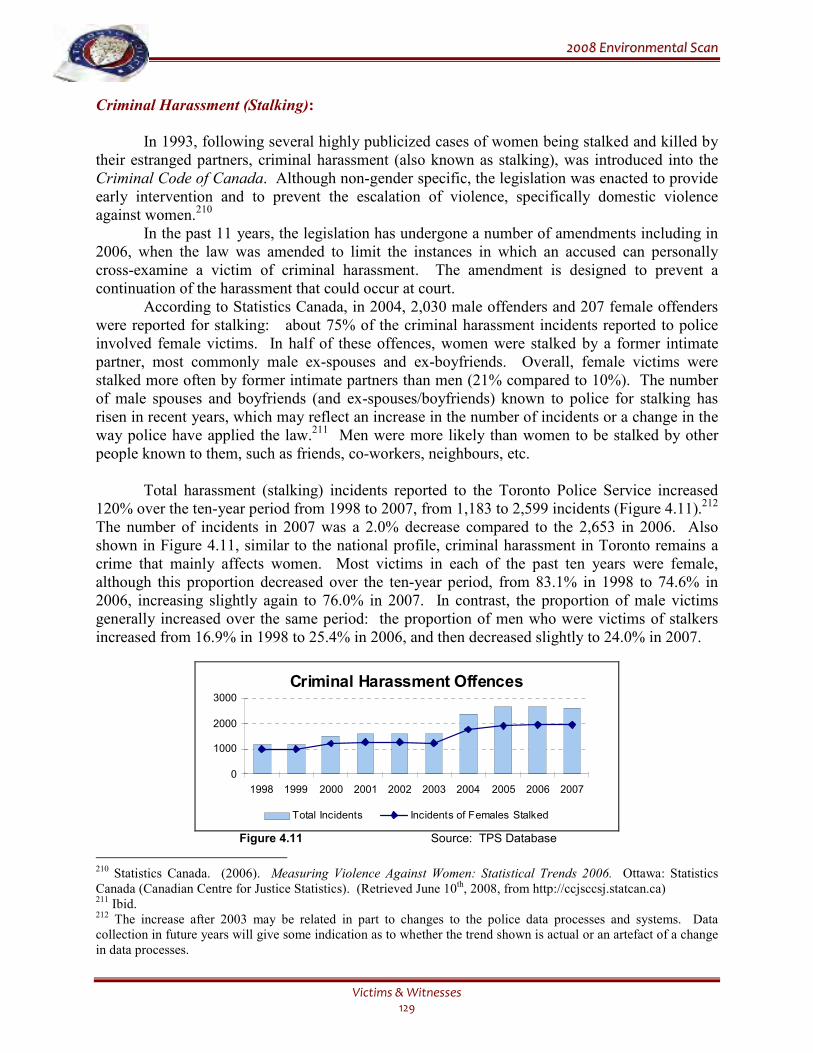
22000088 EEnnvviirroonnmmeennttaall SSccaann
Victims & Witnesses 129
Criminal Harassment (Stalking): In 1993, following several highly publicized cases of women being stalked and killed by their estranged partners, criminal harassment (also known as stalking), was introduced into the Criminal Code of Canada. Although non-gender specific, the legislation was enacted to provide early intervention and to prevent the escalation of violence, specifically domestic violence against women.210 In the past 11 years, the legislation has undergone a number of amendments including in 2006, when the law was amended to limit the instances in which an accused can personally cross-examine a victim of criminal harassment. The amendment is designed to prevent a continuation of the harassment that could occur at court. According to Statistics Canada, in 2004, 2,030 male offenders and 207 female offenders were reported for stalking: about 75% of the criminal harassment incidents reported to police involved female victims. In half of these offences, women were stalked by a former intimate partner, most commonly male ex-spouses and ex-boyfriends. Overall, female victims were stalked more often by former intimate partners than men (21% compared to 10%). The number of male spouses and boyfriends (and ex-spouses/boyfriends) known to police for stalking has risen in recent years, which may reflect an increase in the number of incidents or a change in the way police have applied the law.211 Men were more likely than women to be stalked by other people known to them, such as friends, co-workers, neighbours, etc.
Total harassment (stalking) incidents reported to the Toronto Police Service increased 120% over the ten-year period from 1998 to 2007, from 1,183 to 2,599 incidents (Figure 4.11).212 The number of incidents in 2007 was a 2.0% decrease compared to the 2,653 in 2006. Also shown in Figure 4.11, similar to the national profile, criminal harassment in Toronto remains a crime that mainly affects women. Most victims in each of the past ten years were female, although this proportion decreased over the ten-year period, from 83.1% in 1998 to 74.6% in 2006, increasing slightly again to 76.0% in 2007. In contrast, the proportion of male victims generally increased over the same period: the proportion of men who were victims of stalkers increased from 16.9% in 1998 to 25.4% in 2006, and then decreased slightly to 24.0% in 2007.
Criminal Harassment Offences
0
1000
2000
3000
1998 1999 2000 2001 2002 2003 2004 2005 2006 2007
Total Incidents Incidents of Females Stalked
Figure 4.11 Source: TPS Database
210 Statistics Canada. (2006). Measuring Violence Against Women: Statistical Trends 2006. Ottawa: Statistics Canada (Canadian Centre for Justice Statistics). (Retrieved June 10th, 2008, from http://ccjsccsj.statcan.ca) 211 Ibid. 212 The increase after 2003 may be related in part to changes to the police data processes and systems. Data collection in future years will give some indication as to whether the trend shown is actual or an artefact of a change in data processes.
22000088 EEnnvviirroonnmmeennttaall SSccaann
Victims & Witnesses 130
In 2005, the Department of Justice Canada released a review of criminal harassment research, and described findings related to victims’ experiences with elements of the criminal justice system, including victims’ opinions on how the justice system could deal effectively with criminal harassment.213 The research revealed a lack of awareness of the criminal harassment legislation, specifically among front-line justice system personnel. The victims of harassment, even after having gone through the court system, were largely unaware of criminal harassment law, and remained confused about whether charges were laid and what the definition of stalking was in law. Victims of harassment reported mostly negative and mixed experiences with the justice system. Positive experiences most often occurred when police acted quickly, when the victim was taken seriously, and when use was made of victims’ services. Negative experiences occurred when the victim’s concerns were trivialized, when peace bonds were consistently disobeyed, and when the victim felt they’d been left out of the process. Interviews with victims suggested that they wanted three basic outcomes: victims wanted to feel safe, they wanted the harassment to stop, and they wanted their complaints to be believed. Most of the victims felt that the justice system did not make them feel safe, and even after the case was concluded, the harassment continued or the experience of the justice process left them so insecure, that their life was still disrupted. Many of the victims had an intimate relationship with the accused, so they wanted an end to the constant threats rather than harsh punishment. Victims also expressed great concern over not being taken seriously, at all levels of the process. The emotional stress on the victim was exacerbated by the feelings that personnel, especially police, did not understand why they were afraid, not seeing the harassment as anything other than an annoyance.214 Criminal harassment no longer has to be done in person. There is very little empirical work on cyber-stalking, as little data have been available for study to support or refute opinions related to it. It is unclear if cyber-stalking mainly constitutes an additional weapon in a harasser’s artillery, or whether cyber-stalking is a separate entity with its own patterns and driving forces. In 2007, a study that involved the analysis of the cases of 1,051 stalking victims in the UK, attempted to clarify some issues surrounding cyber-stalking.215
The study found that almost half (48%) of the victims of stalking reported harassment by way of the Internet as well. In addition, using the definition/criteria that the stalking originated online, and remained solely online for a minimum of 4 weeks, only 7% of those victims were judged to have been cyber-stalked. With regard to the stalking process, researchers found that harassment from overseas increased with the degree of cyber involvement, and that threats of harm were most often associated with purely off-line stalking. An increase in threats in ‘cross-over’ stalking cases (cyber-stalkers who crossed over into off-line stalking) was also found. Other findings included: pure cyber-stalking was perpetrated more often by acquaintances and strangers than by ex-partners; and, that more purely cyber-stalked victims reported that police took them more seriously compared to other harassment victims, which may be associated with
213 Department of Justice Canada. (2005). Review of Recent Literature on Criminal Harassment. Just Research,
13: 70-72. (Retrieved June 12th, 2008, from http://www.canada.justice.gc.ca/eng/pi/rs/rep-rap/jr/jr13/jr13.pdf ) 214 Ibid. 215 Grant, S. & Sheridan, L.P. (2007). Is Cyberstalking Different? Journal of Psychology, Crime & Law, 13(6): 627-640.
22000088 EEnnvviirroonnmmeennttaall SSccaann
Victims & Witnesses 131
an additional finding that purely cyber-stalked victims most often retained evidence of the victimization.
Criminal harassment will continue to be a challenge for the Service, as investigations and the laws can be interpreted by different personnel in differing ways that can easily leave an impression with victim, leaving them unsatisfied with the police and justice system. Keeping the victim involved and aware of the process through follow-up and information towards safety can assist the victim in managing the stresses and safety issues involved with stalking. Cyber-stalking will continue to challenge lawmakers and law enforcement personnel, and investigations, technology, and laws may need to be updated to deal with this complex. The Service can look toward the future by quick action, supporting victims, ensuring their safety, and remaining committed to thoroughly investigating victims’ concerns. Once again, comprehensive collection and analysis of data related to criminal harassment occurrences would assist the Service in focusing prevention, investigation, and enforcement efforts. Life on the Streets & Victimization:
216
People who live on Toronto streets are vulnerable to crime in ways that many other communities may never know. They do not have permanent housing, which is an important feature of protection from crime. Furthermore, their exposure to victimization is increased by their concentration in highly populated urban areas. In the search for shelter, the homeless may occupy unsafe places that attract motivated offenders and offer little guardianship. In addition, passing time on the streets during the day and at night may increase opportunities for victimization. The homeless are also more likely to be in positions where they witness crimes, and, as such, their direct and indirect contact with crime can make them more fearful of crime and concerned about their vulnerability. Although persistent poverty, a shortage of affordable housing, economic trends, and other factors, may contribute to an expansion of the at-risk population, researchers have also found that individuals who become literally homeless, often exhibit problems such as substance abuse and mental illness that reduce employability, erode support networks, and create stigmatizing reactions.217
Academic researchers have found that studies of victimization of the homeless have produced inconsistent findings. Different analyses that incorporate only a few variables, and other factors such as small, unrepresentative samples, single-city studies, etc., have presented challenges to a comprehensive examination of marginality among the homeless.218 However, the results that are available still provide information that can be useful.
In 2007, Street Health, a Toronto community agency that provides physical and mental health programs to homeless and under-housed individuals, published the results of a survey they had conducted of 368 homeless men and women in Toronto.219 Among their findings was that about 35% of the homeless people who’d taken the survey said they had been physically
216 Information on the homeless population can also be found in the chapters on Demographic Trends and Urban Trends. 217 Lee, B. & Schreck, C. (2005). Danger on the Streets. Journal of American Behavioral Scientist. 48(8): 1055-1081. 218 Ibid. 219
Street Health. (2007). The Street Health Report 2007. (Retrieved June 16th, 2008, from
http://www.streethealth.ca /Downloads/SHReport2007.pdf)
22000088 EEnnvviirroonnmmeennttaall SSccaann
Victims & Witnesses 132
assaulted or beaten up in the previous year. Of those who’d reported being assaulted in the past year, 56% said they had been assaulted by a stranger, 38% by an acquaintance, 35% by police, 27% by another shelter resident, 21% by a partner or spouse, and 6% by shelter staff. In addition, homeless women in the survey experienced higher levels of sexual assault than homeless men. About 21% of the homeless women surveyed reported having been sexually assaulted in the previous year. Furthermore, about 9% of survey respondents had been hit by a vehicle in the previous year. Since living on the streets most likely increases contact with the officers in enforcement or unfavourable situations, homeless people may be particularly unwilling to report their victimization to police.
It will be a challenge for the Service to balance policing responsibilities in relation to the homeless with the social assistance mandates of community agencies. An important step toward addressing the needs of the homeless and their victimization will be continued and enhanced partnerships with social and city agencies. In addition, more comprehensive data related to homeless victims of crime in Toronto could provide valuable information on factors related to their victimization of homeless, and would assist in further protecting those in the community that call the streets their home.
G. VICTIMIZATION IN THE WORKPLACE
Under the Occupational Health and Safety Act, every employer must take every
precaution reasonable in the circumstances to protect the health and safety of their workers in the workplace, including protection against workplace violence. In response to growing public concern over workplace victimizations, including assaults and criminal harassment, many employers have developed policies to deal with violence and harassment.220
According to Statistics Canada’s 2004 GSS, about 356,000 (17%) of all self-reported incidents of violent victimization, including assault, sexual assault, and robbery occurred at the victim’s place of work.221
Certain employment sectors pose a greater risk for workplace victimization, generally those where employees frequently have contact with the public or clients. The 2004 GSS found that one-third (33%) of all victimizations in the workplace involved a victim who’d been working in social assistance or health care services, such as hospitals, or nursing or residential care facilities. A further 14% of victimizations involved victims working in accommodation or food services, such as hotels, bars, or restaurants, and 11% were committed against those working in educational services.
With regard to location of the victimization, the most common locations (49%) were offices, factories and stores. Other common locations included hospitals, prisons or rehabilitation centres (31% of incidents), restaurants or bars (10%), and inside/on school grounds (10%). According to the GSS, women were only slightly more likely than men to say they had been victimized by violence at the workplace (53% compared to 47%). Physical assaults are the most common type of violence regardless of the work location.
220 Ontario Ministry of Labour. (2008). Workplace Violence. (Retrieved June 16th, 2008, from http://www.labour.gov.on.ca/english/hs/workplace_violence.html) 221 Leseleuc, S. (2007). Criminal Victimization in the Workplace 2004. Ottawa: Statistics Canada (Canadian Centre for Justice Statistics). (Retrieved June 16th, 2008, from http://ccjsccsj.statcan.ca)
22000088 EEnnvviirroonnmmeennttaall SSccaann
Victims & Witnesses 133
About 66% of violent workplace victimizations in 2004 were committed by someone known to the victim. It has been found that the majority of workplace victimizations are committed by a member of the public or a client that came into contact with the victim, rather than by co-workers or members of the same organization. Alcohol or drug consumption can increase the risk of workplace victimization: in 46% of incidents in the 2004 GSS, the victim believed that the victimization was related to the offender’s alcohol or drug use. Almost all (93%) of reported workplace victimizations were committed by a single offender, and most of the offenders were male (93%). Victims were also more likely to report that single offenders were under the age of 35 (54%).
About 21% of victims of workplace violence were injured, which was similar to the level of injuries in non-workplace violence (23%), and males were more likely to be injured than females (27% compared to 17%). Emotional consequences were also apparent in victims as they reported being angry (21% of incidents); upset, confused, or frustrated (20%); or fearful (15%). Only about 27% said the incident had little emotional effect on them. Victims of workplace incidents were more likely than those victims of non-workplace violence to report finding it difficult to carry out normal everyday workplace activities as a result of the victimization (25% versus 14%).222 Workplace violence was much more likely to be reported to the police than non-workplace violence (37% compared to 17%), perhaps due in part to the presence of witnesses or public nature of the work. With regard to incidents that were reported, the majority of victims (97%) said their reason for reporting was a feeling of duty, perhaps to prevent other workers from the same fate. A number of other factors affected the victim’s decision to report the victimization, including: the severity and seriousness of the offence, whether they were injured, whether a weapon was involved, whether they had to take time away from work or their main activities because of the victimization. In addition, male victims were almost three times more likely to bring the violence to the attention of police than female victims (57% compared to 20% of incidents), which may reflect the fact that males were more likely to be injured, and that women were more often victims of sexual, assault which has the lowest reporting rate to police. Victims who reported their violent incident to police were more likely than victims of non-workplace victimization to say they’d been satisfied with the actions that the police had taken (88% compared to 54%).223 Respondents who did not report the victimization to the police most commonly reported that the reason for not reporting was that the incident was dealt with in another way (74%). Other reasons included: the incident was not important enough (44%), the incident was a personal matter and did not concern police (31%), or the victim did not wish to be involved with police (30%). The International Labour Organisation (ILO) includes workplace bullying in its definition of workplace violence and employers are starting efforts to make workplace bullying as unacceptable as sexual harassment or drunkenness in the workplace. Similar to schoolyard bullying, the psychological abuse of an employee represents a quest for control by an insecure, inadequate person, and an exercise of power by humiliating a target. General harassment is far
222 Ibid. 223 Ibid.
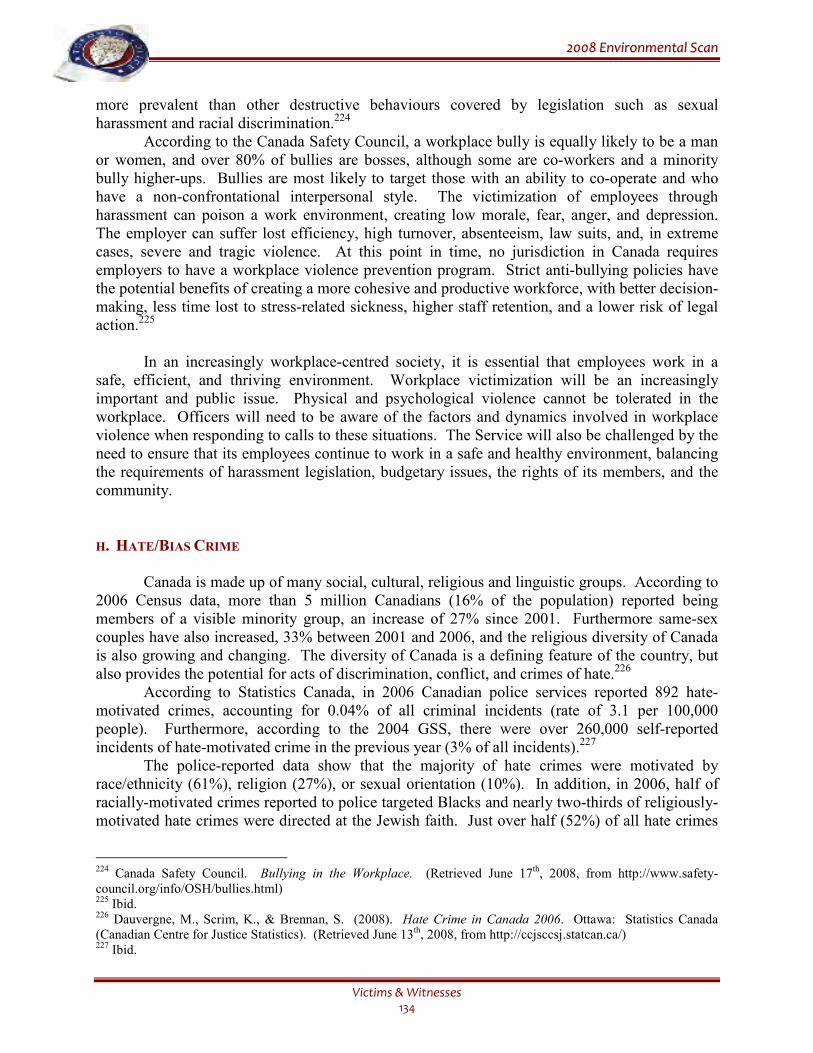
22000088 EEnnvviirroonnmmeennttaall SSccaann
Victims & Witnesses 134
more prevalent than other destructive behaviours covered by legislation such as sexual harassment and racial discrimination.224 According to the Canada Safety Council, a workplace bully is equally likely to be a man or women, and over 80% of bullies are bosses, although some are co-workers and a minority bully higher-ups. Bullies are most likely to target those with an ability to co-operate and who have a non-confrontational interpersonal style. The victimization of employees through harassment can poison a work environment, creating low morale, fear, anger, and depression. The employer can suffer lost efficiency, high turnover, absenteeism, law suits, and, in extreme cases, severe and tragic violence. At this point in time, no jurisdiction in Canada requires employers to have a workplace violence prevention program. Strict anti-bullying policies have the potential benefits of creating a more cohesive and productive workforce, with better decision-making, less time lost to stress-related sickness, higher staff retention, and a lower risk of legal action.225 In an increasingly workplace-centred society, it is essential that employees work in a safe, efficient, and thriving environment. Workplace victimization will be an increasingly important and public issue. Physical and psychological violence cannot be tolerated in the workplace. Officers will need to be aware of the factors and dynamics involved in workplace violence when responding to calls to these situations. The Service will also be challenged by the need to ensure that its employees continue to work in a safe and healthy environment, balancing the requirements of harassment legislation, budgetary issues, the rights of its members, and the community.
H. HATE/BIAS CRIME Canada is made up of many social, cultural, religious and linguistic groups. According to 2006 Census data, more than 5 million Canadians (16% of the population) reported being members of a visible minority group, an increase of 27% since 2001. Furthermore same-sex couples have also increased, 33% between 2001 and 2006, and the religious diversity of Canada is also growing and changing. The diversity of Canada is a defining feature of the country, but also provides the potential for acts of discrimination, conflict, and crimes of hate.226
According to Statistics Canada, in 2006 Canadian police services reported 892 hate-motivated crimes, accounting for 0.04% of all criminal incidents (rate of 3.1 per 100,000 people). Furthermore, according to the 2004 GSS, there were over 260,000 self-reported incidents of hate-motivated crime in the previous year (3% of all incidents).227
The police-reported data show that the majority of hate crimes were motivated by race/ethnicity (61%), religion (27%), or sexual orientation (10%). In addition, in 2006, half of racially-motivated crimes reported to police targeted Blacks and nearly two-thirds of religiously-motivated hate crimes were directed at the Jewish faith. Just over half (52%) of all hate crimes
224 Canada Safety Council. Bullying in the Workplace. (Retrieved June 17th, 2008, from http://www.safety-council.org/info/OSH/bullies.html) 225 Ibid. 226 Dauvergne, M., Scrim, K., & Brennan, S. (2008). Hate Crime in Canada 2006. Ottawa: Statistics Canada (Canadian Centre for Justice Statistics). (Retrieved June 13th, 2008, from http://ccjsccsj.statcan.ca/) 227 Ibid.
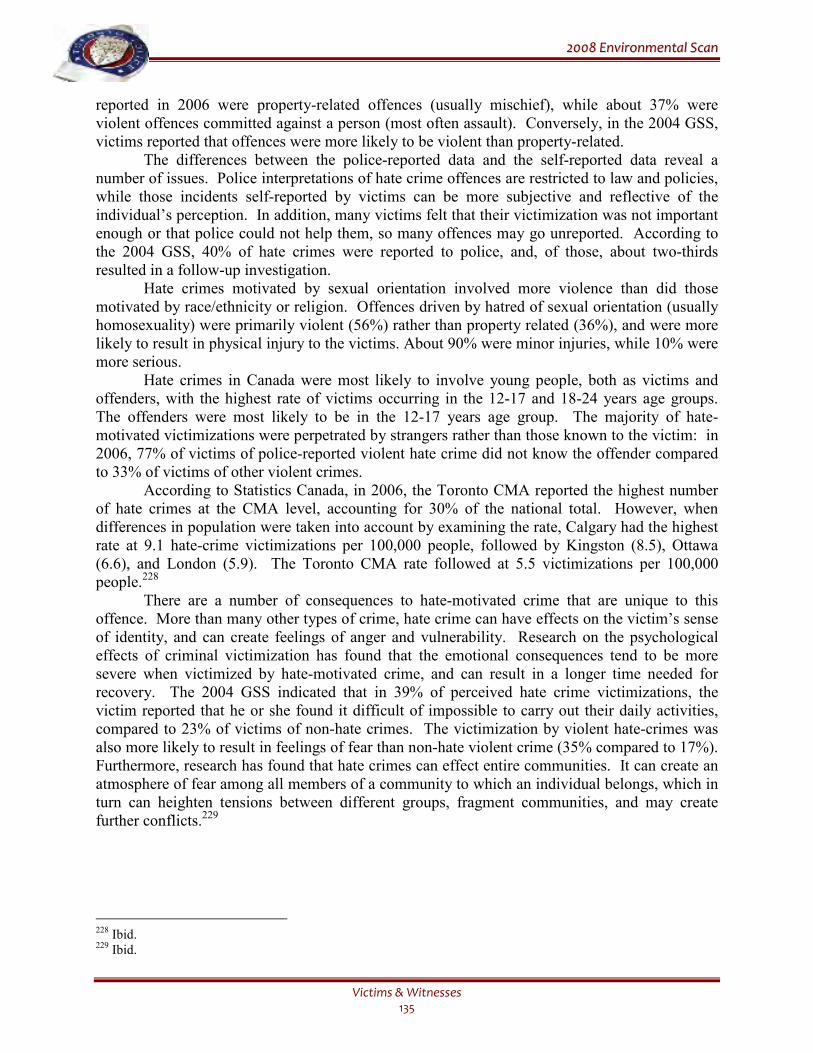
22000088 EEnnvviirroonnmmeennttaall SSccaann
Victims & Witnesses 135
reported in 2006 were property-related offences (usually mischief), while about 37% were violent offences committed against a person (most often assault). Conversely, in the 2004 GSS, victims reported that offences were more likely to be violent than property-related.
The differences between the police-reported data and the self-reported data reveal a number of issues. Police interpretations of hate crime offences are restricted to law and policies, while those incidents self-reported by victims can be more subjective and reflective of the individual’s perception. In addition, many victims felt that their victimization was not important enough or that police could not help them, so many offences may go unreported. According to the 2004 GSS, 40% of hate crimes were reported to police, and, of those, about two-thirds resulted in a follow-up investigation.
Hate crimes motivated by sexual orientation involved more violence than did those motivated by race/ethnicity or religion. Offences driven by hatred of sexual orientation (usually homosexuality) were primarily violent (56%) rather than property related (36%), and were more likely to result in physical injury to the victims. About 90% were minor injuries, while 10% were more serious.
Hate crimes in Canada were most likely to involve young people, both as victims and offenders, with the highest rate of victims occurring in the 12-17 and 18-24 years age groups. The offenders were most likely to be in the 12-17 years age group. The majority of hate-motivated victimizations were perpetrated by strangers rather than those known to the victim: in 2006, 77% of victims of police-reported violent hate crime did not know the offender compared to 33% of victims of other violent crimes.
According to Statistics Canada, in 2006, the Toronto CMA reported the highest number of hate crimes at the CMA level, accounting for 30% of the national total. However, when differences in population were taken into account by examining the rate, Calgary had the highest rate at 9.1 hate-crime victimizations per 100,000 people, followed by Kingston (8.5), Ottawa (6.6), and London (5.9). The Toronto CMA rate followed at 5.5 victimizations per 100,000 people.228
There are a number of consequences to hate-motivated crime that are unique to this offence. More than many other types of crime, hate crime can have effects on the victim’s sense of identity, and can create feelings of anger and vulnerability. Research on the psychological effects of criminal victimization has found that the emotional consequences tend to be more severe when victimized by hate-motivated crime, and can result in a longer time needed for recovery. The 2004 GSS indicated that in 39% of perceived hate crime victimizations, the victim reported that he or she found it difficult of impossible to carry out their daily activities, compared to 23% of victims of non-hate crimes. The victimization by violent hate-crimes was also more likely to result in feelings of fear than non-hate violent crime (35% compared to 17%). Furthermore, research has found that hate crimes can effect entire communities. It can create an atmosphere of fear among all members of a community to which an individual belongs, which in turn can heighten tensions between different groups, fragment communities, and may create further conflicts.229
228 Ibid. 229 Ibid.
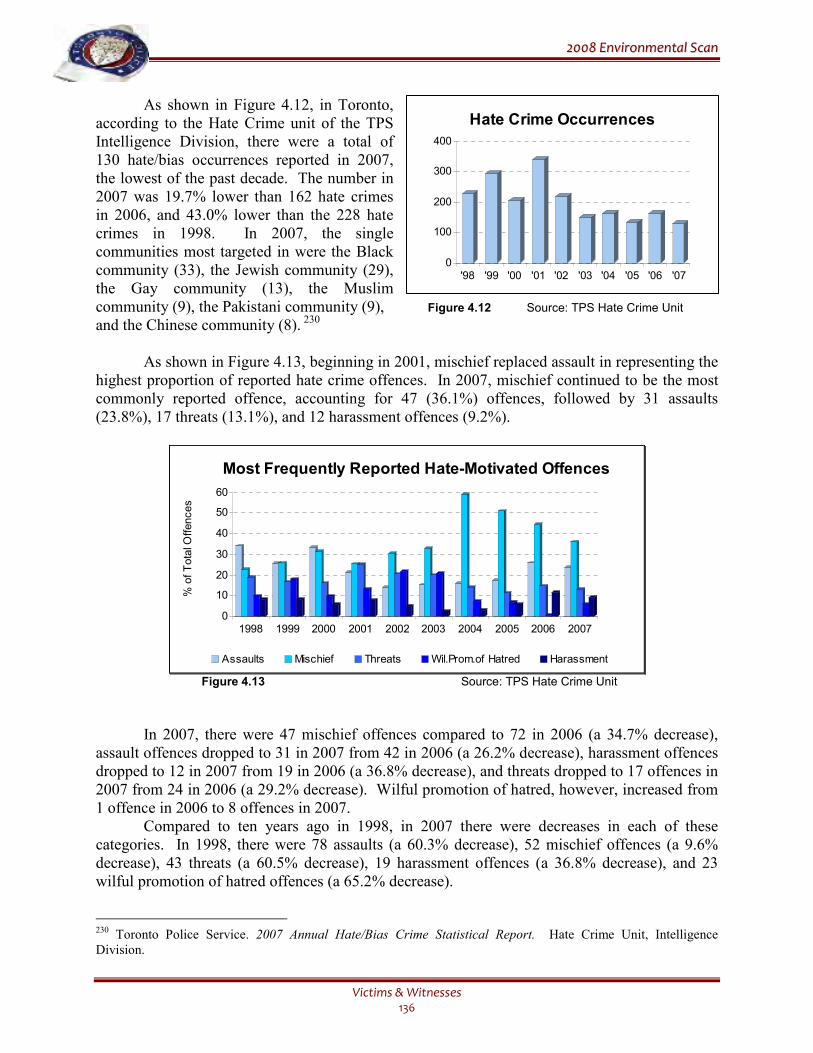
22000088 EEnnvviirroonnmmeennttaall SSccaann
Victims & Witnesses 136
As shown in Figure 4.12, in Toronto, according to the Hate Crime unit of the TPS Intelligence Division, there were a total of 130 hate/bias occurrences reported in 2007, the lowest of the past decade. The number in 2007 was 19.7% lower than 162 hate crimes in 2006, and 43.0% lower than the 228 hate crimes in 1998. In 2007, the single communities most targeted in were the Black community (33), the Jewish community (29), the Gay community (13), the Muslim community (9), the Pakistani community (9), Figure 4.12 Source: TPS Hate Crime Unit and the Chinese community (8). 230 As shown in Figure 4.13, beginning in 2001, mischief replaced assault in representing the highest proportion of reported hate crime offences. In 2007, mischief continued to be the most commonly reported offence, accounting for 47 (36.1%) offences, followed by 31 assaults (23.8%), 17 threats (13.1%), and 12 harassment offences (9.2%).
0
10
20
30
40
50
60
1998 1999 2000 2001 2002 2003 2004 2005 2006 2007
Assaults Mischief Threats Wil.Prom.of Hatred Harassment
% of Total O
ffences
Most Frequently Reported Hate-Motivated Offences
Figure 4.13 Source: TPS Hate Crime Unit
In 2007, there were 47 mischief offences compared to 72 in 2006 (a 34.7% decrease), assault offences dropped to 31 in 2007 from 42 in 2006 (a 26.2% decrease), harassment offences dropped to 12 in 2007 from 19 in 2006 (a 36.8% decrease), and threats dropped to 17 offences in 2007 from 24 in 2006 (a 29.2% decrease). Wilful promotion of hatred, however, increased from 1 offence in 2006 to 8 offences in 2007. Compared to ten years ago in 1998, in 2007 there were decreases in each of these categories. In 1998, there were 78 assaults (a 60.3% decrease), 52 mischief offences (a 9.6% decrease), 43 threats (a 60.5% decrease), 19 harassment offences (a 36.8% decrease), and 23 wilful promotion of hatred offences (a 65.2% decrease).
230 Toronto Police Service. 2007 Annual Hate/Bias Crime Statistical Report. Hate Crime Unit, Intelligence Division.
0
100
200
300
400
'98 '99 '00 '01 '02 '03 '04 '05 '06 '07
Hate Crime Occurrences
22000088 EEnnvviirroonnmmeennttaall SSccaann
Victims & Witnesses 137
In each of the past ten years, hate
offences have typically focused most frequently on race and religion: of the 2,017 hate offences recorded since 1998, these two categories together were the targets of almost two-thirds (60.2%). While both categories showed decreases in 2007 compared to 2006, race showed a 52.2% decrease in 2007 compared to 1998, while religion showed an increase of 18.7%. Figure 4.14 shows the number of offences targeting race and religion in each of the past ten years. Figure 4.14 Source: TPS Hate Crime Unit A number of issues and challenges may face the Service in the future with regard to hate-crime, some of which were discussed during consultations for the Scan in early 2008.231 Proactive responses to hate-crime and the difficulties interpreting the law will continue to be challenging. In addition, cyber-hate (discussed further in the Technology and Policing chapter) will present barriers to investigations and challenges to enforcement. Furthermore, it is possible that public institutions such as university campuses will act as the settings for larger scale clashes of cultures and ideas. It will remain important for the Service to cultivate partnerships with cultural and religious agencies, and other agencies such as university police, and the community and ethnic media. Partnerships and efficient, effective investigation of hate crimes will assist victims of crime, will ease the fear of hate crime in communities, and may result in providing encouragement for those who have been victimized to come forward to the police.
I. VICTIM RESOURCES
According to the most recent Statistics Canada Victims Services survey, more than 400,000 victims of crime sought assistance from the 589 victim service agencies studied within a one-year period between 2005 and 2006.232 Among the agencies that were able to categorize the victims, there were 161,000 female victims and 48,000 male victims served by the agencies (gender not reported for 190,000).
A snapshot study was also conducted, which found that on a single day in Canada in April 2006, 8,080 victims were served by 636 agencies, and 72% of those victims were victims of violent crimes such as physical or sexual assault. Over two-thirds of victims who had sought assistance on the single day were women, which may be related to findings that suggest that female victims in general are more likely to use formal support services than males.233
231 Details from all consultations are provided in the Appendix to this document. 232 Brzozowski, J. (2007). Victim Services in Canada, 2005/2006. Juristat (Canadian Centre for Justice Statistics). (Retrieved May 22nd, 2008, from http://ccjsccsj.statcan.ca/) 233 Ibid.
0
50
100
150
200
'98 '99 '00 '01 '02 '03 '04 '05 '06 '07
Hate Crimes Targeting Race
and Religion
Race Religion
Number
22000088 EEnnvviirroonnmmeennttaall SSccaann
Victims & Witnesses 138
Services most often offered by victim services agencies included: general information (96%), emotional support (95%), liaisons with agencies for the client (90%), immediate safety planning (90%), information on criminal justice system structure and process (89%), and public education/prevention (87%).234
As mentioned previously in the Domestic Violence section, the Service has embarked on a proactive initiative aimed at victim safety and the notification of victims where an accused is released from custody. The current examination of the Service’s business processes with regard to victim notification, and the study of models that affect the notification of vulnerable victims is an important step towards enhancing victim safety. The victim notification process for high-risk offenders, if expanded to include offences other than domestic violence, such as criminal harassment and sexual assault, could further enhance a proactive approach to victim safety.
Victim Services:
In 2007, the Victim Services Program of Toronto assisted 15,872 victims by telephone,
an increase of 4.0% compared to the 15,261 victims assisted in 2006. On-scene attendance was involved in 3,207 of all requests for assistance in 2007, which was also an increase (1.9%) compared to 2006 when 3,147 victims were assisted on-scene. About 1 in 5 requests for assistance in each of these years was dealt with on-scene. In addition, the total number of volunteer hours in 2007 for Victim Services was 22,320.
0
4000
8000
12000
16000
20000
24000
1998 1999 2000 2001 2002 2003 2004 2005 2006 2007
Responses by Victim Services Program
Telephone On Scene
Figure 4.15 Source: Victim Services Program of Toronto, Inc.
As shown in Figure 4.15, there has been a steady increase in the number of victims served in the past three years.235 Although the increase is due in part to the inclusion of numbers relating to DVERS and Supportlink programs, a number of other initiatives that have been undertaken by Victim Services that have and will continue to provide them with the opportunity to assist more victims. Some of the initiatives that have been implemented include: Project PAIN (Promoting Access in Impacted Neighbourhoods), Project TEAR (Teens Ending Abusive Relationships), and the Victim Quick Response Program.
234 Ibid. 235 Victim Services initiatives and the inclusion of DVERS and Supportlink program numbers are the main reasons for a large increase in total numbers after 2004. The numbers in 2005, as represented in Figure 4.15, will be the new baseline for future analysis.
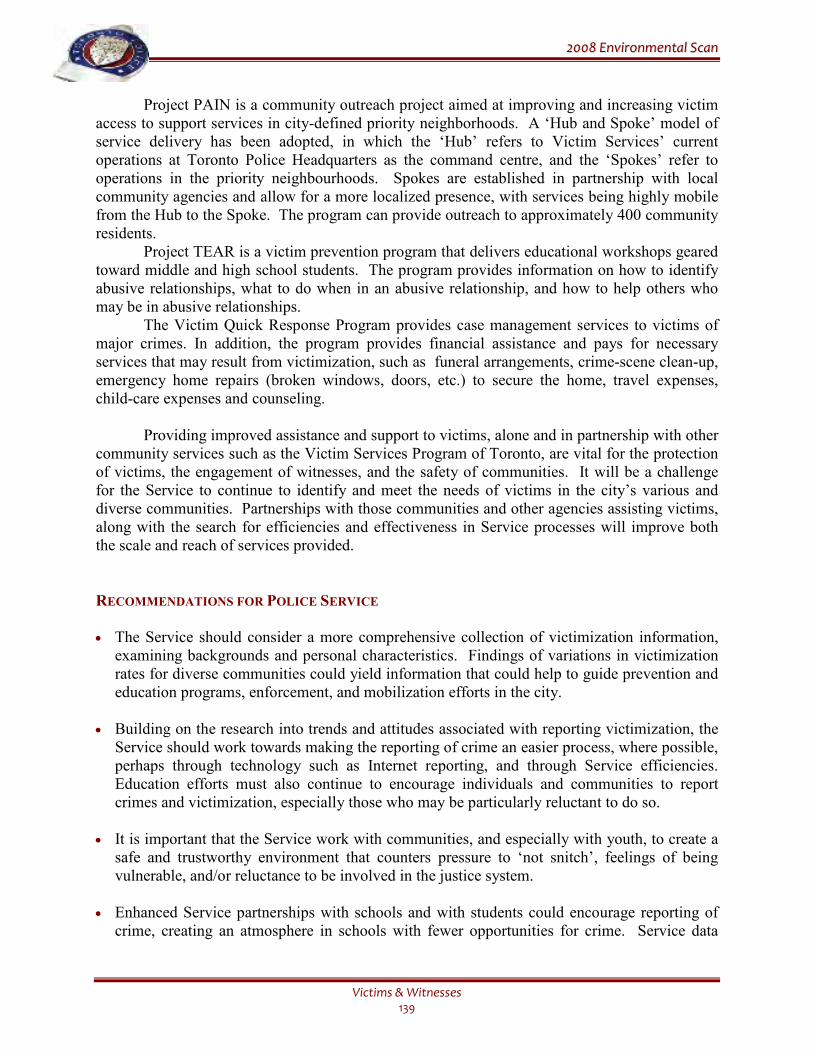
22000088 EEnnvviirroonnmmeennttaall SSccaann
Victims & Witnesses 139
Project PAIN is a community outreach project aimed at improving and increasing victim access to support services in city-defined priority neighborhoods. A ‘Hub and Spoke’ model of service delivery has been adopted, in which the ‘Hub’ refers to Victim Services’ current operations at Toronto Police Headquarters as the command centre, and the ‘Spokes’ refer to operations in the priority neighbourhoods. Spokes are established in partnership with local community agencies and allow for a more localized presence, with services being highly mobile from the Hub to the Spoke. The program can provide outreach to approximately 400 community residents.
Project TEAR is a victim prevention program that delivers educational workshops geared toward middle and high school students. The program provides information on how to identify abusive relationships, what to do when in an abusive relationship, and how to help others who may be in abusive relationships. The Victim Quick Response Program provides case management services to victims of major crimes. In addition, the program provides financial assistance and pays for necessary services that may result from victimization, such as funeral arrangements, crime-scene clean-up, emergency home repairs (broken windows, doors, etc.) to secure the home, travel expenses, child-care expenses and counseling.
Providing improved assistance and support to victims, alone and in partnership with other community services such as the Victim Services Program of Toronto, are vital for the protection of victims, the engagement of witnesses, and the safety of communities. It will be a challenge for the Service to continue to identify and meet the needs of victims in the city’s various and diverse communities. Partnerships with those communities and other agencies assisting victims, along with the search for efficiencies and effectiveness in Service processes will improve both the scale and reach of services provided.
RECOMMENDATIONS FOR POLICE SERVICE
• The Service should consider a more comprehensive collection of victimization information,
examining backgrounds and personal characteristics. Findings of variations in victimization rates for diverse communities could yield information that could help to guide prevention and education programs, enforcement, and mobilization efforts in the city.
• Building on the research into trends and attitudes associated with reporting victimization, the
Service should work towards making the reporting of crime an easier process, where possible, perhaps through technology such as Internet reporting, and through Service efficiencies. Education efforts must also continue to encourage individuals and communities to report crimes and victimization, especially those who may be particularly reluctant to do so.
• It is important that the Service work with communities, and especially with youth, to create a
safe and trustworthy environment that counters pressure to ‘not snitch’, feelings of being vulnerable, and/or reluctance to be involved in the justice system.
• Enhanced Service partnerships with schools and with students could encourage reporting of
crime, creating an atmosphere in schools with fewer opportunities for crime. Service data
22000088 EEnnvviirroonnmmeennttaall SSccaann
Victims & Witnesses 140
collection methods must support the tracking and analysis of crimes and victimization on and around school premises, as well as new types of crimes that may be emerging, such as iCrimes. Such data and analysis will assist in focusing prevention and enforcement efforts.
• Given findings from research and focus groups with regard to domestic violence, the Service
should evaluate their methods of following-up with victims and notifying them of bail conditions. The Service should pursue upgrades to the victim notification systems to ensure that victims are kept aware of issues important for their safety.
• Given the lack of empirical information on cyber-stalking, the Service should evaluate the
need for improvement in its data collection and current technological capabilities. • The Service should increase its awareness of issues related to the victimization of people who
live on the streets, by strengthening partnerships with agencies that assist and/or provide services to the homeless, and through improvements in Service data collection to allow analysis.
• Given the importance of managing workplace bullying, the Service should evaluate its current
environment with regard to workplace bullying and consider imposing specific policies against it.
• While the recent decrease in report hate crimes may reflect an actual decline in incidents, the
Service must also be aware of the possibility that these incidents are simply no longer being reported. It may also be the case that how hate crimes are being carried out is changing and is more complex to identify, for example, cyber-hate. The Service must continue to cultivate partnerships with cultural and religious agencies, and other agencies such as the community and ethnic media, both to encourage reporting and to be attentive to emerging trends.
22000088 EEnnvviirroonnmmeennttaall SSccaann
Traffic 141
V. TRAFFIC As vehicles travel throughout the city, it is important to understand their influence on
public safety and policing. Drivers have a responsibility to operate in a safe manner, and
the police have a responsibility to ensure that they do so. Traffic engineering and design,
education, enforcement, and strong partnerships with traffic safety organisations are vital
to traffic safety. An idea of patterns and trends associated with the movement and volume
of traffic will assist in predicting demand for police resources. Emergency vehicles face
many challenges navigating city streets, and, in addition to this safety concern, traffic
congestion is frustrating to the public, the police, and other drivers. Issues surrounding
vehicle and pedestrian traffic continue to be a priority for the larger community.
HIGHLIGHTS
• Worldwide, approximately 1.2 million people die in road crashes each year, and about 50
million are injured. The term ‘accident’ can give the impression that traffic events cannot be managed because of unpredictability and inevitability. However, traffic events can be analyzed and action taken towards prevention.
• The national target established in Canada’s Road Safety Vision Plan is a 30% reduction in the
average number of road users killed or seriously injured during the 2008-2010 period. Canada is making progress toward the 30% reduction, but continues to lose ground to other top-ranked member nations in the Organization for Economic Cooperation and Development (OECD). When comparing the death rate per billion kilometres travelled, and traffic collision deaths per 100,000 population, Canada is ranked 10th of the 30 member nations in the OECD.
• In Toronto in 2006, there were 1.14 million motor vehicles registered, which translated to an
average of 1.16 vehicles per household. There are approximately 10,033 different streets in Toronto, and the streets, expressways, ramps, and laneways cover approximately 27.4% of the city’s total area.
• Metrolinx, the Province of Ontario’s transportation planning agency for the region extending
from Oshawa to York Region to Hamilton, is developing a Regional Transportation Plan aimed at preparing for population growth and the resulting severe congestion. The plan is estimated for completion in the fall of 2008.
• According to the Toronto Screenline count, during a 24-hour period, there are approximately
1.292 million inbound trips and 1.244 million outbound trips in a day. Most of the trips entered Toronto from the north, followed by travel from the west. The fewest trips originated from the east.
• In 2007, there were approximately 56,026 reportable collisions, an increase of 4.3% from the
53,699 reportable collisions in 2006, but a 14.9% decrease from the 65,838 reportable collisions in 1998. The number of collisions in 2007 represented the third lowest number of collisions of the past 10 years, and extended the relatively stable trend seen since 2004.
22000088 EEnnvviirroonnmmeennttaall SSccaann
Traffic 142
• The average time spent by officers on a property damage collision in 2007 increased 13.7% from 2006, while the average time spent by officers in 2007 on a personal injury collision increased 4.5% from 2006. The average time spent on a personal injury collision (4.4 hours), was the longest average time in the past 10 years.
• There were 52 people killed in traffic collisions in 2007, an 8.8% decrease from the 57 killed
in 2006, and a 40.9% decrease from the 88 killed in 1998. The 52 people killed in 2007 represented the lowest number of traffic deaths in the past 10 years, and the continuation of an encouraging downward trend since 2002. Toronto’s traffic collision fatality rate in 2007 was 1.9 per 100,000, which was the lowest rate compared to seven other large Canadian cities.
• In 2006, the City of Toronto installed 267 traffic signal countdown timers at various
intersections in Toronto, followed by approximately another 260 in 2007. The city, if approved, is planning to install another 840 in 2008, and finish the remaining intersections in 2009. These timers may contribute to safer pedestrian and driver practices at intersections, which may in turn reduce collisions, injuries, and deaths.
• Traditionally, law enforcement agencies have issued traffic tickets using a paper-intensive,
highly manual procedure, which sometimes leads to a lack of accuracy, and to data entry issues. Hand-held electronic ticketing devices are now being used, tested, or considered by police services in a number of North American cities.
• In June 2007, Bill 203, Safer Roads for a Safer Ontario Act, increased fines for street racers
and aggressive drivers, including those who drive 50km/h or more over a posted spend limit. Furthermore, the legislation allows police to immediately suspend the driver’s licence and impound his or her vehicle for seven days for street racing, stunt driving, or participating in a driving contest.
• In 2007, there were a total of 2,107 persons charged with drinking and driving offences in
Toronto. This represented a 3.3% decrease from the 2,180 charged in 2006, but a 13.5% increase from the 1,856 persons charged in 1998.
• The Centre for Addiction and Mental Health found that 20% of Ontario high schools students
admitted to driving a vehicle within one hour of using cannabis at least one time within the preceding year. Other surveys have found that about 4.8% of Canadian drivers had driven a vehicle within two hours of using cannabis, while about 20% admitted to taking a potentially impairing drug (prescription, legal, or illegal) within two hours of driving.
A. THE GLOBAL TRAFFIC SAFETY PARADIGM
Roads are the most complex and most dangerous public systems that people use every
day. Worldwide, approximately 1.2 million people die in road crashes each year, and about 50 million are injured. Many traffic fatalities and injuries are preventable, and great strides have occurred in high-income countries. Interventions such as the enforcement of legislation to control alcohol use when driving and to control speeding, mandating seatbelt use and safety
22000088 EEnnvviirroonnmmeennttaall SSccaann
Traffic 143
mechanisms, and the safer design and use of roadways, have all contributed to significant reductions. According to the World Health Organization (WHO), projections reveal that between 2000 and 2020, road traffic deaths will decline by about 30% in high-income countries.236
The economic cost of traffic fatalities and injuries is estimated to be about 2% of a high-income country’s gross national product (GNP), however, the social cost of traffic fatalities and injuries is much higher. Every person killed, injured, or disabled by a traffic collision has a complex network of family and friends who are deeply affected by the event and its consequences. Throughout the world, many families are driven to poverty due to a loss of a breadwinner, or the added burden of caring for members with a traffic related disability.237
Traditionally, motor vehicle accidents have been viewed as random events that are an inevitable result of road use. While the term ‘accident’ can give the impression that traffic events cannot be managed because of unpredictability and inevitability, traffic events can be analysed and action can be taken towards prevention.238
The fundamental perception among traffic safety professionals around the world has shifted toward a new understanding of road safety. According to the WHO, this road safety paradigm shift includes the assumptions that: 239
• Road collisions are largely preventable and predictable; it is a human-made problem that can be improved with rational analysis and counter-measures.
• Road safety is a multi-sector and public health issue; and all of the levels, including government services and health institutions, need to be responsible for activity and advocacy toward prevention.
• Common driving errors and common pedestrian behaviour should not lead to death and serious injury, and traffic safety systems need to cope effectively with demanding conditions.
• The vulnerability of the human body must be a parameter for speed management and road design.
• Traffic collisions is also a social equity issue; equal protection to all road users should be an aim of protection since non-motor vehicle users bear a disproportionate share of the risk of death and injury.
• Technology should fit local conditions and needs to address research-based local requirements.
• Local knowledge must inform the implementation of local solutions to traffic concerns.
Traffic Safety Models:
A number of world-wide approaches and advances in understanding the behavioural, vehicle-related, and road-related factors that affect the number and severity of traffic casualties
236 World Health Organization. (2004). World Report on Road Traffic Injury Prevention: Summary. (Retrieved April 28th, 2008, from http://www.who.int/violence_injury_prevention/publications/road_traffic/world_report/en/) 237 Ibid. 238 Ibid. 239 Ibid.
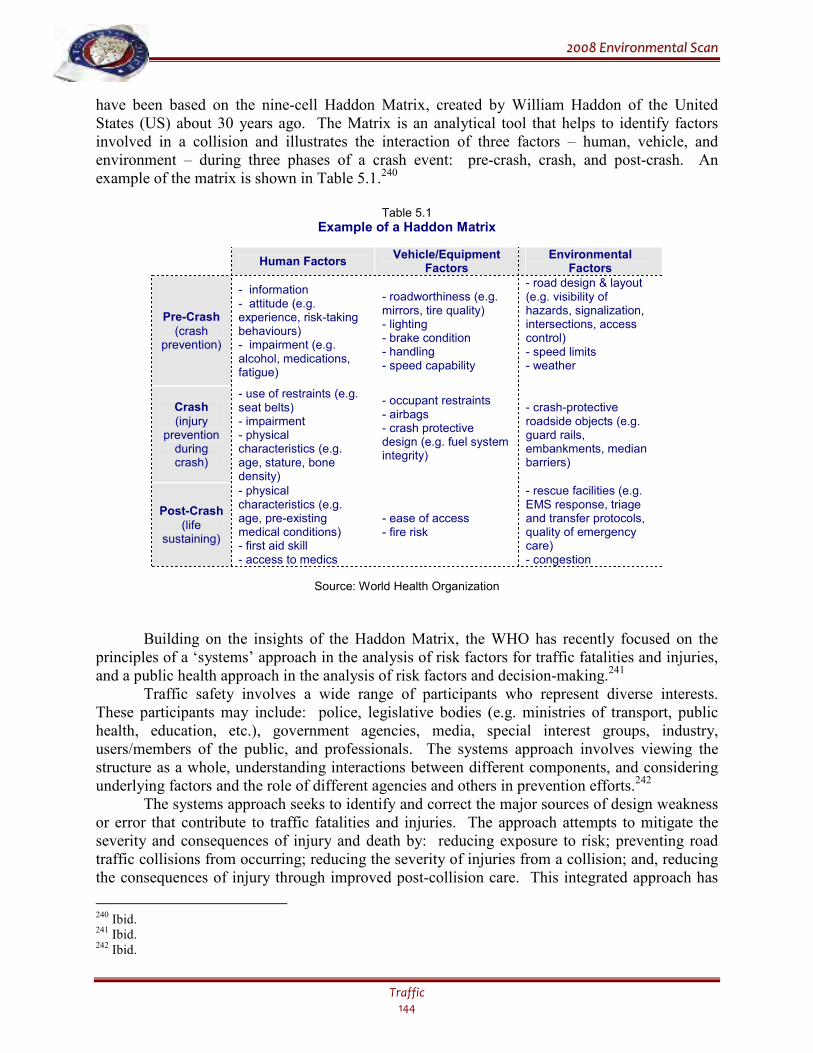
22000088 EEnnvviirroonnmmeennttaall SSccaann
Traffic 144
have been based on the nine-cell Haddon Matrix, created by William Haddon of the United States (US) about 30 years ago. The Matrix is an analytical tool that helps to identify factors involved in a collision and illustrates the interaction of three factors – human, vehicle, and environment – during three phases of a crash event: pre-crash, crash, and post-crash. An example of the matrix is shown in Table 5.1.240
Table 5.1 Example of a Haddon Matrix
Human Factors Vehicle/Equipment
Factors Environmental
Factors
Pre-Crash (crash
prevention)
- information - attitude (e.g. experience, risk-taking behaviours) - impairment (e.g. alcohol, medications, fatigue)
- roadworthiness (e.g. mirrors, tire quality) - lighting - brake condition - handling - speed capability
- road design & layout (e.g. visibility of hazards, signalization, intersections, access control) - speed limits - weather
Crash (injury
prevention during crash)
- use of restraints (e.g. seat belts) - impairment - physical characteristics (e.g. age, stature, bone density)
- occupant restraints - airbags - crash protective design (e.g. fuel system integrity)
- crash-protective roadside objects (e.g. guard rails, embankments, median barriers)
Post-Crash (life
sustaining)
- physical characteristics (e.g. age, pre-existing medical conditions) - first aid skill - access to medics
- ease of access - fire risk
- rescue facilities (e.g. EMS response, triage and transfer protocols, quality of emergency care) - congestion
Source: World Health Organization
Building on the insights of the Haddon Matrix, the WHO has recently focused on the principles of a ‘systems’ approach in the analysis of risk factors for traffic fatalities and injuries, and a public health approach in the analysis of risk factors and decision-making.241
Traffic safety involves a wide range of participants who represent diverse interests. These participants may include: police, legislative bodies (e.g. ministries of transport, public health, education, etc.), government agencies, media, special interest groups, industry, users/members of the public, and professionals. The systems approach involves viewing the structure as a whole, understanding interactions between different components, and considering underlying factors and the role of different agencies and others in prevention efforts.242
The systems approach seeks to identify and correct the major sources of design weakness or error that contribute to traffic fatalities and injuries. The approach attempts to mitigate the severity and consequences of injury and death by: reducing exposure to risk; preventing road traffic collisions from occurring; reducing the severity of injuries from a collision; and, reducing the consequences of injury through improved post-collision care. This integrated approach has
240 Ibid. 241 Ibid. 242 Ibid.
22000088 EEnnvviirroonnmmeennttaall SSccaann
Traffic 145
been successful in a number of highly-motorised countries, with evidence suggesting a marked decline in deaths and serious injuries due to traffic collisions. The biggest challenge to the systems approach for road safety professionals and policy makers is practical realization or implementation.243
The public health approach illustrates four inter-related steps: surveillance – to determine the magnitude, characteristics, and scope of the problem; risk factor identification – to identify factors that contribute to the risk of injury or disability, and determine the potentially modifiable factors; developing and evaluating interventions – to determine what works, assess measures, pilot test, and evaluate interventions; and, implementation – to determine how it is done, implement proven and effective interventions, and evaluate their effectiveness.244
It is important that the Service be involved with partners in the development of traffic intervention programs, using the knowledge gained from data and well planned and structured research and evaluation. Initiatives such as the Service’s 2007/08 Traffic Review illustrate a commitment to planning and recognize the importance of research and evaluation in determining the effectiveness and efficiency of projects.
B. CANADA’S NATIONAL ROAD SAFETY PLAN
Canada’s national road safety plan is laid out in Transportation Canada’s ‘Road Safety Vision 2010’. The strategic objectives of the plan are: to raise public awareness of road safety issues; to improve the communication, collaboration, and co-operation among road safety agencies; to improve national road safety data quality and collection; and, to enhance enforcement measures. The plan emphasizes the significant contributions that multi-level government partnerships make to initiatives that focus on road users, motor vehicles, and roadways. Furthermore, a number of important partners, such as police services, play significant roles in the successful delivery of road safety initiatives. The result of the partnerships is a multi-tiered approach to road safety.245
The national target, as established in the Road Safety Vision plan, is a 30% reduction in the average number of road users killed or seriously injured during the 2008-2010 period compared to 1996-2001 averages. When compared to other countries that have initiated similar targets, Canada is making progress toward the 30% reduction, but continues to lose ground to other top-ranked Organization for Economic Cooperation and Development (OECD) members. When comparing the death rate per billion kilometres travelled, and traffic collision deaths per 100,000 population, Canada is ranked 10th of the 30 member nations in the OECD.246
According to Transport Canada, there were approximately 2,889 traffic fatalities in Canada during 2006. This was a decrease of 0.5% compared to the 2,905 fatalities in 2005 and a
243 World Health Organization. (2007). Road Traffic Injury Prevention Training Manual: Unit 2. (Retrieved April 28th, 2008, from http://www.who.int/violence_injury_prevention/road_traffic/activities/roadsafety_training_manual _unit_2_risk_factors.ppt) 244 Ibid. 245 Transport Canada. (2005). Road Safety Vision 2010 Annual Report – 2005. (Retrieved April 29th, 2008, from http://www.tc.gc.ca/roadsafety/vision/2005/pdf/rsv2005se.pdf ) 246 Ibid.
22000088 EEnnvviirroonnmmeennttaall SSccaann
Traffic 146
decrease of 0.7% compared to the 2,911 fatalities in 1998. In Ontario, in 2006, there were 6.2 fatalities per 100,000, and 539.8 injuries per 100,000.247
Some of the strategies that other, more successful countries have employed to achieve road safety improvement include: speed cameras, reduced speed limits (seasonal or year-round), new lower legal blood alcohol concentration limits, road safety audits, education and enforcement, more severe speed-related and other illegal traffic behaviour sanctions, and traffic safety programs.248 National targets place expectations on municipal police services, and provide insight into the priorities of the federal government with regard to traffic safety. In the future, it will continue to be important that the Service remain focused on national as well as local targets. A challenge may arise in the area of resource allocation and the development of traffic enforcement initiatives, if local traffic concerns differ greatly from national concerns.
C. TORONTO – TRANSPORTATION INFRASTRUCTURE OVERVIEW
The 5th largest city in North America by population, the City of Toronto covers an area of over 630 square kilometres and includes approximately 979,330 households. In 2006, there were 1,141,301 motor vehicles registered, which translated to an average of 1.16 vehicles per household. There are approximately 10,033 different streets in Toronto, and the streets, expressways, ramps, and laneways cover approximately 27.4% of the city’s total area. Some general transportation facts are shown in Tables 5.2 and 5.3, below.249
Table 5.2
Toronto Road Network
Local Roads 3,331km Collectors 768 km Minor Arterials 406 km Major Arterials 756 km Expressways 128 km Total road network 5,389km Source: City of Toronto, Transportation Services
Table 5.3
Transportation Network Facts
Bus Routes 7,199 km Subway Routes 68 km Streetcar Routes 304 km Sidewalks 7060 km Bridges 535 Signalised Intersections 2,028
247 Transport Canada. (2006). Collisions and Casualties 1987 to 2006. (Retrieved April 29th, 2008, from http://www.tc.gc.ca/roadsafety/tp/tp3322/2006/page1.htm) 248 Transport Canada. (2005). Road Safety Vision 2010 Annual Report – 2005. (Retrieved April 29th, 2008, from http://www.tc.gc.ca/roadsafety/vision/2005/pdf/rsv2005se.pdf ) 249 City of Toronto, Toronto Facts. Infrastructure. (Retrieved April 29th, 2008, from http://toronto.ca/toronto_facts/ infrastructure.htm); Traffic Management Centre, Transportation Services. (2007). Collision and Volume Information Report – 2006. Toronto: City of Toronto.
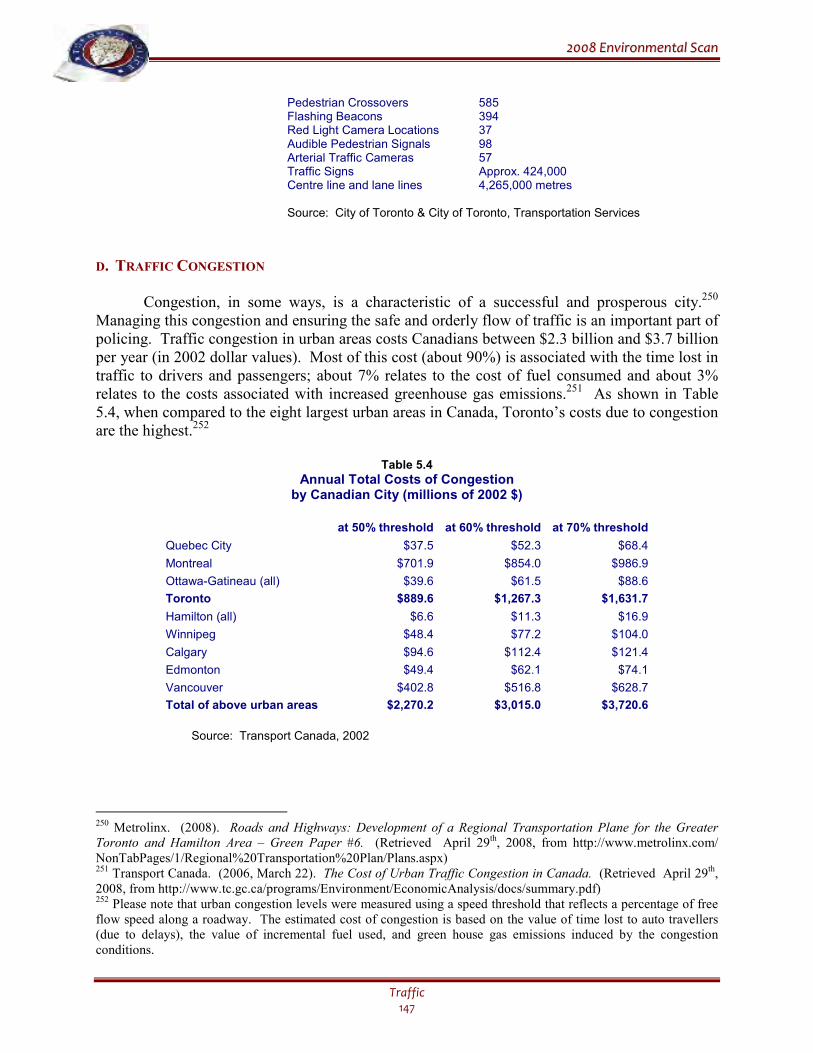
22000088 EEnnvviirroonnmmeennttaall SSccaann
Traffic 147
Pedestrian Crossovers 585 Flashing Beacons 394 Red Light Camera Locations 37 Audible Pedestrian Signals 98 Arterial Traffic Cameras 57 Traffic Signs Approx. 424,000 Centre line and lane lines 4,265,000 metres Source: City of Toronto & City of Toronto, Transportation Services
D. TRAFFIC CONGESTION
Congestion, in some ways, is a characteristic of a successful and prosperous city.250
Managing this congestion and ensuring the safe and orderly flow of traffic is an important part of policing. Traffic congestion in urban areas costs Canadians between $2.3 billion and $3.7 billion per year (in 2002 dollar values). Most of this cost (about 90%) is associated with the time lost in traffic to drivers and passengers; about 7% relates to the cost of fuel consumed and about 3% relates to the costs associated with increased greenhouse gas emissions.251 As shown in Table 5.4, when compared to the eight largest urban areas in Canada, Toronto’s costs due to congestion are the highest.252
Table 5.4
Annual Total Costs of Congestion by Canadian City (millions of 2002 $)
at 50% threshold at 60% threshold at 70% threshold
Quebec City $37.5 $52.3 $68.4
Montreal $701.9 $854.0 $986.9
Ottawa-Gatineau (all) $39.6 $61.5 $88.6
Toronto $889.6 $1,267.3 $1,631.7
Hamilton (all) $6.6 $11.3 $16.9
Winnipeg $48.4 $77.2 $104.0
Calgary $94.6 $112.4 $121.4
Edmonton $49.4 $62.1 $74.1
Vancouver $402.8 $516.8 $628.7
Total of above urban areas $2,270.2 $3,015.0 $3,720.6
Source: Transport Canada, 2002
250 Metrolinx. (2008). Roads and Highways: Development of a Regional Transportation Plane for the Greater Toronto and Hamilton Area – Green Paper #6. (Retrieved April 29th, 2008, from http://www.metrolinx.com/ NonTabPages/1/Regional%20Transportation%20Plan/Plans.aspx) 251 Transport Canada. (2006, March 22). The Cost of Urban Traffic Congestion in Canada. (Retrieved April 29th, 2008, from http://www.tc.gc.ca/programs/Environment/EconomicAnalysis/docs/summary.pdf) 252 Please note that urban congestion levels were measured using a speed threshold that reflects a percentage of free flow speed along a roadway. The estimated cost of congestion is based on the value of time lost to auto travellers (due to delays), the value of incremental fuel used, and green house gas emissions induced by the congestion conditions.
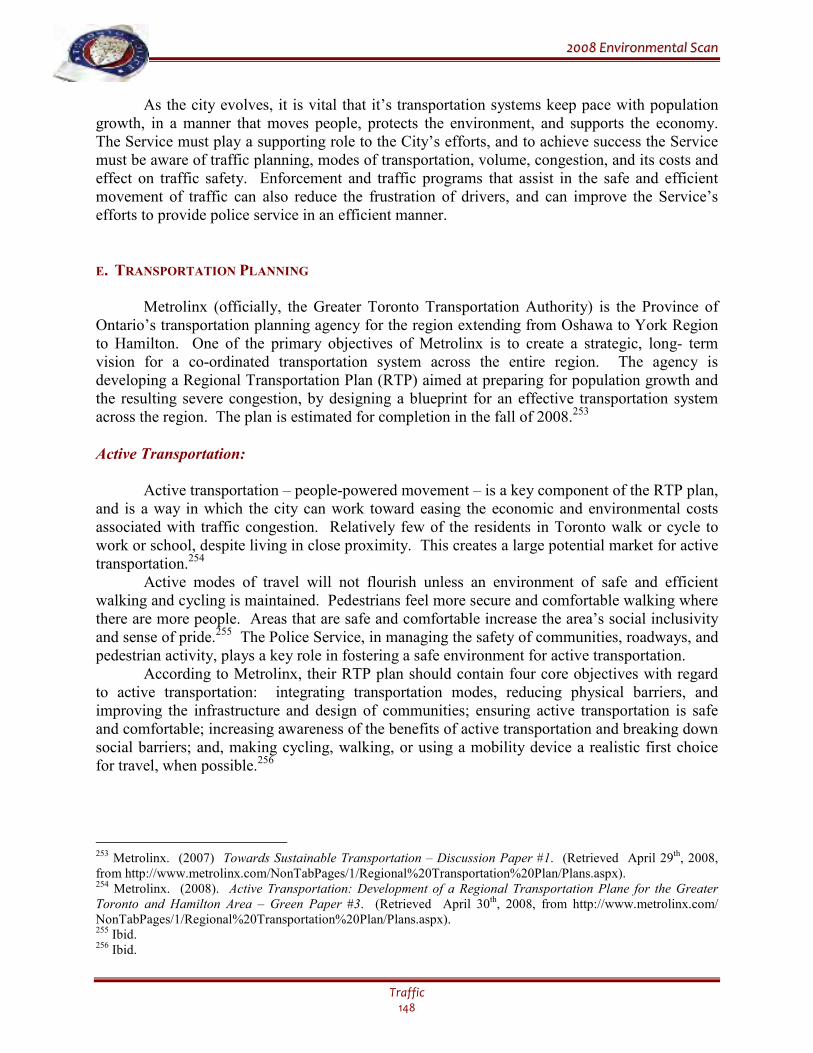
22000088 EEnnvviirroonnmmeennttaall SSccaann
Traffic 148
As the city evolves, it is vital that it’s transportation systems keep pace with population growth, in a manner that moves people, protects the environment, and supports the economy. The Service must play a supporting role to the City’s efforts, and to achieve success the Service must be aware of traffic planning, modes of transportation, volume, congestion, and its costs and effect on traffic safety. Enforcement and traffic programs that assist in the safe and efficient movement of traffic can also reduce the frustration of drivers, and can improve the Service’s efforts to provide police service in an efficient manner.
E. TRANSPORTATION PLANNING
Metrolinx (officially, the Greater Toronto Transportation Authority) is the Province of Ontario’s transportation planning agency for the region extending from Oshawa to York Region to Hamilton. One of the primary objectives of Metrolinx is to create a strategic, long- term vision for a co-ordinated transportation system across the entire region. The agency is developing a Regional Transportation Plan (RTP) aimed at preparing for population growth and the resulting severe congestion, by designing a blueprint for an effective transportation system across the region. The plan is estimated for completion in the fall of 2008.253
Active Transportation:
Active transportation – people-powered movement – is a key component of the RTP plan,
and is a way in which the city can work toward easing the economic and environmental costs associated with traffic congestion. Relatively few of the residents in Toronto walk or cycle to work or school, despite living in close proximity. This creates a large potential market for active transportation.254
Active modes of travel will not flourish unless an environment of safe and efficient walking and cycling is maintained. Pedestrians feel more secure and comfortable walking where there are more people. Areas that are safe and comfortable increase the area’s social inclusivity and sense of pride.255 The Police Service, in managing the safety of communities, roadways, and pedestrian activity, plays a key role in fostering a safe environment for active transportation.
According to Metrolinx, their RTP plan should contain four core objectives with regard to active transportation: integrating transportation modes, reducing physical barriers, and improving the infrastructure and design of communities; ensuring active transportation is safe and comfortable; increasing awareness of the benefits of active transportation and breaking down social barriers; and, making cycling, walking, or using a mobility device a realistic first choice for travel, when possible.256
253 Metrolinx. (2007) Towards Sustainable Transportation – Discussion Paper #1. (Retrieved April 29th, 2008, from http://www.metrolinx.com/NonTabPages/1/Regional%20Transportation%20Plan/Plans.aspx). 254 Metrolinx. (2008). Active Transportation: Development of a Regional Transportation Plane for the Greater Toronto and Hamilton Area – Green Paper #3. (Retrieved April 30th, 2008, from http://www.metrolinx.com/ NonTabPages/1/Regional%20Transportation%20Plan/Plans.aspx). 255 Ibid. 256 Ibid.
22000088 EEnnvviirroonnmmeennttaall SSccaann
Traffic 149
Transportation Demand Management (TDM):
The Metrolinx RTP further supports the management of traffic within the city through the consideration of Transportation Demand Management (TDM) initiatives. TDM is the use of policies, programs, services, and products to influence whether, why, when, where, and how people travel.257 Some proposed and continuing TDM applications include: electronic tolling; the presto smart card project that provides a single card for public transit fare payment across regional services; High Occupancy Vehicle (HOV) lanes to encourage carpooling; cycling promotions; the COMPASS website that provides traffic flow maps to illustrate areas of high congestion; and, incentives and dis-incentives (e.g., distance-based vehicle registrations/insurance premiums, emission charges, parking fees, highway tolls, etc.).258 The Service can support these initiatives through the enforcement of HOV lanes, and through enforcement and safety initiatives that promote safe driving, cycling, and transit use.
Roadway & Congestion Management:
According to Metrolinx, the region needs to change the way roads are planned, maintained, and used. Roads are a key to the quality of life and economy of the city, and competitiveness relies on the ability to reach destinations safely and quickly. Congestion is a threat to the city’s economy and health, and many residents lose their lives or are critically injured on the roads.259
A number of institutional challenges exist with regard to planning, funding, and maintaining roads. For example, roads are often analyzed in isolation from a complete transportation solution (i.e., cycling, walking, and transit are not usually considered in detail); roads are primarily designed for cars and trucks, and walking, cycling, and transit vehicles are only occasionally considered; road are expanded without consideration of other external benefits or costs due to a bias to maintaining a high level of service; a lack of price signals, as the use of roads and highways is typically free, which results in overuse and congestion; new roads and road widening can lead to more use due to new trips not considered previously, while other modes such as cycling or walking suffer; roads require continual maintenance to ensure they are safe and in good condition; accident clearing practices are often slow, resulting in further congestion with lasting effects; and, technology is not used to its full potential (e.g., to warn drivers of optimal routes, etc.).260
Metrolinx RTP will be proposing three alternatives with regard to the roads and highways, based on the benefits to people, the environment, and the economy.
257 Metrolinx. (2008). Transportation Demand Management: Development of a Regional Transportation Plane for the Greater Toronto and Hamilton Area – Green Paper #4. (Retrieved April 30th, 2008, from http://www.metrolinx.com/NonTabPages/1/Regional%20Transportation%20Plan/Plans.aspx) 258 Ibid. 259 Metrolinx. (2008). Roads and Highways: Development of a Regional Transportation Plane for the Greater Toronto and Hamilton Area – Green Paper #6. (Retrieved April 30th, 2008, from http://www.metrolinx.com/ NonTabPages/1/Regional%20Transportation%20Plan/Plans.aspx) 260 Ibid.
22000088 EEnnvviirroonnmmeennttaall SSccaann
Traffic 150
Alternative One:
This basic option, suggests that roads continue to be improved and expanded on the basis of provincial and municipal Official Plans, so that the road network functions in 2031 in a similar fashion to today. Some actions could include: implementing HOV lanes, built through road widening, to preserve vehicular capacity; limited transit priority continues – transit in HOV lanes, signal priority, etc.; tolling restricted to Highway 407; and, improved active transportation and infrastructure for pedestrians, focused around established communities, transit systems, and mobility hubs.261
Alternative Two:
The Toronto road network is well-positioned to support this more incremental option, in which emphasis is placed on facilitating travel by transit and in HOVs. Strategies toward this option could involve: further progress toward a common criteria and funding for the design of a comprehensive transportation system; increased number of HOV lanes designed with transit integration and regional connectivity in mind; increased transportation pricing; increased active transportation network connections to improve the mobility and local connectivity of communities; the investigation of ‘clean air corridors’that give priority to active transportation on specific routes during smog days; and, a restriction on the movement of goods during peak periods.262
Alternative Three:
These more progressive interventions could transform the ways in which roads and highways form the core of the city and region’s transportation system. These strategies could include: a shift from traffic impact studies to true transportation impact studies; the concept of ‘complete streets’, where all pedestrians, motorists, cyclists, and transit riders can move about safely and efficiently, improving and increasing social space and safety through place-making and shared space techniques; more transit-only lanes, with high speed higher-order transit on arterials, and improved flow of local transit on local roads; comprehensive transportation pricing that takes into account time of use, parking use, emissions, etc.; and, restrictions on goods and services delivery in congested areas, combined with the use of urban distribution centres.263
A change to the way city roads and communities are planned will take a co-operative relationship and partnership involving a number of stakeholders and agencies. The public and agencies will need to become more knowledgeable about the effect of their daily travel, and their influence on the quality of life, economy, and environment.264 Furthermore, elected officials and large agencies such as the Police Service will need to share responsibility for understanding, shaping, and promoting a different approach to transportation in the city.
261 Ibid. 262 Ibid. 263 Ibid. 264 Ibid.
22000088 EEnnvviirroonnmmeennttaall SSccaann
Traffic 151
F. BEST PRACTICES – ROADS & HIGHWAYS
A number of traffic interventions are in place around the world, with varied success. Each urban area is somewhat unique, but can also benefit from the visions and designs of others. Traffic flow, and the safety of drivers and pedestrians, is important to the Service and a comprehensive understanding of how road design can reduce collisions and injury can focus efforts and increase effectiveness. Some popular urban road and highways ‘best practices’ include:265
• ‘Tidal Flow’ Operations – This involves, essentially, a centre lane that is reversible. For example, on Jarvis Street in Toronto, five lanes operate with three lanes in one direction depending on the peak time of operation. Other areas throughout Canada use the ‘extra’ peak direction lane for HOVs.
• Contraflow Lanes – These are peak period lanes borrowed from the opposing direction.
This cost effective method is beneficial in physically-constrained environments. In central city conditions, contraflow lanes are sometimes operated on one-way streets, and/or can be limited to certain types of vehicles or users.
• Continuous Flow Intersection (CFI) – This design provides increased left turning
capacity, fewer conflict points (increased safety), and reduced overall delay, by reducing a wide intersection approach into shorter crossing segments for pedestrians. CFIs have been used at major US intersections in lieu of costly grade separation designs.
• Diverging Diamond Interchange – This innovative method requires drivers to cross
briefly to the left side of the road at specifically designed, signalized interchanges, then crossing back to the ‘right’ side of the road. This promotes left turn movements and allows traffic to move from a highway to an intersecting roadway without crossing the path of opposing traffic. It increases road capacity, reduces property requirements, improves safety, and reduces the cost associated of conventional layouts.
• Roundabouts – These popular intersections, used worldwide, are relatively rare in
Toronto. Their space requirements make them difficult to retrofit in many locations, and high-volume situations typically do not benefit from them. However, they have proven successful throughout the world, and should be considered for many new roadways, to improve vehicular safety, increase capacity, and reduce delay and emissions.
• Intelligent Transportation Systems – These include red light cameras, traffic signals
activated by emergency services/buses, ‘smart’ parking facilities (keep track of availability of spaces and guide motorists to open spots), advances in collision avoidance (e.g. intersection collision avoidance systems), automated occupancy detection systems (e.g. HOV lanes), and so on.
• Streetcar/LRT Treatments – LRT tracks typically occupy the middle two lanes and are
flanked by two directions of traffic. As outlined in the Urban Trends chapter, the
265 Ibid.
22000088 EEnnvviirroonnmmeennttaall SSccaann
Traffic 152
Toronto Transit Commission (TTC) is embarking on the ‘Transit City’ initiative, which will introduce LRT systems to a number of key areas in Toronto.
Use of any of these traffic interventions would undoubtedly require some changes to current traffic services and enforcement. In addition, the Service may be involved in the planning of new projects, to ensure that any new traffic interventions will not impede emergency service delivery, for example LRT tracks partitioning off roadways and leading to the inability of emergency vehicles to cross into opposite lanes, etc. It is important, therefore, that the Police Service and the City Transportation Services department maintain a close partnership in information sharing, research, and planning.
G. CITY OF TORONTO – VOLUME COUNTS
The Cordon Count program counts by direction, the number of vehicles (by type) and
number of occupants that pass specific counting stations along Toronto's roadways and railways. Cordon counts have been conducted every alternating 2 and 3 years. An analysis of the cordon count can assist in infrastructure planning, developing transportation policies, monitoring travel trends, and assessing the potential influence of transportation changes. It can also provide baseline information for future projections. The last cordon count was conducted in 2006.266 Between 2004 and 2006, inbound vehicle flow during the morning peak period for the City of Toronto (6:30a.m. to 9:30 a.m.) increased by 1%, while outbound vehicle flow decreased by about 2%. Generally, travel volume across city boundaries correlates with employment figures in the city and the number of inbound person trips continued a steady increase. Between 2004 and 2006, inbound travel increased about 4.3%, from 370,400 to 386,400 trips. Furthermore, in 2006, about 67% of those entering Toronto in a vehicle were alone; only about 1 in 5 (20%) trips into Toronto during the a.m. peak were made using public transit. It should also be noted that the increase in Toronto’s population, combined with increases in population and employment in the surrounding regions, has lead to increased off-peak travel. In 2006, there was a greater volume of inbound trips at most times between 6:30 a.m. and 6:30 p.m. than in all previous cordon counts.267 Looking specifically at the a.m. peak period for the Central Toronto Area between 7:00 a.m. to 10:00 a.m., the number of morning peak-period inbound vehicles has not changed significantly in the past 10 years.268 Differences in inbound vehicular traffic counts varied between ±1%-6% between 1985 and 2006, which may indicate roads operating at capacity during the morning peak period. Furthermore, between 1985 and 2006, outbound morning peak period trips increased 37.8%, from 54,000 vehicles in 1985 to 74,400 in 2006. This increase may be due to employment growth in other regions and areas of Toronto. Similar to the City of Toronto count noted above, the number of inbound person trips for the Central Area in 2006 increased by 10.3%, from 300,550 trips in 1985 to 331,600 in 2006;
266 City of Toronto. (2007). 2006 City of Toronto Cordon Count Program Information Bulletin. (Retrieved May 1st, 2008, from http://www.toronto.ca/planning/pdf/cordon_count_2006.pdf) 267 Ibid. 268 The Central Area is defined as CP Rail North Toronto screenline to the north, Bayview Avenue/Don River screenline to the east, Lake Ontario to the south, and Bathurst Street screenline to the west.
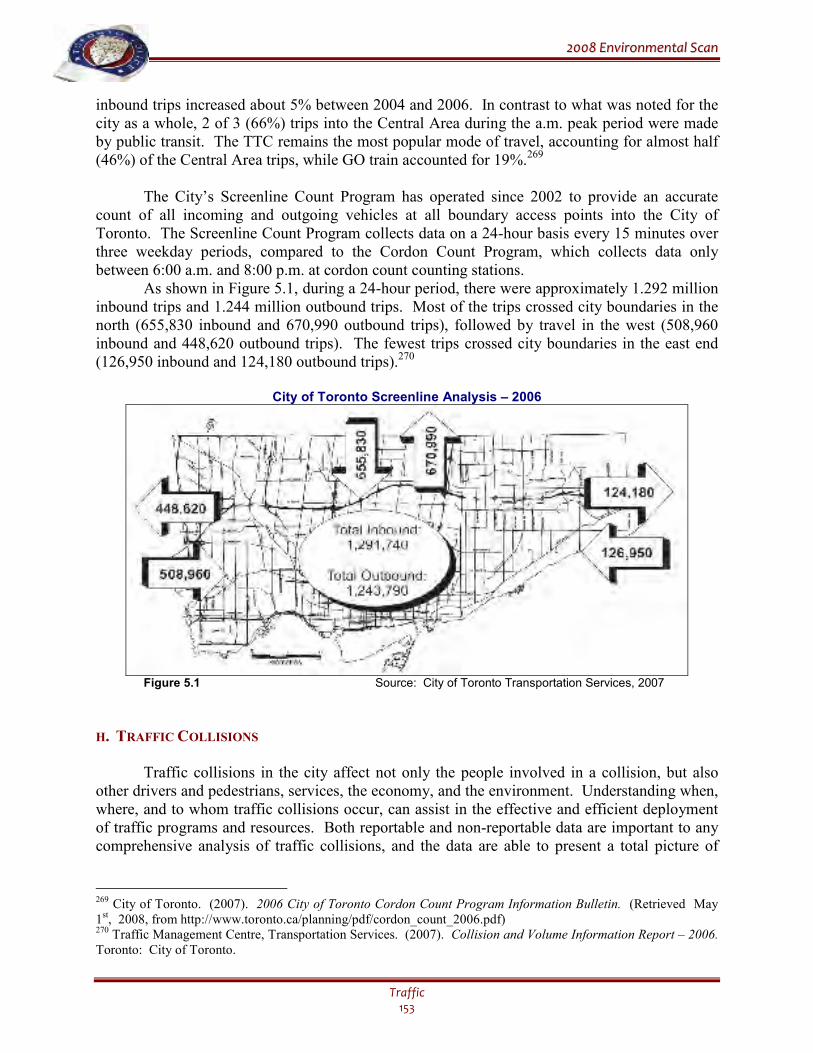
22000088 EEnnvviirroonnmmeennttaall SSccaann
Traffic 153
inbound trips increased about 5% between 2004 and 2006. In contrast to what was noted for the city as a whole, 2 of 3 (66%) trips into the Central Area during the a.m. peak period were made by public transit. The TTC remains the most popular mode of travel, accounting for almost half (46%) of the Central Area trips, while GO train accounted for 19%.269 The City’s Screenline Count Program has operated since 2002 to provide an accurate count of all incoming and outgoing vehicles at all boundary access points into the City of Toronto. The Screenline Count Program collects data on a 24-hour basis every 15 minutes over three weekday periods, compared to the Cordon Count Program, which collects data only between 6:00 a.m. and 8:00 p.m. at cordon count counting stations. As shown in Figure 5.1, during a 24-hour period, there were approximately 1.292 million inbound trips and 1.244 million outbound trips. Most of the trips crossed city boundaries in the north (655,830 inbound and 670,990 outbound trips), followed by travel in the west (508,960 inbound and 448,620 outbound trips). The fewest trips crossed city boundaries in the east end (126,950 inbound and 124,180 outbound trips).270
City of Toronto Screenline Analysis – 2006
Figure 5.1 Source: City of Toronto Transportation Services, 2007
H. TRAFFIC COLLISIONS
Traffic collisions in the city affect not only the people involved in a collision, but also
other drivers and pedestrians, services, the economy, and the environment. Understanding when, where, and to whom traffic collisions occur, can assist in the effective and efficient deployment of traffic programs and resources. Both reportable and non-reportable data are important to any comprehensive analysis of traffic collisions, and the data are able to present a total picture of
269 City of Toronto. (2007). 2006 City of Toronto Cordon Count Program Information Bulletin. (Retrieved May 1st, 2008, from http://www.toronto.ca/planning/pdf/cordon_count_2006.pdf) 270 Traffic Management Centre, Transportation Services. (2007). Collision and Volume Information Report – 2006. Toronto: City of Toronto.
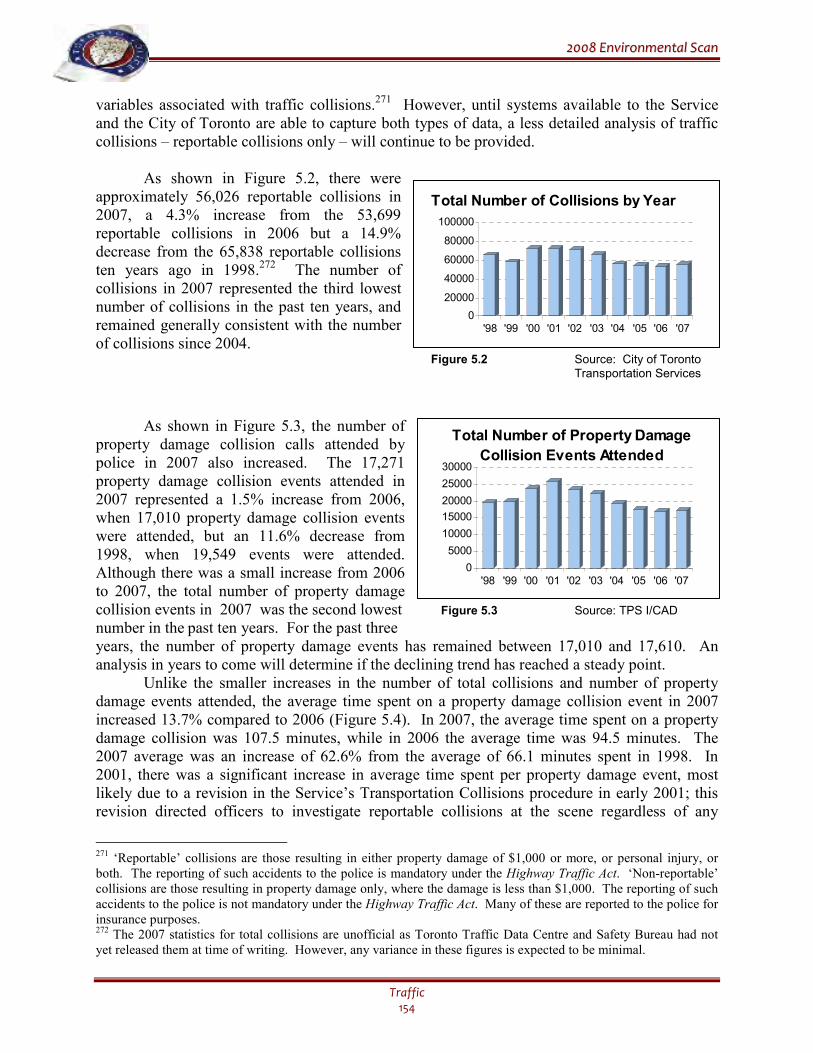
22000088 EEnnvviirroonnmmeennttaall SSccaann
Traffic 154
variables associated with traffic collisions.271 However, until systems available to the Service and the City of Toronto are able to capture both types of data, a less detailed analysis of traffic collisions – reportable collisions only – will continue to be provided.
As shown in Figure 5.2, there were approximately 56,026 reportable collisions in 2007, a 4.3% increase from the 53,699 reportable collisions in 2006 but a 14.9% decrease from the 65,838 reportable collisions ten years ago in 1998.272 The number of collisions in 2007 represented the third lowest number of collisions in the past ten years, and remained generally consistent with the number of collisions since 2004. Figure 5.2 Source: City of Toronto Transportation Services
As shown in Figure 5.3, the number of property damage collision calls attended by police in 2007 also increased. The 17,271 property damage collision events attended in 2007 represented a 1.5% increase from 2006, when 17,010 property damage collision events were attended, but an 11.6% decrease from 1998, when 19,549 events were attended. Although there was a small increase from 2006 to 2007, the total number of property damage collision events in 2007 was the second lowest Figure 5.3 Source: TPS I/CAD number in the past ten years. For the past three years, the number of property damage events has remained between 17,010 and 17,610. An analysis in years to come will determine if the declining trend has reached a steady point.
Unlike the smaller increases in the number of total collisions and number of property damage events attended, the average time spent on a property damage collision event in 2007 increased 13.7% compared to 2006 (Figure 5.4). In 2007, the average time spent on a property damage collision was 107.5 minutes, while in 2006 the average time was 94.5 minutes. The 2007 average was an increase of 62.6% from the average of 66.1 minutes spent in 1998. In 2001, there was a significant increase in average time spent per property damage event, most likely due to a revision in the Service’s Transportation Collisions procedure in early 2001; this revision directed officers to investigate reportable collisions at the scene regardless of any
271 ‘Reportable’ collisions are those resulting in either property damage of $1,000 or more, or personal injury, or both. The reporting of such accidents to the police is mandatory under the Highway Traffic Act. ‘Non-reportable’ collisions are those resulting in property damage only, where the damage is less than $1,000. The reporting of such accidents to the police is not mandatory under the Highway Traffic Act. Many of these are reported to the police for insurance purposes. 272 The 2007 statistics for total collisions are unofficial as Toronto Traffic Data Centre and Safety Bureau had not yet released them at time of writing. However, any variance in these figures is expected to be minimal.
0
20000
40000
60000
80000
100000
'98 '99 '00 '01 '02 '03 '04 '05 '06 '07
Total Number of Collisions by Year
0
5000
10000
15000
20000
25000
30000
'98 '99 '00 '01 '02 '03 '04 '05 '06 '07
Total Number of Property Damage
Collision Events Attended
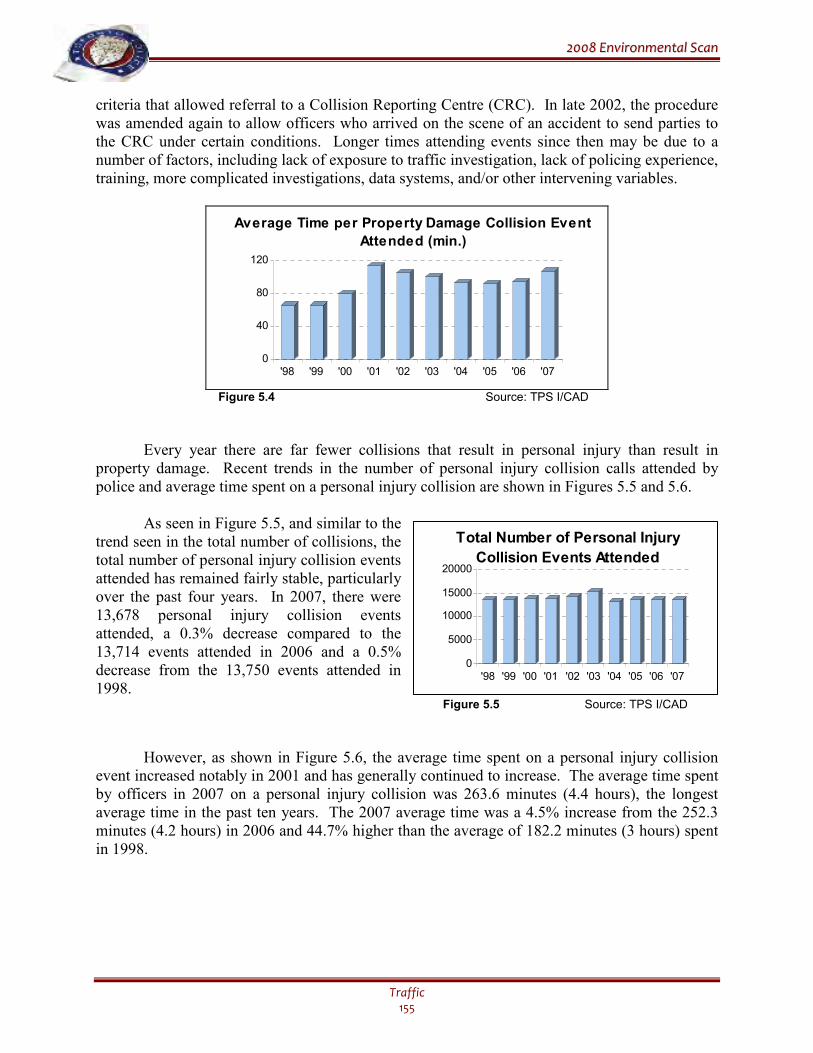
22000088 EEnnvviirroonnmmeennttaall SSccaann
Traffic 155
criteria that allowed referral to a Collision Reporting Centre (CRC). In late 2002, the procedure was amended again to allow officers who arrived on the scene of an accident to send parties to the CRC under certain conditions. Longer times attending events since then may be due to a number of factors, including lack of exposure to traffic investigation, lack of policing experience, training, more complicated investigations, data systems, and/or other intervening variables.
0
40
80
120
'98 '99 '00 '01 '02 '03 '04 '05 '06 '07
Average Time per Property Damage Collision Event
Attended (min.)
Figure 5.4 Source: TPS I/CAD
Every year there are far fewer collisions that result in personal injury than result in property damage. Recent trends in the number of personal injury collision calls attended by police and average time spent on a personal injury collision are shown in Figures 5.5 and 5.6.
As seen in Figure 5.5, and similar to the trend seen in the total number of collisions, the total number of personal injury collision events attended has remained fairly stable, particularly over the past four years. In 2007, there were 13,678 personal injury collision events attended, a 0.3% decrease compared to the 13,714 events attended in 2006 and a 0.5% decrease from the 13,750 events attended in 1998.
Figure 5.5 Source: TPS I/CAD However, as shown in Figure 5.6, the average time spent on a personal injury collision event increased notably in 2001 and has generally continued to increase. The average time spent by officers in 2007 on a personal injury collision was 263.6 minutes (4.4 hours), the longest average time in the past ten years. The 2007 average time was a 4.5% increase from the 252.3 minutes (4.2 hours) in 2006 and 44.7% higher than the average of 182.2 minutes (3 hours) spent in 1998.
0
5000
10000
15000
20000
'98 '99 '00 '01 '02 '03 '04 '05 '06 '07
Total Number of Personal Injury
Collision Events Attended
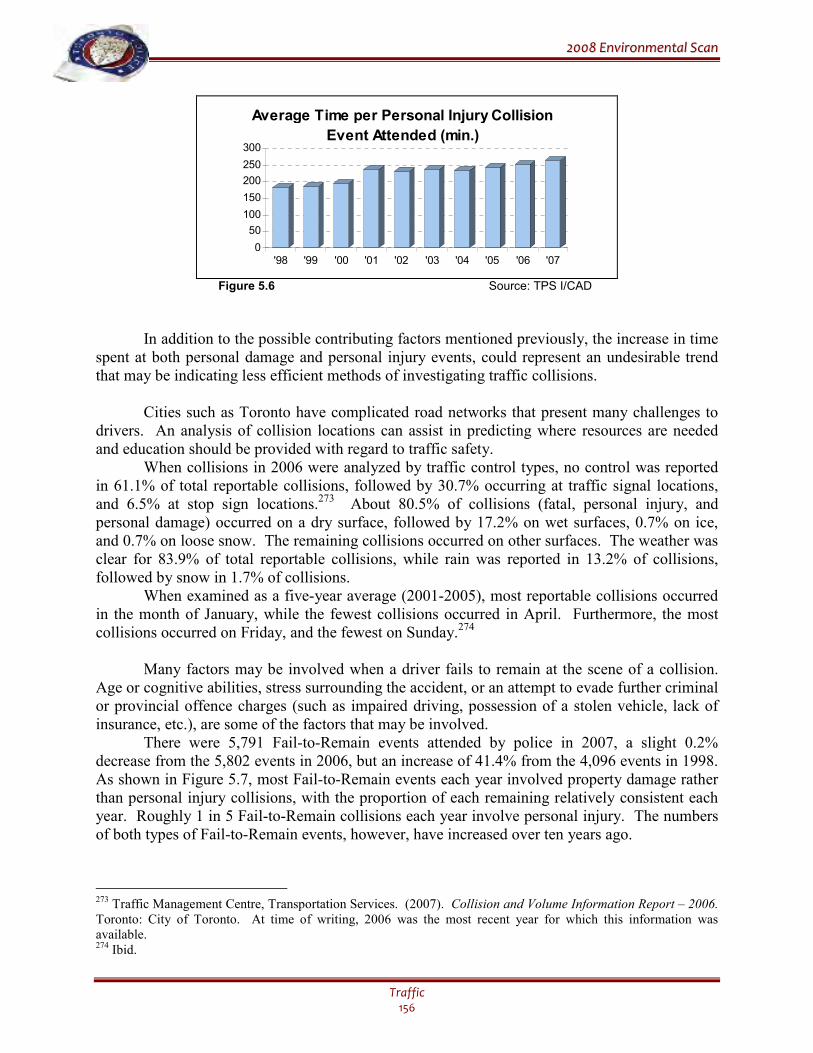
22000088 EEnnvviirroonnmmeennttaall SSccaann
Traffic 156
0
50
100
150
200
250
300
'98 '99 '00 '01 '02 '03 '04 '05 '06 '07
Average Time per Personal Injury Collision
Event Attended (min.)
Figure 5.6 Source: TPS I/CAD
In addition to the possible contributing factors mentioned previously, the increase in time spent at both personal damage and personal injury events, could represent an undesirable trend that may be indicating less efficient methods of investigating traffic collisions.
Cities such as Toronto have complicated road networks that present many challenges to drivers. An analysis of collision locations can assist in predicting where resources are needed and education should be provided with regard to traffic safety.
When collisions in 2006 were analyzed by traffic control types, no control was reported in 61.1% of total reportable collisions, followed by 30.7% occurring at traffic signal locations, and 6.5% at stop sign locations.273 About 80.5% of collisions (fatal, personal injury, and personal damage) occurred on a dry surface, followed by 17.2% on wet surfaces, 0.7% on ice, and 0.7% on loose snow. The remaining collisions occurred on other surfaces. The weather was clear for 83.9% of total reportable collisions, while rain was reported in 13.2% of collisions, followed by snow in 1.7% of collisions.
When examined as a five-year average (2001-2005), most reportable collisions occurred in the month of January, while the fewest collisions occurred in April. Furthermore, the most collisions occurred on Friday, and the fewest on Sunday.274
Many factors may be involved when a driver fails to remain at the scene of a collision. Age or cognitive abilities, stress surrounding the accident, or an attempt to evade further criminal or provincial offence charges (such as impaired driving, possession of a stolen vehicle, lack of insurance, etc.), are some of the factors that may be involved. There were 5,791 Fail-to-Remain events attended by police in 2007, a slight 0.2% decrease from the 5,802 events in 2006, but an increase of 41.4% from the 4,096 events in 1998. As shown in Figure 5.7, most Fail-to-Remain events each year involved property damage rather than personal injury collisions, with the proportion of each remaining relatively consistent each year. Roughly 1 in 5 Fail-to-Remain collisions each year involve personal injury. The numbers of both types of Fail-to-Remain events, however, have increased over ten years ago.
273 Traffic Management Centre, Transportation Services. (2007). Collision and Volume Information Report – 2006. Toronto: City of Toronto. At time of writing, 2006 was the most recent year for which this information was available. 274 Ibid.
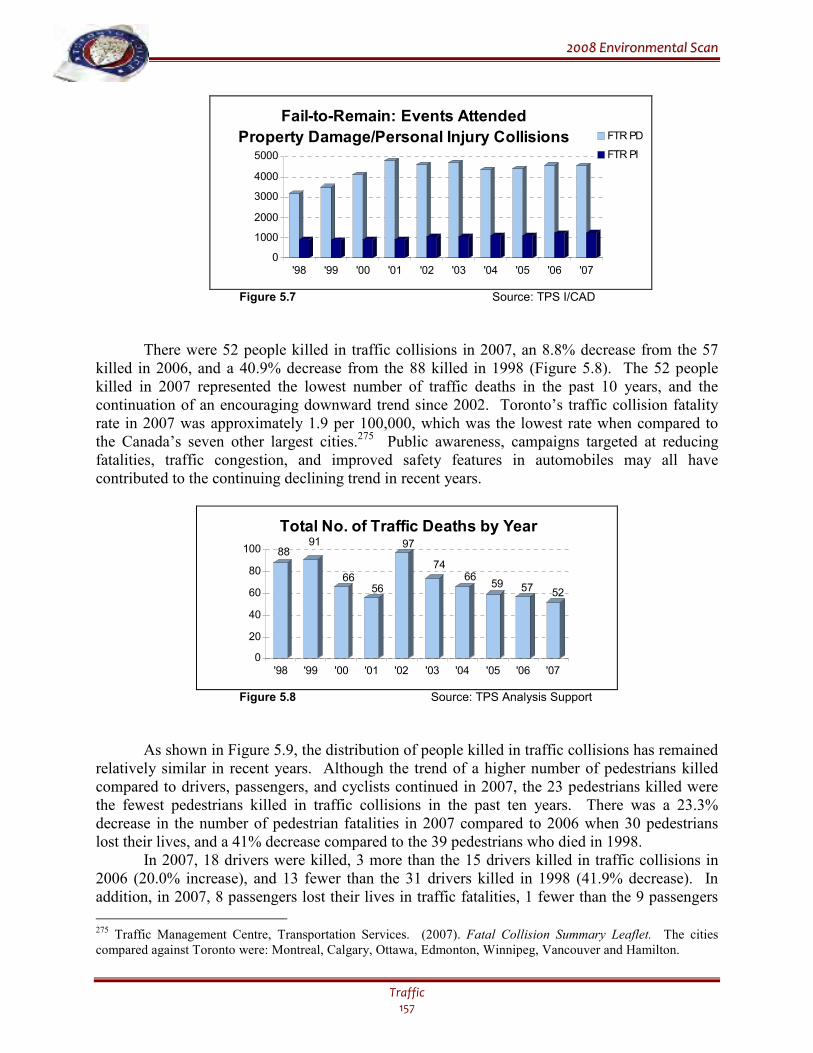
22000088 EEnnvviirroonnmmeennttaall SSccaann
Traffic 157
0
1000
2000
3000
4000
5000
'98 '99 '00 '01 '02 '03 '04 '05 '06 '07
Fail-to-Remain: Events Attended
Property Damage/Personal Injury Collisions FTR PD
FTR PI
Figure 5.7 Source: TPS I/CAD
There were 52 people killed in traffic collisions in 2007, an 8.8% decrease from the 57 killed in 2006, and a 40.9% decrease from the 88 killed in 1998 (Figure 5.8). The 52 people killed in 2007 represented the lowest number of traffic deaths in the past 10 years, and the continuation of an encouraging downward trend since 2002. Toronto’s traffic collision fatality rate in 2007 was approximately 1.9 per 100,000, which was the lowest rate when compared to the Canada’s seven other largest cities.275 Public awareness, campaigns targeted at reducing fatalities, traffic congestion, and improved safety features in automobiles may all have contributed to the continuing declining trend in recent years.
8891
6656
97
7466
59 57 52
0
20
40
60
80
100
'98 '99 '00 '01 '02 '03 '04 '05 '06 '07
Total No. of Traffic Deaths by Year
Figure 5.8 Source: TPS Analysis Support
As shown in Figure 5.9, the distribution of people killed in traffic collisions has remained relatively similar in recent years. Although the trend of a higher number of pedestrians killed compared to drivers, passengers, and cyclists continued in 2007, the 23 pedestrians killed were the fewest pedestrians killed in traffic collisions in the past ten years. There was a 23.3% decrease in the number of pedestrian fatalities in 2007 compared to 2006 when 30 pedestrians lost their lives, and a 41% decrease compared to the 39 pedestrians who died in 1998.
In 2007, 18 drivers were killed, 3 more than the 15 drivers killed in traffic collisions in 2006 (20.0% increase), and 13 fewer than the 31 drivers killed in 1998 (41.9% decrease). In addition, in 2007, 8 passengers lost their lives in traffic fatalities, 1 fewer than the 9 passengers
275 Traffic Management Centre, Transportation Services. (2007). Fatal Collision Summary Leaflet. The cities compared against Toronto were: Montreal, Calgary, Ottawa, Edmonton, Winnipeg, Vancouver and Hamilton.
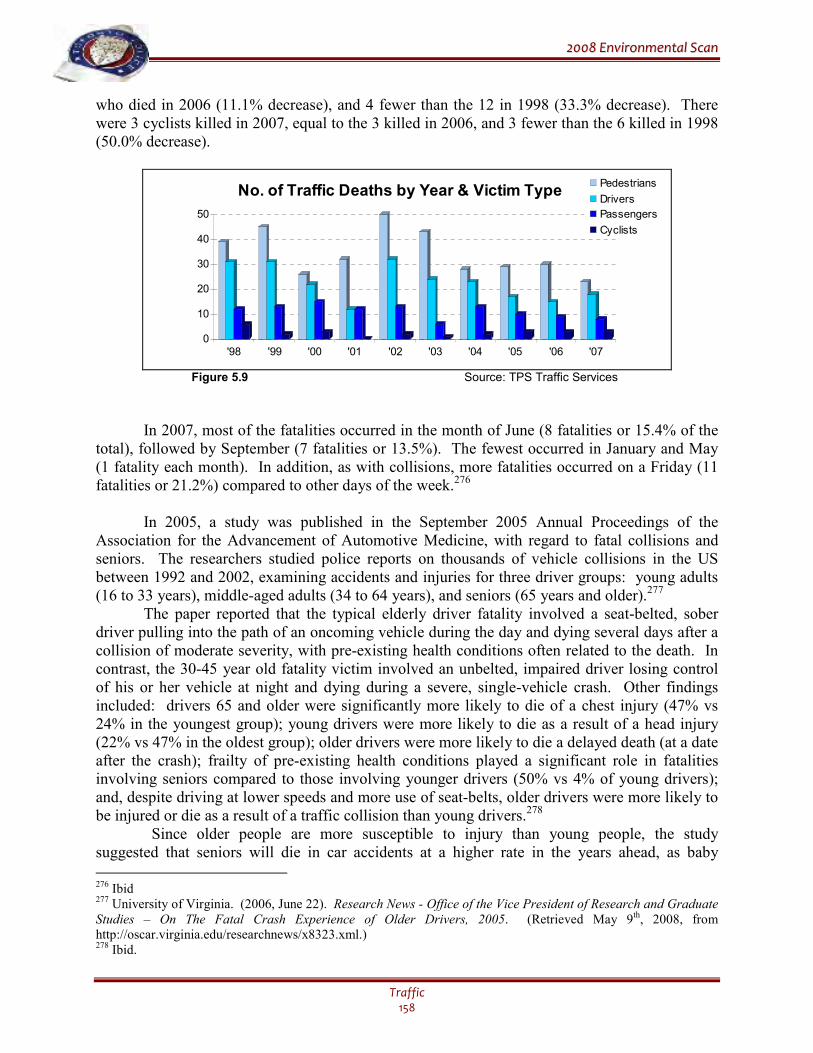
22000088 EEnnvviirroonnmmeennttaall SSccaann
Traffic 158
who died in 2006 (11.1% decrease), and 4 fewer than the 12 in 1998 (33.3% decrease). There were 3 cyclists killed in 2007, equal to the 3 killed in 2006, and 3 fewer than the 6 killed in 1998 (50.0% decrease).
0
10
20
30
40
50
'98 '99 '00 '01 '02 '03 '04 '05 '06 '07
No. of Traffic Deaths by Year & Victim TypePedestrians
Drivers
Passengers
Cyclists
Figure 5.9 Source: TPS Traffic Services
In 2007, most of the fatalities occurred in the month of June (8 fatalities or 15.4% of the total), followed by September (7 fatalities or 13.5%). The fewest occurred in January and May (1 fatality each month). In addition, as with collisions, more fatalities occurred on a Friday (11 fatalities or 21.2%) compared to other days of the week.276
In 2005, a study was published in the September 2005 Annual Proceedings of the Association for the Advancement of Automotive Medicine, with regard to fatal collisions and seniors. The researchers studied police reports on thousands of vehicle collisions in the US between 1992 and 2002, examining accidents and injuries for three driver groups: young adults (16 to 33 years), middle-aged adults (34 to 64 years), and seniors (65 years and older).277
The paper reported that the typical elderly driver fatality involved a seat-belted, sober driver pulling into the path of an oncoming vehicle during the day and dying several days after a collision of moderate severity, with pre-existing health conditions often related to the death. In contrast, the 30-45 year old fatality victim involved an unbelted, impaired driver losing control of his or her vehicle at night and dying during a severe, single-vehicle crash. Other findings included: drivers 65 and older were significantly more likely to die of a chest injury (47% vs 24% in the youngest group); young drivers were more likely to die as a result of a head injury (22% vs 47% in the oldest group); older drivers were more likely to die a delayed death (at a date after the crash); frailty of pre-existing health conditions played a significant role in fatalities involving seniors compared to those involving younger drivers (50% vs 4% of young drivers); and, despite driving at lower speeds and more use of seat-belts, older drivers were more likely to be injured or die as a result of a traffic collision than young drivers.278
Since older people are more susceptible to injury than young people, the study suggested that seniors will die in car accidents at a higher rate in the years ahead, as baby
276 Ibid 277 University of Virginia. (2006, June 22). Research News - Office of the Vice President of Research and Graduate Studies – On The Fatal Crash Experience of Older Drivers, 2005. (Retrieved May 9th, 2008, from http://oscar.virginia.edu/researchnews/x8323.xml.) 278 Ibid.
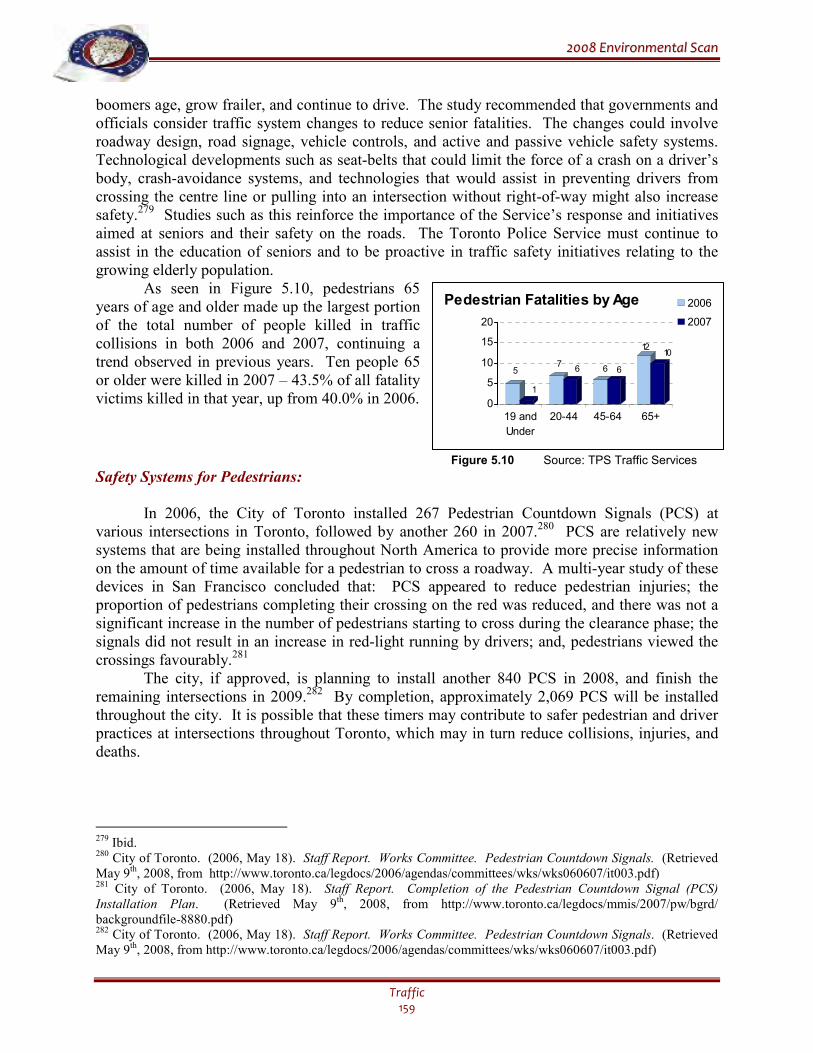
22000088 EEnnvviirroonnmmeennttaall SSccaann
Traffic 159
boomers age, grow frailer, and continue to drive. The study recommended that governments and officials consider traffic system changes to reduce senior fatalities. The changes could involve roadway design, road signage, vehicle controls, and active and passive vehicle safety systems. Technological developments such as seat-belts that could limit the force of a crash on a driver’s body, crash-avoidance systems, and technologies that would assist in preventing drivers from crossing the centre line or pulling into an intersection without right-of-way might also increase safety.279 Studies such as this reinforce the importance of the Service’s response and initiatives aimed at seniors and their safety on the roads. The Toronto Police Service must continue to assist in the education of seniors and to be proactive in traffic safety initiatives relating to the growing elderly population.
As seen in Figure 5.10, pedestrians 65 years of age and older made up the largest portion of the total number of people killed in traffic collisions in both 2006 and 2007, continuing a trend observed in previous years. Ten people 65 or older were killed in 2007 – 43.5% of all fatality victims killed in that year, up from 40.0% in 2006.
Figure 5.10 Source: TPS Traffic Services Safety Systems for Pedestrians:
In 2006, the City of Toronto installed 267 Pedestrian Countdown Signals (PCS) at
various intersections in Toronto, followed by another 260 in 2007.280 PCS are relatively new systems that are being installed throughout North America to provide more precise information on the amount of time available for a pedestrian to cross a roadway. A multi-year study of these devices in San Francisco concluded that: PCS appeared to reduce pedestrian injuries; the proportion of pedestrians completing their crossing on the red was reduced, and there was not a significant increase in the number of pedestrians starting to cross during the clearance phase; the signals did not result in an increase in red-light running by drivers; and, pedestrians viewed the crossings favourably.281
The city, if approved, is planning to install another 840 PCS in 2008, and finish the remaining intersections in 2009.282 By completion, approximately 2,069 PCS will be installed throughout the city. It is possible that these timers may contribute to safer pedestrian and driver practices at intersections throughout Toronto, which may in turn reduce collisions, injuries, and deaths.
279 Ibid. 280 City of Toronto. (2006, May 18). Staff Report. Works Committee. Pedestrian Countdown Signals. (Retrieved May 9th, 2008, from http://www.toronto.ca/legdocs/2006/agendas/committees/wks/wks060607/it003.pdf) 281 City of Toronto. (2006, May 18). Staff Report. Completion of the Pedestrian Countdown Signal (PCS) Installation Plan. (Retrieved May 9th, 2008, from http://www.toronto.ca/legdocs/mmis/2007/pw/bgrd/ backgroundfile-8880.pdf) 282 City of Toronto. (2006, May 18). Staff Report. Works Committee. Pedestrian Countdown Signals. (Retrieved May 9th, 2008, from http://www.toronto.ca/legdocs/2006/agendas/committees/wks/wks060607/it003.pdf)
5
1
76 6 6
1210
0
5
10
15
20
19 and
Under
20-44 45-64 65+
2006
2007
Pedestrian Fatalities by Age
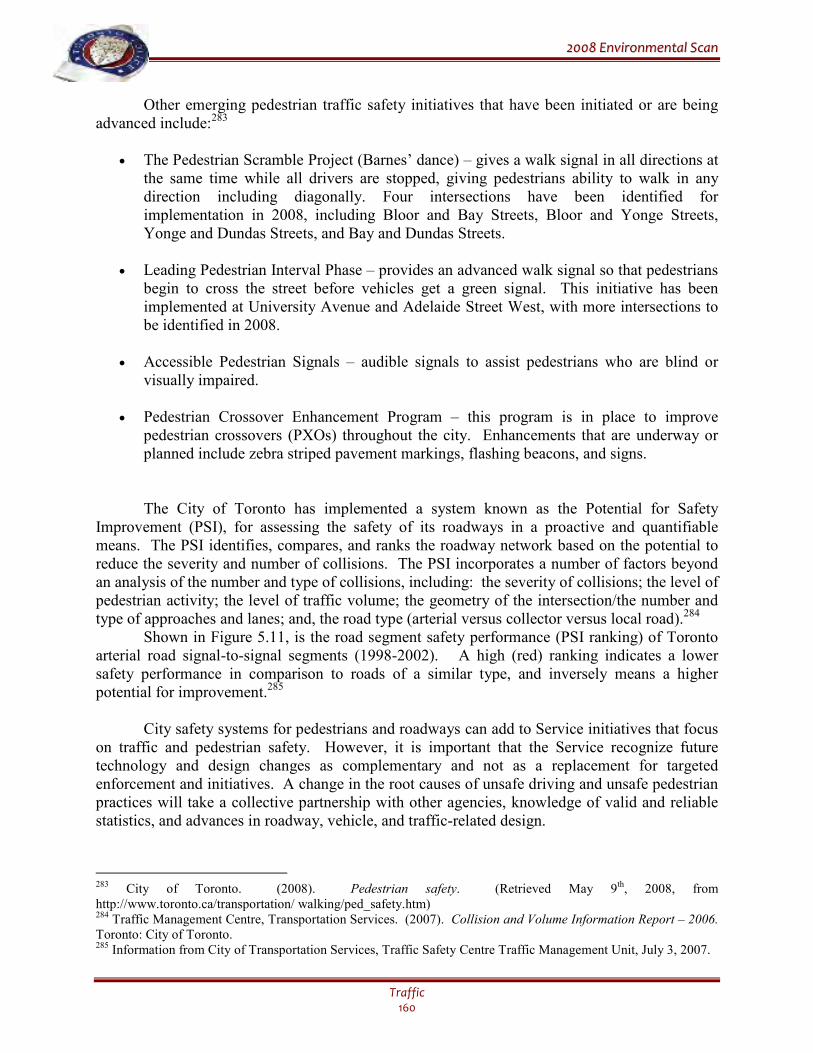
22000088 EEnnvviirroonnmmeennttaall SSccaann
Traffic 160
Other emerging pedestrian traffic safety initiatives that have been initiated or are being advanced include:283
• The Pedestrian Scramble Project (Barnes’ dance) – gives a walk signal in all directions at the same time while all drivers are stopped, giving pedestrians ability to walk in any direction including diagonally. Four intersections have been identified for implementation in 2008, including Bloor and Bay Streets, Bloor and Yonge Streets, Yonge and Dundas Streets, and Bay and Dundas Streets.
• Leading Pedestrian Interval Phase – provides an advanced walk signal so that pedestrians
begin to cross the street before vehicles get a green signal. This initiative has been implemented at University Avenue and Adelaide Street West, with more intersections to be identified in 2008.
• Accessible Pedestrian Signals – audible signals to assist pedestrians who are blind or
visually impaired. • Pedestrian Crossover Enhancement Program – this program is in place to improve
pedestrian crossovers (PXOs) throughout the city. Enhancements that are underway or planned include zebra striped pavement markings, flashing beacons, and signs.
The City of Toronto has implemented a system known as the Potential for Safety Improvement (PSI), for assessing the safety of its roadways in a proactive and quantifiable means. The PSI identifies, compares, and ranks the roadway network based on the potential to reduce the severity and number of collisions. The PSI incorporates a number of factors beyond an analysis of the number and type of collisions, including: the severity of collisions; the level of pedestrian activity; the level of traffic volume; the geometry of the intersection/the number and type of approaches and lanes; and, the road type (arterial versus collector versus local road).284 Shown in Figure 5.11, is the road segment safety performance (PSI ranking) of Toronto arterial road signal-to-signal segments (1998-2002). A high (red) ranking indicates a lower safety performance in comparison to roads of a similar type, and inversely means a higher potential for improvement.285
City safety systems for pedestrians and roadways can add to Service initiatives that focus on traffic and pedestrian safety. However, it is important that the Service recognize future technology and design changes as complementary and not as a replacement for targeted enforcement and initiatives. A change in the root causes of unsafe driving and unsafe pedestrian practices will take a collective partnership with other agencies, knowledge of valid and reliable statistics, and advances in roadway, vehicle, and traffic-related design.
283 City of Toronto. (2008). Pedestrian safety. (Retrieved May 9th, 2008, from http://www.toronto.ca/transportation/ walking/ped_safety.htm) 284 Traffic Management Centre, Transportation Services. (2007). Collision and Volume Information Report – 2006. Toronto: City of Toronto. 285 Information from City of Transportation Services, Traffic Safety Centre Traffic Management Unit, July 3, 2007.
22000088 EEnnvviirroonnmmeennttaall SSccaann
Traffic 161
Figure 5.11 Source: City of Toronto Transportation Services
I. PUBLIC PERCEPTIONS OF TRAFFIC
According to the 2007 Toronto Police Service’s community survey, which is outlined in greater detail in the Public Perceptions chapter, with regard to traffic, people generally felt slightly safer in 2007 than they did in previous years. While showing little change from 2006, as can be seen in Figure 5.12, three-quarters of people in 2007 (75%) said they felt safe as a driver in the city, up from the 54% who’d felt safe in 2000. As passengers, 81% said they felt safe in 2007, up from 67% in 2000. As pedestrians, 74% said they felt safe in 2007, once again an increase from 56% in 2000. And finally, as cyclists, 35% people said they felt safe in 2007, which was more than double the 15% who felt safe as cyclists in 2000. It should also be noted that the proportion of people saying “don’t know/not applicable” for the question on cyclist safety decreased from 53% in 2000 to 33% in 2007, perhaps reflecting an increase in cyclists in the city.
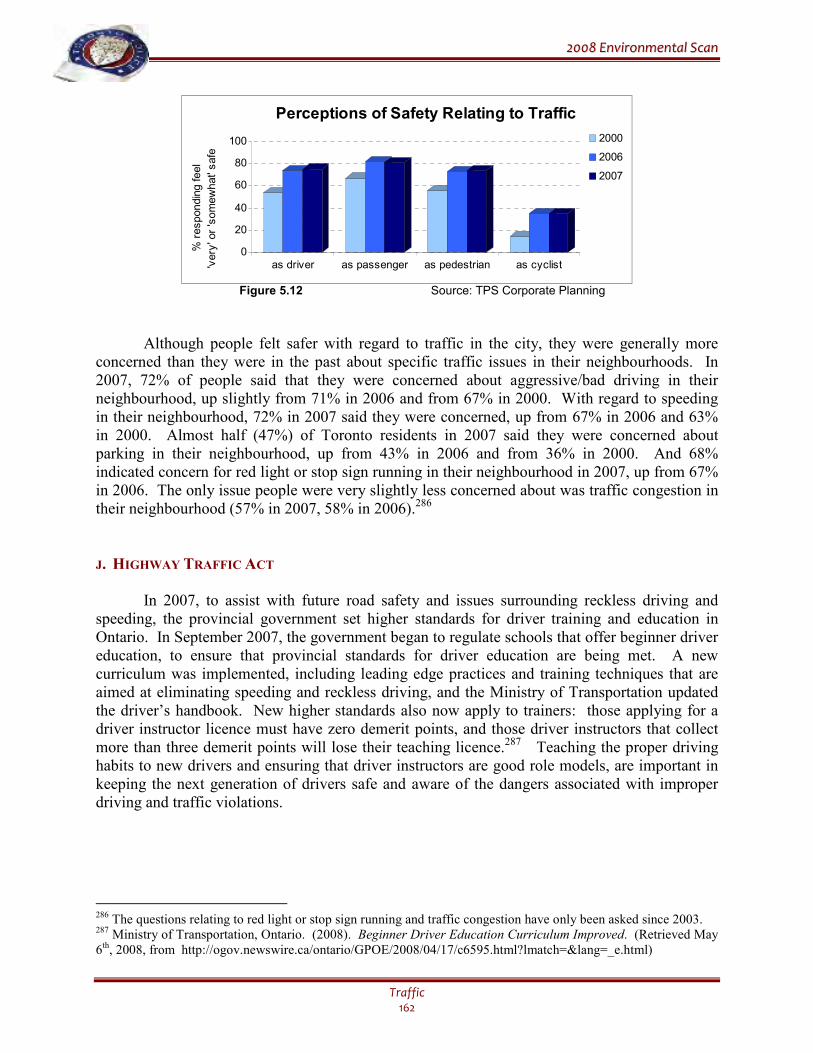
22000088 EEnnvviirroonnmmeennttaall SSccaann
Traffic 162
0
20
40
60
80
100
as driver as passenger as pedestrian as cyclist
2000
2006
2007
Perceptions of Safety Relating to Traffic
% responding feel
'very' or 'somewhat' safe
Figure 5.12 Source: TPS Corporate Planning
Although people felt safer with regard to traffic in the city, they were generally more concerned than they were in the past about specific traffic issues in their neighbourhoods. In 2007, 72% of people said that they were concerned about aggressive/bad driving in their neighbourhood, up slightly from 71% in 2006 and from 67% in 2000. With regard to speeding in their neighbourhood, 72% in 2007 said they were concerned, up from 67% in 2006 and 63% in 2000. Almost half (47%) of Toronto residents in 2007 said they were concerned about parking in their neighbourhood, up from 43% in 2006 and from 36% in 2000. And 68% indicated concern for red light or stop sign running in their neighbourhood in 2007, up from 67% in 2006. The only issue people were very slightly less concerned about was traffic congestion in their neighbourhood (57% in 2007, 58% in 2006).286
J. HIGHWAY TRAFFIC ACT
In 2007, to assist with future road safety and issues surrounding reckless driving and speeding, the provincial government set higher standards for driver training and education in Ontario. In September 2007, the government began to regulate schools that offer beginner driver education, to ensure that provincial standards for driver education are being met. A new curriculum was implemented, including leading edge practices and training techniques that are aimed at eliminating speeding and reckless driving, and the Ministry of Transportation updated the driver’s handbook. New higher standards also now apply to trainers: those applying for a driver instructor licence must have zero demerit points, and those driver instructors that collect more than three demerit points will lose their teaching licence.287 Teaching the proper driving habits to new drivers and ensuring that driver instructors are good role models, are important in keeping the next generation of drivers safe and aware of the dangers associated with improper driving and traffic violations.
286 The questions relating to red light or stop sign running and traffic congestion have only been asked since 2003. 287 Ministry of Transportation, Ontario. (2008). Beginner Driver Education Curriculum Improved. (Retrieved May 6th, 2008, from http://ogov.newswire.ca/ontario/GPOE/2008/04/17/c6595.html?lmatch=&lang=_e.html)
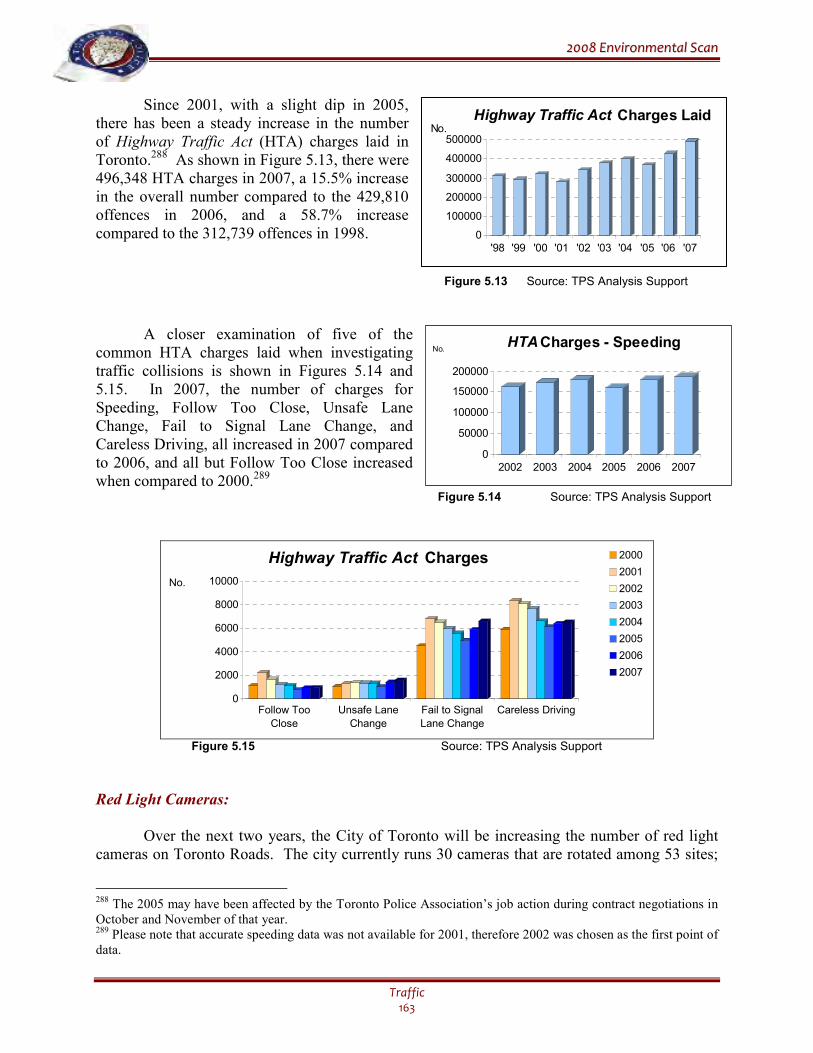
22000088 EEnnvviirroonnmmeennttaall SSccaann
Traffic 163
Since 2001, with a slight dip in 2005, there has been a steady increase in the number of Highway Traffic Act (HTA) charges laid in Toronto.288 As shown in Figure 5.13, there were 496,348 HTA charges in 2007, a 15.5% increase in the overall number compared to the 429,810 offences in 2006, and a 58.7% increase compared to the 312,739 offences in 1998. Figure 5.13 Source: TPS Analysis Support
A closer examination of five of the common HTA charges laid when investigating traffic collisions is shown in Figures 5.14 and 5.15. In 2007, the number of charges for Speeding, Follow Too Close, Unsafe Lane Change, Fail to Signal Lane Change, and Careless Driving, all increased in 2007 compared to 2006, and all but Follow Too Close increased when compared to 2000.289
Figure 5.14 Source: TPS Analysis Support
0
2000
4000
6000
8000
10000
Follow Too
Close
Unsafe Lane
Change
Fail to Signal
Lane Change
Careless Driving
2000
2001
2002
2003
2004
2005
2006
2007
Highway Traffic Act Charges
No.
Figure 5.15 Source: TPS Analysis Support
Red Light Cameras:
Over the next two years, the City of Toronto will be increasing the number of red light
cameras on Toronto Roads. The city currently runs 30 cameras that are rotated among 53 sites;
288 The 2005 may have been affected by the Toronto Police Association’s job action during contract negotiations in October and November of that year. 289 Please note that accurate speeding data was not available for 2001, therefore 2002 was chosen as the first point of data.
0
100000
200000
300000
400000
500000
'98 '99 '00 '01 '02 '03 '04 '05 '06 '07
No.Highway Traffic Act Charges Laid
0
50000
100000
150000
200000
2002 2003 2004 2005 2006 2007
HTACharges - SpeedingNo.
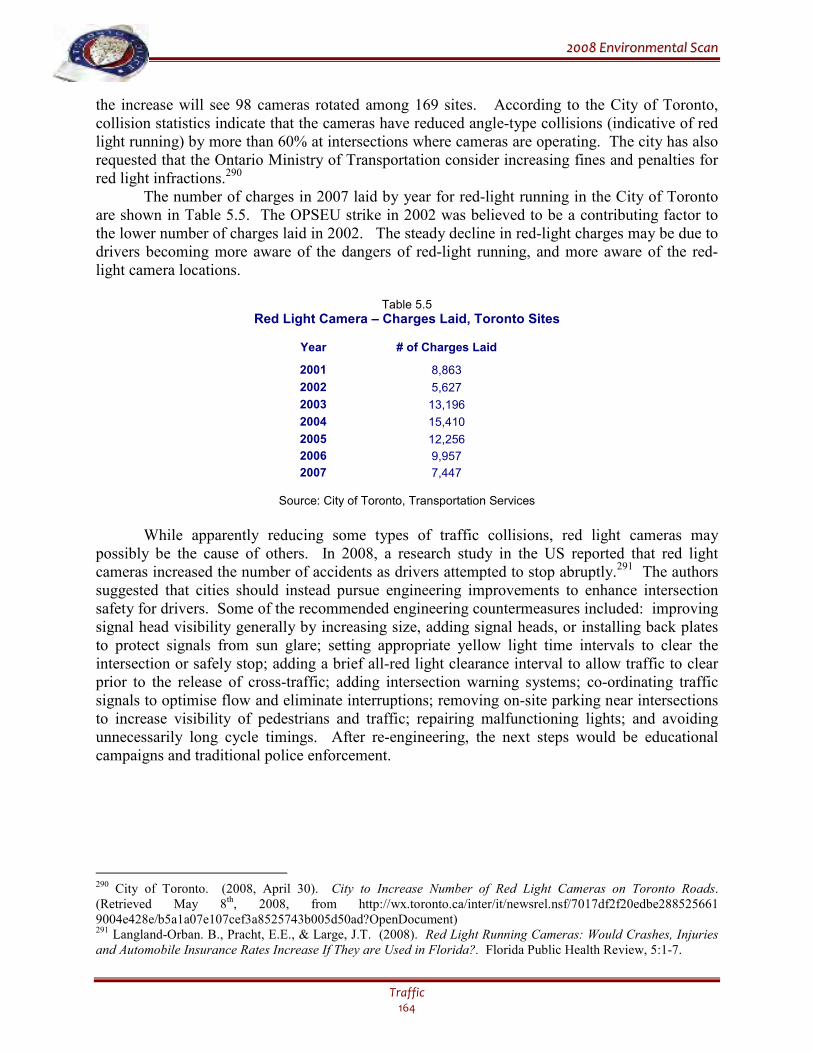
22000088 EEnnvviirroonnmmeennttaall SSccaann
Traffic 164
the increase will see 98 cameras rotated among 169 sites. According to the City of Toronto, collision statistics indicate that the cameras have reduced angle-type collisions (indicative of red light running) by more than 60% at intersections where cameras are operating. The city has also requested that the Ontario Ministry of Transportation consider increasing fines and penalties for red light infractions.290
The number of charges in 2007 laid by year for red-light running in the City of Toronto are shown in Table 5.5. The OPSEU strike in 2002 was believed to be a contributing factor to the lower number of charges laid in 2002. The steady decline in red-light charges may be due to drivers becoming more aware of the dangers of red-light running, and more aware of the red-light camera locations.
Table 5.5
Red Light Camera – Charges Laid, Toronto Sites
Year # of Charges Laid
2001 8,863
2002 5,627
2003 13,196
2004 15,410
2005 12,256
2006 9,957
2007 7,447
Source: City of Toronto, Transportation Services
While apparently reducing some types of traffic collisions, red light cameras may
possibly be the cause of others. In 2008, a research study in the US reported that red light cameras increased the number of accidents as drivers attempted to stop abruptly.291 The authors suggested that cities should instead pursue engineering improvements to enhance intersection safety for drivers. Some of the recommended engineering countermeasures included: improving signal head visibility generally by increasing size, adding signal heads, or installing back plates to protect signals from sun glare; setting appropriate yellow light time intervals to clear the intersection or safely stop; adding a brief all-red light clearance interval to allow traffic to clear prior to the release of cross-traffic; adding intersection warning systems; co-ordinating traffic signals to optimise flow and eliminate interruptions; removing on-site parking near intersections to increase visibility of pedestrians and traffic; repairing malfunctioning lights; and avoiding unnecessarily long cycle timings. After re-engineering, the next steps would be educational campaigns and traditional police enforcement.
290 City of Toronto. (2008, April 30). City to Increase Number of Red Light Cameras on Toronto Roads. (Retrieved May 8th, 2008, from http://wx.toronto.ca/inter/it/newsrel.nsf/7017df2f20edbe288525661 9004e428e/b5a1a07e107cef3a8525743b005d50ad?OpenDocument) 291 Langland-Orban. B., Pracht, E.E., & Large, J.T. (2008). Red Light Running Cameras: Would Crashes, Injuries and Automobile Insurance Rates Increase If They are Used in Florida?. Florida Public Health Review, 5:1-7.
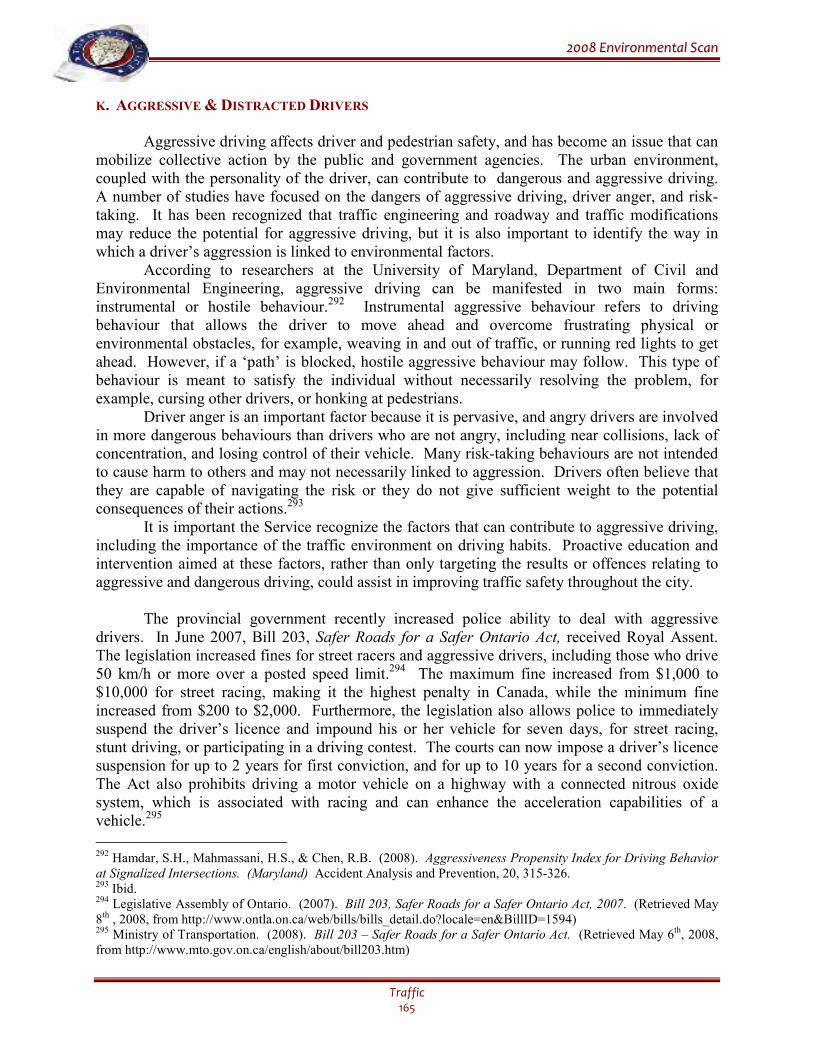
22000088 EEnnvviirroonnmmeennttaall SSccaann
Traffic 165
K. AGGRESSIVE & DISTRACTED DRIVERS
Aggressive driving affects driver and pedestrian safety, and has become an issue that can
mobilize collective action by the public and government agencies. The urban environment, coupled with the personality of the driver, can contribute to dangerous and aggressive driving. A number of studies have focused on the dangers of aggressive driving, driver anger, and risk-taking. It has been recognized that traffic engineering and roadway and traffic modifications may reduce the potential for aggressive driving, but it is also important to identify the way in which a driver’s aggression is linked to environmental factors.
According to researchers at the University of Maryland, Department of Civil and Environmental Engineering, aggressive driving can be manifested in two main forms: instrumental or hostile behaviour.292 Instrumental aggressive behaviour refers to driving behaviour that allows the driver to move ahead and overcome frustrating physical or environmental obstacles, for example, weaving in and out of traffic, or running red lights to get ahead. However, if a ‘path’ is blocked, hostile aggressive behaviour may follow. This type of behaviour is meant to satisfy the individual without necessarily resolving the problem, for example, cursing other drivers, or honking at pedestrians.
Driver anger is an important factor because it is pervasive, and angry drivers are involved in more dangerous behaviours than drivers who are not angry, including near collisions, lack of concentration, and losing control of their vehicle. Many risk-taking behaviours are not intended to cause harm to others and may not necessarily linked to aggression. Drivers often believe that they are capable of navigating the risk or they do not give sufficient weight to the potential consequences of their actions.293
It is important the Service recognize the factors that can contribute to aggressive driving, including the importance of the traffic environment on driving habits. Proactive education and intervention aimed at these factors, rather than only targeting the results or offences relating to aggressive and dangerous driving, could assist in improving traffic safety throughout the city.
The provincial government recently increased police ability to deal with aggressive drivers. In June 2007, Bill 203, Safer Roads for a Safer Ontario Act, received Royal Assent. The legislation increased fines for street racers and aggressive drivers, including those who drive 50 km/h or more over a posted speed limit.294 The maximum fine increased from $1,000 to $10,000 for street racing, making it the highest penalty in Canada, while the minimum fine increased from $200 to $2,000. Furthermore, the legislation also allows police to immediately suspend the driver’s licence and impound his or her vehicle for seven days, for street racing, stunt driving, or participating in a driving contest. The courts can now impose a driver’s licence suspension for up to 2 years for first conviction, and for up to 10 years for a second conviction. The Act also prohibits driving a motor vehicle on a highway with a connected nitrous oxide system, which is associated with racing and can enhance the acceleration capabilities of a vehicle.295
292 Hamdar, S.H., Mahmassani, H.S., & Chen, R.B. (2008). Aggressiveness Propensity Index for Driving Behavior at Signalized Intersections. (Maryland) Accident Analysis and Prevention, 20, 315-326. 293 Ibid. 294 Legislative Assembly of Ontario. (2007). Bill 203, Safer Roads for a Safer Ontario Act, 2007. (Retrieved May 8th , 2008, from http://www.ontla.on.ca/web/bills/bills_detail.do?locale=en&BillID=1594) 295 Ministry of Transportation. (2008). Bill 203 – Safer Roads for a Safer Ontario Act. (Retrieved May 6th, 2008, from http://www.mto.gov.on.ca/english/about/bill203.htm)
22000088 EEnnvviirroonnmmeennttaall SSccaann
Traffic 166
Since Bill 203 came into affect on September 30, 2007, 5,967 vehicles have been seized in Ontario (as of June 26, 2008). Three-quarters of those vehicles were seized by the OPP (75.6% of total), followed by the Toronto Police who seized 393 vehicles (6.6%), and York Regional Police Service (221 vehicles - 3.7%). The average age of drivers is 31 years old, and the majority are male (84.7%). As the new street racing laws produce further data on racing and aggressive driving, a more comprehensive examination of the significance of street racing in Toronto can be conducted.
Although Toronto may not experience the number of seizures that occur in rural areas, racing is an important issue in the City, and for the Service. The populous landscape of Toronto can make speeding more of a potential threat to pedestrians than speeding in rural areas. As Toronto becomes even more developed, it will be important that the Service ensure that the roadways are not used for racing.
In addition to aggressive drivers, distracted drivers have also in recent years become more of a concern, both for the police and the public. With the advent of technology and the pace of life in a large urban city, vehicles have become boardrooms, offices, and entertainment hubs rather than simply a means of transportation. Cellular phones, personal data assistants (PDAs) and BlackBerrys, laptops, etc., are now commonplace in many vehicles. Driving safely requires concentration and, often, quick reflexes. The lack of focus on driving, traffic flow, and the environment, even if only briefly, can have serious consequences.
In an effort to deal with driver distraction, Bill 40, An Act to amend the Highway Traffic Act to prohibit the use of phones and other equipment while a person is driving on a highway,
and Bill 73, An Act to amend the Highway Traffic Act to prohibit the use of phones and other equipment while a person is driving on certain parts of a highway, were introduced into provincial parliament and receiving first readings in 2008.296 These Bills deal with prohibiting the use of cell phones, pagers, PDAs/BlackBerrys, laptops, etc., while driving a motor vehicle, with exceptions for cases such as emergencies.297 If passed, they may have a positive effect on traffic safety and will be another tool that police can use to deal with distracted drivers.
L. IMPAIRED DRIVING
Campaigns:
The Toronto Police Service is a community-oriented organization with strong partnerships, and one which values the roles that other organizations can play in dealing with social and safety issues. Impaired driving is an issue that continues to present a challenge for the Police Service, government agencies and departments, and community organizations alike. Partnerships, strong working relationships, and an awareness of the efforts of each of the partners are all vital to reducing impaired driving in the future.
296 Legislative Assembly of Ontario. (2008). Bill 40, Highway Traffic Amendment Act (Cellular Phones), 2008. (Retrieved July 4th, 2008, from http://www.ontla.on.ca/web/bills/bills_detail.do?locale=en&BillID=1958); Legislative Assembly of Ontario. (2008). Bill 73, Highway Traffic Amendment Act (Cellular Phones), 2008. (Retrieved July 4th, 2008, from http://www.ontla.on.ca/web/bills/bills_detail.do?locale=en&BillID=1998) 297 Government of Ontario website (www.ontla.on.ca/web/bills/status_of_legislation.do?locale=en).
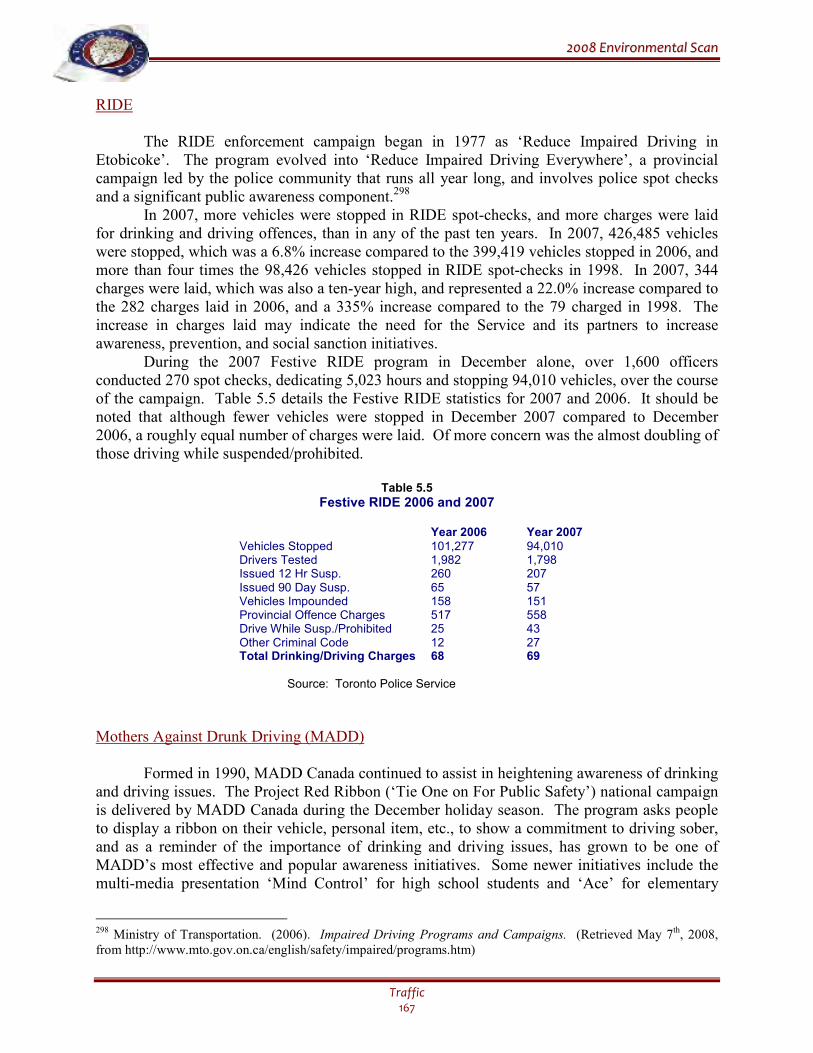
22000088 EEnnvviirroonnmmeennttaall SSccaann
Traffic 167
RIDE
The RIDE enforcement campaign began in 1977 as ‘Reduce Impaired Driving in Etobicoke’. The program evolved into ‘Reduce Impaired Driving Everywhere’, a provincial campaign led by the police community that runs all year long, and involves police spot checks and a significant public awareness component.298
In 2007, more vehicles were stopped in RIDE spot-checks, and more charges were laid for drinking and driving offences, than in any of the past ten years. In 2007, 426,485 vehicles were stopped, which was a 6.8% increase compared to the 399,419 vehicles stopped in 2006, and more than four times the 98,426 vehicles stopped in RIDE spot-checks in 1998. In 2007, 344 charges were laid, which was also a ten-year high, and represented a 22.0% increase compared to the 282 charges laid in 2006, and a 335% increase compared to the 79 charged in 1998. The increase in charges laid may indicate the need for the Service and its partners to increase awareness, prevention, and social sanction initiatives.
During the 2007 Festive RIDE program in December alone, over 1,600 officers conducted 270 spot checks, dedicating 5,023 hours and stopping 94,010 vehicles, over the course of the campaign. Table 5.5 details the Festive RIDE statistics for 2007 and 2006. It should be noted that although fewer vehicles were stopped in December 2007 compared to December 2006, a roughly equal number of charges were laid. Of more concern was the almost doubling of those driving while suspended/prohibited.
Table 5.5
Festive RIDE 2006 and 2007
Year 2006 Year 2007 Vehicles Stopped 101,277 94,010 Drivers Tested 1,982 1,798 Issued 12 Hr Susp. 260 207 Issued 90 Day Susp. 65 57 Vehicles Impounded 158 151 Provincial Offence Charges 517 558 Drive While Susp./Prohibited 25 43 Other Criminal Code 12 27 Total Drinking/Driving Charges 68 69
Source: Toronto Police Service
Mothers Against Drunk Driving (MADD)
Formed in 1990, MADD Canada continued to assist in heightening awareness of drinking and driving issues. The Project Red Ribbon (‘Tie One on For Public Safety’) national campaign is delivered by MADD Canada during the December holiday season. The program asks people to display a ribbon on their vehicle, personal item, etc., to show a commitment to driving sober, and as a reminder of the importance of drinking and driving issues, has grown to be one of MADD’s most effective and popular awareness initiatives. Some newer initiatives include the multi-media presentation ‘Mind Control’ for high school students and ‘Ace’ for elementary
298 Ministry of Transportation. (2006). Impaired Driving Programs and Campaigns. (Retrieved May 7th, 2008, from http://www.mto.gov.on.ca/english/safety/impaired/programs.htm)

22000088 EEnnvviirroonnmmeennttaall SSccaann
Traffic 168
school students, which attempt to encourage prevention by emphasizing to youth the importance of not drinking and driving. These programs join a variety of other public awareness programs, and videos presented by partners, students, the community, and police. Arrive alive DRIVE SOBER This province-wide public awareness campaign runs throughout the year, and has been hosted by Ontario Community Council on Impaired Driving (OCCID) since 1989. The program focuses on the summer months and aims to increase awareness of the injury and death caused by impaired driving. iDRIVE This youth road safety program was developed by the Ministry of Transportation in partnership with the OCCID, Ontario Students Against Impaired Driving (OSAID), and the Student Life Education Company. The program is intended to increase awareness among drivers under the age of 25 about the consequences and risks associated with aggressive and unsafe driving habits, including impaired driving. Ontario Students Against Drunk Driving This registered charity is the largest teen volunteer program focused on risk reduction in the province. This program reaches more than 300,000 students annually, and over the past 10 years has graduated over 20,000 youth leaders who now live, work, and drive in many communities throughout Ontario. OSAID have over 350 chapter groups in Ontario secondary schools. Every year about 5,000 OSAID students run school events, presentations, and community activities aimed at their peers and focused on safe and sober driving.299
SMARTRISK Heroes This internationally recognized Canadian non-profit injury prevention organisation was founded in 1992, and involves a road show that encourages young people to take smart risks. The program combines a large-scale DVD presentation with a live talk given by a young injury survivor. The goal is to assist youth to see the risks in everyday living and to manage those risks so that they can enjoy life responsibly. 1-888 TAXIGUY This program was formed in 1998 by Taxiguy Inc. and Molson Canada, and works with the OOCID, BACCHUS Canada (The Alcohol Education Group-the post-secondary division of The Student Life Education Company), and other government groups. It is available in 250 Ontario cities and towns, and encourages people to take a cab home after drinking by calling the toll free number, which links the person to a partner taxicab company.
299 Ontario Students Against Impaired Driving (OSAID) web page (2008). Retrieved July 5, 2008 from http://www.osaid.org/about.php?pageid=13
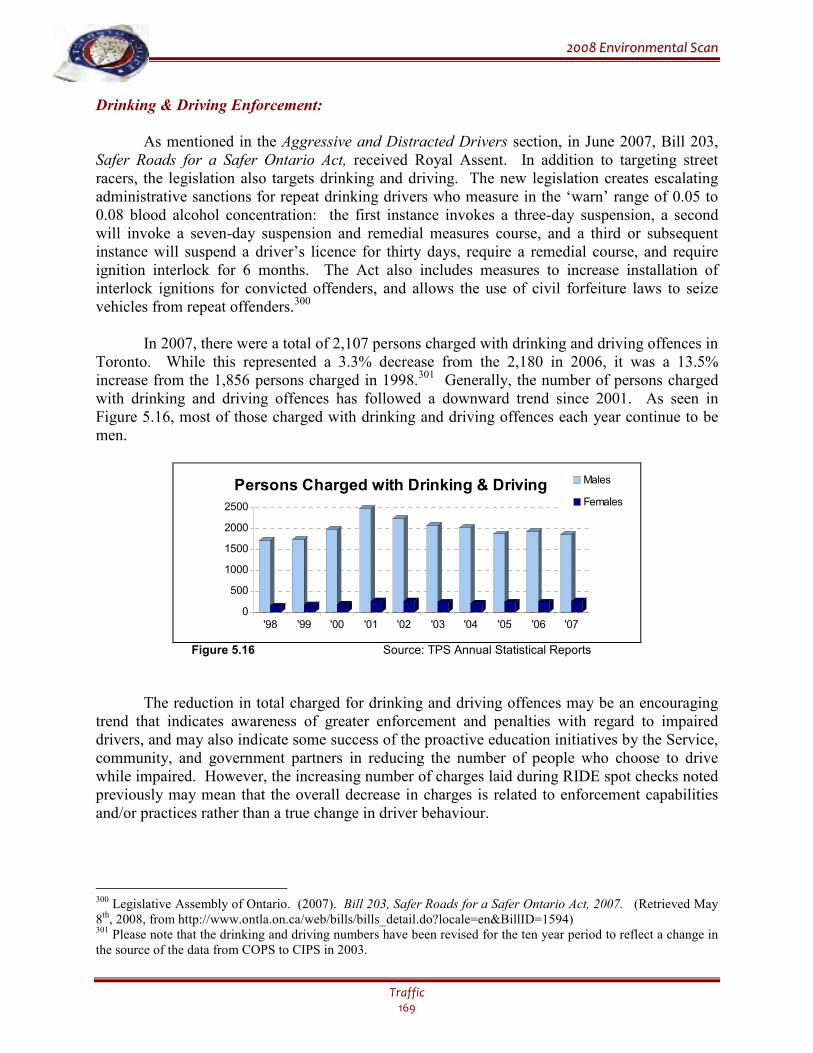
22000088 EEnnvviirroonnmmeennttaall SSccaann
Traffic 169
Drinking & Driving Enforcement:
As mentioned in the Aggressive and Distracted Drivers section, in June 2007, Bill 203,
Safer Roads for a Safer Ontario Act, received Royal Assent. In addition to targeting street racers, the legislation also targets drinking and driving. The new legislation creates escalating administrative sanctions for repeat drinking drivers who measure in the ‘warn’ range of 0.05 to 0.08 blood alcohol concentration: the first instance invokes a three-day suspension, a second will invoke a seven-day suspension and remedial measures course, and a third or subsequent instance will suspend a driver’s licence for thirty days, require a remedial course, and require ignition interlock for 6 months. The Act also includes measures to increase installation of interlock ignitions for convicted offenders, and allows the use of civil forfeiture laws to seize vehicles from repeat offenders.300
In 2007, there were a total of 2,107 persons charged with drinking and driving offences in Toronto. While this represented a 3.3% decrease from the 2,180 in 2006, it was a 13.5% increase from the 1,856 persons charged in 1998.301 Generally, the number of persons charged with drinking and driving offences has followed a downward trend since 2001. As seen in Figure 5.16, most of those charged with drinking and driving offences each year continue to be men.
0
500
1000
1500
2000
2500
'98 '99 '00 '01 '02 '03 '04 '05 '06 '07
Males
Females
Persons Charged with Drinking & Driving
Figure 5.16 Source: TPS Annual Statistical Reports
The reduction in total charged for drinking and driving offences may be an encouraging trend that indicates awareness of greater enforcement and penalties with regard to impaired drivers, and may also indicate some success of the proactive education initiatives by the Service, community, and government partners in reducing the number of people who choose to drive while impaired. However, the increasing number of charges laid during RIDE spot checks noted previously may mean that the overall decrease in charges is related to enforcement capabilities and/or practices rather than a true change in driver behaviour.
300 Legislative Assembly of Ontario. (2007). Bill 203, Safer Roads for a Safer Ontario Act, 2007. (Retrieved May 8th, 2008, from http://www.ontla.on.ca/web/bills/bills_detail.do?locale=en&BillID=1594) 301 Please note that the drinking and driving numbers have been revised for the ten year period to reflect a change in the source of the data from COPS to CIPS in 2003.
22000088 EEnnvviirroonnmmeennttaall SSccaann
Traffic 170
Drug-Impaired Driving:
Drug-impaired driving has been an emerging issue for the past few years, and will continue to be an issue in the near future, especially for youth. The Centre for Addiction and Mental Health (CAMH) in Toronto reported in 2005 that 20% of Ontario high schools students admitted to driving a vehicle within one hour of using cannabis at least one time within the preceding year. In addition, a study in Quebec reported that 30% of fatal accidents in that province involved drugs, while a similar study found that 20% of fatal accidents in British Columbia involved drugs or a combination of drugs and alcohol. Surveys have found that about 4.8% of Canadian drivers have driven a vehicle within two hours of using cannabis, while about 20% admitted to taking a potentially impairing drug (prescription, legal or illegal) within two hours of driving.302
The Federal government has been considering the effects of drug-impaired driving since 1999, when a report entitled Toward Eliminating Impaired Driving was released by the House of Commons Standing Committee on Justice and Human Rights. The report recognized the contribution that drug impairment can make to some fatal motor vehicle collisions, and that the extent of drug-impaired driving has been underestimated because police have no easy means to test for drugs under current legislation.303
The Committee pointed out several obstacles to implementing better measures for detecting drug-impairment and for obtaining evidence necessary for successful prosecution. The Committee approved Drug Recognition Expert (DRE) testing, but noted that the provinces have ultimate control of training. In addition, the Committee emphasized the need to consider the Charter implications of any drug testing, as the tests may be more intrusive and time consuming that alcohol testing.304
The Committee made two recommendations in the 1999 report: that section 256 of the Criminal Code be amended to allow a justice to authorize the taking of a blood sample for alcohol or drugs; and, that the Minister of Justice consult with the provinces to develop legislative proposals for obtaining better drug-impairment evidence.305
A report the Senate Special Committee on Illegal Drugs in 2002, found that between 5% and 12% of drivers may drive under the influence of drugs, and this percentage increased to 20% for men under 25 years old. Furthermore, although cannabis in low doses had little effect on driving skills, and may have led to more cautious driving, it had a negative effect on decision time and trajectory, making it difficult for drivers to stay in their lanes. In addition, a significant percentage of impaired drivers tested positive for both cannabis and alcohol, which together increase the negative effects. 306
Responding to the Standing Committee on Justice and Human Rights’ 1999 recommendations, in 2003 the Department of Justice’s Working Group on Impaired Driving emphasized the need for a legislated system that would allow police to demand that drivers suspected of being drug-impaired submit to testing. The Working Group outlined two main
302 Barnett, L. (2007). Legislative Summary: Bill C-32: An Act to Amend the Criminal Code (Impaired Driving). Ottawa, ON: Library of Parliament: Parliamentary Information and Research Service, Law and Government Division (LS-543E). (Retrieved May 8th, 2008, from http://www.parl.gc.ca/common/bills_ls.asp?lang=E&ls= c32&source=library_prb&Parl=39&Ses=1) 303 Ibid. 304 Ibid. 305 Ibid. 306 Ibid.
22000088 EEnnvviirroonnmmeennttaall SSccaann
Traffic 171
options: the first was to set a legal limit on drugs, recognizing that a zero limit may not be appropriate, as it may catch drivers who had cannabis in their system from weeks earlier and were not currently impaired; the second was to legislate in relation to the ability of police officers to demand drug tests, essentially outlining what has become Bill C-32, An Act to amend the Criminal Code (Impaired Driving). The most recent report by the House of Commons Special Committee on the Non-medical Use of Drugs, published in 2003, called for Parliament to develop a strategy to address drug-impaired driving.307
While a number of Bills (e.g. Bill C-16/Bill C-32) were tabled and defeated due to elections calls, and/or end of sessions, in February 2008, Bill C-2, An Act to Amend the Criminal Code and to make consequential amendments to other acts (Tackling Violent Crime Act) was assented. The Bill groups together five Bills that had previously been proposed, including Bill C-32. Bill C-2 expands drug enforcement capabilities by giving police the authority to demand physical sobriety tests and authorizes peace officers (who are trained as Drug Recognition Experts) to: test whether a person is impaired by a drug, or a combination of alcohol and a drug; and, to take samples of bodily fluids to confirm the presence of the impairing drug. Furthermore, the Bill makes offences for refusing tests, increases penalties for both drug and alcohol impaired driving, and deals with evidentiary issues at court.308 As of July 2008, there were three Service members trained as Drug Recognition Experts (DREs). The current training for DREs is intensive, and is conducted outside of our police service.309 It will be a challenge to ensure that a sufficient number of competent officers are trained as Drug Recognition Experts. In addition, training must also be conducted to ensure that members can conduct sobriety tests. Sobriety tests are based on physical and mechanical observations, therefore court and evidence could be open to further scrutiny. Furthermore, the Service will need to ensure that its facilities can manage the new testing. The Service will likely be challenged to determine what is the most efficient and effective way to train its members and to determine if its facilities can be altered to manage the new investigations.
RECOMMENDATIONS FOR POLICE SERVICE
• The Service should develop traffic intervention/enforcement programs with the contribution
of various community and city partners and with the knowledge gained from data and well-thought out research and evaluation. A solid understanding of the traffic issues that are based in fact, and are promoted at the federal, provincial, and local level will assist in assigning priority to traffic related issues.
• As traffic congestion and environmental responsibility demand action, the Service must
promote activities that contribute to active transportation (people–powered movement), by supporting both internal strategies, such as car-pooling or cycling to work, and by managing traffic congestion through traffic programs and enforcement.
307 Ibid. 308 Barnett, L., MacKay, R., & Valiquet, D. (2007). Legislative Summary: Bill C-2: An Act to Amend the Criminal Code and to Make Consequential Amendments to Other Acts. Ottawa, ON: Library of Parliament, Parliamentary Information and Research Service, Law and Government Division (LS-565E). (Retrieved June 25th, 2008, from http://www.parl.gc.ca/39/2/parlbus/chambus/house/bills/summaries/c2-e.pdf) 309 Information from Traffic Services, July 4th, 2008.
22000088 EEnnvviirroonnmmeennttaall SSccaann
Traffic 172
• The Service should continue to contribute to safe roads, safe walking routes, safe public
transit, and safe parks, so that concerns for community members considering alternate forms of transportation, as opposed to a personal car/vehicle, can be eased.
• The Service needs to be aware of traffic engineering initiatives that ease congestion and make
intersections safer for pedestrians and drivers, and should consider projects associated with new initiatives (such as pedestrian crossings, HOV lanes), and strict enforcement of offences associated with newly re-designed intersections and roadways.
• The Service must assess the increasing officer time spent on property damage and personal
injury collisions, and look at where efficiencies can be gained in such traffic investigations. • The Service must continue to address the educational needs of pedestrians, specifically
seniors, in traffic safety initiatives, including the importance of proper driving habits, pre-existing health conditions of seniors and how they can contribute to accidents and injury, and the importance of safety mechanisms in vehicles such as seatbelts, airbags, and emerging crash avoidance technology.
• The increase in charges laid in relation to drinking and driving may indicate the need for the
Service and its government and community partners to increase awareness, prevention, and social sanction initiatives.
• The Service must aim educational initiatives and enforcement not only at offences under
legislation that result from aggressive or distracted driving, but also at recognizing and dealing more appropriately with contributors such as congestion, traffic flow, and driver frustration in the city.
• The Service must develop programs specific to the dangers of drug use and driving, especially
for students and those under 25 years of age, in an attempt to reduce the practice of driving while impaired.
• The Service must prepare for laws pertaining to drug use and driving, should make certain
that a sufficient number of officers are trained and competent to act as Drug Recognition Experts and are able to conduct sobriety tests, and ensure facilities are able to manage the new investigations.
• The Service must develop appropriate computer systems that will allow analysis of accident
locations across the city, to lead to more effective targeted enforcement during peak hours.
22000088 EEnnvviirroonnmmeennttaall SSccaann
Calls for Service 173
VI. CALLS FOR SERVICE
Information on what types of calls for service are received and how the Service responds to
those calls provides a foundation for decisions relating to the allocation of resources,
including personnel, and to the development of service delivery options and priorities to
meet the needs of the communities served.
HIGHLIGHTS • A total of 1.79 million calls were received in 2007, the same as in 2006, 8.5% fewer than in
2003, and 2.8% more than ten years ago in 1998. • After continued increases in the early years of this decade, the number of calls received
through the emergency and non-emergency lines both showed a trend of decrease in recent years. Compared with calls ten years ago, the number of calls received through the emergency line increased 9%, while calls received through the non-emergency line showed a 3.2% decrease.
• In 2007, about 51.9% of the calls were received through the emergency line, with the rest
(48.1%) received through the non-emergency line. This was a slight reversal compared to ten years ago in 1998 when 48.9% of calls were received through the emergency line and 51.1% were received through the non-emergency line.
• Fewer than half (47.7%) of the calls received in 2007 were dispatched for police response;
this was a slight increase from 2003 (47.4%), but a decrease from 1998 (48.3%). • The number of dispatched calls in 2007 was a 7.9% decrease from 2003, but a 1.4% increase
from ten years ago (1998). • Both emergency and non-emergency calls failed to meet the recommended service standards
for response time and proportion of cases to be covered. Despite some improvement in response time for both emergency and non-emergency calls in the past few years, the 2007 response times for both emergency and non-emergency calls still increased compared to ten years ago.
• The average time required to service a call was found to have increased considerably over the
past ten years. The increases were particularly large over the past five years, with a 22% increase in service time for all calls and an 81% increase for Priority 1 calls.
• Over the past ten years, despite a significant decrease (49.3%) in the number of Priority 1
calls serviced, the total time commitment for servicing calls increased (29.5%), due mainly to increased service time rather than increased time waiting for the police to arrive. Adequately staffing the Primary Response function – the officers who respond to calls – and other police programs, and delivering timely responses to emergencies will remain a serious challenge for the Service.
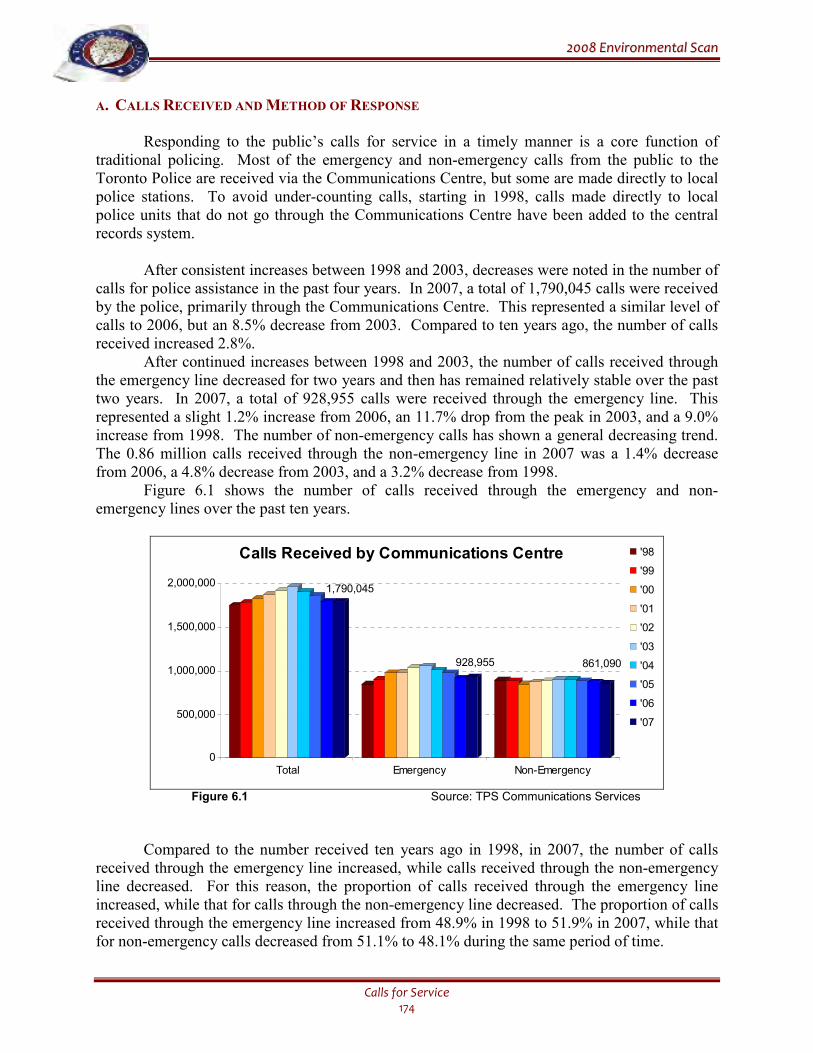
22000088 EEnnvviirroonnmmeennttaall SSccaann
Calls for Service 174
A. CALLS RECEIVED AND METHOD OF RESPONSE Responding to the public’s calls for service in a timely manner is a core function of traditional policing. Most of the emergency and non-emergency calls from the public to the Toronto Police are received via the Communications Centre, but some are made directly to local police stations. To avoid under-counting calls, starting in 1998, calls made directly to local police units that do not go through the Communications Centre have been added to the central records system.
After consistent increases between 1998 and 2003, decreases were noted in the number of calls for police assistance in the past four years. In 2007, a total of 1,790,045 calls were received by the police, primarily through the Communications Centre. This represented a similar level of calls to 2006, but an 8.5% decrease from 2003. Compared to ten years ago, the number of calls received increased 2.8%.
After continued increases between 1998 and 2003, the number of calls received through the emergency line decreased for two years and then has remained relatively stable over the past two years. In 2007, a total of 928,955 calls were received through the emergency line. This represented a slight 1.2% increase from 2006, an 11.7% drop from the peak in 2003, and a 9.0% increase from 1998. The number of non-emergency calls has shown a general decreasing trend. The 0.86 million calls received through the non-emergency line in 2007 was a 1.4% decrease from 2006, a 4.8% decrease from 2003, and a 3.2% decrease from 1998.
Figure 6.1 shows the number of calls received through the emergency and non-emergency lines over the past ten years.
1,790,045
928,955 861,090
0
500,000
1,000,000
1,500,000
2,000,000
Total Emergency Non-Emergency
'98
'99
'00
'01
'02
'03
'04
'05
'06
'07
Calls Received by Communications Centre
Figure 6.1 Source: TPS Communications Services
Compared to the number received ten years ago in 1998, in 2007, the number of calls received through the emergency line increased, while calls received through the non-emergency line decreased. For this reason, the proportion of calls received through the emergency line increased, while that for calls through the non-emergency line decreased. The proportion of calls received through the emergency line increased from 48.9% in 1998 to 51.9% in 2007, while that for non-emergency calls decreased from 51.1% to 48.1% during the same period of time.
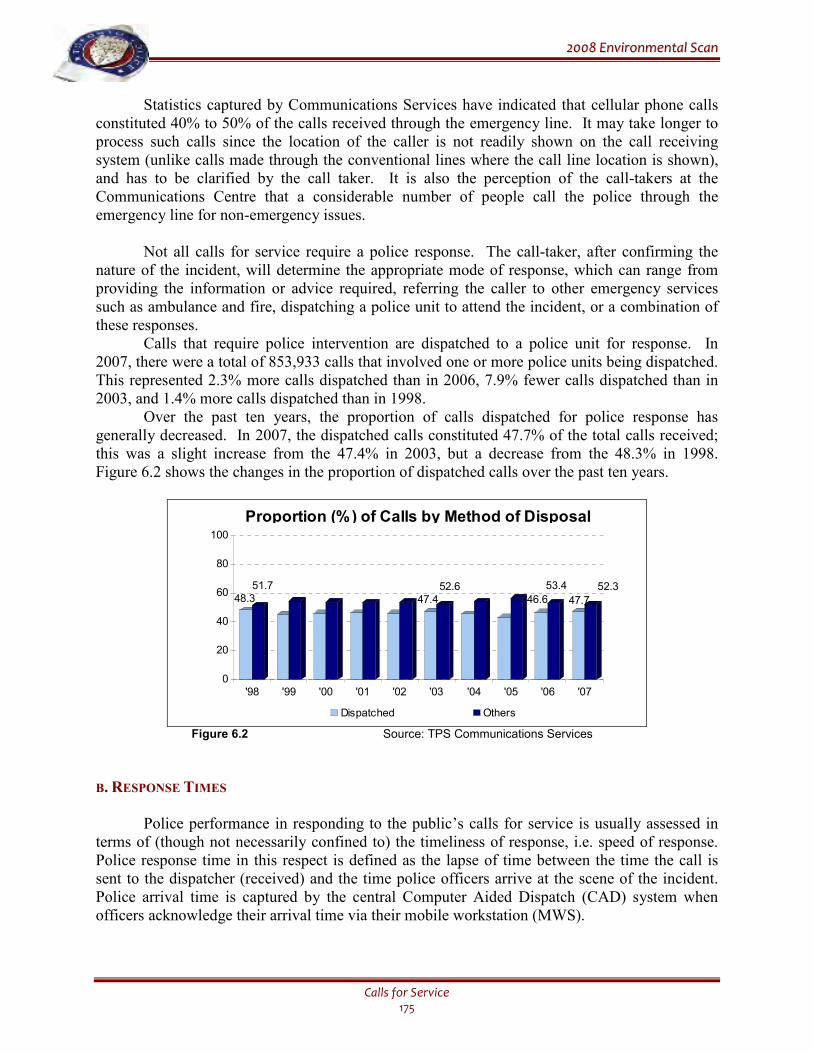
22000088 EEnnvviirroonnmmeennttaall SSccaann
Calls for Service 175
Statistics captured by Communications Services have indicated that cellular phone calls constituted 40% to 50% of the calls received through the emergency line. It may take longer to process such calls since the location of the caller is not readily shown on the call receiving system (unlike calls made through the conventional lines where the call line location is shown), and has to be clarified by the call taker. It is also the perception of the call-takers at the Communications Centre that a considerable number of people call the police through the emergency line for non-emergency issues. Not all calls for service require a police response. The call-taker, after confirming the nature of the incident, will determine the appropriate mode of response, which can range from providing the information or advice required, referring the caller to other emergency services such as ambulance and fire, dispatching a police unit to attend the incident, or a combination of these responses. Calls that require police intervention are dispatched to a police unit for response. In 2007, there were a total of 853,933 calls that involved one or more police units being dispatched. This represented 2.3% more calls dispatched than in 2006, 7.9% fewer calls dispatched than in 2003, and 1.4% more calls dispatched than in 1998.
Over the past ten years, the proportion of calls dispatched for police response has generally decreased. In 2007, the dispatched calls constituted 47.7% of the total calls received; this was a slight increase from the 47.4% in 2003, but a decrease from the 48.3% in 1998. Figure 6.2 shows the changes in the proportion of dispatched calls over the past ten years.
48.351.7
47.452.6
46.6
53.4
47.7
52.3
0
20
40
60
80
100
'98 '99 '00 '01 '02 '03 '04 '05 '06 '07
Dispatched Others
Proportion (%) of Calls by Method of Disposal
Figure 6.2 Source: TPS Communications Services
B. RESPONSE TIMES
Police performance in responding to the public’s calls for service is usually assessed in terms of (though not necessarily confined to) the timeliness of response, i.e. speed of response. Police response time in this respect is defined as the lapse of time between the time the call is sent to the dispatcher (received) and the time police officers arrive at the scene of the incident. Police arrival time is captured by the central Computer Aided Dispatch (CAD) system when officers acknowledge their arrival time via their mobile workstation (MWS).
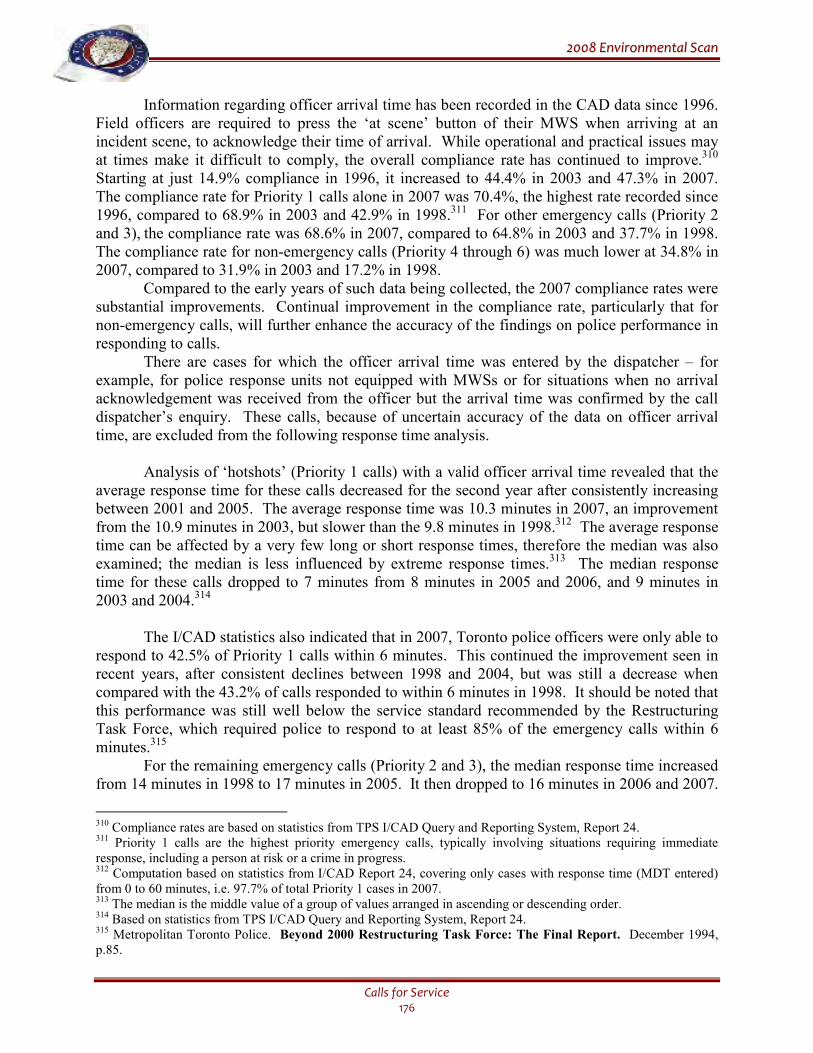
22000088 EEnnvviirroonnmmeennttaall SSccaann
Calls for Service 176
Information regarding officer arrival time has been recorded in the CAD data since 1996. Field officers are required to press the ‘at scene’ button of their MWS when arriving at an incident scene, to acknowledge their time of arrival. While operational and practical issues may at times make it difficult to comply, the overall compliance rate has continued to improve.310 Starting at just 14.9% compliance in 1996, it increased to 44.4% in 2003 and 47.3% in 2007. The compliance rate for Priority 1 calls alone in 2007 was 70.4%, the highest rate recorded since 1996, compared to 68.9% in 2003 and 42.9% in 1998.311 For other emergency calls (Priority 2 and 3), the compliance rate was 68.6% in 2007, compared to 64.8% in 2003 and 37.7% in 1998. The compliance rate for non-emergency calls (Priority 4 through 6) was much lower at 34.8% in 2007, compared to 31.9% in 2003 and 17.2% in 1998.
Compared to the early years of such data being collected, the 2007 compliance rates were substantial improvements. Continual improvement in the compliance rate, particularly that for non-emergency calls, will further enhance the accuracy of the findings on police performance in responding to calls.
There are cases for which the officer arrival time was entered by the dispatcher – for example, for police response units not equipped with MWSs or for situations when no arrival acknowledgement was received from the officer but the arrival time was confirmed by the call dispatcher’s enquiry. These calls, because of uncertain accuracy of the data on officer arrival time, are excluded from the following response time analysis.
Analysis of ‘hotshots’ (Priority 1 calls) with a valid officer arrival time revealed that the average response time for these calls decreased for the second year after consistently increasing between 2001 and 2005. The average response time was 10.3 minutes in 2007, an improvement from the 10.9 minutes in 2003, but slower than the 9.8 minutes in 1998.312 The average response time can be affected by a very few long or short response times, therefore the median was also examined; the median is less influenced by extreme response times.313 The median response time for these calls dropped to 7 minutes from 8 minutes in 2005 and 2006, and 9 minutes in 2003 and 2004.314
The I/CAD statistics also indicated that in 2007, Toronto police officers were only able to respond to 42.5% of Priority 1 calls within 6 minutes. This continued the improvement seen in recent years, after consistent declines between 1998 and 2004, but was still a decrease when compared with the 43.2% of calls responded to within 6 minutes in 1998. It should be noted that this performance was still well below the service standard recommended by the Restructuring Task Force, which required police to respond to at least 85% of the emergency calls within 6 minutes.315
For the remaining emergency calls (Priority 2 and 3), the median response time increased from 14 minutes in 1998 to 17 minutes in 2005. It then dropped to 16 minutes in 2006 and 2007.
310 Compliance rates are based on statistics from TPS I/CAD Query and Reporting System, Report 24. 311 Priority 1 calls are the highest priority emergency calls, typically involving situations requiring immediate response, including a person at risk or a crime in progress. 312 Computation based on statistics from I/CAD Report 24, covering only cases with response time (MDT entered) from 0 to 60 minutes, i.e. 97.7% of total Priority 1 cases in 2007. 313 The median is the middle value of a group of values arranged in ascending or descending order. 314 Based on statistics from TPS I/CAD Query and Reporting System, Report 24. 315 Metropolitan Toronto Police. Beyond 2000 Restructuring Task Force: The Final Report. December 1994, p.85.
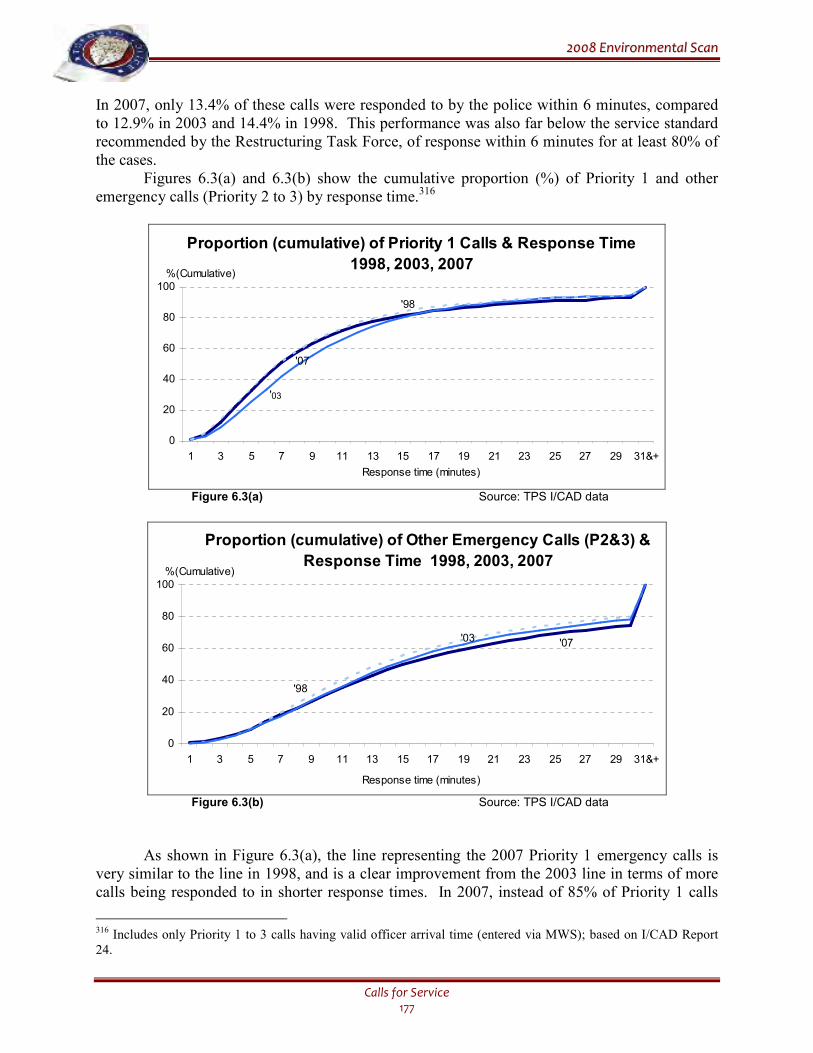
22000088 EEnnvviirroonnmmeennttaall SSccaann
Calls for Service 177
In 2007, only 13.4% of these calls were responded to by the police within 6 minutes, compared to 12.9% in 2003 and 14.4% in 1998. This performance was also far below the service standard recommended by the Restructuring Task Force, of response within 6 minutes for at least 80% of the cases.
Figures 6.3(a) and 6.3(b) show the cumulative proportion (%) of Priority 1 and other emergency calls (Priority 2 to 3) by response time.316
0
20
40
60
80
100
1 3 5 7 9 11 13 15 17 19 21 23 25 27 29 31&+
Proportion (cumulative) of Priority 1 Calls & Response Time
1998, 2003, 2007
Response time (minutes)
%(Cumulative)
'98
'07
'03
Figure 6.3(a) Source: TPS I/CAD data
0
20
40
60
80
100
1 3 5 7 9 11 13 15 17 19 21 23 25 27 29 31&+
Proportion (cumulative) of Other Emergency Calls (P2&3) &
Response Time 1998, 2003, 2007
Response time (minutes)
%(Cumulative)
'03
'98
'07
Figure 6.3(b) Source: TPS I/CAD data
As shown in Figure 6.3(a), the line representing the 2007 Priority 1 emergency calls is very similar to the line in 1998, and is a clear improvement from the 2003 line in terms of more calls being responded to in shorter response times. In 2007, instead of 85% of Priority 1 calls
316 Includes only Priority 1 to 3 calls having valid officer arrival time (entered via MWS); based on I/CAD Report 24.
22000088 EEnnvviirroonnmmeennttaall SSccaann
Calls for Service 178
being responded to within 6 minutes, it was 18 minutes before 85% of Priority 1 calls were covered/responded. This was the same as five years ago (2003), but was an increase from the 16 minutes of ten years ago (1998).
The line showing the response time to Priority 2-3 calls (other emergency calls) for 2007, as shown in Figure 6.3(b), clearly shifted to the right over the past 10 years. Police response time to this category of calls declined, as indicated by a smaller proportion of calls being responded to within a few minutes, meaning that it took longer for police response to arrive in these emergency, though comparatively less serious, situations.
For the non-emergency or low priority calls (Priority 4 through 6) with a valid MWS-entered arrival time, the median response time increased from 24 minutes in 1998 to 27 minutes in 2003, and to 34 minutes in 2007, although decreases were noted in the past two years. It was also found that 66.4% of Priority 4-6 calls received a police response within 60 minutes, which was a drop from the 76.0% in 2003 and the 82.0% in 1998. This, in fact, was the seventh year that police response time was below the standard (80%) that was recommended for this group of calls.317
As the findings above show, while there was improvement in the past year (2007) in terms of response time, the proportion of cases responded to within the recommended service response time standards, and the ‘at-scene’ compliance, police response to calls in general was still well below the recommended service standards, particularly with regard to emergency calls. There is a need to review these response time standards by taking into consideration the current police performance/productivity at current staffing levels and other operational constraints so that more realistic and achievable standards can be identified for guiding and evaluating operations. C. SERVICE TIMES
318
Service time (or officer time spent on a call) is the time required by police to service a call, from dispatch to clearance. Service time per call has a direct impact on police resources required to respond to calls from the public. Given relatively ‘fixed’ police resources assigned to the Primary Response function, the longer the time required to service calls, the more police resources will be stretched and the longer will be the pending time for calls in general. An analysis of service time revealed that the average service time per call increased significantly over the past ten years and particularly over the past five years (Figure 6.4). The average time spent servicing a call was about twice as long in 2007 as in 1998, while the average time spent servicing a Priority 1 call was about 2½ times as long in 2007 as in 1998.
317 The standard recommended for non-emergency ‘police required’ calls is no more than 60 minutes for at least 80% of the calls. (Metropolitan Toronto Police. Beyond 2000 Restructuring Task Force: The Final Report. December 1994, p.85) 318 Service time refers to officer(s’) time on a call, the difference in time between the ‘dispatch time’ of an event and the ‘closure time’ of an event, as defined by the TPS Computer Aided Dispatch Query & Reporting User Reference, pp. 14, 26, 27. All service time statistics used in this analysis were derived from I/CAD Query Report 52.
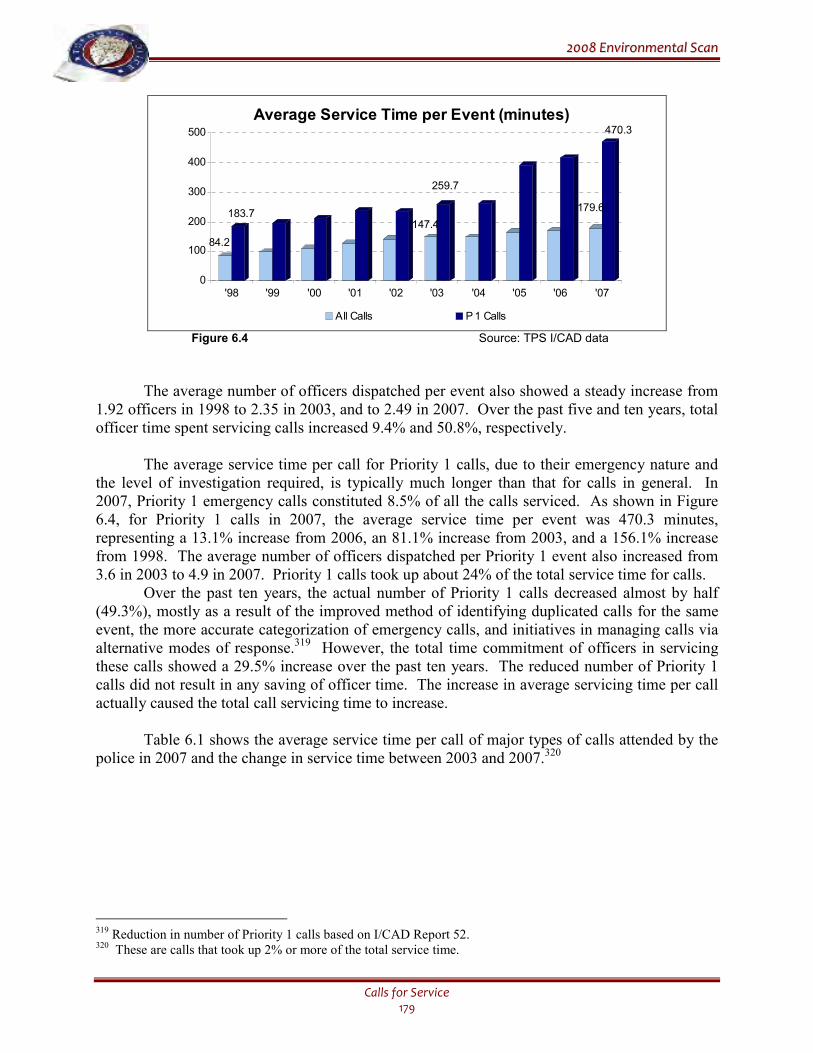
22000088 EEnnvviirroonnmmeennttaall SSccaann
Calls for Service 179
84.2
183.7147.4
259.7
179.6
470.3
0
100
200
300
400
500
'98 '99 '00 '01 '02 '03 '04 '05 '06 '07
All Calls P 1 Calls
Average Service Time per Event (minutes)
Figure 6.4 Source: TPS I/CAD data
The average number of officers dispatched per event also showed a steady increase from 1.92 officers in 1998 to 2.35 in 2003, and to 2.49 in 2007. Over the past five and ten years, total officer time spent servicing calls increased 9.4% and 50.8%, respectively.
The average service time per call for Priority 1 calls, due to their emergency nature and the level of investigation required, is typically much longer than that for calls in general. In 2007, Priority 1 emergency calls constituted 8.5% of all the calls serviced. As shown in Figure 6.4, for Priority 1 calls in 2007, the average service time per event was 470.3 minutes, representing a 13.1% increase from 2006, an 81.1% increase from 2003, and a 156.1% increase from 1998. The average number of officers dispatched per Priority 1 event also increased from 3.6 in 2003 to 4.9 in 2007. Priority 1 calls took up about 24% of the total service time for calls.
Over the past ten years, the actual number of Priority 1 calls decreased almost by half (49.3%), mostly as a result of the improved method of identifying duplicated calls for the same event, the more accurate categorization of emergency calls, and initiatives in managing calls via alternative modes of response.319 However, the total time commitment of officers in servicing these calls showed a 29.5% increase over the past ten years. The reduced number of Priority 1 calls did not result in any saving of officer time. The increase in average servicing time per call actually caused the total call servicing time to increase.
Table 6.1 shows the average service time per call of major types of calls attended by the police in 2007 and the change in service time between 2003 and 2007.320
319 Reduction in number of Priority 1 calls based on I/CAD Report 52. 320 These are calls that took up 2% or more of the total service time.
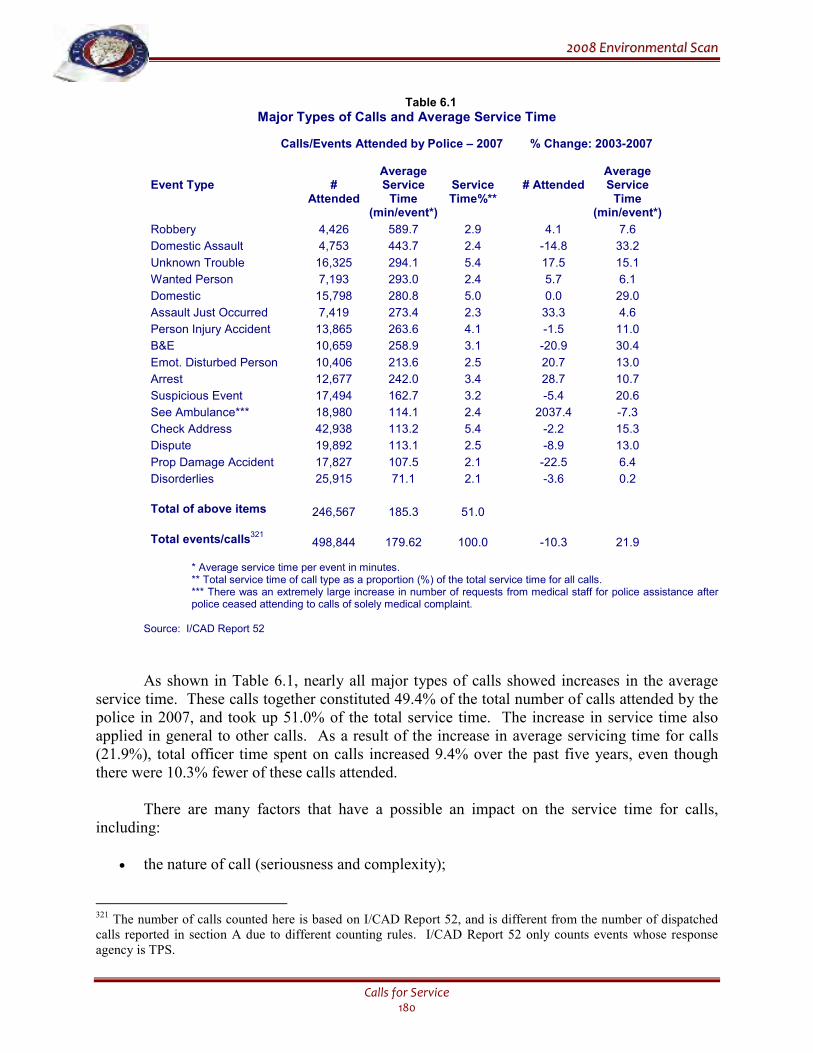
22000088 EEnnvviirroonnmmeennttaall SSccaann
Calls for Service 180
Table 6.1
Major Types of Calls and Average Service Time
Calls/Events Attended by Police – 2007 % Change: 2003-2007
Event Type
#
Attended
Average Service
Time (min/event*)
Service Time%**
# Attended
Average Service
Time (min/event*)
Robbery 4,426 589.7 2.9 4.1 7.6
Domestic Assault 4,753 443.7 2.4 -14.8 33.2
Unknown Trouble 16,325 294.1 5.4 17.5 15.1
Wanted Person 7,193 293.0 2.4 5.7 6.1
Domestic 15,798 280.8 5.0 0.0 29.0
Assault Just Occurred 7,419 273.4 2.3 33.3 4.6
Person Injury Accident 13,865 263.6 4.1 -1.5 11.0
B&E 10,659 258.9 3.1 -20.9 30.4
Emot. Disturbed Person 10,406 213.6 2.5 20.7 13.0
Arrest 12,677 242.0 3.4 28.7 10.7
Suspicious Event 17,494 162.7 3.2 -5.4 20.6
See Ambulance*** 18,980 114.1 2.4 2037.4 -7.3
Check Address 42,938 113.2 5.4 -2.2 15.3
Dispute 19,892 113.1 2.5 -8.9 13.0
Prop Damage Accident 17,827 107.5 2.1 -22.5 6.4
Disorderlies 25,915 71.1 2.1 -3.6 0.2 Total of above items 246,567 185.3 51.0 Total events/calls
321 498,844 179.62 100.0 -10.3 21.9
* Average service time per event in minutes. ** Total service time of call type as a proportion (%) of the total service time for all calls. *** There was an extremely large increase in number of requests from medical staff for police assistance after police ceased attending to calls of solely medical complaint.
Source: I/CAD Report 52
As shown in Table 6.1, nearly all major types of calls showed increases in the average
service time. These calls together constituted 49.4% of the total number of calls attended by the police in 2007, and took up 51.0% of the total service time. The increase in service time also applied in general to other calls. As a result of the increase in average servicing time for calls (21.9%), total officer time spent on calls increased 9.4% over the past five years, even though there were 10.3% fewer of these calls attended.
There are many factors that have a possible an impact on the service time for calls, including:
• the nature of call (seriousness and complexity);
321 The number of calls counted here is based on I/CAD Report 52, and is different from the number of dispatched calls reported in section A due to different counting rules. I/CAD Report 52 only counts events whose response agency is TPS.
22000088 EEnnvviirroonnmmeennttaall SSccaann
Calls for Service 181
• change in enforcement, investigation, and/or other working procedures/practices as a result of changes in legislation, etc.;
• the training and experience of the officer(s) in handling calls; and/or, • supervision by field supervisors.
As noted previously, the service time for calls more than doubled since 1998. It increased from 84.2 minutes per call in 1998 to 179.6 minutes per call in 2007. This trend of increase, if not addressed, will be a serious drain on police resources. Since servicing calls from the public is a major police function, managing a significant increase in service time without a commensurate increase in resources, or the remedy of other management measures to enhance productivity or optimize resource deployment, will necessarily be at the expense of other police programs. This means that the officers’ time for other non-call related functions will continue to be reduced to make up for the ever increasing demand from calls. Adequately staffing the Primary Response and other police programs, and delivering timely responses to emergencies, will remain a serious challenge for the Service.
RECOMMENDATIONS FOR POLICE SERVICE
• Police performance in responding to calls for service is focused on the concepts of
effectiveness and efficiency. Efficiency indicators include the resources required per call (service time) and the extent to which resources are optimally deployed, i.e. the optimal match between supply and demand. Effectiveness indicators include the timeliness of response, usually in relation to a service standard, and the quality of the response. These two concepts provide a framework for evaluating police performance in responding to calls. Research in these two areas should continue so that relevant performance indicators can be identified and maintained to enable systematic evaluation of police performance in this area.
• The persistence of problems related to timely response to calls requires some immediate
attention. Efforts should be directed toward either improving the response time to meet the standards previously recommended by the Restructuring Task Force, or revising the recommended response time standards on the basis of current data so as to make them more realistic.
• The large increase in service time for most major types of calls over recent years also means
significant increase in cost of service. A study should be carried out to determine the factors contributing to this large increase, so that appropriate measures can be taken to address this issue. For example, it may be that the establishment of ‘reasonable’ service time standards for major call types, based on actual performance (I/CAD data), could assist field supervisors in monitoring officer performance and thus help to curb further increases in service time.
• The compliance rate of officers acknowledging their arrival time when responding to calls
affects the validity of findings from any performance evaluation using such data. Therefore, effort should continue be directed to improving the compliance rate of officers responding to calls, particularly the low priority calls. The continued improvement in the compliance rate
22000088 EEnnvviirroonnmmeennttaall SSccaann
Calls for Service 182
for all types of calls will enable more accurate evaluation of response time, which is essential both for monitoring Service performance and for staff deployment analysis.
• Training is another area that should be reviewed in terms of enhancing officers’ performance
and efficiency in the servicing of calls, thus helping to reduce the service time spent on calls. • The increased number of calls received through the emergency line and the possible misuse of
the emergency line for non-emergency issues may have exerted pressures on the call-taking function. Initiatives to divert non-emergency calls from the emergency line should continue.
• Over the past years, the Toronto Police Service dealt with the issue of increase in emergency
calls and servicing time for calls in general by more stringent screening of calls and the divergence of non-emergency calls to alternate modes of response other than an immediate/ rapid police response. Initiatives in this direction, as well as proactive initiatives by the Service to address the factors leading to calls, should continue.
22000088 EEnnvviirroonnmmeennttaall SSccaann
Technology & Policing 183
VII. TECHNOLOGY & POLICING
The modern police service deals with both the benefits and consequences of technology.
Technology can provide police services with valuable tools that enhance the safety of its
members and the service provided to the community. However, technology provides the
means and opportunity for individuals and criminal organizations to commit faceless and
borderless crimes. Reducing vulnerability to cyber-crime by protecting and educating the
organization and the community, and assessing and keeping current with technology is an
important way for the Service to remain at the forefront in the fight against technological
crime.
HIGHLIGHTS
• According to Statistics Canada, about 73% of Canadians aged 16 and older (19.2 million),
went on-line for personal reasons during 2007. This was an increase of 5% compared to the 68% who said they’d been on-line in 2005. Differences in Internet use were found on the basis of income, education, and age.
• Research in 2005 found that 94% of youth reported that they had Internet access at home and
by the time the youth was in Grade 11, more than half (51%) had their own Internet–connected computer that was separate and apart from the family computer.
• Social networks such as Facebook and MySpace can be a medium for criminal and socially
unacceptable behaviour, including cyber-crimes and cyber-bullying. The posting of personal details and photographs on such sites could be used to identify or profile a particular user in order to exploit or to increase the success of other Internet scams or on-line attacks.
• A survey of 2,474 youth conducted by the Kids Help Phone, found that over 70% of
respondents reported being bullied on-line and 44% of respondents reported having bullied someone on-line on at least one occasion.
• According to a report to the United States (US) Congress, despite growing concerns for
national security, computer vulnerabilities continue and the number of computer attacks reported by industry and government increase. Transnational terrorist groups continue to become increasingly skilled in modern technology. Cyber-crime has emerged as a weapon and a tool for transnational criminal organizations and is expected to play a larger role in organized crime in the future.
• Stolen computers, laptops, and mobile phones pose security challenges for individuals and
organizations, as many laptops have integrated wireless local area network capabilities that enable users to access organizational resources by way of third-party networks. Consequently, items such as stolen laptops may be used to gain unauthorized access into an internal network.
• The Internet and illegal access to personal identifiers through hacking and other means has
exacerbated the problem of identity theft and frauds. Identity theft and fraud have become
22000088 EEnnvviirroonnmmeennttaall SSccaann
Technology & Policing 184
major concerns for both the criminal justice system and the private sector, especially given their overlap with other crimes such as terrorism, money laundering, drug trafficking, human smuggling, and weapons dealing.
• ‘Web 2.0’ has transformed how racism, anti-Semitism, homophobia, and general intolerance
against minorities is spread across the Internet. ‘Web 2.0’ refers to a second generation of web-based communities and hosted services, such as Facebook, MySpace, and YouTube, designed to promote collaboration, sharing, and new connections.
• Computers have become one of the most common conduits used by pedophiles to lure
children into illicit sexual relations, produce illegal sexually explicit images of children, and to share images and videos worldwide. Technology has allowed great amounts of storage space to be available on affordable hard drives and portable USB storage devices, enabling pedophiles to store enormous amounts of images and videos.
• Today’s 9-1-1 emergency systems cannot support communications involving text, data,
images, or video, and, in addition, although technologies used by individuals with disabilities have improved dramatically, access to 9-1-1 may have not improved for these users to the same extent as for others.
• Beyond the more traditional methods associated with biometrics, such as fingerprint/palm
print recognition, face recognition, iris recognition, and hand/finger geometry, a number of other identification methods are being further developed and/or commercialized.
• Organizations around the world have begun to realize the frailties of the planet. In response
to environmental issues, police services are producing environmental reports and environmental policies, using e-ticketing, and driving alternative fuel vehicles.
“In many respects, police services have the greatest need among criminal justice agencies for a clear understanding of their environment and the ways they can adapt to it, and this makes them the neediest consumers of new information systems and technology.”322
– T. Dunworth, US Department of Justice, 2000
A. INTERNET USE
The Internet can facilitate communication and transactions, and can expand social
networks and economics across the globe. There are over 6.7 billion people on the planet and it is estimated that approximately 1.4 billion use the Internet.323 According to a May 2008 Net
322 Dunworth, T. (2000). Criminal Justice and the IT Revolution. Policies, Processes, and Decisions of the Criminal Justice System, 3: 371-426. US Department of Justice Office of Justice Programs. (Retrieved July 2nd, 2008, from http://www.ncjrs.gov/criminal_justice2000/vol_3/03h.pdf) 323 Internetworldstats.com. (2008). Internet Usage Statistics. The Internet Big Picture. World Internet Users and Population Stats. (Retrieved June 20th, 2008, from http://internetworldstats.com/stats.htm)
22000088 EEnnvviirroonnmmeennttaall SSccaann
Technology & Policing 185
Server survey, there are over 168 million Internet websites around the world. The Internet is an important medium for participation in our society, and has become a central part of the everyday life of many Canadians.324
According to the latest Statistics Canada Internet survey in 2007, Canadians are making greater and more use of the Internet, but a digital divide exists among certain groups. About 73% Canadians aged 16 and older (19.2 million), went on-line for personal reasons during the 12 months prior to the survey.325 This was an increase of 5% compared to the 68% who said they’d been on-line in 2005. Approximately 75% of Ontarians used the Internet, the third highest province, behind British Columbia (78%) and Alberta (77%).
People living in urban areas were more likely to be using the Internet than others: only about 65% of rural residents accessed the Internet compared to 76% of those living in urban areas. Both proportions, however, were higher than in 2005.326 Differences in Internet use were also found on the basis of income, education, and age. Most people (91%) in the highest income brackets (more than $95,000) used the Internet, which was almost twice the proportion of those with the lowest income (under $24,000), where only 47% used the Internet. With regard to education, 84% of individuals with at least some post-secondary education used the Internet in 2007, compared to 58% with less education. Not unexpectedly, age was also a major indicator of Internet use as in 2007, 96% of persons aged 16 to 24 years went on-line, three times more than the proportion of seniors (29%). The majority of Internet users (16 and older) reported using the Internet more often from home (94%) than work (41%), school (20%), or libraries (15%).
The most popular activities on-line in 2007 were e-mail and general browsing, however the data show that more Canadians were using the Internet for additional activities such as posting images, writing blogs (on-line journals), or participating in discussion groups.327
The Statistics Canada survey also found that about 50% of Canadians were very concerned about on-line credit card use, 44% were concerned about on-line banking transactions, and about 37% were about on-line privacy. Those who were 16-17 years old or those who’d used the Internet longer and for more activities were generally less concerned than others.328
For children and youth, the Internet has become an important part of their social environment. Research conducted by the Media Awareness Network in 2005, found that 94% of youth reported that they had Internet access at home, and a majority (61%) had a high-speed connection. In addition, by the time the youth was in Grade 11, more than half (51%) had their own Internet-connected computer that was separate and apart from the family computer. Although a home computer is the most common way that children and youth connect to the Internet, about 44% of children and youth can connect with cell-phones.329
The research also found that a typical Grade 4 student prefers to play on-line games, but that this was soon replaced by the desire to connect with friends. By Grade 6, girls preferred
324 Netcraft. (2008). May 2008 Net Server Survey. (Retrieved June 30th, 2008, from http://news.netcraft.com/) 325 Statistics Canada. (2008). Canadian Internet Use Survey. The Daily, June 12th, 2008. (Retrieved June 12th, 2008, from http://www.statcanada.ca/Daily/English/080612/d080612b.htm) 326 Ibid. 327 Ibid. 328 Ibid. 329 Media Awareness Network. (2005). Young Canadians in a Wired World Phase 2 - Trends and Recommendation. (Retrieved June 30th, 2008, from http://www.media-awareness.ca/english/research/YCWW/phaseII/upload/ YCWWII_Student_Survey.pdf)
22000088 EEnnvviirroonnmmeennttaall SSccaann
Technology & Policing 186
instant messaging over any other on-line activity; by Grade 8, boys’ interest in gaming was equalled by their interest in instant messaging. From Grade 9 up, instant messaging was the preferred on-line activity for both girls (80-83%) and boys (54-61%). Kids have their own webcams (22%), and cell phone cameras (17%), and it is common for children and youth to post pictures of themselves and personal information on web pages and social networking sites.
As more and more Canadians, youth in particular, participate in activities on-line, there will continue to be more opportunity for cyber-crimes, abuse, harassment, cyber-bullying, and other criminal offences. And, as more people use the Internet, it will be a challenge for police services to keep adequate pace with technology and with the standards of communication that are continuing to evolve rapidly in the digital world.
On-line Society & Generation ‘C’:
Generation ‘C’, like Generation X, Y and the MTV Generation before them, is the term
for the current cohort of young people mainly in their tweens (pre- and early teens), teens, and twenties, not strictly born between specific dates, but who have grown up with information and communications technology. The ‘C’, believed to stand for ‘content’, ‘creativity’, ‘connectivity’, ‘collaboration’, and ‘communication’, was coined by advertising and marketing industries in 2005, and is being described in some popular as well as scholarly work.330
User-generated communication and content has skyrocketed over the past few years, as terabytes of digital information are created and uploaded every day. For example, according to the London-based Informa Telecoms and Media, the number of videos uploaded to YouTube is expected to increase fourfold by 2011, to 198 million, while user-generated mobile content is predicted to increase in worth from $3.5 billion in 2006, to $13.2 billion in 2011.331
Although Generation ‘C’ is skilled at deploying digital content, what makes them different from the Information Technology (IT) wizard of the past is the new generation’s ability to build networks, relationships, and their own identities around and through digital content. Social networks are the main examples of how members of Generation ‘C’ view digital content as a form of self expression, and the best way to communicate, collaborate, and connect with their peers.332
Social networks such as Facebook or MySpace have transformed how the younger generation communicate. The most popular social network, Facebook, came to be in February 2004 as an on-line alternative to Harvard University’s paper-based social directory. It expanded to include a few other universities, then to all other American colleges and high schools; it now exists basically everywhere that an e-mail address exists. Facebook has about 16 million users in 47,000 networks, and is estimated to be the seventh-most visited site in the World Wide Web. What originally set Facebook apart from its competitors was its easy-to-use platform for sharing and uploading digital content, such as pictures, videos, blog notes, and so on.333
330 Bruns, A. (2007). Produsage, Generation C, and Their Effects on the Democratic process. Queensland University of Technology, Brisbane, Australia. (Retrieved June 30th, 2008, from http://web.mit.edu/comm-forum/mit5/papers/Bruns.pdf) 331 Dye, J. (2007). Meet Generation 'C'. Econtent, 30(4): 38-43. 332 Ibid. 333 Ibid.

22000088 EEnnvviirroonnmmeennttaall SSccaann
Technology & Policing 187
Generation ‘C’ digital social networks have caused two major shifts in how youth interact with the world. Their social networks are becoming both larger and narrower than ever before, as the entire globe is their arena and small communities are their audience.334
These networks, however, can also be a medium for criminal and socially unacceptable behaviour, including cyber-crimes and cyber-bullying. Personal details and photographs posted on such sites can be used to identify or profile a particular user in order to exploit or to increase the success of other Internet scams or on-line attacks. Furthermore, the personal information obtained from social networking sites can facilitate identity theft.335
Although the power of these networks has far-reaching potential for police services in communicating with youth and enhancing investigations, the challenge will be for the Service to fit themselves into the new demographic, to accept the lack of control over the content that is released, and to enhance education and awareness in the proactive prevention of on-line crimes.
Cyber-bullying:
Cyber-bullying is an issue that has touched many youth. Although cyber-bullying is sometimes a complicated issue in law and for police services, it can have a considerable effect on youth and is an activity that can escalate to violence and further criminal activity that require the intervention of police. In April 2007, the Kids Help Phone released a study on cyber-bullying to inform emerging policies, education and programming with regard to cyber-bullying and the effects it can have on Canadian youth.336 Like other types of bullying, cyber-bullying often occurs in the context of a peer group and can involve unequal power, hurtful actions, and repetitive behaviours. There are several factors, however, that make cyber-bullying unique: the bully can remain anonymous; the bully can take on a false identity; the bullying can occur anywhere and anytime; the bullying can take on many forms within the cyber-space environment; and, the bully has more ability to instantly act and is unlimited in his or her dissemination of words or images. Of the 2,474 surveys that were conducted in the Kids Help Phone study, over 70% of respondents reported being bullied on-line and 44% of respondents reported having bullied someone on-line on at least one occasion. Other findings included:
• the most frequent on-line bullying experiences were being called names/being made fun of, having rumours spread about them, and being threatened or scared;
• the most frequent mode of bullying was instant messaging (e.g. MSN, etc.), followed by e-mail and social networking sites;
• the most frequent response to being bullied on-line was to do nothing (ignoring or blocking), followed by confronting the person who did it, and telling a friend; and,
334 Ibid. 335 Choo, K., Smith, R., McCusker, R. (2007). Future Directions in Technology-Enabled Crime: 2007-2009. Research and Public Policy Series, Australian Government, No. 78. (Retrieved June 10th, 2008, from http://www.aic.gov.au/publications/rpp/78/) 336 Kids Help Phone. (2007). Cyber-bullying: Our Kids' New Reality. (Retrieved June 23rd, 2008, from http://org.kidshelpphone.ca/media/21704/2007_cyber_bullying_report.pdf)
22000088 EEnnvviirroonnmmeennttaall SSccaann
Technology & Policing 188
• the most frequent reasons for not telling someone about the on-line bullying was that they did not think it would help, they thought the bullying would get worse, and they could not handle telling anyone.337
The Service will continue to be challenged by activities such as cyber-bullying, as the activities related to it affect the victims in a number of ways, but may not reach the level of a criminal offence. In addition, privacy issues and rules of law may affect the ease of investigation and a solution to the bullying in a proactive fashion. Cyber-bullying may escalate to violent confrontations, and the Service will have to work in partnership with the community and with schools to deliver education and information to youth on the dangers of and dealing with on-line bullying.
B. POLICING TECHNOLOGICAL CRIMES
As more people depend on the Internet and digital networks, criminals have found ways
to exploit the digital environment and the vulnerabilities associated with it. Traditional crimes can be replicated on-line, but so, too, have emerged new crimes that are specific to the Internet. Along with these new and evolving crimes, come challenges to policing and surveillance, as well as new issues surrounding rights of privacy and protection. The digital network alters the understanding of traditional policing services in a number of ways. First, it changes the scene or location where crimes occur. Second, it makes possible the commission of new types of crimes. Third, it requires significant changes in policing methods, for example, a shift to prevention and to new forms of co-operation between the public and private sectors. Fourth, it provides law enforcement with new tools of digital surveillance and new methods of sorting data and managing on-line risks. And, fifth, it presents new challenges to the existing legal process and stimulates new ideas of proof and procedure.338 Cyber-crimes demand innovative thinking, specifically in the design of law enforcement systems. The new technological and social conditions of criminal activity have challenged the traditional policing response, which may be ill-equipped to deal with the changing conditions. According to an expert in Internet and information law and security, law enforcement off-line is mainly a reactive system that is generally centralized, publicly managed, and rooted in human discretion. The emerging system of on-line policing is different as it is mainly preventative, highly decentralized, a hybrid of public and private enforcement, and is highly automated. The structure of the Internet makes third parties, such as Internet Service Providers (ISPs) and Domain Name System (DNS) servers, essential to on-line policing, and it further introduces powerful tools such as portals, search engines, and dominant websites that can be used by law enforcement.339 The challenge for police is to find effective, centralized intervention points in a decentralized environment, while still working within the existing legal constraints.
337 Ibid. 338 Balkin, J., & Kozlovski, N. (2007). Introduction. In Balkin, J., Grimmelmann, J., Katz, E. Kozlovski, N., Wagman, S., & Zarsky, T. (Eds.), Cybercrime: Digital Cops in a Networked Environment (pp. 1-13). New York, NY: New York University Press. 339 Kozlovski, N. (2007). Designing Accountable On-line Policing. In Balkin, J., Grimmelmann, J., Katz, E. Kozlovski, N., Wagman, S., & Zarsky, T. (Eds.), Cybercrime: Digital Cops in a Networked Environment (pp. 107-135). New York, NY: New York University Press.
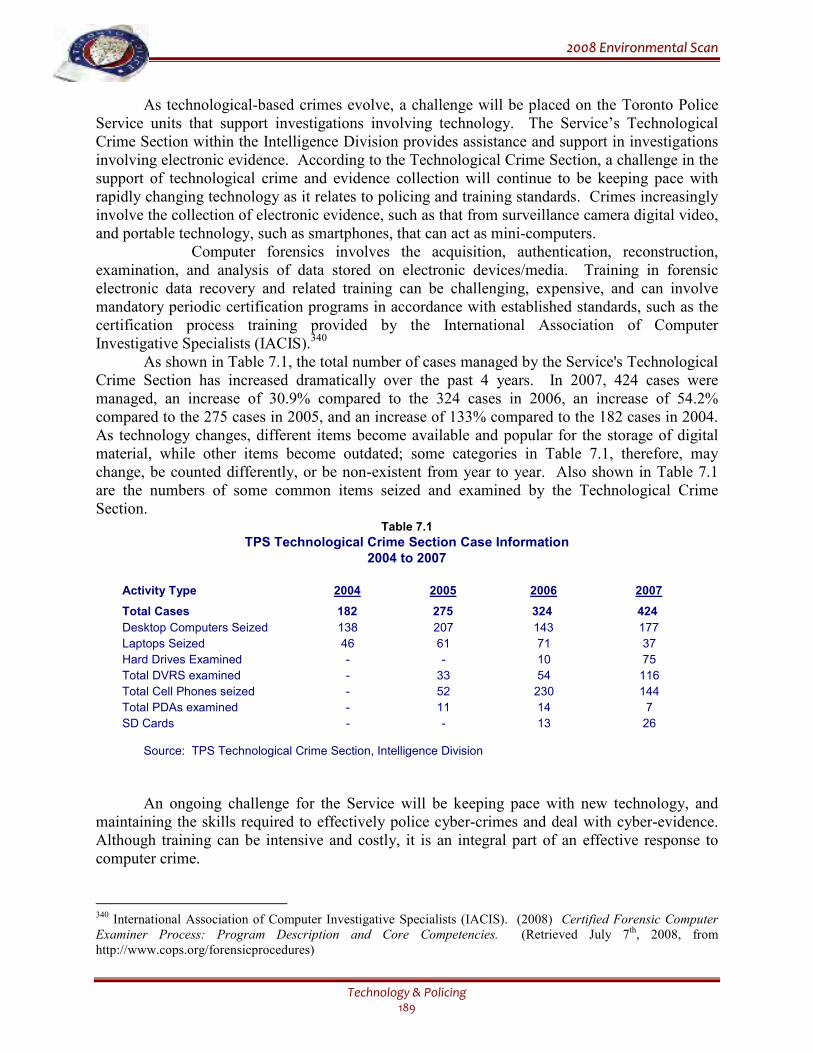
22000088 EEnnvviirroonnmmeennttaall SSccaann
Technology & Policing 189
As technological-based crimes evolve, a challenge will be placed on the Toronto Police Service units that support investigations involving technology. The Service’s Technological Crime Section within the Intelligence Division provides assistance and support in investigations involving electronic evidence. According to the Technological Crime Section, a challenge in the support of technological crime and evidence collection will continue to be keeping pace with rapidly changing technology as it relates to policing and training standards. Crimes increasingly involve the collection of electronic evidence, such as that from surveillance camera digital video, and portable technology, such as smartphones, that can act as mini-computers.
Computer forensics involves the acquisition, authentication, reconstruction, examination, and analysis of data stored on electronic devices/media. Training in forensic electronic data recovery and related training can be challenging, expensive, and can involve mandatory periodic certification programs in accordance with established standards, such as the certification process training provided by the International Association of Computer Investigative Specialists (IACIS).340
As shown in Table 7.1, the total number of cases managed by the Service's Technological Crime Section has increased dramatically over the past 4 years. In 2007, 424 cases were managed, an increase of 30.9% compared to the 324 cases in 2006, an increase of 54.2% compared to the 275 cases in 2005, and an increase of 133% compared to the 182 cases in 2004. As technology changes, different items become available and popular for the storage of digital material, while other items become outdated; some categories in Table 7.1, therefore, may change, be counted differently, or be non-existent from year to year. Also shown in Table 7.1 are the numbers of some common items seized and examined by the Technological Crime Section.
Table 7.1
TPS Technological Crime Section Case Information 2004 to 2007
Activity Type 2004 2005 2006 2007
Total Cases 182 275 324 424
Desktop Computers Seized 138 207 143 177
Laptops Seized 46 61 71 37
Hard Drives Examined - - 10 75
Total DVRS examined - 33 54 116
Total Cell Phones seized - 52 230 144
Total PDAs examined - 11 14 7
SD Cards - - 13 26 Source: TPS Technological Crime Section, Intelligence Division
An ongoing challenge for the Service will be keeping pace with new technology, and maintaining the skills required to effectively police cyber-crimes and deal with cyber-evidence. Although training can be intensive and costly, it is an integral part of an effective response to computer crime.
340 International Association of Computer Investigative Specialists (IACIS). (2008) Certified Forensic Computer Examiner Process: Program Description and Core Competencies. (Retrieved July 7th, 2008, from http://www.cops.org/forensicprocedures)
22000088 EEnnvviirroonnmmeennttaall SSccaann
Technology & Policing 190
C. DIGITAL CRIMES
The increase in technology and crime relating to it will continue to be a challenge for law
enforcement agencies around the world. Criminals can enter countries, cities, and homes virtually, never having to obtain a passport or fly in a plane. Prevention will be a key to protecting our digital vulnerabilities, and the Service will need to have up-to-date knowledge about ever-evolving technology, and to constantly be aware of the types of on-line crimes that are taking place around the world, as what is happening elsewhere can quickly become local.
Organized Cyber-crime:
Cyber-crime has emerged as a weapon and a tool for transnational criminal organizations
and is expected to play a larger role in organized crime in the future. Interconnected global financial networks allow criminal organizations to launder their profits quickly and easily through transactions that are difficult to trace. According to a report published by the Canadian Security Intelligence Service, hacking into computer systems of large organizations and corporations, securing valuable information, and then extorting the corporation by threatening to manipulate, destroy, or deny access to important information or data is an emerging and increasing trend.341
Cyber-terrorism:
Transnational terrorist groups continue to become increasingly skilled in modern
technology. Technology is used by terrorists to gather intelligence, to communicate with each other by way of encrypted messages, to transfer funds electronically, and to mount cyber-attacks on governments and non-government targets. The Internet is also being used as a propaganda and recruitment tool.342 Terrorists could use on-line chat rooms and social networking sites, such as Facebook or MySpace, as conduits to reach an international audience, solicit funding, recruit new members, and to distribute propaganda.343 A number of security experts believe that terrorist groups are recruiting new and younger members who have computer knowledge in order to increase the use of computers as weapons in the future.344
Critical Infrastructure Vulnerabilities:
According to a report to the US Congress, despite growing concerns for national security,
computer vulnerabilities continue and the number of computer attacks reported by industry and government continue to increase. These attacks have included those directed at critical infrastructure companies, such as power, energy, and financial services. For example, in January
341 Canadian Security Intelligence Service. (2000). Report No. 2000/07: Transnational Criminal Activity: A global Context. (Retrieved June 10th, 2008, from http://www.csis-scrs.gc.ca/pblctns/prspctvs/200007-eng.asp) 342 Canadian Security Intelligence Service. (2006) Public Report 2004-2005. Public Works and Government Services Canada 2006. (Retrieved September 7th , 2007, from http://www.csis.gc.ca/pblctns/nnlrprt/2004/rprt2004-eng.asp) 343 Choo, et al. (2007). 344 Wilson, C. (2003). CRS Report For Congress - Computer Attack and Cyber Terrorism: Vulnerabilities and Policy Issues for Congress. Congressional Research Service, the Library of Congress. (Retrieved September 7th, 2007, from http://www.fas.org/irp/crs/RL32114.pdf)
22000088 EEnnvviirroonnmmeennttaall SSccaann
Technology & Policing 191
2003, an Internet worm reportedly entered the computer network of a nuclear power plant in the US and disrupted computer systems for more than five hours.345
Canadian cities, including Toronto, may not be immune to attacks that occur in the US. The Toronto Police Service will play a critical role in managing the city and its communities if cyber attacks against critical infrastructure within or outside the city are successful in the future.
World-wide Hackers:
According to a lecture presented by a computer security expert at the 2007 Brightstar 12th
Annual Security Summit, the top 3 malicious motives for hackers are: defacement, identity theft, and ‘hacktavism’.346
Defacement has been described as new digital age graffiti for hackers who seek fame. Generally these hackers work in groups, trying to make their group or country famous on defacement archive websites. For example, the Turkish hacker ‘iSKORPitz’ is ranked number one on zone-h.org (a popular defacement archive portal).
Identity theft and fraud (covered in more detail further in next section) can be achieved through the Internet. Criminals who want to obtain personal information from people on-line may use phishing, which is the creation of e-mails and websites that falsely appear to belong to financial institutions or on-line auction sites, or spoofing, which is gaining access through impersonation. An Internet user who receives e-mails claiming to be from a legitimate business may be directed to a website, appearing to be for a legitimate business, on which the user is directed to enter large amounts of personal data. Hackers have also been known to steal credit cards or credit card information and sell it to carders who order products on-line to resell on on-line auction sites.
‘Hacktavism’ has been described as hacking to bring about political or social change. For example, with regard to the Iraq War, it was reported that in March 2003, more than 20,000 American websites were defaced in one-week with anti-American/anti-war slogans.347
It is reasonable to suggest that as the world’s population continues to embrace technology and global issues, defacement, identity theft/fraud, and hacktavism may increase and become local issues in the future.
Networked Computers & Cyber-crime:
Networked computers with exposed vulnerabilities may be open to cyber attacks. Computer hackers search the Internet for computer systems that do not have necessary or current software security patches, or that have incorrect computer configurations that leave the computer open to potential attacks. Computers with current and up-to-date software may still be vulnerable to a type of attack known as a ‘zero-day exploit’, which occurs when a hacker
345 Ibid. 346 Craig, P. (2007). Web Application Security: Methods and Demos of Web Application Hacks. Presented at the Brightstar – 12th Annual Security Summit, Auckland, New Zealand, 2007. (Retrieved July 10th, 2008, from www. security-assessment.com/files/presentations/Web%20Application%20Security%20-%20Attack%20Demos. pdf) 347 Ibid.
22000088 EEnnvviirroonnmmeennttaall SSccaann
Technology & Policing 192
discovers a new vulnerability attack on a network and launches an attack program before a security patch is created.348
Furthermore, stolen computers, laptops, and mobile phones pose security challenges for individuals and organizations, as many laptops have integrated wireless local area network capabilities that enable users to access organizational resources by way of third-party networks. Consequently, items such as stolen laptops may be used to gain unauthorized access into an internal network.349
In addition to external attacks, organizations need to be aware of the potential for internal attacks on their systems. For example, low-tech attacks can increase with opportunities for the corruption of IT personnel or other members of an organization, or with the use of violence and duress to compel users to disclose access information. The motivation to damage an organization through the breach of its information technology security is greatest from external sources, while the ability to carry out such damage is greatest for insiders.350
As the Service ventures further into the use of new technology and mobile systems, members need to be aware of the responsibilities attached to those systems, and the potential for security issues if misplaced, lost, or stolen. In addition, the Service must remain vigilant in its human resource practices and internal policies and procedures, to continue to ensure that members are unaffected by any potential pressures from outside the Service to influence activities inside. Computer-facilitated Identity Theft & Frauds:
351
Identity theft and fraud have become major concerns for both the criminal justice system and the private sector, especially in the overlap with other crimes such as terrorism, money laundering, drug trafficking, human smuggling, and weapons dealing. Identity theft can facilitate criminal activities and can assist in avoiding the detection of those acts. The Internet and illegal access to personal identifiers through hacking and other means have exacerbated the problem of identity theft and frauds. More than just identity theft, computer-facilitated frauds include advanced fee scams, on-line auction frauds, fraudulent lottery schemes, modem and webpage high-jacking, and so on.352
Recent media reports have focused on the potential dangers of local trading/buying websites such as ‘Craigslist’ or ‘Kijiji’, and although there is no research available evaluating the potential, local trading and buying sites such as ‘Craigslist’ and ‘Kijiji’ can present unique dangers, as people who use the sites often trust the local nature of the sites and meet with potential sellers or buyers to make transactions.353 These meetings could result in serious criminal victimization, including robberies, assaults, sexual assaults, or homicides.
Phishing attacks and spam dissemination are expected to become more sophisticated and the numbers of attacks is likely to increase.354 These activities are used by identity thieves and
348 Wilson (2003). 349 Choo, et al. (2007). 350 Ibid. 351 Identity theft and frauds are also discussed in the chapter on Crime Trends. 352 Ibid. 353 Fox News.com. (2007). Suspect Charged in Craigslist Nanny Murder. (Retrieved July 10th, 2008, from www.foxnews.com/story/0,2933,306317,00.html) 354 Phishing involves deceptively redirecting Internet users from legitimate financial sites to targeted websites via the Internet.
22000088 EEnnvviirroonnmmeennttaall SSccaann
Technology & Policing 193
criminals to deceive a person into revealing personal information that can be used to steal identity, to obtain account numbers, passwords, social security numbers, etc., which can then be sold on the Internet and/or used to commit identity frauds, money transfers, and the like.355
In addition, the increased use of communication devices has enhanced the opportunity available for phishing and spam. Opportunities relating to voice over Internet Protocols (VoIP), known as vishing, and to mobile phones (via SMS), known as SMiShing, are expected to be used to overcome spam-prevention and detection filtering software. Phishing attacks can be either syntactic (exploiting technical vulnerabilities) or semantic (exploiting social vulnerabilities), and researchers have suggested that the trend from syntactic attacks to semantic attacks will continue. As mentioned in the On-line Communication section, social networking sites offer great opportunity for crime. For example, in 2005, an experiment conducted by researchers at the University of Indiana in the US found that phishers can easily exploit social network data found on the Internet to increase the yield of a phishing attack – Internet users are over four times more likely to become victims if they are solicited by someone appearing to be an acquaintance.356
An ‘identity purifying’ process has been recognized as a key component of successful criminal activities in offences such as drug trafficking, human trafficking, money laundering, and terrorism. In this process, offenders seek to obtain ‘breeder’ documents (e.g. birth certificates) and then use them to acquire other identification documents (e.g. passports), gaining more credibility with each additional document obtained. The breeder documents can assist in obtaining drivers licences and Social Insurance Number (SIN) cards, which can open bank accounts and establish a ‘pure’ identity.357
According to experts in white collar and electronic crimes, a complicating factor for law enforcement agencies is that there is no discrete data source responsible for the compiling and reporting of all incidents of identity fraud, and consequently there is no valuable way to effectively measure the size and scope of identity theft and fraud.358 The bulk of the most valuable data on fraud resides in the private sector (e.g. credit card companies), with some aggregate information collected by public agencies such as Phone Busters or the Federal Trade Commission in the US.
The Internet Crime Complaint Centre (IC3) in the US reported that, in 2007, they processed more than 219,553 complaints with regard to Internet crime that supported investigations by police services and regulatory agencies nationwide.359 The total dollar loss from all cases was $239.09 million, an increase of $40.6 million from $198.44 million in 2006. Internet auction fraud (crimes associated with on-line auctions such as Ebay) was by far the most reported offence, representing 36% of referred crime complaints in 2007.
Perpetrators were predominately male (76%); e-mail (74%) and web pages (33%) were the main mechanisms by which the frauds took place. The high activity Internet scams
355 Choo, et al. (2007). 356 Ibid. 357 Rebovich, D., & Martino, A. (2007). Technology, Crime Control and the Private Sector in the 21st Century. In Byrne, J., & Rebovich, D. (Eds.), The New Technology of Crime, Law and Social Control (pp. 49-80). Monsey, New York: Criminal Justice Press. 358 Ibid. 359 Federal Bureau of Investigation. (2008). 2007 Internet Crime Report: Internet Crime Complaint Centre. The National White Collar Crime Centre, Bureau of Justice Assistance, FBI. (Retrieved July 10th, 2008, from www.ic3.gov/media/annualreport/2007_IC3Report.pdf)
22000088 EEnnvviirroonnmmeennttaall SSccaann
Technology & Policing 194
commonly reported in 2007 included those involving: pets (for sale), cheques (secret shopper/transfer frauds), spam (adoption/charity frauds), and on-line dating sites (romance fraud). The top ten countries with regard to offenders of on-line fraud (by count) included Canada, which ranked fourth with 6% of perpetrators. The country with the highest perpetrator count was the US (63%), followed by the United Kingdom (UK) (15%), and Nigeria (6%).360 With regard to victim (complainant) count, the top country was again the US (92%), followed by Canada (2%) and the UK (1%).
According to data from the Canadian Anti-Fraud call centre PhoneBusters, the number of reported identity theft complaints in Ontario decreased 18.9% between 2007 and 2006, from 5,695 to 4,189 victims, but represented a 14.2% increase compared to 2002 when there were 4,043 victim complaints in Ontario. The numbers in 2007 are likely underestimated, as PhoneBusters uses a live database that is continuously updated with data, much of which comes in large quantities from credit agencies, received and entered at various points in time. Nationally, between 2006 and 2007, there was a 30.0% decrease in complaints, but the 2007 number was a 21.4% increase compared to 2002. Identity theft costs millions of dollars, and in 2007, the estimated dollar loss associated with identity theft in Ontario was approximately $3.56 million, while nationally the dollar loss was about $6.43 million. Once again it should be noted that these values are likely to rise as the PhoneBusters database is live and receives continuous updates.361 Identity theft data from PhoneBusters are shown in Table 7.2.362
Table 7.2 PhoneBusters National Call Centre – Canadian and Provincial Identity Theft Data
No. of Identity Theft Complaints Total Revenue Losses Reported
Ontario Canada Ontario Canada
2002 4,043 8,209 $7,208,066.27 $11,825,602.58
2003 6,228 14,593 $12,856,632.87 $21,850,986.50
2004 4,617 11,941 $12,125,236.48 $19,008,456.98
2005 5,330 12,864 $4,474,707.71 $8,688,953.54
2006 5,695 14,248 $6,954,569.81 $15,752,792.83
2007 4,617 9,970 $3,559,805.62 $6,430,823.75
* Data as of June 26, 2008. Source: PhoneBusters
Law enforcement may have limited control over Internet frauds beyond increasing education and awareness efforts, but the Police Service can make strides toward protecting consumers at points vulnerable to fraud, such as points of purchases. Technology is being used at these entry points to steal banking information, credit card information, and identities that can spread to the illegal acquisition of government documents such as passports, SIN cards, drivers licences, and health cards.
360 Other Top Ten countries included Romania, Italy, Spain, South Africa, Russia, and Ghana. 361 Information obtained from PhoneBusters Canadian Anti-Fraud Call Centre June 26th, 2008. 362 Ibid.
22000088 EEnnvviirroonnmmeennttaall SSccaann
Technology & Policing 195
According to the anti-rackets section of the Ontario Provincial Police (OPP), some technical and not so technical current and emerging challenges in the area of identity theft and fraud include: 363
• keykatchers that are inexpensive and easily obtained on the Internet, designed to capture
everything typed into a computer including passwords, e-mail, etc., and can be attached surreptitiously in seconds between the keyboard and computer;
• mail theft, which can give access to credit card information, tax forms, banking information, etc.;
• unsecured computer networks, which give access to outside individuals; • phishing and pharming, designed to deceive a potential victim into revealing personal
information; and, • skimming at point of purchase, which involves the transfer of electronic data from the
magnetic stripe of one payment card to another payment card.
With the introduction of Bluetooth technology, skimmers have evolved, and offenders are able to capture information remotely in an instant. Skimmers have also become smaller, and more difficult to discover. 364
As discussed further in the chapter on Legislative Impacts, Bill C-27 (An Act to amend the Criminal Code (identity theft and related misconduct)) was introduced in the House of Commons in November 2007. The Bill targets aspects of identity theft that are not already covered by existing provisions, focusing on the preparatory stages of identity theft by making it an offence to obtain, possess, transfer, or sell the identity documents of another person.365
The ease of access to personal information highlights the importance of proactive measures aimed at individuals and organizations. As society moves closer toward a paperless existence, it is essential that the Service educate the community of the dangers of identity fraud and the proactive measures needed to combat it. Furthermore, it is important that the Service work with the business community to educate employers and employees on the dangers of technology such as point of purchase skimmers, and the consequences associated with participation in information and identity theft. A challenge will remain for the Service to keep pace with technology and to prevent identity fraud before the personal information escapes its reach.
363 Information from Ontario Provincial Police Anti-Rackets Section, March 13th, 2008 (Consultation – See the Appendix to this document for a summary of this presentation.) 364 Ibid. 365 Holmes, N., & Valiquet, D. (2008). Bill C-27: An Act to Amend the Criminal Code (Identity Theft and Related Misconduct). Parliamentary Information and Research Service, Library of Parliament. (Retrieved July 10th, 2008, from http://www.parl.gc.ca/39/2/parlbus/chambus/house/bills/summaries/c27-e.pdf)
22000088 EEnnvviirroonnmmeennttaall SSccaann
Technology & Policing 196
Cyberhate:
The Internet has been used to provide an easily accessible and free forum for hate groups since the early 1990s when individuals began holding extremist discussions in an Internet communication system mainly concerned with mainstream, legitimate topics called USENETs. It was a common tactic for extremists to post messages promoting their hate on multiple mainstream USENET newsgroups in hope of attracting new members. The evolution of the Internet into the World Wide Web, with its easily navigated and detailed interface has provided extremists with new ways to communicate with each other, provide their viewpoints, sell items, and recruit members, using pictures, graphics, sounds, games, and animation.366 According to the Anti-Defamation League in the US, those who are spreading hate on-line include: extremists seeking credibility and who want to build increased respectability and mainstream acceptance of their ideas; Holocaust deniers; Identity Church adherents; Ku Klux Klan (KKK) members; neo-Nazis; racist skinheads; and organizations that promote homophobia and, racism towards many groups including mainstream Christians, Jews, African-Americans and other people of colour.367 Extremists also use chat rooms, instant messaging, and e-mail to interact with their supporters and to attract new supporters. The forum most often chosen by extremists is the development of a website, since web development tools have made it easier for extremist groups to create websites that can resemble those of reputable organizations, and that seem to have a legitimate voice of authority.368 According to a paper presented to the Commission on Security and Co-operation in Europe in 2008 by the Chair of the Anti-Defamation League Internet Task Force, ‘Web 2.0’ has transformed how hate is spread across the Internet.369 ‘Web 2.0’ refers to the second generation of web-based communities and hosted services, such as Facebook, MySpace, and YouTube, designed specifically to promote collaboration, sharing, and new connections. For example, on YouTube, the popular user-generated video site, thousands of hate videos have been uploaded, with messages of racism, anti-Semitism, homophobia, and general intolerance against minorities.
In 2006, more than 7,500 instances of on-line hate and discrimination were monitored by members of the International Network Against Cyberhate (INACH), and a common trend reported from all countries was a large increase of hate videos on YouTube. According to INACH, anti-Semitic expressions were at a high level, and hate against Muslims was on the rise.370 National laws limit what can be done to prevent and remove Internet hate, as web forums and newsgroups, hate videos, and other platforms are often hosted abroad. Strategies that have proven somewhat effective in battling on-line hate include improving community awareness, and
366 Anti-Defamation League. (2003). Hate on the Internet: A Response Guide for Educators and Families. (Retrieved June 27th, 2008, from www.partnersagainsthate.org/publications/hoi_full.pdf) 367 Ibid. 368 Ibid. 369 Wolf, C. (2008). Remarks to the Commission on Security and Co-operation in Europe (US Helsinki Commission) Briefing on Hate in the Information Age. (Retrieved June 27th, 2008, from http://www.adl.org/main_internet/Hate_ InformationAge.htm) 370 International Network Against Cyber Hate. (2007). Second INACH Report. (Retrieved June 27th, 2008, from http://www.inach.net/content/second-INACH-report.pdf)
22000088 EEnnvviirroonnmmeennttaall SSccaann
Technology & Policing 197
encouraging Internet service providers to remove racist sites and discriminatory content based on notice and takedown principles outlined in Internet user contracts.371 The Service must continue to be aware that technology and the Internet will be seen as a desirable forum for on-line hate. With the Internet integrated into the daily lives of the younger generations, society will have to be vigilant for on-line hate proponents who target younger and more impressionable members of communities, and try to spread into schools. The Service must continue to thoroughly investigate instances of on-line hate when complaints are made, partner with agencies that can assist in the prevention and removal of cyber-hate, and continue to encourage Internet service providers to remove hateful websites.
D. CHILD EXPLOITATION
The Internet has changed the way in which child exploitation offences are committed, investigated, and prosecuted. Child exploitation (e.g. child pornography, child prostitution, travelling child sex offenders, and luring and/or abduction for sexual purposes) affects people of all ethnic and cultural backgrounds and socio-economic levels.372 Technology-assisted crimes such as child pornography require a technology-assisted response. In April 2005, the Child Exploitation Tracking System (CETS) was launched through collaboration between the Toronto Police Service and Microsoft. The system is currently being used worldwide, and by 125 users representing 16 law enforcement agencies in Canada. CETS is a secure database, housed within the RCMP’s National Child Exploitation Co-ordination Centre (NCECC) and serves as an investigative tool and a repository of information with regard to the on-line exploitation of children. CETS allows safe information-sharing over a secure network through which police can match investigations that reference the same people or on-line identities, reducing duplication of efforts across police services.373
Furthermore, the Canadian Image Database of Exploited Children (CIDEC) is a bank of images gathered from across the nation, collected with the goal of identifying victims. With future efforts against child exploitation in mind, a collection and submission process is being developed by the NCECC to capture images from every police service in the country that has investigated child exploitation. In addition, the NCECC is developing a database and procuring the software that will search image content and perform facial recognition, and is embarking on a dedicated Victim Identification Unit to identify suspects and children.374 The Child Exploitation Section (CES) of the TPS Sex Crimes Unit was formed in 2001 to investigate child exploitative crimes. Using the latest computer equipment and software, the CES investigates computer-facilitated crimes against children, rescues victims of child sexual abuse, and identifies predators who use the Internet to facilitate the sexual exploitation of children. CES members conduct undercover operations in chat rooms and meticulously examine the backgrounds of child pornography images and videos to collect investigative clues that might
371 Ibid. 372 Government of Canada. (2008). Travelling Child Sexual Offenders - Is the Canadian Policing Community Prepared. (Retrieved June 30th, 2008, from http://ncecc.ca/case_study_travelling_e.htm) 373 Government of Canada. (2008). Child Exploitation Tracking System (CETS). (Retrieved June 30th, 2008, from http://ncecc.ca/cets_e.htm) 374 Government of Canada. (2008). Implementing Cutting Edge Technology for Law Enforcement. (Retrieved June 30th, 2008, from http://ncecc.ca/quick_facts/technology_e.htm)
22000088 EEnnvviirroonnmmeennttaall SSccaann
Technology & Policing 198
geographically locate crime scenes. Identifying predators leads to the rescue of children, preventing further sexual abuse and enabling the victim to receive treatment. Computers have become one of the most common conduits used by pedophiles to lure children into illicit sexual relations, to produce illegal sexually explicit images of children, and to share images and videos worldwide. A significant challenge to child exploitation investigations has emerged with regard to the sheer size of data storage space and its portability. Technology has allowed great amounts of storage space to be available on affordable hard drives and portable USB storage devices, enabling pedophiles to store enormous amounts of images and videos. Investigations and search warrants often produce very large numbers of images and videos that must be searched and categorized by members of the CES unit. These investigations can take significantly longer as a result of a large collection of images and/or videos. Furthermore, technology has enabled the hard drives and portable devices to be wireless and/or small and covert, which can prove to be a challenge when trying to locate the devices.375
In addition, a number of other trends and challenges have been identified by the CES, including:
• wireless network access/hotspots that are free or unsecured, and can be accessed from cafés, retail locations, etc., and that can be used to view, transmit, or share images and videos without knowledge of the computer user;
• peer-to-peer networks (P2P), which facilitate the sharing of files on the Internet and allow computers to communicate with each other directly, rather than through a central server. Once installed, anyone can share various types of files, including images and videos, with any other person on the network, in real time;
• use of computer software designed to defeat the forensic retrieval of evidence; • encryption: most new operating systems, such as Windows XP, come with encryption. • large amounts of computer data can be stored on portable storage devices that resemble
items such as key chains and pens; • training investigators to meet new challenges; • new court challenges based on new technologies; • technology that allows cell phones to take pictures or videos and transit them using
wireless technology (PDAs can also be used for the same purpose); • and, as with many specialized units, a challenge will continue to be training and
developing new officers as a result of promotions and staff turnover.
Technology has allowed the police to investigate pedophiles and other child predators using more effective and efficient methods. Equally, evolving technology has allowed pedophiles and other child predators to better disguise their identities, images, and videos. It will always be vital for the Service and its partners to protect children against exploitation. The methods and technology used to investigate offences, and to rescue victims must keep even with, or better still out-pace, the technologies used by offenders.
375 Information from Child Exploitation Section, Sex Crimes Unit, July 2008.
22000088 EEnnvviirroonnmmeennttaall SSccaann
Technology & Policing 199
As shown in Table 7.3, the number of cases opened by the CES increased 18.9% between 2006 and 2007, and increased 311% between 2001 and 2007. Similarly, arrests increased 15.1% between 2006 and 2007, and 280% between the 2001 and 2007.376
Table 7.3
TPS Child Exploitation Section Workload
2001 2002 2003 2004 2005 2006 2007 % change 2006-07
% change 2001-07
Arrests 10 19 37 38 41 33 38 15.1% 280.0%
Charges 50 - - 136 124 141 136 -3.5% 172.0%
Hard-drives Seized
16 82 105 110 65 85 60 -29.4% 275.0%
Cases Opened 75 279 477 587 657 259 308 18.9% 310.7%
As mentioned in the Legislation Impacts chapter, Bill C-2 received royal assent in February 2008. Among other legislative changes, the Bill raised the age of consent for sexual activity from 14 to 16 years. The new legislation may assist in the investigation of child luring by undercover officers to pose as children within a wider age-range, and will result in better protection for 14 and 15 year olds who are victimized.377 Furthermore, in April 2008, Bill 16 (An Act to amend Christopher’s Law (Sex Offender Registry, 2000), received royal assent. Christopher’s Law established and maintains a sex offender registry, requiring persons convicted of a sex offence, or found not criminally responsible of a sex offence due to mental disorder, to register in person at their local police station. Bill 16 amends Christopher’s Law in a number of ways including: adding situations that will trigger a reporting obligation; requiring further information be added to the sex offender registry; and, requiring police to attempt to verify an offender’s address at least once every year.378 The police have a role in enforcing and supporting the new legislation, and it could be a challenge for the Service to manage the offender reporting systems, and specifically to ensure that attempts are made to verify an offender’s address annually.
E. CRIMINAL JUSTICE TECHNOLOGY
According a US-based expert on criminal justice policy, there now exists a real danger that the new IT revolution will come to be seen as little more than a faster way of collecting information that was previously put down on paper. If this view prevails, policing will have missed out on the most important contribution that IT can make – to assist policing to redefine itself along the lines that community and problem-oriented policing suggest.379
376 Ibid. 377 Barnett, L., MacKay, R., & Valiquet, D. (2007). Bill C-2: An Act to Amend the Criminal Code and to Make Consequential Amendments to Other Acts. Parliamentary Information and Research Service, Library of Parliament. (Retrieved July 10th, 2008, from http://www.parl.gc.ca/39/2/parlbus/chambus/house/bills/summaries/c2-e.pdf) 378 Legislative Assembly of Ontario. (2008). Bill 16, Christopher's Law (Sex Offender Registry) Amendment Act, 2008. (Retrieved July 4th, 2008, from http://www.ontla.on.ca/web/bills/bills_detail.do?locale=en&BillID=1904) 379 Dunworth (2000).
22000088 EEnnvviirroonnmmeennttaall SSccaann
Technology & Policing 200
Criminal justice technology can be divided into two broad categories: hard technology and soft technology. Hard technology includes new materials, devices and equipment that can be used to either prevent and control crime or to commit crime; soft technology innovations include new software programs, classification systems, crime analysis techniques, and data sharing/system integration techniques that can also provide opportunities for crime prevention/control or crime commission.380 Some of the hard technologies in the area of crime prevention include Closed Circuit Television Cameras (CCTV), street lighting, metal detectors, and ignition interlock systems for impaired drivers. In the area of policing, some hard technology innovations have also been made and include:
• improved police protection with new helmets, vests, cars, and buildings; • improved and/or new weapons; • less-lethal force options such as for mobile/riot control; • computers in scout cars; in-car cameras; • e-ticketing devices; • hands-free patrol car control (e.g. Project 54 in the US/voice activated vehicle functions); • offender identification by way of biometrics/fingerprints/DNA; • breathalysers/instant drug tests; • polygraph; and, • Global Positioning Systems (GPS).
Some soft technology in the areas of crime prevention and policing include: threat assessment instruments, risk assessment instruments, bullying identification protocol, sex offender registration, criminal profiling, crime mapping, crime analysis, criminal history data systems enhancement, information-sharing within criminal justice system and with other agencies, case flow management systems, radio frequency systems, and data warehousing.381 As a leading police organization, the Service is adept at seeking out and evaluating the latest in policing technology. Many technologies are currently being used or evaluated by the Service, and many more are being considered. Technology such as CCTV, in-car camera systems, Tasers, geo-coding, DNA samples, GPS, new software, electronic disclosure, e-ticketing, and Internet reporting, are being used and/or are being evaluated. Assessing the value to the organization, the effects on rights of individuals, society, and privacy, current infrastructure, and costs, will all be challenges when considering the latest technology. Accountability demands thorough research, testing, and evaluation before new technology is adopted.
380 Byrne, J., & Rebovich, D. (2007). Introduction - The New Technology of Crime, Law and Social Control. In Byrne, J., & Rebovich, D. (Eds.), The New Technology of Crime, Law and Social Control (pp. 1-21). Monsey, New York: Criminal Justice Press. 381 Ibid.
22000088 EEnnvviirroonnmmeennttaall SSccaann
Technology & Policing 201
Communication:
The current 9-1-1 emergency system has served the community well for many years, but
with the evolution of personal communication technology, current 9-1-1- systems are becoming antiquated in the wireless mobile society. According to a report published by the US Department of Transportation in 2008, the proportion of calls to 9-1-1 placed from wireless telephones is approaching one-half in many communities. For those individuals who now use services such a VoIP or wireless devices, the 9-1-1 system may be deficient. Further, today’s 9-1-1 systems cannot support communications involving text, data, images, or video, and, in addition, although technologies used by individuals with disabilities have improved dramatically, access to 9-1-1 for these users may have not improved to the same extent as for others.382
Initiatives such as the Next Generation 9-1-1 (NG9-1-1) system are attempting to fundamentally change the way emergency information is handled, and to assist in the better delivery of emergency service. A transition to a state-of-the-art infrastructure that enables the new transmissions is certainly a challenging one for police services. A comprehensive change to an emergency communications system will involve technical, economic, and institutional change.383 It is vital that the 9-1-1 system continue to provide its critical service to a wide range of users, and it will be a great challenge, and costly, for the Service to evaluate and adopt changes that may be necessary to maintain a 9-1-1 system that provides the best response possible.
A further challenge for the Service will involve its internal radio system, as technologies can easily outpace a radio system. Upgrades to the system can be costly, time consuming, and require commitment and long-term planning. It will be a challenge for the Service to establish a solid foundation on which technology can evolve, and which is important to ensure that members of the Service and the community are protected and continue to be served efficiently and effectively by our communications systems. E-policing is a recent development in communications that involves the transaction of services and information between the police and the community by way of the Internet. One aspect of e-policing that is emerging as a trend is Internet reporting. E-policing presents promising opportunities for police services, and can create an interactive flow of information between the police and community, and, in addition, it signals that the police are in synch with current technology.384 Enhancing communications between members, other law enforcement agencies, and the community may be a future challenge for the Service. As technology moves forward there will be more demands and expectations for information-sharing with other services and with the community; with these demands will be challenges concerning compatibility with other systems, freedom of information legislation, cost, and value.
382 US Department of Transportation. (2008). Next Generation 9-1-1 (NG9-1-1) System Initiative: NG9-1-1 Preliminary Transition Plan. (Retrieved June 26th, 2008, from http://www.its.dot.gov/ng911/ng911_pubs.htm) 383 US Department of Transportation. (2008). Next Generation 9-1-1 System Preliminary Concept of Operations. (Retrieved June 26th, 2008, from http://www.its.dot.gov/ng911/ng911_pubs.htm) 384 Royal Canadian Mounted Police. (2006). E-Policing in Police Services- Definitions, Issues and Current Experiences. Research and Evaluation Branch. (Retrieved June 27th, 2008, from http://dsp-psd.pwgsc.gc.ca/ collection_2007/rcmp-grc/PS64-44-2007E.pdf)
22000088 EEnnvviirroonnmmeennttaall SSccaann
Technology & Policing 202
Biometrics:
Biometrics is the most definitive real-time tool available to identify an individual. Biometric systems are based on an individual’s physiological and behavioural characteristics, and which are much more difficult to compromise, copy, or steal compared to traditional identity tools. Biometric systems have been researched and tested for a number of years, but have only recently entered into the public consciousness due to high profile applications of the technology, the media and entertainment, and the increased use of biometric technology in the public sphere.385 Beyond the more traditional methods associated with biometrics, such as fingerprint/palm print recognition, face recognition, iris recognition, and hand/finger geometry, a number of other identification methods are being further developed and/or being commercialized including:
• speaker recognition, which uses a person’s speech for recognition purposes; • dynamic signature, which measures the speed and pressure a person uses when they sign
their name; • keystroke dynamics, which measures the typing patterns of individuals; • retina recognition, which takes an image of the back of the eye and compares the blood
vessels with existing data; • gait/body recognition, which measures how someone appears as he or she walks; • vascular pattern recognition (vein pattern authentication), which uses near-infrared light
to study images of blood vessels of a hand or finger; and, • facial thermography, which measures how heat dissipated off the face of an individual.386
According to the US National Science and Technology Council Subcommittee on Biometrics, the future of the biometrics community will be shaped by law enforcement, national security, enterprise and e-government services, and personal information and business transactions. Existing and future biometric technology could assist in a number of key areas with regard to evidence collected from people or crime scenes, for example, in analyzing characteristics from video surveillance or other digital evidence collected.387 Law enforcement can have a role in shaping what technology is advanced, and it will be a challenge for the Service to stay as current as possible, to assess the value of, and consider new technology for investigations and the prevention of crime.
385 National Science and Technology Council Subcommittee on Biometrics. (2006). The National Biometrics Challenge. Executive Office of the President of the United States. (Retrieved June 26th, 2008, from www.biometrics.gov/Documents/biochallengedoc.pdf) 386 National Science and Technology Council Subcommittee on Biometrics. (2006). Biometrics Overview. Executive Office of the President of the United States. (Retrieved June 26th, 2008, from http://www.biometricscatalog.org/nstcsubcommittee/Documents/Biometrics%20Overview.pdf) 387 National Science and Technology Council Subcommittee on Biometrics. (2006). The National Biometrics Challenge. Executive Office of the President of the United States. (Retrieved June 26th, 2008, from www.biometrics.gov/Documents/biochallengedoc.pdf)
22000088 EEnnvviirroonnmmeennttaall SSccaann
Technology & Policing 203
Police Equipment and Software:
Police equipment and software relating to policing is also constantly evolving and
improving. The numerous technologies developed and emerging can protect members of law enforcement and the community, assist in creating a safer society, improve front-line and management efficiencies, and improve data systems and evaluation, crime analysis, crime management and investigation. The Service must continue to consider technology aimed at officer safety, technology to reduce injury to officers and those they encounter, technology to reduce events such as vehicle pursuits, and protection of police property. In addition, the community will expect the Service to continue consideration of improvements and any new developments with regard to devices that offer non-lethal use of force options (chemical irritants such as ‘pepper spray’; electric-shock immobilizing technology such as tasers; ‘non-ballistic’ guns such as those that employ rubber, plastic, wooden, or beanbag type projectiles; strobe and acoustical technology (sensory weapons); non-electric immobilizing devices such as trap nets and sticky foam).388 In addition to the hard-technology mentioned previously, soft-technology related to data collection and management will also be a challenge for the Service, as newer strategies in policing based in problem-solving, community-oriented policing, and community mobilization, encourage police to make greater use of the data that is routinely collected, and expects more analytical responses for tactical and strategic decision-making.389 Furthermore, these policing strategies encourage police services to go beyond calls for service and take on the problems underlying them, and to do so police are encouraged to collect data from a wider variety of sources, including from the community and other agencies. Police will likely also be asked to share the information they collect with external agencies and other partners in justice and community. The IT systems and advancements in data systems can be invaluable in facilitating this information-sharing. The Service will be challenged to ensure that record management systems, Computer-Aided Dispatch systems, in-field/in-car computer systems, information sharing and the Internet, etc. are effective and efficient and continue to go beyond mere data collection, to assist in analysis, planning, and decision-making. IT has not only enhanced the potential of police agencies to process, store, and share information – it can enhance tactical and strategic decision making based on a systematic review of sound data at both the operational and administrative level. Some current examples of this technology include: crime analysis and mapping, the Compsat program, early intervention systems, and business intelligence systems.390
Much potential exists within data, if the quality of data are ensured. Business intelligence software, such as Cognos, can provide rich data mining capabilities and produce sophisticated analysis that can further enhance the Service’s decision-making process. It will be a challenge for the Service to continue to ensure that high quality data and location based information are
388 Hummer, D. (2007). Policing and 'Hard' Technology. In Byrne, J., & Rebovich, D. (Eds.), The New Technology of Crime, Law and Social Control (pp. 133-152). Monsey, New York: Criminal Justice Press. 389 Harris, C. (2007). The Police and Soft technology: How Information Technology Contributes to Police Decision Making. In Byrne, J., & Rebovich, D. (Eds.), The New Technology of Crime, Law and Social Control (pp. 153-184). Monsey, New York: Criminal Justice Press. 390 Ibid.
22000088 EEnnvviirroonnmmeennttaall SSccaann
Technology & Policing 204
provided for the database and that the analysis of data is used to complement and enhance operations and public safety.
Green Policing:
Individuals and organizations around the world have begun to realise the frailties of the planet. Communities are being asked to re-use, reduce, and recycle, and organizations are expected to do no less. It is incumbent on organizations to look toward the future and responsibility to the environment. Increasingly, the community will expect the Service to consider environmental practices and environmentally responsible purchases.
In 2006, the largest police service in the UK, the Metropolitan Police Service (MPS), released its Environmental Strategy for 2005-2010. The strategy provided details of how environmental issues will be managed by the police service in the five-year period. The MPS plan focuses on areas that can be affected by the policing organization, including the management of its estate, employees, and policing work.391 The strategic objectives of the strategy include:
• environmental and wildlife crime, such as graffiti, litter, noise, and the prevention of
offences against wildlife in London; • transport strategies, such as relieving congestion, reducing emissions, adopting
alternatively fuelled fleet vehicles, and implementing a sustainable travel plan for employees and operational travel;
• procurement strategies that manage resource consumption, sustainable materials, and green energy;
• resource management and consumption strategies that increase efficiency of buildings, reduce consumption of paper, recycle, and investigate energy technologies and water monitoring;
• training, awareness, and communication strategies that ensure environmental issues are integrated into decision-making processes;
• sustainable design and construction strategies that ensure sustainability is considered in the planning stages of properties; and,
• strategies dealing with the financial aspects of environmental management.
Beyond the strategic objectives, the MPS intends to implement an environmental management system (EMS) in line with the requirements of the international standard for environmental management (ISO 14001); this standard provides a framework for developing and implementing an EMS within an organization and represents best practice.392
Automakers are producing alternative-fuel police cars, some of which are being used as fleet vehicles in other countries. For example, the government of Sweden requires that all police
391 Metropolitan Police Service (UK). (2006). Environmental Strategy 2005-2010. (Retrieved July 14th, 2008, from http://www.met.police.uk/about/environment/docs/environmental_strategy_20051.pdf); Metropolitan Police Service (UK). (2006). Sustainable Travel Plan. (Retrieved July 14th, 2008, from http://www.met.police.uk/about/ environment/docs/corporate_green_travel_plan.pdf) 392 Ibid.
22000088 EEnnvviirroonnmmeennttaall SSccaann
Technology & Policing 205
districts operate a minimum of 20% fuel flexible (Flexifuel) vehicles, which are vehicles that burn bio-ethanol (produced by the sugar fermentation process), petrol, or any mixture of the two.393 Throughout North America products such as Segways are being used to save on fuel costs, and locally, the University of Toronto Campus Police began operating a hybrid vehicle to patrol its downtown St. George campus in 2007.394
Organizations world-wide are encouraging reduced energy use, paperless communications, recycling and reusing, and occupying energy certified buildings. Police services are creating environmental reports and environmental policies, using e-ticketing and driving alternative fuel vehicles. The fate of the planet has become a global priority, and as technology develops further in the area of environmentally friendly products and practices, the Service will be challenged to keep pace with the community’s desire for environmental responsibility.
RECOMMENDATIONS FOR POLICE SERVICE
• As more Canadians, youth in particular, participate in diverse activities on-line, and in
response to cyber-bullying and cyber-crimes directed at school-age children and youth, the Service should continue to partner with school boards and communities in the education of Internet users on the potential dangers associated with social networking sites such as Facebook and MySpace.
• Taking into account the digital networks that are part of the daily lives of youth, the Service
needs to evaluate the importance of interacting with communities, particularly youth, through the Internet, using social networking and digital content sites such as YouTube to enhance communication and investigations.
• The Service should continue to resource, train, and develop its technology-based units and
personnel, as an increasing and diverse number of crimes involve technology and the collection of digital evidence
• The Service must continue to be aware of world-wide issues and trends involving the Internet
and cyber-crime, as these types of crimes can originate from anywhere and require a response that may involve partnerships with agencies internationally as well as nationally.
• Due to the lack of quality data with regard to identity theft and fraud, and other Internet-
related crime, it is important that the Service adapt current information systems to collect data and evaluate cyber-crimes, such as identity theft and fraud. Analysis of such data can provide direction for efforts in proactive education and enforcement.
• Given that the Internet is an easily accessed forum for on-line hate, the Service should
continue to improve its understanding of cyber-hate and address the possibility that social
393 Volvoclub.org. (2008). Volvo V70 Turbocharged Flexifuel Car. (Retrieved June 30th, 2008, from www.volvoclub.org.uk/press/releases/2008/police_v70_flexifuel.shtml) 394 University of Toronto Facilities and Services (2008). Green Patrol. (Retrieved July 10th, 2008, from http://www.fs.utoronto.ca/news/toyota.htm)
22000088 EEnnvviirroonnmmeennttaall SSccaann
Technology & Policing 206
network sites used by school-aged youth could provide a forum for the intolerance of peers and other community members
• The exploitation of children will always be an important policing issue, and technology can
easily outpace the resources of the Service. It is important that sufficient expertise and resources are dedicated to protect children from the dangers of the Internet and on-line predators.
• Given that many organizations see IT solely as a faster way of collecting information that was
previously paper-based, it is vital that the Service remain committed to the collection of data through systems that take full advantage of technology-based opportunities. Both qualitative and quantitative information are critical to decision-making, investigative, and planning processes.
• Given research that has shown deficiencies in policing systems such as 9-1-1, and as soft and
hard policing technology is improved and continues to evolve, it is important that the Service continues to be informed on changing technology, and how it could improve the effectiveness and efficiency of the organization.
• As communities and organizations around the world make environmentally-responsible
choices, the Service should continue to consider technology, planning, and practices that are aimed at protecting the planet’s diminishing resources.
22000088 EEnnvviirroonnmmeennttaall SSccaann
Police Resources 207
VIII. POLICE RESOURCES
Changes in the nature and scope of police services needed and police services demanded
require constant adjustment by this Service. In addition, the Toronto Police Service
continues to strive to reflect the diverse community we serve. These factors affect the
composition and organization of the personnel who deliver police service, how they are
managed, and their priorities. Human resources are central to the organization and all
external and internal trends have an impact, to some degree, on the recruitment,
orientation, maintenance, and development of these resources.
HIGHLIGHTS • In 2007, the total strength of Toronto Police Service was 7,596 members, up 1.0% from 7,518
members in 2006, and 11.8% from 6,796 members in 1998. • Between 2006 and 2007, uniform strength increased from 5,665 in 2006 to 5,681 in 2007,
while civilian strength increased 3.3%, from 1,853 to 1,915.395 Uniform and civilian strengths increased 12.8% and 8.7%, respectively, from 1998. The civilian strength increase was driven by a 63.2% increase in Court Security Officers; staffing in other civilian positions decreased by 1.6%.
• Over the past decade, the number of police officers per 100,000 people in Toronto increased
2.1%, from 202.3 officers in 1998 to 206.6 officers in 2007. • The median age of uniform officers in December 2007 was 39.2 years, down slightly from
39.6 years in 2006. However, the proportion of officers over the age of 50 years almost tripled over the past 10 years, from 6.6% in 1998 to 18.3% in 2007.
• In 2007, almost one in three (31.4%) uniform members had 20 or more years of service, while
almost half (46.3%) of the uniform members had less than 10 years of service. The average uniform length of service was 14.8 years.
• The median age of Primary Response constables was 32.3 years, compared to 36.3 years for
all constables.396 In 2007, the median length of service for Primary Response constables was 3.4 years, compared to 7.9 years for all constables.
• In 2007, there were 253 separations (including 158 retirements), down slightly from the 266
separations in 2006, but almost double the 143 separations in 1998.
395 Uniform strength includes all police officers and 124 cadets-in training. Civilian strength includes all permanent, full-time civilian members with the exception of cadets-in-training and parking enforcement personnel. (As of December 31st, 2007, the Human Resources Directorate reported 401 Parking Enforcement personnel, 291 part-time or temporary personnel, 605 Auxiliary personnel, and 730 school crossing guards; none of these positions are included in the total civilian strength.) 396 Primary Response officers are those officers in the divisions who provide response to calls for service, crisis intervention, targeted patrol/enforcement, short-term problem solving, etc.
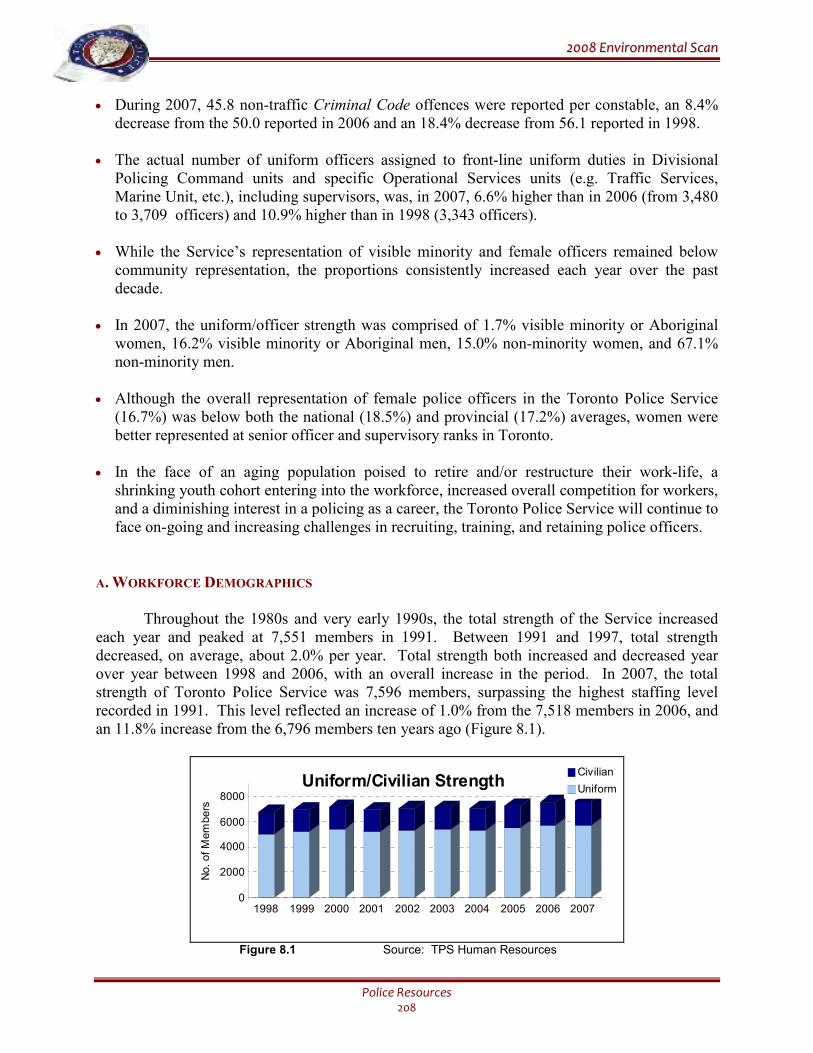
22000088 EEnnvviirroonnmmeennttaall SSccaann
Police Resources 208
• During 2007, 45.8 non-traffic Criminal Code offences were reported per constable, an 8.4% decrease from the 50.0 reported in 2006 and an 18.4% decrease from 56.1 reported in 1998.
• The actual number of uniform officers assigned to front-line uniform duties in Divisional
Policing Command units and specific Operational Services units (e.g. Traffic Services, Marine Unit, etc.), including supervisors, was, in 2007, 6.6% higher than in 2006 (from 3,480 to 3,709 officers) and 10.9% higher than in 1998 (3,343 officers).
• While the Service’s representation of visible minority and female officers remained below
community representation, the proportions consistently increased each year over the past decade.
• In 2007, the uniform/officer strength was comprised of 1.7% visible minority or Aboriginal
women, 16.2% visible minority or Aboriginal men, 15.0% non-minority women, and 67.1% non-minority men.
• Although the overall representation of female police officers in the Toronto Police Service
(16.7%) was below both the national (18.5%) and provincial (17.2%) averages, women were better represented at senior officer and supervisory ranks in Toronto.
• In the face of an aging population poised to retire and/or restructure their work-life, a
shrinking youth cohort entering into the workforce, increased overall competition for workers, and a diminishing interest in a policing as a career, the Toronto Police Service will continue to face on-going and increasing challenges in recruiting, training, and retaining police officers.
A. WORKFORCE DEMOGRAPHICS
Throughout the 1980s and very early 1990s, the total strength of the Service increased
each year and peaked at 7,551 members in 1991. Between 1991 and 1997, total strength decreased, on average, about 2.0% per year. Total strength both increased and decreased year over year between 1998 and 2006, with an overall increase in the period. In 2007, the total strength of Toronto Police Service was 7,596 members, surpassing the highest staffing level recorded in 1991. This level reflected an increase of 1.0% from the 7,518 members in 2006, and an 11.8% increase from the 6,796 members ten years ago (Figure 8.1).
0
2000
4000
6000
8000
No. of Members
1998 1999 2000 2001 2002 2003 2004 2005 2006 2007
Uniform/Civilian StrengthCivilian
Uniform
Figure 8.1 Source: TPS Human Resources
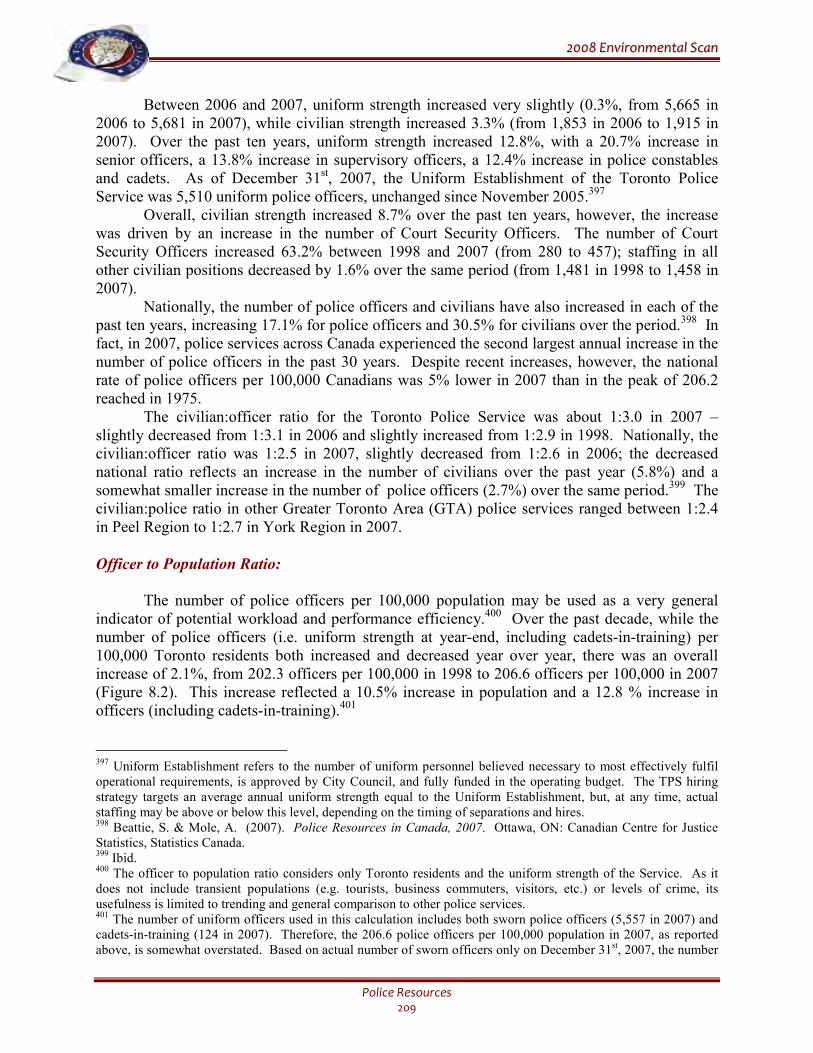
22000088 EEnnvviirroonnmmeennttaall SSccaann
Police Resources 209
Between 2006 and 2007, uniform strength increased very slightly (0.3%, from 5,665 in 2006 to 5,681 in 2007), while civilian strength increased 3.3% (from 1,853 in 2006 to 1,915 in 2007). Over the past ten years, uniform strength increased 12.8%, with a 20.7% increase in senior officers, a 13.8% increase in supervisory officers, a 12.4% increase in police constables and cadets. As of December 31st, 2007, the Uniform Establishment of the Toronto Police Service was 5,510 uniform police officers, unchanged since November 2005.397
Overall, civilian strength increased 8.7% over the past ten years, however, the increase was driven by an increase in the number of Court Security Officers. The number of Court Security Officers increased 63.2% between 1998 and 2007 (from 280 to 457); staffing in all other civilian positions decreased by 1.6% over the same period (from 1,481 in 1998 to 1,458 in 2007).
Nationally, the number of police officers and civilians have also increased in each of the past ten years, increasing 17.1% for police officers and 30.5% for civilians over the period.398 In fact, in 2007, police services across Canada experienced the second largest annual increase in the number of police officers in the past 30 years. Despite recent increases, however, the national rate of police officers per 100,000 Canadians was 5% lower in 2007 than in the peak of 206.2 reached in 1975.
The civilian:officer ratio for the Toronto Police Service was about 1:3.0 in 2007 – slightly decreased from 1:3.1 in 2006 and slightly increased from 1:2.9 in 1998. Nationally, the civilian:officer ratio was 1:2.5 in 2007, slightly decreased from 1:2.6 in 2006; the decreased national ratio reflects an increase in the number of civilians over the past year (5.8%) and a somewhat smaller increase in the number of police officers (2.7%) over the same period.399 The civilian:police ratio in other Greater Toronto Area (GTA) police services ranged between 1:2.4 in Peel Region to 1:2.7 in York Region in 2007.
Officer to Population Ratio:
The number of police officers per 100,000 population may be used as a very general indicator of potential workload and performance efficiency.400 Over the past decade, while the number of police officers (i.e. uniform strength at year-end, including cadets-in-training) per 100,000 Toronto residents both increased and decreased year over year, there was an overall increase of 2.1%, from 202.3 officers per 100,000 in 1998 to 206.6 officers per 100,000 in 2007 (Figure 8.2). This increase reflected a 10.5% increase in population and a 12.8 % increase in officers (including cadets-in-training).401
397 Uniform Establishment refers to the number of uniform personnel believed necessary to most effectively fulfil operational requirements, is approved by City Council, and fully funded in the operating budget. The TPS hiring strategy targets an average annual uniform strength equal to the Uniform Establishment, but, at any time, actual staffing may be above or below this level, depending on the timing of separations and hires. 398 Beattie, S. & Mole, A. (2007). Police Resources in Canada, 2007. Ottawa, ON: Canadian Centre for Justice Statistics, Statistics Canada. 399 Ibid. 400 The officer to population ratio considers only Toronto residents and the uniform strength of the Service. As it does not include transient populations (e.g. tourists, business commuters, visitors, etc.) or levels of crime, its usefulness is limited to trending and general comparison to other police services. 401 The number of uniform officers used in this calculation includes both sworn police officers (5,557 in 2007) and cadets-in-training (124 in 2007). Therefore, the 206.6 police officers per 100,000 population in 2007, as reported above, is somewhat overstated. Based on actual number of sworn officers only on December 31st, 2007, the number
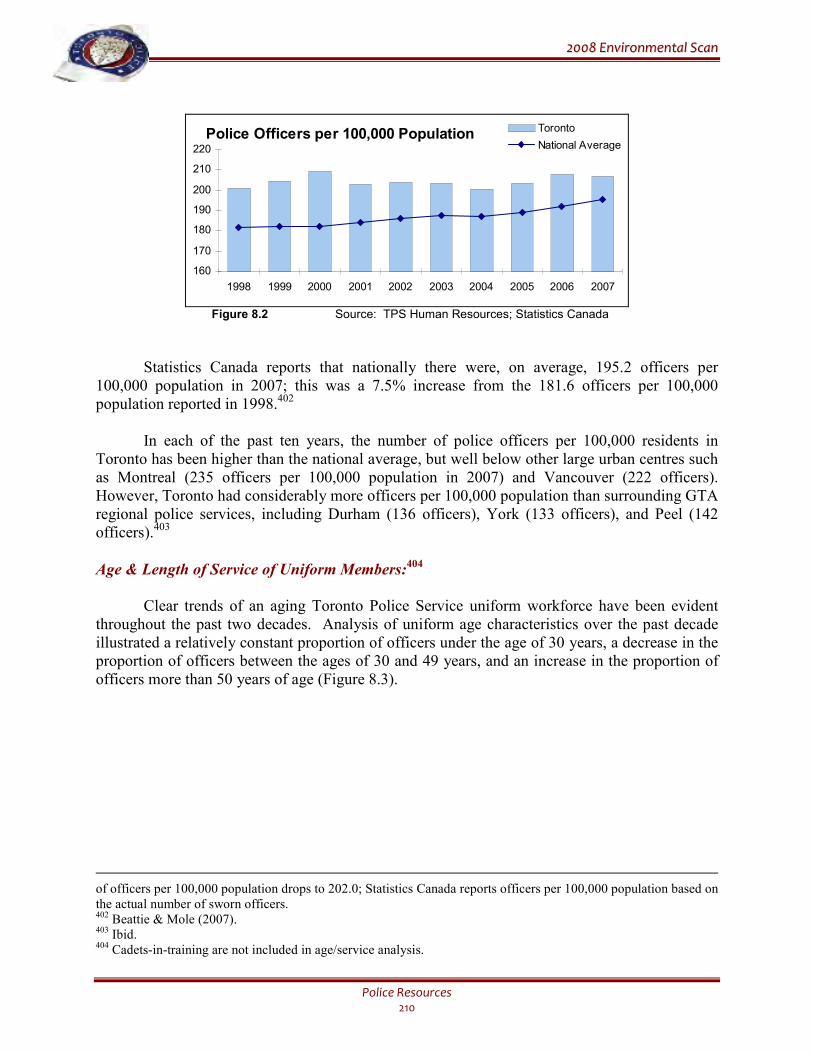
22000088 EEnnvviirroonnmmeennttaall SSccaann
Police Resources 210
Police Officers per 100,000 Population
160
170
180
190
200
210
220
1998 1999 2000 2001 2002 2003 2004 2005 2006 2007
Toronto
National Average
Figure 8.2 Source: TPS Human Resources; Statistics Canada
Statistics Canada reports that nationally there were, on average, 195.2 officers per 100,000 population in 2007; this was a 7.5% increase from the 181.6 officers per 100,000 population reported in 1998.402
In each of the past ten years, the number of police officers per 100,000 residents in Toronto has been higher than the national average, but well below other large urban centres such as Montreal (235 officers per 100,000 population in 2007) and Vancouver (222 officers). However, Toronto had considerably more officers per 100,000 population than surrounding GTA regional police services, including Durham (136 officers), York (133 officers), and Peel (142 officers).403
Age & Length of Service of Uniform Members:404
Clear trends of an aging Toronto Police Service uniform workforce have been evident
throughout the past two decades. Analysis of uniform age characteristics over the past decade illustrated a relatively constant proportion of officers under the age of 30 years, a decrease in the proportion of officers between the ages of 30 and 49 years, and an increase in the proportion of officers more than 50 years of age (Figure 8.3).
of officers per 100,000 population drops to 202.0; Statistics Canada reports officers per 100,000 population based on the actual number of sworn officers. 402 Beattie & Mole (2007). 403 Ibid. 404 Cadets-in-training are not included in age/service analysis.
22000088 EEnnvviirroonnmmeennttaall SSccaann
Police Resources 211
Age of Uniform Police Officers
0%
20%
40%
60%
80%
100%
1998 2003 2004 2005 2006 2007
20 - 29 years 30 - 39 years 40 - 49 years 50 + years
Figure 8.3 Source: TPS Human Resources
Over the past decade, officers between the age of 30 and 49 years have consistently accounted for the majority of the uniform strength. However, this proportion has generally decreased each year over the past decade, falling from 76.9% in 1998 to 66.4% in 2007, largely due to a decrease in officers between 40 and 49 years of age. On the other hand, the proportion of officers over the age of 50 years almost tripled, from 6.6% in 1998 to 18.3% in 2007. The median age of uniform officers in December 2007 was 39.2 years, down very slightly from 39.6 years in 2006.405
The Service’s age distribution is not so different from that of the general Canadian workforce. Statistics Canada reported that for the first time ever, the median age of the Canadian workforce surpassed 40 years in 2006, rising from 39.5 in 2001 to 41.2 in 2006. Compared to 2001, the national workforce in 2006 had fewer workers under the age of 44 years and a 25% increase in workers over the age of 45 years. The median age of the workforce in the Toronto region was 40.6 years.406
The relatively constant proportion of officers under the age of 30 years, given the unusually high hiring levels of the past few years, is largely explained by the age characteristics of new recruits. The average age of recruits hired over the past ten years was about 28 years, almost three in ten recruits (28%) were over the age of 30 years and only 10 officers hired in the past ten years were under the age of 20 years. Prior to the resumption of hiring in 1995, the average age of a recruit was about 22 years and less than 3% of recruits were over the age of 30 years.407
The length of service of uniform members gives some indication of the level of experience in the uniform workforce. As shown in Figure 8.4, the distribution of years of service has changed somewhat over the past decade.
405 The median is the middle value of a group of values arranged in ascending or descending order. 406 Aging Workers, Booming Jobs; Workforce is Older. (2008, March 5). The Toronto Star. (Statistics Canada report (2008). Canada’s Changing Labour Force, 2006 Census.) 407 Average age characteristics of those hired in previous years is based on the age and hire date of currently serving uniform members; due to internal recruiting and separations, the statistics may not exactly reflect the age of all recruits hired in specified years, but are close approximations.
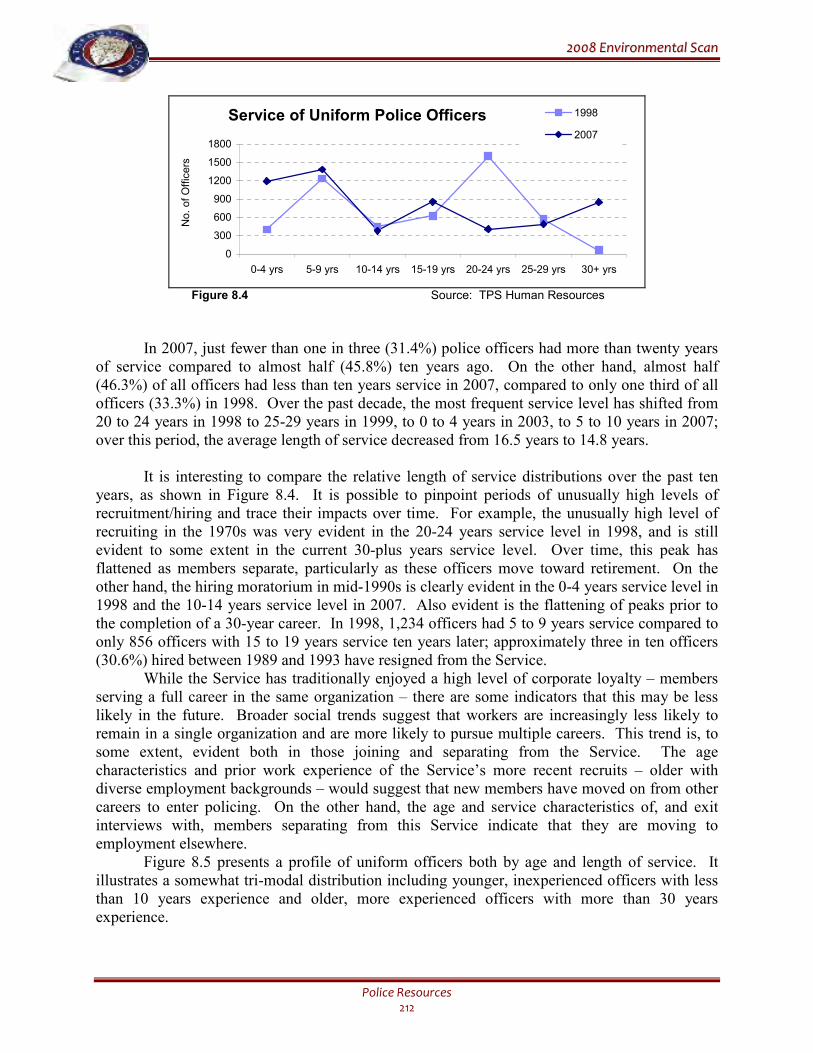
22000088 EEnnvviirroonnmmeennttaall SSccaann
Police Resources 212
Service of Uniform Police Officers
0
300
600
900
1200
1500
1800
0-4 yrs 5-9 yrs 10-14 yrs 15-19 yrs 20-24 yrs 25-29 yrs 30+ yrs
No. of Officers
1998
2007
Figure 8.4 Source: TPS Human Resources
In 2007, just fewer than one in three (31.4%) police officers had more than twenty years of service compared to almost half (45.8%) ten years ago. On the other hand, almost half (46.3%) of all officers had less than ten years service in 2007, compared to only one third of all officers (33.3%) in 1998. Over the past decade, the most frequent service level has shifted from 20 to 24 years in 1998 to 25-29 years in 1999, to 0 to 4 years in 2003, to 5 to 10 years in 2007; over this period, the average length of service decreased from 16.5 years to 14.8 years.
It is interesting to compare the relative length of service distributions over the past ten years, as shown in Figure 8.4. It is possible to pinpoint periods of unusually high levels of recruitment/hiring and trace their impacts over time. For example, the unusually high level of recruiting in the 1970s was very evident in the 20-24 years service level in 1998, and is still evident to some extent in the current 30-plus years service level. Over time, this peak has flattened as members separate, particularly as these officers move toward retirement. On the other hand, the hiring moratorium in mid-1990s is clearly evident in the 0-4 years service level in 1998 and the 10-14 years service level in 2007. Also evident is the flattening of peaks prior to the completion of a 30-year career. In 1998, 1,234 officers had 5 to 9 years service compared to only 856 officers with 15 to 19 years service ten years later; approximately three in ten officers (30.6%) hired between 1989 and 1993 have resigned from the Service.
While the Service has traditionally enjoyed a high level of corporate loyalty – members serving a full career in the same organization – there are some indicators that this may be less likely in the future. Broader social trends suggest that workers are increasingly less likely to remain in a single organization and are more likely to pursue multiple careers. This trend is, to some extent, evident both in those joining and separating from the Service. The age characteristics and prior work experience of the Service’s more recent recruits – older with diverse employment backgrounds – would suggest that new members have moved on from other careers to enter policing. On the other hand, the age and service characteristics of, and exit interviews with, members separating from this Service indicate that they are moving to employment elsewhere.
Figure 8.5 presents a profile of uniform officers both by age and length of service. It illustrates a somewhat tri-modal distribution including younger, inexperienced officers with less than 10 years experience and older, more experienced officers with more than 30 years experience.
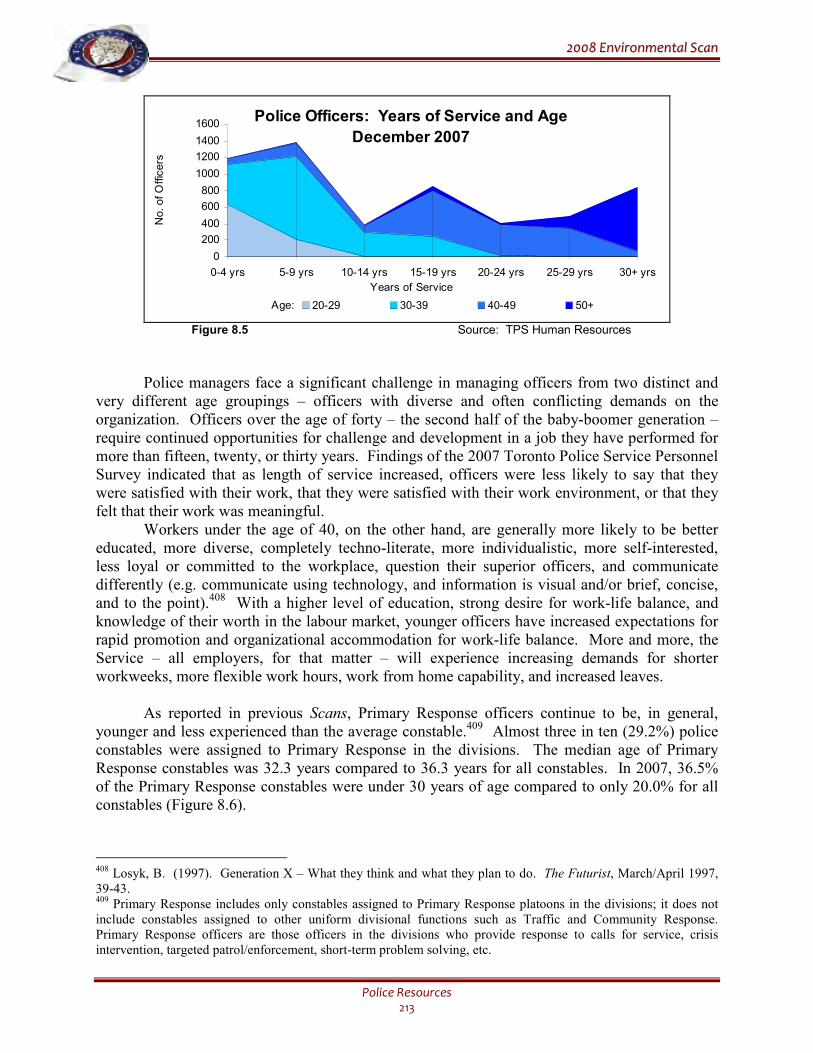
22000088 EEnnvviirroonnmmeennttaall SSccaann
Police Resources 213
Police Officers: Years of Service and Age
December 2007
0
200
400
600
800
1000
1200
1400
1600
0-4 yrs 5-9 yrs 10-14 yrs 15-19 yrs 20-24 yrs 25-29 yrs 30+ yrs
Years of Service
No. of Officers
20-29 30-39 40-49 50+Age:
Figure 8.5 Source: TPS Human Resources
Police managers face a significant challenge in managing officers from two distinct and very different age groupings – officers with diverse and often conflicting demands on the organization. Officers over the age of forty – the second half of the baby-boomer generation – require continued opportunities for challenge and development in a job they have performed for more than fifteen, twenty, or thirty years. Findings of the 2007 Toronto Police Service Personnel Survey indicated that as length of service increased, officers were less likely to say that they were satisfied with their work, that they were satisfied with their work environment, or that they felt that their work was meaningful.
Workers under the age of 40, on the other hand, are generally more likely to be better educated, more diverse, completely techno-literate, more individualistic, more self-interested, less loyal or committed to the workplace, question their superior officers, and communicate differently (e.g. communicate using technology, and information is visual and/or brief, concise, and to the point).408 With a higher level of education, strong desire for work-life balance, and knowledge of their worth in the labour market, younger officers have increased expectations for rapid promotion and organizational accommodation for work-life balance. More and more, the Service – all employers, for that matter – will experience increasing demands for shorter workweeks, more flexible work hours, work from home capability, and increased leaves.
As reported in previous Scans, Primary Response officers continue to be, in general, younger and less experienced than the average constable.409 Almost three in ten (29.2%) police constables were assigned to Primary Response in the divisions. The median age of Primary Response constables was 32.3 years compared to 36.3 years for all constables. In 2007, 36.5% of the Primary Response constables were under 30 years of age compared to only 20.0% for all constables (Figure 8.6).
408 Losyk, B. (1997). Generation X – What they think and what they plan to do. The Futurist, March/April 1997, 39-43. 409 Primary Response includes only constables assigned to Primary Response platoons in the divisions; it does not include constables assigned to other uniform divisional functions such as Traffic and Community Response. Primary Response officers are those officers in the divisions who provide response to calls for service, crisis intervention, targeted patrol/enforcement, short-term problem solving, etc.
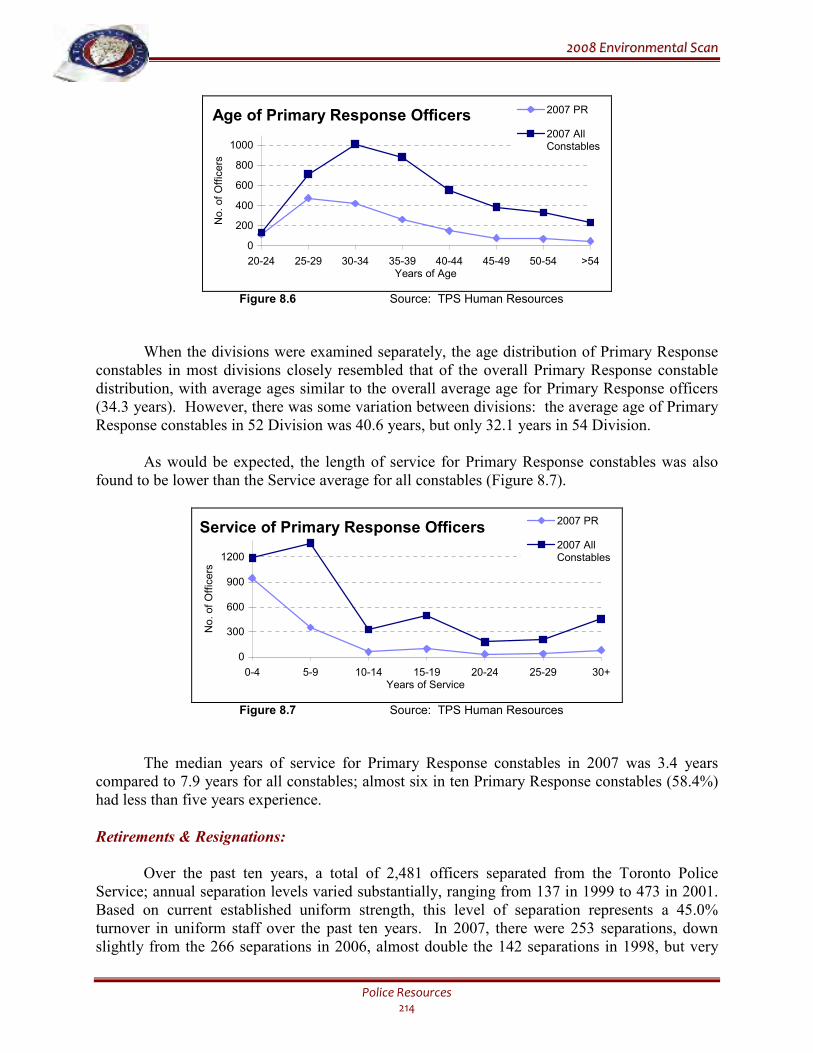
22000088 EEnnvviirroonnmmeennttaall SSccaann
Police Resources 214
Age of Primary Response Officers
0
200
400
600
800
1000
20-24 25-29 30-34 35-39 40-44 45-49 50-54 >54Years of Age
No. of Officers
2007 PR
2007 AllConstables
Figure 8.6 Source: TPS Human Resources
When the divisions were examined separately, the age distribution of Primary Response constables in most divisions closely resembled that of the overall Primary Response constable distribution, with average ages similar to the overall average age for Primary Response officers (34.3 years). However, there was some variation between divisions: the average age of Primary Response constables in 52 Division was 40.6 years, but only 32.1 years in 54 Division.
As would be expected, the length of service for Primary Response constables was also found to be lower than the Service average for all constables (Figure 8.7).
Service of Primary Response Officers
0
300
600
900
1200
0-4 5-9 10-14 15-19 20-24 25-29 30+Years of Service
No. of Officers
2007 PR
2007 AllConstables
Figure 8.7 Source: TPS Human Resources
The median years of service for Primary Response constables in 2007 was 3.4 years compared to 7.9 years for all constables; almost six in ten Primary Response constables (58.4%) had less than five years experience.
Retirements & Resignations:
Over the past ten years, a total of 2,481 officers separated from the Toronto Police
Service; annual separation levels varied substantially, ranging from 137 in 1999 to 473 in 2001. Based on current established uniform strength, this level of separation represents a 45.0% turnover in uniform staff over the past ten years. In 2007, there were 253 separations, down slightly from the 266 separations in 2006, almost double the 142 separations in 1998, but very
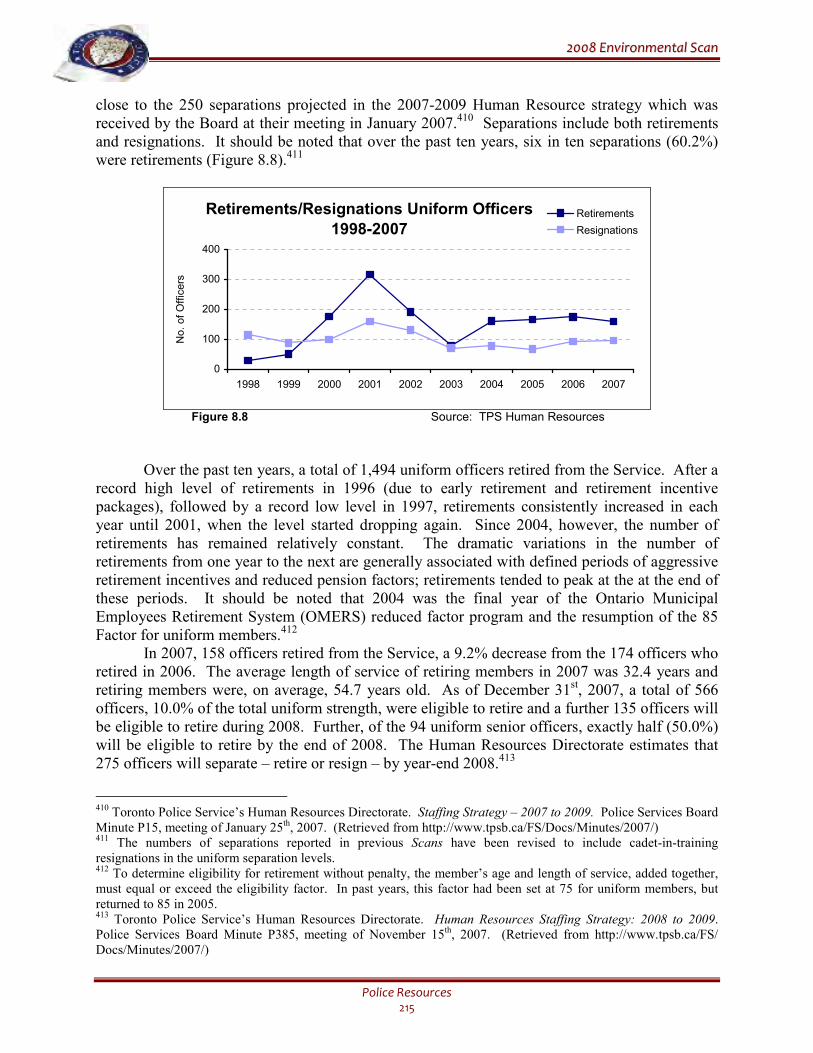
22000088 EEnnvviirroonnmmeennttaall SSccaann
Police Resources 215
close to the 250 separations projected in the 2007-2009 Human Resource strategy which was received by the Board at their meeting in January 2007.410 Separations include both retirements and resignations. It should be noted that over the past ten years, six in ten separations (60.2%) were retirements (Figure 8.8).411
Retirements/Resignations Uniform Officers
1998-2007
0
100
200
300
400
1998 1999 2000 2001 2002 2003 2004 2005 2006 2007
No. of Officers
Retirements
Resignations
Figure 8.8 Source: TPS Human Resources
Over the past ten years, a total of 1,494 uniform officers retired from the Service. After a record high level of retirements in 1996 (due to early retirement and retirement incentive packages), followed by a record low level in 1997, retirements consistently increased in each year until 2001, when the level started dropping again. Since 2004, however, the number of retirements has remained relatively constant. The dramatic variations in the number of retirements from one year to the next are generally associated with defined periods of aggressive retirement incentives and reduced pension factors; retirements tended to peak at the at the end of these periods. It should be noted that 2004 was the final year of the Ontario Municipal Employees Retirement System (OMERS) reduced factor program and the resumption of the 85 Factor for uniform members.412
In 2007, 158 officers retired from the Service, a 9.2% decrease from the 174 officers who retired in 2006. The average length of service of retiring members in 2007 was 32.4 years and retiring members were, on average, 54.7 years old. As of December 31st, 2007, a total of 566 officers, 10.0% of the total uniform strength, were eligible to retire and a further 135 officers will be eligible to retire during 2008. Further, of the 94 uniform senior officers, exactly half (50.0%) will be eligible to retire by the end of 2008. The Human Resources Directorate estimates that 275 officers will separate – retire or resign – by year-end 2008.413
410 Toronto Police Service’s Human Resources Directorate. Staffing Strategy – 2007 to 2009. Police Services Board Minute P15, meeting of January 25th, 2007. (Retrieved from http://www.tpsb.ca/FS/Docs/Minutes/2007/) 411 The numbers of separations reported in previous Scans have been revised to include cadet-in-training resignations in the uniform separation levels. 412 To determine eligibility for retirement without penalty, the member’s age and length of service, added together, must equal or exceed the eligibility factor. In past years, this factor had been set at 75 for uniform members, but returned to 85 in 2005. 413 Toronto Police Service’s Human Resources Directorate. Human Resources Staffing Strategy: 2008 to 2009. Police Services Board Minute P385, meeting of November 15th, 2007. (Retrieved from http://www.tpsb.ca/FS/ Docs/Minutes/2007/)
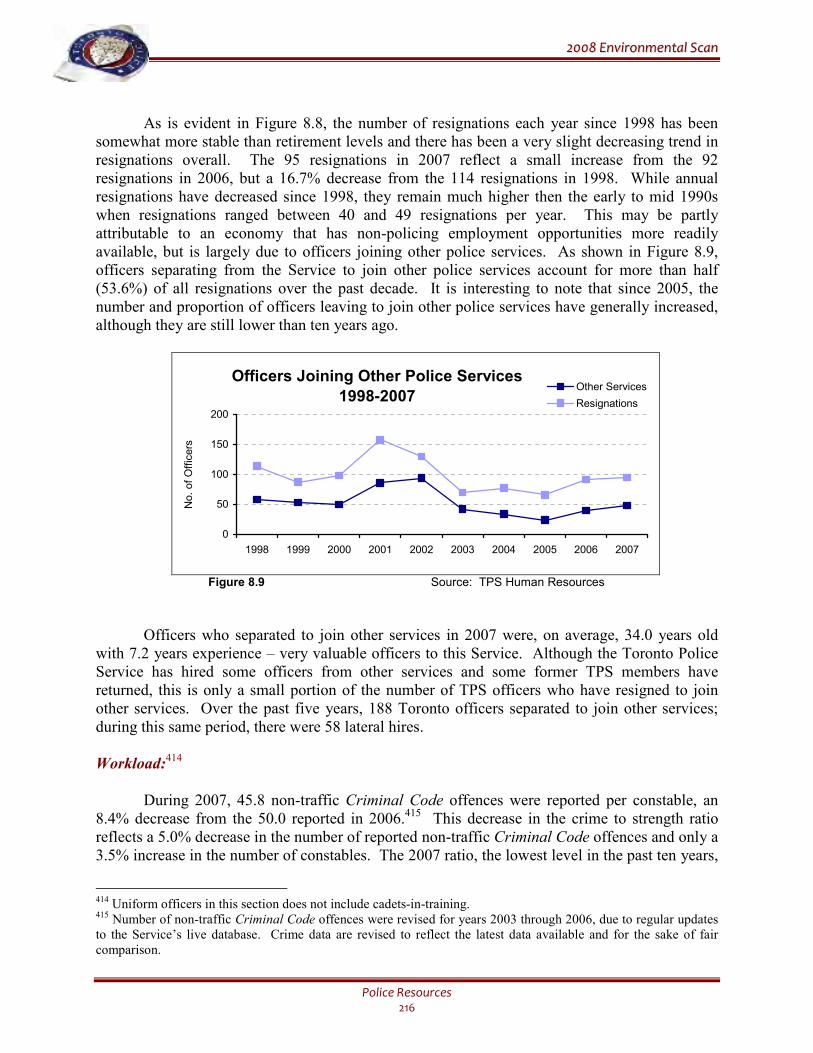
22000088 EEnnvviirroonnmmeennttaall SSccaann
Police Resources 216
As is evident in Figure 8.8, the number of resignations each year since 1998 has been
somewhat more stable than retirement levels and there has been a very slight decreasing trend in resignations overall. The 95 resignations in 2007 reflect a small increase from the 92 resignations in 2006, but a 16.7% decrease from the 114 resignations in 1998. While annual resignations have decreased since 1998, they remain much higher then the early to mid 1990s when resignations ranged between 40 and 49 resignations per year. This may be partly attributable to an economy that has non-policing employment opportunities more readily available, but is largely due to officers joining other police services. As shown in Figure 8.9, officers separating from the Service to join other police services account for more than half (53.6%) of all resignations over the past decade. It is interesting to note that since 2005, the number and proportion of officers leaving to join other police services have generally increased, although they are still lower than ten years ago.
Officers Joining Other Police Services
1998-2007
0
50
100
150
200
1998 1999 2000 2001 2002 2003 2004 2005 2006 2007
No. of Officers
Other Services
Resignations
Figure 8.9 Source: TPS Human Resources
Officers who separated to join other services in 2007 were, on average, 34.0 years old with 7.2 years experience – very valuable officers to this Service. Although the Toronto Police Service has hired some officers from other services and some former TPS members have returned, this is only a small portion of the number of TPS officers who have resigned to join other services. Over the past five years, 188 Toronto officers separated to join other services; during this same period, there were 58 lateral hires. Workload:
414
During 2007, 45.8 non-traffic Criminal Code offences were reported per constable, an
8.4% decrease from the 50.0 reported in 2006.415 This decrease in the crime to strength ratio reflects a 5.0% decrease in the number of reported non-traffic Criminal Code offences and only a 3.5% increase in the number of constables. The 2007 ratio, the lowest level in the past ten years,
414 Uniform officers in this section does not include cadets-in-training. 415 Number of non-traffic Criminal Code offences were revised for years 2003 through 2006, due to regular updates to the Service’s live database. Crime data are revised to reflect the latest data available and for the sake of fair comparison.
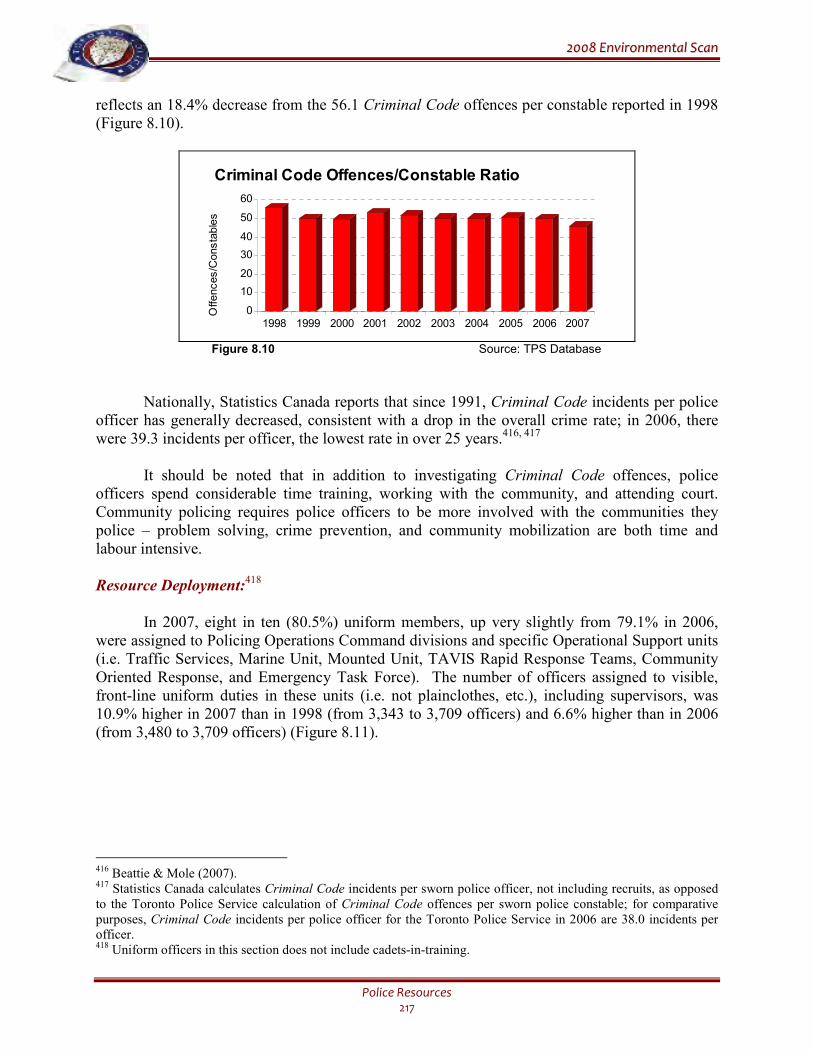
22000088 EEnnvviirroonnmmeennttaall SSccaann
Police Resources 217
reflects an 18.4% decrease from the 56.1 Criminal Code offences per constable reported in 1998 (Figure 8.10).
0
10
20
30
40
50
60
Offences/Constables
1998 1999 2000 2001 2002 2003 2004 2005 2006 2007
Criminal Code Offences/Constable Ratio
Figure 8.10 Source: TPS Database
Nationally, Statistics Canada reports that since 1991, Criminal Code incidents per police officer has generally decreased, consistent with a drop in the overall crime rate; in 2006, there were 39.3 incidents per officer, the lowest rate in over 25 years.416, 417
It should be noted that in addition to investigating Criminal Code offences, police officers spend considerable time training, working with the community, and attending court. Community policing requires police officers to be more involved with the communities they police – problem solving, crime prevention, and community mobilization are both time and labour intensive. Resource Deployment:
418
In 2007, eight in ten (80.5%) uniform members, up very slightly from 79.1% in 2006,
were assigned to Policing Operations Command divisions and specific Operational Support units (i.e. Traffic Services, Marine Unit, Mounted Unit, TAVIS Rapid Response Teams, Community Oriented Response, and Emergency Task Force). The number of officers assigned to visible, front-line uniform duties in these units (i.e. not plainclothes, etc.), including supervisors, was 10.9% higher in 2007 than in 1998 (from 3,343 to 3,709 officers) and 6.6% higher than in 2006 (from 3,480 to 3,709 officers) (Figure 8.11).
416 Beattie & Mole (2007). 417 Statistics Canada calculates Criminal Code incidents per sworn police officer, not including recruits, as opposed to the Toronto Police Service calculation of Criminal Code offences per sworn police constable; for comparative purposes, Criminal Code incidents per police officer for the Toronto Police Service in 2006 are 38.0 incidents per officer. 418 Uniform officers in this section does not include cadets-in-training.
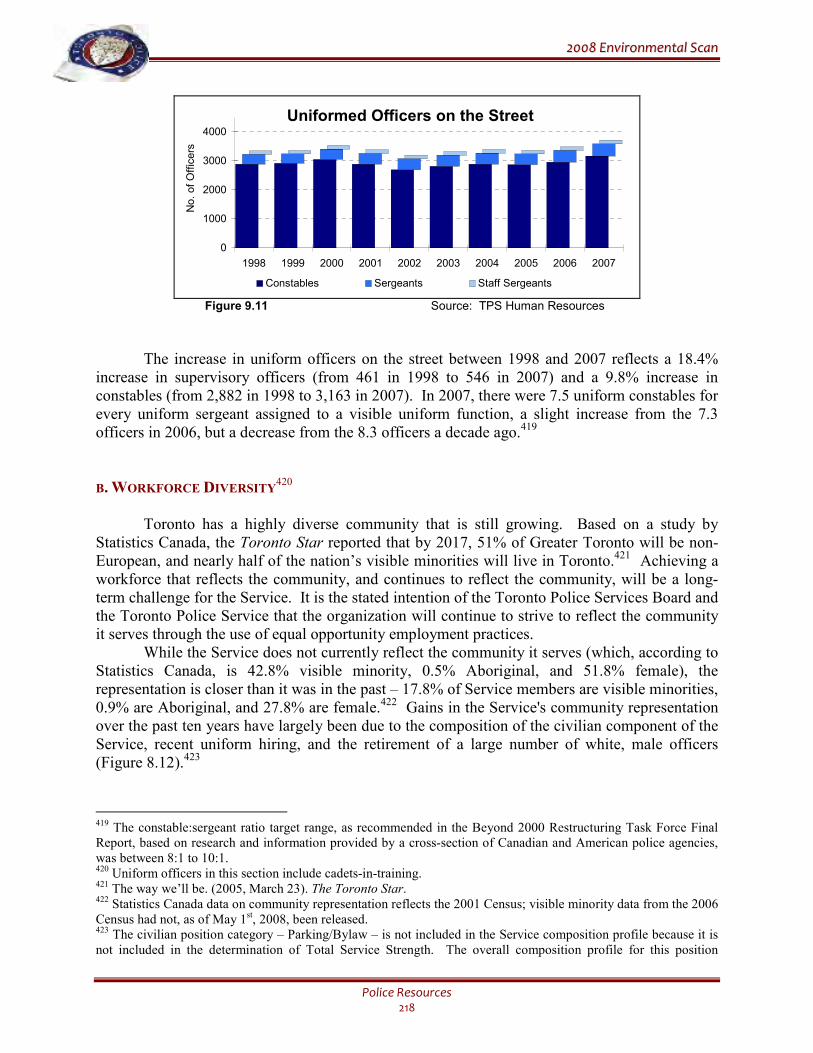
22000088 EEnnvviirroonnmmeennttaall SSccaann
Police Resources 218
Uniformed Officers on the Street
0
1000
2000
3000
4000
1998 1999 2000 2001 2002 2003 2004 2005 2006 2007
No. of Officers
Constables Sergeants Staff Sergeants
Figure 9.11 Source: TPS Human Resources
The increase in uniform officers on the street between 1998 and 2007 reflects a 18.4% increase in supervisory officers (from 461 in 1998 to 546 in 2007) and a 9.8% increase in constables (from 2,882 in 1998 to 3,163 in 2007). In 2007, there were 7.5 uniform constables for every uniform sergeant assigned to a visible uniform function, a slight increase from the 7.3 officers in 2006, but a decrease from the 8.3 officers a decade ago.419 B. WORKFORCE DIVERSITY
420
Toronto has a highly diverse community that is still growing. Based on a study by
Statistics Canada, the Toronto Star reported that by 2017, 51% of Greater Toronto will be non-European, and nearly half of the nation’s visible minorities will live in Toronto.421 Achieving a workforce that reflects the community, and continues to reflect the community, will be a long-term challenge for the Service. It is the stated intention of the Toronto Police Services Board and the Toronto Police Service that the organization will continue to strive to reflect the community it serves through the use of equal opportunity employment practices.
While the Service does not currently reflect the community it serves (which, according to Statistics Canada, is 42.8% visible minority, 0.5% Aboriginal, and 51.8% female), the representation is closer than it was in the past – 17.8% of Service members are visible minorities, 0.9% are Aboriginal, and 27.8% are female.422 Gains in the Service's community representation over the past ten years have largely been due to the composition of the civilian component of the Service, recent uniform hiring, and the retirement of a large number of white, male officers (Figure 8.12).423
419 The constable:sergeant ratio target range, as recommended in the Beyond 2000 Restructuring Task Force Final Report, based on research and information provided by a cross-section of Canadian and American police agencies, was between 8:1 to 10:1. 420 Uniform officers in this section include cadets-in-training. 421 The way we’ll be. (2005, March 23). The Toronto Star. 422 Statistics Canada data on community representation reflects the 2001 Census; visible minority data from the 2006 Census had not, as of May 1st, 2008, been released. 423 The civilian position category – Parking/Bylaw – is not included in the Service composition profile because it is not included in the determination of Total Service Strength. The overall composition profile for this position
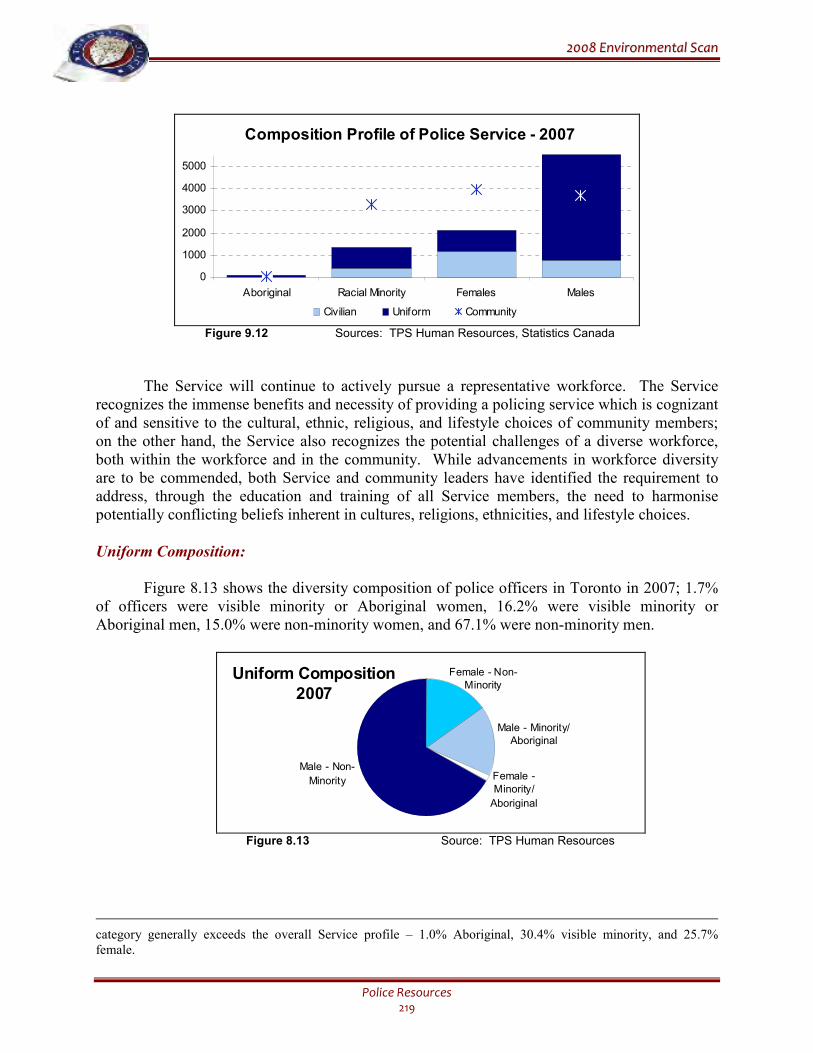
22000088 EEnnvviirroonnmmeennttaall SSccaann
Police Resources 219
Composition Profile of Police Service - 2007
0
1000
2000
3000
4000
5000
Aboriginal Racial Minority Females Males
Civilian Uniform Community
Figure 9.12 Sources: TPS Human Resources, Statistics Canada
The Service will continue to actively pursue a representative workforce. The Service recognizes the immense benefits and necessity of providing a policing service which is cognizant of and sensitive to the cultural, ethnic, religious, and lifestyle choices of community members; on the other hand, the Service also recognizes the potential challenges of a diverse workforce, both within the workforce and in the community. While advancements in workforce diversity are to be commended, both Service and community leaders have identified the requirement to address, through the education and training of all Service members, the need to harmonise potentially conflicting beliefs inherent in cultures, religions, ethnicities, and lifestyle choices.
Uniform Composition:
Figure 8.13 shows the diversity composition of police officers in Toronto in 2007; 1.7%
of officers were visible minority or Aboriginal women, 16.2% were visible minority or Aboriginal men, 15.0% were non-minority women, and 67.1% were non-minority men.
Male - Non-
Minority Female - Minority/
Aboriginal
Male - Minority/ Aboriginal
Female - Non-Minority
Uniform Composition 2007
Figure 8.13 Source: TPS Human Resources
category generally exceeds the overall Service profile – 1.0% Aboriginal, 30.4% visible minority, and 25.7% female.
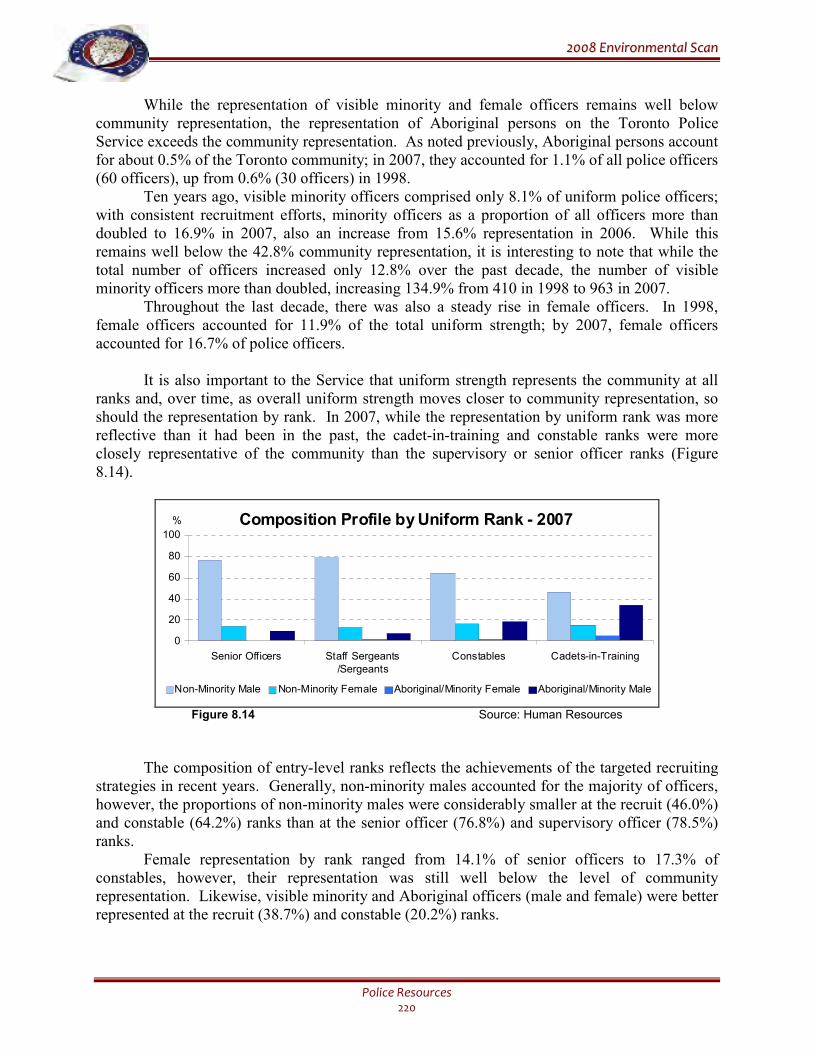
22000088 EEnnvviirroonnmmeennttaall SSccaann
Police Resources 220
While the representation of visible minority and female officers remains well below community representation, the representation of Aboriginal persons on the Toronto Police Service exceeds the community representation. As noted previously, Aboriginal persons account for about 0.5% of the Toronto community; in 2007, they accounted for 1.1% of all police officers (60 officers), up from 0.6% (30 officers) in 1998.
Ten years ago, visible minority officers comprised only 8.1% of uniform police officers; with consistent recruitment efforts, minority officers as a proportion of all officers more than doubled to 16.9% in 2007, also an increase from 15.6% representation in 2006. While this remains well below the 42.8% community representation, it is interesting to note that while the total number of officers increased only 12.8% over the past decade, the number of visible minority officers more than doubled, increasing 134.9% from 410 in 1998 to 963 in 2007.
Throughout the last decade, there was also a steady rise in female officers. In 1998, female officers accounted for 11.9% of the total uniform strength; by 2007, female officers accounted for 16.7% of police officers.
It is also important to the Service that uniform strength represents the community at all ranks and, over time, as overall uniform strength moves closer to community representation, so should the representation by rank. In 2007, while the representation by uniform rank was more reflective than it had been in the past, the cadet-in-training and constable ranks were more closely representative of the community than the supervisory or senior officer ranks (Figure 8.14).
Composition Profile by Uniform Rank - 2007
0
20
40
60
80
100
Senior Officers Staff Sergeants/Sergeants
Constables Cadets-in-Training
Non-Minority Male Non-Minority Female Aboriginal/Minority Female Aboriginal/Minority Male
%
Figure 8.14 Source: Human Resources
The composition of entry-level ranks reflects the achievements of the targeted recruiting strategies in recent years. Generally, non-minority males accounted for the majority of officers, however, the proportions of non-minority males were considerably smaller at the recruit (46.0%) and constable (64.2%) ranks than at the senior officer (76.8%) and supervisory officer (78.5%) ranks. Female representation by rank ranged from 14.1% of senior officers to 17.3% of constables, however, their representation was still well below the level of community representation. Likewise, visible minority and Aboriginal officers (male and female) were better represented at the recruit (38.7%) and constable (20.2%) ranks.
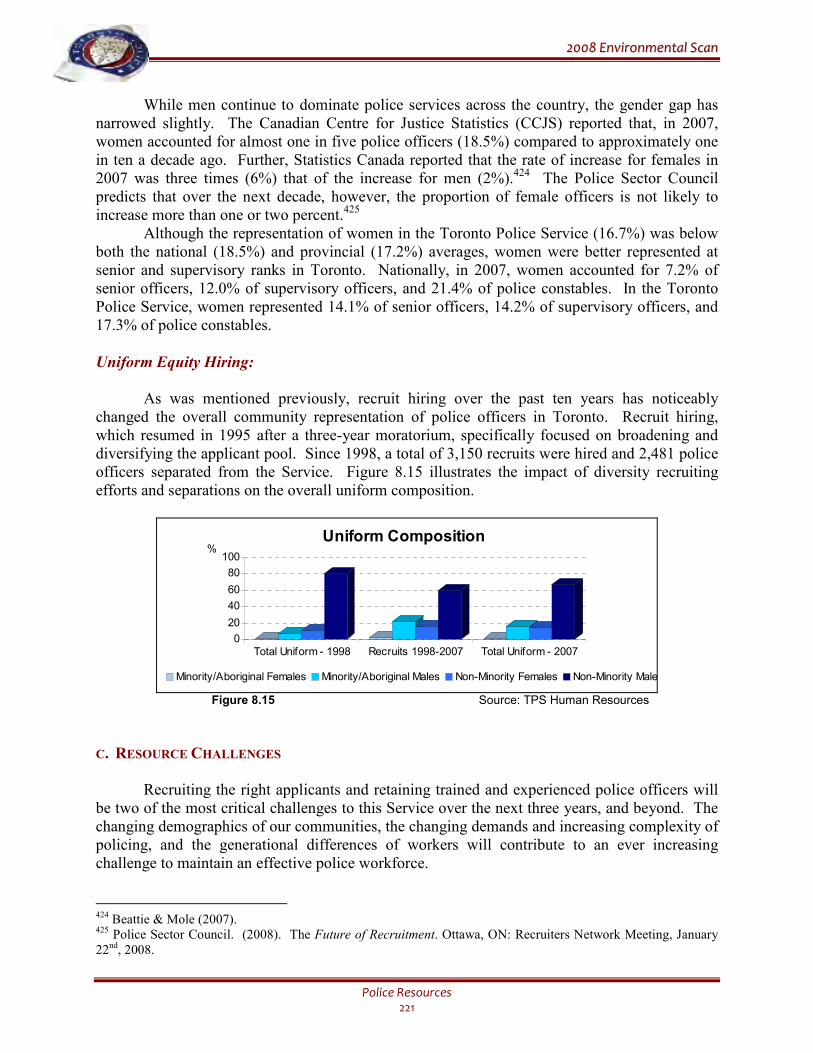
22000088 EEnnvviirroonnmmeennttaall SSccaann
Police Resources 221
While men continue to dominate police services across the country, the gender gap has narrowed slightly. The Canadian Centre for Justice Statistics (CCJS) reported that, in 2007, women accounted for almost one in five police officers (18.5%) compared to approximately one in ten a decade ago. Further, Statistics Canada reported that the rate of increase for females in 2007 was three times (6%) that of the increase for men (2%).424 The Police Sector Council predicts that over the next decade, however, the proportion of female officers is not likely to increase more than one or two percent.425
Although the representation of women in the Toronto Police Service (16.7%) was below both the national (18.5%) and provincial (17.2%) averages, women were better represented at senior and supervisory ranks in Toronto. Nationally, in 2007, women accounted for 7.2% of senior officers, 12.0% of supervisory officers, and 21.4% of police constables. In the Toronto Police Service, women represented 14.1% of senior officers, 14.2% of supervisory officers, and 17.3% of police constables.
Uniform Equity Hiring:
As was mentioned previously, recruit hiring over the past ten years has noticeably changed the overall community representation of police officers in Toronto. Recruit hiring, which resumed in 1995 after a three-year moratorium, specifically focused on broadening and diversifying the applicant pool. Since 1998, a total of 3,150 recruits were hired and 2,481 police officers separated from the Service. Figure 8.15 illustrates the impact of diversity recruiting efforts and separations on the overall uniform composition.
0
20
40
60
80
100
Total Uniform - 1998 Recruits 1998-2007 Total Uniform - 2007
Minority/Aboriginal Females Minority/Aboriginal Males Non-Minority Females Non-Minority Males
%Uniform Composition
Figure 8.15 Source: TPS Human Resources
C. RESOURCE CHALLENGES
Recruiting the right applicants and retaining trained and experienced police officers will be two of the most critical challenges to this Service over the next three years, and beyond. The changing demographics of our communities, the changing demands and increasing complexity of policing, and the generational differences of workers will contribute to an ever increasing challenge to maintain an effective police workforce.
424 Beattie & Mole (2007). 425 Police Sector Council. (2008). The Future of Recruitment. Ottawa, ON: Recruiters Network Meeting, January 22nd, 2008.
22000088 EEnnvviirroonnmmeennttaall SSccaann
Police Resources 222
One of the first lines in the Statistics Canada report, Police Resources in Canada, 2007, reflects the police resource challenges across the country: “The police sector is currently facing significant human resource challenges given an aging workforce, a diminishing youth population, and the need for recruitment and retention of police officers who are reflective of Canada’s increasingly diverse population.”426 Clearly, the Toronto Police Service is not alone in the challenge of recruiting and retaining police officers; other police service across Ontario, Canada, and the United States are also dealing with similar recruiting and retention issues.
Given the age demographics of the Service’s current workforce, changing attitudes towards work and corporate loyalty (i.e. trend is away from career for life), a shrinking youth cohort, and increased community diversity, the Toronto Police Service will likely face the challenge of recruiting new officers and retaining skilled officers for many years to come.
Recruiting:
According to Canadian police chiefs, the three most important objectives of recruiting activities, in order of importance, are to ensure new recruits are competent, to attract the basic skills and competencies needed, and to attract diversity. Chiefs rated ‘attracting the next generation of talent’ as the number one issue to be faced in 5 to 10 years.427
The first objective – to ensure that new recruits are competent – is historical; police services have always strived to hire the most competent officers, matching competency to work demands. What has changed, however, are the competencies required to do a job that has constantly changing demands and increasing complexity. This poses two challenges. First, police services must continuously identify required competencies for new recruits – they continue to change over time – and integrate them into the recruiting and selection processes. Competencies such as multiple language skills, computer literacy, life maturity, etc., are, more and more, a requirement for new police officers. Second, police services now find themselves competing for an expanded recruit profile in a labour market that is more competitive and not necessarily familiar to police recruiters.
To date, the Toronto Police Service has not experienced a shortage of competent applicants, due in large part, to the Service’s enormous effort at recruit outreach. In 2007, there were 1,237 applicants for 262 positions and, in 2006, 1,231 people applied for 450 positions.428 In fact, the Toronto Police has been able to attract enough competent applicants to hire, on average, more than 300 qualified recruits per year for the past ten years.
According to the Hay Group Report, however, the current applicant pool may be insufficient to meet future hiring requirements. Citing year of birth data for police officers across Canada, the report advises that the number of officers reaching retirement age each year through to 2020 will be more than double, perhaps triple, the number in recent years. The report notes that: “Just to stand still in terms of the total size of police officers across Canada, police
426 Beattie & Mole (2007), p. 7. 427 Johnson, P., Packham, R., Stronach, S., & Sissons, D. (2007). A National Diagnostic on Human Resources in Policing. A Report for the Police Sector Council. Ottawa, ON: Hay Group
428 In addition to attracting sufficient applicants, the Service’s outreach has been successful in attracting a diverse pool of applicants. In 2006, the 1,231 police officer applicants included 85 females (6.9%), 307 visible minorities (24.9%) and 18 Aboriginal persons (1.5%), and in 2007, the 1,237 applicants included 156 females (12.6%), 369 visible minorities (29.8%), and 13 Aboriginal persons (1.1%).
22000088 EEnnvviirroonnmmeennttaall SSccaann
Police Resources 223
organizations will have to double or triple their rate of intake and sustain those increased levels for over a decade”.429 Just standing still, however, may not be enough as the complexity of work increases and the number of officers per 100,000 population across Canada remains well below previous levels.
It is unlikely that the Toronto Police Service will experience a doubling or tripling in the level of retirements as is predicted by the Hay Group. Due to the recent retirement of a large number of officers who were hired in the early 1970s to facilitate two-officer vehicle requirements, the Service has already experienced the first wave of elevated retirements and hirings referred to by the Hay Group Report. It is expected that the Service will continue to face hiring requirements at levels at least similar to recent years, as about one-third of serving officers will be eligible to retire over the next ten years. However, as other police services face this heightened recruiting level, movement between police services and competition for limited applicants is likely to increase.
The Service may also find that with a shrinking youth cohort in Canada, it may not attract the same number of applicants in the future. Births between 1978 and 1983 – birth years for applicants aged 25 to 30 years – was about 25% lower than births in 1960.430 Further, on a national level, the ratio of those aged 20 to 34 years entering the labour force to every person over 55 years of age on their way out, has decreased from 3.7 in 1983 to 2.7 in 2001 to 1.9 in 2006; this decreasing trend is predicted to continue through 2025, reflecting both record low births in the late 1990s and the retirement of the second, and larger, decade of the baby boomer generation.431 Finally, after peaking at 2% in the late 1990s, the growth rate of the Canadian labour market is expected to drop to 0.2% by 2025.432
Compounding the issues associated with an aging workforce and a decreasing ratio of those entering to those leaving the workforce, is an apparent lack of interest of youth in policing as a career. An Ipsos-Reid poll, conducted in spring 2007 on behalf of the Police Sector Council, surveyed almost 4,500 Canadians aged 12 to 30 years and found that although the supply of applicants may appear to be healthy now, this may not be the case in the future.433 The survey found that only 4% of respondents said that they would be most interested in pursuing policing as a career, a decrease from 5% of respondents (7% of men and 3% of women) in a similar survey conducted in 2005. Respondents aged 12 to 17 (8%) and respondents with less than a high school education (7%) were more likely to say that they would be most interested in pursing a career in policing. About one in four respondents said they would consider a career in policing (23%) in the 2007 survey, down from 37% in 2005; only 2% of respondents said that policing provides the most employment opportunities.
When asked about the most important employment factors, one-third of respondents choose work-life balance as either their first or second most important factor. Policing, however,
429 Ibid, p. 105. 430 Statistics Canada Health Statistics Division. (2007). Births 2005. (Catalogue No. 84F0210XIE). Ottawa: Statistics Canada. 431 Aging Workers – Workforce officially over the 40-plus hill, (2008, March 5). The Toronto Star. 432 In Conversation with Allan Greg (TVO), March 28th, 2008. (Guest, Sherry Cooper, is the Global Economic Strategist and Executive Vice-President of BMO Financial Group, Chief Economist – BMO Capital Markets, and author of The New Retirement: How it will change our future. (2007)). 433 Police Sector Council. (2006). Results from Ipsos-Reid’s “Reconnecting Government with Youth 2005” and (2007) Research Up-Date: Ipsos-Reid’s “Reconnecting with Youth 2007” and Views on Policing 2007 (HR Diagnostic). (Both retrieved from http://www.policecouncil.ca)
22000088 EEnnvviirroonnmmeennttaall SSccaann
Police Resources 224
was ranked the worst career for work-life balance – two-thirds of respondents (66%) agreed that it’s hard for police officers to balance a career and family life, 85% of respondents agreed that officers are called up to work long hours and shift work, 85% agreed that policing is a dangerous career, and 75% agreed that officers are likely to suffer burn-out from job related stress. Further, no more than 2% of respondents rated each of the traditional policing employment attractors – pension, vacation time, and opportunity to work with others – as their first most important employment factor. When asked what they would say are the most appealing aspects of a career in policing, respondents said helping people (18%) and being able to give back/to serve the community (14%), however, only 6% of respondents said that contributing to the betterment of society was the most important employment factor. On a more positive note, three in ten youth (29%) chose the opportunity to do interesting work and 22% chose job security as their first or second most important employment factor; the opportunity to have a number of different ‘careers’ in thirty years in one organization may help to attract youth to a career in policing.
While most police chiefs agreed that they were currently able to attract sufficient qualified applicants, the challenge is attracting the right candidates. The right candidate is 25-29 years old, with post-secondary education and some measure of work-life experience – according to the Hay Group Report, competency-based assessment techniques validate these preferences – and who is reflective of the community. There are several challenges to attracting this preferred candidate.
To attract 25-29 year old workers with some post-secondary education, a career in policing must be sufficiently attractive to entice applicants away from careers which they embarked on immediately out of high school or university. However, people in this age group were less likely to express interest in policing as a career (3%) than their younger cohorts (8% of youths aged 12-17 years), those with post-secondary education were less likely to say that they were most interested in pursuing policing as a career (3% in 2007) and, with young families, people are more likely to select work-life balance as the most important employment factor.
Recruiting a diverse workforce also presents significant challenges. Most youth responding to the Police Sector Council’s Reconnecting with Youth survey said that ethnic diversity of a community should be reflected in the diversity of the police service, and those respondents who identified themselves as a member of a visible minority were almost twice as likely to completely agree that a police service should reflect the ethnic diversity of a community. However, respondents who identified themselves a member of a visible minority were also almost twice as likely (24%) to completely agree that in some cultural communities policing is not seen as a positive career choice, than those who did not consider themselves a member of a visible community (15%). The opinion that policing is not seen as a positive career choice in some cultural communities was echoed in similar surveys of police employees, human resource leaders, and students of the Police Foundation Program. Realistically, recruiters may not be in a position for much longer to overlook applicants because they do not fit a target demographic.
Although almost six in ten police services across Canada said that they have made special efforts to attract women to policing, women accounted for only one in five police officers across the country.434, 435 Interest in policing as a career is, overall, lower for women; as noted previously, in 2005, 3% of women compared to 7% of men said that they would be most
434 Johnson, et al (2007). 435 Beattie & Mole (2007).
22000088 EEnnvviirroonnmmeennttaall SSccaann
Police Resources 225
interested in policing as career. A strong Toronto Police Service outreach program to recruit women – a 2006-2008 Toronto Police Service Priority – is credited for an 83.5% increase in female applicants (from 85 applicants in 2006 to 156 applicants in 2007), however, the portion of female officers in Toronto remains below that of other GTA police services.
A further challenge to recruiting, although not new, is the recruiting process itself. The process is lengthy, costly in both time and resources to both the applicant and the employer, and, in some instances, restrictive. Applicants must apply separately to each police service they are interested in and, on average, it takes about 9 months for a successful applicant to be offered employment; 90% of applicants are rejected. There is some consensus among police chiefs that the recruiting progress needs to be enhanced, but not about what enhancements or revisions are necessary. Recruitment initiatives recommended in the Hay Group Report have varied levels of support from police chiefs – 80% of Canadian chiefs supported a national recruitment strategy, 60% supported a national application process, but only 30% supported a national standardized test for new applicants. While the need to co-ordinate recruitment with other services is acceptable to most chiefs, the extent to which the process is integrated and the appropriate geographical boundaries – national, provincial, local areas – are not so clear.
Retention:
In 2007, 70% of police chiefs said they did not believe that there was a retention problem.
The results of a 2007 survey of police officers conducted on behalf of the Police Sector Council – 71% of respondents said that policing is a good career, 73% would choose policing as a career again, 78% are satisfied with their job and 83% plan to stay for life – would seem to support this belief.
Notwithstanding the apparent satisfaction and loyalty to policing and individual policing organizations, retaining skilled officers is still likely to be a challenge for police services across Canada through 2020 and beyond. The retention of police officers – the minimization of skilled workforce turnover – includes all separations from the organization, both retirements and resignations.
Based on year of birth of serving police officers across Canada, in the past, about 500 officers per year reached the age of 55 years and typically retired in their mid-late fifties; over the next decade, however, the number of officers reaching the age of 55 years will swell to 1,500 per year as the 1958 - 1960 birth cohort – the height of the baby boom – moves toward age 55 and retirement. As noted earlier, it is not likely that the Toronto Police Service will experience a tripling of annual retirements over the next decade. Although up to one-third of TPS police officers are or will become eligible to retire in the next ten years, in the absence of any retirement incentive, a slightly elevated annual rate of separation is more likely.
However, retaining these experienced officers, particularly officers in leadership roles, may become increasingly critical to maintaining an experienced, skilled workforce: “Due to the demographic realities of an aging population, declining fertility rates, and a slowing growth rate of new employees entering the labour force, older workers are key to sustaining Canada’s economic growth and productivity. From the employer’s perspective, retaining and hiring older
22000088 EEnnvviirroonnmmeennttaall SSccaann
Police Resources 226
workers is a key strategy to avoiding talent shortages and to ensure an experienced and skilled workforce.”436
Recent trends indicate that older workers are remaining in the workforce and are doing so for a variety of reason – to support second families or families started later in life, to amass wealth during what are likely their peak earning years, to remain physically and mentally active and/or to avoid what was historically the personal diminishment of retirement; the baby boomers, more than any other generation, defined their life by their work.437 The elimination of a mandatory retirement age in Ontario paves the way for older workers to continue to work.438 It is unlikely, however, that the new legislation will have an immediate or significant impact on the Service – only 1% of currently serving officers are over the age of 60 and only three officers are over the age of 65 years; Service experience over the past five years shows that the average age of retiring officers has been consistently around 55 years of age.
Anecdotal evidence would suggest, however, that many officers seek other employment after retirement from policing. A recent study suggests that strategies that encourage or enable experienced workers to defer retirement and remain on the job may have increasing importance to the labour supply. The study found that 33% of recent retirees said they would have continued working under different circumstances.439 More than one in four recent retirees indicated that they would continue to work if they could reduce their work schedules (e.g. shorter weeks, shorter days, more vacation, etc.) without affecting their pension.
The obvious benefits of retaining experienced workers must be weighed against the costs and challenges of managing an older workforce, beyond the costs of higher salary, benefit and absenteeism. In order to retain older workers, organizations, particularly police services where job requirements can be physically demanding, will need to adapt working conditions and offer arrangements that better suit the individual needs of older workers – e.g. flex hours, part-time work, job-sharing, phased-in retirement, concessions to physical abilities, etc. In addition, there will be pressure to maintain a continued level of work challenge to older workers.
The retention of younger workers will also present challenges to organizations over the next decade, although somewhat different ones than those posed by older workers. Younger workers are now generally less likely to expect to stay in a career, let alone with a single organization, for 30 years, and the number of youth entrants into the workforce will diminish. The competition for young, educated, and experienced workers will, therefore, increase, putting pressure on employers to offer competitive salaries and benefits, and adapt working environments to better suit the needs of younger workers. The importance that young workers place on work-life balance, as discussed earlier, will increasingly become a defining factor of work-life, a factor which employers cannot ignore. Decade-old predictions of shorter work weeks, flexible hours and home-based work are now a
436 Human Resources Professionals Association of Ontario. (2007). Older Workers: Challenges and Policy Issues. Submission by the Human Resources Professionals Association of Ontario to the Experts Panel on Older Workers, p. 2. 437 In Conversation with Allan Greg (TVO), March 28, 2008. (Guest, Sherry Cooper, is the Global Economic Strategist and Executive Vice-President of BMO Financial Group, Chief Economist – BMO Capital Markets, and author of The New Retirement: How it will change our future. (2007)). 438 Bill 211, Ending Mandatory Retirement Statute Law Amendment Act, 2005, came into effect on December 12th,
2006. 439 Schellenberg, G. & Silver, C. (2004). You can’t always get what you want: Retirement preferences and experiences. Canadian Social Trends (Statistics Canada), Winter 2004 (No. 75), p. 3.
22000088 EEnnvviirroonnmmeennttaall SSccaann
Police Resources 227
reality. Policing is perceived by youth as the career least compatible with a work-life balance. Police services will have to focus on changing the perception that policing can not be compatible with a work-life balance, but more importantly, they will have to actually adopt, where possible, practices more in keeping with best practices to promote a work-life balance for the benefit of both the employee and the organization. Work-life conflict, as opposed to balance, has been associated with significantly increased absenteeism due to illness and child care problems, substandard organizational performance, and a higher reported intent to turnover.440 In addition to expectations for a positive workplace and work-life balance, younger officers, particularly those with post secondary education and previous work experience, have greater expectations for immediate and, perhaps, unrealistic work recognition and reward. “Young college graduates look to start at high-paying positions with power and perks. They have little patience for working their way up.”441 Traditionally, the movement to specialized positions and promotion within the Service is competitive, a long-term career path, and the opportunities are limited – only three in ten officers hold a rank other than constable. It is important to note that the Service will face the same retention issues with civilian staff – work-life balance, corporate loyalty, job challenge, etc. Further, the very limited availability of civilian career development and career path, will pose a significant challenge to the Service in retaining skilled civilian staffing.
Training & Development:
Training and development challenges fall generally into two categories – training recruits
and experienced officers to perform work that is increasing in both demand and complexity, and developing officers to move into leadership positions as current leaders move towards retirement.
Skills training for serving officers poses three distinct challenges – training experienced officers to meet the changing demands of a job they have performed for years (i.e. technological impacts on criminal activities and crime-solving, partnering with communities and social services to effect neighbourhood independence from police), coaching techno-literate but inexperienced recruits to effectively meet the community’s policing demands, and promoting cross-cultural/ethnicity/lifestyle sensitivity. Over the next five years, the challenge of developing officers to assume specialized, supervisory and leadership roles (e.g. mentoring, succession planning) will also increase significantly – almost eight in ten senior officers (78.8%) and a large portion of officers performing specialized services will be eligible for retirement. Similar challenges – changes in job demands particularly in technological applications, and the need for succession planning and leadership development – will again also be evident in the training and development of civilian staff.
440 Duxbury, L. & Higgins, C. (2003). Work-Life Conflict in Canada in the New Millennium – A Status Report. Public Health Agency of Canada. (Retrieved from http://www.phac-aspc.gc.ca/publicat/work-travail/report2/ index.html) 441 Losyk (1997), p. 42.
22000088 EEnnvviirroonnmmeennttaall SSccaann
Police Resources 228
D. WORK ENVIRONMENT
Work environment is believed to be directly related to employee job satisfaction, stress,
turnover, and psychological health – a positive workplace promotes happier, healthier, and more productive workers. On the other hand, a negative workplace may give rise to lost efficiency, absenteeism, high staff turnover, grievances, severance packages, and lawsuits. In an increasingly competitive labour market that sets work-life balance and job satisfaction as high priorities, the impact of the work environment – positive or negative – cannot be underestimated by employers.
Findings of the Toronto Police Service 2007 Personnel Survey revealed that almost nine in ten members who responded to the survey agreed (42%) or somewhat agreed (45%) that, in general, they were satisfied with their work environment. Although almost two-thirds of respondents said that during the past year, they felt they had been discriminated against by another Service member (63%) and six in ten said that they believed that there is a lot of discrimination within the Service (61%), the majority of respondents believed that their workplace was adequately protected from harassment and discrimination (63%) and only one in four respondents believed that the Service should improve how it responds to harassment and discrimination matters (26%).
Like most organizations, the Toronto Police Service has strong and specific policies in place to address sexual harassment and discrimination issues in the workplace; they are legally prohibited in North America. However, workplace bullying has emerged as a growing work environment issue, perhaps made more evident by growing intolerance for sexual harassment and discrimination. Bullying is defined, in legal terms, as deliberate and hurtful actions resulting in the mistreatment of another person; in the work place this may become evident in a range of behaviours – constant criticism, teasing, unsubstantiated blame-laying, exclusion in social situations, unreasonable work demands, harmful gossip, unattainable deadlines, etc. While many people regard bullying as a schoolyard issue, psychological harassment is also a significant issue in the workplace – a recent US study revealed that one in six workers experienced bullying in their workplace.442 Similar to schoolyard bullying, workplace bullying has many of the same effects – stress, anger, anxiety, low morale and self-esteem, absenteeism, family breakdown, and in some cases, retaliatory violence.
Researchers at Queens University and the University of Manitoba examined 110 different studies of workplace sexual harassment and bullying done over the past twenty years and found that employees who were bullied were more stressed out, angrier, care less about their company’s welfare, and were more prone to quit than those who suffered sexual harassment. They believed that this was due to the fact that there is no legal or organizational recourse for workers who are bullied. The study recommended that organizations recognize bullying as a workplace issue and develop strong and specific policies against workplace bullying, and that governments should address workplace bullying through legislation (e.g. inclusion of workplace bullying in workplace health and safety legislation).
442 Schwind, H. (2007). Lawsuit puts spotlight on work bullying. Column for the Halifax Chronicle Herald. (Retrieved from http://www.thechronicalherald.ca/external/sobeys/july07.html)

22000088 EEnnvviirroonnmmeennttaall SSccaann
Police Resources 229
RECOMMENDATIONS FOR POLICE SERVICE
• With regard to recruiting and retaining personnel, the Service will continue to compete for
workers in a market where many other employers are offering widely flexible plans to accommodate employees’ desires to balance home and work life. The provision of accommodation offered by outside organizations, unless matched, could have a notable impact on the Service’s ability both to attract new recruits and to retain existing personnel.
• The current overall age and service distribution illustrates the need for a more constant annual
recruit hiring level. Due to irregular hiring levels over the past 30 years, the current distribution is heavily weighted between older, long-serving officers and younger, inexperienced officers, although there appears to be some flattening of these peaks. The Service must target a more consistent intake of recruits year over year, in order to avoid massive turnovers in a future short time period. Further, with an apparent lack of interest in policing as a career, particularly in some ethnic communities, police services must be prepared to accept qualified candidates, regardless of target demographics.
• The co-existence of diverse employee groups – young, inexperienced officers; older recruits
with diverse prior employment experience; and older, more experienced officers – creates diverse and often conflicting employee needs. The Service will be required to address job content, training and development, lateral and vertical mobility, attrition, physical, emotional and personal (family accommodation, child care, retirement counselling, etc.) challenges for very different types of employees with very different priorities.
• The increasing competition for new employees and the growing need to retain existing
employees will necessitate raising the standards of the workplace environment; the organizational requirement to ensure a healthy and accommodating workplace must increase in order to promote employee effectiveness and reduce employee absenteeism and separation.
• Staff development will become a serious issue in the next few years. As a large number of
senior, supervisory, and specialized officers become eligible to retire and hundreds of new officers are hired each year, there will be a critical need to quickly develop and promote qualified personnel to fill supervisory, management, and specialized positions, and to ensure that all officers, particularly new officers, are given proper direction, coaching and supervision.
• The age and service distributions of Primary Response officers, in particular, show a large
number of officers with little or no policing experience. The Service needs to ensure that these officers receive the training, direction, and supervision they need to carry out their functions effectively and efficiently.
• The importance of community representation on the Toronto Police Service, as a whole and at
all ranks, will continue to increase. Given anticipated demographic changes in the city over the next decade or so, the Toronto Police Service must be prepared to provide policing services appropriate to a changing community.

22000088 EEnnvviirroonnmmeennttaall SSccaann
Police Resources 230
• Continued communication and partnership with the City’s diverse communities will assist the Service with crime prevention and problem solving, and reaching target communities for recruiting purposes.
22000088 EEnnvviirroonnmmeennttaall SSccaann
Urban Trends 231
IX. URBAN TRENDS
Urban environments present unique challenges to police, and a dynamic understanding of
the creation and transformation of modern communities, in both socio-economic and urban
development terms, is essential to understanding the elements and resources of the city.
The jurisdiction of the Toronto Police Service encompasses the largest urban area in
Canada. Involving communities in the response to policing issues, and empowering
communities to resist crime, involves creating strong partnerships and awareness of urban
issues. Adapting to urban growth and socio-economic change involves alliances among
the public, private, and voluntary sectors of society. With urban knowledge and community
partnerships, an assurance can be made to protect public safety while at the same time
ensuring the delivery of efficient policing.
HIGHLIGHTS
• Canada is facing a series of urban challenges including: economic competitiveness,
environmental degradation, urban infrastructure decay, inadequate transportation systems, inadequate housing, and meeting the needs of vulnerable groups.
• Existing federal resources need to be allocated in a more efficient and effective manner, and
strategic investments are required in economic development, physical infrastructure, social services, transportation and transit, communications, housing and environmental protection.
• The participation of communities in creating solutions to urban problems through interaction
and co-operation is important to positive results. Urban society must have concern for the future if communities are to become engaged in the prevention of social problems. This concern can take many forms, including taking responsibility for the preservation of public places, such as city parks, buildings, and communities.
• Toronto is one of the most diverse cities in the world and one of the safest major metropolitan
areas in North America. It was ranked the #1 city in North America for best quality of life and top city region of the future by Foreign Direct Investment (FDI) magazine, and ranked 2nd in North America (15th worldwide) in the 2007 Mercer Human Resources Quality of Living Survey.
• The future of Toronto is about re-building and re-urbanizing – about maturing, because the
city has exhausted opportunities to grow outward. Diversity is a major strength of Toronto and is vital to the social, cultural, and economic life of the city.
• Future success relies on understanding relationships and interdependencies; Toronto must be a
connected city that realizes that all aspects of daily life are linked. A successful future also depends on leaders and stewards coming from all parts of the community: from volunteers in grassroots organizations to CEOs in Toronto’s largest corporations.
• The City of Toronto has been successfully working towards accommodating the residential
growth expected to occur by 2031, and a number of key areas have been marked for growth by the Official Plan. These ‘priority growth areas’, in which the city is encouraging future
22000088 EEnnvviirroonnmmeennttaall SSccaann
Urban Trends 232
development, are the Downtown and Central Waterfront, the Avenues, the Centres, and the Employment Districts.
• Community revitalization projects in the city have been important in bringing a renewed
excitement and community ownership to a number of older neighbourhoods. However, large developments have and will require the uprooting of community members, involve large construction challenges, and require important partnerships.
• Homelessness is an unfortunate reality for many people, and city services must be aware of its
extent, origins, and significance. A continuing challenge for prevention strategies is a lack of complementary planning from other areas, such as corrections, policing, and hospitals. Intervention at these entry points may reduce the likelihood that community members end up on the street or in shelters.
• There is increased interest in expanding public transit as the federal, provincial, and municipal
governments have recognized the economic, social, and environmental costs of traffic congestion in major urban areas.
• Transit can enhance quality of life by: improving traveller choice, keeping downtowns
healthy, bringing opportunity to disadvantaged members of society, improving access to the labour force, containing urban sprawl, improving air quality and health, reducing greenhouse gas emissions, and enhancing municipal standby capability.
• The Toronto Transit Commission (TTC) currently has about 1,144 closed circuit television
cameras (CCTV) installed on its surface vehicles, and 1,200 CCTV cameras located throughout its 69 subway stations. It is planning to have all its surface vehicles equipped with CCTV cameras (4 in each vehicle) and five cameras in each of its 144 Wheel Trans vehicles by 2009. In addition, there are plans to increase the number of cameras in the subway system to 2,300 by the end of 2011.
• The TTC is reviewing its use of force policies, to address health and safety concerns of their
special constables. The review will also assess whether the special constables should be armed with firearms and/or Tasers. A consultant has been hired by the TTC to conduct the study, and results will be published in a report expected at the end of 2008.
• In 2006, a study was published in the journal of Policing and Society on security intelligence
networks and private security. Among the main findings, it was found that the majority of private security firms (76%) reported sharing some form of standardized intelligence information with their clients more often than with the public police.
• The Western Hemisphere Travel Initiative (WHTI) is an American law that requires all
travellers, including citizens from Canada and the United States (US), to present a valid passport or other approved secure document when travelling to, through, or from the US from within the western hemisphere. As of January 1st, 2009, this new requirement will take effect.
22000088 EEnnvviirroonnmmeennttaall SSccaann
Urban Trends 233
• Marine ports that receive international shipping are all vulnerable to criminal infiltration, and exploitation. Organized crime groups have links to marine ports and the most significant influences are linked to outlaw motorcycle gangs, traditional crime groups, and local domestic crime groups. Criminality at marine ports affects law enforcement across Canada, as the ports are conduits for illicit products, including illicit drugs, tobacco, alcohol, firearms, illegal migrants, stolen vehicles, and so on.
• In June 2006, a report entitled Emergency – Municipalities Missing From Disaster Planning
outlined two major challenges for municipalities. First, because municipalities are most likely where initial response will be concentrated, they must have a voice in shaping legislative policies and regulations with regard to security and emergency preparedness. Second, the funds allocated at all levels of government for public security and emergency preparedness must be distributed according to a recognized plan, which would require the recognition, consultation, and proper funding of municipalities.
A. NATIONAL URBAN TRENDS & CHALLENGES
Cities are the primary engines of social well-being, economic growth, global competitiveness, and development, and are the centres of creativity, technical innovation, social transformation, and cultural change. Factors such as increased globalization and economic competition, demographic evolution, and a reduction in costs associated with transportation, travel, and social interaction, have transformed recent urbanization processes. Eighty percent of the population of Canada resides in urban areas. Canada no longer shapes the growth and character of its cities – cities are now redefining and reshaping Canada.443
According to a study presented to the Prime Minister’s Caucus Task Force on Urban Issues by the Canadian Institute of Planners in 2002, Canada is facing a series of urban challenges. A number of key issues were identified in the report including: economic competitiveness, environmental degradation, urban infrastructure decay, inadequate transportation systems, housing, and meeting the needs of vulnerable groups.444
Many cities in Canada lack the fiscal means to compete successfully for economic development in the global economy. Quality of life, economic growth, and the future prosperity of Canada may be at risk. Urban sprawl and inner city decay are compromising the environment, and the health and integrity of natural environments adjacent to cities are threatened. The decay of urban infrastructure has also become an issue as urban physical infrastructure, such as water supply, waste water, and sewage management, become outdated, inefficient, and unsafe in Canadian cities. Transportation systems are inadequate in many urban regions as capital and operating costs are under-supported by senior government. And, housing in many cities is not affordable and choice and supply are limited, not meeting the needs of Canada’s diverse urban
443 Bourne, L. (2007) New Urban Divides: How Economic, Social, and Demographic Trends are Creating New Sources of Urban Difference in Canada. (Retrieved April 4th, 2008, from http://www.urbancentre.utoronto.ca/pdfs/ researchbulletin /CUCSRB33BourneFeb07.pdf) 444 Canadian Institute of Planners. (2002) Towards a Canadian Urban Strategy: Framework for Government of Canada Involvement in Urban Affairs, Submission to the Prime Minister’s Caucus Task Force on Urban Issues. (Retrieved April 4th, 2008, from http://www.cip-icu.ca/English/institute/utf_subm.pdf)
22000088 EEnnvviirroonnmmeennttaall SSccaann
Urban Trends 234
socio-cultural profiles. The individual, family, and community costs associated with poverty, homelessness, and crime in urban areas may increase in scale and scope.445
A number of recommendations were made to the Caucus Task Force to deal with the challenges, including the need for federal contribution to help Canadian cities help themselves. Furthermore, it was felt that a clear national urban vision and strategy that acknowledges the diversity of Canada’s urban regions is needed to guide federal resource decisions and priorities. Downloading of responsibilities is inappropriate without an equal shift of fiscal resources. Existing resources need to be allocated in a more efficient and effective manner, and strategic investments are required in economic development, physical infrastructure, social services, transportation and transit, communications, housing, and environmental protection.446
In November 2007, as a first step toward determining the size, scope, and growth rate of municipal challenges, a report was prepared for the Federation of Canadian Municipalities on the dangers of the upward trend of the infrastructure deficit. Over the past 20 years, Canada’s municipal infrastructure has continued to decline. In 1985, an estimated $12 billion was needed to repair deteriorating infrastructure, doubling to about $20 billion in 1992; in 2003, the deficit was about $60 billion and estimated to grow by about $2 billion a year. The deficit has grown much faster than estimated, however, and in 2007 it reached $123 billion.
Other key findings of this study were: cultural, social, community, and recreational facilities are aging, have deteriorated, and capacity is becoming a concern; funding is needed to address diminishing transportation assets; and, the deterioration of urban transit systems has been considerable as facilities need to be repaired or rehabilitated.447
B. UNDERSTANDING URBAN THINKING
Diverse urban areas present unique challenges. The heterogeneous make-up of the urban landscape may include groups with different interests, but the problems they face are often common to all members of society and call for collective action.448 Urban and community researchers offer a number of ideas that conceive of a city as a public faced with specific problems.
Ordinary citizens participating in solutions to urban problems through interaction and co-operation is important to positive results. An urban public cannot identify with or address common problems if its members are self-interested, because they will not trust each other not to abandon co-operative actions if they think there is a benefit to do so. Cities are made up of a mosaic of people with different lifestyles and values, and tolerance of all members of society is essential to city life. In confronting common problems though, tolerance is insufficient as it could lead to indifference. Tolerance must be united with concern, so that people are not just tolerated, but cared for.449
445 Ibid. 446 Ibid. 447 Mirza, S. (2007) Danger Ahead: The Coming Collapse of Canada’s Municipal Infrastructure – A Report for the Federation of Canadian Municipalities. (Retrieved April 4th, 2008, from http://www.fcm.ca/english/advocacy/ mdeficit.pdf) 448 Cunningham, F. (2007) Cities: A Philosophical Inquiry. Centre for Urban & Community Studies, Research Bulletin no.39. (Retrieved April 4th, 2008, from http://www.urbancentre.utoronto.ca/pdfs/researchbulletins/ CUCSRB39Cunningham.pdf) 449 Ibid.
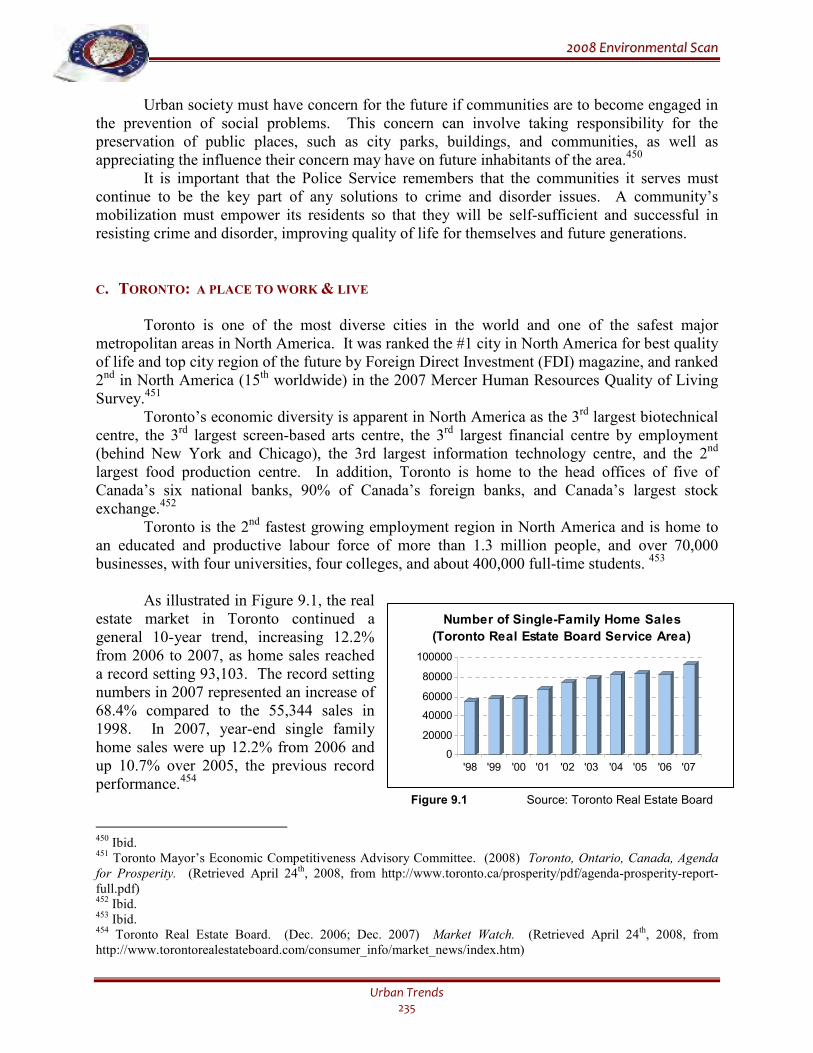
22000088 EEnnvviirroonnmmeennttaall SSccaann
Urban Trends 235
Urban society must have concern for the future if communities are to become engaged in the prevention of social problems. This concern can involve taking responsibility for the preservation of public places, such as city parks, buildings, and communities, as well as appreciating the influence their concern may have on future inhabitants of the area.450
It is important that the Police Service remembers that the communities it serves must continue to be the key part of any solutions to crime and disorder issues. A community’s mobilization must empower its residents so that they will be self-sufficient and successful in resisting crime and disorder, improving quality of life for themselves and future generations.
C. TORONTO: A PLACE TO WORK & LIVE
Toronto is one of the most diverse cities in the world and one of the safest major
metropolitan areas in North America. It was ranked the #1 city in North America for best quality of life and top city region of the future by Foreign Direct Investment (FDI) magazine, and ranked 2nd in North America (15th worldwide) in the 2007 Mercer Human Resources Quality of Living Survey.451 Toronto’s economic diversity is apparent in North America as the 3rd largest biotechnical centre, the 3rd largest screen-based arts centre, the 3rd largest financial centre by employment (behind New York and Chicago), the 3rd largest information technology centre, and the 2nd largest food production centre. In addition, Toronto is home to the head offices of five of Canada’s six national banks, 90% of Canada’s foreign banks, and Canada’s largest stock exchange.452 Toronto is the 2nd fastest growing employment region in North America and is home to an educated and productive labour force of more than 1.3 million people, and over 70,000 businesses, with four universities, four colleges, and about 400,000 full-time students. 453
As illustrated in Figure 9.1, the real estate market in Toronto continued a general 10-year trend, increasing 12.2% from 2006 to 2007, as home sales reached a record setting 93,103. The record setting numbers in 2007 represented an increase of 68.4% compared to the 55,344 sales in 1998. In 2007, year-end single family home sales were up 12.2% from 2006 and up 10.7% over 2005, the previous record performance.454 Figure 9.1 Source: Toronto Real Estate Board
450 Ibid. 451 Toronto Mayor’s Economic Competitiveness Advisory Committee. (2008) Toronto, Ontario, Canada, Agenda for Prosperity. (Retrieved April 24th, 2008, from http://www.toronto.ca/prosperity/pdf/agenda-prosperity-report-full.pdf) 452 Ibid. 453 Ibid. 454 Toronto Real Estate Board. (Dec. 2006; Dec. 2007) Market Watch. (Retrieved April 24th, 2008, from http://www.torontorealestateboard.com/consumer_info/market_news/index.htm)
0
20000
40000
60000
80000
100000
'98 '99 '00 '01 '02 '03 '04 '05 '06 '07
Number of Single-Family Home Sales
(Toronto Real Estate Board Service Area)
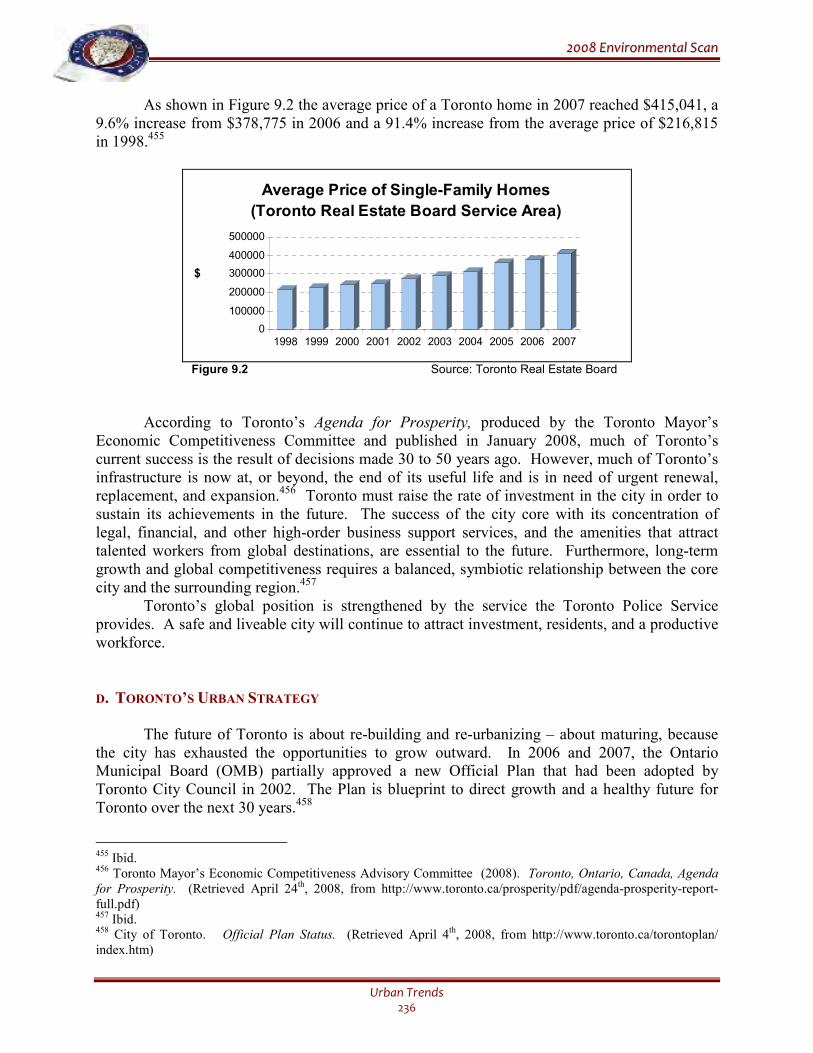
22000088 EEnnvviirroonnmmeennttaall SSccaann
Urban Trends 236
As shown in Figure 9.2 the average price of a Toronto home in 2007 reached $415,041, a 9.6% increase from $378,775 in 2006 and a 91.4% increase from the average price of $216,815 in 1998.455
0
100000
200000
300000
400000
500000
1998 1999 2000 2001 2002 2003 2004 2005 2006 2007
Average Price of Single-Family Homes
(Toronto Real Estate Board Service Area)
$
Figure 9.2 Source: Toronto Real Estate Board
According to Toronto’s Agenda for Prosperity, produced by the Toronto Mayor’s Economic Competitiveness Committee and published in January 2008, much of Toronto’s current success is the result of decisions made 30 to 50 years ago. However, much of Toronto’s infrastructure is now at, or beyond, the end of its useful life and is in need of urgent renewal, replacement, and expansion.456 Toronto must raise the rate of investment in the city in order to sustain its achievements in the future. The success of the city core with its concentration of legal, financial, and other high-order business support services, and the amenities that attract talented workers from global destinations, are essential to the future. Furthermore, long-term growth and global competitiveness requires a balanced, symbiotic relationship between the core city and the surrounding region.457
Toronto’s global position is strengthened by the service the Toronto Police Service provides. A safe and liveable city will continue to attract investment, residents, and a productive workforce.
D. TORONTO’S URBAN STRATEGY
The future of Toronto is about re-building and re-urbanizing – about maturing, because the city has exhausted the opportunities to grow outward. In 2006 and 2007, the Ontario Municipal Board (OMB) partially approved a new Official Plan that had been adopted by Toronto City Council in 2002. The Plan is blueprint to direct growth and a healthy future for Toronto over the next 30 years.458
455 Ibid. 456 Toronto Mayor’s Economic Competitiveness Advisory Committee (2008). Toronto, Ontario, Canada, Agenda for Prosperity. (Retrieved April 24th, 2008, from http://www.toronto.ca/prosperity/pdf/agenda-prosperity-report-full.pdf) 457 Ibid. 458 City of Toronto. Official Plan Status. (Retrieved April 4th, 2008, from http://www.toronto.ca/torontoplan/ index.htm)
22000088 EEnnvviirroonnmmeennttaall SSccaann
Urban Trends 237
The Plan is a long-term policy document, strategic and high level in its approach to future development in the city. The vision of the policy is focused on creating a safe and attractive city that evokes pride, passion, and a sense of belonging – a city where everybody cares about the quality of life. According to the Plan, growth will be focused where it can realize the greatest social, environmental and economic benefits. About 25% of the geographic area of the city will change and grow in ways that enhance local communities, the city, and the region. Other areas, about 75% of the city’s geographical area, will mature and evolve, but will undergo only limited physical change.459
The Plan outlines a number of principles directed at the future of Toronto that provide the basis for building a city-wide consensus around its evolution. Diversity is a main strength of Toronto and is vital to the social, cultural, and economic life of the city. To be successful in the future, diversity must continue to be a building block for success. Furthermore, the city must remain vital, healthy, and beautiful. People choose to live in cities that understand their past and that push the limits of creativity. In addition, the various aspects of the city must feel connected. Future success relies on understanding relationships and interdependencies; Toronto must be a connected city that realizes that all aspects of daily life are linked. A successful future also depends on leaders and stewards participating from all segments of the community, from volunteers in a grassroots organizations, to CEOs of Toronto’s largest corporations.460 Leaders in the public and private sectors with the courage to take risks, develop proactive solutions, and follow through are paramount to a successful, safe, and thriving city.461
According to the Plan, there are important implementation linkages to be established outside of the Official Plan. Other city plans, such as the Council’s Strategic Plan, complement the Official Plan and will help to implement its city building goals.462
The Council’s Strategic Plan describes the Council’s strategic agenda, and guides all other planning initiatives and service delivery activities. It contains the Council’s vision for Toronto, a mission statement for Toronto’s government, and the Council’s goals for the community. The goals revolve around five theme areas: community, economy, environment, governance, and city-building. The City Directions identify how the city government can contribute to the goals and provide a context for assessing priorities and resource allocations in program and service areas. Each Direction contains a general strategy with a number of specific commitments.463
The Social Development Strategy (SDS) is also part of Toronto’s plan for the future, and is the social component of the city’s Strategic Plan. The SDS outlines the City’s social priorities and gives direction for providing service and supporting and strengthening communities. In addition, the SDS describes some of the challenges Toronto faces and outlines principles that should underlie an approach to social development.464
As discussed earlier in the Demographics chapter, income disparities in Toronto are increasing, and single-parent families – who are most at risk and who are usually headed by
459 City of Toronto. Official Plan. (Retrieved April 4th, 2008, from http://www.toronto.ca/planning/official_plan/ pdf_chapter1-5/chapters1_5_aug2007.pdf) 460 Ibid. 461 Ibid. 462 Ibid. 463 City of Toronto. Council’s Strategic Plan. (Retrieved April 7th, 2008, from http://www.toronto.ca/ strategic_plan/) 464 City of Toronto. Social Development Strategy. (Retrieved April 7th, 2008, from http://www.toronto.ca/sds/ introduction.htm)
22000088 EEnnvviirroonnmmeennttaall SSccaann
Urban Trends 238
women – are increasing. About 40% of Toronto’s children are living below Statistics Canada’s low-income cut-off point. The income gap threatens the quality of life for all of Toronto’s residents, but ethno-racial groups are more often and most harshly affected by it.465
Toronto has been built the inclusion of newcomers, children, young people, seniors, people with disabilities, etc., and its strong communities continue to support social inclusion. These cohesive communities benefit everyone, because people who feel part of a larger community have a greater interest in the public good. Toronto’s Social Development Strategy is based on a comprehensive understanding of the challenges facing the city and strategies have been proposed that will strengthen communities, invest in a comprehensive social infrastructure, and expand civic leadership and partnership.466
E. GROWTH & DEVELOPMENT
In October 2006, Bill 51, Planning and Conservation Land Statute Law Amendment Act,
2006 received Royal Assent; it came into effect January 2007. The Act made amendments to the Planning Act that will change aspects of the land use planning process, provide more tools for implementation of provincial policies, and give further support to sustainable development, intensification, and brownfield development.467 In addition, Bill 51 gives residents and local councillors more input on growth and development in their communities.
The City of Toronto has been working toward accommodating the residential growth expected to occur by 2031, with a number of key areas marked for growth by the Official Plan. These ‘priority growth areas’ are the Downtown and Central Waterfront, the Avenues, the Centres, and the Employment Districts. Figure 9.3 illustrates the Official Plan urban structure. The Downtown and Central Waterfront areas accommodate over 400,000 workers, thousands of students, shoppers, and tourists, and have the largest concentration of office towers in Canada. The Avenues are the important corridors along major streets throughout the city, outside the downtown area. The Centres are the key focal points for transit located in Scarborough, North York, Etobicoke, and at Yonge-Eglinton. And, the Employment Districts are large and comprised exclusively of lands where the Employment Areas land use designation applies.
The city is encouraging future development in these areas in order to accommodate the forecast growth, and to: maximize the use of existing infrastructure; reinforce the urban structure of the city (especially in the Centres and Employment Districts); exploit and support development opportunities while protecting the current residential areas; and, reduce land consumption across the wider region.468
Understanding where proposed developments are concentrated can give an idea of how the city will look in the near future. As shown in Figure 9.3, since Council’s adoption of the Official Plan in 2002, there have been more than 1,900 development projects proposed, with almost 70% (68,637) of all proposed residential units found within the priority growth areas. In
465 Ibid. 466 Ibid. 467 Legislative Assembly of Ontario. Bill 51: Planning and Conservation Land Statute Law Amendment Act, 2006. (Retrieved April 7th, 2008, from http://www.ontla.on.ca/web/bills/bills_detail.do?locale=en&BillID=455&isCurrent =false&detailPage=bills_detail_the_bill) 468 City of Toronto. How Does a City Grow. (Retrieved April 7th, 2008, from http://www.toronto.ca/planning/ pdf/grow.pdf)
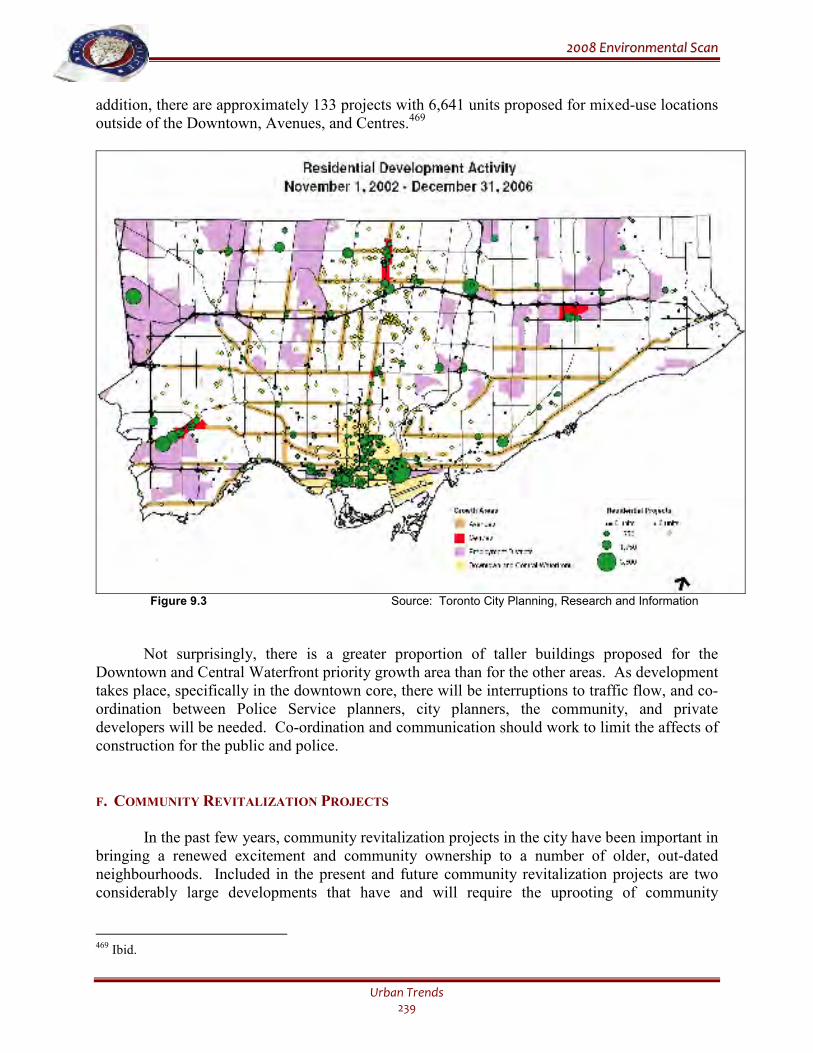
22000088 EEnnvviirroonnmmeennttaall SSccaann
Urban Trends 239
addition, there are approximately 133 projects with 6,641 units proposed for mixed-use locations outside of the Downtown, Avenues, and Centres.469
Figure 9.3 Source: Toronto City Planning, Research and Information
Not surprisingly, there is a greater proportion of taller buildings proposed for the Downtown and Central Waterfront priority growth area than for the other areas. As development takes place, specifically in the downtown core, there will be interruptions to traffic flow, and co-ordination between Police Service planners, city planners, the community, and private developers will be needed. Co-ordination and communication should work to limit the affects of construction for the public and police.
F. COMMUNITY REVITALIZATION PROJECTS
In the past few years, community revitalization projects in the city have been important in
bringing a renewed excitement and community ownership to a number of older, out-dated neighbourhoods. Included in the present and future community revitalization projects are two considerably large developments that have and will require the uprooting of community
469 Ibid.

22000088 EEnnvviirroonnmmeennttaall SSccaann
Urban Trends 240
members, involve large construction challenges, and require important partnerships between developers and stakeholders.
Regent Park:
Regent Park’s revitalization began in 2005 and will continue into the next decade, involving six phases of development. The plan, which involved consultation with more than 2,000 residents and community stakeholders, creates a mixed-community for approximately 12,500 people in 5,115 units. The project will replace all of the existing 2,083 social housing units and will add at least another 700 additional affordable housing units. More than 1,160 residents (400 households) have been relocated from the Regent Park area to facilitate phase one. Phase one will replace 418 apartments with over 700 new eco-friendly and energy efficient homes. All residents that have been relocated will have the right to return once the new residences are built. Phase one is scheduled for completion in 2008, after which, the other phases will follow at two-year intervals, until all six phases are complete.470
Lawrence Heights:
Lawrence Heights was developed in the mid 1950s and is currently home to over 3,500 residents who live in a mix of mid-rise buildings, townhouses, and single family homes. A large number of the 1,208 units are in serious need of repair, and the community has become a priority for revitalization. Over the next several years, Toronto Community Housing will be working with the City of Toronto, its other partners (including the Police Service), and residents to develop a plan that will bring about positive changes to the community and area.
The plan is expected to address the affordable housing needs of Lawrence Heights, and to address community priorities, including the need for education facilities, community services, transportation, health care, and community public spaces.471
Large community revitalization projects will bring a sense of pride for returning residents and for new residents in the area. It is important that the Police Service continue to cultivate current relationships and develop new ones, so that the community feels supported and confident that not only buildings will be revitalized, but so too will partnerships with the police.
G. CRIME PREVENTION THROUGH ENVIRONMENTAL DESIGN (CPTED)
Crime Prevention Through Environmental Design (CPTED) is part of a comprehensive
approach to crime prevention. The Toronto Police Service adopted its use in 1993 to assist with the review of public and private development plans slated for Toronto. CPTED is a process based on the theory that the proper design and effective use of the built environment can lead to a reduction in the incidence and fear of crime, and to an improvement in the quality of life.
470 Toronto Community Housing. Regent Park. (Retrieved April 18th, 2008, from http://www.torontohousing.ca/ investing_buildings/regent_park) 471 Toronto Community Housing. Lawrence Heights Revitalization. (Retrieved April 18th, 2008, from http://www.torontohousing.ca/investing_buildings/lawrence_heights_revitalization)
22000088 EEnnvviirroonnmmeennttaall SSccaann
Urban Trends 241
Although no legislation is in place in Toronto that requires a CPTED audit with for development projects, a number of future and existing development plans are analysed by CPTED-trained Service planners who evaluate the plans, commenting when appropriate on a variety of issues, including CPTED friendly design, possible safety concerns for the community and city services, traffic issues, and so on. The City of Toronto’s Urban Development Services, Toronto Transportation Services, and other public and private developers continue to partner with Toronto Police divisional and corporate planners to ensure safety and city concerns are included in developments at an early stage.
As CPTED design recommendations become more familiar and common, and as the principles of CPTED are further supported by developers, legislation with regard to mandatory CPTED assessment before development approval may be an issue for City consideration in the future. Service input into any such legislation would be critical.
In addition, CPTED Ontario is presently looking at a formal certification program with a core curriculum and testing for CPTED practitioners. A sub-committee has been established by CPTED Ontario to evaluate the current practice and to recommend any changes. If future recommendations develop into action and standardized training and testing are set, the Service will need to re-evaluate the current CPTED training and make any revisions required to reflect a consistent curriculum across the province.
H. STREET LIFE
Homelessness:
472 As an urban policing service, the Toronto Police Service cannot ignore the plight of the socially disadvantaged within the city. Homelessness is an unfortunate reality for some people, and city services must be aware of its extent, origins, and significance. According to the 2003 Toronto Housing and Homelessness Report Card, 552,000 Toronto households had incomes that fell below the low-income cut off (as established by Statistics Canada); 31,985 people stayed in Toronto’s emergency shelters in 2002, and 4,779 of these people were children. Although Toronto has been experiencing a strong economy, a number of groups have been affected by poverty. One-parent families, older single women, recent immigrants, young parent households, and rental tenants have face challenges even during economic growth. Some new immigrants have struggled to establish roots; this can be more difficult for those who face cultural and language barriers or for those who find that their professional credentials are not accepted in Canada. Those with the least income in Toronto typically rely on social assistance or minimum wage employment, both of which have not kept pace with the rising cost of living in recent years. The gap between Ontario’s social assistance and the low-income cut-off increased from 2001 to 2002.473 According to the key findings from the City of Toronto 2006 Street Needs Assessment, there were an estimated 5,052 homeless people in Toronto on April 19th, 2006. Of these people, it was estimated that 72% were in shelters, 16% were on the street, 5% were in health
472 Information on the homeless population can also be found in the chapters on Demographic Trends and Victims & Witnesses. 473 City of Toronto. (2003) The Toronto Report Card on Housing and Homelessness 2003. (Retrieved April 14th, 2008, from http://www.toronto.ca/homelessness/pdf/reportcard2003.pdf)
22000088 EEnnvviirroonnmmeennttaall SSccaann
Urban Trends 242
care/treatment facilities, 3% were in violence against women shelters, and 3% were in correctional facilities. The majority (70%) of outdoor homeless were found in the central core of the city. Eighteen percent of all individuals surveyed (excluding those surveyed while incarcerated) had an interaction with corrections in the past 6 months. Those homeless in corrections were the second highest group to identify a need for permanent housing, but were the least likely to be on a waiting list for permanent housing. Furthermore, they were the most likely to have slept outdoors one or more nights in the 6 months prior to their incarceration.474 The City of Toronto continues to measure the needs of the homeless population with a ‘snapshot’ assessment of homelessness in the city conducted every two years. The next study is scheduled for 2008. The City of Toronto directs approximately $15 million of provincial and municipal funds to community-based prevention programs aimed at homelessness. One of the continuing challenges of prevention strategies is a lack of complementary planning from other institutions in other areas such as corrections, policing, and hospitals. Intervention at these entry points can reduce the likelihood that community members may end up on the street or in shelters. Although shelters are not long-term solutions to homelessness, shelters can be vital to the safety and security of homeless people, providing supports for housing, health, education, employment, and social services. The City of Toronto has a multi-year shelter strategy aimed at future developments with regard to shelters, implementing shelter standards, improving shelter access, and addressing funding.475 In early 2005, City Council approved a housing strategy called Streets to Homes, designed to assist homeless people in finding housing. Over the following two years, more than 1,500 homeless people were moved into permanent housing directly from the street. Between November 2006 and April 2007, a post-occupancy survey was conducted with 88 formerly homeless people housed through the Streets to Homes program. When respondents were asked about their main reason for previous homelessness, 23% said problems with drugs and/or alcohol and 22% said it was because of a personal trauma, such as a relationship break-up or death of a family member. Of those who had been homeless longer than two years or on multiple occasions, the main reason for their situation was drug and/or alcohol use. Homeless individuals with mental health issues were more likely than those without mental health issues to report sleeping on a sidewalk or grate, and less likely to report sleeping in a park.476
In addition, a number of key findings included in the report were that adequate housing reduced use of alcohol and drugs, use of emergency health resources, and use of emergency services, including a 75% decrease in the number of individuals using police detox, a 56% decrease in the number arrested, and a 68% decrease in jail detention. Nine percent of those who’d said they’d been arrested said they had done it intentionally to get off the street, and those with mental heath issues were more likely to have gotten arrested intentionally, according to the report.477
474 City of Toronto. (2006) Staff Report, June 20th, 2006. (Retrieved April 14th, 2008, from http://www.toronto.ca/ housing/pdf/streetneedsassessment.pdf) 475 Ibid. 476 City of Toronto. (2007) What Housing First Means For People: Results of Streets to Homes 2007 Post-Occupancy Research. (Retrieved April 14th, 2008, from http://www.toronto.ca/housing/pdf/results07postocc.pdf ) 477 Ibid.
22000088 EEnnvviirroonnmmeennttaall SSccaann
Urban Trends 243
Harm Reduction:
Street Health, a community-based health care organization in Toronto, has conducted a number of initiatives and studies with regard to harm reduction strategies and practices. Harm reduction is a set of strategies focused on reducing the health, social, and economic harms associated with drug use, and involves programs or policies designed to reduce drug-related harm without requiring the cessation of drug use. One such program is the Crack Users Project (CUP), which is a community capacity-building initiative with the goal of reducing the harms associated with the use of crack cocaine among users in southeast downtown Toronto. The project began in 2005 and includes several weekly drop-in groups, a low-threshold health care clinic, counselling and case management services, as well as peer education and outreach. The two-year pilot project, funded by Health Canada requires Street Health to develop a best practices guide to peer education with illicit drug users.478
Harm reduction is also an aspect of a number of City of Toronto initiatives. For example, the Toronto Drug Strategy, adopted by City Council in December 2005, includes prevention, harm reduction, treatment, and enforcement components. Among the harm reduction outreach services is the provision of safer crack use kits.479 Harm reduction is also a major component of the City of Toronto run program called The Annex. This 124-bed program in Seaton House for men with addictions, provides counselling, community care, health, and social services in a tolerant and low-demand environment. The program focuses on reducing the harm associated with substance abuse rather than abstinence.480
As harm reduction policies and initiatives become more wide-spread and welcomed by government agencies, the Service will see a heightened pressure to become increasingly supportive and involved in such strategies. To balance the societal needs and remedies to drug use with the rules of law will be a challenge to the Service, and will require partnerships with local agencies, lawmakers, and openness to new initiatives.
I. PUBLIC TRANSPORTATION
“Public transit is the lifeline for many of the city's neighbourhoods and it's also an important part of our strategy to green our city. The more we invest in it, the more we are able to enhance the lives of all Torontonians.”481
– Mayor David Miller, 2008 There is increased interest in expanding public transit as the federal, provincial, and municipal governments have recognized the economic, social, and environmental costs of traffic congestion in major urban areas.
478 Street Health. (2006) Best Practices in Harm Reduction Peer Projects. (Retrieved June 11th, 2008, from http://www.streethealth.ca/Downloads/BestPracPeerProj.pdf) 479 City of Toronto. (2006) Fact Sheet: Distribution of Safer Crack Use Kits. (Retrieved June 12th, 2008, from http://www.toronto.ca/health/drugstrategy/pdf/tds_crack_kits.pdf) 480 City of Toronto. A Story to Tell: The Annex. (Retrieved June 12th, 2008, from http://www.toronto.ca/housing/about-story-annex.htm) 481 Transport Canada. (2008, March 18). Transit Funding Keeps the Toronto Transit Commission and Commuters Moving Forward. News Release. (Retrieved April 14th, 2008, from http://www.tc.gc.ca/mediaroom/releases/nat/ 2008/08-h075e.htm)
22000088 EEnnvviirroonnmmeennttaall SSccaann
Urban Trends 244
National concern over increasing traffic congestion and its damaging effects prompted two important events in 2007. In March 2007, the federal government announced its commitment to provide significant federal funding in support of public transit. The FLOW program is the federal government’s action plan for the Greater Toronto Area (GTA), designed to reduce congestion, cut commute times, help clear the air, and help drive the GTA economy. Specifically, FLOW funds will support a number of GTA transit initiatives, including: planning and expansion of York Region’s VIVA bus system, Brampton Transit, Mississauga Transit, and Durham Region Transit to improve connections with Toronto’s transit system; and, the extension of the Toronto Transit Commission’s University-Spadina subway eight kilometres north, providing improved transit connections between York Region and Toronto.482
Also in March 2007, the Big Mayors’ Caucus of the Federation of Canadian Cities released its National Transit Strategy. The Strategy spoke of three areas to which transit can make vital contributions: quality of life, economic competitiveness, and the environment.483
With regard to quality of life, public transit can play an important role in the ability of people to enjoy daily life, and according to the Canadian Urban Transit Association (CUTA), transit can enhance quality of life by: improving traveller choice, keeping downtowns healthy, bringing opportunity to disadvantaged members of society, improving access to the labour force, containing urban sprawl, improving air quality and health, reducing greenhouse gas emissions, and enhancing municipal standby capability. Furthermore, transit can play an essential social role by providing access to city services, employment, healthcare, and recreation, especially for those with physical disabilities and those who have no other means of travel.484
With regard to economic competitiveness, a national transit strategy that provides investment will help to deal with traffic congestion, ultimately influencing the movement of people and goods. This, in turn, can put cities on a more level playing ground with international competitors.485
Environmental issues are also addressed in the Strategy, as public transit undoubtedly contributes to cleaner air and action on climate change. Environmental issues (greenhouse gases, global warming, climate change, etc.) have become a major concern for Canadians and a number of studies and initiatives addressing environmental issues have focused on the benefits of using public transit instead of private vehicles. Use of public transit is seen as one of the most practical, effective, and achievable ways of reducing harmful emissions and greenhouse gases in large urban areas.486
As a large organization, the Toronto Police Service uses many resources that can have a significant effect on the environment. It is important that the organization continues to address environmental concerns by assessing the ecological impact of new technology, facilities and equipment, and by operating in an environmentally respectful way. Environmental concern will continue to rise, as new generations learn of the significant contributions that are needed to lessen the effects of past environmental neglect and exploitation.
482 Toronto Transit Commission. (2007) Toronto Transit City, Light Rail Plan. (Retrieved April 10th, 2008, from http://www.transitcity.ca/index.php?option=com_content&task=view&id=14&Itemid=28) 483 Federation of Canadian Municipalities Big City Mayors’ Caucus. (2007) National Transit Strategy. (Retrieved April 10th, 2008, from http://www.toronto.ca/mayor_miller/pdf/bcmcsubmission.pdf) 484 Ibid. 485 Ibid. 486 Ibid.
22000088 EEnnvviirroonnmmeennttaall SSccaann
Urban Trends 245
Toronto Transit Commission – Expansion & Development:
In March 2008, a $303.5 million contribution agreement was signed by the federal
government, the City of Toronto, and the Toronto Transit Commission (TTC). The federal contribution will allow for improvements in the following areas: subway infrastructure, including new trains; improvements and repairs to tracks, tunnels, escalators, elevators, fire ventilation, and radio systems; streetcar infrastructure, including repairs to tracks and dedicated streetcar lanes; and, bus infrastructure, including new hybrid buses and bus rapid transit links for the York University area. Furthermore, an additional $46.5 million will be available to the TTC upon completion of a proposal for a fare card for the GTA.487
Toronto’s Official Plan was the basis for the TTC’s Ridership Growth Strategy (2003) and its Building a Transit City Program (2004), which included a number of future transit initiatives aimed at making Toronto a more attractive and more viable travel destination, highlighting the need to establish an efficient and attractive network of bus and streetcar rapid transit lines to serve the city.488
A number of major projects, plans, and upgrades are planned for the TTC in the near future. The City of Toronto Official Plan, the TTC Ridership Growth Strategy, the Building a Transit City Plan, and Mayor Miller’s Transit City Platform (2006), have been refined and merged into one high-level plan for light rail in Toronto: Toronto Transit City – Light Rail Plan. This long-term plan is based on developing a large network of electric light rail lines, each on its own right-of-way, that span across the city and connect with the city’s existing and planned rapid transit routes. By 2021, the proposed new lines will be able to accommodate 175 million riders per year and will stretch 120 kilometres. Seven corridors suggested by the Plan are: Eglinton Crosstown (Kennedy station to Pearson Airport), Don Mills (Steeles Avenue to the Bloor-Danforth subway), Etobicoke-Finch West (Yonge Street to Highway 27), Jane (Jane station to Steeles West station), Scarborough Malvern (Kennedy station to Malvern/Morningside), Sheppard East (Don Mills station to Morningside Avenue), and Waterfront West (Union Station/Exhibition to Long Branch).489
An extension of the Spadina subway line has been studied since the early 1990s and continues today. In 2001, the Rapid Transit Expansion Study looked at the long-term needs of Toronto’s transit system to the year 2021, and concluded that the TTC should expand beyond the borders of the City of Toronto into York Region. Since then, several changes to land use and transportation plans have prompted a call for improved surface transit speed, reliability, and capacity in the short-term and subway expansion in the long-term. However, the Spadina subway extension could take up to 10 years to complete, and development in the area of the proposed Spadina line expansion has necessitated a quick response to the transit concerns of the emerging population. A Downsview station to York University Bus-Only Lanes project, which is to accommodate York region and GO transit systems as well as the TTC in the near future, has been planned to provide high-speed and reliable transit.490
487 Transport Canada. (2008, March 18) Transit Funding Keeps the Toronto Transit Commission and Commuters Moving Forward. News Release. (Retrieved April 14th, 2008, from http://www.tc.gc.ca/mediaroom/releases/nat/ 2008/08-h075e.htm) 488 Toronto Transit Commission. (2007) Toronto Transit City, Light Rail Plan. (Retrieved April 10th, 2008, from http://www.transitcity.ca/index.php?option=com_content&task=view&id=14&Itemid=28) 489 Ibid. 490 Toronto Transit Commission. (2008) Spadina Subway Extension Project, February 2008 Update. (Retrieved April 10th, 2008, from http://www.toronto.ca/ttc/spadina_extension/welcome.htm)
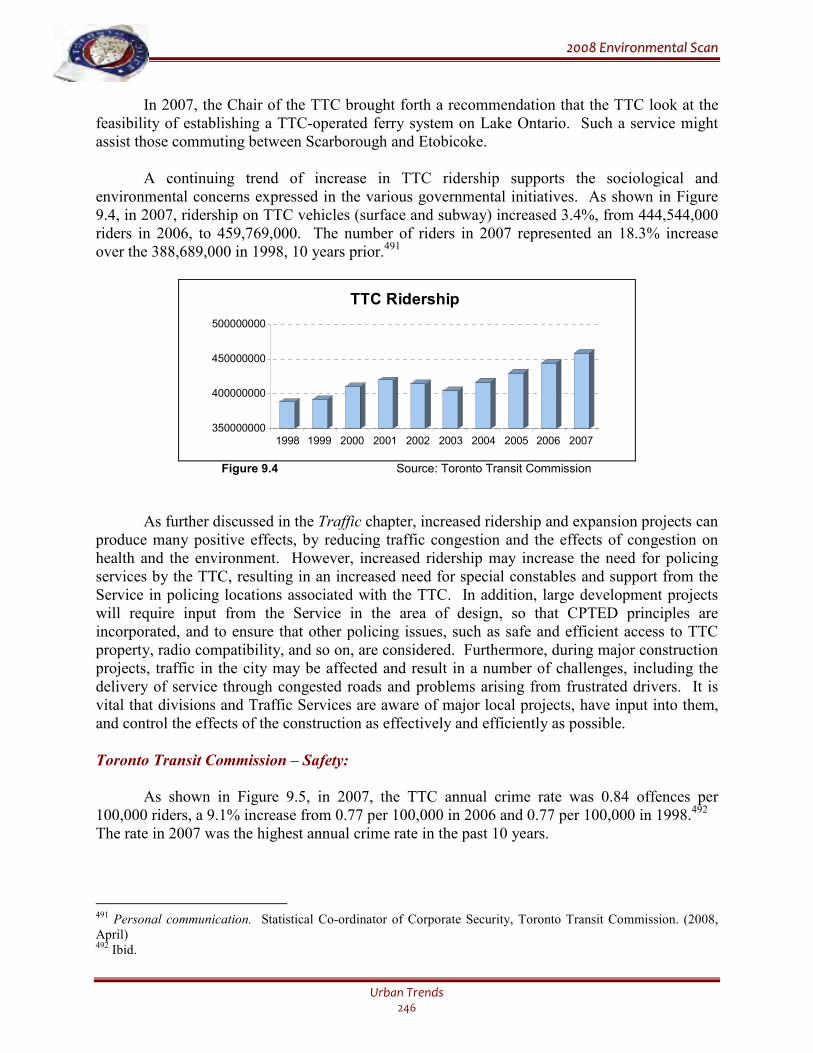
22000088 EEnnvviirroonnmmeennttaall SSccaann
Urban Trends 246
In 2007, the Chair of the TTC brought forth a recommendation that the TTC look at the feasibility of establishing a TTC-operated ferry system on Lake Ontario. Such a service might assist those commuting between Scarborough and Etobicoke.
A continuing trend of increase in TTC ridership supports the sociological and environmental concerns expressed in the various governmental initiatives. As shown in Figure 9.4, in 2007, ridership on TTC vehicles (surface and subway) increased 3.4%, from 444,544,000 riders in 2006, to 459,769,000. The number of riders in 2007 represented an 18.3% increase over the 388,689,000 in 1998, 10 years prior.491
350000000
400000000
450000000
500000000
1998 1999 2000 2001 2002 2003 2004 2005 2006 2007
TTC Ridership
Figure 9.4 Source: Toronto Transit Commission
As further discussed in the Traffic chapter, increased ridership and expansion projects can produce many positive effects, by reducing traffic congestion and the effects of congestion on health and the environment. However, increased ridership may increase the need for policing services by the TTC, resulting in an increased need for special constables and support from the Service in policing locations associated with the TTC. In addition, large development projects will require input from the Service in the area of design, so that CPTED principles are incorporated, and to ensure that other policing issues, such as safe and efficient access to TTC property, radio compatibility, and so on, are considered. Furthermore, during major construction projects, traffic in the city may be affected and result in a number of challenges, including the delivery of service through congested roads and problems arising from frustrated drivers. It is vital that divisions and Traffic Services are aware of major local projects, have input into them, and control the effects of the construction as effectively and efficiently as possible.
Toronto Transit Commission – Safety:
As shown in Figure 9.5, in 2007, the TTC annual crime rate was 0.84 offences per
100,000 riders, a 9.1% increase from 0.77 per 100,000 in 2006 and 0.77 per 100,000 in 1998.492 The rate in 2007 was the highest annual crime rate in the past 10 years.
491 Personal communication. Statistical Co-ordinator of Corporate Security, Toronto Transit Commission. (2008, April) 492 Ibid.
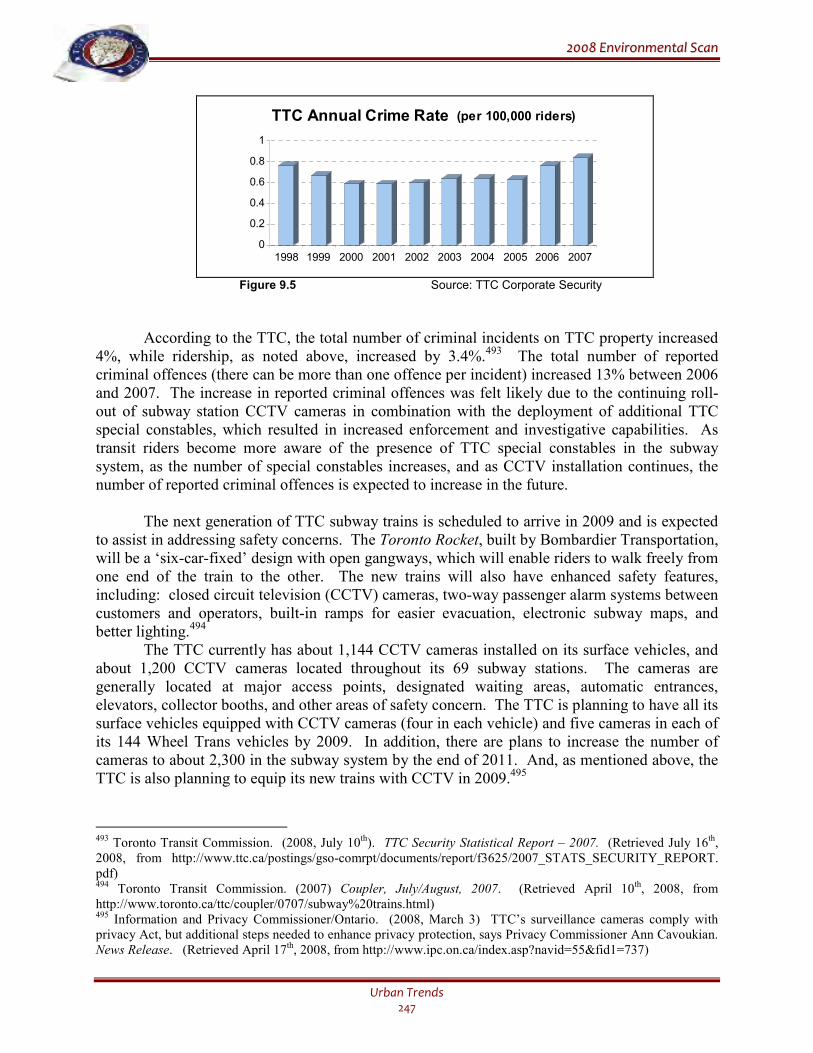
22000088 EEnnvviirroonnmmeennttaall SSccaann
Urban Trends 247
0
0.2
0.4
0.6
0.8
1
1998 1999 2000 2001 2002 2003 2004 2005 2006 2007
TTC Annual Crime Rate (per 100,000 riders)
Figure 9.5 Source: TTC Corporate Security
According to the TTC, the total number of criminal incidents on TTC property increased 4%, while ridership, as noted above, increased by 3.4%.493 The total number of reported criminal offences (there can be more than one offence per incident) increased 13% between 2006 and 2007. The increase in reported criminal offences was felt likely due to the continuing roll-out of subway station CCTV cameras in combination with the deployment of additional TTC special constables, which resulted in increased enforcement and investigative capabilities. As transit riders become more aware of the presence of TTC special constables in the subway system, as the number of special constables increases, and as CCTV installation continues, the number of reported criminal offences is expected to increase in the future. The next generation of TTC subway trains is scheduled to arrive in 2009 and is expected to assist in addressing safety concerns. The Toronto Rocket, built by Bombardier Transportation, will be a ‘six-car-fixed’ design with open gangways, which will enable riders to walk freely from one end of the train to the other. The new trains will also have enhanced safety features, including: closed circuit television (CCTV) cameras, two-way passenger alarm systems between customers and operators, built-in ramps for easier evacuation, electronic subway maps, and better lighting.494 The TTC currently has about 1,144 CCTV cameras installed on its surface vehicles, and about 1,200 CCTV cameras located throughout its 69 subway stations. The cameras are generally located at major access points, designated waiting areas, automatic entrances, elevators, collector booths, and other areas of safety concern. The TTC is planning to have all its surface vehicles equipped with CCTV cameras (four in each vehicle) and five cameras in each of its 144 Wheel Trans vehicles by 2009. In addition, there are plans to increase the number of cameras to about 2,300 in the subway system by the end of 2011. And, as mentioned above, the TTC is also planning to equip its new trains with CCTV in 2009.495
493 Toronto Transit Commission. (2008, July 10th). TTC Security Statistical Report – 2007. (Retrieved July 16th, 2008, from http://www.ttc.ca/postings/gso-comrpt/documents/report/f3625/2007_STATS_SECURITY_REPORT. pdf) 494 Toronto Transit Commission. (2007) Coupler, July/August, 2007. (Retrieved April 10th, 2008, from http://www.toronto.ca/ttc/coupler/0707/subway%20trains.html) 495 Information and Privacy Commissioner/Ontario. (2008, March 3) TTC’s surveillance cameras comply with privacy Act, but additional steps needed to enhance privacy protection, says Privacy Commissioner Ann Cavoukian. News Release. (Retrieved April 17th, 2008, from http://www.ipc.on.ca/index.asp?navid=55&fid1=737)
22000088 EEnnvviirroonnmmeennttaall SSccaann
Urban Trends 248
In 2007, in response to a complaint from Privacy International, an organization based in the United Kingdom, the Ontario Information and Privacy Commissioner conducted an investigation into the expansion of CCTV cameras on TTC property. The Commissioner ruled that the TTC expansion for the purposes of public safety and security is in compliance with Ontario’s Municipal Freedom of Information and Protection of Privacy Act, but she recommended a numbers of specific steps to enhance privacy protection. 496 As discussed further in the Technology and Policing chapter, privacy issues with regard to CCTV cameras will continue to be a matter of legal concern for all organizations and services that use them.
Go Transit:
GO trains and buses serve over 5 million people living throughout the GTA, and connect
downtown Toronto with communities as far as Hamilton, Milton, and Guelph to the west; Orangeville, Barrie, and Beaverton to the north; Stouffville, Port Perry, and Uxbridge to the northeast; and, Oshawa and Newcastle to the east. During rush hours, Go Transit moves as many people into and out of downtown Toronto as eight congested expressways (equal to about 48 highway lanes). More passengers on an annual basis travel through Union Station than all of the passengers travelling though Toronto’s Pearson airport.497 On a typical weekday during the 2006-2007 fiscal year, 181 trains and 1,673 bus trips, carrying about 195,000 passengers per day (165,000 by train and 30,000 by bus), were operated by Go Transit. Ridership on GO Transit has continued to increase in recent years, and reached over 48 million (48,292,000) by the end of 2006, an increase of 3.1% compared to 46,832,900 in 2005.498 Some of the major long-term projects for the future of GO Transit include a renewal program for Union Station to double the station’s capacity to more than 80 million passengers per year and make improvements to tracks by 2014. In addition, a number of projects have begun, or have been planned, under the GO Transit Rail Improvement Project (GO TRIP), including the start of construction in 2006 of a new track on the Lakeshore and Georgetown lines, and the planning of improvements to allow GO train service to Barrie. Furthermore, new locomotives and new rapid transit buses, to allow better reliability and more passengers, will continue to be delivered in 2008.499 The benefits associated with increased capacity and transit reliability, out-weigh the potential for traffic disruption due to construction and frustration that can be associated with it. And, as more people find it convenient to commute by GTA-based transit, it will be increasingly important that the Service be aware of the effect of investigations conducted on or in the area of transit systems. Commuter frustration with delays resulting from police investigations on trains or affecting the tracks may become an increasing issue for the Service. Millions of people will continue to travel into and out of Toronto on transit and it will be a challenge to ease the consequences of construction, congestion associated with construction, and police-related investigations in an efficient manner.
496 Ibid. 497 GO Transit. (2007) Annual Report – The Year in Review 2006-07. (Retrieved April 17th, 2008, from http://www.gotransit.com/public/en/publications/default.htm) 498 Ibid. 499 Ibid.
22000088 EEnnvviirroonnmmeennttaall SSccaann
Urban Trends 249
J. SPECIAL CONSTABLE SERVICES
TTC Special Constables:
The Toronto Police Services Board designated employees of the Toronto Transit
Commission responsible for law enforcement and security as ‘special constables’ in 1997. TTC special constables generally have peace officer powers for the purpose of enforcing the Criminal Code and the Controlled Drugs and Substances Act, and police officer powers for the purpose of enforcing the Liquor Licence Act, the Trespass to Property Act, and Section 17 of the Mental Health Act, for incidents that occur on or in relation to TTC property and vehicles.
As of December 31st, 2007, the TTC employed 91 transit special constables. According to the TTC Special Constable Services 2007 Annual Report to the Toronto Police Services Board, TTC special constables responded to 11,151 calls for service in 2007, and made 975 arrests relating to both criminal and provincial offences, a 1.1% decrease from the 986 arrests in 2006. In addition, in 2007, workload for TTC special constables increased as they completed 1,363 TPS General Occurrences, 1,368 TPS Records of Arrest, and 5,690 Person Contact Cards (TPS 208s), compared to 649 TPS General Occurrences, 1,093 TPS Records of Arrest, and 5,245 Person Contact Cards (TPS 208s) in 2006.500
The TTC is reviewing its use of force policies to address health and safety concerns of their special constables. The review will also assess whether the special constables should be armed with firearms and/or Tasers.501 A consultant has been hired by the TTC to conduct the study, and results will be published in a report expected at the end of 2008.502 The final decision on use of force options will be made by the Toronto Police Services Board. Currently, the use of force options available to TTC special constables are a foam stream oleoresin capsicum spray (pepper spray), a collapsible baton, and handcuffs. The TTC use of force policy is consistent with that of the Toronto Police Service and the provincial Use of Force Model. In 2007, there were 5 incidents that involved TTC special constables using oleoresin capsicum spray, 10 fewer than the 15 incidents in 2006, and 5 fewer than the 10 incidents in 1999, which was the first year that the spray was authorized.503
The TTC is also hoping to increase the number of special constables by 20 in 2008, 20 in 2009, 20 in 2010, and 20 in 2011. These additional special constables will be required to patrol the subways.504
500 Toronto Transit Commission. 2007 TTC Special Constable Annual Report to the Toronto Transit Commission
and the Toronto Police Services Board. Police Services Board Minute P106, meeting of April 17th, 2008. (Retrieved from http://www.tpsb.ca/FS/Docs/Minutes/2008/) 501 Since the time of writing, this issue has been removed from the review. 502 TTC Study Using Tasers. (2008, April 20) The Toronto Star. (Retrieved April 17th, 2008, from http://www.thestar.com/printArticle/415439) 503 Toronto Transit Commission. Oleoresin Capsicum Spray 2007 Year End Report, March 26, 2008. (Retrieved April 17, 2008, from http://www.ttc.ca/postings/gso-comrpt/) 504 Toronto Transit Commission. 2007 TTC Special Constable Annual Report to the Toronto Transit Commission and the Toronto Police Services Board. Police Services Board Minute P106, meeting of April 17th, 2008. (Retrieved from http://www.tpsb.ca/FS/Docs/Minutes/2008/)
22000088 EEnnvviirroonnmmeennttaall SSccaann
Urban Trends 250
Toronto Community Housing Corporation:
The Toronto Community Housing Corporation (TCHC) provides homes for
approximately 164,000 people, in high and low-rise buildings, townhouses, rooming houses, and detached and semi-detached houses. Toronto Housing also operates a Community Safety Unit (CSU) with about 135 staff members, including special constables, provincial offences officers, parking enforcement officers, and safety consultants. As of December 31st, 2007, the TCHC employed 83 special constables who operate out of the CSU.505
In 2007, TCHC special constables reported 20,044 calls, service requests, and investigations relating to TCHC property, a decrease of 20.6% compared to 2006 when TCHC special constables investigated or assisted in 25,254 investigations on or in relation to TCHC property. TCHC special constables arrested and/or charged 570 individuals relating to both criminal and provincial offences in 2007, a decrease of 12.8% compared to the 654 individuals arrested and/or charged in 2006.506
University of Toronto Police:
The University of Toronto (U of T) is the most diverse and largest university in Canada
and the United States (by enrolment). About 15,000 new students are enrolled each year. The special constable services of the U of T provide service to a total community of about 70,000 students. Beyond community policing and law enforcement, these campus police provide safety and security plans, systems, and services based strongly on CPTED principles. 507
As of December 31st, 2007, the University of Toronto employed 31 special constables at the St. George campus and 13 special constables at the Scarborough campus. In 2007, the St. George Campus special constables arrested and investigated 267 persons relating to both criminal and provincial offences, and issued 141 Form 9s (notices to appear in court) and provincial offences tickets (POTs). This was a 3.3% decrease from the 276 persons arrested and investigated and a 50.0% increase from the 94 Form 9s and POTs in 2006. In 2007, the University of Toronto Scarborough Campus special constables arrested and investigated 17 persons relating to criminal and provincial offences, and issued 3 Form 9s and POTs. This was a 72.6% decrease from the 62 persons arrested and investigated, and a 90.0% decreased from the 30 Form 9s and POTs in 2006.508
In July 2006, the U of T campus police joined with Security Tracking of Office Property (STOP) to address a growing concern with thefts of electronic devices and laptops. The STOP anti-theft program involves the adhesion of a owner-registered, patented bar-coded security plate that will deface the stolen property if removed: once a plate is removed, an indelible ‘stolen property’ tattoo renders the property unsuitable for re-sale. The U of T special constables have
505 Toronto Community Housing Community Safety Unit. 2007 Annual Report on Special Constable Operations to the Toronto Police Services Board. Police Services Board Minute P108, meeting of April 17th, 2008. (Retrieved from http://www.tpsb.ca/FS/Docs/Minutes/2008/) 506 Ibid. 507 University of Toronto. 2007 Annual Report to the Police Services Board – University of Toronto Scarborough Community Police Services and 2007 Annual Report to the Police Services Board – Special Constables at the University of Toronto St. George Campus. Police Services Board Minute P107, meeting of April 17th, 2008. (Retrieved from http://www.tpsb.ca/FS/Docs/Minutes/2008/) 508 Ibid.
22000088 EEnnvviirroonnmmeennttaall SSccaann
Urban Trends 251
sold about 4,200 registered plates, and in 2007, no lap-top with the STOP system had been stolen from the St. George campus.509
In October 2006, the U of T special constables also launched a bike bait program, based on a similar program used by police in Victoria, BC, to apprehend offenders and deter bike theft. A Global Positioning System (GPS) beacon is hidden on a bike in a high bike theft area on the St. George campus. When the bike is stolen, members of the Toronto Police Service, with the assistance of U of T special constables, apprehend the suspects; a total of 5 suspects were apprehended in 2007.510
Special constables provide valuable safety and crime prevention services to a number of residents and visitors in the city. Special constables also support the Toronto Police Service by providing policing to locations that might not receive such attention without an increase in municipal police resources and allow the Service to deploy resources elsewhere.
The Police Services Board is authorized under Section 53 of the Police Services Act of Ontario to appoint special constables, subject to the approval of the Solicitor General. The Service’s role with regard to special constables extends to include their hiring, training, and co-ordination. A future challenge for the Service will be to assist in determining force options available to special constables, if special constables expect a level of protection for themselves beyond what is currently authorized, and the public accountability that must accompany any increase in force options. The Service will need to consider the how to address the safety concerns of special constables without blurring the line between municipal policing and special constables.
If the number of special constables is increased in some programs (for example, in the TTC), ensuring training for the additional special constables may also be a challenge for the Service. However, it is important that the Toronto Police remain committed partners with the special constables throughout the city. By supporting the special constables in training, operations, and through improvement initiatives, the communities that they serve will benefit from their response.
K. PRIVATE SECURITY
Private security personnel are made up of two main groups: security guards and private
investigators. Generally, the primary responsibilities of private investigators are to conduct investigations (obtain information for civil and legal litigation cases, locate people, etc.), implement theft and fire prevention strategies, and/or prevent retail theft. Security guards generally control access to buildings and property, protect private property against vandalism and theft, maintain order at public venues, and/or enforce security regulations at businesses.
The focus of private security is in part defined by the mandate and objectives of their client, and primarily concerned with protection and prevention to reduce exposure to
509 Ibid. 510 Ibid.
22000088 EEnnvviirroonnmmeennttaall SSccaann
Urban Trends 252
opportunities for loss and disorder. One of the main sanctions available to private security, acting on behalf of their client, is the ability to restrict access to private property.511
In addition, private security has the ability to collect extensive intelligence information from their interaction with the public. This information can include: case histories on all people its officers confront and the action(s) taken; names, addresses, and offences of individuals (including the specifics of the offence, and date, time, and location), along with details of the offender’s appearance; calls for support; drug activity; reports of abandoned vehicles; and so on.512
In 2006, a study was published in the journal of ‘Policing and Society’ with regard to security intelligence networks and private security. The study examined the results of a 2003 survey of private security originating in Ontario, with an emphasis on the dissemination of intelligence and intelligence networks. The networks included private security, the public police, private security clients, and other private security firms. Among the main findings were that a majority of private security firms (76%) reported sharing some form of standardized intelligence information with their clients more often than with the public police or with other private security firms.513
With regard to the type of intelligence private security firms shared with the public police, fewer than half (46%) shared information about security incidents, 33% shared information on actions taken by the security firm’s officers, 31% shared security concerns expressed by their clients or the public, and 31% shared information about problems with prior personnel. Alternatively, 89% of the firms shared intelligence with their clients about the actions taken by the firm’s officers, 76% shared information on security incidents, 75% shared security concerns, and about 46% shared intelligence on former personnel.
The data showed that private security clients were the main consumers of the intelligence that security firms can offer.514 The client-centred approach of security firms may exclude the police from important sources of information about offenders, incidents, public concerns, and responses to those concerns.515
Over the past 25 years, the client-base of private security has changed. Private security has moved away from manufacturing, toward public sector clients and mass private property consumer sites, such as hospitals, office complexes, and shopping malls.516 Consequently, private security has moved further into the public eye and may have more contact with people, and therefore more intelligence information on people and public activities, than in previous years.
A challenge and opportunity exists for the Service, to strengthen co-operation and partnerships with private security, which may increase access to important information that may not be currently shared; information that could prove valuable in improving the Service’s, investigations and intelligence gathering.
511 Lippert, R., O’Connor, D. (2006) Security Intelligence Networks and the Transformation of Contract Private Security, Policing & Society, 16(1), 50-66. 512 Ibid. 513 Ibid. 514 Ibid. 515 Ibid. 516 Ibid.
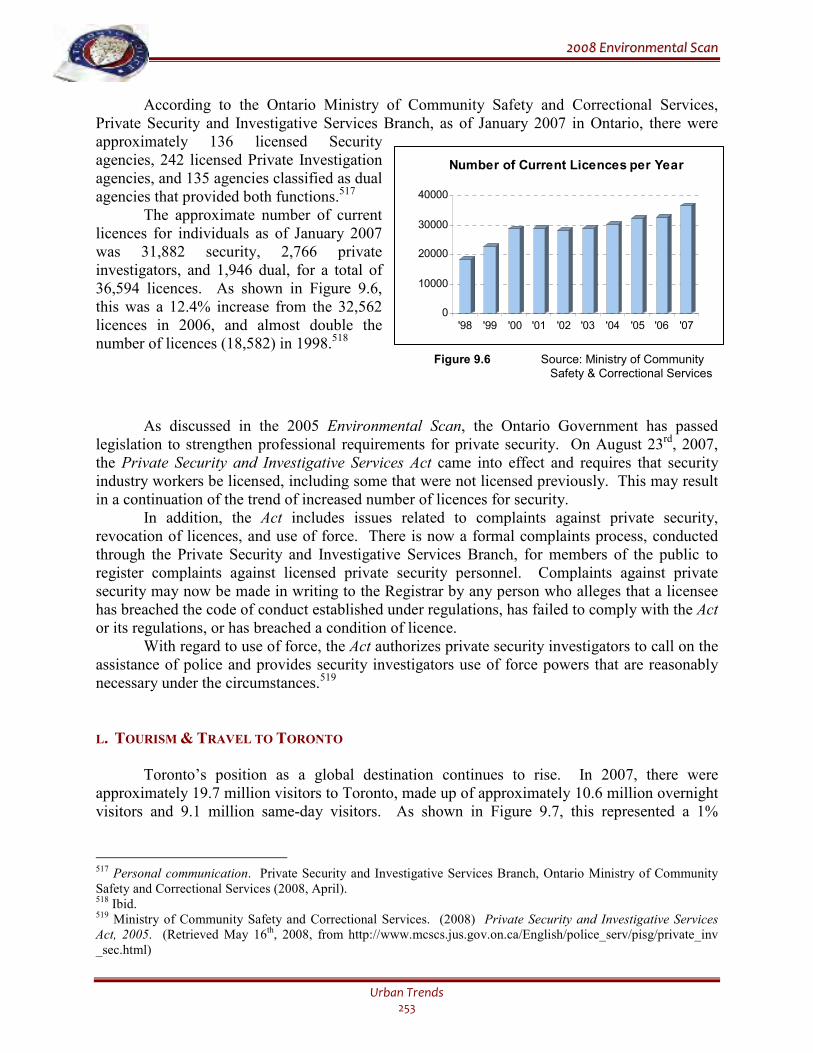
22000088 EEnnvviirroonnmmeennttaall SSccaann
Urban Trends 253
According to the Ontario Ministry of Community Safety and Correctional Services, Private Security and Investigative Services Branch, as of January 2007 in Ontario, there were approximately 136 licensed Security agencies, 242 licensed Private Investigation agencies, and 135 agencies classified as dual agencies that provided both functions.517
The approximate number of current licences for individuals as of January 2007 was 31,882 security, 2,766 private investigators, and 1,946 dual, for a total of 36,594 licences. As shown in Figure 9.6, this was a 12.4% increase from the 32,562 licences in 2006, and almost double the number of licences (18,582) in 1998.518
Figure 9.6 Source: Ministry of Community Safety & Correctional Services
As discussed in the 2005 Environmental Scan, the Ontario Government has passed legislation to strengthen professional requirements for private security. On August 23rd, 2007, the Private Security and Investigative Services Act came into effect and requires that security industry workers be licensed, including some that were not licensed previously. This may result in a continuation of the trend of increased number of licences for security.
In addition, the Act includes issues related to complaints against private security, revocation of licences, and use of force. There is now a formal complaints process, conducted through the Private Security and Investigative Services Branch, for members of the public to register complaints against licensed private security personnel. Complaints against private security may now be made in writing to the Registrar by any person who alleges that a licensee has breached the code of conduct established under regulations, has failed to comply with the Act or its regulations, or has breached a condition of licence.
With regard to use of force, the Act authorizes private security investigators to call on the assistance of police and provides security investigators use of force powers that are reasonably necessary under the circumstances.519
L. TOURISM & TRAVEL TO TORONTO
Toronto’s position as a global destination continues to rise. In 2007, there were approximately 19.7 million visitors to Toronto, made up of approximately 10.6 million overnight visitors and 9.1 million same-day visitors. As shown in Figure 9.7, this represented a 1%
517 Personal communication. Private Security and Investigative Services Branch, Ontario Ministry of Community Safety and Correctional Services (2008, April). 518 Ibid. 519 Ministry of Community Safety and Correctional Services. (2008) Private Security and Investigative Services Act, 2005. (Retrieved May 16th, 2008, from http://www.mcscs.jus.gov.on.ca/English/police_serv/pisg/private_inv _sec.html)
0
10000
20000
30000
40000
'98 '99 '00 '01 '02 '03 '04 '05 '06 '07
Number of Current Licences per Year
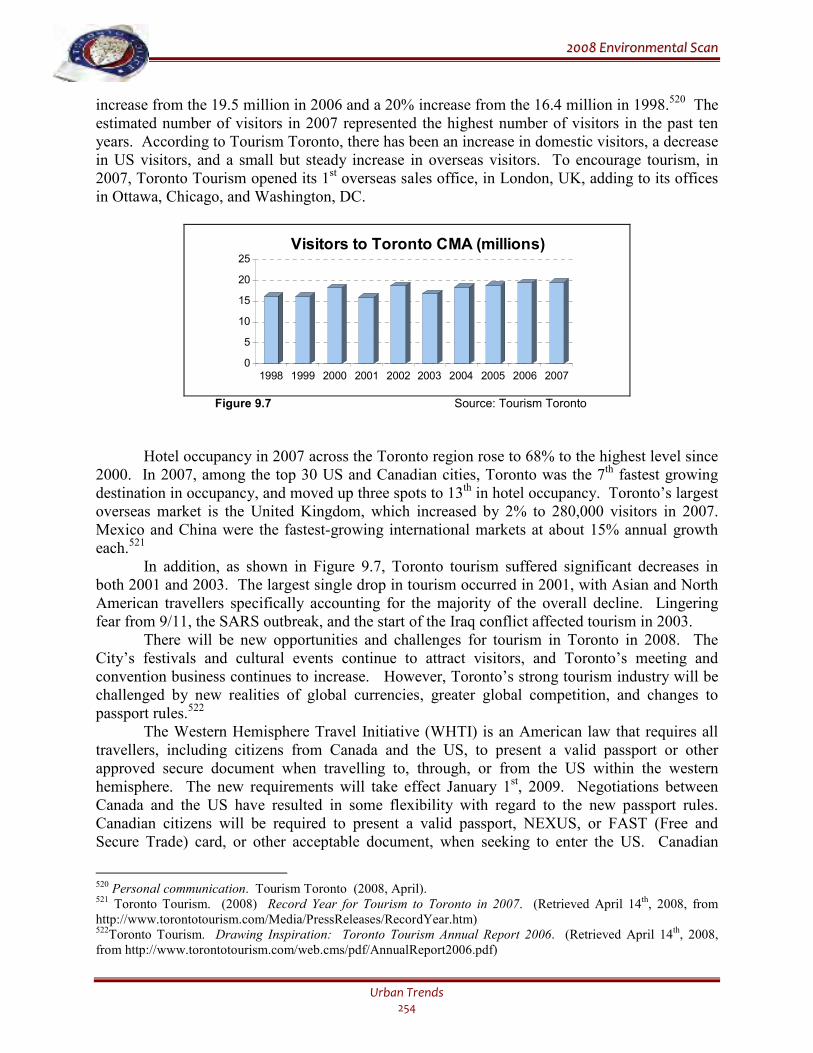
22000088 EEnnvviirroonnmmeennttaall SSccaann
Urban Trends 254
increase from the 19.5 million in 2006 and a 20% increase from the 16.4 million in 1998.520 The estimated number of visitors in 2007 represented the highest number of visitors in the past ten years. According to Tourism Toronto, there has been an increase in domestic visitors, a decrease in US visitors, and a small but steady increase in overseas visitors. To encourage tourism, in 2007, Toronto Tourism opened its 1st overseas sales office, in London, UK, adding to its offices in Ottawa, Chicago, and Washington, DC.
0
5
10
15
20
25
1998 1999 2000 2001 2002 2003 2004 2005 2006 2007
Visitors to Toronto CMA (millions)
Figure 9.7 Source: Tourism Toronto
Hotel occupancy in 2007 across the Toronto region rose to 68% to the highest level since 2000. In 2007, among the top 30 US and Canadian cities, Toronto was the 7th fastest growing destination in occupancy, and moved up three spots to 13th in hotel occupancy. Toronto’s largest overseas market is the United Kingdom, which increased by 2% to 280,000 visitors in 2007. Mexico and China were the fastest-growing international markets at about 15% annual growth each.521 In addition, as shown in Figure 9.7, Toronto tourism suffered significant decreases in both 2001 and 2003. The largest single drop in tourism occurred in 2001, with Asian and North American travellers specifically accounting for the majority of the overall decline. Lingering fear from 9/11, the SARS outbreak, and the start of the Iraq conflict affected tourism in 2003. There will be new opportunities and challenges for tourism in Toronto in 2008. The City’s festivals and cultural events continue to attract visitors, and Toronto’s meeting and convention business continues to increase. However, Toronto’s strong tourism industry will be challenged by new realities of global currencies, greater global competition, and changes to passport rules.522 The Western Hemisphere Travel Initiative (WHTI) is an American law that requires all travellers, including citizens from Canada and the US, to present a valid passport or other approved secure document when travelling to, through, or from the US within the western hemisphere. The new requirements will take effect January 1st, 2009. Negotiations between Canada and the US have resulted in some flexibility with regard to the new passport rules. Canadian citizens will be required to present a valid passport, NEXUS, or FAST (Free and Secure Trade) card, or other acceptable document, when seeking to enter the US. Canadian
520 Personal communication. Tourism Toronto (2008, April). 521 Toronto Tourism. (2008) Record Year for Tourism to Toronto in 2007. (Retrieved April 14th, 2008, from http://www.torontotourism.com/Media/PressReleases/RecordYear.htm) 522Toronto Tourism. Drawing Inspiration: Toronto Tourism Annual Report 2006. (Retrieved April 14th, 2008, from http://www.torontotourism.com/web.cms/pdf/AnnualReport2006.pdf)
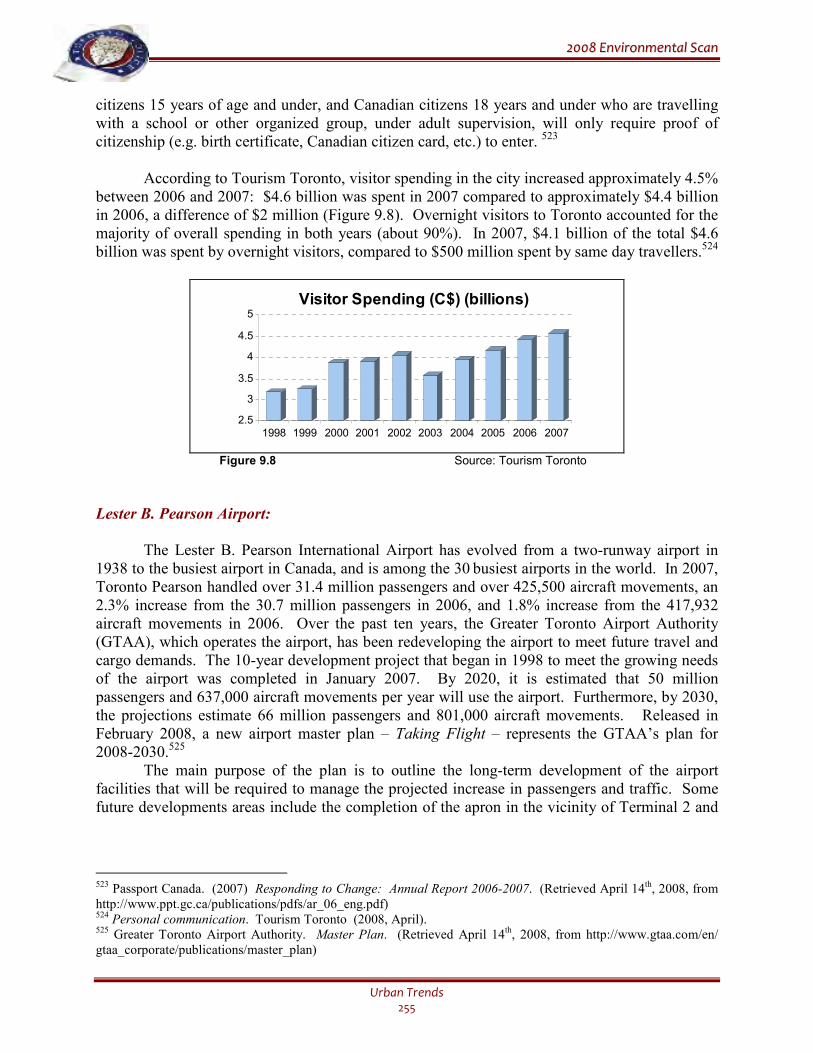
22000088 EEnnvviirroonnmmeennttaall SSccaann
Urban Trends 255
citizens 15 years of age and under, and Canadian citizens 18 years and under who are travelling with a school or other organized group, under adult supervision, will only require proof of citizenship (e.g. birth certificate, Canadian citizen card, etc.) to enter. 523
According to Tourism Toronto, visitor spending in the city increased approximately 4.5% between 2006 and 2007: $4.6 billion was spent in 2007 compared to approximately $4.4 billion in 2006, a difference of $2 million (Figure 9.8). Overnight visitors to Toronto accounted for the majority of overall spending in both years (about 90%). In 2007, $4.1 billion of the total $4.6 billion was spent by overnight visitors, compared to $500 million spent by same day travellers.524
2.5
3
3.5
4
4.5
5
1998 1999 2000 2001 2002 2003 2004 2005 2006 2007
Visitor Spending (C$) (billions)
Figure 9.8 Source: Tourism Toronto
Lester B. Pearson Airport:
The Lester B. Pearson International Airport has evolved from a two-runway airport in 1938 to the busiest airport in Canada, and is among the 30 busiest airports in the world. In 2007, Toronto Pearson handled over 31.4 million passengers and over 425,500 aircraft movements, an 2.3% increase from the 30.7 million passengers in 2006, and 1.8% increase from the 417,932 aircraft movements in 2006. Over the past ten years, the Greater Toronto Airport Authority (GTAA), which operates the airport, has been redeveloping the airport to meet future travel and cargo demands. The 10-year development project that began in 1998 to meet the growing needs of the airport was completed in January 2007. By 2020, it is estimated that 50 million passengers and 637,000 aircraft movements per year will use the airport. Furthermore, by 2030, the projections estimate 66 million passengers and 801,000 aircraft movements. Released in February 2008, a new airport master plan – Taking Flight – represents the GTAA’s plan for 2008-2030.525 The main purpose of the plan is to outline the long-term development of the airport facilities that will be required to manage the projected increase in passengers and traffic. Some future developments areas include the completion of the apron in the vicinity of Terminal 2 and
523 Passport Canada. (2007) Responding to Change: Annual Report 2006-2007. (Retrieved April 14th, 2008, from http://www.ppt.gc.ca/publications/pdfs/ar_06_eng.pdf) 524 Personal communication. Tourism Toronto (2008, April). 525 Greater Toronto Airport Authority. Master Plan. (Retrieved April 14th, 2008, from http://www.gtaa.com/en/ gtaa_corporate/publications/master_plan)
22000088 EEnnvviirroonnmmeennttaall SSccaann
Urban Trends 256
construction of a 7,500 space parking garage by 2013, and, beyond 2013, Pier a new terminal complex, expansion of Terminal 1 parking, and a sixth runway.526 Although Pearson Airport is not directly policed by the Toronto Police Service, it is an important gateway to the City of Toronto. As concern over illegal activity, terrorism, and illegal goods entering the country increases, it is important that the Service remain vigilant of the country’s entry points – especially one of the busiest.
Toronto City Centre Airport:
Toronto City Centre Airport (the Island Airport) is located on 200 acres of land at the western end of the Toronto Islands. The Island Airport is serviced by ferries and has 3 runways. In recent years, the airport has experienced annual aircraft movements of 100,000 to 160,000. The Island Airport is governed by a tri-partite agreement between the Toronto Port Authority, the Federal Government, and the City of Toronto.527
In 2006, Porter Airlines began operations at the Island Airport, signing a long-term operating agreement with the Toronto Port Authority. Their contract with Bombardier Aerospace, which includes the purchase of ten 70-seat aircraft, is worth approximately $500 million, and includes an option to purchase and additional 10 aircraft.528
In 2008, Porter Airlines opened a new terminal at the airport, which tripled passenger lounge space and increased airport gate capacity. By 2009, Porter plans to have 12 aircraft in the fleet and will be serving up to 8 destinations. In addition, its international destination (New York) is expected to increase traffic.529 Increased use of the Island Airport may increase the demand for city services, including police services. Without a land bridge link, the Service’s Marine Unit will likely be called upon to provide response. Training on airport security and response procedures and operations will be required; and, depending on the level of demand, the Marine Unit may also require additional resources.
Toronto Port Terminal:
According to the Criminal Intelligence Service Canada (CISC), many organized crime groups have links to marine ports. The most significant influences are linked to outlaw motorcycle gangs, traditional crime groups, and local domestic crime groups. Criminality at marine ports affects law enforcement across Canada, as the ports are conduits for a variety of illicit products, including drugs, tobacco, alcohol, firearms, and illegal migrants. Furthermore, stolen vehicles are often illegally exported in containers to other countries. Marine ports that receive international shipping are all vulnerable to criminal infiltration and exploitation.530
526 Ibid. 527Toronto Port Authority. Airport Information. (Retrieved April 21st, 2008, from http://www.torontoport.com/ airport_facts.asp) 528 Porter Airlines. (2006) Porter Airlines Takes Flight. News Release. (Retrieved April 21st, 2008, from http://www.flyporter.com/en/press2006.aspx?id=27) 529 Porter Airlines. (2008) Porter Airlines Opens Expanded Terminal at Toronto City Centre Airport. News Release. (Retrieved April 21st, 2008, from http://www.flyporter.com/en/press2008.aspx?id=51) 530 Criminal Intelligence Service Canada. Organized Crime at Marine Ports. 2003 Annual Report: Organized Crime in Canada. (Retrieved April 24th, 2008, from http://www.cisc.gc.ca/annual_reports/annual_report_2003/ ports_2003_e.html)
22000088 EEnnvviirroonnmmeennttaall SSccaann
Urban Trends 257
The majority of all commercial non-US origin trade enters Canada through a marine port. Containers are compact, quickly off-loaded from vessels, and can be moved quickly by rail or truck to a number of Canadian and US destinations. The size and traffic, including the large port workforce, create difficulties for security. Criminal elements operating within marine ports have been identified at the three major container ports in Vancouver, Montreal, and Halifax. The criminal presence at marine ports often goes unnoticed by port employees, and criminal activities may only involve a small number of key employees. A number of large drug seizures have highlighted concerns about organized crime and vulnerability at Canadian ports, including seizures at Halifax port of 11.5 tonnes of hashish and 172 kilograms of cocaine in 2003. Heightened security awareness is vital, as additional concerns are raised about the potential of marine ports to act as conduits for illegal individuals, goods, or materials that could support acts of terrorism.531
The Toronto Port Terminal operations occupy 50 acres of land and include: seven marine berths to St. Lawrence depth; a marine terminal building with 150,000 square feet of storage; a container distribution centre with 100,000 square feet of heated storage; rail service by Canadian National (CN) and Canadian Pacific (CP); and a container yard with handling equipment.532
With further development and expansion expected in the port area and along the waterfront, the Port Authority may be a challenged to inspect and manage cargo and goods, creating increased opportunity for the proliferation of illegal goods and organized crime activity. Service units responsible for these policing service areas, including the Marine Unit and Detective Services units, must continue to be alert to the potential vulnerabilities and challenges and be prepared to address them; the Service, in turn, must ensure these units have the resources they require to carry out these responsibilities.
M. EMERGENCY PREPAREDNESS
Following the terrorist attacks on September 11th, 2001, an initiative began to address
emergency preparedness in the city of Toronto. The primary functions of the Toronto Police Service’s Public Safety and Emergency Management Unit are to oversee the internal emergency preparedness of the Service, and to plan, respond to, and facilitate the recovery from all major disasters and/or emergencies that could affect the City. The Enhanced Emergency Preparedness Initiative brings members of TPS together with other city service partners, including Fire and Emergency Medical Services, as well as other services and agencies to co-ordinate effective emergency preparedness. The Initiative focuses on five main components: emergency management planning; chemical, biological, radiological, and nuclear (CBRN) joint team; heavy urban search and rescue (HUSAR); public health emergencies preparation and response; and, critical infrastructure/counter terrorism.533
Over the past few years, there has been a surge in concern over the possibility of national and world-wide pandemics. The TPS is nearing the completion of a Public Health and Pandemic Response Plan, Procedure, and Vaccination Strategy for its members. Furthermore, the TPS is
531 Ibid. 532Toronto Port Authority. Facilities. (Retrieved April 21st, 2008, from http://www.torontoport.com/ port_facilities.asp) 533 Toronto Police Service. Enhanced Emergency Preparedness 2007 Annual Report. Police Services Board Minute P105, meeting of April 17th, 2008. (Retrieved from http://www.tpsb.ca/FS/Docs/Minutes/2008/)
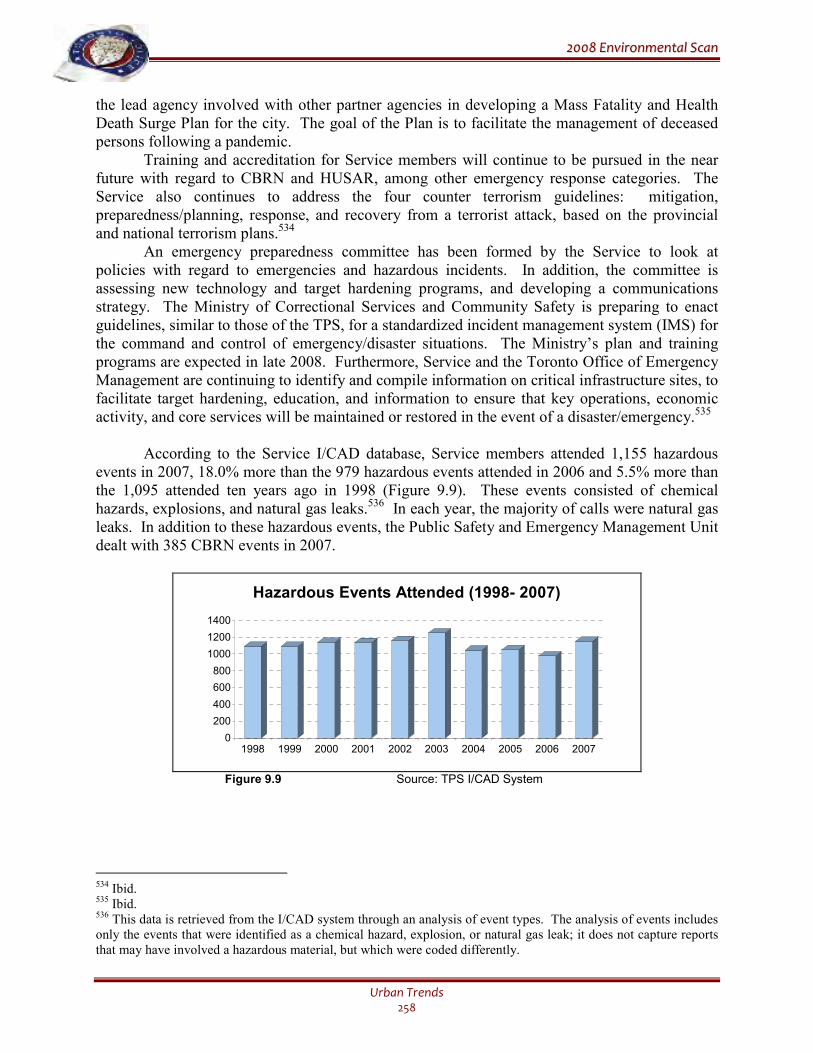
22000088 EEnnvviirroonnmmeennttaall SSccaann
Urban Trends 258
the lead agency involved with other partner agencies in developing a Mass Fatality and Health Death Surge Plan for the city. The goal of the Plan is to facilitate the management of deceased persons following a pandemic.
Training and accreditation for Service members will continue to be pursued in the near future with regard to CBRN and HUSAR, among other emergency response categories. The Service also continues to address the four counter terrorism guidelines: mitigation, preparedness/planning, response, and recovery from a terrorist attack, based on the provincial and national terrorism plans.534
An emergency preparedness committee has been formed by the Service to look at policies with regard to emergencies and hazardous incidents. In addition, the committee is assessing new technology and target hardening programs, and developing a communications strategy. The Ministry of Correctional Services and Community Safety is preparing to enact guidelines, similar to those of the TPS, for a standardized incident management system (IMS) for the command and control of emergency/disaster situations. The Ministry’s plan and training programs are expected in late 2008. Furthermore, Service and the Toronto Office of Emergency Management are continuing to identify and compile information on critical infrastructure sites, to facilitate target hardening, education, and information to ensure that key operations, economic activity, and core services will be maintained or restored in the event of a disaster/emergency.535
According to the Service I/CAD database, Service members attended 1,155 hazardous events in 2007, 18.0% more than the 979 hazardous events attended in 2006 and 5.5% more than the 1,095 attended ten years ago in 1998 (Figure 9.9). These events consisted of chemical hazards, explosions, and natural gas leaks.536 In each year, the majority of calls were natural gas leaks. In addition to these hazardous events, the Public Safety and Emergency Management Unit dealt with 385 CBRN events in 2007.
0
200
400
600
800
1000
1200
1400
1998 1999 2000 2001 2002 2003 2004 2005 2006 2007
Hazardous Events Attended (1998- 2007)
Figure 9.9 Source: TPS I/CAD System
534 Ibid. 535 Ibid. 536 This data is retrieved from the I/CAD system through an analysis of event types. The analysis of events includes only the events that were identified as a chemical hazard, explosion, or natural gas leak; it does not capture reports that may have involved a hazardous material, but which were coded differently.
22000088 EEnnvviirroonnmmeennttaall SSccaann
Urban Trends 259
In June 2006, a report entitled Emergency – Municipalities Missing From Disaster Planning was produced for the Federation of Canadian Municipalities (FCM) by the National Security Group.
The report discussed a number of issues and made a number of recommendations related to Canada’s lead public safety department (Public Safety Canada – formerly Public Safety and Emergency Preparedness Canada). The report outlined two major challenges to municipalities. First, because municipalities are most likely where the initial response will be concentrated, they must have a voice in shaping legislative policies and regulations with regard to security and emergency preparedness. Second, the funds allocated at all levels of government for public security and emergency preparedness must be distributed according to a recognized plan, which would require the recognition, consultation, and proper funding of municipalities. Furthermore, the study suggested that the funding municipalities received through programs such as the Joint Emergency Planning Program (JEPP), Heavy Urban Search and Rescue (HUSAR), etc., was limited and highly bureaucratized. There also seemed to be no appropriate correlation between the allocation of resources dedicated to public safety and the degree of responsibility for increased public safety.537
The report further recommended that the Federation of Canadian Municipalities ask the Canadian Association of Chiefs of Police to advise them on inter-jurisdictional policing challenges and to ensure that its police service members participate in studies and exercises. Services should be advised to seek federal funding through the new Public Safety National Exercises Program (NEP), which consists of training courses and operation centre exercises relating to the National emergency Response System.538
As more responsibility is downloaded to municipal policing services in the area of training and developments to national standards, the Service will be challenged to meet these training standards without other services being affected..
N. SPECIAL EVENTS
Toronto attracts a number of special events and demonstrations that challenge the Police
Service and its resources. Throughout the year, but especially during the summer months, a number of important events take place in Toronto. The events showcase the city, are venues for the Service to strengthen ties with the community, and champion the city as a safe and vibrant place to live, work, and visit. Large annual events include: Caribana, Pride Week, the Canadian National Exhibition (CNE), the Toronto Jazz Festival, the Toronto Marathon, the Santa Clause Parade, and New Years Eve celebrations, as well as various community, neighbourhood, and cultural events. Effective planning of the police response to these events will ensure the effective and efficient management of people and traffic, and is paramount to the safety and success of the events and the promotion of Toronto. Demonstrations are an important reality in a democratic society, and although generally peaceful, they can cause a strain upon police personnel and resources. Unlike scheduled special events, the unpredictability of some demonstrations presents challenges for the Service in the
537 National Security Group. (2006) Emergency: Municipalities Missing From Disaster Planning – A Report to The Federation of Canadian Municipalities (FCM). (Retrieved April 21st, 2008, from http://www.fcm.ca/CMFiles/ emergency1mtc-3282008-7706.pdf) 538 Ibid.
22000088 EEnnvviirroonnmmeennttaall SSccaann
Urban Trends 260
areas of crowd management and community safety. Demonstrators’ emotions are often high and it is important that the police continue to ensure peace while at the same time protecting the safety and rights of all people. It is important to ensure that close ties are kept with city officials, community stakeholders, and event planners to ensure that the safety of the police and public is maintained and that policing services are delivered to everyone throughout Toronto in an efficient and timely manner. The effective and efficient deployment of on-duty personnel, off-duty paid duty personnel, and Auxiliary and volunteer members is important to managing both city-wide and community-specific events and demonstrations. The Service must be cognizant of the strain that can occur for police divisions throughout the city, as their personnel are temporarily re-deployed for the large events in other areas. During both internal and public consultations for this document, concerns were raised that the deployment of on-duty officers for special events meant that community problems or concerns were temporarily not able to receive adequate police attention. A balance must be found that allows the Service to continue to support community special events that are important to the vibrancy of the city, while also assuring the public that regular policing services will not be neglected.
RECOMMENDATIONS FOR POLICE SERVICE
• The Service must continue to involve communities as a key component of any solutions to
crime or disorder issues. The Service must support the community so that they identify with, care about, and address problems as a unified group. Service commitment to and execution of community mobilization must be strengthened and expanded.
• The Service must support increased investment in the city and its services, and be aware of
the important contribution that the Service, the diverse communities, and workforce make to Toronto’s global positioning.
• The Service must remain aware of development throughout the city, and plan its services in
concert with city planners, and public and private developers, to ensure that policing issues such as CPTED and traffic disruption are included in emerging development plans. Deployment and allocation of Service resources must take into account potential demands.
• The Service must strive to understand the extent, origins, and significance of issues related to
the homeless and those on the street, as police officers often come into contact with many groups and individuals at risk.
• Environmental concerns will continue and it is vital that the Service be cognizant of new
technology and the effect of TPS operations, facilities, and equipment on the environment. • With increased interest in expanding public transit as the federal, provincial, and municipal
governments recognize the economic, social, and environmental costs of traffic congestion in major urban areas, the Service must be involved with the planning of and support of TTC
22000088 EEnnvviirroonnmmeennttaall SSccaann
Urban Trends 261
projects. Such involvement will ensure that the Service is aware of and able to address the impacts of expansion, both during construction and after.
• It is important the Toronto Police remain committed partners with the organizations that use
special constables throughout the city and support them in training, operations, and improvement initiatives.
• Private security partnerships offer an opportunity for the Toronto Police to gather important
intelligence information from community-level workers. It is important that the Service assess their relationship with security firms to determine how to create or improve these partnerships.
• The Service must be prepared to deal with the increased challenges and vulnerabilities that
may arise with increased traffic at the airports and the port, including the concern of organized crime activities.
• The Service must be cognizant of the strain that can occur to police divisions throughout the
city, as their personnel are temporarily re-deployed to large events within the division or in other areas of the city. A balance must be found between the deployment of on-duty personnel, off-duty paid duty personnel, and Auxiliary and volunteer members to these events and the requirement to meet regular policing demands. It is important to ensure that police divisions are able to efficiently and effectively provide service to the public during city-wide or community-specific special events.

22000088 EEnnvviirroonnmmeennttaall SSccaann
Urban Trends 262
22000088 EEnnvviirroonnmmeennttaall SSccaann
Public Perceptions 263
X. PUBLIC PERCEPTIONS
The police provide a necessary service for the public, and the police, in turn, depend on the
public for support. The importance of this interdependence is reflected in ongoing efforts
to improve police-community relations. Public perceptions of police performance and
personal safety are major indicators of the effectiveness of police services and strategies
and of the success of the deployment of Service resources. Trends in these indicators can,
therefore, be useful in establishing Police Service priorities.
HIGHLIGHTS • According to the 2004 Statistics Canada General Social Survey, almost all Canadians (94%)
in 2004 said that they were satisfied with their safety from crime – an increase from both 1999 (91%) and 1993 (86%)
• According to the results of the Service’s 2007 community survey, most Toronto residents
(91%) felt their neighbourhoods were safe, up from 86% in 2006 and from 74% in 2000. Slightly fewer people felt that Toronto in general was safe (82%).
• Toronto residents were also generally less likely to be concerned about crime and disorder.
The only disorder issues of increased concern in neighbourhoods were noise, vandalism, and graffiti. People considered guns the most serious policing problem in Toronto overall each year since 2005, although the proportion decreased from 2005 to 2007.
• Most people (89%) said they were satisfied with the delivery of police service to their
neighbourhood, up slightly from 88% in 2006 and from 74% in 2000. Slightly more people, however, said they were satisfied with the Police Service overall (93%).
• Almost three in ten Toronto residents (29%) in 2007 said that they believed that Toronto police
officers targeted members of minority or ethnic groups for enforcement, down from 33% in 2006, but up from 26% in 2000.
• Of those in 2007 who’d had contact with police, most (88%) said they felt the officer treated
them with respect during the contact. This proportion was just slightly higher than in 2006 or 2000 (86% and 87%, respectively). Of those who’d had police-initiated contact with police, 80% said they felt the officer(s) had treated them fairly, up from 77% in 2006 and 76% in 2000.
• According to the results of the Service’s annual survey of high school students, most students
said they felt safe in and around the school at any time of the day, with the proportion showing relatively little change over the years (86% in 2007 and 2006, 85% in 2001).
• When asked about the most serious policing problem in and around their school, the most
common answer from students in both 2006 and 2007, and in 2001, was assaults/fighting. In 2007, bullying was the second most frequent answer, moving up from third in 2006.
22000088 EEnnvviirroonnmmeennttaall SSccaann
Public Perceptions 264
• When asked about the level of violence, if any, at their school, the largest proportion of students in all years said that, generally, their school and school grounds weren’t violent. In 2007, the proportion of students who thought their school was ‘very’ or ‘somewhat’ violent was 33%, up somewhat from 31% in 2006, but the same as the 33% in 2001.
• Starting in 2006, students were asked whether they had ever experienced cyber-bullying or been
harassed through e-mail or the Internet. That year, just over 1 in 5 students (21%) said they had been cyber-bullied. In 2007, the proportion increased to almost 1 in 4 students (24%). There was a similar slight increase in the proportion of students who said that someone they’d only met on the Internet asked to meet them in person (22% in 2007, 20% in 2006).
• Just under two-thirds of students in 2007 (65%) and 2006 (64%) said they would feel
comfortable talking to police about crime or a problem in their schools, down somewhat from 67% in 2001. When asked why they wouldn’t be comfortable talking to police, the most common reasons were that police made them nervous, that it wasn’t their place to talk about what others were doing, and that they didn’t want to be a snitch.
• In both 2006 and 2007, fewer than 1 in 10 students reported that they had been the victim of a
crime at school during the past year. In both years, students who said they’d been victimized most commonly reported being threatened. When students were asked, if applicable, why they didn’t report their victimization to the police, a common answer in both years was that the police wouldn’t do anything.
• The Service conducted telephone surveys with just over 100 victims of domestic violence in
early 2007 and early 2008. While slightly more victims said they felt safe in their neighbourhood in 2008 (82%) than in 2007 (80%), they felt less safe in their neighbourhoods than those in the general community survey (91% at the end of 2007).
• The small sample of victims of domestic violence surveyed were asked about their experience
with police. Somewhat fewer victims in 2008 said they got the service they expected from the officers (84% in 2008, 87% in 2007), however, most in both years said that, overall, they were satisfied with the way police handled the incident (81% in 2008, 82% in 2007).
• Far fewer of the domestic violence victims surveyed in 2008 said they had received follow-up
support or referrals after the initial call: while 80% in 2007 said received follow-up, this dropped to 68% in 2008. This lack of follow-up was also noted in focus groups held with victims of domestic violence.
A. NATIONAL PERCEPTIONS OF PERSONAL SAFETY AND POLICE
Perceptions of Safety:
Fear of crime and perceptions of safety are important indicators of the way people feel about their cities and neighbourhoods. They can also be indicators of confidence in police and how well people feel their police services are performing, and can shape the demands they place
22000088 EEnnvviirroonnmmeennttaall SSccaann
Public Perceptions 265
on those police services. These perceptions can be influenced by many things, including personal experiences or the experiences of family, friends, or neighbours, and the media reports about the ‘crime problem’ in the city or neighbourhood. As noted in the Victimization chapter, in 2004, Statistics Canada carried out the fourth General Social Survey (GSS) on victimization. The GSS also asks Canadians aged 15 and older about their perceptions and fear of crime, as well as their perceptions of the criminal justice system.539 The GSS found that about 6 in 10 people (59%) believed that crime was lower in their neighbourhood than elsewhere in Canada, and a similar proportion (58%) felt that their neighbourhood crime rate hadn’t changed in the past five years.
Almost all Canadians (94%) in 2004 said that they were satisfied with their safety from crime – an increase from both 1999 (91%) and 1993 (86%). While most men and women were not afraid of victimization, in 2004, overall feelings of personal safety were slightly higher among men (95%) than women (93%); this gender difference was smaller than in the past. There were, however, considerable differences between men and women in fear of crime in relation to specific activities at night. More women than men were afraid of being victimized while waiting for or using public transit at night, of being home alone at night, and of walking alone in the dark. It was also found that visible minorities were slightly less likely than non-visible minorities to say they were satisfied with their personal safety.540
The GSS also found that those who did use public transit at night or who regularly walked alone at night were less likely to be fearful of victimization than those who did not. Statistics Canada suggested that either lower levels of fear increased participation in night-time activities, or that those who did participate in night-time activities, through experience, were more likely to believe there was a small probability of becoming a victim.541 The results of a telephone survey by Environics in December 2005 were compared to the results of similar surveys that Environics has been carrying out for almost 30 years.542 The most recent survey found that Canadians were no more concerned about crime now than at any time in the past three decades. Only 15% of people said that crime in their neighbourhood was a serious problem (20% in Toronto). The most common sources of crime in communities were illegal drugs and social conditions (e.g. poverty). The researchers concluded that “These data suggest that people may be picking up on what they see and hear in media reports about violent crime on our streets, but this is not translating into a reduced sense of personal safety.”543 Similarly, an on-line Angus Reid poll of Greater Toronto Area (GTA) residents in February 2008 found that half of respondents (52%) said their city was just as safe now as a year ago; 55% said their neighbourhood was just as safe.544 Just over one-third (36%) said their city
539 Gannon, M. (2005). General Social Survey on Victimization, Cycle 18: An Overview of Findings, 2004. Catalogue no. 85-565-XIE. Ottawa: Statistics Canada. 540 Perreault, S. (2004). Visible Minorities and Victimization. (Canadian Centre for Justice Statistics Profile Series) (Catalogue No. 85F0033MIE – No. 015). Ottawa: Statistics Canada. 541 Gannon (2005). 542 Neuman, K. (2006, March 13th). Who’s afraid of violent crime? Press Release – Environics Research Group. (Retrieved August 28th, 2006, from http://erg.environics.net/news/default.asp?aID=601) 543 Ibid, p.2. 544 Angus Reid Strategies. (2008, February 20th). A Third of Torontonians Feel Their Municipality Has Become
Less Safe. News Release. (Retrieved from http://www.angusreidstrategies.com/ index.cfm?fuseaction=news&newsid =167)
22000088 EEnnvviirroonnmmeennttaall SSccaann
Public Perceptions 266
was less safe and 31% said that their neighbourhood was less safe. However, when these results were compared to the perceptions of the rest of Canada, GTA residents obviously felt less safe. Only 25% of the rest of Canada felt that their city was less safe than a year ago, and just 21% felt the same of their neighbourhood. Once again, media may, to some degree, shape these perceptions.
Perceptions of Police/Policing:
With regard to perceptions of police, the 2004 GSS found that Canadians generally gave a positive assessment of their police: 65% said their local police were doing a good job at being approachable, 61% at ensuring citizens’ safety, 59% at enforcing laws, and 59% at treating people fairly. Fewer felt that police were doing a good job at responding promptly to calls (52%) or supplying information on reducing crime (50%).545 While men and women seemed to hold similar opinions on these issues, opinions were affected by age: positive attitudes generally increased with age. Opinions of police also tended generally to be lower with those who had contact with police in the 12 months prior to the survey. The 2004 GSS also examined perceptions of police held by visible minorities. It was found that visible minorities were less likely to rate the police as doing a good job at being approachable, supplying information on ways to reduce crime, and treating people fairly. There was less difference between visible and non-visible minorities on rating police good at enforcing laws, responding promptly to calls, and ensuring citizens’ safety.546 Chinese people were least likely, while South Asians were most likely, to rate police as doing a good job in all aspects of performance (with Blacks and other visible minorities generally between these two groups). The relatively positive view of the police in the 2004 GSS reinforced findings from the 2003 GSS that looked at confidence in public institutions. Of the nine institutions included, people were most confident in the police: 82% said they had ‘a great deal’ or ‘quite a lot’ of confidence in police.547 Local business people (80%) and banks (68%) followed; and only 57% said they had confidence in the justice system. The high level of confidence in the police in Canada should not be taken for granted – in comparison, in 2003, the Gallup Organization found that 61% of Americans had ‘a great deal’ or ‘quite a lot’ of confidence in the police.548 In a similar vein, Leger Marketing’s 2007 Profession Barometer – conducted annually by through telephone survey – found that police officers were the sixth most trusted profession in Canada (84% of respondents said they trusted police officers), up from seventh place in 2006 (81%). In Ontario, the increase between 2006 and 2007 was even greater, increasing from 78% to 85%.549
545 Gannon (2005). 546 Perreault (2004). 547 Schellenberg, G. (2004) Perceptions of Canadians: A sense of belonging, confidence and trust. Canadian
Social Trends, No.75, 16-21. 548 Roberts, J.V. (2004) Public Confidence in Criminal Justice: A Review of Recent Trends 2004-05. Report
Prepared for Public Safety and Emergency Preparedness Canada (now Public Safety Canada). (Retrieved from http://ww2.ps-sp.gc.ca/publications/corrections/200405-2_e.asp) 549 Leger Marketing. (2007, May 15th). Profession Barometer. (Retrieved from http://www.legermarketing.com/ documents/spclm/070522ENG.pdf)
22000088 EEnnvviirroonnmmeennttaall SSccaann
Public Perceptions 267
As noted above, perceptions of safety can be affected by many things, including perceived disorder or incivility (physical and social) in the neighbourhood. When people become sufficiently uneasy about incivilities like littering, drug use, public drinking, and the like, they may begin to feel that their neighbourhood is unsafe.550 Using data from the 2004 GSS, recent research found that the perception of incivilities – both physical (e.g. graffiti, vandalism) and social (e.g. drug use/dealing, noise, homelessness) – was related to the urban environment. Residents in areas of high housing density or within 5 km or the city centre reported significantly more problems with incivilities in their neighbourhoods than those living in lower density housing or farther from the city centre.551 When these two variables were combined to define urban (high density housing, within 5 km of the city centre) and suburban (low density housing, more than 15 km or more from the city centre), the difference was even more pronounced. In the Toronto Census Metropolitan Area (CMA), 81% of suburban residents reported no problems with incivility, either physical or social, while only 47% of urban residents reported no problems.552 Similarly, while 1 in 4 urban residents (25%) in the Toronto CMA reported both types of incivility in their neighbourhood, only 6% of suburban residents did so. These finding may have implications for the policing strategies that divisions in different areas of the city employ, as well as for the types of problems that should be the focus of police-community problem-solving efforts.
B. GENERAL COMMUNITY
Perceptions of Safety:
In the final quarter of each year, the Toronto Police Service typically contracts for a
community telephone survey of 1,200 Toronto residents; in 2007, 602 Toronto residents were surveyed.553 In each year, the survey focuses on the respondent’s perception of crime and personal safety, satisfaction with the delivery of policing services to their neighbourhood and in general, and, where the respondent has had contact with the police in the past year, satisfaction with the service provided.
550 Keown, L.A. (2008). A Profile of Perceptions of Incivility in the Metropolitan Landscape. Canadian Social Trends, No. 86, 3-10. 551 Ibid. 552 The Toronto Census Metropolitan Area extends from Ajax to Oakville, and north to Newmarket, and includes the following municipalities: Ajax, Aurora, Bradford, West Gwillimbury, Brampton, Caledon, East Gwillimbury, Georgina, Halton Hills, King, Markham, Milton, Mississauga, Mono, New Tecumseh, Newmarket, Oakville, Orangeville, Pickering, Richmond Hill, Toronto, Uxbridge, Vaughan, and Whitchurch-Stouffville. 553 The community survey conducted for the Service is a randomly selected sample of adult residents. For years in which 1,200 adults are surveyed, the results are considered accurate within ±2.8%, 95 times out of 100, of what they would have been had the entire adult resident population of Toronto been surveyed. For the sample of 600 adults, the results are considered accurate within ±4.0%, 95 times out of 100.
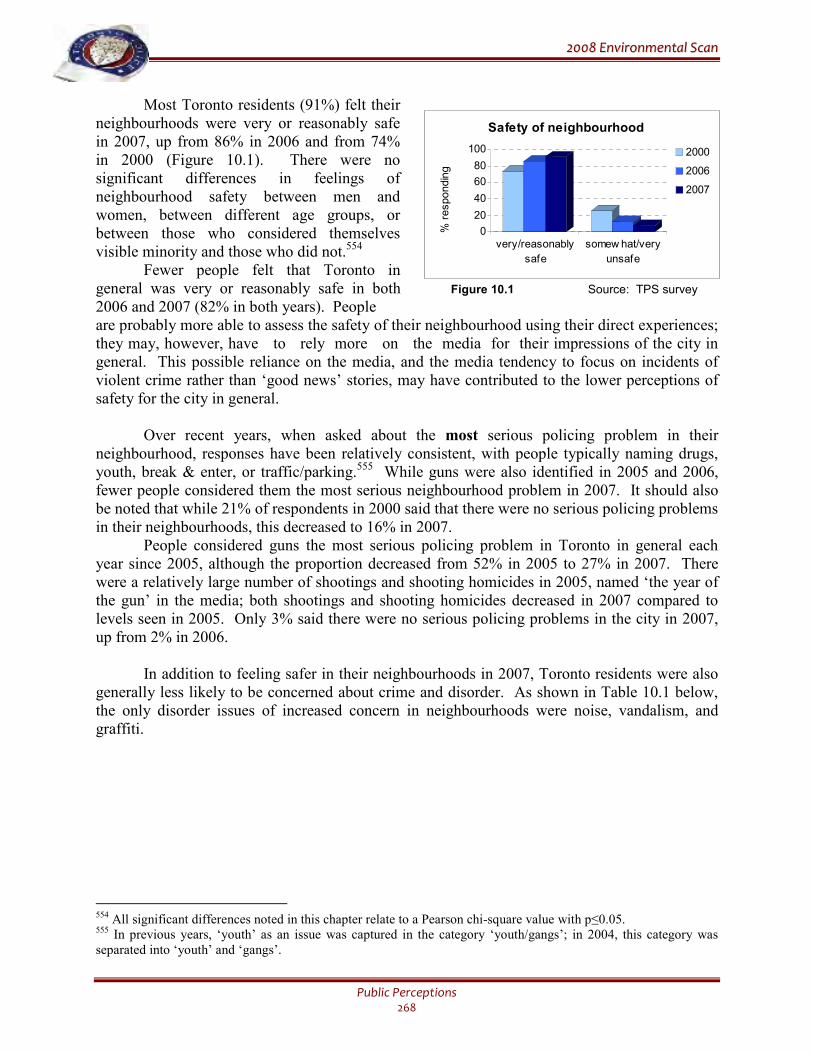
22000088 EEnnvviirroonnmmeennttaall SSccaann
Public Perceptions 268
Most Toronto residents (91%) felt their neighbourhoods were very or reasonably safe in 2007, up from 86% in 2006 and from 74% in 2000 (Figure 10.1). There were no significant differences in feelings of neighbourhood safety between men and women, between different age groups, or between those who considered themselves visible minority and those who did not.554
Fewer people felt that Toronto in general was very or reasonably safe in both Figure 10.1 Source: TPS survey 2006 and 2007 (82% in both years). People are probably more able to assess the safety of their neighbourhood using their direct experiences; they may, however, have to rely more on the media for their impressions of the city in general. This possible reliance on the media, and the media tendency to focus on incidents of violent crime rather than ‘good news’ stories, may have contributed to the lower perceptions of safety for the city in general. Over recent years, when asked about the most serious policing problem in their neighbourhood, responses have been relatively consistent, with people typically naming drugs, youth, break & enter, or traffic/parking.555 While guns were also identified in 2005 and 2006, fewer people considered them the most serious neighbourhood problem in 2007. It should also be noted that while 21% of respondents in 2000 said that there were no serious policing problems in their neighbourhoods, this decreased to 16% in 2007. People considered guns the most serious policing problem in Toronto in general each year since 2005, although the proportion decreased from 52% in 2005 to 27% in 2007. There were a relatively large number of shootings and shooting homicides in 2005, named ‘the year of the gun’ in the media; both shootings and shooting homicides decreased in 2007 compared to levels seen in 2005. Only 3% said there were no serious policing problems in the city in 2007, up from 2% in 2006. In addition to feeling safer in their neighbourhoods in 2007, Toronto residents were also generally less likely to be concerned about crime and disorder. As shown in Table 10.1 below, the only disorder issues of increased concern in neighbourhoods were noise, vandalism, and graffiti.
554 All significant differences noted in this chapter relate to a Pearson chi-square value with p≤0.05. 555 In previous years, ‘youth’ as an issue was captured in the category ‘youth/gangs’; in 2004, this category was separated into ‘youth’ and ‘gangs’.
0
20
40
60
80
100
very/reasonably
safe
somew hat/very
unsafe
2000
2006
2007
Safety of neighbourhood
% responding
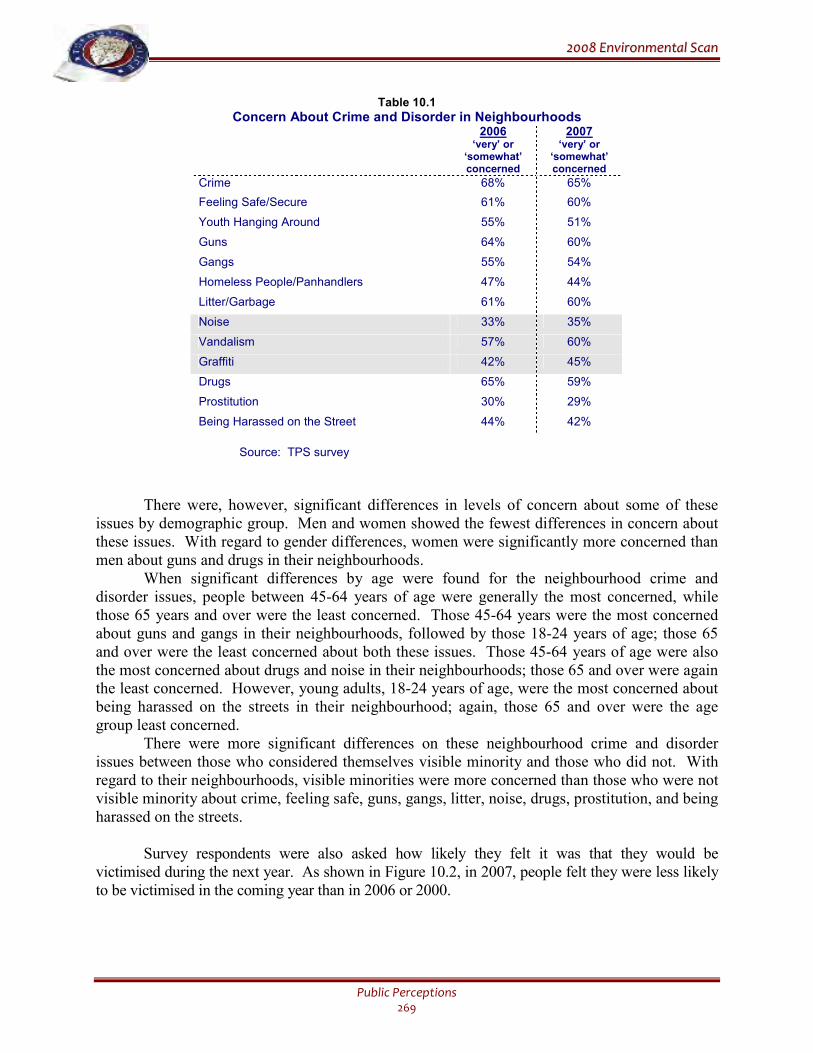
22000088 EEnnvviirroonnmmeennttaall SSccaann
Public Perceptions 269
Table 10.1
Concern About Crime and Disorder in Neighbourhoods 2006 2007 ‘very’ or
‘somewhat’ concerned
‘very’ or ‘somewhat’ concerned
Crime 68% 65%
Feeling Safe/Secure 61% 60%
Youth Hanging Around 55% 51%
Guns 64% 60%
Gangs 55% 54%
Homeless People/Panhandlers 47% 44%
Litter/Garbage 61% 60%
Noise 33% 35%
Vandalism 57% 60%
Graffiti 42% 45%
Drugs 65% 59%
Prostitution 30% 29%
Being Harassed on the Street 44% 42%
Source: TPS survey
There were, however, significant differences in levels of concern about some of these issues by demographic group. Men and women showed the fewest differences in concern about these issues. With regard to gender differences, women were significantly more concerned than men about guns and drugs in their neighbourhoods.
When significant differences by age were found for the neighbourhood crime and disorder issues, people between 45-64 years of age were generally the most concerned, while those 65 years and over were the least concerned. Those 45-64 years were the most concerned about guns and gangs in their neighbourhoods, followed by those 18-24 years of age; those 65 and over were the least concerned about both these issues. Those 45-64 years of age were also the most concerned about drugs and noise in their neighbourhoods; those 65 and over were again the least concerned. However, young adults, 18-24 years of age, were the most concerned about being harassed on the streets in their neighbourhood; again, those 65 and over were the age group least concerned.
There were more significant differences on these neighbourhood crime and disorder issues between those who considered themselves visible minority and those who did not. With regard to their neighbourhoods, visible minorities were more concerned than those who were not visible minority about crime, feeling safe, guns, gangs, litter, noise, drugs, prostitution, and being harassed on the streets. Survey respondents were also asked how likely they felt it was that they would be victimised during the next year. As shown in Figure 10.2, in 2007, people felt they were less likely to be victimised in the coming year than in 2006 or 2000.
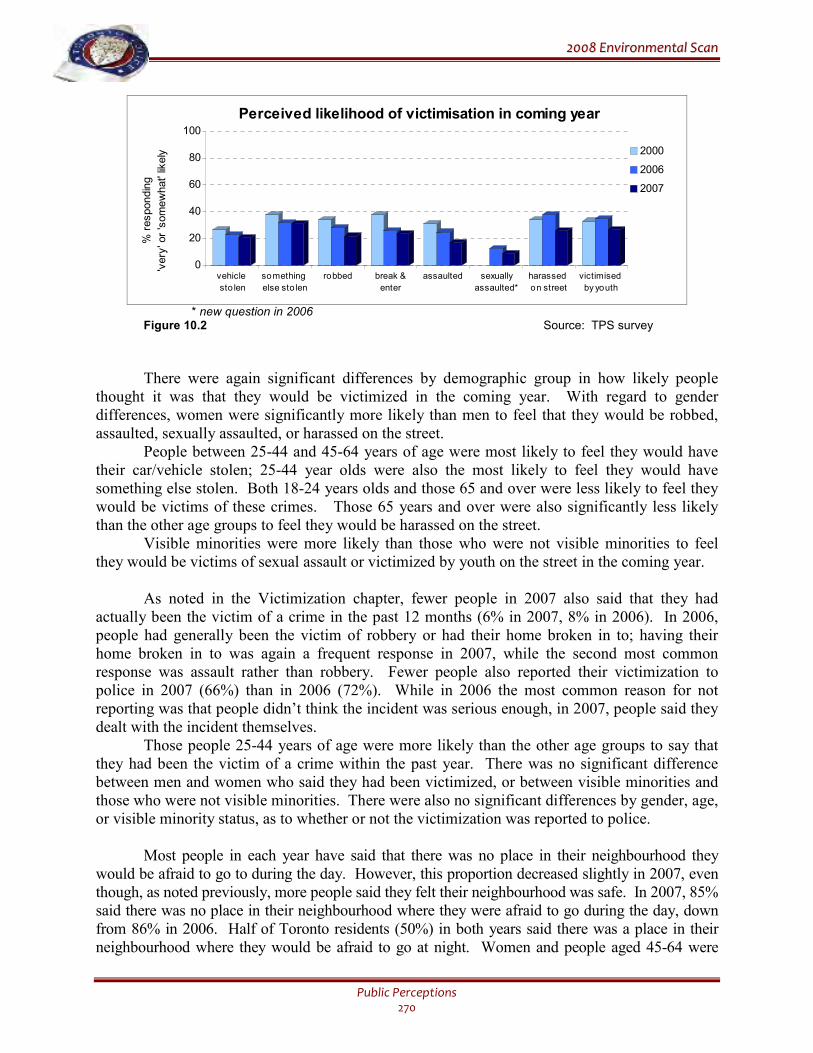
22000088 EEnnvviirroonnmmeennttaall SSccaann
Public Perceptions 270
0
20
40
60
80
100
vehicle
sto len
something
else sto len
robbed break &
enter
assaulted sexually
assaulted*
harassed
on street
victimised
by youth
2000
2006
2007
Perceived likelihood of victimisation in coming year
% responding
'very' or 'somewhat' likely
* new question in 2006
Figure 10.2 Source: TPS survey
There were again significant differences by demographic group in how likely people thought it was that they would be victimized in the coming year. With regard to gender differences, women were significantly more likely than men to feel that they would be robbed, assaulted, sexually assaulted, or harassed on the street.
People between 25-44 and 45-64 years of age were most likely to feel they would have their car/vehicle stolen; 25-44 year olds were also the most likely to feel they would have something else stolen. Both 18-24 years olds and those 65 and over were less likely to feel they would be victims of these crimes. Those 65 years and over were also significantly less likely than the other age groups to feel they would be harassed on the street.
Visible minorities were more likely than those who were not visible minorities to feel they would be victims of sexual assault or victimized by youth on the street in the coming year. As noted in the Victimization chapter, fewer people in 2007 also said that they had actually been the victim of a crime in the past 12 months (6% in 2007, 8% in 2006). In 2006, people had generally been the victim of robbery or had their home broken in to; having their home broken in to was again a frequent response in 2007, while the second most common response was assault rather than robbery. Fewer people also reported their victimization to police in 2007 (66%) than in 2006 (72%). While in 2006 the most common reason for not reporting was that people didn’t think the incident was serious enough, in 2007, people said they dealt with the incident themselves. Those people 25-44 years of age were more likely than the other age groups to say that they had been the victim of a crime within the past year. There was no significant difference between men and women who said they had been victimized, or between visible minorities and those who were not visible minorities. There were also no significant differences by gender, age, or visible minority status, as to whether or not the victimization was reported to police. Most people in each year have said that there was no place in their neighbourhood they would be afraid to go to during the day. However, this proportion decreased slightly in 2007, even though, as noted previously, more people said they felt their neighbourhood was safe. In 2007, 85% said there was no place in their neighbourhood where they were afraid to go during the day, down from 86% in 2006. Half of Toronto residents (50%) in both years said there was a place in their neighbourhood where they would be afraid to go at night. Women and people aged 45-64 were
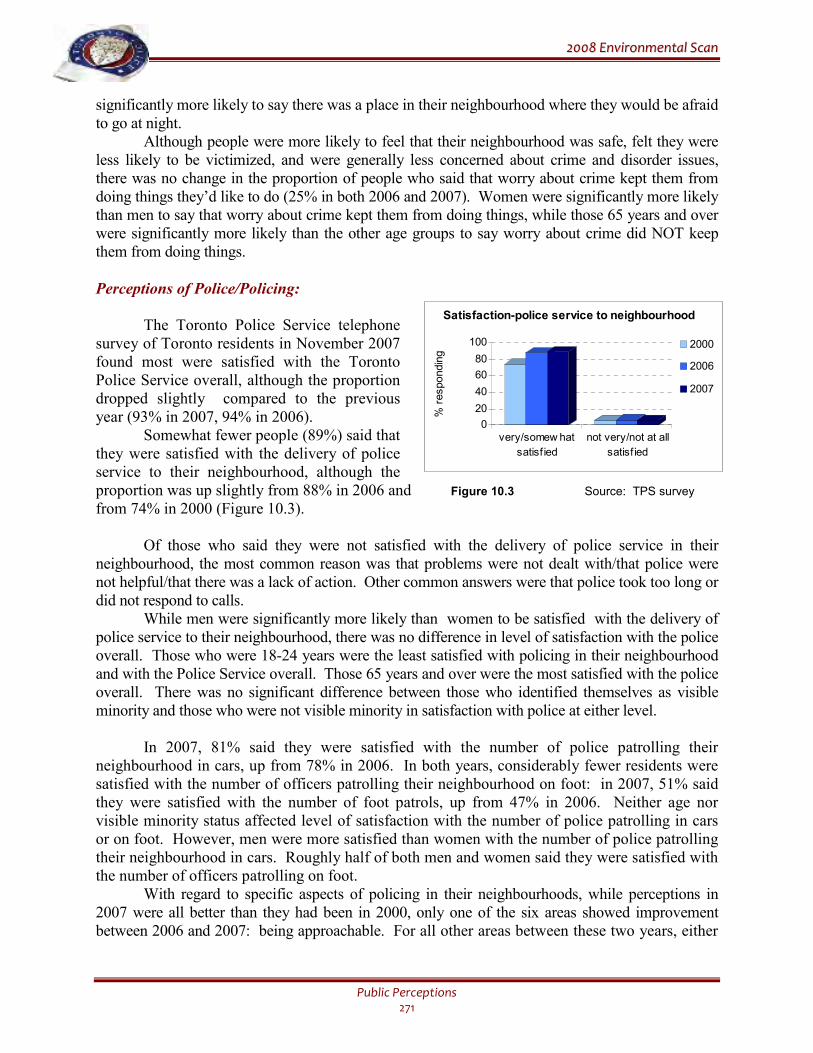
22000088 EEnnvviirroonnmmeennttaall SSccaann
Public Perceptions 271
significantly more likely to say there was a place in their neighbourhood where they would be afraid to go at night. Although people were more likely to feel that their neighbourhood was safe, felt they were less likely to be victimized, and were generally less concerned about crime and disorder issues, there was no change in the proportion of people who said that worry about crime kept them from doing things they’d like to do (25% in both 2006 and 2007). Women were significantly more likely than men to say that worry about crime kept them from doing things, while those 65 years and over were significantly more likely than the other age groups to say worry about crime did NOT keep them from doing things.
Perceptions of Police/Policing:
The Toronto Police Service telephone survey of Toronto residents in November 2007 found most were satisfied with the Toronto Police Service overall, although the proportion dropped slightly compared to the previous year (93% in 2007, 94% in 2006). Somewhat fewer people (89%) said that they were satisfied with the delivery of police service to their neighbourhood, although the proportion was up slightly from 88% in 2006 and Figure 10.3 Source: TPS survey from 74% in 2000 (Figure 10.3).
Of those who said they were not satisfied with the delivery of police service in their neighbourhood, the most common reason was that problems were not dealt with/that police were not helpful/that there was a lack of action. Other common answers were that police took too long or did not respond to calls.
While men were significantly more likely than women to be satisfied with the delivery of police service to their neighbourhood, there was no difference in level of satisfaction with the police overall. Those who were 18-24 years were the least satisfied with policing in their neighbourhood and with the Police Service overall. Those 65 years and over were the most satisfied with the police overall. There was no significant difference between those who identified themselves as visible minority and those who were not visible minority in satisfaction with police at either level.
In 2007, 81% said they were satisfied with the number of police patrolling their neighbourhood in cars, up from 78% in 2006. In both years, considerably fewer residents were satisfied with the number of officers patrolling their neighbourhood on foot: in 2007, 51% said they were satisfied with the number of foot patrols, up from 47% in 2006. Neither age nor visible minority status affected level of satisfaction with the number of police patrolling in cars or on foot. However, men were more satisfied than women with the number of police patrolling their neighbourhood in cars. Roughly half of both men and women said they were satisfied with the number of officers patrolling on foot.
With regard to specific aspects of policing in their neighbourhoods, while perceptions in 2007 were all better than they had been in 2000, only one of the six areas showed improvement between 2006 and 2007: being approachable. For all other areas between these two years, either
0
20
40
60
80
100
very/somew hat
satisf ied
not very/not at all
satisf ied
2000
2006
2007
Satisfaction-police service to neighbourhood
% responding
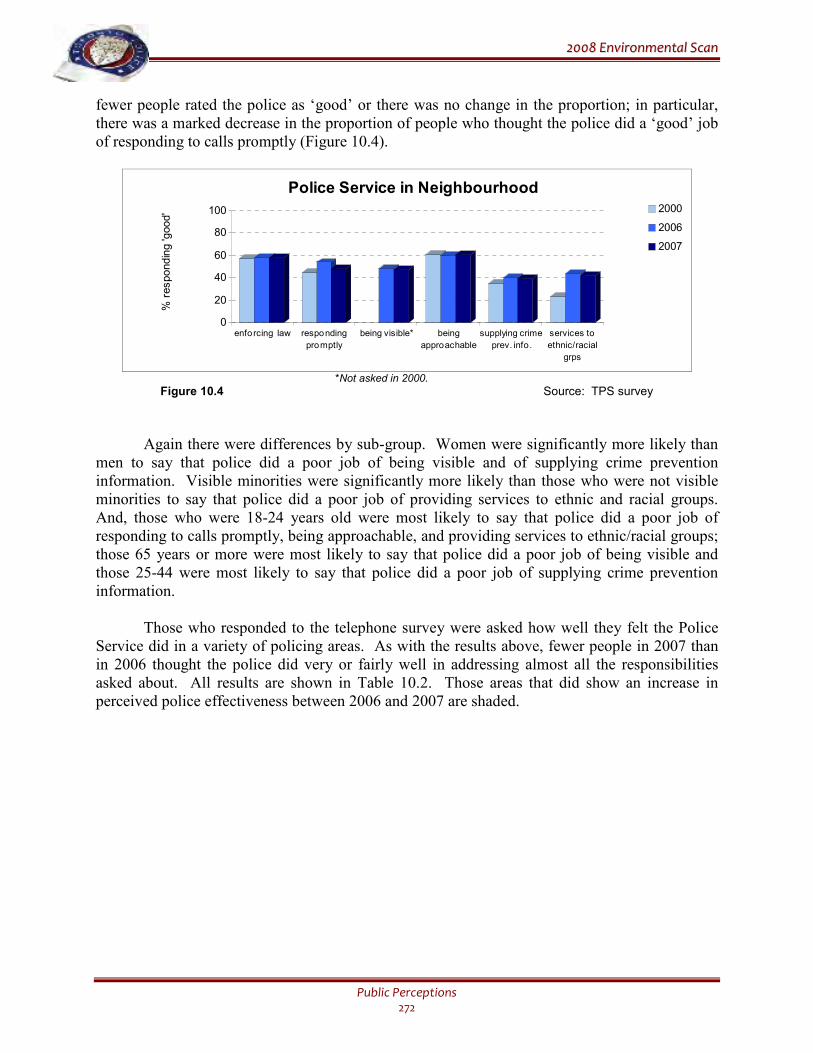
22000088 EEnnvviirroonnmmeennttaall SSccaann
Public Perceptions 272
fewer people rated the police as ‘good’ or there was no change in the proportion; in particular, there was a marked decrease in the proportion of people who thought the police did a ‘good’ job of responding to calls promptly (Figure 10.4).
0
20
40
60
80
100
enforcing law responding
promptly
being visible* being
approachable
supplying crime
prev. info.
services to
ethnic/racial
grps
2000
2006
2007
% responding 'good'
Police Service in Neighbourhood
*Not asked in 2000.
Figure 10.4 Source: TPS survey
Again there were differences by sub-group. Women were significantly more likely than men to say that police did a poor job of being visible and of supplying crime prevention information. Visible minorities were significantly more likely than those who were not visible minorities to say that police did a poor job of providing services to ethnic and racial groups. And, those who were 18-24 years old were most likely to say that police did a poor job of responding to calls promptly, being approachable, and providing services to ethnic/racial groups; those 65 years or more were most likely to say that police did a poor job of being visible and those 25-44 were most likely to say that police did a poor job of supplying crime prevention information.
Those who responded to the telephone survey were asked how well they felt the Police Service did in a variety of policing areas. As with the results above, fewer people in 2007 than in 2006 thought the police did very or fairly well in addressing almost all the responsibilities asked about. All results are shown in Table 10.2. Those areas that did show an increase in perceived police effectiveness between 2006 and 2007 are shaded.
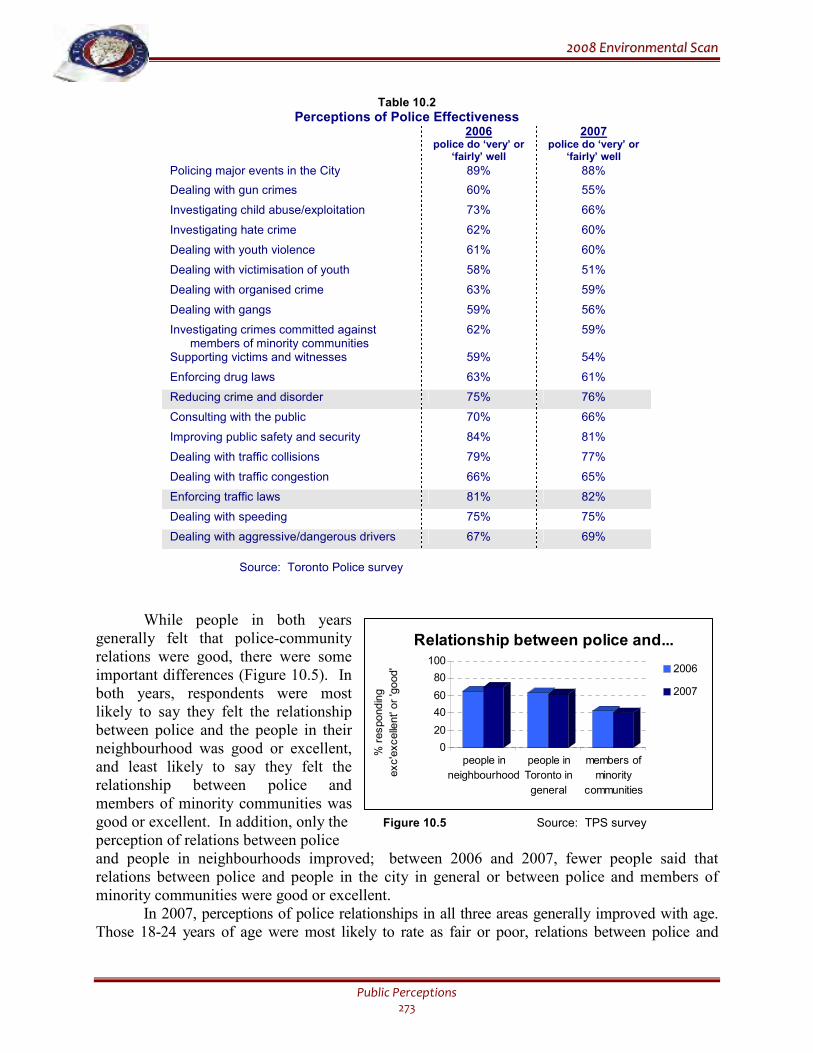
22000088 EEnnvviirroonnmmeennttaall SSccaann
Public Perceptions 273
Table 10.2
Perceptions of Police Effectiveness 2006 2007 police do ‘very’ or
‘fairly’ well police do ‘very’ or
‘fairly’ well
Policing major events in the City 89% 88%
Dealing with gun crimes 60% 55%
Investigating child abuse/exploitation 73% 66%
Investigating hate crime 62% 60%
Dealing with youth violence 61% 60%
Dealing with victimisation of youth 58% 51%
Dealing with organised crime 63% 59%
Dealing with gangs 59% 56%
Investigating crimes committed against members of minority communities
62% 59%
Supporting victims and witnesses 59% 54%
Enforcing drug laws 63% 61%
Reducing crime and disorder 75% 76%
Consulting with the public 70% 66%
Improving public safety and security 84% 81%
Dealing with traffic collisions 79% 77%
Dealing with traffic congestion 66% 65%
Enforcing traffic laws 81% 82%
Dealing with speeding 75% 75%
Dealing with aggressive/dangerous drivers 67% 69%
Source: Toronto Police survey
While people in both years generally felt that police-community relations were good, there were some important differences (Figure 10.5). In both years, respondents were most likely to say they felt the relationship between police and the people in their neighbourhood was good or excellent, and least likely to say they felt the relationship between police and members of minority communities was good or excellent. In addition, only the Figure 10.5 Source: TPS survey perception of relations between police and people in neighbourhoods improved; between 2006 and 2007, fewer people said that relations between police and people in the city in general or between police and members of minority communities were good or excellent. In 2007, perceptions of police relationships in all three areas generally improved with age. Those 18-24 years of age were most likely to rate as fair or poor, relations between police and
0
20
40
60
80
100
people in
neighbourhood
people in
Toronto in
general
members of
minority
communities
2006
2007
Relationship between police and...
% responding
exc'excellent' or 'good'
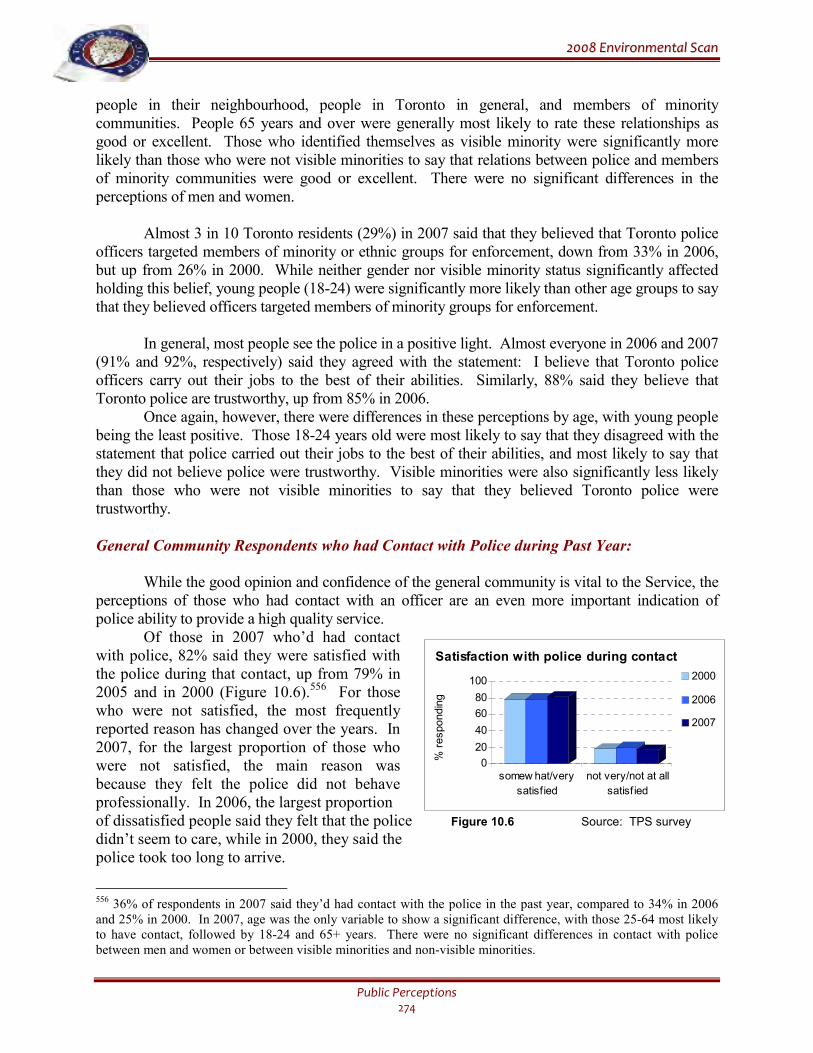
22000088 EEnnvviirroonnmmeennttaall SSccaann
Public Perceptions 274
people in their neighbourhood, people in Toronto in general, and members of minority communities. People 65 years and over were generally most likely to rate these relationships as good or excellent. Those who identified themselves as visible minority were significantly more likely than those who were not visible minorities to say that relations between police and members of minority communities were good or excellent. There were no significant differences in the perceptions of men and women. Almost 3 in 10 Toronto residents (29%) in 2007 said that they believed that Toronto police officers targeted members of minority or ethnic groups for enforcement, down from 33% in 2006, but up from 26% in 2000. While neither gender nor visible minority status significantly affected holding this belief, young people (18-24) were significantly more likely than other age groups to say that they believed officers targeted members of minority groups for enforcement. In general, most people see the police in a positive light. Almost everyone in 2006 and 2007 (91% and 92%, respectively) said they agreed with the statement: I believe that Toronto police officers carry out their jobs to the best of their abilities. Similarly, 88% said they believe that Toronto police are trustworthy, up from 85% in 2006. Once again, however, there were differences in these perceptions by age, with young people being the least positive. Those 18-24 years old were most likely to say that they disagreed with the statement that police carried out their jobs to the best of their abilities, and most likely to say that they did not believe police were trustworthy. Visible minorities were also significantly less likely than those who were not visible minorities to say that they believed Toronto police were trustworthy.
General Community Respondents who had Contact with Police during Past Year:
While the good opinion and confidence of the general community is vital to the Service, the perceptions of those who had contact with an officer are an even more important indication of police ability to provide a high quality service. Of those in 2007 who’d had contact with police, 82% said they were satisfied with the police during that contact, up from 79% in 2005 and in 2000 (Figure 10.6).556 For those who were not satisfied, the most frequently reported reason has changed over the years. In 2007, for the largest proportion of those who were not satisfied, the main reason was because they felt the police did not behave professionally. In 2006, the largest proportion of dissatisfied people said they felt that the police Figure 10.6 Source: TPS survey didn’t seem to care, while in 2000, they said the police took too long to arrive.
556 36% of respondents in 2007 said they’d had contact with the police in the past year, compared to 34% in 2006 and 25% in 2000. In 2007, age was the only variable to show a significant difference, with those 25-64 most likely to have contact, followed by 18-24 and 65+ years. There were no significant differences in contact with police between men and women or between visible minorities and non-visible minorities.
0
20
40
60
80
100
somewhat/very
satisfied
not very/not at all
satisf ied
2000
2006
2007
Satisfaction with police during contact
% responding
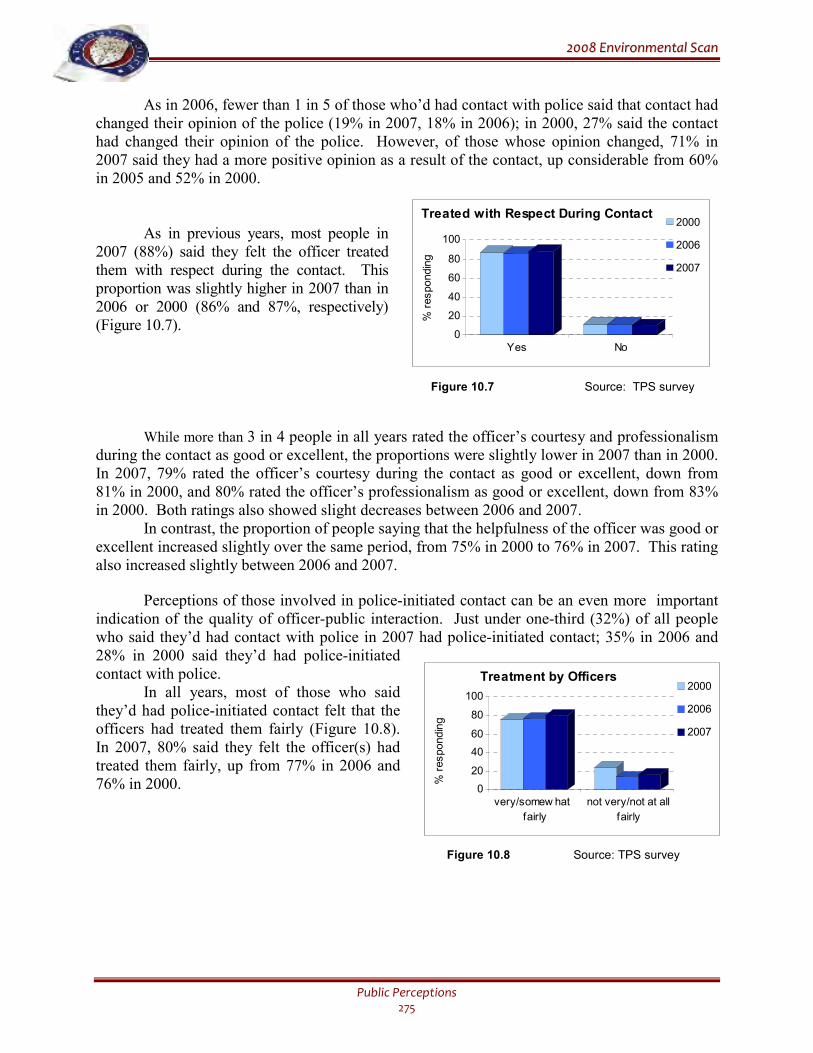
22000088 EEnnvviirroonnmmeennttaall SSccaann
Public Perceptions 275
As in 2006, fewer than 1 in 5 of those who’d had contact with police said that contact had changed their opinion of the police (19% in 2007, 18% in 2006); in 2000, 27% said the contact had changed their opinion of the police. However, of those whose opinion changed, 71% in 2007 said they had a more positive opinion as a result of the contact, up considerable from 60% in 2005 and 52% in 2000.
As in previous years, most people in 2007 (88%) said they felt the officer treated them with respect during the contact. This proportion was slightly higher in 2007 than in 2006 or 2000 (86% and 87%, respectively) (Figure 10.7).
Figure 10.7 Source: TPS survey
While more than 3 in 4 people in all years rated the officer’s courtesy and professionalism during the contact as good or excellent, the proportions were slightly lower in 2007 than in 2000. In 2007, 79% rated the officer’s courtesy during the contact as good or excellent, down from 81% in 2000, and 80% rated the officer’s professionalism as good or excellent, down from 83% in 2000. Both ratings also showed slight decreases between 2006 and 2007.
In contrast, the proportion of people saying that the helpfulness of the officer was good or excellent increased slightly over the same period, from 75% in 2000 to 76% in 2007. This rating also increased slightly between 2006 and 2007.
Perceptions of those involved in police-initiated contact can be an even more important indication of the quality of officer-public interaction. Just under one-third (32%) of all people who said they’d had contact with police in 2007 had police-initiated contact; 35% in 2006 and 28% in 2000 said they’d had police-initiated contact with police.
In all years, most of those who said they’d had police-initiated contact felt that the
officers had treated them fairly (Figure 10.8). In 2007, 80% said they felt the officer(s) had treated them fairly, up from 77% in 2006 and 76% in 2000. Figure 10.8 Source: TPS survey
0
20
40
60
80
100
very/somew hat
fairly
not very/not at all
fairly
2000
2006
2007
Treatment by Officers
% responding
0
20
40
60
80
100
Yes No
2000
2006
2007
Treated with Respect During Contact
% responding
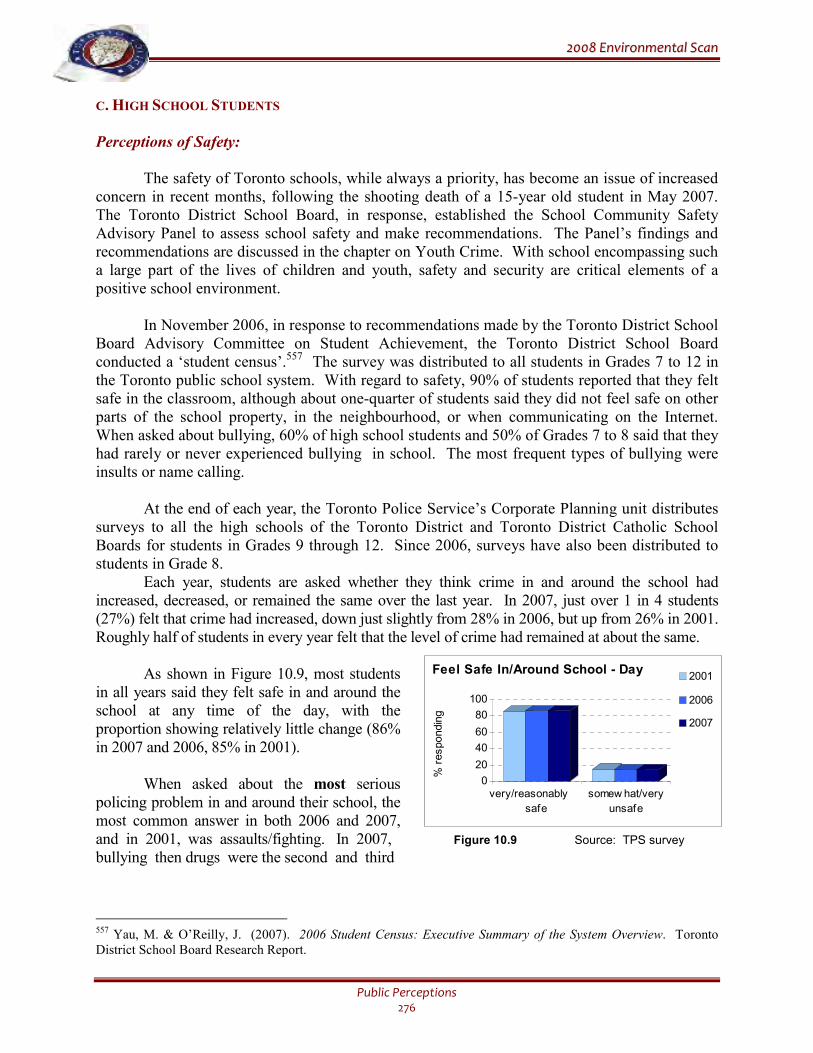
22000088 EEnnvviirroonnmmeennttaall SSccaann
Public Perceptions 276
C. HIGH SCHOOL STUDENTS
Perceptions of Safety:
The safety of Toronto schools, while always a priority, has become an issue of increased concern in recent months, following the shooting death of a 15-year old student in May 2007. The Toronto District School Board, in response, established the School Community Safety Advisory Panel to assess school safety and make recommendations. The Panel’s findings and recommendations are discussed in the chapter on Youth Crime. With school encompassing such a large part of the lives of children and youth, safety and security are critical elements of a positive school environment. In November 2006, in response to recommendations made by the Toronto District School Board Advisory Committee on Student Achievement, the Toronto District School Board conducted a ‘student census’.557 The survey was distributed to all students in Grades 7 to 12 in the Toronto public school system. With regard to safety, 90% of students reported that they felt safe in the classroom, although about one-quarter of students said they did not feel safe on other parts of the school property, in the neighbourhood, or when communicating on the Internet. When asked about bullying, 60% of high school students and 50% of Grades 7 to 8 said that they had rarely or never experienced bullying in school. The most frequent types of bullying were insults or name calling.
At the end of each year, the Toronto Police Service’s Corporate Planning unit distributes surveys to all the high schools of the Toronto District and Toronto District Catholic School Boards for students in Grades 9 through 12. Since 2006, surveys have also been distributed to students in Grade 8. Each year, students are asked whether they think crime in and around the school had increased, decreased, or remained the same over the last year. In 2007, just over 1 in 4 students (27%) felt that crime had increased, down just slightly from 28% in 2006, but up from 26% in 2001. Roughly half of students in every year felt that the level of crime had remained at about the same. As shown in Figure 10.9, most students in all years said they felt safe in and around the school at any time of the day, with the proportion showing relatively little change (86% in 2007 and 2006, 85% in 2001). When asked about the most serious policing problem in and around their school, the most common answer in both 2006 and 2007, and in 2001, was assaults/fighting. In 2007, Figure 10.9 Source: TPS survey
bullying then drugs were the second and third
557 Yau, M. & O’Reilly, J. (2007). 2006 Student Census: Executive Summary of the System Overview. Toronto District School Board Research Report.
0
20
40
60
80
100
very/reasonably
safe
somewhat/very
unsafe
2001
2006
2007
Feel Safe In/Around School - Day
% responding
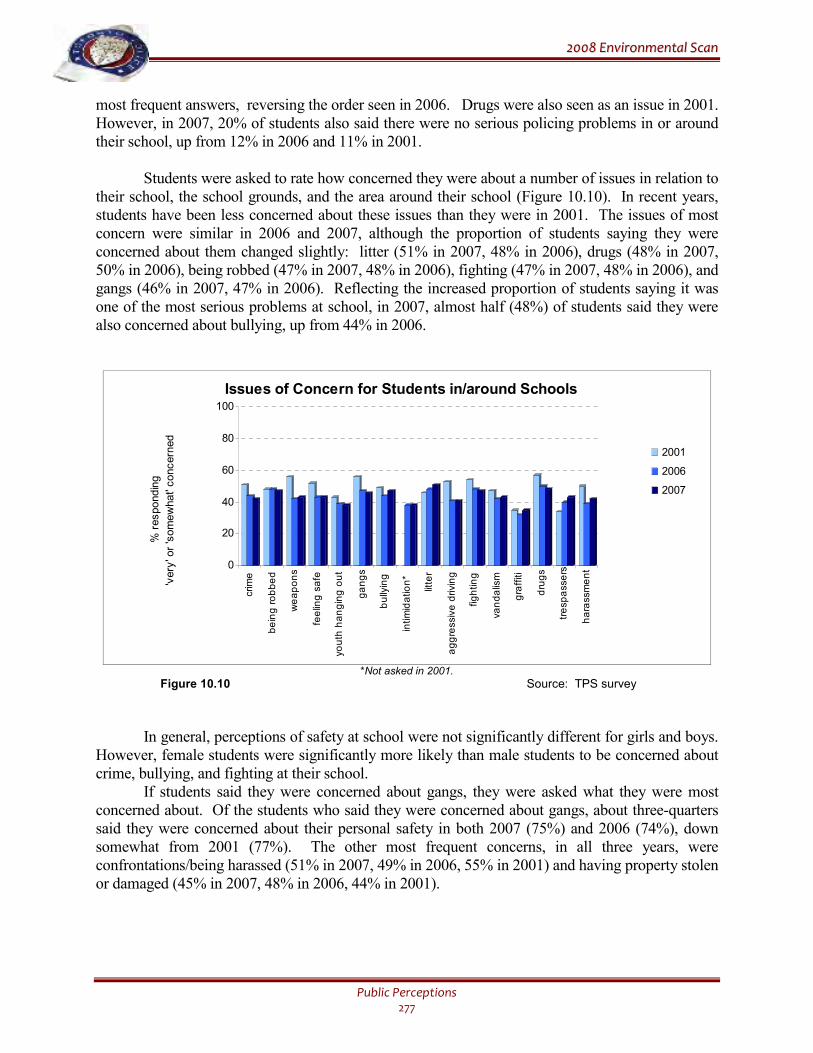
22000088 EEnnvviirroonnmmeennttaall SSccaann
Public Perceptions 277
most frequent answers, reversing the order seen in 2006. Drugs were also seen as an issue in 2001. However, in 2007, 20% of students also said there were no serious policing problems in or around their school, up from 12% in 2006 and 11% in 2001. Students were asked to rate how concerned they were about a number of issues in relation to their school, the school grounds, and the area around their school (Figure 10.10). In recent years, students have been less concerned about these issues than they were in 2001. The issues of most concern were similar in 2006 and 2007, although the proportion of students saying they were concerned about them changed slightly: litter (51% in 2007, 48% in 2006), drugs (48% in 2007, 50% in 2006), being robbed (47% in 2007, 48% in 2006), fighting (47% in 2007, 48% in 2006), and gangs (46% in 2007, 47% in 2006). Reflecting the increased proportion of students saying it was one of the most serious problems at school, in 2007, almost half (48%) of students said they were also concerned about bullying, up from 44% in 2006.
0
20
40
60
80
100
crime
being robbed
weapons
feeling safe
youth hanging out
gangs
bullying
intimidation*
litter
aggressive driving
fighting
vandalism
graffiti
drugs
trespassers
harassment
2001
2006
2007
Issues of Concern for Students in/around Schools
% responding
'very' or 'somewhat' concerned
*Not asked in 2001.
Figure 10.10 Source: TPS survey In general, perceptions of safety at school were not significantly different for girls and boys. However, female students were significantly more likely than male students to be concerned about crime, bullying, and fighting at their school. If students said they were concerned about gangs, they were asked what they were most concerned about. Of the students who said they were concerned about gangs, about three-quarters said they were concerned about their personal safety in both 2007 (75%) and 2006 (74%), down somewhat from 2001 (77%). The other most frequent concerns, in all three years, were confrontations/being harassed (51% in 2007, 49% in 2006, 55% in 2001) and having property stolen or damaged (45% in 2007, 48% in 2006, 44% in 2001).
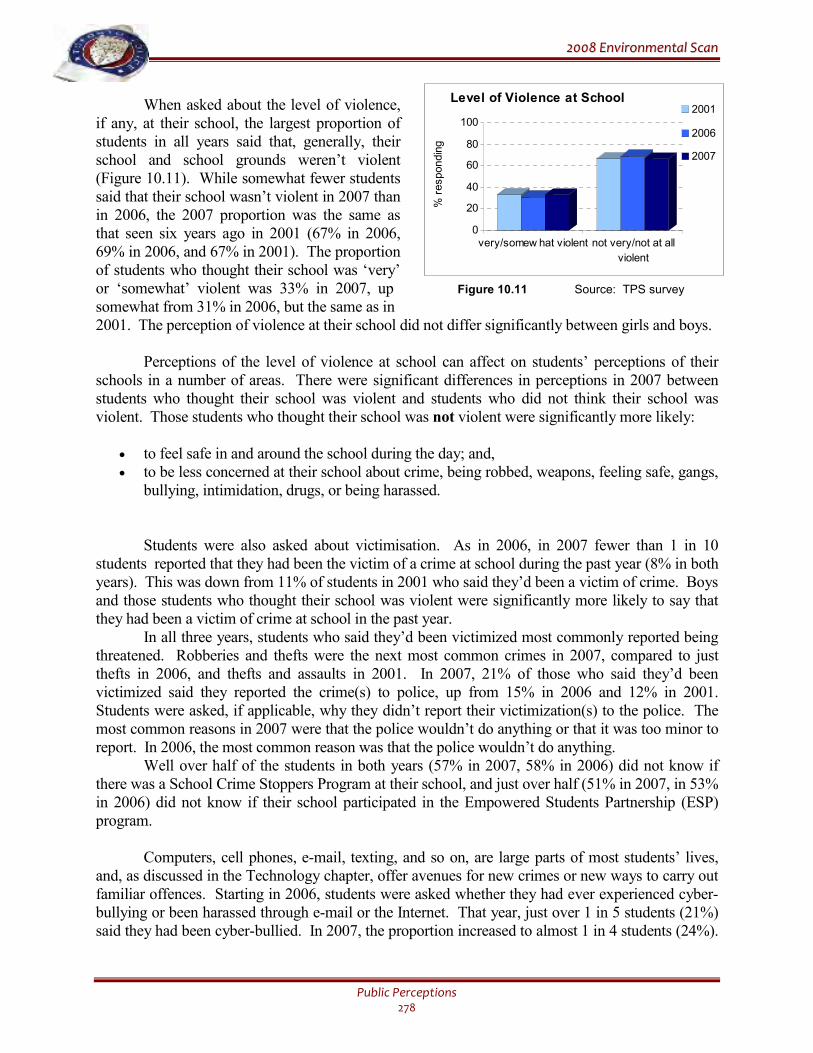
22000088 EEnnvviirroonnmmeennttaall SSccaann
Public Perceptions 278
When asked about the level of violence, if any, at their school, the largest proportion of students in all years said that, generally, their school and school grounds weren’t violent (Figure 10.11). While somewhat fewer students said that their school wasn’t violent in 2007 than in 2006, the 2007 proportion was the same as that seen six years ago in 2001 (67% in 2006, 69% in 2006, and 67% in 2001). The proportion of students who thought their school was ‘very’ or ‘somewhat’ violent was 33% in 2007, up Figure 10.11 Source: TPS survey somewhat from 31% in 2006, but the same as in 2001. The perception of violence at their school did not differ significantly between girls and boys. Perceptions of the level of violence at school can affect on students’ perceptions of their schools in a number of areas. There were significant differences in perceptions in 2007 between students who thought their school was violent and students who did not think their school was violent. Those students who thought their school was not violent were significantly more likely:
• to feel safe in and around the school during the day; and, • to be less concerned at their school about crime, being robbed, weapons, feeling safe, gangs,
bullying, intimidation, drugs, or being harassed. Students were also asked about victimisation. As in 2006, in 2007 fewer than 1 in 10 students reported that they had been the victim of a crime at school during the past year (8% in both years). This was down from 11% of students in 2001 who said they’d been a victim of crime. Boys and those students who thought their school was violent were significantly more likely to say that they had been a victim of crime at school in the past year. In all three years, students who said they’d been victimized most commonly reported being threatened. Robberies and thefts were the next most common crimes in 2007, compared to just thefts in 2006, and thefts and assaults in 2001. In 2007, 21% of those who said they’d been victimized said they reported the crime(s) to police, up from 15% in 2006 and 12% in 2001. Students were asked, if applicable, why they didn’t report their victimization(s) to the police. The most common reasons in 2007 were that the police wouldn’t do anything or that it was too minor to report. In 2006, the most common reason was that the police wouldn’t do anything. Well over half of the students in both years (57% in 2007, 58% in 2006) did not know if there was a School Crime Stoppers Program at their school, and just over half (51% in 2007, in 53% in 2006) did not know if their school participated in the Empowered Students Partnership (ESP) program. Computers, cell phones, e-mail, texting, and so on, are large parts of most students’ lives, and, as discussed in the Technology chapter, offer avenues for new crimes or new ways to carry out familiar offences. Starting in 2006, students were asked whether they had ever experienced cyber-bullying or been harassed through e-mail or the Internet. That year, just over 1 in 5 students (21%) said they had been cyber-bullied. In 2007, the proportion increased to almost 1 in 4 students (24%).
0
20
40
60
80
100
very/somew hat violent not very/not at all
violent
2001
2006
2007
Level of Violence at School
% responding
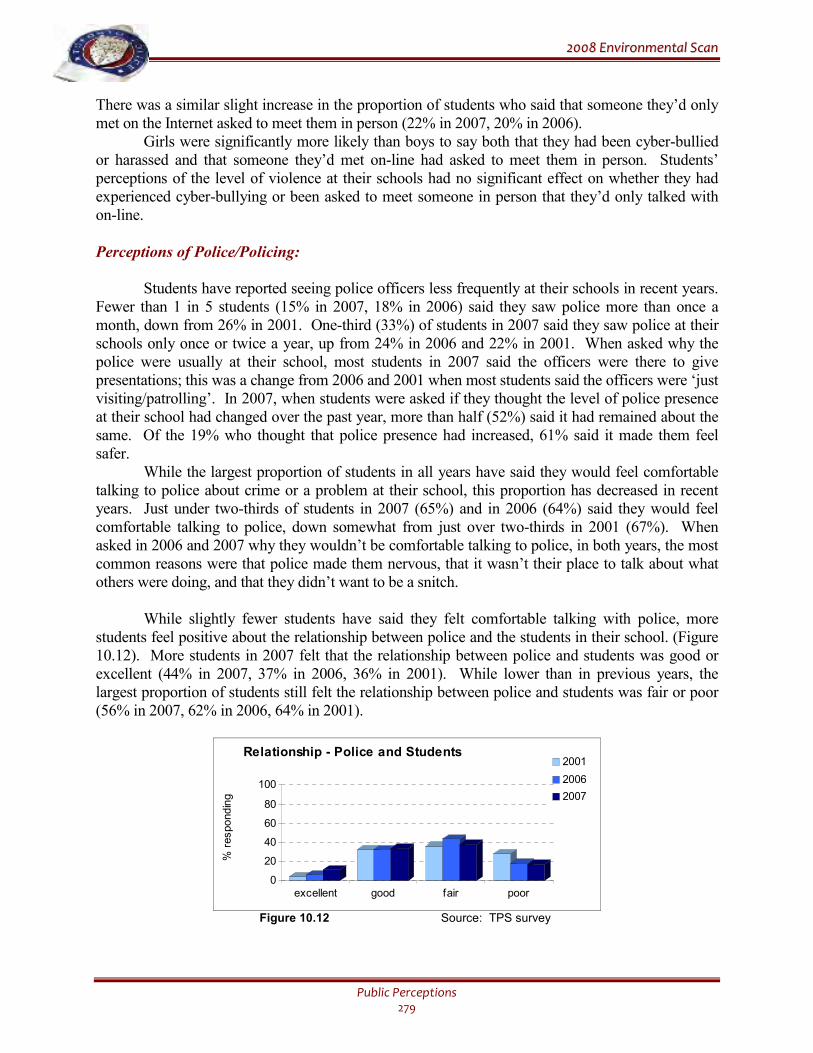
22000088 EEnnvviirroonnmmeennttaall SSccaann
Public Perceptions 279
There was a similar slight increase in the proportion of students who said that someone they’d only met on the Internet asked to meet them in person (22% in 2007, 20% in 2006). Girls were significantly more likely than boys to say both that they had been cyber-bullied or harassed and that someone they’d met on-line had asked to meet them in person. Students’ perceptions of the level of violence at their schools had no significant effect on whether they had experienced cyber-bullying or been asked to meet someone in person that they’d only talked with on-line.
Perceptions of Police/Policing:
Students have reported seeing police officers less frequently at their schools in recent years. Fewer than 1 in 5 students (15% in 2007, 18% in 2006) said they saw police more than once a month, down from 26% in 2001. One-third (33%) of students in 2007 said they saw police at their schools only once or twice a year, up from 24% in 2006 and 22% in 2001. When asked why the police were usually at their school, most students in 2007 said the officers were there to give presentations; this was a change from 2006 and 2001 when most students said the officers were ‘just visiting/patrolling’. In 2007, when students were asked if they thought the level of police presence at their school had changed over the past year, more than half (52%) said it had remained about the same. Of the 19% who thought that police presence had increased, 61% said it made them feel safer. While the largest proportion of students in all years have said they would feel comfortable talking to police about crime or a problem at their school, this proportion has decreased in recent years. Just under two-thirds of students in 2007 (65%) and in 2006 (64%) said they would feel comfortable talking to police, down somewhat from just over two-thirds in 2001 (67%). When asked in 2006 and 2007 why they wouldn’t be comfortable talking to police, in both years, the most common reasons were that police made them nervous, that it wasn’t their place to talk about what others were doing, and that they didn’t want to be a snitch. While slightly fewer students have said they felt comfortable talking with police, more students feel positive about the relationship between police and the students in their school. (Figure 10.12). More students in 2007 felt that the relationship between police and students was good or excellent (44% in 2007, 37% in 2006, 36% in 2001). While lower than in previous years, the largest proportion of students still felt the relationship between police and students was fair or poor (56% in 2007, 62% in 2006, 64% in 2001).
0
20
40
60
80
100
excellent good fair poor
2001
2006
2007
Relationship - Police and Students
% responding
Figure 10.12 Source: TPS survey
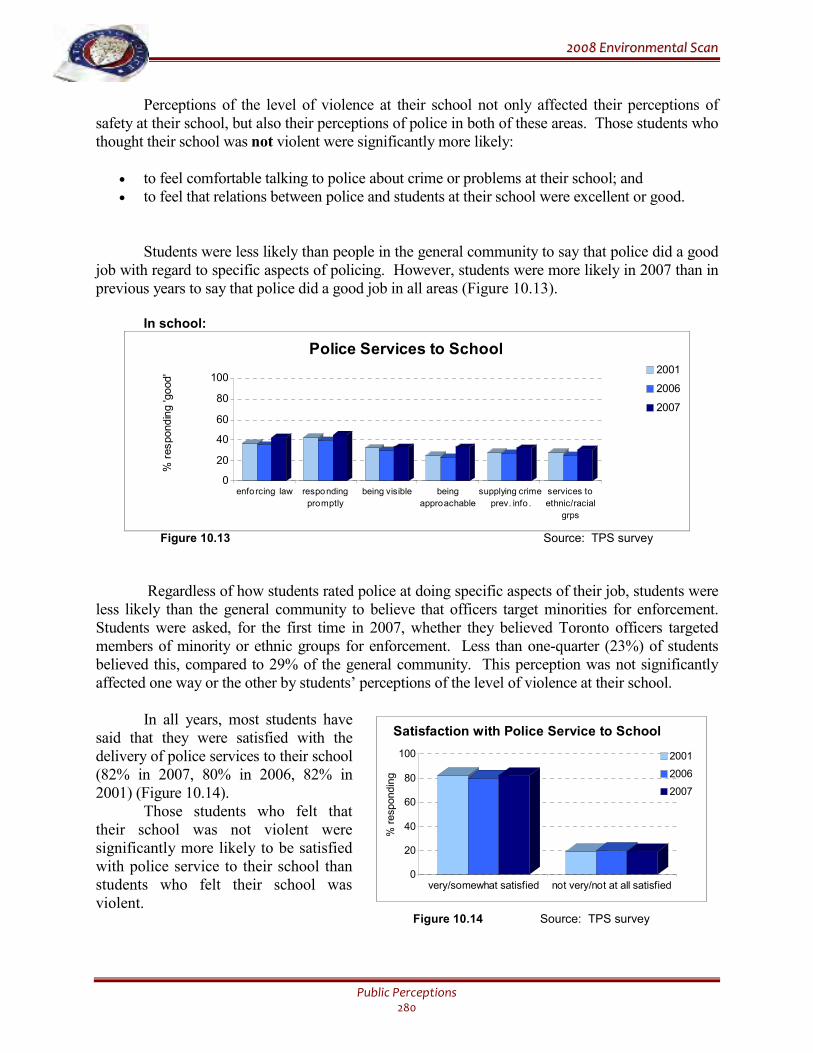
22000088 EEnnvviirroonnmmeennttaall SSccaann
Public Perceptions 280
Perceptions of the level of violence at their school not only affected their perceptions of safety at their school, but also their perceptions of police in both of these areas. Those students who thought their school was not violent were significantly more likely:
• to feel comfortable talking to police about crime or problems at their school; and • to feel that relations between police and students at their school were excellent or good.
Students were less likely than people in the general community to say that police did a good job with regard to specific aspects of policing. However, students were more likely in 2007 than in previous years to say that police did a good job in all areas (Figure 10.13).
In school:
0
20
40
60
80
100
enforcing law responding
promptly
being visible being
approachable
supplying crime
prev. info .
services to
ethnic/racial
grps
2001
2006
2007
% responding 'good'
Police Services to School
Figure 10.13 Source: TPS survey
Regardless of how students rated police at doing specific aspects of their job, students were less likely than the general community to believe that officers target minorities for enforcement. Students were asked, for the first time in 2007, whether they believed Toronto officers targeted members of minority or ethnic groups for enforcement. Less than one-quarter (23%) of students believed this, compared to 29% of the general community. This perception was not significantly affected one way or the other by students’ perceptions of the level of violence at their school.
In all years, most students have said that they were satisfied with the delivery of police services to their school (82% in 2007, 80% in 2006, 82% in 2001) (Figure 10.14).
Those students who felt that their school was not violent were significantly more likely to be satisfied with police service to their school than students who felt their school was violent. Figure 10.14 Source: TPS survey
0
20
40
60
80
100
very/somewhat satisfied not very/not at all satisfied
2001
2006
2007
Satisfaction with Police Service to School
% responding
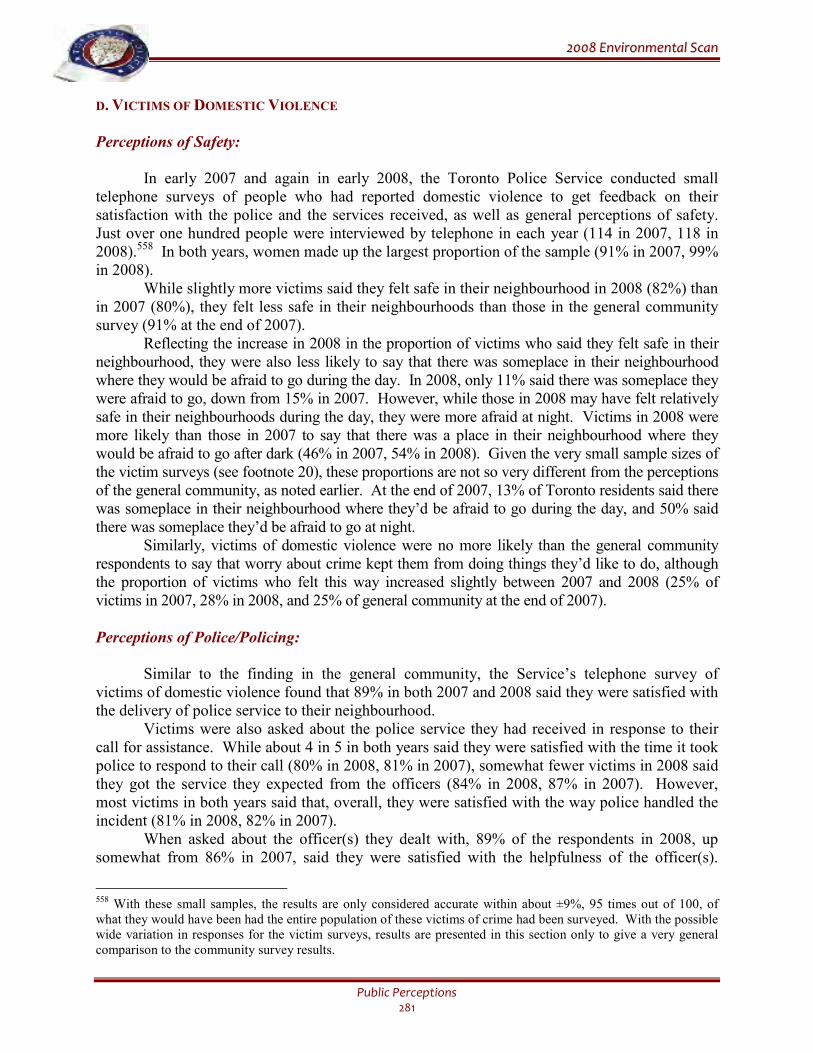
22000088 EEnnvviirroonnmmeennttaall SSccaann
Public Perceptions 281
D. VICTIMS OF DOMESTIC VIOLENCE
Perceptions of Safety:
In early 2007 and again in early 2008, the Toronto Police Service conducted small telephone surveys of people who had reported domestic violence to get feedback on their satisfaction with the police and the services received, as well as general perceptions of safety. Just over one hundred people were interviewed by telephone in each year (114 in 2007, 118 in 2008).558 In both years, women made up the largest proportion of the sample (91% in 2007, 99% in 2008). While slightly more victims said they felt safe in their neighbourhood in 2008 (82%) than in 2007 (80%), they felt less safe in their neighbourhoods than those in the general community survey (91% at the end of 2007). Reflecting the increase in 2008 in the proportion of victims who said they felt safe in their neighbourhood, they were also less likely to say that there was someplace in their neighbourhood where they would be afraid to go during the day. In 2008, only 11% said there was someplace they were afraid to go, down from 15% in 2007. However, while those in 2008 may have felt relatively safe in their neighbourhoods during the day, they were more afraid at night. Victims in 2008 were more likely than those in 2007 to say that there was a place in their neighbourhood where they would be afraid to go after dark (46% in 2007, 54% in 2008). Given the very small sample sizes of the victim surveys (see footnote 20), these proportions are not so very different from the perceptions of the general community, as noted earlier. At the end of 2007, 13% of Toronto residents said there was someplace in their neighbourhood where they’d be afraid to go during the day, and 50% said there was someplace they’d be afraid to go at night. Similarly, victims of domestic violence were no more likely than the general community respondents to say that worry about crime kept them from doing things they’d like to do, although the proportion of victims who felt this way increased slightly between 2007 and 2008 (25% of victims in 2007, 28% in 2008, and 25% of general community at the end of 2007).
Perceptions of Police/Policing:
Similar to the finding in the general community, the Service’s telephone survey of
victims of domestic violence found that 89% in both 2007 and 2008 said they were satisfied with the delivery of police service to their neighbourhood. Victims were also asked about the police service they had received in response to their call for assistance. While about 4 in 5 in both years said they were satisfied with the time it took police to respond to their call (80% in 2008, 81% in 2007), somewhat fewer victims in 2008 said they got the service they expected from the officers (84% in 2008, 87% in 2007). However, most victims in both years said that, overall, they were satisfied with the way police handled the incident (81% in 2008, 82% in 2007). When asked about the officer(s) they dealt with, 89% of the respondents in 2008, up somewhat from 86% in 2007, said they were satisfied with the helpfulness of the officer(s).
558 With these small samples, the results are only considered accurate within about ±9%, 95 times out of 100, of what they would have been had the entire population of these victims of crime had been surveyed. With the possible wide variation in responses for the victim surveys, results are presented in this section only to give a very general comparison to the community survey results.
22000088 EEnnvviirroonnmmeennttaall SSccaann
Public Perceptions 282
Most in both years said they were satisfied with the level of professionalism the officer(s) showed, though the proportion dropped somewhat to 86% in 2008 from 89% in 2007.
Far fewer of the domestic violence victims surveyed in 2008 said they had received follow-up support or referrals after the initial call: while 80% in 2007 said received follow-up, this dropped to 68% in 2008. Of those who did not receive follow-up, more victims in 2008 said they would have liked to receive it. Just over one in four (28%) who had not received follow-up support or referrals in 2007 would have liked it; this increased to just over 1 in 2 (53%) in 2008. As discussed in more detail in the Victimization chapter, the Toronto Police Service contracted for six focus groups with women who had experienced domestic violence, either themselves, a family member, or a close friend. Three groups were held with women from the city-defined priority neighbourhoods, and three were held with women from minority communities (Black, South Asian, and Chinese). These women were asked if they had called the police, and, if they had, they were asked about the experience with the officers.559
The focus groups revealed that these women were generally satisfied with their interactions with the police in situations involving domestic violence, but some main criticisms among individuals who had called the police in the past included:560
• a lack of follow-up after the initial visit, including police referrals to other services (as found in the telephone survey noted above), notification when the offender was released from police custody, and the status of pending court proceedings;
• a lack of sympathy from police officers who had previously responded to a call at the address in question (some respondents felt that the first time the police arrived, the officers were more understanding than when they returned to the same household repeatedly);
• and concern among women from certain geographic areas (such as Regent Park, St. Jamestown, and Malvern) and among the women in the Black focus group, that police who responded to calls may have already pre-judged them and the likely outcome based on where they lived.
Again as was noted in the Victimization chapter, when the women did not call the police for assistance, the main reasons were not based on concerns about how the police would handle the situation but on other factors, such as fear of escalating the situation, belief the incident was isolated, or preferring to seek support and assistance from religious leaders, usually in one’s own religious community but sometimes in areas where the survivor was not known.561
559 Note: Findings from the focus groups are not conclusive and may not reflect the thoughts and impressions of survivors of domestic violence or friends and family of victims of such violence in general. 560 Muldoon, P. (2007). Toronto Police Service: Survivors of Domestic Violence, Research Findings. Commissioned by Toronto Police Service. 561 The full list of reasons is provided in the Victimization chapter.
22000088 EEnnvviirroonnmmeennttaall SSccaann
Public Perceptions 283
RECOMMENDATIONS FOR THE POLICE SERVICE • Fear of crime and perceptions of safety are important indicators of the way people feel about
their cities and neighbourhoods, and can also be an indicator of confidence in their police services. Recognising this, it is important that police address perceptions of fear and safety.
• The public’s perception of the police and their level of satisfaction with police services are
also indicators of the quality and effectiveness of police in a community – the ability of the Service to perform is, in large part, dependent upon the relations between the police and the public. Public confidence and trust are vital to successful policing, and may ultimately be reflected back in community perceptions of crime and safety. The Service must, therefore, continue to build relationships and partnerships with all communities in Toronto.
• To improve perceptions of safety and police service, and to ensure that these perceptions do
not vary widely from reality, the Service must enhance communications with the people of Toronto to increase awareness of levels of crime, positive initiatives and results, what to expect when in contact with police in a variety of situations, and the capabilities and limitations of the Police Service.
• The Service must increase efforts to address the disorder issues that are perceived to have a
negative impact on the environment and perception of safety. Partnership with and input from the community are required for the police to understand, target, and address those offences or problems that are perceived to have a particularly adverse effect on quality of life. It is also important that the Service provide the community with information on the initiatives being used to address problems, as well as the results of those initiatives.
• The Service must increase efforts to develop and be involved in initiatives directed towards
enhancing relations between the public, particularly ethnic and minority communities, and the police.
• To continue to improve satisfaction levels for those who have contact with police, the
Service must continue efforts to ensure professional, integrity, and high quality service by members in any and all dealings with the public.
• Perceived levels of violence in schools can have wide-ranging affects, including students’
feelings of safety as well as their interactions with police. Police, school boards, and the community must continue efforts to enhance safety, and perceptions of safety, in schools and to encourage positive interactions between police and students.
• Bullying and cyber-bullying are being perceived as issues of concern by more students.
Police, school boards, and parents should work in partnership to increase awareness of these issues and assist in the development of strategies to deal with them.
• The Service should work with school boards and community organizations to address the
belief by students that if they report victimization, the police will not do anything.

22000088 EEnnvviirroonnmmeennttaall SSccaann
Public Perceptions 284
• Given findings from both the surveys of and focus groups with victims of domestic violence, the Service should evaluate current processes for providing these victims with follow-up information and support/referrals, with the aim of improving these processes.
22000088 EEnnvviirroonnmmeennttaall SSccaann
Legislative Impacts 285
XI. LEGISLATIVE IMPACTS
Both statute law and case law set out many of the mandates and parameters by which the
Toronto Police Service operates, and by which its members conduct themselves both on
and off duty. Therefore, changes to those laws, actual or expected, affect the Police
Service, its members, and the community as a whole. Laws also reflect the expectations a
community has of its police. Changes to laws can reflect changes in those expectations. It
is, therefore, vital that the Toronto Police Service takes legislation and legislative changes
into account when planning and providing service, whether the changes come from the
Police Services Board, the municipality, the province, or the federal government.
HIGHLIGHTS • Bill C-2, An Act to amend the Criminal Code (Tackling Violent Crime Act) and to make a consequential amendment to another Act, which received royal assent on February 28th, 2008, combines five previously introduced crime bills to provide longer prison sentences and tougher bail provisions for gun-related offences, a system for the detection and investigation of drug-impaired driving, more effective sentencing and monitoring of high-risk offenders, and an increase in the age of consent from 14 to 16 years of age. Other Acts to amend the Criminal Code deal with identity theft, street racing, and registration of a firearm which is not prohibited or restricted.
• In October 2007, the Supreme Court of Canada confirmed that the police may be sued by
persons who are wrongly accused based on negligent investigation. • Bill C-26, An Act to amend the Controlled Drugs and Substances Act and to make consequential amendments to other Acts, received First Reading on November 20th, 2007, and provides for minimum penalties for serious drug offences.
• Bill C-61, An Act to amend the Copyright Act, received First Reading on June 12th, 2008; the
Bill will amend the Copyright Act in order to update rights of copyright holders specific to the Internet and in line with international standards, and clarify the liability of Internet service providers.
• Bill 103, An Act to establish an Independent Police Review Director and create a new public complaints process by amending the Police Services Act, received assent on May 17th, 2007; the Bill amends the Police Services Act by establishing an Independent Police Review Director and creating a new public complaints process.
• Bill 16 – Christopher’s Law (Sex Offender Registry) Amendment Act, 2008, received assent
on April 27th, 2008. The Act broadens the scope of persons required to register, addressing omissions in the current registry requirements.
• Bill 203, Safer Roads for a Safer Ontario Act, 2007, received assent on June 4th, 2007.
Among other things, the Bill amends the Highway Traffic Act to significantly increase penalties specific to street racing and impaired driving related offences.
22000088 EEnnvviirroonnmmeennttaall SSccaann
Legislative Impacts 286
• Bill 107, An Act to amend the Human Rights Code, received assent on December 20th, 2006. The amendments overhaul the administration and functions of the Ontario Human Rights Commission and revise the Tribunal’s powers.
A. CRIMINAL CODE
An Act to amend the Criminal Code (Tackling Violent Crime Act) and to make consequential
amendment to other Acts:
Bill C-2, An Act to amend the Criminal Code and to make a consequential amendment to another Act (Tackling Violent Crime Act), received assent on February 28th, 2008. This enactment was a re-packaging of five major crime bills that failed to pass during the previous parliamentary session.
First, the Act created two new firearm offences – breaking & entering to steal a firearm and robbery to steal a firearm – and provided increased and escalating mandatory jail terms. The Act provided for minimum sentences ranging from five to seven years for serious or repeat gun crimes involving restricted or prohibited weapons or in relation to gang activity, and from three to five years for other gun crimes such as trafficking and smuggling. The impact of this provision on Toronto Police Service policies, procedures, and workload is expected to be minimal.
Second, the Act strengthened the bail provisions for those accused of serious offences involving firearms or other regulated weapons. The Act provided for ‘reverse onus’ for suspects arrested on firearms charges – the accused person must present evidence to show that they are not a risk for pre-trial release. The impact of this provision on Toronto Police Service policies, procedures, and workload is again expected to be minimal.
Third, the Act provided for more effective sentencing and monitoring of high-risk offenders – dangerous and long-term offenders. A long-term offender could be released under the conditions of a long-term supervision order; on the other hand, a dangerous offender would have to serve a prison sentence of indeterminate length. Although the police will take a lead role in the supervision order – e.g. compliance checks – the impact of this provision on Toronto Police Service policies, procedures, and workload is not expected to be substantial as the number of long-term offenders is not significant.
A further section of the Act, formerly Bill C-32, An Act to amend the Criminal Code (impaired driving) and to make consequential amendments to other Acts, was intended to strengthen the enforcement of drug-impaired driving offences by creating a system for the detection and investigation of drug-impaired driving and by increasing the penalties for impaired driving. Although the Criminal Code makes it an offence to drive while impaired by alcohol or a drug, police have had no measure of drug-impaired driving, relying largely on erratic driving behaviour and witness testimony. Drug tests were admissible as evidence in court only if the driver participated voluntarily. Bill C-2 now gives police the authority to demand physical sobriety tests and bodily fluid samples for investigation. First, police officers are now authorized to administer Standardized Field Sobriety Tests (i.e. evaluate the driver’s ability to multi-task). Failure of the driver to pass the SFST is reasonable grounds to believe that a drug-impaired driving offence has been committed and the driver can be escorted to the station to be tested by a Drug Recognition Expert (DRE). If the DRE officer finds that a drug(s) is causing impairment,
22000088 EEnnvviirroonnmmeennttaall SSccaann
Legislative Impacts 287
Bill C-2 allows the officer to demand a saliva, urine, or blood sample. A driver’s refusal to comply with an officer’s request for a physical sobriety or bodily fluid sample test is a criminal offence similar to refusing to perform an alcohol breath or blood test.
The impact of this section of the Act on Toronto Police Service policies, procedures, and workload, will be substantial. The legislation provides the means to gather sufficient evidence of impairment with respect to drugs, a tool that has not been available. However, implementation of these amendments will be costly to the Service, particularly with regard to training. All patrol officers must attend a four-day training course for certification on Standardized Field Sobriety Testing (SFST); Traffic Services, divisional traffic, and 52 Division (Entertainment District) officers have been identified as a priority for this training. Further, the Service will have to train at least 35 officers as certified Drug Recognition Experts; at present, only three officers have been certified, but it is planned that by February 2009, a total of 12 officers will be certified, providing constant deployment of at least one DRE. The DRE certification, fully funded by the federal government, requires officers to attend a two-week training program with additional field training; the difficulty faced by the Service is in securing sufficient class positions.
Appropriate facilities will also have a costly impact on the Service – testing facilities must provide sufficient space to conduct physical testing, interviews, mechanical testing, etc. without any distractions. And finally, the cost and timeliness of testing bodily fluids for the presence of alcohol and/or a drug are unknown at this time. The Ministry of Community Safety and Correctional Services has advised that because the “projected workload will exceed current capabilities, the Centre of Forensic Sciences will immediately discontinue acceptance of all submissions related to the Drug Evaluation and Classification program until the necessary capabilities are developed”.562 It is expected that more precise direction to police services, with respect to this legislation, will be provided in the form of a Regulation. Discussions regarding responsibility for training programs, training costs, timelines and sample testing are ongoing with both the provincial and federal governments.
Finally, Bill C-2 raises the age of consent for sexual activity – including Sexual Interference, Invitation to Sexual Touching, Sexual Exploitation, Sexual Assaults, and Luring a Child – from 14 to 16 years of age. The intent of the this provision of the Act is to protect young people from adult predators; the Bill includes an exception for close-in-age young persons, so as to not criminalize consensual sexual activity between persons within five years of each other’s age. It is expected that there will be some increase in the number of investigations of luring and sex-related offences involving young persons; as these provisions have only recently come into effect, the actual impact on workload is not known.
An Act to amend the Criminal Code (identity theft and related misconduct):
Bill C-27, An Act to amend the Criminal Code (identity theft and related misconduct),
received First Reading on November 21st, 2007. The Act clarifies and creates a number of offences relating to identity theft, trafficking in identity information, and the unlawful possession or trafficking in certain government-issued identity documents (e.g. passport, birth certificate, driver’s licence, etc.). The Act also allows for an order that the offender make restitution to a victim of identity theft. While providing more specific and applicable offences for identity theft,
562 Babbage, M. (2008, July 05). Workload puts driver drug tests on hold. thestar.com. (Retrieved July 7th, 2008, from http://www.thestar.com/printArticle/454869)
22000088 EEnnvviirroonnmmeennttaall SSccaann
Legislative Impacts 288
the overall impact of this legislation on Toronto Police Service policies, procedures, and workload is expected to be minimal.
An Act to amend the Criminal Code (street racing) and to make a consequential amendment to
the Corrections and Conditional Release Act:
An Act to amend the Criminal Code (street racing) and to make consequential
amendments to the Corrections and Conditional Release Act, received assent on December 14th, 2006, created an offence of street racing, based on existing criminal offences of dangerous driving and criminal negligence. The Act provided for increased and escalating minimum punishment with respect to street racing and also provided for minimum prohibitions on driving. While providing a more appropriate offence for police dealing with street racing offences, the overall impact of this legislation on Toronto Police Service policies, procedure, and workload is not expected to be substantial; when the charge is laid officers are required to seize and impound the vehicle for seven days.
An Act to amend the Criminal Code and the Firearms Act (non-registration of firearms that
are neither prohibited nor restricted):
An Act to amend the Criminal Code and the Firearms Act (non-registration of firearms
that are neither prohibited nor restricted), received assent on November 16th, 2007. This Act repealed the requirement to obtain a registration certificate for firearms that are neither prohibited nor restricted. The impact of this legislation on Toronto Police Service policies, procedure, and workload is expected to be minimal.
Hill v. Hamilton-Wentworth Police Services Board:
In October 2007, the Supreme Court of Canada held that, like all other professionals, the police owe a minimum standard of care to suspects. The decision provided the potential for compensation for persons wrongfully accused of a crime if the person suffered compensable harm and the police investigation was conducted negligently, as measured against the standard of how a reasonable police officer in the same situation would have acted. In Hill v. Hamilton-Wentworth Police Services Board, the Court acknowledged that Mr. Hill, wrongly accused of and imprisoned for robbery, had been wronged, but held that although the investigation fell short of good police practices, the investigation was not negligent.
The impact of this decision on the Toronto Police Service is one of potential liability; in the event that the court rules that a police investigation was negligent and the suspect suffered compensable harm, the Toronto Police Service could face a considerable financial penalty.
B. CONTROLLED DRUGS AND SUBSTANCES ACT
Bill C-26, An Act to amend the Controlled Drugs and Substances Act and to make consequential amendments to other Acts, received First Reading on November 20th, 2007. This enactment will provide for minimum penalties for serious drug offences – dealing drugs for organized crime purposes or when a weapon or violence is involved – and increase the maximum
22000088 EEnnvviirroonnmmeennttaall SSccaann
Legislative Impacts 289
penalty for the production of marijuana. The Bill also contains an exception that permits the court not to impose the minimum penalty if the offender successfully completes a drug treatment program. This legislation was introduced as part of the government’s National Anti-Drug Strategy, announced in October 2007.
C. COPYRIGHT ACT
Bill C-61, An Act to amend the Copyright Act, received First Reading on June 12th, 2008. The Bill will update the rights of copyright holders specific to the Internet, in line with international standards, and will clarify the liability of Internet service providers. While it is expected that the new legislation will cause an increase in demand for enforcement by copyright holders, it is difficult to predict the exact impact of this legislation on the policies, procedures, and workload of the Toronto Police Service. The Act has only recently received first reading and it is likely that material changes will be made to the bill before it is passed.
D. ONTARIO POLICE SERVICES ACT
Bill 103, An Act to establish an Independent Police Review Director and create a new public complaints process by amending the Police Services Act, received assent on May 17th, 2007. The Bill adds Part II.1 (Independent Police Review Director) to the Police Services Act, providing for the appointment of an Independent Police Review Director and the creation of the Director’s office, including the appointment of employees and the establishment of regional offices. The function of the Director, as set out in this Part, includes the management of complaints made by the public and to report, on an annual basis, to the Attorney General. This Part also provides for the powers of the Director to investigate public complaints and the requirement of each chief of police to designate a senior officer as a liaison with the Independent Police Review Director. The Bill repealed the current Part V (Public Complaints) of the Police Services Act and substitutes a new Part V (Complaints and Disciplinary Proceedings). Changes to Part V largely reflected the integration of the duties and functions of the Independent Police Review Director, in place of the chief of police and/or his designate, to receive public complaints, determine whether the complaint is about the policy or service of a police service or the conduct of a police officer, and decide, in specific circumstances, whether or not to deal further the complaint, assign the complaint for investigation, and so on. Finally, the Bill provided that the name of the Ontario Civilian Commission on Police Services be changed to the Ontario Civilian Police Commission, that police services boards may continue to establish guidelines for dealing with public complaints in so far as they are consistent with those of the Independent Police Review Officer, and that new regulation-making powers relating to complaints are created. On June 23rd, 2008, the Ontario Government announced the nomination of Gerry McNeilly as Director, subject to appointment by the Lieutenant Governor in Council; it is expected that Mr. McNeilly will be in place next year. At this time, it is difficult to predict the impact of this legislation on the policies, procedures, and workload of the Toronto Police Service as some portion of the impact of the legislation will reflect the interpretations/activities of the
22000088 EEnnvviirroonnmmeennttaall SSccaann
Legislative Impacts 290
Independent Police Review Director, and the Regulations, if any, which will more clearly define the legislated responsibilities and prescribed activities of the police. Professional Standards will continue to monitor the progress in order to identify and respond to any provisions which may affect the workload, policies, and/or procedures of the Service.
E. CHRISTOPHER’S LAW (SEX OFFENDER REGISTRY), 2000
Bill 16, Christopher’s Law (Sex Offender Registry) Amendment Act, 2008, received assent on April 27th, 2008. In brief, the Act broadened the scope of persons required to register to include persons convicted of a ‘designated offence’ as defined under subsection 490.011 (1) of the Criminal Code and subject to an order in Form 52, and persons released from custody on parole in respect of a sex offence, being ordered to serve a sentence for a sex offence on an intermittent basis (e.g. weekends), being released from custody pending an appeal in relation to a sex offence, or changing one’s name. It also provided that provincial correctional institutions or youth custody facilities report to the Registry when an offender is about to be released on an unescorted temporary pass and that designated hospitals report when a person who has been found not criminally responsible for a sex offence due to mental disorder is about to be released unescorted from a hospital. These provisions address omissions in the current registry requirements. It is expected that there will be some increase in the number of registrations.
F. HIGHWAY TRAFFIC ACT
Bill 203, Safer Roads for a Safer Ontario Act, 2007, received assent on June 4th, 2007.
Among other things, the Bill amended the Highway Traffic Act to significantly increase penalties specific to street racing and impaired driving – increasing the minimum and maximum penalties, including an automatic one-year driver’s licence suspension for a person convicted of street racing under the Criminal Code, and providing an escalation of penalty – up to a ten year sentence – for repeat offenders. The Bill also provided for increased and escalating suspension of licences for drivers whose blood alcohol level is in excess of .05 (‘warn’ on Roadside Alert), increasing from 12 hours to 3 to 30 days, but allowing that the roadside test results may be refuted and retaken within 2 hours.
The Service is currently amending relevant procedures to address the process for dealing with a refuted roadside test result. In the short term, the impact of this legislation on Toronto Police Service policies, procedure, and workload is not expected to be significant. However, as citizens become better informed of the penalties imposed (minimum three-day suspension of driver’s licence, fine, vehicle seize/impound) and potential consequences (insurance premium increases) to a driver who has not actually committed an offence (blood alcohol level less than the legal limit of .08), it is expected that drivers may become increasingly likely to refute the test results.
Other amendments to the Highway Traffic Act, recently assented to, amended the Act to impose the use of a speed-limiting system on commercial motor vehicles driven on a highway (Bill 41, Highway Traffic Amendment Act (Speed-limiting System), 2008) and required all passengers in a motor vehicle to wear a seatbelt, setting out rules on how a seat belt is to be properly worn (Bill 148, Highway Traffic Amendment Act (Speed-limiting System), 2008).
22000088 EEnnvviirroonnmmeennttaall SSccaann
Legislative Impacts 291
Finally, separate amendments to prohibit the use of cellular phones, or other prescribed equipment, while operating a motor vehicle on a highway, and to make it an offence to drive on a highway a motor vehicle in which there is an unlawfully possessed firearm, are currently in the initial phases of the legislative process.
G. CHILD PORNOGRAPHY REPORTING ACT
Bill 37, Child Pornography Report Act, 2008, was recently ordered referred to the
Standing Committee on Social Policy. The Act provides a definition of child pornography to clarify the inclusion of child pornography as sexual exploitation and requires that a person who believes a representation to be child pornography report the information to an organization, agency, or person designated by regulation. While it is expected that, if passed, the new legislation will cause an increase in the reporting of child pornography, it is difficult to predict the exact impact of this legislation on the workload of the Toronto Police Service.
H. LABOUR RELATED LEGISLATION
Bill 107, An Act to amend the Human Rights Code, received assent on December 20th, 2006. The amendments overhauled the administration and functions of the Ontario Human Rights Commission, providing that complaints be made directly to the Human Right Tribunal of Ontario and revising the Tribunal’s powers to deal with what is brought before it. It is expected that this will result in a significant increase in the number of complaints which must go to a Tribunal for a hearing; if a complaint is not settled at mediation, it will go to hearing, increasing demands for staff attendance at the hearing, legal costs, possible damage awards and/or ‘public interest’ remedies, etc.
The Human Rights Code was also amended to repeal the mandatory retirement age of 65 years. It is not expected that this will have a significant impact on the Toronto Police Service, as officers tend to retire in their late fifties. However, if a member chooses to continue to work past 65 years of age, the Service will have to, where possible, accommodate the worker with appropriate work. Ontario Regulation 547/07 (Employment Standards Act, 2000) came into effect on October 12th, 2006, and provided for an additional Statutory Holiday and changes to the OMERS Act provided for enhanced retirement benefits for police service members. Both amendments, subject to negotiation between the Toronto Police Services Board and the Toronto Police Association/Senior Officers’ Organization, may have significant financial implications for the Service. Bill 29, Occupational Health and Safety Amendment Act (Harassment and Violence), 2007, requires employers to protect workers from harassment and violence in the workplace, to investigate alleged incidents of workplace harassment and violence, and to prevent further occurrences. At present, the Bill has received First Reading; the impact of the legislation on the
22000088 EEnnvviirroonnmmeennttaall SSccaann
Legislative Impacts 292
policies, procedures, and workload of the Toronto Police Service will depend on the enacted requirements of the legislation – if they exceed the processes already in place in the organization. Finally, a new Guideline to the Workplace Safety & Insurance Act, regarding the definition of ‘suitable work’ is expected by year-end 2008; this Guideline may affect the Service’s return-to-work procedures; however, without a clear indication of the content, it is difficult to predict the impact.
RECOMMENDATIONS FOR POLICE SERVICE
• The Service must continue to ensure that Service members are made aware of relevant
legislative changes and case law decisions in a timely manner. • The Service must ensure procedures are maintained in a manner which accurately and quickly
reflect legislative changes, case law decisions, and investigative techniques, technologies, and requirements so that officers remain current with sanctioned procedures and the Service’s prescribed standards for investigation.

22000088 EEnnvviirroonnmmeennttaall SSccaann
APPENDICES
CONSULTATIONS & PUBLIC FORUMS

22000088 EEnnvviirroonnmmeennttaall SSccaann
22000088 EEnnvviirroonnmmeennttaall SSccaann
Appendix A 293
APPENDIX A EXTERNAL CONSULTATIONS & PUBLIC FORUMS
Summary
The Environmental Scan outlines an assessment of the factors expected to influence the Toronto Police Service or the delivery of policing services. At the beginning of the scanning process, the Service holds a number of consultations. These consultations are held both internally with Service members, and externally with representatives from a variety of public and private sector agencies, government departments, community services, and community members. The consultations are an essential part of the scanning process and have consistently provided valuable information and insights for the Scan document. The primary objective of each of the meetings is for participants to share their views on the changing issues and long range concerns in their particular areas that could affect the nature and extent of future needs for delivery of police services. The intent is to focus on changing environmental and social conditions and anticipate issues that must be addressed in the future delivery of policing services. Consultations were held as part of the 2008 environmental scanning process. In March and April 2008, five consultations were held with City Councillors, representatives from various criminal justice system agencies, community members, and representatives from a number of public and private sector organizations; four public forums, open to everyone in the community, were also held. In addition, one consultation was held in August 2007 with students involved in the Youth in Policing initiative. The main issues and concerns raised during these consultations are listed below (in no order). The presentation of all participants in each consultation and in the public forums have been summarized and these more detailed summaries follow.
Issues and Concerns Raised:
Youth Issues Schools Violence/Guns/Gangs Police Community Partnerships Disorder/Quality of Life Info. to/Communication with Community Traffic Community Diversity General Safety New Immigrants Spousal/Domestic Violence Drugs (incl. grow-ops/crack houses) Police Partnerships with Agencies/Gov’t Problem Properties (non-drug) Police Recruiting/Hiring/Retention Organized Crime Social Issues Victim Assistance Police Visibility Special Events Racial Profiling Criminal Justice System Crimes using Technology New/Proposed Developments Emotionally Disturbed Persons Officer Behaviour Complaint Process Prostitution Hate Crimes Robberies Break & Enters Terrorism Seniors Officer Education Police Workload/Demands Media Police Facilities Need for Police Resources Community Police Liaison Committees Private Policing/Special Constables Notification of Councillors

22000088 EEnnvviirroonnmmeennttaall SSccaann
Appendix A 294
22000088 EEnnvviirroonnmmeennttaall SSccaann
Appendix A 295
APPENDIX A EXTERNAL CONSULTATION – MUNICIPAL COUNCILLORS
(invitations sent to all Councillors)
March 7th, 2008
Councillor Paula Fletcher, Ward 30 (Toronto-Danforth)
• strong relationship with 55 Division – very community-oriented division, sensitive to the multicultural community
• interested in finding out mandate of CPLC (her staff attend meetings)
• advocate of foot and bike patrols – the area has many kilometres of bike lanes and a strong biking community
• seeing officers on bikes sends a strong message to the community
• community wants increased police visibility, especially following recent shootings
• there is need for a strategy to deal with ‘spill-over’ into community from the Don Jail – visitors are often themselves engaged in criminal behaviours/activities
• wants process to notify councillors when meetings are held in the community – recently, community safety meetings were called by a real estate agent and attended by police and CPAT, but she was not advised – leads community members to think councillors not concerned about their issues
• there should be a corporate protocol around notifying councillors during major incidents (just a brief heads-up is needed, not details) – often the media call, but she has been given no information and can’t answer questions
• there are many festival/community events in 55 Division – she often hears that there aren’t enough officers to do other things because all the officers are attending special events – is this the problem it’s presented to be?
• she would like a public report on this issue and what the Service is planning to do about it
• another issue is The Docks, whose liquor licence is currently being re-negotiated – should make sure that the officers who do paid duties here do not come from the division that will be responding if a call is made, since the responding officers may then not do as rigorous an investigation, be as objective as they might be (not wanting to question the judgement of their colleagues)
• enforcement of permit parking is also an issue – are there special people in the division who deal with this? who can Councillors call?
Councillor Janet Davis, Ward 31 (Beaches-East York)
• have a great working relationship with 54 Division, but feels that a communications protocol is needed – she gets mixed messages about who she should be talking to (unit commander, CRU staff sergeant, etc.)
• Toronto Fire has a communications protocol for councillors
• currently, she gets the e-mail information that the rest of the public gets through the 54 Division notification system, but she would like to get the information before the public does
• would like some clarification about CPLCs – how they are elected and accountable to the community, when the meetings are held, whether the minutes are public, and whether anyone can attend
• she says she has been told that it would be ‘political interference’ if she attended CPLC meetings – since councillors and/or their staff attend CPLC meetings in other divisions, a corporate policy is needed
• this type of discussion would be good to have with the division on a regular basis – to keep up-to-date on what the division is focused on, where targeted enforcement is happening, what undercover operations are ongoing, etc.
• would even be good to receive general information (e.g. have shut this place down, are dealing with this problem, are working on this strategy, etc.)
• need consistency among the officers who attend community groups
• AGCO issues – trying to use liquor licence laws to close problem bars, but there is no clear protocol at the City or with police regarding the stopping of liquor licences, getting hearings, getting informed when applications for licences are made, etc.
• foot patrols are really wanted by community members in some neighbourhoods – who decides when/where foot patrols will occur?
• BIA on the Danforth has hired private security with its own patrols, video cameras everywhere – how does the police/private security relationship work?
22000088 EEnnvviirroonnmmeennttaall SSccaann
Appendix A 296
• body rub parlours are a concern – sites have been charged a number of times and still they re-open – why can’t their licences be revoked? can the relationship between MLS and the police be improved?
• the community liaison officer at 54 Division is great at mediating disputes in neighbourhoods, especially when people don’t necessarily want legal involvement)
• she would like to be informed/involved in the process to acquire new property/a new facility for 54 Division
Councillor Shelley Carroll, Ward 33 (Don Valley East)
• agrees that a ‘heads-up’ protocol to inform councillors of community meetings would be a good idea
• in dealing with community requests, councillors are looking to calm the community, not get them excited and worked up
• councillor attendance at community meetings would be beneficial for both sides – police could stick to addressing policing issues and not have to deal with city-service related questions that the councillor could address
• the CPLC allows the unit commander and her staff to meet on a regular basis and share information – the information received by staff can then be shared more widely with her constituency
• the biggest issue in the ward is the subway, in particular muggings inside the subway station
• the TTC special constables have to call police – don’t have the resources to deal with the issue and say it’s not their core business (even though the muggings are happening on TTC property, they’re really happening on the street and the police are the ones to deal with street crime)
• perhaps special constables need to be run by the people for whom dealing with crime is the core business, i.e. the Service – those who run the special constables have to be the ones who know how to do the job (as in New York City)
• seeing police reassures people in a way special constables don’t, and special constables tend to stay around the collector’s booth while the muggings happen in the bus bays
• some analysis of this issue is needed – the TCHC special constables may not need to be run by police; the different focuses of the overseeing agency may be the important factor – the TTC is focused on running transit, not on the people being moved by the transit, while the TCHC is focused on its residents and quality of life
• domestic abuse, senior abuse is being dealt with very effectively through community policing programs
• suburban ‘rooming houses’ (basically low income housing) are a growing concern – people think it’s a police issue, police think it’s a licencing issue
• people who live in these rooming houses are often targeted by neighbours who are concerned about property values being brought down – there’s a growing tension between these two groups
• sorting the situation out with by-law enforcement will take a long time, and the only way to really solve it may be to have licenced rooming houses in the suburbs
Councillor Adam Vaughan, Ward 20 (Trinity-Spadina)
• with regard to AGCO issues raised by Councillor Davis, there will be a common database with the entire regulatory history of addresses – this information can be used in liquor licence hearings, etc.
• there are negative stereotypes of the police in the media, but there is a lot of good work going on
• most damaging are casual comments made by some uniformed officers to other officers when they’re at community meetings, standing on street corners, at paid duties, etc. – negative comments about particular people or groups that are loud enough to be overheard
• when such comments are delivered by uniform officers, it can cause a schism with community members that is difficult to repair and can alienate the middle class
• people are also alienated when the call the police and, being community housing residents, are told to call security instead to deal with their problems (even if the problem being reported deals with weapons)
• there seems to be a lack of attention to public order issues and a concentration instead on major crimes, both institutionally and locally – focusing on the little stuff can help prevent the bigger stuff
• need big ‘p’ parenting – reinforcing civility
• problem properties are usually located in residential neighbourhoods, but the City doesn’t have the capability of neutralizing these properties in any strategic way – need to figure out how to stabilize these situations so that they don’t endanger the neighbourhood
22000088 EEnnvviirroonnmmeennttaall SSccaann
Appendix A 297
• everyone knows what is going on in the property, but nothing can be done until something major happens
• need a multi-jurisdictional, multi-organizational approach to dealing with problem properties
• there is a problem connecting with individual officers – when you call the division and ask for a particular officer, if he or she isn’t there, you get asked to call back – since after major events, communities are often asked to call an officer, we may be losing the opportunity to talk to people wanting to pass on information
• the local division and CIB need to handle calls much better, not just say the officer isn’t there
• there is a sense in the neighbourhood that if you complain against an officer, all your friends will pay the price – if kids ask to be treated fairly by police, police will harass their friends – this situation doesn’t help the relationship between the police and the community
• the complaint process is not working for young people – it’s systematically teaching young people not to complain
• the complaint process is sharing information with front-line officers who are then handing out retribution – something has broken down
Councillor Adrian Heaps, Ward 35 ( Scarborough Southwest)
• good relationship with 41 Division
• either the Councillor himself or a member of his staff attends the CPLC meeting every month
• well engaged with the community – has a number of projects running (e.g. working with schools on prevention projects, working in condos to encourage neighbours to get to know one another)
• currently not a high level of crime in the ward
• however, there is a potential strain on the community with an influx of 7,000 new people into the ward – 41 Division will need more resources to continue preventative projects
• the Youth Corps have been fantastic – he reinforces and strongly supports them
• there is a challenge for police in that there are many new immigrants in the area who are wary of police – it’s a challenge to engage and reassure these people
• tries to have informal, regular meetings with police and TCHC staff to deal with any problems that arise – seems to be working

22000088 EEnnvviirroonnmmeennttaall SSccaann
Appendix A 298
22000088 EEnnvviirroonnmmeennttaall SSccaann
Appendix A 299
APPENDIX A EXTERNAL CONSULTATION – COMMUNITY POLICE LIAISON COMMITTEES
(invitations sent to all Chairs)
March 11th, 2008
Jeff Paulin, 55 Division
• quality of life issues are the main issues of concern in the division, with the number 1 concern on a recent community survey being graffiti (followed by drugs and panhandling)
• with regard to graffiti, big companies (Bell, TTC, Canada Post, newspapers, etc.) need to become proactive in cleaning their street furniture – the CPLC has ongoing clean-ups (funded through a city grant program), but can’t keep up
• before graffiti is removed, officers check it out
• hate graffiti is not an issue
• a town hall meeting is going to be held to discuss the graffiti problem
• the biggest drug issue seems to be related to crack houses that occasionally pop up and are monitored – the information is passed on at divisional crime management meetings (the CPLC is part of 55 Division’s crime management team)
• drugs don’t seem to be a priority for the Service anymore, but need to be – kids are getting money from drugs through thefts, break & enters, thefts from autos, etc.
• residents frequently complain about being hassled by panhandlers, and businesses often call police to remove them
• a pamphlet is going to be created for the community on how to handle panhandlers
• another concern in the division is the large number of special events and festivals – officers get taken from other areas of the division (e.g. the parks) or from other divisions to police the special events, so other things are not getting done
• needs to be better co-ordination with City Hall in the planning of special events
Marie Heron, 41 Division
• Scarborough is undergoing many changes
• the first and most critical issue is the increase in homelessness in the division – due to many factors, including transitioning from the downtown core (people being moved out by downtown revitalization projects), an increasing number of youth leaving home, and high rents and lack of affordable housing
• this has resulted in increased street-level crime (thefts, robberies), trespassing, and overcrowding in shelters that spills over into neighbourhoods
• a second issue is traffic congestion – due mainly to increased development, including a number of big box retail stores and 5 new complexes between Victoria Park and Birchmount
• speeding along Eglinton Avenue is also an issue
• a third issue is unemployment – many new Canadians have arrived with credentials that are not recognized here, there has been a loss of manufacturing jobs, and there are many more working poor due to the rise of the retail sector and minimum wage jobs (see a link between homelessness and unemployment in the division)
• there is also a lack of available office space in the division for new and emerging businesses
• a fourth issue in the division is spousal abuse – many TCHC complexes have women in transitional and risky relationships, women are unable to attain and maintain employment, there is a lack of knowledge among women about the services that are available, and many women are isolated and financially dependent (spousal abuse is also linked to unemployment)
• a fifth issue is the development in the Warden Corridor between Kennedy and Warden Avenues – an influx of more than 10,000 new residents is expected in the new developments over the next 3 years
• there is a lack of clarity and planning around schools and daycares for these new residents
• there are also extensive renovations being done to the Warden subway station
• to try to help address some of these issues, the CPLC will do a number of things, including: o holding a special meeting on increasing inclusiveness o holding a special meeting on youth engagement
22000088 EEnnvviirroonnmmeennttaall SSccaann
Appendix A 300
o consulting with police and agencies on creating an agency/officer wallet-sized card with emergency numbers for domestic violence
o creating a youth advisory mechanism o improving diversity on the CPLC o creating opportunities for positive police/community interaction, and o strengthening information sharing between police and community agencies/institutions o trying to have a representative attend every time there is a meeting in the community (which will not
only help with information sharing, but also hopefully bring new neighbourhood groups onto the CPLC)
Liz Sauter, 52 Division (with input from the Chinatown CPLC)
• the Entertainment District has a number of issues, including guns, gangs, assaults, drugs, and incivility (e.g. drunkenness, disorderly conduct, brawls, vomiting, urination, etc.)
• the high, extremely bright lights in the Entertainment District seems to have helped, people feel safer (although crime may simply be moving to other areas)
• the Yonge Street corridor (north of Dundas) main issues are guns, drugs, and CPTED-related issues such as lighting
• the Spadina corridor main issues are drugs, panhandling, squeegee kids
• the Queen’s Park/downtown area has to deal with protests and demonstrations related to local, national, and international issues
• all of the division has traffic, pedestrian, and cycling issues – gridlock and the blocking of intersections (especially along the Spadina/University arteries), illegal turns, failing to stop at Stop signs, cyclists riding the wrong way on one-way streets, cyclists riding on the sidewalks
• crime and quality of life-related issues across the division include robberies, thefts from autos, thefts of autos, theft of bicycles (especially around the U of T, which is currently piloting a prevention project), panhandling (which is becoming more aggressive), illegal vendors, graffiti, shoplifting, disorderly conduct, and theft of laptops (the U of T STOP program works well and could be used as a best practice for businesses)
• with regard to Chinatown in particular, personal and business safety are issues (shoplifting, theft from autos, illegal vendors on Spadina, etc.), as are all the traffic/cycling issues noted previously
• there is a need to communicate information on robbery and break & enter prevention in Chinatown, along with continued enforcement and education relating to traffic and cycling offences
• there is also a need to educate the community, in many languages, on using 9-1-1 vs. 808-2222
• graffiti gives a bad impression on visitors to the area and encourages disrespect to the neighbourhood
• panhandling and squeegee kids can have an affect on the perceive safety of an area
• addressing a number of issues (homelessness, inadequate lighting on Yonge Street, unlicensed street vendors, panhandling, graffiti, co-ordinating multiple events that affect the downtown core) will require a plan and partnership with the city of Toronto
• the City needs to plan special events better and co-ordinate more with the police – one weekend last year, downtown was essentially shut down due to the number of events going on
Rick Ross, 32 Division
• 32 Division is dealing with the same issues as other divisions – traffic, graffiti, drugs, crack houses, etc.
• presentation concentrates instead on things that are more Service-wide, that can’t really be done at a local level
• suggestion #5: that the Service make use of the community service requirement by high schools – can the Service partner with school boards to make opportunities available for kids to volunteer with us? (e.g. could be involved in graffiti eradication projects) – the kids would be able to take their positive experiences back to their communities and the Service would benefit from their involvement
• suggestion #4: that the Service explore the use of therapeutic dog programs (e.g. Therapeutic Paws of Canada) to provide assistance to adult and child victims of crime – the volunteers in these programs have already been trained, have security clearance, and the agencies are always looking to expand their mandates – victim assistance is a feasible expansion
• suggestion #3: outreach/education programs are great, but many seniors are now being encouraged to stay in their homes as long as possible rather than move to the facilities/residences where these programs are generally offered, and many seniors can’t often (if at all) get out to community centres – the Service should look into
22000088 EEnnvviirroonnmmeennttaall SSccaann
Appendix A 301
offering more information on the Internet or putting the information onto DVDs or videos that volunteers could deliver to seniors in their homes
• partnerships could be used to help fund and create the DVDs and videos (e.g. universities, colleges, etc.)
• in general, the TPS Internet website could be used a lot more broadly to get education information out to the public (e.g. like the TAVIS video) – but the website is under-used because it is not clear, difficult to navigate, and almost impossible to find anything (everything is hidden in menus within menus) – it should also have more links to other websites of use to the community (e.g. PhoneBusters)
• suggestion #2: that the Service look into creating officer trading cards, like the under-used but community favourite TPS horse and dog cards – the cards (which could feature bike and foot patrol officers, ETF officers, etc.) have been successful in building relationships between young children and officers in other jurisdictions
• suggestion #1: the Service has a number of good brochures dealing with fraud, but it would be beneficial to the community to have a 1-800 automated line (perhaps in partnership with Bell) that provided information on the latest scams, Internet frauds, mail frauds, etc., as well as information on how people can protect themselves (a ‘tip of the week’ maybe)
• volunteers, given a script, could also possibly staff the phone line at specified times
• an card with information on where people can get fraud/scam information would also be useful
Barbara Spyropoulos, 12 Division
• the CPLC has created a ‘perfect policing partnership’ wish list as follows
• community policing would be a meaningful partnership of all parts of a community (police, government, education, social services, residents, business owners, and workers) feeding each others’ strengths to create a healthy peaceful environment
• there would be officers in both primary and community response who are willing to use all the tools available to deter crime, working with partners for the good of the community
• the commanding officers would provide support to start and maintain productive police/community partnerships
• Police Service rules and regulations would not stifle initiative and passion that can produce highly beneficial and cost-effective projects and programs in the community
• citizens would participate in a real and productive manner in events and projects designed to mobilize the community and promote peace
• neither neighbourhoods nor groups of people would be demonized by the press to sell papers and capture TV audiences, and fairer, more balanced reporting would occur
• a restorative justice program pilot project will take place within the division (not mediation) – the program hopes to start teaching kids when they’re young about being responsible for and facing the consequences of one’s actions
• the program involves voluntary facilitation between the offender and victim and the supporters of each; in the first phase, each gives the situation from their perspective, in the second phase, they discuss what will ‘fix’ the situation (both must agree)
• such programs in other jurisdictions have generally found high compliance rates and low recidivism
• the program will start in schools with situations that would otherwise result in suspension; when the volunteer facilitators have gained experience, the program will hopefully move to dealing with class 1 offences
• the Law Society has said this pre-court diversion program can be very successful
Mary Reilly, 54 Division
• the division is diverse, with a large immigrant population and many languages spoken
• there are several concentrations of high density, low income public and rental housing communities (e.g. Flemingdon Park, Parma Court, Crescent Town, and the Dawes Road area), and several group homes and secured youth governmental facilities
• the division also has an aging population – police are increasingly involved in providing support and information/education sessions at seniors groups and residential facilities
• there are 3 major high schools and 34 other schools in the division, along with 1 major hospital, and the Ontario Science Centre
22000088 EEnnvviirroonnmmeennttaall SSccaann
Appendix A 302
• there are approximately 30 parks that require constant patrolling and resources to prevent illegal activities, to conduct searches for missing persons, etc.
• the division also services several industrial/commercial parks, focusing on crime prevention and traffic concerns
• a crime corridor is located in the Main and Danforth area where drug dealing and related property and violent crimes are ongoing challenges – this area also has a large shelter for homeless adults and high density, low income housing nearby
• the division has 8 subway stations that experience robberies, thefts, mischief, and sexual assaults, and are used by about 5,000 students at 3 p.m. each day during the school year
• to meet some of the challenges resulting from the above, the division is continuing to increase the diversity of the unit to have the language and cultural skills required to respond effectively and build trust, and has instituted specialized investigations to deal with youth gangs
• large residential areas in the division mean an abundance of domestic-related occurrences
• the 54 Division facility is old, too small, over-crowded, too inaccessible, and lacks a room for community/public meetings – a new site/facility is needed
• 2007 saw a 9% reduction in overall crime rate and the strategic use of TAVIS funding contributed to this success – reduced TAVIS funding for 2008 will affect the division’s ability to sustain this success
• the CPLC has established 5 sub-committees (Newcomers, Seniors, Youth, Crime Prevention, and Fund Raising) to develop initiatives that will address and improve some of the challenges faced in the division
Valerie Plunkett, 42 Division (telephone submission)
• 42 Division is a very large division and some people have to travel very far to get to the station, which is not very easy to get to (some people just don’t go at all)
• therefore, a satellite station is needed in the west or central area of the division
• people used to be able to go to the sub-station at the old traffic station, but with the COR unit now using that building this is no longer possible
• the need for a divisional sub-station should be a priority over the next 2-3 years
22000088 EEnnvviirroonnmmeennttaall SSccaann
Appendix A 303
APPENDIX A EXTERNAL CONSULTATION – CRIMINAL JUSTICE SYSTEM ISSUES
March 13th, 2008
Anthony Doob, Centre of Criminology, University of Toronto
• youth crime and response to youth crime will be affected by public policy – past policies and policies in the future
• police have very little choice about whether or not they will deal with problems, so police response will also be affected by how other institutions deal with issues
• research literature on gangs has shown that the reasons for belonging to gangs varies across groups
• in a complex society, like Toronto, determinants of gang membership will vary widely and the kinds of intervention police use will have to be targeted more carefully – police will have to address specific gangs with specific responses rather than use ‘one size fits all’ programs
• police role in schools will change as a result of public policies that aren’t co-ordinated with one another – the current provincial government has focused on policies that encourage kids to stay in schools and schools to keep kids in the education system, however, school policies addressing minor violence can contradict this
• with the provincial policy, this means that kids who are violent are being encouraged to stay in schools, but there are no supports in place to deal with them (especially in relation to minor forms of violence)
• police will have to work more closely with schools and determine the best role to play to address the problems/issues that arise
• police have latitude and discretion in their response to situations – young people tend to commit offences as a part of growing up – how police deal with this minor offending by youth can either help or create problems
• research has shown that formal intervention through court or diversion may not do any good, that bringing minor offenders into the formal criminal justice process can reduce the possibility of being crime-free in the future
• this can also create conflicts for police – victims want redress, but police know this may not be best in the long run
• what alternatives are available? training, policies, processes to deal with minor offending need to be explored and set up
• there is a tendency in dealing with youth crime to have broad direction rather than explicit policy – this needs to be re-thought – policy doesn’t have to be prohibitively deterministic, but it should be more specific than it currently is
• a balance is needed between having all responses centrally determined and having all responses left to individual officer discretion – how far along the continuum should the line be drawn? (mindful of consistency issues and the possible creation of a huge bureaucracy)
• may also need to consider more psychological support, mental health intervention for youth – intervention for the sake of intervention is not necessarily good – we need to think about the outcomes we want to encourage
• we want to encourage young people into a law-abiding future, but we must also make the best use of available public resources, including the police – the concern is in implementing or using ‘good sounding’ but ineffective (or harmful) programs
• there is an opportunity for police to take a leadership role in the relative vacuum of evidence-based programs for youth – there is not much current research and it would be very beneficial to evaluate programs with youth who offend
• evidence would allow advocating for effective programs rather than just general programs – simple engagement isn’t enough; after school programs, for example, need to be structured, with highly trained staff and an actual curricula
• programs for youth are often implemented that aren’t measurable or that change mid-stream – this needs to change
• it also has to be accepted that not everything will work – a success may even be finding out that something actually doesn’t work
• Youth Criminal Justice Act allows for creativity and innovation – police services should take advantage of this
22000088 EEnnvviirroonnmmeennttaall SSccaann
Appendix A 304
Carroll Robinson, Selection Systems and Appointments Unit, Ontario Ministry of Community Safety &
Correctional Services
• hiring a police officer is a multi-million dollar investment and must be done right – the discipline results of bad hires are well known
• there is a shrinking pool of qualified candidates for police services
• the demographics of the communities served by police are rapidly changing – as, therefore, is the prospective pool of applicants from which to recruit
• there are a number of police recruitment challenges, the most critical being to cultivate a large and vibrant pool of individuals who are interested in a policing career – this requires co-operation with other policing services (municipal, provincial, and federal)
• a national or provincial campaign is needed to promote and market policing as a career (rather than individual police services) – this is currently lacking and will be expensive (police agencies will have to lobby governments for funding) and require sustained commitment
• creating a large pool of applicants can also be assisted by partnerships with colleges and universities (for pre-hiring training) and the provincial government (for post-hiring training)
• the next challenge is to persuade a sufficient number of this expanded pool that the TPS is the employer of first choice – from co-operation to expand the pool, police agencies must now begin to compete for these applicants
• these ‘persuasion’ techniques can include targeted recruitment, mentoring, employee referral incentives, a cadet program, etc.
• the third challenge is then fair, rigorous, but expeditious, assessment of these applicants to select those who have the essential competencies for professional policing and are the right fit for the TPS
• provincial standardization in screening is already in place – the Service can take pre-screened candidates and do a more ‘value-added’ assessment, focusing on organizational fit
• the final challenge is to retain those who are hired
• the threat of losing members to other police services and other occupations can be mitigated by focused recruitment (and assessment of organizational fit pre-hire), by being an ‘employer of choice’, by providing on-the-job training and development, by providing the opportunity to work on special projects, and by implementing diversity strategies to ensure that all members are comfortable within the organization
Sue Blair, Victim/Witness Program
Maureen Bowman, Ontario Victim Services Secretariat
• the Ontario Victim Services Secretariat (OVSS) has a number of core programs in the Toronto region, including: the Victim Services Program of Toronto, 2 sexual assault centres, the Child Victim/Witness Program (Boost), 11 sites for partner assault response programs, a Victim Support Line, SupportLink, the Barbara Schlifer Clinic, and the Victim/Witness Program
• the OVSS also runs a number of time-limited projects, including the Victim Quick Response Program and the Child Internet Luring Program, and supports other projects by providing community grants and community hate crimes response grants
• one of the emerging issues in Toronto is gaps in services for victims of hate crimes, for victims of male sexual assault, and for abused seniors – the senior population is growing and this will become a big issue, particularly elderly domestics or illness exacerbating situations where there are no adequate supports
• another emerging issue is providing assistance to Aboriginal victims (there are Aboriginal-specific courts, but a gap in services for victims) – need to work with police in a very co-ordinated way to ensure that the victim receives support throughout the process and is not re-victimized by the criminal justice system
• there is a need for flexibility in addressing the needs of diverse victims, not just demographically diverse, but also diverse in terms of the type of crime by which they have been victimized (e.g. recognizing the fear of being labelled a ‘snitch’ in a gang-related crime – how can we support their participation in the process? what alternatives can we offer?)
• trauma counselling is not offered to support an effective prosecution, but to support victims and witnesses in participating
• there are also gaps in interpreter services – how can we keep victims adequately informed?
• are working with the domestic courts to look at fast-tracking domestic violence court matters – currently, moving through the courts can take up to a year (particularly outside of Toronto in smaller jurisdictions) and is very disruptive to peoples lives
22000088 EEnnvviirroonnmmeennttaall SSccaann
Appendix A 305
• most critical from the police perspective is the engagement of victims and witnesses in guns and gang offences – this requires co-ordination of all the players (Crowns, police, and the Victim/Witness program)
• if a victim is not supported right from the outset, they are not going to be a good witness or are not going to be a witness at all – research has shown that if you can keep victims engaged, there is more likely to be a successful prosecution
• witness protection works for some people, but we also have to consider how to protect witnesses who don’t want to leave their community, friends, and supports
• lack of resources is a huge issue – having a model of response or support is good, but if there are no resources to support it, then it doesn’t work
Vincent Paris, Toronto Region Liaison on Organized Crime and Firearms Issues, Ontario Ministry of the
Attorney General
• the Combined Office/integrated approach seems to be working – larger scale projects are targeting communities at risk, resources are being contributed by municipal and provincial governments to assist these communities, and TAVIS/high visibility policing is curtailing criminal activity and allowing communities to heal
• the real issue now is to increase the efficiency of the system, make clear to the courts why large-scale projects are needed, and adjust to the changing legal landscape
• the roles of the Crowns and police must remain distinct – Crowns do not direct investigations, they prosecute what is brought to them – but, all partners must work co-operatively together
• Crowns provide legal advice to investigations, reviewing search warrants, assisting with obtaining wiretap authorizations, and consulting on investigative, legal, or procedural matters
• Crowns are also involved in training officers on current legal issues
• the integration of police and Crowns has been recognized by the courts – perceived mistakes or misconduct by Crowns has led to stays of charges; perceived mistakes or misconduct by police has led to costs against the Crown
• three major issues will affect the next few years: delay motions, recent rulings on bail hearings, and limited court space
• additional resources will be needed to address the affects of these issues for: o bail packages and earlier disclosure preparation o electronic disclosure o increased training for officers and Crowns (e.g. affiants in wiretaps, firearms experts) o embedded police officer/project manager who can continue the investigation after arrest o firearms tracking and tracing (moving from evidence to intelligence), and o transcription costs
• these initiatives are having a positive impact on the most vulnerable communities, but there are ways to improve service and the way it’s provided
• recognizing legal hurdles ahead of time is key
• in coming years, pre-arrest disclosure preparation and delay issues must be addressed
Superintendent Allan Bush, Criminal Intelligence Service Ontario
• organized crime is global in nature – crime that affects the streets of Toronto is itself affected by world events and actions in other countries – police agency co-operation is vital
• crime networks are replacing traditional organized crime hierarchies and are difficult to disrupt
• criminal groups are ‘outsourcing’ more, sharing expertise to maximize profits – key criminal facilitators, however, mean multiple vulnerabilities (e.g. one arrest may have an impact on several different crime groups)
• there is rapid replacement by crime groups – as police-driven disruptions occur, other crime groups move in to fill the void (e.g. police intervention in one province may disrupt the local crime group, but a group or groups from other provinces or areas may move in)
• crime is migrating from ‘crime-saturated’ large urban centres to smaller urban centres and rural areas – as these smaller areas become more inundated by crime, competition and violence often occurs
• the above two points again speak to the need for co-operation, partnerships, and information sharing between police services
22000088 EEnnvviirroonnmmeennttaall SSccaann
Appendix A 306
• higher youth unemployment and higher youth poverty levels create a dangerous combination that may result in broader, deeper future threats (e.g. more street gangs and street gang members, more youth violence)
• historical patterns suggest that those involved in serious and organized crime are more likely to remain somehow engaged in those activities
• there is an organized crime continuum running from local, unsophisticated youth ‘gangs’, through street gangs with more criminal intent, to sophisticated organized crime with strong criminal intent – the type of gang, where it sits in the continuum, dictates the type of response needed (intelligence-led response): don’t necessarily respond to youth gangs with enforcement, and don’t respond to organized crime groups with social programs
• it is critical that resources and commitment dedicated to continue and enhance intelligence-led policing efforts and police agency partnerships and co-operation (municipally, regionally, provincially, nationally, and internationally)
Inspector Martin Murray, Anti-Rackets Section, Ontario Provincial Police
• identity theft will continue to increase
• identity theft occurs when a thief assumes your identity by stealing your name, your date of birth, your address, your credit card number, your social insurance number, and/or other personal information
• according to current Canadian law, it is an offence only when someone uses the identification to commit a crime (it is not an offence to possess another person’s identification); it is also an offence to assume a new/false identity (use forged or false documents)
• information that can be used to steal your identity can be acquired in a number of ways, including: o dumpster diving (going through your garbage) o ‘key katchers’ that are connected to computerized systems to collect information you type in o mail theft (stealing ‘pre-approved credit card’ offers, bank statements, tax forms, etc., from unlocked or
unattended mail boxes) o through information sent over unsecured networks o through phishing and pharming scams o through information found about you on the Internet o through a dishonest employee with access to personal records, payroll information, insurance files,
and/or account numbers
• payment card fraud can happen through skimming (the transfer of electronic data from the magnetic stripe of your payment card to the magnetic stripe of another payment card) – the result is the creation of a forged payment card (debit card forgery must also capture the PIN)
• to help prevent identity theft, avoid simple passwords, firewalls and anti-virus programs are essential, use encryption, ensure employees only have access to required programs and ensure an audit/tracking system is in place, carry as few cards/credentials with you as possible, and conduct credit checks periodically
• Bill C-27 (An Act to amend the Criminal Code (identity theft and related misconduct) will create new offences related to identity theft:
o obtaining or possessing identity information with intent to use it to commit certain crimes o trafficking in identity information with knowledge of or recklessness as to its intended use in the
commission of certain crimes, and o unlawfully possessing and trafficking in government-issued identity documents
Shannon Coote, Toronto Drug Treatment Court (e-mail submission)
• there is a need to continue increasing awareness of the Drug Treatment Court (DTC) within the Toronto Police Service – in particular, to continue having the members of the DTC team make presentations to Service members in training sessions at the divisions
• graduates of the DTC program should also be used in training sessions at the divisions, as well as in youth crime prevention seminars, etc.
• the Service and the DTC must maintain a close relationship for input on applicants and for quick attention to bench warrants when DTC participants go missing
• the DTC’s needs could perhaps be integrated more seamlessly into the work of the Service office at the Old City Hall courts
• the Service’s DVD on the DTC needs to be updated, with a particular emphasis on graduates of the program
22000088 EEnnvviirroonnmmeennttaall SSccaann
Appendix A 307
APPENDIX A EXTERNAL CONSULTATION – PUBLIC AND PRIVATE SECTOR AGENCIES
March 19th, 2008
Kate Mason, Street Health
• Street Health is a community-based agency that provides nursing and other health services to homeless and low-income people in southeast Toronto
• conducted a survey of 368 homeless adults in Toronto about their health status and access to health care and other services – findings presented in report released in September 2007
• study partners included the Wellesley Institute, the Centre for Research on Inner City Health (St. Michael’s Hospital), the United Way of Greater Toronto, and the National Film Board of Canada
• results revealed many issues/concerns that could affect policing, including: o more than half of respondents had not been able to get a shelter bed at least once in the last year o nearly three-quarters had at least one physical health condition o one-third weren’t able to get the prescription medication they needed o one-third said they had no one to help them in a crisis o more than half had experienced serious depression and 1 in 10 had attempted suicide in the last year o nearly three-quarters said they’d used alcohol or drugs in the past year
• the survey also found that 12% said that they had been physically assaulted by police in the last year – almost half of these said it happened more than once, and almost three-quarters said they had not made a formal complaint (mainly due to fear of repercussions or feeling that it wouldn’t accomplish anything)
• this finding was similar to those of previous surveys by Street Health in 1992 and the University of Toronto in 2001 (10% and 9% , respectively, of homeless people surveyed reported physical assault by police in the previous year)
• Street Health is also concerned about the criminalization of homelessness with by-laws that prohibit people from sleeping in public places or fine people for panhandling or loitering – it is a waste of police resources to treat being homeless as a crime
• given these issues, Street Health recommends the following: o the Board set explicit policy requiring the Service to address and eliminate police violence and
harassment against the homeless o the Board require the Service to create an action plan, with targets, for addressing police violence
against homeless people, and to submit an annual report on progress in meeting those targets o the Service conduct mandatory training and education of all officers to increase awareness and
understanding about homelessness and ensure officers have strong skills in non-violent de-escalation o during the transition from the existing to the new police complaints process, the Board and the Service
work to ensure the new system is accessible to the homeless and other marginalized people o the Board undertake a study of the effectiveness, including cost-effectiveness, of policing activities such
as panhandling and sleeping in public places
• Street Health has had a long partnership with the police to help them better understand and meet the needs of the homeless community – happy to continue partnership and dialogue
Ann Khan, City of Toronto Transportation Services
• input from Transportation Services staff identified a number of issues for consideration
• with all the traffic data that is collected and analyzed at the city, it would be beneficial and strategic for Toronto Transportation and Service staff to work together in determining the traffic safety and driver issues that require increased attention in education/awareness campaigns
• Toronto Transportation staff would like to work more closely with the Service in planning the annual safety calendar and city-wide and divisional traffic enforcement campaigns
• as parking by-laws are being harmonized and modified, it would be good for city district Operations staff to be included when parking enforcement officers are trained – this would ensure consistency in the interpretation and enforcement of the by-laws
22000088 EEnnvviirroonnmmeennttaall SSccaann
Appendix A 308
• the traffic safety issues that need to be addressed differ in different communities – to ensure that traffic safety and remedial issues are being addressed based on community needs, city district Operations staff would like to increase dialogue with divisional Traffic sergeants
• even though the number of collisions has decreased overall, the number of personal injury collisions has remained relatively consistent – a dedicated traffic unit within the Service would provide increased enforcement presence and would increase compliance with traffic regulations and safety performance
Paul Crawford, Toronto Catholic District School Board
• there is an increased expectation on the part of victims and their families that the police will be called for issues that used to be viewed as minor or the purview of the schools – society is becoming more legalistic
• Bill 212 has mandated schools to look for alternatives to expulsion through mediation and restorative practices – the liaison between the police, school system, and courts will be tested by this expectation
• when charges are laid and bail conditions imposed, there needs to be a consistent person the Board can go to get these altered if the school system has been able to arrange mediation
• TDCSB administrators are being given specific instructions/training on how to proceed by the Service – starting to see it work in some divisions; with training to some school staff is lagging, access to court-approved mediation and knowledge about how it works needs to be part of further Service-School Board liaison meetings
• the culture of silence (not snitching) is so prevalent that it needs a direct and concerted effort by the Service and Schools Boards – in a recent scenario exercise with leadership students, all recognized ethically what should be done, but, practically, many had personal safety concerns
• a higher profile marketing of the Crime Stoppers line needs to take place, and schools are now starting to request phone and e-mail mechanisms to facilitate student reporting
• emerging technologies have expanded the abilities of criminals to affect students and have provided a forum for bullying – the schools have legislated power to deal with cyber-bullying, and appreciate support from the Service in providing information to help keep students safe
• gangs have become family for many students and the gang culture is becoming entrenched at younger ages
• the expectations to provide education to all presents safety concerns when certain combinations of gangs are present in one school – the increased communication to and education of school staff by police is a necessity to prevent troublesome affiliations
• support for the Empowered Student Partnerships (ESP) program is essential, as are dedicated staff who can form strong, positive relationships with School Board staff – commitment at each division is also critical
• it is important that ongoing dialogue through twice yearly meetings of the Police Chief and Director of Education continue, so that procedures to deal with concerns can be operationalized (e.g. lock-downs)
• support for school-specific officers who deliver safety programs in the elementary schools must continue
• the Service must continue to recognize the schools as key community partners when talking about issues of community safety
• the School Board and the Service should work together on a marketing/communication plan that deals with positive practices and safety issues
Bill Byrd, Toronto District School Board
• the TDSB enjoys a very strong, positive relationship with the Service, with dialogue at many levels; the meetings at the executive level, in particular, bring clarity and resolution to many situations and issues – the continuation of these meetings is encouraged
• the TDSB remains concerned about the use of weapons (guns, knives) in and around School Board property – efforts to address this must continue
• with growing apprehension of school communities regarding violence, the collaboration between the School Board and the Service on consistent application and direction around lock-downs and other emergency procedures is important – communication before, during, and after such events is an area of ongoing concern
• the Empowered Student Partnership (ESP) is an extremely positive and powerful preventative collaboration between the school boards, Service, Safe Schools Network, and ProAction – encourage continuation and commend the work of the Service’s Community Mobilization unit, which serves as a bridge between police and schools
22000088 EEnnvviirroonnmmeennttaall SSccaann
Appendix A 309
• the TDSB is somewhat concerned about the continuing decline in funding for ESP from the Service – funding of the project is critical to sustain it; over the long-term, ESP should not become a major drain on the financial resources for any of the partners involved
• the TDSB also supports the relatively new Project PEACE – as this project moves along, its effectiveness must be evaluated and feedback from partners reviewed regarding how well it is doing in schools
• the Police/School Administrators Orientation Sessions are well received and highly regarding, providing local administrators the opportunity to meet with divisional officers
• while understanding the need to sometimes arrest students at schools, it often undermines the good that was achieved by police in the above-mentioned programs – the School Board would encourage the Service to review this matter and educate/discuss with individual officers the discretion available to them regarding timing of arrests, the use of handcuffs, and the manner in which students are removed from schools
• more stringent training of officers on the Police/School Protocol is also needed
• school officials have been encouraged by the Service to always contact the local divisions regarding students involved in sexualized behaviour, even if they’re under 12 years of age, however, feedback from local administrators indicates that divisional response has been varied – there is a need to ensure a consistency of approach and response
• the TDSB is pleased with the response of traffic officers in managing traffic flow, cars parked or idling in front of schools or blocking driveways– traffic is consistently one of the concerns raised at community meetings and parent council meetings
• the Service should increase awareness among community members that, although the schools assist with distribution, community alerts are written and put out by the TPS, not the TDSB – many parents call the local school or School Board with questions
• the opportunity to be involved in training at CO Bick College is very positive and allows us to educate officers and recruits on the school system and relationship with the law
• cyber safety is of increasing concern – the Internet and other forms of electronic communications have had an impact on crime and discipline in the school system – more police resources should be dedicated to this issue
• the School Board would like to see the TPS become a leading edge expert in cyber issues and to use this expertise to help schools deal with the negative affects of the Internet
• the TDSB has recently created a Safety Line, but this is not meant to negate or take over from Crime Stoppers, which is a valuable project worth continuing support
Mergitu Ebba, Woman Abuse Council of Toronto
• the Woman Abuse Council helps to ensure a co-ordinated response to woman abuse in Toronto and is made up of senior-level representatives from each of the key sectors in the community response to woman abuse
• since the implementation of mandatory charge policies, there has been an increase in the number of women arrested in domestic violence situations – in 2000, the number of women charged in domestic violence courts under mandatory charge policy increased from 4% to 12% of total charges
• this was identified as a priority issue by the Council, as was the need to document and study the impact of the mandatory charge policy on abused women and their children
• the study sample included 9 Crown Attorneys and 19 women who had been charged (6 had been dually charged, 17 had children, 14 were Canadian citizens/4 were landed immigrants, 10 were women of colour, and 18 were interviewed in English/1 through an interpreter)
• key findings of the study included: o most of the women were living with partners who were abusive o the ‘gender neutrality’ of the mandatory charge policy decontextualized the abused women’s use of
force o there are serious socio-economic and emotional consequences to women and their children when
women’s self-protective use of force is criminalized o criminalizing the women’s response to male violence increases women’s vulnerability to further abuse
• the criminal justice system and the judiciary must develop an understanding that women’s use of force is often a response to a sustained pattern of abuse by a male partner
• policies including investigation and documentation need to be developed to identify the dominant aggressor in a relationship
22000088 EEnnvviirroonnmmeennttaall SSccaann
Appendix A 310
• opportunities for meaningful participation in the development of criminal justice policy around domestic violence must be provided to survivors and those who work with them
• a workable mechanism must be developed so that women are able to separate their stories from their partners’
• unanticipated outcomes need to be tracked and monitored to assess their impact on women’s safety
• increased support and advocacy must be available to women arrested in domestic violence situations (i.e. the use of professional translation services provided when needed; the woman’s partner should not be used to translate her story)
• research needs to be conducted to document and compare the criminal justice sanctions given to men and women convicted in domestic violence situations
• improved access to legal aid for women charged in domestic violence situations and training for lawyers to better understand women’s use of force in domestic violence situations
Mary Alberti and Vani Jain, Schizophrenia Society of Ontario
• one key issue is poor access to mental health care
• with institutional and community-based care poorly resourced, many people with mental illness (including those in serious distress) often can’t access the care they need or have lengthy waits
• although community care is preferred, in acute phases of mental illness, hospitalization is often safest – however, Ontario has experienced a significant reduction in psychiatric beds over the last 5 years
• wait times to see psychiatrists often range from 4 to 6 months (assuming the person has a family doctor to make the referral in the first place)
• emergency rooms are often used to access treatment during a mental health crisis, however, people must often wait hours for assessment and if officers have accompanied them, they must wait too
• even more frustrating for the person, their family, and the officers is that after a long wait in the emergency room, they are promptly released after having seen a doctor, despite being clearly ill
• it is often unclear about how to go about getting help, there is a lack of clarity about what services exist and how best to access them – this is problematic for police when called to help someone in distress
• there is increasing criminalization of the mentally ill – the number of people with mental disorders in the justice system is increasing about 10% per year, although the number of those considered violent is declining
• criminalization is believed to be an unintended consequence of deinstitutionalization – people who in the past would have been hospitalized for an acute illness are now out in the community; more and more, police find themselves in confrontations with people experiencing severe psychotic symptoms and without enough knowledge about how to interact with these people
• criminalization is also a consequence of mental health laws – changes to the Mental Health Act meant that the criteria for involuntary commitment became ‘dangerousness’ rather than need for treatment – essentially have to wait for a person to become dangerous or criminal before requiring they get treatment
• a mental health ‘revolving door’ has been created – people are discharged prematurely from hospital because there aren’t enough resources and when they get back into the community, they often deteriorate and end up being picked up by police
• there is also a criminal justice system ‘revolving door’ – people commit a criminal act due to mental illness, but are punished through the corrections system rather than given psychiatric treatment; when they are released, their mental health continues to deteriorate and they commit another criminal act
• between 1997 and 2001, the number of mentally disordered offenders increased by 37%, according to Corrections Canada
• anecdotally, police report increased contact with people with mental illness – this has been supported by a recent study by the Vancouver Police Service that found that an average of 31% of calls involved at least one mentally ill person, and that the equivalent of 90 full-time officers, at a cost of $9 million, was spent dealing with incidents in which mental illness was a contributing factors
• given this more frequent contact, crisis intervention/response systems need improvement
• the response must be safe for everyone – the Mobile Crisis Intervention Teams have been extremely successful and should be expanded; non-violent forms of de-escalation should be used if possible; the use of force (e.g. tasers, guns) is an issue of concern
22000088 EEnnvviirroonnmmeennttaall SSccaann
Appendix A 311
• non-criminal, mental health-related contact with police becomes part of an individual’s police record – this can be a barrier to employment, education, or volunteerism; the way this information is disseminated and how it can be used to discriminate against people with mental illness is a concern
• due to limited institutional and community care, people with mental illness sometimes end up homeless – it is estimated that two-thirds of the homeless have a lifetime diagnosis of mental illness, and symptoms of mental illness seem tend to be more severe in the homeless
• homeless persons are more likely to spend time in a police station or jail than in a psychiatric hospital – both homelessness and mental illness are strong predictors of involvement with the criminal justice system
• while some symptoms of mental illness may increase a person’s risk of becoming violent, socioeconomic factors (poverty, victimization, living in high-crime areas) are even stronger predictors
• police services, courts, and corrections facilities cannot be substitutes for health and social services, and police officers many not be properly trained to deal with the complex needs of homeless people and people with mental illness
• many offenders with mental illness face the prospect of homelessness upon release – poor release planning, reduced availability of health and social services, and lack of housing all contribute; once back on the street, the person is again in an environment with a higher prevalence of addiction and mental illness, and a greater likelihood of contact with police
• additional training for police officers in the following areas may help officers respond more effectively when dealing with people with mental illness:
o information about symptoms and how they can influence the individual’s behaviour, as well as strategies for communicating with a mentally ill person during a confrontation
o responding to the needs of and working with the families of people with mental illness (e.g. providing and obtaining information, providing referrals for assistance and support)
o understanding mental health laws, especially as they relate to the duties of a police officer
• better collaboration and communication between police and mental health and other community service providers would help to ensure that officers are equipped to respond more effectively to people’s needs – community liaison-type positions focused on the mental health community could help to increase awareness of mental health resources
• crisis care or emergency room protocols for dealing with mental illness currently do not exist and all hospitals have their own procedures – assessment protocols should be developed for providing care to people in psychiatric distress and police involvement in the development of such protocols is essential
• as noted previously, non-criminal mental health-related interactions with police result in a police record – the sharing of this information through the police reference check system can reinforce the assumed link between mental illness and criminality, and can deter people in mental health crisis from calling the police for help
• interactions with police in the context of mental health issues is personal, medical information and should be treated as such – a policy that forbids disclosure of personal health information through police record checks is needed
• in the meantime, the TPS should look for ways to alter how mental health information is shared through police record checks (e.g. the London Police Service’s recent changes in this area)
• while understanding that the police duty to protect the public may sometimes require the use of force, there are concerns about the use of tasers in situations where non-violent forms of crisis intervention, such as verbal de-escalation, may have been appropriate and have reservations about the expanded use of tasers
Sri-Guggan Sri-Skanda-Rajah and Amy Casipullai, Ontario Council of Agencies Serving Immigrants
• a ‘Don’t Ask, Don’t Tell’ policy is critical for women and girls who are victims of trafficking or domestic violence
• it will assure migrants with less than full immigration status that they can come to the police for help or protection, or assist the police in an investigation
• the implementation of such a policy must be monitored to make sure it is understood by officers and applied consistently
• the Service needs to communicate what expectations community agencies should have, until the policy is implemented
• racial profiling is a long-standing concern in Black communities and a concern in Arab, South Asian, and Muslim communities since 2001
22000088 EEnnvviirroonnmmeennttaall SSccaann
Appendix A 312
• it affects the fragile trust between these communities and the police
• the Service should be begin to collect disaggregated race data and provide a periodical report to the public (even if it’s just a snapshot from time to time)
• recognize and welcome the work the Service has started to establish good relations with newcomer communities, including the Newcomer Outreach Program providing information about police services (only drawback is that if officers don’t always do what the community has been told to expect – makes it hard to re-establish trust)
• many newcomers have had different, often negative experiences with law enforcement in their home countries – many have good reason not to trust police
• newcomers with limited fluency in English, and those with mental health issues, have had negative experiences with police
• many newcomer women who experience domestic violence will not approach the police for help – when they do, it is important to respond with respect and sensitivity
• the Service should continue to work with newcomer communities to build trust
• it is important to build strong, positive relationships with community organizations
• organizations feel strongly that police should not jeopardize the relationship of trust between a community organization and its clients
• when police have to visit a community organization, it is important to recognize and respect that it is a safe space for clients
• if an organization is refused a police permit for a community event, then provide a timely, clear, and valid reason
• work with organizations to support community capacity building
• while the RCMP has said that there have been no human trafficking cases in Toronto, this is unreasonable – a protocol to deal with the trafficking of women and girls is urgently needed (possibly as per the Vancouver model)
• the TPS has much experience in building protocols with communities and could be a valuable leader in assisting the RCMP to develop a protocol to deal with human trafficking
• the women who are victims of trafficking need not to be charged and not sent back to the country/situation that caused the trafficking in the first place
• before people will come forward to help in investigations, etc., they need very clear information on what will happen to them (in some cases, the CIC has sent people who have agreed to be witnesses back to their home country, resulting in the collapse of the case – this does not send a good message)
• the Safe Schools Act has done more to change police/community relations in a negative way than almost anything else, creating the impression that police can’t be trusted (and this is not the fault of the police)
• people don’t remember or know what the child did, or what the school did, just that police came to the school
• police involvement leads to negative perceptions and school actions or lack of follow-through on protocols creates suspicion about what schools are really doing
• communities need to be involved with schools and police – community rumours (sometimes started with no idea of what really happened) often create a barrier between people and the police
• messages from friends, family are trusted more than messages from police or school boards – need to find people who have been in the community for a long time to pass the messages on (find someone who has relationships in the community)
Gillian Mason, United Way Toronto (written submission)
• in November 2007, the United Way Toronto released a research report – using tax filer data from Statistics Canada, it was learned that poverty is persisting and getting worse in some Toronto neighbourhoods
• there is no simple explanation or single factor for this complex problem
• poverty may be concentrated because of the higher housing costs in other neighbourhoods
• newcomers and racialized communities may face additional barriers to social and economic integration
• one can reasonably infer that where there is persistent poverty, there are fewer options and opportunities for people, which can produce a diminished sense of hope – this can be a fertile breeding ground for violence and other crime
22000088 EEnnvviirroonnmmeennttaall SSccaann
Appendix A 313
• to enhance awareness and presence in priority neighbourhoods, the Service might consider involvement or connection with Action for Neighbourhood Change (ANC)
• this process of resident engagement for community development is currently active in 9 priority neighbourhoods – in some of these neighbourhoods, the community response officers are already engaged and this is a positive contribution to community policing
• safety issues are not limited to the city’s 13 priority neighbourhoods, but the challenges in some neighbourhoods may be greater because of limited services and lack of appropriate infrastructure, such as community centres, recreation programs for youth, etc.
• in consultations with the community through ANC, safety was identified as the biggest issue in most priority neighbourhoods; the following feedback/suggestions were provided by residents of these neighbourhoods:
o neighbourhoods would like tools to conduct more efficient and inclusive safety audits o residents of priority neighbourhoods would also like community officers to be involved in conducting
and following-up on safety audits o community officers should work with local resident efforts and find better ways to work together o re-establish police/youth relations beyond just events and celebrations o to build better relationships, the police should use local infrastructure o consider having neighbourhood-specific training/orientation for community police officers (e.g.
introduce new recruits to the neighbourhood, service providers, and local leaders to build resources and personal contacts)

22000088 EEnnvviirroonnmmeennttaall SSccaann
Appendix A 314
22000088 EEnnvviirroonnmmeennttaall SSccaann
Appendix A 315
APPENDIX A EXTERNAL CONSULTATION – CHIEF’S ADVISORY AND YOUTH ADVISORY COUNCILS
April 2nd
, 2008
Peter Ferreira, Portuguese Community
• Portuguese are the 6th largest ethnic group in the city
• challenged by crime – those who are victimized by it and those who commit it – same as other communities
• biggest concerns are visible drug dealing and prostitution in Bloor/Lansdowne area – community appreciates recent major enforcement project
• policing is a big issue – community want to know what police are doing to clean the Bloor/Lansdowne area up – would like police to keep visibility, enforcement levels up
• arrests have had a positive effect – people feel more secure
• recognize that many issues the police end up having to deal with are social issues (e.g. mental illness, etc.) – only so much police can do
• community excited about new 14 Division facility and boundaries – are expecting more police, more security, more attention
• Portuguese community is relatively new – immigration started in the late 1950s and increased in the 1960s and 70s
• first generation immigrants still often have problems with English – are also wary of police due to history/experiences in Portugal and these older people are often more afraid to walk the streets
• encourage more hiring of Portuguese officers, and would be good if could have interpreters available at 14 Divisions (even just by phone)
Rev. Brent Hawkes, LGBTT Community
• LGBTT community feels much good work is being done by the Service – improvements need to continue – also good that work is being done without a negative impetus
• the LGBTT Consultative Committee is very active – people are more willing to be engaged
• the Chief’s Advisory Council is under-used – need to meet more often, even without the Chief – there should be a civilian co-chair or a Deputy could take the Chief’s place
• transgender relations are the biggest issue for the LGBTT community right now – this is where most complaints about interaction with police are coming from – the transgender community feels they are not being treated properly
• hiring a transgender officer would send a positive message
• supports targeted policing – should be implemented more – may be controversial, but it is effective (e.g. moving squeegee kids from park)
• need to work to improve quality of life in city in general rather than just enforcing laws – police will be seen to be supporting the community
• the increasing diversity of the Service is celebrated, but must be aware of potential challenges arising around religious diversity and countries of origin – people from some countries/religious backgrounds may not have yet had the conversation re: sensitivity to the LGBTT community
• the Service needs to maintain sensitivity training to address this potential difficulty
• the Service – and the community – needs to be more vocal around gun control
• cost of policing for community events shouldn’t keep events from occurring – would have a negative impact on communities
• need to push back on politicians – if they want strong, vibrant communities, the need to give the police the budget to police community-building events
• the Service still has a smaller number of out LGBTT officers than other Services – need to do more work, ask what can be done to help officers come out (perhaps talk to officers already out)
• the LGBTT community is no longer only concentrated around Church and Wellesley – people are moving throughout the city, so other divisions that may not have had to deal with LGBTT issues before need to be aware that they soon may have to
22000088 EEnnvviirroonnmmeennttaall SSccaann
Appendix A 316
• the Service is doing many good things that the public in general doesn’t know about – not taking advantage and using these things to create a positive feeling in the community – should use the CAC and community media to ‘brag’ more
• right now, when something negative happens, that becomes the environment – harder to deal with the ‘bumps’ when don’t have a positive feeling in the community already
• may need to hire public media professionals
Abdul Hai Patel, Muslim Community
• representing the Muslim and South Asian communities
• agrees that much good work is being done by the Service – much outreach – needs to continue
• safety is still a concern – the community is still reeling from the after-effects of 9/11 – still much fear among women and children – still much harassment and name-calling that are not reported
• also affects businesses of the South Asian community – bars on doors, vandalism, etc. – so much vandalism that people aren’t reporting anymore since not getting any help from police
• the Muslim Consultative Committee is reaching out in the community on domestic violence and child discipline – trying to get messages out to women
• need more female South Asian officers to go and talk to women in community face-to-face (at women-only gatherings) – will be able to talk about things that wouldn’t be talked about in other circumstances
• possible issue with females applying – wearing of hijab with uniform
• also need more male South Asian officers – need more outreach/recruitment
• but also, men are failing at the last stage of the application process and have no reason why (since none provided) – concerned that they’re not passing security clearance
• welcomes the addition of 2 Muslim officers to the Detective area – are reaching out to the community, community leaders – making good connections
• has received a few complaints this year – people feel they are being stopped because of the way they look, because they have beards
• sensitivity training for officers must continue – Consultative Committee willing to help, facilitate
Mohamed Boudjenane, Arab Community
• insecurity within community
• more narrowly, the dominant issue is hate crime against the community
• it is a complex issue – identifying hate crime vs. racism, defining ‘hate’ crime, etc., how to combat it?
• deals regularly with the Hate Crime unit, but they have limited resources and staffing – need to push government to properly resource, to send a clear message
• the Hate Crime unit needs to be more proactive
• it is also very frustrating when they don’t give or aren’t available to follow up on complaints – people can’t find out what’s happening or what’s happened
• divisional officers need more training about what hate crime is, how to deal with it
• need to see people facing consequences for hate crime – even using alternate measures rather than just court
• cyber hate is a new issue – very difficult since people hide behind ‘freedom of expression’ right
• police need to dedicate officers to monitor hate sites
• the Service needs to provide more education to the community – what hate crime and cyber hate are, how to report, how to fight
• problem with people who incite hate being allowed to visit the country – report them, but they are still able to come and leave with no problem
• perception of racial profiling is still prevalent in the community, especially among youth – don’t trust police services (don’t differentiate between one service and another)
• Somali youth in particular still have a major challenge with police – serious tension between these two groups
• another major problem is domestic violence/violence against women – taboo against reporting – Arab/Muslim community still has a long way to go on this issue; Service should work with Imams (especially progressive ones) at mosques
22000088 EEnnvviirroonnmmeennttaall SSccaann
Appendix A 317
• with regard to recruiting/outreach, may be good to have civilian ‘community liaison’ officers (people from communities) – these people could also play role as mediator in communities at risk – would cost money, but be good outreach
• the Service should use Muslim, Arab events to publicize recruiting, hiring – would be very welcome to attend
• Muslim Consultative Committee gets very frustrated with its role – talk about BBQs, basketball, but don’t talk about issues like recruitment, procedures, policies, taser use, etc. – need to discuss more serious issues
• supports bigger role for the CAC as well
• need to promote, communicate the good things that the police do – use the ethnic media
• also good image building is attending community events – communities feel good, too
Rosa Chan, Chinese Community
• crime won’t go away – especially an issue is violent crime that results in physical harm (e.g. gun crime, organized crime, drug crime, domestic violence, aggressive driving, etc.)
• weakness of the justice system is a concern – no justice for victims, all concern for offender
• see many good things, police working well with the community, but if the Service wants to further improve relationship, need to:
o promote goodwill and trust o handle victims with sensitivity, especially those with major problems – also give them follow up and
keep them updated (not knowing what’s happening creates anxiety) o make reporting of crimes more user-friendly, especially for those with language problems o encourage people to be a part of community-based policing o educate people on crime prevention, especially newcomers o improve communication between youth and the police o seek government support to improve justice for victims
Frank Dimant, Jewish Community
• good working relationship with police – no longer any fear of police, generally no hesitation to report (except sometimes hate crimes)
• clash of cultures in the city is a concern – many people bring difficulties from other lands to Toronto
• physical security is also a concern, especially for synagogues, schools – some now have private security
• the ‘university scene’ has major potential to erupt – will see a situation that is continually aggravated until it gets out of hand
• terrorism is a concern – Canada has been threatened, but not hit yet – is not a matter of ‘if’, but ‘when’ and ‘how’
• B’nai Brith does an annual audit of anti-semitic incidents – have a 24-hour hotline for reporting of such events, but estimate still only get about 10% of total events
• people are not reporting hate crime, especially those who are visibly identified as Jewish
• police and Attorney General seem reluctant to deal with hate crime – don’t want to go in that direction even when it’s very obviously a hate crime; hate crime is being extremely narrowly defined
• organizations need to go into community to encourage reporting immediately – but, if they do, police need to take the calls seriously – every time the ball is dropped, reporting is discouraged even more
• international events have an effect on the number and type of hate crime incidents here
• cyber hate is big concern – police are not dealing with this
• youth gangs and violence are also issues – with Russian and Israeli immigration, expect youth gangs, violence to grow in these communities
• dealing with Russian community will be difficult for police, since people are wary of police due to experiences in home country
Len Rudner, Jewish Community
• major concern is also hate and bias-related crimes
• hate crimes affect an individual and the whole community
22000088 EEnnvviirroonnmmeennttaall SSccaann
Appendix A 318
• for the 2nd year, according to Statistics Canada, the Jewish community was not the most frequently victimized community, but unlike for some other groups, the numbers are still increasing – victimization by hate crimes is still greater than representation in the population
• another great concern is also physical security – have received government grants to establish a security infrastructure program
• the TPS has provided prompt response and awareness to the security issue and events – encourage continuing this level of support (police need to be given adequate resources to do this)
• it is a challenge for police to provide professional and culturally-sensitive service to the many different cultures in Toronto – it is best to decide with the community how service will be provided, what culturally-sensitive service will look like/mean
• maintaining in-service training regarding different cultures is important – communities are willing to help
• while police/community relations are generally good, the rules governing investigations occasionally conflict with religion – discussion is needed on the intersection of police and religious practices
• the Service must continue outreach for recruiting – exploit the current interest by the community
• also need discussion over community events and paid duty requirements – organizers often feel need fewer paid duty officers that what the police assess – this leads to much cost being born by small organizations – need middle ground, especially when there is no specific threat
22000088 EEnnvviirroonnmmeennttaall SSccaann
Appendix A 319
APPENDIX A EXTERNAL CONSULTATION – OPEN PUBLIC FORUM
SCARBOROUGH CIVIC CENTRE – APRIL 8TH
, 2008
Speaker #1
• 3 main concerns to raise
• safety is first – robberies and break & enters are issues, especially of businesses
• people have been robbed so many times, they are tired of complaining – how can people protect their businesses?
• speeding and pedestrian injuries are another issue – more speed control is needed and more police enforcement
• also need more education to stop pedestrians from running across red-lights to catch TTC buses – if drivers see people coming, can’t they wait?
• prostitution on the Kingston Road strip is the final issue – need enforcement all day, not just at night
Speaker #2
• much development is going on in 42 Division and it’s a huge geographic area – the division is massive and going to get bigger – we’re going to be short of police when all the new people move into the new developments
• the division needs a sub-station or needs to be divided into two divisions (this would be the best option) – need to provide access for people who live in the west and north parts of the current division
• the Service needs to do facilities planning
Speaker #3
• would agree with Speaker #2 about the growth going on in the division, but don’t necessarily think another building is needed
• what is needed, are more officers on the street – they can be deployed from wherever, as long as they’re on the streets where they’re needed
• traffic and speeding are also issues
• there are many grow houses in the area now, too – they bring drug dealers into quiet residential areas and people are concerned about walking on the streets at night
• would like to have more police presence to address this – community can work with police to deal with these houses, especially because there are also safety concerns related to the houses themselves (e.g. fire hazard, chemicals, moulds, etc.)
• the number of illegal rooming houses are growing – landlords are exploiting poor people and new immigrants – this is a health and safety issue for them; currently working with Municipal Licensing on this
• the presence of guns in the city is unacceptable – they need to be banned
• neighbourhood is very happy to work with police, likes the current level of partnership
• problem with parking enforcement – when call to make a complaint, get re-directed and re-directed before someone finally takes your report – Internet reporting for this would be good
• it is also difficult to get hold of divisional officers unless you have their name and direct phone number
• the TPS needs to do speed blitzes, more enforcement – like the OPP
Speaker #4
• can the insurance industry be approached to help deal with traffic issues?
• they could be involved in education campaigns, post billboards, etc. to let people know how speeding, etc. affects their insurance and demerit points
22000088 EEnnvviirroonnmmeennttaall SSccaann
Appendix A 320
Speaker #5
• would also like to raise traffic issue – people are speeding through the neighbourhood streets, not stopping at stop signs
• gambling houses are in residential areas
• officers are not visible in the community, we maybe see them once a year – do we need more people or another station? we also have long response times when officers are called
Speaker #6
• (youth outreach worker) have good partnership with the city and police around youth initiatives
• has concerns regarding a few officers when they’re dealing with youth – need more sensitivity training, need to teach officers how to deal with youth in general in non-confrontational way, need awareness of youth issues in general not just crime-related ones
• there are no places for youth to go – few community centres, etc.
• youth feel like they’re being targeted, like they’re being harassed when they hang around with their friends – but where else can they go?
• only a very small proportion of youth cause trouble, some good kids are being harassed – then they start to have a negative attitude, become cynical, problems start; becomes a self-fulfilling prophecy for police
Speaker #7
• police have to get involved in broader social issues, e.g. have police assigned to elementary schools and do foot patrols in neighbourhoods to start to get to know people, become a known figure
• encourage the creation of multi-service centres for people – police, public health, etc. all in one place, a community hub
• why do police go to medical calls with fire and ambulance – this isn’t cost effective and maybe should be looked at
Speaker #8
• (front-line agency worker) youth are the main issue
• see many front-line agency workers who seem afraid of their communities
• agency workers need to be a bridge between the police and youth – need to make both groups examine their actions, figure out what they might have done or said differently in a “bad” interaction
• need to build the capacity of the community
• service providers aren’t providing people with the information they need to hold each other accountable
• police should be held accountable, but youth must also be held accountable – some things come from their actions, too
• kids should complain properly, not just get angry and negative
• trying to build relationships between neighbours – workers need to invest in their communities, keep kids in school, etc.
• service providers/agency workers aren’t doing their jobs in many cases, and services are rare enough in some neighbourhoods as it is
• building relationships is hard to do with the turnover in police – just get to know officers, then they’re moved somewhere else
• youth sometimes have blinkers on where police are involved – for African and Caribbean youth, police back home often treated them much worse than police do here – service workers have to remind them of that
• we also have to tell kids to become part of the system, try to make changes from within – and have to tell youth to back off, to stop harassing the kids who want to apply to the police service or fire department
Speaker #9
• (councillor) when the training unit is moved from the CO Bick College building, could police keep it to use the facility or is the city selling it?
22000088 EEnnvviirroonnmmeennttaall SSccaann
Appendix A 321
• traffic is an issue in the city, bad drivers in particular are a problem
• need to advocate for better driver training and better testing – currently are only training to a bare minimum, only training people to pass the test and nothing more
• grow ops and drug labs are also a problem – owners are learning to mask their operations better, they know what the police will be looking for – how can we counter this?
• also a problem with more families living in grow ops as cover – this is exposing children to danger
Speaker #10
• keep hearing about diversity in hiring for TPS, but senior officers here are all white males – how long before there will be women and minorities sitting up at the front of the room?
• recognizes it is also a cultural issue – many minority communities don’t want their kids to be police officers (due to experiences in home country, not enough status, etc.)
• (Speaker #4 suggested that maybe having more officers who have post-secondary education will change the perception of some cultural groups about the value of the profession)
Speaker #11
• inspired by what has heard here tonight – very encouraging, especially to hear about the diversity hiring progress being made
• police need to carry out much more education, especially in ethnic/cultural communities – re: which number to call, when (9-1-1 and the non-emergency number)
• called parking enforcement on behalf of someone else regarding a problem, but parking said they can’t dispatch to a neighbourhood if you’re not a resident of that neighbourhood – this needs to change – people driving through neighbourhoods should be able to report things if they see them
• another issue with parking enforcement – called in mid-afternoon, but was told that they shift was changing and they wouldn’t be able to deal with the issue right now
• reporting parking concerns on the Internet would be a good option to have
NORTH YORK CIVIC CENTRE – APRIL 16TH
, 2008
Speaker #1
• is concerned about public safety issues and attended a community meeting to discuss public safety
• the face of the community has changed and there are ‘hot spots’ in the neighbourhood
• there is a problem with people knocking on doors in the middle of the night and asking for help – when the occupant offers to call police, but refuses to open the door, the person runs away
• cars are parking on the street in the middle of the night and exchanges are made with people in other vehicles and pedestrians – when the police come, everyone flees
• children have been beaten up at Fairview Mall
• there is also problems with thefts of and from vehicles
• doesn’t want another ‘Jane/Finch’ situation in their neighbourhood
• need more officers and more effective management
• there are a lot of seniors in the neighbourhood; they just want to sleep well
• TTC and officers from 33 Division attended a meeting about security at the Fairview Mall subway stop; TTC officers did not seem to grasp the impact of the end of the line station in relation to the security of the Mall and surrounding area; police officers understood the concerns of the community members – what are the police going to do?
22000088 EEnnvviirroonnmmeennttaall SSccaann
Appendix A 322
Speaker #2
• knows that the TPS is trying to be representative of the community, but police are missing an important point – the city needs officers walking the streets in all neighbourhoods, developing relationships with the community members
• it is harder to hide from officers walking along the sidewalk than from officers driving by in a vehicle – is the ‘beat officer’ in the Service’s plans for the future?
• policing is not just responding to emergencies
• the Internet is a very powerful tool, but it is underused; police need to proactively approach the public on the Internet rather then relying on the public to go to the Toronto Police website – both the city and the police should send messages to community members (on safety, meetings, community events, traffic issues, etc.)
• what happened to the police desk that was set up at Fairview Mall?
• speaker is physically challenged and concerned about the abuse of handicapped parking and abuse of handicapped drivers by other drivers in relation to the use of handicapped parking
• handicapped parking permits are being abused (expired, used by other than the handicapped person for whom it was intended, etc.) – permits should include a photo and be renewed every year with driver’s licence
• doesn’t believe the recent increase in fines for parking in a handicapped parking spot will stop abuse
• we are becoming an impatient society and in an anxious society, people don’t care
Speaker #3
• neighbourhood has a great relationship with the police – thanked the Superintendent for the good work of her officers
• traffic is a concern for the neighbourhood, especially since there is a growing number of young children in the area
Speaker #4
• New York City was once the most crime ridden place on earth – city officials there called on the federal and state governments to assist them with the ‘lawlessness’
• is this something Toronto should be doing? do we need help too?
• with little crime in the neighbourhood, the public is less interested in becoming involved in community safety issues – they are almost complacent
• has noticed distinct ebbs and flows in community involvement in safety over the past 25 years
Speaker #5
• foot patrols are a great idea, but bikes cover more area, more quickly – if necessary, bike officers can walk their bikes
• wondered how many people attended the Scarborough meeting (compared to the 15 or so here)
• (Speaker #1 commented that the only way they knew of the meeting was through the Councillor’s office; Speaker #2 learned of the meeting through the D33 website)
Speaker #6
• wanted to put in a plug for Neighbour’s Night Out, her favourite community policing program
• with the warm weather, neighbours let their guards down – now is the time to introduce yourself to your neighbours so you know who should be around your neighbourhood and shouldn’t
Speaker #7
• can a citizen get a mall security guard to write a ticket for a vehicle without a permit that is parked in a handicapped parking spot?
• remembers the Toronto Cadet Corp and has done some research – Peel Region, New York City, and Santa Barbara have Cadet Corp; in some jurisdictions, cadet are post-secondary students and they work for the police

22000088 EEnnvviirroonnmmeennttaall SSccaann
Appendix A 323
service on a part-time basis (20 hours a week) doing ‘light police duties’ (traffic direction, parking enforcement, etc.) – this is a great program and people who have been cadets commend it
• Citizens on Patrol is a program that has community members volunteer to walk around neighbourhood streets – was a member of COP in 11 Division [pilot] but it was cancelled; he felt that senior management at the time was not interested in the program.
• given that other Canadian jurisdictions that have the program (Halifax, Manitoba, Alberta, and Abbotsford, BC) – Toronto police should reconsider renewing the program
• if the TPS is not willing to consider the Citizens on Patrol program, then they should consider supporting the Guardian Angels – these are dedicated people who need good police guidance; they are well intentioned and just want to help
• need to approach the province to have legislation changed to allow Traffic Wardens – program where people other than police officers direct traffic
• can Parking Control Officers do more and take over some regular traffic duties done by police officers?
ETOBICOKE CIVIC CENTRE – APRIL 23RD
, 2008
Speaker #1
• this is a safe division due to the ongoing addressing of safety concerns and the services that are received
• the Youth in Policing (YIPI) program is a good one – get much positive feedback, very beneficial to youth – the program should be expanded (or at the very least, continued as it is)
• a separate youth CPLC has merit – would give youth a voice, and would be an opportunity for youth and police to work together – the Service should consider a standardised youth CPLC in each division)
• traffic safety is a huge concern – there have been serious fatalities, especially of seniors
• enhanced traffic safety efforts are needed – there are a number of highways nearby that result in much traffic coming and going
• in addition to traffic safety, need programs specific to seniors for fraud, identity theft, etc. (programs should be at both the division and Service level)
• the CPLC is very active and looking for initiatives to be involved in with police
• have good, wide range of community representatives on CPLC
Speaker #2
• non-violent crime has increased in the Queensway/Royal York area, especially graffiti tags, car break-ins, home break-ins
• prostitution is also a problem – seems to be centred at the Queensway motel, but they also use the school yard at the end of the street – many used condoms, needles found in the parking lot
• although when called police say they are aware of the problem, residents haven’t seen any action taken yet – something needs to be done, there are a lot of small children in the area
• need a long-term plan to deal with the prostitution – more than just arresting johns in ones and twos
• also, when reported car break-in, the officer who took the phone call just seemed to brush it off as not important – neighbours have had the same experience
Speakers #3 and #4
• (pastors) the Etobicoke Strategy, based on the Boston Strategy of Dr. Rivers, is working well
• have many people sitting at the table (councillors, police, community leaders, faith community, youth leaders, etc.) – meet once a month; everyone has input into problem solving
• police provide very positive information and guidance, keep us all apprised of the situation
• interaction between the community and police changes the negative perceptions people may have of police – police are especially good at participating in the community’s events, and it’s very appreciated
• pastor-police walks are making a difference in the community – the presence of the clergy dispels tension between police and community people, especially youth – lets people get a different view of each other
22000088 EEnnvviirroonnmmeennttaall SSccaann
Appendix A 324
• having pastors and police walk about together lets people know that the police are not there to hassle anyone – people/youth will engage police in conversation when they might not otherwise do so
• pastors can start the dialogue with people, then the police can join in – we explain to people that everyone just wants to do good for the community
• the walks (every Thursday night for about a year so far) have had a very significant impact on the community, especially youth who may be disenfranchised, have no hope – gives us an opportunity to engage these young people and can reduce youth crime in the community
• would like to see the Etobicoke Strategy model adopted across the city, especially the pastor-police walks
• have faith leaders meetings with police each month – can express to the police the concerns being felt in the community
Speaker #5
• (pastor) also recommends the Etobicoke Strategy
• has worked in community housing – there are some significant ones in 22 Division, even if none have been designated ‘priority’ neighbourhoods by the city
• many new immigrants come from places where they have not had good experiences with the police
• worked with a family of immigrants from Central America and the father had been tortured by police there – when the wife witnessed a triple murder, she was traumatized but still reluctant to contact the police due to past experience – she eventually did, and was treated well
• when the family had a recent crib death and had to call police again, they still expected to be treated badly – instead they received very respectful, helpful service from the officers that was very much appreciated and acknowledged
• believes that having new recruits, new officers who are in their mid-to-late 20s rather than late teens-early 20s is better for the Service
• young officers tend to be too close in age to young gang members, rowdy youth – the adrenaline rush and posturing meant both groups egged each other on, escalating things – officers had the mentality ‘all kids are bad’, kids had the mentality ‘all police are bad’ – they were basically competing gangs
• hasn’t seen confrontations between youth and police so much recently – older officers seem more sensitive to other cultures, languages, beliefs – the mentality barriers are being broken down
• believes that community policing is a nebulous concept to much of the public
• need a resurrection of the old idea of ‘beat cops’ – these officers knew families, kids, businesses, neighbourhoods; areas/people had ‘their’ police officer
• when officers start up sports leagues, work in schools, good relationships are built with kids, but police shifts mean that officers are with one school or are in one area one day, then not back for weeks – need to assign police to neighbourhoods/schools/ community centres
Speaker #6
• have 5 or 6 youth on CPLC this year – have energized the CPLC, taken on active roles (e.g. taken on graffiti program, scholarship program)
• would like to see stronger role for all CPLCs – can be ambassadors to local communities, can do so much more than currently
• would also be good to have something to make them more visible – e.g. have shirts, standard name tags, etc.
• how does the citizen complaint process work? can people phone in safely, with no repercussions or danger to them? need to publicize this information to make people aware
• park safety is an issue – the parks have been ‘taken over’ by young people – need police visibility (patrolling on bikes, in cars, on foot) as a deterrent
• kids are not all bad, many are just bored – divisions need to get involved in sports; maybe there could be a city-wide police/youth games during the summer
• also need an increase in traffic radar locations – even just park unused police cars as a visible deterrent
22000088 EEnnvviirroonnmmeennttaall SSccaann
Appendix A 325
Speaker #7
• disappointed that there was not a better turn-out – the Service could use CPLCs to help publicize these types of meetings since people don’t seem to be hearing about them now
• complimented police on doing an outstanding job
METRO HALL – APRIL 28TH
, 2008
Speaker #1
• police put much focus on/effort into some neighbourhoods, but there is a revolving door in the court system
• the Service needs to work with criminal justice system partners to keep repeat offenders off the streets
• the Service also needs to work with health care and governments to eradicate the reasons that people turn to drugs, prostitution, crime – they need affordable housing, health care, education, etc.; they need the basic necessities covered
• the Service needs to put more ‘feet on the street’ – return to the beat cops that everyone knew
• need to increase police visibility, get to know people in diverse neighbourhoods in non-threatening situations – more police presence will also deter crime and offer reassurance to people in neighbourhoods
Speaker #2
• addressing the root causes of crime is important
• more police ‘feet on the street’ is important, too
• communication between police and the public is a major issue – the TPS website is not easy to navigate and not everyone has a computer
• for meetings like this, other meetings, and to get information out, need to put up flyers in community centres, heath centres, etc. – spread information and get the community involved and working with the police
Speaker #3
• a major concern is that co-operation is needed between all levels of government to address the root causes of crime, guns, gangs
• doesn’t want guns and gangs to driver families out of neighbourhoods
• need programs to prevent crime
• need police on the street who know the neighbourhood and who understand its issues, not officers who change every 6 months
• much of the problem in the neighbourhood is incivility/disorder-related (e.g. graffiti, vandalism, noise, etc.) – shows disrespect for the neighbourhood and leads to more serious issues
• if kids commit crime, like graffiti, they should be made to clean it up as punishment – this would let them know how expensive and time-consuming it is to clean up
• people don’t know a lot about the services police provide, and it’s hard to get people involved with the CPLC (people tend to say ‘someone’ should do something, but aren’t willing to spend even one evening a month working on things themselves)
• a new initiative in the neighbourhood is driving changes – have about 20 different partners involved (including police) and crime has gone down, but it’s still hard to get people to get involved
• people have to make things work – the police can’t do it themselves
Speaker #4
• (community health care worker) harm reduction is important – if prostitution, some drug use was legalized, people wouldn’t have to hide, could have safe injection sites, etc.
• clients say they often get tickets (for drinking on the street, loitering, etc.) – it is a waste of time to give them tickets, since they’re poor and homeless – giving tickets is not helpful
22000088 EEnnvviirroonnmmeennttaall SSccaann
Appendix A 326
• police should work with centres in dealing with people on the street – these centres can provide places for people to hang out – police could bring them there instead of ticketing; this would also start connecting people with services, help
• are there places people can go? safe places outside to stay, drink? they could go to these places rather than just be pushed from place to place – need to create these spaces/places for people
• a lot of the time when we call 9-1-1, we don’t really want or need the primary response, but we do want the Mobile Crisis Intervention Team (MCIT) – this is a very helpful program and needs to be expanded
Speaker #5
• agrees that ticketing is a waste of resources, since the tickets mostly go to vulnerable people who can’t afford to pay – homeless people make less than $200 a month and use panhandling or sex to get money
• need leadership from the police, to take a lead role in dealing with other agencies and the city to connect people with organizations and services that can help them – jail is more expensive than providing treatment beds
• getting a treatment bed is very hard – police advocacy in this area would be a great help
Speaker #6
• poverty is inherent to our privilege structure; there is a built in shortfall for some people and some of these people supplement with criminal activity
• drugs are also driven by perceived need and economics
• the government could take control of the drug trade, regulate drug use, and control the economics – there is a great profit in drugs on the black market and people spend all the money they make; if the government regulated costs, this would be better
• if people are not going to stop using drugs, if society made it more affordable, people wouldn’t spend all their money and have to turn to crime to get more money
• regulated drugs would also be safer – this would help with health care costs
• there needs to be a focus on the root causes of crime
• people have been moved by the restructuring of Regent Park to the Main/Danforth area; social problems have also moved
• when the police take problem people out of neighbourhoods, this doesn’t heal the root causes, it just moves them from one area to another – will just end up costing more if we leave the problems ‘un-fixed’
• how much gain can we make as a society if we can’t heal the underlying problems that lead to criminal activity
• food and housing need to be affordable
• when people are having to finance an active addiction, crime is just a means to an end
• hear from people (drug users) on the streets who have encounters with police that some officers actually engage them in conversation
• seems to be that now some officers are more willing to engage in healthy social interaction – people are reacting well to this (even when the officers take their drugs away)
• interaction is humanizing – people feel included, human, also start to regard police as people rather than ‘cops’
• officers with this skill are usually veteran officers who have learned through experience – can junior officers be paired with these senior officers who know how to deal with people, who have human skills?
• 3 subsidized housing buildings on Kingston Road house a large number of people, with a high concentration of marginalized people – there is a sense of isolation there; people don’t feel integrated with the rest of the community
• when people don’t feel a part of the community, a whole set of behaviours result
• the buildings are about to embark on a pilot with the city – they will be taking in tenants from the homeless population, along with their social workers, which should alleviate some stress on the shelter system
• but, perhaps this is an inappropriate mix of people, since a very large proportion of those already living in the buildings have mental health issues, especially schizophrenia
• ‘bussing’ in people from shelters has good and bad potential
• can the police help to urge the government to allocate money for appropriate housing? to keep those with health concerns (including drugs) separate – direct housing to a narrower range of needs, since some people
22000088 EEnnvviirroonnmmeennttaall SSccaann
Appendix A 327
aren’t equipped or used to dealing with people with mental health problems – fear, anger result and can lead to violence
• not advocating NIMBY re: vulnerable populations being brought together, but people are being ‘warehoused’ rather than getting specialized housing that focuses on their needs
Speaker #7
• what is the role of police? does the Service partner with different levels of government to deal with social issues?
• was under the impression that the police role is enforcement and education
Speaker #8
• (community health care worker) communication within the police service is needed
• there is a disconnect between officers working with the community and those working on the street
• police officers come to meetings, work well with us and are great, enthusiastic – but then sometimes the officers on the street aren’t so great, and these are the stories that get highlighted and repeated on the street – lose trust
• it is hard to get people to access police and the criminal justice system when they don’t trust them
• when they don’t trust them, they also won’t share the information they know
• community health workers would love to come and give talks to officers in divisions, not just speak to the community response officers
Speaker #9
• there used to be meetings in between regular CPLC meetings, but this doesn’t happen as much anymore – used to be able to work out solutions to issues raised at the regular meetings
• also an issue with divisional senior command changing more often, community response officers changing more often
• end result is that the CPLC is not working as well as it used to
Speaker #10
• works in harm reduction – centre gives out safe drug and piercing kits, but people complain that police take the kits away or break them (saying they are drug paraphernalia)
• are police mandated to do this? if so, it’s very unfortunate
• there is a need to educate officers about harm reduction measures, especially when the city is supporting them
Speaker #11
• how many divisions are involved in the MCIT program?
• it is a very good program
• the officers in schools program is not happening to the extent that it used to – need an officer dedicated to each school – the Service could enlist the support of the CPLCs to get funding
Speaker #12
• the TPS needs to support an outside complaints process
• violence and harassment by police does happen sometimes and people who’ve had bad experiences with the police won’t want to go to police to make a complaint – an outside process is needed
• police may be talking to individuals, interacting occasionally, but not always – sometimes they’re almost harassing, which is hard for people who are trying to turn their lives around to deal with
• sex workers and drug users are members of the community, too
• the city is currently in the midst of a Hepatitis C outbreak, which is very costly for health care – that is why they are handing out safe drug kits
22000088 EEnnvviirroonnmmeennttaall SSccaann
Appendix A 328
• would like the police to support this, to take a leadership role in dealing with harm reduction – it would be a bit beyond what the Service is doing now, but maybe a re-evaluation is needed
Speaker #13
• main issue is that of race – the police need to admit that racial profiling happens
• police need to admit it before they can work to solve it
• if police hired in Toronto are coming from all over Ontario, many will not have had experience with diverse groups
• police training in this area is not taken seriously by those who go through the course
• racial profiling marginalizes youth and criminalizes youth – this alienates youth and the community, who then won’t work to solve problems with the police
Speaker #14
• live in an at-risk neighbourhood, with many community services in the area – this results in a lot of street activity
• have CCTV cameras in neighbourhood – believe some activity has been moved out by the cameras
• but, street activity is not necessarily criminal activity – police only need to become involved to reduce criminal activity
• more affordable housing is needed
• and need access to community-based health care, especially for drug users, etc.
• need to lobby the government for more funding for the MCIT program
• requiring police checks on people who would like to be involve in CPLC should be re-examined – people in the best position to offer help may be kept out
• see tonight an interest in engaging with police by community health care workers, harm reduction workers – can a new advisory committee be created to meet on an ongoing basis?
• there is an implementation gap – police policy is not always heard at street level
Speaker #15
• agrees that the need for background checks for people who want to work with police needs to be re-evaluated – losing some potentially good help
• an important role for police is educating kids on the laws related to drugs – form partnerships with other agencies who can talk about the other aspects of drug use; that’s not for police to do
• with regard to the harm reduction advisory committee suggestion – this could be very important – we’re willing to share information with police, let them know what’s going on
• harm reduction can be very helpful to groups that need it – the police mandate and health care mandate sometimes come up against each other on this issue, though
Speaker #16
• worried about prostitutes out at night who are mothers – what can be done to help these women be safe, because they aren’t
• many are just trying to get money to raise their kids
• police, society may have to look outside the box – maybe legalize prostitution or create safe houses
Speaker #17
• police also need to think outside the box when dealing with abused women – shouldn’t have their children taken away by CAS, like she saw in a recent movie
• this just victimizes the woman twice
• women will be afraid to call police when they’re being abused because they don’t want to lose their children
22000088 EEnnvviirroonnmmeennttaall SSccaann
Appendix A 329
Speaker #18
• shifting problems from one area to another is problematic because it doesn’t address the underlying issues
• with regard to domestic violence, in law school, they’ve been told that police charge women with assault, as well as charging the abusers – is this really the policy?
• also, what is the current position of the TPS regarding racial profiling?
• and how can you accurately gauge it if you don’t track it?
Speaker #19
• has seen the poisonous effects of police on society in a poor neighbourhood – hasn’t ever seen a good result after calling police
• police officers at meetings is just good public relations, while the streets are poisoned
• police on the streets can’t be improved – get rid of them and get ones who are controlled
• police from colonial days will have to be completely changed – get rid of the police as an occupational force and have ones who will do real police work
• will need a proper democratic government before any changes can be made
• go to more advanced countries and learn how they are doing things there
• need serious reforms in many areas in this country
Speaker #20
• the Service needs to contact CPLC members directly when holding this type of meeting
• support the community response units and community mobilization, but it is not being applied uniformly across divisions
• police need to be a part of the community in more areas
• need more police out on the streets, on bikes, etc., so that they have more contact with people
• TAVIS is a co-ordinated approach that is good, seems to work well
• police are doing a good job now, just need to do more
Speaker #21
• guns, gangs, and violent crime are ongoing issues in the community – the Service needs to keep a focus on TAVIS, and similar programs, to maintain progress
• most of the issues mentioned tonight support the need to deal with the root causes – need to take this information back to the Board and government, and they need to do something
• the people who spoke tonight need to contact their councillors and MPPs to deal with this
Speaker #22
• in 2006, about 630,000 people were charged under the CDSA, most for possession of marijuana – this number has doubled over the past couple of years
• believe there is a need to take the criminal element out of marijuana and decriminalize it – make it not as profitable for the bad guys
• police can support this by saying they will deal with marijuana possession as a low priority
• 4 cities in Canada have high levels of drug use/crimes; Toronto is one of them – would be a good idea to make it a lower priority to charge and instead get these people the help they need
Speaker #23
• police should do outreach in the shelter system, with pregnant women
• when people suspected of being in the drug trade, sex trade, have been arrested, police have commented that they are better off in prison that on the streets
• this is not the case – in prison, the women are disconnected from their supports; they need to be connected with help, not arrested

22000088 EEnnvviirroonnmmeennttaall SSccaann
Appendix A 330

22000088 EEnnvviirroonnmmeennttaall SSccaann
Appendix A 331
APPENDIX A EXTERNAL CONSULTATION – YOUTH IN POLICING INITIATIVE STUDENTS
August 15th, 2007
Participants:
LaTisha Bell Kadeem Charles Ifeouwa Dada Kadeem Daley Babakayode Fatoba Janeil Gordon Sharna-Kay Hall Mohamed Ismail Samantha Kaminski Odane McKenzie Tara Omorogbe Prashan Pararasasingam Mohammad Qasim Phillip Ramrattan
Discussion involving all Participants:
• feel main issues are violence, gangs, peer pressure in neighbourhoods and schools
• peer pressure for how you dress, how you act towards people – it’s all about ‘fitting in’, everyone wants to be accepted
• most kids want to do what their friends are doing
• friends don’t control what you think, but they do control how you act
• get challenged almost every day
• sometimes you can’t share this with parents, teachers; sometimes it influences how you feel about yourself
• how everyone deals with peer pressure is different, depends on the person – the environment around them helps them deal with peer pressure or not
• whether school peer pressure follows you outside of school, depends on you – sometimes you’re like 2 different people
• act differently in different places – depends on the way you want to be seen where you are; depends on how you deal with criticism
• if someone’s criticized badly at home and school, it starts to be what you expect
• more stuff happens out of school than in – there’s always someone around when you’re in school, but you’re on your own outside of school
• usually bullying, picking on someone is done when in a group of friends – showing off for friends – don’t do it so much when alone
• kids do what they want under age 18 – feel they can get away with it
• few have experienced cyber-bullying; friends haven’t either
• feel it can happen in open chat sites, but not in MSN (which most kids use) – even in open chat sites, not really bullying since you don’t know each other, so it’s just arguing
• cyber bullying can happen when friends fall out, but only rarely since you can delete friends from MSN
• have experienced people talking nastily about other people, dissing them on-line – but insulting people, putting them down isn’t bullying
• can use a different name so people don’t know it’s you on-line
• kids still talking, socializing – just easier now with technology – can use MSN to talk to many people at once, can use technology to do many things at once
• all agree they’re missing face-to-face contact, though – there’s less personal interaction
• people also use phones to take pictures of fights
• generally don’t break up fights when they happen – only break up fights between friends
• feel media pressure to have and use technology – cell phones, iPods, M3P players
• iPods get stolen a lot – stores buy stolen phones to re-sell
• many people sell stolen things (can even buy warranties for electronics) – some people come to school to do business, not to be educated – about 90% of people in school are entrepreneurs

22000088 EEnnvviirroonnmmeennttaall SSccaann
Appendix A 332
• youth get away with things like this because they know technology better than adults
• word gets around – you can buy anything, even guns
• everybody in school knows you don’t leave anything unattended, not even shoes
• if someone sees something you have that they want, they’ll just take it – makes some kids go and get “protection”
• kids who can’t get jobs try to find other means of getting money – turn to dealing drugs, etc., especially if their parents aren’t supportive
• older kids “infect” younger ones, are bad role models
• need stability at home and in life – if you have this, you have few worries; if kids don’t have stability, may turn into problems, violence as they try to get income, etc.
• having support at home helps you deal with peer pressure
• ethics are taught by parents, but more people are influenced by peers than by parents
• some parents are negligent about their kid’s behaviour – let things go
• support at home is important, more so than support at school and from friends – the other support is good, just not as important
• parents teach you right from wrong until you can decide for yourself – can decide your own way using the basis you’ve been given
• every child needs a good foundation to build on
• kids will search for things in the community if they’re not getting them at home – will join gangs
• there aren’t a lot of resources to go to at school, no one to go to
• kids get insulted by teachers and leave school – so they’re not getting educated, they’re out on the street
• good teachers make a difference, but home is very important – need both
• don’t have the same teachers all day in high school – less chance to build relationships
• peers can’t really give you guidance on how to get to the next step
• need to have role model – usually someone outside the home, who you can go to for guidance or help, someone you can talk to
• but, you have to make the choice to go and ask for help or advice
• can’t do it (i.e. ask for help) out in the open sometimes until you leave the environment you’re in
• need more reaching out, more community centres to give people access to these role models
• police have to gain trust
• people see police as the enemy, see police doing things (e.g. raids), so they won’t go to the police for help
• police don’t treat you with respect
• police need to do more in community – need to establish relationships with people and to treat people with respect
• officers have to look at why they’re stopping kids – don’t just stop us for the sake of stopping us
• also, when police stop you, other people who are around and watching don’t know why you’ve been stopped – starts rumours
• kids need to ask officers why they’ve stopped you, because if you don’t then you will always speculate about why (e.g. because I’m black) – officers need to know that when we’re asking, it’s okay
when the group was asked about the best way to get information to them (e.g. their rights if they’re stopped)…
• nobody will pick up a pamphlet with the police logo on it – people will think you’re a snitch; have the city logo on things rather than the police logo
• use media (TTC posters, free newspapers like 24, Metro), not pamphlets
• but also, you can’t possibly get out all the information people need to know in pamphlets or media/newspapers – need the mandatory law classes for kids through schools
• let people get to know police – can have police set up displays at recreation centres, speak to people, make presentations
• police have to be sincere – have to convince people they really want to help
• help to organize events under the names of organizations in the community, not under the police name, or at the very least be partnered with the community organizations and put the police name second

22000088 EEnnvviirroonnmmeennttaall SSccaann
Appendix A 333
• don’t put up signs or billboards in buildings or community centres, because they won’t last – they just aggravate people – will be torn down or covered in graffiti
• have officers come to community fairs and BBQs, but in plainclothes, not uniform – talk and look like normal people
• people don’t like to see police in uniforms – better for officers to come to schools in casual clothes – kids will be more comfortable interacting with officers
• kids won’t talk to officers in uniform, because of peer pressure – uniform attracts too much attention
• even if people know the people in casual clothes are police, still better than when they’re in uniform
• we forget that officers are ‘normal’ people
• people always remember the bad contacts or stories, not the good
• kids usually don’t want to be involved with police/law at all – people have stereotypes about police too
• officers shouldn’t address you and your friends as ‘sir’ or ‘ma’am’ – this is fine if they only want to show respect, but if they want a relationship, they need to relax a bit
• think officers try to be apart from the public, look professional, but this won’t build relationships
• also depends on the person in the uniform, not just the uniform itself
• security guards, for example, actually live in the community – have already earned respect, are known – the uniform is secondary now
• all agree that it’s an issue that officers don’t live in Toronto
• YIPI is a good program – you get to see the police from the inside
• police need to start relationships with kids much earlier, reach out to younger kids
• problem generally is that now police are trying to reach people who are already in trouble
• also, fewer cliques in middle schools – in high schools, things start to change, start to show off for each other/for the opposite sex
• and in high school, you know more people who’ve had a bad experience with police, and the bad ones are the ones who set the trends
• society is more ‘there’ in high school, more pressure to emulate others
• the kids who can’t stand up for themselves, be independent, are the ones who are going to follow the bad examples
• could probably see past the uniform in high school, if learn to in middle school
• on the first day of Grade 9, everything changes – usually you don’t even have the same group of friends around you
• high school expectations come from what you see on the first day
• you’re so young when you start high school, and so many older kids are there – it’s intimidating, you don’t know people, your routine has changed
• police need to reach out to kids before high school – tell kids what to expect
• summers can change everything – kids need more opportunities in summers
• hard to find jobs available in summer – this has changed from the past – now kids just spend summers hanging out (all agree they have at least one friend who’s doing nothing this summer)
• kids also need to know that they need to start looking for a job earlier, that they can’t just start in the summer – need help with job hunting skills
• many more places are starting to help with job opportunities – youth need to take advantage of this
• youth more artistic and more sports-oriented today – people should offer jobs that take advantage of this
• it’s a personal choice whether you’re going to just sit around all summer or not
• money is also an issue – what you want to have, what you want to be able to get, will determine whether you want a job and money or not
• lots of stereotypes for the black community, but sometimes they’re true – sometimes you’re forced to be responsible, help out your family
• sometimes people just don’t want to hire you when they know where you live – more stereotyping
• everyone has to be careful because stereotyping is easy to fall into – have to recognize that we’re all individuals
22000088 EEnnvviirroonnmmeennttaall SSccaann
Appendix A 334
• if someone ends up in jail, it’s because of what “they” want – your life has already been decided by society
• the way society looks at us is the way we start to look at ourselves – people think they know what we’re like, how we’re going to turn out, just because of where we live
• all agree – stereotypes are very powerful – so many kids feel society has already decided about them – how do kids fight this?
• people feel society, government, city don’t care about them
• government, city don’t invest like they say they’re going to – only give the lowest/least amount possible
• people don’t know what else is possible
• if you are expelled or have a record, then there are already a lot of things that are closed to you
• kids know that if they have a record, have gotten into trouble, there’s nothing left for them to do
• when people see police walking by, they think ‘what are they doing here again?’
• more police in the community scares people – when see cruisers, expect another takedown, raids on houses
• police never come into the community and just talk to old ladies or mums with strollers or youth – officers need to have conversations with people
• don’t see police much on foot at all, mostly in cruisers – don’t even get out of the car to talk to you, just roll the window down – the keep apart from the community
• when you do see police on foot, they are in groups and looking for people, not talking to people – trying to find out information, asking questions
• community comes on the alert when they see officers – everyone leaves – they’re like a wolf pack
• sometimes in the community, uniformed officers on foot come up to you with attitude, swaggering – they don’t do that when they’re in plainclothes
• police are NOT approachable
• have noticed officers in community treat you differently when they find out you’re with the YIPI
• media shows like ‘Cops’ give people a bad image of police – think this is what they can expect
• police need to develop real relationships with teens so both sides will see the truth
• media needs to show the positive things that are happening in the communities
• media gives unrealistic impression that everyone can be a basketball star and make millions of dollars, that they don’t need schooling – need the community, schools, and families to counter balance this, but most times they don’t
• need to have people from the community work with others from the community
• community should work together to move towards a better future
• recreation centres can help by holding workshops on how to volunteer, etc.
• need for lots of workshops, lots of opportunities
• communities working together do work
Written Submissions:
Odane McKenzie
Since I moved to Malvern, I have seen a lot of violence. I have seen multiple shootings and stabbings and other acts of violence. Before the gang take-down in 2005, there was a lot of gang vs. gang violence going on in Malvern. There was also a lot of violence involving innocent people wearing the wrong colours in a certain area or saying the wrong thing to the wrong person. I remember when I first moved into Malvern in 2003, there were 2 shootings and 2 stabbings on my street within my first week of living there. This made me feel very uncomfortable and very unsafe. Currently in the years following the gang take-down, there has been little to no violence. I currently feel reasonably safe within Malvern, because I
22000088 EEnnvviirroonnmmeennttaall SSccaann
Appendix A 335
know that there are not as many bad people or gang members around to do anything to each other and to innocent people like myself. When I first moved into Malvern, there was little to no police contact with the general public. The only times that I would see police officer were when they were either investigating a crime scene, arresting someone, or doing a house raid/take-down. Also, the officers rarely, if ever, got out of their cars if they did not have to. They would always roll around in the cruisers patrolling the neighbourhood. I would never see them on foot. Also, the only times I ever came in contact with a police officer was when I was being frisked/searched, innocently interrogated, or when my house was in the middle of a crime scene. After the 2005 take-down, police presence increased a great deal, and there was also an increase in foot patrol officers. This trend lasted for about 1½ years, and then the police officers went back to staying in their cars. I remember within six months after the take-down, there were a lot of parked cruisers and many officers on foot, talking and interacting with the general public. Currently, the police roll around in their cruisers and talk to people through their [the police officers’] car windows. Nowadays there is increased contact between the police and the public, but they continue to drive by the public, remaining in their cars at all times. Even though there is a negative impression about the police in the public, public interaction with just one person would be a small but crucial/beneficial step toward change. I personally do not have a problem with the police and their uniform, but at times, the uniform can be what drives people away from the police. Especially in times like these, where the police are hated in some places, it would be best for officers to dress in plain clothes to blend in with the public. I believe that this way, there would be much more and much smoother interactions between the police and the public.
Sharna-Kay Hall We all know that a community is all the people living in a specific locality. A community could also be a group of people from the same religion, culture, or even profession. But today I’ll be talking about the community I live in – the negative and positive issues that are challenging to the community, and also about recreational activities put in place to promote a better, safer place to live. And lastly, about providing more clubs to promote leadership. First and foremost, the community I live in offers a wide range of schools, clinics, pharmacies, youth programs, libraries, etc. It also opens a lot of doors for kids who need somewhere to be after school is finished during the daytime. But the question is how people in the community have been benefiting from these opportunities. I personally believe that 75% of the people in my community benefit from opportunities provided, while the other 25% spend their time doing illegal activities and spend endless time being pestilence in the community. We as a community need to work with our police on their proposed projects in making our community a crime-free habitat. Opportunities my community offers are: places to go and do volunteer work, youth programs, etc. I believe the majority of the population is just waiting to receive, instead of giving back to a place where they see themselves living for a very long time. Secondly, I believe there should be more clubs in my community to promote leadership. Through the work of the clubs in the home, school, and community, individuals could learn that they are in an organization that is built around the concept of caring. Having a student-led organization, individuals could help to build character and develop leadership and how to present themselves in the work environment. Everyone in my community can be great, because everyone can play a major role in stopping gang violence, and by doing something that is beneficial to the community. Thirdly, there are some negative and positive issues going on in the community. I’ll first start with the positives. I love the fact that the police visit my area on a regular basis, and also have recently built a police station in my area. I believe this will stop the number of crimes going on in the community and people will feel safer. Also, kids are always at the park playing and socializing with other kids from different cultures. However, there are also negative things that the community is affected by. Such as loitering during the night time in front of the buildings at a Coffee Time nearby. There are lots of kids who play in the park with no adult supervision. Even though we have cops
22000088 EEnnvviirroonnmmeennttaall SSccaann
Appendix A 336
coming in and out, we as a community need to take some steps too, in preventing incidents from happening, and be grateful for the opportunities given by the government. We need to work together as a community to prevent unlawful acts from happening. Because we are one people, different races, one community.
Babakayode Fatoba
• 7 years without mother
• ethics that parents taught
• not a single parent thing
• negligent parent is the problem
• the way society looks at us is how we look at ourselves
• teacher attitudes in school
• when younger, need a role model
• the person outside you look at in the community is important, if you are able to go to a good person
• if you end up in jail, it’s because of what they want
• some youth just think that the are pre-determined to be a certain type of person
• how to fix it? community thinks that the government does not care about them – the community that has the most limited resources is the troubled one
• Caribana security on Yonge Street – 7 police officers searched me because I was dressed a certain way
• why police talk/search is an issue with youths
• police should wear casual clothes
• security officers live in the community, therefore earn respect from community – better if community governs community
• if someone picks up a police pamphlet, then he is seen as a snitch
• police should get to kids younger – in middle school
• need social science/civics classes in middle school
• depending on the community, may need environmental change, structural changes
• most youths are artistic – use that
Phillip Ramrattan I am honoured and excited to be able to participate in an event where the perspective of the youth is taken into consideration. I have been given the task of answering the objective question of what I see as the issues, problems, and concerns in my community and school now, or things I see getting bigger in the future. The biggest issue I see within my community is crime. Crime has many negative effects on society and society’s image. And due to this, we as a society expect crimes and criminals because we are prepared with laws, police officers, lawyers, court houses, etc. Is that a good thing or a bad thing? It is never wrong to be prepared, but in this case, we are expecting the worst as opposed to correcting the issue in society. I’m working at 311 Jarvis – this is the family and youth courts. In the Court Services office I deal with Crown briefs, and on those briefs I see various charges that are laid upon youth. In most cases, I see 12-17 year old offenders community minor offences to make money or to participate in gang activity. This is done because a good proportion of the youth does not have strong beliefs and good role models in their parents, so they turn to the streets for the attention that they need and get. The effect of that is that they get involved in crime activity. Now these young offenders are going to have a criminal record for the rest of their lives (depending on the severity of the charge) because they had no guidance from the people that should be helping them, i.e. their parents/teachers. This is very unfair because this part of their life now sets up an obstacle in their way, hindering them from succeeding in life. I am not ignorant enough to believe that every child has two loving and supporting parents, strong values/beliefs, and a stable source of income, like myself. I have been blessed with my parents; they have shown me the way by
22000088 EEnnvviirroonnmmeennttaall SSccaann
Appendix A 337
instituting strong core values in me through my religion. This has given me the right guidance to success, e.g. getting into this program or getting accepted into university. I believe that every youth needs to be shown the way, and in most cases, youths do not have an abundance of role models and helpful hands that I do. That is why I believe that it is important for all youths to be active contributors to the community. The government needs to implement more recreation centres, more reach out programs, and more facilities that are free for any youth to attend after school so that they can get away from crime for free. Many youths need to be exposed to role models during these times, so that they can be guided to being a useful and contributing member of society. A good example is the Blue Jays Children’s Wish Foundation, where children in troubled areas across Toronto can play baseball with their favourite Blue Jays or speak with members of the Toronto Police. And nothing is better than speaking with someone who’s core values are honesty, integrity, fairness, respect, reliability, teamwork, and positive attitude. If more and more programs were like this one, then Toronto would be a better place to live in. The way to stop crime is to prevent it from even starting. If we as a community dedicate our lives to helping youth, then crime would become obsolete as the years pass. We would need everyone’s help to make Toronto a better place to live.
Prashan Pararasasingam
I am here today to discuss a very important issue that I recognise as an unsolved problem in our community. The crucial and disturbing topic that I will be talking about is gangs. Gangs are trouble-making youngsters often involved in criminal activity (including vandalism, break-ins, gang violence, gun battles, theft, etc.). This affects our safety and how the community functions. This influences the perspectives of kids, people in the community, and people outside the community. This prevents parents from leaving children by themselves at the park. This prevents going to the store or leaving the house at night. There’s always danger on the street. If only we can educate these gang members about what’s right and wrong, we can get these guys off the street.

22000088 EEnnvviirroonnmmeennttaall SSccaann
Appendix A 338
22000088 EEnnvviirroonnmmeennttaall SSccaann
Appendix B 339
APPENDIX B INTERNAL CONSULTATIONS
Summary
As noted in the summary for the external consultations, consultations were also held internally with Service members during the scanning process. Again, the primary objective of each of the meetings was for participants to share their views on the changing issues and long range concerns in their particular areas that could affect the nature and extent of future needs for delivery of police services. The intent was to focus on changing environmental and social conditions and anticipate issues that must be addressed in the future delivery of policing services. In February through April 2008, four consultations were held with officers and civilian members from across the Police Service; three forums were also held, open to all officers, civilians, and senior officers. The main issues and concerns raised during these consultations are listed below (in no order). The presentation of all participants in each consultation and in the forums have been summarized and these more detailed summaries follow.
Issues and Concerns Raised:
Member Satisfaction/Retention External Communication/Education Technology – Internal Issues Workload/Demands Information/Data Management Lack of Experience of Front-line Officers Resource Issues due to Special Events Risk Management Member Health & Wellness Facilities Traffic Crime Analysis/Analysts Accountability Emotionally Disturbed Persons Family Violence in Community Emergency Preparedness Infrastructure (non-IT) Police Partnerships with Other Agencies Recruiting Succession Planning Need for Process Efficiencies Lack of Cars in Divisions Staffing/Deployment Calls for Service Private Policing Youth on Youth Violence in Community Disorder/Quality of Life in Community Diversity (Community & Service) Organized Crime Victim Assistance/Support Racially-Biased Policing Two-Tier Policing Aging Workforce Accommodation Resource Requirements Criminal Justice System Changing Community Demographics Service Budget Planning Internal Communication Safety Concerns (uniformed civilians) Community Policing/Community Mobilization Training/Educational Opportunities (including for civilians) Gangs/Drugs (incl. violence, weapons, drug op/crack houses in residential neighbourhoods) Crime Using Technology (especially fraud, identity theft) Staff Development/Career Planning (including for civilians) Reporting of Crime/Information from Community New/Proposed Residential & Business Developments in Community

22000088 EEnnvviirroonnmmeennttaall SSccaann
Appendix B 340
22000088 EEnnvviirroonnmmeennttaall SSccaann
Appendix B 341
APPENDIX B INTERNAL CONSULTATION - SENIOR OFFICER OPEN FORUM
February 6th, 2008
John Sandeman, Manager, Video Services
• main challenge is the increasing number of demands (internally and externally) for access to information gathered by/through technology
• most buildings have CCTV technology now – police can retrieve video information with a request when needed, however, the number of retrievals has increased exponentially resulting in challenges with storage and in preparing/processing videos for the courts
• difficulty with storage is that the information needs to be easily accessed, even after the court case has concluded (e.g. for parole hearings, etc.)
• another challenge is the lack of industry standards in recording, coding, etc. – there are about 200 different security formats, and for some files, the particular company’s software is required to be able to access the information
• lack of quality in video systems is also an issue – when accessing videos from community sources, much work is often required to “clean” the video enough to be used; it is then also necessary to be able to explain to the courts what was done to the video and why
• there is a lack of knowledge in the community about using CCTV cameras (where best to put them, how to run them, etc.) – Video Services is trying to address this with education
• the Digital Video Asset Management System (DVAMS) project is moving forward – for example, enhancements in the near future will allow officers to record interviews right onto the computer, and will make it easier for officers to access/request videos
• DVAMS automation will particularly help Video Services staff in dealing with the large number of impaired driving videos requested by defence lawyers
• with the increase in the number of in-car cameras, physical storage will not be a problem (since everything’s electronic), but the potentially huge number of requests for video related to Provincial offences may be – if paralegals begin to make requests, more staff will be required
• it is a challenge for staff to keep up with rapidly-changing technology – not only the physical resource requirements, but also in the need for training, which is generally only available through the private sector
• technology is changing to high definition, so while Video Services will also have to move in that direction, they also need to keep other systems available (e.g. Beta, VHS), since they have old information in these formats that they still need to access – the main challenge with this is that there is no longer any support for much of this equipment
• expect privacy issues and concerns to become more prevalent
• when a request for video comes in, staff have to retrieve, copy, and then edit non-relevant information out (e.g. “squiggle” out the faces of non-participants) – staff must keep detailed track of what they do when they download CCTV clips
• also trying to make video “non-copiable” so clips don’t end up on U-tube
Superintendent Michael Farrar, Court Services
• major issue for policing will be transparency – who will decide what policing success looks like?
• with an evidence-based policing approach, many organizations are driven internally, they decide what success looks like, but with increasing community mobilization, communities will start to decide what success looks like – challenge will be to get them all to agree
• if success is going to be defined as community satisfaction and perceptions of safety, then police services have to start measuring these
• competitive policing may also become an issue with increasing emphasis on comparative municipal performance results with programs such as the Ontario Municipal CAOs Benchmarking Initiative (OMBI) – questions as to why spending, etc., is greater in one municipality than in another will increase
• smaller, comprehensive communications devices offering phone, radio, e-mail, Internet, etc., are not that far in the future – small screens and keys will be a challenge for older employees, but not younger ones
22000088 EEnnvviirroonnmmeennttaall SSccaann
Appendix B 342
• Employment is hiring of hundreds of new officers and civilians and these “millennials” (aged 20-28 years) are coming into the Service with heightened career expectations – they expect to be promoted within 3-5 years and they expect good career opportunities quickly
• these people will definitely pose a challenge for the organization – the Service will need to shorten tenure in certain positions, and stress what the organization can offer
• for officers, the organization can offer a wide variety of opportunities – the equivalent of having multiple careers while staying with the same company
• for civilians, these opportunities to move around and experience new challenges are not as easily available – the result may be a significant turnover in civilian staff
• the Service needs to help build community infrastructure – communities need to move along the community mobilization continuum (to co- and then self- protection) so that they are more empowered and the police aren’t continually required
• also need to be cautious however, since community mobilization can create opening for private policing to push into core police functions – private policing grows where public policing doesn’t do well or does not respond to community needs
• there are generally few standards and little supervision or training for private police, who often deal with marginalized communities – if private policing increases, this could result in real problems, including an increasing number of police investigations of incidents involving private police
• believes a strategic way to deal with the private policing issues must be developed
• concerned about the accountability framework (whether it would be police service, special constables, private sector policing), governance of private police, and the complaint process for private policing
• need sustainable funding for policing, but also for community and social services
• can see policing moving to the next generation of incapacitative devices – for example, tasers that don’t require physical contact – the Service will need to anticipate these with policies and training
• privacy concerns will become more prevalent with the explosion of web-enabled invasion of personal and private spaces (e.g. video/cameras on houses that property owners can view off-site – the camera will cover their own property but also probably pan over public spaces and other people’s private spaces)
• will the police start requesting the information from what is basically web-enabled surveillance technology?
• racially-biased policing issues will re-surface – with the Service’s and Board’s current policies, practices, how will the Service be able to say whether it is actually happening or not?
• the Service also faces technological challenges with the courts – there is a need for integrated technology from scout car to court to probation/parole hearings, however, the Province is still reluctant to deal with this after the lack of success with the Integrated Justice Committee; the Province must find a way to motivate/compel the judiciary to use electronics/technology (e.g. Justices of the Peace are still insisting on having signed pieces of paper; they won’t accept electronic signatures)
• if prioritized, would see the issues as community infrastructure for at-risk, racially-biased policing, and transparency
Susan Walker-Knapper, Co-ordinator, Court Services
• Service is promoting e-learning, but court officers are not often able to take advantage of this opportunity – they are in locations that don’t allow them access to computers most of the time; also, many are part-time or temporary and don’t have access to Service workstations
• the delivery system for training for the unit must be tailored to unit needs
• as noted above, have many part-time employees – the Service is budgeted for 5 hours a day, but they’re often only scheduled for 3 hours, and it’s often 3-5 years before a full-time position can be offered
• this situation results in a significant amount of turn-over among the part-time staff, which mean continual hiring and training to fill positions – retention efforts must be increased
• the career path for civilians on the Service is far more limited than for officers – civilians are generally hired into a position for/with specific skill sets and are expected to stay there
• with limited opportunities for change or development, it can be a challenge to maintain civilian motivation
• the Service must recognize that although the skills civilians have may be specific, they may translate into different areas of the organization
• also need to increase the profile of training opportunities available to civilians
22000088 EEnnvviirroonnmmeennttaall SSccaann
Appendix B 343
Chuck Lawrence, as representative of the Senior Officers’ Organization
• there is inconsistency in management of the Service below the Deputy level – the independence available to Staff Superintendents and Directors can result in considerable management differences between areas
• need to address the inconsistencies without necessarily limiting the independence of management
• externally, there is risk to senior managers in the form of vicarious liability – indemnity provisions/protections are not set up as in private or volunteer organizations
• there is a risk of Police Service Act charges, charges under the Human Rights Charter, or even criminal charges if managers are held accountable for those they supervise
• privacy could also become an issue – senior officers are public officials and when situations arise, there is sometimes an invasion of privacy, the publication of private information
• support during stressful investigations, etc. is needed, as is an effort to speed up these processes that can drag on for a long time
• technology and business processes need to be more flexible – although there are funding implications and security issues that must be dealt with, there may also be benefits such as improved efficiency
• civilian senior officers face different issues than uniform senior officers
• the uniform senior officers have mostly had long careers together, and have had long-term relationships, while the civilians generally have more lateral movement into senior management positions and are more likely to come from outside the organization
• there are rules about civilianizing police positions, but nothing preventing the organization from filling civilian positions with officers – this takes positions and potential career development opportunities away from civilians
• with the ever-present potential for the “bluing” of positions, civilians can never really plan career paths because the positions might no longer be available to them
• the Service needs to think carefully about this situation, perhaps explore the possibility of posting position vacancies before filling them with officers
• the Service might also want to explore the posting of all senior officer positions, including uniform ones – allow any officer with the basic requirements to apply
• lines of authority, respect are also not clear for civilians – many officers think the uniform ranks are first, then all civilian ranks are below that (changing titles may help in some situations, for example, everyone at the Staff Superintendent/Director rank could have the title “Director”)
• and finally, need more clarity around serious civilian discipline issues – who has responsibility/ownership, the Board or the Office of the Chief?
Chuck Lawrence, Training Manager, Training & Education
• retention of officers is a major issue – newer officers are from a different generation, have different expectations, resulting in a very dichotomous organization right now
• complicating matters further, the older group of officers tend to be a very homogeneous group, while the younger officers are more diverse and have a variety of life experiences
• the organization is not set up to deal very effectively with the expectations of the new generation – it definitely needs to be more flexible (for example, offering leaves of absence or sabbaticals to test out different careers)
• retention pay is not a good solution to the problem of keeping good officers – financial incentive is not necessarily the main motivating factor – officers want job enrichment, development, and training
• to offer continuous learning, the Service must harness the available technology and integrate learning into daily work – the Service culture must change to recognize the value of learning
• governments are imposing more and more regulations and standards, including those related to training – policing organizations need to be more involved when policing standards are set to ensure requirements are feasible
• the Service needs to focus more on managing risks rather than trying to eliminate them – currently, procedures are overly concerned with whether something is misconduct or not when we may be better served by looking at various options for response
22000088 EEnnvviirroonnmmeennttaall SSccaann
Appendix B 344
• the Service must create hiring and succession plans to deal with the large numbers of baby-boomers heading into their retirement years
• Ontario Police College training for recruits is a sleeping problem – the course has not changed from its 12-week length in 40 years, even though policing has become much more complex – 12 weeks is no longer a reasonable length of time and the Service supplements this training with training at the TPS College
• also, while the entry requirements for many other professions (e.g. teaching, nursing) have evolved with changing times, the requirement for policing has not changed and applicants are still only required to have a Grade 12 education
• the Service is under-utilizing on-the-job training, however, with the restriction on the length of time new hires spend with coach officers – critical that this time lasts longer (the costs would not be great and the benefits for both coach and young officers would be good for the Service)
• the Service should make an additional 5 weeks of coach officer training available for unit commanders to use when an evaluation of a new recruit shows they are not quite operating at the level they should
• more e-learning, which doesn’t take officers away from the front-line, is also needed
• more short-term, wide ranging job experiences/placements in a variety of areas would also be good for new officers – would be good job enrichment and increase interest in other areas of policing
• the Service needs to ensure good initial management orientation training for new managers, but it also needs to support ongoing education/learning in human resources management – these courses are easily available in colleges, universities
• members have to take responsibility for managing their own careers, seek out opportunities and find out what the requirements are, how they can start to fulfill those requirements
• the Service should also explore the possibility of supporting career paths for officers – for example, officers could chose to go into either a community policing stream or an investigative stream – officers could then learn for the path they choose
22000088 EEnnvviirroonnmmeennttaall SSccaann
Appendix B 345
APPENDIX B INTERNAL CONSULTATION – OFFICER OPEN FORUM
February 12th, 2008
Detective Andy Sawyer, Organized Crime Enforcement
• challenge for Service is to respond to calls promptly – time to get to calls is increasing, as is service time once officers arrive
• the way the Service responds to calls is not working well any longer – high priority calls have long wait times and front-line officers have no time to do any proactive work
• one major call on a shift can cause a huge backlog in calls
• need to find efficiencies in dealing with calls for service and long service times – may mean responding to particularly calls differently (e.g. missing juvenile calls are often repeat calls – not necessarily serious circumstances, but have to write the same report/get the same information each time – if the call is repeated 30 times a year, that means a lot of hours are spent writing the same things over and over, and not being available to attend other high priority calls)
• if calls/situations are not unique and circumstances haven’t changed, officers should maybe be able to open previous reports and add to them – will cut down on time spent at the call and writing report later
• further, reports now generally written in the car – increases visibility for community and the car stays on the road, but it also means in two officer cars, only one officer is writing, the other is not being productive
• doing reports in cars may also be increasing service time, since there are more distractions in the car than in the station, and glitches on the mobile workstations can result in reports being lost and officers having to start over
• when occurrences are sent through to the CIB, they’re often filed ‘No Further Action’ the next day due to lack of information, etc. – is it possible to streamline the occurrence submission process for the types of incidents that are usually closed this way?
• much redundancy in memobook writing practices as well – officers have to complete their memobooks, then re-type all the same information into an occurrence – it would be more efficient to do everything electronically one time, or at least have one source populate the other so that officers don’t have to write as much in duplicate
• the afternoon/evening shift overlap is also a source of inefficiency in some divisions since no cars are available for the officers coming in for their shift – they end up waiting around the station for cars (in some divisions it is feasible to send these officers out on foot, but it is not in other divisions)
• the Service should make better use of its human resources – there are a number of people on the front-line who have come from private industry – we should ask them to help identify efficiencies and how to streamline processes, and then second them to help with the implementation
• the need to find efficiencies will become more and more important
• the worsening situation with regard to calls for service could end up being a liability issue for the Service
LeeAnn Papizewski, Intelligence Services – Technological Crimes Section
• main challenge is keeping up with rapid pace of technology as it relates to policing
• 75% of adults in Toronto use the Internet
• 18-44 year olds are 1.5 times more likely to use the Internet than other ages
• use also high in homes with children under 18 years of age
• many homes have multiple computers
• phones are now basically mini-computers
• data are stored in a variety of media – some visible, some invisible
• computer technology has also been embraced by criminals
• cyber crime is an offence where a computer has been involved or is used to commit the offence – the main example is child pornography, but cyber crime is not one-dimensional and can encompass a full range of events
• requests for the assistance of the Tech Crimes Section have greatly increased in recent years
• digital evidence retrieval is requested for a wide variety of offences – there is a wealth of evidence available, and the demands will only increase as investigators realize the potential – resources will need to be increased to deal with the increasing retrieval demands and to present in court
22000088 EEnnvviirroonnmmeennttaall SSccaann
Appendix B 346
• there is a need to place officers in high schools and for them to join Facebook and similar sites – they can both create their own pages for education (we must get the message out about what kids should and should not provide on-line) and use the sites as open-source intelligence (gangs, etc., often post incriminating information)
• there is a need to educate officers on things such as identity theft, bank fraud, phishing, etc., since there is about a 1 in 4 chance that a person will become a cyber victim
• officers need to be more tech-aware
• investigation of cyber-crime and the retrieval of cyber evidence needs to be a priority for the Service – need to devote appropriate resources and develop innovative crime prevention strategies and private partnerships
• legislative changes are needed to provide access to communications, etc. (lawful access legislation)
• currently have 8 people qualified in Section – keeping up with training is difficult and expensive (e.g. there are only 20 spots at the Canadian Police College per year for all of Canada) – it takes about 1 year to be fully trained
• there should be both officers and civilians in the unit, and both groups should be accredited – they need the expert status/designation for credibility in court
• need officers to be able to deal with search warrants, investigations, etc., but civilian expertise and continuity would be of great assistance
Detective Larry Straver, Crime Stoppers
• main issues relate to social networking systems (e.g. Facebook) – we need to educate kids about security, how to make sites more secure, what information to give out, etc. – a Crime Stoppers officer is going into schools to start doing this
• Crime Stoppers is also talking to teachers and parents about Facebook, YouTube, etc.
• officers who currently go into schools are generally too out of touch – they are getting laughed at by students
• officers have to be able to talk to kids at their level (including technology-wise), about things they are interested in
• there are people on the Service with the skills needed, but they don’t want to get pigeon-holed into this position – school/tech officer is not seen as a position with police credibility, prestige, priority, etc.
• need to get the right people to do the job
• also need to save the relevant training spots for the people who are actually working in or will be working in the area, not for people who are interested but who won’t be using what they learn
• need to educate people and develop prevention programs for things like identity theft
• the Service really needs to “market” prevention more – say what we can do to help people – there are so many options that people just aren’t aware of
• police are now using YouTube to put information out, ask questions, and create a dialogue – people feel involved on their terms, they can go on-line just to look, to give input, etc. – but this kind of tool needs the right person to keep it going
• putting information up on YouTube can create a spark in the community and create conversations with officers when people see them in person
• YouTube sites can bring information from people in the community who might not want to come in to a division, call in, or be in a CPLC
• re-enactments on the 6 o’clock news aren’t valuable anymore – the target audience for the message doesn’t watch the news
• Crime Stoppers is a tool for other units to use, but it shouldn’t necessarily be the first resort to offer to get witnesses – the Service needs to figure out how to encourage people to be witnesses (who are needed for prosecution) rather than tipsters
• may be offering Crime Stoppers too early in investigations, offering people an easier alternative – Crime Stoppers should be a last resort
• we need to encourage people to stand up in their community – there is a whole generation of young people who are learning to be tipsters rather than witnesses
• text messaging to receive tips is coming in the near future (have received tips on-line since 2003 – represented about ⅓ of tips last year) – texting, like on-line, means you’re limited as to what you can ask, though
22000088 EEnnvviirroonnmmeennttaall SSccaann
Appendix B 347
Staff Sergeant Devin Kealey, Operational Services
• main challenge for the Service is increasing and capitalizing on opportunities for external communications
• media relations are extremely important, since the media are our main link to the public
• we need to improve our provision of timely, effective, and strategic information to the public
• On-line News Releases, Badge, and the Service’s Internet site are good communication initiatives that we need to continue to develop and take advantage of
• however, training is an issue – current media training is inadequate, almost non-existent and there has even been a cut back in the media relations component of other training
• training provides a base knowledge of media relations and the confidence to talk to the media – this is a vital role, and it’s unfair to put people in that position without training
• training may cost the Service, but it may be less than dealing with liability risks and civil suits – it should be recognized as a huge risk management issue (an officer might say the wrong thing at the wrong time to the wrong person, or not say anything at all)
• until we provide adequate training, we won’t get people who want and are properly able to communicate with the media – the Service loses opportunities to connect with and reassure the community when officers won’t talk to the media because they’re uncomfortable
• media relations can’t, however, always be open to everyone – many times, someone with a corporate perspective is needed
• if Service representatives won’t talk to the media, media will go “shopping” for someone to fill the void (may select someone from another Service, a police critic, etc.) – the Service needs to provide a timely response and facilitate communication directly with the experts in situations
• it can also lead people to believe the Service is covering something up if they have no comment for the media
• new technology, tools offer new opportunities in this area – for example, issuing a Blackberry device to dedicated media officers to allow direct and timely communication with the media
• the Service might also take advantage of the large blocks of news time/programs that media outlets need to fill, perhaps by having a dedicated, daily police segment – would allow a regular, direct link to the public – media partners have shown an interest in having such a policing segment
• every interview/segment would be like a commercial for the Service – could use it to provide crime prevention on “slower” days, or bring in special guests for call in questions, or to provide a communication venue for the Chief during a crisis situation
• the technology to have such a segment already exists at headquarters – the only real cost would be the time commitment by a small, dedicated, trained team of Service members with up-to-date communications equipment
Sergeant Steve Callaghan, Training & Education
• a main problem for the Service is the large number of databases and record-keeping systems that don’t interface with each other
• each time a question is asked, it seems another small, stand-alone database is created to track the required information, since the main Service systems can’t accommodate easily
• ITS needs to be involved more to create programs and databases that the whole Service can access and use (the creation must be timely), or to adapt current databases to collect the information that we’re being required to collect/track
• tracking systems/Service-wide databases would especially help in responding to auditor questions, Board questions, etc.
• the Service definitely needs to track training (and the lack of training) better, as well as workload, personnel issues, etc.
• the information needs to be accessible and easily available to people who need it

22000088 EEnnvviirroonnmmeennttaall SSccaann
Appendix B 348
22000088 EEnnvviirroonnmmeennttaall SSccaann
Appendix B 349
APPENDIX B INTERNAL CONSULTATION – CIVILIAN OPEN FORUM
February 13th, 2008
Cheryl McNeil, Operational Services
• challenge for the Service is the training and development of civilian personnel
• moved from Communications to Operational Services in a career development capacity – has greatly expanded her organizational awareness/knowledge and allowed the development of a more comprehensive appreciation for the operations of the Service
• she has been fortunate in being given this opportunity – opportunities for civilian development and advancement are still very limited (need both better lateral and better vertical opportunities)
• current training opportunities are limited by the number of spaces available and restricted by the classification levels of civilians (e.g. little access to Guelph-Humber programs)
• training should be made more accessible for civilians – civilians should also have access to e-learning
• the next generation of workers is different from those hired by the Service in the past – they will be less willing to wait, and will want better, more accessible training and development opportunities
• if the new generation of workers doesn’t get these opportunities, they may be more likely to leave the Service after only a short time – enriching work experiences for civilians may result in longer-term commitment to the Service (have about a 10% annual turnover of civilian staff in Communications)
• two very different streams exist within the Service o one stream for officers that is flexible and allows for much movement (officers are moved into positions
and trained on-the-job with no initial experience) o another stream for civilians that is restrictive and not flexible (civilians must struggle to get training or
get it on their own before being allowed into positions, face a limited ‘job call’ process, and receive no mentoring from the Employment unit on how to successfully navigate the process to get promoted to a higher classification)
• lateral hiring in the civilian area is good because it brings new skills into the organization, but it does block internal advancement possibilities
• she acknowledges that the Service has taken some steps to expand civilian opportunities and include civilians more in planning, analysis, and operations roles – starting to be treated more as part of the Service team
• the Service needs to keep working to change the organizational culture so that officers and others recognize the value of the work civilians do
• civilians with degrees are being hired by the Service, but then they get locked into the classification system and can’t seem to move (mentoring in the job call process may help)
• it would be very helpful to have a complete and accessible directory of all civilian positions on the Service, with the training/skill requirements listed – this would allow people to begin to direct and plan their careers
• a directory of skill sets available to the Service would also be useful (e.g. graphic arts, writing skills, IT skills, etc.) – this would allow the Service to use members’ skills on special projects, etc.
• the new generation of workers is looking to see what they can get out of situations – they are looking for faster and earlier gratification, for something back from their employer that is not just pay-related – the Service will need to deal with this
Surraya Khan, Court Services (Document Services Section)
• document servers do a vital job assisting officers by getting victims and witnesses to court
• however, the use of marked cars by document servers can affect their efficiency as they get mistaken for police or parking enforcement – have to deal with public hostility and spend time to clear up the mistaken impression
• would prefer to use unmarked cars, but can understand the Service wants visibility to help reassure the community (perhaps get a different uniform to differentiate document servers from parking enforcement officers)
• it would also be better not to use marked cars in certain divisions, in high risk areas – this is a safety concern
• officers are good at attending to assist is she feels she is in a dangerous situation, but she would like to have use of force options available as well (e.g. pepper spray and/or a baton) for protection

22000088 EEnnvviirroonnmmeennttaall SSccaann
Appendix B 350
• would also like a wallet badge to give more credibility, a more professional appearance than just the current ID card – parking officers would also probably like this
• the Section is facing an increased workload, but are short-staffed
22000088 EEnnvviirroonnmmeennttaall SSccaann
Appendix B 351
APPENDIX B INTERNAL CONSULTATION – SPECIALIZED OPERATIONS COMMAND
February 18th, 2008
Staff Sergeant Keith Smith, Provincial ROPE/Fugitive Squad
• maintaining the accuracy of the Sex Offender Registry will be a challenge for the unit due both to the number of people on the Registry and the number of people who will need to be put on the Registry (initial Registry interviews take about 30 minutes each)
• officers need ongoing training about the importance of the Registry
• another challenge will be to maintain public safety with the apprehension of high risk offenders
• need to continue to accurately identify parolees (especially sexual predators, firearms offenders) at high risk for re-offending and then prioritize for apprehension
• officers need to maintain a high level of training in tactical and surveillance situations
• need a succession plan for the unit to identify potential new members
• need to maintain partnerships and information sharing with external agencies on a local, national, and international level (e.g. police agencies, Canadian Border Services, Corrections Canada, etc.)
• divisional officers need training about what the different sections of the unit can offer them
Carol Gowanlock, Court Services
• Court Services is a very decentralized operation, so internal communication (especially to manage risk associated with courthouse security and prisoner transportation) is a challenge
• there is a large, physical distance between sections and many members do not have ready access to a computer – there is a definite need for more electronic access/resources (perhaps restricted access terminals in guard rooms)
• the unit is currently working to develop a webpage that can provide information to members, but also need to ensure information is relevant
• many people deal with a huge amount of information each day that is time consuming to review and often not really necessary to their job – perhaps teaching people appropriate use and management of e-mail would help, or providing e-mail filters
• communication with and addressing the needs of divisions is also a challenge – during the day, the Prisoner Transportation unit must give priority to courts, and often then aren’t available to attend divisions quickly to transport new arrests to central lockups, etc.
• it would be helpful if the I/CAD system could be enhanced to give divisional personnel anticipated arrival times or advise of delays
• need to continue ethics and diversity training to deal with cultural, gender, and generational differences
• the current Service recruit process is almost completely structured for hiring constables and gives units little ability to communicate with the public about civilian career opportunities
• starting to have to deal with large, high profile gang trials – Court Services is sometimes overlooked in the planning done by other units, so need to improve communication with the judiciary, crowns, and other units (e.g. Intelligence) so risks can be identified and addressed to ensure safety of all involved
Sergeant Mike Puterbaugh, Mounted and Police Dog Services
• facilities and resources are the two main issues for both sections
• the current lease for Mounted Unit facility on the CNE grounds expires in 2010
• recent BMO stadium and other development on the CNE grounds has increased, and will continue to increase, vehicular and pedestrian traffic in the area
• this affects the parking available since the Mounted Unit has no parking facilities of its own, and the CNE parking used can be taken away by the CNE for other use if it’s needed
• the Unit also shares the riding ring with a riding school – this limits the time available to the Mounted officers for training
22000088 EEnnvviirroonnmmeennttaall SSccaann
Appendix B 352
• the facility has health and safety risks – there is no outside paddock for the horses, so they get no outside exercise or air; also, there is only one major fire exit from the stables and if it gets blocked, officers will have to lead the horses through the office area and out the front doors (current facility is an historical site, so no major renovations/changes are allowed)
• similar problems exist for the dogs – in particular, the 2 outdoor kennels cannot be used during the winter and there is no 24-hour staff for the indoor kennels, both of which are not healthy for the animals
• the dog unit is currently at, and over, capacity – there is no room for storage, including the additional equipment expected with increased HUSAR training, no room for officers
• would like to have the Mounted and Police Dog Services housed in one unit, with appropriate facilities – this would allow administrative duties of both units to be combined without affecting operations, and, since the Mounted unit is staffed 24-hours a day, the kennels could also be monitored
• more than half of the Mounted officers have less than 5 years experience and this proportion will increase when the unit’s 3 vacant constable positions are filled – this means there are few officers with much operational experience (it takes about 5 years experience to become a competent rider)
• almost half of the PDS offices have less than 2 years experience, and with expected promotions and retirements, about two-thirds will have less than 2 years experience by the end of this year
• further, it is difficult for officers to get training time, due to operational demands – try to manage operational demands by changing start times of shifts, callbacks and training requirements through RDO/time exchange – having proper facilities would also allow for more training time and an increase in training budgets would allow the units to bring in professional trainers, eliminating the need to alter shifts
Detective Sergeant Peter Callaghan, Homicide Squad
• the volume of work will continue to be the main challenge for the unit
• the number of homicides in the city, especially shooting homicides, has increased markedly since 2005 – investigations and providing support to the divisions will continue to drain resources
• dealing with case preparation demands will also continue to be a challenge
• the assistance of 18 officers from the field a couple of years ago was of great help, but now are providing support to these officers when cases are in court
• an increasing number of murders are related to gang and drug activity – these are a huge drain on unit resources, involving complex investigations and increased security demands
• the Homicide Squad must work closely with other Specialized Operations units – draw on their resources and expertise to deal with the gang/drug homicides
• the Service needs to implement a priority focusing on drugs and gangs (drug enforcement and street-level dealing conducted by street gangs)
• this would bring the number of homicides back down, supports community mobilization strategies, and is consistent with drug diversion programs and the city’s harm reduction strategies
• the message of the Service’s strategy must be that engaging in this lifestyle endangers your life and that you will be prosecuted to the fullest extent of the law
Staff Sergeant John Badowski, Marine Unit
• the main challenge for the unit is the high staff turnover due to tenure – 29 of 38 members have turned over in a 2 year period
• the high turnover reinvigorates the unit, but creates a huge training demand (legislated requirement) and increases equipment/uniform costs
• another challenge is the massive expansion of the Island Airport with the arrival of Porter Airlines – has increased Island traffic/passengers from 20,000 to 250,000 per year
• this challenge will increase in the near future as Porter doubles its fleet and goes international at the end of March 2008
• with the arrival and screening of international passengers, immediate response to the Island Airport may be needed more often – since there is no bridge link, the Marine Unit will have to respond
• the Unit will also have to now train its officers on airport security/response procedures and operations
22000088 EEnnvviirroonnmmeennttaall SSccaann
Appendix B 353
• the Port of Toronto is expanding as well, and even currently, most cargo is not searched – the expansion will create an increased opportunity for organized crime, so the Marine Unit is moving towards an intelligence-led operation and trying to get officers with experience in this area and adding FIO and crime analyst positions
Staff Inspector Liz Byrnes, Sex Crimes Unit
• trends in sexual assault (including child abuse) have remained relatively stable over recent years and this is not expected to change
• sexual assaults are high risk investigations but occur with relatively low frequency – divisional officers attending therefore are often not experienced in dealing with these incidents
• the Sex Crimes Unit has increased field training for divisional officers and made initial responder and investigator roles and responsibilities clearer – trying to find where we’re not responding as well as we could and make improvements
• going to have an enhanced role for the Sexual Assault Co-ordinator (more in line with what the Domestic Violence Co-ordinator does) – will assist in identifying trends in sexual assaults, identifying where Service response to sexual assaults could be improved (training, investigation, consultation)
• sexual assault is an under-reported crime that has a tremendous impact on the victim – hopefully, improved processes and response, as well as a good relationship between the Sexual Assault Co-ordinator and agencies that work to support victims, will increase confidence in the Service and result in increased reporting and apprehension of offenders
• need to deal with peer-to-peer sexual assaults, especially in schools – the Co-ordinator will review our response and ensure development of education/awareness programs
• there is a need for an enhanced relationship between the Child Exploitation Section officers and the child abuse officers in the divisions so that child abuse investigations are not continually overshadowed by those that involve the Internet
• many investigations have a technological component these days, especially child exploitation offences, and the unit is requiring the involvement of the Technological Crimes unit more frequently
Sergeant James Hung, Emergency Task Force
• the demand for ETF services continues to increase, and about half of the calls now are for high risk search warrants
• the unit is also dealing with court security demands and demands for escorts to and from trials (e.g. Pathfinder trials, biker trials)
• dealing closely now with the Gun and Gang Task Force and with the Drug Squad – this has also increased demands for dynamic entries and search warrant requests that are more high risk and more complex (and also require more preparation time)
• the bomb disposal section is also receiving more high profile calls, requiring more resources
• all the increased demands on the unit have resulted in more overtime required
• there has been a high staff turnover, resulting in great loss of experience and just under half of the unit being junior
• the younger officers need more specialized training – it will take time for them to develop and the training itself takes much time (resulting in people being absent from the unit for long periods)
• there are also ongoing mandatory and maintenance training demands
• one other result of the increased demands for unit services is the more frequent need for ETF officers then to attend court to give evidence
Staff Inspector Bruce Crawford, Hold Up Squad
• numbers of robberies falling within the mandate of the Squad has been generally stable over recent years, but are seeing more home invasions
• most home invasions are actually premises that are being used to run illegal businesses (e.g. bawdy or gaming houses, warehouse for stolen property/drugs, grow operations, etc.) – home invasions where the premise is really a home are relatively
22000088 EEnnvviirroonnmmeennttaall SSccaann
Appendix B 354
• the number of multi-jurisdictional robberies has also increased – being committed by people from around the GTA, not only people who live in Toronto – need more inter-jurisdictional co-operation
• being challenged by technology, particularly in the area of communications – even teenaged offenders have better equipment than the Hold Up Squad (many officers don’t even have a cell phone issued)
• disclosure requirements are a huge burden – have taken one field member off field duties and dedicated them solely to disclosure, but still falling behind – need to deal with this through technology and partnerships with the judiciary
• the Service must pursue lawful access legislation, including for cellular phone records and digital data recovery – currently takes too much time to apply for access/search warrants
• audio and video recordings are part of the majority of investigations now and will only continue to increase – the Service needs to have the proper equipment available to deal with them (e.g. video/audio enhancement equipment and software, high quality monitors and printers, etc.)
• also require standards for video surveillance technology used by the public – we are receiving digital evident in too many formats (many different types of video systems with different components, software, encoding, etc.), which hinders investigations
• visual and video identification are starting to be seen as unreliable evidence – need to be supported by other forensic evidence (“CSI syndrome”) – it is critical for successful prosecutions that FIS investigators and SOCO officers have the training they need
• with regard to succession planning, divisional field investigators need to be trained so that there is a pool of qualified investigators to draw from when have unit turnover
Staff Sergeant Mark Barkley, Communications Services
• the unit is receiving increased requests for separation of divisional radio channels (divisional unit commanders say the channels are too busy to share, officer safety issue) – the unit is currently trying to come up with reasonable standards and determine what the staffing/equipment impacts would be if changes were made
• also examining alternatives like Blackberry-type devices for foot and bike officers to access CPIC and CAD data – since they wouldn’t have to call in to request checks, this would reduce some call volume
• Communications is a technology-heavy/dependent unit and they have to be cautious of technology fatigue – operators already have to use 3 monitors, and they are reaching a maximum as to what they can deal with – much more information will be a strain
• new communications technology is always arising, but the Service doesn’t always have the current capacity to use/take advantage of it
o text messaging for the deaf community, so they can use 9-1-1 when they’re not at home with a text capture phone, or use of an Internet Relay Service
o Phase 2 wireless system to plot x & y co-ordinates of cell phone 9-1-1 callers and that can then be relayed out to the field (about 50% of all 9-1-1 calls currently are via cell phones but the TPS does not receive subscriber or location information)
o video streaming/allowing routing of cell phone pictures and videos to 9-1-1 centre – people want to send us pictures/video from scenes that they’ve caught with their phone camera, but we don’t have the infrastructure to accept it
• nomadic VOIP phones cause difficulties in tracking victims (e.g. if a person has a VOIP phone with a Vancouver-based phone number and make a call to 9-1-1 while they’re in Toronto, they are routed to Vancouver’s 9-1-1 system – multiple agencies then have to work together to find the caller/victim if they can) – this has resulted in civil suits in the US and is a liability risk – Communications Services is working with the CRTC and other emergency services across Canada to set regulations
• the current map is inadequate – need to evolve to aerial mapping, but the Service’s current software does not allow it and the current vendor does not support it – officers see and want access to programs like Google earth, 3-D spin maps, etc. on MSW
• need a strategic technology planning group that deals with issues like these on a proactive, not reactive, basis
• in addition to other staffing challenges, there is increasing demand for audio/data transcription – a quick turn-around time is needed for requests from Homicide, FOI, the SIU, etc., so have to pull people from the floor
• the possibility of GPS devices on portable radios for officers will be a challenge for operators, since it will be another set of data coming in
22000088 EEnnvviirroonnmmeennttaall SSccaann
Appendix B 355
• need to improve response times or the way the Service deals with Priority 3-6 calls – since we can’t dispatch cars across divisional boundaries for these calls, people sometimes wait for hours, if not days – Communications should be able to direct response using any available resource (within reason) to respond to calls for service
Staff Inspector Don Campbell, Drug Squad
• there is a link between drug use and crime and drug use is increasing in Toronto – this results in increased health care costs, property damage, and law enforcement costs – policing and crime costs are huge for the Province
• not only do people commit crimes to support their drug use, but organized gangs fight/commit offences over the drug trafficking market and organized crime groups sell drugs to fund their other activities – drugs are the driving force for many offences
• tougher penalties are needed for those who trafficking or produce drugs – legislation was tabled in November 2007
• CAMH Ontario student drug use survey found about ¼ of students in Grades 7-12 said they’d used cannabis at least one in the previous 12 months
• substance abuse high among the homeless
• drugs are a concern in all divisions and have a negative impact on quality of life in neighbourhoods (e.g. gang graffiti, high hydro rates due to electricity theft for grow operations)
• cocaine and cannabis are the drugs most commonly encountered by police, although heroin, percocet, and oxycontin are increasing, as is the availability of methamphetamine and ecstasy
• about ⅓ of CDSA drug offences were laid against those 18-24 years of age
• persons charged with possession can be diverted to Drug Treatment Court in lieu of a criminal conviction
• the number of marijuana grow operations has seen a huge increase – the Service dismantles about one per business day – with hydro bypasses and use of dangerous chemicals, grow ops pose a serious threat to communities
• grow ops also pose a health risk to people, especially children, who may live there to make the dwelling seem legitimate
• the Toronto Drug Strategy, adopted by City Council, addresses substance abuse through harm reduction, prevention, education, and enforcement
• other organizations have also noted drugs as an issue of concern (e.g. OPP, Interpol)
• need a priority and goals that address the ongoing problems related to drugs in Toronto (both supply and demand) – need investigation/enforcement and education (as in the 2002-2004 Business Plan)
• enforcement and prevention strategies need to address the particular circumstances of certain populations, and must have a co-ordinated multi-disciplinary response
Staff Sergeant Bill Kemp, Traffic Services
• TSV is facing challenges in 6 areas – traffic policing focus, technology, succession planning, legislation, equipment, and the current traffic review
• traffic officers have to become criminal interdiction agents, do more intelligence-gathering, and increase police visibility in high crime areas – this will support the Service’s increased focus on guns, gangs, and drugs to meet community concerns
• technology provides opportunities that the Service could take more advantage of to become more strategically directed, more intelligence-led (e.g. e-ticketing and collision databases assist with the deployment of resources by tracking the movements of criminals and improving safety in problem areas, community complaint databases that could provide analysis of areas of concern)
• the unit has many senior officers in key positions (e.g. collision reconstruction, hit & run, breath testing technicians) – there will be training costs associated with their replacement when they retire
• the upcoming Bill C-2 will have a huge impact as the Service has to deal with Drug Recognition Expert training and a standardized field sobriety testing
• in addition to the cost of new equipment, there are also training cost implications (e.g. officers will have to be trained to use the Intoxilyzer 8000C which will be replacing the current model)
22000088 EEnnvviirroonnmmeennttaall SSccaann
Appendix B 356
• once the traffic review has identified efficiencies and potential improvements, it will take time and commitment to work toward implementation
Staff Inspector Greg Getty, Organized Crime Enforcement
• “Out of the Shadows” (OACP) report – popularized accounts of organized crime desensitize the public to its true nature and impact; many crimes (e.g. drugs, violence, e-crime, fraud, human exploitation, etc.) are linked to organized crime groups and a long-term, proactive, intelligence-driven plan is needed to deal with these groups
• organized crime has a major socio-economic impact on the community and there are a number of associated public safety issues (e.g. violence, marijuana grow operations, etc.)
• organized crime groups are at the root of the widespread supply of drugs in the community
• many organized crime groups operate across jurisdictional boundaries
• proceeds of crime legislation needs to be strengthened so that any financial gains by these groups are taken away
• integration of the Proceeds of Crime office with the units of Organized Crime Enforcement will allow a closer working relationship and better communication, and should lead to increased seizures and forfeitures of assets
• the unit recommends an Organized Crime Priority and a number of goals: o use intelligence-driven enforcement initiatives to disrupt and dismantle criminal organizations o increase seizures of assets of proceeds of crime from those involved in criminal organizations and
ensure forfeiture of those assets in the courts o develop and enhance partnerships in law enforcement and the criminal justice system to ensure a co-
ordinated response to investigations o develop and enhance partnerships with community and/or government agencies to address concerns of
the safety and protection of witnesses in providing information on criminal organizations
Staff Sergeant Russ Cook / Staff Sergeant Scott Roberts, Public Safety Unit
• both sections of the unit (Public Safety and Emergency Management) are facing challenges in a number of areas
• the Public Order section is bound by Adequacy Standards legislation – the 300 officers who are part-time Public Order officers have to do a specified number of training hours per year, as well as annual fitness testing (the unit does its own in-house training) – it is a strain to meet even the minimum requirements
• the Public Order section is nationally respected, but with this comes increasing demands – they are getting an increased number of training and assistance requests from outside agencies, province- and nation-wide
• the unit does mandated training and lecturing on ground search and rescue, for officers (at the College and OPC) and civilian volunteers (TPS Auxiliaries and Humber College Police Foundations Rovers)
• the 2 industrial liaison officers provide training, assistance, and advice to members of organized labour and management – direct benefit to the Service in that PRU officers rarely need to be taken away from front-line duties assigned to strike situations
• federally mandated CBRN training is currently not available due to training requirements for the Olympics – other programs are being considered, particularly for the 150 recently added part-time CBRN responders
• the unit is responsible for hosting 4 live training scenarios and 4 tabletop exercises – this goal will be difficult to meet given the need to develop new personnel in the Emergency Management section
• the growing partnership with HUSAR also has mandatory training and exercise deployment implications for unit personnel
• the Ontario Public Order Advisory Committee had indicated a need for inter-agency training over the next few years in preparation for major events in the Province (e.g. G8 Summit, G12 Summit, etc.)
• developing the new Counter Terrorism/Critical Infrastructure sub-unit is expected to present many challenges
• to maintain the high level of national and international respect for our expertise, the unit needs to maintain a high level of professional development and receive the most up-to-date training – this will involve considerable time, travel, and funding
• with a number of people getting ready to retire, the unit is facing succession planning challenges in the need to find and train replacements
• the ability to conduct research and development in the areas of search and rescue and incident management are hindered by the demands on the unit
22000088 EEnnvviirroonnmmeennttaall SSccaann
Appendix B 357
Staff Inspector Steve Izzett, Intelligence Division
• two Priorities with tangible goals need to be included in the Service’s next Business Plan
• the first Priority should deal with drug enforcement and education since drug distribution fuels many crimes and most organized crime groups are involved in it
• Southern Ontario has become a marijuana, ecstasy, and methamphetamine manufacture/distribution centre
• in particular, the goals of this priority should be: o need a comprehensive drug enforcement strategy created, which outline responsibilities and goals for
enforcement at the street and mid-level markets (the RCMP should be required to create a high-level enforcement strategy to tackle the activity and movement of products between hubs and transited through other countries)
o need to partner with private and public sector to design a marijuana grow op eradication/prevention strategy
o need to design an education program for mainstream media to educate youth on the hazards of using ‘soft’ drugs, such as ecstasy
o need to design an education program for mainstream media that educates youth in the public school age group that it is socially unacceptable to belong to a street gang
• the second Priority should deal with organized crime
• organized crime groups are involved in many different crimes, including drugs and drug-driven crime
• in particular, the goals of this priority should be: o require an enforcement strategy that includes the front-line officer in identifying organized crime
activities and communicating the activities of individuals to the Intelligence Division o education of front-line officers on identifying and dealing with organized crime (without this, any value
of stating that organized crime is a priority would be nullified – the front-line officer needs to be aware that the theft they investigate today could be linked to a larger, more organized group with a greater purpose)
o create a comprehensive business plan on an annual basis that takes into account the Intelligence Division Annual Threat Assessment, provided to Command each November (once priorities have been determined by Command, then resources would be dedicated and strategies developed at the corporate, detective, and field level to address the priorities)
o ensure that we have adequate resources and capacity to deal with the use of technology in perpetrating crime in advance of organized crime groups (e.g. Eastern European and Asian organized crime groups involved in skimming and credit card fraud)
Bill Carter, Parking Enforcement
• Parking Enforcement is a community-based unit and has many community/external partnerships, including partnerships with many city departments
• the unit currently works with citizens, schools, Councillors, city Transportation Services, BIAs, etc. to solve local parking problems (e.g. parent safety program that addresses congestion around schools (information is available in many different languages))
• the unit is also trying to deal with easing parking congestion in areas holding community events
• private property enforcement continues to be a challenge – the unit has site inspection experts providing information on signage for fair enforcement (fair signage will assist providing consistent enforcement in later investigation of complaints)
• Parking Enforcement needs to be more involved in some city working groups (e.g. the unit needs a seat at the table when the city is discussing snow removal, tour buses downtown, courier traffic, etc.)
• the unit also needs to know about potential changes to the processing of parking tags, so that the impact of any changes can be assessed
• Parking Enforcement works closely with a number of Service units (e.g. traffic safety, intelligence gathering, recovery of stolen vehicles), and is exploring opportunities for new partnerships
• automated e-ticketing has resulted in customer service improvements and processing efficiencies at the city
• court re-assignment will become an issue – parking tag court is being moved from Old City Hall to the city’s east end – since the court will no longer be central, some public dissatisfaction is expected
22000088 EEnnvviirroonnmmeennttaall SSccaann
Appendix B 358
• some parking fines (e.g. disabled offences fines, etc.) and parking rates are expected to increase – this may affect people’s responses to parking officers and the enforcement environment, but it may also shift motorist behaviour (e.g. increased compliance with parking by-laws)
• meeting the needs of all the different road users will continue to be a challenge
Staff Inspector Steve Harris, Fraud Squad
• the economic integrity of the community should be added as a Service Priority in the next Business Plan, and 2 current Priorities (Community Policing Partnerships and Safety of Vulnerable Groups) should be retained
• more fraud is increasingly being committed by organized crime groups and gangs to fund other activities – the sheer volume of fraud threatens the economic integrity of the community and will continue into the future
• many fraud offences involve the use of the latest technology that allow large-scale frauds in relatively short times
• financial losses due to fraud can be in the tens of millions of dollars
• when a person is the victim of identity theft, it can be extremely difficult, tedious, and time consuming for the individual to get their identity back
• the units suggests addressing this priority through: o vigorously investigating and prosecuting all types of fraud, including identity theft, cheque and payment
card fraud, mass marketing fraud, and corporate fraud o partnerships with internal units (e.g. divisional major crime units, Source Management, Gun and Gang
Task Force, Mobile Support Services, Fugitive Squad) o shared resources and response strategies with other GTA police agencies o partnerships with public and private sector agencies (e.g. financial institutions, Canadian Bankers
Association, Interact, Ministry of Government Services, retail businesses, International Association of Financial Crime Investigators, Canada Revenue Agency, Competition Bureau of Canada, Insurance Bureau of Canada, US Postal Inspection Service, US Secret Service)
o use of undercover officers o use of the latest computer technology and equipment o education of both the public and private sectors through media releases and strategies and presentations
to groups
• the RCMP currently has an economic integrity priority and the OPP is considering an identity theft priority
• the Community Policing Partnerships priority should be retained with an increased emphasis on developing partnerships with businesses, communities, and government agencies to address economic crimes
• the Service should look at partnering with outside agencies not only for crime investigation/prevention purposes, but also to provide training
• the Safety of Vulnerable Groups priority should be retained, but with a renewed emphasis on the elderly – seniors are the fastest growing demographic group and are particularly susceptible to economic crimes and fraud, so the Service needs to increase education, prevention, and enforcement activities in this area
Sergeant Tim Ralph, Special Events
• the main challenge for the unit involves the sharing of information within the Service
• the unit needs to keep Service members up-to-date on topics, talks, negotiations, and have a central, easily accessible location for current information
• without this in place, time is lost by having members calling to make inquiries, by having members have to respond to complaints and inquiries, and possible risk for members or the Service when information isn’t received in a timely manner
• they currently use faxes, Routine Orders, and have started to use the TPS Intranet screen saver as a potential communication tool for those who have access, but a paging system may also be of benefit
• there are too many operational plans, with too much information and that are too large for the internal e-mail system – the unit is looking to streamline to one general package, with more detailed appendices for those directly involved (the smaller package will also allow more timely electronic distribution)
• the unit is also looking to educate supervisors on how to properly manage an event – will improve event management if supervisors aren’t waiting to be told what to do
22000088 EEnnvviirroonnmmeennttaall SSccaann
Appendix B 359
• with the increase in events (and the city’s stated goal of attracting more downtown events) – the central divisions are overloaded, especially at current levels of staffing, but the surrounding divisions have different operational demands that also tax their staff
• in response, the unit would like to have a limit put on the number of events approved by the city, or explore the use of alternatives such as the use of paid duty rather than on-duty officers or an increased use of barricades rather than officers
• wherever possible, the unit would also like to move events from major roadways (which causes much traffic congestion) to city parklands
• Special Events staff will continue to work with other city services to lessen the impact of events on the Service
Police Constable Scott Mills, Crime Stoppers
• there is call for a Service strategy to educate and assist community workers, since most problems aren’t actually happening in schools but in community centres after school, on the weekends, and in the summer
• the Service needs to make more use of YouTube and Facebook – they need to use media that is relevant to their target audience and kids do not use the traditional media (there is also much intelligence information that can be found on these social networking sites)
• we can use this media and programs like Empowered Student Partnerships to get our messages directly to youth, without intermediaries – the Internet can be used as a violence prevention tool
• Crime Stoppers information has been put into YouTube and Facebook formats, and they do live Internet communication – these networks allow communications/information to be sent to many people at once/with one message
• there are information/system security concerns to be addressed, and procedures that need to be changed, before these electronic resources can be used, but it can be done
• in 2007, Crime Stoppers set a record for the number of anonymous tips received (due to things like positive youth engagement projects)
• however, the Service needs to encourage people to step forward as witnesses rather than as anonymous tipsters – could work with youth in community centres, telling them how/when to call police and what happens with the information
• the Service also needs more proactive prevention activities, and needs to reward officers for being involved in these activities
Staff Sergeant Gord Barratt, Special Constables
• the Service has legislated authority to appoint special constables – there are currently 861, with 647 employed by the TPS (most are court officers and prisoner transportation), 90 employed by the TTC, 42 employed by the University of Toronto, and 82 employed by Toronto Housing
• the number of special constables employed by non-policing organizations has been increasing, particularly transit and housing
• the high cost of public policing and the reduced capacity of public police to address lower priority calls are driving the increase in use of special constables – also the perceived need for powers greater than that of security guards
• policing is changing – police resources are stretched, with increasing pressure to justify budgets, and police organizations have realized they cannot do everything alone – they are, therefore, looking for ways to respond to public demands for safety and security
• private security officers in most jurisdictions currently outnumber public police officers by about 7 to 1 – recent legislation has moved to ensure professionalism and set standards for private police
• there must be clear, timely communication between the police and the agencies that are hiring special constables – accountability and oversight are vital
• we must also make clear to the community, the police, and the hiring agency just who is responsible for what, and ensure as little duplication as possible
• training and equipment standards are needed for special constables – there is little consistency locally or province-wide
• the Service is looking at the feasibility of deploying special constables to police special events
22000088 EEnnvviirroonnmmeennttaall SSccaann
Appendix B 360
• the OACP is calling on the Ministry to direct a legislated review relating to the oversight and regulation of special constables, including
o the development of standards for training, professional development, and certification o a system of oversight that deals with public complaints, allegations of misconduct, and use of force
options o clear uniform and equipment standards and design
Sergeant Don Ryan, Centralized Paid Duty Office
• officers from specialty units are now allowed to participate in the paid duty system, however, this is breaking down current processes a bit – the office will be having an information/training session in the spring to discuss all the issues that have arisen
• officers are supposed to be limited to 12 hours of paid duty at one time, however, many officers are doing 18-20 hours (they should be calling in to get approval for more hours with enough time in advance to get a replacement if it will take them over the time limit, but they aren’t doing this) – unit commanders are being advised on a monthly basis of these incidents
• this raises liability and occupational health & safety issues
• issues are also arising with correctional services using paid duty officers for long hours (e.g. to guard at hospital until a custodian comes, but custodian not arriving; asking officers to follow in their car when prisoners are being taken back to correctional facilities, even if the facility is in another municipality)
• the final issue is an officer safety issue as it deals with the new form that asks correctional services to assess the level of risk of their prisoner – since they are aware that a high-risk prisoner will require more officers, they are rating them low-risk instead
22000088 EEnnvviirroonnmmeennttaall SSccaann
Appendix B 361
APPENDIX B INTERNAL CONSULTATION – EXECUTIVE, ADMINISTRATIVE, & HUMAN RESOURCES COMMANDS
February 26th, 2008
Paula Wilson, Records Management Services
• there are challenges for the Police Reference Checks program in relation to the Mental Health Act (the Reference Checks program includes a criminal record check for people who wish to work or volunteer with vulnerable persons, such as children, etc.) – the results of the record check are not released directly to the agency, but to the person requesting
• pressures are being felt from many different groups
• the Ontario Human Rights Commission wants police agencies to ‘screen to the position’, that is, get the details of the role the applicant would fill with the agency, and then vet the police database information to determine who would best suit the position
• in Ontario, only the London Police Service screens this way (as the result of mediation in an OHRC complaint)
• police agencies generally hold the view that agencies themselves are the best judges of who is suitable to fill their paid or volunteer positions
• lobby groups do not want any Mental Health Act or law enforcement contact information released
• difficult for the Police Service to balance these desires with the need to protect vulnerable populations
• using technology to provide more efficient customer service will continue to be a challenge – currently, a new initiative is exploring the option of requesting and paying for clearance letters over the Internet, and then picking them up at a convenient location (instead of as at present having to come to HQ to request and pay for a letter)
• also exploring the possibility of on-line reporting of relatively minor crimes (e.g. lost wallets, stolen bicycles, etc.) – expecting some resistance from members of the public who want an officer to take the report
• finally, are rolling out scanning equipment and the Livelink tracking database following the 51 Division pilot project – memo books will be scanned in and out of a secure storage area in each division
Sergeant Paul Myers & Constable Randall Lee, Employment Unit
• sector trends suggest that, over the next five years, recruitment may be sufficient to maintain constable employment, supervisory ranks (sergeants and staff sergeants) may be reduced by about 40%, and senior officer ranks may be reduced by about 50%
• in 2008, 782 uniform members will be eligible to retire; between 2008 and 2012, about 23% of uniform members (1,257) will be eligible for retirement
• there will be competition for the shrinking pool of applicants from both other police services and corporate Canada
• the Service needs to increase work promoting policing as a viable career to the city’s diverse communities
• in order for the Service to remain a national leader in sector recruiting, it must continue innovative and creative outreach, and must have an appropriate level of resources allocated to the Employment Unit (and to the Recruiting sub-unit, in particular)
Deidra White, Customer Service, Information Technology Services
• an assessment and review of printer locations and usage within the Service with a view to recommending relocations and different use, with consideration for possible reduction of operating costs
• ideally, this assessment would be part of an overall document handling and printing assessment/strategy, and include faxes, copiers, and information exchange in general, rather than just printers
• in light of growing budget constraints and increasing demand for printers, would be prudent to review and challenge current use rather than simply acquire new printers
• changing the current ‘print everything’ mindset would not only result in cost savings, but would be more ‘green’
• the timing is also good, with maintenance and consumables contracts coming due at the end of 2009
22000088 EEnnvviirroonnmmeennttaall SSccaann
Appendix B 362
• other companies who have done similar reviews and implemented the resulting recommendations have realized benefits such as reduced support costs, reduced consumables costs, reduced cost of ownership of printers, more reliable and manageable print environments, etc.
• the Service could also reduce costs of shredding, educate members about the cost of printing to decrease unnecessary printing, decrease or maintain the number of Service printers (benefiting future lifecycle programs), establish a policy relating to printer deployment, etc.
• for users, the impact would be a fewer personal printers, more shared printers, more file storage, and possible adoption of technology options (re: workflow, electronic signatures, multifunctional devices, etc.)
• assessment can either be a sampling of one or two units (est. cost $10,000), or Service-wide (est. cost $90,000)
• there are potential risks – an assessment may find that no change is necessary, there may be stakeholder resistance and loss of satisfaction
• companies who have performed similar assessments have reduced costs by 10-30% - if the Service reduced costs by 10%, about $88,354 could be saved on toner and paper
Sergeant Warren Wilson, Professional Standards – Investigative Unit
• comprised of four sections – Criminal Investigations, Conduct Investigations, Complaints Administration, and Investigative Support
• current trends have found officers increasingly discharging firearms at vehicles, substance abuse (alcohol, prescription and illegal drugs, steroids), and domestic violence
• particularly for these latter two points, education, awareness, and prevention must be priorities for the Service
• with regard to domestic violence affecting members, in addition to the obstacles to getting the general public to report (e.g. lack of faith in justice system, re-victimization when testifying at court, and fear of retaliation), the Service must also deal with unique factors such as the possibility that the investigator may know the accused, loss of family income if a member is dismissed, familiarity of accused with justice system, and the accused’s access to a firearm
• a challenge for the Service is to create a climate where members feel genuinely obligated, comfortable, and confident in reporting dishonesty and unethical behaviour – all members should feel that they can report openly, with the support of their supervisors and colleagues
• other challenges include: the statutory timeline requirements given the complexity of many investigations, administration associate with internal and external complaint investigations, working in the highly-scrutinized environment (by the Board, media, and Association)
• the Service needs to ensure that a sufficient number of skilled investigators are available to conduct timely, thorough, and professional investigations
• the pending implementation of Bill 103 and the formation of the Office of the Independent Police Review Director will remove the responsibility for classifying complaints from police services – it is anticipated that the IPRD classification process will occur without benefit of or access to all background information, resulting in a decrease in complaints classified as frivolous and an increase in the number of complaints assigned for full investigation
• corruption investigations have identified members hired who have ties to organized crime – in depth and thorough background checks must be done prior to approval for hiring
Donna Gilbert, Professional Standards – Risk Management Unit
• comprised of five sub-units working in support of accountability and compliance – Information Security, Analysis & Support, Prosecutions, Special Investigations, and Inspections, as well as the Awards section and the HQ Duty Desk
• with regard to the Information Security section – the Service’s increasing reliance on computer systems also increases risks for information security; risks include financial risk through lost productivity when members have Internet access, legal risk due to the ease and anonymity with which information can be accessed, copied, manipulated, and disclosed, and reputational risk if attention is brought to any information security breach
• one challenge for this section is for adequate resources to monitor Service compliance with information security and control policies (including budget for training, system tools, and staff)
• proactive monitoring can provide insight into where changes may be needed in policy and/or training, and supports accountability
22000088 EEnnvviirroonnmmeennttaall SSccaann
Appendix B 363
• a second challenge for this section is associated with legal actions that require electronic evidence, specifically excerpts from system logs illustrating members’ computer activities – these demands have increased over recent years and are time-sensitive
• the main challenges for the Analysis & Support section relate to the rollout of PSIS to the divisions – in particular, ensuring unit commanders recognize the significance of alerts and react appropriately, ensuring divisional data entry is accurate and timely, ensuring divisional access to the system (both direct and indirect) is secure and controlled, and ensuring adequate technical support
• current issues affecting Prosecutions Services include accusation pertaining to member abuse of alcohol, impaired driving, and domestic violence
• caseloads for prosecutors are consistently heavy and becoming more complex, including involving greater use of and need to validate electronic evidence from Service data systems – this requires expert testimony and that prosecutors remain up-to-date regarding technologies used by the Service
• also challenging is that prosecutions continue to be handled by police inspectors who face experienced defence counsel
• the Special Investigations section faces liaison responsibilities in an increased number of cases referred to the Provincial Special Investigations Unit, as well as the need to keep current on training standards and Service technologies
• the most significant challenge for the Awards section is acknowledging praiseworthy community and member actions within an acceptable timeframe – this challenge is exacerbated by a backlog of data entry to PSIS and an increasing number of recipients, requiring background checks and the collection/confirmation of event details
Christine Bortkiewicz, Occupational Health & Safety
• the first challenge relates to the need to define and identify all forms of accommodation and develop appropriate business processes to manage them, if needed
• current accommodations include pregnancy accommodations, disciplinary accommodations, equipment accommodations, clothing accommodations, physical/work environment accommodations, ability/disability accommodations, and others
• as part of the consequences of any economic downturn, the Service may not get any increase in financial or human resources, and will have to efficiently use the resources currently available
• if active, full-time members become temporarily affected by illness or injury, accommodation will hopefully be quick and for a short period of time
• this can best be assured through comprehensive accommodation processes, outlining responsibilities, and involving management/unit commanders, OHS, and other units such as Labour Relations, Professional Standards, Compensation & Benefits
• a second challenge relates to Workplace Safety and Insurance Board (WSIB) costs, which have increased slightly between 2006 and 2007 – management needs to be aware of the potential for increased workplace injuries and to assist in developing appropriate prevention programs and initiatives
• while the Service is currently recognized as doing a reasonable job at returning people to work, effective all-inclusive return-to-work processes need to be developed that can produce efficiencies that translate into cost savings
• a third challenge relates to hours of work: o there is limited understanding by Service management that the Service is responsible for income
replacement for officers injured while on paid duties, and further that employees and former employees can submit claims at any time – if they can demonstrate injury (e.g. hearing loss) occurred while a Service member, even if they were on a paid duty, the Service would incur the future debt; paid duty supervisors, therefore, need to ensure officers use personal protective equipment as required
o time worked by some officers in addition to their regular tours of duty needs some review – officers are working overtime and attending court off-duty and the lack of personal down-time can cause fatigue; the current compressed work week schedule can also cause fatigue
• the Service needs to provide direction as to the maximum number of hours a member can work in a work week – fatigue can cause workplace injuries, poor performance, and poor health, all of which result in costs for the member and the Service
22000088 EEnnvviirroonnmmeennttaall SSccaann
Appendix B 364
Staff Sergeant Tim Davey, Corporate Planning – Analysis Support
• crime analysis can enhance deployment efficiencies, assist with crime reduction, and increase understanding of crime trends and patterns, but there are challenges
• the first challenge is to maintain a sufficient pool of qualified, competent crime analysts
• divisional crime analysts are currently uniform officers with varying skill levels – current training provided by Analysis Support has to, therefore, range from basic computer training on Excel to sophisticated spatial analysis of crime, and requires a significant time commitment by Analysis Support
• the objective is for all analysts to be able to independently perform strategic and tactical crime analysis to support the divisions, but some divisional analysts find the training prohibitively difficult
• further, since the divisional analysts are uniform officers, there is turnover in these positions and this results in the need to start training over again – further, since a number of the analysts are senior members, and becoming eligible to retire, significant turnover is anticipated in the next few years
• having these positions filled by skilled civilians would be more effective and efficient for the Service – it is easier to provide a technically skilled civilian with adequate policing knowledge than it is to train police officers in advanced geospatial analysis
• the Service should examine the viability of replacing the uniform divisional crime analysts with skilled, trained civilians
• a second challenge relates to access to crime data and the possibility of a new records management system as the end of the eCOPS lifecycle approaches
• currently, analysts must extract data from a number of crime databases and although Analysis Support has built tools to simplify this, analysts must still sometimes write SQL queries to get the data they need – any new system should consolidate crime data into a single data repository (with the data being cleaned, geocoded, and summarized for reporting and analysis); adequate tools to access the data must also be available
• also, analysts currently have real-time access to crime data – it is critical that this real-time access be maintained in any new system
Clay Beers, Radio & Electronics Services
• unauthorized users have access to radio units that are programmed to the voice radio system – automate clone detection software is needed to detect and prevent illegal access to the Service’s radio system
• officers need to be made aware that all voice communications on the system are insecure – incorrect or misleading information can potentially be broadcast
• all future radio deployments must ensure radio encryption and centralized encryption key management
• some divisions claim that the patched talk groups are too busy, possibly affecting officer safety, but we are currently not able to identify individual divisional radio traffic
• radio traffic is a combination of call for service volume and nature, combined with officer-generated talk (e.g. CPIC requests, officer-to-officer talk, etc.) – there is no industry standard defining ‘too busy’, although the generally accepted threshold is 30 minutes of talk in 1 hour – there is need for expert analysis of this issue
• CAD on a Blackberry-type device is being explored – this would allow foot and bike officers access to CAD and CPIC, reducing the need for these officers to call in their requests
• EMS and Fire are improving the power infrastructure at 4330 Dufferin – this means that at times, the Service does not have a back-up facility
• this highlights the need for a rapid deployment emergency communications centre that is field deployable and has satellite linking capability when required to support radio and 9-1-1
• staff training and skills are currently based on analog radio – the learning curve will be a challenge in the deployment and support of the impending new system
• there is urgent need to have radio sites conform to grounding/lightning protection standards – the current substandard sites mean the system is vulnerable to lightning and power surge damage, and system outages
• site trunking access radios are being used to work around problems with data links between central controllers and master radio sites, but they render the Service’s use of dynamic or system incident tools ineffective or at risk
• there is strong support for the fibre optic initiative to provide a secondary link for tower connectivity, which will also support the future requirements of the new radio system
22000088 EEnnvviirroonnmmeennttaall SSccaann
Appendix B 365
• the current mapping application for AVL is not meeting users’ needs/requests and AVL data is not integrated with key CAD data – the vendor is offering no resolution so alternate AVL reporting and mapping applications are being investigated
• AVL currently provides the location of cars, but not of the officers once they leave the cars; there is also no positioning system for foot, bike, mounted, etc. officers on patrol
• the use of GPS devices on portable radios is being looked at, however the current radio infrastructure will not accommodate this option – testing must wait until the new radio infrastructure is in place
Virginia Fry, Property & Evidence Management Unit
• the major challenge is the storage capacity of the facility
• there is no IT solution that will increase current storage capacity, since unlike a standard warehouse, the seizure and retention of property is controlled by judicial proceedings, case law, and enforcement initiatives
• a 2007 study determined that PEMU would ‘outgrow’ the current facility in the large storage area within six months
• a number of initiatives were undertaken to try to reduce inventory levels (e.g. CIPS Disposition Program, On-Line Bicycle Registration, and the Property Disposition Tool)
• in addition, Training & Education will implement a training module specific to evidentiary relevance
• the Ministry of the Attorney General is researching the feasibility of a mechanism to deal with property at judicial pre-trial rather than sentencing
• the Service has also approved a retrofit to the facility in 2008, involving 2 lean-tos that will be installed on the exterior of the building to store low-value assets and a high-density racking system inside the warehouse
• while these interim measures will extend the longevity of the current facility, by 2012 PEMU will need to re-locate to a larger facility
• infrastructure investment is needed to ensure that evidence is properly stored in accordance with legislative requirements and available for investigative and judicial purposes
• the challenges related to evidence storage are being faced by police services everywhere
Staff Sergeant Barbara McLean, Enterprise Resource Management Systems
• significant investment is required for support and maintenance – upgrades require much consultation with users (often with contracted professional consultants), and the formation of a project team (which takes internal resources away from daily operations)
• there is an increased demand for information – for example, recommendations arising from various reviews require a mechanism for tracking and reporting
• it is challenging to manage people’s expectations about what the systems can do and educate them on the costs associated with maintaining enterprise applications
• it is also challenging to ensure that the IT infrastructure is up-to-date, that new technologies receive a thorough evaluation from ITS, and that support personnel receive the appropriate upgrading of skills to support the system
• training over 7,000 users on the functionality of the system is a challenge and acceptance of new technology is a concern
• accountability of users entering data and supervisors overseeing or authorizing data must also be maintained
Sergeant Chris Boddy, Community Mobilization Unit
• it has been difficult to get buy-in by the field and specialized units of the corporate direction of community mobilization, however front-line officers are now recognizing situations and community problems where CMU can be of assistance
• a full-time liaison is required between the Service and the City’s Community Safety Secretariat – this person could promote the advantages of partnerships with City departments/agencies to the Service and ensure that the Secretariat promotes the value of partnerships with the Service to City departments
22000088 EEnnvviirroonnmmeennttaall SSccaann
Appendix B 366
• there is a need to integrate crime prevention principles into divisional crime management strategies – the challenge for the unit is to educate members on crime prevention strategies and to enhance awareness of the benefits of using Auxiliary officers to assist in carrying out the strategies
• to meet demands for timely training by CMU, effective partnerships must be developed/maintained and new training techniques must be used (e.g. e-learning)
• it is a challenge to meet community demands for information and assistance (e.g. Community Mobilization workshops are full, communities are continually looking for assistance in organizing community events)
• limited funding coupled with increasing Service and community demands have required the unit to seek other funding sources (e.g. ProAction) to support some initiatives
• it is also a challenge to keep up with technological advances, in relation to both ensuring training for staff to keep skills up-to-date and for dealing with partners on issues such as cyber-bullying, youth violence and risks faced on the Internet, etc.
Staff Sergeant Aldo Altomare, Training & Education
• it is a challenge to maintain the training for accreditation required by Adequacy Standards (e.g. General Investigators, Sexual Assault, Major Case Management) so that officers can work in these areas
• maintaining accreditation for instructional staff is an issue
• succession planning affects the unit in two ways – the need to train officers to move into positions in divisions or specialized unit, and dealing with the loss of experience and the need to find appropriately-skilled members when Training unit staff leave
• meeting regulatory requirements for training is challenging (e.g. Use of Force), and the consequences of not meeting them may be serious for the Service (e.g. officers not being able to perform front-line duties)
o there is currently no capacity left – there is a backlog of officers requiring training and classes are full o the College is currently looking for alternative training options
• with all the mandatory training requirements (mandated by the Board, inquests, civil suits, legislation, etc.), there is no time any more to offer other or supplementary training courses
• the field cannot absorb/support any more training requirements, with current training delivery options – trying to ease some of this through new delivery methods for some courses such as e-learning, distance learning, but the technology infrastructure at divisions may not really support this
• there has been a general deterioration in training infrastructure (e.g. the need to shut ranges down), and no excess capacity to deal with the problems that arise
• there is currently little perception of value for training dollars spent – the unit is currently trying to put measurement processes in place to evaluate effectiveness and appropriateness
• the unit is also expanding partnerships with education institutions to provide enhanced training opportunities for members (e.g. Guelph-Humber)
• core subjects such as ethics, professionalism, and respect for diversity are being or will be woven into all training
Elizabeth Hewner, Budget & Control
• the Service’s operating budget is an annual pressure, driven by the number of Service members since salaries and benefits represent 90% of the operating budget (the remaining 10% is largely infrastructure to support these staff)
• due to the high proportion of salary dollars in the budget, any salary settlements have a significant impact (a 3% salary increase results in about a 2.7% increase in total budget) – a salary settlement is pending
• non-salary increases (e.g. inflation on gasoline, benefits, caretaking, etc.) have a 1.5-2% impact on the budget
• the City’s desire to limit overall increases results in intense budget review to show due diligence is taken and all possible cuts have been made
• in addition to the annual pressures, the Service is faced with implementing a lifecycle reserve strategy (this stabilizes operating expenditures while funding equipment replacement that is cyclical in nature) – if equipment needs replacing every four years, the challenge is to contribute one-fourth of the total cost to the reserve each year
o funding the reserve will add significant pressure to the budget over the next several years

22000088 EEnnvviirroonnmmeennttaall SSccaann
Appendix B 367
• technology is also advancing quickly, resulting in a need to keep up with technology requirements both from a systems support/management information and from a crime-related perspective (the Service must have up-to-date technology to keep up with crimes being committed – this is an expensive proposition
• with regard to the capital budget, new facility plans have created significant pressure on the capital budget at a time when annual targets are decreasing
o the City has also advised that the Land Acquisition Fund is depleted, so the Service must also now find money for land, without increase to targets
• the unit is currently beginning a review to find out if the budget is structured appropriately to collect the information people require – this is a first step towards budgeting for outcomes
• there is a need to more strongly link the Service’s budget and future budget planning to the strategic planning processes
• there is also a need to better capture future requirements to decrease the number of surprises annually with projects and acquisitions that ‘must’ occur ‘now’
• finally, gaps in communication between units must be bridged – for example, a group is being established to co-ordinate codes between TRMS, HRMS, and SAP; such co-ordination should be automatic

22000088 EEnnvviirroonnmmeennttaall SSccaann
Appendix B 368

22000088 EEnnvviirroonnmmeennttaall SSccaann
Appendix B 369
APPENDIX B INTERNAL CONSULTATION – DIVISIONAL POLICING COMMAND
February 27th, 2008
Staff Sergeant Bruce Morrison, 11 Division
• biggest challenge for 11 Division is the number of condo developments and the conversion of commercially zoned properties to residential uses (2,000 condo units have been approved in Ward 16 alone)
• expect an increase in population, including youths, and businesses, along with an increase in use of community resources (e.g. community centres, libraries, pools, etc.)
• along with the increase in population, can expect an increase in calls for service – the Service should look into the possibility of using other agencies to provide alternate forms of resolution
• there will also be an increase in traffic and pedestrians – the current infrastructure will not support this increase, and so expect increased congestion, collisions, neighbourhood complaints related to traffic, and possible increases in Service response time
• an increase in TTC routes in the division may also contribute to congestion because the current sidewalks and streets are not equipped to deal with the expected influx of commuters
• expect an increase in break & enters, robberies, theft from autos, etc. as more people with disposable income move into the division; there may also be an increase in youth crime with an increase in the youth population
• the new developments must take CPTED principles into account so that they don’t create havens for crime or disorder
• the division will need to dedicate more resources to crime prevention and assisting victims of crime
• there may be some clash with the more established neighbourhoods and residents
• the disadvantaged/poor are being forced out of the area since they can no longer afford to live here
• the waterfront re-development project will also have an impact, bringing people to the waterfront parks and attractions – there is also potential for more community festivals/events
• the move to the new divisional facility has been planned so that it does not affect response to calls for service – there will need to be community awareness initiative to let people know of the new location and boundary changes
• since the boundary changes will increase the size of the population being served, the number of officers deployed to the division and the divisional budget should be re-examined
• new partnerships will have to be formed with the community groups new to the division
• the division has some difficulty attracting officers, so they are actively doing internal recruiting
Constable Doug Ramsey, 12 Division
• traffic congestion problems are being increased by the growth of big box stores in the division
• public housing areas in the division have drug dealing and gang problems
• areas within the division have low income populations with little English – these areas will be particularly affected by any recession that occurs
• there is a lack of experienced officers within the division, who are not getting the training and mentoring they need because there are few officers with enough service to provide them
• new officers are not being trained enough in plain common sense issues, such as how to walk a beat
• the Service is currently responding to too many calls for service that it hasn’t traditionally attended – not all calls that are received should be dispatched (those that would be best handled by another agency should be forwarded there)
• the current policy in place with regard to projects to address drug dealing is restricting divisional work – divisional operational plans need to be approved by the Drug Squad, but this often takes far too long and sometimes the plans don’t get approved, which means the division can’t do anything
• the Drug Squad won’t come into the division unless the drug issue is big enough – there needs to be some guidelines about drug projects, but not so much control by the Drug Squad
22000088 EEnnvviirroonnmmeennttaall SSccaann
Appendix B 370
Constable Steve Thagard, 13 Division
• the biggest issue faced by the division, and the Service as a whole, is the current lack of senior and experienced officers to train new front-line officers
• it generally takes about 5 years on the job before the basic training stage is over
• in the recent past, there were 2 training officers on each platoon who generally had more than 10 years policing experience, who had worked in many of the divisional sub-units, and who had been to many of the College investigative courses
• these officers were then able to pass on their knowledge and experience to recruits, resulting in well-trained new officers in whom the public could have confidence
• platoons today rarely have 2 officers with 10 years experience
• the level of experience of the current training officers, however, is far less substantial; often officers who have just reached 1st class constable become training officers (some of whom haven’t even testified in court) – they also haven’t had much experience in investigative positions or other divisional sub-units
• this problem comes from the restricted hiring period in the mid-1990s, the large number of officers hired in the late 1970s who are now eligible to retire, and from the fact that the specialty units are also looking for experienced officers
• officers are also being lured away by other police services for a number of reasons, including better working conditions and cheaper housing
• when the division does have experienced training officers, they are in danger of being ‘burned out’ because they have to train non-stop
• instituting an upgraded refresher course for officers who complete 5 years of service might help
• short training courses focusing on only one issue would also be a benefit (e.g. a course on keeping notes and giving evidence in traffic court)
• having officers from specialized units returned to the divisions for a short time to pass along their unique skills and training could also help the new recruits
• newer officers have to be encouraged to make use of the knowledge that their more senior colleagues and supervisors have – they need to be encouraged to ask questions
• the 13 Division station is too small for the number of officers assigned there
• inexperienced officers are giving poor evidence at court – a short training session at the division relating to traffic evidence assisted inexperienced officers with giving evidence
Sergeant Tim Burrows, 14 Division
• 14 Division faces the same problems other divisions do – areas of low income and high density housing that have disorderly crimes (prostitution, drugs, and the associated crimes) affecting the quality of life
• the planned developments in the south end of the division have moved crime more north
• courts need to provide more support – 2 huge recent drug projects charged a number of people, many of whom had previous convictions for drugs
• the Service needs to try to influence the amount of recidivism
• most of the crime activity in the division goes back to drugs, but officers aren’t properly trained to do street-level drug investigations any more
• special events in the city are a draw on staffing – they bring a huge influx of people into the area and take officers away from their regular policing duties
• although there is support from other divisions for the major events, they also create problems for officers to move about the division because of closures and congestion
• dealing the emotionally disturbed persons is also a huge draw on the division’s staffing resources and a large proportion of calls and arrests are Mental Health Act-related (officers are also spending much time tied up at hospitals)
• technology has increased input requirements, resulting in increasing service times on calls
Staff Sergeant Madelaine Tretter, 22 Division
• the greatest challenge facing the division is the rapidly changing demographics, including a large influx of high density housing
22000088 EEnnvviirroonnmmeennttaall SSccaann
Appendix B 371
• previously, the division had established neighbourhoods, typically with single-family dwellings, some apartments, businesses, and some industry – residents and businesses took an interest in local problems and there were effective police-community partnerships
• the recent influx of condominiums bring the challenge of developing new partnerships with these communities, especially since it may be a while before the new residents establish a connection to their community and so they may be less committed to neighbourhood problem-solving initially
• the increase in population will result in an increase in calls for service – busier officers and longer wait times may affect community satisfaction with the police
• the division once had very experienced, senior members of the Service, but with retirements, there is now a large number of new officers
• these new officers have high expectations for personal growth and development – they are eager to learn and have put great demands on the remaining senior officers as coaches and mentors
• it will be a challenge for the Service to retain these new officers and address issues of training and succession planning, but the Service also cannot ignore the value of experienced police officers and must work to ensure their job satisfaction as well
• a number of officers live far beyond the GTA and it may be difficult to keep them from leaving for other police services closer to home
• the Service must use advancing technology to assist in intelligence gathering and customer service – it should both help to solve crimes and help to address the needs of the public effectively and efficiently
• with changes internally and externally, the Service must take steps to maintain standards of service delivery with initiatives like the Divisional Review (which has resulted in greater availability of detectives working during peak times and moves officers through the training program at a faster pace)
Sergeant Rick Blanchard, 23 Division
• a large proportion of the division’s population falls within the 5-19 years age group, contributing to the high level of youth victimization and youth crime
• affecting the youth crime/victimization situation are the number of single parent families, a lack of mentors and leaders for youth, and little access to social/recreational programs
• the division must continue to work on improving communication between youth and police
• the division has 6 vulnerable communities, with low income and high density
• terrorism-related issues are a concern – the international airport is nearby, major transportation arteries go through the division, there is a large industrial base (including companies involved in radiological, biological, and chemical work), the immigration holding centre and the Toronto West Detention Centre are both in the division, and the division borders on Peel and York Regions
• construction on the Woodbine development will begin this year and be completed in 2011 – while it currently employs 1,500 people, this is expected to grow to 12,000, and the current estimate of 13,700 people visiting per day is expected to increase to 41,000
o the site will also have a 6,500-seat live concert venue o both an increase in calls for service and an increased requirement for visible police presence are
anticipate, as is increased traffic congestion o traffic in the area is also expected to be an issue during the construction phase
• retention of trained and experienced officers and civilians is a challenge for the division, due to both retirements and demands from specialized units for experienced officers
• succession planning for specialized areas within the division is also a challenge
• there is insufficient funding for specialized training and it is difficult to maintain compliance with all mandatory training
• demands on the unit’s special pay account are high, particularly related to court (e.g. disclosure requests, defence requests for all police witnesses to attend court, etc.)
• the health and wellness of both officers and civilians will be affected by the increased demands to produce more with fewer resources
• primary response vehicles seem to be at Jane Street for repairs for longer periods of time, meaning that the PR is down cars
22000088 EEnnvviirroonnmmeennttaall SSccaann
Appendix B 372
• education should be expanded – spaces are not available and courses such as at Humber College need to be more accessible
Sergeant Spencer Dennis, 31 Division (written submission)
• the large number of new, inexperienced officers is a challenge for the division – the average length of service is currently about 2 years, and another 10-15 officers will be retiring from the division over the next 2 years
• it is hard to find competent coach officers who are available to train the new officers
• new officers require a high level of supervision and training – in recent years, a number of public complaints and departmental accidents have involved junior members who lack experience
• also, the large number of newer officers will affect the investigation and handling of crimes/events in the division, which historically tend to be complex and serious
• the population of the division is very diverse, presenting challenges such as a lack of reporting and a lack of trust between some communities and the police – the division will need to continue to try and create an environment of co-operation and open communication
• violent crime is an issue in the division – there are high numbers of assaults involving weapons and street robberies involving violence; there is also much gang activity, including drug dealing and violence
• as a result of the number of violent, serious crimes, it is sometimes a challenge for the division to provide staffing for regular duties when there is an on-going serious crime scene to contain
• as a result of recent events and media exposure, demands for service have increased at divisional high schools, and this is expected to continue
• York University does not have enough on-site security, and so places demands on resources, frequently calling on the division to assist with high-profile occurrences
• divisional resources are also taxed by having to occasionally assist with court security at the Finch West criminal courts
• 31 Division is a very busy division and it is anticipated that calls will increase further with the new hospital development and new housing and industrial units being developed – responding to these increased demands with inexperienced officers will be challenging
Constable Frank Bishop, 32 Division
• the prime concern of 32 Division is adjusting and adapting to change: a growing and aging population, technological advances, and infrastructure pressure
• the policing sector faces an aging workforce, the retirement of baby boomers, an increased workload for officers, increasingly complex operational demands, increasing knowledge and skill requirements, requirements for employment diversity and equity, and major case management leadership being assumed by younger and less experienced officers
• the Service must develop both careful recruitment strategies to entice the best candidates and strategies to leverage the knowledge of those retiring
• there is a great reluctance for victims and witnesses of child abuse and domestic violence to come forward with information during investigations, mostly due to fear that police cannot ensure their safety – this situation is not helped by the courts who are more concerned about the rights of the accused than of the victim
• the number of crimes committed through the Internet continues to increase, and is not limited to child exploitation/child pornography – credit card fraud, money laundering, etc. expand the nature of many investigations from local to international and require sharing of intelligence information within and between agencies
• traffic, especially commuter traffic, in the area will continue to increase with the increase in bus and subway lines and the amount of housing construction occurring in York region (the north boundary of the city is very busy)
• Lawrence Heights has been targeted by the city for infrastructure investment and community service improvement – once the revitalization project begins, it will initially disrupt traffic and transit on the arterial roads
• the Yonge Street condominium developments, and the increased population that moves in, will contribute to traffic issues
22000088 EEnnvviirroonnmmeennttaall SSccaann
Appendix B 373
• officer retention will be a major issue, with retirements causing a huge loss of skills, experience, and expertise – the Service should explore innovative strategies to deal with this (for example, re-hiring officers as civilians and put them in positions that allow officer re-deployment to the front-lines)
• officers need improved people skills and a stronger grasp on emerging technologies – these should be areas of focus for training and recruitment
Staff Sergeant Brian Moorcroft, 33 Division
• the population of the division is aging – there are almost as many people over 65 as under the age of 19
• the aging population will mean calls for service that often require many resources (e.g. a search for a missing person); an aging population also means a larger number of potential victims
• there are an increased number of emotionally-disturbed persons living in the division – these people require police services on a regular basis, with police being used to fill deficiencies in the health care system
• domestic-related calls represent a large proportion of the calls for service – these calls are time consuming and potentially high risk, both for the officers attending and the Service
• there are about 5 new high-rise condominiums being constructed in the division – more are anticipated, and will results in a population increase
• an increased population means an increase in crime targets (e.g. a large number of high-end vehicles in one area), an increase in vehicular and pedestrian traffic, and an increase in calls for service
• the division is required to provide an increasing presence at its 81 schools, both proactive and reactive – continuing to provide effective police service to these schools will be a challenge
• although there has been some increase, the division is still staffed at a minimum level – therefore, when something unanticipated happens or the division is asked to assist in another division, it is challenging to meet divisional needs
• in addition, the average length of service of officers in the division is decreasing, which represents a large knowledge drain – this means increased pressure on supervisors and senior members to provide assistance and guidance
Sergeant Chris Kirkpatrick, 41 Division
• three factors will have the most impact on the division in coming years: increased housing, the transition of industrial lands to commercial business, and traffic-related incidents
• there are a number of new residential housing developments planned for 41 Division – the Warden Woods corridor is undergoing revitalization that will see an increase of 2,080 housing units and there is an additional proposal to develop two nearby vacant parcels of land – this could mean approximately 10,000 new residents for the area
• a new long-term care facility for the elderly and a 25,000 sq.ft. community centre will also be located in this area
• industrial spaces along in the Eglinton/Warden and Kennedy/Ellesmere areas are being converted to commercial businesses and big box stores that cover large areas
• Kennedy Road north of Lawrence is also a challenging area for traffic and congestion
• all this development will result in increasing demands for policing services from the division
• with the increase in population and businesses, there will be an increased use of roads in the division – 7 of the highest accident locations in the division are currently in areas of expansion
• there has been some displacement of crime into different areas with the commercial development and the implementation of TAVIS-related strategies – this will need to be evaluated and addressed at the divisional level
Staff Sergeant Jim Darbyshire, 42 Division
• 42 Division is, geographically, the largest division, has a large residential population, and is a very culturally diverse community
• the north-east corner of the division is being changed from farmland to residential neighbourhoods at a rapid pace and is expected to continue for the next few years
22000088 EEnnvviirroonnmmeennttaall SSccaann
Appendix B 374
• new neighbourhoods have meant thousands of new residents in a short period of time, increasing in particular the population of school-age children – phase two of one of these developments will again double the population in the area
• Scarborough is dealing with the ‘sudden’ appearance of complete new neighbourhoods, with new roads, schools, parks, etc. on what used to be farmland
• a major impact on policing in these new neighbourhoods is traffic-related – for example, 2 new schools in one area had residents soon calling with complaints of speeding vehicles, parking, lack of school crossing guards, and heavy truck traffic (this community is also concerned about a proposed by-pass that will see a projected 20,000 cars passing through their neighbourhood daily)
• residents in these new communities are also concerned about the lack of recreational facilities for youth – the division has been working with neighbourhoods to address the issues that arise from this lack (e.g. underage drinking, drug use, and mischief)
• to communicate and open relationships with these new communities, the division has invited representatives onto the divisional CPLC and holds meetings with community groups to address their issues
• working with community partners in these neighbourhoods requires significant resources and the need for resources will continue as neighbourhoods appear and grow
• a number of these communities are also often comprised of similar cultures, religions, etc. – the impact this will have on the division is unknown, but it will undoubtedly require officers with various language abilities be assigned not just to Primary Response, but to other areas of the division as well
• due to the large number of Tamil residents in certain areas, more officers with Tamil language skills are needed; the division is trying to build the same successes with the Tamil community as they have with the Chinese community (e.g. Chinese CPLC)
• the growing population will result in more calls for service – this will affect not only the Primary Response officers, but the school police, youth bureau, and traffic officers as well
• with increasing population and neighbourhood growth, it is possible that Scarborough will one day need a fourth division
Sergeant Alex Macaulay, 43 Division
• the younger age of new officers combined with their lack of driving experience seems to have caused an increase in departmental collisions – this means substantial vehicle losses or damage requiring body shop down time
• with a number of vehicles in the shop, and a lack of replacements or spares, it’s difficult to respond to calls for service
• the CRU has been operating with unmarked vehicles, which means a lack of public visibility
• the Division has received 5 new laser devices, but to effectively deploy officers for traffic enforcement again an unmarked vehicle has to be used
• the Harley-Davidsons at the division is old and problematic – it would be better to exchange it for another marked vehicle that can be used year round by traffic, or PRU, officers
• any change to working hours that would put more officers on the road in the evening hours would mean that the division would need additional vehicles (especially since the division is not one that is easily walkable for the deployment of officers on foot instead of vehicles)
• the secrecy around the work being done on scheduling is causing concern and mistrust – officers want to know what is being discussed since it will affect them
• there needs to be less focus on ticket-writing for traffic offences and more focus on specific community problems, such as high collision areas, school safety, pedestrian safety, impaired drivers, and targeted road safety education programs
• the 80/20 staffing model is too restrictive and doesn’t allow the MCU staffing to be increased in response to increased pressures (such as court, disclosure, annual leave) – the office is often minimally staffed and overtime has increased
• community events during the summer months take CRU officers away from proactive work with dependent communities
• Kingston Road and motels between McCowan and Brimley are always a challenge to police, with prostitution, drugs, and property crime in the area
22000088 EEnnvviirroonnmmeennttaall SSccaann
Appendix B 375
Detective Sergeant Myron Demkiw, 53 Division
• low family income levels, unemployment, adults with less than a high school education, residential turnover, dwelling rental rates, and lone parent family rates all correlate with criminal victimization and all are present in an area of the division – these issues must be addressed to prevent the spread of gun, gang, and drug violence in that neighbourhood
• however, other parts of the division are very affluent and attract serial criminal offenders, especially those specializing in break & enter offences – victimization in these areas must be reduced through strategic intervention and the investment of resources
• investigative resources are strained – investigations require more and lengthier procedures, paperwork, resources, and training, and with investigative experience spread thin, the overall effectiveness of the division could be jeopardized
• proposed restructuring, TRMS self-reporting, and the increase in workload are all contributing to the perception that the CIB is not where officers want to be – ‘burn out’ of officers already there is a real possibility
• an October 2007 Supreme Court decision ruled that people who are wrongly arrested, prosecuted, or convicted can sue police services and/or individual officers for negligent investigations – this puts additional stress on investigative officers and the division/Service must ensure adequate investigative resources are available so this doesn’t happen
• the current Staffing & Deployment Model has frozen the investigative side of the Service to allow for growth on the front-line, but work being done by more front-line officers also means more work for investigative officers whose numbers have not increased
• shifting resources between divisions to fill special event policing requirements has a negative effect throughout the division, especially in the CRU – most events happen in the summer months and take much of the CRU away from proactive policing and projects in 53 Division
• the extraordinary special events demands on the CRU must be reduced so that these officers can maintain actual contact with their assigned neighbourhoods in the time of peak need – it is difficult to strengthen community partnerships, work to develop solutions to local problems, and gather intelligence when the officers are not actually in their communities
• the division must use intelligence-led policing – with a large collection of affluent neighbourhoods to attract serial property crime offenders, property crime activity usually forms identifiable hotspots that have a disproportionate number of victims and prolific offenders
• reactive policing involving constant response to calls for service does not allow for an investment of time in hotspot policing – what is needed is a commitment to proactive patrol that is not discretionary
• with condominium development at Yonge & Eglinton, the residential population will increase – traffic and subway/transit congestion problems, along with increased demand for policing services and increased calls for service are anticipated
• the division also has growing senior and youth populations, both of which will be vulnerable pools of street crime victims
• it is a challenge to get the communities in the division to accept responsibility for their areas as required by community mobilization – people tend to get involved only when there is an urgent problem
• there is a general lack of commitment and apathy, and finding and keeping volunteers to be involved in long-term problem-solving is difficult
• community members must be educated about what police can and cannot do – the community must develop realistic expectations
Detective Kathryn Kinnear, 54 Division
• the division has several areas of high density, low income public and rental housing; residents include a large immigrant population with many languages spoken
• the division must increase the diversity of officers to have the language and cultural skills needed to respond effectively, build trust, and encourage the reporting of crime and witnesses
• youth gangs often operate in these areas and require vigilance and specialized investigations
• the division has in general a large residential population – which also means a large number of domestic-related occurrences
22000088 EEnnvviirroonnmmeennttaall SSccaann
Appendix B 376
• the Main-Danforth corridor has drug problems and the related property and violent crimes (e.g. robberies, break & enters), along with a subway that provides easy access for people from across the city; there is also a large homeless shelter, as well as high-density, low income housing in the area
• the 8 subway stations in the division are magnets for crime (e.g. robberies, thefts, mischief, sexual assaults, etc.), and are a hub for approximately 5,000 students around 3 p.m. each weekday – the Main Street TTC station is a particularly busy area
• the division has 37 schools (including 3 high schools) – youth on youth violence is an issue, as are robberies, thefts, mischief, and busy lunch hours that have an impact on the local community
• officers have also noted an increase of criminal activity in middle schools that used to only occur at high schools (e.g. sexual assaults, harassment, etc.)
• the psychiatric facility at Toronto East General Hospital also requires extra attention, including calls for service to patients in the community and calls for patients gone missing
• the approximately 30 parks within divisional boundaries are typically large and multi-functional, with various recreational facilities – they require constant patrolling (and resources to patrol) to prevent illegal activities
• the division is servicing an aging population, increasing officer involvement and activities at seniors’ support and residential facilities, as well as being targets for certain crimes (e.g. fraud)
• the several group homes and secure youth government facilities in the division require significant police resources, both to address the crime committed and the chronic missing persons calls
• the division has received additional officers in recent years, but there has not been a proportional increase in divisional vehicles
• the additional officers also requires a re-calculation of the number of officers that can be assigned for investigative work (the current ratio was calculated before the additional officers arrived) – this has meant significantly increased workloads for current investigative personnel
• IT issues continue to frustrate officers and take time away from patrolling
• the requirement to attend a large number of out-of-division events, parades, festivals, etc., means that CRU officers are not available to address the local community needs
• TAVIS funding contributed greatly to decreased crime in the division in 2007; the reduced TAVIS funding levels in 2008 will affect the division’s ability to address violent crime and gang activities
• increased training requirements have a negative impact on officer availability; there is also a shortage of experienced officers to train new recruits in the division
• finally, the division is old, too small, overcrowded and needs to be replaced
Sergeant John Spanton, 55 Division
• the increase in property values throughout the division is having a significant impact on policing
• increased property values mean an increase in speculators – they usually rent the property out and are rarely on-scene to manage the tenants; these properties have sometimes turned into crack houses, bringing criminal activity into the area
• the renovation of Regent Park, etc., has resulted in the displacement of a number of lower-income people and the drug problems they sometimes have – many of these people are now renting in the division, bringing along the crime associated with drugs
• a number of housing projects/low income houses have also appeared in the division in recent years, bringing an increase in everyday criminal activity
• homeowners who buy into expensive areas expect they are moving into good areas – they have little tolerance for everyday criminal activity (especially when the source of criminal activity is a crack house in the middle of an established neighbourhood) and the result is an increase in calls for service
• businesses have also moved into the area, paying high rent to be there – they also have high expectations and are affected by the numerous petty crimes, especially graffiti that continually reappears
• the demographics of the division are not changing greatly, so the separation between residents and the criminal element will continue to widen in the next few years
• a canvas of residents and business owners by the CPLC found that the top 3 crime issues for people were graffiti, panhandlers, and drug activity/petty theft/damage – all quality of life offences that negatively affect perceptions of safety just as much as a small number of serious violent offences
22000088 EEnnvviirroonnmmeennttaall SSccaann
Appendix B 377
• policing in the division will have to change to meet the changing needs of the community – police will have to take these lesser crimes very seriously (even though there is a lack of judicial support, with these types of crimes being taken less seriously)
• the increase in drug locations/crack houses is responsible for most of the criminal activity (both violent and property) – the division has been successful in closing a number of houses down, but another soon starts up nearby
• in the spring and summer, the CRU must spend more time in the parks/Greenland areas (e.g. the Beaches) to keep down criminal activities by the thousands of youth who use them; the CRU is also responsible for many major events both in the division and in other divisions – this means they are not available to do proactive work in/with the community
• the Service focus on violent crimes should go one step further to include the less serious/petty crimes that affect quality of life in the community

22000088 EEnnvviirroonnmmeennttaall SSccaann
Appendix B 378
22000088 EEnnvviirroonnmmeennttaall SSccaann
Appendix B 379
APPENDIX B INTERNAL CONSULTATION – SENIOR OFFICERS
April 1st, 2008
Kristine Kijewski, Director, Corporate Services
• the most immediate challenge is information management and the increasing demand for release and retention of information – failure to manage information could bring this organization to its knees
• also challenges around release of information to the community and sharing of information with other law enforcement/criminal justice system agencies – including disclosure, retention schedules, etc.
• need a broad definition of ‘record’ – this means any bit of information we keep, electronic and hard copy
• increased demand for retention will result in challenges around storage
• will have implications for a number of units, including Video Services (particularly in relation to the DVAMS project), Records Management, Property and Evidence Management, etc.
• the issues will also speak to active case continuity, storage of physical assets and records, etc.
• units are hitting the wall with regard to storage capacity and the Service is not quick to rid itself of hard copies of material
• a co-ordinated effort to send material to Toronto Archives is under way
George Cowley, Director, Legal Services
• major issue: e-discovery
• the Service receives about 90 new civil actions each year; Legal currently has about 500 open civil action files
• civil trials require mutual discovery (called disclosure in criminal trials) – each party makes their documents and witnesses available to the opposing party
• when litigation is contemplated, parties have an obligation to preserve records, which are detailed in an Affidavit of Documents when litigation begins
• Affidavits of Documents list all documents and material that a party has or previously had but no longer has, that are relevant to the subject matter of the litigation
• if a party disposes of a document that is shown to have a bearing on the subject of the litigation, the other party can as the Court to infer that the no-longer-available document must have been unfavourable to the party who disposed of it
• with increasing use of electronic communication and storage, current rules need to be updated to include electronic documents (e-discovery)
• now, one of the first steps in litigation (or proposed litigation) will be to send out a preservation letter to the opposing party, requiring the receiving party to identify, preserve, collect, review, and produce all electronically stored information they have that relates to the subject of litigation
• in the US, e-discovery is driving litigation and the cost of e-discovery is often behind a party’s willingness to settle, since depending on the nature of litigation, the cost of preservation can be much more than the amount being claimed in damages
• the current Service Records Retention Schedule addresses hard copy and some TPS databases (e.g. CIPS) but does not address digital forms of communication (e.g. e-mail, peer-to-peer transmissions, etc.)
• the Service needs a policy concerning electronic communications and information management
• when real-time preservation is an issue, e-discovery requires prompt action by counsel to assess the relevance, if any, of information and work with ITS to preserve it – ITS will have to act fast when a litigation hold is requested by counsel
• this requirement to produce electronic communications is also starting to be raised in criminal courts, especially in the more complex cases
Staff Superintendent Tony Corrie, Professional Standards
• significant changes to Professional Standards in recent years to address demands for more accountability and transparency
• greater emphasis now on a risk management approach
22000088 EEnnvviirroonnmmeennttaall SSccaann
Appendix B 380
• alcohol and drug use among police officers are to be watched for
• Police Association has an impact on investigations of alleged misconduct – ‘code of silence’ reinforced, highly-trained lawyers provided to subject officers and witnesses (even witnesses who aren’t part of the Association)
• Bill 103 will affect the intake of complaints, the administration of investigations, and the timelines of investigations
• in particular, shorter timelines may have an effect on the effectiveness of investigations and on officer workload – additional staff may be required
• new officers seem more willing to/confident about speaking out about organizational or individual wrong-doing – must protect those who come forward
• with continuous training on ethical behaviour and encouragement for officers to report misconduct (and providing them with various means to report), the Service will be able to react quickly to investigate
• Professional Standards investigations are becoming more complex – can require mobile surveillance, wire taps – developing and maintaining strong relationships with other police services are also important (investigations often cross boundaries since officers live outside of Toronto)
• many recent recruits have higher education levels than previously and morale may become an issue in 5-10 years if they are not able to achieve career advancement – officer disenfranchisement may make them more vulnerable to unethical behaviour
• other issues: firearm storage, domestic assault, over-legalized tribunals, staff training and development, inexperienced officers failing to properly articulate their actions in court, firearm discharges, civilian oversight, use of force/tasers, human rights (internal and external)
Mike Ellis, Manager, Facilities Management
• 3 main areas of concern are capital program & facilities, security at buildings, and perceived occupational health & safety issues
• new building replacements in the capital budget program are behind schedule – progress is being made very slowly
• not only do the older buildings not support current technology (e.g. computer networks, remote downloads), but they also all have occupational health and safety concerns
• with regard to the operating budget, buildings are owned and operated by the city – the funding provided to maintain them is inadequate (is about ½ of industry standard)
• building inspections are being delayed or missed altogether (i.e. windows, roofs, fire systems, etc.
• the result is little ability to do preventative maintenance – have failures, electrical and plumbing problems, and the response from city is not good (they are losing experienced staff) – sometimes the cost for repairs has to be taken from our budget
• if the Service is going to be required to look after its buildings, the city needs to build this into our budget
• with regard to security at buildings, is concerned about the lack of a policy on security and accountability – a unit commander is responsible for who is given access to facility, but they are not the only one authorized to give access – need to establish who is responsible and restrict authority
• security systems are reasonably well managed, but staff are needed – this is not a part-time job
• recovery of security cards provided to consultants, contracts, temporary workers, etc. is not good; unit commanders also don’t keep track of their ‘visitor’ cards
• about 80% of the requests Facilities receives are framed as occupational health and safety issues – people are making everything into an OHS issue, since they believe that if their request is OHS, management is required to deal with it
• people need to be made aware of what actually constitutes an OHS issue, need a clear definition – they should also be made aware that OHS-related requests have to go to that unit, not Facilities
• the number of ‘OHS’ requests relates back to the general condition of some facilities and the city’s willingness (or unwillingness) to maintain them
• in general, a comprehensive look at the Service’s facilities should be undertaken – the last time this was done was in the 1980s
22000088 EEnnvviirroonnmmeennttaall SSccaann
Appendix B 381
Staff Superintendent Peter Sloly, Operational Services
• more 9-1-1 and 2-2-2-2 calls for service to the Communications Centre come from cell phone/VOIP Internet/On-Star, etc. – these calls do not have traditional call back functions and they present tracking/archiving challenges – new technology and business processes are needed to handle these new demands
• there is an increasing trend in two-tier policing: provide alarm response for those who can afford such systems and the private companies that provide for-profit alarm system products/services; also have patrols paid for by business associations, Board administered Special Constable programs for certain public and private institutions, etc. – a corporate strategy is needed that recognizes and addresses this issue
• increased demands for police service will come from the waterfront – in 2008, there will be international flights from the Island Airport and an increase in commercial water traffic through the TPS waterway jurisdiction; new intelligence information also indicates that organized crime elements use the waterways to traffic/transport illegal goods/persons – the Service will need a marine radar system and increased capacity for the Marine Unit to conduct commercial/ private vessel inspections, criminal interdictions, 9-1-1/2-2-2-2 response to the Island Airport, etc.
• a capital budget investment is needed for a new permanent Mounted Unit (ideally co-located with Police Dog Services), since there is no permanent TPS owned facility for the Mounted Unit – the current space is leased and expires in 2-3 years (there are no guarantees that the lease will be renewed)
• there in an increasing need for IT support to Service operations such as e-ticketing for police officers, more Street Sweeper type technology, geo-coding for crime/traffic/public order analysts, etc.
• increasing use of on duty officers for an increasing number of special events has a huge impact on crime management in the peak summer months, as well as increasing financial, human resource, and administrative impacts – the Service needs a corporate strategy/priority for staffing these events without using CR/Neighbourhood officers, so they can continue to provide effective, visible police service to their assigned communities in the high crime summer periods
• there are an increasing number of emergency preparedness/terrorism threats and service demands – Service capacity to meet these needs must increase, as must the resiliency of the city to overcome and/or minimize the potential threats – emergency preparedness should be a specific Service Priority for the 2009-2011 Business Plan
• there is an increasing need for crime prevention, community mobilization, and neighbourhood policing – the community wants it and recent experiences with crime trends and TAVIS show that more crime prevention/community mobilization/ neighbourhood policing works – the Service needs the budget, staff, infrastructure, and systems/processes to support this demand
• there is an increasing need for talent management, diversity management, and human capital management strategies to be added to our HR strategic plan – the Service needs more focus on retention and development of our people
• there is a need for proactive risk management relating to IT and web-enabled social networking – most officers carry and officially/unofficially use non-issued cell phones, digital cameras, and web-enabled devices; many members have sanctioned access to the Internet for job responsibilities; almost every member has a computer desktop; the majority of corporate communication takes place through e-mail and/or the Intranet; and, more recruiting/hiring activities, community outreach, and criminal investigations are making use of social networking sites and ‘You Tube’-type sites – training courses, governance/rules, and policy frameworks in this area are needed
• there is a need for high level strategic management in the Service – some units do some elements of this but a command-level ‘think tank’ style unit is needed – if staffed with the Service's best thinkers, innovators, and educators, this will assist the Command and Service in addressing the increasing trends mentioned above
Inspector Nick Memme, Community Mobilization Unit
• main issue is dealing effectively and proactively with vulnerable persons, specifically emotionally disturbed persons and older adults
• the Service generally received over 10,000 calls a year relating to emotionally disturbed persons, with an average time per event of about 200 minutes – this represents a significant demand on Service resources
• police shootings and taser use against emotionally disturbed persons often result in a negative public response (and the belief that police have over-reacted), as well as inquiries/investigations
22000088 EEnnvviirroonnmmeennttaall SSccaann
Appendix B 382
• police are often the starting point of interactions between emotionally disturbed persons and the criminal justice system – end up being a front-line extension of the mental health system by default rather than choice
• Toronto’s senior population, especially those over 75 years, has grown and continues to grow, with most seniors living in the suburban areas – City Planning projects that the number of seniors will grow by 38% by 2031,
• women make up a large proportion of all seniors, and about one in four seniors live alone
• elder abuse is seriously and considerably under-reported, and seniors are increasingly targeted by local, national, and international fraud schemes
• also, many seniors experience increasing difficulty handling day-to-day demands as they age, as well as increasing illness and disability – all of which may lead them to call the police for assistance
• the Service is continuing training and education, internally and externally, on issues related to elder abuse, frauds against seniors, and mental health
• a police-only Community-Based Mental Health and Justice Services Access Line was launched in June 2007 to provide officers with information on available services
• partnerships and discussion are ongoing with law enforcement agencies, community service workers, government, health care facilities, etc.
• continued research is needed to update member training and education on intervention strategies, investigation issues, multi-generational and/or multi-cultural issues, aging issues, and issues related to mental illness
• also need continued public education on mental health and elder abuse/neglect, including police roles, responsibilities, terminology, use of force/crisis resolution training, etc.
• need to enhance/expand partnerships and develop new ones as necessary
Staff Superintendent Jeff McGuire (Area Field)
Staff Superintendent Glenn DeCaire (Central Field)
• with retirements, many front-line officers are relatively new to the Service – ensuring they receive appropriate, required training is essential
• with the large number of new officers, training and development of coach officers is also a priority
• continued development of supervisors is vital to ensure risks are identified and managed properly – knowledge of Service procedures, the Police Services Act, the Occupational Health & Safety Act, and relevant case law are required to ensure compliance
• recently implemented e-training provides training to front-line officers and supervisors effectively and efficiently – reduces the time officers are required to spend at the College
• also, providing supervisors with opportunities for higher education (e.g. the Guelph-Humber program) and personal development will also be of benefit – will assist with the management of a diverse workforce in diverse communities
• training on the Service’s infrastructure systems will also assist supervisors and senior officers in managing budgets
• training programs and increased communication/awareness/education information to members has resulted in a significant reduction in the number of Service vehicle collisions
• this reduction benefits not only member health and safety, but also reduces sick time, civil actions, and vehicle repairs
• review of the current compressed work week schedule should result in a shift schedule that also improves the health of members, as well as improving personnel deployment
• some divisions have a large proportion of their population over 55 years of age – this group is often vulnerable to fraud, and investigations are often complex and time consuming
• missing seniors and vehicle collisions involving seniors are also issues
• the Service needs to continue to provide education in these areas to this group
• need a diverse workforce with multiple language skills to meet the demands of the community – need to encourage officers to recommend policing as a career when they’re out in the community
• the size and complexity of many investigations results in much time spent by officers at crime scenes and reviewing/analyzing the evidence collected
• demands of timely disclosure and the required attendance of officers at court also puts a strain on resources – e-disclosure may assist in dealing with these issues
• divisional projects to deal with crime and disorder issues also require human resources

22000088 EEnnvviirroonnmmeennttaall SSccaann
Appendix B 383
• the size and number of community events (planned and unplanned) have an impact on the ability to provide consistent policing services to communities, since Community Response officers are often required at events and therefore are not available for their communities
• to deal with increasing demands on divisions, need to increase the use of available technology that assist with productivity and time management (e.g. in-car cameras, CCTV, information management systems, etc.)
• many divisions are seeing significant changes in commercial and residential areas – will increase demands as once vacant land or industrial land is taken up by residences and big box stores, bringing more people and traffic into areas
• the above will potentially result in an increase in calls for service for frauds, thefts, break & enters, traffic, etc. for divisions

22000088 EEnnvviirroonnmmeennttaall SSccaann
Appendix B 384

Toronto Police Service 40 College Street
Toronto, Ontario, Canada
M5G 2J3
416-808-2222
www.torontopolice.on.ca