Embed Size (px)
Citation preview
©20
08 T
hom
son
Reu
ters
©20
09 T
hom
son
Reu
ters
1
Evaluating Worksite Health Promotion Programs:Are They Cost-Beneficial?
Ron Z. Goetzel, Ph.D., Emory University and Thomson Reuters Healthcare
Employee Health Promotion: Opportunity and Challenge for Massachusetts
AstraZeneca Corporation R&D Center, Weston MA - Friday, April 30, 2010
©20
08 T
hom
son
Reu
ters
©20
09 T
hom
son
Reu
ters
2
U.S. BUSINESS CONCERNS ABOUT HEALTHCARE
• The United States spent $2.24 trillion in healthcare in 2007, or $7,421 for every man, woman and child.
• Private employers contributed 77% to health insurance premiums, a 6.1% increase over 2006
• Private sector share of total spending is 53.7%
• National health expenditure growth trends are expected to average about 6.6% per year through 2015.
• Health expenditures as percent of GDP:– 7.2 % in 1970
– 16.2 % 2007
– 19.7 % in 2017 (est)
– 25.0 % by 2030 (est)
Source: Hartman et al., Health Affairs, 28:1, Jan/Feb, 2009, 246.
©20
08 T
hom
son
Reu
ters
©20
09 T
hom
son
Reu
ters
3
WHY IS HEALTH CARE SO EXPENSIVE?
Source: K.E. Thorpe, "The Rise in Health Care Spending and What to Do About It," Health Affairs 24, no. 6 (2005): 1436-1445; and K.E. Thorpe et al., "The Impact of Obesity on Rising Medical Spending," Health Affairs 23, no. 6 (2004): 480-486.
Innovation/advancing technology (pharmacologic, devices, treatments)
• Newborn delivery costs – five-fold increase from 1987-2002
– NICU, incubators, ventilators, C-sections
• New/better medicines for treating disease– Depression (SSRI introduction – 45% treated in
1987 to 80% treated in 1997
– Allergies (Claritan, Allegra, …)
• New treatment thresholds– Blood pressure
– High blood glucose
– Hyperlipidemia
Rise in spending for treated diseases (37%)
Ken Thorpe
©20
08 T
hom
son
Reu
ters
©20
09 T
hom
son
Reu
ters
4
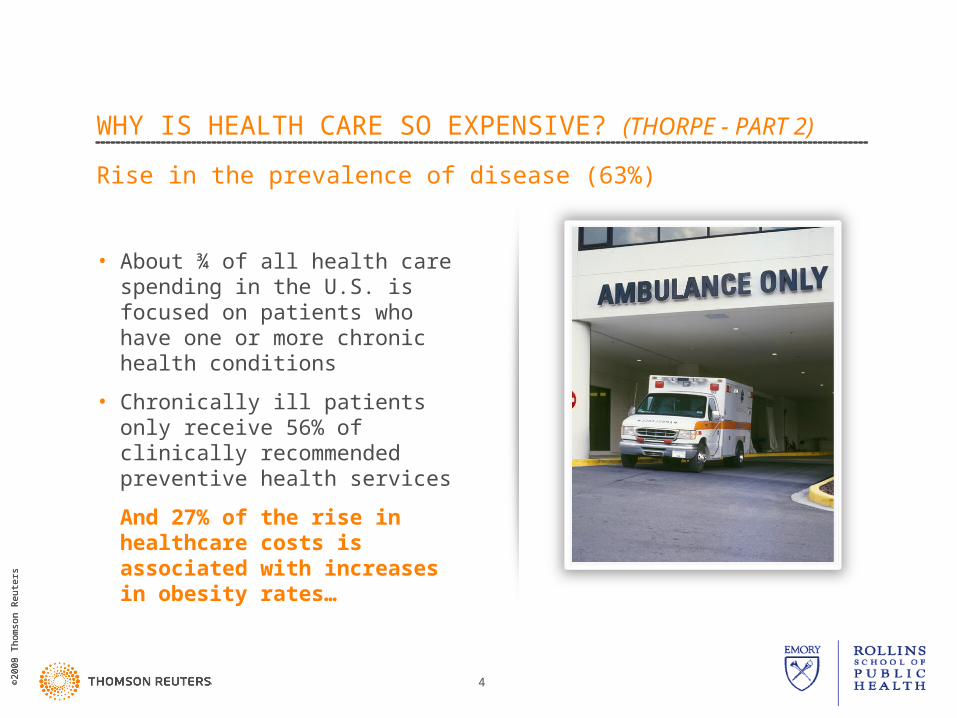
WHY IS HEALTH CARE SO EXPENSIVE? (THORPE - PART 2)
• About ¾ of all health care spending in the U.S. is focused on patients who have one or more chronic health conditions
• Chronically ill patients only receive 56% of clinically recommended preventive health services
And 27% of the rise in healthcare costs is associated with increases in obesity rates…
Rise in the prevalence of disease (63%)
©20
08 T
hom
son
Reu
ters
©20
09 T
hom
son
Reu
ters
5
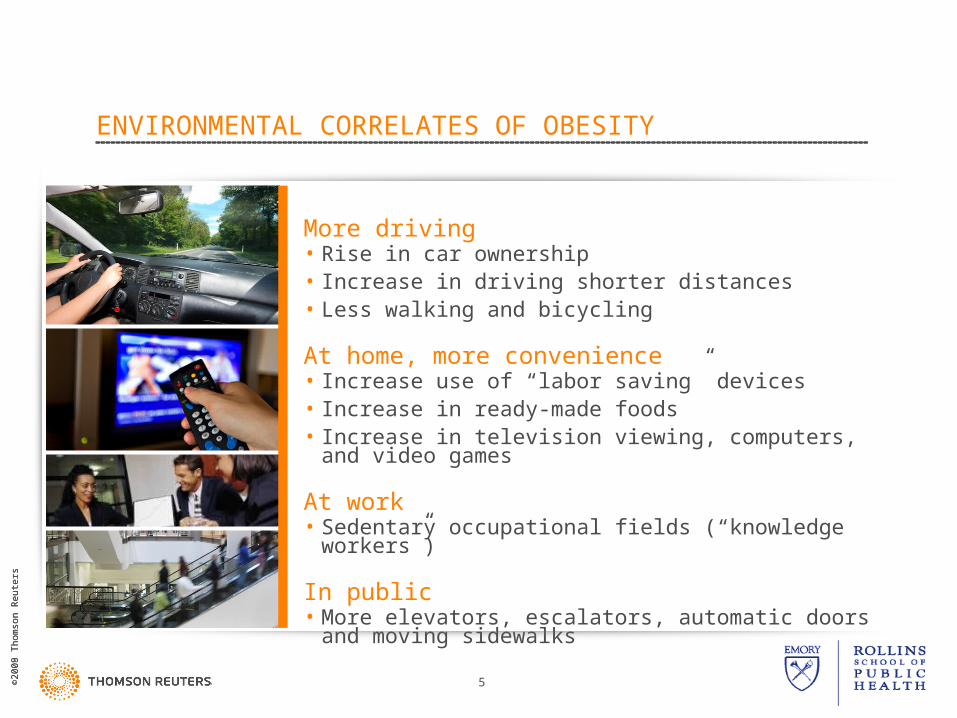
ENVIRONMENTAL CORRELATES OF OBESITY
More driving• Rise in car ownership• Increase in driving shorter distances• Less walking and bicycling
At home, more convenience• Increase use of “labor saving” devices• Increase in ready-made foods• Increase in television viewing, computers, and video games
At work• Sedentary occupational fields (“knowledge workers”)
In public• More elevators, escalators, automatic doors and moving
sidewalks
©20
08 T
hom
son
Reu
ters
©20
09 T
hom
son
Reu
ters
6
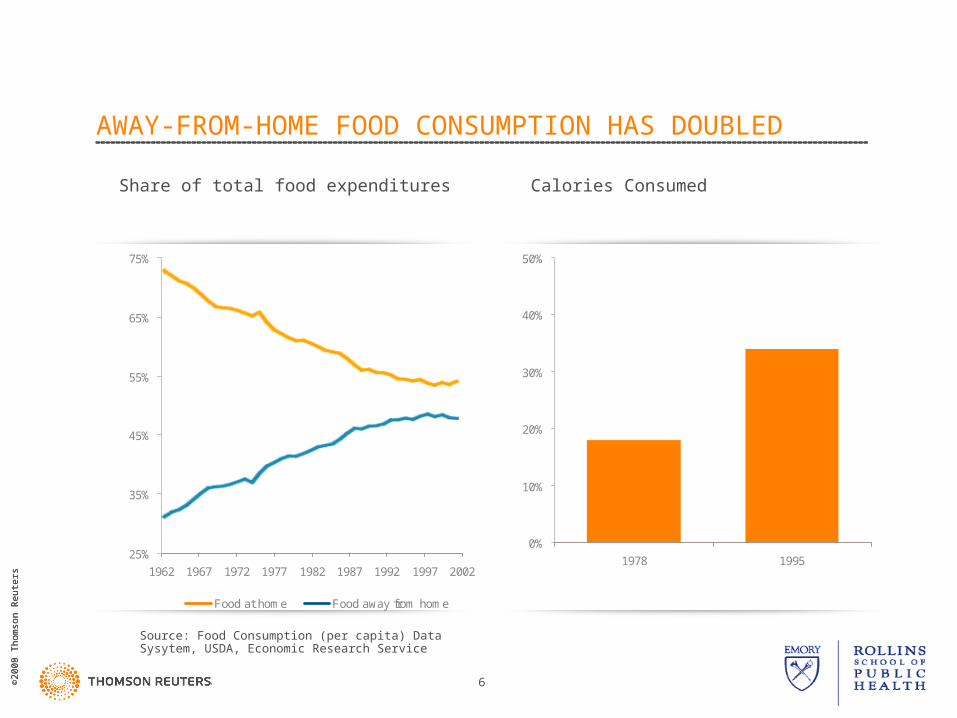
AWAY-FROM-HOME FOOD CONSUMPTION HAS DOUBLED
25%
35%
45%
55%
65%
75%
1962 1967 1972 1977 1982 1987 1992 1997 2002
Food at home Food away from home
Source: Food Consumption (per capita) Data Sysytem, USDA, Economic Research Service
Share of total food expenditures Calories Consumed
0%
10%
20%
30%
40%
50%
1978 1995
©20
08 T
hom
son
Reu
ters
©20
09 T
hom
son
Reu
ters
7
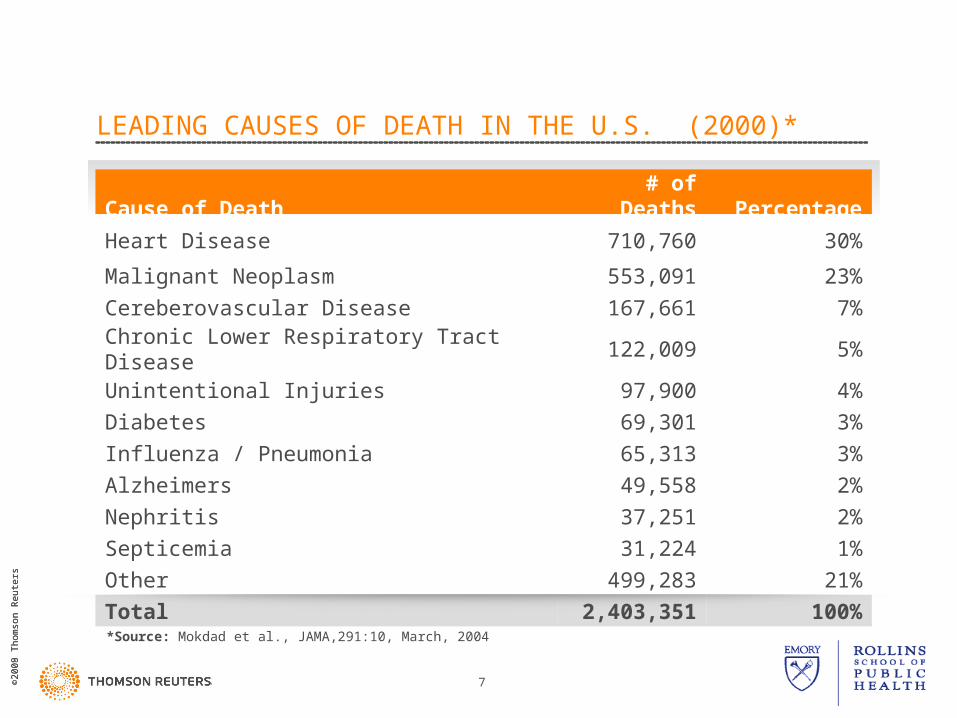
LEADING CAUSES OF DEATH IN THE U.S. (2000)*
Cause of Death # of Deaths Percentage
Heart Disease 710,760 30%
Malignant Neoplasm 553,091 23%
Cereberovascular Disease 167,661 7%
Chronic Lower Respiratory Tract Disease 122,009 5%
Unintentional Injuries 97,900 4%
Diabetes 69,301 3%
Influenza / Pneumonia 65,313 3%
Alzheimers 49,558 2%
Nephritis 37,251 2%
Septicemia 31,224 1%
Other 499,283 21%
Total 2,403,351 100%
*Source: Mokdad et al., JAMA,291:10, March, 2004
©20
08 T
hom
son
Reu
ters
©20
09 T
hom
son
Reu
ters
8
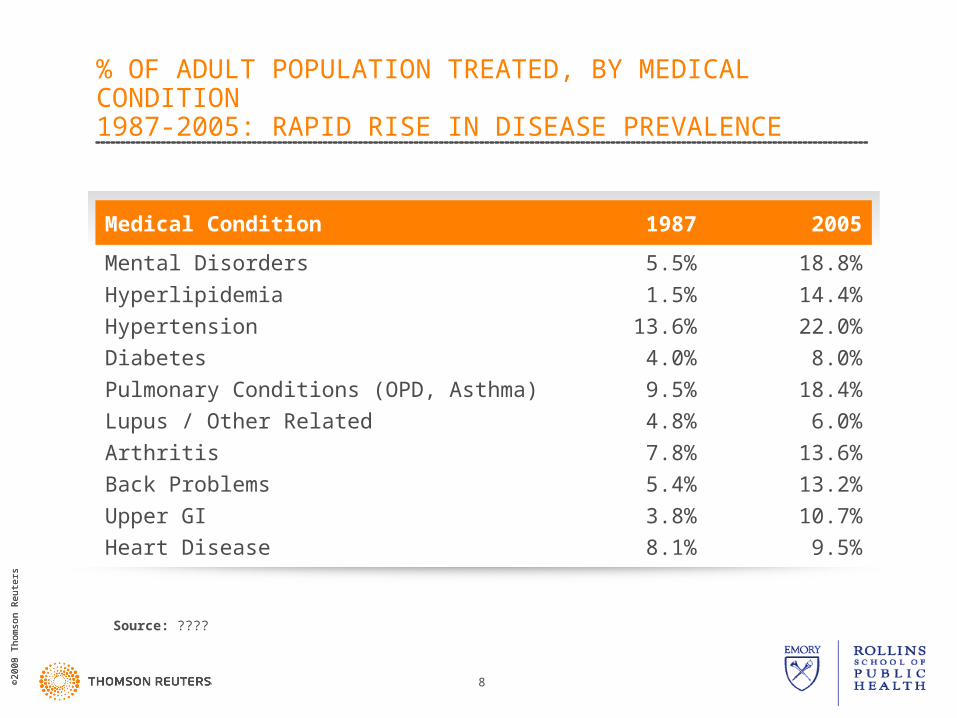
% OF ADULT POPULATION TREATED, BY MEDICAL CONDITION
1987-2005: RAPID RISE IN DISEASE PREVALENCE
Medical Condition 1987 2005
Mental Disorders 5.5% 18.8%
Hyperlipidemia 1.5% 14.4%
Hypertension 13.6% 22.0%
Diabetes 4.0% 8.0%
Pulmonary Conditions (OPD, Asthma) 9.5% 18.4%
Lupus / Other Related 4.8% 6.0%
Arthritis 7.8% 13.6%
Back Problems 5.4% 13.2%
Upper GI 3.8% 10.7%
Heart Disease 8.1% 9.5%
Source: ????
©20
08 T
hom
son
Reu
ters
©20
09 T
hom
son
Reu
ters
9
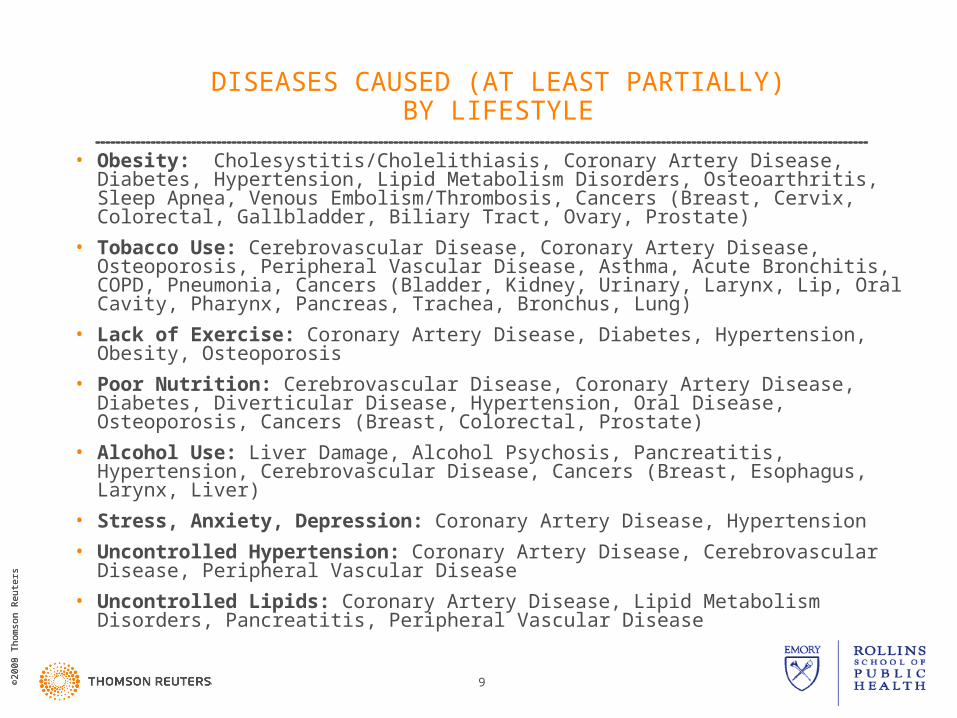
DISEASES CAUSED (AT LEAST PARTIALLY)BY LIFESTYLE
• Obesity: Cholesystitis/Cholelithiasis, Coronary Artery Disease, Diabetes, Hypertension, Lipid Metabolism Disorders, Osteoarthritis, Sleep Apnea, Venous Embolism/Thrombosis, Cancers (Breast, Cervix, Colorectal, Gallbladder, Biliary Tract, Ovary, Prostate)
• Tobacco Use: Cerebrovascular Disease, Coronary Artery Disease, Osteoporosis, Peripheral Vascular Disease, Asthma, Acute Bronchitis, COPD, Pneumonia, Cancers (Bladder, Kidney, Urinary, Larynx, Lip, Oral Cavity, Pharynx, Pancreas, Trachea, Bronchus, Lung)
• Lack of Exercise: Coronary Artery Disease, Diabetes, Hypertension, Obesity, Osteoporosis
• Poor Nutrition: Cerebrovascular Disease, Coronary Artery Disease, Diabetes, Diverticular Disease, Hypertension, Oral Disease, Osteoporosis, Cancers (Breast, Colorectal, Prostate)
• Alcohol Use: Liver Damage, Alcohol Psychosis, Pancreatitis, Hypertension, Cerebrovascular Disease, Cancers (Breast, Esophagus, Larynx, Liver)
• Stress, Anxiety, Depression: Coronary Artery Disease, Hypertension
• Uncontrolled Hypertension: Coronary Artery Disease, Cerebrovascular Disease, Peripheral Vascular Disease
• Uncontrolled Lipids: Coronary Artery Disease, Lipid Metabolism Disorders, Pancreatitis, Peripheral Vascular Disease
©20
08 T
hom
son
Reu
ters
©20
09 T
hom
son
Reu
ters
10
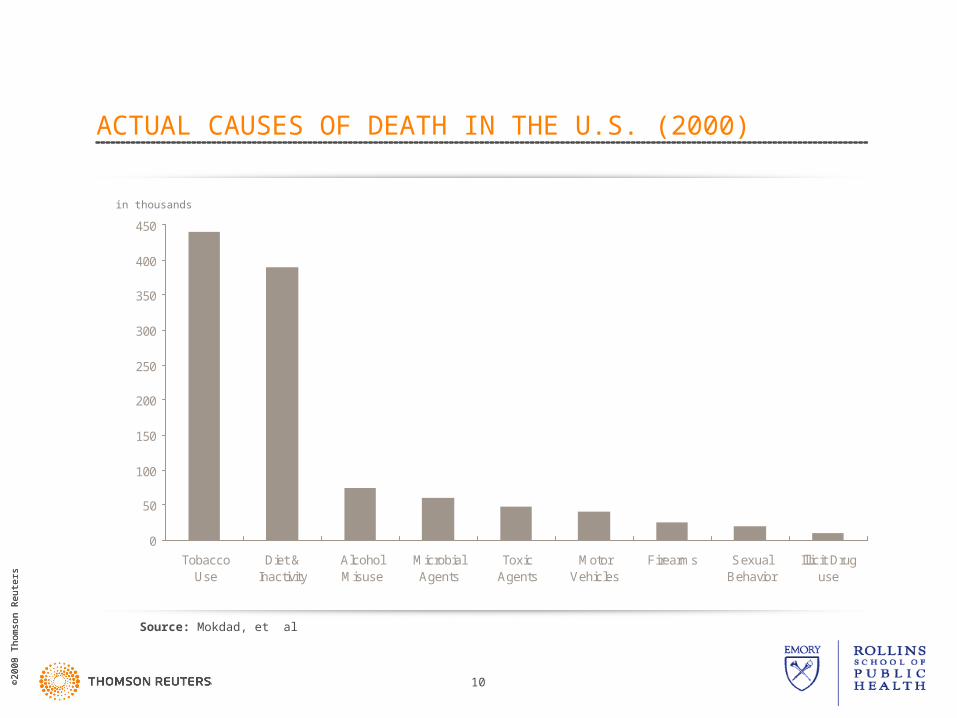
ACTUAL CAUSES OF DEATH IN THE U.S. (2000)
0
50
100
150
200
250
300
350
400
450
TobaccoUse
Diet &Inactivity
AlcoholMisuse
MicrobialAgents
ToxicAgents
MotorVehicles
Firearms SexualBehavior
Illicit Druguse
Source: Mokdad, et al
in thousands
©20
08 T
hom
son
Reu
ters
©20
09 T
hom
son
Reu
ters
11
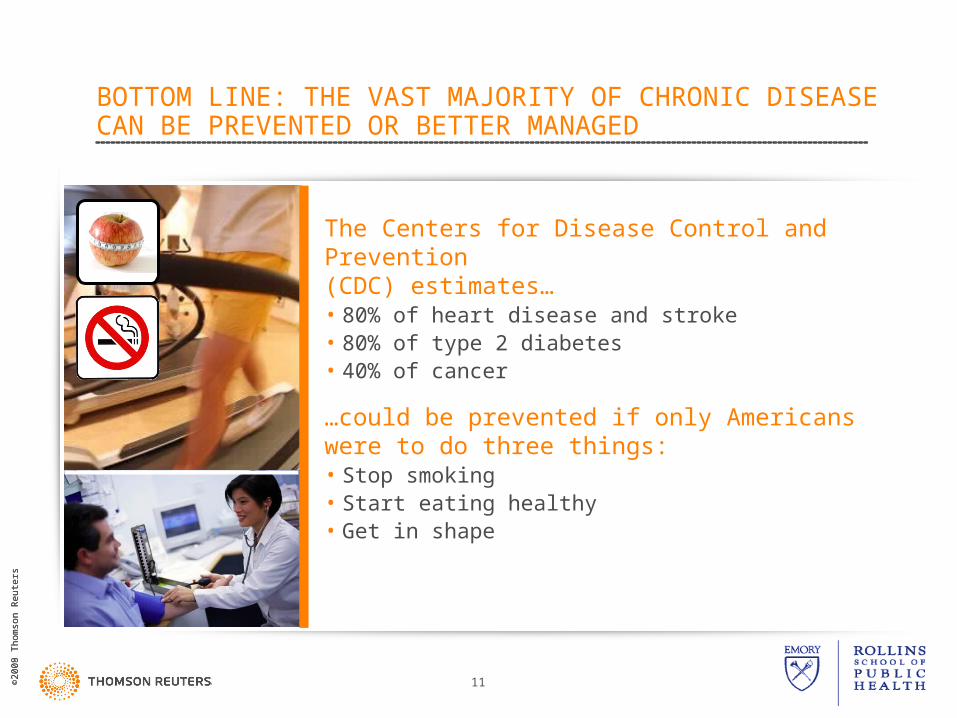
BOTTOM LINE: THE VAST MAJORITY OF CHRONIC DISEASE CAN BE PREVENTED OR BETTER MANAGED
The Centers for Disease Control and Prevention (CDC) estimates…• 80% of heart disease and stroke• 80% of type 2 diabetes• 40% of cancer
…could be prevented if only Americans were to do three things:• Stop smoking• Start eating healthy• Get in shape
©20
08 T
hom
son
Reu
ters
©20
09 T
hom
son
Reu
ters
12
CONVINCE ME…
Why should an employer (or government) invest in the health and well-being of workers?
©20
08 T
hom
son
Reu
ters
©20
09 T
hom
son
Reu
ters
13
IT SEEMS SO LOGICAL…
…if you improve the health and well being of your employees…
…quality of life improves
…healthcare utilization is reduced
…disability is controlled
…productivity is enhanced
©20
08 T
hom
son
Reu
ters
©20
09 T
hom
son
Reu
ters
14
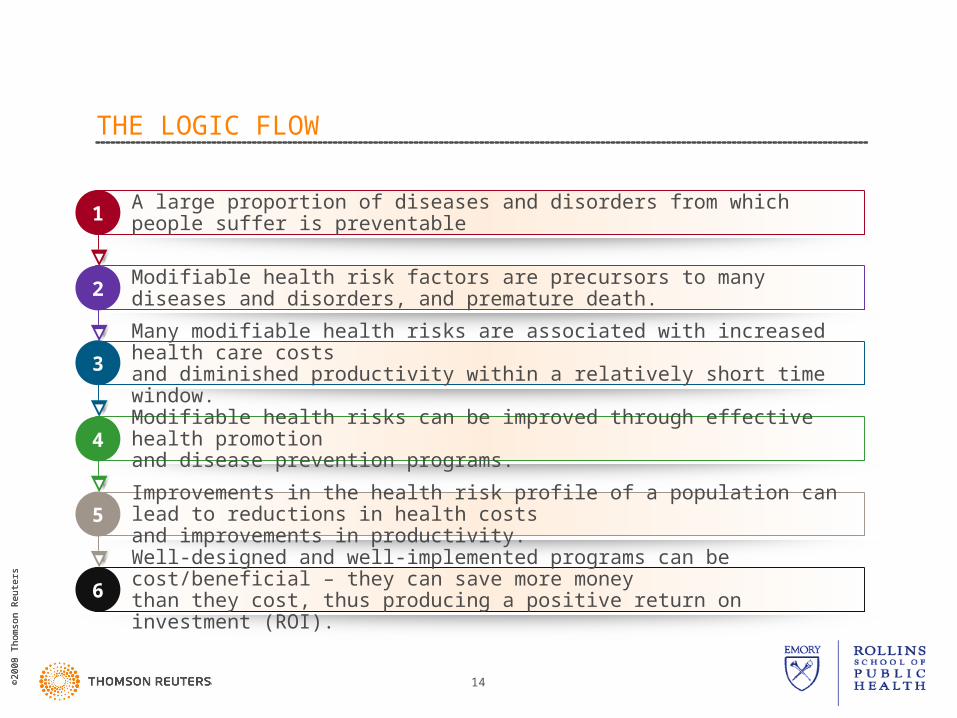
THE LOGIC FLOW
A large proportion of diseases and disorders from which people suffer is preventable
Modifiable health risk factors are precursors to many diseases and disorders, and premature death.
Many modifiable health risks are associated with increased health care costs and diminished productivity within a relatively short time window.
Modifiable health risks can be improved through effective health promotion and disease prevention programs.
Improvements in the health risk profile of a population can lead to reductions in health costs and improvements in productivity.
Well-designed and well-implemented programs can be cost/beneficial – they can save more money than they cost, thus producing a positive return on investment (ROI).
1
2
3
4
5
6
©20
08 T
hom
son
Reu
ters
©20
09 T
hom
son
Reu
ters
15
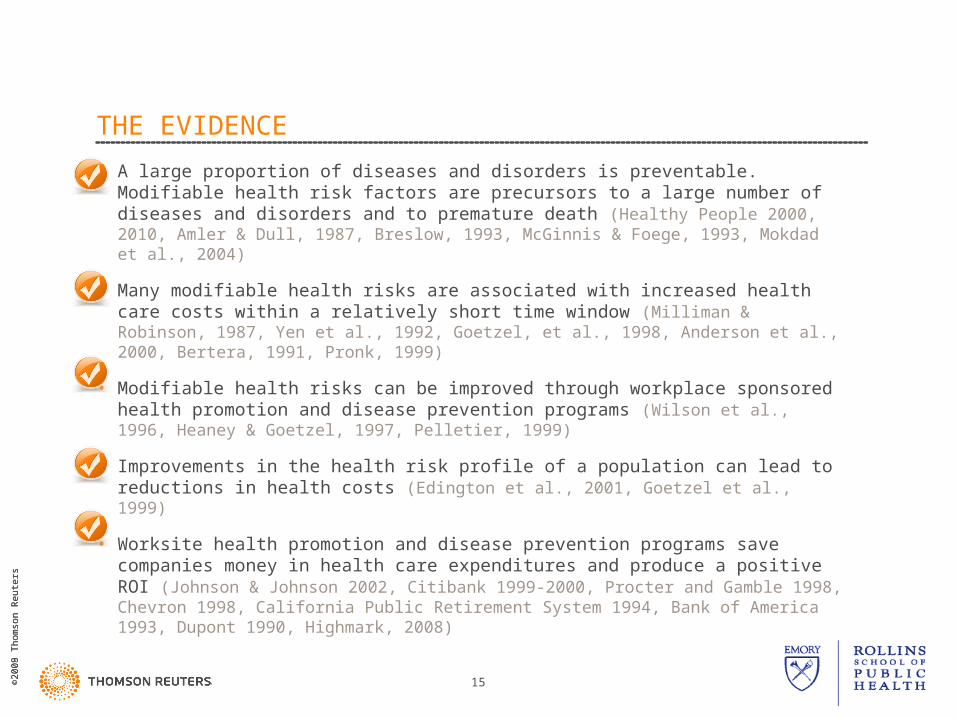
THE EVIDENCE
• A large proportion of diseases and disorders is preventable. Modifiable health risk factors are precursors to a large number of diseases and disorders and to premature death (Healthy People 2000, 2010, Amler & Dull, 1987, Breslow, 1993, McGinnis & Foege, 1993, Mokdad et al., 2004)
• Many modifiable health risks are associated with increased health care costs within a relatively short time window (Milliman & Robinson, 1987, Yen et al., 1992, Goetzel, et al., 1998, Anderson et al., 2000, Bertera, 1991, Pronk, 1999)
• Modifiable health risks can be improved through workplace sponsored health promotion and disease prevention programs (Wilson et al., 1996, Heaney & Goetzel, 1997, Pelletier, 1999)
• Improvements in the health risk profile of a population can lead to reductions in health costs (Edington et al., 2001, Goetzel et al., 1999)
• Worksite health promotion and disease prevention programs save companies money in health care expenditures and produce a positive ROI (Johnson & Johnson 2002, Citibank 1999-2000, Procter and Gamble 1998, Chevron 1998, California Public Retirement System 1994, Bank of America 1993, Dupont 1990, Highmark, 2008)
©20
08 T
hom
son
Reu
ters
©20
09 T
hom
son
Reu
ters
16
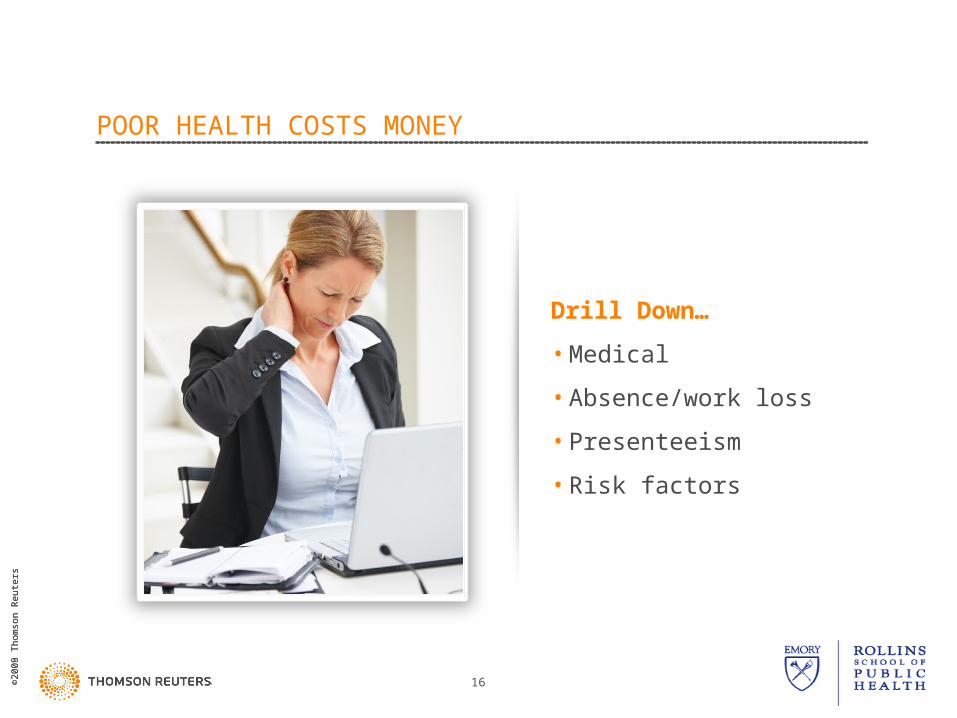
POOR HEALTH COSTS MONEY
Drill Down…
• Medical
• Absence/work loss
• Presenteeism
• Risk factors
©20
08 T
hom
son
Reu
ters
©20
09 T
hom
son
Reu
ters
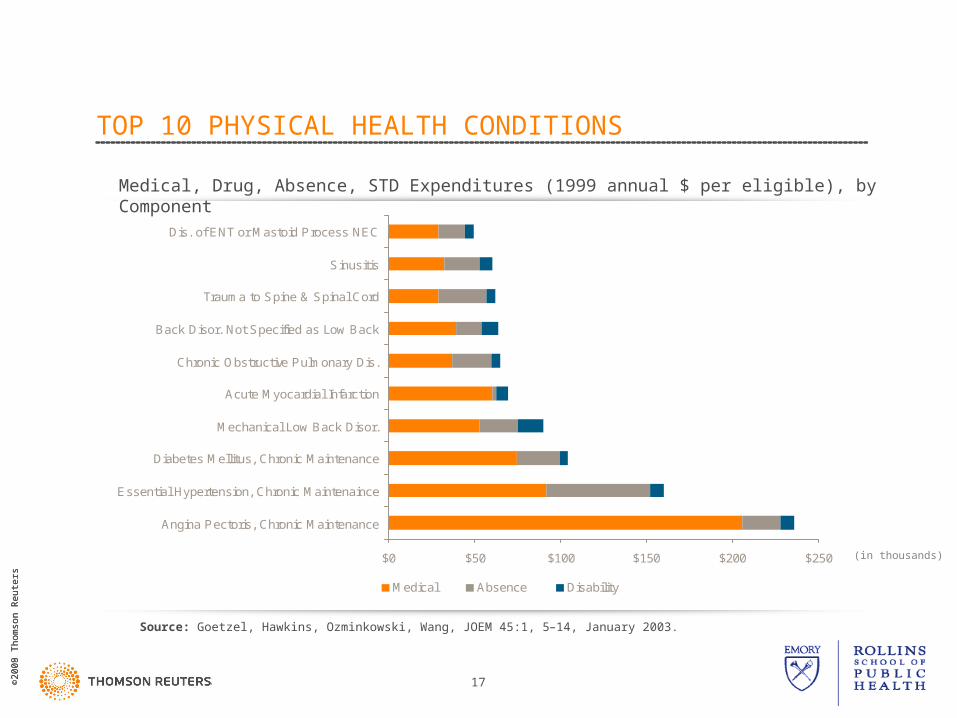
17
TOP 10 PHYSICAL HEALTH CONDITIONS
$0 $50 $100 $150 $200 $250
Angina Pectoris, Chronic Maintenance
Essential Hypertension, Chronic Maintenaince
Diabetes Mellitus, Chronic Maintenance
Mechanical Low Back Disor.
Acute Myocardial Infarction
Chronic Obstructive Pulmonary Dis.
Back Disor. Not Specified as Low Back
Trauma to Spine & Spinal Cord
Sinusitis
Dis. of ENT or Mastoid Process NEC
Medical Absence Disability
Source: Goetzel, Hawkins, Ozminkowski, Wang, JOEM 45:1, 5–14, January 2003.
(in thousands)
Medical, Drug, Absence, STD Expenditures (1999 annual $ per eligible), by Component

©20
08 T
hom
son
Reu
ters
©20
09 T
hom
son
Reu
ters
18
THE BIG PICTURE: OVERALL BURDEN OF ILLNESS BY CONDITION
$0 $50 $100 $150 $200 $250 $300 $350 $400
Respiratory infections
Migraine/Headache
Hypertension
Heart Disease
Diabetes
Depression/Mental illness
Cancer
Asthma
Arthritis
Allergy
Inpatient Outpatient ER RX Absence STD Presenteeism
Source: Goetzel, Hawkins, Ozminkowski, Wang, JOEM 45:46:4, April 2004.
(in thousands)
Using Average Impairment and Prevalence Rates for Presenteeism ($23.15/hour wage estimate)
©20
08 T
hom
son
Reu
ters
©20
09 T
hom
son
Reu
ters
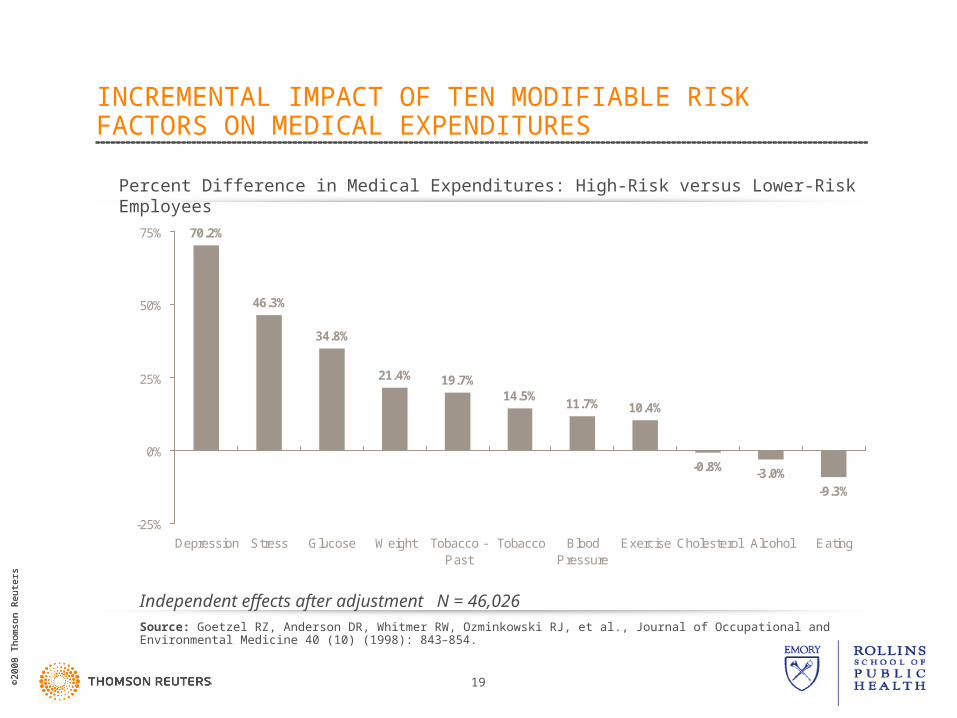
19
INCREMENTAL IMPACT OF TEN MODIFIABLE RISK FACTORS ON MEDICAL EXPENDITURES
70.2%
46.3%
34.8%
21.4% 19.7%14.5%
11.7% 10.4%
-0.8% -3.0%-9.3%
-25%
0%
25%
50%
75%
Depression Stress Glucose Weight Tobacco -Past
Tobacco BloodPressure
Exercise Cholesterol Alcohol Eating
Source: Goetzel RZ, Anderson DR, Whitmer RW, Ozminkowski RJ, et al., Journal of Occupational and Environmental Medicine 40 (10) (1998): 843–854.
Percent Difference in Medical Expenditures: High-Risk versus Lower-Risk Employees
Independent effects after adjustment N = 46,026
©20
08 T
hom
son
Reu
ters
©20
09 T
hom
son
Reu
ters
2020
©20
08 T
hom
son
Reu
ters
©20
09 T
hom
son
Reu
ters
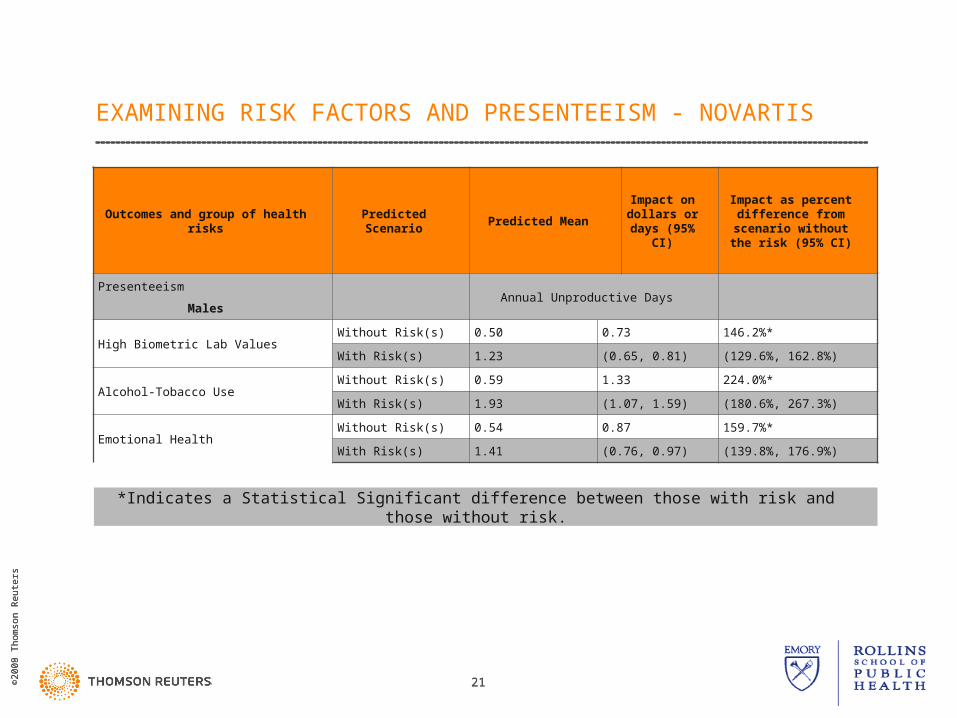
2121
Outcomes and group of health risks Predicted Scenario Predicted Mean
Impact on dollars or days (95%
CI)
Impact as percent difference from
scenario without the risk (95% CI)
Presenteeism
MalesAnnual Unproductive Days
High Biometric Lab ValuesWithout Risk(s) 0.50 0.73 146.2%*
With Risk(s) 1.23 (0.65, 0.81) (129.6%, 162.8%)
Alcohol-Tobacco UseWithout Risk(s) 0.59 1.33 224.0%*
With Risk(s) 1.93 (1.07, 1.59) (180.6%, 267.3%)
Emotional HealthWithout Risk(s) 0.54 0.87 159.7%*
With Risk(s) 1.41 (0.76, 0.97) (139.8%, 176.9%)
EXAMINING RISK FACTORS AND PRESENTEEISM - NOVARTIS
*Indicates a Statistical Significant difference between those with risk and those without risk.
22
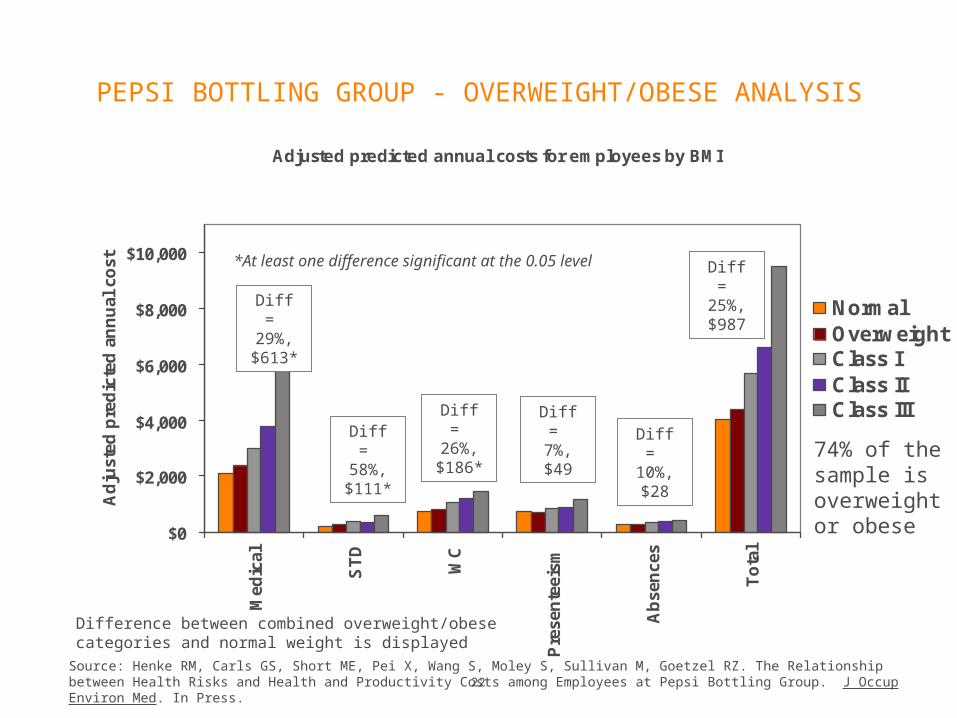
PEPSI BOTTLING GROUP - OVERWEIGHT/OBESE ANALYSIS
Adjusted predicted annual costs for employees by BMI
$0
$2,000
$4,000
$6,000
$8,000
$10,000M
edic
al
ST
D
WC
Pre
sen
teei
sm
Ab
sen
ces
To
tal
Ad
just
ed p
red
icte
d a
nn
ual
co
st
NormalOverweightClass IClass IIClass III
Difference between combined overweight/obese categories and normal weight is displayed
Diff = 25%, $987
Diff = 10%, $28
Diff = 7%, $49
Diff = 26%, $186*
Diff = 58%, $111*
Diff = 29%, $613*
74% of the sample is overweight or obese
*At least one difference significant at the 0.05 level
Source: Henke RM, Carls GS, Short ME, Pei X, Wang S, Moley S, Sullivan M, Goetzel RZ. The Relationship between Health Risks and Health and Productivity Costs among Employees at Pepsi Bottling Group. J Occup Environ Med. In Press.
©20
08 T
hom
son
Reu
ters
©20
09 T
hom
son
Reu
ters
23
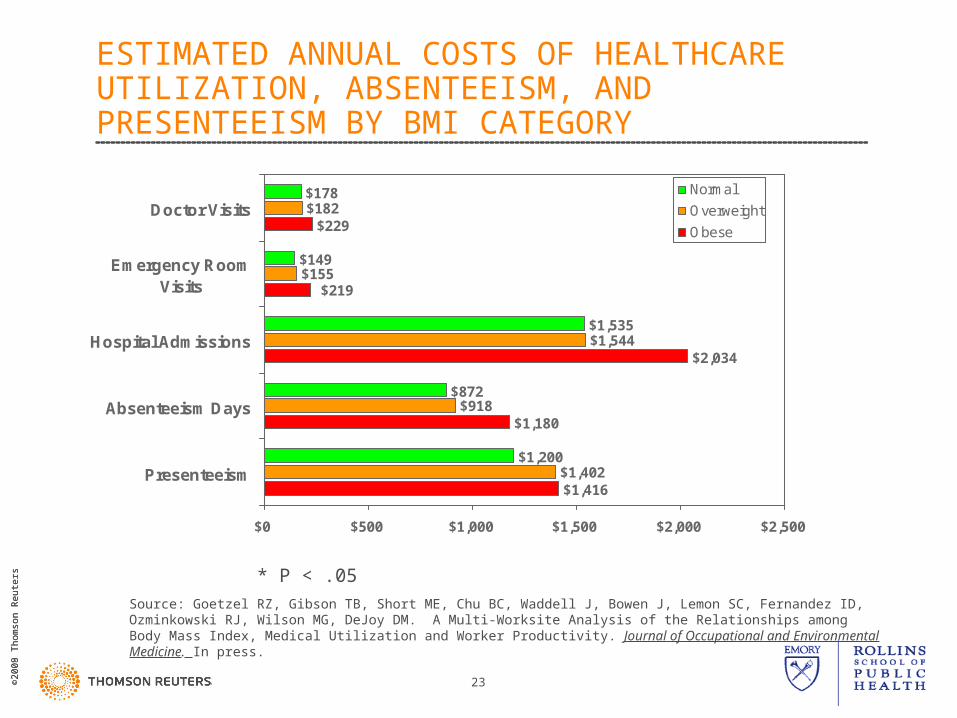
ESTIMATED ANNUAL COSTS OF HEALTHCARE UTILIZATION, ABSENTEEISM, AND PRESENTEEISM BY BMI CATEGORY
$1,416
$1,180
$2,034
$229
$1,402
$918
$1,544
$155
$182
$1,200
$872
$1,535
$149
$178
$219
$0 $500 $1,000 $1,500 $2,000 $2,500
Presenteeism
Absenteeism Days
Hospital Admissions
Emergency RoomVisits
Doctor VisitsNormal
Overweight
Obese
*
*
*
*
*
* P < .05
Source: Goetzel RZ, Gibson TB, Short ME, Chu BC, Waddell J, Bowen J, Lemon SC, Fernandez ID, Ozminkowski RJ, Wilson MG, DeJoy DM. A Multi-Worksite Analysis of the Relationships among Body Mass Index, Medical Utilization and Worker Productivity. Journal of Occupational and Environmental Medicine. In press.
©20
08 T
hom
son
Reu
ters
©20
09 T
hom
son
Reu
ters
24
Quiz: How many Americans lead healthy lifestyles?
1. Non-smokers
2. Healthy weight (BMI of 18.5-25.0)
3. Consume 5+ fruits/vegetable per day
4. Exercise regularly (30 min – 5 days/week)
Bottom Line: practice healthy lifestyle across all four categories
©20
08 T
hom
son
Reu
ters
©20
09 T
hom
son
Reu
ters
25
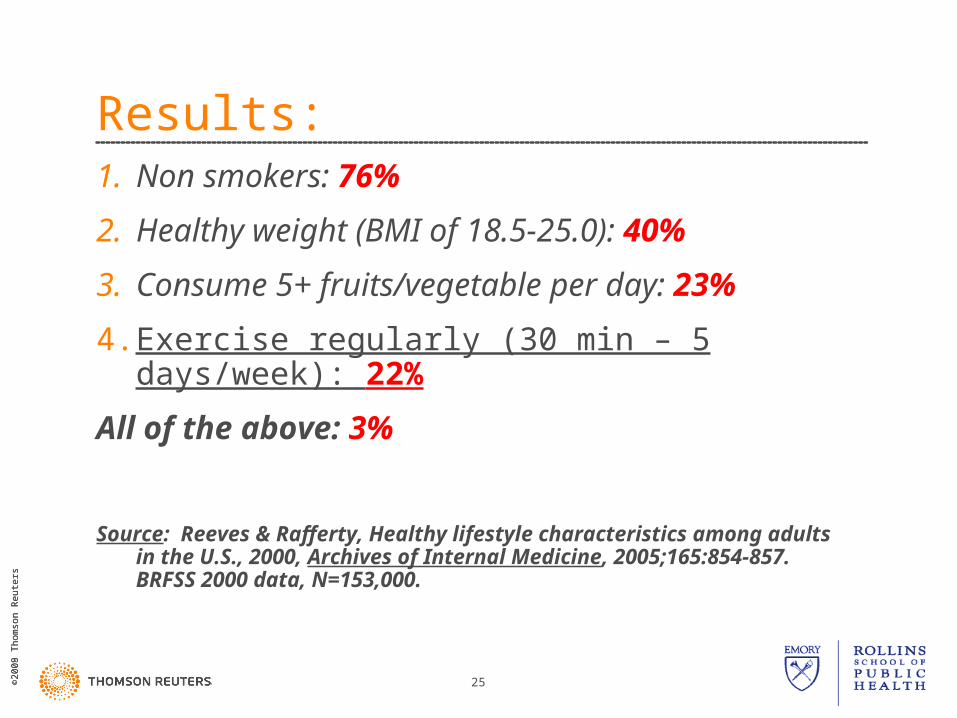
Results:1. Non smokers: 76%
2. Healthy weight (BMI of 18.5-25.0): 40%
3. Consume 5+ fruits/vegetable per day: 23%
4. Exercise regularly (30 min – 5 days/week): 22%
All of the above: 3%
Source: Reeves & Rafferty, Healthy lifestyle characteristics among adults in the U.S., 2000, Archives of Internal Medicine, 2005;165:854-857. BRFSS 2000 data, N=153,000.
©20
08 T
hom
son
Reu
ters
©20
09 T
hom
son
Reu
ters
26
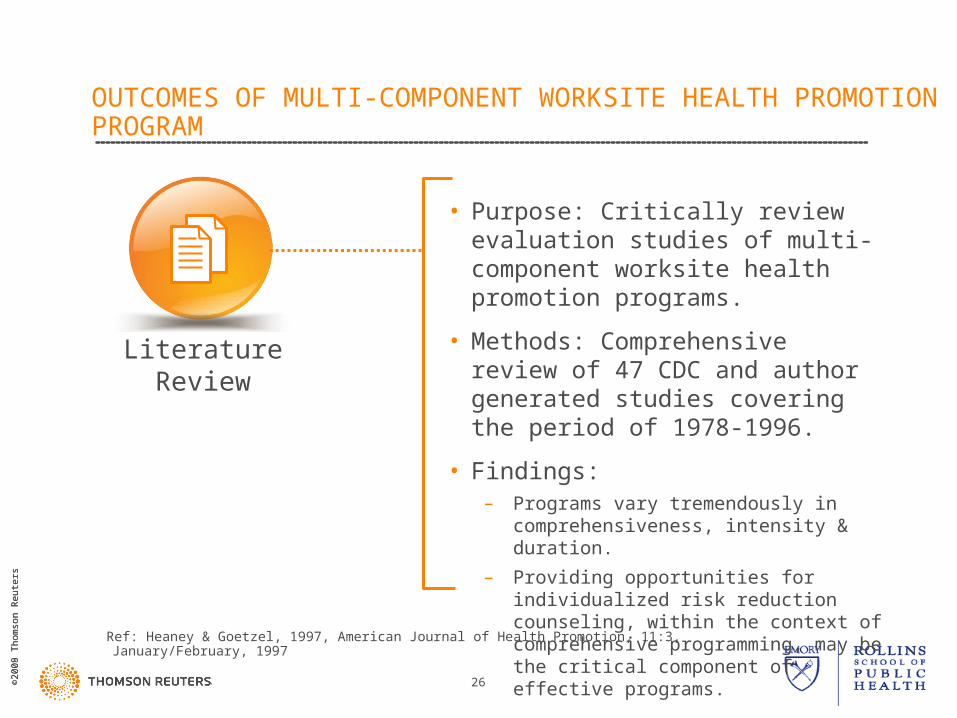
OUTCOMES OF MULTI-COMPONENT WORKSITE HEALTH PROMOTION PROGRAM
Literature Review
• Purpose: Critically review evaluation studies of multi-component worksite health promotion programs.
• Methods: Comprehensive review of 47 CDC and author generated studies covering the period of 1978-1996.
• Findings: – Programs vary tremendously in
comprehensiveness, intensity & duration.
– Providing opportunities for individualized risk reduction counseling, within the context of comprehensive programming, may be the critical component of effective programs.
Ref: Heaney & Goetzel, 1997, American Journal of Health Promotion, 11:3, January/February, 1997
EVALUATION OF WORKSITE HEALTH PROMOTION PROGRAMS — FEBRUARY 2007 ANALYSISWorksite Health Promotion TeamRobin Soler, PhDDavid Hopkins, MD, MPHSima Razi, MPHKimberly Leeks, PhD, MPHMatt Griffith, MPH
©20
08 T
hom
son
Reu
ters
©20
09 T
hom
son
Reu
ters
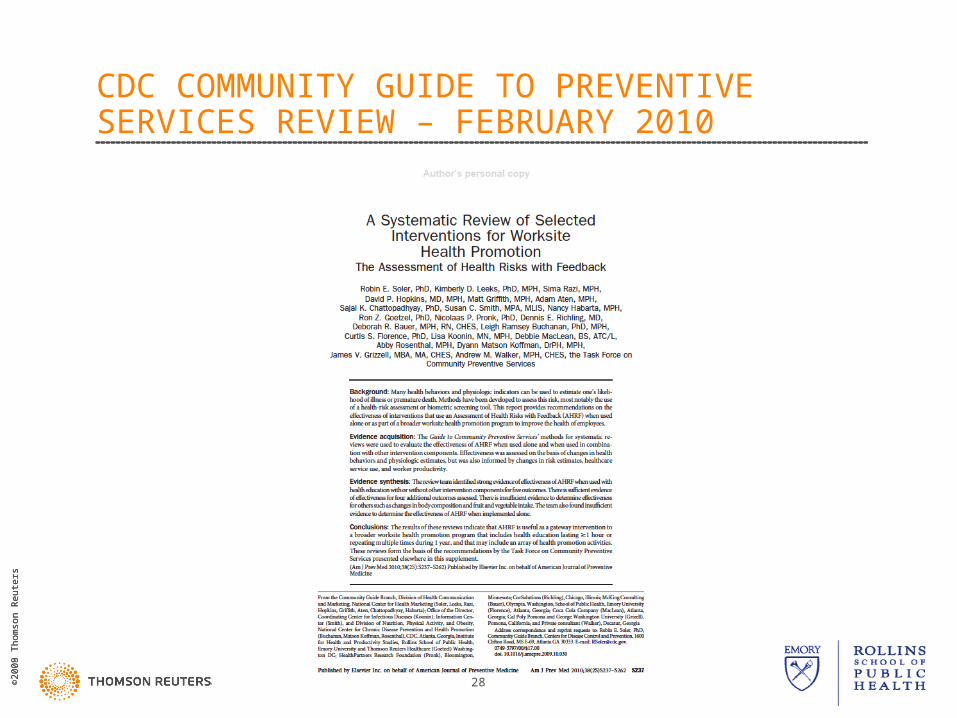
CDC COMMUNITY GUIDE TO PREVENTIVE SERVICES REVIEW – FEBRUARY 2010
28
©20
08 T
hom
son
Reu
ters
©20
09 T
hom
son
Reu
ters
29
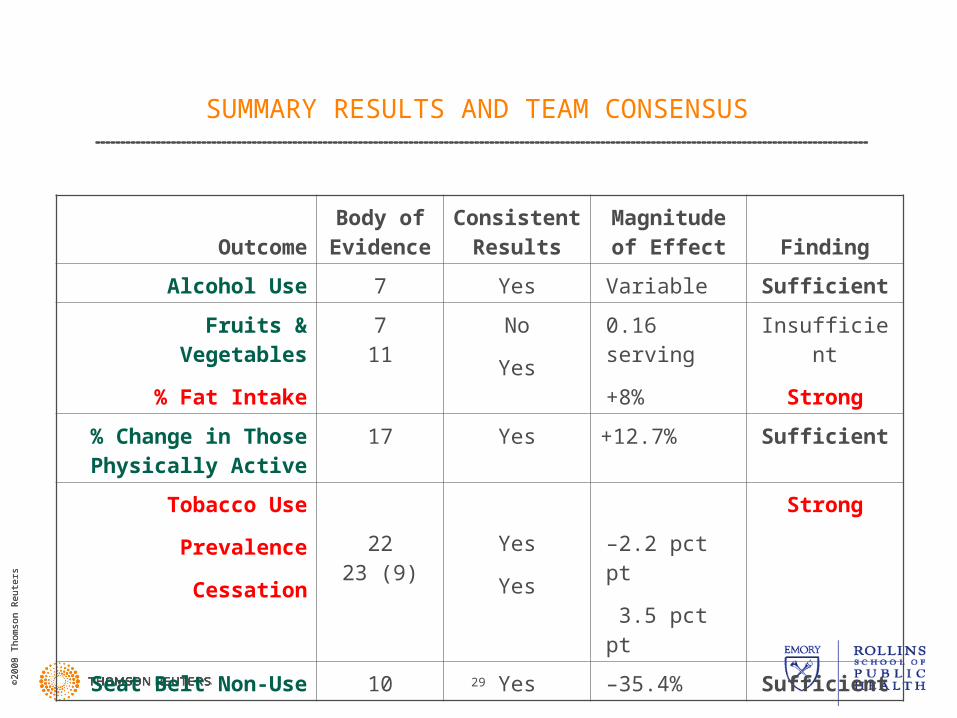
SUMMARY RESULTS AND TEAM CONSENSUS
OutcomeBody of
EvidenceConsistent
ResultsMagnitude of
Effect Finding
Alcohol Use 7 Yes Variable Sufficient
Fruits & Vegetables
% Fat Intake
711
No
Yes
0.16 serving
+8%
Insufficient
Strong
% Change in Those Physically Active
17 Yes +12.7% Sufficient
Tobacco Use
Prevalence
Cessation
2223 (9)
Yes
Yes
–2.2 pct pt
3.5 pct pt
Strong
Seat Belt Non-Use 10 Yes –35.4% Sufficient

©20
08 T
hom
son
Reu
ters
©20
09 T
hom
son
Reu
ters
30
OutcomeBody of
EvidenceConsistent
Results Magnitude of Effect Finding
Diastolic blood pressure
Systolic blood pressure
Risk prevalence
161811
Yes
Yes
Yes
Diastolic:–1.9 mm Hq
Systolic:–3.0 mm Hg
–3.4 pct pt
Strong
BMI
Weight
% body fat
Risk prevalence
61245
Yes
No
Yes
No
–0.5 pt BMI
–0.56 pounds
–2.2% body fat
–2.2% at risk
Insufficient
Total Cholesterol
HDL Cholesterol
Risk prevalence
187
11
Yes
No
Yes
–5.0 mg/dL (total)
+1.1 mg/dL
–6.6 pct pt
Strong
Fitness 5 Yes Small Insufficient
SUMMARY RESULTS AND TEAM CONSENSUS
©20
08 T
hom
son
Reu
ters
©20
09 T
hom
son
Reu
ters
31
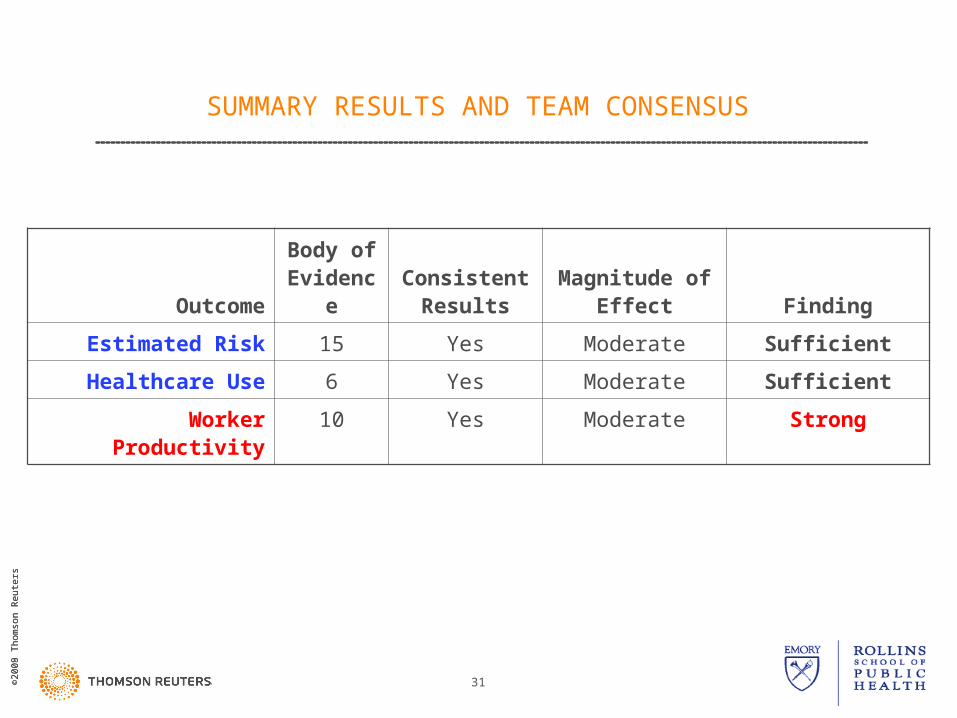
SUMMARY RESULTS AND TEAM CONSENSUS
OutcomeBody of
EvidenceConsistent
ResultsMagnitude of
Effect Finding
Estimated Risk 15 Yes Moderate Sufficient
Healthcare Use 6 Yes Moderate Sufficient
Worker Productivity 10 Yes Moderate Strong
©20
08 T
hom
son
Reu
ters
©20
09 T
hom
son
Reu
ters
32
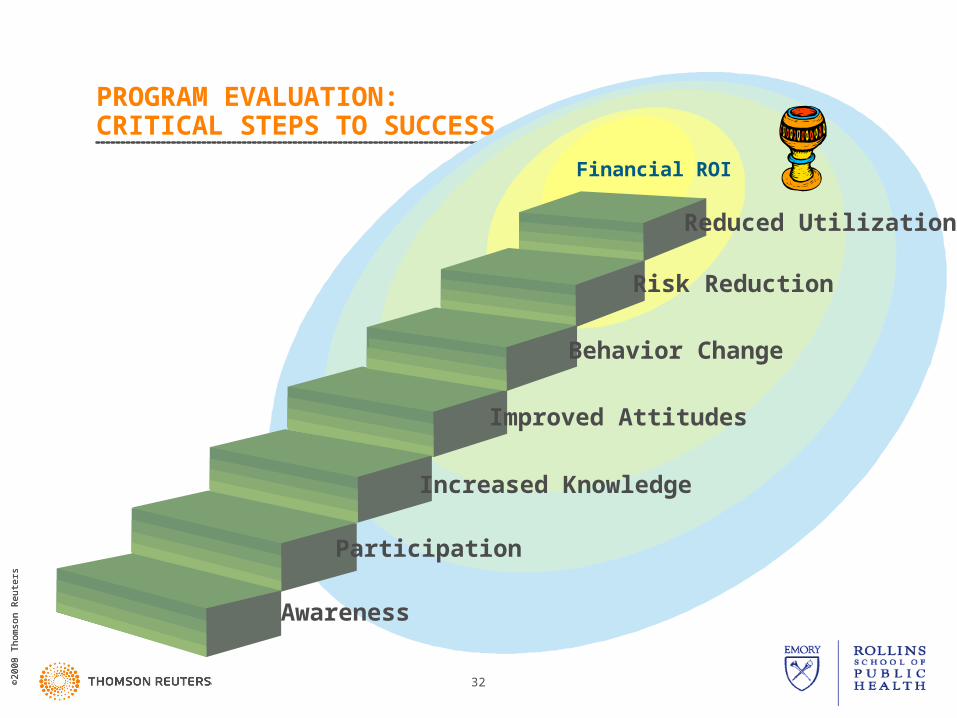
PROGRAM EVALUATION:CRITICAL STEPS TO SUCCESS
Reduced Utilization
Risk Reduction
Behavior Change
Improved Attitudes
Increased Knowledge
Participation
Awareness
Financial ROI

CASE STUDIES
©20
08 T
hom
son
Reu
ters
©20
09 T
hom
son
Reu
ters
34
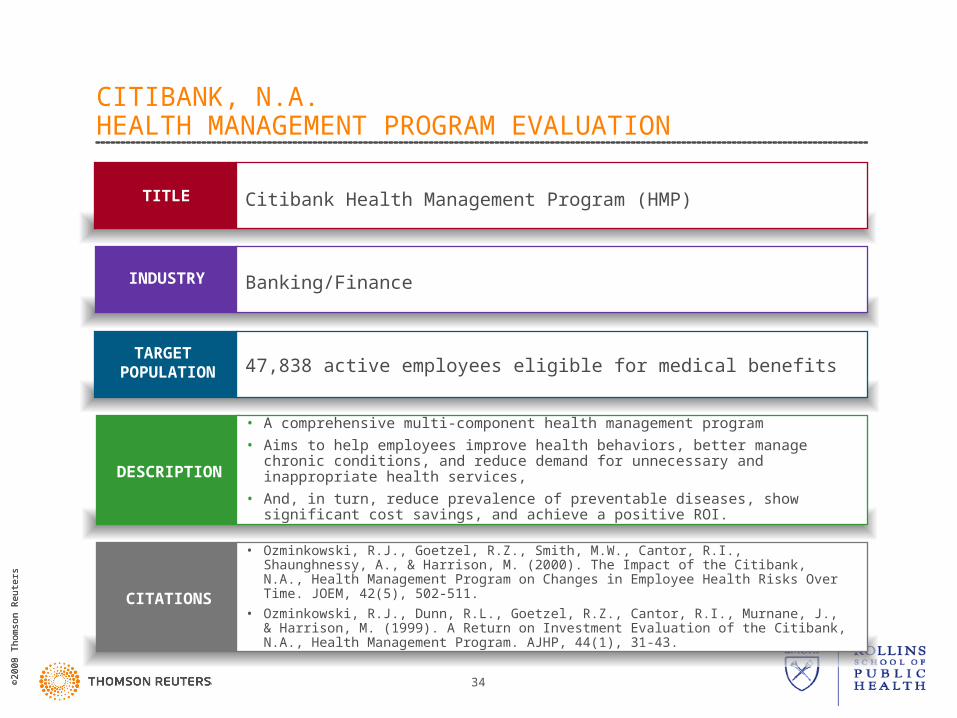
CITIBANK, N.A.HEALTH MANAGEMENT PROGRAM EVALUATION
TITLE Citibank Health Management Program (HMP)
INDUSTRY
TARGET POPULATION
Banking/Finance
DESCRIPTION
CITATIONS
47,838 active employees eligible for medical benefits
• A comprehensive multi-component health management program
• Aims to help employees improve health behaviors, better manage chronic conditions, and reduce demand for unnecessary and inappropriate health services,
• And, in turn, reduce prevalence of preventable diseases, show significant cost savings, and achieve a positive ROI.
• Ozminkowski, R.J., Goetzel, R.Z., Smith, M.W., Cantor, R.I., Shaunghnessy, A., & Harrison, M. (2000). The Impact of the Citibank, N.A., Health Management Program on Changes in Employee Health Risks Over Time. JOEM, 42(5), 502-511.
• Ozminkowski, R.J., Dunn, R.L., Goetzel, R.Z., Cantor, R.I., Murnane, J., & Harrison, M. (1999). A Return on Investment Evaluation of the Citibank, N.A., Health Management Program. AJHP, 44(1), 31-43.
©20
08 T
hom
son
Reu
ters
©20
09 T
hom
son
Reu
ters
35
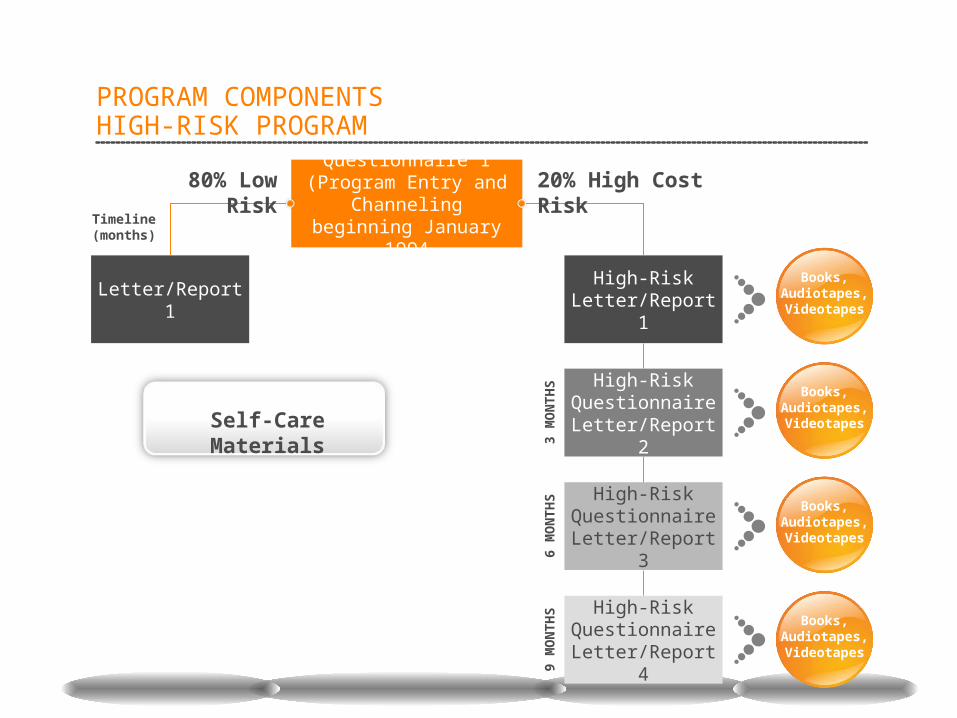
PROGRAM COMPONENTSHIGH-RISK PROGRAM
Questionnaire 1 (Program Entry and Channeling
beginning January 1994
Letter/Report 1High-Risk
Letter/Report 1
High-Risk Questionnaire Letter/Report 2
High-Risk Questionnaire Letter/Report 3
High-Risk Questionnaire Letter/Report 4
Books, Audiotapes, Videotapes
Books, Audiotapes, Videotapes
Books, Audiotapes, Videotapes
Books, Audiotapes, Videotapes
Timeline (months)
80% Low Risk 20% High Cost Risk
3 M
ON
TH
S6
MO
NT
HS
9 M
ON
TH
S
Self-Care Materials
©20
08 T
hom
son
Reu
ters
©20
09 T
hom
son
Reu
ters
36
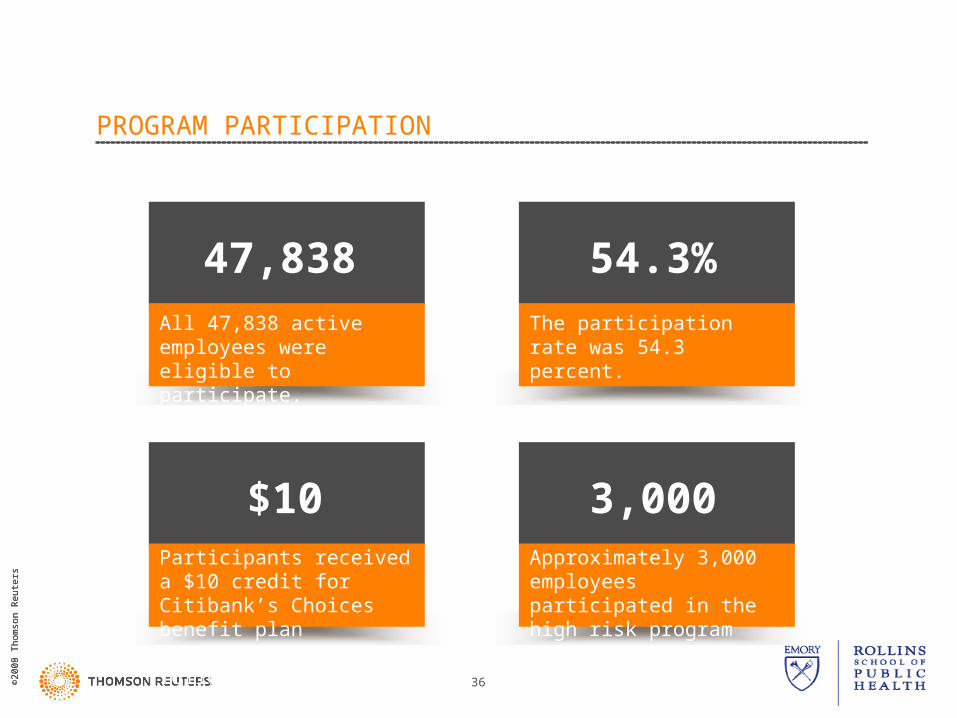
PROGRAM PARTICIPATION
47,838 54.3%
$10 3,000
All 47,838 active employees were eligible to participate.
The participation rate was 54.3 percent.
Participants received a $10 credit for Citibank’s Choices benefit plan enrollment for the following year.
Approximately 3,000 employees participated in the high risk program each year it was offered.

©20
08 T
hom
son
Reu
ters
©20
09 T
hom
son
Reu
ters
37
Source: Ozminkowski, R.J., Goetzel, R.Z., et al., Journal of Occupational and Environmental Medicine 42: 5, May, 2000, 502–511.
CITIBANK RESULTS
Percent of Program Participants at High Risk at First and Last HRA by Risk Category (N=9,234 employees tracked over an average of two years)
95%
33% 32%
21%18%
12%
4% 2% 3% 1% 0%
19%
12%
2% 2% 2% 1% 0%
15%
26%31%
93%
0%
25%
50%
75%
100%
Fiber Stress Exercise Seatbelt BMI Tobacco Fat Cholesterol Salt DiastolicBlood
Pressure
Alcohol
First HRA Last HRA
©20
08 T
hom
son
Reu
ters
©20
09 T
hom
son
Reu
ters
38
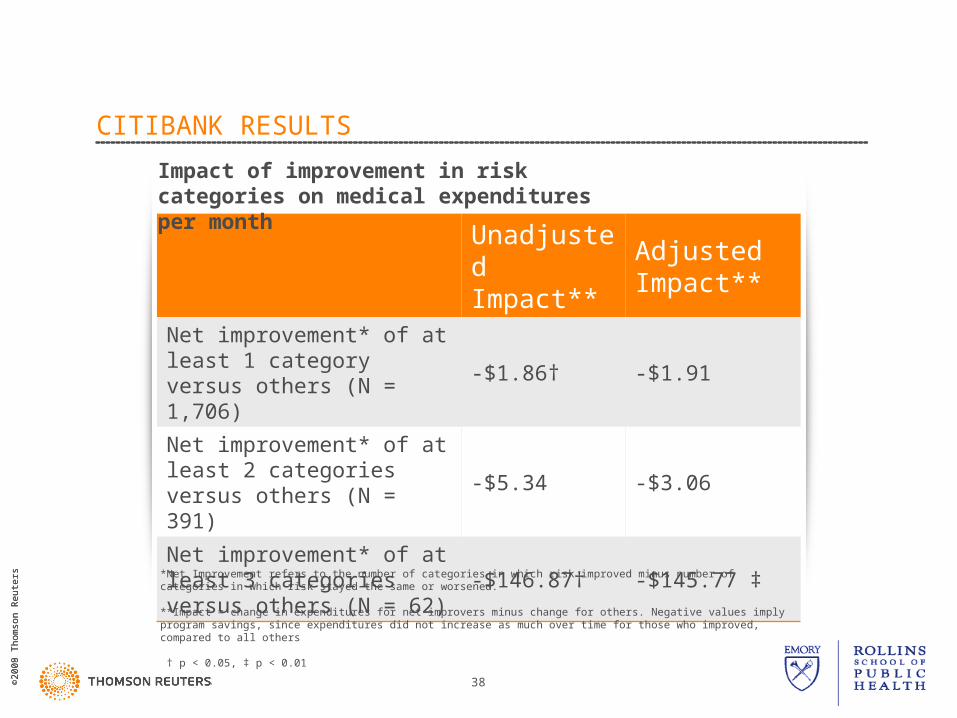
CITIBANK RESULTS
Unadjusted Impact**
Adjusted Impact**
Net improvement* of at least 1 category versus others (N = 1,706)
-$1.86† -$1.91
Net improvement* of at least 2 categories versus others (N = 391)
-$5.34 -$3.06
Net improvement* of at least 3 categories versus others (N = 62)
-$146.87† -$145.77 ‡
Impact of improvement in risk categories on medical expenditures per month
*Net Improvement refers to the number of categories in which risk improved minus number of categories in which risk stayed the same or worsened.
**Impact = change in expenditures for net improvers minus change for others. Negative values imply program savings, since expenditures did not increase as much over time for those who improved, compared to all others
† p < 0.05, ‡ p < 0.01
©20
08 T
hom
son
Reu
ters
©20
09 T
hom
son
Reu
ters
39
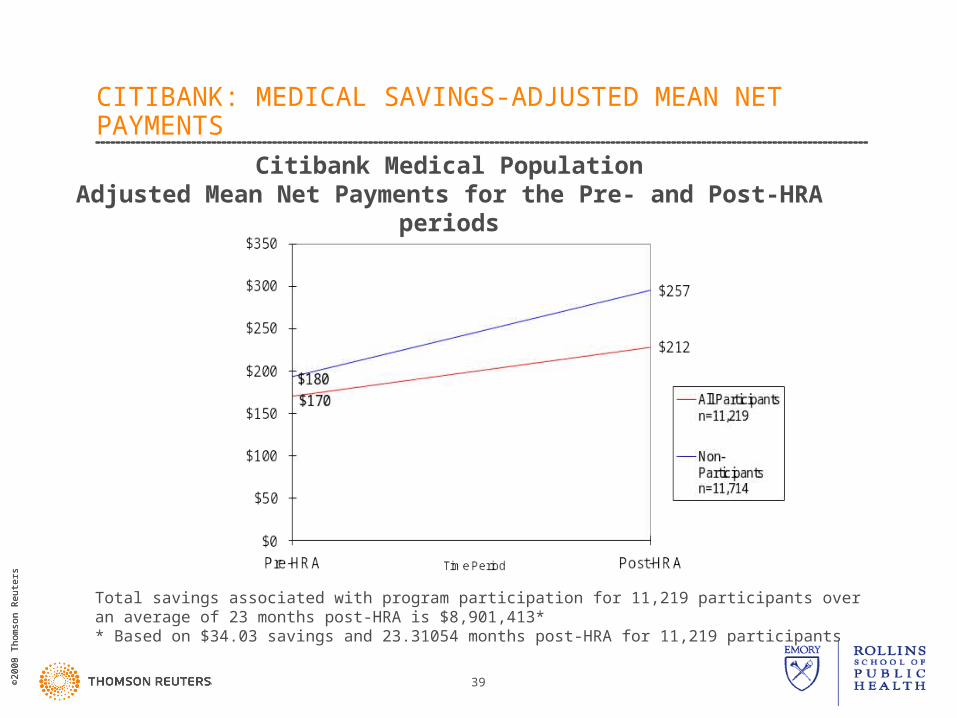
CITIBANK: MEDICAL SAVINGS-ADJUSTED MEAN NET PAYMENTS
Citibank Medical PopulationAdjusted Mean Net Payments for the Pre- and Post-HRA periods
Total savings associated with program participation for 11,219 participants over an average of 23 months post-HRA is $8,901,413** Based on $34.03 savings and 23.31054 months post-HRA for 11,219 participants
©20
08 T
hom
son
Reu
ters
©20
09 T
hom
son
Reu
ters
40
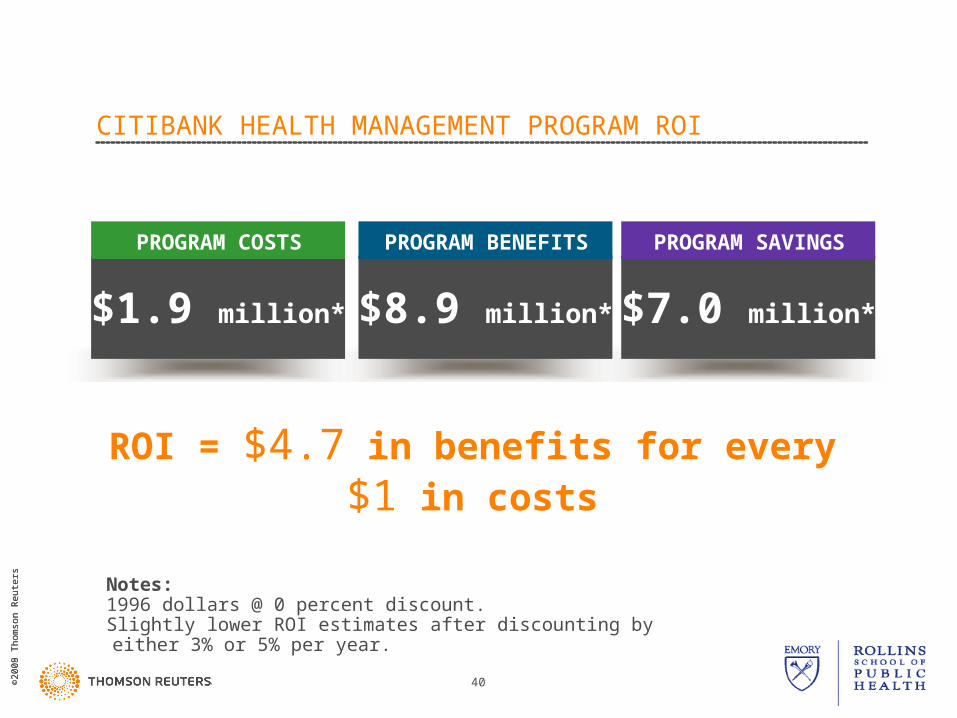
CITIBANK HEALTH MANAGEMENT PROGRAM ROI
$1.9 million*
PROGRAM COSTS
$8.9 million*
PROGRAM BENEFITS
$7.0 million*
PROGRAM SAVINGS
Notes:1996 dollars @ 0 percent discount.Slightly lower ROI estimates after discounting by either 3% or 5% per year.
ROI = $4.7 in benefits for every $1 in costs
©20
08 T
hom
son
Reu
ters
©20
09 T
hom
son
Reu
ters
41
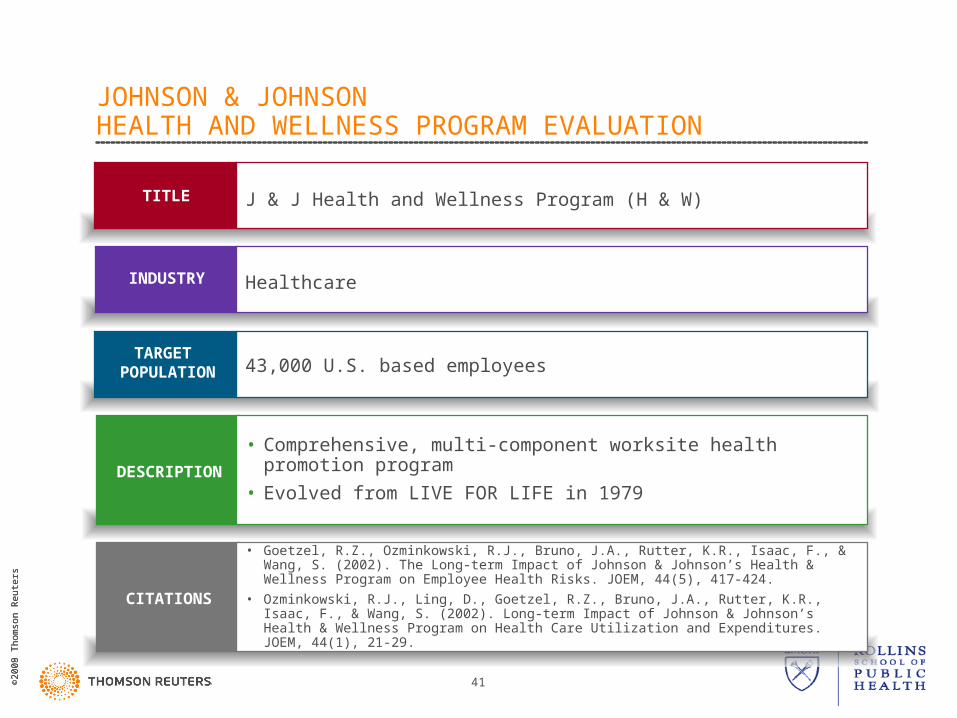
JOHNSON & JOHNSONHEALTH AND WELLNESS PROGRAM EVALUATION
TITLE J & J Health and Wellness Program (H & W)
INDUSTRY
TARGET POPULATION
Healthcare
DESCRIPTION
CITATIONS
43,000 U.S. based employees
• Comprehensive, multi-component worksite health promotion program
• Evolved from LIVE FOR LIFE in 1979
• Goetzel, R.Z., Ozminkowski, R.J., Bruno, J.A., Rutter, K.R., Isaac, F., & Wang, S. (2002). The Long-term Impact of Johnson & Johnson’s Health & Wellness Program on Employee Health Risks. JOEM, 44(5), 417-424.
• Ozminkowski, R.J., Ling, D., Goetzel, R.Z., Bruno, J.A., Rutter, K.R., Isaac, F., & Wang, S. (2002). Long-term Impact of Johnson & Johnson’s Health & Wellness Program on Health Care Utilization and Expenditures. JOEM, 44(1), 21-29.
©20
08 T
hom
son
Reu
ters
©20
09 T
hom
son
Reu
ters
42
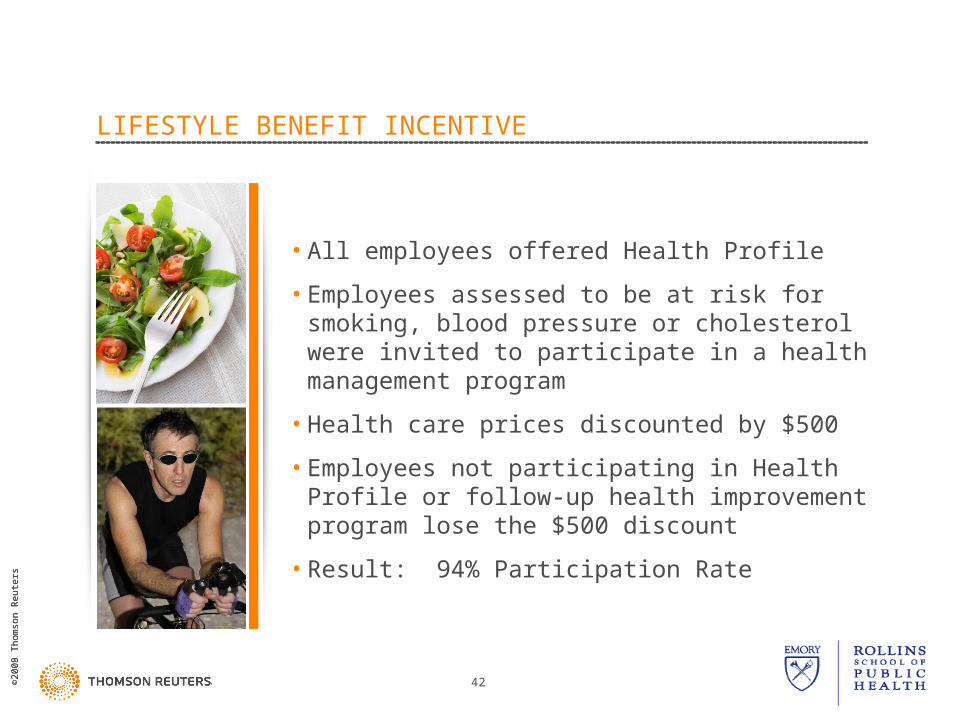
LIFESTYLE BENEFIT INCENTIVE
• All employees offered Health Profile
• Employees assessed to be at risk for smoking, blood pressure or cholesterol were invited to participate in a health management program
• Health care prices discounted by $500
• Employees not participating in Health Profile or follow-up health improvement program lose the $500 discount
• Result: 94% Participation Rate
©20
08 T
hom
son
Reu
ters
©20
09 T
hom
son
Reu
ters
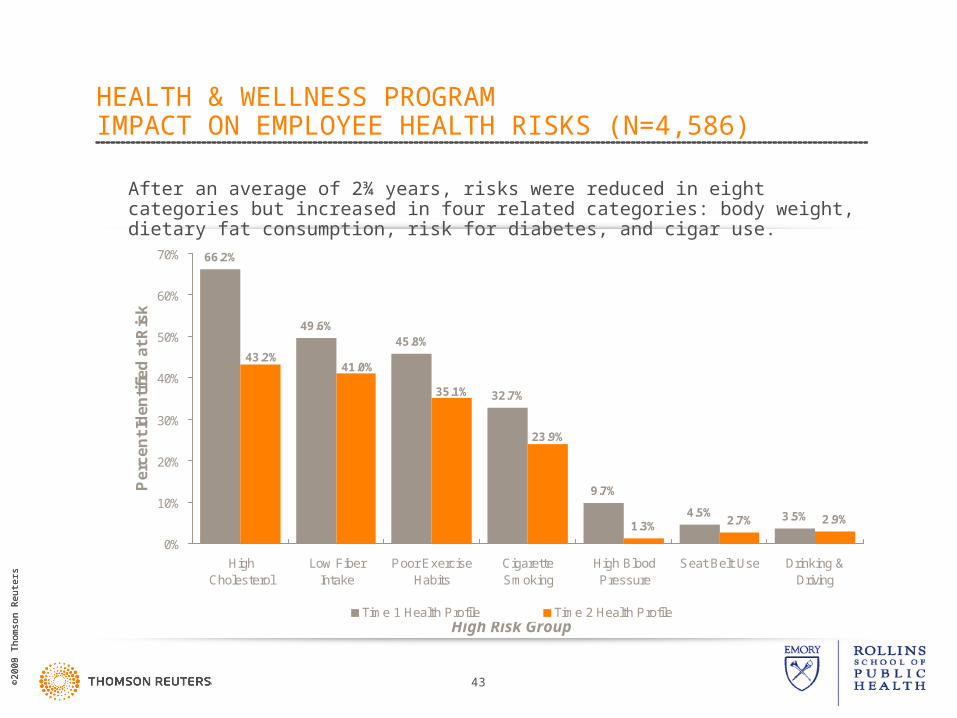
43
HEALTH & WELLNESS PROGRAM IMPACT ON EMPLOYEE HEALTH RISKS (N=4,586)
High Risk Group
After an average of 2¾ years, risks were reduced in eight categories but increased in four related categories: body weight, dietary fat consumption, risk for diabetes, and cigar use.
66.2%
49.6%45.8%
32.7%
9.7%
4.5% 3.5%1.3% 2.7% 2.9%
23.9%
35.1%
41.0%43.2%
0%
10%
20%
30%
40%
50%
60%
70%
HighCholesterol
Low FiberIntake
Poor ExerciseHabits
CigaretteSmoking
High BloodPressure
Seat Belt Use Drinking &Driving
Pe
rce
nt
Ide
nti
fie
d a
t R
isk
Time 1 Health Profile Time 2 Health Profile
©20
08 T
hom
son
Reu
ters
©20
09 T
hom
son
Reu
ters
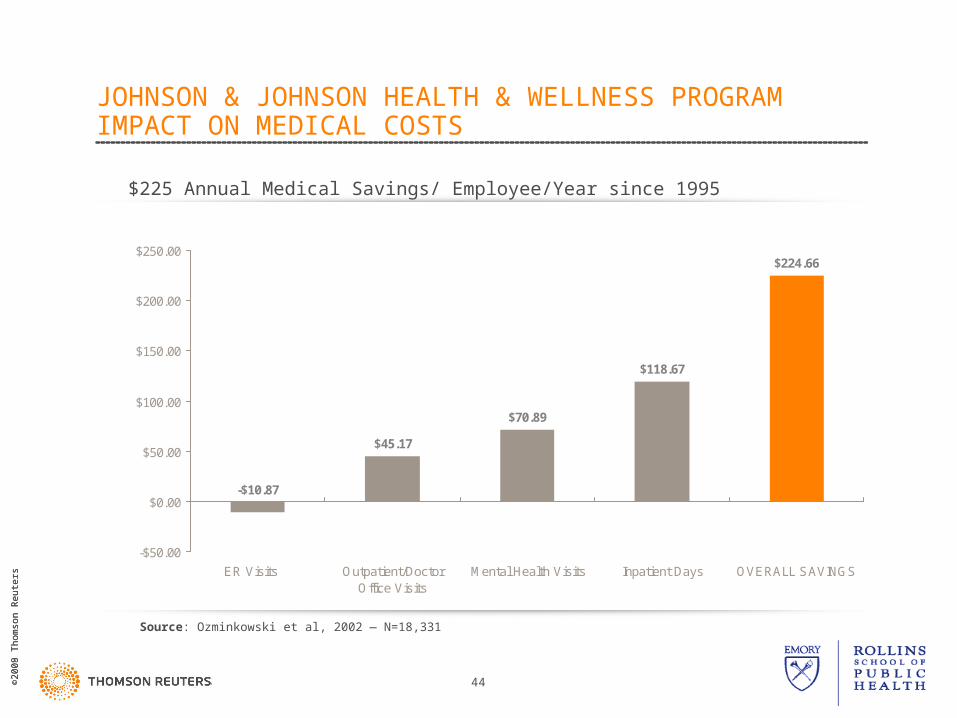
44
JOHNSON & JOHNSON HEALTH & WELLNESS PROGRAM IMPACT ON MEDICAL COSTS
$45.17
$70.89
$118.67
$224.66
-$10.87
-$50.00
$0.00
$50.00
$100.00
$150.00
$200.00
$250.00
ER Visits Outpatient/DoctorOffice Visits
Mental Health Visits Inpatient Days OVERALL SAVINGS
Source: Ozminkowski et al, 2002 — N=18,331
$225 Annual Medical Savings/ Employee/Year since 1995
©20
08 T
hom
son
Reu
ters
©20
09 T
hom
son
Reu
ters
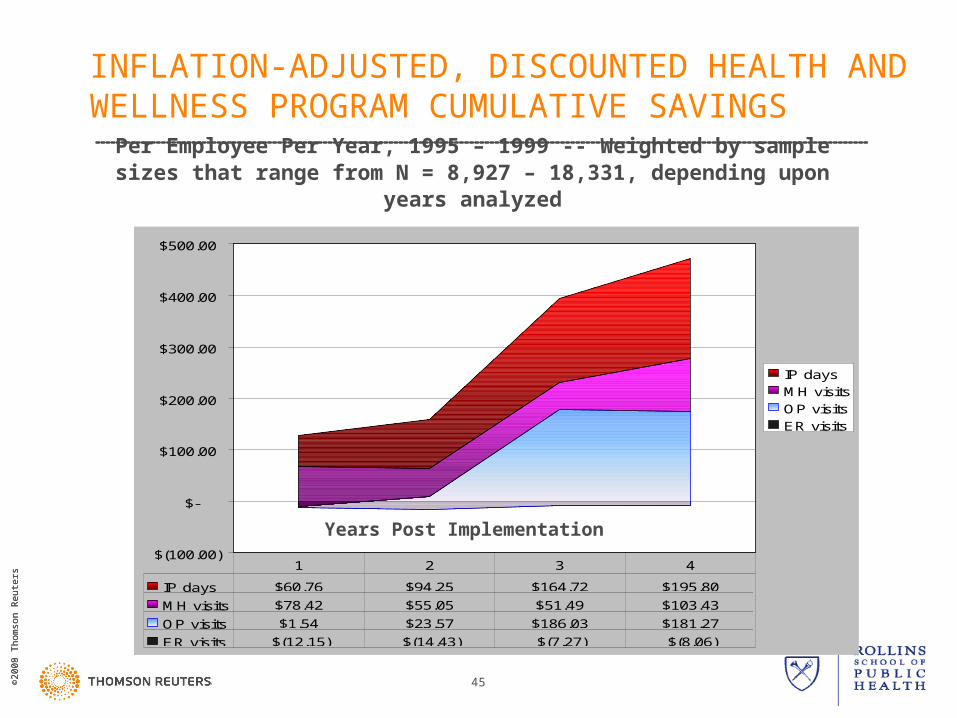
45
Per Employee Per Year, 1995 – 1999 -- Weighted by sample sizes that range from N = 8,927 – 18,331, depending upon years analyzed
$(100.00)
$-
$100.00
$200.00
$300.00
$400.00
$500.00
IP days
MH visits
OP visits
ER visits
IP days $60.76 $94.25 $164.72 $195.80
MH visits $78.42 $55.05 $51.49 $103.43
OP visits $1.54 $23.57 $186.03 $181.27
ER visits $(12.15) $(14.43) $(7.27) $(8.06)
1 2 3 4
Years Post Implementation
INFLATION-ADJUSTED, DISCOUNTED HEALTH AND WELLNESS PROGRAM CUMULATIVE SAVINGS
©20
08 T
hom
son
Reu
ters
©20
09 T
hom
son
Reu
ters
46
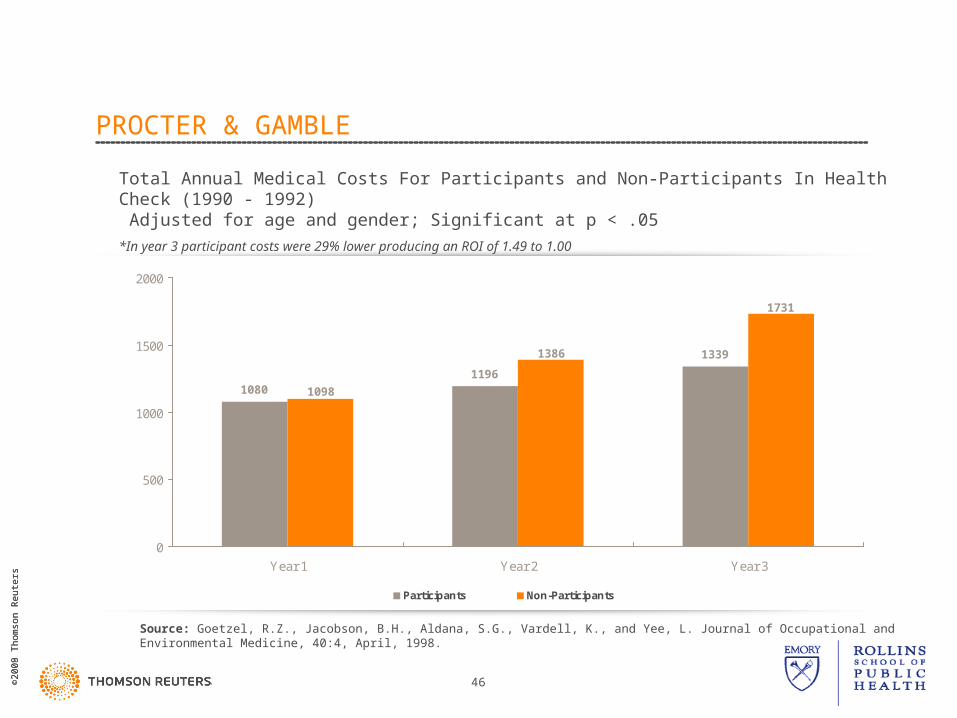
Source: Goetzel, R.Z., Jacobson, B.H., Aldana, S.G., Vardell, K., and Yee, L. Journal of Occupational and Environmental Medicine, 40:4, April, 1998.
PROCTER & GAMBLE
Total Annual Medical Costs For Participants and Non-Participants In Health Check (1990 - 1992) Adjusted for age and gender; Significant at p < .05
*In year 3 participant costs were 29% lower producing an ROI of 1.49 to 1.00
10801196
1339
1731
1386
1098
0
500
1000
1500
2000
Year 1 Year 2 Year 3
Participants Non-Participants

©20
08 T
hom
son
Reu
ters
©20
09 T
hom
son
Reu
ters
47
HIGHMARK ROI STUDY
• Regional health plan with approximately 12,000 workers
• Headquartered in Pittsburgh, with a major operating facility in Camp Hill, PA and other locations in Johnstown, Erie, and Williamsport, PA.
• Worksite Health Promotion Program (introduced in 2002)
– health risk assessments (HRAs)
– online programs in nutrition, weight management and stress management
– tobacco cessation programs
– on-site nutrition and stress classes
– individual nutrition and tobacco cessation coaching
– biometric screenings
– six- to twelve-week campaigns to increase fitness participation and awareness of disease prevention strategies
– state-of-the-art fitness centers (Pittsburgh and Camp Hill, PA) Source: Naydeck, Pearson, Ozminkowski, Day, Goetzel. The Impact of the Highmark Employee Wellness Programs on Four-Year Healthcare Costs. JOEM, 50:2, February 2008
©20
08 T
hom
son
Reu
ters
©20
09 T
hom
son
Reu
ters
48
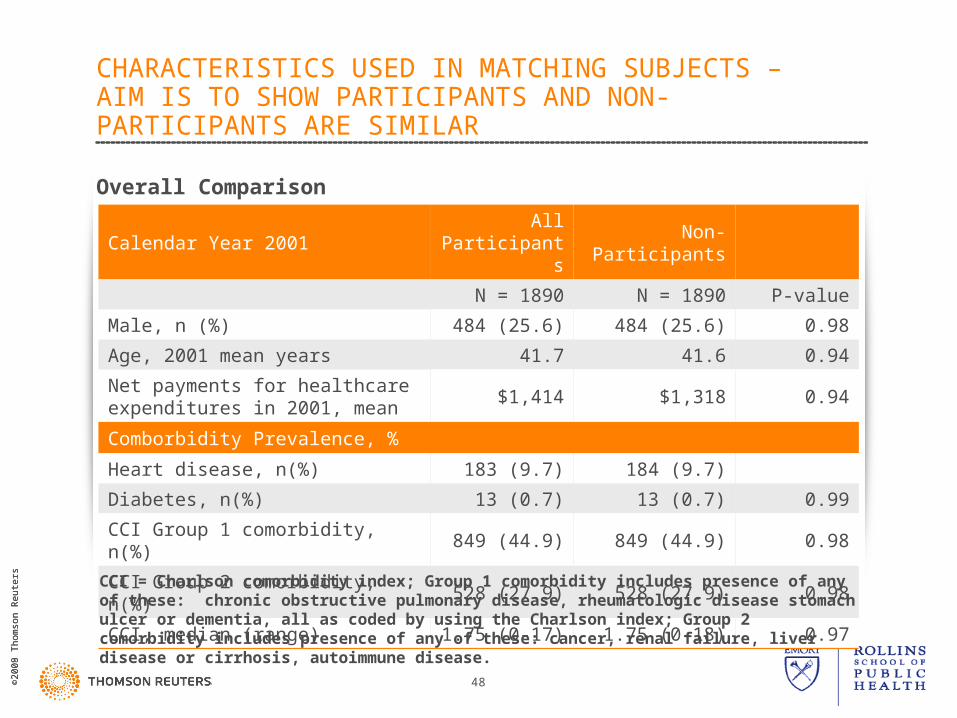
Calendar Year 2001All
ParticipantsNon-Participants
N = 1890 N = 1890 P-value
Male, n (%) 484 (25.6) 484 (25.6) 0.98
Age, 2001 mean years 41.7 41.6 0.94
Net payments for healthcare expenditures in 2001, mean
$1,414 $1,318 0.94
Comborbidity Prevalence, %
Heart disease, n(%) 183 (9.7) 184 (9.7)
Diabetes, n(%) 13 (0.7) 13 (0.7) 0.99
CCI Group 1 comorbidity, n(%) 849 (44.9) 849 (44.9) 0.98
CCI Group 2 comorbidity, n(%) 528 (27.9) 528 (27.9) 0.98
CCI, median (range) 1.75 (0-17) 1.75 (0-18) 0.97
CHARACTERISTICS USED IN MATCHING SUBJECTS – AIM IS TO SHOW PARTICIPANTS AND NON-PARTICIPANTS ARE SIMILAR
Overall Comparison
CCI = Charlson comorbidity index; Group 1 comorbidity includes presence of any of these: chronic obstructive pulmonary disease, rheumatologic disease stomach ulcer or dementia, all as coded by using the Charlson index; Group 2 comorbidity includes presence of any of these: cancer, renal failure, liver disease or cirrhosis, autoimmune disease.
©20
08 T
hom
son
Reu
ters
©20
09 T
hom
son
Reu
ters
49
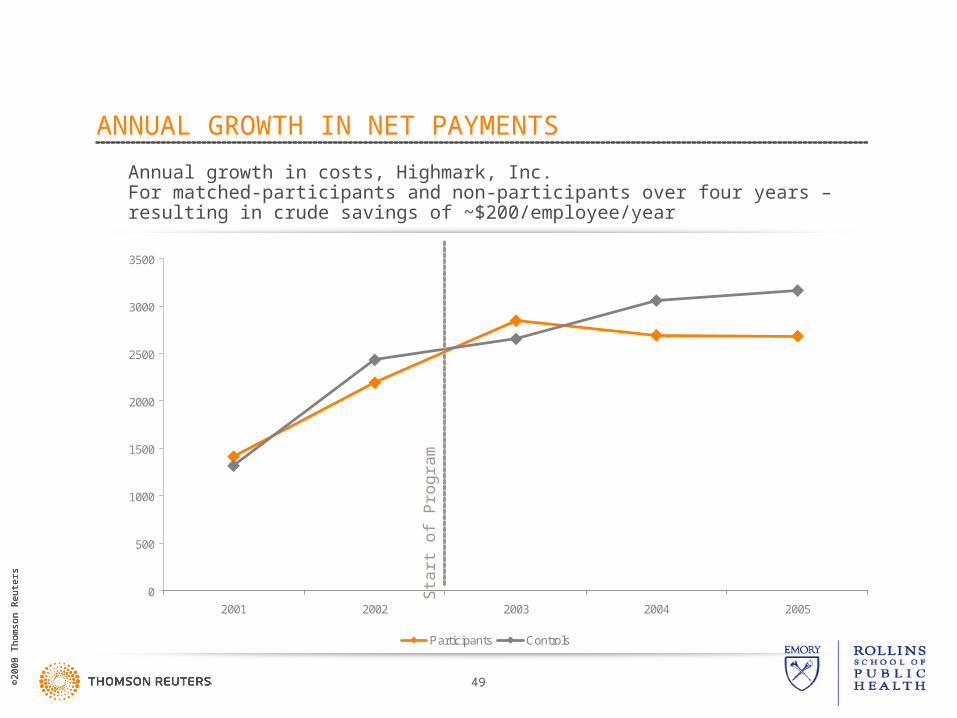
ANNUAL GROWTH IN NET PAYMENTS
0
500
1000
1500
2000
2500
3000
3500
2001 2002 2003 2004 2005
Participants Controls
Sta
rt o
f P
rog
ram
Annual growth in costs, Highmark, Inc.For matched-participants and non-participants over four years – resulting in crude savings of ~$200/employee/year
©20
08 T
hom
son
Reu
ters
©20
09 T
hom
son
Reu
ters
50
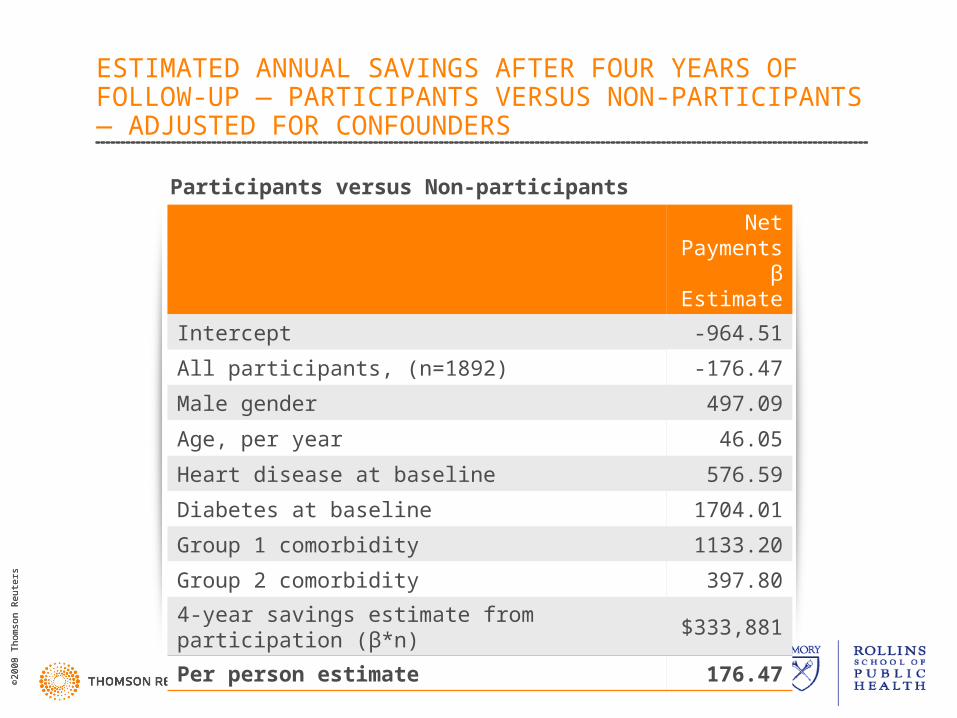
Net Payments
β Estimate
Intercept -964.51
All participants, (n=1892) -176.47
Male gender 497.09
Age, per year 46.05
Heart disease at baseline 576.59
Diabetes at baseline 1704.01
Group 1 comorbidity 1133.20
Group 2 comorbidity 397.80
4-year savings estimate from participation (β*n) $333,881
Per person estimate 176.47
ESTIMATED ANNUAL SAVINGS AFTER FOUR YEARS OF FOLLOW-UP — PARTICIPANTS VERSUS NON-PARTICIPANTS — ADJUSTED FOR CONFOUNDERS
Participants versus Non-participants
©20
08 T
hom
son
Reu
ters
©20
09 T
hom
son
Reu
ters
51
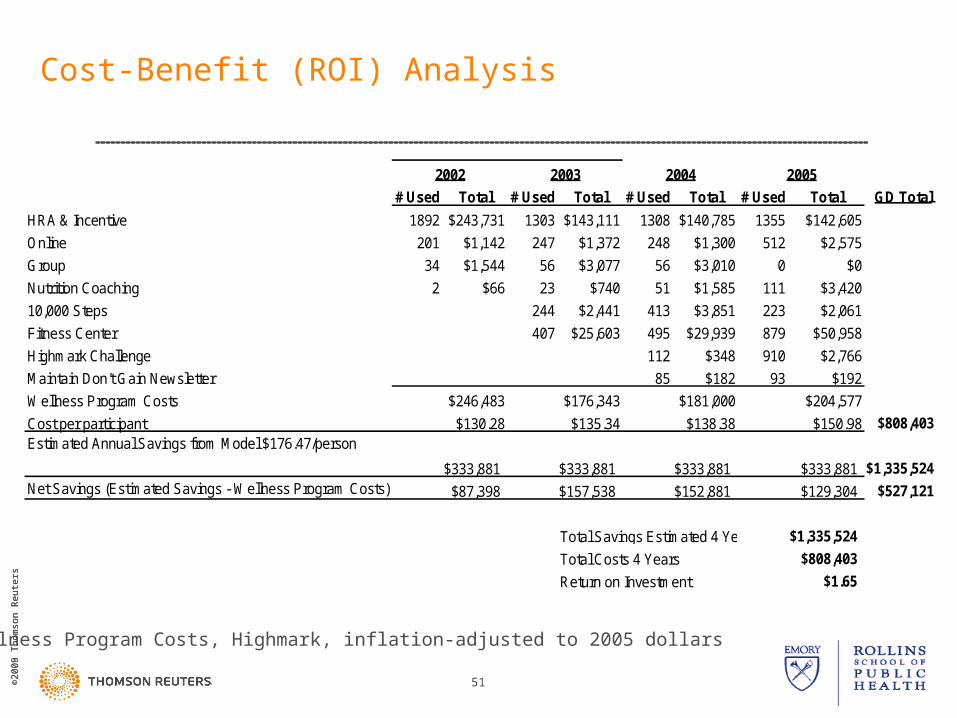
Cost-Benefit (ROI) Analysis
# Used Total # Used Total # Used Total # Used Total GD Total
HRA & Incentive 1892 $243,731 1303 $143,111 1308 $140,785 1355 $142,605
Online 201 $1,142 247 $1,372 248 $1,300 512 $2,575
Group 34 $1,544 56 $3,077 56 $3,010 0 $0
Nutrition Coaching 2 $66 23 $740 51 $1,585 111 $3,420
10,000 Steps 244 $2,441 413 $3,851 223 $2,061
Fitness Center 407 $25,603 495 $29,939 879 $50,958
Highmark Challenge 112 $348 910 $2,766
Maintain Don't Gain Newsletter 85 $182 93 $192
Wellness Program Costs $246,483 $176,343 $181,000 $204,577
Cost per participant $130.28 $135.34 $138.38 $150.98
Net Savings (Estimated Savings - Wellness Program Costs) $87,398 $157,538 $152,881 $129,304 $527,121
$1,335,524
$808,403
$1.65Return on Investment
$333,881 $1,335,524
Total Savings Estimated 4 Years
Total Costs 4 Years
$333,881 $333,881
Estimated Annual Savings from Model $176.47/person
$333,881
$808,403
2002 2003 2004 2005
Wellness Program Costs, Highmark, inflation-adjusted to 2005 dollars

LITERATURE REVIEWS
©20
08 T
hom
son
Reu
ters
©20
09 T
hom
son
Reu
ters
53
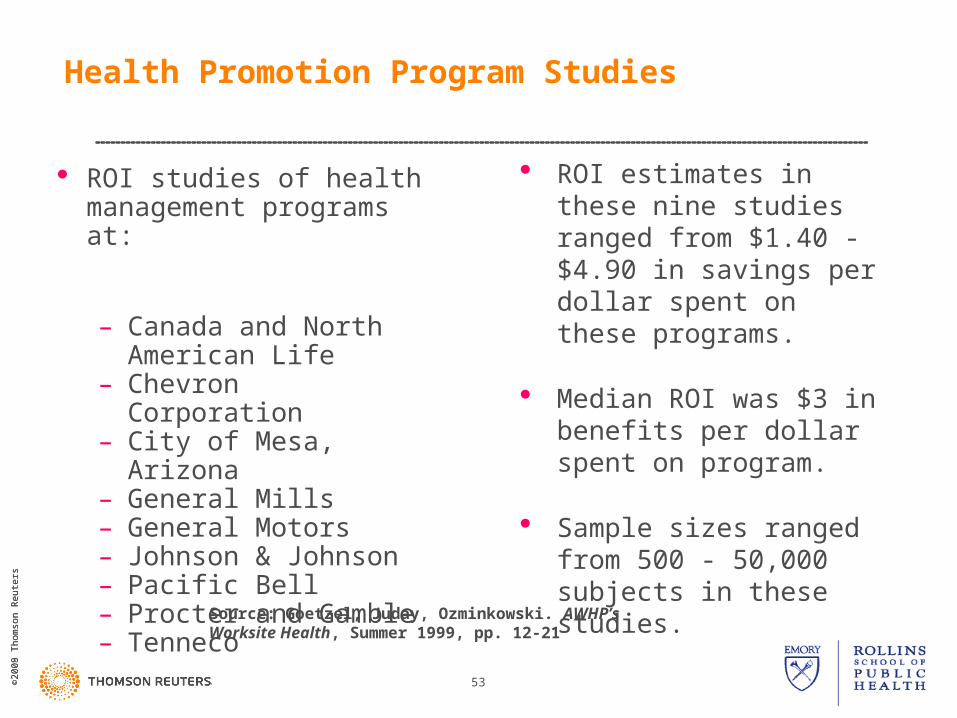
Health Promotion Program Studies
ROI studies of health management programs at:
– Canada and North American Life
– Chevron Corporation– City of Mesa, Arizona– General Mills– General Motors– Johnson & Johnson– Pacific Bell– Procter and Gamble– Tenneco
ROI estimates in these nine studies ranged from $1.40 - $4.90 in savings per dollar spent on these programs.
Median ROI was $3 in benefits per dollar spent on program.
Sample sizes ranged from 500 - 50,000 subjects in these studies.
Source: Goetzel, Juday, Ozminkowski. AWHP’s Worksite Health, Summer 1999, pp. 12-21
©20
08 T
hom
son
Reu
ters
©20
09 T
hom
son
Reu
ters
54
Generic Study Limitations – Corporate Research
Self-Selection
High Attrition
Treatment Diffusion
Poor Instrumentation
“Wish Bias”
Publication Bias
©20
08 T
hom
son
Reu
ters
©20
09 T
hom
son
Reu
ters
55
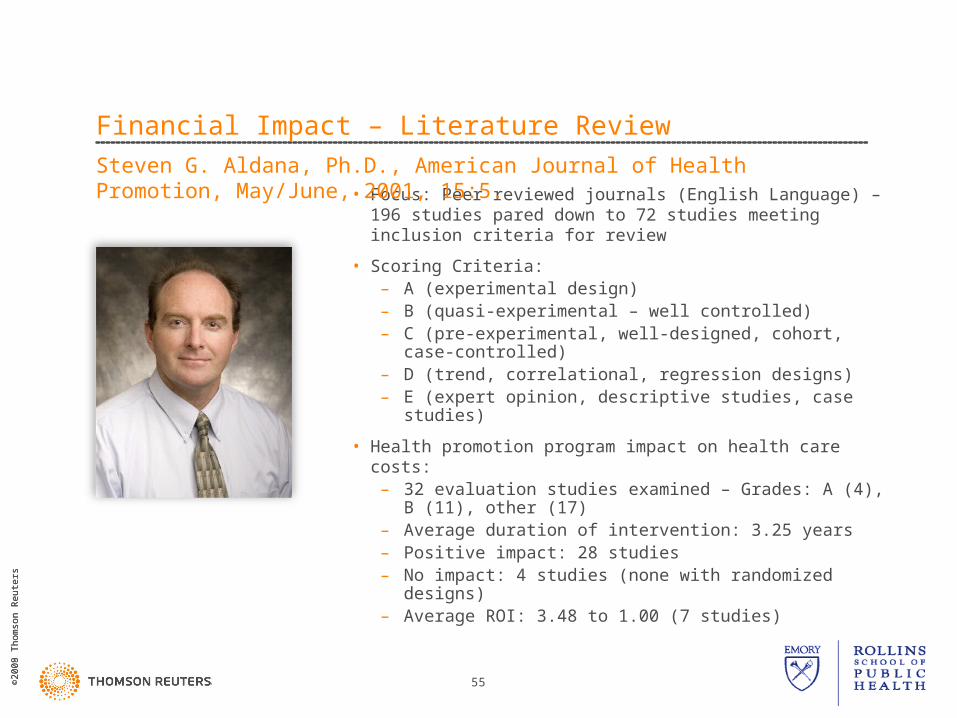
Financial Impact – Literature Review
• Focus: Peer reviewed journals (English Language) – 196 studies pared down to 72 studies meeting inclusion criteria for review
• Scoring Criteria:– A (experimental design)– B (quasi-experimental – well controlled)– C (pre-experimental, well-designed, cohort, case-
controlled)– D (trend, correlational, regression designs)– E (expert opinion, descriptive studies, case studies)
• Health promotion program impact on health care costs:– 32 evaluation studies examined – Grades: A (4), B (11),
other (17)– Average duration of intervention: 3.25 years– Positive impact: 28 studies– No impact: 4 studies (none with randomized designs)– Average ROI: 3.48 to 1.00 (7 studies)
Steven G. Aldana, Ph.D., American Journal of Health Promotion, May/June, 2001, 15:5.
©20
08 T
hom
son
Reu
ters
©20
09 T
hom
son
Reu
ters
56
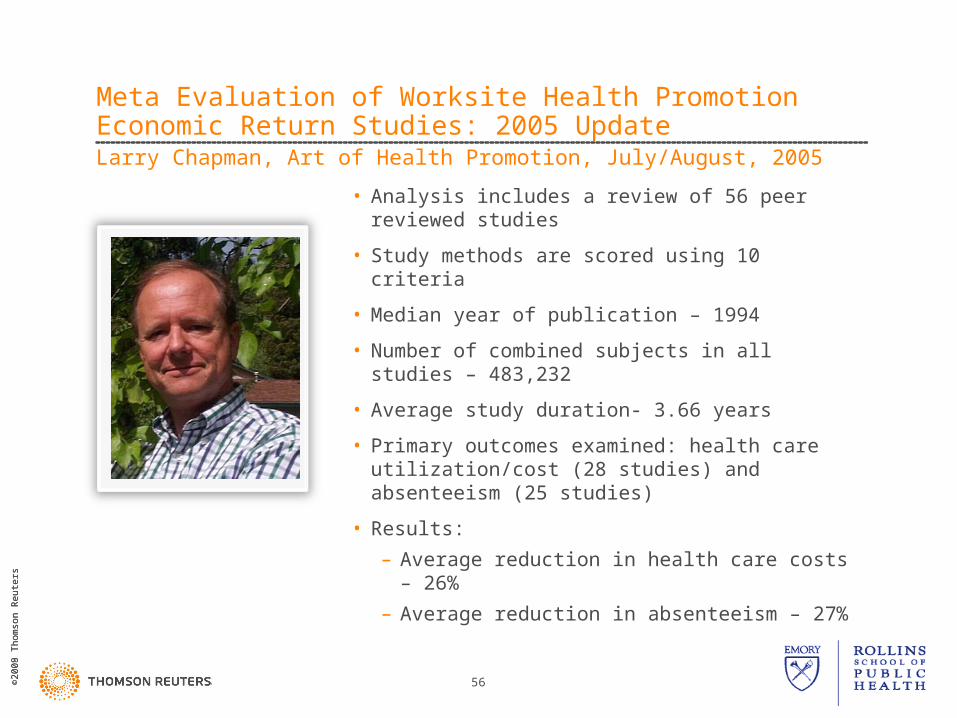
Meta Evaluation of Worksite Health Promotion Economic Return Studies: 2005 Update
• Analysis includes a review of 56 peer reviewed studies
• Study methods are scored using 10 criteria
• Median year of publication – 1994
• Number of combined subjects in all studies – 483,232
• Average study duration- 3.66 years
• Primary outcomes examined: health care utilization/cost (28 studies) and absenteeism (25 studies)
• Results:
– Average reduction in health care costs – 26%
– Average reduction in absenteeism – 27%
Larry Chapman, Art of Health Promotion, July/August, 2005

©20
08 T
hom
son
Reu
ters
©20
09 T
hom
son
Reu
ters
57
DO EMPLOYEE HEALTH MANAGEMENT PROGRAMS WORK?
Health PromotionDisease
ManagementEmployee Health
Management
Low Range
High Range
Low Range
High Range
Low Range
High Range
Average savings (% impact on medical costs)
2.20 2.76 1.01 1.27 3.22 4.02
Average return on investment
3.0:1.0 2.0:1.0 2.5:1.0
Annual Estimated Program Impacts on Self-Insures Employee Populations
SERXNER, GOLD, MERAZ, GRAY, THE ART OF HEALTH PROMOTION, MARCH/APRIL 2009, 1-8.
©20
08 T
hom
son
Reu
ters
©20
09 T
hom
son
Reu
ters
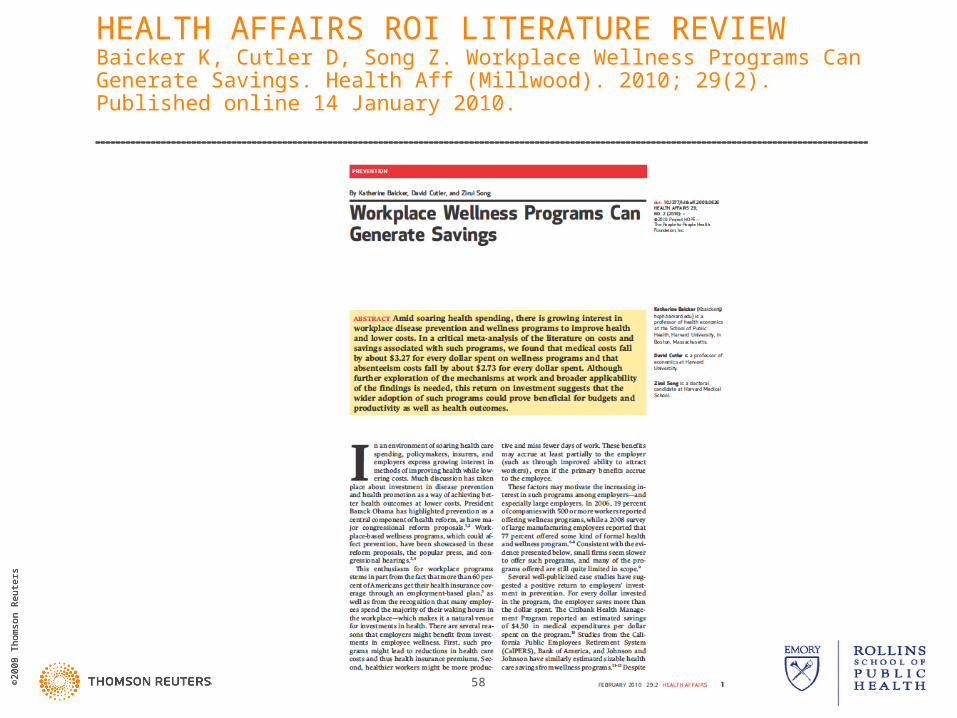
HEALTH AFFAIRS ROI LITERATURE REVIEWBaicker K, Cutler D, Song Z. Workplace Wellness Programs Can Generate Savings. Health Aff (Millwood). 2010; 29(2). Published online 14 January 2010.
58
©20
08 T
hom
son
Reu
ters
©20
09 T
hom
son
Reu
ters
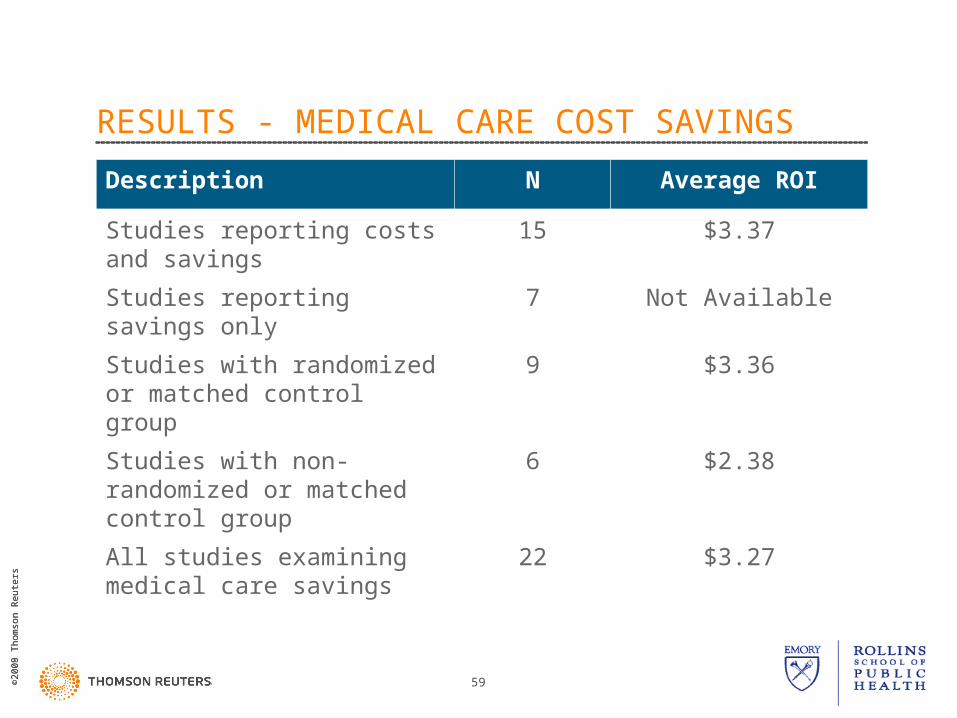
RESULTS - MEDICAL CARE COST SAVINGS
Description N Average ROI
Studies reporting costs and savings
15 $3.37
Studies reporting savings only 7 Not Available
Studies with randomized or matched control group
9 $3.36
Studies with non-randomized or matched control group
6 $2.38
All studies examining medical care savings
22 $3.27
59
©20
08 T
hom
son
Reu
ters
©20
09 T
hom
son
Reu
ters
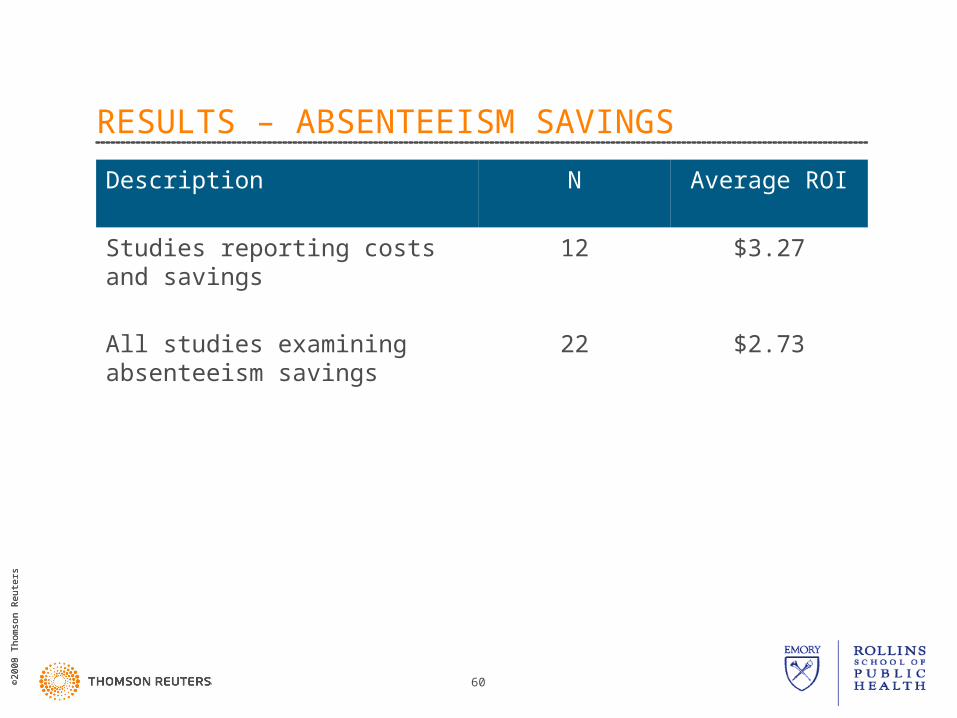
RESULTS – ABSENTEEISM SAVINGS
Description N Average ROI
Studies reporting costs and savings
12 $3.27
All studies examining absenteeism savings
22 $2.73
60
©20
08 T
hom
son
Reu
ters
©20
09 T
hom
son
Reu
ters
61
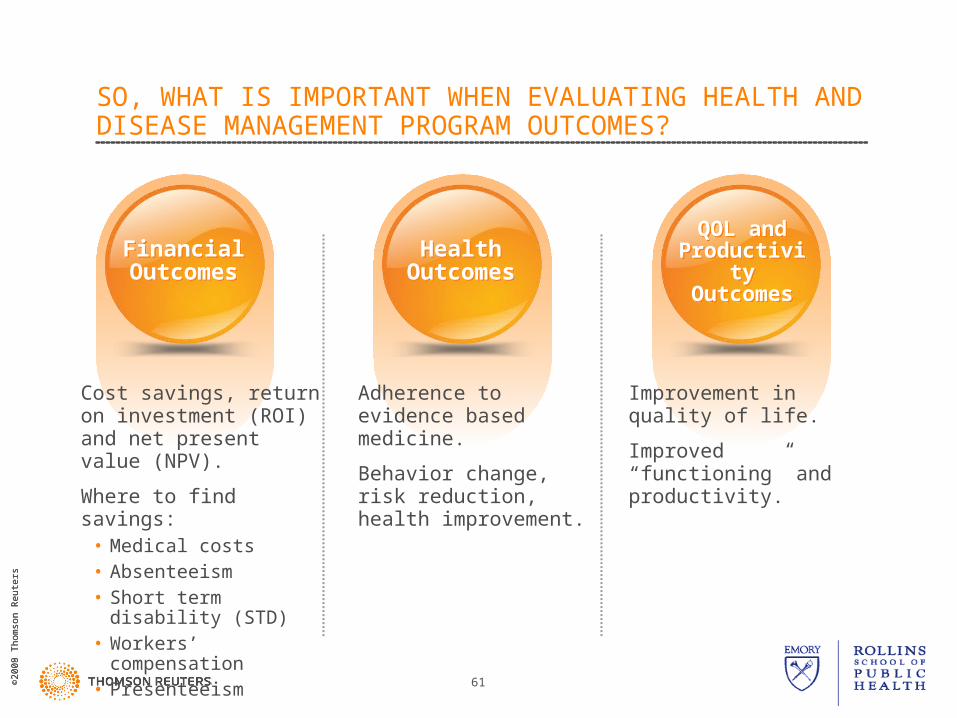
SO, WHAT IS IMPORTANT WHEN EVALUATING HEALTH AND DISEASE MANAGEMENT PROGRAM OUTCOMES?
Financial OutcomesFinancial
OutcomesHealth
OutcomesHealth
OutcomesQOL and
Productivity Outcomes
QOL and Productivity Outcomes
Cost savings, return on investment (ROI) and net present value (NPV).
Where to find savings:• Medical costs• Absenteeism • Short term disability
(STD)• Workers’ compensation• Presenteeism
Adherence to evidence based medicine.
Behavior change, risk reduction, health improvement.
Improvement in quality of life.
Improved “functioning” and productivity.
©20
08 T
hom
son
Reu
ters
©20
09 T
hom
son
Reu
ters
62
SUMMARY
Focusing on improving the health and quality of people’s lives will improve the productivity and competitiveness of our workers and citizens.
A growing body of scientific literature suggests that well-designed, evidence-based health management programs can:
• Improve the health of workers and lower their risk for disease;
• Save businesses money by reducing health-related losses and limiting absence and disability;
• Heighten worker morale and work relations;
• Improve worker productivity; and
• Improve the financial performance of organizations instituting these programs.