Embed Size (px)
Citation preview

11
Investo
r P
resen
tati
on
Jan
uary
2008, H
on
g K
on
g

22
Ag
en
da
11 332
008
CO
SL
Bu
sin
es
s O
utl
oo
k2
008
CO
SL
Bu
sin
es
s O
utl
oo
k
222
00
8
20
08
Ma
cro
Ma
cro
En
vir
on
me
nt
Ou
tlo
ok
En
vir
on
me
nt
Ou
tlo
ok
Re
vie
w o
f 200
7 O
pe
rati
ng
Da
taR
evie
w o
f 200
7 O
pe
rati
ng
Da
ta

33
11R
evie
w o
f 200
7 O
pe
rati
ng
Da
taR
evie
w o
f 200
7 O
pe
rati
ng
Da
ta
44
Dri
llin
g S
erv
ice
s
As
at
31s
t D
ec
20
07
20
06
Ch
an
ge (
%)
Op
era
tin
g D
ay
s (
Da
ys)
5,3
08
4,7
69
11
.3%
Ja
ck-u
p R
igs
4,2
28
3,8
39
10
.1%
Se
mi-
sub
me
rsib
le R
igs
108
09
30
16
.1%
Uti
liz
ati
on
Ra
te (
Av
ail
ab
le D
ays
)1
00
.0%
10
0.0
%0
.0%
Ja
ck-u
p R
igs
100
.0%
10
0.0
%0
.0%
Se
mi-
sub
me
rsib
le R
igs
100
.0%
10
0.0
%0
.0%
Uti
liz
ati
on
Ra
te (
Ca
len
da
r D
ays
)97
.0%
90.0
%7
.0%
Ja
ck-u
p R
igs
96
.5%
91.3
%5
.2%
Se
mi-
sub
me
rsib
le R
igs
98
.6%
84.9
%1
3.7
%

55
We
ll S
erv
ice
s
As a
t 31
st
Dec
20
07
200
6C
han
ge(%
)
Lo
gg
ing
(n
o.
of
job
s)
86
58
37
3.3
%
Dri
llin
g f
luid
s (
no
. o
f w
ell
s)
29
02
91
-0.3
%
Dir
ecti
on
al
Dri
llin
g (
no
. o
f jo
bs)
58
12
42
140
.1%
Cem
en
tin
g (
no
. o
f w
ell
s)
47
43
32
42
.8%
Well
Co
mp
leti
on
(n
o.
of
job
s)
152
71
244
22
.7%
Well
Wo
rko
ve
r (t
eam. ...
days
)15
,944
13,3
69
19
%

66
Ma
rin
e S
up
po
rt a
nd
Tra
ns
po
rta
tio
n S
erv
ice
s
As
at
31s
t D
ec
2007
2006
Ch
an
ge
(%
)
Op
era
tin
g D
ays
(D
ays
)24,2
29
23,6
68
2.4
%
Sta
ndby v
essels
13,2
02
13,3
21
-0.9
%
AH
TS
vessels
7,1
72
6,5
54
9.4
%
PS
V v
essels
2,1
45
2,1
13
1.5
%
Util
ity v
essels
1,7
10
1,6
80
1.8
%
Ve
ss
el U
tilizati
on
Rate
(A
vailab
le D
ays
)99.6
%99.1
%0.5
%
Sta
ndby v
essels
99.8
%99.7
%0.1
%
AH
TS
vessels
100.0
%98.8
%1.2
%
PS
V v
essels
99.7
%99.8
%-0
.1%
Util
ity v
essels
96.6
%94.9
%1.7
%
Ve
ss
el U
tilizati
on
Rate
(C
ale
nd
ar
Days
)94.9
%95.1
%-0
.2%
Sta
ndby v
essels
95.2
%96.0
%-0
.8%
AH
TS
vessels
93.9
%93.7
%0.2
%
PS
V v
essels
97.9
%96.5
%1.4
%
Util
ity v
essels
93.7
%92.1
%1.6
%
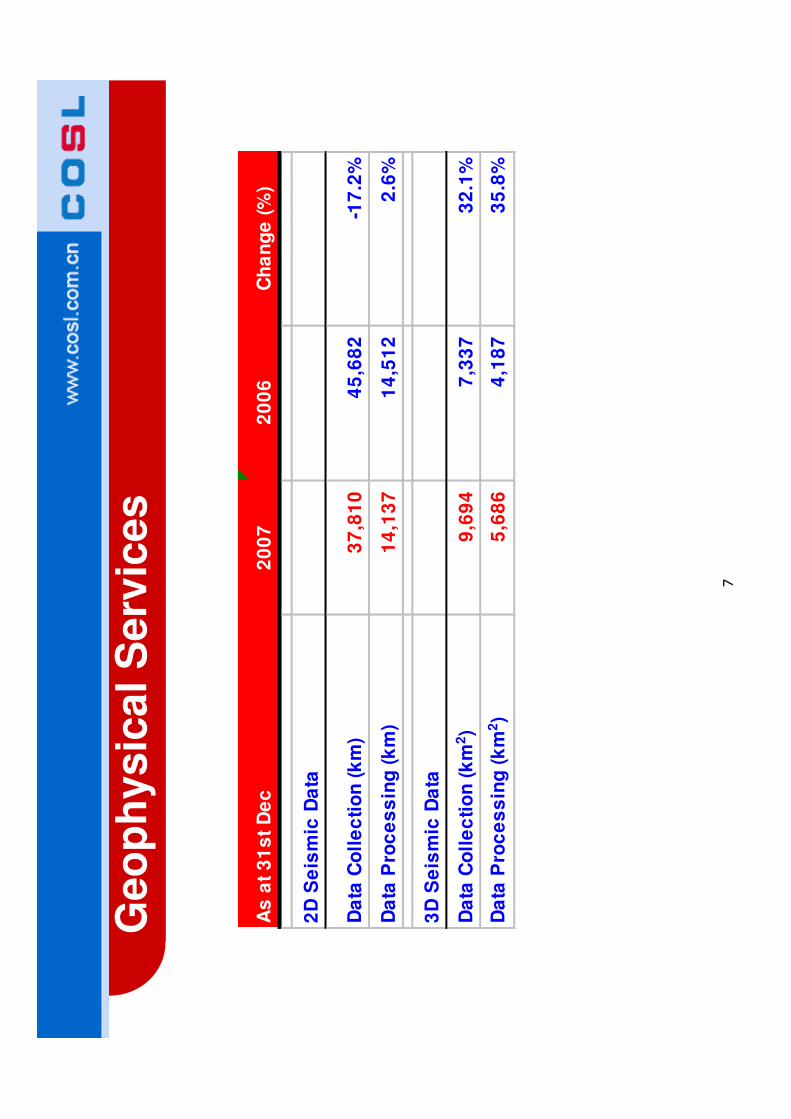
77
Geo
ph
ysic
al S
erv
ices
As
at
31
st
De
c2
00
72
00
6C
ha
ng
e (
%)
2D
Se
ism
ic D
ata
Da
ta C
oll
ec
tio
n (
km
)3
7,8
10
45
,68
2-1
7.2
%
Da
ta P
roc
es
sin
g (
km
)1
4,1
37
14
,51
22
.6%
3D
Se
ism
ic D
ata
Da
ta C
oll
ec
tio
n (
km
2)
9,6
94
7,3
37
32
.1%
Da
ta P
roc
es
sin
g (
km
2)
5,6
86
4,1
87
35
.8%
88
222
00
8 M
ac
ro E
nvir
on
me
nt
Ou
tlo
ok
20
08 M
ac
ro E
nvir
on
me
nt
Ou
tlo
ok
99
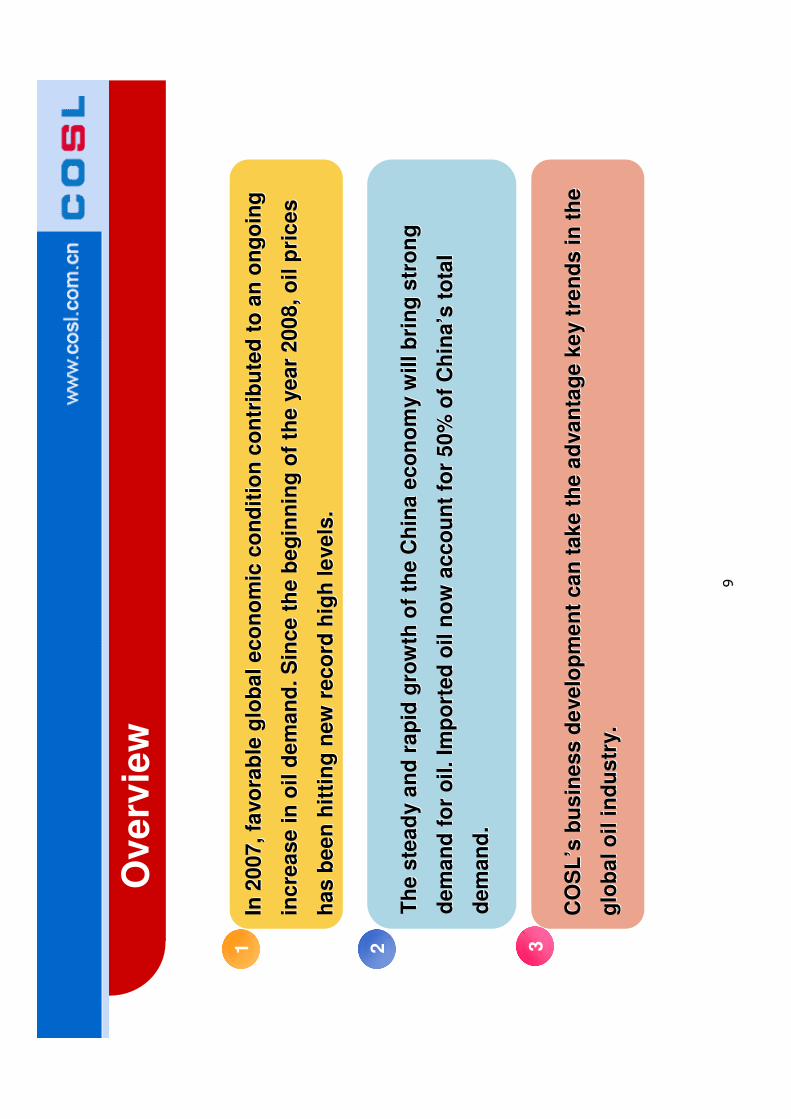
Ov
erv
iew
In 2
00
7,
favo
rab
le g
lob
al
ec
on
om
ic c
on
dit
ion
co
ntr
ibu
ted
to
an
oIn
20
07
, fa
vo
rab
le g
lob
al
ec
on
om
ic c
on
dit
ion
co
ntr
ibu
ted
to
an
on
go
ing
n
go
ing
inc
rea
se
in
oil
de
ma
nd
. S
inc
e t
he
be
gin
nin
g o
f th
e y
ea
r 2
00
8,
oi
inc
rea
se
in
oil
de
ma
nd
. S
inc
e t
he
be
gin
nin
g o
f th
e y
ea
r 2
00
8,
oi l
pri
ce
s
l p
ric
es
ha
s b
ee
n h
itti
ng
new
re
co
rd h
igh
le
ve
ls.
ha
s b
ee
n h
itti
ng
new
re
co
rd h
igh
le
ve
ls.
Th
e s
tea
dy a
nd
ra
pid
gro
wth
of
the
Ch
ina
ec
on
om
y w
ill
bri
ng
str
oT
he
ste
ad
y a
nd
ra
pid
gro
wth
of
the
Ch
ina
ec
on
om
y w
ill
bri
ng
str
on
g
ng
de
ma
nd
fo
r o
il.
Imp
ort
ed
oil
no
w a
cc
ou
nt
for
50
% o
f C
hin
ad
em
an
d f
or
oil
. Im
po
rte
d o
il n
ow
ac
co
un
t fo
r 5
0%
of
Ch
ina
’’ s t
ota
l s
to
tal
de
ma
nd
.d
em
an
d.
CO
SL
CO
SL
’’ ssb
us
ine
ss
de
ve
lop
me
nt
ca
n t
ak
e t
he
ad
va
nta
ge
ke
y t
ren
ds
in
th
e
bu
sin
es
s d
eve
lop
me
nt
ca
n t
ak
e t
he
ad
va
nta
ge
ke
y t
ren
ds
in
th
e
glo
ba
l o
il i
nd
us
try.
glo
ba
l o
il i
nd
us
try.
2 31
1010
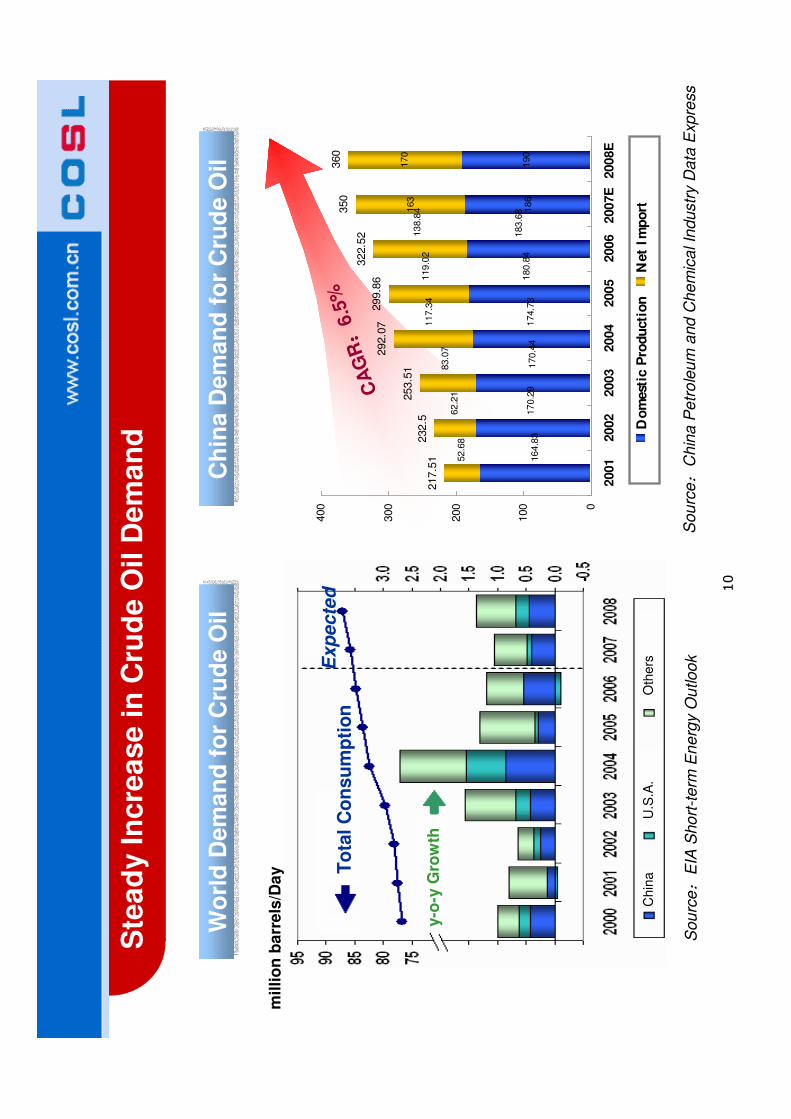
Ste
ad
y I
nc
rea
se
in
Cru
de
Oil
De
ma
nd
Chin
aU
.S.A
.O
thersExp
ecte
d
y-o
-yG
row
th
To
tal C
on
su
mp
tio
n
mil
lio
n b
arr
els
/Da
y
Sou
rce:
EIA
Sho
rt-t
erm
En
erg
y O
utloo
k
186
190
163
170
217.5
1232.5
253.5
1
292.0
7299.8
6
322.5
2
350
360
183.6
8180.8
4164.8
3170.2
9170.4
4174.7
3
138.8
4119.0
2117.3
4
83.0
762.2
152.6
8
0
100
200
300
400
2001
2002
2003
2004
2005
2006
2007E
2008E
Do
mest
ic P
rodu
cti
on
Net
Imp
ort
CA
GR::::
6.5
%
Sou
rce:
Ch
ina
Pe
tro
leu
m a
nd
Ch
em
ica
l In
dustr
y D
ata
Exp
ress
Wo
rld
Dem
an
d f
or
Cru
de O
ilW
orl
d D
em
an
d f
or
Cru
de O
ilC
hin
a D
em
an
d f
or
Cru
de O
ilC
hin
a D
em
an
d f
or
Cru
de O
il
1111
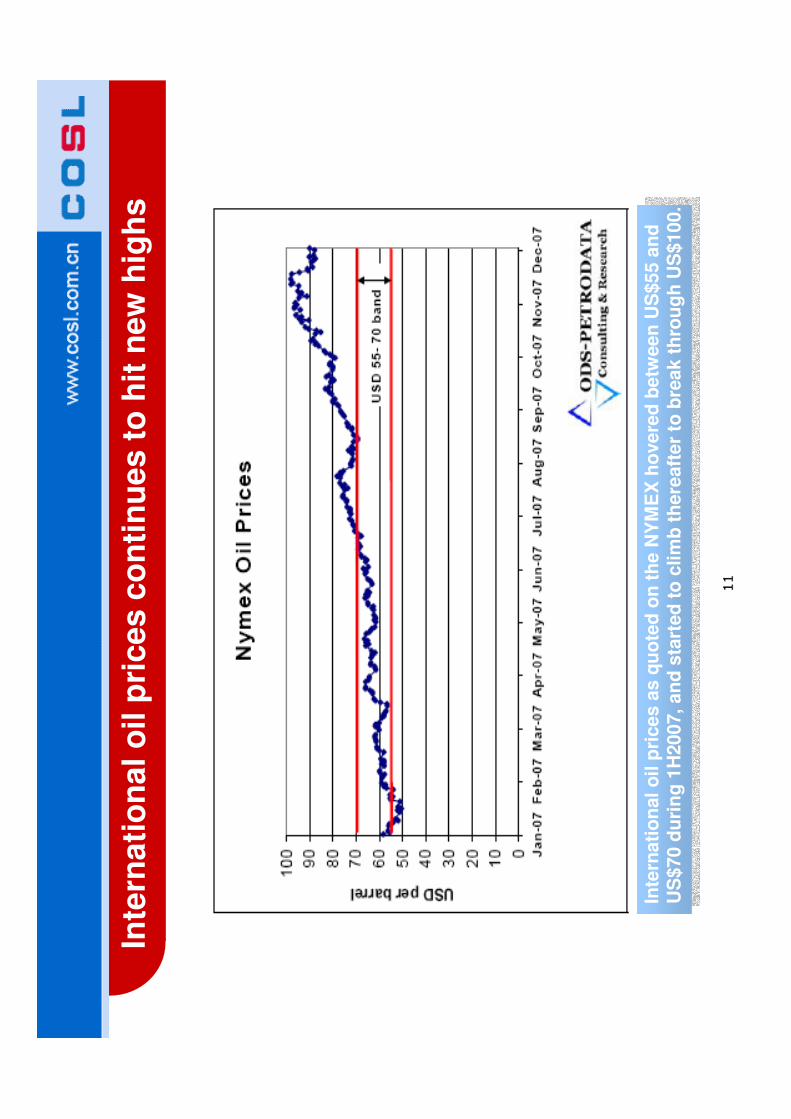
Inte
rnati
on
al o
il p
rices a
s q
uo
ted
on
th
e N
YM
EX
ho
vere
d b
etw
een
US
$55 a
nd
U
S$70 d
uri
ng
1H
2007, an
d s
tart
ed
to
clim
b t
here
aft
er
to b
reak t
hro
ug
h U
S$100.
Inte
rnati
on
al o
il p
rices a
s q
uo
ted
on
th
e N
YM
EX
ho
vere
d b
etw
een
US
$55 a
nd
U
S$70 d
uri
ng
1H
2007, an
d s
tart
ed
to
clim
b t
here
aft
er
to b
reak t
hro
ug
h U
S$100.
Inte
rnati
on
al
oil p
rices c
on
tin
ues t
o h
it n
ew
hig
hs
1212
Co
al
66
.1%
Hyd
ro,
Nu
cle
ar
an
d
Win
d P
ow
er
8.1
%
Na
tura
l G
as
5.3
%
Oil
20
.5%
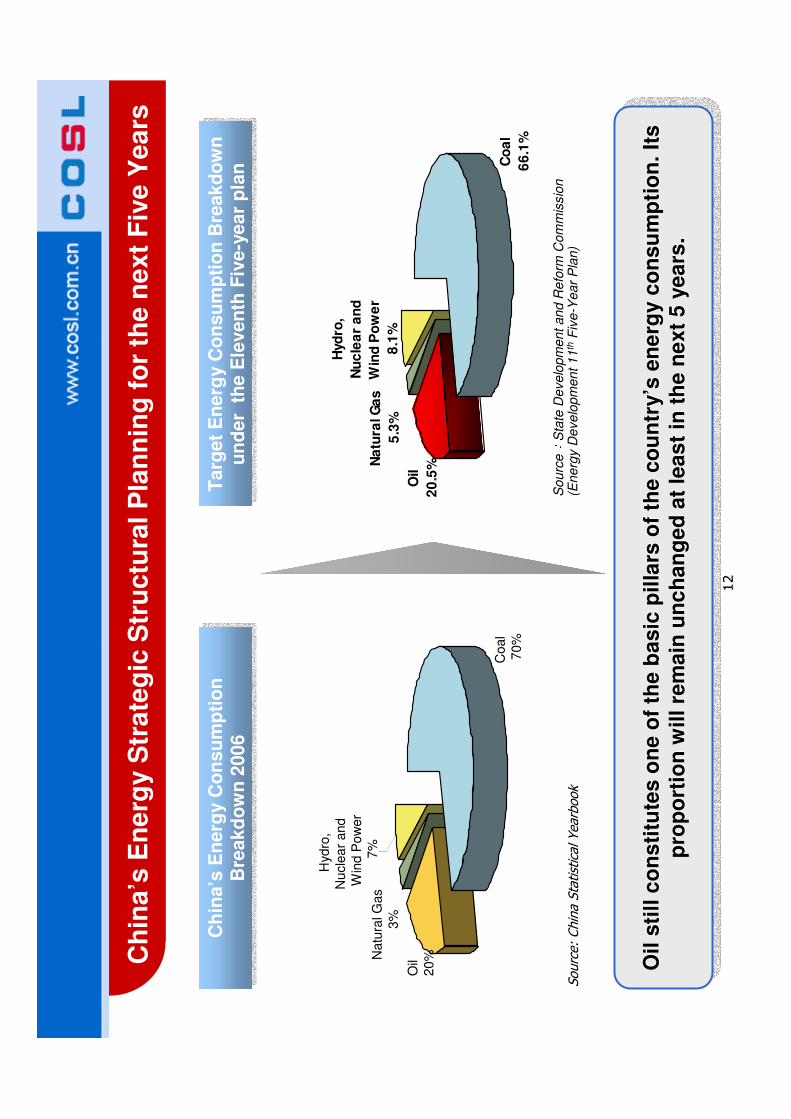
Ch
ina
’s E
ne
rgy S
tra
teg
ic S
tru
ctu
ral P
lan
nin
g f
or
the
ne
xt
Fiv
e Y
ea
rs
Targ
et
En
erg
y C
on
su
mp
tio
n B
reakd
ow
n
un
der
th
e E
leven
th F
ive-y
ear
pla
n
Targ
et
En
erg
y C
on
su
mp
tio
n B
reakd
ow
n
un
der
th
e E
leven
th F
ive-y
ear
pla
nC
hin
a’s
En
erg
y C
on
su
mp
tio
n
Bre
akd
ow
n 2
006
Ch
ina’s
En
erg
y C
on
su
mp
tio
n
Bre
akd
ow
n 2
006
Source: China Statistical Yearbook
Oil
sti
ll c
on
sti
tute
s o
ne
of
the
ba
sic
pil
lars
of
the
co
un
try’s
en
erg
y c
on
su
mp
tio
n.
Its
p
rop
ort
ion
wil
l re
ma
in u
nc
ha
ng
ed
at
lea
st
in t
he
ne
xt
5 y
ea
rs.
Oil
sti
ll c
on
sti
tute
s o
ne
of
the
ba
sic
pil
lars
of
the
co
un
try
Oil
sti
ll c
on
sti
tute
s o
ne
of
the
ba
sic
pil
lars
of
the
co
un
try
’’ s e
ne
rgy c
on
su
mp
tio
n.
Its
s
en
erg
y c
on
su
mp
tio
n.
Its
pro
po
rtio
n w
ill
rem
ain
un
ch
an
ge
d a
t le
as
t in
th
e n
ex
t 5
ye
ars
.p
rop
ort
ion
wil
l re
ma
in u
nc
ha
ng
ed
at
lea
st
in t
he
ne
xt
5 y
ea
rs.
Sourc
e:State Devel
opm
ent and R
efo
rm C
om
mis
sio
n
(Energ
y D
evelo
pm
ent 11
thF
ive-Y
ear
Pla
n)
Coal
70%
Hyd
ro,
Nucle
ar
and
Win
d P
ow
er
7%
Natu
ral G
as
3%
Oil
20%
1313
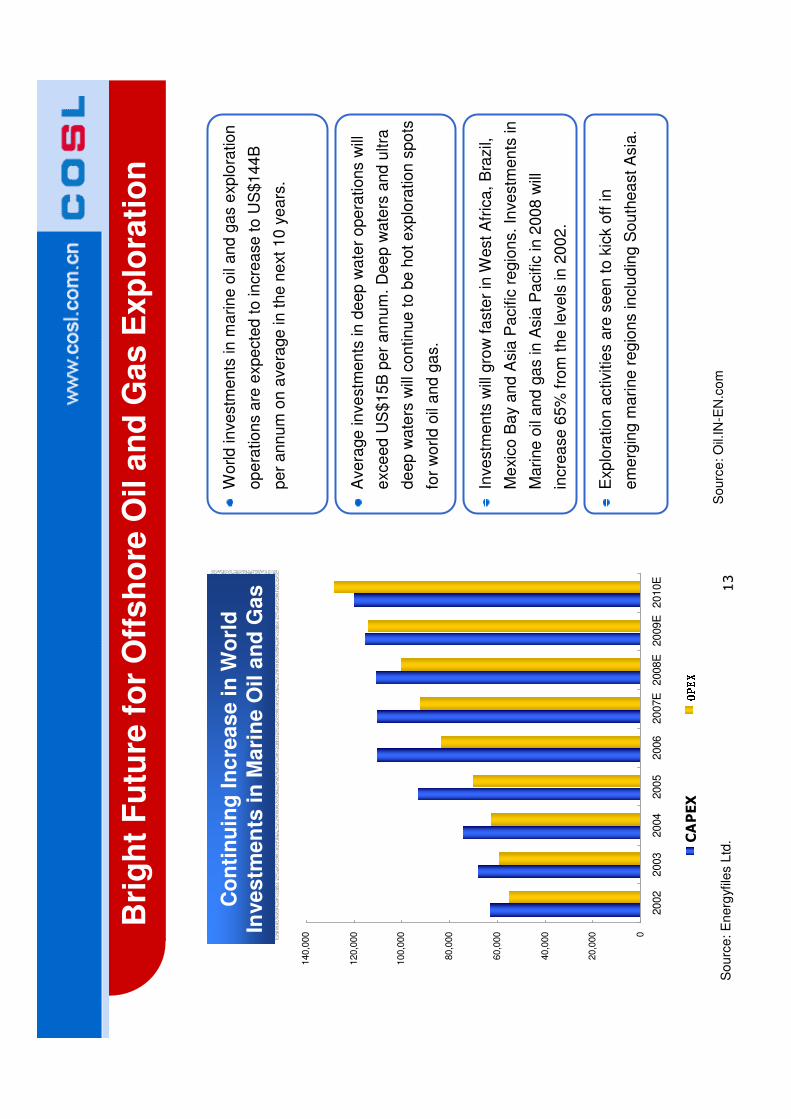
0
20,0
00
40,0
00
60,0
00
80,0
00
100,0
00
120,0
00
140,0
00
2002
2003
2004
2005
2006
2007E
2008E
2009E
2010E
CAPEX
OPEX OPEXOPEXOPEX
Co
nti
nu
ing
In
cre
as
e i
n W
orl
d
Inve
stm
en
ts i
n M
ari
ne
Oil
an
d G
as
Co
nti
nu
ing
In
cre
as
e i
n W
orl
d
Inve
stm
en
ts i
n M
ari
ne
Oil
an
d G
as
Bri
gh
t F
utu
re f
or
Off
sh
ore
Oil a
nd
Gas E
xp
lora
tio
n
World
in
vestm
en
ts in
ma
rine
oil
and
ga
s e
xplo
ratio
n
op
era
tion
s a
re e
xpe
cte
d t
o in
cre
ase
to
US
$1
44
B
pe
r ann
um
on
ave
rage in
the
ne
xt 1
0 y
ea
rs.
Ave
rage
inve
stm
en
ts in
deep
wa
ter
ope
rations w
ill
exc
eed
US
$15
B p
er
ann
um
. D
ee
p w
ate
rs a
nd
ultra
de
ep
wa
ters
will
co
ntin
ue
to
be
ho
t e
xplo
ratio
n s
po
ts
for
wo
rld
oil
and
ga
s.
Inve
stm
en
ts w
ill g
row
fa
ste
r in
West
Afr
ica
, B
razi
l,
Me
xico
Ba
y and
Asia
Pa
cific
re
gio
ns.
Inve
stm
en
ts in
Ma
rine
oil
and
ga
s in
Asia
Pa
cific
in 2
008
will
incre
ase
65%
fro
m t
he le
vels
in 2
002
.
Exp
lora
tion
activi
tie
s a
re s
een
to
kic
k o
ff in
em
erg
ing m
arine
re
gio
ns in
clu
din
g S
ou
thea
st A
sia
.
Sourc
e: E
nerg
yfile
sLtd
.S
ourc
e: O
il.IN
-EN
.com

1414
840
1,0
50
1,2
35
1,6
79
35
40
45
45
23
33
29
600
1,0
00
1,4
00
1,8
00
2,2
00
2003
2004
2005
2006
2007E
2008E
Pro
du
cti
on
We
llG
as
an
d O
ilfi
eld
So
urc
e:
CN
OO
C L
imit
ed
CO
SL
receiv
es
be
nefi
ts f
rom
dif
fere
nt
sta
ges
in
clu
din
g e
xp
lora
tio
n, d
ev
elo
pm
en
t an
d p
rod
uc
tio
n
CO
SL
receiv
es
be
nefi
ts f
rom
dif
fere
nt
sta
ges
in
clu
din
g e
xp
lora
tio
n, d
ev
elo
pm
en
t an
d p
rod
uc
tio
n
Ch
ina’s
off
sh
ore
op
era
tio
ns
at
full
cap
acit
y
Ch
ina’s
off
sh
ore
op
era
tio
ns
at
full
cap
acit
y
20
03
20
04
20
05
20
06
20
07
E0
50
100
150
200
250
300
350
2006
2007E
2008E
2009E
2010E
RM
B b
Petr
oC
hin
aS
inopec
CN
OO
C
So
urc
e:
CL
SA
sta
tis
tics
Exp
lora
tio
n C
AP
EX
in
Ch
ina
Exp
lora
tio
n C
AP
EX
in
Ch
ina
Bri
gh
t F
utu
re f
or
Off
sh
ore
Oil a
nd
Gas
Ex
plo
rati
on
in
Ch
ina 2
00
8E
1515
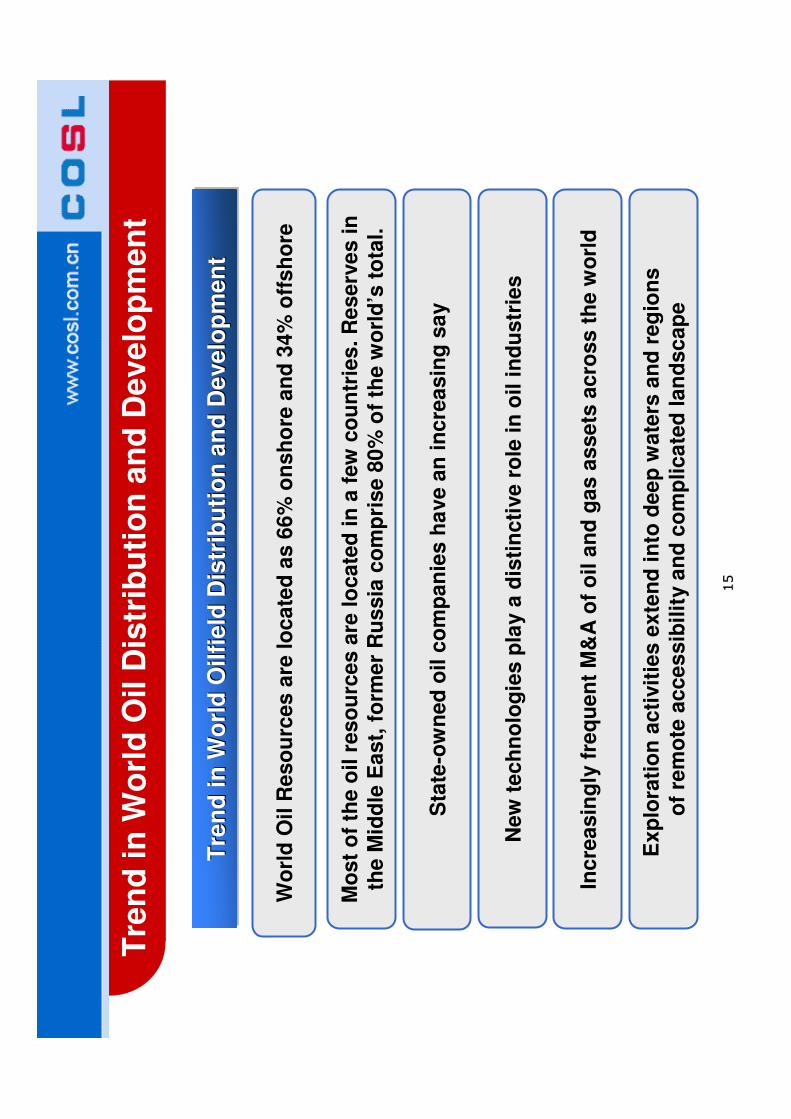
Tre
nd
in
Wo
rld
Oil D
istr
ibu
tio
n a
nd
Dev
elo
pm
en
t
Wo
rld
Oil
Re
so
urc
es
are
lo
ca
ted
as
66
% o
ns
ho
re a
nd
34
% o
ffs
ho
re
Mo
st
of
the
oil
re
so
urc
es
are
lo
ca
ted
in
a f
ew
co
un
trie
s.
Re
se
rve
s i
n
the
Mid
dle
Ea
st,
fo
rme
r R
us
sia
co
mp
ris
e 8
0%
of
the
wo
rld
’s t
ota
l.
Sta
te-o
wn
ed
oil
co
mp
an
ies
ha
ve
an
in
cre
as
ing
sa
y
Tre
nd
in
Wo
rld
Oilfi
eld
Dis
trib
uti
on
an
d D
evelo
pm
en
tT
ren
d i
n W
orl
d O
ilfi
eld
Dis
trib
uti
on
an
d D
evelo
pm
en
tT
ren
d i
n W
orl
d O
ilfi
eld
Dis
trib
uti
on
an
d D
evelo
pm
en
t
New
te
ch
no
log
ies
pla
y a
dis
tin
cti
ve
ro
le i
n o
il i
nd
us
trie
s
Inc
rea
sin
gly
fre
qu
en
t M
&A
of
oil
an
d g
as
as
se
ts a
cro
ss
th
e w
orl
d
Ex
plo
rati
on
ac
tivit
ies
ex
ten
d i
nto
de
ep
wa
ters
an
d r
eg
ion
s
of
rem
ote
ac
ce
ss
ibil
ity a
nd
co
mp
lic
ate
d l
an
ds
ca
pe

1616
Tre
nd
in
Wo
rld
Oil D
istr
ibu
tio
n a
nd
Dev
elo
pm
en
t (c
on
t’d
)

1717
20
08
20
08年 年年年年 年年年
CO
SL
CO
SL发
展展
望发
展展
望发
展展
望发
展展
望发
展展
望发
展展
望发
展展
望发
展展
望
二 二二二二 二二二2
00
8
20
08
CO
SL
C
OS
L B
us
ine
ss O
utl
oo
kB
us
ine
ss O
utl
oo
k33

1818
CO
SL
CO
SL
’’ ssIn
vestm
en
t H
igh
lig
hts
Investm
en
t H
igh
lig
hts
Un
para
llele
d c
om
peti
tive e
dg
e i
n
the o
ffsh
ore
oil
field
serv
ice i
nd
ustr
y
Co
mp
lete
in
du
str
y s
up
ply
c
ha
in
2
5
Hig
h q
ua
lity
cli
en
tele
3
Co
nti
nu
ou
sly
up
gra
din
g
pro
du
cti
on
fa
cil
itie
s a
nd
c
ap
ab
ilit
ies
41C
om
pe
titi
ve
co
st
ad
va
nta
ge
7
Hu
gh
po
ten
tia
l fr
om
new
m
ark
et
se
gm
en
ts a
nd
new
b
us
ine
ss
es
So
un
d f
ina
nc
ial
pe
rfo
rma
nc
e
8
So
lid
co
ntr
ol
on
qu
ali
ty
an
d s
afe
ty s
tan
da
rds
6
Ex
ce
lle
nt
ma
na
ge
me
nt
tea
m a
nd
p
rod
uc
tive
co
rpo
rate
cu
ltu
re
1919
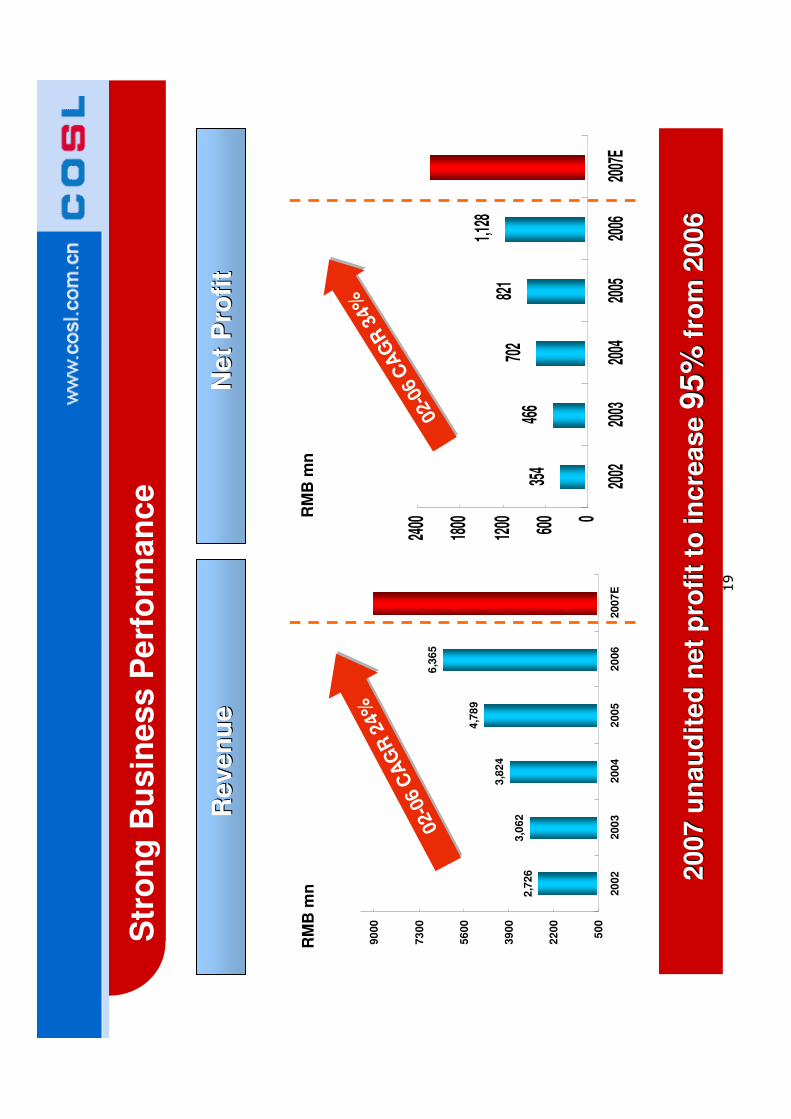
2,7
26
3,0
62
3,8
24
4,7
89
6,3
65
50
0
22
00
39
00
56
00
73
00
90
00
20
02
20
03
20
04
20
05
20
06
20
07
E
02-0
6 C
AG
R 2
4%
02-0
6 C
AG
R 2
4%
RM
B m
n
Re
ve
nu
eR
eve
nu
e
354
466
702
821
1,128
0
600
1200
1800
2400
2002
2003
2004
2005
2006
2007
E
02-0
6 C
AG
R 3
4%
02-0
6 C
AG
R 3
4%
Ne
t P
rofi
tN
et
Pro
fit
RM
B m
n
Str
on
g B
usin
ess P
erf
orm
an
ce
20
07
2
00
7 u
na
ud
ite
du
na
ud
ite
dn
et
pro
fit
to in
cre
as
e
ne
t p
rofi
t to
in
cre
as
e 9
5%
95
%fr
om
20
06
fro
m 2
00
6

2020
Go
als
of
CO
SL
202
0202
0
201
0201
0
Ne
ar-
term
go
al
Ne
ar
Ne
ar --
term
go
al
term
go
al
Lo
ng
-te
rm g
oa
lL
on
gL
on
g-- t
erm
go
al
term
go
al
Be
co
me
a t
op
-no
tch
in
tern
ati
on
al
oil
fie
ld s
erv
ice
pro
vid
ers
Be
co
me
a t
op
Be
co
me
a t
op
-- no
tch
in
tern
ati
on
al
no
tch
in
tern
ati
on
al
oil
fie
ld s
erv
ice
pro
vid
ers
oil
fie
ld s
erv
ice
pro
vid
ers
An
oil
fie
ld s
erv
ice
pro
vid
er
wit
h
str
on
g c
om
pe
ten
ce
s i
n t
he
in
tern
ati
on
al
ma
rke
t
An
oil
fie
ld s
erv
ice
pro
vid
er
wit
h
An
oil
fie
ld s
erv
ice
pro
vid
er
wit
h
str
on
g c
om
pe
ten
ce
s i
n t
he
s
tro
ng
co
mp
ete
nc
es
in
th
e
inte
rna
tio
na
l m
ark
et
inte
rna
tio
na
l m
ark
et
Accele
rate
deve
lopm
ent of
inte
gra
ted
capabili
ties. C
om
pre
hensiv
ely
enhance
pro
fessio
nal c
apabili
ties.
Explo
re n
ew
busin
ess o
pport
uniti
es n
ew
oilf
ield
pro
ductio
n s
erv
ices
Pla
ns
Pla
ns
Expand facili
ties, upgra
de s
erv
ice c
apabili
ty
Str
ength
en d
eep w
ate
r opera
tion c
apabili
ty
Incre
ase in
vestm
ents
in R
&D
to e
nhance
CO
SL’s
technolo
gic
al c
om
petit
iveness
Expand s
cope o
f serv
ice, im
ple
ment glo
bal
deve
lopm
ent st
rate
gie
s
Achie
ve b
reakth
roughs in
technolo
gy,
capacity
expansio
n a
nd c
apabili
ty u
pgra
des
thro
ugh c
apita
l mark
et opera
tions in
clu
din
g
M&
A

2121
Fo
ur
Co
re S
trate
gie
s
Tech
no
log
yT
ech
no
log
y-- d
riven
dri
ven
Co
st
Co
mp
eti
tiven
ess
Co
st
Co
mp
eti
tiven
ess
Inte
gra
tio
nIn
teg
rati
on
GGlo
bal
lob
al
Op
era
tio
nO
pera
tio
n
A u
niq
ue
pu
bli
cly
-lis
ted
in
teg
rate
d o
ilfi
eld
se
rvic
e p
rovid
er
A u
niq
ue
pu
bli
cly
A u
niq
ue
pu
bli
cly
-- lis
ted
in
teg
rate
d o
ilfi
eld
se
rvic
e p
rovid
er
lis
ted
in
teg
rate
d o
ilfi
eld
se
rvic
e p
rovid
er
Str
ate
gic
po
sit
ion
ing
:E
xp
ert
in
co
nve
ntio
nal te
ch
no
logie
sK
ee
n f
ollo
we
r in
ad
va
nce
d a
pp
lica
tio
ns
En
ab
ler
of
hig
hly
eff
icie
nt
op
era
tio
ns
Co
ntr
ibu
tor
to c
ost
red
uctio
n
Pio
ne
er
in in
teg
rate
d s
erv
ice
sP
art
icip
an
t in
glo
ba
l co
mp
etitio
nP
art
ne
r in
win
-win
de
ve
lop
me
nt
Se
rva
nt
for
sh
are
ho
lde
r va
lue
2222
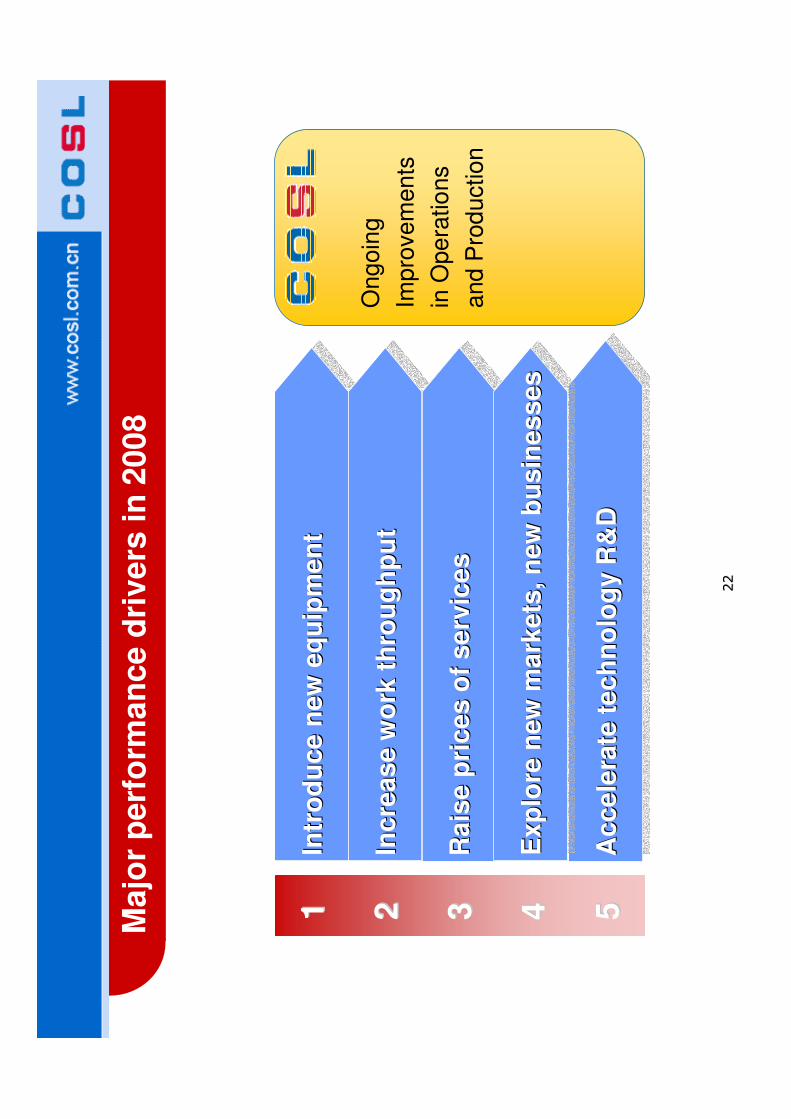
Majo
r p
erf
orm
an
ce d
rivers
in
2008
11In
tro
du
ce
new
eq
uip
me
nt
Intr
od
uce
new
eq
uip
me
nt
Intr
od
uce
new
eq
uip
me
nt
22In
cre
as
e w
ork
th
rou
gh
pu
tIn
cre
as
e w
ork
th
rou
gh
pu
tIn
cre
as
e w
ork
th
rou
gh
pu
t
33R
ais
e p
ric
es o
f se
rvic
es
Ra
ise
pri
ces o
f se
rvic
es
Ra
ise
pri
ces o
f se
rvic
es
44 55A
cc
ele
rate
te
ch
no
log
y R
&D
Ac
ce
lera
te t
ec
hn
olo
gy R
&D
Ac
ce
lera
te t
ec
hn
olo
gy R
&D
Ex
plo
re n
ew
ma
rke
ts, n
ew
bu
sin
es
ses
Ex
plo
re n
ew
ma
rke
ts, n
ew
bu
sin
es
ses
Ex
plo
re n
ew
ma
rke
ts, n
ew
bu
sin
es
ses
Ongoin
g
Impro
vem
ents
in O
pera
tio
ns
and P
rod
uction

2323
CA
PE
X s
inc
e lis
tin
gC
AP
EX
sin
ce
lis
tin
g:
in e
xc
es
s o
f R
MB
10
billio
n:
in e
xc
es
s o
f R
MB
10
billio
n
RM
B M
il’
Bu
sin
es
s d
river
in 2
008:
Intr
od
uce n
ew
eq
uip
men
t
0 0001100 1100110011002200 2200220022003300 3300330033004400 4400440044005500 550055005500 2002 2002200220022003 2003200320032
004 2004200420042005 2005200520052
006 2006200620062007E 2007E 2007E 2007E 2
008E 2008E 2008E 2008E

2424
2010
2010
2009
2009
2008
2008
CO
SL
942 w
ill co
mm
en
ce
op
era
tio
n in
2H; ;;; 4
mo
du
le r
igs o
pera
te f
or
six
mo
re m
on
ths;
5
on
sh
ore
rig
s w
ill
co
mm
en
ce o
pera
tio
n in
C
hin
a a
nd
oth
er
co
un
trie
s
R&
D, b
uild
ing
, p
rocu
re
eq
uip
men
t like
cem
en
tin
g p
um
p, E
LIS
, lift
bo
at
etc
.
Nin
e n
ew
su
pp
ort
ing
v
essels
will co
mm
en
ce
op
era
tio
n in
2H
On
e 8
-str
eam
er
seis
mic
v
essel w
ill co
mm
en
ce
op
era
tio
n in
2Q
Jack-u
p C
OS
L936 w
ill
co
mm
en
ce o
pera
tio
n b
y
year
en
d
R&
D a
nd
pro
cu
re t
oo
ls
for
measu
rem
en
t w
hile
dri
llin
g (
MW
D),
acid
ific
ati
on
an
d
cru
sh
ing
Nin
e n
ew
su
pp
ort
ing
v
essels
will co
mm
en
ce
op
era
tio
n in
1H
. T
wo
hig
h-
po
were
d d
eep
wate
r v
essels
will co
mm
en
ce
op
era
tio
n b
y y
ear
en
d
Jack-u
p C
OS
L937 w
ill
co
mm
en
ce o
pera
tio
n;
4
200-f
eet
jack-u
p r
igs t
o
co
mm
en
ce o
pera
tio
n;
to
op
era
te t
he d
eep
-wate
r ri
gs in
veste
d b
y t
he
pare
nt
co
mp
an
y in
2011
On
e 1
2-s
tream
er
seis
mic
v
essel w
ill co
mm
en
ce
op
era
tio
n
Dri
llin
g
Serv
ice
s
Well
S
erv
ice
s
Mari
ne S
up
po
rt
an
d T
ran
sp
ort
ati
on
S
erv
ice
Geo
ph
ysic
al
Serv
ice
s
Bu
sin
es
s d
rive
r in
20
08
: In
tro
du
ce n
ew
eq
uip
me
nt
(co
nt’
d)
16 o
ffsh
ore
en
gin
eeri
ng
su
pp
ort
ing
vessels

2525
44
48
53
57
62
46
12
16
20
6
11
16
21
2
0
20
40
60
80
100
120
2006
2007E
2008E
2009E
2010E
Cem
en
tin
g P
um
pL
WD
EL
IS L
og
gin
g S
yste
m
70
75
80
95
97
55
4
44
55
55
1
0
20
40
60
80
100
120
2006
2007E
2008E
2009E
2010E
Ch
em
ical
vess
el
Oil
tan
ke
r
Off
sh
ore
wo
rkin
g v
esse
l
Inc
rease
ca
pa
cit
y f
or
dri
llin
g o
pe
rati
on
s
Inc
rease
ca
pa
cit
y f
or
dri
llin
g o
pe
rati
on
sIn
cre
ase
ca
pa
cit
y f
or
well
se
rvic
es
Inc
rease
ca
pa
cit
y f
or
well
se
rvic
es
Inc
rease
ca
pa
cit
y f
or
m
ari
ne
tra
ns
po
rta
tio
n
an
d s
up
po
rt
Inc
rease
ca
pa
cit
y f
or
m
ari
ne
tra
ns
po
rta
tio
n
an
d s
up
po
rt
Inc
rease
ca
pa
cit
y f
or
ge
op
hys
ica
l o
pe
rati
on
s
Inc
rease
ca
pa
cit
y f
or
ge
op
hys
ica
l o
pe
rati
on
s
15
15
16
17
18
44
441
44
4
06
12
18
24
30
2006
2007E
2008E
2009E
2010E
On
sh
ore
Dri
llin
g R
igR
en
ted
De
ep
Wa
ter
Rig
gin
g p
latf
orm
Mo
du
le R
igR
ig p
latf
orm
77
89
44
44
5
8
02468
10
12
14
2006
2007E
2008E
2009E
2010E
Su
rve
yin
g V
es
se
l
Se
ism
ic V
es
se
l
Bu
sin
es
s d
river
in 2
008:
Intr
od
uce n
ew
eq
uip
men
t (c
on
t’d
)
+
2626
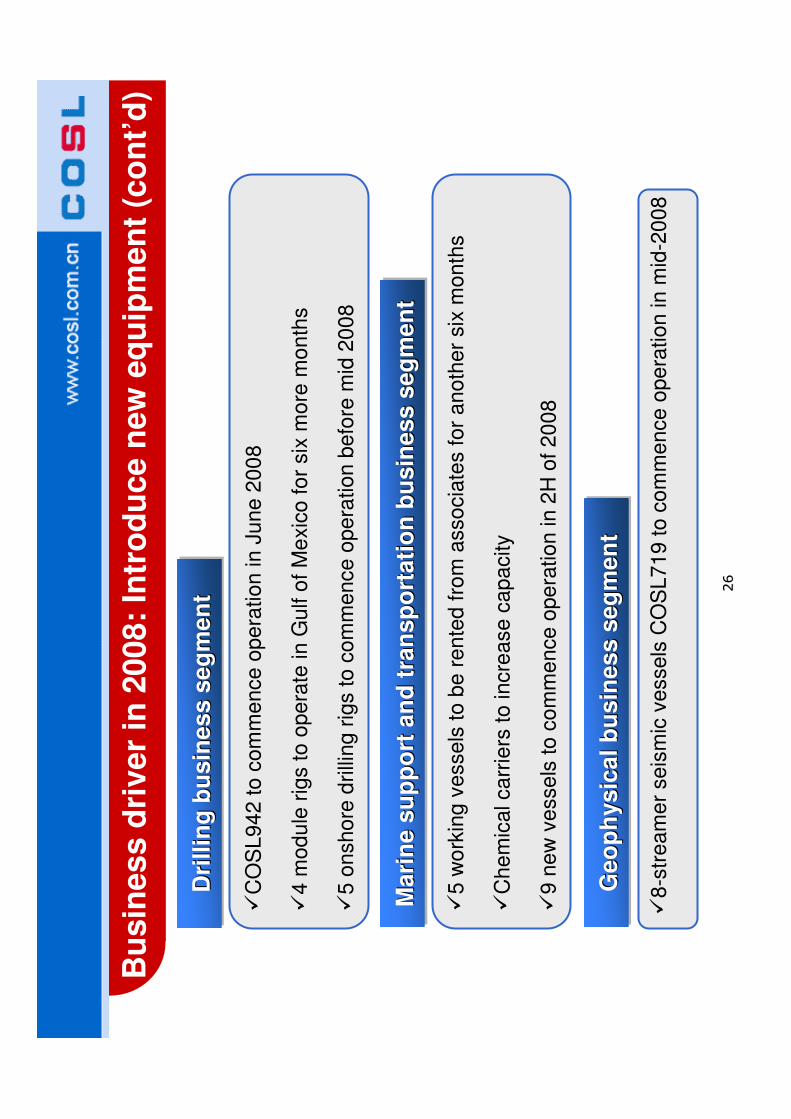
Bu
sin
es
s d
river
in 2
008:
Intr
od
uce n
ew
eq
uip
men
t (c
on
t’d
)
�C
OS
L9
42
to c
om
me
nce
op
era
tio
n in
Ju
ne
20
08
�4
mo
du
le r
igs t
o o
pe
rate
in
Gu
lf o
f M
exic
o f
or
six
mo
re m
on
ths
�5
on
sh
ore
dri
llin
g r
igs t
o c
om
me
nce
op
era
tio
n b
efo
re m
id 2
00
8
Dri
llin
g b
usin
ess s
eg
men
tD
rill
ing
bu
sin
ess s
eg
men
tD
rill
ing
bu
sin
ess s
eg
men
t
�5
wo
rkin
g v
essels
to
be
re
nte
d f
rom
asso
cia
tes f
or
an
oth
er
six
mo
nth
s
�C
he
mic
al ca
rrie
rs t
o in
cre
ase
ca
pa
city
�9
ne
w v
esse
ls t
o c
om
me
nce
op
era
tio
n in
2H
of
20
08
Mari
ne
su
pp
ort
an
d t
ran
sp
ort
ati
on
bu
sin
ess s
eg
men
tMM
ari
ne
ari
ne
su
pp
ort
an
d t
ran
sp
ort
ati
on
bu
sin
ess s
eg
men
tsu
pp
ort
an
d t
ran
sp
ort
ati
on
bu
sin
ess s
eg
men
t
�8
-str
ea
me
r se
ism
ic v
essels
CO
SL
71
9to
co
mm
en
ce
op
era
tio
n in
mid
-20
08
Geo
ph
ysic
al
bu
sin
ess s
eg
men
tG
eo
ph
ysic
al
bu
sin
ess s
eg
men
tG
eo
ph
ysic
al
bu
sin
ess s
eg
men
t
2727
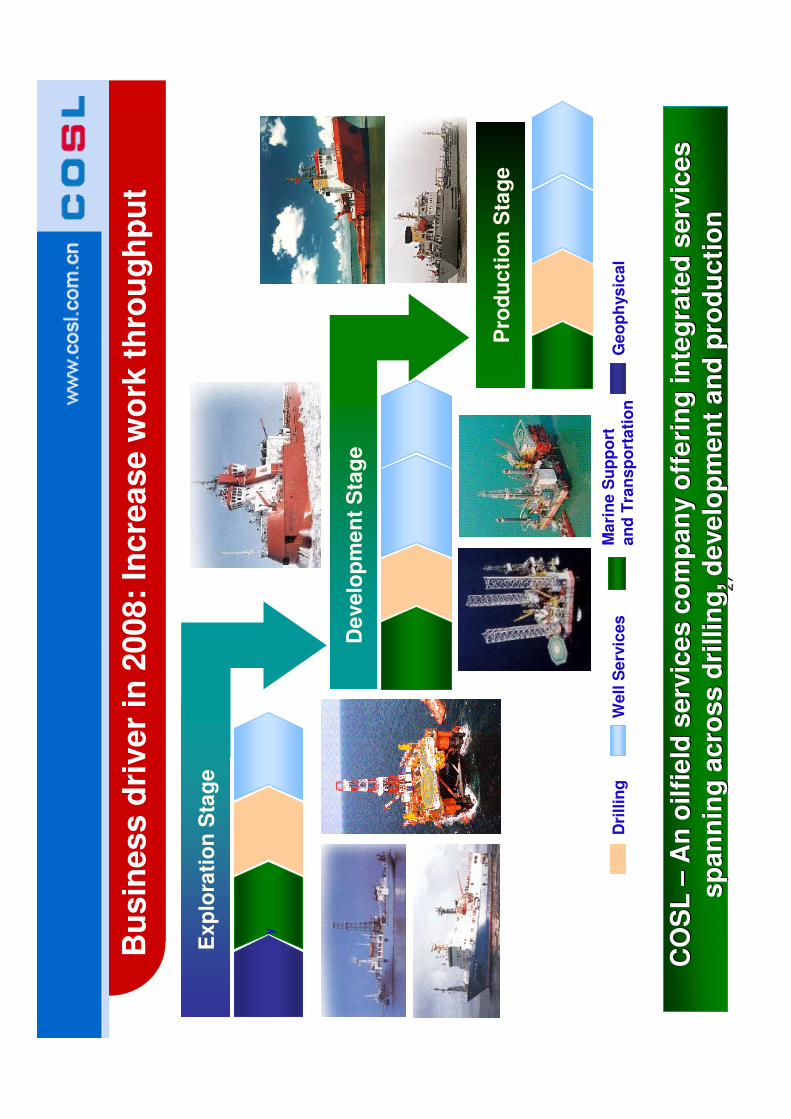
CO
SL
C
OS
L ––
An
oilfi
eld
serv
ice
s c
om
pa
ny o
ffe
rin
g in
teg
rate
d s
erv
ice
s
An
oilfi
eld
serv
ice
s c
om
pa
ny o
ffe
rin
g in
teg
rate
d s
erv
ice
s
sp
an
nin
g a
cro
ss
dri
llin
g, d
eve
lop
me
nt
an
d p
rod
ucti
on
sp
an
nin
g a
cro
ss
dri
llin
g, d
eve
lop
me
nt
an
d p
rod
ucti
on
Ex
plo
rati
on
Sta
ge
Pro
du
cti
on
Sta
ge
y
De
ve
lop
me
nt
Sta
ge
Ge
op
hys
ica
lM
ari
ne
Su
pp
ort
a
nd
Tra
ns
po
rta
tio
nD
rill
ing
We
ll S
erv
ices
Bu
sin
es
s d
river
in 2
008:
Incre
ase w
ork
th
rou
gh
pu
t

2828
Bu
sin
es
s d
river
in 2
008:
Incre
ase w
ork
th
rou
gh
pu
t (c
on
t’d
)
�N
um
ero
us
ma
rke
t o
pp
ort
un
itie
s i
n
dif
fere
nt
sta
ge
s o
f o
ilfi
eld
pro
du
cti
on
�B
es
ide
s i
nc
rea
se
in
wo
rk t
hro
ug
hp
ut
of
log
gin
g,
dir
ec
tio
na
l d
rill
ing
, c
em
en
tin
g
an
d w
ell
co
mp
leti
on
, a
cid
ific
ati
on
, c
rus
hin
g,
sc
ree
n p
ipe
pro
du
cti
on
a
cti
vit
ies
are
ex
pe
cte
d t
o g
row
�U
ptr
en
d i
n C
AP
EX
an
d O
PE
X o
f o
il
co
mp
an
ies
on
oil
fie
ld e
xp
lora
tio
n
�C
NO
OC
an
no
un
ce
d d
isc
ove
ry o
f 1
0
new
oil
an
d g
as
re
se
rve
s i
n N
ov 2
00
7

2929
20,0
00
60,0
00
100,0
00
140,0
00
2002
2003
2004
2005
2006
2007E
25,0
00
50,0
00
75,0
00
2002
2003
2004
2005
2006
2007E
Jack-u
p:
US
D/D
ay
Sem
i-su
bm
ers
ible: :::
US
D/D
ay
Bu
sin
es
s d
river
in 2
008:
Rais
e s
erv
ices p
rices
Uti
lizati
on
to
rem
ain
hig
h d
ue t
o s
tro
ng
dem
an
d,
satu
rate
d c
ap
acit
y,
go
od
cu
sto
mer
rela
tio
nsh
ip a
nd
tig
ht
sch
ed
ule
man
ag
em
en
t
Uti
lizati
on
to
rem
ain
hig
h d
ue t
o s
tro
ng
dem
an
d,
satu
rate
d c
ap
ac
Uti
lizati
on
to
rem
ain
hig
h d
ue t
o s
tro
ng
dem
an
d,
satu
rate
d c
ap
ac
ity,
ity,
go
od
cu
sto
mer
rela
tio
nsh
ip a
nd
tig
ht
sch
ed
ule
man
ag
em
en
tg
oo
d c
usto
mer
rela
tio
nsh
ip a
nd
tig
ht
sch
ed
ule
man
ag
em
en
t

3030
Tap
th
e d
eep
w
ate
r seg
men
t
Exp
an
d f
oo
tho
ld
in o
vers
eas
mark
ets
Ta
rge
ted
So
uth
ea
st
As
ia,
Mid
dle
Ea
st,
Gu
lf
of
Me
xic
o,
Ru
ss
ia a
nd
Afr
ica
Ex
pa
nd
in
to o
ns
ho
re s
erv
ice
s,
leve
rag
ing
o
ur
str
en
gth
in
th
e o
ffs
ho
re m
ark
et.
Ex
pa
nd
pre
se
nc
e i
n t
he
de
ep
wa
ter
se
gm
en
t fo
llo
win
g f
oo
tste
ps
of
oil
co
mp
an
ies
Co
nso
lid
ate
exis
tin
g
mark
et
sh
are
Secu
re f
irst-
mo
ver
ad
van
tag
es in
n
ew
mark
ets
an
d
new
bu
sin
ess
Bu
sin
es
s d
rive
r in
20
08
: E
xp
lore
new
ma
rke
ts, n
ew
bu
sin
es
ses
Pen
etr
ate
in
to
on
sh
ore
mark
ets

3131
�B
reakth
roughs a
chie
ved in d
rilli
ng, w
ell
serv
ices a
nd g
eophys
ical opera
tions in
ove
rseas m
ark
ets
�A
ddin
g m
ore
than U
S 1
00 m
illio
n o
f re
venue to o
nshore
drilli
ng s
erv
ices in b
oth
lo
cal a
nd o
vers
ea m
ark
et
�S
igned a
2-y
ear
geoth
erm
al w
ell
contr
act
with the P
hili
ppin
e N
ational O
il C
om
pany
for
the d
irectional drilli
ng s
erv
ices
RM
B M
n
43.2
%
26.8
%
12.9
%
17.1
%
770
(18.1
%)
Indone
sia
Au
str
alia
Me
xico
Oth
ers
Bre
ak
do
wn
of
Bre
ak
do
wn
of
ove
rse
as
re
ve
nu
e i
n 1
H2
00
7o
ve
rse
as
re
ve
nu
e i
n 1
H2
00
7
RM
B M
n
OOve
rse
as
ma
rke
ts a
dd
ing
mo
me
ntu
mve
rse
as
ma
rke
ts a
dd
ing
mo
me
ntu
m
0
200
400
600
800
1000
1200
2003
2004
2005
20061H2007
0%
2%
4%
6%
8%
10%
12%
14%
16%
18%
20%
ove
rse
as
reve
nu
eo
ve
rse
as/
tota
l
Bu
sin
ess d
river
in 2
008:
Ex
plo
re n
ew
mark
ets
, n
ew
bu
sin
esses (
co
nt’
d)

3232
Ma
rke
tM
ark
et --
ori
en
ted
ori
en
ted
CO
SL
CO
SL
’’ sste
ch
no
log
yte
ch
no
log
y-- d
rive
n s
tra
teg
yd
rive
n s
tra
teg
y
Inte
gra
ted
In
teg
rate
d
Inn
ova
tio
nIn
no
va
tio
n
Le
ap
fro
gL
ea
pfr
og
De
ve
lop
me
nt
De
ve
lop
me
nt
Ta
len
tT
ale
nt
ori
en
ted
ori
en
ted
Bu
sin
es
s d
rive
r in
20
08
: A
cc
ele
rate
te
ch
no
log
y R
&D
Intr
oduced p
roprieta
ry E
LIS
loggin
g s
yste
m
into
dom
estic a
nd o
vers
eas m
ark
ets
Esta
blis
hed the first jo
int la
bora
tory
Intr
oduced c
em
enting s
erv
ices to X
injia
ng
Pro
prieta
ry “
Bohailo
w-d
ensity-
hig
h-s
trength
well
cem
enting technolo
gy
wid
ely
applie
d
CO
SL
’ste
ch
no
log
y s
trate
gy
CO
SL
’ste
ch
no
log
y s
trate
gy
CO
SL
’sap
plicati
on
of
tech
no
log
ies
CO
SL
’sap
plicati
on
of
tech
no
log
ies
Con
ven
tiona
l
Cem
en
t
Lo
w-D
en
sity,
Hig
h-S
tren
gth
Cem
en
t
3333
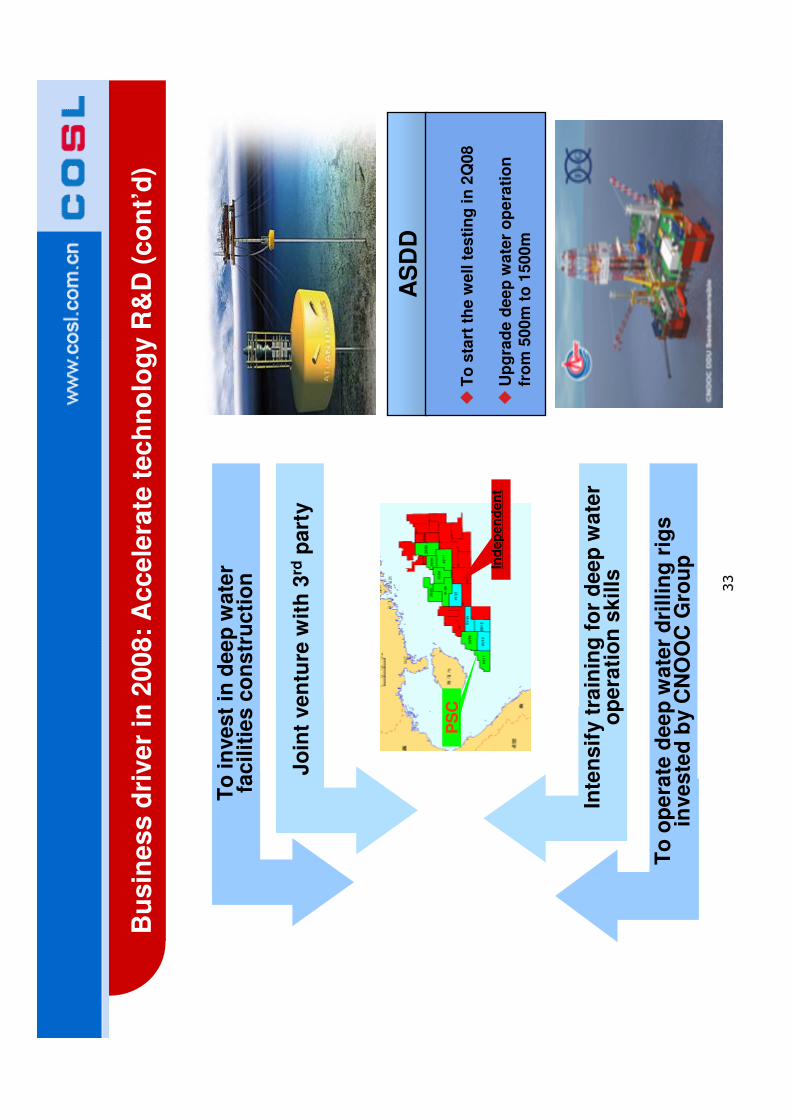
AS
DD
�T
o s
tart
th
e w
ell
tes
tin
g i
n 2
Q08
�U
pg
rad
e d
ee
p w
ate
r o
pe
rati
on
fr
om
50
0m
to
1500
m
PS
C
Ind
ep
en
den
t
Jo
int
ve
ntu
re w
ith
3rd
pa
rty
Inte
ns
ify t
rain
ing
fo
r d
ee
p w
ate
r o
pe
rati
on
sk
ills
To
op
era
te d
ee
p w
ate
r d
rill
ing
rig
s
inve
ste
d b
y C
NO
OC
Gro
up
To
in
ve
st
in d
ee
p w
ate
r fa
cil
itie
s c
on
str
uc
tio
n
Bu
sin
es
s d
rive
r in
20
08
: A
cc
ele
rate
te
ch
no
log
y R
&D
(c
on
t’d
)
3434
Clic
k t
o e
dit
tit
le s
tyle
Th
an
k Y
ou
!


![Defense department-strategic-guidance-010512[1]](https://img.pdfslide.us/doc/110x75/5561860bd8b42ace7d8b4574/defense-department-strategic-guidance-0105121.jpg)