Embed Size (px)
Citation preview
PERCEPTUAL MEASUREMENT OF BREATHY VOICE QUALITY
By
SONA PATEL
A THESIS PRESENTED TO THE GRADUATE SCHOOL OF THE UNIVERSITY OF FLORIDA IN PARTIAL FULFILLMENT
OF THE REQUIREMENTS FOR THE DEGREE OF MASTER OF ARTS
UNIVERSITY OF FLORIDA
2008
1

© 2008 Sona Patel
2

To all who nurtured my intellectual curiosity, academic interests, and sense of scholarship throughout my lifetime, making this milestone possible
3

ACKNOWLEDGMENTS
This research was supported by a grant from the National Institute of Deafness and
Communication Disorders (R21DC006690).
4
TABLE OF CONTENTS page
ACKNOWLEDGMENTS ...............................................................................................................4
LIST OF TABLES...........................................................................................................................6
LIST OF FIGURES .........................................................................................................................7
ABSTRACT.....................................................................................................................................8
CHAPTER
1 BACKGROUND ......................................................................................................................9
Introduction...............................................................................................................................9 The Rating Scale Task ............................................................................................................10 The Magnitude Estimation Task.............................................................................................12 The Matching Task .................................................................................................................14
2 METHODS.............................................................................................................................17
Listeners..................................................................................................................................17 Stimuli.....................................................................................................................................17 Procedures...............................................................................................................................18
Rating Scale Task ............................................................................................................19 Direct Magnitude Estimation Task..................................................................................19 Matching Task .................................................................................................................20
Standards ..................................................................................................................20 Reference signals......................................................................................................21 Threshold measurement ...........................................................................................22 Training ....................................................................................................................22
3 RESULTS...............................................................................................................................26
Reliability ...............................................................................................................................26 Comparison of the Matching and Direct Magnitude Estimation Tasks .................................27 Comparison of the Matching and Rating Scale Tasks............................................................28
4 DISCUSSION.........................................................................................................................35
5 CONCLUSIONS ....................................................................................................................41
LIST OF REFERENCES...............................................................................................................42
BIOGRAPHICAL SKETCH .........................................................................................................44
5
LIST OF TABLES
Table Page 2-1 Klatt-synthesizer parameters used to synthesize the 10 talkers. ........................................24
2-2 Fundamental frequency (F0) and spectral slope of standards............................................25
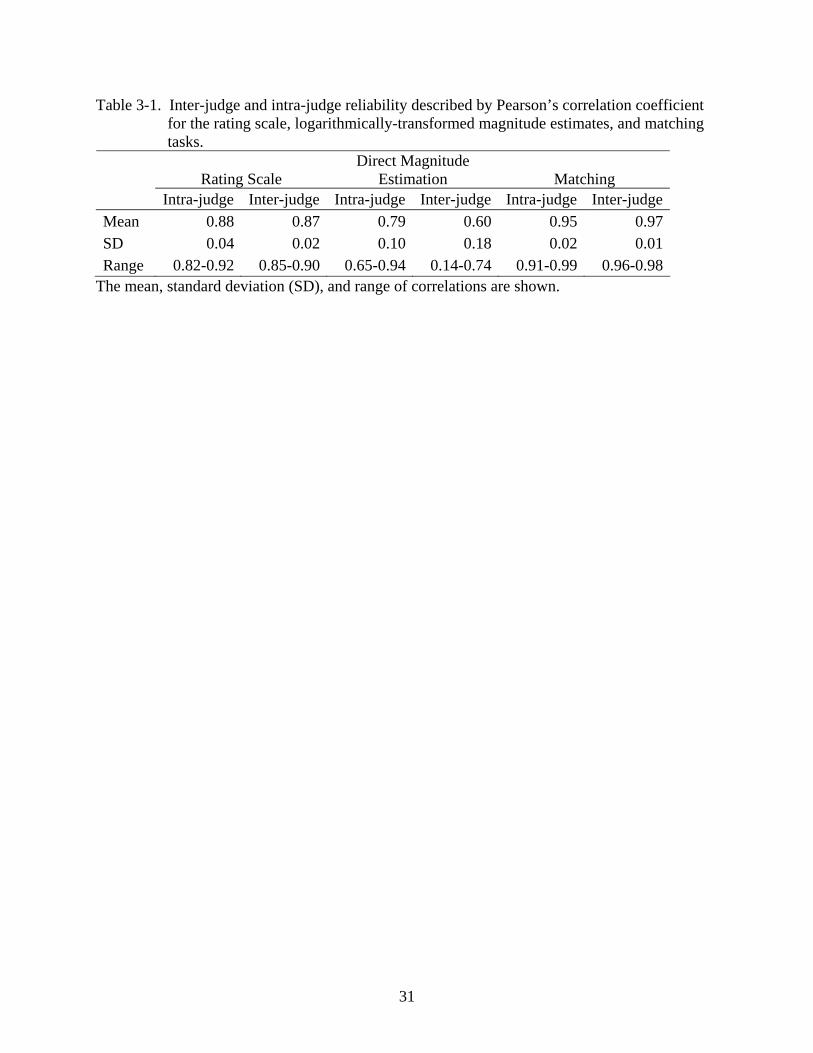
3-1 Inter-judge and intra-judge reliability described by Pearson’s correlation coefficient for the rating scale, logarithmically-transformed magnitude estimates, and matching tasks....................................................................................................................................31
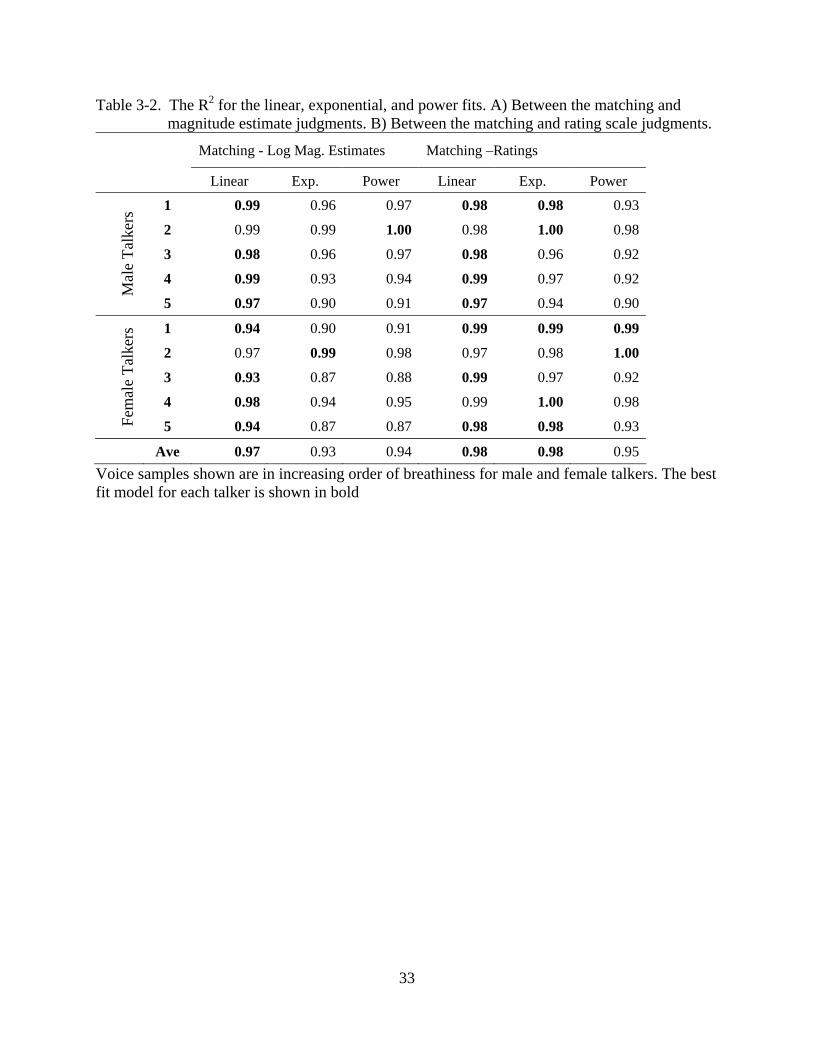
3-2 The R2 for the linear, exponential, and power fits. A) Between the matching and magnitude estimate judgments. B) Between the matching and rating scale judgments.. .........................................................................................................................33
6
LIST OF FIGURES
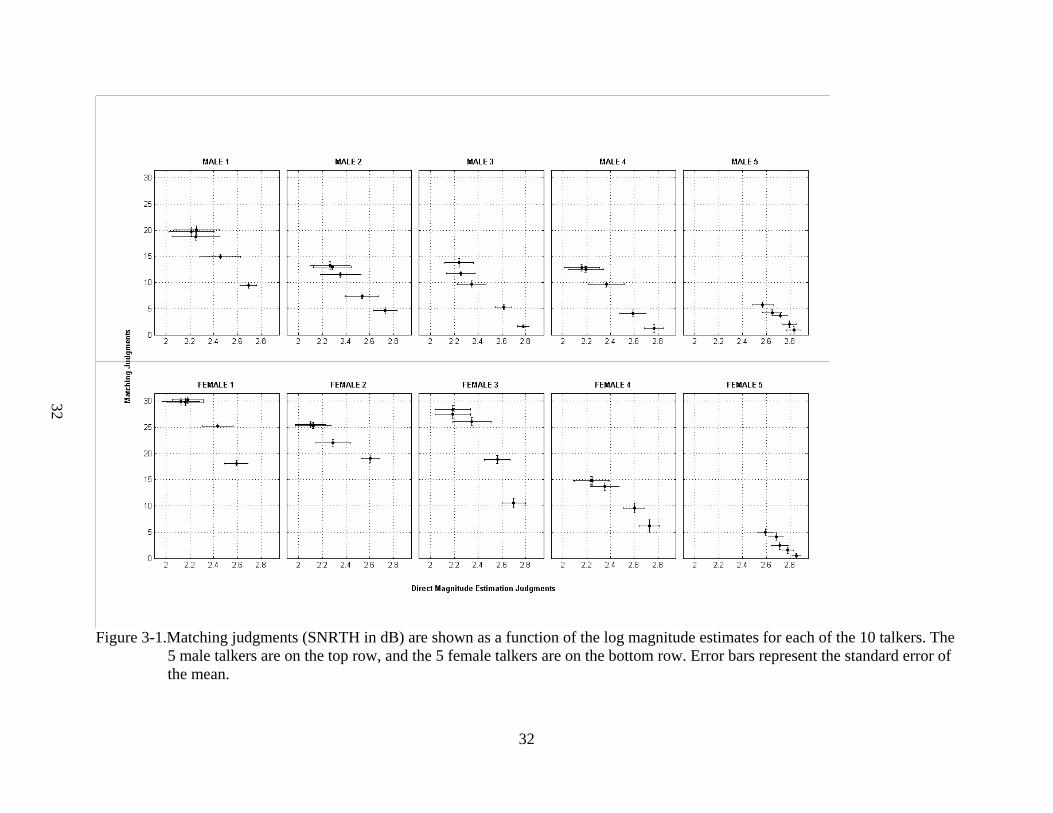
Figure Page 3-1 Matching judgments (SNRTH in dB) are shown as a function of the log magnitude
estimates for each of the 10 talkers....................................................................................32
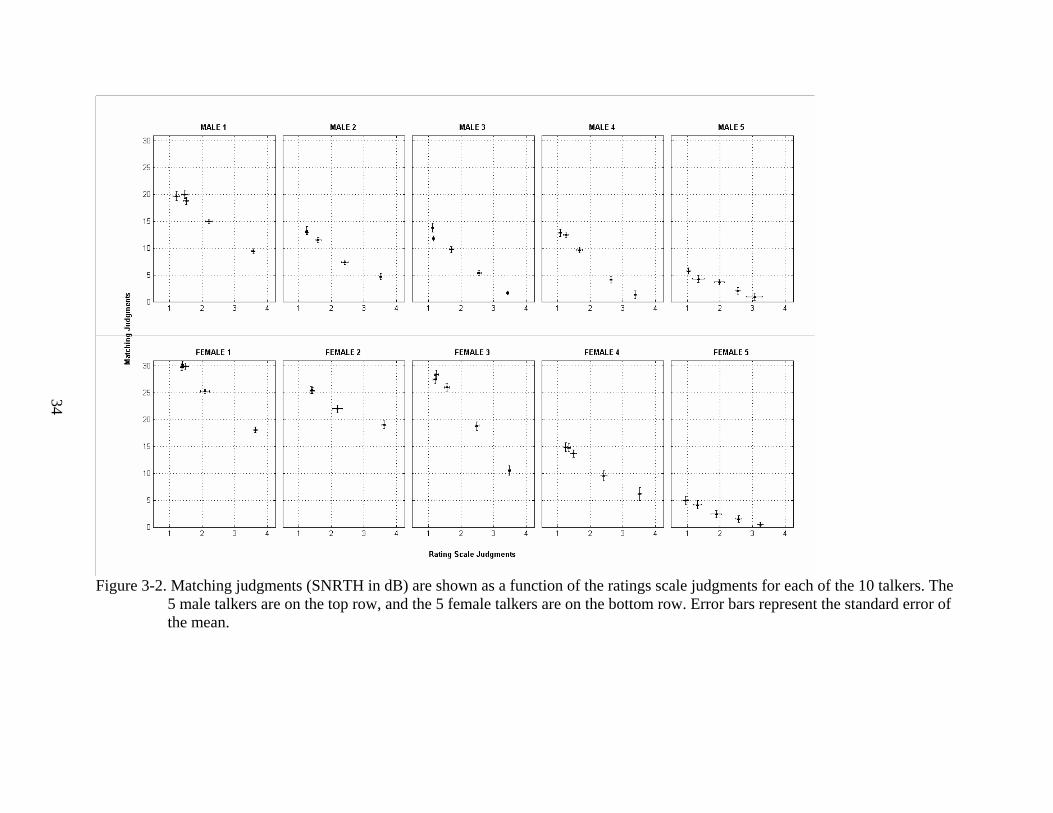
3-2 Matching judgments (SNRTH in dB) are shown as a function of the ratings scale judgments for each of the 10 talkers. .................................................................................34
7
Abstract of Thesis Presented to the Graduate School of the University of Florida in Partial Fulfillment of the
Requirements for the Degree of Master of Arts
PERCEPTUAL MEASUREMENT OF BREATHY VOICE QUALITY
By
Sona Patel
December 2008 Chair: Rahul Shrivastav Major: Communication Sciences and Disorders
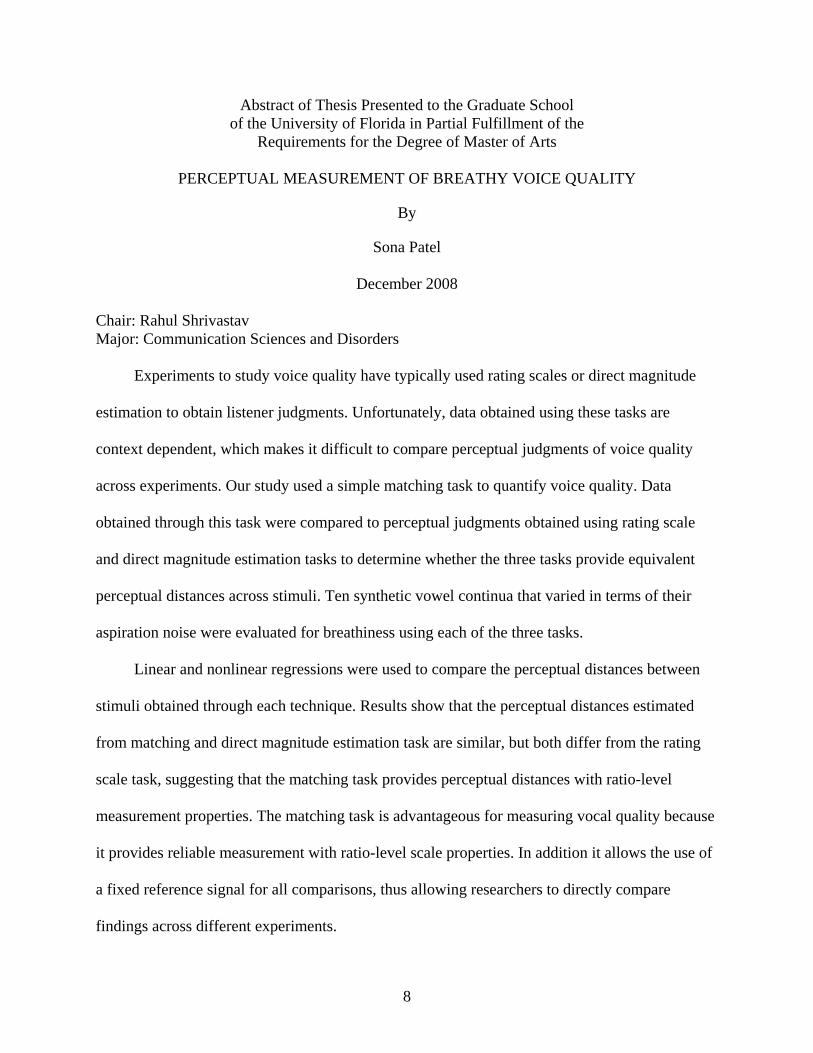
Experiments to study voice quality have typically used rating scales or direct magnitude
estimation to obtain listener judgments. Unfortunately, data obtained using these tasks are
context dependent, which makes it difficult to compare perceptual judgments of voice quality
across experiments. Our study used a simple matching task to quantify voice quality. Data
obtained through this task were compared to perceptual judgments obtained using rating scale
and direct magnitude estimation tasks to determine whether the three tasks provide equivalent
perceptual distances across stimuli. Ten synthetic vowel continua that varied in terms of their
aspiration noise were evaluated for breathiness using each of the three tasks.
Linear and nonlinear regressions were used to compare the perceptual distances between
stimuli obtained through each technique. Results show that the perceptual distances estimated
from matching and direct magnitude estimation task are similar, but both differ from the rating
scale task, suggesting that the matching task provides perceptual distances with ratio-level
measurement properties. The matching task is advantageous for measuring vocal quality because
it provides reliable measurement with ratio-level scale properties. In addition it allows the use of
a fixed reference signal for all comparisons, thus allowing researchers to directly compare
findings across different experiments.
8
CHAPTER 1 BACKGROUND
Introduction
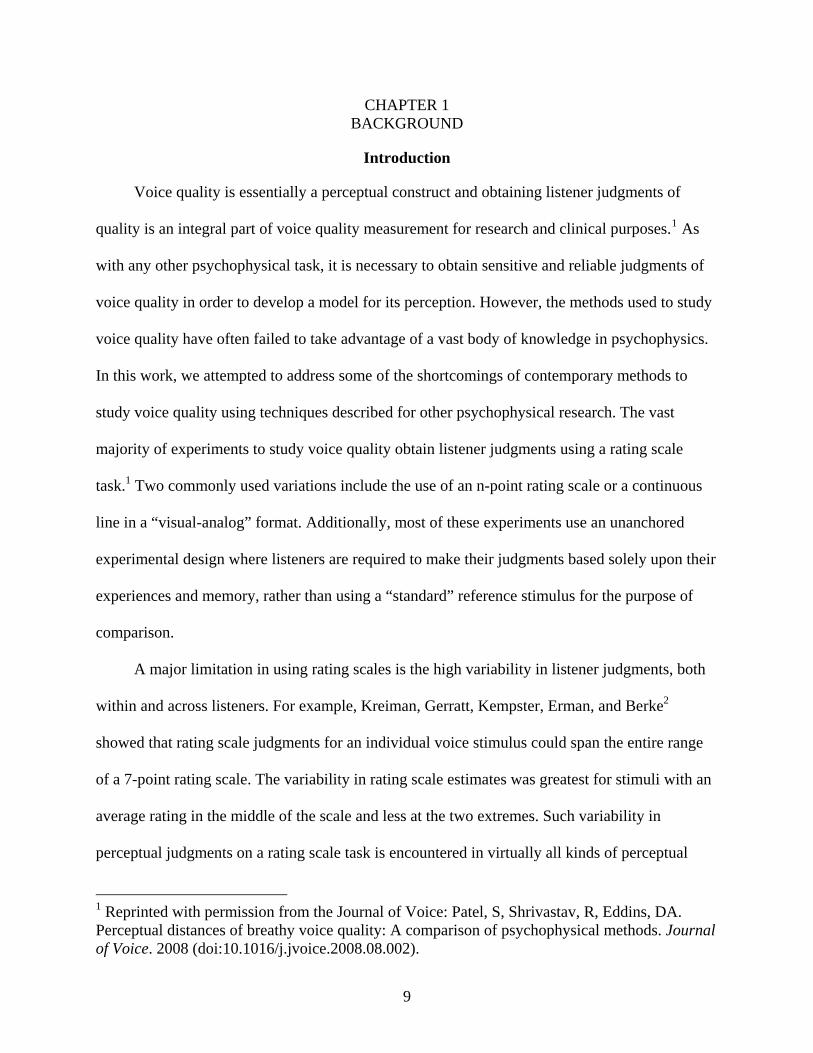
Voice quality is essentially a perceptual construct and obtaining listener judgments of
quality is an integral part of voice quality measurement for research and clinical purposes.1 As
with any other psychophysical task, it is necessary to obtain sensitive and reliable judgments of
voice quality in order to develop a model for its perception. However, the methods used to study
voice quality have often failed to take advantage of a vast body of knowledge in psychophysics.
In this work, we attempted to address some of the shortcomings of contemporary methods to
study voice quality using techniques described for other psychophysical research. The vast
majority of experiments to study voice quality obtain listener judgments using a rating scale
task.1 Two commonly used variations include the use of an n-point rating scale or a continuous
line in a “visual-analog” format. Additionally, most of these experiments use an unanchored
experimental design where listeners are required to make their judgments based solely upon their
experiences and memory, rather than using a “standard” reference stimulus for the purpose of
comparison.
A major limitation in using rating scales is the high variability in listener judgments, both
within and across listeners. For example, Kreiman, Gerratt, Kempster, Erman, and Berke2
showed that rating scale judgments for an individual voice stimulus could span the entire range
of a 7-point rating scale. The variability in rating scale estimates was greatest for stimuli with an
average rating in the middle of the scale and less at the two extremes. Such variability in
perceptual judgments on a rating scale task is encountered in virtually all kinds of perceptual
1 Reprinted with permission from the Journal of Voice: Patel, S, Shrivastav, R, Eddins, DA. Perceptual distances of breathy voice quality: A comparison of psychophysical methods. Journal of Voice. 2008 (doi:10.1016/j.jvoice.2008.08.002).
9
judgments. This finding has been addressed by several researchers who have proposed different
approaches to explain such observations.3-5 These approaches also allow experimenters to design
perceptual tests in ways that account for the variability in perceptual judgments. For example,
Shrivastav, Sapienza, and Nandur6 conducted an experiment to determine whether the low
agreement and high variability across listeners could be minimized by averaging multiple ratings
of a stimulus and standardizing the averaged scores. Listeners were asked to judge breathiness of
vowel stimuli using a 5-point rating scale. Ten repetitions of each stimulus were presented using
ten randomized lists. The probability of exact agreement for judgments based on one list (one
repetition) was calculated as the proportion of listeners who assigned the same rating for a given
stimulus. These values were then averaged across all stimuli. The probability of agreement for
the averaged judgments across two or more lists was calculated as the proportion of listeners
who were within 0.5 above and below the mean rating for a stimulus. These values were also
averaged across all stimuli. The probability of agreement for a single and multiple ratings were
also calculated using the z-transformed scores. Results showed that both agreement and
reliability across listeners improved when multiple ratings were averaged and standardized
scores were used instead of the actual ratings. Therefore, although the variability in voice quality
ratings poses many challenges in everyday situations (such as in a voice clinic), the variability in
listener judgments can be minimized in an experimental setup as long as the experimental
procedures are well designed and controlled.
The Rating Scale Task
Nevertheless, psychophysical scaling data obtained using rating scales has additional
limitations. One problem relates to the level of measurement obtained when listeners are asked to
make perceptual judgments on a rating scale. In the common parlance of voice quality research
the use of an n-point rating scale has often been referred to as an “equal appearing interval”
10
(EAI) scale, suggesting that the data obtained in these experiments is made on an interval scale
(i.e. each unit on the scale is perceptually equidistant from its neighboring units). Such a
conclusion necessitates two basic assumptions. The first assumption is that listeners are able to
perform an additive operation when making subjective judgments for voice quality. In other
words, it assumes that listeners are able to evaluate the voice quality of samples in terms of
constant-perceptual distances from neighboring stimuli. Thus, if a voice is rated as a “3” on a 7-
point rating scale, it implies that this voice is equally different from voices rated as “2” or “4” on
the same scale. Secondly, an EAI scale further necessitates that listeners are aware of the total
range of variation represented by the test stimuli and that they are able to effectively divide this
range into subjectively equal categories. However, there is little evidence to support either of
these assumptions in voice quality research. Indeed, considerable research has shown that
listeners are not very good at describing prothetic continua using an interval scale.7-8 For
example, Zraick and Liss9 performed an experiment to investigate the nature of data obtained for
nasality judgments. Listeners performed both rating scale (referred to as an EAI scale) and direct
magnitude estimation tasks to judge the nasality of 25 synthetically generated vowel stimuli.
Results suggested that the relation between ratings and magnitude estimates was best described
by a curvilinear relation (a second-order polynomial function), suggesting that nasality lies on a
prothetic continuum. In addition, the magnitude estimation task was shown to provide better
inter-judge and intra-judge reliability than the rating scale task.
Similarly, Toner and Emanuel10 examined the perceived roughness of two vowels to
determine whether this percept can be described as a prothetic dimension. Listeners judged
roughness using rating scale (“EAI method”) and direct magnitude estimation tasks. Perceptual
judgments obtained using each task were then plotted against each other to perform linear and
11
nonlinear regression. This analysis showed that a second-order polynomial best fit the perceptual
judgments of both vowels, although the difference between linear and nonlinear fits was small.
Still, the curvilinear relation signifies a prothetic continuum, which would indicate that the
intervals on the rating scale do not actually represent equal intervals. Therefore, a magnitude
estimation task may be better suited for obtaining judgments of rough voice quality, although the
authors concluded that further investigation was required.
Hence, the utility of rating scales in the measurement of voice quality may be
questionable.9 Indeed, in much of psychophysical research, a true EAI rating scale is achieved
only if successive items on the rating scale are somehow determined to be perceptually
equidistant from its neighbors, as described by Thurstone11. However, this intermediate step has
seldom been addressed in voice quality research, further questioning the “equal-appearing
interval” nature of the data thus obtained. Therefore, until further evidence about the equal –
interval nature of rating scale data is obtained, it is best to treat the ratings as being ordinal in
nature.6 If certain assumptions regarding the distribution of this ordinal data are met, then
additional statistical computations may be used to estimate interval-level information from the
same ordinal data.4
The Magnitude Estimation Task
The first of the two problems described above has been addressed in great detail by
Stevens.7, 12 His solution to the problem was to use a direct magnitude estimation task, where
listeners are asked to judge ratios of sensation (instead of intervals) and to use a virtually
unlimited range of numbers, including fractions, to describe the magnitude of sensation for
prothetic continua. This method has been successfully used to study many different perceptual
continua, resulting in a power function between the physical and perceptual magnitude of the
stimulus known as Steven’s Law. Although the exponent of the power function shows
12
considerable variability across different types of perceptual continua, Stevens7 argued that it
suggests the general form in which physical stimuli may be mapped to a psychological sensation.
A very limited number of experiments have used techniques such as direct magnitude
estimation9,10 or matching13, 14 to obtain perceptual judgments of voice quality. Since the goal of
the present work is to understand how a physical signal (the voice) is related to a psychological
construct (its quality), we may assume that a direct magnitude estimation task also may be useful
for the study of voice quality perception.
However, the direct magnitude estimation task is not without its own limitations. One
problem seen in both direct magnitude estimation and rating scale tasks is that listener responses
are highly dependent on the context. For example, perceptual judgments on these tasks are biased
significantly by factors such as the number of stimuli tested in an experiment, the perceptual
range of the attribute being studied, the frequency of occurrence of different stimuli, etc.4, 5, 8
This poses a significant hurdle because the results from one experiment cannot be directly
compared to that of another. Since each experiment may use a different number of stimuli, often
with a different range and frequency of the attribute under study, the associated contextual
variability is difficult to identify and take into account. This makes it difficult to generate an
appropriate model for voice quality perception based on magnitude scaling or rating scale data
because the results from either experiment may fail to generalize to a new set of data.
Direct magnitude estimation, and Steven’s Law itself, are not without other criticisms as
well. Poulton8 has described a number of factors that bias listener judgments made in a direct
magnitude estimation task. These include, for example, the logarithmic response bias, centering
bias, contraction bias, etc. Many of these biases result from how listeners use numbers to reflect
the magnitude of sensation. However, since one cannot directly access the magnitude of a
13
sensation, the use of numbers often cannot be avoided. Nevertheless, certain steps can be taken
to minimize the effects of such bias and to obtain perceptual judgments that are less influenced
by factors such as the context, range- and frequency- effects. One approach to minimize such
errors is to use a matching task to obtain perceptual judgments.
The Matching Task
A matching task provides listeners with a standard against which all comparisons can be
made, thereby minimizing many biases associated with rating scale and the direct magnitude
estimation tasks. In this task, listeners are asked to manipulate a common reference signal to
match the magnitude of one attribute of a test stimulus. For example, the loudness of a test sound
may be judged by manipulating the sound pressure level of a 1 kHz tone until it is perceived to
have the same loudness as the test stimulus. The sound pressure level (SPL) of the 1 kHz tone
then serves as a measure of loudness (measured in units called “Phons”). Although both stimuli
in this example use the same sensory modality (within-modality matching), the same comparison
can be made across two different sensory modalities as well (cross-modality matching). For
example, observers may judge the loudness of a sound by manipulating the intensity of a light. In
both cases, the reference signal acts as a yardstick that listeners can use in making perceptual
judgments of the test stimuli. Using the same yardstick to obtain perceptual judgments for
different stimuli across different listeners and even across different experiments can help
minimize many of the biases that plague ratings scale or direct magnitude estimation data. For
these reasons, matching tasks are often the preferred method for measuring psychophysical
continua and have been successfully used to study many different perceptual phenomena.
A matching task has also been used to study voice quality. In a series of experiments
published over the last decade, Kreiman, Gerratt, and their colleagues have proposed a method to
study voice quality using a novel matching task.13, 14, 15 In this approach, they ask listeners to
14
manipulate one or more parameters of a specially designed speech synthesizer until the quality of
the synthesized speech sample matches that of the test stimulus. The settings of the synthesizer
are then assumed to quantify the magnitude of the quality being studied. While the general
approach taken by Kreiman and colleagues has many similarities with the traditional matching
tasks used in psychophysics, some key differences remain. Primarily, this matching technique
allows listeners to vary multiple parameters of the vowel acoustic signal until a desired
perceptual match in quality is obtained. In contrast, most psychophysical research has used a
reference signal that can only vary along a single physical dimension, making it significantly
easier to compute perceptual distances between various test stimuli. This difference in
methodology likely reflects a somewhat different goal between the two approaches. The primary
aim of Kreiman and colleagues in using a matching task has been to achieve a high degree of
agreement across listeners judging voice quality. In contrast, most psychophysical experiments
that use matching tasks focus on finding unbiased perceptual distances between stimuli. These
experiments are less concerned with exact agreement across listeners because these typically
assume some variability in behavioral responses to be inevitable and model the overall response
by studying the central tendency of its distribution.
In the present research we sought to compare three methods for obtaining perceptual
judgments of voice quality - a standard matching task, a direct magnitude estimation task, and
rating scale task. The objective for this comparison was to determine whether a matching task
would result in the same perceptual distances between stimuli as the direct magnitude estimation
and/or the rating scale task. The search for an appropriate method to obtain perceptual data has
been necessitated by the observation that, as with other psychophysical judgments, perceptual
distances of vocal quality estimated using a rating scale are highly context-dependent. This has
15
an adverse effect on any attempt to generate a model for voice quality perception. Unlike
Kreiman et al.2, this research is not intended to address individual variability in the absolute
magnitude of individual judgments. In our approach, this variability is modeled as noise and
addressed through averaging and, if necessary, standardizing multiple judgments of each
stimulus.6
16
CHAPTER 2 METHODS
Listeners
Twenty-five listeners (mean age: 22 years) were recruited to participate in this study.
Listeners participated in one of three listening tasks – a rating scale task, a direct magnitude
estimation task, or a matching task. Five listeners participated in multiple tasks resulting in a
total of 10 listeners in each task. Since the three tests were separated by a period of at least three
months, practice effects for these listeners, if any, are likely to be negligible. All participants
were native speakers of American English and had normal hearing bilaterally (air-conduction
pure-tone threshold below 20 dB Hearing Level or HL at 250 Hz, 500 Hz, 1000 Hz, 2000 Hz,
and 4000 Hz; 15). All participants were students from either the Department of Communication
Sciences and Disorders (CSD) or the Program in Linguistics at the University of Florida.
Students with the Linguistics Program were required to have taken at least one class in CSD.
This selection criterion was used to identify listeners with a relatively equal exposure and
training in listening to breathy voice quality. Listeners were paid for participating in the
experiment.
Stimuli
Ten samples of the vowel /a/ (5 male, 5 female), each 500-ms in duration, were
synthesized using a Klatt- synthesizer (Sensimetrics Corporation, Malden, MA) with the
Liljencrants-Fant or LF-model17 as the glottal excitation source. The parameters used to
synthesize these voices were based on naturally occurring voices selected from the Kay
Elemetrics Disordered Voice Database. Each of these vowel samples is henceforth referred to as
a talker. These talkers were selected using stratified sampling from a pilot experiment to ensure
selection of voices that represented a wide range of breathiness in the Kay Elemetrics Disordered
17
Voice database. The aspiration noise level (AH) was systematically manipulated for each of
these ten talkers to obtain ten stimulus continua varying in breathiness. AH was selectively
modified because a number of experiments have found the relative aspiration noise level to be
the primary cue for breathiness.18-20
The range of AH used to generate each stimulus continua was determined in a pilot
experiment. First, 17 versions of each synthetic vowel were generated. These were identical in
all respects except for their AH-level, which ranged from 0 dB to 80 dB in 5 dB steps. This range
of AH represents the maximum permissible range of the synthesizer. A pilot listening test was
conducted where three listeners were asked to judge each stimulus as being “natural” or
“synthetic”. The range of AH that resulted in the perception of “natural” stimuli at least 2/3 of
the time was determined for each vowel sample. This range of AH was used to create the stimuli
tested in this experiment.
The range of AH obtained for each talker was divided into ten equal perceptual steps,
thereby resulting in a continuum of 11 tokens varying in AH, Thus, a total of 110 stimuli were
generated for this experiment (10 talkers X 11 stimuli per talker). The parameters used for
generating these stimuli are shown in Table 2-1. Finally all stimuli were shaped to have rise and
decay times of 10 ms and were scaled to have equal root-mean-squared (RMS) energy. A gradual
onset and offset were needed to avoid a click when these stimuli are played during listening
experiments. The RMS energy of all stimuli was equated to minimize loudness differences
between stimuli in order to reduce any bias in perceptual judgments of breathiness arising from
differences in loudness.
Procedures
All listeners were tested individually in a single-walled, sound-treated room. In each of the
three tasks, all stimuli were presented monaurally in the right ear at 75 dB SPL using the RP2
18
processor (Tucker-Davis Technologies, Inc., Alachua, FL) with ER-2 (Etymotic, Inc., Elk Grove
Village, IL) ear inserts. The stimuli were not presented binaurally or diotically to avoid any
binaural interaction effects. Such effects are not easily modeled by loudness models which have
previously been used to predict breathiness from a vowel acoustic signal.20 All experiments were
controlled automatically through the software, SykofizX (Tucker-Davis Technologies, Inc.).
Listeners made their responses using a computer monitor and keyboard. The test procedures for
the three perceptual tasks were as follows.
Rating Scale Task
The rating scale task was completed using the procedures described by Shrivastav et al.6
This task consisted of rating ten blocks of stimuli. Each block included five repetitions of each
stimulus from a single talker. Listeners were asked to rate the severity of breathiness for each
stimulus using a 7-point scale, where “1 = minimal breathiness” and “7 = maximum
breathiness.” No definition of breathiness was provided to the listeners. The order of stimuli
within each block and the order of the blocks were randomized across listeners. Listeners were
provided a short (3-5 minute) break periodically to maintain optimum level of attention and to
minimize fatigue. The rating task was completed in a single 1-hour session.
Direct Magnitude Estimation Task
The direct magnitude estimation task also consisted of 10 blocks of stimuli. As in the
rating task, each block consisted of five repetitions of each stimulus from a single talker
continuum. Listeners estimated the breathiness of each stimulus using a number between 1 and
1000. It was specified that the numbers should represent the ratio of breathiness across samples.
For example, a stimulus perceived to be twice as breathy as the previous stimulus would have to
be given double the score. No anchor was provided and breathiness was not defined for the
19
listeners. The order of stimuli within each block and the order of the blocks were randomized
across listeners. Once again, listeners were tested in a single 1-hour session.
Matching Task
In the matching task, listeners heard pairs of stimuli and were asked to determine whether
the breathiness of a reference stimulus was lesser or greater than that of the test stimulus. In a
classical psychoacoustic matching task, the signal presented first is the one being evaluated and
is referred to as the standard. This is followed by a second stimulus that listeners can manipulate
systematically. This stimulus is called the signal. Listeners are allowed to vary some aspect of
the signal until they find the signal and the standard to be perceptually equal in terms of the
attribute under study. In keeping with this notation scheme, the matching task described here
presented listeners two stimuli in each trial. Listeners first heard the talker stimulus being
evaluated for breathiness (henceforth called the standard). This was followed by a reference
stimulus (henceforth called the signal). Listeners were required to decide whether the signal was
more breathy or less breathy than the standard. If the signal was perceived to be more breathy
than the standard, then the signal-to-noise ratio (SNR) of the signal was increased. However, if
the signal was perceived to be less breathy than the standard, then the signal SNR was decreased.
This process was repeated until the listener perceived both the signal and the standard to have
equal breathiness. When a perceptual match in breathiness was obtained, listeners responded by
clicking on a button marked “equal breathiness.” The SNR of the signal at which it was
perceived to have the same breathiness as the standard was used as a measure of breathiness of
the standard.
Standards
Only five of the eleven stimuli from each standard were evaluated with the matching task.
Fewer stimuli were tested because, (i) this task typically required a longer test time than the
20
rating scale and direct magnitude estimation tasks and, (ii) an analysis of the data obtained using
the rating scale and direct magnitude estimation tasks had shown little difference in the
magnitude of breathiness for the first few stimuli in most (8 out of 10) talker continua. Therefore,
five stimuli from each of the 10 talkers were used, resulting in 50 standards.
Reference signals
The signal always consisted of a sawtooth wave mixed with a broadband noise at a known
SNR. However, both the sawtooth and the noise were customized for each talker. The sawtooth
waves were generated to match the fundamental frequency and spectral slope for each standard,
and the broadband noises were generated by filtering white noise to match the overall spectral
slope of each of the ten sawtooth stimuli. The fundamental frequency was determined based on
the synthesis parameter (F0). The spectral slope can be estimated as the difference between the
first harmonic amplitude and the third formant amplitude (H1-A3). However, the harmonics in
the third formant region are often masked by aspiration noise. Since some of the voice standards
contain high levels of aspiration noise, it was difficult to discern the level of the harmonics from
the noise. Therefore, spectral slope was estimated by comparing the difference in the level of the
first harmonic and the harmonic closest to 1000 Hz.
Next, a sawtooth wave of the same fundamental frequency as each talker and a white noise
were generated using SykofizX (Tucker-Davis Technologies, Inc.). A low-pass filter with an
attenuation rate matching the spectral slope of the reference signal was generated in MATLAB
(Mathworks, Inc.). The cutoff frequencies beyond which the noises were attenuated were based
on the fundamental frequency of each talker. The 10 filter coefficients were saved and imported
into SykofizX. The spectral slopes of the sawtooth and white noise signals were modified in
SykofizX using the filter coefficients. Table 2-2 shows the fundamental frequencies (the filter
cutoff frequencies) and the spectral slopes (filter attenuation rates) for each of the ten standards.
21
Such customization of the signal resulted in similar pitch and loudness for the signal and
standard stimuli.
Threshold measurement
Each standard was tested eight times (each test is called a run). Four of these runs were
initiated with the signal at a very high SNR, so that it was less breathy than the standard
(ascending run). The remaining four runs were initiated with the signal at a low SNR, so that it
was perceived to be more breathy than the standard (descending run). The order of ascending
and descending runs was interleaved. Psychophysical research on the Method of Limits and the
Method of Adjustment has shown that the initial value influences the perceived threshold.21 A
commonly used technique to counter this effect is to average the thresholds obtained through an
equal number of ascending and descending runs, as performed in this study (e.g., 22-25). Hence,
the SNR at which the signal and standard were judged to have equal breathiness for each of these
eight runs were averaged to calculate the SNR threshold (SNRTH) for that voice. The SNRTH for
each standard was used as a measure of its breathiness. The matching task was completed in ten
blocks, each consisting of four ascending and four descending runs of a single voice continuum.
The order of the blocks and the order of standards within each block were randomized across
listeners. Listeners were provided a short (3-5 minute) break after each block to maintain
optimum level of attention and to minimize fatigue.
Training
Listeners were first given a short training session to become accustomed to the type of
judgments they would be making. The goal of this training was to familiarize listeners with the
task and to emphasize that they should be attending to breathiness and not other features of
speech. Natural samples of the vowel /a/ and three sentences from different talkers were selected
as stimuli for this training from a large database of disordered voices. The experimenter
22
randomly selected and played two of these voices over computer speakers, to represent the
stimulus presentation in the matching task. Some of these pairs varied in breathiness and others
varied in pitch. Listeners were reminded multiple times to judge breathiness and not pitch.
Subjects were informally asked if they could perceive the difference in breathiness between the
two stimuli, to mimic the type of decision listeners would have to make in the matching task. No
feedback was provided. Both the practice and test portions of the matching task were completed
in three to four, 1-hour to 1.5 hour sessions within a two-week period.
23
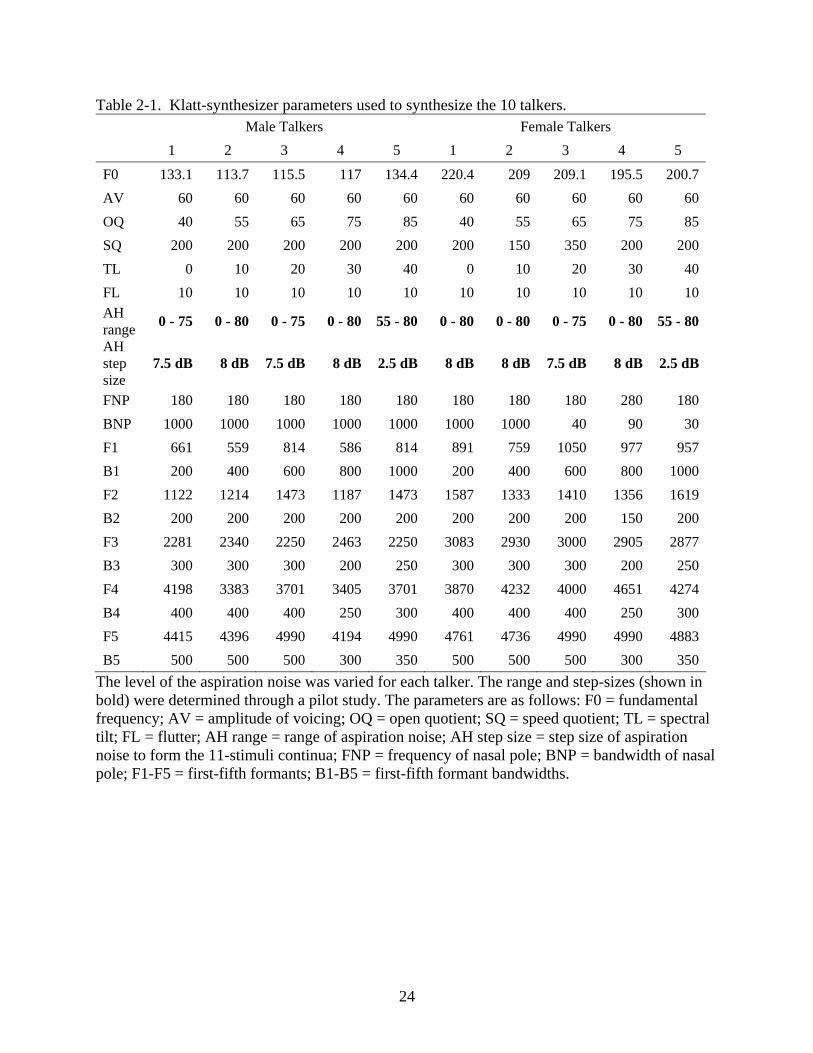
Table 2-1. Klatt-synthesizer parameters used to synthesize the 10 talkers. Male Talkers Female Talkers 1 2 3 4 5 1 2 3 4 5
F0 133.1 113.7 115.5 117 134.4 220.4 209 209.1 195.5 200.7AV 60 60 60 60 60 60 60 60 60 60OQ 40 55 65 75 85 40 55 65 75 85SQ 200 200 200 200 200 200 150 350 200 200TL 0 10 20 30 40 0 10 20 30 40FL 10 10 10 10 10 10 10 10 10 10AH range 0 - 75 0 - 80 0 - 75 0 - 80 55 - 80 0 - 80 0 - 80 0 - 75 0 - 80 55 - 80
AH step size
7.5 dB 8 dB 7.5 dB 8 dB 2.5 dB 8 dB 8 dB 7.5 dB 8 dB 2.5 dB
FNP 180 180 180 180 180 180 180 180 280 180BNP 1000 1000 1000 1000 1000 1000 1000 40 90 30F1 661 559 814 586 814 891 759 1050 977 957B1 200 400 600 800 1000 200 400 600 800 1000F2 1122 1214 1473 1187 1473 1587 1333 1410 1356 1619B2 200 200 200 200 200 200 200 200 150 200F3 2281 2340 2250 2463 2250 3083 2930 3000 2905 2877B3 300 300 300 200 250 300 300 300 200 250F4 4198 3383 3701 3405 3701 3870 4232 4000 4651 4274B4 400 400 400 250 300 400 400 400 250 300F5 4415 4396 4990 4194 4990 4761 4736 4990 4990 4883B5 500 500 500 300 350 500 500 500 300 350
The level of the aspiration noise was varied for each talker. The range and step-sizes (shown in bold) were determined through a pilot study. The parameters are as follows: F0 = fundamental frequency; AV = amplitude of voicing; OQ = open quotient; SQ = speed quotient; TL = spectral tilt; FL = flutter; AH range = range of aspiration noise; AH step size = step size of aspiration noise to form the 11-stimuli continua; FNP = frequency of nasal pole; BNP = bandwidth of nasal pole; F1-F5 = first-fifth formants; B1-B5 = first-fifth formant bandwidths.
24
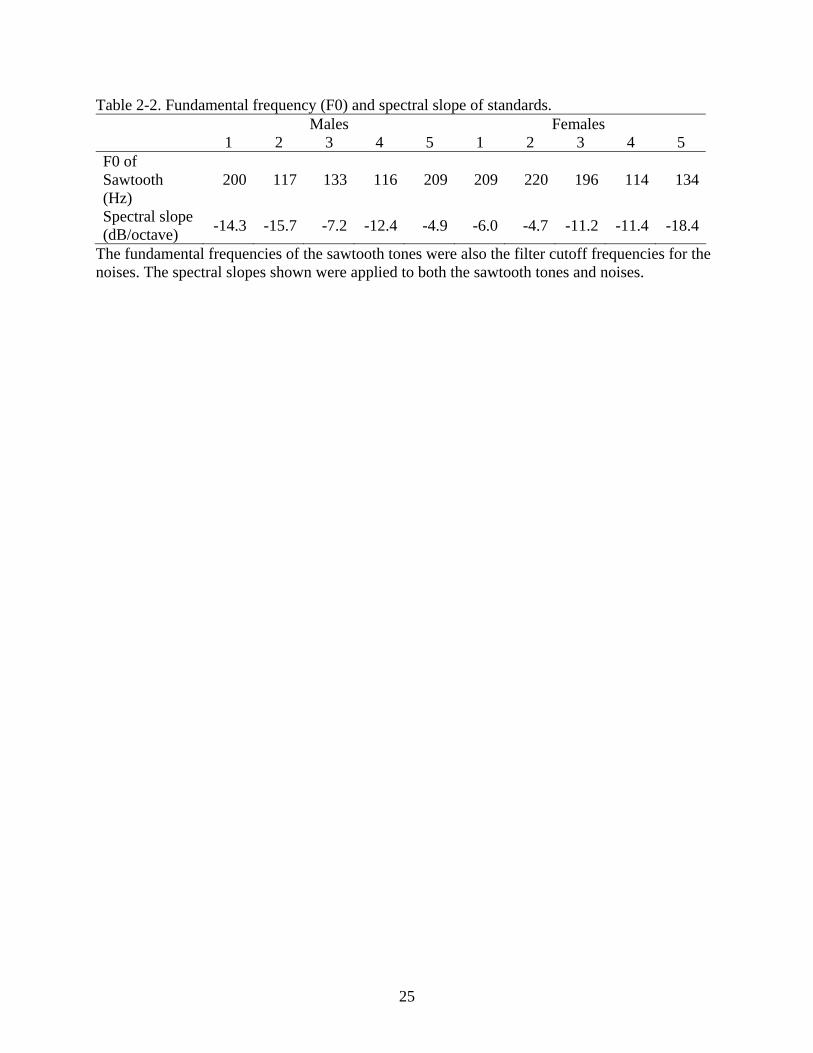
Table 2-2. Fundamental frequency (F0) and spectral slope of standards. Males Females 1 2 3 4 5 1 2 3 4 5
F0 of Sawtooth (Hz)
200 117 133 116 209 209 220 196 114 134
Spectral slope (dB/octave) -14.3 -15.7 -7.2 -12.4 -4.9 -6.0 -4.7 -11.2 -11.4 -18.4
The fundamental frequencies of the sawtooth tones were also the filter cutoff frequencies for the noises. The spectral slopes shown were applied to both the sawtooth tones and noises.
25
CHAPTER 3 RESULTS
Reliability
Intra-judge and inter-judge reliability were measured for each of the three tasks using
Pearson’s correlation coefficient. Reliability for the direct magnitude estimation judgments was
calculated on the logarithmic transform of the absolute magnitude estimates because these
judgments are assumed to be made on the ratio scale. Intra-judge reliability for the rating scale
and the direct magnitude estimation judgments were determined by calculating the Pearson’s
correlation between each of the five judgments made by listeners. Recall that all eleven stimuli
from each talker were tested in the rating scale and direct magnitude estimation tasks, but only
five of the eleven stimuli were tested in the matching task. In order to compare data across the
three tasks, the correlations reported here were computed using only those five stimuli from each
talker that were used across all three experimental tasks. The average Pearson’s correlation was
0.88 (standard deviation or SD: 0.04) and 0.79 (SD: 0.10) for the rating scale and direct
magnitude estimation tasks, respectively. Intra-judge reliability for the matching task was
measured by calculating the Pearson’s correlation between the SNRTH for the eight runs of each
stimulus by each listener. The average intra-judge correlation across listeners was 0.95 (SD:
0.02). A one-way ANOVA was performed to determine whether the mean intra-judge reliability
obtained used the three tasks were statistically different. A significant main effect was found
(F(2,27) = 16.178; p < 0.001). Post-hoc comparisons using the Bonferroni correction, showed that
intra-listener reliability for the rating scale and matching participants were significantly higher
than the reliability of the magnitude estimation participants (p = 0.011 and p < 0.001, for the
rating scale and matching tasks, respectively). On average, the intra-rater reliability for matching
26
was slightly greater than that for the rating scale task, but these difference were not statistically
significant (p = 0.057).
Inter-judge reliability for the rating scale data, log direct magnitude estimation data, and
matching judgments were determined by calculating the Pearson’s correlation coefficient
between the average judgments among the 10 listeners. The averages were 0.87 (SD: 0.02), 0.60
(SD: 0.18), and 0.97 (SD: 0.01), for the rating, direct magnitude estimation and matching tasks,
respectively. Once again, these numbers were computed using only those stimuli that were used
across all three tasks. A one-way ANOVA was performed to determine whether the inter-judge
reliability differed significantly among the three tasks. A significant main effect was found
(F(2,27) = 34.409; p < 0.001). Post hoc comparisons using the Bonferroni correction showed a
significant difference in inter-judge reliability between the matching and magnitude estimation
measures (p < 0.001) and the rating scale and magnitude estimation measures (p = 0.001). The
mean inter-judge reliability between the matching and rating scale tasks was not statistically
significant (p = 0.114). The somewhat poor inter-judge reliability for the direct magnitude
estimation task is biased by one listener who showed poor correlation with the judgments of all
other listeners (average correlation: 0.14; SD: 0.18). If the data from this listener were discarded
from the analysis, the average inter-judge reliability increased to 0.71 (SD: 0.07). The average
intra-judge and inter-judge reliability for each of the three tasks are summarized in Table 3-1.
Comparison of the Matching and Direct Magnitude Estimation Tasks
The perceptual judgments of breathiness obtained from the matching and the direct
magnitude estimation tasks were compared using linear and nonlinear regression to determine
whether the two tasks provided equivalent perceptual distances amongst stimuli within each
talker. For this purpose, the average log magnitude estimates and average matching judgments
were obtained for five stimuli from each talker. The average magnitude estimates for each
27
stimulus was computed by taking the arithmetic mean of the base-10 logarithmic transform of all
judgments for that stimulus. The average matching judgment for each stimulus was computed by
taking the arithmetic mean of all judgments (ascending and descending runs) for that stimulus.
Since the SNRTH was measured on the decibel scale, a further logarithmic transformation was not
necessary. Larger SNRTH indicate less breathiness in the matching task. In contrast, larger
magnitude estimates signify greater breathiness. The averaged perceptual judgments obtained
using the two tasks were compared (Figure 3-1).
Three different regression functions – linear, exponential, and power – were derived to fit
the perceptual data obtained from the two tasks. The proportion of variance accounted for (R2)
by each of the three fits was computed to determine the best-fitting model. The results are
summarized in Table 3-2. It can be seen that the R2 for the linear regression models provided the
best fit for eight of the ten talkers (Males 1, 3, 5, and 5; Females 1, 3, 5, and 5). Data for one
talker (Male 2) were best fit using a power function, whereas data from one talker (Female 2)
was best described using an exponential function. However, even for these two talkers, the linear
function provided an excellent fit, with R2 values being only marginally less than that of the
power or the exponential functions (R2 difference less than 0.02). On average, the linear fit
resulted in the highest R2 across all ten talkers (average R2: 0.97) followed by the power (average
R2: 0.94) and exponential fits (average R2: 0.93), respectively. A one-way ANOVA was used to
determine whether the mean differences among the three fits were statistically significant at the
0.05 level. Results showed no significant main effect (F(2,27) = 2.594; p = 0.093). Together, these
results suggest that data obtained using a matching task provides similar perceptual distances
across stimuli as that obtained using a direct magnitude estimation task.
Comparison of the Matching and Rating Scale Tasks
The perceptual judgments of breathiness obtained from the matching task were also
28
compared to those obtained using the rating scale task. Once again, linear and nonlinear
regressions were used to determine whether the two tasks provide equivalent perceptual
distances amongst stimuli. To compare the ratings with the matching judgments, each listener’s
five ratings were first averaged together. Listeners may use different criteria for assigning
numbers on the rating scale, resulting in a systematic response bias.6 To minimize these errors,
each listener’s ratings for each talker were converted to corresponding z-scores and scaled up by
two so that all data points were positive values. The standardized ratings were then averaged
across listeners to obtain the averaged scores for each speaker. The average matching thresholds
were calculated as the arithmetic mean of all judgments for a particular stimulus. Larger SNRTH
values indicate less breathiness in the matching task, but larger ratings signify greater breathiness
in the rating scale task. The averaged perceptual judgments obtained using the two tasks were
compared (Figure 3-2).
Linear, exponential, and power models were derived between the two sets of data and
their goodness of fit was estimated using the R2 values (Table 3-2). It was observed that seven of
ten talkers (Males 1, 3, 5, and 5; Females 1, 3, and 5) were best described using a linear function.
However, two of these talkers (Male 1 and Female 5) were equally well-described by linear and
exponential functions, and one talker (Female 1) was equally described by the linear,
exponential, and power models. Of the remaining three talkers, two were best fit with an
exponential function (Male 2; Female 4) and one was best fit with a power function (Female 2).
Still, the difference between the three functions was small (largest R-square difference of 0.08
across all talkers). Statistical testing using a one-way ANOVA showed a significant main effect
(F(2,27) = 6.291; p = 0.006). Post-hoc pair-wise comparison using the Bonferroni correction
showed no significant difference between the exponential and linear fits (p = 1.000), but both of
29

these resulted in significantly higher R2 than the power fit (p = 0.027 and 0.009, respectively).
Since matching and rating scale data is best fit using a linear function, these two methods also
appear to provide equivalent perceptual distances across stimuli.
30
31
Table 3-1. Inter-judge and intra-judge reliability described by Pearson’s correlation coefficient for the rating scale, logarithmically-transformed magnitude estimates, and matching tasks.
Rating Scale
Direct Magnitude Estimation
Matching
Intra-judge Inter-judge Intra-judge Inter-judge Intra-judge Inter-judgeMean 0.88 0.87 0.79 0.60 0.95 0.97SD 0.04 0.02 0.10 0.18 0.02 0.01Range 0.82-0.92 0.85-0.90 0.65-0.94 0.14-0.74 0.91-0.99 0.96-0.98
The mean, standard deviation (SD), and range of correlations are shown.
32
Figure 3-1.Matching judgments (SNRTH in dB) are shown as a function of the log magnitude estimates for each of the 10 talkers. The
5 male talkers are on the top row, and the 5 female talkers are on the bottom row. Error bars represent the standard error of the mean.
32
33
Table 3-2. The R2 for the linear, exponential, and power fits. A) Between the matching and magnitude estimate judgments. B) Between the matching and rating scale judgments.
Matching - Log Mag. Estimates Matching –Ratings
Linear Exp. Power Linear Exp. Power
1 0.99 0.96 0.97 0.98 0.98 0.93
2 0.99 0.99 1.00 0.98 1.00 0.98
3 0.98 0.96 0.97 0.98 0.96 0.92
4 0.99 0.93 0.94 0.99 0.97 0.92
Mal
e Ta
lker
s
5 0.97 0.90 0.91 0.97 0.94 0.90
1 0.94 0.90 0.91 0.99 0.99 0.99
2 0.97 0.99 0.98 0.97 0.98 1.00
3 0.93 0.87 0.88 0.99 0.97 0.92
4 0.98 0.94 0.95 0.99 1.00 0.98
Fem
ale
Talk
ers
5 0.94 0.87 0.87 0.98 0.98 0.93
Ave 0.97 0.93 0.94 0.98 0.98 0.95 Voice samples shown are in increasing order of breathiness for male and female talkers. The best fit model for each talker is shown in bold
34
Figure 3-2. Matching judgments (SNRTH in dB) are shown as a function of the ratings scale judgments for each of the 10 talkers. The
5 male talkers are on the top row, and the 5 female talkers are on the bottom row. Error bars represent the standard error of the mean.
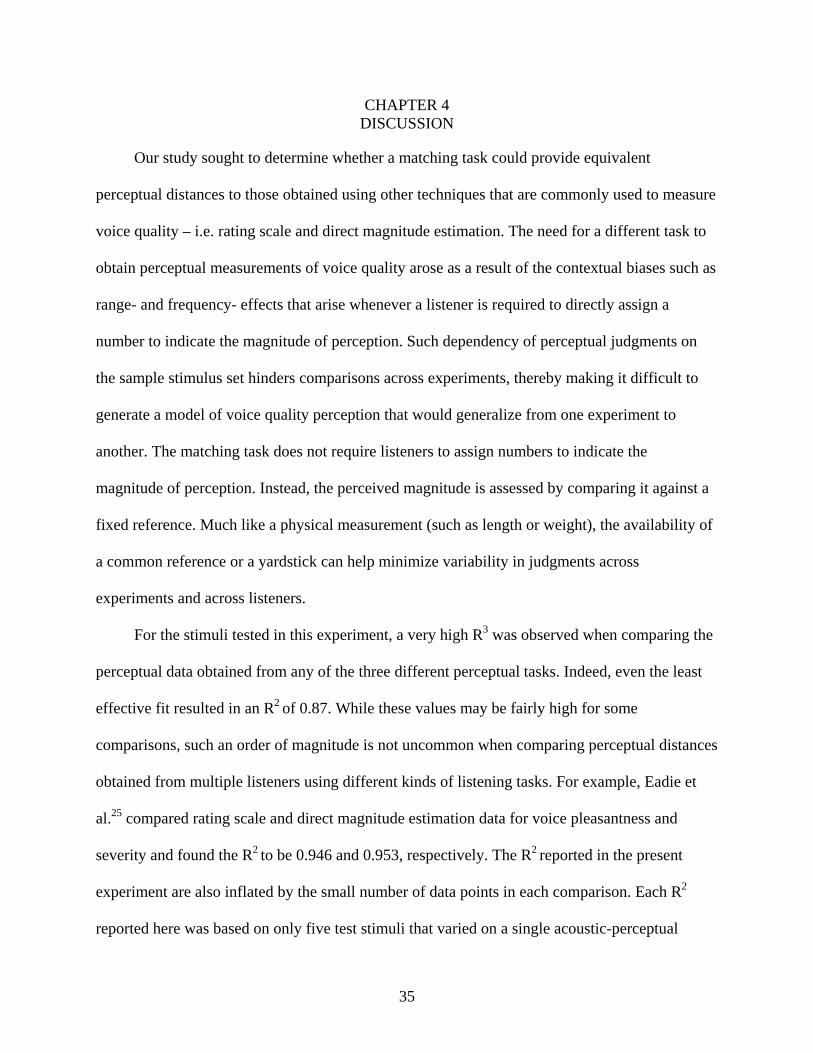
CHAPTER 4 DISCUSSION
Our study sought to determine whether a matching task could provide equivalent
perceptual distances to those obtained using other techniques that are commonly used to measure
voice quality – i.e. rating scale and direct magnitude estimation. The need for a different task to
obtain perceptual measurements of voice quality arose as a result of the contextual biases such as
range- and frequency- effects that arise whenever a listener is required to directly assign a
number to indicate the magnitude of perception. Such dependency of perceptual judgments on
the sample stimulus set hinders comparisons across experiments, thereby making it difficult to
generate a model of voice quality perception that would generalize from one experiment to
another. The matching task does not require listeners to assign numbers to indicate the
magnitude of perception. Instead, the perceived magnitude is assessed by comparing it against a
fixed reference. Much like a physical measurement (such as length or weight), the availability of
a common reference or a yardstick can help minimize variability in judgments across
experiments and across listeners.
For the stimuli tested in this experiment, a very high R3 was observed when comparing the
perceptual data obtained from any of the three different perceptual tasks. Indeed, even the least
effective fit resulted in an R2 of 0.87. While these values may be fairly high for some
comparisons, such an order of magnitude is not uncommon when comparing perceptual distances
obtained from multiple listeners using different kinds of listening tasks. For example, Eadie et
al.25 compared rating scale and direct magnitude estimation data for voice pleasantness and
severity and found the R2 to be 0.946 and 0.953, respectively. The R2 reported in the present
experiment are also inflated by the small number of data points in each comparison. Each R2
reported here was based on only five test stimuli that varied on a single acoustic-perceptual
35
dimension. Nevertheless, for the questions raised in this experiment, it is more important to study
the consistency of one fit over another, rather than to evaluate the magnitude of the R2 per se.
The perceptual distances between stimuli obtained using the direct magnitude estimation
and the matching tasks were almost identical. A linear relationship was observed to account for
the greatest variance between direct magnitude estimation and matching data. In the direct
magnitude estimation task, listeners are asked to judge the perceptual magnitude of stimuli in
terms of ratios, thereby resulting in ratio-level of measurement. Since perceptual data obtained in
the matching task was observed to be linearly related to magnitude estimates, the matching
thresholds also appear to provide ratio-level measurement of breathy voice quality. Such findings
have been reported for a number of other prothetic psychophysical continua such as loudness or
brightness.22
The relationship between the matching and rating scale tasks or the nature of the
information obtained through the rating scale task were less clear. Both linear and exponential
fits accounted for a high amount of variance when comparing perceptual distances on a rating
scale to those obtained in a matching task. It is possible that the matching task results in the same
perceptual distances across stimuli as that obtained in the rating scale task. However, if the rating
scale task truly resulted in “equal-appearing intervals” or interval-level measurement, then an
exponential relationship should have resulted in greater R2 than the linear fit. This is because the
relationship between an equal-interval series (interval scale) and an equal-ratio series (ratio
scale) is an exponential one. The failure to find this difference in the present data makes it
difficult to identify the nature of the data obtained using a rating scale task and it is suggested
that rating scale data is best treated as being ordinal in nature. For the same reason, it is
recommended to avoid the term “equal appearing interval (EAI) scale” when referring a rating
36
scale task.6 However, unlike typical rating scale data, the present experiment used multiple
presentations of all stimuli as well as normalization to correct for some listener biases of the
rating scale task.6 Although this approach is not typical for most experiments in voice quality, it
serves to improve the accuracy and reliability of the rating scale data.
An additional benefit of the matching task was the high inter- and intra-judge reliability.
Even though all three tasks showed fairly high reliability (as measured using the Pearson’s
correlation), the matching task resulted in the highest reliability and the lowest standard
deviations across listeners. It is speculated that higher reliability observed in the matching task
results from avoiding direct assignment of numbers to the perceptual magnitude. Poulton7 has
demonstrated that observers make a variety of errors when judging the magnitude of a physical
stimulus, in particular when the physical stimulus cannot be measured using a familiar physical
units (such as units of lengths, weight, etc.). Thus for example, observers are likely to make
fewer errors when asked to judge the length of a line using direct assignment of numbers than
when asked to judge the brightness of a light in a similar manner. This is because length can be
quantified using a familiar unit (such as meters or inches) whereas brightness cannot be
measured in a unit with any such familiarity. Since voice quality, like brightness, cannot be
judged in any familiar units, listeners resort to using numbers arbitrarily. Thus, any task that
requires listeners to quantify voice quality by direct assignment of numbers will result in a
greater amount of variability within and across listeners.
Despite the higher reliability, there is little doubt that listeners will vary somewhat in their
absolute SNRTH. Some variability is expected in any behavioral measurement and the same holds
true for the matching task as well. As long as the resulting data can be assumed to be normally
distributed, the mean of the distribution may be used to characterize the population. If the
37
assumption of normalcy cannot be met, then a different measure of central tendency should be
used. For this reason, we obtain perceptual judgments from multiple listeners and average their
responses. Even though individual judgments of voice quality may be somewhat variable, the
averaged response from multiple listeners provides a more stable target for developing
computational models of voice quality. However, this approach is in contrast to that proposed by
Kreiman and colleagues who have attempted to identify a method for voice quality judgment that
results in high inter- and intra- listener “agreement.”23
To obtain high agreement, Kreiman and Gerratt13, 14, 15 also proposed using a matching
task. As described previously, this approach requires listeners to manipulate specific parameters
of the vowel acoustic signal in a custom designed voice synthesizer until they generate a
synthetic copy of the voice that is perceptually equivalent to the test voice. Note that there are
several differences between the matching technique proposed here and that proposed by Gerratt
and Kreiman.13 First, as described previously, the two approaches have different theoretical
motivations, with Kreiman et al. seeking better agreement whereas the present work seeking to
minimize contextual biases. Second, the Kreiman et al. approach allows listeners to vary multiple
parameters of the vowel acoustic signal whereas the present approach only allows manipulation
of a single acoustic parameter. One benefit of manipulating only a single parameter in a
matching task is that it is easier to compare the voice quality of one stimulus to another. In
contrast, manipulating multiple parameters is likely to provide a more holistic way to quantify
quality, and the resulting data does not lend itself easily to computational modeling of voice
quality. Another potential limitation of manipulating multiple acoustic parameters for voice
quality judgments is related to the trading cues and redundancy seen in the speech signal. A
number of experiments have shown that listeners can use multiple acoustic cues in the speech
38
acoustic signal when making perceptual judgments.18, 24 Thus, it is possible that two listeners
may provide a different set of acoustic parameters to reflect essentially the same voice quality
percept. Finally, the two matching approaches differ in terms of their practical applications.
Kreiman et al. envision the use of their custom speech synthesizer as a tool for clinical
evaluation of voice quality.2 In contrast, even though the present approach may be modified for
clinical use, it is generally designed for laboratory use when an experimenter seeks to obtain
sensitive and relatively unbiased perceptual judgments of voice quality. As mentioned
previously, such data are essential for developing computational models of voice quality.
Successful development of such computational models will in turn generate the tools necessary
for clinical measurement of voice quality.
The matching task described here has certain other limitations. One potential drawback of
the matching procedures described here is that the reference signal used was customized for each
talker (i.e. the fundamental frequency and the spectral slope were matched to that of each talker).
Thus, the SNRTH for each talker may have been somewhat biased by the nature of the reference
signal itself and data for one talker may or may not be directly comparable to that of another.
However, such customization of the signal was considered essential to ascertain that listeners
were able to match the quality of the two stimuli. To address this limitation, an ongoing
experiment is evaluating the success of the matching task to a single reference signal. If listeners
fail to match quality without adequate customization of the reference signal, then an appropriate
correction factor to account for these changes will need to be developed. Another factor that
limits the accuracy of this and all other perceptual tasks is the dependency of these tasks on
listeners’ understanding of the percept under study. When a listener is asked to rate a particular
voice quality, it is assumed that she/he understands what aspect of the stimulus needs to be
39
judged and only responds to changes in that particular aspect of the stimulus. Failure to do so
may result in erroneous perceptual data. The results obtained from a matching study are also
dependent on such an assumption. However, the matching task may be somewhat better at
avoiding such errors because unlike rating or magnitude estimation, listeners are only allowed to
manipulate a single parameter (which presumably only changes one perceptual aspect of the
stimulus).
A second limitation of this technique is that it requires greater test time. On average,
listeners were observed to need significantly greater time for the matching task than for the
rating scale or the direct magnitude estimation tasks, although they generally become more
adept at completing the matching task with some practice. However, the trade-off of this
increased test time is a greater accuracy in perceptual judgments, less context-dependency, and
greater inter- and intra-listener reliability. Therefore, the matching task provides an excellent
method to obtain perceptual judgments of breathy voice quality when a researcher needs high
accuracy and the ability to compare data across two or more experiments.
40
CHAPTER 5 CONCLUSIONS
Our study compared three different methods for obtaining perceptual data for voice
quality: rating scale, direct magnitude estimation and matching. The comparison was
necessitated by the fact that rating scale and direct magnitude estimation data are highly context
dependent and are difficult to generalize from one experiment to another. Additionally, the
measurement properties of the rating scale data were unconfirmed. Findings show that a simple
matching task, where listeners were asked to manipulate the SNR of a sawtooth signal mixed
with noise, was sufficient to quantify voice quality without the need for direct assignment of
numbers. In this task, the breathiness of a vowel was measured by the SNR of the sawtooth +
noise complex at which the two stimuli were perceived to have equal breathiness (SNRTH). The
voice quality measures obtained through such a task appears to have ratio-level measurement
properties. This approach to quantify perception will help generate computational models of
voice quality, which in turn, can result in better tools for clinical evaluation of voice quality.
41
LIST OF REFERENCES
1. Martin, D, Fitch, J, Wolfe, V. Pathologic voice type and the acoustic prediction of severity, J. Speech Hear. Res. 1995;38:765–771.
2. Kreiman, J, Gerratt, BR, Kempster, GB, Erman, A, Berke, GS. Perceptual evaluation of voice quality: Review, tutorial, and a framework for future research. Journal of Speech, Language, & Hearing Research. 1993;36:21–40.
3. Thurstone, LL. A law of comparative judgment. Psychological Review. 1927;34:273-286.
4. Guilford, JP. Psychometric methods. New York: McGraw-Hill; 1954.
5. Parducci, A, & Wedell, DH. The category effect with rating scales: Number of categories, number of stimuli, and method of presentation. J Exp Psychol Hum Percept Perform. 1986;12(4):496-516.
6. Shrivastav, R, Sapienza, C, Nandur, V. Application of psychometric theory to the measurement of voice quality using rating scales. Journal of Speech, Language, & Hearing Research. 2005;48(2):323-335.
7. Stevens, SS. Perceptual Magnitude and its Measurement. In: Carterette, C, Friedman, MP eds. Handbook of Perception: Psychophysical Judgment and Measurement. New York: Academic Press; 1974:361-389.
8. Poulton, EC. Bias in quantifying judgments. Hove, U.K.: Lawrence Erlbaum Associates Ltd; 1989.
9. Zraick, R, Liss, J. A comparison of equal-appearing interval scaling and direct magnitude estimation of nasal voice quality. Journal of Speech, Language, & Hearing Research. 2000;43:979-988.
10. Toner, MA, Emanuel, FW. Direct magnitude estimation and equal appearing interval scaling of vowel roughness. Journal of Speech, Language, & Hearing Research. 1989;32:78-82.
11. Thurstone, LL. The measurement of values. Psychological Review. 1954;61(1):47-57.
12. Stevens, SS. Psychophysics: Introduction to its Perceptual, Neural, and Social Prospects. New York: John Wiley & Sons, Inc.; 1975.
13. Gerratt, BR, Kreiman, J. Measuring vocal quality with speech synthesis, Journal of the Acoustical Society of America. 2001;110:2560-2566.
14. Kreiman, J, Gerratt, B. Perception of aperiodicity in pathological voice. Journal of the Acoustical Society of America. 2005;117(4):2201-2211.
42
15. Kreiman, J, Gerratt, B. Difference limens for vocal aperiodicities. Journal of the Acoustical Society of America. 2003;113:2328.
16. ANSI S. Methods for Manual Pure-Tone Threshold Audiometry (ANSI S3.21-2004). New York: American National Standards Institute; 2004.
17. Fant, G, Liljencrants, J, Lin, Q. A four parameter model of glottal flow. STL-QPSR. 1985;4:1-13.
18. Klatt, D, Klatt, L. Analysis, synthesis, and perception of voice quality variations among female and male talkers. Journal of the Acoustical Society of America. 1990;87(2):820-857.
19. Hillenbrand, J, Cleveland, RA, Erickson, RL. Acoustic correlates of breathy vocal quality. Journal of Speech, Language, & Hearing Research. 1994;37(4):769-778.
20. Shrivastav, R, Sapienza, C. Objective measures of breathy voice quality obtained using an auditory model. Journal of the Acoustical Society of America. 2003;114(4):2217-2224.
21. Driggers, RG. Encyclopedia of Optical Engineering. New York, NY: Marcel Dekker Inc.; 2003:2183-2184.
22. Penner, MJ. Equal-loudness contours using subjective tinnitus as the standard. Journal of Speech and Hearing Research. 1984;27:274-279.
23. Robin, DA, Tranel, D, Damasio, H. Auditory perception of temporal and spectral events in patients with focal left and right cerebral lesions. Brain and Language. 1990;39:539-555.
24. Lord, SR, Menz, HB, Tiedemann, A. A physiological profile approach to falls risk assessment and prevention. Physical Therapy. 2003;83(3):237-252.
25. Appelle, S. Visual and haptic angle perception in the matching task. The American Journal of Psychology. 1971;84(4):487-499.
26. Eadie, TL, Doyle, PC. Direct magnitude estimation and interval scaling of pleasantness and severity in dysphonic and normal speakers. Journal of the Acoustical Society of America. 2002;112(6):3014-3021.
43
BIOGRAPHICAL SKETCH
Sona Patel was born in 1982, in Champaign, Illinois. The elder of two children, she grew
up in Homer, IL, graduating from Heritage High School as Valedictorian in 2000. She earned her
B.S. in electrical engineering from Boston University in 2004. Upon graduation, Sona began
pursuing her graduate studies at the University of Florida in August 2004. She is presently
completing her doctoral studies in the Communication Sciences and Disorders Department under
the mentorship of Dr. Rahul Shrivastav.
44