Embed Size (px)
Citation preview
Council rate rises offset rising costs, declining grantsEmbargoed - 28 June 2008
The Municipal Association of Victoria’s (MAV) annual analysis of local government budget data shows rateswill increase an average $61 or 5.1 per cent this year.
Cr Dick Gross, MAV President said budget pressures created by declining financial grants from other levelsof government and rising costs made it challenging for councils to balance responsible financialmanagement, community expectations and affordability for ratepayers.
“Councils are not immune to rising prices and have limited revenue sources to help them absorb costpressures without it affecting either rates or the level of services provided to communities.
“Expenses increase faster than CPI as councils are mostly affected by rising labour and construction costs,not price movements for common household goods and services.
“Local government is also heavily reliant on Commonwealth funding, which continues to decline despiteincreasing tax surpluses. Untied grants equalled 1.2 per cent of total national tax revenue (net of GST) in1993-94, but this declined to 0.97 per cent in 1996-97 and 0.77 per cent in 2006-07.
“Councils need to meet these higher expenses and the shortfall in government grants just to stand still.
“Many municipalities are also allocating additional funding to reduce the $280 million annual underspendidentified as essential for meeting local infrastructure maintenance and renewal needs.
“Councils aren’t just planning for current communities, but future ones too. They must implement long-termasset management programs to maintain the $47.7 billion worth of local roads, drains, street lights, footpaths,childcare centres and leisure facilities relied on by communities in their daily lives.
“If not enough money is spent on renewal of ageing infrastructure, the cost of fixing assets grows over timeand leaves a massive cost impost for future ratepayers. Timely effort now prevents higher costs later.
“Funding the asset renewal gap theoretically requires average rate increases of 12 per cent every year until2011. While councils would never impose such financial strain on ratepayers, it does mean incremental raterises are necessary to chip away at the problem,” he said.
The MAV Local Government Cost Index, released in May, forecast the cost of delivering a ‘basket’ of councilservices in 2008 will cost 4.4 per cent more than last year. In addition, councils are short-changed by Stateand Commonwealth grants that link annual indexation to CPI or less. As a benchmarking tool, CPI doesn’treflect actual council cost movements to provide agreed services and programs from one year to the next.
Cr Gross said that despite ongoing cost pressures, councils were very proactive about finding ways toimprove their service innovation, run more efficient and effective operations and stretch a dollar further.
“Councils are increasingly reaping the benefits of joint tendering and service delivery. Many also undertakeservice and asset rationalisation programs, borrow money and sell unutilised assets to help meet theirrevenue needs and lessen the burden on ratepayers.
“Rates account for just three cents of every dollar raised in taxes nationally. Despite this, annual rates noticesattract far more than three per cent of the criticism of taxes because councils are an easy target,” he said.
- Ends -
Rates data for 71 of Victoria’s 79 councils is available at www.mav.asn.au/finance/rates#resources
For further information contact MAV PresidentCr Dick Gross on 0411 446 167 or the
MAV Communications Unit on (03) 9667 5521.
Total budgetedrate revenue,municipal chargeand wastemanagementcharges for 2008-09
Budgeted
total revenuefor 2008-09
Total raterevenue asaproportionof totalrevenue08-09
Total raterevenue asaproportionof totalrevenue 07-08
Average rates,municipalcharge andgarbage charge08-09 perassessment
Change inrates,municipalcharge andgarbagecharge perassessment
Average rates,municipalcharge andgarbagecharge 08-09per head ofpopulation
Change inrates, municipalcharge andgarbage chargeper head ofpopulation
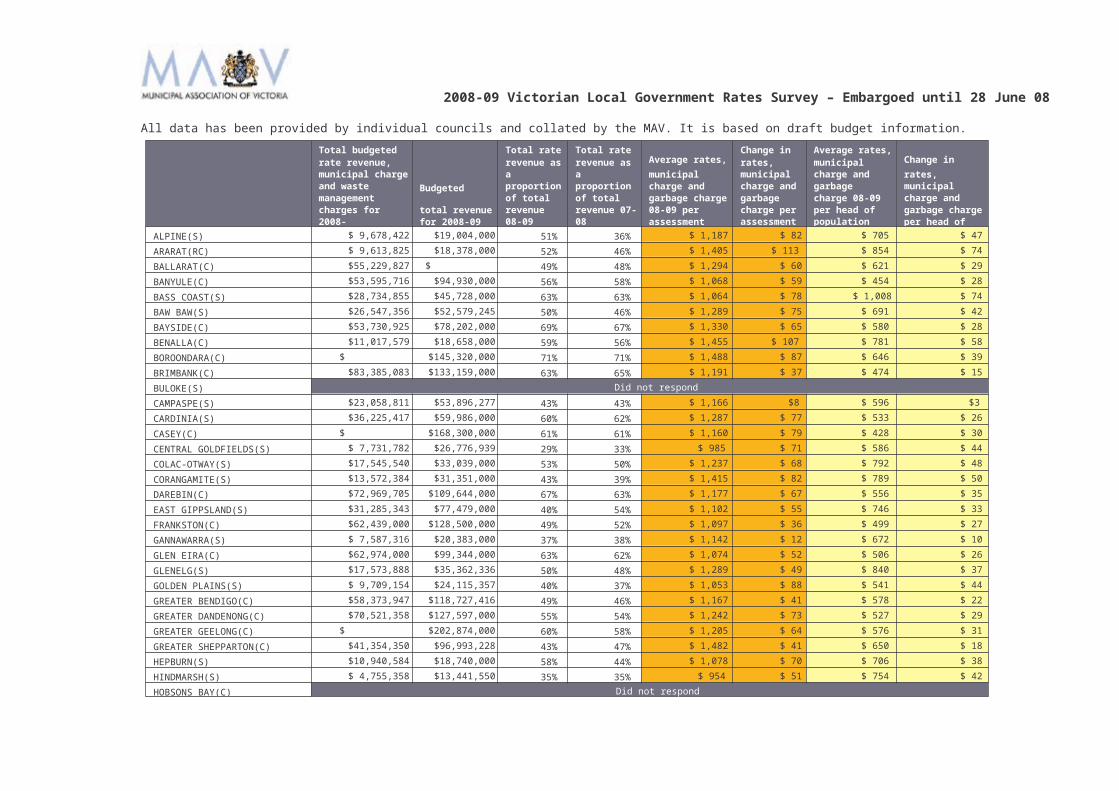
ALPINE(S) $ 9,678,422 $19,004,000 51% 36% $ 1,187 $ 82 $ 705 $ 47
ARARAT(RC) $ 9,613,825 $18,378,000 52% 46% $ 1,405 $ 113 $ 854 $ 74
BALLARAT(C) $55,229,827 $ 112,621,000 49% 48% $ 1,294 $ 60 $ 621 $ 29
BANYULE(C) $53,595,716 $94,930,000 56% 58% $ 1,068 $ 59 $ 454 $ 28
BASS COAST(S) $28,734,855 $45,728,000 63% 63% $ 1,064 $ 78 $ 1,008 $ 74
BAW BAW(S) $26,547,356 $52,579,245 50% 46% $ 1,289 $ 75 $ 691 $ 42
BAYSIDE(C) $53,730,925 $78,202,000 69% 67% $ 1,330 $ 65 $ 580 $ 28
BENALLA(C) $11,017,579 $18,658,000 59% 56% $ 1,455 $ 107 $ 781 $ 58
BOROONDARA(C) $ 103,574,541 $145,320,000 71% 71% $ 1,488 $ 87 $ 646 $ 39
BRIMBANK(C) $83,385,083 $133,159,000 63% 65% $ 1,191 $ 37 $ 474 $ 15
BULOKE(S) Did not respond
CAMPASPE(S) $23,058,811 $53,896,277 43% 43% $ 1,166 $8 $ 596 $3
CARDINIA(S) $36,225,417 $59,986,000 60% 62% $ 1,287 $ 77 $ 533 $ 26
CASEY(C) $ 103,332,502 $168,300,000 61% 61% $ 1,160 $ 79 $ 428 $ 30
CENTRAL GOLDFIELDS(S) $ 7,731,782 $26,776,939 29% 33% $ 985 $ 71 $ 586 $ 44
COLAC-OTWAY(S) $17,545,540 $33,039,000 53% 50% $ 1,237 $ 68 $ 792 $ 48
CORANGAMITE(S) $13,572,384 $31,351,000 43% 39% $ 1,415 $ 82 $ 789 $ 50
DAREBIN(C) $72,969,705 $109,644,000 67% 63% $ 1,177 $ 67 $ 556 $ 35
EAST GIPPSLAND(S) $31,285,343 $77,479,000 40% 54% $ 1,102 $ 55 $ 746 $ 33
FRANKSTON(C) $62,439,000 $128,500,000 49% 52% $ 1,097 $ 36 $ 499 $ 27
GANNAWARRA(S) $ 7,587,316 $20,383,000 37% 38% $ 1,142 $ 12 $ 672 $ 10
GLEN EIRA(C) $62,974,000 $99,344,000 63% 62% $ 1,074 $ 52 $ 506 $ 26
GLENELG(S) $17,573,888 $35,362,336 50% 48% $ 1,289 $ 49 $ 840 $ 37
GOLDEN PLAINS(S) $ 9,709,154 $24,115,357 40% 37% $ 1,053 $ 88 $ 541 $ 44
GREATER BENDIGO(C) $58,373,947 $118,727,416 49% 46% $ 1,167 $ 41 $ 578 $ 22
GREATER DANDENONG(C) $70,521,358 $127,597,000 55% 54% $ 1,242 $ 73 $ 527 $ 29
GREATER GEELONG(C) $ 121,653,832 $202,874,000 60% 58% $ 1,205 $ 64 $ 576 $ 31
GREATER SHEPPARTON(C) $41,354,350 $96,993,228 43% 47% $ 1,482 $ 41 $ 650 $ 18
HEPBURN(S) $10,940,584 $18,740,000 58% 44% $ 1,078 $ 70 $ 706 $ 38
HINDMARSH(S) $ 4,755,358 $13,441,550 35% 35% $ 954 $ 51 $ 754 $ 42
HOBSONS BAY(C) Did not respond
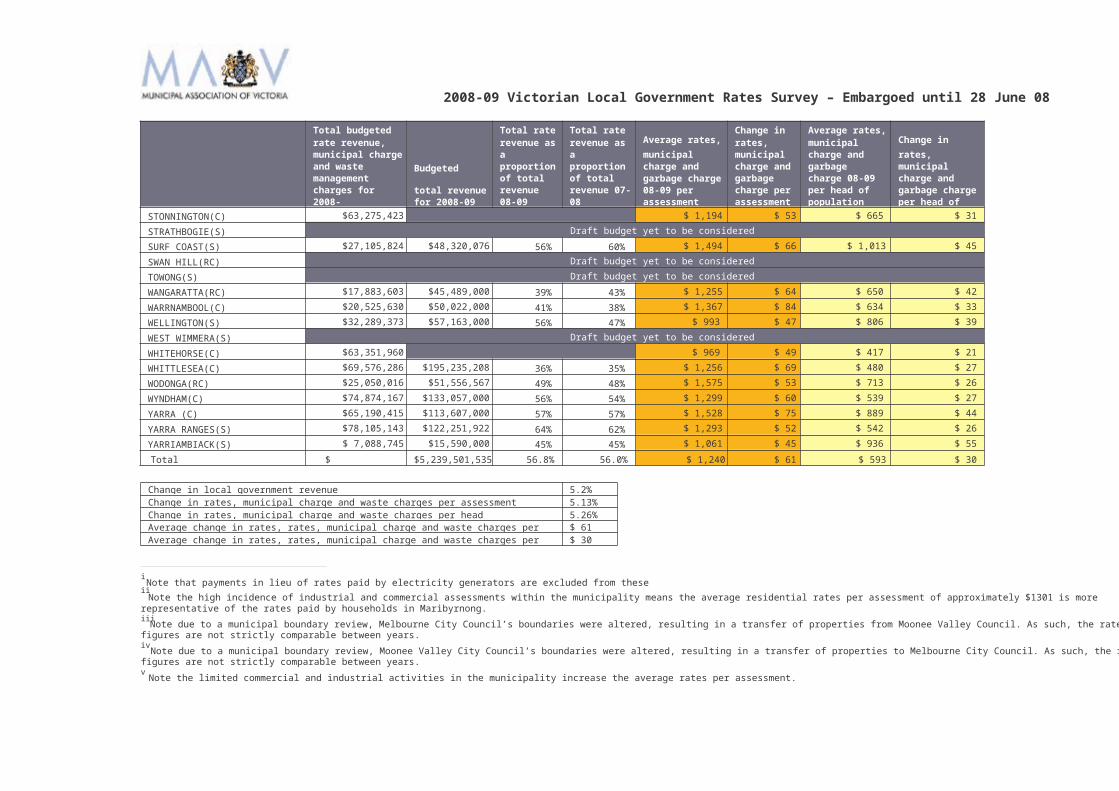
2008-09 Victorian Local Government Rates Survey – Embargoed until 28 June 08
All data has been provided by individual councils and collated by the MAV. It is based on draft budget information.
Total budgetedrate revenue,municipal chargeand wastemanagementcharges for 2008-09
Budgeted
total revenuefor 2008-09
Total raterevenue asaproportionof totalrevenue08-09
Total raterevenue asaproportionof totalrevenue 07-08
Average rates,municipalcharge andgarbage charge08-09 perassessment
Change inrates,municipalcharge andgarbagecharge perassessment
Average rates,municipalcharge andgarbagecharge 08-09per head ofpopulation
Change inrates, municipalcharge andgarbage chargeper head ofpopulation
HORSHAM(RC) $13,750,647 $28,644,709 48% 45% $ 1,191 $ 50 $ 684 $ 41
HUME(C) $79,172,570 $159,387,000 50% 48% $ 1,253 $ 73 $ 497 $ 33
INDIGO(S) $ 9,027,792 $25,868,000 35% 38% $ 1,144 $ 73 $ 579 $ 45
KINGSTON(C) $78,720,000 $132,356,000 59% 59% $ 1,189 $ 71 $ 547 $ 31
KNOX(C) $67,664,000 $104,866,000 65% 62% $ 1,111 $ 71 $ 444 $ 30i
LATROBE(C) $40,116,919 $87,930,000 46% 44% $ 1,132 $ 60 $ 557 $ 29
LODDON(S) $ 6,477,832 $20,027,179 32% 32% $ 865 $6 $ 802 $8
MACEDON RANGES(S) $25,751,029 $57,557,751 45% 48% $ 1,346 $ 68 $ 671 $ 44
MANNINGHAM(C) $59,280,916 $88,708,000 67% 66% $ 1,354 $ 62 $ 508 $ 23
MANSFIELD(C) $ 7,890,415 $15,344,000 51% 59% $ 1,111 $ 49 $ 1,059 $ 62ii
MARIBYRNONG(C) $52,507,911 $82,371,000 64% 63% $ 1,602 $ 95 $ 762 $ 46
MAROONDAH(C) $49,424,134 $80,123,000 62% 59% $ 1,102 $ 33 $ 486 $ 17iii
MELBOURNE(C) $ 169,949,371 $307,520,000 55% 54% $ 2,281 $ 17 $ 2,119 $ 89
MELTON(S) $48,150,298 $79,396,000 61% 58% $ 1,281 $ 58 $ 472 $8
MILDURA(RC) $40,887,523 $78,267,391 52% 52% $ 1,507 $ 63 $ 766 $ 28
MITCHELL(S) $18,145,000 $34,467,000 53% 49% $ 1,188 $ 68 $ 545 $ 27
MOIRA(S) $19,392,691 $42,166,018 46% 50% $ 1,186 -$2 $ 657 -$ 3
MONASH(C) $67,168,785 $126,470,000 53% 55% $ 954 $ 54 $ 373 $ 11iv
MOONEE VALLEY(C) $ 62,989,560 $ 96,823,000 65% 66% $ 1,311 $ 80 $ 583 $ 31
MOORABOOL(S) $18,331,536 $29,888,000 61% 59% $ 1,337 $ 83 $ 633 $ 37
MORELAND(C) $72,800,975 $103,353,000 70% 68% $ 1,106 $ 29 $ 501 $ 16
MORNINGTON PENINSULA(S) $89,957,903 $144,748,000 62% 59% $ 967 $ 64 $ 620 $ 39
MOUNT ALEXANDER(S) $11,583,220 $23,308,450 50% 48% $1,117 $42 $646 $ 27
MOYNE(S) Draft budget yet to be considered
MURRINDINDI(S) Draft budget yet to be consideredv
NILLUMBIK(S) $36,551,395 $61,329,265 60% 59% $ 1,642 $ 71 $ 584 $ 31
NORTHERN GRAMPIANS(S) $ 9,906,037 $21,434,000 46% 44% $ 1,087 $ 79 $ 777 $ 54
PORT PHILLIP(C) $73,882,240 $130,475,000 57% 56% $ 1,201 $ 31 $ 819 $ 10
PYRENEES(S) $ 5,491,136 $17,686,000 31% 36% $ 971 $ 52 $ 832 $ 53
QUEENSCLIFFE(B) $ 4,502,590 $ 8,208,537 55% 59% $ 1,537 $ 93 $ 1,381 $106
SOUTH GIPPSLAND(S) $23,813,276 $39,427,316 60% 55% $ 1,301 $ 75 $ 877 $ 50
SOUTHERN GRAMPIANS(S) $11,282,202 $28,661,838 39% 40% $ 1,074 $ 45 $ 645 $ 28
2008-09 Victorian Local Government Rates Survey – Embargoed until 28 June 08

Total budgetedrate revenue,municipal chargeand wastemanagementcharges for 2008-09
Budgeted
total revenuefor 2008-09
Total raterevenue asaproportionof totalrevenue08-09
Total raterevenue asaproportionof totalrevenue 07-08
Average rates,municipalcharge andgarbage charge08-09 perassessment
Change inrates,municipalcharge andgarbagecharge perassessment
Average rates,municipalcharge andgarbagecharge 08-09per head ofpopulation
Change inrates, municipalcharge andgarbage chargeper head ofpopulation
STONNINGTON(C) $63,275,423 $ 1,194 $ 53 $ 665 $ 31
STRATHBOGIE(S) Draft budget yet to be considered
SURF COAST(S) $27,105,824 $48,320,076 56% 60% $ 1,494 $ 66 $ 1,013 $ 45
SWAN HILL(RC) Draft budget yet to be considered
TOWONG(S) Draft budget yet to be considered
WANGARATTA(RC) $17,883,603 $45,489,000 39% 43% $ 1,255 $ 64 $ 650 $ 42
WARRNAMBOOL(C) $20,525,630 $50,022,000 41% 38% $ 1,367 $ 84 $ 634 $ 33
WELLINGTON(S) $32,289,373 $57,163,000 56% 47% $ 993 $ 47 $ 806 $ 39
WEST WIMMERA(S) Draft budget yet to be considered
WHITEHORSE(C) $63,351,960 $ 969 $ 49 $ 417 $ 21
WHITTLESEA(C) $69,576,286 $195,235,208 36% 35% $ 1,256 $ 69 $ 480 $ 27
WODONGA(RC) $25,050,016 $51,556,567 49% 48% $ 1,575 $ 53 $ 713 $ 26
WYNDHAM(C) $74,874,167 $133,057,000 56% 54% $ 1,299 $ 60 $ 539 $ 27
YARRA (C) $65,190,415 $113,607,000 57% 57% $ 1,528 $ 75 $ 889 $ 44
YARRA RANGES(S) $78,105,143 $122,251,922 64% 62% $ 1,293 $ 52 $ 542 $ 26
YARRIAMBIACK(S) $ 7,088,745 $15,590,000 45% 45% $ 1,061 $ 45 $ 936 $ 55
Total $ 2,975,549,912 $5,239,501,535 56.8% 56.0% $ 1,240 $ 61 $ 593 $ 30
Change in local government revenue 5.2%Change in rates, municipal charge and waste charges per assessment 5.13%Change in rates, municipal charge and waste charges per head 5.26%Average change in rates, rates, municipal charge and waste charges per assessment $ 61Average change in rates, rates, municipal charge and waste charges per head $ 30
Note that payments in lieu of rates paid by electricity generators are excluded from these figures.Note the high incidence of industrial and commercial assessments within the municipality means the average residential rates per assessment of approximately $1301 is more
Note due to a municipal boundary review, Melbourne City Council’s boundaries were altered, resulting in a transfer of properties from Moonee Valley Council. As such, the rates
Note due to a municipal boundary review, Moonee Valley City Council’s boundaries were altered, resulting in a transfer of properties to Melbourne City Council. As such, the rate
Note the limited commercial and industrial activities in the municipality increase the average rates per assessment.
2008-09 Victorian Local Government Rates Survey – Embargoed until 28 June 08
i
ii
representative of the rates paid by households in Maribyrnong.iii
figures are not strictly comparable between years.iv
figures are not strictly comparable between years.v
HOW COUNCIL RATES DATA IS PRESENTED
Rates per assessment
The MAV has used average rates, municipal charges and garbage charges perassessment to measure rate movements in 2005-06, 2006-07, 2007-08 and 2008-09.
Average rates per assessment is an estimate of the average rate bill received byhouseholds.
Demographic characteristics and the economic and industry profile of the communityaffect the quantum average rates per assessment.
For example, councils with high levels of commercial and industrial businesses tendto have higher rates per assessment than other councils do, irrespective of theresidential rates. For these councils, the residential rates per assessment are likelyto be lower than the municipal wide average.
Likewise, councils with little or no commercial and industrial activities and with largehouseholds will also tend to have higher rates per assessment.
In addition, a single farm enterprise may include several assessments, which willskew the data.
Rates per head of population
The MAV has adopted average rates, municipal charges and garbage charges perhead of population to measure rates for 2006-07, 2007-08 and 2008-09.
Average rates per head is a good measure of the comparative tax burden placed onthe communities with other levels of government. Many of the taxes levied by theCommonwealth and State Government are compared on a per head basis; thismeasure enables a valid comparison with these figures.
It is also a useful measure in gaining a clearer picture of the rates structures ofcouncils that have little or no industrial activities and large households.
Rates per head is an increasingly useful measure of local government rates as theservices provided by councils expand from property-based to human based services.
Further Information:Council rates data for 2003, 2004, 2005, 2006, 2007 and 2008 is available on theMAV website at: www.mav.asn.au/finance/rates#resources
VICTORIAN LOCAL GOVERNMENT SNAPSHOT
Local Government Facts
Victoria has 79 municipalities:oooo
31 metropolitan (including eight Interface councils)48 rural and regional (including 10 regional cities)Populations range from 4,000 to more than 200,000Each varies in size, rate base, needs, infrastructure and resources
Each municipality manages significantly different budgets:oo
Rural council budgets average $34 million (smallest is approx $6 million)Metropolitan council budgets average $97 million (largest is approx $312 million)
Governed by 635 democratically elected councillors
Employs 38 600 people
Annual revenue of $4.74 billion
Responsible for $47.7 billion in assets
Service Delivery Statistics
Local government in Victoria:
Services 128,4341 kilometres of roads (approximately 85% of Victoria’s total road network)
Provides 500,000 maternal and child health consultations per annum
Delivers 306,600 immunisations to preschool and secondary school children per annum
Delivers 3.7 million meals per annum to home care recipients
Provides 4 million hours of home assistance, property maintenance and personal and respite care,
per annum.
Spends $40 million on public street lighting each year
Loans 50 million books from 310 public libraries to 2.5 million registered library users per annum
Provides free internet access for more than 1.8 million bookings per annum
Processes more than 49,500 planning applications per annum
Maintains more than 1000 grassed sports surfaces
Collects 1 million tonnes of kerbside garbage per annum
Collects 540,000 tonnes of recyclable materials per annum
Collects 259,000 tonnes of green organic waste per annum
FUNDING OF LOCAL GOVERNMENT
Australian Taxation System
The Australian Constitution unequally divides taxation powers and expenditure responsibilitybetween the Commonwealth and state governmentsThis division has resulted in the Commonwealth collecting around 70 per cent and the statesaround 27 per cent of the total taxes collected in AustraliaLocal government collects three per cent of the total taxes collected by all governmentsTo equalise taxation revenues and spending responsibilities, the Commonwealth makes a seriesof grants to the states and local government.
Local Government Income Sources
There are several sources of funding for local government in Australia:
Rates on property
Fees, fines and charges (eg. swimming pool entry fees, waste depot fees, planning permitfees, parking fees and fines)
Specific purpose grants from State and Commonwealth Governments, for funding specificprojects or programs
General purpose grants from Commonwealth Governments not tied to a specific purpose.
Other sources: borrowings (eg. to pay for large infrastructure projects), asset sales, donations,contributions, reimbursements and interest earned
Local Government Funding Sources
The total funding for local government in Victoria in 2005-06 from all sources was $4.74 billion including:
$2.53 billion or 53.4% in rates$841 million or 17.8% in fees, fines and charges$684 million or 14.4% in specific purpose grants$381 million or 8% in untied revenue from general purpose grants$299 million or 6.3% in other sources (for example interest earned)
Local government collects only three cents of every dollar raised in Australian taxes. TheCommonwealth receives approximately 70% of total taxation revenue and the States receive 27%.
LOCAL GOVERNMENT COST PRESSURESA range of cost pressures influence the decisions each council makes about its annual budgetand the rates it needs to collect.
1. COST SHIFTINGCost shifting is the transfer of responsibility for delivering Commonwealth and State Government programsand services to local government, with no or insufficient funding. In 2006 a tripartite intergovernmentalagreement (IGA) was signed establishing a framework for allocation of responsibilities to local government,including appropriate funding levels. A state-based agreement was signed by the Victorian Government andthe MAV on behalf of Victorian councils in May 2008. While both agreements cover future transfers ofresponsibility, past cost shifting pressures continue to confront councils as rates revenue is used to redressfunding shortfalls. Past instances of cost shifting still impact on services such as home and community care,kindergarten infrastructure, maternal and child health, public libraries, school crossings and immunisations.
2. INFRASTRUCTURE RENEWAL GAPVictorian councils are responsible for $47.7 billion of local infrastructure. Funding for maintenance of ageingassets is a major cost pressure for councils, with the Auditor General identifying a backlog of $1.5-$2.7billion in 2002. The MAV has calculated an annual infrastructure spending shortfall of $280 million forVictorian councils between 2007 and 2011 (equivalent to an annual average 12 per cent rate increase). Toaddress the infrastructure renewal gap and prevent it from growing, councils need to significantly increasespending on asset renewal and capital works programs. With a limited capacity to raise revenue to upgrade,replace and maintain ageing infrastructure, local government must implement a range of options includingrate rises, asset rationalisation, borrowing money and service cuts in other areas.
3. LOCAL GOVERNMENT COST INDEXThe local government cost index, developed by the MAV, is a CPI comparison that calculates any change incosts to deliver goods and services provided by Victorian councils. To deliver the same level and range ofservices as in 2007, it will cost local government 4.4 per cent more in 2008. This is largely due to growth inconstruction, material and wage costs. Local government costs are significantly affected by Average WeeklyEarnings (AWE) and Roads Construction and Maintenance (BTR) indexes, rather than the Consumer PriceIndex (CPI) as the majority of council expenditure is used to employ staff to deliver human-based services;as well as employ people and purchase materials to construct, maintain and upgrade assets.
4. DECLINING GOVERNMENT GRANTSLocal government (Australia-wide) collects only three per cent (or $8.9 billion) of the $298.4 billion in totaltaxes collected by the three levels of government nationally. Core financial assistance throughCommonwealth tax distribution to local government has declined from 1.2 per cent in 1993-94 to 0.97 percent in 1996-97 and 0.77 per cent in 2006-07. Local government is urging a national review of taxesannounced by the Rudd Government to develop a fairer funding formula and more appropriate indexationfor financial assistance grants that takes account of actual local government cost movements over time.
5. CAPPED USER FEES AND CHARGESCapping of many user fees and charges by the Victorian Government leaves councils unable to recover thetrue cost of delivering services such as planning and building, heritage protection, home care and publiclibraries. Instead rate revenue is used to cross-subsidise the delivery of these services.
COUNCIL RESPONSIBILITIES
Role of Local Government
Local government provides for the peace, order and good government of its municipal area, deliversservices and facilities for the community and manages the resources of the district.
Local government must operate in accordance with the Local Government Act 1989 and has responsibility forimplementing many diverse programs, policies and regulations set by the State and Federal Government.
As councils have to respond to local community needs they also have powers to set their own regulationsand by-laws, and to provide a range of discretionary services.
Local laws developed by councils deal with important community safety, peace and order issues such aspublic health, management of council property, environment and amenity. Local laws often apply to noise,fire hazards, abandoned vehicles, parking permits, disabled parking, furniture on footpaths, graffiti, burningoff, animals in public spaces and nuisance pets.
Services and Infrastructure
Each Victorian municipality is different – its community may be young or old, established or still developing,rural or urban, and its population may vary from fewer than 4,000 people to more than 200,000.
Each council collects rates from property owners in its municipality to help fund its local communityinfrastructure and service obligations.
Victorian councils are responsible for $47.7 billion of infrastructure including roads, bridges, townhalls, recreation and leisure facilities, drains, libraries and parks. They also provide over 100 servicesfor local communities from the cradle to the grave. Every time a person leaves their house they areusing services provided by local councils.
Road assets:
Community assets:
local roads, drains, bridges, foot and bike paths, public street lighting, litter bins,school crossings, bus shelters, parking spaces.
libraries, internet services, sporting facilities, community halls, parks and gardens,swimming pools, playgrounds, animal shelters, public toilets, public art, cemeteries.
Community services: community banking, public tips, removal of dumped rubbish, youth and familycounselling, baby capsule hire, childcare programs, playgroup, preschools andkindergartens, school holiday programs, head lice and immunisations, food safetyinspections, and use planning advice and approvals, street cleaning.
In-home services: Family day care, parenting and baby health advice by maternal and child health nurses,multilingual telephone services, recycling and hard waste collections, homemaintenance, meals on wheels, gardening services and respite care.

SETTING A COUNCIL BUDGET
Council Plan
Victoria’s 79 councils operate as separate entities with different local issues, costs and service provision needs.
All councils identify the needs and issues to be dealt with in their municipality in their Council Plan.
This Plan is a statutory requirement which describes the strategic objectives and strategies to beimplemented by a council for the coming year, as well as the following four years.
Each council issues a public notice seeking community input to its draft plan for 14 days, before the plan isfinalised and adopted by council for submission to the Minister. It must be completed by 30 June each year.
Strategic Resources Plan
A Council Plan must include a Strategic Resources Plan, which sets out the financial and human resourcesrequired to achieve its objectives over five financial years.
The Strategic Resources Plan is updated annually.
Council Budget
Each council budget is different to reflect local community needs and priorities. However, there is acommon legislated framework for setting a budget that each council must follow.
The budget process involves a council setting its priorities, identifying measures and allocating funds thatwill show how the key strategic objectives outlined in its Council Plan are to be achieved in the coming year.
Through the budget process a council also specifies the annual maintenance, upgrade and renewal needsof its assets and any new or replacement infrastructure; as well as the community services and facilities itwill provide in the next financial year, and how much these will cost.
A council budget also estimates the revenue to be collected from other sources such as State and FederalGovernment funding and from loans. By using these estimates a council can determine the amount it needsto collect in rates to meet its financial responsibilities for the coming year.
This information is adopted as a draft budget, which is advertised and open to public comment for aminimum of 14 days.
All councils are required to submit their budget to the Minister before 31 August each year.
Local government is the only level of government that provides an open and transparent budget-setting process that seeks community discussion and input to the development of councilspending initiatives and priorities for the coming year.

COUNCIL RATES EXPLAINEDAustralia’s tax system uses the payment of taxes to fund a variety of programs, services andinfrastructure by all levels of government for the public benefit of all.
Property Tax
Council rates are a property tax. Councils use property values as the basis for calculating how much eachproperty owner pays in rates.
In Victoria, council rates can comprise up to three components:
municipal charges (of not more than 20 per cent of a council’s total rates revenue)waste management (garbage) chargesrate in the dollar.
Exemptions from rates apply to crown land, charitable land, land used for religious purposes, and land usedexclusively for mining or forestry.
There is no connection between the amount of rates paid by a property and the level of council servicesreceived.
PRINCIPLE: Those with a higher valued property relative to others within a municipality willcontribute more in rates that those with a lower valued property
Rate Process
Once a council has identified the total amount it needs to collect in rates (as determined by its prescribedbudget process), rates and charges can be calculated. A council begins its rate process each year bydetermining any municipal and waste management charges that may be needed to recover part of theadministrative cost and the cost of providing waste collection and disposal services respectively.
Once these discretionary charges have been accounted for, a council establishes its rate in the dollar bydividing the balance of required budget revenue by the total value of all rateable properties in the municipality.
The rate in the dollar is then multiplied by the value of a property (using one of three valuation bases) toestablish the amount to be paid by each property owner. This amount is known as the general rates.General rates are added to any municipal and waste management charges set by a council to determinethe total rates payable on a property.
Example: Calculating General Rates
The total value of rateable properties within a municipality is $10,000,000,000 and council needs to collect$40,000,000 in rates. The rate in the dollar is 0.004 (40,000,000 10,000,000,000). The rates payable on aproperty valued at $320,000 would be $1280 ($320,000 x 0.004).
An increase in property values does not cause a rate rise. Council budgets are pre-determined tomeet expenditure requirements, and include any potential rate rise. Property valuations are usedto distribute how much each ratepayer will pay, according to the value of their property comparedto other properties within the municipality.
LOCAL GOVERNMENT RATING PRINCIPLES
Property Taxation System
Property taxes (rates) are a wealth tax charged by local government municipalitiesLocal councils can also apply a municipal charge (of not more than 20% of their total rate revenue); a wastemanagement charge; and other special rates and charges as deemed appropriate by councilsExemptions from rates apply to crown land, charitable land, land used for religious purposes, and landused exclusively for mining and forestryRate revenue comprises around 53.4 per cent of Victorian councils’ total revenueCouncil rates do not represent a direct user pays system because local government provides servicesand infrastructure for public benefit.
PRINCIPLE: Those with a higher valued property relative to others within a municipality contributea larger amount in rates
Rating Equity
Rates are distributed between ratepayers based on the relative value of properties within a municipalityProperties are revalued every two years to maintain a fair distribution of the rates burden betweenproperty owners within a mmunicipalityThere is a direct relationship between property holdings and disadvantage – less wealthy people tend toown lower valued housing stockProperty owners with higher valued assets generally have a greater capacity to payProperty taxes do not take into account individual debt levels or income received by owners – there are othertaxes applying to income and expenditure which should be considered when assessing tax equity.
PRINCIPLE: There is no connection between the amount of rates paid and the level of councilservices received by individuals.
Municipal Charges
A municipal charge may be used by a council to collect a portion of revenue not linked to property valuebut paid equally by all ratepayersFarm owners with multiple property assessments for rates only attract a single municipal charge.User fees imposed by councils (such as municipal and waste management charges) help to redistribute theburden of rates as they are paid equally by all ratepayers and reduce the total property rates required by acouncil to fund its annual budget.
PRINCIPLE: The use of a municipal charge reduces the amount that needs to be collected in theform of rates attached to the value of a property.
PROPERTY VALUATIONS
Biennial Property Valuations
Victoria has more than 2.5 million properties valued at more than $900 billion. Local government usesproperty values to apportion the council rates payable for each individual property.
As property values change, a council must periodically reassess the valuation of all properties within itsmunicipality. A valuation determines the market value of a property, at a specific date and in accordancewith relevant legislation and legal precedent.
All Victorian properties have recently undergone valuations at the prescribed date of 1 January 2008. Towork out how much each property is worth, council valuers’ analyse latest property sales and rental datatrends, as well as consider other factors such as the highest and best use of the land; house value andother site improvements; and land shape, size and location.
Each council will use this valuation data to apportion the amount of rates to be paid by each property ownerin the 2008-09 and 2009-10 financial years.
Up-to-date valuations are critical for ensuring property owners pay a fair and equitable share of rates. Two-yearly revaluations assist in delivering rating equity by redistributing the rate burden within a municipalityaccording to property price movements.
Revaluation Facts VS Myths
FACT: Councils use property valuations to determine how much each ratepayer will pay in ratesMYTH: Increased property values increase how much a council collects in rates - NO
Increased property values do not increase the total amount of money a council collects inrates - it redistributes the amount of rates paid between individual properties. Someratepayers will pay more and some will pay less, depending on the new value of their propertyrelative to other properties in their municipality. A council budget determines how much acouncil collects in rates – not property valuations.
Role of Valuer-General Victoria
While the property valuation and rating process is the responsibility of local government, the Valuer-GeneralVictoria (VGV) independently oversees this process to ensure statutory requirements and best practicestandards have been met.
Only qualified valuers - professionals holding recognised tertiary qualifications and with the required practicalexperience - can perform municipal valuations.
Once the VGV certifies that a council’s general valuation meets required standards, the Minister maydeclare that the valuation is suitable to be adopted and used by council.
Ratepayer Rights
Ratepayers have rights under the Valuation of Land Act 1960 to object to the valuation of their property.
COUNCIL RATING BASES
Each Victorian council chooses one of three valuation bases for their municipality - Capital ImprovedValue (CIV), Site Value (SV), or Net Annual Value (NAV).
The common process for calculating each of the three valuation bases is as follows:
Every two years council valuers have a statutory requirement to conduct a review of propertyvalues based on market movements and recent sales trendsThe last revaluation is based on levels as at 1 January 2008Council valuers undertake a physical inspection of a sample of propertiesThe total value of property in a municipality is used as the base against which that council strikesits rate in the dollarThe rate in the dollar is multiplied by the CIV, SV or NAV value of the property to determine thegeneral rates due on each propertyThe Valuer General is responsible for reviewing the total valuation of each municipality foraccuracy before he certifies that the valuations are true and correct.
Capital Improved Value
CIV refers to the total market value of the land plus the improved value of the propertyincluding the house, other buildings and landscaping
Site Value
SV refers to the unimproved market value of the land
Net Annual Value
NAV is the annual rental a property would render, less the landlord’s outgoings (such asinsurance, land tax and maintenance costs) or 5% of the CIV for residential properties and farmsThe value is higher for commercial/industrial and investment properties.