Embed Size (px)
Citation preview

U.S. Department of Education
Cover Sheet Type of School(Check all that apply)
PublicX Private
MIddleElementary High K-12XCharter Title IX Magnet Choice
Mrs. Patsy Guglielmino Name of Principal(Specify: Ms., Miss, Mrs., Dr., Mr., Other) (As it should appear in the official records)
Official School Name Northport Schools(As it should appear in the official records)
School Mailing Address 404 10th Street P.O. Box 1280(If address is P.O. Box, also include street address.)
City Zip Code+4(9 digits total)State
Northport Washington 99157-1280
County Stevens State School Code Number* 33211
Telephone (509) 732-4251 Fax (509) 732-6606
Web site/URL www.northportschools.org E-mail [email protected]
I have reviewed the information in this application, including the eligibility requirements on page 3, and certify that to the best of my knowledge all information is accurate.
Principal's Signature
Date
Name of Superintendent Mrs. Patsy Guglielmino(Specify: Ms., Miss, Mrs., Dr., Mr., Other)
District Name Northport #211 Tel. (509) 732-4251
I have reviewed the information in this application, including the eligibility requirements on page 3, and certify that to the best of my knowledge all information is accurate.
(Superintendent’s Signature)
Date
Name of School Board President/Chairperson Mr. Jeff Brunette
(Specify: Ms., Miss, Mrs., Dr., Mr., Other)
I have reviewed the information in this application, including the eligibility requirements on page 3, and certify that to the best of my knowledge all information is accurate.
(School Board President’s/Chairperson’s Signature)
Date
*Private Schools: If the information requested is not applicable, write N/A in the space.Mail by commercial carrier (FedEx, UPS) or courier original signed cover sheet to Aba Kumi, Director, NCLB-Blue Ribbon Schools Program, US Department of Education, 400 Maryland Avenue, SW, Room 5E103, Washington DC 20202-8173.
2008 No Child Left Behind–Blue Ribbon Schools Program
NCLB-BRS (2008) Page 1 of 29

PART I - ELIGIBILITY CERTIFICATIONInclude this page in the school’s application as page 2.
The signatures on the first page of this application certify that each of the statements below concerning the school’s eligibility and compliance with U.S. Department of Education, Office for Civil Rights (OCR) requirements is true and correct.
1. The school has some configuration that includes grades K-12. (Schools on the same campus with one principal, even K-12 schools, must apply as an entire school.)
The school has made adequate yearly progress each year for the past two years and has not been identified by the state as “persistently dangerous” within the last two years. To meet final eligibility, the school must meet the state’s adequate yearly progress requirement in the 2007-2008 school year.
If the school includes grades 7 or higher, the school must have foreign language as a part of its core curriculum.
The school has been in existence for five full years, that is, from at least September 2002 and has not received the No Child Left Behind–Blue Ribbon Schools award in the past five years.
The nominated school or district is not refusing OCR access to information necessary to investigate a civil rights complaint or to conduct a district wide compliance review.
OCR has not issued a violation letter of findings to the school district concluding that the nominated school or the district as a whole has violated one or more of the civil rights statutes. A violation letter of findings will not be considered outstanding if OCR has accepted a corrective action plan from the district to remedy the violation.
The U.S. Department of Justice does not have a pending suit alleging that the nominated school or the school district as a whole has violated one or more of the civil rights statutes or the Constitution’s equal protection clause.
There are no findings of violations of the Individuals with Disabilities Education Act in a U.S. Department of Education monitoring report that apply to the school or school district in question; or if there are such findings, the state or district has corrected, or agreed to correct, the findings.
2.
3.
4.
5.
6.
7.
8.
NCLB-BRS (2008) Page 2 of 29

PART II - DEMOGRAPHIC DATA
All data are the most recent year available. Throughout the document, round numbers to the nearest whole number to avoid decimals, except for numbers below 1, which should be rounded to the nearest tenth.
DISTRICT (Question 1-2 not applicable to private schools)
1. Number of schools in the district: Elementary schools1
Middle schools1
Junior High Schools0
High schools1
Other0
TOTAL3
District Per Pupil Expenditure: 184382.
Average State Per Pupil Expenditure: 9214
SCHOOL (To be completed by all schools)
3.
Small city or town in a rural are[ ]
Urban or large central city[ ]Suburban school with characteristics typical of an urban are[ ]Suburban[ ]
Rural[ X ]
Number of years the principal has been in her/his position at this school.124.
If fewer than three years, how long was the previous principal at this school?0
Category that best describes the area where the school is located:
5. Number of students as of October 1 enrolled at each grade level or its equivalent in applying school only:
Grade # of Males
# of Females
Grade Total
Pre KK123456
e Grade # of Males
# of Females
Grade Total
789
101112
Other
TOTAL STUDENTS IN THE APPLYING SCHOOL
0 0 09 6 158 7 159 8 17
11 4 157 4 118 5 135 8 13
5 6 1110 4 1412 7 1910 6 165 13 18
10 14 240 0 0
201
NCLB-BRS (2008) Page 3 of 29

6. Racial/ethnic composition of the school: % Asian or Pacific Islander2
% Black or African American1
% American Indian or Alaska Native3
% Hispanic or Latino4
% White90
100 % TOTAL
Use only the five standard categories in reporting the racial/ethnic composition of the school.
Student turnover, or mobility rate, during the past yea 187. %
This rate should be calculated using the grid below. The answer to (6) is the mobility rate.
Number of students who transferred to the school after October 1 until the end of the yearNumber of students who transferred from the school after October 1 until the end of the yearTotal of all transferred students [sum of rows (1) and (2)]Total number of students in the school as of October 1 Total transferred students in row (3) divided by total students in row Amount in row (5) multiplied by 100
( 1 )
( 2 )
( 3 )
( 4 )
( 5 )
( 6 )
24
13
201
18
37
0.18
8. Limited English Proficient students in the school: 0 %
Total Number Limited English Proficient
0
Number of languages represented 0
Specify languages: 0
9. Students eligible for free/reduced-priced meals 68 %
Total number students who qualify: 145
If this method does not produce an accurate estimate of the percentage of students from low income families, or the school does not participate in the federally supported lunch program, specify a more accurate estimate, tell why the school chose it, and explain how it arrived at this estimate.
NCLB-BRS (2008) Page 4 of 29

10. Students receiving special education services: 12 %
Total Number of Students Serve17
Indicate below the number of students with disabilities according to conditions designated in the Individuals with Disabilities Education Act. Do not add additional categories.
Autism1
Deafness0
Deaf-Blindnes0
Emotional Disturbanc1
Hearing Impairment0
Mental Retardation1
Multiple Disabilities1
Orthopedic Impairment0
Other Health Impairment3
Specific Learning Disabilit8
Speech or Language Impairment2
Traumatic Brain Injury0
Visual Impairment Including Blindness
0
11. Indicate number of full time and part time staff members in each of the categories below:
Administrator(s) 1
Full-time
Classroom teachers 14
Special resource teachers/specialist 2
Paraprofessionals 0
Support Staff 3
Total number 20
0
Part-time
2
0
7
13
22
Number of Staff
12. Average school student-classroom teacher ratio, that is, the number of students in the school divided by the FTE of classroom teachers, e.g., 22:1
12 : 1
13. Show the attendance patterns of teachers and students as a percentage. Please explain a high teacher turnover rate. The student dropout rate is defined by the state. The student drop-off rate is the difference between the number of entering students and the number of exiting students from the same cohort. (From the same cohort, subtract the number of exiting students from the number of entering students; divide that number by the number of entering students; multiply by 100 to get the percentage drop-off rate.) Briefly explain in 100 words or fewer any major discrepancy in attendance, dropout or the drop-off rates. Only middle and high schools need to supply dropout rates, and only high schools need to supply drop-off
2006-2007 2005-2006 2004-2005 2003-2004 2002-2003Daily student attendanceDaily teacher attendanceTeacher turnover rateStudent drop out rate (middle/highStudent drop-off rate (high school
75 %93 %8 %0 %20 %
74 %97 %8 %7 %
30 %
68 %96 %26 %5 %41 %
0 %0 %0 %5 %0 %
0 %0 %0 %
11 %0 %
Please provide all explanations below
The information provided by the Office of Superintendent of Public Instruction for Washington State related to the student drop out rate for our district does not include an annual rate for 2006-07 at this time.
NCLB-BRS (2008) Page 5 of 29

14. (High Schools Only. Delete if not used.)Show what the students who graduated in Spring 2007 are doing as of the Fall 2007.
The daily teacher attendance rate reflects sick leave that was taken in each of the prospective years. At this time, we do not have a tracking system for professional leave. Our teachers average 3-4 days professional leave per calendar year to attend classes and training related to school improvement. In addition, we applied for and have been granted 5 waiver days from the state each of the last three years which we have spent to strategically increase academic achievement.
Graduating class size 17Enrolled in a 4-year college or university 41Enrolled in a community college 41Enrolled in vocational training 6Found employment 12Military service 0Other (travel, staying home, etc.) 0Unknown 0
%%%%%%%
Total 100 %
NCLB-BRS (2008) Page 6 of 29

PART III - SUMMARY
Northport is a tiny rural district, averaging 200 students per year. Although we are remote from population centers, our public schools are innovative. Our single K-12 campus offers smaller than average class sizes, opportunities for cross-age tutoring, integrated K-12 curricula and collegial sharing among staff.
The district campus includes two schools (K-8 and 9-12) as well as a shop complex, a computer lab, special education suite, and a gymnasium. The district employs 43 full and part-time people.
Our community, board of directors, administrators, and faculty have been working collaboratively to institute changes that have led to a progressive school system that enjoys academic success and strives to meet our mission statement which is to maximize individual potential. Much of the success is attributed to community-wide strategic planning, the establishment of a clear and shared focus, adoption and implementation of research-based curriculum, and professional training. Our teachers are all certified 'highly qualified' and have received training in some of the most promising and exemplary curriculum materials and effective practices available. In addition, two of our certificated staff have recently achieved National Board Certification status. Our support staff has also been an integral part of our improvement efforts, participating in in-services that strengthen their skills, as well.
Our facilities have improved along with our curriculum and achievement. We have been fortunate to pass tax levies over the past few years as well as a bond to remodel the high school. Student/community/staff pride in the remodeled high school (completed fall 2005) definitely enhanced the possibilities for student achievement. An upgraded science lab, more efficient use of space, huge improvements in lighting and storage have all helped enhance our students' education. In addition, through an E-Rate grant, we upgraded our district's computer system to a state-of-the-art Internet Protocol telephony network that runs over fiber optic lines. Strategically, we have given our other buildings and grounds a facelift as we replaced lighting, flooring, lockers, bleachers, and other worn essentials as well as repainted the interior and exteriors. Moreover, we have improved ball fields and landscaping with the help of our community.
The Northport School District is the heart of the community. Our schools support community efforts to create a vital local economy by providing educational programs that maximize the potential of all individuals.
NCLB-BRS (2008) Page 7 of 29

PART IV - INDICATORS OF ACADEMIC SUCCESS
1. Assessment Results:
Northport School District's performance on the Washington Assessment of Student Learning (WASL) may be found @ www.k12.wa.us Currently, our students in grades 3-8 and 10 are taking WASL tests in reading, writing, math, and science.The WASL is designed to stimulate student thinking-particularly in the areas of application and evaluation. It is not timed, and is designed to be taken over several days. Students are scored in levels. Those that meet/exceed standards receive a Level 3 or 4. Those who do not meet standard receive a Level 1 or 2. In the areas of reading and math, students must receive a score of 400 in order to meet standard. In the area of writing, a student must receive a 9 out of 12 possible points in order to meet standard.
Northport houses approximately 200 students K-12 each year and averages 12 students per grade level. Because of our relatively low numbers, we look for multi-year trends in data to guide our instruction rather than performance year to year. There are years our historical data is incomplete due to low student numbers (N<10). In addition, the assessment results for grades 3 and 5 are incomplete because the WASL at these two grade levels has only been administered by the state since 2006. This is also why our only subgroup in this award application includes information on children from low-income families, and that there are years and grade levels with missing data. Over the last three years, our district has improved dramatically in our reading and math scores, particularly at the 10th grade level. In 2004, 44% of our students met standard in reading, 33% met standard in mathematics, and 33% met standard in writing. In 2007, 90% of our students met standard in reading, 70% met standard in mathematics, and 80% met standard in writing.
We use WASL information as a summative piece of information and together with data from our classroom-based diagnostic and district-wide formative assessments we are able to create, implement, and continually refine individual/group/class learning acceleration plans that maximize individual potential.
2. Using Assessment Results:As part of our Strategic Learning Improvement Plan process, the Northport School District has developed reading/writing and math/science learning improvement teams comprised of certified and classified staff members, parent/community members, and administration members. These teams meet bi-monthly, and the purpose of our meetings is two-fold. First, we complete a careful study of local, state, and national assessment data on all of our students. Data analysis and subsequent discussion drives all decisions regarding student placement. The district utilizes a three-tier instructional plan so that students failing to thrive in core instructional groups (Tier 1) may be provided with additional instruction during our intervention blocks (Tier 2). Some students may demonstrate a need for further instructional support and receive more intensive intervention (Tier 3) through special services. Students move fluidly within the three-tier model so that we can maximize individual potential. Second, we review our K-12 staff's progress toward full implementation of the reading/writing and math/science improvement plans. Our plans are based on the premise that all students can and will meet local, state, and national standards and that our community will continue to provide financial support of schools to ensure a safe, high-quality learning environment. Our administrative team helps the staff keep the vision and mission statement in mind as we set goals, create action plans, define resources needed, and execute timelines for implementation of the plan. We also evaluate our progress toward meeting those goals on a monthly basis through the use of peer observations/academic coaching, perception data surveys of community and staff, and activities that promote thoughtful self-reflection.
3. Communicating Assessment Results:
The Northport School District has adopted district and building-wide policies for parent/community involvement that include details on ways our community can expect to be informed of student progress. Some of these activities include informal gatherings such as the annual Back to School Barbeque where grade level expectations and homework policies are shared, classroom-based parent involvement events, classroom newsletters that outline current subjects for study, 'Good News' postcards that are sent home periodically to honor student achievement, and articles that highlight student success in our local school-community newspaper, the Pioneer. We also host K-12 assemblies each semester to honor academic
NCLB-BRS (2008) Page 8 of 29

achievement and invite our parents and community to attend. We have more formal procedures for keeping parents informed of student progress such as mid-quarter progress reports, quarterly report cards, parent meetings, and by hosting individual student/parent/teacher conferences in the fall and spring. During these conferences, students/teachers/parents work together to develop an individual intervention plan based on results of classroom, district, state, and national-level data that maximizes the student's potential.
4. Sharing Success:
The Northport High School has recently been named a School of Distinction by the Washington State Superintendent of Public Instruction. We received this honor because of the dramatic changes we have seen in student achievement over the last six years. We shared this information with our community by submitting articles to our regional and local newspapers, and by displaying our banner in the gymnasium so that parents and community members from neighboring schools would learn of our recent achievement. As more and more of our students have met/exceeded standard on the WASL, we have honored their achievements with special luncheons, plaques, award assemblies, and honor cords at graduation. Our students' success has also been shared with families and community members via assemblies, local newspaper articles, dedicated bulletin board displays, and classroom newsletters. We've also celebrated our steps to success with the staff by 'toasting' one another at meetings, and by honoring individuals with congratulatory notes, email, and voicemail messages. We are a part of a local consortium of nine small, rural school districts that meet twice per year to share staff development resources and to give teachers an opportunity to exchange ideas for best practices with one another. This has given our staff the chance to talk with colleagues about our success and to solicit ideas for improvement. Our district superintendent also attends monthly principal and superintendent meetings with administrators from other northeast Washington schools and is able to share our success with administrative colleagues.
In the event we were to receive the Blue Ribbon award, we would invite our state and local legislators along with the state Superintendent of Public Instruction to our site to help our students celebrate their achievements. We would submit articles to our community and regional newspapers, host a community gathering, share the news with our local clubs and businesses, and work with our Parent-Teacher Organization to disseminate the good news to all families.
NCLB-BRS (2008) Page 9 of 29

PART V - CURRICULUM AND INSTRUCTION
1. Curriculum:
The Northport School District selects all curriculum including reading, writing, math, science, social studies, foreign language, health and fitness, and the arts based on its alignment with Washington state standards, and based on its adherence to research-based teaching methodologies found to be most effective with students from populations similar to our own. We have adopted a three tier model for instructional delivery so that we can provide appropriate, targeted intervention to all students when necessary and we can maximize the number of students actively engaged in every lesson.In the elementary school, we focus our morning instruction on reading, writing, and mathematics. Students are grouped heterogeneously for writing and math during core instructional time, but are placed in performance-based skill groups for intervention time. In reading, students are placed in performance-based skill groups for a minimum of 90 minutes daily for core instruction, and may also participate in skill-based intervention groups in the afternoon depending upon need. Science and social studies are taught either as special units of study or may be integrated to core subject teaching time. Students also participate in visual/performing arts and health and fitness class two days per week.
In the middle school, students are grouped heterogeneously for core instruction in reading, writing, and math, but are placed in performance-based skill groups in these subjects for intervention in the afternoon. Our students in 7th and 8th grade also work in a college prep language arts curriculum daily. Science and social studies are taught in traditional one hour blocks in the afternoon. Eighth grade students have the opportunity to participate in a visual arts class four days per week. All middle school students attend health and fitness class four days per week.
Currently, our high school graduation requirements exceed that of the state in English, Mathematics, and Social Studies. Our superintendent and board have plans to increase the number of credits in higher level math and English courses required for a Northport diploma in the near future. Students receive core instruction in English, Mathematics, History, and Science in 55 minute blocks daily. Students demonstrating additional assistance in English/Mathematics may also participate in an hour long intervention block daily. Those students in need of the most intensive help in these areas may qualify for assistance in our special services program. Small schools often have difficulty offering a broad range of courses because of the small staff size. We have a unique schedule in our high school with extra staff on Mondays in order to provide a richer array of such elective courses. In the high school, we offer two years of French on site, and have recently increased our course offering capacity for other foreign languages, such as Spanish, through our on-line course subscriptions. We also offer classes in performing and visual arts and music at the middle and high school levels. As part of our Strategic Learning Improvement Plan, we will implement two AP English courses, one AP math course, and one AP Science course in the fall of 2008. Currently, we are offering AP U.S. History, and college prep classes in language arts at the middle and high school levels. Ultimately, we want to prepare all students so that they are equipped with the necessary skills and concepts to successfully enter and remain in college for a minimum of two years.
2a. (Elementary Schools) Reading:
The Northport Elementary school adopted a reading curriculum that was closely aligned with state standards and also utilized teaching methodologies that have been shown through research as best meeting the needs of students in populations similar to our own. We use a three tier model for instructional delivery that includes the use of performance-based groups that meet daily for 90 minutes (Tier 1). Students move fluidly throughout the year based on state and local assessment information. Some students require additional assistance in areas such as phonemic awareness, phonics, vocabulary, fluency, and comprehension and therefore participate in intervention groups five days per week for twenty minutes (Tier 2). If students do not respond to these instructional models, they may also receive special services (Tier 3) in addition to core instruction.
2b. (Secondary Schools) English:
The Northport High School offers college prep English to freshman and sophomores, and Advanced English to juniors and seniors as core classes (Tier 1). Classes meet five days per week for 50 minutes per day. Some students require additional academic assistance and also attend a LanguageLab class (Tier 2) four days per week for fifty minutes daily. The purpose of this class is to better prepare students for district, state, and national assessments. We have also instituted the use of advanced high school Englsih students
NCLB-BRS (2008) Page 10 of 29

as tutors at this level to help with lesson delivery. The cross-age tutoring program benefits both students. Tier 2 students often respond more positively to a peer tutor and thus learn more quickly, and the high school tutor must stretch his/her capabilities in order to teach a previously learned concept to a younger student. Students who do not respond to Tier 1 and Tier 2 intervention may also be referred to special services classes (Tier 3) for additional instruction.
3. Additional Curriculum Area:
The Northport School District offers students the opportunity to participate in constructivist small group work settings as well through their participation in the K-12 math program. Students are grouped heterogenously for 55 minutes of core instruction at their prospective grade levels (Tier 1) . Teachers meet monthly to review data and to determine student placement. Some students may receive additional intervention (20-50 minutes) in areas of need such as number sense, algebraic sense, geometric sense, probability and statistics, and measurement based on their performance on state and local assessments (Tier 2). We have also instituted the use of advanced high school math students as tutors at this level to help with lesson delivery. The cross-age tutoring program benefits both students. Tier 2 students often respond more positively to a peer tutor and thus learn more quickly, and the high school tutor must stretch his/her capabilities in order to teach a previously learned concept to a younger student. Students who demonstrate additional need of more intensive intervention may also receive special services (Tier 3) in the appropriate skill areas.
4. Instructional Methods:
The Northport School District employs a variety of instructional methods. We have found through careful study of research completed on student populations similar to our own that the use of direct, systematic instruction is most effective, particularly in the area of reading and writing. Our student achievement has increased as we have incorporated more lessons with a predictable format, built in preteaching and reteaching opportunities, and have assessed regularly once a concept has been taught. We have also found constructivist methodologies to be particularly effective in the areas of math/science so that our students' receive more practice with higher order thinking skills. Our teachers also regularly plan lessons that require students to be actively engaged, ie. the use of partners, choral responses, etc. so that we can increase the likelihood all students will be held accountable to the learning.
5. Professional Development:
The Northport School District has offered a rich professional development program to all staff for the last several years that has included the use of waiver days from the state of Washington. These days have been spent in two ways. First, these days have been spent on campus in intensive staff development meetings where action plans are developed based on needs cited in the core subject learning areas such as reading and math. We have also developed semester finals that simulate the rigor and format of the WASL, have developed scoring rubrics and practiced scoring student items, and have developed parent/community involvement plans so that we can strengthen our ability to maximize each student's potential. Second, we have partnered with other small schools in neighboring districts in consortium meetings twice yearly. The purpose of these meetings is to develop and offer more varied and challenging curriculum and to find ways to prepare more students for college entry.
In addition, classified and certified staff members attend a variety of workshops/trainings/classes offered by our local Educational Service District, and the state throughout the year to enhance their subject knowledge, to learn about the culture of poverty, and to learn more about the most effective teaching practices available.
NCLB-BRS (2008) Page 11 of 29

PART VII - ASSESSMENT RESULTS
Subject Reading (LA) Grade 10 Test WASL
Edition/Publication Year Publisher Pearson
Testing Month
2006-2007
March
2005-2006
April
2004-2005
April
2003-2004 2002-2003
SCHOOL SCORES* % “Meeting” plus % “Exceeding” State Standards
% “Exceeding” State Standards
Number of students tested
Percent of total students tested
Number of students alternatively assessed
Percent of students alternatively assessed
SUBGROUP SCORES 1. Low-income % “Meeting” plus % “Exceeding” State Standard
Number of students tested
90 70 77
70 45 2920100
0
2.
% "Exceeding" State Standards
% “Meeting” plus % “Exceeding” State Standard
% "Exceeding" State Standards
Number of students tested
3. % “Meeting” plus % “Exceeding” State Standard
% "Exceeding" State Standards
Number of students tested
4. % “Meeting” plus % “Exceeding” State Standard
% "Exceeding" State Standards
Number of students tested
88
7516
20100
15
58
4212
17100
0
71
2914
NCLB-BRS (2008) Page 12 of 29
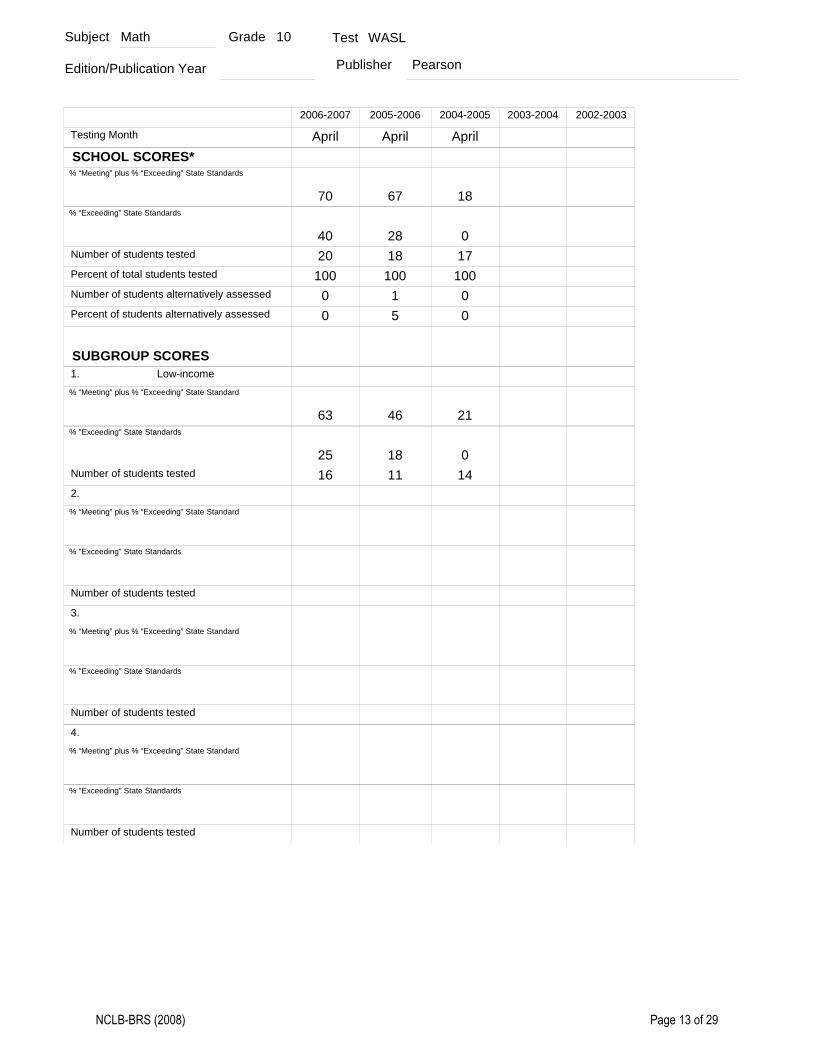
Subject Math Grade 10 Test WASL
Edition/Publication Year Publisher Pearson
Testing Month
2006-2007
April
2005-2006
April
2004-2005
April
2003-2004 2002-2003
SCHOOL SCORES* % “Meeting” plus % “Exceeding” State Standards
% “Exceeding” State Standards
Number of students tested
Percent of total students tested
Number of students alternatively assessed
Percent of students alternatively assessed
SUBGROUP SCORES 1. Low-income % “Meeting” plus % “Exceeding” State Standard
Number of students tested
70 67 18
40 28 020100
00
2.
% "Exceeding" State Standards
% “Meeting” plus % “Exceeding” State Standard
% "Exceeding" State Standards
Number of students tested
3. % “Meeting” plus % “Exceeding” State Standard
% "Exceeding" State Standards
Number of students tested
4. % “Meeting” plus % “Exceeding” State Standard
% "Exceeding" State Standards
Number of students tested
63
2516
18100
15
46
1811
17100
00
21
014
NCLB-BRS (2008) Page 13 of 29

Subject Reading (LA) Grade 8 Test WASL
Edition/Publication Year Publisher Pearson
Testing Month
2006-2007
April
2005-2006
April
2004-2005
April
2003-2004 2002-2003
SCHOOL SCORES* % “Meeting” plus % “Exceeding” State Standards
% “Exceeding” State Standards
Number of students tested
Percent of total students tested
Number of students alternatively assessed
Percent of students alternatively assessed
SUBGROUP SCORES 1. Low-income % “Meeting” plus % “Exceeding” State Standard
Number of students tested
64 46
27 814100
00
2.
% "Exceeding" State Standards
% “Meeting” plus % “Exceeding” State Standard
% "Exceeding" State Standards
Number of students tested
3. % “Meeting” plus % “Exceeding” State Standard
% "Exceeding" State Standards
Number of students tested
4. % “Meeting” plus % “Exceeding” State Standard
% "Exceeding" State Standards
Number of students tested
13100
00
36
911
NCLB-BRS (2008) Page 14 of 29

Subject Math Grade 8 Test WASL
Edition/Publication Year Publisher Pearson
Testing Month
2006-2007
April
2005-2006
April
2004-2005
April
2003-2004 2002-2003
SCHOOL SCORES* % “Meeting” plus % “Exceeding” State Standards
% “Exceeding” State Standards
Number of students tested
Percent of total students tested
Number of students alternatively assessed
Percent of students alternatively assessed
SUBGROUP SCORES 1. Low-income % “Meeting” plus % “Exceeding” State Standard
Number of students tested
36 39
7 014100
00
2.
% "Exceeding" State Standards
% “Meeting” plus % “Exceeding” State Standard
% "Exceeding" State Standards
Number of students tested
3. % “Meeting” plus % “Exceeding” State Standard
% "Exceeding" State Standards
Number of students tested
4. % “Meeting” plus % “Exceeding” State Standard
% "Exceeding" State Standards
Number of students tested
13100
00
36
011
NCLB-BRS (2008) Page 15 of 29

Subject Reading (LA) Grade 7 Test WASL
Edition/Publication Year Publisher Pearson
Testing Month
2006-2007
April
2005-2006
April
2004-2005
April
2003-2004 2002-2003
SCHOOL SCORES* % “Meeting” plus % “Exceeding” State Standards
% “Exceeding” State Standards
Number of students tested
Percent of total students tested
Number of students alternatively assessed
Percent of students alternatively assessed
SUBGROUP SCORES 1. Low-income % “Meeting” plus % “Exceeding” State Standard
Number of students tested
27 73 55
9 40 2711100
00
2.
% "Exceeding" State Standards
% “Meeting” plus % “Exceeding” State Standard
% "Exceeding" State Standards
Number of students tested
3. % “Meeting” plus % “Exceeding” State Standard
% "Exceeding" State Standards
Number of students tested
4. % “Meeting” plus % “Exceeding” State Standard
% "Exceeding" State Standards
Number of students tested
15100
16
70
4010
11100
00
NCLB-BRS (2008) Page 16 of 29

Subject Math Grade 7 Test WASL
Edition/Publication Year Publisher Pearson
Testing Month
2006-2007
April
2005-2006
April
2004-2005
April
2003-2004 2002-2003
SCHOOL SCORES* % “Meeting” plus % “Exceeding” State Standards
% “Exceeding” State Standards
Number of students tested
Percent of total students tested
Number of students alternatively assessed
Percent of students alternatively assessed
SUBGROUP SCORES 1. % “Meeting” plus % “Exceeding” State Standard
Number of students tested
18 47 18
0 7 911100
00
2.
% "Exceeding" State Standards
% “Meeting” plus % “Exceeding” State Standard
% "Exceeding" State Standards
Number of students tested
3. % “Meeting” plus % “Exceeding” State Standard
% "Exceeding" State Standards
Number of students tested
4. % “Meeting” plus % “Exceeding” State Standard
% "Exceeding" State Standards
Number of students tested
15100
16
40
010
11100
00
NCLB-BRS (2008) Page 17 of 29

Subject Reading (LA) Grade 6 Test WASL
Edition/Publication Year Publisher Pearson
Testing Month
2006-2007
April
2005-2006
April
2004-2005
April
2003-2004 2002-2003
SCHOOL SCORES* % “Meeting” plus % “Exceeding” State Standards
% “Exceeding” State Standards
Number of students tested
Percent of total students tested
Number of students alternatively assessed
Percent of students alternatively assessed
SUBGROUP SCORES 1. % “Meeting” plus % “Exceeding” State Standard
Number of students tested
50
3010100
00
2.
% "Exceeding" State Standards
% “Meeting” plus % “Exceeding” State Standard
% "Exceeding" State Standards
Number of students tested
3. % “Meeting” plus % “Exceeding” State Standard
% "Exceeding" State Standards
Number of students tested
4. % “Meeting” plus % “Exceeding” State Standard
% "Exceeding" State Standards
Number of students tested
NCLB-BRS (2008) Page 18 of 29

Subject Reading (LA) Grade 6 Test WASL
Edition/Publication Year Publisher Pearson
Testing Month
2006-2007
April
2005-2006
April
2004-2005
April
2003-2004 2002-2003
SCHOOL SCORES* % “Meeting” plus % “Exceeding” State Standards
% “Exceeding” State Standards
Number of students tested
Percent of total students tested
Number of students alternatively assessed
Percent of students alternatively assessed
SUBGROUP SCORES 1. % “Meeting” plus % “Exceeding” State Standard
Number of students tested
50
3010100
00
2.
% "Exceeding" State Standards
% “Meeting” plus % “Exceeding” State Standard
% "Exceeding" State Standards
Number of students tested
3. % “Meeting” plus % “Exceeding” State Standard
% "Exceeding" State Standards
Number of students tested
4. % “Meeting” plus % “Exceeding” State Standard
% "Exceeding" State Standards
Number of students tested
NCLB-BRS (2008) Page 19 of 29
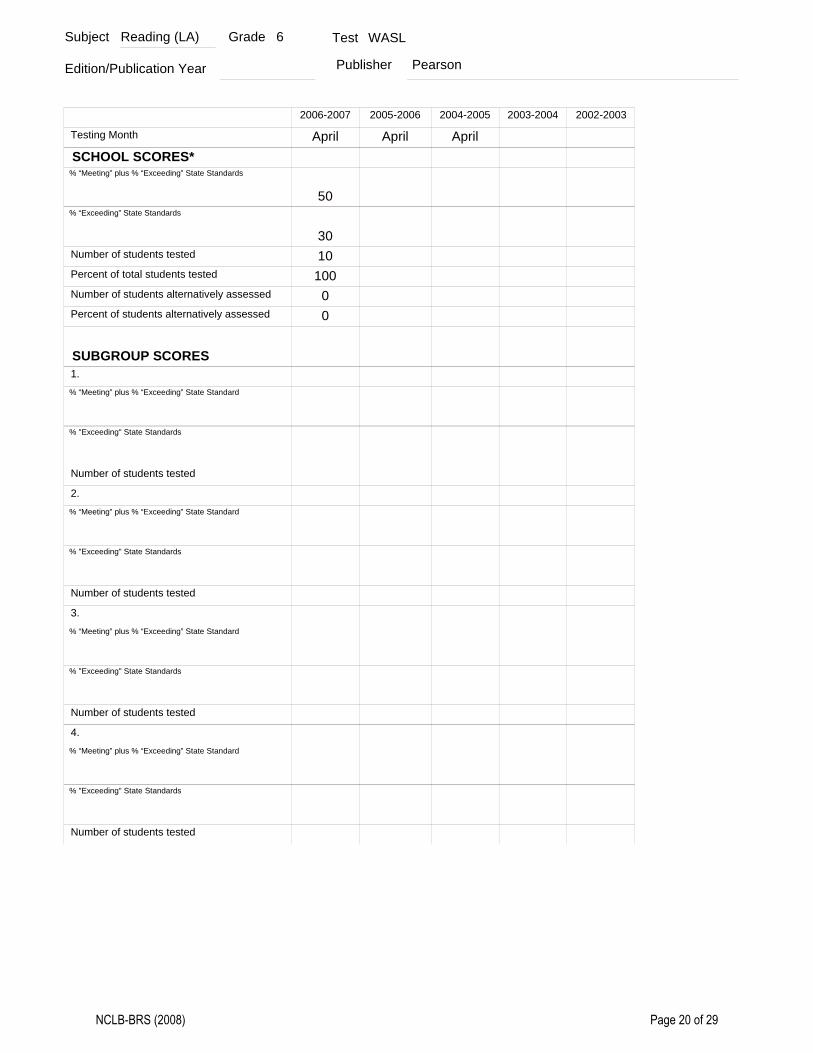
Subject Reading (LA) Grade 6 Test WASL
Edition/Publication Year Publisher Pearson
Testing Month
2006-2007
April
2005-2006
April
2004-2005
April
2003-2004 2002-2003
SCHOOL SCORES* % “Meeting” plus % “Exceeding” State Standards
% “Exceeding” State Standards
Number of students tested
Percent of total students tested
Number of students alternatively assessed
Percent of students alternatively assessed
SUBGROUP SCORES 1. % “Meeting” plus % “Exceeding” State Standard
Number of students tested
50
3010100
00
2.
% "Exceeding" State Standards
% “Meeting” plus % “Exceeding” State Standard
% "Exceeding" State Standards
Number of students tested
3. % “Meeting” plus % “Exceeding” State Standard
% "Exceeding" State Standards
Number of students tested
4. % “Meeting” plus % “Exceeding” State Standard
% "Exceeding" State Standards
Number of students tested
NCLB-BRS (2008) Page 20 of 29

Subject Math Grade 6 Test WASL
Edition/Publication Year Publisher p
Testing Month
2006-2007
April
2005-2006
April
2004-2005
April
2003-2004 2002-2003
SCHOOL SCORES* % “Meeting” plus % “Exceeding” State Standards
% “Exceeding” State Standards
Number of students tested
Percent of total students tested
Number of students alternatively assessed
Percent of students alternatively assessed
SUBGROUP SCORES 1. % “Meeting” plus % “Exceeding” State Standard
Number of students tested
30
3010100
00
2.
% "Exceeding" State Standards
% “Meeting” plus % “Exceeding” State Standard
% "Exceeding" State Standards
Number of students tested
3. % “Meeting” plus % “Exceeding” State Standard
% "Exceeding" State Standards
Number of students tested
4. % “Meeting” plus % “Exceeding” State Standard
% "Exceeding" State Standards
Number of students tested
NCLB-BRS (2008) Page 21 of 29
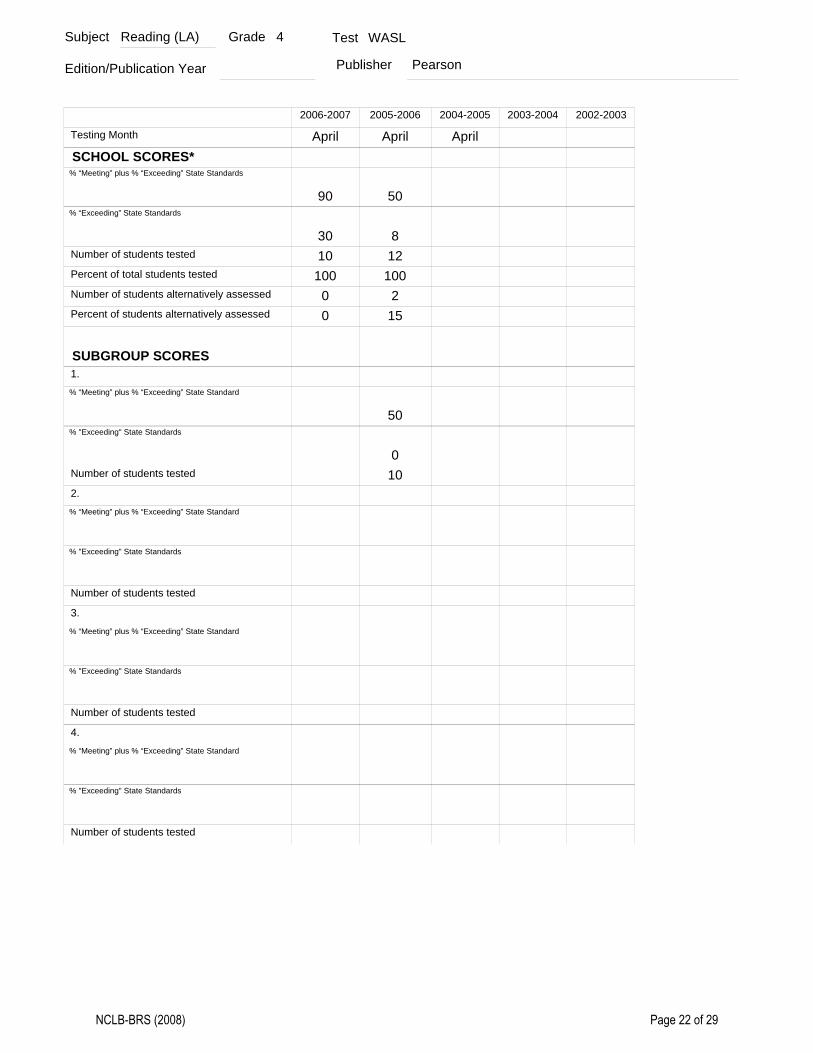
Subject Reading (LA) Grade 4 Test WASL
Edition/Publication Year Publisher Pearson
Testing Month
2006-2007
April
2005-2006
April
2004-2005
April
2003-2004 2002-2003
SCHOOL SCORES* % “Meeting” plus % “Exceeding” State Standards
% “Exceeding” State Standards
Number of students tested
Percent of total students tested
Number of students alternatively assessed
Percent of students alternatively assessed
SUBGROUP SCORES 1. % “Meeting” plus % “Exceeding” State Standard
Number of students tested
90 50
30 810100
00
2.
% "Exceeding" State Standards
% “Meeting” plus % “Exceeding” State Standard
% "Exceeding" State Standards
Number of students tested
3. % “Meeting” plus % “Exceeding” State Standard
% "Exceeding" State Standards
Number of students tested
4. % “Meeting” plus % “Exceeding” State Standard
% "Exceeding" State Standards
Number of students tested
12100
215
50
010
NCLB-BRS (2008) Page 22 of 29

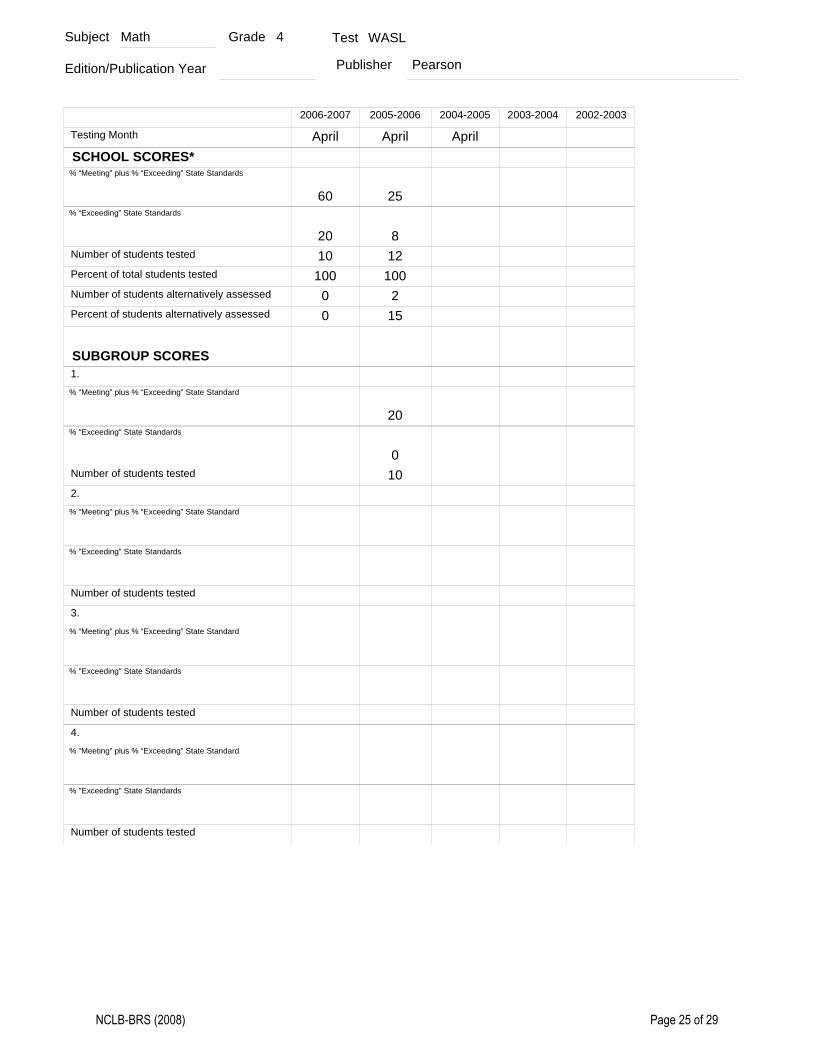
Subject Math Grade 4 Test WASL
Edition/Publication Year Publisher Pearson
Testing Month
2006-2007
April
2005-2006
April
2004-2005
April
2003-2004 2002-2003
SCHOOL SCORES* % “Meeting” plus % “Exceeding” State Standards
% “Exceeding” State Standards
Number of students tested
Percent of total students tested
Number of students alternatively assessed
Percent of students alternatively assessed
SUBGROUP SCORES 1. % “Meeting” plus % “Exceeding” State Standard
Number of students tested
60 25
20 810100
00
2.
% "Exceeding" State Standards
% “Meeting” plus % “Exceeding” State Standard
% "Exceeding" State Standards
Number of students tested
3. % “Meeting” plus % “Exceeding” State Standard
% "Exceeding" State Standards
Number of students tested
4. % “Meeting” plus % “Exceeding” State Standard
% "Exceeding" State Standards
Number of students tested
12100
215
20
010
NCLB-BRS (2008) Page 23 of 29

Subject Math Grade 4 Test WASL
Edition/Publication Year Publisher Pearson
Testing Month
2006-2007
April
2005-2006
April
2004-2005
April
2003-2004 2002-2003
SCHOOL SCORES* % “Meeting” plus % “Exceeding” State Standards
% “Exceeding” State Standards
Number of students tested
Percent of total students tested
Number of students alternatively assessed
Percent of students alternatively assessed
SUBGROUP SCORES 1. % “Meeting” plus % “Exceeding” State Standard
Number of students tested
60 25
20 810100
00
2.
% "Exceeding" State Standards
% “Meeting” plus % “Exceeding” State Standard
% "Exceeding" State Standards
Number of students tested
3. % “Meeting” plus % “Exceeding” State Standard
% "Exceeding" State Standards
Number of students tested
4. % “Meeting” plus % “Exceeding” State Standard
% "Exceeding" State Standards
Number of students tested
12100
215
20
010
NCLB-BRS (2008) Page 24 of 29
Subject Math Grade 4 Test WASL
Edition/Publication Year Publisher Pearson
Testing Month
2006-2007
April
2005-2006
April
2004-2005
April
2003-2004 2002-2003
SCHOOL SCORES* % “Meeting” plus % “Exceeding” State Standards
% “Exceeding” State Standards
Number of students tested
Percent of total students tested
Number of students alternatively assessed
Percent of students alternatively assessed
SUBGROUP SCORES 1. % “Meeting” plus % “Exceeding” State Standard
Number of students tested
60 25
20 810100
00
2.
% "Exceeding" State Standards
% “Meeting” plus % “Exceeding” State Standard
% "Exceeding" State Standards
Number of students tested
3. % “Meeting” plus % “Exceeding” State Standard
% "Exceeding" State Standards
Number of students tested
4. % “Meeting” plus % “Exceeding” State Standard
% "Exceeding" State Standards
Number of students tested
12100
215
20
010
NCLB-BRS (2008) Page 25 of 29

Subject Reading (LA) Grade 5 Test WASL
Edition/Publication Year Publisher Pearson
Testing Month
2006-2007 2005-2006
April
2004-2005 2003-2004 2002-2003
SCHOOL SCORES* % “Meeting” plus % “Exceeding” State Standards
% “Exceeding” State Standards
Number of students tested
Percent of total students tested
Number of students alternatively assessed
Percent of students alternatively assessed
SUBGROUP SCORES 1. % “Meeting” plus % “Exceeding” State Standard
Number of students tested
100
30
2.
% "Exceeding" State Standards
% “Meeting” plus % “Exceeding” State Standard
% "Exceeding" State Standards
Number of students tested
3. % “Meeting” plus % “Exceeding” State Standard
% "Exceeding" State Standards
Number of students tested
4. % “Meeting” plus % “Exceeding” State Standard
% "Exceeding" State Standards
Number of students tested
10100
00
NCLB-BRS (2008) Page 26 of 29

Subject Math Grade 5 Test WASL
Edition/Publication Year Publisher Pearson
Testing Month
2006-2007 2005-2006
April
2004-2005 2003-2004 2002-2003
SCHOOL SCORES* % “Meeting” plus % “Exceeding” State Standards
% “Exceeding” State Standards
Number of students tested
Percent of total students tested
Number of students alternatively assessed
Percent of students alternatively assessed
SUBGROUP SCORES 1. % “Meeting” plus % “Exceeding” State Standard
Number of students tested
60
40
2.
% "Exceeding" State Standards
% “Meeting” plus % “Exceeding” State Standard
% "Exceeding" State Standards
Number of students tested
3. % “Meeting” plus % “Exceeding” State Standard
% "Exceeding" State Standards
Number of students tested
4. % “Meeting” plus % “Exceeding” State Standard
% "Exceeding" State Standards
Number of students tested
10100
00
NCLB-BRS (2008) Page 27 of 29

Subject Reading (LA) Grade 3 Test WASL
Edition/Publication Year Publisher Pearson
Testing Month
2006-2007 2005-2006
April
2004-2005 2003-2004 2002-2003
SCHOOL SCORES* % “Meeting” plus % “Exceeding” State Standards
% “Exceeding” State Standards
Number of students tested
Percent of total students tested
Number of students alternatively assessed
Percent of students alternatively assessed
SUBGROUP SCORES 1. % “Meeting” plus % “Exceeding” State Standard
Number of students tested
83
50
2.
% "Exceeding" State Standards
% “Meeting” plus % “Exceeding” State Standard
% "Exceeding" State Standards
Number of students tested
3. % “Meeting” plus % “Exceeding” State Standard
% "Exceeding" State Standards
Number of students tested
4. % “Meeting” plus % “Exceeding” State Standard
% "Exceeding" State Standards
Number of students tested
12100
00
NCLB-BRS (2008) Page 28 of 29

Subject Math Grade 3 Test WASL
Edition/Publication Year Publisher Pearson
Testing Month
2006-2007 2005-2006
April
2004-2005 2003-2004 2002-2003
SCHOOL SCORES* % “Meeting” plus % “Exceeding” State Standards
% “Exceeding” State Standards
Number of students tested
Percent of total students tested
Number of students alternatively assessed
Percent of students alternatively assessed
SUBGROUP SCORES 1. % “Meeting” plus % “Exceeding” State Standard
Number of students tested
75
25
2.
% "Exceeding" State Standards
% “Meeting” plus % “Exceeding” State Standard
% "Exceeding" State Standards
Number of students tested
3. % “Meeting” plus % “Exceeding” State Standard
% "Exceeding" State Standards
Number of students tested
4. % “Meeting” plus % “Exceeding” State Standard
% "Exceeding" State Standards
Number of students tested
12100
00
NCLB-BRS (2008) Page 29 of 29