Embed Size (px)
Citation preview

2008 Nationwide Survey of LEPCs 1

This survey was funded by the Office of Emergency Management (OEM) of the U.S.
Environmental Protection Agency (EPA).

2008 Nationwide Survey of LEPCs 1
Acknowledgements . . . . . . . . . . . . . . . . . . . . . . . . . . . . . . . . . . . . . . .2
Background and Introduction . . . . . . . . . . . . . . . . . . . . . . . . . . . . . . . . .3
Methodology and Approach . . . . . . . . . . . . . . . . . . . . . . . . . . . . . . . . . .5
Executive Summary — What We Learned . . . . . . . . . . . . . . . . . . . . . . . .6
How are LEPCs Doing? . . . . . . . . . . . . . . . . . . . . . . . . . . . . . . . . . . . . .7
Emergency Response Plans . . . . . . . . . . . . . . . . . . . . . . . . . . . . . . . . . .9
How Accident History Affects LEPCs . . . . . . . . . . . . . . . . . . . . . . . . . . 10
Using and Managing Data . . . . . . . . . . . . . . . . . . . . . . . . . . . . . . . . . . 11
How LEPCs Communicate with the Public . . . . . . . . . . . . . . . . . . . . . . . 12
Changes in Activity Since 9/11: A Focus on Homeland Security . . . . . . . .13
Types of Assistance . . . . . . . . . . . . . . . . . . . . . . . . . . . . . . . . . . . . . . 14
Success Factors and Obstacles to Success . . . . . . . . . . . . . . . . . . . . . .15
Additional LEPC Needs . . . . . . . . . . . . . . . . . . . . . . . . . . . . . . . . . . . . 16
Conclusion . . . . . . . . . . . . . . . . . . . . . . . . . . . . . . . . . . . . . . . . . . . . 17
Appendix A: Survey Responses by Question . . . . . . . . . . . . . . . . . . . . .19
Appendix B: Cross-Tabulations . . . . . . . . . . . . . . . . . . . . . . . . . . . . . . 28
Appendix C: LEPC Websites . . . . . . . . . . . . . . . . . . . . . . . . . . . . . . . . 33
Appendix D: Map of EPA Regions . . . . . . . . . . . . . . . . . . . . . . . . . . . . . 35
Appendix E: Survey Questions . . . . . . . . . . . . . . . . . . . . . . . . . . . . . . . 36
Table of Contents

2008 Nationwide Survey of LEPCs2

2008 Nationwide Survey of LEPCs 3
The Emergency Planning and Community Right-to-Know Act (EPCRA) of 1986, enacted as Title III of the Superfund Amendments and Reauthorization Act (SARA), was passed in the wake of the Bhopal disaster in India, where more than 2,000 people died as a result of an accidental release of a hazardous chemical. In order to prevent similar occurrences in the United States, EPCRA established a national framework to mobilize local government officials, businesses, and other citizens to plan for chemical accidents in their communities and required each state to create a State Emergency Response Commission (SERC).
SERCs were charged with establishing Local Emergency Planning Committees (LEPCs), which provide a forum for first responders, State and local elected officials, emergency managers, industry representatives, hospital and public health officials, the news media, and the general community to work together and achieve local solutions. LEPCs work to identify chemical hazards, develop and maintain emergency plans in case of an accidental release, and encourage continuous attention to chemical safety, risk reduction, and accident prevention in their communities. Because of their broad-based membership, LEPCs are able to foster a valuable dialogue within the community to prevent and prepare for accidental (and terrorist-related) releases of hazardous chemicals.
In April 2008, the U.S. Environmental Protection Agency’s (EPA) Office of Emergency Management (OEM) conducted a Nationwide Survey of Local Emergency Planning Committees (2008 LEPC Survey). EPA surveyed LEPCs in both 1994 and 1999 to gauge levels of LEPC compliance and activity, but there had been no subsequent systematic nationwide analysis of LEPC activity.
In the seven years since the tragic events of September 11, 2001, local emergency planning has evolved — most notably, in the amount of information available to assist LEPCs in preparing for and preventing chemical emergencies. EPA decided to “check the pulse” of LEPCs across the nation by conducting the 2008 LEPC Survey. The goals of this survey were to:
1. Track the progress of LEPCs by assessing their current activity; and
2. Probe current LEPC practices and preferences regarding several important issues, including: communication with local citizens, proactive accident prevention efforts, and the effectiveness of selected OEM products and services.
Background and Introduction

2008 Nationwide Survey of LEPCs4
Methodology and Approach
Survey DesignThe 2008 LEPC Survey employed a universe or census approach. Both lessons-learned from prior LEPC surveys and limited knowledge of the composition of the entire population of LEPCs made a census-based approach most appropriate. Because the methodologies used in this survey differed from those used in past surveys, it is important to note that comparisons between the results reported here and past surveys are not statistically significant.
Data CollectionWhile previous surveys were paper-based, the 2008 LEPC Survey was administered electronically in an attempt to reduce the burden on respondents, increase efficiency, and improve data quality. To ensure confidentiality, provide technical assistance, and guarantee that specific data quality objectives were met, a third-party contractor administered the survey.
In the months prior to launching the survey, EPA conducted a major outreach effort to update the contact information in its LEPC database. At the conclusion of this effort, the database contained e-mail addresses for 2,670 of the more than 3,000 known LEPCs.
On April 2, 2008, EPA launched the Web-based LEPC Survey by sending electronic survey invitations to each LEPC contact person with a listed e-mail address. In the invitation, each contact person was given a user name (their email address) and a unique alpha-numeric password. 313 of the original emails were returned as undeliverable, making the universe of potential respondents 2,357.
The survey was open for five weeks and closed on May 7, 2008. Two reminder emails were sent to all those who had not completed the survey on April 23, 2008 and on May 5, 2008. At the close of the survey, 939 LEPCs had responded, yielding a response rate of 39.8%.
Although a total of 939 LEPC representatives took the survey, the number of people who answered each question varied. Individuals were not required to answer every question and were able to skip questions. Finally, individuals who responded in either the affirmative or negative for certain questions were routed past other questions. Furthermore, for some questions, respondents were able to “select all that apply.”
Data AnalysisA third-party contractor reviewed survey data to ensure data quality. Certain answers were recoded for consistency purposes. Aggregate data tables that contain response frequencies and results for each survey question are included in Appendix A. Special analyses were conducted (cross-tabulations) to determine the relationship between two questions and selective, noteworthy findings are included in Appendix B. This report highlights important findings from both the aggregate data tables and the cross-tabulation tables.
The final survey question was open-ended, allowing LEPCs to provide additional comments, including best practices. Answers to this open-ended question were reviewed and compiled thematically. Important findings from comments provided are included throughout this report.
Maintaining the LEPC DatabaseThe LEPC database currently has over 3,000 listings. It is EPA’s intent to provide the most current and accurate information. We look to the LEPC community to help us successfully meet this goal. Please forward any changes or corrections to [email protected]. LEPC updates and additions are made as they are received.

2008 Nationwide Survey of LEPCs 5
Executive Summary — What We Learned
OverviewIn April 2008, the U.S. Environmental Protection Agency (EPA) Office of Emergency Management (OEM) conducted a nationwide survey of Local Emergency Planning Committees (LEPCs). LEPCs serve as the fundamental link between citizens, industry, and government in emergency preparedness for communities. As the central point around which emergency management agencies, first responders, industry, and the community work together to enhance emergency preparedness, LEPCs are improving chemical safety and protecting human health and the environment in communities across this country.
EPA surveyed LEPCs in 1994 and 1999 to determine compliance and activity levels. The 2008 survey built on the previous surveys and was developed to assess LEPCs’ current activities; and to probe LEPC practices and preferences regarding several important issues, including: communication with local citizens, proactive accident prevention efforts, and the effectiveness of selected OEM products and services. EPA launched the Web-based survey on April 2, 2008 with notification sent via email to a total of 2,357 LEPCs. The survey was password-protected and each LEPC representative was given a unique alpha-numeric password. Nine hundred and thirty nine LEPC representatives took the survey, yielding a response rate of 39.8%.
The majority of LEPCs responding to the 2008 survey serve rural or mixed rural/suburban residential populations under 50,000. Among the four U.S. regions, the Northeast is underrepresented in the survey data while the West, Midwest, and South are overrepresented. This difference in actual response rates vs. the universe of LEPCs is consistent with response rates from the 1999 LEPC Survey.
Survey results indicate that a dedicated membership is the greatest single factor contributing to an LEPC’s success (33.3%) while 15.9% report that regularly scheduled meetings contribute most to their success as an organization. Furthermore, there is an obvious sense of pride in the work of the LEPC—64.9% of responding LEPCs report that the LEPC on which they serve has had a positive impact on chemical safety in their community.
Other Key Findings• NineoutofeverytenrespondingLEPCsmetatleastonceinthepastyear—threequartersof
those LEPCs met at least quarterly.• Closeto60%ofrespondingLEPCsreviewedandupdatedtheiremergencyplaninthepast12
months.• ThreeoutoffourrespondingLEPCsindicatethatthemajorityoftheirmembershipisfamiliarwith
their emergency response plan.• Over75%ofrespondingLEPCsexercisedtheiremergencyresponseplaninthepastyearwith
nearly seven of ten conducting full-scale exercises.• ThemostactiveLEPCsarethosethathadatleastoneaccidentinthepastfiveyears.• WhilethreeoutoffourLEPCsdidnotreceiveanytechnicalassistanceorguidancefromthe
Federal government in the past five years, of those that did, 58.6% report that the assistance came from EPA. Close to 80% of those LEPCs indicate that EPA’s support plays a significant role in guiding their LEPC activity.

2008 Nationwide Survey of LEPCs6
• Nearly70%ofrespondingLEPCsthatreceiveEPCRATierIandTierIIdatareceiveitinthepaperformat.
• OverhalfofrespondingLEPCsuseCAMEO.• TwooutoffiverespondingLEPCshaveanoperatingbudgetofwhich35.9%isdirectfunding.• OverhalfofrespondingLEPCsreceivein-kindfundingwiththemostfrequentformbeingmeeting
space.• SincethelastLEPCsurveyin1999,thepercentageofLEPCsthatincorporatehomelandsecurity
into their emergency response plans nearly doubled (from 40.3% in 1999 to 77.5% today).• Since9/11,nearlyhalfofrespondingLEPCsreportedincreasingtheiroverallactivitylevel.Only
4.0% said the overall activity level of their LEPC decreased since the events of 9/11.

2008 Nationwide Survey of LEPCs 7
Table 1. Demographics Service Area Type
Population Size Rural Rural/Suburban Suburban Suburban/Urban Urban Total
<50,000 40.2% 19.1% 2.1% 0.9% 0.2% 62.5%50,001-100,000 4.2% 9.7% 0.8% 0.6% 0.5% 15.8%100,001-500,000 1.4% 11.1% 0.6% 2.7% 1.4% 17.2%500,001-1,000,000 0.0% 0.8% 0.2% 1.5% 0.1% 2.6%>1,000,000 0.0% 0.6% 0.0% 0.9% 0.4% 1.9%
Grand Total 45.8% 41.3% 3.7% 6.6% 2.6% 100.0%
Figure 1: Actual Response Rates vs. Universe of LEPCs
50%
40%
30%
20%
10%
0% WEST MIDWEST NORTHEAST SOUTH
11%
21% 20%24%
20%
42%
27%
35%
Universe Actual
How are LEPCs Doing?
Responding LEPCs provided critical information about their organization, membership, and meetings.
OrganizationSERCs organized LEPCs within their respective states to facilitate emergency planning. Therefore, the number and average service area size of LEPCs in each state differs. Some SERCs established an LEPC for each county in the state, some established LEPCs for multi-county districts, and some established one LEPC for the entire state. According to the LEPC database, the number of LEPCs per state ranges from one to 553 (the average being 78). The number and make-up of LEPCs is not static; LEPC database update efforts and comments in the open-ended question of the survey show that LEPCs sometimes disband, form, and merge.
Table 1 below shows that the majority of responding LEPCs serve populations under 50,000 and are located in rural or mixed rural/suburban service areas; this finding is similar to those of previous surveys.
Figure 1 illustrates that over one-third (34.6%) of responding LEPCs operate in the South, one-quarter (24.2%) operate in the Midwest, and one-fifth operate in the West (20.9%) and in the Northeast (20.3%).1 When these actual response rates are compared with the regional distribution of all known LEPCs, the Northeast is underrepresented and the West, Midwest, and South are overrepresented in the survey data. This difference in actual response rates vs. the universe of LEPCs is consistent with response rates from the 1999 LEPC Survey.
1In this report: LEPCs in EPA Regions 1, 2, and 3 compose the Northeast; EPA Regions 4 and 6 compose the South; EPA Regions 5 and 7 compose the Midwest; and EPA Regions 8, 9, and 10 compose the West. Refer to Appendix D for an EPA Regional Map.

2008 Nationwide Survey of LEPCs8
MembershipUnder EPCRA, LEPC membership must include (at a minimum): elected state and local officials; police, fire, civil defense, and public health professionals; environment, transportation, and hospital officials; facility representatives; and representatives from community groups and the media.
Figure 2 shows the membership of responding LEPCs. Participation on LEPCs by fire departments or hazmat representatives (93.2%), law enforcement representatives (90.7%), and civil defense representatives and emergency managers (87.1%) are highest. Survey results also reveal that the majority (65.8%) of responding LEPCs elect their chairpersons. Previous surveys did not ask for this level of detail regarding membership. The 1994 and 1999 only collected the total number of individual members in the LEPC.
Meetings38.7% of LEPCs said they met quarterly in the past twelve months, 11.8% met as needed, and 8.8% reported that they had not met. Those that had not met in the past 12 months most frequently cited a lack of interest from members (30.4%), while 8.9% said they had not met due to a lack of resources. LEPCs located in more suburban or urban service areas are more likely to meet bi-monthly than those located in rural areas (see Appendix B, Table 1). Data also show that as accident history in LEPC service area decreases, so does the likelihood that the LEPC met in the past 12 months (see Appendix B, Table 2).
The majority of responding LEPCs (67.6%) indicate that they advertise their meetings to the public, primarily in newspapers (63.5%). This finding is consistent with findings in previous surveys. LEPCs also advertise with postings on-line (42.9%) and in government buildings (42.4%).
In the open-ended question, many LEPCs shared that achieving good participation rates at meetings is difficult because LEPC members are volunteers and are often busy with their other jobs or familial commitments. Several LEPCs that serve small rural populations noted that they had merged with other LEPCs serving similar populations and that this merger effectively increased LEPC activity and support.
Figure 2: LEPCs Membership
0% 10% 20% 30% 40% 50% 60% 70% 80% 90% 100%
Elected State OfficialsOtherLocal Environmental Group/OrganizationGeneral PublicTransportationBroadcast and Print MediaCommunity GroupIndustryHospital or Public HealthFirst Aid or Emergency Medical ServiceElected Local OfficialsCivil Defense or Emergency ManagementLaw EnforcementFire Department or Hazmat Team
% of LEPCs

2008 Nationwide Survey of LEPCs 9
Emergency Response Plans
EPCRA required that LEPCs submit an emergency response plan to their SERC no later than October 1998. Required elements of emergency response plans include, among other things, the identification of facilities and transportation routes of extremely hazardous substances, descriptions of emergency response procedures, outlines of emergency notification procedures and evacuation plans, and designation of a community coordinator and facility emergency coordinator(s) to implement the plan.
Close to 60% of responding LEPCs (58.7%) reviewed and updated their emergency plan in the past 12 months. Furthermore, 42.8% of LEPCs said that their plan was reviewed by their SERC in the last 12 months. Over one-third (37.4%) of responding LEPCs said their emergency response plans were authored primarily by more than one LEPC member and many (32.9%) said that the plan was authored by both LEPC members and outside sources.
LEPCs most frequently answered “somewhat familiar” (36.5%) or “familiar” (35.5%) when asked, “How familiar are the majority of your LEPC members with your emergency response plan?” Data show that members of LEPCs that met in the past 12 months are more likely to be familiar with their emergency response plans than members of LEPCs that did not meet (see Appendix B, Table 3).
Figure 3 shows the various contents of LEPCs’ emergency response plans. Close to nine out of ten LEPCs report that their plans include procedures to inform the public about natural hazards. Fewer than 40% of responding LEPCs include environmental justice in their plans. Of note, the percentage of responding LEPCs that include Homeland Security (77.5%) in their emergency response plan is considerably higher than the 40.3% reported in the 1999 survey. (More detailed findings on Homeland Security can be found on page 13 of this report.)
More than three-quarters of responding LEPCs (76.8%) exercise their emergency response plans; 71.3% of those LEPCs exercised that plan within the past 12 months. This finding is similar to findings from previous surveys. 74.0% of functioning LEPCs in the 1994 survey and 69.1% of active LEPCs in the 1999 survey indicated that they had exercised their emergency response plan in the past year.2 Results from the 2008 LEPC Survey indicate that LEPCs most frequently exercise their plans using table-top (83.5%) or full-scale (68.9%) exercises.
Data also show that LEPCs that reviewed their emergency response plans either in the past 12 months or within the past one to two years are more likely to exercise their plan than those that did not review it as recently (see Appendix B, Table 4).
When asked what plan emergency responders would use if a chemical accident occurred in an LEPC’s jurisdiction, respondents were able to “select all that apply” — 54.3% said that responders would use a plan developed by the LEPC, 56.5% said that they would use a plan developed by another emergency response organization, and 46.5% said responders would coordinate their response efforts with a plan developed by a chemical facility.
Figure 3: Contents of Emergency Response Plan
0% 10% 20% 30% 40% 50% 60% 70% 80% 90% 100%
Environmental JusticeRMP FacilitiesExercising ERPIntegrate State PlansFirst Responder TrainingEvacuation PlansEmergency EquipmentHazmat RoutesTier I and II FacilitiesEHS FacilitiesCoordinators DesignatedShelter-in-Place
Consistency with NIMSHomeland Security
% of LEPCs
Call Down List
Natural HazardsProcedures to Inform the Public
2Past surveys developed specific criteria to determine whether an LEPC was active or functioning. The 1999 LEPC Survey report is available online at http://www.epa.gov/OEM/docs/chem/lepcsurv.pdf

2008 Nationwide Survey of LEPCs10
How Accident History Affects LEPCs
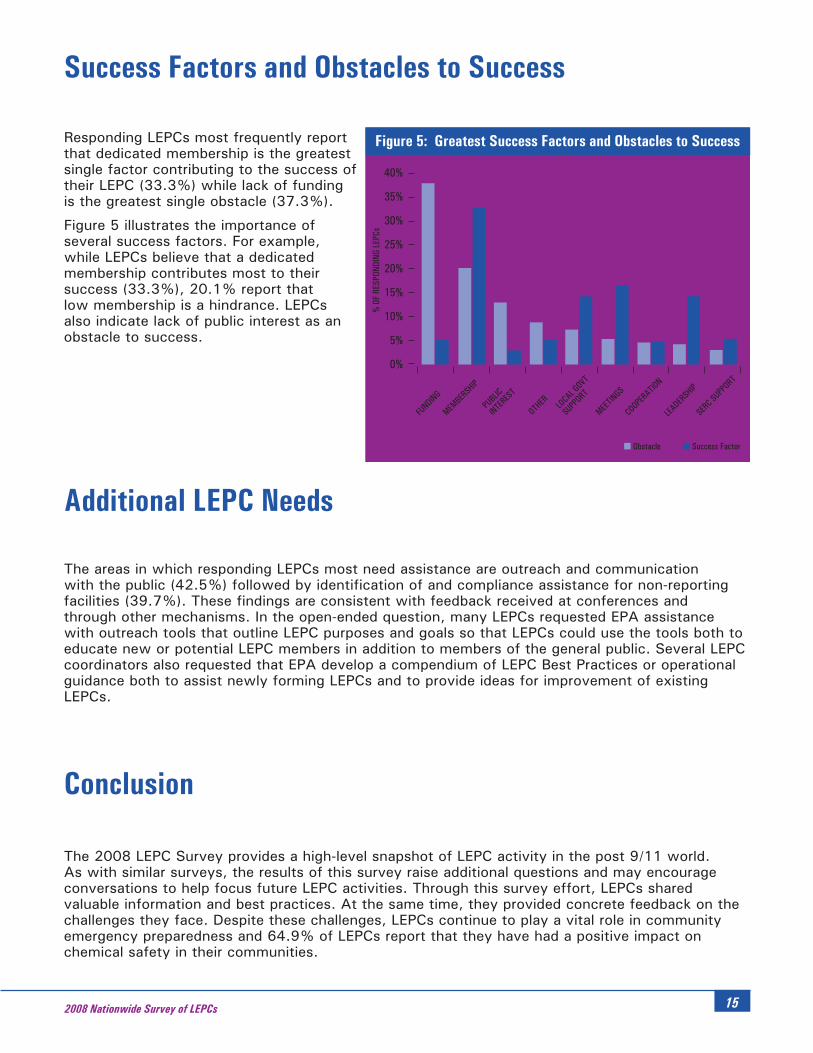
Responding LEPCs most frequently report that one to five chemical accidents occurred in their service area over the past five years. LEPCs also report that these chemical accidents resulted in improved coordination efforts between their LEPC and industry/facilities in their service area (54.4%) and in the revision of emergency response plans based on lessons-learned from the accidents (42.1%). Interestingly, LEPCs located in communities that had no accidents in the past five years indicate lower levels of agreement that their LEPC has a positive impact on chemical safety in their community. The more accidents that occur within a community, the higher level of agreement that the LEPC has a positive impact on chemical safety in their community (see Appendix B, Table 5).

2008 Nationwide Survey of LEPCs 11
Survey respondents provided feedback on the ways that they use CAMEO, Tier I and II data, and RMP data. Questions related to data use and management and specifically asked whether LEPCs use specific applications/data and how they use those applications/data.
CAMEOComputer-Aided Management of Emergency Operations (CAMEO) is a system of software applications used to plan for and respond to chemical emergencies. Developed by EPA and the National Oceanic and Atmospheric Administration (NOAA) Office of Response and Restoration, CAMEO assists front-line chemical emergency planners and responders to access, store, and evaluate information critical for developing emergency plans.
Approximately half of responding LEPCs (51.4%) report use of CAMEO, most often to access chemical information (74.8%), for emergency planning (72.5%), and for actual emergencies (71.6%). 55.4% of LEPCs that use CAMEO use it to manage Tier II data. In the open-ended question, several LEPCs requested that EPA provide training on CAMEO.
Tier I and II DataFacilities subject to EPCRA sections 311-312 are required to annually submit an Emergency and Hazardous Chemical Inventory Form to their LEPC, SERC, and local fire department. Facilities provide either a Tier I or Tier II form (in most states the Tier II form is required). EPA developed Tier2 Submit to help facilities prepare an electronic chemical inventory report. Responding LEPCs primarily receive Tier I and II data via paper submissions (68.7%) with 14.9% of LEPCs primarily receiving that data via state or local electronic submissions (e.g., diskette or CD). Only 8.1% of responding LEPCs receive Tier II data through Tier2 Submit from EPA. LEPCs that serve large urban populations are more likely to receive data via electronic submission or via web-based submission (see Appendix B, Tables 6 and 7).
When asked how they manage Tier I and II data, LEPCs most frequently responded through paper files (73.7%) while 29.7% use CAMEO to manage Tier I and II data. 37.4% of responding LEPCs only use paper filing systems to manage this data, a decrease from both the 1994 and 1998 surveys (55.0% and 46.6% respectively).
The majority of responding LEPCs (75.6%) use Tier I and II data for emergency planning purposes (e.g., hazard analysis and identification of risk areas) and emergency response (71.0%). 39.4% use the data to make preparedness recommendations to local governments and 12.0% use the data to make hazard reduction recommendations to industry.
RMP DataUnder section 112(r) of the Clean Air Act, facilities that produce, handle, process, distribute, or store certain chemicals are required to develop a Risk Management Program, prepare a Risk Management Plan (RMP), and submit the RMP to EPA. Approximately one-third (32.5%) of responding LEPCs use RMP data.
LEPCs that serve larger populations and areas with a history of chemical accidents are more likely to use RMP data (see Appendix B, Tables 8 and 9). Most LEPCs that use RMP data use the data to improve emergency planning (88.6%) and for emergency response (77.9%). 40.4% use the data to support homeland security and 38.6% use the data to work with industry to prevent accidents.
The majority of LEPCs that use RMP data obtain the data from their state (62.3%) although 15.7% obtain it from EPA. The vast majority of those who answered “other” (55.9%) obtain the data directly from facilities.
Using and Managing Data

2008 Nationwide Survey of LEPCs12
How LEPCs Communicate with the Public
Since 9/11, 76.0% of LEPCs report that the number of requests from the public for information has stayed the same. However, 42.2% of LEPCs report a change in the way chemical hazard information is made available to the public due to homeland security concerns. Larger populations with a greater history of accidents are more likely to have changed the way chemical hazard information is made available to the public (see Appendix B, Tables 10 and 11).
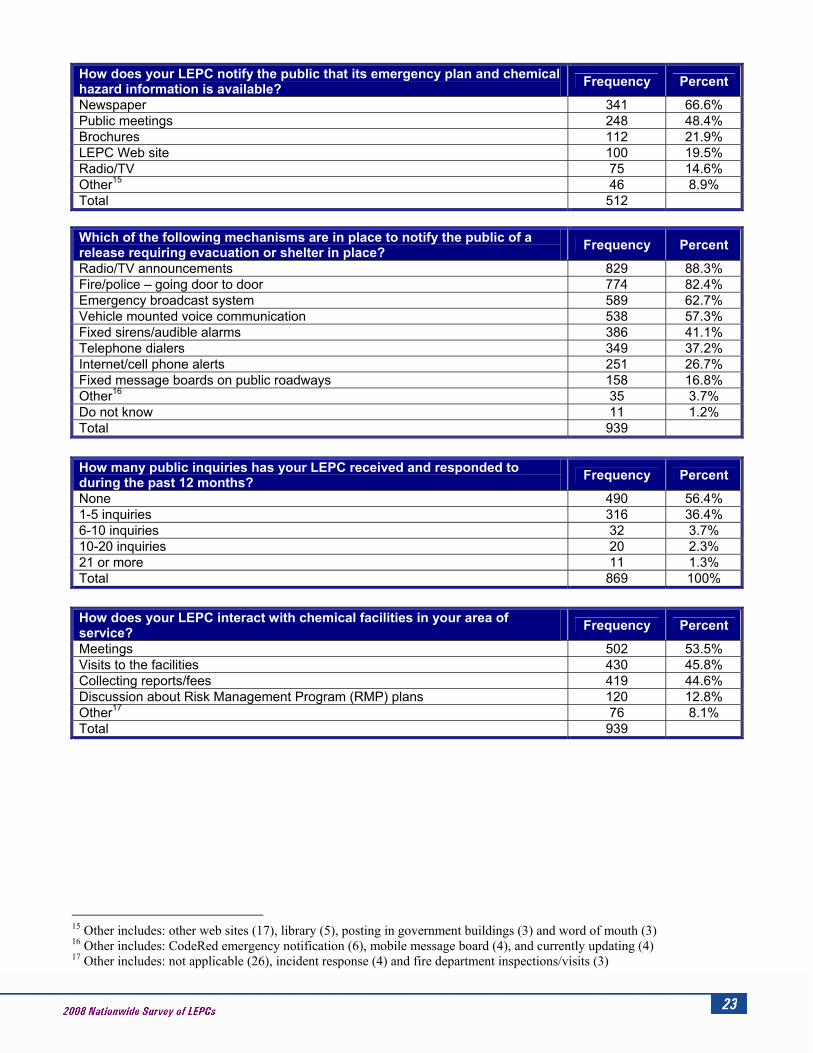
The majority of responding LEPCs (59.1%) notify the public that their emergency plan and chemical hazard information is available, most often through notices in the newspaper (66.6%), which is consistent with how LEPCs say they advertise public meetings.
LEPCs that notify the public of their meetings are also more likely to notify the public that their emergency plans and chemical hazard information are available (see Appendix B, Table 12). Those LEPCs whose membership includes general public representatives are more likely to advertise public meetings and are more likely to notify the public that their plan and emergency information is available (see Appendix B, Tables 13 and 14).
Less than one-quarter (23.6%) of responding LEPCs have a website.3 LEPCs serving large urban populations with a greater history of accidents are more likely to have a website (see Appendix B, Tables 15-17).
LEPCs most often report that radio/TV announcements (88.3%), fire/police departments going door-to-door (82.4%), and an emergency broadcast system (62.7%) are the mechanisms used to notify the public of a release requiring evacuation or shelter-in-place.
Most LEPCs (56.4%) received no public inquiries in the past 12 months; however 36.4% reported receiving and responding to one to five public inquiries. Those LEPCs that advertise meetings and the availability of their emergency plan and chemical information to the public, that serve large urban populations with higher accident histories, and that have a website, are most likely to receive a greater number of public inquiries (see Appendix B, Tables 18-23).
Responding LEPCs interact with chemical facilities in their service area most often through meetings (53.5%), visits to the facilities (45.8%), and the collection of reports and fees (44.6%). When asked how frequently LEPCs communicate with facilities (other than for the receipt of reports/fees), LEPCs most often answered annually (36.7%). Those LEPCs that use Tier I and II data and RMP data to make hazard reduction recommendations to industry are more likely to have more frequent contacts with industry (see Appendix B, Table 24).
3As part of the 2008 LEPC Survey, LEPCs were asked if they had a website and had the option to provide that website for inclusion in this report. A list of functional websites provided is available in Appendix C.
2008 Nationwide Survey of LEPCs 13
Changes in Activity Since 9/11: A Focus on Homeland SecurityOne of the primary goals of the 2008 LEPC Survey was to determine how LEPC activities changed in the post 9/11 environment. Questions on homeland security (defined for the purposes of this survey as the potential for terrorist events and/or events extending beyond chemical to radiological and biological incidents) were first asked in the 1999 survey. At that time, 40.3% of active LEPCs indicated they had incorporated counter-terrorism measures into their emergency response plans. 2008 survey results show that a much higher percentage of responding LEPCs incorporated homeland security into their plans (77.5%).
When asked how LEPC activity levels changed since 9/11, responding LEPCs most frequently reported that their level of activity remained the same (43.9%). 14.9% of LEPCs said their activity levels increased greatly, and one-third (33.0%) said their activity levels increased somewhat. Only 4.0% said the overall activity level of their LEPC decreased since the events of 9/11.
LEPCs were originally designed to provide a forum for emergency management agencies, responders, industry, and the public to work together to evaluate, understand, and communicate chemical hazards in the community and develop appropriate emergency plans in case of accidental release of these chemicals. However, in recent years, LEPCs’ planning efforts have often been refocused to include planning for a variety of disaster that may affect their communities.
Numerous LEPCs report that since 9/11, they take an all-hazards approach to planning and no longer solely focus on chemical emergency preparedness. For some LEPCs, this has resulted in increased interest and participation from both current LEPC membership as well as from the general public.
Many LEPCs also commented on their relationship with the emergency management agency (EMA) in their service area. As LEPCs take more of an all-hazards approach to planning, some responding LEPCs indicate that their activities are duplicative of those activities conducted by the local EMA. Some LEPCs report that they benefit from close coordination with the EMA, while others said that the local EMA had taken over LEPC activities, or that the LEPC had or desired to merge with the EMA.
Citizen CorpsIn January 2002, the USA Freedom Corps was launched to build on the spirit of service that emerged throughout the country following the terrorist attacks of 9/11. Citizen Corps is the component of USA Freedom Corps that creates opportunities for individuals to volunteer to help their communities prepare for and respond to emergencies. Coordinated nationally by the Department of Homeland Security (DHS), at the local level, Citizen Corps initiatives are carried out by Citizen Corps Councils. Currently, there are 2,298 County/Local/Tribal Citizen Corps Councils4 across the country.
Survey results show that 46.6% of LEPCs have Citizen Corps Councils within their communities. LEPCs serving larger urban populations are more likely to have a Citizen Corps Council (see Appendix B, Tables 25 and 26). LEPCs most frequently report that they work independently from the Citizen Corps Council located in their community (36.5%), 26.7% coordinate and work in close cooperation with their Citizen Corps Council, and 24.8% report that their LEPC merged with their local Citizen Corps Council. LEPCs that serve larger populations are more likely to work independently from the Citizen Corps Council (see Appendix B, Table 27). In the open-ended question, several LEPCs said that merging with their Citizen Corps Council resulted in increased interest and meeting attendance as well as the incorporation of all-hazards planning.
4More information about Citizen Corps is available online at http://www.citizencorps.gov/

2008 Nationwide Survey of LEPCs14
Types Of Assistance
Survey respondents provided feedback on the types of assistance that their LEPC receives. This assistance ranges from direct and indirect funding to technical assistance and guidance from Federal agencies.
Direct Funding The majority of responding LEPCs do not have an operating budget (59.3%) and do not receive direct funding (64.1%). In the open-ended question, many LEPCs commented on the need for funding with several LEPCs noting that they would use this funding to develop alternative means of disseminating public warnings/notifications.
Most LEPCs that receive direct funding obtain it through state fees from EPCRA report submissions (54.2%) and Federal funding such as the Department of Transportation (DOT) Hazardous Materials Emergency Preparedness (HMEP) Grants (39.7%). In the open-ended question, several LEPCs that receive HMEP Grants identified the need for more freedom in determining how that funding is spent. LEPCs would like to use funding to hire personnel, buy equipment, and for activities not just related to chemical emergencies but to all hazards.
LEPCs that serve populations over 500,000 are more likely to receive direct funding than LEPCs that serve smaller populations (see Appendix B, Table 28). Furthermore, LEPCs that do not receive direct funding are more likely not to have met in the past 12 months (see Appendix B, Table 29).
Indirect Funding More LEPCs receive indirect funding (56.3%) than direct funding, most often in the form of meeting space (93.3%), materials and office supplies (69.5%), and the use of computers or other equipment (68.9%).
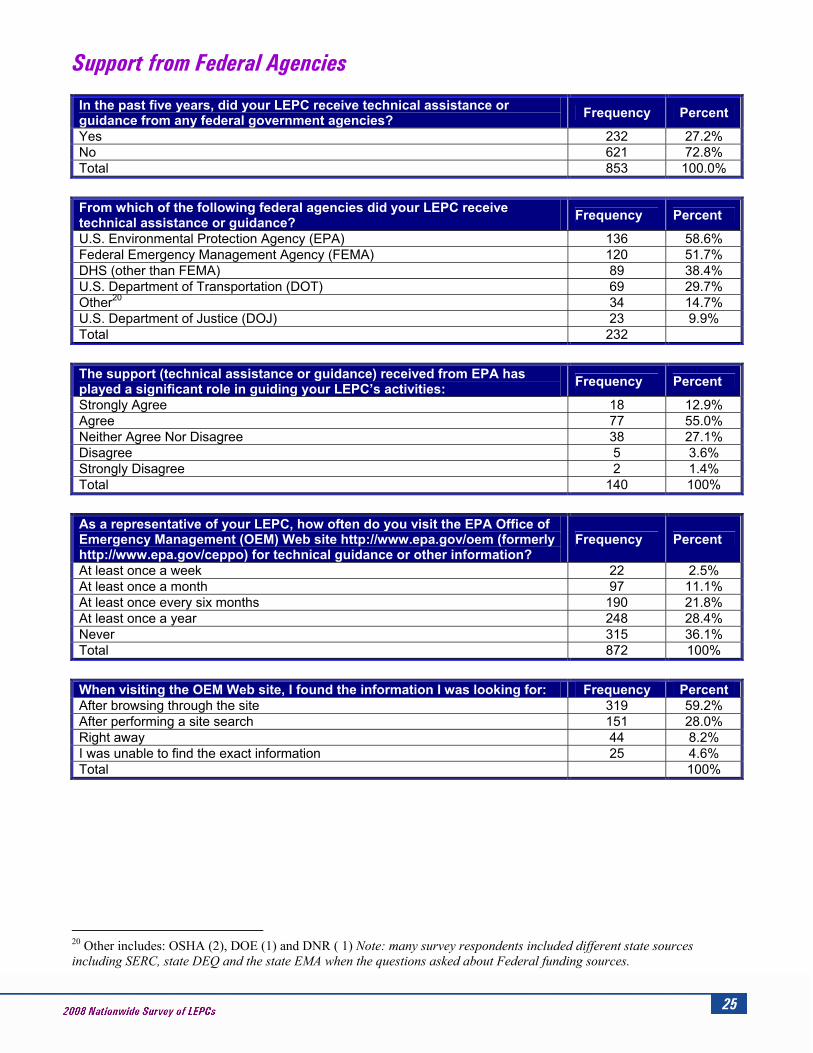
Technical Assistance/GuidanceThe majority of LEPCs (72.8%) do not receive technical assistance or guidance from the Federal government. Figure 4 illustrates that those that receive technical assistance, most often receive that assistance from EPA (58.6%) and FEMA (51.7%).
The majority of LEPCs that receive support from EPA (77.9%) “agree” or “strongly agree” that this support plays a significant role in guiding their LEPC activities. Those LEPCs that receive EPCRA data through Tier2 Submit and RMP data from EPA are more likely to agree that EPA’s support has played a significant role in guiding their LEPC activities than LEPCs that receive data through other channels (see Appendix B, Tables 30 and 31).
When responding LEPCs were asked how frequently they visit the EPA OEM website (www.epa.gov/oem), 36.1% answered “never,” 28.4% answered “at least once a year,” and 21.8% reported visiting the site “at least once every six months.” Those who visited the website found the information they were looking for after browsing through the site (59.2%) or after performing a search (28.0%). The majority of LEPC representatives who use the website (66.0%) said they are “moderately satisfied” with the technical information they received.
Figure 4. Assistance from Federal Agencies
60%
50%
40%
30%
20%
10%
0%AGENCY
EPA
FEM
A
DHS
DOT
OTHE
R
DOJ
2008 Nationwide Survey of LEPCs 15
Success Factors and Obstacles to Success
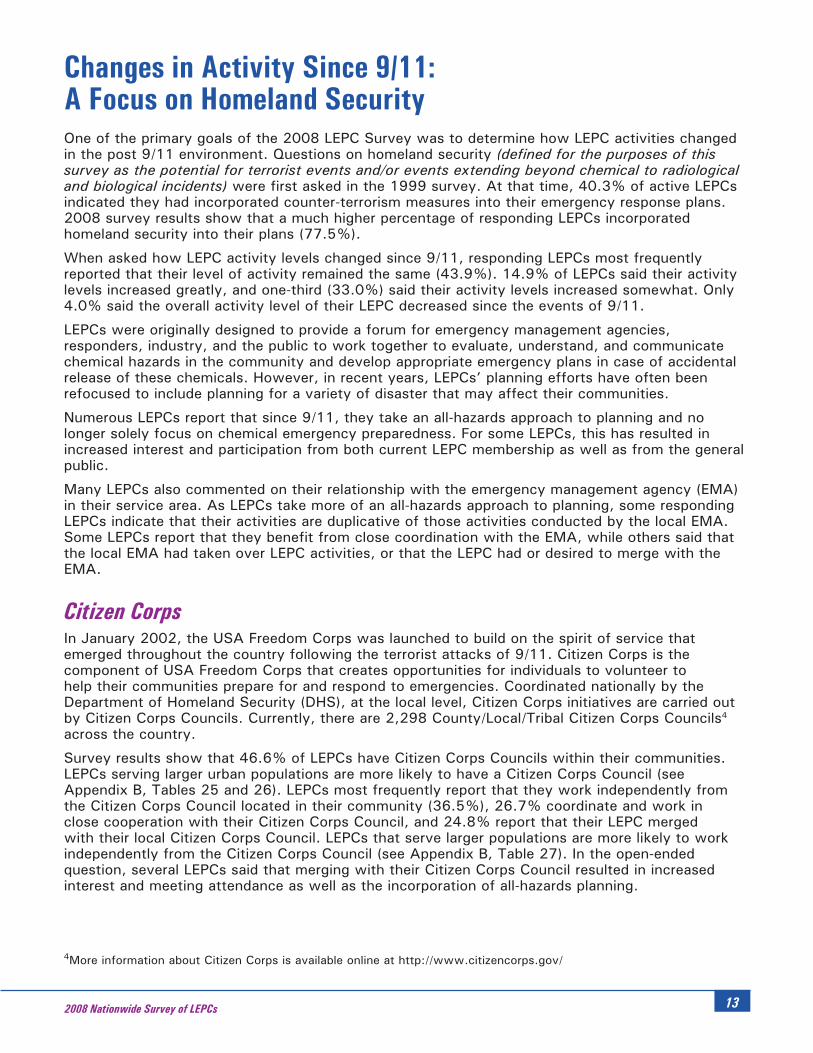
Responding LEPCs most frequently report that dedicated membership is the greatest single factor contributing to the success of their LEPC (33.3%) while lack of funding is the greatest single obstacle (37.3%).
Figure 5 illustrates the importance of several success factors. For example, while LEPCs believe that a dedicated membership contributes most to their success (33.3%), 20.1% report that low membership is a hindrance. LEPCs also indicate lack of public interest as an obstacle to success.
Figure 5: Greatest Success Factors and Obstacles to Success
40%
35%
30%
25%
20%
15%
10%
5%
0%
Obstacle Success Factor
FUNDING
MEMBER
SHIP
PUBLIC
INTERES
T
OTHER LOCAL G
OVT
SUPPORT
MEETINGS
COOPERATION
LEADER
SHIP
SERC SUPP
ORT%
OF
RESP
ONDI
NG L
EPCs
The areas in which responding LEPCs most need assistance are outreach and communication with the public (42.5%) followed by identification of and compliance assistance for non-reporting facilities (39.7%). These findings are consistent with feedback received at conferences and through other mechanisms. In the open-ended question, many LEPCs requested EPA assistance with outreach tools that outline LEPC purposes and goals so that LEPCs could use the tools both to educate new or potential LEPC members in addition to members of the general public. Several LEPC coordinators also requested that EPA develop a compendium of LEPC Best Practices or operational guidance both to assist newly forming LEPCs and to provide ideas for improvement of existing LEPCs.
Additional LEPC Needs
Conclusion
The 2008 LEPC Survey provides a high-level snapshot of LEPC activity in the post 9/11 world. As with similar surveys, the results of this survey raise additional questions and may encourage conversations to help focus future LEPC activities. Through this survey effort, LEPCs shared valuable information and best practices. At the same time, they provided concrete feedback on the challenges they face. Despite these challenges, LEPCs continue to play a vital role in community emergency preparedness and 64.9% of LEPCs report that they have had a positive impact on chemical safety in their communities.

2008 Nationwide Survey of LEPCs16

17
Appendix A: Survey Responses by Question Although a total of 939 representatives of LEPCs completed the survey, the number of people who answered each question varied. Individuals were not required to answer each question and were able to skip questions. Finally, individuals who responded in either the affirmative or negative for certain questions were routed past questions. For other questions, respondents were able to “select all that apply.” For this reason, the percentage for those questions may be greater than 100%.
LEPC Structure How is your chairperson chosen? Frequency Percent Elected by LEPC 601 65.8% Other1 184 20.2% Volunteer 64 7.0% Do not have a chairperson 23 2.5% Have a chairperson but do not know how he/she was chosen 20 2.3% Appointed by State Emergency response Commission (SERC) 15 1.6% Rotating basis 6 0.7% Total 913 100.0%
Representatives from which of the following groups or organizations make up your LEPC’s membership? Frequency Percent
Fire department (or Hazmat) representatives 875 93.2% Law enforcement representatives 852 90.7% Civil defense (or Emergency management) representatives 820 87.1% Hospital or public health representatives 786 83.7% First Aid (Emergency Medical Service) representatives 783 83.4% Elected local officials 782 83.3% Representatives from industry/facilities affected by EPA Tier III of the Superfund Amendment and Reauthorization Act of 1986 641 68.3%
Community group representatives 597 63.6% Broadcast and print media representatives 507 54.0% Transportation representatives 492 52.4% General public 467 49.7% Local environmental group/organization representatives 427 45.5% Other2 132 14.1% Elected state officials 106 11.3% Total 939
1 Other includes: appointed by other local representatives (87) (including County Commissioners, Mayors or EMA directors) and likely other paid positions (70) (including County Judges, Local Emergency Management Manager, or Fire Chief 2 Other includes: local schools, colleges, universities, agriculture groups, and public utilities

18
Is there currently a Citizen Corps Council3 within your community? Frequency Percent Yes 421 46.6% No 483 53.4% Total 904 100%
Please describe the relationship between your LEPC and the Citizen Corps Council within your community. Frequency Percent
My LEPC and the Citizen Corps Council work independently 153 36.5% My LEPC coordinates closely and works in cooperation with the Citizen Corps Council 113 26.7%
My LEPC merged with the Citizen Corps Council 104 24.8% My LEPC infrequently coordinates with the Citizen Corps Council 49 11.7% Total 419 100%
LEPC Meetings How often has your LEPC met in the past 12 months? Frequency Percent Weekly 0 0.0% Monthly 158 17.4% Bi-Monthly (every other month) 148 16.3% Quarterly 352 38.7% Yearly 64 7.0% As needed 107 11.8% Has not met in the past 12 months 80 8.8% Total 909 100%
Why has your LEPC not met in the past 12 months? Frequency Percent Did not need to meet 12 15.2% No interest from members 24 30.4% Insufficient resources (meeting location, time, funding) 7 8.9% LEPC activities covered at other meetings 18 22.8% Other4 18 22.8% Total 79 100%
Do you advertise your LEPC meetings to the public? Frequency Percent Yes 606 67.6% No 291 32.4% Total 897 100%
How do you advertise your LEPC meetings to the public? Frequency Percent Newspapers 385 63.5% On-line 260 42.9% Postings in government buildings 257 42.4% Mailings 102 16.8% Other5 64 10.6% Flyers and handouts 43 7.1% Total 606
3 A component of USA Freedom Corps that creates opportunities for individuals to volunteer to help their communities prepare for and respond to emergencies by bringing together local leaders, citizen volunteers and the network of first responder organizations. 4 Other includes: currently in transition, inactive and lack of interest/time 5 Other includes: media other than print (39), other local publications (7), and phone calls (6)

19
Emergency Plans When did your LEPC last review and update its emergency response plan? Frequency Percent Within the past 12 months 525 58.7% 1 - 2 years ago 137 15.3% Over 2 years ago 112 12.5% Plan has not yet been reviewed or updated 28 3.1% Have a plan, but do not know when it was last reviewed and updated 41 4.6% Do not have a plan 52 5.8% Total 895 100%
Who was the primary author of your LEPC’s emergency plan? Frequency Percent One LEPC member 146 17.5% More than one LEPC member 311 37.4% Both LEPC members and outside sources 274 32.9% A consultant or other outside party 101 12.1% Total 832 100%
When did the State Emergency Response Commission (SERC) last review your emergency plan? Frequency Percent
Within the past 12 months 346 42.8% 1 - 2 years ago 172 21.3% Over 2 years ago 184 22.8% Plan has not yet been reviewed 106 13.1% Total 808 100%
How familiar are the majority of your LEPC members with your emergency response plan? Frequency Percent
Very Familiar 75 9.0% Familiar 295 35.5% Somewhat Familiar 303 36.5% Slightly Familiar 124 14.9% Not at All Familiar 33 4.0% Total 830 100%
Does your emergency plan? Frequency Percent Provide procedures for informing the public in an emergency 736 86.2% Take into account natural hazards (e.g., hurricanes, earthquakes) 723 84.7% Provide procedures for informing the key persons (“call down list”) designated in the emergency plan 690 80.8%
Take into account homeland security (The potential for terrorist events and/or events extending beyond chemical to radiological and biological incidents) 662 77.5%
Demonstrate consistency with NIMS (National Incident Management System) 661 77.4% Address use of shelter-in-place 660 77.3% Designate a community emergency coordinator and facility emergency coordinators, who make necessary determinations to implement the plan 658 77.0%
Identify extremely hazardous substances (EHS) facilities subject to the plan 657 76.9% Identify Tier I and II facilities 627 73.4% Identify the routes likely to be used for the transportation of hazardous substances 606 71.0%
Describe emergency equipment available to the community 606 71.0% Include evacuation plans, such as precautionary evacuations and alternative traffic routes 552 64.6%
Address training for first responders and other response personnel 514 60.2%

20
Integrate with other applicable state plans 514 60.2% Outline methods to determine the area and population likely to be affected by a chemical release 509 59.6%
Include methods and schedules for exercising the emergency plan 478 56.0% Identify Risk Management Program (RMP) facilities 357 41.8% Take into account environmental justice (The fair treatment for people of all races, cultures, and incomes regarding the development of environmental laws, regulations, and policies)
311 36.4%
Total 854
Has your LEPC exercised your emergency plan? Frequency Percent Yes 625 76.8% No 189 23.2% Total 814 100%
How have you exercised your emergency plan? Frequency Percent Table-top exercise 522 83.5% Full-scale exercise 430 68.9% Drill 299 47.8% Actual response 299 47.8% Pubic briefing 82 13.1% Other6 21 4.5% Total 625
When did your LEPC last exercise its emergency plan? Frequency Percent Within the past 12 months 442 71.3% 1 - 2 years ago 128 20.6% Over 2 years ago 44 7.1% Exercised plan, but do not know when 6 1.0% Total 620 100%
If an emergency at a chemical facility occurred tomorrow, responders would coordinate their response efforts with a plan developed by: Frequency Percent
Another emergency response organization (not the LEPC) 531 56.5% The LEPC 510 54.3% Chemical facility 437 46.5% Other7 28 3.0% Do not know 23 2.4% Total 939
In the past five years, approximately how many chemical accidents have occurred in your LEPC’s service area? Frequency Percent
None 162 18.8% 1 - 5 422 48.9% 6 - 10 108 12.5% 11 - 15 40 4.6% 15 or more 131 15.2% Total 863 100%
6 Other includes: functional exercise (12) 7 Other includes: do not have a chemical facility (9), case-by-case (3), and Incident Commander (2)
21
How did these chemical accidents most impact the way your LEPC operates? Frequency Percent
Improved coordination efforts with industry/facilities 327 54.4% Did not impact 266 44.3% Revised emergency plan based on lessons-learned 253 42.1% Extended LEPC membership 106 17.6% Changed the way information is made available to the public 89 14.8% Other8 38 6.3% Increased frequency of LEPC meetings 26 4.3% Total 601 100%
Data Use and Management How do you primarily receive Emergency Planning and Community Right-to-Know Act (EPCRA) Tier I and II data (Sections 311-312)? Frequency Percent
Paper 596 68.7% State or local electronic submission (e.g., diskette or CD) 129 14.9% State or local Web-based submission 73 8.4% Tier II Submit from EPA 70 8.1% Total 868 100%
How does your LEPC manage EPCRA Tier I and II data? Frequency Percent Paper files 692 73.7% CAMEO (Computer-Aided Monitoring of Emergency Operations) (A suite of software developed by EPA and NOAA used widely to plan for and respond to chemical emergencies)
279 29.7%
Database created by LEPC 144 15.3% Other state or local database 143 15.2% Web-based database 65 6.9% Other9 28 3.0% Total 939
How does your LEPC use EPCRA Tier I and II data? Frequency Percent For emergency planning (e.g., hazard analysis, identification of risk areas) 712 75.6% For emergency response 668 71.0% To respond to public inquiries 420 44.7% To make preparedness recommendations to local government 370 39.4% To make hazard reduction recommendations to industry 113 12.0% For zoning or other land use issues 80 8.5% Other10 30 3.6% Total 939
Does your LEPC use Risk Management Program (RMP) data? Frequency Percent Yes 272 32.5% No 566 67.5% Total 838 100%
8 Other includes: increased awareness (9) increased training (4), and added reverse 911 system (2) 9 Other includes: do not know (5), not using (5) and E-Plan (4) 10 Other includes: not used by LEPC (17) , and for reference (2)

22
For what purpose(s) does your LEPC use RMP data? Frequency Percent To improve you local emergency planning 241 88.6% For emergency response 212 77.9% To support Homeland security 110 40.4% To work with industry to prevent accidents 105 38.6% Other11 7 2.6% Total 272
From what source does your LEPC primarily obtain RMP data? Frequency Percent State 167 62.3% Other12 59 22.0% EPA 42 15.7% Total 268 100.0%
Does your LEPC use CAMEO? Frequency Percent Yes 444 51.4% No 420 48.6% Total 864 100.0%
For what purpose(s) does your LEPC use CAMEO? Frequency Percent To access chemical information 332 74.8% For emergency planning (e.g., screening and contingency plans) 324 72.5% For actual emergencies 318 71.6% For drills and exercises 313 70.5% To manage Tier II data 246 55.4% To respond to public inquires 124 27.9% Other13 6 1.4% Total 444
Communication Does your LEPC have a Web site? Frequency Percent Yes14 207 23.6% No 671 76.4% Total 100%
Does your LEPC notify the public that its emergency plan and chemical hazard information is available? Frequency Percent
Yes 512 59.1% No 355 40.9% Total 867 100%
11 Other includes: training, awareness and used by local administrators 12 Other includes: facilities (33), local/county government (10), businesses (5) 13 Other includes: do not use/know, and mapping transportation routes 14 Web site addresses are listed in Appendix C
23
How does your LEPC notify the public that its emergency plan and chemical hazard information is available? Frequency Percent
Newspaper 341 66.6% Public meetings 248 48.4% Brochures 112 21.9% LEPC Web site 100 19.5% Radio/TV 75 14.6% Other15 46 8.9% Total 512
Which of the following mechanisms are in place to notify the public of a release requiring evacuation or shelter in place? Frequency Percent
Radio/TV announcements 829 88.3% Fire/police – going door to door 774 82.4% Emergency broadcast system 589 62.7% Vehicle mounted voice communication 538 57.3% Fixed sirens/audible alarms 386 41.1% Telephone dialers 349 37.2% Internet/cell phone alerts 251 26.7% Fixed message boards on public roadways 158 16.8% Other16 35 3.7% Do not know 11 1.2% Total 939
How many public inquiries has your LEPC received and responded to during the past 12 months? Frequency Percent
None 490 56.4% 1-5 inquiries 316 36.4% 6-10 inquiries 32 3.7% 10-20 inquiries 20 2.3% 21 or more 11 1.3% Total 869 100%
How does your LEPC interact with chemical facilities in your area of service? Frequency Percent
Meetings 502 53.5% Visits to the facilities 430 45.8% Collecting reports/fees 419 44.6% Discussion about Risk Management Program (RMP) plans 120 12.8% Other17 76 8.1% Total 939
15 Other includes: other web sites (17), library (5), posting in government buildings (3) and word of mouth (3) 16 Other includes: CodeRed emergency notification (6), mobile message board (4), and currently updating (4) 17 Other includes: not applicable (26), incident response (4) and fire department inspections/visits (3)

24
Other than receipt of reports/fees from chemical facilities in your area of service, how often does your LEPC communicate with those facilities? Frequency Percent
Weekly 4 0.5% Monthly 74 8.6% Quarterly 193 22.5% Every six months 54 6.3% Annually 314 36.7% Never 217 25.4% Total 856 100.0%
Funding Does your LEPC have an operating budget? Frequency Percent Yes 355 40.7% No 518 59.3% Total 873 100.0%
Does your LEPC receive direct funding? Frequency Percent Yes 312 35.9% No 556 64.1% Total 868 100.0%
Please indicate the agencies/organizations from which your LEPC receives direct funding. Frequency Percent
State fees from Emergency Planning and Community Right to Know Act (EPCRA) report submission 169 54.2%
Federal funding – e.g., Hazmat Emergency Preparedness (HMEP) Grants 124 39.7% Other local government funding 105 33.7% Other state government funding 64 20.5% Local fees from EPCRA report submission 27 8.7% Private industry 26 8.3% Other18 15 4.8% Total 312
Does your LEPC receive any indirect/in-kind funding (e.g., meeting space, office equipment)? Frequency Percent
Yes 489 56.3% No 379 43.7% Total 868 100.0%
Please indicate the type of indirect funding your LEPC receives. Frequency Percent Meeting space 456 93.3% Materials or office supplies 340 69.5% Use of computers or other equipment 337 68.9% Office space 280 57.3% Printing 264 54.0% Other19 47 9.6% Total 489
18 Other includes: other grants (7), donations (3) and membership dues (2) 19 Other includes: supplemental staff (25), grants (4) and advertisements (3)
25
Support from Federal Agencies In the past five years, did your LEPC receive technical assistance or guidance from any federal government agencies? Frequency Percent
Yes 232 27.2% No 621 72.8% Total 853 100.0%
From which of the following federal agencies did your LEPC receive technical assistance or guidance? Frequency Percent
U.S. Environmental Protection Agency (EPA) 136 58.6% Federal Emergency Management Agency (FEMA) 120 51.7% DHS (other than FEMA) 89 38.4% U.S. Department of Transportation (DOT) 69 29.7% Other20 34 14.7% U.S. Department of Justice (DOJ) 23 9.9% Total 232
The support (technical assistance or guidance) received from EPA has played a significant role in guiding your LEPC’s activities: Frequency Percent
Strongly Agree 18 12.9% Agree 77 55.0% Neither Agree Nor Disagree 38 27.1% Disagree 5 3.6% Strongly Disagree 2 1.4% Total 140 100%
As a representative of your LEPC, how often do you visit the EPA Office of Emergency Management (OEM) Web site http://www.epa.gov/oem (formerly http://www.epa.gov/ceppo) for technical guidance or other information?
Frequency Percent
At least once a week 22 2.5% At least once a month 97 11.1% At least once every six months 190 21.8% At least once a year 248 28.4% Never 315 36.1% Total 872 100%
When visiting the OEM Web site, I found the information I was looking for: Frequency Percent After browsing through the site 319 59.2% After performing a site search 151 28.0% Right away 44 8.2% I was unable to find the exact information 25 4.6% Total 100%
20 Other includes: OSHA (2), DOE (1) and DNR ( 1) Note: many survey respondents included different state sources including SERC, state DEQ and the state EMA when the questions asked about Federal funding sources.

26
Please rank your level of satisfaction with the technical information you received by visiting the OEM Web site. Frequency Percent
Very Satisfied 87 16.1% Moderately Satisfied 356 66.0% Slightly Satisfied 90 16.7% Not At All Satisfied 6 1.1% Total 539 100%
Homeland Security Since the events of 9/11, the overall activity level of your LEPC has: Frequency Percent Increased Greatly 130 14.9% Increased Somewhat 288 33.0% Stayed About the Same 383 43.9% Decreased Somewhat 18 2.1% Decreased Greatly 17 1.9% Do Not Know 36 4.1% Total 872 100%
Since 9/11, the number of requests from the public for chemical hazard information has: Frequency Percent
Increased Greatly 5 0.6% Increased Somewhat 70 8.2% Stayed About the Same 646 76.0% Decreased Somewhat 13 1.5% Decreased Greatly 15 1.8% Do Not Know 101 11.9% Total 850 100%
Since 9/11, has your LEPC changed the way chemical hazard information is made available to the public due to homeland security concerns? Frequency Percent
Yes 356 42.2% No 488 57.8% Total 844 100%
Strengths and Additional Needs What is the single greatest factor contributing to the success of your LEPC? Frequency Percent
Dedicated membership 278 33.3% Regularly scheduled meetings 133 15.9% Dedicated leadership (Chair) 118 14.1% Local government support 117 14.0% State Emergency Response Commission (SERC) support 45 5.4% Funding 44 5.3% Other21 42 5.0% Cooperation from regulated community 39 4.7% Public interest 18 2.2% Total 834 100%
21 Other includes: LEPC not successful (13), agency leadership (4) and currently building LEPC (3)

27
What is the greatest obstacle to the success of your LEPC? Frequency Percent Funding 318 37.3% Low membership involvement 171 20.1% Public apathy 110 12.9% Other22 70 8.2% Poor local government support 57 6.7% Infrequent and/or irregular meetings 42 4.9% Limited cooperation from regulated community 35 4.1% Lack of dedicated leadership 30 3.5% Poor State Emergency Response Commission (SERC) support 19 2.2% Total 852 100%
In which of the following areas could your LEPC use assistance? Frequency Percent Outreach and communicating with the public 399 42.5% Identification and compliance assistance for non-reporting facilities 373 39.7% Conducting drills and exercises 347 37.0% Data management 320 34.1% Developing/reviewing local emergency response plans 272 29.0% Determining the level of risk in your jurisdiction 254 27.1% Integrating homeland security into emergency plans 200 21.3% Coordination with state and federal agencies 185 19.7% Total 939
The LEPC on which I serve has had a positive impact on chemical safety in the community (prevention, preparedness, and response). Frequency Percent
Strongly Agree 139 15.9% Agree 427 49.0% Neither Agree Nor Disagree 264 20.3% Disagree 20 2.3% Strongly Disagree 22 2.5% Total 872 100%
22 Other includes: time constraints (13), none (10) and low staff (4)

28
Appendix B: Cross-Tabulations Table 1. Q55 v. Q21 Relationship between activity level and service type Activity Level Rural Mixed/Rural Suburban Mixed/Suburban Urban Has not met 11.06% 6.97% 8.82% 6.67% 4.35% Bi-monthly 11.78% 17.43% 26.47% 30.00% 21.74% Monthly 13.94% 20.91% 14.71% 20.00% 21.74% Quarterly 39.18% 40.21% 38.24% 31.67% 30.43% Yearly 9.62% 4.29% 0.00% 8.33% 8.70% As needed 14.42% 10.19% 11.76% 3.33% 13.04%
Table 2. Q21 v. Q8 Meeting Frequency in Past 12 Months
Number of Accidents Has Not Met Has Met 0 11.11% 88.89% 01-5 9.74% 90.26% 06-10 8.33% 91.67% 11-15 5.00% 95.00% 15+ 3.82% 96.18%
Table 3. Q15 v. Q8 Meeting Frequency in Past 12 Months
Familiarity With Plan Has Not Met Has Met Very Familiar 1.33% 98.67% Familiar 4.75% 95.25% Somewhat Familiar 5.94% 94.06% Slightly Familiar 12.10% 87.90% Not at All Familiar 42.42% 57.58%
Table 4. Q12 v. 17 ERP Exercised
Last ERP Review No Yes <12 months 14.62% 85.38% 1-2 years 23.88% 76.12% Over 2 years 40.74% 59.26% No review 66.67% 33.33% Do not know 61.76% 38.24% Do not have 100.00% 0.00%
Table 5 Q55 v. Q21 Relationship between accident level and community impact Community Impact No Accidents One or More Accidents Strongly Agree 15.32% 84.68% Agree 18.41% 81.59% Neither 22.37% 77.63% Disagree 22.22% 77.78% Strongly Disagree 15.79% 84.21%

29
Table 6. Q2 v. Q23 Tier I and II Data Submitted
Population Size Electronic Web Paper Tier2 Submit <50,000 12.96% 7.59% 71.85% 7.59% 50,001-100,000 11.03% 5.15% 75.00% 8.82% 100,001-500,000 21.19% 12.58% 57.62% 8.61% 500,001-1,000,000 25.00% 8.33% 54.17% 12.50% >1,000,000 40.00% 20.00% 40.00% 0.00%
Table 7. Q3 v. Q23 Tier I and II Data Submitted
Service Area Electronic Web Paper Tier2 Submit Rural 10.26% 8.72% 75.13% 5.90% Mixed Rural 16.62% 8.03% 65.37% 9.97% Suburban 23.53% 2.94% 61.76% 11.76% Mixed Suburban 25.00% 6.67% 60.00% 8.33% Urban 28.57% 19.05% 47.62% 4.76%
Table 8. Q2 v. Q26 RMP Use
Population Size No Yes <50,000 70.43% 29.57% 50,001-100,000 67.91% 32.09% 100,001-500,000 64.86% 35.14% 500,001-1,000,000 50.00% 50.00% >1,000,000 25.00% 75.00%
Table 9. Q3 v. Q26 RMP Use
Service Area No Yes Rural 75.60% 24.40% Mixed Rural 59.77% 40.23% Suburban 75.76% 24.24% Mixed Suburban 62.07% 37.93% Urban 57.89% 42.11%
Table 10. Q2 v. Q51 Change in Info Made Available to Public Population Size No Yes <50,000 61.22% 38.78% 50,001-100,000 59.69% 40.31% 100,001-500,000 49.66% 50.34% 500,001-1,000,000 39.13% 60.87% >1,000,000 37.50% 62.50%
Table 11. Q21 v. Q51 Change in Info Made Available to Public Chemical Accidents No Yes 0 67.74% 32.26% 01-5 57.82% 42.18% 06-10 59.81% 40.19% 11-15 57.89% 42.11% 15+ 44.09% 55.91%

30
Table 12. Q10 v. Q32 Notification of Plan
Notification of Meeting No Yes No 65.34% 34.66% Yes 29.55% 70.45%
Table 13. Q5 v. Q10 Meeting Advertisement
Public Representation No Yes Yes 23.80% 76.20% No 41.46% 58.54%
Table 14. Q5 v. Q32 Plan Notification
Public Representation No Yes Yes 34.23% 65.77% No 47.99% 52.01%
Table 15. Q2 v. Q31 Website Population No Yes <50,000 85.53% 14.47% 50,001-100,000 72.26% 27.74% 100,001-500,000 61.18% 38.82% 500,001-1,000,000 25.00% 75.00% >1,000,000 25.00% 75.00%
Table 16 Q3 v. Q31 Website Service Area No Yes Rural 83.63% 16.37% Mixed Rural 77.41% 22.59% Suburban 67.65% 32.35% Mixed Suburban 40.00% 60.00% Urban 42.86% 57.14%
Table 17. Q21 v. Q31 Website Number of Accidents No Yes 0 88.13% 11.88% 01-5 81.67% 18.33% 06-10 69.44% 30.56% 11-15 60.00% 40.00% 15+ 59.54% 40.46%
Table 18. Q10 v. Q35 Public Inquiries Notification of Meeting 0 01-05 06-10 10-20 21+ N 62.91% 31.64% 2.18% 2.18% 1.09% Y 52.90% 38.91% 4.44% 2.39% 1.37%
Table 19. Q32 v. Q35 Public Inquiries Notification of Plan 0 01-05 06-10 10-20 21+ N 66.86% 29.75% 0.57% 2.27% 0.57% Y 48.52% 41.42% 5.92% 2.37% 1.78%

31
Table 20. Q2 v. Q35 Public Inquiries Population Size 0 01-05 06-10 10-20 21+ <50,000 67.22% 29.26% 2.04% 0.93% 0.56% 50,001-100,000 47.79% 42.65% 7.35% 2.21% 0.00% 100,001-500,000 38.00% 50.00% 5.33% 4.67% 2.00% 500,001-1,000,000 12.50% 66.67% 0.00% 12.50% 8.33% >1,000,000 0.00% 56.25% 18.75% 6.25% 18.75%
Table 21 Q3 v. Q35 Public Inquiries Service Area 0 01-05 06-10 10-20 21+ Rural 69.37% 27.34% 2.03% 1.01% 0.25% Mixed Rural 50.00% 41.34% 4.75% 3.07% 0.84% Suburban 33.33% 60.61% 0.00% 0.00% 6.06% Mixed Suburban 30.00% 51.67% 6.67% 6.67% 5.00% Urban 30.00% 45.00% 15.00% 0.00% 10.00%
Table 22. Q21 v. Q35 Public Inquiries Accidents 0 01-05 06-10 10-20 21+ 0 78.13% 21.25% 0.00% 0.63% 0.00% 01-5 61.87% 31.65% 4.80% 1.44% 0.24% 06-10 40.74% 52.78% 2.78% 1.85% 1.85% 11-15 37.50% 50.00% 2.50% 7.50% 2.50% 15+ 28.24% 54.96% 5.34% 6.11% 5.34%
Table 23. Q31 v. Q35 Public Inquiries Website 0 01-05 06-10 10-20 21+ No 60.69% 33.89% 3.31% 1.66% 0.45% Yes 42.16% 44.61% 4.90% 4.41% 3.92%
Table 24. Q27 v. Q37 Chemical Facility Interaction Hazard Reduction Recommendations to Industry
Weekly Monthly Quarterly Semi-annually Annually Never
Yes 0.95% 17.14% 30.48% 11.43% 34.29% 5.71% No 0.40% 7.46% 21.44% 5.59% 37.02% 28.10%
Table 25. Q2 v. Q6 Citizen Corps Council in Community Population Size No Yes <50,000 64.36% 35.64% 50,001-100,000 41.96% 58.04% 100,001-500,000 32.26% 67.74% 500,001-1,000,000 30.43% 69.57% >1,000,000 6.25% 93.75%
Table 26. Q3 v. Q6 Citizen Corps Council in Community Service Area No Yes Rural 64.25% 35.75% Mixed Rural 48.38% 51.62% Suburban 44.12% 55.88% Mixed Suburban 23.73% 76.27% Urban 29.17% 70.83%

32
Table 27. Q2 v. Q7 Relationship Between LEPC and Citizen Corps Council Population Size Independent Merged Coordinate Closely Coordinate Infrequently
<50,000 27.86% 30.85% 30.85% 10.45% 50,001-100,000 36.59% 31.71% 24.39% 7.32% 100,001-500,000 47.12% 13.46% 25.00% 14.42% 500,001-1,000,000 43.75% 6.25% 25.00% 25.00% >1,000,000 73.33% 6.67% 0.00% 20.00%
Table 28. Q2 v. Q39 Receives Direct Funding Population Size No Yes <50,000 63.45% 36.55% 50,001-100,000 68.38% 31.62% 100,001-500,000 67.33% 32.67% 500,001-1,000,000 50.00% 50.00% >1,000,000 37.50% 62.50%
Table 29. Q39 v. Q8 Meeting Frequency Direct Funding Has Not Met Has Met No 12.97% 87.03% Yes 1.28% 98.72%
Table 30. Q23 v. Q45 EPA Support Plays a Significant Role
Receive EPCRA Data Strongly Agree/Agree Neither Disagree/Strongly
Disagree Tier II 86.67% 13.33% 0.00% Electronic 72.22% 22.22% 5.56% Web 61.11% 33.33% 5.56% Paper 65.91% 29.55% 4.55%
Table 31. Q28 v. Q45 EPA Support Plays a Significant Role
Receive RMP Data Strongly Agree/Agree Neither Disagree/Strongly
Disagree EPA 88.24% 5.88% 5.88% Other 70.59% 23.53% 5.88% State 66.67% 29.63% 3.70%
33
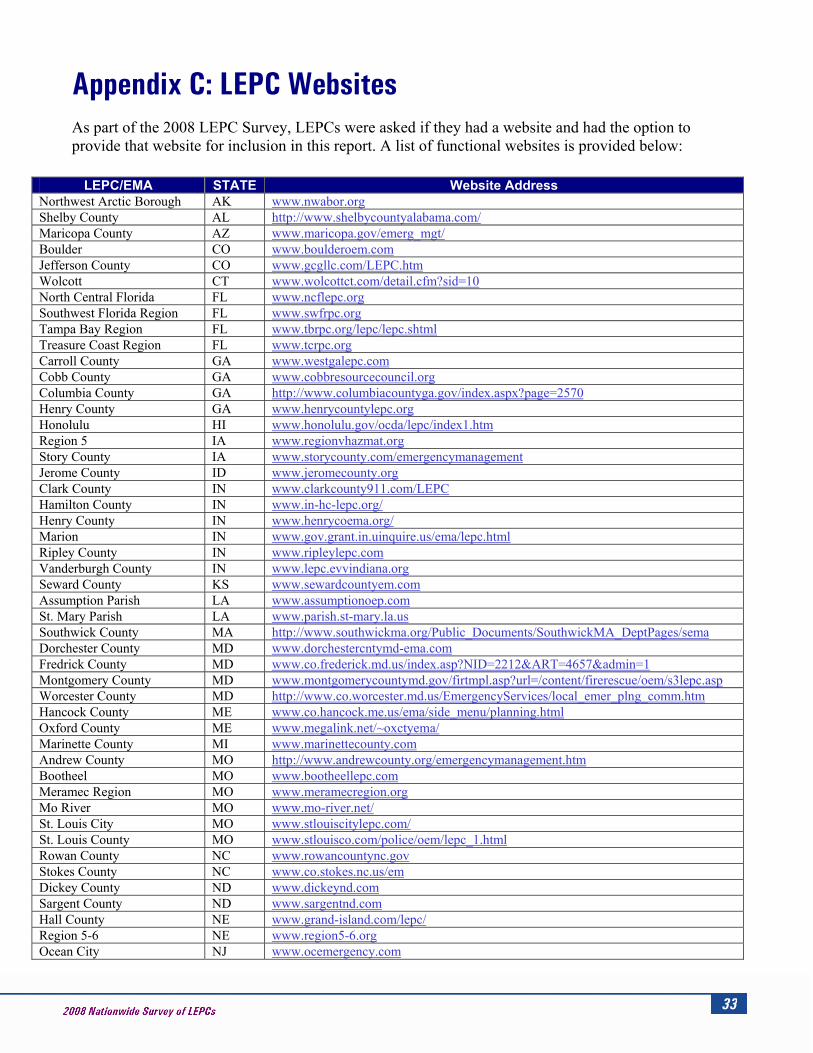
Appendix C: LEPC Websites As part of the 2008 LEPC Survey, LEPCs were asked if they had a website and had the option to provide that website for inclusion in this report. A list of functional websites is provided below:
LEPC/EMA STATE Website Address Northwest Arctic Borough AK www.nwabor.org Shelby County AL http://www.shelbycountyalabama.com/ Maricopa County AZ www.maricopa.gov/emerg_mgt/ Boulder CO www.boulderoem.com Jefferson County CO www.gcgllc.com/LEPC.htm Wolcott CT www.wolcottct.com/detail.cfm?sid=10 North Central Florida FL www.ncflepc.org Southwest Florida Region FL www.swfrpc.org Tampa Bay Region FL www.tbrpc.org/lepc/lepc.shtml Treasure Coast Region FL www.tcrpc.org Carroll County GA www.westgalepc.com Cobb County GA www.cobbresourcecouncil.org Columbia County GA http://www.columbiacountyga.gov/index.aspx?page=2570 Henry County GA www.henrycountylepc.org Honolulu HI www.honolulu.gov/ocda/lepc/index1.htm Region 5 IA www.regionvhazmat.org Story County IA www.storycounty.com/emergencymanagement Jerome County ID www.jeromecounty.org Clark County IN www.clarkcounty911.com/LEPC Hamilton County IN www.in-hc-lepc.org/ Henry County IN www.henrycoema.org/ Marion IN www.gov.grant.in.uinquire.us/ema/lepc.html Ripley County IN www.ripleylepc.com Vanderburgh County IN www.lepc.evvindiana.org Seward County KS www.sewardcountyem.com Assumption Parish LA www.assumptionoep.com St. Mary Parish LA www.parish.st-mary.la.us Southwick County MA http://www.southwickma.org/Public_Documents/SouthwickMA_DeptPages/sema Dorchester County MD www.dorchestercntymd-ema.com Fredrick County MD www.co.frederick.md.us/index.asp?NID=2212&ART=4657&admin=1 Montgomery County MD www.montgomerycountymd.gov/firtmpl.asp?url=/content/firerescue/oem/s3lepc.asp Worcester County MD http://www.co.worcester.md.us/EmergencyServices/local_emer_plng_comm.htm Hancock County ME www.co.hancock.me.us/ema/side_menu/planning.html Oxford County ME www.megalink.net/~oxctyema/ Marinette County MI www.marinettecounty.com Andrew County MO http://www.andrewcounty.org/emergencymanagement.htm Bootheel MO www.bootheellepc.com Meramec Region MO www.meramecregion.org Mo River MO www.mo-river.net/ St. Louis City MO www.stlouiscitylepc.com/ St. Louis County MO www.stlouisco.com/police/oem/lepc_1.html Rowan County NC www.rowancountync.gov Stokes County NC www.co.stokes.nc.us/em Dickey County ND www.dickeynd.com Sargent County ND www.sargentnd.com Hall County NE www.grand-island.com/lepc/ Region 5-6 NE www.region5-6.org Ocean City NJ www.ocemergency.com

34
LEPC/EMA STATE Website Address Albuquerque - Bernalillo NM www.lepcabq.org Clovis-Curry County NM www.cityofclovis.org/lepc Steuben County NY www.steubencony.org/emo/lepc.html Bowling Green/Warren OH www.wclepc.org City of Columbus OH www.cepac.org Cuyahoga County OH www.lepc.cuyahogacounty.us Montgomery/Greene County OH www.mgclerc.org City of Atoka OK www.atokaeoc.org Kingfisher OK www.kfrem.org Berks County PA www.berksema.com Bucks County PA www.buckslepc.org Chester County PA www.chesco.org/des Columbia County PA www.columbiacountyema.org Fayette County PA www.fcema.org Lehigh County PA www.lehighcounty.org/EMA/em.cfm?doc=LEPC.HTM Westchester County PA www.westchestergov.com/health/LEPC2000.htm Aiken County SC www.aikencountysc.gov/lepc/ Spartanburg County SC www.scoem.org Brookings County SD www.emergency.brookingscountysd.gov/LEPC%20Homepage.htm Clay County SD www.claycountyoem.org Davison County SD www.davisoncounty.org Lake County SD www.lakecountysd.com/lepc/ Bradley County TN www.bradleycountylepc.com Morgan County TN www.morgancountyema.com Roane County TN www.roanelepc.com Beaver County TX www.ptsi.net/bvreoc Coastal Plain TX www.coastalplainlepc.org Collin County TX www.co.collin.tx.us/fire_marshal/lepc/lepc.jsp Corpus Christi/Nueces TX www.cclepc.org Humble TX http://www.cityofhumble.com/emd.html Lubbock County TX www.co.lubbock.tx.us/LEPC/lepc.htm Navarro County TX www.navarrocountyoem.org Potter and Randall County TX www.potterrandall-lepc.com Uintah County UT http://www.co.uintah.ut.us/em/lepc.php Windham Region VT www.lepc.windham.vt.us/ Franklin County WA www.franklinem.org Grays-Harbor County WA www.co.grays-harbor.wa.us/info/DEM Skamania County WA www.skamania-dem.org/LEPC.html Milwaukee County WI http://www.county.milwaukee.gov/IncidentsDisasters15644.htm Oneida County WI www.co.oneida.wi.gov Cabell/Wayne WV www.cwlepc.com Kanawha Putnam WV www.kpepc.org Tyler County WV www.tylerwv.org Lincoln County WY www.lcwy.org Sweetwater County WY www.sweet.wy.us/ema Uinta County WY http://www.uintacounty.com/index.asp?NID=125

35
Appendix D: Map of EPA Regions For the purposes of this report, EPA Regions were combined into four larger geographic regions: Northeast (Regions 1, 2 and 3); South (Regions 4 and 6); Midwest (Regions 5 and 7); and West (Regions 8, 9 and 10)

36
Appendix E: Survey Questions Demographic Information 1) In which state is your Local Emergency Planning Committee (LEPC) located? 2) What size population does your LEPC serve?
a) Fewer than 50,000 b) 50,001 to 100,000 c) 100,001 to 500,000 d) 500,001 to 1,000,000 e) More than 1,000,000
3) How would you best describe your LEPC’s service area?
a) Predominantly or entirely rural b) Mixed rural/suburban c) Predominantly suburban d) Mixed suburban/urban e) Predominantly or entirely urban
LEPC Structure 4) How is your chairperson chosen?
a) Elected by LEPC b) Appointed by State Emergency Response Commission (SERC) c) Rotating basis d) Volunteer e) Other _________________ f) Have chairperson but do not know how he/she was chosen g) Do not have a chairperson
5) Representatives from which of the following groups or organizations make up your LEPC’s
membership? (Select all that apply) Elected local officials Elected state officials Fire department (or Hazmat) representatives Law enforcement representatives Civil defense (or Emergency management) representatives First Aid (Emergency Medical Service) representatives Hospital or public health representatives Local environmental group/organization representatives Transportation representatives Broadcast and print media representatives Community group representatives General public

37
Representatives from industry/facilities affected by EPA Title III of the Superfund Amendment and Reauthorization Act of 1986 representatives
Other ________________
6) Is there currently a Citizen Corps Council (component of USA Freedom Corps that creates opportunities for individuals to volunteer to help their communities prepare for and respond to emergencies by bringing together local leaders, citizen volunteers and the network of first responder organizations) within your community? a) Yes b) No – Skip to Question 8
7) Please describe the relationship between your LEPC and the Citizen Corps Council within your
community. a) My LEPC merged with the Citizen Corps Council b) My LEPC coordinates closely and works in cooperation with the Citizen Corps Council c) My LEPC infrequently coordinates with the Citizen Corps Council d) My LEPC and the Citizen Corps Council work independently
LEPC Meetings 8) How often has your LEPC met in the past 12 months?
a) Weekly b) Monthly c) Bi-Monthly (every other month) d) Quarterly e) Yearly f) As needed – (a-f) Skip to Question 10 g) Has not met in the past 12 months
9) Why has your LEPC not met in the past 12 months? a) Did not need to meet b) No interest from members c) Insufficient resources (meeting location, time, funding) d) LEPC activities covered at other meetings e) Other ________________
10) Do you advertise your LEPC meetings to the public?
a) Yes b) No – Skip to Question 12
11) How do you advertise your LEPC meetings to the public? (Select all that apply)
Newspapers On-line Flyers and handouts Mailings Postings in government buildings Other_________________

38
Emergency Plan 12) When did your LEPC last review and update its emergency response plan?
a) Within the past 12 months b) 1 - 2 years ago c) Over 2 years ago d) Plan has not yet been reviewed or updated e) Have a plan, but do not know when it was last reviewed and updated f) Do not have a plan – Skip to Question 19
13) Who was the primary author of your LEPC’s emergency plan?
a) One LEPC member b) More than one LEPC member c) Both LEPC members and outside sources d) A consultant or other outside party
14) When did the State Emergency Response Commission (SERC) last review your emergency plan?
a) Within the past 12 months b) 1 - 2 years ago c) Over 2 years ago d) Plan has not yet been reviewed
15) How familiar are the majority of your LEPC members with your emergency response plan?
Very Familiar
Familiar Somewhat Familiar
Slightly Familiar Not at All Familiar
16) Does your emergency plan? (Select all that apply)
Take into account natural hazards (e.g., hurricanes, earthquakes) Take into account homeland security (The potential for terrorist events and/or events extending
beyond chemical to radiological and biological incidents) Take into account environmental justice (The fair treatment and meaningful involvement of all
people regardless of race, color, national origin or income with respect to the development, implementation and enforcement of environmental laws, regulations and policies)
Identify extremely hazardous substances (EHS) facilities subject to the plan Identify Tier I and II facilities Identify Risk Management Program (RMP) facilities Identify the routes likely to be used for the transportation of hazardous substances Provide procedures for informing the key persons (“call down list”) designated in the emergency
plan Designate a community emergency coordinator and facility emergency coordinators, who make
necessary determinations to implement the plan Provide procedures for informing the public in an emergency

39
Address use of shelter-in-place Outline methods to determine the area and population likely to be affected by a chemical release Describe emergency equipment available to the community Include evacuation plans, such as precautionary evacuations and alternative traffic routes Address training for first responders and other response personnel Include methods and schedules for exercising the emergency plan Integrate with other applicable state plans Demonstrate consistency with NIMS (National Incident Management System)
17) Has your LEPC exercised your emergency plan?
a) Yes b) No – Skip to Question 20
18) How have you exercised your emergency plan? (Select all that apply)
Full-scale exercise Table-top exercise Public briefing Drill Actual response Other________________
19) When did your LEPC last exercise its emergency plan?
a) Within the past 12 months b) 1 - 2 years ago c) Over 2 years ago d) Exercised plan, but do not know when
20) If an emergency at a chemical facility occurred tomorrow, responders would coordinate their
response efforts with a plan developed by: (Select all that apply) The LEPC Another emergency response organization (not the LEPC) Chemical facility Other _________________
21) In the past five years, approximately how many chemical accidents have occurred in your LEPC’s
service area? a) None – Skip to Question 23 b) 1-5 c) 6-10 d) 11-15 e) 15 or more
22) How did these chemical accidents most impact the way your LEPC operates? a) Improved coordination efforts with industry/facilities b) Revised emergency plan based on lessons-learned c) Changed the way information is made available to the public d) Extended LEPC membership e) Increased frequency of LEPC meetings f) Other______________ g) Did not impact

40
Data Use and Management 23) How do you primarily receive Emergency Planning and Community Right-to-Know Act (EPCRA)
Tier I and II data (Sections 311-312)? a) Paper b) Tier2 Submit from EPA c) State or local electronic submissions (e.g., diskette or CD) d) State or local Web-based submission
24) How does your LEPC manage EPCRA Tier I and II data? (Select all that apply)
Paper files CAMEO (Computer-Aided Monitoring of Emergency Operations) (A suite of software
developed by EPA and NOAA used widely to plan for and respond to chemical emergencies) Database created by LEPC Other state or local database Web-based database Other__________________
25) How does your LEPC use EPCRA Tier I and II data? (Select all that apply)
For emergency planning (e.g., hazard analysis, identification of risk areas) For emergency response To make hazard reduction recommendations to industry To make preparedness recommendations to local government To respond to public inquiries For zoning or other land use issues Other______________________
26) Does your LEPC use Risk Management Program (RMP) data?
a) Yes b) No – Skip to Question 29
27) For what purpose(s) does your LEPC use RMP data? (Select all that apply) To improve your local emergency planning For emergency response To work with industry to prevent accidents To support homeland security Other__________________
28) From what source does your LEPC primarily obtain RMP data?
a) State b) EPA c) Other__________________
29) Does your LEPC use CAMEO?
a) Yes b) No – Skip to Question 31
30) For what purpose(s) does your LEPC use CAMEO? (Select all that apply) For emergency planning (e.g., screening and contingency plans) For actual emergencies

41
For drills and exercises To access chemical information To manage Tier II data To respond to public inquires Other______________________
Communication 31) Does your LEPC have a Web site?
a) Yes. Please provide the Web address: __________________(optional) b) No
32) Does your LEPC notify the public that its emergency plan and chemical hazard information is
available? a) Yes b) No – Skip to Question 34
33) How does your LEPC notify the public that its emergency plan and chemical hazard information is
available? (Select all that apply) Brochures Newspaper Radio/TV Public meetings LEPC Web site Other____________
34) Which of the following mechanisms are in place to notify the public of a release requiring
evacuation or shelter in place? (Select all that apply) Radio/TV announcements Internet/cell phone alerts Telephone dialers Fixed sirens/audible alarms Emergency broadcast system Fire/police – going door to door Vehicle mounted voice communication Fixed message boards on public roadways Other____________ Do not know

42
How many public inquiries has your LEPC received and responded to during the past 12 months? a) 1-5 inquiries b) 6-10 inquiries c) 10-20 inquiries d) 21 or more e) None
35) How does your LEPC interact with chemical facilities in your area of service? (Select all that apply)
Collecting reports/fees Meetings Visits to the facilities Discussion about Risk Management Program (RMP) plans Other _____________________
36) Other than receipt of reports/fees from chemical facilities in your area of service, how often does
your LEPC communicate with those facilities? a) Weekly b) Monthly c) Quarterly d) Every six months e) Annually f) Never
Funding 37) Does your LEPC have an operating budget?
a) Yes b) No
38) Does your LEPC receive direct funding?
a) Yes b) No – Skip to Question 42
39) Please indicate the agencies/organizations from which your LEPC receives direct funding. (Select all
that apply) State fees from Emergency Planning and Community Right to Know Act (EPCRA) report
submission Local fees from EPCRA report submission Other local government funding Other state government funding Federal funding – e.g., Hazmat Emergency Preparedness (HMEP) Grants Private industry Other_________________

43
40) Does your LEPC receive any indirect/in-kind funding (e.g, meeting space, office equipment)? a) Yes b) No – Skip to Question 44
41) Please indicate the type of indirect funding your LEPC receives. (Select all that apply)
Office space Meeting space Materials or office supplies Use of computers or other equipment Printing Other ______________________
Support from Federal Agencies 42) In the past five years, did your LEPC receive technical assistance or guidance from any federal
government agencies? a) Yes b) No – Skip to Question 47
43) From which of the following federal agencies did your LEPC receive technical assistance or
guidance? (Select all that apply) U.S. Environmental Protection Agency (EPA) U.S. Department of Justice (DOJ) Federal Emergency Management Agency (FEMA) DHS (other than FEMA) U.S. Department of Transportation (DOT) Other ____________________________________
44) The support (technical assistance or guidance) received from EPA has played a significant role in
guiding your LEPC’s activities:
Strongly Agree
Agree Neither Agree
Nor Disagree Disagree
Strongly Disagree
45) As a representative of your LEPC, how often do you visit the EPA Office of Emergency
Management (OEM) Web site http://www.epa.gov/oem (formerly http://www.epa.gov/ceppo) for technical guidance or other information? a) At least once a week b) At least once a month c) At least once every six months d) At least once a year e) Never – Skip to Question 50

44
46) When visiting the OEM Web site, I found the information I was looking for: a) Right away b) After performing a site search c) After browsing through the site d) I was unable to find the exact information
47) Please rank your level of satisfaction with the technical information you received by visiting the
OEM Web site.
Very Satisfied
Moderately Satisfied
Slightly Satisfied Not At All Satisfied
Homeland Security (The potential for terrorist events and/or events extending beyond chemical to radiological and biological incidents) 48) Since the events of 9/11, the overall activity level of your LEPC has:
Increased Greatly
Increased Somewhat
Stayed About the Same
Decreased Somewhat
Decreased Greatly
Do Not Know
49) Since 9/11, the number of requests from the public for chemical hazard information has:
Increased Greatly
Increased Somewhat
Stayed About the Same
Decreased Somewhat
Decreased Greatly
Do Not Know
50) Since 9/11, has your LEPC changed the way chemical hazard information is made available to the
public due to homeland security concerns? a) Yes b) No
Strengths and Additional Needs 51) What is the single greatest factor contributing to the success of your LEPC?
a) Funding b) Dedicated leadership (Chair) c) Dedicated membership d) Regularly scheduled meetings e) Local government support f) Cooperation from regulated community

45
g) State Emergency Response Commission (SERC) support h) Public interest i) Other____________
52) What is the greatest obstacle to the success of your LEPC?
a) Funding b) Lack of dedicated leadership c) Low membership involvement d) Infrequent and/or irregular meetings e) Poor local government support f) Poor State Emergency Response Commission (SERC) support g) Public apathy h) Limited cooperation from regulated community i) Other___________
53) In which of the following areas could your LEPC use assistance? (Select all that apply)
Determining the level of risk in your jurisdiction Identification and compliance assistance for non-reporting facilities Conducting drills and exercises Developing/reviewing local emergency response plans Data management Outreach and communicating with the public Integrating homeland security into emergency plans Coordination with state and federal agencies
54) The LEPC on which I serve has had a positive impact on chemical safety in the community
(prevention, preparedness, and response).
Strongly Agree
Agree Neither Agree
Nor Disagree Disagree
Strongly Disagree
Please provide additional comments, including best practices, in the space below: