Embed Size (px)
Citation preview

2008 International Telecommunications Data
(Filed as of October 31, 2009)
March 2010
Strategic Analysis and Negotiations Division Multilateral Negotiations and Industry Analysis Branch
International Bureau
This report is available for reference in the FCC’s Reference Information Center at 445 12th Street, S.W., Courtyard Level. Copies may be purchased by calling the FCC’s duplicating contractor, Best Copy and Printing, Inc., 445 12th Street, S.W., Room CY-B402, Washington, DC 20554, telephone 1-800-378-3160, facsimile 202-488-5563, or via e-mail www.bcpiweb.com. The report can also be downloaded [file name: CREPOR08.ZIP or CREPOR08.PDF] from www.fcc.gov/ib. .
2008 International Telecommunications Data March 2010
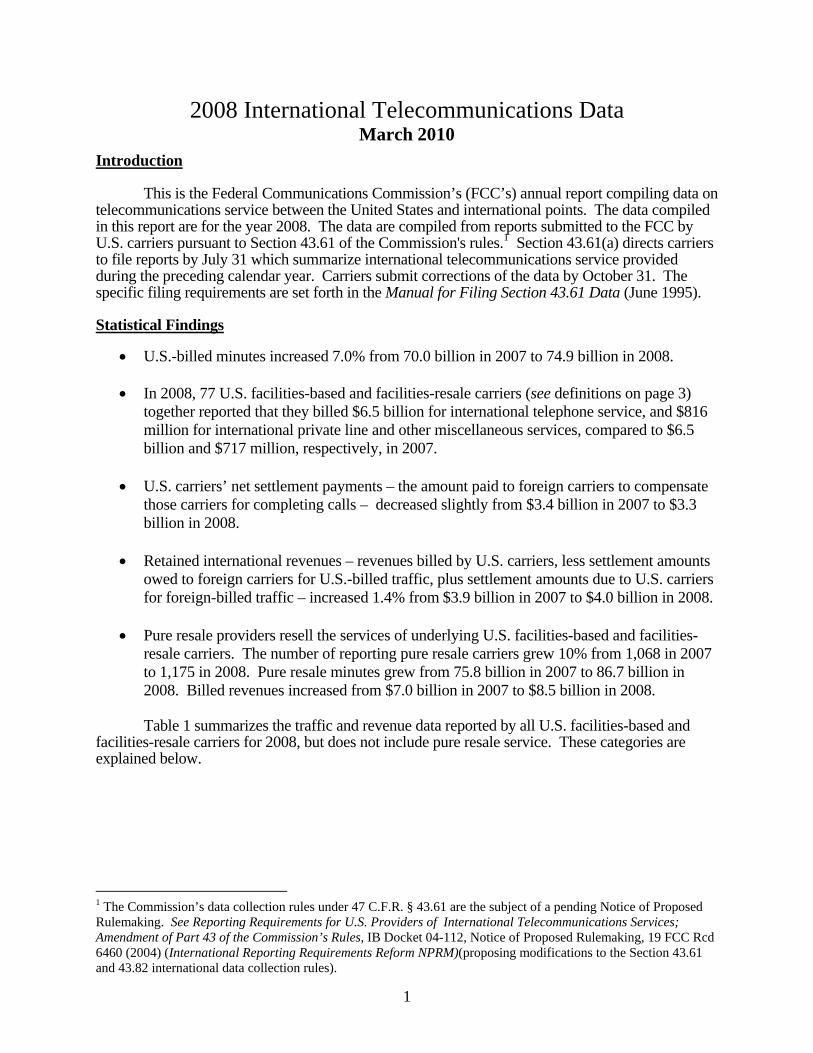
Introduction This is the Federal Communications Commission’s (FCC’s) annual report compiling data on telecommunications service between the United States and international points. The data compiled in this report are for the year 2008. The data are compiled from reports submitted to the FCC by U.S. carriers pursuant to Section 43.61 of the Commission's rules.1 Section 43.61(a) directs carriers to file reports by July 31 which summarize international telecommunications service provided during the preceding calendar year. Carriers submit corrections of the data by October 31. The specific filing requirements are set forth in the Manual for Filing Section 43.61 Data (June 1995). Statistical Findings
• U.S.-billed minutes increased 7.0% from 70.0 billion in 2007 to 74.9 billion in 2008.
• In 2008, 77 U.S. facilities-based and facilities-resale carriers (see definitions on page 3) together reported that they billed $6.5 billion for international telephone service, and $816 million for international private line and other miscellaneous services, compared to $6.5 billion and $717 million, respectively, in 2007.
• U.S. carriers’ net settlement payments – the amount paid to foreign carriers to compensate
those carriers for completing calls – decreased slightly from $3.4 billion in 2007 to $3.3 billion in 2008.
• Retained international revenues – revenues billed by U.S. carriers, less settlement amounts
owed to foreign carriers for U.S.-billed traffic, plus settlement amounts due to U.S. carriers for foreign-billed traffic – increased 1.4% from $3.9 billion in 2007 to $4.0 billion in 2008.
• Pure resale providers resell the services of underlying U.S. facilities-based and facilities-
resale carriers. The number of reporting pure resale carriers grew 10% from 1,068 in 2007 to 1,175 in 2008. Pure resale minutes grew from 75.8 billion in 2007 to 86.7 billion in 2008. Billed revenues increased from $7.0 billion in 2007 to $8.5 billion in 2008.
Table 1 summarizes the traffic and revenue data reported by all U.S. facilities-based and facilities-resale carriers for 2008, but does not include pure resale service. These categories are explained below.
1 The Commission’s data collection rules under 47 C.F.R. § 43.61 are the subject of a pending Notice of Proposed Rulemaking. See Reporting Requirements for U.S. Providers of International Telecommunications Services; Amendment of Part 43 of the Commission’s Rules, IB Docket 04-112, Notice of Proposed Rulemaking, 19 FCC Rcd 6460 (2004) (International Reporting Requirements Reform NPRM)(proposing modifications to the Section 43.61 and 43.82 international data collection rules).
1

Table 1. International Telecommunications Traffic Measures and Revenues, 2008
Traffic Measures*
Revenues Billed by U.S. Carriers
(millions)
Net Settlements with Foreign
Carriers (millions)
Net Retained
Revenues** (millions)
Message Telephone (millions of minutes)
101,334 $6,459 ($3,329) $3,130
Private Line (number of circuits)
149,529 $363 None $363
International Other Miscellaneous***
$4
$(0) $4
Total**** $7,275 ($3,329) $3,946 * Traffic measures for international message telephone and other miscellaneous service include both U.S.-billed traffic and foreign-billed traffic that terminates in the United States, but excludes most traffic that transits the United States. ** Net U.S. carrier retained revenues equal billed revenues plus settlement amounts receivable from foreign carriers less amounts due to foreign carriers. See Table 3, below. Details may not match totals due to necessary rounding. *** In 2008, carriers reported frame relay/ATM, virtual private line, TDM/TDMA, virtual private network, and packet switching services as other miscellaneous international services. That information can be found in Section C (International Miscellaneous Services, Page 1) of this report. Carriers use several different traffic measures when reporting the different types of international other miscellaneous services. Therefore, because they are not uniform, no overall totals are calculated for international other miscellaneous traffic measures or total traffic measures. **** Total above includes $5.2 billion billed revenues, $2.1 billion net settlements, and $3.1 billion net revenues for 30 facilities-based and facilities-resale carriers together requesting confidential treatment in the above categories.
2
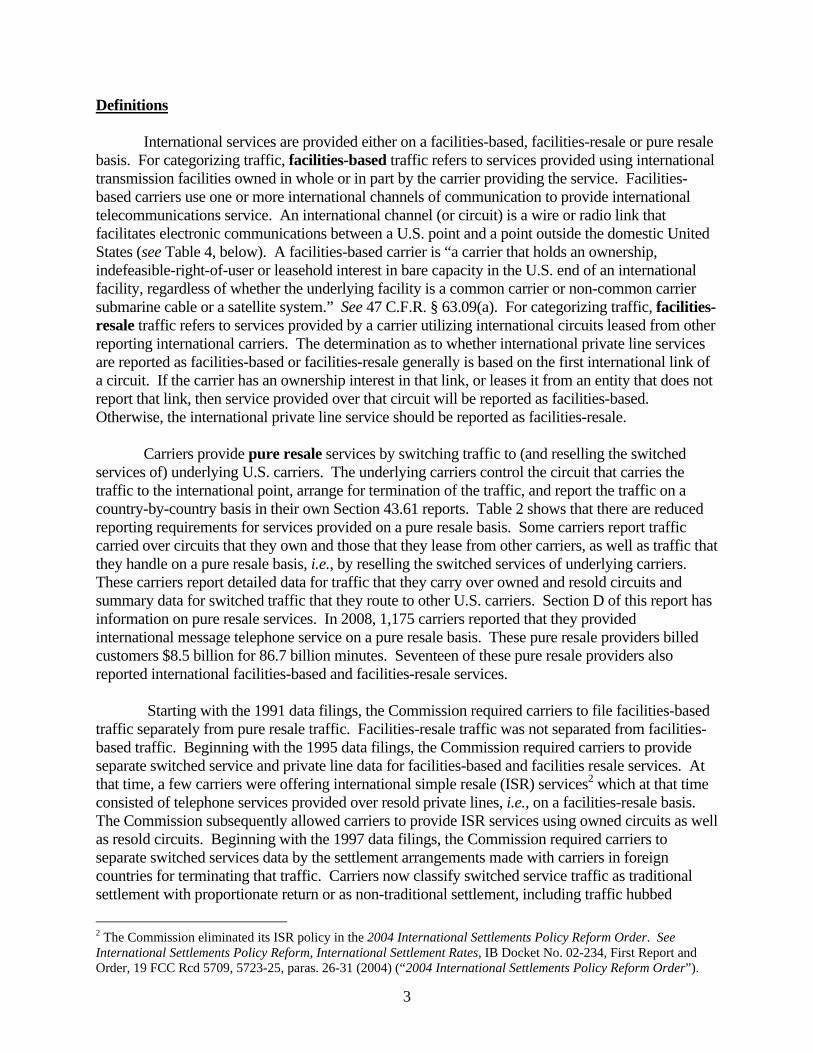
Definitions International services are provided either on a facilities-based, facilities-resale or pure resale basis. For categorizing traffic, facilities-based traffic refers to services provided using international transmission facilities owned in whole or in part by the carrier providing the service. Facilities-based carriers use one or more international channels of communication to provide international telecommunications service. An international channel (or circuit) is a wire or radio link that facilitates electronic communications between a U.S. point and a point outside the domestic United States (see Table 4, below). A facilities-based carrier is “a carrier that holds an ownership, indefeasible-right-of-user or leasehold interest in bare capacity in the U.S. end of an international facility, regardless of whether the underlying facility is a common carrier or non-common carrier submarine cable or a satellite system.” See 47 C.F.R. § 63.09(a). For categorizing traffic, facilities-resale traffic refers to services provided by a carrier utilizing international circuits leased from other reporting international carriers. The determination as to whether international private line services are reported as facilities-based or facilities-resale generally is based on the first international link of a circuit. If the carrier has an ownership interest in that link, or leases it from an entity that does not report that link, then service provided over that circuit will be reported as facilities-based. Otherwise, the international private line service should be reported as facilities-resale. Carriers provide pure resale services by switching traffic to (and reselling the switched services of) underlying U.S. carriers. The underlying carriers control the circuit that carries the traffic to the international point, arrange for termination of the traffic, and report the traffic on a country-by-country basis in their own Section 43.61 reports. Table 2 shows that there are reduced reporting requirements for services provided on a pure resale basis. Some carriers report traffic carried over circuits that they own and those that they lease from other carriers, as well as traffic that they handle on a pure resale basis, i.e., by reselling the switched services of underlying carriers. These carriers report detailed data for traffic that they carry over owned and resold circuits and summary data for switched traffic that they route to other U.S. carriers. Section D of this report has information on pure resale services. In 2008, 1,175 carriers reported that they provided international message telephone service on a pure resale basis. These pure resale providers billed customers $8.5 billion for 86.7 billion minutes. Seventeen of these pure resale providers also reported international facilities-based and facilities-resale services. Starting with the 1991 data filings, the Commission required carriers to file facilities-based traffic separately from pure resale traffic. Facilities-resale traffic was not separated from facilities-based traffic. Beginning with the 1995 data filings, the Commission required carriers to provide separate switched service and private line data for facilities-based and facilities resale services. At that time, a few carriers were offering international simple resale (ISR) services2 which at that time consisted of telephone services provided over resold private lines, i.e., on a facilities-resale basis. The Commission subsequently allowed carriers to provide ISR services using owned circuits as well as resold circuits. Beginning with the 1997 data filings, the Commission required carriers to separate switched services data by the settlement arrangements made with carriers in foreign countries for terminating that traffic. Carriers now classify switched service traffic as traditional settlement with proportionate return or as non-traditional settlement, including traffic hubbed
2 The Commission eliminated its ISR policy in the 2004 International Settlements Policy Reform Order. See International Settlements Policy Reform, International Settlement Rates, IB Docket No. 02-234, First Report and Order, 19 FCC Rcd 5709, 5723-25, paras. 26-31 (2004) (“2004 International Settlements Policy Reform Order”).
3

through an intermediate foreign country (see definitions on page 5).3 Carriers continue to report facilities-based and facilities-resale private line services separately. Carriers must report switched traffic in three broad categories: U.S.-billed, foreign-billed, and transiting. U.S.-billed traffic includes all traffic billed by U.S. carriers, and includes calls that originate in the United States, calls that are placed collect or “caller toll-free” to the United States, U.S. carrier “country-direct” and “country-beyond” calls, and U.S. carrier reorigination traffic. Country-direct and country-beyond services are U.S. carrier offerings that allow customers in foreign locations to route calls through U.S. carrier facilities to reach the United States (country-direct) or any world point (country-beyond). Country-direct and country-beyond services rely on alternative billing arrangements, such as credit cards, and enable the customer at a foreign point to be served by a U.S. carrier rather than by a foreign carrier. Note that U.S. carriers or their affiliates may operate in many foreign countries as foreign carriers. They do not report section 43.61 traffic for calls that they carry from one foreign country to another unless they carry this traffic through a U.S. point. Reorigination traffic is traffic of a foreign carrier that transits a U.S. carrier’s facilities and terminates with another carrier in a foreign point. The carrier terminating the traffic in the foreign point views the traffic as U.S. traffic. Reorigination allows the originating foreign carrier to take advantage of the U.S. carrier’s accounting rate agreement with the carrier in the terminating country. The U.S. carrier treats reorigination traffic like U.S.-billed traffic when it settles with the carrier in the country of termination, and it reports this traffic as U.S.-billed traffic for filing purposes. In their public filings, carriers include country-direct, country-beyond and reorigination traffic with other U.S.-billed traffic. In proprietary filings, carriers separate these services from other U.S.-billed traffic. Table A1 shows that carriers reported 75 billion minutes of U.S.-billed traffic in 2008, for which they billed $6.5 billion. Table A25 shows that 64.3 billion of these minutes and $5.5 billion of this revenue were for calls that originated in the United States or terminated collect or caller toll-free in the United States. Table A26 shows that 1.3 billion of these minutes and $0.2 billion of this revenue was for country-direct and country-beyond type services. Table A27 shows that 9.3 billion of these minutes and $0.8 billion of this revenue was for reorigination services billed to foreign carriers. Foreign-billed traffic is all traffic billed by a foreign or correspondent carrier and includes most calls that originate at foreign points as well as collect and caller toll free calls placed by U.S. customers to foreign points. Foreign-billed calls do not necessarily originate in the country for which the traffic is reported. In some cases, foreign carriers reoriginate traffic for other foreign carriers. U.S. carriers may not know which calls are reoriginated. Transiting traffic is traffic of a foreign carrier that transits a U.S. carrier's facilities and terminates with another carrier in a foreign point. Unlike reorigination traffic, transiting traffic is settled based on the settlement rate between the actual countries of origination and destination. Transiting traffic is billed by the originating foreign carrier, and settlement payments are reported by 3 See Annual Section 43.61(a) International Telecommunications Traffic Reports Due by July 31, 2009, Public Notice, 24 FCC Rcd 9072 (Int’l. Bur. 2009).
4

U.S. carriers for the country in which the service is billed. Where there are so-called “cascade billing arrangements,” U.S. carriers report both settlement receipts and settlement payments for transiting calls. In a cascade billing arrangement, the U.S. carrier collects from the originating foreign carrier both a transit fee and the settlement amount that the originating foreign carrier will owe to the terminating foreign carrier. The U.S. carrier then makes the settlement payment to the terminating foreign carrier. As explained above, carriers separately report international switched telephone, telegraph, telex and miscellaneous services based on the financial termination arrangements. Traditional Settlement Arrangements consist of traffic settled pursuant to the Commission’s International Settlements Policy (ISP). The settlement is based on the accounting rate, which is part of a compensation agreement negotiated between a U.S. carrier and its foreign correspondent on a particular international route. The ISP requires nondiscriminatory accounting rates among U.S. carriers on a given route and that the U.S. carrier and its foreign correspondent share the accounting rate on a 50/50 basis. The ISP also requires that the U.S. carrier agree to accept no more than its proportionate share of return traffic from the foreign carrier. The ISP applies to agreements involving foreign carriers with market power on routes where the termination rates are above benchmark.4 Table A23 shows that U.S. carriers reported 4.4 billion minutes of U.S.-billed traditional settlement traffic in 2008, for which they billed $0.3 billion. Non-Traditional Settlement Arrangements consist of all traffic other than traditionally settled traffic. Table A24 shows that U.S. carriers reported 70.6 billion U.S.-billed non-traditional minutes of traffic in year 2008, for which they billed $6.2 billion. U.S. carriers also reported receiving 24.1 billion foreign-billed non-traditional minutes of traffic in year 2008. These tables may understate the total amount of traffic settled under non-traditional arrangements because it appears that carriers continued to report a small amount of non-traditional settlement traffic as traditional settlement traffic for year 2008.5 Reporting Requirements Different levels of reporting are used for different categories of service. Table 2 shows that
4 See 47 C.F.R. §§ 43.51(e), 64.1001, 64.1002 (2008). In 2004, the Commission lifted the ISP requirements from agreements involving foreign carriers that do not have market power and on routes where the termination rates for U.S.-international services were below benchmark. See International Settlements Policy Reform, International Settlement Rates, IB Docket No. 02-234, First Report and Order, 19 FCC Rcd 5709, 5723-25, paras. 27-28 (2004). Currently, 165 routes are exempted from the ISP. See http://www.fcc.gov/ib/pd/pf/isp_exempt.html. See also U.S.-Cambodia Route Exempted from the International Settlements Policy, Public Notice, IB Docket Nos. 02-324, 96-261, 20 FCC Rcd 963 (Int’l. Bur. 2005). For a discussion of benchmarks, see International Settlement Rates , IB Docket No. 96-261, Report and Order, FCC 97-280, 12 FCC Rcd 19806, 19806, ¶ 1 (1997); Report and Order on Reconsideration and Order Lifting Stay, 14 FCC Rcd 9256 (1999); aff’d sub nom. Cable & Wireless P.L.C. v. FCC , 166 F.3d 1224 (D.C. Cir. 1999). 5 For example, carriers reported 7.9 billion minutes of non-traditional settlement traffic for Canada, and 2.9 billion minutes for the United Kingdom. They also reported 1.6 billion and 2.2 billion, respectively, minutes of traditional settlement traffic for each country. The Commission has permitted non-traditional settlement arrangements for U.S.-Canada and U.S.-U.K. traffic since 1992 and 1994, respectively. It is therefore unlikely that carriers are in fact settling substantial amounts of traffic on these two U.S. international routes under traditional settlement arrangements. Traditional settled traffic is settled using the Commission’s ISP. Canada and the United Kingdom are currently exempt from the ISP.
5
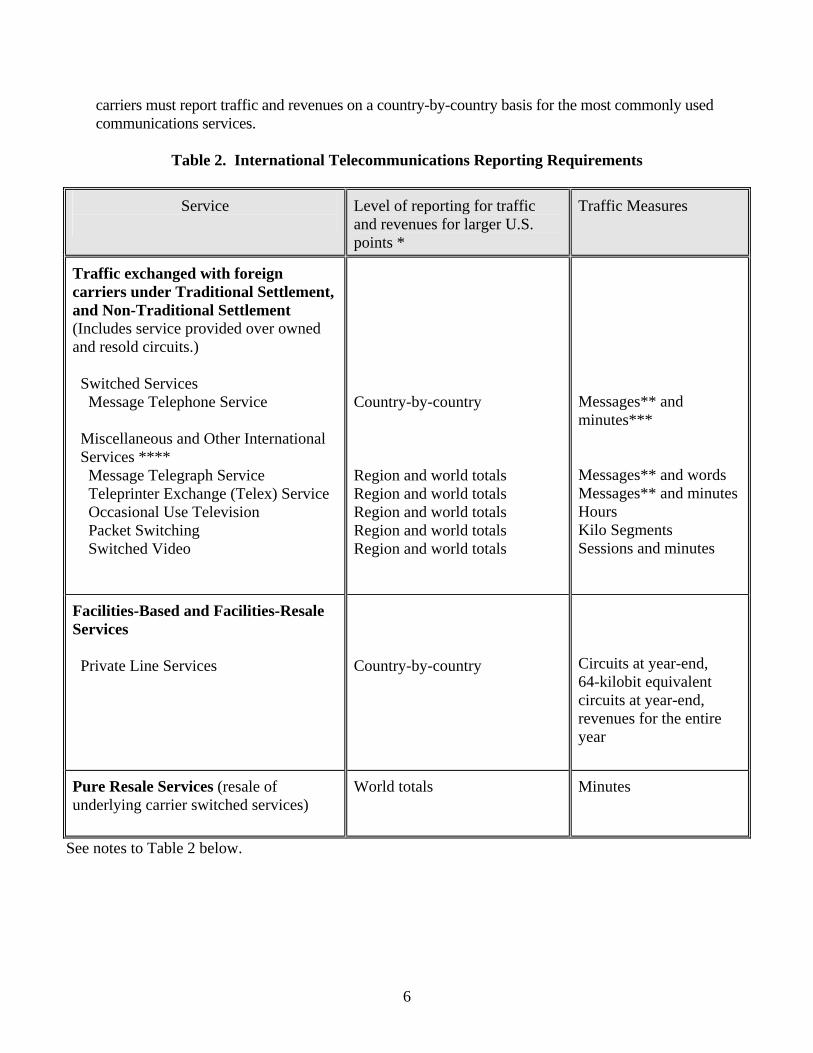
carriers must report traffic and revenues on a country-by-country basis for the most commonly used communications services.
Table 2. International Telecommunications Reporting Requirements
Service
Level of reporting for traffic and revenues for larger U.S. points *
Traffic Measures
Traffic exchanged with foreign carriers under Traditional Settlement, and Non-Traditional Settlement (Includes service provided over owned and resold circuits.) Switched Services Message Telephone Service Miscellaneous and Other International Services **** Message Telegraph Service Teleprinter Exchange (Telex) Service Occasional Use Television Packet Switching Switched Video
Country-by-country Region and world totals Region and world totals Region and world totals Region and world totals Region and world totals
Messages** and minutes*** Messages** and words Messages** and minutes Hours Kilo Segments Sessions and minutes
Facilities-Based and Facilities-Resale Services Private Line Services
Country-by-country
Circuits at year-end, 64-kilobit equivalent circuits at year-end, revenues for the entire year
Pure Resale Services (resale of underlying carrier switched services)
World totals Minutes
See notes to Table 2 below.
6

Table 2. International Telecommunications Reporting Requirements - Continued
Notes: * Carriers may file world totals in lieu of country-by-country data for the smaller U.S. points
identified in Table 4. ** Carriers are not required to file message counts for transiting traffic. *** Many carriers have requested proprietary treatment for country-by-country transiting minutes.
Both U.S. and foreign carriers compete for transiting traffic. The minutes data would allow competitors to estimate contract revenues per minute. The published tables therefore contain region and world totals for transiting minutes.
**** Prior to filing 1995 data, carriers selected their own traffic measures for miscellaneous
services.
For private line services, carriers report the number of actual circuits leased to customers at year-end. Beginning with their 1995 international traffic data, carriers also report these circuits in terms of voice-equivalent circuits. For lower bandwidths, this means reporting the number of 64-kilobit-per-second channels that would equal the actual circuits. An 18-megahertz video channel, however, would be reported as 240 voice-equivalent channels; a 24-megahertz video channel would be reported as 288 voice-equivalent channels; and a 36-megahertz video channel would be reported as 630 voice-equivalent channels. This is the same conversion factor used by carriers in preparing circuit data reports filed pursuant to Section 43.82 of the Commission’s rules.6 Voice-equivalent circuits are denoted “64 K” in the attached tables. Facilities-based U.S. and foreign carriers jointly provide most international services. This is not always apparent to the customer, but is reflected in some of the traffic and revenue data that are filed. For switched services, one carrier collects from customers and then compensates its foreign partners through the settlement process. In the case of traditional settlement traffic, compensation is based on minutes of calling and on accounting rates specified in settlement agreements. The number of minutes used for settlement purposes is generally based on the number of conversation minutes. In many cases, accumulated seconds are used to determine the minutes used in settlements. In the case of Mexico, billed minutes are used to determine settlements. Carriers providing non-traditional traffic may have settlement-like arrangements under which U.S. carriers and their foreign correspondents compensate each other for traffic that originates or terminates at foreign points. Starting in 1991, for facilities-based and facilities-resale services, the Commission directed carriers to report the minutes used for settlement purposes.7 Pure resale carriers file billed minutes, since they do not participate in the
6 Manual for Filing Section 43.82 Circuit Data in accordance with the FCC’s Rules and Regulations, October 1995, available from the FCC’s Internet site at http://www.fcc.gov/ib/pd/pf/csmanual.html. 7 Prior to 1991, carriers were directed to report billed minutes, rather than settlement minutes. Billed minutes tend
7

settlement process and may not have access to settlement minutes data. Country-beyond calls have two international legs. Our rules direct carriers to report both the originating and terminating legs of such calls. Consequently, approximately two minutes will be reported for each conversation minute. Each leg of the call may have settlement payments and these payments should be reported for the appropriate country. Carriers are instructed to report all billed revenues by the country in which the call originates. Country-direct and country-beyond traffic are treated confidentially and are not identified separately from a carrier’s publicly filed data. For U.S.-billed switched services, the tables show the amount that the customers are billed for service, the corresponding settlement amount that the carrier owes to its foreign partner, and the amount of revenues that it retains. Carriers are instructed to report the actual amount of revenues that they bill for service, net of discounts. Many carriers offer discount plans that entitle customers to discounts based on the customer’s total bill. Some carriers do not recalculate discounted bill amounts on a call-by-call basis. These carriers collect country-by-country revenue totals based on non-discounted rates and must estimate the amount of discounts for each country. For foreign-billed traffic, the tables show the settlement amounts owed to U.S. carriers by foreign carriers. The tables refer to these amounts as “Receipts from Foreign Carriers.” In the case of transiting traffic, the U.S. carrier often receives a transit fee for itself, and a settlement amount which is owed to the terminating carrier. Thus, the tables show receipts, payouts and a net amount for transiting traffic. Table 3 shows the revenue relationships between U.S. carriers and foreign carriers. Table 3. International Telecommunications Revenue Relationships
U.S.-Billed Traffic Billed revenues - Settlements owed to foreign carriers = U.S. carrier retained revenues
Foreign-Billed Traffic Settlements due from foreign carriers = U.S. carrier retained revenues
Transiting Traffic Transit fee and settlements due from foreign carriers - Settlements owed to foreign carriers = U.S. carrier retained revenues
Total Retained revenues for U.S.-billed + Retained revenues from foreign-billed + Retained revenues from transiting = Total U.S. carrier retained revenues
U.S. carriers report the number of private line circuits actually leased at year-end. Financial arrangements for private line services are different than those for public switched to be greater than settlement minutes because some carriers bill in 30-second increments.
8

services. Unlike message telephone service, where the rate charged to consumers covers the whole cost of the call, the U.S. carrier’s private line rate traditionally has covered only the half-circuit to the theoretical mid-point. In some cases, each carrier bills for its half of the service; in other cases, one carrier acts as the collection agent. The FCC Filing Manual states that U.S. carriers must report the amount of private line revenues that they record for their half of the service, regardless of who actually collects the revenues.8 The filing manual also states that U.S. carriers should not report revenues that they collect on behalf of the foreign carriers or amounts that they bill for services that they provide in foreign countries. In instances in which a U.S. carrier provides both halves of the circuit, the U.S. carrier should only submit information for the U.S. half portion of the circuit. The portion of the circuit or channel from the theoretical mid-point to the foreign destination is deemed to be foreign telecommunications and not to be reported by the U.S. carrier. International points are grouped into ten regions for reporting purposes. The regions include all countries of the world as well as three maritime classifications - the Atlantic, Pacific, and other oceans. In some cases, international points have been grouped outside the geographic region for reporting purposes. For example, the Azores and Madeira Islands are included with Portugal. Any data reported to these points are included with Portugal traffic and are summarized with Western Europe traffic in the tables.9 Carriers are required to file separate data for each U.S. point that they serve. Alaska and Hawaii, for example, are considered distinct U.S. points for this purpose. Table 4 identifies the U.S. points used for reporting purposes. Carriers serving larger U.S. points are required to file detailed country-by-country data on computer disk. Carriers serving smaller U.S. points may file world totals in lieu of country-by-country data. In a few instances, carriers have obtained waivers so that they can consolidate data for Hawaii and the conterminous United States.10 8 Manual for Filing Section 43.61 Data, June 1995, available from the FCC’s Internet site at http://www.fcc.gov/ib, under “Industry Information,” click “Section 43.61 International Traffic Data.” 9 See FCC report titled, International Points Used for FCC Reporting Purposes, April 1994, available from the FCC’s Internet site at http://www.fcc.gov/wcb/iatd/intl.html. 10 Data for the conterminous United States consists of data from the 48 contiguous states and the District of Columbia.
9

Table 4. Reporting Requirements for Facilities-Based and Facilities-Resale Services
Larger U.S. points for which carriers file country-by-country data
Smaller U.S. points for which carriers file world total data
Domestic U.S. pointsAlaska Conterminous U.S. (48 States) Hawaii Puerto Rico Other U.S. pointsGuam U.S. Virgin Islands
American Samoa Baker Island Howland Island Jarvis Island Johnston Atoll Kingman Reef Midway Atoll Navassa Island Northern Mariana Islands Palmyra Atoll Wake Island
Table 4 shows which U.S. points are classified as domestic and which are classified as other. Calls between domestic U.S. points are considered domestic and therefore are not reported. Calls between domestic U.S. points and other U.S. points are defined as international and are reported. For example, a directly dialed call originating in Guam and terminating in Hawaii is reported by the carrier serving Guam as U.S.-billed traffic to Hawaii. Note that a carrier serving Hawaii reports this same call as a foreign-billed call from Guam.11 Presentation of Data Table 5 lists the carriers whose data are presented in the attached tables. Table 6 summarizes the billed revenue data contained in the tables, and Table 7 summarizes the net revenue data contained in the tables (billed revenues net of settlement payments). This report summarizes Section 43.61 data for all reporting carriers and for all U.S. points. Some tables show totals for all carriers serving individual U.S. points. Other tables show totals for all data filed by individual carriers. Data have been consolidated where a holding company owns more than one carrier. For example, the data EPM Telecomunicaciones S.A. E.S.P. reported for its subsidiary, Cinco Telecom Corporation, have been consolidated and included with other EPM Telecomunicaciones S.A. E.S.P. data. This report organizes the country-by-country data by region of the world. The foreign points are listed alphabetically in each region. 11 Thus, our aggregate call statistics double-count both the call and the associated minutes. Table A1 shows that U.S. carriers reported 15.0 billion calls between the U.S. and international points. Of these calls, 21 million (less than 1%) were reported for traffic between U.S. points. Thus, the double-counting is small when compared to the overall number of calls. The International Reporting Requirements Reform NPRM proposes to eliminate the requirement that carriers report traffic between U.S. points. See supra n.1.
10

U.S. carriers are required to file message and minute counts for switched services that originate or terminate at a U.S. point. They are required to report only minutes for traffic that transits U.S. points, though, because U.S. carriers sometimes have difficulty obtaining message counts for traffic billed by foreign telephone companies. As noted in Table 2, transiting minutes are not published on a country-by-country basis. Region totals are provided for those regions where transiting traffic is carried from more than one country. Carriers file detailed traffic data using a record format contained in the filing manual. For switched services, each record contains a billing type code that signifies the traffic exchange method (e.g., traditional settlement vs. non-traditional settlement) and whether the call was U.S.-billed, foreign-billed, or transiting. For U.S.-billed calls, the billing type code indicates whether the data represents (a) U.S.- originated traffic and U.S.-terminated collect and subscriber toll free traffic; (b) country-direct and country-beyond traffic; or (c) U.S. carrier reorigination traffic. For international private line services, the billing type code signifies whether the data contain facilities-based or facilities-resale circuits. The billing codes used for filing year 2008 data are contained in the International Bureau’s Public Notice DA 09-1526, Annual Section 43.61(a) International Telecommunications Traffic Reports Due by July 31, 2009, released July 13, 2009. The table titles use billing types to indicate the type of data aggregated in a particular table. There are two groups of billing type codes for switched services. Billing types 1 through 6 are used for traditional settlement arrangements. Billing types 11 through 16 (though, as described below, there is not a billing type 13) are used for non-traditional settlement arrangements. Billing type 35 data are not aggregated in the tables. The billing types do not distinguish between a switched service provided over a carrier's owned facilities or a service provided using leased circuits.
11

The specific billing types allow the following breakdowns. Billing Type(s) 1, 11 U.S.-billed calls that originate in, or terminate collect or subscriber toll-free
in, the United States 2, 12 foreign-billed calls 3 traditional transiting calls (there is no billing type 13 because all traditional
transiting calls are exchanged under traditional settlement arrangements) 4, 14 U.S.-billed country-direct and country-beyond calls 5, 15 terminating leg of calls reoriginated by U.S. carriers and terminated via
facilities-based or facilities-resale circuits 35 terminating leg of calls reoriginated by U.S. carriers and terminated via pure
resale of another carrier’s switched services 6, 16 originating leg of calls reoriginated by U.S. carriers There are only two billing type codes used for private line services. Billing type 1 signifies facilities-based circuits. Billing type 11 signifies facilities-resale circuits.
12

Table 5Carriers Filing International Traffic Data for 2008
Switched Services U.S. Pt. Served Traffic toCarrier Traffic Arrangements Facilities Facilities Pure Other >100
No. Traditional Non-Traditional Based Resale Resale Dom. U.S. Int'l. Pts.
1 24-7 Telcom * *3 Rivers Telephone Cooperative, Inc
2 3 Rivers Communications * *3 3S Communications, LLC * * *4 A+ Wireless, Inc. d/b/a Advantage Wireless * *5 A.M.S. Voicecom, Inc. * * *6 ABS-CBN Telecom North America, Inc. * * * *7 Access Media 3, Inc. * *8 Access One, Inc. * * *9 Access2Go, Inc. * * *
10 Accipiter Communications, Inc. * *Ace Telephone Association
11 Ace Link Telecommunications, Inc. * *12 Ace Telephone Association * *13 Adams TelSystems, Inc. * *14 Advanced Communications Technology, Inc. (ACT) * * *15 Advanced Network Communications, LLC * * *16 Advanced Tel., Inc. * *17 Advantage Telecommunications Corp * * *18 Affinity Network, Inc. * * *19 Affordable Voice Communications, Inc. * *
Agate Mutual Telephone Coop. Association20 Prairie Networks * *21 AGM Telecom Corporation * *22 Airdis, LLC d/b/a Airdis Telecom * *23 Airespring, Inc. * * *24 Al-Call, Inc. * *
Alaska Communications Systems25 ACS Long Distance, Inc. * * *26 Albany Mutual Telephone Association * *27 Algona Municipal Utilities * * *
Alhambra-Grantfork Telephone Company28 A-G Long Distance, Inc. * *29 All Access, Inc. d/b/a Directo.com * *30 All West World Connect * * *
Allcom Telink Corporation d/b/a KCI Communications, d/b/a Allcom Telecommunications, d/b/a Allcompass Communications, d/b/a
31 ADC Communications and Enhance VOIP Services * *Allendale Communications
32 Drenthe Telephone Company * *33 Allendale Sales & Service * *
Alliance Communications Cooperative, Inc34 Alliance Long Distance * *35 ALLO Communications * *36 Alma Telephone Company * *37 Alo Communications & Services, LLC * *38 Alpha Enterprises Limited, Inc. d/b/a Alpha Long Distance * *39 Alpine Communications, LC * *40 Alta Municipal Utilities * *41 Alteva, LLC * *42 AMA Communications LLC, d/b/a AMA TechTel Communications * *43 Ambess Enterprises, Inc. * *
American Broadband Communications, LLC44 Holway Long Distance Company * *45 HunTel Cablevision, Inc. d/b/a HunTel Communications * *46 KLM Long Distance Company * *
Private Lines
13

Table 5Carriers Filing International Traffic Data for 2008 - Continued
Switched Services U.S. Pt. Served Traffic toCarrier Traffic Arrangements Facilities Facilities Pure Other >100
No. Traditional Non-Traditional Based Resale Resale Dom. U.S. Int'l. Pts.
47 American Cyber Corporation d/b/a Discount Plus * *48 American Fiber Network, Inc. * * *49 American Samoa License, Inc. * * *
American Telecommunications Systems, Inc. a/k/a50 Ohio American Telecommunications Systems, Inc * *51 Amerimex Communications Corp. * *52 AmeriVision Communications, Inc. d/b/a Affinity 4 * * *53 ANEW Broadband, Inc. * *54 Applewood Communications Corporation * * *55 Applied Communications Technology, Inc. d/b/a ATC LD * *56 Apptix, Inc. * *57 Arcadia Telephone Cooperative * *58 Ardmore Communications LLC * *59 Arkansas Telephone Company, Inc. * *60 ArkWest Communications, Inc. * *61 Armstrong Telecommunications, Inc. * *
Arvig Enterprises, Inc.62 Royale Comtronics, Inc. * * *63 Asia Talk Telecom, Inc. * * *64 Aspen Telecommunications, LLC * *65 ASTAC Long Distance, Inc. * *66 AT Conference * * *
ATC Communications67 ATC Long Distance * *68 ATL Communications * *69 Atlantic Telephone Membership Corporation * *70 Auris, LLC * *71 Aventure Communication Technology, LLC d/b/a Aventure Comm * *72 Baca Valley Telephone Company, Inc. d/b/a Sierra Communications * *73 Baldwin Nashville Telephone Company, Inc * * *
Baldwin Telecom, Inc.74 Baldwin Broadband, LLC * *75 Barnes City Cooperative Telephone Company * *
Barry County Telephone Company76 Message Express Company * *77 Bascom Mutual Telephone Company * * *78 Bay Springs Telephone Company, Inc d/b/a Bay Springs LD * *79 BCN Telecom, Inc. * *80 Belgacom International Carriers Services S.A * * *
Ben Lomand Rural Telephone Coop., Inc81 Ben Lomand Communications, Inc. (BLC) * *82 Benchmark Communications, LLC d/b/a ComOne * *
Benkelman Telephone Company83 BW Telcom, Benkelman * *84 BW Telcom, Hartman * *85 BW Telcom, Wauneta * *86 Bernard Telephone Company, Inc. * * *87 Beulahland Communications, Inc. * *88 BEVCOMM, Inc. * *89 Bharti Airtel Limited * * * *90 Big Bend Telecom, Ltd. * *91 BIT Long Distance (Buggs Island Telephone Cooperative) * *
Blanchard Telephone Association, Inc.92 Central Michigan Communication Co. * *93 Bledsoe Telephone Cooperative, Inc * *
Private Lines
14

Table 5Carriers Filing International Traffic Data for 2008 - Continued
Switched Services U.S. Pt. Served Traffic toCarrier Traffic Arrangements Facilities Facilities Pure Other >100
No. Traditional Non-Traditional Based Resale Resale Dom. U.S. Int'l. Pts.
Block Communications, Inc.94 Buckeye Telesystem, Inc. * *95 Bloomingdale Communications, Inc * *96 Blue Valley Tele-Communications, Inc * *
Bluegrass Cellular97 Bluegrass Telecom LLC * *98 Bluegrass Wireless LLC * *99 Borderland Communications, LLC * *
100 BPS Long Distance * *Brazos Cellular Communications, Ltd.
101 North Texas Cellular, Inc. d/b/a Brazos Long Distance * *102 South RSA #5 d/b/a Brazos Cellular Communications, Ltd * *103 Breda Telephone Corporation * *104 Bright Long Distance, Ltd. * * *105 BringCom International, LLC * *106 Bristol Bay Cellular Partnership (BBCP) * *107 Bristol Virginia Utilities OptiNet * *108 Broadband Dynamics, LLC * *109 Broadband Telecom, Inc. * *110 Broadview Networks Holdings, Inc. * * *
Brooklyn Mutual Telecommunications Cooperative111 Brooklyn Mutual Telephone Company * *112 Bruce Telecommunications, LLC * *113 BTC Broadband * *114 BTC Communications Inc. * *
BTC Holdings, Inc.115 Blackfoot Communications, Inc. * *116 Blackfoot Telephone Cooperative, Inc * *117 BTI America, LLC * *118 Bulloch Net, Inc. d/b/a Bulloch Long Distance * *119 Burke's Garden Telephone Company, Inc * *120 Burlington Telecom * *121 Business Automation Tech., Inc. d/b/a Data Network Solutions * *122 Business Discount Plan, Inc. * * *123 Business Network Long Distance, Inc * * *124 Business Productivity Solutions, Inc. * * *125 Business Telecom, Inc. * *126 C.M., Inc * * *127 C-M-L Telephone Cooperative Association * *128 Cable & Wireless Americas Operation, Inc * *129 Cableco, LLC d/b/a ghValley Long Distance * *130 Cablevision Lightpath, Inc. * * *131 Cal-Ore Long Distance Company * *132 California RSA No. 3 Limited Partnership d/b/a Golden State Cellular * *133 CALTEL Long Distance * *134 Cambridge Telephone Company * *
Cameron Communications Corp.135 Cameron Communications, LLC d/b/a Cameron LD * * *136 Canby Telephone Association d/b/a CTA Long Distance * * *
Cap Rock Telephone Cooperative, Inc137 C.R. Telco, Inc. d/b/a Cap Rock Telcom * *138 Caprock Cellular Limited Partnership * *
Carr Communications, Inc.139 Carr Telephone Company * *140 Carrier PB Telco, Inc. * *141 Cascade Access, LLC * *
Private Lines
15

Table 5Carriers Filing International Traffic Data for 2008 - Continued
Switched Services U.S. Pt. Served Traffic toCarrier Traffic Arrangements Facilities Facilities Pure Other >100
No. Traditional Non-Traditional Based Resale Resale Dom. U.S. Int'l. Pts.
142 Cascade Communications Company * *143 Casey Mutual Telephone Company * * *
Cass Communications144 Cass Long Distance Service, Inc. * *145 Catskills Communications, Inc. * *146 Caused Based Commerce, Inc. d/b/a/ The Sienna Group * * *
Cavalier Telephone Corporation147 Cavalier Telephone, LLC * *
Talk America Inc. d/b/a Cavalier Telephone also d/b/a Cavalier148 Business Communications also d/b/a Cavalier Telephone & TV * *149 Cbeyond Communications, LLC * *150 CC Communications * *151 Celebrate Communications LLC * *152 Cellular Network Partnership, LLC * *153 Cellular South Licenses, Inc. * * *154 CenCom, Inc * *155 Centennial Puerto Rico Operations Corporation * * * *156 Center Junction Telephone Company, Inc. * * *157 Central Arkansas Telephone Cooperative, Inc * *158 Central Indiana Communications, Inc. * * *159 Central Scott Telephone Company * *160 Central Texas Communications, Inc. * *
CenturyTel, Inc.161 CenturyTel Long Distance, LLC * * *162 Coastal Long Distance Services, Inc * * *163 Gulf Long Distance, Inc. * * *164 Madison River Communications, LLC * * *165 Madison River Long Distance Solutions * * *166 Mebtel Long Distance, Inc. * * *167 Chapin Long Distance Company * *168 Chariton Valley L. D. Corporation * * *
Charter Communications Fiberlink, LLC 169 Charter Fiberlink- Alabama, LLC * *170 Charter Fiberlink CA- CCO, LLC * *171 Charter Fiberlink CT- CCO, LLC * *172 Charter Fiberlink Georgia, LLC * *173 Charter Fiberlink- Illinois, LLC * *174 Charter Fiberlink LA- CCO, LLC * *175 Charter Fiberlink MA- CCO, LLC * *176 Charter Fiberlink- Michigan, LLC * *177 Charter Fiberlink, LLC ( Minnesota) * *178 Charter Fiberlink- Missouri, LLC * *179 Charter Fiberlink NC- CCO, LLC * *180 Charter Fiberlink- Nebraska, LLC * *181 Charter Fiberlink NV- CCVII, LLC * *182 Charter Fiberlink OR- CCVII, LLC * *183 Charter Fiberlink SC- CCO, LLC * *184 Charter Fiberlink- Tennessee, LLC * *185 Charter Fiberlink TX- CCO, LLC * *186 Charter Fiberlink VA- CCO, LLC * *187 Charter Fiberlink WA- CCVII, LLC * *188 Charter Fiberlink, LLC ( Wisconsin) * *
Chat Mobility189 Iowa RSA 2 Limited Partnership d/b/a Chat Mobility * *190 RSA 1 Limited Partnership d/b/a Chat Mobility * *
Private Lines
16

Table 5Carriers Filing International Traffic Data for 2008 - Continued
Switched Services U.S. Pt. Served Traffic toCarrier Traffic Arrangements Facilities Facilities Pure Other >100
No. Traditional Non-Traditional Based Resale Resale Dom. U.S. Int'l. Pts.
Chequamegon Communications Cooperative, Inc191 Cheqtel Communications, Inc. * *192 Chequamegon Communications Cooperative, Inc * *193 Chesnee Long Distance, Inc. * *194 Chester Long Distance Services, Inc * *195 Chibardun Telephone Cooperative, Inc. * *196 Chickasaw Long Distance Company * *197 China Unicom USA Corp. * *198 Chippewa Valley Communications, Inc. * *199 Choice Phone, LLC * *200 Christensen Communications Company * *201 Chunghwa Telecom Global, Inc. * * * *202 CIMA Telecom, Inc. * *203 CIMCO Communications, Inc. * *
Cincinnati Bell, Inc.204 Cincinnati Bell Any Distance, Inc. * * * *205 Cincinnati Bell Wireless, LLC * * *
Citizens Communications Company206 CTE Telecom, LLC d/b/a Frontier Commun. CTE Telecom Com * *207 Frontier Communications of America, Inc. (FCA) * *208 GVN Services d/b/a Frontier Communications Global Valley LD * *209 Citizens Long Distance * * *210 Citizens Long Distance Company * *211 Citizens Long Distance, Inc. * *
Citizens Mutual Telephone Cooperative212 Citizens Communication Company * * *213 Citizens Telephone Company d/b/a Citizens Long Distance * *214 Citizens Telephone Cooperative * *215 Citizens Telephone Cooperative, Inc * *216 Citizens Telephone Corporation * *
City of Auburn, Elec. Dept., Essential Services Div. d/b/a217 Auburn Essential Services * *217 City of Hawarden d/b/a HITEC * *219 City of Windom/WindomNet * *220 CL Tel Long Distance, Inc. * *221 Clay Country Rural Telephone Coop., Inc. d/b/a Endeavor Comm * * *222 Clear Creek Telephone & TeleVision * *223 Clear Rate Communications, Inc. * *
Cleartel Communications, Inc.224 Cleartel Telecommunications, Inc * *225 IDS Telcom Corporation * *226 NII Communications, Ltd. * *227 Supra Telecommunications & Information Systems Acquisitions * *228 Cleveland Unlimited, Inc. * *229 CLT Communications, Inc. * *230 CM Tel (USA), Inc. * *231 Cochrane Cellular, Inc. * *
Coleman County Telecommunications Ltd d/b/a Trans232 Texas Technologies Long Distance * *233 Coleman Enterprises Inc. d/b/a/ Local Long Distance * *234 Colo Telephone Company * *235 Colt Telecommunications * *236 Colorado Valley Communications, Inc d/b/a Colorado Valley LD * *237 Colton Telephone Company * *
Columbus Networks USA, Inc.238 Columbus Networks Services, Inc. * *
Private Lines
17

Table 5Carriers Filing International Traffic Data for 2008 - Continued
Switched Services U.S. Pt. Served Traffic toCarrier Traffic Arrangements Facilities Facilities Pure Other >100
No. Traditional Non-Traditional Based Resale Resale Dom. U.S. Int'l. Pts.
239 Columbus Telephone Company * *240 Comanche County Telecommunications, L.P * *
Comcast Corporation241 Comcast Phone, LLC * * *242 Comcast Phone of Maryland, Inc. * * *243 Comcast Phone of New York, LLC * * *244 Comcast Phone of Northern Virginia, Inc. * * *245 Comcell, Inc. * *246 ComLinq, Inc. * * *247 Communication Services Integrated, Inc. (CSII) * * *248 Communications 1 Network, Inc. * *249 Communications Network Billing, Inc. * * *250 Community Long Distance d/b/a Comporium Long Distance * *251 ComoreTel Holdings Ltd. * *252 Compass Global, Inc. * * *253 Computer Tel, Inc. * *254 ComSouth Teleservices, Inc. * *
Comspan Communications255 Comspan Communications # 192 * *256 Comspan Communications - Bandon # 678 * *257 Comspan Communications - Coquille # 193 * *258 Comspan Communications - Myrtle Point # 679 * *259 Comspan Communications - Reedsport # 680 * *260 ComTech Solutions, L.L.C. * *
Consolidated Communications Holdings, Inc261 Consolidated Communications Network Svcs. Company * *262 Consolidated Communications Penn Telecom * *263 Consolidated Communications Telecom Svcs. of Texas Co * *
Consolidated Enterprises, Inc.264 Consolidated Communications Networks, Inc * *265 Consolidated Long Distance, Inc. * *266 Consolidated Telephone Company * *267 Consumer Telcom, Inc. * *
Coon Creek Telecommunications Corporation268 Coon Creek Telecommunications * *269 Coon Creek Telephone Company * *270 Coon Valley Cooperative Telephone Association Inc * *
Coon Valley Farmers Telephone Company271 Coon Valley Telecommunications, Inc * *272 Cooperative Light & Power Association of Lake County * *273 Cooperative Telephone Company * *274 Cooperative Telephone Exchange * * *275 Cordia Communications Corp. * * *276 Corn Belt Telephone Company * * *277 CorrWireless Communications, LLC * *278 Council Grove Telephone Company, Inc * *
Covista Communications 279 Covista, Inc. * * *280 Cox Communications, Inc. * *281 Cozad Telephone Company * *282 CP-Tel Network Services, Inc. * *283 Craigville Telephone Company, Inc * *284 Crocker Telecommunications, LLC * *285 Crockett Telephone Company, Inc. d/b/a Crockett Long Distance * *286 Crosslake Telephone Company d/b/a Crosslake Communications * *287 Crosslink Long Distance Company * *
Private Lines
18

Table 5Carriers Filing International Traffic Data for 2008 - Continued
Switched Services U.S. Pt. Served Traffic toCarrier Traffic Arrangements Facilities Facilities Pure Other >100
No. Traditional Non-Traditional Based Resale Resale Dom. U.S. Int'l. Pts.
288 CS Technologies, Inc. * *289 CSM Wireless, Inc. * *290 CT Communications, Inc. * *291 CTC Telecom, Inc. * *292 CTI Long Distance Inc. * *293 Cumberland Cellular Partnership * * *294 Cumberland Telephone Company * *295 Cunningham Telephone and Cable Company, Inc * *296 Custer Telephone Cooperative Inc., d/b/a Custer Telephone LD * *297 Custom Teleconnect, Inc. * *298 Cutter Communications, Inc., d/b/a GCEC Telecom * *
D & E Communications, Inc.299 CEI Networks, Inc. * *300 D&E Systems, Inc. d/b/a D&E Long Distance * *
D & P Communications, Inc.301 D&P Long Distance * *302 D.D.D. Calling, Inc. * * *303 Dalton Telecommunications, Inc. * *304 Danville Mutual Telephone Company * *305 DAR Communications Corporation * * *
Daviess-Martin Rural Telephone Corp. d/b/a306 RTC Communications * *307 DayStarr, L.L.C. d/b/a DayStarr Communications * *308 DCT Telecom Group, Inc. * *
DeKalb Telephone Cooperative, Inc. (DTC Wireless)309 Advantage Cellular Systems, Inc * *310 Delcom, Inc. * *
Delhi Telephone Company311 DTC Cable Inc. * *312 Delta Communications d/b/a/ Clearwave Communications * *313 Deltacom, Inc. * * *314 DelTel, Inc. * *315 Des Vieux Telecoms, Inc. * *
Deutsche TeleKom AG316 T-Mobile USA, Inc. * * *
DFT Communications317 DFT Local Service Corporation * *318 DFT Long Distance Corporation * *319 Dialink Corporation * * *320 Digital Agent * *321 Digizip.com, Inc. * * *322 DiscoveryTel Communications plc * * *
diversiCOM323 Mainstreet Communications, LLC * *324 Melrose Telephone Company * *325 Dixon Telephone Co. * *326 Dollar Phone Corp. * *327 DoveTel Communications, LLC d/b/a SyncGloba * * *328 DOW Management Company, Inc. d/b/a DOW Networks * * *329 DSCI Corporation * * *330 DST Networks, Inc. * *
Dumont Telephone Company331 Dumont Telephone Company * *332 Universal Communications of Allison, Inc * *333 Dunkerton Telephone Cooperative * *334 East Buchanan Telephone Cooperative * * *
Private Lines
19

Table 5Carriers Filing International Traffic Data for 2008 - Continued
Switched Services U.S. Pt. Served Traffic toCarrier Traffic Arrangements Facilities Facilities Pure Other >100
No. Traditional Non-Traditional Based Resale Resale Dom. U.S. Int'l. Pts.
335 East Kentucky Network, LLC d/b/a Appalachian Wireless * *336 Eastern Colorado Independent Networks, LLC (ECIN) * *337 Eastern Oregon Telecom * *338 Eastern Slope Rural Telephone Association, Inc * *339 Eastern Sub-RSA Limited Partnership * *340 Eastex Telecom Investments, L.P. d/b/a Eastex Long Distance * *341 Easton Telecom Services, L.L.C * * *
Egyptian Telephone Cooperative Association342 Egyptian Communication Services, Inc. * *343 EKU Solutions, LLC * *344 Electra Telephone Company * *345 Ellington Telephone Company, Inc. d/b/a McCormack-Missouri * *346 Ellsworth Cooperative Telephone Association * *347 Embarq Communications, Inc. * * *
Emily Cooperative Telephone Company348 C-I Communications, Inc. (CICOM) * *349 Emily Cooperative Telephone Company * *350 Empire Long Distance Corporation * *351 EN-TEL Communications, LLC * *
En-Touch Systems, Inc.352 ETS Telephone Company, Inc. d/b/a En-Touch Systems * *353 Encartele, Inc. * *354 Encompass Communications, LLC * * *355 Endstream Communications, LLC * *356 Enhanced Communications Group, LLC * * *357 Enterprise Solutions * *358 Epana Networks, Inc. * * *
EPM Telecomunicaciones S.A. E.S.P.359 Cinco Telecom Corporation * * * *360 EPM Telecomunicaciones S.A. E.S.P. * *361 Equivoice, Inc. * * *362 ETCOM * *363 Etex Long Distance * *364 EveryCall Communications, Inc * *365 Express Communications, Inc. * * *366 Ezequiel Guido d/b/a E Marketing * * *367 F&B Communications * *
FairPoint Communications, Inc.368 BE Mobile Communications * *369 Berkshire Cable Corporation * *370 C R Long Distance, Inc. * *371 Chautauqua & Erie Communications, Inc. * *372 Comerco, Inc. d/b/a YCOM Long Distance * *373 El Paso Long Distance Company * *374 Elltel Long Distance * *375 Enhanced Communications of Northern New England, Inc. * * *376 FairPoint Carrier Services * *377 FreTel Communications * *378 Germantown Long Distance * *379 Marianna Long Distance * *380 Orwell Communications * *381 Peoples Mutual Long Distance * *382 Quality One Technology * *383 St Joe Communications, Inc. * *
Private Lines
20

Table 5Carriers Filing International Traffic Data for 2008 - Continued
Switched Services U.S. Pt. Served Traffic toCarrier Traffic Arrangements Facilities Facilities Pure Other >100
No. Traditional Non-Traditional Based Resale Resale Dom. U.S. Int'l. Pts.
FairPoint Communications, Inc. -- Continued384 ST Long Distance, Inc. * *385 Taconic Telcom, Inc. * *386 UI Long Distance d/b/a Northland Long Distance * * *387 Falcon 1, Inc. * *388 Farmers & Merchants Mutual Telephone Company * *389 Farmers Co-Operative Telephone Co * * *390 Farmers Mutual Cooperative Telephone Company * *391 Farmers Mutual Cooperative Telephone Company -- Moulton, IA * * *392 Farmers Mutual Telephone Company -- Fruitland, ID * * *393 Farmers Mutual Telephone Company -- Jesup, Iowa * *394 Farmers Mutual Telephone Cooperative * *395 Farmers Telephone Company * *396 Farmers Telephone Cooperative, Inc * *397 Farmers Telecommunications, Corp., Inc. d/b/a/ Farmers LD * *398 Farmers Telecommunications, Inc. * *399 Farmers' Telephone Company * *400 FastTrack Communications, Inc. * *401 Fenton Cooperative Telephone Company * * *402 FiberComm L.C. * * *
Fidelity Communications Company403 Fidelity Long Distance, Inc. * *404 Fidelity Networks, Inc. * *405 Filer Mutual Telephone Company * *406 Finger Lakes Communication Group, Inc * *407 First Choice Technology, Inc. * *408 First Communications, LLC * * *409 FirstMile Technologies * *410 Five Area Long Distance, Inc. * *
Flat Rock Telephone Co-op, Inc.411 Flat Rock Communications, Inc. * *412 Flowroute, LLC * * *413 FMTC Long Distance * *
Foothills Telephone Cooperative414 Foothills Long Distance * * *415 France Telecom Long Distance USA, LLC * * * *416 FranklinVT, LLC * *
Freedom Ring Communications, L.L.C. d/b/a 417 BayRing Communications * * *418 Frontera Telecommunications, Inc. * *419 FTC Diversified Services, Inc. * *
FTC Management Group, Inc.420 FTC Communications, Inc. d/b/a Farmers Long Distance * *421 Gafachi Telecom - NY, Inc. * * *422 Gardonville Cooperative Telephone Association * *423 Geckotech, LLC * *424 Geetingsville Telephone Co., Inc * *425 Georgetown Communications, Inc. * *426 Gervais Telephone Co. d/b/a DataVision Communications * *427 Giant Communications, Inc. * *428 Giles-Craig Communications, Inc. d/b/a PemTel Long Distance * * *429 Glasford Telephone Company * *430 Glentel Corporation * *
Glenwood Telecommunications, Inc431 Glenwood Long Distance * *
Private Lines
21

Table 5Carriers Filing International Traffic Data for 2008 - Continued
Switched Services U.S. Pt. Served Traffic toCarrier Traffic Arrangements Facilities Facilities Pure Other >100
No. Traditional Non-Traditional Based Resale Resale Dom. U.S. Int'l. Pts.
Global Caribbean Fiber432 Global Caribbean Network and Antilles Crossing - St. Croix, Inc * *
Global Crossing North America, Inc.433 Global Crossing Americas Solutions, Inc * *434 Global Crossing Telecomm., Inc.& Global Crossing Bandwidth, Inc * * *435 Global Tel*Link Corporation * * *436 Global Telecom and Technology Americas, Inc * *437 Globalcom, Inc * * *438 GlobalNova, Inc. * *439 Gold Line Telemanagement, Inc * *440 Golden Belt Telephone Association * *441 Golden Holdings, Inc. * *
Goldfield Communications Services, Corp442 Goldfield Access Network, LC/GAN LD Service * *443 Goldfield Telephone Company/Goldfield Communications LD Svc * *444 Gorham Telephone Company * *
Grafton Communications445 Grafton Long Distance, Inc. * *446 Grand Mound Cooperative Telephone Association * *447 Grand River Mutual Telephone Corporation * *
Grando Telephone Company448 YK Communications, LTD d/b/a GTC-LD * *449 Grandview Mutual Telephone Company * *450 Granite State Long Distance, Inc. * *451 Granite Telecommunications, LLC * * *452 Grantsburg Telcom, Inc. * *453 Great America Networks Inc. * *454 Great Plains Communications Long Distance * *455 Green Hills Communications, Inc. * *456 Green Mountain Long Distance Service, Inc * *457 Greenfield Communications, Inc. * * *458 Gridley Communications, Inc. * *459 Griswold Cooperative Telephone Company * *460 Grundy Center Municipal Utilities * *461 GS Miami, Inc. * *462 GTC, Inc. * *463 Guadalupe Valley Communications Systems, L.P. (GVTC) * * *464 Guam Telecom, LLC d/b/a MCV Telecom * *
Hamilton County Telephone Coop465 Hamilton County Long Distance, Inc. * *466 Hamilton Long Distance Company * *467 Hancock Long Distance, Inc. * *468 Harbor Communications * *469 Hardy Telecommunications, Inc * *
Hargray Holdings Corporation, Inc.470 Hargray, Inc * *471 Hargray of Georgia, Inc. * *472 Low Country Carriers, Inc. d/b/a Hargray LD Co. * *473 Harlan Municipal Utilities * *474 Harmony Telephone Company * *475 Hart Communications, Inc. * *476 Hartington Telecommunications Co, Inc * *
Haviland Telephone Company, Inc.477 Haviland Long Distance * *
Private Lines
22

Table 5Carriers Filing International Traffic Data for 2008 - Continued
Switched Services U.S. Pt. Served Traffic toCarrier Traffic Arrangements Facilities Facilities Pure Other >100
No. Traditional Non-Traditional Based Resale Resale Dom. U.S. Int'l. Pts.
478 Hawaiian Telcom Services Company, Inc. * *479 Hawkeye Telephone Company * * *
Hayneville Holding Company, Inc480 Hayneville Fiber Transport, Inc. d/b/a Camellia Long Distance * *481 Hayneville Fiber Transport, Inc. d/b/a Hayneville LD * *482 Heart of Iowa Communications Cooperative * *
Hector Communications Corporation483 Indianhead Communications Corporation * *
Hiawatha Communications, Inc.484 Superior Long Distance * *
HickoryTech485 Crystal Communications, Inc. * * *486 Enventis Telecom, Inc. * *487 High Plains Telecommunications, Inc. * * *488 Highland Communications Corporation * *489 Highland Telephone Cooperative (HTC) * *490 Hill Country Telephone Coop., Inc. d/b/a Hill Country Long Distance * *491 Hinton CATV Co., Inc. d/b/a Hinton Long Distance * *492 HolaAmerica, LLC * *493 Home Communications, Inc. * *494 Home Telenetworks * *
Home Telephone Company, Inc495 Home Long Distance, Inc. * *496 HomeTown Solutions, LLC * *497 Horry Telephone Long Distance, Inc * *498 HRS Internet LLC d/b/a LightBound * *
HTC Communications499 Hospers Telephone Exchange, Inc. * *
HTC Holding Co.500 HTC Communications Co. * *501 Hubbard Cooperative Telephone Association * * *502 Hutchinson Telecommunications, Inc. * *503 Huxley Communications Cooperative * *504 i-Wireless * *505 i2Telecom * * *
IAMO Telephone Company506 IAMO Telephone Company d/b/a First Fiber Corporation * * *507 IAMO Telephone Company d/b/a IAMO Long Distance * * *508 IBFA Acquisition Company, LLC * *509 iLOKA, Inc. * * *510 Impact Telecom * *511 inContact, Inc. * * *512 Independent Telecommunications Systems, Inc. (ITS) * *513 Industry I-net, Inc * *514 Infinite Conferencing, Inc. * *
Infosat Communications, Inc.515 Infosat Able Holdings, Inc. * *516 Inmark, Inc. d/b/a Preferred Billing * *
Insight Midwest Holdings, LLC517 Insight Phone of Indiana, LLC * * *518 Insight Phone of Kentucky * * *519 Insight Phone of Ohio, LLC * *
Private Lines
23

Table 5Carriers Filing International Traffic Data for 2008 - Continued
Switched Services U.S. Pt. Served Traffic toCarrier Traffic Arrangements Facilities Facilities Pure Other >100
No. Traditional Non-Traditional Based Resale Resale Dom. U.S. Int'l. Pts.
520 Integra Telecom Holdings, Inc. * * *521 Integrated Services, Inc. * * *
Intelleq Communications Corporation522 Intelleq Long Distance Company * * *523 Intellicall Operator Services, Inc. * *524 Intelsat USA License Corp. * *525 Interactive Media Technologies, Inc * * *526 Interactive Services Network, Inc. * *527 InterBel Telephone Cooperative, Inc * *528 Interglobe Communications, Inc. * *529 International Communications Services, Inc. d/b/a Directo.com * *530 International Satellite Services, Inc. * *531 Internet Solver, Inc. * *
Interstate Communications532 Interstate 35 Telephone Company * *533 Southwest Telephone Exchange * *534 Interstate Telecommunications Cooperative, Inc. (ITC) * *535 Iowa Network Services, Inc. (INS) * * *
Iowa Telecommunications Services, Inc536 Iowa Telecom Communications, Inc. * *537 Iowa Telecommunications Services, Inc. * * *538 IT Communications, LLC * * *539 Montezuma Mutual Telephone Company * *540 Iowa Wireless Services, L.L.C., d/b/a i wireless * *541 IP Retail, Inc. * *542 IQ Telecom, Inc. * * *543 Ironton Long Distance Company * * *544 ITS Telecommunications Systems, Inc. * * *545 James Valley Cooperative Telephone Company * *546 JBN Telephone Company, Inc. * *547 Jefferson Telephone Company * *548 Kalona Cooperative Telephone Company * * *
KanOkla Telephone Association549 KanOkla Long Distance * *
KDDI Corporation550 KDDI America, Inc. * * * * *551 KDDI Global LLC * *552 Kentucky RSA #3 Cellular General Partnership * * *553 Kentucky RSA #4 Cellular General Partnership * * *554 KeyArt Comm., Inc. * *555 Keystone Farmers Cooperative Telephone Co * *556 Killduff Telephone Company * *557 Kingdom Telephone Co. d/b/a Kingdom LD * *558 Kinsman Mutual Telephone Company * *559 KNOLOGY Inc. * * *560 Krush Communications, LLC * * *561 KT America, Inc. * *
KTC Telephone Co., Inc.562 Kaplan Telephone Company, Inc. * *563 Pace Cellular Communications * *564 La Harpe Networks, Inc. * *565 La Porte City Telephone Company * *566 Lackawaxen Long Distance Company * *
Private Lines
24

Table 5Carriers Filing International Traffic Data for 2008 - Continued
Switched Services U.S. Pt. Served Traffic toCarrier Traffic Arrangements Facilities Facilities Pure Other >100
No. Traditional Non-Traditional Based Resale Resale Dom. U.S. Int'l. Pts.
567 LaHarpe Telephone Company, Inc. * *568 Lakedale Link, Inc. * * *569 Lakefield Communications, Inc. * *
Lakeland Communications, Inc.570 Lakeland Telecom, Inc. * *
Lamb Communication Services571 WestCom, LLC * *572 LaMotte Telephone Company * *573 Laurel Highland Long Distance Company * *
Laurens Municipal Power & Communications574 Laurens Municipal Broadband Communications Utility * *575 LaValle Long Distance, Inc. * *576 LCR Telecommunications, LLC * * *577 LDL Telecom Services, Inc. d/b/a Key Communications Services * *578 Le-Ru Long Distance Company * *579 Leaco Cellular, Inc. * *
Leaf River Telephone Company580 LR Communications, Inc. * *581 Legent Communications Corporation * *582 Lehigh Valley Cooperative Telephone Association * *
Lemonweir Valley Telephone Company583 LVT Corporation * *584 Level 3 Communications, LLC * * * *585 Lexcom Long Distance, LLC * *586 Liberty Bell Telecom, LLC * * *587 Lightyear Network Solutions, LLC * *588 Ligtel Communications, Inc. * *589 Lincoln Telephone Company * *
Lincolnville Telephone Company590 Lincolnville Communications, Inc * *591 Litespan Inc. * * *592 Local Exchange Technologies LLC * *593 Local Long Distance, L.C. * *594 Locus Telecommunications, Inc * * *595 Logix Communications, LP * * *596 Long Distance Access, Inc. * *597 Long Distance Consolidated Billing Co * *
Long Lines, LLC598 CommChoice of Iowa * *599 Jefferson Telephone Company * *600 Jordan Soldier Valley Telephone Company * *601 Long Lines Metro * *602 Long Lines Siouxland * *603 Northwest Iowa Telephone Company * *604 Loretto Communication Services, Inc. d/b/a Loretto Telecom * *605 Lost Nation-Elwood Telephone Company * * *606 Lotel, Inc. d/b/a Coordinated Billing Services * *607 Louisa Communications, L.C. * * *608 Lucky Communications, Inc. * * *609 Lynnville Telephone Company * *
Mabel Cooperative Telephone Company610 Mabel Long Distance, Inc. * *611 Madison County Telephone Company, Inc * *612 Madison Network Systems, Inc. * *
Private Lines
25

Table 5Carriers Filing International Traffic Data for 2008 - Continued
Switched Services U.S. Pt. Served Traffic toCarrier Traffic Arrangements Facilities Facilities Pure Other >100
No. Traditional Non-Traditional Based Resale Resale Dom. U.S. Int'l. Pts.
613 Madison Telephone, LLC d/b/a MadTel Long Distance * *614 Magellan Hill Technologies, LLC * *615 Magtel Long Distance * *616 Mahaska Communication Group, LLC (MCG) * *617 Manawa Telecom, Inc. * *618 Manning Municipal Communication & Television System Utility * * *619 Mapleton Communications * *
Mark Twain Rural Telephone Co.620 Mark Twain Long Distance, Inc. * *621 Marne & Elk Horne Telephone Company * * *622 Marquette-Adams Communications, LLC * *
Mashell Telecom d/b/a Rainier Connect 623 or Local Access Communications LD * *624 MASScomm, Inc. * *625 Massena Telephone Company * * *626 Matrix Telecom, Inc. * *627 McBlue Telecom, Inc. * *628 McDonald County Telephone Co. * *
McGraw Communications, Inc.629 McGraw Communications, Inc. * * *630 McGraw Communications, Inc. of Virginia * * *631 McLeodUSA Telecommunications Services, Inc * * *632 McNabb Long Distance, Inc. * *633 Mechanicsville Telephone Co * * *634 Mediapolis Telephone Company d/b/a MTC Technologies * *635 MeetingBridge, LLC * *636 Megagate Broadband, Inc. * *637 Mescalero Apache Telecom, Inc * *638 MetroPCS, Inc. * * *639 Metropolitan Telecommunications Holding Company * * *640 MGW Long Distance, LLC * *641 MH Communications, Inc. d/b/a MH Communications * *642 Mid-Rivers Telephone Cooperative, Inc., d/b/a Mid-Rivers LD * * *643 Midcontinent Communications, Inc. * * *644 Miles Cooperative Telephone Association * *645 Millennium Telecom, LLC * *646 Miller Telephone Company * * *647 Millry Communications * *
Minburn Telephone Company648 Minburn Telecommunications, Inc. * * *649 Minburn Telephone Company * * *650 Minerva Valley * *651 Minnesota Valley Communications, Inc * *652 Moapa Valley Telephone Co * *653 MobileCom Investments, LLC d/b/a Danywhere * *654 Mobius Communications Company * *655 MoKan Communications, Incorporated * *
Molalla Communications Co. (MCC)656 MCC Long Distance * *657 Mon-Cre Wireless Incorporated * *658 Monmouth Independence Network * *659 Monon Telephone Company, Inc. * *660 Monroe Telephone Company * *661 Moultrie Infocomm, Inc. * *662 Moundridge Telcom, Inc. * *
Private Lines
26

Table 5Carriers Filing International Traffic Data for 2008 - Continued
Switched Services U.S. Pt. Served Traffic toCarrier Traffic Arrangements Facilities Facilities Pure Other >100
No. Traditional Non-Traditional Based Resale Resale Dom. U.S. Int'l. Pts.
663 Mountain Rural Telephone Coop. Corp., Inc. * *664 Mountain View Telephone Company * *665 Mpower Communications Corporation * *666 MTA Communications, Inc. d/b/a MTA Long Distance * * *667 MTC Communications Inc. * *668 MTC Long Distance, Inc. (Moundville Telephone Company) * *669 MTCO Communications, Inc. * *670 MTel Long Distance * *671 MTPCS, LLC d/b/a CellularOne * *672 Mulberry Cooperative Telephone Co., Inc * *673 Multiline Long Distance, Inc. * * *674 Mutual Telephone Company (Little River, KS) * *
Mutual Telephone Company of Morning Sun675 Louisa Communications, L.C. * * *676 Mutual Telephone Company of Morning Sun * * *677 My Tel Co., Inc. * *678 Natco Technologies, Inc. * *679 National Access Long Distance, Inc. * * *680 National Brands, Inc. * *681 National Telephone of Alabama, Inc. d/b/a Cherokee Long Distance * *682 Nationwide Long Distance Service, Inc. * * *683 Navigator Telecommunications, LLC * *684 Nebraska Central Telecom, Inc. * *685 NECC Telecom, Inc. * *686 NEIT Services, LLC * *687 Nemont Communications, Inc. d/b/a Nemont Long Distance * *688 NEP Cellcorp, Inc. d/b/a NEP Wireless * *689 Nep Long Distance Company * *690 Net One International, Inc. * *691 NetLojix Telecom, Inc. * *692 Network Billing Systems, L.L.C. (NBS) * * *693 Network Innovations, Inc. * *694 Network Service Billing, Inc. * * *695 Network US, Inc. d/b/a CA Affinity * * *696 New Edge Network, Inc. * *697 New Horizon Communications Corporation * *698 New Lisbon Telephone Co. (NLTC) * *699 New Ulm Long Distance, Inc. * *700 Nex-Tech Wireless, LLC * *701 Nex-Tech, Inc. * *702 NeXband Communications, Inc. * *
Nextcarrier Telecom, Inc.703 Nextcarrier Prepaid, Inc. * * *704 Nextcarrier Telecom, Inc. * * *705 NobelTel, LLC * * *706 Norlight, Inc. * * *707 Norsk Telekom, LLC * *708 Nortex Communications Company * *709 North Dakota Long Distance, LLC * *710 North English Cooperative Telephone Company * *711 North Penn Long Distance Corporation * *
North State Telecommunications Corporation712 North State Communications Long Distance, LLC * *713 Northeast Long Distance, LLC * * *714 Northeast Missouri Long Distance, L.L.C * *
Private Lines
27

Table 5Carriers Filing International Traffic Data for 2008 - Continued
Switched Services U.S. Pt. Served Traffic toCarrier Traffic Arrangements Facilities Facilities Pure Other >100
No. Traditional Non-Traditional Based Resale Resale Dom. U.S. Int'l. Pts.
715 Northern Telephone Cooperative, Inc * *716 NorthStar Access, LLC * *717 NorthStar Telecom, Inc. * * *
NOS Communications, Inc.718 NOS Communications, Inc. * * *719 NOSVA Limited Partnership * * *720 Novolink Communications, Inc. * * *721 Now Communications, Inc. * *
Nsight 722 Net Lec, LLC * *723 NTCH-CA, Inc. * *724 NTCNet Long Distance, Inc. * * *
NTELOS Network, Inc.725 NTELOS Network, Inc. * * *726 R&B Network * *727 NTS Communications, Inc. * * *728 NTT America, Inc. * * *
Nunn Telephone Company729 Nunn Communications, LLC * *730 Ogden Telephone Company * *731 Oklahoma 5, LLC * *732 Olin Telephone Company, Inc. * *733 OLS, Inc. * *734 One Communications * *735 One Phone, Inc. * * *736 One Source Communications * *
Oneida Telephone Exchange, Inc.737 Oneida Network Services, Inc. * *738 OneLink Communications, Inc. * * *739 Online Savings, Inc. * *740 ONS-Telecom, LLC * *741 ONSE America, Inc. * *742 Onslow Cooperative Telephone Association * * *743 OnStar, LLC * *744 Onvoy, Inc. * * *745 Opex Communications, Inc. * * *746 Optic Tel Long Distance * *747 Optivon Telecommunication Services, Inc * *748 Oran Mutual Telephone Company (OMTC) * *749 Orange City Communications * *750 Oregon Farmers Mutual Long Distance * *751 Osage Municipal Communications Utility * *
Otelco Holding, LLC Mid-Maine Communications & Pine Tree Networks
752 Communications Design Acquisition Corp. * * *753 CRC Communications of Maine, Inc. * * *754 Mid-Maine Communications, Inc. * * *755 The Grandby Telephone and Telegraph Co. of Ma., Inc * * *756 Otelco Telecommunications, LLC * *757 Otter Com, Inc. * *758 Otz Telephone Cooperative, Inc. * *759 Oxford County Telephone & Telegraph Co. d/b/a Oxford LD * *
Pacific Telecom Inc. (PTI)760 IT&E Overseas, Inc. * * * * *761 PTI Pacifica Inc. d/b/a IT&E * *762 PTI Pacifica Inc. d/b/a PTI * * * *
Private Lines
28
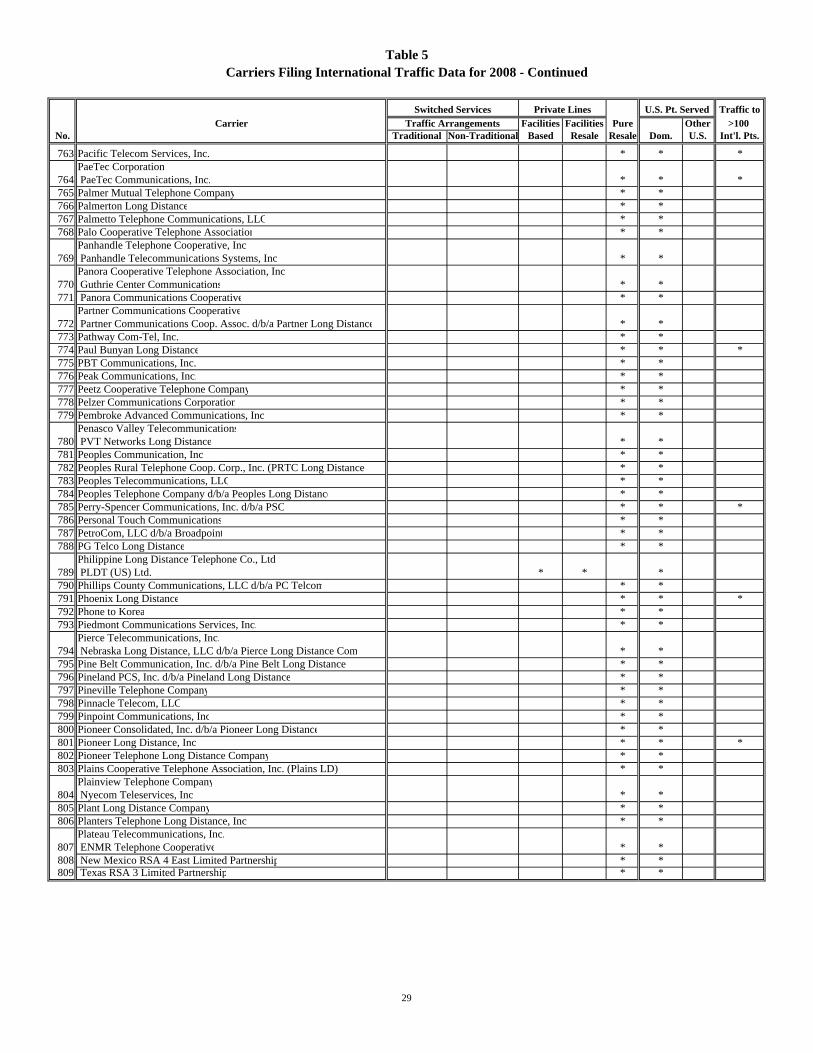
Table 5Carriers Filing International Traffic Data for 2008 - Continued
Switched Services U.S. Pt. Served Traffic toCarrier Traffic Arrangements Facilities Facilities Pure Other >100
No. Traditional Non-Traditional Based Resale Resale Dom. U.S. Int'l. Pts.
763 Pacific Telecom Services, Inc. * * *PaeTec Corporation
764 PaeTec Communications, Inc. * * *765 Palmer Mutual Telephone Company * *766 Palmerton Long Distance * *767 Palmetto Telephone Communications, LLC * *768 Palo Cooperative Telephone Association * *
Panhandle Telephone Cooperative, Inc769 Panhandle Telecommunications Systems, Inc * *
Panora Cooperative Telephone Association, Inc770 Guthrie Center Communications * *771 Panora Communications Cooperative * *
Partner Communications Cooperative772 Partner Communications Coop. Assoc. d/b/a Partner Long Distance * *773 Pathway Com-Tel, Inc. * *774 Paul Bunyan Long Distance * * *775 PBT Communications, Inc. * *776 Peak Communications, Inc. * *777 Peetz Cooperative Telephone Company * *778 Pelzer Communications Corporation * *779 Pembroke Advanced Communications, Inc. * *
Penasco Valley Telecommunications780 PVT Networks Long Distance * *781 Peoples Communication, Inc. * *782 Peoples Rural Telephone Coop. Corp., Inc. (PRTC Long Distance) * *783 Peoples Telecommunications, LLC * *784 Peoples Telephone Company d/b/a Peoples Long Distance * *785 Perry-Spencer Communications, Inc. d/b/a PSC * * *786 Personal Touch Communications * *787 PetroCom, LLC d/b/a Broadpoint * *788 PG Telco Long Distance * *
Philippine Long Distance Telephone Co., Ltd789 PLDT (US) Ltd. * * *790 Phillips County Communications, LLC d/b/a PC Telcom * *791 Phoenix Long Distance * * *792 Phone to Korea * *793 Piedmont Communications Services, Inc. * *
Pierce Telecommunications, Inc.794 Nebraska Long Distance, LLC d/b/a Pierce Long Distance Com * *795 Pine Belt Communication, Inc. d/b/a Pine Belt Long Distance * *796 Pineland PCS, Inc. d/b/a Pineland Long Distance * *797 Pineville Telephone Company * *798 Pinnacle Telecom, LLC * *799 Pinpoint Communications, Inc * *800 Pioneer Consolidated, Inc. d/b/a Pioneer Long Distance * *801 Pioneer Long Distance, Inc. * * *802 Pioneer Telephone Long Distance Company * *803 Plains Cooperative Telephone Association, Inc. (Plains LD) * *
Plainview Telephone Company804 Nyecom Teleservices, Inc. * *805 Plant Long Distance Company * *806 Planters Telephone Long Distance, Inc * *
Plateau Telecommunications, Inc.807 ENMR Telephone Cooperative * *808 New Mexico RSA 4 East Limited Partnership * *809 Texas RSA 3 Limited Partnership * *
Private Lines
29

Table 5Carriers Filing International Traffic Data for 2008 - Continued
Switched Services U.S. Pt. Served Traffic toCarrier Traffic Arrangements Facilities Facilities Pure Other >100
No. Traditional Non-Traditional Based Resale Resale Dom. U.S. Int'l. Pts.
810 Poka Lambro Telecom., Inc. d/b/a Poka Lambro Commun * *811 Ponderosa Cablevision d/b/a Ponderosa Long Distance * *812 PR Wireless, Inc. d/b/a Open Mobile * *813 Prairieburg Telephone Company, Inc. * *814 Premier Communications * * *815 PREPA.Net International Wholesale Transport (PREPA.Net IWT) * *816 Price County Information Systems, LLC * *817 Prime Time Ventures, LLC * *818 PrimeLink, Inc. * *819 Progress International, LLC * *820 Project Mutual Telephone * *821 Protel Advantage, Inc. d/b/a Long Distance Savings * *822 Protel International, LLC * * *823 PRT Communications, LLC * * *824 Public Communications Services, Inc. * *825 Public Service Data, Inc * * *826 Pulaski White Communications, Inc. * *827 Pulse Telecom, LLC * *
Pymatuning Independent Tel. Co. 828 PT Communications, Inc. d/b/a Pymatuning Long Distance * *
Qwest Communications International, Inc.829 El Paso County Telephone Company * *830 Qwest Communications Corporation * * * * *831 Qwest LD Corporation * * *832 Qwest Wireless, L.L.C. * * *833 Radcliffe Telephone Company * *
Rainbow Telecommunications Association, Inc. 834 Carson Communications, LLC d/b/a Rainbow Communications * *835 Randolph Telephone Telecommunications, Inc * * *836 RD Tel, Inc. * *837 Readlyn Telephone Company * *838 Reasnor Telephone Company * *839 Red River Rural Telephone Association * *840 Reduced Rate Long Distance, LLC * * *841 Redwood Long Distance Company * *842 Reedsburg Utility Commission * *
Reliance Communications Ltd.843 Reliance Communications, Inc. * * * *844 Reliance Communications International, Inc * * * *
Respond Communications, Inc.845 Montrose Mutual Long Distance, Inc. * *846 Reunion Communications, Inc. * *847 Reynolds Long Distance, Inc. * *
Rice Belt Long Distance848 Rice Belt Telephone Company * *849 Richland-Grant Long Distance, Inc. * *850 Ringgold Telephone Long Distance * *
Ritter Communications Holdings, Inc.851 E. Ritter Communications, Inc. * *852 E. Ritter Telephone Company * *853 Tri-County Telephone Company * *
RJB Telecommunications Corp.854 Hood Canal Telephone Co. d/b/a Hood Canal Communications * *855 RNK, Inc. d/b/a RNK Communications * * *856 Roanoke Telephone Co., Inc. d/b/a Roanoke Long Distance * *857 Rochester Telephone Co. * *
Private Lines
30

Table 5Carriers Filing International Traffic Data for 2008 - Continued
Switched Services U.S. Pt. Served Traffic toCarrier Traffic Arrangements Facilities Facilities Pure Other >100
No. Traditional Non-Traditional Based Resale Resale Dom. U.S. Int'l. Pts.
858 Rock Port Long Distance * *Rockefeller Group Telecommunications Services, Inc
859 RGT Utilities, Inc. * * *860 Rockwell Cooperative Telephone Association * *861 Roggen Telephone Cooperative Company * *862 ROPIR Communications, Inc. * *863 Royal Telephone Company * *
Runestone Telephone Association d/b/a Runestone Telecom Ass. and Lowry Telephone Company, LLC
864 Runestone * *865 Lowry * *866 Rural Network Services, Inc. (RNS) * *867 Rural Telephone Service Company, Inc * *868 S&A Communications, Inc. * *
S&T Telephone Association, Inc.869 S&T Communications, LLC (Ilec) * *870 S&T Communications, LLC (Goodland/Colby) * *871 S&T Communications, LLC (other) * *872 Sac County Mutual Telephone Company * *873 Sacred Wind Communications, Inc. * *874 Saddleback Communications * *875 San Isabel Telecom, Inc. * *876 Sand Creek Toll Service Company * *877 Sandhill Communications, LLC * *878 Santa Rosa Communications, Ltd. * *879 Santel Communications Cooperative, Inc * *880 Satellite Communication Systems, Inc * * *881 Scatter Creek Communications * *882 Schaller Telephone Company * *883 Scott County Long Distance * * *884 Scranton Telephone Company * *885 SCS Communications & Security, Inc. d/b/a SCTC Long Distance * * *886 Seamless Geoport Communications, Inc * *887 Searsboro Telephone Company * *
Sebastian Enterprises, Inc. (SEI)888 Audeamus d/b/a Sebastian * *889 SEI Data, Inc. d/b/a SEI Long Distance, Inc. * *890 Serengeti Partners International, Inc. * *891 Shared Network Users Group, Inc. * *892 Sharon Independent Long Distance, LLC * *893 Sharon Telephone Company * *
Shawnee Communications, Inc.894 ShawneeLink Corporation * *895 Shenandoah Long Distance Company (Shentel) * *896 Sherburne Long Distance, Inc. * *
Sierra Tel Communications Group897 Sierra Telephone Long Distance * *898 Sierra USA Communications, Inc. * *899 Signal Telecommunications, Inc. * *
Silver Star Telephone Co., Inc.900 Mountain Land Communications, LLC * *901 Single Source Integrated Services, Inc * *902 Singlepipe Communications, Inc. * *903 Siren Communications, Inc. * *904 Siskiyou Long Distance Co. * *
Private Lines
31

Table 5Carriers Filing International Traffic Data for 2008 - Continued
Switched Services U.S. Pt. Served Traffic toCarrier Traffic Arrangements Facilities Facilities Pure Other >100
No. Traditional Non-Traditional Based Resale Resale Dom. U.S. Int'l. Pts.
905 SJI, LLC * *906 Sky Connect, LLC * *907 SkyBest Communications, Inc. * * *
Smart City Telecommunications LLC d/b/a908 Smart City Telecom * * *909 Smitcoms, Inc. * * *910 Smith Bagley, Inc. * *911 Smithville Telecom, LLC * *912 South Arkansas Telephone Company (SATCO) * *913 South Canaan Cellular Communications Company, L.P * *914 South Canaan Long Distance Company * *915 South Carolina Net, Inc. d/b/a Spirit Telecom * * *916 South Central Communications * *917 South Central Wireless, Inc. * * *
South Plains Telephone Cooperative918 SPTC Telcom, LTD * *
South Slope Cooperative Telephone Company919 South Slope Cooperative Telephone Company (CLEC) * *920 South Slope Cooperative Telephone Company (ILEC) * *921 Southeast Nebraska Communications * *922 Southern Kansas Telephone Company * *923 Southern Montana Telephone Company * *924 Southern Telecommunications Co., LLC * *925 Southwest Arkansas Telephone Cooperative, Inc * *926 Southwest Texas Long Distance Company * *927 Spectrotel, Inc. * * *928 Spencer Municipal Utilities * *929 Spring Valley Telephone Long Distance, Inc * *930 Springcom, Inc. * *931 Springville Cooperative Telephone Association, Inc * *932 Spruce Knob Seneca Rocks Telephone Company * *933 SRT Communications, Inc. * *934 SST Long Distance, Inc. (Salina-Spavinaw Telephone Co., Inc.) * *935 St. John Telephone Company * *936 St. Paul Cooperative Telephone Association * *937 StanaCard, LLC * * *
Stanton Telecom, Inc.938 Stanton Long Distance, LLC * *
Star Telephone Membership Corporation939 Star Telephone Long Distance * * *940 State Long Distance Telephone Company * *941 State Telephone Long Distance Company, Inc * *942 Stouffer Communications, Inc. * *
Stratos Holdings, Inc.943 Stratos Communications, Inc. * * *944 Stratos Mobile Networks, Inc. * * * *945 Stratos Offshore Services Company * * * *
Strickland Communications, Inc.946 Brantley Telephone Company Inc. (BTC Long Distance) * *947 Sully Telephone Association * *948 Surry Telecommunications, Inc. * *949 Swayzee Telephone Company, Inc * *
Sweetser Rural Telephone Company, Inc950 Comteck of Indiana, Inc. * *951 Swisher Telephone Company * *
Private Lines
32

Table 5Carriers Filing International Traffic Data for 2008 - Continued
Switched Services U.S. Pt. Served Traffic toCarrier Traffic Arrangements Facilities Facilities Pure Other >100
No. Traditional Non-Traditional Based Resale Resale Dom. U.S. Int'l. Pts.,952 SWO Telecommunications * *953 Syniverse Technologies, Inc. * *
T-Netix, Inc.954 Evercom Systems, Inc. * * *955 T-Netix, Inc. * *956 T3 Communications, Inc. * *957 Taylor Telecommunications d/b/a Taylor Telephone LD * *958 TCO Network, Inc * * *
TDS Telecom959 TDS Long Distance Corporation * *960 TDS Metrocom, LLC * * *961 US Link, Inc. d/b/a TDS Metrocom. * * *962 Tec of Jackson, Inc. * *963 Tech-Com, Inc. * *964 TelAtlantic Communications, Inc. * *965 Telco 214, Inc. * *966 Telco Experts, LLC * *967 Telcom Supply, Inc. * *968 Tele Circuit Network Corporation * *969 Telecal Telecommunications, Inc. * * *970 Telecom Argentina USA, Inc. * * * *971 Telecom Colombia USA, Inc. * *972 Telecom Italia Sparkle of North America, Inc * * * *973 Telecom North America, Inc. * * *974 TeleDias Communications, Inc. * * *975 Telefonica Larga Distancia, Inc. (TLD) * * * * *976 Telegration, Inc. * *977 Telekom Malaysia (USA), Inc. * * *978 Telemanagement Services, Inc * *979 Telenational Communications, Inc. * *980 Telenor Global Services AS * *981 Telepak Networks, Inc. * * *982 TeleUno, Inc. * * *
Telmex983 Telmex Argentina, S.A. * *984 Telmex Chile, S.A. * *985 Telmex Colombia, S.A. * *986 Telmex Do Brasil, Ltda. * *987 Telmex Peru, S.A. * *988 Telmex USA, L.L.C. * * *989 TelNet Worldwide, Inc. * * *990 Telovations, Inc. * *991 Telrite Corporation * * *992 Telscape Communications, Inc. * *993 Templeton Telephone Company * *994 Texas 10, LLC * *995 Thacker-Grisby Tele. Co., Inc. d/b/a Thacker-Grisby Long Distance * *996 The Community Agency * *997 The Contact Network, Inc. * *998 The Farmers Mutual Telephone Company of Stanton Iowa * * *999 The Preston Telephone Company * * *
1000 The Toledo Telephone Co. Inc. * *1001 The Ultimate Connection, LC d/b/a DayStar Communications * *1002 Thrane & Thrane Airtime Ltd. * *
Private Lines
33
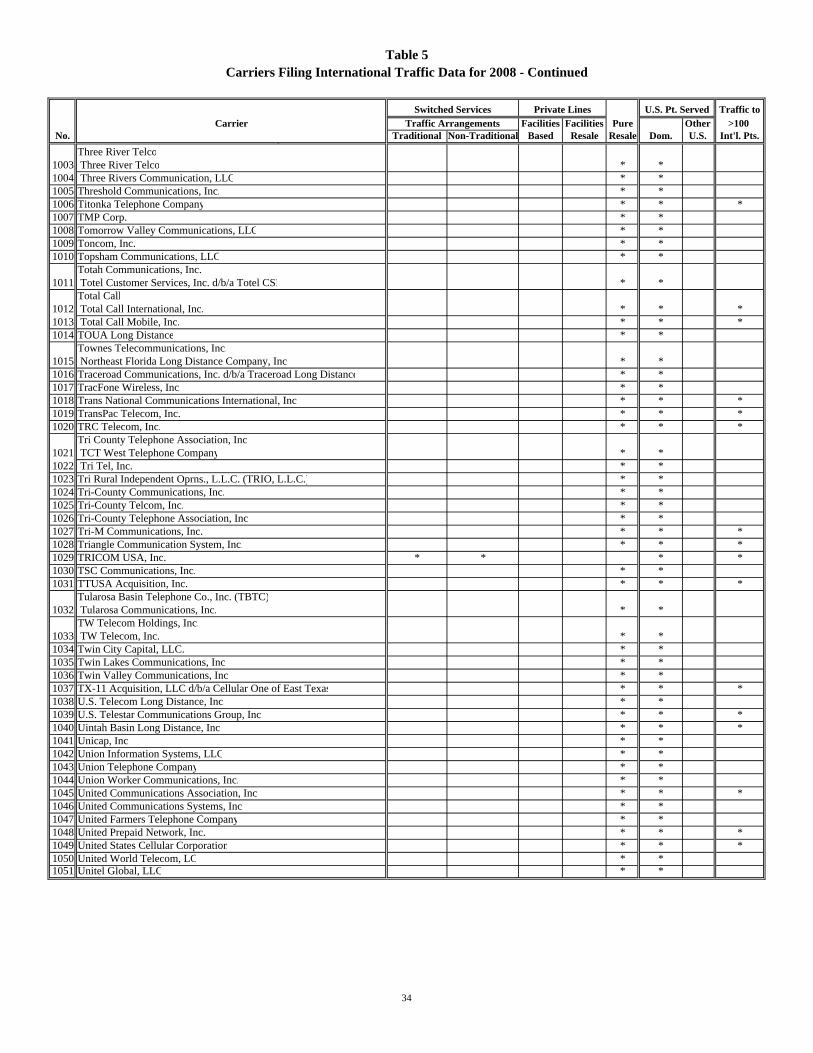
Table 5Carriers Filing International Traffic Data for 2008 - Continued
Switched Services U.S. Pt. Served Traffic toCarrier Traffic Arrangements Facilities Facilities Pure Other >100
No. Traditional Non-Traditional Based Resale Resale Dom. U.S. Int'l. Pts.,Three River Telco
1003 Three River Telco * *1004 Three Rivers Communication, LLC * *1005 Threshold Communications, Inc. * *1006 Titonka Telephone Company * * *1007 TMP Corp. * *1008 Tomorrow Valley Communications, LLC * *1009 Toncom, Inc. * *1010 Topsham Communications, LLC * *
Totah Communications, Inc.1011 Totel Customer Services, Inc. d/b/a Totel CSI * *
Total Call1012 Total Call International, Inc. * * *1013 Total Call Mobile, Inc. * * *1014 TOUA Long Distance * *
Townes Telecommunications, Inc.1015 Northeast Florida Long Distance Company, Inc * *1016 Traceroad Communications, Inc. d/b/a Traceroad Long Distance * *1017 TracFone Wireless, Inc. * *1018 Trans National Communications International, Inc. * * *1019 TransPac Telecom, Inc. * * *1020 TRC Telecom, Inc. * * *
Tri County Telephone Association, Inc.1021 TCT West Telephone Company * *1022 Tri Tel, Inc. * *1023 Tri Rural Independent Oprns., L.L.C. (TRIO, L.L.C.) * *1024 Tri-County Communications, Inc. * *1025 Tri-County Telcom, Inc. * *1026 Tri-County Telephone Association, Inc. * *1027 Tri-M Communications, Inc. * * *1028 Triangle Communication System, Inc. * * *1029 TRICOM USA, Inc. * * * *1030 TSC Communications, Inc. * *1031 TTUSA Acquisition, Inc. * * *
Tularosa Basin Telephone Co., Inc. (TBTC)1032 Tularosa Communications, Inc. * *
TW Telecom Holdings, Inc.1033 TW Telecom, Inc. * *1034 Twin City Capital, LLC. * *1035 Twin Lakes Communications, Inc. * *1036 Twin Valley Communications, Inc. * *1037 TX-11 Acquisition, LLC d/b/a Cellular One of East Texas * * *1038 U.S. Telecom Long Distance, Inc. * *1039 U.S. Telestar Communications Group, Inc. * * *1040 Uintah Basin Long Distance, Inc. * * *1041 Unicap, Inc * *1042 Union Information Systems, LLC * *1043 Union Telephone Company * *1044 Union Worker Communications, Inc. * *1045 United Communications Association, Inc. * * *1046 United Communications Systems, Inc. * *1047 United Farmers Telephone Company * *1048 United Prepaid Network, Inc. * * *1049 United States Cellular Corporation * * *1050 United World Telecom, LC * *1051 Unitel Global, LLC * *
Private Lines
34

Table 5Carriers Filing International Traffic Data for 2008 - Continued
Switched Services U.S. Pt. Served Traffic toCarrier Traffic Arrangements Facilities Facilities Pure Other >100
No. Traditional Non-Traditional Based Resale Resale Dom. U.S. Int'l. Pts.
1052 Universal Telecom Services, Inc * *1053 University Telcom, Inc. * *1054 Upper Peninsula Telephone Company * *1055 US Connection, Inc. * *
US TelePacific Holdings Corporation1056 Arrival Communications, Inc. * *1057 US TelePacific Corp. * *
US Telesis, Inc.1058 U.S. Telesis, Inc. a Nevada Corporation * *1059 United States Telesis, Inc., a California Corporation * *1060 UTC Long Distance, LLC * *
Utilicom Networks, LLC1061 Sigecom, LLC * * *1062 VAL-Ed Joint Venture LLP d/b/a 702 Communications * * *1063 Valley Connections, LLC * *1064 Valliant Telephone Company d/b/a Valliant Long Distance * *1065 Valstar Inc. * *1066 Van Buren Telephone Company, Inc. * * *1067 Van Horne Cooperative Telephone Company * *
Vantage Point Solutions1068 Local Access Network, LLC (LAN) * *1069 Benton Cooperative Telephone Company (BCTC) * *
Verizon Communications, Inc. Cellco Partnership d/b/a Verizon Wireless
1070 Alltel Communications, Inc. * * *1071 Cellco Partnership d/b/a Verizon Wireless * *1072 MCI International, Inc. * * * * * * *1073 Vermont Telephone Company, Inc. * *1074 Verneau Networks, Inc. * *1075 Vernon Communications, LLC * *1076 Vertex Telecom, Inc. * * *1077 Via One Technologies, Inc. * * *1078 Viatel Holding (Bermuda) Limited * *1079 Villisca Farmers Telephone Co. Corp * *1080 VIP Communications, Inc. * * *1081 Virgin Mobile USA, LP * * *1082 Viscom International * * *1083 Voda Networks, Inc. * * *1084 VoIP Tel., L.P. * * *
Volcano Communications Group1085 Volcano Long Distance * * *1086 Volunteer First Services, Inc. * *1087 VoxNet, LLC * *1088 VTX Communications, L.P. * *1089 Wabash Independent Networks, Inc. * *1090 Wahkiakum West Long Distance, Inc. * *1091 Waldron Communication Company * *1092 Walnut Hill Telephone Company * *1093 Walnut Telephone Company * *
Wamego Telecommunications Co., Inc1094 WTC Communications Co., Inc. * *1095 Warwick Valley Long Distance Co., Inc * *1096 Washington County Rural Telephone Cooperative, Inc * *1097 Washington RSA No. 8 Limited Partnership * *1098 Waverly Hall Telephone, L.L.C * * *
Private Lines
35

Table 5Carriers Filing International Traffic Data for 2008 - Continued
Switched Services U.S. Pt. Served Traffic toCarrier Traffic Arrangements Facilities Facilities Pure Other >100
No. Traditional Non-Traditional Based Resale Resale Dom. U.S. Int'l. Pts.
1099 WDT World Discount Telecommunications Corp * * *1100 Wellman Cooperative Telephone Association * * *1101 WERCS Communications * * *1102 Wes-Tex Telecommunications, Ltd * *1103 West Carolina Communications, LLC * *1104 West Central Telephone Association * *
West Kentucky Rural Telephone Coop. Corp., Inc1105 West Kentucky Networks Long Distance, Inc * * *1106 West Liberty Telephone Company * *1107 West River Telecommunications Cooperative * *1108 West Tennessee Telephone Company d/b/a West Tennessee LD * *
West Texas Rural Telephone Coop., Inc1109 Hereford Long Distance Services, Inc. * *1110 West Wisconsin Telcom Coop., Inc * * WesTel Systems1111 HTC Communications LLC d/b/a WesTel Systems * *1112 MidlandsNet LLC d/b/a WesTel Systems * *1113 Westelcom Network, Inc. * *
Western Elite Incorporated Services1114 Inland Long Distance Company d/b/a Inland Networks * *
Western Iowa Telephone Association1115 Western Iowa Long Distance * *1116 Western Long Distance, Inc. * *1117 Westphalia Telephone Co. * *1118 Wheat State Telephone Company * *1119 Wholesale Carrier Services, Inc. * * *
Wiggins Telephone Association1120 Northern Colorado Communications, Inc. * *1121 Wilkes Communications, Inc. * *
Wilkes Telephone & Electric Company1122 Wilkes Long Distance Services * *1123 Wilson Communication Company, Inc. * *
Windstream Communications, Inc.1124 Windstream Communications, Inc. (IXC) * * *1125 Windstream Kerrville Long Distance, LP * * *1126 Windstream Southwest Long Distance, LP * * *1127 Windstream Systems of the Midwest * * *1128 Winn Telephone Company d/b/a Winn Telecom * *
Winnebago Cooperative Telephone Association1129 WCTA Long Distance Co. * *1130 Wittenberg Cable TV Company, Inc. * *
Wood County Telephone Company1131 Central Wisconsin Comm., Inc. d/b/a Solarus Long Distance * *1132 Working Assets Funding Service, Inc. d/b/a Credo Long Distance * * *1133 World Communications, Inc. * * *1134 WorldNet Telecommunications, Inc. * * *1135 Worldwide Telecommunications, Inc. * *1136 WTC Communications, Inc. * * *1137 WTI Communications, Inc. * *1138 WWC, Inc. d/b/a Solution Long Distance * *1139 Wyoming Mutual Telephone Company * *
XIT Rural Telephone Cooperative, Inc1140 HFT Communications LP d/b/a Brazoria Long Distance * *1141 XIT Telecommunications & Technology, Ltd * *
Private Lines
36

Table 5Carriers Filing International Traffic Data for 2008 - Continued
Switched Services U.S. Pt. Served Traffic toCarrier Traffic Arrangements Facilities Facilities Pure Other >100
No. Traditional Non-Traditional Based Resale Resale Dom. U.S. Int'l. Pts.
1142 Xtension Services, Inc. * *1143 Yadkin Valley Telecom, Inc. * *1144 Yak America, Inc. * * *1145 Yelcot Telephone Company * *1146 Yeoman Communications Company, Inc * *
Yucca Telecommunications Systems, Inc. d/b/a1147 Yucca Communications * *1148 Yukon-Waltz Communications, Inc. * *1149 Zefcom, LLC d/b/a Telispire PCS * *
Total 10 18 22 26 1,109 1,142 8 277
Private Lines
37

Addendum to Table 5The following carriers submitted reports with no international message telephone, private line, or miscellaneous services for calendar year 2008:III Oliver Company, LLC National Directory Assistance, LLCAdvanced Integrated Technologies, Inc. National Toll-Free, LLCArizona Dialtone, Inc. NetDotSolutions, Inc.Bandwidth.com CLEC, LLC Network Services Solutions, LLCBay Broadband Communications, LLC Nexus Communications, Inc.BBH Corp. NobelBiz, Inc.BLC Management, LLC Norstar Telecommunications, LLCBoston Conferencing, Inc. Nortel NetworksBuehner-Fry, Inc. NSW Telecom, Inc.Central Telecom Long Distance, Inc. Oak Grove Holdings Corp.CFN Services, Inc. Opex Communications, Inc.Chase Com, Inc. d/b/a GoConference Reliant Communications, Inc.Clarity Communications Advisors, Inc. Ren-Tel Communications, Inc.Comcast Corporation RRV Enterprises, Inc. Comcast Phone II, LLC Rystec, Inc. Comcast Phone of Michigan, LLC SC TXLink, LLCCoreComm ATX, Inc. SelecTel, Inc.Dialtone & More, Inc. Shoutpoint, Inc.Dinamica Telecom, Inc. Source Communications, LLCDirect Connect International, LLC Southeastern Services, Inc.Doylestown Communications, Inc. Southwest Wireless Group, LLCdPi Teleconnect, LLC SuperNet, Inc.Express Phone Service, Inc. SWWG, LLCGillette Global Network, Inc. Telecarrier Services, Inc. d/b/a/ Elec CommunicationsGreatCall, Inc. d/b/a Jitterbug Telecom Access Network, Inc.Hometown Broadband Orlando, LLC Telephony Partners, LLC d/b/a ReefTelHorizon Telecom, Inc. Telmatch Telecommunications, Inc.iCore Networks, Inc. Total Call Holdings, Inc. d/b/a GTC CommunicationsInsight Midwest Holdings, LLC TSG Global, Inc.ITC^DeltaCom, Inc. Vanco Direct USA, LLC Interstate Fibernet, Inc. Vanco US, LLCLafayette City Parish Consolidated VoiceInc.com, Inc. Government d/b/a LUSFiber Zeus Telecommunications, LLCMission Communications, LLCTraffic Arrangements: U.S. carriers use the following types of arrangements to govern the exchange of trafficbetween themselves and foreign carriers.
1/ Traditional settlement arrangements consist of traffic settled pursuant to the Commission's International SettlementsPolicy (ISP). See 47 C.F.R. §§ 43.51(e), 64.1001, 64.1002 (2008).
2/ Non-Traditional settlement arrangements consist of all traffic other than traditionally settled traffic.The following companies' section 43.61(a) international telecommunications traffic reports were combinedbecause of mergers, acquisitions, and changes in corporate structure: 3/ Access Communications, LLC did not have any international services to report for calendar year 2008. 4/ Alliance Long Distance's 2008 section 43.61(a) submission includes information for Hills Telephone Company, Inc. d/b/a Alliance Communications. 5/ American Fiber Systems Holding Corporations subsidiaries, American Fiber Systems of Georgia, Inc. and Idacomm, Inc. were not engaged in providing any form of resold or facilities-based international telecommunications service during calendar year 2008. 6/ American Telephone Company did not have any calendar year 2008 international revenues or services to report. 7/ Arrow Communications International's section 214 authorization was transferred via pro forma assignment, January 1, 2008, to its affiliate, ITS Telecommunications Systems.
In 2004, the Commission lifted the ISP requirements from agreements involving foreign carriers that do not have market power and on routes where the termination rates for U.S.-international services were below benchmark. See International Settlements Policy Reform, International Settlement Rates, IB Docket No. 02-234, First Report and Order, 19 FCC Rcd 5709, 5723-25, paras. 27-28 (2004) . Currently, 165 routes are exempted from the ISP. See http://www.fcc.gov/ib/pd/pf/isp_exempt.html. See also U.S.-Cambodia Route Exempted from the International Settlements Policy, Public Notice, IB Docket Nos. 02-324, 96-261, 20 FCC Rcd 963 (Int’l. Bur. 2005). For a discussion of benchmarks, see International Settlement Rates , IB Docket No. 96-261, Report and Order, FCC 97-280, 12 FCC Rcd 19806, 19806, ¶ 1 (1997); Report and Order on Reconsideration and Order Lifting Stay , 14 FCC Rcd 9256 (1999); aff’d sub nom. Cable & Wireless P.L.C. v. FCC , 166 F.3d 1224 (D.C. Cir. 1999).
38

Addendum to Table 5 -- Continued 8/ AT&T, in 2007, purchased Dobson Cellular Systems, Inc. AT&T Mobility, LLC's 2008 section 43.61(a) submission includes information for Dobson Cellular Systems, Inc. 9/ Baldwin Broadband, LLC and Baldwin Cellcom, Inc. merged July 2007.10/ Baynet, Inc., in 2008, was merged into Net Lec, LLC. Net Lec, LLC's 2008 section 43.61(a) submission in- cludes information for Baynet, Inc.11/ BendTel, Inc. had no section 43.61(a) international services to report for calendar year 2008.12/ Breda Telephone Corporation's 2008 section 43.61(a) submission includes information for the following wholly owned subsidiaries: BTC, Inc. Tele-Services, Ltd. Prairie Telephone Co., Inc. Westside Independent Telephone Company13/ Broadview Networks Holdings, Inc.'s 2008 submission includes information for CoreComm ATX, Inc., Gillette Global Network, Inc. and other subsidiaries.14/ Concord Telecom, LLC had no section 43.61(a) international services to report for calendar year 2008.15/ Connect America Communications, Inc. discontinued providing domestic and international services after calendar year 2007. See Proceeding 07-285, dated December 12, 2007.16/ Easterbrooke Cellular Corporation, on January 2, 2008, sold all of its assets, licenses, network assets and subscribers to AT&T, Inc.17/ FairPoint Communications, Inc.'s subsidiary, UI Long Distance d/b/a Northland Long Distance's, 2008 section 43.61(a) submission includes information for the following subsidiaries: China Telephone Commtel Communications, Inc. Northland of Maine Telephone Co. FairPoint Vermont, Inc. Sidney Telephone Company Maine Telephone Company Standish Telephone Company18/ Farmers Mutual Telephone Company - Nora Springs, Iowa, and Farmers Telephone Company had no international toll usage to report for calendar year 2008.19/ FastBlue Communications, Inc. had no section 43.61(a) international services to report for calendar year 2008.20/ Geetel Communications, Inc., on May 1, 2008, merged with Geetingsville Telephone Co., Inc.21/ HH Ventures had no section 43.61(a) international services to report for calendar year 2008.22/ Hood Canal Long Distance, on January 1, 2008, merged into Hood Canal Telephone Company.23/ I Age Phone, Inc. does not provide international telephone service pursuant to section 43.61 at this time. 24/ Inland Telephone Company withdrew its 2008 section 43.61(a) submission. The carrier determined itself an incumbent local exchange carrier which does not provide international telecommunications service subject to section 43.61. International services are instead provided by its affiliate, Inland Long Distance Company d/b/a Inland Networks.25/ Integra Telecom Holdings, Inc. 2008 section 43.61(a) submission includes information for the following subsidiaries: Advanced TelCom, Inc. OneEighty Communications, Inc. Electric Lightwave, LLC Oregon Telecom, Inc. Eschelon Telecom, Inc. United Communications, Inc. d/b/a UNICOM Mountain Telecommunications, Inc.26/ KerTel Communications, Inc.'s parent, Sebastian Enterprises, Inc. (SEI), transferred all of KerTel's long distance services to its new affiliate, Audeamus, LLC.27/ KPN Global Carrier Services was acquired by iBasis, Inc. in October 2007. 28/ Level 3 Communications, LLC's 2008 section 43.61(a) submission includes information for the following subsidiaries: Broadwing Communications, LLC TelCove of Virginia, LLC ICG Telecom Group, Inc. TelCove Operations, LLC Looking Glass Networks, Inc. Vyvx, LLC Looking Glass Networks of Virginia, Inc. WilTel Communications, LLC TelCove of Pennsylvania, LLC29/ New Access Communications, LLC and Choicetel LLC completed the sale of all of their assets to First Communi- cations, LLC on February 28, 2007. New Access and Choicetel were dissolved as entities on December 14, 2007.30/ Norlight Communications, Inc. did not provide international telephone service after calendar year 2007. 31/ NuVox Communications, Inc.'s 2008 submission includes data for Florida Digital Network, Inc. (FDN). FDN merged with NuVox in 2007.32/ Pacific Telecom Inc. (PTI) purchased selected telecommunications assets of IT&E Overseas, Inc. and the ITE brand name in year 2008.33/ Powercom Corporation went out of business February 28, 2009. 34/ Proactive Communications had no section 43.61(a) international services to report for calendar year 2008.35/ RBJ Corporation, on November 29, 2008, sold its affiliates, Holway Telephone and KLM Telephone to American Broadband Communications, LLC.36/ Sierra USA Communications, Inc. discontinued its international message telephone service after calendar year 2007. The carrier instead reported international private line services in calendar year 2008.37/ Smartcom Telephone, LLC had nothing to report pursuant to section 43.61(a) for calendar year 2008. 38/ Speedypin Prepaid, LLC had no section 43.61(a) international services to report for calendar year 2008.39/ Sprint Nextel Corporation Wireless Division's 2008 section 43.61(a) submission includes information for the following subsidiaries: Nextel Communications, Inc.-CONSOLIDATED Sprint Spectrum Holding Co. L.P. Nextel Partners, Inc. SprintCom, Inc. PhillieCo, L.P.
39
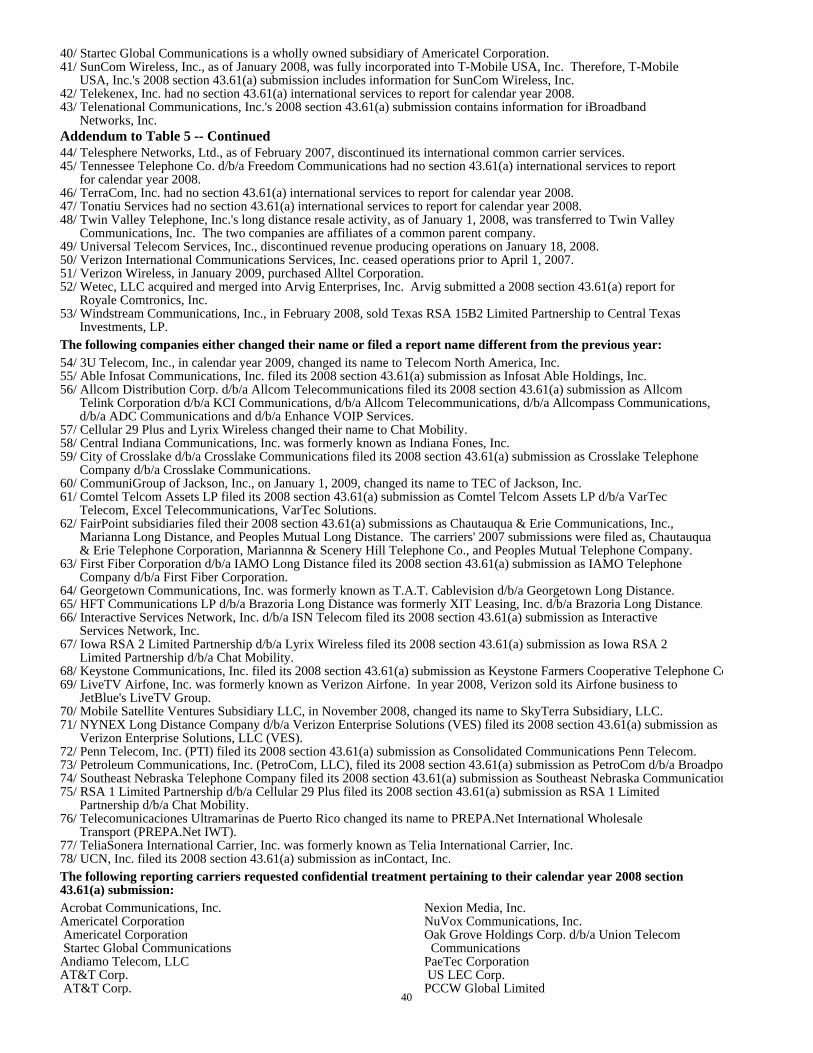
40/ Startec Global Communications is a wholly owned subsidiary of Americatel Corporation. 41/ SunCom Wireless, Inc., as of January 2008, was fully incorporated into T-Mobile USA, Inc. Therefore, T-Mobile USA, Inc.'s 2008 section 43.61(a) submission includes information for SunCom Wireless, Inc.42/ Telekenex, Inc. had no section 43.61(a) international services to report for calendar year 2008.43/ Telenational Communications, Inc.'s 2008 section 43.61(a) submission contains information for iBroadband Networks, Inc.Addendum to Table 5 -- Continued44/ Telesphere Networks, Ltd., as of February 2007, discontinued its international common carrier services.45/ Tennessee Telephone Co. d/b/a Freedom Communications had no section 43.61(a) international services to report for calendar year 2008.46/ TerraCom, Inc. had no section 43.61(a) international services to report for calendar year 2008.47/ Tonatiu Services had no section 43.61(a) international services to report for calendar year 2008.48/ Twin Valley Telephone, Inc.'s long distance resale activity, as of January 1, 2008, was transferred to Twin Valley Communications, Inc. The two companies are affiliates of a common parent company.49/ Universal Telecom Services, Inc., discontinued revenue producing operations on January 18, 2008.50/ Verizon International Communications Services, Inc. ceased operations prior to April 1, 2007.51/ Verizon Wireless, in January 2009, purchased Alltel Corporation.52/ Wetec, LLC acquired and merged into Arvig Enterprises, Inc. Arvig submitted a 2008 section 43.61(a) report for Royale Comtronics, Inc.53/ Windstream Communications, Inc., in February 2008, sold Texas RSA 15B2 Limited Partnership to Central Texas Investments, LP.The following companies either changed their name or filed a report name different from the previous year:54/ 3U Telecom, Inc., in calendar year 2009, changed its name to Telecom North America, Inc.55/ Able Infosat Communications, Inc. filed its 2008 section 43.61(a) submission as Infosat Able Holdings, Inc. 56/ Allcom Distribution Corp. d/b/a Allcom Telecommunications filed its 2008 section 43.61(a) submission as Allcom Telink Corporation d/b/a KCI Communications, d/b/a Allcom Telecommunications, d/b/a Allcompass Communications, d/b/a ADC Communications and d/b/a Enhance VOIP Services.57/ Cellular 29 Plus and Lyrix Wireless changed their name to Chat Mobility. 58/ Central Indiana Communications, Inc. was formerly known as Indiana Fones, Inc. 59/ City of Crosslake d/b/a Crosslake Communications filed its 2008 section 43.61(a) submission as Crosslake Telephone Company d/b/a Crosslake Communications.60/ CommuniGroup of Jackson, Inc., on January 1, 2009, changed its name to TEC of Jackson, Inc. 61/ Comtel Telcom Assets LP filed its 2008 section 43.61(a) submission as Comtel Telcom Assets LP d/b/a VarTec Telecom, Excel Telecommunications, VarTec Solutions.62/ FairPoint subsidiaries filed their 2008 section 43.61(a) submissions as Chautauqua & Erie Communications, Inc., Marianna Long Distance, and Peoples Mutual Long Distance. The carriers' 2007 submissions were filed as, Chautauqua & Erie Telephone Corporation, Mariannna & Scenery Hill Telephone Co., and Peoples Mutual Telephone Company.63/ First Fiber Corporation d/b/a IAMO Long Distance filed its 2008 section 43.61(a) submission as IAMO Telephone Company d/b/a First Fiber Corporation.64/ Georgetown Communications, Inc. was formerly known as T.A.T. Cablevision d/b/a Georgetown Long Distance. 65/ HFT Communications LP d/b/a Brazoria Long Distance was formerly XIT Leasing, Inc. d/b/a Brazoria Long Distance.66/ Interactive Services Network, Inc. d/b/a ISN Telecom filed its 2008 section 43.61(a) submission as Interactive Services Network, Inc.67/ Iowa RSA 2 Limited Partnership d/b/a Lyrix Wireless filed its 2008 section 43.61(a) submission as Iowa RSA 2 Limited Partnership d/b/a Chat Mobility.68/ Keystone Communications, Inc. filed its 2008 section 43.61(a) submission as Keystone Farmers Cooperative Telephone Co69/ LiveTV Airfone, Inc. was formerly known as Verizon Airfone. In year 2008, Verizon sold its Airfone business to JetBlue's LiveTV Group.70/ Mobile Satellite Ventures Subsidiary LLC, in November 2008, changed its name to SkyTerra Subsidiary, LLC. 71/ NYNEX Long Distance Company d/b/a Verizon Enterprise Solutions (VES) filed its 2008 section 43.61(a) submission as Verizon Enterprise Solutions, LLC (VES).72/ Penn Telecom, Inc. (PTI) filed its 2008 section 43.61(a) submission as Consolidated Communications Penn Telecom. 73/ Petroleum Communications, Inc. (PetroCom, LLC), filed its 2008 section 43.61(a) submission as PetroCom d/b/a Broadpo74/ Southeast Nebraska Telephone Company filed its 2008 section 43.61(a) submission as Southeast Nebraska Communication75/ RSA 1 Limited Partnership d/b/a Cellular 29 Plus filed its 2008 section 43.61(a) submission as RSA 1 Limited Partnership d/b/a Chat Mobility.76/ Telecomunicaciones Ultramarinas de Puerto Rico changed its name to PREPA.Net International Wholesale Transport (PREPA.Net IWT).77/ TeliaSonera International Carrier, Inc. was formerly known as Telia International Carrier, Inc. 78/ UCN, Inc. filed its 2008 section 43.61(a) submission as inContact, Inc.The following reporting carriers requested confidential treatment pertaining to their calendar year 2008 section 43.61(a) submission:Acrobat Communications, Inc. Nexion Media, Inc.Americatel Corporation NuVox Communications, Inc. Americatel Corporation Oak Grove Holdings Corp. d/b/a Union Telecom Startec Global Communications CommunicationsAndiamo Telecom, LLC PaeTec CorporationAT&T Corp. US LEC Corp. AT&T Corp. PCCW Global Limited
40

Addendum to Table 5 -- ContinuedConfidential Treatment -- Continued:AT&T Corp. -- Continued AT&T Mobility LLC Primus Telecommunications, Inc. BellSouth Long Distance, Inc. Puerto Rico Telephone Company, Inc. SBC Long Distance, LLC PRT Larga Distancia, Inc. SNET America, Inc. REACH Services (USA) Inc. SNET Diversified Group, Inc. RingCentral, Inc.Balsam West FiberNet, LLC Sage Telecom, Inc.BCE Nexxia Corporation Saskatchewan Telecommunications BCE Nexxia Voice Services Corporation SAVVIS, Inc.Bestel (USA), Inc. SkyTerra Subsidiary, LLCBT Americas, Inc. Singapore Telecom USA, Inc.Budget PrePay, Inc. Sprint Nextel CorporationBuffalo-Lake Erie Wireless Systems, Co. L.L.C. Sprint Communications Company L.P.BullsEye Telecom, Inc. Wireless Division (Sprint Spectrum Holding Co., L.P.; China Telecom (Americas) Corporation PhillieCo. L.P., SprintCom, Inc., Nextel Communications, Comcast Business Communications, Inc. Inc. - Consolidated, and Nextel Partners, Inc. d/b/a/ Comcast Long Distance Sti Prepaid, LLCComtel Telcom Assets LP d/b/a VarTec Telcom, Dialaround Enterprises, Inc. Excel Telecommunications, VarTec Solutions Sti Prepaid, LLCCricket Communications, Inc. Tata Communications LimitedDeutsche TeleKom AG Tata Communications (America) Inc. T-Systems North America, Inc. & Deutsche Tata Communications Services (America) Inc. Telekom North America, Inc. TCS Communications, Solutions, LLCDSLnet Communications, LLC Telecom New Zealand USA, Ltd.Emery Telcom Long Distance TeleGuam Holdings, LLC d/b/a GTAEquant Inc., d/b/a Orange Business Services TeliaSonera ABGeneral Dynamics Satellite Communications Svcs. TeliaSonera International Carrier, Inc.Harris Corporation Telstra Incorporated Maritime Communication Services TELUS Corporation, Inc.Hiawatha Broadband Communications, Inc. Trilogy International Enterprises, LLCiBasis, Inc. Verizon Communications, Inc. iBasis Global Inc. Bell Atlantic Communications, Inc. KPN International Network Services, Inc. d/b/a Verizon Long Distance (VLD)IDT Corporation NYNEX Long Distance Company d/b/a/ IDT Telecom, Inc. Verizon Enterprise Solutions (VES)IUSATEL USA, Inc. Verizon Airfone, Inc.Janaslani Enterprises, LLC Verizon Select Services, Inc. (VSSI)LiveTV Airfone Inc. Vizada, Inc.Logical Telecom, LP Marlink, Inc.Maskina Communications, Inc. Vizada, Inc.Mox Telecom Ireland Ltd. WebEx Communications, Inc.NetCarrier Telecom, Inc. West Central WirelessNetwork Communications International Corp. CGKC&H RCLP No.2 Network Enhanced Telecom, LLP CT Cube LP d/b/a West Central Wireless Network Enhanced Telecom, LLP TX RSA 15B2 RCLP NetworkIP, LLC XO Communications, Inc.New Century InfoComm Tech Co. Ltd. YMax Communications Corp.The following companies filed an annual section 43.61(a) report for calendar year 2007. They have, however, notfiled annual 2008 data and their status at time of publication is unknown.Access Integrated Networks, Inc. Innovative Processing Solutions, LLCACN Communication Services, Inc. Legacy Long Distance International, Inc.ACN Digital Phone Service, LLC Logical Telecom, LPAmerican Samoa Telecommunications Authority Lunex Telecom, Inc.Azteca Mobile, LLC Mid Century Telephone CooperativeCommunication Technology, Inc. Century Enterprises, Inc.Coon Rapids Municipal Utilities (CRMU) Mosinee Telecom, LLCDarien Communications, Inc. Network PTS, Inc.Direct Communications Long Distance NovaTel Ltd., Inc.Eliteview LLC d/b/a Groveline Ocala Communications Corporation Empire One Telecommunications, Inc. OneVoice Communications, Inc.FairPoint Communications, Inc. Phone 1, Inc. Bentleyville Telephone Company Redes Modernas de la Frontera SA de CVGlobal Connect Telecommunications, Inc, River Valley Telecommunications Coop.GlobalStar Telecom, LLC Texas RSA 15B2 Limited PartnershipGo Solo Technologies, Inc. Touch Tone Communications, Inc.GTC Telecom Corp. Unity Communications, Inc.HELIO, LLC WH Link, LLCHOS Interest WQNInfoTech Telecommunications & Network, Inc. Zayo Bandwidth Northwest, Inc. 41

Table 6 2008 U.S. Billed Revenues for Facilities-Based and Facilities-Resale Services *
<<< 2009 Data Not Available at Time of Publication >>> International Total all
International International Telex, Telegraph and International Telephone Private Line Other Miscellaneous Services
ABS-CBN Telecom North America, Inc. $2,101,532 $2,101,532Bharti Airtel Limited 30,279,322 30,279,322BringCom International, LLC $4,031,808 4,031,808Cable & Wireless Americas Operations, Inc. $4,232,160 4,232,160Carrier PB Telco, Inc. 13,321,672 13,321,672Centennial Puerto Rico Operations Corp. 2,993,146 2,993,146China Unicom USA Corp. 6,536,838 227,000 6,763,838Chunghwa Telecom Global, Inc. 1,036,165 1,036,165Cincinnati Bell, Inc. 9,756 9,756Colt Telecommunications 3,581,418 3,581,418Columbus Networks USA, Inc. 622,327 622,327EKU Solutions, LLC 2,883 2,883EPM Telecomunicaciones S.A. E.S.P. 106,569,631 4,619,757 111,189,388France Telecom Long Distance USA, LLC 9,151,533 250,867 9,402,400Global Caribbean Fiber 89,540,000 89,540,000Global Crossing North America, Inc. 14,720,577 14,720,577Global Telecom and Technology Americas, Inc. 2,078,867 2,078,867Golden Holdings, Inc. 1,847 1,847Intelsat USA License Corp. 341,320 341,320KDDI America, Inc. 11,000 9,859,452 9,870,452KT America, Inc. 1,174,377 1,174,377Level 3 Communications, LLC 29,945,096 29,945,096New Edge Networks 281,648 281,648NTT America, Inc. 6,866,975 6,866,975Pacifica Telecom Inc. (PTI) 11,091,708 1,143,861 12,235,569Philippine Long Distance Telephone Co., Ltd. 1,599,053 113,972 1,713,025PREPA.Net International Wholesale Transport 277,320 277,320Qwest Services Corporation 3,849,662 3,849,662Reliance Communications, Inc. 235,766,937 10,164,269 245,931,206Satellite Communication Systems, Inc. 421,254 2,008,800 2,430,054Sierra USA Communications, Inc. 192,780 192,780Smitcoms, Inc. 0Stratos Holdings, Inc. 1,628,967 1,628,967Syniverse Technologies, Inc. 90,305,872 90,305,872Telecom Argentina USA, Inc. 5,691,672 5,691,672Telecom Colombia USA, Inc. 5,232,480 5,232,480Telecom Italia Sparkle of North America, Inc 136,241,734 136,241,734Telefonica Larga Distancia, Inc. (TLD) 1,976,571 247,335 2,223,906Telekom Malaysia (USA), Inc. 947,412 947,412Telenor Global Services AS 1,274,729 1,274,729Telmex 17,785,670 17,785,670Thrane & Thrane Airtime Ltd. 2,265 2,265Tricom USA, Inc. 35,123,924 35,123,924Universal Telecom Services, Inc. 212,313 212,313Verizon Communications Inc. 1,110,878,817 64,820,452 1,175,699,269Viatel Holding (Bermuda) Limited 249,018 26,049 275,067
Total for All U.S. Points ** $6,458,744,802 $363,400,032 $4,422,696 $7,275,078,865 * U.S. billed revenues represent the amount billed to customers by U.S. carriers. * * Total for All U.S. points, "International Telephone", includes $4.7 billion billed revenues for carriers requesting confidential treatment for international telephone services. Total for All U.S. Points, "Total All International Services", includes $449 million billed revenues for carriers requesting confidential treatment for international private line and miscellaneous services. In total, thirty-one carriers requested confidential treatment in the above categories Please see the addendum to Table 5, pages 40-41 herein, for a list of reporting carriers requesting confidential treatment
42

Table 72008 Net Revenues for Facilities-Based and Facilities-Resale Services *
<<< 2009 Data Not Available at Time of Publication >>>International Total all
International International Telex, Telegraph and International Telephone Private Line Other Miscellaneous Services
ABS-CBN Telecom North America, Inc. $1,019,883 $1,019,883Bharti Airtel Limited 34,443,238 34,443,238BringCom International, LLC $4,031,808 4,031,808Cable & Wireless Americas Operations, Inc. $4,232,160 4,232,160Carrier PB Telco, Inc. 896,575 896,575Centennial Puerto Rico Operations Corp. 884,324 884,324China Unicom USA Corp. 653,682 227,000 880,682Chunghwa Telecom Global, Inc. 1,036,165 1,036,165Cincinnati Bell, Inc. 9,756 9,756Colt Telecommunications 3,581,418 3,581,418Columbus Networks USA, Inc. 622,327 622,327EKU Solutions, LLC 2,883 2,883EPM Telecomunicaciones S.A. E.S.P. 11,150,967 4,619,757 15,770,724France Telecom Long Distance USA, LLC 9,151,533 250,867 9,402,400Global Caribbean Fiber 89,540,000 89,540,000Global Crossing North America, Inc. 14,720,577 14,720,577Global Telecom and Technology Americas, Inc. 2,078,867 2,078,867Golden Holdings, Inc. 1,847 1,847Intelsat USA License Corp. 341,320 341,320KDDI America, Inc. 3,720 9,859,452 9,863,172KT America, Inc. (248,125) (248,125)Level 3 Communications, LLC 29,945,096 29,945,096New Edge Networks 281,648 281,648NTT America, Inc. 6,866,975 6,866,975Pacifica Telecom Inc. (PTI) 6,325,573 1,143,861 7,469,434Philippine Long Distance Telephone Co., Ltd. 1,599,053 52,561 1,651,614PREPA.Net International Wholesale Transport 277,320 277,320Qwest Services Corporation 3,849,662 3,849,662Reliance Communications, Inc. 34,488,892 10,164,269 44,653,161Satellite Communication Systems, Inc. 421,254 2,008,800 2,430,054Sierra USA Communications, Inc. 192,780 192,780Smitcoms, Inc. 5,188,622 5,188,622Stratos Holdings, Inc. 1,628,967 1,628,967Syniverse Technologies, Inc. 90,305,872 90,305,872Telecom Argentina USA, Inc. 1,257,643 1,257,643Telecom Colombia USA, Inc. 2,542,982 2,542,982Telecom Italia Sparkle of North America, Inc 6,812,086 6,812,086Telefonica Larga Distancia, Inc. (TLD) 1,471,978 247,335 1,719,313Telekom Malaysia (USA), Inc. 947,412 947,412Telenor Global Services AS 375,726 375,726Telmex 17,785,670 17,785,670Thrane & Thrane Airtime Ltd. 809 809Tricom USA, Inc. 12,547,252 12,547,252Universal Telecom Services, Inc. 212,313 212,313Verizon Communications Inc. 333,369,453 64,820,452 27,321 398,217,226Viatel Holding (Bermuda) Limited 249,018 26,049 275,067
Total for All U.S. Points ** $3,129,672,334 $363,400,032 $4,388,606 $3,945,972,307 * Net revenues represent U.S. billed revenues, less settlement amounts owed to foreign carriers, plus settlement amounts due from foreign carriers* * Total for All U.S. points, "International Telephone", includes $2.7 billion net revenues for carriers requesting confidential treatment for international telephone services. Total for All U.S. Points, "Total All International Services", includes $449 million net revenues for carriers requesting confidential treatment for international private line and miscellaneous services. In total, thirty-one carriers requested confidential treatment in the above categories Please see the addendum to Table 5, pages 40-41 herein, for a list of reporting carriers requesting confidential treatment
43
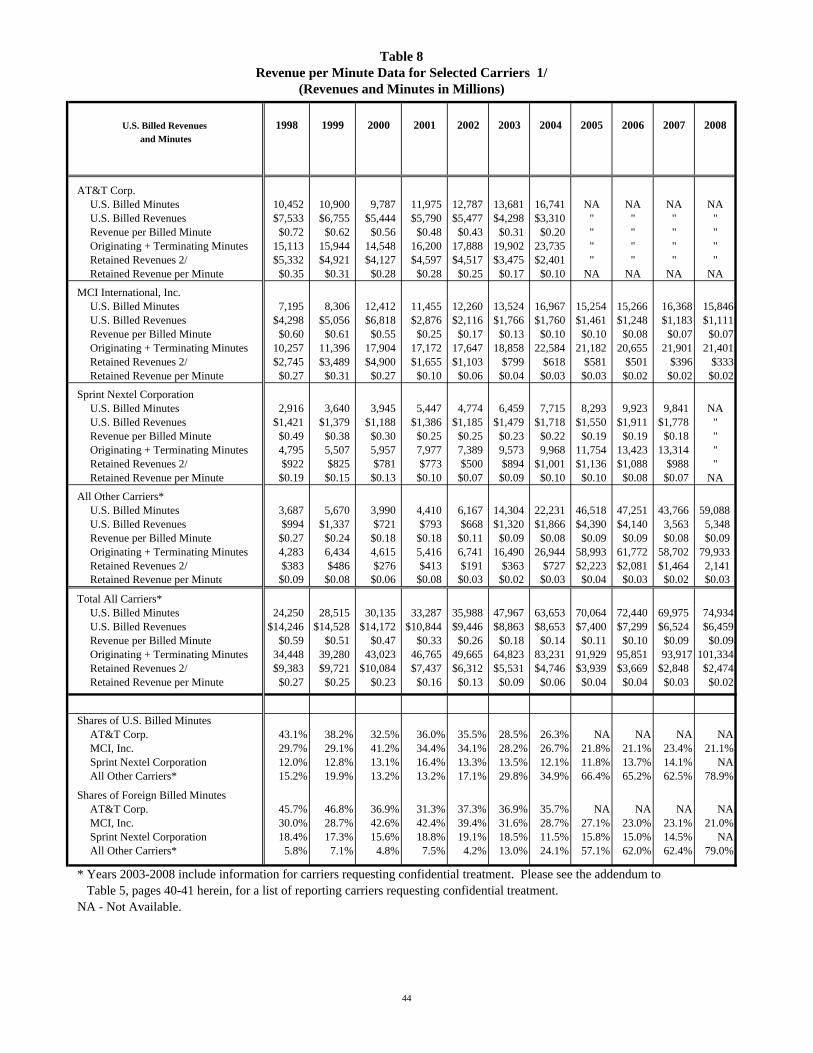
Table 8Revenue per Minute Data for Selected Carriers 1/
(Revenues and Minutes in Millions)
U.S. Billed Revenues 1998 1999 2000 2001 2002 2003 2004 2005 2006 2007 2008and Minutes
AT&T Corp.U.S. Billed Minutes 10,452 10,900 9,787 11,975 12,787 13,681 16,741 NA NA NA NAU.S. Billed Revenues $7,533 $6,755 $5,444 $5,790 $5,477 $4,298 $3,310 " " " "Revenue per Billed Minute $0.72 $0.62 $0.56 $0.48 $0.43 $0.31 $0.20 " " " "Originating + Terminating Minutes 15,113 15,944 14,548 16,200 17,888 19,902 23,735 " " " "Retained Revenues 2/ $5,332 $4,921 $4,127 $4,597 $4,517 $3,475 $2,401 " " " "Retained Revenue per Minute $0.35 $0.31 $0.28 $0.28 $0.25 $0.17 $0.10 NA NA NA NA
MCI International, Inc. U.S. Billed Minutes 7,195 8,306 12,412 11,455 12,260 13,524 16,967 15,254 15,266 16,368 15,846 U.S. Billed Revenues $4,298 $5,056 $6,818 $2,876 $2,116 $1,766 $1,760 $1,461 $1,248 $1,183 $1,111 Revenue per Billed Minute $0.60 $0.61 $0.55 $0.25 $0.17 $0.13 $0.10 $0.10 $0.08 $0.07 $0.07 Originating + Terminating Minutes 10,257 11,396 17,904 17,172 17,647 18,858 22,584 21,182 20,655 21,901 21,401 Retained Revenues 2/ $2,745 $3,489 $4,900 $1,655 $1,103 $799 $618 $581 $501 $396 $333 Retained Revenue per Minute $0.27 $0.31 $0.27 $0.10 $0.06 $0.04 $0.03 $0.03 $0.02 $0.02 $0.02
Sprint Nextel Corporation U.S. Billed Minutes 2,916 3,640 3,945 5,447 4,774 6,459 7,715 8,293 9,923 9,841 NA U.S. Billed Revenues $1,421 $1,379 $1,188 $1,386 $1,185 $1,479 $1,718 $1,550 $1,911 $1,778 " Revenue per Billed Minute $0.49 $0.38 $0.30 $0.25 $0.25 $0.23 $0.22 $0.19 $0.19 $0.18 " Originating + Terminating Minutes 4,795 5,507 5,957 7,977 7,389 9,573 9,968 11,754 13,423 13,314 " Retained Revenues 2/ $922 $825 $781 $773 $500 $894 $1,001 $1,136 $1,088 $988 " Retained Revenue per Minute $0.19 $0.15 $0.13 $0.10 $0.07 $0.09 $0.10 $0.10 $0.08 $0.07 NA
All Other Carriers* U.S. Billed Minutes 3,687 5,670 3,990 4,410 6,167 14,304 22,231 46,518 47,251 43,766 59,088 U.S. Billed Revenues $994 $1,337 $721 $793 $668 $1,320 $1,866 $4,390 $4,140 3,563 5,348 Revenue per Billed Minute $0.27 $0.24 $0.18 $0.18 $0.11 $0.09 $0.08 $0.09 $0.09 $0.08 $0.09 Originating + Terminating Minutes 4,283 6,434 4,615 5,416 6,741 16,490 26,944 58,993 61,772 58,702 79,933 Retained Revenues 2/ $383 $486 $276 $413 $191 $363 $727 $2,223 $2,081 $1,464 2,141 Retained Revenue per Minute $0.09 $0.08 $0.06 $0.08 $0.03 $0.02 $0.03 $0.04 $0.03 $0.02 $0.03
Total All Carriers* U.S. Billed Minutes 24,250 28,515 30,135 33,287 35,988 47,967 63,653 70,064 72,440 69,975 74,934 U.S. Billed Revenues $14,246 $14,528 $14,172 $10,844 $9,446 $8,863 $8,653 $7,400 $7,299 $6,524 $6,459 Revenue per Billed Minute $0.59 $0.51 $0.47 $0.33 $0.26 $0.18 $0.14 $0.11 $0.10 $0.09 $0.09 Originating + Terminating Minutes 34,448 39,280 43,023 46,765 49,665 64,823 83,231 91,929 95,851 93,917 101,334 Retained Revenues 2/ $9,383 $9,721 $10,084 $7,437 $6,312 $5,531 $4,746 $3,939 $3,669 $2,848 $2,474 Retained Revenue per Minute $0.27 $0.25 $0.23 $0.16 $0.13 $0.09 $0.06 $0.04 $0.04 $0.03 $0.02
Shares of U.S. Billed MinutesAT&T Corp. 43.1% 38.2% 32.5% 36.0% 35.5% 28.5% 26.3% NA NA NA NAMCI, Inc. 29.7% 29.1% 41.2% 34.4% 34.1% 28.2% 26.7% 21.8% 21.1% 23.4% 21.1%Sprint Nextel Corporation 12.0% 12.8% 13.1% 16.4% 13.3% 13.5% 12.1% 11.8% 13.7% 14.1% NAAll Other Carriers* 15.2% 19.9% 13.2% 13.2% 17.1% 29.8% 34.9% 66.4% 65.2% 62.5% 78.9%
Shares of Foreign Billed MinutesAT&T Corp. 45.7% 46.8% 36.9% 31.3% 37.3% 36.9% 35.7% NA NA NA NAMCI, Inc. 30.0% 28.7% 42.6% 42.4% 39.4% 31.6% 28.7% 27.1% 23.0% 23.1% 21.0%Sprint Nextel Corporation 18.4% 17.3% 15.6% 18.8% 19.1% 18.5% 11.5% 15.8% 15.0% 14.5% NAAll Other Carriers* 5.8% 7.1% 4.8% 7.5% 4.2% 13.0% 24.1% 57.1% 62.0% 62.4% 79.0%
* Years 2003-2008 include information for carriers requesting confidential treatment. Please see the addendum to Table 5, pages 40-41 herein, for a list of reporting carriers requesting confidential treatment.NA - Not Available.
44

Addendum to Table 8Note: Some previously published data have been revised.
1/ Data exclude pure resale traffic unless otherwise noted.
2/ Retained revenues shown for service that originates or terminates in the United States. These figures exclude revenues for calls that transit the United States. Retained revenues are calculated as revenues billed by U.S. carriers, less settlement amounts owed to foreign carriers for U.S. billed traffic, plus settlement amounts due to U.S. carriers for foreign-billed traffic.
45

2008 Annual Section 43.61 International Traffic Data for All U.S. Points: All Settlement ArrangementsTable A1: All United States Carriers Message Telephone Service Billing Types Covered: 1, 2, 3, 4, 5, 11, 12, 14, 15
International Point Traffic Billed in the United States Traffic Billed in Foreign Countries TotalOriginating or Terminating Transiting the United States U.S.
in the United States (by Country of Origin) CarriersNumber Number U.S. Payout Retained Number Number Receipts Number Receipts Payout Retained Retained
of of Carriers to Foreign Revenues of of from Foreign of from Foreign to Foreign Revenues RevenuesMessages Minutes Revenues Carriers Messages Minutes Carriers Minutes Carriers Carriers
Andorra 197,737 673,874 $95,526 $82,907 $12,619 1 14,790 $977 $60 $21 $39 $13,635Austria 31,698,281 151,347,938 $16,329,911 $11,523,792 $4,806,119 11,398,205 54,563,445 $1,825,474 $840,463 $21,995 $818,468 $7,450,061Belgium 67,730,698 255,603,267 $21,202,971 $13,495,685 $7,707,286 49,249,077 162,417,011 $2,150,480 $19,473,691 $7,427 $19,466,264 $29,324,030Cyprus 7,251,490 27,068,840 $1,881,304 $712,620 $1,168,684 1,860,705 7,579,010 $104,905 $124,472 $302 $124,170 $1,397,759Denmark 26,896,696 128,046,694 $11,136,682 $6,171,793 $4,964,889 4,341,955 27,575,429 $614,610 $4,535,307 $5,066 $4,530,241 $10,109,740Finland 11,458,832 59,766,443 $5,603,208 $3,659,885 $1,943,323 1,375,213 7,395,967 $112,233 $7,325 $15,270 -$7,945 $2,047,611France 154,667,390 699,049,771 $73,775,863 $35,922,039 $37,853,824 100,026,394 506,728,922 $8,033,986 $20,258,689 $53,277 $20,205,412 $66,093,222Germany 274,503,033 1,469,089,050 $99,201,350 $40,851,046 $58,350,304 149,485,741 940,260,553 $14,713,835 $35,996,200 $186,276 $35,809,924 $108,874,063Gibraltar 842,346 3,343,927 $261,180 $220,646 $40,534 77,848 309,132 $4,232 $5,536 $1,631 $3,905 $48,671Greece 31,003,105 214,421,667 $19,344,942 $9,455,531 $9,889,411 16,349,272 87,764,037 $2,322,088 $14,842,460 $17,500 $14,824,960 $27,036,459Greenland 194,630 260,817 $128,617 $99,011 $29,606 1 2,628 $1,288 $237 $41 $196 $31,090Iceland 3,132,093 16,057,054 $1,829,540 $1,112,560 $716,980 1,104,190 5,345,870 $111,995 $1,130 $1,326 -$196 $828,779Ireland 70,666,395 366,359,871 $38,468,029 $16,724,476 $21,743,553 37,271,582 239,945,014 $5,300,736 $7,231,516 $2,526 $7,228,990 $34,273,279Italy 155,096,174 764,308,611 $62,254,856 $36,471,352 $25,783,504 53,453,247 300,230,097 $4,917,768 $59,271,349 $39,841 $59,231,508 $89,932,780Liechtenstein 14,489,355 22,785,677 $9,084,503 $6,781,303 $2,303,200 9 72,060 $19,353 $37,585 $977 $36,608 $2,359,161Luxembourg 9,929,093 31,695,377 $2,730,572 $973,252 $1,757,320 1,618,730 9,658,778 $141,362 $2,942,259 $382 $2,941,877 $4,840,559Malta 3,857,023 20,910,587 $1,454,518 $1,063,265 $391,253 274,089 2,161,818 $42,666 $1,682 $3,532 -$1,850 $432,069Netherlands 151,254,121 713,208,402 $39,503,673 $22,693,509 $16,810,164 36,203,006 163,588,207 $2,199,989 $55,383,000 $240,987 $55,142,013 $74,152,166Norway 27,041,759 115,052,124 $11,690,035 $7,032,757 $4,657,278 17,368,539 90,712,491 $823,465 $4,836,514 $153 $4,836,361 $10,317,104Portugal 17,558,232 149,067,900 $11,987,316 $5,366,201 $6,621,115 7,747,876 48,564,962 $905,786 $2,808,501 $2,185 $2,806,316 $10,333,217Spain 142,481,711 515,037,113 $60,045,031 $36,898,442 $23,146,589 41,511,699 177,779,349 $2,543,318 $53,515,950 $62,253 $53,453,697 $79,143,604Sweden 35,070,294 233,419,510 $18,831,832 $10,365,406 $8,466,426 27,621,521 179,774,704 $2,229,430 $18,434,643 $1,553 $18,433,090 $29,128,946Switzerland 63,224,131 330,707,608 $30,224,400 $19,279,120 $10,945,280 139,347,882 288,772,513 $3,632,511 $18,879,517 $15,021 $18,864,496 $33,442,287Turkey 29,681,864 167,250,296 $17,255,500 $8,565,791 $8,689,709 5,923,075 33,211,165 $516,514 $938,786 $3,717 $935,069 $10,141,292United Kingdom 1,286,771,339 2,861,901,997 $242,244,410 $85,233,867 $157,010,543 552,521,046 1,644,262,881 $17,487,561 $85,627,679 $72,628 $85,555,051 $260,053,155
Western Europe 2,616,697,822 9,316,434,415 $796,565,769 $380,756,256 $415,809,513 1,256,130,903 4,978,690,833 $70,756,562 3,574,134,671 $405,994,551 $755,887 $405,238,664 $891,804,739
Algeria 12,575,429 41,061,275 $5,330,280 $4,715,972 $614,308 194,376 18,448,334 $1,325,064 $878 $8,498 -$7,620 $1,931,752Angola 14,657,041 51,489,773 $10,040,849 $7,010,497 $3,030,352 224,870 1,139,967 $42,677 $98,975 $127 $98,848 $3,171,877Benin 9,573,473 29,857,847 $5,033,191 $4,665,793 $367,398 413,622 1,490,000 $70,480 $851,118 $347 $850,771 $1,288,649Botswana 4,380,249 14,308,881 $2,013,516 $1,566,825 $446,691 251,917 1,506,039 $77,392 $450 $11,280 -$10,830 $513,253Burkina 17,882,722 36,886,122 $5,800,472 $4,850,985 $949,487 14,751,519 75,644,993 $102,122 $34,762 $87,034 -$52,272 $999,337Burundi 1,088,888 5,527,106 $576,773 $367,698 $209,075 1 275,454 $20,539 $684 $20,975 -$20,291 $209,323Cameroon 14,824,943 77,037,721 $13,891,883 $11,876,778 $2,015,105 377,780 2,475,658 $224,993 $4,334 $1,306 $3,028 $2,243,126Canary Island 0 0 $0 $0 $0 0 0 $0 $0 $0 $0 $0Cape Verde 7,298,952 36,651,023 $6,281,711 $6,293,994 -$12,283 120,918 809,775 $31,844 $17,417 $137 $17,280 $36,841Central African Republic 623,137 2,022,542 $517,244 $577,711 -$60,467 1 9,791 $2,390 $10 $6 $4 -$58,073Chad 7,026,856 12,195,599 $1,450,680 $1,183,701 $266,979 1 151,738 $16,193 $1,468 $4 $1,464 $284,636Comoros 2,072,776 6,618,286 $2,248,214 $2,085,674 $162,540 2 31,281 $8,767 $798 $204 $594 $171,901Congo 8,854,063 35,977,976 $4,103,083 $3,629,600 $473,483 1 744,246 $70,190 $3,628 $742 $2,886 $546,559Cote d'Ivoire 15,195,680 58,665,875 $10,726,608 $8,480,713 $2,245,895 701,209 1,834,579 $99,210 $2,670,368 $1,271 $2,669,097 $5,014,202Djibouti 1,704,854 5,521,230 $1,413,883 $1,351,529 $62,354 222,403 815,509 $73,899 $776 $1 $775 $137,028Egypt 91,303,649 390,607,100 $38,059,690 $36,295,948 $1,763,742 10,478,249 30,498,909 $703,630 $52,881 $6,958 $45,923 $2,513,295Equatorial Guinea 2,543,098 7,414,342 $1,538,029 $1,278,429 $259,600 32,616 121,315 $8,986 $974 $14 $960 $269,546
- Switched Services Page 1 -

2008 Annual Section 43.61 International Traffic Data for All U.S. Points: All Settlement ArrangementsTable A1: All United States Carriers Message Telephone Service Billing Types Covered: 1, 2, 3, 4, 5, 11, 12, 14, 15
International Point Traffic Billed in the United States Traffic Billed in Foreign Countries TotalOriginating or Terminating Transiting the United States U.S.
in the United States (by Country of Origin) CarriersNumber Number U.S. Payout Retained Number Number Receipts Number Receipts Payout Retained Retained
of of Carriers to Foreign Revenues of of from Foreign of from Foreign to Foreign Revenues RevenuesMessages Minutes Revenues Carriers Messages Minutes Carriers Minutes Carriers Carriers
Ethiopia 40,473,774 189,944,421 $34,703,732 $34,603,720 $100,012 890,911 5,427,834 $536,630 $65,006 $41,948 $23,058 $659,700Gabon 10,334,702 28,013,879 $2,777,370 $3,425,532 -$648,162 393,886 1,445,849 $54,787 $1,898,256 $93 $1,898,163 $1,304,788Gambia, The 6,130,504 22,218,854 $5,718,336 $5,327,014 $391,322 1 1,227,183 $303,574 $2,717 $17,420 -$14,703 $680,193Ghana 55,142,246 346,672,164 $50,014,164 $36,248,834 $13,765,330 4,033,458 38,491,943 $2,066,933 $48,565 $3,028 $45,537 $15,877,800Guinea 11,032,052 43,600,909 $7,409,046 $6,526,863 $882,183 1 2,387,151 $339,865 $1,988 $19,485 -$17,497 $1,204,551Guinea-Bissau 2,282,856 5,938,913 $3,345,633 $2,150,697 $1,194,936 1 10,138 $4,047 $171 $136 $35 $1,199,018Kenya 10,707,453 63,637,287 $9,107,313 $5,604,751 $3,502,562 289,519 4,506,938 $257,616 $3,588 $272 $3,316 $3,763,494Lesotho 443,746 2,298,051 $422,245 $392,415 $29,830 35,636 168,984 $4,072 $54,200 $32,931 $21,269 $55,171Liberia 8,130,095 32,324,602 $6,161,464 $5,275,773 $885,691 1 181,222 $30,866 $2,657 $190 $2,467 $919,024Libya 21,745,524 52,766,752 $10,583,592 $9,545,924 $1,037,668 21,388 470,407 $82,589 $2,979 $226 $2,753 $1,123,010Madagascar 7,145,732 20,033,758 $6,229,548 $7,696,707 -$1,467,159 1 269,366 $37,547 $12,849 $269 $12,580 -$1,417,032Malawi 6,511,570 27,146,400 $3,077,092 $3,120,720 -$43,628 73,059 850,390 $67,720 $2,521 $16 $2,505 $26,597Mali 15,873,073 45,807,021 $8,115,943 $7,864,189 $251,754 647,005 5,243,264 $723,018 $31,664 $588 $31,076 $1,005,848Mauritania 3,566,491 12,122,915 $2,320,247 $1,894,200 $426,047 51,084 586,718 $40,394 $1,226 $2 $1,224 $467,665Mauritius 11,606,248 32,866,644 $1,043,582 $546,949 $496,633 190,136 8,049,171 $525,185 $177,104 $2,183 $174,921 $1,196,739Morocco 36,858,015 170,484,074 $32,831,388 $33,526,437 -$695,049 3,268,854 17,392,924 $936,377 $10,972 $2,828 $8,144 $249,472Mozambique 4,547,931 9,261,030 $1,422,990 $888,917 $534,073 146,570 938,210 $22,829 $327 $16 $311 $557,213Namibia 1,316,244 5,296,223 $831,514 $623,561 $207,953 141,834 1,138,923 $44,204 $377 $8,438 -$8,061 $244,096Niger 14,300,487 36,929,880 $3,824,140 $3,259,497 $564,643 1 273,981 $25,331 $4 $2 $2 $589,976Nigeria 120,325,769 663,918,605 $80,157,621 $60,860,054 $19,297,567 28,781,084 63,493,487 $1,172,846 $4,061,973 $19,228 $4,042,745 $24,513,158Reunion 1,445,567 6,261,560 $1,037,638 $1,290,936 -$253,298 1 28,296 $3,345 $92 $20 $72 -$249,881Rwanda 1,012,469 5,874,900 $592,403 $507,711 $84,692 1 644,828 $53,912 $649 $12 $637 $139,241Saint Helena 27,825 51,447 $35,263 $24,044 $11,219 73 379 $82 $323 $155 $168 $11,469Sao Tome and Principe 9,265,218 21,654,691 $17,900,351 $16,734,852 $1,165,499 1 569 $241 $1,238 $80 $1,158 $1,166,898Senegal 24,364,640 109,547,106 $19,571,938 $17,065,957 $2,505,981 3,108,949 12,543,924 $730,108 $18,874 $46,303 -$27,429 $3,208,660Seychelles 615,264 2,403,200 $284,080 $150,453 $133,627 1 273,833 $17,840 $23,023 $79 $22,944 $174,411Sierra Leone 12,145,191 70,300,668 $17,926,976 $16,972,060 $954,916 4,087,764 8,062,085 $599,257 $53,176 $12,396 $40,780 $1,594,953Somalia 9,653,860 20,767,345 $7,949,648 $7,548,226 $401,422 1,195,698 1,377,977 $84,901 $34,186 $64 $34,122 $520,445South Africa 49,596,451 252,690,572 $29,495,248 $16,515,650 $12,979,598 49,937,020 149,495,083 $1,525,673 $12,695,606 $4,832 $12,690,774 $27,196,045Sudan 8,237,138 45,199,563 $4,933,860 $3,716,810 $1,217,050 246,676 6,269,905 $395,271 $130,349 $110,245 $20,104 $1,632,425Swaziland 1,722,950 6,016,233 $822,932 $595,843 $227,089 86,843 337,722 $7,843 $117 $436 -$319 $234,613Tanzania 6,380,105 33,642,873 $4,633,023 $2,950,116 $1,682,907 169,036 4,006,163 $318,172 $415,983 $9,183 $406,800 $2,407,879Togo 9,897,717 26,233,615 $6,412,366 $5,910,711 $501,655 59,579 1,883,397 $452,441 $170,667 $91 $170,576 $1,124,672Tunisia 15,115,719 63,323,266 $14,448,569 $14,353,303 $95,266 999,779 4,338,285 $503,619 $31,006 $61,008 -$30,002 $568,883Uganda 9,876,279 56,516,464 $6,842,373 $4,671,545 $2,170,828 710,201 3,774,418 $200,706 $976,416 $108 $976,308 $3,347,842Western Sahara 0 0 $0 $0 $0 0 0 $0 $0 $0 $0 $0Zaire 7,229,388 25,473,008 $6,128,703 $6,036,733 $91,970 2,881,053 11,624,866 $620,114 $6,197,152 $0 $6,197,152 $6,909,236Zambia 6,840,742 40,177,762 $4,215,029 $3,545,381 $669,648 368,389 2,046,147 $87,681 $454,348 $25 $454,323 $1,211,652Zimbabwe 12,020,780 42,670,574 $7,612,103 $6,949,104 $662,999 448,110 5,048,570 $238,128 $2,345 $16,317 -$13,972 $887,155
Africa 785,527,625 3,451,929,927 $529,965,569 $451,154,036 $78,811,533 131,033,089 500,308,118 $15,994,140 249,804,255 $31,324,215 $549,557 $30,774,658 $125,580,331
Bahrain 5,928,690 23,677,937 $2,712,296 $1,234,040 $1,478,256 2,548,187 7,688,885 $71,423 $527,490 $108,325 $419,165 $1,968,844Iran 39,037,701 136,817,027 $13,694,945 $12,344,555 $1,350,390 5,169,632 25,589,140 $783,803 $31,778 $150,980 -$119,202 $2,014,991Iraq 20,004,614 89,490,386 $10,337,786 $6,329,384 $4,008,402 8,613 12,814,203 $929,865 $8,830 $517 $8,313 $4,946,580Israel 90,736,358 538,899,816 $71,520,005 $28,055,238 $43,464,767 73,927,544 359,680,713 $3,340,051 $3,867,300 $171,235 $3,696,065 $50,500,883
- Switched Services Page 2 -

2008 Annual Section 43.61 International Traffic Data for All U.S. Points: All Settlement ArrangementsTable A1: All United States Carriers Message Telephone Service Billing Types Covered: 1, 2, 3, 4, 5, 11, 12, 14, 15
International Point Traffic Billed in the United States Traffic Billed in Foreign Countries TotalOriginating or Terminating Transiting the United States U.S.
in the United States (by Country of Origin) CarriersNumber Number U.S. Payout Retained Number Number Receipts Number Receipts Payout Retained Retained
of of Carriers to Foreign Revenues of of from Foreign of from Foreign to Foreign Revenues RevenuesMessages Minutes Revenues Carriers Messages Minutes Carriers Minutes Carriers Carriers
Jordan 10,715,449 67,813,491 $6,059,948 $3,071,758 $2,988,190 4,918,526 29,449,586 $495,279 $2,517,162 $183,439 $2,333,723 $5,817,192Kuwait 39,203,328 106,418,960 $9,185,926 $7,761,726 $1,424,200 6,043,506 26,329,201 $273,696 $14,481 $2,528 $11,953 $1,709,849Lebanon 39,505,289 239,735,334 $27,601,382 $22,941,262 $4,660,120 3,000,703 25,322,081 $1,189,963 $30,724 $8,544 $22,180 $5,872,263Oman 25,275,112 68,389,964 $10,132,222 $8,956,099 $1,176,123 929,978 5,005,762 $242,990 $28,031 $1,348 $26,683 $1,445,796Qatar 15,105,157 40,210,216 $7,307,216 $5,807,719 $1,499,497 3,641,996 12,514,494 $185,048 $511,318 $7,189 $504,129 $2,188,674Saudi Arabia 85,247,719 269,447,741 $34,102,405 $27,288,690 $6,813,715 17,865,622 65,627,680 $948,096 $616,125 $174,190 $441,935 $8,203,746Syria 20,845,873 91,880,266 $14,433,371 $11,351,851 $3,081,520 1,388,295 11,426,903 $1,029,420 $8,319 $615 $7,704 $4,118,644United Arab Emirates 96,483,749 316,917,638 $48,498,700 $40,684,851 $7,813,849 23,843,429 93,573,750 $1,041,795 $906,837 $27,976 $878,861 $9,734,505Yemen 21,316,958 86,641,861 $9,738,248 $9,155,222 $583,026 1,813,679 4,162,776 $202,088 $7,896 $5,161 $2,735 $787,849
Middle East 509,405,997 2,076,340,637 $265,324,450 $184,982,395 $80,342,055 145,099,710 679,185,174 $10,733,517 137,029,595 $9,076,291 $842,047 $8,234,244 $99,309,816
Anguilla 2,330,489 5,885,589 $1,246,217 $857,829 $388,388 356,828 1,063,056 $10,404 $204,634 $92,383 $112,251 $511,043Antigua and Barbuda 8,738,066 32,581,030 $4,277,235 $17,688,431 -$13,411,196 1,334,559 3,858,398 $52,596 $103,406 $36,190 $67,216 -$13,291,384Aruba 9,847,761 33,510,163 $4,898,908 $3,888,493 $1,010,415 2,708,045 7,576,669 $69,952 $198,766 $93,192 $105,574 $1,185,941Bahamas, The 39,750,689 136,170,617 $9,884,846 $3,424,464 $6,460,382 23,903,918 69,748,506 $784,422 $3,606,789 $1,925 $3,604,864 $10,849,668Barbados 15,826,713 61,247,693 $9,031,607 $6,337,632 $2,693,975 11,458,877 43,278,096 $861,034 $648,836 $27,484 $621,352 $4,176,361Bermuda 15,413,831 52,416,976 $4,358,221 $1,871,576 $2,486,645 6,446,800 37,326,829 $405,595 $5,994 $1,259 $4,735 $2,896,975Cayman Islands 13,614,580 38,991,856 $6,129,860 $3,593,347 $2,536,513 4,015,466 13,579,909 $221,128 $20,476 $8,392 $12,084 $2,769,725Cuba 59,173,113 258,322,444 $215,455,990 $200,051,988 $15,404,002 2 1,071,641 $812,620 $23,002 $16,650 $6,352 $16,222,974Dominica 10,258,140 53,616,442 $5,537,836 $4,927,803 $610,033 708,083 2,206,143 $46,782 $256,762 $120,398 $136,364 $793,179Dominican Republic 255,563,042 1,890,273,281 $133,872,955 $89,446,554 $44,426,401 110,754,849 273,870,933 $4,069,605 $3,342,431 $652,293 $2,690,138 $51,186,144French Overseas Departments 2,861,759 7,316,435 $2,370,196 $1,278,014 $1,092,182 462,974 3,324,612 $37,573 $14,405 $7,087 $7,318 $1,137,073Grenada 6,298,022 46,826,108 $6,317,592 $4,908,295 $1,409,297 916,847 13,082,381 $317,441 $31,254 $14,229 $17,025 $1,743,763Guadeloupe 5,383,958 14,427,269 $2,062,390 $1,814,313 $248,077 1 36,409 $6,935 $487,818 $225,046 $262,772 $517,784Haiti 129,851,782 599,984,470 $108,759,179 $141,155,705 -$32,396,526 15,272,838 39,081,482 $2,534,822 $7,367,396 $5,245,020 $2,122,376 -$27,739,328Jamaica 167,347,171 738,986,453 $106,906,210 $87,985,670 $18,920,540 71,834,108 257,574,336 $3,787,725 $2,649,098 $376,347 $2,272,751 $24,981,016Montserrat 530,045 2,811,717 $375,620 $284,331 $91,289 8,740 29,970 $1,678 $11,501 $3,474 $8,027 $100,994Netherlands Antilles 22,807,433 79,345,239 $8,235,363 $6,206,838 $2,028,525 6,102,668 18,987,178 $196,670 $4,016,277 $3,097,933 $918,344 $3,143,539Saint Kitts and Nevis 5,428,548 21,870,222 $3,795,084 $2,768,261 $1,026,823 292,624 948,629 $15,748 $182,110 $85,736 $96,374 $1,138,945Saint Lucia 6,918,401 35,958,975 $5,008,063 $3,826,992 $1,181,071 854,671 3,967,956 $157,806 $125,348 $55,954 $69,394 $1,408,271Saint Vincent and the Grenadines 4,403,635 28,110,269 $3,616,944 $3,251,107 $365,837 109,622 2,164,334 $211,281 $58,324 $28,752 $29,572 $606,690Trinidad and Tobago 43,686,893 252,582,149 $31,796,803 $18,059,272 $13,737,531 33,923,759 145,411,036 $1,574,629 $589,021 $77,393 $511,628 $15,823,788Turks and Caicos Islands 10,325,777 21,937,616 $4,455,153 $3,440,845 $1,014,308 1,496,813 3,681,214 $57,096 $6,457 $3,533 $2,924 $1,074,328Virgin Islands, British 6,992,771 20,721,563 $4,334,811 $2,458,537 $1,876,274 4,716,117 15,032,573 $261,948 $38,324 $22,821 $15,503 $2,153,725
Navassa Island 0 0 $0 $0 $0 0 0 $0 $0 $0 $0 $0Puerto Rico 3,336 40,092 $1,672 $759 $913 0 0 $0 $0 $0 $0 $913U.S. Virgin Islands 3,471,438 18,667,665 $170,185 $156,875 $13,310 1 155,339 $1,473 $110,984 $25,517 $85,467 $100,250
Caribbean 846,827,393 4,452,602,333 $682,898,940 $609,683,931 $73,215,009 297,679,210 957,057,629 $16,496,963 164,777,689 $24,099,413 $10,319,008 $13,780,405 $103,492,377
Belize 9,452,261 50,200,126 $10,804,000 $8,479,230 $2,324,770 1,838,769 8,125,932 $209,934 $93,725 $1,012 $92,713 $2,627,417Canada 2,249,887,895 9,480,793,659 $583,654,798 $97,664,511 $485,990,287 2,966,822,068 9,485,956,506 $47,938,915 $61,583,569 $10,511,197 $51,072,372 $585,001,574Costa Rica 78,700,264 421,780,276 $42,661,800 $28,318,669 $14,343,131 15,984,929 66,394,955 $2,514,491 $3,238 $1,237 $2,001 $16,859,623El Salvador 126,929,723 959,600,176 $99,038,187 $85,325,664 $13,712,523 154,021,772 683,923,701 $7,504,830 $630,414 $108 $630,306 $21,847,659Guatemala 207,974,071 1,910,345,062 $191,970,359 $177,066,151 $14,904,208 99,016,546 429,200,106 $4,259,339 $3,445,975 $1,429 $3,444,546 $22,608,093Honduras 49,996,655 288,629,331 $43,446,701 $37,855,218 $5,591,483 42,859,949 161,820,098 $2,516,322 $1,801,182 $1,465 $1,799,717 $9,907,522
- Switched Services Page 3 -

2008 Annual Section 43.61 International Traffic Data for All U.S. Points: All Settlement ArrangementsTable A1: All United States Carriers Message Telephone Service Billing Types Covered: 1, 2, 3, 4, 5, 11, 12, 14, 15
International Point Traffic Billed in the United States Traffic Billed in Foreign Countries TotalOriginating or Terminating Transiting the United States U.S.
in the United States (by Country of Origin) CarriersNumber Number U.S. Payout Retained Number Number Receipts Number Receipts Payout Retained Retained
of of Carriers to Foreign Revenues of of from Foreign of from Foreign to Foreign Revenues RevenuesMessages Minutes Revenues Carriers Messages Minutes Carriers Minutes Carriers Carriers
Mexico 1,272,300,023 11,756,224,026 $749,375,034 $565,307,102 $184,067,932 533,069,459 2,315,898,963 $35,336,159 $1,646,451 $900,886 $745,565 $220,149,656Nicaragua 50,665,534 280,819,819 $48,161,262 $36,412,133 $11,749,129 26,060,852 75,695,484 $719,887 $449,270 $1,314 $447,956 $12,916,972Panama 31,966,374 176,904,202 $14,273,945 $8,056,499 $6,217,446 16,635,159 61,714,843 $1,047,816 $1,038,251 $7,608 $1,030,643 $8,295,905Saint Pierre and Miquelon 310,720 814,746 $114,428 $135,040 -$20,612 1 7,248 $1,091 $96 $0 $96 -$19,425
Alaska 9,124 75,414 $3,473 $1,328 $2,145 0 0 $0 $0 $0 $0 $2,145United States (conterminous) 6,142,100 46,447,641 $2,769,325 $402,685 $2,366,640 11,289,595 51,493,973 $581,919 $0 $0 $0 $2,948,559
North and Central America 4,084,334,744 25,372,634,478 $1,786,273,312 $1,045,024,230 $741,249,082 3,867,599,099 13,340,231,809 $102,630,703 935,086,905 $70,692,171 $11,426,256 $59,265,915 $903,145,700
Argentina 94,326,498 693,039,942 $29,197,680 $11,657,723 $17,539,957 21,122,753 94,766,201 $1,790,225 $14,971,947 $3,126 $14,968,821 $34,299,003Bolivia 53,119,108 362,489,911 $29,178,094 $23,274,021 $5,904,073 3,010,976 12,065,670 $266,645 $2,084,922 $3,212 $2,081,710 $8,252,428Brazil 268,116,371 1,197,661,757 $120,053,316 $67,994,313 $52,059,003 36,085,793 206,473,309 $3,717,024 $21,061,296 $7,242 $21,054,054 $76,830,081Chile 30,497,727 243,514,627 $18,738,354 $11,641,709 $7,096,645 18,336,193 98,676,119 $3,789,179 $4,725,397 $1,565 $4,723,832 $15,609,656Colombia 387,829,315 2,745,447,962 $197,945,140 $153,665,628 $44,279,512 15,291,593 107,046,261 $3,228,237 $2,096,719 $88,753 $2,007,966 $49,515,715Ecuador 87,613,782 633,880,014 $76,267,730 $69,791,278 $6,476,452 11,695,340 79,858,627 $4,556,867 $13,963 $3,933 $10,030 $11,043,349French Guiana 7,721,145 14,070,731 $1,809,428 $2,050,007 -$240,579 1 42,898 $3,549 $5,176 $1,890 $3,286 -$233,744Guyana 35,711,371 188,077,332 $42,476,222 $37,852,519 $4,623,703 5,230,978 15,941,916 $648,155 $511,351 $271,440 $239,911 $5,511,769Paraguay 9,777,731 67,374,934 $4,880,793 $4,049,322 $831,471 698,732 5,214,076 $263,163 $235 $70 $165 $1,094,799Peru 117,084,690 1,453,510,705 $58,021,889 $31,400,935 $26,620,954 23,152,694 184,938,911 $3,438,121 $13,333,745 $14,414 $13,319,331 $43,378,406Suriname 15,490,751 75,933,174 $6,413,971 $10,699,328 -$4,285,357 826,575 3,114,249 $160,621 $103,212 $39,816 $63,396 -$4,061,340Uruguay 11,161,879 77,772,608 $8,680,497 $5,163,816 $3,516,681 1,850,149 13,152,892 $260,741 $621,423 $587 $620,836 $4,398,258Venezuela 57,063,636 292,469,457 $30,596,177 $14,523,817 $16,072,360 23,429,588 114,463,176 $1,392,694 $1,310,440 $26,864 $1,283,576 $18,748,630
South America 1,175,514,004 8,045,243,154 $624,259,291 $443,764,416 $180,494,875 160,731,365 935,754,305 $23,515,221 593,952,926 $60,839,826 $462,912 $60,376,914 $264,387,010
Afghanistan 40,427,513 130,757,972 $25,911,784 $23,347,353 $2,564,431 847,976 17,465,726 $2,643,014 $65,013 $2,023 $62,990 $5,270,435Bangladesh 80,053,541 426,126,020 $13,639,391 $17,683,045 -$4,043,654 844,268 31,868,073 $929,219 $447,913 $411 $447,502 -$2,666,933Bhutan 711,467 2,374,274 $325,300 $273,997 $51,303 1 10,154 $1,234 $6,683 $358 $6,325 $58,862Brunei 2,910,740 12,151,618 $529,320 $375,851 $153,469 614,246 2,420,783 $39,619 $634 $477 $157 $193,245Burma 11,077,277 43,083,584 $9,909,719 $9,936,567 -$26,848 1 168,404 $31,907 $4,910 $1,669 $3,241 $8,300Cambodia 13,813,166 132,667,547 $9,797,454 $7,594,061 $2,203,393 240,554 2,681,178 $128,829 $60,193 $5,866 $54,327 $2,386,549Chagos Archipelago 106,811 309,808 $381,943 $128,455 $253,488 4,594 126,416 $47,563 $1,091 $7,218 -$6,127 $294,924China 211,897,881 1,359,049,211 $88,996,743 $37,441,943 $51,554,800 49,096,591 257,712,501 $9,531,963 $316,935 $20,208 $296,727 $61,383,490French Southern and Antarctic Lands 0 0 $0 $0 $0 0 0 $0 $0 $0 $0 $0Hong Kong 61,884,108 292,449,048 $17,572,642 $4,707,298 $12,865,344 51,058,673 219,468,177 $2,396,605 $17,676,033 $3,631 $17,672,402 $32,934,351India 2,201,023,885 8,443,777,596 $531,140,064 $315,737,679 $215,402,385 440,037,361 1,653,855,162 $24,969,225 $14,308,501 $29,901 $14,278,600 $254,650,210Indonesia 47,167,223 209,159,795 $20,227,494 $13,035,385 $7,192,109 5,920,506 26,036,584 $384,402 $108,275 $18,273 $90,002 $7,666,513Japan 126,385,530 693,460,379 $68,009,168 $43,075,253 $24,933,915 73,795,380 450,359,916 $12,564,057 $3,982,478 $157,473 $3,825,005 $41,322,977Korea, North 120,340 105,599 $69,361 $123,698 -$54,337 1 186 $67 $208 $2,535 -$2,327 -$56,597Korea, South 221,502,171 586,035,667 $35,011,745 $19,753,473 $15,258,272 101,676,574 437,396,006 $12,199,916 $9,253,894 $54 $9,253,840 $36,712,028Laos 2,326,108 24,312,650 $1,330,042 $928,855 $401,187 3,205 5,635,616 $235,400 $161,414 $38 $161,376 $797,963Macau 2,605,314 9,538,611 $814,439 $763,125 $51,314 5,755,589 22,921,744 $483,321 $391,243 $624 $390,619 $925,254Malaysia 96,671,946 306,927,277 $20,389,568 $11,116,968 $9,272,600 15,634,045 68,375,774 $1,151,002 $1,563,464 $28,954 $1,534,510 $11,958,112Maldives 697,955 1,819,007 $367,150 $272,579 $94,571 65,001 208,047 $3,199 $280,966 $731 $280,235 $378,005Mongolia 2,221,921 12,302,826 $1,554,607 $1,201,646 $352,961 144,907 528,114 $14,856 $8,666 $69,877 -$61,211 $306,606Nepal 42,479,900 121,645,645 $17,170,434 $16,901,960 $268,474 2,999,915 6,311,834 $242,410 $177,344 $1,547,656 -$1,370,312 -$859,428Pakistan 76,220,808 555,784,448 $43,304,710 $33,344,320 $9,960,390 14,572,154 143,751,582 $3,748,332 $4,862,423 $241,169 $4,621,254 $18,329,976
- Switched Services Page 4 -

2008 Annual Section 43.61 International Traffic Data for All U.S. Points: All Settlement ArrangementsTable A1: All United States Carriers Message Telephone Service Billing Types Covered: 1, 2, 3, 4, 5, 11, 12, 14, 15
International Point Traffic Billed in the United States Traffic Billed in Foreign Countries TotalOriginating or Terminating Transiting the United States U.S.
in the United States (by Country of Origin) CarriersNumber Number U.S. Payout Retained Number Number Receipts Number Receipts Payout Retained Retained
of of Carriers to Foreign Revenues of of from Foreign of from Foreign to Foreign Revenues RevenuesMessages Minutes Revenues Carriers Messages Minutes Carriers Minutes Carriers Carriers
Philippines 428,333,057 2,972,484,872 $359,115,353 $320,024,038 $39,091,315 43,328,959 179,764,335 $6,331,434 $5,439,801 $18,022 $5,421,779 $50,844,528Singapore 61,894,018 343,724,497 $26,035,513 $6,131,680 $19,903,833 24,941,908 124,139,560 $1,755,416 $10,465,884 $331 $10,465,553 $32,124,802Sri Lanka 61,928,835 385,946,524 $31,334,247 $27,797,786 $3,536,461 2,341,955 13,524,225 $446,616 $1,778,357 $1,221,285 $557,072 $4,540,149Taiwan 133,001,156 638,778,440 $46,724,080 $36,819,091 $9,904,989 47,675,046 204,046,581 $5,498,474 $1,620,182 $71,133 $1,549,049 $16,952,512Thailand 65,562,707 290,406,252 $12,296,825 $6,701,583 $5,595,242 15,370,128 251,295,437 $2,977,742 $13,767 $307 $13,460 $8,586,444Vietnam 71,034,792 507,114,150 $27,358,839 $25,021,934 $2,336,905 10,282,968 74,618,114 $2,044,202 $20,777 $16,872 $3,905 $4,385,012
Asia 4,064,060,170 18,502,293,317 $1,409,317,935 $980,239,623 $429,078,312 907,252,506 4,194,690,229 $90,800,024 1,199,382,261 $73,017,049 $3,467,096 $69,549,953 $589,428,289
Australia 265,795,674 802,742,857 $60,605,000 $19,694,307 $40,910,693 88,625,465 483,422,601 $5,242,206 $3,729,721 $34,869 $3,694,852 $49,847,751Cook Islands 148,027 508,275 $286,267 $240,415 $45,852 1 1,465 $649 $17,619 $1 $17,618 $64,119Fiji 5,723,527 40,702,175 $7,830,059 $7,176,716 $653,343 372,636 3,585,703 $253,152 $2,855 $8,907 -$6,052 $900,443French Polynesia 3,349,870 11,327,125 $2,421,002 $1,904,667 $516,335 138,006 509,387 $21,468 $611 $171 $440 $538,243Kiribati 172,195 702,747 $307,839 $275,587 $32,252 1 609 $314 $1,448 $43 $1,405 $33,971Marshall Islands 56,308,406 5,659,905 $2,193,212 $951,644 $1,241,568 8,653 30,583 $2,244 $1,032 $0 $1,032 $1,244,844Micronesia, Federated States of 7,521,466 13,219,189 $2,582,735 $1,660,842 $921,893 75,090 483,743 $4,130 $13 $109 -$96 $925,927Nauru 77,533 304,392 $230,955 $392,089 -$161,134 1 42 $28 $160 $18 $142 -$160,964New Caledonia 725,762 2,280,435 $534,550 $453,701 $80,849 1 16,234 $3,322 $1,110 $534 $576 $84,747New Zealand 34,896,494 218,701,351 $19,376,330 $12,689,685 $6,686,645 10,979,958 87,850,234 $1,291,386 $187,434 $1,574 $185,860 $8,163,891Niue 9,832 44,195 $24,196 $22,736 $1,460 1 737 $344 $1 $1 $0 $1,804Norfolk Island 10,406 23,763 $26,363 $12,854 $13,509 1 66 $47 $0 $0 $0 $13,556Pacific Islands (Palau) 926,067 3,887,438 $1,212,631 $663,593 $549,038 174,893 673,500 $15,949 $34 $145 -$111 $564,876Papua New Guinea 1,169,068 3,173,324 $2,064,267 $1,477,465 $586,802 1 6,530 $2,253 $292 $1,216 -$924 $588,131Solomon Islands 170,118 415,865 $312,061 $365,243 -$53,182 1 1,335 $551 $461 $213 $248 -$52,383Tonga 2,359,970 19,555,440 $3,401,543 $2,965,285 $436,258 193,240 1,170,251 $54,713 $971 $2,878 -$1,907 $489,064Tuvalu 17,294 72,568 $65,298 $103,621 -$38,323 0 0 $0 $9 $60 -$51 -$38,374Vanuatu 227,010 571,849 $225,286 $211,673 $13,613 1 2,769 $1,224 $32 $12 $20 $14,857Wallis and Futuna 33,890 174,162 $68,609 $65,051 $3,558 1 744 $276 $164 $0 $164 $3,998Western Samoa 1,186,922 6,722,127 $1,985,428 $1,740,953 $244,475 2,735 108,581 $31,945 $474 $16 $458 $276,878
American Samoa 2,230,902 13,850,472 $889,454 $794,479 $94,975 462,554 1,346,012 $74,225 $9 $402 -$393 $168,807Baker Island 0 0 $0 $0 $0 0 0 $0 $0 $0 $0 $0Guam 6,427,756 40,359,261 $1,609,084 $430,667 $1,178,417 2,048,578 12,875,803 $142,962 $128 $22 $106 $1,321,485Hawaii 382,647 2,272,683 $131,089 $40,035 $91,054 0 0 $0 $0 $0 $0 $91,054Howland Island 0 0 $0 $0 $0 0 0 $0 $0 $0 $0 $0Jarvis Island 0 0 $0 $0 $0 0 0 $0 $0 $0 $0 $0Johnston Atoll 0 0 $0 $0 $0 0 0 $0 $0 $0 $0 $0Kingman Reef 0 0 $0 $0 $0 0 0 $0 $0 $0 $0 $0Midway Atoll 4 2 $2 $2 $0 0 0 $0 $0 $0 $0 $0Northern Mariana Islands 2,227,712 11,399,325 $583,440 $134,324 $449,116 21,873 135,308 $2,091 $0 $0 $0 $451,207Palmyra Atoll 0 0 $0 $0 $0 0 0 $0 $0 $0 $0 $0Wake Island 0 0 $0 $0 $0 0 0 $0 $1,027 $184 $843 $843
Oceania 392,098,552 1,198,670,925 $108,966,700 $54,467,634 $54,499,066 103,103,691 592,222,237 $7,145,479 56,390,040 $3,945,605 $51,375 $3,894,230 $65,538,775
Albania 13,771,734 68,788,134 $10,396,947 $9,612,419 $784,528 291,534 2,696,024 $134,709 $1,204 $9 $1,195 $920,432Armenia 9,106,307 55,350,412 $3,193,530 $3,282,020 -$88,490 165,916 1,187,474 $15,137 $966 $46,453 -$45,487 -$118,840Azerbaijan 15,848,613 33,882,977 $4,302,024 $3,738,883 $563,141 977,897 3,180,249 $70,540 $9,154 $1,900 $7,254 $640,935Belarus 17,064,964 81,526,507 $15,337,354 $14,715,062 $622,292 641,998 2,820,430 $103,220 $9,175 $3,742 $5,433 $730,945
- Switched Services Page 5 -

2008 Annual Section 43.61 International Traffic Data for All U.S. Points: All Settlement ArrangementsTable A1: All United States Carriers Message Telephone Service Billing Types Covered: 1, 2, 3, 4, 5, 11, 12, 14, 15
International Point Traffic Billed in the United States Traffic Billed in Foreign Countries TotalOriginating or Terminating Transiting the United States U.S.
in the United States (by Country of Origin) CarriersNumber Number U.S. Payout Retained Number Number Receipts Number Receipts Payout Retained Retained
of of Carriers to Foreign Revenues of of from Foreign of from Foreign to Foreign Revenues RevenuesMessages Minutes Revenues Carriers Messages Minutes Carriers Minutes Carriers Carriers
Bosnia and Herzegovina 7,010,098 55,279,592 $8,690,840 $7,772,606 $918,234 168,972 1,858,398 $68,549 $324,963 $108 $324,855 $1,311,638Bulgaria 18,927,183 86,948,598 $16,296,765 $13,815,463 $2,481,302 1,627,770 11,616,101 $256,805 $212,643 $603 $212,040 $2,950,147Croatia 5,063,174 38,836,278 $3,742,326 $2,015,644 $1,726,682 901,612 5,816,661 $102,366 $61,100 $8,637 $52,463 $1,881,511Czech Republic 18,116,755 79,203,228 $12,868,257 $8,318,973 $4,549,284 3,528,545 16,594,189 $295,360 $52,736 $12,125 $40,611 $4,885,255Estonia 3,003,496 14,402,677 $2,922,404 $2,024,819 $897,585 228,706 982,474 $18,934 $575 $102 $473 $916,992Georgia 19,076,233 55,590,446 $5,019,648 $4,212,772 $806,876 382,065 1,514,997 $34,123 $1,144 $58 $1,086 $842,085Hungary 13,161,507 100,240,979 $9,070,034 $4,066,579 $5,003,455 883,434 6,889,705 $118,557 $249,513 $13,979 $235,534 $5,357,546Kazakhstan 7,030,039 39,512,441 $4,113,918 $3,374,531 $739,387 241,159 1,322,914 $22,998 $1,348 $155,642 -$154,294 $608,091Kyrgyzstan 3,281,226 12,100,577 $1,215,016 $1,008,472 $206,544 1 111,606 $8,878 $884 $536 $348 $215,770Latvia 3,073,975 16,366,527 $1,769,591 $1,199,975 $569,616 375,985 2,132,545 $29,271 $124,858 $27,945 $96,913 $695,800Lithuania 3,815,102 24,169,768 $3,895,093 $2,367,912 $1,527,181 454,682 2,576,095 $59,418 $65,732 $785 $64,947 $1,651,546Moldova 6,101,136 19,064,546 $3,141,640 $2,043,452 $1,098,188 944 331,407 $28,529 $99,695 $3,521 $96,174 $1,222,891Poland 145,963,842 543,468,227 $39,923,329 $23,138,989 $16,784,340 6,960,212 32,152,894 $399,288 $699,040 $4,421 $694,619 $17,878,247Romania 14,399,597 108,917,734 $9,598,874 $4,492,568 $5,106,306 4,051,578 31,380,075 $622,812 $435,455 $77,301 $358,154 $6,087,272Russia 79,452,418 422,735,587 $30,248,991 $14,491,921 $15,757,070 14,381,821 63,766,427 $1,124,000 $2,894,704 $172,597 $2,722,107 $19,603,177Serbia 24,363,360 182,131,296 $19,270,071 $16,480,939 $2,789,132 1,105,425 8,218,658 $272,903 $7,737 $2,068 $5,669 $3,067,704Slovakia 5,468,190 28,287,835 $3,059,603 $1,692,417 $1,367,186 816,388 6,011,539 $81,946 $51,817 $3,874 $47,943 $1,497,075Slovenia 3,279,035 15,800,900 $2,847,562 $2,209,896 $637,666 340,594 1,923,346 $39,993 $9,058 $31,159 -$22,101 $655,558Tajikistan 3,736,079 9,626,902 $834,617 $714,993 $119,624 1 70,451 $5,349 $5,691 $13,370 -$7,679 $117,294Turkmenistan 1,957,355 7,096,092 $680,779 $627,855 $52,924 0 0 $0 $713 $9,375 -$8,662 $44,262Ukraine 36,694,320 199,360,133 $22,167,691 $15,805,796 $6,361,895 3,617,418 14,661,131 $374,969 $91,033 $74,661 $16,372 $6,753,236Uzbekistan 70,293,293 190,341,912 $11,855,197 $9,450,600 $2,404,597 260,135 945,679 $35,385 $1,184 $18,386 -$17,202 $2,422,780
Eastern Europe 549,059,031 2,489,030,305 $246,462,101 $172,675,556 $73,786,545 42,404,792 220,761,469 $4,324,039 66,278,495 $5,412,122 $683,357 $4,728,765 $82,839,349
Antarctica 213 561 $1,093 $384 $709 0 0 $0 $21 $0 $21 $730Maritime - Atlantic 74,202 279,622 $436,155 $324,291 $111,864 0 0 $0 $4,560 $3,074 $1,486 $113,350Maritime - other oceans 1,371,596 1,169,678 $3,033,025 $1,342,322 $1,690,703 1 3,974 $5,531 $0 $0 $0 $1,696,234Maritime - Pacific 80,283 156,441 $389,469 $208,895 $180,574 0 0 $0 $0 $0 $0 $180,574
Other Regions 1,526,294 1,606,302 $3,859,742 $1,875,892 $1,983,850 1 3,974 $5,531 610 $4,581 $3,074 $1,507 $1,990,888
American Samoa 210,650 1,520,979 $158,902 $153,643 $5,259 567 2,472 $25 $0 $0 $0 $5,284Baker Island 0 0 $0 $0 $0 0 0 $0 $0 $0 $0 $0Howland Island 0 0 $0 $0 $0 0 0 $0 $0 $0 $0 $0Jarvis Island 0 0 $0 $0 $0 0 0 $0 $0 $0 $0 $0Johnston Atoll 0 0 $0 $0 $0 0 0 $0 $0 $0 $0 $0Kingman Reef 0 0 $0 $0 $0 0 0 $0 $0 $0 $0 $0Midway Atoll 0 0 $0 $0 $0 0 0 $0 $0 $0 $0 $0Navassa Island 0 0 $0 $0 $0 0 0 $0 $0 $0 $0 $0Northern Mariana Islands 3,186,393 25,479,254 $4,692,091 $2,707,404 $1,984,687 295,240 1,193,225 $165,089 $0 $0 $0 $2,149,776Palmyra Atoll 0 0 $0 $0 $0 0 0 $0 $0 $0 $0 $0Wake Island 0 0 $0 $0 $0 0 0 $0 $0 $0 $0 $0
Carriers serving Misc. U.S. points 3,397,043 27,000,233 $4,850,993 $2,861,047 $1,989,946 295,807 1,195,697 $165,114 $0 $0 $0 $2,155,060
Total for Foreign Points 15,007,553,656 74,800,673,471 $6,452,587,078 $4,325,523,862 $2,127,063,216 6,897,507,572 26,334,095,039 $341,764,623 $684,293,676 $28,534,444 $655,759,232 $3,124,587,071
Total for U.S. Points 20,895,019 133,112,555 $6,157,724 $1,961,154 $4,196,570 13,822,601 66,006,435 $802,670 $112,148 $26,125 $86,023 $5,085,263
Total Non-Confidential Included Above 6,395,543,083 27,046,021,484 $1,715,841,142 $1,375,267,534 $340,573,608 1,442,609,350 6,087,816,423 $105,415,190 513,405,513 $29,076,963 $12,307,694 $16,769,269 $462,758,067
Total Confidential Included Above 8,632,905,592 47,887,764,542 $4,742,903,660 $2,952,217,482 $1,790,686,178 5,468,720,823 20,312,285,051 $237,152,103 6,463,431,934 $655,328,861 $16,252,875 $639,075,986 $2,666,914,267
World Total 15,028,448,675 74,933,786,026 $6,458,744,802 $4,327,485,016 $2,131,259,786 6,911,330,173 26,400,101,474 $342,567,293 6,976,837,447 $684,405,824 $28,560,569 $655,845,255 $3,129,672,334
- Switched Services Page 6 -

2008 Annual Section 43.61 International Traffic Data for All U.S. Points: All Settlement ArrangementsTable A2: ABS-CBN Telecom North America, Inc. Message Telephone Service Billing Types Covered: 1, 2, 3, 4, 5, 11, 12, 14, 15
International Point Traffic Billed in the United States Traffic Billed in Foreign Countries TotalOriginating or Terminating Transiting the United States U.S.
in the United States (by Country of Origin) CarriersNumber Number U.S. Payout Retained Number Number Receipts Number Receipts Payout Retained Retained
of of Carriers to Foreign Revenues of of from Foreign of from Foreign to Foreign Revenues RevenuesMessages Minutes Revenues Carriers Messages Minutes Carriers Minutes Carriers Carriers
Austria 29 524 $215 $16 $199 0 0 $0 $0 $0 $0 $199Belgium 101 538 $220 $16 $204 0 0 $0 $0 $0 $0 $204Cyprus 18 336 $128 $30 $98 0 0 $0 $0 $0 $0 $98Denmark 115 1,195 $263 $36 $227 0 0 $0 $0 $0 $0 $227Finland 1 19 $4 $3 $1 0 0 $0 $0 $0 $0 $1France 190 1,896 $528 $62 $466 0 0 $0 $0 $0 $0 $466Germany 550 5,518 $1,655 $166 $1,489 0 0 $0 $0 $0 $0 $1,489Greece 22 439 $141 $18 $123 0 0 $0 $0 $0 $0 $123Iceland 3 11 $4 $2 $2 0 0 $0 $0 $0 $0 $2Ireland 85 937 $319 $28 $291 0 0 $0 $0 $0 $0 $291Italy 693 6,212 $1,739 $186 $1,553 0 0 $0 $0 $0 $0 $1,553Luxembourg 8 180 $52 $11 $41 0 0 $0 $0 $0 $0 $41Malta 3 113 $42 $16 $26 0 0 $0 $0 $0 $0 $26Netherlands 101 799 $504 $24 $480 0 0 $0 $0 $0 $0 $480Norway 71 1,211 $266 $36 $230 0 0 $0 $0 $0 $0 $230Portugal 5 16 $6 $1 $5 0 0 $0 $0 $0 $0 $5Spain 210 1,503 $481 $45 $436 0 0 $0 $0 $0 $0 $436Sweden 56 656 $171 $20 $151 0 0 $0 $0 $0 $0 $151Switzerland 229 2,881 $893 $86 $807 0 0 $0 $0 $0 $0 $807Turkey 3 33 $12 $6 $6 0 0 $0 $0 $0 $0 $6United Kingdom 1,462 20,524 $3,045 $616 $2,429 0 0 $0 $0 $0 $0 $2,429
Western Europe 3,955 45,541 $10,688 $1,424 $9,264 0 0 $0 $0 $0 $0 $9,264
Burkina 1 1 $1 $0 $1 0 0 $0 $0 $0 $0 $1Burundi 1 43 $24 $6 $18 0 0 $0 $0 $0 $0 $18Cape Verde 1 4 $2 $1 $1 0 0 $0 $0 $0 $0 $1Cote d'Ivoire 3 19 $16 $3 $13 0 0 $0 $0 $0 $0 $13Ethiopia 2 2 $2 $0 $2 0 0 $0 $0 $0 $0 $2Ghana 1 2 $1 $0 $1 0 0 $0 $0 $0 $0 $1Kenya 4 4 $6 $1 $5 0 0 $0 $0 $0 $0 $5Libya 10 26 $13 $4 $9 0 0 $0 $0 $0 $0 $9Mauritius 3 11 $9 $2 $7 0 0 $0 $0 $0 $0 $7Morocco 37 221 $124 $31 $93 0 0 $0 $0 $0 $0 $93Nigeria 38 147 $99 $21 $78 0 0 $0 $0 $0 $0 $78Rwanda 2 2 $1 $0 $1 0 0 $0 $0 $0 $0 $1Saint Helena 1 1 $1 $0 $1 0 0 $0 $0 $0 $0 $1South Africa 8 184 $81 $17 $64 0 0 $0 $0 $0 $0 $64Tanzania 10 83 $49 $12 $37 0 0 $0 $0 $0 $0 $37Tunisia 17 43 $21 $6 $15 0 0 $0 $0 $0 $0 $15Zimbabwe 2 26 $14 $4 $10 0 0 $0 $0 $0 $0 $10
Africa 141 819 $464 $108 $356 0 0 $0 $0 $0 $0 $356
Bahrain 152 1,736 $625 $330 $295 0 0 $0 $0 $0 $0 $295Iran 8 28 $27 $4 $23 0 0 $0 $0 $0 $0 $23
- Switched Services Page 7 -

2008 Annual Section 43.61 International Traffic Data for All U.S. Points: All Settlement ArrangementsTable A2: ABS-CBN Telecom North America, Inc. Message Telephone Service Billing Types Covered: 1, 2, 3, 4, 5, 11, 12, 14, 15
International Point Traffic Billed in the United States Traffic Billed in Foreign Countries TotalOriginating or Terminating Transiting the United States U.S.
in the United States (by Country of Origin) CarriersNumber Number U.S. Payout Retained Number Number Receipts Number Receipts Payout Retained Retained
of of Carriers to Foreign Revenues of of from Foreign of from Foreign to Foreign Revenues RevenuesMessages Minutes Revenues Carriers Messages Minutes Carriers Minutes Carriers Carriers
Iraq 5 17 $15 $2 $13 0 0 $0 $0 $0 $0 $13Israel 184 2,199 $550 $88 $462 0 0 $0 $0 $0 $0 $462Jordan 27 211 $156 $40 $116 0 0 $0 $0 $0 $0 $116Kuwait 255 2,684 $1,448 $295 $1,153 0 0 $0 $0 $0 $0 $1,153Lebanon 16 173 $105 $22 $83 0 0 $0 $0 $0 $0 $83Oman 28 396 $265 $12 $253 0 0 $0 $0 $0 $0 $253Qatar 143 1,585 $967 $460 $507 0 0 $0 $0 $0 $0 $507Saudi Arabia 1,125 12,551 $8,033 $2,636 $5,397 0 0 $0 $0 $0 $0 $5,397Syria 6 92 $62 $13 $49 0 0 $0 $0 $0 $0 $49United Arab Emirates 616 8,231 $4,198 $2,140 $2,058 0 0 $0 $0 $0 $0 $2,058
Middle East 2,565 29,903 $16,451 $6,042 $10,409 0 0 $0 $0 $0 $0 $10,409
Aruba 18 89 $40 $12 $28 0 0 $0 $0 $0 $0 $28Cuba 50 93 $133 $13 $120 0 0 $0 $0 $0 $0 $120Haiti 6 83 $47 $12 $35 0 0 $0 $0 $0 $0 $35Netherlands Antilles 7 91 $43 $13 $30 0 0 $0 $0 $0 $0 $30
Caribbean 81 356 $263 $50 $213 0 0 $0 $0 $0 $0 $213
Costa Rica 18 137 $63 $11 $52 0 0 $0 $0 $0 $0 $52Guatemala 10 86 $34 $12 $22 0 0 $0 $0 $0 $0 $22Honduras 13 88 $58 $12 $46 0 0 $0 $0 $0 $0 $46Mexico 76 605 $218 $73 $145 0 0 $0 $0 $0 $0 $145Nicaragua 21 58 $29 $8 $21 0 0 $0 $0 $0 $0 $21
North and Central America 138 974 $402 $116 $286 0 0 $0 $0 $0 $0 $286
Argentina 3 31 $12 $4 $8 0 0 $0 $0 $0 $0 $8Brazil 4 4 $2 $1 $1 0 0 $0 $0 $0 $0 $1Chile 3 3 $1 $0 $1 0 0 $0 $0 $0 $0 $1Colombia 2 2 $1 $0 $1 0 0 $0 $0 $0 $0 $1Ecuador 33 211 $122 $30 $92 0 0 $0 $0 $0 $0 $92Peru 2 5 $2 $1 $1 0 0 $0 $0 $0 $0 $1
South America 47 256 $140 $36 $104 0 0 $0 $0 $0 $0 $104
Afghanistan 8 19 $57 $7 $50 0 0 $0 $0 $0 $0 $50Bangladesh 9 17 $12 $2 $10 0 0 $0 $0 $0 $0 $10Brunei 32 336 $148 $47 $101 0 0 $0 $0 $0 $0 $101Cambodia 2 29 $23 $4 $19 0 0 $0 $0 $0 $0 $19Chagos Archipelago 5 32 $96 $4 $92 0 0 $0 $0 $0 $0 $92China 57 638 $242 $19 $223 0 0 $0 $0 $0 $0 $223Hong Kong 743 8,943 $1,789 $268 $1,521 0 0 $0 $0 $0 $0 $1,521India 260 1,108 $743 $177 $566 0 0 $0 $0 $0 $0 $566Indonesia 117 571 $228 $57 $171 0 0 $0 $0 $0 $0 $171Japan 2,130 18,996 $5,319 $760 $4,559 0 0 $0 $0 $0 $0 $4,559Korea, North 1 1 $3 $0 $3 0 0 $0 $0 $0 $0 $3Korea, South 224 1,689 $1,064 $236 $828 0 0 $0 $0 $0 $0 $828Macau 22 210 $82 $13 $69 0 0 $0 $0 $0 $0 $69
- Switched Services Page 8 -

2008 Annual Section 43.61 International Traffic Data for All U.S. Points: All Settlement ArrangementsTable A2: ABS-CBN Telecom North America, Inc. Message Telephone Service Billing Types Covered: 1, 2, 3, 4, 5, 11, 12, 14, 15
International Point Traffic Billed in the United States Traffic Billed in Foreign Countries TotalOriginating or Terminating Transiting the United States U.S.
in the United States (by Country of Origin) CarriersNumber Number U.S. Payout Retained Number Number Receipts Number Receipts Payout Retained Retained
of of Carriers to Foreign Revenues of of from Foreign of from Foreign to Foreign Revenues RevenuesMessages Minutes Revenues Carriers Messages Minutes Carriers Minutes Carriers Carriers
Malaysia 152 1,276 $804 $51 $753 0 0 $0 $0 $0 $0 $753Pakistan 23 45 $31 $10 $21 0 0 $0 $0 $0 $0 $21Philippines 60,536 8,927,454 $2,053,335 $1,071,294 $982,041 0 0 $0 $0 $0 $0 $982,041Singapore 476 4,810 $1,635 $144 $1,491 0 0 $0 $0 $0 $0 $1,491Sri Lanka 5 44 $34 $6 $28 0 0 $0 $0 $0 $0 $28Taiwan 315 2,688 $1,639 $81 $1,558 0 0 $0 $0 $0 $0 $1,558Thailand 110 906 $372 $91 $281 0 0 $0 $0 $0 $0 $281Vietnam 15 177 $157 $49 $108 0 0 $0 $0 $0 $0 $108 Asia 65,242 8,969,989 $2,067,813 $1,073,320 $994,493 0 0 $0 $0 $0 $0 $994,493
Australia 756 9,511 $4,470 $285 $4,185 0 0 $0 $0 $0 $0 $4,185Cook Islands 1 1 $1 $0 $1 0 0 $0 $0 $0 $0 $1Fiji 3 10 $8 $1 $7 0 0 $0 $0 $0 $0 $7French Polynesia 2 9 $6 $1 $5 0 0 $0 $0 $0 $0 $5Marshall Islands 62 385 $200 $131 $69 0 0 $0 $0 $0 $0 $69Micronesia, Federated States of 1 1 $1 $0 $1 0 0 $0 $0 $0 $0 $1New Zealand 93 979 $333 $39 $294 0 0 $0 $0 $0 $0 $294Niue 6 8 $8 $1 $7 0 0 $0 $0 $0 $0 $7Pacific Islands (Palau) 4 13 $13 $2 $11 0 0 $0 $0 $0 $0 $11Papua New Guinea 20 215 $103 $52 $51 0 0 $0 $0 $0 $0 $51Tuvalu 1 2 $5 $0 $5 0 0 $0 $0 $0 $0 $5Vanuatu 1 1 $1 $0 $1 0 0 $0 $0 $0 $0 $1
American Samoa 16 239 $93 $22 $71 0 0 $0 $0 $0 $0 $71
Oceania 966 11,374 $5,242 $534 $4,708 0 0 $0 $0 $0 $0 $4,708
Albania 9 50 $21 $7 $14 0 0 $0 $0 $0 $0 $14Azerbaijan 1 8 $4 $1 $3 0 0 $0 $0 $0 $0 $3Bosnia and Herzegovina 1 8 $3 $1 $2 0 0 $0 $0 $0 $0 $2Hungary 7 7 $2 $1 $1 0 0 $0 $0 $0 $0 $1Romania 2 19 $9 $3 $6 0 0 $0 $0 $0 $0 $6Russia 7 40 $30 $6 $24 0 0 $0 $0 $0 $0 $24
Eastern Europe 27 132 $69 $19 $50 0 0 $0 $0 $0 $0 $50
Total for Foreign Points 73,146 9,059,105 $2,101,439 $1,081,627 $1,019,812 0 0 $0 $0 $0 $0 $1,019,812
Total for U.S. Points 16 239 $93 $22 $71 0 0 $0 $0 $0 $0 $71
World Total 73,162 9,059,344 $2,101,532 $1,081,649 $1,019,883 0 0 $0 0 $0 $0 $0 $1,019,883
- Switched Services Page 9 -

2008 Annual Section 43.61 International Traffic Data for All U.S. Points: All Settlement ArrangementsTable A3: Bharti Airtel Limited Message Telephone Service Billing Types Covered: 1, 2, 3, 4, 5, 11, 12, 14, 15
International Point Traffic Billed in the United States Traffic Billed in Foreign Countries TotalOriginating or Terminating Transiting the United States U.S.
in the United States (by Country of Origin) CarriersNumber Number U.S. Payout Retained Number Number Receipts Number Receipts Payout Retained Retained
of of Carriers to Foreign Revenues of of from Foreign of from Foreign to Foreign Revenues RevenuesMessages Minutes Revenues Carriers Messages Minutes Carriers Minutes Carriers Carriers
Andorra 34 219 $6 $0 $6 0 0 $0 $3 $7 -$4 $2Austria 10,811 31,821 $3,158 $389,595 -$386,437 0 0 $0 $1,698 $21,441 -$19,743 -$406,180Belgium 66,670 55,706 $5,552 $11,128 -$5,576 0 0 $0 $3,919 $586 $3,333 -$2,243Cyprus 26,498 70,239 $11,192 $9,547 $1,645 0 0 $0 $1,020 $36 $984 $2,629Denmark 2,283 7,342 $1,055 $50,326 -$49,271 0 0 $0 $1,827 $753 $1,074 -$48,197Finland 12,296 53,351 $2,686 $64,229 -$61,543 0 0 $0 $6,009 $14,709 -$8,700 -$70,243France 17,671 52,951 $2,809 $3,640 -$831 0 0 $0 $4,703 $302 $4,401 $3,570Germany 66,949 351,675 $4,867 $2,933 $1,934 0 0 $0 $9,055 $179,471 -$170,416 -$168,482Gibraltar 15 33 $7 $0 $7 0 0 $0 $24 $0 $24 $31Greece 75,337 305,381 $12,625 $6,453 $6,172 0 0 $0 $5,828 $15,817 -$9,989 -$3,817Greenland 315 210 $72 $783 -$711 0 0 $0 $178 $0 $178 -$533Iceland 196 268 $38 $190 -$152 0 0 $0 $469 $753 -$284 -$436Ireland 1,616 10,944 $470 $129,338 -$128,868 0 0 $0 $2,239 $158 $2,081 -$126,787Italy 15,224 52,564 $5,484 $8,118 -$2,634 0 0 $0 $21,258 $3,769 $17,489 $14,855Liechtenstein 117 132 $57 $0 $57 0 0 $0 $229 $406 -$177 -$120Luxembourg 44 298 $233 $159 $74 0 0 $0 $149 $86 $63 $137Malta 185 589 $103 $3 $100 0 0 $0 $525 $3,081 -$2,556 -$2,456Netherlands 48,219 208,342 $4,712 $18,633 -$13,921 0 0 $0 $5,485 $204 $5,281 -$8,640Norway 27,675 65,542 $8,370 $3,406 $4,964 0 0 $0 $5,592 $153 $5,439 $10,403Portugal 472 4,249 $182 $0 $182 0 0 $0 $1,016 $480 $536 $718Spain 81,630 78,582 $5,566 $93,422 -$87,856 0 0 $0 $60,684 $44,755 $15,929 -$71,927Sweden 12,724 102,328 $1,465 $28,725 -$27,260 0 0 $0 $2,926 $80 $2,846 -$24,414Switzerland 30,422 163,948 $6,341 $3,472 $2,869 0 0 $0 $6,661 $279 $6,382 $9,251Turkey 8,770 37,463 $4,669 $59,789 -$55,120 0 0 $0 $9,499 $33 $9,466 -$45,654United Kingdom 1,523,639 1,455,985 $32,720 $108,982 -$76,262 0 0 $0 $88,217 $10,782 $77,435 $1,173
Western Europe 2,029,812 3,110,162 $114,439 $992,871 -$878,432 0 0 $0 3,054,810 $239,213 $298,141 -$58,928 -$937,360
Algeria 2,208 4,391 $506 $93 $413 0 0 $0 $809 $8,481 -$7,672 -$7,259Angola 1,529 2,700 $408 $46,834 -$46,426 0 0 $0 $7,127 $1 $7,126 -$39,300Benin 5,357 7,968 $1,219 $728 $491 0 0 $0 $558 $148 $410 $901Botswana 6,225 24,054 $1,646 $2,293 -$647 0 0 $0 $354 $11,228 -$10,874 -$11,521Burkina 1,070,106 1,166,967 $161,757 $14,296 $147,461 0 0 $0 $34,450 $86,936 -$52,486 $94,975Burundi 34,453 190,108 $15,539 $0 $15,539 0 0 $0 $629 $20,870 -$20,241 -$4,702Cameroon 1,006 4,188 $723 $136,053 -$135,330 0 0 $0 $2,653 $297 $2,356 -$132,974Cape Verde 5,284 24,587 $5,536 $0 $5,536 0 0 $0 $17,411 $132 $17,279 $22,815Chad 2,861 13,338 $1,646 $2,923 -$1,277 0 0 $0 $1,468 $4 $1,464 $187Comoros 1,353 7,129 $1,761 $11,338 -$9,577 0 0 $0 $798 $204 $594 -$8,983Congo 58,557 85,619 $9,096 $1,178 $7,918 0 0 $0 $3,316 $600 $2,716 $10,634Cote d'Ivoire 8,047 35,585 $5,189 $0 $5,189 0 0 $0 $3,205 $215 $2,990 $8,179Djibouti 364 2,045 $594 $0 $594 0 0 $0 $775 $1 $774 $1,368Egypt 75,333 177,858 $15,135 $140,627 -$125,492 0 0 $0 $50,619 $6,230 $44,389 -$81,103Equatorial Guinea 10,605 22,615 $3,654 $2,924 $730 0 0 $0 $953 $1 $952 $1,682Ethiopia 308,000 378,138 $67,052 $38,569 $28,483 0 0 $0 $64,789 $41,811 $22,978 $51,461Gabon 71 249 $29 $0 $29 0 0 $0 $846 $0 $846 $875Gambia, The 2,457 3,006 $755 $12 $743 0 0 $0 $394 $16,002 -$15,608 -$14,865
- Switched Services Page 10 -

2008 Annual Section 43.61 International Traffic Data for All U.S. Points: All Settlement ArrangementsTable A3: Bharti Airtel Limited Message Telephone Service Billing Types Covered: 1, 2, 3, 4, 5, 11, 12, 14, 15
International Point Traffic Billed in the United States Traffic Billed in Foreign Countries TotalOriginating or Terminating Transiting the United States U.S.
in the United States (by Country of Origin) CarriersNumber Number U.S. Payout Retained Number Number Receipts Number Receipts Payout Retained Retained
of of Carriers to Foreign Revenues of of from Foreign of from Foreign to Foreign Revenues RevenuesMessages Minutes Revenues Carriers Messages Minutes Carriers Minutes Carriers Carriers
Ghana 162,593 402,865 $22,085 $267,984 -$245,899 0 0 $0 $42,710 $14 $42,696 -$203,203Guinea 4,796 5,154 $810 $8 $802 0 0 $0 $1,483 $19,205 -$17,722 -$16,920Guinea-Bissau 53 100 $43 $3 $40 0 0 $0 $47 $83 -$36 $4Kenya 4,650 16,591 $1,875 $15,739 -$13,864 0 0 $0 $3,074 $32 $3,042 -$10,822Lesotho 2,329 12,832 $2,359 $7,662 -$5,303 0 0 $0 $836 $32,931 -$32,095 -$37,398Liberia 6,476 24,392 $4,880 $16,342 -$11,462 0 0 $0 $2,394 $55 $2,339 -$9,123Libya 2,322 5,733 $1,153 $12,101 -$10,948 0 0 $0 $2,910 $180 $2,730 -$8,218Madagascar 86 188 $42 $0 $42 0 0 $0 $12,498 $29 $12,469 $12,511Malawi 342 2,719 $381 $12,734 -$12,353 0 0 $0 $203 $4 $199 -$12,154Mali 239,614 349,181 $59,398 $136,312 -$76,914 0 0 $0 $30,474 $26 $30,448 -$46,466Mauritania 1,714 4,953 $749 $4,450 -$3,701 0 0 $0 $1,225 $2 $1,223 -$2,478Mauritius 2,306 4,205 $426 $5,982 -$5,556 0 0 $0 $3,461 $2,022 $1,439 -$4,117Morocco 49,035 116,114 $23,626 $68 $23,558 0 0 $0 $4,381 $49 $4,332 $27,890Mozambique 869 4,004 $850 $0 $850 0 0 $0 $299 $6 $293 $1,143Namibia 5,029 23,212 $3,787 $26 $3,761 0 0 $0 $120 $8,340 -$8,220 -$4,459Nigeria 40,762 131,967 $13,808 $28,150 -$14,342 0 0 $0 $77,778 $11,441 $66,337 $51,995Reunion 107 420 $69 $717 -$648 0 0 $0 $40 $0 $40 -$608Rwanda 2,810 13,310 $1,166 $8,291 -$7,125 0 0 $0 $636 $6 $630 -$6,495Saint Helena 71 27 $11 $3 $8 0 0 $0 $27 $0 $27 $35Sao Tome and Principe 8,253 12,939 $6,113 $0 $6,113 0 0 $0 $1,166 $39 $1,127 $7,240Senegal 87,142 181,856 $24,467 $19 $24,448 0 0 $0 $6,432 $45,597 -$39,165 -$14,717Seychelles 17,188 148,749 $9,673 $0 $9,673 0 0 $0 $22,830 $14 $22,816 $32,489Sierra Leone 21,437 20,233 $3,315 $0 $3,315 0 0 $0 $869 $12,144 -$11,275 -$7,960Somalia 388,386 156,917 $40,038 $257,865 -$217,827 0 0 $0 $34,175 $55 $34,120 -$183,707South Africa 57,708 166,878 $9,778 $173,615 -$163,837 0 0 $0 $6,764 $59 $6,705 -$157,132Sudan 11,835 59,821 $5,485 $1,204 $4,281 0 0 $0 $44,729 $110,236 -$65,507 -$61,226Swaziland 20 108 $15 $0 $15 0 0 $0 $116 $435 -$319 -$304Tanzania 27,903 171,095 $14,672 $0 $14,672 0 0 $0 $12,152 $9,095 $3,057 $17,729Togo 286,309 198,951 $20,498 $46,500 -$26,002 0 0 $0 $19,035 $42 $18,993 -$7,009Tunisia 151,753 197,443 $34,673 $227 $34,446 0 0 $0 $30,056 $60,407 -$30,351 $4,095Uganda 750 3,292 $362 $153 $209 0 0 $0 $1,777 $16 $1,761 $1,970Zambia 115,073 317,835 $34,093 $100,609 -$66,516 0 0 $0 $8,569 $12 $8,557 -$57,959Zimbabwe 18,258 65,778 $5,153 $9,548 -$4,395 0 0 $0 $2,256 $16,246 -$13,990 -$18,385
Africa 3,311,795 4,970,407 $638,098 $1,504,180 -$866,082 0 0 $0 5,001,963 $566,676 $521,983 $44,693 -$821,389
Bahrain 49,973 154,799 $11,394 $10 $11,384 0 0 $0 $4,139 $108,273 -$104,134 -$92,750Iran 120,870 260,832 $22,646 $3,134 $19,512 0 0 $0 $31,625 $150,908 -$119,283 -$99,771Iraq 138,125 222,750 $17,156 $66,524 -$49,368 0 0 $0 $8,621 $463 $8,158 -$41,210Israel 6,485 34,992 $5,002 $173 $4,829 0 0 $0 $15,379 $159,386 -$144,007 -$139,178Jordan 26,633 154,662 $8,794 $5,922 $2,872 0 0 $0 $11,038 $177,243 -$166,205 -$163,333Kuwait 249,971 182,951 $17,640 $159,788 -$142,148 0 0 $0 $13,905 $2,352 $11,553 -$130,595Lebanon 81,490 371,738 $32,557 $49,459 -$16,902 0 0 $0 $17,236 $1,077 $16,159 -$743Oman 26,512 62,751 $9,447 $0 $9,447 0 0 $0 $27,770 $1,261 $26,509 $35,956Qatar 40,744 95,864 $12,847 $9,168 $3,679 0 0 $0 $149,291 $6,597 $142,694 $146,373Saudi Arabia 422,000 1,236,722 $131,671 $856,152 -$724,481 0 0 $0 $613,936 $173,401 $440,535 -$283,946
- Switched Services Page 11 -

2008 Annual Section 43.61 International Traffic Data for All U.S. Points: All Settlement ArrangementsTable A3: Bharti Airtel Limited Message Telephone Service Billing Types Covered: 1, 2, 3, 4, 5, 11, 12, 14, 15
International Point Traffic Billed in the United States Traffic Billed in Foreign Countries TotalOriginating or Terminating Transiting the United States U.S.
in the United States (by Country of Origin) CarriersNumber Number U.S. Payout Retained Number Number Receipts Number Receipts Payout Retained Retained
of of Carriers to Foreign Revenues of of from Foreign of from Foreign to Foreign Revenues RevenuesMessages Minutes Revenues Carriers Messages Minutes Carriers Minutes Carriers Carriers
Syria 36,456 50,505 $7,875 $10,269 -$2,394 0 0 $0 $7,067 $37 $7,030 $4,636United Arab Emirates 283,209 668,312 $90,492 $1,004,624 -$914,132 0 0 $0 $294,460 $25,456 $269,004 -$645,128Yemen 5,775 15,507 $1,849 $3,309 -$1,460 0 0 $0 $6,609 $3,733 $2,876 $1,416 Middle East 1,488,243 3,512,385 $369,370 $2,168,532 -$1,799,162 0 0 $0 9,294,287 $1,201,076 $810,187 $390,889 -$1,408,273
Anguilla 3,497 9,151 $1,819 $22,297 -$20,478 0 0 $0 $57 $0 $57 -$20,421Antigua and Barbuda 759 1,173 $113 $621 -$508 0 0 $0 $205 $35 $170 -$338Aruba 2,074 5,768 $896 $72,752 -$71,856 0 0 $0 $408 $1 $407 -$71,449Bahamas, The 24,969 56,613 $1,155 $350 $805 0 0 $0 $956 $0 $956 $1,761Barbados 3,168 12,903 $1,224 $2,332 -$1,108 0 0 $0 $767 $0 $767 -$341Bermuda 646 1,561 $64 $2,310 -$2,246 0 0 $0 $30 $1 $29 -$2,217Cayman Islands 461 965 $183 $3,471 -$3,288 0 0 $0 $71 $9 $62 -$3,226Cuba 429 934 $903 $215,607 -$214,704 0 0 $0 $1,235 $231 $1,004 -$213,700Dominica 1,129 6,227 $383 $4,578 -$4,195 0 0 $0 $94 $0 $94 -$4,101Dominican Republic 59,413 374,184 $16,419 $44,931 -$28,512 0 0 $0 $679 $9 $670 -$27,842French Overseas Departments 17 16 $3 $125 -$122 0 0 $0 $0 $0 $0 -$122Grenada 259 2,168 $357 $319 $38 0 0 $0 $1 $0 $1 $39Guadeloupe 8,335 13,291 $1,370 $1,273 $97 0 0 $0 $209 $2,808 -$2,599 -$2,502Haiti 11,150 41,313 $5,502 $0 $5,502 0 0 $0 $3,813 $38,458 -$34,645 -$29,143Jamaica 1,596 5,906 $1,363 $738 $625 0 0 $0 $101 $38 $63 $688Montserrat 5 32 $4 $0 $4 0 0 $0 $0 $0 $0 $4Netherlands Antilles 1,638 5,939 $783 $19,459 -$18,676 0 0 $0 $21 $1 $20 -$18,656Saint Kitts and Nevis 8,552 33,509 $3,353 $9,757 -$6,404 0 0 $0 $29 $0 $29 -$6,375Saint Lucia 5,152 10,246 $1,222 $6,085 -$4,863 0 0 $0 $184 $0 $184 -$4,679Saint Vincent and the Grenadines 277 1,384 $240 $662 -$422 0 0 $0 $81 $0 $81 -$341Trinidad and Tobago 2,586 10,460 $900 $13,663 -$12,763 0 0 $0 $61 $2 $59 -$12,704Turks and Caicos Islands 225 1,132 $203 $1,108 -$905 0 0 $0 $207 $10 $197 -$708Virgin Islands, British 641 2,595 $251 $66 $185 0 0 $0 $414 $42 $372 $557
Caribbean 136,978 597,470 $38,710 $422,504 -$383,794 0 0 $0 101,023 $9,623 $41,645 -$32,022 -$415,816
Belize 706 954 $182 $913 -$731 0 0 $0 $65 $3 $62 -$669Canada 311,287 600,768 $3,104 $7,018 -$3,914 0 0 $0 $6,867 $202,487 -$195,620 -$199,534Costa Rica 260 1,252 $80 $211 -$131 0 0 $0 $3 $0 $3 -$128El Salvador 639 4,563 $546 $39,187 -$38,641 0 0 $0 $29,794 $0 $29,794 -$8,847Guatemala 560 2,221 $303 $925 -$622 0 0 $0 $261 $4 $257 -$365Honduras 210 919 $132 $8,923 -$8,791 0 0 $0 $6,528 $9 $6,519 -$2,272Mexico 1,422 14,302 $463 $6,366 -$5,903 0 0 $0 $812 $1,506 -$694 -$6,597Nicaragua 27,094 105,353 $12,788 $24,682 -$11,894 0 0 $0 $1,947 $1 $1,946 -$9,948Panama 202 1,745 $98 $534 -$436 0 0 $0 $31 $0 $31 -$405Saint Pierre and Miquelon 99 358 $45 $0 $45 0 0 $0 $96 $0 $96 $141
North and Central America 342,479 732,435 $17,741 $88,759 -$71,018 0 0 $0 1,593,048 $46,404 $204,010 -$157,606 -$228,624
Argentina 4,143 14,257 $361 $975 -$614 0 0 $0 $446 $0 $446 -$168Bolivia 542 3,577 $171 $2,880 -$2,709 0 0 $0 $101 $6 $95 -$2,614Brazil 4,373 7,019 $975 $28,630 -$27,655 0 0 $0 $790 $13 $777 -$26,878Chile 326 3,411 $220 $247 -$27 0 0 $0 $107 $281 -$174 -$201
- Switched Services Page 12 -

2008 Annual Section 43.61 International Traffic Data for All U.S. Points: All Settlement ArrangementsTable A3: Bharti Airtel Limited Message Telephone Service Billing Types Covered: 1, 2, 3, 4, 5, 11, 12, 14, 15
International Point Traffic Billed in the United States Traffic Billed in Foreign Countries TotalOriginating or Terminating Transiting the United States U.S.
in the United States (by Country of Origin) CarriersNumber Number U.S. Payout Retained Number Number Receipts Number Receipts Payout Retained Retained
of of Carriers to Foreign Revenues of of from Foreign of from Foreign to Foreign Revenues RevenuesMessages Minutes Revenues Carriers Messages Minutes Carriers Minutes Carriers Carriers
Colombia 1,048 8,601 $314 $872 -$558 0 0 $0 $310 $0 $310 -$248Ecuador 380 1,970 $201 $652 -$451 0 0 $0 $85 $4 $81 -$370French Guiana 335 2,145 $173 $256 -$83 0 0 $0 $10 $0 $10 -$73Guyana 489 910 $260 $359 -$99 0 0 $0 $45 $1 $44 -$55Paraguay 173 504 $44 $327 -$283 0 0 $0 $116 $18 $98 -$185Peru 2,104 22,056 $732 $9,794 -$9,062 0 0 $0 $412 $1 $411 -$8,651Suriname 381 848 $181 $7,502 -$7,321 0 0 $0 $132 $3 $129 -$7,192Uruguay 119 582 $57 $2,767 -$2,710 0 0 $0 $276 $0 $276 -$2,434Venezuela 1,345 3,960 $341 $1,327 -$986 0 0 $0 $99 $7 $92 -$894
South America 15,758 69,840 $4,030 $56,588 -$52,558 0 0 $0 40,339 $2,929 $334 $2,595 -$49,963
Afghanistan 107,131 231,056 $47,705 $72,723 -$25,018 0 0 $0 $64,953 $1,997 $62,956 $37,938Bangladesh 272,584 2,136,083 $96,915 $12,485 $84,430 0 0 $0 $447,891 $406 $447,485 $531,915Bhutan 21,183 110,016 $11,569 $258 $11,311 0 0 $0 $6,683 $358 $6,325 $17,636Brunei 4,473 21,571 $508 $0 $508 0 0 $0 $607 $468 $139 $647Burma 2,100 2,194 $533 $64 $469 0 0 $0 $3,281 $855 $2,426 $2,895Cambodia 379 1,807 $120 $19,219 -$19,099 0 0 $0 $1,435 $5,859 -$4,424 -$23,523Chagos Archipelago 87 56 $31 $0 $31 0 0 $0 $1,091 $7,218 -$6,127 -$6,096China 537,829 6,718,806 $893,923 $3,631 $890,292 0 0 $0 $14,470 $7,770 $6,700 $896,992Hong Kong 234,621 1,401,836 $7,558 $11,111 -$3,553 0 0 $0 $3,614 $2,251 $1,363 -$2,190India 89,054,404 623,697,388 $25,792,981 $0 $25,792,981 0 0 $0 $10,694,276 $0 $10,694,276 $36,487,257Indonesia 82,147 292,145 $21,592 $14 $21,578 0 0 $0 $56,459 $13,276 $43,183 $64,761Japan 439,330 2,249,609 $38,470 $13,106 $25,364 0 0 $0 $21,548 $157,232 -$135,684 -$110,320Korea, North 2,450 1,632 $558 $74,996 -$74,438 0 0 $0 $208 $2,535 -$2,327 -$76,765Korea, South 636,009 1,558,852 $58,673 $3,232 $55,441 0 0 $0 $4,713 $4 $4,709 $60,150Laos 9,679 84,619 $3,421 $30 $3,391 0 0 $0 $913 $35 $878 $4,269Macau 1,011 5,850 $176 $7,454 -$7,278 0 0 $0 $1,477 $199 $1,278 -$6,000Malaysia 833,955 4,525,350 $107,841 $698 $107,143 0 0 $0 $163,649 $28,791 $134,858 $242,001Maldives 2,002 4,890 $818 $0 $818 0 0 $0 $21,697 $689 $21,008 $21,826Mongolia 34,088 179,830 $8,955 $7,104 $1,851 0 0 $0 $5,928 $69,877 -$63,949 -$62,098Nepal 218,258 838,854 $127,885 $74,605 $53,280 0 0 $0 $156,072 $1,547,415 -$1,391,343 -$1,338,063Pakistan 1,777,595 10,876,632 $718,874 $7,804 $711,070 0 0 $0 $1,196,256 $241,098 $955,158 $1,666,228Philippines 219,618 514,028 $61,221 $17,328 $43,893 0 0 $0 $145,189 $627 $144,562 $188,455Sri Lanka 1,822,426 9,491,878 $806,974 $422,814 $384,160 0 0 $0 $1,756,131 $1,220,060 $536,071 $920,231Taiwan 8,732 57,586 $988 $1,768 -$780 0 0 $0 $2,996 $70,950 -$67,954 -$68,734Thailand 324,042 1,867,422 $17,213 $16,970 $243 0 0 $0 $11,502 $47 $11,455 $11,698Vietnam 24,857 220,934 $11,921 $26,176 -$14,255 0 0 $0 $16,883 $15,995 $888 -$13,367
Asia 96,670,990 667,090,924 $28,837,423 $793,590 $28,043,833 0 0 $0 313,405,713 $14,799,922 $3,396,012 $11,403,910 $39,447,743
Australia 3,744,838 5,504,514 $76,238 $77,204 -$966 0 0 $0 $54,860 $32,341 $22,519 $21,553Cook Islands 57 109 $52 $24,428 -$24,376 0 0 $0 $17,619 $1 $17,618 -$6,758Fiji 18,949 33,932 $6,058 $0 $6,058 0 0 $0 $2,626 $8,836 -$6,210 -$152French Polynesia 3,668 12,478 $2,111 $0 $2,111 0 0 $0 $5 $0 $5 $2,116Kiribati 212 189 $75 $0 $75 0 0 $0 $1,448 $43 $1,405 $1,480Marshall Islands 3,752 5,946 $1,211 $2,990 -$1,779 0 0 $0 $1,032 $0 $1,032 -$747Micronesia, Federated States of 56 74 $12 $34,318 -$34,306 0 0 $0 $11 $109 -$98 -$34,404
- Switched Services Page 13 -

2008 Annual Section 43.61 International Traffic Data for All U.S. Points: All Settlement ArrangementsTable A3: Bharti Airtel Limited Message Telephone Service Billing Types Covered: 1, 2, 3, 4, 5, 11, 12, 14, 15
International Point Traffic Billed in the United States Traffic Billed in Foreign Countries TotalOriginating or Terminating Transiting the United States U.S.
in the United States (by Country of Origin) CarriersNumber Number U.S. Payout Retained Number Number Receipts Number Receipts Payout Retained Retained
of of Carriers to Foreign Revenues of of from Foreign of from Foreign to Foreign Revenues RevenuesMessages Minutes Revenues Carriers Messages Minutes Carriers Minutes Carriers Carriers
Nauru 169 115 $69 $200,144 -$200,075 0 0 $0 $160 $18 $142 -$199,933New Caledonia 16 27 $6 $0 $6 0 0 $0 $23 $8 $15 $21New Zealand 390,522 1,789,106 $30,412 $31,497 -$1,085 0 0 $0 $126,708 $268 $126,440 $125,355Niue 3 1 $1 $0 $1 0 0 $0 $1 $1 $0 $1Pacific Islands (Palau) 5 19 $4 $0 $4 0 0 $0 $34 $145 -$111 -$107Papua New Guinea 25 15 $5 $0 $5 0 0 $0 $268 $1,191 -$923 -$918Solomon Islands 323 235 $126 $100,396 -$100,270 0 0 $0 $461 $213 $248 -$100,022Tonga 3,738 9,786 $1,265 $0 $1,265 0 0 $0 $970 $2,878 -$1,908 -$643Tuvalu 8 7 $4 $73,888 -$73,884 0 0 $0 $9 $60 -$51 -$73,935Vanuatu 17 30 $14 $0 $14 0 0 $0 $10 $0 $10 $24Wallis and Futuna 10 16 $1 $0 $1 0 0 $0 $164 $0 $164 $165Western Samoa 55 319 $82 $0 $82 0 0 $0 $474 $16 $458 $540American Samoa 55 135 $7 $0 $7 0 0 $0 $9 $402 -$393 -$386Guam 3,577 24,632 $340 $688 -$348 0 0 $0 $37 $0 $37 -$311 Oceania 4,170,055 7,381,685 $118,093 $545,553 -$427,460 0 0 $0 6,482,851 $206,929 $46,530 $160,399 -$267,061
Albania 10,794 58,324 $11,092 $4 $11,088 0 0 $0 $1,194 $0 $1,194 $12,282Armenia 5,600 20,465 $2,567 $0 $2,567 0 0 $0 $946 $46,445 -$45,499 -$42,932Azerbaijan 37,634 72,209 $7,106 $13,460 -$6,354 0 0 $0 $5,743 $1,868 $3,875 -$2,479Belarus 70,230 75,134 $10,852 $39,782 -$28,930 0 0 $0 $5,783 $2,447 $3,336 -$25,594Bosnia and Herzegovina 16,022 15,963 $2,067 $47,267 -$45,200 0 0 $0 $3,754 $1 $3,753 -$41,447Bulgaria 286,651 217,161 $36,886 $106,804 -$69,918 0 0 $0 $11,188 $17 $11,171 -$58,747Croatia 842 2,854 $254 $4 $250 0 0 $0 $612 $7,938 -$7,326 -$7,076Czech Republic 23,363 52,755 $2,063 $1 $2,062 0 0 $0 $1,196 $8,751 -$7,555 -$5,493Estonia 126 385 $176 $380 -$204 0 0 $0 $367 $5 $362 $158Georgia 6,570 30,204 $2,029 $3,883 -$1,854 0 0 $0 $462 $11 $451 -$1,403Hungary 456 3,212 $179 $55 $124 0 0 $0 $806 $12,440 -$11,634 -$11,510Kazakhstan 87,210 164,014 $5,650 $138,569 -$132,919 0 0 $0 $1,222 $155,581 -$154,359 -$287,278Kyrgyzstan 772 1,260 $99 $300 -$201 0 0 $0 $883 $535 $348 $147Latvia 12,732 16,675 $1,378 $3 $1,375 0 0 $0 $3,323 $27,787 -$24,464 -$23,089Lithuania 43 174 $29 $4 $25 0 0 $0 $88 $7 $81 $106Moldova 65 374 $59 $9 $50 0 0 $0 $199 $11 $188 $238Poland 85,188 231,905 $7,807 $24,409 -$16,602 0 0 $0 $11,063 $2,947 $8,116 -$8,486Romania 1,866 11,114 $533 $390 $143 0 0 $0 $5,380 $64,243 -$58,863 -$58,720Russia 62,279 311,727 $14,998 $91,655 -$76,657 0 0 $0 $64,678 $169,418 -$104,740 -$181,397Serbia 6,772 13,003 $1,901 $16,541 -$14,640 0 0 $0 $3,671 $35 $3,636 -$11,004Slovakia 8,097 8,279 $909 $1,015 -$106 0 0 $0 $763 $1,888 -$1,125 -$1,231Slovenia 595 1,197 $170 $1 $169 0 0 $0 $1,421 $30,960 -$29,539 -$29,370Tajikistan 4,361 15,653 $1,130 $0 $1,130 0 0 $0 $5,690 $13,370 -$7,680 -$6,550Turkmenistan 4,269 12,452 $1,123 $1 $1,122 0 0 $0 $712 $9,374 -$8,662 -$7,540Ukraine 115,897 425,026 $30,086 $19,360 $10,726 0 0 $0 $2,227 $73,632 -$71,405 -$60,679Uzbekistan 4,156 5,018 $275 $3 $272 0 0 $0 $1,158 $18,376 -$17,218 -$16,946
Eastern Europe 852,590 1,766,537 $141,418 $503,900 -$362,482 0 0 $0 2,562,673 $134,529 $648,087 -$513,558 -$876,040
- Switched Services Page 14 -

2008 Annual Section 43.61 International Traffic Data for All U.S. Points: All Settlement ArrangementsTable A3: Bharti Airtel Limited Message Telephone Service Billing Types Covered: 1, 2, 3, 4, 5, 11, 12, 14, 15
International Point Traffic Billed in the United States Traffic Billed in Foreign Countries TotalOriginating or Terminating Transiting the United States U.S.
in the United States (by Country of Origin) Carriers
Number Number U.S. Payout Retained Number Number Receipts Number Receipts Payout Retained Retainedof of Carriers to Foreign Revenues of of from Foreign of from Foreign to Foreign Revenues Revenues
Messages Minutes Revenues Carriers Messages Minutes Carriers Minutes Carriers Carriers
Antarctica 0 0 $0 $0 $0 0 0 $0 $21 $0 $21 $21
Other Regions 0 0 $0 $0 $0 0 0 $0 $21 $0 $21 $21
Total for Foreign Points 109,015,068 689,207,078 $30,278,975 $7,075,789 $23,203,186 0 0 $0 $17,207,276 $5,966,527 $11,240,749 $34,443,935
Total for U.S. Points 3,632 24,767 $347 $688 -$341 0 0 $0 $46 $402 -$356 -$697
World Total 109,018,700 689,231,845 $30,279,322 $7,076,477 $23,202,845 0 0 $0 $17,207,322 $5,966,929 $11,240,393 $34,443,238
- Switched Services Page 15 -

2008 Annual Section 43.61 International Traffic Data for All U.S. Points: All Settlement ArrangementsTable A4: Carrier PB Telco, Inc. Message Telephone Service Billing Types Covered: 1, 2, 3, 4, 5, 11, 12, 14, 15
International Point Traffic Billed in the United States Traffic Billed in Foreign Countries TotalOriginating or Terminating Transiting the United States U.S.
in the United States (by Country of Origin) CarriersNumber Number U.S. Payout Retained Number Number Receipts Number Receipts Payout Retained Retained
of of Carriers to Foreign Revenues of of from Foreign of from Foreign to Foreign Revenues RevenuesMessages Minutes Revenues Carriers Messages Minutes Carriers Minutes Carriers Carriers
Poland 45,509,996 77,491,548 $13,321,672 $12,425,097 $896,575 0 0 $0 $0 $0 $0 $896,575
Eastern Europe 45,509,996 77,491,548 $13,321,672 $12,425,097 $896,575 0 0 $0 $0 $0 $0 $896,575
Total for Foreign Points 45,509,996 77,491,548 $13,321,672 $12,425,097 $896,575 0 0 $0 $0 $0 $0 $896,575
World Total 45,509,996 77,491,548 $13,321,672 $12,425,097 $896,575 0 0 $0 0 $0 $0 $0 $896,575
- Switched Services Page 16 -

2008 Annual Section 43.61 International Traffic Data for All U.S. Points: All Settlement ArrangementsTable A5: Centennial Puerto Rico Operations Corp. Message Telephone Service Billing Types Covered: 1, 2, 3, 4, 5, 11, 12, 14, 15
International Point Traffic Billed in the United States Traffic Billed in Foreign Countries TotalOriginating or Terminating Transiting the United States U.S.
in the United States (by Country of Origin) CarriersNumber Number U.S. Payout Retained Number Number Receipts Number Receipts Payout Retained Retained
of of Carriers to Foreign Revenues of of from Foreign of from Foreign to Foreign Revenues RevenuesMessages Minutes Revenues Carriers Messages Minutes Carriers Minutes Carriers Carriers
Dominican Republic 4,796,322 25,855,897 $2,993,146 $2,108,822 $884,324 0 0 $0 $0 $0 $0 $884,324
Caribbean 4,796,322 25,855,897 $2,993,146 $2,108,822 $884,324 0 0 $0 $0 $0 $0 $884,324
Total for Foreign Points 4,796,322 25,855,897 $2,993,146 $2,108,822 $884,324 0 0 $0 $0 $0 $0 $884,324
World Total 4,796,322 25,855,897 $2,993,146 $2,108,822 $884,324 0 0 $0 0 $0 $0 $0 $884,324
- Switched Services Page 17 -

2008 Annual Section 43.61 International Traffic Data for All U.S. Points: All Settlement ArrangementsTable A6: China Unicom USA Corp. Message Telephone Service Billing Types Covered: 1, 2, 3, 4, 5, 11, 12, 14, 15
International Point Traffic Billed in the United States Traffic Billed in Foreign Countries TotalOriginating or Terminating Transiting the United States U.S.
in the United States (by Country of Origin) CarriersNumber Number U.S. Payout Retained Number Number Receipts Number Receipts Payout Retained Retained
of of Carriers to Foreign Revenues of of from Foreign of from Foreign to Foreign Revenues RevenuesMessages Minutes Revenues Carriers Messages Minutes Carriers Minutes Carriers Carriers
Germany 17,153 102,920 $11,321 $10,189 $1,132 0 0 $0 $0 $0 $0 $1,132Italy 79,661 477,967 $79,820 $71,838 $7,982 0 0 $0 $0 $0 $0 $7,982Sweden 2 23 $46 $41 $5 0 0 $0 $0 $0 $0 $5United Kingdom 1,105 6,627 $1,014 $913 $101 0 0 $0 $0 $0 $0 $101
Western Europe 97,921 587,537 $92,201 $82,981 $9,220 0 0 $0 $0 $0 $0 $9,220
China 55,560,685 333,364,106 $3,825,289 $3,442,760 $382,529 0 0 $0 $0 $0 $0 $382,529Hong Kong 1,847,857 11,087,142 $119,689 $107,720 $11,969 0 0 $0 $0 $0 $0 $11,969Indonesia 340 2,042 $52 $47 $5 0 0 $0 $0 $0 $0 $5Japan 5,002 30,010 $3,001 $2,701 $300 0 0 $0 $0 $0 $0 $300Korea, South 125,869 755,214 $13,772 $12,395 $1,377 0 0 $0 $0 $0 $0 $1,377Philippines 39,251 235,508 $274,642 $247,178 $27,464 0 0 $0 $0 $0 $0 $27,464Taiwan 9,220,735 55,324,407 $1,837,252 $1,653,527 $183,725 0 0 $0 $0 $0 $0 $183,725Thailand 974,272 5,845,634 $67,225 $60,503 $6,722 0 0 $0 $0 $0 $0 $6,722Vietnam 1,084,445 6,506,671 $303,715 $273,344 $30,371 0 0 $0 $0 $0 $0 $30,371
Asia 68,858,456 413,150,734 $6,444,637 $5,800,175 $644,462 0 0 $0 $0 $0 $0 $644,462
Total for Foreign Points 68,956,377 413,738,271 $6,536,838 $5,883,156 $653,682 0 0 $0 $0 $0 $0 $653,682
World Total 68,956,377 413,738,271 $6,536,838 $5,883,156 $653,682 0 0 $0 0 $0 $0 $0 $653,682
- Switched Services Page 18 -

2008 Annual Section 43.61 International Traffic Data for All U.S. Points: All Settlement ArrangementsTable A7: EPM Telecomunicaciones S.A. E.S.P. Message Telephone Service Billing Types Covered: 1, 2, 3, 4, 5, 11, 12, 14, 15
International Point Traffic Billed in the United States Traffic Billed in Foreign Countries TotalOriginating or Terminating Transiting the United States U.S.
in the United States (by Country of Origin) CarriersNumber Number U.S. Payout Retained Number Number Receipts Number Receipts Payout Retained Retained
of of Carriers to Foreign Revenues of of from Foreign of from Foreign to Foreign Revenues RevenuesMessages Minutes Revenues Carriers Messages Minutes Carriers Minutes Carriers Carriers
Colombia 220,393,798 1,570,056,291 $106,569,631 $95,418,664 $11,150,967 0 0 $0 $0 $0 $0 $11,150,967
South America 220,393,798 1,570,056,291 $106,569,631 $95,418,664 $11,150,967 0 0 $0 $0 $0 $0 $11,150,967
Total for Foreign Points 220,393,798 1,570,056,291 $106,569,631 $95,418,664 $11,150,967 0 0 $0 $0 $0 $0 $11,150,967
World Total 220,393,798 1,570,056,291 $106,569,631 $95,418,664 $11,150,967 0 0 $0 0 $0 $0 $0 $11,150,967
- Switched Services Page 19 -

2008 Annual Section 43.61 International Traffic Data for All U.S. Points: All Settlement ArrangementsTable A8: France Telecom Long Distance USA, LLC Message Telephone Service Billing Types Covered: 1, 2, 3, 4, 5, 11, 12, 14, 15
International Point Traffic Billed in the United States Traffic Billed in Foreign Countries TotalOriginating or Terminating Transiting the United States U.S.
in the United States (by Country of Origin) CarriersNumber Number U.S. Payout Retained Number Number Receipts Number Receipts Payout Retained Retained
of of Carriers to Foreign Revenues of of from Foreign of from Foreign to Foreign Revenues RevenuesMessages Minutes Revenues Carriers Messages Minutes Carriers Minutes Carriers Carriers
Andorra 10,725 46,892 $1,463 $0 $1,463 0 0 $0 $0 $0 $0 $1,463
Austria 34,581 217,968 $11,807 $0 $11,807 0 0 $0 $0 $0 $0 $11,807
Belgium 62,067 278,885 $32,955 $0 $32,955 0 0 $0 $0 $0 $0 $32,955
Cyprus 3,946 29,424 $656 $0 $656 0 0 $0 $0 $0 $0 $656
Denmark 28,248 148,086 $16,156 $0 $16,156 0 0 $0 $0 $0 $0 $16,156
Finland 51,224 386,006 $29,738 $0 $29,738 0 0 $0 $0 $0 $0 $29,738
France 541,308 3,702,266 $197,911 $0 $197,911 0 0 $0 $0 $0 $0 $197,911
Germany 874,372 2,906,886 $347,047 $0 $347,047 0 0 $0 $0 $0 $0 $347,047
Gibraltar 475 2,074 $194 $0 $194 0 0 $0 $0 $0 $0 $194
Greece 66,655 396,222 $29,146 $0 $29,146 0 0 $0 $0 $0 $0 $29,146
Iceland 1,270 11,544 $912 $0 $912 0 0 $0 $0 $0 $0 $912
Ireland 97,770 618,781 $80,559 $0 $80,559 0 0 $0 $0 $0 $0 $80,559
Italy 1,293,245 8,697,346 $269,371 $0 $269,371 0 0 $0 $0 $0 $0 $269,371
Liechtenstein 28,122 391,566 $128,591 $0 $128,591 0 0 $0 $0 $0 $0 $128,591
Luxembourg 6,262 33,558 $3,372 $0 $3,372 0 0 $0 $0 $0 $0 $3,372
Malta 1,638 8,918 $1,685 $0 $1,685 0 0 $0 $0 $0 $0 $1,685
Netherlands 348,243 2,244,999 $138,583 $0 $138,583 0 0 $0 $0 $0 $0 $138,583
Norway 402,941 861,060 $45,918 $0 $45,918 0 0 $0 $0 $0 $0 $45,918
Portugal 146,270 1,034,071 $106,712 $0 $106,712 0 0 $0 $0 $0 $0 $106,712
Spain 465,137 2,194,319 $112,233 $0 $112,233 0 0 $0 $0 $0 $0 $112,233
Sweden 334,327 1,899,499 $103,988 $0 $103,988 0 0 $0 $0 $0 $0 $103,988
Switzerland 51,259 245,858 $33,997 $0 $33,997 0 0 $0 $0 $0 $0 $33,997
Turkey 38,937 287,396 $26,131 $0 $26,131 0 0 $0 $0 $0 $0 $26,131
United Kingdom 1,727,429 8,795,733 $586,320 $0 $586,320 0 0 $0 $0 $0 $0 $586,320
Western Europe 6,616,451 35,439,357 $2,305,445 $0 $2,305,445 0 0 $0 $0 $0 $0 $2,305,445
Algeria 81,575 710,135 $83,782 $0 $83,782 0 0 $0 $0 $0 $0 $83,782
Angola 4,711 24,316 $3,517 $0 $3,517 0 0 $0 $0 $0 $0 $3,517
Benin 41,482 275,814 $46,485 $0 $46,485 0 0 $0 $0 $0 $0 $46,485
Botswana 10,443 53,678 $7,218 $0 $7,218 0 0 $0 $0 $0 $0 $7,218
Burkina 15,666 98,832 $13,930 $0 $13,930 0 0 $0 $0 $0 $0 $13,930
Burundi 41,474 552,524 $38,210 $0 $38,210 0 0 $0 $0 $0 $0 $38,210
Cameroon 302,121 1,907,272 $303,773 $0 $303,773 0 0 $0 $0 $0 $0 $303,773
Cape Verde 27,466 222,592 $35,742 $0 $35,742 0 0 $0 $0 $0 $0 $35,742
Central African Republic 6,143 39,968 $12,041 $0 $12,041 0 0 $0 $0 $0 $0 $12,041
Chad 38,764 299,950 $26,518 $0 $26,518 0 0 $0 $0 $0 $0 $26,518
Comoros 326 1,097 $316 $0 $316 0 0 $0 $0 $0 $0 $316
Congo 17,323 115,765 $21,036 $0 $21,036 0 0 $0 $0 $0 $0 $21,036
Cote d'Ivoire 180,471 1,348,879 $203,646 $0 $203,646 0 0 $0 $0 $0 $0 $203,646
Djibouti 34,023 213,652 $58,778 $0 $58,778 0 0 $0 $0 $0 $0 $58,778
Egypt 20,510 90,694 $8,173 $0 $8,173 0 0 $0 $0 $0 $0 $8,173
Ethiopia 710,817 5,233,915 $1,005,550 $0 $1,005,550 0 0 $0 $0 $0 $0 $1,005,550
Gabon 16,691 118,144 $13,654 $0 $13,654 0 0 $0 $0 $0 $0 $13,654
- Switched Services Page 20 -

2008 Annual Section 43.61 International Traffic Data for All U.S. Points: All Settlement ArrangementsTable A8: France Telecom Long Distance USA, LLC Message Telephone Service Billing Types Covered: 1, 2, 3, 4, 5, 11, 12, 14, 15
International Point Traffic Billed in the United States Traffic Billed in Foreign Countries TotalOriginating or Terminating Transiting the United States U.S.
in the United States (by Country of Origin) CarriersNumber Number U.S. Payout Retained Number Number Receipts Number Receipts Payout Retained Retained
of of Carriers to Foreign Revenues of of from Foreign of from Foreign to Foreign Revenues RevenuesMessages Minutes Revenues Carriers Messages Minutes Carriers Minutes Carriers Carriers
Gambia, The 10,749 37,838 $9,215 $0 $9,215 0 0 $0 $0 $0 $0 $9,215
Ghana 35,602 289,144 $19,808 $0 $19,808 0 0 $0 $0 $0 $0 $19,808
Guinea 22,340 144,984 $24,057 $0 $24,057 0 0 $0 $0 $0 $0 $24,057
Guinea-Bissau 1,887 8,941 $3,456 $0 $3,456 0 0 $0 $0 $0 $0 $3,456
Kenya 23,670 268,308 $18,787 $0 $18,787 0 0 $0 $0 $0 $0 $18,787
Lesotho 4,276 30,753 $5,253 $0 $5,253 0 0 $0 $0 $0 $0 $5,253
Liberia 9,112 61,003 $11,827 $0 $11,827 0 0 $0 $0 $0 $0 $11,827
Libya 39,714 291,305 $48,389 $0 $48,389 0 0 $0 $0 $0 $0 $48,389
Madagascar 6,578 38,515 $7,155 $0 $7,155 0 0 $0 $0 $0 $0 $7,155
Malawi 126 1,539 $211 $0 $211 0 0 $0 $0 $0 $0 $211
Mali 111,096 482,709 $97,383 $0 $97,383 0 0 $0 $0 $0 $0 $97,383
Mauritania 35,170 189,938 $28,155 $0 $28,155 0 0 $0 $0 $0 $0 $28,155
Mauritius 35,733 293,251 $29,570 $0 $29,570 0 0 $0 $0 $0 $0 $29,570
Morocco 498,175 3,464,269 $587,888 $0 $587,888 0 0 $0 $0 $0 $0 $587,888
Mozambique 2,501 20,849 $1,650 $0 $1,650 0 0 $0 $0 $0 $0 $1,650
Namibia 7,143 34,271 $5,282 $0 $5,282 0 0 $0 $0 $0 $0 $5,282
Niger 65,326 565,234 $52,959 $0 $52,959 0 0 $0 $0 $0 $0 $52,959
Nigeria 21,389 161,146 $15,806 $0 $15,806 0 0 $0 $0 $0 $0 $15,806
Reunion 119 522 $68 $0 $68 0 0 $0 $0 $0 $0 $68
Rwanda 1,417 18,421 $1,649 $0 $1,649 0 0 $0 $0 $0 $0 $1,649
Saint Helena 578 745 $349 $0 $349 0 0 $0 $0 $0 $0 $349
Sao Tome and Principe 273 189 $151 $0 $151 0 0 $0 $0 $0 $0 $151
Senegal 923,131 5,398,350 $857,543 $0 $857,543 0 0 $0 $0 $0 $0 $857,543
Seychelles 255 2,398 $175 $0 $175 0 0 $0 $0 $0 $0 $175
Sierra Leone 9,970 75,759 $16,779 $0 $16,779 0 0 $0 $0 $0 $0 $16,779
Somalia 1,346 5,514 $2,355 $0 $2,355 0 0 $0 $0 $0 $0 $2,355
South Africa 39,207 212,028 $21,255 $0 $21,255 0 0 $0 $0 $0 $0 $21,255
Sudan 4,249 45,068 $4,020 $0 $4,020 0 0 $0 $0 $0 $0 $4,020
Swaziland 3,325 30,153 $2,974 $0 $2,974 0 0 $0 $0 $0 $0 $2,974
Tanzania 3,657 30,241 $2,966 $0 $2,966 0 0 $0 $0 $0 $0 $2,966
Togo 84,777 523,355 $135,106 $0 $135,106 0 0 $0 $0 $0 $0 $135,106
Tunisia 182,514 1,378,057 $252,503 $0 $252,503 0 0 $0 $0 $0 $0 $252,503
Uganda 8,263 73,197 $7,121 $0 $7,121 0 0 $0 $0 $0 $0 $7,121
Zambia 32,950 134,064 $15,358 $0 $15,358 0 0 $0 $0 $0 $0 $15,358
Zimbabwe 49,446 230,383 $52,894 $0 $52,894 0 0 $0 $0 $0 $0 $52,894
Africa 3,826,070 25,849,668 $4,222,486 $0 $4,222,486 0 0 $0 $0 $0 $0 $4,222,486
Bahrain 353 3,822 $276 $0 $276 0 0 $0 $0 $0 $0 $276
Iran 86,189 363,532 $21,497 $0 $21,497 0 0 $0 $0 $0 $0 $21,497
Iraq 3,413 31,223 $3,287 $0 $3,287 0 0 $0 $0 $0 $0 $3,287
Israel 617,791 3,093,134 $207,781 $0 $207,781 0 0 $0 $0 $0 $0 $207,781
Jordan 43,017 535,912 $16,620 $0 $16,620 0 0 $0 $0 $0 $0 $16,620
Kuwait 6,784 34,534 $3,135 $0 $3,135 0 0 $0 $0 $0 $0 $3,135
Lebanon 81,372 838,746 $90,622 $0 $90,622 0 0 $0 $0 $0 $0 $90,622
- Switched Services Page 21 -

2008 Annual Section 43.61 International Traffic Data for All U.S. Points: All Settlement ArrangementsTable A8: France Telecom Long Distance USA, LLC Message Telephone Service Billing Types Covered: 1, 2, 3, 4, 5, 11, 12, 14, 15
International Point Traffic Billed in the United States Traffic Billed in Foreign Countries TotalOriginating or Terminating Transiting the United States U.S.
in the United States (by Country of Origin) CarriersNumber Number U.S. Payout Retained Number Number Receipts Number Receipts Payout Retained Retained
of of Carriers to Foreign Revenues of of from Foreign of from Foreign to Foreign Revenues RevenuesMessages Minutes Revenues Carriers Messages Minutes Carriers Minutes Carriers Carriers
Oman 37,957 69,375 $9,735 $0 $9,735 0 0 $0 $0 $0 $0 $9,735
Qatar 7,235 53,985 $7,655 $0 $7,655 0 0 $0 $0 $0 $0 $7,655
Saudi Arabia 41,476 266,068 $28,951 $0 $28,951 0 0 $0 $0 $0 $0 $28,951
Syria 392,341 3,700,739 $461,783 $0 $461,783 0 0 $0 $0 $0 $0 $461,783
United Arab Emirates 8,315 65,698 $8,823 $0 $8,823 0 0 $0 $0 $0 $0 $8,823
Yemen 27,990 45,091 $5,076 $0 $5,076 0 0 $0 $0 $0 $0 $5,076
Middle East 1,354,233 9,101,859 $865,241 $0 $865,241 0 0 $0 $0 $0 $0 $865,241
Anguilla 2 8 $1 $0 $1 0 0 $0 $0 $0 $0 $1
Aruba 14 91 $14 $0 $14 0 0 $0 $0 $0 $0 $14
Bahamas, The 16 114 $5 $0 $5 0 0 $0 $0 $0 $0 $5
Bermuda 50 181 $8 $0 $8 0 0 $0 $0 $0 $0 $8
Cayman Islands 11 32 $5 $0 $5 0 0 $0 $0 $0 $0 $5
Cuba 59,560 94,333 $65,380 $0 $65,380 0 0 $0 $0 $0 $0 $65,380
Dominica 1,719 11,900 $1,555 $0 $1,555 0 0 $0 $0 $0 $0 $1,555
Dominican Republic 41,285 222,782 $17,280 $0 $17,280 0 0 $0 $0 $0 $0 $17,280
French Overseas Departments 1,086 2,861 $689 $0 $689 0 0 $0 $0 $0 $0 $689
Grenada 38 181 $33 $0 $33 0 0 $0 $0 $0 $0 $33
Guadeloupe 1,745 4,529 $792 $0 $792 0 0 $0 $0 $0 $0 $792
Haiti 37,875 155,059 $28,063 $0 $28,063 0 0 $0 $0 $0 $0 $28,063
Jamaica 5,113 12,450 $2,039 $0 $2,039 0 0 $0 $0 $0 $0 $2,039
Netherlands Antilles 11,802 63,358 $5,554 $0 $5,554 0 0 $0 $0 $0 $0 $5,554
Saint Kitts and Nevis 61 212 $43 $0 $43 0 0 $0 $0 $0 $0 $43
Saint Lucia 57 385 $38 $0 $38 0 0 $0 $0 $0 $0 $38
Saint Vincent and the Grenadines 1,160 3,617 $554 $0 $554 0 0 $0 $0 $0 $0 $554
Trinidad and Tobago 277 982 $99 $0 $99 0 0 $0 $0 $0 $0 $99
Turks and Caicos Islands 734 3,139 $592 $0 $592 0 0 $0 $0 $0 $0 $592
Virgin Islands, British 1,965 7,553 $969 $0 $969 0 0 $0 $0 $0 $0 $969
U.S. Virgin Islands 8 51 $1 $0 $1 0 0 $0 $0 $0 $0 $1
Caribbean 164,578 583,818 $123,714 $0 $123,714 0 0 $0 $0 $0 $0 $123,714
Belize 1,974 7,877 $1,352 $0 $1,352 0 0 $0 $0 $0 $0 $1,352
Canada 37,738 154,167 $1,612 $0 $1,612 0 0 $0 $0 $0 $0 $1,612
Costa Rica 25,845 391,217 $15,570 $0 $15,570 0 0 $0 $0 $0 $0 $15,570
El Salvador 97,600 321,381 $34,618 $0 $34,618 0 0 $0 $0 $0 $0 $34,618
Guatemala 23,541 83,015 $7,968 $0 $7,968 0 0 $0 $0 $0 $0 $7,968
Honduras 32,283 86,048 $12,901 $0 $12,901 0 0 $0 $0 $0 $0 $12,901
Mexico 45,256 307,663 $20,703 $0 $20,703 0 0 $0 $0 $0 $0 $20,703
Nicaragua 69,129 237,429 $38,337 $0 $38,337 0 0 $0 $0 $0 $0 $38,337
Panama 196,581 1,775,992 $37,686 $0 $37,686 0 0 $0 $0 $0 $0 $37,686
Saint Pierre and Miquelon 10 11 $1 $0 $1 0 0 $0 $0 $0 $0 $1
North and Central America 529,957 3,364,800 $170,748 $0 $170,748 0 0 $0 $0 $0 $0 $170,748
Argentina 166,524 845,120 $22,470 $0 $22,470 0 0 $0 $0 $0 $0 $22,470
- Switched Services Page 22 -

2008 Annual Section 43.61 International Traffic Data for All U.S. Points: All Settlement ArrangementsTable A8: France Telecom Long Distance USA, LLC Message Telephone Service Billing Types Covered: 1, 2, 3, 4, 5, 11, 12, 14, 15
International Point Traffic Billed in the United States Traffic Billed in Foreign Countries TotalOriginating or Terminating Transiting the United States U.S.
in the United States (by Country of Origin) CarriersNumber Number U.S. Payout Retained Number Number Receipts Number Receipts Payout Retained Retained
of of Carriers to Foreign Revenues of of from Foreign of from Foreign to Foreign Revenues RevenuesMessages Minutes Revenues Carriers Messages Minutes Carriers Minutes Carriers Carriers
Bolivia 70,420 132,697 $11,422 $0 $11,422 0 0 $0 $0 $0 $0 $11,422
Brazil 398,924 875,850 $79,924 $0 $79,924 0 0 $0 $0 $0 $0 $79,924
Chile 3,461 15,853 $1,120 $0 $1,120 0 0 $0 $0 $0 $0 $1,120
Colombia 331,420 2,225,476 $102,174 $0 $102,174 0 0 $0 $0 $0 $0 $102,174
Ecuador 107,079 988,705 $80,316 $0 $80,316 0 0 $0 $0 $0 $0 $80,316
French Guiana 623 2,102 $510 $0 $510 0 0 $0 $0 $0 $0 $510
Guyana 1,192 4,826 $982 $0 $982 0 0 $0 $0 $0 $0 $982
Paraguay 45,456 177,831 $10,122 $0 $10,122 0 0 $0 $0 $0 $0 $10,122
Peru 14,920 114,173 $3,768 $0 $3,768 0 0 $0 $0 $0 $0 $3,768
Suriname 674 3,071 $476 $0 $476 0 0 $0 $0 $0 $0 $476
Uruguay 9,363 31,376 $3,364 $0 $3,364 0 0 $0 $0 $0 $0 $3,364
Venezuela 139,652 813,320 $44,076 $0 $44,076 0 0 $0 $0 $0 $0 $44,076
South America 1,289,708 6,230,400 $360,724 $0 $360,724 0 0 $0 $0 $0 $0 $360,724
Afghanistan 7,974 53,651 $10,544 $0 $10,544 0 0 $0 $0 $0 $0 $10,544
Bangladesh 56,417 652,745 $18,464 $0 $18,464 0 0 $0 $0 $0 $0 $18,464
Bhutan 3,972 40,564 $4,079 $0 $4,079 0 0 $0 $0 $0 $0 $4,079
Brunei 1,564 5,819 $182 $0 $182 0 0 $0 $0 $0 $0 $182
Burma 1,532 5,608 $1,421 $0 $1,421 0 0 $0 $0 $0 $0 $1,421
Cambodia 336 4,175 $298 $0 $298 0 0 $0 $0 $0 $0 $298
China 35,206 416,490 $3,751 $0 $3,751 0 0 $0 $0 $0 $0 $3,751
Hong Kong 15,958 105,829 $1,403 $0 $1,403 0 0 $0 $0 $0 $0 $1,403
India 699,060 6,498,485 $188,396 $0 $188,396 0 0 $0 $0 $0 $0 $188,396
Indonesia 64,330 387,817 $16,538 $0 $16,538 0 0 $0 $0 $0 $0 $16,538
Japan 28,750 238,949 $5,052 $0 $5,052 0 0 $0 $0 $0 $0 $5,052
Korea, North 14 41 $24 $0 $24 0 0 $0 $0 $0 $0 $24
Korea, South 714,192 1,661,622 $37,394 $0 $37,394 0 0 $0 $0 $0 $0 $37,394
Laos 96,672 1,847,813 $71,179 $0 $71,179 0 0 $0 $0 $0 $0 $71,179
Macau 2,531 20,328 $738 $0 $738 0 0 $0 $0 $0 $0 $738
Malaysia 127,302 978,031 $22,637 $0 $22,637 0 0 $0 $0 $0 $0 $22,637
Maldives 346 782 $141 $0 $141 0 0 $0 $0 $0 $0 $141
Mongolia 2,433 23,573 $2,400 $0 $2,400 0 0 $0 $0 $0 $0 $2,400
Nepal 1,617 10,462 $1,844 $0 $1,844 0 0 $0 $0 $0 $0 $1,844
Pakistan 30,500 280,587 $20,073 $0 $20,073 0 0 $0 $0 $0 $0 $20,073
Philippines 422,799 1,745,426 $178,616 $0 $178,616 0 0 $0 $0 $0 $0 $178,616
Singapore 16,990 177,508 $1,547 $0 $1,547 0 0 $0 $0 $0 $0 $1,547
Sri Lanka 9,792 68,339 $6,173 $0 $6,173 0 0 $0 $0 $0 $0 $6,173
Taiwan 272,232 3,225,934 $29,121 $0 $29,121 0 0 $0 $0 $0 $0 $29,121
Thailand 17,791 53,980 $747 $0 $747 0 0 $0 $0 $0 $0 $747
Vietnam 6,314 66,895 $3,209 $0 $3,209 0 0 $0 $0 $0 $0 $3,209
Asia 2,636,624 18,571,453 $625,971 $0 $625,971 0 0 $0 $0 $0 $0 $625,971
Australia 17,052 135,851 $4,250 $0 $4,250 0 0 $0 $0 $0 $0 $4,250
Cook Islands 441 2,752 $1,456 $0 $1,456 0 0 $0 $0 $0 $0 $1,456
- Switched Services Page 23 -

2008 Annual Section 43.61 International Traffic Data for All U.S. Points: All Settlement ArrangementsTable A8: France Telecom Long Distance USA, LLC Message Telephone Service Billing Types Covered: 1, 2, 3, 4, 5, 11, 12, 14, 15
International Point Traffic Billed in the United States Traffic Billed in Foreign Countries TotalOriginating or Terminating Transiting the United States U.S.
in the United States (by Country of Origin) CarriersNumber Number U.S. Payout Retained Number Number Receipts Number Receipts Payout Retained Retained
of of Carriers to Foreign Revenues of of from Foreign of from Foreign to Foreign Revenues RevenuesMessages Minutes Revenues Carriers Messages Minutes Carriers Minutes Carriers Carriers
Fiji 1,214 12,962 $2,146 $0 $2,146 0 0 $0 $0 $0 $0 $2,146
French Polynesia 435 2,342 $477 $0 $477 0 0 $0 $0 $0 $0 $477
Kiribati 986 2,689 $1,155 $0 $1,155 0 0 $0 $0 $0 $0 $1,155
Marshall Islands 6,585 38,403 $8,835 $0 $8,835 0 0 $0 $0 $0 $0 $8,835
Micronesia, Federated States of 25 4 $1 $0 $1 0 0 $0 $0 $0 $0 $1
New Caledonia 8,127 36,977 $7,490 $0 $7,490 0 0 $0 $0 $0 $0 $7,490
New Zealand 1,749 4,274 $729 $0 $729 0 0 $0 $0 $0 $0 $729
Papua New Guinea 298 1,093 $476 $0 $476 0 0 $0 $0 $0 $0 $476
Solomon Islands 10 6 $3 $0 $3 0 0 $0 $0 $0 $0 $3
Tonga 4,761 40,041 $11,936 $0 $11,936 0 0 $0 $0 $0 $0 $11,936
Tuvalu 6 46 $19 $0 $19 0 0 $0 $0 $0 $0 $19
Wallis and Futuna 90 437 $150 $0 $150 0 0 $0 $0 $0 $0 $150
Western Samoa 3,650 24,319 $6,805 $0 $6,805 0 0 $0 $0 $0 $0 $6,805
Guam 101 749 $39 $0 $39 0 0 $0 $0 $0 $0 $39
Oceania 45,530 302,945 $45,967 $0 $45,967 0 0 $0 $0 $0 $0 $45,967
Albania 60,190 303,761 $58,691 $0 $58,691 0 0 $0 $0 $0 $0 $58,691
Armenia 3,034 31,116 $1,718 $0 $1,718 0 0 $0 $0 $0 $0 $1,718
Azerbaijan 7,182 14,608 $2,206 $0 $2,206 0 0 $0 $0 $0 $0 $2,206
Belarus 22,503 66,757 $11,000 $0 $11,000 0 0 $0 $0 $0 $0 $11,000
Bosnia and Herzegovina 10,370 92,342 $12,031 $0 $12,031 0 0 $0 $0 $0 $0 $12,031
Bulgaria 8,617 55,189 $5,947 $0 $5,947 0 0 $0 $0 $0 $0 $5,947
Croatia 12,300 143,891 $8,405 $0 $8,405 0 0 $0 $0 $0 $0 $8,405
Czech Republic 30,027 208,821 $32,856 $0 $32,856 0 0 $0 $0 $0 $0 $32,856
Estonia 1,639 5,642 $1,290 $0 $1,290 0 0 $0 $0 $0 $0 $1,290
Georgia 16,309 112,612 $11,805 $0 $11,805 0 0 $0 $0 $0 $0 $11,805
Hungary 6,552 47,922 $5,494 $0 $5,494 0 0 $0 $0 $0 $0 $5,494
Kazakhstan 3,264 48,087 $3,994 $0 $3,994 0 0 $0 $0 $0 $0 $3,994
Kyrgyzstan 5,373 42,911 $3,728 $0 $3,728 0 0 $0 $0 $0 $0 $3,728
Latvia 1,110 8,065 $810 $0 $810 0 0 $0 $0 $0 $0 $810
Lithuania 6,615 43,350 $5,573 $0 $5,573 0 0 $0 $0 $0 $0 $5,573
Moldova 5,337 39,938 $5,321 $0 $5,321 0 0 $0 $0 $0 $0 $5,321
Poland 227,891 3,364,321 $53,128 $0 $53,128 0 0 $0 $0 $0 $0 $53,128
Romania 17,913 102,717 $8,584 $0 $8,584 0 0 $0 $0 $0 $0 $8,584
Russia 118,870 1,321,621 $49,595 $0 $49,595 0 0 $0 $0 $0 $0 $49,595
Serbia 55,091 682,361 $48,269 $0 $48,269 0 0 $0 $0 $0 $0 $48,269
Slovakia 29,619 242,825 $42,115 $0 $42,115 0 0 $0 $0 $0 $0 $42,115
Slovenia 3,115 26,235 $6,051 $0 $6,051 0 0 $0 $0 $0 $0 $6,051
Tajikistan 75 551 $56 $0 $56 0 0 $0 $0 $0 $0 $56
Turkmenistan 331 2,883 $267 $0 $267 0 0 $0 $0 $0 $0 $267
Ukraine 70,177 547,115 $38,176 $0 $38,176 0 0 $0 $0 $0 $0 $38,176
Uzbekistan 21,236 159,308 $10,724 $0 $10,724 0 0 $0 $0 $0 $0 $10,724
Eastern Europe 744,740 7,714,949 $427,834 $0 $427,834 0 0 $0 $0 $0 $0 $427,834
- Switched Services Page 24 -

2008 Annual Section 43.61 International Traffic Data for All U.S. Points: All Settlement ArrangementsTable A8: France Telecom Long Distance USA, LLC Message Telephone Service Billing Types Covered: 1, 2, 3, 4, 5, 11, 12, 14, 15
International Point Traffic Billed in the United States Traffic Billed in Foreign Countries TotalOriginating or Terminating Transiting the United States U.S.
in the United States (by Country of Origin) CarriersNumber Number U.S. Payout Retained Number Number Receipts Number Receipts Payout Retained Retained
of of Carriers to Foreign Revenues of of from Foreign of from Foreign to Foreign Revenues RevenuesMessages Minutes Revenues Carriers Messages Minutes Carriers Minutes Carriers Carriers
Maritime - other oceans 2,872 5,505 $3,403 $0 $3,403 0 0 $0 $0 $0 $0 $3,403
Other Regions 2,872 5,505 $3,403 $0 $3,403 0 0 $0 $0 $0 $0 $3,403
Total for Foreign Points 17,210,654 107,163,954 $9,151,493 $0 $9,151,493 0 0 $0 $0 $0 $0 $9,151,493
Total for U.S. Points 109 800 $40 $0 $40 0 0 $0 $0 $0 $0 $40
World Total 17,210,763 107,164,754 $9,151,533 $0 $9,151,533 0 0 $0 0 $0 $0 $0 $9,151,533
- Switched Services Page 25 -
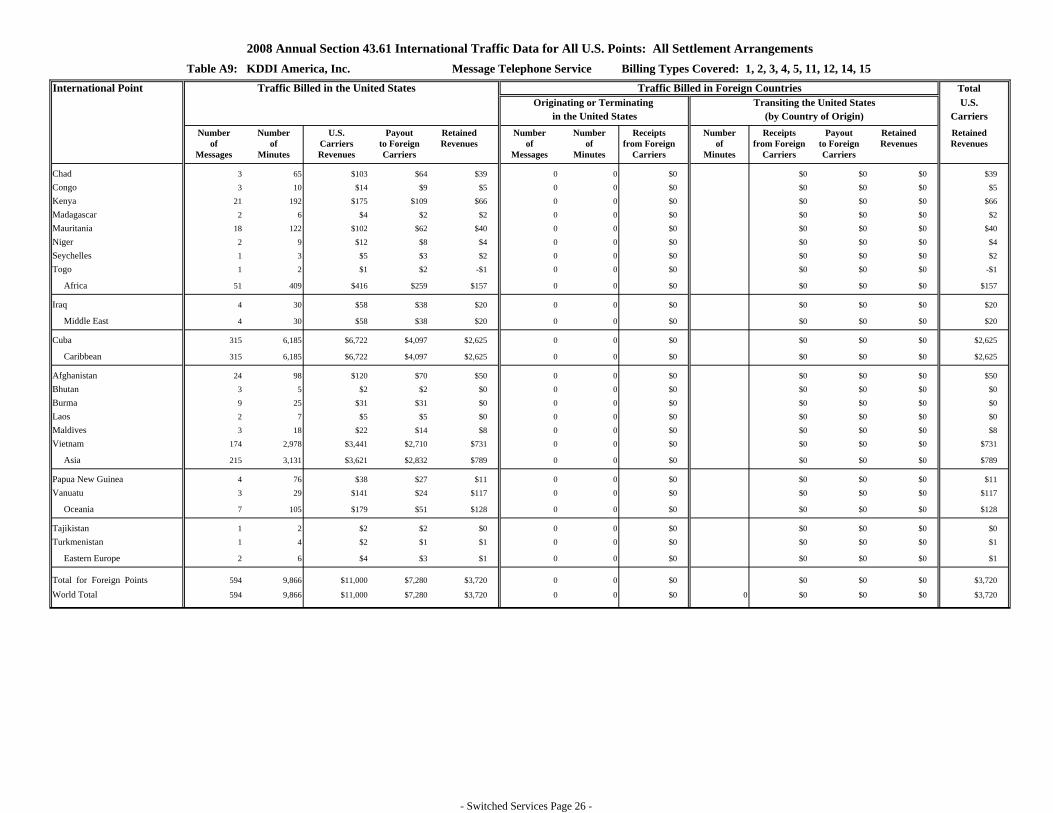
2008 Annual Section 43.61 International Traffic Data for All U.S. Points: All Settlement ArrangementsTable A9: KDDI America, Inc. Message Telephone Service Billing Types Covered: 1, 2, 3, 4, 5, 11, 12, 14, 15
International Point Traffic Billed in the United States Traffic Billed in Foreign Countries TotalOriginating or Terminating Transiting the United States U.S.
in the United States (by Country of Origin) CarriersNumber Number U.S. Payout Retained Number Number Receipts Number Receipts Payout Retained Retained
of of Carriers to Foreign Revenues of of from Foreign of from Foreign to Foreign Revenues RevenuesMessages Minutes Revenues Carriers Messages Minutes Carriers Minutes Carriers Carriers
Chad 3 65 $103 $64 $39 0 0 $0 $0 $0 $0 $39
Congo 3 10 $14 $9 $5 0 0 $0 $0 $0 $0 $5
Kenya 21 192 $175 $109 $66 0 0 $0 $0 $0 $0 $66
Madagascar 2 6 $4 $2 $2 0 0 $0 $0 $0 $0 $2
Mauritania 18 122 $102 $62 $40 0 0 $0 $0 $0 $0 $40
Niger 2 9 $12 $8 $4 0 0 $0 $0 $0 $0 $4
Seychelles 1 3 $5 $3 $2 0 0 $0 $0 $0 $0 $2
Togo 1 2 $1 $2 -$1 0 0 $0 $0 $0 $0 -$1
Africa 51 409 $416 $259 $157 0 0 $0 $0 $0 $0 $157
Iraq 4 30 $58 $38 $20 0 0 $0 $0 $0 $0 $20
Middle East 4 30 $58 $38 $20 0 0 $0 $0 $0 $0 $20
Cuba 315 6,185 $6,722 $4,097 $2,625 0 0 $0 $0 $0 $0 $2,625
Caribbean 315 6,185 $6,722 $4,097 $2,625 0 0 $0 $0 $0 $0 $2,625
Afghanistan 24 98 $120 $70 $50 0 0 $0 $0 $0 $0 $50
Bhutan 3 5 $2 $2 $0 0 0 $0 $0 $0 $0 $0
Burma 9 25 $31 $31 $0 0 0 $0 $0 $0 $0 $0
Laos 2 7 $5 $5 $0 0 0 $0 $0 $0 $0 $0
Maldives 3 18 $22 $14 $8 0 0 $0 $0 $0 $0 $8
Vietnam 174 2,978 $3,441 $2,710 $731 0 0 $0 $0 $0 $0 $731
Asia 215 3,131 $3,621 $2,832 $789 0 0 $0 $0 $0 $0 $789
Papua New Guinea 4 76 $38 $27 $11 0 0 $0 $0 $0 $0 $11
Vanuatu 3 29 $141 $24 $117 0 0 $0 $0 $0 $0 $117
Oceania 7 105 $179 $51 $128 0 0 $0 $0 $0 $0 $128
Tajikistan 1 2 $2 $2 $0 0 0 $0 $0 $0 $0 $0
Turkmenistan 1 4 $2 $1 $1 0 0 $0 $0 $0 $0 $1
Eastern Europe 2 6 $4 $3 $1 0 0 $0 $0 $0 $0 $1
Total for Foreign Points 594 9,866 $11,000 $7,280 $3,720 0 0 $0 $0 $0 $0 $3,720
World Total 594 9,866 $11,000 $7,280 $3,720 0 0 $0 0 $0 $0 $0 $3,720
- Switched Services Page 26 -

2008 Annual Section 43.61 International Traffic Data for All U.S. Points: All Settlement ArrangementsTable A10: KT America, Inc. Message Telephone Service Billing Types Covered: 1, 2, 3, 4, 5, 11, 12, 14, 15
International Point Traffic Billed in the United States Traffic Billed in Foreign Countries TotalOriginating or Terminating Transiting the United States U.S.
in the United States (by Country of Origin) CarriersNumber Number U.S. Payout Retained Number Number Receipts Number Receipts Payout Retained Retained
of of Carriers to Foreign Revenues of of from Foreign of from Foreign to Foreign Revenues RevenuesMessages Minutes Revenues Carriers Messages Minutes Carriers Minutes Carriers Carriers
Korea, South 2,323,835 16,529,438 $1,174,377 $1,422,502 -$248,125 0 0 $0 $0 $0 $0 -$248,125
Asia 2,323,835 16,529,438 $1,174,377 $1,422,502 -$248,125 0 0 $0 $0 $0 $0 -$248,125
Total for Foreign Points 2,323,835 16,529,438 $1,174,377 $1,422,502 -$248,125 0 0 $0 $0 $0 $0 -$248,125
World Total 2,323,835 16,529,438 $1,174,377 $1,422,502 -$248,125 0 0 $0 0 $0 $0 $0 -$248,125
- Switched Services Page 27 -

2008 Annual Section 43.61 International Traffic Data for All U.S. Points: All Settlement ArrangementsTable A11: Pacifica Telecom Inc. (PTI) Message Telephone Service Billing Types Covered: 1, 2, 3, 4, 5, 11, 12, 14, 15
International Point Traffic Billed in the United States Traffic Billed in Foreign Countries TotalOriginating or Terminating Transiting the United States U.S.
in the United States (by Country of Origin) CarriersNumber Number U.S. Payout Retained Number Number Receipts Number Receipts Payout Retained Retained
of of Carriers to Foreign Revenues of of from Foreign of from Foreign to Foreign Revenues RevenuesMessages Minutes Revenues Carriers Messages Minutes Carriers Minutes Carriers Carriers
Austria 887 4,604 $1,120 $536 $584 0 0 $0 $0 $0 $0 $584Belgium 363 1,615 $388 $330 $58 0 0 $0 $0 $0 $0 $58Cyprus 85 886 $137 $22 $115 0 0 $0 $0 $0 $0 $115Denmark 319 2,478 $447 $41 $406 0 0 $0 $0 $0 $0 $406Finland 27 292 $159 $26 $133 0 0 $0 $0 $0 $0 $133France 2,147 15,282 $5,001 $793 $4,208 0 0 $0 $0 $0 $0 $4,208Germany 5,683 51,448 $10,091 $1,994 $8,097 0 0 $0 $0 $0 $0 $8,097Gibraltar 54 434 $96 $0 $96 0 0 $0 $0 $0 $0 $96Greece 476 3,495 $474 $111 $363 0 0 $0 $0 $0 $0 $363Iceland 4 42 $12 $1 $11 0 0 $0 $0 $0 $0 $11Ireland 313 2,167 $472 $83 $389 0 0 $0 $0 $0 $0 $389Italy 7,179 45,526 $10,587 $4,537 $6,050 0 0 $0 $0 $0 $0 $6,050Liechtenstein 133 652 $300 $257 $43 0 0 $0 $0 $0 $0 $43Luxembourg 14 159 $110 $16 $94 0 0 $0 $0 $0 $0 $94Malta 77 555 $195 $58 $137 0 0 $0 $0 $0 $0 $137Netherlands 495 2,849 $1,101 $130 $971 0 0 $0 $0 $0 $0 $971Norway 365 1,733 $850 $140 $710 0 0 $0 $0 $0 $0 $710Portugal 45 532 $133 $23 $110 0 0 $0 $0 $0 $0 $110Spain 919 7,564 $1,892 $452 $1,440 0 0 $0 $0 $0 $0 $1,440Sweden 182 1,706 $458 $54 $404 0 0 $0 $0 $0 $0 $404Switzerland 1,547 16,865 $1,509 $144 $1,365 0 0 $0 $0 $0 $0 $1,365Turkey 3,159 29,584 $1,606 $89 $1,517 0 0 $0 $0 $0 $0 $1,517United Kingdom 8,398 93,193 $14,021 $3,059 $10,962 0 0 $0 $0 $0 $0 $10,962
Western Europe 32,871 283,661 $51,159 $12,896 $38,263 0 0 $0 $0 $0 $0 $38,263
Algeria 17 12 $7 $3 $4 0 0 $0 $0 $0 $0 $4Angola 23 88 $60 $8 $52 0 0 $0 $0 $0 $0 $52Benin 2 4 $2 $1 $1 0 0 $0 $0 $0 $0 $1Botswana 3 24 $7 $3 $4 0 0 $0 $0 $0 $0 $4Burkina 4 4 $2 $1 $1 0 0 $0 $0 $0 $0 $1Congo 69 445 $69 $34 $35 0 0 $0 $0 $0 $0 $35Cote d'Ivoire 19 63 $20 $7 $13 0 0 $0 $0 $0 $0 $13Djibouti 2,310 10,057 $4,455 $2,777 $1,678 0 0 $0 $0 $0 $0 $1,678Egypt 1,536 10,645 $2,527 $514 $2,013 0 0 $0 $0 $0 $0 $2,013Equatorial Guinea 166 1,023 $337 $172 $165 0 0 $0 $0 $0 $0 $165Ethiopia 249 1,063 $636 $184 $452 0 0 $0 $0 $0 $0 $452Gambia, The 2 3 $1 $1 $0 0 0 $0 $0 $0 $0 $0Ghana 996 13,122 $2,749 $1,533 $1,216 0 0 $0 $0 $0 $0 $1,216Guinea 3 4 $1 $0 $1 0 0 $0 $0 $0 $0 $1Kenya 1,649 17,669 $4,704 $1,916 $2,788 0 0 $0 $0 $0 $0 $2,788Liberia 997 7,407 $1,508 $64 $1,444 0 0 $0 $0 $0 $0 $1,444Libya 179 1,179 $240 $130 $110 0 0 $0 $0 $0 $0 $110Mauritania 3 3 $1 $1 $0 0 0 $0 $0 $0 $0 $0Mauritius 30 185 $77 $18 $59 0 0 $0 $0 $0 $0 $59Morocco 134 432 $151 $63 $88 0 0 $0 $0 $0 $0 $88
- Switched Services Page 28 -

2008 Annual Section 43.61 International Traffic Data for All U.S. Points: All Settlement ArrangementsTable A11: Pacifica Telecom Inc. (PTI) Message Telephone Service Billing Types Covered: 1, 2, 3, 4, 5, 11, 12, 14, 15
International Point Traffic Billed in the United States Traffic Billed in Foreign Countries TotalOriginating or Terminating Transiting the United States U.S.
in the United States (by Country of Origin) CarriersNumber Number U.S. Payout Retained Number Number Receipts Number Receipts Payout Retained Retained
of of Carriers to Foreign Revenues of of from Foreign of from Foreign to Foreign Revenues RevenuesMessages Minutes Revenues Carriers Messages Minutes Carriers Minutes Carriers Carriers
Nigeria 2,655 14,845 $6,234 $1,344 $4,890 0 0 $0 $0 $0 $0 $4,890Reunion 1 2 $2 $1 $1 0 0 $0 $0 $0 $0 $1Rwanda 207 2,045 $133 $2 $131 0 0 $0 $0 $0 $0 $131Senegal 34 96 $49 $3 $46 0 0 $0 $0 $0 $0 $46Seychelles 980 7,058 $2,300 $349 $1,951 0 0 $0 $0 $0 $0 $1,951Sierra Leone 11 107 $37 $28 $9 0 0 $0 $0 $0 $0 $9Somalia 11 27 $25 $8 $17 0 0 $0 $0 $0 $0 $17South Africa 357 3,176 $927 $256 $671 0 0 $0 $0 $0 $0 $671Sudan 39 236 $70 $13 $57 0 0 $0 $0 $0 $0 $57Tanzania 117 726 $313 $46 $267 0 0 $0 $0 $0 $0 $267Togo 9 13 $11 $1 $10 0 0 $0 $0 $0 $0 $10Uganda 115 1,165 $209 $111 $98 0 0 $0 $0 $0 $0 $98Zambia 3 24 $4 $2 $2 0 0 $0 $0 $0 $0 $2Zimbabwe 6 11 $4 $2 $2 0 0 $0 $0 $0 $0 $2
Africa 12,936 92,963 $27,872 $9,596 $18,276 0 0 $0 $0 $0 $0 $18,276
Bahrain 2,875 19,243 $5,884 $1,199 $4,685 0 0 $0 $0 $0 $0 $4,685Iran 562 3,814 $1,509 $245 $1,264 0 0 $0 $0 $0 $0 $1,264Iraq 581 2,198 $1,873 $185 $1,688 0 0 $0 $0 $0 $0 $1,688Israel 1,193 9,163 $2,114 $529 $1,585 0 0 $0 $0 $0 $0 $1,585Jordan 337 1,403 $373 $95 $278 0 0 $0 $0 $0 $0 $278Kuwait 3,000 12,495 $2,425 $917 $1,508 0 0 $0 $0 $0 $0 $1,508Lebanon 589 1,167 $587 $90 $497 0 0 $0 $0 $0 $0 $497Oman 254 2,755 $941 $365 $576 0 0 $0 $0 $0 $0 $576Qatar 1,480 9,954 $3,943 $1,350 $2,593 0 0 $0 $0 $0 $0 $2,593Saudi Arabia 12,106 58,025 $20,087 $5,947 $14,140 0 0 $0 $0 $0 $0 $14,140Syria 69 156 $88 $19 $69 0 0 $0 $0 $0 $0 $69United Arab Emirates 10,317 68,036 $22,232 $8,111 $14,121 0 0 $0 $0 $0 $0 $14,121Yemen 558 3,915 $962 $369 $593 0 0 $0 $0 $0 $0 $593
Middle East 33,921 192,324 $63,018 $19,421 $43,597 0 0 $0 $0 $0 $0 $43,597
Antigua and Barbuda 11 115 $36 $4 $32 0 0 $0 $0 $0 $0 $32Bahamas, The 27 172 $26 $18 $8 0 0 $0 $0 $0 $0 $8Barbados 26 224 $83 $25 $58 0 0 $0 $0 $0 $0 $58Bermuda 84 1,278 $210 $27 $183 0 0 $0 $0 $0 $0 $183Cayman Islands 97 698 $150 $127 $23 0 0 $0 $0 $0 $0 $23Cuba 472 1,889 $1,682 $1,347 $335 0 0 $0 $0 $0 $0 $335Dominica 24 44 $20 $7 $13 0 0 $0 $0 $0 $0 $13Dominican Republic 120 1,323 $190 $59 $131 0 0 $0 $0 $0 $0 $131Grenada 3 70 $49 $0 $49 0 0 $0 $0 $0 $0 $49Jamaica 1,432 13,036 $3,375 $1,582 $1,793 0 0 $0 $0 $0 $0 $1,793Netherlands Antilles 51 399 $84 $14 $70 0 0 $0 $0 $0 $0 $70Saint Kitts and Nevis 1 2 $1 $1 $0 0 0 $0 $0 $0 $0 $0Saint Lucia 5 38 $10 $7 $3 0 0 $0 $0 $0 $0 $3Saint Vincent and the Grenadines 2 53 $13 $3 $10 0 0 $0 $0 $0 $0 $10
- Switched Services Page 29 -
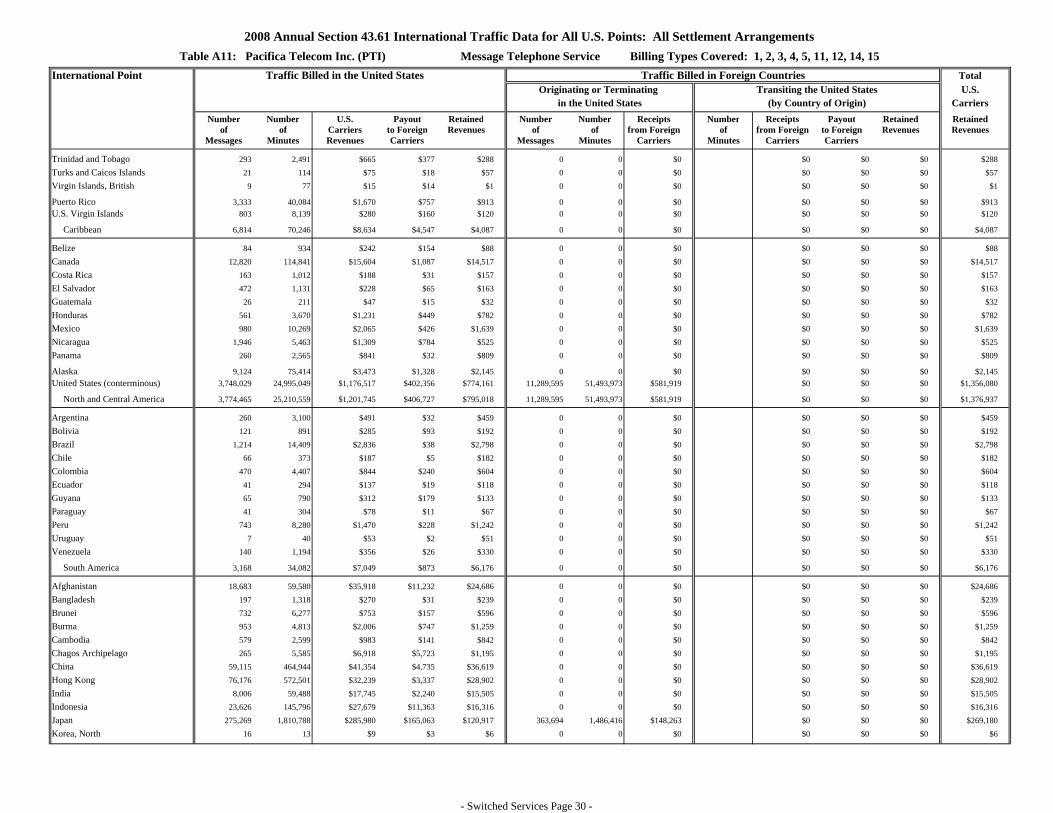
2008 Annual Section 43.61 International Traffic Data for All U.S. Points: All Settlement ArrangementsTable A11: Pacifica Telecom Inc. (PTI) Message Telephone Service Billing Types Covered: 1, 2, 3, 4, 5, 11, 12, 14, 15
International Point Traffic Billed in the United States Traffic Billed in Foreign Countries TotalOriginating or Terminating Transiting the United States U.S.
in the United States (by Country of Origin) CarriersNumber Number U.S. Payout Retained Number Number Receipts Number Receipts Payout Retained Retained
of of Carriers to Foreign Revenues of of from Foreign of from Foreign to Foreign Revenues RevenuesMessages Minutes Revenues Carriers Messages Minutes Carriers Minutes Carriers Carriers
Trinidad and Tobago 293 2,491 $665 $377 $288 0 0 $0 $0 $0 $0 $288Turks and Caicos Islands 21 114 $75 $18 $57 0 0 $0 $0 $0 $0 $57Virgin Islands, British 9 77 $15 $14 $1 0 0 $0 $0 $0 $0 $1
Puerto Rico 3,333 40,084 $1,670 $757 $913 0 0 $0 $0 $0 $0 $913U.S. Virgin Islands 803 8,139 $280 $160 $120 0 0 $0 $0 $0 $0 $120
Caribbean 6,814 70,246 $8,634 $4,547 $4,087 0 0 $0 $0 $0 $0 $4,087
Belize 84 934 $242 $154 $88 0 0 $0 $0 $0 $0 $88Canada 12,820 114,841 $15,604 $1,087 $14,517 0 0 $0 $0 $0 $0 $14,517Costa Rica 163 1,012 $188 $31 $157 0 0 $0 $0 $0 $0 $157El Salvador 472 1,131 $228 $65 $163 0 0 $0 $0 $0 $0 $163Guatemala 26 211 $47 $15 $32 0 0 $0 $0 $0 $0 $32Honduras 561 3,670 $1,231 $449 $782 0 0 $0 $0 $0 $0 $782Mexico 980 10,269 $2,065 $426 $1,639 0 0 $0 $0 $0 $0 $1,639Nicaragua 1,946 5,463 $1,309 $784 $525 0 0 $0 $0 $0 $0 $525Panama 260 2,565 $841 $32 $809 0 0 $0 $0 $0 $0 $809
Alaska 9,124 75,414 $3,473 $1,328 $2,145 0 0 $0 $0 $0 $0 $2,145United States (conterminous) 3,748,029 24,995,049 $1,176,517 $402,356 $774,161 11,289,595 51,493,973 $581,919 $0 $0 $0 $1,356,080
North and Central America 3,774,465 25,210,559 $1,201,745 $406,727 $795,018 11,289,595 51,493,973 $581,919 $0 $0 $0 $1,376,937
Argentina 260 3,100 $491 $32 $459 0 0 $0 $0 $0 $0 $459Bolivia 121 891 $285 $93 $192 0 0 $0 $0 $0 $0 $192Brazil 1,214 14,409 $2,836 $38 $2,798 0 0 $0 $0 $0 $0 $2,798Chile 66 373 $187 $5 $182 0 0 $0 $0 $0 $0 $182Colombia 470 4,407 $844 $240 $604 0 0 $0 $0 $0 $0 $604Ecuador 41 294 $137 $19 $118 0 0 $0 $0 $0 $0 $118Guyana 65 790 $312 $179 $133 0 0 $0 $0 $0 $0 $133Paraguay 41 304 $78 $11 $67 0 0 $0 $0 $0 $0 $67Peru 743 8,280 $1,470 $228 $1,242 0 0 $0 $0 $0 $0 $1,242Uruguay 7 40 $53 $2 $51 0 0 $0 $0 $0 $0 $51Venezuela 140 1,194 $356 $26 $330 0 0 $0 $0 $0 $0 $330
South America 3,168 34,082 $7,049 $873 $6,176 0 0 $0 $0 $0 $0 $6,176
Afghanistan 18,683 59,580 $35,918 $11,232 $24,686 0 0 $0 $0 $0 $0 $24,686Bangladesh 197 1,318 $270 $31 $239 0 0 $0 $0 $0 $0 $239Brunei 732 6,277 $753 $157 $596 0 0 $0 $0 $0 $0 $596Burma 953 4,813 $2,006 $747 $1,259 0 0 $0 $0 $0 $0 $1,259Cambodia 579 2,599 $983 $141 $842 0 0 $0 $0 $0 $0 $842Chagos Archipelago 265 5,585 $6,918 $5,723 $1,195 0 0 $0 $0 $0 $0 $1,195China 59,115 464,944 $41,354 $4,735 $36,619 0 0 $0 $0 $0 $0 $36,619Hong Kong 76,176 572,501 $32,239 $3,337 $28,902 0 0 $0 $0 $0 $0 $28,902India 8,006 59,488 $17,745 $2,240 $15,505 0 0 $0 $0 $0 $0 $15,505Indonesia 23,626 145,796 $27,679 $11,363 $16,316 0 0 $0 $0 $0 $0 $16,316Japan 275,269 1,810,788 $285,980 $165,063 $120,917 363,694 1,486,416 $148,263 $0 $0 $0 $269,180Korea, North 16 13 $9 $3 $6 0 0 $0 $0 $0 $0 $6
- Switched Services Page 30 -

2008 Annual Section 43.61 International Traffic Data for All U.S. Points: All Settlement ArrangementsTable A11: Pacifica Telecom Inc. (PTI) Message Telephone Service Billing Types Covered: 1, 2, 3, 4, 5, 11, 12, 14, 15
International Point Traffic Billed in the United States Traffic Billed in Foreign Countries TotalOriginating or Terminating Transiting the United States U.S.
in the United States (by Country of Origin) CarriersNumber Number U.S. Payout Retained Number Number Receipts Number Receipts Payout Retained Retained
of of Carriers to Foreign Revenues of of from Foreign of from Foreign to Foreign Revenues RevenuesMessages Minutes Revenues Carriers Messages Minutes Carriers Minutes Carriers Carriers
Korea, South 102,874 587,717 $65,892 $38,355 $27,537 105,805 577,760 $86,856 $0 $0 $0 $114,393Laos 115 1,204 $337 $50 $287 0 0 $0 $0 $0 $0 $287Macau 1,634 9,710 $1,490 $277 $1,213 0 0 $0 $0 $0 $0 $1,213Malaysia 12,975 121,291 $14,128 $2,884 $11,244 0 0 $0 $0 $0 $0 $11,244Maldives 67 353 $225 $49 $176 0 0 $0 $0 $0 $0 $176Mongolia 609 3,705 $612 $348 $264 0 0 $0 $0 $0 $0 $264Nepal 568 2,804 $1,143 $306 $837 0 0 $0 $0 $0 $0 $837Pakistan 214 1,293 $1,006 $56 $950 0 0 $0 $0 $0 $0 $950Philippines 2,463,664 18,314,643 $3,437,598 $2,006,551 $1,431,047 869,191 1,309,613 $21,057 $0 $0 $0 $1,452,104Singapore 21,718 191,751 $19,411 $6,691 $12,720 42,938 138,599 $6,984 $0 $0 $0 $19,704Sri Lanka 1,065 7,710 $2,558 $536 $2,022 0 0 $0 $0 $0 $0 $2,022Taiwan 63,286 385,899 $43,033 $6,692 $36,341 0 0 $0 $0 $0 $0 $36,341Thailand 14,523 99,587 $19,160 $956 $18,204 0 0 $0 $0 $0 $0 $18,204Vietnam 13,660 126,858 $34,662 $6,180 $28,482 0 0 $0 $0 $0 $0 $28,482
Asia 3,160,589 22,988,227 $4,093,109 $2,274,703 $1,818,406 1,381,628 3,512,388 $263,160 $0 $0 $0 $2,081,566
Australia 23,271 214,886 $30,241 $25,705 $4,536 27,675 143,798 $43,475 $0 $0 $0 $48,011Cook Islands 13 49 $48 $23 $25 0 0 $0 $0 $0 $0 $25Fiji 4,645 35,157 $12,040 $3,936 $8,104 0 0 $0 $0 $0 $0 $8,104French Polynesia 550 5,566 $2,070 $851 $1,219 0 0 $0 $0 $0 $0 $1,219Kiribati 245 924 $756 $411 $345 0 0 $0 $0 $0 $0 $345Marshall Islands 18,827 96,562 $29,665 $17,928 $11,737 0 0 $0 $0 $0 $0 $11,737Micronesia, Federated States of 254,833 1,570,877 $459,146 $217,935 $241,211 0 0 $0 $0 $0 $0 $241,211Nauru 8 32 $25 $12 $13 0 0 $0 $0 $0 $0 $13New Caledonia 198 1,389 $640 $274 $366 0 0 $0 $0 $0 $0 $366New Zealand 5,948 74,311 $10,405 $2,428 $7,977 0 0 $0 $0 $0 $0 $7,977Pacific Islands (Palau) 59,210 320,774 $125,380 $60,506 $64,874 0 0 $0 $0 $0 $0 $64,874Papua New Guinea 403 2,230 $901 $765 $136 0 0 $0 $0 $0 $0 $136Solomon Islands 358 700 $668 $194 $474 0 0 $0 $0 $0 $0 $474Tonga 151 947 $402 $56 $346 0 0 $0 $0 $0 $0 $346Tuvalu 26 70 $55 $30 $25 0 0 $0 $0 $0 $0 $25Vanuatu 24 65 $60 $19 $41 0 0 $0 $0 $0 $0 $41Western Samoa 476 4,711 $1,834 $1,184 $650 0 0 $0 $0 $0 $0 $650
American Samoa 1,672 13,147 $2,761 $748 $2,013 0 0 $0 $0 $0 $0 $2,013Hawaii 382,646 2,272,681 $131,088 $40,034 $91,054 0 0 $0 $0 $0 $0 $91,054Northern Mariana Islands 343,141 1,627,946 $92,775 $0 $92,775 0 0 $0 $0 $0 $0 $92,775
Oceania 1,096,645 6,243,024 $900,960 $373,039 $527,921 27,675 143,798 $43,475 $0 $0 $0 $571,396
Armenia 11 46 $9 $2 $7 0 0 $0 $0 $0 $0 $7Belarus 58 127 $42 $23 $19 0 0 $0 $0 $0 $0 $19Bulgaria 125 1,189 $335 $33 $302 0 0 $0 $0 $0 $0 $302Croatia 57 541 $76 $13 $63 0 0 $0 $0 $0 $0 $63Czech Republic 182 1,413 $292 $100 $192 0 0 $0 $0 $0 $0 $192Estonia 23 67 $51 $7 $44 0 0 $0 $0 $0 $0 $44Georgia 40 240 $52 $21 $31 0 0 $0 $0 $0 $0 $31
- Switched Services Page 31 -

2008 Annual Section 43.61 International Traffic Data for All U.S. Points: All Settlement ArrangementsTable A11: Pacifica Telecom Inc. (PTI) Message Telephone Service Billing Types Covered: 1, 2, 3, 4, 5, 11, 12, 14, 15
International Point Traffic Billed in the United States Traffic Billed in Foreign Countries TotalOriginating or Terminating Transiting the United States U.S.
in the United States (by Country of Origin) CarriersNumber Number U.S. Payout Retained Number Number Receipts Number Receipts Payout Retained Retained
of of Carriers to Foreign Revenues of of from Foreign of from Foreign to Foreign Revenues RevenuesMessages Minutes Revenues Carriers Messages Minutes Carriers Minutes Carriers Carriers
Hungary 14 19 $5 $2 $3 0 0 $0 $0 $0 $0 $3Kyrgyzstan 3,563 6,603 $4,036 $260 $3,776 0 0 $0 $0 $0 $0 $3,776Latvia 108 773 $222 $94 $128 0 0 $0 $0 $0 $0 $128Lithuania 15 85 $17 $10 $7 0 0 $0 $0 $0 $0 $7Moldova 10 49 $10 $5 $5 0 0 $0 $0 $0 $0 $5Poland 284 1,942 $571 $38 $533 0 0 $0 $0 $0 $0 $533Romania 491 3,885 $325 $32 $293 0 0 $0 $0 $0 $0 $293Russia 20,385 126,205 $22,295 $5,861 $16,434 0 0 $0 $0 $0 $0 $16,434Serbia 262 748 $233 $52 $181 0 0 $0 $0 $0 $0 $181Slovakia 7 31 $11 $2 $9 0 0 $0 $0 $0 $0 $9Slovenia 9 41 $12 $2 $10 0 0 $0 $0 $0 $0 $10Ukraine 125 364 $96 $27 $69 0 0 $0 $0 $0 $0 $69Uzbekistan 7 43 $16 $2 $14 0 0 $0 $0 $0 $0 $14
Eastern Europe 25,776 144,411 $28,706 $6,586 $22,120 0 0 $0 $0 $0 $0 $22,120
Maritime - Pacific 1,198 2,708 $17,365 $3,986 $13,379 0 0 $0 $0 $0 $0 $13,379
Other Regions 1,198 2,708 $17,365 $3,986 $13,379 0 0 $0 $0 $0 $0 $13,379
Northern Mariana Islands 3,186,393 25,479,254 $4,692,091 $2,707,404 $1,984,687 295,240 1,193,225 $165,089 $0 $0 $0 $2,149,776
Carriers serving Misc. U.S. points 3,186,393 25,479,254 $4,692,091 $2,707,404 $1,984,687 295,240 1,193,225 $165,089 $0 $0 $0 $2,149,776
Total for Foreign Points 6,846,028 51,708,999 $9,683,144 $5,374,395 $4,308,749 1,704,543 4,849,411 $471,724 $0 $0 $0 $4,780,473
Total for U.S. Points 4,488,748 29,032,460 $1,408,564 $445,383 $963,181 11,289,595 51,493,973 $581,919 $0 $0 $0 $1,545,100
World Total 11,334,776 80,741,459 $11,091,708 $5,819,778 $5,271,930 12,994,138 56,343,384 $1,053,643 0 $0 $0 $0 $6,325,573
- Switched Services Page 32 -

2008 Annual Section 43.61 International Traffic Data for All U.S. Points: All Settlement ArrangementsTable A12: Reliance Communications, Inc. Message Telephone Service Billing Types Covered: 1, 2, 3, 4, 5, 11, 12, 14, 15
International Point Traffic Billed in the United States Traffic Billed in Foreign Countries TotalOriginating or Terminating Transiting the United States U.S.
in the United States (by Country of Origin) CarriersNumber Number U.S. Payout Retained Number Number Receipts Number Receipts Payout Retained Retained
of of Carriers to Foreign Revenues of of from Foreign of from Foreign to Foreign Revenues RevenuesMessages Minutes Revenues Carriers Messages Minutes Carriers Minutes Carriers Carriers
Andorra 120 359 $79 $78 $1 0 0 $0 $0 $0 $0 $1Austria 807 2,421 $196 $192 $4 0 0 $0 $0 $0 $0 $4Belgium 42,687 128,060 $10,625 $10,369 $256 0 0 $0 $0 $0 $0 $256Cyprus 6,073 18,220 $883 $847 $36 0 0 $0 $0 $0 $0 $36Denmark 20,505 61,513 $5,316 $5,193 $123 0 0 $0 $0 $0 $0 $123Finland 23,208 69,623 $4,875 $4,736 $139 0 0 $0 $0 $0 $0 $139France 3,916 11,749 $594 $571 $23 0 0 $0 $0 $0 $0 $23Germany 357,685 1,073,055 $32,978 $30,832 $2,146 0 0 $0 $0 $0 $0 $2,146Greece 9,541 28,622 $2,852 $2,795 $57 0 0 $0 $0 $0 $0 $57Ireland 23,487 70,461 $11,051 $10,910 $141 0 0 $0 $0 $0 $0 $141Italy 315,214 945,641 $45,674 $43,783 $1,891 0 0 $0 $0 $0 $0 $1,891Liechtenstein 9,357 28,072 $9,809 $9,753 $56 0 0 $0 $0 $0 $0 $56Luxembourg 3,751 11,254 $545 $522 $23 0 0 $0 $0 $0 $0 $23Malta 737 2,212 $630 $625 $5 0 0 $0 $0 $0 $0 $5Netherlands 14,325 42,975 $8,376 $8,290 $86 0 0 $0 $0 $0 $0 $86Norway 16,080 48,241 $6,804 $6,707 $97 0 0 $0 $0 $0 $0 $97Spain 25,740 77,221 $6,145 $5,991 $154 0 0 $0 $0 $0 $0 $154Sweden 33,669 101,008 $8,570 $8,368 $202 0 0 $0 $0 $0 $0 $202Switzerland 44,324 132,971 $5,830 $5,564 $266 0 0 $0 $0 $0 $0 $266Turkey 3,590 10,771 $815 $793 $22 0 0 $0 $0 $0 $0 $22United Kingdom 4,033,140 12,099,419 $461,028 $436,829 $24,199 0 0 $0 $0 $0 $0 $24,199
Western Europe 4,987,956 14,963,868 $623,675 $593,748 $29,927 0 0 $0 $0 $0 $0 $29,927
Algeria 2,434 7,303 $815 $801 $14 0 0 $0 $0 $0 $0 $14Angola 2,023 6,069 $869 $857 $12 0 0 $0 $0 $0 $0 $12Benin 1,056 3,167 $686 $679 $7 0 0 $0 $0 $0 $0 $7Botswana 7,069 21,206 $2,339 $2,297 $42 0 0 $0 $0 $0 $0 $42Burkina 1,423 4,268 $764 $755 $9 0 0 $0 $0 $0 $0 $9Burundi 153 459 $31 $30 $1 0 0 $0 $0 $0 $0 $1Cameroon 702 2,105 $347 $343 $4 0 0 $0 $0 $0 $0 $4Cape Verde 231 692 $178 $177 $1 0 0 $0 $0 $0 $0 $1Central African Republic 99 297 $97 $96 $1 0 0 $0 $0 $0 $0 $1Chad 15 46 $5 $5 $0 0 0 $0 $0 $0 $0 $0Comoros 286 858 $310 $309 $1 0 0 $0 $0 $0 $0 $1Congo 62,689 188,066 $23,168 $22,791 $377 0 0 $0 $0 $0 $0 $377Cote d'Ivoire 2 7 $1 $1 $0 0 0 $0 $0 $0 $0 $0Djibouti 5,234 15,702 $5,218 $5,186 $32 0 0 $0 $0 $0 $0 $32Egypt 10,836 32,509 $2,723 $2,658 $65 0 0 $0 $0 $0 $0 $65Equatorial Guinea 266 797 $166 $164 $2 0 0 $0 $0 $0 $0 $2Ethiopia 2,369 7,107 $1,906 $1,893 $13 0 0 $0 $0 $0 $0 $13Gabon 530 1,591 $222 $219 $3 0 0 $0 $0 $0 $0 $3Gambia, The 427 1,281 $422 $419 $3 0 0 $0 $0 $0 $0 $3Ghana 157,963 473,889 $38,378 $37,431 $947 0 0 $0 $0 $0 $0 $947
- Switched Services Page 33 -

2008 Annual Section 43.61 International Traffic Data for All U.S. Points: All Settlement ArrangementsTable A12: Reliance Communications, Inc. Message Telephone Service Billing Types Covered: 1, 2, 3, 4, 5, 11, 12, 14, 15
International Point Traffic Billed in the United States Traffic Billed in Foreign Countries TotalOriginating or Terminating Transiting the United States U.S.
in the United States (by Country of Origin) CarriersNumber Number U.S. Payout Retained Number Number Receipts Number Receipts Payout Retained Retained
of of Carriers to Foreign Revenues of of from Foreign of from Foreign to Foreign Revenues RevenuesMessages Minutes Revenues Carriers Messages Minutes Carriers Minutes Carriers Carriers
Guinea 1,382 4,147 $820 $811 $9 0 0 $0 $0 $0 $0 $9Kenya 93,392 280,175 $27,975 $27,415 $560 0 0 $0 $0 $0 $0 $560Libya 16,995 50,984 $12,331 $12,229 $102 0 0 $0 $0 $0 $0 $102Madagascar 524 1,573 $312 $309 $3 0 0 $0 $0 $0 $0 $3Malawi 1,555 4,666 $2,940 $2,931 $9 0 0 $0 $0 $0 $0 $9Mali 764 2,292 $419 $415 $4 0 0 $0 $0 $0 $0 $4Mauritius 9,911 29,734 $3,585 $3,525 $60 0 0 $0 $0 $0 $0 $60Morocco 2,083 6,250 $1,307 $1,295 $12 0 0 $0 $0 $0 $0 $12Mozambique 6,170 18,511 $2,597 $2,560 $37 0 0 $0 $0 $0 $0 $37Namibia 896 2,687 $582 $576 $6 0 0 $0 $0 $0 $0 $6Nigeria 184,833 554,498 $47,916 $46,807 $1,109 0 0 $0 $0 $0 $0 $1,109Reunion 657 1,970 $407 $403 $4 0 0 $0 $0 $0 $0 $4Rwanda 1,957 5,871 $649 $637 $12 0 0 $0 $0 $0 $0 $12Saint Helena 5 16 $6 $5 $1 0 0 $0 $0 $0 $0 $1Sao Tome and Principe 35,861 107,583 $33,711 $33,496 $215 0 0 $0 $0 $0 $0 $215Senegal 18,886 56,659 $49,800 $49,687 $113 0 0 $0 $0 $0 $0 $113Sierra Leone 2,490 7,471 $1,459 $1,444 $15 0 0 $0 $0 $0 $0 $15Somalia 4,973 14,918 $6,980 $6,951 $29 0 0 $0 $0 $0 $0 $29South Africa 586,747 1,760,240 $21,223 $17,703 $3,520 0 0 $0 $0 $0 $0 $3,520Sudan 520 1,559 $128 $125 $3 0 0 $0 $0 $0 $0 $3Swaziland 846 2,538 $426 $421 $5 0 0 $0 $0 $0 $0 $5Tanzania 9,804 29,413 $3,055 $2,996 $59 0 0 $0 $0 $0 $0 $59Tunisia 1,840 5,520 $1,409 $1,398 $11 0 0 $0 $0 $0 $0 $11Uganda 44,679 134,036 $7,636 $7,368 $268 0 0 $0 $0 $0 $0 $268Zambia 348,757 1,046,271 $44,510 $42,417 $2,093 0 0 $0 $0 $0 $0 $2,093
Africa 1,632,334 4,897,001 $350,828 $341,035 $9,793 0 0 $0 $0 $0 $0 $9,793
Bahrain 8,405 25,214 $1,306 $1,256 $50 0 0 $0 $0 $0 $0 $50Iran 17,748 53,244 $5,290 $5,184 $106 0 0 $0 $0 $0 $0 $106Iraq 17,197 51,591 $4,046 $3,943 $103 0 0 $0 $0 $0 $0 $103Israel 9,753 29,259 $1,911 $1,852 $59 0 0 $0 $0 $0 $0 $59Jordan 26,462 79,385 $5,008 $4,849 $159 0 0 $0 $0 $0 $0 $159Kuwait 166,344 499,031 $42,871 $41,873 $998 0 0 $0 $0 $0 $0 $998Lebanon 14,948 44,843 $5,704 $5,615 $89 0 0 $0 $0 $0 $0 $89Oman 94,496 283,489 $54,432 $53,865 $567 0 0 $0 $0 $0 $0 $567Qatar 46,701 140,102 $27,249 $26,968 $281 0 0 $0 $0 $0 $0 $281Saudi Arabia 409,452 1,228,356 $90,493 $88,036 $2,457 0 0 $0 $0 $0 $0 $2,457Syria 2,653 7,958 $1,585 $1,569 $16 0 0 $0 $0 $0 $0 $16United Arab Emirates 2,039,227 6,117,680 $882,946 $870,710 $12,236 0 0 $0 $0 $0 $0 $12,236Yemen 1,197,826 3,593,479 $43,038 $35,851 $7,187 0 0 $0 $0 $0 $0 $7,187
Middle East 4,051,212 12,153,631 $1,165,879 $1,141,571 $24,308 0 0 $0 $0 $0 $0 $24,308
Anguilla 483 1,450 $270 $267 $3 0 0 $0 $0 $0 $0 $3Antigua and Barbuda 1,969 5,906 $583 $572 $11 0 0 $0 $0 $0 $0 $11
- Switched Services Page 34 -

2008 Annual Section 43.61 International Traffic Data for All U.S. Points: All Settlement ArrangementsTable A12: Reliance Communications, Inc. Message Telephone Service Billing Types Covered: 1, 2, 3, 4, 5, 11, 12, 14, 15
International Point Traffic Billed in the United States Traffic Billed in Foreign Countries TotalOriginating or Terminating Transiting the United States U.S.
in the United States (by Country of Origin) CarriersNumber Number U.S. Payout Retained Number Number Receipts Number Receipts Payout Retained Retained
of of Carriers to Foreign Revenues of of from Foreign of from Foreign to Foreign Revenues RevenuesMessages Minutes Revenues Carriers Messages Minutes Carriers Minutes Carriers Carriers
Aruba 525 1,574 $245 $242 $3 0 0 $0 $0 $0 $0 $3Bahamas, The 520 1,561 $50 $47 $3 0 0 $0 $0 $0 $0 $3Barbados 1,550 4,651 $653 $643 $10 0 0 $0 $0 $0 $0 $10Bermuda 1,179 3,536 $141 $134 $7 0 0 $0 $0 $0 $0 $7Cayman Islands 2,938 8,813 $1,219 $1,201 $18 0 0 $0 $0 $0 $0 $18Cuba 3,020 9,061 $6,189 $6,171 $18 0 0 $0 $0 $0 $0 $18Dominica 2,615 7,845 $756 $741 $15 0 0 $0 $0 $0 $0 $15Grenada 1,029 3,088 $509 $503 $6 0 0 $0 $0 $0 $0 $6Haiti 30,269 90,808 $4,657 $4,475 $182 0 0 $0 $0 $0 $0 $182Jamaica 5,912 17,736 $2,850 $2,814 $36 0 0 $0 $0 $0 $0 $36Montserrat 94 281 $36 $35 $1 0 0 $0 $0 $0 $0 $1Netherlands Antilles 34,587 103,760 $5,521 $5,314 $207 0 0 $0 $0 $0 $0 $207Saint Kitts and Nevis 647 1,940 $363 $359 $4 0 0 $0 $0 $0 $0 $4Saint Lucia 496 1,488 $264 $261 $3 0 0 $0 $0 $0 $0 $3Saint Vincent and the Grenadines 262 785 $125 $123 $2 0 0 $0 $0 $0 $0 $2Trinidad and Tobago 30,551 91,654 $4,846 $4,662 $184 0 0 $0 $0 $0 $0 $184Turks and Caicos Islands 957 2,870 $582 $576 $6 0 0 $0 $0 $0 $0 $6Virgin Islands, British 239 718 $105 $104 $1 0 0 $0 $0 $0 $0 $1
Caribbean 119,842 359,525 $29,964 $29,244 $720 0 0 $0 $0 $0 $0 $720
Belize 2,995 8,984 $1,862 $1,844 $18 0 0 $0 $0 $0 $0 $18Canada 1,392,890 4,178,669 $50,085 $41,727 $8,358 0 0 $0 $0 $0 $0 $8,358Costa Rica 1,679 5,036 $321 $311 $10 0 0 $0 $0 $0 $0 $10El Salvador 8,380 25,141 $2,999 $2,949 $50 0 0 $0 $0 $0 $0 $50Guatemala 24,309 72,926 $12,650 $12,504 $146 0 0 $0 $0 $0 $0 $146Mexico 792,899 2,378,697 $193,230 $188,472 $4,758 0 0 $0 $0 $0 $0 $4,758Nicaragua 947 2,842 $375 $369 $6 0 0 $0 $0 $0 $0 $6Panama 607 1,820 $80 $77 $3 0 0 $0 $0 $0 $0 $3
North and Central America 2,224,706 6,674,115 $261,602 $248,253 $13,349 0 0 $0 $0 $0 $0 $13,349
Argentina 6,204 18,612 $730 $693 $37 0 0 $0 $0 $0 $0 $37Bolivia 27,263 81,788 $6,107 $5,943 $164 0 0 $0 $0 $0 $0 $164Brazil 16,078 48,235 $4,951 $4,855 $96 0 0 $0 $0 $0 $0 $96Chile 2,021 6,062 $554 $542 $12 0 0 $0 $0 $0 $0 $12Colombia 41,543 124,630 $5,307 $5,058 $249 0 0 $0 $0 $0 $0 $249Ecuador 6,377 19,132 $2,493 $2,455 $38 0 0 $0 $0 $0 $0 $38French Guiana 1,187 3,560 $180 $173 $7 0 0 $0 $0 $0 $0 $7Guyana 2,689 8,067 $1,962 $1,946 $16 0 0 $0 $0 $0 $0 $16Paraguay 280 839 $93 $92 $1 0 0 $0 $0 $0 $0 $1Peru 17,182 51,547 $3,909 $3,806 $103 0 0 $0 $0 $0 $0 $103Uruguay 414 1,241 $116 $114 $2 0 0 $0 $0 $0 $0 $2Venezuela 466,638 1,399,914 $85,478 $82,678 $2,800 0 0 $0 $0 $0 $0 $2,800
South America 587,876 1,763,627 $111,880 $108,355 $3,525 0 0 $0 $0 $0 $0 $3,525
Afghanistan 37,712 113,135 $23,290 $23,064 $226 0 0 $0 $0 $0 $0 $226
- Switched Services Page 35 -

2008 Annual Section 43.61 International Traffic Data for All U.S. Points: All Settlement ArrangementsTable A12: Reliance Communications, Inc. Message Telephone Service Billing Types Covered: 1, 2, 3, 4, 5, 11, 12, 14, 15
International Point Traffic Billed in the United States Traffic Billed in Foreign Countries TotalOriginating or Terminating Transiting the United States U.S.
in the United States (by Country of Origin) Carriers
Number Number U.S. Payout Retained Number Number Receipts Number Receipts Payout Retained Retainedof of Carriers to Foreign Revenues of of from Foreign of from Foreign to Foreign Revenues Revenues
Messages Minutes Revenues Carriers Messages Minutes Carriers Minutes Carriers Carriers
Bangladesh 118,458 355,374 $16,777 $16,066 $711 0 0 $0 $0 $0 $0 $711Bhutan 691 2,073 $337 $333 $4 0 0 $0 $0 $0 $0 $4Brunei 8,152 24,455 $1,512 $1,463 $49 0 0 $0 $0 $0 $0 $49Burma 11,509 34,526 $9,400 $9,331 $69 0 0 $0 $0 $0 $0 $69Cambodia 12,057 36,171 $3,545 $3,472 $73 0 0 $0 $0 $0 $0 $73China 175,874 527,621 $7,607 $6,551 $1,056 0 0 $0 $0 $0 $0 $1,056Hong Kong 73,816 221,449 $2,322 $1,879 $443 0 0 $0 $0 $0 $0 $443India 1,681,814,432 5,045,443,295 $232,090,938 $210,481,782 $21,609,156 152,390,179 457,170,537 $12,539,440 $221,419 $0 $221,419 $34,370,015Indonesia 43,948 131,845 $9,491 $9,228 $263 0 0 $0 $0 $0 $0 $263Japan 18,646 55,937 $5,651 $5,539 $112 0 0 $0 $0 $0 $0 $112Korea, North 1 1 $1 $1 $0 0 0 $0 $0 $0 $0 $0Korea, South 48,349 145,047 $4,802 $4,512 $290 0 0 $0 $0 $0 $0 $290Laos 629 1,886 $172 $168 $4 0 0 $0 $0 $0 $0 $4Macau 1,400 4,201 $199 $191 $8 0 0 $0 $0 $0 $0 $8Malaysia 2,041,945 6,125,834 $230,007 $217,755 $12,252 0 0 $0 $0 $0 $0 $12,252Maldives 1,569 4,708 $657 $648 $9 0 0 $0 $0 $0 $0 $9Mongolia 1,480 4,439 $502 $494 $8 0 0 $0 $0 $0 $0 $8Nepal 252,776 758,327 $110,939 $109,422 $1,517 0 0 $0 $0 $0 $0 $1,517Pakistan 605,539 1,816,617 $140,836 $137,203 $3,633 0 0 $0 $0 $0 $0 $3,633Philippines 703,414 2,110,243 $226,995 $222,774 $4,221 0 0 $0 $0 $0 $0 $4,221Singapore 439,543 1,318,629 $13,683 $11,046 $2,637 0 0 $0 $0 $0 $0 $2,637Sri Lanka 226,233 678,699 $75,671 $74,314 $1,357 0 0 $0 $0 $0 $0 $1,357Taiwan 9,936 29,809 $952 $892 $60 0 0 $0 $0 $0 $0 $60Thailand 77,810 233,429 $7,176 $6,710 $466 0 0 $0 $0 $0 $0 $466Vietnam 16,246 48,739 $2,952 $2,854 $98 0 0 $0 $0 $0 $0 $98
Asia 1,686,742,165 5,060,226,489 $232,986,414 $211,347,692 $21,638,722 152,390,179 457,170,537 $12,539,440 $221,419 $0 $221,419 $34,399,581
Australia 1,051,431 3,154,293 $148,103 $141,795 $6,308 0 0 $0 $0 $0 $0 $6,308Cook Islands 19 56 $33 $33 $0 0 0 $0 $0 $0 $0 $0Fiji 5,444 16,332 $4,383 $4,350 $33 0 0 $0 $0 $0 $0 $33French Polynesia 123 369 $84 $83 $1 0 0 $0 $0 $0 $0 $1Kiribati 126 379 $222 $221 $1 0 0 $0 $0 $0 $0 $1Nauru 4,608 13,823 $9,689 $9,662 $27 0 0 $0 $0 $0 $0 $27New Caledonia 56 167 $48 $47 $1 0 0 $0 $0 $0 $0 $1New Zealand 67,651 202,952 $22,012 $21,606 $406 0 0 $0 $0 $0 $0 $406Niue 1 2 $1 $1 $0 0 0 $0 $0 $0 $0 $0Pacific Islands (Palau) 14 43 $13 $13 $0 0 0 $0 $0 $0 $0 $0Papua New Guinea 2,529 7,588 $4,795 $4,780 $15 0 0 $0 $0 $0 $0 $15Tonga 1,872 5,615 $1,541 $1,529 $12 0 0 $0 $0 $0 $0 $12Vanuatu 318 955 $606 $604 $2 0 0 $0 $0 $0 $0 $2
Guam 801 2,403 $46 $42 $4 0 0 $0 $0 $0 $0 $4Northern Mariana Islands 551 1,653 $200 $197 $3 0 0 $0 $0 $0 $0 $3
Oceania 1,135,544 3,406,630 $191,776 $184,963 $6,813 0 0 $0 $0 $0 $0 $6,813
- Switched Services Page 36 -

2008 Annual Section 43.61 International Traffic Data for All U.S. Points: All Settlement ArrangementsTable A12: Reliance Communications, Inc. Message Telephone Service Billing Types Covered: 1, 2, 3, 4, 5, 11, 12, 14, 15
International Point Traffic Billed in the United States Traffic Billed in Foreign Countries TotalOriginating or Terminating Transiting the United States U.S.
in the United States (by Country of Origin) CarriersNumber Number U.S. Payout Retained Number Number Receipts Number Receipts Payout Retained Retained
of of Carriers to Foreign Revenues of of from Foreign of from Foreign to Foreign Revenues RevenuesMessages Minutes Revenues Carriers Messages Minutes Carriers Minutes Carriers Carriers
Albania 535 1,604 $261 $258 $3 0 0 $0 $0 $0 $0 $3Armenia 2,828 8,485 $893 $876 $17 0 0 $0 $0 $0 $0 $17Azerbaijan 2,675 8,024 $1,171 $1,155 $16 0 0 $0 $0 $0 $0 $16Belarus 1,544 4,632 $1,134 $1,125 $9 0 0 $0 $0 $0 $0 $9Bosnia and Herzegovina 220 660 $164 $163 $1 0 0 $0 $0 $0 $0 $1Bulgaria 10,838 32,515 $9,090 $9,025 $65 0 0 $0 $0 $0 $0 $65Croatia 1,623 4,870 $696 $686 $10 0 0 $0 $0 $0 $0 $10Czech Republic 6,730 20,191 $940 $899 $41 0 0 $0 $0 $0 $0 $41Estonia 157 470 $40 $39 $1 0 0 $0 $0 $0 $0 $1Georgia 1,984 5,952 $598 $587 $11 0 0 $0 $0 $0 $0 $11Hungary 1,368 4,105 $483 $475 $8 0 0 $0 $0 $0 $0 $8Kazakhstan 1,848 5,544 $574 $563 $11 0 0 $0 $0 $0 $0 $11Kyrgyzstan 24,938 74,814 $11,857 $11,707 $150 0 0 $0 $0 $0 $0 $150Lithuania 1,083 3,248 $404 $398 $6 0 0 $0 $0 $0 $0 $6Moldova 197 590 $96 $95 $1 0 0 $0 $0 $0 $0 $1Poland 8,043 24,130 $1,379 $1,330 $49 0 0 $0 $0 $0 $0 $49Romania 5,049 15,148 $2,680 $2,650 $30 0 0 $0 $0 $0 $0 $30Russia 23,684 71,052 $3,251 $3,109 $142 0 0 $0 $0 $0 $0 $142Serbia 1,420 4,261 $669 $661 $8 0 0 $0 $0 $0 $0 $8Tajikistan 1,107 3,321 $365 $358 $7 0 0 $0 $0 $0 $0 $7Turkmenistan 640 1,921 $198 $194 $4 0 0 $0 $0 $0 $0 $4Ukraine 27,510 82,530 $6,444 $6,279 $165 0 0 $0 $0 $0 $0 $165Uzbekistan 20,219 60,656 $1,532 $1,411 $121 0 0 $0 $0 $0 $0 $121 Eastern Europe 146,240 438,723 $44,919 $44,043 $876 0 0 $0 $0 $0 $0 $876
Total for Foreign Points 1,701,626,523 5,104,879,553 $235,766,691 $214,038,665 $21,728,026 152,390,179 457,170,537 $12,539,440 $0 $0 $0 $34,267,466Total for U.S. Points 1,352 4,056 $246 $239 $7 0 0 $0 $0 $0 $0 $7
World Total 1,701,627,875 5,104,883,609 $235,766,937 $214,038,904 $21,728,033 152,390,179 457,170,537 $12,539,440 0 $221,419 $0 $221,419 $34,488,892
- Switched Services Page 37 -

2008 Annual Section 43.61 International Traffic Data for All U.S. Points: All Settlement ArrangementsTable A13: Satellite Communication Systems, Inc. Message Telephone Service Billing Types Covered: 1, 2, 3, 4, 5, 11, 12, 14, 15
International Point Traffic Billed in the United States Traffic Billed in Foreign Countries TotalOriginating or Terminating Transiting the United States U.S.
in the United States (by Country of Origin) CarriersNumber Number U.S. Payout Retained Number Number Receipts Number Receipts Payout Retained Retained
of of Carriers to Foreign Revenues of of from Foreign of from Foreign to Foreign Revenues RevenuesMessages Minutes Revenues Carriers Messages Minutes Carriers Minutes Carriers Carriers
Belgium 6 10 $1 $0 $1 0 0 $0 $0 $0 $0 $1Cyprus 174 982 $54 $0 $54 0 0 $0 $0 $0 $0 $54Denmark 52 139 $103 $0 $103 0 0 $0 $0 $0 $0 $103France 2 2 $1 $0 $1 0 0 $0 $0 $0 $0 $1Germany 28 301 $30 $0 $30 0 0 $0 $0 $0 $0 $30Ireland 1 13 $2 $0 $2 0 0 $0 $0 $0 $0 $2Italy 70 256 $87 $0 $87 0 0 $0 $0 $0 $0 $87Luxembourg 1 1 $1 $0 $1 0 0 $0 $0 $0 $0 $1Netherlands 38 337 $32 $0 $32 0 0 $0 $0 $0 $0 $32Spain 13 84 $25 $0 $25 0 0 $0 $0 $0 $0 $25Switzerland 11 74 $35 $0 $35 0 0 $0 $0 $0 $0 $35United Kingdom 122 486 $68 $0 $68 0 0 $0 $0 $0 $0 $68
Western Europe 518 2,685 $439 $0 $439 0 0 $0 $0 $0 $0 $439
Egypt 1 1 $1 $0 $1 0 0 $0 $0 $0 $0 $1Kenya 3 16 $2 $0 $2 0 0 $0 $0 $0 $0 $2Nigeria 1 3 $1 $0 $1 0 0 $0 $0 $0 $0 $1Togo 2 28 $3 $0 $3 0 0 $0 $0 $0 $0 $3Zaire 55 409 $41 $0 $41 0 0 $0 $0 $0 $0 $41
Africa 62 457 $48 $0 $48 0 0 $0 $0 $0 $0 $48
Bahrain 7 31 $34 $0 $34 0 0 $0 $0 $0 $0 $34Israel 1 1 $1 $0 $1 0 0 $0 $0 $0 $0 $1United Arab Emirates 3 20 $6 $0 $6 0 0 $0 $0 $0 $0 $6
Middle East 11 52 $41 $0 $41 0 0 $0 $0 $0 $0 $41
Bahamas, The 94 464 $46 $0 $46 0 0 $0 $0 $0 $0 $46Barbados 163 493 $131 $0 $131 0 0 $0 $0 $0 $0 $131Cuba 420,782 1,312,288 $412,908 $0 $412,908 0 0 $0 $0 $0 $0 $412,908Dominican Republic 2,405 8,482 $5,894 $0 $5,894 0 0 $0 $0 $0 $0 $5,894French Overseas Departments 3 26 $19 $0 $19 0 0 $0 $0 $0 $0 $19Haiti 62 239 $25 $0 $25 0 0 $0 $0 $0 $0 $25Jamaica 66 413 $43 $0 $43 0 0 $0 $0 $0 $0 $43Netherlands Antilles 6 13 $1 $0 $1 0 0 $0 $0 $0 $0 $1Trinidad and Tobago 78 131 $19 $0 $19 0 0 $0 $0 $0 $0 $19Turks and Caicos Islands 30 37 $53 $0 $53 0 0 $0 $0 $0 $0 $53
Caribbean 423,689 1,322,586 $419,139 $0 $419,139 0 0 $0 $0 $0 $0 $419,139
Canada 667 2,378 $252 $0 $252 0 0 $0 $0 $0 $0 $252Costa Rica 59 210 $130 $0 $130 0 0 $0 $0 $0 $0 $130El Salvador 8 61 $26 $0 $26 0 0 $0 $0 $0 $0 $26Guatemala 49 124 $83 $0 $83 0 0 $0 $0 $0 $0 $83Honduras 77 337 $195 $0 $195 0 0 $0 $0 $0 $0 $195Mexico 132 526 $310 $0 $310 0 0 $0 $0 $0 $0 $310
- Switched Services Page 38 -

2008 Annual Section 43.61 International Traffic Data for All U.S. Points: All Settlement ArrangementsTable A13: Satellite Communication Systems, Inc. Message Telephone Service Billing Types Covered: 1, 2, 3, 4, 5, 11, 12, 14, 15
International Point Traffic Billed in the United States Traffic Billed in Foreign Countries TotalOriginating or Terminating Transiting the United States U.S.
in the United States (by Country of Origin) CarriersNumber Number U.S. Payout Retained Number Number Receipts Number Receipts Payout Retained Retained
of of Carriers to Foreign Revenues of of from Foreign of from Foreign to Foreign Revenues RevenuesMessages Minutes Revenues Carriers Messages Minutes Carriers Minutes Carriers Carriers
Nicaragua 31 139 $236 $0 $236 0 0 $0 $0 $0 $0 $236Panama 1 1 $1 $0 $1 0 0 $0 $0 $0 $0 $1
North and Central America 1,024 3,776 $1,233 $0 $1,233 0 0 $0 $0 $0 $0 $1,233
Bolivia 28 82 $27 $0 $27 0 0 $0 $0 $0 $0 $27Brazil 13 43 $8 $0 $8 0 0 $0 $0 $0 $0 $8Chile 2 16 $2 $0 $2 0 0 $0 $0 $0 $0 $2Colombia 13 9 $8 $0 $8 0 0 $0 $0 $0 $0 $8Ecuador 70 207 $21 $0 $21 0 0 $0 $0 $0 $0 $21Guyana 3 50 $5 $0 $5 0 0 $0 $0 $0 $0 $5Peru 15 78 $8 $0 $8 0 0 $0 $0 $0 $0 $8Uruguay 139 521 $47 $0 $47 0 0 $0 $0 $0 $0 $47Venezuela 38 217 $39 $0 $39 0 0 $0 $0 $0 $0 $39
South America 321 1,223 $165 $0 $165 0 0 $0 $0 $0 $0 $165
Philippines 4 6 $7 $0 $7 0 0 $0 $0 $0 $0 $7Taiwan 5 8 $5 $0 $5 0 0 $0 $0 $0 $0 $5
Asia 9 14 $12 $0 $12 0 0 $0 $0 $0 $0 $12
Australia 13 27 $6 $0 $6 0 0 $0 $0 $0 $0 $6
Oceania 13 27 $6 $0 $6 0 0 $0 $0 $0 $0 $6
Bulgaria 123 1,371 $165 $0 $165 0 0 $0 $0 $0 $0 $165Poland 3 18 $1 $0 $1 0 0 $0 $0 $0 $0 $1Russia 13 68 $5 $0 $5 0 0 $0 $0 $0 $0 $5
Eastern Europe 139 1,457 $171 $0 $171 0 0 $0 $0 $0 $0 $171
Total for Foreign Points 425,786 1,332,277 $421,254 $0 $421,254 0 0 $0 $0 $0 $0 $421,254
World Total 425,786 1,332,277 $421,254 $0 $421,254 0 0 $0 0 $0 $0 $0 $421,254
- Switched Services Page 39 -

2008 Annual Section 43.61 International Traffic Data for All U.S. Points: All Settlement ArrangementsTable A14: Smitcoms, Inc. Message Telephone Service Billing Types Covered: 1, 2, 3, 4, 5, 11, 12, 14, 15
International Point Traffic Billed in the United States Traffic Billed in Foreign Countries TotalOriginating or Terminating Transiting the United States U.S.
in the United States (by Country of Origin) CarriersNumber Number U.S. Payout Retained Number Number Receipts Number Receipts Payout Retained Retained
of of Carriers to Foreign Revenues of of from Foreign of from Foreign to Foreign Revenues RevenuesMessages Minutes Revenues Carriers Messages Minutes Carriers Minutes Carriers Carriers
Andorra 0 0 $0 $0 $0 0 0 $0 $57 $14 $43 $43
Austria 0 0 $0 $0 $0 0 0 $0 $1,460 $554 $906 $906
Belgium 0 0 $0 $0 $0 0 0 $0 $19,174 $6,841 $12,333 $12,333
Cyprus 0 0 $0 $0 $0 0 0 $0 $893 $266 $627 $627
Denmark 0 0 $0 $0 $0 0 0 $0 $9,670 $4,313 $5,357 $5,357
Finland 0 0 $0 $0 $0 0 0 $0 $1,309 $561 $748 $748
France 0 0 $0 $0 $0 0 0 $0 $164,573 $52,975 $111,598 $111,598
Germany 0 0 $0 $0 $0 0 0 $0 $20,517 $6,805 $13,712 $13,712
Gibraltar 0 0 $0 $0 $0 0 0 $0 $5,512 $1,631 $3,881 $3,881
Greece 0 0 $0 $0 $0 0 0 $0 $4,214 $1,683 $2,531 $2,531
Greenland 0 0 $0 $0 $0 0 0 $0 $59 $41 $18 $18
Iceland 0 0 $0 $0 $0 0 0 $0 $661 $573 $88 $88
Ireland 0 0 $0 $0 $0 0 0 $0 $5,568 $2,368 $3,200 $3,200
Italy 0 0 $0 $0 $0 0 0 $0 $78,032 $36,072 $41,960 $41,960
Liechtenstein 0 0 $0 $0 $0 0 0 $0 $805 $571 $234 $234
Luxembourg 0 0 $0 $0 $0 0 0 $0 $1,156 $296 $860 $860
Malta 0 0 $0 $0 $0 0 0 $0 $1,157 $451 $706 $706
Netherlands 0 0 $0 $0 $0 0 0 $0 $674,669 $240,783 $433,886 $433,886
Portugal 0 0 $0 $0 $0 0 0 $0 $4,176 $1,705 $2,471 $2,471
Spain 0 0 $0 $0 $0 0 0 $0 $45,653 $17,498 $28,155 $28,155
Sweden 0 0 $0 $0 $0 0 0 $0 $4,516 $1,473 $3,043 $3,043
Switzerland 0 0 $0 $0 $0 0 0 $0 $23,870 $14,742 $9,128 $9,128
Turkey 0 0 $0 $0 $0 0 0 $0 $13,820 $3,684 $10,136 $10,136
United Kingdom 0 0 $0 $0 $0 0 0 $0 $170,434 $61,846 $108,588 $108,588
Western Europe 0 0 $0 $0 $0 0 0 $0 2,979,228 $1,251,955 $457,746 $794,209 $794,209
Algeria 0 0 $0 $0 $0 0 0 $0 $69 $17 $52 $52
Angola 0 0 $0 $0 $0 0 0 $0 $161 $126 $35 $35
Benin 0 0 $0 $0 $0 0 0 $0 $346 $199 $147 $147
Botswana 0 0 $0 $0 $0 0 0 $0 $96 $52 $44 $44
Burkina 0 0 $0 $0 $0 0 0 $0 $312 $98 $214 $214
Burundi 0 0 $0 $0 $0 0 0 $0 $55 $105 -$50 -$50
Cameroon 0 0 $0 $0 $0 0 0 $0 $1,681 $1,009 $672 $672
Cape Verde 0 0 $0 $0 $0 0 0 $0 $6 $5 $1 $1
Central African Republic 0 0 $0 $0 $0 0 0 $0 $10 $6 $4 $4
Congo 0 0 $0 $0 $0 0 0 $0 $312 $142 $170 $170
Cote d'Ivoire 0 0 $0 $0 $0 0 0 $0 $1,433 $1,056 $377 $377
Djibouti 0 0 $0 $0 $0 0 0 $0 $1 $0 $1 $1
Egypt 0 0 $0 $0 $0 0 0 $0 $2,262 $728 $1,534 $1,534
Equatorial Guinea 0 0 $0 $0 $0 0 0 $0 $21 $13 $8 $8
Ethiopia 0 0 $0 $0 $0 0 0 $0 $217 $137 $80 $80
Gabon 0 0 $0 $0 $0 0 0 $0 $172 $93 $79 $79
Gambia, The 0 0 $0 $0 $0 0 0 $0 $2,323 $1,418 $905 $905
Ghana 0 0 $0 $0 $0 0 0 $0 $5,799 $3,014 $2,785 $2,785
- Switched Services Page 40 -
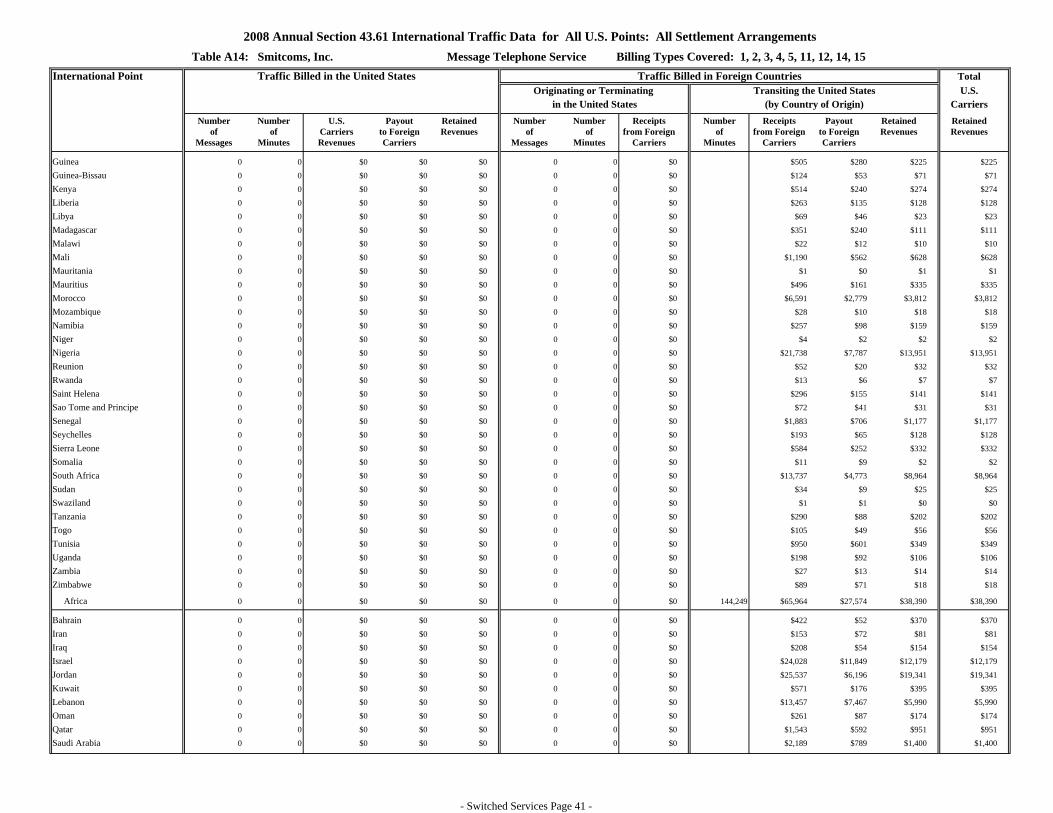
2008 Annual Section 43.61 International Traffic Data for All U.S. Points: All Settlement ArrangementsTable A14: Smitcoms, Inc. Message Telephone Service Billing Types Covered: 1, 2, 3, 4, 5, 11, 12, 14, 15
International Point Traffic Billed in the United States Traffic Billed in Foreign Countries TotalOriginating or Terminating Transiting the United States U.S.
in the United States (by Country of Origin) CarriersNumber Number U.S. Payout Retained Number Number Receipts Number Receipts Payout Retained Retained
of of Carriers to Foreign Revenues of of from Foreign of from Foreign to Foreign Revenues RevenuesMessages Minutes Revenues Carriers Messages Minutes Carriers Minutes Carriers Carriers
Guinea 0 0 $0 $0 $0 0 0 $0 $505 $280 $225 $225
Guinea-Bissau 0 0 $0 $0 $0 0 0 $0 $124 $53 $71 $71
Kenya 0 0 $0 $0 $0 0 0 $0 $514 $240 $274 $274
Liberia 0 0 $0 $0 $0 0 0 $0 $263 $135 $128 $128
Libya 0 0 $0 $0 $0 0 0 $0 $69 $46 $23 $23
Madagascar 0 0 $0 $0 $0 0 0 $0 $351 $240 $111 $111
Malawi 0 0 $0 $0 $0 0 0 $0 $22 $12 $10 $10
Mali 0 0 $0 $0 $0 0 0 $0 $1,190 $562 $628 $628
Mauritania 0 0 $0 $0 $0 0 0 $0 $1 $0 $1 $1
Mauritius 0 0 $0 $0 $0 0 0 $0 $496 $161 $335 $335
Morocco 0 0 $0 $0 $0 0 0 $0 $6,591 $2,779 $3,812 $3,812
Mozambique 0 0 $0 $0 $0 0 0 $0 $28 $10 $18 $18
Namibia 0 0 $0 $0 $0 0 0 $0 $257 $98 $159 $159
Niger 0 0 $0 $0 $0 0 0 $0 $4 $2 $2 $2
Nigeria 0 0 $0 $0 $0 0 0 $0 $21,738 $7,787 $13,951 $13,951
Reunion 0 0 $0 $0 $0 0 0 $0 $52 $20 $32 $32
Rwanda 0 0 $0 $0 $0 0 0 $0 $13 $6 $7 $7
Saint Helena 0 0 $0 $0 $0 0 0 $0 $296 $155 $141 $141
Sao Tome and Principe 0 0 $0 $0 $0 0 0 $0 $72 $41 $31 $31
Senegal 0 0 $0 $0 $0 0 0 $0 $1,883 $706 $1,177 $1,177
Seychelles 0 0 $0 $0 $0 0 0 $0 $193 $65 $128 $128
Sierra Leone 0 0 $0 $0 $0 0 0 $0 $584 $252 $332 $332
Somalia 0 0 $0 $0 $0 0 0 $0 $11 $9 $2 $2
South Africa 0 0 $0 $0 $0 0 0 $0 $13,737 $4,773 $8,964 $8,964
Sudan 0 0 $0 $0 $0 0 0 $0 $34 $9 $25 $25
Swaziland 0 0 $0 $0 $0 0 0 $0 $1 $1 $0 $0
Tanzania 0 0 $0 $0 $0 0 0 $0 $290 $88 $202 $202
Togo 0 0 $0 $0 $0 0 0 $0 $105 $49 $56 $56
Tunisia 0 0 $0 $0 $0 0 0 $0 $950 $601 $349 $349
Uganda 0 0 $0 $0 $0 0 0 $0 $198 $92 $106 $106
Zambia 0 0 $0 $0 $0 0 0 $0 $27 $13 $14 $14
Zimbabwe 0 0 $0 $0 $0 0 0 $0 $89 $71 $18 $18
Africa 0 0 $0 $0 $0 0 0 $0 144,249 $65,964 $27,574 $38,390 $38,390
Bahrain 0 0 $0 $0 $0 0 0 $0 $422 $52 $370 $370
Iran 0 0 $0 $0 $0 0 0 $0 $153 $72 $81 $81
Iraq 0 0 $0 $0 $0 0 0 $0 $208 $54 $154 $154
Israel 0 0 $0 $0 $0 0 0 $0 $24,028 $11,849 $12,179 $12,179
Jordan 0 0 $0 $0 $0 0 0 $0 $25,537 $6,196 $19,341 $19,341
Kuwait 0 0 $0 $0 $0 0 0 $0 $571 $176 $395 $395
Lebanon 0 0 $0 $0 $0 0 0 $0 $13,457 $7,467 $5,990 $5,990
Oman 0 0 $0 $0 $0 0 0 $0 $261 $87 $174 $174
Qatar 0 0 $0 $0 $0 0 0 $0 $1,543 $592 $951 $951
Saudi Arabia 0 0 $0 $0 $0 0 0 $0 $2,189 $789 $1,400 $1,400
- Switched Services Page 41 -

2008 Annual Section 43.61 International Traffic Data for All U.S. Points: All Settlement ArrangementsTable A14: Smitcoms, Inc. Message Telephone Service Billing Types Covered: 1, 2, 3, 4, 5, 11, 12, 14, 15
International Point Traffic Billed in the United States Traffic Billed in Foreign Countries TotalOriginating or Terminating Transiting the United States U.S.
in the United States (by Country of Origin) CarriersNumber Number U.S. Payout Retained Number Number Receipts Number Receipts Payout Retained Retained
of of Carriers to Foreign Revenues of of from Foreign of from Foreign to Foreign Revenues RevenuesMessages Minutes Revenues Carriers Messages Minutes Carriers Minutes Carriers Carriers
Syria 0 0 $0 $0 $0 0 0 $0 $1,252 $578 $674 $674
United Arab Emirates 0 0 $0 $0 $0 0 0 $0 $8,141 $2,520 $5,621 $5,621
Yemen 0 0 $0 $0 $0 0 0 $0 $1,287 $1,428 -$141 -$141
Middle East 0 0 $0 $0 $0 0 0 $0 204,876 $79,049 $31,860 $47,189 $47,189
Anguilla 0 0 $0 $0 $0 0 0 $0 $204,577 $92,383 $112,194 $112,194
Antigua and Barbuda 0 0 $0 $0 $0 0 0 $0 $103,201 $36,155 $67,046 $67,046
Aruba 0 0 $0 $0 $0 0 0 $0 $198,358 $93,191 $105,167 $105,167
Bahamas, The 0 0 $0 $0 $0 0 0 $0 $8,586 $1,925 $6,661 $6,661
Barbados 0 0 $0 $0 $0 0 0 $0 $78,634 $27,484 $51,150 $51,150
Bermuda 0 0 $0 $0 $0 0 0 $0 $4,379 $1,258 $3,121 $3,121
Cayman Islands 0 0 $0 $0 $0 0 0 $0 $20,404 $8,383 $12,021 $12,021
Cuba 0 0 $0 $0 $0 0 0 $0 $21,767 $16,419 $5,348 $5,348
Dominica 0 0 $0 $0 $0 0 0 $0 $256,668 $120,398 $136,270 $136,270
Dominican Republic 0 0 $0 $0 $0 0 0 $0 $1,186,861 $472,332 $714,529 $714,529
French Overseas Departments 0 0 $0 $0 $0 0 0 $0 $14,405 $7,087 $7,318 $7,318
Grenada 0 0 $0 $0 $0 0 0 $0 $31,253 $14,229 $17,024 $17,024
Guadeloupe 0 0 $0 $0 $0 0 0 $0 $487,609 $222,238 $265,371 $265,371
Haiti 0 0 $0 $0 $0 0 0 $0 $597,094 $304,698 $292,396 $292,396
Jamaica 0 0 $0 $0 $0 0 0 $0 $756,295 $376,309 $379,986 $379,986
Montserrat 0 0 $0 $0 $0 0 0 $0 $11,501 $3,474 $8,027 $8,027
Netherlands Antilles 0 0 $0 $0 $0 0 0 $0 $3,974,740 $3,097,932 $876,808 $876,808
Saint Kitts and Nevis 0 0 $0 $0 $0 0 0 $0 $182,081 $85,736 $96,345 $96,345
Saint Lucia 0 0 $0 $0 $0 0 0 $0 $125,164 $55,954 $69,210 $69,210
Saint Vincent and the Grenadines 0 0 $0 $0 $0 0 0 $0 $58,243 $28,752 $29,491 $29,491
Trinidad and Tobago 0 0 $0 $0 $0 0 0 $0 $205,548 $77,391 $128,157 $128,157
Turks and Caicos Islands 0 0 $0 $0 $0 0 0 $0 $6,250 $3,523 $2,727 $2,727
Virgin Islands, British 0 0 $0 $0 $0 0 0 $0 $37,910 $22,779 $15,131 $15,131
U.S. Virgin Islands 0 0 $0 $0 $0 0 0 $0 $110,984 $25,517 $85,467 $85,467
Caribbean 0 0 $0 $0 $0 0 0 $0 51,808,571 $8,682,512 $5,195,547 $3,486,965 $3,486,965
Belize 0 0 $0 $0 $0 0 0 $0 $2,096 $1,009 $1,087 $1,087
Canada 0 0 $0 $0 $0 0 0 $0 $125,952 $31,878 $94,074 $94,074
Costa Rica 0 0 $0 $0 $0 0 0 $0 $3,235 $1,237 $1,998 $1,998
El Salvador 0 0 $0 $0 $0 0 0 $0 $379 $108 $271 $271
Guatemala 0 0 $0 $0 $0 0 0 $0 $3,771 $1,425 $2,346 $2,346
Honduras 0 0 $0 $0 $0 0 0 $0 $4,062 $1,456 $2,606 $2,606
Mexico 0 0 $0 $0 $0 0 0 $0 $18,591 $7,428 $11,163 $11,163
Nicaragua 0 0 $0 $0 $0 0 0 $0 $3,293 $1,313 $1,980 $1,980
Panama 0 0 $0 $0 $0 0 0 $0 $28,521 $7,608 $20,913 $20,913
North and Central America 0 0 $0 $0 $0 0 0 $0 552,767 $189,900 $53,462 $136,438 $136,438
Argentina 0 0 $0 $0 $0 0 0 $0 $12,344 $3,126 $9,218 $9,218
Bolivia 0 0 $0 $0 $0 0 0 $0 $2,529 $931 $1,598 $1,598
Brazil 0 0 $0 $0 $0 0 0 $0 $18,592 $7,229 $11,363 $11,363
- Switched Services Page 42 -

2008 Annual Section 43.61 International Traffic Data for All U.S. Points: All Settlement ArrangementsTable A14: Smitcoms, Inc. Message Telephone Service Billing Types Covered: 1, 2, 3, 4, 5, 11, 12, 14, 15
International Point Traffic Billed in the United States Traffic Billed in Foreign Countries TotalOriginating or Terminating Transiting the United States U.S.
in the United States (by Country of Origin) CarriersNumber Number U.S. Payout Retained Number Number Receipts Number Receipts Payout Retained Retained
of of Carriers to Foreign Revenues of of from Foreign of from Foreign to Foreign Revenues RevenuesMessages Minutes Revenues Carriers Messages Minutes Carriers Minutes Carriers Carriers
Chile 0 0 $0 $0 $0 0 0 $0 $3,418 $1,284 $2,134 $2,134
Colombia 0 0 $0 $0 $0 0 0 $0 $195,210 $88,753 $106,457 $106,457
Ecuador 0 0 $0 $0 $0 0 0 $0 $7,167 $3,929 $3,238 $3,238
French Guiana 0 0 $0 $0 $0 0 0 $0 $5,166 $1,890 $3,276 $3,276
Guyana 0 0 $0 $0 $0 0 0 $0 $441,676 $271,439 $170,237 $170,237
Paraguay 0 0 $0 $0 $0 0 0 $0 $119 $52 $67 $67
Peru 0 0 $0 $0 $0 0 0 $0 $34,230 $14,413 $19,817 $19,817
Suriname 0 0 $0 $0 $0 0 0 $0 $103,080 $39,813 $63,267 $63,267
Uruguay 0 0 $0 $0 $0 0 0 $0 $1,116 $587 $529 $529
Venezuela 0 0 $0 $0 $0 0 0 $0 $80,794 $26,857 $53,937 $53,937
South America 0 0 $0 $0 $0 0 0 $0 2,494,613 $905,441 $460,303 $445,138 $445,138
Afghanistan 0 0 $0 $0 $0 0 0 $0 $58 $26 $32 $32
Bangladesh 0 0 $0 $0 $0 0 0 $0 $19 $5 $14 $14
Brunei 0 0 $0 $0 $0 0 0 $0 $27 $9 $18 $18
Burma 0 0 $0 $0 $0 0 0 $0 $1,629 $814 $815 $815
Cambodia 0 0 $0 $0 $0 0 0 $0 $20 $7 $13 $13
China 0 0 $0 $0 $0 0 0 $0 $47,933 $12,438 $35,495 $35,495
Hong Kong 0 0 $0 $0 $0 0 0 $0 $6,308 $1,380 $4,928 $4,928
India 0 0 $0 $0 $0 0 0 $0 $132,440 $29,901 $102,539 $102,539
Indonesia 0 0 $0 $0 $0 0 0 $0 $13,241 $4,997 $8,244 $8,244
Japan 0 0 $0 $0 $0 0 0 $0 $829 $241 $588 $588
Korea, South 0 0 $0 $0 $0 0 0 $0 $202 $50 $152 $152
Laos 0 0 $0 $0 $0 0 0 $0 $30 $3 $27 $27
Macau 0 0 $0 $0 $0 0 0 $0 $1,319 $425 $894 $894
Malaysia 0 0 $0 $0 $0 0 0 $0 $804 $163 $641 $641
Maldives 0 0 $0 $0 $0 0 0 $0 $69 $42 $27 $27
Mongolia 0 0 $0 $0 $0 0 0 $0 $1 $0 $1 $1
Nepal 0 0 $0 $0 $0 0 0 $0 $352 $241 $111 $111
Pakistan 0 0 $0 $0 $0 0 0 $0 $354 $71 $283 $283
Philippines 0 0 $0 $0 $0 0 0 $0 $39,530 $17,395 $22,135 $22,135
Singapore 0 0 $0 $0 $0 0 0 $0 $1,394 $331 $1,063 $1,063
Sri Lanka 0 0 $0 $0 $0 0 0 $0 $3,329 $1,225 $2,104 $2,104
Taiwan 0 0 $0 $0 $0 0 0 $0 $827 $183 $644 $644
Thailand 0 0 $0 $0 $0 0 0 $0 $2,264 $260 $2,004 $2,004
Vietnam 0 0 $0 $0 $0 0 0 $0 $3,894 $877 $3,017 $3,017
Asia 0 0 $0 $0 $0 0 0 $0 723,157 $256,873 $71,084 $185,789 $185,789
Australia 0 0 $0 $0 $0 0 0 $0 $7,990 $2,528 $5,462 $5,462
Fiji 0 0 $0 $0 $0 0 0 $0 $229 $71 $158 $158
French Polynesia 0 0 $0 $0 $0 0 0 $0 $606 $171 $435 $435
Micronesia, Federated States of 0 0 $0 $0 $0 0 0 $0 $2 $0 $2 $2
New Caledonia 0 0 $0 $0 $0 0 0 $0 $1,087 $526 $561 $561
New Zealand 0 0 $0 $0 $0 0 0 $0 $3,347 $1,306 $2,041 $2,041
Papua New Guinea 0 0 $0 $0 $0 0 0 $0 $24 $25 -$1 -$1
- Switched Services Page 43 -

2008 Annual Section 43.61 International Traffic Data for All U.S. Points: All Settlement ArrangementsTable A14: Smitcoms, Inc. Message Telephone Service Billing Types Covered: 1, 2, 3, 4, 5, 11, 12, 14, 15
International Point Traffic Billed in the United States Traffic Billed in Foreign Countries TotalOriginating or Terminating Transiting the United States U.S.
in the United States (by Country of Origin) CarriersNumber Number U.S. Payout Retained Number Number Receipts Number Receipts Payout Retained Retained
of of Carriers to Foreign Revenues of of from Foreign of from Foreign to Foreign Revenues RevenuesMessages Minutes Revenues Carriers Messages Minutes Carriers Minutes Carriers Carriers
Tonga 0 0 $0 $0 $0 0 0 $0 $1 $0 $1 $1
Vanuatu 0 0 $0 $0 $0 0 0 $0 $22 $12 $10 $10
Guam 0 0 $0 $0 $0 0 0 $0 $91 $22 $69 $69Wake Island 0 0 $0 $0 $0 0 0 $0 $1,027 $184 $843 $843 Oceania 0 0 $0 $0 $0 0 0 $0 33,655 $14,426 $4,845 $9,581 $9,581
Albania 0 0 $0 $0 $0 0 0 $0 $10 $9 $1 $1
Armenia 0 0 $0 $0 $0 0 0 $0 $20 $8 $12 $12
Azerbaijan 0 0 $0 $0 $0 0 0 $0 $44 $32 $12 $12
Belarus 0 0 $0 $0 $0 0 0 $0 $3,392 $1,295 $2,097 $2,097
Bosnia and Herzegovina 0 0 $0 $0 $0 0 0 $0 $210 $107 $103 $103
Bulgaria 0 0 $0 $0 $0 0 0 $0 $1,860 $586 $1,274 $1,274
Croatia 0 0 $0 $0 $0 0 0 $0 $1,864 $699 $1,165 $1,165
Czech Republic 0 0 $0 $0 $0 0 0 $0 $6,411 $3,374 $3,037 $3,037
Estonia 0 0 $0 $0 $0 0 0 $0 $208 $97 $111 $111
Georgia 0 0 $0 $0 $0 0 0 $0 $79 $47 $32 $32
Hungary 0 0 $0 $0 $0 0 0 $0 $4,153 $1,539 $2,614 $2,614
Kazakhstan 0 0 $0 $0 $0 0 0 $0 $126 $61 $65 $65
Kyrgyzstan 0 0 $0 $0 $0 0 0 $0 $1 $1 $0 $0
Latvia 0 0 $0 $0 $0 0 0 $0 $529 $158 $371 $371
Lithuania 0 0 $0 $0 $0 0 0 $0 $1,866 $778 $1,088 $1,088
Moldova 0 0 $0 $0 $0 0 0 $0 $6,392 $3,510 $2,882 $2,882
Poland 0 0 $0 $0 $0 0 0 $0 $3,322 $1,474 $1,848 $1,848
Romania 0 0 $0 $0 $0 0 0 $0 $26,022 $13,058 $12,964 $12,964
Russia 0 0 $0 $0 $0 0 0 $0 $9,356 $3,179 $6,177 $6,177
Serbia 0 0 $0 $0 $0 0 0 $0 $4,066 $2,033 $2,033 $2,033
Slovakia 0 0 $0 $0 $0 0 0 $0 $4,698 $1,986 $2,712 $2,712
Slovenia 0 0 $0 $0 $0 0 0 $0 $329 $199 $130 $130
Tajikistan 0 0 $0 $0 $0 0 0 $0 $1 $0 $1 $1
Turkmenistan 0 0 $0 $0 $0 0 0 $0 $1 $1 $0 $0
Ukraine 0 0 $0 $0 $0 0 0 $0 $3,721 $1,029 $2,692 $2,692
Uzbekistan 0 0 $0 $0 $0 0 0 $0 $26 $10 $16 $16
Eastern Europe 0 0 $0 $0 $0 0 0 $0 151,287 $78,707 $35,270 $43,437 $43,437
Maritime - Atlantic 0 0 $0 $0 $0 0 0 $0 $4,560 $3,074 $1,486 $1,486
Other Regions 0 0 $0 $0 $0 0 0 $0 $4,560 $3,074 $1,486 $1,486
Total for Foreign Points 0 0 $0 $0 $0 0 0 $0 $11,417,285 $6,315,042 $5,102,243 $5,102,243
Total for U.S. Points 0 0 $0 $0 $0 0 0 $0 $112,102 $25,723 $86,379 $86,379
World Total 0 0 $0 $0 $0 0 0 $0 $11,529,387 $6,340,765 $5,188,622 $5,188,622
- Switched Services Page 44 -

2008 Annual Section 43.61 International Traffic Data for All U.S. Points: All Settlement ArrangementsTable A15: Telecom Argentina USA, Inc. Message Telephone Service Billing Types Covered: 1, 2, 3, 4, 5, 11, 12, 14, 15
International Point Traffic Billed in the United States Traffic Billed in Foreign Countries TotalOriginating or Terminating Transiting the United States U.S.
in the United States (by Country of Origin) CarriersNumber Number U.S. Payout Retained Number Number Receipts Number Receipts Payout Retained Retained
of of Carriers to Foreign Revenues of of from Foreign of from Foreign to Foreign Revenues RevenuesMessages Minutes Revenues Carriers Messages Minutes Carriers Minutes Carriers Carriers
Belgium 13,385 58,420 $737 $222 $515 0 0 $0 $0 $0 $0 $515France 258,363 1,468,570 $12,843 $5,581 $7,262 0 0 $0 $0 $0 $0 $7,262Germany 24,119 127,864 $1,069 $486 $583 0 0 $0 $0 $0 $0 $583Spain 540,246 1,793,373 $17,823 $6,848 $10,975 0 0 $0 $0 $0 $0 $10,975United Kingdom 1,183,038 2,628,964 $25,361 $9,492 $15,869 0 0 $0 $0 $0 $0 $15,869
Western Europe 2,019,151 6,077,191 $57,833 $22,629 $35,204 0 0 $0 $0 $0 $0 $35,204
South Africa 27,546 234,883 $8,975 $893 $8,082 0 0 $0 $0 $0 $0 $8,082
Africa 27,546 234,883 $8,975 $893 $8,082 0 0 $0 $0 $0 $0 $8,082
Israel 266,871 2,190,125 $19,157 $8,322 $10,835 0 0 $0 $0 $0 $0 $10,835
Middle East 266,871 2,190,125 $19,157 $8,322 $10,835 0 0 $0 $0 $0 $0 $10,835
Canada 87,901 329,471 $1,942 $1,254 $688 0 0 $0 $0 $0 $0 $688
North and Central America 87,901 329,471 $1,942 $1,254 $688 0 0 $0 $0 $0 $0 $688
Argentina 22,619,876 309,519,695 $4,995,359 $4,006,257 $989,102 0 0 $0 $0 $0 $0 $989,102Bolivia 2,985 43,318 $3,147 $1,901 $1,246 0 0 $0 $0 $0 $0 $1,246Brazil 594 4,550 $149 $71 $78 0 0 $0 $0 $0 $0 $78Chile 127,195 1,572,556 $25,491 $5,976 $19,515 0 0 $0 $0 $0 $0 $19,515Colombia 106 578 $21 $12 $9 0 0 $0 $0 $0 $0 $9Paraguay 418,249 4,673,306 $223,263 $154,476 $68,787 0 0 $0 $0 $0 $0 $68,787Peru 1,650 5,714 $630 $621 $9 0 0 $0 $0 $0 $0 $9Uruguay 420,796 1,709,498 $214,064 $199,320 $14,744 0 0 $0 $0 $0 $0 $14,744
South America 23,591,451 317,529,215 $5,462,124 $4,368,634 $1,093,490 0 0 $0 $0 $0 $0 $1,093,490
Japan 20,528 138,067 $20,188 $525 $19,663 0 0 $0 $0 $0 $0 $19,663Korea, South 369,741 414,666 $6,880 $1,576 $5,304 0 0 $0 $0 $0 $0 $5,304Malaysia 435,210 3,032,575 $58,582 $11,527 $47,055 0 0 $0 $0 $0 $0 $47,055
Asia 825,479 3,585,308 $85,650 $13,628 $72,022 0 0 $0 $0 $0 $0 $72,022
New Zealand 4,845 51,115 $767 $12,774 -$12,007 0 0 $0 $0 $0 $0 -$12,007
Oceania 4,845 51,115 $767 $12,774 -$12,007 0 0 $0 $0 $0 $0 -$12,007
Czech Republic 38,304 278,401 $3,703 $1,058 $2,645 0 0 $0 $0 $0 $0 $2,645Poland 84,273 628,940 $7,325 $3,521 $3,804 0 0 $0 $0 $0 $0 $3,804Romania 33,129 346,276 $44,196 $1,316 $42,880 0 0 $0 $0 $0 $0 $42,880
Eastern Europe 155,706 1,253,617 $55,224 $5,895 $49,329 0 0 $0 $0 $0 $0 $49,329
Total for Foreign Points 26,978,950 331,250,925 $5,691,672 $4,434,029 $1,257,643 0 0 $0 $0 $0 $0 $1,257,643
World Total 26,978,950 331,250,925 $5,691,672 $4,434,029 $1,257,643 0 0 $0 0 $0 $0 $0 $1,257,643
- Switched Services Page 45 -
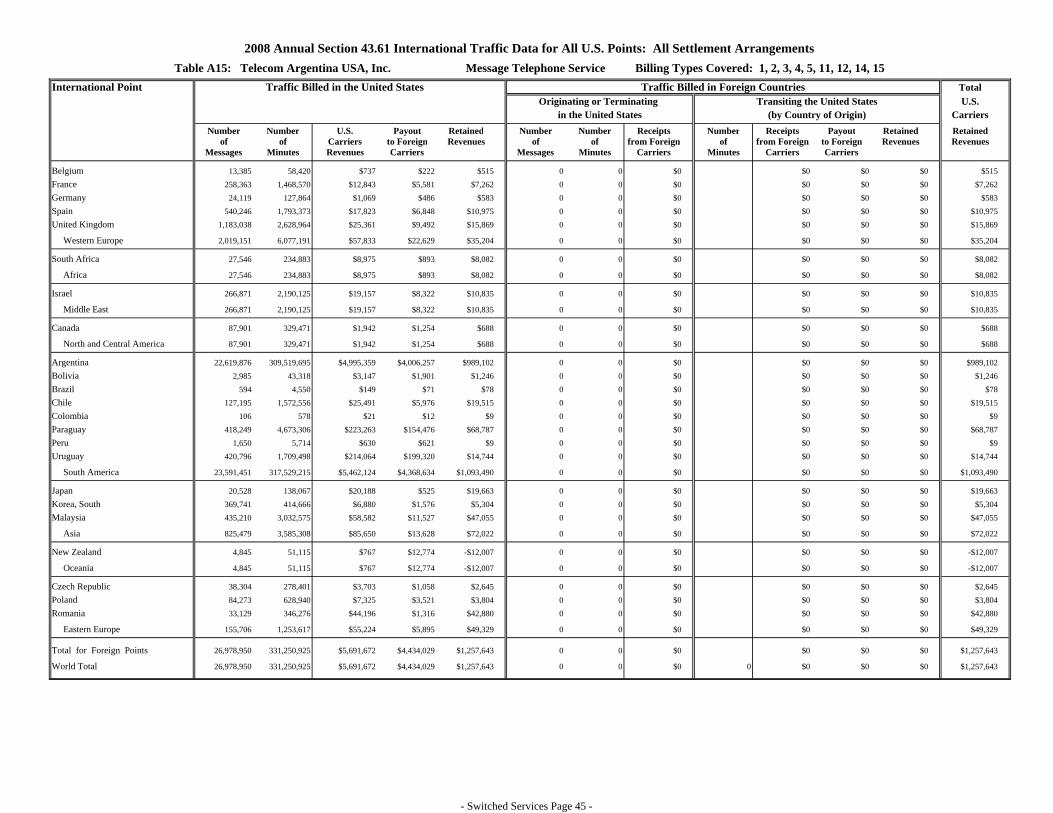

2008 Annual Section 43.61 International Traffic Data for All U.S. Points: All Settlement ArrangementsTable A16: Telecom Colombia USA, Inc. Message Telephone Service Billing Types Covered: 1, 2, 3, 4, 5, 11, 12, 14, 15
International Point Traffic Billed in the United States Traffic Billed in Foreign Countries TotalOriginating or Terminating Transiting the United States U.S.
in the United States (by Country of Origin) CarriersNumber Number U.S. Payout Retained Number Number Receipts Number Receipts Payout Retained Retained
of of Carriers to Foreign Revenues of of from Foreign of from Foreign to Foreign Revenues RevenuesMessages Minutes Revenues Carriers Messages Minutes Carriers Minutes Carriers Carriers
Andorra 6 8 $4 $2 $2 0 0 $0 $0 $0 $0 $2
Austria 72 197 $92 $47 $45 0 0 $0 $0 $0 $0 $45
Belgium 212 542 $260 $134 $126 0 0 $0 $0 $0 $0 $126
Cyprus 22 90 $42 $22 $20 0 0 $0 $0 $0 $0 $20
Denmark 75 162 $75 $38 $37 0 0 $0 $0 $0 $0 $37
Finland 5 16 $8 $4 $4 0 0 $0 $0 $0 $0 $4
France 6,569 50,032 $2,521 $1,296 $1,225 0 0 $0 $0 $0 $0 $1,225
Germany 3,117 29,236 $1,120 $576 $544 0 0 $0 $0 $0 $0 $544
Greece 123 381 $176 $91 $85 0 0 $0 $0 $0 $0 $85
Greenland 1 1 $1 $1 $0 0 0 $0 $0 $0 $0 $0
Iceland 6 40 $18 $9 $9 0 0 $0 $0 $0 $0 $9
Ireland 74 198 $104 $54 $50 0 0 $0 $0 $0 $0 $50
Italy 5,163 64,560 $3,299 $1,696 $1,603 0 0 $0 $0 $0 $0 $1,603
Liechtenstein 9 29 $29 $15 $14 0 0 $0 $0 $0 $0 $14
Luxembourg 1 11 $5 $3 $2 0 0 $0 $0 $0 $0 $2
Malta 10 32 $16 $8 $8 0 0 $0 $0 $0 $0 $8
Netherlands 1,016 2,791 $1,308 $673 $635 0 0 $0 $0 $0 $0 $635
Norway 62 98 $46 $24 $22 0 0 $0 $0 $0 $0 $22
Portugal 20 52 $24 $12 $12 0 0 $0 $0 $0 $0 $12
Spain 81,578 816,429 $41,910 $21,542 $20,368 0 0 $0 $0 $0 $0 $20,368
Sweden 116 406 $189 $97 $92 0 0 $0 $0 $0 $0 $92
Switzerland 337 949 $451 $232 $219 0 0 $0 $0 $0 $0 $219
Turkey 72 242 $113 $58 $55 0 0 $0 $0 $0 $0 $55
United Kingdom 13,460 255,475 $7,884 $4,052 $3,832 0 0 $0 $0 $0 $0 $3,832
Western Europe 112,126 1,221,977 $59,695 $30,686 $29,009 0 0 $0 $0 $0 $0 $29,009
Algeria 3 6 $3 $1 $2 0 0 $0 $0 $0 $0 $2
Angola 10 16 $7 $4 $3 0 0 $0 $0 $0 $0 $3
Benin 3 12 $5 $3 $2 0 0 $0 $0 $0 $0 $2
Botswana 1 10 $5 $3 $2 0 0 $0 $0 $0 $0 $2
Burkina 7 25 $11 $6 $5 0 0 $0 $0 $0 $0 $5
Burundi 48 63 $29 $15 $14 0 0 $0 $0 $0 $0 $14
Cameroon 8 20 $9 $5 $4 0 0 $0 $0 $0 $0 $4
Cape Verde 66 227 $108 $55 $53 0 0 $0 $0 $0 $0 $53
Central African Republic 1 4 $2 $1 $1 0 0 $0 $0 $0 $0 $1
Chad 1 2 $5 $3 $2 0 0 $0 $0 $0 $0 $2
Congo 2 8 $4 $2 $2 0 0 $0 $0 $0 $0 $2
Cote d'Ivoire 4 6 $5 $3 $2 0 0 $0 $0 $0 $0 $2
Djibouti 2 2 $1 $1 $0 0 0 $0 $0 $0 $0 $0
Egypt 155 395 $187 $96 $91 0 0 $0 $0 $0 $0 $91
Ethiopia 16 68 $34 $17 $17 0 0 $0 $0 $0 $0 $17
Gambia, The 7 28 $16 $8 $8 0 0 $0 $0 $0 $0 $8
- Switched Services Page 46 -

2008 Annual Section 43.61 International Traffic Data for All U.S. Points: All Settlement ArrangementsTable A16: Telecom Colombia USA, Inc. Message Telephone Service Billing Types Covered: 1, 2, 3, 4, 5, 11, 12, 14, 15
International Point Traffic Billed in the United States Traffic Billed in Foreign Countries TotalOriginating or Terminating Transiting the United States U.S.
in the United States (by Country of Origin) CarriersNumber Number U.S. Payout Retained Number Number Receipts Number Receipts Payout Retained Retained
of of Carriers to Foreign Revenues of of from Foreign of from Foreign to Foreign Revenues RevenuesMessages Minutes Revenues Carriers Messages Minutes Carriers Minutes Carriers Carriers
Ghana 75 218 $101 $52 $49 0 0 $0 $0 $0 $0 $49
Guinea 20 99 $48 $25 $23 0 0 $0 $0 $0 $0 $23
Kenya 1 4 $2 $1 $1 0 0 $0 $0 $0 $0 $1
Liberia 15 47 $23 $12 $11 0 0 $0 $0 $0 $0 $11
Madagascar 2 5 $2 $1 $1 0 0 $0 $0 $0 $0 $1
Mali 7 8 $4 $2 $2 0 0 $0 $0 $0 $0 $2
Morocco 18 55 $27 $14 $13 0 0 $0 $0 $0 $0 $13
Mozambique 2 3 $1 $1 $0 0 0 $0 $0 $0 $0 $0
Niger 2 4 $2 $1 $1 0 0 $0 $0 $0 $0 $1
Nigeria 78 235 $109 $56 $53 0 0 $0 $0 $0 $0 $53
Rwanda 3 9 $5 $2 $3 0 0 $0 $0 $0 $0 $3
Senegal 16 47 $22 $11 $11 0 0 $0 $0 $0 $0 $11
Sierra Leone 8 22 $10 $5 $5 0 0 $0 $0 $0 $0 $5
Somalia 7 10 $10 $5 $5 0 0 $0 $0 $0 $0 $5
South Africa 185 656 $76 $39 $37 0 0 $0 $0 $0 $0 $37
Sudan 1 2 $1 $1 $0 0 0 $0 $0 $0 $0 $0
Tanzania 5 10 $5 $2 $3 0 0 $0 $0 $0 $0 $3
Togo 6 27 $16 $8 $8 0 0 $0 $0 $0 $0 $8
Tunisia 4 7 $3 $2 $1 0 0 $0 $0 $0 $0 $1
Uganda 6 11 $5 $3 $2 0 0 $0 $0 $0 $0 $2
Zaire 15 43 $20 $10 $10 0 0 $0 $0 $0 $0 $10
Zambia 1 4 $2 $1 $1 0 0 $0 $0 $0 $0 $1
Africa 811 2,418 $925 $477 $448 0 0 $0 $0 $0 $0 $448
Bahrain 6 21 $12 $6 $6 0 0 $0 $0 $0 $0 $6
Iran 96 516 $236 $121 $115 0 0 $0 $0 $0 $0 $115
Iraq 2 4 $2 $1 $1 0 0 $0 $0 $0 $0 $1
Israel 247 875 $411 $211 $200 0 0 $0 $0 $0 $0 $200
Jordan 73 330 $152 $78 $74 0 0 $0 $0 $0 $0 $74
Kuwait 18 63 $30 $15 $15 0 0 $0 $0 $0 $0 $15
Lebanon 55 237 $111 $57 $54 0 0 $0 $0 $0 $0 $54
Oman 2 14 $6 $3 $3 0 0 $0 $0 $0 $0 $3
Qatar 33 51 $24 $12 $12 0 0 $0 $0 $0 $0 $12
Saudi Arabia 14 55 $26 $13 $13 0 0 $0 $0 $0 $0 $13
Syria 7 26 $12 $6 $6 0 0 $0 $0 $0 $0 $6
Yemen 68 277 $128 $66 $62 0 0 $0 $0 $0 $0 $62
Middle East 621 2,469 $1,150 $589 $561 0 0 $0 $0 $0 $0 $561
Aruba 538 1,790 $830 $427 $403 0 0 $0 $0 $0 $0 $403
Cuba 676 898 $1,345 $691 $654 0 0 $0 $0 $0 $0 $654
Dominican Republic 9,105 51,190 $8,014 $4,119 $3,895 0 0 $0 $0 $0 $0 $3,895
French Overseas Departments 1 5 $2 $1 $1 0 0 $0 $0 $0 $0 $1
Guadeloupe 13 33 $19 $10 $9 0 0 $0 $0 $0 $0 $9
- Switched Services Page 47 -

2008 Annual Section 43.61 International Traffic Data for All U.S. Points: All Settlement ArrangementsTable A16: Telecom Colombia USA, Inc. Message Telephone Service Billing Types Covered: 1, 2, 3, 4, 5, 11, 12, 14, 15
International Point Traffic Billed in the United States Traffic Billed in Foreign Countries TotalOriginating or Terminating Transiting the United States U.S.
in the United States (by Country of Origin) CarriersNumber Number U.S. Payout Retained Number Number Receipts Number Receipts Payout Retained Retained
of of Carriers to Foreign Revenues of of from Foreign of from Foreign to Foreign Revenues RevenuesMessages Minutes Revenues Carriers Messages Minutes Carriers Minutes Carriers Carriers
Haiti 1,742 5,424 $1,597 $821 $776 0 0 $0 $0 $0 $0 $776
Jamaica 272 661 $204 $105 $99 0 0 $0 $0 $0 $0 $99
Caribbean 12,347 60,001 $12,011 $6,174 $5,837 0 0 $0 $0 $0 $0 $5,837
Belize 68 209 $99 $51 $48 0 0 $0 $0 $0 $0 $48
Canada 35,216 296,997 $8,882 $4,565 $4,317 0 0 $0 $0 $0 $0 $4,317
Costa Rica 9,343 59,942 $4,829 $2,482 $2,347 0 0 $0 $0 $0 $0 $2,347
El Salvador 11,581 61,116 $8,728 $4,486 $4,242 0 0 $0 $0 $0 $0 $4,242
Guatemala 9,506 59,509 $7,853 $4,037 $3,816 0 0 $0 $0 $0 $0 $3,816
Honduras 4,301 22,294 $5,094 $2,618 $2,476 0 0 $0 $0 $0 $0 $2,476
Mexico 27,401 282,412 $17,252 $8,868 $8,384 0 0 $0 $0 $0 $0 $8,384
Nicaragua 3,616 18,978 $3,885 $1,997 $1,888 0 0 $0 $0 $0 $0 $1,888
Panama 20,031 176,563 $9,675 $4,973 $4,702 0 0 $0 $0 $0 $0 $4,702
North and Central America 121,063 978,020 $66,297 $34,077 $32,220 0 0 $0 $0 $0 $0 $32,220
Argentina 8,315 97,998 $2,578 $1,325 $1,253 0 0 $0 $0 $0 $0 $1,253
Bolivia 2,299 20,377 $1,672 $859 $813 0 0 $0 $0 $0 $0 $813
Brazil 5,161 36,602 $2,176 $1,119 $1,057 0 0 $0 $0 $0 $0 $1,057
Chile 3,482 29,974 $2,707 $1,391 $1,316 0 0 $0 $0 $0 $0 $1,316
Colombia 12,937,100 158,198,838 $5,008,016 $2,574,120 $2,433,896 0 0 $0 $0 $0 $0 $2,433,896
Ecuador 17,298 106,096 $19,265 $9,902 $9,363 0 0 $0 $0 $0 $0 $9,363
Guyana 113 293 $141 $73 $68 0 0 $0 $0 $0 $0 $68
Paraguay 325 2,283 $343 $176 $167 0 0 $0 $0 $0 $0 $167
Peru 40,262 485,672 $15,255 $7,841 $7,414 0 0 $0 $0 $0 $0 $7,414
Suriname 25 77 $36 $18 $18 0 0 $0 $0 $0 $0 $18
Uruguay 1,278 8,547 $1,307 $672 $635 0 0 $0 $0 $0 $0 $635
Venezuela 76,436 819,252 $33,776 $17,361 $16,415 0 0 $0 $0 $0 $0 $16,415
South America 13,092,094 159,806,009 $5,087,272 $2,614,857 $2,472,415 0 0 $0 $0 $0 $0 $2,472,415
Afghanistan 122 222 $109 $56 $53 0 0 $0 $0 $0 $0 $53
Bangladesh 140 1,067 $131 $67 $64 0 0 $0 $0 $0 $0 $64
Brunei 19 31 $15 $8 $7 0 0 $0 $0 $0 $0 $7
Burma 205 249 $135 $69 $66 0 0 $0 $0 $0 $0 $66
Cambodia 10 26 $12 $6 $6 0 0 $0 $0 $0 $0 $6
China 259 1,544 $424 $218 $206 0 0 $0 $0 $0 $0 $206
Hong Kong 50 132 $60 $31 $29 0 0 $0 $0 $0 $0 $29
India 417 2,832 $351 $181 $170 0 0 $0 $0 $0 $0 $170
Indonesia 23 47 $22 $11 $11 0 0 $0 $0 $0 $0 $11
Japan 216 533 $248 $127 $121 0 0 $0 $0 $0 $0 $121
Korea, South 52 138 $63 $32 $31 0 0 $0 $0 $0 $0 $31
Laos 4 15 $7 $4 $3 0 0 $0 $0 $0 $0 $3
Malaysia 46 92 $44 $23 $21 0 0 $0 $0 $0 $0 $21
Nepal 21 65 $31 $16 $15 0 0 $0 $0 $0 $0 $15
Pakistan 1,131 8,989 $946 $486 $460 0 0 $0 $0 $0 $0 $460
Philippines 135 567 $270 $139 $131 0 0 $0 $0 $0 $0 $131
- Switched Services Page 48 -

2008 Annual Section 43.61 International Traffic Data for All U.S. Points: All Settlement ArrangementsTable A16: Telecom Colombia USA, Inc. Message Telephone Service Billing Types Covered: 1, 2, 3, 4, 5, 11, 12, 14, 15
International Point Traffic Billed in the United States Traffic Billed in Foreign Countries TotalOriginating or Terminating Transiting the United States U.S.
in the United States (by Country of Origin) CarriersNumber Number U.S. Payout Retained Number Number Receipts Number Receipts Payout Retained Retained
of of Carriers to Foreign Revenues of of from Foreign of from Foreign to Foreign Revenues RevenuesMessages Minutes Revenues Carriers Messages Minutes Carriers Minutes Carriers Carriers
Singapore 22 168 $77 $39 $38 0 0 $0 $0 $0 $0 $38
Sri Lanka 20 50 $23 $12 $11 0 0 $0 $0 $0 $0 $11
Taiwan 7 27 $12 $6 $6 0 0 $0 $0 $0 $0 $6
Thailand 27 71 $33 $17 $16 0 0 $0 $0 $0 $0 $16
Vietnam 23 67 $31 $16 $15 0 0 $0 $0 $0 $0 $15
Asia 2,949 16,932 $3,044 $1,564 $1,480 0 0 $0 $0 $0 $0 $1,480
Australia 930 4,067 $1,089 $560 $529 0 0 $0 $0 $0 $0 $529
Fiji 1 3 $1 $1 $0 0 0 $0 $0 $0 $0 $0
Kiribati 2 2 $2 $1 $1 0 0 $0 $0 $0 $0 $1
New Zealand 35 67 $32 $17 $15 0 0 $0 $0 $0 $0 $15
Papua New Guinea 2 2 $5 $3 $2 0 0 $0 $0 $0 $0 $2
Tonga 33 39 $18 $9 $9 0 0 $0 $0 $0 $0 $9
Vanuatu 10 10 $12 $6 $6 0 0 $0 $0 $0 $0 $6
Oceania 1,013 4,190 $1,159 $597 $562 0 0 $0 $0 $0 $0 $562
Albania 61 154 $78 $40 $38 0 0 $0 $0 $0 $0 $38
Azerbaijan 5 8 $4 $2 $2 0 0 $0 $0 $0 $0 $2
Bosnia and Herzegovina 8 50 $24 $12 $12 0 0 $0 $0 $0 $0 $12
Bulgaria 15 54 $25 $13 $12 0 0 $0 $0 $0 $0 $12
Croatia 8 29 $14 $7 $7 0 0 $0 $0 $0 $0 $7
Czech Republic 14 10 $12 $6 $6 0 0 $0 $0 $0 $0 $6
Estonia 6 13 $6 $3 $3 0 0 $0 $0 $0 $0 $3
Georgia 19 46 $21 $11 $10 0 0 $0 $0 $0 $0 $10
Hungary 33 108 $49 $25 $24 0 0 $0 $0 $0 $0 $24
Kazakhstan 97 120 $56 $29 $27 0 0 $0 $0 $0 $0 $27
Kyrgyzstan 1 4 $2 $1 $1 0 0 $0 $0 $0 $0 $1
Lithuania 69 692 $316 $162 $154 0 0 $0 $0 $0 $0 $154
Moldova 6 32 $15 $8 $7 0 0 $0 $0 $0 $0 $7
Poland 74 214 $99 $51 $48 0 0 $0 $0 $0 $0 $48
Romania 54 158 $75 $39 $36 0 0 $0 $0 $0 $0 $36
Russia 56 160 $73 $38 $35 0 0 $0 $0 $0 $0 $35
Serbia 19 74 $37 $19 $18 0 0 $0 $0 $0 $0 $18
Slovakia 2 15 $7 $4 $3 0 0 $0 $0 $0 $0 $3
Turkmenistan 4 8 $4 $2 $2 0 0 $0 $0 $0 $0 $2
Uzbekistan 8 18 $10 $5 $5 0 0 $0 $0 $0 $0 $5
Eastern Europe 559 1,967 $927 $477 $450 0 0 $0 $0 $0 $0 $450
Total for Foreign Points 13,343,583 162,093,983 $5,232,480 $2,689,498 $2,542,982 0 0 $0 $0 $0 $0 $2,542,982
World Total 13,343,583 162,093,983 $5,232,480 $2,689,498 $2,542,982 0 0 $0 0 $0 $0 $0 $2,542,982
- Switched Services Page 49 -

2008 Annual Section 43.61 International Traffic Data for All U.S. Points: All Settlement ArrangementsTable A17: Telecom Italia Sparkle of North America, Inc. Message Telephone Service Billing Types Covered: 1, 2, 3, 4, 5, 11, 12, 14, 15
International Point Traffic Billed in the United States Traffic Billed in Foreign Countries TotalOriginating or Terminating Transiting the United States U.S.
in the United States (by Country of Origin) CarriersNumber Number U.S. Payout Retained Number Number Receipts Number Receipts Payout Retained Retained
of of Carriers to Foreign Revenues of of from Foreign of from Foreign to Foreign Revenues RevenuesMessages Minutes Revenues Carriers Messages Minutes Carriers Minutes Carriers Carriers
Andorra 2,387 10,887 $229 $218 $11 0 0 $0 $0 $0 $0 $11
Austria 1,171,007 7,616,575 $174,688 $165,954 $8,734 0 0 $0 $0 $0 $0 $8,734
Belgium 821,778 2,290,134 $240,196 $228,186 $12,010 0 0 $0 $0 $0 $0 $12,010
Cyprus 134,303 816,217 $17,412 $16,541 $871 0 0 $0 $0 $0 $0 $871
Denmark 481,008 2,953,834 $99,600 $94,620 $4,980 0 0 $0 $0 $0 $0 $4,980
Finland 428,507 1,769,644 $94,682 $89,948 $4,734 0 0 $0 $0 $0 $0 $4,734
France 1,072,868 4,314,884 $421,487 $400,413 $21,074 0 0 $0 $0 $0 $0 $21,074
Germany 7,126,028 44,417,223 $703,583 $668,404 $35,179 0 0 $0 $0 $0 $0 $35,179
Gibraltar 40 80 $106 $101 $5 0 0 $0 $0 $0 $0 $5
Greece 2,926,407 20,412,716 $624,228 $593,017 $31,211 0 0 $0 $0 $0 $0 $31,211
Greenland 16 10 $13 $12 $1 0 0 $0 $0 $0 $0 $1
Iceland 3,649 45,305 $1,502 $1,427 $75 0 0 $0 $0 $0 $0 $75
Ireland 943,839 5,208,553 $228,422 $217,001 $11,421 0 0 $0 $0 $0 $0 $11,421
Italy 17,687,788 112,987,498 $3,029,399 $2,877,929 $151,470 0 0 $0 $0 $0 $0 $151,470
Liechtenstein 200,977 2,016,305 $744,637 $707,405 $37,232 0 0 $0 $0 $0 $0 $37,232
Luxembourg 119,785 575,872 $27,897 $26,502 $1,395 0 0 $0 $0 $0 $0 $1,395
Malta 86,231 467,736 $36,648 $34,816 $1,832 0 0 $0 $0 $0 $0 $1,832
Netherlands 2,519,967 14,620,609 $382,637 $363,505 $19,132 0 0 $0 $0 $0 $0 $19,132
Norway 1,070,731 5,812,506 $316,264 $300,451 $15,813 0 0 $0 $0 $0 $0 $15,813
Portugal 1,576,785 15,206,924 $370,331 $351,814 $18,517 0 0 $0 $0 $0 $0 $18,517
Spain 4,337,205 17,492,471 $1,173,600 $1,114,920 $58,680 0 0 $0 $0 $0 $0 $58,680
Sweden 1,368,412 8,320,206 $278,704 $264,769 $13,935 0 0 $0 $0 $0 $0 $13,935
Switzerland 1,125,121 5,984,194 $170,163 $161,655 $8,508 0 0 $0 $0 $0 $0 $8,508
Turkey 4,023,706 37,372,487 $1,210,603 $1,150,073 $60,530 0 0 $0 $0 $0 $0 $60,530
United Kingdom 10,176,673 12,425,422 $664,652 $631,419 $33,233 0 0 $0 $0 $0 $0 $33,233
Western Europe 59,405,218 323,138,292 $11,011,683 $10,461,100 $550,583 0 0 $0 $0 $0 $0 $550,583
Algeria 400,493 2,874,349 $308,612 $293,181 $15,431 0 0 $0 $0 $0 $0 $15,431
Angola 466,941 1,369,493 $167,853 $159,460 $8,393 0 0 $0 $0 $0 $0 $8,393
Benin 254,070 944,080 $154,942 $147,195 $7,747 0 0 $0 $0 $0 $0 $7,747
Botswana 22,838 51,698 $6,534 $6,207 $327 0 0 $0 $0 $0 $0 $327
Burkina 1,283,375 4,269,748 $656,045 $623,243 $32,802 0 0 $0 $0 $0 $0 $32,802
Burundi 16,965 152,031 $15,049 $14,297 $752 0 0 $0 $0 $0 $0 $752
Cameroon 287,345 1,964,925 $367,890 $349,496 $18,394 0 0 $0 $0 $0 $0 $18,394
Cape Verde 227,895 1,632,514 $300,715 $285,679 $15,036 0 0 $0 $0 $0 $0 $15,036
Central African Republic 516 2,300 $730 $694 $36 0 0 $0 $0 $0 $0 $36
Chad 11,140 54,039 $5,763 $5,475 $288 0 0 $0 $0 $0 $0 $288
Comoros 87,409 539,755 $148,893 $141,448 $7,445 0 0 $0 $0 $0 $0 $7,445
Congo 520,513 3,163,601 $322,438 $306,316 $16,122 0 0 $0 $0 $0 $0 $16,122
Cote d'Ivoire 424,466 1,216,380 $187,555 $178,177 $9,378 0 0 $0 $0 $0 $0 $9,378
Djibouti 843 3,290 $1,186 $1,127 $59 0 0 $0 $0 $0 $0 $59
Egypt 1,173,365 5,811,337 $574,907 $546,162 $28,745 0 0 $0 $0 $0 $0 $28,745
Equatorial Guinea 1,663 5,152 $1,015 $964 $51 0 0 $0 $0 $0 $0 $51
- Switched Services Page 50 -

2008 Annual Section 43.61 International Traffic Data for All U.S. Points: All Settlement ArrangementsTable A17: Telecom Italia Sparkle of North America, Inc. Message Telephone Service Billing Types Covered: 1, 2, 3, 4, 5, 11, 12, 14, 15
International Point Traffic Billed in the United States Traffic Billed in Foreign Countries TotalOriginating or Terminating Transiting the United States U.S.
in the United States (by Country of Origin) CarriersNumber Number U.S. Payout Retained Number Number Receipts Number Receipts Payout Retained Retained
of of Carriers to Foreign Revenues of of from Foreign of from Foreign to Foreign Revenues RevenuesMessages Minutes Revenues Carriers Messages Minutes Carriers Minutes Carriers Carriers
Ethiopia 2,936,308 24,824,801 $5,029,143 $4,777,686 $251,457 0 0 $0 $0 $0 $0 $251,457
Gabon 155,487 334,463 $28,181 $26,772 $1,409 0 0 $0 $0 $0 $0 $1,409
Gambia, The 116,902 166,228 $38,929 $36,983 $1,946 0 0 $0 $0 $0 $0 $1,946
Ghana 1,353,355 10,360,211 $868,432 $825,010 $43,422 0 0 $0 $0 $0 $0 $43,422
Guinea 92,885 387,551 $66,526 $63,200 $3,326 0 0 $0 $0 $0 $0 $3,326
Guinea-Bissau 262,514 1,983,560 $335,552 $318,774 $16,778 0 0 $0 $0 $0 $0 $16,778
Kenya 362,619 3,006,685 $225,520 $214,244 $11,276 0 0 $0 $0 $0 $0 $11,276
Lesotho 2,462 12,915 $2,097 $1,992 $105 0 0 $0 $0 $0 $0 $105
Liberia 194,569 1,119,720 $188,791 $179,351 $9,440 0 0 $0 $0 $0 $0 $9,440
Libya 491,376 2,274,777 $476,219 $452,408 $23,811 0 0 $0 $0 $0 $0 $23,811
Madagascar 24,098 118,757 $25,012 $23,761 $1,251 0 0 $0 $0 $0 $0 $1,251
Malawi 274,106 2,093,110 $252,523 $239,897 $12,626 0 0 $0 $0 $0 $0 $12,626
Mali 2,547,709 5,050,684 $943,711 $896,525 $47,186 0 0 $0 $0 $0 $0 $47,186
Mauritania 238,062 655,667 $105,411 $100,140 $5,271 0 0 $0 $0 $0 $0 $5,271
Mauritius 22,306 73,388 $7,290 $6,926 $364 0 0 $0 $0 $0 $0 $364
Morocco 1,462,142 8,610,502 $1,469,309 $1,395,844 $73,465 0 0 $0 $0 $0 $0 $73,465
Mozambique 30,187 166,815 $16,640 $15,808 $832 0 0 $0 $0 $0 $0 $832
Namibia 26,891 102,111 $12,061 $11,458 $603 0 0 $0 $0 $0 $0 $603
Niger 347,362 281,647 $27,077 $25,723 $1,354 0 0 $0 $0 $0 $0 $1,354
Nigeria 1,225,177 6,270,766 $591,474 $561,900 $29,574 0 0 $0 $0 $0 $0 $29,574
Reunion 27,657 140,822 $4,851 $4,608 $243 0 0 $0 $0 $0 $0 $243
Rwanda 13,513 78,073 $8,303 $7,888 $415 0 0 $0 $0 $0 $0 $415
Saint Helena 25 26 $53 $50 $3 0 0 $0 $0 $0 $0 $3
Senegal 2,217,079 9,319,072 $1,628,901 $1,547,456 $81,445 0 0 $0 $0 $0 $0 $81,445
Seychelles 71,482 415,458 $29,092 $27,637 $1,455 0 0 $0 $0 $0 $0 $1,455
Sierra Leone 103,356 299,130 $77,083 $73,229 $3,854 0 0 $0 $0 $0 $0 $3,854
Somalia 79,561 249,183 $96,893 $92,048 $4,845 0 0 $0 $0 $0 $0 $4,845
South Africa 973,396 3,873,150 $343,110 $325,955 $17,155 0 0 $0 $0 $0 $0 $17,155
Sudan 167,440 1,391,538 $116,531 $110,704 $5,827 0 0 $0 $0 $0 $0 $5,827
Swaziland 2,943 11,412 $1,334 $1,267 $67 0 0 $0 $0 $0 $0 $67
Tanzania 149,141 1,264,007 $109,561 $104,083 $5,478 0 0 $0 $0 $0 $0 $5,478
Togo 3,443,263 12,216,427 $2,895,580 $2,750,801 $144,779 0 0 $0 $0 $0 $0 $144,779
Tunisia 674,376 4,473,438 $948,374 $900,955 $47,419 0 0 $0 $0 $0 $0 $47,419
Uganda 339,134 1,736,484 $136,951 $130,103 $6,848 0 0 $0 $0 $0 $0 $6,848
Zambia 913,330 5,987,418 $300,380 $285,361 $15,019 0 0 $0 $0 $0 $0 $15,019
Zimbabwe 271,871 656,816 $117,422 $111,551 $5,871 0 0 $0 $0 $0 $0 $5,871
Africa 26,793,921 134,061,504 $20,744,444 $19,707,219 $1,037,225 0 0 $0 $0 $0 $0 $1,037,225
Bahrain 298,132 845,354 $47,148 $44,791 $2,357 0 0 $0 $0 $0 $0 $2,357
Iran 1,665,933 3,690,402 $242,138 $230,031 $12,107 0 0 $0 $0 $0 $0 $12,107
Iraq 405,757 2,818,993 $242,463 $230,340 $12,123 0 0 $0 $0 $0 $0 $12,123
Israel 1,801,999 12,718,164 $775,838 $737,046 $38,792 0 0 $0 $0 $0 $0 $38,792
Jordan 809,100 6,136,429 $232,918 $221,272 $11,646 0 0 $0 $0 $0 $0 $11,646
Kuwait 2,746,411 7,121,244 $646,695 $614,360 $32,335 0 0 $0 $0 $0 $0 $32,335
- Switched Services Page 51 -

2008 Annual Section 43.61 International Traffic Data for All U.S. Points: All Settlement ArrangementsTable A17: Telecom Italia Sparkle of North America, Inc. Message Telephone Service Billing Types Covered: 1, 2, 3, 4, 5, 11, 12, 14, 15
International Point Traffic Billed in the United States Traffic Billed in Foreign Countries TotalOriginating or Terminating Transiting the United States U.S.
in the United States (by Country of Origin) CarriersNumber Number U.S. Payout Retained Number Number Receipts Number Receipts Payout Retained Retained
of of Carriers to Foreign Revenues of of from Foreign of from Foreign to Foreign Revenues RevenuesMessages Minutes Revenues Carriers Messages Minutes Carriers Minutes Carriers Carriers
Lebanon 4,397,610 35,836,635 $3,793,956 $3,604,258 $189,698 0 0 $0 $0 $0 $0 $189,698
Oman 666,502 1,862,590 $272,476 $258,852 $13,624 0 0 $0 $0 $0 $0 $13,624
Qatar 394,828 2,254,634 $336,778 $319,939 $16,839 0 0 $0 $0 $0 $0 $16,839
Saudi Arabia 648,839 4,028,761 $310,483 $294,959 $15,524 0 0 $0 $0 $0 $0 $15,524
Syria 571,181 5,120,613 $741,266 $704,203 $37,063 0 0 $0 $0 $0 $0 $37,063
United Arab Emirates 8,009,701 32,502,073 $4,226,941 $4,015,594 $211,347 0 0 $0 $0 $0 $0 $211,347
Yemen 460,621 1,024,478 $122,815 $116,674 $6,141 0 0 $0 $0 $0 $0 $6,141
Middle East 22,876,614 115,960,370 $11,991,915 $11,392,319 $599,596 0 0 $0 $0 $0 $0 $599,596
Antigua and Barbuda 6,820 38,694 $4,844 $4,602 $242 0 0 $0 $0 $0 $0 $242
Aruba 46,755 133,504 $18,187 $17,278 $909 0 0 $0 $0 $0 $0 $909
Bahamas, The 640,175 2,986,709 $65,339 $62,072 $3,267 0 0 $0 $0 $0 $0 $3,267
Barbados 5,695 28,561 $15,908 $15,113 $795 0 0 $0 $0 $0 $0 $795
Bermuda 9,758 37,626 $1,782 $1,693 $89 0 0 $0 $0 $0 $0 $89
Cayman Islands 1,383 6,678 $895 $850 $45 0 0 $0 $0 $0 $0 $45
Dominica 1,908 11,396 $2,063 $1,960 $103 0 0 $0 $0 $0 $0 $103
Dominican Republic 2,523,112 18,810,546 $895,414 $850,643 $44,771 0 0 $0 $0 $0 $0 $44,771
French Overseas Departments 73,962 455,991 $31,220 $29,659 $1,561 0 0 $0 $0 $0 $0 $1,561
Grenada 60,832 363,567 $64,159 $60,951 $3,208 0 0 $0 $0 $0 $0 $3,208
Guadeloupe 79,146 431,613 $21,875 $20,781 $1,094 0 0 $0 $0 $0 $0 $1,094
Haiti 16,786,975 92,614,125 $16,806,690 $15,966,356 $840,334 0 0 $0 $0 $0 $0 $840,334
Jamaica 2,925,229 10,424,235 $1,469,779 $1,396,290 $73,489 0 0 $0 $0 $0 $0 $73,489
Saint Lucia 48,921 311,572 $46,203 $43,893 $2,310 0 0 $0 $0 $0 $0 $2,310
Saint Vincent and the Grenadines 50,730 299,735 $49,307 $46,842 $2,465 0 0 $0 $0 $0 $0 $2,465
Trinidad and Tobago 1,192,770 7,520,800 $543,903 $516,708 $27,195 0 0 $0 $0 $0 $0 $27,195
U.S. Virgin Islands 3,371,566 18,223,960 $156,377 $148,558 $7,819 0 0 $0 $0 $0 $0 $7,819
Caribbean 27,825,737 152,699,312 $20,193,945 $19,184,249 $1,009,696 0 0 $0 $0 $0 $0 $1,009,696
Belize 66,327 234,649 $43,902 $41,707 $2,195 0 0 $0 $0 $0 $0 $2,195
Canada 597,577 2,769,855 $13,376 $12,707 $669 0 0 $0 $0 $0 $0 $669
Costa Rica 4,184,693 23,174,967 $940,670 $893,637 $47,033 0 0 $0 $0 $0 $0 $47,033
El Salvador 7,226,882 59,259,905 $6,061,856 $5,758,763 $303,093 0 0 $0 $0 $0 $0 $303,093
Guatemala 13,933,797 117,349,493 $11,420,637 $10,849,605 $571,032 0 0 $0 $0 $0 $0 $571,032
Honduras 3,058,649 17,448,362 $2,405,250 $2,284,988 $120,262 0 0 $0 $0 $0 $0 $120,262
Mexico 3,440,716 37,437,818 $1,882,899 $1,788,754 $94,145 0 0 $0 $0 $0 $0 $94,145
Nicaragua 1,037,148 4,789,188 $582,310 $553,195 $29,115 0 0 $0 $0 $0 $0 $29,115
Panama 2,416,674 12,738,093 $794,984 $755,235 $39,749 0 0 $0 $0 $0 $0 $39,749
North and Central America 35,962,463 275,202,330 $24,145,884 $22,938,591 $1,207,293 0 0 $0 $0 $0 $0 $1,207,293
Argentina 6,217,906 35,834,896 $536,647 $509,815 $26,832 0 0 $0 $0 $0 $0 $26,832
Bolivia 2,677,085 10,560,923 $859,037 $816,085 $42,952 0 0 $0 $0 $0 $0 $42,952
Brazil 3,658,709 23,995,511 $788,799 $749,359 $39,440 0 0 $0 $0 $0 $0 $39,440
Chile 1,049,223 10,157,776 $218,417 $207,496 $10,921 0 0 $0 $0 $0 $0 $10,921
Colombia 8,091,598 57,286,794 $1,119,553 $1,063,575 $55,978 0 0 $0 $0 $0 $0 $55,978
- Switched Services Page 52 -

2008 Annual Section 43.61 International Traffic Data for All U.S. Points: All Settlement ArrangementsTable A17: Telecom Italia Sparkle of North America, Inc. Message Telephone Service Billing Types Covered: 1, 2, 3, 4, 5, 11, 12, 14, 15
International Point Traffic Billed in the United States Traffic Billed in Foreign Countries TotalOriginating or Terminating Transiting the United States U.S.
in the United States (by Country of Origin) CarriersNumber Number U.S. Payout Retained Number Number Receipts Number Receipts Payout Retained Retained
of of Carriers to Foreign Revenues of of from Foreign of from Foreign to Foreign Revenues RevenuesMessages Minutes Revenues Carriers Messages Minutes Carriers Minutes Carriers Carriers
Ecuador 3,736,945 23,763,276 $2,549,741 $2,422,254 $127,487 0 0 $0 $0 $0 $0 $127,487
Guyana 125,676 349,368 $66,228 $62,917 $3,311 0 0 $0 $0 $0 $0 $3,311
Paraguay 581,786 3,184,736 $137,793 $130,903 $6,890 0 0 $0 $0 $0 $0 $6,890
Peru 4,091,622 52,579,706 $824,966 $783,718 $41,248 0 0 $0 $0 $0 $0 $41,248
Uruguay 180,219 1,613,336 $88,003 $83,603 $4,400 0 0 $0 $0 $0 $0 $4,400
Venezuela 2,643,151 17,520,381 $429,328 $407,862 $21,466 0 0 $0 $0 $0 $0 $21,466
South America 33,053,920 236,846,703 $7,618,512 $7,237,587 $380,925 0 0 $0 $0 $0 $0 $380,925
Afghanistan 550,640 2,023,137 $384,946 $365,699 $19,247 0 0 $0 $0 $0 $0 $19,247
Bangladesh 733,828 3,575,869 $118,571 $112,642 $5,929 0 0 $0 $0 $0 $0 $5,929
Bhutan 4,769 24,103 $3,467 $3,294 $173 0 0 $0 $0 $0 $0 $173
Brunei 5,033 22,546 $766 $728 $38 0 0 $0 $0 $0 $0 $38
Burma 37,141 252,405 $62,281 $59,167 $3,114 0 0 $0 $0 $0 $0 $3,114
Cambodia 2,680,654 35,574,163 $2,052,298 $1,949,683 $102,615 0 0 $0 $0 $0 $0 $102,615
Chagos Archipelago 56 36 $73 $69 $4 0 0 $0 $0 $0 $0 $4
China 1,380,348 7,312,358 $66,455 $63,132 $3,323 0 0 $0 $0 $0 $0 $3,323
Hong Kong 181,689 1,058,802 $8,794 $8,354 $440 0 0 $0 $0 $0 $0 $440
India 21,101,543 182,148,828 $6,474,047 $6,150,345 $323,702 0 0 $0 $0 $0 $0 $323,702
Indonesia 1,904,250 12,142,932 $470,993 $447,443 $23,550 0 0 $0 $0 $0 $0 $23,550
Japan 1,729,153 7,821,737 $310,324 $294,808 $15,516 0 0 $0 $0 $0 $0 $15,516
Korea, South 1,473,059 4,381,335 $107,186 $101,827 $5,359 0 0 $0 $0 $0 $0 $5,359
Laos 206,815 2,715,986 $114,832 $109,090 $5,742 0 0 $0 $0 $0 $0 $5,742
Macau 48,077 377,325 $10,930 $10,384 $546 0 0 $0 $0 $0 $0 $546
Malaysia 749,647 3,483,553 $80,329 $76,313 $4,016 0 0 $0 $0 $0 $0 $4,016
Maldives 22,307 68,427 $9,625 $9,144 $481 0 0 $0 $0 $0 $0 $481
Mongolia 133,697 146,557 $13,468 $12,795 $673 0 0 $0 $0 $0 $0 $673
Nepal 515,135 1,532,246 $219,094 $208,139 $10,955 0 0 $0 $0 $0 $0 $10,955
Pakistan 3,114,352 27,793,384 $1,379,335 $1,310,368 $68,967 0 0 $0 $0 $0 $0 $68,967
Philippines 20,379,206 163,049,540 $17,935,625 $17,038,844 $896,781 0 0 $0 $0 $0 $0 $896,781
Singapore 1,314,989 9,241,914 $71,480 $67,906 $3,574 0 0 $0 $0 $0 $0 $3,574
Sri Lanka 203,703 991,005 $83,598 $79,418 $4,180 0 0 $0 $0 $0 $0 $4,180
Taiwan 342,682 1,708,104 $59,631 $56,649 $2,982 0 0 $0 $0 $0 $0 $2,982
Thailand 1,006,696 8,740,608 $80,565 $76,537 $4,028 0 0 $0 $0 $0 $0 $4,028
Vietnam 452,064 4,841,192 $229,700 $218,215 $11,485 0 0 $0 $0 $0 $0 $11,485
Asia 60,271,533 481,028,092 $30,348,413 $28,830,993 $1,517,420 0 0 $0 $0 $0 $0 $1,517,420
Australia 8,561,039 24,433,758 $500,117 $475,111 $25,006 0 0 $0 $0 $0 $0 $25,006
Fiji 3,729 22,415 $4,868 $4,625 $243 0 0 $0 $0 $0 $0 $243
French Polynesia 224 1,322 $3,756 $3,568 $188 0 0 $0 $0 $0 $0 $188
Kiribati 46 128 $588 $559 $29 0 0 $0 $0 $0 $0 $29
Marshall Islands 59 344 $388 $369 $19 0 0 $0 $0 $0 $0 $19
Micronesia, Federated States of 1,371 11,238 $5,264 $5,001 $263 0 0 $0 $0 $0 $0 $263
Nauru 14 8 $11 $10 $1 0 0 $0 $0 $0 $0 $1
New Caledonia 1,549 7,945 $1,624 $1,543 $81 0 0 $0 $0 $0 $0 $81
- Switched Services Page 53 -

2008 Annual Section 43.61 International Traffic Data for All U.S. Points: All Settlement ArrangementsTable A17: Telecom Italia Sparkle of North America, Inc. Message Telephone Service Billing Types Covered: 1, 2, 3, 4, 5, 11, 12, 14, 15
International Point Traffic Billed in the United States Traffic Billed in Foreign Countries TotalOriginating or Terminating Transiting the United States U.S.
in the United States (by Country of Origin) CarriersNumber Number U.S. Payout Retained Number Number Receipts Number Receipts Payout Retained Retained
of of Carriers to Foreign Revenues of of from Foreign of from Foreign to Foreign Revenues RevenuesMessages Minutes Revenues Carriers Messages Minutes Carriers Minutes Carriers Carriers
New Zealand 349,331 1,962,084 $49,647 $47,165 $2,482 0 0 $0 $0 $0 $0 $2,482
Niue 2 2 $5 $5 $0 0 0 $0 $0 $0 $0 $0
Papua New Guinea 235 648 $1,607 $1,527 $80 0 0 $0 $0 $0 $0 $80
Solomon Islands 2,824 6,774 $2,569 $2,441 $128 0 0 $0 $0 $0 $0 $128
Tuvalu 68 329 $146 $139 $7 0 0 $0 $0 $0 $0 $7
Vanuatu 21 11 $21 $20 $1 0 0 $0 $0 $0 $0 $1
Western Samoa 31,113 139,182 $43,285 $41,121 $2,164 0 0 $0 $0 $0 $0 $2,164
American Samoa 941 8,793 $1,099 $1,044 $55 0 0 $0 $0 $0 $0 $55
Guam 4,327 26,744 $794 $754 $40 0 0 $0 $0 $0 $0 $40
Northern Mariana Islands 3,771 32,990 $2,036 $1,934 $102 0 0 $0 $0 $0 $0 $102
Oceania 8,960,664 26,654,715 $617,825 $586,936 $30,889 0 0 $0 $0 $0 $0 $30,889
Albania 1,328,122 8,752,394 $1,142,446 $1,085,324 $57,122 0 0 $0 $0 $0 $0 $57,122
Armenia 562,541 2,330,065 $154,900 $147,155 $7,745 0 0 $0 $0 $0 $0 $7,745
Azerbaijan 248,098 708,362 $71,891 $68,296 $3,595 0 0 $0 $0 $0 $0 $3,595
Belarus 422,639 1,611,127 $241,811 $229,720 $12,091 0 0 $0 $0 $0 $0 $12,091
Bosnia and Herzegovina 438,257 4,067,469 $568,634 $540,202 $28,432 0 0 $0 $0 $0 $0 $28,432
Bulgaria 379,164 2,461,506 $187,511 $178,135 $9,376 0 0 $0 $0 $0 $0 $9,376
Croatia 712,839 8,716,113 $240,310 $228,295 $12,015 0 0 $0 $0 $0 $0 $12,015
Czech Republic 582,871 2,325,380 $224,831 $213,589 $11,242 0 0 $0 $0 $0 $0 $11,242
Estonia 101,292 1,195,726 $40,938 $38,891 $2,047 0 0 $0 $0 $0 $0 $2,047
Georgia 527,306 1,921,567 $105,213 $99,952 $5,261 0 0 $0 $0 $0 $0 $5,261
Hungary 1,631,214 20,106,484 $347,657 $330,274 $17,383 0 0 $0 $0 $0 $0 $17,383
Kazakhstan 385,330 2,005,870 $156,660 $148,827 $7,833 0 0 $0 $0 $0 $0 $7,833
Kyrgyzstan 299,194 1,025,925 $102,511 $97,385 $5,126 0 0 $0 $0 $0 $0 $5,126
Latvia 157,764 1,902,867 $56,658 $53,825 $2,833 0 0 $0 $0 $0 $0 $2,833
Lithuania 47,616 434,983 $27,448 $26,076 $1,372 0 0 $0 $0 $0 $0 $1,372
Moldova 584,685 2,822,023 $277,338 $263,471 $13,867 0 0 $0 $0 $0 $0 $13,867
Poland 4,425,408 38,458,367 $719,218 $683,257 $35,961 0 0 $0 $0 $0 $0 $35,961
Russia 2,614,318 20,517,213 $515,130 $489,374 $25,756 0 0 $0 $0 $0 $0 $25,756
Serbia 2,516,040 29,015,440 $2,241,240 $2,129,177 $112,063 0 0 $0 $0 $0 $0 $112,063
Slovakia 544,413 8,459,703 $172,575 $163,946 $8,629 0 0 $0 $0 $0 $0 $8,629
Slovenia 91,576 557,167 $54,682 $51,948 $2,734 0 0 $0 $0 $0 $0 $2,734
Tajikistan 39,520 358,613 $26,899 $25,554 $1,345 0 0 $0 $0 $0 $0 $1,345
Turkmenistan 132,803 916,131 $79,237 $75,275 $3,962 0 0 $0 $0 $0 $0 $3,962
Ukraine 2,851,234 15,003,122 $1,073,471 $1,019,797 $53,674 0 0 $0 $0 $0 $0 $53,674
Uzbekistan 273,820 1,996,361 $111,225 $105,664 $5,561 0 0 $0 $0 $0 $0 $5,561
Eastern Europe 24,791,089 211,723,247 $9,569,113 $9,090,654 $478,459 0 0 $0 $0 $0 $0 $478,459
Total for Foreign Points 296,560,554 1,939,022,078 $136,081,428 $129,277,358 $6,804,070 0 0 $0 $0 $0 $0 $6,804,070
Total for U.S. Points 3,380,605 18,292,487 $160,306 $152,290 $8,016 0 0 $0 $0 $0 $0 $8,016
World Total 299,941,159 1,957,314,565 $136,241,734 $129,429,648 $6,812,086 0 0 $0 0 $0 $0 $0 $6,812,086
- Switched Services Page 54 -

2008 Annual Section 43.61 International Traffic Data for All U.S. Points: All Settlement ArrangementsTable A18: Telefonica Larga Distancia, Inc. (TLD) Message Telephone Service Billing Types Covered: 1, 2, 3, 4, 5, 11, 12, 14, 15
International Point Traffic Billed in the United States Traffic Billed in Foreign Countries TotalOriginating or Terminating Transiting the United States U.S.
in the United States (by Country of Origin) CarriersNumber Number U.S. Payout Retained Number Number Receipts Number Receipts Payout Retained Retained
of of Carriers to Foreign Revenues of of from Foreign of from Foreign to Foreign Revenues RevenuesMessages Minutes Revenues Carriers Messages Minutes Carriers Minutes Carriers Carriers
Italy 5,042 38,356 $17,906 $17,784 $122 497,202 1,769,445 $7,052 $0 $0 $0 $7,174Spain 59,513 450,018 $241,545 $73,814 $167,731 325,972 1,265,172 $29,969 $0 $0 $0 $197,700
Western Europe 64,555 488,374 $259,451 $91,598 $167,853 823,174 3,034,617 $37,021 $0 $0 $0 $204,874
Antigua and Barbuda 12,945 44,989 $20,110 $7,492 $12,618 0 0 $0 $0 $0 $0 $12,618Bahamas, The 856 2,669 $1,478 $64 $1,414 0 0 $0 $0 $0 $0 $1,414Barbados 2,030 6,798 $3,967 $1,399 $2,568 0 0 $0 $0 $0 $0 $2,568Dominican Republic 586,194 3,891,634 $840,692 $710,731 $129,961 5,292,528 10,770,325 $202,276 $0 $0 $0 $332,237Trinidad and Tobago 4,984 19,686 $10,574 $1,042 $9,532 25,097 80,226 $8,938 $0 $0 $0 $18,470Virgin Islands, British 0 0 $0 $0 $0 108,946 508,448 $40,229 $0 $0 $0 $40,229
Caribbean 607,009 3,965,776 $876,821 $720,728 $156,093 5,426,571 11,358,999 $251,443 $0 $0 $0 $407,536
Canada 25,080 125,719 $21,285 $20,065 $1,220 0 0 $0 $0 $0 $0 $1,220Costa Rica 12,849 79,263 $40,141 $11,246 $28,895 97,094 374,845 $4,005 $0 $0 $0 $32,900Mexico 45,193 332,980 $130,299 $25,698 $104,601 249,743 895,679 $58,614 $0 $0 $0 $163,215Panama 18,776 108,819 $50,172 $14,252 $35,920 547 478 $84 $0 $0 $0 $36,004
North and Central America 101,898 646,781 $241,897 $71,261 $170,636 347,384 1,271,002 $62,703 $0 $0 $0 $233,339
Argentina 42,271 240,825 $143,499 $130,325 $13,174 146,335 637,848 $81,761 $0 $0 $0 $94,935Brazil 16,949 116,783 $66,199 $54,045 $12,154 14,517 47,931 $24,316 $0 $0 $0 $36,470Chile 13,658 94,752 $54,712 $21,308 $33,404 95,640 337,843 $34,316 $0 $0 $0 $67,720Colombia 35,313 266,663 $120,419 $13,236 $107,183 252,982 840,727 $46,244 $0 $0 $0 $153,427Peru 17,118 116,014 $61,811 $23,132 $38,679 198,323 855,509 $41,038 $0 $0 $0 $79,717Uruguay 5,414 30,236 $19,714 $6,842 $12,872 814 2,990 $568 $0 $0 $0 $13,440Venezuela 67,001 363,144 $132,048 $54,752 $77,296 168,570 744,558 $103,224 $0 $0 $0 $180,520
South America 197,724 1,228,417 $598,402 $303,640 $294,762 877,181 3,467,406 $331,467 $0 $0 $0 $626,229
Total for Foreign Points 971,186 6,329,348 $1,976,571 $1,187,227 $789,344 7,474,310 19,132,024 $682,634 $0 $0 $0 $1,471,978
World Total 971,186 6,329,348 $1,976,571 $1,187,227 $789,344 7,474,310 19,132,024 $682,634 0 $0 $0 $0 $1,471,978
- Switched Services Page 55 -
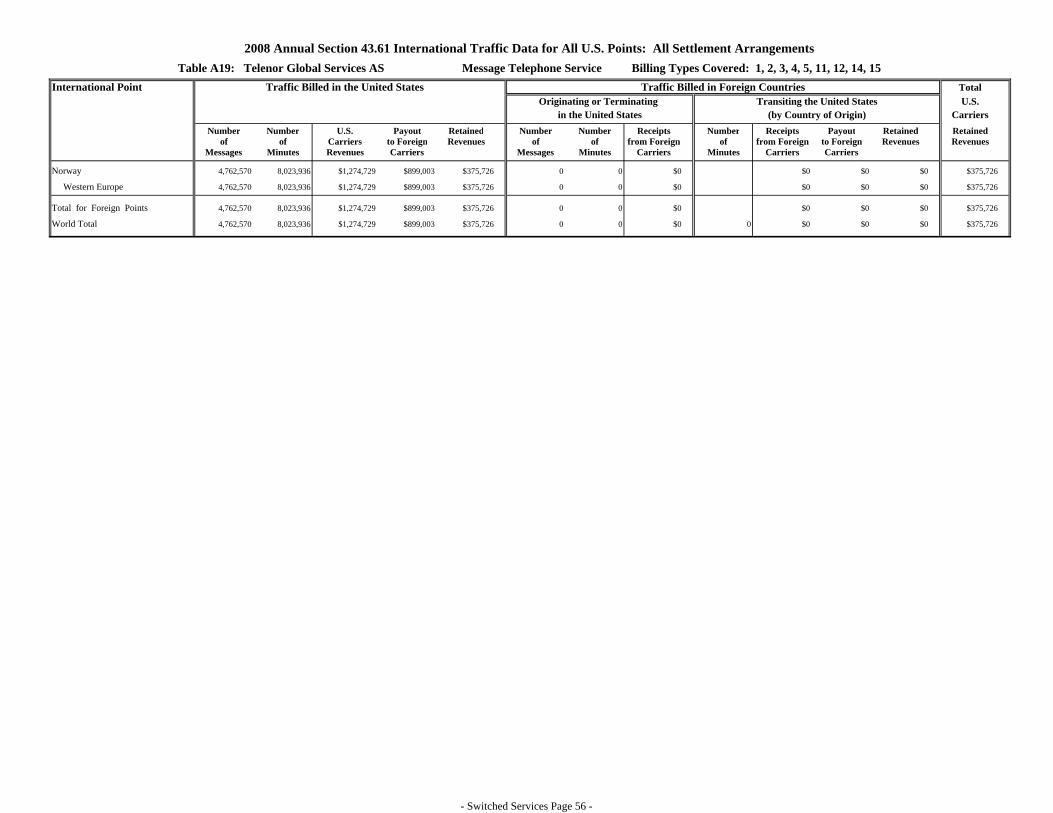
2008 Annual Section 43.61 International Traffic Data for All U.S. Points: All Settlement ArrangementsTable A19: Telenor Global Services AS Message Telephone Service Billing Types Covered: 1, 2, 3, 4, 5, 11, 12, 14, 15
International Point Traffic Billed in the United States Traffic Billed in Foreign Countries TotalOriginating or Terminating Transiting the United States U.S.
in the United States (by Country of Origin) CarriersNumber Number U.S. Payout Retained Number Number Receipts Number Receipts Payout Retained Retained
of of Carriers to Foreign Revenues of of from Foreign of from Foreign to Foreign Revenues RevenuesMessages Minutes Revenues Carriers Messages Minutes Carriers Minutes Carriers Carriers
Norway 4,762,570 8,023,936 $1,274,729 $899,003 $375,726 0 0 $0 $0 $0 $0 $375,726
Western Europe 4,762,570 8,023,936 $1,274,729 $899,003 $375,726 0 0 $0 $0 $0 $0 $375,726
Total for Foreign Points 4,762,570 8,023,936 $1,274,729 $899,003 $375,726 0 0 $0 $0 $0 $0 $375,726
World Total 4,762,570 8,023,936 $1,274,729 $899,003 $375,726 0 0 $0 0 $0 $0 $0 $375,726
- Switched Services Page 56 -

2008 Annual Section 43.61 International Traffic Data for All U.S. Points: All Settlement ArrangementsTable A20: Thrane & Thrane Airtime Ltd. Message Telephone Service Billing Types Covered: 1, 2, 3, 4, 5, 11, 12, 14, 15
International Point Traffic Billed in the United States Traffic Billed in Foreign Countries TotalOriginating or Terminating Transiting the United States U.S.
in the United States (by Country of Origin) CarriersNumber Number U.S. Payout Retained Number Number Receipts Number Receipts Payout Retained Retained
of of Carriers to Foreign Revenues of of from Foreign of from Foreign to Foreign Revenues RevenuesMessages Minutes Revenues Carriers Messages Minutes Carriers Minutes Carriers Carriers
Belgium 1 1 $0 $0 $0 0 0 $0 $0 $0 $0 $0
Denmark 2 683 $826 $597 $229 0 0 $0 $0 $0 $0 $229
Germany 1 8 $1 $1 $0 0 0 $0 $0 $0 $0 $0
Netherlands 2 18 $12 $9 $3 0 0 $0 $0 $0 $0 $3
Norway 1 11 $10 $6 $4 0 0 $0 $0 $0 $0 $4
Spain 1 5 $4 $3 $1 0 0 $0 $0 $0 $0 $1
Sweden 1 91 $82 $59 $23 0 0 $0 $0 $0 $0 $23
United Kingdom 2 3 $3 $2 $1 0 0 $0 $0 $0 $0 $1
Western Europe 11 820 $938 $677 $261 0 0 $0 $0 $0 $0 $261
Chad 2 1,222 $1,087 $612 $475 0 0 $0 $0 $0 $0 $475
Mozambique 1 1 $0 $0 $0 0 0 $0 $0 $0 $0 $0
Namibia 1 20 $18 $14 $4 0 0 $0 $0 $0 $0 $4
Africa 4 1,243 $1,105 $626 $479 0 0 $0 $0 $0 $0 $479
Bahamas, The 1 2 $2 $1 $1 0 0 $0 $0 $0 $0 $1
Virgin Islands, British 1 32 $29 $16 $13 0 0 $0 $0 $0 $0 $13
Caribbean 2 34 $31 $17 $14 0 0 $0 $0 $0 $0 $14
Argentina 1 114 $80 $57 $23 0 0 $0 $0 $0 $0 $23
South America 1 114 $80 $57 $23 0 0 $0 $0 $0 $0 $23
China 1 1 $1 $0 $1 0 0 $0 $0 $0 $0 $1
India 1 2 $1 $1 $0 0 0 $0 $0 $0 $0 $0
Korea, South 1 5 $4 $3 $1 0 0 $0 $0 $0 $0 $1
Pakistan 1 17 $15 $11 $4 0 0 $0 $0 $0 $0 $4
Singapore 1 3 $4 $3 $1 0 0 $0 $0 $0 $0 $1
Asia 5 28 $25 $18 $7 0 0 $0 $0 $0 $0 $7
Georgia 1 5 $4 $3 $1 0 0 $0 $0 $0 $0 $1
Kazakhstan 1 42 $35 $27 $8 0 0 $0 $0 $0 $0 $8
Eastern Europe 2 47 $39 $30 $9 0 0 $0 $0 $0 $0 $9
Maritime - other oceans 2 34 $47 $31 $16 0 0 $0 $0 $0 $0 $16
Other Regions 2 34 $47 $31 $16 0 0 $0 $0 $0 $0 $16
Total for Foreign Points 27 2,320 $2,265 $1,456 $809 0 0 $0 $0 $0 $0 $809
World Total 27 2,320 $2,265 $1,456 $809 0 0 $0 0 $0 $0 $0 $809
- Switched Services Page 57 -

2008 Annual Section 43.61 International Traffic Data for All U.S. Points: All Settlement ArrangementsTable A21: Tricom USA, Inc. Message Telephone Service Billing Types Covered: 1, 2, 3, 4, 5, 11, 12, 14, 15
International Point Traffic Billed in the United States Traffic Billed in Foreign Countries TotalOriginating or Terminating Transiting the United States U.S.
in the United States (by Country of Origin) CarriersNumber Number U.S. Payout Retained Number Number Receipts Number Receipts Payout Retained Retained
of of Carriers to Foreign Revenues of of from Foreign of from Foreign to Foreign Revenues RevenuesMessages Minutes Revenues Carriers Messages Minutes Carriers Minutes Carriers Carriers
Austria 3,515 26,198 $1,747 $580 $1,167 0 0 $0 $0 $0 $0 $1,167
Belgium 373 2,338 $650 $279 $371 0 0 $0 $0 $0 $0 $371
Cyprus 9 51 $14 $5 $9 0 0 $0 $0 $0 $0 $9
Denmark 22 77 $21 $6 $15 0 0 $0 $0 $0 $0 $15
Finland 6 47 $8 $5 $3 0 0 $0 $0 $0 $0 $3
France 872 5,146 $946 $484 $462 0 0 $0 $0 $0 $0 $462
Germany 633 4,544 $702 $178 $524 0 0 $0 $0 $0 $0 $524
Greece 32 119 $27 $7 $20 0 0 $0 $0 $0 $0 $20
Iceland 1 2 $2 $1 $1 0 0 $0 $0 $0 $0 $1
Ireland 98 794 $172 $43 $129 0 0 $0 $0 $0 $0 $129
Italy 4,055 25,951 $5,315 $2,695 $2,620 0 0 $0 $0 $0 $0 $2,620
Luxembourg 12 79 $29 $15 $14 0 0 $0 $0 $0 $0 $14
Malta 10 28 $13 $6 $7 0 0 $0 $0 $0 $0 $7
Netherlands 1,079 7,190 $2,030 $739 $1,291 0 0 $0 $0 $0 $0 $1,291
Norway 27 202 $56 $21 $35 0 0 $0 $0 $0 $0 $35
Portugal 94 460 $130 $48 $82 0 0 $0 $0 $0 $0 $82
Spain 12,900 106,185 $18,911 $9,641 $9,270 0 0 $0 $0 $0 $0 $9,270
Sweden 63 404 $137 $5 $132 0 0 $0 $0 $0 $0 $132
Switzerland 471 2,787 $692 $330 $362 0 0 $0 $0 $0 $0 $362
Turkey 34 111 $40 $18 $22 0 0 $0 $0 $0 $0 $22
United Kingdom 543 4,010 $894 $371 $523 0 0 $0 $0 $0 $0 $523
Western Europe 24,849 186,723 $32,536 $15,477 $17,059 0 0 $0 $0 $0 $0 $17,059
Algeria 26 110 $45 $16 $29 0 0 $0 $0 $0 $0 $29
Angola 162 447 $199 $65 $134 0 0 $0 $0 $0 $0 $134
Benin 2 4 $2 $1 $1 0 0 $0 $0 $0 $0 $1
Botswana 5 37 $5 $2 $3 0 0 $0 $0 $0 $0 $3
Burkina 52 184 $90 $25 $65 0 0 $0 $0 $0 $0 $65
Burundi 1 2 $2 $1 $1 0 0 $0 $0 $0 $0 $1
Cameroon 20 60 $25 $9 $16 0 0 $0 $0 $0 $0 $16
Cape Verde 45 109 $61 $18 $43 0 0 $0 $0 $0 $0 $43
Congo 11 24 $17 $2 $15 0 0 $0 $0 $0 $0 $15
Cote d'Ivoire 518 1,926 $589 $253 $336 0 0 $0 $0 $0 $0 $336
Egypt 70 246 $80 $20 $60 0 0 $0 $0 $0 $0 $60
Ethiopia 7 32 $35 $7 $28 0 0 $0 $0 $0 $0 $28
Gabon 29 83 $39 $7 $32 0 0 $0 $0 $0 $0 $32
Gambia, The 197 405 $187 $91 $96 0 0 $0 $0 $0 $0 $96
Ghana 397 1,032 $426 $95 $331 0 0 $0 $0 $0 $0 $331
Guinea 51 242 $175 $37 $138 0 0 $0 $0 $0 $0 $138
Kenya 2 11 $7 $3 $4 0 0 $0 $0 $0 $0 $4
Liberia 7 50 $26 $10 $16 0 0 $0 $0 $0 $0 $16
Mali 1,556 8,979 $3,205 $1,657 $1,548 0 0 $0 $0 $0 $0 $1,548
Mauritania 38 176 $79 $29 $50 0 0 $0 $0 $0 $0 $50
- Switched Services Page 58 -

2008 Annual Section 43.61 International Traffic Data for All U.S. Points: All Settlement ArrangementsTable A21: Tricom USA, Inc. Message Telephone Service Billing Types Covered: 1, 2, 3, 4, 5, 11, 12, 14, 15
International Point Traffic Billed in the United States Traffic Billed in Foreign Countries TotalOriginating or Terminating Transiting the United States U.S.
in the United States (by Country of Origin) CarriersNumber Number U.S. Payout Retained Number Number Receipts Number Receipts Payout Retained Retained
of of Carriers to Foreign Revenues of of from Foreign of from Foreign to Foreign Revenues RevenuesMessages Minutes Revenues Carriers Messages Minutes Carriers Minutes Carriers Carriers
Morocco 415 1,611 $673 $243 $430 0 0 $0 $0 $0 $0 $430
Mozambique 2 10 $4 $2 $2 0 0 $0 $0 $0 $0 $2
Niger 19 15 $11 $2 $9 0 0 $0 $0 $0 $0 $9
Nigeria 106 486 $265 $53 $212 0 0 $0 $0 $0 $0 $212
Senegal 665 2,522 $957 $360 $597 0 0 $0 $0 $0 $0 $597
Sierra Leone 34 185 $91 $47 $44 0 0 $0 $0 $0 $0 $44
South Africa 29 229 $64 $20 $44 0 0 $0 $0 $0 $0 $44
Sudan 1 1 $3 $2 $1 0 0 $0 $0 $0 $0 $1
Tanzania 7 37 $23 $4 $19 0 0 $0 $0 $0 $0 $19
Togo 17 19 $6 $3 $3 0 0 $0 $0 $0 $0 $3
Tunisia 24 50 $20 $11 $9 0 0 $0 $0 $0 $0 $9
Uganda 165 1,061 $304 $91 $213 0 0 $0 $0 $0 $0 $213
Zaire 2 39 $16 $14 $2 0 0 $0 $0 $0 $0 $2
Zambia 10 42 $27 $5 $22 0 0 $0 $0 $0 $0 $22
Zimbabwe 1 3 $2 $1 $1 0 0 $0 $0 $0 $0 $1
Africa 4,693 20,469 $7,760 $3,206 $4,554 0 0 $0 $0 $0 $0 $4,554
Iran 3 5 $4 $1 $3 0 0 $0 $0 $0 $0 $3
Iraq 6 9 $5 $2 $3 0 0 $0 $0 $0 $0 $3
Israel 76 395 $76 $17 $59 0 0 $0 $0 $0 $0 $59
Jordan 2 5 $3 $1 $2 0 0 $0 $0 $0 $0 $2
Lebanon 45 307 $144 $31 $113 0 0 $0 $0 $0 $0 $113
Saudi Arabia 6 28 $17 $5 $12 0 0 $0 $0 $0 $0 $12
Syria 18 196 $68 $30 $38 0 0 $0 $0 $0 $0 $38
United Arab Emirates 2 4 $1 $1 $0 0 0 $0 $0 $0 $0 $0
Yemen 464 1,316 $475 $138 $337 0 0 $0 $0 $0 $0 $337
Middle East 622 2,265 $793 $226 $567 0 0 $0 $0 $0 $0 $567
Anguilla 50 155 $54 $18 $36 0 0 $0 $0 $0 $0 $36
Antigua and Barbuda 526 2,236 $779 $208 $571 0 0 $0 $0 $0 $0 $571
Aruba 153 899 $335 $144 $191 0 0 $0 $0 $0 $0 $191
Bahamas, The 163 697 $164 $19 $145 0 0 $0 $0 $0 $0 $145
Barbados 47 150 $37 $14 $23 0 0 $0 $0 $0 $0 $23
Cayman Islands 125 580 $212 $76 $136 0 0 $0 $0 $0 $0 $136
Cuba 939,096 6,900,864 $5,773,031 $5,699,592 $73,439 0 0 $0 $0 $0 $0 $73,439
Dominica 164 847 $284 $75 $209 0 0 $0 $0 $0 $0 $209
Dominican Republic 64,399,422 623,558,688 $28,074,282 $15,933,487 $12,140,795 0 0 $0 $0 $0 $0 $12,140,795
French Overseas Departments 196 750 $499 $78 $421 0 0 $0 $0 $0 $0 $421
Grenada 52 247 $103 $44 $59 0 0 $0 $0 $0 $0 $59
Guadeloupe 78 457 $172 $131 $41 0 0 $0 $0 $0 $0 $41
Haiti 2,438 11,506 $3,742 $2,064 $1,678 0 0 $0 $0 $0 $0 $1,678
Jamaica 1,441 7,326 $2,497 $1,238 $1,259 0 0 $0 $0 $0 $0 $1,259
Saint Kitts and Nevis 215 1,040 $496 $192 $304 0 0 $0 $0 $0 $0 $304
Saint Lucia 94 661 $377 $90 $287 0 0 $0 $0 $0 $0 $287
Saint Vincent and the Grenadines 26 202 $75 $26 $49 0 0 $0 $0 $0 $0 $49
- Switched Services Page 59 -

2008 Annual Section 43.61 International Traffic Data for All U.S. Points: All Settlement ArrangementsTable A21: Tricom USA, Inc. Message Telephone Service Billing Types Covered: 1, 2, 3, 4, 5, 11, 12, 14, 15
International Point Traffic Billed in the United States Traffic Billed in Foreign Countries TotalOriginating or Terminating Transiting the United States U.S.
in the United States (by Country of Origin) CarriersNumber Number U.S. Payout Retained Number Number Receipts Number Receipts Payout Retained Retained
of of Carriers to Foreign Revenues of of from Foreign of from Foreign to Foreign Revenues RevenuesMessages Minutes Revenues Carriers Messages Minutes Carriers Minutes Carriers Carriers
Trinidad and Tobago 849 4,263 $1,599 $427 $1,172 0 0 $0 $0 $0 $0 $1,172
Turks and Caicos Islands 120 763 $231 $106 $125 0 0 $0 $0 $0 $0 $125
Virgin Islands, British 95 553 $198 $93 $105 0 0 $0 $0 $0 $0 $105
Caribbean 65,345,350 630,492,884 $33,859,167 $21,638,122 $12,221,045 0 0 $0 $0 $0 $0 $12,221,045
Belize 349 1,059 $428 $158 $270 0 0 $0 $0 $0 $0 $270
Canada 1,488 8,882 $799 $505 $294 0 0 $0 $0 $0 $0 $294
Costa Rica 3,458 22,544 $2,862 $965 $1,897 0 0 $0 $0 $0 $0 $1,897
El Salvador 49,900 420,312 $52,234 $45,515 $6,719 0 0 $0 $0 $0 $0 $6,719
Guatemala 95,899 734,319 $84,596 $69,464 $15,132 0 0 $0 $0 $0 $0 $15,132
Honduras 220,412 1,414,574 $278,002 $199,094 $78,908 0 0 $0 $0 $0 $0 $78,908
Mexico 288,442 2,677,376 $329,527 $263,947 $65,580 0 0 $0 $0 $0 $0 $65,580
Nicaragua 13,046 89,313 $20,627 $14,409 $6,218 0 0 $0 $0 $0 $0 $6,218
Panama 1,656 9,454 $2,116 $420 $1,696 0 0 $0 $0 $0 $0 $1,696
North and Central America 674,650 5,377,833 $771,191 $594,477 $176,714 0 0 $0 $0 $0 $0 $176,714
Argentina 3,581 17,458 $1,225 $263 $962 0 0 $0 $0 $0 $0 $962
Bolivia 3,480 9,255 $1,434 $665 $769 0 0 $0 $0 $0 $0 $769
Brazil 809 5,581 $816 $285 $531 0 0 $0 $0 $0 $0 $531
Chile 14,681 103,546 $10,356 $5,012 $5,344 0 0 $0 $0 $0 $0 $5,344
Colombia 58,264 453,903 $40,067 $24,362 $15,705 0 0 $0 $0 $0 $0 $15,705
Ecuador 206,272 1,919,526 $358,310 $276,957 $81,353 0 0 $0 $0 $0 $0 $81,353
Guyana 243 2,076 $1,335 $464 $871 0 0 $0 $0 $0 $0 $871
Paraguay 260 1,828 $480 $137 $343 0 0 $0 $0 $0 $0 $343
Peru 26,291 150,770 $13,459 $6,777 $6,682 0 0 $0 $0 $0 $0 $6,682
Suriname 39 187 $135 $30 $105 0 0 $0 $0 $0 $0 $105
Uruguay 418 2,719 $949 $254 $695 0 0 $0 $0 $0 $0 $695
Venezuela 12,837 62,078 $8,005 $3,062 $4,943 0 0 $0 $0 $0 $0 $4,943
South America 327,175 2,728,927 $436,571 $318,268 $118,303 0 0 $0 $0 $0 $0 $118,303
Afghanistan 27 25 $19 $5 $14 0 0 $0 $0 $0 $0 $14
Bangladesh 910 5,622 $375 $85 $290 0 0 $0 $0 $0 $0 $290
Burma 56 68 $35 $15 $20 0 0 $0 $0 $0 $0 $20
China 13,319 93,949 $9,035 $4,529 $4,506 0 0 $0 $0 $0 $0 $4,506
India 50 233 $50 $8 $42 0 0 $0 $0 $0 $0 $42
Indonesia 12 34 $20 $16 $4 0 0 $0 $0 $0 $0 $4
Japan 84 516 $158 $70 $88 0 0 $0 $0 $0 $0 $88
Korea, South 24 62 $15 $5 $10 0 0 $0 $0 $0 $0 $10
Malaysia 1 3 $2 $1 $1 0 0 $0 $0 $0 $0 $1
Nepal 7 56 $50 $10 $40 0 0 $0 $0 $0 $0 $40
Pakistan 12 11 $8 $3 $5 0 0 $0 $0 $0 $0 $5
Philippines 65 310 $99 $32 $67 0 0 $0 $0 $0 $0 $67
Singapore 1 1 $4 $2 $2 0 0 $0 $0 $0 $0 $2
Sri Lanka 24 132 $75 $14 $61 0 0 $0 $0 $0 $0 $61
Taiwan 5 41 $20 $3 $17 0 0 $0 $0 $0 $0 $17
- Switched Services Page 60 -

2008 Annual Section 43.61 International Traffic Data for All U.S. Points: All Settlement ArrangementsTable A21: Tricom USA, Inc. Message Telephone Service Billing Types Covered: 1, 2, 3, 4, 5, 11, 12, 14, 15
International Point Traffic Billed in the United States Traffic Billed in Foreign Countries TotalOriginating or Terminating Transiting the United States U.S.
in the United States (by Country of Origin) CarriersNumber Number U.S. Payout Retained Number Number Receipts Number Receipts Payout Retained Retained
of of Carriers to Foreign Revenues of of from Foreign of from Foreign to Foreign Revenues RevenuesMessages Minutes Revenues Carriers Messages Minutes Carriers Minutes Carriers Carriers
Thailand 29 236 $111 $4 $107 0 0 $0 $0 $0 $0 $107
Vietnam 1,310 8,346 $2,102 $978 $1,124 0 0 $0 $0 $0 $0 $1,124
Asia 15,936 109,645 $12,178 $5,780 $6,398 0 0 $0 $0 $0 $0 $6,398
Australia 71 542 $145 $25 $120 0 0 $0 $0 $0 $0 $120
Solomon Islands 1 1 $3 $1 $2 0 0 $0 $0 $0 $0 $2
Guam 1 8 $2 $1 $1 0 0 $0 $0 $0 $0 $1
Oceania 73 551 $150 $27 $123 0 0 $0 $0 $0 $0 $123
Albania 10 9 $4 $2 $2 0 0 $0 $0 $0 $0 $2
Armenia 5 4 $2 $1 $1 0 0 $0 $0 $0 $0 $1
Bosnia and Herzegovina 8 85 $29 $3 $26 0 0 $0 $0 $0 $0 $26
Bulgaria 25 148 $48 $17 $31 0 0 $0 $0 $0 $0 $31
Croatia 3,402 25,575 $1,579 $516 $1,063 0 0 $0 $0 $0 $0 $1,063
Czech Republic 8 32 $4 $3 $1 0 0 $0 $0 $0 $0 $1
Georgia 30 218 $31 $9 $22 0 0 $0 $0 $0 $0 $22
Hungary 1 9 $3 $1 $2 0 0 $0 $0 $0 $0 $2
Kyrgyzstan 8 17 $13 $1 $12 0 0 $0 $0 $0 $0 $12
Latvia 1 3 $2 $1 $1 0 0 $0 $0 $0 $0 $1
Lithuania 1 14 $7 $1 $6 0 0 $0 $0 $0 $0 $6
Poland 84 989 $364 $95 $269 0 0 $0 $0 $0 $0 $269
Romania 65 377 $136 $25 $111 0 0 $0 $0 $0 $0 $111
Russia 283 967 $1,051 $335 $716 0 0 $0 $0 $0 $0 $716
Serbia 36 180 $109 $17 $92 0 0 $0 $0 $0 $0 $92
Slovakia 6 66 $12 $7 $5 0 0 $0 $0 $0 $0 $5
Slovenia 24 186 $61 $35 $26 0 0 $0 $0 $0 $0 $26
Ukraine 71 285 $123 $20 $103 0 0 $0 $0 $0 $0 $103
Eastern Europe 4,068 29,164 $3,578 $1,089 $2,489 0 0 $0 $0 $0 $0 $2,489
Total for Foreign Points 66,397,415 638,948,453 $35,123,922 $22,576,671 $12,547,251 0 0 $0 $0 $0 $0 $12,547,251
Total for U.S. Points 1 8 $2 $1 $1 0 0 $0 $0 $0 $0 $1
World Total 66,397,416 638,948,461 $35,123,924 $22,576,672 $12,547,252 0 0 $0 0 $0 $0 $0 $12,547,252
- Switched Services Page 61 -

2008 Annual Section 43.61 International Traffic Data for All U.S. Points: All Settlement ArrangementsTable A22: Verizon Communications Inc. Message Telephone Service Billing Types Covered: 1, 2, 3, 4, 5, 11, 12, 14, 15
International Point Traffic Billed in the United States Traffic Billed in Foreign Countries TotalOriginating or Terminating Transiting the United States U.S.
in the United States (by Country of Origin) CarriersNumber Number U.S. Payout Retained Number Number Receipts Number Receipts Payout Retained Retained
of of Carriers to Foreign Revenues of of from Foreign of from Foreign to Foreign Revenues RevenuesMessages Minutes Revenues Carriers Messages Minutes Carriers Minutes Carriers Carriers
Andorra 47,072 134,977 $11,771 $27,221 -$15,450 0 0 $0 $0 $0 $0 -$15,450Austria 10,474,544 50,091,837 $5,187,281 $5,075,177 $112,104 6,045,021 28,908,775 $727,918 $0 $0 $0 $840,022Belgium 11,360,201 52,579,537 $2,164,871 $2,055,570 $109,301 15,240,971 70,541,283 $695,909 $0 $0 $0 $805,210Cyprus 1,455,956 5,596,288 $226,423 $145,465 $80,958 787,243 3,025,943 $53,406 $0 $0 $0 $134,364Denmark 8,963,773 51,414,469 $2,961,890 $2,102,626 $859,264 2,889,908 16,801,796 $152,897 $0 $0 $0 $1,012,161Finland 3,812,120 19,771,029 $1,372,814 $1,182,759 $190,055 603,143 3,128,118 $59,999 $0 $0 $0 $250,054France 46,583,977 212,904,564 $12,727,019 $10,432,010 $2,295,009 33,798,877 163,160,373 $3,191,096 $0 $0 $0 $5,486,105Germany 81,653,827 439,752,651 $18,965,514 $9,754,128 $9,211,386 49,916,132 268,826,974 $4,414,242 $0 $0 $0 $13,625,628Gibraltar 3,985 15,482 $855 $16,689 -$15,834 0 0 $0 $0 $0 $0 -$15,834Greece 10,513,986 86,855,195 $3,953,575 $2,804,070 $1,149,505 3,853,020 31,829,495 $1,059,655 $0 $0 $0 $2,209,160Greenland 4,284 4,724 $1,657 $1,657 $0 0 0 $0 $0 $0 $0 $0Iceland 995,794 5,135,918 $452,330 $448,094 $4,236 529,973 2,733,394 $45,498 $0 $0 $0 $49,734Ireland 24,607,985 145,049,195 $6,580,817 $4,468,744 $2,112,073 15,297,138 90,167,384 $1,684,462 $0 $0 $0 $3,796,535Italy 38,183,729 153,109,017 $9,198,990 $7,117,550 $2,081,440 11,279,657 45,278,295 $1,342,655 $0 $0 $0 $3,424,095Liechtenstein 1,230,797 6,333,190 $2,183,888 $1,983,569 $200,319 0 0 $0 $0 $0 $0 $200,319Luxembourg 6,108,846 18,763,488 $629,516 $456,222 $173,294 494,361 1,518,444 $28,390 $0 $0 $0 $201,684Malta 445,102 2,861,397 $371,162 $235,823 $135,339 236,518 1,520,486 $15,645 $0 $0 $0 $150,984Netherlands 56,916,694 225,072,828 $5,561,250 $4,369,859 $1,191,391 27,392,416 108,321,268 $1,549,508 $1 $0 $1 $2,740,900Norway 7,175,952 45,153,042 $2,366,747 $1,917,803 $448,944 6,337,204 39,875,411 $308,302 $0 $0 $0 $757,246Portugal 6,965,598 67,960,992 $3,250,826 $2,423,834 $826,992 2,639,232 25,750,092 $605,893 $0 $0 $0 $1,432,885Spain 43,346,223 140,410,577 $10,383,995 $7,635,246 $2,748,749 12,366,839 40,059,660 $833,203 $0 $0 $0 $3,581,952Sweden 15,462,013 125,365,897 $6,199,818 $5,891,848 $307,970 7,559,621 61,293,346 $699,612 $0 $0 $0 $1,007,582Switzerland 15,909,552 101,022,137 $3,751,494 $2,775,013 $976,481 8,814,793 55,971,987 $656,564 $0 $0 $0 $1,633,045Turkey 7,232,858 44,055,585 $2,612,792 $1,821,854 $790,938 1,007,389 6,136,039 $55,394 $0 $0 $0 $846,332United Kingdom 871,622,224 959,901,328 $52,830,579 $17,771,329 $35,059,250 231,400,295 254,836,837 $3,505,432 $0 $0 $0 $38,564,682
Western Europe 1,271,077,092 2,959,315,344 $153,947,874 $92,914,160 $61,033,714 438,489,751 1,319,685,400 $21,685,680 $1 $0 $1 $82,719,395
Algeria 3,395,881 8,351,012 $976,801 $960,077 $16,724 0 0 $0 $0 $0 $0 $16,724Angola 6,084,017 22,916,340 $3,472,412 $3,273,544 $198,868 0 0 $0 $0 $0 $0 $198,868Benin 4,778,945 13,067,027 $2,144,165 $2,321,712 -$177,547 76,215 208,393 $9,165 $0 $0 $0 -$168,382Botswana 905,503 3,136,656 $355,633 $288,179 $67,454 0 0 $0 $0 $0 $0 $67,454Burkina 8,232,547 14,394,013 $2,321,113 $2,024,567 $296,546 209,247 365,854 $12,080 $0 $0 $0 $308,626Burundi 278,331 1,733,456 $168,523 $122,741 $45,782 0 0 $0 $0 $0 $0 $45,782Cameroon 1,373,786 5,453,681 $877,643 $1,082,484 -$204,841 142,446 565,484 $26,946 $0 $0 $0 -$177,895Cape Verde 4,427,052 24,413,722 $4,489,498 $4,143,701 $345,797 120,917 666,816 $9,694 $0 $0 $0 $355,491Central African Republic 205,701 623,221 $194,753 $185,555 $9,198 0 0 $0 $0 $0 $0 $9,198Chad 1,888,414 6,666,048 $701,635 $646,443 $55,192 0 0 $0 $0 $0 $0 $55,192Comoros 333,974 1,535,564 $537,313 $523,955 $13,358 0 0 $0 $0 $0 $0 $13,358Congo 2,781,739 9,569,737 $1,547,450 $1,415,068 $132,382 0 0 $0 $0 $0 $0 $132,382Cote d'Ivoire 4,814,183 17,077,257 $2,606,837 $2,448,295 $158,542 0 0 $0 $0 $0 $0 $158,542Djibouti 183,773 475,866 $136,587 $130,985 $5,602 0 0 $0 $0 $0 $0 $5,602Egypt 31,370,355 126,811,720 $11,277,551 $12,149,130 -$871,579 1,657,688 6,701,048 $166,014 $0 $0 $0 -$705,565Equatorial Guinea 869,730 1,980,384 $390,489 $369,478 $21,011 0 0 $0 $0 $0 $0 $21,011Ethiopia 16,762,012 75,555,420 $14,864,470 $14,463,679 $400,791 296,706 1,339,051 $20,626 $0 $0 $0 $421,417Gabon 5,654,503 15,689,911 $1,344,608 $2,222,941 -$878,333 194,648 540,103 $11,886 $0 $0 $0 -$866,447
- Switched Services Page 62 -

2008 Annual Section 43.61 International Traffic Data for All U.S. Points: All Settlement ArrangementsTable A22: Verizon Communications Inc. Message Telephone Service Billing Types Covered: 1, 2, 3, 4, 5, 11, 12, 14, 15
International Point Traffic Billed in the United States Traffic Billed in Foreign Countries TotalOriginating or Terminating Transiting the United States U.S.
in the United States (by Country of Origin) CarriersNumber Number U.S. Payout Retained Number Number Receipts Number Receipts Payout Retained Retained
of of Carriers to Foreign Revenues of of from Foreign of from Foreign to Foreign Revenues RevenuesMessages Minutes Revenues Carriers Messages Minutes Carriers Minutes Carriers Carriers
Gambia, The 1,514,241 1,752,963 $417,259 $388,149 $29,110 0 0 $0 $0 $0 $0 $29,110Ghana 8,197,872 38,278,965 $4,405,943 $4,257,523 $148,420 1,581,509 7,384,662 $88,420 $0 $0 $0 $236,840Guinea 2,714,845 6,091,161 $1,059,755 $1,052,903 $6,852 0 0 $0 $0 $0 $0 $6,852Guinea-Bissau 1,564,654 3,074,591 $2,599,729 $1,499,076 $1,100,653 0 0 $0 $0 $0 $0 $1,100,653Kenya 1,502,278 7,498,036 $978,712 $804,138 $174,574 109,275 545,404 $8,180 $0 $0 $0 $182,754Lesotho 70,694 424,637 $73,604 $73,586 $18 0 0 $0 $0 $0 $0 $18Liberia 811,004 2,905,258 $515,684 $514,333 $1,351 0 0 $0 $0 $0 $0 $1,351Libya 3,085,948 5,373,091 $1,055,746 $925,088 $130,658 0 0 $0 $0 $0 $0 $130,658Madagascar 1,522,741 6,766,768 $1,414,396 $1,447,044 -$32,648 0 0 $0 $0 $0 $0 -$32,648Malawi 2,304,479 9,458,013 $1,114,913 $1,092,658 $22,255 68,482 281,065 $8,433 $2,296 $0 $2,296 $32,984Mali 4,303,446 12,982,928 $2,008,098 $2,140,563 -$132,465 430,027 1,297,331 $52,506 $0 $0 $0 -$79,959Mauritania 451,467 1,422,591 $236,059 $228,819 $7,240 0 0 $0 $0 $0 $0 $7,240Mauritius 19,664 71,661 $9,148 $7,205 $1,943 0 0 $0 $0 $0 $0 $1,943Morocco 8,541,409 33,329,975 $7,586,588 $7,183,940 $402,648 1,098,487 4,286,476 $36,155 $0 $0 $0 $438,803Mozambique 649,281 1,166,628 $126,624 $121,444 $5,180 0 0 $0 $0 $0 $0 $5,180Namibia 206,112 629,038 $102,513 $99,919 $2,594 0 0 $0 $0 $0 $0 $2,594Niger 2,211,665 4,358,231 $519,415 $424,917 $94,498 0 0 $0 $0 $0 $0 $94,498Nigeria 10,621,778 36,939,878 $3,721,885 $3,375,727 $346,158 7,385 25,682 $1,105 $0 $0 $0 $347,263Reunion 474,018 3,111,975 $428,952 $757,402 -$328,450 0 0 $0 $0 $0 $0 -$328,450Rwanda 209,441 992,142 $87,737 $75,359 $12,378 0 0 $0 $0 $0 $0 $12,378Saint Helena 9,978 12,213 $7,443 $5,691 $1,752 0 0 $0 $0 $0 $0 $1,752Sao Tome and Principe 1,907,259 4,185,836 $3,430,022 $3,047,113 $382,909 0 0 $0 $0 $0 $0 $382,909Senegal 3,456,672 16,195,305 $2,460,715 $2,339,665 $121,050 727,975 3,410,730 $38,805 $0 $0 $0 $159,855Seychelles 180,984 665,630 $83,132 $43,626 $39,506 0 0 $0 $0 $0 $0 $39,506Sierra Leone 710,287 2,837,837 $649,275 $675,075 -$25,800 0 0 $0 $0 $0 $0 -$25,800Somalia 1,335,579 1,605,786 $660,452 $547,451 $113,001 0 0 $0 $0 $0 $0 $113,001South Africa 8,015,118 51,984,174 $3,202,688 $3,335,792 -$133,104 986,439 6,397,811 $73,159 $0 $0 $0 -$59,945Sudan 2,459,268 14,086,259 $1,259,031 $1,235,725 $23,306 0 0 $0 $0 $0 $0 $23,306Swaziland 54,825 309,110 $35,400 $15,354 $20,046 0 0 $0 $0 $0 $0 $20,046Tanzania 1,392,431 5,317,140 $615,881 $489,395 $126,486 96,491 368,461 $8,870 $0 $0 $0 $135,356Togo 3,158,804 3,938,600 $835,354 $876,520 -$41,166 0 0 $0 $0 $0 $0 -$41,166Tunisia 3,466,348 12,763,751 $2,557,419 $3,313,516 -$756,097 0 0 $0 $0 $0 $0 -$756,097Uganda 2,352,269 7,658,376 $710,988 $670,055 $40,933 4,334 14,110 $170 $0 $0 $0 $41,103Zambia 1,589,433 6,539,000 $737,728 $640,843 $96,885 9,060 37,276 $932 $601 $0 $601 $98,418Zimbabwe 3,915,849 11,957,349 $1,748,241 $1,554,922 $193,319 28 85 $2 $0 $0 $0 $193,321
Africa 179,322,587 666,135,931 $95,864,010 $94,033,070 $1,830,940 7,817,359 34,435,842 $573,148 8,561 $2,897 $0 $2,897 $2,406,985
Bahrain 2,103,859 5,452,746 $304,598 $289,813 $14,785 2,052,155 5,318,742 $42,551 $0 $0 $0 $57,336Iran 3,729,136 12,150,860 $1,468,258 $1,584,357 -$116,099 1,336,422 4,354,541 $87,091 $0 $0 $0 -$29,008Iraq 7,205,437 38,360,797 $2,823,340 $2,410,670 $412,670 8,611 45,845 $688 $0 $0 $0 $413,358Israel 18,053,417 111,202,377 $6,808,877 $5,179,987 $1,628,890 11,760,200 72,438,489 $668,645 $0 $0 $0 $2,297,535Jordan 2,636,369 15,965,600 $810,513 $673,327 $137,186 1,616,303 9,788,175 $78,306 $0 $0 $0 $215,492Kuwait 6,377,182 11,210,101 $931,729 $923,868 $7,861 0 0 $0 $0 $0 $0 $7,861Lebanon 18,954,585 123,176,762 $11,699,673 $11,247,971 $451,702 1,100,775 7,153,411 $146,948 $0 $0 $0 $598,650Oman 8,359,014 19,770,522 $2,938,413 $2,817,298 $121,115 240,535 568,904 $8,382 $0 $0 $0 $129,497
- Switched Services Page 63 -

2008 Annual Section 43.61 International Traffic Data for All U.S. Points: All Settlement ArrangementsTable A22: Verizon Communications Inc. Message Telephone Service Billing Types Covered: 1, 2, 3, 4, 5, 11, 12, 14, 15
International Point Traffic Billed in the United States Traffic Billed in Foreign Countries TotalOriginating or Terminating Transiting the United States U.S.
in the United States (by Country of Origin) CarriersNumber Number U.S. Payout Retained Number Number Receipts Number Receipts Payout Retained Retained
of of Carriers to Foreign Revenues of of from Foreign of from Foreign to Foreign Revenues RevenuesMessages Minutes Revenues Carriers Messages Minutes Carriers Minutes Carriers Carriers
Qatar 7,008,625 18,584,787 $2,926,020 $2,716,240 $209,780 2,137,637 5,668,376 $45,348 $0 $0 $0 $255,128Saudi Arabia 23,755,890 72,301,101 $7,987,094 $7,273,725 $713,369 7,312,996 22,257,121 $162,833 $0 $0 $0 $876,202Syria 5,628,324 25,364,906 $3,558,494 $3,184,706 $373,788 772,746 3,482,494 $247,143 $0 $0 $0 $620,931United Arab Emirates 31,755,876 93,863,029 $12,519,045 $12,173,555 $345,490 9,172,951 27,113,126 $231,740 $0 $0 $0 $577,230Yemen 7,830,494 24,694,082 $3,054,943 $2,891,196 $163,747 462,820 1,459,537 $16,011 $0 $0 $0 $179,758
Middle East 143,398,208 572,097,670 $57,830,997 $53,366,713 $4,464,284 37,974,151 159,648,761 $1,735,686 $0 $0 $0 $6,199,970
Anguilla 587,270 1,754,773 $261,075 $269,976 -$8,901 0 0 $0 $0 $0 $0 -$8,901Antigua and Barbuda 2,160,993 9,301,261 $956,118 $863,685 $92,433 0 0 $0 $0 $0 $0 $92,433Aruba 1,361,463 4,724,114 $692,706 $606,595 $86,111 872,876 3,028,778 $23,542 $0 $0 $0 $109,653Bahamas, The 5,541,167 17,111,039 $760,661 $444,379 $316,282 2,540,846 7,846,095 $117,691 $0 $0 $0 $433,973Barbados 2,011,883 9,990,378 $1,176,673 $1,300,899 -$124,226 3,027,469 15,033,468 $332,994 $0 $0 $0 $208,768Bermuda 2,925,384 9,576,593 $544,043 $414,494 $129,549 2,276,087 7,451,044 $113,386 $0 $0 $0 $242,935Cayman Islands 3,776,599 8,742,386 $1,065,786 $904,455 $161,331 888,210 2,056,105 $41,885 $0 $0 $0 $203,216Cuba 4,565,382 17,409,916 $13,106,754 $14,112,587 -$1,005,833 0 0 $0 $0 $0 $0 -$1,005,833Dominica 1,024,959 4,924,343 $632,322 $585,850 $46,472 0 0 $0 $0 $0 $0 $46,472Dominican Republic 33,384,312 171,135,697 $12,480,498 $10,993,039 $1,487,459 6,984,662 35,804,998 $495,219 $0 $0 $0 $1,982,678French Overseas Departments 311,865 931,473 $164,047 $210,832 -$46,785 16 49 $3 $0 $0 $0 -$46,782Grenada 1,725,499 13,419,388 $1,538,278 $1,457,047 $81,231 0 0 $0 $0 $0 $0 $81,231Guadeloupe 1,252,534 5,220,297 $891,114 $840,727 $50,387 0 0 $0 $0 $0 $0 $50,387Haiti 13,149,448 49,626,745 $8,887,049 $8,214,998 $672,051 1,458,310 5,503,743 $63,335 $0 $0 $0 $735,386Jamaica 24,504,734 109,081,046 $15,046,499 $15,429,559 -$383,060 3,746,939 16,679,227 $277,513 $34 $0 $34 -$105,513Montserrat 264,797 1,619,489 $166,175 $161,709 $4,466 0 0 $0 $0 $0 $0 $4,466Netherlands Antilles 2,603,590 10,352,072 $1,021,725 $841,503 $180,222 2,060,791 8,193,866 $81,939 $0 $0 $0 $262,161Saint Kitts and Nevis 874,788 3,685,530 $571,131 $499,815 $71,316 0 0 $0 $0 $0 $0 $71,316Saint Lucia 2,191,758 9,154,014 $1,294,515 $1,180,276 $114,239 2,127 8,881 $889 $0 $0 $0 $115,128Saint Vincent and the Grenadines 1,315,057 8,524,635 $1,016,964 $1,025,610 -$8,646 0 0 $0 $0 $0 $0 -$8,646Trinidad and Tobago 7,694,128 45,333,418 $4,252,600 $3,455,122 $797,478 4,736,252 27,905,759 $315,919 $0 $0 $0 $1,113,397Turks and Caicos Islands 3,207,978 6,961,647 $1,145,738 $1,104,250 $41,488 965,729 2,095,733 $42,265 $0 $0 $0 $83,753Virgin Islands, British 1,273,135 4,155,495 $589,585 $540,130 $49,455 952,146 3,107,793 $68,387 $0 $0 $0 $117,842
Caribbean 117,708,723 522,735,749 $68,262,056 $65,457,537 $2,804,519 30,512,460 134,715,539 $1,974,967 $34 $0 $34 $4,779,520
Belize 3,226,518 20,349,468 $3,384,982 $3,611,114 -$226,132 812,505 5,124,423 $155,629 $91,564 $0 $91,564 $21,061Canada 627,705,491 2,736,274,288 $165,236,630 $38,251,959 $126,984,671 384,711,564 1,677,022,705 $17,034,871 $0 $0 $0 $144,019,542Costa Rica 6,948,510 35,029,014 $2,248,725 $2,393,216 -$144,491 1,863,083 9,392,224 $825,785 $0 $0 $0 $681,294El Salvador 12,712,216 89,004,844 $10,435,266 $10,749,356 -$314,090 8,425,425 58,990,790 $588,787 $0 $0 $0 $274,697Guatemala 10,633,382 76,695,258 $7,711,374 $7,690,716 $20,658 7,914,148 57,082,272 $533,161 $0 $0 $0 $553,819Honduras 15,824,861 89,489,859 $12,927,525 $12,027,021 $900,504 8,848,412 50,037,924 $498,067 $5,784 $0 $5,784 $1,404,355Mexico 229,790,206 2,044,019,921 $162,855,962 $149,326,356 $13,529,606 75,476,019 671,371,023 $14,838,128 $8,082 $0 $8,082 $28,375,816Nicaragua 7,164,069 39,425,339 $5,943,968 $5,736,614 $207,354 1,668,458 9,181,863 $121,556 $0 $0 $0 $328,910Panama 3,166,253 14,853,169 $993,558 $1,261,067 -$267,509 1,207,613 5,665,019 $235,836 $0 $0 $0 -$31,673Saint Pierre and Miquelon 11,846 45,065 $7,533 $7,181 $352 0 0 $0 $0 $0 $0 $352
North and Central America 917,183,352 5,145,186,225 $371,745,523 $231,054,600 $140,690,923 490,927,227 2,543,868,243 $34,831,820 1,886,031 $105,430 $0 $105,430 $175,628,173
Argentina 26,162,745 163,365,402 $2,808,745 $2,037,745 $771,000 4,846,071 30,308,682 $333,205 $0 $0 $0 $1,104,205Bolivia 19,930,211 131,542,366 $8,219,600 $8,128,513 $91,087 251,386 1,659,182 $19,912 $0 $0 $0 $110,999
- Switched Services Page 64 -

2008 Annual Section 43.61 International Traffic Data for All U.S. Points: All Settlement ArrangementsTable A22: Verizon Communications Inc. Message Telephone Service Billing Types Covered: 1, 2, 3, 4, 5, 11, 12, 14, 15
International Point Traffic Billed in the United States Traffic Billed in Foreign Countries TotalOriginating or Terminating Transiting the United States U.S.
in the United States (by Country of Origin) CarriersNumber Number U.S. Payout Retained Number Number Receipts Number Receipts Payout Retained Retained
of of Carriers to Foreign Revenues of of from Foreign of from Foreign to Foreign Revenues RevenuesMessages Minutes Revenues Carriers Messages Minutes Carriers Minutes Carriers Carriers
Brazil 55,070,774 337,227,655 $20,381,207 $18,480,266 $1,900,941 12,075,880 73,947,035 $1,654,785 $0 $0 $0 $3,555,726Chile 4,638,630 43,493,934 $2,137,491 $2,917,422 -$779,931 2,079,356 19,496,981 $845,088 $272 $0 $272 $65,429Colombia 33,530,307 226,903,049 $12,818,817 $12,273,577 $545,240 1,506,003 10,191,281 $183,112 $0 $0 $0 $728,352Ecuador 3,794,790 23,761,252 $3,537,029 $2,132,890 $1,404,139 1,638,407 10,258,960 $135,087 $6,693 $0 $6,693 $1,545,919French Guiana 812,729 2,482,440 $344,221 $324,194 $20,027 0 0 $0 $0 $0 $0 $20,027Guyana 3,096,611 15,299,440 $3,743,548 $3,466,821 $276,727 116,166 573,947 $132,008 $0 $0 $0 $408,735Paraguay 3,050,011 16,828,663 $1,112,964 $747,069 $365,895 195,978 1,081,324 $51,956 $0 $0 $0 $417,851Peru 24,069,740 258,406,687 $8,663,676 $6,142,658 $2,521,018 6,451,056 69,256,920 $700,430 $0 $0 $0 $3,221,448Suriname 1,547,659 4,963,046 $789,293 $707,789 $81,504 521,947 1,673,783 $66,951 $0 $0 $0 $148,455Uruguay 2,351,890 18,915,604 $1,309,978 $999,266 $310,712 341,793 2,748,947 $41,234 $0 $0 $0 $351,946Venezuela 13,070,832 61,779,102 $3,619,699 $3,165,241 $454,458 11,819,168 55,863,133 $554,420 $0 $0 $0 $1,008,878
South America 191,126,929 1,304,968,640 $69,486,268 $61,523,451 $7,962,817 41,843,211 277,060,175 $4,718,188 70,272 $6,965 $0 $6,965 $12,687,970
Afghanistan 13,458,444 49,303,368 $9,537,838 $9,549,916 -$12,078 847,937 3,106,319 $55,914 $0 $0 $0 $43,836Bangladesh 18,008,501 76,994,041 $2,985,929 $2,295,650 $690,279 5,694 24,345 $1,948 $2 $0 $2 $692,229Bhutan 355,776 1,086,702 $152,024 $128,979 $23,045 0 0 $0 $0 $0 $0 $23,045Brunei 1,399,425 5,350,157 $151,155 $136,161 $14,994 158,177 604,727 $16,757 $0 $0 $0 $31,751Burma 2,860,492 7,143,112 $1,878,451 $1,752,125 $126,326 0 0 $0 $0 $0 $0 $126,326Cambodia 6,973,808 40,831,211 $2,461,577 $2,341,898 $119,679 59,508 348,411 $6,620 $0 $0 $0 $126,299Chagos Archipelago 62,390 118,117 $91,159 $81,601 $9,558 0 0 $0 $0 $0 $0 $9,558China 67,499,492 482,167,845 $7,917,126 $15,213,910 -$7,296,784 10,269,854 73,360,455 $5,315,198 $0 $0 $0 -$1,981,586Hong Kong 21,142,286 104,950,149 $3,520,273 $1,708,339 $1,811,934 16,395,182 81,385,557 $770,278 $0 $0 $0 $2,582,212India 80,253,023 616,474,430 $30,075,939 $22,977,889 $7,098,050 32,717,371 251,322,906 $2,017,056 $0 $0 $0 $9,115,106Indonesia 18,250,211 68,792,548 $5,790,231 $5,029,384 $760,847 1,968,057 7,527,430 $83,031 $0 $0 $0 $843,878Japan 31,653,013 254,352,596 $14,037,579 $15,934,999 -$1,897,420 12,812,492 102,956,723 $5,498,257 $139 $0 $139 $3,600,976Korea, North 37,438 38,853 $16,543 $15,304 $1,239 0 0 $0 $0 $0 $0 $1,239Korea, South 57,090,513 121,171,317 $5,561,550 $5,295,764 $265,786 34,769,119 73,795,449 $4,318,686 $0 $0 $0 $4,584,472Laos 598,621 5,583,889 $288,529 $225,999 $62,530 0 0 $0 $0 $0 $0 $62,530Macau 877,441 3,331,669 $135,524 $221,084 -$85,560 2,008,625 7,626,805 $174,183 $0 $0 $0 $88,623Malaysia 39,171,217 95,019,682 $3,106,988 $2,360,050 $746,938 2,950,844 7,158,017 $99,767 $0 $0 $0 $846,705Maldives 114,405 251,591 $45,951 $34,760 $11,191 0 0 $0 $0 $0 $0 $11,191Mongolia 281,232 1,445,726 $133,717 $131,282 $2,435 0 0 $0 $0 $0 $0 $2,435Nepal 10,143,216 14,639,663 $2,024,701 $1,861,345 $163,356 0 0 $0 $0 $0 $0 $163,356Pakistan 42,089,970 304,089,222 $21,998,567 $21,392,467 $606,100 9,210,766 66,545,420 $669,622 $0 $0 $0 $1,275,722Philippines 99,089,880 802,916,711 $89,968,857 $88,156,306 $1,812,551 2,953,473 23,931,731 $272,325 $0 $0 $0 $2,084,876Singapore 20,575,378 106,592,362 $3,070,031 $1,034,638 $2,035,393 10,021,599 51,917,692 $519,177 $0 $0 $0 $2,554,570Sri Lanka 3,670,545 20,794,913 $1,881,217 $1,781,422 $99,795 93,234 528,199 $12,882 $0 $0 $0 $112,677Taiwan 24,810,010 108,000,183 $3,251,584 $3,636,332 -$384,748 20,697,058 90,096,134 $2,503,735 $0 $0 $0 $2,118,987Thailand 37,933,171 142,939,569 $2,268,239 $1,623,990 $644,249 6,689,112 25,205,876 $621,117 $0 $0 $0 $1,265,366Vietnam 29,417,911 184,550,821 $9,638,133 $8,455,478 $1,182,655 1,951,303 12,241,339 $122,413 $0 $0 $0 $1,305,068
Asia 627,817,809 3,618,930,447 $221,989,412 $213,377,072 $8,612,340 166,579,405 879,683,535 $23,078,966 4,242 $141 $0 $141 $31,691,447
Australia 65,463,327 195,846,387 $8,128,897 $5,217,004 $2,911,893 41,593,861 124,436,195 $1,671,173 $0 $0 $0 $4,583,066Cook Islands 13,690 62,845 $32,004 $31,085 $919 0 0 $0 $0 $0 $0 $919Fiji 2,446,633 18,650,549 $3,323,740 $3,242,858 $80,882 280,007 2,134,478 $38,420 $0 $0 $0 $119,302
- Switched Services Page 65 -

2008 Annual Section 43.61 International Traffic Data for All U.S. Points: All Settlement ArrangementsTable A22: Verizon Communications Inc. Message Telephone Service Billing Types Covered: 1, 2, 3, 4, 5, 11, 12, 14, 15
International Point Traffic Billed in the United States Traffic Billed in Foreign Countries TotalOriginating or Terminating Transiting the United States U.S.
in the United States (by Country of Origin) CarriersNumber Number U.S. Payout Retained Number Number Receipts Number Receipts Payout Retained Retained
of of Carriers to Foreign Revenues of of from Foreign of from Foreign to Foreign Revenues RevenuesMessages Minutes Revenues Carriers Messages Minutes Carriers Minutes Carriers Carriers
French Polynesia 1,190,934 4,071,522 $731,170 $682,545 $48,625 138,005 471,807 $14,155 $0 $0 $0 $62,780Kiribati 50,789 202,285 $72,782 $88,725 -$15,943 0 0 $0 $0 $0 $0 -$15,943Marshall Islands 55,984,558 4,136,625 $1,715,232 $704,608 $1,010,624 0 0 $0 $0 $0 $0 $1,010,624Micronesia, Federated States of 6,301,907 5,204,395 $876,215 $796,747 $79,468 377 311 $148 $0 $0 $0 $79,616Nauru 9,414 15,197 $12,994 $10,104 $2,890 0 0 $0 $0 $0 $0 $2,890New Caledonia 336,781 1,034,382 $226,209 $208,411 $17,798 0 0 $0 $0 $0 $0 $17,798New Zealand 8,916,546 64,816,652 $3,952,479 $3,882,874 $69,605 4,761,543 34,629,443 $286,113 $0 $0 $0 $355,718Niue 3,328 18,446 $10,114 $9,556 $558 0 0 $0 $0 $0 $0 $558Pacific Islands (Palau) 521,187 2,075,781 $395,022 $354,154 $40,868 0 0 $0 $0 $0 $0 $40,868Papua New Guinea 84,993 269,087 $166,606 $151,430 $15,176 0 0 $0 $0 $0 $0 $15,176Solomon Islands 25,563 39,836 $31,082 $21,591 $9,491 0 0 $0 $0 $0 $0 $9,491Tonga 711,159 5,999,804 $809,652 $737,966 $71,686 71,610 604,147 $12,082 $0 $0 $0 $83,768Tuvalu 3,033 8,402 $4,318 $3,632 $686 0 0 $0 $0 $0 $0 $686Vanuatu 35,844 73,838 $30,551 $29,090 $1,461 0 0 $0 $0 $0 $0 $1,461Wallis and Futuna 26,499 169,911 $64,845 $63,125 $1,720 0 0 $0 $0 $0 $0 $1,720Western Samoa 162,819 979,798 $271,514 $261,242 $10,272 0 0 $0 $0 $0 $0 $10,272Guam 6,382,532 40,093,717 $1,597,834 $425,261 $1,172,573 2,048,577 12,868,733 $142,866 $0 $0 $0 $1,315,439Northern Mariana Islands 1,827,267 9,303,286 $471,356 $123,928 $347,428 21,872 111,360 $1,671 $0 $0 $0 $349,099
Oceania 150,498,803 353,072,745 $22,924,616 $17,045,936 $5,878,680 48,915,852 175,256,474 $2,166,628 $0 $0 $0 $8,045,308
Albania 3,551,811 9,905,061 $1,291,551 $1,360,900 -$69,349 0 0 $0 $0 $0 $0 -$69,349Armenia 3,297,350 20,403,375 $1,272,478 $1,148,710 $123,768 5,086 31,467 $298 $0 $0 $0 $124,066Azerbaijan 4,605,022 9,321,724 $1,189,912 $1,144,436 $45,476 204,083 413,114 $4,545 $3,367 $0 $3,367 $53,388Belarus 2,737,490 17,154,611 $3,298,363 $3,447,473 -$149,110 252,729 1,583,740 $63,350 $0 $0 $0 -$85,760Bosnia and Herzegovina 1,077,511 9,601,821 $1,449,146 $1,406,541 $42,605 138,993 1,238,577 $10,813 $0 $0 $0 $53,418Bulgaria 1,835,865 12,779,344 $1,645,201 $1,109,894 $535,307 193,406 1,346,291 $13,994 $0 $0 $0 $549,301Croatia 882,700 5,914,241 $533,781 $405,737 $128,044 282,342 1,891,740 $18,112 $0 $0 $0 $146,156Czech Republic 2,668,959 10,434,587 $1,514,953 $1,153,805 $361,148 364,827 1,426,331 $15,445 $0 $0 $0 $376,593Estonia 842,288 3,213,416 $1,127,853 $798,541 $329,312 221,867 846,448 $14,474 $0 $0 $0 $343,786Georgia 12,191,779 33,500,727 $2,757,034 $2,631,997 $125,037 380,838 1,046,471 $11,511 $0 $0 $0 $136,548Hungary 3,049,898 32,043,039 $1,845,181 $840,189 $1,004,992 12,175 127,915 $4,052 $0 $0 $0 $1,009,044Kazakhstan 1,200,622 4,074,548 $436,559 $437,669 -$1,110 218,277 740,762 $6,930 $0 $0 $0 $5,820Kyrgyzstan 1,252,709 4,547,053 $388,953 $339,265 $49,688 0 0 $0 $0 $0 $0 $49,688Latvia 1,274,044 6,512,623 $484,689 $460,685 $24,004 225,879 1,154,641 $14,293 $0 $0 $0 $38,297Lithuania 672,170 4,479,236 $1,262,067 $607,881 $654,186 94,846 632,036 $6,622 $0 $0 $0 $660,808Moldova 2,163,787 3,073,869 $373,660 $369,489 $4,171 0 0 $0 $0 $0 $0 $4,171Poland 70,252,704 192,181,947 $5,607,935 $3,107,484 $2,500,451 1,737,589 4,753,316 $47,548 $0 $0 $0 $2,547,999Romania 2,132,016 17,733,717 $1,361,329 $832,086 $529,243 112,128 932,661 $9,560 $0 $0 $0 $538,803Russia 14,591,161 74,859,318 $2,980,734 $2,598,072 $382,662 187,614 962,548 $9,434 $0 $0 $0 $392,096Serbia 6,776,740 47,528,985 $4,028,818 $3,771,043 $257,775 567,028 3,968,880 $39,669 $0 $0 $0 $297,444Slovakia 648,363 4,305,171 $514,236 $362,357 $151,879 712,510 4,731,105 $42,879 $0 $0 $0 $194,758Slovenia 837,492 3,500,510 $359,749 $589,226 -$229,477 1,296 5,416 $54 $0 $0 $0 -$229,423Tajikistan 900,088 1,327,276 $108,672 $99,191 $9,481 0 0 $0 $0 $0 $0 $9,481
- Switched Services Page 66 -

2008 Annual Section 43.61 International Traffic Data for All U.S. Points: All Settlement ArrangementsTable A22: Verizon Communications Inc. Message Telephone Service Billing Types Covered: 1, 2, 3, 4, 5, 11, 12, 14, 15
International Point Traffic Billed in the United States Traffic Billed in Foreign Countries TotalOriginating or Terminating Transiting the United States U.S.
in the United States (by Country of Origin) CarriersNumber Number U.S. Payout Retained Number Number Receipts Number Receipts Payout Retained Retained
of of Carriers to Foreign Revenues of of from Foreign of from Foreign to Foreign Revenues RevenuesMessages Minutes Revenues Carriers Messages Minutes Carriers Minutes Carriers Carriers
Turkmenistan 978,945 2,980,622 $307,245 $283,703 $23,542 0 0 $0 $0 $0 $0 $23,542Ukraine 5,754,848 23,799,228 $2,163,142 $2,095,086 $68,056 623,209 2,577,283 $20,617 $0 $0 $0 $88,673Uzbekistan 55,765,543 146,020,863 $8,822,079 $7,479,909 $1,342,170 154,018 403,295 $20,165 $0 $0 $0 $1,362,335
Eastern Europe 201,941,905 701,196,912 $47,125,320 $38,881,369 $8,243,951 6,690,740 30,814,037 $374,365 $3,367 $0 $3,367 $8,621,683
Maritime - Atlantic 38,372 188,662 $189,688 $268,348 -$78,660 0 0 $0 $0 $0 $0 -$78,660Maritime - other oceans 1,103,823 541,110 $1,294,312 $617,561 $676,751 0 0 $0 $0 $0 $0 $676,751Maritime - Pacific 47,955 72,933 $59,839 $74,212 -$14,373 0 0 $0 $0 $0 $0 -$14,373
Other Regions 1,190,150 802,705 $1,543,839 $960,121 $583,718 0 0 $0 $0 $0 $0 $583,718
American Samoa 210,650 1,520,979 $158,902 $153,643 $5,259 567 2,472 $25 $0 $0 $0 $5,284
Carriers serving Misc. U.S. points 210,650 1,520,979 $158,902 $153,643 $5,259 567 2,472 $25 $0 $0 $0 $5,284
Total for Foreign Points 3,793,266,409 15,796,566,344 $1,108,809,627 $868,218,483 $240,591,144 1,267,680,274 5,542,190,385 $90,994,936 $118,835 $0 $118,835 $331,704,915
Total for U.S. Points 8,209,799 49,397,003 $2,069,190 $549,189 $1,520,001 2,070,449 12,980,093 $144,537 $0 $0 $0 $1,664,538
World Total 3,801,476,208 15,845,963,347 $1,110,878,817 $868,767,672 $242,111,145 1,269,750,723 5,555,170,478 $91,139,473 2,066,184 $118,835 $0 $118,835 $333,369,453
- Switched Services Page 67 -

2008 Annual Section 43.61 International Traffic Data for All U.S. Points: Traditional Settlement ArrangementsTable A23: All United States Carriers Message Telephone Service Billing Types Covered: 1, 2, 3, 4, 5
International Point Traffic Billed in the United States Traffic Billed in Foreign Countries TotalOriginating or Terminating Transiting the United States U.S.
in the United States (by Country of Origin) CarriersNumber Number U.S. Payout Retained Number Number Receipts Number Receipts Payout Retained Retained
of of Carriers to Foreign Revenues of of from Foreign of from Foreign to Foreign Revenues RevenuesMessages Minutes Revenues Carriers Messages Minutes Carriers Minutes Carriers Carriers
Andorra 118,933 371,547 $56,242 $50,550 $5,692 0 0 $0 $60 $21 $39 $5,731Austria 20,325 82,312 $18,919 $6,317 $12,602 153 906 $38 $840,463 $21,995 $818,468 $831,108Belgium 144,891 503,571 $46,900 $20,658 $26,242 769 1,774 $84 $19,473,691 $7,427 $19,466,264 $19,492,590Cyprus 1,882 8,654 $2,294 $262 $2,032 0 0 $0 $124,472 $302 $124,170 $126,202Denmark 25,998 110,807 $18,996 $6,169 $12,827 0 0 $0 $4,535,307 $5,066 $4,530,241 $4,543,068Finland 6,475 34,460 $5,917 $2,651 $3,266 3,570 13,350 $341 $7,325 $15,270 -$7,945 -$4,338France 167,105 714,950 $109,405 $33,942 $75,463 10 53 $2 $20,258,689 $53,277 $20,205,412 $20,280,877Germany 379,805 2,004,190 $273,240 $130,192 $143,048 1,555,263 10,879,027 $513,556 $35,996,200 $186,276 $35,809,924 $36,466,528Gibraltar 769,878 3,132,828 $232,125 $180,233 $51,892 77,847 276,429 $2,980 $5,536 $1,631 $3,905 $58,777Greece 26,413 144,962 $26,414 $11,593 $14,821 38,963 144,281 $7,050 $14,842,460 $17,500 $14,824,960 $14,846,831Greenland 50,380 74,629 $38,313 $26,479 $11,834 0 0 $0 $237 $41 $196 $12,030Iceland 1,795 6,160 $1,503 $647 $856 18 58 $3 $1,130 $1,326 -$196 $663Ireland 104,447 516,928 $73,011 $36,032 $36,979 626 2,493 $115 $7,231,516 $2,526 $7,228,990 $7,266,084Italy 342,045 1,723,668 $261,757 $163,723 $98,034 56,412 181,287 $5,684 $59,271,349 $39,841 $59,231,508 $59,335,226Liechtenstein 212 2,186 $2,031 $715 $1,316 0 0 $0 $37,585 $977 $36,608 $37,924Luxembourg 3,431 9,514 $1,785 $379 $1,406 473 2,224 $65 $2,942,259 $382 $2,941,877 $2,943,348Malta 482 1,842 $841 $228 $613 6 22 $1 $1,682 $3,532 -$1,850 -$1,236Netherlands 40,532 206,851 $42,024 $11,277 $30,747 6,829 55,666 $1,875 $55,383,000 $240,987 $55,142,013 $55,174,635Norway 30,313 123,448 $22,121 $10,671 $11,450 0 0 $0 $4,836,514 $153 $4,836,361 $4,847,811Portugal 9,321 58,452 $10,164 $2,790 $7,374 0 0 $0 $2,808,501 $2,185 $2,806,316 $2,813,690Spain 530,383 2,114,547 $345,467 $188,570 $156,897 208,247 1,293,801 $15,787 $53,515,950 $62,253 $53,453,697 $53,626,381Sweden 43,719 203,096 $26,080 $14,892 $11,188 0 0 $0 $18,434,643 $1,553 $18,433,090 $18,444,278Switzerland 76,422 352,650 $62,469 $28,844 $33,625 141 453 $21 $18,879,517 $15,021 $18,864,496 $18,898,142Turkey 18,900 71,096 $18,903 $5,686 $13,217 0 0 $0 $938,786 $3,717 $935,069 $948,286United Kingdom 445,058 2,201,391 $257,941 $129,474 $128,467 281,331 1,444,917 $56,488 $85,627,679 $72,628 $85,555,051 $85,740,006
Western Europe 3,359,145 14,774,739 $1,954,862 $1,062,974 $891,888 2,230,658 14,296,741 $604,090 3,574,134,671 $405,994,551 $755,887 $405,238,664 $406,734,642
Algeria 2,366 10,298 $4,004 $1,066 $2,938 15 10 $1 $878 $8,498 -$7,620 -$4,681Angola 1,613 7,251 $6,776 $626 $6,150 197 649 $11 $98,975 $127 $98,848 $105,009Benin 4,398 19,186 $9,432 $1,824 $7,608 0 0 $0 $851,118 $347 $850,771 $858,379Botswana 1,752 9,172 $4,514 $885 $3,629 1,007 2,877 $74 $450 $11,280 -$10,830 -$7,127Burkina 810 4,276 $5,053 $84 $4,969 0 0 $0 $34,762 $87,034 -$52,272 -$47,303Burundi 452,828 2,495,767 $250,238 $199,132 $51,106 0 0 $0 $684 $20,975 -$20,291 $30,815Cameroon 1,599 8,505 $7,033 $684 $6,349 21 23 $2 $4,334 $1,306 $3,028 $9,379Canary Island 0 0 $0 $0 $0 0 0 $0 $0 $0 $0 $0Cape Verde 229 1,046 $571 $97 $474 0 0 $0 $17,417 $137 $17,280 $17,754Central African Republic 332,823 1,082,576 $251,429 $342,772 -$91,343 0 0 $0 $10 $6 $4 -$91,339Chad 2,766,971 8,108,659 $940,532 $800,612 $139,920 0 0 $0 $1,468 $4 $1,464 $141,384Comoros 718,837 4,018,857 $1,519,849 $1,356,302 $163,547 0 0 $0 $798 $204 $594 $164,141Congo 2,787,023 9,598,961 $1,603,227 $1,415,091 $188,136 0 0 $0 $3,628 $742 $2,886 $191,022Cote d'Ivoire 6,428 27,013 $21,929 $2,937 $18,992 237 435 $17 $2,670,368 $1,271 $2,669,097 $2,688,106Djibouti 696,908 2,396,229 $536,801 $594,003 -$57,202 222,402 698,024 $41,682 $776 $1 $775 -$14,745Egypt 39,922 270,421 $49,828 $25,485 $24,343 55,680 285,317 $10,216 $52,881 $6,958 $45,923 $80,482Equatorial Guinea 4,574 19,364 $5,186 $3,381 $1,805 213 529 $79 $974 $14 $960 $2,844
- Switched Services Page 68 -

2008 Annual Section 43.61 International Traffic Data for All U.S. Points: Traditional Settlement ArrangementsTable A23: All United States Carriers Message Telephone Service Billing Types Covered: 1, 2, 3, 4, 5
International Point Traffic Billed in the United States Traffic Billed in Foreign Countries TotalOriginating or Terminating Transiting the United States U.S.
in the United States (by Country of Origin) CarriersNumber Number U.S. Payout Retained Number Number Receipts Number Receipts Payout Retained Retained
of of Carriers to Foreign Revenues of of from Foreign of from Foreign to Foreign Revenues RevenuesMessages Minutes Revenues Carriers Messages Minutes Carriers Minutes Carriers Carriers
Ethiopia 3,341 11,755 $7,657 $1,469 $6,188 17 28 $4 $65,006 $41,948 $23,058 $29,250Gabon 534 2,457 $1,998 $176 $1,822 0 0 $0 $1,898,256 $93 $1,898,163 $1,899,985Gambia, The 1,117 5,210 $5,131 $292 $4,839 0 0 $0 $2,717 $17,420 -$14,703 -$9,864Ghana 12,608 62,637 $27,191 $5,768 $21,423 3,171 5,221 $196 $48,565 $3,028 $45,537 $67,156Guinea 860 3,816 $1,904 $393 $1,511 0 0 $0 $1,988 $19,485 -$17,497 -$15,986Guinea-Bissau 1,725,105 3,460,645 $2,734,452 $1,644,827 $1,089,625 0 0 $0 $171 $136 $35 $1,089,660Kenya 3,281,324 16,674,124 $3,558,041 $1,826,443 $1,731,598 216,729 1,029,948 $10,193 $3,588 $272 $3,316 $1,745,107Lesotho 363,260 1,833,036 $325,419 $314,953 $10,466 28,564 120,775 $649 $54,200 $32,931 $21,269 $32,384Liberia 571 2,847 $1,281 $416 $865 0 0 $0 $2,657 $190 $2,467 $3,332Libya 183 1,036 $471 $197 $274 0 0 $0 $2,979 $226 $2,753 $3,027Madagascar 6,150,791 16,483,145 $5,494,754 $7,070,912 -$1,576,158 0 0 $0 $12,849 $269 $12,580 -$1,563,578Malawi 1,387 6,466 $2,281 $519 $1,762 0 0 $0 $2,521 $16 $2,505 $4,267Mali 1,714 5,999 $3,013 $687 $2,326 79 139 $11 $31,664 $588 $31,076 $33,413Mauritania 2,775,840 9,340,634 $1,793,857 $1,479,870 $313,987 51,083 313,241 $2,244 $1,226 $2 $1,224 $317,455Mauritius 170,237 745,729 $177,339 $56,036 $121,303 2,292 16,438 $1,030 $177,104 $2,183 $174,921 $297,254Morocco 11,059 46,036 $15,013 $8,702 $6,311 4,004 7,050 $92 $10,972 $2,828 $8,144 $14,547Mozambique 682 2,684 $2,570 $86 $2,484 0 0 $0 $327 $16 $311 $2,795Namibia 1,067 5,391 $2,813 $302 $2,511 199 985 $63 $377 $8,438 -$8,061 -$5,487Niger 3,008,424 8,342,512 $790,371 $843,145 -$52,774 0 0 $0 $4 $2 $2 -$52,772Nigeria 19,284 76,176 $25,814 $6,435 $19,379 0 0 $0 $4,061,973 $19,228 $4,042,745 $4,062,124Reunion 130 335 $238 $149 $89 0 0 $0 $92 $20 $72 $161Rwanda 697,883 3,831,125 $325,464 $323,246 $2,218 0 0 $0 $649 $12 $637 $2,855Saint Helena 6,403 18,217 $19,855 $12,479 $7,376 71 219 $5 $323 $155 $168 $7,549Sao Tome and Principe 8,554,735 20,743,527 $17,226,218 $16,256,405 $969,813 0 0 $0 $1,238 $80 $1,158 $970,971Senegal 2,391 12,615 $11,637 $861 $10,776 1,730 3,676 $224 $18,874 $46,303 -$27,429 -$16,429Seychelles 275,758 1,022,680 $172,337 $67,404 $104,933 0 0 $0 $23,023 $79 $22,944 $127,877Sierra Leone 3,833,967 22,704,469 $4,872,785 $5,707,001 -$834,216 0 0 $0 $53,176 $12,396 $40,780 -$793,436Somalia 2,646,986 4,641,037 $1,829,720 $1,712,570 $117,150 0 0 $0 $34,186 $64 $34,122 $151,272South Africa 56,000 258,695 $72,324 $19,655 $52,669 2,420 10,134 $103 $12,695,606 $4,832 $12,690,774 $12,743,546Sudan 720 5,465 $2,198 $322 $1,876 90 122 $3 $130,349 $110,245 $20,104 $21,983Swaziland 1,508 6,941 $3,544 $615 $2,929 0 0 $0 $117 $436 -$319 $2,610Tanzania 2,283 13,427 $6,450 $1,048 $5,402 41 150 $3 $415,983 $9,183 $406,800 $412,205Togo 4,129,926 7,733,253 $1,794,280 $1,824,209 -$29,929 0 0 $0 $170,667 $91 $170,576 $140,647Tunisia 5,558 21,679 $6,382 $4,847 $1,535 348 483 $7 $31,006 $61,008 -$30,002 -$28,460Uganda 891 4,047 $2,130 $157 $1,973 0 0 $0 $976,416 $108 $976,308 $978,281Western Sahara 0 0 $0 $0 $0 0 0 $0 $0 $0 $0 $0Zaire 3,154,586 9,205,883 $2,623,594 $3,184,062 -$560,468 2,849,195 8,315,426 $28,223 $6,197,152 $0 $6,197,152 $5,664,907Zambia 1,352 6,671 $3,198 $466 $2,732 40 73 $2 $454,348 $25 $454,323 $457,057Zimbabwe 1,931 10,660 $10,560 $418 $10,142 0 0 $0 $2,345 $16,317 -$13,972 -$3,830
Africa 48,721,477 155,430,642 $49,170,686 $47,122,523 $2,048,163 3,439,845 10,811,972 $95,134 249,804,255 $31,324,215 $549,557 $30,774,658 $32,917,955
Bahrain 6,207 38,026 $17,843 $2,110 $15,733 3,307 14,387 $566 $527,490 $108,325 $419,165 $435,464Iran 1,286 8,071 $2,496 $910 $1,586 0 0 $0 $31,778 $150,980 -$119,202 -$117,616Iraq 10,063,903 51,566,207 $6,084,886 $3,526,462 $2,558,424 8,611 45,845 $688 $8,830 $517 $8,313 $2,567,425Israel 79,115 508,316 $66,766 $42,105 $24,661 26,876 138,233 $5,056 $3,867,300 $171,235 $3,696,065 $3,725,782
- Switched Services Page 69 -

2008 Annual Section 43.61 International Traffic Data for All U.S. Points: Traditional Settlement ArrangementsTable A23: All United States Carriers Message Telephone Service Billing Types Covered: 1, 2, 3, 4, 5
International Point Traffic Billed in the United States Traffic Billed in Foreign Countries TotalOriginating or Terminating Transiting the United States U.S.
in the United States (by Country of Origin) CarriersNumber Number U.S. Payout Retained Number Number Receipts Number Receipts Payout Retained Retained
of of Carriers to Foreign Revenues of of from Foreign of from Foreign to Foreign Revenues RevenuesMessages Minutes Revenues Carriers Messages Minutes Carriers Minutes Carriers Carriers
Jordan 8,539 52,046 $9,980 $2,692 $7,288 14,600 69,218 $889 $2,517,162 $183,439 $2,333,723 $2,341,900Kuwait 26,524 139,146 $27,560 $11,360 $16,200 625 2,254 $64 $14,481 $2,528 $11,953 $28,217Lebanon 2,364 17,592 $6,616 $1,798 $4,818 0 0 $0 $30,724 $8,544 $22,180 $26,998Oman 2,283 8,432 $2,149 $1,217 $932 83 306 $5 $28,031 $1,348 $26,683 $27,620Qatar 5,734 26,980 $10,440 $4,152 $6,288 330 1,311 $14 $511,318 $7,189 $504,129 $510,431Saudi Arabia 9,687 60,016 $18,591 $7,768 $10,823 0 0 $0 $616,125 $174,190 $441,935 $452,758Syria 15,506,979 63,262,096 $9,832,871 $7,910,718 $1,922,153 1,388,294 5,406,971 $325,607 $8,319 $615 $7,704 $2,255,464United Arab Emirates 29,318 139,382 $43,764 $19,304 $24,460 23,715 92,453 $741 $906,837 $27,976 $878,861 $904,062Yemen 3,064 19,220 $3,150 $2,207 $943 0 0 $0 $7,896 $5,161 $2,735 $3,678
Middle East 25,745,003 115,845,530 $16,127,112 $11,532,803 $4,594,309 1,466,441 5,770,978 $333,630 137,029,595 $9,076,291 $842,047 $8,234,244 $13,162,183
Anguilla 71,650 201,735 $62,579 $30,375 $32,204 229 1,223 $44 $204,634 $92,383 $112,251 $144,499Antigua and Barbuda 141,800 566,860 $108,830 $51,020 $57,810 103,350 333,569 $8,911 $103,406 $36,190 $67,216 $133,937Aruba 45,520 138,874 $31,742 $14,592 $17,150 4,369 12,357 $277 $198,766 $93,192 $105,574 $123,001Bahamas, The 52,462 143,326 $16,880 $6,019 $10,861 8,830 21,443 $525 $3,606,789 $1,925 $3,604,864 $3,616,250Barbados 58,876 193,087 $62,872 $23,688 $39,184 1,127 1,832 $67 $648,836 $27,484 $621,352 $660,603Bermuda 40,370 131,155 $16,961 $5,675 $11,286 2,460 15,190 $431 $5,994 $1,259 $4,735 $16,452Cayman Islands 31,012 94,123 $24,778 $9,064 $15,714 9,683 32,692 $822 $20,476 $8,392 $12,084 $28,620Cuba 10,135,610 48,565,159 $61,299,308 $38,787,500 $22,511,808 0 0 $0 $23,002 $16,650 $6,352 $22,518,160Dominica 110,169 407,812 $88,074 $59,763 $28,311 0 0 $0 $256,762 $120,398 $136,364 $164,675Dominican Republic 2,160,026 11,532,015 $1,284,556 $877,943 $406,613 88,279 199,751 $5,332 $3,342,431 $652,293 $2,690,138 $3,102,083French Overseas Departments 48,910 116,690 $78,868 $22,657 $56,211 0 0 $0 $14,405 $7,087 $7,318 $63,529Grenada 11,959 93,477 $20,562 $12,002 $8,560 0 0 $0 $31,254 $14,229 $17,025 $25,585Guadeloupe 0 0 $0 $0 $0 0 0 $0 $487,818 $225,046 $262,772 $262,772Haiti 24,646 109,549 $22,850 $19,383 $3,467 495 1,772 $79 $7,367,396 $5,245,020 $2,122,376 $2,125,922Jamaica 183,121 554,138 $134,126 $79,922 $54,204 76,598 102,316 $4,779 $2,649,098 $376,347 $2,272,751 $2,331,734Montserrat 7,198 41,295 $9,079 $4,539 $4,540 2,504 5,298 $178 $11,501 $3,474 $8,027 $12,745Netherlands Antilles 91,693 288,041 $38,185 $24,247 $13,938 11,295 22,509 $310 $4,016,277 $3,097,933 $918,344 $932,592Saint Kitts and Nevis 179,136 668,893 $172,676 $96,103 $76,573 0 0 $0 $182,110 $85,736 $96,374 $172,947Saint Lucia 82,491 262,460 $69,131 $34,762 $34,369 98,971 261,702 $6,172 $125,348 $55,954 $69,394 $109,935Saint Vincent and the Grenadines 16,280 66,054 $18,922 $8,769 $10,153 0 0 $0 $58,324 $28,752 $29,572 $39,725Trinidad and Tobago 140,635 630,655 $135,328 $49,382 $85,946 348,842 1,079,876 $15,560 $589,021 $77,393 $511,628 $613,134Turks and Caicos Islands 15,734 42,445 $11,542 $6,739 $4,803 0 0 $0 $6,457 $3,533 $2,924 $7,727Virgin Islands, British 630,681 1,933,714 $375,426 $266,924 $108,502 23,143 99,944 $2,189 $38,324 $22,821 $15,503 $126,194
Navassa Island 0 0 $0 $0 $0 0 0 $0 $0 $0 $0 $0Puerto Rico 0 0 $0 $0 $0 0 0 $0 $0 $0 $0 $0U.S. Virgin Islands 0 0 $0 $0 $0 0 0 $0 $110,984 $25,517 $85,467 $85,467
Caribbean 14,279,979 66,781,557 $64,083,275 $40,491,068 $23,592,207 780,175 2,191,474 $45,676 164,777,689 $24,099,413 $10,319,008 $13,780,405 $37,418,288
Belize 6,301 34,203 $10,923 $5,946 $4,977 583 2,513 $127 $93,725 $1,012 $92,713 $97,817Canada 513,053,490 1,616,580,214 $33,982,625 $125,164 $33,857,461 753,027,250 2,146,234,079 $11 $61,583,569 $10,511,197 $51,072,372 $84,929,844Costa Rica 331,482 1,611,884 $140,638 $156,302 -$15,664 199,477 752,674 $102,798 $3,238 $1,237 $2,001 $89,135El Salvador 54,849 406,063 $60,301 $40,001 $20,300 28,660 129,571 $2,684 $630,414 $108 $630,306 $653,290Guatemala 51,486 454,849 $68,685 $41,785 $26,900 48,947 230,225 $2,187 $3,445,975 $1,429 $3,444,546 $3,473,633Honduras 62,221 356,292 $79,992 $55,833 $24,159 65 226 $5 $1,801,182 $1,465 $1,799,717 $1,823,881
- Switched Services Page 70 -

2008 Annual Section 43.61 International Traffic Data for All U.S. Points: Traditional Settlement ArrangementsTable A23: All United States Carriers Message Telephone Service Billing Types Covered: 1, 2, 3, 4, 5
International Point Traffic Billed in the United States Traffic Billed in Foreign Countries TotalOriginating or Terminating Transiting the United States U.S.
in the United States (by Country of Origin) CarriersNumber Number U.S. Payout Retained Number Number Receipts Number Receipts Payout Retained Retained
of of Carriers to Foreign Revenues of of from Foreign of from Foreign to Foreign Revenues RevenuesMessages Minutes Revenues Carriers Messages Minutes Carriers Minutes Carriers Carriers
Mexico 126,291,487 1,503,660,224 $49,109,461 $42,283,845 $6,825,616 108,604 492,506 $10,723 $1,646,451 $900,886 $745,565 $7,581,904Nicaragua 26,779 174,956 $45,057 $21,786 $23,271 4,899 12,742 $448 $449,270 $1,314 $447,956 $471,675Panama 211,461 957,530 $160,522 $45,498 $115,024 57,425 254,691 $6,784 $1,038,251 $7,608 $1,030,643 $1,152,451Saint Pierre and Miquelon 84,404 280,079 $46,392 $34,615 $11,777 0 0 $0 $96 $0 $96 $11,873
Alaska 0 0 $0 $0 $0 0 0 $0 $0 $0 $0 $0United States (conterminous) 0 0 $0 $0 $0 11,289,595 51,493,973 $581,919 $0 $0 $0 $581,919
North and Central America 640,173,960 3,124,516,294 $83,704,596 $42,810,775 $40,893,821 764,765,505 2,199,603,200 $707,686 935,086,905 $70,692,171 $11,426,256 $59,265,915 $100,867,422
Argentina 191,272 868,603 $227,217 $87,004 $140,213 2,153 5,601 $132 $14,971,947 $3,126 $14,968,821 $15,109,166Bolivia 10,699 54,568 $12,109 $3,642 $8,467 6,227 22,139 $489 $2,084,922 $3,212 $2,081,710 $2,090,666Brazil 133,051 673,498 $133,865 $56,104 $77,761 7,885 32,674 $2,145 $21,061,296 $7,242 $21,054,054 $21,133,960Chile 49,907 257,127 $64,683 $37,896 $26,787 8,297 40,133 $1,766 $4,725,397 $1,565 $4,723,832 $4,752,385Colombia 338,838 1,898,068 $311,640 $158,100 $153,540 75,779 404,631 $64,750 $2,096,719 $88,753 $2,007,966 $2,226,256Ecuador 40,333 224,324 $45,324 $28,317 $17,007 6,058 37,850 $750 $13,963 $3,933 $10,030 $27,787French Guiana 13,418 17,413 $4,684 $4,097 $587 0 0 $0 $5,176 $1,890 $3,286 $3,873Guyana 16,616 111,265 $36,708 $24,188 $12,520 569 1,255 $294 $511,351 $271,440 $239,911 $252,725Paraguay 4,628 28,770 $4,610 $2,253 $2,357 157 657 $61 $235 $70 $165 $2,583Peru 93,138 636,472 $110,702 $31,156 $79,546 9,178 50,309 $1,289 $13,333,745 $14,414 $13,319,331 $13,400,166Suriname 6,142 30,482 $6,899 $4,323 $2,576 10,854 35,915 $2,119 $103,212 $39,816 $63,396 $68,091Uruguay 8,398 55,184 $11,720 $3,838 $7,882 25,320 122,269 $2,908 $621,423 $587 $620,836 $631,626Venezuela 221,333 1,045,137 $214,438 $83,015 $131,423 9,730 41,420 $775 $1,310,440 $26,864 $1,283,576 $1,415,774
South America 1,127,773 5,900,911 $1,184,599 $523,933 $660,666 162,207 794,853 $77,478 593,952,926 $60,839,826 $462,912 $60,376,914 $61,115,058
Afghanistan 15,575,648 57,639,548 $11,572,764 $11,185,079 $387,685 847,937 3,106,319 $55,914 $65,013 $2,023 $62,990 $506,589Bangladesh 1,490 11,298 $2,429 $796 $1,633 0 0 $0 $447,913 $411 $447,502 $449,135Bhutan 529,948 1,712,128 $229,944 $205,452 $24,492 0 0 $0 $6,683 $358 $6,325 $30,817Brunei 168 1,023 $488 $69 $419 1,896 3,855 $132 $634 $477 $157 $708Burma 6,481,282 23,588,784 $5,271,655 $5,604,088 -$332,433 0 0 $0 $4,910 $1,669 $3,241 -$329,192Cambodia 840 5,787 $2,318 $370 $1,948 0 0 $0 $60,193 $5,866 $54,327 $56,275Chagos Archipelago 16,022 127,338 $239,435 $7,876 $231,559 4,593 23,122 $581 $1,091 $7,218 -$6,127 $226,013China 55,607,349 333,621,643 $3,890,701 $3,463,700 $427,001 229,373 767,574 $87,807 $316,935 $20,208 $296,727 $811,535French Southern and Antarctic Lands 0 0 $0 $0 $0 0 0 $0 $0 $0 $0 $0Hong Kong 1,915,678 11,408,143 $170,260 $119,511 $50,749 2,391 7,161 $363 $17,676,033 $3,631 $17,672,402 $17,723,514India 43,430 314,814 $97,719 $14,216 $83,503 4,686 14,510 $164 $14,308,501 $29,901 $14,278,600 $14,362,267Indonesia 23,650 115,231 $27,486 $9,840 $17,646 279 975 $25 $108,275 $18,273 $90,002 $107,673Japan 1,007,473 5,634,885 $871,692 $378,465 $493,227 3,388,641 12,698,588 $568,716 $3,982,478 $157,473 $3,825,005 $4,886,948Korea, North 39,473 42,664 $27,229 $16,761 $10,468 0 0 $0 $208 $2,535 -$2,327 $8,141Korea, South 369,090 2,242,552 $170,713 $101,119 $69,594 1,780,859 8,046,983 $487,389 $9,253,894 $54 $9,253,840 $9,810,823Laos 656,409 5,865,861 $404,463 $239,136 $165,327 0 0 $0 $161,414 $38 $161,376 $326,703Macau 2,074 7,583 $2,354 $1,016 $1,338 7,304 51,854 $2,775 $391,243 $624 $390,619 $394,732Malaysia 29,796 108,017 $18,059 $3,065 $14,994 48,525 194,940 $5,864 $1,563,464 $28,954 $1,534,510 $1,555,368Maldives 202,216 578,096 $118,413 $83,829 $34,584 0 0 $0 $280,966 $731 $280,235 $314,819Mongolia 1,016 5,492 $1,494 $678 $816 0 0 $0 $8,666 $69,877 -$61,211 -$60,395Nepal 2,317 8,241 $3,500 $1,181 $2,319 29 66 $13 $177,344 $1,547,656 -$1,370,312 -$1,367,980Pakistan 4,407 27,965 $5,757 $1,695 $4,062 0 0 $0 $4,862,423 $241,169 $4,621,254 $4,625,316
- Switched Services Page 71 -

2008 Annual Section 43.61 International Traffic Data for All U.S. Points: Traditional Settlement ArrangementsTable A23: All United States Carriers Message Telephone Service Billing Types Covered: 1, 2, 3, 4, 5
International Point Traffic Billed in the United States Traffic Billed in Foreign Countries TotalOriginating or Terminating Transiting the United States U.S.
in the United States (by Country of Origin) CarriersNumber Number U.S. Payout Retained Number Number Receipts Number Receipts Payout Retained Retained
of of Carriers to Foreign Revenues of of from Foreign of from Foreign to Foreign Revenues RevenuesMessages Minutes Revenues Carriers Messages Minutes Carriers Minutes Carriers Carriers
Philippines 1,049,243 16,006,777 $3,493,205 $2,097,592 $1,395,613 869,471 1,310,106 $21,068 $5,439,801 $18,022 $5,421,779 $6,838,460Singapore 35,454 190,600 $31,169 $8,130 $23,039 92,731 407,579 $22,861 $10,465,884 $331 $10,465,553 $10,511,453Sri Lanka 1,748 8,636 $3,495 $560 $2,935 821 3,870 $97 $1,778,357 $1,221,285 $557,072 $560,104Taiwan 9,275,015 55,620,706 $1,880,465 $1,675,902 $204,563 186,437 802,464 $72,075 $1,620,182 $71,133 $1,549,049 $1,825,687Thailand 1,054,698 6,303,896 $162,134 $120,178 $41,956 116,404 363,196 $50,855 $13,767 $307 $13,460 $106,271Vietnam 48,663,779 322,201,550 $15,900,610 $16,068,522 -$167,912 3,451,860 24,450,205 $166,154 $20,777 $16,872 $3,905 $2,147
Asia 142,589,713 843,399,258 $44,599,951 $41,408,826 $3,191,125 11,034,237 52,253,367 $1,542,853 1,199,382,261 $73,017,049 $3,467,096 $69,549,953 $74,283,931
Australia 331,167 1,617,511 $228,702 $101,672 $127,030 39,154 241,388 $47,743 $3,729,721 $34,869 $3,694,852 $3,869,625Cook Islands 5,471 20,736 $24,219 $10,192 $14,027 0 0 $0 $17,619 $1 $17,618 $31,645Fiji 14,703 72,178 $31,511 $13,649 $17,862 0 0 $0 $2,855 $8,907 -$6,052 $11,810French Polynesia 33,072 100,232 $38,705 $15,745 $22,960 0 0 $0 $611 $171 $440 $23,400Kiribati 55,965 219,333 $96,025 $96,396 -$371 0 0 $0 $1,448 $43 $1,405 $1,034Marshall Islands 82,235 422,773 $154,911 $74,829 $80,082 2,001 8,755 $141 $1,032 $0 $1,032 $81,255Micronesia, Federated States of 6,548,057 7,372,135 $1,642,942 $1,184,726 $458,216 74,644 479,417 $3,574 $13 $109 -$96 $461,694Nauru 57,489 255,927 $194,456 $161,342 $33,114 0 0 $0 $160 $18 $142 $33,256New Caledonia 2,001 5,208 $2,937 $1,073 $1,864 0 0 $0 $1,110 $534 $576 $2,440New Zealand 56,453 319,922 $71,213 $27,841 $43,372 38,781 363,764 $9,492 $187,434 $1,574 $185,860 $238,724Niue 66 204 $331 $100 $231 0 0 $0 $1 $1 $0 $231Norfolk Island 427 1,558 $10,143 $1,128 $9,015 0 0 $0 $0 $0 $0 $9,015Pacific Islands (Palau) 244,692 1,049,760 $498,343 $178,019 $320,324 174,892 671,525 $15,547 $34 $145 -$111 $335,760Papua New Guinea 184,926 527,068 $699,028 $264,792 $434,236 0 0 $0 $292 $1,216 -$924 $433,312Solomon Islands 21,343 58,966 $46,313 $41,922 $4,391 0 0 $0 $461 $213 $248 $4,639Tonga 8,377 52,634 $26,877 $7,860 $19,017 76 184 $6 $971 $2,878 -$1,907 $17,116Tuvalu 2,268 14,903 $37,867 $6,488 $31,379 0 0 $0 $9 $60 -$51 $31,328Vanuatu 46,777 119,370 $47,315 $47,303 $12 0 0 $0 $32 $12 $20 $32Wallis and Futuna 241 586 $904 $231 $673 0 0 $0 $164 $0 $164 $837Western Samoa 681,075 3,779,239 $1,101,326 $982,949 $118,377 2,734 9,316 $58 $474 $16 $458 $118,893
American Samoa 785,137 6,242,746 $395,174 $373,869 $21,305 462,553 1,325,089 $73,182 $9 $402 -$393 $94,094Baker Island 0 0 $0 $0 $0 0 0 $0 $0 $0 $0 $0Guam 1 8 $2 $1 $1 0 0 $0 $128 $22 $106 $107Hawaii 0 0 $0 $0 $0 0 0 $0 $0 $0 $0 $0Howland Island 0 0 $0 $0 $0 0 0 $0 $0 $0 $0 $0Jarvis Island 0 0 $0 $0 $0 0 0 $0 $0 $0 $0 $0Johnston Atoll 0 0 $0 $0 $0 0 0 $0 $0 $0 $0 $0Kingman Reef 0 0 $0 $0 $0 0 0 $0 $0 $0 $0 $0Midway Atoll 0 0 $0 $0 $0 0 0 $0 $0 $0 $0 $0Northern Mariana Islands 0 0 $0 $0 $0 0 0 $0 $0 $0 $0 $0Palmyra Atoll 0 0 $0 $0 $0 0 0 $0 $0 $0 $0 $0Wake Island 0 0 $0 $0 $0 0 0 $0 $1,027 $184 $843 $843
Oceania 9,161,943 22,252,997 $5,349,244 $3,592,127 $1,757,117 794,835 3,099,438 $149,743 56,390,040 $3,945,605 $51,375 $3,894,230 $5,801,090
Albania 379 2,202 $596 $379 $217 0 0 $0 $1,204 $9 $1,195 $1,412Armenia 422 2,554 $473 $199 $274 0 0 $0 $966 $46,453 -$45,487 -$45,213Azerbaijan 534 2,165 $741 $227 $514 254,642 731,988 $17,191 $9,154 $1,900 $7,254 $24,959Belarus 570 3,688 $1,246 $676 $570 36 114 $5 $9,175 $3,742 $5,433 $6,008
- Switched Services Page 72 -

2008 Annual Section 43.61 International Traffic Data for All U.S. Points: Traditional Settlement ArrangementsTable A23: All United States Carriers Message Telephone Service Billing Types Covered: 1, 2, 3, 4, 5
International Point Traffic Billed in the United States Traffic Billed in Foreign Countries TotalOriginating or Terminating Transiting the United States U.S.
in the United States (by Country of Origin) CarriersNumber Number U.S. Payout Retained Number Number Receipts Number Receipts Payout Retained Retained
of of Carriers to Foreign Revenues of of from Foreign of from Foreign to Foreign Revenues RevenuesMessages Minutes Revenues Carriers Messages Minutes Carriers Minutes Carriers Carriers
Bosnia and Herzegovina 1,220 7,051 $3,033 $1,019 $2,014 0 0 $0 $324,963 $108 $324,855 $326,869Bulgaria 5,285 21,539 $7,198 $3,254 $3,944 1,807 5,857 $228 $212,643 $603 $212,040 $216,212Croatia 3,979 26,662 $7,322 $1,463 $5,859 16 118 $7 $61,100 $8,637 $52,463 $58,329Czech Republic 7,977 41,370 $12,539 $4,897 $7,642 7,259 41,291 $2,294 $52,736 $12,125 $40,611 $50,547Estonia 1,593 7,360 $2,678 $862 $1,816 0 0 $0 $575 $102 $473 $2,289Georgia 2,566 7,905 $2,234 $524 $1,710 0 0 $0 $1,144 $58 $1,086 $2,796Hungary 13,495 75,646 $17,923 $4,247 $13,676 0 0 $0 $249,513 $13,979 $235,534 $249,210Kazakhstan 62 415 $5 $35 -$30 0 0 $0 $1,348 $155,642 -$154,294 -$154,324Kyrgyzstan 2,266,876 8,261,406 $828,649 $692,003 $136,646 0 0 $0 $884 $536 $348 $136,994Latvia 983 5,776 $4,849 $318 $4,531 0 0 $0 $124,858 $27,945 $96,913 $101,444Lithuania 3,604 16,391 $4,279 $1,553 $2,726 0 0 $0 $65,732 $785 $64,947 $67,673Moldova 1,560 6,904 $2,020 $791 $1,229 0 0 $0 $99,695 $3,521 $96,174 $97,403Poland 10,982 70,063 $12,887 $3,729 $9,158 0 0 $0 $699,040 $4,421 $694,619 $703,777Romania 7,449 38,265 $14,425 $2,756 $11,669 0 0 $0 $435,455 $77,301 $358,154 $369,823Russia 26,694 134,278 $25,610 $4,478 $21,132 4,205 12,971 $401 $2,894,704 $172,597 $2,722,107 $2,743,640Serbia 7,618 47,876 $15,248 $5,478 $9,770 5,846 17,989 $352 $7,737 $2,068 $5,669 $15,791Slovakia 1,572 8,314 $8,313 $301 $8,012 0 0 $0 $51,817 $3,874 $47,943 $55,955Slovenia 1,956 8,223 $3,099 $1,236 $1,863 0 0 $0 $9,058 $31,159 -$22,101 -$20,238Tajikistan 1,865,037 4,031,901 $376,964 $322,588 $54,376 0 0 $0 $5,691 $13,370 -$7,679 $46,697Turkmenistan 1,408,235 4,718,363 $426,681 $429,502 -$2,821 0 0 $0 $713 $9,375 -$8,662 -$11,483Ukraine 8,967 61,352 $13,448 $5,313 $8,135 0 0 $0 $91,033 $74,661 $16,372 $24,507Uzbekistan 2,150 6,573 $725 $350 $375 2 7 $1 $1,184 $18,386 -$17,202 -$16,826
Eastern Europe 5,651,765 17,614,242 $1,793,185 $1,488,178 $305,007 273,813 810,335 $20,479 66,278,495 $5,412,122 $683,357 $4,728,765 $5,054,251
Antarctica 8 34 $618 $28 $590 0 0 $0 $21 $0 $21 $611Maritime - Atlantic 0 0 $0 $0 $0 0 0 $0 $4,560 $3,074 $1,486 $1,486Maritime - other oceans 187,366 293,169 $932,409 $315,482 $616,927 0 0 $0 $0 $0 $0 $616,927Maritime - Pacific 0 0 $0 $0 $0 0 0 $0 $0 $0 $0 $0
Other Regions 187,374 293,203 $933,027 $315,510 $617,517 0 0 $0 610 $4,581 $3,074 $1,507 $619,024
American Samoa 3,652 34,785 $4,304 $3,932 $372 0 0 $0 $0 $0 $0 $372Baker Island 0 0 $0 $0 $0 0 0 $0 $0 $0 $0 $0Howland Island 0 0 $0 $0 $0 0 0 $0 $0 $0 $0 $0Jarvis Island 0 0 $0 $0 $0 0 0 $0 $0 $0 $0 $0Johnston Atoll 0 0 $0 $0 $0 0 0 $0 $0 $0 $0 $0Kingman Reef 0 0 $0 $0 $0 0 0 $0 $0 $0 $0 $0Midway Atoll 0 0 $0 $0 $0 0 0 $0 $0 $0 $0 $0Navassa Island 0 0 $0 $0 $0 0 0 $0 $0 $0 $0 $0Northern Mariana Islands 0 0 $0 $0 $0 0 0 $0 $0 $0 $0 $0Palmyra Atoll 0 0 $0 $0 $0 0 0 $0 $0 $0 $0 $0Wake Island 0 0 $0 $0 $0 0 0 $0 $0 $0 $0 $0
Carriers serving Misc. U.S. points 3,652 34,785 $4,304 $3,932 $372 0 0 $0 $0 $0 $0 $372
Total for Foreign Points 890,216,646 4,360,601,404 $268,509,665 $189,978,779 $78,530,886 773,195,568 2,236,813,296 $2,921,668 $684,293,676 $28,534,444 $655,759,232 $737,211,786
Total for U.S. Points 785,138 6,242,754 $395,176 $373,870 $21,306 11,752,148 52,819,062 $655,101 $112,148 $26,125 $86,023 $762,430
World Total 891,001,784 4,366,844,158 $268,904,841 $190,352,649 $78,552,192 784,947,716 2,289,632,358 $3,576,769 6,976,837,447 $684,405,824 $28,560,569 $655,845,255 $737,974,216
- Switched Services Page 73 -
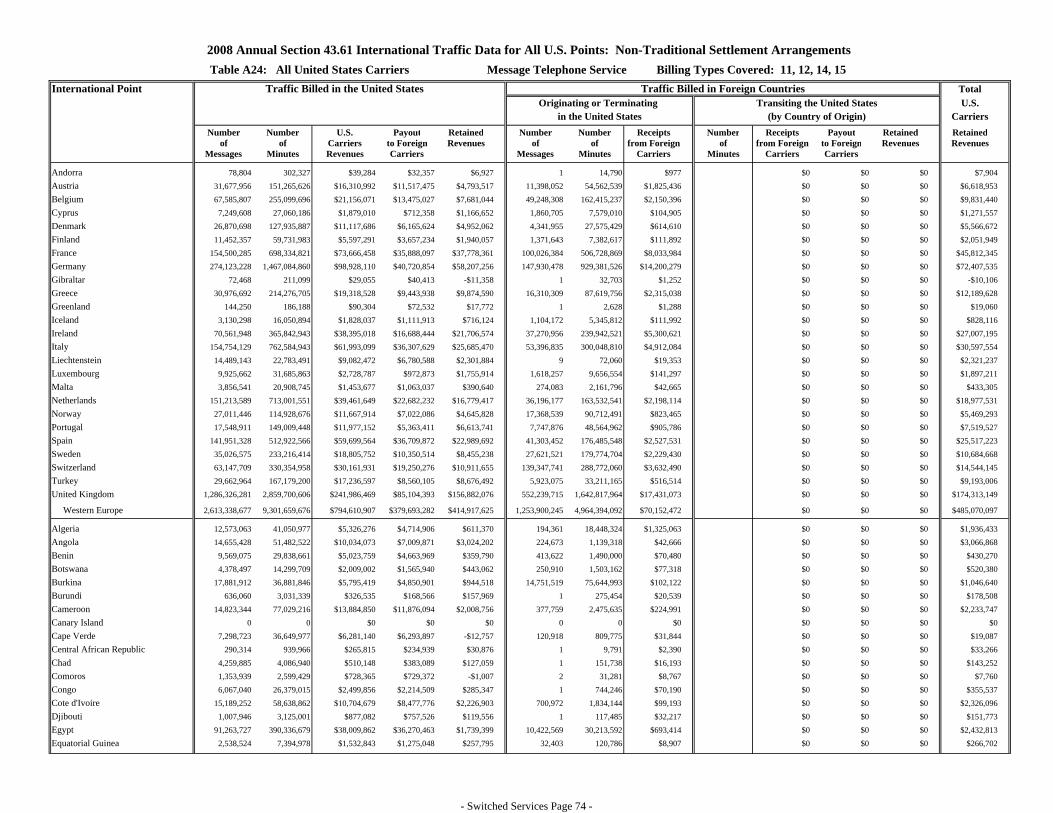
2008 Annual Section 43.61 International Traffic Data for All U.S. Points: Non-Traditional Settlement ArrangementsTable A24: All United States Carriers Message Telephone Service Billing Types Covered: 11, 12, 14, 15
International Point Traffic Billed in the United States Traffic Billed in Foreign Countries TotalOriginating or Terminating Transiting the United States U.S.
in the United States (by Country of Origin) CarriersNumber Number U.S. Payout Retained Number Number Receipts Number Receipts Payout Retained Retained
of of Carriers to Foreign Revenues of of from Foreign of from Foreign to Foreign Revenues RevenuesMessages Minutes Revenues Carriers Messages Minutes Carriers Minutes Carriers Carriers
Andorra 78,804 302,327 $39,284 $32,357 $6,927 1 14,790 $977 $0 $0 $0 $7,904Austria 31,677,956 151,265,626 $16,310,992 $11,517,475 $4,793,517 11,398,052 54,562,539 $1,825,436 $0 $0 $0 $6,618,953Belgium 67,585,807 255,099,696 $21,156,071 $13,475,027 $7,681,044 49,248,308 162,415,237 $2,150,396 $0 $0 $0 $9,831,440Cyprus 7,249,608 27,060,186 $1,879,010 $712,358 $1,166,652 1,860,705 7,579,010 $104,905 $0 $0 $0 $1,271,557Denmark 26,870,698 127,935,887 $11,117,686 $6,165,624 $4,952,062 4,341,955 27,575,429 $614,610 $0 $0 $0 $5,566,672Finland 11,452,357 59,731,983 $5,597,291 $3,657,234 $1,940,057 1,371,643 7,382,617 $111,892 $0 $0 $0 $2,051,949France 154,500,285 698,334,821 $73,666,458 $35,888,097 $37,778,361 100,026,384 506,728,869 $8,033,984 $0 $0 $0 $45,812,345Germany 274,123,228 1,467,084,860 $98,928,110 $40,720,854 $58,207,256 147,930,478 929,381,526 $14,200,279 $0 $0 $0 $72,407,535Gibraltar 72,468 211,099 $29,055 $40,413 -$11,358 1 32,703 $1,252 $0 $0 $0 -$10,106Greece 30,976,692 214,276,705 $19,318,528 $9,443,938 $9,874,590 16,310,309 87,619,756 $2,315,038 $0 $0 $0 $12,189,628Greenland 144,250 186,188 $90,304 $72,532 $17,772 1 2,628 $1,288 $0 $0 $0 $19,060Iceland 3,130,298 16,050,894 $1,828,037 $1,111,913 $716,124 1,104,172 5,345,812 $111,992 $0 $0 $0 $828,116Ireland 70,561,948 365,842,943 $38,395,018 $16,688,444 $21,706,574 37,270,956 239,942,521 $5,300,621 $0 $0 $0 $27,007,195Italy 154,754,129 762,584,943 $61,993,099 $36,307,629 $25,685,470 53,396,835 300,048,810 $4,912,084 $0 $0 $0 $30,597,554Liechtenstein 14,489,143 22,783,491 $9,082,472 $6,780,588 $2,301,884 9 72,060 $19,353 $0 $0 $0 $2,321,237Luxembourg 9,925,662 31,685,863 $2,728,787 $972,873 $1,755,914 1,618,257 9,656,554 $141,297 $0 $0 $0 $1,897,211Malta 3,856,541 20,908,745 $1,453,677 $1,063,037 $390,640 274,083 2,161,796 $42,665 $0 $0 $0 $433,305Netherlands 151,213,589 713,001,551 $39,461,649 $22,682,232 $16,779,417 36,196,177 163,532,541 $2,198,114 $0 $0 $0 $18,977,531Norway 27,011,446 114,928,676 $11,667,914 $7,022,086 $4,645,828 17,368,539 90,712,491 $823,465 $0 $0 $0 $5,469,293Portugal 17,548,911 149,009,448 $11,977,152 $5,363,411 $6,613,741 7,747,876 48,564,962 $905,786 $0 $0 $0 $7,519,527Spain 141,951,328 512,922,566 $59,699,564 $36,709,872 $22,989,692 41,303,452 176,485,548 $2,527,531 $0 $0 $0 $25,517,223Sweden 35,026,575 233,216,414 $18,805,752 $10,350,514 $8,455,238 27,621,521 179,774,704 $2,229,430 $0 $0 $0 $10,684,668Switzerland 63,147,709 330,354,958 $30,161,931 $19,250,276 $10,911,655 139,347,741 288,772,060 $3,632,490 $0 $0 $0 $14,544,145Turkey 29,662,964 167,179,200 $17,236,597 $8,560,105 $8,676,492 5,923,075 33,211,165 $516,514 $0 $0 $0 $9,193,006United Kingdom 1,286,326,281 2,859,700,606 $241,986,469 $85,104,393 $156,882,076 552,239,715 1,642,817,964 $17,431,073 $0 $0 $0 $174,313,149
Western Europe 2,613,338,677 9,301,659,676 $794,610,907 $379,693,282 $414,917,625 1,253,900,245 4,964,394,092 $70,152,472 $0 $0 $0 $485,070,097
Algeria 12,573,063 41,050,977 $5,326,276 $4,714,906 $611,370 194,361 18,448,324 $1,325,063 $0 $0 $0 $1,936,433Angola 14,655,428 51,482,522 $10,034,073 $7,009,871 $3,024,202 224,673 1,139,318 $42,666 $0 $0 $0 $3,066,868Benin 9,569,075 29,838,661 $5,023,759 $4,663,969 $359,790 413,622 1,490,000 $70,480 $0 $0 $0 $430,270Botswana 4,378,497 14,299,709 $2,009,002 $1,565,940 $443,062 250,910 1,503,162 $77,318 $0 $0 $0 $520,380Burkina 17,881,912 36,881,846 $5,795,419 $4,850,901 $944,518 14,751,519 75,644,993 $102,122 $0 $0 $0 $1,046,640Burundi 636,060 3,031,339 $326,535 $168,566 $157,969 1 275,454 $20,539 $0 $0 $0 $178,508Cameroon 14,823,344 77,029,216 $13,884,850 $11,876,094 $2,008,756 377,759 2,475,635 $224,991 $0 $0 $0 $2,233,747Canary Island 0 0 $0 $0 $0 0 0 $0 $0 $0 $0 $0Cape Verde 7,298,723 36,649,977 $6,281,140 $6,293,897 -$12,757 120,918 809,775 $31,844 $0 $0 $0 $19,087Central African Republic 290,314 939,966 $265,815 $234,939 $30,876 1 9,791 $2,390 $0 $0 $0 $33,266Chad 4,259,885 4,086,940 $510,148 $383,089 $127,059 1 151,738 $16,193 $0 $0 $0 $143,252Comoros 1,353,939 2,599,429 $728,365 $729,372 -$1,007 2 31,281 $8,767 $0 $0 $0 $7,760Congo 6,067,040 26,379,015 $2,499,856 $2,214,509 $285,347 1 744,246 $70,190 $0 $0 $0 $355,537Cote d'Ivoire 15,189,252 58,638,862 $10,704,679 $8,477,776 $2,226,903 700,972 1,834,144 $99,193 $0 $0 $0 $2,326,096Djibouti 1,007,946 3,125,001 $877,082 $757,526 $119,556 1 117,485 $32,217 $0 $0 $0 $151,773Egypt 91,263,727 390,336,679 $38,009,862 $36,270,463 $1,739,399 10,422,569 30,213,592 $693,414 $0 $0 $0 $2,432,813Equatorial Guinea 2,538,524 7,394,978 $1,532,843 $1,275,048 $257,795 32,403 120,786 $8,907 $0 $0 $0 $266,702
- Switched Services Page 74 -

2008 Annual Section 43.61 International Traffic Data for All U.S. Points: Non-Traditional Settlement ArrangementsTable A24: All United States Carriers Message Telephone Service Billing Types Covered: 11, 12, 14, 15
International Point Traffic Billed in the United States Traffic Billed in Foreign Countries TotalOriginating or Terminating Transiting the United States U.S.
in the United States (by Country of Origin) CarriersNumber Number U.S. Payout Retained Number Number Receipts Number Receipts Payout Retained Retained
of of Carriers to Foreign Revenues of of from Foreign of from Foreign to Foreign Revenues RevenuesMessages Minutes Revenues Carriers Messages Minutes Carriers Minutes Carriers Carriers
Ethiopia 40,470,433 189,932,666 $34,696,075 $34,602,251 $93,824 890,894 5,427,806 $536,626 $0 $0 $0 $630,450Gabon 10,334,168 28,011,422 $2,775,372 $3,425,356 -$649,984 393,886 1,445,849 $54,787 $0 $0 $0 -$595,197Gambia, The 6,129,387 22,213,644 $5,713,205 $5,326,722 $386,483 1 1,227,183 $303,574 $0 $0 $0 $690,057Ghana 55,129,638 346,609,527 $49,986,973 $36,243,066 $13,743,907 4,030,287 38,486,722 $2,066,737 $0 $0 $0 $15,810,644Guinea 11,031,192 43,597,093 $7,407,142 $6,526,470 $880,672 1 2,387,151 $339,865 $0 $0 $0 $1,220,537Guinea-Bissau 557,751 2,478,268 $611,181 $505,870 $105,311 1 10,138 $4,047 $0 $0 $0 $109,358Kenya 7,426,129 46,963,163 $5,549,272 $3,778,308 $1,770,964 72,790 3,476,990 $247,423 $0 $0 $0 $2,018,387Lesotho 80,486 465,015 $96,826 $77,462 $19,364 7,072 48,209 $3,423 $0 $0 $0 $22,787Liberia 8,129,524 32,321,755 $6,160,183 $5,275,357 $884,826 1 181,222 $30,866 $0 $0 $0 $915,692Libya 21,745,341 52,765,716 $10,583,121 $9,545,727 $1,037,394 21,388 470,407 $82,589 $0 $0 $0 $1,119,983Madagascar 994,941 3,550,613 $734,794 $625,795 $108,999 1 269,366 $37,547 $0 $0 $0 $146,546Malawi 6,510,183 27,139,934 $3,074,811 $3,120,201 -$45,390 73,059 850,390 $67,720 $0 $0 $0 $22,330Mali 15,871,359 45,801,022 $8,112,930 $7,863,502 $249,428 646,926 5,243,125 $723,007 $0 $0 $0 $972,435Mauritania 790,651 2,782,281 $526,390 $414,330 $112,060 1 273,477 $38,150 $0 $0 $0 $150,210Mauritius 11,436,011 32,120,915 $866,243 $490,913 $375,330 187,844 8,032,733 $524,155 $0 $0 $0 $899,485Morocco 36,846,956 170,438,038 $32,816,375 $33,517,735 -$701,360 3,264,850 17,385,874 $936,285 $0 $0 $0 $234,925Mozambique 4,547,249 9,258,346 $1,420,420 $888,831 $531,589 146,570 938,210 $22,829 $0 $0 $0 $554,418Namibia 1,315,177 5,290,832 $828,701 $623,259 $205,442 141,635 1,137,938 $44,141 $0 $0 $0 $249,583Niger 11,292,063 28,587,368 $3,033,769 $2,416,352 $617,417 1 273,981 $25,331 $0 $0 $0 $642,748Nigeria 120,306,485 663,842,429 $80,131,807 $60,853,619 $19,278,188 28,781,084 63,493,487 $1,172,846 $0 $0 $0 $20,451,034Reunion 1,445,437 6,261,225 $1,037,400 $1,290,787 -$253,387 1 28,296 $3,345 $0 $0 $0 -$250,042Rwanda 314,586 2,043,775 $266,939 $184,465 $82,474 1 644,828 $53,912 $0 $0 $0 $136,386Saint Helena 21,422 33,230 $15,408 $11,565 $3,843 2 160 $77 $0 $0 $0 $3,920Sao Tome and Principe 710,483 911,164 $674,133 $478,447 $195,686 1 569 $241 $0 $0 $0 $195,927Senegal 24,362,249 109,534,491 $19,560,301 $17,065,096 $2,495,205 3,107,219 12,540,248 $729,884 $0 $0 $0 $3,225,089Seychelles 339,506 1,380,520 $111,743 $83,049 $28,694 1 273,833 $17,840 $0 $0 $0 $46,534Sierra Leone 8,311,224 47,596,199 $13,054,191 $11,265,059 $1,789,132 4,087,764 8,062,085 $599,257 $0 $0 $0 $2,388,389Somalia 7,006,874 16,126,308 $6,119,928 $5,835,656 $284,272 1,195,698 1,377,977 $84,901 $0 $0 $0 $369,173South Africa 49,540,451 252,431,877 $29,422,924 $16,495,995 $12,926,929 49,934,600 149,484,949 $1,525,570 $0 $0 $0 $14,452,499Sudan 8,236,418 45,194,098 $4,931,662 $3,716,488 $1,215,174 246,586 6,269,783 $395,268 $0 $0 $0 $1,610,442Swaziland 1,721,442 6,009,292 $819,388 $595,228 $224,160 86,843 337,722 $7,843 $0 $0 $0 $232,003Tanzania 6,377,822 33,629,446 $4,626,573 $2,949,068 $1,677,505 168,995 4,006,013 $318,169 $0 $0 $0 $1,995,674Togo 5,767,791 18,500,362 $4,618,086 $4,086,502 $531,584 59,579 1,883,397 $452,441 $0 $0 $0 $984,025Tunisia 15,110,161 63,301,587 $14,442,187 $14,348,456 $93,731 999,431 4,337,802 $503,612 $0 $0 $0 $597,343Uganda 9,875,388 56,512,417 $6,840,243 $4,671,388 $2,168,855 710,201 3,774,418 $200,706 $0 $0 $0 $2,369,561Western Sahara 0 0 $0 $0 $0 0 0 $0 $0 $0 $0 $0Zaire 4,074,802 16,267,125 $3,505,109 $2,852,671 $652,438 31,858 3,309,440 $591,891 $0 $0 $0 $1,244,329Zambia 6,839,390 40,171,091 $4,211,831 $3,544,915 $666,916 368,349 2,046,074 $87,679 $0 $0 $0 $754,595Zimbabwe 12,018,849 42,659,914 $7,601,543 $6,948,686 $652,857 448,110 5,048,570 $238,128 $0 $0 $0 $890,985
Africa 736,806,148 3,296,499,285 $480,794,883 $404,031,513 $76,763,370 127,593,244 489,496,146 $15,899,006 $0 $0 $0 $92,662,376
Bahrain 5,922,483 23,639,911 $2,694,453 $1,231,930 $1,462,523 2,544,880 7,674,498 $70,857 $0 $0 $0 $1,533,380Iran 39,036,415 136,808,956 $13,692,449 $12,343,645 $1,348,804 5,169,632 25,589,140 $783,803 $0 $0 $0 $2,132,607Iraq 9,940,711 37,924,179 $4,252,900 $2,802,922 $1,449,978 2 12,768,358 $929,177 $0 $0 $0 $2,379,155Israel 90,657,243 538,391,500 $71,453,239 $28,013,133 $43,440,106 73,900,668 359,542,480 $3,334,995 $0 $0 $0 $46,775,101
- Switched Services Page 75 -

2008 Annual Section 43.61 International Traffic Data for All U.S. Points: Non-Traditional Settlement ArrangementsTable A24: All United States Carriers Message Telephone Service Billing Types Covered: 11, 12, 14, 15
International Point Traffic Billed in the United States Traffic Billed in Foreign Countries TotalOriginating or Terminating Transiting the United States U.S.
in the United States (by Country of Origin) CarriersNumber Number U.S. Payout Retained Number Number Receipts Number Receipts Payout Retained Retained
of of Carriers to Foreign Revenues of of from Foreign of from Foreign to Foreign Revenues RevenuesMessages Minutes Revenues Carriers Messages Minutes Carriers Minutes Carriers Carriers
Jordan 10,706,910 67,761,445 $6,049,968 $3,069,066 $2,980,902 4,903,926 29,380,368 $494,390 $0 $0 $0 $3,475,292Kuwait 39,176,804 106,279,814 $9,158,366 $7,750,366 $1,408,000 6,042,881 26,326,947 $273,632 $0 $0 $0 $1,681,632Lebanon 39,502,925 239,717,742 $27,594,766 $22,939,464 $4,655,302 3,000,703 25,322,081 $1,189,963 $0 $0 $0 $5,845,265Oman 25,272,829 68,381,532 $10,130,073 $8,954,882 $1,175,191 929,895 5,005,456 $242,985 $0 $0 $0 $1,418,176Qatar 15,099,423 40,183,236 $7,296,776 $5,803,567 $1,493,209 3,641,666 12,513,183 $185,034 $0 $0 $0 $1,678,243Saudi Arabia 85,238,032 269,387,725 $34,083,814 $27,280,922 $6,802,892 17,865,622 65,627,680 $948,096 $0 $0 $0 $7,750,988Syria 5,338,894 28,618,170 $4,600,500 $3,441,133 $1,159,367 1 6,019,932 $703,813 $0 $0 $0 $1,863,180United Arab Emirates 96,454,431 316,778,256 $48,454,936 $40,665,547 $7,789,389 23,819,714 93,481,297 $1,041,054 $0 $0 $0 $8,830,443Yemen 21,313,894 86,622,641 $9,735,098 $9,153,015 $582,083 1,813,679 4,162,776 $202,088 $0 $0 $0 $784,171
Middle East 483,660,994 1,960,495,107 $249,197,338 $173,449,592 $75,747,746 143,633,269 673,414,196 $10,399,887 $0 $0 $0 $86,147,633
Anguilla 2,258,839 5,683,854 $1,183,638 $827,454 $356,184 356,599 1,061,833 $10,360 $0 $0 $0 $366,544Antigua and Barbuda 8,596,266 32,014,170 $4,168,405 $17,637,411 -$13,469,006 1,231,209 3,524,829 $43,685 $0 $0 $0 -$13,425,321Aruba 9,802,241 33,371,289 $4,867,166 $3,873,901 $993,265 2,703,676 7,564,312 $69,675 $0 $0 $0 $1,062,940Bahamas, The 39,698,227 136,027,291 $9,867,966 $3,418,445 $6,449,521 23,895,088 69,727,063 $783,897 $0 $0 $0 $7,233,418Barbados 15,767,837 61,054,606 $8,968,735 $6,313,944 $2,654,791 11,457,750 43,276,264 $860,967 $0 $0 $0 $3,515,758Bermuda 15,373,461 52,285,821 $4,341,260 $1,865,901 $2,475,359 6,444,340 37,311,639 $405,164 $0 $0 $0 $2,880,523Cayman Islands 13,583,568 38,897,733 $6,105,082 $3,584,283 $2,520,799 4,005,783 13,547,217 $220,306 $0 $0 $0 $2,741,105Cuba 49,037,503 209,757,285 $154,156,682 $161,264,488 -$7,107,806 2 1,071,641 $812,620 $0 $0 $0 -$6,295,186Dominica 10,147,971 53,208,630 $5,449,762 $4,868,040 $581,722 708,083 2,206,143 $46,782 $0 $0 $0 $628,504Dominican Republic 253,403,016 1,878,741,266 $132,588,399 $88,568,611 $44,019,788 110,666,570 273,671,182 $4,064,273 $0 $0 $0 $48,084,061French Overseas Departments 2,812,849 7,199,745 $2,291,328 $1,255,357 $1,035,971 462,974 3,324,612 $37,573 $0 $0 $0 $1,073,544Grenada 6,286,063 46,732,631 $6,297,030 $4,896,293 $1,400,737 916,847 13,082,381 $317,441 $0 $0 $0 $1,718,178Guadeloupe 5,383,958 14,427,269 $2,062,390 $1,814,313 $248,077 1 36,409 $6,935 $0 $0 $0 $255,012Haiti 129,827,136 599,874,921 $108,736,329 $141,136,322 -$32,399,993 15,272,343 39,079,710 $2,534,743 $0 $0 $0 -$29,865,250Jamaica 167,164,050 738,432,315 $106,772,084 $87,905,748 $18,866,336 71,757,510 257,472,020 $3,782,946 $0 $0 $0 $22,649,282Montserrat 522,847 2,770,422 $366,541 $279,792 $86,749 6,236 24,672 $1,500 $0 $0 $0 $88,249Netherlands Antilles 22,715,740 79,057,198 $8,197,178 $6,182,591 $2,014,587 6,091,373 18,964,669 $196,360 $0 $0 $0 $2,210,947Saint Kitts and Nevis 5,249,412 21,201,329 $3,622,408 $2,672,158 $950,250 292,624 948,629 $15,748 $0 $0 $0 $965,998Saint Lucia 6,835,910 35,696,515 $4,938,932 $3,792,230 $1,146,702 755,700 3,706,254 $151,634 $0 $0 $0 $1,298,336Saint Vincent and the Grenadines 4,387,355 28,044,215 $3,598,022 $3,242,338 $355,684 109,622 2,164,334 $211,281 $0 $0 $0 $566,965Trinidad and Tobago 43,546,258 251,951,494 $31,661,475 $18,009,890 $13,651,585 33,574,917 144,331,160 $1,559,069 $0 $0 $0 $15,210,654Turks and Caicos Islands 10,310,043 21,895,171 $4,443,611 $3,434,106 $1,009,505 1,496,813 3,681,214 $57,096 $0 $0 $0 $1,066,601Virgin Islands, British 6,362,090 18,787,849 $3,959,385 $2,191,613 $1,767,772 4,692,974 14,932,629 $259,759 $0 $0 $0 $2,027,531
Navassa Island 0 0 $0 $0 $0 0 0 $0 $0 $0 $0 $0Puerto Rico 3,336 40,092 $1,672 $759 $913 0 0 $0 $0 $0 $0 $913U.S. Virgin Islands 3,471,438 18,667,665 $170,185 $156,875 $13,310 1 155,339 $1,473 $0 $0 $0 $14,783
Caribbean 832,547,414 4,385,820,776 $618,815,665 $569,192,863 $49,622,802 296,899,035 954,866,155 $16,451,287 $0 $0 $0 $66,074,089
Belize 9,445,960 50,165,923 $10,793,077 $8,473,284 $2,319,793 1,838,186 8,123,419 $209,807 $0 $0 $0 $2,529,600Canada 1,736,834,405 7,864,213,445 $549,672,173 $97,539,347 $452,132,826 2,213,794,818 7,339,722,427 $47,938,904 $0 $0 $0 $500,071,730Costa Rica 78,368,782 420,168,392 $42,521,162 $28,162,367 $14,358,795 15,785,452 65,642,281 $2,411,693 $0 $0 $0 $16,770,488El Salvador 126,874,874 959,194,113 $98,977,886 $85,285,663 $13,692,223 153,993,112 683,794,130 $7,502,146 $0 $0 $0 $21,194,369Guatemala 207,922,585 1,909,890,213 $191,901,674 $177,024,366 $14,877,308 98,967,599 428,969,881 $4,257,152 $0 $0 $0 $19,134,460Honduras 49,934,434 288,273,039 $43,366,709 $37,799,385 $5,567,324 42,859,884 161,819,872 $2,516,317 $0 $0 $0 $8,083,641
- Switched Services Page 76 -

2008 Annual Section 43.61 International Traffic Data for All U.S. Points: Non-Traditional Settlement ArrangementsTable A24: All United States Carriers Message Telephone Service Billing Types Covered: 11, 12, 14, 15
International Point Traffic Billed in the United States Traffic Billed in Foreign Countries TotalOriginating or Terminating Transiting the United States U.S.
in the United States (by Country of Origin) CarriersNumber Number U.S. Payout Retained Number Number Receipts Number Receipts Payout Retained Retained
of of Carriers to Foreign Revenues of of from Foreign of from Foreign to Foreign Revenues RevenuesMessages Minutes Revenues Carriers Messages Minutes Carriers Minutes Carriers Carriers
Mexico 1,146,008,536 10,252,563,802 $700,265,573 $523,023,257 $177,242,316 532,960,855 2,315,406,457 $35,325,436 $0 $0 $0 $212,567,752Nicaragua 50,638,755 280,644,863 $48,116,205 $36,390,347 $11,725,858 26,055,953 75,682,742 $719,439 $0 $0 $0 $12,445,297Panama 31,754,913 175,946,672 $14,113,423 $8,011,001 $6,102,422 16,577,734 61,460,152 $1,041,032 $0 $0 $0 $7,143,454Saint Pierre and Miquelon 226,316 534,667 $68,036 $100,425 -$32,389 1 7,248 $1,091 $0 $0 $0 -$31,298
Alaska 9,124 75,414 $3,473 $1,328 $2,145 0 0 $0 $0 $0 $0 $2,145United States (conterminous) 6,142,100 46,447,641 $2,769,325 $402,685 $2,366,640 0 0 $0 $0 $0 $0 $2,366,640
North and Central America 3,444,160,784 22,248,118,184 $1,702,568,716 $1,002,213,455 $700,355,261 3,102,833,594 11,140,628,609 $101,923,017 $0 $0 $0 $802,278,278
Argentina 94,135,226 692,171,339 $28,970,463 $11,570,719 $17,399,744 21,120,600 94,760,600 $1,790,093 $0 $0 $0 $19,189,837Bolivia 53,108,409 362,435,343 $29,165,985 $23,270,379 $5,895,606 3,004,749 12,043,531 $266,156 $0 $0 $0 $6,161,762Brazil 267,983,320 1,196,988,259 $119,919,451 $67,938,209 $51,981,242 36,077,908 206,440,635 $3,714,879 $0 $0 $0 $55,696,121Chile 30,447,820 243,257,500 $18,673,671 $11,603,813 $7,069,858 18,327,896 98,635,986 $3,787,413 $0 $0 $0 $10,857,271Colombia 387,490,477 2,743,549,894 $197,633,500 $153,507,528 $44,125,972 15,215,814 106,641,630 $3,163,487 $0 $0 $0 $47,289,459Ecuador 87,573,449 633,655,690 $76,222,406 $69,762,961 $6,459,445 11,689,282 79,820,777 $4,556,117 $0 $0 $0 $11,015,562French Guiana 7,707,727 14,053,318 $1,804,744 $2,045,910 -$241,166 1 42,898 $3,549 $0 $0 $0 -$237,617Guyana 35,694,755 187,966,067 $42,439,514 $37,828,331 $4,611,183 5,230,409 15,940,661 $647,861 $0 $0 $0 $5,259,044Paraguay 9,773,103 67,346,164 $4,876,183 $4,047,069 $829,114 698,575 5,213,419 $263,102 $0 $0 $0 $1,092,216Peru 116,991,552 1,452,874,233 $57,911,187 $31,369,779 $26,541,408 23,143,516 184,888,602 $3,436,832 $0 $0 $0 $29,978,240Suriname 15,484,609 75,902,692 $6,407,072 $10,695,005 -$4,287,933 815,721 3,078,334 $158,502 $0 $0 $0 -$4,129,431Uruguay 11,153,481 77,717,424 $8,668,777 $5,159,978 $3,508,799 1,824,829 13,030,623 $257,833 $0 $0 $0 $3,766,632Venezuela 56,842,303 291,424,320 $30,381,739 $14,440,802 $15,940,937 23,419,858 114,421,756 $1,391,919 $0 $0 $0 $17,332,856
South America 1,174,386,231 8,039,342,243 $623,074,692 $443,240,483 $179,834,209 160,569,158 934,959,452 $23,437,743 $0 $0 $0 $203,271,952
Afghanistan 24,851,865 73,118,424 $14,339,020 $12,162,274 $2,176,746 39 14,359,407 $2,587,100 $0 $0 $0 $4,763,846Bangladesh 80,052,051 426,114,722 $13,636,962 $17,682,249 -$4,045,287 844,268 31,868,073 $929,219 $0 $0 $0 -$3,116,068Bhutan 181,519 662,146 $95,356 $68,545 $26,811 1 10,154 $1,234 $0 $0 $0 $28,045Brunei 2,910,572 12,150,595 $528,832 $375,782 $153,050 612,350 2,416,928 $39,487 $0 $0 $0 $192,537Burma 4,595,995 19,494,800 $4,638,064 $4,332,479 $305,585 1 168,404 $31,907 $0 $0 $0 $337,492Cambodia 13,812,326 132,661,760 $9,795,136 $7,593,691 $2,201,445 240,554 2,681,178 $128,829 $0 $0 $0 $2,330,274Chagos Archipelago 90,789 182,470 $142,508 $120,579 $21,929 1 103,294 $46,982 $0 $0 $0 $68,911China 156,290,532 1,025,427,568 $85,106,042 $33,978,243 $51,127,799 48,867,218 256,944,927 $9,444,156 $0 $0 $0 $60,571,955French Southern and Antarctic Lands 0 0 $0 $0 $0 0 0 $0 $0 $0 $0 $0Hong Kong 59,968,430 281,040,905 $17,402,382 $4,587,787 $12,814,595 51,056,282 219,461,016 $2,396,242 $0 $0 $0 $15,210,837India 2,200,980,455 8,443,462,782 $531,042,345 $315,723,463 $215,318,882 440,032,675 1,653,840,652 $24,969,061 $0 $0 $0 $240,287,943Indonesia 47,143,573 209,044,564 $20,200,008 $13,025,545 $7,174,463 5,920,227 26,035,609 $384,377 $0 $0 $0 $7,558,840Japan 125,378,057 687,825,494 $67,137,476 $42,696,788 $24,440,688 70,406,739 437,661,328 $11,995,341 $0 $0 $0 $36,436,029Korea, North 80,867 62,935 $42,132 $106,937 -$64,805 1 186 $67 $0 $0 $0 -$64,738Korea, South 221,133,081 583,793,115 $34,841,032 $19,652,354 $15,188,678 99,895,715 429,349,023 $11,712,527 $0 $0 $0 $26,901,205Laos 1,669,699 18,446,789 $925,579 $689,719 $235,860 3,205 5,635,616 $235,400 $0 $0 $0 $471,260Macau 2,603,240 9,531,028 $812,085 $762,109 $49,976 5,748,285 22,869,890 $480,546 $0 $0 $0 $530,522Malaysia 96,642,150 306,819,260 $20,371,509 $11,113,903 $9,257,606 15,585,520 68,180,834 $1,145,138 $0 $0 $0 $10,402,744Maldives 495,739 1,240,911 $248,737 $188,750 $59,987 65,001 208,047 $3,199 $0 $0 $0 $63,186Mongolia 2,220,905 12,297,334 $1,553,113 $1,200,968 $352,145 144,907 528,114 $14,856 $0 $0 $0 $367,001Nepal 42,477,583 121,637,404 $17,166,934 $16,900,779 $266,155 2,999,886 6,311,768 $242,397 $0 $0 $0 $508,552Pakistan 76,216,401 555,756,483 $43,298,953 $33,342,625 $9,956,328 14,572,154 143,751,582 $3,748,332 $0 $0 $0 $13,704,660
- Switched Services Page 77 -

2008 Annual Section 43.61 International Traffic Data for All U.S. Points: Non-Traditional Settlement ArrangementsTable A24: All United States Carriers Message Telephone Service Billing Types Covered: 11, 12, 14, 15
International Point Traffic Billed in the United States Traffic Billed in Foreign Countries TotalOriginating or Terminating Transiting the United States U.S.
in the United States (by Country of Origin) CarriersNumber Number U.S. Payout Retained Number Number Receipts Number Receipts Payout Retained Retained
of of Carriers to Foreign Revenues of of from Foreign of from Foreign to Foreign Revenues RevenuesMessages Minutes Revenues Carriers Messages Minutes Carriers Minutes Carriers Carriers
Philippines 427,283,814 2,956,478,095 $355,622,148 $317,926,446 $37,695,702 42,459,488 178,454,229 $6,310,366 $0 $0 $0 $44,006,068Singapore 61,858,564 343,533,897 $26,004,344 $6,123,550 $19,880,794 24,849,177 123,731,981 $1,732,555 $0 $0 $0 $21,613,349Sri Lanka 61,927,087 385,937,888 $31,330,752 $27,797,226 $3,533,526 2,341,134 13,520,355 $446,519 $0 $0 $0 $3,980,045Taiwan 123,726,141 583,157,734 $44,843,615 $35,143,189 $9,700,426 47,488,609 203,244,117 $5,426,399 $0 $0 $0 $15,126,825Thailand 64,508,009 284,102,356 $12,134,691 $6,581,405 $5,553,286 15,253,724 250,932,241 $2,926,887 $0 $0 $0 $8,480,173Vietnam 22,371,013 184,912,600 $11,458,229 $8,953,412 $2,504,817 6,831,108 50,167,909 $1,878,048 $0 $0 $0 $4,382,865
Asia 3,921,470,457 17,658,894,059 $1,364,717,984 $938,830,797 $425,887,187 896,218,269 4,142,436,862 $89,257,171 $0 $0 $0 $515,144,358
Australia 265,464,507 801,125,346 $60,376,298 $19,592,635 $40,783,663 88,586,311 483,181,213 $5,194,463 $0 $0 $0 $45,978,126Cook Islands 142,556 487,539 $262,048 $230,223 $31,825 1 1,465 $649 $0 $0 $0 $32,474Fiji 5,708,824 40,629,997 $7,798,548 $7,163,067 $635,481 372,636 3,585,703 $253,152 $0 $0 $0 $888,633French Polynesia 3,316,798 11,226,893 $2,382,297 $1,888,922 $493,375 138,006 509,387 $21,468 $0 $0 $0 $514,843Kiribati 116,230 483,414 $211,814 $179,191 $32,623 1 609 $314 $0 $0 $0 $32,937Marshall Islands 56,226,171 5,237,132 $2,038,301 $876,815 $1,161,486 6,652 21,828 $2,103 $0 $0 $0 $1,163,589Micronesia, Federated States of 973,409 5,847,054 $939,793 $476,116 $463,677 446 4,326 $556 $0 $0 $0 $464,233Nauru 20,044 48,465 $36,499 $230,747 -$194,248 1 42 $28 $0 $0 $0 -$194,220New Caledonia 723,761 2,275,227 $531,613 $452,628 $78,985 1 16,234 $3,322 $0 $0 $0 $82,307New Zealand 34,840,041 218,381,429 $19,305,117 $12,661,844 $6,643,273 10,941,177 87,486,470 $1,281,894 $0 $0 $0 $7,925,167Niue 9,766 43,991 $23,865 $22,636 $1,229 1 737 $344 $0 $0 $0 $1,573Norfolk Island 9,979 22,205 $16,220 $11,726 $4,494 1 66 $47 $0 $0 $0 $4,541Pacific Islands (Palau) 681,375 2,837,678 $714,288 $485,574 $228,714 1 1,975 $402 $0 $0 $0 $229,116Papua New Guinea 984,142 2,646,256 $1,365,239 $1,212,673 $152,566 1 6,530 $2,253 $0 $0 $0 $154,819Solomon Islands 148,775 356,899 $265,748 $323,321 -$57,573 1 1,335 $551 $0 $0 $0 -$57,022Tonga 2,351,593 19,502,806 $3,374,666 $2,957,425 $417,241 193,164 1,170,067 $54,707 $0 $0 $0 $471,948Tuvalu 15,026 57,665 $27,431 $97,133 -$69,702 0 0 $0 $0 $0 $0 -$69,702Vanuatu 180,233 452,479 $177,971 $164,370 $13,601 1 2,769 $1,224 $0 $0 $0 $14,825Wallis and Futuna 33,649 173,576 $67,705 $64,820 $2,885 1 744 $276 $0 $0 $0 $3,161Western Samoa 505,847 2,942,888 $884,102 $758,004 $126,098 1 99,265 $31,887 $0 $0 $0 $157,985
American Samoa 1,445,765 7,607,726 $494,280 $420,610 $73,670 1 20,923 $1,043 $0 $0 $0 $74,713Baker Island 0 0 $0 $0 $0 0 0 $0 $0 $0 $0 $0Guam 6,427,755 40,359,253 $1,609,082 $430,666 $1,178,416 2,048,578 12,875,803 $142,962 $0 $0 $0 $1,321,378Hawaii 382,647 2,272,683 $131,089 $40,035 $91,054 0 0 $0 $0 $0 $0 $91,054Howland Island 0 0 $0 $0 $0 0 0 $0 $0 $0 $0 $0Jarvis Island 0 0 $0 $0 $0 0 0 $0 $0 $0 $0 $0Johnston Atoll 0 0 $0 $0 $0 0 0 $0 $0 $0 $0 $0Kingman Reef 0 0 $0 $0 $0 0 0 $0 $0 $0 $0 $0Midway Atoll 4 2 $2 $2 $0 0 0 $0 $0 $0 $0 $0Northern Mariana Islands 2,227,712 11,399,325 $583,440 $134,324 $449,116 21,873 135,308 $2,091 $0 $0 $0 $451,207Palmyra Atoll 0 0 $0 $0 $0 0 0 $0 $0 $0 $0 $0Wake Island 0 0 $0 $0 $0 0 0 $0 $0 $0 $0 $0
Oceania 382,936,609 1,176,417,928 $103,617,456 $50,875,507 $52,741,949 102,308,856 589,122,799 $6,995,736 $0 $0 $0 $59,737,685
Albania 13,771,355 68,785,932 $10,396,351 $9,612,040 $784,311 291,534 2,696,024 $134,709 $0 $0 $0 $919,020Armenia 9,105,885 55,347,858 $3,193,057 $3,281,821 -$88,764 165,916 1,187,474 $15,137 $0 $0 $0 -$73,627Azerbaijan 15,848,079 33,880,812 $4,301,283 $3,738,656 $562,627 723,255 2,448,261 $53,349 $0 $0 $0 $615,976Belarus 17,064,394 81,522,819 $15,336,108 $14,714,386 $621,722 641,962 2,820,316 $103,215 $0 $0 $0 $724,937
- Switched Services Page 78 -

2008 Annual Section 43.61 International Traffic Data for All U.S. Points: Non-Traditional Settlement ArrangementsTable A24: All United States Carriers Message Telephone Service Billing Types Covered: 11, 12, 14, 15
International Point Traffic Billed in the United States Traffic Billed in Foreign Countries TotalOriginating or Terminating Transiting the United States U.S.
in the United States (by Country of Origin) CarriersNumber Number U.S. Payout Retained Number Number Receipts Number Receipts Payout Retained Retained
of of Carriers to Foreign Revenues of of from Foreign of from Foreign to Foreign Revenues RevenuesMessages Minutes Revenues Carriers Messages Minutes Carriers Minutes Carriers Carriers
Bosnia and Herzegovina 7,008,878 55,272,541 $8,687,807 $7,771,587 $916,220 168,972 1,858,398 $68,549 $0 $0 $0 $984,769Bulgaria 18,921,898 86,927,059 $16,289,567 $13,812,209 $2,477,358 1,625,963 11,610,244 $256,577 $0 $0 $0 $2,733,935Croatia 5,059,195 38,809,616 $3,735,004 $2,014,181 $1,720,823 901,596 5,816,543 $102,359 $0 $0 $0 $1,823,182Czech Republic 18,108,778 79,161,858 $12,855,718 $8,314,076 $4,541,642 3,521,286 16,552,898 $293,066 $0 $0 $0 $4,834,708Estonia 3,001,903 14,395,317 $2,919,726 $2,023,957 $895,769 228,706 982,474 $18,934 $0 $0 $0 $914,703Georgia 19,073,667 55,582,541 $5,017,414 $4,212,248 $805,166 382,065 1,514,997 $34,123 $0 $0 $0 $839,289Hungary 13,148,012 100,165,333 $9,052,111 $4,062,332 $4,989,779 883,434 6,889,705 $118,557 $0 $0 $0 $5,108,336Kazakhstan 7,029,977 39,512,026 $4,113,913 $3,374,496 $739,417 241,159 1,322,914 $22,998 $0 $0 $0 $762,415Kyrgyzstan 1,014,350 3,839,171 $386,367 $316,469 $69,898 1 111,606 $8,878 $0 $0 $0 $78,776Latvia 3,072,992 16,360,751 $1,764,742 $1,199,657 $565,085 375,985 2,132,545 $29,271 $0 $0 $0 $594,356Lithuania 3,811,498 24,153,377 $3,890,814 $2,366,359 $1,524,455 454,682 2,576,095 $59,418 $0 $0 $0 $1,583,873Moldova 6,099,576 19,057,642 $3,139,620 $2,042,661 $1,096,959 944 331,407 $28,529 $0 $0 $0 $1,125,488Poland 145,952,860 543,398,164 $39,910,442 $23,135,260 $16,775,182 6,960,212 32,152,894 $399,288 $0 $0 $0 $17,174,470Romania 14,392,148 108,879,469 $9,584,449 $4,489,812 $5,094,637 4,051,578 31,380,075 $622,812 $0 $0 $0 $5,717,449Russia 79,425,724 422,601,309 $30,223,381 $14,487,443 $15,735,938 14,377,616 63,753,456 $1,123,599 $0 $0 $0 $16,859,537Serbia 24,355,742 182,083,420 $19,254,823 $16,475,461 $2,779,362 1,099,579 8,200,669 $272,551 $0 $0 $0 $3,051,913Slovakia 5,466,618 28,279,521 $3,051,290 $1,692,116 $1,359,174 816,388 6,011,539 $81,946 $0 $0 $0 $1,441,120Slovenia 3,277,079 15,792,677 $2,844,463 $2,208,660 $635,803 340,594 1,923,346 $39,993 $0 $0 $0 $675,796Tajikistan 1,871,042 5,595,001 $457,653 $392,405 $65,248 1 70,451 $5,349 $0 $0 $0 $70,597Turkmenistan 549,120 2,377,729 $254,098 $198,353 $55,745 0 0 $0 $0 $0 $0 $55,745Ukraine 36,685,353 199,298,781 $22,154,243 $15,800,483 $6,353,760 3,617,418 14,661,131 $374,969 $0 $0 $0 $6,728,729Uzbekistan 70,291,143 190,335,339 $11,854,472 $9,450,250 $2,404,222 260,133 945,672 $35,384 $0 $0 $0 $2,439,606
Eastern Europe 543,407,266 2,471,416,063 $244,668,916 $171,187,378 $73,481,538 42,130,979 219,951,134 $4,303,560 $0 $0 $0 $77,785,098
Antarctica 205 527 $475 $356 $119 0 0 $0 $0 $0 $0 $119Maritime - Atlantic 74,202 279,622 $436,155 $324,291 $111,864 0 0 $0 $0 $0 $0 $111,864Maritime - other oceans 1,184,230 876,509 $2,100,616 $1,026,840 $1,073,776 1 3,974 $5,531 $0 $0 $0 $1,079,307Maritime - Pacific 80,283 156,441 $389,469 $208,895 $180,574 0 0 $0 $0 $0 $0 $180,574
Other Regions 1,338,920 1,313,099 $2,926,715 $1,560,382 $1,366,333 1 3,974 $5,531 $0 $0 $0 $1,371,864
American Samoa 206,998 1,486,194 $154,598 $149,711 $4,887 567 2,472 $25 $0 $0 $0 $4,912Baker Island 0 0 $0 $0 $0 0 0 $0 $0 $0 $0 $0Howland Island 0 0 $0 $0 $0 0 0 $0 $0 $0 $0 $0Jarvis Island 0 0 $0 $0 $0 0 0 $0 $0 $0 $0 $0Johnston Atoll 0 0 $0 $0 $0 0 0 $0 $0 $0 $0 $0Kingman Reef 0 0 $0 $0 $0 0 0 $0 $0 $0 $0 $0Midway Atoll 0 0 $0 $0 $0 0 0 $0 $0 $0 $0 $0Navassa Island 0 0 $0 $0 $0 0 0 $0 $0 $0 $0 $0Northern Mariana Islands 3,186,393 25,479,254 $4,692,091 $2,707,404 $1,984,687 295,240 1,193,225 $165,089 $0 $0 $0 $2,149,776Palmyra Atoll 0 0 $0 $0 $0 0 0 $0 $0 $0 $0 $0Wake Island 0 0 $0 $0 $0 0 0 $0 $0 $0 $0 $0
Carriers serving Misc. U.S. points 3,393,391 26,965,448 $4,846,689 $2,857,115 $1,989,574 295,807 1,195,697 $165,114 $0 $0 $0 $2,154,688
Total for Foreign Points 14,117,337,010 70,440,072,067 $6,184,077,413 $4,135,545,083 $2,048,532,330 6,124,312,004 24,097,281,743 $338,842,955 $0 $0 $0 $2,387,375,285
Total for U.S. Points 20,109,881 126,869,801 $5,762,548 $1,587,284 $4,175,264 2,070,453 13,187,373 $147,569 $0 $0 $0 $4,322,833
World Total 14,137,446,891 70,566,941,868 $6,189,839,961 $4,137,132,367 $2,052,707,594 6,126,382,457 24,110,469,116 $338,990,524 0 $0 $0 $0 $2,391,698,118
- Switched Services Page 79 -

2008 Annual Section 43.61 International Traffic Data for All U.S. Points: All Settlement ArrangementsTable A25: All United States Carriers Message Telephone Service Billing Types Covered: 1, 2, 3, 11, 12
International Point Traffic Billed in the United States Traffic Billed in Foreign Countries TotalOriginating or Terminating Transiting the United States U.S.
in the United States (by Country of Origin) CarriersNumber Number U.S. Payout Retained Number Number Receipts Number Receipts Payout Retained Retained
of of Carriers to Foreign Revenues of of from Foreign of from Foreign to Foreign Revenues RevenuesMessages Minutes Revenues Carriers Messages Minutes Carriers Minutes Carriers Carriers
Andorra 120,089 401,290 $54,289 $51,280 $3,009 1 14,790 $977 $60 $21 $39 $4,025
Austria 24,687,131 119,618,900 $13,420,572 $9,182,252 $4,238,320 11,398,205 54,563,445 $1,825,474 $840,463 $21,995 $818,468 $6,882,262
Belgium 49,166,949 188,073,428 $17,026,061 $8,436,090 $8,589,971 49,249,077 162,417,011 $2,150,480 $19,473,691 $7,427 $19,466,264 $30,206,715
Cyprus 5,594,708 22,234,320 $1,684,360 $563,499 $1,120,861 1,860,705 7,579,010 $104,905 $124,472 $302 $124,170 $1,349,936
Denmark 21,062,162 106,381,288 $9,213,318 $4,779,758 $4,433,560 4,341,955 27,575,429 $614,610 $4,535,307 $5,066 $4,530,241 $9,578,411
Finland 8,594,804 44,490,373 $4,743,617 $2,793,314 $1,950,303 1,375,213 7,395,967 $112,233 $7,325 $15,270 -$7,945 $2,054,591
France 113,437,381 526,726,339 $57,160,555 $23,409,334 $33,751,221 100,026,394 506,728,922 $8,033,986 $20,258,689 $53,277 $20,205,412 $61,990,619
Germany 190,272,490 1,059,022,995 $86,130,697 $23,060,043 $63,070,654 149,485,741 940,260,553 $14,713,835 $35,996,200 $186,276 $35,809,924 $113,594,413
Gibraltar 332,821 1,292,902 $103,639 $63,769 $39,870 77,848 309,132 $4,232 $5,536 $1,631 $3,905 $48,007
Greece 27,960,633 197,343,642 $18,267,957 $8,707,990 $9,559,967 16,349,272 87,764,037 $2,322,088 $14,842,460 $17,500 $14,824,960 $26,707,015
Greenland 107,346 130,180 $57,389 $42,360 $15,029 1 2,628 $1,288 $237 $41 $196 $16,513
Iceland 2,497,517 12,818,077 $1,608,913 $940,791 $668,122 1,104,190 5,345,870 $111,995 $1,130 $1,326 -$196 $779,921
Ireland 51,488,007 302,846,918 $32,506,491 $11,978,521 $20,527,970 37,271,582 239,945,014 $5,300,736 $7,231,516 $2,526 $7,228,990 $33,057,696
Italy 119,617,642 598,951,981 $53,392,837 $29,339,095 $24,053,742 53,453,247 300,230,097 $4,917,768 $59,271,349 $39,841 $59,231,508 $88,203,018
Liechtenstein 13,516,461 19,277,421 $7,653,797 $5,596,444 $2,057,353 9 72,060 $19,353 $37,585 $977 $36,608 $2,113,314
Luxembourg 8,766,091 27,387,416 $2,238,127 $761,705 $1,476,422 1,618,730 9,658,778 $141,362 $2,942,259 $382 $2,941,877 $4,559,661
Malta 3,470,358 19,566,407 $1,190,696 $837,455 $353,241 274,089 2,161,818 $42,666 $1,682 $3,532 -$1,850 $394,057
Netherlands 135,659,965 653,835,079 $34,183,362 $17,414,865 $16,768,497 36,203,006 163,588,207 $2,199,989 $55,383,000 $240,987 $55,142,013 $74,110,499
Norway 23,415,866 100,704,837 $10,355,924 $5,989,282 $4,366,642 17,368,539 90,712,491 $823,465 $4,836,514 $153 $4,836,361 $10,026,468
Portugal 14,247,491 126,418,388 $10,734,777 $4,318,796 $6,415,981 7,747,876 48,564,962 $905,786 $2,808,501 $2,185 $2,806,316 $10,128,083
Spain 98,518,040 373,549,378 $42,821,434 $23,066,077 $19,755,357 41,511,699 177,779,349 $2,543,318 $53,515,950 $62,253 $53,453,697 $75,752,372
Sweden 29,941,815 208,578,180 $17,151,501 $8,838,600 $8,312,901 27,621,521 179,774,704 $2,229,430 $18,434,643 $1,553 $18,433,090 $28,975,421
Switzerland 48,304,917 265,155,187 $25,360,312 $14,634,158 $10,726,154 139,347,882 288,772,513 $3,632,511 $18,879,517 $15,021 $18,864,496 $33,223,161
Turkey 23,424,173 145,916,920 $14,760,164 $6,864,386 $7,895,778 5,923,075 33,211,165 $516,514 $938,786 $3,717 $935,069 $9,347,361
United Kingdom 1,208,417,640 2,614,047,763 $221,094,131 $72,306,602 $148,787,529 552,521,046 1,644,262,881 $17,487,561 $85,627,679 $72,628 $85,555,051 $251,830,141
Western Europe 2,222,622,497 7,734,769,609 $682,914,920 $283,976,466 $398,938,454 1,256,130,903 4,978,690,833 $70,756,562 3,574,134,671 $405,994,551 $755,887 $405,238,664 $874,933,680
Algeria 9,692,560 31,608,348 $4,120,494 $3,449,034 $671,460 194,376 18,448,334 $1,325,064 $878 $8,498 -$7,620 $1,988,904
Angola 12,255,566 42,543,892 $8,791,748 $5,667,222 $3,124,526 224,870 1,139,967 $42,677 $98,975 $127 $98,848 $3,266,051
Benin 8,100,006 25,013,085 $4,491,203 $4,026,841 $464,362 413,622 1,490,000 $70,480 $851,118 $347 $850,771 $1,385,613
Botswana 3,107,204 10,416,449 $1,452,429 $1,077,808 $374,621 251,917 1,506,039 $77,392 $450 $11,280 -$10,830 $441,183
Burkina 16,428,236 34,585,392 $5,502,650 $4,503,159 $999,491 14,751,519 75,644,993 $102,122 $34,762 $87,034 -$52,272 $1,049,341Burundi 855,234 4,644,298 $516,834 $271,772 $245,062 1 275,454 $20,539 $684 $20,975 -$20,291 $245,310Cameroon 11,046,447 55,183,803 $11,386,376 $9,170,830 $2,215,546 377,780 2,475,658 $224,993 $4,334 $1,306 $3,028 $2,443,567Canary Island 0 0 $0 $0 $0 0 0 $0 $0 $0 $0 $0
Cape Verde 6,592,241 32,492,573 $6,097,771 $5,494,864 $602,907 120,918 809,775 $31,844 $17,417 $137 $17,280 $652,031
Central African Republic 369,448 1,307,000 $388,341 $353,742 $34,599 1 9,791 $2,390 $10 $6 $4 $36,993
Chad 5,674,203 10,076,026 $1,202,976 $957,027 $245,949 1 151,738 $16,193 $1,468 $4 $1,464 $263,606
Comoros 1,767,501 5,260,450 $1,656,815 $1,654,759 $2,056 2 31,281 $8,767 $798 $204 $594 $11,417
Congo 7,089,758 30,111,640 $3,453,909 $2,969,133 $484,776 1 744,246 $70,190 $3,628 $742 $2,886 $557,852
Cote d'Ivoire 11,956,401 50,263,530 $9,618,083 $7,138,692 $2,479,391 701,209 1,834,579 $99,210 $2,670,368 $1,271 $2,669,097 $5,247,698
Djibouti 1,096,778 3,519,629 $1,050,145 $789,146 $260,999 222,403 815,509 $73,899 $776 $1 $775 $335,673
Egypt 49,966,500 219,686,606 $26,089,737 $19,792,077 $6,297,660 10,478,249 30,498,909 $703,630 $52,881 $6,958 $45,923 $7,047,213
Equatorial Guinea 1,522,287 4,615,123 $1,015,849 $822,318 $193,531 32,616 121,315 $8,986 $974 $14 $960 $203,477
- Switched Services Page 80 -

2008 Annual Section 43.61 International Traffic Data for All U.S. Points: All Settlement ArrangementsTable A25: All United States Carriers Message Telephone Service Billing Types Covered: 1, 2, 3, 11, 12
International Point Traffic Billed in the United States Traffic Billed in Foreign Countries TotalOriginating or Terminating Transiting the United States U.S.
in the United States (by Country of Origin) CarriersNumber Number U.S. Payout Retained Number Number Receipts Number Receipts Payout Retained Retained
of of Carriers to Foreign Revenues of of from Foreign of from Foreign to Foreign Revenues RevenuesMessages Minutes Revenues Carriers Messages Minutes Carriers Minutes Carriers Carriers
Ethiopia 32,720,605 155,678,839 $30,788,032 $28,030,109 $2,757,923 890,911 5,427,834 $536,630 $65,006 $41,948 $23,058 $3,317,611
Gabon 9,432,277 25,787,580 $2,453,191 $3,115,793 -$662,602 393,886 1,445,849 $54,787 $1,898,256 $93 $1,898,163 $1,290,348
Gambia, The 4,868,547 17,811,996 $4,820,122 $4,206,528 $613,594 1 1,227,183 $303,574 $2,717 $17,420 -$14,703 $902,465
Ghana 49,798,756 319,245,384 $46,453,007 $33,101,077 $13,351,930 4,033,458 38,491,943 $2,066,933 $48,565 $3,028 $45,537 $15,464,400
Guinea 8,929,310 34,268,549 $6,370,920 $5,070,136 $1,300,784 1 2,387,151 $339,865 $1,988 $19,485 -$17,497 $1,623,152
Guinea-Bissau 2,094,027 5,562,135 $3,205,024 $2,000,745 $1,204,279 1 10,138 $4,047 $171 $136 $35 $1,208,361
Kenya 8,193,781 53,223,217 $7,965,767 $4,556,696 $3,409,071 289,519 4,506,938 $257,616 $3,588 $272 $3,316 $3,670,003
Lesotho 212,272 1,264,472 $276,492 $219,080 $57,412 35,636 168,984 $4,072 $54,200 $32,931 $21,269 $82,753
Liberia 6,415,504 25,771,607 $5,028,195 $4,192,963 $835,232 1 181,222 $30,866 $2,657 $190 $2,467 $868,565
Libya 13,932,742 30,995,505 $6,522,424 $4,846,712 $1,675,712 21,388 470,407 $82,589 $2,979 $226 $2,753 $1,761,054
Madagascar 3,106,050 12,052,645 $2,512,779 $3,813,420 -$1,300,641 1 269,366 $37,547 $12,849 $269 $12,580 -$1,250,514
Malawi 3,868,365 17,776,979 $2,227,405 $2,043,664 $183,741 73,059 850,390 $67,720 $2,521 $16 $2,505 $253,966
Mali 12,613,984 36,384,466 $6,802,554 $6,195,486 $607,068 647,005 5,243,264 $723,018 $31,664 $588 $31,076 $1,361,162
Mauritania 1,621,144 6,083,325 $1,116,683 $953,120 $163,563 51,084 586,718 $40,394 $1,226 $2 $1,224 $205,181
Mauritius 11,131,202 31,435,284 $909,012 $392,053 $516,959 190,136 8,049,171 $525,185 $177,104 $2,183 $174,921 $1,217,065
Morocco 20,042,108 89,667,141 $19,156,498 $16,472,786 $2,683,712 3,268,854 17,392,924 $936,377 $10,972 $2,828 $8,144 $3,628,233
Mozambique 3,733,420 6,821,778 $1,188,808 $636,103 $552,705 146,570 938,210 $22,829 $327 $16 $311 $575,845
Namibia 860,476 3,615,750 $638,015 $395,794 $242,221 141,834 1,138,923 $44,204 $377 $8,438 -$8,061 $278,364
Niger 11,143,918 28,412,800 $3,158,100 $2,416,784 $741,316 1 273,981 $25,331 $4 $2 $2 $766,649
Nigeria 112,215,041 635,822,667 $76,867,486 $58,323,364 $18,544,122 28,781,084 63,493,487 $1,172,846 $4,061,973 $19,228 $4,042,745 $23,759,713
Reunion 1,118,871 5,013,595 $772,271 $1,029,868 -$257,597 1 28,296 $3,345 $92 $20 $72 -$254,180
Rwanda 454,410 2,977,920 $464,535 $255,010 $209,525 1 644,828 $53,912 $649 $12 $637 $264,074
Saint Helena 24,364 38,351 $28,924 $17,298 $11,626 73 379 $82 $323 $155 $168 $11,876Sao Tome and Principe 2,662,867 5,215,981 $4,305,513 $3,652,338 $653,175 1 569 $241 $1,238 $80 $1,158 $654,574Senegal 16,472,806 78,584,774 $15,513,505 $11,562,768 $3,950,737 3,108,949 12,543,924 $730,108 $18,874 $46,303 -$27,429 $4,653,416Seychelles 370,467 1,630,339 $223,016 $98,405 $124,611 1 273,833 $17,840 $23,023 $79 $22,944 $165,395
Sierra Leone 8,959,863 51,294,764 $14,572,566 $12,189,447 $2,383,119 4,087,764 8,062,085 $599,257 $53,176 $12,396 $40,780 $3,023,156
Somalia 7,262,433 15,902,852 $6,053,751 $5,717,698 $336,053 1,195,698 1,377,977 $84,901 $34,186 $64 $34,122 $455,076
South Africa 34,920,037 186,141,419 $24,332,302 $12,222,066 $12,110,236 49,937,020 149,495,083 $1,525,673 $12,695,606 $4,832 $12,690,774 $26,326,683
Sudan 5,211,126 31,333,501 $3,984,071 $2,593,429 $1,390,642 246,676 6,269,905 $395,271 $130,349 $110,245 $20,104 $1,806,017
Swaziland 570,114 2,477,135 $443,044 $247,439 $195,605 86,843 337,722 $7,843 $117 $436 -$319 $203,129
Tanzania 4,719,961 26,645,994 $3,979,998 $2,273,507 $1,706,491 169,036 4,006,163 $318,172 $415,983 $9,183 $406,800 $2,431,463
Togo 8,610,241 23,056,968 $5,704,141 $5,153,255 $550,886 59,579 1,883,397 $452,441 $170,667 $91 $170,576 $1,173,903
Tunisia 11,405,975 47,945,725 $11,239,904 $10,789,440 $450,464 999,779 4,338,285 $503,619 $31,006 $61,008 -$30,002 $924,081
Uganda 8,428,697 50,724,244 $6,523,153 $4,182,140 $2,341,013 710,201 3,774,418 $200,706 $976,416 $108 $976,308 $3,518,027
Western Sahara 0 0 $0 $0 $0 0 0 $0 $0 $0 $0 $0
Zaire 3,994,068 16,630,034 $3,880,219 $2,894,211 $986,008 2,881,053 11,624,866 $620,114 $6,197,152 $0 $6,197,152 $7,803,274
Zambia 5,632,672 35,349,487 $3,845,577 $3,093,236 $752,341 368,389 2,046,147 $87,681 $454,348 $25 $454,323 $1,294,345
Zimbabwe 7,735,817 28,719,979 $5,020,287 $4,121,872 $898,415 448,110 5,048,570 $238,128 $2,345 $16,317 -$13,972 $1,122,571
Africa 593,008,688 2,708,693,025 $426,182,651 $331,214,264 $94,968,387 131,033,089 500,308,118 $15,994,140 249,804,255 $31,324,215 $549,557 $30,774,658 $141,737,185
Bahrain 4,379,446 14,541,448 $2,337,143 $747,398 $1,589,745 2,548,187 7,688,885 $71,423 $527,490 $108,325 $419,165 $2,080,333
Iran 27,505,411 94,581,127 $9,733,009 $7,457,206 $2,275,803 5,169,632 25,589,140 $783,803 $31,778 $150,980 -$119,202 $2,940,404
Iraq 17,417,911 79,179,564 $9,286,945 $5,459,045 $3,827,900 8,613 12,814,203 $929,865 $8,830 $517 $8,313 $4,766,078
Israel 74,852,458 455,263,953 $65,814,201 $21,963,571 $43,850,630 73,927,544 359,680,713 $3,340,051 $3,867,300 $171,235 $3,696,065 $50,886,746
- Switched Services Page 81 -

2008 Annual Section 43.61 International Traffic Data for All U.S. Points: All Settlement ArrangementsTable A25: All United States Carriers Message Telephone Service Billing Types Covered: 1, 2, 3, 11, 12
International Point Traffic Billed in the United States Traffic Billed in Foreign Countries TotalOriginating or Terminating Transiting the United States U.S.
in the United States (by Country of Origin) CarriersNumber Number U.S. Payout Retained Number Number Receipts Number Receipts Payout Retained Retained
of of Carriers to Foreign Revenues of of from Foreign of from Foreign to Foreign Revenues RevenuesMessages Minutes Revenues Carriers Messages Minutes Carriers Minutes Carriers Carriers
Jordan 9,012,505 60,172,461 $5,381,997 $2,676,912 $2,705,085 4,918,526 29,449,586 $495,279 $2,517,162 $183,439 $2,333,723 $5,534,087
Kuwait 27,465,990 77,649,773 $6,825,663 $5,475,919 $1,349,744 6,043,506 26,329,201 $273,696 $14,481 $2,528 $11,953 $1,635,393
Lebanon 36,005,821 223,250,263 $25,416,817 $21,083,459 $4,333,358 3,000,703 25,322,081 $1,189,963 $30,724 $8,544 $22,180 $5,545,501
Oman 19,784,513 51,241,808 $7,791,612 $6,569,911 $1,221,701 929,978 5,005,762 $242,990 $28,031 $1,348 $26,683 $1,491,374
Qatar 9,007,297 27,808,288 $5,462,715 $4,016,445 $1,446,270 3,641,996 12,514,494 $185,048 $511,318 $7,189 $504,129 $2,135,447
Saudi Arabia 46,072,109 162,067,754 $23,977,888 $15,801,082 $8,176,806 17,865,622 65,627,680 $948,096 $616,125 $174,190 $441,935 $9,566,837
Syria 17,439,027 78,110,673 $12,303,072 $9,267,097 $3,035,975 1,388,295 11,426,903 $1,029,420 $8,319 $615 $7,704 $4,073,099
United Arab Emirates 66,736,345 223,941,731 $37,499,173 $28,508,953 $8,990,220 23,843,429 93,573,750 $1,041,795 $906,837 $27,976 $878,861 $10,910,876
Yemen 15,568,396 60,246,322 $7,667,631 $6,489,050 $1,178,581 1,813,679 4,162,776 $202,088 $7,896 $5,161 $2,735 $1,383,404
Middle East 371,247,229 1,608,055,165 $219,497,866 $135,516,048 $83,981,818 145,099,710 679,185,174 $10,733,517 137,029,595 $9,076,291 $842,047 $8,234,244 $102,949,579
Anguilla 1,689,964 4,710,798 $1,046,413 $669,240 $377,173 356,828 1,063,056 $10,404 $204,634 $92,383 $112,251 $499,828
Antigua and Barbuda 6,096,498 24,773,367 $3,576,933 $16,963,351 -$13,386,418 1,334,559 3,858,398 $52,596 $103,406 $36,190 $67,216 -$13,266,606
Aruba 5,084,108 16,280,322 $2,812,609 $1,901,934 $910,675 2,708,045 7,576,669 $69,952 $198,766 $93,192 $105,574 $1,086,201
Bahamas, The 33,217,564 121,271,312 $9,009,842 $2,934,537 $6,075,305 23,903,918 69,748,506 $784,422 $3,606,789 $1,925 $3,604,864 $10,464,591
Barbados 10,494,912 46,980,312 $7,112,763 $4,629,776 $2,482,987 11,458,877 43,278,096 $861,034 $648,836 $27,484 $621,352 $3,965,373
Bermuda 11,340,661 37,749,750 $3,793,574 $1,274,894 $2,518,680 6,446,800 37,326,829 $405,595 $5,994 $1,259 $4,735 $2,929,010
Cayman Islands 10,560,385 29,299,361 $4,917,027 $2,597,786 $2,319,241 4,015,466 13,579,909 $221,128 $20,476 $8,392 $12,084 $2,552,453
Cuba 47,468,269 188,157,243 $159,144,215 $141,381,341 $17,762,874 2 1,071,641 $812,620 $23,002 $16,650 $6,352 $18,581,846
Dominica 8,742,451 49,204,965 $4,949,358 $4,282,546 $666,812 708,083 2,206,143 $46,782 $256,762 $120,398 $136,364 $849,958
Dominican Republic 234,274,298 1,751,003,351 $126,934,304 $81,497,335 $45,436,969 110,754,849 273,870,933 $4,069,605 $3,342,431 $652,293 $2,690,138 $52,196,712
French Overseas Departments 1,873,123 5,435,680 $1,969,148 $924,831 $1,044,317 462,974 3,324,612 $37,573 $14,405 $7,087 $7,318 $1,089,208
Grenada 5,304,431 41,562,915 $5,871,859 $4,304,933 $1,566,926 916,847 13,082,381 $317,441 $31,254 $14,229 $17,025 $1,901,392
Guadeloupe 4,338,373 12,445,341 $1,690,470 $1,471,528 $218,942 1 36,409 $6,935 $487,818 $225,046 $262,772 $488,649
Haiti 101,772,567 505,932,504 $92,776,562 $110,133,774 -$17,357,212 15,272,838 39,081,482 $2,534,822 $7,367,396 $5,245,020 $2,122,376 -$12,700,014
Jamaica 128,896,935 567,021,210 $84,731,434 $63,883,448 $20,847,986 71,834,108 257,574,336 $3,787,725 $2,649,098 $376,347 $2,272,751 $26,908,462
Montserrat 408,246 2,416,888 $328,118 $240,863 $87,255 8,740 29,970 $1,678 $11,501 $3,474 $8,027 $96,960
Netherlands Antilles 9,712,345 34,773,522 $4,564,277 $2,698,878 $1,865,399 6,102,668 18,987,178 $196,670 $4,016,277 $3,097,933 $918,344 $2,980,413
Saint Kitts and Nevis 3,938,522 16,580,970 $3,077,779 $2,028,863 $1,048,916 292,624 948,629 $15,748 $182,110 $85,736 $96,374 $1,161,038
Saint Lucia 5,610,303 30,292,666 $4,485,357 $3,149,244 $1,336,113 854,671 3,967,956 $157,806 $125,348 $55,954 $69,394 $1,563,313
Saint Vincent and the Grenadines 3,502,739 23,124,400 $3,227,330 $2,616,194 $611,136 109,622 2,164,334 $211,281 $58,324 $28,752 $29,572 $851,989
Trinidad and Tobago 37,819,249 220,644,217 $29,813,059 $15,572,715 $14,240,344 33,923,759 145,411,036 $1,574,629 $589,021 $77,393 $511,628 $16,326,601
Turks and Caicos Islands 6,470,133 16,019,599 $3,237,345 $2,433,654 $803,691 1,496,813 3,681,214 $57,096 $6,457 $3,533 $2,924 $863,711
Virgin Islands, British 4,148,830 15,048,178 $3,393,273 $1,686,773 $1,706,500 4,716,117 15,032,573 $261,948 $38,324 $22,821 $15,503 $1,983,951
Navassa Island 0 0 $0 $0 $0 0 0 $0 $0 $0 $0 $0Puerto Rico 3,336 40,092 $1,672 $759 $913 0 0 $0 $0 $0 $0 $913U.S. Virgin Islands 3,446,690 18,525,854 $167,148 $155,833 $11,315 1 155,339 $1,473 $110,984 $25,517 $85,467 $98,255
Caribbean 686,214,932 3,779,294,817 $562,631,869 $469,435,030 $93,196,839 297,679,210 957,057,629 $16,496,963 164,777,689 $24,099,413 $10,319,008 $13,780,405 $123,474,207
Belize 7,262,516 38,304,850 $7,405,208 $6,402,132 $1,003,076 1,838,769 8,125,932 $209,934 $93,725 $1,012 $92,713 $1,305,723
Canada 2,020,923,602 8,508,410,348 $513,153,861 $84,217,549 $428,936,312 2,966,822,068 9,485,956,506 $47,938,915 $61,583,569 $10,511,197 $51,072,372 $527,947,599
Costa Rica 50,523,224 280,120,025 $20,208,017 $15,015,335 $5,192,682 15,984,929 66,394,955 $2,514,491 $3,238 $1,237 $2,001 $7,709,174
El Salvador 88,889,084 769,435,887 $89,674,251 $70,714,880 $18,959,371 154,021,772 683,923,701 $7,504,830 $630,414 $108 $630,306 $27,094,507
Guatemala 165,500,943 1,501,331,984 $174,212,233 $137,348,221 $36,864,012 99,016,546 429,200,106 $4,259,339 $3,445,975 $1,429 $3,444,546 $44,567,897
Honduras 46,548,709 272,222,384 $41,219,099 $35,307,495 $5,911,604 42,859,949 161,820,098 $2,516,322 $1,801,182 $1,465 $1,799,717 $10,227,643
- Switched Services Page 82 -

2008 Annual Section 43.61 International Traffic Data for All U.S. Points: All Settlement ArrangementsTable A25: All United States Carriers Message Telephone Service Billing Types Covered: 1, 2, 3, 11, 12
International Point Traffic Billed in the United States Traffic Billed in Foreign Countries TotalOriginating or Terminating Transiting the United States U.S.
in the United States (by Country of Origin) CarriersNumber Number U.S. Payout Retained Number Number Receipts Number Receipts Payout Retained Retained
of of Carriers to Foreign Revenues of of from Foreign of from Foreign to Foreign Revenues RevenuesMessages Minutes Revenues Carriers Messages Minutes Carriers Minutes Carriers Carriers
Mexico 1,092,375,077 10,961,340,873 $714,736,922 $514,174,388 $200,562,534 533,069,459 2,315,898,963 $35,336,159 $1,646,451 $900,886 $745,565 $236,644,258
Nicaragua 43,132,233 247,380,259 $42,084,132 $32,131,153 $9,952,979 26,060,852 75,695,484 $719,887 $449,270 $1,314 $447,956 $11,120,822
Panama 21,938,446 118,945,695 $11,450,558 $5,806,501 $5,644,057 16,635,159 61,714,843 $1,047,816 $1,038,251 $7,608 $1,030,643 $7,722,516
Saint Pierre and Miquelon 199,837 424,744 $57,051 $68,655 -$11,604 1 7,248 $1,091 $96 $0 $96 -$10,417
Alaska 9,124 75,414 $3,473 $1,328 $2,145 0 0 $0 $0 $0 $0 $2,145United States (conterminous) 6,142,100 46,447,641 $2,769,325 $402,685 $2,366,640 11,289,595 51,493,973 $581,919 $0 $0 $0 $2,948,559
North and Central America 3,543,444,895 22,744,440,104 $1,616,974,130 $901,590,322 $715,383,808 3,867,599,099 13,340,231,809 $102,630,703 935,086,905 $70,692,171 $11,426,256 $59,265,915 $877,280,426
Argentina 87,588,530 656,386,781 $25,613,365 $9,984,958 $15,628,407 21,122,753 94,766,201 $1,790,225 $14,971,947 $3,126 $14,968,821 $32,387,453
Bolivia 44,931,921 305,816,382 $23,743,890 $18,850,723 $4,893,167 3,010,976 12,065,670 $266,645 $2,084,922 $3,212 $2,081,710 $7,241,522
Brazil 210,695,673 993,075,196 $91,981,549 $53,093,256 $38,888,293 36,085,793 206,473,309 $3,717,024 $21,061,296 $7,242 $21,054,054 $63,659,371
Chile 24,373,205 216,657,592 $16,322,119 $8,957,741 $7,364,378 18,336,193 98,676,119 $3,789,179 $4,725,397 $1,565 $4,723,832 $15,877,389
Colombia 350,448,955 2,567,993,707 $183,067,985 $136,735,014 $46,332,971 15,291,593 107,046,261 $3,228,237 $2,096,719 $88,753 $2,007,966 $51,569,174
Ecuador 66,147,377 469,880,182 $60,052,161 $53,578,745 $6,473,416 11,695,340 79,858,627 $4,556,867 $13,963 $3,933 $10,030 $11,040,313
French Guiana 2,995,263 7,424,627 $705,799 $709,873 -$4,074 1 42,898 $3,549 $5,176 $1,890 $3,286 $2,761
Guyana 28,855,956 160,331,919 $37,412,742 $31,606,612 $5,806,130 5,230,978 15,941,916 $648,155 $511,351 $271,440 $239,911 $6,694,196
Paraguay 7,258,506 45,732,751 $3,529,170 $2,315,850 $1,213,320 698,732 5,214,076 $263,163 $235 $70 $165 $1,476,648
Peru 106,094,275 1,377,068,233 $50,417,894 $26,461,144 $23,956,750 23,152,694 184,938,911 $3,438,121 $13,333,745 $14,414 $13,319,331 $40,714,202
Suriname 3,061,832 10,336,237 $1,974,257 $1,409,774 $564,483 826,575 3,114,249 $160,621 $103,212 $39,816 $63,396 $788,500
Uruguay 7,258,492 54,264,878 $6,250,782 $3,230,747 $3,020,035 1,850,149 13,152,892 $260,741 $621,423 $587 $620,836 $3,901,612
Venezuela 45,800,596 241,623,880 $26,276,577 $11,577,335 $14,699,242 23,429,588 114,463,176 $1,392,694 $1,310,440 $26,864 $1,283,576 $17,375,512
South America 985,510,581 7,106,592,365 $527,348,290 $358,511,772 $168,836,518 160,731,365 935,754,305 $23,515,221 593,952,926 $60,839,826 $462,912 $60,376,914 $252,728,653
Afghanistan 33,166,117 106,133,943 $21,196,767 $18,510,301 $2,686,466 847,976 17,465,726 $2,643,014 $65,013 $2,023 $62,990 $5,392,470
Bangladesh 54,128,706 266,501,746 $10,671,233 $7,771,156 $2,900,077 844,268 31,868,073 $929,219 $447,913 $411 $447,502 $4,276,798
Bhutan 524,252 1,737,111 $243,993 $195,812 $48,181 1 10,154 $1,234 $6,683 $358 $6,325 $55,740
Brunei 2,112,260 8,672,013 $395,351 $247,441 $147,910 614,246 2,420,783 $39,619 $634 $477 $157 $187,686
Burma 6,896,456 25,241,961 $6,224,660 $5,723,379 $501,281 1 168,404 $31,907 $4,910 $1,669 $3,241 $536,429
Cambodia 13,536,167 131,771,455 $9,743,801 $7,532,464 $2,211,337 240,554 2,681,178 $128,829 $60,193 $5,866 $54,327 $2,394,493
Chagos Archipelago 101,459 283,989 $366,554 $124,099 $242,455 4,594 126,416 $47,563 $1,091 $7,218 -$6,127 $283,891
China 180,399,107 1,152,234,698 $70,397,988 $27,552,422 $42,845,566 49,096,591 257,712,501 $9,531,963 $316,935 $20,208 $296,727 $52,674,256
French Southern and Antarctic Lands 0 0 $0 $0 $0 0 0 $0 $0 $0 $0 $0
Hong Kong 57,801,749 272,175,829 $15,378,091 $4,333,623 $11,044,468 51,058,673 219,468,177 $2,396,605 $17,676,033 $3,631 $17,672,402 $31,113,475
India 2,101,739,425 7,791,925,742 $499,917,637 $285,141,912 $214,775,725 440,037,361 1,653,855,162 $24,969,225 $14,308,501 $29,901 $14,278,600 $254,023,550
Indonesia 38,262,640 177,871,601 $16,513,293 $10,421,812 $6,091,481 5,920,506 26,036,584 $384,402 $108,275 $18,273 $90,002 $6,565,885
Japan 77,767,633 507,202,314 $51,984,799 $26,215,970 $25,768,829 73,795,380 450,359,916 $12,564,057 $3,982,478 $157,473 $3,825,005 $42,157,891
Korea, North 112,923 83,327 $54,939 $112,309 -$57,370 1 186 $67 $208 $2,535 -$2,327 -$59,630
Korea, South 132,350,135 424,189,740 $28,292,838 $13,214,562 $15,078,276 101,676,574 437,396,006 $12,199,916 $9,253,894 $54 $9,253,840 $36,532,032
Laos 2,260,712 23,863,561 $1,304,973 $909,397 $395,576 3,205 5,635,616 $235,400 $161,414 $38 $161,376 $792,352
Macau 1,909,050 7,305,776 $700,599 $597,486 $103,113 5,755,589 22,921,744 $483,321 $391,243 $624 $390,619 $977,053
Malaysia 86,362,719 270,261,837 $18,356,425 $10,093,321 $8,263,104 15,634,045 68,375,774 $1,151,002 $1,563,464 $28,954 $1,534,510 $10,948,616
Maldives 474,988 1,107,196 $230,939 $166,018 $64,921 65,001 208,047 $3,199 $280,966 $731 $280,235 $348,355
Mongolia 1,769,322 10,509,737 $1,352,121 $993,846 $358,275 144,907 528,114 $14,856 $8,666 $69,877 -$61,211 $311,920
Nepal 25,529,375 59,350,453 $9,702,403 $7,662,459 $2,039,944 2,999,915 6,311,834 $242,410 $177,344 $1,547,656 -$1,370,312 $912,042
Pakistan 66,418,223 503,188,996 $39,801,859 $30,197,844 $9,604,015 14,572,154 143,751,582 $3,748,332 $4,862,423 $241,169 $4,621,254 $17,973,601
- Switched Services Page 83 -

2008 Annual Section 43.61 International Traffic Data for All U.S. Points: All Settlement ArrangementsTable A25: All United States Carriers Message Telephone Service Billing Types Covered: 1, 2, 3, 11, 12
International Point Traffic Billed in the United States Traffic Billed in Foreign Countries TotalOriginating or Terminating Transiting the United States U.S.
in the United States (by Country of Origin) CarriersNumber Number U.S. Payout Retained Number Number Receipts Number Receipts Payout Retained Retained
of of Carriers to Foreign Revenues of of from Foreign of from Foreign to Foreign Revenues RevenuesMessages Minutes Revenues Carriers Messages Minutes Carriers Minutes Carriers Carriers
Philippines 296,931,776 2,224,777,199 $263,977,812 $230,601,733 $33,376,079 43,328,959 179,764,335 $6,331,434 $5,439,801 $18,022 $5,421,779 $45,129,292
Singapore 57,313,729 318,327,804 $21,996,454 $5,352,882 $16,643,572 24,941,908 124,139,560 $1,755,416 $10,465,884 $331 $10,465,553 $28,864,541
Sri Lanka 38,099,029 239,380,617 $18,742,620 $16,048,410 $2,694,210 2,341,955 13,524,225 $446,616 $1,778,357 $1,221,285 $557,072 $3,697,898
Taiwan 96,893,898 437,818,842 $33,882,141 $22,888,265 $10,993,876 47,675,046 204,046,581 $5,498,474 $1,620,182 $71,133 $1,549,049 $18,041,399
Thailand 53,604,072 236,443,349 $10,174,936 $4,123,841 $6,051,095 15,370,128 251,295,437 $2,977,742 $13,767 $307 $13,460 $9,042,297
Vietnam 48,856,148 351,792,607 $21,575,468 $16,581,590 $4,993,878 10,282,968 74,618,114 $2,044,202 $20,777 $16,872 $3,905 $7,041,985
Asia 3,475,322,070 15,550,153,443 $1,173,180,694 $753,314,354 $419,866,340 907,252,506 4,194,690,229 $90,800,024 1,199,382,261 $73,017,049 $3,467,096 $69,549,953 $580,216,317
Australia 216,220,674 719,619,706 $48,776,523 $17,001,657 $31,774,866 88,625,465 483,422,601 $5,242,206 $3,729,721 $34,869 $3,694,852 $40,711,924
Cook Islands 103,118 367,942 $211,911 $174,835 $37,076 1 1,465 $649 $17,619 $1 $17,618 $55,343
Fiji 4,934,572 35,744,188 $7,005,714 $6,228,871 $776,843 372,636 3,585,703 $253,152 $2,855 $8,907 -$6,052 $1,023,943
French Polynesia 2,328,334 8,350,716 $1,800,546 $1,401,503 $399,043 138,006 509,387 $21,468 $611 $171 $440 $420,951
Kiribati 162,931 661,487 $282,140 $255,856 $26,284 1 609 $314 $1,448 $43 $1,405 $28,003
Marshall Islands 56,239,675 5,364,067 $2,121,251 $897,936 $1,223,315 8,653 30,583 $2,244 $1,032 $0 $1,032 $1,226,591
Micronesia, Federated States of 7,440,071 12,881,151 $2,531,708 $1,605,834 $925,874 75,090 483,743 $4,130 $13 $109 -$96 $929,908
Nauru 14,762 33,270 $25,677 $219,682 -$194,005 1 42 $28 $160 $18 $142 -$193,835New Caledonia 647,561 1,992,760 $469,966 $392,918 $77,048 1 16,234 $3,322 $1,110 $534 $576 $80,946New Zealand 31,158,106 197,841,543 $16,994,407 $11,228,938 $5,765,469 10,979,958 87,850,234 $1,291,386 $187,434 $1,574 $185,860 $7,242,715Niue 8,908 40,216 $21,845 $20,686 $1,159 1 737 $344 $1 $1 $0 $1,503
Norfolk Island 6,191 15,347 $16,809 $6,912 $9,897 1 66 $47 $0 $0 $0 $9,944
Pacific Islands (Palau) 799,596 3,467,303 $1,027,658 $588,799 $438,859 174,893 673,500 $15,949 $34 $145 -$111 $454,697
Papua New Guinea 876,317 2,405,274 $1,500,965 $1,070,344 $430,621 1 6,530 $2,253 $292 $1,216 -$924 $431,950
Solomon Islands 132,163 313,201 $230,279 $290,569 -$60,290 1 1,335 $551 $461 $213 $248 -$59,491
Tonga 2,114,773 17,905,922 $3,177,517 $2,740,101 $437,416 193,240 1,170,251 $54,713 $971 $2,878 -$1,907 $490,222
Tuvalu 8,630 29,204 $20,427 $84,901 -$64,474 0 0 $0 $9 $60 -$51 -$64,525
Vanuatu 222,003 553,903 $217,892 $204,211 $13,681 1 2,769 $1,224 $32 $12 $20 $14,925
Wallis and Futuna 31,865 173,371 $67,842 $64,565 $3,277 1 744 $276 $164 $0 $164 $3,717
Western Samoa 771,443 4,612,212 $1,446,291 $1,205,526 $240,765 2,735 108,581 $31,945 $474 $16 $458 $273,168
American Samoa 1,499,296 12,308,844 $763,728 $702,404 $61,324 462,554 1,346,012 $74,225 $9 $402 -$393 $135,156Baker Island 0 0 $0 $0 $0 0 0 $0 $0 $0 $0 $0Guam 6,422,353 40,319,976 $1,605,623 $429,875 $1,175,748 2,048,578 12,875,803 $142,962 $128 $22 $106 $1,318,816Hawaii 382,647 2,272,683 $131,089 $40,035 $91,054 0 0 $0 $0 $0 $0 $91,054Howland Island 0 0 $0 $0 $0 0 0 $0 $0 $0 $0 $0Jarvis Island 0 0 $0 $0 $0 0 0 $0 $0 $0 $0 $0Johnston Atoll 0 0 $0 $0 $0 0 0 $0 $0 $0 $0 $0Kingman Reef 0 0 $0 $0 $0 0 0 $0 $0 $0 $0 $0Midway Atoll 2 1 $1 $1 $0 0 0 $0 $0 $0 $0 $0Northern Mariana Islands 2,226,710 11,395,653 $582,866 $134,048 $448,818 21,873 135,308 $2,091 $0 $0 $0 $450,909Palmyra Atoll 0 0 $0 $0 $0 0 0 $0 $0 $0 $0 $0Wake Island 0 0 $0 $0 $0 0 0 $0 $1,027 $184 $843 $843
Oceania 334,752,701 1,078,669,940 $91,030,675 $46,991,007 $44,039,668 103,103,691 592,222,237 $7,145,479 56,390,040 $3,945,605 $51,375 $3,894,230 $55,079,377
Albania 10,402,883 49,945,894 $6,563,126 $6,062,530 $500,596 291,534 2,696,024 $134,709 $1,204 $9 $1,195 $636,500
Armenia 6,388,238 33,503,792 $2,606,607 $2,013,491 $593,116 165,916 1,187,474 $15,137 $966 $46,453 -$45,487 $562,766
Azerbaijan 11,166,786 18,713,044 $2,637,752 $2,055,208 $582,544 977,897 3,180,249 $70,540 $9,154 $1,900 $7,254 $660,338
Belarus 11,031,898 54,918,026 $10,421,527 $9,478,780 $942,747 641,998 2,820,430 $103,220 $9,175 $3,742 $5,433 $1,051,400
- Switched Services Page 84 -
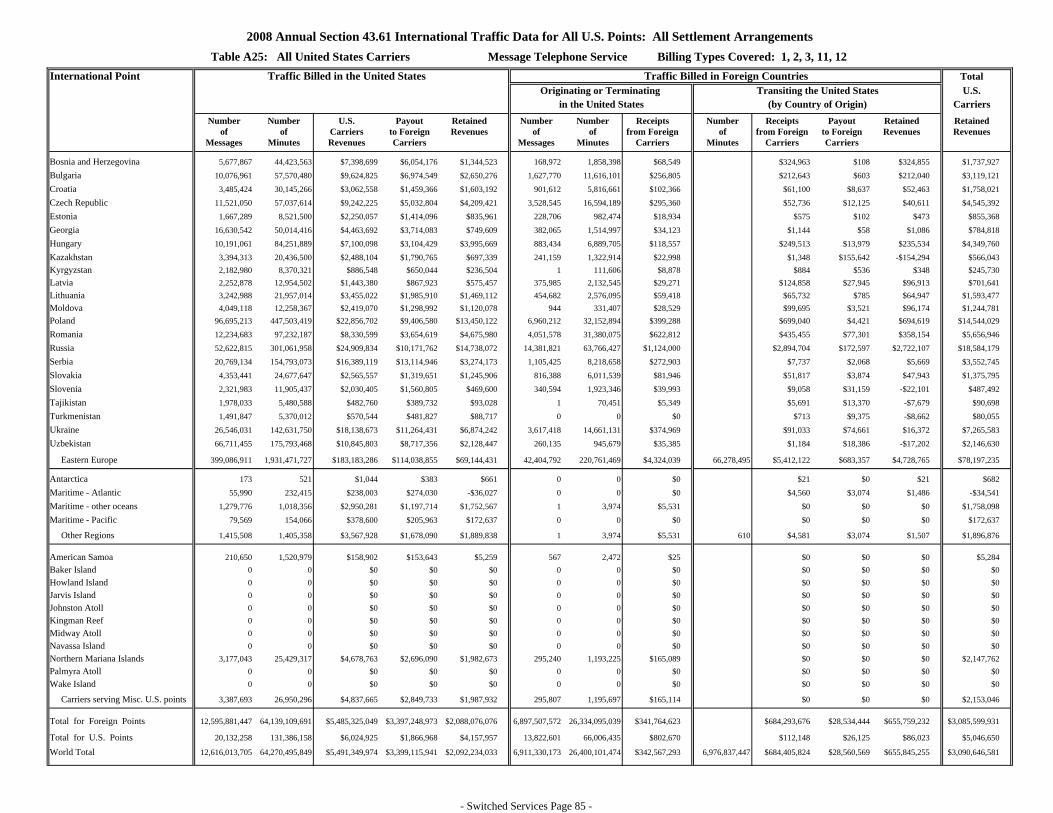
2008 Annual Section 43.61 International Traffic Data for All U.S. Points: All Settlement ArrangementsTable A25: All United States Carriers Message Telephone Service Billing Types Covered: 1, 2, 3, 11, 12
International Point Traffic Billed in the United States Traffic Billed in Foreign Countries TotalOriginating or Terminating Transiting the United States U.S.
in the United States (by Country of Origin) CarriersNumber Number U.S. Payout Retained Number Number Receipts Number Receipts Payout Retained Retained
of of Carriers to Foreign Revenues of of from Foreign of from Foreign to Foreign Revenues RevenuesMessages Minutes Revenues Carriers Messages Minutes Carriers Minutes Carriers Carriers
Bosnia and Herzegovina 5,677,867 44,423,563 $7,398,699 $6,054,176 $1,344,523 168,972 1,858,398 $68,549 $324,963 $108 $324,855 $1,737,927
Bulgaria 10,076,961 57,570,480 $9,624,825 $6,974,549 $2,650,276 1,627,770 11,616,101 $256,805 $212,643 $603 $212,040 $3,119,121
Croatia 3,485,424 30,145,266 $3,062,558 $1,459,366 $1,603,192 901,612 5,816,661 $102,366 $61,100 $8,637 $52,463 $1,758,021
Czech Republic 11,521,050 57,037,614 $9,242,225 $5,032,804 $4,209,421 3,528,545 16,594,189 $295,360 $52,736 $12,125 $40,611 $4,545,392
Estonia 1,667,289 8,521,500 $2,250,057 $1,414,096 $835,961 228,706 982,474 $18,934 $575 $102 $473 $855,368
Georgia 16,630,542 50,014,416 $4,463,692 $3,714,083 $749,609 382,065 1,514,997 $34,123 $1,144 $58 $1,086 $784,818
Hungary 10,191,061 84,251,889 $7,100,098 $3,104,429 $3,995,669 883,434 6,889,705 $118,557 $249,513 $13,979 $235,534 $4,349,760
Kazakhstan 3,394,313 20,436,500 $2,488,104 $1,790,765 $697,339 241,159 1,322,914 $22,998 $1,348 $155,642 -$154,294 $566,043Kyrgyzstan 2,182,980 8,370,321 $886,548 $650,044 $236,504 1 111,606 $8,878 $884 $536 $348 $245,730Latvia 2,252,878 12,954,502 $1,443,380 $867,923 $575,457 375,985 2,132,545 $29,271 $124,858 $27,945 $96,913 $701,641Lithuania 3,242,988 21,957,014 $3,455,022 $1,985,910 $1,469,112 454,682 2,576,095 $59,418 $65,732 $785 $64,947 $1,593,477Moldova 4,049,118 12,258,367 $2,419,070 $1,298,992 $1,120,078 944 331,407 $28,529 $99,695 $3,521 $96,174 $1,244,781Poland 96,695,213 447,503,419 $22,856,702 $9,406,580 $13,450,122 6,960,212 32,152,894 $399,288 $699,040 $4,421 $694,619 $14,544,029
Romania 12,234,683 97,232,187 $8,330,599 $3,654,619 $4,675,980 4,051,578 31,380,075 $622,812 $435,455 $77,301 $358,154 $5,656,946
Russia 52,622,815 301,061,958 $24,909,834 $10,171,762 $14,738,072 14,381,821 63,766,427 $1,124,000 $2,894,704 $172,597 $2,722,107 $18,584,179
Serbia 20,769,134 154,793,073 $16,389,119 $13,114,946 $3,274,173 1,105,425 8,218,658 $272,903 $7,737 $2,068 $5,669 $3,552,745
Slovakia 4,353,441 24,677,647 $2,565,557 $1,319,651 $1,245,906 816,388 6,011,539 $81,946 $51,817 $3,874 $47,943 $1,375,795
Slovenia 2,321,983 11,905,437 $2,030,405 $1,560,805 $469,600 340,594 1,923,346 $39,993 $9,058 $31,159 -$22,101 $487,492
Tajikistan 1,978,033 5,480,588 $482,760 $389,732 $93,028 1 70,451 $5,349 $5,691 $13,370 -$7,679 $90,698
Turkmenistan 1,491,847 5,370,012 $570,544 $481,827 $88,717 0 0 $0 $713 $9,375 -$8,662 $80,055
Ukraine 26,546,031 142,631,750 $18,138,673 $11,264,431 $6,874,242 3,617,418 14,661,131 $374,969 $91,033 $74,661 $16,372 $7,265,583
Uzbekistan 66,711,455 175,793,468 $10,845,803 $8,717,356 $2,128,447 260,135 945,679 $35,385 $1,184 $18,386 -$17,202 $2,146,630
Eastern Europe 399,086,911 1,931,471,727 $183,183,286 $114,038,855 $69,144,431 42,404,792 220,761,469 $4,324,039 66,278,495 $5,412,122 $683,357 $4,728,765 $78,197,235
Antarctica 173 521 $1,044 $383 $661 0 0 $0 $21 $0 $21 $682
Maritime - Atlantic 55,990 232,415 $238,003 $274,030 -$36,027 0 0 $0 $4,560 $3,074 $1,486 -$34,541
Maritime - other oceans 1,279,776 1,018,356 $2,950,281 $1,197,714 $1,752,567 1 3,974 $5,531 $0 $0 $0 $1,758,098
Maritime - Pacific 79,569 154,066 $378,600 $205,963 $172,637 0 0 $0 $0 $0 $0 $172,637
Other Regions 1,415,508 1,405,358 $3,567,928 $1,678,090 $1,889,838 1 3,974 $5,531 610 $4,581 $3,074 $1,507 $1,896,876
American Samoa 210,650 1,520,979 $158,902 $153,643 $5,259 567 2,472 $25 $0 $0 $0 $5,284Baker Island 0 0 $0 $0 $0 0 0 $0 $0 $0 $0 $0Howland Island 0 0 $0 $0 $0 0 0 $0 $0 $0 $0 $0Jarvis Island 0 0 $0 $0 $0 0 0 $0 $0 $0 $0 $0Johnston Atoll 0 0 $0 $0 $0 0 0 $0 $0 $0 $0 $0Kingman Reef 0 0 $0 $0 $0 0 0 $0 $0 $0 $0 $0Midway Atoll 0 0 $0 $0 $0 0 0 $0 $0 $0 $0 $0Navassa Island 0 0 $0 $0 $0 0 0 $0 $0 $0 $0 $0Northern Mariana Islands 3,177,043 25,429,317 $4,678,763 $2,696,090 $1,982,673 295,240 1,193,225 $165,089 $0 $0 $0 $2,147,762Palmyra Atoll 0 0 $0 $0 $0 0 0 $0 $0 $0 $0 $0Wake Island 0 0 $0 $0 $0 0 0 $0 $0 $0 $0 $0
Carriers serving Misc. U.S. points 3,387,693 26,950,296 $4,837,665 $2,849,733 $1,987,932 295,807 1,195,697 $165,114 $0 $0 $0 $2,153,046
Total for Foreign Points 12,595,881,447 64,139,109,691 $5,485,325,049 $3,397,248,973 $2,088,076,076 6,897,507,572 26,334,095,039 $341,764,623 $684,293,676 $28,534,444 $655,759,232 $3,085,599,931
Total for U.S. Points 20,132,258 131,386,158 $6,024,925 $1,866,968 $4,157,957 13,822,601 66,006,435 $802,670 $112,148 $26,125 $86,023 $5,046,650
World Total 12,616,013,705 64,270,495,849 $5,491,349,974 $3,399,115,941 $2,092,234,033 6,911,330,173 26,400,101,474 $342,567,293 6,976,837,447 $684,405,824 $28,560,569 $655,845,255 $3,090,646,581
- Switched Services Page 85 -

2008 Annual Section 43.61 International Traffic Data for All U.S. Points: All Settlement ArrangementsTable A26: All United States Carriers Message Telephone Service Billing Types Covered: 4, 14
International Point Traffic Billed in the United States Traffic Billed in Foreign Countries TotalOriginating or Terminating Transiting the United States U.S.
in the United States (by Country of Origin) CarriersNumber Number U.S. Payout Retained Number Number Receipts Number Receipts Payout Retained Retained
of of Carriers to Foreign Revenues of of from Foreign of from Foreign to Foreign Revenues RevenuesMessages Minutes Revenues Carriers Messages Minutes Carriers Minutes Carriers Carriers
Andorra 0 0 $0 $0 $0 0 0 $0 $0 $0 $0 $0Austria 89,428 1,213,294 $718,483 $36,209 $682,274 0 0 $0 $0 $0 $0 $682,274Belgium 452,883 3,462,575 $990,454 $147,069 $843,385 0 0 $0 $0 $0 $0 $843,385Cyprus 10,849 80,977 $9,801 $2,186 $7,615 0 0 $0 $0 $0 $0 $7,615Denmark 93,484 781,483 $352,925 $24,139 $328,786 0 0 $0 $0 $0 $0 $328,786Finland 4,510 126,806 $65,085 $3,913 $61,172 0 0 $0 $0 $0 $0 $61,172France 1,845,857 10,438,007 $3,611,048 $586,225 $3,024,823 0 0 $0 $0 $0 $0 $3,024,823Germany 3,533,470 28,557,853 $5,356,828 $1,982,004 $3,374,824 0 0 $0 $0 $0 $0 $3,374,824Gibraltar 1,587 23,635 $920 $703 $217 0 0 $0 $0 $0 $0 $217Greece 316,580 2,080,707 $308,725 $89,368 $219,357 0 0 $0 $0 $0 $0 $219,357Greenland 0 0 $0 $0 $0 0 0 $0 $0 $0 $0 $0Iceland 6,664 58,771 $9,611 $3,211 $6,400 0 0 $0 $0 $0 $0 $6,400Ireland 374,180 4,204,786 $2,189,985 $239,679 $1,950,306 0 0 $0 $0 $0 $0 $1,950,306Italy 969,559 5,881,302 $1,624,248 $189,083 $1,435,165 0 0 $0 $0 $0 $0 $1,435,165Liechtenstein 0 0 $0 $0 $0 0 0 $0 $0 $0 $0 $0Luxembourg 49,817 254,538 $92,924 $4,176 $88,748 0 0 $0 $0 $0 $0 $88,748Malta 5,202 38,903 $13,559 $2,013 $11,546 0 0 $0 $0 $0 $0 $11,546Netherlands 315,959 3,258,082 $1,242,630 $126,556 $1,116,074 0 0 $0 $0 $0 $0 $1,116,074Norway 84,143 465,632 $186,858 $37,246 $149,612 0 0 $0 $0 $0 $0 $149,612Portugal 187,834 747,128 $282,128 $60,734 $221,394 0 0 $0 $0 $0 $0 $221,394Spain 730,265 6,169,509 $1,755,334 $543,295 $1,212,039 0 0 $0 $0 $0 $0 $1,212,039Sweden 182,588 1,261,742 $399,348 $93,669 $305,679 0 0 $0 $0 $0 $0 $305,679Switzerland 324,032 2,946,655 $1,398,026 $65,041 $1,332,985 0 0 $0 $0 $0 $0 $1,332,985Turkey 164,076 1,175,752 $318,902 $92,267 $226,635 0 0 $0 $0 $0 $0 $226,635United Kingdom 3,286,015 31,793,614 $11,289,526 $1,351,844 $9,937,682 0 0 $0 $0 $0 $0 $9,937,682
Western Europe 13,028,982 105,021,751 $32,217,348 $5,680,630 $26,536,718 0 0 $0 $0 $0 $0 $26,536,718
Algeria 0 0 $0 $0 $0 0 0 $0 $0 $0 $0 $0Angola 1,087 8,324 $824 $770 $54 0 0 $0 $0 $0 $0 $54Benin 0 0 $0 $0 $0 0 0 $0 $0 $0 $0 $0Botswana 0 0 $0 $0 $0 0 0 $0 $0 $0 $0 $0Burkina 0 0 $0 $0 $0 0 0 $0 $0 $0 $0 $0Burundi 0 0 $0 $0 $0 0 0 $0 $0 $0 $0 $0Cameroon 0 0 $0 $0 $0 0 0 $0 $0 $0 $0 $0Canary Island 0 0 $0 $0 $0 0 0 $0 $0 $0 $0 $0Cape Verde 0 0 $0 $0 $0 0 0 $0 $0 $0 $0 $0Central African Republic 0 0 $0 $0 $0 0 0 $0 $0 $0 $0 $0Chad 1 1,216 $1,082 $609 $473 0 0 $0 $0 $0 $0 $473Comoros 0 0 $0 $0 $0 0 0 $0 $0 $0 $0 $0Congo 0 0 $0 $0 $0 0 0 $0 $0 $0 $0 $0Cote d'Ivoire 3,997 18,535 $13,059 $3,162 $9,897 0 0 $0 $0 $0 $0 $9,897Djibouti 0 0 $0 $0 $0 0 0 $0 $0 $0 $0 $0Egypt 166,978 1,110,040 $480,588 $155,407 $325,181 0 0 $0 $0 $0 $0 $325,181Equatorial Guinea 0 0 $0 $0 $0 0 0 $0 $0 $0 $0 $0
- Switched Services Page 86 -

2008 Annual Section 43.61 International Traffic Data for All U.S. Points: All Settlement ArrangementsTable A26: All United States Carriers Message Telephone Service Billing Types Covered: 4, 14
International Point Traffic Billed in the United States Traffic Billed in Foreign Countries TotalOriginating or Terminating Transiting the United States U.S.
in the United States (by Country of Origin) CarriersNumber Number U.S. Payout Retained Number Number Receipts Number Receipts Payout Retained Retained
of of Carriers to Foreign Revenues of of from Foreign of from Foreign to Foreign Revenues RevenuesMessages Minutes Revenues Carriers Messages Minutes Carriers Minutes Carriers Carriers
Ethiopia 0 0 $0 $0 $0 0 0 $0 $0 $0 $0 $0Gabon 0 0 $0 $0 $0 0 0 $0 $0 $0 $0 $0Gambia, The 354 2,729 $3,044 $327 $2,717 0 0 $0 $0 $0 $0 $2,717Ghana 14,999 70,343 $44,593 $3,747 $40,846 0 0 $0 $0 $0 $0 $40,846Guinea 0 0 $0 $0 $0 0 0 $0 $0 $0 $0 $0Guinea-Bissau 0 0 $0 $0 $0 0 0 $0 $0 $0 $0 $0Kenya 2,053 10,387 $2,040 $922 $1,118 0 0 $0 $0 $0 $0 $1,118Lesotho 0 0 $0 $0 $0 0 0 $0 $0 $0 $0 $0Liberia 0 0 $0 $0 $0 0 0 $0 $0 $0 $0 $0Libya 0 0 $0 $0 $0 0 0 $0 $0 $0 $0 $0Madagascar 0 0 $0 $0 $0 0 0 $0 $0 $0 $0 $0Malawi 0 0 $0 $0 $0 0 0 $0 $0 $0 $0 $0Mali 0 0 $0 $0 $0 0 0 $0 $0 $0 $0 $0Mauritania 0 0 $0 $0 $0 0 0 $0 $0 $0 $0 $0Mauritius 2,967 8,393 $3,111 $1,043 $2,068 0 0 $0 $0 $0 $0 $2,068Morocco 60,392 319,518 $132,697 $37,989 $94,708 0 0 $0 $0 $0 $0 $94,708Mozambique 1 1 $0 $0 $0 0 0 $0 $0 $0 $0 $0Namibia 1 20 $18 $14 $4 0 0 $0 $0 $0 $0 $4Niger 0 0 $0 $0 $0 0 0 $0 $0 $0 $0 $0Nigeria 1 3 $1 $0 $1 0 0 $0 $0 $0 $0 $1Reunion 58 379 $190 $5 $185 0 0 $0 $0 $0 $0 $185Rwanda 0 0 $0 $0 $0 0 0 $0 $0 $0 $0 $0Saint Helena 0 0 $0 $0 $0 0 0 $0 $0 $0 $0 $0Sao Tome and Principe 0 0 $0 $0 $0 0 0 $0 $0 $0 $0 $0Senegal 12,162 86,254 $87,028 $9,851 $77,177 0 0 $0 $0 $0 $0 $77,177Seychelles 107 814 $3,005 $0 $3,005 0 0 $0 $0 $0 $0 $3,005Sierra Leone 0 0 $0 $0 $0 0 0 $0 $0 $0 $0 $0Somalia 0 0 $0 $0 $0 0 0 $0 $0 $0 $0 $0South Africa 312,999 2,024,834 $911,051 $122,641 $788,410 0 0 $0 $0 $0 $0 $788,410Sudan 0 0 $0 $0 $0 0 0 $0 $0 $0 $0 $0Swaziland 0 0 $0 $0 $0 0 0 $0 $0 $0 $0 $0Tanzania 0 0 $0 $0 $0 0 0 $0 $0 $0 $0 $0Togo 2 28 $3 $0 $3 0 0 $0 $0 $0 $0 $3Tunisia 0 0 $0 $0 $0 0 0 $0 $0 $0 $0 $0Uganda 0 0 $0 $0 $0 0 0 $0 $0 $0 $0 $0Western Sahara 0 0 $0 $0 $0 0 0 $0 $0 $0 $0 $0Zaire 55 409 $41 $0 $41 0 0 $0 $0 $0 $0 $41Zambia 5,017 42,729 $6,492 $1,070 $5,422 0 0 $0 $0 $0 $0 $5,422Zimbabwe 0 0 $0 $0 $0 0 0 $0 $0 $0 $0 $0
Africa 583,231 3,704,956 $1,688,867 $337,557 $1,351,310 0 0 $0 $0 $0 $0 $1,351,310
Bahrain 538,414 6,138,657 $114,557 $291,688 -$177,131 0 0 $0 $0 $0 $0 -$177,131Iran 82 266 $32 $39 -$7 0 0 $0 $0 $0 $0 -$7Iraq 34,839 230,742 $242,796 $1,311 $241,485 0 0 $0 $0 $0 $0 $241,485Israel 232,820 1,881,754 $654,405 $46,602 $607,803 0 0 $0 $0 $0 $0 $607,803
- Switched Services Page 87 -

2008 Annual Section 43.61 International Traffic Data for All U.S. Points: All Settlement ArrangementsTable A26: All United States Carriers Message Telephone Service Billing Types Covered: 4, 14
International Point Traffic Billed in the United States Traffic Billed in Foreign Countries TotalOriginating or Terminating Transiting the United States U.S.
in the United States (by Country of Origin) CarriersNumber Number U.S. Payout Retained Number Number Receipts Number Receipts Payout Retained Retained
of of Carriers to Foreign Revenues of of from Foreign of from Foreign to Foreign Revenues RevenuesMessages Minutes Revenues Carriers Messages Minutes Carriers Minutes Carriers Carriers
Jordan 29,600 161,140 $69,006 $4,000 $65,006 0 0 $0 $0 $0 $0 $65,006Kuwait 20,296 119,478 $65,751 $0 $65,751 0 0 $0 $0 $0 $0 $65,751Lebanon 33,414 188,430 $102,917 $16,792 $86,125 0 0 $0 $0 $0 $0 $86,125Oman 0 0 $0 $0 $0 0 0 $0 $0 $0 $0 $0Qatar 0 0 $0 $0 $0 0 0 $0 $0 $0 $0 $0Saudi Arabia 93,166 686,025 $313,480 $161,670 $151,810 0 0 $0 $0 $0 $0 $151,810Syria 24,972 119,056 $30,030 $15,652 $14,378 0 0 $0 $0 $0 $0 $14,378United Arab Emirates 449,157 3,761,082 $601,364 $505,483 $95,881 0 0 $0 $0 $0 $0 $95,881Yemen 0 0 $0 $0 $0 0 0 $0 $0 $0 $0 $0
Middle East 1,456,760 13,286,630 $2,194,338 $1,043,237 $1,151,101 0 0 $0 $0 $0 $0 $1,151,101
Anguilla 30,239 24,700 $11,407 $2,238 $9,169 0 0 $0 $0 $0 $0 $9,169Antigua and Barbuda 41,600 157,666 $37,976 $14,255 $23,721 0 0 $0 $0 $0 $0 $23,721Aruba 224,252 166,077 $35,679 $11,459 $24,220 0 0 $0 $0 $0 $0 $24,220Bahamas, The 3,228,839 1,995,984 $614,903 $44,619 $570,284 0 0 $0 $0 $0 $0 $570,284Barbados 1,621,553 725,182 $275,329 $61,512 $213,817 0 0 $0 $0 $0 $0 $213,817Bermuda 243,131 1,106,088 $132,137 $46,644 $85,493 0 0 $0 $0 $0 $0 $85,493Cayman Islands 167,957 674,857 $86,277 $43,891 $42,386 0 0 $0 $0 $0 $0 $42,386Cuba 422,695 1,324,112 $415,635 $0 $415,635 0 0 $0 $0 $0 $0 $415,635Dominica 15,664 59,688 $15,029 $4,858 $10,171 0 0 $0 $0 $0 $0 $10,171Dominican Republic 231,839 1,257,339 $279,714 $184,595 $95,119 0 0 $0 $0 $0 $0 $95,119French Overseas Departments 5,231 25,200 $15,012 $789 $14,223 0 0 $0 $0 $0 $0 $14,223Grenada 17,302 70,821 $13,024 $6,073 $6,951 0 0 $0 $0 $0 $0 $6,951Guadeloupe 0 0 $0 $0 $0 0 0 $0 $0 $0 $0 $0Haiti 153,948 318,004 $599,698 $60,169 $539,529 0 0 $0 $0 $0 $0 $539,529Jamaica 561,915 1,303,250 $250,399 $94,124 $156,275 0 0 $0 $0 $0 $0 $156,275Montserrat 360 2,820 $2,852 $310 $2,542 0 0 $0 $0 $0 $0 $2,542Netherlands Antilles 82,052 146,227 $27,643 $12,963 $14,680 0 0 $0 $0 $0 $0 $14,680Saint Kitts and Nevis 13,447 72,649 $23,602 $6,374 $17,228 0 0 $0 $0 $0 $0 $17,228Saint Lucia 4,379 22,538 $7,401 $1,934 $5,467 0 0 $0 $0 $0 $0 $5,467Saint Vincent and the Grenadines 2,687 15,803 $4,689 $1,404 $3,285 0 0 $0 $0 $0 $0 $3,285Trinidad and Tobago 829,538 1,748,937 $315,231 $107,999 $207,232 0 0 $0 $0 $0 $0 $207,232Turks and Caicos Islands 37,334 251,575 $40,015 $22,651 $17,364 0 0 $0 $0 $0 $0 $17,364Virgin Islands, British 650,383 215,585 $121,287 $19,509 $101,778 0 0 $0 $0 $0 $0 $101,778
Navassa Island 0 0 $0 $0 $0 0 0 $0 $0 $0 $0 $0Puerto Rico 0 0 $0 $0 $0 0 0 $0 $0 $0 $0 $0U.S. Virgin Islands 0 0 $0 $0 $0 0 0 $0 $0 $0 $0 $0
Caribbean 8,586,345 11,685,102 $3,324,939 $748,370 $2,576,569 0 0 $0 $0 $0 $0 $2,576,569
Belize 2,895 17,323 $3,232 $2,935 $297 0 0 $0 $0 $0 $0 $297Canada 201,634,635 839,270,067 $67,986,030 $12,252,602 $55,733,428 0 0 $0 $0 $0 $0 $55,733,428Costa Rica 529,355 4,921,963 $871,740 $740,949 $130,791 0 0 $0 $0 $0 $0 $130,791El Salvador 126,754 791,745 $191,384 $94,347 $97,037 0 0 $0 $0 $0 $0 $97,037Guatemala 211,245 1,258,283 $188,616 $175,392 $13,224 0 0 $0 $0 $0 $0 $13,224Honduras 86,989 684,552 $214,625 $106,969 $107,656 0 0 $0 $0 $0 $0 $107,656
- Switched Services Page 88 -

2008 Annual Section 43.61 International Traffic Data for All U.S. Points: All Settlement ArrangementsTable A26: All United States Carriers Message Telephone Service Billing Types Covered: 4, 14
International Point Traffic Billed in the United States Traffic Billed in Foreign Countries TotalOriginating or Terminating Transiting the United States U.S.
in the United States (by Country of Origin) CarriersNumber Number U.S. Payout Retained Number Number Receipts Number Receipts Payout Retained Retained
of of Carriers to Foreign Revenues of of from Foreign of from Foreign to Foreign Revenues RevenuesMessages Minutes Revenues Carriers Messages Minutes Carriers Minutes Carriers Carriers
Mexico 6,628,708 53,962,128 $8,196,145 $4,816,872 $3,379,273 0 0 $0 $0 $0 $0 $3,379,273Nicaragua 48,770 282,904 $67,296 $46,199 $21,097 0 0 $0 $0 $0 $0 $21,097Panama 194,488 1,321,609 $282,157 $55,192 $226,965 0 0 $0 $0 $0 $0 $226,965Saint Pierre and Miquelon 0 0 $0 $0 $0 0 0 $0 $0 $0 $0 $0
Alaska 0 0 $0 $0 $0 0 0 $0 $0 $0 $0 $0United States (conterminous) 0 0 $0 $0 $0 0 0 $0 $0 $0 $0 $0
North and Central America 209,463,839 902,510,574 $78,001,225 $18,291,457 $59,709,768 0 0 $0 $0 $0 $0 $59,709,768
Argentina 830,365 6,306,385 $1,875,497 $702,880 $1,172,617 0 0 $0 $0 $0 $0 $1,172,617Bolivia 245,971 755,266 $239,412 $104,125 $135,287 0 0 $0 $0 $0 $0 $135,287Brazil 4,590,612 29,666,106 $9,019,491 $3,479,399 $5,540,092 0 0 $0 $0 $0 $0 $5,540,092Chile 423,155 2,050,307 $826,676 $380,764 $445,912 0 0 $0 $0 $0 $0 $445,912Colombia 1,736,177 10,463,776 $2,351,088 $1,525,012 $826,076 0 0 $0 $0 $0 $0 $826,076Ecuador 321,874 1,993,341 $667,889 $338,466 $329,423 0 0 $0 $0 $0 $0 $329,423French Guiana 256 3,311 $855 $0 $855 0 0 $0 $0 $0 $0 $855Guyana 227,615 195,286 $637,331 $54,717 $582,614 0 0 $0 $0 $0 $0 $582,614Paraguay 7,963 54,128 $35,438 $7,807 $27,631 0 0 $0 $0 $0 $0 $27,631Peru 339,431 2,041,480 $702,082 $405,412 $296,670 0 0 $0 $0 $0 $0 $296,670Suriname 3,432 24,587 $13,613 $3,442 $10,171 0 0 $0 $0 $0 $0 $10,171Uruguay 74,443 408,117 $144,094 $20,181 $123,913 0 0 $0 $0 $0 $0 $123,913Venezuela 583,652 3,228,300 $629,798 $511,075 $118,723 0 0 $0 $0 $0 $0 $118,723
South America 9,384,946 57,190,390 $17,143,264 $7,533,280 $9,609,984 0 0 $0 $0 $0 $0 $9,609,984
Afghanistan 1,352 7,887 $11,934 $2 $11,932 0 0 $0 $0 $0 $0 $11,932Bangladesh 2,697 19,512 $10,299 $1,182 $9,117 0 0 $0 $0 $0 $0 $9,117Bhutan 0 0 $0 $0 $0 0 0 $0 $0 $0 $0 $0Brunei 6,856 79,420 $19,321 $2,423 $16,898 0 0 $0 $0 $0 $0 $16,898Burma 0 0 $0 $0 $0 0 0 $0 $0 $0 $0 $0Cambodia 31 211 $46 $13 $33 0 0 $0 $0 $0 $0 $33Chagos Archipelago 2,610 19,609 $1,173 $1,372 -$199 0 0 $0 $0 $0 $0 -$199China 5,435,110 38,059,075 $15,863,454 $4,915,022 $10,948,432 0 0 $0 $0 $0 $0 $10,948,432French Southern and Antarctic Lands 0 0 $0 $0 $0 0 0 $0 $0 $0 $0 $0Hong Kong 668,767 4,710,048 $1,872,555 $212,572 $1,659,983 0 0 $0 $0 $0 $0 $1,659,983India 2,373,146 21,361,479 $15,993,928 $2,959,621 $13,034,307 0 0 $0 $0 $0 $0 $13,034,307Indonesia 74,287 425,152 $200,029 $88,708 $111,321 0 0 $0 $0 $0 $0 $111,321Japan 2,895,677 17,627,934 $4,221,856 $1,338,980 $2,882,876 0 0 $0 $0 $0 $0 $2,882,876Korea, North 0 0 $0 $0 $0 0 0 $0 $0 $0 $0 $0Korea, South 4,541,178 22,648,406 $3,464,243 $2,060,671 $1,403,572 0 0 $0 $0 $0 $0 $1,403,572Laos 0 0 $0 $0 $0 0 0 $0 $0 $0 $0 $0Macau 17,304 58,370 $28,323 $6,860 $21,463 0 0 $0 $0 $0 $0 $21,463Malaysia 526,333 2,517,695 $1,442,822 $106,656 $1,336,166 0 0 $0 $0 $0 $0 $1,336,166Maldives 0 0 $0 $0 $0 0 0 $0 $0 $0 $0 $0Mongolia 0 0 $0 $0 $0 0 0 $0 $0 $0 $0 $0Nepal 0 0 $0 $0 $0 0 0 $0 $0 $0 $0 $0Pakistan 59,098 289,190 $202,284 $20,373 $181,911 0 0 $0 $0 $0 $0 $181,911
- Switched Services Page 89 -

2008 Annual Section 43.61 International Traffic Data for All U.S. Points: All Settlement ArrangementsTable A26: All United States Carriers Message Telephone Service Billing Types Covered: 4, 14
International Point Traffic Billed in the United States Traffic Billed in Foreign Countries TotalOriginating or Terminating Transiting the United States U.S.
in the United States (by Country of Origin) CarriersNumber Number U.S. Payout Retained Number Number Receipts Number Receipts Payout Retained Retained
of of Carriers to Foreign Revenues of of from Foreign of from Foreign to Foreign Revenues RevenuesMessages Minutes Revenues Carriers Messages Minutes Carriers Minutes Carriers Carriers
Philippines 2,360,249 6,227,601 $3,158,711 $1,638,233 $1,520,478 0 0 $0 $0 $0 $0 $1,520,478Singapore 1,173,796 11,916,180 $3,882,520 $365,912 $3,516,608 0 0 $0 $0 $0 $0 $3,516,608Sri Lanka 14,732 75,258 $32,697 $8,135 $24,562 0 0 $0 $0 $0 $0 $24,562Taiwan 544,828 3,707,795 $1,886,816 $450,626 $1,436,190 0 0 $0 $0 $0 $0 $1,436,190Thailand 583,873 2,873,964 $1,072,692 $419,697 $652,995 0 0 $0 $0 $0 $0 $652,995Vietnam 36,402 291,860 $93,188 $37,041 $56,147 0 0 $0 $0 $0 $0 $56,147
Asia 21,318,326 132,916,646 $53,458,891 $14,634,099 $38,824,792 0 0 $0 $0 $0 $0 $38,824,792
Australia 1,573,817 12,281,094 $4,324,287 $323,781 $4,000,506 0 0 $0 $0 $0 $0 $4,000,506Cook Islands 21 146 $184 $0 $184 0 0 $0 $0 $0 $0 $184Fiji 38,144 147,248 $69,869 $25,753 $44,116 0 0 $0 $0 $0 $0 $44,116French Polynesia 0 0 $0 $0 $0 0 0 $0 $0 $0 $0 $0Kiribati 0 0 $0 $0 $0 0 0 $0 $0 $0 $0 $0Marshall Islands 0 0 $0 $0 $0 0 0 $0 $0 $0 $0 $0Micronesia, Federated States of 9,199 29,341 $8,226 $4,705 $3,521 0 0 $0 $0 $0 $0 $3,521Nauru 0 0 $0 $0 $0 0 0 $0 $0 $0 $0 $0New Caledonia 0 0 $0 $0 $0 0 0 $0 $0 $0 $0 $0New Zealand 187,237 1,656,351 $661,864 $44,216 $617,648 0 0 $0 $0 $0 $0 $617,648Niue 0 0 $0 $0 $0 0 0 $0 $0 $0 $0 $0Norfolk Island 0 0 $0 $0 $0 0 0 $0 $0 $0 $0 $0Pacific Islands (Palau) 4,353 9,709 $56,275 $2,072 $54,203 0 0 $0 $0 $0 $0 $54,203Papua New Guinea 0 0 $0 $0 $0 0 0 $0 $0 $0 $0 $0Solomon Islands 0 0 $0 $0 $0 0 0 $0 $0 $0 $0 $0Tonga 28 238 $72 $29 $43 0 0 $0 $0 $0 $0 $43Tuvalu 0 0 $0 $0 $0 0 0 $0 $0 $0 $0 $0Vanuatu 0 0 $0 $0 $0 0 0 $0 $0 $0 $0 $0Wallis and Futuna 0 0 $0 $0 $0 0 0 $0 $0 $0 $0 $0Western Samoa 8 108 $365 $19 $346 0 0 $0 $0 $0 $0 $346
American Samoa 1,198 2,258 $8,433 $30 $8,403 0 0 $0 $0 $0 $0 $8,403Baker Island 0 0 $0 $0 $0 0 0 $0 $0 $0 $0 $0Guam 0 0 $0 $0 $0 0 0 $0 $0 $0 $0 $0Hawaii 0 0 $0 $0 $0 0 0 $0 $0 $0 $0 $0Howland Island 0 0 $0 $0 $0 0 0 $0 $0 $0 $0 $0Jarvis Island 0 0 $0 $0 $0 0 0 $0 $0 $0 $0 $0Johnston Atoll 0 0 $0 $0 $0 0 0 $0 $0 $0 $0 $0Kingman Reef 0 0 $0 $0 $0 0 0 $0 $0 $0 $0 $0Midway Atoll 0 0 $0 $0 $0 0 0 $0 $0 $0 $0 $0Northern Mariana Islands 0 0 $0 $0 $0 0 0 $0 $0 $0 $0 $0Palmyra Atoll 0 0 $0 $0 $0 0 0 $0 $0 $0 $0 $0Wake Island 0 0 $0 $0 $0 0 0 $0 $0 $0 $0 $0
Oceania 1,814,005 14,126,493 $5,129,575 $400,605 $4,728,970 0 0 $0 $0 $0 $0 $4,728,970
Albania 2,146 10,399 $7,004 $683 $6,321 0 0 $0 $0 $0 $0 $6,321Armenia 1,146 12,388 $20,081 $2,849 $17,232 0 0 $0 $0 $0 $0 $17,232Azerbaijan 0 0 $0 $0 $0 0 0 $0 $0 $0 $0 $0Belarus 7,114 23,399 $10,342 $4,566 $5,776 0 0 $0 $0 $0 $0 $5,776
- Switched Services Page 90 -

2008 Annual Section 43.61 International Traffic Data for All U.S. Points: All Settlement ArrangementsTable A26: All United States Carriers Message Telephone Service Billing Types Covered: 4, 14
International Point Traffic Billed in the United States Traffic Billed in Foreign Countries TotalOriginating or Terminating Transiting the United States U.S.
in the United States (by Country of Origin) CarriersNumber Number U.S. Payout Retained Number Number Receipts Number Receipts Payout Retained Retained
of of Carriers to Foreign Revenues of of from Foreign of from Foreign to Foreign Revenues RevenuesMessages Minutes Revenues Carriers Messages Minutes Carriers Minutes Carriers Carriers
Bosnia and Herzegovina 2,481 13,842 $2,344 $1,609 $735 0 0 $0 $0 $0 $0 $735Bulgaria 66,902 413,468 $188,723 $18,386 $170,337 0 0 $0 $0 $0 $0 $170,337Croatia 20,930 130,129 $37,560 $26,601 $10,959 0 0 $0 $0 $0 $0 $10,959Czech Republic 133,514 1,069,903 $609,951 $139,858 $470,093 0 0 $0 $0 $0 $0 $470,093Estonia 11,359 46,226 $29,336 $762 $28,574 0 0 $0 $0 $0 $0 $28,574Georgia 641 1,764 $144 $56 $88 0 0 $0 $0 $0 $0 $88Hungary 119,952 1,618,172 $946,084 $78,647 $867,437 0 0 $0 $0 $0 $0 $867,437Kazakhstan 15,875 67,074 $15,309 $4,591 $10,718 0 0 $0 $0 $0 $0 $10,718Kyrgyzstan 0 0 $0 $0 $0 0 0 $0 $0 $0 $0 $0Latvia 14,915 67,452 $30,042 $8,331 $21,711 0 0 $0 $0 $0 $0 $21,711Lithuania 61 283 $2,001 $81 $1,920 0 0 $0 $0 $0 $0 $1,920Moldova 0 0 $0 $0 $0 0 0 $0 $0 $0 $0 $0Poland 45,869,767 79,170,398 $13,739,605 $12,448,634 $1,290,971 0 0 $0 $0 $0 $0 $1,290,971Romania 50,365 407,743 $165,634 $41,062 $124,572 0 0 $0 $0 $0 $0 $124,572Russia 145,988 865,969 $531,307 $56,348 $474,959 0 0 $0 $0 $0 $0 $474,959Serbia 2,703 18,999 $1,550 $2,638 -$1,088 0 0 $0 $0 $0 $0 -$1,088Slovakia 37,548 218,805 $113,582 $18,861 $94,721 0 0 $0 $0 $0 $0 $94,721Slovenia 0 0 $0 $0 $0 0 0 $0 $0 $0 $0 $0Tajikistan 0 0 $0 $0 $0 0 0 $0 $0 $0 $0 $0Turkmenistan 0 0 $0 $0 $0 0 0 $0 $0 $0 $0 $0Ukraine 141,954 751,375 $268,501 $64,301 $204,200 0 0 $0 $0 $0 $0 $204,200Uzbekistan 16,838 44,089 $2,593 $2,204 $389 0 0 $0 $0 $0 $0 $389
Eastern Europe 46,662,199 84,951,877 $16,721,693 $12,921,068 $3,800,625 0 0 $0 $0 $0 $0 $3,800,625
Antarctica 0 0 $0 $0 $0 0 0 $0 $0 $0 $0 $0Maritime - Atlantic 0 0 $0 $0 $0 0 0 $0 $0 $0 $0 $0Maritime - other oceans 1 24 $37 $25 $12 0 0 $0 $0 $0 $0 $12Maritime - Pacific 0 0 $0 $0 $0 0 0 $0 $0 $0 $0 $0
Other Regions 1 24 $37 $25 $12 0 0 $0 $0 $0 $0 $12
American Samoa 0 0 $0 $0 $0 0 0 $0 $0 $0 $0 $0Baker Island 0 0 $0 $0 $0 0 0 $0 $0 $0 $0 $0Howland Island 0 0 $0 $0 $0 0 0 $0 $0 $0 $0 $0Jarvis Island 0 0 $0 $0 $0 0 0 $0 $0 $0 $0 $0Johnston Atoll 0 0 $0 $0 $0 0 0 $0 $0 $0 $0 $0Kingman Reef 0 0 $0 $0 $0 0 0 $0 $0 $0 $0 $0Midway Atoll 0 0 $0 $0 $0 0 0 $0 $0 $0 $0 $0Navassa Island 0 0 $0 $0 $0 0 0 $0 $0 $0 $0 $0Northern Mariana Islands 9,350 49,937 $13,328 $11,314 $2,014 0 0 $0 $0 $0 $0 $2,014Palmyra Atoll 0 0 $0 $0 $0 0 0 $0 $0 $0 $0 $0Wake Island 0 0 $0 $0 $0 0 0 $0 $0 $0 $0 $0
Carriers serving Misc. U.S. points 9,350 49,937 $13,328 $11,314 $2,014 0 0 $0 $0 $0 $0 $2,014
Total for Foreign Points 312,306,786 1,325,442,122 $209,885,072 $61,601,612 $148,283,460 0 0 $0 $0 $0 $0 $148,283,460
Total for U.S. Points 1,198 2,258 $8,433 $30 $8,403 0 0 $0 $0 $0 $0 $8,403
World Total 312,307,984 1,325,444,380 $209,893,505 $61,601,642 $148,291,863 0 0 $0 0 $0 $0 $0 $148,291,863
- Switched Services Page 91 -

2008 Annual Section 43.61 International Traffic Data for All U.S. Points: All Settlement ArrangementsTable A27: All United States Carriers Message Telephone Service Billing Types Covered: 5, 15
International Point Traffic Billed in the United States Traffic Billed in Foreign Countries TotalOriginating or Terminating Transiting the United States U.S.
in the United States (by Country of Origin) CarriersNumber Number U.S. Payout Retained Number Number Receipts Number Receipts Payout Retained Retained
of of Carriers to Foreign Revenues of of from Foreign of from Foreign to Foreign Revenues RevenuesMessages Minutes Revenues Carriers Messages Minutes Carriers Minutes Carriers Carriers
Andorra 77,648 272,584 $41,237 $31,627 $9,610 0 0 $0 $0 $0 $0 $9,610Austria 6,921,722 30,515,744 $2,190,856 $2,305,331 -$114,475 0 0 $0 $0 $0 $0 -$114,475Belgium 18,110,866 64,067,264 $3,186,456 $4,912,526 -$1,726,070 0 0 $0 $0 $0 $0 -$1,726,070Cyprus 1,645,933 4,753,543 $187,143 $146,935 $40,208 0 0 $0 $0 $0 $0 $40,208Denmark 5,741,050 20,883,923 $1,570,439 $1,367,896 $202,543 0 0 $0 $0 $0 $0 $202,543Finland 2,859,518 15,149,264 $794,506 $862,658 -$68,152 0 0 $0 $0 $0 $0 -$68,152France 39,384,152 161,885,425 $13,004,260 $11,926,480 $1,077,780 0 0 $0 $0 $0 $0 $1,077,780Germany 80,697,073 381,508,202 $7,713,825 $15,808,999 -$8,095,174 0 0 $0 $0 $0 $0 -$8,095,174Gibraltar 507,938 2,027,390 $156,621 $156,174 $447 0 0 $0 $0 $0 $0 $447Greece 2,725,892 14,997,318 $768,260 $658,173 $110,087 0 0 $0 $0 $0 $0 $110,087Greenland 87,284 130,637 $71,228 $56,651 $14,577 0 0 $0 $0 $0 $0 $14,577Iceland 627,912 3,180,206 $211,016 $168,558 $42,458 0 0 $0 $0 $0 $0 $42,458Ireland 18,804,208 59,308,167 $3,771,553 $4,506,276 -$734,723 0 0 $0 $0 $0 $0 -$734,723Italy 34,508,973 159,475,328 $7,237,771 $6,943,174 $294,597 0 0 $0 $0 $0 $0 $294,597Liechtenstein 972,894 3,508,256 $1,430,706 $1,184,859 $245,847 0 0 $0 $0 $0 $0 $245,847Luxembourg 1,113,185 4,053,423 $399,521 $207,371 $192,150 0 0 $0 $0 $0 $0 $192,150Malta 381,463 1,305,277 $250,263 $223,797 $26,466 0 0 $0 $0 $0 $0 $26,466Netherlands 15,278,197 56,115,241 $4,077,681 $5,152,088 -$1,074,407 0 0 $0 $0 $0 $0 -$1,074,407Norway 3,541,750 13,881,655 $1,147,253 $1,006,229 $141,024 0 0 $0 $0 $0 $0 $141,024Portugal 3,122,907 21,902,384 $970,411 $986,671 -$16,260 0 0 $0 $0 $0 $0 -$16,260Spain 43,233,406 135,318,226 $15,468,263 $13,289,070 $2,179,193 0 0 $0 $0 $0 $0 $2,179,193Sweden 4,945,891 23,579,588 $1,280,983 $1,433,137 -$152,154 0 0 $0 $0 $0 $0 -$152,154Switzerland 14,595,182 62,605,766 $3,466,062 $4,579,921 -$1,113,859 0 0 $0 $0 $0 $0 -$1,113,859Turkey 6,093,615 20,157,624 $2,176,434 $1,609,138 $567,296 0 0 $0 $0 $0 $0 $567,296United Kingdom 75,067,684 216,060,620 $9,860,753 $11,575,421 -$1,714,668 0 0 $0 $0 $0 $0 -$1,714,668
Western Europe 381,046,343 1,476,643,055 $81,433,501 $91,099,160 -$9,665,659 0 0 $0 $0 $0 $0 -$9,665,659
Algeria 2,882,869 9,452,927 $1,209,786 $1,266,938 -$57,152 0 0 $0 $0 $0 $0 -$57,152Angola 2,400,388 8,937,557 $1,248,277 $1,342,505 -$94,228 0 0 $0 $0 $0 $0 -$94,228Benin 1,473,467 4,844,762 $541,988 $638,952 -$96,964 0 0 $0 $0 $0 $0 -$96,964Botswana 1,273,045 3,892,432 $561,087 $489,017 $72,070 0 0 $0 $0 $0 $0 $72,070Burkina 1,454,486 2,300,730 $297,822 $347,826 -$50,004 0 0 $0 $0 $0 $0 -$50,004Burundi 233,654 882,808 $59,939 $95,926 -$35,987 0 0 $0 $0 $0 $0 -$35,987Cameroon 3,778,496 21,853,918 $2,505,507 $2,705,948 -$200,441 0 0 $0 $0 $0 $0 -$200,441Canary Island 0 0 $0 $0 $0 0 0 $0 $0 $0 $0 $0Cape Verde 706,711 4,158,450 $183,940 $799,130 -$615,190 0 0 $0 $0 $0 $0 -$615,190Central African Republic 253,689 715,542 $128,903 $223,969 -$95,066 0 0 $0 $0 $0 $0 -$95,066Chad 1,352,652 2,118,357 $246,622 $226,065 $20,557 0 0 $0 $0 $0 $0 $20,557Comoros 305,275 1,357,836 $591,399 $430,915 $160,484 0 0 $0 $0 $0 $0 $160,484Congo 1,764,305 5,866,336 $649,174 $660,467 -$11,293 0 0 $0 $0 $0 $0 -$11,293Cote d'Ivoire 3,235,282 8,383,810 $1,095,466 $1,338,859 -$243,393 0 0 $0 $0 $0 $0 -$243,393Djibouti 608,076 2,001,601 $363,738 $562,383 -$198,645 0 0 $0 $0 $0 $0 -$198,645Egypt 41,170,171 169,810,454 $11,489,365 $16,348,464 -$4,859,099 0 0 $0 $0 $0 $0 -$4,859,099Equatorial Guinea 1,020,811 2,799,219 $522,180 $456,111 $66,069 0 0 $0 $0 $0 $0 $66,069
- Switched Services Page 92 -

2008 Annual Section 43.61 International Traffic Data for All U.S. Points: All Settlement ArrangementsTable A27: All United States Carriers Message Telephone Service Billing Types Covered: 5, 15
International Point Traffic Billed in the United States Traffic Billed in Foreign Countries TotalOriginating or Terminating Transiting the United States U.S.
in the United States (by Country of Origin) CarriersNumber Number U.S. Payout Retained Number Number Receipts Number Receipts Payout Retained Retained
of of Carriers to Foreign Revenues of of from Foreign of from Foreign to Foreign Revenues RevenuesMessages Minutes Revenues Carriers Messages Minutes Carriers Minutes Carriers Carriers
Ethiopia 7,753,169 34,265,582 $3,915,700 $6,573,611 -$2,657,911 0 0 $0 $0 $0 $0 -$2,657,911Gabon 902,425 2,226,299 $324,179 $309,739 $14,440 0 0 $0 $0 $0 $0 $14,440Gambia, The 1,261,603 4,404,129 $895,170 $1,120,159 -$224,989 0 0 $0 $0 $0 $0 -$224,989Ghana 5,328,491 27,356,437 $3,516,564 $3,144,010 $372,554 0 0 $0 $0 $0 $0 $372,554Guinea 2,102,742 9,332,360 $1,038,126 $1,456,727 -$418,601 0 0 $0 $0 $0 $0 -$418,601Guinea-Bissau 188,829 376,778 $140,609 $149,952 -$9,343 0 0 $0 $0 $0 $0 -$9,343Kenya 2,511,619 10,403,683 $1,139,506 $1,047,133 $92,373 0 0 $0 $0 $0 $0 $92,373Lesotho 231,474 1,033,579 $145,753 $173,335 -$27,582 0 0 $0 $0 $0 $0 -$27,582Liberia 1,714,591 6,552,995 $1,133,269 $1,082,810 $50,459 0 0 $0 $0 $0 $0 $50,459Libya 7,812,782 21,771,247 $4,061,168 $4,699,212 -$638,044 0 0 $0 $0 $0 $0 -$638,044Madagascar 4,039,682 7,981,113 $3,716,769 $3,883,287 -$166,518 0 0 $0 $0 $0 $0 -$166,518Malawi 2,643,205 9,369,421 $849,687 $1,077,056 -$227,369 0 0 $0 $0 $0 $0 -$227,369Mali 3,259,089 9,422,555 $1,313,389 $1,668,703 -$355,314 0 0 $0 $0 $0 $0 -$355,314Mauritania 1,945,347 6,039,590 $1,203,564 $941,080 $262,484 0 0 $0 $0 $0 $0 $262,484Mauritius 472,079 1,422,967 $131,459 $153,853 -$22,394 0 0 $0 $0 $0 $0 -$22,394Morocco 16,755,515 80,497,415 $13,542,193 $17,015,662 -$3,473,469 0 0 $0 $0 $0 $0 -$3,473,469Mozambique 814,510 2,439,251 $234,182 $252,814 -$18,632 0 0 $0 $0 $0 $0 -$18,632Namibia 455,767 1,680,453 $193,481 $227,753 -$34,272 0 0 $0 $0 $0 $0 -$34,272Niger 3,156,569 8,517,080 $666,040 $842,713 -$176,673 0 0 $0 $0 $0 $0 -$176,673Nigeria 8,110,727 28,095,935 $3,290,134 $2,536,690 $753,444 0 0 $0 $0 $0 $0 $753,444Reunion 326,638 1,247,586 $265,177 $261,063 $4,114 0 0 $0 $0 $0 $0 $4,114Rwanda 558,059 2,896,980 $127,868 $252,701 -$124,833 0 0 $0 $0 $0 $0 -$124,833Saint Helena 3,461 13,096 $6,339 $6,746 -$407 0 0 $0 $0 $0 $0 -$407Sao Tome and Principe 6,602,351 16,438,710 $13,594,838 $13,082,514 $512,324 0 0 $0 $0 $0 $0 $512,324Senegal 7,879,672 30,876,078 $3,971,405 $5,493,338 -$1,521,933 0 0 $0 $0 $0 $0 -$1,521,933Seychelles 244,690 772,047 $58,059 $52,048 $6,011 0 0 $0 $0 $0 $0 $6,011Sierra Leone 3,185,328 19,005,904 $3,354,410 $4,782,613 -$1,428,203 0 0 $0 $0 $0 $0 -$1,428,203Somalia 2,391,427 4,864,493 $1,895,897 $1,830,528 $65,369 0 0 $0 $0 $0 $0 $65,369South Africa 14,363,415 64,524,319 $4,251,895 $4,170,943 $80,952 0 0 $0 $0 $0 $0 $80,952Sudan 3,026,012 13,866,062 $949,789 $1,123,381 -$173,592 0 0 $0 $0 $0 $0 -$173,592Swaziland 1,152,836 3,539,098 $379,888 $348,404 $31,484 0 0 $0 $0 $0 $0 $31,484Tanzania 1,660,144 6,996,879 $653,025 $676,609 -$23,584 0 0 $0 $0 $0 $0 -$23,584Togo 1,287,474 3,176,619 $708,222 $757,456 -$49,234 0 0 $0 $0 $0 $0 -$49,234Tunisia 3,709,744 15,377,541 $3,208,665 $3,563,863 -$355,198 0 0 $0 $0 $0 $0 -$355,198Uganda 1,447,582 5,792,220 $319,220 $489,405 -$170,185 0 0 $0 $0 $0 $0 -$170,185Western Sahara 0 0 $0 $0 $0 0 0 $0 $0 $0 $0 $0Zaire 3,235,265 8,842,565 $2,248,443 $3,142,522 -$894,079 0 0 $0 $0 $0 $0 -$894,079Zambia 1,203,053 4,785,546 $362,960 $451,075 -$88,115 0 0 $0 $0 $0 $0 -$88,115Zimbabwe 4,284,963 13,950,595 $2,591,816 $2,827,232 -$235,416 0 0 $0 $0 $0 $0 -$235,416
Africa 191,935,706 739,531,946 $102,094,051 $119,602,215 -$17,508,164 0 0 $0 $0 $0 $0 -$17,508,164
Bahrain 1,010,830 2,997,832 $260,596 $194,954 $65,642 0 0 $0 $0 $0 $0 $65,642Iran 11,532,208 42,235,634 $3,961,904 $4,887,310 -$925,406 0 0 $0 $0 $0 $0 -$925,406Iraq 2,551,864 10,080,080 $808,045 $869,028 -$60,983 0 0 $0 $0 $0 $0 -$60,983Israel 15,651,080 81,754,109 $5,051,399 $6,045,065 -$993,666 0 0 $0 $0 $0 $0 -$993,666
- Switched Services Page 93 -

2008 Annual Section 43.61 International Traffic Data for All U.S. Points: All Settlement ArrangementsTable A27: All United States Carriers Message Telephone Service Billing Types Covered: 5, 15
International Point Traffic Billed in the United States Traffic Billed in Foreign Countries TotalOriginating or Terminating Transiting the United States U.S.
in the United States (by Country of Origin) CarriersNumber Number U.S. Payout Retained Number Number Receipts Number Receipts Payout Retained Retained
of of Carriers to Foreign Revenues of of from Foreign of from Foreign to Foreign Revenues RevenuesMessages Minutes Revenues Carriers Messages Minutes Carriers Minutes Carriers Carriers
Jordan 1,673,344 7,479,890 $608,945 $390,846 $218,099 0 0 $0 $0 $0 $0 $218,099Kuwait 11,717,042 28,649,709 $2,294,512 $2,285,807 $8,705 0 0 $0 $0 $0 $0 $8,705Lebanon 3,466,054 16,296,641 $2,081,648 $1,841,011 $240,637 0 0 $0 $0 $0 $0 $240,637Oman 5,490,599 17,148,156 $2,340,610 $2,386,188 -$45,578 0 0 $0 $0 $0 $0 -$45,578Qatar 6,097,860 12,401,928 $1,844,501 $1,791,274 $53,227 0 0 $0 $0 $0 $0 $53,227Saudi Arabia 39,082,444 106,693,962 $9,811,037 $11,325,938 -$1,514,901 0 0 $0 $0 $0 $0 -$1,514,901Syria 3,381,874 13,650,537 $2,100,269 $2,069,102 $31,167 0 0 $0 $0 $0 $0 $31,167United Arab Emirates 29,298,247 89,214,825 $10,398,163 $11,670,415 -$1,272,252 0 0 $0 $0 $0 $0 -$1,272,252Yemen 5,748,562 26,395,539 $2,070,617 $2,666,172 -$595,555 0 0 $0 $0 $0 $0 -$595,555
Middle East 136,702,008 454,998,842 $43,632,246 $48,423,110 -$4,790,864 0 0 $0 $0 $0 $0 -$4,790,864
Anguilla 610,286 1,150,091 $188,397 $186,351 $2,046 0 0 $0 $0 $0 $0 $2,046Antigua and Barbuda 2,599,968 7,649,997 $662,326 $710,825 -$48,499 0 0 $0 $0 $0 $0 -$48,499Aruba 4,539,401 17,063,764 $2,050,620 $1,975,100 $75,520 0 0 $0 $0 $0 $0 $75,520Bahamas, The 3,304,286 12,903,321 $260,101 $445,308 -$185,207 0 0 $0 $0 $0 $0 -$185,207Barbados 3,710,248 13,542,199 $1,643,515 $1,646,344 -$2,829 0 0 $0 $0 $0 $0 -$2,829Bermuda 3,830,039 13,561,138 $432,510 $550,038 -$117,528 0 0 $0 $0 $0 $0 -$117,528Cayman Islands 2,886,238 9,017,638 $1,126,556 $951,670 $174,886 0 0 $0 $0 $0 $0 $174,886Cuba 11,282,149 68,841,089 $55,896,140 $58,670,647 -$2,774,507 0 0 $0 $0 $0 $0 -$2,774,507Dominica 1,500,025 4,351,789 $573,449 $640,399 -$66,950 0 0 $0 $0 $0 $0 -$66,950Dominican Republic 21,056,905 138,012,591 $6,658,937 $7,764,624 -$1,105,687 0 0 $0 $0 $0 $0 -$1,105,687French Overseas Departments 983,405 1,855,555 $386,036 $352,394 $33,642 0 0 $0 $0 $0 $0 $33,642Grenada 976,289 5,192,372 $432,709 $597,289 -$164,580 0 0 $0 $0 $0 $0 -$164,580Guadeloupe 1,045,585 1,981,928 $371,920 $342,785 $29,135 0 0 $0 $0 $0 $0 $29,135Haiti 27,925,267 93,733,962 $15,382,919 $30,961,762 -$15,578,843 0 0 $0 $0 $0 $0 -$15,578,843Jamaica 37,888,321 170,661,993 $21,924,377 $24,008,098 -$2,083,721 0 0 $0 $0 $0 $0 -$2,083,721Montserrat 121,439 392,009 $44,650 $43,158 $1,492 0 0 $0 $0 $0 $0 $1,492Netherlands Antilles 13,013,036 44,425,490 $3,643,443 $3,494,997 $148,446 0 0 $0 $0 $0 $0 $148,446Saint Kitts and Nevis 1,476,579 5,216,603 $693,703 $733,024 -$39,321 0 0 $0 $0 $0 $0 -$39,321Saint Lucia 1,303,719 5,643,771 $515,305 $675,814 -$160,509 0 0 $0 $0 $0 $0 -$160,509Saint Vincent and the Grenadines 898,209 4,970,066 $384,925 $633,509 -$248,584 0 0 $0 $0 $0 $0 -$248,584Trinidad and Tobago 5,038,106 30,188,995 $1,668,513 $2,378,558 -$710,045 0 0 $0 $0 $0 $0 -$710,045Turks and Caicos Islands 3,818,310 5,666,442 $1,177,793 $984,540 $193,253 0 0 $0 $0 $0 $0 $193,253Virgin Islands, British 2,193,558 5,457,800 $820,251 $752,255 $67,996 0 0 $0 $0 $0 $0 $67,996
Navassa Island 0 0 $0 $0 $0 0 0 $0 $0 $0 $0 $0Puerto Rico 0 0 $0 $0 $0 0 0 $0 $0 $0 $0 $0U.S. Virgin Islands 24,748 141,811 $3,037 $1,042 $1,995 0 0 $0 $0 $0 $0 $1,995
Caribbean 152,026,116 661,622,414 $116,942,132 $139,500,531 -$22,558,399 0 0 $0 $0 $0 $0 -$22,558,399
Belize 2,186,850 11,877,953 $3,395,560 $2,074,163 $1,321,397 0 0 $0 $0 $0 $0 $1,321,397Canada 27,329,658 133,113,244 $2,514,907 $1,194,360 $1,320,547 0 0 $0 $0 $0 $0 $1,320,547Costa Rica 27,647,685 136,738,288 $21,582,043 $12,562,385 $9,019,658 0 0 $0 $0 $0 $0 $9,019,658El Salvador 37,913,885 189,372,544 $9,172,552 $14,516,437 -$5,343,885 0 0 $0 $0 $0 $0 -$5,343,885Guatemala 42,261,883 407,754,795 $17,569,510 $39,542,538 -$21,973,028 0 0 $0 $0 $0 $0 -$21,973,028Honduras 3,360,957 15,722,395 $2,012,977 $2,440,754 -$427,777 0 0 $0 $0 $0 $0 -$427,777
- Switched Services Page 94 -

2008 Annual Section 43.61 International Traffic Data for All U.S. Points: All Settlement ArrangementsTable A27: All United States Carriers Message Telephone Service Billing Types Covered: 5, 15
International Point Traffic Billed in the United States Traffic Billed in Foreign Countries TotalOriginating or Terminating Transiting the United States U.S.
in the United States (by Country of Origin) CarriersNumber Number U.S. Payout Retained Number Number Receipts Number Receipts Payout Retained Retained
of of Carriers to Foreign Revenues of of from Foreign of from Foreign to Foreign Revenues RevenuesMessages Minutes Revenues Carriers Messages Minutes Carriers Minutes Carriers Carriers
Mexico 173,296,238 740,921,025 $26,441,967 $46,315,842 -$19,873,875 0 0 $0 $0 $0 $0 -$19,873,875Nicaragua 7,484,531 33,156,656 $6,009,834 $4,234,781 $1,775,053 0 0 $0 $0 $0 $0 $1,775,053Panama 9,833,440 56,636,898 $2,541,230 $2,194,806 $346,424 0 0 $0 $0 $0 $0 $346,424Saint Pierre and Miquelon 110,883 390,002 $57,377 $66,385 -$9,008 0 0 $0 $0 $0 $0 -$9,008
Alaska 0 0 $0 $0 $0 0 0 $0 $0 $0 $0 $0United States (conterminous) 0 0 $0 $0 $0 0 0 $0 $0 $0 $0 $0
North and Central America 331,426,010 1,725,683,800 $91,297,957 $125,142,451 -$33,844,494 0 0 $0 $0 $0 $0 -$33,844,494
Argentina 5,907,603 30,346,776 $1,708,818 $969,885 $738,933 0 0 $0 $0 $0 $0 $738,933Bolivia 7,941,216 55,918,263 $5,194,792 $4,319,173 $875,619 0 0 $0 $0 $0 $0 $875,619Brazil 52,830,086 174,920,455 $19,052,276 $11,421,658 $7,630,618 0 0 $0 $0 $0 $0 $7,630,618Chile 5,701,367 24,806,728 $1,589,559 $2,303,204 -$713,645 0 0 $0 $0 $0 $0 -$713,645Colombia 35,644,183 166,990,479 $12,526,067 $15,405,602 -$2,879,535 0 0 $0 $0 $0 $0 -$2,879,535Ecuador 21,144,531 162,006,491 $15,547,680 $15,874,067 -$326,387 0 0 $0 $0 $0 $0 -$326,387French Guiana 4,725,626 6,642,793 $1,102,774 $1,340,134 -$237,360 0 0 $0 $0 $0 $0 -$237,360Guyana 6,627,800 27,550,127 $4,426,149 $6,191,190 -$1,765,041 0 0 $0 $0 $0 $0 -$1,765,041Paraguay 2,511,262 21,588,055 $1,316,185 $1,725,665 -$409,480 0 0 $0 $0 $0 $0 -$409,480Peru 10,650,984 74,400,992 $6,901,913 $4,534,379 $2,367,534 0 0 $0 $0 $0 $0 $2,367,534Suriname 12,425,487 65,572,350 $4,426,101 $9,286,112 -$4,860,011 0 0 $0 $0 $0 $0 -$4,860,011Uruguay 3,828,944 23,099,613 $2,285,621 $1,912,888 $372,733 0 0 $0 $0 $0 $0 $372,733Venezuela 10,679,388 47,617,277 $3,689,802 $2,435,407 $1,254,395 0 0 $0 $0 $0 $0 $1,254,395
South America 180,618,477 881,460,399 $79,767,737 $77,719,364 $2,048,373 0 0 $0 $0 $0 $0 $2,048,373
Afghanistan 7,260,044 24,616,142 $4,703,083 $4,837,050 -$133,967 0 0 $0 $0 $0 $0 -$133,967Bangladesh 25,922,138 159,604,762 $2,957,859 $9,910,707 -$6,952,848 0 0 $0 $0 $0 $0 -$6,952,848Bhutan 187,215 637,163 $81,307 $78,185 $3,122 0 0 $0 $0 $0 $0 $3,122Brunei 791,624 3,400,185 $114,648 $125,987 -$11,339 0 0 $0 $0 $0 $0 -$11,339Burma 4,180,821 17,841,623 $3,685,059 $4,213,188 -$528,129 0 0 $0 $0 $0 $0 -$528,129Cambodia 276,968 895,881 $53,607 $61,584 -$7,977 0 0 $0 $0 $0 $0 -$7,977Chagos Archipelago 2,742 6,210 $14,216 $2,984 $11,232 0 0 $0 $0 $0 $0 $11,232China 26,063,664 168,755,438 $2,735,301 $4,974,499 -$2,239,198 0 0 $0 $0 $0 $0 -$2,239,198French Southern and Antarctic Lands 0 0 $0 $0 $0 0 0 $0 $0 $0 $0 $0Hong Kong 3,413,592 15,563,171 $321,996 $161,103 $160,893 0 0 $0 $0 $0 $0 $160,893India 96,911,314 630,490,375 $15,228,499 $27,636,146 -$12,407,647 0 0 $0 $0 $0 $0 -$12,407,647Indonesia 8,830,296 30,863,042 $3,514,172 $2,524,865 $989,307 0 0 $0 $0 $0 $0 $989,307Japan 45,722,220 168,630,131 $11,802,513 $15,520,303 -$3,717,790 0 0 $0 $0 $0 $0 -$3,717,790Korea, North 7,417 22,272 $14,422 $11,389 $3,033 0 0 $0 $0 $0 $0 $3,033Korea, South 84,610,858 139,197,521 $3,254,664 $4,478,240 -$1,223,576 0 0 $0 $0 $0 $0 -$1,223,576Laos 65,396 449,089 $25,069 $19,458 $5,611 0 0 $0 $0 $0 $0 $5,611Macau 678,960 2,174,465 $85,517 $158,779 -$73,262 0 0 $0 $0 $0 $0 -$73,262Malaysia 9,782,894 34,147,745 $590,321 $916,991 -$326,670 0 0 $0 $0 $0 $0 -$326,670Maldives 222,967 711,811 $136,211 $106,561 $29,650 0 0 $0 $0 $0 $0 $29,650Mongolia 452,599 1,793,089 $202,486 $207,800 -$5,314 0 0 $0 $0 $0 $0 -$5,314Nepal 16,950,525 62,295,192 $7,468,031 $9,239,501 -$1,771,470 0 0 $0 $0 $0 $0 -$1,771,470Pakistan 9,743,487 52,306,262 $3,300,567 $3,126,103 $174,464 0 0 $0 $0 $0 $0 $174,464
- Switched Services Page 95 -

2008 Annual Section 43.61 International Traffic Data for All U.S. Points: All Settlement ArrangementsTable A27: All United States Carriers Message Telephone Service Billing Types Covered: 5, 15
International Point Traffic Billed in the United States Traffic Billed in Foreign Countries TotalOriginating or Terminating Transiting the United States U.S.
in the United States (by Country of Origin) CarriersNumber Number U.S. Payout Retained Number Number Receipts Number Receipts Payout Retained Retained
of of Carriers to Foreign Revenues of of from Foreign of from Foreign to Foreign Revenues RevenuesMessages Minutes Revenues Carriers Messages Minutes Carriers Minutes Carriers Carriers
Philippines 129,041,032 741,480,072 $91,978,830 $87,784,072 $4,194,758 0 0 $0 $0 $0 $0 $4,194,758Singapore 3,406,493 13,480,513 $156,539 $412,886 -$256,347 0 0 $0 $0 $0 $0 -$256,347Sri Lanka 23,815,074 146,490,649 $12,558,930 $11,741,241 $817,689 0 0 $0 $0 $0 $0 $817,689Taiwan 35,562,430 197,251,803 $10,955,123 $13,480,200 -$2,525,077 0 0 $0 $0 $0 $0 -$2,525,077Thailand 11,374,762 51,088,939 $1,049,197 $2,158,045 -$1,108,848 0 0 $0 $0 $0 $0 -$1,108,848Vietnam 22,142,242 155,029,683 $5,690,183 $8,403,303 -$2,713,120 0 0 $0 $0 $0 $0 -$2,713,120
Asia 567,419,774 2,819,223,228 $182,678,350 $212,291,170 -$29,612,820 0 0 $0 $0 $0 $0 -$29,612,820
Australia 48,001,183 70,842,057 $7,504,190 $2,368,869 $5,135,321 0 0 $0 $0 $0 $0 $5,135,321Cook Islands 44,888 140,187 $74,172 $65,580 $8,592 0 0 $0 $0 $0 $0 $8,592Fiji 750,811 4,810,739 $754,476 $922,092 -$167,616 0 0 $0 $0 $0 $0 -$167,616French Polynesia 1,021,536 2,976,409 $620,456 $503,164 $117,292 0 0 $0 $0 $0 $0 $117,292Kiribati 9,264 41,260 $25,699 $19,731 $5,968 0 0 $0 $0 $0 $0 $5,968Marshall Islands 68,731 295,838 $71,961 $53,708 $18,253 0 0 $0 $0 $0 $0 $18,253Micronesia, Federated States of 72,196 308,697 $42,801 $50,303 -$7,502 0 0 $0 $0 $0 $0 -$7,502Nauru 62,771 271,122 $205,278 $172,407 $32,871 0 0 $0 $0 $0 $0 $32,871New Caledonia 78,201 287,675 $64,584 $60,783 $3,801 0 0 $0 $0 $0 $0 $3,801New Zealand 3,551,151 19,203,457 $1,720,059 $1,416,531 $303,528 0 0 $0 $0 $0 $0 $303,528Niue 924 3,979 $2,351 $2,050 $301 0 0 $0 $0 $0 $0 $301Norfolk Island 4,215 8,416 $9,554 $5,942 $3,612 0 0 $0 $0 $0 $0 $3,612Pacific Islands (Palau) 122,118 410,426 $128,698 $72,722 $55,976 0 0 $0 $0 $0 $0 $55,976Papua New Guinea 292,751 768,050 $563,302 $407,121 $156,181 0 0 $0 $0 $0 $0 $156,181Solomon Islands 37,955 102,664 $81,782 $74,674 $7,108 0 0 $0 $0 $0 $0 $7,108Tonga 245,169 1,649,280 $223,954 $225,155 -$1,201 0 0 $0 $0 $0 $0 -$1,201Tuvalu 8,664 43,364 $44,871 $18,720 $26,151 0 0 $0 $0 $0 $0 $26,151Vanuatu 5,007 17,946 $7,394 $7,462 -$68 0 0 $0 $0 $0 $0 -$68Wallis and Futuna 2,025 791 $767 $486 $281 0 0 $0 $0 $0 $0 $281Western Samoa 415,471 2,109,807 $538,772 $535,408 $3,364 0 0 $0 $0 $0 $0 $3,364
American Samoa 730,408 1,539,370 $117,293 $92,045 $25,248 0 0 $0 $0 $0 $0 $25,248Baker Island 0 0 $0 $0 $0 0 0 $0 $0 $0 $0 $0Guam 5,403 39,285 $3,461 $792 $2,669 0 0 $0 $0 $0 $0 $2,669Hawaii 0 0 $0 $0 $0 0 0 $0 $0 $0 $0 $0Howland Island 0 0 $0 $0 $0 0 0 $0 $0 $0 $0 $0Jarvis Island 0 0 $0 $0 $0 0 0 $0 $0 $0 $0 $0Johnston Atoll 0 0 $0 $0 $0 0 0 $0 $0 $0 $0 $0Kingman Reef 0 0 $0 $0 $0 0 0 $0 $0 $0 $0 $0Midway Atoll 2 1 $1 $1 $0 0 0 $0 $0 $0 $0 $0Northern Mariana Islands 1,002 3,672 $574 $276 $298 0 0 $0 $0 $0 $0 $298Palmyra Atoll 0 0 $0 $0 $0 0 0 $0 $0 $0 $0 $0Wake Island 0 0 $0 $0 $0 0 0 $0 $0 $0 $0 $0
Oceania 55,531,846 105,874,492 $12,806,450 $7,076,022 $5,730,428 0 0 $0 $0 $0 $0 $5,730,428
Albania 3,366,705 18,831,841 $3,826,817 $3,549,206 $277,611 0 0 $0 $0 $0 $0 $277,611Armenia 2,716,923 21,834,232 $566,842 $1,265,680 -$698,838 0 0 $0 $0 $0 $0 -$698,838Azerbaijan 4,681,827 15,169,933 $1,664,272 $1,683,675 -$19,403 0 0 $0 $0 $0 $0 -$19,403Belarus 6,025,952 26,585,082 $4,905,485 $5,231,716 -$326,231 0 0 $0 $0 $0 $0 -$326,231
- Switched Services Page 96 -
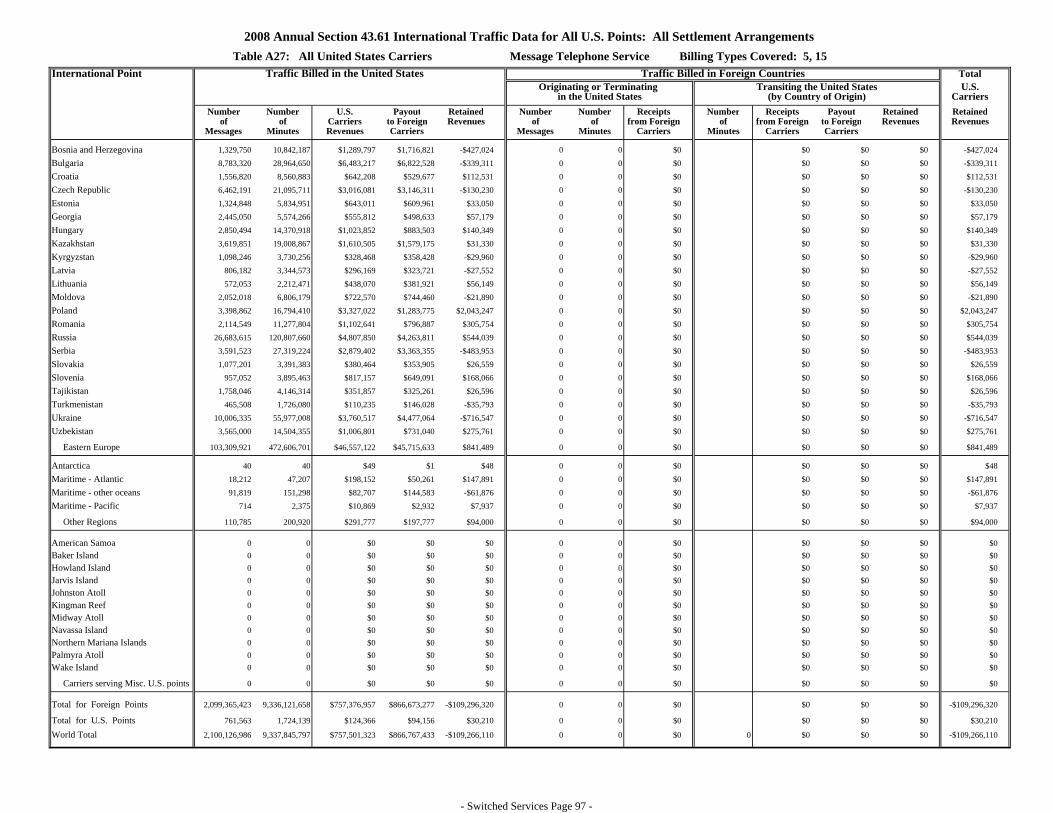
2008 Annual Section 43.61 International Traffic Data for All U.S. Points: All Settlement ArrangementsTable A27: All United States Carriers Message Telephone Service Billing Types Covered: 5, 15
International Point Traffic Billed in the United States Traffic Billed in Foreign Countries TotalOriginating or Terminating Transiting the United States U.S.
in the United States (by Country of Origin) CarriersNumber Number U.S. Payout Retained Number Number Receipts Number Receipts Payout Retained Retained
of of Carriers to Foreign Revenues of of from Foreign of from Foreign to Foreign Revenues RevenuesMessages Minutes Revenues Carriers Messages Minutes Carriers Minutes Carriers Carriers
Bosnia and Herzegovina 1,329,750 10,842,187 $1,289,797 $1,716,821 -$427,024 0 0 $0 $0 $0 $0 -$427,024Bulgaria 8,783,320 28,964,650 $6,483,217 $6,822,528 -$339,311 0 0 $0 $0 $0 $0 -$339,311Croatia 1,556,820 8,560,883 $642,208 $529,677 $112,531 0 0 $0 $0 $0 $0 $112,531Czech Republic 6,462,191 21,095,711 $3,016,081 $3,146,311 -$130,230 0 0 $0 $0 $0 $0 -$130,230Estonia 1,324,848 5,834,951 $643,011 $609,961 $33,050 0 0 $0 $0 $0 $0 $33,050Georgia 2,445,050 5,574,266 $555,812 $498,633 $57,179 0 0 $0 $0 $0 $0 $57,179Hungary 2,850,494 14,370,918 $1,023,852 $883,503 $140,349 0 0 $0 $0 $0 $0 $140,349Kazakhstan 3,619,851 19,008,867 $1,610,505 $1,579,175 $31,330 0 0 $0 $0 $0 $0 $31,330Kyrgyzstan 1,098,246 3,730,256 $328,468 $358,428 -$29,960 0 0 $0 $0 $0 $0 -$29,960Latvia 806,182 3,344,573 $296,169 $323,721 -$27,552 0 0 $0 $0 $0 $0 -$27,552Lithuania 572,053 2,212,471 $438,070 $381,921 $56,149 0 0 $0 $0 $0 $0 $56,149Moldova 2,052,018 6,806,179 $722,570 $744,460 -$21,890 0 0 $0 $0 $0 $0 -$21,890Poland 3,398,862 16,794,410 $3,327,022 $1,283,775 $2,043,247 0 0 $0 $0 $0 $0 $2,043,247Romania 2,114,549 11,277,804 $1,102,641 $796,887 $305,754 0 0 $0 $0 $0 $0 $305,754Russia 26,683,615 120,807,660 $4,807,850 $4,263,811 $544,039 0 0 $0 $0 $0 $0 $544,039Serbia 3,591,523 27,319,224 $2,879,402 $3,363,355 -$483,953 0 0 $0 $0 $0 $0 -$483,953Slovakia 1,077,201 3,391,383 $380,464 $353,905 $26,559 0 0 $0 $0 $0 $0 $26,559Slovenia 957,052 3,895,463 $817,157 $649,091 $168,066 0 0 $0 $0 $0 $0 $168,066Tajikistan 1,758,046 4,146,314 $351,857 $325,261 $26,596 0 0 $0 $0 $0 $0 $26,596Turkmenistan 465,508 1,726,080 $110,235 $146,028 -$35,793 0 0 $0 $0 $0 $0 -$35,793Ukraine 10,006,335 55,977,008 $3,760,517 $4,477,064 -$716,547 0 0 $0 $0 $0 $0 -$716,547Uzbekistan 3,565,000 14,504,355 $1,006,801 $731,040 $275,761 0 0 $0 $0 $0 $0 $275,761
Eastern Europe 103,309,921 472,606,701 $46,557,122 $45,715,633 $841,489 0 0 $0 $0 $0 $0 $841,489
Antarctica 40 40 $49 $1 $48 0 0 $0 $0 $0 $0 $48Maritime - Atlantic 18,212 47,207 $198,152 $50,261 $147,891 0 0 $0 $0 $0 $0 $147,891Maritime - other oceans 91,819 151,298 $82,707 $144,583 -$61,876 0 0 $0 $0 $0 $0 -$61,876Maritime - Pacific 714 2,375 $10,869 $2,932 $7,937 0 0 $0 $0 $0 $0 $7,937
Other Regions 110,785 200,920 $291,777 $197,777 $94,000 0 0 $0 $0 $0 $0 $94,000
American Samoa 0 0 $0 $0 $0 0 0 $0 $0 $0 $0 $0Baker Island 0 0 $0 $0 $0 0 0 $0 $0 $0 $0 $0Howland Island 0 0 $0 $0 $0 0 0 $0 $0 $0 $0 $0Jarvis Island 0 0 $0 $0 $0 0 0 $0 $0 $0 $0 $0Johnston Atoll 0 0 $0 $0 $0 0 0 $0 $0 $0 $0 $0Kingman Reef 0 0 $0 $0 $0 0 0 $0 $0 $0 $0 $0Midway Atoll 0 0 $0 $0 $0 0 0 $0 $0 $0 $0 $0Navassa Island 0 0 $0 $0 $0 0 0 $0 $0 $0 $0 $0Northern Mariana Islands 0 0 $0 $0 $0 0 0 $0 $0 $0 $0 $0Palmyra Atoll 0 0 $0 $0 $0 0 0 $0 $0 $0 $0 $0Wake Island 0 0 $0 $0 $0 0 0 $0 $0 $0 $0 $0
Carriers serving Misc. U.S. points 0 0 $0 $0 $0 0 0 $0 $0 $0 $0 $0
Total for Foreign Points 2,099,365,423 9,336,121,658 $757,376,957 $866,673,277 -$109,296,320 0 0 $0 $0 $0 $0 -$109,296,320
Total for U.S. Points 761,563 1,724,139 $124,366 $94,156 $30,210 0 0 $0 $0 $0 $0 $30,210
World Total 2,100,126,986 9,337,845,797 $757,501,323 $866,767,433 -$109,266,110 0 0 $0 0 $0 $0 $0 -$109,266,110
- Switched Services Page 97 -

2008 Annual Section 43.61 International Traffic Data for All U.S. Points: Facilities-Based & Facilities-ResaleTable B1 (Revised): All United States Carriers Private Line Services Billing Types Covered: 1, 11
International Point Voice Circuits Up to 1200 1201 to 9600 9601 to 30 Million Greater than 30 Mbps Totalbits per second (bps) bits per second (bps) bits per second (Mbps) Private
(.01 to 18 Megahertz) (greater than 18 Megahertz) Lines
Circuits 64 K Revenues Circuits 64 K Revenues Circuits 64 K Revenues Circuits 64 K Revenues Circuits 64 K Revenues 64 K Revenues
Andorra 0 0 $0 0 0 $0 0 0 $0 0 0 $0 0 0 $0 0 $0Austria 0 0 $0 0 0 $0 2 2 $1,566,560 5 51 $54,764 0 0 $0 53 $1,621,324Belgium 0 0 $0 0 0 $0 8 8 $962,627 3 57 $1,129 0 0 $0 65 $963,756Cyprus 0 0 $0 0 0 $0 0 0 $0 0 0 $0 0 0 $0 0 $0Denmark 0 0 $0 0 0 $0 1 1 $139,992 1 24 $92 0 0 $0 25 $140,084Finland 0 0 $0 0 0 $0 1 1 $102,289 0 0 $0 0 0 $0 1 $102,289France 0 0 $0 0 0 $0 50 50 $22,500 26 133,797 $4,728,839 5 11,065 $2,105,306 144,912 $6,856,645Germany 0 0 $0 0 0 $0 8 8 $5,316,492 24 545,028 $2,800,692 5 138,588 $617,924 683,624 $8,735,108Gibraltar 0 0 $0 0 0 $0 0 0 $0 1 2 $31,560 0 0 $0 2 $31,560Greece 0 0 $0 0 0 $0 1 1 $261,565 2 64 $122,400 0 0 $0 65 $383,965Greenland 0 0 $0 0 0 $0 0 0 $0 0 0 $0 0 0 $0 0 $0Iceland 0 0 $0 0 0 $0 0 0 $0 0 0 $0 0 0 $0 0 $0Ireland 0 0 $0 0 0 $0 1 1 $565,409 10 3,163 $344,458 0 0 $0 3,164 $909,867Italy 0 0 $0 0 0 $0 4 4 $823,809 13 68 $79,751 0 0 $0 72 $903,560Liechtenstein 0 0 $0 0 0 $0 0 0 $0 0 0 $0 0 0 $0 0 $0Luxembourg 0 0 $0 0 0 $0 1 1 $156,150 0 0 $0 0 0 $0 1 $156,150Malta 0 0 $0 0 0 $0 0 0 $0 0 0 $0 0 0 $0 0 $0Netherlands 2 88 $249,488 0 0 $0 50 50 $1,118,460 13 46,386 $5,463,323 2 702 $49,234 47,226 $6,880,505Norway 0 0 $0 0 0 $0 2 2 $367,885 0 0 $0 0 0 $0 2 $367,885Portugal 0 0 $0 0 0 $0 1 1 $172,195 2 2 $96,552 0 0 $0 3 $268,747Spain 0 0 $0 0 0 $0 12 12 $756,160 24 101 $163,835 1 1,890 $122,304 2,003 $1,042,299Sweden 0 0 $0 0 0 $0 8 8 $502,913 0 0 $0 0 0 $0 8 $502,913Switzerland 0 0 $0 0 0 $0 7 7 $396,003 43 168,246 $905,338 1 129,024 $496,036 297,277 $1,797,377Turkey 0 0 $0 0 0 $0 0 0 $0 0 0 $0 0 0 $0 0 $0United Kingdom 14 305 $214,752 0 0 $0 96 96 $9,758,547 288 1,171,603 $22,233,031 29 322,674 $1,070,405 1,494,678 $33,276,735
Western Europe 16 393 $464,240 0 0 $0 253 253 $22,989,556 455 2,068,592 $37,025,764 43 603,943 $4,461,209 2,673,181 $64,940,769
Algeria 0 0 $0 0 0 $0 0 0 $0 0 0 $0 0 0 $0 0 $0Angola 0 0 $0 0 0 $0 1 1 $61,059 0 0 $0 0 0 $0 1 $61,059Benin 0 0 $0 0 0 $0 0 0 $0 0 0 $0 0 0 $0 0 $0Botswana 0 0 $0 0 0 $0 0 0 $0 0 0 $0 0 0 $0 0 $0Burkina 0 0 $0 0 0 $0 0 0 $0 0 0 $0 0 0 $0 0 $0Burundi 0 0 $0 0 0 $0 0 0 $0 0 0 $0 0 0 $0 0 $0Cameroon 0 0 $0 0 0 $0 0 0 $0 0 0 $0 0 0 $0 0 $0Canary Island 0 0 $0 0 0 $0 0 0 $0 0 0 $0 0 0 $0 0 $0Cape Verde 0 0 $0 0 0 $0 0 0 $0 0 0 $0 0 0 $0 0 $0Central African Republic 0 0 $0 0 0 $0 0 0 $0 0 0 $0 0 0 $0 0 $0Chad 0 0 $0 0 0 $0 0 0 $0 0 0 $0 0 0 $0 0 $0Comoros 0 0 $0 0 0 $0 0 0 $0 0 0 $0 0 0 $0 0 $0Congo 0 0 $0 0 0 $0 0 0 $0 0 0 $0 0 0 $0 0 $0Cote d'Ivoire 0 0 $0 0 0 $0 0 0 $0 0 0 $0 0 0 $0 0 $0Djibouti 0 0 $0 0 0 $0 0 0 $0 0 0 $0 0 0 $0 0 $0Egypt 0 0 $0 0 0 $0 2 2 $188,186 2 21 $67,689 0 0 $0 23 $255,875Equatorial Guinea 0 0 $0 0 0 $0 0 0 $0 0 0 $0 0 0 $0 0 $0Ethiopia 0 0 $0 0 0 $0 0 0 $0 1 8 $75,048 0 0 $0 8 $75,048Gabon 0 0 $0 0 0 $0 0 0 $0 2 2 $55,752 0 0 $0 2 $55,752Gambia, The 0 0 $0 0 0 $0 0 0 $0 0 0 $0 0 0 $0 0 $0Ghana 0 0 $0 0 0 $0 0 0 $0 2 2 $99,288 0 0 $0 2 $99,288Guinea 0 0 $0 0 0 $0 0 0 $0 2 29 $62,640 0 0 $0 29 $62,640Guinea-Bissau 0 0 $0 0 0 $0 0 0 $0 0 0 $0 0 0 $0 0 $0Kenya 0 0 $0 0 0 $0 0 0 $0 2 2 $28,500 0 0 $0 2 $28,500
Revised: August 26, 2010- Private Line Services Page 1 -

2008 Annual Section 43.61 International Traffic Data for All U.S. Points: Facilities-Based & Facilities-ResaleTable B1 (Revised): All United States Carriers Private Line Services Billing Types Covered: 1, 11
International Point Voice Circuits Up to 1200 1201 to 9600 9601 to 30 Million Greater than 30 Mbps Totalbits per second (bps) bits per second (bps) bits per second (Mbps) Private
(.01 to 18 Megahertz) (greater than 18 Megahertz) Lines
Circuits 64 K Revenues Circuits 64 K Revenues Circuits 64 K Revenues Circuits 64 K Revenues Circuits 64 K Revenues 64 K Revenues
Lesotho 0 0 $0 0 0 $0 0 0 $0 0 0 $0 0 0 $0 0 $0Liberia 0 0 $0 0 0 $0 0 0 $0 0 0 $0 0 0 $0 0 $0Libya 0 0 $0 0 0 $0 0 0 $0 0 0 $0 0 0 $0 0 $0Madagascar 0 0 $0 0 0 $0 0 0 $0 0 0 $0 0 0 $0 0 $0Malawi 0 0 $0 0 0 $0 0 0 $0 0 0 $0 0 0 $0 0 $0Mali 0 0 $0 0 0 $0 0 0 $0 0 0 $0 0 0 $0 0 $0Mauritania 0 0 $0 0 0 $0 0 0 $0 0 0 $0 0 0 $0 0 $0Mauritius 0 0 $0 0 0 $0 0 0 $0 2 43 $57,720 0 0 $0 43 $57,720Morocco 0 0 $0 0 0 $0 0 0 $0 0 0 $0 0 0 $0 0 $0Mozambique 0 0 $0 0 0 $0 0 0 $0 0 0 $0 0 0 $0 0 $0Namibia 0 0 $0 0 0 $0 0 0 $0 0 0 $0 0 0 $0 0 $0Niger 0 0 $0 0 0 $0 0 0 $0 0 0 $0 0 0 $0 0 $0Nigeria 0 0 $0 0 0 $0 0 0 $0 0 0 $0 0 0 $0 0 $0Reunion 0 0 $0 0 0 $0 0 0 $0 0 0 $0 0 0 $0 0 $0Rwanda 0 0 $0 0 0 $0 0 0 $0 0 0 $0 0 0 $0 0 $0Saint Helena 0 0 $0 0 0 $0 0 0 $0 1 1 $11,163 0 0 $0 1 $11,163Sao Tome and Principe 0 0 $0 0 0 $0 0 0 $0 0 0 $0 0 0 $0 0 $0Senegal 0 0 $0 0 0 $0 0 0 $0 0 0 $0 0 0 $0 0 $0Seychelles 0 0 $0 0 0 $0 0 0 $0 0 0 $0 0 0 $0 0 $0Sierra Leone 0 0 $0 0 0 $0 0 0 $0 0 0 $0 0 0 $0 0 $0Somalia 0 0 $0 0 0 $0 0 0 $0 0 0 $0 0 0 $0 0 $0South Africa 0 0 $0 0 0 $0 0 0 $0 2 2 $22,330 0 0 $0 2 $22,330Sudan 0 0 $0 0 0 $0 0 0 $0 0 0 $0 0 0 $0 0 $0Swaziland 0 0 $0 0 0 $0 0 0 $0 0 0 $0 0 0 $0 0 $0Tanzania 0 0 $0 0 0 $0 0 0 $0 0 0 $0 0 0 $0 0 $0Togo 0 0 $0 0 0 $0 0 0 $0 0 0 $0 0 0 $0 0 $0Tunisia 0 0 $0 0 0 $0 0 0 $0 1 1 $264,097 0 0 $0 1 $264,097Uganda 0 0 $0 0 0 $0 0 0 $0 0 0 $0 0 0 $0 0 $0Western Sahara 0 0 $0 0 0 $0 0 0 $0 0 0 $0 0 0 $0 0 $0Zaire 0 0 $0 0 0 $0 0 0 $0 0 0 $0 0 0 $0 0 $0Zambia 0 0 $0 0 0 $0 0 0 $0 0 0 $0 0 0 $0 0 $0Zimbabwe 0 0 $0 0 0 $0 0 0 $0 0 0 $0 0 0 $0 0 $0
Africa 0 0 $0 0 0 $0 3 3 $249,245 17 111 $744,227 0 0 $0 114 $993,472
Bahrain 0 0 $0 0 0 $0 0 0 $0 3 3 $1,839,465 0 0 $0 3 $1,839,465Iran 0 0 $0 0 0 $0 0 0 $0 0 0 $0 0 0 $0 0 $0Iraq 0 0 $0 0 0 $0 0 0 $0 7 643 $2,527,371 0 0 $0 643 $2,527,371Israel 0 0 $0 0 0 $0 4 4 $336,587 17 154 $211,570 0 0 $0 158 $548,157Jordan 0 0 $0 0 0 $0 0 0 $0 1 1 $126,696 0 0 $0 1 $126,696Kuwait 0 0 $0 0 0 $0 0 0 $0 0 0 $0 0 0 $0 0 $0Lebanon 0 0 $0 0 0 $0 0 0 $0 0 0 $0 0 0 $0 0 $0Oman 0 0 $0 0 0 $0 0 0 $0 0 0 $0 0 0 $0 0 $0Qatar 0 0 $0 0 0 $0 0 0 $0 0 0 $0 0 0 $0 0 $0Saudi Arabia 0 0 $0 0 0 $0 2 2 $2,700,557 2 97 $653,228 0 0 $0 99 $3,353,785Syria 0 0 $0 0 0 $0 0 0 $0 0 0 $0 0 0 $0 0 $0United Arab Emirates 0 0 $0 0 0 $0 0 0 $0 2 9 $23,741 0 0 $0 9 $23,741Yemen 0 0 $0 0 0 $0 3 3 $100,828 3 4 $108,036 0 0 $0 7 $208,864
Middle East 0 0 $0 0 0 $0 9 9 $3,137,972 35 911 $5,490,107 0 0 $0 920 $8,628,079
Anguilla 0 0 $0 0 0 $0 0 0 $0 4 4 $20,934 0 0 $0 4 $20,934Antigua and Barbuda 0 0 $0 0 0 $0 0 0 $0 16 120 $261,693 5 2,010 $3,100,000 2,130 $3,361,693
Revised: August 26, 2010- Private Line Services Page 2 -

2008 Annual Section 43.61 International Traffic Data for All U.S. Points: Facilities-Based & Facilities-ResaleTable B1 (Revised): All United States Carriers Private Line Services Billing Types Covered: 1, 11
International Point Voice Circuits Up to 1200 1201 to 9600 9601 to 30 Million Greater than 30 Mbps Totalbits per second (bps) bits per second (bps) bits per second (Mbps) Private
(.01 to 18 Megahertz) (greater than 18 Megahertz) Lines
Circuits 64 K Revenues Circuits 64 K Revenues Circuits 64 K Revenues Circuits 64 K Revenues Circuits 64 K Revenues 64 K Revenues
Aruba 0 0 $0 0 0 $0 2 2 $68,086 6 58 $134,304 0 0 $0 60 $202,390Bahamas, The 0 0 $0 0 0 $0 1 1 $218,400 736 987 $1,334,575 2 1,344 $213,300 2,332 $1,766,275Barbados 0 0 $0 0 0 $0 0 0 $0 114 240 $337,867 0 0 $0 240 $337,867Bermuda 0 0 $0 0 0 $0 4 4 $436,032 30 2,006 $2,127,074 0 0 $0 2,010 $2,563,106Cayman Islands 0 0 $0 0 0 $0 7 7 $57,962 37 6,947 $1,799,145 0 0 $0 6,954 $1,857,107Cuba 0 0 $0 0 0 $0 0 0 $0 9 752 $6,312,216 0 0 $0 752 $6,312,216Dominica 0 0 $0 0 0 $0 5 5 $895,614 4 4 $6,500 0 0 $0 9 $902,114Dominican Republic 720 720 $277,320 0 0 $0 0 0 $0 373 872 $1,969,460 0 0 $0 1,592 $2,246,780French Overseas Departments 0 0 $0 0 0 $0 0 0 $0 1 32 $40,944 2 15,120 $16,000,000 15,152 $16,040,944Grenada 0 0 $0 0 0 $0 0 0 $0 12 12 $7,590 0 0 $0 12 $7,590Guadeloupe 0 0 $0 0 0 $0 0 0 $0 0 0 $0 1 1,890 $5,500,000 1,890 $5,500,000Haiti 0 0 $0 0 0 $0 0 0 $0 13 53 $179,816 0 0 $0 53 $179,816Jamaica 0 0 $0 0 0 $0 1 1 $520,556 308 487 $1,831,401 0 0 $0 488 $2,351,957Montserrat 0 0 $0 0 0 $0 0 0 $0 0 0 $0 0 0 $0 0 $0Netherlands Antilles 0 0 $0 0 0 $0 1 1 $81,904 111 319 $2,308,825 0 0 $0 320 $2,390,729Saint Kitts and Nevis 0 0 $0 0 0 $0 0 0 $0 26 30 $160,851 3 62,370 $21,620,000 62,400 $21,780,851Saint Lucia 0 0 $0 0 0 $0 0 0 $0 1 16 $27,252 3 64,260 $30,120,000 64,276 $30,147,252Saint Vincent and the Grenadines 0 0 $0 0 0 $0 0 0 $0 4 4 $91,208 0 0 $0 4 $91,208Trinidad and Tobago 0 0 $0 0 0 $0 2 2 $191,027 748 1,706 $2,007,335 5 34,080 $11,756,327 35,788 $13,954,689Turks and Caicos Islands 0 0 $0 0 0 $0 1 1 $4,003 22 23 $288,593 0 0 $0 24 $292,596Virgin Islands, British 0 0 $0 0 0 $0 2 2 $117,353 70 119 $982,253 0 0 $0 121 $1,099,606
Navassa Island 0 0 $0 0 0 $0 0 0 $0 0 0 $0 0 0 $0 0 $0Puerto Rico 0 0 $0 0 0 $0 0 0 $0 0 0 $0 0 0 $0 0 $0U.S. Virgin Islands 0 0 $0 0 0 $0 0 0 $0 0 0 $0 0 0 $0 0 $0
Caribbean 720 720 $277,320 0 0 $0 26 26 $2,590,937 2,645 14,791 $22,229,836 21 181,074 $88,309,627 196,611 $113,407,720
Belize 0 0 $0 0 0 $0 1 1 $41,407 32 32 $193,223 0 0 $0 33 $234,630Canada 61 793 $486,882 0 0 $0 124 124 $17,041,408 16,803 35,834 $15,196,891 24 23,520 $299,386 60,271 $33,024,567Costa Rica 0 0 $0 0 0 $0 0 0 $0 320 12,222 $3,463,761 9 13,235 $1,493,777 25,457 $4,957,538El Salvador 0 0 $0 0 0 $0 1 1 $61,733 376 1,823 $1,895,798 1 703 $68,182 2,527 $2,025,713Guatemala 0 0 $0 0 0 $0 3 3 $216,337 252 1,104 $1,219,136 1 2,430 $11,780 3,537 $1,447,253Honduras 0 0 $0 0 0 $0 1 1 $9,932 112 1,376 $920,533 0 0 $0 1,377 $930,465Mexico 1 4,704 $192,780 0 0 $0 81 81 $8,719,740 1,951 10,235 $8,100,816 58 50,170 $3,288,108 65,190 $20,301,444Nicaragua 0 0 $0 0 0 $0 1 1 $59,878 102 228 $160,433 0 0 $0 229 $220,311Panama 0 0 $0 0 0 $0 2 2 $113,126 356 666 $651,299 3 2,109 $354,808 2,777 $1,119,233Saint Pierre and Miquelon 0 0 $0 0 0 $0 0 0 $0 0 0 $0 0 0 $0 0 $0
Alaska 0 0 $0 0 0 $0 0 0 $0 0 0 $0 0 0 $0 0 $0United States (conterminous) 0 0 $0 0 0 $0 0 0 $0 306 306 $813,742 0 0 $0 306 $813,742
North and Central America 62 5,497 $679,662 0 0 $0 214 214 $26,263,561 20,610 63,826 $32,615,632 96 92,167 $5,516,041 161,704 $65,074,896
Argentina 0 0 $0 0 0 $0 4 4 $943,999 289 1,336 $1,218,351 5 3,549 $115,494 4,889 $2,277,844Bolivia 0 0 $0 0 0 $0 0 0 $0 168 168 $268,297 0 0 $0 168 $268,297Brazil 0 0 $0 0 0 $0 5 5 $661,945 1,773 5,443 $3,188,681 10 11,486 $1,001,087 16,934 $4,851,713Chile 0 0 $0 0 0 $0 2 2 $237,056 12 495 $1,031,045 0 0 $0 497 $1,268,101Colombia 0 0 $0 0 0 $0 1 1 $106,477 6,705 141,682 $7,279,374 2 1,371 $275,188 143,054 $7,661,039Ecuador 0 0 $0 0 0 $0 0 0 $0 30 106 $1,012,440 0 0 $0 106 $1,012,440French Guiana 0 0 $0 0 0 $0 0 0 $0 0 0 $0 0 0 $0 0 $0Guyana 0 0 $0 0 0 $0 0 0 $0 20 40 $228,381 0 0 $0 40 $228,381Paraguay 0 0 $0 0 0 $0 0 0 $0 12 12 $116,020 0 0 $0 12 $116,020Peru 0 0 $0 0 0 $0 1 1 $427,658 263 935 $609,803 1 672 $77,125 1,608 $1,114,586
Revised: August 26, 2010- Private Line Services Page 3 -

2008 Annual Section 43.61 International Traffic Data for All U.S. Points: Facilities-Based & Facilities-ResaleTable B1 (Revised): All United States Carriers Private Line Services Billing Types Covered: 1, 11
International Point Voice Circuits Up to 1200 1201 to 9600 9601 to 30 Million Greater than 30 Mbps Totalbits per second (bps) bits per second (bps) bits per second (Mbps) Private
(.01 to 18 Megahertz) (greater than 18 Megahertz) Lines
Circuits 64 K Revenues Circuits 64 K Revenues Circuits 64 K Revenues Circuits 64 K Revenues Circuits 64 K Revenues 64 K Revenues
Suriname 0 0 $0 0 0 $0 0 0 $0 0 0 $0 0 0 $0 0 $0Uruguay 0 0 $0 0 0 $0 3 3 $87,355 4 60 $66,995 0 0 $0 63 $154,350Venezuela 0 0 $0 0 0 $0 4 4 $1,217,878 595 1,595 $1,511,445 3 2,109 $232,009 3,708 $2,961,332
South America 0 0 $0 0 0 $0 20 20 $3,682,368 9,871 151,872 $16,530,832 21 19,187 $1,700,903 171,079 $21,914,103
Afghanistan 0 0 $0 0 0 $0 0 0 $0 6 4 $744,000 0 0 $0 4 $744,000Bangladesh 0 0 $0 0 0 $0 2 2 $55,325 1 1 $21,732 0 0 $0 3 $77,057Bhutan 0 0 $0 0 0 $0 0 0 $0 0 0 $0 0 0 $0 0 $0Brunei 0 0 $0 0 0 $0 0 0 $0 0 0 $0 0 0 $0 0 $0Burma 0 0 $0 0 0 $0 0 0 $0 0 0 $0 0 0 $0 0 $0Cambodia 0 0 $0 0 0 $0 0 0 $0 0 0 $0 0 0 $0 0 $0Chagos Archipelago 0 0 $0 0 0 $0 0 0 $0 9 33 $1,640,350 0 0 $0 33 $1,640,350China 0 0 $0 0 0 $0 4 4 $2,286,305 13 903 $624,572 2 1,344 $21,384 2,251 $2,932,261French Southern and Antarctic Lands 0 0 $0 0 0 $0 0 0 $0 0 0 $0 0 0 $0 0 $0Hong Kong 0 0 $0 0 0 $0 24 24 $19,684,463 8 112 $80,711 13 50,290 $340,905 50,426 $20,106,079India 0 0 $0 0 0 $0 3 3 $544,721 220 18,851 $13,992,194 27 19,807 $3,455,319 38,661 $17,992,234Indonesia 0 0 $0 0 0 $0 3 3 $158,132 0 0 $0 0 0 $0 3 $158,132Japan 0 0 $0 0 0 $0 9 9 $2,102,812 443 19,325 $8,550,243 76 1,378,387 $10,865,617 1,397,721 $21,518,672Kampuchea 0 0 $0 0 0 $0 0 0 $0 0 0 $0 0 0 $0 0 $0Korea, North 0 0 $0 0 0 $0 0 0 $0 0 0 $0 0 0 $0 0 $0Korea, South 0 0 $0 0 0 $0 2 2 $2,278,936 9 1,216 $367,567 1 703 $86,115 1,921 $2,732,618Laos 0 0 $0 0 0 $0 0 0 $0 0 0 $0 0 0 $0 0 $0Macau 0 0 $0 0 0 $0 1 1 $5,473 0 0 $0 0 0 $0 1 $5,473Malaysia 1 24 $87,295 0 0 $0 0 0 $0 657 657 $887,194 0 0 $0 681 $974,489Maldives 0 0 $0 0 0 $0 0 0 $0 0 0 $0 0 0 $0 0 $0Mongolia 0 0 $0 0 0 $0 1 1 $10,000 0 0 $0 0 0 $0 1 $10,000Nepal 0 0 $0 0 0 $0 0 0 $0 0 0 $0 0 0 $0 0 $0Pakistan 0 0 $0 0 0 $0 0 0 $0 5 12 $239,660 0 0 $0 12 $239,660Philippines 0 0 $0 0 0 $0 1 1 $17,177 98 2,948 $1,346,778 28 25,524 $2,651,029 28,473 $4,014,984Singapore 0 0 $0 0 0 $0 1 1 $77,062 20 46 $407,330 5 6,953 $277,855 7,000 $762,247Sri Lanka 0 0 $0 0 0 $0 0 0 $0 162 207 $270,987 0 0 $0 207 $270,987Taiwan 0 0 $0 0 0 $0 2 2 $298,913 31 665 $208,351 112,199 524,329 $738,670 524,996 $1,245,934Thailand 0 0 $0 0 0 $0 1 1 $384,923 4 36 $28,954 0 0 $0 37 $413,877Vietnam 2 2 $212,313 0 0 $0 3 3 $340,890 0 0 $0 0 0 $0 5 $553,203
Asia 3 26 $299,608 0 0 $0 57 57 $28,245,132 1,686 45,016 $29,410,623 112,351 2,007,337 $18,436,894 2,052,436 $76,392,257
Australia 0 0 $0 0 0 $0 4 4 $979,681 20 170 $283,959 6 48,384 $188,752 48,558 $1,452,392Cook Islands 0 0 $0 0 0 $0 0 0 $0 0 0 $0 0 0 $0 0 $0Fiji 0 0 $0 0 0 $0 1 1 $10,863 2 1 $33,365 0 0 $0 2 $44,228French Polynesia 0 0 $0 0 0 $0 0 0 $0 1 1 $82,875 0 0 $0 1 $82,875Kiribati 0 0 $0 0 0 $0 0 0 $0 0 0 $0 0 0 $0 0 $0Marshall Islands 0 0 $0 0 0 $0 0 0 $0 2 2 $2,723,313 0 0 $0 2 $2,723,313Micronesia, Federated States of 0 0 $0 0 0 $0 0 0 $0 1 1 $29,111 0 0 $0 1 $29,111Nauru 0 0 $0 0 0 $0 0 0 $0 0 0 $0 0 0 $0 0 $0New Caledonia 0 0 $0 0 0 $0 0 0 $0 0 0 $0 0 0 $0 0 $0New Zealand 5 123 $590,550 0 0 $0 3 3 $424,643 10 218 $150,286 0 0 $0 344 $1,165,479Niue 0 0 $0 0 0 $0 0 0 $0 0 0 $0 0 0 $0 0 $0Norfolk Island 0 0 $0 0 0 $0 0 0 $0 0 0 $0 0 0 $0 0 $0Pacific Islands (Palau) 0 0 $0 0 0 $0 0 0 $0 1 1 $21,528 0 0 $0 1 $21,528Papua New Guinea 0 0 $0 0 0 $0 0 0 $0 0 0 $0 0 0 $0 0 $0Solomon Islands 0 0 $0 0 0 $0 0 0 $0 0 0 $0 0 0 $0 0 $0
Revised: August 26, 2010- Private Line Services Page 4 -

2008 Annual Section 43.61 International Traffic Data for All U.S. Points: Facilities-Based & Facilities-ResaleTable B1 (Revised): All United States Carriers Private Line Services Billing Types Covered: 1, 11
International Point Voice Circuits Up to 1200 1201 to 9600 9601 to 30 Million Greater than 30 Mbps Totalbits per second (bps) bits per second (bps) bits per second (Mbps) Private
(.01 to 18 Megahertz) (greater than 18 Megahertz) Lines
Circuits 64 K Revenues Circuits 64 K Revenues Circuits 64 K Revenues Circuits 64 K Revenues Circuits 64 K Revenues 64 K Revenues
Tonga 0 0 $0 0 0 $0 0 0 $0 0 0 $0 0 0 $0 0 $0Tuvalu 0 0 $0 0 0 $0 0 0 $0 0 0 $0 0 0 $0 0 $0Vanuatu 0 0 $0 0 0 $0 0 0 $0 0 0 $0 0 0 $0 0 $0Wallis and Futuna 0 0 $0 0 0 $0 0 0 $0 0 0 $0 0 0 $0 0 $0Western Samoa 0 0 $0 0 0 $0 0 0 $0 0 0 $0 0 0 $0 0 $0
American Samoa 0 0 $0 0 0 $0 0 0 $0 0 0 $0 0 0 $0 0 $0Baker Island 0 0 $0 0 0 $0 0 0 $0 0 0 $0 0 0 $0 0 $0Guam 0 0 $0 0 0 $0 3 3 $583,428 37 19,708 $2,709,393 0 0 $0 19,711 $3,292,821Hawaii 0 0 $0 0 0 $0 0 0 $0 53 53 $64,482 0 0 $0 53 $64,482Howland Island 0 0 $0 0 0 $0 0 0 $0 0 0 $0 0 0 $0 0 $0Jarvis Island 0 0 $0 0 0 $0 0 0 $0 0 0 $0 0 0 $0 0 $0Johnston Atoll 0 0 $0 0 0 $0 0 0 $0 0 0 $0 0 0 $0 0 $0Kingman Reef 0 0 $0 0 0 $0 0 0 $0 0 0 $0 0 0 $0 0 $0Midway Atoll 0 0 $0 0 0 $0 0 0 $0 0 0 $0 0 0 $0 0 $0Northern Mariana Islands 0 0 $0 0 0 $0 28 28 $218,279 38 41 $686,932 2 37,392 $27,955 37,461 $933,166Palmyra Atoll 0 0 $0 0 0 $0 0 0 $0 0 0 $0 0 0 $0 0 $0Wake Island 0 0 $0 0 0 $0 0 0 $0 0 0 $0 0 0 $0 0 $0
Oceania 5 123 $590,550 0 0 $0 39 39 $2,216,894 165 20,196 $6,785,244 8 85,776 $216,707 106,134 $9,809,395
Albania 0 0 $0 0 0 $0 1 1 $54,826 0 0 $0 0 0 $0 1 $54,826Armenia 0 0 $0 0 0 $0 0 0 $0 0 0 $0 0 0 $0 0 $0Azerbaijan 0 0 $0 0 0 $0 0 0 $0 2 10 $96,456 0 0 $0 10 $96,456Belarus 0 0 $0 0 0 $0 0 0 $0 0 0 $0 0 0 $0 0 $0Bosnia and Herzegovina 0 0 $0 0 0 $0 0 0 $0 0 0 $0 0 0 $0 0 $0Bulgaria 0 0 $0 0 0 $0 0 0 $0 2 1,552 $95,794 0 0 $0 1,552 $95,794Croatia 0 0 $0 0 0 $0 0 0 $0 0 0 $0 0 0 $0 0 $0Czech Republic 0 0 $0 0 0 $0 1 1 $88,154 0 0 $0 0 0 $0 1 $88,154Estonia 0 0 $0 0 0 $0 1 1 $35,175 0 0 $0 0 0 $0 1 $35,175Georgia 0 0 $0 0 0 $0 1 1 $42,653 0 0 $0 0 0 $0 1 $42,653Hungary 0 0 $0 0 0 $0 1 1 $110,521 0 0 $0 0 0 $0 1 $110,521Kazakhstan 0 0 $0 0 0 $0 0 0 $0 3 3 $28,253 0 0 $0 3 $28,253Kyrgyzstan 0 0 $0 0 0 $0 0 0 $0 0 0 $0 0 0 $0 0 $0Latvia 0 0 $0 0 0 $0 1 1 $84,327 0 0 $0 0 0 $0 1 $84,327Lithuania 0 0 $0 0 0 $0 1 1 $79,908 0 0 $0 0 0 $0 1 $79,908Moldova 0 0 $0 0 0 $0 0 0 $0 0 0 $0 0 0 $0 0 $0Poland 0 0 $0 0 0 $0 0 0 $0 0 0 $0 0 0 $0 0 $0Romania 0 0 $0 0 0 $0 1 1 $83,889 0 0 $0 0 0 $0 1 $83,889Russia 10 10 $1,847 0 0 $0 5 5 $291,297 4 16 $102,852 0 0 $0 31 $395,996Serbia 0 0 $0 0 0 $0 0 0 $0 0 0 $0 0 0 $0 0 $0Slovakia 0 0 $0 0 0 $0 0 0 $0 0 0 $0 0 0 $0 0 $0Slovenia 0 0 $0 0 0 $0 0 0 $0 1 1 $85,710 0 0 $0 1 $85,710Tajikistan 0 0 $0 0 0 $0 0 0 $0 0 0 $0 0 0 $0 0 $0Turkmenistan 0 0 $0 0 0 $0 0 0 $0 0 0 $0 0 0 $0 0 $0Ukraine 0 0 $0 0 0 $0 1 1 $20,320 0 0 $0 0 0 $0 1 $20,320Uzbekistan 0 0 $0 0 0 $0 1 1 $40,860 1 1 $305,688 0 0 $0 2 $346,548
Eastern Europe 10 10 $1,847 0 0 $0 15 15 $931,930 13 1,583 $714,753 0 0 $0 1,608 $1,648,530
Antarctica 0 0 $0 0 0 $0 0 0 $0 0 0 $0 0 0 $0 0 $0Maritime - Atlantic 0 0 $0 0 0 $0 0 0 $0 0 0 $0 0 0 $0 0 $0Maritime - other oceans 0 0 $0 0 0 $0 0 0 $0 0 0 $0 0 0 $0 0 $0Maritime - Pacific 0 0 $0 0 0 $0 0 0 $0 1 1 $168,960 0 0 $0 1 $168,960
Revised: August 26, 2010- Private Line Services Page 5 -

2008 Annual Section 43.61 International Traffic Data for All U.S. Points: Facilities-Based & Facilities-ResaleTable B1 (Revised): All United States Carriers Private Line Services Billing Types Covered: 1, 11
International Point Voice Circuits Up to 1200 1201 to 9600 9601 to 30 Million Greater than 30 Mbps Totalbits per second (bps) bits per second (bps) bits per second (Mbps) Private
(.01 to 18 Megahertz) (greater than 18 Megahertz) Lines
Circuits 64 K Revenues Circuits 64 K Revenues Circuits 64 K Revenues Circuits 64 K Revenues Circuits 64 K Revenues 64 K Revenues
Other Regions 0 0 $0 0 0 $0 0 0 $0 1 1 $168,960 0 0 $0 1 $168,960
American Samoa 0 0 $0 0 0 $0 0 0 $0 0 0 $0 0 0 $0 0 $0Baker Island 0 0 $0 0 0 $0 0 0 $0 0 0 $0 0 0 $0 0 $0Howland Island 0 0 $0 0 0 $0 0 0 $0 0 0 $0 0 0 $0 0 $0Jarvis Island 0 0 $0 0 0 $0 0 0 $0 0 0 $0 0 0 $0 0 $0Johnston Atoll 0 0 $0 0 0 $0 0 0 $0 0 0 $0 0 0 $0 0 $0Kingman Reef 0 0 $0 0 0 $0 0 0 $0 0 0 $0 0 0 $0 0 $0Midway Atoll 0 0 $0 0 0 $0 0 0 $0 0 0 $0 0 0 $0 0 $0Navassa Island 0 0 $0 0 0 $0 0 0 $0 0 0 $0 0 0 $0 0 $0Northern Mariana Islands 0 0 $0 0 0 $0 0 0 $0 39 134 $421,851 0 0 $0 134 $421,851Palmyra Atoll 0 0 $0 0 0 $0 0 0 $0 0 0 $0 0 0 $0 0 $0Wake Island 0 0 $0 0 0 $0 0 0 $0 0 0 $0 0 0 $0 0 $0
Carriers serving Misc. U.S. points 0 0 $0 0 0 $0 0 0 $0 39 134 $421,851 0 0 $0 134 $421,851
Total for Foreign Points 816 6,769 $2,313,227 0 0 $0 605 605 $89,505,888 35,103 2,346,925 $147,863,280 112,538 2,952,092 $118,613,426 5,306,391 $358,295,821
Total for U.S. Points 0 0 $0 0 0 $0 31 31 $801,707 434 20,108 $4,274,549 2 37,392 $27,955 57,531 $5,104,211World Total 816 6,769 $2,313,227 0 0 $0 636 636 $90,307,595 35,537 2,367,033 $152,137,829 112,540 2,989,484 $118,641,381 5,363,922 $363,400,032
Revised: August 26, 2010- Private Line Services Page 6 -

2008 Annual Section 43.61 International Traffic Data for All U.S. Points: Facilities-Based & Facilities-ResaleTable B2: Cable & Wireless Americas Operations, Inc. Private Line Services Billing Types Covered: 1, 11
International Point Voice Circuits Up to 1200 1201 to 9600 9601 to 30 Million Greater than 30 Mbps Totalbits per second (bps) bits per second (bps) bits per second (Mbps) Private
(.01 to 18 Megahertz) (greater than 18 Megahertz) Lines
Circuits 64 K Revenues Circuits 64 K Revenues Circuits 64 K Revenues Circuits 64 K Revenues Circuits 64 K Revenues 64 K Revenues
Germany 0 0 $0 0 0 $0 0 0 $0 2 6,266 $454,224 0 0 $0 6,266 $454,224Greece 0 0 $0 0 0 $0 0 0 $0 2 64 $122,400 0 0 $0 64 $122,400Spain 0 0 $0 0 0 $0 0 0 $0 1 32 $24,000 0 0 $0 32 $24,000Switzerland 0 0 $0 0 0 $0 0 0 $0 1 39,063 $396,000 0 0 $0 39,063 $396,000United Kingdom 0 0 $0 0 0 $0 0 0 $0 8 119,323 $945,444 0 0 $0 119,323 $945,444
Western Europe 0 0 $0 0 0 $0 0 0 $0 14 164,748 $1,942,068 0 0 $0 164,748 $1,942,068
Bahamas, The 0 0 $0 0 0 $0 0 0 $0 1 24 $130,800 0 0 $0 24 $130,800Bermuda 0 0 $0 0 0 $0 0 0 $0 1 48 $324,552 0 0 $0 48 $324,552Cayman Islands 0 0 $0 0 0 $0 0 0 $0 3 1,430 $925,680 0 0 $0 1,430 $925,680Jamaica 0 0 $0 0 0 $0 0 0 $0 1 31 $4,800 0 0 $0 31 $4,800Trinidad and Tobago 0 0 $0 0 0 $0 0 0 $0 1 24 $60,000 0 0 $0 24 $60,000
Caribbean 0 0 $0 0 0 $0 0 0 $0 7 1,557 $1,445,832 0 0 $0 1,557 $1,445,832
Canada 0 0 $0 0 0 $0 0 0 $0 2 727 $122,004 0 0 $0 727 $122,004Panama 0 0 $0 0 0 $0 0 0 $0 2 47 $93,600 0 0 $0 47 $93,600
North and Central America 0 0 $0 0 0 $0 0 0 $0 4 774 $215,604 0 0 $0 774 $215,604
China 0 0 $0 0 0 $0 0 0 $0 1 703 $115,200 0 0 $0 703 $115,200India 0 0 $0 0 0 $0 0 0 $0 2 96 $315,456 0 0 $0 96 $315,456Japan 0 0 $0 0 0 $0 0 0 $0 1 2,430 $198,000 0 0 $0 2,430 $198,000
Asia 0 0 $0 0 0 $0 0 0 $0 4 3,229 $628,656 0 0 $0 3,229 $628,656
Total for Foreign Points 0 0 $0 0 0 $0 0 0 $0 29 170,308 $4,232,160 0 0 $0 170,308 $4,232,160
World Total 0 0 $0 0 0 $0 0 0 $0 29 170,308 $4,232,160 0 0 $0 170,308 $4,232,160
- Private Line Services Page 7 -

2008 Annual Section 43.61 International Traffic Data for All U.S. Points: Facilities-Based & Facilities-ResaleTable B3: China Unicom USA Corp. Private Line Services Billing Types Covered: 1, 11
International Point Voice Circuits Up to 1200 1201 to 9600 9601 to 30 Million Greater than 30 Mbps Totalbits per second (bps) bits per second (bps) bits per second (Mbps) Private
(.01 to 18 Megahertz) (greater than 18 Megahertz) Lines
Circuits 64 K Revenues Circuits 64 K Revenues Circuits 64 K Revenues Circuits 64 K Revenues Circuits 64 K Revenues 64 K Revenues
China 0 0 $0 0 0 $0 0 0 $0 2 60 $227,000 0 0 $0 60 $227,000
Asia 0 0 $0 0 0 $0 0 0 $0 2 60 $227,000 0 0 $0 60 $227,000
Total for Foreign Points 0 0 $0 0 0 $0 0 0 $0 2 60 $227,000 0 0 $0 60 $227,000
World Total 0 0 $0 0 0 $0 0 0 $0 2 60 $227,000 0 0 $0 60 $227,000
- Private Line Services Page 8 -

2008 Annual Section 43.61 International Traffic Data for All U.S. Points: Facilities-Based & Facilities-ResaleTable B4: Chunghwa Telecom Global, Inc. Private Line Services Billing Types Covered: 1, 11
International Point Voice Circuits Up to 1200 1201 to 9600 9601 to 30 Million Greater than 30 Mbps Totalbits per second (bps) bits per second (bps) bits per second (Mbps) Private
(.01 to 18 Megahertz) (greater than 18 Megahertz) Lines
Circuits 64 K Revenues Circuits 64 K Revenues Circuits 64 K Revenues Circuits 64 K Revenues Circuits 64 K Revenues 64 K Revenues
Mexico 0 0 $0 0 0 $0 0 0 $0 5 49 $52,924 0 0 $0 49 $52,924
North and Central America 0 0 $0 0 0 $0 0 0 $0 5 49 $52,924 0 0 $0 49 $52,924
China 0 0 $0 0 0 $0 0 0 $0 1 24 $30,600 2 1,344 $21,384 1,368 $51,984Taiwan 0 0 $0 0 0 $0 0 0 $0 25 600 $160,312 112,199 524,329 $738,670 524,929 $898,982
Asia 0 0 $0 0 0 $0 0 0 $0 26 624 $190,912 112,201 525,673 $760,054 526,297 $950,966
New Zealand 0 0 $0 0 0 $0 0 0 $0 3 72 $4,320 0 0 $0 72 $4,320
Northern Mariana Islands 0 0 $0 0 0 $0 0 0 $0 0 0 $0 2 37,392 $27,955 37,392 $27,955
Oceania 0 0 $0 0 0 $0 0 0 $0 3 72 $4,320 2 37,392 $27,955 37,464 $32,275
Total for Foreign Points 0 0 $0 0 0 $0 0 0 $0 34 745 $248,156 112,201 525,673 $760,054 526,418 $1,008,210
Total for U.S. Points 0 0 $0 0 0 $0 0 0 $0 0 0 $0 2 37,392 $27,955 37,392 $27,955
World Total 0 0 $0 0 0 $0 0 0 $0 34 745 $248,156 112,203 563,065 $788,009 563,810 $1,036,165
- Private Line Services Page 9 -

2008 Annual Section 43.61 International Traffic Data for All U.S. Points: Facilities-Based & Facilities-ResaleTable B5: Cincinnati Bell, Inc. Private Line Services Billing Types Covered: 1, 11
International Point Voice Circuits Up to 1200 1201 to 9600 9601 to 30 Million Greater than 30 Mbps Totalbits per second (bps) bits per second (bps) bits per second (Mbps) Private
(.01 to 18 Megahertz) (greater than 18 Megahertz) Lines
Circuits 64 K Revenues Circuits 64 K Revenues Circuits 64 K Revenues Circuits 64 K Revenues Circuits 64 K Revenues 64 K Revenues
Canada 0 0 $0 0 0 $0 0 0 $0 2 2 $9,756 0 0 $0 2 $9,756
North and Central America 0 0 $0 0 0 $0 0 0 $0 2 2 $9,756 0 0 $0 2 $9,756
Total for Foreign Points 0 0 $0 0 0 $0 0 0 $0 2 2 $9,756 0 0 $0 2 $9,756
World Total 0 0 $0 0 0 $0 0 0 $0 2 2 $9,756 0 0 $0 2 $9,756
- Private Line Services Page 10 -

2008 Annual Section 43.61 International Traffic Data for All U.S. Points: Facilities-Based & Facilities-ResaleTable B6: Colt Telecommunications Private Line Services Billing Types Covered: 1, 11
International Point Voice Circuits Up to 1200 1201 to 9600 9601 to 30 Million Greater than 30 Mbps Totalbits per second (bps) bits per second (bps) bits per second (Mbps) Private
(.01 to 18 Megahertz) (greater than 18 Megahertz) Lines
Circuits 64 K Revenues Circuits 64 K Revenues Circuits 64 K Revenues Circuits 64 K Revenues Circuits 64 K Revenues 64 K Revenues
France 0 0 $0 0 0 $0 0 0 $0 12 121,590 $306,932 0 0 $0 121,590 $306,932Germany 0 0 $0 0 0 $0 0 0 $0 6 153,090 $314,857 0 0 $0 153,090 $314,857Ireland 0 0 $0 0 0 $0 0 0 $0 5 3,150 $322,834 0 0 $0 3,150 $322,834Netherlands 0 0 $0 0 0 $0 0 0 $0 6 6,690 $435,177 0 0 $0 6,690 $435,177Switzerland 0 0 $0 0 0 $0 0 0 $0 8 129,150 $474,147 0 0 $0 129,150 $474,147United Kingdom 0 0 $0 0 0 $0 0 0 $0 91 601,896 $1,727,471 0 0 $0 601,896 $1,727,471
Western Europe 0 0 $0 0 0 $0 0 0 $0 128 1,015,566 $3,581,418 0 0 $0 1,015,566 $3,581,418
Total for Foreign Points 0 0 $0 0 0 $0 0 0 $0 128 1,015,566 $3,581,418 0 0 $0 1,015,566 $3,581,418
World Total 0 0 $0 0 0 $0 0 0 $0 128 1,015,566 $3,581,418 0 0 $0 1,015,566 $3,581,418
- Private Line Services Page 11 -

2008 Annual Section 43.61 International Traffic Data for All U.S. Points: Facilities-Based & Facilities-ResaleTable B7: Columbus Networks USA, Inc. Private Line Services Billing Types Covered: 1, 11
International Point Voice Circuits Up to 1200 1201 to 9600 9601 to 30 Million Greater than 30 Mbps Totalbits per second (bps) bits per second (bps) bits per second (Mbps) Private
(.01 to 18 Megahertz) (greater than 18 Megahertz) Lines
Circuits 64 K Revenues Circuits 64 K Revenues Circuits 64 K Revenues Circuits 64 K Revenues Circuits 64 K Revenues 64 K Revenues
Trinidad and Tobago 0 0 $0 0 0 $0 0 0 $0 0 0 $0 3 1,950 $556,327 1,950 $556,327
Caribbean 0 0 $0 0 0 $0 0 0 $0 0 0 $0 3 1,950 $556,327 1,950 $556,327
Costa Rica 0 0 $0 0 0 $0 0 0 $0 1 30 $66,000 0 0 $0 30 $66,000
North and Central America 0 0 $0 0 0 $0 0 0 $0 1 30 $66,000 0 0 $0 30 $66,000
Total for Foreign Points 0 0 $0 0 0 $0 0 0 $0 1 30 $66,000 3 1,950 $556,327 1,980 $622,327
World Total 0 0 $0 0 0 $0 0 0 $0 1 30 $66,000 3 1,950 $556,327 1,980 $622,327
- Private Line Services Page 12 -

2008 Annual Section 43.61 International Traffic Data for All U.S. Points: Facilities-Based & Facilities-ResaleTable B8: EKU Solutions, LLC Private Line Services Billing Types Covered: 1, 11
International Point Voice Circuits Up to 1200 1201 to 9600 9601 to 30 Million Greater than 30 Mbps Totalbits per second (bps) bits per second (bps) bits per second (Mbps) Private
(.01 to 18 Megahertz) (greater than 18 Megahertz) Lines
Circuits 64 K Revenues Circuits 64 K Revenues Circuits 64 K Revenues Circuits 64 K Revenues Circuits 64 K Revenues 64 K Revenues
United Kingdom 0 0 $0 0 0 $0 0 0 $0 1 24 $2,883 0 0 $0 24 $2,883
Western Europe 0 0 $0 0 0 $0 0 0 $0 1 24 $2,883 0 0 $0 24 $2,883
Total for Foreign Points 0 0 $0 0 0 $0 0 0 $0 1 24 $2,883 0 0 $0 24 $2,883
World Total 0 0 $0 0 0 $0 0 0 $0 1 24 $2,883 0 0 $0 24 $2,883
- Private Line Services Page 13 -

2008 Annual Section 43.61 International Traffic Data for All U.S. Points: Facilities-Based & Facilities-ResaleTable B9: EPM Telecomunicaciones S.A. E.S.P. Private Line Services Billing Types Covered: 1, 11
International Point Voice Circuits Up to 1200 1201 to 9600 9601 to 30 Million Greater than 30 Mbps Totalbits per second (bps) bits per second (bps) bits per second (Mbps) Private
(.01 to 18 Megahertz) (greater than 18 Megahertz) Lines
Circuits 64 K Revenues Circuits 64 K Revenues Circuits 64 K Revenues Circuits 64 K Revenues Circuits 64 K Revenues 64 K Revenues
Spain 0 0 $0 0 0 $0 0 0 $0 0 0 $0 1 1,890 $122,304 1,890 $122,304
Western Europe 0 0 $0 0 0 $0 0 0 $0 0 0 $0 1 1,890 $122,304 1,890 $122,304
Colombia 0 0 $0 0 0 $0 0 0 $0 4,547 136,350 $4,341,552 0 0 $64,200 136,350 $4,405,752Ecuador 0 0 $0 0 0 $0 0 0 $0 1 4 $91,701 0 0 $0 4 $91,701
South America 0 0 $0 0 0 $0 0 0 $0 4,548 136,354 $4,433,253 0 0 $64,200 136,354 $4,497,453
Total for Foreign Points 0 0 $0 0 0 $0 0 0 $0 4,548 136,354 $4,433,253 1 1,890 $186,504 138,244 $4,619,757
World Total 0 0 $0 0 0 $0 0 0 $0 4,548 136,354 $4,433,253 1 1,890 $186,504 138,244 $4,619,757
- Private Line Services Page 14 -

2008 Annual Section 43.61 International Traffic Data for All U.S. Points: Facilities-Based & Facilities-ResaleTable B10: Global Caribbean Fiber Private Line Services Billing Types Covered: 1, 11
International Point Voice Circuits Up to 1200 1201 to 9600 9601 to 30 Million Greater than 30 Mbps Totalbits per second (bps) bits per second (bps) bits per second (Mbps) Private
(.01 to 18 Megahertz) (greater than 18 Megahertz) Lines
Circuits 64 K Revenues Circuits 64 K Revenues Circuits 64 K Revenues Circuits 64 K Revenues Circuits 64 K Revenues 64 K Revenues
France 0 0 $0 0 0 $0 0 0 $0 0 0 $0 1 7,560 $2,000,000 7,560 $2,000,000
Western Europe 0 0 $0 0 0 $0 0 0 $0 0 0 $0 1 7,560 $2,000,000 7,560 $2,000,000
Antigua and Barbuda 0 0 $0 0 0 $0 0 0 $0 0 0 $0 5 2,010 $3,100,000 2,010 $3,100,000French Overseas Departments 0 0 $0 0 0 $0 0 0 $0 0 0 $0 2 15,120 $16,000,000 15,120 $16,000,000Guadeloupe 0 0 $0 0 0 $0 0 0 $0 0 0 $0 1 1,890 $5,500,000 1,890 $5,500,000Saint Kitts and Nevis 0 0 $0 0 0 $0 0 0 $0 0 0 $0 3 62,370 $21,620,000 62,370 $21,620,000Saint Lucia 0 0 $0 0 0 $0 0 0 $0 0 0 $0 3 64,260 $30,120,000 64,260 $30,120,000Trinidad and Tobago 0 0 $0 0 0 $0 0 0 $0 0 0 $0 2 32,130 $11,200,000 32,130 $11,200,000
Caribbean 0 0 $0 0 0 $0 0 0 $0 0 0 $0 16 177,780 $87,540,000 177,780 $87,540,000
Total for Foreign Points 0 0 $0 0 0 $0 0 0 $0 0 0 $0 17 185,340 $89,540,000 185,340 $89,540,000
World Total 0 0 $0 0 0 $0 0 0 $0 0 0 $0 17 185,340 $89,540,000 185,340 $89,540,000
- Private Line Services Page 15 -

2008 Annual Section 43.61 International Traffic Data for All U.S. Points: Facilities-Based & Facilities-ResaleTable B11: Global Crossing North America, Inc. Private Line Services Billing Types Covered: 1, 11
International Point Voice Circuits Up to 1200 1201 to 9600 9601 to 30 Million Greater than 30 Mbps Totalbits per second (bps) bits per second (bps) bits per second (Mbps) Private
(.01 to 18 Megahertz) (greater than 18 Megahertz) Lines
Circuits 64 K Revenues Circuits 64 K Revenues Circuits 64 K Revenues Circuits 64 K Revenues Circuits 64 K Revenues 64 K Revenues
Germany 0 0 $0 0 0 $0 0 0 $0 4 4 $4,144 0 0 $0 4 $4,144Netherlands 0 0 $0 0 0 $0 0 0 $0 2 2 $10,924 0 0 $0 2 $10,924Spain 0 0 $0 0 0 $0 0 0 $0 16 16 $2,249 0 0 $0 16 $2,249Switzerland 0 0 $0 0 0 $0 0 0 $0 31 31 $11,095 0 0 $0 31 $11,095United Kingdom 0 0 $0 0 0 $0 0 0 $0 62 62 $55,373 0 0 $0 62 $55,373
Western Europe 0 0 $0 0 0 $0 0 0 $0 115 115 $83,785 0 0 $0 115 $83,785
Anguilla 0 0 $0 0 0 $0 0 0 $0 4 4 $20,934 0 0 $0 4 $20,934Antigua and Barbuda 0 0 $0 0 0 $0 0 0 $0 8 8 $41,869 0 0 $0 8 $41,869Bahamas, The 0 0 $0 0 0 $0 0 0 $0 703 703 $352,672 0 0 $0 703 $352,672Barbados 0 0 $0 0 0 $0 0 0 $0 96 96 $178,267 0 0 $0 96 $178,267Cayman Islands 0 0 $0 0 0 $0 0 0 $0 20 20 $39,790 0 0 $0 20 $39,790Dominica 0 0 $0 0 0 $0 0 0 $0 4 4 $6,500 0 0 $0 4 $6,500Dominican Republic 0 0 $0 0 0 $0 0 0 $0 342 342 $1,018,887 0 0 $0 342 $1,018,887Grenada 0 0 $0 0 0 $0 0 0 $0 12 12 $7,590 0 0 $0 12 $7,590Haiti 0 0 $0 0 0 $0 0 0 $0 8 8 $60,236 0 0 $0 8 $60,236Jamaica 0 0 $0 0 0 $0 0 0 $0 296 296 $1,476,194 0 0 $0 296 $1,476,194Netherlands Antilles 0 0 $0 0 0 $0 0 0 $0 96 96 $345,307 0 0 $0 96 $345,307Saint Kitts and Nevis 0 0 $0 0 0 $0 0 0 $0 24 24 $119,415 0 0 $0 24 $119,415Saint Vincent and the Grenadines 0 0 $0 0 0 $0 0 0 $0 4 4 $91,208 0 0 $0 4 $91,208Trinidad and Tobago 0 0 $0 0 0 $0 0 0 $0 728 728 $905,557 0 0 $0 728 $905,557Turks and Caicos Islands 0 0 $0 0 0 $0 0 0 $0 16 16 $117,238 0 0 $0 16 $117,238Virgin Islands, British 0 0 $0 0 0 $0 0 0 $0 8 8 $280,497 0 0 $0 8 $280,497
Caribbean 0 0 $0 0 0 $0 0 0 $0 2,369 2,369 $5,062,161 0 0 $0 2,369 $5,062,161
Belize 0 0 $0 0 0 $0 0 0 $0 32 32 $193,223 0 0 $0 32 $193,223Canada 0 0 $0 0 0 $0 0 0 $0 15,704 15,704 $779,766 0 0 $0 15,704 $779,766Costa Rica 0 0 $0 0 0 $0 0 0 $0 237 237 $539,222 0 0 $0 237 $539,222El Salvador 0 0 $0 0 0 $0 0 0 $0 348 348 $460,543 0 0 $0 348 $460,543Guatemala 0 0 $0 0 0 $0 0 0 $0 226 226 $336,306 0 0 $0 226 $336,306Honduras 0 0 $0 0 0 $0 0 0 $0 94 94 $166,551 0 0 $0 94 $166,551Mexico 0 0 $0 0 0 $0 0 0 $0 1,440 1,440 $625,287 0 0 $0 1,440 $625,287Nicaragua 0 0 $0 0 0 $0 0 0 $0 96 96 $33,670 0 0 $0 96 $33,670Panama 0 0 $0 0 0 $0 0 0 $0 345 345 $322,680 0 0 $0 345 $322,680
North and Central America 0 0 $0 0 0 $0 0 0 $0 18,522 18,522 $3,457,248 0 0 $0 18,522 $3,457,248
Argentina 0 0 $0 0 0 $0 0 0 $0 260 260 $412,871 0 0 $0 260 $412,871Bolivia 0 0 $0 0 0 $0 0 0 $0 168 168 $268,297 0 0 $0 168 $268,297Brazil 0 0 $0 0 0 $0 0 0 $0 1,724 1,724 $1,761,725 0 0 $0 1,724 $1,761,725Colombia 0 0 $0 0 0 $0 0 0 $0 2,074 2,074 $2,048,493 0 0 $0 2,074 $2,048,493Ecuador 0 0 $0 0 0 $0 0 0 $0 12 12 $21,565 0 0 $0 12 $21,565Guyana 0 0 $0 0 0 $0 0 0 $0 16 16 $156,718 0 0 $0 16 $156,718Paraguay 0 0 $0 0 0 $0 0 0 $0 12 12 $116,020 0 0 $0 12 $116,020Peru 0 0 $0 0 0 $0 0 0 $0 239 239 $273,534 0 0 $0 239 $273,534Venezuela 0 0 $0 0 0 $0 0 0 $0 563 563 $1,058,160 0 0 $0 563 $1,058,160
South America 0 0 $0 0 0 $0 0 0 $0 5,068 5,068 $6,117,383 0 0 $0 5,068 $6,117,383
Total for Foreign Points 0 0 $0 0 0 $0 0 0 $0 26,074 26,074 $14,720,577 0 0 $0 26,074 $14,720,577
World Total 0 0 $0 0 0 $0 0 0 $0 26,074 26,074 $14,720,577 0 0 $0 26,074 $14,720,577
- Private Line Services Page 16 -

2008 Annual Section 43.61 International Traffic Data for All U.S. Points: Facilities-Based & Facilities-ResaleTable B12: Global Telecom and Technology Americas, Inc. Private Line Services Billing Types Covered: 1, 11
International Point Voice Circuits Up to 1200 1201 to 9600 9601 to 30 Million Greater than 30 Mbps Totalbits per second (bps) bits per second (bps) bits per second (Mbps) Private
(.01 to 18 Megahertz) (greater than 18 Megahertz) Lines
Circuits 64 K Revenues Circuits 64 K Revenues Circuits 64 K Revenues Circuits 64 K Revenues Circuits 64 K Revenues 64 K Revenues
Belgium 0 0 $0 0 0 $0 0 0 $0 1 24 $1,002 0 0 $0 24 $1,002France 0 0 $0 0 0 $0 0 0 $0 0 0 $0 1 672 $12,277 672 $12,277Germany 0 0 $0 0 0 $0 0 0 $0 0 0 $0 2 828 $75,000 828 $75,000Italy 0 0 $0 0 0 $0 0 0 $0 1 30 $38,562 0 0 $0 30 $38,562Netherlands 0 0 $0 0 0 $0 0 0 $0 0 0 $0 1 30 $46,650 30 $46,650United Kingdom 0 0 $0 0 0 $0 0 0 $0 6 156 $27,938 5 13,440 $76,755 13,596 $104,693
Western Europe 0 0 $0 0 0 $0 0 0 $0 8 210 $67,502 9 14,970 $210,682 15,180 $278,184
Israel 0 0 $0 0 0 $0 0 0 $0 1 24 $19,512 0 0 $0 24 $19,512
Middle East 0 0 $0 0 0 $0 0 0 $0 1 24 $19,512 0 0 $0 24 $19,512
Bahamas, The 0 0 $0 0 0 $0 0 0 $0 2 36 $631 2 1,344 $213,300 1,380 $213,931Barbados 0 0 $0 0 0 $0 0 0 $0 16 115 $130,500 0 0 $0 115 $130,500Dominican Republic 0 0 $0 0 0 $0 0 0 $0 1 24 $74,678 0 0 $0 24 $74,678
Caribbean 0 0 $0 0 0 $0 0 0 $0 19 175 $205,809 2 1,344 $213,300 1,519 $419,109
Canada 0 0 $0 0 0 $0 0 0 $0 19 4,704 $96,792 12 8,064 $239,965 12,768 $336,757Mexico 0 0 $0 0 0 $0 0 0 $0 5 254 $229,340 0 0 $0 254 $229,340
North and Central America 0 0 $0 0 0 $0 0 0 $0 24 4,958 $326,132 12 8,064 $239,965 13,022 $566,097
Brazil 0 0 $0 0 0 $0 0 0 $0 3 2,076 $179,319 0 0 $0 2,076 $179,319Colombia 0 0 $0 0 0 $0 0 0 $0 3 469 $53,113 1 672 $198,105 1,141 $251,218Peru 0 0 $0 0 0 $0 0 0 $0 1 30 $35,817 1 672 $77,125 702 $112,942Uruguay 0 0 $0 0 0 $0 0 0 $0 1 8 $22,050 0 0 $0 8 $22,050
South America 0 0 $0 0 0 $0 0 0 $0 8 2,583 $290,299 2 1,344 $275,230 3,927 $565,529
China 0 0 $0 0 0 $0 0 0 $0 2 48 $56,580 0 0 $0 48 $56,580Japan 0 0 $0 0 0 $0 0 0 $0 1 180 $84,427 0 0 $0 180 $84,427
Asia 0 0 $0 0 0 $0 0 0 $0 3 228 $141,007 0 0 $0 228 $141,007
Australia 0 0 $0 0 0 $0 0 0 $0 2 60 $40,296 0 0 $0 60 $40,296
Oceania 0 0 $0 0 0 $0 0 0 $0 2 60 $40,296 0 0 $0 60 $40,296
Bulgaria 0 0 $0 0 0 $0 0 0 $0 1 1,536 $49,133 0 0 $0 1,536 $49,133
Eastern Europe 0 0 $0 0 0 $0 0 0 $0 1 1,536 $49,133 0 0 $0 1,536 $49,133
Total for Foreign Points 0 0 $0 0 0 $0 0 0 $0 66 9,774 $1,139,690 25 25,722 $939,177 35,496 $2,078,867World Total 0 0 $0 0 0 $0 0 0 $0 66 9,774 $1,139,690 25 25,722 $939,177 35,496 $2,078,867
- Private Line Services Page 17 -

2008 Annual Section 43.61 International Traffic Data for All U.S. Points: Facilities-Based & Facilities-ResaleTable B13: Golden Holdings, Inc. Private Line Services Billing Types Covered: 1, 11
International Point Voice Circuits Up to 1200 1201 to 9600 9601 to 30 Million Greater than 30 Mbps Totalbits per second (bps) bits per second (bps) bits per second (Mbps) Private
(.01 to 18 Megahertz) (greater than 18 Megahertz) Lines
Circuits 64 K Revenues Circuits 64 K Revenues Circuits 64 K Revenues Circuits 64 K Revenues Circuits 64 K Revenues 64 K Revenues
Russia 10 10 $1,847 0 0 $0 0 0 $0 0 0 $0 0 0 $0 10 $1,847
Eastern Europe 10 10 $1,847 0 0 $0 0 0 $0 0 0 $0 0 0 $0 10 $1,847
Total for Foreign Points 10 10 $1,847 0 0 $0 0 0 $0 0 0 $0 0 0 $0 10 $1,847
World Total 10 10 $1,847 0 0 $0 0 0 $0 0 0 $0 0 0 $0 10 $1,847
- Private Line Services Page 18 -

2008 Annual Section 43.61 International Traffic Data for All U.S. Points: Facilities-Based & Facilities-ResaleTable B14: Intelsat USA License Corp. Private Line Services Billing Types Covered: 1, 11
International Point Voice Circuits Up to 1200 1201 to 9600 9601 to 30 Million Greater than 30 Mbps Totalbits per second (bps) bits per second (bps) bits per second (Mbps) Private
(.01 to 18 Megahertz) (greater than 18 Megahertz) Lines
Circuits 64 K Revenues Circuits 64 K Revenues Circuits 64 K Revenues Circuits 64 K Revenues Circuits 64 K Revenues 64 K Revenues
Northern Mariana Islands 0 0 $0 0 0 $0 0 0 $0 7 68 $341,320 0 0 $0 68 $341,320
Carriers serving Misc. U.S. points 0 0 $0 0 0 $0 0 0 $0 7 68 $341,320 0 0 $0 68 $341,320
Total for Foreign Points 0 0 $0 0 0 $0 0 0 $0 7 68 $341,320 0 0 $0 68 $341,320
World Total 0 0 $0 0 0 $0 0 0 $0 7 68 $341,320 0 0 $0 68 $341,320
- Private Line Services Page 19 -

2008 Annual Section 43.61 International Traffic Data for All U.S. Points: Facilities-Based & Facilities-ResaleTable B15: KDDI America, Inc. Private Line Services Billing Types Covered: 1, 11
International Point Voice Circuits Up to 1200 1201 to 9600 9601 to 30 Million Greater than 30 Mbps Totalbits per second (bps) bits per second (bps) bits per second (Mbps) Private
(.01 to 18 Megahertz) (greater than 18 Megahertz) Lines
Circuits 64 K Revenues Circuits 64 K Revenues Circuits 64 K Revenues Circuits 64 K Revenues Circuits 64 K Revenues 64 K Revenues
France 0 0 $0 0 0 $0 0 0 $0 1 31 $6,564 0 0 $0 31 $6,564United Kingdom 0 0 $0 0 0 $0 0 0 $0 7 560 $79,989 1 625 $10,712 1,185 $90,701
Western Europe 0 0 $0 0 0 $0 0 0 $0 8 591 $86,553 1 625 $10,712 1,216 $97,265
Israel 0 0 $0 0 0 $0 0 0 $0 1 23 $2,509 0 0 $0 23 $2,509
Middle East 0 0 $0 0 0 $0 0 0 $0 1 23 $2,509 0 0 $0 23 $2,509
Canada 0 0 $0 0 0 $0 0 0 $0 4 47 $20,481 0 0 $0 47 $20,481Mexico 0 0 $0 0 0 $0 0 0 $0 2 27 $37,922 0 0 $0 27 $37,922
North and Central America 0 0 $0 0 0 $0 0 0 $0 6 74 $58,403 0 0 $0 74 $58,403
Argentina 0 0 $0 0 0 $0 0 0 $0 1 1 $77,320 0 0 $0 1 $77,320Brazil 0 0 $0 0 0 $0 0 0 $0 2 4 $151,976 0 0 $0 4 $151,976Chile 0 0 $0 0 0 $0 0 0 $0 1 2 $83,345 0 0 $0 2 $83,345Colombia 0 0 $0 0 0 $0 0 0 $0 1 1 $49,435 0 0 $0 1 $49,435Venezuela 0 0 $0 0 0 $0 0 0 $0 1 1 $44,355 0 0 $0 1 $44,355
South America 0 0 $0 0 0 $0 0 0 $0 6 9 $406,431 0 0 $0 9 $406,431
Hong Kong 0 0 $0 0 0 $0 0 0 $0 0 0 $0 1 703 $35,545 703 $35,545India 0 0 $0 0 0 $0 0 0 $0 4 148 $159,976 1 703 $116,477 851 $276,453Japan 0 0 $0 0 0 $0 0 0 $0 298 7,710 $2,416,907 28 732,484 $6,392,706 740,194 $8,809,613Korea, South 0 0 $0 0 0 $0 0 0 $0 0 0 $0 1 703 $86,115 703 $86,115Philippines 0 0 $0 0 0 $0 0 0 $0 0 0 $0 1 703 $40,457 703 $40,457
Asia 0 0 $0 0 0 $0 0 0 $0 302 7,858 $2,576,883 32 735,296 $6,671,300 743,154 $9,248,183
Bulgaria 0 0 $0 0 0 $0 0 0 $0 1 16 $46,661 0 0 $0 16 $46,661
Eastern Europe 0 0 $0 0 0 $0 0 0 $0 1 16 $46,661 0 0 $0 16 $46,661
Total for Foreign Points 0 0 $0 0 0 $0 0 0 $0 324 8,571 $3,177,440 33 735,921 $6,682,012 744,492 $9,859,452
World Total 0 0 $0 0 0 $0 0 0 $0 324 8,571 $3,177,440 33 735,921 $6,682,012 744,492 $9,859,452
- Private Line Services Page 20 -

2008 Annual Section 43.61 International Traffic Data for All U.S. Points: Facilities-Based & Facilities-ResaleTable B16 (Revised): Level 3 Communications, LLC Private Line Services Billing Types Covered: 1, 11
International Point Voice Circuits Up to 1200 1201 to 9600 9601 to 30 Million Greater than 30 Mbps Totalbits per second (bps) bits per second (bps) bits per second (Mbps) Private
(.01 to 18 Megahertz) (greater than 18 Megahertz) Lines
Circuits 64 K Revenues Circuits 64 K Revenues Circuits 64 K Revenues Circuits 64 K Revenues Circuits 64 K Revenues 64 K Revenues
France 0 0 $0 0 0 $0 0 0 $0 3 11,970 $4,327,905 0 0 $0 11,970 $4,327,905Germany 0 0 $0 0 0 $0 0 0 $0 3 385,560 $1,896,697 0 0 $0 385,560 $1,896,697Netherlands 0 0 $0 0 0 $0 0 0 $0 1 39,690 $5,009,884 0 0 $0 39,690 $5,009,884United Kingdom 0 0 $0 0 0 $0 0 0 $0 40 448,608 $18,710,610 0 0 $0 448,608 $18,710,610
Western Europe 0 0 $0 0 0 $0 0 0 $0 47 885,828 $29,945,096 0 0 $0 885,828 $29,945,096
Total for Foreign Points 0 0 $0 0 0 $0 0 0 $0 47 885,828 $29,945,096 0 0 $0 885,828 $29,945,096World Total 0 0 $0 0 0 $0 0 0 $0 47 885,828 $29,945,096 0 0 $0 885,828 $29,945,096
Revised: August 26, 2010- Private Line Services Page 21 -

2008 Annual Section 43.61 International Traffic Data for All U.S. Points: Facilities-Based & Facilities-ResaleTable B17: New Edge Networks Private Line Services Billing Types Covered: 1, 11
International Point Voice Circuits Up to 1200 1201 to 9600 9601 to 30 Million Greater than 30 Mbps Totalbits per second (bps) bits per second (bps) bits per second (Mbps) Private
(.01 to 18 Megahertz) (greater than 18 Megahertz) Lines
Circuits 64 K Revenues Circuits 64 K Revenues Circuits 64 K Revenues Circuits 64 K Revenues Circuits 64 K Revenues 64 K Revenues
Canada 0 0 $0 0 0 $0 0 0 $0 210 9,740 $281,648 0 0 $0 9,740 $281,648
North and Central America 0 0 $0 0 0 $0 0 0 $0 210 9,740 $281,648 0 0 $0 9,740 $281,648
Total for Foreign Points 0 0 $0 0 0 $0 0 0 $0 210 9,740 $281,648 0 0 $0 9,740 $281,648
World Total 0 0 $0 0 0 $0 0 0 $0 210 9,740 $281,648 0 0 $0 9,740 $281,648
- Private Line Services Page 22 -

2008 Annual Section 43.61 International Traffic Data for All U.S. Points: Facilities-Based & Facilities-ResaleTable B18: NTT America, Inc. Private Line Services Billing Types Covered: 1, 11
International Point Voice Circuits Up to 1200 1201 to 9600 9601 to 30 Million Greater than 30 Mbps Totalbits per second (bps) bits per second (bps) bits per second (Mbps) Private
(.01 to 18 Megahertz) (greater than 18 Megahertz) Lines
Circuits 64 K Revenues Circuits 64 K Revenues Circuits 64 K Revenues Circuits 64 K Revenues Circuits 64 K Revenues 64 K Revenues
France 0 0 $0 0 0 $0 0 0 $0 1 23 $11,832 1 703 $11,613 726 $23,445Germany 0 0 $0 0 0 $0 0 0 $0 3 48 $12,600 0 0 $13,302 48 $25,902Ireland 0 0 $0 0 0 $0 0 0 $0 1 8 $1,620 0 0 $0 8 $1,620Italy 0 0 $0 0 0 $0 0 0 $0 1 8 $14,424 0 0 $0 8 $14,424Netherlands 0 0 $0 0 0 $0 0 0 $0 0 0 $7,323 0 0 $0 0 $7,323United Kingdom 0 0 $0 0 0 $0 0 0 $0 22 304 $359,087 1 703 $25,452 1,007 $384,539
Western Europe 0 0 $0 0 0 $0 0 0 $0 28 391 $406,886 2 1,406 $50,367 1,797 $457,253
Canada 0 0 $0 0 0 $0 1 1 $1,386 5 20 $23,584 0 0 $0 21 $24,970Mexico 0 0 $0 0 0 $0 1 1 $198 6 54 $15,315 0 0 $0 55 $15,513
North and Central America 0 0 $0 0 0 $0 2 2 $1,584 11 74 $38,899 0 0 $0 76 $40,483
Brazil 0 0 $0 0 0 $0 0 0 $0 9 111 $32,370 0 0 $0 111 $32,370
South America 0 0 $0 0 0 $0 0 0 $0 9 111 $32,370 0 0 $0 111 $32,370
Hong Kong 0 0 $0 0 0 $0 0 0 $0 5 86 $56,039 5 5,235 $134,848 5,321 $190,887India 0 0 $0 0 0 $0 0 0 $0 1 23 $4,200 0 0 $0 23 $4,200Japan 0 0 $0 0 0 $0 1 1 $120 47 614 $672,079 15 242,031 $2,920,216 242,646 $3,592,415Korea, South 0 0 $0 0 0 $0 0 0 $0 3 55 $28,482 0 0 $0 55 $28,482Philippines 0 0 $0 0 0 $0 0 0 $0 17 327 $490,678 10 10,469 $1,643,447 10,796 $2,134,125Singapore 0 0 $0 0 0 $0 0 0 $0 2 27 $4,295 5 6,953 $277,855 6,980 $282,150Taiwan 0 0 $0 0 0 $0 0 0 $0 6 65 $48,039 0 0 $0 65 $48,039
Asia 0 0 $0 0 0 $0 1 1 $120 81 1,197 $1,303,812 35 264,688 $4,976,366 265,886 $6,280,298
Australia 0 0 $0 0 0 $0 0 0 $0 6 78 $36,840 0 0 $2,739 78 $39,579New Zealand 0 0 $0 0 0 $0 0 0 $0 1 23 $16,992 0 0 $0 23 $16,992
Oceania 0 0 $0 0 0 $0 0 0 $0 7 101 $53,832 0 0 $2,739 101 $56,571
Total for Foreign Points 0 0 $0 0 0 $0 3 3 $1,704 136 1,874 $1,835,799 37 266,094 $5,029,472 267,971 $6,866,975
World Total 0 0 $0 0 0 $0 3 3 $1,704 136 1,874 $1,835,799 37 266,094 $5,029,472 267,971 $6,866,975
- Private Line Services Page 23 -

2008 Annual Section 43.61 International Traffic Data for All U.S. Points: Facilities-Based & Facilities-ResaleTable B19: Pacifica Telecom Inc. (PTI) Private Line Services Billing Types Covered: 1, 11
International Point Voice Circuits Up to 1200 1201 to 9600 9601 to 30 Million Greater than 30 Mbps Totalbits per second (bps) bits per second (bps) bits per second (Mbps) Private
(.01 to 18 Megahertz) (greater than 18 Megahertz) Lines
Circuits 64 K Revenues Circuits 64 K Revenues Circuits 64 K Revenues Circuits 64 K Revenues Circuits 64 K Revenues 64 K Revenues
United States (conterminous) 0 0 $0 0 0 $0 0 0 $0 306 306 $813,742 0 0 $0 306 $813,742
North and Central America 0 0 $0 0 0 $0 0 0 $0 306 306 $813,742 0 0 $0 306 $813,742
Japan 0 0 $0 0 0 $0 0 0 $0 67 67 $46,158 0 0 $0 67 $46,158Philippines 0 0 $0 0 0 $0 0 0 $0 24 24 $58,440 0 0 $0 24 $58,440Singapore 0 0 $0 0 0 $0 0 0 $0 12 12 $34,800 0 0 $0 12 $34,800
Asia 0 0 $0 0 0 $0 0 0 $0 103 103 $139,398 0 0 $0 103 $139,398
Hawaii 0 0 $0 0 0 $0 0 0 $0 53 53 $64,482 0 0 $0 53 $64,482Northern Mariana Islands 0 0 $0 0 0 $0 0 0 $0 30 30 $45,708 0 0 $0 30 $45,708
Oceania 0 0 $0 0 0 $0 0 0 $0 83 83 $110,190 0 0 $0 83 $110,190
Northern Mariana Islands 0 0 $0 0 0 $0 0 0 $0 32 66 $80,531 0 0 $0 66 $80,531
Carriers serving Misc. U.S. points 0 0 $0 0 0 $0 0 0 $0 32 66 $80,531 0 0 $0 66 $80,531
Total for Foreign Points 0 0 $0 0 0 $0 0 0 $0 135 169 $219,929 0 0 $0 169 $219,929
Total for U.S. Points 0 0 $0 0 0 $0 0 0 $0 389 389 $923,932 0 0 $0 389 $923,932
World Total 0 0 $0 0 0 $0 0 0 $0 524 558 $1,143,861 0 0 $0 558 $1,143,861
- Private Line Services Page 24 -

2008 Annual Section 43.61 International Traffic Data for All U.S. Points: Facilities-Based & Facilities-ResaleTable B20: Philippine Long Distance Telephone Co., Ltd. Private Line Services Billing Types Covered: 1, 11
International Point Voice Circuits Up to 1200 1201 to 9600 9601 to 30 Million Greater than 30 Mbps Totalbits per second (bps) bits per second (bps) bits per second (Mbps) Private
(.01 to 18 Megahertz) (greater than 18 Megahertz) Lines
Circuits 64 K Revenues Circuits 64 K Revenues Circuits 64 K Revenues Circuits 64 K Revenues Circuits 64 K Revenues 64 K Revenues
Philippines 0 0 $0 0 0 $0 0 0 $0 52 1,374 $643,537 14 8,820 $955,516 10,194 $1,599,053
Asia 0 0 $0 0 0 $0 0 0 $0 52 1,374 $643,537 14 8,820 $955,516 10,194 $1,599,053
Total for Foreign Points 0 0 $0 0 0 $0 0 0 $0 52 1,374 $643,537 14 8,820 $955,516 10,194 $1,599,053World Total 0 0 $0 0 0 $0 0 0 $0 52 1,374 $643,537 14 8,820 $955,516 10,194 $1,599,053
- Private Line Services Page 25 -

2008 Annual Section 43.61 International Traffic Data for All U.S. Points: Facilities-Based & Facilities-ResaleTable B21: PREPA.Net International Wholesale Transport Private Line Services Billing Types Covered: 1, 11
International Point Voice Circuits Up to 1200 1201 to 9600 9601 to 30 Million Greater than 30 Mbps Totalbits per second (bps) bits per second (bps) bits per second (Mbps) Private
(.01 to 18 Megahertz) (greater than 18 Megahertz) Lines
Circuits 64 K Revenues Circuits 64 K Revenues Circuits 64 K Revenues Circuits 64 K Revenues Circuits 64 K Revenues 64 K Revenues
Dominican Republic 720 720 $277,320 0 0 $0 0 0 $0 0 0 $0 0 0 $0 720 $277,320
Caribbean 720 720 $277,320 0 0 $0 0 0 $0 0 0 $0 0 0 $0 720 $277,320
Total for Foreign Points 720 720 $277,320 0 0 $0 0 0 $0 0 0 $0 0 0 $0 720 $277,320
World Total 720 720 $277,320 0 0 $0 0 0 $0 0 0 $0 0 0 $0 720 $277,320
- Private Line Services Page 26 -

2008 Annual Section 43.61 International Traffic Data for All U.S. Points: Facilities-Based & Facilities-ResaleTable B22: Qwest Services Corporation Private Line Services Billing Types Covered: 1, 11
International Point Voice Circuits Up to 1200 1201 to 9600 9601 to 30 Million Greater than 30 Mbps Totalbits per second (bps) bits per second (bps) bits per second (Mbps) Private
(.01 to 18 Megahertz) (greater than 18 Megahertz) Lines
Circuits 64 K Revenues Circuits 64 K Revenues Circuits 64 K Revenues Circuits 64 K Revenues Circuits 64 K Revenues 64 K Revenues
Austria 0 0 $0 0 0 $0 0 0 $0 3 26 $100 0 0 $0 26 $100Belgium 0 0 $0 0 0 $0 0 0 $0 2 33 $127 0 0 $0 33 $127Denmark 0 0 $0 0 0 $0 0 0 $0 1 24 $92 0 0 $0 24 $92France 0 0 $0 0 0 $0 0 0 $0 1 1 $4 0 0 $0 1 $4Germany 0 0 $0 0 0 $0 0 0 $0 1 24 $92 3 137,760 $529,622 137,784 $529,714Ireland 0 0 $0 0 0 $0 0 0 $0 2 2 $8 0 0 $0 2 $8Italy 0 0 $0 0 0 $0 0 0 $0 4 4 $15 0 0 $0 4 $15Netherlands 0 0 $0 0 0 $0 0 0 $0 4 4 $15 1 672 $2,584 676 $2,599Spain 0 0 $0 0 0 $0 0 0 $0 2 25 $96 0 0 $0 25 $96Switzerland 0 0 $0 0 0 $0 0 0 $0 0 0 $0 1 129,024 $496,036 129,024 $496,036United Kingdom 0 0 $0 0 0 $0 0 0 $0 34 487 $1,872 9 213,696 $821,559 214,183 $823,431
Western Europe 0 0 $0 0 0 $0 0 0 $0 54 630 $2,421 14 481,152 $1,849,801 481,782 $1,852,222
Israel 0 0 $0 0 0 $0 0 0 $0 2 2 $8 0 0 $0 2 $8
Middle East 0 0 $0 0 0 $0 0 0 $0 2 2 $8 0 0 $0 2 $8
Canada 0 0 $0 0 0 $0 4 4 $15 231 4,049 $15,566 12 15,456 $59,421 19,509 $75,002Mexico 0 0 $0 0 0 $0 1 1 $4 38 538 $2,068 3 2,016 $7,751 2,555 $9,823
North and Central America 0 0 $0 0 0 $0 5 5 $19 269 4,587 $17,634 15 17,472 $67,172 22,064 $84,825
Argentina 0 0 $0 0 0 $0 0 0 $0 1 1 $4 0 0 $0 1 $4Brazil 0 0 $0 0 0 $0 0 0 $0 2 25 $96 0 0 $0 25 $96Chile 0 0 $0 0 0 $0 0 0 $0 1 1 $4 0 0 $0 1 $4Colombia 0 0 $0 0 0 $0 0 0 $0 3 49 $188 0 0 $0 49 $188Ecuador 0 0 $0 0 0 $0 0 0 $0 1 1 $4 0 0 $0 1 $4
South America 0 0 $0 0 0 $0 0 0 $0 8 77 $296 0 0 $0 77 $296
China 0 0 $0 0 0 $0 0 0 $0 2 25 $96 0 0 $0 25 $96Hong Kong 0 0 $0 0 0 $0 0 0 $0 2 25 $96 7 44,352 $170,512 44,377 $170,608India 0 0 $0 0 0 $0 0 0 $0 5 5 $19 0 0 $0 5 $19Japan 0 0 $0 0 0 $0 0 0 $0 4 73 $281 33 403,872 $1,552,695 403,945 $1,552,976Philippines 0 0 $0 0 0 $0 0 0 $0 0 0 $0 1 672 $2,584 672 $2,584
Asia 0 0 $0 0 0 $0 0 0 $0 13 128 $492 41 448,896 $1,725,791 449,024 $1,726,283
Australia 0 0 $0 0 0 $0 0 0 $0 4 4 $15 6 48,384 $186,013 48,388 $186,028
Oceania 0 0 $0 0 0 $0 0 0 $0 4 4 $15 6 48,384 $186,013 48,388 $186,028
Total for Foreign Points 0 0 $0 0 0 $0 5 5 $19 350 5,428 $20,866 76 995,904 $3,828,777 1,001,337 $3,849,662
World Total 0 0 $0 0 0 $0 5 5 $19 350 5,428 $20,866 76 995,904 $3,828,777 1,001,337 $3,849,662
- Private Line Services Page 27 -

2008 Annual Section 43.61 International Traffic Data for All U.S. Points: Facilities-Based & Facilities-ResaleTable B23: Reliance Communications, Inc. Private Line Services Billing Types Covered: 1, 11
International Point Voice Circuits Up to 1200 1201 to 9600 9601 to 30 Million Greater than 30 Mbps Totalbits per second (bps) bits per second (bps) bits per second (Mbps) Private
(.01 to 18 Megahertz) (greater than 18 Megahertz) Lines
Circuits 64 K Revenues Circuits 64 K Revenues Circuits 64 K Revenues Circuits 64 K Revenues Circuits 64 K Revenues 64 K Revenues
India 0 0 $0 0 0 $0 0 0 $0 91 11,572 $6,825,427 26 19,104 $3,338,842 30,676 $10,164,269
Asia 0 0 $0 0 0 $0 0 0 $0 91 11,572 $6,825,427 26 19,104 $3,338,842 30,676 $10,164,269
Total for Foreign Points 0 0 $0 0 0 $0 0 0 $0 91 11,572 $6,825,427 26 19,104 $3,338,842 30,676 $10,164,269
World Total 0 0 $0 0 0 $0 0 0 $0 91 11,572 $6,825,427 26 19,104 $3,338,842 30,676 $10,164,269
- Private Line Services Page 28 -

2008 Annual Section 43.61 International Traffic Data for All U.S. Points: Facilities-Based & Facilities-ResaleTable B24: Satellite Communication Systems, Inc. Private Line Services Billing Types Covered: 1, 11
International Point Voice Circuits Up to 1200 1201 to 9600 9601 to 30 Million Greater than 30 Mbps Totalbits per second (bps) bits per second (bps) bits per second (Mbps) Private
(.01 to 18 Megahertz) (greater than 18 Megahertz) Lines
Circuits 64 K Revenues Circuits 64 K Revenues Circuits 64 K Revenues Circuits 64 K Revenues Circuits 64 K Revenues 64 K Revenues
Guinea 0 0 $0 0 0 $0 0 0 $0 2 29 $62,640 0 0 $0 29 $62,640
Africa 0 0 $0 0 0 $0 0 0 $0 2 29 $62,640 0 0 $0 29 $62,640
Bahamas, The 0 0 $0 0 0 $0 0 0 $0 4 50 $108,000 0 0 $0 50 $108,000Cuba 0 0 $0 0 0 $0 0 0 $0 7 750 $1,620,000 0 0 $0 750 $1,620,000Haiti 0 0 $0 0 0 $0 0 0 $0 3 43 $92,880 0 0 $0 43 $92,880Trinidad and Tobago 0 0 $0 0 0 $0 0 0 $0 1 8 $17,280 0 0 $0 8 $17,280
Caribbean 0 0 $0 0 0 $0 0 0 $0 15 851 $1,838,160 0 0 $0 851 $1,838,160
Canada 0 0 $0 0 0 $0 0 0 $0 2 32 $69,120 0 0 $0 32 $69,120El Salvador 0 0 $0 0 0 $0 0 0 $0 1 1 $2,160 0 0 $0 1 $2,160Honduras 0 0 $0 0 0 $0 0 0 $0 2 12 $25,920 0 0 $0 12 $25,920Nicaragua 0 0 $0 0 0 $0 0 0 $0 1 4 $8,640 0 0 $0 4 $8,640
North and Central America 0 0 $0 0 0 $0 0 0 $0 6 49 $105,840 0 0 $0 49 $105,840
Peru 0 0 $0 0 0 $0 0 0 $0 1 1 $2,160 0 0 $0 1 $2,160
South America 0 0 $0 0 0 $0 0 0 $0 1 1 $2,160 0 0 $0 1 $2,160
Total for Foreign Points 0 0 $0 0 0 $0 0 0 $0 24 930 $2,008,800 0 0 $0 930 $2,008,800
World Total 0 0 $0 0 0 $0 0 0 $0 24 930 $2,008,800 0 0 $0 930 $2,008,800
- Private Line Services Page 29 -
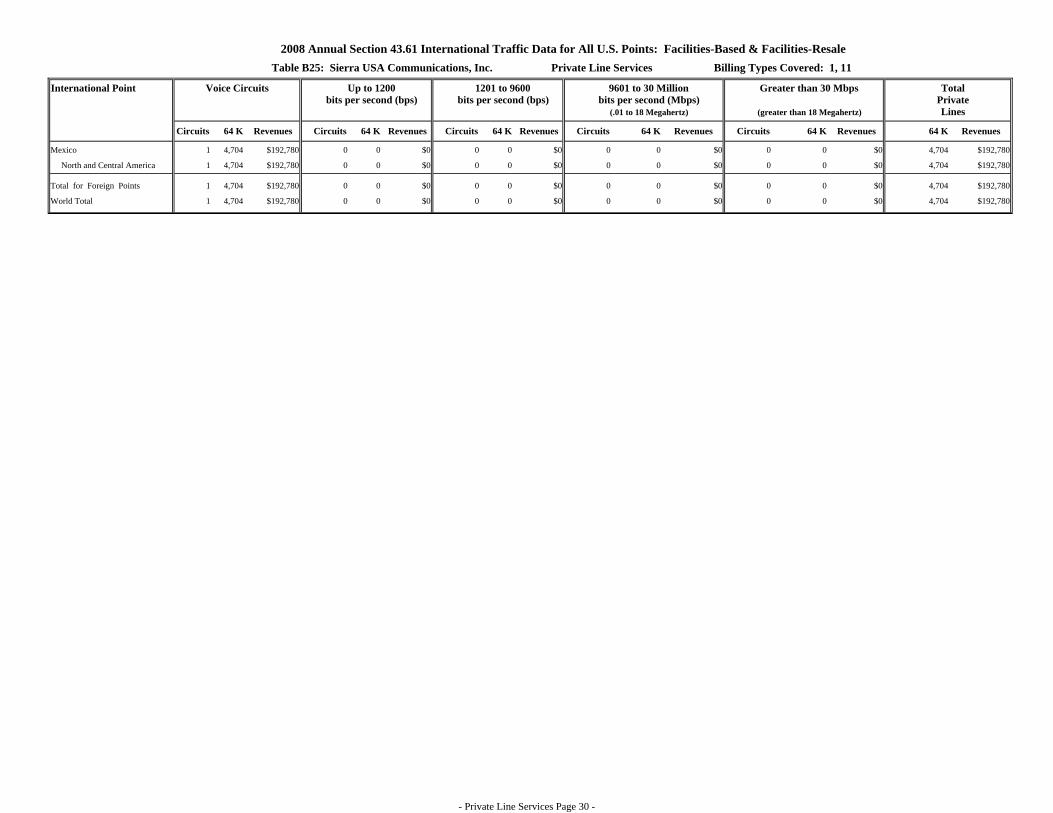
2008 Annual Section 43.61 International Traffic Data for All U.S. Points: Facilities-Based & Facilities-ResaleTable B25: Sierra USA Communications, Inc. Private Line Services Billing Types Covered: 1, 11
International Point Voice Circuits Up to 1200 1201 to 9600 9601 to 30 Million Greater than 30 Mbps Totalbits per second (bps) bits per second (bps) bits per second (Mbps) Private
(.01 to 18 Megahertz) (greater than 18 Megahertz) Lines
Circuits 64 K Revenues Circuits 64 K Revenues Circuits 64 K Revenues Circuits 64 K Revenues Circuits 64 K Revenues 64 K Revenues
Mexico 1 4,704 $192,780 0 0 $0 0 0 $0 0 0 $0 0 0 $0 4,704 $192,780
North and Central America 1 4,704 $192,780 0 0 $0 0 0 $0 0 0 $0 0 0 $0 4,704 $192,780
Total for Foreign Points 1 4,704 $192,780 0 0 $0 0 0 $0 0 0 $0 0 0 $0 4,704 $192,780
World Total 1 4,704 $192,780 0 0 $0 0 0 $0 0 0 $0 0 0 $0 4,704 $192,780
- Private Line Services Page 30 -

2008 Annual Section 43.61 International Traffic Data for All U.S. Points: Facilities-Based & Facilities-ResaleTable B26: Stratos Holdings, Inc. Private Line Services Billing Types Covered: 1, 11
International Point Voice Circuits Up to 1200 1201 to 9600 9601 to 30 Million Greater than 30 Mbps Totalbits per second (bps) bits per second (bps) bits per second (Mbps) Private
(.01 to 18 Megahertz) (greater than 18 Megahertz) Lines
Circuits 64 K Revenues Circuits 64 K Revenues Circuits 64 K Revenues Circuits 64 K Revenues Circuits 64 K Revenues 64 K Revenues
Netherlands 2 88 $249,488 0 0 $0 0 0 $0 0 0 $0 0 0 $0 88 $249,488United Kingdom 14 305 $214,752 0 0 $0 0 0 $0 0 0 $0 0 0 $0 305 $214,752
Western Europe 16 393 $464,240 0 0 $0 0 0 $0 0 0 $0 0 0 $0 393 $464,240
Canada 61 793 $486,882 0 0 $0 0 0 $0 0 0 $0 0 0 $0 793 $486,882
North and Central America 61 793 $486,882 0 0 $0 0 0 $0 0 0 $0 0 0 $0 793 $486,882
Malaysia 1 24 $87,295 0 0 $0 0 0 $0 0 0 $0 0 0 $0 24 $87,295
Asia 1 24 $87,295 0 0 $0 0 0 $0 0 0 $0 0 0 $0 24 $87,295
New Zealand 5 123 $590,550 0 0 $0 0 0 $0 0 0 $0 0 0 $0 123 $590,550
Oceania 5 123 $590,550 0 0 $0 0 0 $0 0 0 $0 0 0 $0 123 $590,550
Total for Foreign Points 83 1,333 $1,628,967 0 0 $0 0 0 $0 0 0 $0 0 0 $0 1,333 $1,628,967
World Total 83 1,333 $1,628,967 0 0 $0 0 0 $0 0 0 $0 0 0 $0 1,333 $1,628,967
- Private Line Services Page 31 -
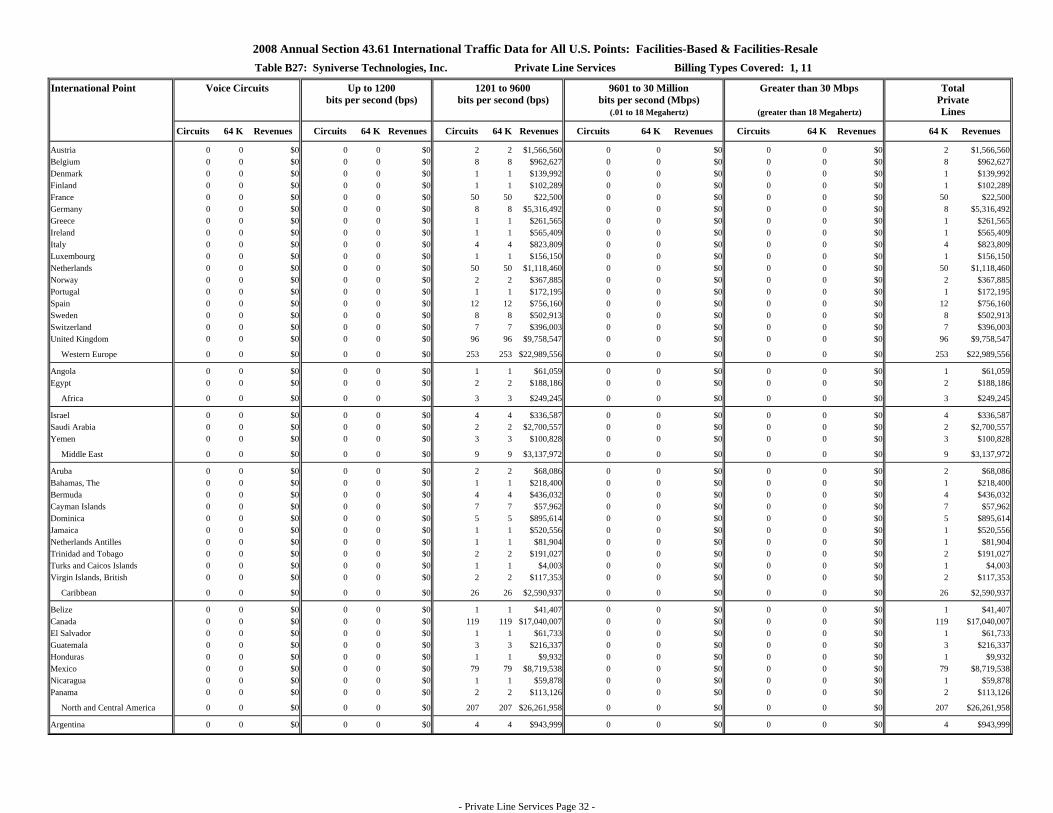
2008 Annual Section 43.61 International Traffic Data for All U.S. Points: Facilities-Based & Facilities-ResaleTable B27: Syniverse Technologies, Inc. Private Line Services Billing Types Covered: 1, 11
International Point Voice Circuits Up to 1200 1201 to 9600 9601 to 30 Million Greater than 30 Mbps Totalbits per second (bps) bits per second (bps) bits per second (Mbps) Private
(.01 to 18 Megahertz) (greater than 18 Megahertz) Lines
Circuits 64 K Revenues Circuits 64 K Revenues Circuits 64 K Revenues Circuits 64 K Revenues Circuits 64 K Revenues 64 K Revenues
Austria 0 0 $0 0 0 $0 2 2 $1,566,560 0 0 $0 0 0 $0 2 $1,566,560Belgium 0 0 $0 0 0 $0 8 8 $962,627 0 0 $0 0 0 $0 8 $962,627Denmark 0 0 $0 0 0 $0 1 1 $139,992 0 0 $0 0 0 $0 1 $139,992Finland 0 0 $0 0 0 $0 1 1 $102,289 0 0 $0 0 0 $0 1 $102,289France 0 0 $0 0 0 $0 50 50 $22,500 0 0 $0 0 0 $0 50 $22,500Germany 0 0 $0 0 0 $0 8 8 $5,316,492 0 0 $0 0 0 $0 8 $5,316,492Greece 0 0 $0 0 0 $0 1 1 $261,565 0 0 $0 0 0 $0 1 $261,565Ireland 0 0 $0 0 0 $0 1 1 $565,409 0 0 $0 0 0 $0 1 $565,409Italy 0 0 $0 0 0 $0 4 4 $823,809 0 0 $0 0 0 $0 4 $823,809Luxembourg 0 0 $0 0 0 $0 1 1 $156,150 0 0 $0 0 0 $0 1 $156,150Netherlands 0 0 $0 0 0 $0 50 50 $1,118,460 0 0 $0 0 0 $0 50 $1,118,460Norway 0 0 $0 0 0 $0 2 2 $367,885 0 0 $0 0 0 $0 2 $367,885Portugal 0 0 $0 0 0 $0 1 1 $172,195 0 0 $0 0 0 $0 1 $172,195Spain 0 0 $0 0 0 $0 12 12 $756,160 0 0 $0 0 0 $0 12 $756,160Sweden 0 0 $0 0 0 $0 8 8 $502,913 0 0 $0 0 0 $0 8 $502,913Switzerland 0 0 $0 0 0 $0 7 7 $396,003 0 0 $0 0 0 $0 7 $396,003United Kingdom 0 0 $0 0 0 $0 96 96 $9,758,547 0 0 $0 0 0 $0 96 $9,758,547
Western Europe 0 0 $0 0 0 $0 253 253 $22,989,556 0 0 $0 0 0 $0 253 $22,989,556
Angola 0 0 $0 0 0 $0 1 1 $61,059 0 0 $0 0 0 $0 1 $61,059Egypt 0 0 $0 0 0 $0 2 2 $188,186 0 0 $0 0 0 $0 2 $188,186
Africa 0 0 $0 0 0 $0 3 3 $249,245 0 0 $0 0 0 $0 3 $249,245
Israel 0 0 $0 0 0 $0 4 4 $336,587 0 0 $0 0 0 $0 4 $336,587Saudi Arabia 0 0 $0 0 0 $0 2 2 $2,700,557 0 0 $0 0 0 $0 2 $2,700,557Yemen 0 0 $0 0 0 $0 3 3 $100,828 0 0 $0 0 0 $0 3 $100,828
Middle East 0 0 $0 0 0 $0 9 9 $3,137,972 0 0 $0 0 0 $0 9 $3,137,972
Aruba 0 0 $0 0 0 $0 2 2 $68,086 0 0 $0 0 0 $0 2 $68,086Bahamas, The 0 0 $0 0 0 $0 1 1 $218,400 0 0 $0 0 0 $0 1 $218,400Bermuda 0 0 $0 0 0 $0 4 4 $436,032 0 0 $0 0 0 $0 4 $436,032Cayman Islands 0 0 $0 0 0 $0 7 7 $57,962 0 0 $0 0 0 $0 7 $57,962Dominica 0 0 $0 0 0 $0 5 5 $895,614 0 0 $0 0 0 $0 5 $895,614Jamaica 0 0 $0 0 0 $0 1 1 $520,556 0 0 $0 0 0 $0 1 $520,556Netherlands Antilles 0 0 $0 0 0 $0 1 1 $81,904 0 0 $0 0 0 $0 1 $81,904Trinidad and Tobago 0 0 $0 0 0 $0 2 2 $191,027 0 0 $0 0 0 $0 2 $191,027Turks and Caicos Islands 0 0 $0 0 0 $0 1 1 $4,003 0 0 $0 0 0 $0 1 $4,003Virgin Islands, British 0 0 $0 0 0 $0 2 2 $117,353 0 0 $0 0 0 $0 2 $117,353
Caribbean 0 0 $0 0 0 $0 26 26 $2,590,937 0 0 $0 0 0 $0 26 $2,590,937
Belize 0 0 $0 0 0 $0 1 1 $41,407 0 0 $0 0 0 $0 1 $41,407Canada 0 0 $0 0 0 $0 119 119 $17,040,007 0 0 $0 0 0 $0 119 $17,040,007El Salvador 0 0 $0 0 0 $0 1 1 $61,733 0 0 $0 0 0 $0 1 $61,733Guatemala 0 0 $0 0 0 $0 3 3 $216,337 0 0 $0 0 0 $0 3 $216,337Honduras 0 0 $0 0 0 $0 1 1 $9,932 0 0 $0 0 0 $0 1 $9,932Mexico 0 0 $0 0 0 $0 79 79 $8,719,538 0 0 $0 0 0 $0 79 $8,719,538Nicaragua 0 0 $0 0 0 $0 1 1 $59,878 0 0 $0 0 0 $0 1 $59,878Panama 0 0 $0 0 0 $0 2 2 $113,126 0 0 $0 0 0 $0 2 $113,126
North and Central America 0 0 $0 0 0 $0 207 207 $26,261,958 0 0 $0 0 0 $0 207 $26,261,958
Argentina 0 0 $0 0 0 $0 4 4 $943,999 0 0 $0 0 0 $0 4 $943,999
- Private Line Services Page 32 -

2008 Annual Section 43.61 International Traffic Data for All U.S. Points: Facilities-Based & Facilities-ResaleTable B27: Syniverse Technologies, Inc. Private Line Services Billing Types Covered: 1, 11
International Point Voice Circuits Up to 1200 1201 to 9600 9601 to 30 Million Greater than 30 Mbps Totalbits per second (bps) bits per second (bps) bits per second (Mbps) Private
(.01 to 18 Megahertz) (greater than 18 Megahertz) Lines
Circuits 64 K Revenues Circuits 64 K Revenues Circuits 64 K Revenues Circuits 64 K Revenues Circuits 64 K Revenues 64 K Revenues
Brazil 0 0 $0 0 0 $0 5 5 $661,945 0 0 $0 0 0 $0 5 $661,945Chile 0 0 $0 0 0 $0 2 2 $237,056 0 0 $0 0 0 $0 2 $237,056Colombia 0 0 $0 0 0 $0 1 1 $106,477 0 0 $0 0 0 $0 1 $106,477Peru 0 0 $0 0 0 $0 1 1 $427,658 0 0 $0 0 0 $0 1 $427,658Uruguay 0 0 $0 0 0 $0 3 3 $87,355 0 0 $0 0 0 $0 3 $87,355Venezuela 0 0 $0 0 0 $0 4 4 $1,217,878 0 0 $0 0 0 $0 4 $1,217,878
South America 0 0 $0 0 0 $0 20 20 $3,682,368 0 0 $0 0 0 $0 20 $3,682,368
Bangladesh 0 0 $0 0 0 $0 2 2 $55,325 0 0 $0 0 0 $0 2 $55,325China 0 0 $0 0 0 $0 4 4 $2,286,305 0 0 $0 0 0 $0 4 $2,286,305Hong Kong 0 0 $0 0 0 $0 24 24 $19,684,463 0 0 $0 0 0 $0 24 $19,684,463India 0 0 $0 0 0 $0 3 3 $544,721 0 0 $0 0 0 $0 3 $544,721Indonesia 0 0 $0 0 0 $0 3 3 $158,132 0 0 $0 0 0 $0 3 $158,132Japan 0 0 $0 0 0 $0 8 8 $2,102,692 0 0 $0 0 0 $0 8 $2,102,692Korea, South 0 0 $0 0 0 $0 2 2 $2,278,936 0 0 $0 0 0 $0 2 $2,278,936Macau 0 0 $0 0 0 $0 1 1 $5,473 0 0 $0 0 0 $0 1 $5,473Mongolia 0 0 $0 0 0 $0 1 1 $10,000 0 0 $0 0 0 $0 1 $10,000Philippines 0 0 $0 0 0 $0 1 1 $17,177 0 0 $0 0 0 $0 1 $17,177Singapore 0 0 $0 0 0 $0 1 1 $77,062 0 0 $0 0 0 $0 1 $77,062Taiwan 0 0 $0 0 0 $0 2 2 $298,913 0 0 $0 0 0 $0 2 $298,913Thailand 0 0 $0 0 0 $0 1 1 $384,923 0 0 $0 0 0 $0 1 $384,923Vietnam 0 0 $0 0 0 $0 3 3 $340,890 0 0 $0 0 0 $0 3 $340,890
Asia 0 0 $0 0 0 $0 56 56 $28,245,012 0 0 $0 0 0 $0 56 $28,245,012
Australia 0 0 $0 0 0 $0 4 4 $979,681 0 0 $0 0 0 $0 4 $979,681Fiji 0 0 $0 0 0 $0 1 1 $10,863 0 0 $0 0 0 $0 1 $10,863New Zealand 0 0 $0 0 0 $0 3 3 $424,643 0 0 $0 0 0 $0 3 $424,643
Guam 0 0 $0 0 0 $0 3 3 $583,428 0 0 $0 0 0 $0 3 $583,428Northern Mariana Islands 0 0 $0 0 0 $0 28 28 $218,279 0 0 $0 0 0 $0 28 $218,279
Oceania 0 0 $0 0 0 $0 39 39 $2,216,894 0 0 $0 0 0 $0 39 $2,216,894
Albania 0 0 $0 0 0 $0 1 1 $54,826 0 0 $0 0 0 $0 1 $54,826Czech Republic 0 0 $0 0 0 $0 1 1 $88,154 0 0 $0 0 0 $0 1 $88,154Estonia 0 0 $0 0 0 $0 1 1 $35,175 0 0 $0 0 0 $0 1 $35,175Georgia 0 0 $0 0 0 $0 1 1 $42,653 0 0 $0 0 0 $0 1 $42,653Hungary 0 0 $0 0 0 $0 1 1 $110,521 0 0 $0 0 0 $0 1 $110,521Latvia 0 0 $0 0 0 $0 1 1 $84,327 0 0 $0 0 0 $0 1 $84,327Lithuania 0 0 $0 0 0 $0 1 1 $79,908 0 0 $0 0 0 $0 1 $79,908Romania 0 0 $0 0 0 $0 1 1 $83,889 0 0 $0 0 0 $0 1 $83,889Russia 0 0 $0 0 0 $0 5 5 $291,297 0 0 $0 0 0 $0 5 $291,297Ukraine 0 0 $0 0 0 $0 1 1 $20,320 0 0 $0 0 0 $0 1 $20,320Uzbekistan 0 0 $0 0 0 $0 1 1 $40,860 0 0 $0 0 0 $0 1 $40,860
Eastern Europe 0 0 $0 0 0 $0 15 15 $931,930 0 0 $0 0 0 $0 15 $931,930
Total for Foreign Points 0 0 $0 0 0 $0 597 597 $89,504,165 0 0 $0 0 0 $0 597 $89,504,165
Total for U.S. Points 0 0 $0 0 0 $0 31 31 $801,707 0 0 $0 0 0 $0 31 $801,707
World Total 0 0 $0 0 0 $0 628 628 $90,305,872 0 0 $0 0 0 $0 628 $90,305,872
- Private Line Services Page 33 -

2008 Annual Section 43.61 International Traffic Data for All U.S. Points: Facilities-Based & Facilities-ResaleTable B28: Telefonica Larga Distancia, Inc. (TLD) Private Line Services Billing Types Covered: 1, 11
International Point Voice Circuits Up to 1200 1201 to 9600 9601 to 30 Million Greater than 30 Mbps Totalbits per second (bps) bits per second (bps) bits per second (Mbps) Private
(.01 to 18 Megahertz) (greater than 18 Megahertz) Lines
Circuits 64 K Revenues Circuits 64 K Revenues Circuits 64 K Revenues Circuits 64 K Revenues Circuits 64 K Revenues 64 K Revenues
Dominican Republic 0 0 $0 0 0 $0 0 0 $0 1 1 $105,525 0 0 $0 1 $105,525Trinidad and Tobago 0 0 $0 0 0 $0 0 0 $0 1 1 $42,326 0 0 $0 1 $42,326
Caribbean 0 0 $0 0 0 $0 0 0 $0 2 2 $147,851 0 0 $0 2 $147,851
Argentina 0 0 $0 0 0 $0 0 0 $0 1 1 $70,126 0 0 $0 1 $70,126Venezuela 0 0 $0 0 0 $0 0 0 $0 1 1 $29,358 0 0 $0 1 $29,358
South America 0 0 $0 0 0 $0 0 0 $0 2 2 $99,484 0 0 $0 2 $99,484
Total for Foreign Points 0 0 $0 0 0 $0 0 0 $0 4 4 $247,335 0 0 $0 4 $247,335World Total 0 0 $0 0 0 $0 0 0 $0 4 4 $247,335 0 0 $0 4 $247,335
- Private Line Services Page 34 -

2008 Annual Section 43.61 International Traffic Data for All U.S. Points: Facilities-Based & Facilities-ResaleTable B29: Telekom Malaysia (USA), Inc. Private Line Services Billing Types Covered: 1, 11
International Point Voice Circuits Up to 1200 1201 to 9600 9601 to 30 Million Greater than 30 Mbps Totalbits per second (bps) bits per second (bps) bits per second (Mbps) Private
(.01 to 18 Megahertz) (greater than 18 Megahertz) Lines
Circuits 64 K Revenues Circuits 64 K Revenues Circuits 64 K Revenues Circuits 64 K Revenues Circuits 64 K Revenues 64 K Revenues
Malaysia 0 0 $0 0 0 $0 0 0 $0 656 656 $871,194 0 0 $0 656 $871,194Sri Lanka 0 0 $0 0 0 $0 0 0 $0 156 156 $76,218 0 0 $0 156 $76,218
Asia 0 0 $0 0 0 $0 0 0 $0 812 812 $947,412 0 0 $0 812 $947,412
Total for Foreign Points 0 0 $0 0 0 $0 0 0 $0 812 812 $947,412 0 0 $0 812 $947,412World Total 0 0 $0 0 0 $0 0 0 $0 812 812 $947,412 0 0 $0 812 $947,412
- Private Line Services Page 35 -

2008 Annual Section 43.61 International Traffic Data for All U.S. Points: Facilities-Based & Facilities-ResaleTable B30: Telmex Private Line Services Billing Types Covered: 1, 11
International Point Voice Circuits Up to 1200 1201 to 9600 9601 to 30 Million Greater than 30 Mbps Totalbits per second (bps) bits per second (bps) bits per second (Mbps) Private
(.01 to 18 Megahertz) (greater than 18 Megahertz) Lines
Circuits 64 K Revenues Circuits 64 K Revenues Circuits 64 K Revenues Circuits 64 K Revenues Circuits 64 K Revenues 64 K Revenues
Italy 0 0 $0 0 0 $0 0 0 $0 1 24 $3,662 0 0 $0 24 $3,662
Western Europe 0 0 $0 0 0 $0 0 0 $0 1 24 $3,662 0 0 $0 24 $3,662
Cayman Islands 0 0 $0 0 0 $0 0 0 $0 1 4 $26,808 0 0 $0 4 $26,808Dominican Republic 0 0 $0 0 0 $0 0 0 $0 14 330 $355,961 0 0 $0 330 $355,961Jamaica 0 0 $0 0 0 $0 0 0 $0 2 32 $107,454 0 0 $0 32 $107,454Trinidad and Tobago 0 0 $0 0 0 $0 0 0 $0 2 32 $160,368 0 0 $0 32 $160,368
Caribbean 0 0 $0 0 0 $0 0 0 $0 19 398 $650,591 0 0 $0 398 $650,591
Canada 0 0 $0 0 0 $0 0 0 $0 2 192 $96,166 0 0 $0 192 $96,166Costa Rica 0 0 $0 0 0 $0 0 0 $0 53 6,439 $650,099 9 13,235 $1,493,777 19,674 $2,143,876El Salvador 0 0 $0 0 0 $0 0 0 $0 20 898 $481,758 1 703 $68,182 1,601 $549,940Guatemala 0 0 $0 0 0 $0 0 0 $0 19 838 $605,150 1 2,430 $11,780 3,268 $616,930Honduras 0 0 $0 0 0 $0 0 0 $0 10 1,192 $220,106 0 0 $0 1,192 $220,106Mexico 0 0 $0 0 0 $0 0 0 $0 274 7,689 $4,669,876 55 48,154 $3,280,357 55,843 $7,950,233Nicaragua 0 0 $0 0 0 $0 0 0 $0 5 128 $118,123 0 0 $0 128 $118,123Panama 0 0 $0 0 0 $0 0 0 $0 9 274 $235,019 3 2,109 $354,808 2,383 $589,827
North and Central America 0 0 $0 0 0 $0 0 0 $0 392 17,650 $7,076,297 69 66,631 $5,208,904 84,281 $12,285,201
Argentina 0 0 $0 0 0 $0 0 0 $0 19 435 $339,399 5 3,549 $115,494 3,984 $454,893Brazil 0 0 $0 0 0 $0 0 0 $0 30 1,500 $1,022,632 10 11,486 $1,001,087 12,986 $2,023,719Chile 0 0 $0 0 0 $0 0 0 $0 10 492 $947,696 0 0 $0 492 $947,696Colombia 0 0 $0 0 0 $0 0 0 $0 75 2,737 $533,689 1 699 $12,883 3,436 $546,572Ecuador 0 0 $0 0 0 $0 0 0 $0 4 56 $37,821 0 0 $0 56 $37,821Peru 0 0 $0 0 0 $0 0 0 $0 20 663 $230,388 0 0 $0 663 $230,388Uruguay 0 0 $0 0 0 $0 0 0 $0 3 52 $44,945 0 0 $0 52 $44,945Venezuela 0 0 $0 0 0 $0 0 0 $0 29 1,006 $319,148 3 2,109 $232,009 3,115 $551,157
South America 0 0 $0 0 0 $0 0 0 $0 190 6,941 $3,475,718 19 17,843 $1,361,473 24,784 $4,837,191
Philippines 0 0 $0 0 0 $0 0 0 $0 0 0 $0 2 4,860 $9,025 4,860 $9,025
Asia 0 0 $0 0 0 $0 0 0 $0 0 0 $0 2 4,860 $9,025 4,860 $9,025
Total for Foreign Points 0 0 $0 0 0 $0 0 0 $0 602 25,013 $11,206,268 90 89,334 $6,579,402 114,347 $17,785,670World Total 0 0 $0 0 0 $0 0 0 $0 602 25,013 $11,206,268 90 89,334 $6,579,402 114,347 $17,785,670
- Private Line Services Page 36 -

2008 Annual Section 43.61 International Traffic Data for All U.S. Points: Facilities-Based & Facilities-ResaleTable B31: Universal Telecom Services, Inc. Private Line Services Billing Types Covered: 1, 11
International Point Voice Circuits Up to 1200 1201 to 9600 9601 to 30 Million Greater than 30 Mbps Totalbits per second (bps) bits per second (bps) bits per second (Mbps) Private
(.01 to 18 Megahertz) (greater than 18 Megahertz) Lines
Circuits 64 K Revenues Circuits 64 K Revenues Circuits 64 K Revenues Circuits 64 K Revenues Circuits 64 K Revenues 64 K Revenues
Vietnam 2 2 $212,313 0 0 $0 0 0 $0 0 0 $0 0 0 $0 2 $212,313
Asia 2 2 $212,313 0 0 $0 0 0 $0 0 0 $0 0 0 $0 2 $212,313
Total for Foreign Points 2 2 $212,313 0 0 $0 0 0 $0 0 0 $0 0 0 $0 2 $212,313
World Total 2 2 $212,313 0 0 $0 0 0 $0 0 0 $0 0 0 $0 2 $212,313
- Private Line Services Page 37 -

2008 Annual Section 43.61 International Traffic Data for All U.S. Points: Facilities-Based & Facilities-ResaleTable B32: Verizon Communications Inc. Private Line Services Billing Types Covered: 1, 11
International Point Voice Circuits Up to 1200 1201 to 9600 9601 to 30 Million Greater than 30 Mbps Totalbits per second (bps) bits per second (bps) bits per second (Mbps) Private
(.01 to 18 Megahertz) (greater than 18 Megahertz) Lines
Circuits 64 K Revenues Circuits 64 K Revenues Circuits 64 K Revenues Circuits 64 K Revenues Circuits 64 K Revenues 64 K Revenues
Austria 0 0 $0 0 0 $0 0 0 $0 2 25 $54,664 0 0 $0 25 $54,664France 0 0 $0 0 0 $0 0 0 $0 2 2 $75,601 0 0 $0 2 $75,601Germany 0 0 $0 0 0 $0 0 0 $0 5 36 $118,078 0 0 $0 36 $118,078Gibraltar 0 0 $0 0 0 $0 0 0 $0 1 2 $31,560 0 0 $0 2 $31,560Ireland 0 0 $0 0 0 $0 0 0 $0 2 3 $19,996 0 0 $0 3 $19,996Italy 0 0 $0 0 0 $0 0 0 $0 6 2 $23,088 0 0 $0 2 $23,088Portugal 0 0 $0 0 0 $0 0 0 $0 2 2 $96,552 0 0 $0 2 $96,552Spain 0 0 $0 0 0 $0 0 0 $0 5 28 $137,490 0 0 $0 28 $137,490Switzerland 0 0 $0 0 0 $0 0 0 $0 3 2 $24,096 0 0 $0 2 $24,096United Kingdom 0 0 $0 0 0 $0 0 0 $0 12 33 $290,690 0 0 $0 33 $290,690
Western Europe 0 0 $0 0 0 $0 0 0 $0 40 135 $871,815 0 0 $0 135 $871,815
Egypt 0 0 $0 0 0 $0 0 0 $0 2 21 $67,689 0 0 $0 21 $67,689Ethiopia 0 0 $0 0 0 $0 0 0 $0 1 8 $75,048 0 0 $0 8 $75,048Gabon 0 0 $0 0 0 $0 0 0 $0 2 2 $55,752 0 0 $0 2 $55,752Ghana 0 0 $0 0 0 $0 0 0 $0 2 2 $99,288 0 0 $0 2 $99,288Kenya 0 0 $0 0 0 $0 0 0 $0 2 2 $28,500 0 0 $0 2 $28,500Mauritius 0 0 $0 0 0 $0 0 0 $0 2 43 $57,720 0 0 $0 43 $57,720Saint Helena 0 0 $0 0 0 $0 0 0 $0 1 1 $11,163 0 0 $0 1 $11,163South Africa 0 0 $0 0 0 $0 0 0 $0 2 2 $22,330 0 0 $0 2 $22,330Tunisia 0 0 $0 0 0 $0 0 0 $0 1 1 $264,097 0 0 $0 1 $264,097
Africa 0 0 $0 0 0 $0 0 0 $0 15 82 $681,587 0 0 $0 82 $681,587
Bahrain 0 0 $0 0 0 $0 0 0 $0 3 3 $1,839,465 0 0 $0 3 $1,839,465Iraq 0 0 $0 0 0 $0 0 0 $0 7 643 $2,527,371 0 0 $0 643 $2,527,371Israel 0 0 $0 0 0 $0 0 0 $0 13 105 $189,541 0 0 $0 105 $189,541Jordan 0 0 $0 0 0 $0 0 0 $0 1 1 $126,696 0 0 $0 1 $126,696Saudi Arabia 0 0 $0 0 0 $0 0 0 $0 2 97 $653,228 0 0 $0 97 $653,228United Arab Emirates 0 0 $0 0 0 $0 0 0 $0 2 9 $23,741 0 0 $0 9 $23,741Yemen 0 0 $0 0 0 $0 0 0 $0 3 4 $108,036 0 0 $0 4 $108,036
Middle East 0 0 $0 0 0 $0 0 0 $0 31 862 $5,468,078 0 0 $0 862 $5,468,078
Antigua and Barbuda 0 0 $0 0 0 $0 0 0 $0 8 112 $219,824 0 0 $0 112 $219,824Aruba 0 0 $0 0 0 $0 0 0 $0 6 58 $134,304 0 0 $0 58 $134,304Bahamas, The 0 0 $0 0 0 $0 0 0 $0 26 174 $742,472 0 0 $0 174 $742,472Barbados 0 0 $0 0 0 $0 0 0 $0 2 29 $29,100 0 0 $0 29 $29,100Bermuda 0 0 $0 0 0 $0 0 0 $0 29 1,958 $1,802,522 0 0 $0 1,958 $1,802,522Cayman Islands 0 0 $0 0 0 $0 0 0 $0 13 5,493 $806,867 0 0 $0 5,493 $806,867Cuba 0 0 $0 0 0 $0 0 0 $0 2 2 $4,692,216 0 0 $0 2 $4,692,216Dominican Republic 0 0 $0 0 0 $0 0 0 $0 15 175 $414,409 0 0 $0 175 $414,409French Overseas Departments 0 0 $0 0 0 $0 0 0 $0 1 32 $40,944 0 0 $0 32 $40,944Haiti 0 0 $0 0 0 $0 0 0 $0 2 2 $26,700 0 0 $0 2 $26,700Jamaica 0 0 $0 0 0 $0 0 0 $0 9 128 $242,953 0 0 $0 128 $242,953Netherlands Antilles 0 0 $0 0 0 $0 0 0 $0 15 223 $1,963,518 0 0 $0 223 $1,963,518Saint Kitts and Nevis 0 0 $0 0 0 $0 0 0 $0 2 6 $41,436 0 0 $0 6 $41,436Saint Lucia 0 0 $0 0 0 $0 0 0 $0 1 16 $27,252 0 0 $0 16 $27,252Trinidad and Tobago 0 0 $0 0 0 $0 0 0 $0 15 913 $821,804 0 0 $0 913 $821,804Turks and Caicos Islands 0 0 $0 0 0 $0 0 0 $0 6 7 $171,355 0 0 $0 7 $171,355Virgin Islands, British 0 0 $0 0 0 $0 0 0 $0 62 111 $701,756 0 0 $0 111 $701,756
Caribbean 0 0 $0 0 0 $0 0 0 $0 214 9,439 $12,879,432 0 0 $0 9,439 $12,879,432
- Private Line Services Page 38 -

2008 Annual Section 43.61 International Traffic Data for All U.S. Points: Facilities-Based & Facilities-ResaleTable B32: Verizon Communications Inc. Private Line Services Billing Types Covered: 1, 11
International Point Voice Circuits Up to 1200 1201 to 9600 9601 to 30 Million Greater than 30 Mbps Totalbits per second (bps) bits per second (bps) bits per second (Mbps) Private
(.01 to 18 Megahertz) (greater than 18 Megahertz) Lines
Circuits 64 K Revenues Circuits 64 K Revenues Circuits 64 K Revenues Circuits 64 K Revenues Circuits 64 K Revenues 64 K Revenues
Canada 0 0 $0 0 0 $0 0 0 $0 622 617 $13,682,008 0 0 $0 617 $13,682,008Costa Rica 0 0 $0 0 0 $0 0 0 $0 29 5,516 $2,208,440 0 0 $0 5,516 $2,208,440El Salvador 0 0 $0 0 0 $0 0 0 $0 7 576 $951,337 0 0 $0 576 $951,337Guatemala 0 0 $0 0 0 $0 0 0 $0 7 40 $277,680 0 0 $0 40 $277,680Honduras 0 0 $0 0 0 $0 0 0 $0 6 78 $507,956 0 0 $0 78 $507,956Mexico 0 0 $0 0 0 $0 0 0 $0 181 184 $2,468,084 0 0 $0 184 $2,468,084
North and Central America 0 0 $0 0 0 $0 0 0 $0 852 7,011 $20,095,505 0 0 $0 7,011 $20,095,505
Argentina 0 0 $0 0 0 $0 0 0 $0 7 638 $318,631 0 0 $0 638 $318,631Brazil 0 0 $0 0 0 $0 0 0 $0 3 3 $40,563 0 0 $0 3 $40,563Colombia 0 0 $0 0 0 $0 0 0 $0 2 2 $252,904 0 0 $0 2 $252,904Ecuador 0 0 $0 0 0 $0 0 0 $0 12 33 $861,349 0 0 $0 33 $861,349Guyana 0 0 $0 0 0 $0 0 0 $0 4 24 $71,663 0 0 $0 24 $71,663Peru 0 0 $0 0 0 $0 0 0 $0 2 2 $67,904 0 0 $0 2 $67,904Venezuela 0 0 $0 0 0 $0 0 0 $0 1 24 $60,424 0 0 $0 24 $60,424
South America 0 0 $0 0 0 $0 0 0 $0 31 726 $1,673,438 0 0 $0 726 $1,673,438
Afghanistan 0 0 $0 0 0 $0 0 0 $0 6 4 $744,000 0 0 $0 4 $744,000Bangladesh 0 0 $0 0 0 $0 0 0 $0 1 1 $21,732 0 0 $0 1 $21,732Chagos Archipelago 0 0 $0 0 0 $0 0 0 $0 9 33 $1,640,350 0 0 $0 33 $1,640,350China 0 0 $0 0 0 $0 0 0 $0 5 43 $195,096 0 0 $0 43 $195,096Hong Kong 0 0 $0 0 0 $0 0 0 $0 1 1 $24,576 0 0 $0 1 $24,576India 0 0 $0 0 0 $0 0 0 $0 117 7,007 $6,687,116 0 0 $0 7,007 $6,687,116Japan 0 0 $0 0 0 $0 0 0 $0 25 8,251 $5,132,391 0 0 $0 8,251 $5,132,391Korea, South 0 0 $0 0 0 $0 0 0 $0 6 1,161 $339,085 0 0 $0 1,161 $339,085Malaysia 0 0 $0 0 0 $0 0 0 $0 1 1 $16,000 0 0 $0 1 $16,000Pakistan 0 0 $0 0 0 $0 0 0 $0 5 12 $239,660 0 0 $0 12 $239,660Philippines 0 0 $0 0 0 $0 0 0 $0 5 1,223 $154,123 0 0 $0 1,223 $154,123Singapore 0 0 $0 0 0 $0 0 0 $0 6 7 $368,235 0 0 $0 7 $368,235Sri Lanka 0 0 $0 0 0 $0 0 0 $0 6 51 $194,769 0 0 $0 51 $194,769Thailand 0 0 $0 0 0 $0 0 0 $0 4 36 $28,954 0 0 $0 36 $28,954
Asia 0 0 $0 0 0 $0 0 0 $0 197 17,831 $15,786,087 0 0 $0 17,831 $15,786,087
Australia 0 0 $0 0 0 $0 0 0 $0 8 28 $206,808 0 0 $0 28 $206,808Fiji 0 0 $0 0 0 $0 0 0 $0 2 1 $33,365 0 0 $0 1 $33,365French Polynesia 0 0 $0 0 0 $0 0 0 $0 1 1 $82,875 0 0 $0 1 $82,875Marshall Islands 0 0 $0 0 0 $0 0 0 $0 2 2 $2,723,313 0 0 $0 2 $2,723,313Micronesia, Federated States of 0 0 $0 0 0 $0 0 0 $0 1 1 $29,111 0 0 $0 1 $29,111New Zealand 0 0 $0 0 0 $0 0 0 $0 6 123 $128,974 0 0 $0 123 $128,974Pacific Islands (Palau) 0 0 $0 0 0 $0 0 0 $0 1 1 $21,528 0 0 $0 1 $21,528
Guam 0 0 $0 0 0 $0 0 0 $0 37 19,708 $2,709,393 0 0 $0 19,708 $2,709,393Northern Mariana Islands 0 0 $0 0 0 $0 0 0 $0 8 11 $641,224 0 0 $0 11 $641,224
Oceania 0 0 $0 0 0 $0 0 0 $0 66 19,876 $6,576,591 0 0 $0 19,876 $6,576,591
Azerbaijan 0 0 $0 0 0 $0 0 0 $0 2 10 $96,456 0 0 $0 10 $96,456Kazakhstan 0 0 $0 0 0 $0 0 0 $0 3 3 $28,253 0 0 $0 3 $28,253Russia 0 0 $0 0 0 $0 0 0 $0 4 16 $102,852 0 0 $0 16 $102,852Slovenia 0 0 $0 0 0 $0 0 0 $0 1 1 $85,710 0 0 $0 1 $85,710Uzbekistan 0 0 $0 0 0 $0 0 0 $0 1 1 $305,688 0 0 $0 1 $305,688
Eastern Europe 0 0 $0 0 0 $0 0 0 $0 11 31 $618,959 0 0 $0 31 $618,959
- Private Line Services Page 39 -

2008 Annual Section 43.61 International Traffic Data for All U.S. Points: Facilities-Based & Facilities-ResaleTable B32: Verizon Communications Inc. Private Line Services Billing Types Covered: 1, 11
International Point Voice Circuits Up to 1200 1201 to 9600 9601 to 30 Million Greater than 30 Mbps Totalbits per second (bps) bits per second (bps) bits per second (Mbps) Private
(.01 to 18 Megahertz) (greater than 18 Megahertz) Lines
Circuits 64 K Revenues Circuits 64 K Revenues Circuits 64 K Revenues Circuits 64 K Revenues Circuits 64 K Revenues 64 K Revenues
Maritime - Pacific 0 0 $0 0 0 $0 0 0 $0 1 1 $168,960 0 0 $0 1 $168,960
Other Regions 0 0 $0 0 0 $0 0 0 $0 1 1 $168,960 0 0 $0 1 $168,960
Total for Foreign Points 0 0 $0 0 0 $0 0 0 $0 1,413 36,275 $61,469,835 0 0 $0 36,275 $61,469,835
Total for U.S. Points 0 0 $0 0 0 $0 0 0 $0 45 19,719 $3,350,617 0 0 $0 19,719 $3,350,617World Total 0 0 $0 0 0 $0 0 0 $0 1,458 55,994 $64,820,452 0 0 $0 55,994 $64,820,452
- Private Line Services Page 40 -

2008 Annual Section 43.61 International Traffic Data for All U.S. Points: Facilities-Based & Facilities-ResaleTable B33: Viatel Holding (Bermuda) Limited Private Line Services Billing Types Covered: 1, 11
International Point Voice Circuits Up to 1200 1201 to 9600 9601 to 30 Million Greater than 30 Mbps Totalbits per second (bps) bits per second (bps) bits per second (Mbps) Private
(.01 to 18 Megahertz) (greater than 18 Megahertz) Lines
Circuits 64 K Revenues Circuits 64 K Revenues Circuits 64 K Revenues Circuits 64 K Revenues Circuits 64 K Revenues 64 K Revenues
France 0 0 $0 0 0 $0 0 0 $0 6 180 $1 2 2,130 $81,416 2,310 $81,417United Kingdom 0 0 $0 0 0 $0 0 0 $0 5 150 $31,674 13 94,210 $135,927 94,360 $167,601
Western Europe 0 0 $0 0 0 $0 0 0 $0 11 330 $31,675 15 96,340 $217,343 96,670 $249,018
Total for Foreign Points 0 0 $0 0 0 $0 0 0 $0 11 330 $31,675 15 96,340 $217,343 96,670 $249,018World Total 0 0 $0 0 0 $0 0 0 $0 11 330 $31,675 15 96,340 $217,343 96,670 $249,018
- Private Line Services Page 41 -

2008 Annual Section 43.61 International Traffic Data for All U.S. Points: Facilities-Based ServiceTable B34 (Revised): All United States Carriers Private Line Services Billing Types Covered: 1
International Point Voice Circuits Up to 1200 1201 to 9600 9601 to 30 Million Greater than 30 Mbps Totalbits per second (bps) bits per second (bps) bits per second (Mbps) Private
(.01 to 18 Megahertz) (greater than 18 Megahertz) Lines
Circuits 64 K Revenues Circuits 64 K Revenues Circuits 64 K Revenues Circuits 64 K Revenues Circuits 64 K Revenues 64 K Revenues
Andorra 0 0 $0 0 0 $0 0 0 $0 0 0 $0 0 0 $0 0 $0Austria 0 0 $0 0 0 $0 0 0 $0 2 25 $54,664 0 0 $0 25 $54,664Belgium 0 0 $0 0 0 $0 0 0 $0 0 0 $0 0 0 $0 0 $0Cyprus 0 0 $0 0 0 $0 0 0 $0 0 0 $0 0 0 $0 0 $0Denmark 0 0 $0 0 0 $0 0 0 $0 0 0 $0 0 0 $0 0 $0Finland 0 0 $0 0 0 $0 0 0 $0 0 0 $0 0 0 $0 0 $0France 0 0 $0 0 0 $0 0 0 $0 11 12,152 $4,403,507 2 2,130 $81,416 14,282 $4,484,923Germany 0 0 $0 0 0 $0 0 0 $0 14 391,866 $2,473,143 1 129,024 $496,036 520,890 $2,969,179Gibraltar 0 0 $0 0 0 $0 0 0 $0 1 2 $31,560 0 0 $0 2 $31,560Greece 0 0 $0 0 0 $0 0 0 $0 2 64 $122,400 0 0 $0 64 $122,400Greenland 0 0 $0 0 0 $0 0 0 $0 0 0 $0 0 0 $0 0 $0Iceland 0 0 $0 0 0 $0 0 0 $0 0 0 $0 0 0 $0 0 $0Ireland 0 0 $0 0 0 $0 0 0 $0 2 3 $19,996 0 0 $0 3 $19,996Italy 0 0 $0 0 0 $0 0 0 $0 6 2 $23,088 0 0 $0 2 $23,088Liechtenstein 0 0 $0 0 0 $0 0 0 $0 0 0 $0 0 0 $0 0 $0Luxembourg 0 0 $0 0 0 $0 0 0 $0 0 0 $0 0 0 $0 0 $0Malta 0 0 $0 0 0 $0 0 0 $0 0 0 $0 0 0 $0 0 $0Netherlands 0 0 $0 0 0 $0 0 0 $0 3 39,692 $5,020,808 0 0 $0 39,692 $5,020,808Norway 0 0 $0 0 0 $0 0 0 $0 0 0 $0 0 0 $0 0 $0Portugal 0 0 $0 0 0 $0 0 0 $0 2 2 $96,552 0 0 $0 2 $96,552Spain 0 0 $0 0 0 $0 0 0 $0 22 76 $163,739 1 1,890 $122,304 1,966 $286,043Sweden 0 0 $0 0 0 $0 0 0 $0 0 0 $0 0 0 $0 0 $0Switzerland 0 0 $0 0 0 $0 0 0 $0 35 39,096 $431,191 0 0 $0 39,096 $431,191Turkey 0 0 $0 0 0 $0 0 0 $0 0 0 $0 0 0 $0 0 $0United Kingdom 0 0 $0 0 0 $0 0 0 $0 134 568,736 $20,113,780 17 288,371 $890,692 857,107 $21,004,472
Western Europe 0 0 $0 0 0 $0 0 0 $0 234 1,051,716 $32,954,428 21 421,415 $1,590,448 1,473,131 $34,544,876
Algeria 0 0 $0 0 0 $0 0 0 $0 0 0 $0 0 0 $0 0 $0Angola 0 0 $0 0 0 $0 0 0 $0 0 0 $0 0 0 $0 0 $0Benin 0 0 $0 0 0 $0 0 0 $0 0 0 $0 0 0 $0 0 $0Botswana 0 0 $0 0 0 $0 0 0 $0 0 0 $0 0 0 $0 0 $0Burkina 0 0 $0 0 0 $0 0 0 $0 0 0 $0 0 0 $0 0 $0Burundi 0 0 $0 0 0 $0 0 0 $0 0 0 $0 0 0 $0 0 $0Cameroon 0 0 $0 0 0 $0 0 0 $0 0 0 $0 0 0 $0 0 $0Canary Island 0 0 $0 0 0 $0 0 0 $0 0 0 $0 0 0 $0 0 $0Cape Verde 0 0 $0 0 0 $0 0 0 $0 0 0 $0 0 0 $0 0 $0Central African Republic 0 0 $0 0 0 $0 0 0 $0 0 0 $0 0 0 $0 0 $0Chad 0 0 $0 0 0 $0 0 0 $0 0 0 $0 0 0 $0 0 $0Comoros 0 0 $0 0 0 $0 0 0 $0 0 0 $0 0 0 $0 0 $0Congo 0 0 $0 0 0 $0 0 0 $0 0 0 $0 0 0 $0 0 $0Cote d'Ivoire 0 0 $0 0 0 $0 0 0 $0 0 0 $0 0 0 $0 0 $0Djibouti 0 0 $0 0 0 $0 0 0 $0 0 0 $0 0 0 $0 0 $0Egypt 0 0 $0 0 0 $0 0 0 $0 2 21 $67,689 0 0 $0 21 $67,689Equatorial Guinea 0 0 $0 0 0 $0 0 0 $0 0 0 $0 0 0 $0 0 $0Ethiopia 0 0 $0 0 0 $0 0 0 $0 1 8 $75,048 0 0 $0 8 $75,048Gabon 0 0 $0 0 0 $0 0 0 $0 2 2 $55,752 0 0 $0 2 $55,752Gambia, The 0 0 $0 0 0 $0 0 0 $0 0 0 $0 0 0 $0 0 $0Ghana 0 0 $0 0 0 $0 0 0 $0 2 2 $99,288 0 0 $0 2 $99,288Guinea 0 0 $0 0 0 $0 0 0 $0 2 29 $62,640 0 0 $0 29 $62,640Guinea-Bissau 0 0 $0 0 0 $0 0 0 $0 0 0 $0 0 0 $0 0 $0Kenya 0 0 $0 0 0 $0 0 0 $0 2 2 $28,500 0 0 $0 2 $28,500
Revised: August 26, 2010- Private Line Services Page 42 -

2008 Annual Section 43.61 International Traffic Data for All U.S. Points: Facilities-Based ServiceTable B34 (Revised): All United States Carriers Private Line Services Billing Types Covered: 1
International Point Voice Circuits Up to 1200 1201 to 9600 9601 to 30 Million Greater than 30 Mbps Totalbits per second (bps) bits per second (bps) bits per second (Mbps) Private
(.01 to 18 Megahertz) (greater than 18 Megahertz) Lines
Circuits 64 K Revenues Circuits 64 K Revenues Circuits 64 K Revenues Circuits 64 K Revenues Circuits 64 K Revenues 64 K Revenues
Lesotho 0 0 $0 0 0 $0 0 0 $0 0 0 $0 0 0 $0 0 $0Liberia 0 0 $0 0 0 $0 0 0 $0 0 0 $0 0 0 $0 0 $0Libya 0 0 $0 0 0 $0 0 0 $0 0 0 $0 0 0 $0 0 $0Madagascar 0 0 $0 0 0 $0 0 0 $0 0 0 $0 0 0 $0 0 $0Malawi 0 0 $0 0 0 $0 0 0 $0 0 0 $0 0 0 $0 0 $0Mali 0 0 $0 0 0 $0 0 0 $0 0 0 $0 0 0 $0 0 $0Mauritania 0 0 $0 0 0 $0 0 0 $0 0 0 $0 0 0 $0 0 $0Mauritius 0 0 $0 0 0 $0 0 0 $0 2 43 $57,720 0 0 $0 43 $57,720Morocco 0 0 $0 0 0 $0 0 0 $0 0 0 $0 0 0 $0 0 $0Mozambique 0 0 $0 0 0 $0 0 0 $0 0 0 $0 0 0 $0 0 $0Namibia 0 0 $0 0 0 $0 0 0 $0 0 0 $0 0 0 $0 0 $0Niger 0 0 $0 0 0 $0 0 0 $0 0 0 $0 0 0 $0 0 $0Nigeria 0 0 $0 0 0 $0 0 0 $0 0 0 $0 0 0 $0 0 $0Reunion 0 0 $0 0 0 $0 0 0 $0 0 0 $0 0 0 $0 0 $0Rwanda 0 0 $0 0 0 $0 0 0 $0 0 0 $0 0 0 $0 0 $0Saint Helena 0 0 $0 0 0 $0 0 0 $0 1 1 $11,163 0 0 $0 1 $11,163Sao Tome and Principe 0 0 $0 0 0 $0 0 0 $0 0 0 $0 0 0 $0 0 $0Senegal 0 0 $0 0 0 $0 0 0 $0 0 0 $0 0 0 $0 0 $0Seychelles 0 0 $0 0 0 $0 0 0 $0 0 0 $0 0 0 $0 0 $0Sierra Leone 0 0 $0 0 0 $0 0 0 $0 0 0 $0 0 0 $0 0 $0Somalia 0 0 $0 0 0 $0 0 0 $0 0 0 $0 0 0 $0 0 $0South Africa 0 0 $0 0 0 $0 0 0 $0 2 2 $22,330 0 0 $0 2 $22,330Sudan 0 0 $0 0 0 $0 0 0 $0 0 0 $0 0 0 $0 0 $0Swaziland 0 0 $0 0 0 $0 0 0 $0 0 0 $0 0 0 $0 0 $0Tanzania 0 0 $0 0 0 $0 0 0 $0 0 0 $0 0 0 $0 0 $0Togo 0 0 $0 0 0 $0 0 0 $0 0 0 $0 0 0 $0 0 $0Tunisia 0 0 $0 0 0 $0 0 0 $0 1 1 $264,097 0 0 $0 1 $264,097Uganda 0 0 $0 0 0 $0 0 0 $0 0 0 $0 0 0 $0 0 $0Western Sahara 0 0 $0 0 0 $0 0 0 $0 0 0 $0 0 0 $0 0 $0Zaire 0 0 $0 0 0 $0 0 0 $0 0 0 $0 0 0 $0 0 $0Zambia 0 0 $0 0 0 $0 0 0 $0 0 0 $0 0 0 $0 0 $0Zimbabwe 0 0 $0 0 0 $0 0 0 $0 0 0 $0 0 0 $0 0 $0
Africa 0 0 $0 0 0 $0 0 0 $0 17 111 $744,227 0 0 $0 111 $744,227
Bahrain 0 0 $0 0 0 $0 0 0 $0 3 3 $1,839,465 0 0 $0 3 $1,839,465Iran 0 0 $0 0 0 $0 0 0 $0 0 0 $0 0 0 $0 0 $0Iraq 0 0 $0 0 0 $0 0 0 $0 7 643 $2,527,371 0 0 $0 643 $2,527,371Israel 0 0 $0 0 0 $0 0 0 $0 13 105 $189,541 0 0 $0 105 $189,541Jordan 0 0 $0 0 0 $0 0 0 $0 1 1 $126,696 0 0 $0 1 $126,696Kuwait 0 0 $0 0 0 $0 0 0 $0 0 0 $0 0 0 $0 0 $0Lebanon 0 0 $0 0 0 $0 0 0 $0 0 0 $0 0 0 $0 0 $0Oman 0 0 $0 0 0 $0 0 0 $0 0 0 $0 0 0 $0 0 $0Qatar 0 0 $0 0 0 $0 0 0 $0 0 0 $0 0 0 $0 0 $0Saudi Arabia 0 0 $0 0 0 $0 0 0 $0 2 97 $653,228 0 0 $0 97 $653,228Syria 0 0 $0 0 0 $0 0 0 $0 0 0 $0 0 0 $0 0 $0United Arab Emirates 0 0 $0 0 0 $0 0 0 $0 2 9 $23,741 0 0 $0 9 $23,741Yemen 0 0 $0 0 0 $0 0 0 $0 3 4 $108,036 0 0 $0 4 $108,036
Middle East 0 0 $0 0 0 $0 0 0 $0 31 862 $5,468,078 0 0 $0 862 $5,468,078
Anguilla 0 0 $0 0 0 $0 0 0 $0 4 4 $20,934 0 0 $0 4 $20,934Antigua and Barbuda 0 0 $0 0 0 $0 0 0 $0 16 120 $261,693 0 0 $0 120 $261,693
Revised: August 26, 2010- Private Line Services Page 43 -

2008 Annual Section 43.61 International Traffic Data for All U.S. Points: Facilities-Based ServiceTable B34 (Revised): All United States Carriers Private Line Services Billing Types Covered: 1
International Point Voice Circuits Up to 1200 1201 to 9600 9601 to 30 Million Greater than 30 Mbps Totalbits per second (bps) bits per second (bps) bits per second (Mbps) Private
(.01 to 18 Megahertz) (greater than 18 Megahertz) Lines
Circuits 64 K Revenues Circuits 64 K Revenues Circuits 64 K Revenues Circuits 64 K Revenues Circuits 64 K Revenues 64 K Revenues
Aruba 0 0 $0 0 0 $0 0 0 $0 6 58 $134,304 0 0 $0 58 $134,304Bahamas, The 0 0 $0 0 0 $0 0 0 $0 734 951 $1,333,944 0 0 $0 951 $1,333,944Barbados 0 0 $0 0 0 $0 0 0 $0 98 125 $207,367 0 0 $0 125 $207,367Bermuda 0 0 $0 0 0 $0 0 0 $0 30 2,006 $2,127,074 0 0 $0 2,006 $2,127,074Cayman Islands 0 0 $0 0 0 $0 0 0 $0 36 6,943 $1,772,337 0 0 $0 6,943 $1,772,337Cuba 0 0 $0 0 0 $0 0 0 $0 9 752 $6,312,216 0 0 $0 752 $6,312,216Dominica 0 0 $0 0 0 $0 0 0 $0 4 4 $6,500 0 0 $0 4 $6,500Dominican Republic 720 720 $277,320 0 0 $0 0 0 $0 357 517 $1,433,296 0 0 $0 1,237 $1,710,616French Overseas Departments 0 0 $0 0 0 $0 0 0 $0 1 32 $40,944 0 0 $0 32 $40,944Grenada 0 0 $0 0 0 $0 0 0 $0 12 12 $7,590 0 0 $0 12 $7,590Guadeloupe 0 0 $0 0 0 $0 0 0 $0 0 0 $0 0 0 $0 0 $0Haiti 0 0 $0 0 0 $0 0 0 $0 13 53 $179,816 0 0 $0 53 $179,816Jamaica 0 0 $0 0 0 $0 0 0 $0 306 455 $1,723,947 0 0 $0 455 $1,723,947Montserrat 0 0 $0 0 0 $0 0 0 $0 0 0 $0 0 0 $0 0 $0Netherlands Antilles 0 0 $0 0 0 $0 0 0 $0 111 319 $2,308,825 0 0 $0 319 $2,308,825Saint Kitts and Nevis 0 0 $0 0 0 $0 0 0 $0 26 30 $160,851 0 0 $0 30 $160,851Saint Lucia 0 0 $0 0 0 $0 0 0 $0 1 16 $27,252 0 0 $0 16 $27,252Saint Vincent and the Grenadines 0 0 $0 0 0 $0 0 0 $0 4 4 $91,208 0 0 $0 4 $91,208Trinidad and Tobago 0 0 $0 0 0 $0 0 0 $0 745 1,673 $1,804,641 0 0 $0 1,673 $1,804,641Turks and Caicos Islands 0 0 $0 0 0 $0 0 0 $0 22 23 $288,593 0 0 $0 23 $288,593Virgin Islands, British 0 0 $0 0 0 $0 0 0 $0 70 119 $982,253 0 0 $0 119 $982,253
Navassa Island 0 0 $0 0 0 $0 0 0 $0 0 0 $0 0 0 $0 0 $0Puerto Rico 0 0 $0 0 0 $0 0 0 $0 0 0 $0 0 0 $0 0 $0U.S. Virgin Islands 0 0 $0 0 0 $0 0 0 $0 0 0 $0 0 0 $0 0 $0
Caribbean 720 720 $277,320 0 0 $0 0 0 $0 2,605 14,216 $21,225,585 0 0 $0 14,936 $21,502,905
Belize 0 0 $0 0 0 $0 0 0 $0 32 32 $193,223 0 0 $0 32 $193,223Canada 0 0 $0 0 0 $0 0 0 $0 16,330 17,080 $14,652,898 0 0 $0 17,080 $14,652,898Costa Rica 0 0 $0 0 0 $0 0 0 $0 266 5,753 $2,747,662 0 0 $0 5,753 $2,747,662El Salvador 0 0 $0 0 0 $0 0 0 $0 356 925 $1,414,040 0 0 $0 925 $1,414,040Guatemala 0 0 $0 0 0 $0 0 0 $0 233 266 $613,986 0 0 $0 266 $613,986Honduras 0 0 $0 0 0 $0 0 0 $0 102 184 $700,427 0 0 $0 184 $700,427Mexico 1 4,704 $192,780 0 0 $0 0 0 $0 1,621 1,624 $3,093,371 0 0 $0 6,328 $3,286,151Nicaragua 0 0 $0 0 0 $0 0 0 $0 97 100 $42,310 0 0 $0 100 $42,310Panama 0 0 $0 0 0 $0 0 0 $0 347 392 $416,280 0 0 $0 392 $416,280Saint Pierre and Miquelon 0 0 $0 0 0 $0 0 0 $0 0 0 $0 0 0 $0 0 $0
Alaska 0 0 $0 0 0 $0 0 0 $0 0 0 $0 0 0 $0 0 $0United States (conterminous) 0 0 $0 0 0 $0 0 0 $0 306 306 $813,742 0 0 $0 306 $813,742
North and Central America 1 4,704 $192,780 0 0 $0 0 0 $0 19,690 26,662 $24,687,939 0 0 $0 31,366 $24,880,719
Argentina 0 0 $0 0 0 $0 0 0 $0 267 898 $731,502 0 0 $0 898 $731,502Bolivia 0 0 $0 0 0 $0 0 0 $0 168 168 $268,297 0 0 $0 168 $268,297Brazil 0 0 $0 0 0 $0 0 0 $0 1,727 1,727 $1,802,288 0 0 $0 1,727 $1,802,288Chile 0 0 $0 0 0 $0 0 0 $0 0 0 $0 0 0 $0 0 $0Colombia 0 0 $0 0 0 $0 0 0 $0 6,617 138,292 $6,362,383 0 0 $0 138,292 $6,362,383Ecuador 0 0 $0 0 0 $0 0 0 $0 24 45 $882,914 0 0 $0 45 $882,914French Guiana 0 0 $0 0 0 $0 0 0 $0 0 0 $0 0 0 $0 0 $0Guyana 0 0 $0 0 0 $0 0 0 $0 20 40 $228,381 0 0 $0 40 $228,381Paraguay 0 0 $0 0 0 $0 0 0 $0 12 12 $116,020 0 0 $0 12 $116,020Peru 0 0 $0 0 0 $0 0 0 $0 242 242 $343,598 0 0 $0 242 $343,598
Revised: August 26, 2010- Private Line Services Page 44 -

2008 Annual Section 43.61 International Traffic Data for All U.S. Points: Facilities-Based ServiceTable B34 (Revised): All United States Carriers Private Line Services Billing Types Covered: 1
International Point Voice Circuits Up to 1200 1201 to 9600 9601 to 30 Million Greater than 30 Mbps Totalbits per second (bps) bits per second (bps) bits per second (Mbps) Private
(.01 to 18 Megahertz) (greater than 18 Megahertz) Lines
Circuits 64 K Revenues Circuits 64 K Revenues Circuits 64 K Revenues Circuits 64 K Revenues Circuits 64 K Revenues 64 K Revenues
Suriname 0 0 $0 0 0 $0 0 0 $0 0 0 $0 0 0 $0 0 $0Uruguay 0 0 $0 0 0 $0 0 0 $0 0 0 $0 0 0 $0 0 $0Venezuela 0 0 $0 0 0 $0 0 0 $0 564 587 $1,118,584 0 0 $0 587 $1,118,584
South America 0 0 $0 0 0 $0 0 0 $0 9,641 142,011 $11,853,967 0 0 $0 142,011 $11,853,967
Afghanistan 0 0 $0 0 0 $0 0 0 $0 6 4 $744,000 0 0 $0 4 $744,000Bangladesh 0 0 $0 0 0 $0 0 0 $0 1 1 $21,732 0 0 $0 1 $21,732Bhutan 0 0 $0 0 0 $0 0 0 $0 0 0 $0 0 0 $0 0 $0Brunei 0 0 $0 0 0 $0 0 0 $0 0 0 $0 0 0 $0 0 $0Burma 0 0 $0 0 0 $0 0 0 $0 0 0 $0 0 0 $0 0 $0Cambodia 0 0 $0 0 0 $0 0 0 $0 0 0 $0 0 0 $0 0 $0Chagos Archipelago 0 0 $0 0 0 $0 0 0 $0 9 33 $1,640,350 0 0 $0 33 $1,640,350China 0 0 $0 0 0 $0 0 0 $0 8 806 $537,296 0 0 $0 806 $537,296French Southern and Antarctic Lands 0 0 $0 0 0 $0 0 0 $0 0 0 $0 0 0 $0 0 $0Hong Kong 0 0 $0 0 0 $0 0 0 $0 6 87 $80,615 12 49,587 $305,360 49,674 $385,975India 0 0 $0 0 0 $0 0 0 $0 211 18,698 $13,832,199 26 19,104 $3,338,842 37,802 $17,171,041Indonesia 0 0 $0 0 0 $0 0 0 $0 0 0 $0 0 0 $0 0 $0Japan 0 0 $0 0 0 $0 1 1 $120 438 19,072 $8,465,535 75 1,377,715 $10,863,033 1,396,788 $19,328,688Kampuchea 0 0 $0 0 0 $0 0 0 $0 0 0 $0 0 0 $0 0 $0Korea, North 0 0 $0 0 0 $0 0 0 $0 0 0 $0 0 0 $0 0 $0Korea, South 0 0 $0 0 0 $0 0 0 $0 9 1,216 $367,567 0 0 $0 1,216 $367,567Laos 0 0 $0 0 0 $0 0 0 $0 0 0 $0 0 0 $0 0 $0Macau 0 0 $0 0 0 $0 0 0 $0 0 0 $0 0 0 $0 0 $0Malaysia 0 0 $0 0 0 $0 0 0 $0 1 1 $16,000 0 0 $0 1 $16,000Maldives 0 0 $0 0 0 $0 0 0 $0 0 0 $0 0 0 $0 0 $0Mongolia 0 0 $0 0 0 $0 0 0 $0 0 0 $0 0 0 $0 0 $0Nepal 0 0 $0 0 0 $0 0 0 $0 0 0 $0 0 0 $0 0 $0Pakistan 0 0 $0 0 0 $0 0 0 $0 5 12 $239,660 0 0 $0 12 $239,660Philippines 0 0 $0 0 0 $0 0 0 $0 98 2,948 $1,346,778 24 19,289 $2,598,963 22,237 $3,945,741Singapore 0 0 $0 0 0 $0 0 0 $0 20 46 $407,330 5 6,953 $277,855 6,999 $685,185Sri Lanka 0 0 $0 0 0 $0 0 0 $0 6 51 $194,769 0 0 $0 51 $194,769Taiwan 0 0 $0 0 0 $0 0 0 $0 6 65 $48,039 0 0 $0 65 $48,039Thailand 0 0 $0 0 0 $0 0 0 $0 4 36 $28,954 0 0 $0 36 $28,954Vietnam 2 2 $212,313 0 0 $0 0 0 $0 0 0 $0 0 0 $0 2 $212,313
Asia 2 2 $212,313 0 0 $0 1 1 $120 828 43,076 $27,970,824 142 1,472,648 $17,384,053 1,515,727 $45,567,310
Australia 0 0 $0 0 0 $0 0 0 $0 14 106 $243,648 5 40,320 $157,750 40,426 $401,398Cook Islands 0 0 $0 0 0 $0 0 0 $0 0 0 $0 0 0 $0 0 $0Fiji 0 0 $0 0 0 $0 0 0 $0 2 1 $33,365 0 0 $0 1 $33,365French Polynesia 0 0 $0 0 0 $0 0 0 $0 1 1 $82,875 0 0 $0 1 $82,875Kiribati 0 0 $0 0 0 $0 0 0 $0 0 0 $0 0 0 $0 0 $0Marshall Islands 0 0 $0 0 0 $0 0 0 $0 2 2 $2,723,313 0 0 $0 2 $2,723,313Micronesia, Federated States of 0 0 $0 0 0 $0 0 0 $0 1 1 $29,111 0 0 $0 1 $29,111Nauru 0 0 $0 0 0 $0 0 0 $0 0 0 $0 0 0 $0 0 $0New Caledonia 0 0 $0 0 0 $0 0 0 $0 0 0 $0 0 0 $0 0 $0New Zealand 0 0 $0 0 0 $0 0 0 $0 7 146 $145,966 0 0 $0 146 $145,966Niue 0 0 $0 0 0 $0 0 0 $0 0 0 $0 0 0 $0 0 $0Norfolk Island 0 0 $0 0 0 $0 0 0 $0 0 0 $0 0 0 $0 0 $0Pacific Islands (Palau) 0 0 $0 0 0 $0 0 0 $0 1 1 $21,528 0 0 $0 1 $21,528Papua New Guinea 0 0 $0 0 0 $0 0 0 $0 0 0 $0 0 0 $0 0 $0Solomon Islands 0 0 $0 0 0 $0 0 0 $0 0 0 $0 0 0 $0 0 $0
Revised: August 26, 2010- Private Line Services Page 45 -

2008 Annual Section 43.61 International Traffic Data for All U.S. Points: Facilities-Based ServiceTable B34 (Revised): All United States Carriers Private Line Services Billing Types Covered: 1
International Point Voice Circuits Up to 1200 1201 to 9600 9601 to 30 Million Greater than 30 Mbps Totalbits per second (bps) bits per second (bps) bits per second (Mbps) Private
(.01 to 18 Megahertz) (greater than 18 Megahertz) Lines
Circuits 64 K Revenues Circuits 64 K Revenues Circuits 64 K Revenues Circuits 64 K Revenues Circuits 64 K Revenues 64 K Revenues
Tonga 0 0 $0 0 0 $0 0 0 $0 0 0 $0 0 0 $0 0 $0Tuvalu 0 0 $0 0 0 $0 0 0 $0 0 0 $0 0 0 $0 0 $0Vanuatu 0 0 $0 0 0 $0 0 0 $0 0 0 $0 0 0 $0 0 $0Wallis and Futuna 0 0 $0 0 0 $0 0 0 $0 0 0 $0 0 0 $0 0 $0Western Samoa 0 0 $0 0 0 $0 0 0 $0 0 0 $0 0 0 $0 0 $0
American Samoa 0 0 $0 0 0 $0 0 0 $0 0 0 $0 0 0 $0 0 $0Baker Island 0 0 $0 0 0 $0 0 0 $0 0 0 $0 0 0 $0 0 $0Guam 0 0 $0 0 0 $0 0 0 $0 37 19,708 $2,709,393 0 0 $0 19,708 $2,709,393Hawaii 0 0 $0 0 0 $0 0 0 $0 53 53 $64,482 0 0 $0 53 $64,482Howland Island 0 0 $0 0 0 $0 0 0 $0 0 0 $0 0 0 $0 0 $0Jarvis Island 0 0 $0 0 0 $0 0 0 $0 0 0 $0 0 0 $0 0 $0Johnston Atoll 0 0 $0 0 0 $0 0 0 $0 0 0 $0 0 0 $0 0 $0Kingman Reef 0 0 $0 0 0 $0 0 0 $0 0 0 $0 0 0 $0 0 $0Midway Atoll 0 0 $0 0 0 $0 0 0 $0 0 0 $0 0 0 $0 0 $0Northern Mariana Islands 0 0 $0 0 0 $0 0 0 $0 38 41 $686,932 0 0 $0 41 $686,932Palmyra Atoll 0 0 $0 0 0 $0 0 0 $0 0 0 $0 0 0 $0 0 $0Wake Island 0 0 $0 0 0 $0 0 0 $0 0 0 $0 0 0 $0 0 $0
Oceania 0 0 $0 0 0 $0 0 0 $0 156 20,060 $6,740,613 5 40,320 $157,750 60,380 $6,898,363
Albania 0 0 $0 0 0 $0 0 0 $0 0 0 $0 0 0 $0 0 $0Armenia 0 0 $0 0 0 $0 0 0 $0 0 0 $0 0 0 $0 0 $0Azerbaijan 0 0 $0 0 0 $0 0 0 $0 2 10 $96,456 0 0 $0 10 $96,456Belarus 0 0 $0 0 0 $0 0 0 $0 0 0 $0 0 0 $0 0 $0Bosnia and Herzegovina 0 0 $0 0 0 $0 0 0 $0 0 0 $0 0 0 $0 0 $0Bulgaria 0 0 $0 0 0 $0 0 0 $0 0 0 $0 0 0 $0 0 $0Croatia 0 0 $0 0 0 $0 0 0 $0 0 0 $0 0 0 $0 0 $0Czech Republic 0 0 $0 0 0 $0 0 0 $0 0 0 $0 0 0 $0 0 $0Estonia 0 0 $0 0 0 $0 0 0 $0 0 0 $0 0 0 $0 0 $0Georgia 0 0 $0 0 0 $0 0 0 $0 0 0 $0 0 0 $0 0 $0Hungary 0 0 $0 0 0 $0 0 0 $0 0 0 $0 0 0 $0 0 $0Kazakhstan 0 0 $0 0 0 $0 0 0 $0 3 3 $28,253 0 0 $0 3 $28,253Kyrgyzstan 0 0 $0 0 0 $0 0 0 $0 0 0 $0 0 0 $0 0 $0Latvia 0 0 $0 0 0 $0 0 0 $0 0 0 $0 0 0 $0 0 $0Lithuania 0 0 $0 0 0 $0 0 0 $0 0 0 $0 0 0 $0 0 $0Moldova 0 0 $0 0 0 $0 0 0 $0 0 0 $0 0 0 $0 0 $0Poland 0 0 $0 0 0 $0 0 0 $0 0 0 $0 0 0 $0 0 $0Romania 0 0 $0 0 0 $0 0 0 $0 0 0 $0 0 0 $0 0 $0Russia 0 0 $0 0 0 $0 0 0 $0 4 16 $102,852 0 0 $0 16 $102,852Serbia 0 0 $0 0 0 $0 0 0 $0 0 0 $0 0 0 $0 0 $0Slovakia 0 0 $0 0 0 $0 0 0 $0 0 0 $0 0 0 $0 0 $0Slovenia 0 0 $0 0 0 $0 0 0 $0 1 1 $85,710 0 0 $0 1 $85,710Tajikistan 0 0 $0 0 0 $0 0 0 $0 0 0 $0 0 0 $0 0 $0Turkmenistan 0 0 $0 0 0 $0 0 0 $0 0 0 $0 0 0 $0 0 $0Ukraine 0 0 $0 0 0 $0 0 0 $0 0 0 $0 0 0 $0 0 $0Uzbekistan 0 0 $0 0 0 $0 0 0 $0 1 1 $305,688 0 0 $0 1 $305,688
Eastern Europe 0 0 $0 0 0 $0 0 0 $0 11 31 $618,959 0 0 $0 31 $618,959
Antarctica 0 0 $0 0 0 $0 0 0 $0 0 0 $0 0 0 $0 0 $0Maritime - Atlantic 0 0 $0 0 0 $0 0 0 $0 0 0 $0 0 0 $0 0 $0Maritime - other oceans 0 0 $0 0 0 $0 0 0 $0 0 0 $0 0 0 $0 0 $0Maritime - Pacific 0 0 $0 0 0 $0 0 0 $0 1 1 $168,960 0 0 $0 1 $168,960
Revised: August 26, 2010- Private Line Services Page 46 -

2008 Annual Section 43.61 International Traffic Data for All U.S. Points: Facilities-Based ServiceTable B34 (Revised): All United States Carriers Private Line Services Billing Types Covered: 1
International Point Voice Circuits Up to 1200 1201 to 9600 9601 to 30 Million Greater than 30 Mbps Totalbits per second (bps) bits per second (bps) bits per second (Mbps) Private
(.01 to 18 Megahertz) (greater than 18 Megahertz) Lines
Circuits 64 K Revenues Circuits 64 K Revenues Circuits 64 K Revenues Circuits 64 K Revenues Circuits 64 K Revenues 64 K Revenues
Other Regions 0 0 $0 0 0 $0 0 0 $0 1 1 $168,960 0 0 $0 1 $168,960
American Samoa 0 0 $0 0 0 $0 0 0 $0 0 0 $0 0 0 $0 0 $0Baker Island 0 0 $0 0 0 $0 0 0 $0 0 0 $0 0 0 $0 0 $0Howland Island 0 0 $0 0 0 $0 0 0 $0 0 0 $0 0 0 $0 0 $0Jarvis Island 0 0 $0 0 0 $0 0 0 $0 0 0 $0 0 0 $0 0 $0Johnston Atoll 0 0 $0 0 0 $0 0 0 $0 0 0 $0 0 0 $0 0 $0Kingman Reef 0 0 $0 0 0 $0 0 0 $0 0 0 $0 0 0 $0 0 $0Midway Atoll 0 0 $0 0 0 $0 0 0 $0 0 0 $0 0 0 $0 0 $0Navassa Island 0 0 $0 0 0 $0 0 0 $0 0 0 $0 0 0 $0 0 $0Northern Mariana Islands 0 0 $0 0 0 $0 0 0 $0 39 134 $421,851 0 0 $0 134 $421,851Palmyra Atoll 0 0 $0 0 0 $0 0 0 $0 0 0 $0 0 0 $0 0 $0Wake Island 0 0 $0 0 0 $0 0 0 $0 0 0 $0 0 0 $0 0 $0
Carriers serving Misc. U.S. points 0 0 $0 0 0 $0 0 0 $0 39 134 $421,851 0 0 $0 134 $421,851
Total for Foreign Points 723 5,426 $682,413 0 0 $0 1 1 $120 32,819 1,278,772 $128,580,882 168 1,934,383 $19,132,251 3,218,582 $148,395,666
Total for U.S. Points 0 0 $0 0 0 $0 0 0 $0 434 20,108 $4,274,549 0 0 $0 20,108 $4,274,549World Total 723 5,426 $682,413 0 0 $0 1 1 $120 33,253 1,298,880 $132,855,431 168 1,934,383 $19,132,251 3,238,690 $152,670,215
Revised: August 26, 2010- Private Line Services Page 47 -

2008 Annual Section 43.61 International Traffic Data for All U.S. Points: Facilities-Resale ServiceTable B35: All United States Carriers Private Line Services Billing Types Covered: 11
International Point Voice Circuits Up to 1200 1201 to 9600 9601 to 30 Million Greater than 30 Mbps Totalbits per second (bps) bits per second (bps) bits per second (Mbps) Private
(.01 to 18 Megahertz) (greater than 18 Megahertz) Lines
Circuits 64 K Revenues Circuits 64 K Revenues Circuits 64 K Revenues Circuits 64 K Revenues Circuits 64 K Revenues 64 K Revenues
Andorra 0 0 $0 0 0 $0 0 0 $0 0 0 $0 0 0 $0 0 $0Austria 0 0 $0 0 0 $0 2 2 $1,566,560 3 26 $100 0 0 $0 28 $1,566,660Belgium 0 0 $0 0 0 $0 8 8 $962,627 3 57 $1,129 0 0 $0 65 $963,756Cyprus 0 0 $0 0 0 $0 0 0 $0 0 0 $0 0 0 $0 0 $0Denmark 0 0 $0 0 0 $0 1 1 $139,992 1 24 $92 0 0 $0 25 $140,084Finland 0 0 $0 0 0 $0 1 1 $102,289 0 0 $0 0 0 $0 1 $102,289France 0 0 $0 0 0 $0 50 50 $22,500 15 121,645 $325,332 3 8,935 $2,023,890 130,630 $2,371,722Germany 0 0 $0 0 0 $0 8 8 $5,316,492 10 153,162 $327,549 4 9,564 $121,888 162,734 $5,765,929Gibraltar 0 0 $0 0 0 $0 0 0 $0 0 0 $0 0 0 $0 0 $0Greece 0 0 $0 0 0 $0 1 1 $261,565 0 0 $0 0 0 $0 1 $261,565Greenland 0 0 $0 0 0 $0 0 0 $0 0 0 $0 0 0 $0 0 $0Iceland 0 0 $0 0 0 $0 0 0 $0 0 0 $0 0 0 $0 0 $0Ireland 0 0 $0 0 0 $0 1 1 $565,409 8 3,160 $324,462 0 0 $0 3,161 $889,871Italy 0 0 $0 0 0 $0 4 4 $823,809 7 66 $56,663 0 0 $0 70 $880,472Liechtenstein 0 0 $0 0 0 $0 0 0 $0 0 0 $0 0 0 $0 0 $0Luxembourg 0 0 $0 0 0 $0 1 1 $156,150 0 0 $0 0 0 $0 1 $156,150Malta 0 0 $0 0 0 $0 0 0 $0 0 0 $0 0 0 $0 0 $0Netherlands 2 88 $249,488 0 0 $0 50 50 $1,118,460 10 6,694 $442,515 2 702 $49,234 7,534 $1,859,697Norway 0 0 $0 0 0 $0 2 2 $367,885 0 0 $0 0 0 $0 2 $367,885Portugal 0 0 $0 0 0 $0 1 1 $172,195 0 0 $0 0 0 $0 1 $172,195Spain 0 0 $0 0 0 $0 12 12 $756,160 2 25 $96 0 0 $0 37 $756,256Sweden 0 0 $0 0 0 $0 8 8 $502,913 0 0 $0 0 0 $0 8 $502,913Switzerland 0 0 $0 0 0 $0 7 7 $396,003 8 129,150 $474,147 1 129,024 $496,036 258,181 $1,366,186Turkey 0 0 $0 0 0 $0 0 0 $0 0 0 $0 0 0 $0 0 $0United Kingdom 14 305 $214,752 0 0 $0 96 96 $9,758,547 154 602,867 $2,119,251 12 34,303 $179,713 637,571 $12,272,263
Western Europe 16 393 $464,240 0 0 $0 253 253 $22,989,556 221 1,016,876 $4,071,336 22 182,528 $2,870,761 1,200,050 $30,395,893
Algeria 0 0 $0 0 0 $0 0 0 $0 0 0 $0 0 0 $0 0 $0Angola 0 0 $0 0 0 $0 1 1 $61,059 0 0 $0 0 0 $0 1 $61,059Benin 0 0 $0 0 0 $0 0 0 $0 0 0 $0 0 0 $0 0 $0Botswana 0 0 $0 0 0 $0 0 0 $0 0 0 $0 0 0 $0 0 $0Burkina 0 0 $0 0 0 $0 0 0 $0 0 0 $0 0 0 $0 0 $0Burundi 0 0 $0 0 0 $0 0 0 $0 0 0 $0 0 0 $0 0 $0Cameroon 0 0 $0 0 0 $0 0 0 $0 0 0 $0 0 0 $0 0 $0Canary Island 0 0 $0 0 0 $0 0 0 $0 0 0 $0 0 0 $0 0 $0Cape Verde 0 0 $0 0 0 $0 0 0 $0 0 0 $0 0 0 $0 0 $0Central African Republic 0 0 $0 0 0 $0 0 0 $0 0 0 $0 0 0 $0 0 $0Chad 0 0 $0 0 0 $0 0 0 $0 0 0 $0 0 0 $0 0 $0Comoros 0 0 $0 0 0 $0 0 0 $0 0 0 $0 0 0 $0 0 $0Congo 0 0 $0 0 0 $0 0 0 $0 0 0 $0 0 0 $0 0 $0Cote d'Ivoire 0 0 $0 0 0 $0 0 0 $0 0 0 $0 0 0 $0 0 $0Djibouti 0 0 $0 0 0 $0 0 0 $0 0 0 $0 0 0 $0 0 $0Egypt 0 0 $0 0 0 $0 2 2 $188,186 0 0 $0 0 0 $0 2 $188,186Equatorial Guinea 0 0 $0 0 0 $0 0 0 $0 0 0 $0 0 0 $0 0 $0Ethiopia 0 0 $0 0 0 $0 0 0 $0 0 0 $0 0 0 $0 0 $0Gabon 0 0 $0 0 0 $0 0 0 $0 0 0 $0 0 0 $0 0 $0Gambia, The 0 0 $0 0 0 $0 0 0 $0 0 0 $0 0 0 $0 0 $0Ghana 0 0 $0 0 0 $0 0 0 $0 0 0 $0 0 0 $0 0 $0Guinea 0 0 $0 0 0 $0 0 0 $0 0 0 $0 0 0 $0 0 $0Guinea-Bissau 0 0 $0 0 0 $0 0 0 $0 0 0 $0 0 0 $0 0 $0Kenya 0 0 $0 0 0 $0 0 0 $0 0 0 $0 0 0 $0 0 $0
- Private Line Services Page 48 -

2008 Annual Section 43.61 International Traffic Data for All U.S. Points: Facilities-Resale ServiceTable B35: All United States Carriers Private Line Services Billing Types Covered: 11
International Point Voice Circuits Up to 1200 1201 to 9600 9601 to 30 Million Greater than 30 Mbps Totalbits per second (bps) bits per second (bps) bits per second (Mbps) Private
(.01 to 18 Megahertz) (greater than 18 Megahertz) Lines
Circuits 64 K Revenues Circuits 64 K Revenues Circuits 64 K Revenues Circuits 64 K Revenues Circuits 64 K Revenues 64 K Revenues
Lesotho 0 0 $0 0 0 $0 0 0 $0 0 0 $0 0 0 $0 0 $0Liberia 0 0 $0 0 0 $0 0 0 $0 0 0 $0 0 0 $0 0 $0Libya 0 0 $0 0 0 $0 0 0 $0 0 0 $0 0 0 $0 0 $0Madagascar 0 0 $0 0 0 $0 0 0 $0 0 0 $0 0 0 $0 0 $0Malawi 0 0 $0 0 0 $0 0 0 $0 0 0 $0 0 0 $0 0 $0Mali 0 0 $0 0 0 $0 0 0 $0 0 0 $0 0 0 $0 0 $0Mauritania 0 0 $0 0 0 $0 0 0 $0 0 0 $0 0 0 $0 0 $0Mauritius 0 0 $0 0 0 $0 0 0 $0 0 0 $0 0 0 $0 0 $0Morocco 0 0 $0 0 0 $0 0 0 $0 0 0 $0 0 0 $0 0 $0Mozambique 0 0 $0 0 0 $0 0 0 $0 0 0 $0 0 0 $0 0 $0Namibia 0 0 $0 0 0 $0 0 0 $0 0 0 $0 0 0 $0 0 $0Niger 0 0 $0 0 0 $0 0 0 $0 0 0 $0 0 0 $0 0 $0Nigeria 0 0 $0 0 0 $0 0 0 $0 0 0 $0 0 0 $0 0 $0Reunion 0 0 $0 0 0 $0 0 0 $0 0 0 $0 0 0 $0 0 $0Rwanda 0 0 $0 0 0 $0 0 0 $0 0 0 $0 0 0 $0 0 $0Saint Helena 0 0 $0 0 0 $0 0 0 $0 0 0 $0 0 0 $0 0 $0Sao Tome and Principe 0 0 $0 0 0 $0 0 0 $0 0 0 $0 0 0 $0 0 $0Senegal 0 0 $0 0 0 $0 0 0 $0 0 0 $0 0 0 $0 0 $0Seychelles 0 0 $0 0 0 $0 0 0 $0 0 0 $0 0 0 $0 0 $0Sierra Leone 0 0 $0 0 0 $0 0 0 $0 0 0 $0 0 0 $0 0 $0Somalia 0 0 $0 0 0 $0 0 0 $0 0 0 $0 0 0 $0 0 $0South Africa 0 0 $0 0 0 $0 0 0 $0 0 0 $0 0 0 $0 0 $0Sudan 0 0 $0 0 0 $0 0 0 $0 0 0 $0 0 0 $0 0 $0Swaziland 0 0 $0 0 0 $0 0 0 $0 0 0 $0 0 0 $0 0 $0Tanzania 0 0 $0 0 0 $0 0 0 $0 0 0 $0 0 0 $0 0 $0Togo 0 0 $0 0 0 $0 0 0 $0 0 0 $0 0 0 $0 0 $0Tunisia 0 0 $0 0 0 $0 0 0 $0 0 0 $0 0 0 $0 0 $0Uganda 0 0 $0 0 0 $0 0 0 $0 0 0 $0 0 0 $0 0 $0Western Sahara 0 0 $0 0 0 $0 0 0 $0 0 0 $0 0 0 $0 0 $0Zaire 0 0 $0 0 0 $0 0 0 $0 0 0 $0 0 0 $0 0 $0Zambia 0 0 $0 0 0 $0 0 0 $0 0 0 $0 0 0 $0 0 $0Zimbabwe 0 0 $0 0 0 $0 0 0 $0 0 0 $0 0 0 $0 0 $0
Africa 0 0 $0 0 0 $0 3 3 $249,245 0 0 $0 0 0 $0 3 $249,245
Bahrain 0 0 $0 0 0 $0 0 0 $0 0 0 $0 0 0 $0 0 $0Iran 0 0 $0 0 0 $0 0 0 $0 0 0 $0 0 0 $0 0 $0Iraq 0 0 $0 0 0 $0 0 0 $0 0 0 $0 0 0 $0 0 $0Israel 0 0 $0 0 0 $0 4 4 $336,587 4 49 $22,029 0 0 $0 53 $358,616Jordan 0 0 $0 0 0 $0 0 0 $0 0 0 $0 0 0 $0 0 $0Kuwait 0 0 $0 0 0 $0 0 0 $0 0 0 $0 0 0 $0 0 $0Lebanon 0 0 $0 0 0 $0 0 0 $0 0 0 $0 0 0 $0 0 $0Oman 0 0 $0 0 0 $0 0 0 $0 0 0 $0 0 0 $0 0 $0Qatar 0 0 $0 0 0 $0 0 0 $0 0 0 $0 0 0 $0 0 $0Saudi Arabia 0 0 $0 0 0 $0 2 2 $2,700,557 0 0 $0 0 0 $0 2 $2,700,557Syria 0 0 $0 0 0 $0 0 0 $0 0 0 $0 0 0 $0 0 $0United Arab Emirates 0 0 $0 0 0 $0 0 0 $0 0 0 $0 0 0 $0 0 $0Yemen 0 0 $0 0 0 $0 3 3 $100,828 0 0 $0 0 0 $0 3 $100,828
Middle East 0 0 $0 0 0 $0 9 9 $3,137,972 4 49 $22,029 0 0 $0 58 $3,160,001
Anguilla 0 0 $0 0 0 $0 0 0 $0 0 0 $0 0 0 $0 0 $0Antigua and Barbuda 0 0 $0 0 0 $0 0 0 $0 0 0 $0 5 2,010 $3,100,000 2,010 $3,100,000
- Private Line Services Page 49 -

2008 Annual Section 43.61 International Traffic Data for All U.S. Points: Facilities-Resale ServiceTable B35: All United States Carriers Private Line Services Billing Types Covered: 11
International Point Voice Circuits Up to 1200 1201 to 9600 9601 to 30 Million Greater than 30 Mbps Totalbits per second (bps) bits per second (bps) bits per second (Mbps) Private
(.01 to 18 Megahertz) (greater than 18 Megahertz) Lines
Circuits 64 K Revenues Circuits 64 K Revenues Circuits 64 K Revenues Circuits 64 K Revenues Circuits 64 K Revenues 64 K Revenues
Aruba 0 0 $0 0 0 $0 2 2 $68,086 0 0 $0 0 0 $0 2 $68,086Bahamas, The 0 0 $0 0 0 $0 1 1 $218,400 2 36 $631 2 1,344 $213,300 1,381 $432,331Barbados 0 0 $0 0 0 $0 0 0 $0 16 115 $130,500 0 0 $0 115 $130,500Bermuda 0 0 $0 0 0 $0 4 4 $436,032 0 0 $0 0 0 $0 4 $436,032Cayman Islands 0 0 $0 0 0 $0 7 7 $57,962 1 4 $26,808 0 0 $0 11 $84,770Cuba 0 0 $0 0 0 $0 0 0 $0 0 0 $0 0 0 $0 0 $0Dominica 0 0 $0 0 0 $0 5 5 $895,614 0 0 $0 0 0 $0 5 $895,614Dominican Republic 0 0 $0 0 0 $0 0 0 $0 16 355 $536,164 0 0 $0 355 $536,164French Overseas Departments 0 0 $0 0 0 $0 0 0 $0 0 0 $0 2 15,120 $16,000,000 15,120 $16,000,000Grenada 0 0 $0 0 0 $0 0 0 $0 0 0 $0 0 0 $0 0 $0Guadeloupe 0 0 $0 0 0 $0 0 0 $0 0 0 $0 1 1,890 $5,500,000 1,890 $5,500,000Haiti 0 0 $0 0 0 $0 0 0 $0 0 0 $0 0 0 $0 0 $0Jamaica 0 0 $0 0 0 $0 1 1 $520,556 2 32 $107,454 0 0 $0 33 $628,010Montserrat 0 0 $0 0 0 $0 0 0 $0 0 0 $0 0 0 $0 0 $0Netherlands Antilles 0 0 $0 0 0 $0 1 1 $81,904 0 0 $0 0 0 $0 1 $81,904Saint Kitts and Nevis 0 0 $0 0 0 $0 0 0 $0 0 0 $0 3 62,370 $21,620,000 62,370 $21,620,000Saint Lucia 0 0 $0 0 0 $0 0 0 $0 0 0 $0 3 64,260 $30,120,000 64,260 $30,120,000Saint Vincent and the Grenadines 0 0 $0 0 0 $0 0 0 $0 0 0 $0 0 0 $0 0 $0Trinidad and Tobago 0 0 $0 0 0 $0 2 2 $191,027 3 33 $202,694 5 34,080 $11,756,327 34,115 $12,150,048Turks and Caicos Islands 0 0 $0 0 0 $0 1 1 $4,003 0 0 $0 0 0 $0 1 $4,003Virgin Islands, British 0 0 $0 0 0 $0 2 2 $117,353 0 0 $0 0 0 $0 2 $117,353
Navassa Island 0 0 $0 0 0 $0 0 0 $0 0 0 $0 0 0 $0 0 $0Puerto Rico 0 0 $0 0 0 $0 0 0 $0 0 0 $0 0 0 $0 0 $0U.S. Virgin Islands 0 0 $0 0 0 $0 0 0 $0 0 0 $0 0 0 $0 0 $0
Caribbean 0 0 $0 0 0 $0 26 26 $2,590,937 40 575 $1,004,251 21 181,074 $88,309,627 181,675 $91,904,815
Belize 0 0 $0 0 0 $0 1 1 $41,407 0 0 $0 0 0 $0 1 $41,407Canada 61 793 $486,882 0 0 $0 124 124 $17,041,408 473 18,754 $543,993 24 23,520 $299,386 43,191 $18,371,669Costa Rica 0 0 $0 0 0 $0 0 0 $0 54 6,469 $716,099 9 13,235 $1,493,777 19,704 $2,209,876El Salvador 0 0 $0 0 0 $0 1 1 $61,733 20 898 $481,758 1 703 $68,182 1,602 $611,673Guatemala 0 0 $0 0 0 $0 3 3 $216,337 19 838 $605,150 1 2,430 $11,780 3,271 $833,267Honduras 0 0 $0 0 0 $0 1 1 $9,932 10 1,192 $220,106 0 0 $0 1,193 $230,038Mexico 0 0 $0 0 0 $0 81 81 $8,719,740 330 8,611 $5,007,445 58 50,170 $3,288,108 58,862 $17,015,293Nicaragua 0 0 $0 0 0 $0 1 1 $59,878 5 128 $118,123 0 0 $0 129 $178,001Panama 0 0 $0 0 0 $0 2 2 $113,126 9 274 $235,019 3 2,109 $354,808 2,385 $702,953Saint Pierre and Miquelon 0 0 $0 0 0 $0 0 0 $0 0 0 $0 0 0 $0 0 $0
Alaska 0 0 $0 0 0 $0 0 0 $0 0 0 $0 0 0 $0 0 $0United States (conterminous) 0 0 $0 0 0 $0 0 0 $0 0 0 $0 0 0 $0 0 $0
North and Central America 61 793 $486,882 0 0 $0 214 214 $26,263,561 920 37,164 $7,927,693 96 92,167 $5,516,041 130,338 $40,194,177
Argentina 0 0 $0 0 0 $0 4 4 $943,999 22 438 $486,849 5 3,549 $115,494 3,991 $1,546,342Bolivia 0 0 $0 0 0 $0 0 0 $0 0 0 $0 0 0 $0 0 $0Brazil 0 0 $0 0 0 $0 5 5 $661,945 46 3,716 $1,386,393 10 11,486 $1,001,087 15,207 $3,049,425Chile 0 0 $0 0 0 $0 2 2 $237,056 12 495 $1,031,045 0 0 $0 497 $1,268,101Colombia 0 0 $0 0 0 $0 1 1 $106,477 88 3,390 $916,991 2 1,371 $275,188 4,762 $1,298,656Ecuador 0 0 $0 0 0 $0 0 0 $0 6 61 $129,526 0 0 $0 61 $129,526French Guiana 0 0 $0 0 0 $0 0 0 $0 0 0 $0 0 0 $0 0 $0Guyana 0 0 $0 0 0 $0 0 0 $0 0 0 $0 0 0 $0 0 $0Paraguay 0 0 $0 0 0 $0 0 0 $0 0 0 $0 0 0 $0 0 $0Peru 0 0 $0 0 0 $0 1 1 $427,658 21 693 $266,205 1 672 $77,125 1,366 $770,988
- Private Line Services Page 50 -

2008 Annual Section 43.61 International Traffic Data for All U.S. Points: Facilities-Resale ServiceTable B35: All United States Carriers Private Line Services Billing Types Covered: 11
International Point Voice Circuits Up to 1200 1201 to 9600 9601 to 30 Million Greater than 30 Mbps Totalbits per second (bps) bits per second (bps) bits per second (Mbps) Private
(.01 to 18 Megahertz) (greater than 18 Megahertz) Lines
Circuits 64 K Revenues Circuits 64 K Revenues Circuits 64 K Revenues Circuits 64 K Revenues Circuits 64 K Revenues 64 K Revenues
Suriname 0 0 $0 0 0 $0 0 0 $0 0 0 $0 0 0 $0 0 $0Uruguay 0 0 $0 0 0 $0 3 3 $87,355 4 60 $66,995 0 0 $0 63 $154,350Venezuela 0 0 $0 0 0 $0 4 4 $1,217,878 31 1,008 $392,861 3 2,109 $232,009 3,121 $1,842,748
South America 0 0 $0 0 0 $0 20 20 $3,682,368 230 9,861 $4,676,865 21 19,187 $1,700,903 29,068 $10,060,136
Afghanistan 0 0 $0 0 0 $0 0 0 $0 0 0 $0 0 0 $0 0 $0Bangladesh 0 0 $0 0 0 $0 2 2 $55,325 0 0 $0 0 0 $0 2 $55,325Bhutan 0 0 $0 0 0 $0 0 0 $0 0 0 $0 0 0 $0 0 $0Brunei 0 0 $0 0 0 $0 0 0 $0 0 0 $0 0 0 $0 0 $0Burma 0 0 $0 0 0 $0 0 0 $0 0 0 $0 0 0 $0 0 $0Cambodia 0 0 $0 0 0 $0 0 0 $0 0 0 $0 0 0 $0 0 $0Chagos Archipelago 0 0 $0 0 0 $0 0 0 $0 0 0 $0 0 0 $0 0 $0China 0 0 $0 0 0 $0 4 4 $2,286,305 5 97 $87,276 2 1,344 $21,384 1,445 $2,394,965French Southern and Antarctic Lands 0 0 $0 0 0 $0 0 0 $0 0 0 $0 0 0 $0 0 $0Hong Kong 0 0 $0 0 0 $0 24 24 $19,684,463 2 25 $96 1 703 $35,545 752 $19,720,104India 0 0 $0 0 0 $0 3 3 $544,721 9 153 $159,995 1 703 $116,477 859 $821,193Indonesia 0 0 $0 0 0 $0 3 3 $158,132 0 0 $0 0 0 $0 3 $158,132Japan 0 0 $0 0 0 $0 8 8 $2,102,692 5 253 $84,708 1 672 $2,584 933 $2,189,984Korea, North 0 0 $0 0 0 $0 0 0 $0 0 0 $0 0 0 $0 0 $0Korea, South 0 0 $0 0 0 $0 2 2 $2,278,936 0 0 $0 1 703 $86,115 705 $2,365,051Laos 0 0 $0 0 0 $0 0 0 $0 0 0 $0 0 0 $0 0 $0Macau 0 0 $0 0 0 $0 1 1 $5,473 0 0 $0 0 0 $0 1 $5,473Malaysia 1 24 $87,295 0 0 $0 0 0 $0 656 656 $871,194 0 0 $0 680 $958,489Maldives 0 0 $0 0 0 $0 0 0 $0 0 0 $0 0 0 $0 0 $0Mongolia 0 0 $0 0 0 $0 1 1 $10,000 0 0 $0 0 0 $0 1 $10,000Nepal 0 0 $0 0 0 $0 0 0 $0 0 0 $0 0 0 $0 0 $0Pakistan 0 0 $0 0 0 $0 0 0 $0 0 0 $0 0 0 $0 0 $0Philippines 0 0 $0 0 0 $0 1 1 $17,177 0 0 $0 4 6,235 $52,066 6,236 $69,243Singapore 0 0 $0 0 0 $0 1 1 $77,062 0 0 $0 0 0 $0 1 $77,062Sri Lanka 0 0 $0 0 0 $0 0 0 $0 156 156 $76,218 0 0 $0 156 $76,218Taiwan 0 0 $0 0 0 $0 2 2 $298,913 25 600 $160,312 112,199 524,329 $738,670 524,931 $1,197,895Thailand 0 0 $0 0 0 $0 1 1 $384,923 0 0 $0 0 0 $0 1 $384,923Vietnam 0 0 $0 0 0 $0 3 3 $340,890 0 0 $0 0 0 $0 3 $340,890
Asia 1 24 $87,295 0 0 $0 56 56 $28,245,012 858 1,940 $1,439,799 112,209 534,689 $1,052,841 536,709 $30,824,947
Australia 0 0 $0 0 0 $0 4 4 $979,681 6 64 $40,311 1 8,064 $31,002 8,132 $1,050,994Cook Islands 0 0 $0 0 0 $0 0 0 $0 0 0 $0 0 0 $0 0 $0Fiji 0 0 $0 0 0 $0 1 1 $10,863 0 0 $0 0 0 $0 1 $10,863French Polynesia 0 0 $0 0 0 $0 0 0 $0 0 0 $0 0 0 $0 0 $0Kiribati 0 0 $0 0 0 $0 0 0 $0 0 0 $0 0 0 $0 0 $0Marshall Islands 0 0 $0 0 0 $0 0 0 $0 0 0 $0 0 0 $0 0 $0Micronesia, Federated States of 0 0 $0 0 0 $0 0 0 $0 0 0 $0 0 0 $0 0 $0Nauru 0 0 $0 0 0 $0 0 0 $0 0 0 $0 0 0 $0 0 $0New Caledonia 0 0 $0 0 0 $0 0 0 $0 0 0 $0 0 0 $0 0 $0New Zealand 5 123 $590,550 0 0 $0 3 3 $424,643 3 72 $4,320 0 0 $0 198 $1,019,513Niue 0 0 $0 0 0 $0 0 0 $0 0 0 $0 0 0 $0 0 $0Norfolk Island 0 0 $0 0 0 $0 0 0 $0 0 0 $0 0 0 $0 0 $0Pacific Islands (Palau) 0 0 $0 0 0 $0 0 0 $0 0 0 $0 0 0 $0 0 $0Papua New Guinea 0 0 $0 0 0 $0 0 0 $0 0 0 $0 0 0 $0 0 $0Solomon Islands 0 0 $0 0 0 $0 0 0 $0 0 0 $0 0 0 $0 0 $0
- Private Line Services Page 51 -

2008 Annual Section 43.61 International Traffic Data for All U.S. Points: Facilities-Resale ServiceTable B35: All United States Carriers Private Line Services Billing Types Covered: 11
International Point Voice Circuits Up to 1200 1201 to 9600 9601 to 30 Million Greater than 30 Mbps Totalbits per second (bps) bits per second (bps) bits per second (Mbps) Private
(.01 to 18 Megahertz) (greater than 18 Megahertz) Lines
Circuits 64 K Revenues Circuits 64 K Revenues Circuits 64 K Revenues Circuits 64 K Revenues Circuits 64 K Revenues 64 K Revenues
Tonga 0 0 $0 0 0 $0 0 0 $0 0 0 $0 0 0 $0 0 $0Tuvalu 0 0 $0 0 0 $0 0 0 $0 0 0 $0 0 0 $0 0 $0Vanuatu 0 0 $0 0 0 $0 0 0 $0 0 0 $0 0 0 $0 0 $0Wallis and Futuna 0 0 $0 0 0 $0 0 0 $0 0 0 $0 0 0 $0 0 $0Western Samoa 0 0 $0 0 0 $0 0 0 $0 0 0 $0 0 0 $0 0 $0
American Samoa 0 0 $0 0 0 $0 0 0 $0 0 0 $0 0 0 $0 0 $0Baker Island 0 0 $0 0 0 $0 0 0 $0 0 0 $0 0 0 $0 0 $0Guam 0 0 $0 0 0 $0 3 3 $583,428 0 0 $0 0 0 $0 3 $583,428Hawaii 0 0 $0 0 0 $0 0 0 $0 0 0 $0 0 0 $0 0 $0Howland Island 0 0 $0 0 0 $0 0 0 $0 0 0 $0 0 0 $0 0 $0Jarvis Island 0 0 $0 0 0 $0 0 0 $0 0 0 $0 0 0 $0 0 $0Johnston Atoll 0 0 $0 0 0 $0 0 0 $0 0 0 $0 0 0 $0 0 $0Kingman Reef 0 0 $0 0 0 $0 0 0 $0 0 0 $0 0 0 $0 0 $0Midway Atoll 0 0 $0 0 0 $0 0 0 $0 0 0 $0 0 0 $0 0 $0Northern Mariana Islands 0 0 $0 0 0 $0 28 28 $218,279 0 0 $0 2 37,392 $27,955 37,420 $246,234Palmyra Atoll 0 0 $0 0 0 $0 0 0 $0 0 0 $0 0 0 $0 0 $0Wake Island 0 0 $0 0 0 $0 0 0 $0 0 0 $0 0 0 $0 0 $0
Oceania 5 123 $590,550 0 0 $0 39 39 $2,216,894 9 136 $44,631 3 45,456 $58,957 45,754 $2,911,032
Albania 0 0 $0 0 0 $0 1 1 $54,826 0 0 $0 0 0 $0 1 $54,826Armenia 0 0 $0 0 0 $0 0 0 $0 0 0 $0 0 0 $0 0 $0Azerbaijan 0 0 $0 0 0 $0 0 0 $0 0 0 $0 0 0 $0 0 $0Belarus 0 0 $0 0 0 $0 0 0 $0 0 0 $0 0 0 $0 0 $0Bosnia and Herzegovina 0 0 $0 0 0 $0 0 0 $0 0 0 $0 0 0 $0 0 $0Bulgaria 0 0 $0 0 0 $0 0 0 $0 2 1,552 $95,794 0 0 $0 1,552 $95,794Croatia 0 0 $0 0 0 $0 0 0 $0 0 0 $0 0 0 $0 0 $0Czech Republic 0 0 $0 0 0 $0 1 1 $88,154 0 0 $0 0 0 $0 1 $88,154Estonia 0 0 $0 0 0 $0 1 1 $35,175 0 0 $0 0 0 $0 1 $35,175Georgia 0 0 $0 0 0 $0 1 1 $42,653 0 0 $0 0 0 $0 1 $42,653Hungary 0 0 $0 0 0 $0 1 1 $110,521 0 0 $0 0 0 $0 1 $110,521Kazakhstan 0 0 $0 0 0 $0 0 0 $0 0 0 $0 0 0 $0 0 $0Kyrgyzstan 0 0 $0 0 0 $0 0 0 $0 0 0 $0 0 0 $0 0 $0Latvia 0 0 $0 0 0 $0 1 1 $84,327 0 0 $0 0 0 $0 1 $84,327Lithuania 0 0 $0 0 0 $0 1 1 $79,908 0 0 $0 0 0 $0 1 $79,908Moldova 0 0 $0 0 0 $0 0 0 $0 0 0 $0 0 0 $0 0 $0Poland 0 0 $0 0 0 $0 0 0 $0 0 0 $0 0 0 $0 0 $0Romania 0 0 $0 0 0 $0 1 1 $83,889 0 0 $0 0 0 $0 1 $83,889Russia 10 10 $1,847 0 0 $0 5 5 $291,297 0 0 $0 0 0 $0 15 $293,144Serbia 0 0 $0 0 0 $0 0 0 $0 0 0 $0 0 0 $0 0 $0Slovakia 0 0 $0 0 0 $0 0 0 $0 0 0 $0 0 0 $0 0 $0Slovenia 0 0 $0 0 0 $0 0 0 $0 0 0 $0 0 0 $0 0 $0Tajikistan 0 0 $0 0 0 $0 0 0 $0 0 0 $0 0 0 $0 0 $0Turkmenistan 0 0 $0 0 0 $0 0 0 $0 0 0 $0 0 0 $0 0 $0Ukraine 0 0 $0 0 0 $0 1 1 $20,320 0 0 $0 0 0 $0 1 $20,320Uzbekistan 0 0 $0 0 0 $0 1 1 $40,860 0 0 $0 0 0 $0 1 $40,860
Eastern Europe 10 10 $1,847 0 0 $0 15 15 $931,930 2 1,552 $95,794 0 0 $0 1,577 $1,029,571
Antarctica 0 0 $0 0 0 $0 0 0 $0 0 0 $0 0 0 $0 0 $0Maritime - Atlantic 0 0 $0 0 0 $0 0 0 $0 0 0 $0 0 0 $0 0 $0Maritime - other oceans 0 0 $0 0 0 $0 0 0 $0 0 0 $0 0 0 $0 0 $0Maritime - Pacific 0 0 $0 0 0 $0 0 0 $0 0 0 $0 0 0 $0 0 $0
- Private Line Services Page 52 -

2008 Annual Section 43.61 International Traffic Data for All U.S. Points: Facilities-Resale ServiceTable B35: All United States Carriers Private Line Services Billing Types Covered: 11
International Point Voice Circuits Up to 1200 1201 to 9600 9601 to 30 Million Greater than 30 Mbps Totalbits per second (bps) bits per second (bps) bits per second (Mbps) Private
(.01 to 18 Megahertz) (greater than 18 Megahertz) Lines
Circuits 64 K Revenues Circuits 64 K Revenues Circuits 64 K Revenues Circuits 64 K Revenues Circuits 64 K Revenues 64 K Revenues
Other Regions 0 0 $0 0 0 $0 0 0 $0 0 0 $0 0 0 $0 0 $0
American Samoa 0 0 $0 0 0 $0 0 0 $0 0 0 $0 0 0 $0 0 $0Baker Island 0 0 $0 0 0 $0 0 0 $0 0 0 $0 0 0 $0 0 $0Howland Island 0 0 $0 0 0 $0 0 0 $0 0 0 $0 0 0 $0 0 $0Jarvis Island 0 0 $0 0 0 $0 0 0 $0 0 0 $0 0 0 $0 0 $0Johnston Atoll 0 0 $0 0 0 $0 0 0 $0 0 0 $0 0 0 $0 0 $0Kingman Reef 0 0 $0 0 0 $0 0 0 $0 0 0 $0 0 0 $0 0 $0Midway Atoll 0 0 $0 0 0 $0 0 0 $0 0 0 $0 0 0 $0 0 $0Navassa Island 0 0 $0 0 0 $0 0 0 $0 0 0 $0 0 0 $0 0 $0Northern Mariana Islands 0 0 $0 0 0 $0 0 0 $0 0 0 $0 0 0 $0 0 $0Palmyra Atoll 0 0 $0 0 0 $0 0 0 $0 0 0 $0 0 0 $0 0 $0Wake Island 0 0 $0 0 0 $0 0 0 $0 0 0 $0 0 0 $0 0 $0
Carriers serving Misc. U.S. points 0 0 $0 0 0 $0 0 0 $0 0 0 $0 0 0 $0 0 $0
Total for Foreign Points 93 1,343 $1,630,814 0 0 $0 604 604 $89,505,768 2,284 1,068,153 $19,282,398 112,370 1,017,709 $99,481,175 2,087,809 $209,900,155
Total for U.S. Points 0 0 $0 0 0 $0 31 31 $801,707 0 0 $0 2 37,392 $27,955 37,423 $829,662World Total 93 1,343 $1,630,814 0 0 $0 635 635 $90,307,475 2,284 1,068,153 $19,282,398 112,372 1,055,101 $99,509,130 2,125,232 $210,729,817
- Private Line Services Page 53 -

2008 Section 43.61 International Traffic DataTraffic Measures Used For Miscellaneous Service Tables *
Traffic TrafficMeasure Measure
Company / Service ** #1 #2
Facilities-Based and Facilities-Resale Providers of Miscellaneous Services
BringCom International, LLC TDM/TDMA Service 64 KBPS
France Telecom Virtual Private Line Leases Voice Equivalent Circuits
Philippine Long Distance Co., Ltd Virtual Private Network Messages Minutes
Verizon Communications/MCI Packet Switching Kilo Segments Hours
Viatel Holding (Bermuda) Limited Virtual Private Network Leased Circuits Voice Equivalent Circuits
* Traffic measures are specified in the Manual for Filing Section 43.61 Data, June 1995. ** In 2009, recognizing the de minimis nature of associated revenues and burden to file, the Commissiongranted MCI International Inc.'s request not to report its other miscellaneous international telex and telegraph services. The Commission, however, did require the carrier to retain the data for telex and telegraphservices for two years from the date of the Commission's response to the carrier's waiver request (i.e. , until August 13, 2011). Other carriers that previously reported providing telex and telegraph servicesexplained that they had either sold or discontinued the services. As a result, there are no data reportedfor these other miscellaneous international services in 2008.
- Miscellaneous Services Page C -

2008 Annual Section 43.61 International Traffic Data for All U.S. Points: All Settlement ArrangementsTable C1: All United States Carriers Miscellaneous Services Billing Types Covered: 1, 2, 3, 4, 5, 11, 12, 14, 15
International Point Traffic Billed in the United States Traffic Billed in Foreign Countries TotalOriginating or Terminating Transiting the United States U.S.
in the United States (by Country of Origin) CarriersTraffic Traffic U.S. Payout Retained Traffic Traffic Receipts Traffic Receipt Payout Retained Retained
Measure Measure Carriers to Foreign Revenues Measure Measure from Foreign Measure from Foreign to Foreign Revenues Revenues# 1 # 2 Revenues Carriers # 1 # 2 Carriers # 1 Carriers Carriers
PACKET SWITCHING Western Europe 0 0 $0 $0 $0 10,139 493 $18,341 0 $0 $0 $0 $18,341Africa 0 0 $0 $0 $0 0 0 $0 0 $0 $0 $0 $0Middle East 0 0 $0 $0 $0 0 0 $0 0 $0 $0 $0 $0Caribbean 0 0 $0 $0 $0 0 0 $0 0 $0 $0 $0 $0North and Central America 0 0 $0 $0 $0 0 0 $0 0 $0 $0 $0 $0South America 0 0 $0 $0 $0 0 0 $0 1,406 $8,980 $0 $8,980 $8,980Asia 0 0 $0 $0 $0 0 0 $0 0 $0 $0 $0 $0Oceania 0 0 $0 $0 $0 0 0 $0 0 $0 $0 $0 $0Eastern Europe 0 0 $0 $0 $0 0 0 $0 0 $0 $0 $0 $0Other Regions 0 0 $0 $0 $0 0 0 $0 0 $0 $0 $0 $0
WORLD TOTAL 0 0 0 0 0 10,139 493 18,341 1,406 8,980 0 8,980 27,321
TDM/TDMA SERVICE Western Europe 0 0 $0 $0 $0 0 0 $0 0 $0 $0 $0 $0Africa 78,460 0 $3,668,945 $0 $3,668,945 0 0 $0 0 $0 $0 $0 $3,668,945Middle East 0 0 $0 $0 $0 0 0 $0 0 $0 $0 $0 $0Caribbean 6,960 0 $362,863 $0 $362,863 0 0 $0 0 $0 $0 $0 $362,863North and Central America 0 0 $0 $0 $0 0 0 $0 0 $0 $0 $0 $0South America 0 0 $0 $0 $0 0 0 $0 0 $0 $0 $0 $0Asia 0 0 $0 $0 $0 0 0 $0 0 $0 $0 $0 $0Oceania 0 0 $0 $0 $0 0 0 $0 0 $0 $0 $0 $0Eastern Europe 0 0 $0 $0 $0 0 0 $0 0 $0 $0 $0 $0Other Regions 0 0 $0 $0 $0 0 0 $0 0 $0 $0 $0 $0
WORLD TOTAL 85,420 0 4,031,808 0 4,031,808 0 0 $0 0 $0 $0 $0 4,031,808
VIRTUAL PRIVATE LINE Western Europe 2 5,670 $250,867 $0 $250,867 0 0 $0 0 $0 $0 $0 $250,867Africa 0 0 $0 $0 $0 0 0 $0 0 $0 $0 $0 $0Middle East 0 0 $0 $0 $0 0 0 $0 0 $0 $0 $0 $0Caribbean 0 0 $0 $0 $0 0 0 $0 0 $0 $0 $0 $0North and Central America 0 0 $0 $0 $0 0 0 $0 0 $0 $0 $0 $0South America 0 0 $0 $0 $0 0 0 $0 0 $0 $0 $0 $0Asia 0 0 $0 $0 $0 0 0 $0 0 $0 $0 $0 $0Oceania 0 0 $0 $0 $0 0 0 $0 0 $0 $0 $0 $0Eastern Europe 0 0 $0 $0 $0 0 0 $0 0 $0 $0 $0 $0Other Regions 0 0 $0 $0 $0 0 0 $0 0 $0 $0 $0 $0
WORLD TOTAL 2 5,670 250,867 0 250,867 0 0 $0 0 $0 $0 $0 250,867
VIRTUAL PRIVATE NETWORK Western Europe 275 851 $110 $33 $77 0 0 $0 0 $0 $0 $0 $77Africa 42 103 $19 $18 $1 0 0 $0 0 $0 $0 $0 $1Middle East 56 172 $43 $37 $6 0 0 $0 0 $0 $0 $0 $6Caribbean 3 27 $8 $10 -$2 0 0 $0 0 $0 $0 $0 -$2North and Central America 1,768,978 3,046,100 $50,925 $30,460 $20,465 0 0 $0 0 $0 $0 $0 $20,465South America 8 25 $2 $3 -$1 0 0 $0 0 $0 $0 $0 -$1Asia 741 3,023 $26,308 $112 $26,196 0 0 $0 0 $0 $0 $0 $26,196Oceania 731,855 726,617 $62,603 $30,733 $31,870 0 0 $0 0 $0 $0 $0 $31,870Eastern Europe 9 21 $3 $5 -$2 0 0 $0 0 $0 $0 $0 -$2Other Regions 0 0 $0 $0 $0 0 0 $0 0 $0 $0 $0 $0WORLD TOTAL 2,501,967 3,776,939 140,021 61,411 78,610 0 0 $0 0 $0 $0 $0 78,610
- Miscellaneous Services Page 1 -

2008 Annual Section 43.61 International Traffic Data for All U.S. Points: All Settlement ArrangementsTable C2: BringCom International, LLC Miscellaneous Services Billing Types Covered: 1, 2, 3, 4, 5, 11, 12, 14, 15
International Point Traffic Billed in the United States Traffic Billed in Foreign Countries TotalOriginating or Terminating Transiting the United States U.S.
in the United States (by Country of Origin) CarriersTraffic Traffic U.S. Payout Retained Traffic Traffic Receipts Traffic Receipt Payout Retained Retained
Measure Measure Carriers to Foreign Revenues Measure Measure from Foreign Measure from Foreign to Foreign Revenues Revenues# 1 # 2 Revenues Carriers # 1 # 2 Carriers # 1 Carriers Carriers
TDM/TDMA SERVICE Africa 78,460 0 $3,668,945 $0 $3,668,945 0 0 $0 0 $0 $0 $0 $3,668,945Caribbean 6,960 0 $362,863 $0 $362,863 0 0 $0 0 $0 $0 $0 $362,863
WORLD TOTAL 85,420 0 $4,031,808 $0 $4,031,808 0 0 $0 0 $0 $0 $0 $4,031,808
- Miscellaneous Services Page 2 -

2008 Annual Section 43.61 International Traffic Data for All U.S. Points: All Settlement ArrangementsTable C3: France Telecom Long Distance USA, LLC Miscellaneous Services Billing Types Covered: 1, 2, 3, 4, 5, 11, 12, 14, 15
International Point Traffic Billed in the United States Traffic Billed in Foreign Countries TotalOriginating or Terminating Transiting the United States U.S.
in the United States (by Country of Origin) CarriersTraffic Traffic U.S. Payout Retained Traffic Traffic Receipts Traffic Receipt Payout Retained Retained
Measure Measure Carriers to Foreign Revenues Measure Measure from Foreign Measure from Foreign to Foreign Revenues Revenues# 1 # 2 Revenues Carriers # 1 # 2 Carriers # 1 Carriers Carriers
VIRTUAL PRIVATE LINE Western Europe 2 5,670 $250,867 $0 $250,867 0 0 $0 0 $0 $0 $0 $250,867
WORLD TOTAL 2 5,670 $250,867 $0 $250,867 0 0 $0 0 $0 $0 $0 $250,867
- Miscellaneous Services Page 3 -

2008 Annual Section 43.61 International Traffic Data for All U.S. Points: All Settlement ArrangementsTable C4: Philippine Long Distance Telephone Co., Ltd. Miscellaneous Services Billing Types Covered: 1, 2, 3, 4, 5, 11, 12, 14, 15
International Point Traffic Billed in the United States Traffic Billed in Foreign Countries TotalOriginating or Terminating Transiting the United States U.S.
in the United States (by Country of Origin) CarriersTraffic Traffic U.S. Payout Retained Traffic Traffic Receipts Traffic Receipt Payout Retained Retained
Measure Measure Carriers to Foreign Revenues Measure Measure from Foreign Measure from Foreign to Foreign Revenues Revenues# 1 # 2 Revenues Carriers # 1 # 2 Carriers # 1 Carriers Carriers
VIRTUAL PRIVATE NETWORK Western Europe 275 851 $110 $33 $77 0 0 $0 0 $0 $0 $0 $77Africa 42 103 $19 $18 $1 0 0 $0 0 $0 $0 $0 $1Middle East 56 172 $43 $37 $6 0 0 $0 0 $0 $0 $0 $6Caribbean 3 27 $8 $10 -$2 0 0 $0 0 $0 $0 $0 -$2North and Central America 1,768,978 3,046,100 $50,925 $30,460 $20,465 0 0 $0 0 $0 $0 $0 $20,465South America 8 25 $2 $3 -$1 0 0 $0 0 $0 $0 $0 -$1Asia 737 2,239 $259 $112 $147 0 0 $0 0 $0 $0 $0 $147Oceania 731,855 726,617 $62,603 $30,733 $31,870 0 0 $0 0 $0 $0 $0 $31,870Eastern Europe 9 21 $3 $5 -$2 0 0 $0 0 $0 $0 $0 -$2WORLD TOTAL 2,501,963 3,776,155 $113,972 $61,411 $52,561 0 0 $0 0 $0 $0 $0 $52,561
- Miscellaneous Services Page 4 -

2008 Annual Section 43.61 International Traffic Data for All U.S. Points: All Settlement ArrangementsTable C5: Verizon Communications Inc. Miscellaneous Services Billing Types Covered: 1, 2, 3, 4, 5, 11, 12, 14, 15
International Point Traffic Billed in the United States Traffic Billed in Foreign Countries TotalOriginating or Terminating Transiting the United States U.S.
in the United States (by Country of Origin) CarriersTraffic Traffic U.S. Payout Retained Traffic Traffic Receipts Traffic Receipt Payout Retained Retained
Measure Measure Carriers to Foreign Revenues Measure Measure from Foreign Measure from Foreign to Foreign Revenues Revenues# 1 # 2 Revenues Carriers # 1 # 2 Carriers # 1 Carriers Carriers
PACKET SWITCHING Western Europe 0 0 $0 $0 $0 10,139 493 $18,341 0 $0 $0 $0 $18,341South America 0 0 $0 $0 $0 0 0 $0 1,406 $8,980 $0 $8,980 $8,980WORLD TOTAL 0 0 $0 $0 $0 10,139 493 $18,341 1,406 $8,980 $0 $8,980 $27,321
- Miscellaneous Services Page 5 -

2008 Annual Section 43.61 International Traffic Data for All U.S. Points: All Settlement ArrangementsTable C6: Viatel Holding (Bermuda) Limited Miscellaneous Services Billing Types Covered: 1, 2, 3, 4, 5, 11, 12, 14, 15
International Point Traffic Billed in the United States Traffic Billed in Foreign Countries TotalOriginating or Terminating Transiting the United States U.S.
in the United States (by Country of Origin) CarriersTraffic Traffic U.S. Payout Retained Traffic Traffic Receipts Traffic Receipt Payout Retained Retained
Measure Measure Carriers to Foreign Revenues Measure Measure from Foreign Measure from Foreign to Foreign Revenues Revenues# 1 # 2 Revenues Carriers # 1 # 2 Carriers # 1 Carriers Carriers
VIRTUAL PRIVATE NETWORKAsia 4 784 $26,049 $0 $26,049 0 0 $0 0 $0 $0 $0 $26,049
WORLD TOTAL 4 784 $26,049 $0 $26,049 0 0 $0 0 $0 $0 $0 $26,049
- Miscellaneous Services Page 6 -

Table D: 2008 Annual Section 43.61 International Pure Resale Traffic Data for All U.S. PointsInternational Message Telephone Resale Service
<<< 2009 Data Not Available at Time of Publication >>>
% of TotalNumber of Number of U.S. Carrier IMTS Resale
Carrier Messages Minutes Revenues Revenues24-7 Telcom 3,856 20,355 4,579 0.000 %3 Rivers Telephone Cooperative, Inc. 3 Rivers Communications 91,704 581,855 49,671 0.0013S Communications, LLC 8,428,380 23,746,299 1,020,749 0.012A+ Wireless, Inc. d/b/a Advantage Wireless 35,160 159,414 3,450 0.000A.M.S. Voicecom, Inc. 1,883,497 15,070,374 1,624,262 0.019ABS-CBN Telecom North America, Inc. 703,157 9,490,748 2,201,602 0.026Access Media 3, Inc 110 769 2,575 0.000Access One, Inc. 705,554 2,674,050 438,370 0.005Access2Go, Inc 1,978 5,540 49,462 0.001Accipiter Communications, Inc 39 211 28 0.000Ace Telephone Association Ace Link Telecommunications, Inc. 1,419 14,702 2,405 0.000 Ace Telephone Association 4,317 32,449 10,361 0.000Adams TelSystems, Inc. 2,052 9,155 1,933 0.000Advanced Communications Technology Inc. 27,284 231,044 42,631 0.001Advanced Network Communications, LLC 653 5,551 3,239 0.000Advanced Tel., Inc. 78,498 417,076 148,995 0.002Advantage Telecommunications Corp. 7,641 74,878 8,320 0.000Affinity Network Incorporated 8,985,675 84,465,345 5,041,804 0.060Affordable Voice Communications, Inc. 39,436 315,488 37,859 0.000Agate Mutual Telephone Coop. Association Prairie Networks 570 1,500 1,232 0.000AGM Telecom Corporation 13,398 133,980 16,747 0.000Airdis, LLC d/b/a Airdis Telecom 136,424 621,846 107,233 0.001Airespring, Inc. 26,890,858 27,914,631 1,861,337 0.022Al-Call, Inc. 13,378 72,803 14,839 0.000Alaska Communications Systems ACS Long Distance, Inc. 982,717 5,674,555 1,063,522 0.013Albany Mutual Telephone Association 879 6,187 3,233 0.000Algona Municipal Utilities 1,424 7,378 1,304 0.000Alhambra-Grantfork Telephone Company A-G Long Distance, Inc. 172 918 48 0.000All Access, Inc. d/b/a Directo.com 2,042,724 20,427,240 2,553,405 0.030All West World Connect 2,676 24,204 4,446 0.000Allcom Telink Corporation d/b/a KCI Communications, d/b/a Allcom Telecommunications, d/b/a Allcompass Communications, d/b/a ADC Communications and Enhance VOIP Services 88,088,465 578,643,360 49,555,429 0.586Allendale Communciations Drenthe Telephone Company 145 1,639 311 0.000Allendale Sales & Service 1,609 19,205 2,650 0.000Alliance Communications Cooperative, Inc. Alliance Long Distance 1,424 13,598 11,413 0.000Allo Communications 5,449 30,986 5,849 0.000Alma Telephone Company 3 6 2 0.000Alo Communications & Services, LLC 91,545,854 65,852,983 3,055,016 0.036Alpha Enterprises Limited, Inc. d/b/a Alpha Long Distance 602 4,385 3,689 0.000Alpine Communications, LC 2,341 21,919 3,020 0.000Alta Municipal Utilities 205 669 327 0.000Alteva, LLC 123,298 440,645 60,712 0.001AMA Communications LLC, d/b/a AMA TechTel Communications 10,649 61,715 15,803 0.000Ambess Enterprises, Inc. 102,471 1,088,897 284,669 0.003American Broadband Communications Holway Long Distance Company 79 359 91 0.000 HunTel CableVision, Inc. d/b/a HunTel Communications 7,103 53,879 14,408 0.000 KLM Long Distance Company 156 1,177 421 0.000American Cyber Corporation d/b/a Discount Plus 719 2,137 1,976 0.000American Fiber Network, Inc 156,318 1,340,739 217,261 0.003American Samoa License, Inc. 1,761,223 6,471,960 1,172,532 0.014
- Pure Resale Services Page 1 -
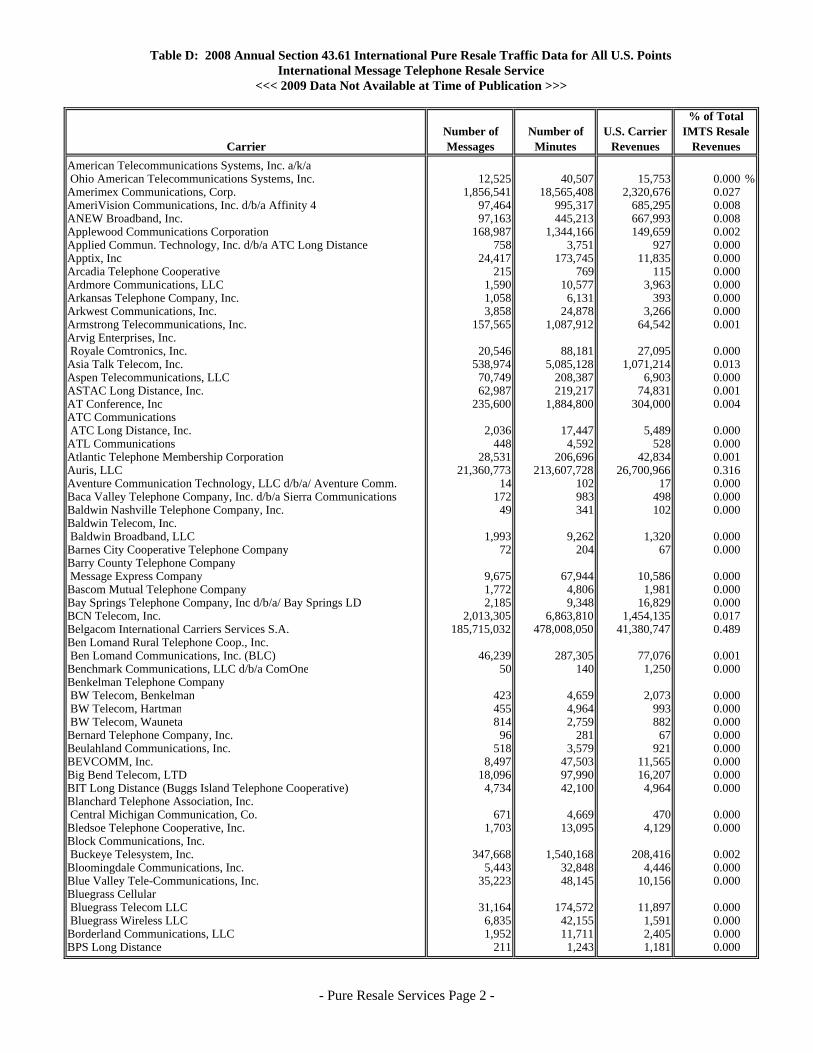
Table D: 2008 Annual Section 43.61 International Pure Resale Traffic Data for All U.S. PointsInternational Message Telephone Resale Service
<<< 2009 Data Not Available at Time of Publication >>>
% of TotalNumber of Number of U.S. Carrier IMTS Resale
Carrier Messages Minutes Revenues RevenuesAmerican Telecommunications Systems, Inc. a/k/a Ohio American Telecommunications Systems, Inc. 12,525 40,507 15,753 0.000 %Amerimex Communications, Corp. 1,856,541 18,565,408 2,320,676 0.027AmeriVision Communications, Inc. d/b/a Affinity 4 97,464 995,317 685,295 0.008ANEW Broadband, Inc. 97,163 445,213 667,993 0.008Applewood Communications Corporation 168,987 1,344,166 149,659 0.002Applied Commun. Technology, Inc. d/b/a ATC Long Distance 758 3,751 927 0.000Apptix, Inc 24,417 173,745 11,835 0.000Arcadia Telephone Cooperative 215 769 115 0.000Ardmore Communications, LLC 1,590 10,577 3,963 0.000Arkansas Telephone Company, Inc. 1,058 6,131 393 0.000Arkwest Communications, Inc. 3,858 24,878 3,266 0.000Armstrong Telecommunications, Inc. 157,565 1,087,912 64,542 0.001Arvig Enterprises, Inc. Royale Comtronics, Inc. 20,546 88,181 27,095 0.000Asia Talk Telecom, Inc. 538,974 5,085,128 1,071,214 0.013Aspen Telecommunications, LLC 70,749 208,387 6,903 0.000ASTAC Long Distance, Inc. 62,987 219,217 74,831 0.001AT Conference, Inc 235,600 1,884,800 304,000 0.004ATC Communications ATC Long Distance, Inc. 2,036 17,447 5,489 0.000ATL Communications 448 4,592 528 0.000Atlantic Telephone Membership Corporation 28,531 206,696 42,834 0.001Auris, LLC 21,360,773 213,607,728 26,700,966 0.316Aventure Communication Technology, LLC d/b/a/ Aventure Comm. 14 102 17 0.000Baca Valley Telephone Company, Inc. d/b/a Sierra Communications 172 983 498 0.000Baldwin Nashville Telephone Company, Inc. 49 341 102 0.000Baldwin Telecom, Inc. Baldwin Broadband, LLC 1,993 9,262 1,320 0.000Barnes City Cooperative Telephone Company 72 204 67 0.000Barry County Telephone Company Message Express Company 9,675 67,944 10,586 0.000Bascom Mutual Telephone Company 1,772 4,806 1,981 0.000Bay Springs Telephone Company, Inc d/b/a/ Bay Springs LD 2,185 9,348 16,829 0.000BCN Telecom, Inc. 2,013,305 6,863,810 1,454,135 0.017Belgacom International Carriers Services S.A. 185,715,032 478,008,050 41,380,747 0.489Ben Lomand Rural Telephone Coop., Inc. Ben Lomand Communications, Inc. (BLC) 46,239 287,305 77,076 0.001Benchmark Communications, LLC d/b/a ComOne 50 140 1,250 0.000Benkelman Telephone Company BW Telecom, Benkelman 423 4,659 2,073 0.000 BW Telecom, Hartman 455 4,964 993 0.000 BW Telecom, Wauneta 814 2,759 882 0.000Bernard Telephone Company, Inc. 96 281 67 0.000Beulahland Communications, Inc. 518 3,579 921 0.000BEVCOMM, Inc. 8,497 47,503 11,565 0.000Big Bend Telecom, LTD 18,096 97,990 16,207 0.000BIT Long Distance (Buggs Island Telephone Cooperative) 4,734 42,100 4,964 0.000Blanchard Telephone Association, Inc. Central Michigan Communication, Co. 671 4,669 470 0.000Bledsoe Telephone Cooperative, Inc. 1,703 13,095 4,129 0.000Block Communications, Inc. Buckeye Telesystem, Inc. 347,668 1,540,168 208,416 0.002Bloomingdale Communications, Inc. 5,443 32,848 4,446 0.000Blue Valley Tele-Communications, Inc. 35,223 48,145 10,156 0.000Bluegrass Cellular Bluegrass Telecom LLC 31,164 174,572 11,897 0.000 Bluegrass Wireless LLC 6,835 42,155 1,591 0.000Borderland Communications, LLC 1,952 11,711 2,405 0.000BPS Long Distance 211 1,243 1,181 0.000
- Pure Resale Services Page 2 -

Table D: 2008 Annual Section 43.61 International Pure Resale Traffic Data for All U.S. PointsInternational Message Telephone Resale Service
<<< 2009 Data Not Available at Time of Publication >>>
% of TotalNumber of Number of U.S. Carrier IMTS Resale
Carrier Messages Minutes Revenues RevenuesBrazos Cellular Communications, Ltd. North Texas Cellular, Inc. d/b/a Brazos Long Distance 811 5,440 1,936 0.000 % South RSA #5 d/b/a Brazos Cellular Communications, Ltd. 522 1,505 933 0.000Breda Telephone Corporation 1,106 5,683 2,065 0.000Bright Long Distance, Ltd. 7,792 46,435 7,144 0.000Bristol Bay Cellular Partnership (BBCP) 1,017 4,537 1,026 0.000Bristol Virginia Utilities OptiNet 4,874 36,248 5,363 0.000Broadband Dynamics, LLC 12,361,533 9,260,966 501,822 0.006Broadband Telecom, Inc. 50,430,000 151,311,057 7,264,772 0.086Broadview Networks Holdings, Inc. 14,946,766 40,372,034 8,775,535 0.104Brooklyn Mutual Telecommunications Cooperative Brooklyn Mutual Telephone Company 976 5,166 2,008 0.000Bruce Telecommunications, LLC 513 4,792 1,306 0.000BTC Broadband 6,253 43,948 14,189 0.000BTC Communications, Inc. 1,006 4,007 586 0.000BTC Holdings, Inc. Blackfoot Communications, Inc. 1,594 18,202 5,889 0.000 Blackfoot Telephone Cooperative, Inc. 5,921 48,754 12,875 0.000BTI America, LLC 1,041,033 6,645,560 355,187 0.004Bulloch Net, Inc. d/b/a Bulloch Long Distance 5,596 31,171 5,723 0.000Burke's Garden Telephone Company, Inc. 1 1 1 0.000Burlington Telecom 25,659 205,052 18,740 0.000Business Automation Tech., Inc. d/b/a Data Network Solutions 2,862 12,210 1,422 0.000Business Discount Plan, Inc. 9,220 42,511 79,575 0.001Business Network Long Distance, Inc 122,185 539,776 285,466 0.003Business Productivity Solutions, Inc. 113,412 587,384 153,191 0.002Business Telecom, Inc. 426,367 1,571,135 339,872 0.004C.M., Inc 17,221 89,283 11,550 0.000C-M-L Telephone Cooperative Association 370 3,150 1,342 0.000Cableco, LLC d/b/a ghValley Long Distance 1,693 14,858 3,814 0.000Cablevision Lightpath, Inc. 18,319,501 146,698,855 1,141,011 0.013Cal-Ore Long Distance Company 2,540 17,358 3,206 0.000California RSA No. 3 Limited Partnership d/b/a Golden State Cellular 18,904 100,582 6,280 0.000CALTEL Long Distance 402 4,085 644 0.000Cambridge Telephone Company 1,699 10,293 3,882 0.000Cameron Communications Corp. Cameron Communications, LLC d/b/a Cameron LD 7,869 54,977 8,120 0.000Canby Telephone Association d/b/a CTA LD 19,076 125,449 24,203 0.000Cap Rock Telephone Cooperative, Inc. C.R. Telco, Inc. d/b/a CapRock Telcom 2,983 28,616 2,764 0.000Caprock Cellular Limited Partnership 9,109 64,233 5,925 0.000Carr Communications, Inc. Carr Telephone Company 354 2,807 399 0.000Cascade Access, LLC 9,174 75,420 13,431 0.000Cascade Communications Company 1,285 8,768 3,154 0.000Casey Mutual Telephone Company 111 619 133Cass Communications Cass Long Distance Service, Inc. 684 3,239 456 0.000Catskills Communications, Inc 2,119 15,451 3,435 0.000Cause Based Commerce, Inc. d/b/a The Sienna Group 133,287 679,766 111,437 0.001Cavalier Telephone Corporation Cavalier Telephone, LLC 2,034,626 20,346,256 2,543,282 0.030 Talk America Inc. d/b/a Cavalier Telephone also d/b/a Cavalier Business Communications also d/b/a Cavalier Telephone & TV 2,346,466 23,464,656 2,933,082 0.035Cbeyond Communications, LLC 838,796 3,357,809 2,975,458 0.035CC Communications 118,186 904,234 97,820 0.001Celebrate Communications LLC 1,905 10,776 7,435 0.000Cellular Network Partnership, LP 13,571 84,094 17,317 0.000Cellular South Licenses, Inc. 294,838 2,291,656 2,882,171 0.034
- Pure Resale Services Page 3 -

Table D: 2008 Annual Section 43.61 International Pure Resale Traffic Data for All U.S. PointsInternational Message Telephone Resale Service
<<< 2009 Data Not Available at Time of Publication >>>
% of TotalNumber of Number of U.S. Carrier IMTS Resale
Carrier Messages Minutes Revenues RevenuesCenCom, Inc 742 2,615 219 0.000 %Centennial Puerto Rico Operations Corporation 1,855,163 9,708,112 2,653,239 0.031Center Junction Telephone Company, Inc. 18 48 17 0.000Central Arkansas Telephone Cooperative, Inc. 449 2,733 1,372 0.000Central Indiana Communications, Inc. 14,626 98,529 12,979 0.000Central Scott Telephone Company 1,389 86,651 1,811 0.000Central Texas Communications, Inc. 7,685 63,872 14,987 0.000CenturyTel, Inc. CenturyTel Long Distance, LLC 2,343,735 11,401,968 6,451,644 0.076 Coastal Long Distance Services, Inc. 84,366 671,173 242,775 0.003 Gulf Long Distance, Inc. 59,854 325,781 254,050 0.003 Madison River Communications, LLC 20,461 97,804 8,476 0.000 Madison River Long Distance Solutions 32,589 194,683 62,070 0.001 Mebtel Long Distance, Inc. 19,878 173,517 142,378 0.002Chapin Long Distance Company 318 2,208 370 0.000Chariton Valley L. D. Corporation 1,312 5,297 4,468 0.000Charter Communications Fiberlink, LLC Charter Fiberlink- Alabama, LLC 126,190 679,976 152,507 0.002 Charter Fiberlink CA- CCO, LLC 2,390,667 14,190,063 2,136,957 0.025 Charter Fiberlink CT- CCO, LLC 237,283 1,522,201 234,730 0.003 Charter Fiberlink Georgia, LLC 586,302 3,420,616 833,853 0.010 Charter Fiberlink- Illinois, LLC 136,799 853,678 134,446 0.002 Charter Fiberlink LA- CCO, LLC 69,536 377,930 100,164 0.001 Charter Fiberlink MA- CCO, LLC 384,761 2,219,090 462,548 0.005 Charter Fiberlink- Michigan, LLC 501,920 2,977,377 479,800 0.006 Charter Fiberlink, LLC ( Minnesota) 246,171 1,486,301 275,540 0.003 Charter Fiberlink- Missouri, LLC 527,273 3,034,851 453,718 0.005 Charter Fiberlink NC- CCO, LLC 226,857 1,248,890 253,850 0.003 Charter Fiberlink- Nebraska, LLC 9,087 49,561 8,665 0.000 Charter Fiberlink NV- CCVII, LLC 417,801 2,498,367 420,118 0.005 Charter Fiberlink OR- CCVII, LLC 95,271 568,681 95,354 0.001 Charter Fiberlink SC- CCO, LLC 372,887 2,224,607 418,370 0.005 Charter Fiberlink- Tennessee, LLC 382,202 2,104,309 435,739 0.005 Charter Fiberlink TX- CCO, LLC 377,199 2,215,704 329,287 0.004 Charter Fiberlink VA- CCO, LLC 4,198 26,316 8,997 0.000 Charter Fiberlink WA- CCVII, LLC 222,175 1,479,269 236,433 0.003 Charter Fiberlink, LLC ( Wisconsin) 701,301 4,482,488 668,272 0.008Chat Mobility Iowa RSA 2 Limited Partnership d/b/a Chat Mobility 721 2,964 2,125 0.000 RSA 1 Limited Partnership d/b/a Chat Mobility 3,094 16,727 14,050 0.000Chequamegon Communications Cooperative, Inc Cheqtel Communications, Inc. 3,878 30,966 1,669 0.000 Chequamegon Communications Cooperative, Inc 14,140 105,843 12,010 0.000Chesnee Long Distance, Inc. 2,321 21,149 4,124 0.000Chester Long Distance Services, Inc. 21,463 133,399 47,342 0.001Chibardun Telephone Cooperative, Inc. 6,178 49,097 10,554 0.000Chickasaw Long Distance Company 35,285 316,044 46,469 0.001Chippewa Valley Communications, Inc. 2,748 12,533 3,193 0.000Choice Phone, LLC 212,093 1,149,594 63,859 0.001Christensen Communications Company 1,307 4,702 1,508 0.000Chunghwa Telecom Global, Inc. 67,275,668 195,412,544 6,434,901 0.076CIMA Telecom, Inc. 42,019,447 420,194,472 52,524,309 0.621CIMCO Communications, Inc. 1,853,336 3,489,652 616,764 0.007Cincinnati Bell, Inc. Cincinnati Bell Any Distance, Inc. 3,001,818 14,892,955 3,979,217 0.047 Cincinnati Bell Wireless, LLC 982,976 4,544,829 1,785,804 0.021Citizens Communications Company CTE Telecom, LLC d/b/a Frontier Commun. CTE Telecom Com. 159,936 1,172,817 320,408 0.004 Frontier Communications of America, Inc. (FCA) 3,221,649 18,888,744 14,906,225 0.176 GVN Services d/b/a Frontier Communications Global Valley LD 67,163 593,040 199,947 0.002
- Pure Resale Services Page 4 -

Table D: 2008 Annual Section 43.61 International Pure Resale Traffic Data for All U.S. PointsInternational Message Telephone Resale Service
<<< 2009 Data Not Available at Time of Publication >>>
% of TotalNumber of Number of U.S. Carrier IMTS Resale
Carrier Messages Minutes Revenues RevenuesCitizens Long Distance 2,956 18,443 1,991 0.000 %Citizens Long Distance Company 205 1,054 453 0.000Citizens Long Distance, Inc. 1,380 5,458 1,960 0.000Citizens Mutual Telephone Cooperative Citizens Communication Company 1,082 9,759 2,066 0.000Citizens Telephone Company, Inc. d/b/a Citizens Long Distance 193 466 358 0.000Citizens Telephone Cooperative 3,621 19,540 2,980 0.000Citizens Telephone Cooperative, Inc. 938 6,002 1,899 0.000Citizens Telephone Corporation 775 12,557 1,527 0.000City of Auburn, Elec. Dept., Essential Services Div. d/b/a Auburn Essential Services 22 125 2 0.000City of Hawarden d/b/a HITEC 340 4,224 1,182 0.000City of Windom/WindomNet 933 2,014 6,531 0.000CL Tel Long Distance, Inc. 2,112 11,795 4,192 0.000Clay County Rural Telephone Coop., Inc. d/b/a Endeavor Comm. 8,637 62,619 18,498 0.000Clear Creek Telephone & TeleVision 2,236 15,289 3,932 0.000Clear Rate Communications, Inc 77,141 493,978 78,981 0.001Cleartel Communications, Inc. Cleartel Telecommunications, Inc. 839,750 5,604,637 652,477 0.008 IDS Telcom Corporation 439,177 1,615,622 349,000 0.004 NII Communications, Ltd. 30,344 194,506 49,365 0.001 Supra Telecommunications & Information Systems Acquisitions 1,779,501 11,237,923 2,639,599 0.031Cleveland Unlimited, Inc. 52,394 348,795 3,606 0.000CLT Communications, Inc. 365 2,091 436 0.000CM Tel, USA 40,086,325 470,326,721 6,200,870 0.073Cochrane Cellular, Inc. 640 2,570 615 0.000Coleman County Telecommunications Ltd. d/b/a Trans Texas Technologies Long Distance 856 9,908 1,738 0.000Coleman Enterprises, Inc. d/b/a Local Long Distance 206 717 1,030 0.000Colo Telephone Company 349 2,703 433 0.000Colorado Valley Communications, Inc d/b/a Colorado Valley LD 9,998 82,850 19,985 0.000Colton Telephone Company 353 3,644 975 0.000Columbus Telephone Company 1,080 6,016 3,486 0.000Comanche County Telecommunications, L.P. 2,693 13,487 6,049 0.000Comcast Corporation Comcast Phone, LLC 258,286 2,585,856 646,464 0.008 Comcast Phone of Maryland, Inc. 498 4,976 1,244 0.000 Comcast Phone of New York, LLC 54,469 544,692 136,173 0.002 Comcast Phone of Northern Virginia, Inc. 5,341 53,408 13,352 0.000Comcell, Inc. 3,522 24,636 8,980 0.000ComLinq, Inc. 326,975 3,184,394 308,159 0.004Communication Services Integrated, Inc. (CSII) 5,305 11,989 4,019 0.000Communications 1 Network, Inc. 1,508 5,285 758 0.000Communications Network Billing, Inc. 69,971 380,710 114,585 0.001Community Long Distance d/b/a Comporium Long Distance 123,006 845,510 175,892 0.002ComoreTel Holdings Ltd. 641,823 2,231,313 2,284 0.000Compass Global, Inc. 128,499,144 578,412,877 22,383,424 0.265Computer Tel, Inc. 169,624,955 1,458,640,694 85,838,633 1.015ComSouth Teleservices, Inc. 2,310 25,279 3,605 0.000ComSpan Communications ComSpan Communications- Coquille 853 4,436 998 0.000 ComSpan Comunications-Reedsport 6 64 7 0.000 ComSpan Communications-Bandon 4,430 33,480 4,132 0.000 ComSpan Communications 9,768 46,160 5,861 0.000 ComSpan Communications-Myrtle Point 190 2,004 357 0.000ComTech Solutions, L.L.C. 94 564 209 0.000Consolidated Communications Holdings, Inc. Consolidated Communications Network Svcs. Company 86,653 455,252 68,785 0.001 Consolidated Communications Penn Telecom. 138,986 1,182,487 80,470 0.001 Consolidated Communications Telecom Svcs. of Texas Co. 268,938 1,004,598 497,924 0.006
- Pure Resale Services Page 5 -

Table D: 2008 Annual Section 43.61 International Pure Resale Traffic Data for All U.S. PointsInternational Message Telephone Resale Service
<<< 2009 Data Not Available at Time of Publication >>>
% of TotalNumber of Number of U.S. Carrier IMTS Resale
Carrier Messages Minutes Revenues RevenuesConsolidated Enterprises, Inc. Consolidated Communications Networks, Inc. 20,389 126,593 10,708 0.000 %Consolidated Long Distance, Inc. 501 6,003 590 0.000Consolidated Telephone Company 8,723 31,072 4,112 0.000Consumer Telcom, Inc. 546,183 5,047,194 770,513 0.009Coon Creek Telecommunications Corporation Coon Creek Telecommunications 481 2,707 967 0.000 Coon Creek Telephone Company 171 1,243 207 0.000Coon Valley Cooperative Telephone Association Inc. 65 655 157 0.000Coon Valley Farmers Telephone Company Coon Valley Telecommunications, Inc. 1,678 11,375 2,196 0.000Cooperative Light & Power Association of Lake County 750 7,495 937 0.000Cooperative Telephone Company 1,964 9,388 1,676 0.000Cooperative Telephone Exchange 144 976 345 0.000Cordia Communications Corp. 665,325 5,671,630 709,919 0.008Corn Belt Telephone Company 98 953 147 0.000Corr Wireless Communications, LLC. 71,267 342,143 133,861 0.002Council Grove Telephone Company, Inc. 1,384 6,259 1,975 0.000Covista Communications Covista, Inc. 1,081,250 21,624,991 2,402,777 0.028Cox Communications, Inc. 22,311,541 226,748,934 44,477,226 0.526Cozad Telephone Company 308 1,353 375 0.000CP-Tel Network Services, Inc 2,589 21,599 4,508 0.000Craigville Telephone Co., Inc. 3,928 21,073 1,948 0.000Crocker Telecommunications, LLC 1,007 4,422 544 0.000Crockett Telephone Company, Inc. d/b/a Crockett Long Distance 109 480 1,068 0.000Crosslake Telephone Communications d/b/a Crosslake Communications 1,022 5,691 1,879 0.000Crosslink Long Distance Company 107 291 419 0.000CS Technologies, Inc. 502 2,213 151 0.000CSM Wireless, Inc. 25,806 729,416 7,540 0.000CT Communications, Inc. 5,773 42,059 5,935 0.000CTC Telecom, Inc. 1,795 10,993 4,759 0.000CTI Long Distance Inc. 25,452 273,196 35,302 0.000Cumberland Cellular Partnership 29,093 179,444 6,772 0.000Cumberland Telephone Company 65 238 33 0.000Cunningham Telephone and Cable Company, Inc. 1,036 3,583 725 0.000Custer Telephone Cooperative Inc., d/b/a Custer Telephone LD 2,209 17,548 1,682 0.000Custom Teleconnect, Inc. 12,217 88,327 233,192 0.003Cutter Communications, Inc., d/b/a GCEC Telecom 13,149 90,060 19,082 0.000D & E Communications, Inc. CEI Networks, Inc. 190,335 910,209 125,098 0.001 D&E Systems, Inc. d/b/a D&E Long Distance 190,664 916,065 121,672 0.001D & P Communications, Inc. D&P Long Distance 2,224 14,523 2,518 0.000D.D.D. Calling, Inc. 342 2,536 685 0.000Dalton Telecommunications, Inc. 741 2,438 728 0.000Danville Mutual Telephone Company 105 437 101 0.000DAR Communications Corporation 893,030 6,937,438 221,730 0.003Daviess-Martin Rural Telephone Corp. d/b/a RTC Communications 1,384 9,559 823 0.000DayStarr, LLC d/b/a DayStarr Communications 4,211 9,181 456 0.000DCT Telecom Group, Inc. 1,176,504 2,923,055 447,552 0.005DeKalb Telephone Cooperative, Inc. (DTC Wireless) Advantage Cellular Systems, Inc. 9,702 75,925 35,711 0.000Delcom, Inc. 5,581 42,966 3,580 0.000Delhi Telephone Company DTC Cable inc. 1,375 8,312 3,125 0.000Delta Communications d/b/a Clearwave Communications 10,485 47,106 9,920 0.000Deltacom, Inc. 3,759,264 15,685,432 3,081,696 0.036DelTel Communications, Inc. 802 3,978 1,732 0.000
- Pure Resale Services Page 6 -

Table D: 2008 Annual Section 43.61 International Pure Resale Traffic Data for All U.S. PointsInternational Message Telephone Resale Service
<<< 2009 Data Not Available at Time of Publication >>>
% of TotalNumber of Number of U.S. Carrier IMTS Resale
Carrier Messages Minutes Revenues RevenuesDes Vieux Telecoms, Inc 8,983,969 32,592,600 3,075,421 0.036 %Deutsche TeleKom AG T-Mobile USA, Inc. 467,355,620 2,039,464,046 418,790,076 4.951DFT Communications DFT Local Service Corporation 17,715 78,165 23,969 0.000 DFT Long Distance Corporation 4,448 21,310 3,753 0.000Dialink Corporation 32,983 149,408 44,529 0.001Digital Agent, LLC 43,256 189,427 35,093 0.000Digizip.com, Inc. 16,988 47,565 424,690 0.005DiscoveryTel Communications plc 233,139,288 1,165,223,161 107,008,650 1.265diversiCOM Mainstreet Communications, LLC 6,292 516,377 2,776 0.000 Melrose Telephone Company 6,361 39,284 9,388 0.000Dixon Telephone Co. 310 1,477 473 0.000Dollar Phone Corp. 271,000,485 3,674,249,588 273,082,885 3.228DoveTel Communications, LLC d/b/a SyncGlobal 3,105 11,968 3,290 0.000DOW Management Company, Inc. d/b/a DOW Networks 9,622,932 39,342,612 2,880,437 0.034DSCI Corporation 584,095 2,458,351 479,758 0.006DST Networks, Inc 361,693 2,893,540 466,700 0.006Dumont Telephone Company Dumont Telephone Company 391 3,032 985 0.000 Universal Communications of Allison, Inc. 329 2,577 737 0.000Dunkerton Telephone Cooperative 1,172 4,570 1,256 0.000East Buchanan Telephone Cooperative 671 4,881 1,067 0.000East Kentucky Network, LLC d/b/a Appalachian Wireless 19,396 109,635 108,539 0.001Eastern Colorado Independent Networks, LLC (ECIN) 2,121 22,956 2,561 0.000Eastern Oregon Telecom 8,662 46,290 16,836 0.000Eastern Slope Rural Telephone Association, Inc. 1,687 12,931 3,427 0.000Eastern Sub-RSA Limited Partnership 1,540 9,821 4,259 0.000Eastex Telecom Investments, L.P. d/b/a Eastex Long Distance 1,481 10,946 2,656 0.000Easton Telecom Services, L.L.C. 462,464 1,532,331 255,238 0.003Egyptian Telephone Cooperative Association Egyptian Communication Services, Inc. 519 4,666 807 0.000Electra Telephone Company 44 314 151 0.000Ellington Telephone Company, Inc. d/b/a McCormack-Missouri 85 267 89 0.000Ellsworth Cooperative Telephone Association 207 969 172 0.000Embarq Communications, Inc. 11,736,594 86,030,150 29,614,447 0.350Emily Cooperative Telephone Company C-I Communications, Inc. (CICOM) 1,908 7,882 1,179 0.000 Emily Cooperative Telephone Company 412 2,914 702 0.000Empire Long Distance Corporation 4,426 20,200 3,247 0.000EN-TEL Communications, LLC 2,343 15,022 5,755 0.000En-Touch Systems, Inc. ETS Telephone Company, Inc. d/b/a En-Touch Systems 71,148 679,847 128,882 0.002Encartele, Inc. 817 7,718 6,739 0.000Encompass Communications, LLC 7,316,925 77,460,463 6,321,904 0.075Endstream Communications, LLC 26,707 2,136,576 267,072 0.003Enhanced Communications Group, LLC 31,823 89,105 795,577 0.009Enterprise Solutions 707,152 8,914,540 600,281 0.007Epana Networks, Inc. 227,071,676 4,081,467,901 134,626,066 1.592Equivoice, Inc. 83,256 319,317 38,669 0.000ETCOM 1,523 11,738 2,537 0.000Etex Long Distance 2,636 16,788 563 0.000EveryCall Communications, Inc 11,102 59,522 10,642 0.000Express Communications, Inc. 91,669 463,521 150,174 0.002Ezequiel Guido d/b/a E Marketing 8,628 159,420 143,800 0.002F&B Communications, Inc. 21,210 27,435 6,834 0.000FairPoint Communications, Inc. BE Mobile Communications 2,562 12,759 1,649 0.000 Berkshire Cable Corporation 2,982 27,163 2,267 0.000
- Pure Resale Services Page 7 -

Table D: 2008 Annual Section 43.61 International Pure Resale Traffic Data for All U.S. PointsInternational Message Telephone Resale Service
<<< 2009 Data Not Available at Time of Publication >>>
% of TotalNumber of Number of U.S. Carrier IMTS Resale
Carrier Messages Minutes Revenues RevenuesFairPoint Communications, Inc. -- Con't. C R Long Distance, Inc 377 2,714 180 0.000 % Chautauqua & Erie Communications, Inc. 5,864 40,206 3,103 0.000 Comerco, Inc. d/b/a YCOM Long Distance 15,388 155,112 22,228 0.000 El Paso Long Distance, Inc 387 2,018 103 0.000 Elltel Long Distance 9,459 77,894 6,223 0.000 Enhanced Communications of Northern New England, Inc. 2,873,684 23,806,462 6,791,072 0.080 FairPoint Carrier Services 396,949 2,739,997 281,236 0.003 FreTel Communications 4,843 27,872 2,596 0.000 Germantown Long Distance 548 3,882 257 0.000 Marianna Long Distance 777 5,559 279 0.000 Orwell Communications 3,632 32,678 3,487 0.000 Peoples Mutual Long Distance 1,183 10,143 957 0.000 Quality One Technology 415 3,206 276 0.000 St Joe Communications, Inc. 16,244 146,618 22,789 0.000 ST Long Distance, Inc. 20,737 177,823 16,512 0.000 Taconic Telcom, Inc. 31,033 225,604 18,872 0.000 UI Long Distance d/b/a Northland Long Distance 137,552 873,789 49,523 0.001Falcon 1, Inc. 884 7,113 1,180 0.000Farmers & Merchants Mutual Telephone Company 319 1,186 826 0.000Farmers Co-Operative Telephone Company 608 4,732 991 0.000Farmers Mutual Cooperative Telephone Company 915 4,989 1,299 0.000Farmers Mutual Cooperative Telephone Company -- Moulton, IA 15 102 17 0.000Farmers Mutual Telephone Company -- Fruitland, ID 2,672 18,318 4,594 0.000Farmers Mutual Telephone Company -- Jesup, Iowa 917 4,504 987 0.000Farmers Mutual Telephone Cooperative 797 61,001 1,482 0.000Farmers Telephone Company 59 562 133 0.000Farmers Telephone Cooperative, Inc 24,568 258,263 39,096 0.000Farmers Telecommunications Corp., Inc d/b/a Farmers LD 8,023 62,699 21,490 0.000Farmers Telecommunications, Inc. 448 3,648 984 0.000Farmers' Telephone Company 68 605 224 0.000FastTrack Communications, Inc 2,146 8,413 789 0.000Fenton Cooperative Telephone Company 50 296 94 0.000FiberComm L.C. 35,853 92,653 14,106 0.000Fidelity Communications Company Fidelity Long Distance, Inc. 3,856 21,922 6,162 0.000 Fidelity Networks, Inc. 15,524 132,609 61,651 0.001Filer Mutual Telephone Company 842 8,744 2,391 0.000Finger Lakes Communication Group, Inc. 9,867 63,756 13,574 0.000First Choice Technology, Inc. 6,042 1,427,146 151,058 0.002First Communications, LLC 8,111,031 79,279,972 8,663,738 0.102FirstMile Technologies 1,511 28,370 2,264 0.000Five Area Long Distance, Inc. 3,938 33,468 12,191 0.000Flat Rock Telephone Co-op, Inc. Flat Rock Communications, Inc. 13 30 44 0.000Flowroute, LLC 334,486 366,304 22,636 0.000FMTC Long Distance 1,056 9,362 1,465 0.000Foothills Telephone Cooperative Foothills Long Distance 4,652 24,476 12,278 0.000FranklinVT, LLC 4,873 28,202 2,747 0.000Freedom Ring Communications, L.L.C. d/b/a BayRing Communications 677,198 1,156,185 153,949 0.002Frontera Telecommunications, Inc. 1,028 3,465 550 0.000FTC Diversified Services, inc 3,859 19,451 2,192 0.000FTC Management Group, Inc. FTC Communications, Inc. d/b/a Farmers Long Distance 57,328 551,254 87,280 0.001Gafachi Telecom - NY, Inc. 4,788,884 16,692,596 500,080 0.006Gardonville Cooperative Telephone Association 1,788 16,041 6,737 0.000Geckotech, LLC 2,515 25,150 3,018 0.000Geetingsville Telephone Co., Inc. 245 1,621 294 0.000
- Pure Resale Services Page 8 -

Table D: 2008 Annual Section 43.61 International Pure Resale Traffic Data for All U.S. PointsInternational Message Telephone Resale Service
<<< 2009 Data Not Available at Time of Publication >>>
% of TotalNumber of Number of U.S. Carrier IMTS Resale
Carrier Messages Minutes Revenues RevenuesGeorgetown Communications, Inc. 93 513 187 0.000 %Gervais Telephone Co. d/b/a DataVision Communications 3,766 43,139 4,772 0.000Giant Communications, Inc. 857 8,185 3,227 0.000Giles-Craig Communications, Inc. d/b/a PemTel Long Distance 1,342 7,938 1,780 0.000Glasford Telephone Company 1,093 5,056 986 0.000Glentel Corporation 3,880 19,474 56,528 0.001Glenwood Telecommunications, Inc. Glenwood Long Distance 527 5,361 989 0.000Global Crossing North America, Inc. Global Crossing Telecomm., Inc. & Global Crossing Bandwidth, Inc. 549,589,321 2,295,003,411 69,231,613 0.818Global Tel*Link Corporation 380,095 1,724,165 1,421,877 0.017Globalcom, Inc 1,662,381 5,425,140 914,084 0.011GlobalNova, Inc. 4,619,462 24,021,200 1,444,729 0.017Gold Line Telemanagement, Inc. 15,359,962 67,323,049 8,111,528 0.096Golden Belt Telephone Association 4,946 53,423 9,554 0.000Goldfield Communications Services, Corp. Goldfield Access Network, LC/GAN LD Service 1,201 61,334 2,042 0.000 Goldfield Telephone Co./Goldfield Communications LD Svc. 124 396 94 0.000Gorham Telephone Company 199 925 245 0.000Grafton Communications Grafton Long Distance Company 4,025 23,334 4,146 0.000Grand Mound Cooperative Telephone Association 228 1,549 263 0.000Grand River Mutual Telephone Corporation 4,960 30,189 11,591 0.000Grando Telephone Company YK Communications, LTD d/b/a GTC-LD 1,007 10,001 1,057 0.000Grandview Mutual Telephone Company 17 82 15 0.000Granite State Long Distance, Inc. 7,202 47,551 17,228 0.000Granite Telecommunications, LLC 488,388 1,464,953 395,530 0.005Grantsburg Telcom, Inc. 877 7,279 1,046 0.000Great America Networks, Inc. 110,500 339,274 53,028 0.001Great Plains Communications Long Distance 13,458 92,275 16,300 0.000Green Hills Communications, Inc. 420 1,141 1,194 0.000Green Mountain Long Distance Service, Inc. 36,261 223,332 67,079 0.001Greenfield Communications, Inc. 5,100 16,495 980 0.000Gridley Communications, Inc. 380 2,779 2,235 0.000Griswold Cooperative Telephone Company 432 3,051 943 0.000Grundy Center Municipal Utilities 154 612 119 0.000GS Miami, Inc. 322,373 1,872,000 150,344 0.002GTC, Inc. 820 2,631 447 0.000Guadalupe Valley Communications Systems, L.P. (GVTC) 58,405 395,701 208,734 0.002Guam Telecom, LLC d/b/a MCV Telecom 975 4,348 927 0.000Hamilton County Telephone Coop. Hamilton County Long Distance, Inc. 722 5,048 882 0.000Hamilton Long Distance Company 16,724 58,605 3,149 0.000Hancock Long Distance, Inc. 141 721 830 0.000Harbor Communications 7,617 37,216 11,356 0.000Hardy Telecommunications, Inc 2,272 14,455 3,746 0.000Hargray Holdings Corporation, Inc. Hargray, Inc 15,975 165,097 77,737 0.001 Hargray of Georgia, Inc. 2,391 31,190 18,687 0.000 Low Country Carriers, Inc. d/b/a Hargray LD Co. 169,370 1,677,677 535,490 0.006Harlan Municipal Utilities 555 6,075 1,620 0.000Harmony Telephone Company 110 932 143 0.000Hart Communications, Inc. 563 2,448 1,376 0.000Hartington Telecommunications Co, Inc 439 2,868 332 0.000Haviland Telephone Company, Inc. Haviland Long Distance 1,107 10,659 3,140 0.000Hawaiian Telcom Services Company, Inc. 3,594,907 38,697,296 9,617,523 0.114Hawkeye Telephone Company 254 1,650 256 0.000
- Pure Resale Services Page 9 -

Table D: 2008 Annual Section 43.61 International Pure Resale Traffic Data for All U.S. PointsInternational Message Telephone Resale Service
<<< 2009 Data Not Available at Time of Publication >>>
% of TotalNumber of Number of U.S. Carrier IMTS Resale
Carrier Messages Minutes Revenues RevenuesHayneville Holding Company, Inc. Hayneville Fiber Transport, Inc. d/b/a Camellia Long Distance 11,548 58,048 3,625 0.000 % Hayneville Fiber Transport, Inc. d/b/a Hayneville LD 1,100 6,928 500 0.000Heart of Iowa Communications Cooperative 2,573 17,404 4,965 0.000Hector Communications Corporation Indianhead Communications Corporation 1,476 6,972 1,509 0.000Hiawatha Communications, Inc. Superior Long Distance, Inc 5,070 23,077 4,471 0.000HickoryTech Crystal Communications, Inc. 108,459 511,002 109,612 0.001 Enventis Telecom, Inc 10,331 44,529 7,256 0.000High Plains Telecommunications, Inc. 89,659 487,988 112,544 0.001Highland Communications Corporation 4,599 21,637 10,403 0.000Highland Telephone Cooperative (HTC) 36 153 27 0.000Hill Country Telephone Coop., Inc. d/b/a Hill Country Long Distance 1,446 12,777 1,508 0.000Hinton CATV Co., Inc. d/b/a Hinton Long Distance 3,670 18,349 6,292 0.000HolaAmerica, LLC 3,200,915 6,794,202 3,998,366 0.047Home Communications, Inc 883 6,954 2,299 0.000Home TeleNetworks, Inc. 624 4,484 996 0.000Home Telephone Company, Inc. Home Long Distance, Inc. 24,816 181,498 33,356 0.000HomeTown Solutions, LLC 3,658 11,580 2,719 0.000Horry Telephone Long Distance, Inc. 85,213 591,538 225,747 0.003HRS Internet LLC d/b/a LightBound 4,049 16,536 1,978 0.000HTC Communications Hospers Telephone Exchange, Inc. 661 1,499 300 0.000HTC Holding Co. HTC Communications Co. 13,968 81,862 23,080 0.000Hubbard Cooperative Telephone Association 116 886 236 0.000Hutchinson Telecommunications, Inc. 7,093 41,817 17,283 0.000Huxley Communications Cooperative 1,254 5,657 1,046 0.000i-Wireless 382,472 1,397,745 507,744 0.006i2Telecom 650,132 5,988,697 357,186 0.004IAMO Telephone Company IAMO Telephone Company d/b/a First Fiber Corporation 4 30 9 0.000 IAMO Telephone Company d/b/a IAMO Long Distance 59 458 87 0.000IBFA Acquisition Company, LLC 22,866 199,970 38,973 0.000iLOKA, Inc. 113,273 749,849 70,943 0.001Impact Telecom 35,059 141,002 22,849 0.000inContact, Inc. 1,412,559 7,520,593 1,071,781 0.013Independent Telecommunications Systems, Inc. (ITS) 104,222 353,014 119,698 0.001Industry I-net, Inc 1,746 8,857 2,228 0.000InfiniteConferencing, Inc 4,265 34,119 5,503 0.000Infosat Communications, Inc. Infosat Able Holdings, Inc. 9,396 28,133 27,420 0.000Inmark, Inc. d/b/a Preferred Billing 11,477 77,437 50,805 0.001Insight Midwest Holding, LLC Insight Phone of Indiana, LLC 63,063 630,627 78,828 0.001 Insight Phone of Kentucky 496,889 4,968,893 621,112 0.007 Insight Phone of Ohio, LLC 159,905 1,599,048 199,881 0.002Integra Telecom Holdings, Inc. 7,179,663 23,987,585 4,361,976 0.052Integrated Services, Inc. 46,531 216,829 119,010 0.001Intelleq Communications Corporation Intelleq Long Distance Company 4,861 33,061 10,699 0.000Intellicall Operator Services, Inc. 770,101 3,392,561 2,879,048 0.034Interactive Media Technologies, Inc. 607,142 7,285,700 874,284 0.010Interactive Services Network, Inc. 381,594 3,815,940 476,992 0.006InterBel Telephone Cooperative, Inc. 47,871 189,150 23,298 0.000Interglobe Communications, Inc. 232,980 2,329,800 291,225 0.003International Communication Services, Inc. d/b/a Directo.com 1,955,622 19,556,216 2,444,527 0.029
- Pure Resale Services Page 10 -
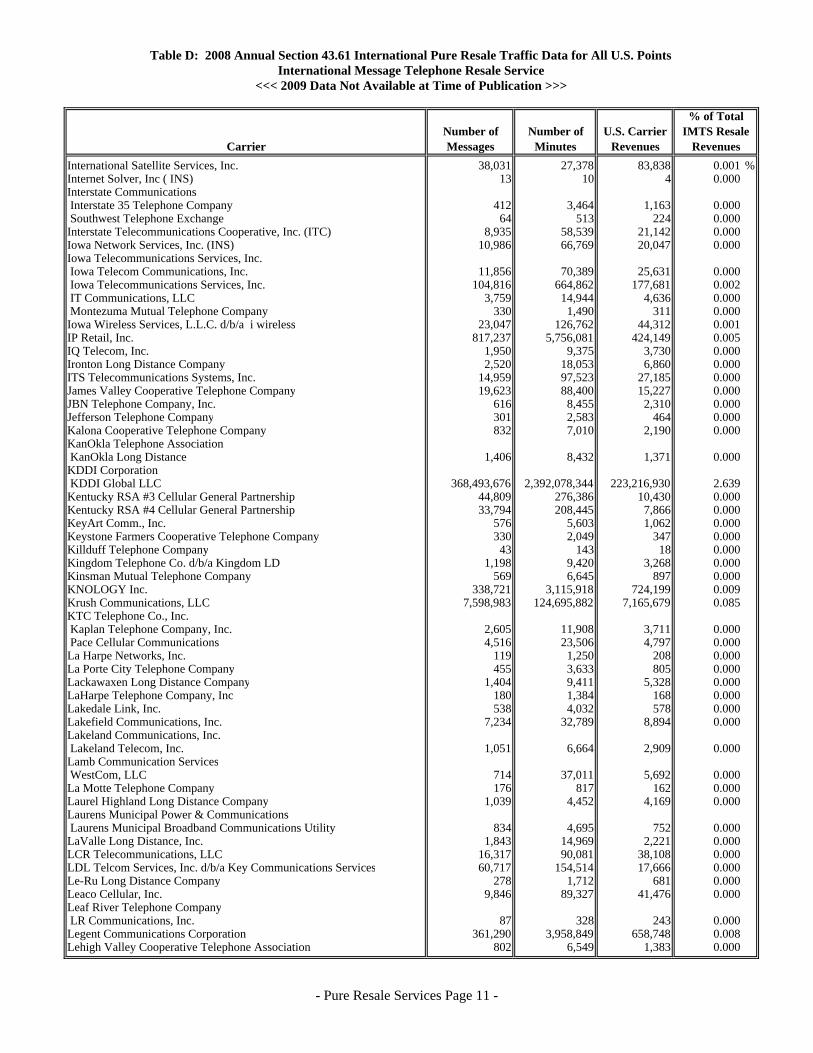
Table D: 2008 Annual Section 43.61 International Pure Resale Traffic Data for All U.S. PointsInternational Message Telephone Resale Service
<<< 2009 Data Not Available at Time of Publication >>>
% of TotalNumber of Number of U.S. Carrier IMTS Resale
Carrier Messages Minutes Revenues RevenuesInternational Satellite Services, Inc. 38,031 27,378 83,838 0.001 %Internet Solver, Inc ( INS) 13 10 4 0.000Interstate Communications Interstate 35 Telephone Company 412 3,464 1,163 0.000 Southwest Telephone Exchange 64 513 224 0.000Interstate Telecommunications Cooperative, Inc. (ITC) 8,935 58,539 21,142 0.000Iowa Network Services, Inc. (INS) 10,986 66,769 20,047 0.000Iowa Telecommunications Services, Inc. Iowa Telecom Communications, Inc. 11,856 70,389 25,631 0.000 Iowa Telecommunications Services, Inc. 104,816 664,862 177,681 0.002 IT Communications, LLC 3,759 14,944 4,636 0.000 Montezuma Mutual Telephone Company 330 1,490 311 0.000Iowa Wireless Services, L.L.C. d/b/a i wireless 23,047 126,762 44,312 0.001IP Retail, Inc. 817,237 5,756,081 424,149 0.005IQ Telecom, Inc. 1,950 9,375 3,730 0.000Ironton Long Distance Company 2,520 18,053 6,860 0.000ITS Telecommunications Systems, Inc. 14,959 97,523 27,185 0.000James Valley Cooperative Telephone Company 19,623 88,400 15,227 0.000JBN Telephone Company, Inc. 616 8,455 2,310 0.000Jefferson Telephone Company 301 2,583 464 0.000Kalona Cooperative Telephone Company 832 7,010 2,190 0.000KanOkla Telephone Association KanOkla Long Distance 1,406 8,432 1,371 0.000KDDI Corporation KDDI Global LLC 368,493,676 2,392,078,344 223,216,930 2.639Kentucky RSA #3 Cellular General Partnership 44,809 276,386 10,430 0.000Kentucky RSA #4 Cellular General Partnership 33,794 208,445 7,866 0.000KeyArt Comm., Inc. 576 5,603 1,062 0.000Keystone Farmers Cooperative Telephone Company 330 2,049 347 0.000Killduff Telephone Company 43 143 18 0.000Kingdom Telephone Co. d/b/a Kingdom LD 1,198 9,420 3,268 0.000Kinsman Mutual Telephone Company 569 6,645 897 0.000KNOLOGY Inc. 338,721 3,115,918 724,199 0.009Krush Communications, LLC 7,598,983 124,695,882 7,165,679 0.085KTC Telephone Co., Inc. Kaplan Telephone Company, Inc. 2,605 11,908 3,711 0.000 Pace Cellular Communications 4,516 23,506 4,797 0.000La Harpe Networks, Inc. 119 1,250 208 0.000La Porte City Telephone Company 455 3,633 805 0.000Lackawaxen Long Distance Company 1,404 9,411 5,328 0.000LaHarpe Telephone Company, Inc 180 1,384 168 0.000Lakedale Link, Inc. 538 4,032 578 0.000Lakefield Communications, Inc. 7,234 32,789 8,894 0.000Lakeland Communications, Inc. Lakeland Telecom, Inc. 1,051 6,664 2,909 0.000Lamb Communication Services WestCom, LLC 714 37,011 5,692 0.000La Motte Telephone Company 176 817 162 0.000Laurel Highland Long Distance Company 1,039 4,452 4,169 0.000Laurens Municipal Power & Communications Laurens Municipal Broadband Communications Utility 834 4,695 752 0.000LaValle Long Distance, Inc. 1,843 14,969 2,221 0.000LCR Telecommunications, LLC 16,317 90,081 38,108 0.000LDL Telcom Services, Inc. d/b/a Key Communications Services 60,717 154,514 17,666 0.000Le-Ru Long Distance Company 278 1,712 681 0.000Leaco Cellular, Inc. 9,846 89,327 41,476 0.000Leaf River Telephone Company LR Communications, Inc. 87 328 243 0.000Legent Communications Corporation 361,290 3,958,849 658,748 0.008Lehigh Valley Cooperative Telephone Association 802 6,549 1,383 0.000
- Pure Resale Services Page 11 -

Table D: 2008 Annual Section 43.61 International Pure Resale Traffic Data for All U.S. PointsInternational Message Telephone Resale Service
<<< 2009 Data Not Available at Time of Publication >>>
% of TotalNumber of Number of U.S. Carrier IMTS Resale
Carrier Messages Minutes Revenues RevenuesLemonweir Valley Telephone Company LVT Corporation 2,036 8,397 1,258 0.000 %Level 3 Communications, LLC 489,139,350 2,956,486,953 173,475,876 2.051Lexcom Long Distance, LLC 15,418 112,696 33,586 0.000Liberty Bell Telecom, LLC 68,406 593,612 76,389 0.001Lightyear Network Solutions, LLC 2,480,893 9,091,248 1,346,076 0.016Ligtel Communications, Inc. 7,616 72,582 10,683 0.000Lincoln Telephone Company, Inc 573 4,000 268 0.000Lincolnville Telephone Company Lincolnville Communications, Inc. 14,485 108,833 24,644 0.000Litespan, Inc. 84,800 358,000 21,233 0.000Local Exchange Technologies LLC 12,563 52,448 15,696 0.000Local Long Distance, L.C. 506 2,243 293 0.000Locus Telecommunications, Inc 233,183,963 300,856,833 169,923,959 2.009Logix Communications, LP 1,123,697 4,520,996 828,521 0.010Long Distance Access, Inc. 26,346 190,018 69,086 0.001Long Distance Consolidated Billing Co. 53,660 203,680 48,381 0.001Long Lines, LLC CommChoice of Iowa 982 4,338 1,952 0.000 Jefferson Telephone Company 118 608 273 0.000 Jordan Soldier Valley Telephone Company 1,023 856 385 0.000 Long Lines Metro 1,676 4,867 2,190 0.000 Long Lines Siouxland 2,282 11,001 4,951 0.000 Northwest Iowa Telephone Company 1,483 4,818 2,168 0.000Loretto Communication Services, Inc. d/b/a Loretto Telecom 2,010 9,711 1,704 0.000Lost Nation - Elwood Telephone Company 88 688 136 0.000Lotel, Inc. d/b/a Coordinated Billing Services 2,388 11,187 13,151 0.000Louisa Communications, L.C. 367 2,161 796 0.000Lucky Communications, Inc. 723,113 12,617,872 683,310 0.008Lynnville Telephone Company 105 652 136 0.000Mabel Cooperative Telephone Company Mabel Long Distance, Inc. 330 3,687 715 0.000Madison County Telephone Company, Inc. 384 2,367 140 0.000Madison Network Systems, Inc. 2,389 19,064 4,516 0.000Madison Telephone, LLC d/b/a MadTel Long Distance 44 118 38 0.000Magellan Hill Technologies, LLC 22,183 87,483 14,284 0.000Magtel Long Distance 715 12,649 2,246 0.000Mahaska Communication Group, LLC (MCG) 7,770 30,550 6,946 0.000Manawa Telecom, Inc. 601 4,362 662 0.000Manning Municipal Communication & Television System Utility 101 282 57 0.000Mapleton Communications 140 856 110 0.000Mark Twain Rural Telephone Co. Mark Twain Long Distance, Inc. 1,976 13,062 17,445 0.000Marne & Elk Horn Telephone Company 891 4,276 845 0.000Marquette-Adams Communications, LLC 1,379 10,215 2,108 0.000Mashell Telecom d/b/a Rainier Connect or Local Access Communications 9,028 37,887 18,687 0.000MASScomm, Inc. 532 3,722 653 0.000Massena Telephone Company 273 1,963 273 0.000Matrix Telecom, Inc. 4,966,435 18,164,356 2,884,563 0.034McBlue Telecom, Inc. 516,995 4,819,426 382,143 0.005McDonald County Long Distance 1,003 10,200 4,104 0.000McGraw Communications, Inc. McGraw Communications, Inc. 2,105,377 3,909,107 851,447 0.010 McGraw Communications, Inc. of Virginia 10,305 15,046 6,020 0.000McLeodUSA Telecommunications Service, Inc. 6,899,441 18,712,988 2,302,369 0.027McNabb Long Distance, Inc. 517 1,553 693 0.000Mechanicsville Telephone Co. 119 740 163 0.000Mediapolis Telephone Company d/b/a MTC Technologies 795 4,521 1,407 0.000MeetingBridge, LLC 15,550 124,403 20,065 0.000
- Pure Resale Services Page 12 -

Table D: 2008 Annual Section 43.61 International Pure Resale Traffic Data for All U.S. PointsInternational Message Telephone Resale Service
<<< 2009 Data Not Available at Time of Publication >>>
% of TotalNumber of Number of U.S. Carrier IMTS Resale
Carrier Messages Minutes Revenues RevenuesMegagate Broadband, Inc. 6,774 42,184 8,292 0.000 %Mescalero Apache Telecom, Inc 453 1,966 860 0.000MetroPCS, Inc. 15,325,941 113,564,614 11,424,059 0.135Metropolitan Telecommunications Holding Company 1,446,335 5,899,607 901,824 0.011MGW Long Distance, LLC 1,511 8,811 984 0.000MH Communications, Inc. d/b/a MH Communications 9,902 74,208 15,594 0.000Mid-Rivers Telephone Cooperative, Inc., d/b/a Mid-Rivers LD 51,016 304,861 24,999 0.000Midcontinent Communications, Inc. 57,707 555,769 85,841 0.001Miles Cooperative Telephone Association 2 2 1 0.000Millennium Telecom, LLC 502 1,318 299 0.000Miller Telephone Company 15 140 24 0.000Millry Communications 2,114 10,578 3,423 0.000Minburn Telephone Company Minburn Telecommunications, Inc. 35 131 66 0.000 Minburn Telephone Company 35 135 25 0.000Minerva Valley 20 94 16 0.000Minnesota Valley Communications, Inc. 184 615 63 0.000Moapa Valley Telephone Co. 3,083 25,374 6,784 0.000MobileCom Investments, LLC d/b/a LDanywhere 26,215 103,995 17,829 0.000Mobius Communications Company 1,253 6,513 728 0.000MoKan Communications, Incorporated 3,727 16,326 4,615 0.000Molalla Communications Co. (MCC) MCC Long Distance 2,484 12,727 2,249 0.000Mon-Cre Wireless Incorporated 197 3,090 3,096 0.000Monmouth Independence Network 1,552 16,133 1,172 0.000Monon Telephone Company, Inc. 444 2,929 556 0.000Monroe Telephone Company 1,111 11,683 1,090 0.000Moultrie Infocomm, Inc. 114 647 760 0.000Moundridge Telcom, Inc. 1,349 11,136 3,269 0.000Mountain Rural Telephone Coop. Corp., Inc. 6,316 41,162 4,380 0.000Mountain View Telephone Company 674 4,673 1,480 0.000Mpower Communications Corporation 922,629 9,226,288 1,153,286 0.014MTA Communications, Inc. d/b/a MTA Long Distance 13,937 140,015 134,087 0.002MTC Communications Inc. 645 4,157 1,361 0.000MTC Long Distance, Inc. (Moundville Telephone Company) 802 2,069 166 0.000MTCO Communications, Inc. 15,202 104,311 6,479 0.000MTel Long Distance 13,356 127,875 24,111 0.000MTPCS LLC, d/b/a CellularOne 622,848 1,245,696 33,898 0.000Mulberry Cooperative Telephone Co., Inc. 1,905 10,460 1,100 0.000Multiline Long Distance, Inc. 22,796 112,566 66,273 0.001Mutual Telephone Company 167 589 222 0.000Mutual Telephone Company of Morning Sun Louisa Communications, L.C. 268 1,407 477 0.000 Mutual Telephone Company of Morning Sun 141 584 184 0.000My Tel Co., Inc. 15,850 132,952 15,215 0.000Natco Technologies, Inc. 1,266 7,179 1,832 0.000National Access Long Distance, Inc. 54,105 210,077 109,246 0.001National Brands, Inc. 3,314 25,320 47,135 0.001National Telephone of Alabama, Inc. d/b/a Cherokee Long Distance 192 750 1,318 0.000Nationwide Long Distance Service, Inc. 65,931 303,627 150,621 0.002Navigator Telecommunications, LLC 51,577 240,230 55,265 0.001Nebraska Central Telecom, INC 1,780 7,028 1,475 0.000NECC Telecom, Inc. 14,648,022 138,070,759 13,489,445 0.159NEIT Services, LLC 181 1,466 467 0.000Nemont Communications, Inc. d/b/a Nemont Long Distance 33,436 170,315 17,728 0.000NEP Cellcorp, Inc d/b/a NEP Wireless 1,820 7,553 3,086 0.000Nep Long Distance Company 15,480 102,508 13,142 0.000Net One International, Inc. 19,626,922 32,711,537 3,925,384 0.046NetLojix Telecom, Inc. 948 170,604 18,956 0.000Network Billing Systems, L.L.C. 2,723,795 6,986,269 1,147,203 0.014
- Pure Resale Services Page 13 -

Table D: 2008 Annual Section 43.61 International Pure Resale Traffic Data for All U.S. PointsInternational Message Telephone Resale Service
<<< 2009 Data Not Available at Time of Publication >>>
% of TotalNumber of Number of U.S. Carrier IMTS Resale
Carrier Messages Minutes Revenues RevenuesNetwork Innovations, Inc 33,546 119,754 33,457 0.000 %Network Service Billing, Inc. 89,770 386,908 205,238 0.002Network US, Inc. d/b/a CA Affinity 9,980 27,943 249,492 0.003New Horizon Communications Corporation 218,925 1,047,160 249,202 0.003New Lisbon Telephone Co. (NLTC) 104 688 102 0.000New Ulm Long Distance, Inc. 4,207 21,453 1,177 0.000Nex-Tech Wireless, LLC 6,779 77,984 8,673 0.000Nex-Tech, Inc 17,040 100,925 25,028 0.000NeXband Communications 12,347 89,512 11,370 0.000Nextcarrier Telecom, Inc. Nextcarrier Prepaid, Inc. 27,523,172 179,880,127 23,517,737 0.278 Nextcarrier Telecom, Inc. 130,750,860 690,609,729 52,065,132 0.615NobelTel, LLC 175,754,539 1,034,184,613 120,874,947 1.429Norlight, Inc 352,920 1,347,121 275,806 0.003Norsk Telekom, LLC 1,243 2,653 1,226 0.000Nortex Communications Company 2,191 17,106 7,620 0.000North Dakota Long Distance, LLC 365,475 1,456,136 160,134 0.002North English Cooperative Telephone Company 729 6,006 1,834 0.000North Penn Long Distance Corporation 1,967 14,118 2,830 0.000North State Telecommunications Corporation North State Communications Long Distance, LLC 143,568 807,935 168,908 0.002Northeast Long Distance, LLC 259 1,295 1,619 0.000Northeast Missouri Long Distance, L.L.C. 900 10,466 3,699 0.000Northern Telephone Cooperative, Inc. 11,251 45,872 9,144 0.000NorthStar Access, LLC 16,669 94,741 15,545 0.000NorthStar Telecom, Inc. 162,111 1,458,862 173,597 0.002NOS Communications, Inc. NOS Communications, Inc. 976,354 9,516,905 4,369,541 0.052 NOSVA Limited Partnership 4,628,879 47,091,120 11,681,589 0.138Novolink Communications, Inc. 134,046,938 1,753,686,626 55,674,345 0.658Now Communications, Inc 16,711 139,482 16,923 0.000Nsight Net Lec, LLC 18,874 92,547 16,892 0.000NTCH-CA, Inc. 509,329 1,630,367 78,400 0.001NTCNet Long Distance, Inc. 2,289 7,486 4,029 0.000NTELOS Network, Inc. NTELOS Network, Inc. 38,798 395,734 33,503 0.000 R&B Network Inc 7,697 73,162 7,409 0.000NTS Communications, Inc. 424,383 2,704,016 325,729 0.004Nunn Telephone Company Nunn Communications, LLC 557 3,786 1,148 0.000Ogden Telephone Company 132 992 249 0.000Oklahoma 5, LLC 294,086 588,172 16,006 0.000Olin Telephone Company, Inc. 239 2,169 521 0.000OLS, Inc. 2,095 22,772 3,400 0.000One Communications 7,245,697 28,183,841 4,437,698 0.052One Phone, Inc. 15,788,166 151,565,016 31,268,676 0.370One Source Communiations 51,367 418,395 64,772 0.001Oneida Telephone Exchange, Inc. Oneida Network Services, Inc. 283 1,778 267 0.000OneLink Communications, Inc. 398,020 5,003,736 810,941 0.010Online Savings, Inc. 6,279 49,892 50,336 0.001ONS-Telecom, LLC 1,074 14,125 1,275 0.000ONSE America, Inc. 8,490,088 72,246,118 1,341,949 0.016Onslow Cooperative Telephone Association 380 4,369 1,595 0.000OnStar, LLC 490,498 1,190,491 345,242 0.004Onvoy, Inc. 168,823 580,783 175,490 0.002Opex Communications, Inc. 597,890 4,424,384 850,843 0.010Optic Tel Long Distance 10,540 68,273 18,837 0.000Optivon Telecommunication Services, Inc. 709,343 3,114,670 322,505 0.004Oran Mutual Telephone Company (OMTC) 1 1 1 0.000
- Pure Resale Services Page 14 -
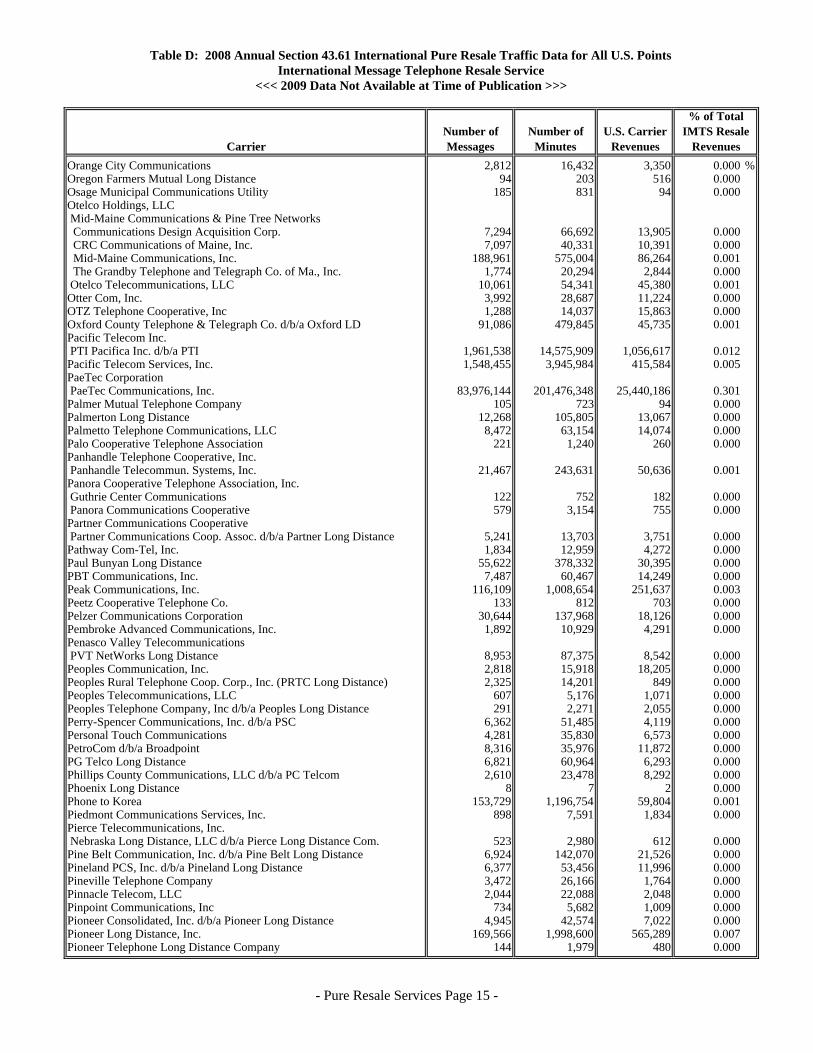
Table D: 2008 Annual Section 43.61 International Pure Resale Traffic Data for All U.S. PointsInternational Message Telephone Resale Service
<<< 2009 Data Not Available at Time of Publication >>>
% of TotalNumber of Number of U.S. Carrier IMTS Resale
Carrier Messages Minutes Revenues RevenuesOrange City Communications 2,812 16,432 3,350 0.000 %Oregon Farmers Mutual Long Distance 94 203 516 0.000Osage Municipal Communications Utility 185 831 94 0.000Otelco Holdings, LLC Mid-Maine Communications & Pine Tree Networks Communications Design Acquisition Corp. 7,294 66,692 13,905 0.000 CRC Communications of Maine, Inc. 7,097 40,331 10,391 0.000 Mid-Maine Communications, Inc. 188,961 575,004 86,264 0.001 The Grandby Telephone and Telegraph Co. of Ma., Inc. 1,774 20,294 2,844 0.000 Otelco Telecommunications, LLC 10,061 54,341 45,380 0.001Otter Com, Inc. 3,992 28,687 11,224 0.000OTZ Telephone Cooperative, Inc 1,288 14,037 15,863 0.000Oxford County Telephone & Telegraph Co. d/b/a Oxford LD 91,086 479,845 45,735 0.001Pacific Telecom Inc. PTI Pacifica Inc. d/b/a PTI 1,961,538 14,575,909 1,056,617 0.012Pacific Telecom Services, Inc. 1,548,455 3,945,984 415,584 0.005PaeTec Corporation PaeTec Communications, Inc. 83,976,144 201,476,348 25,440,186 0.301Palmer Mutual Telephone Company 105 723 94 0.000Palmerton Long Distance 12,268 105,805 13,067 0.000Palmetto Telephone Communications, LLC 8,472 63,154 14,074 0.000Palo Cooperative Telephone Association 221 1,240 260 0.000Panhandle Telephone Cooperative, Inc. Panhandle Telecommun. Systems, Inc. 21,467 243,631 50,636 0.001Panora Cooperative Telephone Association, Inc. Guthrie Center Communications 122 752 182 0.000 Panora Communications Cooperative 579 3,154 755 0.000Partner Communications Cooperative Partner Communications Coop. Assoc. d/b/a Partner Long Distance 5,241 13,703 3,751 0.000Pathway Com-Tel, Inc. 1,834 12,959 4,272 0.000Paul Bunyan Long Distance 55,622 378,332 30,395 0.000PBT Communications, Inc. 7,487 60,467 14,249 0.000Peak Communications, Inc. 116,109 1,008,654 251,637 0.003Peetz Cooperative Telephone Co. 133 812 703 0.000Pelzer Communications Corporation 30,644 137,968 18,126 0.000Pembroke Advanced Communications, Inc. 1,892 10,929 4,291 0.000Penasco Valley Telecommunications PVT NetWorks Long Distance 8,953 87,375 8,542 0.000Peoples Communication, Inc. 2,818 15,918 18,205 0.000Peoples Rural Telephone Coop. Corp., Inc. (PRTC Long Distance) 2,325 14,201 849 0.000Peoples Telecommunications, LLC 607 5,176 1,071 0.000Peoples Telephone Company, Inc d/b/a Peoples Long Distance 291 2,271 2,055 0.000Perry-Spencer Communications, Inc. d/b/a PSC 6,362 51,485 4,119 0.000Personal Touch Communications 4,281 35,830 6,573 0.000PetroCom d/b/a Broadpoint 8,316 35,976 11,872 0.000PG Telco Long Distance 6,821 60,964 6,293 0.000Phillips County Communications, LLC d/b/a PC Telcom 2,610 23,478 8,292 0.000Phoenix Long Distance 8 7 2 0.000Phone to Korea 153,729 1,196,754 59,804 0.001Piedmont Communications Services, Inc. 898 7,591 1,834 0.000Pierce Telecommunications, Inc. Nebraska Long Distance, LLC d/b/a Pierce Long Distance Com. 523 2,980 612 0.000Pine Belt Communication, Inc. d/b/a Pine Belt Long Distance 6,924 142,070 21,526 0.000Pineland PCS, Inc. d/b/a Pineland Long Distance 6,377 53,456 11,996 0.000Pineville Telephone Company 3,472 26,166 1,764 0.000Pinnacle Telecom, LLC 2,044 22,088 2,048 0.000Pinpoint Communications, Inc 734 5,682 1,009 0.000Pioneer Consolidated, Inc. d/b/a Pioneer Long Distance 4,945 42,574 7,022 0.000Pioneer Long Distance, Inc. 169,566 1,998,600 565,289 0.007Pioneer Telephone Long Distance Company 144 1,979 480 0.000
- Pure Resale Services Page 15 -

Table D: 2008 Annual Section 43.61 International Pure Resale Traffic Data for All U.S. PointsInternational Message Telephone Resale Service
<<< 2009 Data Not Available at Time of Publication >>>
% of TotalNumber of Number of U.S. Carrier IMTS Resale
Carrier Messages Minutes Revenues RevenuesPlains Cooperative Telephone Association, Inc. (Plains LD) 376 2,315 760 0.000 %Plainview Telephone Company Nyecom Teleservices, Inc. 181 858 114 0.000Plant Long Distance Company 6,964 70,246 14,671 0.000Planters Telephone Long Distance, Inc. 5,492 37,448 38,673 0.000Plateau Telecommunications, Inc. ENMR Telephone Cooperative 133,696 655,254 382,805 0.005 New Mexico RSA 4 East Limited Partnership 70,864 330,138 77,861 0.001 Texas RSA 3 Limited Partnership 33,304 172,833 20,914 0.000Poka Lambro Telecom., Inc. d/b/a Poka Lambro Commun. 6,274 47,918 22,267 0.000Ponderosa Cablevision d/b/a Ponderosa Long Distance 1,317 10,988 4,189 0.000PR Wireless, Inc. d/b/a Open Mobile 973,874 4,200,305 217,500 0.003Prairieburg Telephone Company, Inc. 1 1 1 0.000Premier Communications 17,599 97,745 26,026 0.000Price County Information Systems, LLC 1,544 13,825 1,793 0.000Prime Time Ventures, LLC 3,211,260 3,040,270 77,141 0.001PrimeLink, Inc. 371,384 928,368 97,558 0.001Progress International, LLC 73,170,529 1,535,949,159 41,732,568 0.493Project Mutual Telephone 17,896 170,375 47,347 0.001Protel Advantage, Inc. d/b/a Long Distance Savings 4,916 36,907 45,714 0.001Protel International, LLC 2,749,394 8,832,240 472,092 0.006PRT Communications, LLC 12,513 81,342 23,551 0.000Public Communications Services, Inc. 988,497 9,884,972 1,235,622 0.015Public Service Data, Inc 4,063 35,350 7,233 0.000Pulaski White Communications, Inc. 1,172 8,623 1,754 0.000Pulse Telecom, LLC 4,370,748 39,212,544 3,329,599 0.039Pymatuning Independent Tel. Co. PT Communications, Inc. d/b/a Pymatuning Long Distance 1,306 7,876 3,168 0.000Qwest Services Corporation El Paso County Telephone Company 2,938 30,491 5,751 0.000 Qwest Communications Company 1,544,128,556 6,185,778,995 311,105,277 3.678 Qwest LD Corporation 79,002,148 330,228,981 65,923,583 0.779 Qwest Wireless, L.L.C. 1,608,664 12,745,883 2,011,554 0.024Radcliffe Telephone Company 42 256 80 0.000Rainbow Telecommunications Association, Inc. Carson Communications, LLC d/b/a Rainbow Communications 1,711 17,248 4,040 0.000Randolph Telephone Telecommunications, Inc. 5,430 40,729 8,984 0.000RD Tel, Inc. 1,364,736 6,549,092 1,541,885 0.018Readlyn Telephone Company 186 1,232 421 0.000Reasnor Telephone Company 66 690 180 0.000Red River Rural Telephone Association 3,932 16,524 4,679 0.000Reduced Rate Long Distance, LLC 5,012 1,127,643 125,294 0.001Redwood Long Distance Company 388 1,573 3,101 0.000Reedsburg Utility Commission 1,395 8,620 2,234 0.000Reliance Communications International, Inc. 149,084,006 1,556,947,430 113,560,691 1.342Respond Communications, Inc. Montrose Mutual Long Distance, Inc. 287 1,646 1,097 0.000Reunion Communications, Inc. 37,144 260,010 48,150 0.001Reynolds Long Distance, Inc. 399 2,338 501 0.000Rice Belt Telephone Company, Inc. Rice Belt Telephone Company 416 1,733 487 0.000Richland-Grant Long Distance, Inc. 2,956 23,695 4,062 0.000Ringgold Telephone Long Distance 7,404 59,141 13,821 0.000Ritter Communications Holdings, Inc E. Ritter Communications, Inc. 8,013 20,859 3,735 0.000 E. Ritter Telephone Company 969 4,664 1,784 0.000 Tri-County Telephone Company 2,024 14,226 5,500 0.000RJB Telecommunications Corp. Hood Canal Telephone Co. d/b/a Hood Canal Communications 2,627 16,416 1,225 0.000RNK, Inc. d/b/a RNK Communications 70,708,619 204,408,022 4,987,292 0.059
- Pure Resale Services Page 16 -

Table D: 2008 Annual Section 43.61 International Pure Resale Traffic Data for All U.S. PointsInternational Message Telephone Resale Service
<<< 2009 Data Not Available at Time of Publication >>>
% of TotalNumber of Number of U.S. Carrier IMTS Resale
Carrier Messages Minutes Revenues RevenuesRoanoke Telephone Co., Inc. d/b/a Roanoke Long Distance 500 3,731 11,268 0.000 %Rochester Telephone Company, Inc. 11,318 55,656 17,997 0.000Rock Port Long Distance 1,150 5,461 935 0.000Rockefeller Group Telecommunications Services, Inc. RGT Utilities, Inc. 783,701 2,938,880 779,816 0.009Rockwell Cooperative Telephone Association 429 4,442 1,037 0.000Roggen Telephone Cooperative Company 94 259 78 0.000ROPIR Communications, Inc. 637 2,009 230 0.000Royal Telephone Company 1 1 1 0.000Runestone Telephone Association d/b/a Runestone Telecom Ass. and Lowry Telephone Company, LLC Runestone 1,002 6,507 1,239 0.000 Lowry 67 421 58 0.000Rural Network Services, Inc. (RNS) 1,682 38,022 4,496 0.000Rural Telephone Service Company, Inc 10,477 81,912 21,261 0.000S&A Communications, Inc. 265 3,518 533 0.000S&T Telephone Association, Inc. S&T Communications, LLC (Ilec) 1,747 18,394 3,874 0.000 S&T Communications, LLC (Goodland/Colby) 4,877 39,210 11,776 0.000 S&T Communications, LLC (other) 212 1,314 334 0.000Sac County Mutual Telephone Company 278 2,486 774 0.000Sacred Wind Communications, Inc 10 18 6 0.000Saddleback Communications 40,937 152,444 19,926 0.000San Isabel Telecom, Inc. 5,268 29,510 2,757 0.000Sand Creek Toll Service Company 782 4,267 210 0.000Sandhill Communications, LLC 11,467 100,148 18,861 0.000Santa Rosa Communications, Ltd. 11,711 37,697 14,841 0.000Santel Communications Cooperative, Inc. 4,517 29,417 9,398 0.000Scatter Creek Communications 2,902 17,182 4,166 0.000Schaller Telephone Company 101 380 94 0.000Scott County Long Distance, Inc. 1,105 6,737 2,285 0.000Scranton Telephone Company 123 1,586 303 0.000SCS Communications & Security, Inc. d/b/a SCTC Long Distance 8,709 66,505 14,787 0.000Seamless Geoport Communications, Inc. 3,126 19,349 3,663 0.000Searsboro Telephone Company 15 43 9 0.000Sebastian Enterprises, Inc. (SEI) Audeamus d/b/a Sebastian 19,434 151,236 76,990 0.001SEI Data, Inc. d/b/a SEI Long Distance, Inc. 1,341 12,388 6,318 0.000Serengeti Partners International, Inc 54,742 348,796 69,103 0.001Shared Network Users Group, Inc. 6,190 21,277 3,877 0.000Sharon Independent Long Distance, LLC 151 682 132 0.000Sharon Telephone Company 294 3,910 1,195 0.000Shawnee Communications, Inc. ShawneeLink Corporation 2,399 17,540 3,557 0.000Shenandoah Long Distance Company (Shentel) 5,696 33,711 3,091 0.000Sherburne Long Distance, Inc. 14,149 99,151 18,503 0.000Sierra Tel Communications Group Sierra Telephone Long Distance 8,208 59,720 4,897 0.000Signal Telecommunications, Inc 2,937,863 17,354,780 2,094,068 0.025Silver Star Telephone Co., Inc. Mountain Land Communications, LLC 16,886 134,408 33,580 0.000Single Source Integrated Services, Inc. 54,354 543,537 67,942 0.001Singlepipe Communications, Inc 82,916 420,068 28,273 0.000Siren Communications, Inc. 1,260 9,294 1,521 0.000Siskiyou Long Distance Co. 3,258 33,681 9,066 0.000SJI, LLC 11,244 64,264 28,551 0.000Sky Connect, LLC 6,004 5,934 8,902 0.000SkyBest Communications, Inc. 24,702 192,727 26,406 0.000Smart City Telecommunications LLC d/b/a Smart City Telecom 84,562 566,223 97,583 0.001Smith Bagley, Inc 905 4,542 9,039 0.000
- Pure Resale Services Page 17 -

Table D: 2008 Annual Section 43.61 International Pure Resale Traffic Data for All U.S. PointsInternational Message Telephone Resale Service
<<< 2009 Data Not Available at Time of Publication >>>
% of TotalNumber of Number of U.S. Carrier IMTS Resale
Carrier Messages Minutes Revenues RevenuesSmithville Telecom, LLC 23,200 311,344 44,734 0.001 %South Arkansas Telephone Company (SATCO) 1,029 4,548 1,725 0.000South Canaan Cellular Communications Company, L.P. 30,502 146,217 22,092 0.000South Canaan Long Distance 1,394 11,980 2,027 0.000South Carolina Net, Inc. d/b/a Spirit Telecom 593,825 4,349,000 559,513 0.007South Central Communications 11,587 86,383 14,417 0.000South Central Wireless, Inc. 2,956 23,590 6,071 0.000South Plains Telephone Cooperative SPTC Telcom, LTD 244 1,119 54 0.000South Slope Cooperative Telephone Company South Slope Cooperative Telephone Company (CLEC) 1,382 11,416 2,741 0.000 South Slope Cooperative Telephone Company (ILEC) 3,667 25,629 8,116 0.000Southeast Nebraska Communications 1,085 8,476 2,489 0.000Southern Kansas Telephone Company 2,757 33,902 8,168 0.000Southern Montana Telephone Company 2,494 30,792 5,068 0.000Southern Telecommunications Co., LLC 10,941 36,180 7,575 0.000Southwest Arkansas Telephone Cooperative, Inc. 1,340 8,745 911 0.000Southwest Texas Long Distance Company 24,993 3,556 16,429 0.000Spectrotel, Inc. 291,155 1,484,745 230,797 0.003Spencer Municipal Utilities 674 3,903 1,342 0.000Spring Valley Telephone Long Distance, Inc. 469 3,744 790 0.000Springcom, Inc. 535 4,803 898 0.000Springville Cooperative Telephone Association, Inc. 362 2,127 689 0.000Spruce Knob Seneca Rocks Telephone Company 398 2,435 165 0.000SRT Communications, Inc. 118,780 591,919 123,727 0.001SST Long Distance (Salina-Spavinaw Telephone Co., Inc.) 1,310 8,583 2,527 0.000St. John Telephone Company 796 4,719 975 0.000St. Paul Cooperative Telephone Association 1,685 11,038 2,755 0.000StanaCard, LLC 16,328,790 148,993,793 12,060,587 0.143Stanton Telecom, Inc. Stanton Long Distance, LLC 592 6,546 917 0.000Star Telephone Membership Corporation Star Telephone Long Distance 12,898 81,969 23,073 0.000State Long Distance Telephone Co. 2,817 31,657 9,125 0.000State Telephone Long Distance Company, Inc. 1,139,517 285,912 172,023 0.002Stouffer Communications, Inc. 533 4,495 491 0.000Stratos Holdings, Inc. Stratos Communications, Inc. 232,859 558,771 422,920 0.005 Stratos Mobile Networks, Inc. 82,261 324,395 199,345 0.002 Stratos Offshore Services Company 244,460 1,168,074 569,418 0.007Strickland Communications, Inc. Brantley Telephone Company Inc. (BTC Long Distance) 3,438 25,718 9,925 0.000Sully Telephone Association 243 1,132 243 0.000Surry Telecommunications, Inc. 8,931 77,196 11,648 0.000Swayzee Telephone Company, Inc. 109 817 80 0.000Sweetser Rural Telephone Company, Inc. Comteck of Indiana, Inc. 525 4,933 255 0.000Swisher Telephone Company 1,292 8,869 1,486 0.000SWO Telecommunications 17 58 19 0.000T-Netix, Inc. Evercom Systems, Inc. 199,018 1,990,180 1,186,750 0.014 T-Netix, Inc. 24,387 243,877 103,892 0.001T3 Communications, Inc. 30,161 164,776 54,401 0.001Taylor Telecommunications, Ltd. d/b/a Taylor Telephone LD 2,098 19,614 3,816 0.000TCO Network, Inc 253,673 507,345 87,995 0.001TDS Telecom TDS Long Distance Corporation 737,739 6,188,511 1,255,023 0.015 TDS Metrocom, LLC 1,135,944 5,762,379 1,053,584 0.012 US Link, Inc. d/b/a TDS Metrocom 537,447 1,689,519 246,213 0.003TEC of Jackson, Inc. 113,822 439,805 52,743 0.001
- Pure Resale Services Page 18 -

Table D: 2008 Annual Section 43.61 International Pure Resale Traffic Data for All U.S. PointsInternational Message Telephone Resale Service
<<< 2009 Data Not Available at Time of Publication >>>
% of TotalNumber of Number of U.S. Carrier IMTS Resale
Carrier Messages Minutes Revenues RevenuesTech-Com, Inc. 402 2,594 2,996 0.000 %TelAtlantic Communications, Inc. 2,089 12,543 1,260 0.000Telco 214, Inc 80,494,928 643,959,423 103,864,423 1.228Telco Experts, LLC 63,569 110,867 23,248 0.000Telcom Supply, Inc. 1,871 15,633 1,765 0.000Tele Circuit Network Corporation 628,161 7,788,586 919,892 0.011Telecal Telecommunications, Inc 6,828,906 66,513,548 11,368,925 0.134Telecom Argentina USA, Inc. 25,450,853 170,910,518 1,424,175 0.017Telecom Italia Sparkle of North America, Inc. 252,687,110 1,111,523,935 46,730,541 0.552Telecom North America, Inc. 90,095,738 178,171,969 5,601,488 0.066TeleDias Communications, Inc. 238,795 2,878,488 566,741 0.007Telefonica Larga Distancia, Inc. (TLD) 1,026,815 3,095,904 351,112 0.004Telegration, Inc. 545,928 2,062,159 271,738 0.003Telekom Malaysia (USA), Inc. 42,307,041 155,209,308 7,826,160 0.093Telemanagement Services, Inc. 5,996 1,645,100 904,805 0.011Telenational Communications, Inc. 2,437,383 19,825,405 1,942,265 0.023Telepak Networks, Inc. 9,851 59,923 4,882 0.000TeleUno, Inc. 236,340 2,797,471 508,781 0.006Telmex Telmex USA, L.L.C. 15,241,465 191,711,511 29,835,391 0.353TelNet Worldwide, Inc. 72,269 321,593 62,736 0.001Telovations, Inc. 10,473 104,733 13,092 0.000Telrite Corporation 23,438 2,237,885 468,765 0.006Telscape Communications, Inc. 7,269,312 69,691,226 8,467,393 0.100Templeton Telephone Company 46 852 773 0.000Texas 10, LLC 528,109 1,056,188 27,741 0.000Thacker-Grisby Tele. Co., Inc. d/b/a Thacker-Grisby Long Distance 579 3,109 1,415 0.000The Community Agency 2,082 9,266 3,990 0.000The Contact Network, Inc. 334 2,804 2,411 0.000The Farmers Mutual Telephone Company of Stanton Iowa 382 5,070 1,075 0.000The Preston Telephone Company 87 896 198 0.000The Toledo Telephone Co. Inc. 1,043 6,957 1,989 0.000The Ultimate Connection, LC d/b/a DayStar Communications 14,080 42,682 14,701 0.000Three River Telco Three River Telco 1,120 9,653 2,629 0.000 Three Rivers Communication, LLC 1,016 4,235 1,099 0.000Threshold Communications 42 189 16 0.000Titonka Telephone Company 422 2,941 496 0.000TMP Corp. 1,856 7,828 3,573 0.000Tomorrow Valley Communications, LLC 534 2,580 459 0.000Toncom, Inc. 125 1,462 348 0.000Topsham Communications, LLC 362 2,978 593 0.000Totah Communications, Inc. Totel Customer Services, Inc. d/b/a Totel CSI 635 5,920 2,139 0.000Total Call Total Call International, Inc 77,962,887 576,925,362 110,947,185 1.312 Total Call Mobile, Inc 1,114,611 8,248,120 1,586,177 0.019TOUA Long Distance 2,283 10,730 4,916 0.000Townes Telecommunications, Inc Northeast Florida Long Distance Company, Inc. 2,289 11,584 3,613 0.000Traceroad Communications, Inc d/b/a/Traceroad Long Distance 20 13 13 0.000TracFone Wireless, Inc. 7,520,076 39,180,091 6,483,085 0.077Trans National Communications International, Inc. 3,723,777 11,024,595 1,957,026 0.023TransPac Telecom, Inc. 365,028 6,065,741 745,409 0.009TRC Telecom, Inc. 190,301 955,059 179,617 0.002Tri County Telephone Association, Inc. TCT West Telephone Company 12,689 133,809 14,632 0.000 Tri Tel, Inc. 3,856 48,080 7,426 0.000Tri Rural Independent Oprns., L.L.C. (TRIO, L.L.C.) 322 4,180 585 0.000Tri-County Communications, Inc. 2,143 19,581 4,917 0.000Tri-County Telcom, Inc. 4,504 39,948 8,062 0.000
- Pure Resale Services Page 19 -

Table D: 2008 Annual Section 43.61 International Pure Resale Traffic Data for All U.S. PointsInternational Message Telephone Resale Service
<<< 2009 Data Not Available at Time of Publication >>>
% of TotalNumber of Number of U.S. Carrier IMTS Resale
Carrier Messages Minutes Revenues RevenuesTri-County Telephone Association, Inc. 2,017 16,912 4,992 0.000 %Tri-M Communications, Inc. 5,444,607 9,817,207 1,200,417 0.014Triangle Communication System, Inc. 43,018 252,785 44,244 0.001TSC Communications, Inc. 14,200 186,816 44,940 0.001TTUSA Acquisition, Inc. 122,396 22,031,352 2,447,928 0.029Tularosa Basin Telephone Co., Inc. (TBTC) Tularosa Communications, Inc. 1,251 6,558 3,627 0.000TW Telecom Holdings, Inc. TW Telecom, Inc. 12,418,701 55,450,390 5,455,476 0.064Twin City Capital, LLC. 16,183 106,766 78,095 0.001Twin Lakes Communications, Inc. 14,988 90,315 7,630 0.000Twin Valley Communications, Inc. 3,048 22,235 6,802 0.000TX-11 Acquisition LLC d/b/a Cellular One of East Texas 12,828 22,013,698 31,091 0.000U.S. Telecom Long Distance, Inc. 301,937 2,943,974 428,219 0.005U.S. Telestar Commnunications Group, Inc. 2,585 15,783 4,792 0.000Uintah Basin Long Distance, Inc. 9,075 66,342 16,208 0.000Unicap, Inc 11,724 116,271 5,299 0.000Union Information Systems, LLC 1,053 5,431 902 0.000Union Telephone Company 145,352 632,036 156,121 0.002Union Worker Communications, Inc. 3,773 10,226 1,007 0.000United Communications Association, Inc. 31,217 124,866 22,185 0.000United Communications Systems, Inc. 154,863 751,204 123,707 0.001United Farmers Telephone Company 451 1,511 764 0.000United Prepaid Network, Inc 3,769,864 31,739,811 2,590,565 0.031United States Cellular Corporation 14,054,688 57,337,425 15,213,816 0.180United World Telecom, LC 15,929,656 42,489,697 6,482,204 0.077Unitel Global, LLC 4,256,509 31,389,186 4,944,658 0.058University Telcom, Inc 23 571 393 0.000Upper Peninsula Telephone Company 61 334 1,333 0.000US Connection, Inc. 394,264 7,808,819 1,201,720 0.014US Telepacific Holdings Corporation Arrival Communications, Inc 322,021 3,220,208 402,526 0.005 US Telepacific Corporation 4,690,848 46,908,480 5,863,560 0.069US Telesis, Inc. U.S. Telesis, Inc. a Nevada Corporation 1,997 6,391 2,812 0.000 United States Telesis, Inc., a California Corporation 31,290 87,611 12,266 0.000UTC Long Distance, LLC 2,581 20,649 13,771 0.000Utilicom Networks, LLC Sigecom, LLC 54,047 295,305 38,866 0.000VAL-Ed Joint Venture LLP d/b/a 702 Communications 26,261 111,832 19,797 0.000Valley Connections, LLC 17,426 153,185 15,946 0.000Valliant Telephone Company d/b/a Valliant Long Distance 34 178 45 0.000Valstar Inc. 2,320 19,837 3,659 0.000Van Buren Telephone Company, Inc. 860 7,461 2,141 0.000Van Horne Cooperative Telephone Company 123 1,156 206 0.000Vantage Point Solutions Local Access Network, LLC (LAN) 231 2,276 679 0.000 Benton Cooperative Telephone Company (BCTC) 2,144 15,696 2,095 0.000Verizon Communications, Inc. Cellco Partnership Alltel Communications, LLC 30,292,057 64,841,119 15,152,000 0.179 Cellco Partnership d/b/a Verizon Wireless 387,644,427 1,708,891,819 340,307,854 4.023 MCI International, Inc. 412,579,376 1,719,782,031 137,941,547 1.631Vermont Telephone Company, Inc. 15,549 110,146 38,241 0.000Verneau Networks, Inc. 181 924 231 0.000Vernon Communications, LLC 3,200 23,405 4,986 0.000Vertex Telecom, Inc. 28,306,671 39,822,441 16,362,041 0.193Via One Technologies, Inc. 8,322 124,582 9,986 0.000Villisca Farmers Telephone Co. Corp. 95 682 118 0.000VIP Communications, Inc. 8,322,027 65,873,336 11,698,676 0.138
- Pure Resale Services Page 20 -

Table D: 2008 Annual Section 43.61 International Pure Resale Traffic Data for All U.S. PointsInternational Message Telephone Resale Service
<<< 2009 Data Not Available at Time of Publication >>>
% of TotalNumber of Number of U.S. Carrier IMTS Resale
Carrier Messages Minutes Revenues RevenuesVirgin Mobile USA, LP 18,986,105 102,535,483 26,102,209 0.309 %Viscom International 7,067,306 88,409,916 10,860,799 0.128Voda Networks, Inc. 170 17,974 3,794 0.000VoIP Tel, L.P 91,043,194 642,722,812 15,364,750 0.182Volcano Communications Group Volcano Long Distance 1,507 11,297 3,706 0.000Volunteer First Services, Inc. 1,283 4,014 583 0.000VoxNet, LLC 7,911 7,153 507 0.000VTX Communications, L.P. 57,142 381,515 94,071 0.001Wabash Independent Networks, Inc. 1,291 7,945 6,892 0.000Wahkiakum West Long Distance, Inc. 1,533 13,722 4,575 0.000Waldron Communication Company 466 1,510 99 0.000Walnut Hill Telephone Company 682 3,528 1,463 0.000Walnut Telephone Company 1,078 7,237 1,990 0.000Wamego Telecommunications Co., Inc. WTC Communications Co., Inc. 4,931 45,906 8,689 0.000Warwick Valley Long Distance Co., Inc. 27,156 227,577 23,483 0.000Washington County Rural Telephone Cooperative, Inc. 334 2,583 140 0.000Washington RSA No. 8 Limited Partnership 10,917 29,506 8,438 0.000Waverly Hall Telephone, L.L.C. 256 993 451 0.000WDT World Discount Telecommunications Corp. 25,304,305 228,408,727 16,678,953 0.197Wellman Cooperative Telephone Association 400 3,467 1,367 0.000WERCS Communications 71 1,751 156 0.000Wes-Tex Telecommunications, Ltd. 10,691 89,802 23,310 0.000West Carolina Communications, LLC 9,872 89,299 18,144 0.000West Central Telephone Association 729 3,668 950 0.000West Kentucky Rural Telephone Coop. Corp., Inc. West Kentucky Networks Long Distance, Inc. 13,657 87,791 10,827 0.000West Liberty Telephone Company 8,540 66,473 25,663 0.000West River Telecommunications Cooperative 10,824 65,613 22,861 0.000West Tennessee Telephone Company, Inc d/b/a West Tennessee LD 92 289 792 0.000West Texas Rural Telephone Coop., Inc. Hereford Long Distance 1,494 10,342 4,894 0.000West Wisconsin Telcom Coop., Inc. 3,978 24,940 8,380 0.000WesTel Systems HTC Communications LLC d/b/a WesTel Systems 318 3,416 1,432 0.000 MidlandsNet LLC d/b/a WesTel Systems 1,471 7,639 3,135 0.000Westelcom Networks, Inc. 76,037 253,104 16,095 0.000Western Elite Incorporated Services Inland Long Distance Company d/b/a Inland Networks 1,210 8,498 2,115 0.000Western Iowa Telephone Association Western Iowa Long Distance 1,403 10,118 2,511 0.000Western Long Distance, Inc 132,224 617,825 68,753 0.001Westphalia Telephone Company 628 4,248 733 0.000Wheat State Telephone Company 1,408 2,121 8,371 0.000Wholesale Carrier Services, Inc. 877,977 2,187,544 407,796 0.005Wiggins Telephone Association Northern Colorado Communications, Inc. 1,145 9,268 2,474 0.000Wilkes Communications, Inc 3,986 28,016 10,147 0.000Wilkes Telephone & Electric Company Wilkes Long Distance Services 4,309 20,896 9,278 0.000Wilson Communication Company, Inc. 1,158 6,690 1,887 0.000Windstream Communications, Inc. Windstream Communications, Inc. (IXC) 3,326,260 25,301,846 4,232,977 0.050 Windstream Kerrville Long Distance, LLC 28,296 260,366 48,257 0.001 Windstream Southwest Long Distance, LP 614,386 5,924,102 1,031,271 0.012 Windstream Systems of the Midwest 426,927 2,240,254 377,271 0.004Winn Telephone Company d/b/a Winn Telecom 3,352 20,573 3,358 0.000Winnebago Cooperative Telephone Association WCTA Long Distance Co. 9,817 47,912 22,908 0.000Wittenberg Cable TV Company, Inc. 950 4,802 1,507 0.000
- Pure Resale Services Page 21 -

Table D: 2008 Annual Section 43.61 International Pure Resale Traffic Data for All U.S. PointsInternational Message Telephone Resale Service
<<< 2009 Data Not Available at Time of Publication >>>
% of TotalNumber of Number of U.S. Carrier IMTS Resale
Carrier Messages Minutes Revenues RevenuesWood County Telephone Company Central Wisconsin Comm., Inc. d/b/a Solarus Long Distance 17,221 104,770 149,801 0.002 %Working Assets Funding Service, Inc. d/b/a Credo Long Distance 1,222,212 11,836,723 4,345,176 0.051World Communications, Inc. 1,297,946 2,385,227 429,252 0.005WorldNet Telecommunications, Inc. 407,146 1,776,961 628,359 0.007Worldwide Telecommunications, Inc. 824,685 1,793,318 172,024 0.002WTC Communications, Inc. 133 685 179 0.000WTI Communications, Inc. 40,573 405,726 99,603 0.001WWC, Inc. d/b/a Solution Long Distance 136 523 168 0.000Wyoming Mutual Telephone Co 42 297 56 0.000XIT Rural Telephone Cooperative, Inc. HFT Communications LP d/b/a Brazoria Long Distance 1,607 9,312 6,708 0.000 XIT Telecommunications & Technology, Ltd. 11,950 114,700 16,435 0.000Xtension Services, Inc. 26,257,982 21,656,035 596,636 0.007Yadkin Valley Telecom, Inc. 16,179 160,258 26,501 0.000Yak America, Inc. 1,424,594 14,245,938 1,780,742 0.021Yelcot Telephone Company 1,051 6,872 2,388 0.000Yeoman Communications Company, Inc. 39 241 50 0.000Yucca Telecommunications Systems, Inc. d/b/a Yucca Communications 3,531 26,351 2,547 0.000Yukon-Waltz Communications, Inc. 3,128 15,869 2,445 0.000Zefcom, LLC d/b/a Telispire PCS 4,532 95,633 32,819 0.000 Total Above Reporting IMTS Resale Carriers: 1,109 8,365,873,543 48,287,674,919 4,078,985,691 48.221 % Sum of 66 Carriers Requesting Confidential Treatment 6,259,809,952 38,388,501,668 4,380,039,685 51.779 Sum of All Carriers 14,625,683,495 86,676,176,587 8,459,025,376 100.000 %
Note: Carriers provide pure resale services by switching traffic to (and reselling the switched services of) underlying U.S. carriers. The underlying carriers control the circuit that carries the traffic to the international point, arrange for termination of the traffic and report the traffic on a country-by-country basis. Reporting underlying U.S. carriers' country-by-country data are available in Section A: Switched Services Telephone of this annual publication, International Telecommunications Data.
- Pure Resale Services Page 22 -

2008 Annual Section 43.61 International Traffic Data for All U.S. Points: All Settlement ArrangementsTable E: Market Shares Message Telephone Service Billing Types Covered: 1, 2, 3, 4, 5, 11, 12, 14, 15
International Point Traffic Billed in the United States Traffic Billed in Foreign Countries U.S. and Foreign Billed TrafficOriginating or Terminating Originating or Terminating Transiting the United States Originating or Terminating
in the United States in the United States (by Country of Origin) in the United States
Billed Percent share by carrier Receipts Percent share by carrier Receipts Percent share by carrier Total Percent share by carrier
Revenues 1 2 3 4 Other from PTT 1 2 3 4 Other from PTT 1 2 3 4 Other Minutes 1 2 3 4 Other
Andorra $95,526 0.0 0.1 0.2 12.3 87.4 $977 0.0 0.0 0.0 0.0 100.0 $60 0.0 0.0 0.0 0.0 100.0 688,664 0.0 0.1 1.6 19.6 78.8Austria $16,329,911 0.0 0.0 1.1 31.8 67.2 $1,825,474 0.0 0.0 0.0 39.9 60.1 $840,463 0.0 0.0 0.0 0.0 100.0 205,911,383 0.0 0.0 3.7 38.4 57.9Belgium $21,202,971 0.0 0.1 1.1 10.2 88.6 $2,150,480 0.0 0.0 0.0 32.4 67.6 $19,473,691 0.0 0.0 0.0 0.0 100.0 418,020,278 0.0 0.0 0.5 29.5 70.0Cyprus $1,881,304 0.0 0.0 0.9 12.0 87.0 $104,905 0.0 0.0 0.0 50.9 49.1 $124,472 0.0 0.0 0.0 0.0 100.0 34,647,850 0.0 0.1 2.4 24.9 72.7Denmark $11,136,682 0.0 0.0 0.9 26.6 72.5 $614,610 0.0 0.0 0.0 24.9 75.1 $4,535,307 0.0 0.0 0.0 0.0 100.0 155,622,123 0.0 0.0 1.9 43.8 54.2Finland $5,603,208 0.0 0.1 1.7 24.5 73.7 $112,233 0.0 0.0 0.0 53.5 46.5 $7,325 0.0 0.0 0.0 0.0 100.0 67,162,410 0.0 0.1 2.6 34.1 63.2France $73,775,863 0.0 0.0 0.6 17.3 82.2 $8,033,986 0.0 0.0 0.0 39.7 60.3 $20,258,689 0.0 0.0 0.0 0.0 100.0 1,205,778,693 0.0 0.0 0.4 31.2 68.5Germany $99,201,350 0.0 0.0 0.7 19.1 80.1 $14,713,835 0.0 0.0 0.0 30.0 70.0 $35,996,200 0.0 0.0 0.0 0.0 100.0 2,409,349,603 0.0 0.0 1.8 29.4 68.7Gibraltar $261,180 0.0 0.0 0.0 0.3 99.6 $4,232 0.0 0.0 0.0 0.0 100.0 $5,536 0.0 0.0 0.0 0.0 100.0 3,653,059 0.0 0.0 0.0 0.4 99.6Greece $19,344,942 0.0 0.0 3.2 20.4 76.3 $2,322,088 0.0 0.0 0.0 45.6 54.4 $14,842,460 0.0 0.0 0.0 0.0 100.0 302,185,704 0.0 0.0 6.8 39.3 54.0Greenland $128,617 0.0 0.0 0.0 1.3 98.7 $1,288 0.0 0.0 0.0 0.0 100.0 $237 0.0 0.0 0.0 0.0 100.0 263,445 0.0 0.0 0.0 1.8 98.2Iceland $1,829,540 0.0 0.0 0.1 24.7 75.2 $111,995 0.0 0.0 0.0 40.6 59.4 $1,130 0.0 0.0 0.0 0.0 100.0 21,402,924 0.0 0.0 0.2 36.8 63.0Ireland $38,468,029 0.0 0.0 0.6 17.1 82.3 $5,300,736 0.0 0.0 0.0 31.8 68.2 $7,231,516 0.0 0.0 0.0 0.0 100.0 606,304,885 0.0 0.0 0.9 38.8 60.3Italy $62,254,856 0.0 0.1 4.9 14.8 80.3 $4,917,768 0.0 0.0 0.0 27.3 72.7 $59,271,349 0.0 0.0 0.0 0.0 100.0 1,064,538,708 0.0 0.1 10.6 18.6 70.7Liechtenstein $9,084,503 0.0 0.1 8.2 24.0 67.7 $19,353 0.0 0.0 0.0 0.0 100.0 $37,585 0.0 0.0 0.0 0.0 100.0 22,857,737 0.0 0.1 8.8 27.7 63.3Luxembourg $2,730,572 0.0 0.0 1.0 23.1 75.9 $141,362 0.0 0.0 0.0 20.1 79.9 $2,942,259 0.0 0.0 0.0 0.0 100.0 41,354,155 0.0 0.0 1.4 49.0 49.5Malta $1,454,518 0.0 0.0 2.5 25.5 71.9 $42,666 0.0 0.0 0.0 36.7 63.3 $1,682 0.0 0.0 0.0 0.0 100.0 23,072,405 0.0 0.0 2.0 19.0 79.0Netherlands $39,503,673 0.0 0.0 1.0 14.1 84.9 $2,199,989 0.0 0.0 0.0 70.4 29.6 $55,383,000 0.0 0.0 0.0 0.0 100.0 876,796,609 0.0 0.0 1.7 38.0 60.3Norway $11,690,035 0.0 0.1 2.7 20.2 77.0 $823,465 0.0 0.0 0.0 37.4 62.6 $4,836,514 0.0 0.0 0.0 0.0 100.0 205,764,615 0.0 0.0 2.8 41.3 55.8Portugal $11,987,316 0.0 0.0 3.1 27.1 69.8 $905,786 0.0 0.0 0.0 66.9 33.1 $2,808,501 0.0 0.0 0.0 0.0 100.0 197,632,862 0.0 0.0 7.7 47.4 44.9Spain $60,045,031 0.0 0.0 2.0 17.3 80.7 $2,543,318 0.0 0.0 0.0 32.8 67.2 $53,515,950 0.0 0.0 0.0 0.0 100.0 692,816,462 0.0 0.0 2.5 26.0 71.4Sweden $18,831,832 0.0 0.0 1.5 32.9 65.6 $2,229,430 0.0 0.0 0.0 31.4 68.6 $18,434,643 0.0 0.0 0.0 0.0 100.0 413,194,214 0.0 0.0 2.0 45.2 52.8Switzerland $30,224,400 0.0 0.0 0.6 12.4 87.0 $3,632,511 0.0 0.0 0.0 18.1 81.9 $18,879,517 0.0 0.0 0.0 0.0 100.0 619,480,121 0.0 0.0 1.0 25.3 73.7Turkey $17,255,500 0.0 0.0 7.0 15.1 77.8 $516,514 0.0 0.0 0.0 10.7 89.3 $938,786 0.0 0.0 0.0 0.0 100.0 200,461,461 0.0 0.0 18.6 25.0 56.3United Kingdom $242,244,410 0.0 0.2 0.3 21.8 77.7 $17,487,561 0.0 0.0 0.0 20.0 80.0 $85,627,679 0.0 0.0 0.0 0.0 100.0 4,506,164,878 0.0 0.3 0.3 27.0 72.5
Western Europe $796,565,769 0.0 0.1 1.4 19.3 79.2 $70,756,562 0.0 0.0 0.0 30.6 69.4 $405,994,551 0.0 0.0 0.0 0.0 100.0 14,295,125,248 0.0 0.1 2.3 29.9 67.7
Algeria $5,330,280 0.0 0.0 5.8 18.3 75.9 $1,325,064 0.0 0.0 0.0 0.0 100.0 $878 0.0 0.0 0.0 0.0 100.0 59,509,609 0.0 0.0 4.8 14.0 81.1Angola $10,040,849 0.0 0.0 1.7 34.6 63.7 $42,677 0.0 0.0 0.0 0.0 100.0 $98,975 0.0 0.0 0.0 0.0 100.0 52,629,740 0.0 0.0 2.6 43.5 53.8Benin $5,033,191 0.0 0.0 3.1 42.6 54.3 $70,480 0.0 0.0 0.0 13.0 87.0 $851,118 0.0 0.0 0.0 0.0 100.0 31,347,847 0.0 0.0 3.0 42.3 54.6Botswana $2,013,516 0.0 0.1 0.3 17.7 81.9 $77,392 0.0 0.0 0.0 0.0 100.0 $450 0.0 0.0 0.0 0.0 100.0 15,814,920 0.0 0.1 0.3 19.8 79.7Burkina $5,800,472 0.0 0.0 11.3 40.0 48.7 $102,122 0.0 0.0 0.0 11.8 88.2 $34,762 0.0 0.0 0.0 0.0 100.0 112,531,115 0.0 0.0 3.8 13.1 83.1Burundi $576,773 0.0 0.0 2.6 29.2 68.2 $20,539 0.0 0.0 0.0 0.0 100.0 $684 0.0 0.0 0.0 0.0 100.0 5,802,560 0.0 0.0 2.6 29.9 67.5Cameroon $13,891,883 0.0 0.0 2.6 6.3 91.0 $224,993 0.0 0.0 0.0 12.0 88.0 $4,334 0.0 0.0 0.0 0.0 100.0 79,513,379 0.0 0.0 2.5 7.6 90.0Canary Island $0 $0 $0 0Cape Verde $6,281,711 0.0 0.0 4.8 71.5 23.7 $31,844 0.0 0.0 0.0 30.4 69.6 $17,417 0.0 0.0 0.0 0.0 100.0 37,460,798 0.0 0.0 4.4 67.0 28.7Central African Republic $517,244 0.0 0.0 0.1 37.7 62.2 $2,390 0.0 0.0 0.0 0.0 100.0 $10 0.0 0.0 0.0 0.0 100.0 2,032,333 0.0 0.0 0.1 30.7 69.2Chad $1,450,680 0.0 0.0 0.4 48.4 51.2 $16,193 0.0 0.0 0.0 0.0 100.0 $1,468 0.0 0.0 0.0 0.0 100.0 12,347,337 0.0 0.0 0.4 54.0 45.6Comoros $2,248,214 0.0 0.0 6.6 23.9 69.5 $8,767 0.0 0.0 0.0 0.0 100.0 $798 0.0 0.0 0.0 0.0 100.0 6,649,567 0.0 0.0 8.1 23.1 68.8Congo $4,103,083 0.0 0.6 7.9 37.7 53.9 $70,190 0.0 0.0 0.0 0.0 100.0 $3,628 0.0 0.0 0.0 0.0 100.0 36,722,222 0.0 0.5 8.6 26.1 64.8Cote d'Ivoire $10,726,608 0.0 0.0 1.7 24.3 73.9 $99,210 0.0 0.0 0.0 0.0 100.0 $2,670,368 0.0 0.0 0.0 0.0 100.0 60,500,454 0.0 0.0 2.0 28.2 69.8Djibouti $1,413,883 0.0 0.4 0.1 9.7 89.9 $73,899 0.0 0.0 0.0 0.0 100.0 $776 0.0 0.0 0.0 0.0 100.0 6,336,739 0.0 0.2 0.1 7.5 92.2Egypt $38,059,690 0.0 0.0 1.5 29.6 68.9 $703,630 0.0 0.0 0.0 23.6 76.4 $52,881 0.0 0.0 0.0 0.0 100.0 421,106,009 0.0 0.0 1.4 31.7 66.9Equatorial Guinea $1,538,029 0.0 0.0 0.1 25.4 74.5 $8,986 0.0 0.0 0.0 0.0 100.0 $974 0.0 0.0 0.0 0.0 100.0 7,535,657 0.0 0.0 0.1 26.3 73.6Ethiopia $34,703,732 0.0 0.0 14.5 42.8 42.7 $536,630 0.0 0.0 0.0 3.8 96.2 $65,006 0.0 0.0 0.0 0.0 100.0 195,372,255 0.0 0.0 12.7 39.4 47.9Gabon $2,777,370 0.0 0.0 1.0 48.4 50.6 $54,787 0.0 0.0 0.0 21.7 78.3 $1,898,256 0.0 0.0 0.0 0.0 100.0 29,459,728 0.0 0.0 1.1 55.1 43.8Gambia, The $5,718,336 0.0 0.0 0.7 7.3 92.0 $303,574 0.0 0.0 0.0 0.0 100.0 $2,717 0.0 0.0 0.0 0.0 100.0 23,446,037 0.0 0.0 0.7 7.5 91.8
Carrier 1: EPM Telecomunicaciones S.A. E.S.P. Carrier 2: Reliance Communications, Inc. Carrier 3: Telecom Italia Sparkle of North America., Inc. Carrier 4: Verizon Communications Inc.
- Switched Services Market Shares Page 1 -

2008 Annual Section 43.61 International Traffic Data for All U.S. Points: All Settlement ArrangementsTable E: Market Shares Message Telephone Service Billing Types Covered: 1, 2, 3, 4, 5, 11, 12, 14, 15
International Point Traffic Billed in the United States Traffic Billed in Foreign Countries U.S. and Foreign Billed TrafficOriginating or Terminating Originating or Terminating Transiting the United States Originating or Terminating
in the United States in the United States (by Country of Origin) in the United States
Billed Percent share by carrier Receipts Percent share by carrier Receipts Percent share by carrier Total Percent share by carrier
Revenues 1 2 3 4 Other from PTT 1 2 3 4 Other from PTT 1 2 3 4 Other Minutes 1 2 3 4 Other
Ghana $50,014,164 0.0 0.1 1.7 8.8 89.4 $2,066,933 0.0 0.0 0.0 4.3 95.7 $48,565 0.0 0.0 0.0 0.0 100.0 385,164,107 0.0 0.1 2.7 11.9 85.3Guinea $7,409,046 0.0 0.0 0.9 14.3 84.8 $339,865 0.0 0.0 0.0 0.0 100.0 $1,988 0.0 0.0 0.0 0.0 100.0 45,988,060 0.0 0.0 0.8 13.2 85.9Guinea-Bissau $3,345,633 0.0 0.0 10.0 77.7 12.3 $4,047 0.0 0.0 0.0 0.0 100.0 $171 0.0 0.0 0.0 0.0 100.0 5,949,051 0.0 0.0 33.3 51.7 15.0Kenya $9,107,313 0.0 0.3 2.5 10.7 86.5 $257,616 0.0 0.0 0.0 3.2 96.8 $3,588 0.0 0.0 0.0 0.0 100.0 68,144,225 0.0 0.4 4.4 11.8 83.4Lesotho $422,245 0.0 0.0 0.5 17.4 82.1 $4,072 0.0 0.0 0.0 0.0 100.0 $54,200 0.0 0.0 0.0 0.0 100.0 2,467,035 0.0 0.0 0.5 17.2 82.3Liberia $6,161,464 0.0 0.0 3.1 8.4 88.6 $30,866 0.0 0.0 0.0 0.0 100.0 $2,657 0.0 0.0 0.0 0.0 100.0 32,505,824 0.0 0.0 3.4 8.9 87.6Libya $10,583,592 0.0 0.1 4.5 10.0 85.4 $82,589 0.0 0.0 0.0 0.0 100.0 $2,979 0.0 0.0 0.0 0.0 100.0 53,237,159 0.0 0.1 4.3 10.1 85.5Madagascar $6,229,548 0.0 0.0 0.4 22.7 76.9 $37,547 0.0 0.0 0.0 0.0 100.0 $12,849 0.0 0.0 0.0 0.0 100.0 20,303,124 0.0 0.0 0.6 33.3 66.1Malawi $3,077,092 0.0 0.1 8.2 36.2 55.5 $67,720 0.0 0.0 0.0 12.5 87.5 $2,521 0.0 0.0 0.0 91.1 8.9 27,996,790 0.0 0.0 7.5 34.8 57.7Mali $8,115,943 0.0 0.0 11.6 24.7 63.6 $723,018 0.0 0.0 0.0 7.3 92.7 $31,664 0.0 0.0 0.0 0.0 100.0 51,050,285 0.0 0.0 9.9 28.0 62.1Mauritania $2,320,247 0.0 0.0 4.5 10.2 85.3 $40,394 0.0 0.0 0.0 0.0 100.0 $1,226 0.0 0.0 0.0 0.0 100.0 12,709,633 0.0 0.0 5.2 11.2 83.6Mauritius $1,043,582 0.0 0.3 0.7 0.9 98.1 $525,185 0.0 0.0 0.0 0.0 100.0 $177,104 0.0 0.0 0.0 0.0 100.0 40,915,815 0.0 0.1 0.2 0.2 99.6Morocco $32,831,388 0.0 0.0 4.5 23.1 72.4 $936,377 0.0 0.0 0.0 3.9 96.1 $10,972 0.0 0.0 0.0 0.0 100.0 187,876,998 0.0 0.0 4.6 20.0 75.4Mozambique $1,422,990 0.0 0.2 1.2 8.9 89.7 $22,829 0.0 0.0 0.0 0.0 100.0 $327 0.0 0.0 0.0 0.0 100.0 10,199,240 0.0 0.2 1.6 11.4 86.7Namibia $831,514 0.0 0.1 1.5 12.3 86.2 $44,204 0.0 0.0 0.0 0.0 100.0 $377 0.0 0.0 0.0 0.0 100.0 6,435,146 0.0 0.0 1.6 9.8 88.6Niger $3,824,140 0.0 0.0 0.7 13.6 85.7 $25,331 0.0 0.0 0.0 0.0 100.0 $4 0.0 0.0 0.0 0.0 100.0 37,203,861 0.0 0.0 0.8 11.7 87.5Nigeria $80,157,621 0.0 0.1 0.7 4.6 94.6 $1,172,846 0.0 0.0 0.0 0.1 99.9 $4,061,973 0.0 0.0 0.0 0.0 100.0 727,412,092 0.0 0.1 0.9 5.1 94.0Reunion $1,037,638 0.0 0.0 0.5 41.3 58.2 $3,345 0.0 0.0 0.0 0.0 100.0 $92 0.0 0.0 0.0 0.0 100.0 6,289,856 0.0 0.0 2.2 49.5 48.3Rwanda $592,403 0.0 0.1 1.4 14.8 83.7 $53,912 0.0 0.0 0.0 0.0 100.0 $649 0.0 0.0 0.0 0.0 100.0 6,519,728 0.0 0.1 1.2 15.2 83.5Saint Helena $35,263 0.0 0.0 0.2 21.1 78.7 $82 0.0 0.0 0.0 0.0 100.0 $323 0.0 0.0 0.0 0.0 100.0 51,826 0.0 0.0 0.1 23.6 76.4Sao Tome and Principe $17,900,351 0.0 0.2 0.0 19.2 80.6 $241 0.0 0.0 0.0 0.0 100.0 $1,238 0.0 0.0 0.0 0.0 100.0 21,655,260 0.0 0.5 0.0 19.3 80.2Senegal $19,571,938 0.0 0.3 8.3 12.6 78.9 $730,108 0.0 0.0 0.0 5.3 94.7 $18,874 0.0 0.0 0.0 0.0 100.0 122,091,030 0.0 0.0 7.6 16.1 76.3Seychelles $284,080 0.0 0.0 10.2 29.3 60.5 $17,840 0.0 0.0 0.0 0.0 100.0 $23,023 0.0 0.0 0.0 0.0 100.0 2,677,033 0.0 0.0 15.5 24.9 59.6Sierra Leone $17,926,976 0.0 0.0 0.4 3.6 95.9 $599,257 0.0 0.0 0.0 0.0 100.0 $53,176 0.0 0.0 0.0 0.0 100.0 78,362,753 0.0 0.0 0.4 3.6 96.0Somalia $7,949,648 0.0 0.1 1.2 8.3 90.4 $84,901 0.0 0.0 0.0 0.0 100.0 $34,186 0.0 0.0 0.0 0.0 100.0 22,145,322 0.0 0.1 1.1 7.3 91.6South Africa $29,495,248 0.0 0.1 1.2 10.9 87.9 $1,525,673 0.0 0.0 0.0 4.8 95.2 $12,695,606 0.0 0.0 0.0 0.0 100.0 402,185,655 0.0 0.4 1.0 14.5 84.1Sudan $4,933,860 0.0 0.0 2.4 25.5 72.1 $395,271 0.0 0.0 0.0 0.0 100.0 $130,349 0.0 0.0 0.0 0.0 100.0 51,469,468 0.0 0.0 2.7 27.4 69.9Swaziland $822,932 0.0 0.1 0.2 4.3 95.5 $7,843 0.0 0.0 0.0 0.0 100.0 $117 0.0 0.0 0.0 0.0 100.0 6,353,955 0.0 0.0 0.2 4.9 94.9Tanzania $4,633,023 0.0 0.1 2.4 13.3 84.3 $318,172 0.0 0.0 0.0 2.8 97.2 $415,983 0.0 0.0 0.0 0.0 100.0 37,649,036 0.0 0.1 3.4 15.1 81.5Togo $6,412,366 0.0 0.0 45.2 13.0 41.8 $452,441 0.0 0.0 0.0 0.0 100.0 $170,667 0.0 0.0 0.0 0.0 100.0 28,117,012 0.0 0.0 43.4 14.0 42.5Tunisia $14,448,569 0.0 0.0 6.6 17.7 75.7 $503,619 0.0 0.0 0.0 0.0 100.0 $31,006 0.0 0.0 0.0 0.0 100.0 67,661,551 0.0 0.0 6.6 18.9 74.5Uganda $6,842,373 0.0 0.1 2.0 10.4 87.5 $200,706 0.0 0.0 0.0 0.1 99.9 $976,416 0.0 0.0 0.0 0.0 100.0 60,290,882 0.0 0.2 2.9 12.7 84.2Western Sahara $0 $0 $0 0Zaire $6,128,703 0.0 0.0 0.0 0.0 100.0 $620,114 0.0 0.0 0.0 0.0 100.0 $6,197,152 0.0 0.0 0.0 0.0 100.0 37,097,874 0.0 0.0 0.0 0.0 100.0Zambia $4,215,029 0.0 1.1 7.1 17.5 74.3 $87,681 0.0 0.0 0.0 1.1 98.9 $454,348 0.0 0.0 0.0 0.1 99.9 42,223,909 0.0 2.5 14.2 15.6 67.8Zimbabwe $7,612,103 0.0 0.0 1.5 23.0 75.5 $238,128 0.0 0.0 0.0 0.0 100.0 $2,345 0.0 0.0 0.0 0.0 100.0 47,719,144 0.0 0.0 1.4 25.1 73.6
Africa $529,965,569 0.0 0.1 3.9 18.1 77.9 $15,994,140 0.0 0.0 0.0 3.6 96.4 $31,324,215 0.0 0.0 0.0 0.0 100.0 3,952,238,045 0.0 0.1 3.4 17.7 78.8
Bahrain $2,712,296 0.0 0.0 1.7 11.2 87.0 $71,423 0.0 0.0 0.0 59.6 40.4 $527,490 0.0 0.0 0.0 0.0 100.0 31,366,822 0.0 0.1 2.7 34.3 62.9Iran $13,694,945 0.0 0.0 1.8 10.7 87.5 $783,803 0.0 0.0 0.0 11.1 88.9 $31,778 0.0 0.0 0.0 0.0 100.0 162,406,167 0.0 0.0 2.3 10.2 87.5Iraq $10,337,786 0.0 0.0 2.3 27.3 70.3 $929,865 0.0 0.0 0.0 0.1 99.9 $8,830 0.0 0.0 0.0 0.0 100.0 102,304,589 0.0 0.1 2.8 37.5 59.7Israel $71,520,005 0.0 0.0 1.1 9.5 89.4 $3,340,051 0.0 0.0 0.0 20.0 80.0 $3,867,300 0.0 0.0 0.0 0.0 100.0 898,580,529 0.0 0.0 1.4 20.4 78.1Jordan $6,059,948 0.0 0.1 3.8 13.4 82.7 $495,279 0.0 0.0 0.0 15.8 84.2 $2,517,162 0.0 0.0 0.0 0.0 100.0 97,263,077 0.0 0.1 6.3 26.5 67.1Kuwait $9,185,926 0.0 0.5 7.0 10.1 82.4 $273,696 0.0 0.0 0.0 0.0 100.0 $14,481 0.0 0.0 0.0 0.0 100.0 132,748,161 0.0 0.4 5.4 8.4 85.8Lebanon $27,601,382 0.0 0.0 13.7 42.4 43.8 $1,189,963 0.0 0.0 0.0 12.3 87.7 $30,724 0.0 0.0 0.0 0.0 100.0 265,057,415 0.0 0.0 13.5 49.2 37.3Oman $10,132,222 0.0 0.5 2.7 29.0 67.8 $242,990 0.0 0.0 0.0 3.4 96.6 $28,031 0.0 0.0 0.0 0.0 100.0 73,395,726 0.0 0.4 2.5 27.7 69.4Qatar $7,307,216 0.0 0.4 4.6 40.0 55.0 $185,048 0.0 0.0 0.0 24.5 75.5 $511,318 0.0 0.0 0.0 0.0 100.0 52,724,710 0.0 0.3 4.3 46.0 49.5Saudi Arabia $34,102,405 0.0 0.3 0.9 23.4 75.4 $948,096 0.0 0.0 0.0 17.2 82.8 $616,125 0.0 0.0 0.0 0.0 100.0 335,075,421 0.0 0.4 1.2 28.2 70.2
Carrier 1: EPM Telecomunicaciones S.A. E.S.P. Carrier 2: Reliance Communications, Inc. Carrier 3: Telecom Italia Sparkle of North America., Inc. Carrier 4: Verizon Communications Inc.
- Switched Services Market Shares Page 2 -

2008 Annual Section 43.61 International Traffic Data for All U.S. Points: All Settlement ArrangementsTable E: Market Shares Message Telephone Service Billing Types Covered: 1, 2, 3, 4, 5, 11, 12, 14, 15
International Point Traffic Billed in the United States Traffic Billed in Foreign Countries U.S. and Foreign Billed TrafficOriginating or Terminating Originating or Terminating Transiting the United States Originating or Terminating
in the United States in the United States (by Country of Origin) in the United States
Billed Percent share by carrier Receipts Percent share by carrier Receipts Percent share by carrier Total Percent share by carrier
revenues 1 2 3 4 Other from PTT 1 2 3 4 Other from PTT 1 2 3 4 Other Minutes 1 2 3 4 Other
Syria $14,433,371 0.0 0.0 5.1 24.7 70.2 $1,029,420 0.0 0.0 0.0 24.0 76.0 $8,319 0.0 0.0 0.0 0.0 100.0 103,307,169 0.0 0.0 5.0 27.9 67.1United Arab Emirates $48,498,700 0.0 1.8 8.7 25.8 63.7 $1,041,795 0.0 0.0 0.0 22.2 77.8 $906,837 0.0 0.0 0.0 0.0 100.0 410,491,388 0.0 1.5 7.9 29.5 61.1Yemen $9,738,248 0.0 0.4 1.3 31.4 66.9 $202,088 0.0 0.0 0.0 7.9 92.1 $7,896 0.0 0.0 0.0 0.0 100.0 90,804,637 0.0 4.0 1.1 28.8 66.1
Middle East $265,324,450 0.0 0.4 4.5 21.8 73.2 $10,733,517 0.0 0.0 0.0 16.2 83.8 $9,076,291 0.0 0.0 0.0 0.0 100.0 2,755,525,811 0.0 0.4 4.2 26.6 68.8
Anguilla $1,246,217 0.0 0.0 0.0 20.9 79.0 $10,404 0.0 0.0 0.0 0.0 100.0 $204,634 0.0 0.0 0.0 0.0 100.0 6,948,645 0.0 0.0 0.0 25.3 74.7Antigua and Barbuda $4,277,235 0.0 0.0 0.1 22.4 77.5 $52,596 0.0 0.0 0.0 0.0 100.0 $103,406 0.0 0.0 0.0 0.0 100.0 36,439,428 0.0 0.0 0.1 25.5 74.4Aruba $4,898,908 0.0 0.0 0.4 14.1 85.5 $69,952 0.0 0.0 0.0 33.7 66.3 $198,766 0.0 0.0 0.0 0.0 100.0 41,086,832 0.0 0.0 0.3 18.9 80.8Bahamas, The $9,884,846 0.0 0.0 0.7 7.7 91.6 $784,422 0.0 0.0 0.0 15.0 85.0 $3,606,789 0.0 0.0 0.0 0.0 100.0 205,919,123 0.0 0.0 1.5 12.1 86.4Barbados $9,031,607 0.0 0.0 0.2 13.0 86.8 $861,034 0.0 0.0 0.0 38.7 61.3 $648,836 0.0 0.0 0.0 0.0 100.0 104,525,789 0.0 0.0 0.0 23.9 76.0Bermuda $4,358,221 0.0 0.0 0.0 12.5 87.5 $405,595 0.0 0.0 0.0 28.0 72.0 $5,994 0.0 0.0 0.0 0.0 100.0 89,743,805 0.0 0.0 0.0 19.0 81.0Cayman Islands $6,129,860 0.0 0.0 0.0 17.4 82.6 $221,128 0.0 0.0 0.0 18.9 81.1 $20,476 0.0 0.0 0.0 0.0 100.0 52,571,765 0.0 0.0 0.0 20.5 79.4Cuba $215,455,990 0.0 0.0 0.0 6.1 93.9 $812,620 0.0 0.0 0.0 0.0 100.0 $23,002 0.0 0.0 0.0 0.0 100.0 259,394,085 0.0 0.0 0.0 6.7 93.3Dominica $5,537,836 0.0 0.0 0.0 11.4 88.5 $46,782 0.0 0.0 0.0 0.0 100.0 $256,762 0.0 0.0 0.0 0.0 100.0 55,822,585 0.0 0.0 0.0 8.8 91.1Dominican Republic $133,872,955 0.0 0.0 0.7 9.3 90.0 $4,069,605 0.0 0.0 0.0 12.2 87.8 $3,342,431 0.0 0.0 0.0 0.0 100.0 2,164,144,214 0.0 0.0 0.9 9.6 89.6French Overseas Departments $2,370,196 0.0 0.0 1.3 6.9 91.8 $37,573 0.0 0.0 0.0 0.0 100.0 $14,405 0.0 0.0 0.0 0.0 100.0 10,641,047 0.0 0.0 4.3 8.8 87.0Grenada $6,317,592 0.0 0.0 1.0 24.3 74.6 $317,441 0.0 0.0 0.0 0.0 100.0 $31,254 0.0 0.0 0.0 0.0 100.0 59,908,489 0.0 0.0 0.6 22.4 77.0Guadeloupe $2,062,390 0.0 0.0 1.1 43.2 55.7 $6,935 0.0 0.0 0.0 0.0 100.0 $487,818 0.0 0.0 0.0 0.0 100.0 14,463,678 0.0 0.0 3.0 36.1 60.9Haiti $108,759,179 0.0 0.0 15.5 8.2 76.4 $2,534,822 0.0 0.0 0.0 2.5 97.5 $7,367,396 0.0 0.0 0.0 0.0 100.0 639,065,952 0.0 0.0 14.5 8.6 76.9Jamaica $106,906,210 0.0 0.0 1.4 14.1 84.5 $3,787,725 0.0 0.0 0.0 7.3 92.7 $2,649,098 0.0 0.0 0.0 0.0 100.0 996,560,789 0.0 0.0 1.0 12.6 86.3Montserrat $375,620 0.0 0.0 0.0 44.2 55.8 $1,678 0.0 0.0 0.0 0.0 100.0 $11,501 0.0 0.0 0.0 0.0 100.0 2,841,687 0.0 0.0 0.0 57.0 43.0Netherlands Antilles $8,235,363 0.0 0.1 0.0 12.4 87.5 $196,670 0.0 0.0 0.0 41.7 58.3 $4,016,277 0.0 0.0 0.0 0.0 100.0 98,332,417 0.0 0.1 0.0 18.9 81.0Saint Kitts and Nevis $3,795,084 0.0 0.0 0.0 15.0 84.9 $15,748 0.0 0.0 0.0 0.0 100.0 $182,110 0.0 0.0 0.0 0.0 100.0 22,818,851 0.0 0.0 0.0 16.2 83.8Saint Lucia $5,008,063 0.0 0.0 0.9 25.8 73.2 $157,806 0.0 0.0 0.0 0.6 99.4 $125,348 0.0 0.0 0.0 0.0 100.0 39,926,931 0.0 0.0 0.8 22.9 76.3Saint Vincent and the Grenadines $3,616,944 0.0 0.0 1.4 28.1 70.5 $211,281 0.0 0.0 0.0 0.0 100.0 $58,324 0.0 0.0 0.0 0.0 100.0 30,274,603 0.0 0.0 1.0 28.2 70.8Trinidad and Tobago $31,796,803 0.0 0.0 1.7 13.4 84.9 $1,574,629 0.0 0.0 0.0 20.1 79.9 $589,021 0.0 0.0 0.0 0.0 100.0 397,993,185 0.0 0.0 1.9 18.4 79.7Turks and Caicos Islands $4,455,153 0.0 0.0 0.0 25.7 74.3 $57,096 0.0 0.0 0.0 74.0 26.0 $6,457 0.0 0.0 0.0 0.0 100.0 25,618,830 0.0 0.0 0.0 35.4 64.6Virgin Islands, British $4,334,811 0.0 0.0 0.0 13.6 86.4 $261,948 0.0 0.0 0.0 26.1 73.9 $38,324 0.0 0.0 0.0 0.0 100.0 35,754,136 0.0 0.0 0.0 20.3 79.7
Navassa Island $0 $0 $0 0Puerto Rico $1,672 0.0 0.0 0.0 0.0 100.0 $0 $0 40,092 0.0 0.0 0.0 0.0 100.0U.S. Virgin Islands $170,185 0.0 0.0 91.9 0.0 8.1 $1,473 0.0 0.0 0.0 0.0 100.0 $110,984 0.0 0.0 0.0 0.0 100.0 18,823,004 0.0 0.0 96.8 0.0 3.2
Caribbean $682,898,940 0.0 0.0 3.0 10.0 87.0 $16,496,963 0.0 0.0 0.0 12.0 88.0 $24,099,413 0.0 0.0 0.0 0.0 100.0 5,409,659,962 0.0 0.0 2.8 12.2 85.0
Belize $10,804,000 0.0 0.0 0.4 31.3 68.2 $209,934 0.0 0.0 0.0 74.1 25.9 $93,725 0.0 0.0 0.0 97.7 2.3 58,326,058 0.0 0.0 0.4 43.7 55.9Canada $583,654,798 0.0 0.0 0.0 28.3 71.7 $47,938,915 0.0 0.0 0.0 35.5 64.5 $61,583,569 0.0 0.0 0.0 0.0 100.0 18,966,750,165 0.0 0.0 0.0 23.3 76.7Costa Rica $42,661,800 0.0 0.0 2.2 5.3 92.5 $2,514,491 0.0 0.0 0.0 32.8 67.2 $3,238 0.0 0.0 0.0 0.0 100.0 488,175,231 0.0 0.0 4.7 9.1 86.2El Salvador $99,038,187 0.0 0.0 6.1 10.5 83.3 $7,504,830 0.0 0.0 0.0 7.8 92.2 $630,414 0.0 0.0 0.0 0.0 100.0 1,643,523,877 0.0 0.0 3.6 9.0 87.4Guatemala $191,970,359 0.0 0.0 5.9 4.0 90.0 $4,259,339 0.0 0.0 0.0 12.5 87.5 $3,445,975 0.0 0.0 0.0 0.0 100.0 2,339,545,168 0.0 0.0 5.0 5.7 89.3Honduras $43,446,701 0.0 0.0 5.5 29.8 64.7 $2,516,322 0.0 0.0 0.0 19.8 80.2 $1,801,182 0.0 0.0 0.0 0.3 99.7 450,449,429 0.0 0.0 3.9 31.0 65.2Mexico $749,375,034 0.0 0.0 0.3 21.7 78.0 $35,336,159 0.0 0.0 0.0 42.0 58.0 $1,646,451 0.0 0.0 0.0 0.5 99.5 14,072,122,989 0.0 0.0 0.3 19.3 80.4Nicaragua $48,161,262 0.0 0.0 1.2 12.3 86.4 $719,887 0.0 0.0 0.0 16.9 83.1 $449,270 0.0 0.0 0.0 0.0 100.0 356,515,303 0.0 0.0 1.3 13.6 85.0Panama $14,273,945 0.0 0.0 5.6 7.0 87.5 $1,047,816 0.0 0.0 0.0 22.5 77.5 $1,038,251 0.0 0.0 0.0 0.0 100.0 238,619,045 0.0 0.0 5.3 8.6 86.1Saint Pierre and Miquelon $114,428 0.0 0.0 0.0 6.6 93.4 $1,091 0.0 0.0 0.0 0.0 100.0 $96 0.0 0.0 0.0 0.0 100.0 821,994 0.0 0.0 0.0 5.5 94.5
Alaska $3,473 0.0 0.0 0.0 0.0 100.0 $0 $0 75,414 0.0 0.0 0.0 0.0 100.0United States (conterminous) $2,769,325 0.0 0.0 0.0 0.0 100.0 $581,919 0.0 0.0 0.0 0.0 100.0 $0 97,941,614 0.0 0.0 0.0 0.0 100.0
North and Central America $1,786,273,312 0.0 0.0 1.4 20.8 77.8 $102,630,703 0.0 0.0 0.0 33.9 66.1 $70,692,171 0.0 0.0 0.0 0.1 99.9 38,712,866,287 0.0 0.0 0.7 19.9 79.4
Carrier 1: EPM Telecomunicaciones S.A. E.S.P. Carrier 2: Reliance Communications, Inc. Carrier 3: Telecom Italia Sparkle of North America., Inc. Carrier 4: Verizon Communications Inc.
- Switched Services Market Shares Page 3 -

2008 Annual Section 43.61 International Traffic Data for All U.S. Points: All Settlement ArrangementsTable E: Market Shares Message Telephone Service Billing Types Covered: 1, 2, 3, 4, 5, 11, 12, 14, 15
International Point Traffic Billed in the United States Traffic Billed in Foreign Countries U.S. and Foreign Billed TrafficOriginating or Terminating Originating or Terminating Transiting the United States Originating or Terminating
in the United States in the United States (by Country of Origin) in the United States
Billed Percent share by carrier Receipts Percent share by carrier Receipts Percent share by carrier Total Percent share by carrier
Revenues 1 2 3 4 Other from PTT 1 2 3 4 Other from PTT 1 2 3 4 Other Minutes 1 2 3 4 Other
Argentina $29,197,680 0.0 0.0 1.8 9.6 88.5 $1,790,225 0.0 0.0 0.0 18.6 81.4 $14,971,947 0.0 0.0 0.0 0.0 100.0 787,806,143 0.0 0.0 4.5 24.6 70.9Bolivia $29,178,094 0.0 0.0 2.9 28.2 68.9 $266,645 0.0 0.0 0.0 7.5 92.5 $2,084,922 0.0 0.0 0.0 0.0 100.0 374,555,581 0.0 0.0 2.8 35.6 61.6Brazil $120,053,316 0.0 0.0 0.7 17.0 82.4 $3,717,024 0.0 0.0 0.0 44.5 55.5 $21,061,296 0.0 0.0 0.0 0.0 100.0 1,404,135,066 0.0 0.0 1.7 29.3 69.0Chile $18,738,354 0.0 0.0 1.2 11.4 87.4 $3,789,179 0.0 0.0 0.0 22.3 77.7 $4,725,397 0.0 0.0 0.0 0.0 100.0 342,190,746 0.0 0.0 3.0 18.4 78.6Colombia $197,945,140 53.8 0.0 0.6 6.5 39.1 $3,228,237 0.0 0.0 0.0 5.7 94.3 $2,096,719 0.0 0.0 0.0 0.0 100.0 2,852,494,223 55.0 0.0 2.0 8.3 34.6Ecuador $76,267,730 0.0 0.0 3.3 4.6 92.0 $4,556,867 0.0 0.0 0.0 3.0 97.0 $13,963 0.0 0.0 0.0 47.9 52.1 713,738,641 0.0 0.0 3.3 4.8 91.9French Guiana $1,809,428 0.0 0.0 0.0 19.0 81.0 $3,549 0.0 0.0 0.0 0.0 100.0 $5,176 0.0 0.0 0.0 0.0 100.0 14,113,629 0.0 0.0 0.0 17.6 82.4Guyana $42,476,222 0.0 0.0 0.2 8.8 91.0 $648,155 0.0 0.0 0.0 20.4 79.6 $511,351 0.0 0.0 0.0 0.0 100.0 204,019,248 0.0 0.0 0.2 7.8 92.0Paraguay $4,880,793 0.0 0.0 2.8 22.8 74.4 $263,163 0.0 0.0 0.0 19.7 80.3 $235 0.0 0.0 0.0 0.0 100.0 72,589,010 0.0 0.0 4.4 24.7 70.9Peru $58,021,889 0.0 0.0 1.4 14.9 83.6 $3,438,121 0.0 0.0 0.0 20.4 79.6 $13,333,745 0.0 0.0 0.0 0.0 100.0 1,638,449,616 0.0 0.0 3.2 20.0 76.8Suriname $6,413,971 0.0 0.0 0.0 12.3 87.7 $160,621 0.0 0.0 0.0 41.7 58.3 $103,212 0.0 0.0 0.0 0.0 100.0 79,047,423 0.0 0.0 0.0 8.4 91.6Uruguay $8,680,497 0.0 0.0 1.0 15.1 83.9 $260,741 0.0 0.0 0.0 15.8 84.2 $621,423 0.0 0.0 0.0 0.0 100.0 90,925,500 0.0 0.0 1.8 23.8 74.4Venezuela $30,596,177 0.0 0.3 1.4 11.8 86.5 $1,392,694 0.0 0.0 0.0 39.8 60.2 $1,310,440 0.0 0.0 0.0 0.0 100.0 406,932,633 0.0 0.3 4.3 28.9 66.4
South America $624,259,291 17.1 0.0 1.2 11.1 70.6 $23,515,221 0.0 0.0 0.0 20.1 79.9 $60,839,826 0.0 0.0 0.0 0.0 100.0 8,980,997,459 17.5 0.0 2.6 17.6 62.2
Afghanistan $25,911,784 0.0 0.1 1.5 36.8 61.6 $2,643,014 0.0 0.0 0.0 2.1 97.9 $65,013 0.0 0.0 0.0 0.0 100.0 148,223,698 0.0 0.1 1.4 35.4 63.2Bangladesh $13,639,391 0.0 0.1 0.9 21.9 77.1 $929,219 0.0 0.0 0.0 0.2 99.8 $447,913 0.0 0.0 0.0 0.0 100.0 457,994,093 0.0 0.1 0.8 16.8 82.3Bhutan $325,300 0.0 0.1 1.1 46.7 52.1 $1,234 0.0 0.0 0.0 0.0 100.0 $6,683 0.0 0.0 0.0 0.0 100.0 2,384,428 0.0 0.1 1.0 45.6 53.3Brunei $529,320 0.0 0.3 0.1 28.6 71.0 $39,619 0.0 0.0 0.0 42.3 57.7 $634 0.0 0.0 0.0 0.0 100.0 14,572,401 0.0 0.2 0.2 40.9 58.8Burma $9,909,719 0.0 0.1 0.6 19.0 80.3 $31,907 0.0 0.0 0.0 0.0 100.0 $4,910 0.0 0.0 0.0 0.0 100.0 43,251,988 0.0 0.1 0.6 16.5 82.8Cambodia $9,797,454 0.0 0.0 20.9 25.1 53.9 $128,829 0.0 0.0 0.0 5.1 94.9 $60,193 0.0 0.0 0.0 0.0 100.0 135,348,725 0.0 0.0 26.3 30.4 43.3Chagos Archipelago $381,943 0.0 0.0 0.0 23.9 76.1 $47,563 0.0 0.0 0.0 0.0 100.0 $1,091 0.0 0.0 0.0 0.0 100.0 436,224 0.0 0.0 0.0 27.1 72.9China $88,996,743 0.0 0.0 0.1 8.9 91.0 $9,531,963 0.0 0.0 0.0 55.8 44.2 $316,935 0.0 0.0 0.0 0.0 100.0 1,616,761,712 0.0 0.0 0.5 34.4 65.2French Southern and Antarctic Lands $0 $0 $0 0Hong Kong $17,572,642 0.0 0.0 0.1 20.0 79.9 $2,396,605 0.0 0.0 0.0 32.1 67.9 $17,676,033 0.0 0.0 0.0 0.0 100.0 511,917,225 0.0 0.0 0.2 36.4 63.4India $531,140,064 0.0 43.7 1.2 5.7 49.4 $24,969,225 0.0 50.2 0.0 8.1 41.7 $14,308,501 0.0 1.5 0.0 0.0 98.5 10,097,632,758 0.0 54.5 1.8 8.6 35.1Indonesia $20,227,494 0.0 0.0 2.3 28.6 69.0 $384,402 0.0 0.0 0.0 21.6 78.4 $108,275 0.0 0.0 0.0 0.0 100.0 235,196,379 0.0 0.1 5.2 32.4 62.3Japan $68,009,168 0.0 0.0 0.5 20.6 78.9 $12,564,057 0.0 0.0 0.0 43.8 56.2 $3,982,478 0.0 0.0 0.0 0.0 100.0 1,143,820,295 0.0 0.0 0.7 31.2 68.1Korea, North $69,361 0.0 0.0 0.0 23.9 76.1 $67 0.0 0.0 0.0 0.0 100.0 $208 0.0 0.0 0.0 0.0 100.0 105,785 0.0 0.0 0.0 36.7 63.3Korea, South $35,011,745 0.0 0.0 0.3 15.9 83.8 $12,199,916 0.0 0.0 0.0 35.4 64.6 $9,253,894 0.0 0.0 0.0 0.0 100.0 1,023,431,673 0.0 0.0 0.4 19.1 80.5Laos $1,330,042 0.0 0.0 8.6 21.7 69.7 $235,400 0.0 0.0 0.0 0.0 100.0 $161,414 0.0 0.0 0.0 0.0 100.0 29,948,266 0.0 0.0 9.1 18.6 72.3Macau $814,439 0.0 0.0 1.3 16.6 82.0 $483,321 0.0 0.0 0.0 36.0 64.0 $391,243 0.0 0.0 0.0 0.0 100.0 32,460,355 0.0 0.0 1.2 33.8 65.1Malaysia $20,389,568 0.0 1.1 0.4 15.2 83.2 $1,151,002 0.0 0.0 0.0 8.7 91.3 $1,563,464 0.0 0.0 0.0 0.0 100.0 375,303,051 0.0 1.6 0.9 27.2 70.2Maldives $367,150 0.0 0.2 2.6 12.5 84.7 $3,199 0.0 0.0 0.0 0.0 100.0 $280,966 0.0 0.0 0.0 0.0 100.0 2,027,054 0.0 0.2 3.4 12.4 84.0Mongolia $1,554,607 0.0 0.0 0.9 8.6 90.5 $14,856 0.0 0.0 0.0 0.0 100.0 $8,666 0.0 0.0 0.0 0.0 100.0 12,830,940 0.0 0.0 1.1 11.3 87.6Nepal $17,170,434 0.0 0.6 1.3 11.8 86.3 $242,410 0.0 0.0 0.0 0.0 100.0 $177,344 0.0 0.0 0.0 0.0 100.0 127,957,479 0.0 0.6 1.2 11.4 86.8Pakistan $43,304,710 0.0 0.3 3.2 50.8 45.7 $3,748,332 0.0 0.0 0.0 17.9 82.1 $4,862,423 0.0 0.0 0.0 0.0 100.0 699,536,030 0.0 0.3 4.0 53.0 42.8Philippines $359,115,353 0.0 0.1 5.0 25.1 69.9 $6,331,434 0.0 0.0 0.0 4.3 95.7 $5,439,801 0.0 0.0 0.0 0.0 100.0 3,152,249,207 0.0 0.1 5.2 26.2 68.5Singapore $26,035,513 0.0 0.1 0.3 11.8 87.9 $1,755,416 0.0 0.0 0.0 29.6 70.4 $10,465,884 0.0 0.0 0.0 0.0 100.0 467,864,057 0.0 0.3 2.0 33.9 63.9Sri Lanka $31,334,247 0.0 0.2 0.3 6.0 93.5 $446,616 0.0 0.0 0.0 2.9 97.1 $1,778,357 0.0 0.0 0.0 0.0 100.0 399,470,749 0.0 0.2 0.2 5.3 94.2Taiwan $46,724,080 0.0 0.0 0.1 7.0 92.9 $5,498,474 0.0 0.0 0.0 45.5 54.5 $1,620,182 0.0 0.0 0.0 0.0 100.0 842,825,021 0.0 0.0 0.2 23.5 76.3Thailand $12,296,825 0.0 0.1 0.7 18.4 80.8 $2,977,742 0.0 0.0 0.0 20.9 79.1 $13,767 0.0 0.0 0.0 0.0 100.0 541,701,689 0.0 0.0 1.6 31.0 67.3Vietnam $27,358,839 0.0 0.0 0.8 35.2 63.9 $2,044,202 0.0 0.0 0.0 6.0 94.0 $20,777 0.0 0.0 0.0 0.0 100.0 581,732,264 0.0 0.0 0.8 33.8 65.3
Asia $1,409,317,935 0.0 16.5 2.2 15.8 65.6 $90,800,024 0.0 13.8 0.0 25.4 60.8 $73,017,049 0.0 0.3 0.0 0.0 99.7 22,696,983,546 0.0 24.3 2.1 19.8 53.8
Australia $60,605,000 0.0 0.2 0.8 13.4 85.5 $5,242,206 0.0 0.0 0.0 31.9 68.1 $3,729,721 0.0 0.0 0.0 0.0 100.0 1,286,165,458 0.0 0.2 1.9 24.9 73.0Cook Islands $286,267 0.0 0.0 0.0 11.2 88.8 $649 0.0 0.0 0.0 0.0 100.0 $17,619 0.0 0.0 0.0 0.0 100.0 509,740 0.0 0.0 0.0 12.3 87.7Fiji $7,830,059 0.0 0.1 0.1 42.4 57.4 $253,152 0.0 0.0 0.0 15.2 84.8 $2,855 0.0 0.0 0.0 0.0 100.0 44,287,878 0.0 0.0 0.1 46.9 53.0
Carrier 1: EPM Telecomunicaciones S.A. E.S.P. Carrier 2: Reliance Communications, Inc. Carrier 3: Telecom Italia Sparkle of North America., Inc. Carrier 4: Verizon Communications Inc.
- Switched Services Market Shares Page 4 -

2008 Annual Section 43.61 International Traffic Data for All U.S. Points: All Settlement ArrangementsTable E: Market Shares Message Telephone Service Billing Types Covered: 1, 2, 3, 4, 5, 11, 12, 14, 15
International Point Traffic Billed in the United States Traffic Billed in Foreign Countries U.S. and Foreign Billed TrafficOriginating or Terminating Originating or Terminating Transiting the United States Originating or Terminating
in the United States in the United States (by Country of Origin) in the United States
Billed Percent share by carrier Receipts Percent share by carrier Receipts Percent share by carrier Total Percent share by carrier
Revenues 1 2 3 4 Other from PTT 1 2 3 4 Other from PTT 1 2 3 4 Other Minutes 1 2 3 4 Other
French Polynesia $2,421,002 0.0 0.0 0.2 30.2 69.6 $21,468 0.0 0.0 0.0 65.9 34.1 $611 0.0 0.0 0.0 0.0 100.0 11,836,512 0.0 0.0 0.0 38.4 61.6Kiribati $307,839 0.0 0.1 0.2 23.6 76.1 $314 0.0 0.0 0.0 0.0 100.0 $1,448 0.0 0.0 0.0 0.0 100.0 703,356 0.0 0.1 0.0 28.8 71.2Marshall Islands $2,193,212 0.0 0.0 0.0 78.2 21.8 $2,244 0.0 0.0 0.0 0.0 100.0 $1,032 0.0 0.0 0.0 0.0 100.0 5,690,488 0.0 0.0 0.0 72.7 27.3Micronesia, Federated States of $2,582,735 0.0 0.0 0.2 33.9 65.9 $4,130 0.0 0.0 0.0 3.6 96.4 $13 0.0 0.0 0.0 0.0 100.0 13,702,932 0.0 0.0 0.1 38.0 61.9Nauru $230,955 0.0 4.2 0.0 5.6 90.2 $28 0.0 0.0 0.0 0.0 100.0 $160 0.0 0.0 0.0 0.0 100.0 304,434 0.0 4.5 0.0 5.0 90.5New Caledonia $534,550 0.0 0.0 0.3 42.3 57.4 $3,322 0.0 0.0 0.0 0.0 100.0 $1,110 0.0 0.0 0.0 0.0 100.0 2,296,669 0.0 0.0 0.3 45.0 54.6New Zealand $19,376,330 0.0 0.1 0.3 20.4 79.2 $1,291,386 0.0 0.0 0.0 22.2 77.8 $187,434 0.0 0.0 0.0 0.0 100.0 306,551,585 0.0 0.1 0.6 32.4 66.9Niue $24,196 0.0 0.0 0.0 41.8 58.2 $344 0.0 0.0 0.0 0.0 100.0 $1 0.0 0.0 0.0 0.0 100.0 44,932 0.0 0.0 0.0 41.1 58.9Norfolk Island $26,363 0.0 0.0 0.0 0.0 100.0 $47 0.0 0.0 0.0 0.0 100.0 $0 23,829 0.0 0.0 0.0 0.0 100.0Pacific Islands (Palau) $1,212,631 0.0 0.0 0.0 32.6 67.4 $15,949 0.0 0.0 0.0 0.0 100.0 $34 0.0 0.0 0.0 0.0 100.0 4,560,938 0.0 0.0 0.0 45.5 54.5Papua New Guinea $2,064,267 0.0 0.2 0.1 8.1 91.6 $2,253 0.0 0.0 0.0 0.0 100.0 $292 0.0 0.0 0.0 0.0 100.0 3,179,854 0.0 0.2 0.0 8.5 91.3Solomon Islands $312,061 0.0 0.0 0.8 10.0 89.2 $551 0.0 0.0 0.0 0.0 100.0 $461 0.0 0.0 0.0 0.0 100.0 417,200 0.0 0.0 1.6 9.5 88.8Tonga $3,401,543 0.0 0.0 0.0 23.8 76.2 $54,713 0.0 0.0 0.0 22.1 77.9 $971 0.0 0.0 0.0 0.0 100.0 20,725,691 0.0 0.0 0.0 31.9 68.1Tuvalu $65,298 0.0 0.0 0.2 6.6 93.2 $0 $9 0.0 0.0 0.0 0.0 100.0 72,568 0.0 0.0 0.5 11.6 88.0Vanuatu $225,286 0.0 0.3 0.0 13.6 86.2 $1,224 0.0 0.0 0.0 0.0 100.0 $32 0.0 0.0 0.0 0.0 100.0 574,618 0.0 0.2 0.0 12.8 87.0Wallis and Futuna $68,609 0.0 0.0 0.0 94.5 5.5 $276 0.0 0.0 0.0 0.0 100.0 $164 0.0 0.0 0.0 0.0 100.0 174,906 0.0 0.0 0.0 97.1 2.9Western Samoa $1,985,428 0.0 0.0 2.2 13.7 84.1 $31,945 0.0 0.0 0.0 0.0 100.0 $474 0.0 0.0 0.0 0.0 100.0 6,830,708 0.0 0.0 2.0 14.3 83.6
American Samoa $889,454 0.0 0.0 0.1 0.0 99.9 $74,225 0.0 0.0 0.0 0.0 100.0 $9 0.0 0.0 0.0 0.0 100.0 15,196,484 0.0 0.0 0.1 0.0 99.9Baker Island $0 $0 $0 0Guam $1,609,084 0.0 0.0 0.0 99.3 0.6 $142,962 0.0 0.0 0.0 99.9 0.1 $128 0.0 0.0 0.0 0.0 100.0 53,235,064 0.0 0.0 0.1 99.5 0.5Hawaii $131,089 0.0 0.0 0.0 0.0 100.0 $0 $0 2,272,683 0.0 0.0 0.0 0.0 100.0Howland Island $0 $0 $0 0Jarvis Island $0 $0 $0 0Johnston Atoll $0 $0 $0 0Kingman Reef $0 $0 $0 0Midway Atoll $2 0.0 0.0 0.0 0.0 100.0 $0 $0 2 0.0 0.0 0.0 0.0 100.0Northern Mariana Islands $583,440 0.0 0.0 0.3 80.8 18.8 $2,091 0.0 0.0 0.0 79.9 20.1 $0 11,534,633 0.0 0.0 0.3 81.6 18.1Palmyra Atoll $0 $0 $0 0Wake Island $0 $0 $1,027 0.0 0.0 0.0 0.0 100.0 0
Oceania $108,966,700 0.0 0.2 0.6 21.0 78.2 $7,145,479 0.0 0.0 0.0 30.3 69.7 $3,945,605 0.0 0.0 0.0 0.0 100.0 1,790,893,162 0.0 0.2 1.5 29.5 68.8
Albania $10,396,947 0.0 0.0 11.0 12.4 76.6 $134,709 0.0 0.0 0.0 0.0 100.0 $1,204 0.0 0.0 0.0 0.0 100.0 71,484,158 0.0 0.0 12.2 13.9 73.9Armenia $3,193,530 0.0 0.0 4.9 39.8 55.3 $15,137 0.0 0.0 0.0 2.0 98.0 $966 0.0 0.0 0.0 0.0 100.0 56,537,886 0.0 0.0 4.1 36.1 59.7Azerbaijan $4,302,024 0.0 0.0 1.7 27.7 70.6 $70,540 0.0 0.0 0.0 6.4 93.6 $9,154 0.0 0.0 0.0 36.8 63.2 37,063,226 0.0 0.0 1.9 26.3 71.8Belarus $15,337,354 0.0 0.0 1.6 21.5 76.9 $103,220 0.0 0.0 0.0 61.4 38.6 $9,175 0.0 0.0 0.0 0.0 100.0 84,346,937 0.0 0.0 1.9 22.2 75.9Bosnia and Herzegovina $8,690,840 0.0 0.0 6.5 16.7 76.8 $68,549 0.0 0.0 0.0 15.8 84.2 $324,963 0.0 0.0 0.0 0.0 100.0 57,137,990 0.0 0.0 7.1 19.0 73.9Bulgaria $16,296,765 0.0 0.1 1.2 10.1 88.7 $256,805 0.0 0.0 0.0 5.4 94.6 $212,643 0.0 0.0 0.0 0.0 100.0 98,564,699 0.0 0.0 2.5 14.3 83.1Croatia $3,742,326 0.0 0.0 6.4 14.3 79.3 $102,366 0.0 0.0 0.0 17.7 82.3 $61,100 0.0 0.0 0.0 0.0 100.0 44,652,939 0.0 0.0 19.5 17.5 63.0Czech Republic $12,868,257 0.0 0.0 1.7 11.8 86.5 $295,360 0.0 0.0 0.0 5.2 94.8 $52,736 0.0 0.0 0.0 0.0 100.0 95,797,417 0.0 0.0 2.4 12.4 85.2Estonia $2,922,404 0.0 0.0 1.4 38.6 60.0 $18,934 0.0 0.0 0.0 76.4 23.6 $575 0.0 0.0 0.0 0.0 100.0 15,385,151 0.0 0.0 7.8 26.4 65.8Georgia $5,019,648 0.0 0.0 2.1 54.9 43.0 $34,123 0.0 0.0 0.0 33.7 66.3 $1,144 0.0 0.0 0.0 0.0 100.0 57,105,443 0.0 0.0 3.4 60.5 36.1Hungary $9,070,034 0.0 0.0 3.8 20.3 75.8 $118,557 0.0 0.0 0.0 3.4 96.6 $249,513 0.0 0.0 0.0 0.0 100.0 107,130,684 0.0 0.0 18.8 30.0 51.2Kazakhstan $4,113,918 0.0 0.0 3.8 10.6 85.6 $22,998 0.0 0.0 0.0 30.1 69.9 $1,348 0.0 0.0 0.0 0.0 100.0 40,835,355 0.0 0.0 4.9 11.8 83.3Kyrgyzstan $1,215,016 0.0 1.0 8.4 32.0 58.6 $8,878 0.0 0.0 0.0 0.0 100.0 $884 0.0 0.0 0.0 0.0 100.0 12,212,183 0.0 0.6 8.4 37.2 53.8Latvia $1,769,591 0.0 0.0 3.2 27.4 69.4 $29,271 0.0 0.0 0.0 48.8 51.2 $124,858 0.0 0.0 0.0 0.0 100.0 18,499,072 0.0 0.0 10.3 41.4 48.3Lithuania $3,895,093 0.0 0.0 0.7 32.4 66.9 $59,418 0.0 0.0 0.0 11.1 88.9 $65,732 0.0 0.0 0.0 0.0 100.0 26,745,863 0.0 0.0 1.6 19.1 79.3Moldova $3,141,640 0.0 0.0 8.8 11.9 79.3 $28,529 0.0 0.0 0.0 0.0 100.0 $99,695 0.0 0.0 0.0 0.0 100.0 19,395,953 0.0 0.0 14.5 15.8 69.6Poland $39,923,329 0.0 0.0 1.8 14.0 84.1 $399,288 0.0 0.0 0.0 11.9 88.1 $699,040 0.0 0.0 0.0 0.0 100.0 575,621,121 0.0 0.0 6.7 34.2 59.1
Carrier 1: EPM Telecomunicaciones S.A. E.S.P. Carrier 2: Reliance Communications, Inc. Carrier 3: Telecom Italia Sparkle of North America., Inc. Carrier 4: Verizon Communications Inc.
- Switched Services Market Shares Page 5 -

2008 Annual Section 43.61 International Traffic Data for All U.S. Points: All Settlement ArrangementsTable E: Market Shares Message Telephone Service Billing Types Covered: 1, 2, 3, 4, 5, 11, 12, 14, 15
International Point Traffic Billed in the United States Traffic Billed in Foreign Countries U.S. and Foreign Billed TrafficOriginating or Terminating Originating or Terminating Transiting the United States Originating or Terminating
in the United States in the United States (by Country of Origin) in the United States
Billed Percent share by carrier Receipts Percent share by carrier Receipts Percent share by carrier Total Percent share by carrier
Revenues 1 2 3 4 Other from PTT 1 2 3 4 Other from PTT 1 2 3 4 Other Minutes 1 2 3 4 Other
Romania $9,598,874 0.0 0.0 6.5 14.2 79.2 $622,812 0.0 0.0 0.0 1.5 98.5 $435,455 0.0 0.0 0.0 0.0 100.0 140,297,809 0.0 0.0 24.3 13.3 62.4Russia $30,248,991 0.0 0.0 1.7 9.9 88.4 $1,124,000 0.0 0.0 0.0 0.8 99.2 $2,894,704 0.0 0.0 0.0 0.0 100.0 486,502,014 0.0 0.0 4.2 15.6 80.2Serbia $19,270,071 0.0 0.0 11.6 20.9 67.5 $272,903 0.0 0.0 0.0 14.5 85.5 $7,737 0.0 0.0 0.0 0.0 100.0 190,349,954 0.0 0.0 15.2 27.1 57.7Slovakia $3,059,603 0.0 0.0 5.6 16.8 77.6 $81,946 0.0 0.0 0.0 52.3 47.7 $51,817 0.0 0.0 0.0 0.0 100.0 34,299,374 0.0 0.0 24.7 26.3 49.0Slovenia $2,847,562 0.0 0.0 1.9 12.6 85.4 $39,993 0.0 0.0 0.0 0.1 99.9 $9,058 0.0 0.0 0.0 0.0 100.0 17,724,246 0.0 0.0 3.1 19.8 77.1Tajikistan $834,617 0.0 0.0 3.2 13.0 83.7 $5,349 0.0 0.0 0.0 0.0 100.0 $5,691 0.0 0.0 0.0 0.0 100.0 9,697,353 0.0 0.0 3.7 13.7 82.6Turkmenistan $680,779 0.0 0.0 11.6 45.1 43.2 $0 $713 0.0 0.0 0.0 0.0 100.0 7,096,092 0.0 0.0 12.9 42.0 45.1Ukraine $22,167,691 0.0 0.0 4.8 9.8 85.4 $374,969 0.0 0.0 0.0 5.5 94.5 $91,033 0.0 0.0 0.0 0.0 100.0 214,021,264 0.0 0.0 7.0 12.3 80.6Uzbekistan $11,855,197 0.0 0.0 0.9 74.4 24.6 $35,385 0.0 0.0 0.0 57.0 43.0 $1,184 0.0 0.0 0.0 0.0 100.0 191,287,591 0.0 0.0 1.0 76.5 22.4
Eastern Europe $246,462,101 0.0 0.0 3.9 19.1 77.0 $4,324,039 0.0 0.0 0.0 8.7 91.3 $5,412,122 0.0 0.0 0.0 0.1 99.9 2,709,791,774 0.0 0.0 7.8 27.0 65.2
Antarctica $1,093 0.0 0.0 0.0 0.0 100.0 $0 $21 0.0 0.0 0.0 0.0 100.0 561 0.0 0.0 0.0 0.0 100.0Maritime - Atlantic $436,155 0.0 0.0 0.0 43.5 56.5 $0 $4,560 0.0 0.0 0.0 0.0 100.0 279,622 0.0 0.0 0.0 67.5 32.5Maritime - other oceans $3,033,025 0.0 0.0 0.0 42.7 57.3 $5,531 0.0 0.0 0.0 0.0 100.0 $0 1,173,652 0.0 0.0 0.0 46.1 53.9Maritime - Pacific $389,469 0.0 0.0 0.0 15.4 84.6 $0 $0 156,441 0.0 0.0 0.0 46.6 53.4
Other Regions $3,859,742 0.0 0.0 0.0 40.0 60.0 $5,531 0.0 0.0 0.0 0.0 100.0 $4,581 0.0 0.0 0.0 0.0 100.0 1,610,276 0.0 0.0 0.0 49.8 50.2
American Samoa $158,902 0.0 0.0 0.0 100.0 0.0 $25 0.0 0.0 0.0 100.0 0.0 $0 1,523,451 0.0 0.0 0.0 100.0 0.0Baker Island $0 $0 $0 0Howland Island $0 $0 $0 0Jarvis Island $0 $0 $0 0Johnston Atoll $0 $0 $0 0Kingman Reef $0 $0 $0 0Midway Atoll $0 $0 $0 0Navassa Island $0 $0 $0 0Northern Mariana Islands $4,692,091 0.0 0.0 0.0 0.0 100.0 $165,089 0.0 0.0 0.0 0.0 100.0 $0 26,672,479 0.0 0.0 0.0 0.0 100.0Palmyra Atoll $0 $0 $0 0Wake Island $0 $0 $0 0
Carriers serving Misc. U.S. points $4,850,993 0.0 0.0 0.0 3.3 96.7 $165,114 0.0 0.0 0.0 0.0 100.0 $0 28,195,930 0.0 0.0 0.0 5.4 94.6
Total for Foreign Points $6,452,587,078 1.7 3.7 2.1 17.2 75.4 $341,764,623 0.0 3.7 0.0 26.6 69.7 $684,293,676 0.0 0.0 0.0 0.0 100.0 101,134,768,510 1.6 5.5 1.9 21.1 69.9
Total for U.S. Points $6,157,724 0.0 0.0 2.6 33.6 63.8 $802,670 0.0 0.0 0.0 18.0 82.0 $112,148 0.0 0.0 0.0 0.0 100.0 199,118,990 0.0 0.0 9.2 31.3 59.5WORLD TOTAL $6,458,744,802 1.7 3.7 2.1 17.2 75.4 $342,567,293 0.0 3.7 0.0 26.6 69.7 $684,405,824 0.0 0.0 0.0 0.0 100.0 101,333,887,500 1.5 5.5 1.9 21.1 69.9
Carrier 1: EPM Telecomunicaciones S.A. E.S.P. Carrier 2: Reliance Communications, Inc. Carrier 3: Telecom Italia Sparkle of North America., Inc. Carrier 4: Verizon Communications Inc.
- Switched Services Market Shares Page 6 -

2008 Annual Section 43.61 International Traffic Data for All U.S. Points: Facilities-Based ServiceTable F (Revised): Market Shares Private Line Services Billing Types Covered: 1
Carrier 1: Global Crossing North America, Inc. Carrier 2: Level 3 Communications, LLC Carrier 3: Reliance Communications, Inc. Carrier 4: Verizon Communications Inc.
International Point All Private Line Services Up to 9600 bits per second (bps) 9601 to 30 million bits per second Greater than 30 million bits per second [ .01 to 18 Megahertz; incl. voice circuits] [ over 18 Megahertz ]
64 kilo bit Percent share by carrier Billed Percent share by carrier Billed Percent share by carrier Billed Percent share by carrierequivalent circuits 1 2 3 4 Other Revenues 1 2 3 4 Other Revenues 1 2 3 4 Other Revenues 1 2 3 4 Other
Andorra 0 $0 $0 $0Austria 25 0.0 0.0 0.0 100.0 0.0 $0 $54,664 0.0 0.0 0.0 100.0 0.0 $0Belgium 0 $0 $0 $0Cyprus 0 $0 $0 $0Denmark 0 $0 $0 $0Finland 0 $0 $0 $0France 14,282 0.0 83.8 0.0 0.0 16.2 $0 $4,403,507 0.0 98.3 0.0 1.7 0.0 $81,416 0.0 0.0 0.0 0.0 100.0Germany 520,890 0.0 74.0 0.0 0.0 26.0 $0 $2,473,143 0.2 76.7 0.0 4.8 18.4 $496,036 0.0 0.0 0.0 0.0 100.0Gibraltar 2 0.0 0.0 0.0 100.0 0.0 $0 $31,560 0.0 0.0 0.0 100.0 0.0 $0Greece 64 0.0 0.0 0.0 0.0 100.0 $0 $122,400 0.0 0.0 0.0 0.0 100.0 $0Greenland 0 $0 $0 $0Iceland 0 $0 $0 $0Ireland 3 0.0 0.0 0.0 100.0 0.0 $0 $19,996 0.0 0.0 0.0 100.0 0.0 $0Italy 2 0.0 0.0 0.0 100.0 0.0 $0 $23,088 0.0 0.0 0.0 100.0 0.0 $0Liechtenstein 0 $0 $0 $0Luxembourg 0 $0 $0 $0Malta 0 $0 $0 $0Netherlands 39,692 0.0 100.0 0.0 0.0 0.0 $0 $5,020,808 0.2 99.8 0.0 0.0 0.0 $0Norway 0 $0 $0 $0Portugal 2 0.0 0.0 0.0 100.0 0.0 $0 $96,552 0.0 0.0 0.0 100.0 0.0 $0Spain 1,966 0.8 0.0 0.0 1.4 97.8 $0 $163,739 1.4 0.0 0.0 84.0 14.7 $122,304 0.0 0.0 0.0 0.0 100.0Sweden 0 $0 $0 $0Switzerland 39,096 0.1 0.0 0.0 0.0 99.9 $0 $431,191 2.6 0.0 0.0 5.6 91.8 $0Turkey 0 $0 $0 $0United Kingdom 857,107 0.0 52.3 0.0 0.0 47.6 $0 $20,113,780 0.3 93.0 0.0 1.4 5.3 $890,692 0.0 0.0 0.0 0.0 100.0
Western Europe 1,473,131 0.0 60.1 0.0 0.0 39.9 $0 $32,954,428 0.3 90.9 0.0 2.6 6.2 $1,590,448 0.0 0.0 0.0 0.0 100.0
Algeria 0 $0 $0 $0Angola 0 $0 $0 $0Benin 0 $0 $0 $0Botswana 0 $0 $0 $0Burkina 0 $0 $0 $0Burundi 0 $0 $0 $0Cameroon 0 $0 $0 $0Canary Island 0 $0 $0 $0Cape Verde 0 $0 $0 $0Central African Republic 0 $0 $0 $0Chad 0 $0 $0 $0Comoros 0 $0 $0 $0Congo 0 $0 $0 $0Cote d'Ivoire 0 $0 $0 $0Djibouti 0 $0 $0 $0Egypt 21 0.0 0.0 0.0 100.0 0.0 $0 $67,689 0.0 0.0 0.0 100.0 0.0 $0Equatorial Guinea 0 $0 $0 $0Ethiopia 8 0.0 0.0 0.0 100.0 0.0 $0 $75,048 0.0 0.0 0.0 100.0 0.0 $0Gabon 2 0.0 0.0 0.0 100.0 0.0 $0 $55,752 0.0 0.0 0.0 100.0 0.0 $0Gambia, The 0 $0 $0 $0
Revised: August 26, 2010
- Private Line Market Shares Page 1 -

2008 Annual Section 43.61 International Traffic Data for All U.S. Points: Facilities-Based ServiceTable F (Revised): Market Shares Private Line Services Billing Types Covered: 1
Carrier 1: Global Crossing North America, Inc. Carrier 2: Level 3 Communications, LLC Carrier 3: Reliance Communications, Inc. Carrier 4: Verizon Communications Inc.
International Point All Private Line Services Up to 9600 bits per second (bps) 9601 to 30 million bits per second Greater than 30 million bits per second [ .01 to 18 Megahertz; incl. voice circuits] [ over 18 Megahertz ]
64 kilo bit Percent share by carrier Billed Percent share by carrier Billed Percent share by carrier Billed Percent share by carrierequivalent circuits 1 2 3 4 Other Revenues 1 2 3 4 Other Revenues 1 2 3 4 Other Revenues 1 2 3 4 Other
Ghana 2 0.0 0.0 0.0 100.0 0.0 $0 $99,288 0.0 0.0 0.0 100.0 0.0 $0Guinea 29 0.0 0.0 0.0 0.0 100.0 $0 $62,640 0.0 0.0 0.0 0.0 100.0 $0Guinea-Bissau 0 $0 $0 $0Kenya 2 0.0 0.0 0.0 100.0 0.0 $0 $28,500 0.0 0.0 0.0 100.0 0.0 $0Lesotho 0 $0 $0 $0Liberia 0 $0 $0 $0Libya 0 $0 $0 $0Madagascar 0 $0 $0 $0Malawi 0 $0 $0 $0Mali 0 $0 $0 $0Mauritania 0 $0 $0 $0Mauritius 43 0.0 0.0 0.0 100.0 0.0 $0 $57,720 0.0 0.0 0.0 100.0 0.0 $0Morocco 0 $0 $0 $0Mozambique 0 $0 $0 $0Namibia 0 $0 $0 $0Niger 0 $0 $0 $0Nigeria 0 $0 $0 $0Reunion 0 $0 $0 $0Rwanda 0 $0 $0 $0Saint Helena 1 0.0 0.0 0.0 99.9 0.1 $0 $11,163 0.0 0.0 0.0 100.0 0.0 $0Sao Tome and Principe 0 $0 $0 $0Senegal 0 $0 $0 $0Seychelles 0 $0 $0 $0Sierra Leone 0 $0 $0 $0Somalia 0 $0 $0 $0South Africa 2 0.0 0.0 0.0 100.0 0.0 $0 $22,330 0.0 0.0 0.0 100.0 0.0 $0Sudan 0 $0 $0 $0Swaziland 0 $0 $0 $0Tanzania 0 $0 $0 $0Togo 0 $0 $0 $0Tunisia 1 0.0 0.0 0.0 99.9 0.1 $0 $264,097 0.0 0.0 0.0 100.0 0.0 $0Uganda 0 $0 $0 $0Western Sahara 0 $0 $0 $0Zaire 0 $0 $0 $0Zambia 0 $0 $0 $0Zimbabwe 0 $0 $0 $0
Africa 111 0.0 0.0 0.0 73.9 26.1 $0 $744,227 0.0 0.0 0.0 91.6 8.4 $0
Bahrain 3 0.0 0.0 0.0 100.0 0.0 $0 $1,839,465 0.0 0.0 0.0 100.0 0.0 $0Iran 0 $0 $0 $0Iraq 643 0.0 0.0 0.0 100.0 0.0 $0 $2,527,371 0.0 0.0 0.0 100.0 0.0 $0Israel 105 0.0 0.0 0.0 100.0 0.0 $0 $189,541 0.0 0.0 0.0 100.0 0.0 $0Jordan 1 0.0 0.0 0.0 99.9 0.1 $0 $126,696 0.0 0.0 0.0 100.0 0.0 $0Kuwait 0 $0 $0 $0Lebanon 0 $0 $0 $0Oman 0 $0 $0 $0Qatar 0 $0 $0 $0Saudi Arabia 97 0.0 0.0 0.0 100.0 0.0 $0 $653,228 0.0 0.0 0.0 100.0 0.0 $0
Revised: August 26, 2010
- Private Line Market Shares Page 2 -

2008 Annual Section 43.61 International Traffic Data for All U.S. Points: Facilities-Based ServiceTable F (Revised): Market Shares Private Line Services Billing Types Covered: 1
Carrier 1: Global Crossing North America, Inc. Carrier 2: Level 3 Communications, LLC Carrier 3: Reliance Communications, Inc. Carrier 4: Verizon Communications Inc.
International Point All Private Line Services Up to 9600 bits per second (bps) 9601 to 30 million bits per second Greater than 30 million bits per second [ .01 to 18 Megahertz; incl. voice circuits] [ over 18 Megahertz ]
64 kilo bit Percent share by carrier Billed Percent share by carrier Billed Percent share by carrier Billed Percent share by carrierequivalent circuits 1 2 3 4 Other Revenues 1 2 3 4 Other Revenues 1 2 3 4 Other Revenues 1 2 3 4 Other
Syria 0 $0 $0 $0United Arab Emirates 9 0.0 0.0 0.0 100.0 0.0 $0 $23,741 0.0 0.0 0.0 100.0 0.0 $0Yemen 4 0.0 0.0 0.0 100.0 0.0 $0 $108,036 0.0 0.0 0.0 100.0 0.0 $0Middle East 862 0.0 0.0 0.0 100.0 0.0 $0 $5,468,078 0.0 0.0 0.0 100.0 0.0 $0
Anguilla 4 100.0 0.0 0.0 0.0 0.0 $0 $20,934 100.0 0.0 0.0 0.0 0.0 $0Antigua and Barbuda 120 6.7 0.0 0.0 93.3 0.0 $0 $261,693 16.0 0.0 0.0 84.0 0.0 $0Aruba 58 0.0 0.0 0.0 100.0 0.0 $0 $134,304 0.0 0.0 0.0 100.0 0.0 $0Bahamas, The 951 73.9 0.0 0.0 18.3 7.8 $0 $1,333,944 26.4 0.0 0.0 55.7 17.9 $0Barbados 125 76.8 0.0 0.0 23.2 0.0 $0 $207,367 86.0 0.0 0.0 14.0 0.0 $0Bermuda 2,006 0.0 0.0 0.0 97.6 2.4 $0 $2,127,074 0.0 0.0 0.0 84.7 15.3 $0Cayman Islands 6,943 0.3 0.0 0.0 79.1 20.6 $0 $1,772,337 2.2 0.0 0.0 45.5 52.2 $0Cuba 752 0.0 0.0 0.0 0.3 99.7 $0 $6,312,216 0.0 0.0 0.0 74.3 25.7 $0Dominica 4 100.0 0.0 0.0 0.0 0.0 $0 $6,500 100.0 0.0 0.0 0.0 0.0 $0Dominican Republic 1,237 27.6 0.0 0.0 14.1 58.2 $0 $1,710,616 59.6 0.0 0.0 24.2 16.2 $0French Overseas Departments 32 0.0 0.0 0.0 100.0 0.0 $0 $40,944 0.0 0.0 0.0 100.0 0.0 $0Grenada 12 100.0 0.0 0.0 0.0 0.0 $0 $7,590 100.0 0.0 0.0 0.0 0.0 $0Guadeloupe 0 $0 $0 $0Haiti 53 15.1 0.0 0.0 3.8 81.1 $0 $179,816 33.5 0.0 0.0 14.8 51.7 $0Jamaica 455 65.1 0.0 0.0 28.1 6.8 $0 $1,723,947 85.6 0.0 0.0 14.1 0.3 $0Montserrat 0 $0 $0 $0Netherlands Antilles 319 30.1 0.0 0.0 69.9 0.0 $0 $2,308,825 15.0 0.0 0.0 85.0 0.0 $0Saint Kitts and Nevis 30 80.0 0.0 0.0 20.0 0.0 $0 $160,851 74.2 0.0 0.0 25.8 0.0 $0Saint Lucia 16 0.0 0.0 0.0 100.0 0.0 $0 $27,252 0.0 0.0 0.0 100.0 0.0 $0Saint Vincent and the Grenadines 4 100.0 0.0 0.0 0.0 0.0 $0 $91,208 100.0 0.0 0.0 0.0 0.0 $0Trinidad and Tobago 1,673 43.5 0.0 0.0 54.6 1.9 $0 $1,804,641 50.2 0.0 0.0 45.5 4.3 $0Turks and Caicos Islands 23 69.6 0.0 0.0 30.4 0.0 $0 $288,593 40.6 0.0 0.0 59.4 0.0 $0Virgin Islands, British 119 6.7 0.0 0.0 93.3 0.0 $0 $982,253 28.6 0.0 0.0 71.4 0.0 $0
Navassa Island 0 $0 $0 $0Puerto Rico 0 $0 $0 $0U.S. Virgin Islands 0 $0 $0 $0
Caribbean 14,936 15.9 0.0 0.0 63.2 20.9 $0 $21,502,905 23.5 0.0 0.0 59.9 16.6 $0
Belize 32 100.0 0.0 0.0 0.0 0.0 $0 $193,223 100.0 0.0 0.0 0.0 0.0 $0Canada 17,080 91.9 0.0 0.0 3.6 4.4 $0 $14,652,898 5.3 0.0 0.0 93.4 1.3 $0Costa Rica 5,753 4.1 0.0 0.0 95.9 0.0 $0 $2,747,662 19.6 0.0 0.0 80.4 0.0 $0El Salvador 925 37.6 0.0 0.0 62.3 0.1 $0 $1,414,040 32.6 0.0 0.0 67.3 0.2 $0Guatemala 266 85.0 0.0 0.0 15.0 0.0 $0 $613,986 54.8 0.0 0.0 45.2 0.0 $0Honduras 184 51.1 0.0 0.0 42.4 6.5 $0 $700,427 23.8 0.0 0.0 72.5 3.7 $0Mexico 6,328 22.8 0.0 0.0 2.9 74.3 $0 $3,286,151 19.0 0.0 0.0 75.1 5.9 $0Nicaragua 100 96.0 0.0 0.0 0.0 4.0 $0 $42,310 79.6 0.0 0.0 0.0 20.4 $0Panama 392 88.0 0.0 0.0 0.0 12.0 $0 $416,280 77.5 0.0 0.0 0.0 22.5 $0Saint Pierre and Miquelon 0 $0 $0 $0
Alaska 0 $0 $0 $0United States (conterminous) 306 0.0 0.0 0.0 0.0 100.0 $0 $813,742 0.0 0.0 0.0 0.0 100.0 $0
North and Central America 31,366 59.1 0.0 0.0 22.4 18.6 $0 $24,880,719 13.9 0.0 0.0 80.8 5.3 $0
Argentina 898 29.0 0.0 0.0 71.0 0.0 $0 $731,502 56.4 0.0 0.0 43.6 0.0 $0Bolivia 168 100.0 0.0 0.0 0.0 0.0 $0 $268,297 100.0 0.0 0.0 0.0 0.0 $0
Revised: August 26, 2010
- Private Line Market Shares Page 3 -

2008 Annual Section 43.61 International Traffic Data for All U.S. Points: Facilities-Based ServiceTable F (Revised): Market Shares Private Line Services Billing Types Covered: 1
Carrier 1: Global Crossing North America, Inc. Carrier 2: Level 3 Communications, LLC Carrier 3: Reliance Communications, Inc. Carrier 4: Verizon Communications Inc.
International Point All Private Line Services Up to 9600 bits per second (bps) 9601 to 30 million bits per second Greater than 30 million bits per second [ .01 to 18 Megahertz; incl. voice circuits] [ over 18 Megahertz ]
64 kilo bit Percent share by carrier Billed Percent share by carrier Billed Percent share by carrier Billed Percent share by carrierequivalent circuits 1 2 3 4 Other Revenues 1 2 3 4 Other Revenues 1 2 3 4 Other Revenues 1 2 3 4 Other
Brazil 1,727 99.8 0.0 0.0 0.2 0.0 $0 $1,802,288 97.7 0.0 0.0 2.3 0.0 $0Chile 0 $0 $0 $0Colombia 138,292 1.5 0.0 0.0 0.0 98.5 $0 $6,362,383 32.2 0.0 0.0 4.0 63.8 $0Ecuador 45 26.7 0.0 0.0 73.3 0.0 $0 $882,914 2.4 0.0 0.0 97.6 0.0 $0French Guiana 0 $0 $0 $0Guyana 40 40.0 0.0 0.0 60.0 0.0 $0 $228,381 68.6 0.0 0.0 31.4 0.0 $0Paraguay 12 100.0 0.0 0.0 0.0 0.0 $0 $116,020 100.0 0.0 0.0 0.0 0.0 $0Peru 242 98.8 0.0 0.0 0.8 0.4 $0 $343,598 79.6 0.0 0.0 19.8 0.6 $0Suriname 0 $0 $0 $0Uruguay 0 $0 $0 $0Venezuela 587 95.9 0.0 0.0 4.1 0.0 $0 $1,118,584 94.6 0.0 0.0 5.4 0.0 $0
South America 142,011 3.6 0.0 0.0 0.5 95.9 $0 $11,853,967 51.6 0.0 0.0 14.1 34.3 $0
Afghanistan 4 0.0 0.0 0.0 100.0 0.0 $0 $744,000 0.0 0.0 0.0 100.0 0.0 $0Bangladesh 1 0.0 0.0 0.0 99.9 0.1 $0 $21,732 0.0 0.0 0.0 100.0 0.0 $0Bhutan 0 $0 $0 $0Brunei 0 $0 $0 $0Burma 0 $0 $0 $0Cambodia 0 $0 $0 $0Chagos Archipelago 33 0.0 0.0 0.0 100.0 0.0 $0 $1,640,350 0.0 0.0 0.0 100.0 0.0 $0China 806 0.0 0.0 0.0 5.3 94.7 $0 $537,296 0.0 0.0 0.0 36.3 63.7 $0French Southern and Antarctic Lands 0 $0 $0 $0Hong Kong 49,674 0.0 0.0 0.0 0.0 100.0 $0 $80,615 0.0 0.0 0.0 30.5 69.5 $305,360 0.0 0.0 0.0 0.0 100.0India 37,802 0.0 0.0 81.1 18.5 0.3 $0 $13,832,199 0.0 0.0 49.3 48.3 2.3 $3,338,842 0.0 0.0 100.0 0.0 0.0Indonesia 0 $0 $0 $0Japan 1,396,788 0.0 0.0 0.0 0.6 99.4 $120 0.0 0.0 0.0 0.0 100.0 $8,465,535 0.0 0.0 0.0 60.6 39.4 $10,863,033 0.0 0.0 0.0 0.0 100.0Kampuchea 0 $0 $0 $0Korea, North 0 $0 $0 $0Korea, South 1,216 0.0 0.0 0.0 95.5 4.5 $0 $367,567 0.0 0.0 0.0 92.3 7.7 $0Laos 0 $0 $0 $0Macau 0 $0 $0 $0Malaysia 1 0.0 0.0 0.0 99.9 0.1 $0 $16,000 0.0 0.0 0.0 100.0 0.0 $0Maldives 0 $0 $0 $0Mongolia 0 $0 $0 $0Nepal 0 $0 $0 $0Pakistan 12 0.0 0.0 0.0 100.0 0.0 $0 $239,660 0.0 0.0 0.0 100.0 0.0 $0Philippines 22,237 0.0 0.0 0.0 5.5 94.5 $0 $1,346,778 0.0 0.0 0.0 11.4 88.6 $2,598,963 0.0 0.0 0.0 0.0 100.0Singapore 6,999 0.0 0.0 0.0 0.1 99.9 $0 $407,330 0.0 0.0 0.0 90.4 9.6 $277,855 0.0 0.0 0.0 0.0 100.0Sri Lanka 51 0.0 0.0 0.0 100.0 0.0 $0 $194,769 0.0 0.0 0.0 100.0 0.0 $0Taiwan 65 0.0 0.0 0.0 0.0 100.0 $0 $48,039 0.0 0.0 0.0 0.0 100.0 $0Thailand 36 0.0 0.0 0.0 100.0 0.0 $0 $28,954 0.0 0.0 0.0 100.0 0.0 $0Vietnam 2 0.0 0.0 0.0 0.0 100.0 $0 $212,313 0.0 0.0 0.0 0.0 100.0 $0
Asia 1,515,727 0.0 0.0 2.0 1.2 96.8 $120 0.0 0.0 0.0 0.0 100.0 $28,183,137 0.0 0.0 24.2 56.0 19.8 $17,384,053 0.0 0.0 19.2 0.0 80.8
Australia 40,426 0.0 0.0 0.0 0.1 99.9 $0 $243,648 0.0 0.0 0.0 84.9 15.1 $157,750 0.0 0.0 0.0 0.0 100.0Cook Islands 0 $0 $0 $0Fiji 1 0.0 0.0 0.0 99.9 0.1 $0 $33,365 0.0 0.0 0.0 100.0 0.0 $0French Polynesia 1 0.0 0.0 0.0 99.9 0.1 $0 $82,875 0.0 0.0 0.0 100.0 0.0 $0Kiribati 0 $0 $0 $0Marshall Islands 2 0.0 0.0 0.0 100.0 0.0 $0 $2,723,313 0.0 0.0 0.0 100.0 0.0 $0
Revised: August 26, 2010
- Private Line Market Shares Page 4 -

2008 Annual Section 43.61 International Traffic Data for All U.S. Points: Facilities-Based ServiceTable F (Revised): Market Shares Private Line Services Billing Types Covered: 1
Carrier 1: Global Crossing North America, Inc. Carrier 2: Level 3 Communications, LLC Carrier 3: Reliance Communications, Inc. Carrier 4: Verizon Communications Inc.
International Point All Private Line Services Up to 9600 bits per second (bps) 9601 to 30 million bits per second Greater than 30 million bits per second [ .01 to 18 Megahertz; incl. voice circuits] [ over 18 Megahertz ]
64 kilo bit Percent share by carrier Billed Percent share by carrier Billed Percent share by carrier Billed Percent share by carrierequivalent circuits 1 2 3 4 Other Revenues 1 2 3 4 Other Revenues 1 2 3 4 Other Revenues 1 2 3 4 Other
Micronesia, Federated States of 1 0.0 0.0 0.0 99.9 0.1 $0 $29,111 0.0 0.0 0.0 100.0 0.0 $0Nauru 0 $0 $0 $0New Caledonia 0 $0 $0 $0New Zealand 146 0.0 0.0 0.0 84.2 15.8 $0 $145,966 0.0 0.0 0.0 88.4 11.6 $0Niue 0 $0 $0 $0Norfolk Island 0 $0 $0 $0Pacific Islands (Palau) 1 0.0 0.0 0.0 99.9 0.1 $0 $21,528 0.0 0.0 0.0 100.0 0.0 $0Papua New Guinea 0 $0 $0 $0Solomon Islands 0 $0 $0 $0Tonga 0 $0 $0 $0Tuvalu 0 $0 $0 $0Vanuatu 0 $0 $0 $0Wallis and Futuna 0 $0 $0 $0Western Samoa 0 $0 $0 $0
American Samoa 0 $0 $0 $0Baker Island 0 $0 $0 $0Guam 19,708 0.0 0.0 0.0 100.0 0.0 $0 $2,709,393 0.0 0.0 0.0 100.0 0.0 $0Hawaii 53 0.0 0.0 0.0 0.0 100.0 $0 $64,482 0.0 0.0 0.0 0.0 100.0 $0Howland Island 0 $0 $0 $0Jarvis Island 0 $0 $0 $0Johnston Atoll 0 $0 $0 $0Kingman Reef 0 $0 $0 $0Midway Atoll 0 $0 $0 $0Northern Mariana Islands 41 0.0 0.0 0.0 26.8 73.2 $0 $686,932 0.0 0.0 0.0 93.3 6.7 $0Palmyra Atoll 0 $0 $0 $0Wake Island 0 $0 $0 $0
Oceania 60,380 0.0 0.0 0.0 32.9 67.1 $0 $6,740,613 0.0 0.0 0.0 97.6 2.4 $157,750 0.0 0.0 0.0 0.0 100.0
Albania 0 $0 $0 $0Armenia 0 $0 $0 $0Azerbaijan 10 0.0 0.0 0.0 100.0 0.0 $0 $96,456 0.0 0.0 0.0 100.0 0.0 $0Belarus 0 $0 $0 $0Bosnia and Herzegovina 0 $0 $0 $0Bulgaria 0 $0 $0 $0Croatia 0 $0 $0 $0Czech Republic 0 $0 $0 $0Estonia 0 $0 $0 $0Georgia 0 $0 $0 $0Hungary 0 $0 $0 $0Kazakhstan 3 0.0 0.0 0.0 100.0 0.0 $0 $28,253 0.0 0.0 0.0 100.0 0.0 $0Kyrgyzstan 0 $0 $0 $0Latvia 0 $0 $0 $0Lithuania 0 $0 $0 $0Moldova 0 $0 $0 $0Poland 0 $0 $0 $0Romania 0 $0 $0 $0Russia 16 0.0 0.0 0.0 100.0 0.0 $0 $102,852 0.0 0.0 0.0 100.0 0.0 $0Serbia 0 $0 $0 $0Slovakia 0 $0 $0 $0
Revised: August 26, 2010
- Private Line Market Shares Page 5 -

2008 Annual Section 43.61 International Traffic Data for All U.S. Points: Facilities-Based ServiceTable F (Revised): Market Shares Private Line Services Billing Types Covered: 1
Carrier 1: Global Crossing North America, Inc. Carrier 2: Level 3 Communications, LLC Carrier 3: Reliance Communications, Inc. Carrier 4: Verizon Communications Inc.
International Point All Private Line Services Up to 9600 bits per second (bps) 9601 to 30 million bits per second Greater than 30 million bits per second [ .01 to 18 Megahertz; incl. voice circuits] [ over 18 Megahertz ]
64 kilo bit Percent share by carrier Billed Percent share by carrier Billed Percent share by carrier Billed Percent share by carrierequivalent circuits 1 2 3 4 Other Revenues 1 2 3 4 Other Revenues 1 2 3 4 Other Revenues 1 2 3 4 Other
Slovenia 1 0.0 0.0 0.0 99.9 0.1 $0 $85,710 0.0 0.0 0.0 100.0 0.0 $0Tajikistan 0 $0 $0 $0Turkmenistan 0 $0 $0 $0Ukraine 0 $0 $0 $0Uzbekistan 1 0.0 0.0 0.0 99.9 0.1 $0 $305,688 0.0 0.0 0.0 100.0 0.0 $0Eastern Europe 31 0.0 0.0 0.0 100.0 0.0 $0 $618,959 0.0 0.0 0.0 100.0 0.0 $0
Antarctica 0 $0 $0 $0Maritime - Atlantic 0 $0 $0 $0Maritime - other oceans 0 $0 $0 $0Maritime - Pacific 1 0.0 0.0 0.0 99.9 0.1 $0 $168,960 0.0 0.0 0.0 100.0 0.0 $0
Other Regions 1 0.0 0.0 0.0 99.9 0.1 $0 $168,960 0.0 0.0 0.0 100.0 0.0 $0
American Samoa 0 $0 $0 $0Baker Island 0 $0 $0 $0Howland Island 0 $0 $0 $0Jarvis Island 0 $0 $0 $0Johnston Atoll 0 $0 $0 $0Kingman Reef 0 $0 $0 $0Midway Atoll 0 $0 $0 $0Navassa Island 0 $0 $0 $0Northern Mariana Islands 134 0.0 0.0 0.0 0.0 100.0 $0 $421,851 0.0 0.0 0.0 0.0 100.0 $0Palmyra Atoll 0 $0 $0 $0Wake Island 0 $0 $0 $0
Carriers serving Misc. U.S. points 134 0.0 0.0 0.0 0.0 100.0 $0 $421,851 0.0 0.0 0.0 0.0 100.0 $0
Total for Foreign Points 3,218,582 0.8 27.5 1.0 1.1 69.6 $120 0.0 0.0 0.0 0.0 100.0 ########## 11.4 23.2 5.3 47.6 12.6 $19,132,251 0.0 0.0 17.5 0.0 82.5
Total for U.S. Points 20,108 0.0 0.0 0.0 98.1 1.9 $0 $4,274,549 0.0 0.0 0.0 78.4 21.6 $0WORLD TOTAL 3,238,690 0.8 27.4 0.9 1.7 69.2 $120 0.0 0.0 0.0 0.0 100.0 ########## 11.0 22.4 5.1 48.5 12.9 $19,132,251 0.0 0.0 17.5 0.0 82.5
Revised: August 26, 2010
- Private Line Market Shares Page 6 -