Embed Size (px)
Citation preview

7/30/2019 2008 _ harrison county _ marshall isd _ 2008 texas school survey of drug and alcohol use _ elementary report
http://slidepdf.com/reader/full/2008-harrison-county-marshall-isd-2008-texas-school-survey-of-drug-and 1/40
Marshall
Spring 2008
Table T-1: How recently, if ever, have you used...
Ever
Used
School
Year
Not Past
Year
Never
Used
Any tobacco product
All 8.0% 4.5% 3.5% 92.0%
Grade 4 3.8% 3.2% 0.6% 96.2%
Grade 5 6.5% 4.7% 1.8% 93.5%
Grade 6 13.4% 5.6% 7.8% 86.6%
Cigarettes
All 6.0% 3.5% 2.5% 94.0%
Grade 4 1.8% 1.5% 0.3% 98.2%
Grade 5 4.4% 3.6% 0.7% 95.6%
Grade 6 11.6% 5.3% 6.3% 88.4%
Smokeless tobacco
All 2.8% 1.0% 1.8% 97.2%
Grade 4 2.7% 1.8% 0.9% 97.3%
Grade 5 2.6% 1.1% 1.5% 97.4%Grade 6 3.2% 0.3% 2.8% 96.8%
Table T-2: Average number of times selected tobacco products were used by thosewho reported use of ..
School
Year Lifetime
All 2.7 2.5
Grade 4 1.5 2.5
Grade 5 2.5 2.8Grade 6 3.2 2.4
Elementary Report-Page

7/30/2019 2008 _ harrison county _ marshall isd _ 2008 texas school survey of drug and alcohol use _ elementary report
http://slidepdf.com/reader/full/2008-harrison-county-marshall-isd-2008-texas-school-survey-of-drug-and 2/40
7/30/2019 2008 _ harrison county _ marshall isd _ 2008 texas school survey of drug and alcohol use _ elementary report
http://slidepdf.com/reader/full/2008-harrison-county-marshall-isd-2008-texas-school-survey-of-drug-and 3/40
Marshall
Spring 2008
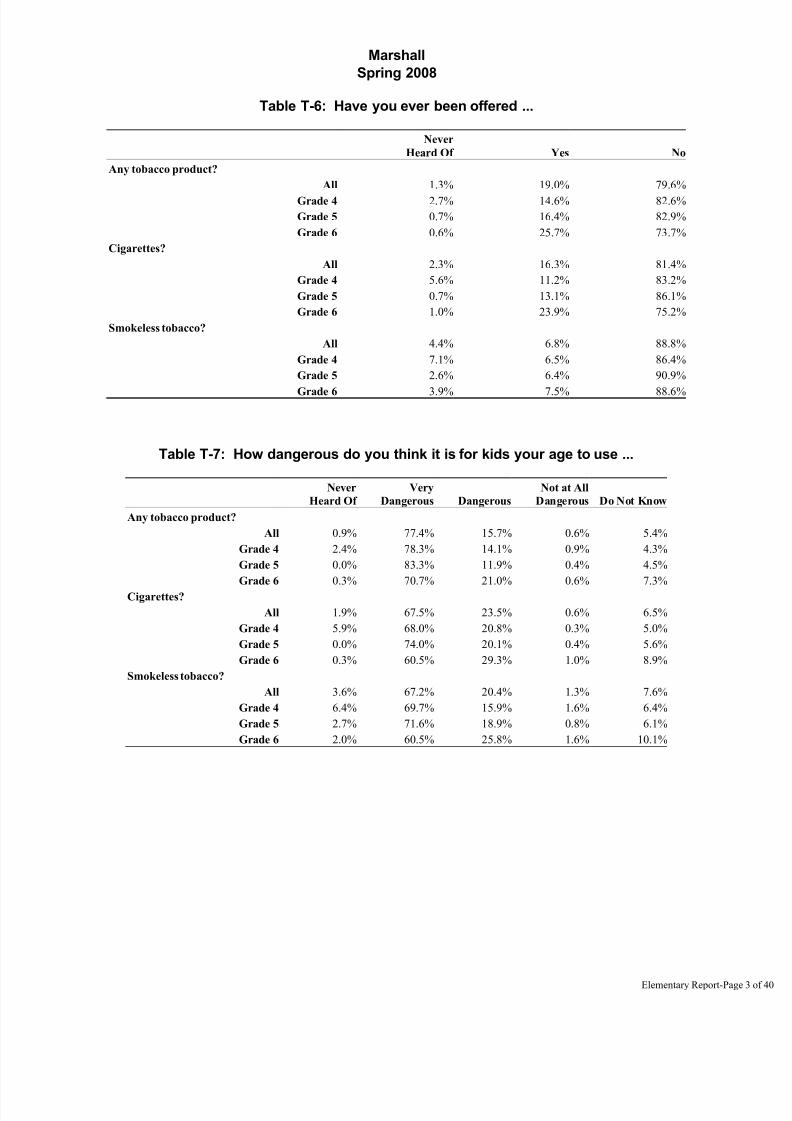
Table T-6: Have you ever been offered ...
Never
Heard Of Yes No
Any tobacco product?
All 1.3% 19.0% 79.6%
Grade 4 2.7% 14.6% 82.6%
Grade 5 0.7% 16.4% 82.9%
Grade 6 0.6% 25.7% 73.7%
Cigarettes?
All 2.3% 16.3% 81.4%
Grade 4 5.6% 11.2% 83.2%
Grade 5 0.7% 13.1% 86.1%
Grade 6 1.0% 23.9% 75.2%
Smokeless tobacco?
All 4.4% 6.8% 88.8%
Grade 4 7.1% 6.5% 86.4%
Grade 5 2.6% 6.4% 90.9%
Grade 6 3.9% 7.5% 88.6%
Table T-7: How dangerous do you think it is for kids your age to use ...
Never
Heard Of
Very
Dangerous Dangerous
Not at All
Dangerous Do Not Know
Any tobacco product?
All 0.9% 77.4% 15.7% 0.6% 5.4%
Grade 4 2.4% 78.3% 14.1% 0.9% 4.3%
Grade 5 0.0% 83.3% 11.9% 0.4% 4.5%
Grade 6 0.3% 70.7% 21.0% 0.6% 7.3%
Cigarettes?
All 1.9% 67.5% 23.5% 0.6% 6.5%
Grade 4 5.9% 68.0% 20.8% 0.3% 5.0%
Grade 5 0.0% 74.0% 20.1% 0.4% 5.6%
Grade 6 0.3% 60.5% 29.3% 1.0% 8.9%
Smokeless tobacco?
All 3.6% 67.2% 20.4% 1.3% 7.6%
Grade 4 6.4% 69.7% 15.9% 1.6% 6.4%
Grade 5 2.7% 71.6% 18.9% 0.8% 6.1%
Grade 6 2.0% 60.5% 25.8% 1.6% 10.1%
Elementary Report-Page

7/30/2019 2008 _ harrison county _ marshall isd _ 2008 texas school survey of drug and alcohol use _ elementary report
http://slidepdf.com/reader/full/2008-harrison-county-marshall-isd-2008-texas-school-survey-of-drug-and 4/40
Marshall
Spring 2008
Table T-8: How do your parents feel about kids your age smoking cigarettes?
Don't Like Don't Care Think It's OK Don't know
All 86.6% 1.7% 1.1% 10.7%
Grade 4 88.6% 1.2% 1.2% 9.0%
Grade 5 82.5% 2.2% 0.7% 14.6%
Grade 6 88.9% 1.6% 1.3% 8.2%
Elementary Report-Page

7/30/2019 2008 _ harrison county _ marshall isd _ 2008 texas school survey of drug and alcohol use _ elementary report
http://slidepdf.com/reader/full/2008-harrison-county-marshall-isd-2008-texas-school-survey-of-drug-and 5/40
Marshall
Spring 2008
Table A-1: How recently, if ever, have you used..
Ever
Used
School
Year
Not Past
Year
Never
Used
Any alcohol product
All 25.4% 16.7% 8.7% 74.6%
Grade 4 16.1% 10.9% 5.3% 83.9%
Grade 5 18.9% 13.1% 5.8% 81.1%
Grade 6 40.6% 25.8% 14.8% 59.4%
Beer
All 16.5% 9.1% 7.4% 83.5%
Grade 4 9.3% 6.3% 3.0% 90.7%
Grade 5 14.4% 9.2% 5.2% 85.6%
Grade 6 25.3% 11.7% 13.6% 74.7%
Wine coolers
All 12.1% 7.8% 4.3% 87.9%
Grade 4 5.4% 3.6% 1.8% 94.6%
Grade 5 6.3% 2.6% 3.7% 93.7%
Grade 6 24.1% 16.8% 7.3% 75.9%Wine
All 12.1% 7.0% 5.1% 87.9%
Grade 4 7.5% 4.2% 3.3% 92.5%
Grade 5 7.4% 4.1% 3.3% 92.6%
Grade 6 21.0% 12.4% 8.6% 79.0%
Liquor
All 6.6% 4.7% 1.9% 93.4%
Grade 4 3.6% 2.7% 0.9% 96.4%
Grade 5 5.1% 2.9% 2.2% 94.9%
Grade 6 10.8% 8.2% 2.5% 89.2%
Elementary Report-Page

7/30/2019 2008 _ harrison county _ marshall isd _ 2008 texas school survey of drug and alcohol use _ elementary report
http://slidepdf.com/reader/full/2008-harrison-county-marshall-isd-2008-texas-school-survey-of-drug-and 6/40
Marshall
Spring 2008
Table A-2: Average number of times selected alcohol products were used by thosewho reported use of ..
School
Year Lifetime
Beer
All 2.9 2.7
Grade 4 3.1 3.3
Grade 5 2.5 2.4
Grade 6 3.2 2.7
Liquor
All 3.0 3.1
Grade 4 3.6 3.6
Grade 5 1.5 1.9
Grade 6 3.4 3.5
Wine
All 2.0 2.2
Grade 4 2.9 2.4
Grade 5 2.0 1.5Grade 6 1.8 2.4
Elementary Report-Page

7/30/2019 2008 _ harrison county _ marshall isd _ 2008 texas school survey of drug and alcohol use _ elementary report
http://slidepdf.com/reader/full/2008-harrison-county-marshall-isd-2008-texas-school-survey-of-drug-and 7/40
Marshall
Spring 2008
Table A-3: In the past year, how many times have you had two or more drinks at one time of ..
Never 1 Time 2 Times 3+ Times Ever
Beer?
All 86.8% 8.6% 1.9% 2.7% 13.2%
Grade 4 88.3% 8.9% 1.5% 1.2% 11.7%
Grade 5 89.0% 7.6% 1.1% 2.3% 11.0%
Grade 6 83.3% 9.3% 2.9% 4.5% 16.7%
Wine Coolers?
All 90.6% 5.4% 2.0% 2.0% 9.4%
Grade 4 94.2% 3.2% 1.9% 0.6% 5.8%
Grade 5 96.6% 2.3% 0.4% 0.8% 3.4%
Grade 6 81.7% 10.3% 3.5% 4.5% 18.3%
Wine?
All 90.9% 5.9% 2.3% 0.9% 9.1%
Grade 4 93.4% 4.0% 1.7% 1.0% 6.6%
Grade 5 95.0% 3.1% 1.2% 0.8% 5.0%
Grade 6 84.8% 10.4% 3.9% 1.0% 15.2%
Liquor?
All 95.1% 2.6% 1.0% 1.2% 4.9%
Grade 4 97.0% 2.0% 0.3% 0.7% 3.0%
Grade 5 98.8% 0.8% 0.4% 0.0% 1.2%
Grade 6 89.9% 4.9% 2.3% 2.9% 10.1%
Elementary Report-Page

7/30/2019 2008 _ harrison county _ marshall isd _ 2008 texas school survey of drug and alcohol use _ elementary report
http://slidepdf.com/reader/full/2008-harrison-county-marshall-isd-2008-texas-school-survey-of-drug-and 8/40
Marshall
Spring 2008
Table A-4: Average age of first use of alcohol:
Grade 4 Grade 5 Grade 6
Beer
8.1 9.2 9.7
Wine Coolers
8.1 9.2 10.2
Wine
8.6 9.7 10.6
Liquor
8.8 9.3 10.9
Any Alcohol
8.2 9.2 9.8
Table A-5: Age of first use of alcohol by family situation:
Never Under 8 8 9 10 11 Over 11
Two Parent Family
All 76.6% 5.7% 2.7% 2.5% 5.1% 3.5% 3.9%
Grade 4 88.3% 5.1% 3.0% 2.5% 1.0% 0.0% 0.0%
Grade 5 77.6% 5.8% 2.6% 1.9% 5.1% 5.8% 1.3%
Grade 6 65.5% 6.1% 2.5% 3.0% 8.6% 4.6% 9.6%
Other Family Situation
All 73.5% 4.5% 4.9% 4.7% 6.9% 3.3% 2.3%
Grade 4 83.7% 3.7% 4.4% 6.7% 1.5% 0.0% 0.0%
Grade 5 83.6% 4.5% 2.7% 0.9% 7.3% 0.0% 0.9%
Grade 6 52.1% 5.1% 7.7% 6.8% 12.0% 10.3% 6.0%
Table A-6 : Lifetime prevalence of use of alcohol by reported conduct problemsthis school year:
No Absences
or Conduct
Problems Cut School
Sent to
Principal Both
16.8% 54.7% 37.4% 59.4%
Elementary Report-Page

7/30/2019 2008 _ harrison county _ marshall isd _ 2008 texas school survey of drug and alcohol use _ elementary report
http://slidepdf.com/reader/full/2008-harrison-county-marshall-isd-2008-texas-school-survey-of-drug-and 9/40
Marshall
Spring 2008
Table A-7: When you drink alcohol, do you get it from ..
Don't Drink Yes No
Home?
All 75.4% 10.4% 14.2%
Grade 4 80.7% 6.5% 12.7%
Grade 5 78.9% 10.2% 10.9%
Grade 6 66.9% 14.1% 19.0%
Friends?
All 75.3% 4.0% 20.7%
Grade 4 81.1% 1.7% 17.2%
Grade 5 79.9% 1.5% 18.5%
Grade 6 65.4% 8.6% 25.9%
Somewhere else?
All 73.6% 9.8% 16.6%
Grade 4 79.6% 5.6% 14.8%
Grade 5 77.9% 9.2% 13.0%
Grade 6 63.9% 14.2% 21.9%
Elementary Report-Page

7/30/2019 2008 _ harrison county _ marshall isd _ 2008 texas school survey of drug and alcohol use _ elementary report
http://slidepdf.com/reader/full/2008-harrison-county-marshall-isd-2008-texas-school-survey-of-drug-and 10/40
Marshall
Spring 2008
Table A-8: About how many of your close friends use ..
Never
Heard Of None Some Most
Any alcohol product?
All 1.0% 73.3% 20.7% 5.0%
Grade 4 1.5% 79.5% 14.8% 4.2%
Grade 5 0.8% 79.0% 17.2% 3.1%
Grade 6 0.6% 62.2% 29.5% 7.7%
Beer?
All 1.4% 78.3% 17.3% 2.9%
Grade 4 2.2% 81.9% 13.0% 2.9%
Grade 5 0.8% 83.7% 14.0% 1.6%
Grade 6 1.3% 69.8% 24.6% 4.3%
Wine coolers?
All 11.0% 77.2% 9.2% 2.6%
Grade 4 15.7% 78.2% 4.5% 1.6%
Grade 5 9.4% 83.9% 4.3% 2.4%
Grade 6 8.3% 69.9% 18.2% 3.6%Wine?
All 2.4% 86.4% 9.9% 1.3%
Grade 4 3.9% 87.5% 7.2% 1.3%
Grade 5 2.4% 90.2% 6.5% 0.8%
Grade 6 1.0% 81.9% 15.4% 1.7%
Liquor?
All 7.9% 83.4% 7.0% 1.7%
Grade 4 14.5% 80.3% 4.2% 1.0%
Grade 5 6.8% 88.8% 4.0% 0.4%
Grade 6 3.0% 81.1% 12.3% 3.6%
Elementary Report-Page

7/30/2019 2008 _ harrison county _ marshall isd _ 2008 texas school survey of drug and alcohol use _ elementary report
http://slidepdf.com/reader/full/2008-harrison-county-marshall-isd-2008-texas-school-survey-of-drug-and 11/40
Marshall
Spring 2008
Table A-9: Have you ever been offered ..
Never
Heard Of Yes No
Any alcohol product?
All 1.2% 26.4% 72.4%
Grade 4 1.5% 20.9% 77.6%
Grade 5 1.1% 22.5% 76.4%
Grade 6 1.0% 35.5% 63.6%
Beer?
All 1.2% 20.5% 78.2%
Grade 4 1.6% 17.1% 81.3%
Grade 5 0.8% 17.1% 82.2%
Grade 6 1.3% 27.1% 71.6%
Wine coolers?
All 10.6% 11.6% 77.8%
Grade 4 15.1% 6.6% 78.4%
Grade 5 9.9% 6.7% 83.4%
Grade 6 7.3% 20.9% 71.9%Wine?
All 2.0% 12.7% 85.3%
Grade 4 3.0% 10.8% 86.2%
Grade 5 1.6% 9.0% 89.4%
Grade 6 1.4% 17.9% 80.7%
Liquor?
All 7.0% 8.7% 84.3%
Grade 4 11.7% 5.4% 82.9%
Grade 5 5.9% 5.1% 89.0%
Grade 6 4.0% 15.0% 81.1%
Elementary Report-Page

7/30/2019 2008 _ harrison county _ marshall isd _ 2008 texas school survey of drug and alcohol use _ elementary report
http://slidepdf.com/reader/full/2008-harrison-county-marshall-isd-2008-texas-school-survey-of-drug-and 12/40
Marshall
Spring 2008
Table A-10: How do your parents feel about kids your age drinking beer?
Don't Like Don't Care Think It's OK Don't know
All 81.0% 3.8% 2.0% 13.2%
Grade 4 84.0% 3.3% 1.5% 11.2%
Grade 5 80.6% 3.7% 1.5% 14.3%
Grade 6 78.8% 4.4% 2.8% 13.9%
Table A-11: How dangerous do you think it is for kids your age to use ..
Never
Heard Of
Very
Dangerous Dangerous
Not at All
Dangerous Do Not Know
Any alcohol product?
All 0.5% 74.2% 18.1% 2.1% 5.1%
Grade 4 1.2% 75.5% 15.6% 2.4% 5.2%
Grade 5 0.0% 79.8% 15.8% 0.7% 3.7%
Grade 6 0.3% 67.4% 22.8% 3.2% 6.3%Beer?
All 0.5% 56.2% 29.7% 4.9% 8.6%
Grade 4 1.3% 61.2% 24.6% 4.2% 8.7%
Grade 5 0.0% 61.0% 29.5% 3.4% 6.1%
Grade 6 0.3% 47.2% 34.3% 7.1% 11.0%
Wine coolers?
All 9.4% 53.5% 20.7% 5.6% 10.8%
Grade 4 13.8% 57.7% 15.4% 3.2% 9.9%
Grade 5 9.1% 58.6% 21.7% 2.7% 8.0%
Grade 6 5.9% 44.6% 24.4% 10.7% 14.3%
Wine?
All 1.4% 56.4% 26.4% 5.6% 10.2%Grade 4 3.3% 58.5% 24.1% 4.7% 9.4%
Grade 5 0.4% 62.5% 27.0% 2.7% 7.3%
Grade 6 0.7% 48.5% 27.8% 9.4% 13.7%
Liquor?
All 5.5% 65.8% 19.2% 1.5% 8.1%
Grade 4 10.8% 63.4% 18.3% 1.0% 6.5%
Grade 5 4.6% 70.7% 17.4% 0.4% 6.9%
Grade 6 1.6% 63.3% 21.6% 3.0% 10.5%
Elementary Report-Page

7/30/2019 2008 _ harrison county _ marshall isd _ 2008 texas school survey of drug and alcohol use _ elementary report
http://slidepdf.com/reader/full/2008-harrison-county-marshall-isd-2008-texas-school-survey-of-drug-and 13/40
Marshall
Spring 2008
Table D-1: How recently, if ever, have you used Marijuana..
Ever
Used
School
Year
Not Past
Year
Never
Used
All 0.7% 0.4% 0.3% 99.3%
Grade 4 0.9% 0.3% 0.6% 99.1%
Grade 5 0.0% 0.0% 0.0% 100.0%
Grade 6 1.3% 0.9% 0.3% 98.7%
Table D-2: Average number of times marijuana was used by those reporting usage:
School
Year Lifetime
All 4.0 4.0
Grade 4 * *
Grade 5 * *
Grade 6 * *
Elementary Report-Page

7/30/2019 2008 _ harrison county _ marshall isd _ 2008 texas school survey of drug and alcohol use _ elementary report
http://slidepdf.com/reader/full/2008-harrison-county-marshall-isd-2008-texas-school-survey-of-drug-and 14/40
Marshall
Spring 2008
Table D-3: Average age of first use of marijuana:
Grade 4 Grade 5 Grade 6
* * *
Table D-4: Age of first use of marijuana by family situation:
Never Under 8 8 9 10 11 Over 11
Two Parent Family
All 99.5% 0.2% 0.0% 0.0% 0.0% 0.2% 0.2%
Grade 4 99.0% 0.5% 0.0% 0.0% 0.0% 0.5% 0.0%
Grade 5 100.0% 0.0% 0.0% 0.0% 0.0% 0.0% 0.0%
Grade 6 99.5% 0.0% 0.0% 0.0% 0.0% 0.0% 0.5%
Other Family Situation
All 99.2% 0.0% 0.0% 0.0% 0.0% 0.6% 0.3%
Grade 4 100.0% 0.0% 0.0% 0.0% 0.0% 0.0% 0.0%
Grade 5 100.0% 0.0% 0.0% 0.0% 0.0% 0.0% 0.0%
Grade 6 97.4% 0.0% 0.0% 0.0% 0.0% 1.7% 0.9%
Elementary Report-Page

7/30/2019 2008 _ harrison county _ marshall isd _ 2008 texas school survey of drug and alcohol use _ elementary report
http://slidepdf.com/reader/full/2008-harrison-county-marshall-isd-2008-texas-school-survey-of-drug-and 15/40
Marshall
Spring 2008
Table D-5 : Lifetime prevalence of use of marijuana by reported conductproblems this school year:
No Absences
or Conduct
Problems Cut School
Sent to
Principal Both
0.3% 4.8% 1.3% 6.4%
Table D-6: About how many of your close friends use marijuana?
Never
Heard Of None Some Most
All 12.2% 83.9% 3.4% 0.5%
Grade 4 27.3% 69.8% 2.3% 0.6%
Grade 5 5.9% 93.0% 1.2% 0.0%
Grade 6 4.9% 87.6% 6.5% 1.0%
Table D-7: Have you ever been offered marijuana?
Never
Heard Of Yes No
All 10.5% 4.9% 84.5%
Grade 4 22.8% 3.2% 74.0%
Grade 5 5.1% 3.9% 91.1%
Grade 6 4.9% 7.5% 87.6%
Table D-8: How do your parents feel about kids your age smoking marijuana?
Don't Like Don't Care Think It's OK Don't know
All 86.6% 1.1% 0.5% 11.8%
Grade 4 83.9% 0.6% 0.6% 14.9%
Grade 5 85.4% 1.8% 0.0% 12.8%
Grade 6 90.2% 0.9% 0.9% 7.9%
Table D-9: How dangerous do you think it is for kids your age to use marijuana?
Never
Heard Of
Very
Dangerous Dangerous
Not at All
Dangerous Do Not Know
All 9.9% 75.9% 8.8% 0.2% 5.2%
Grade 4 21.9% 61.6% 8.7% 0.0% 7.7%
Grade 5 4.3% 84.0% 8.2% 0.0% 3.5%
Grade 6 4.6% 80.8% 9.4% 0.7% 4.6%
Elementary Report-Page

7/30/2019 2008 _ harrison county _ marshall isd _ 2008 texas school survey of drug and alcohol use _ elementary report
http://slidepdf.com/reader/full/2008-harrison-county-marshall-isd-2008-texas-school-survey-of-drug-and 16/40
Marshall
Spring 2008
Table I-1: How recently, if ever, have you used Inhalants..
Ever
Used
School
Year
Not Past
Year
Never
Used
All 7.3% 5.8% 1.5% 92.7%
Grade 4 7.8% 6.9% 0.9% 92.2%
Grade 5 6.6% 5.1% 1.5% 93.4%
Grade 6 7.6% 5.4% 2.2% 92.4%
Table I-2: Have you ever sniffed any of the following inhalants to get high?
Not Used Used
Correction Fluid/Whiteout
All 97.9% 2.1%
Grade 4 98.4% 1.6%
Grade 5 98.1% 1.9%
Grade 6 97.1% 2.9%Gasoline
All 97.1% 2.9%
Grade 4 96.3% 3.7%
Grade 5 97.0% 3.0%
Grade 6 97.8% 2.2%
Glue
All 97.6% 2.4%
Grade 4 97.4% 2.6%
Grade 5 96.6% 3.4%
Grade 6 98.7% 1.3%
Paint Thinner
All 98.3% 1.7%Grade 4 98.1% 1.9%
Grade 5 98.5% 1.5%
Grade 6 98.4% 1.6%
Spray Paint
All 98.0% 2.0%
Grade 4 97.1% 2.9%
Grade 5 98.1% 1.9%
Grade 6 98.7% 1.3%
Other Inhalants
All 96.0% 4.0%
Grade 4 96.5% 3.5%
Grade 5 96.6% 3.4%
Grade 6 94.9% 5.1%
Elementary Report-Page

7/30/2019 2008 _ harrison county _ marshall isd _ 2008 texas school survey of drug and alcohol use _ elementary report
http://slidepdf.com/reader/full/2008-harrison-county-marshall-isd-2008-texas-school-survey-of-drug-and 17/40
Marshall
Spring 2008
Table I-3: Average number of times inhalants were used by those reporting usage:
School
Year Lifetime
All 2.7 3.2
Grade 4 2.7 4.2
Grade 5 4.3 4.5
Grade 6 1.9 2.3
Table I-4: Number of different kinds of inhalants used:
None One Two to Three Four Plus
All 93.1% 3.2% 2.6% 1.1%
Grade 4 93.1% 2.9% 2.9% 1.1%
Grade 5 93.5% 3.6% 1.4% 1.4%
Grade 6 92.8% 3.1% 3.4% 0.6%
Elementary Report-Page

7/30/2019 2008 _ harrison county _ marshall isd _ 2008 texas school survey of drug and alcohol use _ elementary report
http://slidepdf.com/reader/full/2008-harrison-county-marshall-isd-2008-texas-school-survey-of-drug-and 18/40
Marshall
Spring 2008
Table I-5: Average age of first use of inhalants:
Grade 4 Grade 5 Grade 6
8.3 9.0 9.9
Table I-6: Age of first use of inhalants by family situation:
Never Under 8 8 9 10 11 Over 11
Two Parent Family
All 96.1% 0.7% 0.5% 0.5% 0.8% 0.6% 0.8%
Grade 4 96.8% 0.5% 1.1% 1.1% 0.5% 0.0% 0.0%
Grade 5 97.4% 0.0% 0.7% 0.0% 0.7% 1.3% 0.0%
Grade 6 94.3% 1.6% 0.0% 0.5% 1.0% 0.5% 2.1%
Other Family Situation
All 96.2% 0.9% 0.6% 0.9% 0.9% 0.6% 0.0%
Grade 4 98.4% 0.8% 0.8% 0.0% 0.0% 0.0% 0.0%
Grade 5 96.3% 1.8% 0.9% 0.0% 0.9% 0.0% 0.0%
Grade 6 93.9% 0.0% 0.0% 2.6% 1.8% 1.8% 0.0%
Elementary Report-Page

7/30/2019 2008 _ harrison county _ marshall isd _ 2008 texas school survey of drug and alcohol use _ elementary report
http://slidepdf.com/reader/full/2008-harrison-county-marshall-isd-2008-texas-school-survey-of-drug-and 19/40
Marshall
Spring 2008
Table I-7: Lifetime prevalence of use of inhalants by reported conductproblems this school year:
No Absences
or Conduct
Problems Cut School
Sent to
Principal Both
2.3% 9.2% 7.1% 12.1%
Table I-8: About how many of your close friends use inhalants?
Never
Heard Of None Some Most
All 8.1% 84.8% 6.0% 1.1%
Grade 4 15.8% 79.4% 3.2% 1.6%
Grade 5 3.5% 91.4% 4.7% 0.4%
Grade 6 5.6% 83.2% 9.9% 1.3%
Elementary Report-Page

7/30/2019 2008 _ harrison county _ marshall isd _ 2008 texas school survey of drug and alcohol use _ elementary report
http://slidepdf.com/reader/full/2008-harrison-county-marshall-isd-2008-texas-school-survey-of-drug-and 20/40
Marshall
Spring 2008
Table I-9: Have you ever been offered inhalants?
Never
Heard Of Yes No
All 7.9% 6.0% 86.2%
Grade 4 14.4% 3.3% 82.3%
Grade 5 3.9% 5.1% 91.1%
Grade 6 5.9% 9.2% 84.8%
Table I-10: How dangerous do you think it is for kids your age to use inhalants?
Never
Heard Of
Very
Dangerous Dangerous
Not at All
Dangerous Do Not Know
All 7.1% 68.7% 14.9% 1.6% 7.8%
Grade 4 13.0% 64.5% 14.0% 1.3% 7.2%
Grade 5 4.2% 72.9% 14.9% 0.8% 7.3%
Grade 6 4.7% 68.1% 15.6% 2.7% 9.0%
Elementary Report-Page

7/30/2019 2008 _ harrison county _ marshall isd _ 2008 texas school survey of drug and alcohol use _ elementary report
http://slidepdf.com/reader/full/2008-harrison-county-marshall-isd-2008-texas-school-survey-of-drug-and 21/40
Marshall
Spring 2008
Table X-1: Since school began in the fall, have you gotten information on drugsor alcohol from ..
CATEGORY Yes
An Assembly Program? All 42.1%
Grade 4 34.8%
Grade 5 48.1%
Grade 6 42.0%
Guidance Counselor? All 23.0%
Grade 4 37.9%
Grade 5 15.6%
Grade 6 17.8%
Visitor to Class? All 60.4%
Grade 4 45.6%
Grade 5 88.3%
Grade 6 43.8%
Someone Else at School? All 34.4%
Grade 4 37.3%
Grade 5 38.3%
Grade 6 28.0%
Your Teacher? All 54.1%
Grade 4 50.2%
Grade 5 66.2%
Grade 6 44.9%
Any School Source? All 81.6%
Grade 4 76.8%
Grade 5 99.3%
Grade 6 68.0%
Elementary Report-Page

7/30/2019 2008 _ harrison county _ marshall isd _ 2008 texas school survey of drug and alcohol use _ elementary report
http://slidepdf.com/reader/full/2008-harrison-county-marshall-isd-2008-texas-school-survey-of-drug-and 22/40
Marshall
Spring 2008
Table B1: Prevalence and recency of use of selected substances by gradeAll Students
Ever
Used
School
Year
Not Past
Year
Never
Used
Tobacco
All 8.0% 4.5% 3.5% 92.0%
Grade 4 3.8% 3.2% 0.6% 96.2%
Grade 5 6.5% 4.7% 1.8% 93.5%
Grade 6 13.4% 5.6% 7.8% 86.6%
Alcohol
All 25.4% 16.7% 8.7% 74.6%
Grade 4 16.1% 10.9% 5.3% 83.9%
Grade 5 18.9% 13.1% 5.8% 81.1%
Grade 6 40.6% 25.8% 14.8% 59.4%
Inhalants
All 7.3% 5.8% 1.5% 92.7%
Grade 4 7.8% 6.9% 0.9% 92.2%
Grade 5 6.6% 5.1% 1.5% 93.4%Grade 6 7.6% 5.4% 2.2% 92.4%
Marijuana
All 0.7% 0.4% 0.3% 99.3%
Grade 4 0.9% 0.3% 0.6% 99.1%
Grade 5 0.0% 0.0% 0.0% 100.0%
Grade 6 1.3% 0.9% 0.3% 98.7%
Elementary Report-Page
7/30/2019 2008 _ harrison county _ marshall isd _ 2008 texas school survey of drug and alcohol use _ elementary report
http://slidepdf.com/reader/full/2008-harrison-county-marshall-isd-2008-texas-school-survey-of-drug-and 23/40
Marshall
Spring 2008
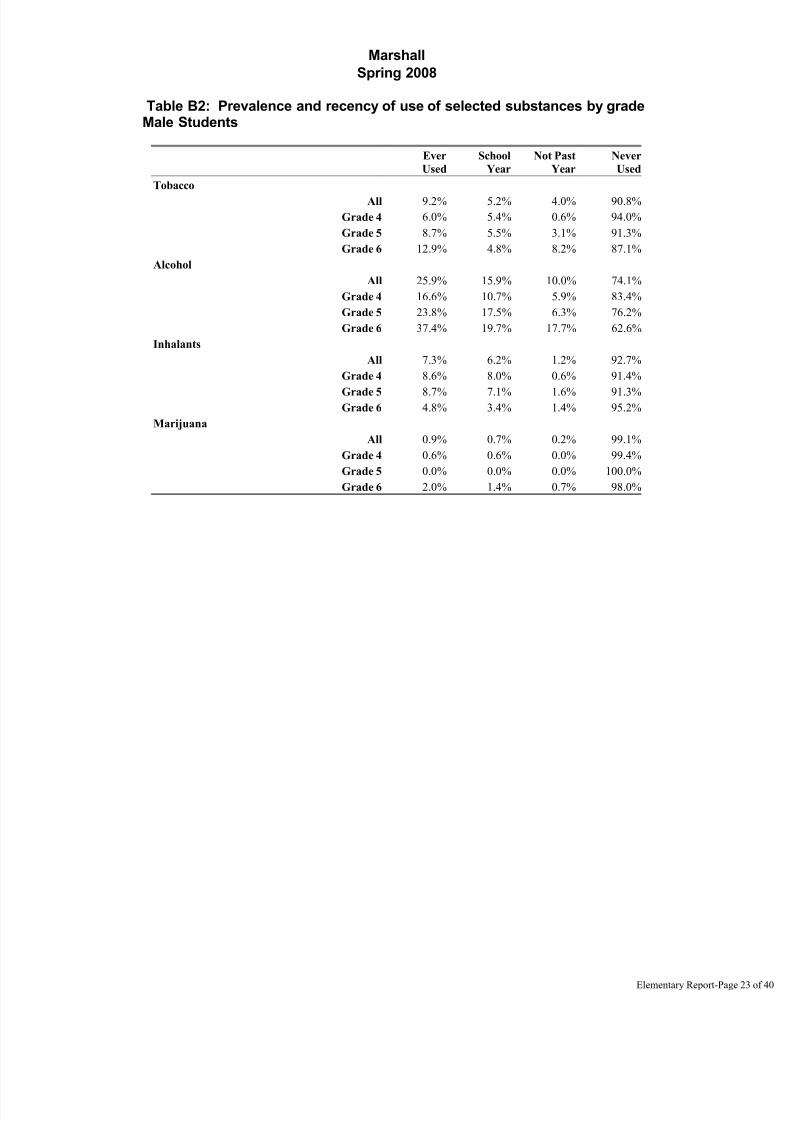
Table B2: Prevalence and recency of use of selected substances by gradeMale Students
Ever
Used
School
Year
Not Past
Year
Never
Used
Tobacco
All 9.2% 5.2% 4.0% 90.8%
Grade 4 6.0% 5.4% 0.6% 94.0%
Grade 5 8.7% 5.5% 3.1% 91.3%
Grade 6 12.9% 4.8% 8.2% 87.1%
Alcohol
All 25.9% 15.9% 10.0% 74.1%
Grade 4 16.6% 10.7% 5.9% 83.4%
Grade 5 23.8% 17.5% 6.3% 76.2%
Grade 6 37.4% 19.7% 17.7% 62.6%
Inhalants
All 7.3% 6.2% 1.2% 92.7%
Grade 4 8.6% 8.0% 0.6% 91.4%
Grade 5 8.7% 7.1% 1.6% 91.3%Grade 6 4.8% 3.4% 1.4% 95.2%
Marijuana
All 0.9% 0.7% 0.2% 99.1%
Grade 4 0.6% 0.6% 0.0% 99.4%
Grade 5 0.0% 0.0% 0.0% 100.0%
Grade 6 2.0% 1.4% 0.7% 98.0%
Elementary Report-Page

7/30/2019 2008 _ harrison county _ marshall isd _ 2008 texas school survey of drug and alcohol use _ elementary report
http://slidepdf.com/reader/full/2008-harrison-county-marshall-isd-2008-texas-school-survey-of-drug-and 24/40
Marshall
Spring 2008
Table B3: Prevalence and recency of use of selected substances by gradeFemale Students
Ever
Used
School
Year
Not Past
Year
Never
Used
Tobacco
All 7.0% 4.0% 3.0% 93.0%
Grade 4 1.7% 1.1% 0.6% 98.3%
Grade 5 4.8% 4.1% 0.7% 95.2%
Grade 6 13.9% 6.4% 7.5% 86.1%
Alcohol
All 25.0% 17.5% 7.6% 75.0%
Grade 4 15.8% 11.1% 4.7% 84.2%
Grade 5 14.9% 9.5% 5.4% 85.1%
Grade 6 43.3% 31.0% 12.3% 56.7%
Inhalants
All 7.3% 5.5% 1.9% 92.7%
Grade 4 7.1% 5.9% 1.2% 92.9%
Grade 5 4.8% 3.4% 1.4% 95.2%Grade 6 10.1% 7.1% 3.0% 89.9%
Marijuana
All 0.6% 0.2% 0.4% 99.4%
Grade 4 1.2% 0.0% 1.2% 98.8%
Grade 5 0.0% 0.0% 0.0% 100.0%
Grade 6 0.6% 0.6% 0.0% 99.4%
Elementary Report-Page

7/30/2019 2008 _ harrison county _ marshall isd _ 2008 texas school survey of drug and alcohol use _ elementary report
http://slidepdf.com/reader/full/2008-harrison-county-marshall-isd-2008-texas-school-survey-of-drug-and 25/40
Marshall
Spring 2008
Table B4: Prevalence and recency of use of selected substances by gradeWhite Students
Ever
Used
School
Year
Not Past
Year
Never
Used
Tobacco
All 8.7% 4.3% 4.4% 91.3%
Grade 4 4.0% 4.0% 0.0% 96.0%
Grade 5 5.9% 3.9% 2.0% 94.1%
Grade 6 15.7% 5.0% 10.7% 84.3%
Alcohol
All 20.9% 13.6% 7.3% 79.1%
Grade 4 11.2% 8.0% 3.2% 88.8%
Grade 5 15.7% 10.8% 4.9% 84.3%
Grade 6 34.7% 21.5% 13.2% 65.3%
Inhalants
All 7.0% 5.2% 1.8% 93.0%
Grade 4 6.5% 5.7% 0.8% 93.5%
Grade 5 5.9% 5.0% 1.0% 94.1%Grade 6 8.3% 5.0% 3.3% 91.7%
Marijuana
All 0.8% 0.5% 0.3% 99.2%
Grade 4 1.6% 0.8% 0.8% 98.4%
Grade 5 0.0% 0.0% 0.0% 100.0%
Grade 6 0.8% 0.8% 0.0% 99.2%
Elementary Report-Page

7/30/2019 2008 _ harrison county _ marshall isd _ 2008 texas school survey of drug and alcohol use _ elementary report
http://slidepdf.com/reader/full/2008-harrison-county-marshall-isd-2008-texas-school-survey-of-drug-and 26/40
Marshall
Spring 2008
Table B5: Prevalence and recency of use of selected substances by gradeAfrican/American Students
Ever
Used
School
Year
Not Past
Year
Never
Used
Tobacco
All 7.6% 5.0% 2.5% 92.4%
Grade 4 4.0% 3.0% 1.0% 96.0%
Grade 5 7.0% 4.7% 2.3% 93.0%
Grade 6 11.3% 7.2% 4.1% 88.7%
Alcohol
All 29.8% 17.7% 12.1% 70.2%
Grade 4 18.4% 11.2% 7.1% 81.6%
Grade 5 19.5% 10.3% 9.2% 80.5%
Grade 6 50.5% 30.9% 19.6% 49.5%
Inhalants
All 6.7% 4.9% 1.8% 93.3%
Grade 4 6.3% 5.2% 1.0% 93.8%
Grade 5 3.5% 2.4% 1.2% 96.5%Grade 6 10.4% 7.3% 3.1% 89.6%
Marijuana
All 0.7% 0.4% 0.4% 99.3%
Grade 4 0.0% 0.0% 0.0% 100.0%
Grade 5 0.0% 0.0% 0.0% 100.0%
Grade 6 2.1% 1.0% 1.0% 97.9%
Elementary Report-Page

7/30/2019 2008 _ harrison county _ marshall isd _ 2008 texas school survey of drug and alcohol use _ elementary report
http://slidepdf.com/reader/full/2008-harrison-county-marshall-isd-2008-texas-school-survey-of-drug-and 27/40
Marshall
Spring 2008
Table B6: Prevalence and recency of use of selected substances by gradeMexican/American Students
Ever
Used
School
Year
Not Past
Year
Never
Used
Tobacco
All 7.3% 3.9% 3.4% 92.7%
Grade 4 4.0% 2.7% 1.3% 96.0%
Grade 5 4.4% 4.4% 0.0% 95.6%
Grade 6 12.2% 4.4% 7.8% 87.8%
Alcohol
All 25.9% 19.1% 6.8% 74.1%
Grade 4 18.7% 13.3% 5.3% 81.3%
Grade 5 19.4% 16.4% 3.0% 80.6%
Grade 6 36.7% 25.6% 11.1% 63.3%
Inhalants
All 7.8% 6.5% 1.4% 92.2%
Grade 4 9.5% 8.1% 1.4% 90.5%
Grade 5 10.3% 7.4% 2.9% 89.7%Grade 6 4.5% 4.5% 0.0% 95.5%
Marijuana
All 0.0% 0.0% 0.0% 100.0%
Grade 4 0.0% 0.0% 0.0% 100.0%
Grade 5 0.0% 0.0% 0.0% 100.0%
Grade 6 0.0% 0.0% 0.0% 100.0%
Elementary Report-Page

7/30/2019 2008 _ harrison county _ marshall isd _ 2008 texas school survey of drug and alcohol use _ elementary report
http://slidepdf.com/reader/full/2008-harrison-county-marshall-isd-2008-texas-school-survey-of-drug-and 28/40
Marshall
Spring 2008
Table B7: Prevalence and recency of use of selected substances by gradeStudents Reporting A Grades
Ever
Used
School
Year
Not Past
Year
Never
Used
Tobacco
All 4.9% 2.2% 2.7% 95.1%
Grade 4 1.8% 1.8% 0.0% 98.2%
Grade 5 3.1% 3.1% 0.0% 96.9%
Grade 6 9.4% 1.6% 7.8% 90.6%
Alcohol
All 24.2% 16.3% 7.9% 75.8%
Grade 4 15.5% 11.8% 3.6% 84.5%
Grade 5 17.7% 13.1% 4.6% 82.3%
Grade 6 38.3% 23.4% 14.8% 61.7%
Inhalants
All 6.5% 4.8% 1.8% 93.5%
Grade 4 4.6% 4.6% 0.0% 95.4%
Grade 5 8.7% 6.3% 2.4% 91.3%Grade 6 5.5% 3.1% 2.3% 94.5%
Marijuana
All 0.0% 0.0% 0.0% 100.0%
Grade 4 0.0% 0.0% 0.0% 100.0%
Grade 5 0.0% 0.0% 0.0% 100.0%
Grade 6 0.0% 0.0% 0.0% 100.0%
Elementary Report-Page

7/30/2019 2008 _ harrison county _ marshall isd _ 2008 texas school survey of drug and alcohol use _ elementary report
http://slidepdf.com/reader/full/2008-harrison-county-marshall-isd-2008-texas-school-survey-of-drug-and 29/40
Marshall
Spring 2008
Table B8: Prevalence and recency of use of selected substances by gradeStudents Reporting grades lower than A
Ever
Used
School
Year
Not Past
Year
Never
Used
Tobacco
All 10.2% 6.3% 3.9% 89.8%
Grade 4 5.0% 4.1% 0.9% 95.0%
Grade 5 9.4% 6.5% 2.9% 90.6%
Grade 6 16.2% 8.4% 7.9% 83.8%
Alcohol
All 26.7% 17.2% 9.6% 73.3%
Grade 4 16.4% 10.0% 6.4% 83.6%
Grade 5 20.9% 13.7% 7.2% 79.1%
Grade 6 42.3% 27.5% 14.8% 57.7%
Inhalants
All 7.9% 6.7% 1.2% 92.1%
Grade 4 9.8% 8.4% 1.4% 90.2%
Grade 5 4.3% 4.3% 0.0% 95.7%Grade 6 9.1% 7.0% 2.1% 90.9%
Marijuana
All 1.2% 0.7% 0.5% 98.8%
Grade 4 1.4% 0.5% 0.9% 98.6%
Grade 5 0.0% 0.0% 0.0% 100.0%
Grade 6 2.1% 1.6% 0.5% 97.9%
Elementary Report-Page

7/30/2019 2008 _ harrison county _ marshall isd _ 2008 texas school survey of drug and alcohol use _ elementary report
http://slidepdf.com/reader/full/2008-harrison-county-marshall-isd-2008-texas-school-survey-of-drug-and 30/40
Marshall
Spring 2008
Table B9: Prevalence and recency of use of selected substances by gradeStudents Living With 2 Parents
Ever
Used
School
Year
Not Past
Year
Never
Used
Tobacco
All 7.9% 4.2% 3.7% 92.1%
Grade 4 3.9% 3.9% 0.0% 96.1%
Grade 5 7.6% 5.7% 1.9% 92.4%
Grade 6 11.6% 3.0% 8.5% 88.4%
Alcohol
All 24.3% 15.3% 9.0% 75.7%
Grade 4 14.9% 11.4% 3.5% 85.1%
Grade 5 20.4% 12.7% 7.6% 79.6%
Grade 6 36.2% 21.1% 15.1% 63.8%
Inhalants
All 7.7% 6.4% 1.3% 92.3%
Grade 4 10.2% 8.6% 1.5% 89.8%
Grade 5 7.1% 5.8% 1.3% 92.9%Grade 6 6.1% 5.1% 1.0% 93.9%
Marijuana
All 0.5% 0.3% 0.2% 99.5%
Grade 4 1.0% 0.5% 0.5% 99.0%
Grade 5 0.0% 0.0% 0.0% 100.0%
Grade 6 0.5% 0.5% 0.0% 99.5%
Elementary Report-Page
7/30/2019 2008 _ harrison county _ marshall isd _ 2008 texas school survey of drug and alcohol use _ elementary report
http://slidepdf.com/reader/full/2008-harrison-county-marshall-isd-2008-texas-school-survey-of-drug-and 31/40
Marshall
Spring 2008
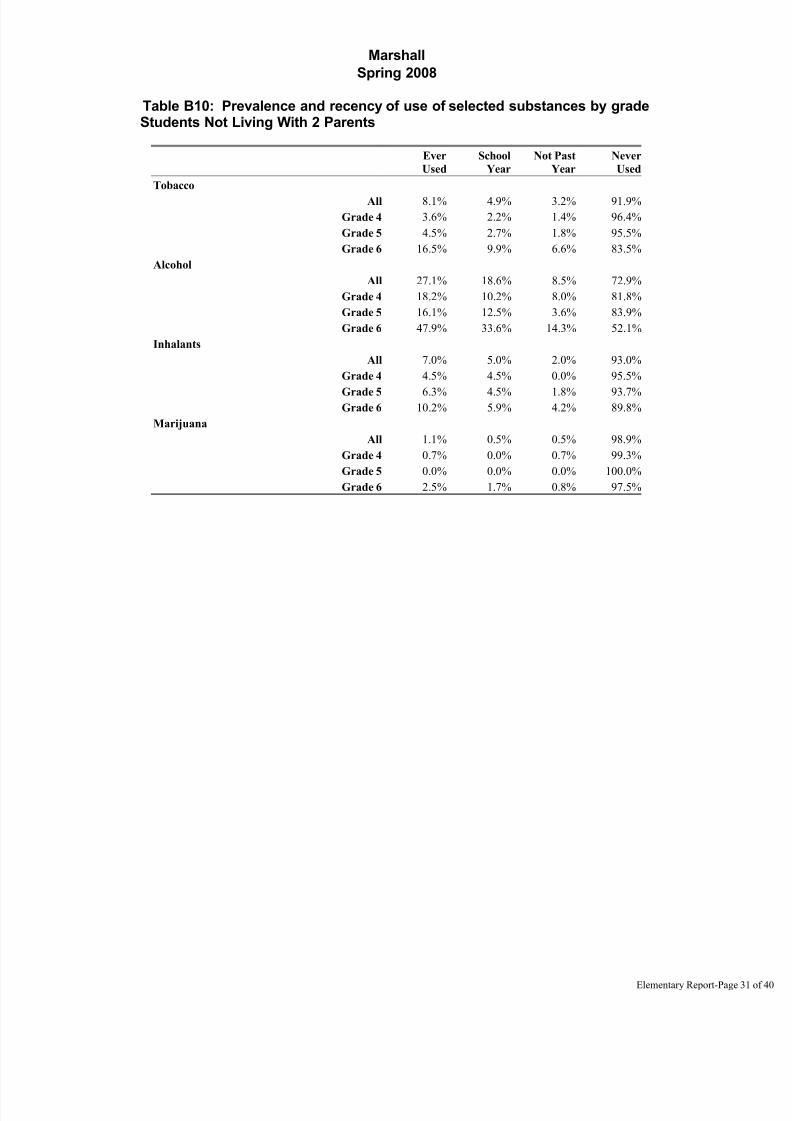
Table B10: Prevalence and recency of use of selected substances by gradeStudents Not Living With 2 Parents
Ever
Used
School
Year
Not Past
Year
Never
Used
Tobacco
All 8.1% 4.9% 3.2% 91.9%
Grade 4 3.6% 2.2% 1.4% 96.4%
Grade 5 4.5% 2.7% 1.8% 95.5%
Grade 6 16.5% 9.9% 6.6% 83.5%
Alcohol
All 27.1% 18.6% 8.5% 72.9%
Grade 4 18.2% 10.2% 8.0% 81.8%
Grade 5 16.1% 12.5% 3.6% 83.9%
Grade 6 47.9% 33.6% 14.3% 52.1%
Inhalants
All 7.0% 5.0% 2.0% 93.0%
Grade 4 4.5% 4.5% 0.0% 95.5%
Grade 5 6.3% 4.5% 1.8% 93.7%Grade 6 10.2% 5.9% 4.2% 89.8%
Marijuana
All 1.1% 0.5% 0.5% 98.9%
Grade 4 0.7% 0.0% 0.7% 99.3%
Grade 5 0.0% 0.0% 0.0% 100.0%
Grade 6 2.5% 1.7% 0.8% 97.5%
Elementary Report-Page

7/30/2019 2008 _ harrison county _ marshall isd _ 2008 texas school survey of drug and alcohol use _ elementary report
http://slidepdf.com/reader/full/2008-harrison-county-marshall-isd-2008-texas-school-survey-of-drug-and 32/40
Marshall
Spring 2008
Table B11: Prevalence and recency of use of selected substances by gradeStudents Living in Town More Than 3 Years
Ever
Used
School
Year
Not Past
Year
Never
Used
Tobacco
All 8.6% 5.0% 3.6% 91.4%
Grade 4 5.0% 4.3% 0.8% 95.0%
Grade 5 5.8% 4.4% 1.3% 94.2%
Grade 6 14.4% 6.1% 8.4% 85.6%
Alcohol
All 25.9% 17.3% 8.5% 74.1%
Grade 4 17.0% 12.0% 5.0% 83.0%
Grade 5 18.5% 13.7% 4.8% 81.5%
Grade 6 41.0% 25.7% 15.3% 59.0%
Inhalants
All 7.1% 5.7% 1.5% 92.9%
Grade 4 6.7% 5.6% 1.2% 93.3%
Grade 5 6.2% 5.3% 0.9% 93.8%Grade 6 8.4% 6.1% 2.3% 91.6%
Marijuana
All 0.8% 0.4% 0.4% 99.2%
Grade 4 1.2% 0.4% 0.8% 98.8%
Grade 5 0.0% 0.0% 0.0% 100.0%
Grade 6 1.1% 0.8% 0.4% 98.9%
Elementary Report-Page

7/30/2019 2008 _ harrison county _ marshall isd _ 2008 texas school survey of drug and alcohol use _ elementary report
http://slidepdf.com/reader/full/2008-harrison-county-marshall-isd-2008-texas-school-survey-of-drug-and 33/40
Marshall
Spring 2008
Table B12: Prevalence and recency of use of selected substances by gradeStudents Living in Town 3 Years or Less
Ever
Used
School
Year
Not Past
Year
Never
Used
Tobacco
All 5.3% 3.1% 2.1% 94.7%
Grade 4 0.0% 0.0% 0.0% 100.0%
Grade 5 6.1% 3.0% 3.0% 93.9%
Grade 6 9.1% 6.1% 3.0% 90.9%
Alcohol
All 27.9% 18.6% 9.3% 72.1%
Grade 4 15.6% 9.4% 6.3% 84.4%
Grade 5 24.2% 15.2% 9.1% 75.8%
Grade 6 42.4% 30.3% 12.1% 57.6%
Inhalants
All 9.2% 7.0% 2.2% 90.8%
Grade 4 12.5% 12.5% 0.0% 87.5%
Grade 5 9.4% 6.3% 3.1% 90.6%Grade 6 6.3% 3.1% 3.1% 93.8%
Marijuana
All 1.0% 1.0% 0.0% 99.0%
Grade 4 0.0% 0.0% 0.0% 100.0%
Grade 5 0.0% 0.0% 0.0% 100.0%
Grade 6 3.1% 3.1% 0.0% 96.9%
Elementary Report-Page

7/30/2019 2008 _ harrison county _ marshall isd _ 2008 texas school survey of drug and alcohol use _ elementary report
http://slidepdf.com/reader/full/2008-harrison-county-marshall-isd-2008-texas-school-survey-of-drug-and 34/40
Marshall
Spring 2008
The FREQ Procedure
GENDER
Q1 Frequency Percent
Female 498 52.80
Male 446 47.20
Frequency Missing = 2.0318812626
GRADE LEVEL
Q2 Frequency Percent
Grade 4 306 32.35
Grade 5 319 33.70
Grade 6 321 33.95
DO YOU LIVE WITH
BOTH PARENTS?
Q3 Frequency Percent
No 375 40.04
Yes 561 59.96
Frequency Missing = 9.5608134413
AGE
Q4 Frequency Percent
9 77 8.20
10 276 29.29
11 290 30.85
12 257 27.27
13 or older 41 4.39
Frequency Missing = 5.2188190764
ETHNICITY
Q5 Frequency Percent
African/American 286 30.75
Asian/American 6 0.64
Mexican/American 234 25.17
Native/American 15 1.62
Other 39 4.19
White 350 37.62
Frequency Missing = 15.069312085
WHAT GRADES DO YOU
USUALLY GET
Q6 Frequency Percent
Mostly A's 379 40.88
Mostly B's 428 46.19
Mostly C's 95 10.26
Mostly D's 16 1.78
Mostly F's 8 0.89
Frequency Missing = 18.452835744
LIVED IN THIS TOWN FOR
MORE THAN 3 YEARS
Q7 Frequency Percent
Don't Know 83 8.85
No 103 10.91
Yes 755 80.24
Frequency Missing = 4.7861305847
EITHER PARENT
GRADUATE FROM
COLLEGE
Q8 Frequency Percent
Don't Know 380 40.41
No 199 21.18
Yes 361 38.41
Frequency Missing = 6.1887375107
QUALIFY FOR A
FREE/REDUCED PRICE
LUNCH?
Q9 Frequency Percent
Don't Know 216 23.24
No 275 29.52
Yes 440 47.24
Frequency Missing = 15.235216466
PARENTS ATTEND
PTA MEETINGS?
Q10 Frequency Percent
No 494 53.65
Yes 427 46.35
Frequency Missing = 25.7045854
EVER INHALED
GASOLINE TO GET
HIGH?
Q11a Frequency Percent
Not Used 884 97.06
Used 27 2.94
Frequency Missing = 35.1327883
EVER INHALED PAINT
THINNER TO GET HIGH?
Q11b Frequency Percent
Not Used 869 98.32
Used 15 1.68
Frequency Missing = 62.1266038
EVER INHALED GLUE TO
GET HIGH?
Q11c Frequency Percent
Not Used 863 97.58
Used 21 2.42
Frequency Missing = 61.5280110
EVER INHALED
WHITEOUT TO GET
HIGH?
Q11d Frequency Percent
Not Used 874 97.85
Used 19 2.15
Frequency Missing = 53.2767107
EVER INHALED SPRAYPAINT TO GET HIGH?
Q11e Frequency Percent
Not Used 872 98.02
Used 18 1.98
Frequency Missing = 55.865055
The frequencies have been weighted so that the
analysis reflects the distribution of students by grade
level in the district
Page

7/30/2019 2008 _ harrison county _ marshall isd _ 2008 texas school survey of drug and alcohol use _ elementary report
http://slidepdf.com/reader/full/2008-harrison-county-marshall-isd-2008-texas-school-survey-of-drug-and 35/40
Marshall
Spring 2008
EVER USED OTHER
INHALANTS TO GET
HIGH?
Q11f Frequency Percent
Not Used 865 96.00
Used 36 4.00
Frequency Missing = 45.210548647
CIGARETTE USE DURING
LIFETIME
Q12A Frequency Percent
Never heard of 46 4.98
Never used 830 89.19
1-2 times 45 4.83
3-10 times 7 0.79
11+ times 2 0.22
Frequency Missing = 15.235216466
SNUFF/CHEWING TOBACCO
USE IN LIFETIME
Q12B Frequency Percent
Never heard of 83 9.07
Never used 809 88.32
1-2 times 22 2.38
3-10 times 2 0.24
Frequency Missing = 29.913969252
BEER USE DURING LIFETIME
Q12C Frequency Percent
Never heard of 18 1.93
Never used 746 82.07
1-2 times 118 13.03
3-10 times 18 2.01
11+ times 9 0.97
Frequency Missing = 37.257763314
WINE COOLER USE DURING
LIFETIME
Q12D Frequency Percent
Never heard of 182 20.24
Never used 611 68.06
1-2 times 78 8.67
3-10 times 16 1.79
11+ times 11 1.23
Frequency Missing = 48.831224281
WINE USE DURING LIFETIME
Q12E Frequency Percent
Never heard of 31 3.62
Never used 734 84.47
1-2 times 92 10.57
3-10 times 9 1.01
11+ times 3 0.33
Frequency Missing = 77.421620211
LIQUOR USE DURING
LIFETIME
Q12F Frequency Percent
Never heard of 110 12.25
Never used 731 81.53
1-2 times 42 4.67
3-10 times 9 1.02
11+ times 5 0.53
Frequency Missing = 49.418369425
SHIMERON USE DURING
LIFETIME
Q12G Frequency Percent
Never heard of 657 72.82
Never used 245 27.18
Frequency Missing = 44.230231813
INHALANT USE DURIN
LIFETIM
Q12H Frequency Perce
Never heard of 101 11.
Never used 765 84.
1-2 times 26 2.
3-10 times 4 0.
11+ times 4 0.
Frequency Missing = 45.5090635
MARIJUANA USE DURIN
LIFETIM
Q12I Frequency Perce
Never heard of 135 14.
Never used 763 84.
1-2 times 4 0.
3-10 times 1 0.
11+ times 1 0.
Frequency Missing = 41.4759824
CIGARETTE USE IN PAS
SCHOOL YEA
Q13A Frequency Perce
Never heard of 32 3.
Never used 866 93.
1-2 times 26 2.
3-10 times 6 0.
11+ times 1 0.
Frequency Missing = 15.1114412
SNUFF/CHEWING TOBACC
USE IN PAST YEA
Q13B Frequency Perce
Never heard of 70 7.
Never used 834 91.
1-2 times 10 1.
Frequency Missing = 32.3171760
The frequencies have been weighted so that the
analysis reflects the distribution of students by grade
level in the district
Page

7/30/2019 2008 _ harrison county _ marshall isd _ 2008 texas school survey of drug and alcohol use _ elementary report
http://slidepdf.com/reader/full/2008-harrison-county-marshall-isd-2008-texas-school-survey-of-drug-and 36/40
Marshall
Spring 2008
BEER USE IN PAST SCHOOL
YEAR
Q13C Frequency Percent
Never heard of 12 1.33
Never used 793 89.18
1-2 times 66 7.45
3-10 times 11 1.28
11+ times 7 0.76
Frequency Missing = 57.267662636
WINE COOLER USE IN PAST
SCHOOL YEAR
Q13D Frequency Percent
Never heard of 151 16.77
Never used 677 75.27
1-2 times 57 6.30
3-10 times 9 0.99
11+ times 6 0.67
Frequency Missing = 45.941752043
WINE USE IN PAST SCHOOL
YEAR
Q13E Frequency Percent
Never heard of 28 3.15
Never used 788 89.58
1-2 times 58 6.62
3-10 times 5 0.56
11+ times 1 0.10
Frequency Missing = 66.407235313
LIQUOR USE IN PAST SCHOOL
YEAR
Q13F Frequency Percent
Never heard of 97 10.79
Never used 759 84.41
1-2 times 34 3.83
3-10 times 4 0.45
11+ times 5 0.53
Frequency Missing = 46.95379967
SHIMERON USE IN PAST
SCHOOL YEAR
Q13G Frequency Percent
Never heard of 604 67.14
Never used 296 32.86
Frequency Missing = 46.219983883
INHALANT USE IN PAST
SCHOOL YEAR
Q13H Frequency Percent
Never heard of 100 11.05
Never used 773 85.73
1-2 times 24 2.63
3-10 times 3 0.37
11+ times 2 0.23
Frequency Missing = 43.951999974
MARIJUANA USE IN PAST
SCHOOL YEAR
Q13I Frequency Percent
Never heard of 136 15.25
Never used 754 84.32
1-2 times 3 0.32
11+ times 1 0.11
Frequency Missing = 51.677517997
AGE WHEN FIRST USED
CIGARETTES
Q14A Frequency Percent
7 or younger 11 1.16
8 years old 4 0.44
9 years old 8 0.92
10 years old 16 1.70
11 years old 10 1.12
12 or older 8 0.87
Never heard/used 862 93.77
Frequency Missing = 27.086909272
AGE WHEN FIRST US
SNUFF/CHEW TOBAC
Q14B Frequency Perc
7 or younger 5 0
8 years old 2 0
9 years old 4 0
10 years old 4 0
11 years old 4 0
12 or older 2 0
Never heard/used 883 97
Frequency Missing = 41.8779895
AGE WHEN FIRST USED BE
Q14C Frequency Perc
7 or younger 35 3
8 years old 20 2
9 years old 20 2
10 years old 34 3
11 years old 21 2
12 or older 17 1
Never heard/used 745 83
Frequency Missing = 52.7405301
AGE WHEN FIRST USED WI
COOLE
Q14D Frequency Perc
7 or younger 15 1
8 years old 17 1
9 years old 11 1
10 years old 21 2
11 years old 21 2
12 or older 20 2
Never heard/used 791 88
Frequency Missing = 49.5728260
AGE WHEN FIRST USED WI
Q14E Frequency Perc
7 or younger 11 1
8 years old 9 1
9 years old 11 1
10 years old 24 2
11 years old 29 3
12 or older 17 1
Never heard/used 780 88
The frequencies have been weighted so that the
analysis reflects the distribution of students by grade
level in the district
Page

7/30/2019 2008 _ harrison county _ marshall isd _ 2008 texas school survey of drug and alcohol use _ elementary report
http://slidepdf.com/reader/full/2008-harrison-county-marshall-isd-2008-texas-school-survey-of-drug-and 37/40
Marshall
Spring 2008
Frequency Missing = 65.2610141
AGE WHEN FIRST USED LIQUOR
Q14F Frequency Percent7 or younger 5 0.60
8 years old 3 0.34
9 years old 6 0.70
10 years old 15 1.63
11 years old 10 1.18
12 or older 14 1.58
Never heard/used 835 93.97
Frequency Missing = 57.164170514
AGE WHEN FIRST USEDSHIMERON
Q14G Frequency Percent
Never heard/used 879 100.00
Frequency Missing = 67.169120175
AGE WHEN FIRST USED
INHALANTS
Q14H Frequency Percent
7 or younger 7 0.79
8 years old 5 0.559 years old 6 0.64
10 years old 7 0.80
11 years old 5 0.59
12 or older 4 0.45
Never heard/used 859 96.17
Frequency Missing = 52.26571247
AGE WHEN FIRST USED
MARIJUANA
Q14I Frequency Percent7 or younger 1 0.10
11 years old 3 0.32
12 or older 2 0.22
Never heard/used 895 99.36
Frequency Missing = 45.158021055
CLOSE FRIENDS USE
CIGARETTES
Q15A Frequency Percent
Never heard of 24 2.63
None 766 84.99
Some 106 11.80
Most 5 0.58
Frequency Missing = 44.837660022
CLOSE FRIENDS USE
SNUFF/CHEWING TOBACCO
Q15B Frequency Percent
Never heard of 41 4.57
None 812 90.99
Some 38 4.22
Most 2 0.23
Frequency Missing = 53.687553132
CLOSE FRIENDS USE BEER
Q15C Frequency Percent
Never heard of 12 1.42
None 685 78.32
Some 152 17.34
Most 26 2.92
Frequency Missing = 71.770112643
CLOSE FRIENDS USE WINE
COOLERS
Q15D Frequency Percent
Never heard of 96 11.00
None 672 77.24
Some 80 9.19
Most 22 2.56
Frequency Missing = 75.71009998
CLOSE FRIENDS USE WINE
Q15E Frequency Percent
Never heard of 20 2.41
None 734 86.44
Some 84 9.87
Most 11 1.27
Frequency Missing = 97.1226062
CLOSE FRIENDS USE LIQUO
Q15F Frequency PerceNever heard of 68 7.
None 720 83.
Some 60 6.
Most 15 1.
Frequency Missing = 83.2390321
CLOSE FRIENDS US
SHIMERO
Q15G Frequency Perce
Never heard of 489 56.None 377 43.
Some 3 0.
Most 1 0.
Frequency Missing = 75.4625496
CLOSE FRIENDS US
INHALANT
Q15H Frequency Perce
Never heard of 70 8.
None 738 84.Some 53 6.
Most 10 1.
Frequency Missing = 75.3080929
CLOSE FRIENDS US
MARIJUAN
Q15I Frequency Perce
Never heard of 107 12.
None 734 83.
Some 30 3.Most 5 0.
Frequency Missing = 70.4288686
The frequencies have been weighted so that the
analysis reflects the distribution of students by grade
level in the district
Page
7/30/2019 2008 _ harrison county _ marshall isd _ 2008 texas school survey of drug and alcohol use _ elementary report
http://slidepdf.com/reader/full/2008-harrison-county-marshall-isd-2008-texas-school-survey-of-drug-and 38/40
Marshall
Spring 2008
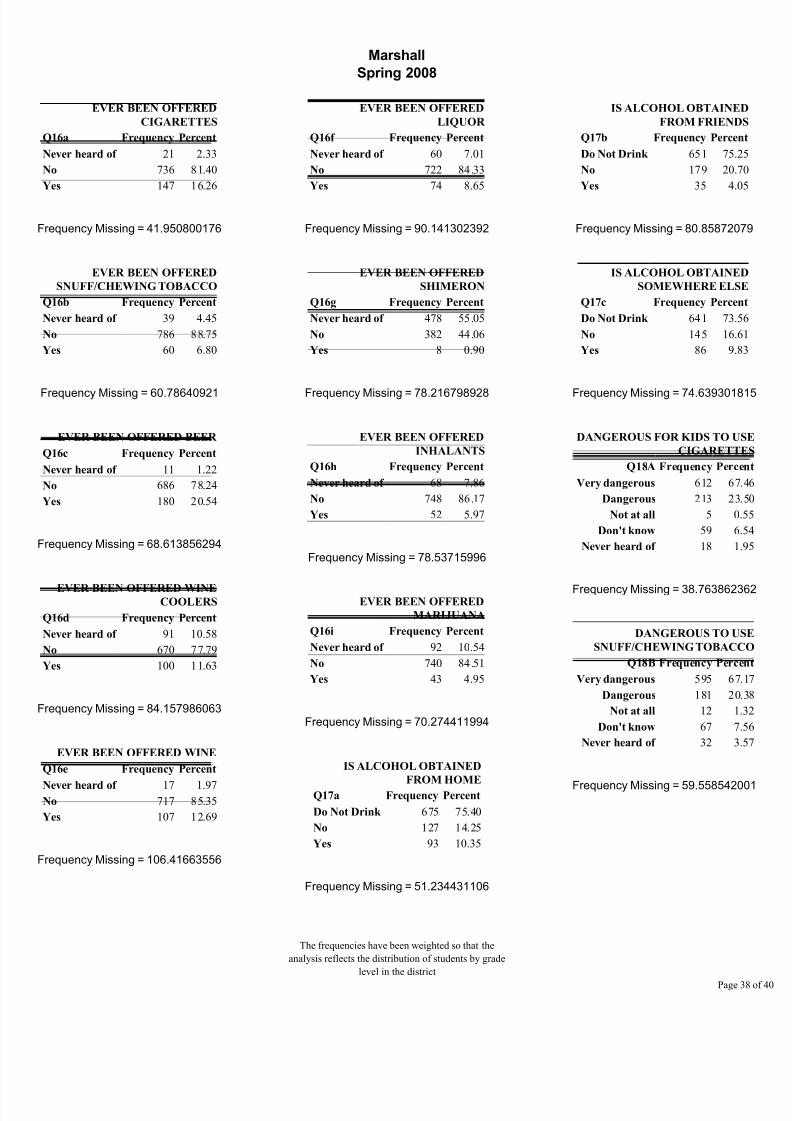
EVER BEEN OFFERED
CIGARETTES
Q16a Frequency Percent
Never heard of 21 2.33
No 736 81.40
Yes 147 16.26
Frequency Missing = 41.950800176
EVER BEEN OFFERED
SNUFF/CHEWING TOBACCO
Q16b Frequency Percent
Never heard of 39 4.45
No 786 88.75
Yes 60 6.80
Frequency Missing = 60.78640921
EVER BEEN OFFERED BEER
Q16c Frequency Percent
Never heard of 11 1.22
No 686 78.24
Yes 180 20.54
Frequency Missing = 68.613856294
EVER BEEN OFFERED WINECOOLERS
Q16d Frequency Percent
Never heard of 91 10.58
No 670 77.79
Yes 100 11.63
Frequency Missing = 84.157986063
EVER BEEN OFFERED WINE
Q16e Frequency Percent
Never heard of 17 1.97No 717 85.35
Yes 107 12.69
Frequency Missing = 106.41663556
EVER BEEN OFFERED
LIQUOR
Q16f Frequency Percent
Never heard of 60 7.01
No 722 84.33
Yes 74 8.65
Frequency Missing = 90.141302392
EVER BEEN OFFERED
SHIMERON
Q16g Frequency Percent
Never heard of 478 55.05
No 382 44.06
Yes 8 0.90
Frequency Missing = 78.216798928
EVER BEEN OFFERED
INHALANTS
Q16h Frequency Percent
Never heard of 68 7.86
No 748 86.17
Yes 52 5.97
Frequency Missing = 78.53715996
EVER BEEN OFFERED
MARIJUANA
Q16i Frequency Percent
Never heard of 92 10.54
No 740 84.51
Yes 43 4.95
Frequency Missing = 70.274411994
IS ALCOHOL OBTAINED
FROM HOMEQ17a Frequency Percent
Do Not Drink 675 75.40
No 127 14.25
Yes 93 10.35
Frequency Missing = 51.234431106
IS ALCOHOL OBTAINE
FROM FRIEND
Q17b Frequency Percen
Do Not Drink 651 75.2
No 179 20.7
Yes 35 4.0
Frequency Missing = 80.858720
IS ALCOHOL OBTAINE
SOMEWHERE ELS
Q17c Frequency Percen
Do Not Drink 641 73.5
No 145 16.6
Yes 86 9.8
Frequency Missing = 74.6393018
DANGEROUS FOR KIDS TO U
CIGARETT
Q18A Frequency Perce
Very dangerous 612 67
Dangerous 213 23
Not at all 5 0
Don't know 59 6
Never heard of 18 1
Frequency Missing = 38.7638623
DANGEROUS TO U
SNUFF/CHEWING TOBACC
Q18B Frequency Perce
Very dangerous 595 67
Dangerous 181 20
Not at all 12 1
Don't know 67 7
Never heard of 32 3
Frequency Missing = 59.5585420
The frequencies have been weighted so that the
analysis reflects the distribution of students by grade
level in the district
Page

7/30/2019 2008 _ harrison county _ marshall isd _ 2008 texas school survey of drug and alcohol use _ elementary report
http://slidepdf.com/reader/full/2008-harrison-county-marshall-isd-2008-texas-school-survey-of-drug-and 39/40
Marshall
Spring 2008
DANGEROUS FOR KIDS TO USE
BEER
Q18C Frequency Percent
Very dangerous 498 56.24
Dangerous 263 29.69
Not at all 44 4.95
Don't know 76 8.61
Never heard of 5 0.51
Frequency Missing = 60.940865862
DANGEROUS FOR KIDS TO USE
WINE COOLERS
Q18D Frequency Percent
Very dangerous 473 53.45
Dangerous 183 20.69
Not at all 50 5.64
Don't know 95 10.79
Never heard of 83 9.43
Frequency Missing = 61.466648077
DANGEROUS FOR KIDS TO USE
WINE
Q18E Frequency Percent
Very dangerous 486 56.44
Dangerous 227 26.38
Not at all 48 5.62
Don't know 88 10.17
Never heard of 12 1.39
Frequency Missing = 85.490394723
DANGEROUS FOR KIDS TO USE
LIQUOR
Q18F Frequency Percent
Very dangerous 575 65.84
Dangerous 167 19.15
Not at all 13 1.47
Don't know 70 8.06
Never heard of 48 5.48
Frequency Missing = 73.349022348
DANGEROUS FOR KIDS TO USE
SHIMERON
Q18G Frequency Percent
Very dangerous 277 31.90
Dangerous 39 4.50
Not at all 1 0.10
Don't know 76 8.78
Never heard of 475 54.71
Frequency Missing = 77.856921093
DANGEROUS FOR KIDS TO USE
INHALANTS
Q18H Frequency Percent
Very dangerous 599 68.65
Dangerous 130 14.87
Not at all 14 1.58
Don't know 68 7.82
Never heard of 62 7.08
Frequency Missing = 73.009427579
DANGEROUS FOR KIDS TO USE
MARIJUANA
Q18I Frequency Percent
Very dangerous 664 75.91
Dangerous 77 8.80
Not at all 2 0.23
Don't know 45 5.20
Never heard of 86 9.87
Frequency Missing = 71.305693358
DRUG/ALCOHOL INFO
FROM TEACHER
Q19a Frequency Percent
No 392 45.90
Yes 462 54.10
Frequency Missing = 92.877367306
DRUG/ALC INFO
FROM VISITOR TO
CLASS
Q19b Frequency Percent
No 336 39.59
Yes 512 60.41
Frequency Missing = 97.839800
DRUG/ALC INFO
FROM ASSEMBLY
PROGRAM
Q19c Frequency Percent
No 480 57.92
Yes 349 42.08
Frequency Missing = 117.510105
DRUG/ALC INFO
FROM GUIDE
COUNSELOR
Q19d Frequency Percent
No 635 76.97
Yes 190 23.03
Frequency Missing = 120.71732
DRUG/ALC INF FROM
SOMEONE ELSE AT
SCHOOL
Q19e Frequency Percent
No 545 65.56
Yes 286 34.44
Frequency Missing = 115.115733
BEER, TWO OR MORE
AT ONE TIME
Q20a Frequency PercentNever 782 86.81
1 time 78 8.61
2 times 17 1.87
3+ times 24 2.71
Frequency Missing = 44.910470
The frequencies have been weighted so that the
analysis reflects the distribution of students by grade
level in the district
Page

7/30/2019 2008 _ harrison county _ marshall isd _ 2008 texas school survey of drug and alcohol use _ elementary report
http://slidepdf.com/reader/full/2008-harrison-county-marshall-isd-2008-texas-school-survey-of-drug-and 40/40
Marshall
Spring 2008
WINE COOLERS, TWO
OR MORE AT ONE TIME
Q20b Frequency Percent
Never 800 90.57
1 time 48 5.41
2 times 17 1.97
3+ times 18 2.05
Frequency Missing = 63.281660429
WINE, TWO OR MORE
AT ONE TIME
Q20c Frequency Percent
Never 796 90.91
1 time 52 5.92
2 times 20 2.27
3+ times 8 0.91
Frequency Missing = 70.822040336
LIQUOR, TWO OR MORE
AT ONE TIME
Q20d Frequency Percent
Never 829 95.14
1 time 23 2.59
2 times 9 1.04
3+ times 11 1.23
Frequency Missing = 74.700664744
MISSED SCHOOL
WITHOUT PARENT'S
CONSENT
Q21 Frequency Percent
No 901 97.46
Yes 24 2.54
Frequency Missing = 21.620539821
SENT TO
PRINCIPAL/DEAN
SINCE SEPTEMBER
Q22 Frequency Percent
No 597 65.29
Frequency Missing = 31.389386835
PARENTS FEEL ABOUT KIDS
SMOKING CIGARETTES
Q23 Frequency Percent
Don't like it 801 86.61
Don't care 15 1.67
Think it's O.K. 10 1.06
Don't know 99 10.66
Frequency Missing = 21.342307982
PARENTS FEEL ABOUT KIDS
DRINKING BEER
Q24 Frequency Percent
Don't like it 747 81.04
Don't care 35 3.82
Think it's O.K. 18 1.95
Don't know 122 13.18
Frequency Missing = 24.251013956
PARENTS FEEL ABOUT KIDS
USING MARIJUANA
q25 Frequency Percent
Don't like it 802 86.55
Don't care 11 1.14
Think it's O.K. 5 0.51
Don't know 109 11.80
Frequency Missing = 19.588658558