Embed Size (px)
Citation preview
CBI MARKET SURVEY: THE (ORGANIC) COFFEE, TEA AND COCOA MARKET IN THE EU
Source: CBI Market Information Database • URL: www.cbi.eu • Contact: [email protected] • www.cbi.eu/disclaimer
Page 1 of 63
CBI MARKET SURVEY
THE (ORGANIC) COFFEE, TEA AND COCOA MARKET IN THE EU
Publication date: May 2008
CONTENTS
REPORT SUMMARY .................................................................................................. 2
INTRODUCTION....................................................................................................... 4
1 CONSUMPTION ................................................................................................. 5
2 PRODUCTION ................................................................................................. 19
3 TRADE STRUCTURE......................................................................................... 21
4 TRADE: IMPORTS AND EXPORTS..................................................................... 34
5 PRICE DEVELOPMENTS ................................................................................... 48
6 MARKET ACCESS REQUIREMENTS................................................................... 54
7 OPPORTUNITIES AND THREATS ..................................................................... 56
APPENDIX A PRODUCT CHARACTERISTICS ........................................................ 57
APPENDIX B INTRODUCTION TO THE EU MARKET.............................................. 60
APPENDIX C LISTS OF DEVELOPING COUNTRIES ............................................... 61
APPENDIX D REFERENCES .................................................................................. 63
This survey was compiled for CBI by ProFound – Advisers In Development in collaboration with Mr. Joost Pierrot
Disclaimer CBI market information tools: http://www.cbi.eu/disclaimer
CBI MARKET SURVEY: THE (ORGANIC) COFFEE, TEA AND COCOA MARKET IN THE EU
Source: CBI Market Information Database • URL: www.cbi.eu • Contact: [email protected] • www.cbi.eu/disclaimer
Page 2 of 63
REPORT SUMMARY This CBI market survey profiles the (organic) coffee, tea and cocoa market in the EU. The (organic) coffee, tea and cocoa markets in individual EU countries are discussed in separate market surveys. These market surveys as well as EU export marketing guidelines for (organic) coffee, tea and cocoa can be downloaded from http://www.cbi.eu/marketinfo. Consumption and trends In 2006, total EU coffee consumption amounted to 2.5 million tonnes, representing an average EU per capita consumption of 5.0 kg. This indicated a small annual increase between 2002 and 2006. Germany, Italy and France are the main consuming countries, accounting for almost 50% of EU consumption. Taking the organic and Fair-trade coffee markets together, they would account for more than 2% of the total coffee market. In 2006, the EU consumed 243.3 thousand tonnes of tea, of which 135.4 thousand tonnes was consumed in the United Kingdom (International Tea Committee, 2008). Other leading EU markets for tea are Poland, Germany, France, Ireland and The Netherlands. In terms of per capita consumption, tea is most popular in Ireland and the United Kingdom. In general, tea consumption in the EU shows a slight decrease, although green tea consumption is increasing. While consumption in traditional tea-drinking countries is decreasing, consumption in other countries such as Italy, Hungary and the Czech Republic is increasing fast. The leading EU markets for organic tea are the United Kingdom and Germany. In order to assess the demand for cocoa beans, total grindings per country are an important determinant. Almost 40% of global cocoa bean supplies are ground in the European Union, amounting to a volume of 1.44 million tonnes in the cocoa year 2007/08, increasing by 4.2% per year. The most important cocoa grinding EU member countries are The Netherlands and Germany. Other countries with considerable cocoa grinding facilities are France and the United Kingdom. In 2005/2006 consumption in the EU amounted to 1.4 million tonnes, an increase of 3.0% annually since 2001/2002. The largest consumers are Germany, France and the UK. Chocolate confectionery is very popular in Belgium, Germany, Ireland, the United Kingdom and Austria, all having a per capita consumption of 8 kg or higher in 2005. In the same year, total consumption amounted to 2.4 million tonnes and it is expected that this will continue to increase. Organic cocoa products still account for a small share of the total market, but this share is increasing rapidly. Important trends influencing the EU market for coffee, tea and cocoa are: • The trend towards convenience and smaller portions has led to an increasing demand for
products like instant coffee, coffee and tea pods, chocolate bars, tea-for-one bags, iced tea and coffee, etcetera.
• An increasing awareness of the environmental and social aspects of production led to greater importance of ‘sustainable’ coffee, tea or cocoa, including organic, Fair trade, Utz Certified, and other certification schemes. A “Common Code for the Coffee Community” (4C) and a ‘Sustainable Coffee Initiative’ have also received support.
• In line with the trend towards organic certification, is the trend among EU consumers towards a healthy life-style and, consequently, increased consumption of health food.
• Moreover, European consumers are calling for more variety and specialties. Single origin products are an important component of this trend.
Production Because of climatic conditions, no production of coffee, tea and cocoa beans takes place within the EU. However, coffee and tea are processed in the EU. The processing companies buy the raw material from developing country producers and do not compete directly with developing
CBI MARKET SURVEY: THE (ORGANIC) COFFEE, TEA AND COCOA MARKET IN THE EU
Source: CBI Market Information Database • URL: www.cbi.eu • Contact: [email protected] • www.cbi.eu/disclaimer
Page 3 of 63
countries on the market. Actually, developing countries play no relevant role in the EU market for roasted coffee and tea blends. The EU is a major grinder of cocoa beans imported from developing countries, and is therefore a competitor to developing countries on the markets for processed cocoa products. The Netherlands is the leading grinder and is also the world’s leading producer of processed cocoa products. Germany, France and the UK also have large production facilities. Trade structure In general, traders are the most important trade channel for all three products for developing country producers, but in certain cases local agents of EU buyers, or EU processors, can also be an interesting channel. Regarding organic products, the main organic traders mostly located in Germany and The Netherlands, are probably the most important trade channel. Imports Between 2002 and 2006, imports of coffee increased by 14% annually in value, and by 3% in volume, amounting to € 6.3 billion / 3.3 million tonnes in 2005. Germany is the leading EU importer, followed by France, Italy and Belgium. Imports mostly come directly from developing countries, the most important suppliers being Brazil and Vietnam, with direct imports accounting for 67% of total imports in value and 80% in volume. Organic coffee is mostly sourced in Latin America. Roasted coffee is supplied by European countries. Imports of tea into the EU decreased each year between 2002 and 2006. Between 2004 and 2006, however, imports rebounded somewhat, amounting to € 801 million / 336 thousand tonnes. Except for The Netherlands, imports by the main consuming countries in the EU decreased. However, imports by Eastern, Southern and Central European countries are showing a much better development. More than 60% of EU tea imports is sourced directly in developing countries, while the remainder consists of re-exports by other EU member countries. While imports of black tea showed a small decrease, imports of green tea are increasing. Both in terms of value and in volume, the EU imports of cocoa beans, cocoa paste and cocoa powder decreased between 2002 and 2006, especially for cocoa powder, amounting to € 2.1 billion, € 565 million and € 294 million respectively in the latter year. Imports of cocoa butter increased, amounting to € 1.3 billion. The Netherlands, Germany, Belgium and France are the leading importers of cocoa beans and derivate products. Almost 90% of the imports of cocoa beans originate directly in developing countries. The role of developing countries for paste and butter is also large. However, powder imports come mostly, and increasingly, from EU countries. Prices Prices for coffee, tea and cocoa are world market prices, either determined in futures markets (coffee and cocoa) or auctions (tea). Prices for coffee have shown a very favourable development in the last couple of months, and in general since 2004. Only recently have prices started to increase somewhat for tea. Prices for cocoa beans increased fast in the second half of 2006, and although they are now again increasing, still lie quite a bit under the record prices in mid-2007.
CBI MARKET SURVEY: THE (ORGANIC) COFFEE, TEA AND COCOA MARKET IN THE EU
Source: CBI Market Information Database • URL: www.cbi.eu • Contact: [email protected] • www.cbi.eu/disclaimer
Page 4 of 63
INTRODUCTION This CBI market survey profiles the coffee, tea and cocoa market in the EU. The emphasis of this survey lies on those products, which are of importance to developing country suppliers. The role of and opportunities for developing countries are highlighted. This market survey discusses the following product groups: • Coffee (Arabica and Robusta varieties)
o Green coffee o Roasted coffee
• Tea o Black tea (including Oolong tea) o Green tea (including White tea)
• Cocoa o Cocoa beans o Cocoa paste o Cocoa butter o Cocoa powder
For detailed information on the selected product groups, please consult appendix A. More information about the EU can be found in appendix B. CBI market surveys covering the market in specific EU member states, specific product(group)s or documents on market access requirements can be downloaded from the CBI website. For information on how to make optimal use of the CBI market surveys and other CBI market information, please consult ‘From survey to success - export guidelines’. All information can be downloaded from http://www.cbi.eu/marketinfo Go to ‘Search CBI database’ and select your market sector and the EU.
CBI MARKET SURVEY: THE (ORGANIC) COFFEE, TEA AND COCOA MARKET IN THE EU
Source: CBI Market Information Database • URL: www.cbi.eu • Contact: [email protected] • www.cbi.eu/disclaimer
Page 5 of 63
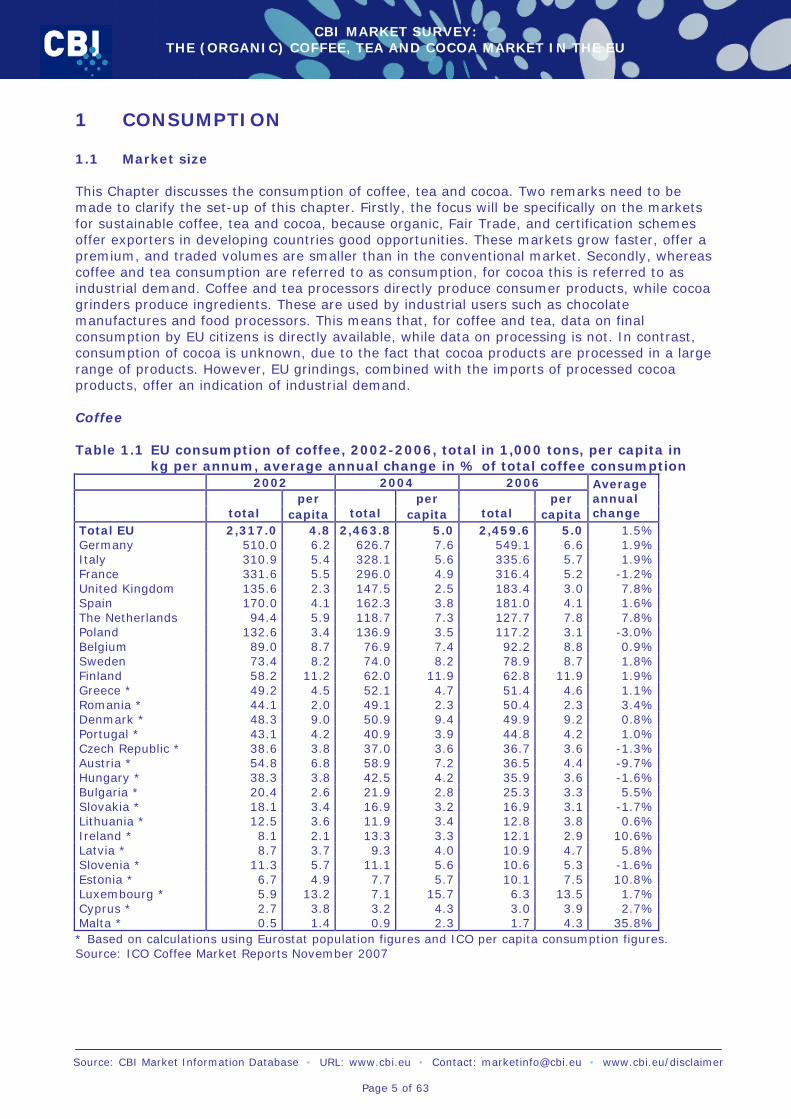
1 CONSUMPTION 1.1 Market size This Chapter discusses the consumption of coffee, tea and cocoa. Two remarks need to be made to clarify the set-up of this chapter. Firstly, the focus will be specifically on the markets for sustainable coffee, tea and cocoa, because organic, Fair Trade, and certification schemes offer exporters in developing countries good opportunities. These markets grow faster, offer a premium, and traded volumes are smaller than in the conventional market. Secondly, whereas coffee and tea consumption are referred to as consumption, for cocoa this is referred to as industrial demand. Coffee and tea processors directly produce consumer products, while cocoa grinders produce ingredients. These are used by industrial users such as chocolate manufactures and food processors. This means that, for coffee and tea, data on final consumption by EU citizens is directly available, while data on processing is not. In contrast, consumption of cocoa is unknown, due to the fact that cocoa products are processed in a large range of products. However, EU grindings, combined with the imports of processed cocoa products, offer an indication of industrial demand. Coffee Table 1.1 EU consumption of coffee, 2002-2006, total in 1,000 tons, per capita in
kg per annum, average annual change in % of total coffee consumption 2002 2004 2006
per per per total capita total capita total capita
Average annual change
Total EU 2,317.0 4.8 2,463.8 5.0 2,459.6 5.0 1.5% Germany 510.0 6.2 626.7 7.6 549.1 6.6 1.9% Italy 310.9 5.4 328.1 5.6 335.6 5.7 1.9% France 331.6 5.5 296.0 4.9 316.4 5.2 -1.2% United Kingdom 135.6 2.3 147.5 2.5 183.4 3.0 7.8% Spain 170.0 4.1 162.3 3.8 181.0 4.1 1.6% The Netherlands 94.4 5.9 118.7 7.3 127.7 7.8 7.8% Poland 132.6 3.4 136.9 3.5 117.2 3.1 -3.0% Belgium 89.0 8.7 76.9 7.4 92.2 8.8 0.9% Sweden 73.4 8.2 74.0 8.2 78.9 8.7 1.8% Finland 58.2 11.2 62.0 11.9 62.8 11.9 1.9% Greece * 49.2 4.5 52.1 4.7 51.4 4.6 1.1% Romania * 44.1 2.0 49.1 2.3 50.4 2.3 3.4% Denmark * 48.3 9.0 50.9 9.4 49.9 9.2 0.8% Portugal * 43.1 4.2 40.9 3.9 44.8 4.2 1.0% Czech Republic * 38.6 3.8 37.0 3.6 36.7 3.6 -1.3% Austria * 54.8 6.8 58.9 7.2 36.5 4.4 -9.7% Hungary * 38.3 3.8 42.5 4.2 35.9 3.6 -1.6% Bulgaria * 20.4 2.6 21.9 2.8 25.3 3.3 5.5% Slovakia * 18.1 3.4 16.9 3.2 16.9 3.1 -1.7% Lithuania * 12.5 3.6 11.9 3.4 12.8 3.8 0.6% Ireland * 8.1 2.1 13.3 3.3 12.1 2.9 10.6% Latvia * 8.7 3.7 9.3 4.0 10.9 4.7 5.8% Slovenia * 11.3 5.7 11.1 5.6 10.6 5.3 -1.6% Estonia * 6.7 4.9 7.7 5.7 10.1 7.5 10.8% Luxembourg * 5.9 13.2 7.1 15.7 6.3 13.5 1.7% Cyprus * 2.7 3.8 3.2 4.3 3.0 3.9 2.7% Malta * 0.5 1.4 0.9 2.3 1.7 4.3 35.8% * Based on calculations using Eurostat population figures and ICO per capita consumption figures. Source: ICO Coffee Market Reports November 2007

CBI MARKET SURVEY: THE (ORGANIC) COFFEE, TEA AND COCOA MARKET IN THE EU
Source: CBI Market Information Database • URL: www.cbi.eu • Contact: [email protected] • www.cbi.eu/disclaimer
Page 6 of 63
Coffee is mainly consumed in the developed countries of the northern hemisphere, and much less in the producing countries in the South. Between 2002 and 2006, the EU coffee consumption increased by an average annual rate of 1%, peeking in 2004. In 2005, however, consumption dropped by 6%, and in 2006 the consumption level was still somewhat below the 2004 level. In 2006, total consumption amounted to 2.5 million tonnes or 5.0 kilos per capita. The EU accounts for a third of world coffee consumption, which is twice as large as the consumption in the United States. After a period of decreasing consumption, consumption in Germany and France picked up in 2006. However, even with this growth for Germany, the record year 2004 was not equalled. Italy showed a more stable increase. Together, these three major markets accounted for almost 50% of total EU consumption in 2006. Other important EU coffee consuming countries are the UK (7%), Spain (7%), The Netherlands (5%) and Poland (5%). Of these countries, the United Kingdom and The Netherlands showed the largest average annual growth rates during the review period. Consumption decreased in France and Poland. According to ICO, coffee consumption is traditionally higher in Nordic countries, especially Finland, with per capita consumption amounting to 11.9 kg per capita in 2006. Other EU member countries with high per capita consumption are Luxemburg (13.5 kg) and Belgium (8.8 kg). Coffee consumption is rapidly increasing in Ireland and the UK, traditionally tea-consuming countries. Within the EU, the most important forms in which coffee is consumed are: • Ground coffee - this coffee, used for filter coffee systems, or in coffee pods, is still the
principal type of coffee consumed in the EU. • Roasted coffee beans – With the increasing prevalence of espresso and cappuccino systems
sold for use in the household, direct sales of roasted coffee beans is increasing fast. The increasing number of coffee bars is also strengthening this trend.
• Decaffeinated coffee – the International Tea Committee (ITC) estimated that decaffeinated coffee accounts for around 10% of all coffee sales (ITC, 2002). Decaffeinated coffee is losing share, as caffeine no longer appears to be an issue of particular concern to most consumers. However, in some South European countries decaffeinated is still an ongoing trend. Moreover, with production predominately taking place in the EU, this is of limited interest to developing country producers.
• Soluble or instant coffee – The share of soluble coffee in the total coffee consumption varies considerably among EU member countries; in Germany, soluble coffee comprises only 8% of total coffee consumption, whereas in the United Kingdom and Ireland, both typically tea-consuming nations, this share amounts to about 75%, although as coffee consumption is becoming more sophisticated, this is decreasing. Among developing countries, it is mostly Brazil that plays a role supplying this segment, with actual production predominately taking place in Europe.
• Ready-to-drink coffee – Less important than in the US market, but upcoming in the EU along with the trend towards convenience food product, are ready-to-use coffee drinks like iced coffee. These are mostly produced in the EU. This is also of importance in the catering sector.
• Flavoured coffee – An interesting and fast growing area of the market is flavoured coffees. Organic and other certified coffees Within the coffee market, sustainable coffee is an increasingly important segment of the market, especially as certifications, next to organic and Fair-trade, are supported by major European supermarkets and roasters. A curious phenomenon in much of northern Europe is that consumption of organic coffee has not responded very much to falling premiums of organic coffee. More attention must be paid to branding and promotion, in addition to quality to be able to increase this market share. ITC estimated total world consumption of coffee at around 57,000 tonnes in 2006, of which over 40% or 24,000 tonnes in the EU. For 2007, ITC expects that total consumption will have increased by around 10% worldwide. The strongest growth is expected for France and the UK.

CBI MARKET SURVEY: THE (ORGANIC) COFFEE, TEA AND COCOA MARKET IN THE EU
Source: CBI Market Information Database • URL: www.cbi.eu • Contact: [email protected] • www.cbi.eu/disclaimer
Page 7 of 63
Within the sustainable coffee market, organic certification takes a subordinate position compared to Fair-trade certified and especially Utz Certified coffee (former Utz Kapeh). Fair trade was until recently, the volume leader among certified coffees in Europe. As can be seen in Table 1.2, consumption of Fair-trade certified coffee increased by 30% annually between 2002 and 2006, amounting to 26,000 tonnes. Table 1.2 Consumption of Fair-trade certified coffee in selected EU countries
2002-2006, in tonnes 2002 2004 2006 Average annual change Austria 409 519 747 16% Belgium 632 865 1,047 13% Canada 425 826 2,268 52% Denmark 655 550 733 3% Finland 109 120 284 27% France 1,386 2,784 6,175 45% Germany 2,942 2,981 3,908 7% United Kingdom 1,954 3,339 6,238 34% Ireland 60 126 304 50% Italy 243 225 260 2% Luxemburg 68 70 91 8% The Netherlands 3,140 2,982 2,845 -2% Sweden 289 375 953 35% Spain n.a. n.a. 193 n.a. TOTAL* 9,172 15,762 26,046 30% Source: FLO International 2007 Utz Certified recently took over the lead among sustainable coffees. Between 2006 and 2007, sales of Utz Certified certified coffee increased from 36,000 tonnes to more than 50,000 tonnes, still for the larger part in Europe, an increase of almost 40% (Utz Certified website 2007). Starting as an initiative of Ahold Coffee in 2003, it was quickly followed by other retailers. For example, McDonalds announced it would feature certified sustainable coffee in Western Europe, mainly based on the Utz Certified scheme. Especially in The Netherlands, Utz Certified plays an important role, with a market share of 25% in 2006. In Belgium, its share was 5% in the same year. No further country specific data is available for Utz Certified. Shade-grown and bird-friendly certifications have just begun to reach Europe, but might also profit from the McDonalds scheme, with its sustainable coffee scheme also based on bird-friendly certification in several countries. No figures are available for these markets. For other certification schemes, such as the Common Code for the Coffee Community (4C) (http://www.sustainable-coffee.net), no market information is available. The initiative is broadly accepted by supporters both in producing and consuming countries. Within the EU, it concerns traders such as Armajaro and Ecom, large roasters such as Nestlé, Kraft and Sara Lee and retailers such as COOP. As such, it can be expected that its impact will be quite significant. 4C aims at achieving sustainability in the coffee chain through continuous improvements of the social, environmental and economic practices of the production, processing and trading of mainstream coffee. Through a third-party verification scheme, it aims at excluding the use of “Unacceptable Practices” and at supporting continuous improvement towards sustainable practices in the mainstream coffee sector. Responding to concerns about global warming, Impatto Zero is an Italian certification scheme based on the Kyoto protocol for the compensation on CO2 emissions (http://www.impattozero.it). Impatto Zero quantifies the environmental impact of companies, products and persons by calculating the emission of carbon dioxide and compensating them with the creation and protection of forests in Italy and around the world. The market impact of this and other CO2 schemes is not known.
CBI MARKET SURVEY: THE (ORGANIC) COFFEE, TEA AND COCOA MARKET IN THE EU
Source: CBI Market Information Database • URL: www.cbi.eu • Contact: [email protected] • www.cbi.eu/disclaimer
Page 8 of 63
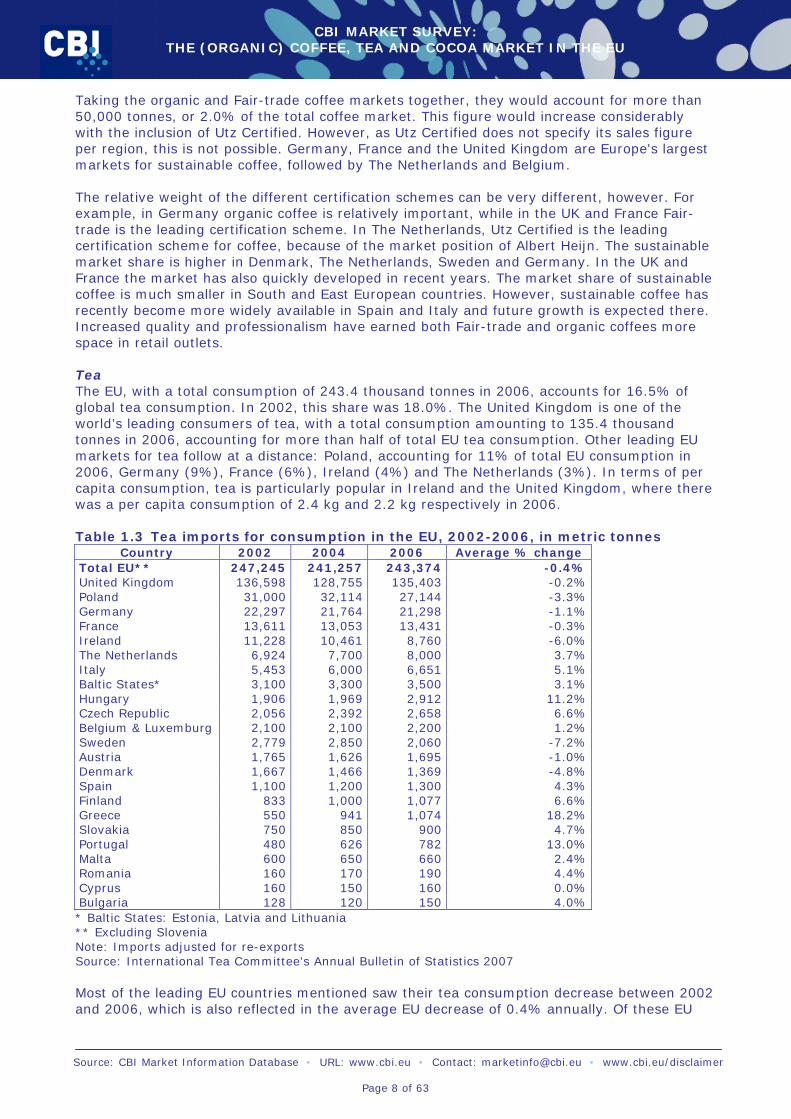
Taking the organic and Fair-trade coffee markets together, they would account for more than 50,000 tonnes, or 2.0% of the total coffee market. This figure would increase considerably with the inclusion of Utz Certified. However, as Utz Certified does not specify its sales figure per region, this is not possible. Germany, France and the United Kingdom are Europe's largest markets for sustainable coffee, followed by The Netherlands and Belgium. The relative weight of the different certification schemes can be very different, however. For example, in Germany organic coffee is relatively important, while in the UK and France Fair-trade is the leading certification scheme. In The Netherlands, Utz Certified is the leading certification scheme for coffee, because of the market position of Albert Heijn. The sustainable market share is higher in Denmark, The Netherlands, Sweden and Germany. In the UK and France the market has also quickly developed in recent years. The market share of sustainable coffee is much smaller in South and East European countries. However, sustainable coffee has recently become more widely available in Spain and Italy and future growth is expected there. Increased quality and professionalism have earned both Fair-trade and organic coffees more space in retail outlets. Tea The EU, with a total consumption of 243.4 thousand tonnes in 2006, accounts for 16.5% of global tea consumption. In 2002, this share was 18.0%. The United Kingdom is one of the world’s leading consumers of tea, with a total consumption amounting to 135.4 thousand tonnes in 2006, accounting for more than half of total EU tea consumption. Other leading EU markets for tea follow at a distance: Poland, accounting for 11% of total EU consumption in 2006, Germany (9%), France (6%), Ireland (4%) and The Netherlands (3%). In terms of per capita consumption, tea is particularly popular in Ireland and the United Kingdom, where there was a per capita consumption of 2.4 kg and 2.2 kg respectively in 2006. Table 1.3 Tea imports for consumption in the EU, 2002-2006, in metric tonnes
Country 2002 2004 2006 Average % change Total EU** 247,245 241,257 243,374 -0.4% United Kingdom 136,598 128,755 135,403 -0.2% Poland 31,000 32,114 27,144 -3.3% Germany 22,297 21,764 21,298 -1.1% France 13,611 13,053 13,431 -0.3% Ireland 11,228 10,461 8,760 -6.0% The Netherlands 6,924 7,700 8,000 3.7% Italy 5,453 6,000 6,651 5.1% Baltic States* 3,100 3,300 3,500 3.1% Hungary 1,906 1,969 2,912 11.2% Czech Republic 2,056 2,392 2,658 6.6% Belgium & Luxemburg 2,100 2,100 2,200 1.2% Sweden 2,779 2,850 2,060 -7.2% Austria 1,765 1,626 1,695 -1.0% Denmark 1,667 1,466 1,369 -4.8% Spain 1,100 1,200 1,300 4.3% Finland 833 1,000 1,077 6.6% Greece 550 941 1,074 18.2% Slovakia 750 850 900 4.7% Portugal 480 626 782 13.0% Malta 600 650 660 2.4% Romania 160 170 190 4.4% Cyprus 160 150 160 0.0% Bulgaria 128 120 150 4.0% * Baltic States: Estonia, Latvia and Lithuania ** Excluding Slovenia Note: Imports adjusted for re-exports Source: International Tea Committee's Annual Bulletin of Statistics 2007 Most of the leading EU countries mentioned saw their tea consumption decrease between 2002 and 2006, which is also reflected in the average EU decrease of 0.4% annually. Of these EU
CBI MARKET SURVEY: THE (ORGANIC) COFFEE, TEA AND COCOA MARKET IN THE EU
Source: CBI Market Information Database • URL: www.cbi.eu • Contact: [email protected] • www.cbi.eu/disclaimer
Page 9 of 63
member countries, only The Netherlands (3.7% annually) witnessed increase in tea consumption during the review period. Other less important EU tea markets where tea consumption increased substantially are, in order of market volume, Hungary (11.2%), Greece (18.2%) and Portugal (13%). Within the EU, the teas consumed are: • Green/Black tea: The tea market has seen a decline in sales of mainstream black tea bags.
Black tea accounts for about 72.5% of global production and around 90% of the market in Western countries. However, as is also reflected in the increasing EU imports of green tea, this product is increasingly gaining popularity in the West, partly due to health reasons.
• Flavoured tea – flavoured tea was introduced as a response to an increased demand for variety in tea consumption. It includes fruit teas and perfumed teas (e.g. containing anise or cinnamon flavour). These are predominately blended in the EU.
• Herbal tea – herbal drinks, particularly herbal teas and infusions, are becoming increasingly popular in the EU. According to the Association of Dutch Coffee Roasters and Tea Packers (VNKT), for example, in The Netherlands herbal infusions (e.g. rooibos) comprised 16.3% of total tea consumption in 2006, increasing from 14.7% in 2005 (VNKT, 2007). Please note that herbal teas are not included in the table below, as although they are consumed as teas, they (often) do not contain tea.
• Ready-to-drink teas – iced tea was initially introduced in Belgium as a sports drink, but is now a widely accepted drink in the EU. It is a particularly popular beverage in Germany and Italy.
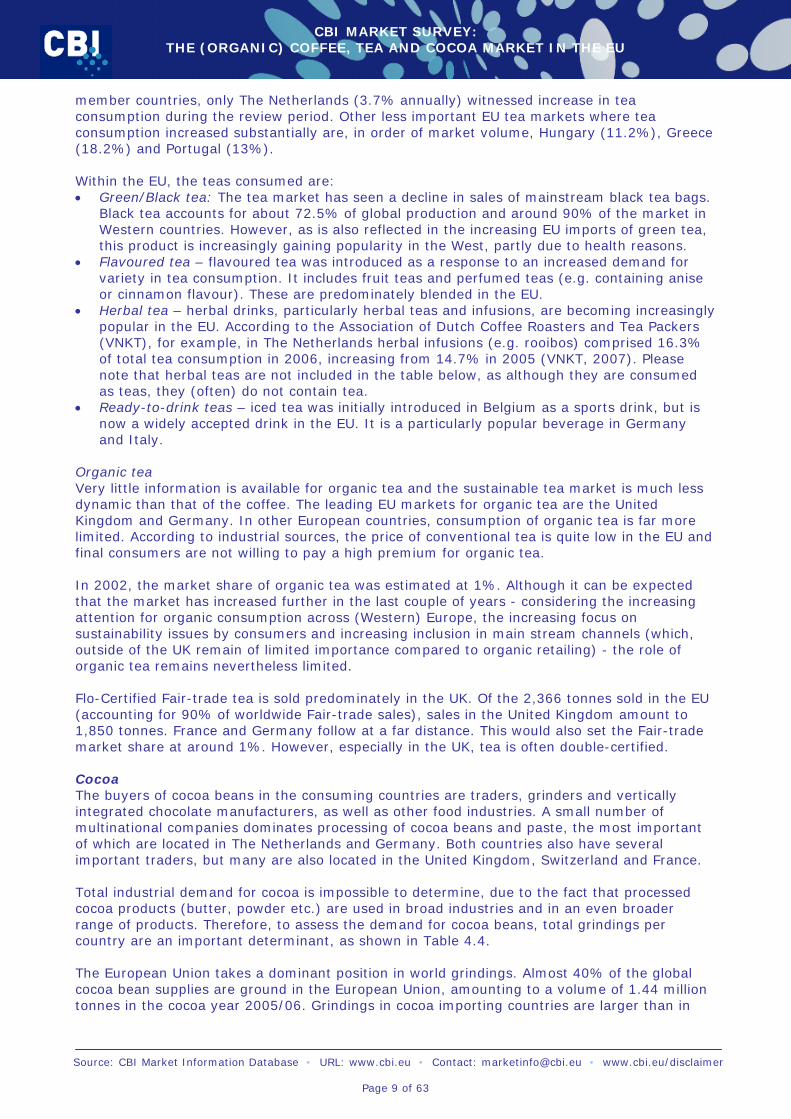
Organic tea Very little information is available for organic tea and the sustainable tea market is much less dynamic than that of the coffee. The leading EU markets for organic tea are the United Kingdom and Germany. In other European countries, consumption of organic tea is far more limited. According to industrial sources, the price of conventional tea is quite low in the EU and final consumers are not willing to pay a high premium for organic tea. In 2002, the market share of organic tea was estimated at 1%. Although it can be expected that the market has increased further in the last couple of years - considering the increasing attention for organic consumption across (Western) Europe, the increasing focus on sustainability issues by consumers and increasing inclusion in main stream channels (which, outside of the UK remain of limited importance compared to organic retailing) - the role of organic tea remains nevertheless limited. Flo-Certified Fair-trade tea is sold predominately in the UK. Of the 2,366 tonnes sold in the EU (accounting for 90% of worldwide Fair-trade sales), sales in the United Kingdom amount to 1,850 tonnes. France and Germany follow at a far distance. This would also set the Fair-trade market share at around 1%. However, especially in the UK, tea is often double-certified. Cocoa The buyers of cocoa beans in the consuming countries are traders, grinders and vertically integrated chocolate manufacturers, as well as other food industries. A small number of multinational companies dominates processing of cocoa beans and paste, the most important of which are located in The Netherlands and Germany. Both countries also have several important traders, but many are also located in the United Kingdom, Switzerland and France. Total industrial demand for cocoa is impossible to determine, due to the fact that processed cocoa products (butter, powder etc.) are used in broad industries and in an even broader range of products. Therefore, to assess the demand for cocoa beans, total grindings per country are an important determinant, as shown in Table 4.4. The European Union takes a dominant position in world grindings. Almost 40% of the global cocoa bean supplies are ground in the European Union, amounting to a volume of 1.44 million tonnes in the cocoa year 2005/06. Grindings in cocoa importing countries are larger than in
CBI MARKET SURVEY: THE (ORGANIC) COFFEE, TEA AND COCOA MARKET IN THE EU
Source: CBI Market Information Database • URL: www.cbi.eu • Contact: [email protected] • www.cbi.eu/disclaimer
Page 10 of 63
cocoa bean exporting counties and are increasing at a higher rate. During the review period, EU grindings increased by 4.2% per year, demonstrating the positive development of cocoa demand. Table 1.4 Grindings of cocoa beans in the EU, 2003/04-2007/08, in 1,000 tonnes
2003/2004 2005/2006 2007/2008* Average annual
change % of EU
EU-total 1,227.1 1,317.2 1,444.0 4.2% The Netherlands 445.0 455.0 465.0 1.1% 32.2% Germany 224.5 306.5 410.0 16.2% 28.4% France 150.2 155.2 165.0 2.4% 11.4% United Kingdom 130.0 137.8 130.0 0.0% 9.0% Spain 67.2 75.7 85.0 6.1% 5.9% Italy 66.0 61.8 70.0 1.5% 4.8% Belgium 50.0 50.0 55.0 2.4% 3.8% Poland 21.1 22.2 20.0 -1.3% 1.4% Ireland 10.2 17.0 13.0 6.3% 0.9% Slovak Republic 10.3 10.1 11.0 1.7% 0.8% Austria 26.7 9.0 10.0 -21.8% 0.7% Greece 3.5 4.5 4.5 6.5% 0.3% Denmark 0.2 10.0 3.0 96.8% 0.2% Latvia 2.0 1.6 1.7 -4.0% 0.1% Lithuania 4.5 0.6 0.5 -42.3% 0.0% Estonia 0.1 0.1 0.1 0.0% 0.0% Portugal - 0.1 0.1 n.a. 0.0% Romania 0.2 0.1 0.1 -15.9% 0.0% Bulgaria 0.7 - - n.a. n.a. Czech Republic 14.7 - - n.a. n.a. World 3237.7 3505.9 3727 3.6% Share EU 37.9% 37.6% 38.7% * Estimates Note: cocoa year: 1 October to 30 September Source: ICCO Quarterly Bulletin 2008 The most important cocoa grinding EU member country is The Netherlands, followed by Germany. Other countries with considerable cocoa grinding facilities are France and the United Kingdom, while Spain, Italy and Belgium play a role as well. Grinding in new EU countries is very limited in importance and, in fact, appears to be stagnating or decreasing. Industrial demand for processed cocoa products is much more difficult to assess. The International Cocoa Organization (ICCO) provides information on apparent consumption of cocoa (grindings plus net imports of cocoa products and of chocolate products in beans equivalent1) which could offer further insight in industrial demand. However, this information should be used with caution, as it still does not represent total industrial demand for cocoa products. Business-to-business trade of cocoa products is not reflected in these figures, as part of the products produced is exported and is not included in apparent consumption, while their inputs concern industrial demand. For example, Belgium is a large chocolate manufacturer, importing huge quantities of cocoa butter, paste and powder. The industrial demand is quite high. However, large quantities of chocolate are exported and not consumed locally, thereby negatively affecting apparent consumption. The largest consumers of cocoa are Germany, France and the UK, followed at a distance by Italy and Spain. Most countries are showing increasing consumption of cocoa. Especially most
1 Using the following conversion factors: cocoa butter 1.33, cocoa paste/liquor 1.25, cocoa powder and cake 1.18, chocolate and chocolate products 0.40 or 0.20.
CBI MARKET SURVEY: THE (ORGANIC) COFFEE, TEA AND COCOA MARKET IN THE EU
Source: CBI Market Information Database • URL: www.cbi.eu • Contact: [email protected] • www.cbi.eu/disclaimer
Page 11 of 63
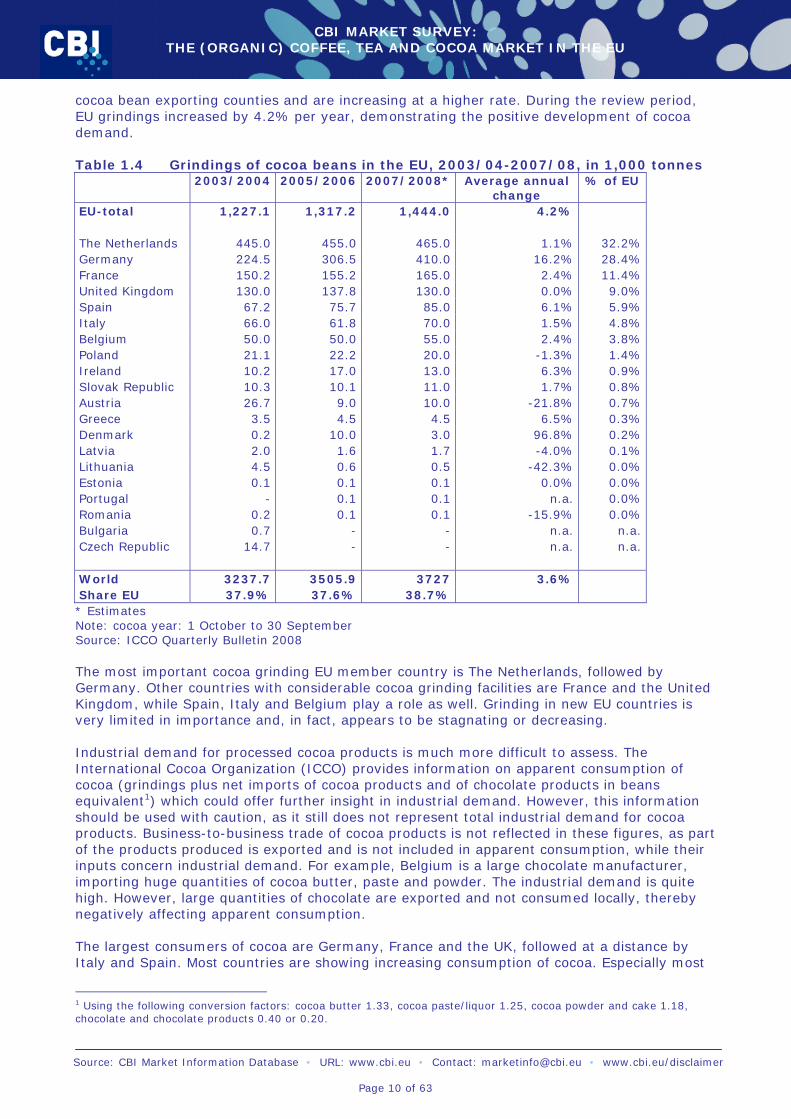
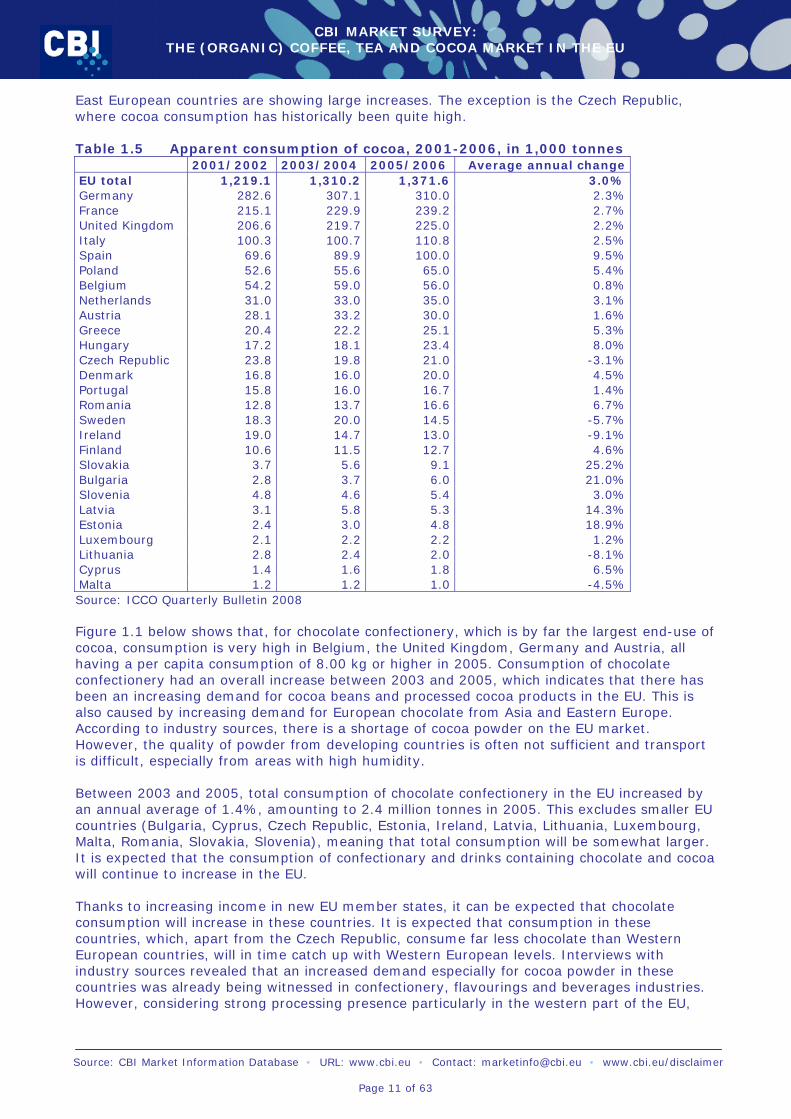
East European countries are showing large increases. The exception is the Czech Republic, where cocoa consumption has historically been quite high. Table 1.5 Apparent consumption of cocoa, 2001-2006, in 1,000 tonnes 2001/2002 2003/2004 2005/2006 Average annual change EU total 1,219.1 1,310.2 1,371.6 3.0% Germany 282.6 307.1 310.0 2.3% France 215.1 229.9 239.2 2.7% United Kingdom 206.6 219.7 225.0 2.2% Italy 100.3 100.7 110.8 2.5% Spain 69.6 89.9 100.0 9.5% Poland 52.6 55.6 65.0 5.4% Belgium 54.2 59.0 56.0 0.8% Netherlands 31.0 33.0 35.0 3.1% Austria 28.1 33.2 30.0 1.6% Greece 20.4 22.2 25.1 5.3% Hungary 17.2 18.1 23.4 8.0% Czech Republic 23.8 19.8 21.0 -3.1% Denmark 16.8 16.0 20.0 4.5% Portugal 15.8 16.0 16.7 1.4% Romania 12.8 13.7 16.6 6.7% Sweden 18.3 20.0 14.5 -5.7% Ireland 19.0 14.7 13.0 -9.1% Finland 10.6 11.5 12.7 4.6% Slovakia 3.7 5.6 9.1 25.2% Bulgaria 2.8 3.7 6.0 21.0% Slovenia 4.8 4.6 5.4 3.0% Latvia 3.1 5.8 5.3 14.3% Estonia 2.4 3.0 4.8 18.9% Luxembourg 2.1 2.2 2.2 1.2% Lithuania 2.8 2.4 2.0 -8.1% Cyprus 1.4 1.6 1.8 6.5% Malta 1.2 1.2 1.0 -4.5% Source: ICCO Quarterly Bulletin 2008 Figure 1.1 below shows that, for chocolate confectionery, which is by far the largest end-use of cocoa, consumption is very high in Belgium, the United Kingdom, Germany and Austria, all having a per capita consumption of 8.00 kg or higher in 2005. Consumption of chocolate confectionery had an overall increase between 2003 and 2005, which indicates that there has been an increasing demand for cocoa beans and processed cocoa products in the EU. This is also caused by increasing demand for European chocolate from Asia and Eastern Europe. According to industry sources, there is a shortage of cocoa powder on the EU market. However, the quality of powder from developing countries is often not sufficient and transport is difficult, especially from areas with high humidity. Between 2003 and 2005, total consumption of chocolate confectionery in the EU increased by an annual average of 1.4%, amounting to 2.4 million tonnes in 2005. This excludes smaller EU countries (Bulgaria, Cyprus, Czech Republic, Estonia, Ireland, Latvia, Lithuania, Luxembourg, Malta, Romania, Slovakia, Slovenia), meaning that total consumption will be somewhat larger. It is expected that the consumption of confectionary and drinks containing chocolate and cocoa will continue to increase in the EU. Thanks to increasing income in new EU member states, it can be expected that chocolate consumption will increase in these countries. It is expected that consumption in these countries, which, apart from the Czech Republic, consume far less chocolate than Western European countries, will in time catch up with Western European levels. Interviews with industry sources revealed that an increased demand especially for cocoa powder in these countries was already being witnessed in confectionery, flavourings and beverages industries. However, considering strong processing presence particularly in the western part of the EU,
CBI MARKET SURVEY: THE (ORGANIC) COFFEE, TEA AND COCOA MARKET IN THE EU
Source: CBI Market Information Database • URL: www.cbi.eu • Contact: [email protected] • www.cbi.eu/disclaimer
Page 12 of 63
and an unfavourable development of the processing industry in the new EU member countries, a substantial part of this demand increase is likely to be supplied by processing countries such as The Netherlands, Belgium and Germany. Figure 1.1 Consumption of chocolate confectionery in the EU, 2005, in kg per capita
5.2
10.79.9
9.08.3
7.1 7.06.4
4.7
3.63.2 2.9
2.62.0
1.5
0.7
0
2
4
6
8
10
12
EU
Belg
ium
United
Kin
gdom
Germ
any
Aust
ria
Denm
ark
Sw
eden
Finla
nd
France
Italy
Hungary
Neth
erl
ands
Gre
ece
Port
ugal
Spain
Pola
nd
Source: Caobisco (2007)
The feared diminishing demand for cocoa, which was expected due to changing legislation (Directive 2000/36/EC) for the use of cocoa butter replacers (CBRs) in chocolate, did not occur. According to industry sources, future trends will not suffer. This is because chocolate consumption continues to rise in the European Union, replacement allowances were already accepted in most major EU markets, while many substitutes allowed have also become pricy. The markets for cocoa powder and paste in the EU are also positive. Organic cocoa According to industry sources, organic products still account for a small share of the total market, but this share is steadily increasing. These sources indicate that the total industrial demand for organic and Fairtrade beans amounted to around 25,000 to 30,000 tonnes in 2006, mostly in the EU and the USA. The EU takes by far the largest share of this demand, since part of American demand for organic cocoa is also sourced through European importers. The largest EU markets are Germany, The Netherlands and France - although non-EU member Switzerland is also of great importance. It can be estimated that this has increased substantially in the last years. As European processors are seeing increased demand for organic cocoa products from their buyers (mostly chocolate makers), demand for organic beans is increasing. The organic market can be an important niche market for smaller producers of cocoa beans and butter. Several industry sources (large processors) indicated that they are currently examining potential suppliers of organic cocoa, while interest from specialized importers also remains strong. Of importance is that Utz Certified, one of the major certification schemes within the coffee trade, is also entering the cocoa trade. However, its impact on the cocoa market is still uncertain.
CBI MARKET SURVEY: THE (ORGANIC) COFFEE, TEA AND COCOA MARKET IN THE EU
Source: CBI Market Information Database • URL: www.cbi.eu • Contact: [email protected] • www.cbi.eu/disclaimer
Page 13 of 63
1.2 Market segmentation Coffee and tea The coffee and tea markets are more similar to each other and are therefore discussed together. The market can be divided into three segments where coffee and tea are consumed • At-home consumption – This market segment is becoming increasingly diverse. As was
discussed above, coffee used to be consumed mostly as soluble or ground coffee for coffee filter machines. However, roasted coffee (espresso) beans are now also increasingly consumed, and ground coffee is also packaged as one-consumption pods. The same holds for tea. Next to the old fashioned tea-for-a-pot bags, single cup tea bags are very prevalent, next to unbagged (often premium) tea. Tea bagged in pyramid bags are also seen more often on the market. Moreover, the variety of brands, flavours etc. has increased tremendously the last two decades. Consumers (but also small companies) can purchase coffee and tea in these forms at:
o Supermarkets o Specialty tea and coffee shops o Organic shops o Purchases through the internet are not very important for this segment.
• Out-of-home – 30% of coffee production takes place out of home, in restaurants, coffee bars, cafes etc. Espresso bars like Starbucks, serving a great variety of high-quality coffees, are becoming more popular.
• Consumption at work - is also of great importance, and is incorporated in the 30% above. Most offices in the EU have coffee machines. Tea is also consumed in large quantities in this institutional market. This market segment is partly provided for by the same players as for the at-home segment. Small companies would still buy coffee and tea at retailers or if they are larger might order it directly from distributors or retailers. Interesting is that companies can now also purchase coffee and tea through companies offering coffee through the internet. An interesting example is the Dutch company Ahrend, one of world’s largest office supply companies, which also offers a large variety of coffee and tea products, including organic and Fairtrade. However, large companies often have coffee and tea vending machines. This market is dominated by a limited number of companies. For example, in The Netherlands Sara Lee/DE has a strong position on the institutional (vending machine) market. The institutional market is seeing a steady development towards increasing quality.
Next to this, a segmentation of the EU market can be made by looking into regional differences. This geographic segmentation is possible regarding the varieties of coffee consumed (Arabica coffee more in the northern European states, and strong Robusta coffees more in the Southern EU states) as well as the size of consumption (with consumption still limited in many East European states (for example Poland, Romania, Slovakia, Bulgaria and the Czech Republic) as well as the UK and high consumption in Scandinavia, Benelux countries and Germany. The same holds for tea, with black tea consumption very much concentrated in the UK, Ireland, and Poland. Green tea and herbal teas are relatively popular in Germany, while in Denmark, Belgium, and Austria they are growing fast. Cocoa The chocolate industry uses about 90% of total cocoa produced worldwide, according to Caobisco (2007, see Figure 4.1). The other 10% of cocoa is used in the production of flavourings for food products, beverages and, to a very limited extent in cosmetics (cocoa butter). Less than 5% of cocoa butter is used in cosmetics. These products include baking cocoa, hot cocoa mix, baking mixes, ice-cream, breakfast cereals and other packaged food, and cocoa(-butter) based body-care products. 1.3 Trends Important shared patterns and trends which can be observed for the EU markets for coffee and tea, as well as cocoa, are the following:
CBI MARKET SURVEY: THE (ORGANIC) COFFEE, TEA AND COCOA MARKET IN THE EU
Source: CBI Market Information Database • URL: www.cbi.eu • Contact: [email protected] • www.cbi.eu/disclaimer
Page 14 of 63
• Convenience and smaller portions – European people (including women) are working more
and more in jobs outside their home and have busy social lives. Moreover, the number of single households is increasing. These developments have resulted in an increasing demand for products like coffee and tea pods, easy to use at-home espresso and cappuccino machines, chocolate bars, tea-for-one bags, iced tea and coffee, etcetera.
• Sustainable products – An increasing awareness of the environmental and social aspects has led to an increasing trend towards the certification of ‘sustainable’ coffee, tea or cocoa, including organic, fair trade, Utz Certified, and other labels. Utz Certified (for coffee and soon cocoa) greatly profits from its recognition among retailers. A Common Code for the Coffee Community (4C) and a ‘Sustainable Coffee Initiative’ have also received support, among which are the two largest roasters in the world (Kraft and Nestlé) and some of the largest traders, such as ECOM. Currently, the sustainable coffee market accounts for about 2% of the market (Fair-trade and organic), but is growing rapidly. Information on the consumption of organic coffee tea and cocoa is not available on a country level. However, an indication is provided by overall organic consumption. According to the Research Institute of Organic Agriculture (FiBL), in 2006, the biggest market for organic products in the EU was Germany, with a turnover of €5 billion, followed by the UK (€3 billion). The highest market shares of organic products of the total market with around 5% were in Austria and Denmark (FiBL, 2007).
• Health consideration – in line with the trend towards organic certification, is the trend among EU consumers towards a healthy life-style and, consequently, increased consumption of health food.
• Single origin – Single origin products stand for quality, exclusivity, luxury etc. and are in increasing demand in the EU. Notable is that for cocoa single origin mostly relates to premium cocoa from Venezuela and Ecuador, while for coffee and tea the single origin market is of much wider interest.
Coffee • A few years ago, the electronics company Philips, together with the coffee roaster
Sara Lee/Douwe Egberts, introduced the Senseo coffee machine in The Netherlands. This device uses coffee pods to make coffee. Since its introduction on the market, this concept had become extremely popular and the popularity has spilled over to a growing number of other EU member countries as well. In the espresso market, a variety of capsules and pods is also available. What they have in common is convenience of preparation, consistency of quality, and easy and mess-free disposal of spent coffee grounds (filter and espresso pads). What they also achieve is an increase in the number of drinking moments which would otherwise be lost. Easy-to-use cappuccino and espresso machines for use at home are also gaining in popularity.
• Following the Senseo idea, Nestlé introduced the Nespresso machine concept in the EU market. The product was introduced in the market with such success that from 2001 to 2006, sales of Nespresso rose more than 30% annually. Nowadays, espresso is the most popular style of coffee across much of southern Europe. Nestlé praised the division for driving the company's 7.8% increase in beverage sales during the first half of 2006 and announced the opening of a new production and distribution centre in Switzerland (Food & Drink, 2006).
• An increasing “coffee culture” is being felt in the EU. This trend kicked of with the market entry of Starbucks. Customers can drink a wide variety of coffee for take-away or in the café. Because of their popularity, especially with young Europeans, there is a spread of coffee shops in the continent. Fast food chains are gearing up to take part in this rising consumption. Many companies are now copying the idea and creating a “coffee celebration” atmosphere in their cafés and products.
• Convergence in EU consumption patterns. For example, espresso and cappuccino are now not only popular and well-known in Italy, but also in other EU member countries. In general, regional variations in coffee consumption are becoming less pronounced and coffee blends are becoming more universal throughout the EU. The addition of spices (i.e. cardamom) in the coffee is also a new trend in the EU market.
CBI MARKET SURVEY: THE (ORGANIC) COFFEE, TEA AND COCOA MARKET IN THE EU
Source: CBI Market Information Database • URL: www.cbi.eu • Contact: [email protected] • www.cbi.eu/disclaimer
Page 15 of 63
• Single origin coffees are becoming more popular among EU consumers. This trend is, however, less pronounced than in, for example the USA, since the quality of coffee in the EU has always remained relatively high, unlike in the USA.
• An increasing trend for single origin organic coffee is the interest in 100% Arabica coffee beans for espresso.
• Among all different kinds of certifications for organic and fair-trade products, an interesting certification which may become a trend in the EU is a certification on emissions of CO2. There is already such certification for the coffee sector in the German consumer market. The certification comes from Italy, but the certified products are commercialized in Germany. The certification is called Impatto Zero (http://www.impattozero.it) and one already certified coffee is Caffe Agust (http://www.caffeagust.it).
• Regarding the use of coffee waste products, an interesting trend in the EU is that utility company Essent (http://www.essent.nl) in The Netherlands, plans to generate energy from coffee husks. According to the expert commodity analyst F.O.Licht, Essent is already importing the husks from Brazil (around 3,200 tonnes) (F.O.Lichts, 2008).
Tea • The trend towards convenience had led the tea industry to develop products like tea tablets
and ready-to-drink teas such as iced tea. On the other hand, the introduction of instant tea into the UK market two decades ago turned out to be a commercial disappointment. More recently, Douwe Egberts of The Netherlands introduced tea pods in The Netherlands, which can be used in Senseo coffee machines. Industry sources expect that these so-called ‘T-pads’ will become popular in other EU member countries as well, just like its coffee pods counterpart.
• Responding to the growing number of single households and to the need to vary between tea flavours, the ‘tea for one’ packages, often containing various flavours, are becoming more popular.
• The tea market has seen a decline in sales of mainstream black tea bags, an increase in consumption of green teas, a growing interest in fruit and herbal teas, and growth in the consumption of sustainable tea.
• The availability of herbal teas has increased fast in recent years, with much innovation in new blends, new herbs etc. Herbal teas and infusions are becoming increasingly popular. Noteworthy is the consumption of rooibos tea (officially not a tea), which has shown a very strong surge in the past few years and has become one of the principal herbs used in teas, especially in North West Europe. However, rooibos is almost exclusively produced in South Africa.
• Another consumption trend is the increasing appeal of teas with ginger, especially during winter time. The use of ginger is related to the prevention of colds, which makes this ingredient attractive to consumers. This is related to a larger trend where health conscious Europeans are looking for tea with health properties, for example nettle.
• The consumption of organic fennel tea for babies is also an increasing trend. • Pyramid teabags are the trend for the future with leaf tea/herbs instead of teabag tea.
Cocoa • The modern consumer does not confine himself to the traditional three meals a day
(breakfast, lunch and dinner), but is eating smaller bites (‘snacks’) at more frequent intervals: ready-to-eat products or products requiring very little final preparation. Suppliers of fast food and (chocolate) snacks have benefited from people’s increasing tendency to eat snacks.
• The chocolate industry is the largest end-user of cocoa. Future growth in chocolate confectionery sales is being sought in special occasions (St. Valentine's Day, Easter or Christmas) and in special or attractively packed chocolates for young people, e.g. chocolate for children, or chocolate for nutritional replenishment after sports. Furthermore, the development of EU consumption is to a considerable degree dependent on consumption in East European member states.
• Within the chocolate market, the health trend is fuelled by marketing campaigns portraying chocolate as a healthy product. According to industrial sources, this is leading to a shift
CBI MARKET SURVEY: THE (ORGANIC) COFFEE, TEA AND COCOA MARKET IN THE EU
Source: CBI Market Information Database • URL: www.cbi.eu • Contact: [email protected] • www.cbi.eu/disclaimer
Page 16 of 63
towards darker chocolate, which drives the consumption of chocolate for the future. Specific ‘healthy chocolate’ relates to marketing of chocolate containing very little sugar, the use of other sweeteners, and the use of cocoa species with high polyphenol content. Much research is currently being conducted into which cocoa species contain these antioxidant substances, so that known species are higher in demand. Actually, according to the Food Navigator (an online news magazine), Nestlé announced in March, 2008 the establishment of a research and development (R&D) facility dedicated entirely to dark and premium chocolate (Food Navigator, 2008).
• Chocolate powder with chilli, and dark chocolate with ginger or pepper, are increasing trends in the EU market. In addition, orange peels are highly used to give an extra flavour in dark chocolates.
• A new trend for hot white chocolate drinks is starting up now in North America and is expected to reach the EU consumer market in no time (Food Ingredients First, 2008).
• According to a market research group - Global Industry Analysts (GIA) - strong economic growth will boost global confectionery sales to € 101 billion by 2010 (Food Navigator, 2008). This will drive the demand for European confectionery products and also ingredients of cocoa in the EU. As indicated, confectionery and chocolate products produced in countries such as France and Belgium have a good name in other regions.
• According to industrial sources, there is a limited amount of organic and fair-trade cocoa in the world. The industry is searching for special varieties from specific sources and, when those are organic-certified, they become even more interesting. Prices can be very high for high-quality organic cocoa varieties.
• Utz Certified has also started working with cocoa. The first aim is Ivory Coast producers. 1.4 Opportunities and threats Opportunities for and threats to for exporters of coffee in developing countries: Opportunities: + Green coffee is mostly supplied by developing countries. + The popularity of sustainable coffee is increasing. Premium quality coffees, such as
espresso beans are increasingly consumed. Moreover, this development is becoming ever more widespread across the EU.
+ Single origin coffee, with outstanding characteristics, could also offer interesting opportunities for developing country producers. The relation between buyers and producers is more direct. It offers cooperatives with a regional focus the opportunity to promote their products and to find EU companies carrying regional specialties in their assortment.
Threats: - Most of the processing of coffee takes place within the EU itself. This applies to
roasting and the production of decaffeinated and soluble coffee. On the one hand, this leaves little opportunity for value addition in developing countries but, on the other hand, it also means that investments in processing facilities are not needed in the developing countries.
- The roasting and blending companies are highly concentrated in the EU, which makes it difficult, particularly for small-scale producers, to enter the coffee market.
- Consumption of coffee is not increasing much in many EU countries, and overall growth is limited. However, several other countries are showing high increases in coffee consumption.
Opportunities for and threats to exporters of tea in developing countries: Opportunities: + Black tea still constitutes the largest share of EU tea consumption, but green tea is
increasing in popularity, offering good opportnities for producers of green tea. + Herbal teas and infusions are on the rise, offering opportunities for producers of herbs
used in herbal teas and infusions. Threats: - Tea consumption is decreasing in the majority of EU member countries. However, the
CBI MARKET SURVEY: THE (ORGANIC) COFFEE, TEA AND COCOA MARKET IN THE EU
Source: CBI Market Information Database • URL: www.cbi.eu • Contact: [email protected] • www.cbi.eu/disclaimer
Page 17 of 63
pace of the decrease is becoming smaller. Several non-traditional tea countries are showing a considerable increase.
- Most of the tea-packing occurs in the EU. On the one hand, this leaves little opportunity for value addition in developing countries but, on the other hand, also means that investments in processing facilities are not needed.
- The tea market is highly concentrated. Each country or region has several dominant players, leaving only a limited role for smaller companies concentrating on niches. This makes approaching the market more difficult for smaller exporters.
Opportunities for and threats to exporters of cocoa in developing countries: Opportunities: + Increased consumption in the new EU member states is likely to spur the demand for
cocoa beans in the EU. The same holds for the increasing demand from Asian countries for (EU) chocolate and confectionery products.
+ Demand for organic beans is increasing, as European processors, as well as specialised importers, are seeing increased demand for organic cocoa products from their buyers (mostly chocolate makers). In fact, consumption of organic cocoa and its end-products is increasing more than conventional demand and this higher growth is expected to continue in the coming years.
+ The organic market can become an important niche market for smaller producers of cocoa beans and butter.
+ Demand for single origin and high-quality cocoa is large. However, only certain origins are of interest, such as Venezuela and Ecuador.
+ Thanks to its large production capacity and trade function, in particular The Netherlands, but also Germany, offer opportunities to enter the EU market.
Threats: - A major part of the cocoa trade is in the hands of a few large companies, which makes
it difficult for (smaller) developing country exporters to enter the market. - The EU market for cocoa powder shows a positive development. However, prices for
powder on EU markets, and the often superior quality produced by EU processors, making it easier in use for producers of confectionery and beverages, means that powder offers few prospects for conventional DC producers.
1.5 Useful sources • Handbook by FiBL, SIPPO and Naturland “Organic coffee, cocoa and tea”; downloadable at
http://www.fibl.ch/buehne/publikationen/pdfs/verzeichnisse/handbook-coffee.pdf for € 38. • Information about FairTrade for coffee, tea and cocoa can be found at:
http://www.fairtrade.net. • Information about the developments in the beverage and food industries can be found at
online-magazines such as Just Drinks (http://www.just-drinks.com), Food and Beverage International (http://www.foodandbeverageinternational.com) and Food and Drink International (http://www.foodanddrinkinternational.co.uk).
Coffee • Another interesting publication is "The State of Sustainable Coffee: a study of twelve major
markets" published in 2003 by the World Bank, and “Coffee Markets: New Paradigms in Global Supply and demand”. Both can be downloaded at http://www.iisd.org/pdf/2003/trade_state_sustainable_coffee.pdf
• International trade Centre’s coffee guide: http://www.thecoffeeguide.org • International Coffee Organization’s Coffee Market Reports, online available at
http://www.ico.org/show_doc_category.asp?id=2 Tea • International Tea Committee's Annual Bulletin of Statistics 2007, which can be purchased
at http://www.inttea.com/publications.asp
CBI MARKET SURVEY: THE (ORGANIC) COFFEE, TEA AND COCOA MARKET IN THE EU
Source: CBI Market Information Database • URL: www.cbi.eu • Contact: [email protected] • www.cbi.eu/disclaimer
Page 18 of 63
Cocoa • An extensive range of reports on the international cocoa market is available at
http://www.marketresearch.com/search/results.asp?sid=88777351-368538246-280875009&query=cocoa
• An interesting source for information for cocoa is http://r0.unctad.org/infocomm/anglais/cocoa/sitemap.htm
• International Cocoa Organization at http://www.ICCO.org
CBI MARKET SURVEY: THE (ORGANIC) COFFEE, TEA AND COCOA MARKET IN THE EU
Source: CBI Market Information Database • URL: www.cbi.eu • Contact: [email protected] • www.cbi.eu/disclaimer
Page 19 of 63
2 PRODUCTION 2.1 Size of production Coffee Except for some scattered small-scale local production in the Mediterranean area, no production of coffee takes place in the EU. Almost all coffee consumed in the EU is roasted within the EU, or in Switzerland. However, these roasters are not competitors to developing country producers, but buyers (often through, or also acting as, traders), because developing countries do not play a role on the European market for roasted coffee. These companies are discussed in combination with the trade structure of coffee in Chapter 8, and separately in the surveys covering individual EU countries. Tea Due to climatic conditions, tea production does not take place in the EU. Only very limited production takes place in overseas territories, such as the Azores Islands, which are part of Portugal. Therefore, the availability of tea for consumption in the EU market entirely depends on imports from developing countries like Kenya, India, China and Sri Lanka. Almost all tea consumed in the EU is blended within the EU. These blenders are not competitors to developing country producers, but are buyers (often through, or integrated with, traders), because developing countries do not play a role on the European market for tea blends. EU blenders are discussed in combination with the trade structure of tea in Chapter 8, and separately in the survey’s covering individual EU countries. Cocoa Because of climatic conditions, no production of cocoa beans takes place in the EU. However, the EU is the largest grinder of cocoa beans in the world. Therefore the EU is a buyer of cocoa beans, but EU grinders are also competitors to developing countries on the EU and global market for processed cocoa products. In order to gain a picture of the production of processed cocoa products in the EU, the grinding data provided in the previous chapter offers a good picture of the major EU producing countries. Actual production data for cocoa butter, paste and powder are not available. The EU grinds more than 1.4 million tonnes of cocoa beans, of which The Netherlands alone accounts for more than one third. The Netherlands is also the world’s biggest producer of cocoa powder, accounting for a share of about 25% (European Cocoa Association 2007). Germany is increasing in importance as producer of processed cocoa products, while France and the UK are the other major EU countries where grinding takes place. EU grindings are increasing faster than global grindings. However, for several years now, grindings in Africa have been increasing faster than those in Europe. Major grinders in the EU are discussed in combination with the trade structure of cocoa in Chapter 8, and separately in the surveys covering individual EU countries. 2.2 Trends The situation for coffee and tea as described above is not expected to change. Production of green coffee and tea will remain limited to tropical countries, whereas the further processes of roasting and blending will continue to take place in the EU. Trends for these companies are discussed in the following chapter. Regarding cocoa paste, butter and powder, in the coming years the EU will continue to be the principal production area in the world. German production in particular is expected to continue to increase. The European cocoa processing sector is strongly consolidated and, thanks to its modern production techniques, very well able to compete with other regions. European quality processed cocoa products are considered of superior quality and get a higher price than their
CBI MARKET SURVEY: THE (ORGANIC) COFFEE, TEA AND COCOA MARKET IN THE EU
Source: CBI Market Information Database • URL: www.cbi.eu • Contact: [email protected] • www.cbi.eu/disclaimer
Page 20 of 63
African counterparts. Moreover, especially cocoa powder is relatively difficult to transport, especially from high-humidity areas. The use of sterilisation means that the product cannot be used for some applications. The role for developing countries in cocoa powder is therefore expected to remain limited. 2.3 Opportunities and threats + The EU is fully dependent on coffee and tea grown in developing countries. ± East European countries are experiencing an increasing demand for processed cocoa
products; however, processing capacity is very limited and, in some countries, is decreasing. This could offer an opportunity for developing country producers. However, these countries are increasingly sourcing processed cocoa products from West European countries.
- The EU has a very strong competitive cocoa processing sector, competing with products from developing countries.
- The quality of EU cocoa products is (seen as) higher than those from developing countries. 2.4 Useful sources Information sources for global production of coffee, tea and cocoa are: • Coffee, tea, as well as cocoa: FAOSTAT at http://faostat.fao.org • Coffee: International Coffee Organization’s Coffee Market Reports, online available at
http://www.ico.org/show_doc_category.asp?id=2 • Tea: International Tea Committee's Annual Bulletin of Statistics 2006, which can be
purchased at http://www.inttea.com/publications.asp • Cocoa: International Cocoa Organization at http://www.ICCO.org
CBI MARKET SURVEY: THE (ORGANIC) COFFEE, TEA AND COCOA MARKET IN THE EU
Source: CBI Market Information Database • URL: www.cbi.eu • Contact: [email protected] • www.cbi.eu/disclaimer
Page 21 of 63
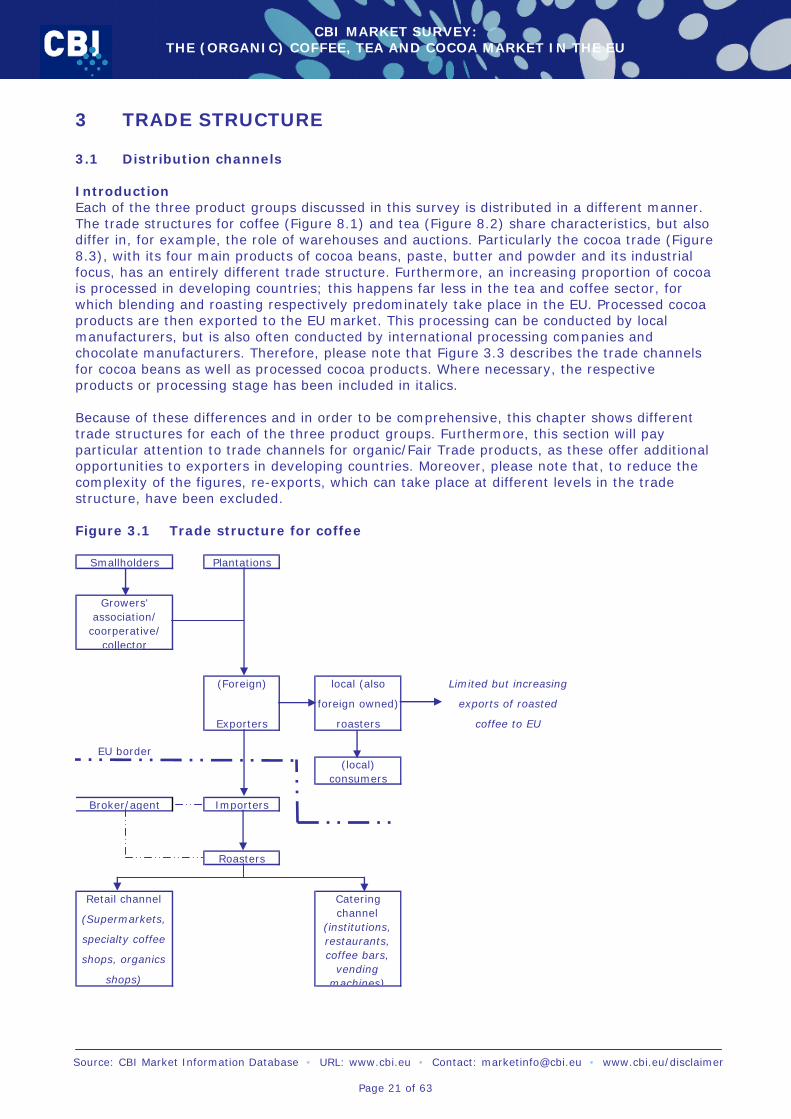
3 TRADE STRUCTURE 3.1 Distribution channels Introduction Each of the three product groups discussed in this survey is distributed in a different manner. The trade structures for coffee (Figure 8.1) and tea (Figure 8.2) share characteristics, but also differ in, for example, the role of warehouses and auctions. Particularly the cocoa trade (Figure 8.3), with its four main products of cocoa beans, paste, butter and powder and its industrial focus, has an entirely different trade structure. Furthermore, an increasing proportion of cocoa is processed in developing countries; this happens far less in the tea and coffee sector, for which blending and roasting respectively predominately take place in the EU. Processed cocoa products are then exported to the EU market. This processing can be conducted by local manufacturers, but is also often conducted by international processing companies and chocolate manufacturers. Therefore, please note that Figure 3.3 describes the trade channels for cocoa beans as well as processed cocoa products. Where necessary, the respective products or processing stage has been included in italics. Because of these differences and in order to be comprehensive, this chapter shows different trade structures for each of the three product groups. Furthermore, this section will pay particular attention to trade channels for organic/Fair Trade products, as these offer additional opportunities to exporters in developing countries. Moreover, please note that, to reduce the complexity of the figures, re-exports, which can take place at different levels in the trade structure, have been excluded. Figure 3.1 Trade structure for coffee
Smallholders Plantations
Growers' association/
coorperative/ collector
(Foreign)
Exporters
local (also
foreign owned)
roasters
Limited but increasing
exports of roasted
coffee to EU
EU border(local)
consumers
Broker/agent Importers
Roasters
Retail channel
(Supermarkets,
specialty coffee
shops, organics
shops)
Catering channel
(institutions, restaurants, coffee bars,
vending machines)
CBI MARKET SURVEY: THE (ORGANIC) COFFEE, TEA AND COCOA MARKET IN THE EU
Source: CBI Market Information Database • URL: www.cbi.eu • Contact: [email protected] • www.cbi.eu/disclaimer
Page 22 of 63
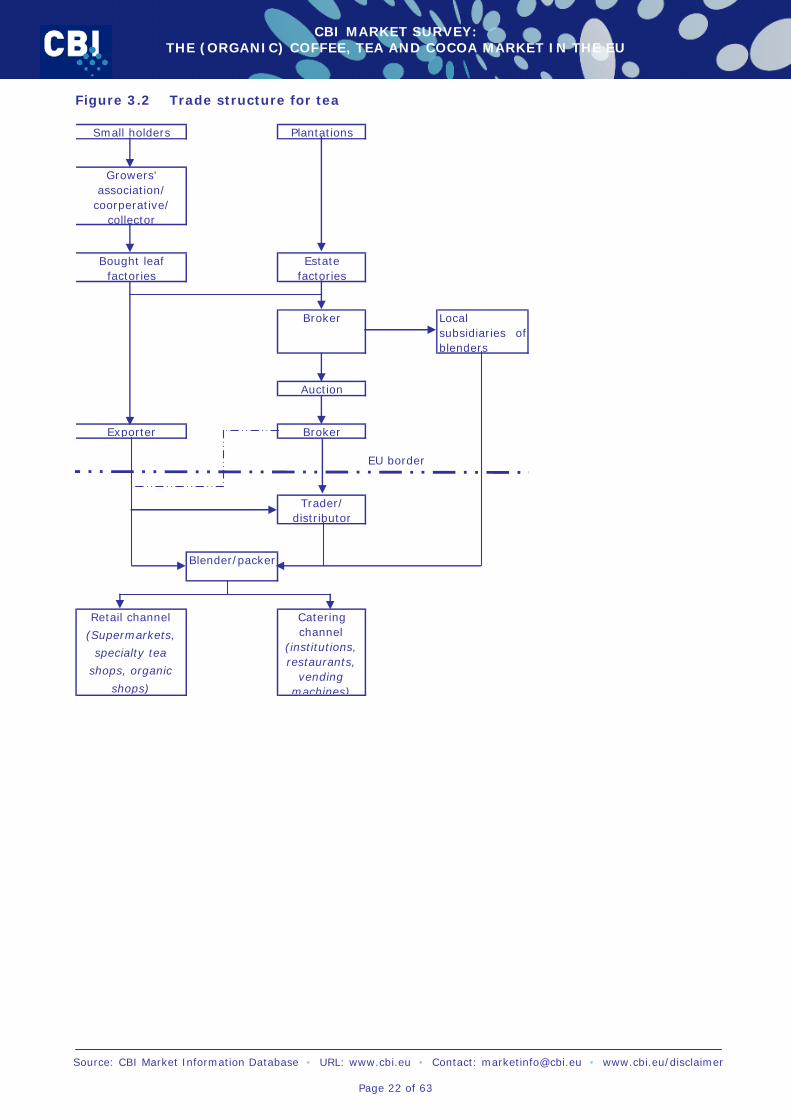
Figure 3.2 Trade structure for tea
Small holders Plantations
Growers' association/
coorperative/ collector
Bought leaf factories
Estate factories
Broker Local subsidiaries ofblenders
Auction
Exporter Broker
EU border
Trader/ distributor
Blender/packer
Retail channel
(Supermarkets,
specialty tea
shops, organic
shops)
Catering channel
(institutions, restaurants,
vending machines)
CBI MARKET SURVEY: THE (ORGANIC) COFFEE, TEA AND COCOA MARKET IN THE EU
Source: CBI Market Information Database • URL: www.cbi.eu • Contact: [email protected] • www.cbi.eu/disclaimer
Page 23 of 63
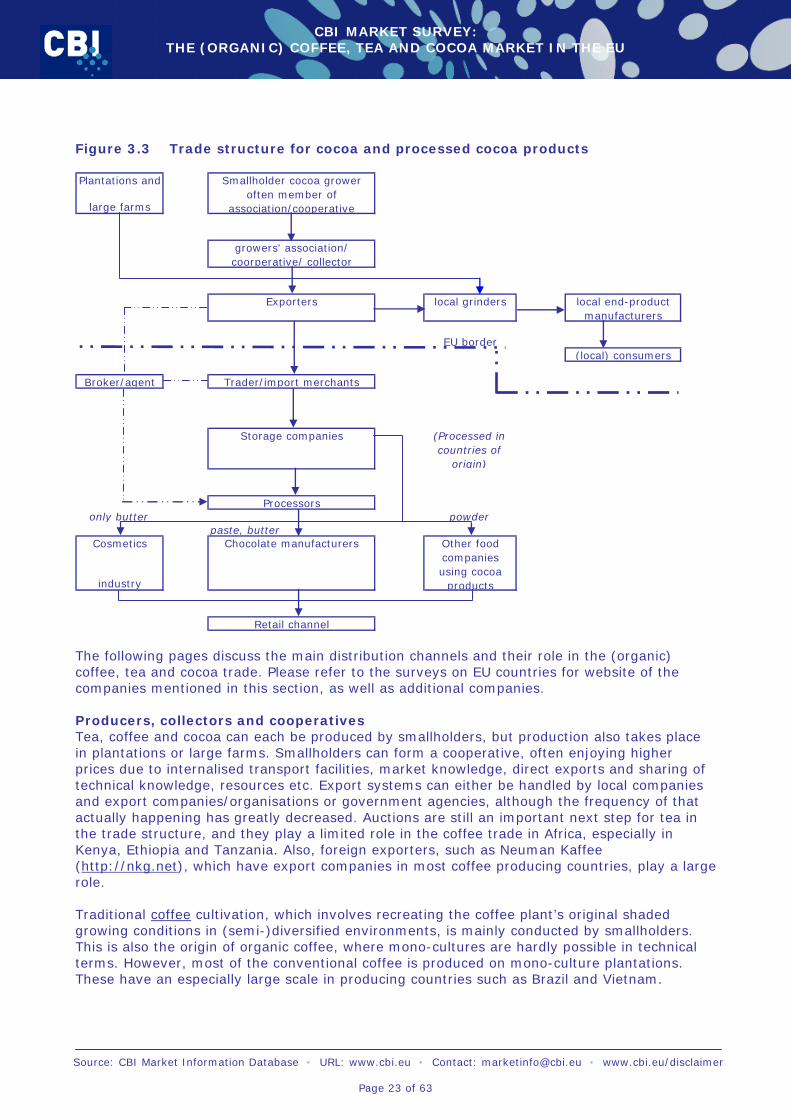
Figure 3.3 Trade structure for cocoa and processed cocoa products Plantations and
large farms
Smallholder cocoa grower often member of
association/cooperative
growers' association/ coorperative/ collector
Exporters local grinders local end-product manufacturers
EU border(local) consumers
Broker/agent Trader/import merchants
Storage companies (Processed in countries of
origin)
Processorsonly butter powder
paste, butterCosmetics
industry
Chocolate manufacturers Other food companies using cocoa
products
Retail channel The following pages discuss the main distribution channels and their role in the (organic) coffee, tea and cocoa trade. Please refer to the surveys on EU countries for website of the companies mentioned in this section, as well as additional companies. Producers, collectors and cooperatives Tea, coffee and cocoa can each be produced by smallholders, but production also takes place in plantations or large farms. Smallholders can form a cooperative, often enjoying higher prices due to internalised transport facilities, market knowledge, direct exports and sharing of technical knowledge, resources etc. Export systems can either be handled by local companies and export companies/organisations or government agencies, although the frequency of that actually happening has greatly decreased. Auctions are still an important next step for tea in the trade structure, and they play a limited role in the coffee trade in Africa, especially in Kenya, Ethiopia and Tanzania. Also, foreign exporters, such as Neuman Kaffee (http://nkg.net), which have export companies in most coffee producing countries, play a large role. Traditional coffee cultivation, which involves recreating the coffee plant’s original shaded growing conditions in (semi-)diversified environments, is mainly conducted by smallholders. This is also the origin of organic coffee, where mono-cultures are hardly possible in technical terms. However, most of the conventional coffee is produced on mono-culture plantations. These have an especially large scale in producing countries such as Brazil and Vietnam.
CBI MARKET SURVEY: THE (ORGANIC) COFFEE, TEA AND COCOA MARKET IN THE EU
Source: CBI Market Information Database • URL: www.cbi.eu • Contact: [email protected] • www.cbi.eu/disclaimer
Page 24 of 63
Tea is traditionally a plantation product, but in many countries it is also cultivated by smallholders. In Sri Lanka and Southern India in particular, smallholder production plays a large role. Smallholders sell their green leaves to middlemen, plantations or processors, often through contractual arrangements. Since low prices are paid for green leaves, especially due to the (sometimes justified) reputation of inferiority compared to plantation produced tea, profits made at this level are low. Initial processing, rolling fermenting drying etc, takes place near the tea production areas. In the Indian situation, small farmers sell to ‘bought leaf factories’, as they rarely own processing facilities of their own. In Kenya, many small holders operate co-operative processing plants. Cocoa is typically produced by smallholder or family subsistence farming. Large scale cultivation in plantations occurs in Brazil, Ecuador and Malaysia. This situation exists because of the fact that cocoa cultivation is ill-suited for mechanisation. These plantations are often owned by or produce exclusively for international corporations. Initial processing, involving seed extraction, fermentation and drying, takes place at the farm level. Furthermore, cocoa beans are increasingly processed in the country of origin, after which cocoa butter, powder and paste are exported to the EU. These products are mostly traded through traders in the EU, but in some cases also directly to EU cocoa processors and food processors. Brokers Brokers are intermediaries who bring buyers and sellers together, for which they get paid a commission. Products do not physically come into the possession of brokers. Customers can be trading companies, but are mostly processors. Many larger brokers are active in both coffee and cocoa, and then especially on the futures and options markets. Several (very) large brokers are affiliated with the Federation of Cocoa Merchants. These are mostly located in the UK and include Marex Carlton (http://www.marexfinancial.com/commodities_argrl.htm), Sucden (http://www.sucden.co.uk), Man Financial (http://www.manfinancial.com), Fimat International (http://www.fimat.com), TRX Futures (http://www.trxfutures.com/home, part of Neuman Kaffee) and several financial institutions, but also Calyon Financial SNC (http://www.calyonfinancial.com) in France. Most of these parties also broker coffee. Furthermore, specialised, smaller brokers exist. In certain cases, brokers represent a specific party either as its selling agent or its purchasing agent. Many importing companies maintain representatives in producing countries, either through their own offices or agents. These can form an interesting channel for exporters to approach the European market, apart from directly contacting European offices. Tea brokers play an especially important function as will be explained below, but they can also play the role described above as an intermediary between exporters and importing companies. Tea brokers and auctions Tea is still for a considerable part traded at auctions. Nowadays, the main auction centres are Kolkata, Cochin, Colombo, Mombasa, Blantyre and Djakarta. The system is the same for all auction centres. The tea auction system brings the buyers (traders, agents and importers/blenders from consumer countries) and sellers (estates/small holder cooperatives) together, to determine the price through interactive competitive bidding on the basis of prior assessment of quality of the tea. If bidding does not reach the price desired, the broker or producer can withdraw the tea from the auction. These auctions are heavily dominated by a few privileged brokers. 11 brokers are registered with the Tea Board of Kenya, while there are 4 registered brokers at Kolkata, the largest of which are J. Thomas & Co. (http://www.jthomas-india.com), Carritt Moran & Co. (http://www.carrittmoran.com) and Contemporary Targett (http://darjeelingtea.com). J. Thomas & Co. Pvt. Ltd., the largest tea broker in the world, handles one-third of all tea auctioned in India. Carritt Moran & Co. Ltd., the world’s second largest tea broker, handles around a fourth of teas auctioned in India. Generally, brokers must be registered with the appropriate tea board in order to operate, which limits the number of auction houses where
CBI MARKET SURVEY: THE (ORGANIC) COFFEE, TEA AND COCOA MARKET IN THE EU
Source: CBI Market Information Database • URL: www.cbi.eu • Contact: [email protected] • www.cbi.eu/disclaimer
Page 25 of 63
tea can be sold. New buyers are inherently discriminated against, while unknown buyers are only marginally allowed to trade at auctions. More and more tea is sold through forward contracts and private sales. The benefit of this to producers is often considerable; they receive payment faster, endure less uncertainty about sales and price, and can avoid the charges associated with auctioning tea (broker fees, warehousing). Likewise, the system appeals to buyers, because it guarantees faster delivery (and therefore higher quality). Especially non-traditional exporters (i.e. excluding India, Sri Lanka and Kenya) sell their tea directly to importers. Countries such as Argentina, China etc. do not work with auction systems at all. Next to tea, limited quantities of (African) coffee are also traded through auctions, mainly in Ethiopia, Kenya and Tanzania. Traders/ Import Merchants Traders play a very important role for all three product groups, but especially for coffee and cocoa (both for cocoa beans and processed cocoa products). Vertical integration within the tea industry between blenders and traders is considerable, while for coffee, roasters also play a considerable role as traders. Integration between cocoa grinders and traders has also increased, with most processors now part of larger agro-industrial companies or large multi-commodity trading companies. The trader/importers level of the trade structure offers good, if not the best, opportunities for market entry for all three product groups. International coffee traders went through considerable restructuring and market concentration in recent decades. While some of the large number of coffee traders went bankrupt as they were unable to compete, many merged into larger companies. Large players are Neumann Gruppe (Germany), British-Swiss Volcafé-ED&F Man (http://www.edfman.com) and ECOM (http://www.ecomtrading.com) from Switzerland. These three main traders control almost half of the coffee trade. Coffee is generally purchased from the exporting countries by international trade houses, although the largest European roasters also maintain their own in-house buying companies. In the main, however, roasters tend to buy their coffee from international trade houses and specialised traders representing specific exporters in producing countries. At the same time, prospects are still good for smaller specialised traders who trade in non-conventional coffees (high quality, specific origin). Traditionally, most traders and dealers operate in ports where coffee is delivered, the major trading points being Hamburg (Germany), Rotterdam (The Netherlands), Le Havre, Marseilles (France), Antwerp (Belgium) and Trieste (Italy). The structure of trade is broadly similar across the EU, with the exception of the Nordic countries, which lack main traders. Their imports are conducted by roasters and agents, often through traders in the main trading centres. Furthermore, traders in some East European countries increasingly import from the main EU coffee centres, instead of directly from producing countries. The vertical integration for tea in the trade structure is the most advanced. The largest tea importers are also major blenders and packers. Other important tea importers often also have their own blending and packing facilities, while smaller importers cooperate closely with blenders and packers. A large number of traders operates in the European Union, but western trade is dominated by only a few multinational companies. The UK plays a very important role in the tea trade. At the global level, 85% of world production is sold by multinationals. Four companies are most dominant in the tea trade: • Unilever (Brooke Bond, Lipton, Unilever Trading Company (UTC) London) from The
Netherlands/the UK, which owns plantations in India and Eastern Africa (11% of Kenyan output for example) http://www.unilever.com
• Van Rees (trader/blender, supplying many packers) The Netherlands, which has no important role in tea production http://www.vanrees.com
• James Finlay (Scotland), possessing major production areas in Kenya, Uganda, Bangladesh and Sri Lanka http://www.finlays.net
• Tetley/Stansand (United Kingdom). Tetley is part of Tata Tea, one of the principal Indian brands, owning major production areas in India and Sri Lanka. http://www.tetley.com
CBI MARKET SURVEY: THE (ORGANIC) COFFEE, TEA AND COCOA MARKET IN THE EU
Source: CBI Market Information Database • URL: www.cbi.eu • Contact: [email protected] • www.cbi.eu/disclaimer
Page 26 of 63
The large tea companies have a considerable influence on supply and demand, and thus on prices at auctions. Their ownership of both plantations and processing factories is essential in this. Other blenders, such as Teekanne (http://www.teekanne.de) Germany also import considerable quantities into the European Union. The first customers for cocoa beans and processed cocoa products in the EU are usually traders, rather than grinders or final product manufacturers (for processed cocoa products). As mentioned above, the distinction between grinders and traders is decreasing, with more and more grinders being integrated with trading companies, or larger agro-industrial companies. There is still a considerable number of ‘pure’ traders, however, as these also trade in processed cocoa products, which are only very seldom imported directly by final product manufacturers. Larger processors often have a separate purchasing department which sources directly in developing countries, but these also source a lot through traders. Some (vertically integrated) chocolate manufacturers also buy directly in developing countries, but these transactions are normally confined to fine or flavour cocoas, or trade between firms with long-term relationships, or belonging to the same group. Most major traders are either located in The Netherlands (with examples such as Theobroma (http://www.theobroma.nl), Huyser Moller & Co. (mailto:[email protected]), Daarnhouwer (http://www.daarnhouwer.nl), Bensdorp (part of Barry Callebaut) and Unicom (part of Indcresa); the United Kingdom, where one of the two major future trading platforms (LIFFE) for cocoa is located (with companies such as Etco International Commodities (http://www.etco.co.uk), Finagra (http://www.londononline.co.uk/profiles/61231), Louis Dreyfus (http://www.louisdreyfus.com) and ED & F Man)); Germany (Albrecht & Dill Trading (http://www.albrecht-dill.de), Vogler & Trummer (http://www.vogler-trummer.de), RAMM (mailto:[email protected]) and Corinth (http://www.corinth.de)); Switzerland (Ecom (http://www.ecomtrading.com), Taloca (part of American Kraft Foods (www.kraft.com), Noble Resources (European branch of Asian company http://www.thisisnoble.com), Walter Matter (http://www.columbus-finder.de/webvisitenkarten_133986_Walter-Matter-SA.html) and Barry Callebaut Sourcing (http://www.barry-callebaut.com)); and France (Contango Trading (http://www.cocoafederation.com/membership/members.jsp?alpha=C), Orebi & Cie (http://www.hotfrog.fr/Entreprises/Orebi-Et-Cie) and Touton (http://www.touton.fr). The Belgian trader Efico (http://www.efico.com) is also of importance. Storage companies These companies can play a role in the cocoa trade. They receive and store products on behalf of clients. They do not own the products, but often act as independent surveyors testing the quality of the products stored. Examples are B&P Commodities & Logistics (http://www.bpchull.co.uk) in London, Cotterell (http://www.cotterell.de) in Amsterdam and Hamburg, Handelsveem (http://www.handelsveem.com) and Unieveem (http://www.schuttergroep.nl) in Amsterdam, Interporto Rivalta Scrivia (http://www.interportors.it) in Italy, and Quast & Cons. (http://www.quast-cons.de) in Hamburg. Processors Within the coffee market, the level of vertical integration between roasters and international traders remains limited. Although large roasters also import coffee from producing countries themselves, in general the trade structure follows the structure as shown in figure 8.1 from exporters to importers to roasters. Roasting of the original green coffee usually takes place in consumption countries, but in the EU it is done to a large extent by multinationals supplying several EU countries from their production facilities. The level of concentration in the coffee roasting sector exceeds the level of concentration in the coffee trade. In 2002 the top two roasters (Nestlé (http://www.nestle.com) of Switzerland and Kraft Foods of the USA (with European companies such as Jacobs Kaffee
CBI MARKET SURVEY: THE (ORGANIC) COFFEE, TEA AND COCOA MARKET IN THE EU
Source: CBI Market Information Database • URL: www.cbi.eu • Contact: [email protected] • www.cbi.eu/disclaimer
Page 27 of 63
(http://www.jacobs.de), Gevalia (http://www.gevalia.com) in Sweden, Grand Mere and Carte Noire (http://www.kraft.com) in France and internationally under the Kraft label) controlled almost 60% of the world market for roasted and instant coffees. The top five players controlled 87% of the market, while national and specialty niche players constitute the remainder. However, Europe’s mega-roasters have also entered the specialty market. Therefore small producers are, also in the specialty sector, increasingly dependent on specialty importers and agents for efficient entry to the EU market. Nestlé dominates the soluble market with a global market share of 50% and is especially dominant in the EU. Kraft is the second player, the two together accounting for more than three-quarters of the market. The scope for outside manufactures lies mostly in private label production. The role of coffee producing countries in soluble coffee consumption in the EU has decreased, with most production taking place in the EU (Agitrade 2006). Of the three soluble coffee segments, premium freeze-dried, conventional spray-dried and cheap spray-dried (in the eastern EU), only the latter two are produced in developing countries. The level of concentration in the roasting sector is very different per country, however, with different multinational and smaller nationally oriented roasters dominating the market, ranging from almost the entire market in Finland to around three quarters in Italy. In virtually every EU country small roasters continue to play a role, even though their marketing expenditures, which for major roasters can range to up to 6% of sales revenue, are fairly limited. They sell under their own brand name or supply retailers with private label products. Moreover, the number of roasters can still be very high, although often decreasing. In Italy and France, for example, there is still more of a tradition of smaller roasters, with their number still in the hundreds for both countries. Italy has several large specialty roasters, most notably Illy (http://www.illy.com) and Lavazza (http://www.lavazza.com) which play a strong role across Europe. East European countries import a relatively significant share of their roasted and soluble coffee needs. Especially Italy plays a large role in supplying East European markets (ITC 2002). Tea is exported at a relatively early stage in the supply chain. The most lucrative value adding activities, blending and packaging, accruing up to 50% of the consumer price, are carried out by blenders in consumption countries. Tea processing is less concentrated internationally than the international trade, but concentration on national markets can be very large. The top three firms hold around 60% of the market in the United Kingdom and around two thirds in Germany and Italy. This can concern worldwide players such as Lipton, the world’s principal tea brand, or national players. Important international packers in the EU are: • Unilever (Lipton, with a world market share of 10% and a name for innovation) (15% of
black tea sales) • Tetley • Hillsdown Holdings - http://www.hillsdown.com • Sara Lee International (Pickwick) - http://www.pickwicktea.com • Ostfriesche Tee Gesellschaft (OTG) (mostly Germany but also surrounding countries) -
http://www.otg.de • Teekanne (mostly Germany but also surrounding countries) • R. Twinings - http://www.twinings.com Next to these, a large number of national players and niche and specialty players is active on the European market. The next step for the coffee and tea trade is the marketing of the retail and catering/institutionally packaged products. This is either done directly to large retailers and catering-companies/institutions or through distributors supplying smaller and specialty players. The latter are also more often dependent on specialty traders and processors. In most countries, the retail sales for in-home consumption generally account for 70-80% of the overall market. Because of increasing retail concentration and buying power in consuming countries and increasing private label sales, the coffee and tea trade are becoming further concentrated across the board.
CBI MARKET SURVEY: THE (ORGANIC) COFFEE, TEA AND COCOA MARKET IN THE EU
Source: CBI Market Information Database • URL: www.cbi.eu • Contact: [email protected] • www.cbi.eu/disclaimer
Page 28 of 63
Also of importance is the vending machine market, which has several processing companies focussing on this specialised market, such as Riant, of The Netherlands. Furthermore, several large processors have branches focusing specifically on the vending market. This sector is now also following the trend of upgrading the quality, as is the coffee and tea market in general. Cocoa processing companies can be divided in two types. Firstly, the grinding industry, producing cocoa paste, butter, and powder from cocoa beans (also cocoa cake), and secondly, secondary processing companies which buy processed cocoa products, (in general cocoa butter) to process them further, with the goal of selling these to certain end-product manufacturers. For example, cocoa butter may be deodorised or refined before it is sold to the cosmetics industry. However, this represents a relatively small share of total industrial demand for cocoa. One of the most important processors (and trader) of cocoa beans is Armajero (UK http://www.armajaro.com) with production in Hamburg, France and Indonesia. It also owns a controlling share in Indcresa (Spain http://www.indcresa.com) one of the largest producers of cocoa powder in Europe, and owns Unicom, a large trader in Amsterdam. Some of the largest producers are located in The Netherlands such as Gerkens (http://www.gerkenscacao.com), a subsidiary of Cargill, ADM (http://www.admworld.com), Schoemaker (http://www.janschoemaker.com) and Dutch Cocoa (http://www.dutchcocoa.com). German producers include Euromar (http://www.euromar.de) and Schokinag (http://www.schokinag.de), whereas large Spanish producers include Moner & Llacuna (http://www.hotfrog.es/Empresas/Moner-y-Llacuna) and Natra (http://www.natracacao.com). Chocolate manufacturers and other end-industries End-industries process cocoa paste, cocoa butter and cocoa powder into consumer products such as chocolate, cocoa confectionery, cocoa beverages, and cosmetics (the latter being the smallest segment and applying only to cocoa butter). Some end-product manufacturers who need large quantities of these ingredients (on a regular basis) purchase their products directly from producers abroad. However, it is unlikely that manufacturing companies or retail companies themselves will be acting as buyers of these products from the country of origin. End-product manufacturers often prefer to use the trading companies discussed above or agents, as the latter offer a reference situated within their own country. However, directly contacting chocolate manufacturers can offer insight into the sourcing strategies of such companies and reveal their suppliers. With more than 2,000 companies represented by Caobisco, the Association of the Chocolate, Biscuit & Confectionery Industries of the EU, it is not feasible to make a selection for this market survey. To locate these companies, please refer to the country associations, which can be found through http://www.caobisco.com. However, the market for chocolate is highly concentrated. For example, regarding industrial chocolate, Barry Callebaut by itself accounts for 50% of world production. Regarding consumer chocolate, six manufacturers account for 50% of global chocolate sales. These are: Nestlé, Mars (http://www.mars.com), Philip Morris/Kraft (http://www.kraft.com), Cadbury (http://www.cadbury.co.uk), Ferrero (http://www.ferrero.it), and Hershey’s (http://www.hersheys.com). Consumers buy chocolate or cocoa beverages and confectionery directly through supermarkets and specialty chocolate shops, but these products are also consumed through the catering and institutional sector. Channels for certified products Although the markets for sustainable coffee, tea and cocoa are relatively small, they offer interesting opportunities for smaller exporters in developing countries, as discussed above. Importers of certified coffee, tea and cocoa are often not specialized in coffee, tea or cocoa but have an organic (or/and FairTrade) focus, concentrating on a large number of food products.
CBI MARKET SURVEY: THE (ORGANIC) COFFEE, TEA AND COCOA MARKET IN THE EU
Source: CBI Market Information Database • URL: www.cbi.eu • Contact: [email protected] • www.cbi.eu/disclaimer
Page 29 of 63
Furthermore, they are mostly dedicated primarily to regular, and not specialty, qualities of coffee, tea and cocoa. These organic commodity importers are for example Tradin (http://www.tradinorganic.com), Do-it (http://www.organic.nl) and Doens (http://www.doensfood.com) in The Netherlands, Rapunzel (http://www.rapunzel.de); Gepa (organic/fair-trade http://www.gepa.de), and Care Naturkost (http://www.care-natur.de) in Germany; and Claro Fair Trade (http://www.claro.ch) in Switzerland. Next to these specialised organic food ingredients traders, conventional trading houses of coffee, tea and cocoa, play an increasing role in the trade in organic products. Some of them started earlier to incorporate organic commodities, others started later, once the organic trend appeared to be stronger than they expected. The trade structure for FairTrade certified products is more or less comparable to the organic trade structure and also partly overlaps in terms of companies. However, specific Fair-trade players also exist. Coffee Previous logistic and administrative issues concerning redistributing organic coffee from containers into smaller batches, has largely been solved by the introduction of Certificates of Import, introduced in 2003. FairTrade and organic certification, in that order, have been on the market longer than Utz Certified, but Utz Certified is growing more rapidly than the other certification schemes. According to the Utz Certified website, it surpassed the other schemes in importance in 2006 thanks to the support it enjoys from major retailers. Rainforest certified products play a limited role in the EU. New types of certification (for example Bird Friendly) have recently entered the market, but industry and market response to them has yet to be evaluated. In recent years, supermarkets have gained hugely in importance for the sales for certified coffee. The primary retail chains in the EU offer organic and Fair-Trade coffee and often have their own brand of organic coffee, or sell Fair Trade brands (for example Fair Trade Original). Utz Certified also began as the certification scheme of the Ahold Coffee Company (http://aholdcoffeecompany.nl) and is sold in Ahold supermarkets across Europe. The primary means for selling certified coffee is now conventional commerce (supermarkets). World Shops are present in all the European countries and are related to the Fair-Trade initiative. Furthermore, there are also organic food supermarkets and stores which sell organic coffee. Another major channel is institutional consumption: sales made to company and government offices. In Europe, the official coffee of the European Parliament is Fair-Trade. Supermarkets acquire the services of large-sized (not mega-) roasters; among them are Drie Mollen (http://www.driemollen.com), J.J. Darboven Kaffee (http://www.darboven.com), and Autobar (also specialised in vending machine coffee http://www.autobar.nl). There are also certified roasters that sell coffee under their own brand. Among the best known in Europe are Café Direct, England (http://www.cafedirect.co.uk), Simon Levelt, The Netherlands (http://www.simonlevelt.nl), Rapunzel and Lebensbaum, Germany (http://www.lebensbaum.de), Käfer (http://www.kaefer-produkte.de) or under the umbrella of the Fair-Trade label, such as Gepa, Fair Trade original, Solidar Monde (http://www.solidarmonde.fr), Fairglobe (http://www.lidl-fairglobe.de) - the Fair Trade brand of the German discounter Lidl, or CTM Altromercato (http://www.altromercato.it). In the EU, CIMS has identified around 100 certified coffee importers, 80 for organic, 70 for FairTrade, 19 for Utz Certified, 12 for Rainforest Alliance and 1 for Bird Friendly, including double counts. Most are located in The Netherlands and Germany and are companies dedicated to re-exporting to other countries such as Scandinavia, Switzerland, and Italy. The UK also has a number of major importers, but they are oriented towards local consumption. The Intelligence Centre on Sustainable Markets (CIMS) identified around 250 roasters in Europe which offer some sort of sustainable certified coffee. Two-thirds offer Fair-Trade coffee and half offer organic coffee. There are 23 roasters registered with Rainforest Alliance, 12 with Utz Certified and 1 with Bird Friendly.
CBI MARKET SURVEY: THE (ORGANIC) COFFEE, TEA AND COCOA MARKET IN THE EU
Source: CBI Market Information Database • URL: www.cbi.eu • Contact: [email protected] • www.cbi.eu/disclaimer
Page 30 of 63
In Europe, certified coffee (i.e., organic, FairTrade, Utz Certified, Rainforest Alliance, etc.), mostly does not belong to the specialty coffee sector and is sold primarily through traditional channels (either mainstream retailers or organic retailers). Tea Germany and the UK are the most important markets in the EU for organic tea. The UK is also by far the most important market for Fair Trade tea, accounting for 70% of the 3,900 tonne global market in 2006 (FLO international 2007). Major organic importers/traders/blenders such as Clipper Teas (http://www.clipper-teas.com), Whistbray, Hampstead Tea (http://www.hampsteadtea.com), Dragonfly Teas (http://www.dragonflyteas.com), Qi Herbal Health (http://www.qi-teas.com) (all UK), Oasis (http://www.oasistee.de), Lebensbaum (http://www.lebensbaum.de), Kloth & Köhnken (http://www.kktee.de) (all Germany) are also located in these countries. Major organics trading houses, which also carry tea in their product assortment, are more often located in The Netherlands and Germany and have been mentioned above. Major tea importers such as Unilever, Van Rees, James Finlay and Tetley/Stansand are active on the conventional market. Premium tea producers in the United Kingdom, such as Twinings London, also have organic lines, also specifically for the catering and institutional markets. Organic and/or Fair Trade tea is relatively broadly carried in supermarket assortments in the United Kingdom, but less often in Germany or other European countries. In the latter, the bulk of organic tea is sold via organic shops or health food stores. Therefore, the German and British market will be of special interest. However, another interesting company, De Drie Mollen, a coffee and tea processor also producing organic and Fair Trade tea, is located in The Netherlands. Simon Levelt and Algra Mocca d'Or (http://www.algrakoffie.nl), another organic/Fair Trade certified tea and coffee producer is also located in The Netherlands. Relevant companies can be found in the CBI market surveys covering the (organic) coffee, tea and cocoa market in individual EU countries. In many EU countries, the focus within the tea market is more on Fair Trade than on organic teas, and the number of supermarkets carrying organic tea is far more limited. In general, private labels are of less importance in the organic tea market than in the organic coffee market. For example, both Super de Boer and Albert Heijn in The Netherlands have only one type of organic tea, which is also Fair Trade certified. Cocoa Specialized cocoa traders play a limited role in the organic cocoa market, but in interviews with industry sources it was found that large traders of cocoa are also examining the possibilities of entering the organic market and are looking for suppliers of cocoa beans, paste and butter. Demand for organic cocoa powder was not indicated. However, many processing companies will source their products through specialised organics traders. Cocoa processors will usually be involved on request of end-users (Dutch Cocoa, Nederland SA - http://www.dutchcocoa.com - in Spain), or they are part of integrated chocolate companies which also have organic lines (ICAM - http://www.icamcioccolato.it -, Barry Callebaut and Debelis - http://www.puratos.com ). However, ADM also indicated looking for organic suppliers while certifying part of their facilities for organic production. These integrated industrial chocolate manufacturers and processors currently import most of the cocoa not actually imported by importers. These companies are looking for organic cocoa beans as well as processed cocoa products. Part of the organic cocoa is processed at the point of origin, with certified processing plants being available in, amongst others, Bolivia, Peru and the Dominican Republic. Currently, there is only one major consumer chocolate manufacturer involved in the organic chocolate market (Barry Callebaut), as well as several up-market retailers. Important
CBI MARKET SURVEY: THE (ORGANIC) COFFEE, TEA AND COCOA MARKET IN THE EU
Source: CBI Market Information Database • URL: www.cbi.eu • Contact: [email protected] • www.cbi.eu/disclaimer
Page 31 of 63
specialized brands and manufacturers include Green & Black’s (http://www.greenandblacks.com/uk), Vivani (http://www.vivani.de, produced by Weinrich & Co (http://www.weinrich-schokolade.de) and Mascao (produced by Bernrain AG (http://www.swisschocolate.ch). Other major chocolate manufacturers are becoming involved in the market, either by starting organic lines, or buying specialised organic chocolate (in the case of Cadbury buying Green & Black’s). Only rarely do chocolate manufacturers source cocoa products directly in production countries, and then only when it concerns company-owned local processing facilities. Some major European companies involved in processing of Fair-Trade cocoa are Daarnhouwer & Co. and Dutch Cocoa BV (Holland). Two prominent companies which manufacture (not process) Fair-Trade and organic chocolate are Chocolat Bernrain (Switzerland), which produces conventional, organic, and Fair-Trade chocolate, and Weinrich & Co. (Germany), a chocolate manufacturer producing both organic and Fair-Trade products. Rapunzel and Gepa only produce organic/Fair-Trade chocolate. 3.2 Price structure The margins charged by different intermediaries in the coffee, tea and cocoa trade are influenced by many different factors. These include the type of commodity, quality, the current and expected future harvest situation, the availability or number of sources for the particular commodity, the level of demand and the trend in prices. All these factors make it extremely difficult to provide information on typical margins in the trade of these three commodities. As an example of how prices fluctuate along the supply chain, we will use the variation on black tea prices: Production costs Tea plantation: cultivation, harvesting, fertilizing, weeding, pruning, other Processing: sorting, withering, breaking up, fermentation, drying, sifting, packing Total: € 1.25/kg FOB (of which € 0.51/kg is labourer’s wage) Auction: € 1.63/kg FOB Transportation costs Export-tax, harbour costs, transport Total: € 2.47/kg FOB Manufacturing costs Marketing, re-packing, tea bagging, transport 2x, warehousing Total: € 8.51/kg Supermarket: € 18.10/kg (including 6% VAT) From this figure it becomes clear that the largest margins can be found at the final stages of the value chain, when an ingredient is manufactured into a final product. It is essential that producers and exporters focus on their area of expertise and keep themselves informed on costs of production and returns on investment, clearly identifying the value added systems and possibilities of competitive advantage. They should also be aware of what competitors are doing. Opportunities for suppliers to move up the supply chain require an analysis of the whole system. Suppliers should understand the value of the product offered by the downstream supplier and the risks of supplying that particular product. Suppliers should also decide on whether the upstream company can make appropriate investments and compete effectively with the downstream company.

CBI MARKET SURVEY: THE (ORGANIC) COFFEE, TEA AND COCOA MARKET IN THE EU
Source: CBI Market Information Database • URL: www.cbi.eu • Contact: [email protected] • www.cbi.eu/disclaimer
Page 32 of 63
Regarding organic coffee, tea and cocoa, there is a price mark-up attached to the product, which is also paid to the exporter. As the organically certified products may be traded in relatively smaller quantities, there can be an additional cost incurred by the importer. 3.3 Useful sources Coffee • A great deal of information on the coffee trade can be found in ITC’s “Coffee: An Exporter’s
guide”. The study can be ordered at: http://www.intracen.org/eshop/f_e_IP_Title.Asp?ID=26556&LN=EN. Finding companies active in the coffee trade is easiest through the links page of the International Coffee Organisation: http://www.ico.org/coffee_authorities.asp
• The European Coffee Federation also shows its national association members and company members at http://www.ecf-coffee.org
• Both the national member sites are most useful for finding additional companies active in the trade. For example, at http://www.kaffeeverband.de/25.htm, the German Coffee Association Germany’s coffee companies are arranged according to their position in their activities.
• ICCO’s 2002 report on Organic Coffee, Cocoa and Tea provides information on major players in the organic market for all three products discussed. This survey can be found at: http://www.sippo.ch/cgi/news/publications.asp?mode=6#org2
• The Tea and Coffee Trade Journal: http://www.teaandcoffee.net Tea • Inttea’s annual bulletin of statistics also contains a very useful trade directory in which the
most important companies in producing and consumption countries can be encountered. This publication can be ordered at http://www.inttea.com/publications.asp
• Furthermore at the website of the European Tea Committee (ETC): http://www.etc-online.org/member.html#a you can find national member organisations to which you should refer to encounter other companies active in the tea trade.
• The UK Tea Council also offers business contacts specified by trade channel at: http://www.tea.co.uk/businessdirectory.php?mode=alpha&let=D
Cocoa • “Cocoa: A Guide to Trade Practices” is a very comprehensive information source for the
cocoa trade. The study can be ordered at: http://www.intracen.org/eshop/f_e_IP_Title.Asp?ID=9602&LN=EN.
• Companies active in the cocoa trade can be encountered at the following websites. o http://www.cocoafederation.com/membership/members.jsp o http://www.worldcocoafoundation.org/about/member-companies.asp o http://www.eurococoa.com
• Far more comprehensive is ICCO’s World Cocoa Directory, which can be ordered at http://www.ICCO.org/documents/publications.aspx € 127.50 or £ 85.
On-line company databases for finding companies working in the coffee, tea and cocoa markets are firstly national associations for the appropriate products, which are mentioned in Section 6 of the surveys covering EU countries. Others include: • Food world: http://www.thefoodworld.com (an extensive online food business directory,
with full EU coverage. Coffee, tea and cocoa are a separate product group.) • Europages (except for coffee and tea): http://www.europages.com (online business
directory, with full EU coverage. Cocoa and chocolate, with coffee and tea being two separate product groups)
Business-to-business sources include the following; • Agronetwork.com: http://www.agronetwork.com/global (coffee and tea are included under
food)

CBI MARKET SURVEY: THE (ORGANIC) COFFEE, TEA AND COCOA MARKET IN THE EU
Source: CBI Market Information Database • URL: www.cbi.eu • Contact: [email protected] • www.cbi.eu/disclaimer
Page 33 of 63
• IngridNet: http://www.ingridnet.com (a marketing instrument for companies supplying ingredients to, among others, food industries. Cocoa and cocoa products, and tea and coffee products are two separate product groups).
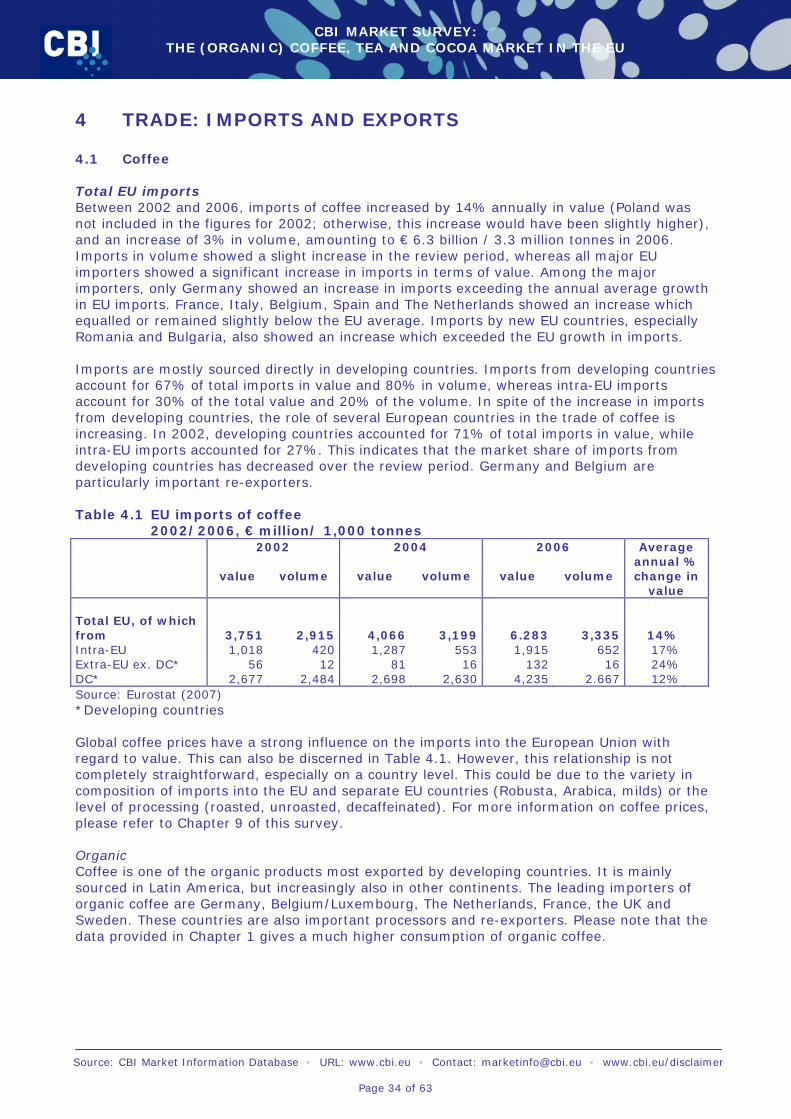
CBI MARKET SURVEY: THE (ORGANIC) COFFEE, TEA AND COCOA MARKET IN THE EU
Source: CBI Market Information Database • URL: www.cbi.eu • Contact: [email protected] • www.cbi.eu/disclaimer
Page 34 of 63
4 TRADE: IMPORTS AND EXPORTS 4.1 Coffee Total EU imports Between 2002 and 2006, imports of coffee increased by 14% annually in value (Poland was not included in the figures for 2002; otherwise, this increase would have been slightly higher), and an increase of 3% in volume, amounting to € 6.3 billion / 3.3 million tonnes in 2006. Imports in volume showed a slight increase in the review period, whereas all major EU importers showed a significant increase in imports in terms of value. Among the major importers, only Germany showed an increase in imports exceeding the annual average growth in EU imports. France, Italy, Belgium, Spain and The Netherlands showed an increase which equalled or remained slightly below the EU average. Imports by new EU countries, especially Romania and Bulgaria, also showed an increase which exceeded the EU growth in imports. Imports are mostly sourced directly in developing countries. Imports from developing countries account for 67% of total imports in value and 80% in volume, whereas intra-EU imports account for 30% of the total value and 20% of the volume. In spite of the increase in imports from developing countries, the role of several European countries in the trade of coffee is increasing. In 2002, developing countries accounted for 71% of total imports in value, while intra-EU imports accounted for 27%. This indicates that the market share of imports from developing countries has decreased over the review period. Germany and Belgium are particularly important re-exporters. Table 4.1 EU imports of coffee 2002/2006, € million/ 1,000 tonnes
2002 2004 2006
value volume value volume value volume
Average annual % change in
value Total EU, of which from 3,751 2,915 4,066 3,199 6.283 3,335 14%
Intra-EU 1,018 420 1,287 553 1,915 652 17% Extra-EU ex. DC* 56 12 81 16 132 16 24% DC* 2,677 2,484 2,698 2,630 4,235 2.667 12% Source: Eurostat (2007) *Developing countries Global coffee prices have a strong influence on the imports into the European Union with regard to value. This can also be discerned in Table 4.1. However, this relationship is not completely straightforward, especially on a country level. This could be due to the variety in composition of imports into the EU and separate EU countries (Robusta, Arabica, milds) or the level of processing (roasted, unroasted, decaffeinated). For more information on coffee prices, please refer to Chapter 9 of this survey. Organic Coffee is one of the organic products most exported by developing countries. It is mainly sourced in Latin America, but increasingly also in other continents. The leading importers of organic coffee are Germany, Belgium/Luxembourg, The Netherlands, France, the UK and Sweden. These countries are also important processors and re-exporters. Please note that the data provided in Chapter 1 gives a much higher consumption of organic coffee.
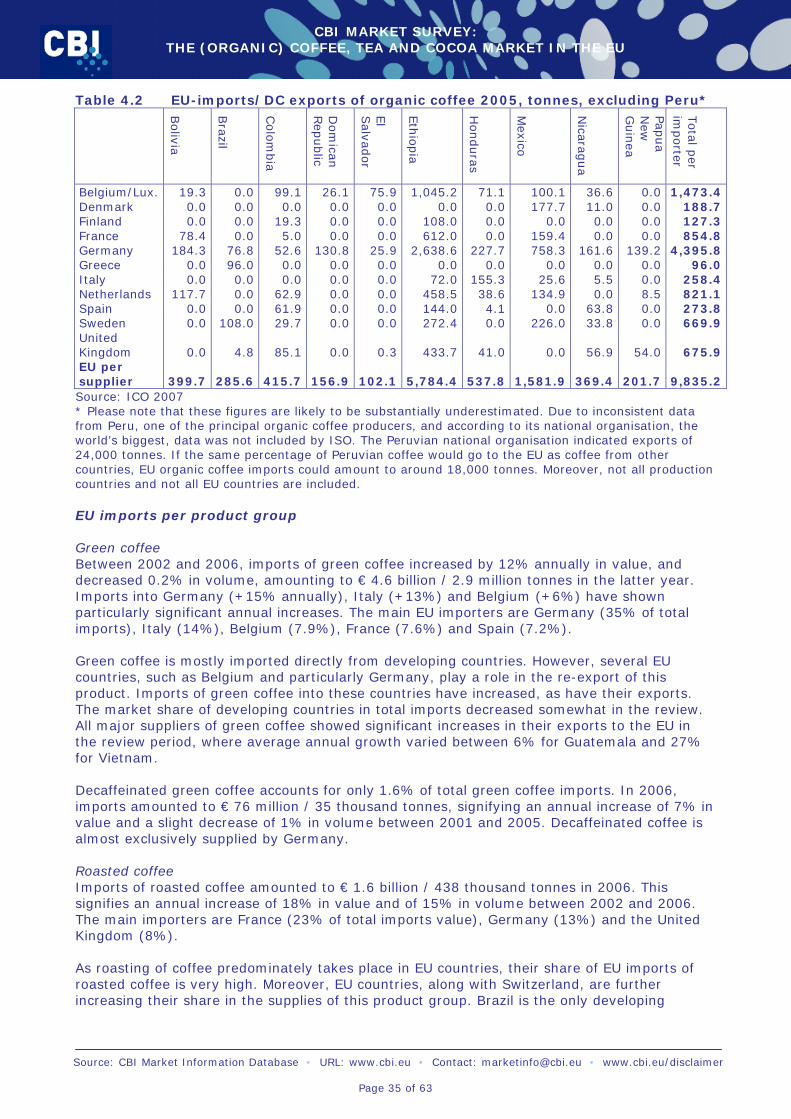
CBI MARKET SURVEY: THE (ORGANIC) COFFEE, TEA AND COCOA MARKET IN THE EU
Source: CBI Market Information Database • URL: www.cbi.eu • Contact: [email protected] • www.cbi.eu/disclaimer
Page 35 of 63
Table 4.2 EU-imports/DC exports of organic coffee 2005, tonnes, excluding Peru*
Bolivia
Brazil
Colo
mbia
Dom
ican
Rep
ublic
El
Salvad
or
Eth
iopia
Honduras
Mexico
Nicarag
ua
Papua
New
G
uin
ea
Total p
er im
porter
Belgium/Lux. 19.3 0.0 99.1 26.1 75.9 1,045.2 71.1 100.1 36.6 0.0 1,473.4 Denmark 0.0 0.0 0.0 0.0 0.0 0.0 0.0 177.7 11.0 0.0 188.7 Finland 0.0 0.0 19.3 0.0 0.0 108.0 0.0 0.0 0.0 0.0 127.3 France 78.4 0.0 5.0 0.0 0.0 612.0 0.0 159.4 0.0 0.0 854.8 Germany 184.3 76.8 52.6 130.8 25.9 2,638.6 227.7 758.3 161.6 139.2 4,395.8 Greece 0.0 96.0 0.0 0.0 0.0 0.0 0.0 0.0 0.0 0.0 96.0 Italy 0.0 0.0 0.0 0.0 0.0 72.0 155.3 25.6 5.5 0.0 258.4 Netherlands 117.7 0.0 62.9 0.0 0.0 458.5 38.6 134.9 0.0 8.5 821.1 Spain 0.0 0.0 61.9 0.0 0.0 144.0 4.1 0.0 63.8 0.0 273.8 Sweden 0.0 108.0 29.7 0.0 0.0 272.4 0.0 226.0 33.8 0.0 669.9 United Kingdom 0.0 4.8 85.1 0.0 0.3 433.7 41.0 0.0 56.9 54.0 675.9 EU per supplier 399.7 285.6 415.7 156.9 102.1 5,784.4 537.8 1,581.9 369.4 201.7 9,835.2 Source: ICO 2007 * Please note that these figures are likely to be substantially underestimated. Due to inconsistent data from Peru, one of the principal organic coffee producers, and according to its national organisation, the world’s biggest, data was not included by ISO. The Peruvian national organisation indicated exports of 24,000 tonnes. If the same percentage of Peruvian coffee would go to the EU as coffee from other countries, EU organic coffee imports could amount to around 18,000 tonnes. Moreover, not all production countries and not all EU countries are included. EU imports per product group Green coffee Between 2002 and 2006, imports of green coffee increased by 12% annually in value, and decreased 0.2% in volume, amounting to € 4.6 billion / 2.9 million tonnes in the latter year. Imports into Germany (+15% annually), Italy (+13%) and Belgium (+6%) have shown particularly significant annual increases. The main EU importers are Germany (35% of total imports), Italy (14%), Belgium (7.9%), France (7.6%) and Spain (7.2%). Green coffee is mostly imported directly from developing countries. However, several EU countries, such as Belgium and particularly Germany, play a role in the re-export of this product. Imports of green coffee into these countries have increased, as have their exports. The market share of developing countries in total imports decreased somewhat in the review. All major suppliers of green coffee showed significant increases in their exports to the EU in the review period, where average annual growth varied between 6% for Guatemala and 27% for Vietnam. Decaffeinated green coffee accounts for only 1.6% of total green coffee imports. In 2006, imports amounted to € 76 million / 35 thousand tonnes, signifying an annual increase of 7% in value and a slight decrease of 1% in volume between 2001 and 2005. Decaffeinated coffee is almost exclusively supplied by Germany. Roasted coffee Imports of roasted coffee amounted to € 1.6 billion / 438 thousand tonnes in 2006. This signifies an annual increase of 18% in value and of 15% in volume between 2002 and 2006. The main importers are France (23% of total imports value), Germany (13%) and the United Kingdom (8%). As roasting of coffee predominately takes place in EU countries, their share of EU imports of roasted coffee is very high. Moreover, EU countries, along with Switzerland, are further increasing their share in the supplies of this product group. Brazil is the only developing
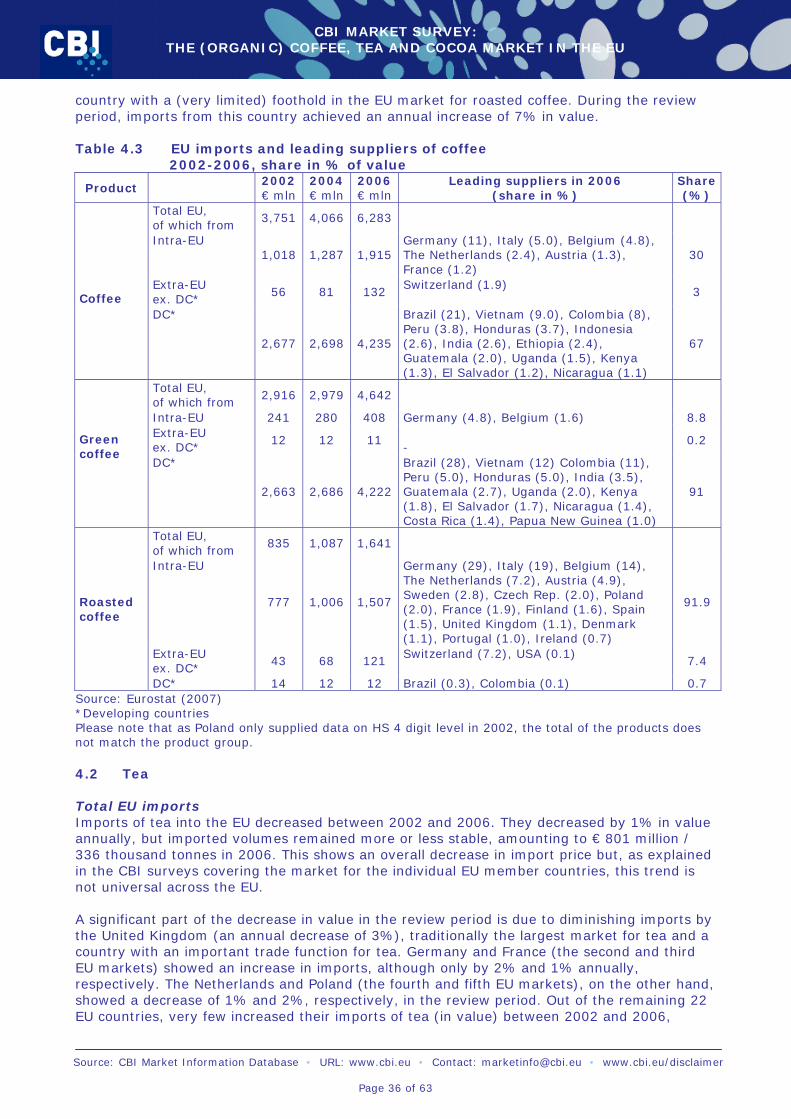
CBI MARKET SURVEY: THE (ORGANIC) COFFEE, TEA AND COCOA MARKET IN THE EU
Source: CBI Market Information Database • URL: www.cbi.eu • Contact: [email protected] • www.cbi.eu/disclaimer
Page 36 of 63
country with a (very limited) foothold in the EU market for roasted coffee. During the review period, imports from this country achieved an annual increase of 7% in value. Table 4.3 EU imports and leading suppliers of coffee
2002-2006, share in % of value
Product 2002 € mln
2004 € mln
2006 € mln
Leading suppliers in 2006 (share in %)
Share (%)
Total EU, of which from
3,751 4,066 6,283
Intra-EU 1,018 1,287 1,915
Germany (11), Italy (5.0), Belgium (4.8), The Netherlands (2.4), Austria (1.3), France (1.2)
30
Extra-EU ex. DC*
56 81 132 Switzerland (1.9)
3 Coffee
DC*
2,677 2,698 4,235
Brazil (21), Vietnam (9.0), Colombia (8), Peru (3.8), Honduras (3.7), Indonesia (2.6), India (2.6), Ethiopia (2.4), Guatemala (2.0), Uganda (1.5), Kenya (1.3), El Salvador (1.2), Nicaragua (1.1)
67
Total EU, of which from
2,916 2,979 4,642
Intra-EU 241 280 408 Germany (4.8), Belgium (1.6) 8.8 Extra-EU ex. DC*
12 12 11 -
0.2 Green coffee DC*
2,663 2,686 4,222
Brazil (28), Vietnam (12) Colombia (11), Peru (5.0), Honduras (5.0), India (3.5), Guatemala (2.7), Uganda (2.0), Kenya (1.8), El Salvador (1.7), Nicaragua (1.4), Costa Rica (1.4), Papua New Guinea (1.0)
91
Total EU, of which from
835 1,087 1,641
Intra-EU
777 1,006 1,507
Germany (29), Italy (19), Belgium (14), The Netherlands (7.2), Austria (4.9), Sweden (2.8), Czech Rep. (2.0), Poland (2.0), France (1.9), Finland (1.6), Spain (1.5), United Kingdom (1.1), Denmark (1.1), Portugal (1.0), Ireland (0.7)
91.9
Extra-EU ex. DC*
43 68 121 Switzerland (7.2), USA (0.1)
7.4
Roasted coffee
DC* 14 12 12 Brazil (0.3), Colombia (0.1) 0.7 Source: Eurostat (2007) *Developing countries Please note that as Poland only supplied data on HS 4 digit level in 2002, the total of the products does not match the product group. 4.2 Tea Total EU imports Imports of tea into the EU decreased between 2002 and 2006. They decreased by 1% in value annually, but imported volumes remained more or less stable, amounting to € 801 million / 336 thousand tonnes in 2006. This shows an overall decrease in import price but, as explained in the CBI surveys covering the market for the individual EU member countries, this trend is not universal across the EU. A significant part of the decrease in value in the review period is due to diminishing imports by the United Kingdom (an annual decrease of 3%), traditionally the largest market for tea and a country with an important trade function for tea. Germany and France (the second and third EU markets) showed an increase in imports, although only by 2% and 1% annually, respectively. The Netherlands and Poland (the fourth and fifth EU markets), on the other hand, showed a decrease of 1% and 2%, respectively, in the review period. Out of the remaining 22 EU countries, very few increased their imports of tea (in value) between 2002 and 2006,
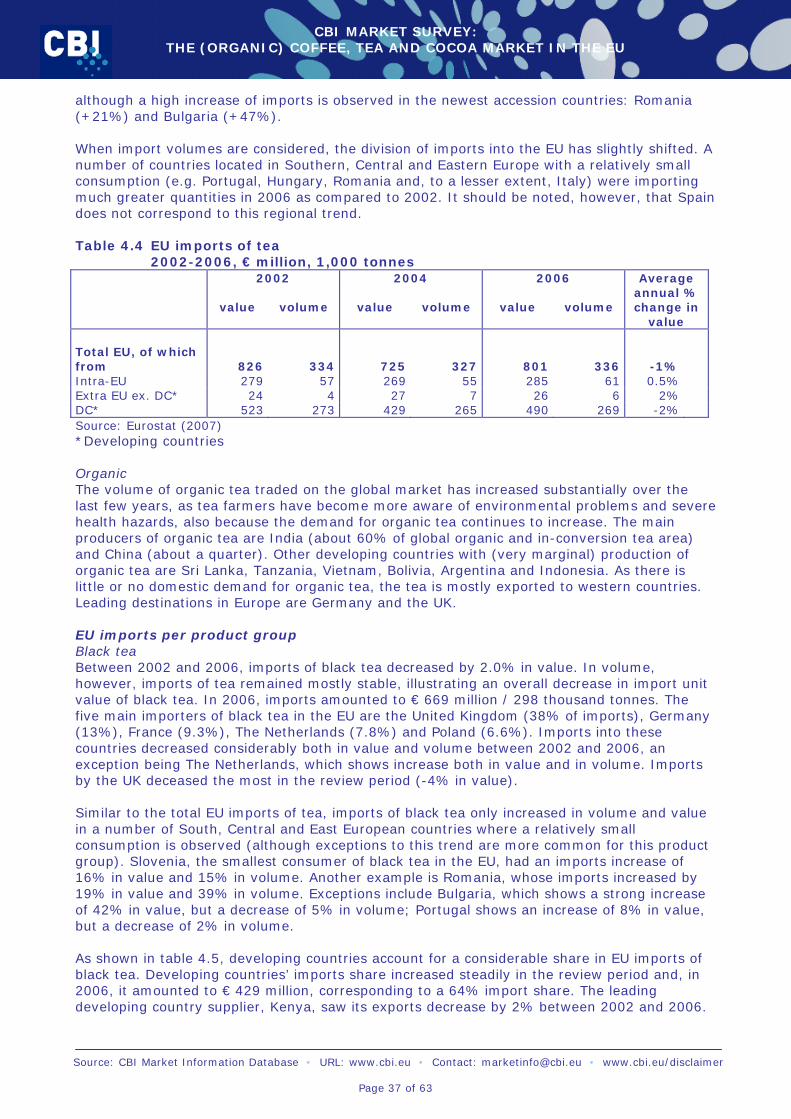
CBI MARKET SURVEY: THE (ORGANIC) COFFEE, TEA AND COCOA MARKET IN THE EU
Source: CBI Market Information Database • URL: www.cbi.eu • Contact: [email protected] • www.cbi.eu/disclaimer
Page 37 of 63
although a high increase of imports is observed in the newest accession countries: Romania (+21%) and Bulgaria (+47%). When import volumes are considered, the division of imports into the EU has slightly shifted. A number of countries located in Southern, Central and Eastern Europe with a relatively small consumption (e.g. Portugal, Hungary, Romania and, to a lesser extent, Italy) were importing much greater quantities in 2006 as compared to 2002. It should be noted, however, that Spain does not correspond to this regional trend. Table 4.4 EU imports of tea 2002-2006, € million, 1,000 tonnes
2002 2004 2006
value volume value volume value volume
Average annual % change in
value Total EU, of which from 826 334 725 327 801 336 -1%
Intra-EU 279 57 269 55 285 61 0.5% Extra EU ex. DC* 24 4 27 7 26 6 2% DC* 523 273 429 265 490 269 -2% Source: Eurostat (2007) *Developing countries Organic The volume of organic tea traded on the global market has increased substantially over the last few years, as tea farmers have become more aware of environmental problems and severe health hazards, also because the demand for organic tea continues to increase. The main producers of organic tea are India (about 60% of global organic and in-conversion tea area) and China (about a quarter). Other developing countries with (very marginal) production of organic tea are Sri Lanka, Tanzania, Vietnam, Bolivia, Argentina and Indonesia. As there is little or no domestic demand for organic tea, the tea is mostly exported to western countries. Leading destinations in Europe are Germany and the UK. EU imports per product group Black tea Between 2002 and 2006, imports of black tea decreased by 2.0% in value. In volume, however, imports of tea remained mostly stable, illustrating an overall decrease in import unit value of black tea. In 2006, imports amounted to € 669 million / 298 thousand tonnes. The five main importers of black tea in the EU are the United Kingdom (38% of imports), Germany (13%), France (9.3%), The Netherlands (7.8%) and Poland (6.6%). Imports into these countries decreased considerably both in value and volume between 2002 and 2006, an exception being The Netherlands, which shows increase both in value and in volume. Imports by the UK deceased the most in the review period (-4% in value). Similar to the total EU imports of tea, imports of black tea only increased in volume and value in a number of South, Central and East European countries where a relatively small consumption is observed (although exceptions to this trend are more common for this product group). Slovenia, the smallest consumer of black tea in the EU, had an imports increase of 16% in value and 15% in volume. Another example is Romania, whose imports increased by 19% in value and 39% in volume. Exceptions include Bulgaria, which shows a strong increase of 42% in value, but a decrease of 5% in volume; Portugal shows an increase of 8% in value, but a decrease of 2% in volume. As shown in table 4.5, developing countries account for a considerable share in EU imports of black tea. Developing countries’ imports share increased steadily in the review period and, in 2006, it amounted to € 429 million, corresponding to a 64% import share. The leading developing country supplier, Kenya, saw its exports decrease by 2% between 2002 and 2006.
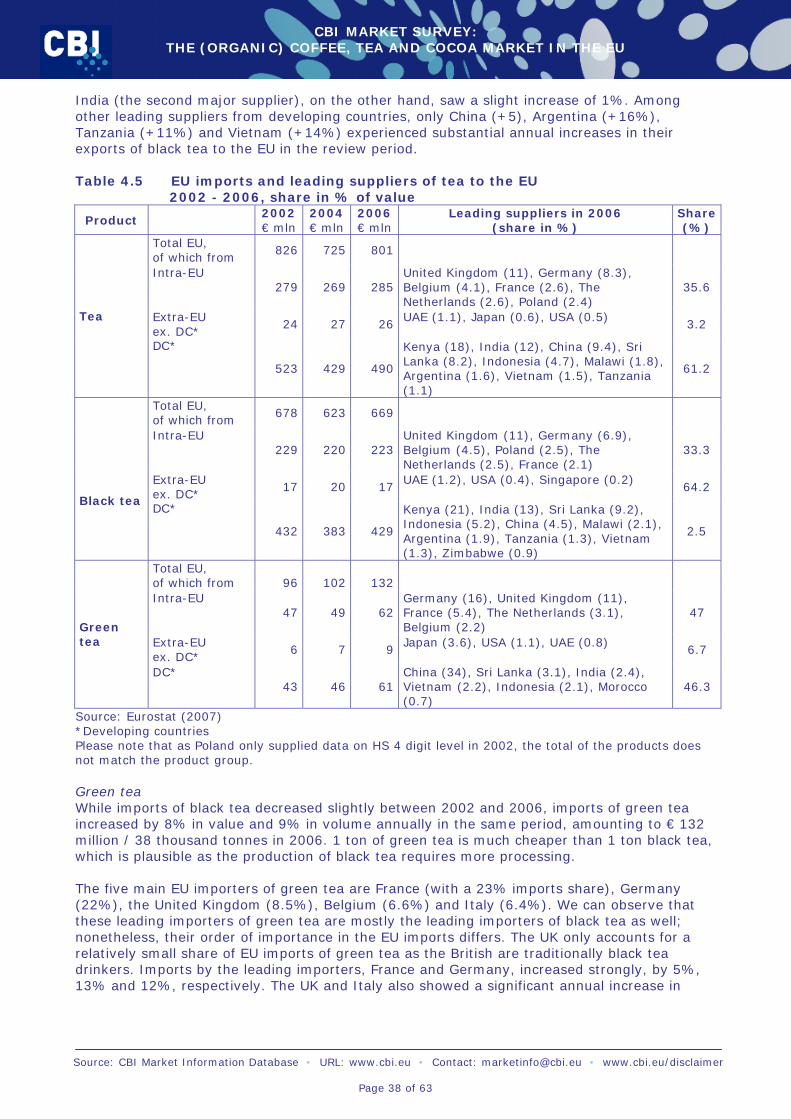
CBI MARKET SURVEY: THE (ORGANIC) COFFEE, TEA AND COCOA MARKET IN THE EU
Source: CBI Market Information Database • URL: www.cbi.eu • Contact: [email protected] • www.cbi.eu/disclaimer
Page 38 of 63
India (the second major supplier), on the other hand, saw a slight increase of 1%. Among other leading suppliers from developing countries, only China (+5), Argentina (+16%), Tanzania (+11%) and Vietnam (+14%) experienced substantial annual increases in their exports of black tea to the EU in the review period. Table 4.5 EU imports and leading suppliers of tea to the EU
2002 - 2006, share in % of value
Product 2002 € mln
2004 € mln
2006 € mln
Leading suppliers in 2006 (share in %)
Share (%)
Total EU, of which from
826 725 801
Intra-EU 279 269 285
United Kingdom (11), Germany (8.3), Belgium (4.1), France (2.6), The Netherlands (2.6), Poland (2.4)
35.6
Extra-EU ex. DC*
24 27 26 UAE (1.1), Japan (0.6), USA (0.5)
3.2 Tea
DC*
523 429 490
Kenya (18), India (12), China (9.4), Sri Lanka (8.2), Indonesia (4.7), Malawi (1.8), Argentina (1.6), Vietnam (1.5), Tanzania (1.1)
61.2
Total EU, of which from
678 623 669
Intra-EU 229 220 223
United Kingdom (11), Germany (6.9), Belgium (4.5), Poland (2.5), The Netherlands (2.5), France (2.1)
33.3
Extra-EU ex. DC*
17 20 17 UAE (1.2), USA (0.4), Singapore (0.2)
64.2
Black tea
DC*
432 383 429
Kenya (21), India (13), Sri Lanka (9.2), Indonesia (5.2), China (4.5), Malawi (2.1), Argentina (1.9), Tanzania (1.3), Vietnam (1.3), Zimbabwe (0.9)
2.5
Total EU, of which from
96
102
132
Intra-EU 47 49 62
Germany (16), United Kingdom (11), France (5.4), The Netherlands (3.1), Belgium (2.2)
47
Extra-EU ex. DC*
6 7 9 Japan (3.6), USA (1.1), UAE (0.8)
6.7
Green tea
DC* 43 46 61
China (34), Sri Lanka (3.1), India (2.4), Vietnam (2.2), Indonesia (2.1), Morocco (0.7)
46.3
Source: Eurostat (2007) *Developing countries Please note that as Poland only supplied data on HS 4 digit level in 2002, the total of the products does not match the product group. Green tea While imports of black tea decreased slightly between 2002 and 2006, imports of green tea increased by 8% in value and 9% in volume annually in the same period, amounting to € 132 million / 38 thousand tonnes in 2006. 1 ton of green tea is much cheaper than 1 ton black tea, which is plausible as the production of black tea requires more processing. The five main EU importers of green tea are France (with a 23% imports share), Germany (22%), the United Kingdom (8.5%), Belgium (6.6%) and Italy (6.4%). We can observe that these leading importers of green tea are mostly the leading importers of black tea as well; nonetheless, their order of importance in the EU imports differs. The UK only accounts for a relatively small share of EU imports of green tea as the British are traditionally black tea drinkers. Imports by the leading importers, France and Germany, increased strongly, by 5%, 13% and 12%, respectively. The UK and Italy also showed a significant annual increase in
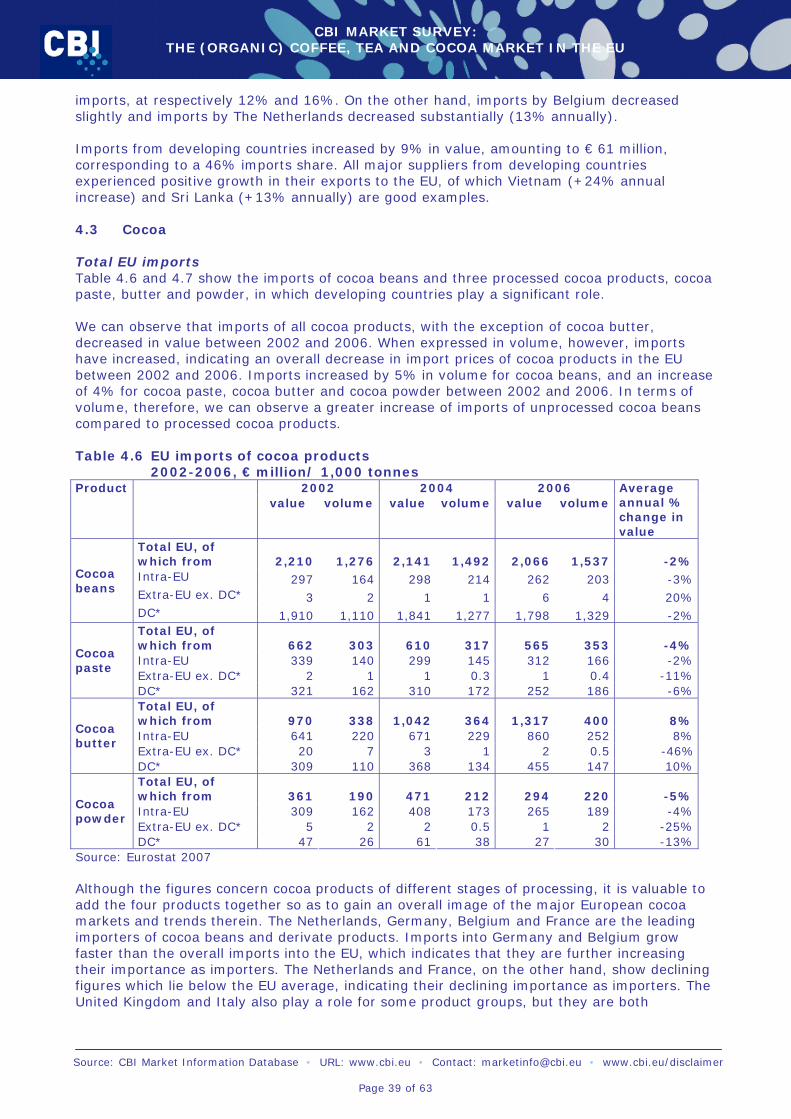
CBI MARKET SURVEY: THE (ORGANIC) COFFEE, TEA AND COCOA MARKET IN THE EU
Source: CBI Market Information Database • URL: www.cbi.eu • Contact: [email protected] • www.cbi.eu/disclaimer
Page 39 of 63
imports, at respectively 12% and 16%. On the other hand, imports by Belgium decreased slightly and imports by The Netherlands decreased substantially (13% annually). Imports from developing countries increased by 9% in value, amounting to € 61 million, corresponding to a 46% imports share. All major suppliers from developing countries experienced positive growth in their exports to the EU, of which Vietnam (+24% annual increase) and Sri Lanka (+13% annually) are good examples. 4.3 Cocoa Total EU imports Table 4.6 and 4.7 show the imports of cocoa beans and three processed cocoa products, cocoa paste, butter and powder, in which developing countries play a significant role. We can observe that imports of all cocoa products, with the exception of cocoa butter, decreased in value between 2002 and 2006. When expressed in volume, however, imports have increased, indicating an overall decrease in import prices of cocoa products in the EU between 2002 and 2006. Imports increased by 5% in volume for cocoa beans, and an increase of 4% for cocoa paste, cocoa butter and cocoa powder between 2002 and 2006. In terms of volume, therefore, we can observe a greater increase of imports of unprocessed cocoa beans compared to processed cocoa products. Table 4.6 EU imports of cocoa products 2002-2006, € million/ 1,000 tonnes
2002 2004 2006 Product value volume value volume value volume
Average annual % change in value
Total EU, of which from 2,210 1,276 2,141 1,492 2,066 1,537 -2% Intra-EU 297 164 298 214 262 203 -3% Extra-EU ex. DC* 3 2 1 1 6 4 20%
Cocoa beans
DC* 1,910 1,110 1,841 1,277 1,798 1,329 -2% Total EU, of which from 662 303 610 317 565 353 -4% Intra-EU 339 140 299 145 312 166 -2% Extra-EU ex. DC* 2 1 1 0.3 1 0.4 -11%
Cocoa paste
DC* 321 162 310 172 252 186 -6% Total EU, of which from 970 338 1,042 364 1,317 400 8% Intra-EU 641 220 671 229 860 252 8% Extra-EU ex. DC* 20 7 3 1 2 0.5 -46%
Cocoa butter
DC* 309 110 368 134 455 147 10% Total EU, of which from 361 190 471 212 294 220 -5% Intra-EU 309 162 408 173 265 189 -4% Extra-EU ex. DC* 5 2 2 0.5 1 2 -25%
Cocoa powder
DC* 47 26 61 38 27 30 -13% Source: Eurostat 2007 Although the figures concern cocoa products of different stages of processing, it is valuable to add the four products together so as to gain an overall image of the major European cocoa markets and trends therein. The Netherlands, Germany, Belgium and France are the leading importers of cocoa beans and derivate products. Imports into Germany and Belgium grow faster than the overall imports into the EU, which indicates that they are further increasing their importance as importers. The Netherlands and France, on the other hand, show declining figures which lie below the EU average, indicating their declining importance as importers. The United Kingdom and Italy also play a role for some product groups, but they are both
CBI MARKET SURVEY: THE (ORGANIC) COFFEE, TEA AND COCOA MARKET IN THE EU
Source: CBI Market Information Database • URL: www.cbi.eu • Contact: [email protected] • www.cbi.eu/disclaimer
Page 40 of 63
decreasing in importance as importers as well. No regional development trends can be discerned. Organic cocoa As markets for organic products in developing countries are still limited, the majority of the production of organic cocoa is exported to western countries. Imports of organic cocoa into Europe were estimated to measure 14,000 tons of cocoa bean equivalents in 2003, of which an estimated 2,000 tons was re-exported to the USA. European importers deal with most of the organic cocoa bean processing and trading (Ecomercados2, 2005). Germany and The Netherlands are the leading importers of organic cocoa, of which most is re-exported by the Netherlands. Other important importers were France and Italy (importing partly from Germany). Spain, Belgium and the UK were small importers. There is only a very limited number of importers in Europe. EU imports per product group Cocoa beans Between 2002 and 2006, imports of cocoa beans decreased by 2% annually, amounting to € 2.1 billion. At the same time, imports in terms of volume increased by an annual average of 5%. This indicates an overall decrease in prices of cocoa beans in the review period. The most important EU importers of cocoa beans are The Netherlands, accounting for 34% of total EU imports, followed by Germany (19%), Belgium (14%), France (11%) and the United Kingdom (8.7%). The lion’s share of cocoa beans is imported from Ivory Coast and Ghana. Other countries, such as Nigeria and Cameroon, also play an important role. Considering the fact that cocoa production does not take place in Europe, the import share of EU countries such as Belgium, the UK and particularly The Netherlands consists entirely of re-exports of beans originating in developing countries. Cocoa paste A similar development observed for cocoa beans can be found for cocoa paste. Between 2002 and 2006, imports decreased in terms of value (-4% annually), whereas imports in terms of volume increased (+4% annually). Imports amounted to € 565 million / 353 thousand tonnes in 2006. The most important importer of cocoa paste is France (26%), followed by The Netherlands (15%), Germany (14%), Belgium (14%) and Poland (10%). EU countries play a far larger role in the supply of cocoa paste than for cocoa beans. A large share of the processing of cocoa products (paste/liquor, butter/powder) takes place in the EU, especially in The Netherlands. The country is the second largest supplier of cocoa paste to the EU, following Ivory Coast, the leading supplier. However, The Netherlands is also, jointly with France, the principal importer of cocoa paste from developing countries, accounting for almost a third of developing country imports. It is likely that part of the exports of these countries also consists of re-exports of paste produced in developing countries. Cocoa butter Among the cocoa products investigated in this survey, cocoa butter is the only one which showed an annual increase of imports in terms of both value and volume. Imports increased by an annual average of 8% in value between 2002 and 2006, whereas an annual increase of 4% is observed when imports are considered in terms of volume. These figures reflect an increase in the average price of cocoa butter in the review period. In 2006, imports of cocoa butter amounted to € 1.3 billion/ 400 thousand tonnes. The major importers of cocoa butter in the EU are: Germany (21% of EU imports), Belgium (18%), France (16%), The Netherlands (14%) and the United Kingdom (11%).
2 For more information, see Appendix D.
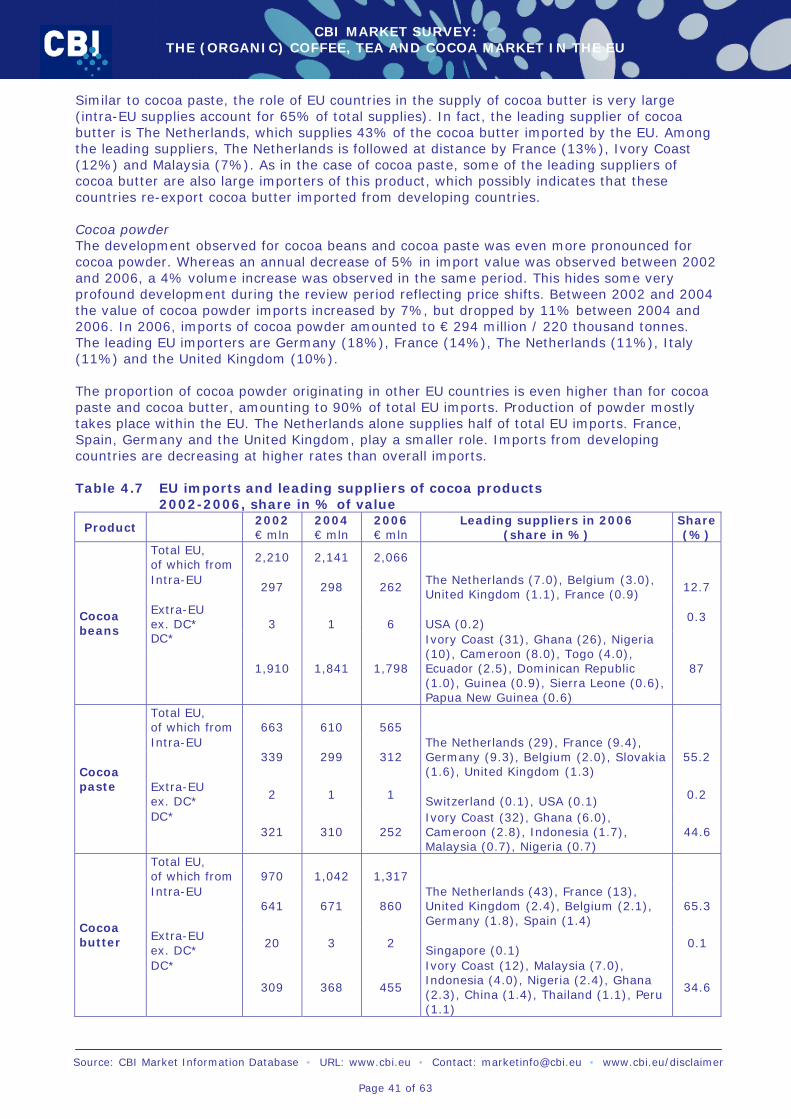
CBI MARKET SURVEY: THE (ORGANIC) COFFEE, TEA AND COCOA MARKET IN THE EU
Source: CBI Market Information Database • URL: www.cbi.eu • Contact: [email protected] • www.cbi.eu/disclaimer
Page 41 of 63
Similar to cocoa paste, the role of EU countries in the supply of cocoa butter is very large (intra-EU supplies account for 65% of total supplies). In fact, the leading supplier of cocoa butter is The Netherlands, which supplies 43% of the cocoa butter imported by the EU. Among the leading suppliers, The Netherlands is followed at distance by France (13%), Ivory Coast (12%) and Malaysia (7%). As in the case of cocoa paste, some of the leading suppliers of cocoa butter are also large importers of this product, which possibly indicates that these countries re-export cocoa butter imported from developing countries. Cocoa powder The development observed for cocoa beans and cocoa paste was even more pronounced for cocoa powder. Whereas an annual decrease of 5% in import value was observed between 2002 and 2006, a 4% volume increase was observed in the same period. This hides some very profound development during the review period reflecting price shifts. Between 2002 and 2004 the value of cocoa powder imports increased by 7%, but dropped by 11% between 2004 and 2006. In 2006, imports of cocoa powder amounted to € 294 million / 220 thousand tonnes. The leading EU importers are Germany (18%), France (14%), The Netherlands (11%), Italy (11%) and the United Kingdom (10%). The proportion of cocoa powder originating in other EU countries is even higher than for cocoa paste and cocoa butter, amounting to 90% of total EU imports. Production of powder mostly takes place within the EU. The Netherlands alone supplies half of total EU imports. France, Spain, Germany and the United Kingdom, play a smaller role. Imports from developing countries are decreasing at higher rates than overall imports. Table 4.7 EU imports and leading suppliers of cocoa products 2002-2006, share in % of value
Product 2002 € mln
2004 € mln
2006 € mln
Leading suppliers in 2006 (share in %)
Share (%)
Total EU, of which from
2,210 2,141 2,066
Intra-EU 297 298 262
The Netherlands (7.0), Belgium (3.0), United Kingdom (1.1), France (0.9)
12.7
Extra-EU ex. DC*
3
1
6
USA (0.2)
0.3 Cocoa beans DC*
1,910 1,841 1,798
Ivory Coast (31), Ghana (26), Nigeria (10), Cameroon (8.0), Togo (4.0), Ecuador (2.5), Dominican Republic (1.0), Guinea (0.9), Sierra Leone (0.6), Papua New Guinea (0.6)
87
Total EU, of which from
663
610
565
Intra-EU 339 299 312
The Netherlands (29), France (9.4), Germany (9.3), Belgium (2.0), Slovakia (1.6), United Kingdom (1.3)
55.2
Extra-EU ex. DC* 2 1 1
Switzerland (0.1), USA (0.1) 0.2
Cocoa paste
DC* 321 310 252
Ivory Coast (32), Ghana (6.0), Cameroon (2.8), Indonesia (1.7), Malaysia (0.7), Nigeria (0.7)
44.6
Total EU, of which from
970
1,042
1,317
Intra-EU 641 671 860
The Netherlands (43), France (13), United Kingdom (2.4), Belgium (2.1), Germany (1.8), Spain (1.4)
65.3
Extra-EU ex. DC*
20 3 2 Singapore (0.1)
0.1 Cocoa butter
DC*
309 368 455
Ivory Coast (12), Malaysia (7.0), Indonesia (4.0), Nigeria (2.4), Ghana (2.3), China (1.4), Thailand (1.1), Peru (1.1)
34.6
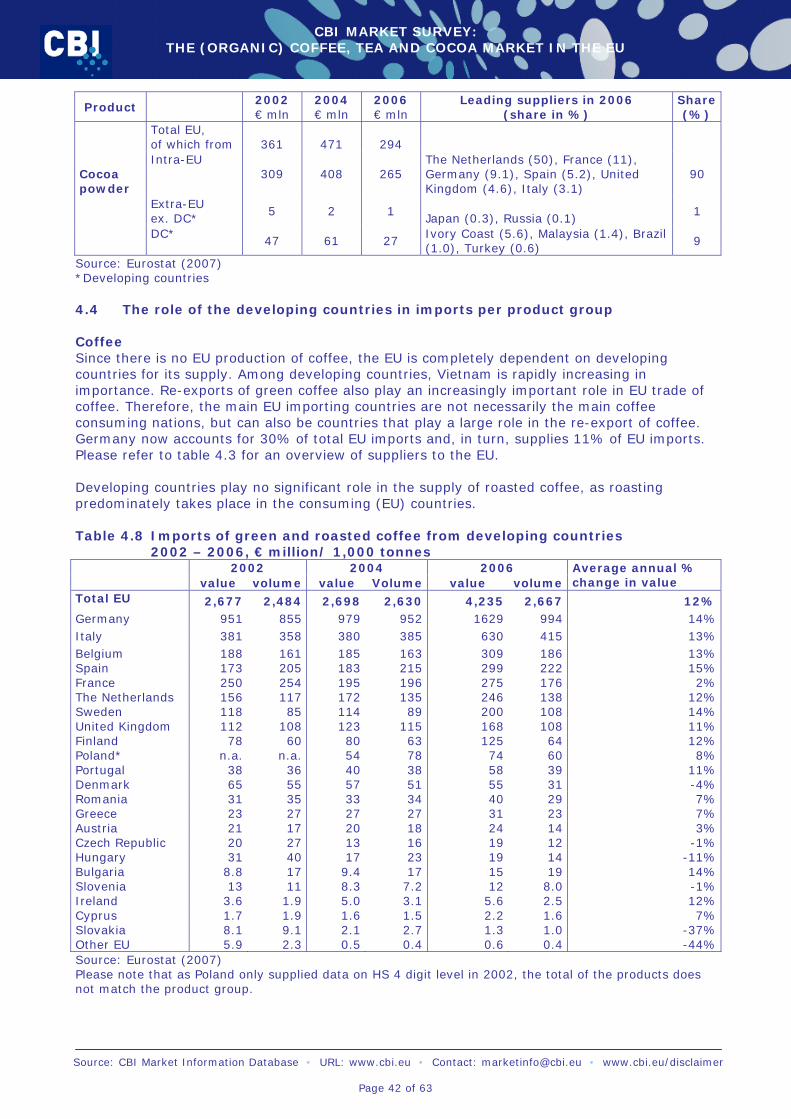
CBI MARKET SURVEY: THE (ORGANIC) COFFEE, TEA AND COCOA MARKET IN THE EU
Source: CBI Market Information Database • URL: www.cbi.eu • Contact: [email protected] • www.cbi.eu/disclaimer
Page 42 of 63
Product 2002 € mln
2004 € mln
2006 € mln
Leading suppliers in 2006 (share in %)
Share (%)
Total EU, of which from
361
471
294
Intra-EU 309 408 265
The Netherlands (50), France (11), Germany (9.1), Spain (5.2), United Kingdom (4.6), Italy (3.1)
90
Extra-EU ex. DC*
5 2 1 Japan (0.3), Russia (0.1)
1
Cocoa powder
DC* 47 61 27
Ivory Coast (5.6), Malaysia (1.4), Brazil (1.0), Turkey (0.6)
9
Source: Eurostat (2007) *Developing countries 4.4 The role of the developing countries in imports per product group Coffee Since there is no EU production of coffee, the EU is completely dependent on developing countries for its supply. Among developing countries, Vietnam is rapidly increasing in importance. Re-exports of green coffee also play an increasingly important role in EU trade of coffee. Therefore, the main EU importing countries are not necessarily the main coffee consuming nations, but can also be countries that play a large role in the re-export of coffee. Germany now accounts for 30% of total EU imports and, in turn, supplies 11% of EU imports. Please refer to table 4.3 for an overview of suppliers to the EU. Developing countries play no significant role in the supply of roasted coffee, as roasting predominately takes place in the consuming (EU) countries. Table 4.8 Imports of green and roasted coffee from developing countries 2002 – 2006, € million/ 1,000 tonnes
2002 2004 2006 value volume value Volume value volume
Average annual % change in value
Total EU 2,677 2,484 2,698 2,630 4,235 2,667 12% Germany 951 855 979 952 1629 994 14% Italy 381 358 380 385 630 415 13% Belgium 188 161 185 163 309 186 13% Spain 173 205 183 215 299 222 15% France 250 254 195 196 275 176 2% The Netherlands 156 117 172 135 246 138 12% Sweden 118 85 114 89 200 108 14% United Kingdom 112 108 123 115 168 108 11% Finland 78 60 80 63 125 64 12% Poland* n.a. n.a. 54 78 74 60 8% Portugal 38 36 40 38 58 39 11% Denmark 65 55 57 51 55 31 -4% Romania 31 35 33 34 40 29 7% Greece 23 27 27 27 31 23 7% Austria 21 17 20 18 24 14 3% Czech Republic 20 27 13 16 19 12 -1% Hungary 31 40 17 23 19 14 -11% Bulgaria 8.8 17 9.4 17 15 19 14% Slovenia 13 11 8.3 7.2 12 8.0 -1% Ireland 3.6 1.9 5.0 3.1 5.6 2.5 12% Cyprus 1.7 1.9 1.6 1.5 2.2 1.6 7% Slovakia 8.1 9.1 2.1 2.7 1.3 1.0 -37% Other EU 5.9 2.3 0.5 0.4 0.6 0.4 -44% Source: Eurostat (2007) Please note that as Poland only supplied data on HS 4 digit level in 2002, the total of the products does not match the product group.
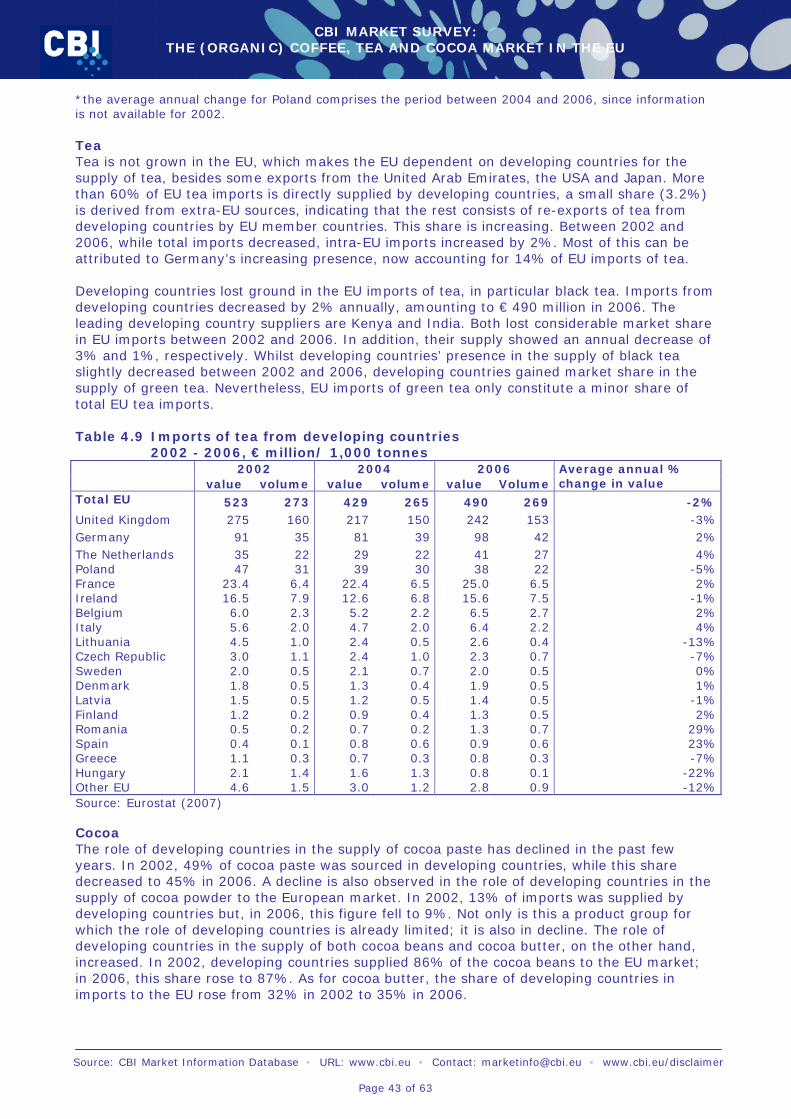
CBI MARKET SURVEY: THE (ORGANIC) COFFEE, TEA AND COCOA MARKET IN THE EU
Source: CBI Market Information Database • URL: www.cbi.eu • Contact: [email protected] • www.cbi.eu/disclaimer
Page 43 of 63
*the average annual change for Poland comprises the period between 2004 and 2006, since information is not available for 2002. Tea Tea is not grown in the EU, which makes the EU dependent on developing countries for the supply of tea, besides some exports from the United Arab Emirates, the USA and Japan. More than 60% of EU tea imports is directly supplied by developing countries, a small share (3.2%) is derived from extra-EU sources, indicating that the rest consists of re-exports of tea from developing countries by EU member countries. This share is increasing. Between 2002 and 2006, while total imports decreased, intra-EU imports increased by 2%. Most of this can be attributed to Germany’s increasing presence, now accounting for 14% of EU imports of tea. Developing countries lost ground in the EU imports of tea, in particular black tea. Imports from developing countries decreased by 2% annually, amounting to € 490 million in 2006. The leading developing country suppliers are Kenya and India. Both lost considerable market share in EU imports between 2002 and 2006. In addition, their supply showed an annual decrease of 3% and 1%, respectively. Whilst developing countries’ presence in the supply of black tea slightly decreased between 2002 and 2006, developing countries gained market share in the supply of green tea. Nevertheless, EU imports of green tea only constitute a minor share of total EU tea imports. Table 4.9 Imports of tea from developing countries 2002 - 2006, € million/ 1,000 tonnes
2002 2004 2006 value volume value volume value Volume
Average annual % change in value
Total EU 523 273 429 265 490 269 -2% United Kingdom 275 160 217 150 242 153 -3% Germany 91 35 81 39 98 42 2% The Netherlands 35 22 29 22 41 27 4% Poland 47 31 39 30 38 22 -5% France 23.4 6.4 22.4 6.5 25.0 6.5 2% Ireland 16.5 7.9 12.6 6.8 15.6 7.5 -1% Belgium 6.0 2.3 5.2 2.2 6.5 2.7 2% Italy 5.6 2.0 4.7 2.0 6.4 2.2 4% Lithuania 4.5 1.0 2.4 0.5 2.6 0.4 -13% Czech Republic 3.0 1.1 2.4 1.0 2.3 0.7 -7% Sweden 2.0 0.5 2.1 0.7 2.0 0.5 0% Denmark 1.8 0.5 1.3 0.4 1.9 0.5 1% Latvia 1.5 0.5 1.2 0.5 1.4 0.5 -1% Finland 1.2 0.2 0.9 0.4 1.3 0.5 2% Romania 0.5 0.2 0.7 0.2 1.3 0.7 29% Spain 0.4 0.1 0.8 0.6 0.9 0.6 23% Greece 1.1 0.3 0.7 0.3 0.8 0.3 -7% Hungary 2.1 1.4 1.6 1.3 0.8 0.1 -22% Other EU 4.6 1.5 3.0 1.2 2.8 0.9 -12% Source: Eurostat (2007) Cocoa The role of developing countries in the supply of cocoa paste has declined in the past few years. In 2002, 49% of cocoa paste was sourced in developing countries, while this share decreased to 45% in 2006. A decline is also observed in the role of developing countries in the supply of cocoa powder to the European market. In 2002, 13% of imports was supplied by developing countries but, in 2006, this figure fell to 9%. Not only is this a product group for which the role of developing countries is already limited; it is also in decline. The role of developing countries in the supply of both cocoa beans and cocoa butter, on the other hand, increased. In 2002, developing countries supplied 86% of the cocoa beans to the EU market; in 2006, this share rose to 87%. As for cocoa butter, the share of developing countries in imports to the EU rose from 32% in 2002 to 35% in 2006.
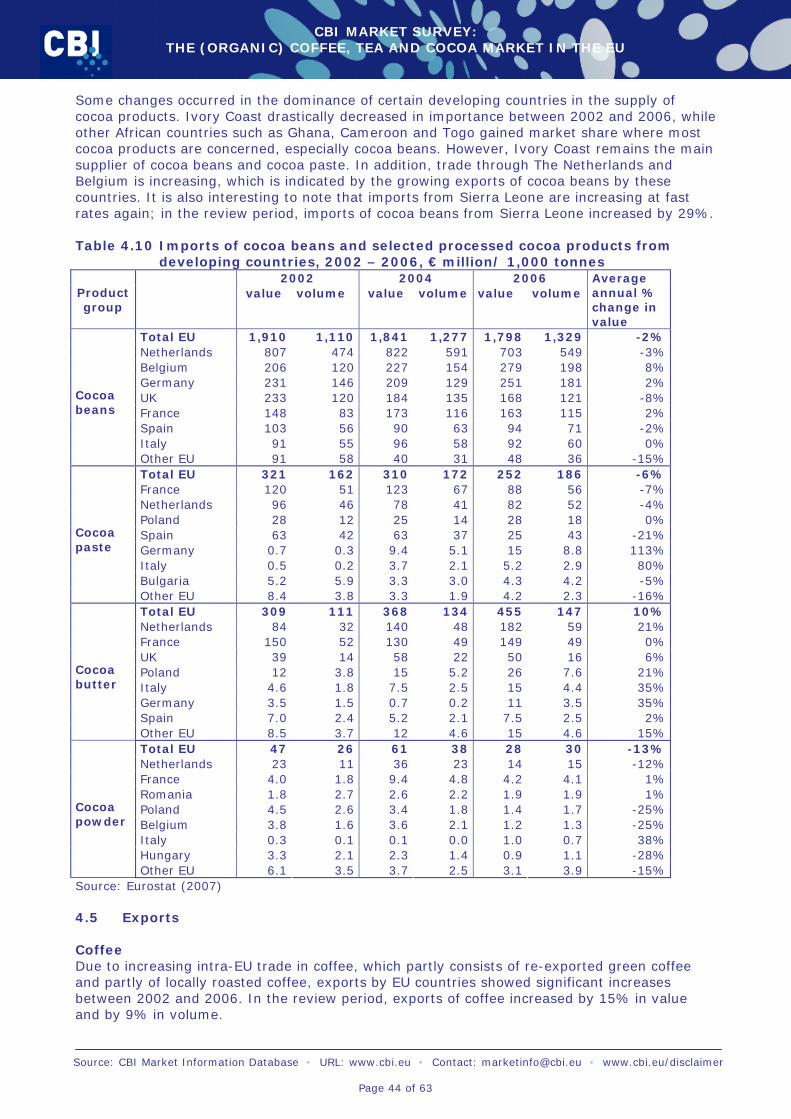
CBI MARKET SURVEY: THE (ORGANIC) COFFEE, TEA AND COCOA MARKET IN THE EU
Source: CBI Market Information Database • URL: www.cbi.eu • Contact: [email protected] • www.cbi.eu/disclaimer
Page 44 of 63
Some changes occurred in the dominance of certain developing countries in the supply of cocoa products. Ivory Coast drastically decreased in importance between 2002 and 2006, while other African countries such as Ghana, Cameroon and Togo gained market share where most cocoa products are concerned, especially cocoa beans. However, Ivory Coast remains the main supplier of cocoa beans and cocoa paste. In addition, trade through The Netherlands and Belgium is increasing, which is indicated by the growing exports of cocoa beans by these countries. It is also interesting to note that imports from Sierra Leone are increasing at fast rates again; in the review period, imports of cocoa beans from Sierra Leone increased by 29%. Table 4.10 Imports of cocoa beans and selected processed cocoa products from
developing countries, 2002 – 2006, € million/ 1,000 tonnes 2002 2004 2006
Product group
value volume value volume value volume
Average annual % change in value
Total EU 1,910 1,110 1,841 1,277 1,798 1,329 -2% Netherlands 807 474 822 591 703 549 -3% Belgium 206 120 227 154 279 198 8% Germany 231 146 209 129 251 181 2% UK 233 120 184 135 168 121 -8% France 148 83 173 116 163 115 2% Spain 103 56 90 63 94 71 -2% Italy 91 55 96 58 92 60 0%
Cocoa beans
Other EU 91 58 40 31 48 36 -15% Total EU 321 162 310 172 252 186 -6% France 120 51 123 67 88 56 -7% Netherlands 96 46 78 41 82 52 -4% Poland 28 12 25 14 28 18 0% Spain 63 42 63 37 25 43 -21% Germany 0.7 0.3 9.4 5.1 15 8.8 113% Italy 0.5 0.2 3.7 2.1 5.2 2.9 80% Bulgaria 5.2 5.9 3.3 3.0 4.3 4.2 -5%
Cocoa paste
Other EU 8.4 3.8 3.3 1.9 4.2 2.3 -16% Total EU 309 111 368 134 455 147 10% Netherlands 84 32 140 48 182 59 21% France 150 52 130 49 149 49 0% UK 39 14 58 22 50 16 6% Poland 12 3.8 15 5.2 26 7.6 21% Italy 4.6 1.8 7.5 2.5 15 4.4 35% Germany 3.5 1.5 0.7 0.2 11 3.5 35% Spain 7.0 2.4 5.2 2.1 7.5 2.5 2%
Cocoa butter
Other EU 8.5 3.7 12 4.6 15 4.6 15% Total EU 47 26 61 38 28 30 -13% Netherlands 23 11 36 23 14 15 -12% France 4.0 1.8 9.4 4.8 4.2 4.1 1% Romania 1.8 2.7 2.6 2.2 1.9 1.9 1% Poland 4.5 2.6 3.4 1.8 1.4 1.7 -25% Belgium 3.8 1.6 3.6 2.1 1.2 1.3 -25% Italy 0.3 0.1 0.1 0.0 1.0 0.7 38% Hungary 3.3 2.1 2.3 1.4 0.9 1.1 -28%
Cocoa powder
Other EU 6.1 3.5 3.7 2.5 3.1 3.9 -15% Source: Eurostat (2007) 4.5 Exports Coffee Due to increasing intra-EU trade in coffee, which partly consists of re-exported green coffee and partly of locally roasted coffee, exports by EU countries showed significant increases between 2002 and 2006. In the review period, exports of coffee increased by 15% in value and by 9% in volume.
CBI MARKET SURVEY: THE (ORGANIC) COFFEE, TEA AND COCOA MARKET IN THE EU
Source: CBI Market Information Database • URL: www.cbi.eu • Contact: [email protected] • www.cbi.eu/disclaimer
Page 45 of 63
Exports of green coffee increased by 15% in value and by 7% in volume annually, amounting to € 811 million / 428 thousand tonnes. The most important exporters are Germany (67% of EU exports) and Belgium (18%). Of EU exports of green coffee, 69% is destined to other EU countries and 29% to other developed countries, mainly the USA. As the EU does not have domestic production of coffee, this exclusively concerns re-exports. Exports of roasted coffee mainly concern exports of coffee which is processed in the EU. Exports of roasted coffee are increasing faster than exports of green coffee, achieving an annual increase of 15% in terms of value between 2002 and 2006, and an annual increase of 12% in volume. In 2006, exports amounted to € 1.9 billion / 469 thousand tonnes. The main exporters are Italy (27%), Germany (23%), and Belgium (13%). More than 80% of roasted coffee exports is destined to other EU countries, whereas the USA is also an important destination. Tea Total EU tea exports increased by an annual average of 4% in value between 2002 and 2006, whilst total EU imports decreased by an annual average of -1% in value. As the EU does not grow tea, this signifies that re-exports increased in importance in the review period. 55% of EU exports finds its way to other EU countries, whereas 45% is exported to extra-EU countries. The main EU exporter is the UK (41% of EU exports), followed at a distance by Germany (23%). The EU exports tea to a wide range of different countries; the most important ones being France (12%), Canada (9%), the USA (6.7%), Italy (5.9%) and Germany (5.1%). Exports to both the USA and Canada increased very fast. Exports of black tea increased by 3%, both in terms of value and volume. In 2006, exports of black tea amounted to € 439 million / 78 thousand tonnes. EU exports of green tea also increased between 2002 and 2006. The export value increased by an annual average of 17%, whereas the export volume increased by 16%. In 2006, exports of green tea amounted to € 107 million / 13.7 thousand tonnes. Clearly, these data signify that green tea is gaining popularity in Europe at the expense of black tea, as already discussed in Chapter 4. Consumption is increasing and EU trade in green tea is deepening. Cocoa During the review period, exports for all cocoa products, with the exception of cocoa powder, increased considerably in terms of value. The increase in the exports of cocoa beans, with an average annual growth of 6%, indicates increasing re-exports of this product. In 2006, cocoa bean exports amounted to € 388 million / 285 thousand tonnes. Leading EU re-exporters are The Netherlands and Belgium, together accounting for 95% of total EU exports. Exports are almost entirely destined to other EU member countries. Between 2002 and 2006, exports by EU member countries of cocoa paste increased by 3% in value and by 2% in volume annually, amounting to € 358 million / 188 thousand tonnes in the latter year. The leading EU exporter is, by far, The Netherlands, accounting for 55% of total EU exports; this constitutes Dutch production as well as re-exports. More than 75% of the total export value concerns intra-EU trade, while the remaining part is exported to countries outside the EU. Exports of cocoa butter by the EU increased by an annual average of 10% in value and 2% in volume between 2002 and 2006. In 2006, exports amounted to € 1.1 billion / 327 thousand tonnes. The Netherlands is the leading exporter of this product in the EU, accounting for 65% of the exports. The country is followed at a considerable distance by France, which accounts for 23% of the exports of cocoa butter. This concerns both butter produced in the EU and re-exports.
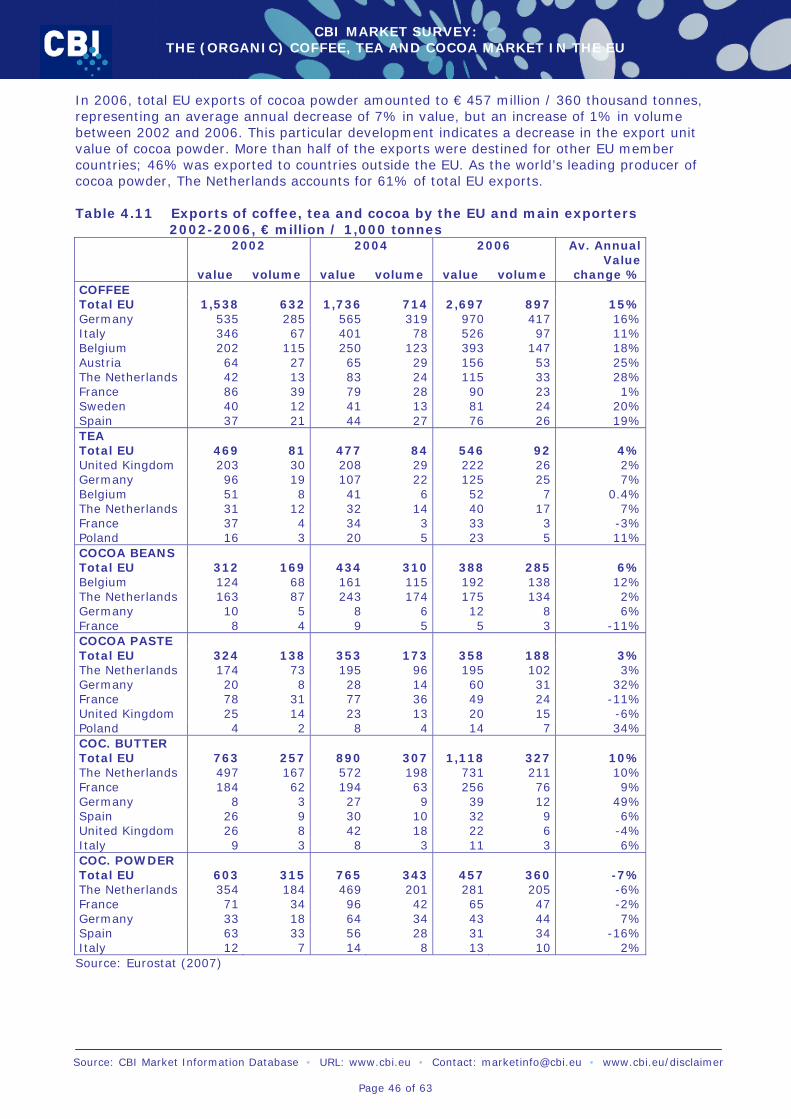
CBI MARKET SURVEY: THE (ORGANIC) COFFEE, TEA AND COCOA MARKET IN THE EU
Source: CBI Market Information Database • URL: www.cbi.eu • Contact: [email protected] • www.cbi.eu/disclaimer
Page 46 of 63
In 2006, total EU exports of cocoa powder amounted to € 457 million / 360 thousand tonnes, representing an average annual decrease of 7% in value, but an increase of 1% in volume between 2002 and 2006. This particular development indicates a decrease in the export unit value of cocoa powder. More than half of the exports were destined for other EU member countries; 46% was exported to countries outside the EU. As the world’s leading producer of cocoa powder, The Netherlands accounts for 61% of total EU exports. Table 4.11 Exports of coffee, tea and cocoa by the EU and main exporters
2002-2006, € million / 1,000 tonnes 2002 2004 2006
value volume value volume value volume
Av. Annual Value
change % COFFEE Total EU 1,538 632 1,736 714 2,697 897 15% Germany 535 285 565 319 970 417 16% Italy 346 67 401 78 526 97 11% Belgium 202 115 250 123 393 147 18% Austria 64 27 65 29 156 53 25% The Netherlands 42 13 83 24 115 33 28% France 86 39 79 28 90 23 1% Sweden 40 12 41 13 81 24 20% Spain 37 21 44 27 76 26 19% TEA Total EU 469 81 477 84 546 92 4% United Kingdom 203 30 208 29 222 26 2% Germany 96 19 107 22 125 25 7% Belgium 51 8 41 6 52 7 0.4% The Netherlands 31 12 32 14 40 17 7% France 37 4 34 3 33 3 -3% Poland 16 3 20 5 23 5 11% COCOA BEANS Total EU 312 169 434 310 388 285 6% Belgium 124 68 161 115 192 138 12% The Netherlands 163 87 243 174 175 134 2% Germany 10 5 8 6 12 8 6% France 8 4 9 5 5 3 -11% COCOA PASTE Total EU 324 138 353 173 358 188 3% The Netherlands 174 73 195 96 195 102 3% Germany 20 8 28 14 60 31 32% France 78 31 77 36 49 24 -11% United Kingdom 25 14 23 13 20 15 -6% Poland 4 2 8 4 14 7 34% COC. BUTTER Total EU 763 257 890 307 1,118 327 10% The Netherlands 497 167 572 198 731 211 10% France 184 62 194 63 256 76 9% Germany 8 3 27 9 39 12 49% Spain 26 9 30 10 32 9 6% United Kingdom 26 8 42 18 22 6 -4% Italy 9 3 8 3 11 3 6% COC. POWDER Total EU 603 315 765 343 457 360 -7% The Netherlands 354 184 469 201 281 205 -6% France 71 34 96 42 65 47 -2% Germany 33 18 64 34 43 44 7% Spain 63 33 56 28 31 34 -16% Italy 12 7 14 8 13 10 2% Source: Eurostat (2007)
CBI MARKET SURVEY: THE (ORGANIC) COFFEE, TEA AND COCOA MARKET IN THE EU
Source: CBI Market Information Database • URL: www.cbi.eu • Contact: [email protected] • www.cbi.eu/disclaimer
Page 47 of 63
4.6 Opportunities and threats Coffee + Imports of coffee are increasing, both in value and in volume. Due to price increases, the
increase in value has been especially large. + Although Brazil previously dominated coffee supply to the EU, a wide range of countries
now plays a role. ± The role of Germany and Belgium in the trade of green coffee is increasing. - Imports of green coffee have decreased slightly in volume. - Imports of roasted coffee originate in EU countries. The limited roasted coffee imports from
Brazil which took place in the past have further decreased. Tea ± The substantial decrease in black tea imports seen in the last couple of years has stabilised
somewhat. Imports in value still decreased by 2% annually between 2002 and 2006, but volume imports have been more stable.
± While imports in several traditional tea-countries such as the UK and Poland is decreasing, other main consumers are showing an increase, such as The Netherlands. Furthermore, south and East European countries are also showing increasing imports.
+ Imports of green tea are showing a considerable increase. + The share of developing countries in EU imports increased, showing an increasing tendency
for direct imports, instead of through the main trading countries, such as Germany and the UK.
Cocoa - Imports of cocoa beans, paste and powder into the EU decreased in value. However,
imports increased in volume, showing a decrease in import prices. + Imports of cocoa butter show a very good development, with imports increasing both in
value and volume. Moreover, imports from developing countries are increasing faster than overall imports.
± Only a few EU countries play a role in the imports of cocoa beans. - The share of developing countries in cocoa paste and powder imports has decreased. For
cocoa beans and paste, direct imports from developing countries remain prominent, but for powder, developing countries have a more marginal position in EU supply.
+ Although Ivory Coast and Ghana take a dominant position in developing country supply to the EU, many countries play a role in the supply of cocoa beans. This is less the case for the processed cocoa products.
4.7 Useful sources • EU Expanding Exports Helpdesk - http://exporthelp.europa.eu go to: trade statistics • Eurostat – official statistical office of the EU http://epp.eurostat.ec.europa.eu go to
‘themes’ on the left side of the home page go to ‘external trade’ go to ‘data – full view’ go to ‘external trade - detailed data’
• Understanding Eurostat: quick guide to easy Comext http://epp.eurostat.ec.europa.eu/newxtweb/assets/User_guide_Easy_Comext_20080117.pdf
• International Coffee Report, World Tea Markets, Chocolate & Confectionery International - http://www.agra-net.com
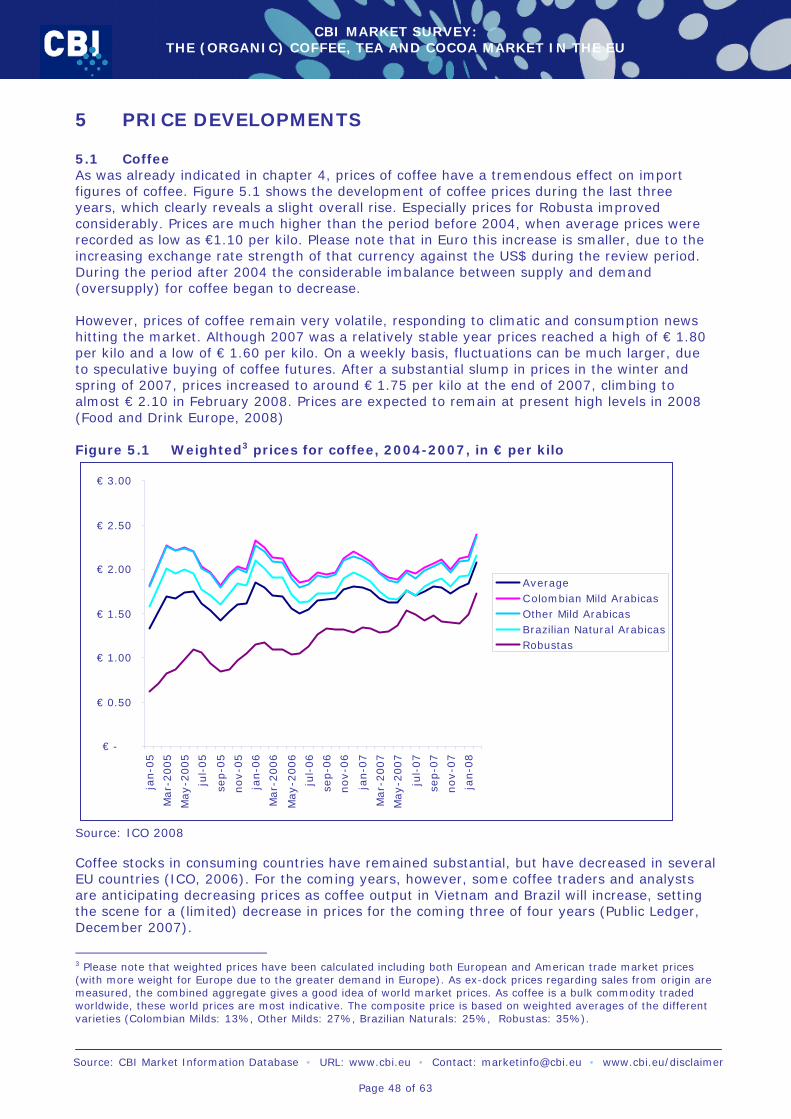
CBI MARKET SURVEY: THE (ORGANIC) COFFEE, TEA AND COCOA MARKET IN THE EU
Source: CBI Market Information Database • URL: www.cbi.eu • Contact: [email protected] • www.cbi.eu/disclaimer
Page 48 of 63
5 PRICE DEVELOPMENTS 5.1 Coffee As was already indicated in chapter 4, prices of coffee have a tremendous effect on import figures of coffee. Figure 5.1 shows the development of coffee prices during the last three years, which clearly reveals a slight overall rise. Especially prices for Robusta improved considerably. Prices are much higher than the period before 2004, when average prices were recorded as low as €1.10 per kilo. Please note that in Euro this increase is smaller, due to the increasing exchange rate strength of that currency against the US$ during the review period. During the period after 2004 the considerable imbalance between supply and demand (oversupply) for coffee began to decrease. However, prices of coffee remain very volatile, responding to climatic and consumption news hitting the market. Although 2007 was a relatively stable year prices reached a high of € 1.80 per kilo and a low of € 1.60 per kilo. On a weekly basis, fluctuations can be much larger, due to speculative buying of coffee futures. After a substantial slump in prices in the winter and spring of 2007, prices increased to around € 1.75 per kilo at the end of 2007, climbing to almost € 2.10 in February 2008. Prices are expected to remain at present high levels in 2008 (Food and Drink Europe, 2008) Figure 5.1 Weighted3 prices for coffee, 2004-2007, in € per kilo
€ -
€ 0.50
€ 1.00
€ 1.50
€ 2.00
€ 2.50
€ 3.00
jan-0
5
Mar-
2005
May-2
005
jul-
05
sep-0
5
nov-0
5
jan-0
6
Mar-
2006
May-2
006
jul-
06
sep-0
6
nov-0
6
jan-0
7
Mar-
2007
May-2
007
jul-
07
sep-0
7
nov-0
7
jan-0
8
AverageColombian Mild ArabicasOther Mild ArabicasBrazilian Natural ArabicasRobustas
Source: ICO 2008 Coffee stocks in consuming countries have remained substantial, but have decreased in several EU countries (ICO, 2006). For the coming years, however, some coffee traders and analysts are anticipating decreasing prices as coffee output in Vietnam and Brazil will increase, setting the scene for a (limited) decrease in prices for the coming three of four years (Public Ledger, December 2007).
3 Please note that weighted prices have been calculated including both European and American trade market prices (with more weight for Europe due to the greater demand in Europe). As ex-dock prices regarding sales from origin are measured, the combined aggregate gives a good idea of world market prices. As coffee is a bulk commodity traded worldwide, these world prices are most indicative. The composite price is based on weighted averages of the different varieties (Colombian Milds: 13%, Other Milds: 27%, Brazilian Naturals: 25%, Robustas: 35%).

CBI MARKET SURVEY: THE (ORGANIC) COFFEE, TEA AND COCOA MARKET IN THE EU
Source: CBI Market Information Database • URL: www.cbi.eu • Contact: [email protected] • www.cbi.eu/disclaimer
Page 49 of 63
Please note that coffee is not a homogenous product. Each parcel of coffee is unique with regard to its characteristics, flavour and quality and, hence, attracts a different price. However, coffee is traditionally treated as a homogenous product, with prices established on one of the main terminal or futures markets. Consequently, coffee trade is conducted on a price-differential basis, with prices of actual trade transactions expressed as differentials to future market prices on an FOB basis. Because of increasingly sophisticated roasting practices it is becoming easier for roasters to switch between origins without jeopardizing constant quality, making it easier for them to look for value for their money, resulting in increasingly volatile markets. As can be seen in Table 5.1, prices paid to growers in developing countries are considerably lower. Whereas world market prices for Arabica averaged around €2.05 in 2006, only Indonesian growers received payments approaching this figure. Table 5.1 Prices paid to growers in exporting Member countries, € per kg
(Arabica), 2006 Producing country Price Brazil € 1.53 Colombia € 1.58 Ethiopia € 1.03 Guatemala € 1.60 India € 1.68 Indonesia € 1.89 Source: ICO 2008 Organic and Fair-Trade coffee According to industry sources, prices for organic coffee depend much on the location characteristics, which affect the bean quality. At the moment, organic premiums are increasing but can in some cases be rather low. Organic premiums for Arabica coffee range between € 0.14 (US$ 0.22) per kilo for Bolivian coffees, to almost € 0.64 (US$ 1.00) for Colombian and Mexican coffee. Peruvian coffee takes an intermediate position with premiums around € 0.35 (US$ 0.55) per kilo. This ranges between 6% and 30% above conventional prices. More in general, premiums range between 15% and 25%. With premiums as low as 6% reaching a breakeven point, producers make higher costs when producing organic will depend on the quantities produced. The premium for Robusta coffee is around 15% above the conventional price in London.
The FairTrade premium, which was established on 1st June 2007 by the FairTrade Labelling Organisations International (FLO), is € 0.14 (US$ 0.22) per kilo. The premium for organic FairTrade coffee is € 0.28 (US$ 0.44) per kilo. FLO decided last December to increase the Fair-Trade minimum price levels for Arabica coffee. This will become effective from 1st June 2008. See the table below. Furthermore, specialty coffees and regional specialties command a much higher market price.
Table 5.2 Fairtrade minimum price, US$ per kilo Conventional Organic Washed arabica € 1.89 US$ 2.97 € 2.17 US$ 3.41 Unwashed arabica € 1.82 US$ 2.86 € 2.10 US$ 3.30
Source: FLO, 2008 Retail prices The average retail price of coffee shows a very large divergence between the EU countries. Prices per kilo range from € 4.86 in Poland to € 27.79 in the United Kingdom. Prices in East European countries reflect the overall lower price levels for food products in these countries. Scandinavian countries have among the lowest prices, which are caused by the very high consumption in these countries and the extremely fierce competition prevailing on the coffee
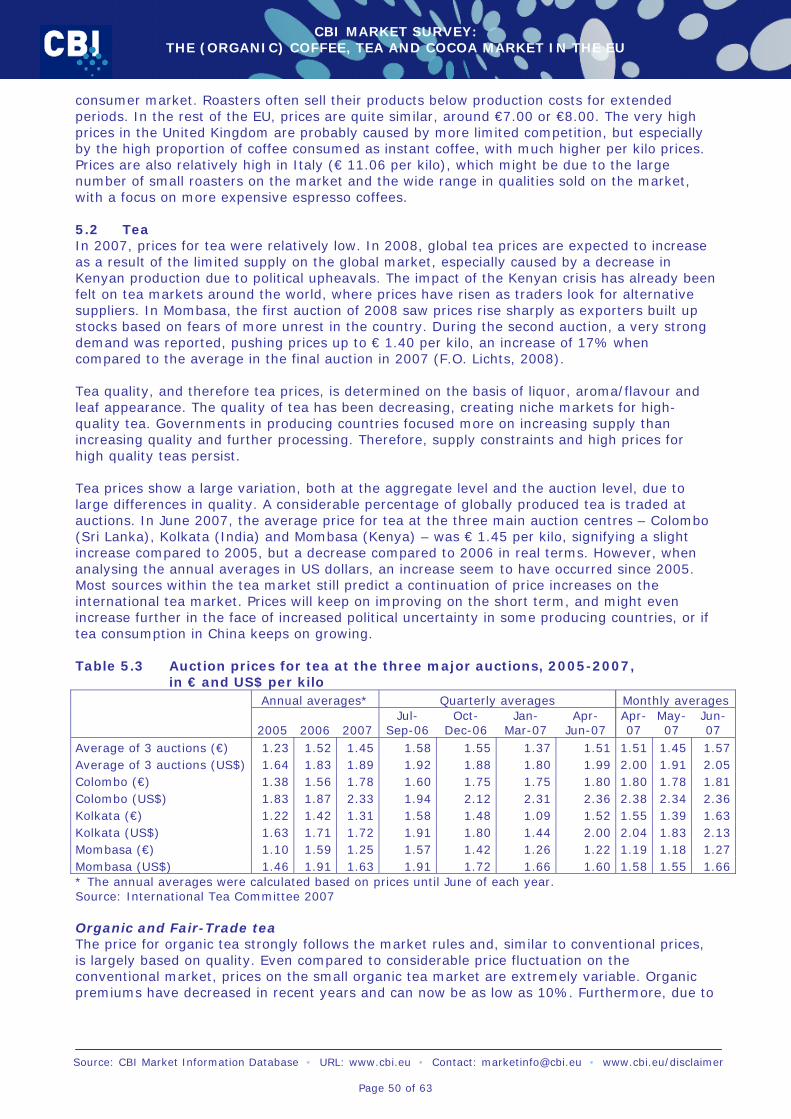
CBI MARKET SURVEY: THE (ORGANIC) COFFEE, TEA AND COCOA MARKET IN THE EU
Source: CBI Market Information Database • URL: www.cbi.eu • Contact: [email protected] • www.cbi.eu/disclaimer
Page 50 of 63
consumer market. Roasters often sell their products below production costs for extended periods. In the rest of the EU, prices are quite similar, around €7.00 or €8.00. The very high prices in the United Kingdom are probably caused by more limited competition, but especially by the high proportion of coffee consumed as instant coffee, with much higher per kilo prices. Prices are also relatively high in Italy (€ 11.06 per kilo), which might be due to the large number of small roasters on the market and the wide range in qualities sold on the market, with a focus on more expensive espresso coffees. 5.2 Tea In 2007, prices for tea were relatively low. In 2008, global tea prices are expected to increase as a result of the limited supply on the global market, especially caused by a decrease in Kenyan production due to political upheavals. The impact of the Kenyan crisis has already been felt on tea markets around the world, where prices have risen as traders look for alternative suppliers. In Mombasa, the first auction of 2008 saw prices rise sharply as exporters built up stocks based on fears of more unrest in the country. During the second auction, a very strong demand was reported, pushing prices up to € 1.40 per kilo, an increase of 17% when compared to the average in the final auction in 2007 (F.O. Lichts, 2008). Tea quality, and therefore tea prices, is determined on the basis of liquor, aroma/flavour and leaf appearance. The quality of tea has been decreasing, creating niche markets for high-quality tea. Governments in producing countries focused more on increasing supply than increasing quality and further processing. Therefore, supply constraints and high prices for high quality teas persist. Tea prices show a large variation, both at the aggregate level and the auction level, due to large differences in quality. A considerable percentage of globally produced tea is traded at auctions. In June 2007, the average price for tea at the three main auction centres – Colombo (Sri Lanka), Kolkata (India) and Mombasa (Kenya) – was € 1.45 per kilo, signifying a slight increase compared to 2005, but a decrease compared to 2006 in real terms. However, when analysing the annual averages in US dollars, an increase seem to have occurred since 2005. Most sources within the tea market still predict a continuation of price increases on the international tea market. Prices will keep on improving on the short term, and might even increase further in the face of increased political uncertainty in some producing countries, or if tea consumption in China keeps on growing. Table 5.3 Auction prices for tea at the three major auctions, 2005-2007,
in € and US$ per kilo Annual averages* Quarterly averages Monthly averages
2005 2006 2007 Jul-
Sep-06 Oct-
Dec-06 Jan-
Mar-07 Apr-
Jun-07 Apr-07
May-07
Jun-07
Average of 3 auctions (€) 1.23 1.52 1.45 1.58 1.55 1.37 1.51 1.51 1.45 1.57 Average of 3 auctions (US$) 1.64 1.83 1.89 1.92 1.88 1.80 1.99 2.00 1.91 2.05 Colombo (€) 1.38 1.56 1.78 1.60 1.75 1.75 1.80 1.80 1.78 1.81 Colombo (US$) 1.83 1.87 2.33 1.94 2.12 2.31 2.36 2.38 2.34 2.36 Kolkata (€) 1.22 1.42 1.31 1.58 1.48 1.09 1.52 1.55 1.39 1.63 Kolkata (US$) 1.63 1.71 1.72 1.91 1.80 1.44 2.00 2.04 1.83 2.13 Mombasa (€) 1.10 1.59 1.25 1.57 1.42 1.26 1.22 1.19 1.18 1.27 Mombasa (US$) 1.46 1.91 1.63 1.91 1.72 1.66 1.60 1.58 1.55 1.66 * The annual averages were calculated based on prices until June of each year. Source: International Tea Committee 2007 Organic and Fair-Trade tea The price for organic tea strongly follows the market rules and, similar to conventional prices, is largely based on quality. Even compared to considerable price fluctuation on the conventional market, prices on the small organic tea market are extremely variable. Organic premiums have decreased in recent years and can now be as low as 10%. Furthermore, due to
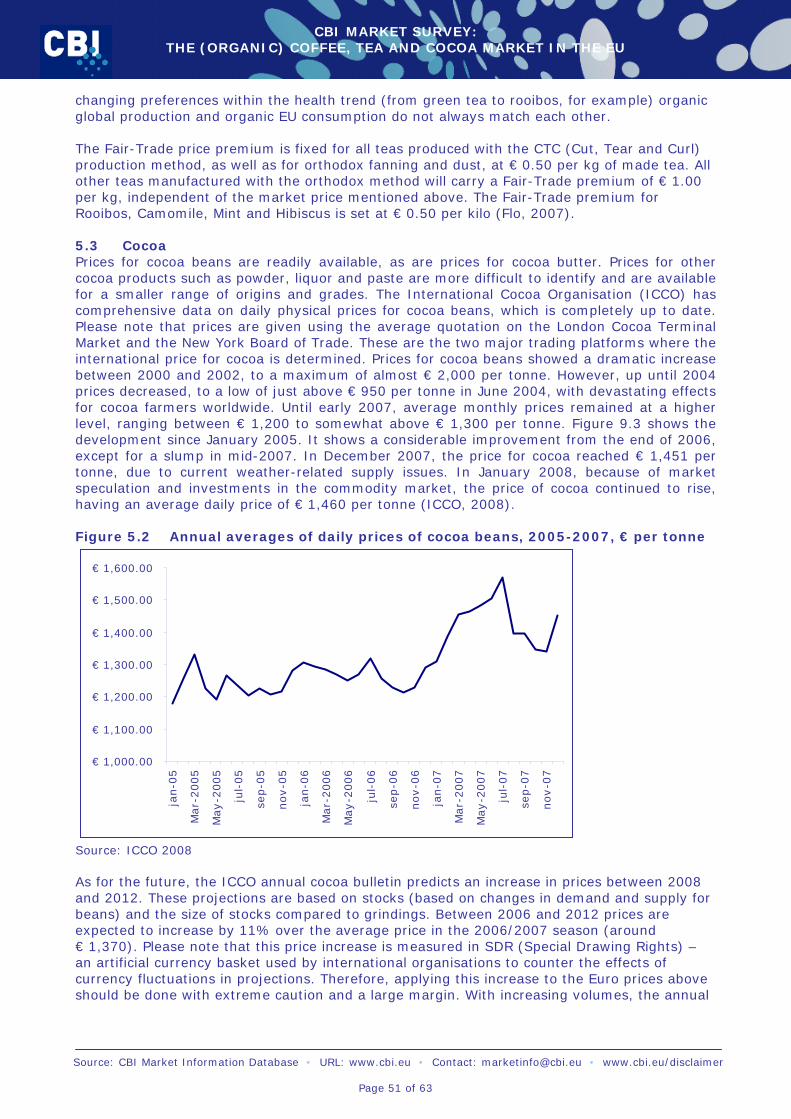
CBI MARKET SURVEY: THE (ORGANIC) COFFEE, TEA AND COCOA MARKET IN THE EU
Source: CBI Market Information Database • URL: www.cbi.eu • Contact: [email protected] • www.cbi.eu/disclaimer
Page 51 of 63
changing preferences within the health trend (from green tea to rooibos, for example) organic global production and organic EU consumption do not always match each other. The Fair-Trade price premium is fixed for all teas produced with the CTC (Cut, Tear and Curl) production method, as well as for orthodox fanning and dust, at € 0.50 per kg of made tea. All other teas manufactured with the orthodox method will carry a Fair-Trade premium of € 1.00 per kg, independent of the market price mentioned above. The Fair-Trade premium for Rooibos, Camomile, Mint and Hibiscus is set at € 0.50 per kilo (Flo, 2007). 5.3 Cocoa Prices for cocoa beans are readily available, as are prices for cocoa butter. Prices for other cocoa products such as powder, liquor and paste are more difficult to identify and are available for a smaller range of origins and grades. The International Cocoa Organisation (ICCO) has comprehensive data on daily physical prices for cocoa beans, which is completely up to date. Please note that prices are given using the average quotation on the London Cocoa Terminal Market and the New York Board of Trade. These are the two major trading platforms where the international price for cocoa is determined. Prices for cocoa beans showed a dramatic increase between 2000 and 2002, to a maximum of almost € 2,000 per tonne. However, up until 2004 prices decreased, to a low of just above € 950 per tonne in June 2004, with devastating effects for cocoa farmers worldwide. Until early 2007, average monthly prices remained at a higher level, ranging between € 1,200 to somewhat above € 1,300 per tonne. Figure 9.3 shows the development since January 2005. It shows a considerable improvement from the end of 2006, except for a slump in mid-2007. In December 2007, the price for cocoa reached € 1,451 per tonne, due to current weather-related supply issues. In January 2008, because of market speculation and investments in the commodity market, the price of cocoa continued to rise, having an average daily price of € 1,460 per tonne (ICCO, 2008). Figure 5.2 Annual averages of daily prices of cocoa beans, 2005-2007, € per tonne
€ 1,000.00
€ 1,100.00
€ 1,200.00
€ 1,300.00
€ 1,400.00
€ 1,500.00
€ 1,600.00
jan-0
5
Mar-
2005
May-2
005
jul-
05
sep-0
5
nov-0
5
jan-0
6
Mar-
2006
May-2
006
jul-
06
sep-0
6
nov-0
6
jan-0
7
Mar-
2007
May-2
007
jul-
07
sep-0
7
nov-0
7
Source: ICCO 2008 As for the future, the ICCO annual cocoa bulletin predicts an increase in prices between 2008 and 2012. These projections are based on stocks (based on changes in demand and supply for beans) and the size of stocks compared to grindings. Between 2006 and 2012 prices are expected to increase by 11% over the average price in the 2006/2007 season (around € 1,370). Please note that this price increase is measured in SDR (Special Drawing Rights) – an artificial currency basket used by international organisations to counter the effects of currency fluctuations in projections. Therefore, applying this increase to the Euro prices above should be done with extreme caution and a large margin. With increasing volumes, the annual
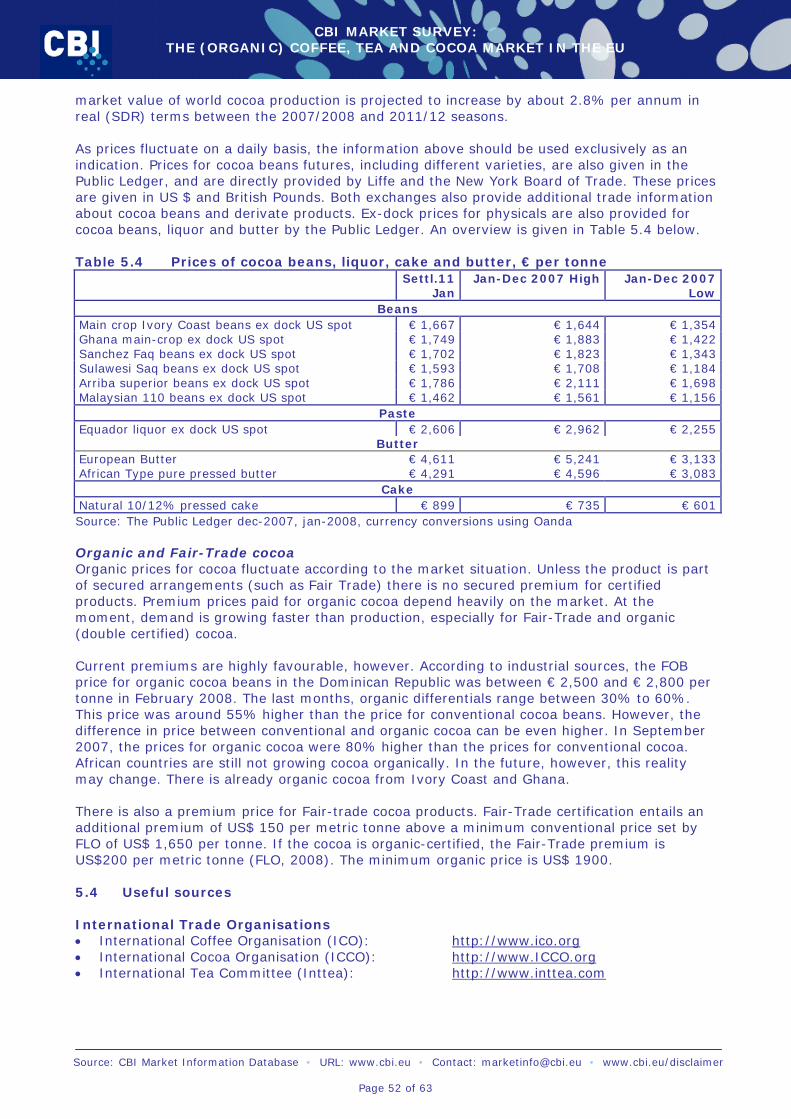
CBI MARKET SURVEY: THE (ORGANIC) COFFEE, TEA AND COCOA MARKET IN THE EU
Source: CBI Market Information Database • URL: www.cbi.eu • Contact: [email protected] • www.cbi.eu/disclaimer
Page 52 of 63
market value of world cocoa production is projected to increase by about 2.8% per annum in real (SDR) terms between the 2007/2008 and 2011/12 seasons. As prices fluctuate on a daily basis, the information above should be used exclusively as an indication. Prices for cocoa beans futures, including different varieties, are also given in the Public Ledger, and are directly provided by Liffe and the New York Board of Trade. These prices are given in US $ and British Pounds. Both exchanges also provide additional trade information about cocoa beans and derivate products. Ex-dock prices for physicals are also provided for cocoa beans, liquor and butter by the Public Ledger. An overview is given in Table 5.4 below. Table 5.4 Prices of cocoa beans, liquor, cake and butter, € per tonne Settl.11
Jan Jan-Dec 2007 High Jan-Dec 2007
Low Beans
Main crop Ivory Coast beans ex dock US spot € 1,667 € 1,644 € 1,354 Ghana main-crop ex dock US spot € 1,749 € 1,883 € 1,422 Sanchez Faq beans ex dock US spot € 1,702 € 1,823 € 1,343 Sulawesi Saq beans ex dock US spot € 1,593 € 1,708 € 1,184 Arriba superior beans ex dock US spot € 1,786 € 2,111 € 1,698 Malaysian 110 beans ex dock US spot € 1,462 € 1,561 € 1,156
Paste Equador liquor ex dock US spot € 2,606 € 2,962 € 2,255
Butter European Butter € 4,611 € 5,241 € 3,133 African Type pure pressed butter € 4,291 € 4,596 € 3,083
Cake Natural 10/12% pressed cake € 899 € 735 € 601 Source: The Public Ledger dec-2007, jan-2008, currency conversions using Oanda Organic and Fair-Trade cocoa Organic prices for cocoa fluctuate according to the market situation. Unless the product is part of secured arrangements (such as Fair Trade) there is no secured premium for certified products. Premium prices paid for organic cocoa depend heavily on the market. At the moment, demand is growing faster than production, especially for Fair-Trade and organic (double certified) cocoa. Current premiums are highly favourable, however. According to industrial sources, the FOB price for organic cocoa beans in the Dominican Republic was between € 2,500 and € 2,800 per tonne in February 2008. The last months, organic differentials range between 30% to 60%. This price was around 55% higher than the price for conventional cocoa beans. However, the difference in price between conventional and organic cocoa can be even higher. In September 2007, the prices for organic cocoa were 80% higher than the prices for conventional cocoa. African countries are still not growing cocoa organically. In the future, however, this reality may change. There is already organic cocoa from Ivory Coast and Ghana. There is also a premium price for Fair-trade cocoa products. Fair-Trade certification entails an additional premium of US$ 150 per metric tonne above a minimum conventional price set by FLO of US$ 1,650 per tonne. If the cocoa is organic-certified, the Fair-Trade premium is US$200 per metric tonne (FLO, 2008). The minimum organic price is US$ 1900. 5.4 Useful sources International Trade Organisations • International Coffee Organisation (ICO): http://www.ico.org • International Cocoa Organisation (ICCO): http://www.ICCO.org • International Tea Committee (Inttea): http://www.inttea.com
CBI MARKET SURVEY: THE (ORGANIC) COFFEE, TEA AND COCOA MARKET IN THE EU
Source: CBI Market Information Database • URL: www.cbi.eu • Contact: [email protected] • www.cbi.eu/disclaimer
Page 53 of 63
Other Sources • Public Ledger: http://www.agra-net.com • Liffe: http://www.liffe-commodities.com • New York Board of Trade: https://www.nybotlive.com • Fairtrade Labelling Organizations International http://www.fairtrade.net
CBI MARKET SURVEY: THE (ORGANIC) COFFEE, TEA AND COCOA MARKET IN THE EU
Source: CBI Market Information Database • URL: www.cbi.eu • Contact: [email protected] • www.cbi.eu/disclaimer
Page 54 of 63
6 MARKET ACCESS REQUIREMENTS As a manufacturer in a developing country preparing to access EU markets, you should be aware of the market access requirements of your trading partners and the EU governments. Requirements are demanded through legislation and through labels, codes and management systems. These requirements are based on environmental, consumer health and safety and social concerns. You need to comply with EU legislation and have to be aware of the additional non-legislative requirements that your trading partners in the EU might request. For information on legislative and non-legislative requirements, go to ‘Search CBI database’ at http://www.cbi.eu/marketinfo, select coffee, tea and cocoa and the EU in the category search, click on the search button and click on market access requirements. Coffee beans are usually transported in bags. Currently, most coffee is transported in 20-foot dry containers, which is a considerable improvement over the old break-bulk method, but still involves extensive handling. Coffee is also transported in bulk in polypropylene fitted containers. Container shipment is not suited for longer stretches unless containers are ventilated: this is a condition which can be specified in contracts by EU traders and roasters. The limited exports from developing countries of soluble coffee as finished product (in primary packaging, mostly bags but also bulk) with retail packaging are taking place in the EU. In the case of tea, a distinction can be made between packaging of tea in the producing country and consumer packaging in the EU. Packaging in producing countries is only to a limited degree in tinfoil lined 50 kg plywood boxes. Packaging is increasingly taking place in paper bag packages with protective layers, which limits packaging waste and is easier to transport in containers. Cocoa beans have been traditionally shipped in bags or sacks, which are often stored in ventilated containers during shipment. Cocoa powder is also transported and often also stored in bags from 25 kilos upwards, but is also supplied in bulk. Important aspects to monitor are air humidity (to avoid lumping), temperature fluctuations (to avoid crystallisation), pressure (to avoid lumping), and transport in odour-free environments. The storage temperature should be between 15oC and 18oC and not more than 20oC and the air humidity below 50%. A good information source is the International Trade Centre’s “Cocoa: A Guide to Trade Practices” (http://www.intracen.org/eShop/f_e_IP_Title.Asp?ID=9602&LN=EN). Cocoa butter is transported in moulded slabs or as liquids in tanks. The standard packaging of cocoa butter during intercontinental transport is 25 kilo in polypropylene or polyester sacks. These are then put in cardboard boxes and allowed to cool into moulded slabs. Cocoa butter has a low content of unsaturated fatty acids, especially polyunsaturated, and therefore the shelf life of the fat is relatively good. According to ICCO, if cocoa butter is moulded into slabs directly after production and the slabs are well packed in order to prevent oxidation, the shelf life should be several years. Cocoa butter is also transported in liquid form in tankers. This happens mainly for shorter stretches. More care must be taken if the shelf life is to be maintained. Factors to watch are temperature (below 45oC), air/oxidation (air coming into contact with the cocoa butter causes rancidity), storage in the dark, and humidity (between 50% and 60%). In addition, after the tanks are emptied all residues of cocoa butter must be removed as they will go rancid and contaminate the next batch to be delivered. The EU Commission and the International Maritime Organisation (IMO) in London issue packaging requirements for crude and (semi) processed products. Directive 96/3/EC regulates the sea transport in bulk of liquid oil and fats in respect to food hygiene standards. EU Directive 93/43/EC applies to bulk packaging of animal and vegetable oils and fats.
CBI MARKET SURVEY: THE (ORGANIC) COFFEE, TEA AND COCOA MARKET IN THE EU
Source: CBI Market Information Database • URL: www.cbi.eu • Contact: [email protected] • www.cbi.eu/disclaimer
Page 55 of 63
Additional information on packaging can be found at the website of ITC on export packaging: http://www.intracen.org/ep/packaging/packit.htm Information on tariffs and quota can be found at http://exporthelp.europa.eu
CBI MARKET SURVEY: THE (ORGANIC) COFFEE, TEA AND COCOA MARKET IN THE EU
Source: CBI Market Information Database • URL: www.cbi.eu • Contact: [email protected] • www.cbi.eu/disclaimer
Page 56 of 63
7 OPPORTUNITIES AND THREATS This survey discusses three different markets. Although developments across the three are partly related, especially between coffee and tea, there exist large differences in the development of the different markets, and therefore also in the opportunities and threats which influence exporters in developing countries. Several of the previous chapters provided information on trends and developments shaping the EU markets for coffee, tea and cocoa. Furthermore, these were translated into opportunities and threats affecting the possibilities for developing country exporters to do business in the EU. However, it is important to keep in mind that the same development or trend can be an opportunity for one exporter and a threat to another. Exporters should therefore analyse if the developments and trends discussed in the previous chapters provide opportunities or threats. The outcome of this analysis depends on the specific situation of an exporter. An example is the increasing interest in the EU in single origin products. Although this offers opportunities to exporters of coffee, tea and cocoa alike, several critical notes should be made. First, single origin cocoa mostly relates to premium cocoa from Venezuela and Ecuador. These countries are known for their high-quality cocoa products; these qualities are recognised by EU traders, resulting in significant premiums, the premiums being related to the higher quality. It is interesting to note, however, that Barry Callebaut, the world’s leading manufacturer of high quality cocoa and chocolate products, has recently increased its single origin offerings. This tactical manoeuvre may change the market for premium chocolate. The single origin market for coffee and tea is of much wider interest and is also marketed more directly to EU consumers. For example, Mount Kenya teas growing on the slopes of the mountain, or Café de Colombia – which is actually a protected brand on the EU market etc. Secondly, exporters in developing countries cannot just decide to market their products as a single origin product. Development of single origin, which is in this sense a brand that needs to be marketed, takes time, and needs to be related to a high quality, and/or a specific ‘story’. Only certain locations will ‘ring a bell’ with EU consumers. However, this type of marketing is far more evolved for coffee and tea than for cocoa. For example, premium coffee shops, but also premium ranges of supermarkets, offer a range of coffees from one country, which provide a special taste, differentiating them both from the other country tastes offered, as well as from conventional coffee. These considerations mean that an exporter cannot simply enter the EU market with single-origin coffee, tea or cocoa. It requires time, a good quality product, often a specific story underwriting the uniqueness of the location, etc. Only in certain occasions will the appellation of origin already exist and then it would still be necessary to find buyers in the EU, as these are often already working with existing producers from the same region.
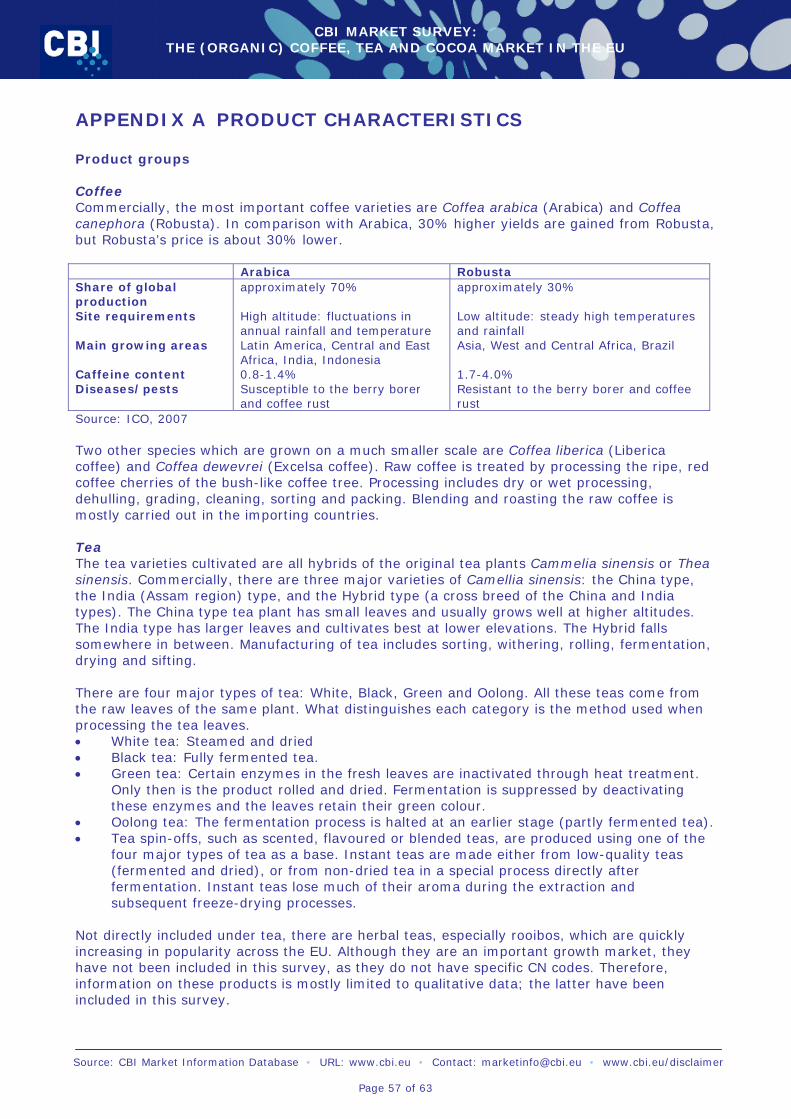
CBI MARKET SURVEY: THE (ORGANIC) COFFEE, TEA AND COCOA MARKET IN THE EU
Source: CBI Market Information Database • URL: www.cbi.eu • Contact: [email protected] • www.cbi.eu/disclaimer
Page 57 of 63
APPENDIX A PRODUCT CHARACTERISTICS Product groups Coffee Commercially, the most important coffee varieties are Coffea arabica (Arabica) and Coffea canephora (Robusta). In comparison with Arabica, 30% higher yields are gained from Robusta, but Robusta’s price is about 30% lower. Arabica Robusta Share of global production
approximately 70% approximately 30%
Site requirements High altitude: fluctuations in annual rainfall and temperature
Low altitude: steady high temperatures and rainfall
Main growing areas Latin America, Central and East Africa, India, Indonesia
Asia, West and Central Africa, Brazil
Caffeine content 0.8-1.4% 1.7-4.0% Diseases/pests Susceptible to the berry borer
and coffee rust Resistant to the berry borer and coffee rust
Source: ICO, 2007 Two other species which are grown on a much smaller scale are Coffea liberica (Liberica coffee) and Coffea dewevrei (Excelsa coffee). Raw coffee is treated by processing the ripe, red coffee cherries of the bush-like coffee tree. Processing includes dry or wet processing, dehulling, grading, cleaning, sorting and packing. Blending and roasting the raw coffee is mostly carried out in the importing countries. Tea The tea varieties cultivated are all hybrids of the original tea plants Cammelia sinensis or Thea sinensis. Commercially, there are three major varieties of Camellia sinensis: the China type, the India (Assam region) type, and the Hybrid type (a cross breed of the China and India types). The China type tea plant has small leaves and usually grows well at higher altitudes. The India type has larger leaves and cultivates best at lower elevations. The Hybrid falls somewhere in between. Manufacturing of tea includes sorting, withering, rolling, fermentation, drying and sifting. There are four major types of tea: White, Black, Green and Oolong. All these teas come from the raw leaves of the same plant. What distinguishes each category is the method used when processing the tea leaves. • White tea: Steamed and dried • Black tea: Fully fermented tea. • Green tea: Certain enzymes in the fresh leaves are inactivated through heat treatment.
Only then is the product rolled and dried. Fermentation is suppressed by deactivating these enzymes and the leaves retain their green colour.
• Oolong tea: The fermentation process is halted at an earlier stage (partly fermented tea). • Tea spin-offs, such as scented, flavoured or blended teas, are produced using one of the
four major types of tea as a base. Instant teas are made either from low-quality teas (fermented and dried), or from non-dried tea in a special process directly after fermentation. Instant teas lose much of their aroma during the extraction and subsequent freeze-drying processes.
Not directly included under tea, there are herbal teas, especially rooibos, which are quickly increasing in popularity across the EU. Although they are an important growth market, they have not been included in this survey, as they do not have specific CN codes. Therefore, information on these products is mostly limited to qualitative data; the latter have been included in this survey.
CBI MARKET SURVEY: THE (ORGANIC) COFFEE, TEA AND COCOA MARKET IN THE EU
Source: CBI Market Information Database • URL: www.cbi.eu • Contact: [email protected] • www.cbi.eu/disclaimer
Page 58 of 63
Cocoa This survey focuses on the market for cocoa beans, but will also look into markets for processed cocoa products such as cocoa paste, cocoa butter and cocoa powder. Cocoa beans Although fruits mature throughout the year, usually there are only two harvests. Pods are cut from trees and allowed to mellow on the ground. The extracted beans are fermented before drying in the sun, at which time they change from purple to brown. Beans are then bagged for further processing, which firstly concerns roasting and grinding to form cocoa paste. While other material is discarded, they have certain applications 4. The products below will be referred to as processed cocoa products. Cocoa liquor/paste/mass Cocoa paste (also called liquor or mass) concerns cocoa particles suspended in cocoa butter. The cocoa paste is pressed to extract the cocoa butter leaving a solid mass called cocoa press cake, which is pulverised to make cocoa powder. Cocoa cake is also traded separately but mainly on a continental scale, and is of limited interest for developing country producers and therefore not included here. Cocoa paste is also used directly in the production of chocolate. Cocoa powder Cocoa powder contains not less than 20% cocoa butter, calculated according to the weight of the dry matter, and not more than 9% water. Fat-reduced cocoa powder signifies cocoa powder containing less than 20% cocoa butter. Cocoa powder is used in a very wide range of food products and beverages. Cocoa butter Designates the fat obtained from cocoa beans or its parts: • Maximum of 1.75% free fatty acid content • Maximum of 0.5% unsaponifiable matter, except for press cocoa butter for which the maximum is 0.35%. Cocoa butter is the only product which is used outside of the food sector, i.e. in cosmetics. Conventional versus organic production Organic farming practised in almost all countries of the world. The development which has taken place in the organic market in recent years has thus been driven in Europe by a solid base of producers and consumers, who are convinced of the ecological and social benefits of organic methods. Therefore, organic food products are increasingly becoming an established market segment. In 2005 organic consumption in the EU exceeded € 14 billion (FiBL 2007)5. The market for organic products offers good possibilities to exporters of coffee, tea and cocoa, with growth exceeding developments in the regular market. Fair Trade, as well as other certification schemes for coffee, offer good possibilities also increasingly in combination with organic certification. Moreover, organic and other certified products, as well as high-quality specialties, are an especially good opportunity, because conventional products are mass commodities where traded quantities are large and it is more difficult to compete. Organic products also offer a premium, compared to conventional products. Products labelled as organic are those certified as having been produced using clearly defined organic production methods. In other words, “organic” is a claim related to the production process rather than to the product itself. It should be noted that the term “organic” is mainly used by the English-speaking countries, while other countries (for instance French-speaking) use the term “biologic”. Also of importance is the term “sustainable” agriculture or production, which is often used in literature. Sustainable is a broader term than organic, which, while also
4 An ICCO (International Cocoa Organisation) funded project finished in 2003 had the objective to assess the possibilities for the commercial production and marketing of a range of by-products using these materials. Products investigated include animal feed and potash derived from cocoa-pod husk. Cocoa-pulp juice is used in the production of soft drinks, alcoholic drinks, industrial alcohol, pectin, marmalade and jams. 5 BioPlus AG/ORA/Organic Monitor/FiBL 2007
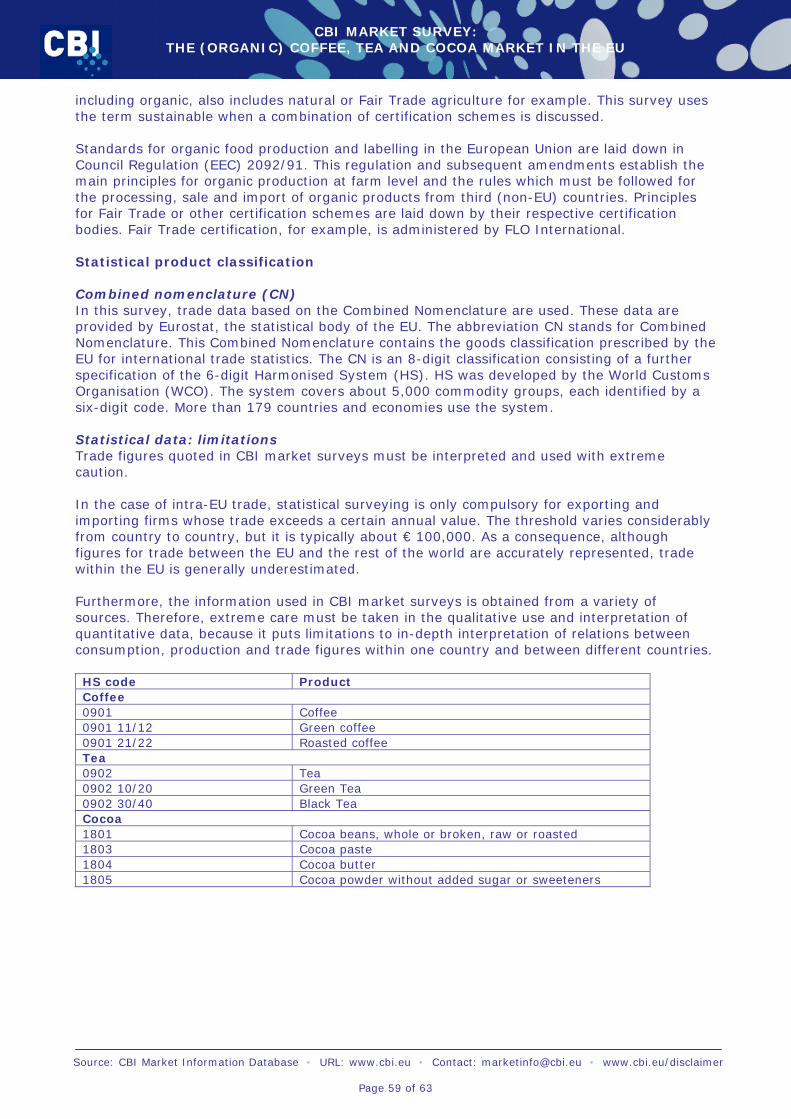
CBI MARKET SURVEY: THE (ORGANIC) COFFEE, TEA AND COCOA MARKET IN THE EU
Source: CBI Market Information Database • URL: www.cbi.eu • Contact: [email protected] • www.cbi.eu/disclaimer
Page 59 of 63
including organic, also includes natural or Fair Trade agriculture for example. This survey uses the term sustainable when a combination of certification schemes is discussed. Standards for organic food production and labelling in the European Union are laid down in Council Regulation (EEC) 2092/91. This regulation and subsequent amendments establish the main principles for organic production at farm level and the rules which must be followed for the processing, sale and import of organic products from third (non-EU) countries. Principles for Fair Trade or other certification schemes are laid down by their respective certification bodies. Fair Trade certification, for example, is administered by FLO International. Statistical product classification Combined nomenclature (CN) In this survey, trade data based on the Combined Nomenclature are used. These data are provided by Eurostat, the statistical body of the EU. The abbreviation CN stands for Combined Nomenclature. This Combined Nomenclature contains the goods classification prescribed by the EU for international trade statistics. The CN is an 8-digit classification consisting of a further specification of the 6-digit Harmonised System (HS). HS was developed by the World Customs Organisation (WCO). The system covers about 5,000 commodity groups, each identified by a six-digit code. More than 179 countries and economies use the system. Statistical data: limitations Trade figures quoted in CBI market surveys must be interpreted and used with extreme caution. In the case of intra-EU trade, statistical surveying is only compulsory for exporting and importing firms whose trade exceeds a certain annual value. The threshold varies considerably from country to country, but it is typically about € 100,000. As a consequence, although figures for trade between the EU and the rest of the world are accurately represented, trade within the EU is generally underestimated. Furthermore, the information used in CBI market surveys is obtained from a variety of sources. Therefore, extreme care must be taken in the qualitative use and interpretation of quantitative data, because it puts limitations to in-depth interpretation of relations between consumption, production and trade figures within one country and between different countries. HS code Product Coffee 0901 Coffee 0901 11/12 Green coffee 0901 21/22 Roasted coffee Tea 0902 Tea 0902 10/20 Green Tea 0902 30/40 Black Tea Cocoa 1801 Cocoa beans, whole or broken, raw or roasted 1803 Cocoa paste 1804 Cocoa butter 1805 Cocoa powder without added sugar or sweeteners
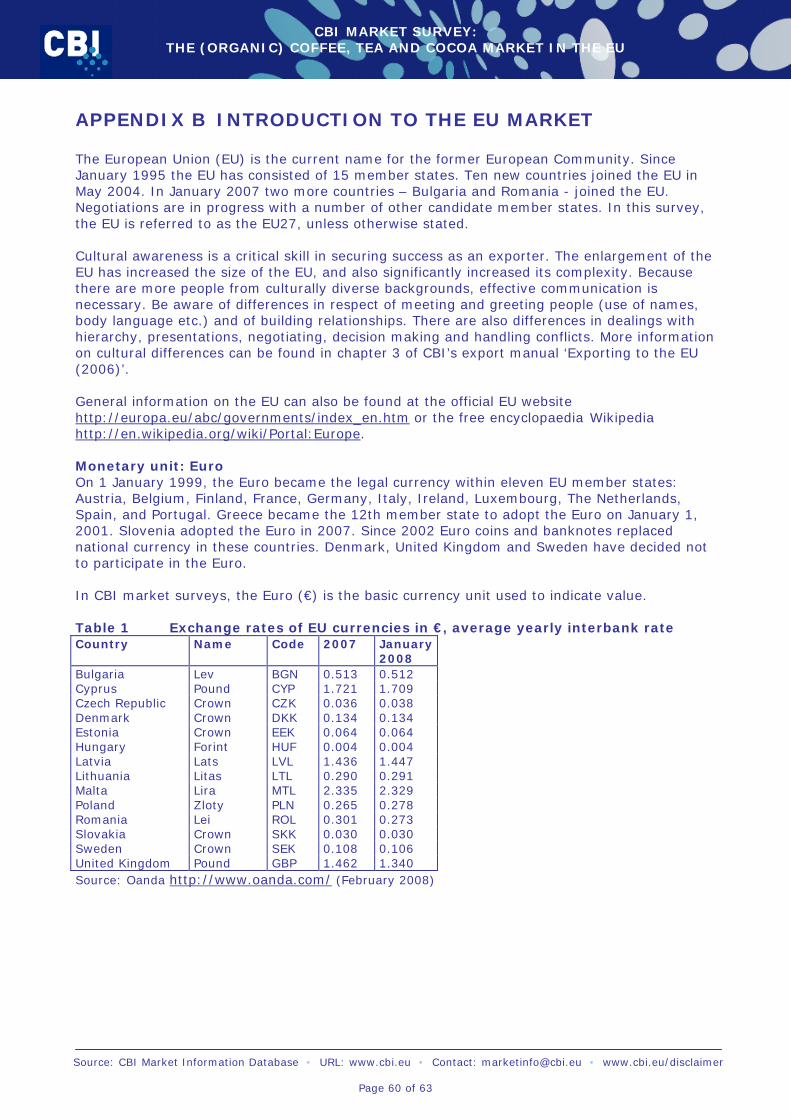
CBI MARKET SURVEY: THE (ORGANIC) COFFEE, TEA AND COCOA MARKET IN THE EU
Source: CBI Market Information Database • URL: www.cbi.eu • Contact: [email protected] • www.cbi.eu/disclaimer
Page 60 of 63
APPENDIX B INTRODUCTION TO THE EU MARKET The European Union (EU) is the current name for the former European Community. Since January 1995 the EU has consisted of 15 member states. Ten new countries joined the EU in May 2004. In January 2007 two more countries – Bulgaria and Romania - joined the EU. Negotiations are in progress with a number of other candidate member states. In this survey, the EU is referred to as the EU27, unless otherwise stated. Cultural awareness is a critical skill in securing success as an exporter. The enlargement of the EU has increased the size of the EU, and also significantly increased its complexity. Because there are more people from culturally diverse backgrounds, effective communication is necessary. Be aware of differences in respect of meeting and greeting people (use of names, body language etc.) and of building relationships. There are also differences in dealings with hierarchy, presentations, negotiating, decision making and handling conflicts. More information on cultural differences can be found in chapter 3 of CBI’s export manual ‘Exporting to the EU (2006)’. General information on the EU can also be found at the official EU website http://europa.eu/abc/governments/index_en.htm or the free encyclopaedia Wikipedia http://en.wikipedia.org/wiki/Portal:Europe. Monetary unit: Euro On 1 January 1999, the Euro became the legal currency within eleven EU member states: Austria, Belgium, Finland, France, Germany, Italy, Ireland, Luxembourg, The Netherlands, Spain, and Portugal. Greece became the 12th member state to adopt the Euro on January 1, 2001. Slovenia adopted the Euro in 2007. Since 2002 Euro coins and banknotes replaced national currency in these countries. Denmark, United Kingdom and Sweden have decided not to participate in the Euro. In CBI market surveys, the Euro (€) is the basic currency unit used to indicate value. Table 1 Exchange rates of EU currencies in €, average yearly interbank rate Country Name Code 2007 January
2008 Bulgaria Lev BGN 0.513 0.512 Cyprus Pound CYP 1.721 1.709 Czech Republic Crown CZK 0.036 0.038 Denmark Crown DKK 0.134 0.134 Estonia Crown EEK 0.064 0.064 Hungary Forint HUF 0.004 0.004 Latvia Lats LVL 1.436 1.447 Lithuania Litas LTL 0.290 0.291 Malta Lira MTL 2.335 2.329 Poland Zloty PLN 0.265 0.278 Romania Lei ROL 0.301 0.273 Slovakia Crown SKK 0.030 0.030 Sweden Crown SEK 0.108 0.106 United Kingdom Pound GBP 1.462 1.340 Source: Oanda http://www.oanda.com/ (February 2008)
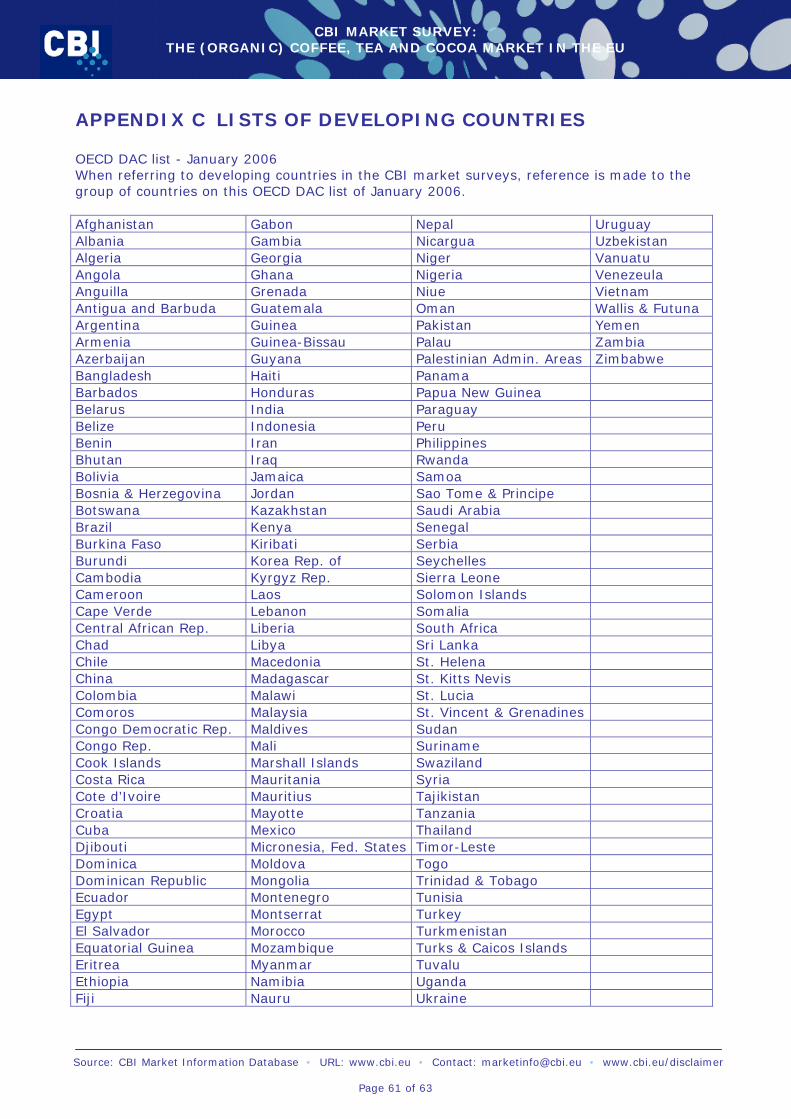
CBI MARKET SURVEY: THE (ORGANIC) COFFEE, TEA AND COCOA MARKET IN THE EU
Source: CBI Market Information Database • URL: www.cbi.eu • Contact: [email protected] • www.cbi.eu/disclaimer
Page 61 of 63
APPENDIX C LISTS OF DEVELOPING COUNTRIES OECD DAC list - January 2006 When referring to developing countries in the CBI market surveys, reference is made to the group of countries on this OECD DAC list of January 2006. Afghanistan Gabon Nepal Uruguay Albania Gambia Nicargua Uzbekistan Algeria Georgia Niger Vanuatu Angola Ghana Nigeria Venezeula Anguilla Grenada Niue Vietnam Antigua and Barbuda Guatemala Oman Wallis & Futuna Argentina Guinea Pakistan Yemen Armenia Guinea-Bissau Palau Zambia Azerbaijan Guyana Palestinian Admin. Areas Zimbabwe Bangladesh Haiti Panama Barbados Honduras Papua New Guinea Belarus India Paraguay Belize Indonesia Peru Benin Iran Philippines Bhutan Iraq Rwanda Bolivia Jamaica Samoa Bosnia & Herzegovina Jordan Sao Tome & Principe Botswana Kazakhstan Saudi Arabia Brazil Kenya Senegal Burkina Faso Kiribati Serbia Burundi Korea Rep. of Seychelles Cambodia Kyrgyz Rep. Sierra Leone Cameroon Laos Solomon Islands Cape Verde Lebanon Somalia Central African Rep. Liberia South Africa Chad Libya Sri Lanka Chile Macedonia St. Helena China Madagascar St. Kitts Nevis Colombia Malawi St. Lucia Comoros Malaysia St. Vincent & Grenadines Congo Democratic Rep. Maldives Sudan Congo Rep. Mali Suriname Cook Islands Marshall Islands Swaziland Costa Rica Mauritania Syria Cote d’Ivoire Mauritius Tajikistan Croatia Mayotte Tanzania Cuba Mexico Thailand Djibouti Micronesia, Fed. States Timor-Leste Dominica Moldova Togo Dominican Republic Mongolia Trinidad & Tobago Ecuador Montenegro Tunisia Egypt Montserrat Turkey El Salvador Morocco Turkmenistan Equatorial Guinea Mozambique Turks & Caicos Islands Eritrea Myanmar Tuvalu Ethiopia Namibia Uganda Fiji Nauru Ukraine
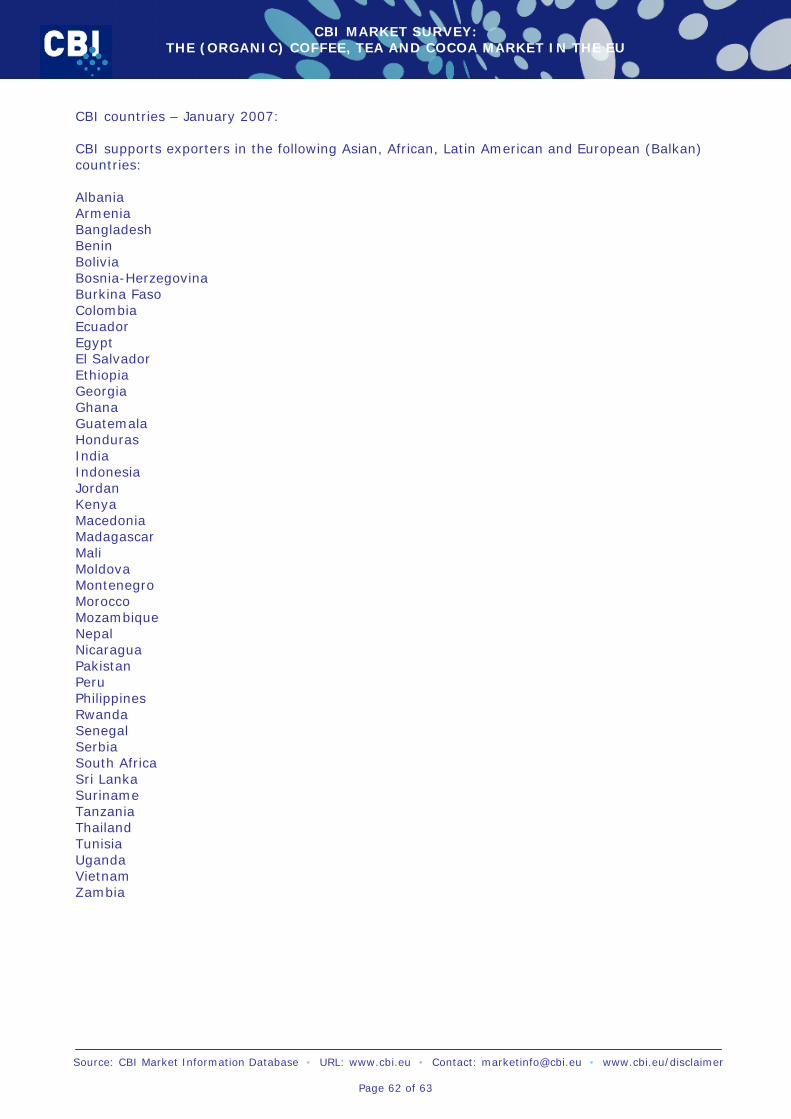
CBI MARKET SURVEY: THE (ORGANIC) COFFEE, TEA AND COCOA MARKET IN THE EU
Source: CBI Market Information Database • URL: www.cbi.eu • Contact: [email protected] • www.cbi.eu/disclaimer
Page 62 of 63
CBI countries – January 2007: CBI supports exporters in the following Asian, African, Latin American and European (Balkan) countries: Albania Armenia Bangladesh Benin Bolivia Bosnia-Herzegovina Burkina Faso Colombia Ecuador Egypt El Salvador Ethiopia Georgia Ghana Guatemala Honduras India Indonesia Jordan Kenya Macedonia Madagascar Mali Moldova Montenegro Morocco Mozambique Nepal Nicaragua Pakistan Peru Philippines Rwanda Senegal Serbia South Africa Sri Lanka Suriname Tanzania Thailand Tunisia Uganda Vietnam Zambia
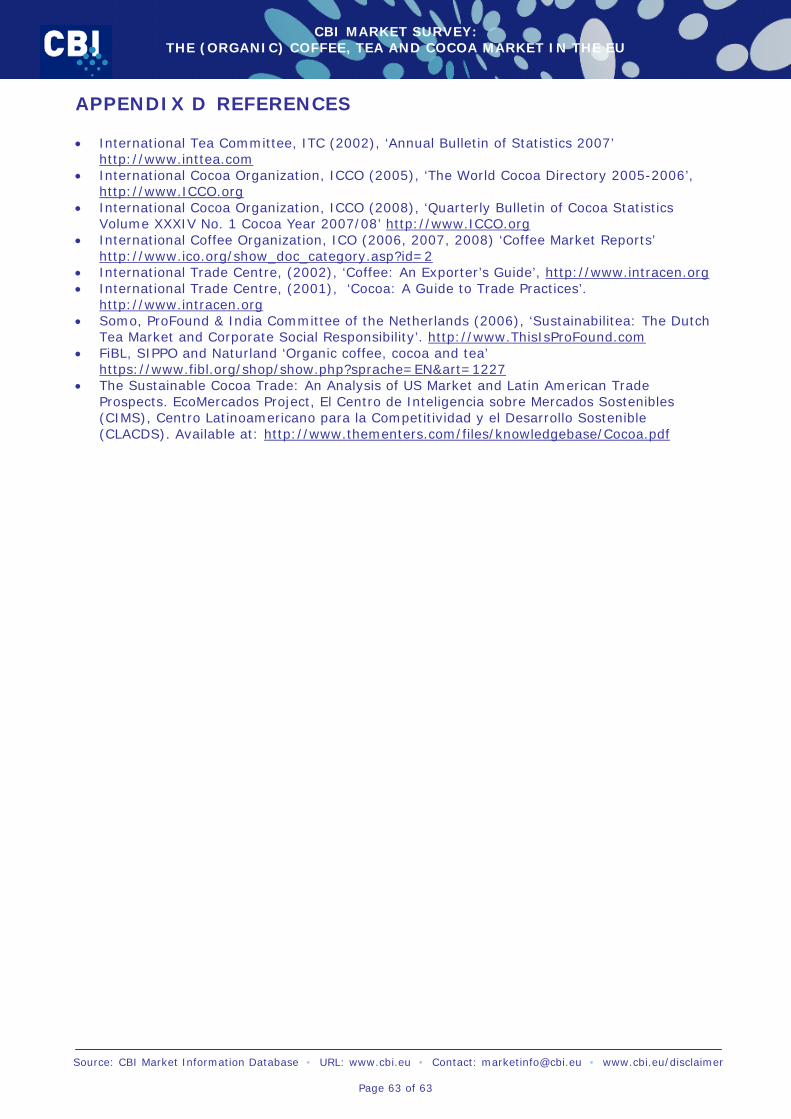
CBI MARKET SURVEY: THE (ORGANIC) COFFEE, TEA AND COCOA MARKET IN THE EU
Source: CBI Market Information Database • URL: www.cbi.eu • Contact: [email protected] • www.cbi.eu/disclaimer
Page 63 of 63
APPENDIX D REFERENCES • International Tea Committee, ITC (2002), ‘Annual Bulletin of Statistics 2007’
http://www.inttea.com • International Cocoa Organization, ICCO (2005), ‘The World Cocoa Directory 2005-2006’,
http://www.ICCO.org • International Cocoa Organization, ICCO (2008), ‘Quarterly Bulletin of Cocoa Statistics
Volume XXXIV No. 1 Cocoa Year 2007/08’ http://www.ICCO.org • International Coffee Organization, ICO (2006, 2007, 2008) ‘Coffee Market Reports’
http://www.ico.org/show_doc_category.asp?id=2 • International Trade Centre, (2002), ‘Coffee: An Exporter’s Guide’, http://www.intracen.org • International Trade Centre, (2001), ‘Cocoa: A Guide to Trade Practices’.
http://www.intracen.org • Somo, ProFound & India Committee of the Netherlands (2006), ‘Sustainabilitea: The Dutch
Tea Market and Corporate Social Responsibility’. http://www.ThisIsProFound.com • FiBL, SIPPO and Naturland ‘Organic coffee, cocoa and tea’
https://www.fibl.org/shop/show.php?sprache=EN&art=1227 • The Sustainable Cocoa Trade: An Analysis of US Market and Latin American Trade
Prospects. EcoMercados Project, El Centro de Inteligencia sobre Mercados Sostenibles (CIMS), Centro Latinoamericano para la Competitividad y el Desarrollo Sostenible (CLACDS). Available at: http://www.thementers.com/files/knowledgebase/Cocoa.pdf