Embed Size (px)
Citation preview
The identification of human decision strategies has been of particular interest for both academics and practitioners. Understanding decision makers’ cognitive processes not only allows us to infer the decision strategy used, but also makes it possible to predict future decisional behavior and decision outcomes (Payne, Braunstein, & Carroll, 1978). Furthermore, knowing people’s decision strategies facili-tates the design of decision support systems (Browne, Pitts, & Wetherbe, 2007; A. L. Montgomery, Hosanagar, Krish-nan, & Clay, 2004; Payne, Bettman, & Johnson, 1993).
Since the mid-1960s, a large body of research has in-vestigated the cognitive processes underlying individual decision making.1 In most studies, one of two method-ologically distinct research approaches has been used: structural or procedural. Structural approaches describe the relation between information stimuli (input) and de-cision responses (output) to infer the decision strategy used (Abelson & Levi, 1985; Brehmer, 1994; Dawes, 1979; Einhorn, Kleinmuntz, & Kleinmuntz, 1979; Ford, Schmitt, Schechtmann, Hults, & Doherty, 1989; Westen-berg & Koele, 1994). In the structural-modeling paradigm, decision behavior is investigated by fitting mathematical models to the relation between the attribute values of op-tions (input) and the final response (output)—that is, ei-ther the statement of one preferred option or a rank order of options (Billings & Scherer, 1988).
The major criticism regarding the use of structural models in studying decision processes concerns two issues (Ford et al., 1989; Payne et al., 1978; Svenson, 1979). First, since structural models focus on the rela-tion between attribute values and the final response of decisions, they are often said to be limited, because they do not investigate decision processes directly. Second,
other models, such as compensatory and noncompensa-tory ones, have often been shown to fit the same set of choices equally well (Dawes & Corrigan, 1974; Harte & Koele, 2001; Yntema & Torgerson, 1961).
As a result of the limitations of structural models, process-tracing techniques were developed to directly un-cover the cognitive processes that take place between the onset of a stimulus and the decision maker’s response. In most process-tracing studies, stimuli are attribute values that are presented in an information display matrix (Ford et al., 1989). An information display matrix consists of at least two options that are characterized by at least two attributes. At the beginning of a choice experiment, all boxes in the matrix are closed. To arrive at the final deci-sion, a participant has to open boxes of the matrix. While the participants open a new box, the previously opened box closes. Hence, during the experiment, there is always only one box opened at a time. After the final response has been given, the researcher can analyze the informa-tion acquisition behavior, inferring participants’ cognitive processes and, thereby, the decision strategy used.
The variety of process-tracing techniques is large. During the past decades, the following techniques have been developed and continuously enhanced: (1) trac-ing of eye movements (Just & Carpenter, 1976; Lohse & Johnson, 1996; Russo, 1978a, 1978b; Russo & Rosen, 1975); (2) information display boards (Arch, Bettman, & Kakkar, 1978; Payne, 1976; Wilkins, 1964); (3) comput-erized process tracing, such as Mouselab (Payne et al., 1993), ISLab (G. J. Cook & Swain, 1993), ISCube (Ta-batabai, 1998), or MouseTrace (Jasper & Shapiro, 2002); (4) phased narrowing (Jasper & Levin, 2001; Levin & Jas-per, 1995); (5) active information search (Huber, Wider,
795 Copyright 2008 Psychonomic Society, Inc.
Identifying decision strategies: A process- and outcome-based classification method
René Riedl, eduaRd BRandstätteR, and FRiedRich RoithmayRJohannes Kepler University of Linz, Linz, Austria
This article presents a classification method that makes possible the detection of important decision strategies that people use in nonrisky multiattribute decision tasks. The classification method incorporates a multimethod approach that combines elements of both structural modeling and process tracing. We begin with a discussion of nine common characteristics of decision strategies and then classify 13 decision strategies on the basis of these characteristics. Next, we demonstrate that six of the characteristics can be used to develop one outcome-based and three process-based metrics. In addition, we present an algorithm that shows how to use the metrics. We demonstrate that using our metrics in conjunction with a measure for direction of search allows identification of most of the 13 decision strategies. Finally, we outline the potential of our research for the design of decision support systems such as online shops.
Behavior Research Methods2008, 40 (3), 795-807doi: 10.3758/BRM.40.3.795
R. Riedl, [email protected]
796 Riedl, BRandstätteR, and RoithmayR
plication of quantitative and qualitative process-tracing techniques. Payne (1976), for example, used information boards and verbal protocols; that is, participants had to “think aloud” while acquiring pieces of information se-quentially and making their final decision. Furthermore, Newell and Simon (1972) claimed that adding eye fixa-tions to the standard analysis of verbal protocols facili-tated the identification of decision strategies. However, there is empirical evidence that “thinking aloud”—if carried out retrospectively rather than concurrently—often yields unreliable data on decision processes, due to memory distortion, interpretation, and an inability to re-call facts, which were not encoded in long-term memory (Ericsson & Simon, 1984; Nisbett & Wilson, 1977; Todd & Benbasat, 1987).
To identify the decision strategy used by individuals in experimental decision situations, researchers from differ-ent academic fields stress the importance of multimethod approaches that combine elements of both structural ap-proaches and process-tracing techniques (Costa-Gomes, Crawford, & Broseta, 2001; Einhorn et al., 1979; Harte & Koele, 2001; Payne et al., 1978; Svenson, 1979). To our knowledge, a comprehensive theoretical framework that allows for the identification of individual decision strat-egies in a nonrisky multiattribute decision environment does not yet exist.4 In this article, we present a classifica-tion method that applies a multimethod approach.
The remainder of this article is structured as follows. In the next section, 13 decision strategies will be dis-cussed and described on the basis of nine characteristics. In the subsequent section, we will introduce four new metrics. We will combine them into an algorithm, which allows for the identification of most of 13 decision strat-
& Huber, 1997; Williamson, Ranyard, & Cuthbert, 2000); and finally, (6) verbal protocols (Ericsson & Simon, 1980; Newell & Simon, 1972; Nisbett & Wilson, 1977).2 Tech-niques 1–4 can be regarded as quantitative, whereas Tech-niques 5 and 6 are qualitative in nature.
To investigate information acquisition behavior and to infer each person’s cognitive strategy in a nonrisky mul-tiattribute decision situation, several metrics have been developed (sorting by the date of their publication): de-cision time (Hogarth, 1975; Pollay, 1970); proportion of information searched, search index, and variability in the amount of information searched per option (Payne, 1976); reacquisition rate (Jacoby, Chestnut, Weigl, & Fisher, 1976); variability in the amount of information searched per attribute and a contingency measure (Klay-man, 1982); total amount of processing, total amount of time spent on the information in the boxes, and average time spent per item of information acquired (Payne et al., 1993); a strategy measure (Böckenholt & Hynan, 1994); and a multiple- step transition index (Ball, 1997).3
Although these metrics make possible the identification of decision strategy types, they usually cannot be used to identify a particular decision strategy precisely. For example, Payne’s (1976, p. 376) search index (SI) indicates the “direc-tion of search” that can be either “interdimensional” (option-wise) or “intradimensional” (attribute-wise). Since there are many decision strategies that imply either an option-wise or an attribute-wise search (see Table 1), SI does not allow for the precise identification of a particular decision strategy.
Even if several of the above-mentioned metrics are used together, it is seldom possible to precisely identify a particular decision strategy (Ford et al., 1989). Therefore, some researchers have argued for the complementary ap-
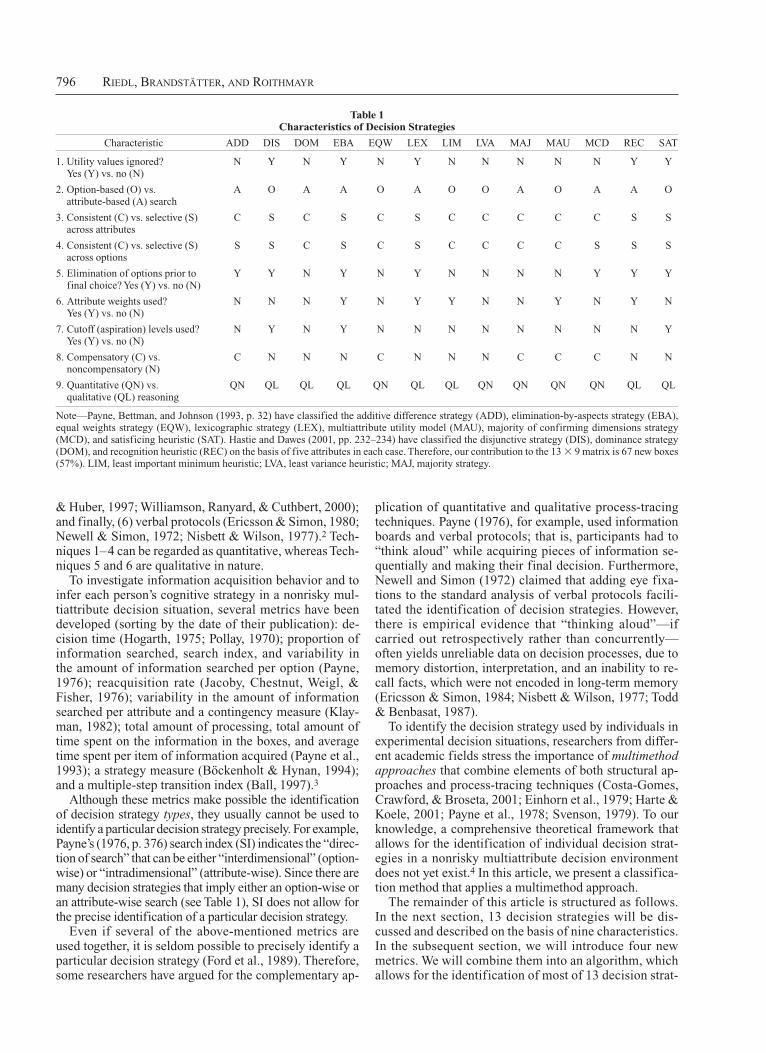
Table 1 Characteristics of Decision Strategies
Characteristic ADD DIS DOM EBA EQW LEX LIM LVA MAJ MAU MCD REC SAT
1. Utility values ignored? Yes (Y) vs. no (N)
N Y N Y N Y N N N N N Y Y
2. Option-based (O) vs. attribute-based (A) search
A O A A O A O O A O A A O
3. Consistent (C) vs. selective (S) across attributes
C S C S C S C C C C C S S
4. Consistent (C) vs. selective (S) across options
S S C S C S C C C C S S S
5. Elimination of options prior to final choice? Yes (Y) vs. no (N)
Y Y N Y N Y N N N N Y Y Y
6. Attribute weights used? Yes (Y) vs. no (N)
N N N Y N Y Y N N Y N Y N
7. Cutoff (aspiration) levels used? Yes (Y) vs. no (N)
N Y N Y N N N N N N N N Y
8. Compensatory (C) vs. noncompensatory (N)
C N N N C N N N C C C N N
9. Quantitative (QN) vs. qualitative (QL) reasoning
QN QL QL QL QN QL QL QN QN QN QN QL QL
Note—Payne, Bettman, and Johnson (1993, p. 32) have classified the additive difference strategy (ADD), elimination-by-aspects strategy (EBA), equal weights strategy (EQW), lexicographic strategy (LEX), multiattribute utility model (MAU), majority of confirming dimensions strategy (MCD), and satisficing heuristic (SAT). Hastie and Dawes (2001, pp. 232–234) have classified the disjunctive strategy (DIS), dominance strategy (DOM), and recognition heuristic (REC) on the basis of five attributes in each case. Therefore, our contribution to the 13 3 9 matrix is 67 new boxes (57%). LIM, least important minimum heuristic; LVA, least variance heuristic; MAJ, majority strategy.
identifying decision stRategies 797
option, and so on. The chosen option has won all compari-sons (Tversky, 1969).
2. The disjunctive strategy (DIS) first sets cutoff points on the attributes and then looks for the first option that is at least as good as the cutoff value on any attribute (Coombs, 1964; Dawes, 1964; Einhorn, 1970, 1971).
3. The dominance strategy (DOM) chooses the option that is at least as good as every other option on all at-tributes and better on at least one attribute (Lee, 1971; H. Montgomery, 1983).
4. The elimination-by-aspects strategy (EBA) elimi-nates options that do not meet the cutoff value for the most important attribute. This elimination process is repeated for the second most important attribute. Processing con-tinues until a single option remains (Tversky, 1972).
5. The equal weights strategy (EQW) chooses the op-tion with the highest overall utility score that is defined as the sum of an option’s attribute utilities. In contrast to MAU (see Number 10 below), EQW simplifies decision making by ignoring attribute weights (Dawes, 1979; Ein-horn & Hogarth, 1975).
6. The lexicographic strategy (LEX) selects the option with the best value on the most important attribute. If there is not one but two or more options with a best value, LEX selects the option with the best value on the second most important attribute, and so on (Fishburn, 1974).
7. The least important minimum heuristic (LIM) first determines the worst value of each option and then chooses the option with the least important worst value (Jungermann et al., 2005).
8. The least variance heuristic (LVA) chooses the op-tion with the lowest variance across the attribute values. LVA makes sense only for decision situations in which no dominant option exists (Jungermann et al., 2005).
9. The majority strategy (MAJ) chooses the option with the highest number of dominant attribute values (Bowman & Colantoni, 1973; Inada, 1964, 1969; Sen, 1966; Sen & Pattanaik, 1969).
10. The multiattribute utility model (MAU) chooses the option with the highest weighted overall utility score that is defined as the sum of the weighted attribute utilities. MAU is usually viewed as the normative rule (Anderson, 1974; Keeney & Raiffa, 1976; von Winterfeldt & Fischer, 1975).
11. The majority of confirming dimensions strategy (MCD) involves processing pairs of options (like ADD). The values for each of the two options are compared on each attribute. The option with the majority of winning attribute values is retained and is then compared with the next option. The process of pairwise comparison stops if all options have been evaluated and the final winning op-tion has been identified (Russo & Dosher, 1983; Wright & Barbour, 1977).
12. The recognition heuristic (REC) chooses the option with the best value on the attribute name recognition. REC can be considered as a special case of LEX, because REC selects the option with the best value on the most important attribute—namely, name recognition. If there is not one but two or more options with a best value, REC selects the option with the best value on the second most important attribute, and so on (Goldstein & Gigerenzer, 2002).6
egies. On the basis of this algorithm, we will present a computer program, called DecisionTracer, that can be used to identify decision strategies. The final section outlines the conclusions, limitations, and applications of our approach.
Decision StrategiesIn close resemblance to Payne, Bettman, Coupey, and
Johnson (1992), we define a decision strategy as a se-quence of operations used to transform an initial stage of knowledge into a final goal state of knowledge in which the decision maker feels that the decision problem is solved.
Several characteristics describe a decision strategy (Hastie & Dawes, 2001; Jungermann, Pfister, & Fischer, 2005; Payne et al., 1993). Hence, if one wants to distin-guish decision strategies from each other, these character-istics allow for discrimination. First, some decision strate-gies do not process all attribute (utility) values available, whereas others do. Hence, strategies can be distinguished by the amount of information processed. Second, infor-mation processing is either option-wise or attribute-wise. In option-wise processing, the attribute values of a single option are considered before information about the next option is processed. In attribute-wise processing, the val-ues of several options on a single attribute are processed before information about a further attribute is processed. Third, strategies can be distinguished by the degree to which the amount of processing is consistent or selective across attributes—that is, whether the same amount of in-formation is examined for each attribute or whether it var-ies. Fourth, whether the amount of processing is consis-tent or selective cannot be assessed only for attributes, but also for options. Fifth, decision strategies differ with re-gard to the elimination of options prior to the final choice. Sixth, some decision strategies take into consideration the importance of each attribute; that is, they use attribute weights, whereas others do not. Seventh, some decision strategies use cutoff (aspiration) levels, whereas others do not. Eighth, decision strategies can be distinguished by whether they allow for compensating for a bad value on one attribute with a good value on another attribute. If so, such so-called compensatory strategies require trade-offs among attributes, whereas noncompensatory strategies do not. Ninth, decision strategies differ with regard to the degree of quantitative and qualitative reasoning used. In general, strategies that involve summing, subtracting, and/or multiplying values, as well as counting, are considered to be quantitative. In contrast, strategies that simply com-pare values are regarded as qualitative.
The following list summarizes and defines 13 decision strategies.5 Table 1 compares the 13 decision strategies on the basis of the nine characteristics. In the Classifica-tion Method section, we demostrate that six of the nine characteristics can be used to develop metrics that are the fundamental elements of our classification method.
1. The additive difference strategy (ADD) compares two options at a time, attribute by attribute. Then the dif-ferences across the attributes are summed to provide a single overall difference score across all attributes for that pair of options. The winner is then compared with the next
798 Riedl, BRandstätteR, and RoithmayR
pant will move to the next option. This transition from one option to another option can be either an attribute-wise or a mixed transition. Any of the four strategies predicts that
AT 1 MT 5 o 2 1, (2)
where AT is the number of attribute-wise transitions and MT is the number of mixed transitions with 0 # AT # (o 2 1); 0 # MT # (o 2 1); AT 1 MT $ 1.
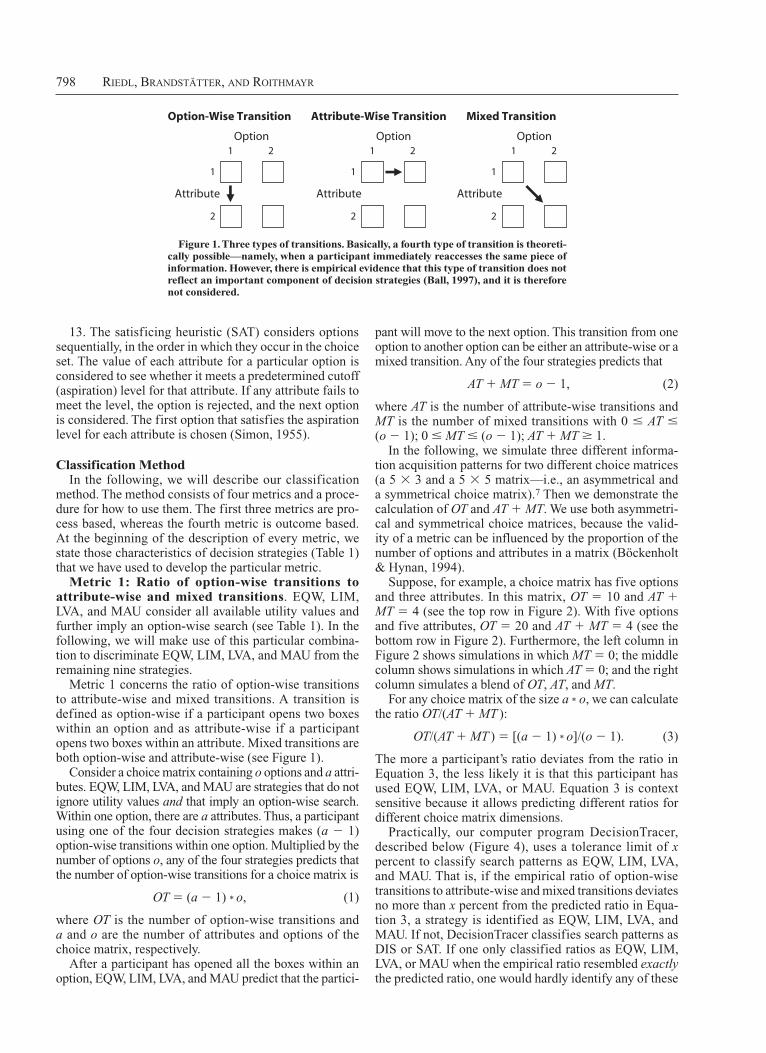
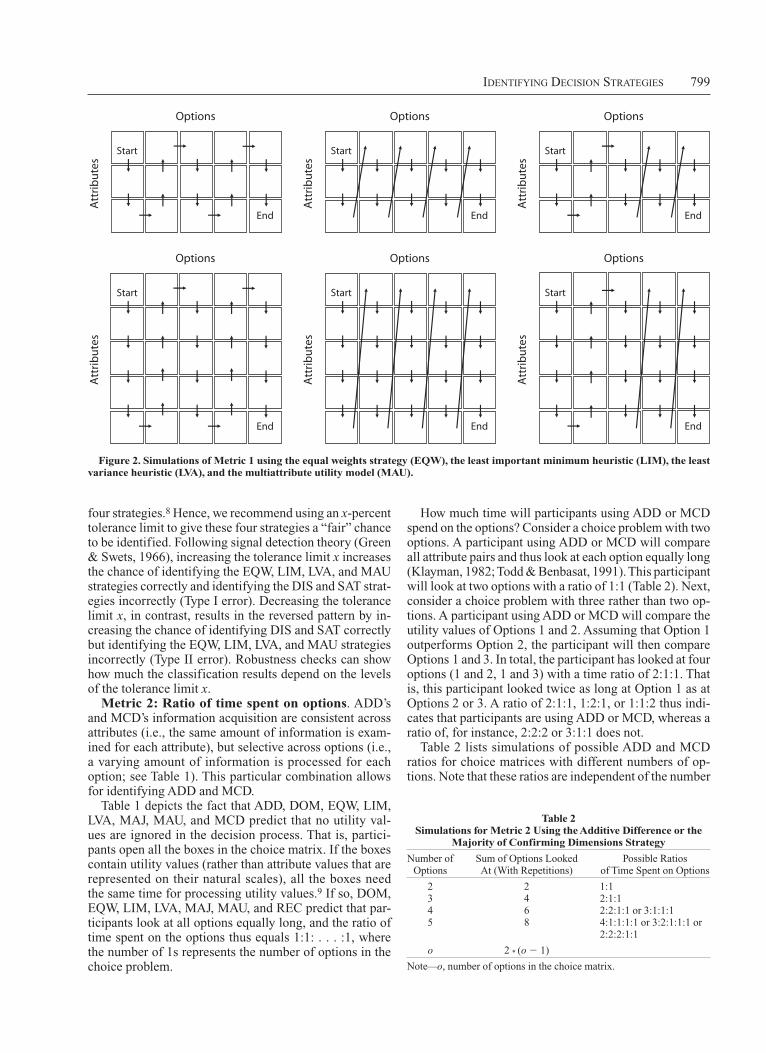
In the following, we simulate three different informa-tion acquisition patterns for two different choice matrices (a 5 3 3 and a 5 3 5 matrix—i.e., an asymmetrical and a symmetrical choice matrix).7 Then we demonstrate the calculation of OT and AT 1 MT. We use both asymmetri-cal and symmetrical choice matrices, because the valid-ity of a metric can be influenced by the proportion of the number of options and attributes in a matrix (Böckenholt & Hynan, 1994).
Suppose, for example, a choice matrix has five options and three attributes. In this matrix, OT 5 10 and AT 1 MT 5 4 (see the top row in Figure 2). With five options and five attributes, OT 5 20 and AT 1 MT 5 4 (see the bottom row in Figure 2). Furthermore, the left column in Figure 2 shows simulations in which MT 5 0; the middle column shows simulations in which AT 5 0; and the right column simulates a blend of OT, AT, and MT.
For any choice matrix of the size a * o, we can calculate the ratio OT/(AT 1 MT ):
OT/(AT 1 MT ) 5 [(a 2 1) * o]/(o 2 1). (3)
The more a participant’s ratio deviates from the ratio in Equation 3, the less likely it is that this participant has used EQW, LIM, LVA, or MAU. Equation 3 is context sensitive because it allows predicting different ratios for different choice matrix dimensions.
Practically, our computer program DecisionTracer, described below (Figure 4), uses a tolerance limit of x percent to classify search patterns as EQW, LIM, LVA, and MAU. That is, if the empirical ratio of option-wise transitions to attribute-wise and mixed transitions deviates no more than x percent from the predicted ratio in Equa-tion 3, a strategy is identified as EQW, LIM, LVA, and MAU. If not, DecisionTracer classifies search patterns as DIS or SAT. If one only classified ratios as EQW, LIM, LVA, or MAU when the empirical ratio resembled exactly the predicted ratio, one would hardly identify any of these
13. The satisficing heuristic (SAT) considers options sequentially, in the order in which they occur in the choice set. The value of each attribute for a particular option is considered to see whether it meets a predetermined cutoff (aspiration) level for that attribute. If any attribute fails to meet the level, the option is rejected, and the next option is considered. The first option that satisfies the aspiration level for each attribute is chosen (Simon, 1955).
Classification MethodIn the following, we will describe our classification
method. The method consists of four metrics and a proce-dure for how to use them. The first three metrics are pro-cess based, whereas the fourth metric is outcome based. At the beginning of the description of every metric, we state those characteristics of decision strategies (Table 1) that we have used to develop the particular metric.
Metric 1: Ratio of option-wise transitions to attribute- wise and mixed transitions. EQW, LIM, LVA, and MAU consider all available utility values and further imply an option-wise search (see Table 1). In the following, we will make use of this particular combina-tion to discriminate EQW, LIM, LVA, and MAU from the remaining nine strategies.
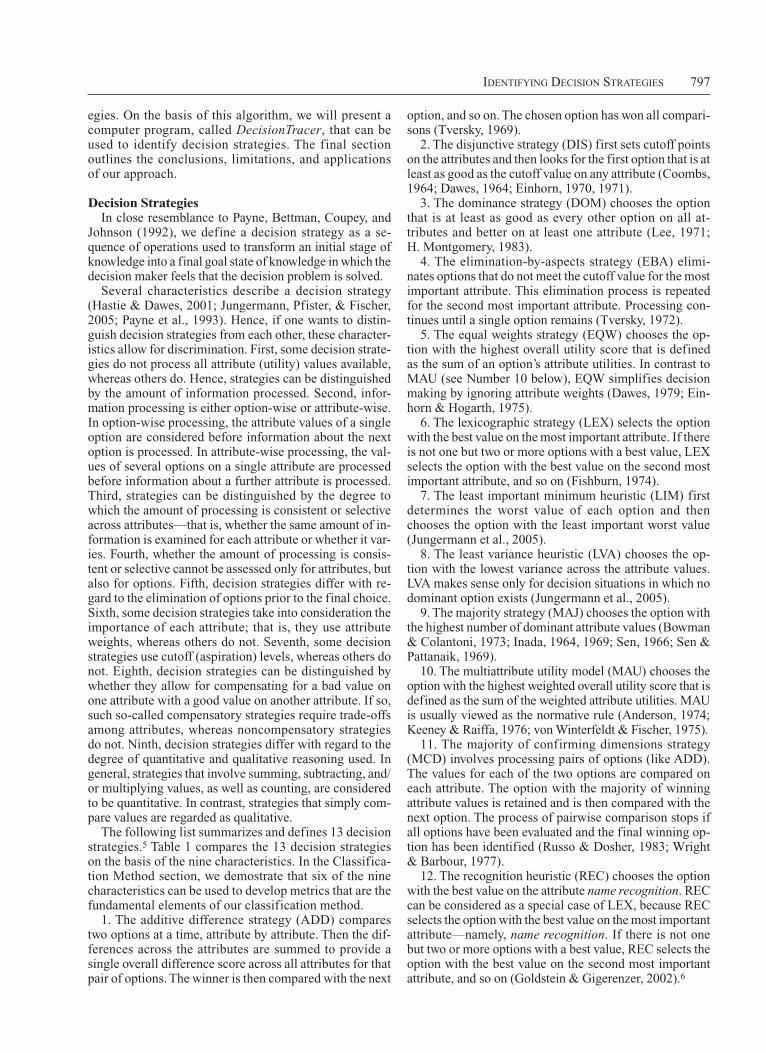
Metric 1 concerns the ratio of option-wise transitions to attribute-wise and mixed transitions. A transition is defined as option-wise if a participant opens two boxes within an option and as attribute-wise if a participant opens two boxes within an attribute. Mixed transitions are both option-wise and attribute-wise (see Figure 1).
Consider a choice matrix containing o options and a attri-butes. EQW, LIM, LVA, and MAU are strategies that do not ignore utility values and that imply an option-wise search. Within one option, there are a attributes. Thus, a participant using one of the four decision strategies makes (a 2 1) option- wise transitions within one option. Multiplied by the number of options o, any of the four strategies predicts that the number of option-wise transitions for a choice matrix is
OT 5 (a 2 1) * o, (1)
where OT is the number of option-wise transitions and a and o are the number of attributes and options of the choice matrix, respectively.
After a participant has opened all the boxes within an option, EQW, LIM, LVA, and MAU predict that the partici-
Option
Attribute
1 2
1
2
Option-Wise Transition
1 2Option
Attribute
1
2
Attribute-Wise Transition
1 2Option
Attribute
1
2
Mixed Transition
Figure 1. Three types of transitions. Basically, a fourth type of transition is theoreti-cally possible—namely, when a participant immediately reaccesses the same piece of information. However, there is empirical evidence that this type of transition does not reflect an important component of decision strategies (Ball, 1997), and it is therefore not considered.
identifying decision stRategies 799
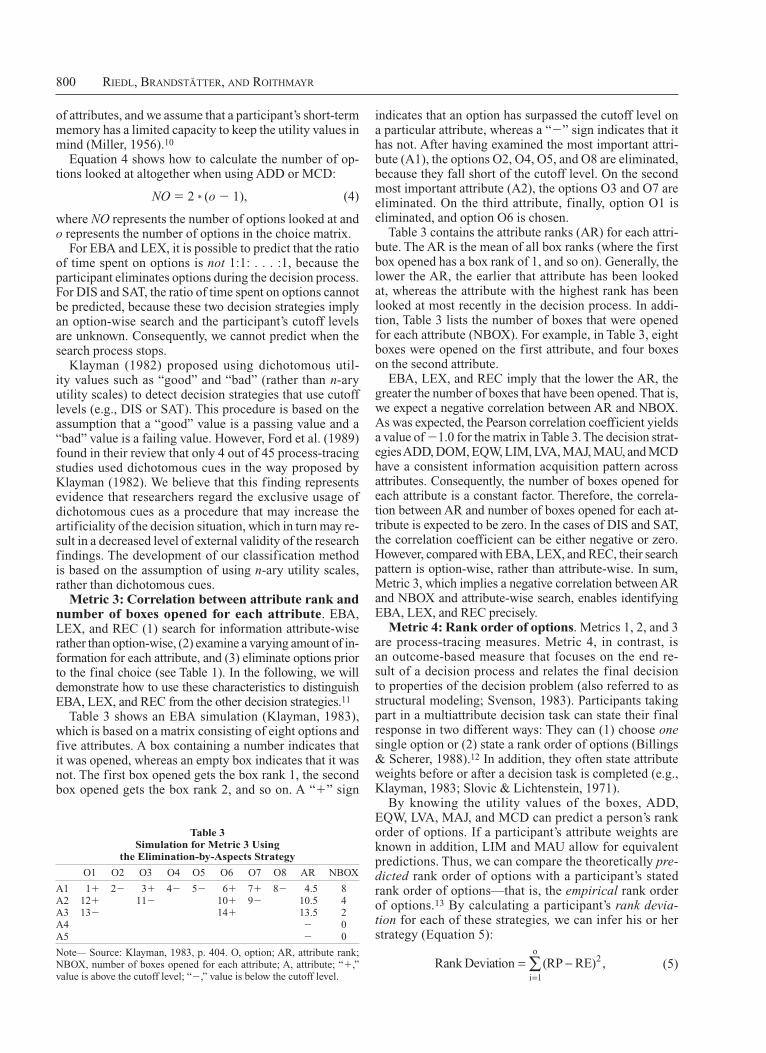
How much time will participants using ADD or MCD spend on the options? Consider a choice problem with two options. A participant using ADD or MCD will compare all attribute pairs and thus look at each option equally long (Klayman, 1982; Todd & Benbasat, 1991). This participant will look at two options with a ratio of 1:1 (Table 2). Next, consider a choice problem with three rather than two op-tions. A participant using ADD or MCD will compare the utility values of Options 1 and 2. Assuming that Option 1 outperforms Option 2, the participant will then compare Options 1 and 3. In total, the participant has looked at four options (1 and 2, 1 and 3) with a time ratio of 2:1:1. That is, this participant looked twice as long at Option 1 as at Options 2 or 3. A ratio of 2:1:1, 1:2:1, or 1:1:2 thus indi-cates that participants are using ADD or MCD, whereas a ratio of, for instance, 2:2:2 or 3:1:1 does not.
Table 2 lists simulations of possible ADD and MCD ratios for choice matrices with different numbers of op-tions. Note that these ratios are independent of the number
four strategies.8 Hence, we recommend using an x-percent tolerance limit to give these four strategies a “fair” chance to be identified. Following signal detection theory (Green & Swets, 1966), increasing the tolerance limit x increases the chance of identifying the EQW, LIM, LVA, and MAU strategies correctly and identifying the DIS and SAT strat-egies incorrectly (Type I error). Decreasing the tolerance limit x, in contrast, results in the reversed pattern by in-creasing the chance of identifying DIS and SAT correctly but identifying the EQW, LIM, LVA, and MAU strategies incorrectly (Type II error). Robustness checks can show how much the classification results depend on the levels of the tolerance limit x.
Metric 2: Ratio of time spent on options. ADD’s and MCD’s information acquisition are consistent across attributes (i.e., the same amount of information is exam-ined for each attribute), but selective across options (i.e., a varying amount of information is processed for each option; see Table 1). This particular combination allows for identifying ADD and MCD.
Table 1 depicts the fact that ADD, DOM, EQW, LIM, LVA, MAJ, MAU, and MCD predict that no utility val-ues are ignored in the decision process. That is, partici-pants open all the boxes in the choice matrix. If the boxes contain utility values (rather than attribute values that are represented on their natural scales), all the boxes need the same time for processing utility values.9 If so, DOM, EQW, LIM, LVA, MAJ, MAU, and REC predict that par-ticipants look at all options equally long, and the ratio of time spent on the options thus equals 1:1: . . . :1, where the number of 1s represents the number of options in the choice problem.
Options
Att
rib
ute
s
Start
End
Options
Att
rib
ute
s
Start
End
Options
Att
rib
ute
s
Start
End
Options
Att
rib
ute
s Start
End
Options
Att
rib
ute
s
Start
End
Options
Att
rib
ute
s
Start
End
Figure 2. Simulations of Metric 1 using the equal weights strategy (EQW), the least important minimum heuristic (LIM), the least variance heuristic (LVA), and the multiattribute utility model (MAU).
Table 2 Simulations for Metric 2 Using the Additive Difference or the
Majority of Confirming Dimensions Strategy
Number of Options
Sum of Options Looked At (With Repetitions)
Possible Ratios of Time Spent on Options
2 2 1:13 4 2:1:14 6 2:2:1:1 or 3:1:1:15 8 4:1:1:1:1 or 3:2:1:1:1 or
2:2:2:1:1
o 2 * (o 2 1)
Note—o, number of options in the choice matrix.
800 Riedl, BRandstätteR, and RoithmayR
indicates that an option has surpassed the cutoff level on a particular attribute, whereas a “2” sign indicates that it has not. After having examined the most important attri-bute (A1), the options O2, O4, O5, and O8 are eliminated, because they fall short of the cutoff level. On the second most important attribute (A2), the options O3 and O7 are eliminated. On the third attribute, finally, option O1 is eliminated, and option O6 is chosen.
Table 3 contains the attribute ranks (AR) for each attri-bute. The AR is the mean of all box ranks (where the first box opened has a box rank of 1, and so on). Generally, the lower the AR, the earlier that attribute has been looked at, whereas the attribute with the highest rank has been looked at most recently in the decision process. In addi-tion, Table 3 lists the number of boxes that were opened for each attribute (NBOX). For example, in Table 3, eight boxes were opened on the first attribute, and four boxes on the second attribute.
EBA, LEX, and REC imply that the lower the AR, the greater the number of boxes that have been opened. That is, we expect a negative correlation between AR and NBOX. As was expected, the Pearson correlation coefficient yields a value of 21.0 for the matrix in Table 3. The decision strat-egies ADD, DOM, EQW, LIM, LVA, MAJ, MAU, and MCD have a consistent information acquisition pattern across attributes. Consequently, the number of boxes opened for each attribute is a constant factor. Therefore, the correla-tion between AR and number of boxes opened for each at-tribute is expected to be zero. In the cases of DIS and SAT, the correlation coefficient can be either negative or zero. However, compared with EBA, LEX, and REC, their search pattern is option-wise, rather than attribute-wise. In sum, Metric 3, which implies a negative correlation between AR and NBOX and attribute-wise search, enables identifying EBA, LEX, and REC precisely.
Metric 4: Rank order of options. Metrics 1, 2, and 3 are process-tracing measures. Metric 4, in contrast, is an outcome-based measure that focuses on the end re-sult of a decision process and relates the final decision to properties of the decision problem (also referred to as structural modeling; Svenson, 1983). Participants taking part in a multiattribute decision task can state their final response in two different ways: They can (1) choose one single option or (2) state a rank order of options (Billings & Scherer, 1988).12 In addition, they often state attribute weights before or after a decision task is completed (e.g., Klayman, 1983; Slovic & Lichtenstein, 1971).
By knowing the utility values of the boxes, ADD, EQW, LVA, MAJ, and MCD can predict a person’s rank order of options. If a participant’s attribute weights are known in addition, LIM and MAU allow for equivalent predictions. Thus, we can compare the theoretically pre-dicted rank order of options with a participant’s stated rank order of options—that is, the empirical rank order of options.13 By calculating a participant’s rank devia-tion for each of these strategies, we can infer his or her strategy (Equation 5):
Rank Deviationi
o
= −=∑ (RP RE) ,2
1 (5)
of attributes, and we assume that a participant’s short-term memory has a limited capacity to keep the utility values in mind (Miller, 1956).10
Equation 4 shows how to calculate the number of op-tions looked at altogether when using ADD or MCD:
NO 5 2 * (o 2 1), (4)
where NO represents the number of options looked at and o represents the number of options in the choice matrix.
For EBA and LEX, it is possible to predict that the ratio of time spent on options is not 1:1: . . . :1, because the participant eliminates options during the decision process. For DIS and SAT, the ratio of time spent on options cannot be predicted, because these two decision strategies imply an option-wise search and the participant’s cutoff levels are unknown. Consequently, we cannot predict when the search process stops.
Klayman (1982) proposed using dichotomous util-ity values such as “good” and “bad” (rather than n-ary utility scales) to detect decision strategies that use cutoff levels (e.g., DIS or SAT). This procedure is based on the assumption that a “good” value is a passing value and a “bad” value is a failing value. However, Ford et al. (1989) found in their review that only 4 out of 45 process-tracing studies used dichotomous cues in the way proposed by Klayman (1982). We believe that this finding represents evidence that researchers regard the exclusive usage of dichotomous cues as a procedure that may increase the artificiality of the decision situation, which in turn may re-sult in a decreased level of external validity of the research findings. The development of our classification method is based on the assumption of using n-ary utility scales, rather than dichotomous cues.
Metric 3: Correlation between attribute rank and number of boxes opened for each attribute. EBA, LEX, and REC (1) search for information attribute-wise rather than option-wise, (2) examine a varying amount of in-formation for each attribute, and (3) eliminate options prior to the final choice (see Table 1). In the following, we will demonstrate how to use these characteristics to distinguish EBA, LEX, and REC from the other decision strategies.11
Table 3 shows an EBA simulation (Klayman, 1983), which is based on a matrix consisting of eight options and five attributes. A box containing a number indicates that it was opened, whereas an empty box indicates that it was not. The first box opened gets the box rank 1, the second box opened gets the box rank 2, and so on. A “1” sign
Table 3 Simulation for Metric 3 Using
the Elimination-by-Aspects Strategy
O1 O2 O3 O4 O5 O6 O7 O8 AR NBOX
A1 11 22 31 42 52 61 71 82 4.5 8A2 121 112 101 92 10.5 4A3 132 141 13.5 2A4 2 0A5 2 0
Note— Source: Klayman, 1983, p. 404. O, option; AR, attribute rank; NBOX, number of boxes opened for each attribute; A, attribute; “1,” value is above the cutoff level; “2,” value is below the cutoff level.
identifying decision stRategies 801
est utility value on the most important attribute (for REC, name recognition represents the most important attribute), one can infer that LEX (or REC) was used. If there is not one but, rather, two or more options with a highest value on the most important attribute (in other words, if there is a tie), and if a person selects the option with the highest utility value on the second most important attribute, LEX (or REC) was used again, and so on.
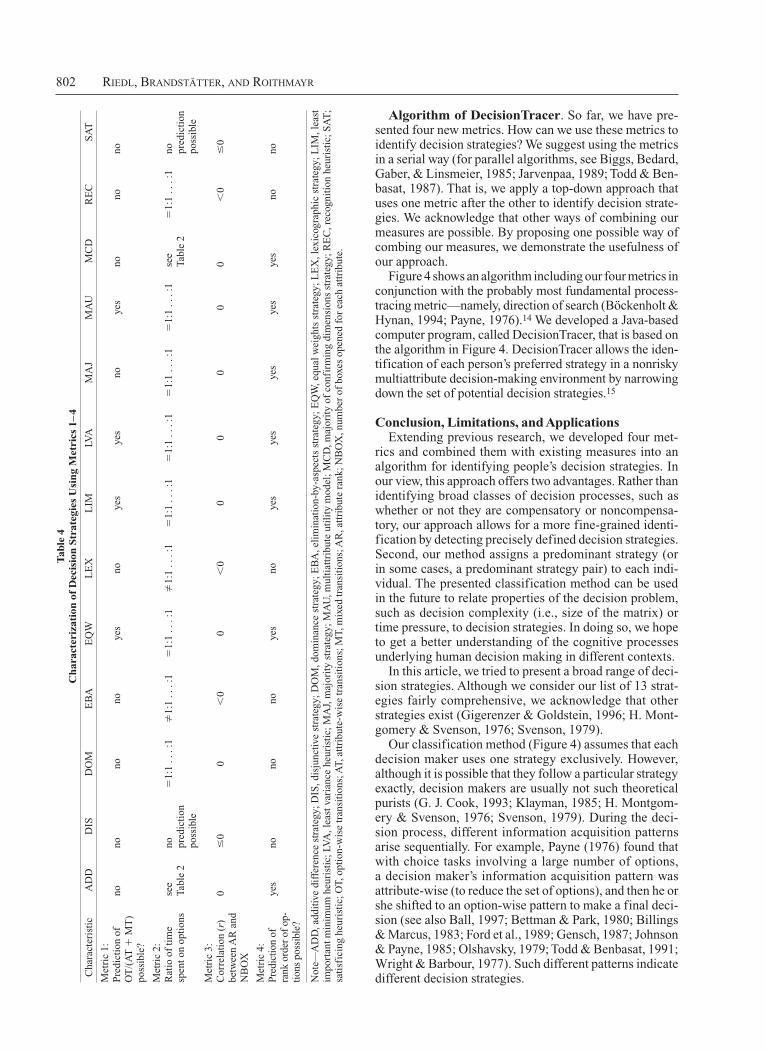
Table 4 characterizes all 13 decision strategies. We used Characteristics 1 and 2 for Metric 1, Characteristics 3 and 4 for Metric 2, Characteristics 2, 3, and 5 for Metric 3, and Characteristics 1 and 6 for Metric 4 (see Table 1).
Although we did not use characteristics 7, 8, and 9 here-after, they can be used in further investigations. Charac-teristic 7 concerns cutoff (aspiration) levels. To increase external validity, we use n-ary, rather than dichotomous, utility values. However, using dichotomous, rather than n-ary, utility values (e.g., “good” and “bad”) allows for detecting strategies that imply cutoff levels (e.g., DIS or SAT). This is based on the assumption that a “good” util-ity value exceeds a cutoff level, whereas a “bad” utility value falls short of a cutoff level. Characteristic 8 concerns whether a strategy is compensatory or noncompensatory; Characteristic 9 concerns whether a strategy uses quantita-tive or qualitative reasoning. Consider a participant’s ver-bal protocol describing a decision process that is both com-pensatory and quantitative (Payne, 1976, p. 378). Such a protocol allows eliminating DIS, DOM, EBA, LEX, LIM, LVA, REC, and SAT, because none of these strategies is both compensatory and quantitative (Table 1).
where o represents the number of options in the choice ma-trix, RP denotes the predicted rank order, and RE denotes the empirical rank order of options. That is, the lower the rank deviation, the more likely it is that a particular deci-sion strategy was used.
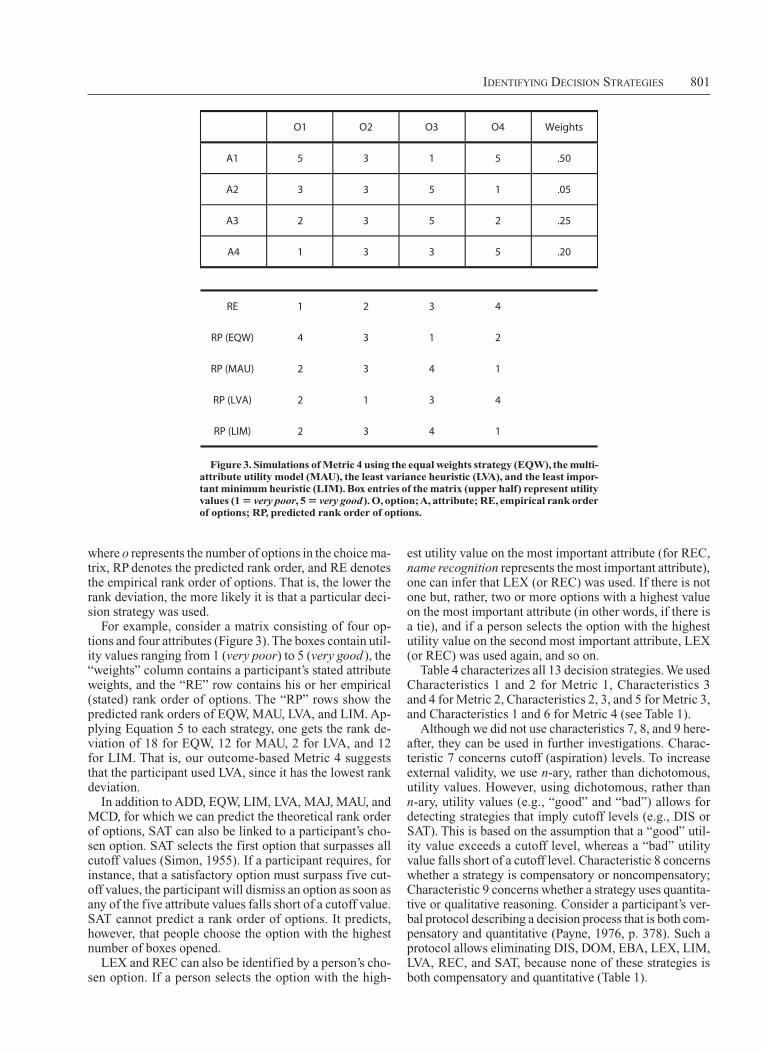
For example, consider a matrix consisting of four op-tions and four attributes (Figure 3). The boxes contain util-ity values ranging from 1 (very poor) to 5 (very good ), the “weights” column contains a participant’s stated attribute weights, and the “RE” row contains his or her empirical (stated) rank order of options. The “RP” rows show the predicted rank orders of EQW, MAU, LVA, and LIM. Ap-plying Equation 5 to each strategy, one gets the rank de-viation of 18 for EQW, 12 for MAU, 2 for LVA, and 12 for LIM. That is, our outcome-based Metric 4 suggests that the participant used LVA, since it has the lowest rank deviation.
In addition to ADD, EQW, LIM, LVA, MAJ, MAU, and MCD, for which we can predict the theoretical rank order of options, SAT can also be linked to a participant’s cho-sen option. SAT selects the first option that surpasses all cutoff values (Simon, 1955). If a participant requires, for instance, that a satisfactory option must surpass five cut-off values, the participant will dismiss an option as soon as any of the five attribute values falls short of a cutoff value. SAT cannot predict a rank order of options. It predicts, however, that people choose the option with the highest number of boxes opened.
LEX and REC can also be identified by a person’s cho-sen option. If a person selects the option with the high-
Figure 3. Simulations of Metric 4 using the equal weights strategy (EQW), the multi-attribute utility model (MAU), the least variance heuristic (LVA), and the least impor-tant minimum heuristic (LIM). Box entries of the matrix (upper half) represent utility values (1 5 very poor, 5 5 very good). O, option; A, attribute; RE, empirical rank order of options; RP, predicted rank order of options.
O1
A1 5
A2 3 3 5 1 .05
A3
A4
2
1
3
3
5
3
2
5
.25
.20
RE 1 2 3 4
O2 O3 O4 Weights
3 1 5 .50
RP (EQW) 4 13 2
RP (MAU) 2 43 1
RP (LVA) 2 31 4
RP (LIM) 2 43 1
802 Riedl, BRandstätteR, and RoithmayR
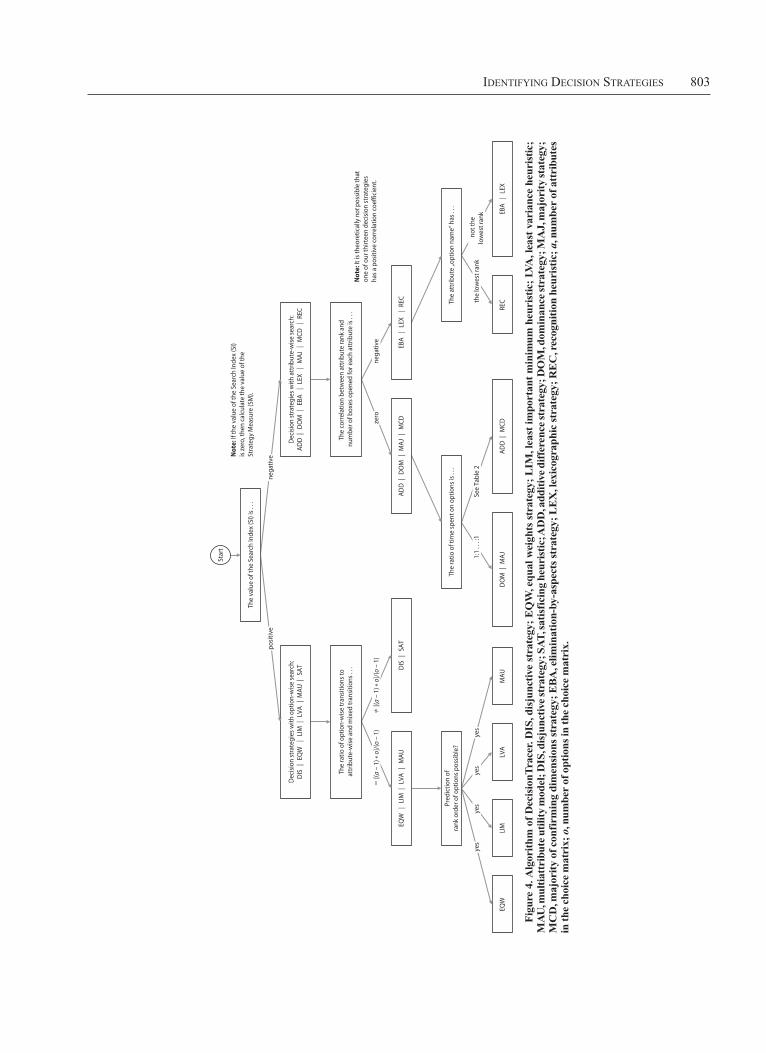
Algorithm of DecisionTracer. So far, we have pre-sented four new metrics. How can we use these metrics to identify decision strategies? We suggest using the metrics in a serial way (for parallel algorithms, see Biggs, Bedard, Gaber, & Linsmeier, 1985; Jarvenpaa, 1989; Todd & Ben-basat, 1987). That is, we apply a top-down approach that uses one metric after the other to identify decision strate-gies. We acknowledge that other ways of combining our measures are possible. By proposing one possible way of combing our measures, we demonstrate the usefulness of our approach.
Figure 4 shows an algorithm including our four metrics in conjunction with the probably most fundamental process- tracing metric—namely, direction of search (Böckenholt & Hynan, 1994; Payne, 1976).14 We developed a Java-based computer program, called DecisionTracer, that is based on the algorithm in Figure 4. DecisionTracer allows the iden-tification of each person’s preferred strategy in a nonrisky multiattribute decision-making environment by narrowing down the set of potential decision strategies.15
Conclusion, Limitations, and ApplicationsExtending previous research, we developed four met-
rics and combined them with existing measures into an algorithm for identifying people’s decision strategies. In our view, this approach offers two advantages. Rather than identifying broad classes of decision processes, such as whether or not they are compensatory or noncompensa-tory, our approach allows for a more fine-grained identi-fication by detecting precisely defined decision strategies. Second, our method assigns a predominant strategy (or in some cases, a predominant strategy pair) to each indi-vidual. The presented classification method can be used in the future to relate properties of the decision problem, such as decision complexity (i.e., size of the matrix) or time pressure, to decision strategies. In doing so, we hope to get a better understanding of the cognitive processes underlying human decision making in different contexts.
In this article, we tried to present a broad range of deci-sion strategies. Although we consider our list of 13 strat-egies fairly comprehensive, we acknowledge that other strategies exist (Gigerenzer & Goldstein, 1996; H. Mont-gomery & Svenson, 1976; Svenson, 1979).
Our classification method (Figure 4) assumes that each decision maker uses one strategy exclusively. However, although it is possible that they follow a particular strategy exactly, decision makers are usually not such theoretical purists (G. J. Cook, 1993; Klayman, 1985; H. Montgom-ery & Svenson, 1976; Svenson, 1979). During the deci-sion process, different information acquisition patterns arise sequentially. For example, Payne (1976) found that with choice tasks involving a large number of options, a decision maker’s information acquisition pattern was attribute-wise (to reduce the set of options), and then he or she shifted to an option-wise pattern to make a final deci-sion (see also Ball, 1997; Bettman & Park, 1980; Billings & Marcus, 1983; Ford et al., 1989; Gensch, 1987; Johnson & Payne, 1985; Olshavsky, 1979; Todd & Benbasat, 1991; Wright & Barbour, 1977). Such different patterns indicate different decision strategies.
Tab
le 4
C
har
acte
riza
tion
of
Dec
isio
n S
trat
egie
s U
sin
g M
etri
cs 1
–4
Cha
ract
eris
tic
A
DD
D
IS
DO
M
EB
A
EQ
W
LE
X
LIM
LV
A
MA
J
MA
U
MC
D
RE
C
SA
T
Met
ric
1:P
redi
ctio
n of
O
T/(
AT
1 M
T)
poss
ible
?
nono
nono
yes
noye
sye
sno
yes
nono
no
Met
ric
2:R
atio
of
tim
e sp
ent o
n op
tion
sse
e Ta
ble
2no
pr
edic
tion
po
ssib
le
51:
1 . .
. :1
1:
1 . .
. :1
51:
1 . .
. :1
1:
1 . .
. :1
51:
1 . .
. :1
51:
1 . .
. :1
51:
1 . .
. :1
51:
1 . .
. :1
see
Tabl
e 2
51:
1 . .
. :1
no
pred
icti
on
poss
ible
Met
ric
3:C
orre
lati
on (
r)
betw
een
AR
and
N
BO
X
0#
00
0
0
00
00
00
0
#0
Met
ric
4:Pr
edic
tion
of
rank
ord
er o
f op
-tio
ns p
ossi
ble?
yes
nono
noye
sno
yes
yes
yes
yes
yes
nono
Not
e—A
DD
, add
itiv
e di
ffer
ence
str
ateg
y; D
IS, d
isju
nctiv
e st
rate
gy; D
OM
, dom
inan
ce s
trat
egy;
EB
A, e
lim
inat
ion-
by-a
spec
ts s
trat
egy;
EQ
W, e
qual
wei
ghts
str
ateg
y; L
EX
, lex
icog
raph
ic s
trat
egy;
LIM
, lea
st
impo
rtan
t min
imum
heu
rist
ic; L
VA
, lea
st v
aria
nce
heur
isti
c; M
AJ,
maj
orit
y st
rate
gy; M
AU
, mul
tiat
trib
ute
util
ity
mod
el; M
CD
, maj
orit
y of
con
firm
ing
dim
ensi
ons
stra
tegy
; RE
C, r
ecog
niti
on h
euri
stic
; SA
T;
sati
sfic
ing
heur
isti
c; O
T, o
ptio
n-w
ise
tran
siti
ons;
AT,
att
ribu
te-w
ise
tran
siti
ons;
MT,
mix
ed tr
ansi
tion
s; A
R, a
ttri
bute
ran
k; N
BO
X, n
umbe
r of
box
es o
pene
d fo
r ea
ch a
ttri
bute
.
identifying decision stRategies 803
Star
t
The
valu
e of
the
Sear
ch In
dex
(SI)
is .
. .
Dec
isio
n st
rate
gies
with
att
ribut
e-w
ise
sear
ch:
AD
D |
DO
M |
EBA
|
LEX
|
MA
J |
MC
D
| R
EC
posi
tive
nega
tive
The
corr
elat
ion
betw
een
attr
ibut
e ra
nk a
nd
num
ber o
f box
es o
pene
d fo
r eac
h at
trib
ute
is .
. .
AD
D |
DO
M |
MA
J |
MC
Dzero
EBA
|
LEX
|
REC
nega
tive
The
ratio
of t
ime
spen
t on
optio
ns is
. . .
DO
M |
MA
JA
DD
| M
CD
1:1
. . .
:1Se
e Ta
ble
2
The
attr
ibut
e „o
ptio
n na
me“
has
. . .
REC
EBA
|
LEX
the
low
est r
ank
not t
helo
wes
t ran
k
EQW
|
LIM
| L
VA
| M
AU
� [(
a –
1) *
o]/
(o –
1)
DIS
| S
AT
� [(
a –
1) *
o]/
(o –
1)
Pred
ictio
n of
rank
ord
er o
f opt
ions
pos
sibl
e?
EQW
yes
LIM
LVA
MA
U
yes
yes
yes
Not
e: It
is th
eore
tical
ly n
ot p
ossi
ble
that
on
e of
our
thirt
een
deci
sion
str
ateg
ies
has
a po
sitiv
e co
rrel
atio
n co
effic
ient
.
Not
e: If
the
valu
e of
the
Sear
ch In
dex
(SI)
is z
ero,
then
cal
cula
te th
e va
lue
of th
e St
rate
gy M
easu
re (S
M).
Dec
isio
n st
rate
gies
with
opt
ion-
wis
e se
arch
:D
IS |
EQ
W
| L
IM |
LVA
|
MA
U |
SA
T
The
ratio
of o
ptio
n-w
ise
tran
sitio
ns to
attr
ibut
e-w
ise
and
mix
ed tr
ansi
tions
. . .
Fig
ure
4. A
lgor
ith
m o
f D
ecis
ion
Tra
cer.
DIS
, dis
jun
ctiv
e st
rate
gy;
EQ
W, e
qu
al w
eigh
ts s
trat
egy;
LIM
, lea
st im
por
tan
t m
inim
um
heu
rist
ic;
LVA
, lea
st v
aria
nce
heu
rist
ic;
MA
U, m
ult
iatt
ribu
te u
tili
ty m
odel
; DIS
, dis
jun
ctiv
e st
rate
gy; S
AT
, sat
isfi
cin
g h
euri
stic
; AD
D, a
dd
itiv
e d
iffe
ren
ce s
trat
egy;
DO
M, d
omin
ance
str
ateg
y; M
AJ,
maj
orit
y st
ateg
y;
MC
D, m
ajor
ity
of c
onfi
rmin
g d
imen
sion
s st
rate
gy;
EB
A, e
lim
inat
ion
-by-
asp
ects
str
ateg
y; L
EX
, lex
icog
rap
hic
str
ateg
y; R
EC
, rec
ogn
itio
n h
euri
stic
; a,
nu
mb
er o
f at
trib
ute
s in
th
e ch
oice
mat
rix;
o, n
um
ber
of
opti
ons
in t
he
choi
ce m
atri
x.
804 Riedl, BRandstätteR, and RoithmayR
verbal protocols, however, it is possible to identify each strategy of the four pairs precisely.
Our measures are limited by the assumption that people closely follow a strategy’s algorithm. In the case of MAU, for instance, we assume—in line with the process-tracing literature (e.g., Payne et al., 1993)—that people search option-wise, rather than attribute-wise, because MAU chooses the option with the highest weighted overall util-ity score. Theoretically, however, a person may search attribute-wise, remember all attribute utilities, calculate the sum of weighted attribute utilities for each option, and choose the option with the highest score. Limited capacity of short-term memory (Miller, 1956), however, renders attribute-wise search unlikely.
We believe that our work is of high relevance not only for computerized process-tracing methods, but also for eye-tracking and clickstream studies. Consider, for example, a decision situation in which information is presented in a matrix-like format on a computer screen and information acquisition is registered by eyetracking. Our classification method may help identify which people use which strat-egy in which situation. Understanding people’s decision processes enables practitioners developing better decision support systems. Consider, for instance, the design of In-ternet shops. If marketers and software engineers know their potential customers’ preferred decision strategies, they can tailor online shops that actively support custom-ers’ decision-making processes (for recent research, see Cothey, 2002; Jaillet, 2002; Johnson, Moe, Fader, Bellman, & Lohse, 2004; Lohse & Spiller, 1998; A. L. Montgomery et al., 2004; Venkatesh & Agarwal, 2006).
Finally, our classification method can also be used in combination with clickstream data. Within consumer behavior, research programs have started investigating clickstream data, which represent a person’s information acquisitions within a Web site (Awad, Jones, & Zhang, 2006; Bucklin & Sismeiro, 2003; Chatterjee, Hoffman, & Novak, 2003; Cothey, 2002; Jaillet, 2002; Johnson et al., 2004). Imagine, for instance, a study in which par-ticipants are taking part in a choice matrix experiment using Decision Tracer. In addition, the same people are participating in a study with a quasiexperimental design in which the task is to buy a product in an Internet shop. As a result of the quasiexperiment, we can obtain data on click-streams, amount of money spent, shopping time, stopping behavior, or satisfaction with the Internet shop. Knowing a person’s predominant decision strategy (e.g., MAU), in combination with clickstreams and the like, is important for practitioners because tailor-made online shops may positively affect ease of use, customers’ decision times, the likelihood of buying, and finally the retailer’s turnover. Our multimethod approach, we think, offers one promis-ing way to reach these goals.
AUTHOR NOTE
E.B. was supported by Austrian Science Fund (FWF) Grant P18907-G11. We thank Max H. Bazerman, Iris A. Junglas, Michael Schrefl, and Stephan Zelewski for their thoughtful comments on an ear-lier version of the manuscript. We further acknowledge the support of Wynne Chin and David Gefen, who served as chairs of the track “Quan-
The objective of our classification method was to find decision makers’ strategies that were used during the entire decision process. To find people’s sequential use of strate-gies, one can split the entire decision process into several parts by dividing the total decision time into time blocks (G. J. Cook, 1993; Svenson, 1979; van Raaij, 1976). Fur-thermore, one may combine quantitative (computerized-process tracing or eyetracking) and qualitative (verbal protocols) process-tracing techniques (e.g., Payne, 1976). Considering this, one possible way to identify blends of decision strategies would be to use our classification method in conjunction with verbal protocols.
In this article, we developed a process- and outcome-based classification method that incorporates three process- based metrics. Hence, the value of the classifica-tion method depends on the validity of process-tracing assumptions. The main assumptions are, first, when a participant opens a box of the choice matrix, this infor-mation is assumed to be processed at a cognitive level. Second, a decision maker’s attention to a particular utility value reflects the search for a piece of information, which is a necessary constituent of a specific decision strategy (Svenson, 1979).
Process-tracing approaches offer the advantage of not requiring participants to be conscious of or formulate their mental processes underlying choice behavior. Hayek (1962) made a clear-cut statement:
While we are clearly often not aware of mental pro-cesses because they have not yet risen to the level of consciousness but proceed on what are (both physi-ologically and psychologically) lower levels, there is no reason why the conscious level should be the highest level, and many grounds which make it prob-able that, to be conscious, processes must be guided by a supra-conscious order which cannot be the ob-ject of its own representations. Mental events may thus be unconscious and uncommunicable because they proceed on too high a level as well as because they proceed on too low a level. (p. 340)
Unlike think-aloud protocols, DecisionTracer, similar process-tracing tools (e.g., Mouselab), and eyetracking systems register information acquisition without the need of verbalization.
In four cases, our classification method cannot distin-guish between decision strategy pairs: DIS/SAT, DOM/MAJ, ADD/MCD, and EBA/LEX. All other decision strat-egies, however, can be identified precisely (see Figure 4). Both DIS and SAT use aspiration levels. Intuitively, a per-son using SAT is likely to open more boxes in the matrix than is a person using DIS. MAJ can be considered as a special case of DOM. If no dominant option exists, MAJ selects the option with the highest number of dominant attribute values. Similarly, MCD is a special case of ADD, since MCD implies a rank scale and ADD an interval scale. Finally, since it is possible that EBA and LEX may have identical information acquisition patterns, a distinction with current quantitative process-tracing methods is not possible. By using DecisionTracer in combination with
identifying decision stRategies 805
for obtaining subjective descriptions of judgmental policy. Organiza-tional Behavior & Human Performance, 13, 31-45.
Coombs, C. H. A. (1964). Theory of data. New York: Wiley.Costa-Gomes, M., Crawford, V. P., & Broseta, B. (2001). Cognition
and behavior in normal-form games: An experimental study. Econo-metrica, 69, 1193-1235.
Cothey, V. (2002). A longitudinal study of World Wide Web users’ information-searching behavior. Journal of the American Society for Information Science & Technology, 53, 67-78.
Covey, J. A., & Lovie, A. D. (1998). Information selection and uti-lization in hypothesis testing: A comparison of process-tracing and structural analysis techniques. Organizational Behavior & Human Decision Processes, 75, 56-74.
Dahlstrand, V., & Montgomery, H. (1984). Information search and evaluation processes in decision-making: A computer-based process-tracing study. Acta Psychologica, 56, 113-123.
Dawes, R. M. (1964). Social selection based on multidimensional crite-ria. Journal of Abnormal & Social Psychology, 68, 104-109.
Dawes, R. M. (1979). The robust beauty of improper linear models in decision making. American Psychologist, 34, 571-582.
Dawes, R. M., & Corrigan, B. (1974). Linear models in decision mak-ing. Psychological Bulletin, 81, 95-106.
Einhorn, H. J. (1970). The use of non-linear, noncompensatory models in decision making. Psychological Bulletin, 73, 221-230.
Einhorn, H. J. (1971). Use of nonlinear, noncompensatory models as a function of task and amount of information. Organizational Behavior & Human Performance, 6, 1-27.
Einhorn, H. J., & Hogarth, R. M. (1975). Unit weighting schemes for decision making. Organizational Behavior & Human Performance, 13, 171-192.
Einhorn, H. J., Kleinmuntz, D. N., & Kleinmuntz, B. (1979). Lin-ear regression and process-tracing models of judgment. Psychological Review, 86, 465-485.
Ericsson, K. A., & Simon, H. A. (1980). Verbal protocols as data. Psychological Review, 87, 215-251.
Ericsson, K. A., & Simon, H. A. (1984). Protocol analysis: Verbal re-ports as data. Cambridge, MA: MIT Press.
Fishburn, P. C. (1974). Lexographic orders, utilities and decision rules: A survey. Management Science, 20, 1442-1471.
Ford, J. K., Schmitt, N., Schechtmann, S. L., Hults, B. M., & Do-herty, M. L. (1989). Process tracing methods: Contributions, prob-lems and neglected research questions. Organizational Behavior & Human Decision Processes, 43, 75-117.
Gensch, D. H. (1987). A two-stage disaggregate attribute choice model. Marketing Science, 6, 223-231.
Gigerenzer, G., & Goldstein, D. G. (1996). Reasoning the fast and frugal way: Models of bounded rationality. Psychological Review, 103, 650-669.
Goldstein, D. G., & Gigerenzer, G. (2002). Models of ecological rationality: The recognition heuristic. Psychological Review, 109, 75-90.
Green, D. M., & Swets, J. A. (1966). Signal detection theory and psychophysics. New York: Wiley.
Harte, J. M., & Koele, P. (1995). A comparision of different methods for the elicitation of attribute weights: Structural modeling, process tracing, and self-reports. Organizational Behavior & Human Decision Processes, 64, 49-64.
Harte, J. M., & Koele, P. (2001). Modelling and describing human judgment processes: The multiattribute evaluation case. Thinking & Reasoning, 7, 29-49.
Hastie, R., & Dawes, R. M. (2001). Rational choice in an uncertain world: The psychology of judgment and decision making. Thousand Oaks, CA: Sage.
Hayek, F. A. (1962). Rules, perception, and intelligibility. Proceedings of the British Academy, 48, 321-344.
Hogarth, R. M. (1975). Decision time as a function of task complexity. In D. Wendt & C. A. J. Viek (Eds.), Utility, probability, and human decision making (pp. 321-338). Dordrecht: Riedel.
Huber, O., Wider, R., & Huber, O. W. (1997). Active information search and complete information presentation in naturalistic risky de-cision tasks. Acta Psychologica, 95, 15-29.
Inada, K. I. (1964). A note on the simple majority decision rule. Econo-metrica, 32, 525-531.
titative Research Methods” at the Twenty-Seventh International Confer-ence on Information Systems, where we presented an earlier version of the algorithm of DecisionTracer. We also acknowledge the excellent com-ments during the review process. We are grateful to Hasan Cakmak for implementing DecisionTracer. Correspondence concerning this article should be addressed to R. Riedl, Department of Business Informatics– Information Engineering, University of Linz, Altenberger Strabe 69, 4040 Linz, Austria (e-mail: [email protected]).
REFERENCES
Abelson, R. P., & Levi, A. (1985). Decision making and decision the-ory. In G. Lindzey & E. Aronson (Eds.), The handbook of social psy-chology (3rd ed., pp. 231-309). New York: Random House.
Anderson, N. H. (1974). Algebraic models of perception. In E. C. Car-terette & M. P. Friedman (Eds.), Handbook of perception (Vol. 2). New York: Academic Press.
Arch, D. C., Bettman, J. R., & Kakkar, P. (1978). Subjects’ informa-tion processing in information display board studies. In H. K. Hunt (Ed.), Advances in consumer research (Vol. 5, pp. 555-560). Ann Arbor, MI: Association for Consumer Research.
Awad, N. F., Jones, J. L., & Zhang, J. (2006). Does search mater? Using online clickstream data to examine the relationship between online search and purchase behavior. In D. Straub, S. Klein, W. Hase-man, & C. Washburne (Eds.), Proceedings of the Twenty-Seventh International Conference on Information Systems (pp. 1159-1174). Milwaukee, WI: Association for Information Systems.
Ball, C. (1997). A comparison of single-step and multiple-step tran-sition analyses of multiattribute decision strategies. Organizational Behavior & Human Decision Processes, 69, 195-204.
Bettman, J. R., & Park, C. W. (1980). Effects of prior knowledge and experience and phase of the choice process on consumer decision processes: A protocol analysis. Journal of Consumer Research, 7, 234-248.
Biggs, S. F., Bedard, J. C., Gaber, B. G., & Linsmeier, T. J. (1985). The effects of task size and similarity on the decision behavior of bank loan officers. Management Science, 31, 970-987.
Billings, R. S., & Marcus, S. (1983). Measures of compensatory and noncompensatory models of decision behavior: Process tracing versus policy capturing. Organizational Behavior & Human Performance, 31, 331-352.
Billings, R. S., & Scherer, L. L. (1988). The effects of response mode and importance on decision-making strategies: Judgment versus choice. Organizational Behavior & Human Decision Processes, 41, 1-19.
Böckenholt, U., & Hynan, L. S. (1994). Caveats on a process-tracing measure and a remedy. Journal of Behavioral Decision Making, 7, 103-117.
Bowman, V. J., & Colantoni, C. S. (1973). Majority rule under transi-tivity constraints. Management Science, 19, 1029-1041.
Brehmer, B. (1994). The psychology of linear judgement models. Acta Psychologica, 87, 137-154.
Bröder, A. (2002). Take the best, Dawes’ rule, and compensatory deci-sion strategies: A regression-based classification method. Quality & Quantity, 36, 219-238.
Browne, G. J., Pitts, M. G., & Wetherbe, J. C. (2007). Cognitive stopping rules for terminating information search in online tasks. MIS Quarterly, 31, 89-104.
Brucks, M. (1988). Search monitor: An approach for computer- controlled experiments involving customer information search. Jour-nal of Customer Research, 15, 117-121.
Bucklin, R. E., & Sismeiro, C. (2003). A model of Web site brows-ing behavior estimated on clickstream data. Journal of Marketing Research, 40, 249-267.
Chatterjee, P., Hoffman, D. L., & Novak, T. P. (2003). Modeling the clickstream: Implications for Web-based advertising efforts. Market-ing Science, 22, 520-542.
Cook, G. J. (1993). An empirical investigation of information search strategies with implications for decision support system design. Deci-sion Sciences, 24, 683-697.
Cook, G. J., & Swain, M. R. (1993). A computerized approach to de-cision process tracing for decision support system design. Decision Sciences, 24, 931-952.
Cook, R. L., & Stewart, T. R. (1975). A comparison of seven methods
806 Riedl, BRandstätteR, and RoithmayR
in decision making: A replication and extension. Organizational Be-havior & Human Performance, 24, 300-316.
Payne, J. W. (1976). Task complexity and contingent processing in deci-sion making: An information search and protocol analysis. Organiza-tional Behavior & Human Decision Processes, 16, 366-387.
Payne, J. W., Bettman, J. R., Coupey, E., & Johnson, E. J. (1992). A constructive process view of decision making: Multiple strategies in judgment and choice. Acta Psychologica, 80, 107-141.
Payne, J. W., Bettman, J. R., & Johnson, E. J. (1993). The adaptive decision maker. Cambridge: Cambridge University Press.
Payne, J. W., & Braunstein, M. L. (1978). Risky choice: An examina-tion of information acquisition behavior. Memory & Cognition, 6, 554-561.
Payne, J. W., Braunstein, M. L., & Carroll, J. S. (1978). Exploring predecisional behavior: An alternative approach to decision research. Organizational Behavior & Human Decision Processes, 22, 17-44.
Pollay, R. W. (1970). A model of decision times in difficult decision situations. Psychological Review, 77, 274-281.
Russo, J. E. (1978a). Adaptation of cognitive processes to eye movement systems. In J. W. Senders, D. F. Fisher, & R. A. Monty (Eds.), Eye movements and higher psychological functions (pp. 89-109). Hills-dale, NJ: Erlbaum.
Russo, J. E. (1978b). Eye fixations can save the world: A critical evalu-ation and a comparison between eye fixations and other information processing methodologies. In H. K. Hunt (Ed.), Advances in consumer research (Vol. 5, pp. 561-570). Ann Arbor, MI: Association for Con-sumer Research.
Russo, J. E., & Dosher, B. A. (1983). Strategies for multiattribute bi-nary choice. Journal of Experimental Psychology: Learning, Memory, & Cognition, 9, 676-696.
Russo, J. E., & Rosen, L. D. (1975). An eye fixation analysis of multi-alternative choice. Memory & Cognition, 3, 267-276.
Sen, A. K. (1966). A possibility theorem on majority decisions. Econo-metrica, 34, 491-499.
Sen, A. K., & Pattanaik, P. K. (1969). Necessary and sufficient condi-tions for rational choice under majority decision. Journal of Economic Theory, 1, 178-202.
Simon, H. A. (1955). A behavioral model of rational choice. Quarterly Journal of Economics, 69, 99-118.
Slovic, P., & Lichtenstein, S. (1971). Comparison of Bayesian and regression approaches to the study of information processing in judg-ment. Organizational Behavior & Human Performance, 6, 649-744.
Summers, D. A., Taliaferro, J. D., & Fletcher, D. J. (1970). Subjec-tive vs. objective description of judgment policy. Psychonomic Sci-ence, 18, 249-250.
Svenson, O. (1979). Process descriptions of decision making. Organi-zational Behavior & Human Performance, 23, 86-112.
Svenson, O. (1983). Decision rules and information processing in deci-sion making. In L. Sjöberg, T. Tyszka, & J. Wise (Eds.), Human deci-sion making (pp. 131-162). Bodafors, Sweden: Doxa.
Tabatabai, M. (1998). Investigation of decision making process: A hy-permedia approach. Interacting With Computers, 9, 385-396.
Todd, P., & Benbasat, I. (1987). Process tracing methods in decision support systems research: Exploring the black box. MIS Quarterly, 11, 492-512.
Todd, P., & Benbasat, I. (1991). An experimental investigation of the impact of computer based decision aids on decision making strategies. Information Systems Research, 2, 87-115.
Tversky, A. (1969). Intransitivity of preferences. Psychological Review, 76, 31-48.
Tversky, A. (1972). Elimination by aspects: A theory of choice. Psycho-logical Review, 79, 281-299.
van Raaij, W. F. (1976). Consumer choice behaviour: An information-processing approach. Tilburg, The Netherlands: Katholieke Hoge-school te Tilburg.
Venkatesh, V., & Agarwal, R. (2006). Turning visitors into custom-ers: A usability-centric perspective on purchase behavior in electronic channels. Management Science, 52, 367-382.
von Winterfeldt, D., & Fischer, G. W. (1975). Multiattribute utility theory: Models and assessment procedures. In D. Wendt & C. A. J. Viek (Eds.), Utility, probability, and human decision making (pp. 47-86). Dordrecht: Riedel.
Westenberg, M. R. M., & Koele, P. (1994). Multi-attribute evalua-
Inada, K. I. (1969). The simple majority decision rule. Econometrica, 37, 490-506.
Jacoby, J., Chestnut, R. W., Weigl, K. C., & Fisher, W. (1976). Pre-purchase information acquisition: Description of a process methodol-ogy, research paradigm, and pilot investigation. In B. B. Anderson (Ed.), Advances in consumer research (Vol. 3, pp. 306-314). Cincin-nati, OH: Association for Consumer Research.
Jaillet, H. F. (2002). Web metrics: Measuring patterns in online shop-ping. Journal of Consumer Behavior, 2, 369-381.
Jarvenpaa, S. L. (1989). The effect of task demands and graphical for-mat on information processing strategies. Management Science, 35, 285-303.
Jasper, J. D., & Levin, I. P. (2001). Validating a new process tracing method for decision making. Behavior Research Methods, Instru-ments, & Computers, 33, 496-512.
Jasper, J. D., & Shapiro, J. (2002). MouseTrace: A better mousetrap for catching decision processes. Behavior Research Methods, Instru-ments, & Computers, 34, 364-374.
Johnson, E. J., Moe, W. W., Fader, P. S., Bellman, S., & Lohse, G. L. (2004). On the depth and dynamics of online search behavior. Management Science, 50, 299-308.
Johnson, E. J., & Payne, J. W. (1985). Effort and accuracy in choice. Management Science, 31, 395-414.
Jungermann, H., Pfister, H.-R., & Fischer, K. (2005). Die Psychologie der Entscheidung: Eine Einführung (2nd ed.). Heidelberg: Elsevier.
Just, M. A., & Carpenter, P. A. (1976). Eye fixations and cognitive processes. Cognitive Psychology, 8, 441-480.
Keeney, R. L., & Raiffa, H. (1976). Decisions with multiple objects: Preferences and value tradeoffs. New York: Wiley.
Klayman, J. (1982). Simulations of six decision strategies: Compari-sons of search patterns, processing characteristics, and response to task complexity (Working Paper No. 100). Chicago: University of Chicago, Center for Decision Research.
Klayman, J. (1983). Analysis of predecisional information search pat-terns. In P. Humphreys, O. Svenson, & A. Vári (Eds.), Analysing and aiding decision processes (pp. 401-414). Amsterdam: North-Holland.
Klayman, J. (1985). Children’s decision strategies and their adaptation to task characteristics. Organizational Behavior & Human Decision Processes, 35, 179-201.
Lee, W. (1971). Decision theory and human behavior. New York: Wiley.
Levin, I. P., & Jasper, J. D. (1995). Phased narrowing: A new process tracing method for decision making. Organizational Behavior & Human Decision Processes, 64, 1-8.
Lohse, G. L., & Johnson, E. J. (1996). A comparison of two process tracing methods for choice tasks. Organizational Behavior & Human Decision Processes, 68, 28-43.
Lohse, G. L., & Spiller, P. (1998). Electronic shopping: The effect of customer interfaces on traffic and sales. Communications of the ACM, 41, 81-87.
Miller, G. A. (1956). The magical number seven, plus or minus two: Some limits on our capacity for processing information. Psycho-logical Review, 63, 81-97.
Montgomery, A. L., Hosanagar, K., Krishnan, R., & Clay, K. B. (2004). Designing a better shopbot. Management Science, 50, 189-206.
Montgomery, H. (1983). Decision rules and the search for a dominance structure: Towards a process model of decision making. In P. Hum-phreys, O. Svenson, & A. Vári (Eds.), Analysing and aiding decision processes (pp. 343-369). Amsterdam: North-Holland.
Montgomery, H., & Svenson, O. (1976). On decision rules and infor-mation processing strategies for choices among multiattribute alterna-tives. Scandinavian Journal of Psychology, 17, 283-291.
Mynatt, C. R., Doherty, M. E., & Dragan, W. (1993). Information relevance, working memory, and the consideration of alternatives. Quarterly Journal of Experimental Psychology, 46A, 759-778.
Newell, A., & Simon, H. A. (1972). Human problem solving. Engle-wood Cliffs, NJ: Prentice Hall.
Nisbett, R. E., & Wilson, T. D. (1977). Telling more than we can know: Verbal protocols on mental processes. Psychological Review, 84, 231-259.
Olshavsky, R. W. (1979). Task complexity and contingent processing
identifying decision stRategies 807
8. Bröder (2002) also discussed the importance of tolerance limits (he uses the term error models) and stressed that even in the case of simple strategies, “we cannot expect people to use them completely error-free” (p. 224).
9. See, for example, Payne (1976, p. 372) for an illustration of many naturally scaled attributes in the context of an apartment selection task.
10. Other researchers, such as Mynatt, Doherty, and Dragan (1993) and Todd and Benbasat (1991), stress the relevance of Miller’s (1956) work in the context of process tracing as well.
11. Due to the fact that REC can be considered as a special case of LEX (i.e., the attribute option name is necessarily the most important attribute; see the definitions), we will consider only the more general LEX in the following.
12. Ford et al. (1989) found in their review that 35 of 45 process- tracing studies required participants to make a choice of one of the avail-able options. Seven studies required a rank order of options. Three stud-ies required both choice and a rank order of options.
13. Summers, Taliaferro, and Fletcher (1970) were among the first to suggest the idea of comparing theoretical predictions with actual judg-ments in the field of structural modeling. Later, others, such as R. L. Cook and Stewart (1975) and Harte and Koele (1995), adopted this idea.
14. Note that it is common practice in the field of process tracing to use one’s own measures in conjunction with existing measures to in-crease the discriminative power of a classification method. For example, Klayman (1985) used several measures he had developed himself in con-junction with Payne’s (1976) search index.
15. As is shown in Figure 4, the algorithm allows for a very precise discrimination of the 13 decision strategies. Only in four cases (DIS/SAT, DOM/MAJ, ADD/MCD, and EBA/LEX) can our algorithm not distin-guish between the 2 strategies in each case. Since the four decision strategy pairs differ by nuances only in each case (e.g., MCD is a rank order version of ADD that uses interval scales), we do not consider this a major limita-tion. However, using DecisionTracer in combination with verbal protocols may help discriminate the strategies used within each pair.
(Manuscript received October 29, 2007; revision accepted for publication February 1, 2008.)
tion processes: Methodological and conceptional issues. Acta Psy-chologica, 87, 65-84.
Wilkins, L. T. (1964). Appendix IV: Confidence and competence in de-cision making. In Social deviance: Social policy, action and research (pp. 294-304). London: Tavistock.
Williamson, J., Ranyard, R., & Cuthbert, L. (2000). A conversation-based process tracing method for use with naturalistic decisions: An evaluation study. British Journal of Psychology, 91, 203-221.
Wright, P., & Barbour, F. (1977). Phased decision strategies: Sequels to an initial screening (Research Paper No. 353). Stanford, CA: Stan-ford University, Graduate School of Business.
Yntema, D. B., & Torgerson, W. S. (1961). Man–computer coopera-tion in decision requiring common sense. IRE Transactions of Human Factors in Electronics, 2, 20-26.
NOTES
1. Ford et al. (1989, p. 88), in a review of 45 process-tracing studies, identified the work of Wilkins (1964) as the oldest one.
2. Computerized process tracing can be considered as the computer-assisted version of information display boards. Programs that were de-veloped in the early stages of information technology—that is, in the late 1970s and 1980s—are not explicitly listed above (see, e.g., Brucks, 1988; Dahlstrand & Montgomery, 1984; Payne & Braunstein, 1978).
3. Nonrisky means that outcomes are for sure and, therefore, there are no probability statements, as in the case of gambles. In the case of an information display matrix, the outcomes are the attribute values or utilities in the boxes of the matrix.
4. But compare, for example, Covey and Lovie (1998), who present a multi method approach in the field of risky decision making.
5. If a strategy selects two or more options, guessing is assumed.6. We use a slightly different version of REC, as compared with Gold-
stein and Gigerenzer (2002, p. 76), because their original version was de-veloped for binary choices only, whereas our definition includes choice situations with two or more options available.
7. Simulation, in the context of this article, means imitation of real information acquisition behavior (Klayman, 1982).