Embed Size (px)
Citation preview
A RE AAFFORD1ABiL'EýýR XRELI `E
R~sDOCKETED
USNRCSeptember 28, 2007
.!Advisbry Boaird
Arthur J, ("Jerry") KremerAdvisory Board Chairman
Kenneth Adams:The Business Council ofNew York State'
Richard.T. AndersonNew York nuildingCon gress
atick Curran"The Energy. Associafion ofNew York State.
Thomas DeJesus y
5pan Energy
•GaVin J Donohue"Independent PowerP"roduers of New York, Inc.
Dr. Marsha GordonThe Business Council ofWestchester
Anthony R Katz¢.Harbor Group
Communications
.-Tom Klein.!Boilermakers Local No.5
Jim KnubelBoard M~rmber
:-Norris McDonaldAifican'Am•erican"'Environmentalist-.'A'ssociation ' ,
•Ralph RanghelliI ntertitonal Brotherhood
of Electrical Workers 1049
Kathryn Wylde'Prtnership for
:.f.4Ww'York City
The Honorable Annette L. Vietti-CookSecretary of the CommissionU.S. Nuclear Regulatory CommissionWashington, D.C. 20555-0001
October 2, 2007 (8:00am)
OFFICE OF SECRETARYRULEMAKINGS AND
ADJUDICATIONS STAFF
Docket Nos. 50-247 and 50-286
Sent via overnight delivery and U.S. Mail
Dear Secretary Vietti-Cook:
The New York Affordable Reliable Electricity Alliance (New York AREA) herebyrequests approval by the U.S. Nuclear Regulatory Commission (NRC) and allappropriate agencies that we be recognized as a party to any proceeding dealingwith the license renewal application of Indian Point Unit 2 (DPR-26) and/or IndianPoint Unit 3 (DPR-64).
After reviewing the application submitted by Entergy and after reviewing theNRC's process to review that application, we conclude that a formal hearing is notnecessary to assure Public Health and Safety. However, knowing that others mayraise issues that the Licensing Board may conclude merits a formal hearing, weformally request acceptance as a party to any such proceedings.
New York AREA, located at 347 Fifth Avenue, Suite 508, New York, NY 10016,with the phone number (212) 683-1203, is a 501 (c)(6) not-for-profit tradeassociation established to conduct business in the State of New York. Our missionis to advocate for our members on energy-related issues in the State of New York.We have a diverse membership that includes business, organized labor, community-based and trade groups as well as professionals from across a broad spectrum ofbackgrounds and professions. Attached is a list of some of our members.
New York AREA should be a party to any proceeding concerning the Indian Pointpower plants for the following reasons:
1. Two of our members (Con Edison and the New York Power Authority) arewholesale purchasers of the output from the Indian Point units and have a vestedinterest in license renewal of these units.
2. Mr. James Knubel, 14 Angela Drive, Putnam Valley, NY 10579, is a member ofour Advisory Board and lives approximately six (6) miles from the Indian Pointsite. Other Advisory Board and regular members of New York AREA alsoreside within close proximity to the site.
%347 Fifth Avenue., Suite 508 - New York, NY 10016 * 2.12.683.1203 * Fax: 212-683-8481
••,. •..:: : ti rn If o @ "a r'. 6:' :a:;.- :a I:: i ý c:: ": e ? 'o r': a + . + W w :w ..a: r e a ý:-:a ~ a :-n c:ie :?)+:,o . r:~ [email protected]~rg wwware-allanc~o9
I ,Me _

3. As parties who will be directly affected by any decision with respect to licenserenewal and the direct impact any Licensing Board decisions would have on ourmembers, and the fact that our members live and do business in close proximityto the Indian Point site, we conclude that we have a right and obligation toparticipate in any proceedings.
Among the many business organizations from throughout the state that are in ourmembership, the Business Council of Westchester and the Westchester CountyAssociation are two local groups that represent the business community inWestchester County. Together, they represent over 1,500 businesses andorganizations that employ thousands of Westchester and Hudson Valleyresidents, many who live and work near Indian Point. Other local businessorganizations include the Rockland Business Association, the African-AmericanMen of Westchester, and the Westchester Hispanic Chamber of Commerce.
Additionally, there are many labor unions who are members of our coalitionwhose members work at Indian Point and live in the vicinity of the plant. TheCarpenters, Millwrights & Machinery Erectors, Boilermakers, and UtilityWorkers of America represent hundreds of families whose livelihood depends onIndian Point's continued operation.
4. Any decision by the Licensing Board with respect to the license renewal of theIndian Point plants will have an immediate and direct impact on our organizationand its members.
A:. A decision to not grant license renewal will cause two of our memberorganizations to lose their low cost supplier of bulk power and will requirethat they seek higher priced alternative suppliers.
B. As shown in an April 2004 study conducted by the Nuclear Energy Institute("Economic Benefits of Indian Point Energy Center," attached), there will bea severe economic impact on the community should the Indian Point unitsberequired to shutdown.
C. An April 2002 study by National Economic Research Associates ("ElectricitySystem Impacts of Nuclear Shutdown Alternatives") shows that without theIndian Point plants, grid reliability will suffer and the likelihood of blackoutswill increase by 700 percent.
D. The National Academy of Sciences (NAS) published a report in 2006 whichconcluded that even with both of the Indian Point units operating that therewould be a severe shortfall of electric supply for the lower Hudson Valleyregion of New York.
NAS also concluded that it would be POSSIBLE (emphasis added) to meetthe region's electrical supply needs without the Indian Point plants.
347 Fifth Avenue, Suite 508 - New York, NY 10016 - 212.683.1203 , Fax: 212-683-8481
i n fo @ a r e a- a I a n c e. o r g w ww. a r e a- a I a n c e. o r g

The report went on to state that this could only be accomplished if eightactions/steps were taken and all eight steps would have to occur for even thepossibility to exist. To date not one single action deemed necessary by theNAS to replace. Indian Point's energy has occurred.
E. The southeast portion of New York State is a "non-attainment" region froman air quality standpoint. Any alternative to License Renewal for the IndianPoint units would adversely affect air quality in the region.
F. From the perspective of Environmental Justice, any decision that deniesLicense Renewal or reduces total plant output will have a disproportionatelyadverse impact on lower income and minority communities. This will takethe form of higher electric bills and increased air pollution.
This is of particular interest to a number of our member organizations.including the African American Chamber, of Commerce of Westchester, theAfrican American Men of Westchester, and the African AmericanEnvironmentalist Association.
Finally, the Indian Point nuclear power plants have operated with an excellentsafety record. The NRC's Reactor Oversite Process (ROP) has shown that the unitsare operated in a fashion that meets NRC requirements and ensures the "Health andSafety" of the public.
The current regulatory procedural template used by the NRC for License Renewalis a good one. There are those who have demanded that the process be changed.We whole-heartedly disagree. New York AREA and its members feel strongly thatthe process used by the NRC on more than 48 plants nationwide is proven,technically sound and will result in a fair review of the plants.
III summary, we, New York AREA, support the License Renewal for Indian PointUnits 2 & 3. We support the current methodology used by the NRC for LicenseRenewal. We do not believe a formal hearing is necessary nor would it add anyvalue to the process. If, however, the Licensing Board concludes that a hearing isrequired, as an organization with a vested interest in Indian Point we hereby requestthat we be granted full-party status as an interested party in any and all proceedings.
We appreciate your consideration in this important matter.
Sincerely,
,'7
Arthur "Jef•y" KremerChairman
347 Fifth Avenue, Suite 508 N New York, NY 10016 2 12.683.1203 * Fax: 212-683-8481
. i n f o @ a r e a- a a n ce. o r g www.. a r ea-a I a n ce o rg

Advisory Board
Arthur J. ("Jerry") KrmmerAdvisory Board Chairman
Kenneth AdamsThe Business Council ofNew York State
Richard T. AndersonNew York BuildingCongress
Patrick CurranThe Energy Association ofNew York State
Thomas DeJesuKeySpan Energy
Gavin J. DonohueIndependent PowerProducers of New York. Inc.
Dr. Marsha GordonThe Business Council ofWestchester
Anthony R. KatzHarbor GroupCommunications
Tom KleinBoilermakers Local No.5
Jim KnubelBoard Member
Norris McDonaldAfrican AmericanEnvironmentalistAssociation
Ralph RanghelliInternational Brotherhoodof Electrical. Workers. 1049
Kathryn WyldePartnership forNew York City
NEW YORK AREA MEMBERSHIP
African American EnvironmentalistAssociation
African American Chamber OfCommerce
Aquarius Services CorporationAssociated Builders & Owners
of Greater New YorkAssociation for Energy AffordabilityAutomatic Meter Reading CorporationBoilermakers Local Lodge No. 5Braemar Energy VenturesBronx Chamber of CommerceBuilding & Construction Trades Council of
Nassau & Suffolk CountiesBuilding Contractors AssociationBuilding Trade Employers AssociationBusiness Council of New York StateBusiness Council of WestchesterChappaqua Capital ConsultantsCINN Worldwide. Inc.Clean Energy Systems - New York, LLCCommunications Workers of America
(Local 1103)Consolidated EdisonConstruction Industry Council of
Westchester &lHudson Valley, Inc.Construction Contractors Association of the
Hudson ValleyE-J Electric Installation Co.Energy Association of New York StateEnergy SpectrumEnsign Engineering, PCEntergy NuclearFire Alarm Dispatchers Benevolent
AssociationForest ElectricG.A.L. Manufacturing CorporationGeneral Contractors Association of NYGenergy Holding Company, LLCGreater New York Chamber of CommerceHarbor Group CommunicationsHarris InteractiveHudson Research, Inc.
Independent Power Producers of New YorkInternational Association of Heat Insulators
(Local 12)International Brotherhood of Electrical
Workers (Local 1049)International Brotherhood of Electrical
Workers (Local 1381)International Brotherhood of Electrical
Workers (Local 2230)International Brotherhood of Electrical
Workers (Local 3)International Union of Operating Engineers
(Local 138, 138A & 138B)J. A. Fitzpatrick Nuclear PlantKeySpan EnergyLong Island City Business Development
CorporationMichael F. Adanuncio Electric, Inc.Millwrights and Machinery Erectors
(Local 740)Moore Development GroupNational Field Service CorporationNational Taxpayers UnionNew York Building CongressNew York Capitol Consultants, Inc.New York City Central Labor CouncilNew York City District Council of
CarpentersNew York City Economic Development
CorporationNew York Electrical Contractors
Association, IncNew York Power AuthorityNew York Regional InterconnectionNew York State Correctional Officers &
Police Benevolent AssociationNew York State Hispanic Chambers of
CommerceNew York State Restaurant AssociationNuclear Energy InstituteOrange County Chamber of CommercePalladium Equity Partners
347 Fifth Avenue, Suite 508 , New York, NY 10016 - 212.683.1203 - Fax: 212-683-8481
S : . i n f o @ a r e a- a I a n ce o r g w w w a r ea-a lia nce o r gA S.;•-. .. •.':,•';• . •• k

NEW YORK AREA MEMBERSHIP (CONTINUED)
Paper Enterprises, IncPartnership for New York CityPlumbers Local IPoughkeepsie Area Chamber of CommercePratt Center for Community Development /
NY Energy SmartQueens Chamber of CommerceReal Estate Board of New YorkRent Stabilization Association of New York
City.Rockland Business AssociationScientific Fire Prevention CompanySmall Business Survival CommitteeSteamfittersSubcontractors Trade AssociationTile, Marble, and Terrazzo Local 7 of New
York and New JerseyTransCanadaTransGasUnited Food and Commercial Workers
Local 1500United Seniors AssociationUtility Workers Union of America Local 1-2West Side Federation for Senior &
Supportive HousingWestchester County AssociationWHEDCoZNC International Inc.
347 Fifth Avenue, Suite 508 * New York, NY 10016 * 212.683.1203 Fax: 212-683-8481
0 a aoI a nc e o r g

EconomicBenefits of
Indian PointEnergy Center
An Economic Impact
Study by the
Nuclear Energy Institute
N.E: IENERGN U S L E A RE N E R• G Y
IN S T IT U T E

EconomicBenefits of
Indian PointEnergy Center
An Economic Impact
Study by the
Nuclear Energy Institute
April 2004
1l U C L E A R
E Nl E R 6 Y
INSTITUTE
©2004

2
Economic Benefits of Indian Point Energy Center
Contents
Executive Sum m ary ............................................................................................................................................. 5
Section I: Introduction ....................................................................................................................................... 7
Section 2: The Indian Point Energy C enter ........................................................................................... 9
Section 3: Econom ic and Fiscal Im pacts ................................................................................................... 17
Section 4: Additional Benefits Provided by Indian Point ......................................................................... 29
Section 5: N uclear Industry Trends ......................................................................................................... 35
Section 6: Econornic Im pact A nalysis M ethodology ............................................................................. . 41
3

4

Economic Benefits of Indian Point Energy Center
Executive Summary
The Indian Point Energy Center in Buchanan, N.Y., is an integral part of the local economy. Theplant provides jobs and makes purchases that stimulate the local economy directly and indirectly.Among the tangible benefits that the plant provides to the area are jobs, taxes, economic output andlabor income, together with contributions to the local community. And there are other intangiblebenefits to tie region, such as clean air and low, stable electricity prices. Indian Point's economicimpact reaches beyond the local community to the state and even the national level.
The total economic impact of the Indian Point plant on Westchester, Orange, Rockland, Putnamand Dutchess counties tfor 2002 was S763.3 million. Indian Point's total impact on New Yorkstate's economy for the same period was $81 1.7 million and $1.5 billion for the U.S. economy.The plant's total economic impact includes direct effects, which comprise the value of plantoutput, as well as secondary effects resulting from plant operation.
In 2002, the Indian Point Energy Center employed 1,683 people (including Entergy NuclearNortheast's headquarters in White Plains). Eighty percent live in the five-county area surroundingthe plant, including an estimated 302 employees in Westchester County, 646 in Dutchess Countyand 249 in Orange County. Ini addition, these jobs pay salaries that are on par with the highaverage salaries of Westchester County and are on average 12 percent higher than salaries inRockland and Putnam counties, and 45 percent higher than average salaries inOrange andDutchess counties.
The economic activity generated by Indian Point creates another 1.200 jobs in the five-countyregion. Given the combination of employees at the plant and secondary jobs created by IndianPoint's economic activity, the plant is responsible for 2,500 jobs in Westchester, Orange,Rockland, Putnam and Dutchess counties.
The main expenditure of the Indian Point plant in the local area is employee compensation.During the study period, Indian Point paid $126.6 million in compensation to employees living inthe five counties near the plant and an additional $19.3 million to employees in New York statewho reside outside these counties. Additionally, the economic activity created by the IndianPoint plant accounted for $44.8 million in employee compensation in the surrounding fivecounties and an additional $65.2 million in other areas of the state. Together, the direct andindirect compensation from the plant accounts for $171.4 million in labor income in the fivecounties and an additional $39.7 million in other areas of New York state.
The Indian Point plant makes substantial purchases in the region. In 2002, the plant madeS287.7 mnillion in purchases, including $54.9 million in New York state and $16.8 million inWestchester, Orange, Rockland, Putnam and Dutchess counties. Economic activity generated bythe Indian Point plant also led to $113.3 million in increased economic production in the fivecounties and $48.4 million throughout the rest of New York state.
fn 2002, the Indian Point plant paid S25.3 million in taxes to entities within Westchester County.This represented approximately 87.6 percent of total tax revenues in the village of Buchanan and93 percent of the total tax revenues of the Hendrick Hudson Central School District. Further, theeconomic activity generated by Indian Point contributed another S24.4 million in state and localtaxes, through increased income, property and sales taxes. By combining the direct and indirecttaxes, the Indian Point plant accounts for $49.7 million in state and local tax payments.
In addition to the direct economic benefits provided by Indian Point, the plant generated15.7 billion kilowatt-hours (ckWh) of electricity im' 2002, approximately II percent of New Yorkstate's electricity needs. This low-cost electricity helped keep energy prices in New York state
5

Economic Benefits of Indian Point Energy Center
affordable. A 2002 study, ElectricitI S'stem Impacts of Nuclear Shitclot'n 41terniatives,estimates that if Indian Point were shut down, wholesale electricity prices in the downstateNew York area would increase between 13 percent and 25 percent. The report was prepared byGeneral Electric Systems Energy Consulting and National Economic Research Associates.
Indian Point also plays a vital role in maintaining regional air quality. Estimates indicate that inthe absence of Indian Point, the state's nitrous oxide emissions would be 19 percent higher andsulfur dioxide emissions would be 11 percent higher because fossil-fueled power plants wouldoffset Indian Point's electricity production. Additionally, carbon dioxide emissions, which havebeen linked to global warming, would be 20 percent higher.
Indian Point also is an integral part of the community, with civic involvement that ranges fromparticipating in numerous charitable organizations to investing in the area's infrastructure throughmajor donations to government, hospitals and schools. Without Indian Point, many smallerchatities and local organizations would suffer disproportionately, given their dependence on thecompany and plant employees for both volunteers and financial resources.
6
Economic Benefits of Indian Point Energy Center
Section I: Introduction
This economic study, conducted by the Nuclear Energy Institute' (NEI), examines the economic,fiscal and community benefits-together with other benefits-provided by the Indian Point plant,which is owned by Entergy 2. Benefits analyzed include those to the five counties within the plantcommunity: Westchester, Orange, Rockland, Putnam and Dutchess. Impacts throughout bothNew York state and the United States are also reviewed. The study draws on detailed data fromthe plant to assess these benefits.
Although this study focuses primarily on the benefits to the local community, state and nationalimpacts also are calculated. These include direct impacts--such as people employed by tile plant,plant expenditures within the community, and corporate tax paymnents-and indirect impacts,such as jobs created indirectly by plant expenditures in the local economy. The study alsoincludes other benefits provided by the plant, such as reliable, low-cost electricity, the benefits ofa clean-air source of electricity and other contributions to the local community.
Entergy and NEl cooperated in developing this study. Entergy provided data on Indian Pointemployment, operating expenditures and tax payments, as well as guidance on particular detailsspecific to the local area and the plant. NEI coordinated the project and applied Impact Analysisfor Planning (IMPLAN), a nationally recognized economic model to estimate the direct andindirect impacts of the plant on the local community. The methodology employed in this studywas developed by RTI International, a nonprofit research organization in Research Triangle Park,N.C. This is the third such study that NEI has undertaken with a member company.
This report includes the following sections:
o Section 2 provides background on the Indian Point plant, including plant history,performance, cost, employment, taxes and local area details, such as total employmentand earnings.
" Section 3 examines the economic and fiscal impacts of the plant on the local, state andnational leveis.
o Section 4 provides data on benefits not captured by the model.o Section 5 outlines recent trends in the nuclear industry as a whole, especially in cost,
performance and safety.* The final section discusses the methodology used in the study, including the economic
modeling software employed as part of this effort.
The Nuclear Energy Institute is the nuclear energy industiy's policy organization. Additional infonnation
about nuclear energy is available oin NEI's Web site at http.'/v"w'.nei.org.
2 Entergy Nuclear Indian Point 2, LLC and Entergy Nuclear Indian Point 3, LLC are the respective owners
of Indian Point 2 and Indian Point 3. Entergy Nuclcar Operations Inc. is the operator of both units.
7

8

Economic Benefits of Indian Point Energy Center
Section 2: The Indian Point Energy Center
This section provides background information onl the Indian Point plant and the suI'oundingcounties of Westchester, Orange, Putnam, Rockland and Dutchess, including a brief histo.y of theplant, as well as information on its performance, employment and taxes. This section alsoincludes local area details, such as total employment, earnings, local tax collections and regionalelectricity costs for the village of Buchanan, the five counties suI'ounding the plant and NewYork state.
2.1 History and Information
Indian Point Energy Center is on the east bank of the Hudson River, about 25 miles north of NewYork City. The plant lies within Buchanan, a village of more than 2,000 residents. Buchanan isin the town of Cortlandt, which is inhabited by about 29,000 people. Cortlandt is part ofWestchester County, home to roughly 920,000.
Indian Point was built by Consolidated Edison Co., the New York City metropolitan area'sprimary utility. Indian Point I, a 275-megawatt pressurized water reactor, began producingelectricity in 1962.
Two more reactors were added at Indian Point in 1974 and 1976. lndian Point I was permanentlyshut down in 1974 because revised Nuclear Regulatory Commission requirements for upgradingthe emergency core cooling system and the.price of fuel oil for the oil-fired system heaters madecontinued operation no longer cost effective. The Unit I technology differed from reactors builtin the 1970s, such as Indian Point 2 and 3. Unit I is currently in decommissioning and is beingkept in long-term, safe storage until Units 2 and 3 cease to operate. At that time, the threereactors will be dismantled concurrently.
Today, all three of the Indian Point reactors are owned by Entergy, which bought Indian Point 3from the New York Power Authority in 2000, and purchased Units I and 2 from Con Edison in2001. Today, Entergy operates 10 reactors in six states.
Indian Point 2's license allows it to operate until 2013, while Indian Point 3 can continue tooperate until 2015. Entergy has announced that it plans to submit license renewal applications forsome of its Northeast plants starting in 2005.
Table 2- 1. The Indian Point Energy Center at a Glance
Commercial Year of LicenseUnit Capacity (MW) Operation Year Expiration Reactor Type
Unit I 275 1962 In Decommissioning PWR
Unit 2 984 1974 2013 PWRUnit 3 994 1976 2015 PWR
PWR = pressurized water reactor; MW = megawatts
9

Economic Benefits of Indian Point Energ-y Center
Indian Point Energy Center andSurrounding Area
ST. .WMIPE*
Ci' TOT.
IN
"4it iPizR
%v hi t
.wlk
CiiiI IAS I;NN
1 .. r.-Aht I F Ti
Hlic N)"1@ NON
AI .- C.i;~ I IJStG '0 - Lj
Ch- tiOOA DFUMIA 'wF
NEESI-C)
sill Svii
-HAT -- £-i~E
10
Economic Benefits of lndian Point Energy Center
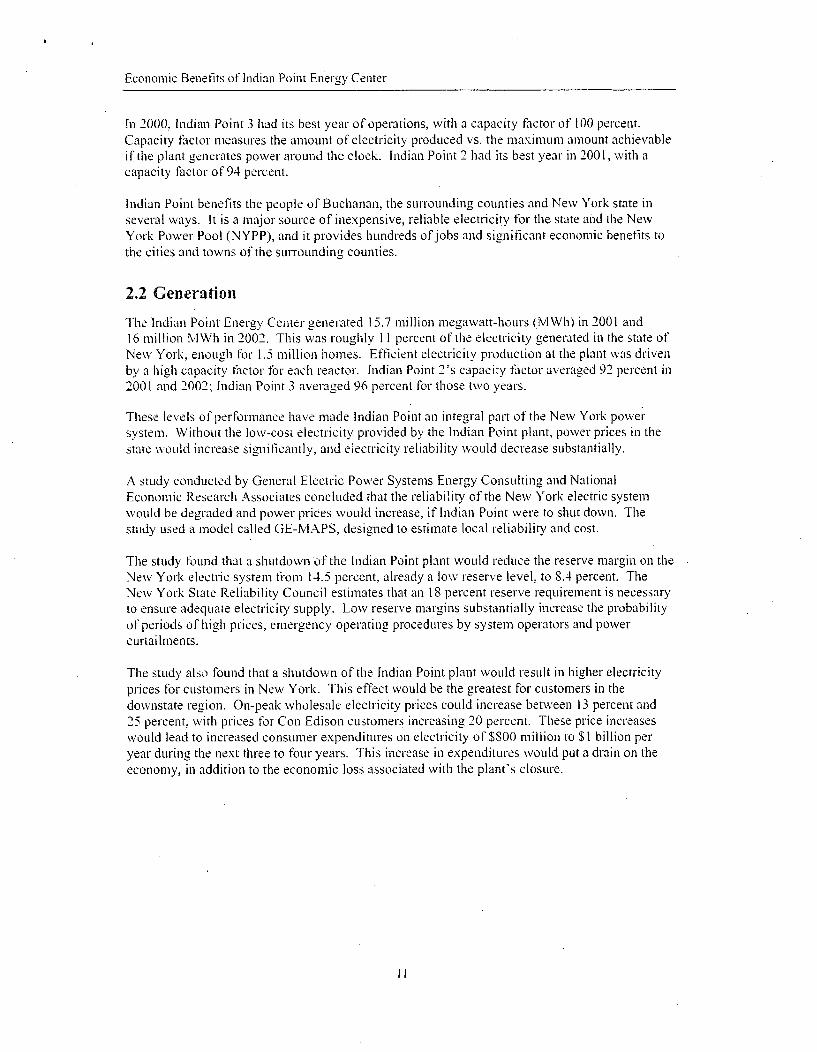
In 2000, Indian Point 3 had its best year of operations, with a capacity factor of 100 percent.Capacity factor measures the amount of electricity produced vs. tile maxinmum amount achievableif the plant generates power around thle clock. Indian Point 2 had its best year in 2001, with acapacity factor of 94 percent.
Indian Point benefits the people of Buchanan, the surrounding counties and New York state inseveral ways. It is a major source of inexpensive, reliable electricity for the state and the NewYork Power Pool (NYPP), and it provides hundreds ofjobs and significant economic benefits tothe cities and towns of tile surrounding counties.
2.2 Generation
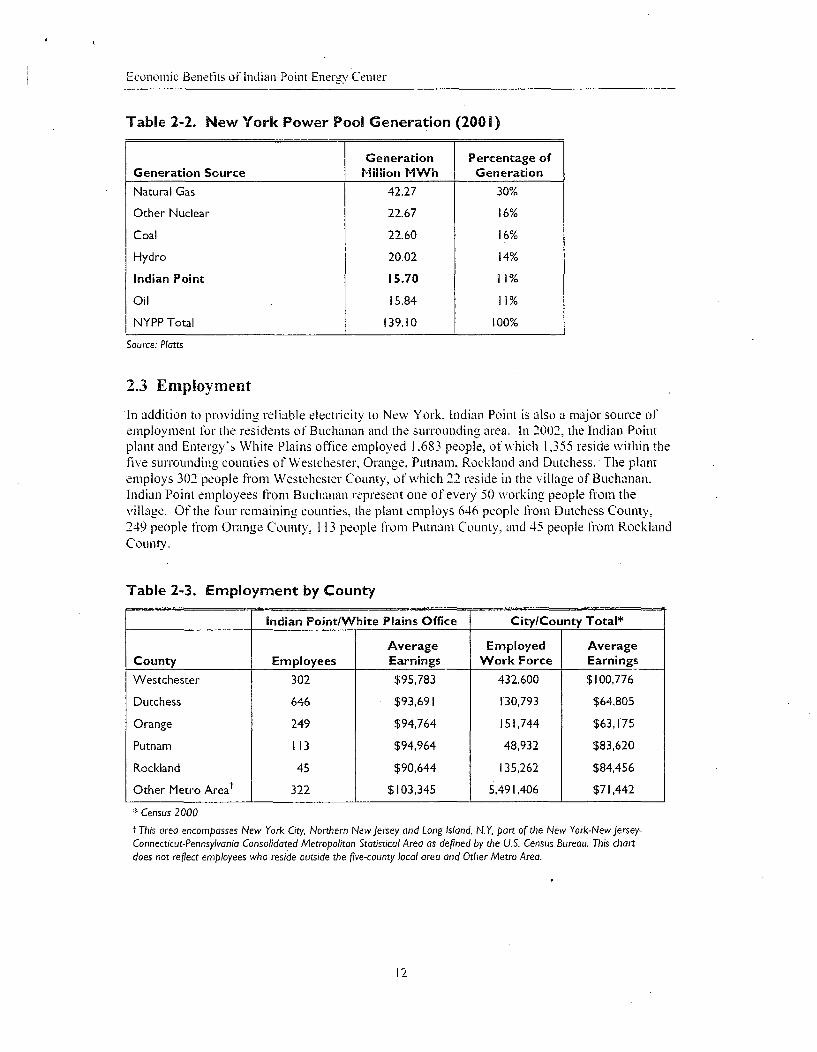
The Indian Point Energy Center generated 15.7 million megawatt-hours (MWh) in 2001 and16 million MWh in 2002. This was roughly I I percent of the electricity generated in the state ofNew York, enough for 1.5 million homes. Efficient electricity production at the plant was drivenby a high capacity factor tbr each reactor. Indian Point 2's capacity factor averaged 92 percent in2001 and 2002; Indian Point 3 averaged 96 percent for those two years.
These levels of performance have made Indian Point an integral part of the New York powersystem. Without the low-cost electricity provided by the Indian Point plant, power prices in thestate would increase significantly, and electricity reliability would decrease substantially.
A study conduicted by General Electric Power Systems Energy Consulting and NationalEconomic Research Associates concluded that the reliability of the New York electric systemwould be degraded and power prices would increase, if Indian Point were to shut down. Thestudy used a model called GE-MAPS, designed to estimate local reliability and cost.
The study found that a shutdown of the Indian Point plant would reduce the reserve margin on theNew York electric system from 14.5 percent, already a low reserve level, to 8.4 percent. TheNew York State Reliability Council estimates that an l18 percent reserve requirement is necessaryto ensure adequate electricity supply. Low reserve margins substantially increase the probabilityof periods of high prices, emergency operating procedures by system operators and powercurtailments.
The study also found that a shutdown of the Indian Point plant would result in higher electricityprices for customers in New York. This effect would be the greatest for customers in thedownstate region. On-peak wholesale electricity prices could increase betwveen 13 percent and25 percent, with prices for Con Edison customers increasing 20 percent. These price increaseswould lead to increased consumer expenditures on electricity of $800 million to $1 billion peryear during the next three to four years. This increase in expenditures would put a drain on theeconomy, in addition to the economic loss associated with the plant's closure.
I I
Economic Benefits of Indian Point Energy Center
Table 2-2. New York Power Pool Generation (2001)
Generation Percentage of
Generation Source Million MWh Generation
Natural Gas 42.27 30%
Other Nuclear 22.67 16%
Coal 22.60 16%
Hydro 20.02 14%
Indian Point 15.70 11%
Oil 15.84 11%
NYPP Total 139.10 100%
Source: Platts
2.3 Employment
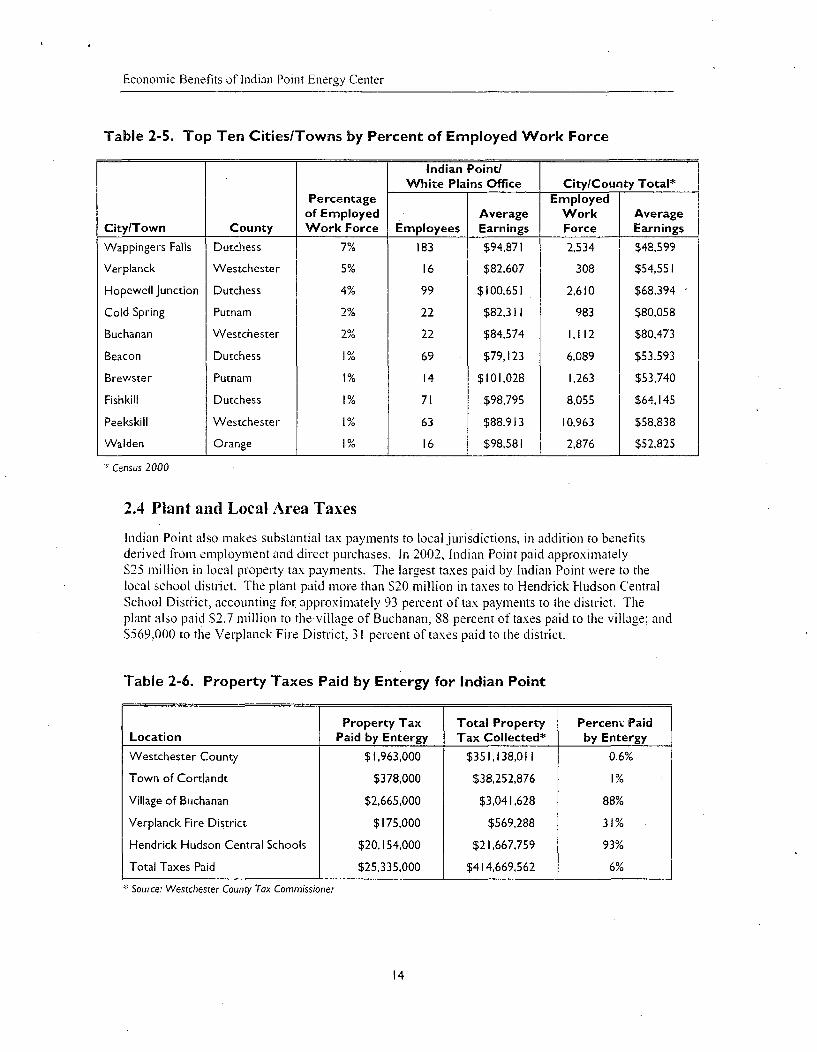
In addition to providing reliable electricity to New York, Indian Point is also a major source ofemployment for the residents of Buchanan and the suIrounding area. In 2002, the Indian Pointplant and Entergy's White Plains office employed 1,683 people, of which 1,355 reside within thefive surrounding counties of Westchester, Orange, Putnam. Rockland and Dutchess. The plantemploys 302 people from Westchester County, of which 22 reside in the village of Buchanan.Indian Point employees from Buchanan re'present one of every 50 working people from thevillage. Of the four remaining counties, the plant employs 646 people from DLutchess C'ounty,
249 people from Orange County, 113 people fiom Putnam County, and 45 people from RocklandCounty.
Table 2-3. Employment by County
Indian Point/White Plains Office City/County Total*
Average Employed AverageCounty Employees Earnings Work Force Earnings
Westchester 302 $95,783 432.600 $100,776
Dutchess 646 $93,691 130,793 $64,805
Orange 249 $94,764 151,744 $63,175
Putnam 113 $94,964 48,932 $83,620
Rockland 45 $90,644 135,262 $84,456
Other Metro Areat 322 $103,345 5,491,406 $71,442
Census 2000This area encompasses New York City, Northern New Jersey and Long Island, N.Y, part of the New York-NewJersey-
Connecticut-Pennsylvania Consolidated Metropolitan Statistical Area as defined by the U.S. Census Bureau. This chartdoes not reflect employees who reside outside the five-county local area and Other Metro Area.
12

Economic Benefits of Indian Point Energy Center
Jobs provided by the Indian Point plant also are typically higher paying than most jobs in thearea. Employees at Indian Point earned on average about $95,000 in 2002, including salary andovertime. This is almost 50 percent higher than the average salary in New York state, which isabout $64,000 a year. Plant employees residing in the village of Buchanan had average earningsof $84,574, about 5 percent higher than average earnings in the village. Indian Point employeesfrom four of the five counties suiTounding the plant had higher average earnings than the averagesalaries in the counties in which they reside.
in addition to the jobs provided by Indian Point, the plant also spends a large amount of money inthe local community. In the one-year period of this study, the Indian Point plant made$11. 1 million worth of purchases in Westchester County and an additional $6 million inDutchess, Orange, Putnam and Rockland counties.
Table 2-4. Top Ten Cities/Towns by Total Employees
Indian Point/White Plains Office City/County Total*
Average Employed AverageCity/Town County Employees Earnings Work Force Earnings
Wappingers Falls Dutchess 183 $94,871 2,534 $48,599
Poughkeepsie Dutchess 109 $93,784 20,105 $63,440
Hopewell Junction Dutchess 99 $100,651 1,430 $68,394
Fishkill Dutchess 71 $98,795 8,055 $64,145
Beacon Dutchess 69 $79,123 6,089 $53,593
Peekskill Westchester 63 $88,913 10,963 $58,838
Newburgh Orange 57 $81,047 13,731 $67,739
Cortlandt Manor Westchester 36 $95,875 19,052 $94,147
Middletown Orange 24 $94,690 10,852 $51,708
Buchanan Westchester 22 $84,574 1,112 $80,473
:ý' Census 2000
13
Economic Benefits of Indian Point Energy Center
Table 2-5. Top Ten Cities/Towns by Percent of Employed Work Force
Indian Point/White Plains Office City/County Total*
Percentage Employedof Employed Average Work Average
City/Town County Work Force Employees Earnings Force Earnings
Wappingers Falls Dutchess 7% 083 $94,871 2,534 $48,599
Verplanck Westchester 5% 16 $82,607 308 $54,551
Hopewell Junction Dutchess 4% 99 $100,651 2,610 $68,394 -
Cold Spring Putnam 2% 22 $82,31 I 983 $80,058
Buchanan Westchester 2%" 22 $84,574 1, 112 $80,473
Beacon Dutchess /0 69 $79,123 6,089 $53,593
Brewster Putnam 1% 14 $101,028 1,263 $53,740
Fishkill Dutchess 1% 71 $98,795 8,055 $64,145
Peelkskill Westchester I11 63 $88,913 10,963 $58,838
Walden Orange 1% 16 $98,581 2,876 $52,825
Census 2000
2.4 Plant and Local Area Taxes
Indian Point also makes substantial tax payments to local jurisdictions, in addition to benefitsderived fr'om employment and direct purchases. In 2002, Indian Point paid approximatelyS25 million in local property tax payments. The largest taxes paid by Indian Point were to thelocal school district. The plant paid more than 520 million in taxes to Hendrick Hudson CentralSchool Distr'ict, accounting for approximately 93 percent of tax payments to the district. Theplant also paid $2.7 million to thevillage of Buchanan, 88 percent of taxes paid to the village; andS569.,000 to the Verplanck Fire District, 3 1 percent of taxes paid to the district.
Table 2-6. Property Taxes Paid by Entergy for Indian Point
Property Tax Total Property Percent: PaidLocation Paid by Entergy Tax Collected* by Entergy
Westchester County $1,963,000 $35 1,138,011 0.6%
Town of Cortlandt $378,000 $38,252,876 1%
Village of Buchanan $2,665,000 $3,041,628 88%
Verplanck Fire District $175,000 $569,288 31%
Hendrick Hudson Central Schools $20,154,000 $21,667,759 93%
Total Taxes Paid $25,335,000 $414,669,562 6%
* Source: Westchester County Tax Commissioner
14

Economic Benefits of Indian Point Energy Center
2.5 Summary
The performance of the Indian Point plant mirrors the performance of the nuclear industry as awhole. Indian Point provides reliable electricity generation and keeps power prices affordable indownstate New York. The plant also offers well-paid employment to Westchester andsurrounding counties and a large tax base to Westchester County and the local jurisdictionsaround the plant. However, these are only the direct economic benefits of the plant. Asillustrated in the next section, the secondary effects on the local and regional economies are aslarge as the direct benefits.
15

16
Economic Benefits of Indian Point Energy Center
Section 3: Economic and Fiscal Impacts
The economic and fiscal effects of Indian Point go well beyond employee benefits, purchases ofgoods and services, salaries, taxes, and wages. They also reflect the strong stimulus that IndianPoint's large wage and salary payments provide to key measures of economic activity-the valueof electricity production, employment and labor income-in the local and state economies.
Indian Point's spending lifts economic activity throughout the local and state economies, as wellas tax payments related to economic activity. This multipliereffect is felt throughout the localand state economies-by the private sector in the form of increased sales and employment and bythe public sector through increased tax revenues to support public services.
Estimates of these effects were developed by applying the IMPLAN model to expenditure dataprovided by Entergy, owner of the Indian Point plants. (For more information on IMPLAN., seeSection 6.)
3.1 Plant Expenditures in Westchester, Rockland, Orange, Putnamand Dutchess Counties
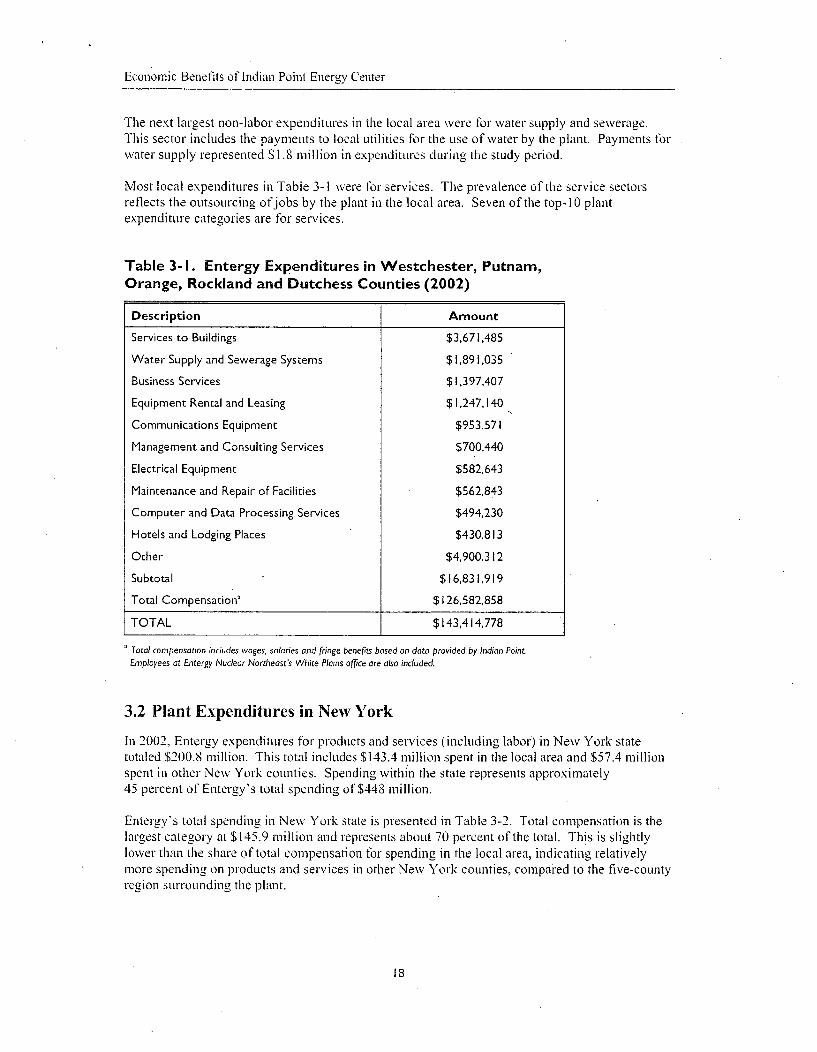
Indian Point and White Plains office expenditures for products and services (including labor) inlWestchester, Rockland, Putnam, Orange and Dutchess counties totaled $143.4 million for 2002.Spending within the local area represents approximately 30 percent of Indian Point's totalspending of $448.8 million and approximately three-quarters of the $200.8 million of spending inNew York state.
The expenditure totals for the local area were provided by Entergy and are shown in Table 3-1.The 10 sectors receiving the largest amount of Entergy spending are listed in the table accordingto the amount spent in the local area. The categories are chosen from among 528 IMPLANsectors and are listed largely according to the IMPLAN description for each. Total compensation,which includes benefits, salaries and wages, is listed separately.
Similar expenditure totals for New York state and the United States are presented in Tables 3-2and 3-3, respectively. Expenditure totals for the local area are included in the totals for NewYork state in Table 3-2, and for the United States in Table '3-3.
By far, the largest expenditures made by Entergy in the local area were for labor. Totalcompensation for labor services was $126.6 million-approximately 90 percent of Entergy'sexpenditures in the study area. This reflects the fact that most of Indian Point's expenditures forlabor services (wages, salaries and employee benefits) are made locally. Naturally, this share forthe five counties surrounding Indian Point is much larger than that of New York state and theUnited States.
Building services represented the largest non-labor expenditures in the local area at $3.7 million.This sector includes all of the maintenance activities performed at the plant by outsidecontractors. Most of these services relate to the maintenance of plant facilities, such as janitorialservices., landscaping, pest control and plumbing. Although these are non-labor expenses, theactivities are typically labor intensive and thus mainly represent personnel costs and local jobs.
17
Economic Benefits of Indian Point Energy Center
The next largest non-labor expenditures in the local area were for water supply and sewerage.This sector includes the payments to local utilities for the use of water by the plant. Payments forwater supply represented S1.8 million in expenditures during the study period.
Most local expenditures in Table 3-1 were for services. The prevalence of the service sectorsreflects the outsourcing of jobs by the plant in the local area. Seven of the top-10 plantexpenditure categories are for services.
Table 3-I. Entergy Expenditures in Westchester, Putnam,Orange, Rockland and Dutchess Counties (2002)
Description AmountDescription AmountServices to Buildings
Water Supply and Sewerage Systems
Business Services
Equipment Rental and Leasing
Communications Equipment
Management and Consulting Services
Electrical Equipment
Maintenance and Repair of Facilities
Computer and Data Processing Services
Hotels and Lodging Places
Other
Subtotal
Total Compensation'
$3,671,485
$1,891.035
$1,397,407
$1,247,140
$953.571
$700,440
$582,643
$562,843
$494,230
$430,813
$4,900.312
$16,831,919
$126,582,858
TOTAL $143,414.778
Total compensation inciudes wages, salaries and fringe benefits based on data provided by Indian Point.Employees at Entergy Nuclear Northeast's White Plains office are also included.
3.2 Plant Expenditures in New York
In 2002, Entergy expendilures for products and services (including labor) in New York statetotaled S200.8 million. This total includes $143.4 million spent in the local area and $57.4 millionspent in other New York counties. Spending within the state represents approximately45 percent of Entergy's total spending of S448 million.
Entergy's total spending in New York state is presented in Table 3-2. Total compensation is thelargest category at $145.9 million and represents about 70 percent of the total. This is slightlylower than the share of total compensation for spending in the local area, indicating relativelymore spending on products and services in other New York counties, compared to the five-countyregion surrounding the plant.
18
Economic Benefits of Indian Point Energy Center
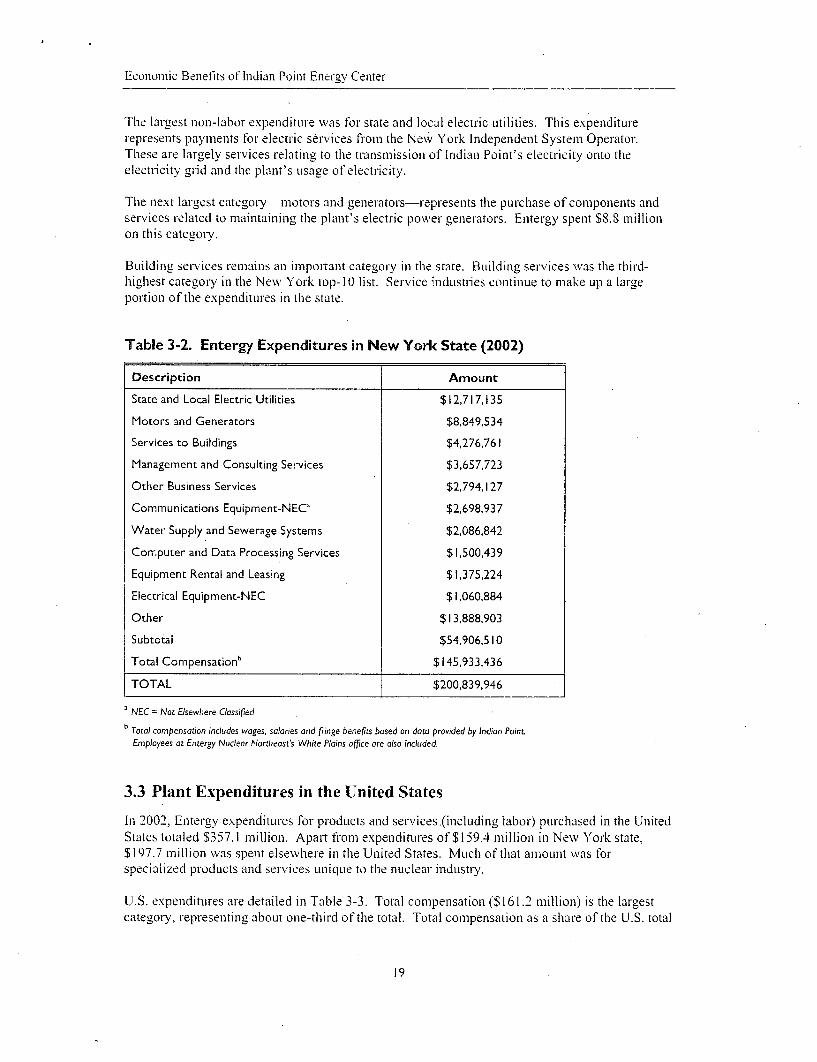
The largest non-labor expenditure was for state and local electric utilities. This expenditurerepresents payments for electric services from the New York Independent System Operator.These are largely services relating to the transmission of Indian Point's electricity onto theelectricity grid and the plant's uisage of electricity.
The next largest category-motors and generators-represents the putrchase of components andservices related to maintaining the plant's electric power generators. Entergy spent S8.8 millionon this category.
Building services remains an important category in the state. Building services was the third-highest category in the New York top-I10 list. Service industries continue to make itp a largeportion of the expenditures in the state.
Table 3-2. Entergy Expenditures in New York State (2002)
Description AmountDescription AmountState and Local Electric Utilities
Motors and Generators
Services to Buildings
Management and Consulting Services
Other Business Services
Communications Equipment-NEC'
Water Supply and Sewerage Systems
Computer and Data Processing Services
Equipment Rental and Leasing
Electrical Equipment-NEC
Other
Subtotal
Total Compensationb
$12,717,135
$8,849,534
$4,276,761
$3,657,723
$2,794,127
$2,698,937
$2,086,842
$1,500,439
$1,375,2.24
$1,060,884
$13,888,903
$54,906,5 10
$145,933,436
TOTAL [ $200,839,946
' NEC = Not Elsewhere Classifiedb Total compensation includes wages, salaries and fringe benefits based on data provided by Indian Point.
Employees at Entergy Nuclear Northeast's White Plains office are also included.
3.3 Plant Expenditures in the United States
In 2002, Entergy expenditutres for products and serVices.(including labor) purchased in the UnitedStates totaled $357.1 million. Apart from expenditures of $159.4 million in New York state,$197.7 million was spent elsewhere in the United States. Much of that anmount was forspecialized products and services unique to the nuclear industry.
U.S. expenditures are detailed in Table 3-3. Total compensation ($161.2 million) is the largestcategory, representing about one-third of the total. Total compensation as a share of the U.S. total
19

Economic Benefits of Indian Point Energy Center
is Much lower because plant employees live mostly in New York state (and particularly in thelocal area), whcreas spending on products and non-labor services is concentrated outside thestate.
Tile largest spending for products and non-labor services was for maintenance and repair offacilities (S57.5 million). This result is not unique to Indian Point, since specialized maintenanceand repair spending is typically the largest component of expenditures at other nuclear plants,reflecting the strong emphasis on these activities to maintain plants properly and ensure highavailability rates and capacity f-actors.
The second largest non-labor spending category was management and consulting services. As istypical in the nuclear industry, Indian Point relies on highly specialized contractors andconsuiltants to analyze the plant and its operations to ensure consistent performance. The thirdlargest sector-uranium, radium and vanadium ores-represents fuel expenses for the plant.Indian Point's fuel is purchased outside New York state. At the national level, services are animportant part of Entergy's expenditures. Six of the top 10 expenditures made nationally are forservices.
Table 3-3. Indian Point Expenditures in the United States (2002)
Description AmountDescrptionAmoun
Maintenance and Repair of Other Facilities
Management and Consulting Services
Uranium-Radium-Vanadium Ores
Engineering-Architectural Services
State and Local Electric Utilities
Federal Government Enterprises
Computer and Data Processing Services
Motors and Generators
Services to Buildings
Insurance Agents and Brokers
Other
Subtotal
Total Compensation'
$57,532,646
$35,390,076
$30,224,443
$15,951,100
$12,720,334
$10,606,775
$ 10,380;878
$10,159,757
$9,666,271
$8,894,087
$86,169,119
$287,695,487
$161,202,683F
TOTAL $448,898,170
Total compensation includes wages, salaries and fringe benefits based on data provided by Indian Point and
includes employees at Entergy Nuclear Northeast's White Plains office.
20

Economic Benefits of Indian Point Energy Center
3.4 Taxes Paid and Accrued
A summary of taxes paid by Entergyon behalf of Indian Point in 2002 is presented in Table 3-4.Corporate income taxes were not included in the data because those taxes are paid at thecorporate level and not explicitly by the Indian Point plant.
Local taxes in this table refer to the towns and districts in the study area. Property taxes paid inthe local area ($25.3 million) represent almost 70 percent of the taxes paid by the plant. Theseinclude payments to local school districts and fire districts. Property taxes are paid toWestchester County, the town of Cortlandt, the village of Buchanan, the Hendrick HudsonCentral School District and the Verplank Fire District. By far, the largest payments are made tothe Hendrick Hudson School District, which accounts for approximately 80 percent of theproperty tax payments.
In addition to property taxes, Indian Point also paid payroll taxes to the state and federalgovernments totaling nearly S 10 million. The plant also contributes to the profits of Entergy,which pays state and federal corporate income taxes. However, these taxes are not quantified inthis study.
Table 3-4. Taxes Paid by Indian Point (2002)
Federal Payroll Tax' $9.794,398
State and Local Taxes $25,479,732
Property Tax $25,335,000
Payroll Tax' $144,732
Total Taxes Paid $35,274, 130b
The division of payroll taxes between federal and state is based on the average distribution from IMPLAN data.
b Excludes federal income taxes paid by Indian Point.
21
Economic Benefits of Indian Point Enermy Center
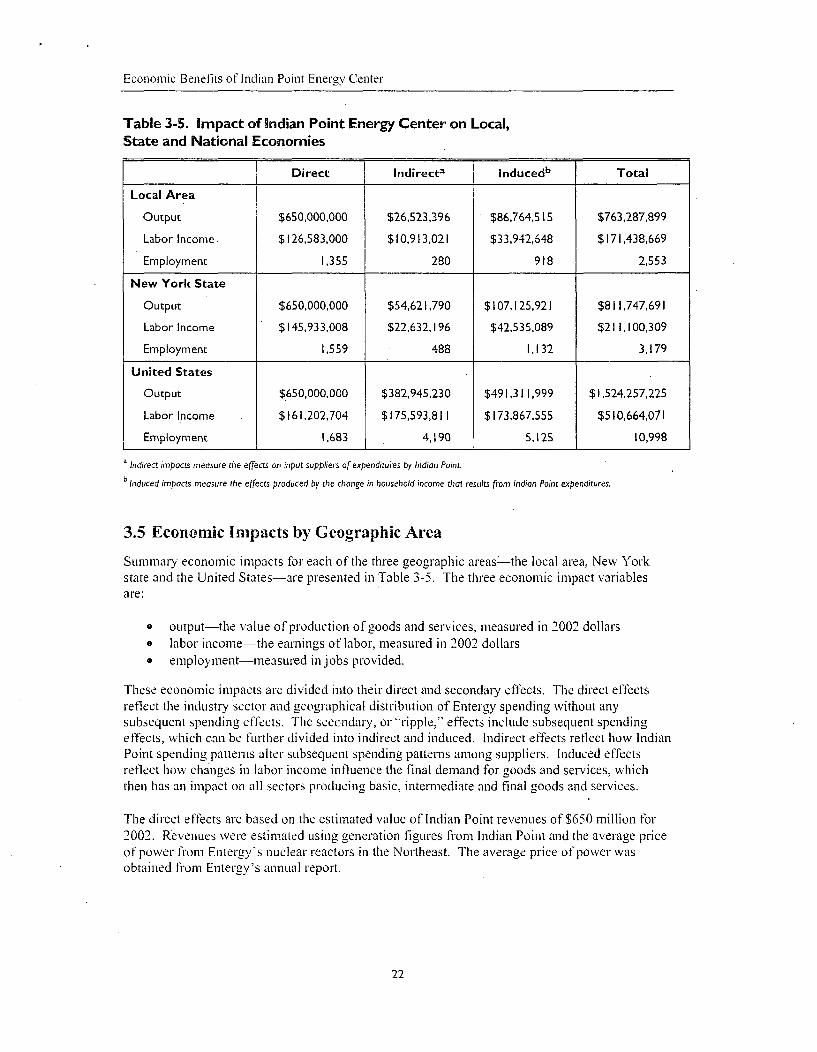
Table 3-5. Impact of Indian Point Energy Center on Local,State and National Economies
Direct Indirect 3 Inducedb Total
Local Area
Output $650,000,000 $26,523,396 $86,764,515 $763,287,899
Labor Income. $126,583,000 $10,913,021 $33,942,648 $171,438,669
Employment 1.355 280 918 2,553
New York State
Output $650,000,000 $54,621,790 $107,125,921 $811,747,691
Labor Income $145,933,008 $22,632,196 $42,535,089 $211,100,309
Employment 1,559 488 1,132 3,179
United States
Output $650,000.000 $382,945.230 $491,311,999 $1,524,257,225
Labor Income $161,202,704 $175,593,81 I $173,867.555 $510,664,071
Employment 1.683 4,190 5,125 10,998
a Indirect impacts measure the effects on input suppliers ofexpenditures by Indian Point.
Induced impacts measure the effects produced by the change in household income that results from Indian Point expenditures.
3.5 Economic Impacts by Geographic Area
Sumnmllary economic impacts for each of the three geographic areas the local area, New Yorkstate and the United States-are presented in Table 3-5. The three economic impact variablesare:
o output-the value of production of goods and services, measured in 2002 dollars* labor income-the earnings of labor, measured in 2002 dollarso employmnent-measured in jobs provided.
These economic impacts are divided into their direct and secondary effects. The direct effectsreflect the industry sector and geographical distribution of Entergy spending without anysubsequent spending effects. The secondary, or "ripple," effects include subsequent spendingeffects, which can be further divided into indirect and induced. Indirect effects reflect how IndianPoint spending patterns alter subsequent spending patterns among suppliers. Induced effectsreflect how changes in labor income influence the final demand for goods and services, whichthen has an impact on all sectors producing basic, intermediate and final goods and services.
The direct effects are based on the estimated valuLe of Indian Point revenues of $651) million for2002. Revenues were estimated using generation figures fiom Indian Point and the average priceof power firom Entergy's nuclear reactors in the Northeast. The average price of power wasobtained fr'om Entergy's annual report.
22

Economic Benefits of Indian Point Energy Center
These revenues, which are spent, distributed, invested or paid as taxes, reflect the total output ofproducts and services associated directly with Indian Point and the White Plains office. This totalincludes the expenditures for products and services (including labor) itemized in Tables 3-1, 3-2
and 3-3.
Nationwide, the direct employment (1,683 jobs) is the average Indian Point employment levelover this period. Eighty-one percent of these jobs are filled by workers residing in the local area.Of the remaining 328 jobs, 204 are filled by residents of New York state outside the local area,and the remainder are filled by residents of other states. As Table 3-5 indicates, direct effects aretypically the largest contributor to total effects for each of the measures of economic impact andfor local area and New York. State ripple effects are the largest contributor to total effects in theUnited States.
Induced effects are larger than indirect effects for the state and local economies, because there ismore spending on labor income, which causes induced effects, than on goods and services, whichcauses indirect effects. Indirect effects are more important as a share of the total at the nationallevel.
A helpful way of measuring the ripple effects is by using multipliers. Multipliers show the ratioof the plant's "total economic impact" to its "direct economic impact" and can be mleasured foreach geographic region. Multipliers essentially measure how many dollars are created in theeconomy for every dollar spent by the plant.
In terms of output, Indian Point's direct impact for the local area is $650 million, while its totalimpact is $763.3 million (see Table 3-5). Thus, the multiplier for Indian Point's outpuit for thelocal area is 1. 17. This indicates that for every dollar of output from the Indian Point plant, thelocal area economy produces S1. 17. Using the same formula, the output multiplier is 1.25 for thestate and 2.35 for the United States. This means for every dollar of Indian Point output, the stateeconomy produces SI .25 and the U.S. economy produces $2.35.
23
Economic Benefits of Indian Point Energy Center
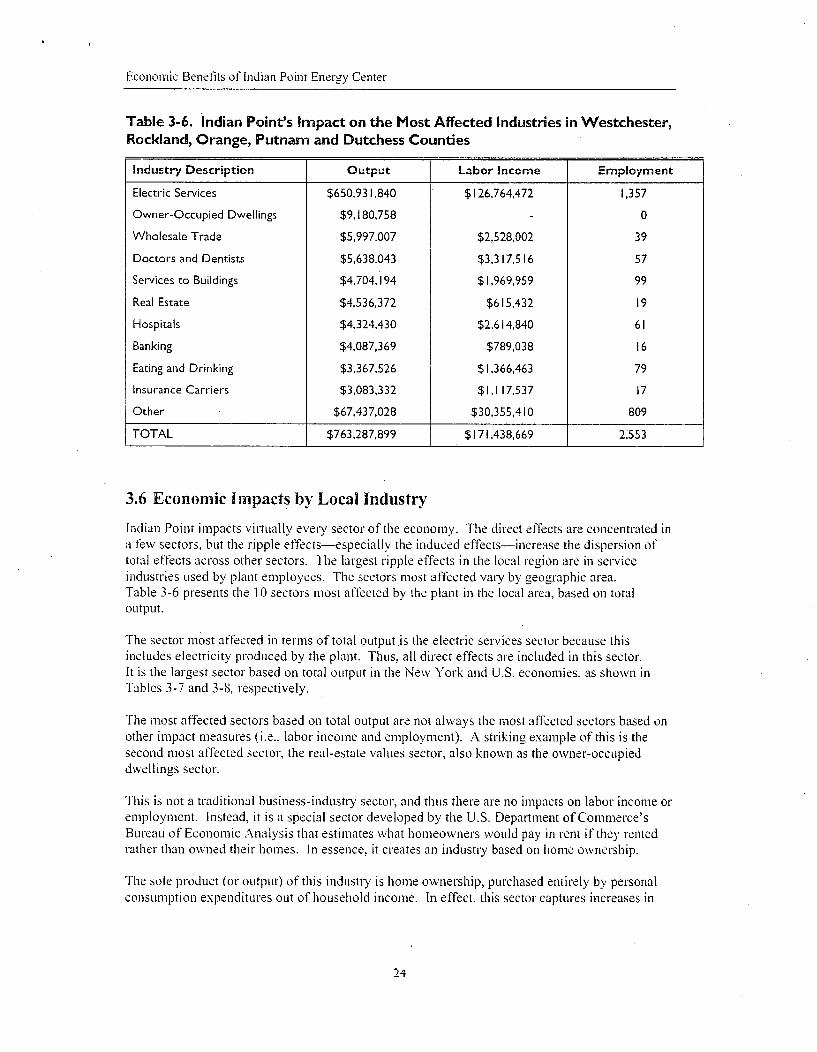
Table 3-6. Indian Point's Impact on the Most Affected Industries in Westchester,Rockland, Orange, Putnam and Dutchess Counties
Industry Description Output Labor Income Employment
Electric Services $650,931,840 $126,764,472 1,357
Owner-Occupied Dwellings $9,180,758 0
Wholesale Trade $5,997,007 $2,528,002 39
Doctors and Dentists $5,638,043 $3,317,516 57
Services to Buildings $4,704,1 94 $1,969,959 99
Real Estate $4,536,372 $615,432 19
Hospitals $4,324,430 $2.614,840 61
Banking $4,087,369 $789,038 16
Eating and Drinking $3,367,526 $1,366,463 79
Insurance Carriers $3,083,332 $1,117,537 17
Other $67,437,028 $30,355,410 809
TOTAL $763,287,899 $171,438,669 21553
3.6 Economic Impacts by Local Industry
Indian Point impacts virtually every sector of the economy. The direct effects are concentrated ina few sectors, but the ripple effects-especially the induced effects-increase the dispersion oftotal effects across other sectors. The largest ripple effects in the local region are in serviceindustries used by plant employees. The sectors most affected vary by geographic area.Table 3-6 presents the 10 sectors most affected by the plant in the local area, based on totaloutput.
The sector most affected in terms of total output.is the electric services sector because thisincludes electricity produced by the plant. Thus, all direct effects are included in this sector.It is the largest sector based on total output in the New York and U.S. economies, as shown inTables 3-7 and 3-8, respectively.
The most affected sectors based on total output are not always the most affected sectors based onother impact measures (i.e., labor income and employment). A striking example of this is thesecond most affected sector, the real-estate values sector, also known as the owner-occupieddwellings sector.
This is not a traditional business-industry sector, and thus there are no impacts on labor income oremployment. Instead, it is a special sector developed by the U.S. Department of Commerce'sBureau of Economic Analysis that estimates what homeowners would pay in rent if they rentedrather than owned their homes. In essence, it creates an industry based on home ownership.
The sole product (or output) of this industry is home ownership, purchased entirely by personalconsumrption expenditures out of household income. In effect, this sector captures increases in
24
Economic Benefits of Indian Point Energy Center
housing values due to increased labor resulting from the plant. Rental costs are included in thereal estate category in Table 3-6.
The oWner-OcCUpied dwellings sector is influenced by the large numnber of employees at the plant.These employees require housing and this additional demand leads to increased output from thehousing sector. This affect also leads indirectly to increased local tax revenues, since increases inhousing raise local property tax revenues.
TI he third most affected sector is wholesale trade, which represents the intermediate buying andselling of goods purchased by the plant and its employees. This section is large becausepurchased goods are typically distributed through a wholesaler, so this category is involved inmost of the expenditures by Entergy, its employees and its suppliers.
As Table 3-6 indicates, many of the most affected local industries are related to services requiredby the plant's workers, such as doctors and dentists, real estate, hospitals, banking, andrestaurants, in addition to the owner-occupied dwellings category. Further, building services, alarge direct expenditure of the plant, remains an important component of the plant's localimpacts.
Overall, the IMPLAN model estimates that 1,196 people are employed in the local area as a resultof spending by Entergy and its employees.
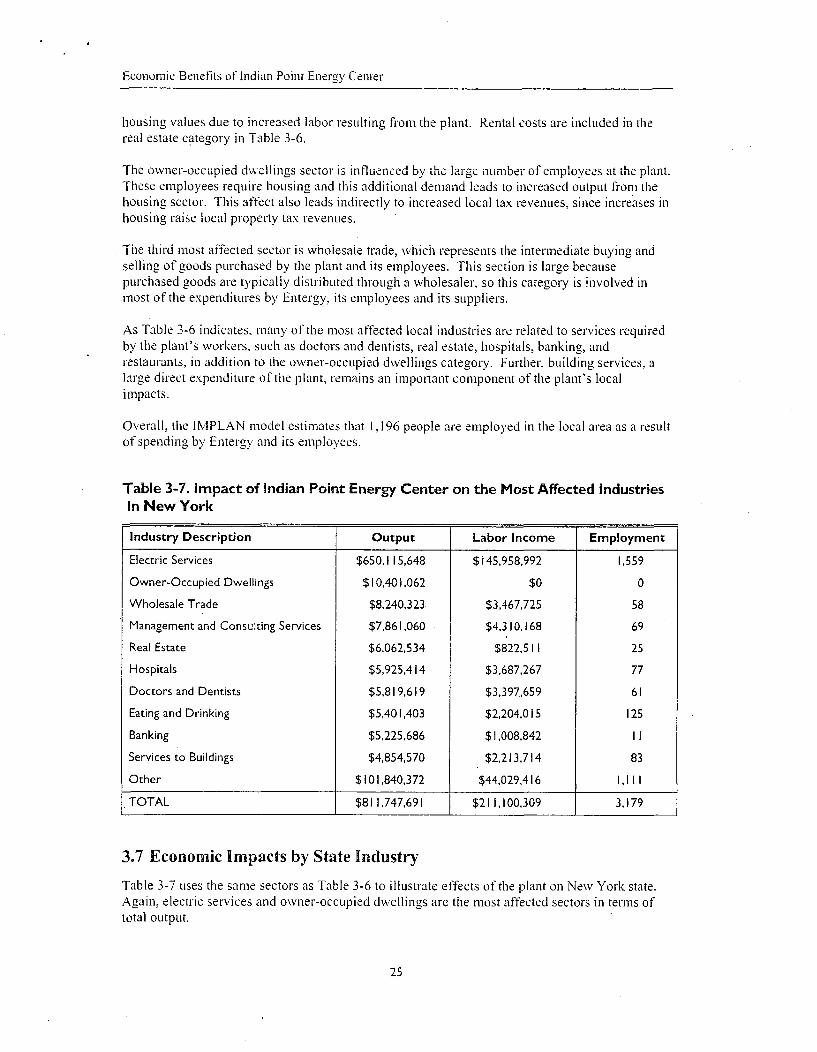
Table 3-7. Impact of Indian Point Energy Center on the Most Affected IndustriesIn New York
Industry Description Output Labor Income Employment
Electric Services $650,11 5,648 $145,958.992 1,559
Owner-Occupied Dwellings $10,401,062 $0 0
Wholesale Trade $8,240,323. $3,467.725 58
Management and Consulting Services $7,861,060 $4.310,168 69
Real Estate $6,062,534 $822,51 I 25
Hospitals $5,925,414 $3,687,267 77
Doctors and Dentists $5,819,619 $3,397,659 61
Eating and Drinking $5,401,403 $2,204,015 125
Banking $5,225,686 $1,008,842 II
Services to Buildings $4,854,570 $2,213,714 83
Other $101,840,372 $44,029.416 1,111
TOTAL $811.747,691 $211,100.309 3.179
3.7 Economic Impacts by State Industry
Table 3-7 uses the same sectors as Table 3-6 to illustrate effects of the plant on New York state.Again, electric services and owner-occupied dwellings are the most affected sectors in terms oftotal output.
25
Economic Benefits of Indian Point Energy Center
The entries in Table 3-7 for the most affected industries in New York are similar to those in thefive counties suiToLinding the plant. The primary exception is the inclusion of management andconsulting services among the top-10 sectors affected in the state. These services, which arehighly specialized, tend to have offices located outside the study area or outside tile state.
As with local impacts, the most affected state categories are primarily related to purchases byplant employees for services. Many of these services, such as restaurants, doctors and dentists,and real estate, are owned and operated by local small business owners.
The IMPLAN model estimates that 1,620 jobs (in addition to those at the plant) are created in thestate of New York as a result of Indian Point. In other words, for every person employed at theIndian Point plant, another person is employed in the state.
Table 3-8. Impact of Indian Point Energy Center on the Most AffectedU.S. Industries
Industry Description Output Labor Income Employment
Electric Services $650,026,176 $161,209,200 1,683
Management and Consulting Services $73,699,360 $36,9 13,264 772
Maintenance and Repair Other Facilities $43,311,992 $27,672,752 646
Owner-Occupied Dwellings $38, 156,280 $0 0
Wholesale Trade $32,882,724 $ 13,798,861 259
Real Estate $32,344,150 $4,384,204 169
Computer and Data Processing Services $30,098,628 $22,451,376 257
Banking $25,652,060 $4,952,178 102
Engineering-Architectural Services $24,950,872 $ 11,228,860 247
Communications-Except Radio and TV $22,292,954 $5.518,133 69
Other $550,842,029 $222,535,243 6,793
TOTAL $1,524,257,225 $510,664,071 10,998
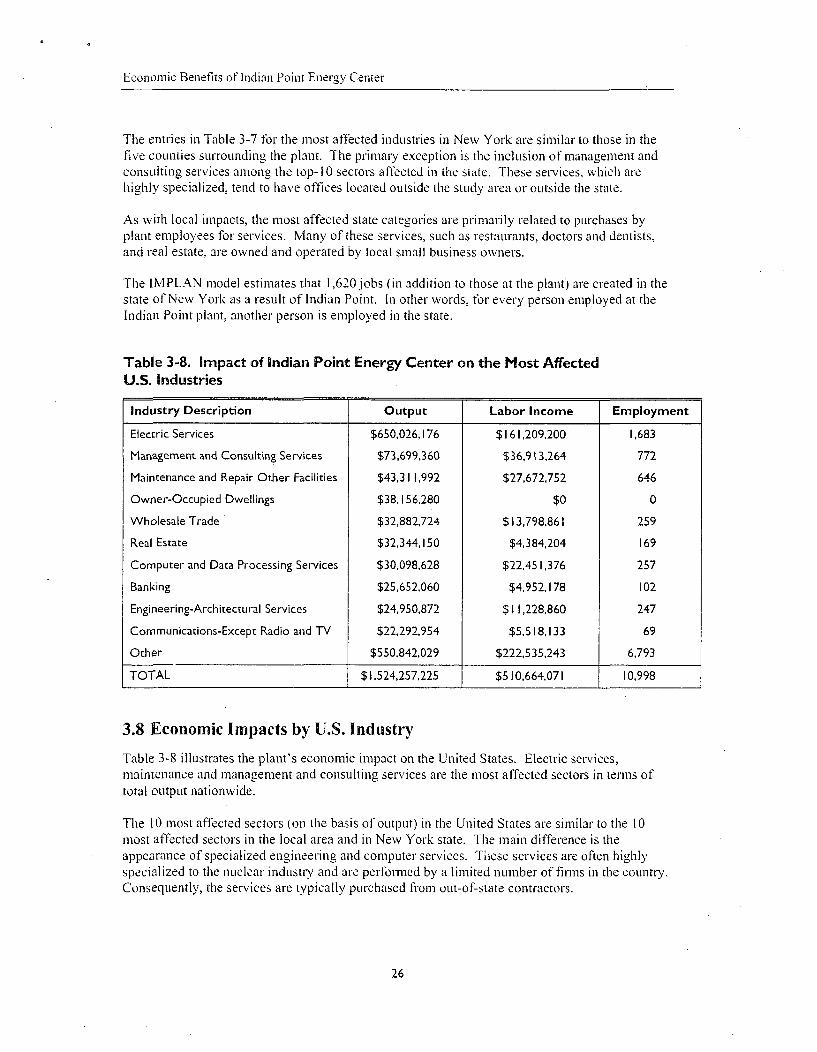
3.8 Economic Impacts by U.S. Industry
Table 3-8 illustrates the plant's economic impact on the United States. Electric set-vices,maintenance and management and consulting services are the most affected sectors in terms oftotal output nationwide.
The 10 most affected sectors (on the basis of output) in the United States are similar to the 10most affected sectors in the local area and in New York state. The main difference is theappearance of specialized engineering and computer services. These services are often highlyspecialized to the nuclear industi'y and are performed by a limited number of firms in the country.Consequently, the services are typically purchased from out-of-state contractors.
26
Economic Benefits of Indian Point Energy Center
3.9 Tax Impacts
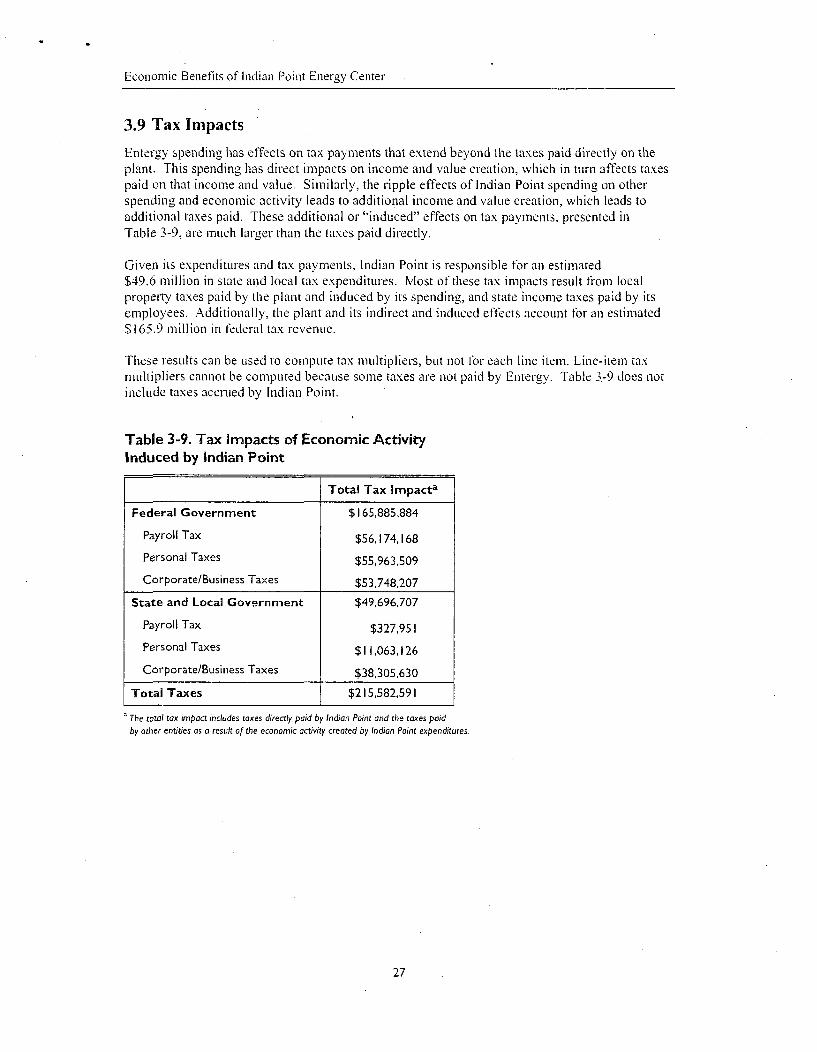
Entergy spending has effects on tax payments that extend beyond the taxes paid directly on theplant. This spending has direct impacts on income and value creation, which in turn affects taxespaid on that income and value. Similarly, the ripple effects of Indian Point spending on otherspending and economic activity leads to additional income and value creation, which leads toadditional taxes paid. These additional or "induced" effects on tax payments, presented inTable 3-9, are much larger than the taxes paid directly.
Given its expenditures and tax payments, Indian Point is responsible for an estimated$49.6 million in state and local tax expenditures. Most of these tax impacts result from localproperty taxes paid by the plant and induced by its spending, and state income taxes paid by itsemployees. Additionally, the plant and its indirect and induced effects account for an estimated$165.9 million in federal tax revenue.
These results can be used to compute tax multipliers, but not tor each line item. Line-item taxmultipliers cannot be computed because some taxes are not paid by Entergy. Table 3-9 does notinclude taxes accrued by Indian Point.
Table 3-9. Tax Impacts of Economic ActivityInduced by Indian Point
Total Tax Impacta
Federal Government $165,885,884
Payroll Tax $56,174,168
Personal Taxes $55,963,509
Corporate/Business Taxes $53,748,207
State and Local Government $49,696,707
Payroll Tax $327,95 I
Personal Taxes $ 11,063,126
Corporate/Business Taxes $38,305,630
Total Taxes $215,582,591
The total tax impact includes taxes directly paid by Indian Point and the taxes paidby other entities as a result of the econoanic activity created by Indian Point expenditures.
27

Economic Benefits of Indian Point Energy Center
3.10 Summary
The Indian Point Energy Center has substantial economic and fiscal impacts locally and in NewYork. When compared with their respective economies, the relative impacts of Indian Point arehighest for the local area and next highest for New York state. The plant's job-creation impact.(direct and indirect) of 2,553 is a significant number of jobs deriving from a single establishment.These impacts are greater in absolute terms at the national level than at the state level, andsimilarly are greater at the state level than at the county level.
As is the case with other nuclear plants, Indian Point buys specialized products and services fromnational and international markets. The state and local economic and fiscal effects are great, inlarge part because of the buying power created by Indian Point's high wages, salaries andbenefits, which are bpent on goods and services provided locally and in nearby areas.
28

Economic Benefits of Indian Point Energy Center
Section 4: Additional Benefits Provided by Indian Point
Since buying the Indian Point Energy Center in 2001, Entergy has continued the plant's long-standing tradition of playing an integral role in the community. This involvement ranges fromparticipating in numerous charitable organizations to investing in community infrastructurethrough major donations to governments, hospitals and schools. Without Entergy and itsemployees, many smaller charities and local organizations would suffer disproportionately,because of their dependence on the site for both volunteers and financial resources. In addition.Entergy provides direct financial aid, equipment and training to local jurisdictions, counties andthe state for emergency planning purposes.
4.1 Introduction
Indian Point and Entergy have a long tradition of comm1unity involvement. Company leaderssupport volunteerismn and promote the sharing of financial and intellectual talent in the local area.Civic involvement is an integral part of Entergy's corporate mission, which the company views asan investment in its communities.
Entergy's community investments take many forms, such as grants to community organizations,employee gift matches and volunteerism. Because local problems are best solved through localsolutions, Entergy relies on employees who are part of the comrmunity and are knowledgeableabout their area's unique needs. These employees serve on local contributions committees thatmake funding decisions.
The mission of the Indian Point local contributions committee is to participate in communityevents, support local schools and charities, and encourage volunteerism among employees andtheir families. In addition, the Indian Point local contributions committee helps identifycommunity problems and mobilizes site resources to help solve them.
The committee has approved contributions to such groups as the Brooklyn Children's Museum,Orange County Amateur Radio Club, Haldane Central School District, Careers for People WithDisabilities, the Blue Mountain Middle School and town of Fishkill Volunteer Cadet Program.Hillcrest School, African American Men of Westchester, Association for Pupil Transportation,McQuade Children's Services, Westchester Youth Dance Ensemble and the American CancerSociety have also received support from the committee.
Entergy's corporate giving programs include a variety of open, community partnership, employeematching and environmental stewardship grants. The Entergy Charitable Foundation is a privatefoundation dedicated to building stronger communities through a special focus on low-incomeinitiatives, as well as educational and literacy programs.
In 2002, Entergy and the Entergy Charitable Foundation on a national basis funded more than3,000 grant requests totaling approximately $10 million in cash contributions. In New York state,Indian Point and Entergy donated $290,000 in 2002 and $1.2 million in 2003. The beneficiariesincluded educational institutions, social services agencies, charitable organizations, andenvironmental, civic and governmental organizations. Among the groups receiving donationswere the Juvenile Diabetes Research Foundation, the Alzheimer's Disease and Related DisorderAssociation of Central New York, Hendrick Hudson Free Library and the Research Foundationon Behalf of the State University of New York. Other recipients included Apropos HousingOpportunities and Management, Hudson Valley Hospital Center, American Red Cross,
29
Economic Benefits of Indian Point Energy Center
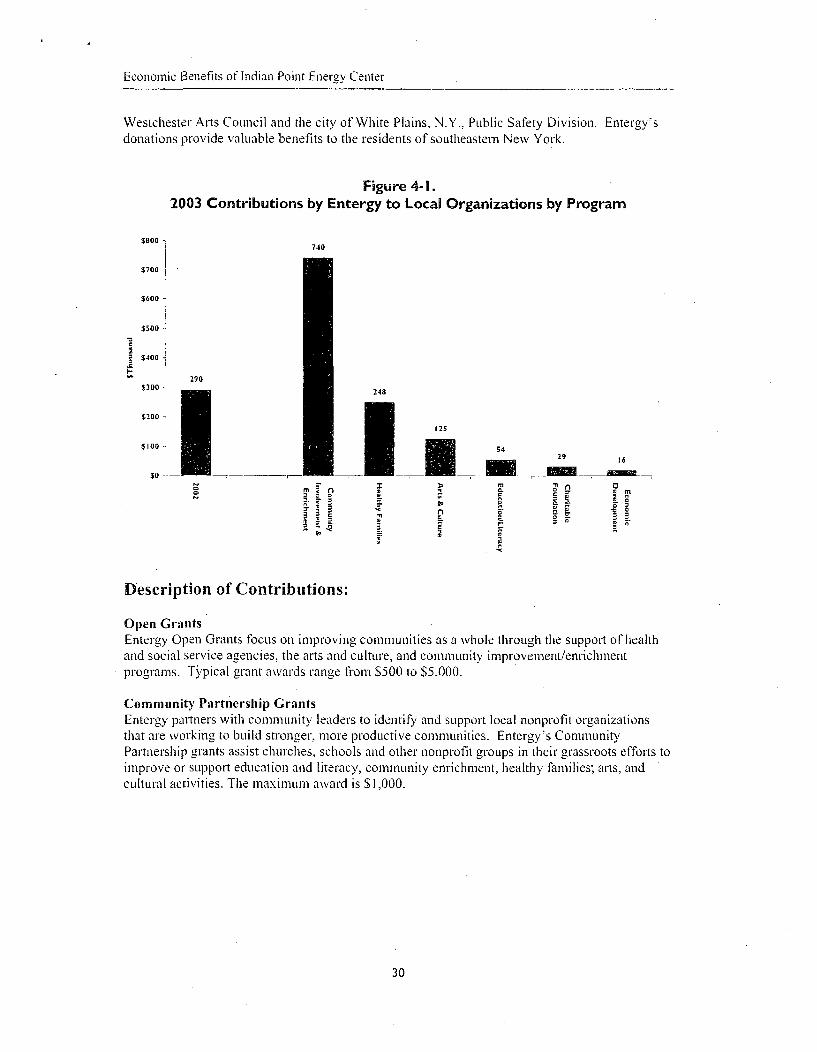
Westchester Arts Council and the city of White Plains, N.Y., Public Safety Division. Entergy'sdonations provide valuable benefits to the residents of southeastern New York.
Figure 4-I.2003 Contributions by Entergy to Local Organizations by Program
$800 77400
$700
$600 -
$500
. $400 -
t 290$300248
$200 -
$100 -296
$0 ~
0==", •- -.x 0-
3 -.
Description of Contributions:
Open GrantsEntergy Open Grants focus on improving communities as a whole through the support of healthand social service agencies, the arts and culture, and comrlunit, improvement/enrichmentprograms. [',pical grant awards range from $500 to $5,000.
Community Partnership GrantsEntergy partners with community leaders to identify and support local nonprofit organizationsthat are working to build stronger, more productive communities. Entergy's CommunityPartnership grants assist churches, schools and other nonprofit groLIps in their grassroots efforts toimprove or Sul)port education and literacy, community enrichment, healthy families; arts, andcultural activities. The mnaximum award is $1,000.
30
Economic Benefits of Indian Point Energy Center
Entergy Charitable FoundationThe Entergy Charitable Foundation supports programs that provide innovative and measurableways to positively affect low-income families and help them break the cycle of poverty. Typicalgrants range from $2,500 to $5,000.
United Way CampaignsIn 2002, Entergy matched employee gifts to the United Way campaign dollar-for-dollar.Entergy's employee, retiree and corporate gifts to the United Way in 2002 totaled almost$4 million. Indian Point and White Plains employees contributed $35,000 to local United Wayagencies, with a $55,000 corporate match.
Matching Educational GiftsEducation is the key to the future-both for individuals and for society as a whole. That's whyEntergy provides dollar-Tor-dollar matches to employee, board member and retiree contributionsto high schools, colleges and universities.
Community Connectors GrantsWhen the needs are great and resources scarce, volunteerism is essential to help fill the gap.
/ Entergy's Community Connectors program is designed to celebrate and honor its employees'commitment to volunteerism. Through Community Connectors, Entergy employees log andredeem their volunteer hours for grants to the nonprofit organization of their choice. Anindividual can earn up to $250, and a team can earn $500 per year.
Community Power ScholarshipsWith the cost of higher education skyrocketing, Entergy established the Com1munity PowerScholarship program for children of employees. Although academic performance is.a consideration,the scholarship program is unique because it focuses on the applicant's community involvement.In 2003, a total of 20 scholarships, for $5,000 each, were awarded.
Power of America ScholarshipsIn the aftermath of Sept. 11, 2001., Entergy helped lead an industrywide effort to providescholarships for the children of the victims. Entergy contributed $500,000 as seed money to startthe fund, which currently stands at more than $3.1 million. In 2003, 35 scholarships, for $1,000each, were awarded.
4.2 Social Services
Entergy is one of the largest charitable contributors in the region. The company's charitableefforts include offering multiyear grants to Hudson Valley Hospital to substantially increase thefacility's emergency room and emergency preparedness capabilities, as well as providingsignificant funding for the Westchester Arts Council. Entergy contributions helped theWestchester County Chapter of the American Red Cross launch the Emergency Planning andPreparedness Academy for training first-responders in the region. Entergy is a recognizable forcein charitable giving.
In 2003, Entergy copied its successful fuel fund program from its southern region and initiatedthe Heartshare Energy Assistance Program in the Northeast-an employee-sponsored subsidythat supports elderly or disabled persons in their efforts to pay the ever-increasing cost of coolingand heating their homes.
31
Economic Benefits of Indian Point Energy Center
4.3 Education
Public education is an important part of Indian Point's commitment to the communitiessurrounding the site. One of the most successful programs in the plant's history has been theEnergy Institute-a two-week continuing education seminar for local high school teachers run bythe State University of New York at Oswego. This annual, multidimensional course covers awide range of energy options and issues beyond just learning about nuclear energy. Teacherslearn new techniques for instructing students on the latest alternative forms of energy by usinghands-on experim-nentation and explorin- 'g the subject th.ough tHe Use 01active debate.
Started as a sponsorship tinder the prior ownership of Indian Point 3, the Energy Institute hasgrown into a partnership of equals under Entergy's direction. This interactive learning experiencepresents attendees with a comprehensive overview of energy issues, including (but not limited to)nuclear power. Although Entergy takes a hands-off approach to the development of coursecontent by the college, the company takes an active role in providing nuclear engineers, whopresent the science of nuclear energy in an informative and relaxed forum.
Many Indian Point employees also use their knowledge of nuclear engineering, occupationalsafety and radiation as invited speakers at various educational forums.
4.4 Environmental Protection
In addition to the economic benefits that Indian Point provides to the local area, tile plant alsoplays a vital role in preserving air quality in New York, particularly the Hudson Valley and NewYork City. Nuclear power does not produce any air pollution in the process of generatingelectricity. If Indian Point no longer operated, its electiicity production would need to bereplaced by existing fossil-fired power plants in the region, which would increase the region's airpollution.
A 2002 study by TRC Environmental Corp. found that if Indian Point were closed, the state'scarbon dioxide emissions would increase by 20 percent. Carbon dioxide has been identified bymany scientists as a contributor to global climate change. The study also estimates that withoutIndian Point, nitrous oxide emissions would be 19 percent higher in the state. Nitrous oxide hasbeen linked to respiratory illness and is a precursor to ozone depletion and acid rain.
Westchester County is designated as a non-attainment area for ozone by the U.S. EnvironmentalProtection Agency. Without the Indian Point plant, Westchester County would have severedifficulty meeting its ozone goals. Ozone has been linked to lung illness and leads to smog andreduced visibility.
In the absence of Indian Point, sulfur dioxide levels would be 11 percent higher in New Yorkstate. Sulfur dioxide is a precursor to acid rain and has been linked to respiratory illness.
The study also estimates that in the absence of Indian Point, carbon monoxide levels would be42 percent higher, particulate matter emissions Would be 28 percent greater, and emissions ofvolatile organic compounds would be 35 percent higher. These emissions have similar health andenvironmental impacts as nitrogen oxide and sulfur dioxide.
32

Economic Benefits of Indian Point Energy Center
4.5 Civic/Government
Indian Point employees represent a cross-section of civic participation and volunteer positionswithin government agencies, law enforcement, emergency medical services, hazardous materialsquads and Fire departments. Following the Sept. I I attacks, Indian Point personnel were calledupon to assist regional fire, police and emergency services departments in responding to theevent. Some employees went immediately to join fellow volunteers in assisting with rescueefforts, others helped with coordination of relief plans. When breathing apparatus for rescueworkers rn.' out, emergency workers turned to Indian Point, because the site had one of the largestinventories of breathing equipment in the region. In addition to the loan of equipment, severalIndian Point workers provided training on the equipment to rescue workers, who were usingassisted breathing gear for the first time.
Local CelebrationsBesides charitable contributions, Entergy is a supporter of two premier local celebrations. TheNew York Power Authority has a longstanding tradition of supporting Peekskill Celebration, andwhen Entergy purchased Indian Point 3 from the authority in 2000, the company continued as amajor sponsor of this important event. The company also supports the highlight of the multi-dayevent-the Saturday night fireworks show. Additionally, Entergy provides volunteers to helpguide the development and execution of the celebration.
Likewise. Harborfest is the crowning jewel of Oswego County's yearlong com1munity eventcalendar. As one of the largest employers in the county, Entergy provides financial and volunteerresources to event coordinators when planning this celebration. Hundreds of local businessesdepend on this mu, lti-day event for revenue, and Entergy is proud to assist those businessesthrough its sponsorship of Harborfest.
33

34
Economic Benefits of Indian Point Energy Center
Section 5: Nuclear IndustryTrends
U.S. nuclear power plant performance reached an all-time high in 2002, the fifth consecutiverecord-setting year. The nuclear energy industry has steadily improved performance and cost,while also improving plant safety. The nuclear energy industry is a model of industrial safety.Power plant performance is commonly measured by capacity factor, which expresses the amountof electricity actually produced by a plant, compared with the maximum achievable. U.S. nuclearpower plants achieved a capacity factor of9l.9 percent in 2002. Total electricity production forU.S. nuclear power plants reached new heights in 2002. At the same time, production costs forthose plants have been among the lowest of any baseload fuel source.
5.1 Nuclear Industry Performance
U.S. nuclear power plants have increased their output and improved their performancesignificantly over the past 10 years. Nuclear energy repriesents about 20 percent of all electricity
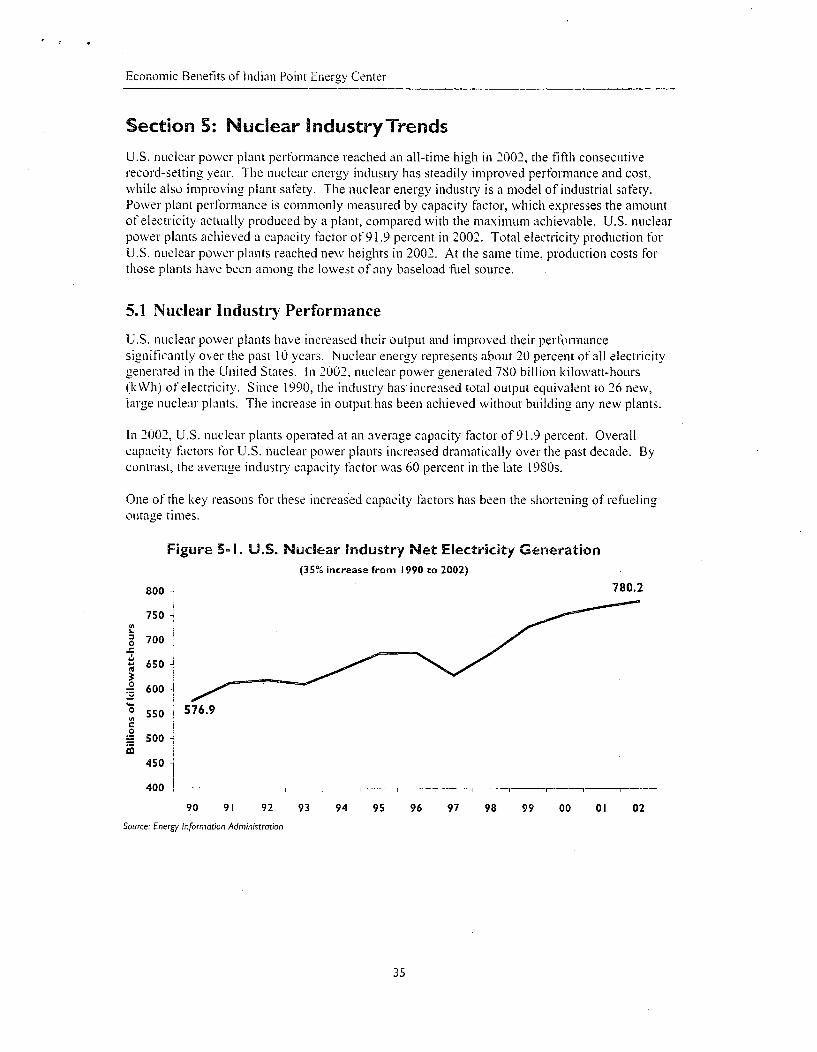
generated in the United States. In 2002, nuclear power generated 780 billion kilowatt-hours(kWh) of electricity. Since 1990, the industry has-increased total output equivalent to 26 new,large nuclear plants. The increase in output. has been achieved without building any new plants.
In 200., U.S. nuclear plants operated at an average capacity factor of 91.9 percent. Overallcapacity factors for U.S. nIuclear power plants increased dramatically over the past decade. Bycontrast, the average in dustry capacity factor was 60 percent in the late 1980s.
One of the key reasons for these increased capacity factors has been the shortening of refuelingoutage times.
Figure 5-1. U.S. Nuclear Industry Net Electricity Generation(35% increase from 1990 to 2002)
800 780.2
750
0 700S650U
'•550 576.90 500
450
4001
90 91 92 93 94 95 96 97 98 99 00 01 02
Source: Energy Information Administration
35
Economnic Benefits of Indian Point Energy Center
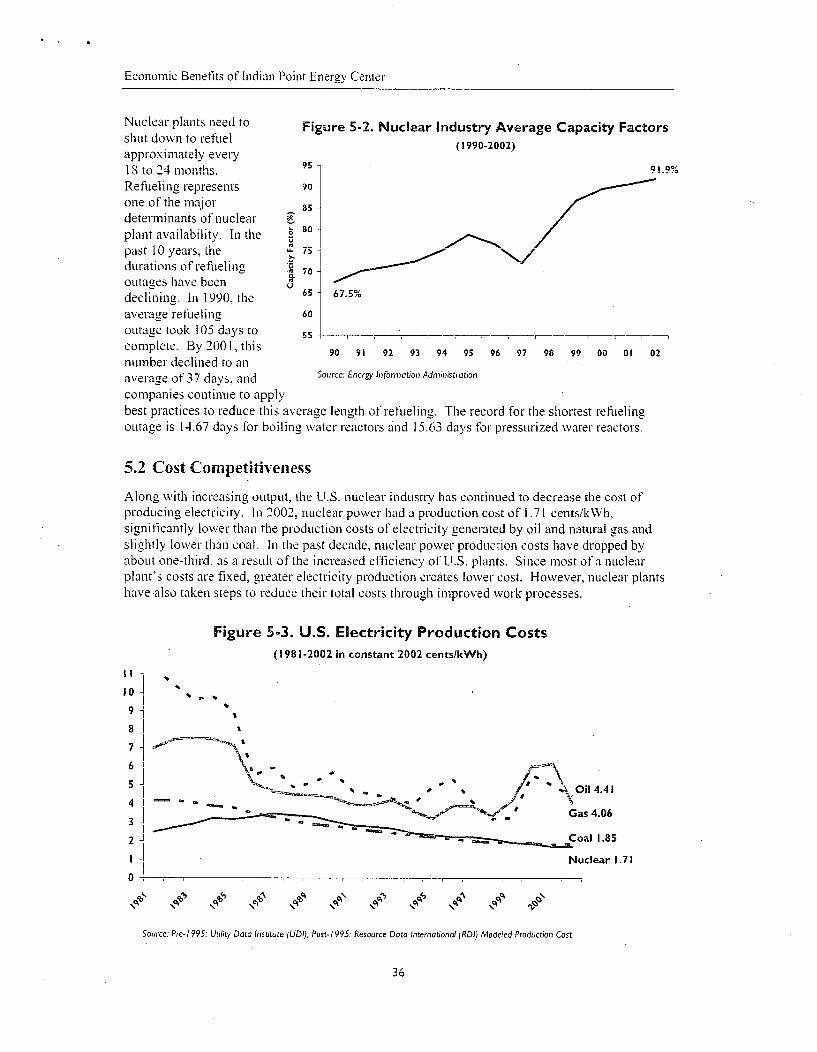
Nuclear plants need toshut down to refuelapproximately every18 to 24 months.Refueling representsone of the majordeterminants of nuclearplant availability. In thepast 10 years, thedurations of refuielingoutages have beendeclining. In 1990, theaverage refuelingoLitage took 105 days tocomplete. By 2001, thisnumber declined to anaverage of 37 days, and
Figure 5-2. Nuclear Industry Average Capacity Factors(1990-2002)
0
U
95
90
85-
80
7S
70
65
60
55
92.9%
67.5%
90 91 92 93 94 95 96 97 98 99 00 01 02
Source: Energy Infornmation Administration
companies continue to applybest practices to reduce this average length ofrefueling. The record for the shortest refuelingoutage is 14.67 days for boiling water reactors and 15.63 days for pressurized water reactors.
5.2 Cost Competitiveness
Along with increasing output, the U.S. nuclear industl'y has continued to decrease the cost ofproducing electricity. In 2002, nuclear power had a production cost of 1.71 cents/kWh,significantly lower than the production costs of electricity generated by oil and natural gas andslightly lower than coal. In the past decade, nuclear power production costs have dropped byabout one-third, as a result of the increased efficiency of U.S. plants. Since most of a nuclearplant's costs are fixed, greater electricity production creates lower cost. However, nuclear plantshave also taken steps to reduce their total costs through improved work processes.
Figure 5-3. U.S. Electricity Production Costs
(1981-2002 in constant 2002 cents/kWh)
I I
10-
9
8-
7-
6-
5
4
3-
= - # 4 a.Oil4.41
~ Gas 4.06l
I-
0-;-
Source: Pre-/ 995: Utility Data Institute (UDI). Post- 1995: Resource Data International (RDI) Modeled Production Cost
:oal 1.85
iuclear 1.71
36
Economic Benefits of Indian Point Energy Center
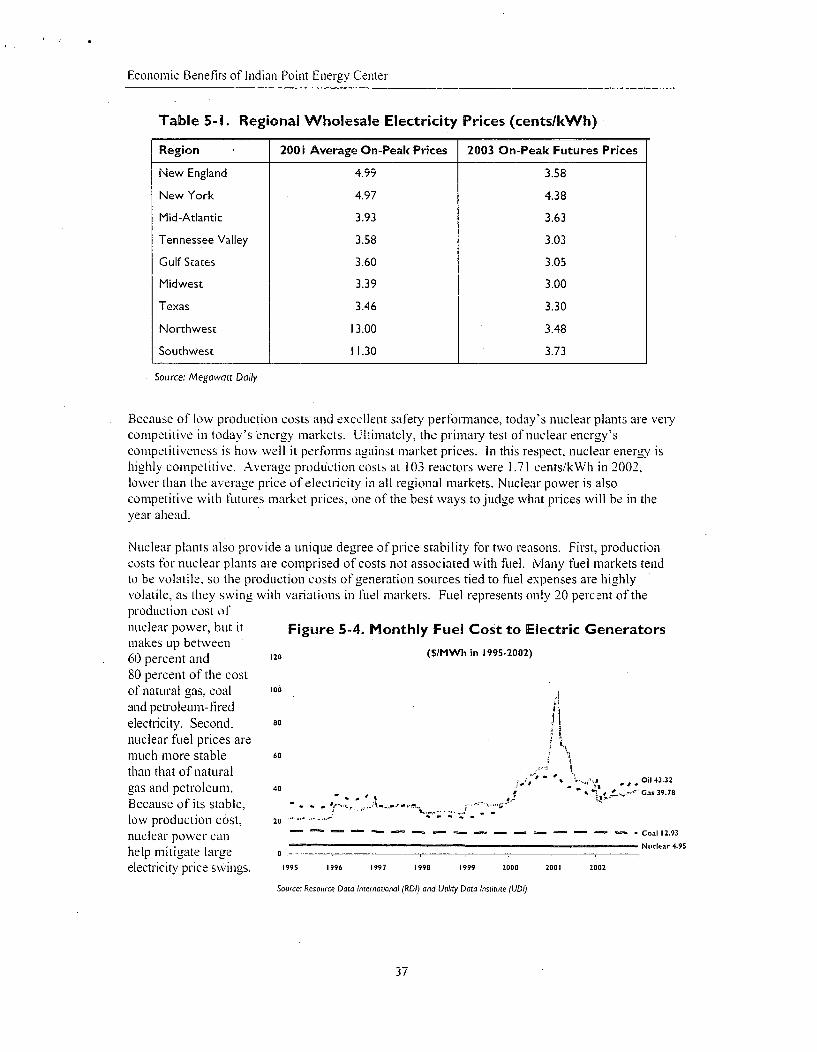
Table 5-I. Regional Wholesale Electricity Prices (cents/kWh)
Region 2001 Average On-Peak Prices 2003 On-Peak Futures Prices
New England 4.99 3.58
New York 4.97 4.38
Mid-Atlantic 3.93 3.63
Tennessee Valley 3.58 3.03
Gulf States 3.60 3.05
Midwest 3.39 3.00
Texas 3.46 3.30
Northwest 13.00 3.48
Southwest 11.30 3.73
Source: Megawatt Daily
Because of low prodcttcion costs and excellent safety performance, today's nuclear plants are verycompetitive in today's energy markets. Ultimately, the primary test of nuclear energy'scompetitiveness is how well it performs against market prices. In this respect, nuclear energy ishighly competitive. Average prodtfction costs at 103 reactors were 1.71 cents/kWh in 2002,lower than the average price of electricity in all regional markets. Nuclear power is alsocompetitive with fututres market prices, one of the best ways to judge what prices will be in theyear ahead.
Nuclear plants also provide a unique degree ofprice stability for two reasons. First, productioncosts for nuclear plants are comprised of costs not associated. with fuel. Many fuel markets tendto be volatile, so the production costs of generation sources tied to fuel expenses are highlyvolatile, as they swing with variations in fuel markets. Fuel represents only 20 perce~nt of theproduction cost ofnuclear power, but it Figure 5-4. Monthly Fuel Cost to Electric Generatorsmakes uip between60 percent and 120 ($IMWh in 1995-2002)
80 percent of the costof natural gas, coal 100 II
and petroleum-tiredelectricity. Second. 80nuclear fuel prices aremuch more stable 60than that of natural O,, 43.32
gas and petroleumn. 40o, Oil 43.32
• , ,ý" •'Gas 39.78
Because of its stable, .- - , .low production cost, 20 - -
nuclear power can- ------------------ -- - -- - ---- -- Coal 12.93
help mitigate large 0 .Nuclear 4.95
electricity price swings. 1995 1996 1997 1998 1999 2000 2001 2002
Source: Resource Data International (RDI) and Utility Data Institute (UDI).
37
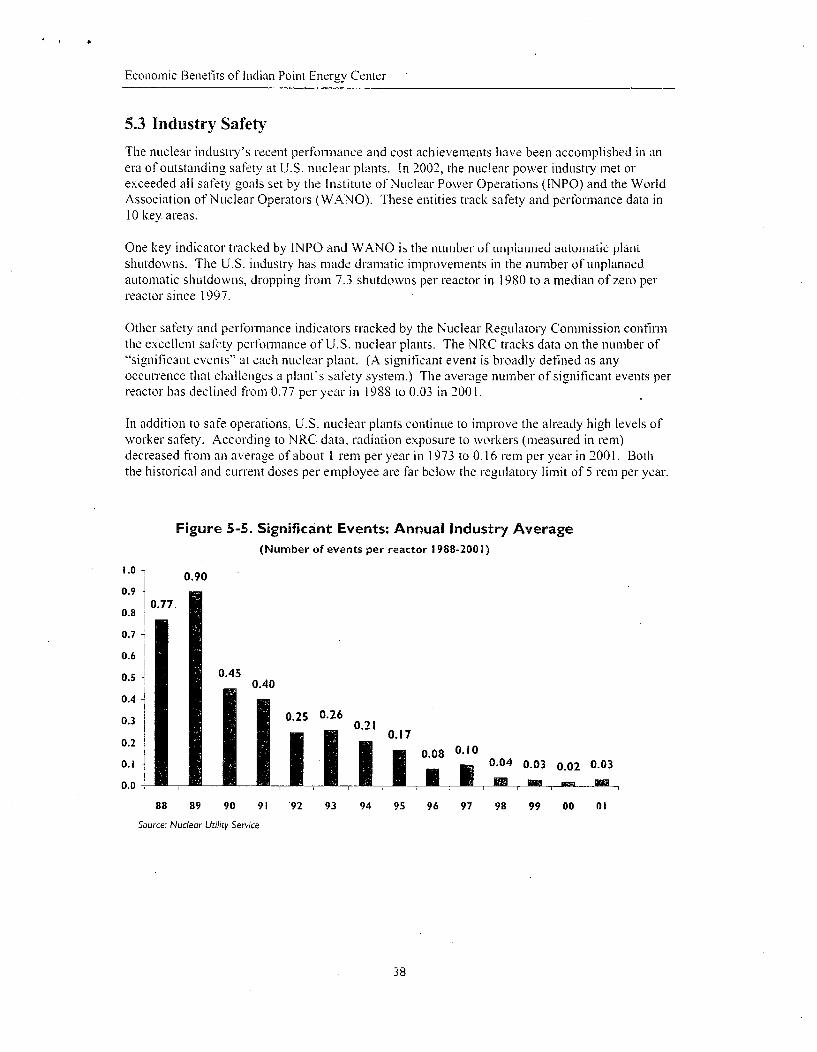
Economic Benefits of Indian Point Energy Center
5.3 Industry Safety
The nuclear industry's recent performance and cost achievements have been accomplished in anera of outstanding safety at U.S. nuclear plants. in 2002, the nuclear power industry met orexceeded all safety goals set by the Institute of Nuclear Power Operations (INPO) and the WorldAssociation of Nuclear Operators (WANO). These entities track safety and performance data in10 key. areas.
One key indicator tracked. by INP and WA.N is tile nuilmbeir of Unlplannelldll automatic plantshutdowns. The U.S. industry has made dramatic improvements in the number of unplannedautomatic shutdowns, dropping from 7.3 shutdowns per reactor in 1980 to a median of zero perreactor since 1997.
Other safety and performance indicators tracked by the Nuclear Regulatory Commission confirmthe excellent safety performance of U.S. nuclear plants. The NRC tracks data on the number of"significant events" at each nuclear plant. (A significant event is broadly defined as anyoccurrence that challenges a plant's safety system.) The average number of significant events perreactor has declined from 0.77 per year in 1988 to 0.03 in 200 1.
In addition to safe operations, U.S. nuclear plants continue to improve the already high levels ofworker safety. According to NRC data, radiation exposure to workers (measured in rem)decreased from an average of about I rem per year in 1973 to 0.16 remn per year in 2001. Boththe historical and current doses per employee are far below the regulatory limit of 5 rem per year.
Figure 5-5. Significant Events: Annual Industry Average(Number of events per reactor 1988-200 1)
1.0 -0
0.9 0.77 .90
0.8
0.7
0.6 -
0.5 0.450.40
0.4
03 0.25 0.26 0.21 0.170..1
0.2 0.08 0.10
0. 1 "0.04 0.03 0.02 0.03
0.0 , ,n1
88 89 90 91 92 93 94 95 96 97 98 99 00 01
Source: Nuclear Utility Service
38
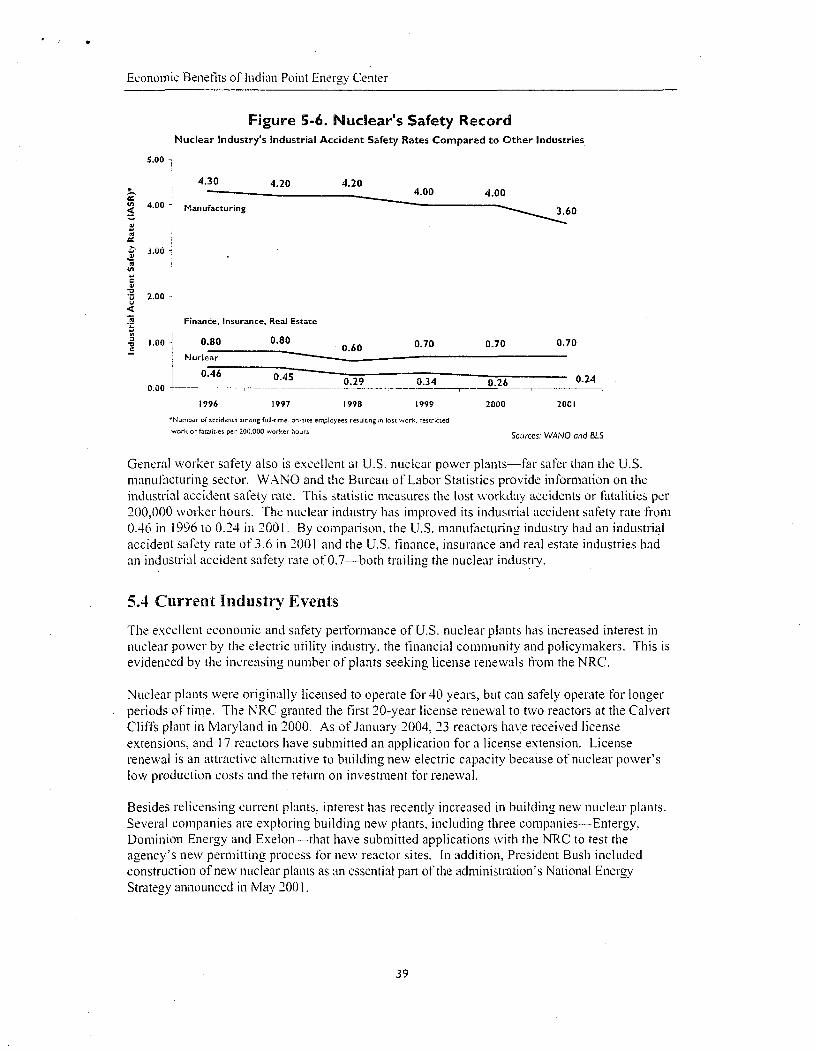
Economic Benefits of Indian Point Energy Center
Figure 5-6. Nuclear's Safety RecordNuclear Industry's Industrial Accident Safety Rates Compared to Other Industries
5.00
4.30 4.20 4.20444.00 4.00
4.00 Manufacturing 3.0
z 2.00
Finance, Insurance, Real Estate
.00 - 0.80 0.80 0.70 0.70 0.70Nuclear
0.46 0.45 0.29 0.34 0.26 0.240.00 r- "r --
1996 1997 1998 1999 2000 2001*rNumber of accidents among full-time. on-site employees resulting in lost work, restricted
work or fatalities per 200,000 worker hours Sources: WANO and BLS
General worker safety also is excellent at U.S. nuclear power plants-far safer than the U.S.manufacturing sector. WANO and the Bureau of Labor Statistics provide information on theindustrial accident safety rate. This statistic measures the lost workday accidents or fatalities per200,)00 worker hours. The nuclear industry has improved its industrial accident safety rate from0.46 in 1996 to 0.24 in 2001. By comparison, the U.S. manufacturing industry. had an industrialaccident safety rate of 3.6 in 2001 and the U.S. finance, insurance and real estate industries hadan industrial accident safety rate of 0.7-both trailing the nuclear industry.
5.4 Current Industry Events
The excellent economic and safety performance of U.S. nuclear plants has increased interest innuclear power by the electric utility industry, the financial community and policymakers. This isevidenced by the increasing number of plants seeking license renewals firom the NRC.
Nuclear plants were originally licensed to operate for 40 years, but can safely operate for longerperiods of time. The NRC granted the first 20-year license renewal to two reactors at the CalvertCliffs plant in Maryland in 2000. As of January 2004, 23 reactors have received licenseextensions, and 17 reactors have submitted an application for a license extension. Licenserenewal is an attractive alternative to building new electric capacity because of nuclear power'slow production costs and the return on investment for renewal.
Besides relicensing current plants, interest has recently increased in building new nuclear plants.Several companies are exploring building new plants, including three companies-Entergy,Dominion Energy and Exelon-that have submitted applications with the NRC to test theagency's new permitting process for new reactor sites. In addition, President Bush includedconstruction of new nuclear plants as an essential part of the administration's National EnergyStrategy announced in May 2001.
39

T" ., a
40
Economic Benefits of Indian Point Energy Center
Section 6: Economic Impact Analysis Methodology
The methodology used to estimate the economic and fiscal impacts of the Indian Point powerplant is commonly referred to as input/output methodology. Several operational input/outputmodels are available in the marketplace-the market leaders are Impact Analysis for Planning([MPLAN), REMI and RIMS-Il. The IMPLAN model was selected for use in this study,primarily because the model and many of the data sets were already on hand, the relevance ofIMPLAN to the particular application, as well as its transoarency and ease of use.
This report section presents typical applications of input/output methodology and explains themethodology and its underpinnings. It also describes how Indian Point data and the IMPLANmodel were used to estimate local, state and national economic and fiscal impacts of plantoperation.
6.1 Use of Input/Output Models
Input/output models capture input-or demand-and output-or supply-interrelationships fordetailed business, government and industry sectors in a geographic region. They also capture theconsumption of goods and services for final demand by these sectors and by the household sector.The basic geographic region is a county, and model results can be developed at the county, multi-county, state, multi-state and national levels. They are particularly useful in examining the totaleffects of an economic activity or of a change in the level of that activity.
These models are typically used when the following key questions need to be addressed:
* How much spending does an economic activity (such as a power plant) bring to a regionor local area?
o How much of this spending results in sales growth by local businesses?* How much income is generated for local businesses and households?S1low many jobs does this activity support?
H Iow much tax revenue is.generated by this activity?
These models are also useful in addressing related questions, such as the geographic and industrydistribution of economic and fiscal impacts. Typical applications of these models include facilityor military base openings and closings, transport or other public infrastructure investments,industrial recruitment and relocation, and tourism.
6.2 Overview of the Input/Output Methodology
Input/output models link various sectors of the economy-agriculture, construction, government,households, manuLfCturi ng-, services and trade-through their respective spending flows in areference year. These linkages include geographic linkages, primarily at national, state andcounty levels.
As a result of these linkages, the impact of an economic activity in any sector or geographic areaon other sectors and areas can be modeled. These impacts can extend well beyond the sector andarea in which the original economic activity is located. They include not only the direct, orinitial, effects of the economic activity, but also the subsequent, or "ripple," effects that flow fromthis activity. Direct effects are analogous to the initial "splash" made by the economic activity,
41

. I I A
Economic Benefits of Indian Point Energy Center
and ripple effects are analogous to the subsequent "waves" of economic activity (employment,new income, production and spending) that are triggered by this splash. A fuill accounting of thesplash's effect also must include the waves emanating fr'om the splash itself.
The sum of the direct and ripple effects is called the total effect, and the ratio of the total effect tothe direct effect is called the "total effect multiplier," or simply the multiplier eff&ct. Multiplierscan be developed for any of tile model outputs, such as earned income, employment, industryoutput and total income (which includes the effect of transfers between institutions).
Multipliers can also be developed for any industry or business sector or geographic area in the
model. Multipliers for a county are smaller than for a larger area (the state in which the county islocated) because some of the spending associated with an economic activity "leaks" from thesmall area into the larger area. At the local area level, multipliers are larger if the local areaeconomy is more diversified and if the economic activity being modeled is a good "fit" withinthat economic base.
Ripple effects include two components-indirect and induced effects-that are separatelymodeled within input/output models. Indirect, or "upstream," effects are the effects on the supplychain that feeds into the business-industry sector in which the economic activity is located. Forexample, when Indian Point buys a hammer for $5, it contributes directly to the economy by thispurchase, but tile company that makes the hammer also has to increase its purchases of steel andwood to maintain its inventory, and this will increase output in the steel and wood industries. Thesteel and wood industries will then have to purchase more inputs for their production processes,and so on. The result will be an economic impact that is greater than the S5 initially spent byIndian Point for the hamnmer.
Induced effects are the impacts on all sectors that result from changes in final demand ofcommodities and services that are associated with changes in income from the economic activity.They are primarily associated with changes in household spending on goods and services for finaldemand. These are the result of changes in labor income.
To illustrate, when Indian Point pays $5 for a hammer, a portion of the S5 goes to pay the wagesof employees at the company that makes the hammer. This portion contributes to labor income,which provides an additional contribution to the economy through its effects on householdspending for goods and services. There also will be a contribution from the effect of thispurchase on labor income in the wood and steel industries, and on the resulting householdspending for goods and services. Indian Point's own wage and salary expenditures createinduced effects as well, and they occur primarily in the local area economy.
As with any model, input/output models incorporate some simplifying assumptions to make themtractable. There are several key simplifying assumptions in input/output models.
Input/output models assume a fixed commodity input structure. In essence, the "recipe" forproducing a product or service is fixed, and there is no substinttion of inputs, either new inputs(which weren't in the mix before) for old inputs, or among inputs within tile mix. Inputsubstitution does not occur if technical improvements in some inputs make them relatively moreproductive. Nor does substitution occur if there are relative price changes among inputs. Wereany of these types of substitutions allowed, they might dampen the multiplier effects, especiallyfor larger geographic areas.
42

Economic Benefits of Indian Point Energy Center
Another key simplifying assumption is constant returns to scale. A doubling of commodity orservice output requires a doubling of inputs, and a halving of commodity or service outputrequires a halving of inputs. There is no opportunity for input use relative to comrnodity orservice production levels to change, as those levels expand or contract, so there are noopportunities for either economies or diseconomies of scale. This will not dramatically alter theoverall results as long as the economic activity whose effects are being modeled isn't largerelative to the rest of the sectors.
in other words, the models assume that for every dollar of output, the same dollar amounts arerequired for the various input categories. Returning to the hammer example, if a $5 hamllmerrequires $3 of steel. then two haammers would require $6 of steel. Although that works for steeland hammers, some inputs do not vary directly with output. For instance, if an oil refinery'sefficiency and output increases, a corresponding increase in personnel operating the plant isunlikely. The return to scale assumption, which takes such differences into account, is necessaryfor modeling.
Input/output models assume no input supply or commodity/service production capabilityconstraints. This simplifying assumption is related in part to the constant returns to scaleassutrmption, for if there were supply constraints, there likely would be diseconomies of scale. Asin the case of the constant returns to scale assumption, this "no supply constraints" assumption isnot a major concern as long as the economic activity of interest isn't large relative to the rest ofthe sectors.
To illustrate, the no-supply-constraints assumption assumes that a hammer manufacturer wouldpurchase all the steel for the same price. If not, doubling the number of hammers sold couldmean that the dollar value of the steel might more than double if the manufaciturer had to buymore steel at a higher price. This would violate the constant returns to scale assumption, whichsimplifies modeling.
Homogeneity is also a key simplifying assumption. Basically, firms within sectors andtechnologies within sectors are characterized as very similar. There is some ability to edit sectorfiles to characterize specialized firms, but there is no ability to reflect full diversity of firmswithin sectors.
6.3 The IMPLAN Model and Its Application to Indian Point
IMPLAN was originally developed by the U.S. Department of Agriculture's Forest Service incooperation with the Federal Emergency Management Agency and the U.S. Department of theInterior's Bureau of Land Management to assist in land and resource management planning.IMPLAN, which has been used since 1979, is supported by the Minnesota IMPLAN Group Inc.
There are two components of the IMPLAN system: the software and the database. The softwareperforms the necessary calculations, Ltsing study area data, to create the models. It also providesan interface for the user to change the region's economic description, create impact scenarios andintroduce changes into the local model. The software is described in a user's guide provided bythe Minnesota IMPLAN Group.
The software was designed to serve three functions: data retrieval, data reduction and modeldevelopment, and impact analyses.
43

.1 *-
Economic Benefits of Indian Point Energy Center
The IMPLAN database consists of two major parts: national-level technology matrices andestimates of regional data for institutional demand and transfers, value added, industry output andemployment for each county in the United States, as well as state and national totals.
The model's data and account structure closely follow the accounting conventions used in theinput/output studies of the U.S. economy by the Department of Commerce's Bureau of EconomicAnalysis. The comprehensive and detailed data. coverage of the entire United States by countyand the ability to incorporate user-supplied data at each stage of the model-building processprovide a high degree of flexibility, both in terms of geographic coverage and model formulation.
In applying the IMPLAN model to Indian Point, three basic types of data were provided byEntergy: purchase order expenditures by Indian Point purchase order code, employeecompensation expenditures and tax payment data.
Purchase order expenditures were provided for 2002 by Entergy. Employee compensation (salarydata and an estimate of the value of benelits) was provided for the same period. Tax paymentdata were provided for 2002. For each of these data types, the location of the expenditure wasidenti fled.
The purchase order data were mapped to IMPLAN's 528 codes by comparing the descriptions ofthe purchase orders with the Standard Industrial Classification codes used in IMPLAN sectorcodes.
The purchase order and compensation data were then augmented by an estimate of revenues firomIndian Point sales into the wholesale market over this period. This augmentation was necessarybecause purchase orders and compensation do not reflect all Indian Point expenditures, and totalexpenditures (approximated by total revenues) better reflect the full economic impacts of IndianPoint. This estimate was obtained from reported data by Entergy.
In tailoring the model to Indian Point, the underlying data sets provided by IMPLAN werereviewed to see if any IMPLAN coefficient could be edited to better reflect local conditions.These coefficients are based on national relationships, and in some cases may not reflect localconditions. In this report, the coefficients within the electric services sector were edited to moreaccurately retlect a nuclear power plant rather than a "national average power plant of all types."This constituted the majority of the coefficient editing.
IMPLAN was then used to develop the economic and impact estimates contained in this report.
44

S. lb.
mb N.
N
E
I
U
NS
C L E A
E It G
"T"I T U T
R
YI
1776 1 Street, N.W., Suite 400
Washington, D.C. 20006-3708
Phone: 202.739.8000
Fax: 202.785.4019
www.nei.org