Embed Size (px)
Citation preview

Part 2
Chapter 4Foods and drinks 66
Chapter 5 Physical activity 198
Chapter 6Growth, development, body composition 210
Chapter 7 Cancers 244
Chapter 8Determinants of weight gain, overweight, obesity 322
Chapter 9 Cancer survivors 342
Chapter 10Findings of other reports 348
Chapter 11Research issues 360

64
The brief of the Panel, and of the systematic literature review teams thatprovided the basis for the Panel’s work, has included the task of presenting aclear, strong, and reliable foundation for the final recommendations. These inturn form the basis of sound policies and effective programmes to reduce therates of cancer in populations, and the risk of cancer in people, whether asmembers of communities, or as families, or as individuals.
In this central part of the Report, seven chapters display the findings of theindependently assembled systematic literature reviews, and the judgements ofthe Panel derived from these reviews and other evidence as needed. The Panel’sjudgements are displayed in the form of matrices that introduce five of thesechapters. Judgements of ‘convincing’ and ‘probable’ causal relationships,shown in the top part of these matrices, are the basis for recommendationsmade in Part 3 of the Report.
Chapter 4, the first and longest chapter that follows, is concerned with types offood and drink. The judgements of the Panel are generally food- and drink-based, reflecting the evidence. Findings on dietary constituents andmicronutrients are identified as, for example, on ‘foods containing dietaryfibre’ or ‘foods containing folate’. For consistency, findings on methods of foodprocessing are, where possible, shown as part of the whole evidence on theassociated foods so that, for example, the processing and preparation of meatis integrated with the evidence on meat. Evidence specifically on dietarysupplements and on patterns of diet is included in the two final sections of thischapter.
Chapters 5 and 6 are concerned with physical activity, and with bodycomposition, growth, and development. Evidence in these areas is moreimpressive than was the case up to the mid-1990s; the evidence on growth anddevelopment indicates the importance of a whole life-course approach to theprevention of cancer. As with the chapter on foods and drinks, these chaptersinclude detailed summaries of the evidence collected in the systematicliterature reviews together with graphic representations of the most significantevidence.
Chapter 7 summarises and judges the evidence as applied to 17 cancer sites,with briefer summaries based on narrative reviews on cancers of five otherbody systems and sites. The judgements as shown in the matrices in thischapter correspond with the judgements shown in the matrices in the previouschapters.
Chapter 8, in which judgements are also based on the evidence from thesystematic literature reviews amplified by knowledge of physiologicalprocesses, concerns the biological and associated determinants of weight gain,overweight, and obesity. Before work on this chapter began, the Panel agreedthat a comprehensive review of the evidence would be likely to show that
P A R T 2EV
IDEN
CE
AN
D J
UD
GEM
ENTS Introduction to Part 2

65
obesity is or may be a cause of a number of cancers. It was therefore importantto identify what aspects of food, nutrition, and physical activity themselvesaffect the risk of obesity and associated factors.
Improved screening, diagnosis, and medical services, including therapy andsurgery, are in many countries improving the rates of survival for people withcancer. The number of cancer survivors — people living after diagnosis of cancer— is therefore increasing. The relevance of food, nutrition, physical activity, andbody composition to people living with cancer, and to the prevention ofrecurrent cancer, is summarised in Chapter 9.
The Panel agreed that its final recommendations should be principally based onthe evidence concerning cancer, and also should take into account findings onfood, nutrition, physical activity, and the prevention of other chronic diseases,and of nutritional deficiencies and nutrition-related infectious diseases,especially of childhood. Chapter 10, which is also based on a systematicliterature review, is a summary of the findings of expert reports in these areas.
The proposals for further research contained in Chapter 11 are, in the view ofthe Panel, the most promising avenues to explore in order to refineunderstanding of the links between food, nutrition, physical activity, andcancer, and so improve the prevention of cancer, worldwide.
As expected, a comprehensive assessment of all relevant types of evidencerelating to food, nutrition, physical activity, body composition, and the risk ofcancer has proved to be a massive task. The Panel was impressed not only bythe quantity but also the quality of much of the evidence, and the degree towhich a great deal of the evidence was consistent. As a result,recommendations designed to prevent cancer in general can be made withconfidence. These are contained in Part 3.

66
P A R T 2 • E V I D E N C E A N D J U D G E M E N T S
This chapter, with the following chapters in PartTwo, forms the basis for the population goals andpersonal recommendations in Part Three.
The Panel decided that the evidence on food,nutrition, and cancer is generally most persuasivefor foods rather than for specific nutrients or otherfood constituents; and that the evidence fromepidemiological and experimental studies in thisfield, usually undertaken to address questionsabout cancers of specific or related sites, is mostusefully synthesised in terms of foods and drinks.
The detailed evidence on foods and drinks ispresented in this chapter, and that on physicalactivity and on body composition in the followingtwo chapters. These three chapters includesummaries of the evidence, including meta-analysespresented in graphic form, as well as the Panel’sjudgements. Chapter 7 presents the evidence oncancer sites in more summarised form.
In this chapter, whenever possible andappropriate, the evidence on dietary constituents,and on food production, preservation, processing,and preparation (including cooking), is integratedwith the evidence on foods and drinks. So here, forexample, the evidence on carotenoids is consideredtogether with the evidence on vegetables andfruits; the evidence on methods of cooking meats isconsidered with the evidence on red meat and onprocessed meats; and the evidence on ethanol isconsidered with alcoholic drinks.
The result is not perfect. There is no single, idealway of categorising the evidence on food andnutrition. But an approach emphasising foods anddrinks is consistent with the generally acceptedview that food-based dietary guidelines andrecommendations are particularly valuable as afoundation for policies designed to improve publichealth.
The first two sections of this chapter summariseand judge the evidence on plant foods; the nexttwo sections that on animal foods; and thefollowing two sections that on fats and oils, andsugars and salt. The next two sections concerndrinks, the second of which covers alcoholic drinks.These are followed by sections concerned withthose aspects of dietary constituents, and with food
production, preservation, processing, andpreparation (including cooking), that have not beenincorporated in previous sections. The final sectionsummarises evidence on dietary patterns, includingbeing breastfed.
The pattern that emerges, though different insome important respects, is largely similar to thatbased on the evidence gathered in the mid-1990s,although the confidence with which variousexposures are judged to cause or protect fromcancer has sometimes changed.
Foods and drinks
C H A P T E R 4

67
C H A P T E R 4 • F O O D S A N D D R I N K S
These starchy plant foods have been the staple sources ofdietary energy and bulk for humans since thedevelopment of settled communities and agriculture. Theyhave to be prepared in some way to make them edible. Inwhole or relatively unprocessed forms, they are alsosources of dietary fibre and various micronutrients.Cereals in whole form contain essential fats. When theouter layers of these foods are removed and they arerefined, most of what remains is starch and protein.
In general, with industrialisation and urbanisation,consumption of these foods decreases, and more isconsumed in the form of cereal products, which aretypically more energy-dense and which may containsubstantial amounts of fat, sugar, or salt. Pure starch fromthese foods is also used as an ingredient in manyprocessed foods. Wheat, rice, maize (corn), and potatoesand their products are now the main cereals androots/tubers produced and consumed globally.
Overall, the Panel judges that evidence indicating thatcereals (grains), roots, tubers, or plantains affect the riskof any cancer, remains insubstantial.
The Panel judges as follows: Foods containing dietary fibre probably protect againstcolorectal cancer; and there is limited evidencesuggesting that such foods protect against oesophagealcancer. Dietary fibre is found in plant foods: vegetables,fruits, and pulses (legumes) (see chapter 4.2), as well asin cereals, roots, tubers, and plantains. All these foods arehighest in dietary fibre when in whole or minimallyprocessed form.
Foods high in dietary fibre may have a protective effectbecause of being bulky and relatively low in energydensity. See chapters 6.1, 7.3, 7.9, and Chapter 8 fordiscussion of the role of energy density in weight gain,overweight, and obesity, and of weight gain, overweight,and obesity in the risk of some cancers, including those ofthe oesophagus and colorectum.
The Panel also judges that the evidence that foodscontaminated with aflatoxins are a cause of liver cancer isconvincing. Cereals (grains) and peanuts (see chapter4.2) are the foods most commonly infested by thesefungal toxins. Contamination is most widespread in
CEREALS (GRAINS), STARCHY ROOTS AND TUBERS, PLANTAINS, AND THE RISK OF CANCER
In the judgement of the Panel, the factors listed below modify the risk of cancer. Judgements are graded according to the strength of the evidence.
DECREASES RISK INCREASES RISK
Exposure Cancer site Exposure Cancer site
Convincing Aflatoxins1 Liver
Probable Foods containing Colorectumdietary fibre2
Limited — Foods containing Oesophagus suggestive dietary fibre2
Substantial effect on risk None identifiedunlikely
1 Foods that may be contaminated with aflatoxins include cereals (grains), and also pulses (legumes), seeds, nuts, and some vegetables and fruits (see chapter 4.2). 2 Includes both foods naturally containing the constituent and foods which have the constituent added (see chapter 3.5.3). Dietary fibre is contained in plant foods
(see chapter 4.2 and box 4.1.2).
For an explanation of all the terms used in the matrix, please see chapter 3.5.1, the text of this section, and the glossary.
4.1 Cereals (grains), roots, tubers,and plantains

68
P A R T 2 • E V I D E N C E A N D J U D G E M E N T S
countries with hot, damp climates and poor storagefacilities.
Within the remit of this Report, the strongest evidence,corresponding to judgements of ‘convincing’ and‘probable’, shows that foods containing dietary fibreprobably protect against colorectal cancer; and that foodscontaminated with aflatoxins are a convincing cause ofliver cancer. Also see chapter 4.2 for judgements ofprobable protective effects of foods containing variousmicronutrients also found in cereals, roots, and tubers,particularly when relatively unprocessed.
Cereals (grains) are the staple foods in large parts of the world,supplying most of the energy and bulk in diets. In some regions,roots, tubers, or plantains are staple foods as well as or insteadof cereals (grains). These generalisations apply to practicallyall settled rural and most urban populations. Monotonous‘poverty diets’ containing very high levels of these foods, par-ticularly if refined, are low and sometimes inadequate in pro-tein and other nutrients. Gatherer–hunter and pastoralcommunities usually consume less of these starchy foods. Theirnutrient content is variable, largely depending on the degreeto which they are refined.
Consumption of cereals, roots, and tubers in general gradu-ally drops with industrialisation and urbanisation, and anincreasing amount of wheat in particular is grown for animalfeed. These foods are increasingly used as a basis for or ingre-dients in processed products that are often energy-dense, high in fats or sugars, and sometimes salt. In lower-incomecountries, total population consumption of these foods may amount to 60–80 per cent of total energy, and in high-income countries, usually to less than 30 per cent. Also seeChapter 1.
Early reports concerned with nutritional deficiencies gen-erally did not pay much attention to these foods and insteadgave priority to energy- and nutrient-dense foods of animalorigin, such as milk, eggs, and meat. Beginning in the 1970s,interest in dietary fibre increased, following informal epi-demiological findings that diets high in dietary fibre wereassociated with a lower risk of a number of chronic diseases.12 By the 1990s, it was generally agreed that diets relativelyhigh in cereals (grains) and other starchy staple foods, prefer-ably relatively unrefined, protect against obesity, type 2 dia-betes, coronary heart disease, and perhaps also digestivedisorders.3 4 Evidence that such diets protect against cancerof any site has been less impressive, but epidemiologicalstudies tend not to distinguish between degrees of refine-ment of cereals, roots, and tubers.
This section (4.1) includes cereal products and dietaryfibre. It also includes contamination by aflatoxins, thoughthis may also affect other plant foods (also see chapter 4.2).Non-starchy root vegetables such as carrots are included inchapter 4.2. Micronutrients found in plant foods are includ-ed in chapter 4.2, though most of these are also found incereals (grains), roots, tubers, and plantains.
4.1.1 Definitions, sources
Cereals (grains)Cereals (grains) are the seeds and energy stores of cultivat-ed grasses. The main types are wheat, rice, maize (corn),millet, sorghum, barley, oats, and rye. In some countries,‘cereal’ is also a term for dry foods made from grains andother ingredients, often eaten with milk for breakfast.
Roots, tubers, plantainsRoots and tubers are energy stores of plants. Names and def-initions can vary around the world — potatoes are tubers,which are the tips of underground stems that swell withstarch (a polysaccharide) and water. While potatoes areoften classed as vegetables (in the USA, for instance), theyare grouped separately from non-starchy vegetables in thisReport. Sweet potatoes, sometimes called ‘yams’ in NorthAmerica, are a type of storage root rather than a tuber, buttrue yams are starchy tubers. Cassava (manioc) and yuccaare elongated roots, and sago is a starchy food made fromthe pith of some types of palm tree. Taro is cultivated for itsedible leaves, as well as its starchy corm, which is similar toa tuber. Plantains are one of several fruits used as vegeta-bles: they grow on trees and look like bananas, but only asmall proportion of the starch is converted to sugar duringthe ripening process, which makes them similar to potatoesto cook with.
Many of the cereals (grains) that we consume are refined. Grainsare first broken into pieces and then refined, sifting away thebran, germ and, usually, the aleurone layer. This removes mostof the fibre, oil, and B vitamins, as well as approximately 25 percent of the protein. Polishing, as often performed on rice,removes additional nutrients. Many high-income countriestherefore fortify refined cereals, including flour, with B vitaminsand iron. Wholegrain products generally contain the con-stituents of the grain but, given the absence of an internation-ally accepted definition, intact grains are present to a variableextent. The extent to which the grain remains intact influencesphysiological processes in the bowel and hence health.
Cereal foods may be eaten in wholegrain form, although con-sumption in refined forms, such as white rice, bread, or pasta,is generally much more common, particularly in high-incomecountries. Refined grains are considered easier than wholegrainsto cook and to chew; are light in colour — which is attractiveto many consumers; and also have a longer shelf-life thanwholegrain products, as the oil in bran goes rancid relativelyquickly.
Breakfast cereals, particularly in the United States and partsof Europe, also account for a significant proportion of graineaten. Many breakfast cereals, although based on grains(whole or refined), may contain substantial amounts of addedsugars. Grains are further processed to provide ingredients suchas corn syrup, starch, or alcohol. They also form the basis ofmany animal feeds.
Processed grains have a higher glycaemic index thanunprocessed grains and, generally, the greater the degree ofprocessing, the greater the glycaemic index (box 4.1.3).
Box 4.1.1 Wholegrain and refinedcereals and their products

69
C H A P T E R 4 • F O O D S A N D D R I N K S
The concept of dietary fibre arose from observations of the lowprevalence of colon cancer, diabetes, and coronary heart diseasein parts of Africa amongst people whose diets were high inunrefined carbohydrates and whose stools were typically bulky,and often or sometimes semisolid. Considerable efforts havebeen dedicated to characterising the dietary components ofwhat has come to be called dietary fibre that might conferhealth benefit. Naturally occurring dietary fibre is only derivedfrom plant foods. Pulses (legumes) and minimally processedcereals are particularly concentrated sources, but vegetables andfruits also contain significant amounts. Dietary fibre isolatedfrom plant cell walls and in synthetic forms are increasinglyentering the food supply.
High intakes of dietary fibre, variously defined, have beenassociated with reduced risk of cardiovascular disease as well asof some cancers. Definitions of dietary fibre vary. Some arebased on chemical analyses of the components of plant cellwalls, such as non-starch polysaccharide, others on physiologi-cal effects — the carbohydrates that enter the large bowel hav-ing escaped digestion in the small intestine being defined asdietary fibre. The latter definition includes oligosaccharides andresistant starch. The World Health Organization and Food andAgriculture Organization have recently proposed that only poly-saccharides which form part of plant cell walls should be regard-ed as dietary fibre and that the health benefits of resistantstarch and oligosaccharides are more appropriately consideredseparately.
Box 4.1.2 Foods containing dietary fibre
The degree to which different foods and meals raise blood glu-cose depends not only on the nature of the carbohydrate, butalso on the characteristics of the foods consumed. Glycaemicindex (GI) is a measure of the degree to which a food raisesblood glucose compared with a standard food (usually glucoseor white bread) under standard conditions. The test food mustcontain the same amount of available carbohydrate (usually 50grams) as the standard. GI was originally used as an aid to foodchoice in diabetes and has more recently been applied to peo-ple without diabetes. The rise in blood glucose after consuminga food depends not only on the GI but also on the amount offood eaten. A related measure, glycaemic load (GL), takes intoaccount both the GI of a food as well as the actual amount ofcarbohydrate consumed. The GL of a food may be measureddirectly or calculated by multiplying the GI of a food by the num-ber of carbohydrate grams in a serving of the food.
Factors that influence the GI of a food include the type of car-bohydrate, how the food is processed or cooked, and the othercomponents present in the food (for example, fat, protein,fibre). There is some relationship (inverse) between GI and fibrecontent, although some foods high in fibre have a high GI andvice versa. Factors can affect GI by influencing speed of absorp-tion, for instance higher fat foods tend to have a low GI. Thecalculated GI of a mixed meal or whole diet has been shown insome studies to correlate with the actual GI obtained by feed-ing a mixed meal. Although the concept of GI has been contro-versial, the GI and GL of diets have predicted risks of type 2diabetes and coronary heart disease and related biomarkers,independent of dietary fibre, in prospective epidemiologicalstudies, suggesting that GI and GL may be useful markers.
The relevance to cancer might lie in the fact that the rise inblood glucose after a meal is closely linked to that of insulin,which apart from its crucial role in carbohydrate and lipidmetabolism, is also one of a family of important growth factors(also see Chapter 2).
Box 4.1.3 Glycaemic index and load
This section refers to starchy roots, tubers, and plantains.Carrots, beets, parsnips, turnips, and swedes are non-starchyroots, and are classified as non-starchy vegetables in thisReport. Also see chapter 4.2.
4.1.2 Composition
Cereals (grains)The relative amounts of dietary constituents in cereals andcereal foods depend largely on the degree of refinement andother forms of processing (box 4.1.1). Starch makes upabout 70 per cent of the raw weight of the storage tissues(endosperm) of unprocessed cereal grains. The outer partsof the grain (the bran and the aleurone layer) contain non-starch polysaccharide, a type of carbohydrate that charac-terises dietary fibre (box 4.1.2).
Cereals also contain variable amounts of protein, oils, Bvitamins, vitamin E and tocotrienols, iron, and various traceelements, as well as phytochemicals, some of which, suchas the antioxidants, are bioactive (box 4.1.2). The germ isthe embryonic part of cereal plants and contains oils, pro-teins, and fibre. Various cereals contain other specific com-ponents. Wheat contains gluten (a mixture of proteins). Ryehas high levels of pentosans and oats contain beta-glucans,both of which are non-starch polysaccharides, a character-ising feature of dietary fibre.
Cereals (grains) and pulses (legumes) may be contami-nated with aflatoxins. See box 4.1.4.
Roots, tubers, and plantainsRoots and tubers are less concentrated stores of starch,although this accounts for almost all of their raw weightapart from water. Starch content varies from around 15–20per cent in sweet potatoes to 25–30 per cent in cassava andyams, which translates into around 80–95 per cent of thedietary energy of these roots and tubers. Cooking sweetpotatoes makes them taste sweet because an enzyme con-verts as much as 75 per cent of the starch into maltose (adisaccharide). Roots and tubers eaten with the skin on arehigh in dietary fibre. These foods are generally poor sourcesof protein, so although protein deficiency is uncommon,populations that subsist on these foods, and do not eat pro-tein-rich pulses (legumes), are at risk of deficiency, especiallychildren weaned on thin gruels made with these low-proteinfoods. They contain variable amounts of other nutrients.Potatoes contain vitamin C, for example, and the orangevarieties of sweet potatoes contain carotenoids. Yams con-tain many bioactive compounds and taro corms are high invitamin B6, fibre, and manganese.

70
P A R T 2 • E V I D E N C E A N D J U D G E M E N T S
4.1.3 Consumption patterns
Cereals and grainsAs societies moved to more settled, agricultural ways of life10–15 000 years ago, cereals became the main staple foods;the types of cereal crops grown depended largely on climateand terrain. Wheat, barley, oats, and rye are traditionally sta-ple foods for people living in the Middle East and Europe;and with rice in Asia; maize (corn) in the Americas; andsorghum and millet in Africa. But the market for cereals andtheir products is now global, although some, such assorghum, remain largely regional.
The importance of starchy staples in food systems anddiets is broadly connected to economic and industrial devel-opment. Both in higher-income countries and across theworld, there has been a long-term decline in their con-sumption. With increasing urbanisation in lower-incomecountries, wheat and maize are replacing traditional staplefoods. An important exception is Asia, where rice remains thestaple grain. Cereal cultivation and consumption tends to behighest in most of Asia and lowest in Oceania, parts ofEurope, and North America.
Globally, cereal foods provide more than 45 per cent ofdietary energy; diets based on these foods tend to be bulkywith a low energy density (see chapter 8.8.4). Cereals pro-vide more than 50 per cent of dietary energy in low-incomecountries, but only around 30 per cent in high-income coun-tries. While grains contribute roughly 20 per cent of dietaryenergy in Australia, North America, and central Europe, theycan provide as much as 70 per cent in parts of Asia (main-ly from rice). Although more wheat is grown than rice on aglobal basis, much of it is used for animal feed. Rice is theprincipal food for half of the world’s population.
Cereals are very versatile once they have been processedfrom the raw grain. Wheat is mainly milled to make flourfor bread, pastries, cakes, and pasta. Maize (corn) is a sta-ple food in Latin America and parts of Asia and Africa, where
it is used to make grits, cornmeal (used for polenta as wellas corn breads), corn flour, tortillas, tamales, and corn chips.It is also the basis of corn starch (a thickener), corn syrup(a sweetner), and corn oils. Sweetcorn is also eaten as a veg-etable, either on or off the cob. Rice is usually processed toremove the bran and aleurone layers, turning ‘brown rice’into ‘white’. It is also used to make flour (the basis for gluten-free breads), rice powder, noodles, rice paper, rice milk,Japanese mochi, and lao-chao (Chinese fermented rice).Barley is used primarily in Asia (tsampa and miso soya paste)and in North Africa (soups, porridges, and flat breads).Whole rye grains are milled and used to make bread in somenorth and east European countries. Whole oats are made into porridges and used in muesli and baked goods, such as biscuits. Fonio, millet, sorghum, teff, and triticale aretraditional crops and staples in parts of Africa and Asia.Many grains are also fermented to make alcoholic drinks (seechapter 4.8.1).
Roots, tubers, and plantainsRoots, tubers, and plantains are staple foods in some partsof the world. For instance, populations in some regions of sub-Saharan Africa, Latin America, and Oceania base their diets on these foods. Globally, starchy roots providearound 5 per cent of dietary energy. Consumption is high-est in the Pacific islands and parts of Africa, with cassava andyams providing more than 40 per cent of dietary energy inGhana. Potatoes can provide as much as 10 per cent ofdietary energy in North America and Europe. Globally, plan-tains provide less than 0.5 per cent of dietary energy, butthey are locally important in some African, Latin American,and Caribbean countries, where they can provide more than15 per cent of dietary energy. Some populations do not relyon any of these foods — for instance, pastoralist societiessuch as the Maasai hunters in East Africa, and the Inuit andother Arctic populations, maintain their traditional ways oflife and diets.
Mycotoxins are toxins produced by certainmoulds or fungi. Although moulds thatcontaminate foods are usually destroyedby cooking temperatures, the toxins theyproduce may remain. Aflatoxins are onetype of mycotoxin. All naturally occurringaflatoxins are classified as human carcino-gens (group 1) by the International Agencyfor Research on Cancer; other mycotoxins,such as fumonisins, are suspected carcino-gens.5 It is common to find co-contamina-tion by more than one species of myco-toxin-producing fungus. In Europe, theJoint FAO/WHO Expert Committee on FoodAdditives and Contaminants recommendsthat aflatoxin concentrations in foods bekept as low as possible.6
The main foods that may be contami-nated by aflatoxins are all types of cereal
(grain), including wheat, rice, maize (corn),barley, and oats; and pulses (legumes) —notably peanuts. Nuts and seeds may alsobe contaminated. Feedstuffs for farm ani-mals may also be contaminated with afla-toxins, which can then be secreted in milkor accumulated in tissues.
Aflatoxins, which are produced byAspergillus flavus and A. parasiticus, aremost problematic in countries with hot,damp climates and poor storage facilities.Under these conditions, foods may becomecontaminated with fungi and then accu-mulate such toxins. Such foods are mar-keted and consumed in the countries inwhich they are produced; they are alsoexported to neighbouring countries andintercontinentally. Aflatoxin contamina-tion is therefore a international issue.
Levels of aflatoxin contamination tendto be highest in countries where rates ofliver cancer are high, such as some Africancountries and South-East Asia, includingChina. In general, rates are low in Europe,but relatively high rates of contaminationhave on occasion been found in the USA.
Aflatoxin exposure levels are low inEurope and Australia, higher in the USA,and high in many low-income countries.This is particularly the case in tropical andsubtropical regions where grains and nutsare stored for long periods under non-idealconditions.
Rates are reduced by inspection, use offungicides, and screening of importedfoods. However, monitoring of levels ofaflatoxin contamination in low-incomecountries is generally lacking.
Box 4.1.4 Aflatoxins

71
C H A P T E R 4 • F O O D S A N D D R I N K S
Dietary fibreDietary fibre intake, measured as non-starch polysaccharides,varies from 10–13 grams (g)/day in Japan and the UK to15–20 g/day or more in Africa and India. Intake among indi-viduals in a population may vary between 7 and 25 g/day.7
4.1.4 Interpretation of the evidence
Interpretation of the evidence on any and all foods anddrinks, their constituents, their methods of production,preservation, processing and preparation, and other factors,with the risk of cancer, is never simple, for general and spe-cific reasons.
4.1.4.1 GeneralFor general considerations that may affect interpretation ofthe evidence, see chapters 3.3 and 3.5, and boxes 3.1, 3.2,3.6, and 3.7.
‘Relative risk’ (RR) is used in this Report to denote ratiomeasures of effect, including ‘risk ratios’, ‘rate ratios’, ‘haz-ard ratios’, and ‘odds ratios’.
4.1.4.2 Specific Some considerations specific to cereals (grains), roots,tubers, and plantains are as follows.
Classification. ‘Cereals’ is a broad classification. Differentcereals have different nutritional composition and biologicaleffects, as do different types of dietary fibre. Any effects of specific cereals or their constituents may not becomeapparent.
Patterns and ranges of intake. Little evidence relates to roots,or tubers other than potatoes, or plantains, some of which,such as cassava (manioc) or yams, are staple foods in someparts of the world. Terminology. Potatoes are usually (as here) defined as tubers,but are sometimes (in the USA especially) included with veg-etables. Bananas, a significant item in many diets, may be(as here) defined as a fruit, or else with plantains as a starchyfood. There is no internationally agreed definition for dietaryfibre (box 4.1.1).
Measurement. Non-starch polysaccharides are measured pre-cisely by the Englyst method,8 but there are fewer epidemi-ological data on non-starch polysaccharides specifically thanfor dietary fibre. The various analytical techniques used toassess the fibre content of foods give widely different results.
Confounding. In high-income countries, high intakes ofwholegrain cereal products tend to go together with otherhealth-conscious dietary and other habits. Also there is pos-sible confounding between dietary fibre and other dietaryconstituents and in general with ‘healthier’ dietary patternsand ways of life. Data on dietary fibre come predominantlyfrom dietary sources, that is, plant-based foods (also see box4.1.1 and chapter 4.2); therefore, no effect can be attributedto different types and sources of dietary fibre.
Production, preservation, processing, preparation. Few stud-ies distinguish between unrefined and refined cereals andtheir products. Many processed foods grouped as cerealproducts, such as ready-to-eat breakfast cereals, are high inadded sugars and sometimes salt. The ways in which cere-als are processed, prepared, and consumed varies greatly indifferent cultures.
4.1.5 Evidence and judgements
The full systematic literature review (SLR) is contained onthe CD included with this Report.
4.1.5.1 Cereals (grains)The evidence was too limited in amount, consistency, orquality to draw any conclusions.
4.1.5.2 Roots, tubers, and plantains The evidence was too limited in amount, consistency, orquality to draw any conclusions.
4.1.5.3 Foods containing dietary fibre ColorectumSixteen cohort studies9-37 and 91 case-control studies inves-tigated dietary fibre and colorectal cancer. The Harvard pool-ing project also analysed original data from 13 separatecohort studies.38
An association was apparent from many, though not all,cohort studies. Ten studies showed decreased risk when com-paring high with low intake groups,14 19 21 25-29 33 34 which wasstatistically significant in one (figure 4.1.1).28 Two reportednon-significant increased risk,36 39 one showed no effect onrisk,30 and one reported no association.18 One study report-ed non-significant decreased risk in women and non-significant increased risk in men23; one study reportednon-significant increased risk in women and non-significantdecreased risk in men.37 Meta-analysis was possible on eightstudies, giving a summary effect estimate of 0.90 (95% con-fidence interval (CI) 0.84–0.97) per 10 g/day increment,with moderate heterogeneity (figure 4.1.2). A dose-responserelationship was apparent from cohort data.
Because of the abundant prospective data from cohortstudies, case-control studies were not summarised.
The Harvard pooled analysis from 13 prospective cohortstudies (725 628 participants, followed up for 6 to 20 years,8081 colorectal cancer cases) gave a significant inverse asso-ciation in the age-adjusted model (0.84, 95% CI0.77–0.92).38 However, the association was attenuated and no longer statistically significant after adjusting for other risk factors (0.94, 95% CI 0.86–1.03). One compari-son group was statistically significant when maximallyadjusted, others were not. Compared with dietary fibreintake of 10 to < 15 g/day, the pooled effect estimate was1.18 (95% CI 1.05–1.31) for less than 10 g/day (low com-pared with moderate intake). All other measures were notassociated with risk of colorectal cancer. The pooled analy-sis therefore found that, after accounting for other dietaryrisk factors, high dietary fibre intake was not associated

72
P A R T 2 • E V I D E N C E A N D J U D G E M E N T S
with a reduced risk of colorectal cancer. Fibre exerts several effects in the gastrointestinal tract but
the precise mechanisms for its probable protective role arenot clearly understood. Fibre dilutes faecal contents, decreas-es transit time, and increases stool weight.40 Fermentationproducts, especially short-chain fatty acids, are produced bythe gut flora from a wide range of dietary carbohydrates thatreach the colon. Short-chain fatty acids, particularlybutyrate, can induce apoptosis and cell cycle arrest, and pro-mote differentiation. Fibre intake is also strongly correlatedwith intake of folate.
A clear dose-response relationship is apparent fromgenerally consistent cohort studies, supported byevidence for plausible mechanisms, but residualconfounding could not be excluded. Foods containingdietary fibre probably protect against colorectal cancer.
The Panel is aware that since the conclusion of the SLR, sixcohort studies41-46 and one case-control study47 have been pub-lished. This new information does not change the Panel judge-ment (see box 3.8).
OesophagusOne cohort study,48 nine case-control studies,49-58 and twoecological studies59 60 investigated dietary fibre and cancerof the oesophagus.
There was some evidence of an association between dietaryfibre and reduced oesophageal cancer risk. The single cohortstudy reported decreased risk when comparing high with lowintakes, with an effect estimate of 0.50, though no assess-ment of statistical significance was included.48
The nine case-control studies produced 13 independenteffect estimates. Of these, 11 estimates were of decreasedrisk,50-53 55 56 58 61 which were statistically significant in eight.One estimate indicated no effect on risk54 and one other gavenon-significant increased risk.62 The data were mostconsistent when stratified for adenocarcinomas; of sixstudies, five reported significant decreased risk; results wereless consistent for squamous cell carcinoma. All studies were adjusted for alcohol and smoking except one, whichwas adjusted for alcohol but not smoking.50
The ecological studies were inconclusive. Neither was sta-tistically significant, with one in the direction of increasedand the other of decreased risk.
There is no evidence of a plausible biological mechanismthrough which dietary fibre reduces the risk of oesophagealcancer. It is not possible to conclude whether an as yetunknown mechanism is responsible for an apparent reduc-tion in risk, or whether it is due to other components foundin the vegetables and fruits that contain dietary fibre.
There is limited evidence from sparse and inconsistentcase-control studies only, suggesting that foodscontaining dietary fibre protect against oesophagealcancer.
4.1.5.4 Aflatoxins(Also see box 4.1.4; chapter 4.9; and chapter 7.8). There aretwo approaches to measuring aflatoxin intake. The first useslocal food tables to estimate exposure to aflatoxins from diet.The second approach uses biomarkers of exposure. These arederived from knowledge of aflatoxin metabolism. In humans,metabolised products of aflatoxins can be detected in blood,
Figure 4.1.2 Dietary fibre and colorectal cancer;cohort studies
Heilbrun 1989 Men 0.77 (0.48–1.24)
Bostick 1993 Women 0.88 (0.77–1.01)
Fuchs 1999 Women 0.99 (0.83–1.18)
Terry 2001 Women 1.08 (0.84–1.39)
Colbert 2001 Men 1.02 (0.88–1.18)
Konings 2002 Men 0.95 (0.84–1.07)
Konings 2002 Women 0.85 (0.73–1.00)
Higginbotham 2004 Women 0.83 (0.61–1.13)
Norat 2005 Men 0.77 (0.71–0.83)
Norat 2005 Women 0.89 (0.82–0.97)
Summary estimate 0.90 (0.84–0.97)
510.2 0.5 2
Relative risk (95% CI)
Relative risk, per 10 g/day
Figure 4.1.1 Dietary fibre and colorectal cancer;cohort studies
Wu 1987 Men 1.19 (0.60–2.11)
Wu 1987 Women 0.64 (0.37–1.11)
Heilbrun 1989 Men 0.71 (0.45–1.13)
Giovannucci 1994 Men 1.08 (0.68–1.71)
Steinmetz 1994 Women 0.80 (0.40–1.91)
Gaard 1996 Men 0.82 (0.46–1.46)
Kato 1997 Women 0.95 (0.79–1.24)
Pietinen 1999 Men 1.00 (0.68–1.58)
Soneham 2000 Women 0.96 (0.70–1.32)
Bingham 2003 0.75 (0.50–0.95)
COL00535 Women 0.94 (0.70–1.26)
IARCIM 1977 Men 0.92 (0.64–1.32)
IARCIM 1977 Women 0.86 (0.52–1.42)
Baron 1997 Women 0.79 (0.45–1.38)
510.2 0.5 2
Relative risk (95% CI)
Relative risk, highest vs lowest exposure category

73
C H A P T E R 4 • F O O D S A N D D R I N K S
urine, or breastmilk. Biomarkers of exposure are more accu-rate and precise.
Liver Five cohort studies63-70 and seven case-control studies71-79
assessed associations between biomarkers of exposure toaflatoxin and hepatocellular carcinoma.
The cohort studies used a variety of different biomarkersfor exposure to aflatoxin, some in blood and some in urine.Despite this variety, all five studies reported increased riskfor the highest levels when compared to the lowest, and allof these reported at least one measure that resulted in a sta-tistically significant increased risk (figure 4.1.3). Studies thatadjusted for hepatitis virus infection tended to show thegreater effects.65 66 There is some evidence of an interactionwhereby the risk is increased by a multiplicative effect if afla-toxin exposure is combined with hepatitis infection. Onestudy showed that people with hepatitis virus antibodies andbiomarkers of aflatoxin exposure had a higher risk than thosewith hepatitis virus antibodies alone, with an effect estimateof 10.0 (95% CI 1.6–60.9).65
There is evidence from some of the cohort studies for inter-action with glutathione-S-transferase (GST) genotype.63 64
GST is an enzyme involved in the metabolic pathway that‘detoxifies’ aflatoxins. Different genotypes show varying effi-ciencies at this task. Two genes (GSTT1 and GSTM1) wereassessed separately. For each, it is possible to have a posi-tive or negative genotype. In each case, a negative genotypeincreases risk of hepatocellular carcinoma when exposed toaflatoxins. There is clear, consistent evidence thatGSTM1/GSTT1 positive genotypes protect against theincreased risk of liver cancer from hepatitis infection com-bined with aflatoxin exposure, which supports a causal rolefor aflatoxins in hepatocellular carcinoma.
Four case-control studies showed statistically significantincreased risk for the highest levels of biomarkers when com-pared to the lowest.71 74 78 79 Two studies showed no effecton risk.73 77 One study showed a non-significant decreasedrisk.72 Heterogeneity may be explained by the diversity inmethods of exposure assessment.
A dose-response relationship is apparent from most cohort
studies and some of the case-control studies. The areas in the world where there is considerable afla-
toxin contamination of foods coincide with the areas whereprimary liver cancer rates are high. The epoxide product ofaflatoxin AFB1 is known to be genotoxic and is formed in theliver.80 It damages DNA, causing G:C base pairs to becomeT:A. GST enzymes can repair this damage with varying effi-ciency between genotypes. Recent studies have shown thataflatoxins can damage the p53 gene, which is an importantregulator of normal growth.67 Damage to p53 DNA can leadto increased proliferation of abnormal cells and formationof cancers.
The synergistic effect of hepatitis virus infection and afla-toxin exposure might be explained by hepatitis virus increas-ing the production of the enzyme (CYP1A2) that producesthe genotoxic metabolite of aflatoxin.81 It is also possible thatthe hepatitis virus increases the number of G:C to T:A trans-versions, or that it inhibits nucleotide repair, or that it actsas a tumour promoter.
The evidence is ample and consistent and is supportedby strong evidence for mechanisms operating inhumans. A dose response is apparent from both cohortand case-control studies. The evidence that aflatoxinsand aflatoxin-contaminated foods are a cause of livercancer is convincing.
4.1.6 Comparison with previous report
The previous report concluded that dietary fibre/non-starchpolysaccharides possibly protect against cancers of the pan-creas, colorectum, and breast. The previous report also con-cluded that wholegrain cereals possibly decrease the risk ofstomach cancer and that refined cereals possibly increase therisk of oesophageal cancer.
Since the mid-1990s, evidence for a protective effect ofdietary fibre against colorectal and oesophageal cancer riskhas become somewhat stronger. The finding of the previousreport, suggesting that the degree of refinement (other thanrelative amounts of dietary fibre) may be a factor in modi-fication of the risk of some cancers, was not found.
The previous report classified bananas as plantains. Herethey are classified as fruits. The previous report considereddietary fibre separately from cereals (grains) and other plantfoods. Here, dietary fibre is considered in the context of cere-als (grains) and other plant foods.
4.1.7 Conclusions
The Panel concludes: The direct evidence that cereals (grains), roots, tubers, orplantains affect the risk of any cancer remains unimpressive.
However, foods containing dietary fibre probably protectagainst colorectal cancer; and there is limited evidence sug-gesting that such foods protect against oesophageal cancer.Dietary fibre is mostly found in cereals, roots and tubers, andalso in vegetables, fruits, and pulses (legumes) (see chapter
Figure 4.1.3 Aflatoxins and liver cancer;cohort studies
Qian 1994 Men 5.00 (2.11–11.85)
Wang 1996 3.80 (1.11–12.96)
Yu 1997 Men 6.00 (1.22–29.49)
Sun 1999 Men 4.52 (1.57–13.01)
51 2 52 6
Relative risk (95% CI)
Relative risk, highest vs lowest exposure category

74
P A R T 2 • E V I D E N C E A N D J U D G E M E N T S
4.2). All of these are highest in dietary fibre when in wholeor minimally processed forms.
Foods high in dietary fibre may also have a protectiveeffect indirectly because they are relatively low in energydensity. See chapters 6.1, 7.3, 7.9, and 8 for discussion ofthe role of energy density in weight gain, overweight, andobesity, and of weight gain, overweight, and obesity in therisk of some cancers, including those of the oesophagus andcolorectum.
The evidence that foods contaminated with aflatoxins area cause of liver cancer is convincing. Cereals (grains) andpeanuts (see chapter 4.2) are the foods most commonlyinfested by these fungal toxins. Contamination is most wide-spread in countries with hot, damp climates and poor stor-age facilities.
75
C H A P T E R 4 • F O O D S A N D D R I N K S
Vegetables and fruits are generally low in energy density(with a few exceptions) and, when consumed in variety,are sources of many vitamins, minerals, and otherbioactive compounds (phytochemicals). Many non-starchyvegetables, including salad vegetables and fruits, may beeaten raw and may also be cooked. Pulses (legumes) arehigh in protein. Traditional diets all over the worldcombine cereals (grains) with pulses (legumes) and, inthis way, ensure sufficient protein of adequate quality,usually with small amounts of animal foods. Nuts andseeds are concentrated sources of numerousmicronutrients and of essential fatty acids. All these foodsare sources of dietary fibre. Many herbs and spices havepotent pharmacological as well as culinary properties.
Consumption of vegetables and fruits is very variable:high around the Mediterranean littoral and some tropicalcountries; low in many low-income countries, includingsome in which fruits are abundant. Consumption of pulses(legumes) is also very variable: beans and chickpeas andtheir products are basic foods in a number of LatinAmerican, Middle Eastern, and Asian countries, but pulsesare insignificant in typical North American and mostEuropean diets. Consumption of nuts, seeds, herbs, andspices also varies. Traditional Middle Eastern and Indiancuisines use a great variety of herbs and spices; garlic,usually classified as a herb, is consumed in remarkablequantities in some countries.
In general, the Panel judges that findings from cohortstudies conducted since the mid-1990s have made theoverall evidence, that vegetables or fruits protect againstcancers, somewhat less impressive. In no case now is theevidence of protection judged to be convincing. However,in a substantial number of cases, a judgement of probableis justified. Evidence on legumes (pulses), nuts, seeds, and(with two exceptions) herbs and spices remainsinsubstantial.
The Panel judges as follows: Non-starchy vegetables probably protect against cancers ofthe mouth, pharynx, and larynx, and those of theoesophagus and stomach. There is limited evidencesuggesting that they also protect against cancers of thenasopharynx, lung, colorectum, ovary, and endometrium.Allium vegetables probably protect against stomachcancer. Garlic (an allium vegetable, commonly classed as aherb) probably protects against colorectal cancer. There islimited evidence suggesting that carrots protect againstcervical cancer; and that pulses (legumes), including soyaand soya products, protect against stomach and prostatecancers. Fruits in general probably protect against cancersof the mouth, pharynx, and larynx, and those of the
oesophagus, lung, and stomach. There is limited evidencesuggesting that fruits also protect against cancers of thenasopharynx, pancreas, liver, and colorectum. There islimited evidence suggesting that chilli is a cause ofstomach cancer.
Fruits and non-starchy vegetables are generally lowenergy-dense foods. For a discussion of the effect of suchfoods and drinks on weight gain, overweight, and obesity,and the role of weight gain, overweight, and obesity in therisk of some cancers, see Chapters 6, 7, and 8.
Evidence that vegetables and fruits protect against somecancers is supported by evidence on foods containingvarious micronutrients, found especially in vegetables,fruits, and pulses (legumes), and nuts and seeds, as wellas in cereals, roots, tubers, and other plant foods. Foodscontaining folate probably protect against pancreaticcancer, and there is limited evidence suggesting that thesefoods also protect against oesophageal and colorectalcancers. Foods containing carotenoids probably protectagainst cancers of the mouth, pharynx, and larynx, andalso lung cancer. Foods containing the carotenoid beta-carotene probably protect against oesophageal cancer; andfoods containing lycopene probably protect againstprostate cancer. Foods containing vitamin C probablyprotect against oesophageal cancer. There is limitedevidence suggesting that foods containing quercetinprotect against lung cancer.
Evidence also relevant to chapter 4.1 is grouped here.Foods containing selenium (also found in animal foods)probably protect against prostate cancer; and there islimited evidence suggesting that they protect againststomach and colorectal cancers. There is limited evidencesuggesting that foods containing pyridoxine protectagainst oesophageal and prostate cancers; and that foodscontaining vitamin E protect against oesophageal andprostate cancers.
The strongest evidence, here corresponding tojudgements of ‘probable’, shows that non-starchyvegetables and also fruits probably protect against cancersof the mouth, larynx, pharynx, oesophagus, and stomach,and that fruits also probably protect against lung cancer;and that allium vegetables, and garlic specifically,probably protect against stomach cancer. The case thatvegetables, fruits, and pulses (legumes) may be protectiveagainst cancers of some sites is supported by evidence onfoods containing micronutrients found in these and otherplant foods. Thus, foods containing carotenoids probablyprotect against cancers of the mouth, pharynx, larynx, andlung; foods containing beta-carotene and also vitamin Cprobably protect against oesophageal cancer; foodscontaining selenium and also lycopene probably protect
4.2 Vegetables, fruits, pulses (legumes),nuts, seeds, herbs, spices

76
P A R T 2 • E V I D E N C E A N D J U D G E M E N T S
VEGETABLES,1 FRUITS,1 PULSES (LEGUMES), NUTS, SEEDS, HERBS, SPICES, AND THE RISK OF CANCER
In the judgement of the Panel, the factors listed below modify the risk of cancer. Judgements are graded according to the strength of the evidence.
DECREASES RISK INCREASES RISK
Exposure Cancer site Exposure Cancer site
Convincing
Probable Non-starchy vegetables1 Mouth, pharynx, larynx Oesophagus Stomach
Allium vegetables1 Stomach
Garlic1 Colorectum
Fruits1 Mouth, pharynx, larynxOesophagus LungStomach
Foods containing folate2 Pancreas
Foods containing Mouth, pharynx, larynxcarotenoids2 Lung
Foods containing Oesophagusbeta-carotene2
Foods containing Prostatelycopene2 3
Foods containing Oesophagusvitamin C2 4
Foods containing Prostateselenium2 5
Limited — Non-starchy vegetables1 Nasopharynx Chilli1 Stomachsuggestive Lung
ColorectumOvaryEndometrium
Carrots1 Cervix
Fruits1 Nasopharynx PancreasLiverColorectum
Pulses (legumes)7 Stomach Prostate
Foods containing folate2 Oesophagus Colorectum
Foods containing Oesophagus pyridoxine2 8
Foods containing Oesophagus vitamin E2 6 Prostate
Foods containing Lungselenium2 5 Stomach
Colorectum
Foods containing Lungquercetin2
Substantialeffect on risk Foods containing beta-carotene9: prostate; skin (non-melanoma)unlikely
1 Judgements on vegetables and fruits do not include those preserved by salting and/or pickling.2 Includes both foods naturally containing the constituent and foods which have the constituent added (see chapter 3.5.3).3 Mostly contained in tomatoes and tomato products. Also fruits such as grapefruit, watermelon, guava, and apricot.4 Also found in some roots and tubers — notably potatoes. See chapter 4.1. 5 Also found in cereals (grains) and in some animal foods. See chapters 4.1 and 4.3.6 Also found in plant seed oils. See chapter 4.5.7 Including soya and soya products.8 Vitamin B6. Also found in cereals. See chapter 4.1. 9 The evidence is derived from studies using supplements and foods containing beta-carotene: see chapter 4.10.
For an explanation of all the terms used in the matrix, please see chapter 3.5.1, the text of this section, and the glossary.

77
C H A P T E R 4 • F O O D S A N D D R I N K S
against prostate cancer; and foods containing folateprobably protect against pancreatic cancer. Also seechapter 4.1 for the evidence that foods containing dietaryfibre, found in plant foods (particularly when in whole orrelatively unprocessed forms), probably protect againstcolorectal cancer.
Vegetables and fruits (including berries), nuts and seeds, andherbs and spices, where they grow and can be cultivated,have always been part of human diets. Gatherer–hunters andpastoral peoples probably consumed more than relativelyimpoverished urban dwellers: for them, vegetables were themain sources of many vitamins, and fruits were a mainsource of energy, from sugar (also found in wild honey).They are consumed abundantly as part of many long-estab-lished traditional cuisines, around the Mediterranean littoral,the Middle East, in many Asian countries, and the Pacificislands, where substantial amounts of meat, dairy products,and other animal foods are traditionally consumed only occa-sionally. In contrast, monotonous ‘poverty’ diets include fewof these foods.
Globally, consumption of these foods is lower than nowgenerally recommended. Vegetables and fruits are sometimesseen as relatively expensive. Well stocked supermarkets usu-ally now display a variety of local and imported fresh veg-etables and fruits, although supplies in smaller stores aremore variable. Consumption of fresh vegetables and fruits inmany tropical countries in Africa and Latin America is low:on average people in Brazil, for example, consume roughlythe same as people in Britain. The explanation may be thatin Africa, many rural communities are obliged to grow cashcrops that displace gardens, and that in Latin America knowl-edge of the value — and pleasure — of many indigenousvegetables and fruits has been lost. Many programmes intropical countries are now dedicated to regaining this knowl-edge.1
Even before the discovery of vitamins as essential nutri-ents beginning in the early 20th century, vegetables andfruits have been recommended as ‘protective foods’. Earlyreports concerned with nutritional deficiencies paid lessattention to pulses (legumes), nuts, and seeds, even thoughthese plant foods contain protein, and nuts and seeds arenutrient- and also energy-dense, perhaps because they arenot much consumed in the countries where most suchreports were compiled. Instead, as already mentioned, pri-ority was given to energy- and nutrient-dense foods of ani-mal origin. By the 1980s, most reports concerned withprevention of chronic diseases recommended relatively highintakes of vegetables and fruits and sometimes also pulses(legumes), either because these foods were seen as nour-ishing substitutes for energy-dense fatty or sugary foods, orelse because they were identified as positively protectiveagainst cardiovascular disease.2 Evidence that vegetables and fruits might be protective against some cancers emergedin the 1990s.3 A common recommendation has been for atleast five portions (or at least 400 g) of vegetables and fruitsa day.4
Non-starchy root vegetables such as carrots are included
here. Chapter 4.1 includes dietary fibre, only found naturallyin plant foods. Chapter 4.1 also includes aflatoxins, whichalso contaminate pulses (legumes), notably peanuts, nutsand seeds, and other plant foods. The micronutrients includ-ed here, as contained in vegetables, fruits, pulses (legumes),nuts and seeds, are also found in other plant foods, and somealso in animal foods.
4.2.1 Definitions, sources
Vegetables and fruits are defined in this Report by their culi-nary use, and are grouped for discussion below as vegeta-bles and fruits, pulses (legumes), nuts and seeds, and herbs,spices, and condiments.
Vegetables and fruitsVegetables are the edible parts of plants, usually includingfungi. Typical examples include cultivated or gatheredleaves, roots, stalks, bulbs, and flowers. Some foods are culi-nary vegetables but are classified botanically as fruits; theseinclude cucumbers, peppers, squash, and tomatoes. Non-starchy vegetables are included here, while starchy root veg-etables are considered in chapter 4.1. Non-starchy vegetablescan be further divided into green, leafy vegetables, such asspinach and lettuce; cruciferous vegetables (the cabbagefamily), for example, bok choy, broccoli, cabbage, and water-cress; and allium vegetables, such as onions, garlic, andleeks.
A fruit is the seed-containing part of the plant; but onlythose that are eaten as fruits are included in the culinary def-inition, for example, apples, bananas, berries, figs, grapes,mangoes, and melons. This also includes citrus fruits suchas oranges, grapefruits, lemons, and limes; and also driedfruits, such as apricots, figs, and raisins.
Pulses (legumes)Leguminous plants produce their fruits as pods and are con-sidered here separately. The dried, edible seeds of this fam-ily are often called pulses, although this term is usedinterchangeably with legumes. They include beans, lentils,peas, and peanuts (groundnuts). The dried forms, whichhave matured and dried on the plant, are eaten most wide-ly. But some varieties are eaten as a green vegetable, suchas peas; the pods are sometimes eaten like this too, for exam-ple, green beans and runner beans. Some legumes can alsobe sprouted (germinated) and eaten, such as beanspouts.
Nuts and seedsNuts are edible seeds surrounded by a tough, dry shell. Thisdefinition includes true nuts (such as hazelnuts and chest-nuts), as well as seeds that most people think of as nuts(including Brazil nuts, macadamia nuts, and cashews). Otherseeds commonly eaten include sunflower, sesame, pumpkin,and poppy seeds. Nuts and seeds are processed for their oil,ground into pastes, used as ingredients, or eaten raw orroasted as snack foods. Cereals (grains) are also the seedsof plants, but these are discussed separately in this Report(see chapter 4.1). Seeds, like nuts, have a relatively high oil

78
P A R T 2 • E V I D E N C E A N D J U D G E M E N T S
content, and the oils produced from them are considered inchapter 4.4.
Herbs, spices, and condimentsHerbs and spices, which are generally used to flavour or pre-serve foods, are of plant origin, although a very small num-ber of animal products are classed as spices (such asambergris). Definitions of herbs and spices vary, but herbsare usually the fresh or dry leaves or whole plant, whilespices are produced from other parts of the plant, such asthe seeds, and are usually dried.5 Many different parts of
plants are used as herbs or spices, such as the leaves (sage,bay, or basil), stems (ginger, lemongrass), bark (cinnamon),rhizomes (ginger), roots (horseradish), flower buds (cloves),stamens (saffron), seeds (mustard, cumin), kernels (nut-meg), and fruits (peppers).
A condiment is a substance that adds taste to other foods;the term is often used for sauces added at the table, whichare usually of plant origin. Examples include vinegars,ketchups, chutneys, harissa, mustard, and soy sauce. Salt isneither a herb nor a spice, although it is used as a condiment(see chapter 4.5).
Vegetables, fruits, pulses (legumes), nuts,and seeds are sources of a wide variety ofmicronutrients and other bioactive com-pounds. Foods containing several of theseconstituents have been identified in the sys-tematic literature reviews, on which thischapter is based, as being associated withcancer risk. These are carotenoids (includ-ing beta-carotene and lycopene), folate,vitamin C, vitamin D, vitamin E, quercetin,pyridoxine, and selenium. Mechanisms bywhich they might affect cancer risk are dis-cussed in chapter 4.2.5. However, it is notpossible to ascribe the association betweenthese foods and lower cancer risk to acausal effect of specific compounds withconfidence, as each food contains a com-plex mixture of different constituents, all ofwhich might also contribute to any effect.
Carotenoids are found in varying con-centrations in all vegetables, particularlythose that are red or orange. They are afamily of more than 600 fat-solublered/orange pigments that comprise xan-thophylls (such as lutein) and carotenes(such as alpha- and beta-carotene, andlycopene). Some carotenoids, most impor-tantly beta-carotene, can be converted bythe body to retinol and are sometimescalled pro-vitamin A carotenoids. Thesecompounds tend to be the main dietarysource of vitamin A in low-income coun-tries.
Only about half of the 50 or socarotenoids in human diets can be absorb-ed. They have antioxidant and other bioac-tivities that are discussed in chapter 4.10.Sources of carotenoids include spinach,kale, butternut squash, pumpkin, red (bell)peppers, carrots, tomatoes, cantaloupemelon, and sweet potatoes.
Beta-carotene is found in yellow, orange,and green fruits and green, leafy vegeta-bles including carrots, spinach, lettuce,tomatoes, sweet potatoes, broccoli, can-taloupe melon, oranges, and winter squash(pumpkin).
As a rule of thumb, the greater the inten-sity of the colour of the fruit or vegetable,the more beta-carotene it contains.
The most concentrated source oflycopene is tomatoes, but it is also presentin watermelon, red (bell) peppers, pink orred grapefruit, pink-fleshed guava, andpersimmons.
The B-vitamin folate is a family of com-pounds essential for human health. Folicacid, the synthetic form, is used to fortifymanufactured cereal products, spreads,and, in some countries, flour or grains.Folates are involved in a number of meta-bolic pathways, especially in the synthesisof purines and pyrimidines, which areimportant for DNA synthesis and cell repli-cation (also see chapter 4.2.5.4). Sources ofdietary folate include liver, beans, spinach,broccoli, romaine lettuce, chicory, oranges,and papaya.
Vitamin C (ascorbic acid) is a water-solu-ble vitamin. Humans, like a small number ofother animals, cannot synthesise vitamin C,so it is an essential part of diets. Vitamin Cis essential for collagen synthesis and alsohas antioxidant activity. Severe deficiencycauses scurvy. It is added to many foods,including bread and soft drinks, in smallamounts as an antioxidant preservative.Natural dietary sources are vegetables,tubers, and fruits, including red/yellow(bell) peppers, kiwi fruits, broccoli, papaya,citrus fruits, strawberries, and potatoes, butit is destroyed by heat or contact with theair (for instance, when vegetables arechopped), or lost into cooking water.
Vitamin E is a fat-soluble vitamin and apotent antioxidant that occurs as eight dif-ferent forms: alpha- and gamma-toco-pherol are the most common. The mostimportant dietary sources of vitamin E arevegetable oils such as palm, sunflower,corn, soya bean, and olive oils. Nuts, sun-flower seeds, and wheatgerm are alsosources. Wholegrains, fish, peanut butter,green, leafy vegetables, and fortified
breakfast cereals also contain this vitamin. Pyridoxine is one of a group of water-
soluble compounds collectively known asvitamin B6. This vitamin is involved in neu-rotransmitter synthesis, red blood cell for-mation and function, niacin (vitamin B3)formation, steroid hormone function, andnucleic acid synthesis (also see chapter4.2.5.5).15 Food sources include bananas,fish, poultry, liver, potatoes eaten with theskin, green, leafy vegetables, beans, pulses(legumes), nuts, wholegrains, and fortifiedbreakfast cereals.
Selenium is a mineral element thatoccurs in different chemical forms. It istoxic in large amounts, but is essential inthe diet at trace levels. It is present at vary-ing concentrations in different soils; andsince plants take up selenium from the soil,these levels determine the amount presentin vegetables. Thus selenium deficiency ismore prevalent in regions where the soilselenium content is low. Selenium is a com-ponent of the amino acids selenocysteineand selenomethionine, which are inte-grated into proteins to form selenopro-teins. Selenoproteins include antioxidantenzymes such as glutathione peroxidases,thioredoxin reductase, which is importantfor DNA synthesis, and iodothyronine deio-dinase, which is important for the synthe-sis of thyroid hormones.16 Dietary sourcesof selenium include brazil nuts, fish, whole-grains, wheatgerm, and sunflower seeds.
Quercetin is a flavonoid, which is a typeof polyphenol; it is not an essential dietarycomponent. Many studies in cultured cellsand animals suggest that quercetin hasantioxidant activity, which could give riseto a range of biological activities, includingreducing inflammation (also see chapter4.2.5.9). Quercetin is found in apples,green and black tea, onions, raspberries,red wine, red grapes, citrus fruits, leafy,green vegetables, cherries, elderberries,broccoli, blueberries, cranberries, andbilberries.
Box 4.2.1 Micronutrients and other bioactive compounds and cancer risk
79
C H A P T E R 4 • F O O D S A N D D R I N K S
4.2.2 Composition
Vegetables and fruitsThe composition of fruits and vegetables depends both onspecies and on subtype, as well as on the environmental,farming, production, and storage conditions. These includefactors such as sun exposure, soil quality, agricultural prac-tices, harvesting time, ripeness, length of time between har-vest and consumption, and preservation and preparation
methods. For instance, the outer leaves of lettuces can havehigher levels of some micronutrients than the inner leaves;and harvested, unripe fruit that ripens in transit may havelower levels of nutrients than fruits ripened on the plant (box 4.2.1).6
Vegetables and fruits contain vitamins, minerals, dietaryfibre, and other bioactive compounds, such as phytochemi-cals (box 4.2.2). This is a collective term for a variety of plantcomponents that often perform important functions in theplant, such as providing colour, flavour, or protection, butare not essential in the human diet. They include salicylates,flavonoids, glucosinolates, terpenes, lignans, andisoflavones. All of these groups of compounds have beenshown either in humans or in laboratory experiments to havepotentially beneficial health effects when they are includedin diets. However, the bioavailability of these compounds is variable (box 4.2.3) and their ultimate heath effectsuncertain.
Plant cell walls are the main source of dietary fibre, andall whole fruits and vegetables (but not their juices) containvarying amounts of fibre (box 4.2.4). Most vegetables andfruits are low energy-dense foods, although there are excep-tions, for example, avocados, nuts, and seeds.
Some families of fruits and vegetables have characteristiccomponents that may confer a particular health benefit (orrisk) to the whole family. For instance, cruciferous vegeta-bles are sources of glucosinolates and their products isoth-iocyanates and indoles. Allium vegetables and others, suchas chicory and Jerusalem artichokes, store energy as inulin(chains of fructose sugars) rather than starch (chains of glu-cose sugars). The body cannot digest inulin, which is calleda prebiotic — a substance that is claimed to have health ben-efits by promoting the growth of certain types of gut bacte-ria. Allyl sulphides and allicin in garlic are distinctive flavourmolecules that give vegetables of the onion family their‘sting’ (box 4.2.3). Green, leafy vegetables are sources offolate, and tomatoes have high levels of lycopene. All ofthese components, as well as other phytochemicals (box
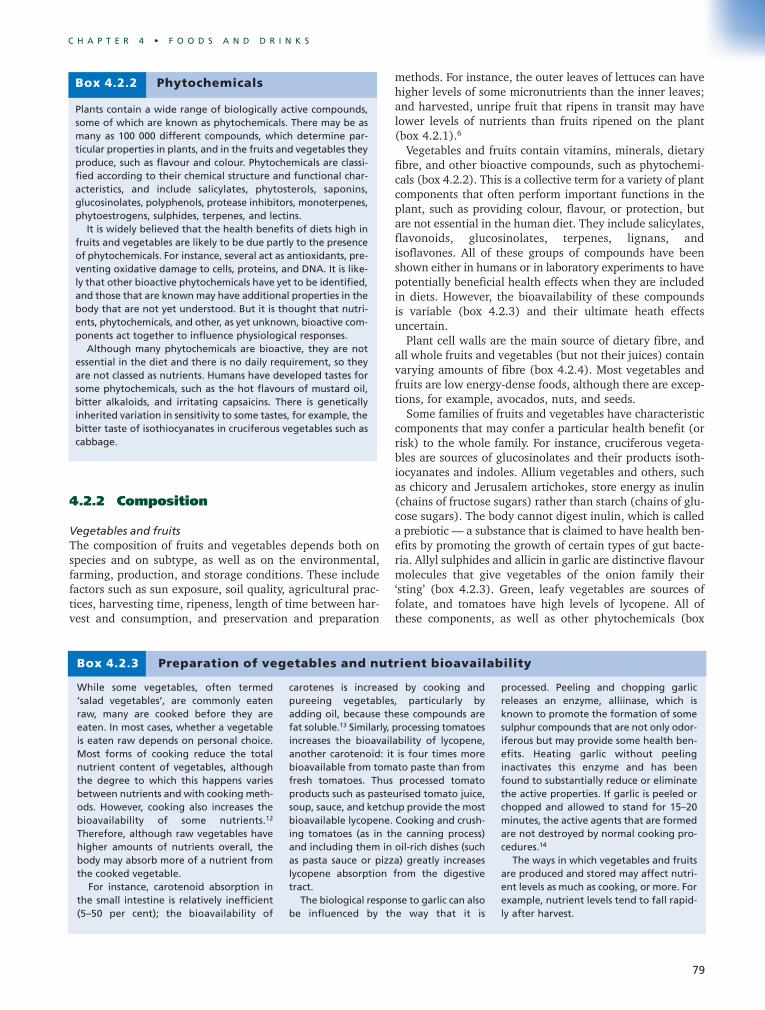
Plants contain a wide range of biologically active compounds,some of which are known as phytochemicals. There may be asmany as 100 000 different compounds, which determine par-ticular properties in plants, and in the fruits and vegetables theyproduce, such as flavour and colour. Phytochemicals are classi-fied according to their chemical structure and functional char-acteristics, and include salicylates, phytosterols, saponins,glucosinolates, polyphenols, protease inhibitors, monoterpenes,phytoestrogens, sulphides, terpenes, and lectins.
It is widely believed that the health benefits of diets high infruits and vegetables are likely to be due partly to the presenceof phytochemicals. For instance, several act as antioxidants, pre-venting oxidative damage to cells, proteins, and DNA. It is like-ly that other bioactive phytochemicals have yet to be identified,and those that are known may have additional properties in thebody that are not yet understood. But it is thought that nutri-ents, phytochemicals, and other, as yet unknown, bioactive com-ponents act together to influence physiological responses.
Although many phytochemicals are bioactive, they are notessential in the diet and there is no daily requirement, so theyare not classed as nutrients. Humans have developed tastes forsome phytochemicals, such as the hot flavours of mustard oil,bitter alkaloids, and irritating capsaicins. There is geneticallyinherited variation in sensitivity to some tastes, for example, thebitter taste of isothiocyanates in cruciferous vegetables such ascabbage.
Box 4.2.2 Phytochemicals
While some vegetables, often termed‘salad vegetables’, are commonly eatenraw, many are cooked before they areeaten. In most cases, whether a vegetableis eaten raw depends on personal choice.Most forms of cooking reduce the totalnutrient content of vegetables, althoughthe degree to which this happens variesbetween nutrients and with cooking meth-ods. However, cooking also increases thebioavailability of some nutrients.12
Therefore, although raw vegetables havehigher amounts of nutrients overall, thebody may absorb more of a nutrient fromthe cooked vegetable.
For instance, carotenoid absorption inthe small intestine is relatively inefficient(5–50 per cent); the bioavailability of
carotenes is increased by cooking andpureeing vegetables, particularly byadding oil, because these compounds arefat soluble.13 Similarly, processing tomatoesincreases the bioavailability of lycopene,another carotenoid: it is four times morebioavailable from tomato paste than fromfresh tomatoes. Thus processed tomatoproducts such as pasteurised tomato juice,soup, sauce, and ketchup provide the mostbioavailable lycopene. Cooking and crush-ing tomatoes (as in the canning process)and including them in oil-rich dishes (suchas pasta sauce or pizza) greatly increaseslycopene absorption from the digestivetract.
The biological response to garlic can alsobe influenced by the way that it is
processed. Peeling and chopping garlicreleases an enzyme, alliinase, which isknown to promote the formation of somesulphur compounds that are not only odor-iferous but may provide some health ben-efits. Heating garlic without peelinginactivates this enzyme and has beenfound to substantially reduce or eliminatethe active properties. If garlic is peeled orchopped and allowed to stand for 15–20minutes, the active agents that are formedare not destroyed by normal cooking pro-cedures.14
The ways in which vegetables and fruitsare produced and stored may affect nutri-ent levels as much as cooking, or more. Forexample, nutrient levels tend to fall rapid-ly after harvest.
Box 4.2.3 Preparation of vegetables and nutrient bioavailability

80
P A R T 2 • E V I D E N C E A N D J U D G E M E N T S
4.2.2), have been shown to have potentially beneficial effectsin laboratory experiments, as detailed in the evidence inchapter 4.2.5 (also see Chapter 2).7-9
Pulses (legumes)Dry pulses are seeds and are higher in protein than mostother plant foods. Soya beans and peanuts contain 37 g per100 g and 26 g per 100 g protein dry weight respectively,although, on average, pulses contain around 20 g per 100 gprotein dry weight.10 These foods are typically high in car-bohydrates and non-starch polysaccharides (dietary fibre),and are generally low in fat. Soya beans and peanuts areexceptions, being relatively high in fat with 8 g per 100 gand 47 g per 100 g fat, respectively (mostly mono- andpolyunsaturated fatty acids). They also contain oligosac-charides that are not digested in the gut but are fermentedby bacteria in the colon. Soya beans are distinct from otherlegumes in that they have a high content of bioactiveisoflavones, or phytoestrogens, which have hormone-likeeffects in the body. They are also good sources of saponinsand phytosterols, which decrease cholesterol absorption.Many legumes contain deguelin, which has been shown tohave anti-tumour effects in laboratory experiments.11 Mostpulses are virtually indigestible and inedible before cooking;immature legumes that are eaten green have higher levelsof sugar and lower levels of non-digestible polysaccharidesthan dried pulses.
Nuts and seedsOther seeds and nuts are also relatively high in protein andfat; some contain as much as 60 g fat per 100 g. They aretherefore energy-dense foods (see Chapter 8), as well asbeing nutrient-dense. Weight-for-weight, nuts provide morecalories than either meat or cereals (grains), although chest-nuts are the exception as they are relatively low in fat. Mostnuts contain mainly monounsaturated fatty acids, althoughthe exceptions are coconuts, which contain a high propor-tion of saturated fatty acids, and walnuts and pecans, whichcontain mostly polyunsaturated fatty acids (see chapter4.5.2). Nuts and seeds are high in dietary fibre (box 4.2.4),especially when they are eaten with their skins or hulls; thefibre content is typically 5–11 g per 100 g. Nuts and seedsare also high in vitamins and minerals, particularly the B vit-amins, vitamin E, and folate; and the seed coats contain phe-nolic compounds.
Herbs and spicesNearly all herbs and spices contain aromatic compounds,which are volatile molecules that are usually fat- rather thanwater-soluble. The flavour compounds may make up as muchas 15 g per 100 g of a spice by weight, although herbs con-tain much lower levels — typically around 1 g per 100 g.Many plants have evolved to contain these compoundsbecause they act as deterrents to herbivores. Some of thesearomatic compounds may be bioactive, although possibly notat the levels found in most diets. Isothiocyanates are respon-sible for the spicy/hot flavour of mustard and horseradish,produced from glucosinolates in cruciferous plants. Chivesand garlic (allium vegetables) contain the distinctive sul-phides discussed above. Terpenoids are common componentsin herbs and spices, providing distinctive flavours. Examplesinclude monoterpenes, such as geranial in lemon grass, andlinalool in bergamot; sesquiterpenes, such as bisabolene inginger; triterpenoids, such as the saponin glycrrhizic acid,found in liquorice root; and tetraterpenoids, such as thecarotenoid, lycopene.
4.2.3 Consumption patterns
Fruits and vegetablesThe global average for vegetable consumption (based onavailability and not including vegetable oils) is 2.6 per centof total daily energy intake.17 It is generally highest in NorthAfrica, the Middle East, parts of Asia, the USA and Cuba, andin southern Europe. Although consumption levels are similarin countries of high and low economic status, vegetables rep-resent a greater proportion of daily energy intake in the low-income countries. Intakes range from 5.3 per cent in parts ofAsia to as little as 0.2 per cent in sub-Saharan Africa. On aver-age, the availability of vegetables is increasing globally.
The global average for fruit consumption (based on avail-ability) is 2.7 per cent of total daily energy intake. Fruit con-sumption is generally higher than vegetable consumption,but it shows a greater degree of variability. Fruit consump-tion is higher in high-income countries, although it repre-sents a similar percentage of total available dietary energy
The concept of dietary fibre arose from observations of the lowprevalence of colon cancer, diabetes, and coronary heart diseasein parts of Africa amongst people whose diets were high inunrefined carbohydrates and whose stools were typically bulky,and often or sometimes semisolid. Considerable efforts havebeen dedicated to characterising the dietary components ofwhat has come to be called dietary fibre that might conferhealth benefit. Naturally occurring dietary fibre is only derivedfrom plant foods. Pulses (legumes) and minimally processedcereals are particularly concentrated sources, but vegetables andfruits also contain significant amounts. Dietary fibre isolatedfrom plant cell walls and synthetic forms are increasingly enter-ing the food supply.
High intakes of dietary fibre, variously defined, have beenassociated with reduced risk of cardiovascular disease as well asof some cancers. Definitions of dietary fibre vary. Some arebased on chemical analyses of the components of plant cellwalls, such as non-starch polysaccharide, others on physiologi-cal effects — the carbohydrates that enter the large bowel hav-ing escaped digestion in the small intestine being defined asdietary fibre. The latter definition includes oligosaccharides andresistant starch. The World Health Organization and Food andAgriculture Organization have recently proposed that only poly-saccharides which form part of plant cell walls should be regard-ed as dietary fibre and that the health benefits of resistantstarch and oligosaccharides are more appropriately consideredseparately.
Box 4.2.4 Foods containing dietary fibre
This box also appears as box 4.1.2 in the previous section

81
C H A P T E R 4 • F O O D S A N D D R I N K S
to that seen in low-income countries. Intakes are highest insome parts of Africa, the Middle East, southern Europe, andOceania, and lowest in other parts of Africa and Asia. Fruitconsumption also tends to be low in north-eastern Europe.Intakes range from as much as 20 per cent of daily energyin parts of Africa to as little as 0.5 per cent in parts of Asia.The availability of fruit has increased globally in recentdecades, although there was a slight decrease in the 1990s.
Most countries have national recommendations for thedaily amount of vegetables and fruits that need to be eatento maintain optimal health (Chapter 10). These vary, butthey tend to recommend three or more servings per day ofvegetables and two or more servings per day of fruits; a serv-ing is about 80 g (or half a US cup). In most high-incomecountries for which data were available, daily consumptionof vegetables fell short of this target, although this is not dueto lack of availability; indeed, availability is high due to thewide use of refrigeration. Fruit consumption tended to becloser to national targets. Seasonal availability influencesoverall availability, although less so in high-income countrieswhere vegetables and fruits are more likely to be imported.
Pulses (legumes)Globally, pulses supply 2 per cent of total energy intake(based on availability) and 3.5 per cent of daily proteinintake.17 The highest availability is in parts of Africa, SouthAmerica, Asia, and the Middle East. In these areas, pulsesare a dietary staple, and can account for as much as 20 percent of daily energy intake and 50 per cent of protein intake.In societies with high intakes of meat and other foods of ani-mal origin, pulses are less important in diets, and are usu-ally consumed infrequently or in small amounts. Peanuts andsoya beans account for most of the legume products eatenaround the world.
Soya bean availability per person represents 0.5 per centof daily energy intake globally, but it is notably high in partsof Asia, and higher than average in parts of Africa andCentral America. In parts of Asia, soya beans account for upto 4.9 per cent of daily energy availability and 15 per centof protein.
Pulses are eaten in a variety of ways around the world; forinstance, Japanese and Chinese bean curd (tofu), Chinesemung bean sprouts, Mexican chilli and refried beans, Indiandahl, Middle Eastern falafel and hummus, Indonesian cul-tured soya bean cakes (tempeh), Cuban black beans and rice,Boston baked beans, French cassoulet, Brazilian feijoada,Swedish pea soup, and US peanut butter. Soya beans are par-ticularly versatile and their products are a common featurein manufactured foods, although they are not commonlyeaten whole. Soya foods include soya drinks and flour, tofu,tempeh, textured vegetable protein, and the many productsthat can be prepared from these foods. Fermented soya beansproduce soy sauce and miso. Soya bean oil is also used wide-ly (see chapter 4.5.3).
Nuts and seedsNuts and seeds were an important part of human diets beforethe advent of agriculture and they remain locally importantin a few areas. Globally, tree nuts supply 0.4 per cent of daily
energy availability. The highest availability is in the MiddleEast and parts of Europe, and the lowest is in South Americaand parts of Africa; intakes range from 3 per cent of totalenergy in parts of the Middle East to virtually zero in manylow-income countries.
Coconuts represent 0.5 per cent of daily energy availabil-ity globally, although coconuts can be locally important intropical islands, for instance in parts of Oceania, Asia (SriLanka and Indonesia), the Caribbean, and in the Africanislands. In parts of Oceania, for example, coconuts provideas much as 20 per cent of energy in the diet.
Sunflower, rape, mustard, and sesame seeds together sup-ply 0.2 per cent of daily energy intake globally. There arefewer data available for seeds than for many other foods,although sesame seed intake is relatively high in parts ofAfrica and Asia, providing a maximum of 3.9 per cent ofenergy in parts of central Africa. Oils from seed crops arewidely used (see chapter 4.5.3).
Herbs, spices, and condimentsAlthough spices are consumed in small amounts to flavourfood, they are such a regular feature of some diets that theyaccount for a measurable quantity of daily energy intake.Worldwide, spices provide 0.3 per cent of available dietaryenergy and in parts of Asia they constitute as much as 1.8per cent. Herbs and spices tend to be part of the tradition-al diet in the areas from which they originate, and many tra-ditional cuisines are characterised by the use of herbs, spices,and condiments. Most are now available worldwide,although their use still varies greatly in different parts of theworld. Many herbs and spices are believed to have medici-nal or tonic value and have been used in this way at leastsince the times of the earliest medical records. Many mod-ern pharmaceuticals are derived from herbs and other plants.
Many herbs and some spices are biologically very potent:the modern pharmacopoeia lists drugs, many of which havebeen isolated from herbs, sometimes known as ‘plants withhealing powers’. There are some in vivo experimental datafor potentially beneficial effects in the cases of turmeric, saf-fron, ginger, pepper, garam masala (a herb and spice mix),and also eugenol and myristin, constituents of a number ofherbs and spices.
Conversely, it is at least theoretically possible that somecondiments have adverse effects. Two examples are hot chillijuices and harissa, a fiery condiment; both are consumed insubstantial quantities in Mexico and the Mahgreb countriesof North Africa, respectively, and both irritate the mouth andthroat.
4.2.4 Interpretation of the evidence
4.2.4.1 GeneralFor general considerations that may affect interpretation ofthe evidence, see chapter 3.3 and 3.5, and boxes 3.1, 3.2,3.6 and 3.7.
‘Relative risk’ (RR) is used in this Report to denote ratiomeasures of effect, including ‘risk ratios’, ‘rate ratios’, ‘haz-ard ratios’, and ‘odds ratios’.

82
P A R T 2 • E V I D E N C E A N D J U D G E M E N T S
4.2.4.2 Specific
Considerations specific to vegetables, fruits, pulses(legumes), nuts, seeds, herbs, and spices include:
Patterns and ranges of intake. Most studies of consumptionof vegetables, fruits, and pulses (legumes) have been con-ducted in populations that have relatively homogeneousdiets. The limited data on nuts, seeds, herbs, spices, andcondiments come mainly from a few human case-controlstudies and some experimental animal studies.
Classification. There is no general agreement on classifica-tion. Some studies have included cereals such as corn, andtubers such as potatoes, as vegetables, and plantains as fruit.Broccoli and green peppers are included as ‘green vegetables’in some studies, while only leafy greens are included in thiscategory in others; tomatoes are considered ‘yellow-orangevegetables’ in some but not in others. Some studies reportresults only for broad categories (for example, ‘all vegetables’or ‘all fruits’), whereas others have reported results for morenarrowly defined categories (for example, ‘raw vegetables’,‘green vegetables’, ‘citrus fruits’) or for individual food items(for example, ‘spinach’, ‘carrots’, ‘tomatoes’). In some stud-ies, vegetables and fruits have been categorised according tobotanical classification; in others, categorisation has beenaccording to culinary usage. In this report, the terms ‘veg-etables’ and ‘fruits’ are used according to their culinary def-inition. Some studies have included pulses as vegetableswhereas others have classified these as a separate entity ornot at all. Many older studies have not differentiatedbetween retinol and carotenoids. Vitamin E intakes are dif-ficult to quantify since much comes from the vegetable oilsused in food preparation, and intakes within populations areusually homogenous because of the widespread occurrenceof vitamin E in commonly consumed foods.
Measurement. Assessment of selenium intake is problemat-ic because the content of selenium in foods depends to alarge extent on the soil selenium content of the area in whichthe foods were grown. Blood and toenail levels of seleniumare thought to be fairly accurate indicators of intake andhave been used in several studies.
Confounding. Smokers consume fewer vegetables and fruitsthan non-smokers.18 19 Fat intake inversely correlates withvegetable and, particularly, fruit intake in the USA.20 Recentstudies of the effects of fruits and vegetables in cancersthought to be caused by smoking have controlled for theeffect of smoking. Folate intake is correlated with intake ofnon-starchy polysaccharide (dietary fibre).
Reporting bias. Studies using self-reporting tend to over-report vegetable and fruit consumption. Where an effectexists, results from such studies are liable to underestimatethe extent to which vegetables and fruits modify the risk ofcancer.
4.2.5 Evidence and judgements
The full systematic literature review (SLR) is contained onthe CD included with this Report.
4.2.5.1 Non-starchy vegetablesMouth, pharynx, and larynx Thirty-one case-control studies21-50 and 3 ecological studies51-
53 investigated non-starchy vegetables and mouth, pharynx,or larynx cancers; 1 cohort study54 and 6 case-control stud-ies33 39 45 55-57 investigated non-starchy vegetables and fruits;23 case-control studies investigated raw vegetables24 27 28 33
36-43 45 47 50 58-65; 1 cohort study,66 14 case-control studies,24
26-29 39 41 43 45-47 50 63 67 and 1 ecological study68 investigatedcruciferous vegetables; 1 cohort study66 and 10 case-controlstudies24 26-29 39 47 61 67 69 investigated green, leafy vegetables;3 cohort studies66 70 71 and 18 case-control studies23 24 26-29 39
41-43 46 49 50 63 65 72-75 investigated carrots; and 1 cohort study66
and 12 case-control studies26-29 39-43 46 50 58 62 65 investigatedtomatoes.
Non-starchy vegetablesMost studies showed decreased risk with increased intake ofnon-starchy vegetables. Twenty-two studies reported com-parisons of high against low intake (figure 4.2.1).22 23 25 26 29-
31 33 35-46 49 50 Of these, 19 showed decreased risk for thehighest intake group,22 25 26 30 31 33 35-44 46 49 50 which was sta-tistically significant in 13.22 25 30 31 35 37 38 40 42 43 46 49 50 Theother 3 studies showed non-significant increased risk.23 29 45
Figure 4.2.1 Non-starchy vegetables and mouth, pharynx,and larynx cancer; case-control studies
Notari 1987 0.42 (0.25–0.71)
Franco 1989 1.70 (0.92–3.16)
Oreggia 1991 0.19 (0.05–0.68)
Franceschi 1991 0.80 (0.55–0.68)
Franceschi 1992 0.40 (0.20–0.80)
Zheng 1993 1.73 (0.79–3.78)
Kune 1993 0.30 (0.11–0.85)
De Stefani 1994 0.40 (0.19–0.85)
Takezaki 1996 0.80 (0.59–1.08)
Esteve 1996 0.61 (0.45–0.81)
Levi 1998 0.14 (0.08–0.23)
De Stefani 1999 0.50 (0.29–0.87)
Franceschi 1999 0.50 (0.33–0.76)
De Stefani 1999 0.57 (0.30–1.08)
Garrote 2001 0.78 (0.40–1.52)
Bosetti 2002 0.17 (0.11–0.27)
Marchioni 2003 0.86 (0.54–1.38)
Lissowska 2003 0.17 (0.07–0.27)
Rajkumar 2003 0.44 (0.28–0.69)
Sanchez 2003 0.54 (0.34–0.86)
Gaud 2004 1.40 (0.71–2.76)
De Stefani 2005 0.60 (0.33–1.10)
Relative risk (95% CI)
Relative risk, highest vs lowest exposure category
1 50.2 0.5 2

83
C H A P T E R 4 • F O O D S A N D D R I N K S
The remaining studies showed no consistent association,probably due to varying exposure definitions and studydesign.21 24 27 28 32 34 47 48 Meta-analysis was possible on 4 case-control studies, giving a summary effect estimate of 0.72(95% confidence interval (CI) 0.63–0.82) per 50 g/day, withmoderate heterogeneity (figure 4.2.2). All studies adjustedfor sex, smoking, and alcohol consumption.
A dose-response relationship is apparent from the fourcase-control studies that could be meta-analysed (figure4.2.3). There is some suggestion that the greatest effectappears to be with the first increment. That is, any increaseabove the lowest levels of vegetable consumption confers aprotective effect. However, it is not clear that the effect con-tinues in a linear fashion with increased dose.
Of the three ecological studies, one (Hong Kong) studyfound a significant negative association between vegetableconsumption and cancer incidence51; the other two
(international) found no significant association with cancermortality.52 53
Non-starchy vegetables and fruitsA cohort study that reported results for non-starchy vegeta-bles and fruits in combination reported a statistically signif-icant protective effect in the highest consumers (0.55, 95%CI 0.32–0.95).54 All six case-control studies looking at thesame exposure group reported reduced risk estimates in sim-ilar comparisons,33 39 45 55-57 which were statistically signifi-cant in four.33 39 55 57 All of these studies adjusted for smokingand alcohol consumption.
Raw vegetablesTwenty-three case-control studies reported separate risk esti-mates for raw vegetable consumption.24 27 28 33 36-43 45 47 50 58-
65 All of these reported comparisons of risk between high andlow intake groups, which produced reduced risk estimatesin 2224 27 28 33 36-43 45 47 50 58 60-65; 16 of these were statistical-ly significant.24 33 36-40 42 43 47 50 60-63 65 No studies reported sta-tistically significant increased risk estimates. Meta-analysisof 7 case-control studies gave an effect estimate of 0.71 (95%CI 0.59–0.86) per 50 g/day, with moderate heterogeneity.37
39 42 45 59 62 65 These studies also provided evidence of a dose-response relationship. The heterogeneity could be partiallyexplained by variable exposure definitions. These results areconsistent with data for non-starchy vegetables.
Cruciferous vegetablesOne cohort study,66 14 case-control studies,24 26-29 39 41 43 45-
47 50 63 67 and 1 ecological study68 reported separate risk esti-mates for cruciferous vegetable consumption.
The single cohort study showed a non-significant increasedrisk for increased intake of cauliflower and a non-significantdecreased risk for cabbage.66 Four case-control studiesshowed statistically significant decreased risk with increasedintake, either overall or in specific subgroups.24 29 43 47 Onestudy showed statistically significant increased risk associ-ated with eating kimchi or pickled cabbage.67 The other ninestudies showed inconsistent and non-significant associa-tions.26-28 39 41 45 46 50 63 The ecological study showed a sta-tistically significant decreased risk.68
Green, leafy vegetablesOne cohort study66 and 10 case-control studies24 26-29 39 47 61
67 69 reported separate risk estimates for green, leafy veg-etable consumption.
The single cohort study showed no effect for the highestintake group of lettuce when compared to the lowest.66 Ninecase-control studies showed decreased risk with increasedintake,24 26 27 29 39 47 61 67 69 which was statistically significantin four.24 39 61 69 One study showed non-significant increasedrisk.28
CarrotsThree cohort studies66 70 71 and 18 case-control studies23 24
26-29 39 41-43 46 50 63 65 72-75 investigated non-starchy root veg-etables and mouth, larynx, or pharynx cancers. There wasvariation in the exposure classification in studies. Most
Figure 4.2.3 Non-starchy vegetables and mouth,pharynx, and larynx cancer; case-controlstudies: dose response
De Stefani 1994
Levi 1998
De Stefani 2000
Bosetti 2002
0 200100 300 400
Non-starchy vegetables (g/day)
Figure 4.2.2 Non-starchy vegetables and mouth, pharynx,and larynx cancer; case-control studies
De Stefani 1994 0.53 (0.26–1.09)
Levi 1998 0.62 (0.53–0.74)
De Stefani 2000 0.82 (0.64–1.05)
Bosetti 2002 0.75 (0.70–0.81)
Summary estimate 0.72 (0.63–0.82)
Relative risk (95% CI)
Relative risk, per 50 g/day
10.5 0.75 1.5

84
P A R T 2 • E V I D E N C E A N D J U D G E M E N T S
assessed carrots, but some looked at ‘tubers and carrots’ or‘non-starchy root vegetables’ or ‘yellow/orange vegetables’.
One cohort study, looking at ‘tubers and carrots’, report-ed a non-significant increased risk when comparing highagainst low intakes, with a wide confidence interval (1.9,95% CI 0.6–6.0).66 Another that reported on ‘carotene-richfruits and vegetables’ found a non-significant reduced riskwhen comparing the highest intake group against the low-est (0.50, p value for linear trend 0.10).70 The third, whichevaluated yellow/orange vegetables in postmenopausal USwomen, reported a significant reduced risk for the same com-parison (0.58, 95% CI 0.39–0.87).71
All of the 18 case-control studies reported comparisons ofrisk between high- and low-intake groups.23 24 26-29 39 41-43 46
49 50 63 65 72-75 Sixteen reported reduced risk estimates,23 26-29
39 41-43 50 63 65 72-75 6 of which were statistically significant.49
72 75 The other 2 were non-significant in the direction ofincreased risk.24 27 28 39 43 46 The majority of studies werehospital-based and analysed carrots as a separate exposure.
TomatoesOne cohort study66 and 12 case-control studies26-29 39-43 46 50
58 62 65 investigated tomatoes and mouth, larynx, or pharynxcancers.
The cohort study reported a non-significant increased riskwhen comparing the highest intake group against the low-est, with a wide confidence interval (1.7, 95% CI 0.8–3.7).66
Of the 12 case-control studies,26-29 39-43 46 50 58 62 65 10 report-ed reduced risk estimates,26 29 39-43 46 50 58 62 65 5 of which werestatistically significant.26 29 39 40 62 Only 2 reported anincreased risk, which was non-significant.27 28 These studieswere also the only studies not to adjust for both smoking andalcohol intake.
The general mechanisms through which vegetables couldplausibly protect against cancers of the mouth, larynx, andpharynx are outlined below.
Although all of the studies mentioned here adjust forsmoking behaviour and nearly all adjust for alcohol, the rel-ative risk of smoking is large (particularly when combinedwith alcoholic drinks). It is therefore difficult to eliminateconfidently the possibility of residual confounding with waysof life associated with smoking: for instance, smokers con-sume fewer vegetables than non-smokers.
A substantial amount of consistent evidence on non-starchy vegetables, including specific subtypes, mostlyfrom case-control studies, shows a dose-responserelationship. There is evidence for plausiblemechanisms. Non-starchy vegetables probably protectagainst mouth, pharynx, and larynx cancers.
The Panel is aware that since the conclusion of the SLR, twocohort76 77 and two case-control studies78 79 have been pub-lished. This new information does not change the Panel judge-ment (see box 3.8).
OesophagusFive cohort studies,70 80-83 37 case-control studies22 40 60 84-115
and 6 ecological studies51 52 116-119 investigated non-starchy
vegetables and oesophageal cancer. Eight case-control stud-ies investigated vegetable and fruit consumption (com-bined)95 104 107 114 120-123; 16 case-control studies investigatedraw vegetables40 60 85 95-97 103 109 113 114 124-129; 1 cohort study66
and 5 case-control studies86 93 107 124 125 investigated crucif-erous vegetables; 1 cohort study82 and 8 case-control stud-ies86 101 103 107 109 111 129 130 investigated allium vegetables; 1cohort study66 and 11 case-control studies86 96 98 111 124 127 131-
135 investigated green, leafy vegetables; 1 cohort study66 and9 case-control studies58 62 109 111 113 129-132 136 investigatedtomatoes.
Non-starchy vegetablesData suggest an association with reduced risk. Of the fivecohort studies, three reported decreased risk when compar-ing the highest intake group against the lowest, one of whichwas statistically significant (0.66, 95% CI 0.44–0.99, non-starchy vegetables82; 0.5, p value for linear trend 0.1, yel-
Figure 4.2.4 Non-starchy vegetables and oesophagealcancer; cohort and case-control studies
Cohort
Hiryama 1990 1.06 (0.91–1.24)
Yu 1993 0.66 (0.44–0.99)
Guo 1999 0.80 (0.62–1.53)
Tran 2005 1.02 (0.85–1.18)
Case control
Cook-Mozalfari 1979 Men 0.85 (0.58–1.25)
Cook-Mozalfari 1979 Women 0.81 (0.49–1.33)
Notani 1967 1.06 (5.70–1.64)
Brown 1968 0.70 (0.39–1.20)
Jun-lao 1989 1.50 (0.19–1.89)
De Stefani 1990 0.56 (0.31–1.02)
Ren 1991 2.57 (1.25–5.27)
Negni 1991 0.20 (0.09–0.45)
Sammon 1992 1.44 (0.62–2.10)
Ho 1994 0.60 (0.30–1.35)
Sammon 1998 2.30 (1.06–4.89)
Lauroy 1998 0.24 (0.11–3.54)
De Stefani 1999 0.50 (0.29–0.87)
Takazaki 2000 0.60 (0.45–0.78)
De Stefani 2000 0.64 (0.34–1.20)
Levi 2000 0.19 (0.11–0.33)
Nayor 2000 0.53 (0.36–0.87)
Cheng 2000 0.56 (0.22–1.34)
Bosets 2000 0.79 (0.47–1.32)
Takezaki 2001 0.81 (0.40–1.43)
Terry 2001 0.60 (0.38–5.35)
Zhany 2001 1.94 (1.22–2.85)
Chen 2002 0.62 (0.26–1.35)
Cnuk 2002 10.10 (4.42–23.09)
Xibin 2003 0.44 (0.21–0.34)
Li 2003 0.76 (0.55–1.19)
Hung 2004 0.50 (0.31–0.82)
De Stefani 2005 0.53 (0.27–1.00)
Yang 2005 0.62 (0.32–1.18)
Relative risk (95% CI)
Relative risk, highest vs lowest exposure category
1 50.2 0.5 2

85
C H A P T E R 4 • F O O D S A N D D R I N K S
low/orange vegetables70; and 0.8, 95% CI 0.60–1.0 and pvalue for trend 0.08, stated as not statistically significant,non-starchy vegetables80). The other two reported a non-significant increased risk (1.06, 95% CI 0.91–1.24, non-starchy vegetables81; and 1.02, 95% CI 0.88–1.19, freshnon-starchy vegetables83) (figure 4.2.4).
Most (29) of the case-control studies published decreasedrisk estimates when comparing the highest intake groupagainst the lowest,40 60 85-90 94-99 101-105 107-109 111-115 which werestatistically significant in 14 (figure 4.2.4).40 88 89 94 97-99 101
102 104 105 109 Five studies reported statistically significantincreased risk.84 91 93 100 106 110 Meta-analysis was possible on5 of the case-control studies, giving a summary effectestimate of 0.87 (95% CI 0. 72–1.05) per 50 g/day incre-ment, with high heterogeneity (figure 4.2.5). A potentialcause of heterogeneity is the disparate nature of the expo-sure definition in different studies, some of which includedpickled and cured vegetables, cooked or uncookedvegetables.
Two of the ecological studies reported a statistically sig-nificant, positive association between vegetable consumptionand cancer incidence116 117; one reported a statistically sig-nificant, negative association between vegetable consump-tion and cancer incidence51; and the other three reported nosignificant association between vegetable consumption andcancer mortality.52 118 119
The Panel is aware that data from the EuropeanProspective Investigation into Cancer and Nutrition (EPIC;521 457 participants from 10 European countries; 65 casesof adenocarcinomas of the oesophagus), published after theconclusion of the SLR,140 showed a non-significant reducedrisk (0.72, 95% CI 0.32–1.64) per 100 g/day increase in veg-etable consumption (adjusted for several variables includingsmoking and alcohol, red meat, and processed meat).
Non-starchy vegetables and fruitsEight case-control studies investigated vegetable and fruitconsumption (combined) and oesophageal cancer. Allreported a decreased risk with increased consumption.95 104
107 114 120-123 Six of these were statistically significant.95 104 107
114 120 121
Raw vegetablesSixteen case-control studies investigated raw vegetables andoesophageal cancer.40 60 85 95-97 103 109 113 114 124-129
All of these studies reported associations with decreasedrisk, which were statistically significant in 10.40 60 85 95 97 109
113 126 127 129 Dose-response meta-analysis was possible on fivestudies, giving a summary effect estimate of 0.69 (95% CI0.58–0.83) per 50 g/day increment (figures 4.2.6 and 4.2.7).
This exposure category could be less disparate than othervegetable groupings, as it is clear that preserved vegetablesare not included and variation in cooking methods isremoved. This may account for the lack of heterogeneity indirection of effect in this subcategory of vegetables.
Figure 4.2.5 Non-starchy vegetables and oesophagealcancer; case-control studies
Jun-Lao Li 1989 1.08 (1.03–1.14)
De Stefani 2000 0.81 (0.66–0.99)
Levi 2000 0.66 (0.58–0.74)
Cheng 2000 0.90 (0.74–1.11)
De Stefani 2005 0.94 (0.86–1.02)
Summary estimate 0.87 (0.72–1.05)
Relative risk (95% CI)
Relative risk, per 50 g/day
1 20.5 0.75 1.5
Figure 4.2.7 Raw vegetables and oesophageal cancer;case-control studies: dose response
Castelletto 1994
Cheng 2000
De Stefani 2000
Levi 2000
Sharp 2001
De Stefani 2003
0 200100 300
Non-starchy vegetables (g/day)
Figure 4.2.6 Raw vegetables and oesophageal cancer;case-control studies
De Stefani 2000 0.38 (0.21–0.69)
Levi 2000 0.64 (0.57–0.72)
Cheng 2000 0.83 (0.68–1.02)
Sharp 2001 0.84 (0.75–0.95)
De Stefani 2003 0.60 (0.48–0.76)
Summary estimate 0.69 (0.58–0.83)
Relative risk (95% CI)
Relative risk, per 50 g/day
10.25 0.75 1.50.5

86
P A R T 2 • E V I D E N C E A N D J U D G E M E N T S
Non-starchy root vegetables and tubersOne cohort study66 and six case-control studies114 122 128 132
136 141 142 reported separate risk estimates for consumption ofnon-starchy root vegetables and tubers.
The single cohort study showed a non-significant increasedrisk for the highest intake group when compared to the low-est, after adjustment.66 All six case-control studies showednon-significant decreased risk with increased intake.114 122 128
132 136 141 142
Cruciferous vegetables One cohort study66 and five case-control studies86 93 107 124 125
reported separate risk estimates for consumption of crucif-erous vegetables.
The single cohort study showed a non-significantdecreased risk for increased intake of cauliflower or swedeand a non-significant increased risk for cabbage, after adjust-ment.66 Three case-control studies showed decreased riskwith increased intake,93 107 124 which was statistically signif-icant in two.93 124 One study showed a non-significantincreased risk125; and one study showed a non-significantincreased risk in women and a non-significant decreased riskin men.86
Allium vegetables One cohort study82 and eight case-control studies86 101 103 107
109 111 129 130 reported separate risk estimates for alliumvegetable consumption.
The single cohort study showed that garlic intake had noeffect on risk.82 Four case-control studies showed non-sig-nificant decreased risk with increased intake.101 103 107 130 Twostudies showed non-significant increased risk.86 111 One studyshowed a statistically significant decreased risk for garlic andthat onions/leeks had no effect on risk109; and one studyshowed a statistically significant reduced risk for onions anda non-significant increased risk for garlic.129
Green, leafy vegetables One cohort study66 and 11 case-control studies86 96 98 111 124
127 131-135 reported separate risk estimates for green, leafy veg-etable consumption.
The single cohort study showed no effect for the highestintake group of lettuce when compared to the lowest.66 Tencase-control studies showed decreased risk with increasedintake,96 98 111 124 127 131-135 which was statistically significantin five.96 127 132-134 One study showed a non-significantincreased risk in women and a non-significant decreased riskin men.86
TomatoesOne cohort study66 and nine case-control studies58 62 109 111
113 129-132 136 reported separate risk estimates for consumptionof tomatoes.
The single cohort study showed a non-significant increasedrisk for the highest intake group of lettuce, when comparedto the lowest, after adjustment.66 Eight case-control studiesshowed decreased risk with increased intake,58 62 109 111 113 129
131 132 136 which was statistically significant in two.62 129 Onestudy showed no effect on risk.130
The general mechanisms through which vegetables couldplausibly protect against oesophageal cancer are outlinedbelow.
There is more evidence, including on vegetablesubtypes, from case-control studies than from cohortstudies, but both are moderately consistent and thereis some evidence for a dose-response relationship.There is evidence for plausible mechanisms. Non-starchy vegetables probably protect againstoesophageal cancer.
The Panel is aware that since the conclusion of the SLR, onecohort140 and two case-control studies78 143 have been pub-lished. This new information does not change the Panel judge-ment (see box 3.8).
Stomach Ten cohort studies,71 80 140 144-150 45 case-control studies,109
151-195 and 19 ecological studies51 52 116-119 196-209 investigatedtotal vegetables. Eleven cohort studies,71 144 150 210-218 21 case-control studies,89 165 169 178 179 188 191 219-232 and 8 ecologicalstudies233-240 investigated green-yellow vegetables; 6 cohortstudies70 140 144 146 150 241, 13 case-control studies,162 174 175 179
180 187 223 227 229 230 232 242 243 and 2 ecological studies202 240
investigated green, leafy vegetables; 3 cohort studies70 146 241
and 19 case-control studies58 109 129 152 156 164 171 172 174 232 243-
251 investigated tomatoes; 2 cohort studies150 214 and 6 case-control studies157 165 169 226 228 243 investigated white or palevegetables; 6 cohort studies,146 148 214 252-254 25 case-controlstudies,109 129 161 162 167 172 174 183 184 191 219 225 226 243 247 248 250 255-
264and 3 ecological studies202 208 238 investigated raw vegeta-bles; 5 cohort studies144 146 148 253 265 and 6 case-controlstudies158 161 162 164 257 266 267 investigated non-starchy veg-etables and fruits.
Non-starchy vegetablesOf 12 independent estimates from the 10 cohort studies thatinvestigated non-starchy vegetable consumption, none wasstatistically significant.71 80 140 144-150 Seven studies showednon-significant reduced risk71 140 144-147 150 and 2 reportednon-significant increased risk.80 149 One study showed non-significant increased risk in women and non-significantdecreased risk in men.148 Most effect estimates were close to1. Meta-analysis was possible on 9 independent estimatesfrom 7 cohort studies, giving a summary effect estimate of0.98 (95% CI 0.91–1.06) per 100 g/day, with moderate het-erogeneity (figure 4.2.8).
Of 45 case-control studies that reported on non-starchyvegetable consumption, 28 reported statistically significantdecreased risk.109 151-153 156-160 163 164 168 169 171 173 176-179 181 182
184 185 187 190 192 The majority of the 17 remaining studies thatreported no significant effect on risk were in the direction ofdecreased risk.155 162 165-167 170 172 174 183 191 194 195 Four studiesshowed non-significant increased risk,180 188 189 193 1 studyshowed no effect on risk,154 and 1 study stated that there wasno significant association.175 One study showed non-signif-icant decreased risk in women and non-significant increasedrisk in men186; and 1 study showed statistically significant

87
C H A P T E R 4 • F O O D S A N D D R I N K S
decreased risk in men and non-significant increased risk inwomen.161 No studies reported statistically significantincreased risk. Meta-analysis was possible on 20 studies, giv-ing a summary effect estimate of 0.70 (95% CI 0.62–0.79)per 100 g/day, with high heterogeneity (figure 4.2.8). Thisheterogeneity tended to reflect differences in size, ratherthan direction, of effect.
A dose-response relationship was apparent from case-control but not cohort data.
Results from ecological studies reporting on non-starchyvegetable consumption were mixed, with almost as manystudies reporting increased risk as reported decreased risk.51 52 116-119 196-209
Green-yellow vegetablesEight of the 11 cohort studies that reported on green-yellowvegetable consumption showed decreased risk,71 144 150 210 211
214-217 statistically significant in 4.150 210 215 216 Two other stud-ies showed non-significant increased risk212 213 and 1 otherstudy reported no statistically significant association.218
Meta-analysis was possible on 6 independent estimates from5 studies, giving a summary effect estimate of 0.63 (95% CI0.48–0.82) per 100 g/day, with no heterogeneity (figure4.2.9).
Of the 21 case-control studies that reported on green-yellow vegetable consumption, 16 showed decreased risk,89
165 169 178 179 191 219 220 222-228 230-232 statistically significant in12.89 165 169 178 179 191 220 222 223 226 231 232 The remaining 5 stud-ies reported increased risk,111 188 221 229 1 of which was sta-tistically significant.221 Meta-analysis was possible on 12independent estimates from 11 studies, giving a summaryeffect estimate of 0.59 (95% CI 0.46–0.75) per 100 g/day,with high heterogeneity (figure 4.2.9).
All of the studies adjusted for age and sex; none wasadjusted for infection with Helicobacter pylori. Nine studieswere maximally adjusted, seven of which reported asignificant negative association with higher consumption ofgreen-yellow vegetables, and the other two reported nosignificant association.
A dose-response relationship was apparent from both
Figure 4.2.8 Non-starchy vegetables and stomach cancer;cohort and case-control studies
Cohort
Chyou 1990 Men 0.76 (0.53–1.10)
Guo 1994 1.05 (0.93–1.18)
Botterweck 1998 0.92 (0.78–1.09)
McCullough 2001 Men 0.98 (0.84–1.02)
McCullough 2001 Women 1.16 (1.00–1.34)
Fujino 2002 Men 1.12 (0.93–1.34)
Fujino 2002 Women 1.03 (0.77–1.36)
Kobayashi 2002 0.86 (0.72–1.02)
Gonzalez 2006 0.91 (0.66–1.28)
Summary estimate 0.98 (0.91–1.06)
Case control
Risch 1985 0.84 (0.73–0.97)
You 1988 0.81 (0.75–0.86)
De Stefani 1990 0.40 (0.27–0.60)
Menik 1992 0.36 (0.16–0.80)
Hansson 1993 0.60 (0.46–0.79)
Cornee 1995 0.85 (0.57–1.28)
De Stefani 1998 0.39 (0.32–0.48)
Ji 1998 Men 0.86 (0.82–0.90)
Ji 1998 Women 0.94 (0.86–1.01)
Ward 1999 0.22 (0.11–0.43)
Mathew 2000 0.52 (0.18–1.46)
De Stefani 2001 0.89 (0.60–1.32)
Takezaki 2001 0.47 (0.26–0.81)
Sriamporn 2002 0.86 (0.56–1.33)
Hara 2003 1.06 (0.84–1.33)
Sipetic 2003 0.07 (0.03–0.15)
Suh 2003 1.04 (0.89–1.22)
Lagiou 2004 0.51 (0.39–0.68)
Lissowska 2004 0.90 (0.74–1.09)
Boccia 2005 1.09 (0.56–2.12)
Nan 2005 0.90 (0.66–1.25)
Summary estimate 0.70 (0.62–0.79)
1 20.5 0.75 1.5
Relative risk (95% CI)
Relative risk, per 100 g/day
Figure 4.2.9 Green-yellow vegetables and stomachcancer; cohort and case-control studies
Cohort
Chyou 1990 Men 0.74 (0.52–1.05)
Kasum 2002 Women 0.57 (0.19–1.75)
Kobayashi 2002 0.56 (0.33–0.94)
Ngoan 2002 0.41 (0.18–0.94)
Khan 2004 Men 0.66 (0.11–3.89)
Khan 2004 Women 0.18 (0.02–2.13)
Summary estimate 0.63 (0.48–0.82)
Case control
Lee 1990 0.94 (0.68–1.29)
Cai 1991 0.44 (0.38–0.50)
Negri 1991 0.24 (0.13–0.44)
Hoshiyama and Sasaba 1992 0.49 (0.32–0.74)
Ji 1998 Men 0.77 (0.69–0.86)
Ji 1998 Women 0.89 (0.77–1.04)
Ward 1999 0.33 (0.24–0.46)
Hamada 2002 1.09 (0.41–2.93)
Nishimoto 2002 0.62 (0.33–3.43)
Hara 2003 1.59 (0.73–3.43)
Ito 2003 Women 0.55 (0.38–0.81)
Lissowska 2004 0.28 (0.12–0.66)
Summary estimate 0.59 (0.46–0.75)
Relative risk (95% CI)
Relative risk, per 100 g/day
1 20.5
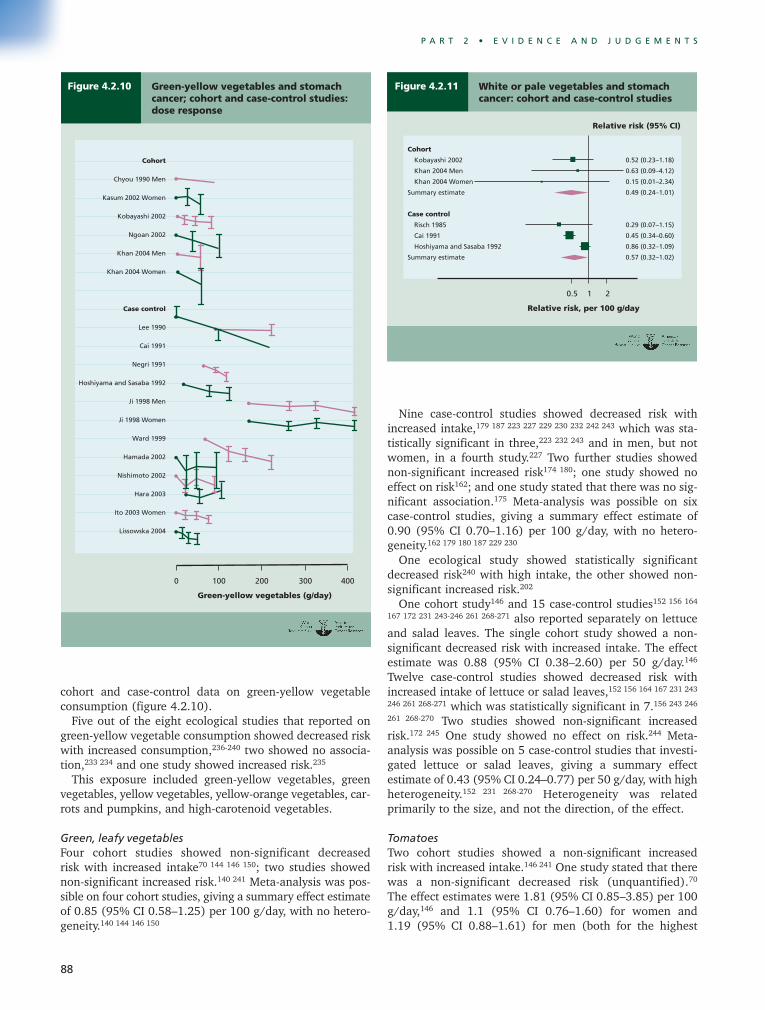
88
P A R T 2 • E V I D E N C E A N D J U D G E M E N T S
cohort and case-control data on green-yellow vegetableconsumption (figure 4.2.10).
Five out of the eight ecological studies that reported ongreen-yellow vegetable consumption showed decreased riskwith increased consumption,236-240 two showed no associa-tion,233 234 and one study showed increased risk.235
This exposure included green-yellow vegetables, greenvegetables, yellow vegetables, yellow-orange vegetables, car-rots and pumpkins, and high-carotenoid vegetables.
Green, leafy vegetables Four cohort studies showed non-significant decreased risk with increased intake70 144 146 150; two studies showednon-significant increased risk.140 241 Meta-analysis was pos-sible on four cohort studies, giving a summary effect estimateof 0.85 (95% CI 0.58–1.25) per 100 g/day, with no hetero-geneity.140 144 146 150
Nine case-control studies showed decreased risk withincreased intake,179 187 223 227 229 230 232 242 243 which was sta-tistically significant in three,223 232 243 and in men, but notwomen, in a fourth study.227 Two further studies showednon-significant increased risk174 180; one study showed noeffect on risk162; and one study stated that there was no sig-nificant association.175 Meta-analysis was possible on sixcase-control studies, giving a summary effect estimate of0.90 (95% CI 0.70–1.16) per 100 g/day, with no hetero-geneity.162 179 180 187 229 230
One ecological study showed statistically significantdecreased risk240 with high intake, the other showed non-significant increased risk.202
One cohort study146 and 15 case-control studies152 156 164
167 172 231 243-246 261 268-271 also reported separately on lettuceand salad leaves. The single cohort study showed a non-significant decreased risk with increased intake. The effectestimate was 0.88 (95% CI 0.38–2.60) per 50 g/day.146
Twelve case-control studies showed decreased risk withincreased intake of lettuce or salad leaves,152 156 164 167 231 243
246 261 268-271 which was statistically significant in 7.156 243 246
261 268-270 Two studies showed non-significant increasedrisk.172 245 One study showed no effect on risk.244 Meta-analysis was possible on 5 case-control studies that investi-gated lettuce or salad leaves, giving a summary effectestimate of 0.43 (95% CI 0.24–0.77) per 50 g/day, with highheterogeneity.152 231 268-270 Heterogeneity was relatedprimarily to the size, and not the direction, of the effect.
TomatoesTwo cohort studies showed a non-significant increased risk with increased intake.146 241 One study stated that therewas a non-significant decreased risk (unquantified).70
The effect estimates were 1.81 (95% CI 0.85–3.85) per 100g/day,146 and 1.1 (95% CI 0.76–1.60) for women and 1.19 (95% CI 0.88–1.61) for men (both for the highest
Figure 4.2.11 White or pale vegetables and stomachcancer: cohort and case-control studies
Cohort
Kobayashi 2002 0.52 (0.23–1.18)
Khan 2004 Men 0.63 (0.09–4.12)
Khan 2004 Women 0.15 (0.01–2.34)
Summary estimate 0.49 (0.24–1.01)
Case control
Risch 1985 0.29 (0.07–1.15)
Cai 1991 0.45 (0.34–0.60)
Hoshiyama and Sasaba 1992 0.86 (0.32–1.09)
Summary estimate 0.57 (0.32–1.02)
Relative risk (95% CI)
Relative risk, per 100 g/day
1 20.5
Figure 4.2.10 Green-yellow vegetables and stomachcancer; cohort and case-control studies:dose response
Cohort
Chyou 1990 Men
Kasum 2002 Women
Kobayashi 2002
Ngoan 2002
Khan 2004 Men
Khan 2004 Women
Case control
Lee 1990
Cai 1991
Negri 1991
Hoshiyama and Sasaba 1992
Ji 1998 Men
Ji 1998 Women
Ward 1999
Hamada 2002
Nishimoto 2002
Hara 2003
Ito 2003 Women
Lissowska 2004
0 200100 300 400
Green-yellow vegetables (g/day)

89
C H A P T E R 4 • F O O D S A N D D R I N K S
intake group when compared to the lowest).241
Most case-control studies showed decreased risk withincreased intake, which was statistically significant in 10.58
109 152 156 164 171 232 246-248 No studies showed statistically sig-nificant increased risk. Meta-analysis was possible on 6 case-control studies, giving a summary effect estimate of 0.40(95% CI 0.19–0.82) per 100 g/day, with high hetero-geneity.109 152 171 232 244 250
White or pale vegetablesThis incorporates a wide range of vegetables. For example,in Japan white vegetables such as daikon (radish) are com-monly consumed. Descriptions used for this exposure werewhite vegetables, pale green or light green vegetables, andraw chicory.
Both cohort studies showed non-significant decreased riskwith increased intake.150 214 Meta-analysis was possible onboth studies, giving a summary effect estimate of 0.49 (95%CI 0.24–1.01) per 100 g/day, with no heterogeneity (figure4.2.11).
All six case-control studies showed decreased risk withincreased intake,157 165 169 226 228 243 which was statistically sig-nificant in three.165 169 243 Meta-analysis was possible on threestudies, giving a summary effect estimate of 0.57 (95% CI0.32–1.02) per 100 g/day, with high heterogeneity, whichwas caused by varying size, not direction of the effect (figure4.2.11).
Raw vegetablesOf seven independent estimates from six cohort studies thatreported on raw vegetables, four reported non-significantreduced risk,146 214 253 254 two reported non-significantincreased risk,214 252 and the other reported a significantincreased risk.148 Two of the increased risk estimates, includ-ing the one that reached statistical significance, were strat-ified for women only. Meta-analysis was possible on fourestimates from three studies (not including the one that wasstatistically significant), giving a summary effect estimate of0.80 (95% CI 0.54–1.18) per 100 g/day, with no hetero-geneity (figure 4.2.12).
Of the 25 case-control studies that reported on raw veg-etables, 21 reported decreased risk,109 129 161 162 167 172 174 183
184 191 219 225 226 243 247 248 250 255 256 258 260 261 264 which was sta-tistically significant in 13.129 161 172 174 225 226 243 247 248 256 260 261
264 None of the remaining 4 studies that reported increasedrisk reached statistical significance.257 259 262 263 Meta-analy-sis was possible on 14 independent estimates from 13 case-control studies, giving a summary effect estimate of 0.50(95% CI 0.38–0.65) per 100 g/day, with moderate hetero-geneity (figure 4.2.12).
A dose-response relationship was apparent from case-control but not cohort data (figure 4.2.13).
Of the three ecological studies, two reported statistically sig-nificant reduced risk208 238 and one reported a non-significantincreased risk with increased raw vegetable consumption.202
Figure 4.2.12 Raw vegetables and stomach cancer;cohort and case-control studies
Cohort
Botterweck 1998 0.51 (0.05–4.73)
Galanis 1998 0.81 (0.53–1.23)
Khan 2004 Men 0.63 (0.16–2.51)
Khan 2004 Women 2.03 (0.14–29.46)
Summary estimate 0.80 (0.54–1.18)
Case control
Jedrychowski 1981 0.10 (0.02–0.41)
Jedrychowski 1986 1.56 (0.12–20.74)
Buiatti 1989 0.56 (0.45–0.71)
Caggon 1989 0.13 (0.01–2.88)
Kato 1990 Men 0.59 (0.38–0.91)
Kato 1990 Women 0.86 (0.48–1.48)
Hoshiyama and Sasaba 1992 0.44 (0.29–0.68)
Ramon 1993 0.35 (0.16–0.78)
Cornee 1995 0.27 (0.10–0.72)
Huang 1999 0.77 (0.62–0.94)
De Stefani 2001 0.46 (0.16–1.34)
Sriamporn 2002 0.40 (0.01–15.73)
Lee 2003 0.11 (0.04–0.27)
Lissowska 2004 0.82 (0.52–1.28)
Summary estimate 0.50 (0.38–0.65)
Relative risk (95% CI)
Relative risk, per 100 g/day
1 20.5
Figure 4.2.13 Raw vegetables and stomach cancer;case-control studies: dose response
Jedrychowski 1981
Jedrychowski 1986
Buiatti 1989
Coggon 1989
Kato 1990 Men
Kato 1990 Women
Hoshiyama and Sasaba 1992
Ramon 1993
Cornee 1995
Huang 1999
De Stefani 2001
Sriamporn 2002
Lee 2003
0 10050 150
Raw vegetables (g/day)

90
P A R T 2 • E V I D E N C E A N D J U D G E M E N T S
Non-starchy vegetables and fruitsAll five cohort studies showed decreased risk for the high-est intake group when compared to the lowest,144 146 148 253
265 which was statistically significant in two,253 265 and inmen, but not women, in a third study.148 Meta-analysis waspossible on two cohort studies, giving a summary effect esti-mate of 0.81 (95% CI 0.58–1.14) per 100 g/day.146 253 Allsix case-control studies showed decreased risk with increasedintake,158 161 162 164 257 266 267which was statistically significantin four.158 162 164 257 Meta-analysis was possible on two case-control studies, giving a summary effect estimate of 0.79(95% CI 0.63–0.99) per 100 g/day.162 267
The stomach is a particularly unusual chemical environ-ment and it is possible that, in addition to the general mech-anisms described below, specific mechanisms apply, forinstance, in relation to nitrosamine formation.
A substantial amount of evidence is available,including on specific subtypes, particularly green-yellow vegetables, with a dose-response relationship incase-control, but not cohort data. There is evidence forplausible mechanisms. Vegetables probably protectagainst stomach cancer.
Nasopharynx Five case-control studies272-276 and two ecological studies51
277 investigated non-starchy vegetables and nasopharyngealcancer; a further four case-control studies investigated greenvegetables.278-281 Preserved vegetables were excluded fromall categories.
Eight of the case-control studies reported reduced riskwhen comparing high against low intake groups,272 273 275 276
278-281 which was statistically significant in three of the non-starchy vegetable studies272 275 276 and in two of the greenvegetable studies.279 280 One other study stated that there wasno significant association.274 All studies were based in China.
The ecological studies produced mixed results. Oneshowed significant correlations between the consumption of fresh vegetables and reduced risk of nasopharyngeal car-cinoma after adjusting for age (r2 = -0.77, p = 0.009 amongmen and r2 = -0.75, p = 0.013 among women).51 The secondstudy showed an increasing risk with increases in local consumption of non-starchy vegetables (r2 = 2.36).277
This study did not report any adjustments for potentialconfounding variables or whether the finding was signifi-cant.
The general mechanisms through which vegetables couldplausibly protect against nasopharyngeal cancer are outlinedbelow.
The evidence for non-starchy vegetables is sparse butgenerally consistent. There is limited evidencesuggesting that non-starchy vegetables protect againstnasopharyngeal cancer.
Lung Seventeen cohort studies,282-300 27 case-control studies,301-331
and 6 ecological studies52 116 332-335 investigated total veg-etables and lung cancer (some studies did not separate non-
starchy vegetables from this grouping); in addition, therewas 1 relevant pooling project publication.336 Three cohortstudies337-339 and 1 case-control study321 investigated non-starchy vegetables specifically; 5 cohort studies285 292 299 340
341 and 17 case-control studies65 301 307 312 320-322 326 330 342-350
investigated green, leafy vegetables (excluding cruciferous);2 cohort studies investigated non-starchy root vegetables andtubers289 291; and 6 cohort studies,285 289 293 299 339 341 21 case-control studies,65 261 304 307 313 320-322 325-327 342 344 346-348 351-358
and 1 ecological study333 investigated carrots specifically.
Total vegetablesOut of 19 effect estimates from 17 cohort studies, 14 showedreduced risk with higher levels of vegetable consumption,282
283 286-289 291-297 299 300 which was statistically significant in 3286
297 299 300 and in women only in another285; 1 reported noeffect on risk,298 2 showed increased risk,284 290 none of whichwas statistically significant, and 2 showed non-significantincreased risk in men but not women.285 296 Meta-analysiswas possible on 10 studies, all of which adjusted for smok-ing, giving a summary effect estimate of 0.95 (95% CI0.92–0.98) per 80 g serving/day, with no heterogeneity.282
283 285-287 292 296 297 300 Two studies did not adjust for smoking,1 of which showed a non-significant lower vegetable intakein cases than in controls,295 and the other reported no effecton risk.298
Pooled analysis from 8 cohort studies (over 430 000 par-ticipants, followed up for 6 to 16 years, more than 3200 lungcancer cases) showed a non-significant reduced risk whencomparing high against low intake groups (0.88, 95% CI0.78–1.00), with a p value for trend of 0.12.336
Out of 27 case-control studies, 17 showed reduced riskwith higher levels of vegetable consumption,301-304 306-312 314
316 317 319 322 325-331 which was statistically significant in 8303
304 306 308-310 314 316 319 325-328; 7 studies showed non-significantincreased risk305 313 315 318 320 323 324 and 1 study showed noeffect on risk.321 Meta-analysis was possible on 10 studies,all of which adjusted for smoking, giving a summary effectestimate of 0.67 (95% CI 0.53–0.86) per serving/day, withhigh heterogeneity.303 308 309 313 316 317 323 325 326 328 329 Threestudies did not adjust for smoking, all of which showedstatistically significant decreased risk.306 316 319
A dose-response relationship was apparent from bothcohort and case-control data.
Most of the ecological studies are suggestive of an associ-ation between increased vegetable consumption anddecreased risk.
Non-starchy vegetablesAll three cohort studies reported non-significant reduced riskwhen comparing highest and lowest vegetable intakes, witheffect estimates of 0.9 (lung cancer mortality, 95% CI0.61–1.33),337 0.75 (95% CI 0.41–1.37),338 and 0.54 (p valuefor trend 0.2, squamous and small-cell carcinomas only)when comparing the highest with the lowest intakegroups.339 The single case-control study reported a non-significant increased risk when comparing high and lowvegetable intakes.321

91
C H A P T E R 4 • F O O D S A N D D R I N K S
Green, leafy vegetablesAll five cohort studies reported reduced risk when compar-ing high to low intake groups,285 292 299 340 341 which was sta-tistically significant in one.299 Dose-response meta-analysiswas possible on three cohort studies, giving a summary effectestimate of 0.91 (95% CI 0.89–0.93) per serving/day, withno heterogeneity.285 340 The two non-included studies report-ed high-versus-low effect estimates of 0.89 (95% CI0.66–1.19)292 and 0.45 (95% CI 0.26–0.78).299 All fivecohort studies adjusted for smoking.
Of the 17 case-control studies, 12 reported decreased risk65
301 307 320 321 326 330 342 343 345-348 (reaching statistical significancein 2343 345 348 and 5 reported non-significant increased risk.312
322 344 349 350 Dose-response meta-analysis was possible on 8case-control studies, giving a summary effect estimate of0.96 (95% CI 0.91–1.02) per serving/day, with moderate-to-high heterogeneity.65 322 326 343 346-349 Some of this hetero-geneity may be due to variation in exposure classification,with some studies listing ‘green vegetables’ being includedin this category.
Total non-starchy root vegetables and tubersBoth cohort studies reported reduced risk with increased con-sumption,289 291 with effect estimates of 0.56 (95% CI0.36–0.88)289 when comparing the highest with the lowestintake groups, and 0.70 (95% CI 0.53–0.93) when compar-ing the third highest quartile with the lowest (the highestintake group had a non-significant decreased risk).291 Bothstudies adjusted for smoking.
Carrots All six cohort studies reported reduced risk,285 289 293 299 339 341
which was statistically significant in one (0.4, p value fortrend 0.003).341 The other, non-significant, risk estimatesranged from 0.61 to 0.82.285 289 293 299 339
Twenty of the 21 case-control studies showed decreasedrisk when comparing high against low intake groups,65 261 304
307 313 321 322 325-327 342 344 346-348 351-358 which was statisticallysignificant in 8.261 304 321 325 327 346 347 351 353 356-358 One studyreported no effect.320 Meta-analysis on studies that adjustedfor smoking was possible on 11 studies, giving a summaryeffect estimate of 0.81 (95% CI 0.73–0.89), per serving/dayincrement, with high heterogeneity.65 307 313 322 325-327 347 348 351
352 354-357
There was some evidence of publication bias for bothcohort and case-control studies.
The single ecological study reported lower mean intake ofcarrots in an area of high lung cancer risk.333
The general mechanisms through which vegetables couldplausibly protect against lung cancer are outlined below.
A substantial amount of evidence is available but somestudies were not adjusted for smoking. A dose-response relationship is apparent from both cohort andcase-control studies. There is limited evidencesuggesting that non-starchy vegetables protect againstlung cancer.
ColorectumSeventeen cohort studies81 359-379 and 71 case-control studies investigated non-starchy vegetables and colorectalcancer.
Of 20 effect estimates from 17 cohort studies that report-ed comparisons of the highest and lowest intake groups, 11were in the direction of reduced risk,81 362 364 366 371-374 376-378
3 of which were statistically significant.81 366 371 377 One studyshowed non-significant decreased risk in women and non-significant increased risk in men.360 The other 8 reportednon-significant increased risk.359 361 363 365 367-370 375 One studystated that there was no significant association.379 Meta-analysis was possible on 9 independent estimates from 6studies, giving a summary effect estimate of 1.00 (95% CI0.90–1.11) per 2 servings/day increment, with moderate tohigh heterogeneity.360 362-364 366 370
Because of the abundant prospective data from cohortstudies, case-control studies were not summarised.
The general mechanisms through which vegetables couldplausibly protect against colorectal cancer are outlinedbelow.
A substantial amount of evidence is available but it isinconsistent. There is limited evidence suggesting thatnon-starchy vegetables protect against colorectalcancer.
The Panel is aware that since the conclusion of the SLR, threecase-control studies78 261 380 have been published. This newinformation does not change the Panel judgement (see box3.8).
Ovary Five cohort studies,381-385 eight case-control studies,89 386-392
and two ecological studies393 394 investigated non-starchyvegetables, and three cohort studies381-383 and two case-control studies395 396 investigated green, leafy vegetables.
Non-starchy vegetablesAll of the cohort studies reported decreased risk withincreased vegetable consumption.381-385 Meta-analysis waspossible on four cohort studies, giving a summary effect esti-mate of 0.64 (95% CI 0.33–0.97) for an increase of one serv-ing/day, with no heterogeneity.381 383-385 The study that couldnot be included reported an effect estimate of 0.76 (95% CI0.42–1.37) for the highest intake group when compared withthe lowest.382
Pooled analysis from 12 cohort studies (over 560 000 par-ticipants, followed up for 7 to 22 years, more than 2100 lungcancer cases) showed a non-significant reduced risk whencomparing high against low intake groups (0.90, 95% CI0.78–1.04), with a p value for trend of 0.06.397
All of the case-control studies reported reduced risk,89
386-392 which was statistically significant in five.89 386 387 391 392
One ecological study reported a non-significant positiveregression/correlation between continents393 and the other reported a negative regression/correlation betweencountries.394

92
P A R T 2 • E V I D E N C E A N D J U D G E M E N T S
Green, leafy vegetablesAll three cohort studies reported decreased risk withincreased green, leafy vegetable consumption.381-383 Meta-analysis was possible on two cohort studies, giving a sum-mary effect estimate of 0.96 (95% CI 0.88–1.03) per twoservings/day, with no heterogeneity.381 383 The third cohortstudy reported a statistically significant reduced risk (0.44,95% CI 0.25–0.79) when comparing the highest and lowestintake groups.382
Both case-control studies reported reduced risk fromincreased consumption of green, leafy vegetables,395 396 oneof which was statistically significant.396
The general mechanisms through which vegetables couldplausibly protect against ovarian cancer are outlined below.
Evidence from cohort and case-control studies issparse. There is limited evidence suggesting that non-starchy vegetables protect against ovarian cancer.
The Panel is aware that since the conclusion of the SLR onecase-control study78 has been published. This new informationdoes not change the Panel judgement (see box 3.8).
EndometriumTen case-control studies investigated non-starchy vegetableconsumption.398-407 Seven case-control studies investigatedcruciferous vegetables and endometrial cancer.398-400 405 407-410
Of the 10 studies that reported on non-starchy vegetables,7 showed decreased risk when comparing the highest withthe lowest intake groups,400-405 407 which was statistically sig-nificant in 5.400 402-404 407 Two reported a non-significantincreased risk398 406 and the other showed no effect on risk.399
Meta-analysis was possible on 8 studies, giving a summaryestimate of 0.90 (95% CI 0.86–0.95) per 100 g of vegetableintake/day, with low heterogeneity.399 401-407 A dose-responserelationship was apparent from these data.
Five out of the seven case-control studies that investigat-ed cruciferous vegetables reported reduced risk when com-paring high to low intake groups,399 405 407-410 which wasstatistically significant in one.405 The other two studiesreported non-significant increased risk.398 400 Meta-analysiswas possible on five studies, giving a summary effect esti-mate of 0.79 (95% CI 0.69–0.90) per 100 g/day, with no het-erogeneity.399 405 407 409 410 The two studies that could not beincluded suggested increased risk, though not statisticallysignificant.398 400
A dose-response relationship is apparent from case-controldata.
The general mechanisms through which vegetables couldplausibly protect against endometrial cancer are outlinedbelow. Cruciferous vegetables contain glucosinolates. Certainhydrolysis products of glucosinolates, including indoles andisothiocyanates, have shown anti-carcinogenic properties inlaboratory experiments and in diets in live experiments inanimals.411 The human genotype of glutathione S-transferasehas been shown to have a significant role in the metabolismof these phytochemicals and may therefore influence poten-tial anti-cancer properties.412
Evidence comes from case-control studies only. There is limited evidence suggesting that non-starchyvegetables protect against endometrial cancer.
General mechanisms — non-starchy vegetables Also see Chapter 2. Non-starchy vegetables provide a pletho-ra of potentially cancer-preventive substances, including sev-eral antioxidant nutrients (such as carotenoids and vitaminC), dietary fibre, as well as phytochemicals (such as glu-cosinolates, dithiolthiones, indoles, chlorophyll, flavonoids,allylsulphides, and phytoestrogens). Phytochemicals mightinfluence cancer risk through their antioxidant activities,modulation of detoxification enzymes, stimulation of theimmune system, antiproliferative activities, and/or modula-tion of steroid hormone concentration and hormone metab-olism, to name a few possible mechanisms. Non-starchyvegetables are also a source of folate, which plays an impor-tant role in synthesis and methylation of DNA. AbnormalDNA methylation has been linked to aberrant gene expres-sion and also to cancers at several sites, and may be partic-ularly important in rapidly dividing tissues. It is difficult tounravel the relative importance of each constituent and like-ly that a protective effect may result from a combination ofinfluences on several pathways involved in carcinogenesis.
Carrots are a source of carotenoids, particularly alpha-carotene and beta-carotene, as well as other vitamins andphytochemicals with potentially protective effects. Tomatoesare a source of vitamin C and carotenoids, particularlylycopene. Potential mechanisms of inhibition include theantioxidant properties of carotenoids and ligand-dependentsignalling through retinoid receptors (see chapter 4.2.5.3).
There is a complex mixture of phytochemicals present inwhole vegetables and these may have additive and syner-gistic effects responsible for anti-cancer activities.
4.2.5.1.1 Allium vegetables Stomach Two cohort studies,413 414 27 case-control studies,109 129 152 162
164 171 178 182 185 187 191 194 195 232 243-245 247 248 251 266 270 415-419 and2 ecological studies202 208 investigated allium vegetables andstomach cancer; 1 cohort study,413 16 case-control studies,109
129 182 184 195 232 246 247 251 262 418 420-422 and 2 ecological studies203
208 investigated garlic and stomach cancer. There was also 1relevant intervention study that combined allitridium andselenium supplements.423 424
Allium vegetablesBoth cohort studies reported decreased risk,413 414 which wasstatistically significant in one.413 Meta-analysis was possibleon both, giving a summary effect estimate of 0.55 (95% CI0.35–0.87) per 100 g/day, with no heterogeneity (figure4.2.14).413 414
Twenty of the case-control studies showed reduced riskwhen comparing high with low intake groups,129 152 162 164 171
178 182 185 187 191 194 195 232 243 247 248 270 416 418 419 which was sta-tistically significant in 12.129 152 162 164 182 187 194 243 248 270 416 418
Four studies showed increased risk,109 245 266 415 which was sta-tistically significant in 2,245 and the remaining 3 reported nosignificant effect on risk.244 251 417 Meta-analysis was possible

93
C H A P T E R 4 • F O O D S A N D D R I N K S
on 14 studies, giving a summary effect estimate of 0.59 (95%CI 0.47–0.74) per 100 g/day, with high heterogeneity (figure 4.2.14).109 129 152 162 171 178 182 187 191 194 232 247 270 416
Both ecological studies reported statistically significantdecreased risk with increased consumption.202 208
A statistically significant dose-response relationship isapparent from cohort and case-control data.
GarlicThe single cohort study, which was specific to supplemen-tary garlic, showed a non-significant increased risk whencomparing garlic supplement use versus no supplement use(1.29, 95% CI 0.62–2.67).413
Fifteen of the case-control studies showed decreased riskwhen comparing highest to lowest intake groups,109 129 182 184
195 232 246 247 251 418 420-422 which was statistically significant inseven.129 182 232 246 247 418 420 422 One study showed a non-significant increased risk.262 Meta-analysis was possible onfive studies, giving a summary effect estimate of 0.41 (95% CI 0.23–0.73) per serving/day.109 129 182 232 421
One ecological study showed statistically significantdecreased risk with increased intake208; the other showed nosignificant association.203
Intervention studyThe double-blind, randomised trial had an intervention dura-tion of 3 years, and a 5- and 10-year follow-up, and morethan 5000 participants, all of whom had been identified asbeing at increased risk of stomach cancer. The intervention
was a combined selenium/allitridium supplement.423 424 The5-year follow-up suggested that the intervention waseffective in reducing stomach cancer incidence in men (0.36,95% CI 0.14–0.92) but not in women (1.14, 95% CI0.22–5.76).423 The statistically significant protective effectfor men had dissipated at the 10-year follow-up.424 (Also seechapter 4.2.5.8.)
Allium vegetables are high in flavonols and organosulphurcompounds. They also, particularly garlic, have antibioticproperties. Although this may act directly against H pylori(a known cause of stomach cancers), a study in humans hasnot shown this effect.425 It is also possible that antibacteri-al effects of garlic might inhibit the secondary colonisationof the stomach after H pylori-induced atrophy. At present,there is no evidence to support or refute this mechanism. Ananimal study provides evidence that dietary garlic can reducethe severity of H pylori-associated gastritis.426
The evidence, though not copious and mostly fromcase-control studies, is consistent, with a dose-response relationship. There is evidence for plausiblemechanisms. Allium vegetables probably protectagainst stomach cancer.
Colorectum GarlicTwo cohort studies361 362 and six case-control studies427-435
investigated garlic consumption.Both cohort studies reported non-significant decreased risk
when comparing the highest with the lowest intake groups,with effect estimates of 0.77 (95% CI 0.51–1.16)361 and 0.68(95% CI 0.46–1.01) (figure 4.2.15).362
All six case-control studies showed decreased risk for thehighest consumers of garlic,427-435 which was statistically sig-nificant in three (figure 4.2.16).431 432
There is considerable preclinical evidence with model car-cinogens and transplantable tumours that supports an anti-cancer effect of garlic and some of its allyl sulphurcomponents. Animal studies demonstrate that allyl sulphideseffectively inhibit colon tumour formation and also caninhibit cell growth in the laboratory.436-439
Figure 4.2.14 Allium vegetables and stomach cancer;cohort and case-control studies
Cohort
Dorant 1996 0.55 (0.35–0.88)
Gonzalez 2006 0.31 (0.01–11.69)
Summary estimate 0.55 (0.35–0.87)
Case control
Haenszel 1972 0.49 (0.33–0.72)
Trichopoulos 1985 0.23 (0.16–0.35)
You 1988 0.32 (0.17–0.59)
Buiatti 1989 0.85 (0.72–1.00)
Hansson 1993 0.79 (0.47–1.34)
Ji 1998 Men 0.66 (0.43–1.02)
Ji 1998 Women 0.69 (0.38–1.24)
Gao 1999 0.00 (0.00–0.02)
De Stefani 2001 0.29 (0.11–0.81)
Munoz 2001 0.70 (0.61–0.80)
Takezaki 2001 1.45 (0.74–2.82)
Sipetic 2003 0.40 (0.20–0.80)
Lissowka 2004 0.86 (0.67–1.10)
Nan 2005 0.49 (0.28–0.84)
Zickute 2005 0.91 (0.71–1.16)
Summary estimate 0.59 (0.47–0.74)
Relative risk (95% CI)
Relative risk, per 100 g/day
1 20.5
Figure 4.2.15 Garlic and colon cancer; cohort studies
Giovannucci 1994 Men 0.77 (0.51–1.16)
Steinmetz 1994 Women 0.68 (0.46–1.01)
Relative risk (95% CI)
Relative risk, highest vs lowest exposure category
1 50.2 0.5 2

94
P A R T 2 • E V I D E N C E A N D J U D G E M E N T S
The evidence, though not copious and mostly fromcase-control studies, is consistent, with a dose-response relationship. There is evidence for plausiblemechanisms. Garlic probably protects againstcolorectal cancer.
The Panel is aware that since the conclusion of the SLR, onecase-control study78 has been published. This new informationdoes not change the Panel judgement (see box 3.8).
In addition to this judgement, data on garlic havecontributed to the evidence base for allium vegetables andstomach cancer (also see chapter 7.5).
4.2.5.1.2 CarrotsCervixFive case-control studies440-444 and one ecological study445
investigated carrots and cervical cancer.Case-control studies were consistent in showing reduced
risk for the highest levels of consumption, which was sta-tistically significant in three.440-442 All studies used hospital-based controls and none adjusted for human papilloma virusstatus. The single ecological study showed non-significantincreased risk with high intake of carrots.445
Some carotenoids, including beta-carotene and alpha-carotene, which are found at high levels in carrots, are pre-cursors of vitamin A. They also have properties independentof their pro-vitamin A activity. Carotenoids are recognisedantioxidants and low blood levels of dietary antioxidants areassociated with human papilloma virus persistence.446
The evidence, from case-control studies only, is sparsebut consistent. There is limited evidence suggestingthat carrots protect against cervical cancer.
Data on carrots have contributed to the evidence base fornon-starchy vegetables and mouth, pharynx, and larynx can-cers (chapter 7.1) and lung cancer (chapter 7.4). Also seechapter 4.2.5.1.
4.2.5.2 FruitsMouth, pharynx, and larynxOne cohort study,447 35 case-control studies21 22 24-26 28 30-33 35
36 39-50 59-61 63 64 67 69 72 74 448-450 and 2 ecological studies52 68
investigated fruits and mouth, pharynx, and larynx cancers;and 1 cohort study,66 23 case-control studies23 26-29 31 33 34 37-
39 41-43 45-47 50 63 65 75 451 452 and 1 ecological study52 investigatedcitrus fruits. In addition, 1 cohort study54 and 6 case-controlstudies33 39 45 55-57investigated non-starchy vegetables andfruits in combination (also see evidence on non-starchyvegetables, chapter 4.2.5.1).
General fruitsThe single cohort study, which adjusted for smoking,showed a non-significant decreased risk for the highest whencompared to the lowest intake groups, with an effect esti-mate of 0.82 (95% CI 0.64–1.04) (figure 4.2.17).447
Most (32) of the case-control studies reported decreasedrisk associated with higher intake of fruits,24-26 28 30-33 35 36 39-
48 50 59-61 63 64 69 72 74 448 450 which was statistically significantin 17.26 31 32 35 39-43 46-48 50 63 64 69 72 448 No study reported sta-tistically significant increased risk. Meta-analysis was possi-ble on 7 studies (all of which adjusted for smoking), givinga summary effect estimate of 0.72 (95% CI 0.59–0.87) per100 g/day, with high heterogeneity (figure 4.2.17).30 39 42 44
45 69 72 Heterogeneity came from the varying size, not direc-tion, of effect.
One ecological study showed a weak inverse correlationbetween fruits and oral cancer.68 The other observed inversecorrelations among women for fruit and both oral and laryn-geal cancers and positive correlations among men for thesame two sites.52
Figure 4.2.17 Fruits and mouth, pharynx, and larynxcancer; cohort and case-control studies
Cohort
Chyou 1995 0.82 (0.64–1.04)
Summary estimate 0.82 (0.64–1.04)
Case control
La Vecchia 1991 0.59 (0.41–0.86)
De Stefani 1994 0.58 (0.30–1.12)
De Stefani 2000 0.66 (0.52–0.85)
Bosetti 2002 0.92 (0.88–0.97)
Marchioni 2003 0.96 (0.86–1.08)
Gaudet 2004 0.90 (0.74–1.10)
Kapil 2005 0.17 (0.10–0.31)
Summary estimate 0.72 (0.59–0.87)
Relative risk (95% CI)
Relative risk, per 100 g/day
10.750.1 0.5 1.5
Figure 4.2.16 Garlic consumption and colorectal cancer;case-control studies
Huetal 1991 0.21 (0.04–0.98)
Le Marchand 1997 Men 0.80 (0.54–1.19)
Le Marchand 1997 Women 0.90 (0.59–1.37)
Franceschi 1998 0.90 (0.80–1.01)
Levi 1999 0.39 (0.21–0.71)
Kamel 2002 0.83 (0.44–1.55)
Relative risk (95% CI)
Relative risk, highest vs lowest exposure category
1 50.2 0.5 2

95
C H A P T E R 4 • F O O D S A N D D R I N K S
Citrus fruitsThe single cohort study, which was specific to oranges andwas adjusted for smoking, showed a non-significantdecreased risk for the highest when compared to the lowestintake groups, with an effect estimate of 0.50 (95% CI0.30–1.00), with a p value for trend of 0.03.66 This risk esti-mate was for cancers of the upper aerodigestive tract.
Twenty-two of the case-control studies showed decreasedrisk associated with higher intake of fruits,23 27-29 31 33 34 37-39
41-43 45-47 50 63 65 75 451 452 which was statistically significant in13.23 27-29 31 33 37 39 42 43 47 50 75 The 23rd study showed no effecton risk.26 Meta-analysis was possible on 7 studies (all ofwhich adjusted for smoking), giving a summary effect esti-mate of 0.76 (95% CI 0.66–0.87) per 50 g/day, with highheterogeneity (figure 4.2.18).23 29 37 39 42 45 65 Heterogeneity
came from the varying size, not direction, of effect.A dose-response relationship was apparent from case-
control but not cohort data for both general and citrus fruits(figures 4.2.19 and 4.2.20). There is some suggestion thatthe greatest effect appears to be with the first increment.That is, some fruit consumption confers a protective effectcompared to none. However, it is not clear that the effectcontinues in a linear fashion with increased doses.
One ecological study found no significant associationbetween citrus fruit consumption and cancer mortality inmen or women.52
Studies that reported on combined intake of non-starchyvegetables and fruits showed evidence of an association withdecreased risk (see chapter 4.2.5.1).
The general mechanisms through which fruits could plau-sibly protect against mouth, pharynx, and larynx cancer areoutlined below.
The evidence, including on fruit subtypes, thoughmostly from case-control studies, is consistent, with adose-response relationship. There is evidence forplausible mechanisms. Fruits probably protect againstmouth, pharynx, and larynx cancers.
The Panel is aware that since the conclusion of the SLR, twocohort studies76 77 and one case-control study79 have been pub-lished. This new information does not change the Panel judge-ment (see box 3.8).
OesophagusFour cohort studies,80 82 83 447 36 case-control studies22 40 60
84 86 87 89 94-96 98-100 102 104 108-110 112-115 125-129 134-136 138 453-456 and7 ecological studies52 68 116 118 119 234 457 458 investigated fruitsand oesophageal cancer; 1 cohort study,66 16 case-control
Figure 4.2.18 Citrus fruits and mouth, pharynx, andlarynx cancer; case-control studies
Franco 1989 0.72 (0.56–0.93)
Zheng 1993 0.45 (0.31–0.66)
Levi 1998 0.88 (0.82–0.95)
De Stefani 2000 0.27 (0.14–0.52)
Bosetti 2002 0.91 (0.85–0.97)
Pisa 2002 0.71 (0.51–0.99)
Gaudet 2004 0.89 (0.73–1.10)
Summary estimate 0.76 (0.66–0.87)
Relative risk (95% CI)
Relative risk, per 50 g/day
10.750.5 1.5 2
Figure 4.2.19 Fruits and mouth, pharynx, and larynxcancer; case-control studies: dose response
LaVecchia 1991
De Stefani 1994
De Stefani 2000
Bosetti 2002
Marchioni 2003
Gaudet 2004
Kapil 2005
0 800400 1000200 600
Fruits (g/day)
Figure 4.2.20 Citrus fruits and mouth, pharynx, and larynxcancer; case-control studies: dose response
Franco 1989
Zheng 1993
Levi 1998
De Stefani 2000
Bosetti 2002
Pisa 2002
Gaudet 2004
0 200 300100
Citrus fruits (g/day)

96
P A R T 2 • E V I D E N C E A N D J U D G E M E N T S
studies,33 85 86 88 90 97 105 111 113 124 125 128 130 132 133 136 459 and 1ecological study52 investigated citrus fruits.
General fruitsAll of the cohort studies reported reduced risk with higherintakes of fruit,80 82 83 447 which was statistically significantin two.83 447 One study reported a statistically significantdose-response relationship, with a risk estimate of 0.68(95% CI 0.53–0.88) per 100 g/day after adjustment forsmoking.447 The other three reported risks for the highestintake groups relative to the lowest, with risk estimates of0.8 (95% CI 0.7–0.9; not adjusted for smoking),83 0.9 (95%
CI 0.8–1.1; adjusted for smoking),80 and 0.99 (95% CI0.85–1.15; not adjusted for smoking).82
Thirty-two of the case-control studies reported reducedrisk for the highest intake groups when compared to the low-est (figure 4.2.21),22 40 60 84 86 87 89 95 96 98 99 102 104 108-110 113-115
125-129 134-136 138 453-456 which was statistically significant in24.40 60 84 86 87 89 95 96 102 104 110 113-115 127 134-136 138 454-456 Onestudy reported statistically significant increased risk,100 onereported no effect on risk,112 and one reported no statisticallysignificant association.94 Meta-analysis was possible on eightstudies, giving a summary effect estimate of 0.56 (95% CI0.42–0.74) per 100 g/day, with high heterogeneity (figure
Figure 4.2.21 Fruits and oesophageal cancer; cohortand case-control studies
Cohort
Yu 1993 0.99 (0.85–1.15)
Chyou 1995 0.65 (0.39–1.08)
Guo 1999 0.90 (0.77–1.06)
Tran 2005 0.80 (0.70–0.91)
Case control
Notani 1987 0.99 (0.63–1.57)
Victoria 1987 0.66 (0.50–0.88)
Nakachi 1988 Women 0.23 (0.12–0.45)
Nakachi 1988 Men 0.31 (0.22–0.44)
Brown 1988 0.50 (0.29–0.87)
Jun-lao 1989 1.00 (0.82–1.22)
De Stefani 1990 0.33 (0.21–0.52)
Negri 1991 0.30 (0.21–0.42)
Tavani 1993 0.40 (0.19–0.85)
Tavani 1994 0.30 (0.11–0.85)
Castelletto 1994 0.70 (0.31–1.57)
Hanaoka 1994 0.50 (0.18–1.39)
Srivastava 1995 3.15 (1.29–7.72)
Gimeno 1995 0.55 (0.33–0.94)
Zhang 1997 0.40 (0.16–0.98)
De Stefani 1999 0.30 (0.17–0.52)
Wang 1999 0.51 (0.27–0.98)
Gao 1999 0.75 (0.36–1.56)
Cheng 2000 0.08 (0.01–0.56)
Nayar 2000 0.96 (0.45–2.05)
De Stefani 2000 0.18 (0.09–0.37)
Takezaki 2000 0.70 (0.52–0.94)
Phukan 2001 0.30 (0.04–2.17)
Terry 2001 0.60 (0.36–0.99)
Wolfgarten 2001 0.32 (0.12–0.89)
Takezaki 2001 0.91 (0.48–1.73)
Sharp 2001 0.64 (0.25–1.65)
Zhang 2001 0.64 (0.42–0.97)
Onuk 2002 7.10 (3.21–15.73)
Lik 2003 0.08 (0.06–0.11)
Hung 2004 0.60 (0.40–0.90)
Yang 2005 0.42 (0.19–0.91)
De Stefani 0.21 (0.10–0.44)
Relative risk (95% CI)
Relative risk, highest vs lowest exposure category
1 50.2 0.5 2
Figure 4.2.22 Fruits and oesophageal cancer;case-control studies
Jun-lao 1989 1.52 (0.47–4.91)
Hanaoke 1994 0.30 (0.13–0.67)
Castelletto 1994 0.33 (0.13–0.80)
Gao 1999 0.38 (0.01–20.03)
De Stefani 2000 0.53 (0.42–0.67)
Wolfgarten 2001 0.40 (0.27–0.59)
Sharp 2001 0.84 (0.74–0.96)
De Stefani 2005 0.59 (0.49–0.71)
Summary estimate 0.56 (0.42–0.74)
Relative risk (95% CI)
Relative risk, per 100 g/day
10.750.5 1.50.2
Figure 4.2.23 Citrus fruits and oesophageal cancer;cohort and case-control studies
Cohort
Kjaerheim 1998 0.50 (0.27–0.91)
Case control
Brown 1988 0.50 (0.29–0.87)
Cheng 1992 0.10 (0.04–0.26)
Castelletto 1994 1.60 (0.81–3.15)
Cheng 1995 Non-smokers 0.39 (0.16–0.97)
Cheng 1995 Never drinkers 0.59 (0.23–1.52)
Zhang 1997 0.70 (0.29–1.71)
Launoy 1998 0.54 (0.33–0.89)
Levi 2000 0.22 (0.09–0.54)
Bosetti 2000 0.42 (0.25–0.71)
Terry 2000 0.90 (0.50–1.61)
Chen 2002 0.48 (0.21–1.10)
De Stefani 2005 0.28 (0.15–0.54)
Relative risk (95% CI)
Relative risk, highest vs lowest exposure category
1 50.2 0.5 2

97
C H A P T E R 4 • F O O D S A N D D R I N K S
4.2.22). Heterogeneity may be partially explained by differ-ential adjustment for confounders between studies.
All seven ecological studies reported reduced risk withincreased intake,52 68 116 118 119 234 457 458 which was statisticallysignificant in one.68 458
Citrus fruitsThe single cohort study, which was specific to oranges andwas adjusted for smoking, showed a non-significantdecreased risk for the highest when compared to the lowestintake groups, with an effect estimate of 0.50 (95% CI0.30–1.00), with a p value for trend of 0.03.66 This risk esti-mate was for cancers of the upper aerodigestive tract; 22 outof 71 cases were oesophageal cancers.
Fifteen of the case-control studies reported decreased riskfor the highest intake groups when compared to the lowest,33
85 86 88 90 97 105 111 113 124 125 130 132 133 136 459 which was statisti-cally significant in 10 (figure 4.2.23).33 85 86 88 97 105 113 132 133
136 459 The other study reported a non-significant increasedrisk.128 Meta-analysis was possible on six studies, giving asummary effect estimate of 0.70 (95% CI 0.56–0.88) per 50 g/day, with high heterogeneity (figure 4.2.24).33 97 128 130
132 133 Four of these studies adjusted for smoking.33 97 128 132
133 Heterogeneity may be partially explained by differentialadjustment for confounders between studies.
The single ecological study reported a non-significantincreased risk.52
The general mechanisms through which fruits could plau-sibly protect against cancer are outlined below.
The evidence, including on fruit subtypes, thoughmostly from case-control studies, is consistent, with adose-response relationship. There is evidence forplausible mechanisms. Fruits probably protect againstoesophageal cancer.
The Panel is aware that since the conclusion of the SLR, onecohort study140 and two case-control studies143 460 have been
published. This new information does not change the Paneljudgement (see box 3.8).
LungTwenty-five cohort studies,214 216 282-300 337 339 360 461-467 32case-control studies,261 303-306 308-318 320-322 324 326-328 330 331 343 346
349 350 352 355 357 358 468-472 and 7 ecological studies52 116 332-334
473 474 investigated fruits and lung cancer.Twenty of the cohort studies showed decreased risk for the
highest intake groups when compared to the lowest,214 216 282-
289 291-294 296 297 299 300 337 461-467 which was statistically signifi-cant in four.216 289 292 300 461 464 Four studies showednon-significant increased risk290 295 339 360 and the other report-ed no statistically significant association.298 Meta-analysis waspossible on 14 cohort studies, giving a summary effect esti-mate of 0.94 (95% CI 0.90–0.97) per 80 g serving/day, withlow heterogeneity (figure 4.2.25). All but one of these stud-ies adjusted for smoking.462
Pooled analysis from 8 cohort studies (over 430 000 par-ticipants, followed up for 6 to 16 years, more than 3200 lung
Figure 4.2.24 Citrus fruits and oesophageal cancer;case-control studies
Cheng 1992 0.46 (0.39–0.55)
Castelletto 1994 1.22 (0.79–1.89)
Cheng 1995 Never drinkers 0.65 (0.48–0.89)
Cheng 1995 Non-smokers 0.57 (0.43–0.75)
Levi 2000 0.75 (0.67–0.84)
Terry 2000 0.97 (0.84–1.13)
De Stefani 2005 0.62 (0.49–0.78)
Summary estimate 0.70 (0.56–0.88)
Relative risk (95% CI)
Relative risk, per 50 g/day
10.750.2 0.5 1.5 2
Figure 4.2.25 Fruits and lung cancer; cohort andcase-control studies
Cohort
Alavanja 2004 (pesticide applicators) 0.89 (0.59–1.35)
Alavanja 2004 (applicator spouses) 0.65 (0.28–1.51)
Breslow 2000 0.92 (0.71–1.18)
Feskanich 2000 (HPFS) Men 1.05 (0.94–1.17)
Feskanich 2000 (NHS) Women 0.94 (0.87–1.02)
Fraser 1991 0.47 (0.32–0.69)
Fu 1997 0.94 (0.67–1.32)
Holick 2002 0.94 (0.89–1.00)
Jansen 2004 0.84 (0.65–1.09)
Miller 2002 0.96 (0.86–1.07)
Olson 2002 0.91 (0.86–0.96)
Shibata 1992 0.99 (0.87–1.14)
Skuladottir 2004 0.95 (0.86–1.05)
Takezaki 2003 0.63 (0.24–1.63)
Vorrips 2000 0.92 (0.86–0.98)
Summary estimate 0.94 (0.90–0.97)
Case control
Axelsson 1996 0.77 (0.46–1.28)
Brennan 2000 1.08 (0.52–2.28)
De Stefani 2002 0.84 (0.66–1.06)
Gao 1993 0.45 (0.30–0.67)
Hu 2002 1.04 (0.85–1.27)
Ko 1997 1.00 (0.54–1.84)
Kreuzer 2002 0.79 (0.45–1.39)
Lagiou 2004 0.79 (0.60–1.04)
Pawlega 1997 0.01 (0.00–0.24)
Rachtan 2002 0.49 (0.32–0.75)
Raunoi-Ravina 2002 1.19 (0.74–1.91)
De Stefani 1999 0.67 (0.54–0.82)
Suzuki 1994 1.33 (0.56–3.18)
Swanson 1997 0.91 (0.76–1.09)
Summary estimate 0.80 (0.68–0.94)
Relative risk (95% CI)
Relative risk, per serving/day
10.05 2

98
P A R T 2 • E V I D E N C E A N D J U D G E M E N T S
cancer cases) showed a statistically significant reduced risk forthe highest intake group when compared to the lowest (0.77,95% CI 0.67–0.87), with a p value for trend of < 0.001.336
Twenty-one case-control studies showed decreased risk forthe highest intake groups when compared to the lowest,261
303 305 306 308 309 311 312 315 317 318 320-322 324 327 328 331 343 346 349 350
355 357 358 468 469 472 which was statistically significant in 7.261
309 311 324 327 343 346 357 358 468 472 Three studies reported no effecton risk310 316 330 352 and 8 showed increased risk,304 313 314 326
470 471 which was statistically significant in 3.304 326 470 Meta-analysis was possible on 14 case-control studies, giving asummary effect estimate of 0.80 (95% CI 0.68–0.94) perserving/day, with moderate heterogeneity (figures 4.2.25and 4.2.26). All but 2 of these studies adjusted for smoking,and exclusion of these 2 studies did not significantly alterthe meta-analysis.316 352
Of the seven ecological studies, four reported non-significant decreased risk in areas of higher fruit consump-tion,52 332 473 474 one reported no consistent association,334 andtwo reported non-significant increased risk.116 333
The general mechanisms through which fruits could plau-sibly protect against cancer are outlined below. In addition,flavonoids found in fruit directly inhibit expression ofCYP1A1 (a cytochrome P450 enzyme that helps tometabolise toxins), resulting in decreased DNA damage.475
Elevated CYP1A1 activity has been associated with increasedrisk of lung cancer, primarily in smokers.476 The protectiveassociation of flavonoids is associated with specific CYP1A1genotypes, which supports the importance of flavonoids andpotentially explains heterogeneous results.476 477
The evidence is ample and consistent. A dose-responserelationship is apparent from both cohort and case-control studies and there is evidence for plausiblemechanisms operating in humans. The evidence thatfruits protect against lung cancer is convincing.
The Panel is aware that since the conclusion of the SLR, onecase-control study478 has been published. This new informationdoes not change the Panel judgement (see box 3.8).
Stomach Sixteen cohort studies,71 80 144-147 149 150 213-217 252-254 414 51case-control studies,89 109 129 151 154 156 158-163 167-169 174-176 178-180
182 184-187 189-191 193 195 219 221 222 224-227 229 230 246 255-258 260 261 264
270 479-482 and 23 ecological studies52 116 118 119 197 198 200-202 204-
209 234 236-240 483-485 investigated fruits.Ten cohort studies reported decreased risk for the highest
intake groups when compared to the lowest,71 80 144 146 150 214-
217 253 254 which was statistically significant in one,253 and inwomen only in a second study.216 Six studies showedincreased risk,145 147 149 213 214 252 414 which was statistically sig-nificant in one.213 Meta-analysis was possible on eight stud-ies, giving a summary effect estimate of 0.95 (95% CI0.89–1.02) per 100 g/day, with low heterogeneity (figure4.2.27).
One of the cohort studies considered in the meta-analysisabove (EPIC, more than 521000 participants in over 10European countries) reported results stratified by H pyloristatus. The effect estimate for the H pylori-negative groupwas 0.72 (95% CI 0.39–1.33) and 0.98 (95% CI 0.81–1.2)for the positive group.140
Forty case-control studies showed decreased risk for thehighest intake groups when compared to the lowest,89 109 151
156 158-160 162 163 167-169 174 176 178-180 184 186 187 189-191 195 219 221 222
225 226 229 230 246 256-258 260 261 264 270 479-481 which was statistical-ly significant in 25.89 109 151 158-160 162 163 167-169 174 176 178 186 187
190 191 221 222 226 229 246 256 261 264 479 481 Seven showed increasedrisk,129 161 182 185 193 224 482 which was statistically significantin two.182 193 One study showed non-significant increased riskin men and non-significant decreased risk in women.227 Twostudies showed no effect on risk154 255 and the remaining onereported that there was no significant association.175 Meta-analysis was possible on 26 studies, giving a summary effectestimate of 0.67 (95% CI 0.59–0.76) per 100 g/day, with
Figure 4.2.26 Fruits and lung cancer; cohort andcase-control studies; dose response
Cohort
Voorrips 2000
Takezaki 2003
Skuladottir 2004
Oslon 2002
Miller 2002
Jansen 2004
Holick 2002
Fu 1997
Fraser 1991
Feskanich 2000 (NHS)Women
Feskanich 2000 (HPFS)Men
Breslow 2000
Alavanja 2004(Pesticide applicators)
Alavanja 2004(Applicator spouses)
Case control
Swanson 1997
Suzuki 1994
Stefani 1999
Ruano-Ravina 2002
Rachtan 2002
Pawlega 1997
Lagiou 2004
Kreuzer 2002
Ko 1997
Hu 2002
Gao 1993
De Stefani 2002
Brennan 2000
Axelsson 1996
0 51 2 3 4
Fruits (servings/day)

99
C H A P T E R 4 • F O O D S A N D D R I N K S
high heterogeneity (figure 4.2.27).A dose-response relationship is apparent from case-control
but not cohort data. There is statistically significant hetero-geneity between study types.
Eighteen ecological studies showed decreased risk withincreased intake of fruits,116 118 197 200 201 204-208 234 237-239 484 485
which was statistically significant in eight.204-208 237 Four stud-ies showed increased risk with increased intake,52 118 119 202
239 240 which was statistically significant in one.240 Two stud-ies showed non-significant decreased risk in women andnon-significant increased risk in men209 236; one studyshowed non-significant decreased risk in men and non-significant increased risk in women198; and one study
showed non-significant increased risk in white men andJapanese men and women, and non-significant decreasedrisk in white women.483
The stomach is a particularly unusual chemical environ-ment and it is possible that, in addition to the general mech-anisms described below, specific mechanisms apply, forinstance, in relation to nitrosamine formation.486 It is alsoplausible that bioactive constituents in fruit would protectagainst H pylori-induced damage, particularly inflammation,which is implicated in the development of stomach cancers.
The evidence is ample and more consistent with adose-response relationship for case-control studiesthan for cohorts. There is evidence for plausiblemechanisms. Fruits probably protect against stomachcancer.
The Panel is aware that since the conclusion of the SLR, threecase-control studies487-489have been published. This new infor-mation does not change the Panel judgement (see box 3.8).
Nasopharynx Six case-control studies investigated general fruits andnasopharyngeal cancers274 275 281 490-492; a further five case-control studies investigated citrus fruits.273 278-281 Preservedfruits were excluded from all categories.
Of the six case-control studies that investigated generalfruits, four reported decreased risk for the highest intakegroups when compared to the lowest,275 281 491 492 which wasstatistically significant in two.275 491 The other two studiesreported that there was no significant effect on risk, with-out further detail.274 490 All five of the case-control studiesthat investigated citrus fruits reported decreased risk for thehighest intake groups when compared to the lowest,273 278-
281 four of which were statistically significant.273 278-280
Preserved fruits were excluded as they introduced sub-stantial heterogeneity.
The general mechanisms through which fruits could plau-sibly protect against nasopharyngeal cancer are outlinedbelow. In addition, it is possible that active constituents infruit could act directly on Epstein-Barr virus infection.493
The evidence, from case-control studies only, is sparse.There is limited evidence suggesting that fruits protectagainst nasopharyngeal cancer.
PancreasSix cohort studies,214 216 252 494-496 16 case-control studies,219
497-511 and 8 ecological studies52 197 485 512-515 investigatedfruits and pancreatic cancer.
All six cohort studies showed decreased risk for the high-est intake groups when compared to the lowest,214 216 252 494-
496 which was statistically significant in one.496 Meta-analysiswas possible on three cohort studies, giving a summary effectestimate of 0.92 (95% CI 0.81–1.04) per 100 g/day, with noheterogeneity.216 494 495
Eleven case-control studies showed decreased risk for thehighest intake groups when compared to the lowest,219 497 498
500 501 503-509 511 which was statistically significant in four,503
Figure 4.2.27 Fruits and stomach cancer; cohort andcase-control studies
Cohort
Chyou 1990 0.95 (0.84–1.07)
Botterweck 1998 0.92 (0.83–1.02)
Galanis 1998 0.68 (0.51–0.92)
Fujino 2002 Men 1.01 (0.90–1.13)
Fujino 2002 Women 1.12 (0.85–1.49)
Kobayashi 2002 0.75 (0.55–1.00)
Ngoan 2002 0.94 (0.28–1.19)
Khan 2004 Men 1.14 (0.28–4.70)
Gonzalez 2006 1.04 (0.91–1.19)
Summary estimate 0.95 (0.89–1.02)
Case control
Jedrychowski 1981 0.71 (0.53–0.95)
Jedrychowski 1986 0.98 (0.66–1.47)
You 1988 0.61 (0.48–0.79)
Burr 1989 Men 0.53 (0.32–0.89)
Burr 1989 Women 0.39 (0.15–0.97)
Coggon 1989 0.48 (0.07–3.45)
De Stefani 1990 0.42 (0.30–0.61)
Kato 1990 Men 0.89 (0.65–1.22)
Kato 1990 Women 0.85 (0.49–1.50)
Lee 1990 1.05 (0.79–1.39)
Wu-Williams 1990 Men 0.64 (0.37–1.11)
Hoshiyama 1992 0.54 (0.41–0.70)
Memik 1992 0.57 (0.36–0.90)
Cornee 1995 0.75 (0.67–0.99)
De Stefani 1998 0.49 (0.42–0.58)
Ji 1998 Men 0.49 (0.37–0.80)
Ji 1998 Women 0.55 (0.37–0.80)
Gao 1999 5.46 (0.36–17.98)
Huang 1999 0.93 (0.80–1.08)
Ward 1999 0.90 (0.55–1.47)
Mathew 2000 0.90 (0.55–1.47)
De Stefani 2001 0.65 (0.53–0.79)
Takezaki 2001 0.60 (0.37–0.97)
Nishimoto 2002 0.74 (0.62–1.06)
Lee 2003 0.36 (0.18–0.73)
Sipetic 2003 0.17 (0.07–0.32)
Suh 2003 0.80 (0.69–0.92)
Lissowska 2004 0.65 (0.47–0.91)
Boccia 2995 2.06 (1.10–3.84)
Summary estimate 0.67 (0.59–0.76)
Relative risk (95% CI)
Relative risk, per 100 g/day
10.5 2

100
P A R T 2 • E V I D E N C E A N D J U D G E M E N T S
504 508 511 and in men but not women in a fifth study,506 andin women but not men in a sixth.501 One study reported a sta-tistically significant increased risk for men and a statisticallysignificant decreased risk for women.510 No other studyreported statistically significant increased risk. Meta-analysiswas possible on eight case-control studies, giving a summa-ry effect estimate of 0.89 (95% CI 0.82–0.98) per 100 g/day,with high heterogeneity.497 498 502 503 505 506 508 510 Heterogeneitycould be partly explained by proxy reporting, poor study qual-ity, and varying adjustment for known confounders.
A dose-response relationship is apparent from case-control,but not cohort data.
Ecological studies show no consistent association.52 197 485
512-515
The general mechanisms through which fruits could plau-sibly protect against pancreatic cancer are outlined below.
The evidence is inconsistent. There is limited evidencesuggesting that fruits protect against pancreatic cancer.
The Panel is aware that since the conclusion of the SLR, onecohort study516 has been published. This new information doesnot change the Panel judgement (see box 3.8).
Liver cancerOne cohort study216 517 and five case-control studies89 518-521
investigated fruits and liver cancer.The single cohort study showed non-significant decreased
risk for the highest intake groups when compared to the low-est (0.98, 95% CI 0.75–1.21).216 517
Four case-control studies showed decreased risk for thehighest intake groups when compared to the lowest,89 518 520
521 which was statistically significant in two.89 518 One studyshowed non-significant increased risk.519 Heterogeneitycould be partly explained by poor study quality and varyingadjustment for known confounders.
The general mechanisms through which fruits could plau-sibly protect against liver cancer are outlined below. In addi-tion, grape extracts and auraptene (from citrus fruit) haveshown protective effects against the development of hepa-tocellular carcinoma in rats.522-525
The evidence is sparse and inconsistent. There islimited evidence suggesting that fruits protect againstliver cancer.
The Panel is aware that since the conclusion of the SLR, onecase-control study526 has been published. This new informationdoes not change the Panel judgement (see box 3.8).
ColorectumTwenty cohort studies214 216 359-372 374-376 378 379 527-529 and 57case-control studies investigated fruits and colorectal cancer.
Thirteen cohort studies showed decreased risk withincreased intake,214 216 360-364 366 371 374-376 378 which was sta-tistically significant in two.360 364 No studies reported statis-tically significant increased risk. Meta-analysis was possibleon eight cohort studies, giving a summary effect estimate of0.97 (95% CI 0.92–1.03) per serving/day, with high het-erogeneity.360 362-364 366 370 529 When results were stratified by
sex, a statistically significant decreased risk was apparent inwomen (0.81, 95% CI 0.85–0.98 per serving/day based onfive studies), with low heterogeneity.
Because of the abundant prospective data from cohortstudies, case-control studies were not summarised.
The mechanism for this sex difference is unknown. Thereis speculation the mechanism could be related to the (part-ly understood) explanation for protective effects observed inpostmenopausal women provided with hormone replace-ment therapy. Another possibility is that the result could beartifactual if men are poorer at reporting their diets thanwomen.
The general mechanisms through which fruits could plau-sibly protect against colorectal cancer are outlined below.
There is a substantial amount of evidence but it isinconsistent. There is limited evidence suggesting thatfruits protect against colorectal cancer.
The Panel is aware that since the conclusion of the SLR, onecohort530 and five case-control studies 261 380 531-533 have beenpublished. This new information does not change the Paneljudgement (see box 3.8).
General mechanisms — fruits Fruits, in particular citrus fruits, are sources of vitamin C andother antioxidants, such as phenols and flavonoids, as wellas potentially bioactive phytochemicals. Vitamin C traps freeradicals and reactive oxygen molecules, protecting againstoxidation damage. It also regenerates other antioxidantvitamins such as vitamin E.534 Vitamin C also inhibits the formation of carcinogens and protects DNA from mutagenic attack.535
Beta-carotene and other carotenoid antioxidants are alsofound in fruits. Some fruits contain high levels of flavonoids,including apples (quercetin) and grapefruit (naringin).Flavonoids have antioxidant effects and can also inhibitcarcinogen-activating enzymes. Flavonoids can also alter themetabolism of other dietary agents. For instance, quercetindirectly inhibits expression of CYP1A1 (a cytochrome P450enzyme that helps to metabolise toxins), resulting indecreased DNA damage.475 The phytochemical antioxidantscontained in fruit could reduce free-radical damage gener-ated by inflammation. A single study reported that applesgiven in physiological quantities inhibited carcinogen-induced mammary cancer in rodents in a dose-responsemanner.536
There is a complex mixture of phytochemicals present inwhole vegetables and these may have additive and syner-gistic effects responsible for anti-cancer activities.
4.2.5.3 Foods containing carotenoidsMouth, pharynx, and larynx Two cohort studies537 538 investigated total serum carotenoidsand two case-control studies539 540 investigated total dietarycarotenoids and mouth, pharynx, and larynx cancers. Ten case-control studies investigated pro-vitamin A caro-tenoids.26-29 47 48 450 451 541-544 Three cohort studies investigat-ed serum alpha-carotene537 538 545; one cohort study
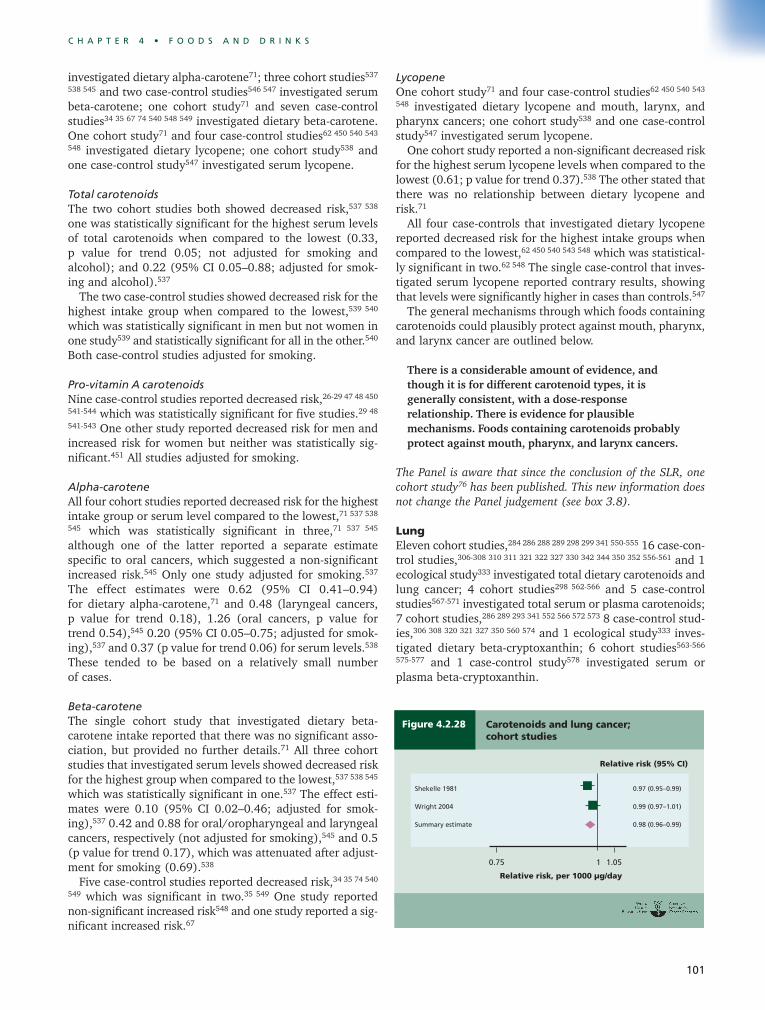
101
C H A P T E R 4 • F O O D S A N D D R I N K S
investigated dietary alpha-carotene71; three cohort studies537
538 545 and two case-control studies546 547 investigated serumbeta-carotene; one cohort study71 and seven case-controlstudies34 35 67 74 540 548 549 investigated dietary beta-carotene.One cohort study71 and four case-control studies62 450 540 543
548 investigated dietary lycopene; one cohort study538 andone case-control study547 investigated serum lycopene.
Total carotenoidsThe two cohort studies both showed decreased risk,537 538
one was statistically significant for the highest serum levelsof total carotenoids when compared to the lowest (0.33, p value for trend 0.05; not adjusted for smoking andalcohol); and 0.22 (95% CI 0.05–0.88; adjusted for smok-ing and alcohol).537
The two case-control studies showed decreased risk for thehighest intake group when compared to the lowest,539 540
which was statistically significant in men but not women inone study539 and statistically significant for all in the other.540
Both case-control studies adjusted for smoking.
Pro-vitamin A carotenoidsNine case-control studies reported decreased risk,26-29 47 48 450
541-544 which was statistically significant for five studies.29 48
541-543 One other study reported decreased risk for men andincreased risk for women but neither was statistically sig-nificant.451 All studies adjusted for smoking.
Alpha-caroteneAll four cohort studies reported decreased risk for the highestintake group or serum level compared to the lowest,71 537 538
545 which was statistically significant in three,71 537 545
although one of the latter reported a separate estimatespecific to oral cancers, which suggested a non-significantincreased risk.545 Only one study adjusted for smoking.537
The effect estimates were 0.62 (95% CI 0.41–0.94) for dietary alpha-carotene,71 and 0.48 (laryngeal cancers, p value for trend 0.18), 1.26 (oral cancers, p value for trend 0.54),545 0.20 (95% CI 0.05–0.75; adjusted for smok-ing),537 and 0.37 (p value for trend 0.06) for serum levels.538
These tended to be based on a relatively small number of cases.
Beta-caroteneThe single cohort study that investigated dietary beta-carotene intake reported that there was no significant asso-ciation, but provided no further details.71 All three cohortstudies that investigated serum levels showed decreased riskfor the highest group when compared to the lowest,537 538 545
which was statistically significant in one.537 The effect esti-mates were 0.10 (95% CI 0.02–0.46; adjusted for smok-ing),537 0.42 and 0.88 for oral/oropharyngeal and laryngealcancers, respectively (not adjusted for smoking),545 and 0.5(p value for trend 0.17), which was attenuated after adjust-ment for smoking (0.69).538
Five case-control studies reported decreased risk,34 35 74 540
549 which was significant in two.35 549 One study reportednon-significant increased risk548 and one study reported a sig-nificant increased risk.67
LycopeneOne cohort study71 and four case-control studies62 450 540 543
548 investigated dietary lycopene and mouth, larynx, andpharynx cancers; one cohort study538 and one case-controlstudy547 investigated serum lycopene.
One cohort study reported a non-significant decreased riskfor the highest serum lycopene levels when compared to thelowest (0.61; p value for trend 0.37).538 The other stated thatthere was no relationship between dietary lycopene andrisk.71
All four case-controls that investigated dietary lycopenereported decreased risk for the highest intake groups whencompared to the lowest,62 450 540 543 548 which was statistical-ly significant in two.62 548 The single case-control that inves-tigated serum lycopene reported contrary results, showingthat levels were significantly higher in cases than controls.547
The general mechanisms through which foods containingcarotenoids could plausibly protect against mouth, pharynx,and larynx cancer are outlined below.
There is a considerable amount of evidence, andthough it is for different carotenoid types, it isgenerally consistent, with a dose-responserelationship. There is evidence for plausiblemechanisms. Foods containing carotenoids probablyprotect against mouth, pharynx, and larynx cancers.
The Panel is aware that since the conclusion of the SLR, onecohort study76 has been published. This new information doesnot change the Panel judgement (see box 3.8).
Lung Eleven cohort studies,284 286 288 289 298 299 341 550-555 16 case-con-trol studies,306-308 310 311 321 322 327 330 342 344 350 352 556-561 and 1ecological study333 investigated total dietary carotenoids andlung cancer; 4 cohort studies298 562-566 and 5 case-controlstudies567-571 investigated total serum or plasma carotenoids;7 cohort studies,286 289 293 341 552 566 572 573 8 case-control stud-ies,306 308 320 321 327 350 560 574 and 1 ecological study333 inves-tigated dietary beta-cryptoxanthin; 6 cohort studies563-566
575-577 and 1 case-control study578 investigated serum orplasma beta-cryptoxanthin.
Figure 4.2.28 Carotenoids and lung cancer;cohort studies
Shekelle 1981 0.97 (0.95–0.99)
Wright 2004 0.99 (0.97–1.01)
Summary estimate 0.98 (0.96–0.99)
Relative risk (95% CI)
1 1.050.75

102
P A R T 2 • E V I D E N C E A N D J U D G E M E N T S
Dietary carotenoidsAll 11 cohort studies showed decreased risk of lung cancerfor the highest intake group when compared to the lowest,284
286 288 289 298 299 341 550-555 which was statistically significant inthree.286 550 553 Meta-analysis was possible on two cohortstudies, giving a summary effect estimate of 0.98 (95% CI0.96–0.99) per 1000 µg/day, with no heterogeneity (figure4.2.28).553 554 All cohort studies adjusted for smoking.
Twelve of the case-control studies showed decreased riskof lung cancer for the highest intake group when comparedto the lowest,306-308 310 311 321 322 327 330 344 350 352 556 559-561 whichwas statistically significant in seven (figure 4.2.29).306-308 321
322 327 344 556 560 Three studies reported increased risk,342 557 558
which was statistically significant in one,557 and one report-ed no effect on risk.350 Heterogeneity was high, which maybe partially explained by varying adjustment for knownconfounders. Four case-control studies did not adjust forsmoking.306 352 556-558
The single ecological study showed an association betweenincreased carotenoid intake and decreased lung cancerrisk.333
Serum or plasma or carotenoidsAll four of the cohort studies showed decreased risk of lungcancer for the highest serum or plasma levels when com-pared to the lowest,298 562-566 which was statistically signifi-cant in three.298 562 563 Effect estimates were 0.27 (95% CI
0.1–0.7; adjusted for age, sex, smoking habits, alcohol drink-ing, and cholesterol),563 0.57 (95% CI 0.35–0.93; adjustedfor age, smoking habits, and the intake of other nutrients,foods, and supplements),298 1.84 (low compared to high; pvalue for trend 0.033; adjusted for age and smoking),562 and0.84 (95% CI 0.48–1.47; adjusted for age and smoking).566
All five of the case-control studies showed decreased risk of lung cancer for the highest serum or plasma levelswhen compared to the lowest567-571; one was statisticallysignificant.568
Dietary beta-cryptoxanthinAll seven cohort studies showed decreased risk withincreased intake of beta-cryptoxanthin,286 289 293 341 552 566 572
573 which was statistically significant in one.293 566 Meta-analysis was possible on two studies, giving a summary effectestimate of 0.98 (95% CI 0.96–1.00) per 10 µg/day, with noheterogeneity.286 572
Pooled analysis from 7 cohort studies (almost 400 000 par-ticipants, followed up for 7 to 16 years, more than 3100 lungcancer cases) showed a statistically significant decreased riskwhen comparing high against low intake groups (0.76, 95%CI 0.67–0.89), p value for trend < 0.001.579
Six case-control studies showed increased risk for the high-est intake groups when compared to the lowest,306 308 321 327
560 574 which was statistically significant in four.306 308 327 560
Two studies showed non-significant increased risk.320 350
The single ecological study showed an association betweenincreased intake and increased risk.333
Serum or plasma beta-cryptoxanthinFive cohort studies showed decreased risk with increasedintake,563-566 575 576 which was statistically significant inthree.563 566 575 One study showed statistically significantincreased risk.577 Meta-analysis was possible on two studies(including the latter described study), giving a summaryeffect estimate of 0.95 (95% CI 0.69–1.29) per 0.05 µmol/l,with high heterogeneity.563 577
The single case-control study showed a non-significantdecreased risk with increased consumption.578
Data on beta-carotene supplements (see chapter4.10.6.4.2) provide convincing evidence that high-dosesupplements have a contrasting effect, at least in smokers,increasing the risk of lung cancer. Data on dietary beta-carotene (15 cohort studies, a pooled analysis, 32 case-control studies, 2 ecological studies) and serum or plasmabeta-carotene (13 cohort studies, 16 case-control studies, 1ecological study) showed no consistent evidence of an asso-ciation. The full SLR is contained on the CD included withthis Report.
The general mechanisms through which foods containingcarotenoids could plausibly protect against lung cancer areoutlined below.
There is a substantial amount of evidence availablefrom both cohort and case-control studies. A cleardose-response relationship is apparent from cohortstudies. Foods containing carotenoids probably protectagainst lung cancer.
Figure 4.2.29 Carotenoids and lung cancer; cohort andcase-control studies
Cohort
Bandera 1997 0.75 (0.61–0.93)
Chow 1992 0.80 (0.52–1.24)
Holick 2002 0.84 (0.72–0.98)
Knekt 1999 0.92 (0.60–1.41)
Michaud 2000 (HPFS) Men 0.64 (0.37–1.12)
Michaud 2000 (NHS) Women 0.69 (0.46–1.03)
Neuhouser 2003 0.90 (0.62–1.32)
Yong 1997 0.74 (0.52–1.06)
Case control
Bond 1987 1.18 (0.73–1.91)
Brennan 2000 0.80 (0.62–1.03)
Candelora 1992 0.30 (0.12–0.73)
Darby 2001 0.74 (0.57–0.97)
Dorgon 1993 0.83 (0.66–3.11)
Fontham 1988 0.88 (0.70–1.11)
Garcia 1995 1.45 (0.68–3.11)
Mohr 1999 0.60 (0.36–1.00)
Nyberg 1998 0.43 (0.20–0.91)
Samet 1985 0.77 (0.54–1.09)
De Stefani 1999 0.43 (0.29–0.64)
Wright 2003 0.61 (0.41–0.91)
Relative risk (95% CI)
Relative risk, highest vs lowest exposure category
10.05 2

103
C H A P T E R 4 • F O O D S A N D D R I N K S
OesophagusThree cohort studies537 545 580 and one case-control study581
investigated serum beta-carotene; 10 case-control studiesinvestigated dietary beta-carotene and oesophageal cancer95
107 125 141 548 582-587; one cohort study70 and three case-control studies86 585 587 investigated dietary pro-vitamin Acarotenoids.
Serum beta-caroteneOne of the cohort studies showed decreased risk for the high-est levels when compared to the lowest, which was statisti-cally significant after adjusting for smoking (0.11, 95% CI0.04–0.34).537 Another cohort study showed no effect on risk(RR 1.0) and was specific for squamous cell carcinoma.580
Another study reported a non-significant association but didnot provide further details.545
The single case-control study showed that serum beta-carotene levels were non-significantly lower in cases thancontrols.581
Dietary beta-caroteneNine of the case-control studies showed decreased risk forthe highest intake group when compared to the lowest,95 107
125 141 582-587 which was statistically significant in six.95 141 582-
585 One study reported a non-significant increased risk (fig-ure 4.2.30).548
Dietary pro-vitamin A carotenoidsThe single cohort study showed a non-significant decreasedrisk for the highest intake group when compared to thelowest, with an effect estimate of 0.70 (95% CI 0.29–1.71)(figure 4.2.30).70
All case-control studies showed decreased risk for the high-est intake group when compared to the lowest,86 585 587 whichwas statistically significant in one585 and in men, but notwomen, in another (figure 4.2.30).86
The general mechanisms through which foods containingcarotenoids, including beta-carotene, could plausibly protectagainst oesophageal cancer are outlined below.
There is a substantial amount of consistent evidenceavailable from both cohort and case-control studies.Foods containing beta-carotene probably protectagainst oesophageal cancer.
ProstateFive cohort studies,588-594 9 case-control studies,595-608 and 3ecological studies609-611 investigated tomatoes; 3 cohort stud-ies590 591 612-615 and 14 case-control studies595 596 598 599 601 602
606 616-625 investigated dietary lycopene; 6 cohort studies576
594 626-630 and 2 case-control studies596 608 619 investigatedserum or plasma lycopene.
TomatoesThree of the cohort studies showed decreased risk for thehighest intake groups when compared to the lowest,588 591
592 which was statistically significant in two.591 592 One studyshowed a non-significant increased risk589 and one studyreported that there was no statistically significant associa-tion.594 Meta-analysis was possible on four of the cohortstudies, giving a summary effect estimate of 0.69 (95% CI0.43–1.08) per serving/day, with moderate heterogeneity.588
589 591 592 One of these studies reported an effect estimate of0.24 (95% CI 0.13–0.47) per 15 g/day for cumulative intakeof tomato sauce.591 Two of the cohort studies reported onadvanced or aggressive prostate cancer.590 591 594 One report-ed a risk estimate of 0.11 (95% CI 0.02–0.70) per increasein serving/day for tomato sauce590 and the other found nostatistically significant association.594
Seven of the case-control studies showed decreased riskfor the highest intake groups when compared to the low-est,595 598-600 602 603 608 which was statistically significant inone.602 One study reported non-significant increased risk597
and the other stated that there was no significant associa-tion without further details.606 Meta-analysis was possible onfive relatively high quality studies595 597-600 and two relativelylow quality ones.602 603 The former gave a summary effectestimate of 0.97 (95% CI 0.91–1.03) per serving/day, withno heterogeneity; the latter gave a summary effect estimateof 0.33 (95% CI 0.04–2.74) per serving/day, with highheterogeneity.
The three ecological studies showed no consistent association.609-611
Dietary lycopeneTwo cohort studies showed non-significant decreased risk forthe highest intake groups when compared to the lowest,590
614 the other study showed non-significant increased risk.613
Meta-analysis was possible on all three cohort studies, giv-ing a summary effect estimate of 0.97 (95% CI 0.64–1.45)per 5 mg/day, with low heterogeneity (figures 4.2.31 and
Figure 4.2.30 Beta-carotene and oesophageal cancer;cohort and case-control studies
Cohort
Zheng 1995 0.70 (0.29–1.71)
Case control
Decarli 1987 0.23 (0.12–0.45)
Brown 1988 0.80 (0.45–1.43)
Graham 1990 0.66 (0.36–1.22)
Valsecchi 1992 2.50 (1.67–3.74)
Tavani 1993 0.50 (0.22–1.12)
Tavani 1994 0.40 (0.19–0.85)
Hu 1994 0.70 (0.37–1.31)
Launoy 1998 0.61 (0.31–1.20)
De Stefani 1999 0.60 (0.40–0.90)
Franceschi 2000 0.30 (0.17–0.52)
Mayne 2001 0.43 (0.29–0.63)
Chen 2002 0.60 (0.31–1.15)
Relative risk (95% CI)
Relative risk, highest vs lowest exposure category
10.2 20.5 0.75 51.5

104
P A R T 2 • E V I D E N C E A N D J U D G E M E N T S
4.2.32). One of these studies also reported cumulative mea-sures of lycopene consumption, which is a robust measureof long-term consumption.590 The effect estimate was 0.95(95% CI 0.92–0.99) per 5 mg/day. All studies were fullyadjusted.
Two of the cohort studies reported separately on advanced
or aggressive cancer, giving estimates of 0.89 (95% CI0.28–2.84) per 5 mg /day613 and 0.57 (95% CI 0.37–0.87)for the highest intake groups when compared to the lowest.591
Nine case-control studies showed decreased risk for thehighest intake groups when compared to the lowest,595 598 602
606 616 617 619 621 624 which was statistically significant in one.602
Five studies reported non-significant increased risk.596 599 601
620 625 Meta-analysis was possible on six relatively high qual-ity case-control studies595 598 599 601 616 617 and three relative-ly low quality ones.602 619 620 The former gave a summaryeffect estimate of 0.995 (95% CI 0.95–1.04) per 5 mg/day,with no heterogeneity and the latter gave a summary esti-mate of 0.56 (95% CI 0.23–1.36) per 5 mg/day, with highheterogeneity (figures 4.2.31 and 4.2.32).
Serum or plasma lycopeneFive cohort studies showed a non-significant reduced risk forthe highest intake groups when compared to the lowest576
626-628; the other study showed a non-significant increasedrisk.629 Meta-analysis was possible on four cohort studies,giving a summary estimate of 0.96 (95% CI 0.926–0.999)per 10 µg/l, with no heterogeneity.576 626 627 All cohort stud-ies were fully adjusted.
Both case-control studies of serum or plasma lycopeneshowed a statistically significant reduced risk for the high-est intake groups when compared to the lowest.596 619
Lycopene is most bioavailable from cooked and pureedtomatoes. The best measures of systemic exposure are there-fore studies on tomato sauce, particularly of cumulative con-sumption, or on serum or plasma lycopene. The Panel alsogave emphasis to studies on advanced or aggressive cancers,which may be better linked to prognosis than studies thatinclude early stage or latent disease, or screening-detecteddisease.
The general mechanisms through which foods containingcarotenoids, including lycopene, could plausibly protectagainst prostate cancer are outlined below. In addition,amongst the common carotenoids, lycopene is thought to bethe most efficient antioxidant in the body.631
There is a substantial amount of consistent evidence,in particular on tomato products, from both cohort andcase-control studies. There is evidence for plausiblemechanisms. Foods containing lycopene probablyprotect against prostate cancer.
The Panel is aware that since the conclusion of the SLR, twocohort studies632 633 and one case-control study634 have beenpublished. This new information does not change the Paneljudgement (see box 3.8).
ProstateAlso see chapter 4.10.6.4.2 for evidence on beta-carotenesupplements. Six cohort studies147 360 591 594 613 635 636 and 21case-control studies595 598 599 602 616 617 619-621 624 625 637-648 inves-tigated dietary beta-carotene and prostate cancer.
Ten cohort studies576 594 626 628-630 635 649-652 and five case-control studies584 596 608 619 653 investigated serum or plasmabeta-carotene.
Figure 4.2.32 Dietary lycopene and prostate cancer; cohortand case-control studies: dose response
Cohort
Parker 1999
Giovanucci 2002
Schuurman 2002
Case control
McCann 2005
Hodge 2004
Key 1997
Jain 1999
Cohen 2000
Norrish 2000
0 421 3 5
Dietary lycopene (mg/day)
Figure 4.2.31 Lycopene and prostate cancer; cohort andcase-control studies
Cohort
Schuurman 2002 1.01 (0.46–2.22)
Parker 1999 0.01 (0.00–2.26)
Giovanucci 2002 0.99 (0.95–1.02)
Summary estimate 0.97 (0.64–1.45)
Case control
McCann 2005 0.99 (0.79–1.22)
Hodge 2004 0.93 (0.81–1.05)
Norrish 2000 0.70 (0.35–1.38)
Cohen 2000 0.96 (0.79–1.16)
Jain 1999 1.01 (0.96–1.06)
Key 1997 1.05 (0.13–8.85)
Summary estimate 1.00 (0.95–1.04)
Relative risk (95% CI)
Relative risk, per 5 mg/day
10.125 20.5 84

105
C H A P T E R 4 • F O O D S A N D D R I N K S
Dietary beta-caroteneThree cohort studies showed non-significant increased riskwith increased intake.594 635 636 Three studies showed noeffect on risk.360 591 613 Meta-analysis was possible on all sixcohort studies, giving a summary effect estimate of 1.00(95% CI 0.99–1.01) per 700 µg/day, with no hetero-geneity.360 591 594 613 635 636
Two cohort studies reported results separately foradvanced/aggressive prostate cancer.594 613 Meta-analysiswas possible on both studies, giving a summary effect esti-mate of 0.97 (95% CI 0.88–1.06) per 700 µg/day, with noheterogeneity.
Fourteen case-control studies showed decreased risk withincreased intake,595 599 602 616 617 619-621 625 637 638 642 646 648 whichwas statistically significant in two relatively low quality stud-ies.602 646 648 Four studies showed no effect on risk624 639 644
645 and three studies showed non-significant increasedrisk.598 640 641 Meta-analysis was possible on nine relativelyhigh quality595 598 599 616 617 637-640 and six relatively low qual-ity case-control studies,602 619 620 624 641 642 giving summaryeffect estimates of 0.99 (95% CI 0.98–1.00) and 0.98 (95%CI 0.94–1.01) per 700 µg/day, with no and moderate het-erogeneity, respectively.
Serum or plasma beta-caroteneFive cohort studies showed decreased risk with increasedintake,576 626 628 649 651 652 which was statistically significant inone.649 Four studies showed non-significant increased risk.594
626 629 635 Meta-analysis was possible on seven cohort stud-ies, giving a summary effect estimate of 1.00 (95% CI0.91–1.09) per 10 µg beta-carotene/100 ml, with moderateheterogeneity.576 626 629 635 649
Four case-control studies showed decreased risk withincreased intake,584 608 619 653 which was statistically signifi-cant in one relatively low quality study.653 One study showednon-significant increased risk.596
It is unlikely that foods containing beta-carotene havea substantial effect on the risk of prostate cancer.
The Panel is aware that since the conclusion of the SLR, twocohort studies632 633 have been published. This new informationdoes not change the Panel judgement (see box 3.8).
Skin Also see chapter 4.10.5.1 for evidence on beta-carotene sup-plements. Two cohort studies654 655 and seven case-controlstudies656-663 investigated dietary beta-carotene and skin can-cer. Three cohort studies655 664-666 and one case-controlstudy657 investigated beta-carotene from food and supple-ments combined; eight cohort studies545 630 651 655 667-672 andthree case-control studies584 673 674 investigated serum or plas-ma beta-carotene.Dietary beta-caroteneBoth cohort studies showed non-significant increased riskwith increased intake, both for basal cell carcinoma.654 655 Onecase-control study showed a non-significant decreased risk ofbasal cell carcinoma for the highest intake group when com-pared to the lowest662; one showed a non-significant
increased risk of squamous cell carcinoma.658 659 Three case-control studies showed decreased risk of melanoma forthe highest intake group when compared to the lowest,657 661
663 which was statistically significant in two.657 663
Two studies showed non-significant increased risk of mela-noma.656 660
Beta-carotene from foods and supplementsTwo cohort studies showed increased risk of basal cell car-cinoma for the highest intake group when compared to thelowest.655 665 One cohort study showed non-significantincreased risk of squamous cell carcinoma.666 One cohortstudy showed a non-significant increased risk ofmelanoma.664 One case-control study showed a statisticallysignificant decreased risk of melanoma for the highest intakegroup when compared to the lowest.657
Serum or plasma beta-caroteneTwo studies showed decreased risk for skin cancer of unspec-ified type with increased serum or plasma beta-carotene,669
671 which was statistically significant in one.669 One cohortstudy showed non-significant decreased risk of non-melanoma skin cancer.667 One cohort study (fully adjusted)showed a non-significant decreased risk for basal cell carci-noma672; two showed a non-significant increased risk630 655;and one a non-significant increased risk in women and anon-significant decreased risk in men.651 Two studiesshowed non-significant decreased risk on squamous cell car-cinoma.668 672 Two studies showed decreased risk ofmelanoma, which was statistically significant in one545 670;and one study showed non-significant increased risk.630
Meta-analysis was possible on both cohort studies that inves-tigated squamous cell carcinoma, giving a summary effectestimate of 0.99 (95% CI 0.98–1.00) per µg beta-carotene/100 ml, with no heterogeneity.668 672 Meta-analy-sis was possible on two cohort studies that investigatedmelanoma, giving a summary effect estimate of 0.90 (95%CI 0.78–1.03) per µg beta-carotene/100 ml, with moderateheterogeneity.545 670
One case-control study showed a statistically significantdecreased risk of non-melanoma skin cancer, which, at 0.999per µg/100 ml (95% CI 0.999–0.999), was close to noeffect.673 One case-control study showed non-significantincreased risk of basal cell carcinoma for the highest intakegroup when compared to the lowest.584 The same studyshowed non-significant increased risk of squamous cell car-cinoma and non-significant increased risk of melanoma.584
One additional study showed non-significant decreased riskof melanoma.674
It is unlikely that foods containing beta-carotene haveany substantial effect on the risk of non-melanomaskin cancer.
General mechanisms — foods containing carotenoidsCarotenoids are antioxidants, which can prevent lipid oxi-dation and related oxidative stress. Oxidative stress inducedby free radicals causes DNA damage. Base mutation, single-and double-strand breaks, DNA cross-linking, and chromo-

106
P A R T 2 • E V I D E N C E A N D J U D G E M E N T S
somal breakage and rearrangement can all occur if this ini-tial damage is left unrepaired. This damage could plausiblybe prevented or limited by dietary antioxidants found infruits and vegetables.675
Many of the carotenoids, including beta-carotene, are alsoretinoid (vitamin A) precursors. The pro-vitamin Acarotenoids may be converted to retinol where they functionin cellular differentiation, immunoenhancement, and acti-vation of carcinogen-metabolising enzymes.580 676
Lycopene is the most potent carotenoid antioxidant, hasan antiproliferative effect, reduces plasma low-densitylipoprotein cholesterol, improves immune function, andreduces inflammation.
4.2.5.4 Foods containing folateFoods naturally containing folates are vegetables, fruits, andliver, but increasingly foods such as breakfast cereals are for-tified with folic acid.
PancreasThree cohort studies,677 678 two case-control studies,509 679
and one ecological study515 investigated folate from foodsand/or supplements, and pancreatic cancer.
One cohort study reported a statistically significantreduced risk for the highest intake groups (without specify-ing the source of folate) when compared to the lowest677; onereported no effect on risk in men678 and the other reporteda non-significant increased risk in women.678 Meta-analysiswas possible on all three cohort studies, giving a summaryeffect estimate of 0.94 (95% CI 0.80–1.11) per 100 µg/day,with high heterogeneity.677 678
When these results were stratified according to dietary orsupplemental folate, this heterogeneity was removed. Twocohort studies reported separately on dietary folate.678 Bothreported non-significant decreased risk; meta-analysis waspossible on both, giving a summary effect estimate of 0.86(95% CI 0.73–1.00) per 100 µg/day, with no heterogeneity(figure 4.2.33). All three cohort studies reported separatelyon supplemental folate, showing non-significant increasedrisk, with no heterogeneity.677 678
In addition, one of the cohort studies included a nestedcase-control study investigating blood folate levels. Thisreported a statistically significant decreased risk for the high-
est levels when compared to the lowest, with an effect esti-mate of 0.45 (95% CI 0.24–0.82).680
The Panel is aware of an additional cohort study, publishedafter the conclusion of the literature review, which showeda statistically significant decreased risk for the highest intakegroups when compared to the lowest.681 The effect estimatewas 0.25 (95% CI 0.11–0.59) for dietary folate and 0.33(95% CI 0.15–0.72) for total folate (combining dietary andsupplemental sources). No association was observed withfolate supplements only.
One of the case-control studies reported a statistically sig-nificant reduced risk for the highest intake groups when com-pared to the lowest.679 The other reported a non-significantdecreased risk in women and no effect on risk in men.509
The ecological study showed a statistically significantdecreased risk in areas of high folate intake.515
The possible differential effect between folate from foodsand from supplements could be explained by folate servingas a marker for fruit and vegetable intake, by a differentmetabolic effect of the folic acid in supplements, or by con-founders associated with supplement use.
The general mechanisms through which foods containingfolate could plausibly protect against pancreatic cancer areoutlined below.
The evidence available is sparse but a dose-responserelationship was apparent from cohort studies. There islimited evidence suggesting that foods containingfolate protect against pancreatic cancer.
The Panel is aware that since the conclusion of the SLR, onecohort study681 has been published. This new information doesnot change the Panel judgement (see box 3.8).
OesophagusEight case-control studies investigated dietary folate113 124 125
136 548 583 585 587 and two case-control studies investigated redcell and/or plasma folate.682-684
All eight case-control studies that investigated dietaryfolate reported decreased risk for the highest intake groupswhen compared to the lowest,113 124 125 136 548 583 585 587 whichwas statistically significant in two.583 587 Most studies adjust-ed for smoking and alcohol.
Both case-control studies that investigated red cell and/orplasma folate reported that levels were lower (statisticallysignificant) in cases than controls.682-684 One study wasadjusted for smoking and alcohol.684
The general mechanisms through which foods containingfolate could plausibly protect against oesophageal cancer areoutlined below. In addition, folate may reduce human papil-loma virus proliferation in cells.685
The evidence, from case-control studies only, is sparse.There is limited evidence suggesting that folateprotects against oesophageal cancer.
The Panel is aware that since the conclusion of the SLR, onecase-control study78 has been published. This new informationdoes not change the Panel judgement (see box 3.8).
Figure 4.2.33 Folate and pancreatic cancer;cohort studies
Skinner 2004 Women 0.85 (0.63–1.15)
Skinner 2004 Men 0.86 (0.71–1.04)
Summary estimate 0.86 (0.73–1.00)
Relative risk (95% CI)
1 20.5 1.50.75

107
C H A P T E R 4 • F O O D S A N D D R I N K S
ColorectumNine cohort studies investigated dietary folate and colorec-tal cancer.686-694 Two cohorts investigated serum folate.694 695
Seven cohort studies that investigated dietary folateshowed decreased risk for the highest intake groups whencompared to the lowest, 686-690 692 693 which was statisticallysignificant in one.689 Two cohort studies reported non-significant increased risk.691 694 Meta-analysis was possible onfour studies, giving a summary effect estimate of 0.84 (95%CI 0.76–0.93) per 100 µg/day, with low heterogeneity (figure 4.2.34).686 689 692 696
One study of serum folate levels showed statistically sig-nificant decreased risk for the highest intake groups whencompared to the lowest, with an effect estimate of 0.52 (95%CI 0.27–0.97).695 The other showed a non-significantdecreased risk for colon cancer (0.96, 95% CI 0.4–2.3) anda non-significant increased risk for rectal cancer incidence(2.94, 95% CI 0.84–10.33).694
Because of the abundant prospective data from cohortstudies, case-control studies were not summarised.
A published meta-analysis of seven cohort studies and ninecase-control studies reported a statistically significantdecreased risk of colorectal cancer for the highest dietaryfolate intake when compared to the lowest (0.75, 95% CI0.64–0.89).697
The general mechanisms through which foods containingfolate could plausibly protect against colorectal cancer areoutlined below. In addition, folate intake is also strongly cor-related with intake of dietary fibre, which probably preventscolorectal cancer (also see chapter 7.1).
The evidence from cohort studies is plentiful, with adose-response relationship, but there is unexplainedinconsistency. Residual confounding from dietary fibre ispossible. There is limited evidence suggesting that foodscontaining folate protect against colorectal cancer.
The Panel is aware that since the conclusion of the SLR, fourcohort698-701 and two case-control studies380 702 have been
published. This new information does not change the Paneljudgement (see box 3.8).
General mechanisms — foods containing folate Also see Chapter 2. Folate plays an important role in the syn-thesis and methylation of DNA.703 Abnormal DNA methyl-ation leading to aberrant gene expression has beendemonstrated in several types of cancer. Folate deficiencymay produce misincorporation of uracil instead of thymineinto DNA. The effects of folate deficiency and supplemen-tation on DNA methylation are gene- and site-specific, andappear to depend on cell type, target organ, stage of trans-formation, and degree and duration of folate depletion.
Animal studies have shown that dose and timing of folateintervention are critical in determining its effect: excep-tionally high folate doses, and intervention after the forma-tion of microscopic neoplastic foci, may promote rather thansuppress colorectal carcinogenesis, at least in the animalmodels studied.704
There is a known interaction between folate and alcoholand the risk of some cancers.
4.2.5.5 Foods containing pyridoxine (vitamin B6)OesophagusSix case-control studies investigated foods containing pyri-doxine and oesophageal cancer.88 125 548 583 585 587
All six studies showed decreased risk for the highest intakegroups when compared to the lowest,88 125 548 583 585 587 whichwas statistically significant in four.88 125 583 585 All studiesadjusted for alcohol and five adjusted for smoking.
Together with folate and cobalamin (B12), vitamin B6 isinvolved in one-carbon metabolism and thus is important forDNA synthesis, repair, and methylation.
The evidence, from case-control studies only, wassparse. There is limited evidence suggesting thatpyridoxine protects against oesophageal cancer.
The Panel is aware that since the conclusion of the SLR, onecase-control study78 has been published. This new informationdoes not change the Panel judgement (see box 3.8).
4.2.5.6 Foods containing vitamin COesophagusOne cohort study,70 19 case-control studies,86 88 94 95 104 105 107
113 120 121 124 125 136 548 583 585-587 705-707 and 3 ecological stud-ies118 203 708 investigated vitamin C and oesophageal cancer.
The single cohort study reported a non-significant reducedrisk for the highest intake groups when compared to the low-est after adjustment for smoking, with an effect estimate of0.70 (95% CI 0.3–1.7).70
Eighteen of the case-control studies showed decreased riskfor the highest intake groups when compared to the lowest,86
88 94 95 104 105 107 113 120 121 124 136 548 583 585-587 705-707 which wasstatistically significant in 13 (figure 4.2.35).86 88 95 104 105 113
120 121 136 548 583 585 705 707 Three studies showed a non-signifi-cant increased risk, all specific to adenocarcinoma.124 125 706
None of the ecological studies reported a statistically sig-nificant association.118 203 708
Figure 4.2.34 Dietary folate intake and colorectal cancer;cohort studies
Giovannucci 1998 Women 0.91 (0.76–1.10)
Su 2001 Women 0.93 (0.72–1.19)
Su 2001 Men 0.69 (0.52–0.90)
Konings 2002 Men 0.81 (0.64–1.03)
Konings 2002 Women 0.90 (0.63–1.29)
Larsson 2005 Women 0.77 (0.60–0.98)
Summary estimate 0.84 (0.76–0.93)
Relative risk (95% CI)
10.5 1.50.75 2

108
P A R T 2 • E V I D E N C E A N D J U D G E M E N T S
It is biologically plausible that vitamin C should protectagainst cancer. It traps free radicals and reactive oxygen mol-ecules, protecting against lipid peroxidation, reducingnitrates, and stimulating the immune system.586 709 Moreover,it can recycle other antioxidant vitamins such as vitamin E.534
Vitamin C has also been shown to inhibit formation of car-cinogens and protect DNA from mutagenic attack.535
However, evidence supporting a specific mechanism in theoesophagus is limited.586
A substantial amount of consistent evidence isavailable, from both cohort and case-control studies.Foods containing vitamin C probably protect againstoesophageal cancer.
The Panel is aware that since the conclusion of the SLR, onecase-control study710 has been published. This new informationdoes not change the Panel judgement (see box 3.8).
4.2.5.7 Foods containing vitamin EOesophagusOne cohort study,70 nine case-control studies,86 88 95 105 125 548
583 585 587 and one ecological study708 investigated dietary vit-amin E and oesophageal cancer. Three cohort studies537 545
711 and four case-control studies581 682 683 712 investigatedserum vitamin E.
Dietary vitamin EThe single cohort study showed decreased risk for the high-est intake groups when compared to the lowest, with an effectestimate of 0.8 (95% CI 0.3–2.0; adjusted for smoking).70
Eight case-control studies reported decreased risk for thehighest intake groups when compared to the lowest,86 88 95
105 125 548 583 585 which was statistically significant in seven86
88 95 105 548 583 585; the other study reported no effect on risk.587
All studies adjusted for alcohol and all but one also adjust-ed for smoking.
The single ecological study reported no association.708
Serum vitamin EAll three cohort studies showed decreased risk for the high-est intake groups when compared to the lowest,537 545 711
which was statistically significant in two. The effect estimateswere 0.63 (95% CI 0.44–0.91) for alpha-tocopherol (the same study showed no significant association withserum gamma-tocopherol),711 and 0.39 (95% CI 0.19–0.80)for gamma-tocopherol.537 The third cohort study found lowermean values in cases than controls (8.52 vs 10.21 mg/l),which was not statistically significant.545 The two formerstudies were maximally adjusted.537 711
Two case-control studies reported that cases had higherplasma vitamin E than controls,682 683 statistically significantin one.683 One study reported statistically significant lowerlevels in cases than those in controls712; and another report-ed no significant difference.581 None of these studies was welladjusted.
The general mechanisms through which foods containingvitamin E could plausibly protect against oesophageal cancerare outlined below.
Much of the evidence on vitamin E, mostly from case-control studies, was of poor quality. There is limitedevidence suggesting that foods containing vitamin Eprotect against oesophageal cancer.
Prostate Two cohort studies,147 613 650 713 13 case-control studies,595 599
601 604 607 616 619-621 625 637 714-717 and 1 ecological study708 inves-tigated dietary vitamin E and prostate cancer; 4 cohort stud-ies629 630 718-722 and 1 case-control study716 investigated serumvitamin E; 8 cohort studies576 626 627 629 635 650 652 713 718 723-725
and 2 case-control studies619 653 investigated serum or plas-ma alpha-tocopherol; 6 cohort studies576 626 627 629 650 718 724
and 1 case-control study619 investigated serum gamma-tocopherol.
Dietary vitamin EMost studies showed non-significant decreased risk, althoughthere is heterogeneity in the direction of effect reported andeffect estimates are usually very close to 1 (no effect). Onecohort study reported an effect size of 0.96 (0.75–1.2) per10 mg/day for advanced/aggressive prostate cancer.613 Meta-analysis was possible on seven relatively good quality case-control studies, giving a summary effect estimate of 1.04(95% CI 0.99–1.11) per 10 mg/day, with low hetero-geneity.595 599 601 616 637 714 715 Dietary studies produce noconsistent effect.
Serum or plasma alpha-tocopherolSeven cohort studies showed decreased risk for the highest
Figure 4.2.35 Vitamin C and oesophageal cancer;case-control studies
Mettlin 1981 0.42 (023–0.77)
Tuyns 1983 Men 0.63 (0.50–0.79)
Tuyns 1983 Women 0.56 (0.20–0.91)
Brown 1988 0.50 (0.27–0.91)
Barone 1992 0.40 (0.10–1.55)
Kabat 1993 0.53 (0.22–1.25)
Hu 1994 0.60 (0.31–1.15)
Launoy 1998 0.40 (0.20–0.79)
De Stefani 1999 0.70 (0.52–0.94)
De Stefani 1999 0.50 (0.31–0.82)
Terry 2000 0.60 (0.38–0.95)
De Stefani 2000 0.14 (0.06–0.35)
Franceschi 2000 0.40 (0.24–0.65)
Mayne 2001 0.53 (0.36–0.79)
Zhang 1997 1.30 (0.48–3.49)
Chen 2002 0.60 (0.30–1.20)
Relative risk (95% CI)
Relative risk, highest vs lowest exposure category
10.2 20.5 5

109
C H A P T E R 4 • F O O D S A N D D R I N K S
intake groups when compared to the lowest,576 626 629 635 650
652 713 718 723-725 which was statistically significant in one.576
One cohort study showed no effect on risk.627 Meta-analysiswas possible on seven cohort studies, giving a summaryeffect estimate of 0.99 (95% CI 0.97–1.00) per mg/l, withno heterogeneity.576 626 713 723-725
Both case-control studies showed decreased risk for thehighest intake groups when compared to the lowest,619 653
which was statistically significant in one.653
Serum gamma-tocopherolAll six cohort studies showed decreased risk for the highestintake groups when compared to the lowest,576 626 627 629 650
718 724 which was statistically significant in two.650 724 Meta-analysis was possible on all six cohort studies, giving a sum-mary effect estimate of 0.90 (95% CI 0.81–0.996) per mg/l,with moderate heterogeneity.
The single case-control study showed non-significantdecreased risk for the highest intake groups when comparedto the lowest.619
The general mechanisms through which foods containingvitamin E could plausibly protect against prostate cancer are outlined below. Vitamin E has also been shown to inhibit the growth of human prostate tumours induced inmice.726
The evidence, mostly from case-control studies, wasinconsistent. There is limited evidence suggesting thatfoods containing vitamin E protect against prostatecancer.
The Panel is aware that since the conclusion of the SLR, twocohort studies632 633 have been published. This new informationdoes not change the Panel judgement (see box 3.8).
General mechanisms — foods containing vitamin EVitamin E is an antioxidant that has been reported to pre-vent DNA damage, enhance DNA repair, prevent lipid per-oxidation, and prevent activation of carcinogens such asnitrosamines. Vitamin E protects vitamin A and selenium inthe body. In addition to acting as a free-radical scavenger,vitamin E enhances the body’s immune response, which mayplay a role in cancer defences.727
4.2.5.8 Foods containing seleniumData from selenium levels in serum or nails can be inter-preted more robustly than dietary data because they are lessprone to certain sources of error; serum data are a short-termreflection of intake; levels in nails are cumulative and reflectlong-term intake.
It is not possible to rule out residual confounding betweenselenium levels and healthy lifestyles. Individuals with high-er selenium levels may be more likely to be following sev-eral strategies to improve their health, including taking supplements.
It is plausible that an effect attributed to selenium couldonly be apparent in areas of selenium deficiency.
Lung Two cohort studies,288 464 two case-control studies,469 557 andtwo ecological studies728 729 investigated dietary seleniumand lung cancer.
Ten cohort studies,463 575 577 730-738 seven case-control stud-ies,570 571 739-743 and four ecological studies729 744-746 investi-gated plasma or serum selenium; three cohort studies747-749
investigated selenium levels in nails.
Dietary seleniumOne cohort study showed non-significant decreased risk forthe highest intake group when compared to the lowest.464
One cohort study showed non-significant increased risk innon-smokers and non-significant decreased risk insmokers.288 Both case-control studies showed a non-signifi-cant increased risk for the highest intake group when com-pared to the lowest.469 557 One ecological study showedstatistically significant decreased risk in high-intake areas,728
the other showed no consistent association.729
Plasma or serum seleniumSeven cohort studies showed decreased risk for the highestselenium levels when compared to the lowest,463 575 731-734
736-738 which was statistically significant in two.733 737 Fourstudies showed increased risk,577 730 735 738 which was statis-tically significant in two.735 738 Meta-analysis was possible onfour cohort studies, giving a summary effect estimate of0.969 (95% CI 0.940–0.999) per 10 µg/l, with low hetero-geneity.577 731 733 736
Six case-control studies showed decreased risk for thehighest levels when compared to the lowest,570 739-743 whichwas statistically significant in four.739 740 742 743 One studyshowed non-significant increased risk.571
One ecological study showed statistically significantdecreased risk in areas of high plasma selenium729; the oth-ers showed no consistent effect.729 744-746
NailsTwo cohort studies showed decreased risk for the highestselenium levels when compared to the lowest,748 749 whichwas statistically significant in one.749 One study showed non-significant increased risk.747
The general mechanisms through which selenium couldplausibly protect against lung cancer are outlined below.
The evidence available is sparse. There is limitedevidence to suggest that foods containing seleniumprotect against lung cancer.
Prostate One cohort,713 750 7 case-control studies,599 601 639 715 716 751 752
and 2 ecological studies729 753 754 investigated dietary sele-nium; 12 cohort studies652 730 732 755-765 and 4 case-controlstudies716 741 752 754 766 767 investigated serum or plasma sele-nium; and 3 cohort studies,615 724 768 3 case-control studies,717
769 770 and 1 ecological study771 investigated levels in nails.Further to this, 1 randomised controlled trial772 773 and 2cohorts612 628 713 investigated selenium supplements (seechapter 4.10.6.4.5).

110
P A R T 2 • E V I D E N C E A N D J U D G E M E N T S
Dietary seleniumOne cohort study showed a statistically significant decreasedrisk. The effect estimate was 0.66 (95% CI 0.44–0.98) per50 µg/day.713 This study did not adjust for confounders.
Two case-control studies showed non-significant decreasedrisk for the highest intake groups when compared to the low-est751 752; five showed increased risk,599 601 639 715 716 one ofwhich was statistically significant.715 Meta-analysis was pos-sible on three studies, giving a summary effect estimate of1.07 (95% CI 0.92–1.25) per increase in 50 µg/day, with noheterogeneity.599 601 639
The two ecological studies reported that increasingselenium intake was associated with decreasing prostatecancer levels.729 753 754
Serum or plasma seleniumEight cohort studies that investigated serum or plasma sele-nium showed decreased risk for the highest intake groupswhen compared to the lowest,652 732 755-759 761 763 764 which wasstatistically significant in two. Four reported non-significantincreased risk.730 760 762 765 Meta-analysis was possible on nineof these studies, giving a summary effect estimate of 0.95(95% CI 0.89–1.00) per 10 µg/l, with moderate hetero-geneity (figure 4.2.36).732 755 757 758 761 762 764 765
Two of these 12 cohort studies reported separately onadvanced/aggressive cancer.730 755 758 Both showed decreasedrisk for the highest intake groups when compared to the low-est, which was statistically significant in one.758 Meta-analy-sis was possible on both, giving a summary effect estimateof 0.87 (95% CI 0.79–0.97) per 10 µg/l, with no hetero-geneity (figure 4.2.37).755 758
A dose-response relationship is apparent from the studieson advanced or aggressive disease (figure 4.2.38).
All four of the case-control studies showed decreased riskfor the highest intake groups when compared to the low-est,716 741 752 766 767 which was statistically significant inthree.741 752 767
NailsTwo cohort studies investigated selenium levels in nails forall prostate cancer. Both showed non-significant decreasedrisk for the highest intake groups when compared to the low-est. Meta-analysis was possible on both studies, giving a sum-mary effect estimate of 0.91 (95% 0.81–1.02) per 100 ng/g,with moderate heterogeneity.724 768
Two cohort studies investigated selenium levels in nails foradvanced or aggressive prostate cancer. Both showed statis-tically significant decreased risk for the highest intake groupswhen compared to the lowest. Meta-analysis was possible onboth studies, giving a summary effect estimate of 0.80 (95%0.69–0.91) per 100 ng/g, with no heterogeneity.615 768
One case-control study showed non-significant decreasedrisk for the highest intake groups when compared to the low-est,770 one showed no effect on risk717 and the other showeda non-significant increased risk.769
The single ecological study reported a non-significant asso-ciation.771
These data are supported by data on supplements, whichhave been shown to decrease prostate cancer risk (see chap-ter 4.10.6.4.5).
There is no significant heterogeneity within the meta-
Figure 4.2.36 Selenium (in plasma or serum) andprostate cancer; cohort studies
Nomura 2000 0.89 (0.40–0.99)
Li 2004 0.95 (0.89–1.01)
Knekt 1990 0.99 (0.78–1.24)
Goodman 2001 1.01 (0.93–1.11)
Brooks 2001 0.77 (0.65–0.89)
Ringstad 1988 0.99 (0.97–1.01)
Willett 1983 0.64 (0.37–1.12)
Virtamo 1987 1.16 (0.82–1.65)
Salonen 1984 1.03 (0.63–1.70)
Summary estimate 0.95 (0.89–1.00)
Relative risk (95% CI)
10.5 2
Figure 4.2.37 Selenium (in serum or plasma) andadvanced or aggressive prostate cancer;cohort studies
Nomura 2000 0.80 (0.64–1.00)
Li 2004 0.89 (0.80–1.00)
Summary estimate 0.87 (0.79–0.97)
Relative risk (95% CI)
10.5 2
Figure 4.2.38 Selenium (in serum or plasma) and advancedor aggressive prostate cancer;cohort studies: dose response
Li 2004
Nomura 2000
8 12 1610 14

111
C H A P T E R 4 • F O O D S A N D D R I N K S
analyses of advanced/aggressive cancer. The low to moder-ate heterogeneity observed for other outcomes and differentstudy types may be explained by the variable inclusion oflatent cancers in the outcome and by variations in studyquality.
The general mechanisms through which foods containingselenium could plausibly protect against prostate cancer areoutlined below. In addition, selenoproteins are involved intestosterone production, which is an important regulator ofboth normal and abnormal prostate growth.774 775
The evidence from cohort and case-control studies isconsistent, with a dose-response relationship. There isevidence for plausible mechanisms. Foods containingselenium probably protect against prostate cancer.
Stomach One case-control study776 and five ecological studies238 729 777-
779 investigated dietary selenium and stomach cancer. Threecohort studies,731 732 736 nine case-control studies,738 741 754
780-785 and three ecological studies236 729 786 investigated bloodselenium. One cohort study787 and one case-control study788
investigated selenium in toenails or hair. In addition, onerandomised controlled trial and one combined trial investi-gated selenium supplements.423 424
Dietary seleniumThe single case-control study showed that dietary seleniumwas not significantly associated with risk of stomachcancer.776
Most ecological studies showed that low selenium levelswere associated with increased stomach cancer risk,238 777-779
one of which was statistically significant.779
Blood seleniumAll three cohort studies that investigated blood selenium lev-els showed decreased risk for the highest levels when com-pared to the lowest,731 732 736 which was statisticallysignificant in men in one study.732 Meta-analysis was possi-ble on all three, giving a summary effect estimate of 0.89(95% CI 0.78–1.00) per 0.1 µmol/l, with moderate hetero-geneity.731 732 736
All nine case-control studies showed statistically significantdecreased risk for the highest levels when compared to the low-est.738 741 754 780-785 Meta-analysis was possible on six of these,giving a summary effect estimate of 0.44 (95% CI 0.35–0.55)per 0.1 µmol/l, with high heterogeneity.741 754 782-785
This heterogeneity was caused by varying size, not direction,of effect.
All three ecological studies reported inverse associationsbetween blood or plasma selenium and stomach cancermortality,236 729 786 which were statistically significant intwo.236 786
A dose-response relationship is apparent from case-controlbut not cohort data.
Two additional cohort studies, both from China, stratifiedresults according to tumour location.789 790 The apparent pro-tective effect was strengthened for cardia cancers, but dis-appeared for proximal.
Nails and hairThe single cohort study that investigated selenium in nailsshowed statistically significant decreased risk for the high-est levels when compared to the lowest in men, but notwomen. The effect estimates were 0.4 in men (95% CI0.17–0.96; 72 cases) and 1.68 in women (95% CI 0.43–6.54;20 cases).787
The single case-control study found that mean hairselenium levels were significantly lower in the 15 stomachcancer cases than in controls.788
The general mechanisms through which foods containingselenium could plausibly protect against stomach cancer areoutlined below. In addition, selenoproteins with powerfulantioxidant activity may provide protection against theinflammatory effect of H pylori, which can lead to gastriccancer in infected individuals.791
A substantial amount of evidence was available onselenium, from dietary questionnaires, as well asblood, nails, and hair, mostly from case-controlstudies. There is limited evidence suggesting that foodscontaining selenium protect against stomach cancer.
ColorectumFifteen case-control studies investigated dietary seleniumand colorectal cancer.738 785 792-795
Dietary, serum or plasma, toenail seleniumMeta-analysis was possible on six independent effect esti-mates from five case-control studies, giving a summary effectestimate of 0.86 (95% CI 0.78–0.95) per 10 µg/dl serum,with high heterogeneity.785 792-795 All of these studies report-ed decreased risk, which was statistically significant in fourof the five studies.792-795 The heterogeneity is thereforederived from varying size, but not direction of effect. Theremaining 10 studies reported non-significant decreasedrisk.738 These data are supported by limited evidence sug-gesting that there is also a protective effect from seleniumsupplements (see chapter 4.10.6.4.5).
The general mechanisms through which foods containingselenium could plausibly protect against colorectal cancer areoutlined below.
A substantial amount of data was available, from case-control studies only. There is limited evidencesuggesting that foods containing selenium protectagainst colorectal cancer.
General mechanisms — foods containing selenium Dietary selenium deficiency has been shown to cause a lackof selenoprotein expression. Twenty-five selenoproteinshave been identified in animals and a number of these haveimportant anti-inflammatory and antioxidant properties.796
Four are glutathione peroxidises, which protect againstoxidative damage to lipids, lipoproteins, and DNA. Theseenzymes are rapidly degraded during selenium deprivation.Three are thioredoxin reductases and, amongst other func-tions, these regenerate oxidised ascorbic acid to its activeantioxidant form.
112
P A R T 2 • E V I D E N C E A N D J U D G E M E N T S
Selenoproteins appear to reach their maximal levelsrelatively easily at normal dietary selenium intake and not to increase with selenium supplementation. It is, how-ever, plausible that supraphysiological amounts of seleniummight affect programmed cell death, DNA repair, carcinogenmetabolism, immune system, and anti-angiogenic effects.797
4.2.5.9 Foods containing quercetinLung Two cohort studies147 798 and three case-control studies327 477
799 investigated foods containing quercetin and lung cancer.Both cohort studies showed statistically significant
decreased risk for the highest intake groups when comparedto the lowest.147 798 The effect estimates were 0.63 (95% CI0.52–0.78)147 and 0.42 (95% CI 0.25–0.72).798 Both studiesadjusted for smoking.
Two case-control studies showed decreased risk for thehighest intake groups when compared to the lowest,327 477
which was statistically significant in one.327 One studyreported non-significant increased risk.799 The effect esti-mates were 0.58 (95% CI 0.39–0.85),327 0.7 (95% CI0.4–1.1),477 and 1.89 (95% CI 0.72–4.92).799 The latter studymay have been over-adjusted.
Quercetin is a flavonoid. It is an antioxidant and alsodirectly inhibits expression of CYP1A1 (a cytochrome P450enzyme that helps to metabolise toxins), resulting indecreased formation of DNA adducts.475 Elevated CYP1A1activity has been associated with increased risk of lung can-cer, primarily in smokers.476 The evidence for CYP1A1/flavonoid interactions is supported by the observation thatprotective associations of flavonoids are associated withspecific CYP1A1 genotypes.476 477
The evidence available is sparse and inconsistent.There is limited evidence suggesting that foodscontaining quercetin protect against lung cancer.
4.2.5.10 Pulses (legumes) Studies conducted in Western countries, as most cohortshave been, are likely to have limited power to detect an asso-ciation between pulses, and particularly soya intake, andcancer risk because consumption tends to be low.
Stomach Three cohort studies,144 146 241 22 case-control studies,109 157
161 162 165 175 179 180 185-187 190 219 224 243 244 247 249-251 270 271 482
2 cross-sectional studies,196 800 and 16 ecological studies116-
119 197 198 200-203 208 209 236 238 239 801 investigated pulses(legumes) and stomach cancer. Two cohort studies,802 803
9 case-control studies,109 129 159 178 184 194 226 229 262 and 2 eco-logical studies208 804 investigated soya and soya products.
Pulses (legumes)All three cohort studies reported decreased risk with increasedintake of pulses (legumes),144 146 241 which was statisticallysignificant in one.146 Meta-analysis was possible on twostudies, giving a summary effect estimate of 0.93 (95% CI0.82–1.05) per 20 g/day, with moderate heterogeneity.144 146
Twelve case-control studies showed decreased risk for the
highest intake groups when compared to the lowest,109 157 161
165 179 185-187 190 219 247 249 250 271 which was statistically signifi-cant in six.109 161 165 179 190 249 Six studies reported increasedrisk,162 224 243 251 270 482 which was statistically significant intwo.224 243 270 The remaining four studies reported no effecton risk,180 244 or stated that there was no significant effecton risk.175 Meta-analysis was possible on eight studies, giv-ing a summary effect estimate of 0.93 (95% CI 0.87–0.99)per 20 g/day, with moderate to high heterogeneity.157 162 179
180 186 187 247 249
A dose-response relationship is apparent from case-controlbut not cohort data.
One ecological study reported a statistically significantassociation, so that higher soya consumption was associatedwith lower stomach cancer risk.208 The other 15 reported nosignificant association.116-119 197 198 200-203 209 236 238 239 801
Soya and soya productsBoth cohort studies showed decreased risk for the highestintake groups when compared to the lowest,802 803 which wasstatistically significant in one.803 The effect estimates were0.60 (44 cases, 95% CI 0.40–1.10)802 and 0.86 (121 cases,95% CI 0.77–0.96) per 20 g/day.803 The smaller study wasnot adjusted for any confounders.
All nine case-control studies showed decreased risk for thehighest intake groups when compared to the lowest,109 129 159
178 184 194 226 229 262 which was statistically significant in five.129
159 178 184 226 Meta-analysis was possible on seven studies, giv-ing a summary effect estimate of 0.82 (95% CI 0.72–0.94)per 20 g/day, with high heterogeneity.109 129 159 178 194 226 229
Heterogeneity is derived from the size, and not the direction,of the effect.
A dose-response relationship is apparent from case-controldata, as well as from one of the two cohort studies.
Both ecological studies reported statistically significantinverse relationships, with stomach cancer risk decreasing inareas of increased soya consumption.208 804
The general mechanisms through which pulses (legumes),soya and soya products could plausibly protect against stom-ach cancer are outlined below. In addition, laboratory exper-iments have shown that genistein slows down thedevelopment of stomach cancers promoted by sodium chlo-ride by increasing apoptosis, and lowering cell proliferationand blood vessel growth.805 Additionally, in a rodent model,a diet containing miso inhibited N-nitrosamine-inducedstomach tumours.806
The evidence, mostly from case-control studies, isinconsistent. There is limited evidence suggesting thatpulses (legumes), including soya and soya products,protect against stomach cancer.
Prostate Three cohort studies,589 592-594 11 case-control studies,595 597
599-601 604 608 617 620 624 715 and 6 ecological studies116 118 609 807-
809 investigated pulses (legumes) and prostate cancer. Fourcohort studies,597 810-813 4 case-control studies,603 715 814-816
and 2 ecological studies804 808 investigated soya and soyaproducts.

113
C H A P T E R 4 • F O O D S A N D D R I N K S
Pulses (legumes)Two cohort studies reported statistically significant decreasedrisk with increased intake589 592; the third study reported thatthere was no significant association.594 The reported effectestimates were 0.93 (95% CI 0.87–0.996)589 and 0.817 (95%CI 0.714–0.934)592 per serving/week. The latter was specif-ic to beans and lentils.
Eight of the case-control studies showed decreased riskwith increased intake,595 597 599 608 617 620 624 715 which was sta-tistically significant in two.597 624 One study showed a non-significant increased risk604 and the other reported no effecton risk.600 One study showed a non-significant increased riskfor dried beans and lentils and a non-significant decreasedrisk with fresh beans and lentils.601 Meta analysis was pos-sible on four relatively good quality case-control studies, giv-ing a summary effect estimate of 0.97 (95% CI 0.95–0.98)per serving/week, with no heterogeneity.595 597 599 601
A dose-response relationship is apparent from two of thecohort studies, as well as case-control data.
The five ecological studies generally fail to show a clearrelationship between consumption of pulses and prostatecancer risk; correlations range from -0.15 to -0.63.116 118 609
807-809
Soya and soya productsThe cohort studies reported a wide range of results based ondifferent specific exposures.810-813 One study, which report-ed on soya and soya products, showed a non-significantdecreased risk for the highest intake groups when comparedto the lowest, with an effect estimate of 0.79 (95% CI0.53–1.18).810 One study reported a statistically significantdecreased risk with increased intake of soya milk (0.93, 95%CI 0.87–0.99) per serving/week and a non-significantdecreased risk with increased intake of vegetarian soya prod-ucts (0.93, 95% CI 0.85–1.01) per serving/week.813 Onereported no association between soya bean paste soup intakeand prostate cancer.811 The final study reported non-signif-icant harmful effects for miso soup and foods cooked in soysauce, with effect estimates of 1.05 (95% CI 0.94–1.18) and1.06 (0.474, 2.39) respectively per serving/day.812
All four case-control studies showed non-significantdecreased risk with increased intake.597 603 715 814-816 Metaanalysis was possible on two case-control studies, giving asummary effect estimate of 0.98 (95% CI 0.95–1.00).597 715
The two ecological studies reported no clear relationshipbetween soya consumption and prostate cancer.804 808
Heterogeneity is likely to be derived from the wide vari-ety in specific foods being investigated.
The general mechanisms through which pulses (legumes),soya and soya products could plausibly protect againstprostate cancer are outlined below. In addition, phytoestro-gens in pulses and soya can have an androgenic effect, poten-tially inhibiting testosterone-induced growth of the prostate.
The evidence, mostly from case-control studies, isinconsistent. There is limited evidence suggesting thatpulses (legumes), including soya and soya products,protect against prostate cancer.
General mechanisms — pulses (legumes) Pulses (legumes), particularly soya foods, contain variouscompounds that may have anti-cancer effects, including pro-tease inhibitors, saponins, and phytoestrogens, such as genis-tein and daidzein, which are found in high concentrationsin soya.817 These compounds could plausibly influenceoestrogen metabolism. They have also been shown to haveantioxidant effects, inhibit the growth of blood vessels to atumour, and may influence apoptosis and cell growth.818
4.2.5.11 Nuts and seeds The evidence was too limited in amount, consistency, orquality to draw any conclusions
4.2.5.12 Herbs and spicesGarlic can be classified as a herb or as an allium vegetable.Data on garlic have contributed to the evidence base for alli-um vegetables and stomach cancer (see chapter 4.2.5.1.1)and garlic also probably protects against colorectal cancer(see chapter 4.2.5.1.1).
4.2.5.12.1 ChilliStomach Fourteen case-control studies investigated chilli use andstomach cancer.171 175 176 180 182 187 189 219 246 247 259 415 819-821
Nine studies showed increased risk for the highest intakegroups when compared to the lowest,175 176 180 187 189 219 259
415 820 821 which was statistically significant in four,175 180 259
821 statistically significant in men but not women in a fifthstudy,219 and statistically significant in non-drinkers of alco-hol, but not alcohol drinkers, in a sixth.176 Four studiesshowed decreased risk,171 182 246 247 which was statistically sig-nificant in three.182 246 247 One study reported no significanteffect on risk.819
Chilli may be used to disguise ‘off ’ flavours in foods, there-fore these data may be confounded by socioeconomic sta-tus, the availability of refrigeration, and H pylori infection.
Some constituents of chilli are irritants which could there-fore plausibly increase inflammation in the stomach.
The evidence, from case-control studies only, isinconsistent. There is limited evidence suggesting thatchilli is associated with an increased risk of stomachcancer.
4.2.4 Comparison with previous report
The previous report concluded that the evidence that dietshigh in vegetables and fruits protect against cancers of themouth, pharynx, oesophagus, lung, and stomach was con-vincing; and that the evidence that diets high in vegetablesprotect against colorectal cancer was also convincing. Theprevious report also judged that diets high in vegetables andfruits probably protected against cancers of the larynx, pan-creas, breast, and bladder. The panel also noted a patternwhereby diets high in vegetables and fruits possibly pro-tected against cancers of the cervix, ovary, endometrium,and thyroid; and that diets high in vegetables possibly pro-

114
P A R T 2 • E V I D E N C E A N D J U D G E M E N T S
tected against cancers of the liver, prostate, and kidney. Since the mid-1990s, a number of cohort studies have
somewhat weakened the overall evidence for the protectiveeffects of vegetables and fruits. A number of judgements ofprobable protective effects are made for non-starchy veg-etables and for fruits (mouth, pharynx, larynx, oesophagus,stomach, and (fruits only) lung). In general, the reason forthis is that the more recent cohort studies failed to show theeffect seen in case-control studies.
The previous report also made judgements on types of veg-etables and fruits in a footnote, while choosing not to enterthese into the matrix. The evidence that green vegetablesprotected against lung and stomach cancer was judged con-vincing; and probable for mouth and oesophageal cancer.The evidence that cruciferous vegetables protected againstcolorectal and thyroid cancer was judged probable. The evi-dence that allium vegetables protected against stomach can-cer was judged probable. The evidence that raw vegetablesand citrus fruits protected against stomach cancer wasjudged convincing. These classifications are somewhat dif-ferent from those made in this Report, but mostly also gen-erated more confident judgements than are made here.
Vitamins, minerals, and other bioactive constituents offoods and drinks were assessed as such in the previousreport, whereas here they are assessed either as containedin foods and drinks or (see chapter 4.10) as supplements.The previous report judged that carotenoids (in food) prob-ably protected against lung cancer; that vitamin C (in food)probably protected against stomach cancer; and that thesevitamins and vitamin E possibly protected against cancers ofa number of sites.
The previous panel regretted the lack of evidence on puls-es (legumes), nuts, seeds, herbs, and spices, and made nosignificant judgements. Since then, evidence on soya and itsproducts, and on garlic (as well as allium vegetables in gen-eral) and chilli, has increased and allowed some judgements.
The previous report judged that aflatoxin contaminationwas a probable cause of liver cancer. Since then, the overallevidence, particularly on the underlying mechanisms, hasstrengthened.
The previous report emphasised evidence on vegetablesand on fruits as a whole, while noting evidence on categoriesof vegetables and fruits. This Report has not made any sep-arate judgement on raw vegetables and fruits. The previousreport classified bananas as plantains. Here they are classi-fied as fruits. The previous report considered micronutrientsand phytochemicals contained in foods of plant origin in sep-arate chapters. Here, the evidence has been characterised interms of foods containing specified micronutrients, and theyare considered together with vegetables and fruits, pulses(legumes), nuts and seeds, and other plant foods. Similarly,the previous report considered dietary fibre separately fromcereals (grains) and other plant foods. Here, dietary fibre isconsidered in the context of cereals (grains) and other plantfoods, including those assessed in this section.
4.2.7 Conclusions
The Panel concludes:Findings from cohort studies conducted since the mid-1990shave made the overall evidence that vegetables, or fruits,protect against cancers, somewhat less impressive. In no casenow is evidence of protection judged to be convincing.However, there is evidence that some types of vegetables,and fruits in general, probably protect against a number ofcancers. The few judgements on legumes (pulses), nuts,seeds, and (with two exceptions) herbs and spices, reflect thesmall amount of epidemiological evidence.
Non-starchy vegetables probably protect against cancers ofthe mouth, pharynx, and larynx, and those of the oesopha-gus and stomach. There is limited evidence suggesting thatthey also protect against cancers of the nasopharynx, lung,colorectum, ovary, and endometrium. Allium vegetables prob-ably protect against stomach cancer. Garlic (an allium veg-etable, commonly classed as a herb) probably protects againstcolorectal cancer.
Fruits in general probably protect against cancers of themouth, pharynx, and larynx, and of the oesophagus, lung,and stomach. There is limited evidence suggesting that fruitsalso protect against cancers of the nasopharynx, pancreas,liver, and colorectum.
There is limited evidence suggesting that carrots protectagainst cervical cancer; and that pulses (legumes), includingsoya and soya products, protect against stomach and prostatecancers. There is limited evidence suggesting that chilli is acause of stomach cancer.
Fruits and non-starchy vegetables are low energy-densefoods. For a discussion of the effect of such foods and drinkson weight gain, overweight, and obesity, and the role ofweight gain, overweight, and obesity in the risk of some can-cers, see Chapters 6, 7, and 8.
Evidence that vegetables, fruits, and pulses protect againstsome cancers is supported by evidence on various micronu-trients, which act as markers for consumption of vegetables,fruits, and pulses (legumes), and other plant foods. Foodscontaining folate probably protect against pancreatic cancer,and there is limited evidence suggesting that these also pro-tect against oesophageal and colorectal cancers. Foods con-taining carotenoids probably protect against cancers of themouth, pharynx, and larynx, and also lung cancer. Foods con-taining the carotenoid beta-carotene probably protect againstoesophageal cancer; and foods containing lycopene, found intomatoes and also fruits such as watermelon, guavas, andapricots, probably protect against prostate cancer. Foods con-taining vitamin C, found in some vegetables, citrus and otherfruits, and potatoes, probably protect against oesophagealcancer. There is limited evidence suggesting that foods con-taining quercetin, such as apples, tea, and onions, protectagainst lung cancer.
Evidence on foods containing other micronutrients is grouped here, for ease of reference. Foods containing

115
C H A P T E R 4 • F O O D S A N D D R I N K S
selenium probably protect against prostate cancer; there is limited evidence suggesting that they protect againststomach and colorectal cancers. There is limited evidencesuggesting that foods containing the B vitamin pyridoxineprotect against oesophageal and prostate cancers; and thatfoods containing vitamin E protect against oesophageal andprostate cancers.

116
P A R T 2 • E V I D E N C E A N D J U D G E M E N T S
These animal foods are sources of protein andmicronutrients. The amount and nature of the fat contentof meat, poultry, and fish depends on methods of rearing,processing, and preparation, as well as the type of animal.
Production and consumption of red meat and processedmeat generally rise with increases in available income.Consumption of beef and products made with beef is stillincreasing, notably in China and other middle- and low-income countries. In many countries, poultry is now alsointensively reared and consumption has increased greatly.Much fish is now farmed.
In general, the Panel judges that the evidence on red meatand processed meat is stronger than it was in the mid-1990s.Epidemiological evidence on other methods of preservingand preparing meats and other animal foods is sparse; theoverall evidence remains suggestive, at most. The evidenceon poultry, fish, and eggs is generally insubstantial.
The Panel judges as follows:The evidence that red meats and processed meats are acause of colorectal cancer is convincing. Cantonese-stylesalted fish is a probable cause of nasopharyngeal cancer.This finding does not apply to any other type of fishproduct. Cantonese-style salted fish is also subject tofermentation.
There is limited evidence suggesting that fish, and alsofoods containing vitamin D, protect against colorectalcancer. There is limited evidence suggesting that red meatis a cause of cancers of the oesophagus, lung, pancreasand endometrium; that processed meat is a cause ofcancers of the oesophagus, lung, stomach and prostate;and that foods containing iron are a cause of colorectalcancer. There is also limited evidence that animal foodsthat are grilled (broiled), barbecued (charbroiled), orsmoked, are a cause of stomach cancer.
4.3 Meat, poultry, fish, and eggs
MEAT, POULTRY, FISH, EGGS, AND THE RISK OF CANCER
In the judgement of the Panel, the factors listed below modify the risk of cancer. Judgements are graded according to the strength of the evidence.
DECREASES RISK INCREASES RISK
Exposure Cancer site Exposure Cancer site
Convincing Red meat1 Colorectum
Processed meat2 Colorectum
Probable Cantonese-style Nasopharynxsalted fish3
Limited — Fish Colorectum Red meat1 Oesophagussuggestive Foods containing Colorectum Lung
vitamin D4 7 PancreasEndometrium
Processed meat2 Oesophagus Lung StomachProstate
Foods containing iron4 5 Colorectum
Smoked foods6 Stomach
Grilled (broiled) or Stomachbarbecued (charbroiled) animal foods6
Substantialeffect on risk None identifiedunlikely
1 The term ‘red meat’ refers to beef, pork, lamb, and goat from domesticated animals. 2 The term ‘processed meat’ refers to meats preserved by smoking, curing, or salting, or addition of chemical preservatives. 3 This style of preparation is characterised by treatment with less salt than typically used, and fermentation during the drying process due to relatively high outdoor
temperature and moisture levels. This conclusion does not apply to fish prepared (or salted) by other means.4 Includes both foods naturally containing the constituent and foods which have the constituent added (see chapter 3.5.3).5 Although red and processed meats contain iron, the general category of ‘foods containing iron’ comprises many other foods, including those of plant origin.6 The evidence is mostly from meats preserved or cooked in these ways. 7 Found mostly in fortified foods and animal foods.
For an explanation of all the terms used in the matrix, please see chapter 3.5.1, the text of this section, and the glossary.

117
C H A P T E R 4 • F O O D S A N D D R I N K S
Red meat can be relatively high in animal fats. For adiscussion of the role of animal fats on cancer, see chapter4.4 and Chapter 7. Meat can also be energy dense. Fordiscussion on the role of energy-dense foods on weightgain, overweight, and obesity, and the role of weight gain,overweight, and obesity in the risk of some cancers, seeChapters 6 and 8.
The strongest evidence, corresponding to judgements of‘convincing’ and ‘probable’, shows that red meat andprocessed meat are causes of colorectal cancer, and thatCantonese-style salted fish is probably a cause ofnasopharyngeal cancer. The Panel also notes limitedevidence suggesting that red meat and processed meat arecauses of other cancers.
It is generally, though not universally, agreed that humansevolved as omnivores, and that healthy diets usually includefoods of plant and of animal origin — including meat, poul-try, fish, and eggs, as well as milk and other dairy products.
Most people who do not eat meat, flesh, or any food of ani-mal origin do so for religious or ethical reasons. Impoverishedcommunities eat little flesh and meat is reserved for feasts.Partly because meat-eating is a sign of prosperity and partlybecause many people enjoy eating meat, poultry, and fish,production and consumption generally rise as availableincome increases. Consumption of beef is, for example, nowincreasing very rapidly in China, and consumption of ‘burg-ers’ made from beef is increasing worldwide.
Early reports concerned with nutritional deficiencies iden-tified meat, poultry, and fish as good sources of protein, iron,and other nutrients, and eggs as a ‘complete food’, especiallyfor children. By contrast, in the second half of the 20th cen-tury, reports on meat, poultry, fish, and eggs tended to focuson red meat as a source of fat and saturated fatty acids andon eggs as a source of dietary cholesterol in the causationof coronary heart disease. These reports promoted poultryand fish as better choices than red meat, either because theycontain less fat and saturated fatty acids or, in the case ofoily fish, they contain unsaturated fats identified as protec-tive. Little attention has been given to flesh from wild ani-mals and birds, despite this being known to have a differentnutritional profile — lower in total fat and higher in unsat-urated fatty acids. On the other hand, since the mid-1990smore attention has been given in epidemiological studies toprocessed meat as a cause or possible cause of cancers ofsome sites.
For discussion of the role of red meat and processed meatin energy-dense foods and drinks, the effect of energy-densefoods and drinks on weight gain, overweight, and obesity,and the role of weight gain, overweight, and obesity in therisk of some cancers, see Chapters 6 and 8.
In this Report, methods of production, preservation, pro-cessing, and preparation (including cooking), that are sole-ly or mainly to do with meat and other animal foods, areincluded here. Processed meat as a category is included here.The mineral iron is also covered here, although it is alsofound in plant foods.
4.3.1 Definitions and sources
Meat and poultryIn this Report, meat includes all animal flesh apart from fishand seafood. Meat can be further classed as either red meat,which generally refers to flesh from animals that have morered than white muscle fibres (in this Report, beef, goat, lamb,and pork), or poultry, which usually has more white than redmuscle fibres (from birds such as chickens, guinea fowl, andturkeys). Meat can also be categorised by dividing it intomeats from skeletal muscles or the internal organs (offal,such as the brain, liver, heart, intestines, and tongue). Meatcan also be divided according to whether the animal wasdomesticated or wild. Most meats consumed around theworld today are from domesticated animals. ‘Wild’ meats,that is from non-domesticated or free-ranging species, are asignificant source of protein and energy among some popu-lations. Some non-domesticated animals, such as deer or buf-falo, are also farmed. However, the evidence presented inthis chapter applies only to meat from domesticated animals.Some meats are processed in various ways (box 4.3.1).
FishThis Report uses the culinary definition of fish, whichincludes shellfish. There are more than 27 000 species of saltand freshwater fish; many more crustaceans, bivalves, andcephalopods can also be eaten. Fish and shellfish are the onlyfoods that, globally, are still obtained in significant quanti-ties from the wild. But many species are on the verge of com-mercial extinction and aquaculture is increasing worldwide.For instance, more than a third of the salmon eaten world-wide is farmed. Like meat, fish is also processed, for instanceby drying, salting, and smoking.
EggsEggs are the ova of animals and in this Report mean only
What is ‘processed meat’? The question is important because, asshown here, the evidence that processed meat is a cause ofcolorectal cancer is convincing.
In the broad sense of the word, most meat is processed — cook-ing is a process. But as commonly used, the term ‘processed meat’refers to meats (usually red meats) preserved by smoking, curing,or salting, or by the addition of preservatives. Meats preservedonly by refrigeration, however they are cooked, are usually notclassified as ‘processed meat’.
There is no generally agreed definition of ‘processed meat’. Theterm is used inconsistently in epidemiological studies. Judgementsand recommendations are therefore less clear than they could be.
Ham, bacon, pastrami, and salami are processed meats. So aresausages, bratwursts, frankfurters, and ‘hot dogs’ to which nitritesor nitrates or other preservatives are added (box 4.3.2). Mincedmeats sometimes fall inside this definition, often if they are pre-served chemically, but not always. The same point applies to ‘ham-burgers’. Given the importance of this issue, transnationalburger caterers should specify the methods they use to processtheir products.
Box 4.3.1 Processed meat

118
P A R T 2 • E V I D E N C E A N D J U D G E M E N T S
those of birds; because they are generally eaten before theyhave been fertilised, they do not contain an embryo. Eggsare eaten both on their own and as an ingredient in a vari-ety of baked goods, sauces, and other composite foods.Chicken eggs are most commonly eaten, although peoplealso eat duck, ostrich, and quail eggs. Fish eggs (roe) andturtle eggs are not included here.
4.3.2 Composition
Meat and poultryMeat contains around 20–35 per cent protein by weight. Thefat content by weight ranges from less than 4 per cent in leanpoultry to 30–40 per cent in fatty meat from domesticated,farmed animals. About 50 per cent of the fatty acids in leanmeat are monounsaturated fatty acids, while saturated fattyacids make up around 40–50 per cent (see chapter 4.4.2).Poultry contains a lower proportion of saturated fatty acids(30–35 per cent) and a higher proportion of polyunsaturat-ed fatty acids (15–30 per cent compared with 4–10 per cent).1
There are differences between meats from domesticated ani-mals and wild meats. Wild animals are typically more mature,leaner, and contain a greater variety of aromatic compoundsthan farmed animals. They will have received no medicationand their diets will have been uncontrolled. Wild animals arenot only lower in fat, but also have a higher proportion ofpolyunsaturated fatty acids than farmed varieties and a lowerproportion of saturated fatty acids.
Two iron-containing components of muscle tissue, myo-globin and cytochromes, give meat its red colour. It also con-tains relatively high levels of B vitamins, particularly B6(pyridoxine) and B12, as well as vitamin D, and provides
readily absorbable iron, zinc, and selenium. Eating red meatincreases levels of N-nitroso compounds in the body (box4.3.2), which may be partially due to its high haem content(box 4.3.3). If meat is cooked over an open flame, at hightemperatures, and charred or ‘well done’, heterocyclicamines or polycyclic aromatic hydrocarbons can be formed(box 4.3.4).
Vitamin D is a fat-soluble vitamin that plays a critical rolein calcium and bone metabolism and in controlling cell dif-ferentiation. Low levels may lead to osteomalacia or, in chil-dren, rickets and possibly osteoporosis, with increasedfracture risk. Most vitamin D is derived from the action ofsunlight on the skin. Foods such as milk or fat spreads (seechapter 4.9) may be fortified, and then become the majordietary source of vitamin D; natural sources include sardinesand other oily fish, meat, and eggs.
FishFish has similar levels of protein to meat. It has a fat byweight content of between 0.5 per cent in low-fat fish suchas cod or skate to as much as 20 per cent in oily fish suchas Atlantic salmon or eels. Fat from fish contains lower lev-els of saturated fatty acids (around 20–25 per cent) thanmeat.
Fish oils from saltwater fish contain long-chain n-3 fattyacids (see chapter 4.4.2). Wild fish have a lower fat contentthan farmed fish, with a higher proportion of n-3 fatty acids.Only marine algae and phytoplankton produce these fattyacids, so the fish that feed on them are the primary dietarysources. These fatty acids are essential to the developmentand function of the brain and retina; they also reduce inflam-mation, blood clotting, and cholesterol production. The body
Iron deficiency is the most common and widespread nutritionaldisorder in the world. It is most common among children andpremenopausal women, and results in iron deficiency anaemia.
Haem iron is found only in foods of animal origin, such asmeat and meat products, fish, and blood products. Non-haemiron is found in plant foods, such as lentils, beans, leafy veg-etables, tofu, chickpeas, black-eyed peas, figs, and apricots. Theamount of dietary iron needed to meet the body’s requirementsdepends on its bioavailability from the diet. This varies with thediet, as well as factors related to the consumer such as their ironstatus. Iron from animal sources is better absorbed than ironfrom plant sources, but non-haem iron absorption is enhancedwhen the body’s iron status is low, or when iron-rich foods areeaten together with vitamin-C rich foods or with meat.
Iron has a central role in metabolism. It is involved in oxida-tive metabolism within cells and is a component of a numberof enzymes. Free iron can also catalyse the generation of freeradicals, which cause oxidative damage to specific cell compo-nents including DNA, protein, and membrane lipids. Iron metab-olism and transport are strictly regulated to reduce thelikelihood of cells being exposed to free iron and so to oxida-tive damage; most iron in living tissues is bound to proteins, suchas transferrin and ferritin, which prevent its involvement in free-radical generation. Also see chapter 4.10.
Box 4.3.3 Foods containing iron
Nitrate occurs naturally in plants; levels vary between speciesand with different soil conditions and the amount of fertiliserused. In high-income countries, vegetables account for 70–97per cent of dietary nitrate intake.2 Between 5 and 20 per centof the nitrate in diets is converted by the body into nitrite, a sub-stance that is also found in some vegetables (notably potatoes).Nitrite is used to preserve processed meats (it is extremely toxicto bacteria) and gives cured meats their recognisable colour andflavours. The addition of nitrite and nitrate to food is regulat-ed and monitored in most countries.
Nitrite can react with the degradation products of aminoacids to form N-nitroso compounds (nitrosamines ornitrosamides). These may be formed in meat during the curingprocess or in the body (particularly in the stomach) from dietarynitrite (or nitrate).
Several N-nitroso compounds are known human or animalcarcinogens.3 There is concern that nitrite, from processed meatsfor example, nitrates in vegetables, and preformed nitrosaminesmay be involved in carcinogenesis, particularly in the stomach(see Chapter 2). Dietary nitrates and nitrites are probable humancarcinogens because they are converted in the body to N-nitrosocompounds.3
Box 4.3.2 Nitrates, nitrites, and N-nitroso compounds
119
C H A P T E R 4 • F O O D S A N D D R I N K S
can convert alpha-linolenic acid (found in plant foods andessential in the diet) to eicosapentaenoic acid and docoso-hexanoic acid, which are found in fish oils, but the rates ofconversion are low.
Fish contain lower levels of B vitamins, iron, and zinc thanmeat and poultry, but oily fish are a source of retinol and vit-amin D. Fish are also a source of calcium if the bones areeaten with the flesh, for example, when canned.
Fish and shellfish have the potential to accumulate pollu-tants that are washed into rivers and oceans, and these tendto accumulate in their fat. These pollutants can includeheavy metals and organic compounds, some of which areknown carcinogens. Farmed fish are exposed to veterinarymedicines, and some environmental toxins may reach highconcentrations in their food. But farmed fish are less likelythan wild fish to become contaminated with environmentalpollutants. The balance of risks and benefits of eating fishat various stages of the life course needs to be determined.Also see chapter 4.9.
EggsEggs, like meat, poultry, and fish, contain all the essential
amino acids needed by humans. A typical large hen’s egg hasroughly equal weights of protein and fat, with 60 per centof the energy coming from fat. A typical large shelled eggcontains 6 g protein; 1 g carbohydrate; 4.5 g fat (2.0 gmonounsaturated, 0.5 g polyunsaturated, and 1.5 g satu-rated fatty acids); and about 200 mg cholesterol. It also con-tains retinol, folate, thiamin, riboflavin, vitamin B12,vitamin D, and iron. The yolk’s colour comes fromcarotenoids, and contains all of the fat and cholesterol andmost of the iron, thiamin, and retinol. The white is 90 percent water and is virtually fat free, containing mainly pro-tein, with some vitamins, and traces of glucose.
In Asia, eggs containing 2–3 week old chick fetuses mayoccasionally be included in diets. There is no nutritional dif-ference between these and unfertilised eggs, except that fer-tilised eggs contain additional calcium absorbed from theshell.
4.3.3 Consumption patterns
Meat and poultryGlobally, meat accounts for about 8 per cent of total energyavailability, 18 per cent of dietary protein, and 23 per centof dietary fat. Meat consumption is considerably higher inhigh-income countries (10 per cent of total energy intakecompared with 7 per cent in low-income countries), and isparticularly high in the USA, parts of South America, someparts of Asia, northern Europe, and most of Oceania.Consumption is particularly low in most of Africa and otherparts of Asia where vegetarian ways of life are commonplace.Bangladesh has the lowest level of intake (0.6 per cent) andMongolia the highest (28 per cent).7
As a general rule, meat consumption increases with eco-nomic development. Worldwide, between 1961 and 2002,meat consumption per person doubled, with pork and poul-try showing the greatest increases; in Japan it increasednearly six-fold. Globally, overall energy availability increas-ed in the same period by just 12 per cent. Consumption ofmeat and other animal foods from wild and undomesticat-ed animals is low on a global basis, but these foods areimportant parts of diets within many middle- and low-income countries, as well as being delicacies in high-incomecountries.
FishWorldwide, fish (including shellfish) account for 1 per centof available dietary energy; these foods are particularlyimportant in island and coastal communities. For instance,in the Maldives, marine fish account for 15 per cent ofdietary energy, but in some landlocked, low-income coun-tries, this figure is practically zero. In general, fish con-sumption is highest in Asia and Oceania. Freshwater fishprovide a relatively small proportion of dietary energy (0.3per cent), but they are a more important source of dietaryenergy in low-income countries, and are particularly impor-tant in regions with large lakes and rivers. Salting is a tra-ditional method of preserving raw fish throughout much ofthe world (box 4.3.5).
Heterocyclic amines are formed when muscle meats such asbeef, pork, fowl, and fish are cooked. High cooking tempera-tures cause amino acids and creatine (a chemical found in mus-cles) to react together to form these chemicals. So far, 17different heterocyclic amines have been identified as beingformed by cooking muscle meats and which may pose a cancerrisk (also see Chapter 2).
Temperature is the most important factor in the formation ofthese chemicals. Frying, grilling (broiling), and barbecuing (char-broiling) produce the largest amounts because these cookingmethods use very high temperatures. Oven roasting and bak-ing involve lower temperatures, so meats cooked in this way arelower in heterocyclic amines, but gravy made from meat drip-pings contains substantial amounts. Meats that are partiallycooked in a microwave oven before being cooked by otherhigher-temperature methods also have lower levels of thesechemicals.4
Polycyclic aromatic hydrocarbons (PAHs) are a group of over100 different chemicals formed when organic substances liketobacco or meat are burnt incompletely. Grilling (broiling) andbarbecuing (charbroiling) meat, fish, or other foods with intenseheat over a direct flame results in fat dropping on the hot fire;this produces PAHs that stick to the surface of food. The moreintense the heat, the higher the level of contamination; usingwood creates more PAHs than charcoal. Cereals contaminatedwith PAHs are also a common source of these chemicals in thediet. Levels in cereals are considerably lower than in grilledmeats, but their overall contribution to diets is larger.5 Takentogether, cereals and meat and meat products account for morethan 50 per cent of dietary levels of these chemicals. Intakes arethought to be relatively high in Europe, particularly in north-ern Europe, although measures are only available from a few,generally high-income, countries.6
Box 4.3.4 Heterocyclic amines and poly-cyclic aromatic hydrocarbons
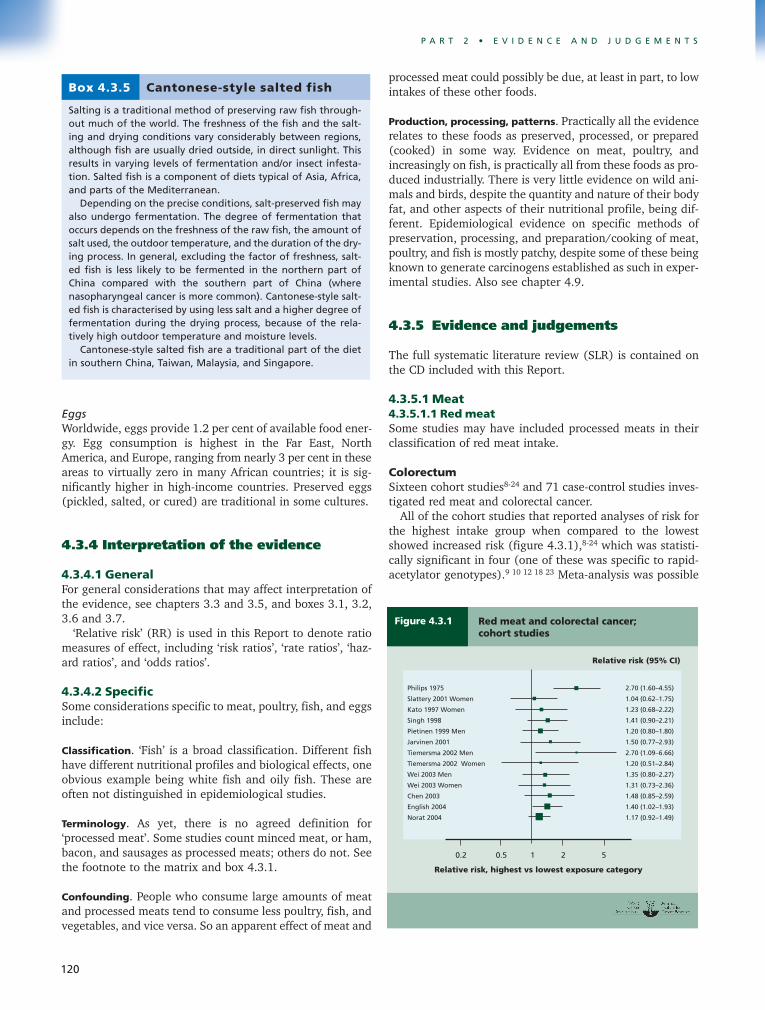
120
P A R T 2 • E V I D E N C E A N D J U D G E M E N T S
EggsWorldwide, eggs provide 1.2 per cent of available food ener-gy. Egg consumption is highest in the Far East, NorthAmerica, and Europe, ranging from nearly 3 per cent in theseareas to virtually zero in many African countries; it is sig-nificantly higher in high-income countries. Preserved eggs(pickled, salted, or cured) are traditional in some cultures.
4.3.4 Interpretation of the evidence
4.3.4.1 GeneralFor general considerations that may affect interpretation ofthe evidence, see chapters 3.3 and 3.5, and boxes 3.1, 3.2,3.6 and 3.7.
‘Relative risk’ (RR) is used in this Report to denote ratiomeasures of effect, including ‘risk ratios’, ‘rate ratios’, ‘haz-ard ratios’, and ‘odds ratios’.
4.3.4.2 Specific Some considerations specific to meat, poultry, fish, and eggsinclude:
Classification. ‘Fish’ is a broad classification. Different fishhave different nutritional profiles and biological effects, oneobvious example being white fish and oily fish. These areoften not distinguished in epidemiological studies.
Terminology. As yet, there is no agreed definition for‘processed meat’. Some studies count minced meat, or ham,bacon, and sausages as processed meats; others do not. Seethe footnote to the matrix and box 4.3.1.
Confounding. People who consume large amounts of meatand processed meats tend to consume less poultry, fish, andvegetables, and vice versa. So an apparent effect of meat and
processed meat could possibly be due, at least in part, to lowintakes of these other foods.
Production, processing, patterns. Practically all the evidencerelates to these foods as preserved, processed, or prepared(cooked) in some way. Evidence on meat, poultry, andincreasingly on fish, is practically all from these foods as pro-duced industrially. There is very little evidence on wild ani-mals and birds, despite the quantity and nature of their bodyfat, and other aspects of their nutritional profile, being dif-ferent. Epidemiological evidence on specific methods ofpreservation, processing, and preparation/cooking of meat,poultry, and fish is mostly patchy, despite some of these beingknown to generate carcinogens established as such in exper-imental studies. Also see chapter 4.9.
4.3.5 Evidence and judgements
The full systematic literature review (SLR) is contained onthe CD included with this Report.
4.3.5.1 Meat 4.3.5.1.1 Red meat Some studies may have included processed meats in theirclassification of red meat intake.
ColorectumSixteen cohort studies8-24 and 71 case-control studies inves-tigated red meat and colorectal cancer.
All of the cohort studies that reported analyses of risk forthe highest intake group when compared to the lowestshowed increased risk (figure 4.3.1),8-24 which was statisti-cally significant in four (one of these was specific to rapid-acetylator genotypes).9 10 12 18 23 Meta-analysis was possible
Salting is a traditional method of preserving raw fish through-out much of the world. The freshness of the fish and the salt-ing and drying conditions vary considerably between regions,although fish are usually dried outside, in direct sunlight. Thisresults in varying levels of fermentation and/or insect infesta-tion. Salted fish is a component of diets typical of Asia, Africa,and parts of the Mediterranean.
Depending on the precise conditions, salt-preserved fish mayalso undergo fermentation. The degree of fermentation thatoccurs depends on the freshness of the raw fish, the amount ofsalt used, the outdoor temperature, and the duration of the dry-ing process. In general, excluding the factor of freshness, salt-ed fish is less likely to be fermented in the northern part ofChina compared with the southern part of China (wherenasopharyngeal cancer is more common). Cantonese-style salt-ed fish is characterised by using less salt and a higher degree offermentation during the drying process, because of the rela-tively high outdoor temperature and moisture levels.
Cantonese-style salted fish are a traditional part of the dietin southern China, Taiwan, Malaysia, and Singapore.
Box 4.3.5 Cantonese-style salted fish
Figure 4.3.1 Red meat and colorectal cancer;cohort studies
Philips 1975 2.70 (1.60–4.55)
Slattery 2001 Women 1.04 (0.62–1.75)
Kato 1997 Women 1.23 (0.68–2.22)
Singh 1998 1.41 (0.90–2.21)
Pietinen 1999 Men 1.20 (0.80–1.80)
Jarvinen 2001 1.50 (0.77–2.93)
Tiemersma 2002 Men 2.70 (1.09–6.66)
Tiemersma 2002 Women 1.20 (0.51–2.84)
Wei 2003 Men 1.35 (0.80–2.27)
Wei 2003 Women 1.31 (0.73–2.36)
Chen 2003 1.48 (0.85–2.59)
English 2004 1.40 (1.02–1.93)
Norat 2004 1.17 (0.92–1.49)
Relative risk (95% CI)
Relative risk, highest vs lowest exposure category
1 50.2 0.5 2

121
C H A P T E R 4 • F O O D S A N D D R I N K S
on seven studies that measured red meat intake in ‘times perweek’ and three studies that measured grams per day. Thesummary effect estimates were 1.43 (95% confidence inter-val (CI) 1.05–1.94) per times/week and 1.29 (95% CI1.04–1.60) per 100 g/day, respectively (figures 4.3.2 and4.3.3). There was moderate heterogeneity in the formeranalysis and low heterogeneity in the latter.
A dose-response relationship is apparent from cohort data(figure 4.3.4).
These data are supported by a recently published meta-analysis of 15 prospective studies, which reported a sum-mary effect estimate of 1.28 (95% CI 1.18–1.39) per 120g/day.25
Because of the abundant prospective data from cohortstudies, case-control studies were not summarised.
The general mechanisms through which red meat couldplausibly cause cancer are outlined below. In addition,dietary haem iron induces colonic cytotoxicity and hyper-proliferation.26
A substantial amount of data from cohort and case-control studies showed a dose-response relationship,supported by evidence for plausible mechanismsoperating in humans. Red meat is a convincing causeof colorectal cancer.
The Panel is aware that since the conclusion of the SLR, sixcohort27-32 and four case control studies33-36 have been pub-lished. This new information does not change the Panel judge-ment (see box 3.8).
OesophagusTwelve case-control studies37-50 investigated red meat andoesophageal cancer.
Eight studies reported increased risk for the highest intakegroup when compared to the lowest,37-39 41-45 49 50 which wasstatistically significant in five.37 41 42 45 Three studies reported
non-significant decreased risk38 40 46; one study reported no significant effect on risk,47 48 but did not provide furtherdetails. Most of these studies adjusted for smoking andalcohol.
The general mechanisms through which red meat couldplausibly cause cancer are outlined below.
There is limited evidence, from case-control studies,some of which were poor quality, suggesting that redmeat is a cause of oesophageal cancer.
The Panel is aware that since the conclusion of the SLR, onecohort study51 has been published. This new information doesnot change the Panel judgement (see box 3.8).
Lung One cohort study52 and nine case-control studies53-62 inves-tigated red meat and lung cancer.
Figure 4.3.2 Red meat and colorectal cancer;cohort studies
Willet 1990 Women 1.81 (1.17–2.80)
Bostick 1994 Women 0.96 (0.80–1.14)
Giovannucci 1994 Men 2.20 (1.24–3.91)
Singh 1998 4.51 (0.38–53.27)
Chen 1998 Men, NAT rapid 2.57 (0.78–8.84)
Chen 1998 Men, NAT slow 0.88 (0.45–1.75)
Tiemersma 2002 Men 3.44 (0.83–14.18)
Tiemersma 2002 Women 1.42 (0.22–9.00)
English 2004 1.23 (0.88–1.73)
Summary estimate 1.43 (1.05–1.94)
Relative risk (95% CI)
Relative risk, per time/week
1 50.2 0.5 2 9
Figure 4.3.3 Red meat and colorectal cancer;cohort studies
Pietinen 1999 1.05 (0.74–1.48)
Norat 2005 1.49 (0.91–2.43)
Larsson 2005 Women 1.43 (1.05–0.95)
Summary estimate 1.29 (1.05–1.59)
Relative risk (95% CI)
Relative risk, per 100 g/day
1 50.2 0.5 2
Figure 4.3.4 Red meat and colorectal cancer; cohortstudies: dose response
Kinlen 1983 Men
Kinlen 1983 Women
Giovannucci 1994 Men
Bostick 1994
English 2004
0 105 15
Red meat (times/week)

122
P A R T 2 • E V I D E N C E A N D J U D G E M E N T S
The single cohort study showed increased risk for the high-est intake group when compared to the lowest, with an effectestimate of 1.6 (95% CI 1.0–2.6; p value for trend < 0.014),based on 158 cases.52
Seven case-control studies showed increased risk for thehighest intake group when compared to the lowest,53-58 60 61
which was statistically significant in four.54 55 60 61 One studyreported non-significant decreased risk59 and one studyshowed no effect on risk.62 All except the latter study adjust-ed for smoking.
The general mechanisms through which red meat couldplausibly cause cancer are outlined below.
There is limited evidence, mostly from inconsistentcase-control studies, suggesting that red meat is acause of lung cancer.
PancreasSeven cohort studies63-69 and four case-control studies46 70-72
investigated red meat and pancreatic cancer.Six cohort studies showed increased risk for the highest
intake group when compared to the lowest,63-65 67-69 whichwas statistically significant in one,64 and two of the studiesalso had statistically significant tests for trend.65 67 One studyreported a non-significant increased risk that was very closeto no effect.66 Meta-analysis was possible on two studies, giv-ing a summary effect estimate of 1.00 (95% CI 0.95–1.05)per 20 g/day, with no heterogeneity.63 66 However, the twoincluded studies were not typical. The effect estimates for thehighest intake group when compared to the lowest in theother five cohort studies were 1.45 (95% CI 1.19–1.76),64
1.73 (95% CI 0.99–2.98; with a statistically significant testfor trend),65 2.4 (95% CI 1–6.1; with a statistically signifi-cant test for trend),67 1.1 (95% CI 0.9–1.2),68 and 1.4 (95%CI 0.4–4.8) for men and 2.7 (95% CI 0.8–8.9) for women.69
All of the case-control studies showed increased risk forthe highest intake group when compared to the lowest,46 70-
72 which was statistically significant in three.46 71 72 Meta-analysis was possible on three case-control studies, giving asummary effect estimate of 1.11 (95% CI 1.08–1.15) per 20g/day, with no heterogeneity.46 71 72
The general mechanisms through which red meat couldplausibly cause cancer are outlined below. In addition, boththe secretory function of the pancreas and cell turnover with-in the pancreas are altered by the types of foods eaten.73
Amino acids and fatty acids stimulate more pancreatic secre-tions than do carbohydrates.74
Evidence from cohort studies is less consistent thanthat from case-control studies. There is limitedevidence suggesting that red meat is a cause ofpancreatic cancer.
EndometriumOne cohort study75 and seven case-control studies46 76-81
investigated red meat and endometrial cancer.The single cohort study showed a non-significant increased
risk for the highest intake group when compared to the low-est, with an effect estimate of 1.10 (95% CI 0.70–1.73).75
Five case-control studies showed increased risk for thehighest intake group when compared to the lowest,46 76-79
which was statistically significant in two.77 78 Two studiesshowed non-significant reduced risk.80 81 Meta-analysis waspossible on six studies, giving a summary effect estimate of1.20 (95% CI 1.03–1.39) per 50 g red meat/day, with mod-erate heterogeneity.46 76-80
The general mechanisms through which red meat couldplausibly cause cancer are outlined below.
The evidence, mostly from case-control studies, issparse. There is limited evidence suggesting that redmeat is a cause of endometrial cancer.
The Panel is aware that since the conclusion of the SLR, onecase-control study82 has been published. This new informationdoes not change the Panel judgement (see box 3.8).
General mechanismsThere are several potential underlying mechanisms for anassociation between red meat consumption and cancer,including the generation by stomach and gut bacteria ofpotentially carcinogenic N-nitroso compounds. Some redmeats are also cooked at high temperatures, resulting in theproduction of heterocyclic amines and polycyclic aromatichydrocarbons (box 4.3.4). Haem promotes the formation of N-nitroso compounds and also contains iron. Free iron canlead to production of free radicals (box 4.3.3). Iron overloadalso activates oxidative responsive transcription factors,pro-inflammatory cytokines, and iron-induced hypoxiasignalling.83
Figure 4.3.5 Processed meat and colorectal cancer;cohort studies
Philips 1975 2.05 (1.50–4.06)
Goldbohm 1994 Men 1.84 (0.85–3.97)
Goldbohm 1994 Women 1.66 (0.82–2.36)
Bostick 1994 Women 1.51 (0.72–3.17)
Gaard 1996 Women 3.50 (1.02–11.95)
Gaard 1996 Men 1.98 (0.70–5.59)
Kato 1997 Women 1.09 (0.59–2.02)
Pietinen 1999 Men 1.20 (0.75–1.92)
Tiemersma 2002 Men 1.00 (0.51–1.95)
Tiemersma 2002 Women 0.80 (0.43–1.50)
Flood 2003 Women 0.97 (0.73–1.28)
Wei 2003 Men 1.27 (0.87–1.85)
Wei 2003 Women 1.32 (0.95–1.83)
English 2004 1.50 (1.11–2.02)
Chao 2005 Men 1.11 (0.80–1.54)
Chao 2005 Women 1.16 (0.85–1.58)
Norat 2005 1.42 (1.09–1.85)
Relative risk (95% CI)
Relative risk, highest vs lowest exposure category
1 20.50.2 5

123
C H A P T E R 4 • F O O D S A N D D R I N K S
4.3.5.1.2 Processed meatThe variation in definitions for processed meat used by dif-ferent studies (see chapter 4.3.1) is likely to contribute tothe observed heterogeneity.
ColorectumFourteen cohort studies8-10 14-19 21 27 69 84 85 and 44 case-controlstudies investigated processed meat and colorectal cancer.
Twelve cohort studies showed increased risk for the high-est intake group when compared to the lowest (figure4.3.5),8-10 14-19 21 27 69 85 which was statistically significant inthree.9 14 15 85 One study reported non-significant decreasedrisk and one study reported that there was no effect on risk.84
Meta-analysis was possible on five studies, giving a summaryeffect estimate of 1.21 (95% CI 1.04–1.42) per 50 g/day,with low heterogeneity (figures 4.3.6 and 4.3.7). What het-erogeneity there is could be explained by the disparity in cat-egory definitions between studies, as well as by improvedadjustment for confounders in recent studies. A dose-response relationship was also apparent from cohort studiesthat measured in times/day (figure 4.3.8).
The majority of case-control studies showed increased riskwith increasing intake of processed meat. Because of theabundant prospective data from cohort studies, case-controlstudies were not summarised.
These data are supported by a recently published meta-analysis of 14 cohort studies, which reported a summaryeffect estimate of 1.09 (95% CI 1.05–1.13) per 30 g/day.25
The general mechanisms through which processed meatcould plausibly cause cancer are outlined below.
There is a substantial amount of evidence, with a dose-response relationship apparent from cohort studies.There is strong evidence for plausible mechanismsoperating in humans. Processed meat is a convincingcause of colorectal cancer.
The Panel is aware that since the conclusion of the SLR, fivecohort28 30 32 86 87 and two case-control studies36 88 have beenpublished. This new information does not change the Paneljudgement (see box 3.8).
OesophagusTwo cohort studies89 90 and eight case-control studies40 41 43
44 49 50 91-94 investigated processed meat and oesophagealcancer.
Both cohort studies showed non-significant increased riskfor the highest intake groups when compared to the lowest.89
90 The effect estimates were 1.24 (95% CI 0.73–2.1)90 and1.6 (95% CI 0.4–6.9).89 Both analyses adjusted for age,smoking, and alcohol.
Six case-control studies showed increased risk for the high-est intake groups when compared to the lowest,43 44 49 50 91-
93 which was statistically significant in one.93 Two studiesshowed non-significant reduced risk.40 41 94
The general mechanisms through which processed meatcould plausibly cause cancer are outlined below.
Figure 4.3.6 Processed meat and colorectal cancer;cohort studies
Goldbohm 1994 1.69 (1.10–2.58)
Pietinen 1999 0.99 (0.79–1.24)
Chao 2005 Men 1.40 (1.04–1.88)
Chao 2005 Women 1.14 (0.64–2.05)
Norat 2005 1.30 (0.93–1.80)
Larsson 2005 Women 1.13 (0.85–1.51)
Summary estimate 1.21 (1.04–1.42)
Relative risk (95% CI)
Relative risk, per 50 g/day
1 50.2 0.5 2
Figure 4.3.7 Processed meat and colorectal cancer;cohort studies: dose response
Choa 2005 Men
Choa 2005 Women
Goldbohm 1994 Men
Goldbohm 1994 Women
0 200100 300
Processed meat (g/day)
Figure 4.3.8 Processed meat and colorectal cancer;cohort studies: dose response
Giovannucci 1994 Men
Bostick 1994 Women
English 2004
0 0.40.2 10.6 0.8
Processed meat (times/day)

124
P A R T 2 • E V I D E N C E A N D J U D G E M E N T S
There is limited evidence, mostly from case-controlstudies, suggesting that processed meat is a cause ofoesophageal cancer.
The Panel is aware that since the conclusion of the SLR, onecohort study51 has been published. This new information doesnot change the Panel judgement (see box 3.8).
Lung Four cohort studies52 69 95 96 and 10 case-control studies33 55-
57 59 97-104 investigated processed meat and lung cancer.Three cohort studies reported non-significant increased
risk for the highest intake group when compared to the low-est.69 95 96 One study reported no effect on risk.52 95 Meta-analysis was possible on two of the studies, giving asummary effect estimate of 1.03 (95% CI 0.92–1.16) perserving/week, with no heterogeneity.52 All four cohort stud-ies adjusted for smoking.
Six case-control studies reported increased risk for thehighest intake group when compared to the lowest,33 56 57 59
99 100 102-104 which was statistically significant in two.100 102
Four studies reported non-significant decreased risk.55 97 98 101
All of the studies adjusted for smoking.The general mechanisms through which processed meat
could plausibly cause cancer are outlined below.
There is limited, inconsistent evidence suggesting thatprocessed meat is a cause of lung cancer.
Stomach cancer Eight cohort studies,51 69 105-110 21 case-control studies,49 111-
132 1 cross-sectional study,133 and 1 ecological study134 inves-tigated processed meat and stomach cancer.
Five cohort studies showed increased risk for the highestintake group when compared to the lowest,51 106-108 110 whichwas statistically significant in one.51 Two studies reportednon-significant decreased risk105 109; and one showed noeffect on risk in men and non-significant decreased risk inwomen.69 Meta-analysis was possible on all eight cohortstudies, giving a summary effect estimate of 1.02 (95% CI1.00–1.05) per 20 g/day, with no heterogeneity.
Thirteen case-control studies showed increased risk for thehighest intake group when compared to the lowest,49 113 117
119-121 124-132 which was statistically significant in seven.120 125
128-132 Three studies showed decreased risk,118 122 123 whichwas statistically significant in one118; and one showed noeffect on risk.116 Four other studies reported no significantdifference between mean intakes in cases and controls.111 112
114 115 Meta-analysis was possible on nine studies, giving asummary effect estimate of 1.13 (95% CI 1.01–1.25) per 20 g/day, with high heterogeneity.49 117-119 121 123 128-130
A dose-response relationship is apparent from case-controlbut not cohort data.
The single ecological study reports a statistically significantcorrelation between increased processed meat and stomachcancer risk.134
The general mechanisms through which processed meatcould plausibly cause cancer are outlined below.
The evidence is inconsistent. There is limited evidencesuggesting that processed meat is a cause of stomachcancer.
The Panel is aware that since the conclusion of the SLR, onecohort135 and two case-control studies136 137 have been pub-lished. This new information does not change the Panel judge-ment (see box 3.8).
Prostate Four cohort studies138-141 and six case-control studies142-147
investigated processed meat and prostate cancer.All four cohort studies showed increased risk for the high-
est intake group when compared to the lowest,138-141 whichwas statistically significant in two.139 141 Meta-analysis waspossible on all four cohort studies, giving a summary effectestimate of 1.11 (95% CI 0.995–1.25) per serving/week,with high heterogeneity. Heterogeneity was caused by vary-ing size, not direction, of effect.
Two of these studies reported separately on advanced or aggressive cancer. Both showed increased risk withincreasing intake of processed meat,138 141 which was statis-tically significant in one.141 Meta-analysis was possible onboth studies, giving a summary effect estimate of 1.09 (95%CI 0.98–1.22) per serving/week, with moderate hetero-geneity.
Four case-control studies showed non-significantdecreased risk with increasing intake of processed meat143-
145 147; two showed non-significant increased risk.142 146 Meta-analysis was possible on five case-control studies, giving asummary effect estimate of 1.01 (95% CI 0.98–1.04) perserving/week, with low heterogeneity.143-147 The generalmechanisms through which processed meat could plausiblycause cancer are outlined below.
There is limited evidence from sparse and inconsistentstudies suggesting that processed meat is a cause ofprostate cancer.
The Panel is aware that since the conclusion of the SLR, twocohort studies148 149 have been published. This new informationdoes not change the Panel judgement (see box 3.8).
General mechanismsNitrates are produced endogenously at the low pH in thestomach and are added as preservatives to processed meats,both of which may contribute to N-nitroso compound pro-duction and exposure. N-nitroso compounds are suspectedmutagens and carcinogens.150 Many processed meats alsocontain high levels of salt and nitrite. Some processed meatsare also cooked at high temperatures, resulting in the pro-duction of heterocyclic amines and polycyclic aromatichydrocarbons. Red meat contains haem iron. Haem promotesthe formation of N-nitroso compounds and also containsiron. Free iron can lead to production of free radicals (box4.3.3).

125
C H A P T E R 4 • F O O D S A N D D R I N K S
4.3.5.2 Poultry The evidence was too limited in amount, consistency, orquality to draw any conclusions.
4.3.5.3 Fish, shellfishColorectumNineteen cohort studies8-10 14-18 21 23 69 85 151-161 and 55 case-control studies investigated fish and colorectal cancer.
Nine cohort studies showed decreased risk for the highestintake group when compared to the lowest,8 15-17 21 69 85 154
157 158 160 which was statistically significant in two.15 16 Eightstudies showed non-significant increased risk.9 10 18 23 151-153
155 156 159 One study showed no effect on risk14 and one studyreported that there was no statistically significant associa-tion.161 Meta-analysis was possible on seven cohort studies,giving a summary effect estimate of 0.96 (95% CI 0.92–1.00)per serving/week, with low heterogeneity.8 9 14 18 21 158 160
Because of the abundant prospective data from cohortstudies, case-control studies were not summarised.
Heterogeneity may be partially explained by varying def-initions of fish in different studies that included fresh and/orsalted or dried fish. It is also possible that high fish intakeis associated with low meat intake, which is a potential con-founder that has not been adjusted for.
It is biologically plausible that fish n-3 polyunsaturatedfatty acids (PUFAs) protect against cancer. Fish oils reducetumours in animal studies.162 Likely mechanisms are thoughtto revolve around their role in reduction of n-6 PUFA-derivedeicosanoid biosynthesis (eicosanoids promote inflammation)and direct inhibition of COX-2 (cyclooxygenase-2, an enzymeinvolved in the production of prostaglandins), which is alsoimplicated in the cancer process (see Chapter 2). This mech-anism, though plausible, is not well supported.163 Alternativesuggestions include the relatively high selenium or vitaminD content of fish.
A substantial amount of data is available but theresults are inconsistent, and residual confounding bymeat could not be excluded. There is limited evidencesuggesting that eating fish protects against colorectalcancer.
The Panel is aware that since the conclusion of the SLR, sixcohort28 30 164 165 and two case-control studies33 166 have beenpublished. This new information does not change the Paneljudgement (see box 3.8).
4.3.5.3.1 Cantonese-style salted fishNasopharynxOne cohort study167 and 21 case-control studies161-188 inves-tigated Cantonese-style salted fish (box 4.3.5) intake inadults and nasopharyngeal cancer. Sixteen case-control stud-ies168 170-174 177-179 181 188-193 investigated intake in childhoodand 10 case-control studies168 171-174 177 188 189 194 195 investi-gated intake in infancy (less than 3 years).
Adult intakeThe single cohort study showed increased risk for the high-est intake group when compared to the lowest. Intake was
assessed in the 1960s, 1970s, and 1980s. The p value fortrend for the association between each decade’s intake andincreased risk was < 0.001, 0.014, and 0.21, respectively.
Seventeen of the case-control studies showed increasedrisk for the highest intake group when compared to the low-est,169-178 182-188 which was statistically significant in nine.170
172 173 176 178 182 185-188 One study showed a non-significantdecreased risk168; three studies reported that there was noassociation.179-181 Meta-analysis was possible on nine stud-ies, giving a summary effect estimate of 1.28 (95% CI1.13–1.44) per serving/ week, with high heterogeneity (fig-ure 4.3.9). Heterogeneity was related to size, and not direc-tion, of effect.
Figure 4.3.9 Salted fish and nasopharyngeal cancer;case control
Yuan 2000 1.73 (0.66–4.52)
Lee 1994 1.17 (0.85–1.61)
Zheng 1994 2.50 (1.63–3.85)
Sriamporn 1992 1.35 (1.06–1.72)
Yu 1989 1.10 (1.00–1.21)
Yu 1986 1.31 (1.13–1.51)
Weiming 1995 1.71 (1.08–2.70)
Cai 1996 1.06 (1.00–1.02)
Zou 1999 1.32 (1.13–1.54)
Summary estimate 1.28 (1.13–1.44)
Relative risk (95% CI)
Relative risk, per time/week
1 50.1
Figure 4.3.10 Salted fish and nasopharyngeal cancer;case-control studies
Ward 2000 0.80 (0.52–1.24)
Yuan 2000 1.82 (0.86–3.86)
Armstrong 1998 4.22 (2.23–7.99)
Lee 1994 4.40 (0.72–26.76)
Zheng 1994 4.07 (0.36–45.80)
Zheng 1994b 17.20 (2.28–104.79)
West 1993 1.30 (0.67–2.52)
Sriamporn 1992 2.50 (1.20–5.20)
Yu 1989 1.80 (0.90–3.60)
Yu 1986 7.50 (0.88–63.89)
Ning 1990 2.20 (1.30–3.71)
Ye 1995 5.00 (1.27–19.72)
Ye 1995b 2.00 (0.88–4.56)
Cai 1996 1.32 (0.98–1.77)
Chen 1994 5.51 (1.74–17.44)
Wang 1993 8.99 (1.60–50.44)
Zou 1999 3.04 (1.66–5.69)
Relative risk (95% CI)
Relative risk, highest vs lowest exposure category
10.01 100

126
P A R T 2 • E V I D E N C E A N D J U D G E M E N T S
Childhood intakeFifteen case-control studies that investigated the intake ofsalted fish at 10 years of age showed increased risk for thehighest intake group when compared to the lowest,168 170 172-
174 177-179 181 188-193 which was statistically significant in 8170
172 173 177-179 188 190 (figure 4.3.10). One study showed a non-significant decreased risk.171 Meta-analysis was possible on9 studies,171 173 174 177 178 181 188-190 giving a summary effectestimate of 1.35 (95% CI 1.14–1.60) per serving/week, withhigh heterogeneity. Heterogeneity was related to size, andnot direction, of effect.
Nine case-control studies that investigated the intake ofsalted fish at 3 years of age showed increased risk for thehighest intake group when compared to the lowest,171-174 177
188 189 194 195 which was statistically significant in five.172 173
177 188 195 One study showed no effect on risk.168 Meta-analy-sis was possible on five studies,171 173 174 177 189 giving a sum-mary effect estimate of 1.42 (95% CI 1.11–1.81) perserving/week, with moderate heterogeneity. Heterogeneitywas related to size, and not direction, of effect.
A dose-response relationship is apparent from case-controldata (figure 4.3.11). Cohort and case-control data suggest adelayed and/or cumulative effect from eating Cantonese-style salted fish.
General mechanisms Evidence suggests that high intake of nitrate and nitrosaminefrom salted fish accounts for some of this increased risk ofnasopharyngeal cancer development. Nitrosamines areknown mutagens and animal carcinogens that induce genemutation. The N-nitrosamines are a large group of com-
pounds with a common carcinogenic mechanism.150 Saltedfish has been shown to contain N-nitrosamines, with thehighest levels in salted fish from areas with the highest mor-tality from nasopharyngeal cancer.196 197 The variation innitrosamine content of salted fish may contribute to hetero-geneity in assigning risk to salted fish consumption in dif-ferent geographic locations. There is also some evidence thatgenotype interacts with the risk associated with salted fishintake, particularly the gene for the cytochrome P450enzyme, CYP2E1.192 198
Evidence from several case-control studies isconsistent and shows a dose-response effect. There isevidence for plausible mechanisms. Cantonese-stylesalted fish is probably associated with increased risk ofnasopharyngeal cancer.
4.3.5.4 EggsThe evidence was too limited in amount, consistency, orquality to draw any conclusions.
4.3.5.5 Foods containing vitamin DColorectumEleven cohort studies17 24 154 199-210 and 17 case-control stud-ies investigated total vitamin D and/or dietary vitamin D andcolorectal cancer. Four cohort studies investigated plasma orserum vitamin D.22 210-212
Dietary vitamin DTwelve estimates from 11 cohort studies reported analysesof the highest intake groups compared to the lowest.17 154 199-
206 Six of these showed non-significant decreased risk154 199-
202 205; 2 studies reported no effect on risk17 205; and 4 studiesshow non-significant increased risk.203 204 206 Meta-analysiswas possible on 9 studies that investigated dietary vitaminD, giving a summary effect estimate of 0.99 (95% CI0.97–1.00) per 100 IU/day, with moderate heterogeneity.17
154 199 202 204-206 209 210
Serum or plasma vitamin DAll four cohort studies showed non-significant decreased riskfor the highest intake groups when compared to the lowest.22
210-212 Effect estimates were 0.73 (stated as non-signifi-cant)211; 0.4 (95% CI 1–1.4; serum 25-hydroxyvitamin D)and 1.1 (95% CI 0.4–3.2; serum 1,25 hydroxyvitamin D)212;0.6 (95% CI 0.3–1.1; serum 25-hydroxyvitamin D) and 0.9(95% CI 0.5–1.7; serum 1,25 hydroxyvitamin D)210; and 0.53(95% CI 0.27–1.04).22
Because of the abundant prospective data from cohortstudies, case-control studies were not summarised.
The effects of vitamin D and calcium are strongly interre-lated because both are growth restraining, both induce dif-ferentiation and apoptosis in intestinal cells, and calcium-mediated effects are strongly dependent on vitamin D lev-els. Data from observational studies are probably hamperedby the fact that total levels of the biologically active form arenot only dependent on diet but also on supplements and UVexposure of the skin.
Figure 4.3.11 Salted fish and nasopharyngeal cancer;case-control studies: dose response
Zou 1999
Cai 1996
Ye 1995
Yu 1986
Yu 1989
Sriamporn 1992
Zheng 1994b
Lee 1994
Yuan 2000
0 42 86
Salted fish, times/week

127
C H A P T E R 4 • F O O D S A N D D R I N K S
The evidence on vitamin D was inconsistent. There islimited evidence suggesting that foods containingvitamin D, or better vitamin D status, protect againstcolorectal cancer.
The Panel is aware that since the conclusion of the SLR, twocase-control studies166 213 have been published. This new infor-mation does not change the Panel judgement (see box 3.8).
4.3.5.6 Foods containing ironColorectumFour cohort studies214-217 and 23 case-control studies inves-tigated iron intake and colorectal cancer. One cohort studyinvestigated haem iron intake.218
The four cohort studies showed increased risk for the high-est intake group when compared to the lowest,214-216 218
which was statistically significant in two.214 218 Effect esti-mates were 1.17 (95% CI 0.6–2.3)216; 3.35 (95% CI1.74–6.46; colon cancer)214; and 2.18 (95% CI 1.24–3.86;proximal colon cancer).218 One study reported a non-signif-icant higher intake in cancer cases (18.4 mg) than in con-trols (17.4 mg).215 The other reported that mean iron intakeswere similar between male colon cancer cases, rectal cancercases, and male sub-cohort cases (13.2, 13.3, and 13.2 mgper day, respectively), and between female colon cancercases, rectal cancer cases, and female sub-cohort cases (11.4,11.6, and 11.7 mg/day, respectively).217
Data suggest that the effect may be limited to proximalcancer cases and attenuated in distal cancer. Two studiesreported results separately for proximal and distal colon can-cer cases.214-218 The effect estimates for the former were 1.44(95% CI 1.23–1.69)214 and 2.18 (95% CI 1.24–3.86),218 and1.03 (95% CI 0.8–1.32)214 and 0.90 (95% CI 0.45–1.81) forthe latter.218
Because of the abundant prospective data from cohortstudies, case-control studies were not summarised.
It is biologically plausible that iron increases colorectalcancer risk due to its catalytic activity on the formation ofreactive oxygen species. Haem promotes the formation of N-nitroso compounds and also contains iron. Free iron can leadto production of free radicals (box 4.3.3). However, this rolehas not been confirmed in animal studies. Another hypoth-esis is that dietary haem induces colonic cytotoxicity andhyperproliferation.26 Iron overload also activates oxidativeresponsive transcription factors, proinflammatory cytokines,and iron-induced hypoxia signalling.83
The evidence is sparse, of poor quality, andinconsistent. There is limited evidence suggesting thatfoods containing iron are in general a cause ofcolorectal cancer. (Also see chapter 4.3.5.1.1 forevidence on red and processed meat, which areclassified as convincing causes of colorectal cancer.)
The Panel is aware that since the conclusion of the SLR, twocohort studies87 219 have been published. This new informationdoes not change the Panel judgement (see box 3.8).
4.3.5.7 Smoked foodsStomach Seventeen case-control studies116 118 220-235 and two ecologicalstudies236 237 investigated smoked foods and stomach cancer.
Fourteen case-control studies showed increased risk for thehighest intake group when compared to the lowest,118 220 221
224-235 which was statistically significant in 11.118 224-234 Onestudy reported non-significant decreased risk222 and 2 stud-ies reported no effect on risk.116 223 More than half of theeffect estimates were greater than 1.5. None of the studiesadjusted for infection with Helicobacter pylori.
One ecological study reported a statistically significantincreased risk with higher intake of smoked foods236; theother reported decreased risk, though one constituent ofsmoked food (3,4-benzopyrene) was associated withincreased risk.237
Heterogeneity may be partly explained by variationbetween studies in the definition of smoked foods — somewere specific to smoked meats and most included meats.
Smoked foods, particularly meats, may contain polycyclicaromatic hydrocarbons, depending on the fuel burned toproduce the smoke.238 Smoked meats are also often saltedor cured, meaning that they are likely to raise endogenousproduction of N-nitroso compounds in the stomach (box4.3.4).
There is limited evidence from case-control andecological studies, some of which were of poor quality,that smoked foods are causes of stomach cancer.
The Panel is aware that since the conclusion of the SLR, threecase-control studies136 137 239 have been published. This newinformation does not change the Panel judgement (see box3.8).
4.3.5.8 Grilled (broiled) or barbecued(charbroiled) animal foods
Stomach Three cohort studies240-242 and 12 case-control studies inves-tigated grilled (broiled) and barbecued (charbroiled) foodsand stomach cancer.
Two cohort studies showed increased risk for the highestintake group when compared to the lowest,240 242 which wasstatistically significant in one.242 One study reported a non-significant reduced risk.241 Effect estimates were 1.67 (pvalue for trend < 0.05)242; 1.77 (95% CI 0.59–5.33) forgrilled (broiled) fish and 2.08 (95% CI 0.97–4.46) for grilled(broiled) meat240; and 0.84 (95% CI 0.55–1.29).241 None ofthe studies adjusted for H pylori infection.
Eight case-control studies showed increased risk for thehighest intake group when compared to the lowest,126 129 130
233 243 245-247 which was statistically significant in seven. Onestudy reported a statistically significant decreased risk121;two studies reported non-significant decreased risk220 248;and one study stated that there was no significant effect onrisk.244
Charring or cooking meats over open flame generates het-erocyclic amines and polycyclic hydrocarbons, which maycause cancer (box 4.3.4).

128
P A R T 2 • E V I D E N C E A N D J U D G E M E N T S
There is limited, inconsistent evidence, mostly fromcase-control studies, that grilled (broiled) orbarbecued (charbroiled) animal foods are causes ofstomach cancer.
4.3.6 Comparison with previous report
The panel responsible for the previous report judged thatdiets relatively high in red meat were probable causes of col-orectal cancer, and noted a pattern whereby red meat was apossible cause of cancers of the pancreas, breast, prostate,and kidney.
The previous report considered methods of production,preservation, processing, and preparation (including cook-ing). Cured meats were judged to be a possible cause of col-orectal cancer; and grilled, barbecued, and fried meats, andother foods to be a possible cause of colorectal cancer; andgrilling (broiling) and barbecuing (charbroiling) to be a pos-sible cause of stomach cancer. Processed meat was not iden-tified as such. The evidence on Cantonese-style salted fishwas judged to be convincing for nasopharyngeal cancer. Thepanel noted that the risk was highest when this food is eatenfrequently in early childhood. This Report concluded the evi-dence to be probable, in view of the paucity of prospectivedata
Since the mid-1990s, the results of cohort studies havestrengthened the evidence on red meat and processed meatas causes of colorectal cancer.
4.3.7 Conclusions
The Panel concludes: The evidence on red meat and processed meat is strongerthan in the mid-1990s. Epidemiological evidence on othermethods of preserving and preparing meats and other ani-mal foods is sparse, and the overall evidence remains sug-gestive, at most. The evidence on poultry, fish, and eggs isgenerally insubstantial.
The evidence that red meats and processed meats are a cause of colorectal cancer is convincing. Cantonese-stylesalted fish is a probable cause of nasopharyngeal cancer.This finding does not apply to any other type of fish product. Cantonese-style salted fish is also subject tofermentation.
There is limited evidence suggesting that fish, and alsofoods containing vitamin D, protect against colorectal can-cer. There is limited evidence suggesting that red meat is acause of cancers of the oesophagus, lung, pancreas andendometrium; that processed meat is a cause of cancers ofthe oesophagus, lung, stomach and prostate; and that foodscontaining iron are a cause of colorectal cancer. There is alsolimited evidence that foods that are grilled (broiled), bar-becued (charbroiled), and smoked are a cause of stomachcancer. The evidence comes mostly from meat preserved orprepared in these ways.
Meat, as mentioned above, is likely to be relatively highin animal fats. For discussion of the role of animal fats on
cancer, see chapter 4.4. Meat may also be energy dense. Fordiscussion on the role of energy-dense foods on weight gain,overweight, and obesity, and the role of weight gain, over-weight, and obesity in the risk of some cancers, see Chapters6 and 8.

129
C H A P T E R 4 • F O O D S A N D D R I N K S
Milk and products made from milk, such as cheese, butter,ghee, and yoghurt, have been consumed ever since suitableanimals were domesticated. Whole milk and cheese andyoghurt made from whole milk have a high proportion ofenergy from fat and from protein, although the absoluteconcentrations in liquid milk are lower than those in cheesedue to the higher water content. They also contain anumber of vitamins, including retinol and riboflavin, andminerals, particularly calcium. In countries whereconsumption of milk and dairy products is high, these arethe main sources of calcium. Low-fat dairy products retainall of the protein, the water-soluble vitamins, and themineral content. However, the fat-soluble vitamins aresignificantly reduced. Low-fat milk or whole milk issometimes fortified with vitamins A and D.
Until the late 19th century, milk from animals was used asa substitute for human milk for feeding infants. Adults didnot usually consume such milks; if they did, it was in lowamounts. Populations that kept milk-giving animalsconsumed other dairy products. From the early 20thcentury, a number of factors were responsible for cow’s milkbecoming almost a staple food in the USA and someEuropean countries. These included the industrialisation ofcattle farming; the identification of milk as a basic food,especially for children; and the development of refrigerationtechniques and ultra-heat treated packaging. Dried milk isnow a common ingredient in many processed foods.
Overall, the Panel judges that the evidence on milk anddairy products, and on calcium, shows that their impacton the risk of cancer varies in different tissues.
The Panel judges as follows: Milk probably protects against colorectal cancer. There islimited evidence suggesting that milk protects againstbladder cancer. There is limited evidence suggesting thatcheese is a cause of colorectal cancer. Diets high incalcium are a probable cause of prostate cancer; and thereis limited evidence suggesting that high consumption ofmilk and dairy products is a cause of prostate cancer.
The strongest evidence, corresponding to judgements of‘convincing’ and ‘probable’, shows that milk probablyprotects against colorectal cancer, and that diets high incalcium are a probable cause of prostate cancer.
Milk and dairy products are important components of dietsin some but not all parts of the world. Until recently in his-tory, milk from several ruminant animals was used as a par-tial substitute for or in addition to human milk; but thesemilks were usually consumed infrequently and, if at all, laterin childhood or by adults. In countries where milk-givinganimals were raised, their products were consumed in theform of cheese, butter, ghee, and in fermented form asyoghurts or in combination with alcoholic drinks.
4.4 Milk and dairy products
MILK, DAIRY PRODUCTS, AND THE RISK OF CANCER
In the judgement of the Panel, the factors listed below modify the risk of cancer. Judgements are graded according to the strength of the evidence.
DECREASES RISK INCREASES RISK
Exposure Cancer site Exposure Cancer site
Convincing
Probable Milk1 4 Colorectum Diets high in calcium2 3 Prostate
Limited — Milk1 Bladder Milk and dairy products2 Prostatesuggestive Cheese4 Colorectum
Substantialeffect on risk None identifiedunlikely
1 Milk from cows. Most data are from high-income populations, where calcium can be taken to be a marker for milk/dairy consumption. The Panel judges that a higherintake of dietary calcium is one way in which milk could have a protective effect.
2 Effect only apparent at high calcium intakes (around 1.5 g/day or more). Evidence for milk and dairy products (but not calcium) was derived only from data forcountries with populations that have high calcium and dairy consumption.
3 Includes diets that naturally contain calcium and that contain foods fortified with calcium. See box 4.10.1.4 Although both milk and cheese are included in the general category of dairy products, their different nutritional composition and
consumption patterns may result in different findings.
For an explanation of all the terms used in the matrix, please see chapter 3.5.1, the text of this section, and the glossary.

130
P A R T 2 • E V I D E N C E A N D J U D G E M E N T S
From the late 19th century, consumption of cow’s milkgreatly increased in the USA, the UK, and some otherEuropean countries. This was a result of a massive increasein dairy farming supported by new techniques such as con-densation, drying, and cooling. In the 20th century,consumption was further boosted by pasteurisation anddoorstep delivery, the decline of breastfeeding, and the com-mon view that modified cow’s milk is a suitable food forinfants and an excellent food for young children. Dried milkis a mainstay of programmes of food aid to impoverishedcountries. However, populations living outside North Americaand northern Europe have until recently consumed little milkas such, and dairy products consumed are in the form ofyoghurt or products derived from it. This may be due to thelimited capacity to digest lactose beyond infancy observed inthese populations. Yoghurt is fermented, which lowers lactoseconcentration, and is therefore better tolerated.
Reports in the early part of the 20th century of differentforms of malnutrition in young children, which documenteda requirement for high amounts of animal protein to curethese conditions, supported the categorisation of milk, eggs,and meat as protective foods. By contrast, reports publishedsince the 1960s have identified whole milk and dairy prod-ucts, which have a high proportion of energy from fat and sat-urated fatty acids, as foods that contribute to the pathogenesisof coronary heart disease. More recently, some reports con-cerned with the prevention of osteoporosis in Western pop-ulations have recommended high intakes of calcium.
This chapter is concerned with milk and its products. Theevidence on milk is on milk from cows, and the evidence oncheese is from all sources. It does not consider human milkor infant formula. For human milk, see chapter 4.11. Nor doesit consider soya drinks or other plant-derived alternatives. Forsoya drinks, see chapter 4.2. For butter, see chapter 4.5.
Calcium is included here because in countries where milkand dairy products are important in diets, these are the mainsources of what is a generally high intake of calcium. Dietarycalcium also comes from bones when these are consumed(small or tinned fish, for example, and in stews), egg shells,and from some plant foods. In many countries, plant foodsare the main source of calcium. See chapters 4.1, 4.2, and 4.4.
4.4.1 Definitions, sources
Milk is produced by all mammal species to suckle theiryoung. It has evolved to be the ideal nourishment for mam-malian infants of each species and, in normal conditions,contains all the nutrients they need at that stage of theirlives. Although all mammal species produce milk, only a feware employed widely as milk producers, and they are allruminants. Milk from other species must be modified beforefeeding to infants to allow for their limited capacity tometabolise and excrete nitrogenous compounds and salts inearly life.
Ruminant animals have a large, multichambered stomachthat contains microbes, which allows them to ferment cel-lulose and extract nutrients from green and dried grasses.Some species or breeds (notably European cows) have been
bred to produce copious amounts of milk. Around the world,other bovine animals used to supply milk include zebu cowsin Asia, water buffalo in Asia and some parts of Europe, andyaks, although usually only in the mountainous regions inAsia. Goats and sheep are also important and widespreadmilk-producing animals, as well as camels, which live in aridclimates around the world. In some areas of the world, otheranimals such as horses, old- and new-world camels, and rein-deer are locally important.
Fresh milk can be consumed raw (untreated) or, as is com-mon in many high-income countries, pasteurised (see chap-ter 4.9.3). Milk is also commonly processed into a widevariety of foods including cream, concentrated milks,cheese, fats such as butter and ghee, and fermented foodssuch as yoghurt.
4.4.2 Composition
Milk and dairy products in whole form have a high propor-tion of energy from fat and protein, and contain some vita-mins and minerals.1 The precise composition varies betweenspecies and breeds, and with the nature of their feed. Sheepand yak milks are particularly high in protein; buffalo, sheep,and yak milks are high in fat. Typical whole cow’s milk con-tains 3.4 g protein and 3.6 g fat per 100 g.1 Reduced fat(semi-skimmed) and low-fat (skimmed) milks are producedfrom whole milk, and the foods made from these milks havea correspondingly lower fat and fat-soluble vitamin contentthan those made from whole milk.
Around two thirds of the fatty acids in cow’s milk are sat-urated. Polyunsaturated fatty acids make up less than 4 percent of milk fat (see chapter 4.5.2). Fat accounts for half ofthe energy in whole milk. Milk contains all the essentialamino acids in the appropriate proportions for humans (seechapter 4.10.1).
The only significant carbohydrate found in milk is thedisaccharide lactose. Milk products such as cheese andyoghurt contain varying amounts of lactose. Hard cheesescontain only traces, soft cheeses 2–3 per cent, yoghurts 4 percent, compared to 5 per cent found in whole milk; this isbecause cheese and yoghurt have been fermented by bacte-ria used in the production of these foods.
Milk, cheese, and yoghurt contain high levels of calcium(box 4.4.1). They are also sources of riboflavin and vitaminB12, and full-fat dairy products are sources of retinol, andto a lesser extent, other fat-soluble vitamins. Milk also con-tains several growth factors and hormones, though these areprobably digested in the stomach. However, milk consump-tion has been shown to elevate circulating levels of insulin-like growth factor.
4.4.3 Consumption patterns
Consumption of milk and dairy products throughout theworld is highly variable. The overall global average of around5 per cent of available dietary energy2 conceals wide varia-tions. The range is from 10–15 per cent of dietary energy in

131
C H A P T E R 4 • F O O D S A N D D R I N K S
the USA and some European countries to less than 0.5 percent in some African and Asian countries.
4.4.4 Interpretation of the evidence
4.4.4.1 GeneralFor general considerations that may affect interpretation ofthe evidence, see chapters 3.3 and 3.5, and boxes 3.1, 3.2,3.6 and 3.7
‘Relative risk’ (RR) is used in this Report to denote ratiomeasures of effect, including ‘risk ratios’, ‘rate ratios’, ‘haz-ard ratios’, and ‘odds ratios’.
4.4.4.2 SpecificPatterns and ranges of intake. Most studies are carried outin high-income countries where consumption of cow’s milkand its products is high, and where the main dairy productconsumed is milk.
Classification. Studies usually do not make any distinctionbetween dairy products, such as cheeses from differentsources and with different compositions.
4.4.5 Evidence and judgements
The full systematic literature review (SLR) is contained onthe CD included with this Report.
4.4.5.1 Milk and dairy productsProstate Ten cohort studies,4-15 13 case-control studies,16-29 and 2 eco-logical studies30 31 investigated milk and dairy products andprostate cancer; 16 cohort studies,5-8 10 12 14 32-40 11 case-con-trol studies,21 26 27 41-51 and 11 ecological studies30 31 52-61
investigated milk.
Milk and dairy productsSeven cohort studies showed increased risk with increasedintake of milk and dairy products,4 6 8-11 13 15 which wasstatistically significant in two.6 10 Two studies showed non-significant decreased risk5 12 14; and one study showed noeffect on risk.7 Meta-analysis was possible on eight studies,giving a summary effect estimate of 1.06 (95% confidenceinterval (CI) 1.01–1.11) per serving/day, with moderateheterogeneity.4-12
Five of these cohort studies reported separately onadvanced/aggressive prostate cancer.5 7 9 10 12 Two studiesshowed increased risk with increased intake of milk anddairy products,9 10 which was statistically significant in one.9
Three studies showed non-significant decreased risk.5 7 12
Meta-analysis was possible on four studies, giving a sum-mary effect estimate of 1.00 (95% CI 0.94–1.06) per serv-ing/day, with low heterogeneity.5 7 10 12 The study that couldnot be included in the meta-analysis was inconsistent withthis result, reporting an effect estimate of 2.35 (95% CI1.29–4.26) per serving/day increase (dry weight).9
Eight case-control studies showed increased risk withincreased intake of milk and dairy products,16 19-21 23 24 26 28
which was statistically significant in one. 28 Four studiesshowed non-significant decreased risk17 18 22 25 27; and onestudy reported that there was no statistically significanteffect on risk.29 Meta-analysis was possible on five relative-ly high-quality studies, giving a summary effect estimate of1.03 (95% CI 0.99–1.07) per serving/day, with low hetero-geneity.16-20
One ecological study showed no significant association,with an age-adjusted correlation coefficient of -0.49.30 Oneother ecological study reported no statistically significanteffect.31
There are many separate exposures being measured with-in this broad category, which may explain the observed het-erogeneity.
A dose-response relationship is apparent from cohort dataon all prostate cancer, but not from cohort data onadvanced/aggressive prostate cancer or case-control data.
MilkSix cohort studies showed increased risk with increasedintake of milk,6 8 33 36 37 39 which was statistically significantin one.6 Three studies showed no effect on risk32 34 35 and onestudy showed non-significant decreased risk.14 The remain-ing six studies did not report quantified results, but statedresults were not statistically significant.5 7 10 12 38 40 Meta-analysis was possible on eight studies, giving a summaryeffect estimate of 1.05 (95% CI 0.98–1.14) per serving/day,with low heterogeneity.6 8 14 32-36
Six studies reported separately on advanced/aggressiveprostate cancer.7 12 33 36 39 40 Three studies showed increasedrisk with increased intake of milk, with effect estimates of1.30 (95% CI 1.04–1.61) per serving/day36; 2.8 (in menaged 72.5 years or less, for the highest intake groups com-pared to the lowest, with no CI reported)33; and an increasedrisk with a p value for trend of 0.005.39 Three studies didnot report quantified results but stated that there was no sig-nificant association.7 12 40
In countries with high intakes of milk and dairy products, theseare the main source of calcium. Most of the epidemiologicalstudies reviewed here are from those countries.
Calcium is found in plant as well as in animal foods, but it is lesseasily absorbed. Other animal sources include small fish (wheneaten with their bones) and meat (when rendered on the bone instews). Plant sources include green vegetables, nuts, and pulses(legumes).1 3
Calcium is the most abundant mineral in the body and is themajor mineral constituent of bones. It is central to a variety offunctions in the body, such as bone metabolism, nerve and mus-cle activity, and the control of cell differentiation and prolifer-ation. Calcium metabolism is controlled by various factors,including vitamin D and related hormonal compounds formedby the liver and kidney, necessary for the absorption of calciumfrom foods, and its regulation in the body.
Box 4.4.1 Foods containing calcium

132
P A R T 2 • E V I D E N C E A N D J U D G E M E N T S
Seven case-control studies showed increased risk withincreased intake of milk,27 41-44 47-51 which was statisticallysignificant in three (including the single relatively high qual-ity study).41 43 44 47 Two studies showed non-significantdecreased risk21 45; one study reported no effect on risk46 andone study stated that there was no significant association butdid not present results.26 Meta-analysis was possible on sixrelatively low quality studies, giving a summary effect esti-mate of 1.08 (95% CI 0.98–1.19) per serving/day, with mod-erate heterogeneity.21 27 42-45
Ten ecological studies reported correlations in the direc-tion of increased risk.31 52 54-61 One study did not provide aquantified result, but stated there was no statistically sig-nificant association.53 One study showed a non-significantdecreased risk in areas of increased intake.30
Milk could plausibly cause prostate cancer through theactions of calcium (see chapter 4.4.5.1.1). Also, consump-tion of milk increases blood levels of insulin-like growth fac-tor-1, which has been associated with increased prostatecancer risk in some studies.62 63
The evidence is inconsistent from both cohort andcase-control studies. There is limited evidencesuggesting that milk and dairy products are a cause ofprostate cancer.
The Panel is aware that since the conclusion of the SLR, twocohort studies64 65 and one case-control study66 have been pub-lished. This new information does not change the Panel judge-ment (see box 3.8).
4.4.5.1.1 MilkColorectumThirteen cohort studies67-82 and 36 case-control studies inves-tigated milk and colorectal cancer. Fifteen cohort studies72-
77 79 80 82-101 and 58 case-control studies investigated dietarycalcium.
MilkNine cohort studies showed decreased risk with increasedintake of milk,67 69 70 72 74 75 77 80-82 which was statistically sig-
nificant in two.67 80 Two studies showed non-significantincreased risk69 71 78 79 and two studies showed non-signifi-cant increased risk in women and non-significant decreasedrisk in men.68 73 76 Meta-analysis was possible on four stud-ies, giving a summary effect estimate of 0.94 (95% CI0.85–1.03) per serving/day, with low heterogeneity (figures4.4.1 and 4.4.2).72 73 76 81
In addition, there was a pooled analysis from 10 cohortstudies which included 534 536 participants with 4992 casesof colorectal cancer. Milk intake was related to a statistical-ly significant reduced risk of colorectal cancer (relative risk(RR) 0.78; 95% CI 0.69–0.88) for the highest intake groupwhen compared to the lowest.102
Dietary calcium Eleven studies showed decreased risk with increased intakeof calcium,76 79 82 84 85 90-93 99 which was statistically significantin three.84 85 90 One study showed non-significant increasedrisk74; one study showed non-significant increased risk inwomen and non-significant decreased risk in men73; and twostudies showed non-significant decreased risk of colon can-cer and non-significant increased risk of rectal cancer.88 89
Meta-analysis was possible on 10 cohort studies giving a sum-mary effect estimate of 0.98 (95% CI 0.95–1.00) per 200mg/day, with low heterogeneity (figure 4.4.3).72 73 76 77 79 83
87 90 98 99 When meta-analysis was restricted to eight studiesthat reported results separately for colon cancer, a summaryeffect estimate of 0.95 (95% CI 0.92–0.98) per 200 mg/daywas produced, with no heterogeneity.72 73 76 77 83 87 89 90
Dose-response plotFigure 4.4.4 shows the dose-response curve for dietary cal-cium intake and colorectal cancer incidence.
In addition, there was a pooled analysis from 10 cohortstudies which included 534 536 participants with 4992 cases of colorectal cancer. Dietary calcium intake was related to a statistically significant reduced risk of colorec-tal cancer (RR 0.86; 95% CI 0.78–0.95) for the highest
Figure 4.4.2 Milk and colorectal cancer: cohort studies:dose response
Ma 2001 Men
McCullough 2003 Women
McCullough 2003 Men
Keamey 1996 Men
0 10.5 1.5
Milk (servings/day)
Figure 4.4.1 Milk and colorectal cancer; cohort studies
Keamey 1996 Men 0.80 (0.57–1.11)
Gaard 1996 Women 1.05 (0.74–1.49)
Gaard 1996 Men 0.98 (0.86–1.11)
Ma 2001 Men 0.64 (0.35–1.19)
McCullough 2003 Women 1.08 (0.86–1.36)
McCullough 2003 Men 0.86 (0.72–1.01)
Summary estimate 0.94 (0.85–1.03)
Relative risk (95% CI)
Relative risk, per serving/day
1 50.2 0.5 2

133
C H A P T E R 4 • F O O D S A N D D R I N K S
intake group when compared to the lowest.102
Because of the abundant prospective data from cohortstudies, case-control studies were not summarised.
Dietary calcium intake can be interpreted as a marker ofdairy intake only in those populations (usually European,Australian, or from the Americas) that consume relativelyregular and large amounts of milk and dairy products. Otherdietary sources of calcium include vegetables, nuts, pulses,and fish or meat cooked on the bone (box 4.4.1).
The general mechanisms through which milk could plau-sibly protect against cancer are outlined below.
The evidence on milk from cohort studies is reasonablyconsistent, supported by stronger evidence fromdietary calcium as a dietary marker. There is evidencefor plausible mechanisms. Milk probably protectsagainst colorectal cancer.
The Panel is aware that since the conclusion of the SLR, threecohort80 103 104 and three case-control studies66 105 106 have beenpublished. This new information does not change the Paneljudgement (see box 3.8).
Bladder cancer Five cohort studies,34 107-111 14 case-control studies,48 112-124
and 1 ecological study56 investigated milk and bladdercancer.
All five cohort studies showed decreased risk withincreased intake of milk,34 107-111 which was statistically sig-nificant in one.108 Meta-analysis was possible on four stud-ies, giving a summary effect estimate of 0.82 (95% CI0.67–0.99) per serving/day, with moderate heterogeneity.34
108-110
Seven case-control studies showed decreased risk withincreased intake of milk,48 112 115-117 121 122 which was statis-tically significant in four.115 117 121 122 Four studies showednon-significant increased risk,113 114 120 123 and three studiesstated that there was no significant association.118 119 124
Meta-analysis was possible on three relatively high-qualitycase-control studies, giving a summary effect estimate of1.00 (95% CI 0.87–1.14) per serving/day, with high het-erogeneity.113-115
A dose-response relationship is apparent from cohort, butnot case-control data.
The single ecological study reported a correlation of 0.45between milk consumption and death from bladder cancer.56
The general mechanisms through which milk could plau-sibly protect against cancer are outlined below.
The evidence is inconsistent and comes mainly fromevidence on dietary calcium. There is limited evidencesuggesting that milk protects against bladder cancer.
General mechanisms — milkThe probable effect of milk in reducing cancer risk is likelyto be mediated at least in part by calcium. Calcium from dietis an import micronutrient, and intracellular calcium direct-ly influences cell growth and apoptosis. Calcium may alsobind to bile and fatty acids, preventing them from damag-ing the intestinal lining.125 Milk includes many bioactive con-stituents, however, which may also play a role.
4.4.5.1.2 CheeseColorectumEleven cohort studies67 68 70 72 74 78-80 82 126-128 and 25 case-control studies investigated cheese and colorectal cancer.
Eight cohort studies showed increased risk with increasedintake of cheese, none of which was statistically significant.67
68 70 72 74 79 80 126 127 Two studies reported non-significantdecreased risk78 82 and one study reported that there was nosignificant association.128 Two meta-analyses were possible
Figure 4.4.4 Dietary calcium and colorectal cancer;cohort studies: dose response
0 1000500 20001500
Dietary calcium (mg/day)
Figure 4.4.3 Dietary calcium and colorectal cancer:cohort studies
Stemmermann, 1990 Men 0.98 (0.91-1.06)
Bostick 1993 Women 0.95 (0.87-1.02)
Martinez 1996 Women 0.95 (0.89-1.01)
Kearney 1996 Men 0.95 (0.85-1.05)
Gaard 1996 Men 0.86 (0.68-1.09)
Gaard 1996 0.98 (0.71-1.36)
Tangrea 1997 Men 1.00 (0.92-1.08)
Terry 2002 Women >=55 years 0.85 (0.75-0.96)
Terry 2002 Women <55 years 0.97 (0.80-1.19)
McCullough 2003 Men 0.95 (0.88-1.02)
McCullough 2003 Women 1.02 (0.93-1.11)
Koh 2004 1.00 (1.00-1.00)
Lin 2005 Women 0.99 (0.90-1.10)
Summary estimate 0.98 (0.95-1.00)
10.5 2
Relative risk (95% CI)
Relative risk, per 200 mg/day

134
P A R T 2 • E V I D E N C E A N D J U D G E M E N T S
on three and two cohort studies, respectively, giving sum-mary effect estimates of 1.14 (95% CI 0.82–1.58) per serv-ing/day72 79 126 and 1.11 (95% CI 0.88–1.39) per 50 g/day,80
82 both with low heterogeneity.Because of the abundant prospective data from cohort
studies, case-control studies were not summarised.No specific mechanism has been identified but cheese
could plausibly cause colorectal cancer through the indirectmechanisms connected to saturated fats. Saturated fatsintake increases insulin production and expression of insulinreceptors on colonic cells.129 Saturated fats can also induceexpression of certain inflammatory mediators associatedwith carcinogenesis.130
Epidemiological evidence for cheese intake is consistent-ly in contrast to the probable protective effect from milk.
The evidence is inconsistent. There is limited evidencesuggesting that cheese is a cause of colorectal cancer.
The Panel is aware that since the conclusion of the SLR, twocohort studies66 103 104 and one case-control study66 have beenpublished. This new information does not change the Paneljudgement (see box 3.8).
4.4.5.2 Diets high in calciumFor evidence on calcium supplements, see chapter4.10.6.4.4.
Calcium is a good marker for dairy intake in Western diets.In areas outside the USA, Europe, and Oceania, dairy prod-ucts are not as widely consumed and the range of calciumintake is smaller (see also box 4.4.1).
Prostate Nine cohort studies,4-8 10 11 131-133 12 case-control studies,18 19
23 24 134-144 and 2 ecological studies145 146 investigated dietarycalcium and prostate cancer.
Seven cohort studies showed increased risk with increasedintake of dietary calcium,4-7 10 11 131 133 which was statistical-ly significant in three.6 10 133 Two studies showed non-signif-icant decreased risk, including the only unadjusted study.8132 Meta-analysis was possible on eight cohort studies, giv-ing a summary effect estimate of 1.27 (95% CI 1.09–1.48)per g/day, with moderate heterogeneity.5-8 10 11 131-133
Four of these cohort studies reported separately onadvanced/aggressive prostate cancer.5 7 10 133 Three studiesshowed increased risk with increased intake of milk anddairy products,7 10 133 which was statistically significant inone.133 One study showed non-significant decreased risk.5
Meta-analysis was possible on all four studies, giving a sum-mary effect estimate of 1.32 (95% CI 1.05–1.64) per g/day,with moderate heterogeneity.5 7 10 133
Six case-control studies showed non-significant decreasedrisk with increased intake of dietary calcium.18 134 136 138-140
143 144 Five studies showed increased risk,19 23 24 135 137 141
which was statistically significant in one19 138; and one otherstudy showed no effect on risk.142 Meta-analysis was possi-ble on three relatively high-quality studies, giving a summaryeffect estimate of 1.16 (95% CI 0.64–2.14) per gram ofcalcium/day, with high heterogeneity.18 19 134
A dose-response relationship was apparent from cohort butnot case-control data.
One ecological study from Germany showed a significantincreased risk of prostate cancer with higher calciumintakes.146 Another study from Taiwan reported a non-significant decreased risk with higher calcium intakes.145
High calcium intake downregulates the formation of 1,25dihydroxy vitamin D(3) from vitamin D, thereby increasingcell proliferation in the prostate.7 Prostate cancer tumoursin rats treated with 1,25 dihydroxy vitamin D(3) were sig-nificantly smaller and presented smaller numbers of lungmetastases.147
The evidence, from both cohort and case-controlstudies, is substantial and consistent with a dose-response relationship. There is evidence for plausiblemechanisms. Diets high in calcium are a probablecause of prostate cancer.
The Panel is aware that since the conclusion of the SLR, twocohort studies64 65 have been published. This new informationdoes not change the Panel judgement (see box 3.8).
4.4.6 Comparison with previous report
The previous report judged that milk and dairy products pos-sibly increase the risk of prostate and kidney cancer. Calciumwas judged possibly not to affect the risk of colorectal can-cer. Since the mid-1990s, more evidence has emerged onprostate cancer, and that for kidney cancer is now incon-clusive.
4.4.7 Conclusions
The Panel concludes:The evidence on the relationship between milk and dairyproducts, and also diets high in calcium, and the risk of can-cer, points in different directions.
Milk probably protects against colorectal cancer; there islimited evidence suggesting that milk protects against blad-der cancer. But there is limited evidence suggesting thatcheese is a cause of colorectal cancer.
Diets high in calcium are a probable cause of prostate can-cer; there is limited evidence suggesting that high con-sumption of milk and dairy products is a cause of prostatecancer.
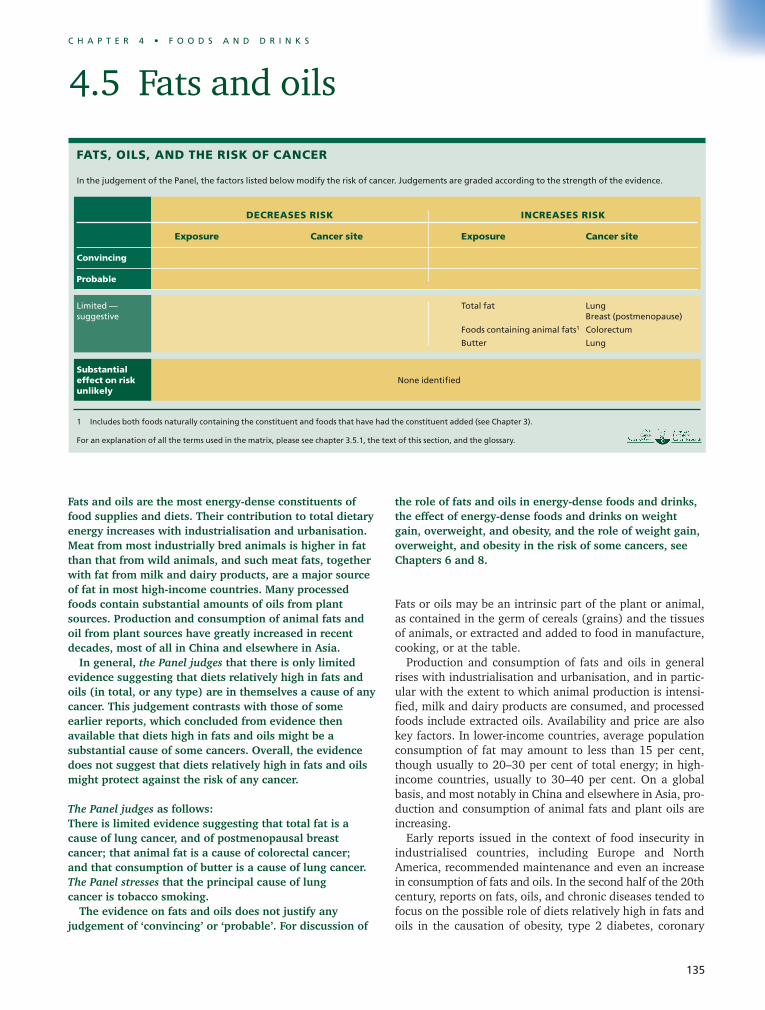
135
C H A P T E R 4 • F O O D S A N D D R I N K S
Fats and oils are the most energy-dense constituents offood supplies and diets. Their contribution to total dietaryenergy increases with industrialisation and urbanisation.Meat from most industrially bred animals is higher in fatthan that from wild animals, and such meat fats, togetherwith fat from milk and dairy products, are a major sourceof fat in most high-income countries. Many processedfoods contain substantial amounts of oils from plantsources. Production and consumption of animal fats andoil from plant sources have greatly increased in recentdecades, most of all in China and elsewhere in Asia.
In general, the Panel judges that there is only limitedevidence suggesting that diets relatively high in fats andoils (in total, or any type) are in themselves a cause of anycancer. This judgement contrasts with those of someearlier reports, which concluded from evidence thenavailable that diets high in fats and oils might be asubstantial cause of some cancers. Overall, the evidencedoes not suggest that diets relatively high in fats and oilsmight protect against the risk of any cancer.
The Panel judges as follows: There is limited evidence suggesting that total fat is acause of lung cancer, and of postmenopausal breastcancer; that animal fat is a cause of colorectal cancer; and that consumption of butter is a cause of lung cancer.The Panel stresses that the principal cause of lung cancer is tobacco smoking.
The evidence on fats and oils does not justify anyjudgement of ‘convincing’ or ‘probable’. For discussion of
the role of fats and oils in energy-dense foods and drinks,the effect of energy-dense foods and drinks on weightgain, overweight, and obesity, and the role of weight gain,overweight, and obesity in the risk of some cancers, seeChapters 6 and 8.
Fats or oils may be an intrinsic part of the plant or animal,as contained in the germ of cereals (grains) and the tissuesof animals, or extracted and added to food in manufacture,cooking, or at the table.
Production and consumption of fats and oils in generalrises with industrialisation and urbanisation, and in partic-ular with the extent to which animal production is intensi-fied, milk and dairy products are consumed, and processedfoods include extracted oils. Availability and price are alsokey factors. In lower-income countries, average populationconsumption of fat may amount to less than 15 per cent,though usually to 20–30 per cent of total energy; in high-income countries, usually to 30–40 per cent. On a globalbasis, and most notably in China and elsewhere in Asia, pro-duction and consumption of animal fats and plant oils areincreasing.
Early reports issued in the context of food insecurity inindustrialised countries, including Europe and NorthAmerica, recommended maintenance and even an increasein consumption of fats and oils. In the second half of the 20thcentury, reports on fats, oils, and chronic diseases tended tofocus on the possible role of diets relatively high in fats andoils in the causation of obesity, type 2 diabetes, coronary
4.5 Fats and oils
FATS, OILS, AND THE RISK OF CANCER
In the judgement of the Panel, the factors listed below modify the risk of cancer. Judgements are graded according to the strength of the evidence.
DECREASES RISK INCREASES RISK
Exposure Cancer site Exposure Cancer site
Convincing
Probable
Limited — Total fat Lungsuggestive Breast (postmenopause)
Foods containing animal fats1 Colorectum
Butter Lung
Substantialeffect on risk None identifiedunlikely
1 Includes both foods naturally containing the constituent and foods that have had the constituent added (see Chapter 3).
For an explanation of all the terms used in the matrix, please see chapter 3.5.1, the text of this section, and the glossary.
136
P A R T 2 • E V I D E N C E A N D J U D G E M E N T S
heart disease, and cancers of some sites. In recent decades,more attention has been given to issues of the nutritionalquality of fats and oils. Distinctions are made between rela-tively saturated (including hydrogenated) fats, such as frommeat, milk, and their products, or from hydrogenated oils inbaked goods and many other processed foods; relativelymonounsaturated oils, notably olive oil; and relativelypolyunsaturated oils, from seeds, nuts, fish, and othersources, some of which — like vitamins — are essential tohuman health and life. These distinctions are to some extentreflected in the studies reviewed here.
For discussion of the role of fats and oils in energy-densefoods and drinks, the effect of energy-dense foods and drinkson weight gain, overweight, and obesity, and the role ofweight gain, overweight, and obesity in the risk of some can-cers, see Chapters 6 and 8.
In this Report, fats and oils are classified as foods. This sec-tion also covers dietary cholesterol, as well as total fat andindividual fatty acids as dietary constituents. Food process-es affecting the composition of fats and oils, such as hydro-genation, are also covered here.
4.5.1 Definitions and sources
Dietary fat is mostly made up of triglycerides (three fatty acidmolecules attached to a glycerol backbone). Triglycerides arelipids, a class of hydrocarbon-containing organic compounds,which also includes cholesterol. Lipids are used by plants,animals, and humans as a means of storing energy, as struc-tural components of cell membranes, and as precursors ofimportant hormones.
Fatty acids are classified as either ‘saturated’ or ‘unsatu-rated’, depending on their chemical structure (see chapter4.5.2), and these differences determine their shape and phys-ical properties. Fats high in saturated fatty acids are gener-ally solid at room temperature, whereas those rich inunsaturated fatty acids are liquid. Trans-fatty acids, formedin a process called hydrogenation (box 4.5.1), are physical-ly more like saturated fats (harder at lower temperatures),and have similar effects on the body.
The term ‘fats’ is often used for fats and for oils. Fats canbe classified according to their source, use, or chemical com-position. Those that are solid or semisolid at ambient tem-perature are generally high in saturated fatty acids and areoften of animal origin; and oils, which are from plant andmarine sources, are liquid at ambient temperature in theirplaces of origin. Palm oil and coconut oil, which are relativelyhigh in saturated fatty acids, are semisolid in temperate cli-mates but liquid in the tropics, where coconut and otherpalm trees grow (also see chapter 4.5.2).
Fats and oils are eaten as part of animal and plant foods,are contained in manufactured foods, used for cooking, andmay be added at the table. Animal fats include tallow, lard,and suet, produced as part of the slaughtering process, andbutter. Margarine and other fat spreads are made from fishand plant oils. Plant oils are extracted from oily fruits (suchas olives), seeds (such as rape and sunflower), nuts (suchas walnuts), and other sources.
A small amount of dietary fat is essential to allow absorp-tion of fat-soluble vitamins (A, D, E, and K) and to providethe essential fatty acids that cannot be made by the body.Fat also helps food to taste more interesting and be morepalatable, for instance in terms of its texture. Linoleic acidand alpha-linolenic acid are the two essential fatty acids, andare found in vegetables, nuts, and seed oils; lower levels arealso found in meat, eggs, and dairy products. Oily fish alsocontain long-chain unsaturated fatty acids, which influenceinflammatory processes in the body.1 For instance, eicos-apentaenoic and docosahexaenoic acids, and related fattyacids, are precursors to prostaglandins, which are hormone-like compounds with diverse effects, including roles in bloodvessel dilation and constriction, blood clotting, and inflam-mation.
Cholesterol is found only in foods of animal origin, suchas cheese, butter, meat, seafood, and egg yolks. Most of thecholesterol in the body is manufactured in the liver, ratherthan coming from these dietary sources.1 The proportion andtypes of saturated and unsaturated fatty acids eaten in thediet are more important influences on cholesterol meta-bolism than the amount of dietary cholesterol.
4.5.2 Composition
The properties of fats and oils are determined by the lengthand structure of the fatty acids they contain. Liquid oils tendto be higher in unsaturated fatty acids, whereas more solidfats have more saturated fatty acids.
Whether or not a fatty acid is saturated depends on thechemical bonds that join together the chain of carbon atomsthat forms the backbone of the molecule. Saturated fattyacids have only single bonds, whereas unsaturated fatty acidshave at least one double bond between two adjacent carbonatoms. Monounsaturated fatty acids have only one doublebond; polyunsaturated fatty acids have two or more doublebonds. The position of the first double bond along the car-bon chain is denoted by an ‘n’. Thus linoleic acid is ‘n-6’ andalpha-linolenic acid is ‘n-3’. These were previously known as‘omega-6’ and ‘omega-3’ fatty acids.
Saturated fatty acids are long and straight, forming wellordered, relatively solid structures. But each of the doublebonds in an unsaturated fatty acid causes the carbon chainto kink; and the more kinks, the less well they pack togeth-er, which means they form less solid structures. So, saturat-ed fats are usually solid at room temperature andunsaturated fats are liquid (oils). Trans-fatty acids are unsat-urated fatty acids formed by a process called hydrogenation,which removes and reconfigures the double bonds, makingthe carbon chain less kinked. Plant oils can be turned intosaturated fats by this process, which, when only partiallycomplete, also leads to production of trans-fatty acids (box4.5.1).
Fats from ruminants (cattle and sheep) contain moresaturated fatty acids than pork or poultry fats. Fats from under the skin have a smaller proportion of saturatedfatty acids than fats stored around the organs. Beef suet is the hardest culinary fat, while chicken, duck, and

137
C H A P T E R 4 • F O O D S A N D D R I N K S
goose fats are semiliquid at room temperature. In general, the amount and type of body fat carried by ani-
mals and poultry depend on how they live, and this deter-mines the fat content of their meat, unless some of it hasbeen removed during processing. Wild and free-living landanimals and birds are lean, and much of their fat is unsatu-rated; domesticated animals and birds carry more fat, whichis higher in saturated fatty acids. Indeed, they are often bredto be more fatty, so that their meat is more succulent.
4.5.3 Consumption patterns
Consumption of total fats and oils varies greatly throughoutthe world. Average intake of total fat is highest (30–40 percent of total energy) in most urbanised and industrialisedregions such as Europe, North America, Australia, and NewZealand, where people consume relatively more meat andmilk and their products. By contrast, fat usually accounts foronly 20–30 per cent of total energy in lower-income parts ofthe world, for instance in Africa, Asia, and Latin America;this may be even lower in rural areas, where people consumelow levels of added fats or oils (for instance, from processedfoods). However, in general, consumption of fats — and inparticular plant oils — is increasing in middle- and low-income countries. (Also see Chapter 1.)
Higher amounts of separated animal fats (as distinct fromthe fats that are naturally components of foods of animal ori-gin) are consumed in high-income countries. Availability istypically highest in North America, northern Europe,Australia, and New Zealand — as much as 10 per cent inparts of northern Europe, compared with less than 0.5 percent in much of Africa and Asia.3
More plant oils are also consumed in high-income coun-tries; availability is highest in North America, southernEurope and some parts of the Middle East, and lowest inparts of Asia and Africa. Greece has the highest level of con-sumption — almost 20 per cent of dietary energy — com-pared with 1.4 per cent in Laos.
Soya bean oil is the most widely consumed oil in theworld, particularly in North America, as well as in someAsian and African countries. Sunflower seed oil is the sec-ond most widely consumed vegetable oil (particularly inEurope, South Africa, Argentina, Chile, and New Zealand)and palm oil the third (particularly in some African, Asian,and Latin American countries, as well as in Australia). Oliveoil is the most widely consumed oil in southern Europe (par-ticularly in Greece, Italy, and Spain). Rapeseed oils are mostcommon in northern Europe and Canada, while groundnutoil is common in some African countries.
The industrial revolution brought significant changes tofood supplies, methods of food production, and hence peo-ple’s diets (see chapter 1.1.3). Before then, it is thought thatthe amounts of n-6 and n-3 oils in diets had been roughlyequal. But with the move to urban–industrial ways of life,vegetable oils (which are predominantly n-6) became cheapand widely available. The ratio of n-6 to n-3 fatty acids isnow thought to be between 10 and 20 to 1 in many high-income countries.4
The World Health Organization recommends limiting aver-age fat intake for populations to between 15 and 30 per centof total daily energy intake, and saturated fatty acids to lessthan 10 per cent.5 In higher-income countries, fat con-sumption as a percentage of total energy has been decreas-ing for some time. However, this is no longer the case insome countries such as the USA, where the percentage ofenergy from fat has started to increase again.
4.5.4 Interpretation of the evidence
4.5.4.1 GeneralFor general considerations that may affect interpretation of the evidence, see chapters 3.3 and 3.5, and boxes 3.1, 3.2,3.6 and 3.7.
‘Relative risk’ (RR) is used in this Report to denote ratiomeasures of effect, including ‘risk ratios’, ‘rate ratios’, ‘haz-ard ratios’, and ‘odds ratios’.
The main single factor that has increasedproduction and consumption of total fatand saturated fatty acids throughout theworld, and therefore the energy density offood supplies, is the industrial process ofhydrogenation, invented at the beginningof the 20th century.2 The hydrogenationprocess was at first used mostly for themanufacture of margarine, but it is nowused in the manufacture of many pro-cessed foods supplied and consumedthroughout the world.
Complete hydrogenation converts theunsaturated fatty acids in oils of plant andmarine origin into saturated fatty acids.This process has two commercial benefits.
First, it greatly extends ‘shelf-life’: oils highin unsaturated fatty acids become rancid,whereas fats high in saturated fatty acids‘keep’ for very much longer. Second, itenables conversion of whatever plant andmarine oils are cheapest at the time into auniform, reliable ingredient and product.
Partial hydrogenation produces trans-fatty acids, which, although chemicallyunsaturated, physiologically behave morelike saturated fatty acids. For instance, highlevels in the diet increase the risk of coro-nary heart disease. Biscuits and other bakedgoods may contain as much as 25 per centor more of their fats in trans form. Smallamounts of trans-fats are also naturally
found in milk and butter. Because of the evidence on coronary
heart disease, regulatory authorities inmany countries now require food manu-facturers to list trans-fatty acid content onnutrition labels of processed foods.Hydrogenated fats found in foods, andlabelled as such, are hydrogenated to avariable extent and may therefore containunspecified amounts of trans-fatty acids.This may not be clear on labels where a dec-laration of trans-fatty acid content is notrequired.
The Panel notes that any effect of trans-fatty acids specifically on the risk of anycancer is not known.
Box 4.5.1 Hydrogenation and trans-fatty acids

138
P A R T 2 • E V I D E N C E A N D J U D G E M E N T S
4.5.4.2 Specific Some considerations specific to fats and oils are as follows.
Patterns and ranges of intake. In high-income countrieswhere most studies are undertaken, average consumption offats and oils is relatively high and variation in consumptionis not great.
Classification. Studies tend to use classifications relevant tocoronary heart disease, some of which may not be relevantto cancer. Thus, they examine not only animal and vegetablefats; meat, fish, and dairy fats; but also saturated and unsat-urated fatty acids; monounsaturated and polyunsaturatedfatty acids; n-3 and trans-fatty acids; and oleic, linoleic, andother individual fatty acids. This makes aggregation andanalysis of intakes of fats and oils as a whole, problematic.
Study design. Practically all studies have analysed con-sumption of fats and oils as an issue of quantity (percentageof total energy intake) rather than nutritional quality (effectof different types of fats and oils). But oils are complex mix-tures of nutrients and other bioactive compounds, some ofwhich may have harmful effects on cancer risk and othersbeneficial effects.
Reporting bias. The use of questionnaires to record con-sumption of fats and oils may change behaviour. As peoplebecome more conscious of what they consume, they tend tounder-report true consumption of foods and drinks theyregard as unhealthy, including fats and oils. So studies usingquestionnaires may disproportionately underestimate con-sumption of fats and oils.
4.5.5 Evidence and judgements
The relationship between the risk of cancer and fat and oilintake may be assessed as weight of fat consumed or adjust-ed for total energy intake, so that fat is assessed as a pro-portion of total dietary energy.6 Where this is the case, thishas been stated below.
The full systematic literature review (SLR) is contained onthe CD included with this Report.
4.5.5.1 Total fats Lung Nine cohort studies,7-15 17 case-control studies,16-32 and 4ecological studies33-36 investigated total fat and lung cancer.(Also see chapter 7.4.)
Six cohort studies showed non-significant increased risk forthe highest intake group when compared to the lowest.7 8 10
11 13 14 Three studies showed decreased risk,9 12 15 which wasstatistically significant in one.15 Meta-analysis was possible ontwo cohort studies, with a summary effect estimate of 1.01(95% confidence interval (CI) 0.94–1.09) per 10 g fat/day,with high heterogeneity.11 12 Six of the studies adjusted forsmoking, including the two studies in the meta-analysis andnot including the statistically significant reduced risk.7-12
Pooled analysis from 8 cohort studies (over 430 000 partici-
pants, followed up for 6 to 16 years, more than 3100 lung can-cer cases) showed a non-significant increased risk of 1.01 (95%CI 0.98–1.05) per 5 per cent daily energy intake from fat.37
Twelve of the case-control studies showed increased risk forthe highest intake group when compared to the lowest,16 17 19-
21 23 25 27-29 31 32 which was statistically significant in five.16 17 19-21 25 31 No studies reported statistically significant reduced risk. Most (12) of these studies adjusted for smoking.16 19-22 24 25 27 30-32
The ecological studies reported mixed results, most of whichwere not statistically significant.33-35 One study reported a sta-tistically significant decreased risk with increased fat intake.36
Although no evidence for plausible mechanisms was found,based on the epidemiological evidence, there is limited evi-dence suggesting that total fat is a cause of lung cancer.
The mixed results from cohort studies contrast withthe more consistent results from other studies. Overall,there is limited evidence suggesting that consumptionof total fat is a cause of lung cancer. The Panelemphasises that the principal cause of lung cancer issmoking tobacco.
Breast (all ages) Nineteen cohort studies,38-60 49 case-control studies,61-118 and10 ecological studies119-128 investigated total fat intake andbreast cancer.
Breast (premenopause)Total fat intake for all ages, and also for premenopausalbreast cancer, did not give any overall indication of effect.
Breast (postmenopause) Nine cohort studies38 40 43 45 50-52 57-59 and 16 case-control stud-ies62-65 75 79 85 86 96-98 101 102 109 110 112 116 reported results specif-ically for postmenopausal breast cancer.
Six cohort studies showed increased risk with increasingfat intake,38 40 45 50-52 59 which was statistically significant inthree.38 51 52 Three studies reported non-significant reducedrisk.40 43 57 58 Meta-analysis was possible on five cohort stud-ies, giving a summary estimate of 1.06 (95% CI 0.99–1.14)per 20 g/day, with moderate heterogeneity.38 43 45 50 51
Pooling project data (7329 invasive postmenopausalbreast cancer cases among 351 821 women) showed areduced risk, with an estimate of 0.96 (95% CI 0.86–1.08)per 25 g increase in energy-adjusted total fat. Menopausalstatus was not an effect modifier on these data.129 130
Eleven case-control studies showed increased risk withincreasing fat intake,62 64 65 75 85 86 96-98 102 109 110 112 which wasstatistically significant in three.97 109 112 Five studies showeddecreased risk,63 64 79 101 116 which was statistically significantin one.64 Meta-analysis was possible on seven control stud-ies, giving a summary estimate of 1.11 (95% CI 1.06–1.16),with no heterogeneity.62 63 65 75 97 102 109
There is also evidence on percentage energy from fat. Thereare four cohort studies131-134; three reported decreased risk.131
133 134 The other study reported non-significant increasedrisk.132 There were two case-control studies; both reported anon-significant decreased risk.135 136
139
C H A P T E R 4 • F O O D S A N D D R I N K S
There is interest in the varying role that different types ofindividual fatty acids might have on breast cancer risk butthere are insufficient data to draw any conclusions. There aremechanistic data connecting polyunsaturated fatty acids andperoxidation.
Higher endogenous oestrogen levels after menopause area known cause of breast cancer.137 138 Dietary fat is relative-ly well established as a cause of increased endogenousoestrogen production.139 Low-fat diets are usually associat-ed with high fibre consumption, which may reduce oestro-gen concentration by decreasing intestinal reabsorption. Inpremenopausal women, there is little evidence that serumoestrogen levels are associated either with fat consumptionor with breast cancer risk.
An alternative mechanism by which dietary fat could influ-ence steroid hormone levels is that increased serum-free fattyacids could displace oestradiol from serum albumin, thusincreasing free oestradiol concentration.140 However, theserum concentration of sex hormone-binding globulin is amore important determinant of the proportion of oestradiolthat can enter the breast epithelial cells. Sex hormone-bind-ing globulin decreases with increasing body mass index andinsulin resistance.
Energy-dense diets (among other factors) lower the ageof menarche. Early menarche is an established risk factor forbreast cancer.
Evidence from prospective epidemiological studies ofdifferent types shows inconsistent effects on the whole,while case-control studies show a significant positiveassociation. Mechanistic evidence is speculative.Overall, there is limited evidence suggesting thatconsumption of total fat is a cause of postmenopausalbreast cancer.
4.5.5.1.1 ButterLungTwo cohort studies8 141 and eight case-control studies142-149
investigated butter and lung cancer. (Also see chapter 7.4.)One cohort study showed statistically significant increased
risk, with a summary estimate of 1.8 (95% CI 1.0–3.0) forthe highest intake group when compared to the lowest.8 Theother cohort study showed non-significant decreased risk inthree independent estimates: 0.92 (95% CI 0.65–1.30) formen; 0.90 (95% CI 0.46–1.77) for women; and 0.94 (95%CI 0.62–1.42) for non-smokers.141 Both studies adjusted forsmoking.
Seven case-control studies showed increased risk for thehighest intake group when compared to the lowest,143-149
which was statistically significant in three.143 145 149 One studyshowed a non-significant decreased risk.142 Most studiesadjusted for smoking.142 143 145-149
Although no evidence for plausible mechanisms was found,based on the epidemiological evidence, there is limited evi-dence suggesting that butter is a cause of lung cancer.
There is a limited amount of inconsistent evidencesuggesting that consumption of butter is a cause oflung cancer.
4.5.5.2 Foods containing animal fat
The evidence here refers to animal fats as foods, for instance,lard, suet, or dripping, and not to estimated amounts con-tained within other foods (such as meat and milk and theirproducts, or baked goods).
ColorectumFive cohort studies investigated animal fats and colorectalcancer.150-154 (Also see chapter 7.9.)
Three studies showed increased risk with increasing intakeof animal fats,150 151 153 which was statistically significant inone,150 and statistically significant when comparing the sec-ond highest intake to the lowest intake group, but not whencomparing the highest to lowest, in another study.151 Onestudy reported no effect on risk152 and another showed non-significant increased risk in men and non-significantdecreased risk in women.154 Meta-analysis was possible onthree studies, giving a summary effect estimate of 1.13 (95%CI 0.92–1.38) per 20 g/day, with moderate heterogeneity.150
152 154
Because of the abundant prospective data from cohortstudies, case-control studies were not summarised.
There is a limited amount of fairly consistent evidencesuggesting that consumption of foods containinganimal fat is a cause of colorectal cancer.
The Panel is aware that since the conclusion of the SLR, onecohort study155 has been published. This new information doesnot change the Panel judgement (see box 3.8).
4.5.6 Comparison with previous report
The panel responsible for the previous report judged it pos-sible that diets relatively high in total fat, and/or in satu-rated/animal fat, were causes of cancers of the lung,colorectum, breast, endometrium, and prostate. That panelnoted a pattern whereby diets relatively high in fat couldincrease the risk of some cancers, and pointed out that fatsand oils are energy-dense, and agreed that energy-densediets increase the risk of obesity, itself a risk factor for somecancers.
The previous report judged that diets high in dietary cho-lesterol were a possible cause of cancers of the lung and pan-creas. The overall evidence now does not support anassociation.
Since the mid-1990s, the results of cohort studies haveoverall tended to weaken the evidence on fats and oils asdirect causes of cancer.
4.5.7 Conclusions
The Panel concludes:Findings from cohort studies conducted since the mid-1990shave made the overall evidence associating fats and oils withthe risk of any cancer somewhat less impressive.
There is limited evidence suggesting that total fat is a

140
P A R T 2 • E V I D E N C E A N D J U D G E M E N T S
cause of lung cancer or postmenopausal breast cancer; thatfoods containing animal fat are a cause of colorectal cancer;and that butter is a cause of lung cancer. The Panel stressesthat the main cause of lung cancer is smoking tobacco.
Fats and oils are the most energy-dense constituents offoods. For discussion of the effect of energy-dense foods onweight gain, overweight, and obesity, and the role of weightgain, overweight, and obesity in the risk of some cancers, seeChapters 6, 7, and 8.

141
C H A P T E R 4 • F O O D S A N D D R I N K S
Sugars are sweeteners and, in some forms, also apreservative and a bulking agent. Free sugars in the solidstate or as syrups are ingredients in many processed foodsand drinks. Nutritionally, sugars supply energy andnothing else. Sugars added to food were a luxury untilsugar from cane became a major international cash crop,beginning in the 16th century. Consumption of addedsugars, from beet as well as cane, and syrups increasedrapidly in industrialised countries in the 19th and 20thcenturies. High-fructose corn syrups are now also usedextensively. Overall consumption of sugars is increasingworldwide, particularly in lower-income countries. Inrecent decades, and in many countries, consumption ofadded sugars, notably in the form of sugary drinks,accounts for a substantial proportion of energy intake.
Salt (sodium chloride) is also a preservative. Thesodium and chloride in salt are essential nutrients in smallamounts. In nature, foods are generally low or very low insodium. Like sugar, salt historically was scarce and aprecious commodity; the Romans paid their labourers insalt, thus the word ‘salary’ (from ‘sal’ for salt).Consumption of salt, in the form of many processed,salted, and salty foods, or of salt added in cooking and attable, remains variable. Consumption of salt, and salty andsalt-preserved foods, is high in some maritime nationssuch as Japan, Portugal, and other Portuguese-speakingcountries. In inland regions, such as landlocked Africancountries, consumption has been very low.
Overall, the Panel judges that the evidence on salt
is confined to stomach cancer, and that on sugars islimited.
The Panel judges as follows: Salt is a probable cause of stomach cancer. Salt-preservedfoods are also a probable cause of stomach cancer. Thereis limited evidence suggesting that sugars are a cause ofcolorectal cancer. Within the remit of this Report, thestrongest evidence, corresponding to judgements of‘convincing’ and ‘probable’, shows that salt, and also salt-preserved foods, are probably causes of stomach cancer.
‘Extrinsic’, mainly refined, sugars amount to a substantialpart of most industrialised food supplies. Sugars and syrupsmanufactured from cane, beet, and corn are profitable cashcrops and are ingredients in many processed foods anddrinks.
There is reason to believe that humans have evolved witha built-in desire for sweet foods. It has also been proposedthat humans have a specific appetite for salt that might haveevolved because sodium is scarce in nature. In any case, assugars and salt become readily available and increasinglycheap, consumption tends to rise. In industrialised settings,sugars and salt are mostly consumed, not in food prepara-tion or at the table, but as ingredients of processed foods.
Reports concerned with undernutrition have often, andstill do, recommend substantial consumption of sugars andfats; their energy density enables quick weight gain, and the
SUGARS AND SALT, AND THE RISK OF CANCER
In the judgement of the Panel, the factors listed below modify the risk of cancer. Judgements are graded according to the strength of the evidence.
DECREASES RISK INCREASES RISK
Exposure Cancer site Exposure Cancer site
Convincing
Probable Salt1 Stomach
Salted and salty foods Stomach
Limited — Foods containing sugars2 Colorectumsuggestive
Substantial effect on risk None identifiedunlikely
1 ‘Salt’ here means total salt consumption, from processed foods, including salty and salted foods, and also salt added in cooking and at the table. 2 ‘Sugars’ here means all ‘non-milk extrinsic’ sugars, including refined and other added sugars, honey, and as contained in fruit juices and syrups.
It does not include sugars naturally present in whole foods such as fruits. It also does not include lactose as contained in animal or human milk.
For an explanation of all the terms used in the matrix, please see chapter 3.5.1, the text of this section, and the glossary.
4.6 Sugars and salt

142
P A R T 2 • E V I D E N C E A N D J U D G E M E N T S
taste preference promotes energy consumption. By contrast,reports concerned with prevention of chronic diseases fre-quently recommend restraint in consumption of sugars. Onereason for this is that sugars are the dietary cause of dentalcaries. Sugars in the amounts typically consumed in manyindustrialised countries have also been identified as a causeof obesity, and therefore also indirectly of obesity-related dis-ease. Reports concerned with nutritional deficiencies oftenrecommend the iodisation of salt supplies, to prevent goitre.Reports concerned with the prevention of chronic diseasesfrequently highlight that salt intakes are usually greatly inexcess of requirements, and recommend substantial decreas-es in salt consumption to prevent hypertension and cardio-vascular disease, especially stroke.
For sugared drinks, see chapter 4.7. For the contributionof sugar to weight gain, overweight, and obesity in drinksor through energy density of foods, see Chapter 8. For salt-ed animal products, including Cantonese-style salted fish, seechapter 4.3.
Non-caloric chemical sweeteners are included here.
4.6.1 Definitions, sources
4.6.1.1 SugarsSugars here means all sugars in the diet. These are mainlybut not only ‘extrinsic sugars’, which include sucrose (com-monly called sugar), maltose, lactose, glucose, and fructose;in foods and drinks, including juices and milk, and in honeyand syrups, including high-fructose corn syrup; refined sug-ars added to food in processing, preparation (cooking), andat the table. ‘Intrinsic’ sugars are those naturally present inwhole foods such as fruits.
Sugars are now cheap and are used widely as sweeteners,preservatives, and bulking agents. They also often have thefunction of making processed starches, fats, and other ingre-dients more palatable. Also see box 4.6.1
Sucrose is refined from sugar beet and sugar cane. Maltoseand glucose are refined predominantly from corn. High-fruc-tose corn syrup comprises a mixture of glucose with fructose,commonly in close to equal amounts, and is now used ingreat quantity in food and drink manufacture, particularly inthe USA.
The amount of sugars in manufactured foods and drinksvaries. Sugared drinks are about 10 per cent by weight addedsugars, and up to 100 per cent of their energy comes fromsugars. Sugars are often added to fruit juices. Jams and otherpreserves are about 60 per cent sugars. Cakes, biscuits (cook-ies), and other baked goods contain starches, fats, and sug-ars in varying proportions. Most chocolate and muchconfectionery are high in sugars. It is often supposed thatalmost all added sugars are contained in obviously sweetfoods: this is not so. Breakfast cereals may contain anythingfrom negligible amounts to 50 per cent sugars. Yoghurts maycontain anything between 0 to 20 per cent sugars; and ready-to-eat desserts even more. Many canned products includeadded sugars. Savoury processed foods, such as soups, pick-les, bread, and buns, often contain significant amounts of sugars.
4.6.1.2 SaltThe term ‘salt’, in common usage, refers to sodium chloride.It is now a cheap commodity. Like sugar, salt is a preserva-tive and a flavour enhancer. Both salt and sugar trap freewater from foods, thus preventing microbial proliferationand spoilage. Salt is found in some rocks and dissolved inseawater, and can be extracted from seawater by evapora-tion. Both sodium and chloride are essential components ofthe diet in small amounts.
Usually most salt in diets is contained in processed foods,with only a relatively small amount added in cooking or atthe table (box 4.6.2). Some traditional diets include sub-stantial amounts of salt-preserved foods, including saltedmeat, fish, vegetables, and sometimes also fruits; and alsosalted foods such as bacon, sausages, and ham, which con-tain from 3 to 5 g of salt per 100 g. Industrialised diets includemany processed foods that are not salt-preserved but con-tribute substantial amounts of salt to the diet, even if theydo not seem salty, as well as more obviously salty foods suchas potato crisps (chips), salted nuts, and other salty snackfoods. Most of the sodium consumed in urban environmentscomes from salt added to processed foods, and thus is beyondthe control of typical consumers. Many foods such as bread,soups, breakfast cereals, and biscuits may contain substantialamounts of salt; anything from 1 to 4 g per 100 g.
4.6.2 Composition
4.6.2.1 Sugars Sugars are simple carbohydrates, and provide 3.75 kilo-calories per gram (see chapter 4.10.1). Sugars are singlemolecules such as glucose, fructose, and galactose (mono-saccharides), or two molecules bound together (disaccha-rides) such as sucrose (fructose and glucose), lactose(glucose and galactose), or maltose (two glucose molecules).
The body metabolises different sugars at different rates;for instance, fructose is absorbed and metabolised moreslowly than either glucose or sucrose. It is also slightly sweet-er than glucose or sucrose, and thus is able to replace themin lower total amounts. Non-caloric chemical sweeteners pro-duce a sweet taste, but are not sugars (box 4.6.3).
There is no dietary requirement for sugars. The World
As indicated in chapter 4.6.4, it is particularly difficult to mea-sure and assess the overall effect of sugars as possible modifiersof the risk of any disease, including cancer. This is partly becauseof inconsistency in the classification of sugars. Sometimes ‘sugar’is equated with sucrose, which has been the chief sugar inhuman diets, but now is less so. Some studies investigate only‘packet’ sugar purchased for use in the home; this is in generala relatively small and diminishing proportion of total sugars con-sumed. Other studies include sugars as found naturally in fruitsand milk.
Box 4.6.1 Sugar, sugars, sugary foods, and drinks

143
C H A P T E R 4 • F O O D S A N D D R I N K S
Health Organization recommends that average consumptionof sugars by populations should be less than 10 per cent oftotal energy.1
4.6.2.2 SaltPure salt, as sodium chloride, contains no metabolisableenergy. Formulated, granulated table salts often includeadditives, such as anti-caking agents, which prevent salt crys-tals from sticking together; potassium iodide, included toprevent iodine deficiency; traces of other sodium compounds(carbonate or thiosulphate); and also sugar, to stabilise thepotassium iodide. Sea salt may be refined to almost puresodium chloride, or unrefined, in which case they mayinclude traces of other minerals, algae, and a few salt-toler-ant bacteria. Salt may also be flavoured, for example withcelery or garlic.
Sodium is essential for the body to function normally. Itis a major electrolyte in extracellular fluid. The body’s sodi-um content and its concentration in body fluids are con-trolled homeostatically to very precise limits; excess sodiumis excreted in the urine. Sodium is also involved in regula-tion of osmolarity, acid-base balance, and the membranepotential of cells. The daily requirement for sodium has beenestimated at around 500 mg for adults. On a pragmatic basis,WHO recommends restricting average salt consumption forpopulations to less than 5 g per day.1
4.6.3 Consumption patterns
4.6.3.1 Sugars Sugars supply on average around 8 per cent of dietary ener-gy worldwide. This figure disguises a wide range of intakes
in different parts of the world. Diets in high-income coun-tries contain roughly twice the amount of sugars as those inlower-income countries. In North America and someEuropean countries, average consumption is around 15–17per cent of dietary energy, with a fairly wide range aroundthis average. In the USA, in the last decades of the 20th cen-tury, many processed foods were reformulated to contain lessfat but more sugars. In some parts of Asia, consumption isnegligible, although globally sugar supplies are increasingrapidly. Children in high-income countries usually obtain ahigher proportion of their daily energy from sugar thanadults.11
Consumption of sugars has generally increased over thelast century, particularly in high-income countries, and alsomore recently in many countries undergoing economic tran-sition in Asia, Africa, the Middle East, and Latin America.
4.6.3.2 SaltThe use of salt as a preservative has generally decreased asindustrial and domestic use of refrigeration has increased(box 4.6.4). But diets containing few salt-preserved foodsmay nevertheless be high in salt.
The average adult daily intake of salt worldwide variesfrom less than 6 g to 18 g. Very high levels of intake arefound in Japan, some parts of China, Korea, Portugal, Brazil,and other Portuguese-speaking countries, where diets con-tain substantial amounts of salt-preserved, salt-pickled, salt-ed, or salty foods. The average adult intake is around 9–12g per day in high-income countries, including Europe andNorth America.
4.6.4 Interpretation of the evidence
4.6.4.1 GeneralFor general considerations that may affect interpretation ofthe evidence, see chapters 3.3 and 3.5, and boxes 3.1, 3.2,3.6 and 3.7.
‘Relative risk’ (RR) is used in this Report to denote ratiomeasures of effect, including ‘risk ratios’, ‘rate ratios’, ‘haz-ard ratios’, and ‘odds ratios’.
4.6.4.2 SpecificClassification. Studies of sugars may be of total sugars; of
As indicated in chapter 4.6.4.2, it is difficult to measure saltintake, or the contribution from separate sources (salty, salted,or salt-preserved foods). The most reliable estimates come frommeasuring the amount of sodium excreted in the urine.
Salt is itself readily identified, although it is sometimes com-bined in studies with other sodium compounds. Some studiesinvestigate only salt added in cooking or at the table, but thisis usually a small proportion of total salt consumption. Resultsfrom such studies are liable to produce different results, com-pared with those from studies that have examined total salt con-sumption.
It has been thought that any effect of salt on stomach can-cer (see chapter 4.6.5.2) is principally the result of regularconsumption of salted and salt-preserved foods, rather than saltas such. This is partly because such foods are a substantial partof traditional Japanese and other Asian diets, where incidenceof stomach cancer has been and still is high. However, the inci-dence of this cancer is also high in countries where traditionaldiets contain substantial amounts of salty as distinct from salt-preserved foods; and the concentration of salt in manyprocessed foods consumed in Europe and North Americaapproaches that of salt-preserved foods.
Box 4.6.2 Salt, and salty, salted, andsalt-preserved foods
Chemical sweeteners such as saccharin, cyclamates, and aspar-tame have been thought to be possible causes of cancer. This isbecause some animal studies have shown that very high dosesof saccharin, in particular, increase the incidence of bladder can-cer in rats. In common with many chemical additives, some sweet-eners can be shown to be carcinogenic in experimental settingsin massive amounts, far greater than humans could consume infoods and drinks.
The evidence from epidemiological studies does not suggestthat chemical sweeteners have a detectable effect on the risk ofany cancer.
Box 4.6.3 Chemical sweeteners

144
P A R T 2 • E V I D E N C E A N D J U D G E M E N T S
sugars added at the table; of sugary foods and/or drinks; ofsucrose; or of added sugars generally; and may or may notinclude those sugars naturally present in foods. Studies usingsuch varying classifications are difficult to compare.Similarly, studies of salt may be of salt added in cookingand/or at the table; of salty or salted foods; or of salt con-sumption as a whole. These studies are also difficult to com-pare. See box 4.6.1 and box 4.6.2.
Measurement. Measurement of salt intake is notoriously dif-ficult, and is best done by measuring the excretion of sodi-um in urine over a 24-hour period. But this method has onlyrarely been used.
Study design. See Classification. Also studies may under-estimate the amounts of sugars and of salt in foods anddrinks consumed outside the home.
Reporting bias. Added sugars are generally regarded asunhealthy, and studies that depend on self-reporting may dis-proportionately underestimate the consumption of sugars.
4.6.5 Evidence and judgements
The full systematic literature review (SLR) is contained onthe CD included with this Report.
The relationship between the intake of sugars and the riskof cancer is often adjusted for total energy intake, meaningthat sugars are assessed as a proportion of total dietary ener-gy.12 Where this is the case, this has been stated.
4.6.5.1 Sugars ColorectumOne cohort study13 and 7 case-control studies14-20 investi-gated sugars as foods and colorectal cancer. Seven cohortstudies21-27 and 16 case-control studies investigated sugarsas nutrients, defined as sucrose or fructose.
Sugars as foodsThe single cohort study stated that there was no associationbetween usually adding sugar to cereals and colorectalcancer.13
All seven case-control studies showed increased risk withincreased sugar intake,14-20 which was statistically significantin two.17 18 The classification of ‘sugars as foods’ varied con-siderably between studies.
Sugars as nutrientsFour cohort studies reported on total sugar intake.21 22 25 26 Onestudy reported a non-significant increased risk for the highestintake group when compared to the lowest, with an effect esti-mate of 1.03 (95% confidence interval (CI) 0.73–1.44).22 Onestudy reported a non-significant lower sugar intake in casesthan controls.21 Two cohort studies stated that there was noassociation between sugar intake and risk.25 26
Three cohort studies reported on sucrose intake.23 24 27 Twocohort studies showed non-significant increased risk whencomparing the highest intake group against the lowest.23 27
Effect estimates were 1.45 (95% CI 0.88–2.39)23 and 1.30(95% CI 0.99–1.69) in men.27 One study reported a non-statistically significant decreased risk (0.89 (95% CI0.72–1.11) in women).27
Freezing and cooling by use of natural iceand snow is a method of food preservationtraditionally available only in cold climatesor in winter in temperate climates. Naturalice refrigeration on an industrial scale firstdeveloped in the late 19th century, whenrefrigerated containers used in trains,ships, and then later trucks, greatlyincreased the production and consumptionof red meat. Domestic freezing, chilling,and refrigeration on a mass scale is a phe-nomenon mostly of the second half of the20th century.
Today, much perishable food is soldfrozen or chilled. Together with thegrowth of industrial refrigeration, domes-tic refrigerators began to be used in theUSA, Australia, and New Zealand on anyscale in the 1920s, and in Europe and Japanmostly since the 1950s. In Japan, for exam-ple, households possessing refrigeratorsincreased from 9 per cent in 1960 to 91 percent in 1970, and 99 per cent in 2004.Supermarkets with freezers, chill cabinets,and domestic refrigerators are now com-
monplace in the cities and towns of tropi-cal countries; poorer rural communities stillrely on drying, fermenting, salting, bot-tling, tinning, and other methods of foodpreservation, as well as their own gardensand farms. It is unlikely that refrigerationitself has any direct effect on the risk ofcancer. Its effects are indirect.
Refrigeration: • Enables consumption of fresh perishable
foods including seasonal vegetables andfruits all year round, as well as of freshmeat.
• Reduces microbial and fungalcontamination of perishable foods,notably cereals (grains) and pulses(legumes).
• Reduces the need for and use of salting,smoking, curing, and pickling asmethods of preserving vegetables,fruits, and meat.
It can therefore be said that refrigeration(including freezing and chilling) indirectly
influences risk of those cancers, the risk of which is affected by the above factors.
Evidence amounting to a judgement of‘convincing’ or ‘probable’ for such factorsis summarised in earlier sections of thischapter, and in Chapter 7, and relates tocancers of the mouth, pharynx, larynx,nasopharynx, oesophagus, lung, stomach,pancreas, liver, and colorectum.
In particular, many studies have noted areciprocal relationship between use ofrefrigeration and consumption of salt andfoods preserved with salt. Meta-analysis ofeight case-control studies2-9 has shown asignificant association between the use ofrefrigeration (usually as gauged by poss-ession of a domestic refrigerator) andreduced risk of stomach cancer.
The one cohort study10 identified mea-sured effects in the Netherlands over a 25-year period, in which almost the entirepopulation had access to commercial anddomestic refrigeration, and did not findany association.
Box 4.6.4 Refrigeration

145
C H A P T E R 4 • F O O D S A N D D R I N K S
Three cohort studies reported separate results for fruc-tose23 24 27; one reported a significant increased risk in menof 1.37 (95% CI 1.05–1.78).27 Two other studies reportednon-significant decreased risk.23 27
Because of the abundant prospective data from cohortstudies, case-control studies were not summarised.
In most, though not all, animal experiments, sucrose andfructose are associated with increased colonic proliferation andaberrant crypt foci. These sugars may interfere with levels ofblood glucose and/or triglycerides, either directly or throughhormones like insulin and others (also see Chapter 2).28
The evidence is hard to interpret. There is limitedevidence suggesting that sugar is a cause of colorectalcancer.
4.6.5.2 Salt Stomach Three cohort studies,10 29 30 21 case-control studies,2 4 31-48
and 12 ecological studies49-60 investigated total salt use andstomach cancer. Two cohort studies10 61 and 13 case-controlstudies4 9 39 43 62-71 investigated salt added at the table; 1cohort study72 and 8 case-control studies4 39 73-78 investigat-ed sodium intake.
Total salt useTwo cohort studies showed increased risk with increased saltintake,10 30 which was statistically significant in one study inmen but not women.30 One study showed statistically sig-nificant decreased risk.29 Meta-analysis was possible on twocohort studies, giving a summary effect estimate of 1.08(95% CI 1.00–1.17) per 1 g/day, with moderate hetero-geneity (figure 4.6.1). The study that could not be included
was inconsistent with this summary, with an effect estimateof 0.53 (95% CI 0.31–0.91) for the highest intake groupwhen compared to the lowest; however, this study did notadjust for other factors.29 The two cohort studies that report-ed increased risk used much more detailed questionnaires toassess salt intake (150 compared to 27 items). They alsoadjusted for a greater number of confounders than the studythat reported decreased risk.
Twelve of the case-control studies showed increased riskwith increased salt intake,2 32 34 35 39 40 42-46 which was statis-tically significant in six.32 40 42-45 None of the studies showedstatistically significant decreased risk. Most other studiesreported either risk estimates close to 1.0 or reported thatthere was no statistical association. Meta-analysis was pos-sible on eight case-control studies, giving a summary effectestimate of 1.01 (95% CI 0.99–1.04) per 1 g/day, with highheterogeneity (figure 4.6.1).
A dose-response relationship was apparent from cohort butnot case-control data.
Seven ecological studies reported increased risk withincreased salt intake,49 52-55 57 58 which was statistically sig-nificant in four.53 54 57 58 The remaining five studies reportedeither a decreased risk with increased salt intake50 56 59 60 orno association,51 none of which was statistically significant.Stomach cancer rates are highest in those areas of the world,such as parts of Asia and Latin America, where diets are tra-ditionally salty due to the regular consumption of meat, fish,vegetables, and other foods preserved by salting, as well asof salty foods.
Salt added at the tableBoth cohort studies reported that there was no significanteffect, and estimates were close to one (1.0) (95% CI0.6–1.6)61 and 0.9 (95% CI 0.56–1.44).10
Twelve case-control studies showed increased risk for thehighest intake group when compared to the lowest,4 9 39 43 62-
64 66-71 which was statistically significant in eight.4 9 43 62-64 67
One other study reported similar intakes in cases andcontrol.65
SodiumThe single cohort study showed a non-significant decreasedrisk.72
Six case-control studies showed increased risk for the high-est intake group when compared to the lowest,39 73-77 whichwas statistically significant in three.39 74 77 Two studiesshowed decreased risk, which was statistically significant inboth.4 78 Meta-analysis was possible on five studies, givinga summary effect estimate of 1.18 (95% CI 1.02–1.38) per1 g/day, with high heterogeneity.39 74-76 78
Interaction with Helicobacter pylori infectionTwo case-control studies that investigated total salt use alsoinvestigated the potential for interaction with H pylori infec-tion (also see box 7.5.1).79 80 One study was suggestive of amultiplicative effect on risk for high salt use and H pylori pos-itive status79; the other stated that there was no association.80
Salt intake may be inversely related to the availability ofrefrigeration both within and between populations. Salt-
Figure 4.6.1 Total salt use and stomach cancer; cohortand case-control studies
Cohort
Van de brandt 2003 1.07 (0.97–1.18)
Tsugane 2004 Men 1.14 (1.08–1.21)
Tsugane 2004 Women 1.01 (0.92–1.11)
Summary estimate 1.08 (1.00–1.17)
Case control
You 1988 1.00 (0.99–1.01)
Nazario 1993 1.17 (1.08–1.27)
Ramon 1993 1.36 (1.01–1.82)
Ye 1998 1.03 (0.99–1.07)
Setiawan 2000 1.02 (0.99–1.04)
Munoz 2001 0.96 (0.93–1.00)
Tsukino 2004 0.98 (0.88–1.10)
Setiawan 2005 1.00 (0.86–1.16)
Setiawan 2005 0.96 (0.99–1.04)
Summary estimate 1.01 (0.99–1.04)
Relative risk (95% CI)
Relative risk, per g/day
1 20.5 0.75 1.5

146
P A R T 2 • E V I D E N C E A N D J U D G E M E N T S
preserved foods may be eaten more by those to whomrefrigeration is not available.
There is evidence from laboratory experiments that highsalt intake damages the lining of the stomach.81 It has alsobeen shown to increase endogenous N-nitroso compoundformation.82 In addition, a high salt diet has been shown tohave a synergistic interaction with gastric carcinogens.82 Itmay only contribute to gastric cancer in subjects who haveH pylori infections and are also exposed to a chemicalcarcinogen.
There is a substantial amount of evidence from studieson total salt use, salt added at the table, and sodiumintake. For total salt use, a dose-response relationshipwas apparent from cohort but not case-control studies.For sodium intake, a dose-response was also apparentfrom case-control studies. The mechanistic evidence isstrong. Salt is a probable cause of stomach cancer.
The Panel is aware that since the conclusion of the SLR, onecohort83 and two case-control studies84 85 have been published.This new information does not change the Panel judgement (seebox 3.8).
4.6.5.2.1 Salted and salty foodsStomach Four cohort studies86-89, 17 case-control studies4 6-8 33 41 45 90-
99 and 1 ecological study100 investigated salted or salty foodsand stomach cancer.
Three cohort studies showed non-significant increased risk with increased salt intake.86 88 89 One study reported that there was no association.87 Meta-analysis was possibleon three cohort studies, giving a summary effect estimate of 1.32 (95% CI 0.90–1.95) per one serving/day with
no heterogeneity (figure 4.6.2).Eleven case-control studies showed increased risk for the
highest intake groups when compared to the lowest,6-8 41 45
91 94-98 which was statistically significant in seven.6-8 45 94-96
Two studies showed non-significant decreased risk.4 99 Fourstudies reported either the same intakes in cases and con-trols or no statistical association.33 90 92 93 Meta-analysis waspossible on four case-control studies, giving a summary effectestimate of 5.2 (95% CI 2.49–10.83) per one serving/day,with high heterogeneity (figure 4.6.2).
A dose-response relationship is apparent from case-control,but not cohort data (figure 4.6.3).
Heterogeneity may be partly explained by variationbetween studies in the precise foods being assessed.
The single ecological study showed non-significantdecreased risk in areas of increased salt consumption.100
The mechanisms through which salt could plausibly causestomach cancer are given above.
The evidence from both case-control and cohortstudies is consistent. A dose-response relationship isapparent from case-control but not cohort studies.There is robust evidence for mechanisms operating inhumans. Salted and salty foods are a probable cause ofstomach cancer.
Figure 4.6.3 Salted/salty foods and stomach cancer; cohortand case-control studies: dose response
Cohort
Galanis 1998
Ngoan 2002
Khan 2004 Men
Khan 2994 Women
Case control
Demirer 1990
Hirayama 1992 Men
Hirayama 1992 Women
Ward 1999
Sriamporn 2002
0 10.6 1.40.2 0.4 0.8 1.2
Salted/salty foods (serving/day)
Figure 4.6.2 Salty/salted foods and stomach cancer;cohort and case-control studies
Cohort
Galaris 1998 1.14 (0.61–2.13)
Ngoan 2002 1.21 (0.68–2.16)
Khan 2004 Men 1.76 (0.58–5.32)
Khan 2004 Woman 6.01 (0.85–42.61)
Summary estimate 1.32 (0.90–1.95)
Case control
Demirer 1990 116.86 (13.16–1037.90)
Hirayama 1992 Men 2.85 (2.13–3.81)
Hirayama 1992 Women 3.53 (2.34–5.34)
Ward 1999 113.13 (3.76–3403.01)
Sriamporn 2002 3.98 (0.65–24.22)
Summary estimate 5.20 (2.49–10.83)
Relative risk (95% CI)
Relative risk, per serving/day
1 20.5 6

147
C H A P T E R 4 • F O O D S A N D D R I N K S
The Panel is aware that since the conclusion of the SLR, twocase-control studies84 85 have been published. This new infor-mation does not change the Panel judgement (see box 3.8).
4.6.6 Comparison with previous report
The judgement of the previous report on sugars and col-orectal cancer was in effect similar to that in this Report.
The previous report judged that salt and also salting areprobable causes of stomach cancer. This judgement is alsomuch the same as that in this Report.
4.6.7 Conclusions
The Panel concludes:Salt is a probable cause of stomach cancer. Salted and saltyfoods are also a probable cause of stomach cancer. There islimited evidence suggesting that sugars are a cause of col-orectal cancer.

148
P A R T 2 • E V I D E N C E A N D J U D G E M E N T S
Water is essential. Without water, people die in a matter ofdays. As well as adequate supplies of water, a major publichealth issue throughout the world is the safety of domesticand other water. Water quality may be compromised bychemical or microbiological contamination.
Fruit juices made from fruits or fruit pulps are oftenconcentrated for storage and transport, then diluted withwater to produce the final product. Sugar and otheringredients are frequently added in this finalreconstitution process. Soft drinks are usually made fromwater, sugar, colourings, flavourings, and mixtures ofherbs and other ingredients, to give a distinctive taste andcharacter. Consumption of branded, carbonated softdrinks, and cola drinks in particular, has increased greatlyin the 20th century, and continues to increase throughoutthe world. The rise is most marked in lower incomegroups.
Tea and coffee are now the main hot drinks consumedworldwide. Both contain stimulants and other bioactiveconstituents, and many people add milk and sugar. A greatvariety of herbal infusions are also drunk, including maté,the traditional hot drink in parts of South America.
Overall, the Panel judges that the direct evidence relatingnon-alcoholic drinks to cancer is contamination of watersupplies with inorganic arsenic and irritation of the oral
cavity by maté, and possibly by other very high-temperature drinks. For evidence relating sugared softdrinks to body fatness, see Chapter 8.
The Panel judges as follows:The evidence that inorganic arsenic in drinking water is acause of lung cancer is convincing. Water contaminated inthis way is probably a cause of skin cancer. Arsenic andarsenic compounds are recognised carcinogens. There islimited evidence suggesting that water contaminated inthis way is a cause of cancers of the kidney and bladder.
Maté, a herbal infusion, as drunk traditionally in partsof Latin America, is probably a cause of oesophagealcancer. Damage caused by the very high temperature ofthe drink, rather than by the herb itself, is judged to beresponsible. There is limited evidence suggesting thatmaté is a cause of cancers of the mouth, pharynx, andlarynx, for the same reason. There is also limited evidencesuggesting that high-temperature drinks are a cause ofoesophageal cancer.
It is unlikely that coffee has any substantial effect on therisk of cancer either of the pancreas or of the kidney.
Within the remit of this Report, the strongest evidence,corresponding to judgements of ‘convincing’ or ‘probable’,shows that inorganic arsenic in drinking water is a cause
WATER, FRUIT JUICES, SOFT DRINKS, HOT DRINKS, AND THE RISK OF CANCER
In the judgement of the Panel, the factors listed below modify the risk of cancer. Judgements are graded according to the strength of the evidence.
DECREASES RISK INCREASES RISK
Exposure Cancer site Exposure Cancer site
Convincing Arsenic in drinking water1 Lung
Probable Arsenic in drinking water1 Skin
Maté2 Oesophagus
Limited — Arsenic in drinking water1 Kidneysuggestive Bladder
Maté2 Mouth, pharynx, larynx
High-temperature drinks Oesophagus
Substantialeffect on risk Coffee: pancreas; kidneyunlikely
1 The International Agency for Research on Cancer has graded arsenic and arsenic compounds as class 1 carcinogens. The grading for this entry applies specifically toinorganic arsenic in drinking water.
2 As drunk traditionally in parts of South America, scalding hot through a metal straw. Any increased risk of cancer is judged to be caused by epithelial damageresulting from the heat, and not by the herb itself.
For an explanation of all the terms used in the matrix, please see chapter 3.5.1, the text of this section, and the glossary.
4.7 Water, fruit juices and other softdrinks, and hot drinks

149
C H A P T E R 4 • F O O D S A N D D R I N K S
of lung cancer and probably a cause of skin cancer. Maté isprobably a cause of oesophageal cancer. It is unlikely thatcoffee has any substantial effect on the risk of eithercancer of the pancreas or of the kidney.
Chapter 4.7 concerns all non-alcoholic drinks. Water, including that contained in drinks and foods, is an
invariable part of all diets. Bottled spring and mineral watersare consumed by people who can afford them. Juices madefrom fruits and water, often sweetened (at first with honeyand then sugar), have been drunk throughout history.Cordials, squashes, and other drinks made mainly fromcolourings and flavourings, with some fruit juices, herbs, orother ingredients added, started to become popular from thebeginning of the 19th century. Carbonated sweet drinks(sometimes known as sodas) such as cola were first mass-manufactured in the USA and are now commonly consumedthroughout the world.
Tea was cultivated and drunk in China for over a thousandyears. Then, from the 18th century, it became commonlydrunk in Britain, and was cultivated in India and other coun-tries, and drunk in other parts of the world. The original teaswere green and drunk without adding milk or sugar.Manufacture of black teas came later; from the 19th centu-ry, teas became the main hot stimulant drink in Britain,almost always drunk with milk and often with sugar added.Coffee was cultivated in and exported to many parts of theworld from the 19th century; it remains the main cash cropin a number of tropical countries such as Ethiopia and Brazil.Coffee is the main hot stimulant drink in the Americas, manyEuropean countries, and also in the Arab world. In someparts of the world, coffee is usually drunk black, with orwithout sugar; in other countries, milk or cream is oftenadded. Chocolate is also consumed as a beverage.
Reports concerned with infectious diseases, especially ofchildhood, usually emphasise the importance of safe watersupplies. Reports concerned with the prevention of chronicdiseases sometimes specify sugared soft drinks as contribu-tors to overweight and obesity. They occasionally recom-mend substantial consumption of water as healthy in itselfand preferable to soft or alcoholic drinks.
Contaminants of water, and also of foods and other drinks,are grouped here with water. High-temperature foods aregrouped here with high-temperature drinks.
For the relationship between sugared drinks and body fat-ness, see Chapter 8.
4.7.1 Definitions, sources
4.7.1.1 WaterWater comes from rain, underground aquifers accessed bywells, springs, and freshwater lakes and rivers.
People cannot live without water, which is vital for the nor-mal functioning of the body. Even mild dehydration (waterloss of 1–2 per cent of the body weight) can produce symp-toms such as dry mouth and headaches. Stopping all fluidintake may cause death in days, the number depending on
the health of the individual and external conditions such astemperature and humidity.
Water can be used as a vehicle to provide fluoride and cancontribute to intakes of essential elements, calcium, iron,and copper, depending on its origin and the piping materi-als used.
The water content of the body is around 70 per cent: men’sbodies contain a higher proportion of water than those ofwomen because women have more body fat, which has min-imal amounts of water. Adults produce an average of around1.5 litres of urine each day and lose an additional litre ofwater through breathing, from the skin by evaporation orsweating, and in the faeces. Approximately 80 per cent ofwater intake comes from drinks; food provides the other 20per cent.
Tap water quality is regulated in most countries based onWorld Health Organization guidelines for drinking waterthat includes tap water and bottled water.1
Around the world, ground, rain, and river waters are alsodrunk, often without first being treated to secure safety. Morethan 1 billion people (around 15 per cent of the world’s pop-ulation) lack access to safe, clean water2 and are at risk ofexposure to water-borne contaminants and infectious dis-eases. Arsenic, the bacterium Helicobacter pylori, and para-sitic schistosomes are among the many contaminants thatmay be found in water supplies. In many low-income coun-tries, access to clean water is limited for the low-incomesegments of the populations and those living in rural areas.
4.7.1.2 Fruit juicesFruit juices include liquids extracted from whole or pulpedfruits. Commercially prepared fruit juices may be pasteurisedto extend shelf-life, and concentrated at source to be recon-stituted before packaging, closer to the point of sale.
4.7.1.3 Soft drinksThe term ‘soft drinks’ is used for a wide range of colouredand flavoured non-alcoholic drinks, usually sold in cans, car-tons, or bottles. They may be carbonated (such as cola drinksor lemonade) or still (such as fruit squashes). Some softdrinks are milk-based (milkshakes and yoghurt drinks).Depending on the ingredients, some soft drinks may be mar-keted with health claims, and are sometimes known as ‘func-tional drinks’ (also see box 4.10.2).
4.7.1.4 Hot drinksThe most common hot drinks currently consumed are teaand coffee. These are infusions (brewed using boiling water)usually drunk hot, sometimes very hot (box 4.7.1). Coffeeis made from ground, roasted coffee beans — the dried seedsof coffee plant berries. The beans naturally contain caffeine.Decaffeinated coffees are produced by various processes,using water, organic solvents, steam, or by interfering withthe expression of the gene coding for caffeine. Instant cof-fee comprises the soluble solids derived from dried, double-brewed coffee. Coffee is a large bush native to Ethiopia,cultivated in many hot and humid climates. The main cof-fee-exporting countries are Brazil, Vietnam, and Colombia.
Although many herbal infusions are known as teas, tea is

150
P A R T 2 • E V I D E N C E A N D J U D G E M E N T S
specifically the infusion of the dried leaves of the plantCamellia sinensis. Green tea is made from leaves that havefirst been cooked, pressed, and dried. To produce black tea,the fresh leaves are withered, rolled repeatedly, allowed toturn deep brown, and then air-dried until they are dark incolour. Tea leaves contain caffeine and theophylline.Decaffeinated teas are produced using similar processes tothose used for coffee. Most tea is grown in Asia.
Maté is a type of herbal tea prepared from the dried leavesof the plant Ilex paraguariensis that has stimulant propertiessimilar to the other methylxanthine-containing drinks (cof-fee and tea).
Herbal and other teas are also consumed cold. Iced teasare popular in the USA and some other countries: these aresugared and considered here as soft drinks.
4.7.2 Composition
4.7.2.1 WaterWater is a molecule comprising hydrogen and oxygen: chem-ically, H2O. Rainwater may contain traces of air pollutants;water from underground aquifers may contain traces of min-erals from surrounding rocks and other surfaces. Groundwater may also be contaminated with natural minerals aswell as with various industrial and agricultural chemicals,some of which are carcinogenic in laboratory conditions (box4.7.2). Mineral water from springs and other sources con-
tains higher trace amounts of various minerals and othersubstances, often detectable to taste. Some spring water isnaturally carbonated. Bottled water is either still or car-bonated, sometimes artificially. The safety of water in termsof chemical and microbial contamination is well regulatedby the WHO programme on chemical safety, but unfortu-nately, monitoring and surveillance in most countries arelimited.
Arsenic residues can arise from agricultural, mining, andindustrial practices, or may occur naturally from volcanicactivity. WHO guidelines recommend that levels of arsenicin drinking water should not exceed 10 µg/l.4 Levels ofarsenic in affected areas may range from tens to hundreds,or even thousands, of micrograms per litre. In unaffectedareas, levels are typically less than 10 µg/l. Inorganic arsenic(arsenate or arsenite) is the form that predominantly cont-aminates drinking water.
Arsenic is classified as a human carcinogen by theInternational Agency for Research on Cancer. Drinking watercontaminated with arsenic is also classed separately as ahuman carcinogen.5
The bacterium H pylori is found in water supplies conta-minated with faeces. It is an established necessary cause ofdistal stomach cancer (see box 7.5.1).
Chronic schistosomiasis (infestation with schistosomes) isa known cause of bladder and liver cancer (see chapters7.16 and 7.8).6 It is caused by contact with water contam-inated by parasite eggs.
Constant mechanical irritation of epithelial surfaces causesinflammation, which predisposes to the development of cancer(see Chapter 2). It has also been suggested that foods and drinkswith chemically irritant components may be a cause of cancersof those sites with which they come into direct contact. Again,there is not much evidence for this theory, with the possibleexception of chilli and stomach cancer (see chapter 4.2).
There is, however, some evidence that some thermally hot(and therefore irritant) drinks are a cause of cancers of thosesites with which they come into direct contact. As shown in thissection, maté, the herbal infusion, is probably a cause of cancerof the oesophagus, and there is limited evidence suggesting thatit is also a cause of other cancers of the oral cavity. This is prob-ably not because of any carcinogen in the herb itself, butbecause of the way the infusion is traditionally drunk in thepampas region within the southern cone of Latin America, innorthern Argentina, Paraguay, and southern Brazil. It is drunkextremely hot from a gourd through a metal straw, which isoften kept rested in the mouth, rather like the stem of a tobac-co pipe.3 There is no substantive evidence that maté preparedin the style of tea, loose or in sachets (bags), affects the risk ofcancer.
There is also limited evidence suggesting that various othervery hot drinks and foods are a cause of cancer of the oesoph-agus when they are consumed regularly. The implications of thisevidence, while so far not strong, suggest that more researchmay be warranted (see chapter 4.7.5.6).
Box 4.7.1 High-temperature, and irritantdrinks and foods
Water contaminants that are causes of cancer are inorganicarsenic (reviewed here) and Helicobacter pylori and schistosomes(see Chapter 7).
Many other contaminants of water are identified as or havebeen thought to be carcinogenic, usually as a result of animaland other experiments, or else as a result of industrial accidentsor gross overuse. These include herbicides and pesticides, fer-tilisers that contain and release nitrates, and disinfectants thatalso produce potentially toxic contaminants such as chlorinat-ed and brominated organic compounds. They also include chem-icals deliberately added to drinking water as public healthmeasures, notably chlorine and fluoride.
These and other industrial, agricultural, and other chemicalsare the subject of tests and regulations for toxicity and safetyin use. Nevertheless, they are often popularly believed to be sig-nificant causes of cancer. This subject is controversial and is like-ly to remain so.
Currently there is no substantial epidemiological evidencethat any of these substances, singly or in combination, as cur-rently regulated and usually consumed in water, or in foods andother drinks, has any significant effect on the risk of any can-cer. The Panel considers that the evidence is insufficient to con-clude that usual intakes of industrial, agricultural, and otherchemicals have an effect on the risk of human cancer. Toxicityand carcinogenicity of pollutants as a result of industrial acci-dents or overuse are outside the scope of this Report.
Box 4.7.2 Contamination of water, and offoods and other drinks
151
C H A P T E R 4 • F O O D S A N D D R I N K S
4.7.2.2 Fruit juicesBottled or canned or otherwise packaged fruit juices aremade from the fruits they contain or from fruit pulp. As wellas added water, they usually also contain some added sug-ars, preservatives, and other additives. They often containtrivial amounts of dietary fibre. Fruit and vegetable juiceshave different nutritional properties from whole fruits andvegetables. For these reasons, the international ‘at least fivea day’ campaign to encourage people to eat more fruits andvegetables (at least five portions per day) recommends thatjuices only count as one portion per day, irrespective of theamount consumed.
4.7.2.3 Soft drinks Soft drinks are made from water, colourings, flavourings, andherbal or other ingredients. They may or may not containfruit juice. They also contain either sugars or, in ‘diet’ form,chemical sweeteners (see chapter 4.6 and box 4.6.3). Theymay or may not be carbonated. The original formulations ofcola drinks contained stimulants from the coca and colaplants. Soft drinks may also include yoghurt and other milkderivatives, as yoghurt drinks or fruit ‘smoothies’, and alsoadded vitamins and minerals. ‘Sports’ drinks contain sugars,electrolytes, and other additives.
4.7.2.4 Hot drinksThe main hot drinks are tea (usually black tea but also greentea, which is often preferred in China) and coffee. Both con-tain various antioxidants and phenolic compounds, some ofwhich have been shown to have anti-cancer properties in lab-oratory conditions.7 They both also contain caffeine (and therelated compound theophylline in tea). There is more caffeinein tea leaves than in coffee beans, but brewed coffee containsmore caffeine than brewed tea. Caffeine and theophylline arebioactive, quickening reaction times, relieving fatigue, andstimulating the cardiovascular and central nervous systems.
Tea and coffee, when drunk without adding milk, cream,sugar, lemon, or honey, contain no energy and trivialamounts of some micronutrients; the bioactive chemicalsthey contain are mentioned above. When these drinks areconsumed frequently, both may be substantial dietarysources of some of these bioactive constituents. Thus, coffeeis a major source of some antioxidants in the US diet.8
4.7.3 Consumption patterns
4.7.3.1 WaterEnvironmental conditions, health, activity levels, and otherfactors determine the amount of water needed, but there isno international recommendation for daily consumption.The Institute of Medicine in the USA recommends 2.7 litresper day total water for women and 3.7 litres for men. TheUK’s Food Standards Agency estimates that most people need to drink at least 1.2 litres of fluids per day. More than half of the world’s population has access to drinkingwater through taps in their homes or outside. Tap water should be regulated to meet international qualityguidelines, such as those prepared by WHO.9
Most people who do not have access to clean drinkingwater live in Asia, sub-Saharan Africa, and some parts ofLatin America. High concentrations of arsenic in drinkingwater have been found in areas of Bangladesh, China, andWest Bengal (India), and also in more localised areas ofArgentina, Australia, Chile, Mexico, Taiwan, China, the USA,and Vietnam. In many of these regions, the drinking watersource is groundwater naturally contaminated by arsenic-rich geological formations.10
4.7.3.2 Fruit juicesThere is little information on the general or local consump-tion of fruit juices.
4.7.3.3 Soft drinksIn 2004, global consumption of soft drinks was estimated at480 000 million litres (including bottled water),11 of whichcola and other carbonated drinks accounted for 40 per cent.In terms of sales, carbonated drinks are the largest single cat-egory. World sales of cola drinks continue to rise, as do morerecently, sales of bottled waters, fruit juices, and ‘function-al drinks’. The USA is the biggest per capita consumer of softdrinks, followed by Mexico and Chile. The USA aloneaccounts for more than a 20 per cent share of the globaltotal. Asia is the fastest growing market for soft drinks: salesare increasing at around 3.5 per cent each year.
Average consumption of soft drinks in the USA is arounda 12-ounce can (about 350 ml) per person/day. Older chil-dren consume about this amount, and sometimes more. Mostof these drinks are sugared. At this level, soft drinks con-tribute a substantial proportion of total sugars intake.
4.7.3.4 Hot drinksAfter water, tea and coffee are the most commonly con-sumed drinks in the world. There are various different meth-ods of preparing these hot drinks depending on culture andpersonal preference. Coffee consumption is high in northernEurope and North America. Low-income countries exportmost of the world’s coffee; high-income countries consumeapproximately seven times as much (per capita) as low-income countries.
Average worldwide consumption of tea is around 0.5 kgper person/year; this is exceeded significantly in severalAsian countries (notably, China, India, and Japan), and inthe UK and Ireland. Worldwide, black tea is the most popu-lar type, although green tea is more commonly drunk in Asia.Maté, as traditionally prepared, is drunk almost exclusivelyin parts of South America.
4.7.4 Interpretation of the evidence
4.7.4.1 GeneralFor general considerations that may affect interpretation ofthe evidence, see chapters 3.3 and 3.5, and boxes 3.1, 3.2,3.6 and 3.7.
‘Relative risk’ (RR) is used in this Report to denote ratiomeasures of effect, including ‘risk ratios’, ‘rate ratios’, ‘hazardratios’, and ‘odds ratios’.
152
P A R T 2 • E V I D E N C E A N D J U D G E M E N T S
4.7.4.2 SpecificClassification. Different types of tea, coffee, and soft drinksare consumed in different cultures. The ways in which teaand coffee are prepared and drunk also vary. For coffee, thisincludes the degree of roasting, the methods of brewing(which determine the strength and composition), and thedifferent substances added. Similarly, tea may be consumedwith or without milk and in different strengths. Associationsseen in one population but not another may reflect someaspect of the drink as consumed in that population ratherthan the drinks themselves. In some studies, fruit juices andbottled waters are included in the definition of soft drinks.
Measurement. Fluid intake is best estimated from urinecollection, but this is rarely done. Instead, estimates areusually made from food frequency questionnaires.
Confounding. In interpreting the results of epidemiologicalstudies of all types of drink, confounding by other habitsshould be considered. For example, heavy consumers of softdrinks, tea, or coffee may also be smokers and drinkers ofalcohol.
People who are physically active often consume more liq-uid than those who are not. Physical activity is therefore a con-founder of the relationship between the volume of fluid drunkand cancer risk, but may not be adequately adjusted for.
Reporting bias. Soft and cola drinks are often identified asunhealthy, and studies that depend on self-reporting maydisproportionately underestimate consumption.
4.7.5 Evidence and judgements
The full systematic literature review (SLR) is contained onthe CD included with this Report.
4.7.5.1 Water The evidence was too sparse or inconsistent to draw any con-clusion about the relationship between water quantity andcancer risk.
4.7.5.1.1 Water-borne contaminants: arsenicEcological studies based on known arsenic concentrations inwater may be interpreted more robustly than for many otherdietary exposures.
Lung Two cohort studies,12-17 2 case-control studies18 19 and 12ecological studies20-30 investigated arsenic in drinking waterand lung cancer.
Both cohort studies showed statistically significantincreased risk of lung cancer for the highest intake groupcompared to the lowest.12-17 Although meta-analysis was notpossible, both studies reported that a dose-response rela-tionship was apparent. One study (in Taiwan) based in apopulation with endemic black foot disease, a manifestationof arsenicosis, reported an effect estimate of 3.29 (95% con-fidence interval (CI) 1.60–6.78) for average arsenic level in
well water.13 The other study reported a quantified effectestimate, which was 3.66 (95% CI 1.81–7.03), but this study(based in Japan) did not adjust for smoking.17
Both case-control studies showed increased risk of lungcancer for the highest intake group compared to the lowest,18
19 which was statistically significant in one.19 The other studydid not report confidence intervals. Effect estimates were3.0118 and 8.9 (95% CI 4.0–19.6).19
Ecological studies were made in populations fromArgentina,27 Belgium,21 Chile,29 China,23 Switzerland,20 andTaiwan,22-26 30 as well as worldwide.28 Eight studies showedincreased risk of lung cancer with increasing levels of arsenicin drinking water,21-25 27 29 30 which was statistically signifi-cant in four.24 27 29 30 Two studies showed decreased risk,20 26
which was statistically significant in one.26 One study report-ed different inconsistent results for men and women (corre-lation coefficients of -0.51 for men and 0.07 for women).28
One study showed that measures to lower arsenic levels indrinking water by using tap water rather than well waterwere associated with a fall in lung cancer rates in a regionof Taiwan with endemic black foot disease.25
The general mechanisms through which arsenic couldplausibly cause cancer are outlined below. In addition, sol-uble arsenic in drinking water induces lung cancers in ani-mal models and causes chronic lung disease.5
The evidence is ample and consistent, both fromcohort and case-control as well as ecological studies.There is a dose-response relationship and the effectsize is relatively large. There is robust evidence formechanisms. The evidence that arsenic is a cause oflung cancer is convincing.
Skin Two cohort studies,31 32 5 case-control studies,33-37 1 cross-sectional study,38 and 11 ecological studies20 22 24 27 29 30 39-43
investigated arsenic in drinking water and skin cancer.Both cohort studies showed non-significant increased risk
with increasing levels of arsenic in the water31 32; however,for one study the increased risk was apparent in women butnot in men.32 Effect estimates were 1.82 (95% CI 0.5–4.66)for women and 0.83 (95% CI 0.17–2.43) for men in Utah,32
and 1.21 (95% CI 1.00–1.47) per 100 µg/l.31
Two case-control studies measured arsenic levels in toe-and fingernails.36 37 Such measures are less subject to errorand bias than some other methods to assess actual exposureto a carcinogen. One study reported a significant increasedrisk for melanoma with a risk estimate of 1.65 (95% CI1.27–2.14) per 100 ng/g36; the other study reported non-sig-nificant increased risk 1.02 (95% CI 0.90–1.17) per 100 ng/gfor basal cell carcinoma and 1.12 (95% CI 0.95–1.32) forsquamous cell carcinoma.37
Two case-control studies that reported on dietary arsenicshowed increased risk with increased intake,33 35 which wasstatistically significant in one.33 One study reported a non-significant decreased risk.34
The cross-sectional study showed a statistically significantincreased risk, with a partially adjusted effect estimate of5.04 (95% CI 1.07–23.8) for > 0.71 versus 0 parts per mil-

153
C H A P T E R 4 • F O O D S A N D D R I N K S
lion average arsenic content in water.38
All 11 ecological studies reported increased risk for skincancer with increased arsenic exposure,20 22 24 27 29 30 39-43
which was statistically significant in 4,24 29 30 40 41 and statis-tically significant in women but not in men in 127; and sig-nificant in men but not women in another study.20 The effectincreased with age (cumulative exposure), where that wasmeasured, and the reported effect estimates were usuallylarge, more than half being greater than 2.5.
The general mechanisms through which arsenic couldplausibly cause cancer are outlined below.
The evidence is consistent, from cohort, case-controland ecological studies. There is robust mechanisticevidence. Arsenic is a probable cause of skin cancer.
Kidney Three cohort studies,32 44 45 one time-series study,46 and nineecological studies20 22 24 27 29 30 40 47 48 investigated arsenic indrinking water and kidney cancer.
All three cohort studies showed increased risk for the high-est intake levels compared to the lowest,32 44 45 which wasstatistically significant in one.45 Effect estimates were 1.49(95% CI 0.67–3.31; adjusted for smoking),44 2.82 (95% CI1.29–5.36),45 and 1.13 (women; confidence intervals notreported) and 1.43 (men; confidence intervals not report-ed).32
The single time-series study reported a statistically signif-icant decreased risk in kidney cancer following the installa-tion of a tap water supply system in an arsenic-endemic areaof Taiwan.46
All nine ecological studies showed increased risk withhigher levels of arsenic in drinking water,20 22 24 27 29 30 40 47 48
which was statistically significant in six.24 27 30 40 48
The general mechanisms through which arsenic couldplausibly cause cancer are outlined below. In addition,arsenic in drinking water is well absorbed in the gastro-intestinal tract, and both inorganic arsenic and its methyl-ated metabolites are excreted in urine.49 Arsenic can modifythe urinary excretion of porphyrins in animals and humans.50
The evidence is sparse. There is limited evidencesuggesting that arsenic is a cause of kidney cancer.
Bladder Six cohort studies,14 17 32 44 45 51 1 time-series study,52 7 case-control studies,18 53-60 and 11 ecological studies20 22 24 29 30 40
47 48 61-64 investigated arsenic in drinking water and bladdercancer.
Four cohort studies showed increased risk for the highestintake levels compared to the lowest,14 17 44 45 which was sta-tistically significant in two.17 45 One study showed non-sig-nificant decreased risk.32 The single cohort study thatmeasured arsenic levels in finger- or toenails reported aneffect estimate of 1.05 (95% CI 0.85–1.29) per 100 ng/g.51
Three case-control studies showed increased risk for thehighest intake levels compared to the lowest,18 56-59 whichwas statistically significant in one.18 Two studies showednon-significant decreased risk,53 55 two studies showed no
effect on risk,54 60 including the single case-control study thatmeasured arsenic levels in finger- or toenails.60
Six ecological studies showed increased risk with higherlevels of arsenic in drinking water; all were statisticallysignificant.22 24 29 30 40 62 64 Two studies reported decreasedrisk,47 61 which was statistically significant in one.47 Onestudy showed a non-significant decreased risk in men and anon-significant increased risk in women.20 Two studies didnot provide quantified results.48 63
The general mechanisms through which arsenic couldplausibly cause cancer are outlined below. In addition,arsenic in drinking water is well absorbed in the gastro-intestinal tract, and both inorganic arsenic and its methyl-ated metabolites are excreted in urine.49 Arsenic can modifythe urinary excretion of porphyrins in animals and humans.50
The evidence is inconsistent. There is limited evidencesuggesting that arsenic is a cause of bladder cancer.
General mechanisms — arsenicArsenic is carcinogenic to humans and causes chromosomalabnormalities.10 It can result in changes in the methylationof oncogenes or tumour-suppressor genes. It also interfereswith the activities of several enzymes of the haem biosyn-thetic pathway. Exposure to arsenite or arsenate results ingeneration of reduced oxygen species (free radicals) in lab-oratory animals and human cells. Arsenic biotransformationis thought to deplete cells of reduced glutathione, leadingto a state of oxidative stress, characterised by decreased scav-enging of free radicals, which can directly damage DNA andinduce cell proliferation.65
There are several compounds suspected to modulate thechronic environmental toxicity of arsenic –- variables thatmay either enhance or suppress its genotoxicity and car-cinogenicity. Among them are nutritional factors like sele-nium and zinc, as well as drinking water co-contaminantslike antimony.66
4.7.5.2 Soft drinksThe evidence was too limited in amount, consistency, orquality to draw any conclusions
4.7.5.3 Fruit juicesThe evidence was too limited in amount, consistency, orquality to draw any conclusions.
4.7.5.4 CoffeePancreasEighteen cohort studies,67-83 37 case-control studies,77 84-119
and 11 ecological studies120-130 investigated coffee and pan-creatic cancer.
Seven cohort studies showed increased risk for the high-est intake groups when compared to the lowest,67 68 71 72 78
80 which was statistically significant in two.72 80 Seven stud-ies showed non-significant decreased risk.69 70 73 75 79 81 83 Twostudies stated that there was no significant effect on risk.77
82 One study reported a non-significant increased risk in menand decreased risk in women76; and one study reported anon-significant increased risk in women and a non-signifi-

154
P A R T 2 • E V I D E N C E A N D J U D G E M E N T S
cant decreased risk in men.74 Meta-analysis was possible oneight cohort studies, giving a summary effect estimate of1.00 (95% CI 0.94–1.07) per cup/day, with low hetero-geneity (figure 4.7.1).
Some, though not all, of the cohort studies suggest a J-shaped dose-response relationship. An effect at high levelsof coffee consumption cannot be excluded.
Case-control studies reported inconsistent results.77 84-119
Eighteen studies reported increased risk,84-87 89-91 94 97 99 102-
106 112 114 116 119 of which nine were statistically significant.85
87 94 102 112 114 Eleven studies reported decreased risk,77 92 93 95
96 101 107 109 111 113 118 which was statistically significant inone.118 Three studies showed no effect on risk88 98 and onestudy stated there was no significant effect on risk.110 Fourother studies reported different effects in men and women;however none was statistically significant.100 108 115 117 Meta-analysis was possible on 26 studies, giving a summary effectestimate of 1.04 (95% CI 1.01–1.07) per cup/day, with mod-erate heterogeneity (figures 4.7.1 and 4.7.2). Studies thatdid not adjust for smoking behaviour were more likely toreport increased risk. Confounding with smoking could notbe excluded.
The ecological studies overall showed an increased mor-tality between coffee consumption and pancreatic cancer.120-
130 Correlation coefficients ranged from +0.15122 to+0.59.124 125
There is ample evidence, including prospective data,which is consistent and with low heterogeneity, andwhich fails to show an association. It is unlikely thatcoffee has any substantial effect on the risk ofpancreatic cancer.
Figure 4.7.1 Coffee and pancreatic cancer; cohort andcase-control studies
Cohort
Snowdon 1984 0.98 (0.69–1.40)
Zheng 1993 Men 0.93 (0.81–1.08)
Shibata 1994 1.13 (0.79–1.62)
Stensvold 1994 Men 0.97 (0.83–1.14)
Stensvold 1994 Women 1.08 (0.85–1.37)
Harnack 1997 Women 1.24 (1.02–1.49)
Michaud 2001 Men 0.86 (0.74–1.00)
Michaud 2001 Women 0.96 (0.87–1.07)
Lin 2002 Men 1.14 (0.92–1.41)
Lin 2002 Women 0.86 (0.58–1.26)
Stolzenberg-Solomon 2002 Men 1.05 (0.94–1.17)
Summary estimate 1.00 (0.94–1.07)
Case control
Elinder 1981 0.85 (0.66–1.09)
MacMahon 1981 1.13 (1.05–1.23)
Wynder 1983 Men 1.01 (0.93–1.10)
Wynder 1983 Women 1.00 (0.90–1.10)
Gold 1985 1.06 (0.89–1.26)
Mack 1986 1.20 (1.07–1.34)
La Vechhia 1987 1.06 (0.89–1.27)
Gorham 1988 1.15 (0.98–1.35)
Falk 1988 Men 1.09 (1.03–1.16)
Falk 1988 Women 1.06 (0.97–1.15)
Clavel 1989 Women 2.00 (1.22–3.28)
Olsen 1989 All respondents 0.97 (0.87–1.08)
Clavel 1989 Men 1.32 (0.91–1.92)
Cuzick 1989 0.93 (0.83–1.05)
Farrow 1990 Men 1.03 (0.94–1.13)
Jain 1991 1.00 (1.00–1.00)
Ghadirian 1991 0.99 (0.93–1.05)
Bueno de Mesquita 1992 0.78 (0.61–1.00)
Stefanati 1992 1.14 (0.80–1.62)
Lyon 1992 1.15 (1.02–1.30)
Zatonski 1993 0.53 (0.27–1.02)
Kalapothaki 1993 0.85 (0.68–1.06)
Sciallero 1993 1.02 (0.84–1.24)
Partanen 1995 0.97 (0.92–1.03)
Gullo 1995 1.25 (1.12–1.40)
Silverman 1998 Men 1.05 (0.98–1.13)
Silverman 1998 Women 1.03 (0.94–1.13)
Villeneuve 2000 Men 1.05 (0.94–1.17)
Villeneuve 2000 Women 0.99 (0.88–1.12)
Kreiger 2001 Women 1.00 (0.77–1.32)
Summary estimate 1.04 (1.01–1.07)
Relative risk (95% CI)
Relative risk, per cup/day
1 1.20.8 20.5
Figure 4.7.2 Coffee and pancreatic cancer;cohort studies: dose response
Snowdon 1984
Zheng 1993
Shibata 1994
Stensvold 1994 Men
Stensvold 1994 Women
Honack 1997 Women
Michaud 2001 Men
Michaud 2001 Women
Lin 2002 Men
Lin 2002 Women
Stolzenberg-Solomon
2002 Men
0 6 102 4 8
Coffee (cups/day)

155
C H A P T E R 4 • F O O D S A N D D R I N K S
Kidney Five cohort studies,73 74 131-134 18 case-control studies,135-152 and1 ecological study153 investigated coffee and kidney cancer.
Two cohort studies showed non-significant decreased riskfor the highest intake groups when compared to the lowest.73
131 One study showed non-significant increased risk133; onestudy stated that there was no association132 134; and anoth-er study showed non-significant increased risk in women andnon-significant decreased risk in men.74 Effect estimates were0.15 (95% CI 0.02–1.16),73 0.87 (95% CI 0.66–1.16) percup/day,131 2.69 (95% CI 0.89–8.1),133 and 0.7 (no CI; men)and 1.2 (no CI; women) for highest versus lowest categoriesof exposure.74
The case-control studies reported inconsistent results, onlyone of which was statistically significant (in women but notin men).146 Seven studies showed non-significant decreasedrisk for the highest intake groups when compared to the low-est.135-138 140 142 143 145 Four studies showed non-significantincreased risk141 144 149 152; one study reported no effect on risk;four studies stated that there was no association147 148 150 151;and two studies showed increased risk in women, which wasstatistically significant in one,146 and non-significant decreasedrisk in men.139 146 Only four of the best quality case-controlstudies were able to be meta-analysed, giving a summary esti-mate of 0.99 (95% CI 0.96–1.01) (figure 4.7.3).
The ecological study reported correlation of incidence of0.62 for men and 0.4 for women.153
There is substantial evidence both from cohort andcase-control studies, which is consistent and of lowheterogeneity, and which fails to show an association.It is unlikely that coffee has a substantial effect on therisk of kidney cancer.
The Panel is aware that since the conclusion of the SLR, onecohort study154 has been published. This new information doesnot change the Panel judgement (see box 3.8).
4.7.5.5 TeaThe evidence was too limited in amount, consistency, orquality to draw any conclusions.
4.7.5.6 Herbal teas, infusions4.7.5.6.1 Maté OesophagusEight case-control studies155-163 and one ecological study164
investigated maté and oesophageal cancer.Seven case-control studies showed increased risk for the
highest intake groups when compared to the lowest (figure4.7.4)155-159 161-163 which was statistically significant infour.155 157 159 161 One study showed non-significant decreasedrisk.160 Meta-analysis was possible on five studies, all adjust-ing for smoking, giving a summary effect estimate of 1.16(95% CI 1.07–1.25) per cup/day, with moderate hetero-geneity relating to size but not direction of effect (figure4.7.5). The two studies not included in the meta-analysis didnot adjust for smoking; both reported non-significantincreased risk.156 159
The single ecological study showed a non-significantrelationship between increased maté consumption andoesophageal cancer mortality.164
The general mechanisms through which maté could plau-sibly cause cancer are outlined below.
The evidence, from case-control studies, is consistentand a dose-response relationship is apparent. There isrobust evidence for plausible mechanisms. Regularconsumption of maté, as drunk in the traditional stylein South America, is a probable cause of oesophagealcancer.
Mouth, pharynx, and larynx Six case-control studies investigated maté and mouth,pharynx, and larynx cancers.165-170
All six case-control studies showed increased risk for thehighest intake groups when compared to the lowest,165-170
which was statistically significant in four.165 167-169
The general mechanisms through which maté could plau-sibly cause cancer are outlined below.
The evidence is sparse. There is limited evidencesuggesting that maté is a cause of mouth, pharynx, andlarynx cancers.
General mechanisms — matéMaté is typically drunk scalding hot through a metal straw.This produces heat damage in the mouth, pharynx, larynx,and oesophagus. Repeated damage of this nature can leadto cancer (also see Chapter 2). Chemical carcinogenesis fromconstituents of maté has also been postulated.171 172
4.7.5.7 High-temperature foods and drinks OesophagusThree cohort studies173-176 and 15 case-control studies162 177-
196 investigated hot foods or drinks and oesophageal cancer.Two cohort studies showed increased risk for consuming
high-temperature foods or drinks,173 174 which was statisti-cally significant in one.174 The other study stated that therewas no association for hot drinks.175 176 Effect estimates were1.44 (95% CI 0.91–2.26; hot food),173 and 1.5 (95% CI1.1–2.0; men; hot tea) and 1.8 (95% CI 1.1–2.9; women;
Figure 4.7.3 Coffee and kidney cancer;case-control studies
Mattioli 2002 0.89 (0.63–1.26)
Yuan 1998 0.98 (0.95–1.01)
McLaughlin 1984 1.00 (0.95–1.04)
Kreiger 1993 0.99 (0.94–1.04)
Summary estimate 0.99 (0.96–1.01)
Relative risk (95% CI)
Coffee (cups/day)
1 20.5

156
P A R T 2 • E V I D E N C E A N D J U D G E M E N T S
hot tea).174 Both these studies adjusted for smoking.Seven case-control studies investigated food tempera-
ture162 178-183 189-191; seven investigated hot drinks177 182 184-186
188 192 193; and four investigated high-temperature hot drinksand soups combined.191 194-196 For high-temperature food, sixstudies showed increased risk,162 178-183 187 189 191 which wasstatistically significant in three162 179 180 187 189; one studyshowed non-significant decreased risk.190 For hot drinks, fivestudies showed increased risk,177 182 185 186 188 which was sta-tistically significant in four177 185 186; two studies showed nosignificant association192 193; one study showed non-signifi-cant decreased risk.184 For hot drinks and soups combined,all four studies showed increased risk,191 194-196 which wasstatistically significant in two.194 195 Several studies did notadjust for smoking or alcohol.177 180 182 186 194 195
High-temperature foods and/or drinks produce heat dam-age in the mouth, pharynx, larynx, and oesophagus.
Repeated damage of this nature can lead to cancer (also seechapter 2.4.1.3).
The evidence is inconsistent. There is limited evidencesuggesting that high-temperature drinks are a cause ofoesophageal cancer.
4.7.6 Comparison with previous report
Water was not reviewed in the previous report, which hadlittle to say about contaminants in water and did not reviewarsenic contamination. The previous report did not reviewsoft drinks as such.
The previous report judged that green tea possibly protectsagainst stomach cancer, but this was not supported by thecurrent review. The previous report judged that black teaprobably has no relationship with cancers of the stomach,pancreas, and kidney. This time the evidence was judged toolimited to draw a clear conclusion. The judgements of theprevious report on coffee were practically the same as in thisReport, except that the previous report judged that drinkingmore than five cups per day was a possible cause of bladdercancer. The evidence now indicates that coffee is unlikely tohave a substantial effect on risk of this cancer. The previousreport judged it possible that maté and other very hot drinksincrease the risk of oesophageal cancer. Since the mid-1990s,a greater body of consistent data has been published onmaté.
Skin cancer was not reviewed in the previous report.
4.7.7 Conclusions
The Panel concludes:The evidence that inorganic arsenic in drinking water is acause of lung cancer is convincing. Water contaminated inthis way is probably a cause of skin cancer. There is limitedevidence suggesting that water contaminated in this way isa cause of cancers of the kidney and bladder.
Maté is probably a cause of oesophageal cancer whendrunk scalding hot through a metal straw, as traditional inparts of South America. The temperature is judged to beresponsible for any increased risk of cancer. There is limitedevidence suggesting that maté as drunk traditionally is acause of cancers of the mouth, pharynx, and larynx. Thereis limited evidence suggesting that high-temperature drinksare a cause of oesophageal cancer.
It is unlikely that coffee has a substantial effect on the riskof cancer either of the pancreas or of the kidney.
Figure 4.7.5 Maté and oesophageal cancer;case-control studies
Vassallo 1995 Men 1.26 (1.18–1.35)
Vassallo 1995 Women 1.43 (1.20–1.69)
De Stefani 1990 1.17 (1.12–1.22)
Rolon 1995 1.04 (0.95–1.13)
Sewram 2003 1.17 (1.09–1.25)
De Stefani 2003 1.04 (1.00–1.08)
Summary estimate 1.16 (1.07–1.25)
Relative risk (95% CI)
Relative risk, per cup/day
1 1.750.95 1.4
Figure 4.7.4 Maté and oesophageal cancer;case-control studies
Victora 1987 1.47 (0.67–3.25)
Sewram 2003 1.62 (1.01–2.61)
Castelletto 1994 1.70 (1.00–2.89)
De Stefani 2003 3.50 (1.39–8.82)
De Stefani 1990 12.21 (3.78–39.42)
Dietz 1998 5.48 (0.96–31.44)
Rolon 1995 0.90 (0.44–1.86)
Vassallo 1985 Men 4.80 (1.90–12.11)
Vassallo 1985 Women 34.60 (4.88–245.40)
Relative risk (95% CI)
Relative risk, highest vs lowest exposure category
1 50.2 20.5 3510

157
C H A P T E R 4 • F O O D S A N D D R I N K S
Many plant and some animal foods can be fermented toproduce alcoholic drinks; alcohol has been made this wayfor thousands of years.
The main alcoholic drinks consumed, in ascending orderof alcohol (ethanol) content, are beers and ciders; wines;wines ‘fortified’ with spirits; and spirits (liquors) andliqueurs. The alcohol content of the many different drinkswithin each of these categories varies.
Alcoholic drinks induce changes in mood; they alsoproduce physical effects such as loss of coordination. Inmost countries they are the legal ‘intoxicant’ of choice,used as a social and professional lubricant; however,certain cultures forbid the drinking of alcohol.
With industrialisation and urbanisation, and the readyavailability of alcoholic drinks (which may or may not betaxed), consumption tends to rise.
Alcohol relaxes people’s social inhibitions, but it isaddictive; dependency on alcohol can seriously affectpeople’s personal and professional lives.
It has been known for a long time that prolonged highconsumption of alcohol is a cause of cirrhosis of the liver,though not all people are equally susceptible. Knowledgeof its other ill-effects is more recent.
Overall, the Panel judges that alcoholic drinks are a
cause of cancers of a number of sites and that, in general,the evidence is stronger than it was in the mid-1990s. Theevidence does not show any ‘safe limit’ of intake. Theeffect is from ethanol, irrespective of the type of drink.Ethanol is classified by the International Agency forCancer Research as a human carcinogen.
The Panel judges as follows:The evidence that alcoholic drinks are a cause of cancersof the mouth, pharynx, and larynx, oesophagus,colorectum (men), and breast is convincing. They areprobably a cause of liver cancer, and of colorectal cancerin women. It is unlikely that alcoholic drinks have asubstantial adverse effect on the risk of kidney cancer.
In final summary, the evidence is that alcoholic drinksare a cause of cancers of the mouth, pharynx, and larynx;the oesophagus; the colorectum in men, and the breast;and probably of liver cancer and colorectal cancer inwomen. It is unlikely that alcoholic drinks have asubstantial adverse effect on the risk of kidney cancer.
Chapter 4.8 concerns all alcoholic drinks. Alcoholic drinks have been popular in most societies ever
4.8 Alcoholic drinks
ALCOHOLIC DRINKS, AND THE RISK OF CANCER
In the judgement of the Panel, the factors listed below modify the risk of cancer. Judgements are graded according to the strength of the evidence.
DECREASES RISK INCREASES RISK
Exposure Cancer site Exposure Cancer site
Convincing Alcoholic drinks Mouth, pharynx andlarynxOesophagusColorectum (men)1
Breast (pre- andpostmenopause)
Probable Alcoholic drinks Liver2
Colorectum (women)1
Limited —suggestive
Substantialeffect on risk Alcoholic drinks (adverse effect): kidney3
unlikely
1 The judgements for men and women are different because there are fewer data for women. Increased risk is only apparent above a threshold of 30 g/day of ethanolfor both sexes.
2 Cirrhosis is an essential precursor of liver cancer caused by alcohol. The International Agency for Research on Cancer has graded alcohol as a class 1 carcinogen forliver cancer. Alcohol alone only causes cirrhosis in the presence of other factors.
3 The evidence was sufficient to judge that alcoholic drinks were unlikely to have an adverse effect on the risk of kidney cancer; it was inadequate to draw aconclusion regarding a protective effect.
For an explanation of all the terms used in the matrix, please see chapter 3.5.1, the text of this section, and the glossary.

158
P A R T 2 • E V I D E N C E A N D J U D G E M E N T S
since the effects on mood of the fermented products of plantfoods and some animal foods were discovered, probably inPalaeolithic or even earlier times.
Ethanol is the active ingredient in alcoholic drinks; the con-centration varies, depending on the type of drink. In the past,beers were made from grains, ciders from fruits, mead fromhoney, and brews from milk; these were followed by wines,generally made from grapes and with higher concentrationsof ethanol. The process of distillation was a later invention,which produced more highly concentrated alcoholic drinksmade from grains, fruits, sugar, and other substrates.
Alcohol is liable to be addictive. Its specific effects are toinduce a mood of euphoria and disinhibition, which may bedangerous. Much domestic and other violence, and manyreckless and violent incidents, and crimes such as arson,wounding, homicide, and car crashes, are alcohol-related.
Reports concerned with food, nutrition, and the preven-tion of disease have often excluded alcohol. This is becausealcohol is also a drug, the impact of which is behavioural andsocial, as well as biological. More recently, alcoholic drinkshave been included in such reports because of the evidencethat low to moderate consumption protects against coronaryheart disease (but not cerebrovascular disease), and alsobecause of the evidence on cancer, given that ethanol is ahuman carcinogen.
4.8.1 Definitions and sources
Alcohol is the common term for ethanol, one of a family ofalcohols, produced in nature when sugar molecules are bro-ken down to release energy by yeasts. This process of fer-mentation is used to produce alcoholic drinks. Alcohol is asource of dietary energy (see chapter 4.10.1). It also acts asa drug, affecting both mental and physical responses (alco-hol intoxication). Alcoholic drinks include beers, wines, andspirits. Other alcoholic drinks that may be locally importantinclude fermented milks, fermented honey-water (mead),and fermented apples (cider).
Most alcoholic drinks are manufactured industrially. Someare made domestically or illegally, as ‘moonshine’ or ‘hooch’.
4.8.1.1 BeersBeer, ale, and lager are traditionally produced from barley;today other cereal grains are used. Beer contains between 3and 7 per cent alcohol. The grain starches are converted tosugars and then fermented by yeasts. The term ‘beer’ in thisReport includes ales and lagers.
4.8.1.2 WinesWines are usually produced from grapes and containbetween around 9 to 15 per cent alcohol; they are crushedto produce juice and must, which is then fermented. Thecolour of the grapes and the length of fermentation deter-mine the colour and strength of the final product. Grapevines grow best in temperate regions. Wines can also be pro-duced from other fruits and from rice (sake). Here, wine istaken to mean grape wines. Wines may be fortified with spir-its (see chapter 4.8.2.2) to produce drinks of alcohol con-
tent between about 16 and 20 per cent.
4.8.1.3 Spirits/liquors Spirits are usually produced from cereal grains and some-times from other plant foods. They are distilled, to give adrink with a higher concentration of ethanol than eitherbeers or wines — around 35–50 per cent or higher. Some ofthe most globally familiar spirits are brandy (distilled wine),whisky and gin (distilled from grains), rum (from molasses),aguardente also known as cachaça (from sugar), vodka(sometimes from grain, sometimes potatoes), and tequilaand mescal (from agave and cactus plants). Spirits andliqueurs are also made from fruits.
4.8.2 Composition
Alcohol has an energy content of 7 kilocalories per gram, andis metabolised in the liver. On average, blood alcohol levelsreach a maximum between 30 and 60 minutes afterdrinking an alcoholic drink, and the body can metabolise10–15 g alcohol per hour.
Alcohol alters the way the central nervous system func-tions. Very high alcohol consumption (where blood alcoholreaches 0.4 per cent) can be fatal, as can long-term, regu-lar, high intakes.
4.8.2.1 BeersThere are many varieties of beer, with different compositions.Their alcohol content ranges from around 3 to 7 per cent byvolume; beers generally contain a variety of bioavailablephenolic and polyphenolic compounds, which contribute tothe taste and colour, many of which have antioxidant prop-erties. Beer is also a source of magnesium, potassium,riboflavin, folate, and other B vitamins.
4.8.2.2 WinesThe composition of wine depends on the grape varietiesused, as well as the growing conditions and the wine-makingmethods, which may vary between vineyards. The alcoholcontent ranges from around 9 to 15 per cent by volume. Redwines contain high levels of phenolic and polyphenolic com-pounds (up to a total of around 800–4000 mg/l), particu-larly resveratrol, derived from the grape skins. Like those inbeer, these phenolic compounds add taste and colour. Whitewines contain fewer phenolics. Red wine has been shown tohave antioxidant activity in laboratory experiments. Winealso contains sugars (mainly glucose and fructose), volatileacids (mainly acetic acid), carboxylic acids, and varying lev-els of calcium, copper, iron, magnesium, potassium, and vit-amins B1, B2, B6, and C. Wines may be flavoured with herbsand fortified with spirits (see chapter 4.8.2.3) to producedrinks of alcohol content between about 16 and 20 per cent.
4.8.2.3 Spirits/liquors The alcohol content of spirits/liquors and liqueurs is usual-ly between 35 and 50 per cent by volume, but can be evenhigher. Distilled drinks may have herbs and other ingredi-ents added to give them their distinctive character.

159
C H A P T E R 4 • F O O D S A N D D R I N K S
4.8.3 Consumption patterns
Much of the information on average consumption of alco-holic drinks, internationally and nationally, is not informa-tive. Within almost all populations, consumption varieswidely, usually as a function of availability, price, culture orreligion, and dependency. In general, men consume sub-stantially more alcoholic drinks than women. In countrieswhere considerable amounts of alcoholic drinks are produceddomestically and by artisanal methods, overall consumptionwill (if only for this reason) be underestimated. In manycountries, alcohol is a public health problem. This is not somuch because of the average level of intake, but because aminority of the population, which in high-income countriesincludes an increasing number of young people, drink alco-hol excessively (‘binge’ drinking).
Worldwide, alcoholic drinks supply an average of 2.3 percent of total dietary energy. This ranges from around 10 percent in some northern European countries, to (as recorded)practically zero in Islamic countries. Average consumptionis nearly four times higher in high-income compared withlow-income countries, and tends to be highest in Europe,North America, and Oceania. Consumption varies withincountries: many people do not consume alcoholic drinks,some drink occasionally and others consume 15–25 per centor more of their dietary energy as alcohol.
Alcoholic drinks are illegal in Islamic countries. In coun-tries where these drinks are legal, there are often restrictionson price and availability to adults, and in particular to youngpeople.
Many countries recommend restriction of alcohol intakefor health reasons. In the USA, men are advised not to exceedtwo drinks per day and women one drink per day. In the UK,the government advises men not to exceed 3–4 units per dayand women 2–3 units per day. One US ‘drink’ is equivalentto about 15 g ethanol, almost two UK units; a unit is 10 mlor 8 g of pure ethanol.
4.8.3.1 BeersBeers are the most widely consumed alcoholic drinks world-wide. They provide an average of 1 per cent of dietary ener-gy, with a peak of more than 6 per cent in parts of northernEurope. People living in Europe, North America, andOceania tend to drink the most beer.
4.8.3.2 WinesWines provide an average of 0.2 per cent of dietary energyworldwide. They are drunk mainly in Europe, Australasia,and the Americas, with highest levels of consumption inwestern and southern Europe.
4.8.3.3 Spirits/liquors There are few data on average consumption of spirits/liquors.
4.8.4 Interpretation of the evidence
4.8.4.1 GeneralFor general considerations that may affect interpretation ofthe evidence, see chapters 3.3 and 3.5, and boxes 3.1, 3.2,3.6 and 3.7.
‘Relative risk’ (RR) is used in this Report to denote ratiomeasures of effect, including ‘risk ratios’, ‘rate ratios’, ‘haz-ard ratios’, and ‘odds ratios’.
4.8.4.2 SpecificConfounding. At high levels of consumption, the effects ofalcohol are heavily confounded by other behaviours, such assmoking tobacco.
Reporting bias. Self-reporting of consumption of alcoholicdrinks is liable to underestimate consumption, sometimesgrossly, because alcohol is known to be unhealthy and un-desirable, and is sometimes drunk secretly. Heavy drinkersusually underestimate their consumption, as do drinkers ofillegal or unregulated alcoholic drinks.
Measurement. In recent years, the strength and serving sizeof some alcoholic drinks have increased. For example, in theUK, wine is commonly served in 250 ml glasses as opposedto the standard 125 or 175 ml glass. In addition, alcohol con-tent of drinks varies widely. Studies that measure consump-tion in terms of number of drinks may be referring to verydifferent amounts of alcohol (also see box 4.8.1).
4.8.5 Evidence and judgements
The full systematic literature review (SLR) is contained onthe CD included with this Report.
4.8.5.1 Alcoholic drinksThere are two different measures of exposure: the numberof alcoholic drinks per time period and/or ethanol intake ingrams or millilitres per time period. The former measure islikely to be less precise because the size and strength of eachdrink are unknown.
The Panel judges that alcoholic drinks are or may be a cause ofvarious cancers, irrespective of the type of alcoholic drink. Thecausal factor is evidently alcohol (ethanol) itself. There is no sig-nificant evidence that alcohol protects against any cancer. Theextent to which alcoholic drinks are a cause of various cancersdepends on the amount of alcohol drunk.
Epidemiological studies commonly identify the type of alco-holic drink consumed. Some of the evidence reviewed in chap-ter 4.8.5 does appear to show that some types of drink seem tohave different effects. For example, for cancers of the mouth,pharynx, and larynx, the evidence is stronger for consumptionof beer and spirits than for wine. Here is the possibility of resid-ual confounding: wine drinkers in many countries tend to havehealthier ways of life than beer or spirit drinkers.
Apparent discrepancies in the strength of evidence may alsobe due partly to variation in the amounts of different types ofalcoholic drinks consumed. In general, the evidence suggestssimilar effects for different types of alcoholic drink.
Box 4.8.1 Types of alcoholic drink

160
P A R T 2 • E V I D E N C E A N D J U D G E M E N T S
Mouth, pharynx, and larynx Five cohort studies,1-6 89 case-control studies,7-93 and 4 eco-logical studies94-97 investigated alcoholic drinks and mouth,pharynx, and larynx cancers.
Total alcoholic drinks All five cohort studies showed increased risk for the highestintake group when compared to the lowest (figure 4.8.1),1-6
which was statistically significant in four.1 2 4 6 Meta-analy-sis was possible on two studies, giving a summary effect esti-mate of 1.24 (95% confidence interval (CI) 1.18–1.30) perdrink/week, with no heterogeneity (figures 4.8.2 and4.8.3).1 2 All cohort studies adjusted for smoking.
Almost all of the case-control studies showed increased riskfor the highest intake group when compared to the lowest(figure 4.8.1),7-19 21-32 34-70 72-93 which was statistically signif-icant in more than half (as can be seen from the high to low
Figure 4.8.2 Alcoholic drinks and mouth, pharynx, andlarynx cancer; cohort and case-control studies
Cohort
Kjaerheim 1998 1.26 (1.10–1.44)
Boeing 2002 1.24 (1.18–1.30)
Summary estimate 1.24 (1.18–1.30)
Case control
Martinez 1969 1.02 (1.01–1.04)
Martinez 1969 Men 1.03 (1.01–1.05)
Elwood 1984 1.05 (1.04–1.06)
Brownson 1987 1.02 (1.02–1.03)
Blot 1988 1.05 (1.04–1.06)
Blot 1988 Women 1.04 (1.02–1.06)
Falk R 1989 1.02 (1.00–1.04)
Merletti 1989 Men 1.01 (0.99–1.04)
Merletti 1989 Women 1.10 (0.99–1.22)
La Vecchia 1991 1.03 (1.01–1.02)
Choi1991 Men 1.17 (1.08–1.04)
Choi 1991 Women 1.03 (0.89–1.18)
Franceschi 1992 1.02 (1.01–1.03)
Mashberg 1993 1.01 (1.00–1.01)
Negri 1993 1.02 (1.02–1.03)
Day 1993 White 1.05 (1.04–1.06)
Day 1993 Black 1.05 (1.03–1.06)
Ng 1993 Men 1.02 (1.01–1.04)
Ng 1993 Women 1.07 (0.99–1.02)
Su 1998 Men 1.18 (1.03–1.36)
Franceschi 1999 1.03 (1.02–1.03)
Hayes 199 Men 1.03 (1.03–1.04)
Zavras 2001 1.02 (1.00–1.04)
Garrote 2001 1.02 (1.01–1.03)
Dal Maso 2002 1.02 (1.01–1.03)
Pisa 2002 1.04 (1.01–1.06)
Lissowska 2002 1.04 (1.01–1.08)
Pelucchi 2003 1.03 (1.02–1.03)
Castellsague 2004 1.01 (1.01–1.02)
Altieri 2004 1.03 (1.02–1.03)
Peters 2005 1.04 (1.03–1.05)
Summary estimate 1.03 (1.02–1.04)
Relative risk (95% CI)
Relative risk, per drink/week
1 1.50.5 0.75 2
Figure 4.8.1 Alcoholic drinks and mouth, pharynx, andlarynx cancer; cohort and case-control studies
Cohort
Gronbaek 1998 11.70 (4.91–27.87)
Kjaerheim 1998 3.20 (1.64–6.25)
Boeing 2002 9.22 (2.75–30.25)
Case control
Maier 1992 9.00 (5.21–15.54)
Wynder 1976 22.10 (7.83–62.36)
Herity 1982 5.60 (2.99–12.48)
Elwood 1984 7.70 (3.16–18.76)
Zagraniski 1986 4.00 (1.80–8.89)
De Stefani 1987 9.30 (3.49–24.81)
Brownson 1987 4.55 (2.81–8.37)
Blot 1988 Men 8.50 (5.41–14.32)
Blot 1988 Women 9.10 (3.92–21.12)
Tuyns 1988 2.56 (1.81–3.62)
Franco 1989 8.50 (2.48–29.15
Falk 1989 2.12 (0.89–5.04)
Sankaranarayanan 1989 a 6.25 (0.76–51.16)
Sankaranarayanan 1989 b 3.15 (0.74–13.12)
Merletti 1989 Men 2.10 (0.62–7.07)
Merletti 1989 Women 3.40 (0.90–12.87)
Zheng 1990 1.59 (1.05–2.41)
Sankaranarayanan 1990 a 7.69 (3.56–16.62)
Sankaranarayanan 1990 b 8.18 (2.79–23.97)
La Vecchia 1991 3.50 (2.03–7.11)
Choi 1991 Men 3.42 (1.77–6.60)
Choi 1991 Women 1.48 (0.12–18.14)
Zheng 1990 Men 0.80 (0.52–1.22)
Franceschi 1992 3.00 (1.38–6.51)
Zheng 1992 Men 1.56 (0.97–2.50)
Gonzalo 1992 4.64 (0.41–52.39)
Mashberg 1993 7.10 (4.12–12.25)
Day 1993 White 5.50 (5.72–13.54)
Day 1993 Black 16.60 (6.28–44.95)
Ng 1993 Men 4.36 (1.39–13.68)
Ng 1993 Women 2.62 (0.51–13.40)
Hedberg 1994 3.10 (1.21–7.95)
Rao 1994 1.51 (1.12–2.04)
Guo 1995 2.25 (1.23–4.13)
Takezaki 1996 Men 3.40 (1.18–9.77)
Takezaki 1996 Women 2.30 (1.58–3.58)
Zheng 1997 1.17 (0.58–2.35)
Sandersson 1997 20.80 (11.42–37.87)
Dosemeci 1997 1.60 (0.72–3.58)
Pintos 1998 4.10 (2.80–6.00)
Rao 1998 1.38 (1.00–1.91)
Wasnik 1998 1.84 (1.02–3.32)
Su 1998 Men 5.14 (0.95–27.81)
Smith 1998 2.57 (1.22–5.42)
Franceschi 1999 11.90 (6.22–22.77)
Rao 1999 1.53 (1.10–2.14)
Hayes 1999 Men 7.70 (3.31–17.93)
Zavras 2001 4.90 (1.20–19.95)
Brown 2001 60.40 (20.98–173.86)
Schlecht 2001 2.70 (0.90–8.11)
Garrote 2001 5.73 (1.77–18.53)
Zang 2001 4.80 (3.47–6.64)
Dal Maso 2002 4.30 (1.92–9.61)
Pisa 2002 4.00 (0.87–18.33)
Petridou 2002 2.02 (1.11–3.68)
Uzcudun 2002 3.50 (2.36–6.11)
Lissowska 2003 4.25 (1.07–16.90)
Pelucchi 2003 5.80 (3.79–8.88)
Sanchez 2003 3.28 (1.80–5.99)
Llewellyn 2004 Men 1.60 (0.81–3.15)
Llewellyn 2004 Women 1.60 (0.60–4.23)
Castellsague 2004 10.29 (4.57–23.17)
Relative risk (95% CI)
Relative risk, highest vs lowest exposure category
1 50.2 20.5

161
C H A P T E R 4 • F O O D S A N D D R I N K S
comparison plot).8-19 21 23-25 28-32 34-36 40-48 52 54-57 59-67 70 72-75 77-
86 89-91 93 No studies reported statistically significant contra-dictory results. Meta-analysis was possible on 25 studies,giving a summary effect estimate of 1.03 (95% CI 1.02–1.04)per drink/week, with high heterogeneity (figures 4.8.2 and4.8.4).17 21 26 27 32 34 35 40-42 52 57 60 62 65 67 69 75 78-80 83-85 89
Heterogeneity related to the size, and not the direction, ofeffect, and is largely explained by varying design and qual-ity of studies.
A continuous curvilinear dose-response relationship wasapparent from cohort and case-control data with no obviousthreshold (figures 4.8.3 and 4.8.4).
There was some evidence of publication bias as a result ofsmall studies that did not report a significant associationbeing unpublished. However, such small studies may sufferfrom issues of quality.
Ecological studies tended to show increased risk withincreased consumption.94-97
BeersTwo cohort studies,1 6 27 case-control studies,25 26 32 33 36 42 47
58 62 64 65 68 79 83-85 98-105 and 4 ecological studies94-96 106 report-ed separately on beer drinking.
Both cohort studies showed statistically significantincreased risk with increased intake; both studies adjustedfor smoking.1 6 Almost all case-control studies also showedincreased risk,25 26 32 33 36 42 47 58 62 64 65 68 83-85 98-104 which wasstatistically significant in many.36 42 47 62 68 83-85 98-102 Meta-analysis was possible on six case-control studies, giving asummary effect estimate of 1.06 (95% CI 1.03–1.08), withhigh heterogeneity. Most studies adjusted for smoking. Theecological studies did not show any consistent or statisticallysignificant effect.94-96 106
WinesTwenty-six case-control studies25 26 32 33 42 58 62 64 65 68 79 83-85 98
99 101 102 104 105 107-109 and four ecological studies94-96 110 report-ed separately on wine drinking.
Most of the case-control studies showed increased risk withincreased intake,25 32 33 58 62 64 68 79 84 85 101 102 105 107-109 which
was statistically significant in less than half.32 33 58 62 68 79 85
108 109 Five studies showed decreased risk,26 65 83 98 99 whichwas statistically significant in one.98 99 Meta-analysis waspossible on 11 case-control studies, giving a summary effectestimate of 1.02 (95% CI 1.01–1.03), with high hetero-geneity.32 33 62 68 79 83-85 102 105 109 All studies adjusted for smok-ing. All four ecological studies showed statistically significantincreased risk.94-96 110
SpiritsOne cohort study,1 35 case-control studies,19 25 26 28 31-33 36 38
42 47 49 50 58 62 64 65 68 79 83-85 98 100-102 104 105 108 109 111-113 and 5 eco-logical studies94-96 106 114 reported separately on spirits.
The single cohort study showed a non-significant increasedrisk with increased intake.1 Almost all case-control studies
Figure 4.8.3 Alcoholic drinks and mouth, pharynx, andlarynx cancer; cohort studies: dose response
Kjaerheim 1998
Boeing 2002
0 155 10
Alcoholic drinks (drinks/week)
Figure 4.8.4 Alcoholic drinks and mouth, pharynx,and larynx cancer; case-control studies:dose response
Martinez 1969 Men
Martinez 1969 Women
Elwood 1984
Brownson 1987
Blot 1988 Men
Blot 1988 Women
Falk 1989
Merletti 1989 Men
Merletti 1989 Women
Choi 1991 Men
Choi 1991 Women
La Vecchia 1991
Franceschi 1992
Day 1993 Black
Day 1993 White
Mashberg 1993
Negri 1993
Ng 1993 Men
Ng 1993 Women
Su 1998 Men
Francechi 1999
Hayes 1999 Men
Garrote 2001
Zavras 2001
Dal Maso 2002
Pisa 2002
Lissowska 2003
Pelucchi 2003
Altieri 2004
Castellsague 2004
Peters 2005
0 250150 20050 100
Alcoholic drinks (drinks/week)

162
P A R T 2 • E V I D E N C E A N D J U D G E M E N T S
showed increased risk, which was statistically significant in many. Meta-analysis was possible on nine case-controlstudies, giving a summary effect estimate of 1.03 (95% CI 1.04–1.05), with high heterogeneity. Most studiesadjusted for smoking. One ecological study reported a sig-nificant increased risk; the others tended to show non-significant increased risk in men and non-significantdecreased risk in women.
The general mechanisms through which alcohol couldplausibly cause cancer are outlined below. In addition, alco-hol acts as a synergistic carcinogen with tobacco. Tobaccomay induce specific mutations in DNA that are less efficientlyrepaired in the presence of alcohol. Alcohol may also func-tion as a solvent, enhancing penetration of other carcino-genic molecules into mucosal cells.
There is ample and consistent evidence, both fromcase-control and cohort studies, with a dose-responserelationship. There is robust evidence for mechanismsoperating in humans. The evidence that alcoholicdrinks are a cause of mouth, pharynx, and larynxcancers is convincing. Alcohol and tobacco togetherincrease the risk of these cancers more than eitheracting independently. No threshold was identified.
The Panel is aware that since the conclusion of the SLR, onecohort115 and four case-control studies116-119 have been pub-lished. This new information does not change the Panel judge-ment (see box 3.8).
OesophagusEight cohort studies,1 3 120-125 56 case-control studies,33 61 67
80 126-182 and 10 ecological studies2 94 95 114 183-189 investigat-ed alcoholic drinks and oesophageal cancers.
Total alcoholic drinksEight cohort studies,1 3 120-125 56 case-control studies,33 61 67
80 126-137 139-182 and 10 ecological studies2 94 95 114 183-189 report-ed on total alcoholic drinks.
Six cohort studies showed increased risk for the highestintake group when compared to the lowest (figure 4.8.5),13 120-122 124 which was statistically significant in four,1 120 122
124 and in men, but not in women in a fifth study.121 Twostudies showed non-significant decreased risk.123 125 Effectestimates for all studies are shown in the high to low forestplot (figure 4.8.5). Four studies did not adjust for smok-ing.122-125
Most case-control studies showed increased risk for thehighest intake group when compared to the lowest (figure4.8.5),33 61 67 80 126 128-137 139 141-148 150-166 169 170 172 174 175 177-182
which was statistically significant in 25.33 61 67 80 128 129 132 133
135 137 139 141 145 147 148 150 152 153 155-166 170 172 174 175 178-180 182
A few studies showed decreased risk, but none was statisti-cally significant.140 149 167 168 171 173 176 Meta-analysis was pos-sible on 20 case-control studies, giving a summary effectestimate of 1.04 (95% CI 1.03–1.05) per drink/week, withhigh heterogeneity (figures 4.8.6 and 4.8.7).33 61 67 131 133 137
144 149 150 156 157 160 161 170 178-182 Heterogeneity is related pre-dominantly to size, rather than direction, of effect and may
Figure 4.8.5 Alcoholic drinks and oesophageal cancer;cohort and case-control studies
Cohort
Kono 1987 14.46 (3.00–69.70)
Hirayama 1990 2.28 (1.96–2.65)
Yu 1993 0.50 (0.21–1.20)
Zheng 1995 1.40 (0.62–3.18)
Kinjo 1998 Men 2.40 (1.77–3.25)
Kjaerheim 1998 Women 3.20 (1.64–6.25)
Khjo 1998 Women 2.00 (0.62–6.43)
Sakata 2005 2.40 (1.20–4.80)
Tran 2005 0.92 (0.82–1.03)
Case control
Jozala 1983 26.70 (6.87–10.374)
Tuyns 1982 2.72 (1.03–7.16)
Rossi 1982 13.08 (4.55–37.61)
Tuyns 1983 Men 101.03 (109.9–928.52)
Tuyns 1983 Women 11.04 (1.08–112.57)
Adelhardt 1985 2.95 (1.12–7.76)
Decarli 1987 10.43 (4.37–24.90)
La Vecchia 1989 3.60 (0.93–13.99)
Franceschi 1990 0.90 (0.57–1.42)
De Stefani 1990 Men 5.27 (2.71–10.24)
De Stefani 1990 Women 1.89 (0.71–5.00)
Sankaranarayaran 1991 Men 2.33 (1.52–3.56)
Choi 1991 Men 9.14 (3.79–22.06)
Valsecchi 1992 9.30 (5.11–16.93)
Wang 1992 Men 2.10 (1.06–4.15)
Cheng 1992 11.45 (6.66–19.69)
Tavani 1993 2.30 (0.99–5.34)
Kabat 1993 Men 10.90 (4.88–24.32)
Kabat 1993 Women 13.20 (6.08–28.68)
Parkin 1994 0.80 (0.59–1.08)
Castelletto 1994 8.00 (3.01–21.27)
Hanaoka 1994 6.59 (2.51–17.33)
Tavani 1994 5.40 (1.39–20.91)
Gao 1994 Men 1.40 (1.07–1.84)
Gao 1994 Women 0.60 (0.24–1.53)
Brown 1994 White Men 16.10 (6.68–38.79)
Brown 1994 Black Men 26.90 (11.89–60.85)
Vaughan 1995 9.50 (4.02–22.43)
Cheng 1995 1.50 (0.99–2.27)
Srivastava 1995 3.70 (1.50–9.11)
Gimeno 1995 4.40 (1.86–10.40)
Cheng 1995 Non-smokers 14.43 (3.60–57.82)
Vizcaino 1995 0.90 (0.69–1.18)
Nandakumar 1996 Men 1.80 (1.20–2.70)
Garidou 1996 1.26 (1.09–1.45)
Gammon 1997 7.40 (4.00–13.69)
Dietz 1998 8.60 (3.82–19.38)
Tao 1999 1.54 (0.86–2.76)
Gao 1999 0.78 (0.38–1.62)
Bosetti 2000 12.35 (8.37–18.22)
Levi 2000 15.65 (6.81–35.96)
Nayar 2000 7.81 (3.28–5.61)
Takezaki 2000 8.50 (5.56–13.00)
Takezaki 2001 0.75 (0.46–1.22)
Wu 2001 0.70 (0.47–1.04)
Sharp 2001 0.86 (0.25–2.95)
Dal Maso 2002 13.80 (4.00–47.60)
Gao 2002 1.48 (0.78–2.81)
Boonyaphiphat 2002 5.84 (3.15–10.83)
Engel 2003 9.40 (4.60–19.20)
Chita 2004 men 3.50 (1.72–7.10)
Wang 2004 3.45 (1.73–6.88)
Lee 2005 7.60 (5.20–11.10)
Yang 2005 6.71 (1.92–23.42)
Trivers 2005 1.08 (0.81–1.44)
Relative risk (95% CI)
Relative risk, highest vs lowest exposure category
10.2 20.5 5 10

163
C H A P T E R 4 • F O O D S A N D D R I N K S
be partially explained by the variation in measurement ofalcohol intake, variation in the outcome measured(oesophageal or upper aerodigestive tract), or by inadequateadjustment for smoking in some studies. There is a trend forsmaller effect estimates from more recent publications, whichcould be due to improved methods of adjustment for con-founders. Not all studies adjusted for smoking.
There is some evidence of publication bias; with smallerstudies tending to report larger effects.
The ecological studies were not consistent.2 94 95 114 183-189
Two reported statistically significant results, both in thedirection of increased risk.94 186
BeersOne cohort study,4 15 case-control studies,103 129 143 144 159 170
173 176 190-197 and seven ecological studies94 95 106 184 187 198 199
reported separately on beer drinking.The single cohort study showed statistically significant
increased risk with increased intake after adjustment for
smoking.4 All case-control studies with the exception oftwo173 176 also showed increased risk, which was statistical-ly significant in seven.103 129 144 159 170 191 193 195-197 Meta-analy-sis was possible on five case-control studies, giving asummary effect estimate of 1.05 (95% CI 1.03–1.07), withhigh heterogeneity.144 159 170 193 197 About half of the studiesdid not adjust for smoking. The ecological studies wereinconsistent and one reported a statistically significant result,which was in the direction of increased risk.94
WinesTen case-control studies,143 144 159 161 170 173 190 194 195 one cross-sectional study,200 and five ecological studies94 95 106 184 198
reported separately on wine drinking.All but one of the case-control studies showed increased
risk with increased intake,144 which was statisticallysignificant in seven.159 161 170 190 195 About half of the studiesadjusted for smoking. The single cross-sectional studyshowed non-significant increased risk.200 Most ecological
Figure 4.8.6 Alcoholic drinks and oesophageal cancer;cohort and case-control studies
Cohort
Kjaerheim 1998 1.26 (1.10–1.44)
Case control
Tuyns 1983 Men 1.12 (1.07–1.17)
Tuyns 1983 Women 1.04 (1.00–1.09)
Decarli 1987 1.04 (1.03–1.05)
La Vecchia 1989 1.01 (0.99–1.03)
Franceschi 1990 1.02 (1.01–1.04)
De Stefani 1990 Men 1.04 (1.03–1.06)
De Stefani 1990 Women 1.13 (0.99–1.29)
Sankaranarayanan 1991 Men 1.02 (1.01–1.03)
Cheng 1992 1.08 (1.07–1.09)
Tavani 1993 1.03 (1.00–1.06)
Tavani 1994 1.02 (1.00–1.04)
Hanaoka 1994 1.24 (1.14–1.33)
Brown 1994 Black men 1.04 (1.03–1.04)
Brown 1994 White men 1.03 (1.05–1.07)
Castelletto 1994 1.05 (1.03–1.07)
Gammon 1997 1.07 (1.05–1.08)
Bosetti 2000 1.03 (1.03–1.03)
Takezaki 2001 1.00 (0.96–1.04)
Sharp 2001 1.00 (0.95–1.05)
Boonyaphiphat 2002 1.05 (1.04–1.07)
Dal Maso 2002 1.03 (1.02–1.04)
Lee 2005 0.99 (0.97–1.00)
Yang 2005 1.05 (1.03–1.06)
Summary estimate 1.04 (1.03–1.05)
Relative risk (95% CI)
Relative risk, per drink/week
1 1.50.8 1.25
Figure 4.8.7 Alcoholic drinks and oesophageal cancer;case-control studies: dose response
Tuyns 1983 Men
Tuyns 1983 Women
Decarli 1987
De Stefani 1990 Men
De Stefani 1990 Women
Cheng 1992
Tavani 1993
Brown 1994 Black Men
Brown 1994 White Men
Castelletto 1994
Hanaoka 1994
Tavani 1994
Gammon 1997
Bosetti 2000
Cheng 2000
Sharp 2001
Boonyaphiphat 2002
Dal Maso 2002
0 10040 6020 80
Alcoholic drinks (drinks/week)

164
P A R T 2 • E V I D E N C E A N D J U D G E M E N T S
studies were in the direction of increased risk.94 106 184 198
SpiritsOne cohort study,4 15 case-control studies,139 143-145 159 170 173
181 190 191 194-196 201 202 one cross-sectional study,200 and five eco-logical studies94 95 106 184 198 reported separately on spirits.
The single cohort study showed statistically significantincreased risk with increased intake after adjustment forsmoking.4 All of the case-control studies also showedincreased risk, which was statistically significant in eight.139
144 145 191 194 195 201 202 Most studies adjusted for smoking. Thesingle cross-sectional study showed non-significant increasedrisk.200 The ecological studies were inconsistent and tworeported statistically significant results; both were in thedirection of increased risk.94 106
The general mechanisms through which alcohol couldplausibly cause cancer are outlined below. In addition, alco-hol acts as a synergistic carcinogen with tobacco. Tobaccomay induce specific mutations in DNA that are less efficientlyrepaired in the presence of alcohol. Alcohol may also func-tion as a solvent, enhancing penetration of other carcino-genic molecules into mucosal cells.
There is ample and consistent evidence, both fromcohort and case-control studies, with a dose-responserelationship. There is robust evidence for mechanismsoperating in humans. The evidence that alcoholicdrinks are a cause of oesophageal cancer is convincing.No threshold was identified.
The Panel is aware that since the conclusion of the SLR, onecohort203 and four case-control studies204-207 have been pub-lished. This new information does not change the Panel judge-ment (see box 3.8).
ColorectumTwenty-four cohort studies investigated alcoholic drinks andcolorectal cancer.124 208-235 Thirteen cohort studies214 216 219 227
230 232 236-251 and 41 case-control studies investigated ethanolintake and colorectal cancer.
Total alcoholic drinksEighteen cohort studies showed increased risk for the high-est intake group when compared to the lowest,124 209 210 212-
217 220-223 225-228 233-235 which was statistically significant infour.209 210 216 227 One study showed non-significant increasedrisk in men and non-significant decreased risk in women.211
219 Two studies reported no effect on risk218 231 and threestudies reported decreased risk; none was statistically sig-nificant.208 224 229 230 232 Meta-analysis was possible on sixcohort studies, giving a summary effect estimate of 1.01(95% CI 0.95–1.08) per drink/day, with no heterogeneity(figure 4.8.8).
Alcohol (as ethanol)Eleven of the cohort studies showed increased risk for thehighest intake group when compared to the lowest (figure4.8.9),214 216 219 227 230 232 237 239-251 which was statistically sig-nificant in six.219 227 230 240 244 245 251 One study reported no
effect on risk for men and non-significant decreased risk forwomen,238 and one study reported no statistically significantassociation.236 Meta-analysis was possible on nine cohortstudies, of which one reported on colorectal cancer and eightreported on colon cancer, giving a summary effect estimateof 1.09 (95% CI 1.03–1.14) per 10 g/day, with moderate het-erogeneity(figures 4.8.10 and 4.8.11).
In a separate meta-analysis of nine studies for rectal can-cer, the summary effect estimate was 1.06 (95% CI1.01–1.12) per 10 g/day, with low heterogeneity (figure4.8.12). It is apparent from the meta-analysis that the report-ed effect for men was larger and more often statistically sig-nificant than for women. Stratified meta-analyses forcolorectal cancer gave summary effect estimates of 1.09(95% CI 1.02–1.15) for seven studies for men, and 1.00(95% CI 0.89–1.40) for three studies for women. There wasno statistically significant difference with cancer site. Therewas, however, apparent sexual dimorphism, with a largereffect in men than in women, which explains the bulk of theobserved heterogeneity.
Figure 4.8.8 Alcoholic drinks and colorectal cancer;cohort studies
Kato 1999 Women 1.00 (0.82–1.22)
Ford 1997 0.97 (0.82–1.15)
Schoen 1999 1.24 (0.91–1.69)
Chen 2001 Men 1.26 (0.79–2.01)
Flood 2002 Women 1.02 (0.85–1.21)
Pedersen 2003 1.00 (0.91–1.09)
Summary estimate 1.01 (0.95–1.08)
Relative risk (95% CI)
Relative risk, per drink/day
10.2 20.5 5
Figure 4.8.9 Ethanol and colorectal cancer; cohort studies
Slattery 1990 Men 2.21 (0.81–6.05)
Slattery 1990 Women 1.66 (0.78–3.52)
Goldbohm 1994 1.10 (0.32–3.81)
Glynn 1996 Men 3.60 (1.27–10.18)
Chyou 1996 Men 1.39 (1.05–1.84)
Murata 1996 Men 3.20 (1.53–6.70)
Harnack 2002 Women 1.08 (0.72–1.62)
Wei 2003 Men 1.55 (1.05–2.28)
Wei 2003 Women 1.14 (0.86–1.52)
Relative risk (95% CI)
Relative risk, highest vs lowest exposure category
10.2 20.5 5

165
C H A P T E R 4 • F O O D S A N D D R I N K S
When data were analysed separately for drink type (beers,wines, or spirits), they became insufficient to draw any firmconclusions.
Pooled analysis from 8 cohort studies (over 475 000 par-ticipants, followed up for 6 to 16 years, more than 4600 col-orectal cancer cases) showed a significant increased risk forthe highest intake group when compared to the lowest, withan effect estimate of 1.41 (95% CI 1.16–1.72) for those whoconsumed 45 g/day or greater.252 No increased risk wasobserved below intakes of 30 g/day. No significant hetero-geneity was observed by sex or cancer site.
In addition, a published meta-analysis of 27 studies report-ed a statistically significant increased risk, with a summaryeffect estimate of 1.10 (95% CI 1.05–1.14) per twodrinks/day.
Because of the abundant prospective data from cohortstudies, case-control studies were not summarized.
The general mechanisms through which alcohol could
plausibly cause cancer are outlined below. In addition, theassociation between alcohol intake and colorectal cancer riskis modified by acetaldehyde dehydrogenase and alcoholdehydrogenase genetic status.253 254 Alcohol may inducefolate deficiency in the colon and rectum, possibly by reduc-ing absorption of folate or by inhibition of critical enzymes.Also, alcohol may disrupt one-carbon metabolism (seeChapter 2). Intestinal bacteria, because of their high alco-hol dehydrogenase activity, can oxidise ethanol in colorec-tal tissue to produce levels of acetaldehyde up to 1000-foldhigher than that in blood.
The more elevated risk related to alcohol intake amongmen compared with women may be because of the gener-ally lower consumption of alcohol among women. That is,it is possible that men exhibit a greater range in the amountof alcohol drunk, which makes effects easier to detect. Also,preferred beverages may differ between the sexes, or theremay be hormone-related differences in alcohol metabolismor susceptibility to alcohol.
There is ample and generally consistent evidence fromcohort studies. A dose-response is apparent. There isevidence for plausible mechanisms. The evidence thatconsumption of more than 30 g/day of ethanol fromalcoholic drinks is a cause of colorectal cancer in menis convincing, and probably also in women.
The Panel is aware that since the conclusion of the SLR, fourcohort255-258 and four case-control studies259-262 have been pub-lished. This new information does not change the Panel judge-ment (see box 3.8).
Breast Eleven cohort studies,183 263-271 31 case-control studies272-310
and 2 ecological studies311 312 investigated total alcoholicdrinks and breast cancer at all ages. Four cohort studies313-
316 and 19 case-control studies289 302 317-333 investigated alco-holic drinks. Twenty-five cohort studies,315 334-364 29 case-
Figure 4.8.10 Ethanol and colon cancer; cohort studies
Wu 1987 1.18 (1.06–1.31)
Kreger 1992 Men 1.00 (0.92–1.09)
Kreger 1992 Women 0.88 (0.71–1.10)
Goldbohm 1994 Men 1.08 (0.95–1.23)
Goldbohm 1994 Women 1.07 (0.90–1.29)
Giovanucci 1995 Men, >646 µg/day folate intake 1.02 (0.64–1.61)
Chyou 1996 Men 1.17 (1.06–1.28)
Murata 1994 Men 1.12 (0.94–1.28)
Colbert 2001 Men 1.03 (0.96–1.12)
Harnack 2002 Women 1.05 (0.80–1.38)
Nakaya 2005 Men 1.25 (1.06–1.47)
Summary estimate 1.09 (1.03–1.14)
Relative risk (95% CI)
Relative risk, per 10 g/day
10.2 20.5 5
Figure 4.8.11 Ethanol and colon cancer incidence;cohort studies: dose response
Goldbohm 1994 Men
Goldbohm 1994 Women
Chyou 1996 Men
0 402010 30
Ethanol (g/day)
Figure 4.8.12 Ethanol and colorectal cancer; cohort studies
Kreger 1992 Men 0.98 (0.83–1.15)
Kreger 1992 Women 0.81 (0.48–1.37)
Goldbohm 1994 Men 1.08 (0.92–1.27)
Goldbohm 1994 Women 1.05 (0.78–1.39)
Chyou 1996 Men 1.11 (1.07–1.16)
Murata 1996 1.14 (0.93–1.39)
Colbert 2001 Women 0.99 (0.90–1.07)
Hamack 2002 0.94 (0.54–1.65)
Nakaya 2005 1.15 (0.92–1.44)
Summary estimate 1.06 (1.01–1.12)
Relative risk (95% CI)
Relative risk, per 10 g/day
10.2 20.5 5

166
P A R T 2 • E V I D E N C E A N D J U D G E M E N T S
control studies,280 282 317 318 332 333 365-391 and 4 ecologicalstudies392-395 investigated ethanol intake.
Total alcoholic drinks Six cohort studies showed increased risk for the highestintake group of total alcoholic drinks when compared to thelowest,263 264 267-271 which was statistically significant inthree.267 269 270 Three studies showed non-significantdecreased risk265 266; one study showed no effect on risk.183
Meta-analysis was possible on three cohort studies, giving asummary effect estimate of 1.07 (95% CI 0.89–1.29) per fivetimes/week, with no heterogeneity (figures 4.8.13 and4.8.14).263 271
Two cohort studies reported separately on premenopausalbreast cancer.264 268 Both showed increased risk for the high-est intake group when compared to the lowest, which wasstatistically significant in one.268 Three cohort studiesreported separately on postmenopausal breast cancer.264 268
269 Two showed increased risk for the highest intake groupwhen compared to the lowest,264 269 which was statisticallysignificant in one.269 The other study showed non-significantdecreased risk.268
Four additional cohort studies investigated alcoholicdrinks.313-316 All four showed non-significant increased riskfor breast cancer at unspecified ages. One study also report-ed statistically significant increased risk for postmenopausalbreast cancer and non-significant decreased risk for pre-menopausal breast cancer.315
Most of the 22 case-control studies that reported on all-age breast cancer and total alcoholic drinks showedincreased risk for the highest intake group when comparedto the lowest,273 274 280 282-285 287 288 290 295 297 301-303 305-309 318
which was statistically significant in seven.273 284 285 306 318
A few studies showed decreased risk, none was statisticallysignificant.276 291 295 298 302 304 Meta-analysis was possible on10 case-control studies reporting on breast cancer at all ages,giving a summary estimate of 1.05 (95% CI 1.03–1.07) foran increment of five times/week, with high heterogeneity(figures 4.8.13 and 4.8.14).274 276 284 286 287 296 306 307 No het-erogeneity was apparent with menopausal status. Twelvecase-control studies reported separately on premenopausalbreast cancer.272 275 277-279 281 282 292-294 297 299 300 306 310 318 Tenshowed increased risk,272 275 277 279 281 292-294 299 300 306 318 whichwas statistically significant in two.272 281 294 299 300 306 Onestudy showed no effect on risk297 and the other study showednon-significant decreased risk.278 282 310 Six studies reportedseparately on postmenopausal breast cancer.277 278 281 282 289
297 306 310 Five of these showed increased risk,278 281 282 289 306
310 which was statistically significant in one.306 The otherstudy reported non-significant decreased risk.297
In addition, 19 case-control studies investigated alcoholicdrinks.289 302 318-323 325-331 333 Most showed increased risk forthe highest intake group when compared to the lowest,which was statistically significant in six.302 318 321 323 327 329
Two studies showed non-significant decreased risk317 324; onestudy showed no effect on risk.332 Four studies reported sep-arate results for premenopausal breast cancer.318 320 322 333 Ofthese, two studies showed non-significant increased risk,318
333 one showed statistically significant increased risk in
Figure 4.8.13 Alcoholic drinks and breast cancer; cohortand case-control studies
Cohort
Wu 1999 1.38 (0.84–2.26)
Wu 1999 1.08 (0.78–1.50)
Byrne 1996 0.99 (0.77–1.28)
Summary estimate 1.07 (0.89–1.29)
Case control
La Vecchia 1989 1.10 (1.07–1.13)
Baumgartner 2002 1.07 (0.82–1.38)
Katsoyannis 1994 1.05 (0.97–1.12)
Kinney 2000 1.03 (0.92–1.15)
Lash 2000 1.01 (0.86–1.19)
Rosenberg 1990 0.97 (0.86–1.10)
Viladiu 1996 0.97 (0.93–1.11)
Freudenheim 1995 0.94 (0.79–1.13)
Sneyd 1991 0.94 (0.81–1.09)
Baughmater 2002 0.90 (0.79–1.03)
Summary estimate 1.05 (1.03–1.07)
Relative risk (95% CI)
Relative risk, per 5 times/week
10.2 2 4 61.50.5
Figure 4.8.14 Alcoholic drinks and breast cancer; cohortand case-control studies: dose response
Cohort
Wu 1999
Byrne 1996
Case control
Baughmater 2002
La Vecchia 1989
Rosenberg 1990
Freudenheim 1995
Lash 2000
Baughmater 2002
Vlladiu 1996
Sneyd 1991
Kinney 2000
Katsouyanni 1994
0 4 8 12 16 20 24 28
Alcoholic drinks (times/week)
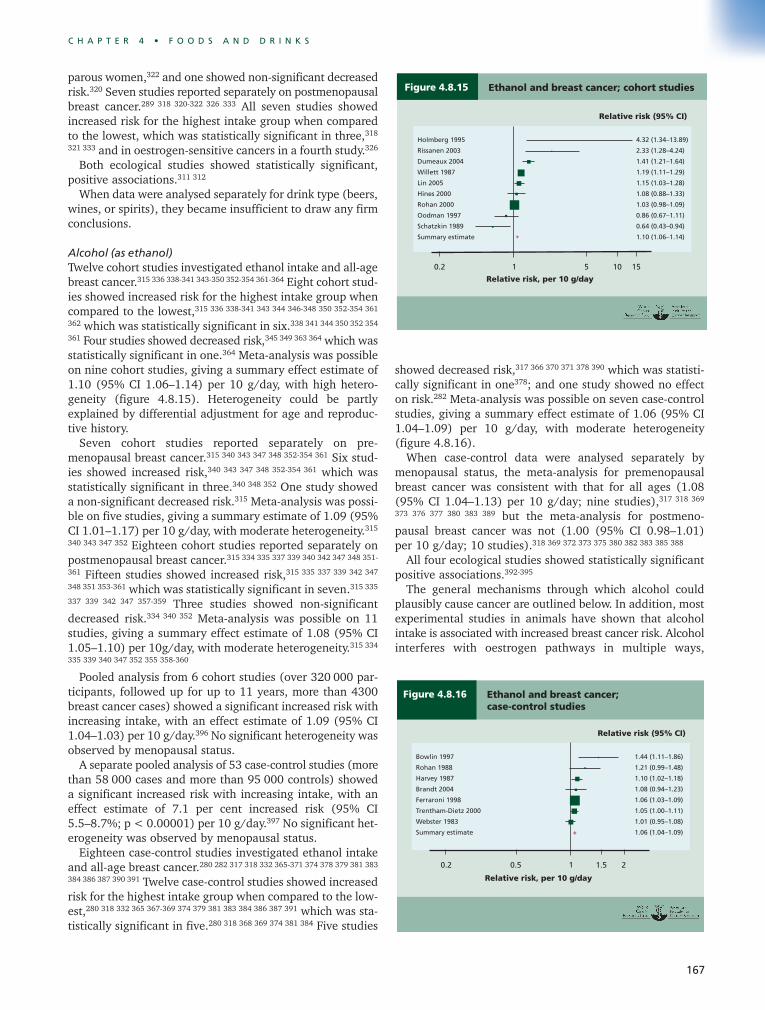
167
C H A P T E R 4 • F O O D S A N D D R I N K S
parous women,322 and one showed non-significant decreasedrisk.320 Seven studies reported separately on postmenopausalbreast cancer.289 318 320-322 326 333 All seven studies showedincreased risk for the highest intake group when comparedto the lowest, which was statistically significant in three,318
321 333 and in oestrogen-sensitive cancers in a fourth study.326
Both ecological studies showed statistically significant,positive associations.311 312
When data were analysed separately for drink type (beers,wines, or spirits), they became insufficient to draw any firmconclusions.
Alcohol (as ethanol) Twelve cohort studies investigated ethanol intake and all-agebreast cancer.315 336 338-341 343-350 352-354 361-364 Eight cohort stud-ies showed increased risk for the highest intake group whencompared to the lowest,315 336 338-341 343 344 346-348 350 352-354 361
362 which was statistically significant in six.338 341 344 350 352 354
361 Four studies showed decreased risk,345 349 363 364 which wasstatistically significant in one.364 Meta-analysis was possibleon nine cohort studies, giving a summary effect estimate of1.10 (95% CI 1.06–1.14) per 10 g/day, with high hetero-geneity (figure 4.8.15). Heterogeneity could be partlyexplained by differential adjustment for age and reproduc-tive history.
Seven cohort studies reported separately on pre-menopausal breast cancer.315 340 343 347 348 352-354 361 Six stud-ies showed increased risk,340 343 347 348 352-354 361 which wasstatistically significant in three.340 348 352 One study showeda non-significant decreased risk.315 Meta-analysis was possi-ble on five studies, giving a summary estimate of 1.09 (95%CI 1.01–1.17) per 10 g/day, with moderate heterogeneity.315
340 343 347 352 Eighteen cohort studies reported separately onpostmenopausal breast cancer.315 334 335 337 339 340 342 347 348 351-
361 Fifteen studies showed increased risk,315 335 337 339 342 347
348 351 353-361 which was statistically significant in seven.315 335
337 339 342 347 357-359 Three studies showed non-significantdecreased risk.334 340 352 Meta-analysis was possible on 11studies, giving a summary effect estimate of 1.08 (95% CI1.05–1.10) per 10g/day, with moderate heterogeneity.315 334
335 339 340 347 352 355 358-360
Pooled analysis from 6 cohort studies (over 320 000 par-ticipants, followed up for up to 11 years, more than 4300breast cancer cases) showed a significant increased risk withincreasing intake, with an effect estimate of 1.09 (95% CI1.04–1.03) per 10 g/day.396 No significant heterogeneity wasobserved by menopausal status.
A separate pooled analysis of 53 case-control studies (morethan 58 000 cases and more than 95 000 controls) showeda significant increased risk with increasing intake, with aneffect estimate of 7.1 per cent increased risk (95% CI5.5–8.7%; p < 0.00001) per 10 g/day.397 No significant het-erogeneity was observed by menopausal status.
Eighteen case-control studies investigated ethanol intakeand all-age breast cancer.280 282 317 318 332 365-371 374 378 379 381 383
384 386 387 390 391 Twelve case-control studies showed increasedrisk for the highest intake group when compared to the low-est,280 318 332 365 367-369 374 379 381 383 384 386 387 391 which was sta-tistically significant in five.280 318 368 369 374 381 384 Five studies
showed decreased risk,317 366 370 371 378 390 which was statisti-cally significant in one378; and one study showed no effecton risk.282 Meta-analysis was possible on seven case-controlstudies, giving a summary effect estimate of 1.06 (95% CI1.04–1.09) per 10 g/day, with moderate heterogeneity(figure 4.8.16).
When case-control data were analysed separately bymenopausal status, the meta-analysis for premenopausalbreast cancer was consistent with that for all ages (1.08(95% CI 1.04–1.13) per 10 g/day; nine studies),317 318 369
373 376 377 380 383 389 but the meta-analysis for postmeno-pausal breast cancer was not (1.00 (95% CI 0.98–1.01) per 10 g/day; 10 studies).318 369 372 373 375 380 382 383 385 388
All four ecological studies showed statistically significantpositive associations.392-395
The general mechanisms through which alcohol couldplausibly cause cancer are outlined below. In addition, mostexperimental studies in animals have shown that alcoholintake is associated with increased breast cancer risk. Alcoholinterferes with oestrogen pathways in multiple ways,
Figure 4.8.15 Ethanol and breast cancer; cohort studies
Holmberg 1995 4.32 (1.34–13.89)
Rissanen 2003 2.33 (1.28–4.24)
Dumeaux 2004 1.41 (1.21–1.64)
Willett 1987 1.19 (1.11–1.29)
Lin 2005 1.15 (1.03–1.28)
Hines 2000 1.08 (0.88–1.33)
Rohan 2000 1.03 (0.98–1.09)
Oodman 1997 0.86 (0.67–1.11)
Schatzkin 1989 0.64 (0.43–0.94)
Summary estimate 1.10 (1.06–1.14)
Relative risk (95% CI)
Relative risk, per 10 g/day
10.2 5 10 15
Figure 4.8.16 Ethanol and breast cancer;case-control studies
Bowlin 1997 1.44 (1.11–1.86)
Rohan 1988 1.21 (0.99–1.48)
Harvey 1987 1.10 (1.02–1.18)
Brandt 2004 1.08 (0.94–1.23)
Ferraroni 1998 1.06 (1.03–1.09)
Trentham-Dietz 2000 1.05 (1.00–1.11)
Webster 1983 1.01 (0.95–1.08)
Summary estimate 1.06 (1.04–1.09)
Relative risk (95% CI)
Relative risk, per 10 g/day
10.2 1.5 20.5

168
P A R T 2 • E V I D E N C E A N D J U D G E M E N T S
influencing hormone levels and oestrogen receptors.398
There is an interaction between folate and alcohol affect-ing breast cancer risk: increased folate status partiallymitigates the risk from increased alcohol consumption.399
There is ample, generally consistent evidence fromcase-control and cohort studies. A dose-responserelationship is apparent. There is robust evidence formechanisms operating in humans. The evidence thatalcoholic drinks are a cause of premenopausal andpostmenopausal breast cancer is convincing. Nothreshold was identified.
The Panel is aware that since the conclusion of the SLR, onecase-control study400 has been published. This new informationdoes not change the Panel judgement (see box 3.8).
Liver Fifteen cohort studies120 208 220 227 401-422 and 33 case-controlstudies158 423-460 investigated alcoholic drinks and liver can-cer. Fourteen cohort studies6 120 227 244 403 404 409 410 412 416 422
461-468 and 21 case-control studies158 427 431 434 436 440 446 452 456
459 469-485 investigated ethanol intake.
Total alcoholic drinksData are available from 15 cohort studies.120 208 220 227 401-422
Eleven cohort studies showed increased risk for the highestintake group when compared to the lowest,120 220 227 401-404 407-
410 413 414 416 417 420 422 which was statistically significant intwo.120 401 Two studies showed non-significant decreasedrisk.405 406 412 418 419 Two studies stated that there was no sig-nificant difference but did not provide further data.411 415 421
Heterogeneity is partially explained by differences inwhether and how studies have adjusted for hepatitis virusstatus. The effect estimates of eight studies are given in thehigh to low comparison forest plot (figure 4.8.17).
Data are available from 33 case-control studies.158 423-460
Twenty-eight case-control studies showed increased risk forthe highest intake group when compared to the lowest,158 423-
432 434-448 451-456 460 which was statistically significant in 12 (oneof these studies reported a non-significant decreased risk inwomen, but a statistically significant increased risk inmen440).158 423 427 429-432 434 439 440 442 444 446 447 454-456 Two studiesshowed non-significant decreased risk.449 Three studies stat-ed that there was no significant effect on risk.433 450 457-459 Meta-analysis was possible on five studies, giving a summary effectestimate of 1.18 (95% CI 1.11–1.26) per drink/week, withhigh heterogeneity (figure 4.8.18).158 425 434 449 460
A dose-response relationship is apparent from case-controlbut not cohort data.
Alcohol (as ethanol) Ten cohort studies showed increased risk for the highestintake group when compared to the lowest,6 120 244 403 404 409
410 416 422 461 465-468 which was statistically significant in five(one of these studies reported a non-significant increased riskin women, but a statistically significant increased risk inmen461).6 120 244 416 461 465 468 Three studies in men with cir-rhosis showed non-significant decreased risk.227 412 462 463 One
study stated that there was no significant effect on risk.464
Meta-analysis was possible on six cohort studies, giving asummary effect estimate of 1.10 (95% CI 1.02–1.17) per 10g/day or 10 ml/day, with no heterogeneity (figure 4.8.19).
Twenty case-control studies showed increased risk for thehighest intake group when compared to the lowest,158 427 431
434 436 440 446 452 456 469 470 472-475 477-479 481-485 which was statisti-cally significant in 12.158 427 431 434 440 446 456 474 475 477-479 481 483-
485 One study showed non-significant decreased risk.476
Meta-analysis was possible on 14 case-control studies, giv-ing a summary effect estimate of 1.17 (95% CI 1.09–1.25)per 10 g/day or 10 ml/day, with high heterogeneity (figure
Figure 4.8.17 Alcoholic drinks and liver cancer:cohort and case-control studies
Cohort
Kono 1987 2.36 (1.04–5.35)
Hirayama 1989 1.89 (1.40–2.55)
Ross 1992 1.10 (0.46–2.60)
Goodman 1995 Men 1.11 (0.72–1.71)
Goodman 1995 Women 1.25 (0.78–1.99)
Mutu 1989 1.50 (0.42–5.31)
Yu 1999 1.39 (0.68–2.14)
Evans 2002 Men 0.90 (0.90–1.01)
Evans 2002 Women 0.57 (0.29–1.18)
Wang 2003 HBsAg positive 1.29 (0.78–2.10)
Wang 2003 HBsAg negative 2.00 (0.89–4.51)
Case control
Stemhagen 1983 Men 1.30 (0.64–2.63)
Stemhagen 1983 Women 1.63 (0.92–2.89)
Inaba 1984 3.62 (1.68–7.79)
Austin 1986 2.60 (1.26–5.35)
Harris 1988 Men 1.28 (0.69–2.39)
La Vecchia 1988 1.43 (0.83–2.46)
Harris 1988 Women 1.93 (0.66–5.63)
Tsukuma 1990 Men 2.60 (1.70–3.99)
Olubuyide 1990 Men 1.70 (0.90–3.21)
Olubuyide 1990 Women 1.40 (0.04–50.00)
Hiyama 1990 8.00 (1.30–49.36)
Qureshi 1990 3.04 (0.31–29.54)
Yu 1991 Anti-HCV negative 2.10 (1.20–3.69)
Choi 1991 Men 2.46 (1.16–5.22)
Yamaguchi 1993 HBsAg negative 2.70 (1.81–4.02)
Newton 1996 1.20 (0.50–2.89)
Wang 1996 1.28 (0.98–1.67)
Braga 2000 Men 1.68 (1.14–2.48)
Braga 2000 Women 1.30 (0.42–4.01)
Mukaiya 1998 2.31 (1.20–4.42)
Mandishona 1998 2.00 (0.49–8.10)
Kuper 2000 1.90 (0.91–3.96)
Yu 2002 1.38 (0.68–2.81)
Donato 2002 Men 2.70 (1.09–6.71)
Donato 2002 Women 0.90 (0.33–2.49)
Munaka 2003 1.45 (0.81–2.60)
Tsai 2004 2.55 (1.50–4.33)
0.2 0.5 1 2 5
Relative risk (95% CI)
Relative risk, highest vs lowest exposure category

169
C H A P T E R 4 • F O O D S A N D D R I N K S
4.8.20). Heterogeneity may be due to the inclusion of stud-ies that reported alcoholic behaviour.
A dose-response relationship is apparent from cohort andcase-control data (figure 4.8.21).
BeersTwo cohort studies6 486 and five case-control studies425 435 444
452 473 479 reported separately on beer drinking.Both cohort studies showed statistically significant
increased risk with increased intake.6 486 Four case-controlstudies also showed increased risk,425 435 444 452 479 which wasstatistically significant in three.435 444 452 479 One study report-ed no effect on risk.473
WinesThree cohort studies6 410 486 and one case-control study425
reported separately on wine drinking.One cohort study showed non-significant increased risk
with increased intake.410 Two studies stated that there wasno significant effect on risk.6 486 The single case-control studyshowed non-significant increased risk.425
Figure 4.8.18 Alcoholic drinks and liver cancer;case-control studies
Austin 1986 HBsAg 1.07 (0.86–1.33)
Lu 1988 0.89 (0.77–1.02)
Choi 1991 1.30 (1.19–1.41)
Yu 1991 1.39 (1.08–1.79)
Mukaiya 1998 1.21 (1.01–1.44)
Summary estimate 1.18 (1.11–1.26)
Relative risk (95% CI)
Relative risk, per drink/week
10.7 1.51.20.8
Figure 4.8.19 Ethanol and liver cancer; cohort studies
Oshima 1984 1.24 (1.03–1.50)
Ross 1992 1.20 (0.88–1.63)
Murata 1996 0.99 (0.85–1.16)
Miyakawa 1996 HBV-carrier 0.96 (0.62–1.48)
Khan 2000 1.09 (1.00–1.20)
Sharp 2005 1.26 (0.82–1.93)
Summary estimate 1.10 (1.02–1.17)
Relative risk (95% CI)
Relative risk, per 10 g/day
10.2 520.5
Figure 4.8.20 Ethanol and liver cancer; case-control studies
Infante 1980 Cirrhotic 5.01 (2.42–10.37)
Infante 1980 Non-cirrhotic 6.10 (2.20–16.93)
Yu 1983 1.12 (1.00–1.26)
Inaba 1984 1.81 (1.27–2.59)
Tsukuma 1990 1.17 (1.09–1.29)
Mayans 1990 1.19 (1.09–1.29)
Yamaguchi 1993 Men 1.11 (1.06–1.15)
Arico 1994 0.93 (0.87–1.00)
Pyong 1994 Men 1.40 (1.16–1.69)
Shin 1996 1.05 (0.97–1.15)
Zhang 1998 1.05 (0.95–1.17)
Mukaiya 1998 1.28 (1.05–1.57)
Kuper 2000 1.04 (0.96–1.13)
Hassan 2002 1.16 (1.03–1.30)
Gelatti 2005 1.28 (1.19–1.38)
Summary estimate 1.17 (1.09–1.25)
Relative risk (95% CI)
Relative risk, per 10 g/day
10.2 520.5
Figure 4.8.21 Ethanol and liver cancer; cohort studies:dose response
Sharp 2005
Ross 1992
Oshima 1984
Murata 1996
Miyakawa 1996 HBV-carrier
Khan 2000
0 20 40 60 80 100
Ethanol (g/day)

170
P A R T 2 • E V I D E N C E A N D J U D G E M E N T S
SpiritsTwo cohort studies6 486 and five case-control studies425 444 469
472 479 487 reported separately on spirits.Both cohort studies showed no significant effect on risk.6
486 All case-control studies showed increased risk,425 444 469 472
479 487 which was statistically significant in one444 479; and onecase-control study showed statistically significant increasedrisk for consumption of illicit liquor.487
Several studies used participants judged to be at high riskof developing liver cancer, that is, people who already hadliver cirrhosis. These results are particularly hard to interpretas cirrhosis status affects drinking behaviour. Also the can-cer disease path may be different in people with cirrhosis.
Assessment of some studies was hampered by poor expo-sure assessment, and not all studies adjusted for known con-founders such as hepatitis B or C virus.
The general mechanisms through which alcohol couldplausibly cause cancer are outlined below. In addition, reg-ular, high levels of alcohol consumption are known to causeliver damage. Tumour promotion has been linked to inflam-mation in the liver through alcohol-associated fibrosis andhepatitis.488 489 Alcohol consumption, even at moderate lev-els, is associated with increases in levels of circulating hepati-tis C virus RNA in carriers. Hepatitis C virus infection ishighly prevalent among alcoholics with chronic liver diseaseand appears to accelerate the course of alcoholic liver disease(see chapter 7.8).
There is ample, generally consistent evidence fromboth cohort and case-control studies. A dose-responserelationship is apparent. Alcohol is a cause of cirrhosisthat predisposes to liver cancer, but the factors thatdetermine why some people are susceptible tocirrhosis are not known. Alcoholic drinks are aprobable cause of liver cancer. No threshold wasidentified.
The Panel is aware that since the conclusion of the SLR, onecase-control study490 has been published. This new informationdoes not change the Panel judgement (see box 3.8).
Kidney Three cohort studies491-493 and 16 case-control studies308 494-
509 investigated alcoholic drinks and kidney cancer. Fourcohort studies6 492 510-513 and five case-control studies503 504
514-516 investigated ethanol intake.
Total alcoholic drinksTwo cohort studies showed non-significant increased risk forthe highest intake group when compared to the lowest.491 493
One study showed a statistically significant decreasedrisk.492 None of the studies was adjusted for smoking; effectestimates were 1.42 (95% CI 0.69–2.9),493 1.7 (95% CI0.8–3.5) for women491 and 1.2 (95% CI 0.5–2.6) for men,491
and 0.62 (95% CI 0.41–0.94).492
Seven case-control studies showed decreased risk for thehighest intake group when compared to the lowest,308 494 496
499 501-504 of which one was statistically significant494and onewas statistically significant in women but not in men.504
Three studies showed no effect on risk495 497 509; three stud-ies stated that there was no significant association505-507; twostudies showed non-significant increased risk498 500; onestudy showed a non-significant decreased risk in men and anon-significant increased risk in women.508 Meta-analysiswas possible on two studies that adjusted for smoking, giv-ing a summary effect estimate of 0.92 (95% CI 0.71–1.20)per serving/day, with moderate heterogeneity (figure4.8.22).496 498
Alcohol (as ethanol)All four cohort studies showed decreased risk with increasedethanol intake,6 492 510-513 which was statistically significantin one.510 512 Meta-analysis was possible on two unadjustedstudies, giving a summary effect estimate of 0.48 (95% CI0.26–0.90) per serving/day, with no heterogeneity.492 511
Three case-control studies showed non-significantdecreased risk with increased ethanol intake.504 514 516 Onestudy showed no effect on risk,515 and one study stated nosignificant association.503 Meta-analysis was possible on twounadjusted studies, giving a summary effect estimate of 0.90(95% CI 0.77–1.05) per serving/day, with no heterogeneity(figure 4.8.23).514 515
There is no known mechanism through which alcoholcould decrease kidney cancer risk.
It is unlikely that alcohol increases the risk of kidneycancer, though a protective effect cannot be excluded.
Figure 4.8.22 Ethanol and kidney cancer;case-control studies
Yuan 1998 1.01 (0.97–1.05)
Parker 2002 0.76 (0.53–1.07)
Summary estimate 0.92 (0.71–1.20)
Relative risk (95% CI)
Relative risk, per unit/day
1 20.5
Figure 4.8.23 Alcoholic drinks and kidney cancer;case-control studies
Mattioli 2002 0.90 (0.76–1.04)
Lindblad 1997 1.00 (0.39–2.59)
Summary estimate 0.90 (0.77–1.05)
Relative risk (95% CI)
Relative risk, per unit/day
10.25 420.5
171
C H A P T E R 4 • F O O D S A N D D R I N K S
The Panel is aware that since the conclusion of the SLR, onecohort study517 has been published. This new information doesnot change the Panel judgement (see box 3.8).
General mechanismsEvidence suggests that reactive metabolites of alcohol, suchas acetaldehyde, may be carcinogenic. Additionally, theeffects of alcohol may be mediated through the productionof prostaglandins, lipid peroxidation, and the generation offree-radical oxygen species. Alcohol also acts as a solvent,enhancing penetration of carcinogens into cells. Alcohol hasbeen demonstrated to alter retinoid status in rodent studiesand, as a result, cellular growth, cellular differentiation, andapoptosis are adversely altered. For all these pathways,genetic polymorphisms might also influence risk.398
Lastly, heavy consumers of alcohol may have dietsdeficient in essential nutrients, making tissue susceptible tocarcinogenesis.
4.8.6 Comparison with previous report
In general, the evidence that alcohol is a cause of a numberof cancers has become stronger since the mid-1990s.
The previous report did not find any distinctions betweendifferent types of alcoholic drink. This finding is upheld.
The previous report identified a threshold of modestconsumption of alcoholic drinks, below which no effect oncancer risk was observed, with the exception of breast can-cer. Current evidence does not identify a generally ‘safe’threshold.
Current evidence strengthens the previous judgements oncolorectal and breast cancers.
4.8.7 Conclusions
The Panel concludes:Evidence that alcoholic drinks of any type are a cause ofvarious cancers has, on the whole, strengthened.
The evidence that alcoholic drinks are a cause of cancersof the mouth, pharynx, and larynx, oesophagus, colorectum(men), and breast is convincing. They are probably a causeof colorectal cancer in women, and of liver cancer. It isunlikely that alcoholic drinks have a substantial adverseeffect on the risk of kidney cancer.

172
P A R T 2 • E V I D E N C E A N D J U D G E M E N T S
Practically all food and drink is changed before it isconsumed, for instance by peeling or cooking. Themajority of foods and drinks consumed by most peoplearound the world are now modified in many more ways.Products on sale in supermarkets, small shops, and otherretail outlets are chilled, pasteurised, canned, bottled,vacuum packed, or otherwise packaged. Most contain anumber of ingredients, some of which are also processed.The use of ingredients such as modified starches, addedsugars, hydrogenated fats, and also additives used asbulking aids, preservatives, colours, flavours, sweeteners,and for other purposes, is common. In general, rises inconsumption of fats, oils, and added sugars occur becauseof their increased use in processed foods and drinks.Animal and plant products both contain traces ofagricultural chemicals. Methods of industrial and domesticfood preparation and cooking change the nature of food aseaten.
It is possible that processing and/or preserving methodsmay alter the nature of food. Different methods of foodpreservation and processing may be protective, causative,or neutral in their effects on the risk of cancer.
It is for this reason that the Panel decided that, as far aspractically possible, the evidence on methods of foodproduction, preservation, processing, and preparation(including cooking) should be summarised and judged inthe context of the relevant foods and drinks. Most of thisevidence is to be found in the previous sections ofChapter 4.
This section summarises other information and findingsconcerning the ways in which foods and drinks arechanged before consumption. These include where datafrom animal and other experimental studies are notsupported by evidence from epidemiological studies. Suchstudies are often carried out for the purposes ofestablishing regulations for the safety in use of chemicalsknown to be toxic, but may use levels of exposure farhigher than occur in foods and drinks.
In line with its general criteria for judgement, the Paneldecided to make no judgements on experimental findingsalone that are not supported by epidemiological or otherevidence. Nevertheless, the Panel concurs that, in general,it seems reasonable to conclude that the changes made tofoods and drinks within well regulated, modern foodsystems, and made to foods and drinks as usuallyprepared and cooked, are of themselves unlikely to modifythe risk of cancer significantly. For this reason, no matrixshowing Panel judgements is included in this section.
In line with its general criteria for judgement, the Panelhas decided to make no judgements on experimentalfindings from studies using doses of substances at levels
far above those found in foods and drinks, many if notmost of which are conducted to guide toxicologicalregulations. The Panel also concurs that changes made toprocessed foods and drinks within well regulated, modernfood systems are of themselves unlikely to modify the riskof cancer significantly. For this reason, no matrix showingPanel judgements is included in this section. Those aspectsof food production, preservation, processing, andpreparation that have been examined in epidemiologicalas well as experimental settings are discussed and judgedin earlier sections of Chapter 4.
This section summarises some of the general methods bywhich foods and drinks may be changed during their pro-duction, preservation, processing, and preparation (includ-ing cooking) that may be relevant to the risk of cancer.Almost all foods and drinks are altered — processed, in ageneral sense of the word — before being consumed.
Reports concerned with the prevention of chronic diseasesoften mention the added nutritional value of lightlyprocessed cereals (grains), and of vegetables and fruits. Butthey may not make much distinction between foods anddrinks as such, and as modified in production, preservation,processing, and preparation. Previous reports concerned withcancer have concluded that some methods of food and drinkmodification can produce carcinogens in experimental set-tings, and that this might reasonably influence cancer risk.Storage conditions that allow contamination of cereals(grains) and other plant foods by aflatoxins, and the prepa-ration of fish Cantonese-style by salting and fermentation,have previously been identified as causes of cancer.
This section covers aspects of food production, preserva-tion, processing, and preparation that are sometimes thoughtto be relevant to the risk of cancer, but where experimentalinformation (when this exists) is not supported by epidemi-ological evidence or where there is no such evidence. Wherethe evidence for foods or drinks is sufficient to judge thatthey may cause or protect against any cancer, this is sum-marised and judged in earlier sections of this chapter. Forexample, see chapter 4.1 for the Panel’s findings on aflatoxincontamination; for processed meat and also cooking meth-ods, see chapter 4.3; for salting, see chapter 4.6.
4.9.1 Production
Modern food systems (box 4.9.1) involve various aspects offood production that have some potential to modify the riskof cancer. A clear benefit of these systems of production, dis-tribution, and retail sale, with chilling used at all stages, is
4.9 Food production, preservation,processing, and preparation

173
C H A P T E R 4 • F O O D S A N D D R I N K S
the all-year round supply of fresh vegetables and fruits (seechapter 4.2).
The industrialised farming methods that are part of mostmodern food systems in most countries use various tech-nologies to maximise production. These include the use offertilisers, pesticides, and herbicides on food crops; and ofveterinary drugs in rearing livestock and in aquaculture.Fertilisers play a part in determining nutrient levels in plants,as well as potentially modifying concentrations of otherbioactive microconstituents. Residues of these and otherchemicals applied to crops are washed from soils by the rain and can contaminate water supplies. See boxes 4.9.2and 4.9.3.
Methods or consequences of food production, where epi-demiological evidence shows or suggests an effect on the riskof cancer, are summarised and judged earlier in this chapter.These are fungal contamination (chapter 4.1), hot drinks and foods (chapter 4.7), and arsenic contamination (chapter 4.7).
4.9.1.1 Pesticides and herbicidesThe use of synthetic pesticides and herbicides has increasedvastly since the middle of the 20th century. Nearly 2500tonnes of these chemicals were used worldwide in 2001.1
The chlorinated pesticide dichloro-diphenyl-trichloro-ethane (DDT) has been banned from use in many countries.Other organochlorine pesticides are now largely beingreplaced with organophosphorus and carbamate pesticides.These newer types are less persistent in the environment,and have not been found to be carcinogenic in experimen-tal settings.
In many countries, the use of pesticides and herbicides isregulated to minimise residues in foods and drinks, and thereare internationally recommended maximum residue limits(box 4.9.3). The use of persistent organic pollutants(organochlorine pesticides, furans, dioxins, and polychlori-nated biphenyls) will be banned by 2025 under the UnitedNations Environment Programme’s Stockholm Convention,which entered into force in May 2004.
Many of these contaminants have the potential to accu-mulate within food systems, and residues of pesticides andherbicides that have been banned from use, or are beingphased out, may still be present in foods eaten today. Somecontaminants, such as heavy metals and persistent organiccompounds, tend to be deposited in fatty tissues and are noteasily metabolised or excreted. They accumulate in livingcreatures, in amounts higher than background levels (forinstance, in the soil). Dietary exposure increases with eachstep up the food chain, as predators consume prey contam-inated with these residues.
There are theoretical grounds for concern, which are con-stantly reviewed by international and national regulatorybodies. However, there is no epidemiological evidence thatcurrent exposures are causes of cancers in humans, and sothe Panel has made no judgements. Nevertheless, a precau-tionary approach is wise for women of reproductive age,since vulnerability during embryonic phases of developmentis increased, and early exposure may result in increased riskat later stages in life.
4.9.1.2 Veterinary drugsIndustrial animal production, as distinct from ‘organic’ farm-ing (box 4.9.2), requires constant use of antimicrobial drugsto treat and prevent infectious diseases, and promote growth.Residues of these antimicrobials can be found in foods anddrinks, normally at levels lower than internationally recom-mended maximum residue limits (box 4.9.3). When anti-microbials have been found to be carcinogenic in animals,their licence for that use has been withdrawn.
Hormonal anabolic agents are used in animal husbandryin some countries, including the USA, to prevent and ter-minate pregnancy in cows and to promote growth. Their usehas been banned in other countries as well as in theEuropean Union. Hormones designed to stimulate milk pro-duction include bovine somatotropin and porcine soma-totropin. Many hormones have been found to be multisitecarcinogens in experimental settings.2 These include oestro-gens, classed as group 1, human carcinogens, by theInternational Agency for Research on Cancer (IARC), prog-
Food systems involve the production, preservation, processing,and preparation (including cooking) of food. Gatherer–hunterstake food as it is found in nature and modify it by the use of fire.Pastoralists modify the animals that are a source of their foodthrough breeding. Agriculture improves plants for human fooduse, by selective breeding and planting, and animals too are sub-ject to selective breeding. In Egypt, selectively bred wheat wasground into flour, kneaded with water and other ingredients,and baked into bread as early as 4000 years ago.
Thousands of years before industrialisation, most food anddrink consumed by the majority of people was modified in someway in its production. This included preservation by drying, andlater other methods such as salting, fermenting, pickling, curing,spicing, and freezing in cold climates; and various methods ofpreparation and cooking, including boiling and roasting.
Food systems were transformed as part of the industrial andlater, the technological revolution. But this was not the point atwhich foods and drinks became modified for the first time.Rather, many new processes were developed such as sterile bot-tling and canning. Then, beginning in the late 19th century, steelroller mills were devised for the mass-manufacture of white flourand thus white bread; refrigerated transport using railways andships made possible the industrial production and internationalexport of meat and dairy products. In the 20th century, com-mercialisation of the hydrogenation process to turn liquid oilsinto solid fats made margarine manufacture a big business, andthe mass manufacture of soft drinks developed.
What is now known as ‘conventional’ farming, making exten-sive use of chemical fertilisers, herbicides, and pesticides, andfeed concentrates for animals, developed mainly in the secondhalf of the 20th century. More recent developments in food sys-tems include the use of containers to transport foods and drinksnationally and internationally; the development of supermar-kets, of which the biggest are now transnational; and the increas-ing concentration of food producers, manufacturers, retailers,and caterers.
Box 4.9.1 Food systems

174
P A R T 2 • E V I D E N C E A N D J U D G E M E N T S
estins (IARC group 2B, possible human carcinogens), andalso testosterone (IARC group 1, human carcinogens).
The toxicity of antimicrobial drugs is constantly reviewedby international and national regulatory bodies. The Panelnotes the findings on hormonal anabolic agents and also thelack of epidemiological evidence. Because there is no sup-porting epidemiological or other evidence, the Panel madeno judgements.
4.9.1.3 Genetic modification Plant breeding is a process of genetic exchange which is oftenundertaken with the purpose of acquiring traits that areeither beneficial to humans or increase yield. More recently,the use of new technologies of genetic modification, intrin-sic to agriculture and animal husbandry from their begin-nings, has raised great public interest and controversy. Manycrops are now genetically modified by means of gene trans-fer within and between species. Potential uses of moderngenetic modification technology in food production includechanging nutritional composition (for example, beta-carotene in ‘golden rice’); increasing the hardiness of crops;improving pest or disease resistance; and increasing herbi-cide tolerance in crop plants (to allow the use of genericherbicides).
Not all genetic modifications include transgenes, in whicha gene from one species is transferred across species, or even
kingdoms — that is to say, from plants to animals. Somegenetic modifications involve only inactivating existinggenes. For example, tomatoes have been genetically modi-fied to render inactive the enzyme that softens the tomatoonce ripe; thus, the tomato remains hard despite being ripe.This is beneficial for transport and storage purposes.
The production and use of transgenic and genetically mod-ified foods for humans or animal consumption are regulat-ed in most but not all countries. The regulations require thatall genetically modified foods be of equivalent safety as the food they are replacing, both nutritionally andtoxicologically.
Any effect of genetically modified foods on risk of humandisease might be a result of changes in the types of chemi-cal pesticides or herbicides used, rather than of genetic mod-ification itself. Genetically modified crops may require lessuse of pesticides and herbicides.
Any effect of modern methods of genetic modification offoods on the risk of cancer is unknown. Because there is nosupporting epidemiological or other evidence, the Panelmade no judgements.
There is too little evidence to draw any conclusion aboutthe association between methods of production and risk ofcancer.
4.9.2 Preservation
Methods of preserving foods have probably been in use sincebefore recorded history began. Gatherer–hunter and peas-ant–agricultural food systems (see chapter 1.1) includevarious techniques to preserve foods, which remain in use,such as drying, underground storage, fermenting, smoking,and salting. A range of other methods of preservation accom-panies, and is part of, industrialisation and urbanisation.These include canning, bottling, refrigeration, heat treat-ment, and irradiation.
Methods of food preservation, where epidemiological evi-dence shows or suggests an effect on the risk of cancer, aresummarised and judged earlier in this chapter. These arerefrigeration (box 4.6.4); processing meat (‘processed meat’refers to red meats preserved by smoking, curing, or salting,or by the addition of chemicals, see box 4.3.1 in chapter 4.3);preserving fish Cantonese-style (see box 4.3.5 in chapter4.3); and salting (chapter 4.6).
4.9.2.1 DryingDrying is an ancient method used to preserve cereals(grains), pulses (legumes), fruits, and other plant foods. Itis also used to preserve meat and fish, often as part of anoth-er preservation process such as salting (see box 4.3.5 in chap-ter 4.3). Freeze-drying, where the food is frozen and thewater extracted, has been in commercial use since the mid-20th century, and is used to preserve fruits, herbs, meat, fish,milk, eggs, coffee, and other foods.
4.9.2.2 FermentingFermentation is an ancient method used to preserve manyfoods and drinks. It may originally have been discovered by
So-called ‘organic’ farming is essentially a reversion to, or revivalof, methods of agriculture that were the standard until the intro-duction of farming systems dependent on chemical fertilisers,pesticides, and biocides, in the second half of the 20th century.
Organic farming avoids or largely excludes the use of syntheticfertilisers and pesticides, plant growth regulators, and livestockfeed additives. Farmers tend to rely on crop rotation, cropresidues, animal manures, and mechanical cultivation to main-tain soil productivity, and to supply plant nutrients and controlweeds, insects, and other pests. Organic farming is intended tobe indefinitely sustainable.
This type of farming has become well established withinEurope and is expanding at a steady rate. More than 10 per centof farms in Austria, Switzerland, and several other countries useorganic methods.
The retail market for organic farming in high-income countrieshas grown about 20 per cent each year since the early 1990s dueto increasing consumer demand. Production and distributionhave become correspondingly large scale. The variety and avail-ability of processed organic food has increased dramatically, andthe cost — which was initially high — is continuing to fall.
Claims that foods produced by organic methods are biologi-cally or nutritionally superior to food produced by intensivemethods are not supported by clinical or epidemiological evi-dence, but some food compositional data indicates higher con-centrations of some constituents like vitamin C and dietary fibre.There is evidence that organic products contain fewer residuesfrom chemicals employed in conventional agriculture. However,the subject remains a matter of controversy.
Box 4.9.2 ‘Organic’ farming

175
C H A P T E R 4 • F O O D S A N D D R I N K S
accident, because foods ferment as a result of the action ofbacteria or moulds (yeasts). Fermentation has special fea-tures. It characteristically changes the sensory and nutri-tional qualities of foods and drinks: for example, bacterialfermentation turns milk into yoghurt and cabbage into kim-chi (a staple food in Korea) and sauerkraut. Fermentationby yeasts turns sugar into alcohol, and so is an essential partof the process by which cereals (grains), vegetables, fruits,and other plant foods are the basis for beers, wine, andspirits.
4.9.2.3 Canning, bottlingBottling and canning were first developed around 1800. Theprocess involves heating or cooking fruits, vegetables, meats,and other foods in containers, then sealing them while stillhot. Glass bottles were first used, and then cans.
4.9.2.4 Pasteurisation Heat can be used to preserve milk and fruit juices by pas-teurisation, which kills many micro-organisms. This involvesvarious methods of rapid heating to a specific temperature,maintaining that temperature for a set period of time, fol-lowed by rapid cooling.
4.9.2.5 Chemical preservation Chemical preservative additives are added to perishableprocessed foods. Antimicrobials inhibit the growth of bac-teria and fungi. Antioxidants reduce the rate at which lipidsare oxidised through exposure to air, which leads to rancid-ity. A third type blocks the natural ripening processes thatcontinue to occur in plant foods following harvest. The mostcommonly used antimicrobial preservatives are benzoates,nitrites (see box 4.3.2 in chapter 4.3), and sulphites. Thereare internationally specified limits for levels of chemicalpreservatives in foods and drinks.
4.9.2.6 IrradiationIrradiation was first patented at the beginning of the 20thcentury as a means of preserving food using ionising radia-tion. The process has been tested extensively, but there isconsiderable public suspicion over the safety of irradiatedfoods. For example, 2-alkylcyclobutanones, which interactwith DNA in laboratory settings, are found exclusively inirradiated foods.
Methods of preservation tend to improve food security andenable more reliable availability of food, but may haveadverse effects too. Some methods of food preservation suchas drying are almost certainly benign, and others like fer-mentation may have some beneficial effects. The toxicity ofpreservatives and preservation methods is constantlyreviewed by international and national regulatory bodies.Because experimental data are not supported by epidemio-logical or other evidence, the Panel made no judgements.
There is too little evidence to draw any conclusion aboutthe association between methods of preservation and risk ofcancer.
4.9.3 Processing
Food processing transforms basic ingredients into manufac-tured foods and drinks. In the broad sense of the word, foodproduction, processing, preservation, and preparation aremethods of processing. The term ‘processing’ here is used torefer to techniques and technologies other than methods ofpreservation that are used by manufacturers of industrialisedprocessed foods. The processes that take place in kitchens(commercial or domestic) are considered in chapter 4.9.4.
Methods of food processing, where there is evidence thatthey may affect the risk of cancer, are summarised andjudged earlier in this chapter. These are hydrogenation(chapter 4.5); refining (chapters 4.1 and 4.6); and the pro-duction of alcohol by fermentation (chapter 4.8).
4.9.3.1 AdditivesMany if not most processed foods contain additives. Thesemay be synthetic, ‘nature-identical’, or natural. As well aspreservatives, these include bulking aids, colours, flavours,solvents, and many other categories. For general issues oftoxicity in use, see box 4.9.3. Additives mentioned here aresome of those where issues of carcinogenicity have arisen(also see box 4.9.4).
Flavours Alkenylbenzenes are a group of naturally occurring flavours,some of which have been found to cause liver cancer in
Any chemicals that have a useful function in the production,processing, or preservation of foods or drinks may neverthelessbe toxic, and possibly mutagenic or carcinogenic. For this rea-son, food additives and contaminants, such as traces of chemi-cals used in industrial agricultural production, are subject tointernational and national surveillance and regulations.
They are a cause for concern and vigilance because some, andin particular agricultural chemicals, are known to be toxic inexperimental settings, though at levels well above those foundin foods and drinks.
There is little epidemiological evidence on the possible effectsof contaminants and additives as present in foods and drinks.
Because contaminants and additives are subject to interna-tional and national regulation, there is a vast amount of toxi-cological information from experiments on laboratory animalsand other settings. Failing any other method, it seems reason-able to observe the effects of food additives and contaminantson laboratory animals at levels greatly in excess of any likely tobe present in foods and drinks; and based on several assump-tions and judgements, to set limits for safety in use. When suchlimits are used as regulatory limits, they are also subject to sur-veillance and special investigation when any chemical presentin foods and drinks seems to be a cause for special concern.
This area remains controversial. Theoretically, it would beideal if food supplies contained no trace of any toxic substance,including those that are or may be mutagenic or carcinogenic.However, some foods in nature contain carcinogens and theissue is not confined to methods of industrial food processing.
Box 4.9.3 Regulation of additives andcontaminants

176
P A R T 2 • E V I D E N C E A N D J U D G E M E N T S
rodents at levels vastly higher than normal human dietaryintakes.3
Colours About 50 colour compounds are permitted for use in foods.4
The number varies in different countries. Various azo dyesand other colours found to be carcinogenic in experimentalsettings have been withdrawn from use.
Those dyes now regulated for use in food are judged byUN and other expert committees not to be carcinogenic inthe amounts found in foods and drinks. The xanthene colourerythrosine and ammonia caramel (a class 3 carcinogen,according to IARC) cause cancers in rats given high doses,but are judged to be safe as now used.10
SolventsAround 20 solvents are permitted for food use.4 Two —dichloromethane and trichloroethylene — once used wide-ly for decaffeinating coffee and tea, have been classified byIARC as possibly and probably carcinogenic to humans,respectively. The Joint FAO/WHO Expert Committee on FoodAdditives has recommended that use of these solvents shouldbe restricted, and that levels in food should be as low as tech-nologically possible.10 These solvents are now generally notused for decaffeination.
4.9.3.2 PackagingFoods and drinks can become contaminated with traces of
chemicals that migrate from packaging materials such asplastic wrappings and bottles, and metal cans. Migrationfrom food-contact materials can occur during the processing,storage, and preparation of food. The polymers used in plas-tic packaging are biologically inert, but their monomers suchas vinyl chloride, acrylonitrile, and acrylamide can and domigrate into foods. Plasticisers such as phthalates, used inthe manufacture of these polymers, can also migrate intofoods and drinks. These are mutagenic or carcinogenic inexperimental animals. Nonylphenol and bisphenol-A, usedin packaging, mimic the action of oestrogens in the body.Synthetic oestrogens in the diet are not readily excreted andmay therefore accumulate in the body.
The potential effects of industrial food-processing meth-ods and of additives and contaminants in foods and drinkson carcinogenicity are constantly reviewed by internationaland national regulatory bodies. In view of the lack of sup-porting epidemiological or other evidence, the Panel madeno judgements. There is too little evidence to draw any con-clusion about the association between methods of preserva-tion and risk of cancer.
4.9.4 Preparation
‘Preparation’ here means domestic cooking or the cookingdone in industrial kitchens, by caterers for indirect or directsale.
Methods of food preparation, where epidemiological evi-dence shows or suggests an effect on the risk of cancer, aresummarised and judged earlier in this chapter. These aregrilling (broiling) and barbecuing (charbroiling) animalfoods (chapter 4.3), and carcinogenic compounds generat-ed by cooking these foods in a flame or at very high tem-peratures (see box 4.3.4 in chapter 4.3), and ‘fast foods’(Chapter 8).
4.9.4.1 Industrial cookingReady-to-heat and ready-to-eat dishes sold in supermarketsand other retail outlets are a massively increasing market.Like ‘fast foods’ sold for immediate consumption, these areusually energy dense (see Chapter 8). Intense and prolongedindustrial cooking of starch-based foods such as crisps(chips), French fries (chips), and other snack foods, gener-ates acrylamides, classified by IARC as ‘probably carcinogenicto humans’. At the time when this Report was completed,acrylamides were the subject of special surveillance andstudy.
4.9.4.2 Steaming, boiling, stewingThese are methods of cooking at up to 100°C. Some labilewater-soluble vitamins are destroyed or lost in this process.
4.9.4.3 Baking, roastingThese are methods of cooking at up to 200°C, but not on adirect flame. During baking, the high temperatures are usu-ally reached only on the surface of the food, while the innerparts often remain below 100°C. Traditional forms of roast-ing usually involve basting foods with oils or fats.
In the early 1940s, people who lived where drinking water sup-plies had higher naturally occurring fluoride levels were foundto have less dental caries than people who lived in areas withlower naturally occurring fluoride levels. This finding is supportedby more recent studies.5
Where natural fluoride levels are low, fluoride compounds aresometimes added to water supplies in order to reduce dentalcaries in the general population.
Most cities in the USA now fluoridate their water supplies;most of Europe does not. The advisability of fluoridation is dis-puted: fluoride can have adverse effects at doses not much abovethat recommended for prevention of dental caries, and excesscan cause dental fluorosis and bone fragility.
Studies in experimental animals have identified an increasedrisk of osteosarcomas (bone cancers) when exposed to water con-taining high concentrations of fluoride. A report published in theUSA in 2006 considered all the available evidence on fluoride andosteosarcoma and found the overall evidence to be tentative andmixed, and made no recommendations for revising current avail-able fluoride levels in drinking water.6 A study published later in2006 suggested an association between drinking fluoridatedwater and osteosarcoma in adolescent men.7 However, prelimi-nary analysis of a second set of cases from the same study doesnot replicate the findings.8 The US Centers for Disease Controland Prevention continues to support community water fluori-dation as a safe and effective public health measure to preventand control tooth decay.
These findings are not the basis for any judgement.9
Box 4.9.4 Water fluoridation
177
C H A P T E R 4 • F O O D S A N D D R I N K S
4.9.4.4 MicrowavingMicrowaving exposes food to temperatures up to 200°C.Microwaves are a form of electromagnetic radiation. Theycause vibration of water molecules, which produces heat.There is no evidence that microwaves have any specific effecton food composition beyond that of heat.
4.9.4.5 Frying, grilling (broiling), barbecuing(charbroiling)
Also see box 4.3.4 in chapter 4.3. Frying, grilling (broiling),and barbecuing (charbroiling) generate temperatures of upto 400°C, and sometimes use a direct flame to cook food.These methods create high levels of carcinogenic com-pounds. For any cooking involving wood fires, the type ofwood used can also be an important factor in determiningwhich chemicals contaminate the food. Hardwoods such asoak and hickory burn cleanly; others such as mesquite gen-erate copious quantities of polycyclic aromatic hydrocarbons.
Because of the experimental evidence of carcinogen pro-duction, it is prudent not to consume burned or charredfoods frequently or in large amounts. Industrial food prepa-ration methods are regulated. Because there is no support-ing epidemiological or other evidence, the Panel made nojudgements.
There is too little evidence to draw any conclusion aboutthe association between methods of preparation and risk ofcancer.
4.9.5 Interpretation of the evidence
4.9.5.1 GeneralFor general considerations that may affect interpretation ofthe evidence, see chapters 3.3 and 3.5, and boxes 3.1, 3.2,3.6 and 3.7.
Aspects of food production, preservation, processing, andpreparation (including cooking), where epidemiological evi-dence enables judgements to be made, are summarised, withPanel judgements, in previous sections of this chapter.
4.9.5.2 SpecificMeasurement. It is practically impossible to measure smallamounts of additives and trace amounts of contaminants infoods and drinks except by analysis. Epidemiological stud-ies using usual methods of dietary assessment are thereforegenerally uninformative.
Terminology. The terms used for different types of cookingvary around the world. ‘Broiling’ in the USA is called ‘grilling’in other countries. ‘Barbecuing’ may mean grilling in flameor slow cooking near smoking embers. Results of studies inthese areas need to be interpreted with care, given that car-cinogenic compounds are particularly generated when meatand other animal and plant foods are cooked in a flame, andeven more so when they are burned or charred.
Study design. Practically all studies of the topics covered inthis section are laboratory experiments on animals. They arecommonly carried out to assess toxicity to determine safety
in use, as a basis for food safety regulations. The relevanceof such work to the actual levels consumed of substancesidentified in this section is obscure. Also, it is commonlyagreed, as in this Report, that information from animal andother experimental settings, which is unsupported by evi-dence from epidemiological studies, is not a sound basis forfirm judgements.
Confounding. Studies commonly report the difficulty in sep-arating out specific methods of processing or cooking, whenfoods are characteristically processed and prepared in a num-ber of different ways.
4.9.6 Evidence and judgements
The Panel decided to make no judgements on experimentalfindings of toxicity that are not supported by epidemiologi-cal or other evidence.
The evidence considered by the Panel is in the systemat-ic literature review (SLR). Because the Panel made no judge-ment on the isolated experimental data, this evidence is notsummarised separately here.
The full SLR is contained on the CD included with thisReport.
4.9.7 Comparison with previous report
In general, the previous report found that information fromanimal and other experimental settings unsupported by epi-demiological evidence, was not a basis for judgement. In thisrespect, the view of the Panel responsible for this Report issimilar. The findings of the previous report on food additives,microbial contaminants, salt and salted foods, salted fish(Cantonese-style), cured meats, and the grilling and barbe-cuing of meat, fish, and other foods, were all contained ina chapter on food processing. The previous panel’s judge-ments were mostly similar to those made here, with theimportant exception of processed meat, which was not con-sidered separately from smoked and cured meats by the pre-vious report. The judgements of this Report on these subjectsare made in previous sections of this chapter.
4.9.8 Conclusions
The Panel concludes:The Panel decided to make no judgements on isolated exper-imental findings that were not supported by epidemiologi-cal or other evidence.
It is not possible to make any definitive judgement in theabsence of epidemiological evidence. Nevertheless, the Panelconcurs that, in general, it seems reasonable to conclude thatthe changes made to foods and drinks within well regulat-ed, modern food systems, and those made to foods anddrinks as usually prepared and cooked, are of themselvesunlikely to modify the risk of cancer significantly.
There are important exceptions to this tentative conclusion

178
P A R T 2 • E V I D E N C E A N D J U D G E M E N T S
and in these cases, the Panel’s judgements and conclusionsare found in the relevant earlier sections of this chapter.These judgements and conclusions are made in those sec-tions wherever epidemiological and other evidence justifiesa judgement of a protective or causative effect, using theagreed criteria, for aspects of food production (includingcontamination), processing, preservation, and preparation(including cooking).

179
C H A P T E R 4 • F O O D S A N D D R I N K S
Nutritional science conventionally divides foods anddrinks into their chemical constituent parts, such as water,carbohydrates, fats, proteins, vitamins, and minerals.Their biological functions are then explored, singly or incombination. It is now increasingly agreed by the nutritionscience community that research and also public healthcan additionally benefit from a more integrated approach,in which the emphasis is placed on foods and drinks. Inthis Report, the evidence, its summaries, and the Panel’sjudgements are food-based, wherever possible.
Here, the evidence on macronutrients, micronutrients(isolated in the form of supplements), and bioactiveconstituents of plant foods (also known asphytochemicals) is summarised and judged.
Overall, the Panel judges that the evidence that dietarymacronutrients specifically affect the risk of cancer isunimpressive. The evidence, based on observational dataand randomised controlled trials of supplements, thatcertain vitamins and minerals affect the risk of specificcancers is, in some cases, impressive.
The Panel judges as follows:The evidence that high-dose beta-carotene supplementsare a cause of lung cancer in tobacco smokers isconvincing. There is limited evidence suggesting that high-dose retinol supplements are a cause of lung cancer intobacco smokers.
Calcium probably protects against colorectal cancer. Atspecific doses, selenium probably protects against prostatecancer.
It is unlikely that beta-carotene has a substantial effecton the risk of either prostate cancer or non-melanomaskin cancer.
There is limited evidence suggesting that retinol atspecific doses protects against squamous cell carcinoma ofthe skin. There is also limited evidence suggesting thatalpha-tocopherol protects against prostate cancer, and thatselenium at specific doses protects against colorectal andlung cancer. There is limited evidence suggesting thatselenium supplements are a cause of skin cancer.
Within the remit of this Report, the strongest evidence,
4.10 Dietary constituents and supplements
DIETARY CONSTITUENTS AND SUPPLEMENTS, AND THE RISK OF CANCER
In the judgement of the Panel, the factors listed below modify the risk of cancer. Judgements are graded according to the strength of the evidence.
DECREASES RISK INCREASES RISK
Exposure Cancer site Exposure Cancer site
Convincing Beta-carotene Lungsupplements1
Probable Calcium2 Colorectum
Selenium3 Prostate
Limited — Retinol4 Skin5 Retinol supplements1 Lungsuggestive Alpha-tocopherol2 Prostate Selenium supplements2 Skin
Selenium3 Lung3
Colorectum6
Substantial effect on risk Beta-carotene7: prostate; skin (non-melanoma)unlikely
1 The evidence is derived from studies using high-dose supplements (20 mg/day for beta-carotene; 25 000 international units/day for retinol) in smokers.2 The evidence is derived from studies using supplements at a dose of 200 µg/day.3 The evidence is derived from studies using supplements at 200 µg/day. Selenium is toxic at high doses. 4 The evidence is derived from studies using supplements at a dose of 25 000 international units/day. 5 Applies only to squamous cell carcinoma.6 The evidence is derived from studies using supplements at a dose of 200 µg/day. Selenium is toxic at high doses.7 The evidence is derived from studies using supplements (at doses of 20, 30, 50 mg for prostate, and doses of 30, 50 mg/day for skin), and foods containing
beta-carotene: see chapter 4.2.
For an explanation of all the terms used in the matrix, please see chapter 3.5.1, the text of this section, and the glossary.

180
P A R T 2 • E V I D E N C E A N D J U D G E M E N T S
corresponding to judgements of ‘convincing’ or ‘probable’,shows that high-dose beta-carotene supplements intobacco smokers are a cause of lung cancer; that calciumprobably protects against colorectal cancer; and thatselenium probably protects against prostate cancer. It isunlikely that beta-carotene, or foods containing it, have asubstantial effect on the risk of either prostate or skin(non-melanoma) cancer. The Panel emphasises that thisevidence and these judgements relate to thesemicronutrients only at the specified doses.
Nutrition science in its conventional form as a biological dis-cipline was created in the early 19th century following theidentification of carbohydrates, fats, and proteins. As nutri-ents, these all supply energy and are essential for tissue struc-ture and function, and physical and mental growth anddevelopment. Later research has divided these macronutri-ents into many constituent parts such as monosaccharidesand polysaccharides (including non-starch polysaccharidesor ‘dietary fibre’); saturated and unsaturated fatty acids(which themselves have many fractions); and amino acids.Many of these constituents of the main nutrients are knownto have different metabolic, physiological, biochemical, andother effects, in isolation or combination.
Beginning in the early 20th century, a series of substancesthat do not supply energy were identified also as being vitalto life, typically in very small amounts: these are vitamins,minerals, and trace elements. More recently a large numberof other substances that are not nutrients, in the sense ofbeing essential components of metabolic processes or cellstructure, have been identified as bioactive. Because theseare contained in plants, they are commonly known asphytochemicals.
Reports concerned with specifying recommended dietary(or daily) amounts or reference values for nutrients, by theirnature, are structured accordingly. Compilations of the chem-ical composition of foods, used as standard references in epi-demiological studies of food, nutrition, and the risk ofdiseases including cancer, also specify macro- and micro-constituents of foods and drinks, to varied degrees of com-pleteness and accuracy.
Reports concerned with nutritional deficiencies charac-teristically make recommendations for the relevant micro-constituents. Increasingly though, they often now makerecommendations for dietary patterns, diets, and foods anddrinks that are high in the microconstituents with which theyare concerned. So a report on vitamin A deficiency may spec-ify foods high in carotenoids and retinol, and may also rec-ommend methods of agriculture that emphasise such foods.Reports concerned with prevention of chronic diseases wereinitially structured in terms of dietary constituents, with onlysecondary reference to foods. But following a general inter-national agreement that food-based dietary guidelines aremore useful, and often better reflect the science, such reportsnow give more emphasis to foods and drinks, both in theiranalysis of evidence and in their recommendations.
The policy of this Report is to always emphasise foods anddrinks. Thus, earlier sections of this chapter include sum-
maries and judgements of the evidence on dietary fibre, vit-amins, minerals, and trace elements as contained in foods,and also on fats, oils, sugars, salt, and alcohol as foods. Alsosee chapters 4.1 to 4.8. This section is concerned with macro-nutrients and micronutrients as such, and with non-nutrientbioactive constituents of food (phytochemicals).
4.10.1 Macronutrients
Chemically, macronutrients are classified as carbohydrates,fats, and proteins, and these categories have many sub-classifications. Diets need to include adequate amounts of macronutrients for physical and mental growth and devel-opment, and for maintenance of normal tissue structure andfunction. All macronutrients supply energy. Alcohol alsosupplies energy, but there is no requirement for it. Also seechapter 4.8.
4.10.1.1 CarbohydratesCarbohydrates consist of monosaccharide sugars, or largermolecules of these units joined together: disaccharides (twounits), oligosaccharides (a few), or polymers (many). Forinstance, glucose is a monosaccharide and starch is a poly-mer of glucose units. Polysaccharides are sometimes called‘complex’ carbohydrates and sugars ‘simple’ carbohydrates.
Carbohydrates are generally the largest single source ofenergy in diets. They supply around 4 kilocalories per gram.They form part of important structural components in thebody and, in the form of glucose, are the principal and pre-ferred energy source for metabolism. They also play majorroles in several essential cellular and physiological process-es. Non-starch polysaccharides are the characterising featureof dietary fibre.
Glycaemic index and glycaemic load are terms used tocharacterise foods and diets based on their effects on bloodglucose levels. Also see box 4.1.3 in chapter 4.1.
Cereals (grains) and products made from them (such asbreads, pastas, and breakfast cereals), as well as starchy rootsand tubers, are all high in carbohydrates. These foods con-tain a mixture of complex and simple carbohydrates andother nutrients. Until recently, starches have been the mainsource of carbohydrate in human diets. With industrialisa-tion and urbanisation, sugars have been added in increas-ing quantities in food preparation and as an ingredient inprocessed foods. Diets consumed in some high-incomecountries now may contain roughly as much carbohydratein the form of sugars as they do starches. Diets high in com-plex carbohydrates are usually associated with lower preva-lence of obesity, heart disease, and type 2 diabetes.
For summaries and judgements on dietary fibre, see chap-ter 4.1. For summaries and judgements on sugars, seechapter 4.6. For food processing, see chapter 4.9.
4.10.1.2 FatFats in diets are mostly made up from triglycerides — threefatty acid molecules attached to a glycerol backbone.Triglycerides are lipids, a class of organic compounds char-acterised by their solubility in organic solvents (such as ether

181
C H A P T E R 4 • F O O D S A N D D R I N K S
and chloroform); they are usually insoluble in water. Thebody stores excess energy as lipids in the form of body fat(also known as adipose tissue). Lipids also form part of thestructural components of cellular membranes as well asbeing precursors of important hormones.
Dietary fats include solid fats and liquid oils. Their phys-ical form at a particular temperature is determined by thechemical structure of their constituent fatty acids. Fats witha high proportion of ‘saturated’ fatty acids are solid or semi-solid at ambient temperatures; those with a higher amountof ‘unsaturated’ fatty acids are more likely to be oils. The dif-ferent degrees of saturation produce various effects in thebody. Diets high in saturated fatty acids (and also trans-fattyacids) (see chapter 4.5 and box 4.5.1) increase circulatingblood concentrations of cholesterol and the risk of cardio-vascular disease. The World Health Organization recom-mends limiting total fat to between 15 and 30 per cent oftotal daily energy intake and saturated fatty acids to less than10 per cent.1
Fats are the most concentrated energy source, supplyingaround 9 kcal per gram. They also carry the fat-soluble vit-amins (see chapter 4.10.2.1). The body can make all but twoof the fatty acids it needs — linoleic acid and alpha-linolenicacid, known as the ‘essential’ fatty acids. Both are found invegetables, nuts, and seeds and their oils, in varying quan-tities. They are also found in meat, eggs, and dairy products,but at lower levels. The long-chain fatty acids found in oilyfish (eicosapentaenoic and docosahexaenoic acids) can bemade to a limited extent in the body, where they play a rolein inflammation.2 These and related fatty acids are precur-sors to prostaglandins; these hormone-like compounds haveother diverse effects, including roles in blood vessel dilationand constriction, blood clotting, and transmission of nerveimpulses.
Nuts, seeds, meat, oily fish, whole milk and dairy prod-ucts, cooking oils and fats, spreadable fats, and a wide rangeof manufactured foods all contain varying amounts and typesof fats. Those from animal sources usually have a higher pro-portion of saturated fatty acids, and these are common inprocessed foods.
For summaries and judgements on fats and oils as foods,see chapter 4.5. For summaries and judgements on foodsthat are or may be high in fats, see chapters 4.3 and 4.4.
4.10.1.3 ProteinsProteins are large organic molecules made up of amino acidsarranged in a chain. Short chains are called peptides, forinstance di- and tripeptides (made up of two and threeamino acids respectively). Longer chains are known asoligopeptides, and long chains as polypeptides. Proteins arefundamental structural and functional elements within everycell in the body.
Many proteins are enzymes that catalyse biochemical reac-tions and are vital to metabolism. Others have structural ormechanical functions, such as the proteins in the cytoskele-ton, which give cells their shape and strength. They are alsoimportant in cell signalling, immune responses, cell adhe-sion, and the cell cycle.
Proteins supply around 4 kcal per gram. They are digest-
ed into their constituent amino acids, which are thenabsorbed into the blood. The body has the ability to makesome amino acids, but others, so called essential aminoacids, must be obtained from foods and drinks.
Dietary sources of protein include meats, milk andcheese, pulses (legumes), nuts, and cereals (grains) andproducts made from them, such as breads. Animal proteinsfrom eggs, milk, and meat contain all the essential aminoacids in the proportions needed by humans; soya protein isthe only plant food to do so. Other plant protein sources havediffering proportions of various essential amino acids, sodiets without animal foods or soya need to include a vari-ety of plant protein sources to provide enough of the essen-tial amino acids.
For summaries and judgements on foods that containproteins, see chapters 4.1, 4.2, 4.3, and 4.4.
4.10.2 Micronutrients
Micronutrients are essential constituents of diets needed insmall quantities compared with macronutrients, and are notsources of energy. These are vitamins, minerals, and traceelements. Deficiency of any dietary constituents classified asa micronutrient causes debility, disease, and eventuallydeath.
Many processed foods are ‘fortified’ with synthetic vita-mins and minerals (box 4.10.1). Others contain variousmicroconstituents such as phytochemicals, and sometimesother ingredients such as bacteria and ‘prebiotic’ polysac-charides; these products are sometimes termed ‘functionalfoods’ (box 4.10.2). Both types of product are often marketedwith health claims relating to these added constituents or tothe whole food.
4.10.2.1 VitaminsVitamins are organic molecules, classed as fat- or water-soluble, that are needed for metabolism but cannot be madein the body and so must be supplied in the diet. They havedifferent specific functions in the body. For example, vitaminK is needed for blood clotting and vitamin C for the pro-duction of collagen in connective tissue.
Vitamins A (retinol), D, E, and K are fat-soluble and canonly be digested, absorbed, and transported in conjunctionwith dietary fats. So they are found mainly in fatty foodssuch as liver and oily fish, milk and dairy products, animalfats (such as butter), and vegetable oils. The main sourcesof vitamin A are plant foods containing the retinol precur-sors known as carotenoids, which are converted by the bodyto retinol (see box 4.2.1 in chapter 4.2). Preformed retinol,which is absorbed better than carotenes in plant foods, isfound only in animal products, of which liver is a particu-larly rich source. Fat-soluble vitamins are stored in the liverand in body fat stores. For this reason, they do not need tobe consumed every day. For the same reason, some are toxicin high doses.
Vitamin C and the B vitamins are water-soluble. The Bgroup includes thiamin (vitamin B1), riboflavin (B2), niacin(B3), pyridoxine (vitamin B6), biotin, pantothenic acid,
182
P A R T 2 • E V I D E N C E A N D J U D G E M E N T S
folate, and cobalamin (vitamin B12). Excess amounts ofwater-soluble vitamins are generally not toxic because theyare excreted in the urine rather than stored in the body. Thisalso means that they generally have to be consumed morefrequently than fat-soluble vitamins. Plant foods are impor-tant sources of water-soluble vitamins: for example, cereals(grains), vegetables, fruits, some roots and tubers, and puls-es (legumes). They can be destroyed by heat or exposure tothe air, or lost by leaching during cooking, for instance whenvegetables are boiled (see chapter 4.9.4).
4.10.2.2 Minerals, trace elements Minerals are inorganic substances. Most foods contain sig-nificant amounts of one or more minerals, and these com-pounds have many specific functions in the body. Some areessential components of enzymes and other proteins (as‘cofactors’, such as iron). They are also involved in main-taining normal cell function (sodium, potassium, calcium),and for structure (calcium in bones and teeth). Othersinclude magnesium, phosphorus, and sulphur.
Trace elements are minerals needed by the body in verysmall amounts. Whether a mineral is defined as a trace ele-ment is somewhat arbitrary: iron, zinc, and copper are min-erals that may or may not be identified as trace elements.Others include iodine, selenium, chromium, fluoride, boron,cobalt, manganese, molybdenum, and silicon.
4.10.3 Phytochemicals
Phytochemicals are bioactive constituents of plant foods notidentified as nutrients because they are not essential in thesense of being vital to life itself. Unlike vitamins and miner-als, people do not suffer diseases when their diets are lowin phytochemicals. However, consuming them may have ben-eficial effects on health or active roles in the prevention ofdiseases. Also see box 4.2.2 in chapter 4.2.
Various phytochemicals have been shown to have anti-oxidant, anti-carcinogenic, anti-inflammatory, immunomod-ulatory, and antimicrobial effects in laboratory experiments.But it is not yet clear whether consuming these compoundsproduces these or other effects in the body.
Phytochemicals have various chemical structures and aregrouped into families on this basis. They include flavonoids,isoflavones (phytoestrogens), glucosinolates, terpenes,organosulphur compounds, saponins, capsaicinoids, andphytosterols. Many vegetables, fruits, pulses (legumes),herbs, and teas are high in phytochemicals.
4.10.4 SupplementsVitamins, minerals, trace elements, and other bioactive sub-stances are available as supplements, usually in pill or pow-der form. These began to be manufactured and marketedafter their functions were identified, and claims made fortheir general benefits in prevention of disease and promo-tion of well-being.
Many dietary supplements are classed as foods, although
Functional foods are so-called because they are believed orclaimed to have special qualities, such as promoting well-beingor protecting against disease. What marks them out from ‘nor-mal’ foods is that they are specifically formulated, manufactured,and marketed as being ‘functional’ in specified ways, for whichclaims are made. Some fortified products, such as breakfast cere-als and yoghurts, are positioned as functional foods.
The ingredients in functional foods claimed to have specialqualities may be added fractions of macronutrients, such asamino acids or fatty acids, or vitamins, minerals, or trace ele-ments. Very often the ‘functional’ ingredients will be known orclaimed to be bioactive in other ways: these include phyto-chemicals, herbal extracts, and commensal bacteria.
Box 4.10.2 Functional foods
Food ‘fortification’ refers to the addition ofnutrients, often in synthetic form, to foods,so that the food contains more of the nutri-ents added. The term ‘enrichment’ is some-times also used.
The United Nations and other interna-tional organisations are responsible formajor food fortification programmes,designed in particular to reduce rates ofdeficiency of vitamin A, iodine, iron, andother nutrients, mostly within low-incomecountries. But common foods have beenfortified in many countries since the early20th century. For example, in some coun-tries margarine and other fat spreads, ormilk, have been fortified with vitamins Aand D. White flour, and therefore whitebread and other products made from it, is
commonly fortified with some B vitamins,and also sometimes with calcium and iron.
The term ‘fortification’ in these andother examples may refer to the partialreplacement of nutrients otherwise absentor depleted by food-processing methods.Or it may refer to the addition of nutrientsto levels not found in the food in wholeform; for example, the addition of calciumto white bread in the UK is to levels high-er than those found in wholegrain breads;and salt may not contain iodine.
Many common processed foods anddrinks, including some that would other-wise be low in nutrients, are now fortifiedwith various combinations of syntheticnutrients. These include breakfast cereals,biscuits (cookies) and other baked goods,
dried milk, milk-based products, and softdrinks, and even confectionery. Many suchproducts are designed to be consumed bychildren.
In an increasing number of countries,the nutrients consumed in fortified foodsand drinks amount to a substantial andgrowing proportion of total consumptionof these nutrients. For example, since 1998in the USA, grain has been fortified withfolic acid, the synthetic equivalent offolate, as a public health measure designedto reduce the incidence of neural tubedefects in the fetus. As a result, it is esti-mated that over one third of all intake ofthis nutrient in the USA comes from thissource, as well as from fortified breakfastcereals.3
Box 4.10.1 Food fortification
183
C H A P T E R 4 • F O O D S A N D D R I N K S
some may be regulated medicinal products. Manufacturersof food supplements may market their products using healthclaims, although in some countries such as the UK, medici-nal claims that the product can prevent, cure, or treat a dis-ease may not be made. Herbal products may be permittedto make certain claims based on their history of being usedfor a particular condition. The regulatory status of dietarysupplements varies from country to country.
Some nutrients such as water-soluble vitamins have beenthought to be harmless at pharmacological doses; but there isnow evidence, including some summarised and judged in thisReport, that this is not always the case. Other nutrients, includ-ing fat-soluble vitamins and all minerals and trace elements,are known to be toxic at pharmacological doses; some of these,selenium being one example, are known to be toxic at rela-tively low pharmacological levels (also see box 4.10.3).
Expert reports issued by United Nations agencies andnational governments specify levels of nutrients agreed toprotect against deficiency diseases, and also (sometimes)agreed to be safe in use.
Many people take dietary supplements. Their use is high-er in high-income countries. In the UK, 35 per cent of respon-dents reported taking dietary supplements. Around 50 percent of people in the USA take supplements in some form.
4.10.5 Interpretation of the evidence
4.10.5.1 GeneralFor general considerations that may affect interpretation ofthe evidence, see chapters 3.3 and 3.5, and boxes 3.1, 3.2,3.6 and 3.7.
‘Relative risk’ (RR) is used in this Report to denote ratiomeasures of effect, including ‘risk ratios’, ‘rate ratios’, ‘haz-ard ratios’, and ‘odds ratios’.
4.10.5.2 SpecificThese specific points apply only to trials using micronutri-ent supplements.
Measurement. The results of supplement trials can beassumed only to apply to levels and forms of the micro-nutrient present in the supplement.
Study design. Randomised controlled trials (RCTs) usingnutrient supplements provide strong evidence. But the evi-dence can only be taken to apply to supplements at the dosesand in the form given, under the specific experimental con-ditions. The doses used in trials are often pharmacological,in which case they cannot be taken as directly relevant tothe nutrients as contained in foods and diets. Supplementsin synthetic forms are sometimes but not always chemical-ly identical to the nutrient as found in food, and so may havedifferent biochemical effects. This may also be because of thelevel of the dose, because the nutrient is given in isolationor separated from the nutritional matrix as found in foods,or for other reasons.
Confounding. In trials using supplements given in combi-nations, it is not possible to attribute any effect to an indi-vidual nutrient.
4.10.6 Evidence and judgements
The full systematic literature review (SLR) is contained onthe CD included with this Report.
4.10.6.1 CarbohydratesFor the evidence on foods containing carbohydrate, includ-ing dietary fibre, see chapter 4.1. For the evidence on sugarsas a food, see chapter 4.6.
4.10.6.2 FatsFor the evidence on foods containing substantial amounts offats and oils, see chapters 4.3 and 4.4. For the evidence on fats and oils as foods, see chapter 4.5.
4.10.6.3 ProteinsThe evidence from the SLRs did not suggest that proteinsspecifically modify the risk of cancers of any sites. For theevidence on foods containing protein, see chapters 4.1, 4.3,and 4.4.
4.10.6.4 Vitamin supplements The evidence presented here is derived from studies of vit-amins and beta-carotene (a vitamin A precursor) in supple-ment form only. Microconstituents in supplement form mayhave very different effects according to form, dosage, com-bination with other nutrients, interaction with diets as awhole, and other factors.
The effects of bioactive substances vary with the quantities con-sumed. The amounts of nutrients and other substances in dietsdepend on the nature and quantity of the foods and drinks thattaken together make up diets.
The amounts of nutrients and other substances contained indietary supplements, in this context usually referred to as doses,may or may not be at levels that can be found in diets. Loweramounts, at levels about the same as those that can be foundin diets, are known as ‘physiological doses’. Higher amounts, atlevels above any that can be found in diets, are known as ‘phar-macological doses’, or sometimes as ‘mega-doses’.
Evidence from trials and studies using supplements are oftendifficult to compare. One reason for this is that both human andanimal studies use supplements in different combinations andconcentrations. A nutrient that has one effect at a relatively lowor physiological dose may have a different effect at a higher orpharmacological dose. For instance, a nutrient that may evi-dently be protective at a lower or physiological dose may betoxic or pathogenic at a higher dose.
Randomised controlled trials using various doses of micro-nutrients have produced evidence of the effects of thesesupplements in modification of the risk of cancers of some sites.This evidence is summarised and judged in chapter 4.10.6.
Box 4.10.3 Levels of supplementation

184
P A R T 2 • E V I D E N C E A N D J U D G E M E N T S
4.10.6.4.1 Retinol Skin Two RCTs investigated retinol supplements and skin cancer(table 4.10.1).4 5
Both trials included only participants at risk of develop-ing non-melanoma skin cancer. The retinoid skin cancer pre-vention (actinic keratoses) trial (SKICAP-AK) includedpeople with a history of precancerous lesions (actinin ker-atoses); the retinoid skin cancer prevention (squamous cellcarcinoma/basal cell carcinoma) trial (SKICAP-S/B) includ-ed people with a history of non-melanoma skin cancer. SKI-CAP-AK showed non-significant increased risk for basal cellcarcinoma, with an effect estimate of 1.14 (95% confidenceinterval (CI) 0.91–1.43), but it did show a statistically sig-nificant decreased risk for squamous cell carcinoma 0.68(95% CI 0.51–0.92), comparing intervention to placebo.5
SKICAP-S/B produced no evidence of effect for either basalcell carcinoma (106 cases intervention group: 110 casesplacebo group) or squamous cell carcinoma (41 cases eachin intervention and placebo group).4
Meta-analysis was possible on both trials, giving summaryeffect estimates of 1.10 (95% CI 0.90–1.34) for basal cell car-cinoma and 0.93 (95% CI 0.70–1.23) for squamous cellcarcinoma.
The mechanism of anti-tumour action of the retinoids isnot completely known but retinol is known to bind to cellreceptors with promotion of differentiation, alteration ofmembranes, and immunological adjuvant effects.6
The evidence is sparse and studies were conducted ona narrowly defined population group (people at risk ofdeveloping skin cancer). There is limited evidencesuggesting that retinol supplements protect againstsquamous cell skin cancer.
The Panel is aware that since the conclusion of the SLR, onecase-control study7 has been published. This new informationdoes not change the Panel judgement (see box 3.8).
Lung Two trials (one an RCT, the other a non-randomised trial),8-11
two cohort studies,12 13 and two case-control studies14 15
investigated retinol or vitamin A supplements and lungcancer (table 4.10.2).
The single RCT was the Beta-Carotene and RetinolEfficacy Trial (CARET) trial (table 4.10.2) among currentand former smokers (some of whom were asbestos workers)who were given retinyl palmitate and beta-carotene, orplacebo. It showed statistically significant increased risk ofall lung cancers in the treated subjects, with an effect esti-mate of 1.28 (95% CI 1.04–1.57). The risk of death fromlung cancers was 1.46 (95% CI 1.07–2.00).9 The risk wasespecially elevated in those who had the intervention as wellas exposure to either asbestos or heavy smoking, althoughneither subgroup analysis was statistically significant. Atfollow-up (5 years after trial termination), the effect wasreduced and no longer statistically significant, with an effectestimate of 1.12 (95% CI 0.97–1.31).8
The other trial, which was not randomised, gave retinolor beta-carotene to asbestos-exposed people and used amatched comparison group, giving an adjusted effect esti-mate of 0.67 (95% CI 0.33–1.37).11
One cohort study was stratified according to smoking sta-tus (current, former, and never).12 In current smokers, high-dose vitamin A supplements (synthetic beta-carotene orretinol) were associated with an increased risk, with an effectestimate of 3.42 (with no CI or value for trend reported),when compared to no supplements. Men who never smokedshowed a non-significant decreased risk.12 The other cohortstudy showed no effect on risk for men and non-significantdecreased risk in women. Effect estimates were 1.0 (95% CI0.66–1.51) for men and 0.65 (95% CI 0.39–1.06) forwomen, when comparing supplement use to non-use.13 Onecase-control study showed a non-significant increased riskwith supplement use,14 the other showed no effect on risk.15
It is possible that the potential protective associations pre-sent at dietary intake amounts of vitamins are lost orreversed by pharmacological supplementation and the high-er levels that this may supply.
The evidence is sparse and inconsistent. There islimited evidence suggesting that high-dose retinol
Table 4.10.1 Retinol supplements and skin cancer; trials
Trial Number of Intervention Length of Length of name participants intervention follow-up
SKICAP-AK 2297 with 25000 IU 5 years 3.8 yearsMoon 1997 moderate retinol or
risk of skin placebo dailycancer
SKICAP-S/B 525 with 25000 IU 3 years 3 yearsLevine 1997 high risk of retinol, 5–10 mg
skin cancer isotretinoin or placebo daily
Table 4.10.2 Vitamin A supplements and lung cancer; trials
Trial Number of Intervention Length of Length of name participants intervention follow-up
Beta- 18 314 at 30 mg beta- 4 years 5 yearsCarotene high risk of carotene and (trial ended and Retinol developing 25 000 IU early)Efficacy lung cancer retinyl palmitateTrial (CARET)Goodman2004Omenn 1996
Western 1203 Annual supplies Maximum –Perth participants, of vitamin A of 4 yearsasbestos 996 (either synthetic workers comparison beta-carotene orMusk 1998 subjects retinol), help in
quitting smoking, and dietary advice

185
C H A P T E R 4 • F O O D S A N D D R I N K S
supplements are a cause of lung cancer in currentsmokers.
4.10.6.4.2 Beta-carotene Lung Five RCTs8-10 16-20 and one cohort study21 investigated beta-carotene supplements and lung cancer (table 4.10.3).
Four studies showed increased risk with a beta-caroteneintervention,16 17 19 20 which was statistically significant intwo (during the trial, not at follow-up; smokers).8-10 16 17 Onestudy showed a non-significant decreased risk.18 Meta-analysis was possible on three trials, giving a summary effectestimate of 1.10 (95% CI 0.89–1.36) for beta-carotene sup-plementation versus none, with moderate heterogeneity (fig-ure 4.10.1). Two trials could not be included in themeta-analysis. One trial reported an effect estimate of 1.50(95% CI 0.43–5.28) for those taking beta-carotene comparedto those taking retinol from a total of 10 lung cancers in allparticipants.20 The other RCT was the CARET trial (table4.10.3) among current and former smokers (some of whomwere asbestos workers) who were given retinyl palmitate andbeta-carotene, or placebo. It showed statistically significantincreased risk of all lung cancers in the treated subjects, withan effect estimate of 1.28 (95% CI 1.04–1.57). The risk ofdeath from lung cancers was 1.46 (95% CI 1.07–2.00).9 Therisk was especially elevated in those who had the interven-tion as well as exposure to either asbestos or heavy smok-ing, although neither subgroup analysis was statistically
significant. At follow-up (five years after trial termination),the effect was reduced and no longer statistically significant,with an effect estimate of 1.12 (95% CI 0.97–1.31).8
One cohort study showed non-significant increased risk forbeta-carotene supplementation compared to none in women.The other study showed non-significant decreased risk inmen. Effect estimates were 1.23 (95% CI 0.55–2.76;women) and 0.82 (95% CI 0.36–1.85; men).21
There is a marked interaction between beta-carotene,heavy smoking and genotype.22 23 When beta-carotene sup-plementation among those without the glutathione-S-trans-ferase variant GSTM1 who smoked more than 42 cigarettesper day was compared to beta-carotene supplementationamong those without GSTM1 who smoked less than 37 cig-arettes per day, a RR of 6.01 (95% CI 1.90–19.08) wasobserved.22 After adjusting for age and smoking habits, anRR of 3 (95% CI 1.3–7.1) was observed for the Arg/Arggenotype when 545 µg/l of serum beta-carotene was com-pared to 45 µg g/l.23 Glutathione-S transferase 1 and 2 arecarcinogen-detoxifying enzymes. People without or with lessactive forms of these enzymes, due to genetic variation, areless able to metabolise toxins than others and have higherrisk of cancer, particularly if they are smokers or exposed toregular doses of toxins through another source.
It is possible that the protective association present atdietary intake amounts of carotenoids is lost or reversed bypharmacological supplementation and the higher levels thatthis may supply. In one animal study, low-dose beta-carotenewas protective against smoking-induced changes in p53,while high doses promoted these changes.24 A second expla-nation could be the complex nature of naturally occurringcarotenoids and the possibility that the protective associa-tions are not due to the specific agent used in supplementstudies, but rather to other carotenoids present in dietaryexposure25 or other associated dietary or health relatedbehaviours.
There is strong evidence from good quality trials,consistent with cohort studies. An interaction betweensmoking, genetics, and beta-carotene is apparent. Theevidence that beta-carotene supplements cause lungcancer in current smokers is convincing.
Table 4.10.3 Beta-carotene supplements and lung cancer; trials
Trial Number of Intervention Length of Length of name participants intervention follow-up
Physicians’ 22 071 50 mg beta- 13 years –Health Study carotene taken (PHS) on alternate daysCook 2000
Women’s 39 876 50 mg of beta- 2 years 4 yearsHealth Study carotene taken (WHS) on alternate daysLee 1999
ATBC study 29 133 20 mg of beta- 5–8 years 6–8 years(male carotene onlysmokers) or with 50 mg of Virtamo 2003 alpha-tocopherolAlbanes 1996
Western 1024 30 mg/day Up to 5 years –Perth beta-carotene orasbestos 25 000 IU/day workers retinolde Klerk 1998
Beta- 18 314 at 30 mg beta- 4 years 5 yearsCarotene high risk of carotene and (trial ended and Retinol developing 25 000 IU early)Efficacy lung cancer retinyl palmitateTrial (CARET)Goodman2004Omenn 1996
Figure 4.10.1 Beta-carotene supplements and lungcancer; trials
Virtamo 2003 (ATBC) Men 1.17 (1.02–1.34)
Cook 2000 (PHS) Men 0.90 (0.68–1.18)
Lee 1999 (Women’s Health Study) 1.43 (0.83–2.48)
Summary estimate 1.10 (0.89–1.36)
Relative risk (95% CI)
Relative risk, intervention group vs control group
1 20

186
P A R T 2 • E V I D E N C E A N D J U D G E M E N T S
Prostate See also chapter 4.2.5.3 for evidence on foods containingbeta-carotene. Three RCTs9 10 16 18 26 and two cohort studies27
28 investigated beta-carotene supplements (table 4.10.4).Two trials showed a non-significant increased risk for beta-
carotene supplementation compared to none9 10 16; the othershowed no effect on risk.18 Effect estimates were 1.26 (95%CI 0.98–1.62) for the 1985 to 1993 follow-up period,16 1.01(95% CI 0.80–1.27),9 10 and 1.0 (95% CI 0.9–1.1).18
One cohort study showed a non-significant increased riskfor beta-carotene supplementation compared to none27;the other stated that there was no significant association.28
The single reported effect estimate was 1.17 (95% CI0.85–1.61).27
There is no evidence for any mechanism of action.
There is strong evidence from good quality trials, andfrom cohort studies, which consistently fails todemonstrate a protective effect. Beta-carotenesupplements are unlikely to have a substantialprotective effect against prostate cancer. The evidenceis too limited to draw a conclusion on a harmful effect.
Skin See also chapter 4.2.5.3 for evidence on foods containingbeta-carotene. Four RCTs19 29-32 and one cohort study33 inves-tigated beta-carotene supplements (table 4.10.5).
Non-melanoma skin cancerThree RCTs investigated non-melanoma skin cancer as anoutcome.29 31 32 Two trials showed non-significant increasedrisk for beta-carotene supplementation compared to none31 32; one trial showed a non-significant decreased risk.29
The results are shown in the forest plot, separated for basalcell carcinoma and squamous cell carcinoma (figure 4.10.2).Meta-analysis was possible on all three trials, giving a
summary effect estimate of 1.00 (95% CI 0.94–1.07) forbasal cell carcinoma and 1.01 (95% CI 0.95–1.06) for squa-mous cell carcinoma.
The single cohort study showed a non-significantdecreased risk for beta-carotene supplementation comparedto none. The effect estimate was 0.42 (95% CI 0.12–1.47).33
Table 4.10.4 Beta-carotene supplements and prostate cancer; trials
Trial Number of Intervention Length of Length of name participants intervention follow-up
Beta- 18 314 at 30 mg beta- 4 years 5 yearsCarotene high risk of carotene and (trial ended and Retinol developing 25 000 IU early)Efficacy lung cancer retinyl palmitateTrial (CARET)Omenn 1996
Goodman
2004
Physicians’ 22 071 50 mg beta- 13 years –Health carotene taken Study (PHS) on alternate daysCook 2000
ATBC Study 29133 20 mg of beta- 5–8 years 6–8 years(male carotene only orsmokers) with 50 mg of Virtamo 2003 alpha-tocopherolHeinonen 1998
Table 4.10.5 Beta-carotene supplements and skin cancer; trials
Trial Number of Intervention Length of Length of name participants intervention follow-up
Nambour 1621 Four treatment 4.5 years –Skin Cancer groups: daily Prevention application of Trial sunscreen and Green 1999 beta-carotene
supplementation (30 mg per day); sunscreen plus placebo tablets; beta-carotene only; or placebo only
Beta- 1805 (with 50 mg daily 5 years 1–5 yearsCarotene history ofTrial non-melanomaGreenberg skin cancer)1990
Physicians’ 22 071 50 mg beta- 12 yearsHealth Study carotene taken (PHS) on alternate daysFrieling 2000Hennekens1999
Women’s 39 876 50 mg of beta- 2 years 4 yearsHealth Study carotene taken (WHS) on alternate daysLee 1999
Figure 4.10.2 Beta-carotene supplements and non-melanoma skin cancer; trials
Basal cell carcinoma
Greenberg 1990 1.04 (0.89–1.21)
Green 1999 1.04 (0.79–1.37)
Frieling 2000 0.99 (0.92–1.06)
Summary estimate 1.00 (0.94–1.07)
Squamous cell carcinoma
Greenberg 1990 1.22 (0.87–1.72)
Green 1999 1.35 (0.84–2.18)
Frieling 2000 0.97 (0.84–1.13)
Summary estimate 1.01 (0.95–1.06)
Relative risk (95% CI)
Relative risk, intervention group vs control group
1 20.5
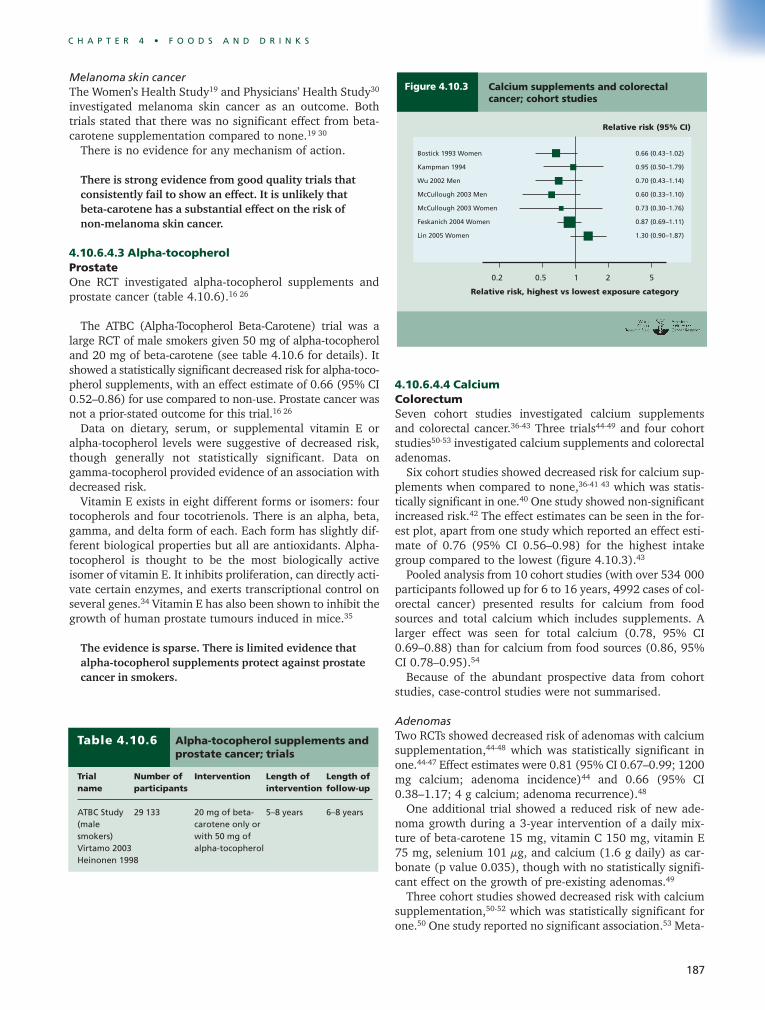
187
C H A P T E R 4 • F O O D S A N D D R I N K S
Melanoma skin cancerThe Women’s Health Study19 and Physicians’ Health Study30
investigated melanoma skin cancer as an outcome. Bothtrials stated that there was no significant effect from beta-carotene supplementation compared to none.19 30
There is no evidence for any mechanism of action.
There is strong evidence from good quality trials thatconsistently fail to show an effect. It is unlikely thatbeta-carotene has a substantial effect on the risk ofnon-melanoma skin cancer.
4.10.6.4.3 Alpha-tocopherol Prostate One RCT investigated alpha-tocopherol supplements andprostate cancer (table 4.10.6).16 26
The ATBC (Alpha-Tocopherol Beta-Carotene) trial was alarge RCT of male smokers given 50 mg of alpha-tocopheroland 20 mg of beta-carotene (see table 4.10.6 for details). Itshowed a statistically significant decreased risk for alpha-toco-pherol supplements, with an effect estimate of 0.66 (95% CI0.52–0.86) for use compared to non-use. Prostate cancer wasnot a prior-stated outcome for this trial.16 26
Data on dietary, serum, or supplemental vitamin E oralpha-tocopherol levels were suggestive of decreased risk,though generally not statistically significant. Data ongamma-tocopherol provided evidence of an association withdecreased risk.
Vitamin E exists in eight different forms or isomers: fourtocopherols and four tocotrienols. There is an alpha, beta,gamma, and delta form of each. Each form has slightly dif-ferent biological properties but all are antioxidants. Alpha-tocopherol is thought to be the most biologically activeisomer of vitamin E. It inhibits proliferation, can directly acti-vate certain enzymes, and exerts transcriptional control onseveral genes.34 Vitamin E has also been shown to inhibit thegrowth of human prostate tumours induced in mice.35
The evidence is sparse. There is limited evidence thatalpha-tocopherol supplements protect against prostatecancer in smokers.
4.10.6.4.4 Calcium Colorectum Seven cohort studies investigated calcium supplements and colorectal cancer.36-43 Three trials44-49 and four cohortstudies50-53 investigated calcium supplements and colorectaladenomas.
Six cohort studies showed decreased risk for calcium sup-plements when compared to none,36-41 43 which was statis-tically significant in one.40 One study showed non-significantincreased risk.42 The effect estimates can be seen in the for-est plot, apart from one study which reported an effect esti-mate of 0.76 (95% CI 0.56–0.98) for the highest intakegroup compared to the lowest (figure 4.10.3).43
Pooled analysis from 10 cohort studies (with over 534 000participants followed up for 6 to 16 years, 4992 cases of col-orectal cancer) presented results for calcium from foodsources and total calcium which includes supplements. Alarger effect was seen for total calcium (0.78, 95% CI0.69–0.88) than for calcium from food sources (0.86, 95%CI 0.78–0.95).54
Because of the abundant prospective data from cohortstudies, case-control studies were not summarised.
AdenomasTwo RCTs showed decreased risk of adenomas with calciumsupplementation,44-48 which was statistically significant inone.44-47 Effect estimates were 0.81 (95% CI 0.67–0.99; 1200mg calcium; adenoma incidence)44 and 0.66 (95% CI0.38–1.17; 4 g calcium; adenoma recurrence).48
One additional trial showed a reduced risk of new ade-noma growth during a 3-year intervention of a daily mix-ture of beta-carotene 15 mg, vitamin C 150 mg, vitamin E75 mg, selenium 101 µg, and calcium (1.6 g daily) as car-bonate (p value 0.035), though with no statistically signifi-cant effect on the growth of pre-existing adenomas.49
Three cohort studies showed decreased risk with calciumsupplementation,50-52 which was statistically significant forone.50 One study reported no significant association.53 Meta-
Table 4.10.6 Alpha-tocopherol supplements and prostate cancer; trials
Trial Number of Intervention Length of Length of name participants intervention follow-up
ATBC Study 29 133 20 mg of beta- 5–8 years 6–8 years(male carotene only or smokers) with 50 mg of Virtamo 2003 alpha-tocopherolHeinonen 1998
Figure 4.10.3 Calcium supplements and colorectalcancer; cohort studies
Bostick 1993 Women 0.66 (0.43–1.02)
Kampman 1994 0.95 (0.50–1.79)
Wu 2002 Men 0.70 (0.43–1.14)
McCullough 2003 Men 0.60 (0.33–1.10)
McCullough 2003 Women 0.73 (0.30–1.76)
Feskanich 2004 Women 0.87 (0.69–1.11)
Lin 2005 Women 1.30 (0.90–1.87)
Relative risk (95% CI)
Relative risk, highest vs lowest exposure category
1 50.2 20.5
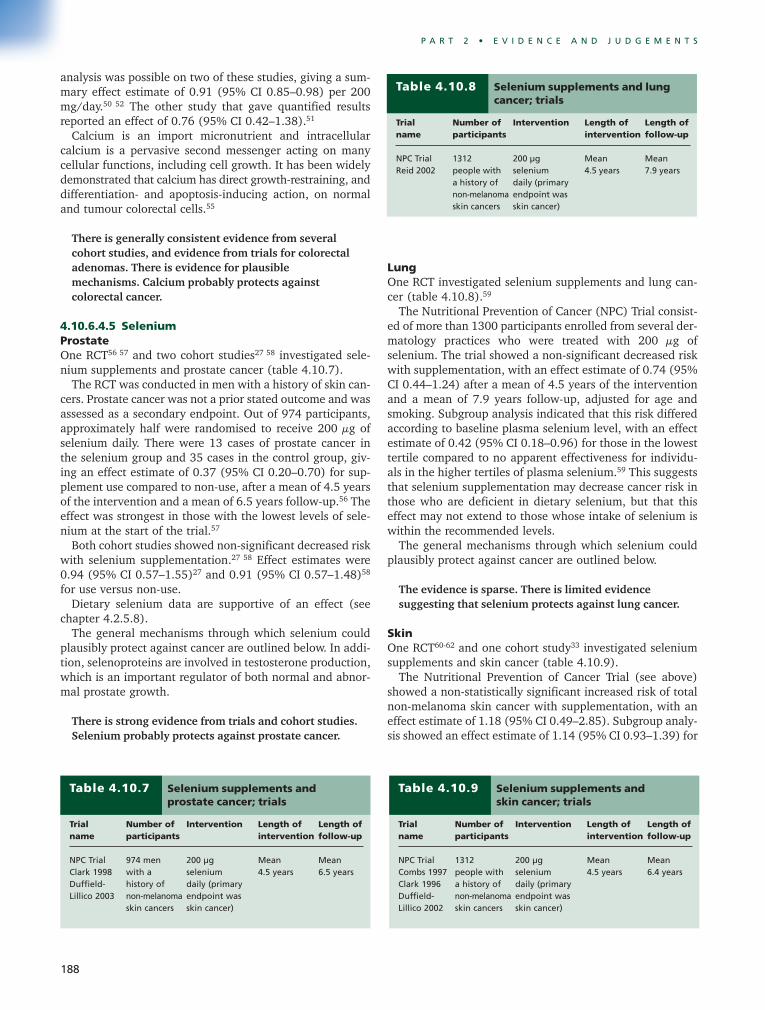
188
P A R T 2 • E V I D E N C E A N D J U D G E M E N T S
analysis was possible on two of these studies, giving a sum-mary effect estimate of 0.91 (95% CI 0.85–0.98) per 200mg/day.50 52 The other study that gave quantified resultsreported an effect of 0.76 (95% CI 0.42–1.38).51
Calcium is an import micronutrient and intracellularcalcium is a pervasive second messenger acting on manycellular functions, including cell growth. It has been widelydemonstrated that calcium has direct growth-restraining, anddifferentiation- and apoptosis-inducing action, on normaland tumour colorectal cells.55
There is generally consistent evidence from severalcohort studies, and evidence from trials for colorectaladenomas. There is evidence for plausiblemechanisms. Calcium probably protects againstcolorectal cancer.
4.10.6.4.5 Selenium Prostate One RCT56 57 and two cohort studies27 58 investigated sele-nium supplements and prostate cancer (table 4.10.7).
The RCT was conducted in men with a history of skin can-cers. Prostate cancer was not a prior stated outcome and wasassessed as a secondary endpoint. Out of 974 participants,approximately half were randomised to receive 200 µg ofselenium daily. There were 13 cases of prostate cancer in the selenium group and 35 cases in the control group, giv-ing an effect estimate of 0.37 (95% CI 0.20–0.70) for sup-plement use compared to non-use, after a mean of 4.5 yearsof the intervention and a mean of 6.5 years follow-up.56 Theeffect was strongest in those with the lowest levels of sele-nium at the start of the trial.57
Both cohort studies showed non-significant decreased riskwith selenium supplementation.27 58 Effect estimates were0.94 (95% CI 0.57–1.55)27 and 0.91 (95% CI 0.57–1.48)58
for use versus non-use.Dietary selenium data are supportive of an effect (see
chapter 4.2.5.8).The general mechanisms through which selenium could
plausibly protect against cancer are outlined below. In addi-tion, selenoproteins are involved in testosterone production,which is an important regulator of both normal and abnor-mal prostate growth.
There is strong evidence from trials and cohort studies.Selenium probably protects against prostate cancer.
Lung One RCT investigated selenium supplements and lung can-cer (table 4.10.8).59
The Nutritional Prevention of Cancer (NPC) Trial consist-ed of more than 1300 participants enrolled from several der-matology practices who were treated with 200 µg ofselenium. The trial showed a non-significant decreased riskwith supplementation, with an effect estimate of 0.74 (95%CI 0.44–1.24) after a mean of 4.5 years of the interventionand a mean of 7.9 years follow-up, adjusted for age andsmoking. Subgroup analysis indicated that this risk differedaccording to baseline plasma selenium level, with an effectestimate of 0.42 (95% CI 0.18–0.96) for those in the lowesttertile compared to no apparent effectiveness for individu-als in the higher tertiles of plasma selenium.59 This suggeststhat selenium supplementation may decrease cancer risk inthose who are deficient in dietary selenium, but that thiseffect may not extend to those whose intake of selenium iswithin the recommended levels.
The general mechanisms through which selenium couldplausibly protect against cancer are outlined below.
The evidence is sparse. There is limited evidencesuggesting that selenium protects against lung cancer.
Skin One RCT60-62 and one cohort study33 investigated seleniumsupplements and skin cancer (table 4.10.9).
The Nutritional Prevention of Cancer Trial (see above)showed a non-statistically significant increased risk of totalnon-melanoma skin cancer with supplementation, with aneffect estimate of 1.18 (95% CI 0.49–2.85). Subgroup analy-sis showed an effect estimate of 1.14 (95% CI 0.93–1.39) for
Table 4.10.7 Selenium supplements and prostate cancer; trials
Trial Number of Intervention Length of Length of name participants intervention follow-up
NPC Trial 974 men 200 µg Mean MeanClark 1998 with a selenium 4.5 years 6.5 yearsDuffield- history of daily (primaryLillico 2003 non-melanoma endpoint was
skin cancers skin cancer)
Table 4.10.8 Selenium supplements and lungcancer; trials
Trial Number of Intervention Length of Length of name participants intervention follow-up
NPC Trial 1312 200 µg Mean MeanReid 2002 people with selenium 4.5 years 7.9 years
a history of daily (primarynon-melanoma endpoint was skin cancers skin cancer)
Table 4.10.9 Selenium supplements and skin cancer; trials
Trial Number of Intervention Length of Length of name participants intervention follow-up
NPC Trial 1312 200 µg Mean MeanCombs 1997 people with selenium 4.5 years 6.4 yearsClark 1996 a history of daily (primaryDuffield- non-melanoma endpoint wasLillico 2002 skin cancers skin cancer)

189
C H A P T E R 4 • F O O D S A N D D R I N K S
squamous cell carcinoma and 1.10 (95% CI 0.95–1.28) forbasal cell carcinoma.61
The single cohort study stated that there was no statisti-cally significant association.33
The evidence is sparse and no plausible mechanismshave been identified. There is limited evidencesuggesting that selenium supplements are a cause ofskin cancer.
ColorectumOne RCT60 62 and one cohort study63 investigated seleniumsupplements and colorectal cancer (table 4.10.10).
The single trial included 1312 participants who were ran-domised to receive 200 µg selenium or a placebo. There were8 colorectal cancer cases in the intervention group and 19in the control group, giving an effect estimate of 0.36 (pvalue for trend 0.025) for use versus non-use.60 A hazardratio of 0.46 (95% CI 0.21–1.02) is given after a further 2.5years follow-up.62
The single cohort study showed non-significant decreasedrisk, with an effect estimate of 0.60 (95% CI 0.27–1.32) foruse versus non-use.63
Dietary selenium data are supportive of an effect (seechapter 4.2.5.8).
The general mechanisms through which selenium couldplausibly protect against cancer are outlined below.
The evidence is sparse. There is limited evidence tosuggest that selenium protects against colorectalcancer.
General mechanismsDietary selenium deficiency has been shown to cause a lackof selenoprotein expression. Twenty-five selenoproteinshave been identified in animals, and a number of these haveimportant anti-inflammatory and antioxidant properties.64
Four are glutathione peroxidises, which protect againstoxidative damage to lipids, lipoproteins, and DNA. Theseenzymes are rapidly degraded during selenium deprivation.Three are thioredoxin reductases and, amongst other func-tions, these regenerate oxidised ascorbic acid to its activeantioxidant form.
Selenoproteins appear to reach their maximal levelsrelatively easily at normal dietary selenium intake and not to increase with selenium supplementation. It is,
however, plausible that supraphysiological amounts ofselenium might affect programmed cell death, DNA repair,carcinogen metabolism, immune system, and anti-angio-genic effects.65
4.10.7 Comparison with previous report
This Report associates nutrients and dietary constituentswith foods and drinks wherever possible; and findings andjudgements on these as contained in foods and drinks arefound in previous sections of this chapter. The previousreport included a whole chapter on dietary constituents. Itfound that starch (probably when it is the staple of povertydiets) possibly protected against colorectal cancer but waspossibly a cause of stomach cancer. The evidence from theSLRs undertaken for this Report did not reproduce thesefindings.
The previous report noted that trials using supplements ofvarious micronutrients such as beta-carotene, vitamin E, andmultiple vitamins and minerals had produced mixed results.But it did not make formal judgements as a result of thesetrials, although one of the report’s recommendations wasthat dietary supplements are probably unnecessary, and pos-sibly unhelpful, for reducing cancer risk. RCTs publishedsince the mid-1990s have strengthened the evidence on therelationship of some dietary supplements and the risk of can-cers of some sites.
For comparisons with the previous report concerningdietary constituents here identified as foods (such as sugars,fats and oils, and alcohol) or foods which contain certainconstituents (such as dietary fibre, vitamins, minerals, andtrace elements), see chapters 4.1 to 4.8.
4.10.8 Conclusions
The Panel concludes:The evidence that the use of high-dose beta-carotenesupplements in tobacco smokers is a cause of lung cancer isconvincing. There is limited evidence suggesting that high-dose retinol supplements are a cause of lung cancer in this group. The principal cause of lung cancer is smokingtobacco.
Calcium probably protects against colorectal cancer. Atspecific doses, selenium probably protects against prostatecancer.
There is limited evidence suggesting that retinol at specificdoses protects against squamous cell carcinoma of the skin.There is also limited evidence suggesting that alpha-toco-pherol protects against prostate cancer; and also that sele-nium at specific doses protects against colorectal cancer (ata level of 200 µg/day, the dose used in the studies on whichthis judgement is based).
There is limited evidence suggesting that selenium sup-plements are a cause of skin cancer. It is unlikely that beta-carotene supplements, or foods containing it, have asubstantial effect on the risk of either prostate cancer or skin(non-melanoma) cancer.
Table 4.10.10 Selenium supplements andcolorectal cancer; trials
Trial Number of Intervention Length of Length of name participants intervention follow-up
NPC Trial 1312 200 µg Mean MeanCombs 1997 people with selenium 4.5 years 6.4 yearsDuffield- a history of daily (primaryLillico 2002 non-melanoma endpoint was
skin cancers skin cancer)

190
P A R T 2 • E V I D E N C E A N D J U D G E M E N T S
The nature, quality, quantities, and proportions ofdifferent foods and drinks in diets, and the frequency withwhich they are habitually consumed, constitute dietarypatterns. Populations, communities, and families mayshare similar dietary patterns, which are determined byvarious factors such as the ecological niche they inhabit,physical environments in which they live, or by tradition,culture, religion, or choice. Dietary patterns, as well aspatterns of physical activity, have co-evolved with humansover millennia and are intimately related to long-termsurvival of the species within a given environment. Thechanges in environment including diets and activitypatterns over the past century are likely to have affectedthe risk of chronic diseases, including cancer. Indeed, theimpact of food and nutrition on health is not generallydetermined by individual foods and drinks, specific dietaryconstituents, or the ways in which foods are modified, forexample by processing or cooking. No food or drink is anelixir and few are poisons, unless they are contaminatedwith pathogenic micro-organisms. It is dietary patterns,with physical activity levels and other factors thatinfluence nutritional requirements, that determinenutritional status and other health outcomes that are ofinterest to this Report.
Dietary patterns are difficult to characterise and are aninfrequent subject for epidemiological and experimentalinvestigations which, by their reductionist approach,typically address specific foods and dietary components.This precisely focused approach may overlook thesignificance of diets as a whole. There is now increasinginterest in the examination of the impact of dietarypatterns on well-being and disease outcomes, includingthe risk of cancer.
The Panel notes that existing studies of specific dietarypatterns use different definitions and that the evidencethey have produced is unclear. Currently, given the agreedcriteria for grading evidence in this Report, no judgementscan be made on any possible relationship between dietarypatterns, as defined in the literature, and the risk ofcancer. For this reason, no matrix showing Paneljudgements is included in this section. However, anarrative summary provides an analysis of existingevidence relating dietary patterns and cancer-relatedoutcomes.
For most populations at most times, food systems determinedietary patterns; traditionally, these systems have themselvesbeen largely determined by climate and terrain. Until recent-ly in history, diets have been mostly made up from locallyavailable plant and animal sources, as gathered, hunted,reared, cultivated, preserved, processed, prepared, and con-sumed. The current dietary patterns of subsistence farmersaround the world, in East Africa, Mexico, India, and Chinafor instance, differ mostly not as a matter of communal orfamily choice, but because different staple crops flourish indifferent parts of the world. The same applies to communi-ties that live near rivers, lakes, and seas: their dietary pat-terns are different from those of inland populations largelybecause fish and seafood are available. Traditional diets inthe territories on or close to the Mediterranean littoral aretypically high in vegetables, fruits, fish, and seafood. Thedietary patterns of pastoralist populations, especially thoseliving in Arctic climates, are high in meat and animal foods.The extreme example of imposed dietary patterns are‘poverty’ or ‘deficiency’ diets, consumed by impoverishedcommunities.
One characteristic of human civilisation is food culture: thedevelopment of dietary patterns throughout or within soci-eties as part of general culture. It is thought that dietary pat-terns have acquired a cultural dimension based on the factthat they have evolved with human populations providingadvantages for survival within a given ecological setting.Thus food cultures sometimes have become an expression ofsome system of belief.
Dietetics, in its original form as a general philosophy ofthe well-led life, was developed in Greece and then later inwestern Europe (for example, by the School of Salerno, fromthe 12th century). Scholars and teachers of dietetics rec-ommended various dietary regimes, which involved dietarypatterns selected as a matter of choice. These were often sim-ple or frugal, and not just for personal well-being and free-dom from disease, but also as an expression of virtue.1 Morerecently, people began to adopt certain dietary patterns inthe belief that these could protect against disease.
The urban–industrial food systems that generate the foodsand drinks now purchased and consumed by most people inthe world are characterised by the increased use of tech-nology in production, manufacture, processing, distribution,and sale. Another key feature is globalisation. Spices havebeen transported from Asia to Europe for thousands of years;sugar has been shipped around the world for half a millen-nium; similarly, the export of tropical fruits, meat, and teabecame subject to major intercontinental trade in the 19thcentury. Very many if not most foods, or their ingredients,now travel long distances before reaching their point of sale.Globalised food systems are now shaping dietary patterns inall continents.2 3
This chapter summarises some of the dietary patterns thatmight modify the risk of cancer. Breastfeeding is also men-
4.11 Dietary patterns

191
C H A P T E R 4 • F O O D S A N D D R I N K S
tioned here in this context. For evidence and judgement onlactation, see Chapter 6; on being breastfed in relation toweight gain, overweight, and obesity, see Chapter 8.
4.11.1 Traditional and industrial dietarypatterns
Dietary patterns are determined by many factors. This firstgroup includes some traditional and industrial dietary pat-terns, determined mainly by climate and terrain, materialresources, technology, and culture.
4.11.1.1 Mediterranean The traditional food systems of the territories on or near theMediterranean littoral, in southern-most Europe, the MiddleEast, and northern-most Africa, are the fount of a numberof great cuisines. These were developed by peoples, oftenfrom the East, who settled in successive waves within whatis now Spain, southern France and Italy, former Yugoslavia,Greece, Turkey, Cyprus, Crete, Lebanon, Israel, Palestine,Egypt, Libya, Algeria, Tunisia, and Morocco. The Med-iterranean dietary patterns that have since evolved general-ly have some common aspects.
Traditional Mediterranean diets are broadly characterisedby high consumption of breads and other cereal foods usu-ally made from wheat, and of vegetables and fruits, fish,cheese, olive oil, tree nuts (almonds and walnuts), and (innon-Islamic countries) wine. Extensive use is made of manyherbs and spices. Meat is also consumed, but often only onrelatively special occasions or in small amounts in combi-nation with other foods in everyday dishes. Coffee, drunkwith added sugar (in modern times), is the traditional hotdrink. Desserts may also be sweet but overall consumptionof sugar is low.
Since the second half of the 20th century, much attentionhas been given to the ‘Mediterranean’ diet. This interest isbecause of evidence associating the dietary patterns of thepopulations living in this region with low incidence of coro-nary heart disease.4 It is usually thought that this associa-tion is causal, and that the reasons include high consumptionof fresh foods, dietary fibre, vegetables, fruits, and fish; mod-est consumption of alcoholic drinks; and low intakes of sat-urated fatty acids. In addition, historically, habitual levels ofphysical activity have been high.
Recommendations published since the early 1980s onfood, nutrition, and the prevention of cancer have similari-ties with those for the prevention of coronary heart disease.Mediterranean dietary patterns might therefore also be pro-tective against cancer, either generally or of specific sites.
Traditional Mediterranean dietary patterns are graduallybecoming less common as the food supplies of the countriesof the Mediterranean littoral become increasingly ‘western’or ‘globalised’.
4.11.1.2 Asian Traditional Asian cuisines are very diverse. But traditionalAsian dietary patterns do have some qualities in common,certainly those of southern and eastern Asian countries
including India, Sri Lanka, Thailand, Cambodia, Vietnam,China, and Korea.
Such traditional Asian dietary patterns are of low energydensity. The staple cereal (grain) is usually rice, which is alsousually the main source of energy. Traditionally, rice paddyis often also used to breed fish. The amounts of vegetables,fruits, and fish in diets vary; consumption is relatively lowin impoverished communities, and often high in those thatare more prosperous. In the more affluent centres of civili-sation, traditional Indian and Chinese cuisines have beenand often remain extremely diverse. But they are almostalways made up mainly from foods of plant origin, againwith very extensive use of herbs and spices. As in theMediterranean region, large amounts of meat are usuallyreserved for special occasions. Japan is a maritime nation,and so the traditional dietary pattern is high in fish andseafood and in salt and salt-preserved foods. The maritimeregions of other Asian countries have the same dietary pat-terns. Traditionally, most alcoholic drinks consumed in Asiaare made from grains. Most foods are cooked at low tem-peratures (steaming, boiling), although some high-temper-ature methods are also used (stir-frying, deep-frying,roasting). Tea is the traditional hot drink in China, India, SriLanka, and Japan. Consumption of fat and sugars is tradi-tionally low.
As with Mediterranean dietary patterns, and probably forbroadly the same nutritional reasons, traditional southernand eastern Asian dietary patterns are associated with rela-tively low rates of obesity, type 2 diabetes, coronary heartdisease, and some cancers. However, those that are high insalt are associated with elevated rates of hypertension andstroke. Traditional Asian dietary patterns remain the normin rural and impoverished regions of southern and easternAsia, but are now gradually becoming increasingly ‘western’or ‘globalised’ in the urban and more prosperous parts ofthese countries.
These generalisations do not apply to the countries ofnorthern Asia, including those of the former USSR.
4.11.1.3 Plant-based Plant-based diets are mainly but not necessarily solely madeup from foods of plant origin. Characteristically, cereals(whole or minimally processed grains) and other starchyfoods, vegetables and fruits, pulses (legumes), herbs andspices, plant oils, and other foods and ingredients of plantorigin are the basis of almost all everyday foods and meals.Meat, poultry, fish, milk and dairy products, animal fats, andother foods and ingredients of animal origin are consumed,usually in small amounts on normal days, but often abun-dantly on special and feast days. Consumption of alcoholicdrinks is also usually reserved for special social occasions.
It is estimated that the dietary patterns of most of theworld’s population — perhaps around 4 billion people — areplant-based. Traditional Mediterranean and southern andeastern Asian dietary patterns (summarised above) are plant-based, as are the dietary patterns of most rural communi-ties in middle- and low-income countries. Most populationsthat consume plant-based diets do not do so from choice, butbecause for them, animals are valuable and animal foods are

192
P A R T 2 • E V I D E N C E A N D J U D G E M E N T S
relatively costly. In some traditions (see chapters 4.11.1.1and 4.11.1.2), plant-based or vegetarian diets are consumedas an expression of philosophy of life or of religion. Thesecultures, teachings, or faiths often also include periodic peri-ods of fasting.
The nutritional profiles of plant-based dietary patterns arevery variable, depending largely on the degree of variety ofthe foods consumed, though their energy density is gener-ally low. Traditional plant-based cuisines from all over theworld combine cereals (grains) and other starchy foods withbeans and other pulses (legumes) as the staple foods. Whenfood supplies are secure they are generally adequate in ener-gy, and also in protein, unless reliant on very low-proteinstarchy staples such as cassava (manioc). Plant-based dietsmay be of relatively low energy density, but not necessarilyso. Most of the fatty acids in plant-based diets are unsatu-rated. Levels of vitamins, minerals, trace elements, and phy-tochemicals vary, again depending on the degree of varietyin diets.
Obesity, type 2 diabetes, coronary heart disease, cancersof some sites, and other chronic diseases have been rare oruncommon in those parts of the world where traditionaldietary patterns are plant-based. Such diets are now com-monly advocated and consumed by health-conscious peoplein high-income countries, partly on this basis. These diets arealso increasingly popular because of the epidemiological andother evidence that components of plant-based dietary pat-terns are potentially protective against various chronic dis-eases including some cancers.
4.11.1.4 ‘Western’ The dietary patterns sometimes classified as ‘western’ havebeen generated by industrialised food systems, at first inwestern Europe, then in the USA. These patterns have alsoevolved in countries settled mostly by British and westernEuropean peoples, including those of the white populationsof South Africa, Australia, New Zealand, and enclaves else-where in the world. This broad generalisation does not applyto some countries of Latin America, but in general representsthe emerging dominant pattern observed in urban centres ofthe region.
‘Western’ dietary patterns are energy dense, and areincreasingly made up from processed foods.5 They are highin meat, milk and other dairy products, fatty or sugary foodssuch as processed meats, pastries, baked goods, confec-tionery, sugared and often also alcoholic drinks, with vari-able amounts of vegetables and fruits. The starchy staplefoods are usually breads, cereal products, or potatoes. A fea-ture of the global ‘nutrition transition’ (see chapter 1.2.1) isthat ‘western’ dietary patterns are becoming ‘exported’ glob-ally with accelerating speed.
‘Western’ diets defined in this way are associated withoverweight and obesity, type 2 diabetes, cardiovascular dis-ease, stroke, some cancers, and other chronic diseases.However, the term ‘western diet’ is potentially confusing:variations of such diets consumed within ‘western’ countriescan and do have very different nutritional profiles.
4.11.2 Cultural dietary patterns
These dietary patterns are strongly influenced by culturalfactors. These include ethical and religious beliefs, andbeliefs about health. The distinction is somewhat arbitrary:these patterns are also influenced by climate and terrain,material resources, and technology.
4.11.2.1 Vegetarian and vegan dietsPlant-based dietary patterns need not be vegetarian, exceptin a loose sense; but vegetarian diets are generally plant-based. The distinction is more one of attitude than nutri-tional profile. Typically, vegetarians are at least as concernedabout the ethics and environmental effects of consuming(and producing) animal foods as they are with their ownwell-being and protection against disease.
There are many types of vegetarian dietary patterns, andall exclude red meat and processed meat made from redmeat. However, people whose intention is to be vegetarianmay occasionally eat these meats; and many if not most willconsume some foods containing ingredients derived fromanimals that supply red meat, perhaps inadvertently.
Lacto-ovo vegetarians consume milk and dairy productsand also eggs. Vegans consume no foods of animal origin,although some are stricter than others about what they eat.People who avoid red meats may consume poultry and fish,and are sometimes termed ‘semi-vegetarian’. The dietarypractices of a number of religions are plant-based or vege-tarian. Hindus are often vegetarian. Jains are vegan.Rastafarians are semi-vegetarian. Zen macrobiotic food ismostly vegetarian, although the main emphasis is on wholefoods. For Seventh-day Adventists, see chapter 4.11.5.5.
Taken together, vegetarian dietary patterns are heteroge-neous, as is the nutritional profile of most types of vegetar-ian diets. Studies of some vegetarians have identified lowerrates of obesity and cardiovascular disease, and all-causemortality. But people who are the subjects of such studies inhigh-income countries, who are vegetarian as a matter ofbelief or choice, are frequently of higher socioeconomic sta-tus compared with the general population. They are also lesslikely to smoke and more likely to be physically active (alsosee chapter 4.11.5.4).
4.11.2.2 Religious Seventh-day Adventists are a Christian denomination ofabout 14 million people who, among other ways of life aspart of their faith, are sparing in their consumption of meatand meat products; about half are lacto-ovo vegetarians.Most avoid hot condiments and spices, tea and coffee, andalcoholic drinks. Smoking is proscribed. The effect ofSeventh-day Adventist ways of life on well-being and healthhas been the subject of a large number of studies. Rates ofchronic diseases are generally lower among Adventists, andthis is usually attributed to be their generally healthy waysof life.
Several other religions enjoin their adherents to refrainfrom consumption of certain foods or beverages — forinstance, Islam forbids consumption of pork and alcohol,Judaism pork and other foods, and Hinduism beef.

193
C H A P T E R 4 • F O O D S A N D D R I N K S
4.11.2.3 ‘Healthy’ People who are conscious of the effects of food and nutri-tion on well-being, and on the risk of disease, may chooseto consume ‘healthy’ diets. Such diets are featured in verymany popular television programmes, newspapers, maga-zines, and books. However, there are as many ‘healthy’dietary patterns as there are concepts of what constitutes ahealthy diet; and for many people a ‘healthy’ diet is seen asa diet regime designed to reduce excess body fat. In the USA,the ‘Healthy Diet Indicator’6 and also the ‘Healthy EatingIndex’ are used to assess how well people adhere to theDietary Guidelines for Americans.
4.11.3 Other dietary patterns
4.11.3.1 Meal frequencyOne hypothesis about food, nutrition, and cancer is that riskmay be modified by meal patterns. The times of day at whichfood is eaten vary greatly in different populations.Gatherer–hunters and pastoralists often consume most oftheir food once a day only, or may not eat large amounts offood every day. Settled agriculturalists may consume twomeals at different times of the day, depending on their work.
In urban settings, having three meals a day has been acommon pattern. Some may be light meals and some moresubstantial, but the time of day at which each type is eatenvaries in different parts of the world, and also within coun-tries. Some people choose to eat lighter meals or snacks morefrequently throughout the day, rather than having threemeals. A feature of globalised food supplies and other aspectsof modern cultures is the decline of the family meal; instead,an increasing amount of food is eaten alone in the form ofquick meals or snacks, in fast-food outlets, in the street, orat home.
4.11.3.2 Breastfeeding Being breastfed is a type of dietary pattern for infants. In factit is the only pattern for healthy individuals based on a sin-gle food which provides all known essential nutrients for agiven period of life. For a general summary of lactation andbreastfeeding, see chapter 6.3. For being breastfed, seeChapter 8.
4.11.4 Interpretation of the evidence
4.11.4.1 GeneralFor general considerations that may affect interpretation ofthe evidence, see chapters 3.3 and 3.5, and boxes 3.1, 3.2,3.6 and 3.7.
‘Relative risk’ (RR) is used in this Report to denote ratiomeasures of effect, including ‘risk ratios’, ‘rate ratios’, ‘haz-ard ratios’, and ‘odds ratios’.
4.11.4.2 SpecificClassification. A major limitation with most studies of dietarypatterns is that there is no general agreement on just whatconstitutes any dietary pattern. For example, ‘healthy’ diets
vary substantially; different types of diets are termed ‘vege-tarian’; and there are various types of ‘Mediterranean’ diet.In general, there is considerable scope for variation withinany dietary pattern.
Confounding. Patterns of diet are interrelated with otherhabitual behaviour that may affect the risk of cancer, suchas smoking or physical activity; people who habitually con-sume any type of diet for the sake of their health or for rea-sons of belief, may also modify other aspects of their way oflife. This is likely to confound results that appear to showassociations with the risk of cancer.
Study design. The analysis of conventional epidemiologicalstudies tends to focus on specific foods and drinks and spe-cific aspects of diets, rather than the overall pattern.
Reporting bias. People who habitually consume or who tryto follow types of diets in the belief that these are healthymay, in studies relying on self-reporting, provide inaccuraterecords. They may overestimate their consumption of foodslike vegetables, fruits, and other foods they believe to behealthy, and underestimate or fail to report consumption offoods and drinks they believe to be unhealthy. This type ofreporting bias is a general issue with studies relying on self-reporting, but may be a special issue here. Studies of specific dietary patterns undertaken by scientists who them-selves follow these patterns may be seen as biased for thisreason.
4.11.5 Evidence and judgements
Epidemiological research concerned with food, nutrition, andthe risk of cancer, characteristically examines individualfoods and dietary constituents.
There is a growing body of epidemiological work ondietary patterns; these were within the terms of reference ofthe systematic literature reviews (SLRs) whose findings arethe primary basis for the Panel judgements in this Report.However, the evidence on dietary patterns examined in thisway, relative to cancers of individual sites, does not permitconclusions to be drawn and the Panel decided not to makeany judgements. Also see chapter 4.11.4.2.
In the case of dietary patterns, evidence from the SLRs hasbeen supplemented by an informal narrative literaturereview, and the results are summarised here.
The full SLR is contained on the CD included with thisReport.
4.11.5.1 Mediterranean dietary patternsIn a Swedish cohort study, a 2-point increase in a‘Mediterranean’ diet score was associated with a 16% (95%confidence interval (CI) 1%–29%) reduced risk of cancermortality in women aged 40–49, but not among youngerwomen.7
An intervention trial investigated the recurrence of colo-rectal adenomas. This showed that the ‘Mediterranean’ diet(characterised by high consumption of vegetables, fruit, lean

194
P A R T 2 • E V I D E N C E A N D J U D G E M E N T S
meat, fish, and olive oil) was associated with a reduced riskof recurrence of colorectal adenomas in women (RR 0.30(95% CI 0.09–0.98), but not in men. 8
4.11.5.2 Asian dietary patternsA Japanese cohort study9 showed significant associationsbetween certain dietary patterns and the risk of stomach can-cer. These were for a ‘traditional’ Japanese dietary patternin men (RR 2.88, 95% CI 1.76–4.72) and in women (RR2.40, 95% CI 1.76–4.72); and for a ‘healthy’ dietary patternin women (RR 0.56, 95% CI 0.32–0.96) but not in men.There was no association found with the ‘western’ dietarypattern. In the same Japanese cohort,10 ‘traditional’ and‘western’ dietary patterns were both positively associatedwith colon cancer risk in women, but not in men: ‘traditional’RR 2.06 (95% CI 1.10–3.84) and ‘western’ RR 2.06 (95% CI1.10–4.45).
The narrative review did not identify any other studies onAsian dietary patterns and the risk of cancer.
For evidence and judgements on salt, salting, and saltedfood, and the risk of stomach cancer, see chapter 4.6 andchapter 7.5.
4.11.5.3 ‘Western’ dietary patternsThe narrative review identified several studies that have useddata from large cohorts, mostly undertaken in the USA, toderive various types of ‘western’ dietary patterns fromdietary intake information. This is done by combining keycomponents of diets into what is then identified as types ofdietary pattern that may be related to the risk of cancer risk.Some case-control and ecological studies have also been car-ried out.
Analysis of data from the Health Professionals Follow-UpStudy found no association between a ‘western’ dietary pat-tern and prostate cancer risk. In the study, this pattern wascharacterised as being high in refined cereals (grains), redand processed meats, fat, and sweets.11 Similarly, for breastcancer, another large cohort study reported no associationbetween a ‘western’ dietary pattern and breast cancer risk.12
A ‘drinker’ dietary pattern, characterised as being high inbeer, wine, and spirits, was identified as being associatedwith a moderately increased risk of breast cancer (RR 1.27,95% CI 1.06–1.52).
A case-control study from Uruguay reported an associationwith increased breast cancer risk and a ‘western’ diet; asso-ciations with decreased risk were found for ‘traditional’,‘stew’, and ‘healthy’ dietary patterns.13 Another case-controlstudy from Uruguay reported an association with increasedstomach cancer risk and a ‘starchy’ pattern; associations withdecreased risk were found for ‘healthy’ and ‘mixed’ patterns.14
A Swedish case-control study found that a diet high inmeat, red meat, high-fat dairy products, high-fat gravy, andsweets was significantly associated with increased risk of gas-tric cardia adenocarcinoma and oesophageal adenocarcino-ma. It also found that a ‘drinker’ pattern (high intakes ofbeer, spirits/liquor, and French fries) was significantly asso-ciated with the risk of squamous cell carcinoma of theoesophagus.15
One of the first studies to investigate diet and cancer using
factor analysis was a Japanese study looking at gallblad-der/biliary tract cancer mortality using data collectedbetween 1958 and 1975.16 Western-style diets high in foodswith high levels of fats and proteins were associated withdecreased risk. For breast cancer mortality in Japan, anoth-er ecological study found that westernised diets high in bothanimal and saturated fats were associated with increasedrisk.17
Another Japanese cohort study showed no associationbetween a western dietary pattern and stomach cancer risk.9
For colon cancer risk in the same Japanese cohort, ‘western’as well as ‘traditional’ dietary patterns were associated withincreased colon cancer risk in women, RR 2.06 (95% CI1.10–3.84) and RR 2.06 (95% CI 1.10–4.45) respectively,but not in men.10
Three dietary patterns were identified from analysis of aSwedish cohort: ‘healthy’, including wholegrains, vegetables,fruits, tomatoes, poultry, and fish; ‘western’, includingrefined grains, fried potato, meat, processed meat, high-fatdairy products, margarine/butter, sweets and soft drinks;and ‘drinker’, including beer, wine, spirits, and snacks. Theonly pattern significantly associated with increased risk ofrenal cell carcinoma was the ‘drinker’ pattern (RR 0.56, 95%CI 0.34–0.95).18
An analysis of the Nurses’ Health Study cohort alsoshowed no evidence of an association between breast can-cer risk and either a ‘prudent’ or a ‘western’ dietary pattern.19
Similarly, no associations were reported between thesedietary patterns and pancreatic cancer in a US cohort study.20
Two ‘western’ dietary patterns were identified from a UScohort. These were a ‘prudent’ type, characterised as beinghigh in wholegrains, vegetables, fruits, low-fat dairy prod-ucts, poultry, and fish; and a ‘typical’ type, characterised asbeing high in refined cereals (grains), red and processedmeats, high-fat dairy products, sweets, and desserts. Neitherwas associated with overall breast cancer risk. However, the typical western pattern was associated with higher riskof breast cancer among smokers (RR 1.44, 95% CI 1.02–2.03).21
A Canadian case-control study identified an associationbetween prostate cancer risk and a ‘processed’ dietary pat-tern, characterised as being high in refined cereals (grains),white bread, onions and tomatoes, red meat, processed meat,organ meats, vegetable oil and juice, soft drinks, and bottledwater. No significant associations were found with ‘healthyliving’, ‘traditional western’, or ‘beverages’ patterns.22
A case-control study conducted in central Italy identifieda ‘vitamin-rich’ as well as a ‘traditional’ dietary pattern; bothwere strongly associated with decreased risk of stomachcancer.23
For colon cancer, a case-control study reported a protec-tive effect of a ‘prudent’ western dietary pattern andincreased risk with a ‘typical’ western pattern.24 Anotherreported a protective effect of a western ‘physical activity’pattern.25
Analysis of data from the French European ProspectiveInvestigation into Cancer and Nutrition (EPIC) cohortshowed a significant association between two ‘western’dietary patterns and increased risk of colorectal cancer. The
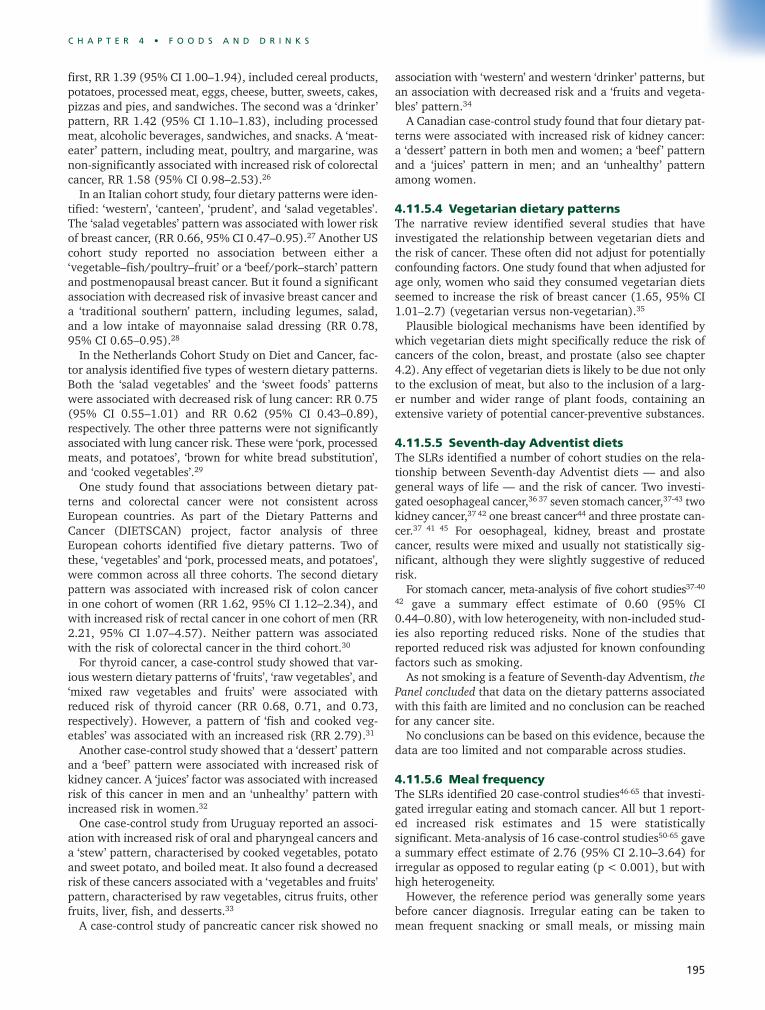
195
C H A P T E R 4 • F O O D S A N D D R I N K S
first, RR 1.39 (95% CI 1.00–1.94), included cereal products,potatoes, processed meat, eggs, cheese, butter, sweets, cakes,pizzas and pies, and sandwiches. The second was a ‘drinker’pattern, RR 1.42 (95% CI 1.10–1.83), including processedmeat, alcoholic beverages, sandwiches, and snacks. A ‘meat-eater’ pattern, including meat, poultry, and margarine, wasnon-significantly associated with increased risk of colorectalcancer, RR 1.58 (95% CI 0.98–2.53).26
In an Italian cohort study, four dietary patterns were iden-tified: ‘western’, ‘canteen’, ‘prudent’, and ‘salad vegetables’.The ‘salad vegetables’ pattern was associated with lower riskof breast cancer, (RR 0.66, 95% CI 0.47–0.95).27 Another UScohort study reported no association between either a‘vegetable–fish/poultry–fruit’ or a ‘beef/pork–starch’ patternand postmenopausal breast cancer. But it found a significantassociation with decreased risk of invasive breast cancer anda ‘traditional southern’ pattern, including legumes, salad,and a low intake of mayonnaise salad dressing (RR 0.78,95% CI 0.65–0.95).28
In the Netherlands Cohort Study on Diet and Cancer, fac-tor analysis identified five types of western dietary patterns.Both the ‘salad vegetables’ and the ‘sweet foods’ patternswere associated with decreased risk of lung cancer: RR 0.75(95% CI 0.55–1.01) and RR 0.62 (95% CI 0.43–0.89),respectively. The other three patterns were not significantlyassociated with lung cancer risk. These were ‘pork, processedmeats, and potatoes’, ‘brown for white bread substitution’,and ‘cooked vegetables’.29
One study found that associations between dietary pat-terns and colorectal cancer were not consistent acrossEuropean countries. As part of the Dietary Patterns andCancer (DIETSCAN) project, factor analysis of threeEuropean cohorts identified five dietary patterns. Two ofthese, ‘vegetables’ and ‘pork, processed meats, and potatoes’,were common across all three cohorts. The second dietarypattern was associated with increased risk of colon cancerin one cohort of women (RR 1.62, 95% CI 1.12–2.34), andwith increased risk of rectal cancer in one cohort of men (RR2.21, 95% CI 1.07–4.57). Neither pattern was associatedwith the risk of colorectal cancer in the third cohort.30
For thyroid cancer, a case-control study showed that var-ious western dietary patterns of ‘fruits’, ‘raw vegetables’, and‘mixed raw vegetables and fruits’ were associated withreduced risk of thyroid cancer (RR 0.68, 0.71, and 0.73,respectively). However, a pattern of ‘fish and cooked veg-etables’ was associated with an increased risk (RR 2.79).31
Another case-control study showed that a ‘dessert’ patternand a ‘beef ’ pattern were associated with increased risk ofkidney cancer. A ‘juices’ factor was associated with increasedrisk of this cancer in men and an ‘unhealthy’ pattern withincreased risk in women.32
One case-control study from Uruguay reported an associ-ation with increased risk of oral and pharyngeal cancers anda ‘stew’ pattern, characterised by cooked vegetables, potatoand sweet potato, and boiled meat. It also found a decreasedrisk of these cancers associated with a ‘vegetables and fruits’pattern, characterised by raw vegetables, citrus fruits, otherfruits, liver, fish, and desserts.33
A case-control study of pancreatic cancer risk showed no
association with ‘western’ and western ‘drinker’ patterns, butan association with decreased risk and a ‘fruits and vegeta-bles’ pattern.34
A Canadian case-control study found that four dietary pat-terns were associated with increased risk of kidney cancer:a ‘dessert’ pattern in both men and women; a ‘beef ’ patternand a ‘juices’ pattern in men; and an ‘unhealthy’ patternamong women.
4.11.5.4 Vegetarian dietary patternsThe narrative review identified several studies that haveinvestigated the relationship between vegetarian diets andthe risk of cancer. These often did not adjust for potentiallyconfounding factors. One study found that when adjusted forage only, women who said they consumed vegetarian dietsseemed to increase the risk of breast cancer (1.65, 95% CI1.01–2.7) (vegetarian versus non-vegetarian).35
Plausible biological mechanisms have been identified bywhich vegetarian diets might specifically reduce the risk ofcancers of the colon, breast, and prostate (also see chapter4.2). Any effect of vegetarian diets is likely to be due not onlyto the exclusion of meat, but also to the inclusion of a larg-er number and wider range of plant foods, containing anextensive variety of potential cancer-preventive substances.
4.11.5.5 Seventh-day Adventist diets The SLRs identified a number of cohort studies on the rela-tionship between Seventh-day Adventist diets — and alsogeneral ways of life — and the risk of cancer. Two investi-gated oesophageal cancer,36 37 seven stomach cancer,37-43 twokidney cancer,37 42 one breast cancer44 and three prostate can-cer.37 41 45 For oesophageal, kidney, breast and prostate cancer, results were mixed and usually not statistically sig-nificant, although they were slightly suggestive of reducedrisk.
For stomach cancer, meta-analysis of five cohort studies37-40
42 gave a summary effect estimate of 0.60 (95% CI0.44–0.80), with low heterogeneity, with non-included stud-ies also reporting reduced risks. None of the studies thatreported reduced risk was adjusted for known confoundingfactors such as smoking.
As not smoking is a feature of Seventh-day Adventism, thePanel concluded that data on the dietary patterns associatedwith this faith are limited and no conclusion can be reachedfor any cancer site.
No conclusions can be based on this evidence, because thedata are too limited and not comparable across studies.
4.11.5.6 Meal frequency The SLRs identified 20 case-control studies46-65 that investi-gated irregular eating and stomach cancer. All but 1 report-ed increased risk estimates and 15 were statisticallysignificant. Meta-analysis of 16 case-control studies50-65 gavea summary effect estimate of 2.76 (95% CI 2.10–3.64) forirregular as opposed to regular eating (p < 0.001), but withhigh heterogeneity.
However, the reference period was generally some yearsbefore cancer diagnosis. Irregular eating can be taken tomean frequent snacking or small meals, or missing main

196
P A R T 2 • E V I D E N C E A N D J U D G E M E N T S
meals. But none of these studies defined ‘irregular eating’ orquantified the frequency with which meals might beskipped.
Eight case-control studies investigated meal frequency andcolorectal cancer.66-80 Most showed increased risks withincreased frequency of meals. Meta-analysis of 11 estimatesfrom 7 of these studies67-69 76 78-80 gave a summary effect esti-mate of 1.10 (95% CI 1.02–1.19), with high heterogeneity.
This evidence is also unclear. No cohort studies have beenidentified as examining meal frequency. People who havestomach or colorectal problems are likely to eat irregularly.There is also high probability of confounding, as regular eat-ing patterns are associated with generally healthy behaviour.
The significance of these findings on meal frequency andstomach and colorectal cancer is unclear, in part because ofthe high probability of confounding. For this reason, nojudgement is made.
4.11.5.7 Being breastfedThe SLRs produced no evidence on any relationship betweenhaving been breastfed and the risk of cancer in adult life.However, the reviews did produce evidence on the relation-ship between lactation and cancer in women, and alsobetween having been breastfed and the risk of overweightand obesity in childhood and thereafter. See chapters 6.3.3and 8.8.3.
4.11.6 Comparison with previous report
The previous report reviewed evidence on vegetarian andmostly-vegetarian dietary patterns of various types, includ-ing Seventh-day Adventist and macrobiotic diets. The reportconcluded that various types of vegetarian dietary patternseem to decrease the incidence of cancer in general, as wellas of some specific sites. It also concluded that semi-vege-tarian diets that include small amounts of meat and foodsof animal origin may also be beneficial. This conclusion wasnot made as a formal judgement.
The previous report identified ‘poverty’ or ‘deficiency’ pat-terns of diet. These are monotonous, very high in refinedcereal foods (such as rice), with only small amounts of otherfoods. This was partly in response to its finding that refinedcereals (grains) were a possible cause of oesophageal can-cer and that starch was a possible cause of stomach cancer.In explanation, the panel responsible for that report con-cluded that any increase in the risk of cancer here was like-ly to be caused by poverty/deficiency dietary patterns, notby the specific food or dietary constituent.
The first recommendation of the previous report was ineffect for: ‘nutritionally adequate and varied diets, based pri-marily on foods of plant origin’. This was based partly on theevidently protective effects of vegetables and fruits, and alsoon the general balance of evidence. The panel emphasisedthat ‘plant-based diets’ do and may include relatively mod-est amounts of foods of animal origin.
4.11.7 Conclusions
The Panel concludes:Currently, no firm judgements can be made on any possiblerelationship between dietary patterns and the risk of cancer.