Embed Size (px)
Citation preview
Total Diet Study Statistics on Element Results
U.S. Food and Drug AdministrationCenter for Food Safety and Applied Nutrition
College Park, MD
Na Mg
Hg
Cd
Pb
AsCaK Ni Cu FeMn
Mo
P
Zn Se
I
Revision 4.1, Market Baskets 1991-3 through 2005-4December 11, 2007
US Food and Drug Administration — Total Diet Study — Market Baskets 1991-3 through 2005-4
Summaries of element analytical results in food and nominal element analytical limits are provided for samples analyzed under the Food and Drug Administration's Total Diet Study program. The information pertains to Total Diet Study market baskets 1991-3 through 2005-4. Go to the FDA Total Diet Study website for more information.<http://www.cfsan.fda.gov/~comm/tds-toc.html>
Notes • Trace: Analytical result is greater than or equal to the limit of detection but less than the limit of quantification. • Statistics were calculated using value of 0 for results below the limit of detection. • Some values have been rounded.
Document Name: Total Diet Study Statistics on Element Results
Revision 4.1, 1991-2005, December 11, 2007 Revision 4, 1991-2004, August 21, 2006 Revision 3, 1991-2003, August 21, 2005 Revision 2, 1991-2002, July 6, 2004 Revision 1, 1991-1998, April 25, 2000 Revision 0, 1991-1996, June 15, 1999
This document is available on the Internet at <http://www.cfsan.fda.gov/~comm/tds-res.html>.
US Food and Drug Administration Center for Food Safety and Applied Nutrition Office of Regulatory Science Division of Bioanalytical Chemistry Chemical Contaminants Branch (HFS-716) 5100 Paint Branch Parkway College Park, Maryland 20740-3835 USA
Page 2 of 211 Rev 4.1
US Food and Drug Administration — Total Diet Study — Market Baskets 1991-3 through 2005-4
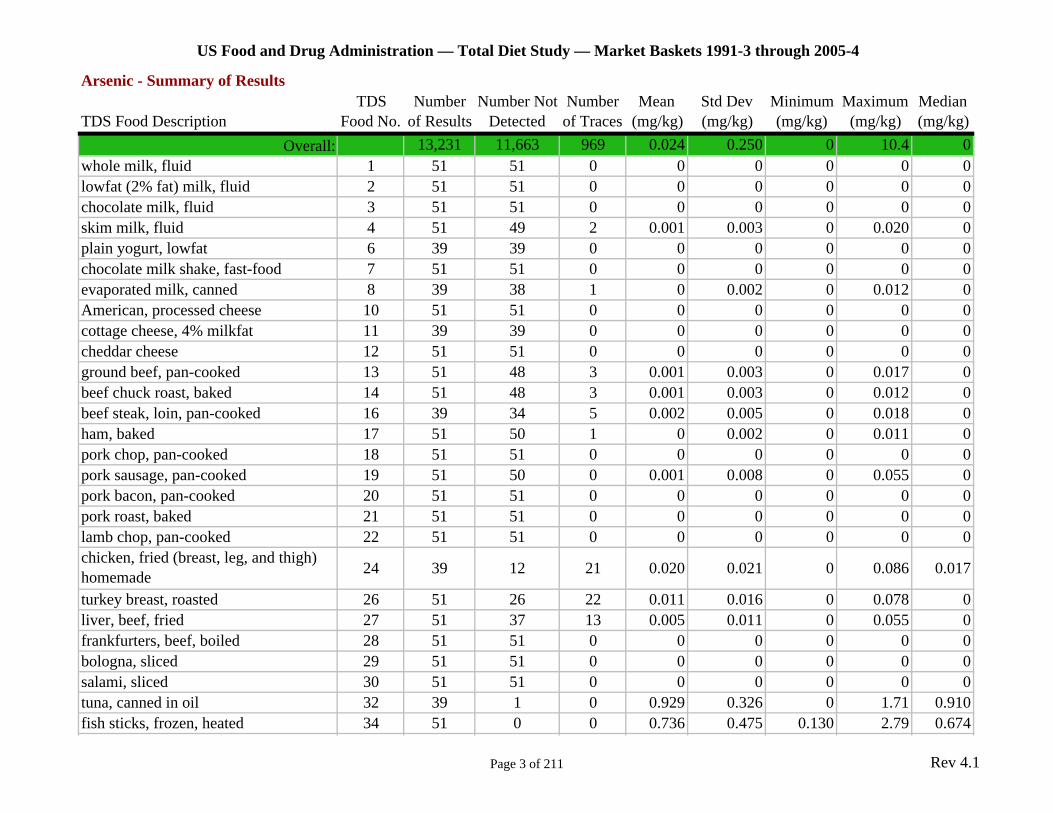
Arsenic - Summary of Results TDS Number Number Not Number Mean Std Dev Minimum Maximum Median
TDS Food Description Food No. of Results Detected of Traces (mg/kg) (mg/kg) (mg/kg) (mg/kg) (mg/kg) Overall: 13,231 11,663 969 0.024 0.250 0 10.4 0
whole milk, fluid 1 51 51 0 0 0 0 0 0 lowfat (2% fat) milk, fluid 2 51 51 0 0 0 0 0 0 chocolate milk, fluid 3 51 51 0 0 0 0 0 0 skim milk, fluid 4 51 49 2 0.001 0.003 0 0.020 0 plain yogurt, lowfat 6 39 39 0 0 0 0 0 0 chocolate milk shake, fast-food 7 51 51 0 0 0 0 0 0 evaporated milk, canned 8 39 38 1 0 0.002 0 0.012 0 American, processed cheese 10 51 51 0 0 0 0 0 0 cottage cheese, 4% milkfat 11 39 39 0 0 0 0 0 0 cheddar cheese 12 51 51 0 0 0 0 0 0 ground beef, pan-cooked 13 51 48 3 0.001 0.003 0 0.017 0 beef chuck roast, baked 14 51 48 3 0.001 0.003 0 0.012 0 beef steak, loin, pan-cooked 16 39 34 5 0.002 0.005 0 0.018 0 ham, baked 17 51 50 1 0 0.002 0 0.011 0 pork chop, pan-cooked 18 51 51 0 0 0 0 0 0 pork sausage, pan-cooked 19 51 50 0 0.001 0.008 0 0.055 0 pork bacon, pan-cooked 20 51 51 0 0 0 0 0 0 pork roast, baked 21 51 51 0 0 0 0 0 0 lamb chop, pan-cooked 22 51 51 0 0 0 0 0 0 chicken, fried (breast, leg, and thigh) homemade 24 39 12 21 0.020 0.021 0 0.086 0.017
turkey breast, roasted 26 51 26 22 0.011 0.016 0 0.078 0 liver, beef, fried 27 51 37 13 0.005 0.011 0 0.055 0 frankfurters, beef, boiled 28 51 51 0 0 0 0 0 0 bologna, sliced 29 51 51 0 0 0 0 0 0 salami, sliced 30 51 51 0 0 0 0 0 0 tuna, canned in oil 32 39 1 0 0.929 0.326 0 1.71 0.910 fish sticks, frozen, heated 34 51 0 0 0.736 0.475 0.130 2.79 0.674
Page 3 of 211 Rev 4.1
US Food and Drug Administration — Total Diet Study — Market Baskets 1991-3 through 2005-4
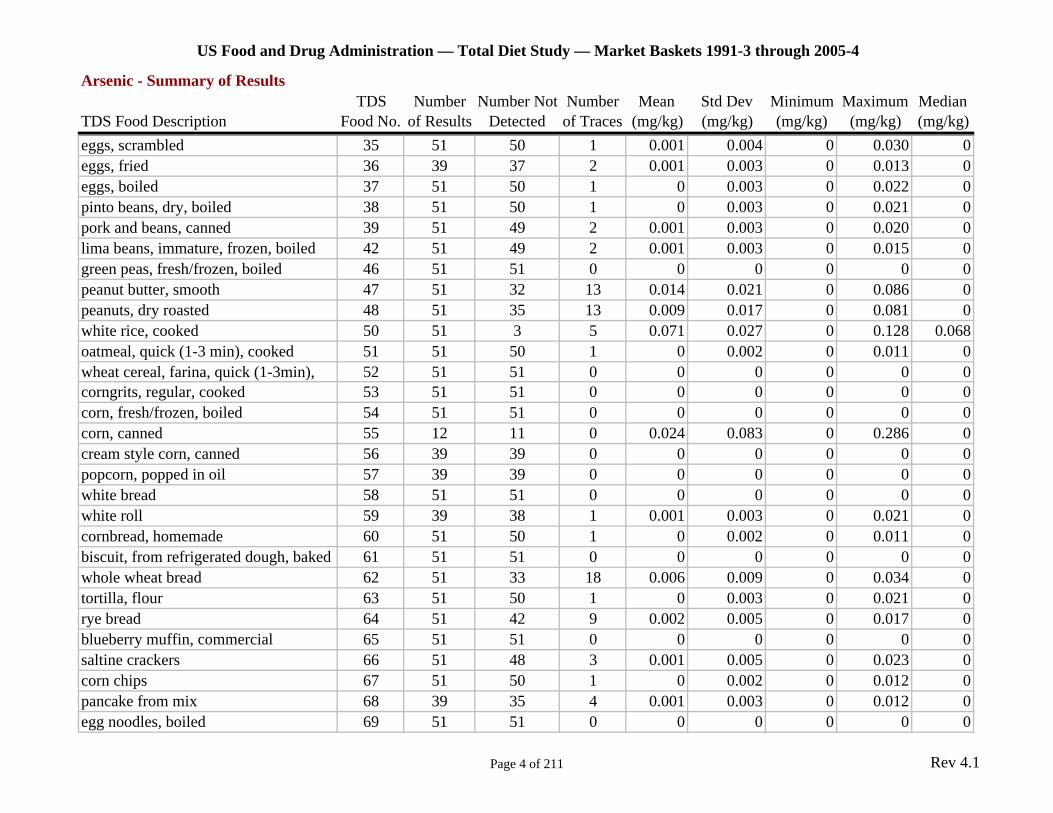
Arsenic - Summary of Results TDS Number Number Not Number Mean Std Dev Minimum Maximum Median
TDS Food Description Food No. of Results Detected of Traces (mg/kg) (mg/kg) (mg/kg) (mg/kg) (mg/kg) eggs, scrambled 35 51 50 1 0.001 0.004 0 0.030 0 eggs, fried 36 39 37 2 0.001 0.003 0 0.013 0 eggs, boiled 37 51 50 1 0 0.003 0 0.022 0 pinto beans, dry, boiled 38 51 50 1 0 0.003 0 0.021 0 pork and beans, canned 39 51 49 2 0.001 0.003 0 0.020 0 lima beans, immature, frozen, boiled 42 51 49 2 0.001 0.003 0 0.015 0 green peas, fresh/frozen, boiled 46 51 51 0 0 0 0 0 0 peanut butter, smooth 47 51 32 13 0.014 0.021 0 0.086 0 peanuts, dry roasted 48 51 35 13 0.009 0.017 0 0.081 0 white rice, cooked 50 51 3 5 0.071 0.027 0 0.128 0.068 oatmeal, quick (1-3 min), cooked 51 51 50 1 0 0.002 0 0.011 0 wheat cereal, farina, quick (1-3min), 52 51 51 0 0 0 0 0 0 corngrits, regular, cooked 53 51 51 0 0 0 0 0 0 corn, fresh/frozen, boiled 54 51 51 0 0 0 0 0 0 corn, canned 55 12 11 0 0.024 0.083 0 0.286 0 cream style corn, canned 56 39 39 0 0 0 0 0 0 popcorn, popped in oil 57 39 39 0 0 0 0 0 0 white bread 58 51 51 0 0 0 0 0 0 white roll 59 39 38 1 0.001 0.003 0 0.021 0 cornbread, homemade 60 51 50 1 0 0.002 0 0.011 0 biscuit, from refrigerated dough, baked 61 51 51 0 0 0 0 0 0 whole wheat bread 62 51 33 18 0.006 0.009 0 0.034 0 tortilla, flour 63 51 50 1 0 0.003 0 0.021 0 rye bread 64 51 42 9 0.002 0.005 0 0.017 0 blueberry muffin, commercial 65 51 51 0 0 0 0 0 0 saltine crackers 66 51 48 3 0.001 0.005 0 0.023 0 corn chips 67 51 50 1 0 0.002 0 0.012 0 pancake from mix 68 39 35 4 0.001 0.003 0 0.012 0 egg noodles, boiled 69 51 51 0 0 0 0 0 0
Page 4 of 211 Rev 4.1
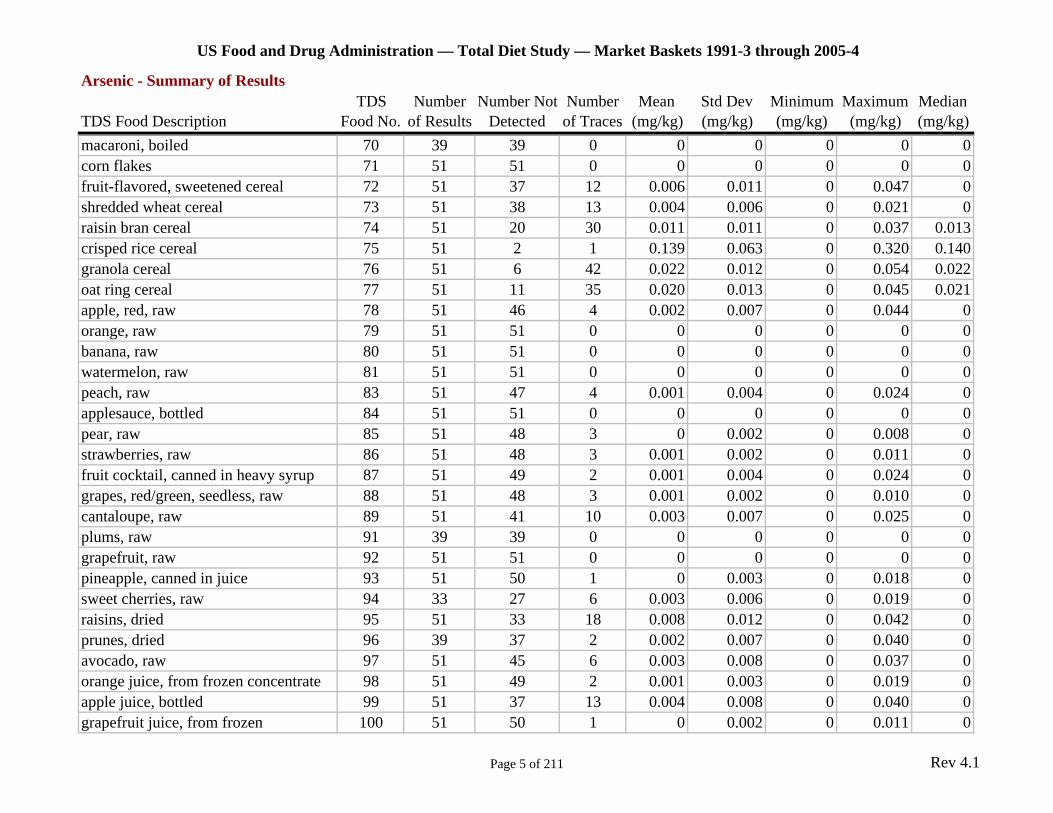
US Food and Drug Administration — Total Diet Study — Market Baskets 1991-3 through 2005-4
Arsenic - Summary of Results TDS Number Number Not Number Mean Std Dev Minimum Maximum Median
TDS Food Description Food No. of Results Detected of Traces (mg/kg) (mg/kg) (mg/kg) (mg/kg) (mg/kg) macaroni, boiled 70 39 39 0 0 0 0 0 0 corn flakes 71 51 51 0 0 0 0 0 0 fruit-flavored, sweetened cereal 72 51 37 12 0.006 0.011 0 0.047 0 shredded wheat cereal 73 51 38 13 0.004 0.006 0 0.021 0 raisin bran cereal 74 51 20 30 0.011 0.011 0 0.037 0.013 crisped rice cereal 75 51 2 1 0.139 0.063 0 0.320 0.140 granola cereal 76 51 6 42 0.022 0.012 0 0.054 0.022 oat ring cereal 77 51 11 35 0.020 0.013 0 0.045 0.021 apple, red, raw 78 51 46 4 0.002 0.007 0 0.044 0 orange, raw 79 51 51 0 0 0 0 0 0 banana, raw 80 51 51 0 0 0 0 0 0 watermelon, raw 81 51 51 0 0 0 0 0 0 peach, raw 83 51 47 4 0.001 0.004 0 0.024 0 applesauce, bottled 84 51 51 0 0 0 0 0 0 pear, raw 85 51 48 3 0 0.002 0 0.008 0 strawberries, raw 86 51 48 3 0.001 0.002 0 0.011 0 fruit cocktail, canned in heavy syrup 87 51 49 2 0.001 0.004 0 0.024 0 grapes, red/green, seedless, raw 88 51 48 3 0.001 0.002 0 0.010 0 cantaloupe, raw 89 51 41 10 0.003 0.007 0 0.025 0 plums, raw 91 39 39 0 0 0 0 0 0 grapefruit, raw 92 51 51 0 0 0 0 0 0 pineapple, canned in juice 93 51 50 1 0 0.003 0 0.018 0 sweet cherries, raw 94 33 27 6 0.003 0.006 0 0.019 0 raisins, dried 95 51 33 18 0.008 0.012 0 0.042 0 prunes, dried 96 39 37 2 0.002 0.007 0 0.040 0 avocado, raw 97 51 45 6 0.003 0.008 0 0.037 0 orange juice, from frozen concentrate 98 51 49 2 0.001 0.003 0 0.019 0 apple juice, bottled 99 51 37 13 0.004 0.008 0 0.040 0 grapefruit juice, from frozen 100 51 50 1 0 0.002 0 0.011 0
Page 5 of 211 Rev 4.1
US Food and Drug Administration — Total Diet Study — Market Baskets 1991-3 through 2005-4
Arsenic - Summary of Results TDS Number Number Not Number Mean Std Dev Minimum Maximum Median
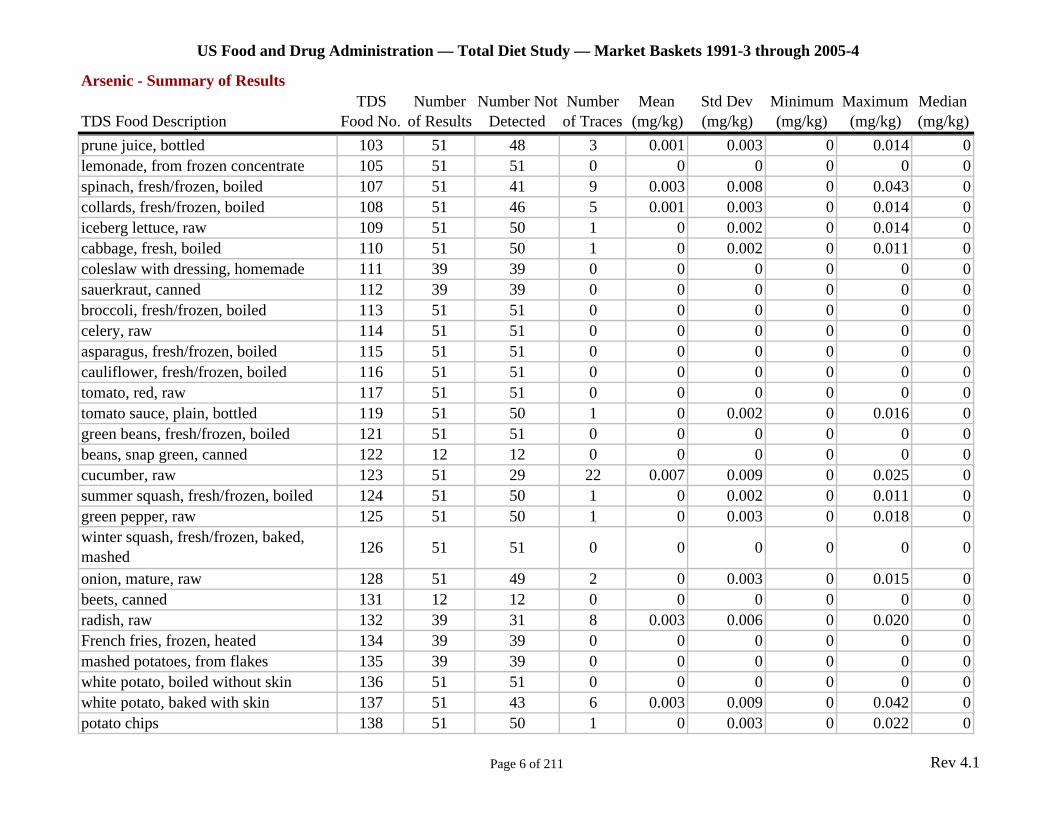
TDS Food Description Food No. of Results Detected of Traces (mg/kg) (mg/kg) (mg/kg) (mg/kg) (mg/kg) prune juice, bottled 103 51 48 3 0.001 0.003 0 0.014 0 lemonade, from frozen concentrate 105 51 51 0 0 0 0 0 0 spinach, fresh/frozen, boiled 107 51 41 9 0.003 0.008 0 0.043 0 collards, fresh/frozen, boiled 108 51 46 5 0.001 0.003 0 0.014 0 iceberg lettuce, raw 109 51 50 1 0 0.002 0 0.014 0 cabbage, fresh, boiled 110 51 50 1 0 0.002 0 0.011 0 coleslaw with dressing, homemade 111 39 39 0 0 0 0 0 0 sauerkraut, canned 112 39 39 0 0 0 0 0 0 broccoli, fresh/frozen, boiled 113 51 51 0 0 0 0 0 0 celery, raw 114 51 51 0 0 0 0 0 0 asparagus, fresh/frozen, boiled 115 51 51 0 0 0 0 0 0 cauliflower, fresh/frozen, boiled 116 51 51 0 0 0 0 0 0 tomato, red, raw 117 51 51 0 0 0 0 0 0 tomato sauce, plain, bottled 119 51 50 1 0 0.002 0 0.016 0 green beans, fresh/frozen, boiled 121 51 51 0 0 0 0 0 0 beans, snap green, canned 122 12 12 0 0 0 0 0 0 cucumber, raw 123 51 29 22 0.007 0.009 0 0.025 0 summer squash, fresh/frozen, boiled 124 51 50 1 0 0.002 0 0.011 0 green pepper, raw 125 51 50 1 0 0.003 0 0.018 0 winter squash, fresh/frozen, baked, mashed 126 51 51 0 0 0 0 0 0
onion, mature, raw 128 51 49 2 0 0.003 0 0.015 0 beets, canned 131 12 12 0 0 0 0 0 0 radish, raw 132 39 31 8 0.003 0.006 0 0.020 0 French fries, frozen, heated 134 39 39 0 0 0 0 0 0 mashed potatoes, from flakes 135 39 39 0 0 0 0 0 0 white potato, boiled without skin 136 51 51 0 0 0 0 0 0 white potato, baked with skin 137 51 43 6 0.003 0.009 0 0.042 0 potato chips 138 51 50 1 0 0.003 0 0.022 0
Page 6 of 211 Rev 4.1
US Food and Drug Administration — Total Diet Study — Market Baskets 1991-3 through 2005-4
Arsenic - Summary of Results TDS Number Number Not Number Mean Std Dev Minimum Maximum Median
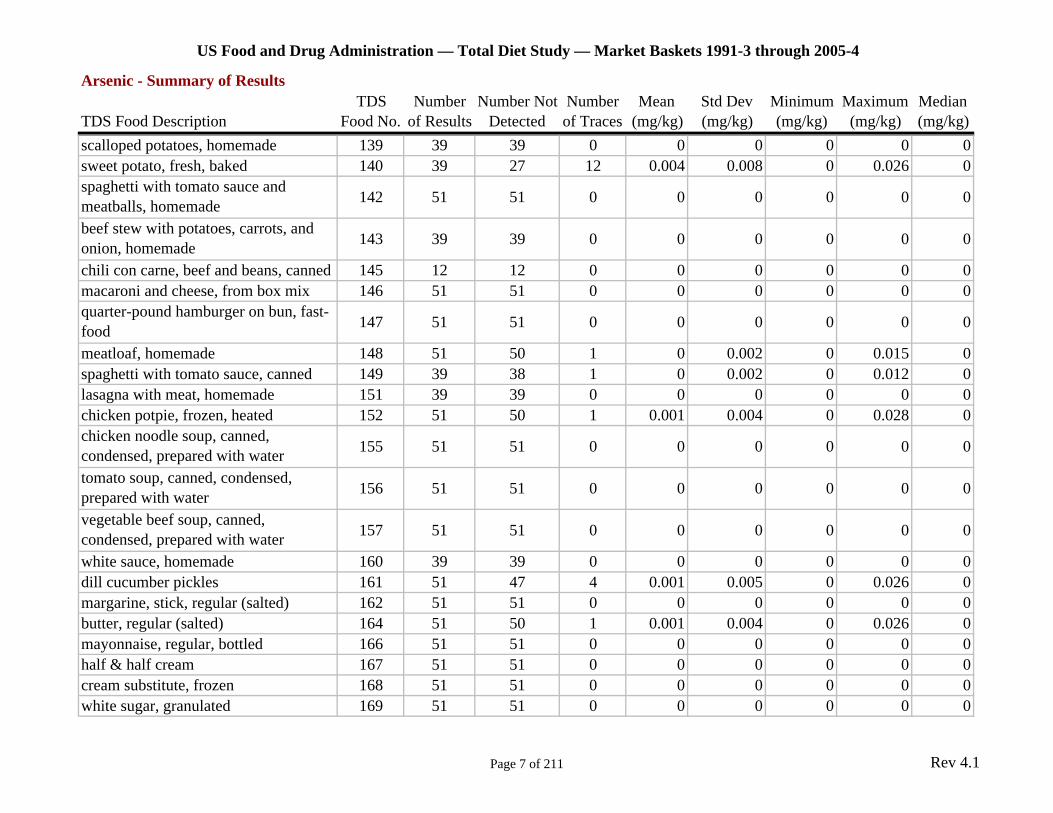
TDS Food Description Food No. of Results Detected of Traces (mg/kg) (mg/kg) (mg/kg) (mg/kg) (mg/kg) scalloped potatoes, homemade 139 39 39 0 0 0 0 0 0 sweet potato, fresh, baked 140 39 27 12 0.004 0.008 0 0.026 0 spaghetti with tomato sauce and meatballs, homemade 142 51 51 0 0 0 0 0 0
beef stew with potatoes, carrots, and onion, homemade 143 39 39 0 0 0 0 0 0
chili con carne, beef and beans, canned 145 12 12 0 0 0 0 0 0 macaroni and cheese, from box mix 146 51 51 0 0 0 0 0 0 quarter-pound hamburger on bun, fast-food 147 51 51 0 0 0 0 0 0
meatloaf, homemade 148 51 50 1 0 0.002 0 0.015 0 spaghetti with tomato sauce, canned 149 39 38 1 0 0.002 0 0.012 0 lasagna with meat, homemade 151 39 39 0 0 0 0 0 0 chicken potpie, frozen, heated 152 51 50 1 0.001 0.004 0 0.028 0 chicken noodle soup, canned, condensed, prepared with water 155 51 51 0 0 0 0 0 0
tomato soup, canned, condensed, prepared with water 156 51 51 0 0 0 0 0 0
vegetable beef soup, canned, condensed, prepared with water 157 51 51 0 0 0 0 0 0
white sauce, homemade 160 39 39 0 0 0 0 0 0 dill cucumber pickles 161 51 47 4 0.001 0.005 0 0.026 0 margarine, stick, regular (salted) 162 51 51 0 0 0 0 0 0 butter, regular (salted) 164 51 50 1 0.001 0.004 0 0.026 0 mayonnaise, regular, bottled 166 51 51 0 0 0 0 0 0 half & half cream 167 51 51 0 0 0 0 0 0 cream substitute, frozen 168 51 51 0 0 0 0 0 0 white sugar, granulated 169 51 51 0 0 0 0 0 0
Page 7 of 211 Rev 4.1
US Food and Drug Administration — Total Diet Study — Market Baskets 1991-3 through 2005-4
Arsenic - Summary of Results TDS Number Number Not Number Mean Std Dev Minimum Maximum Median
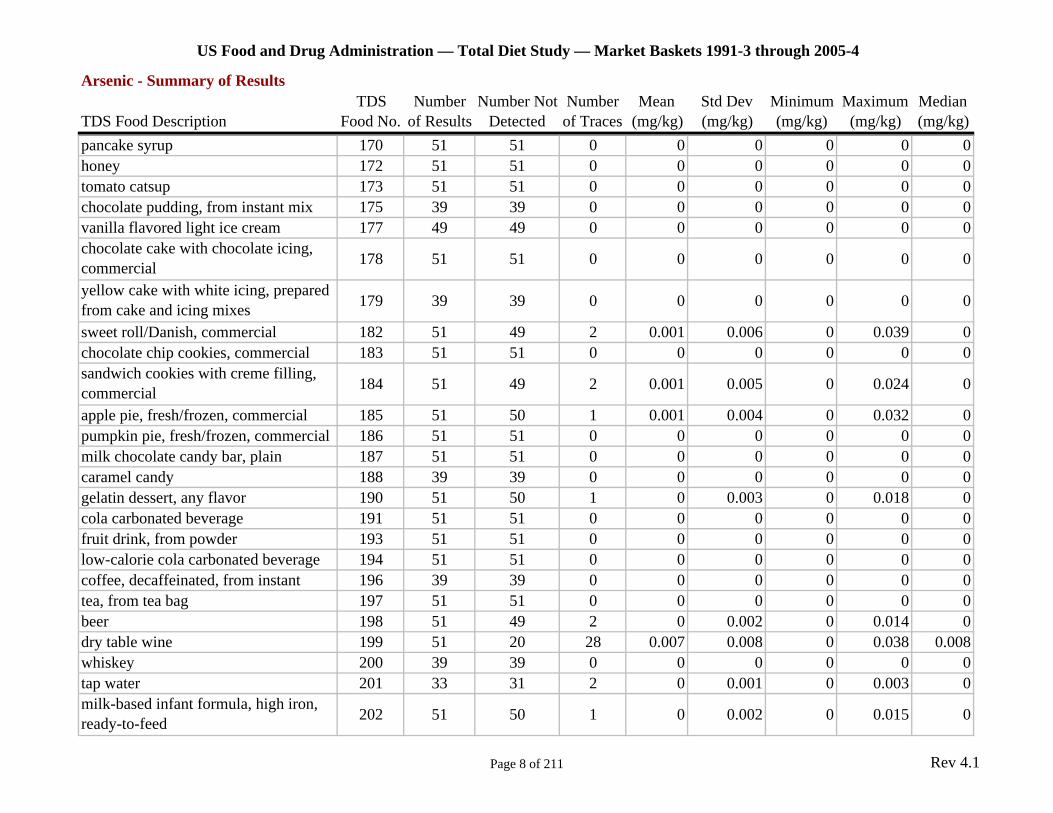
TDS Food Description Food No. of Results Detected of Traces (mg/kg) (mg/kg) (mg/kg) (mg/kg) (mg/kg) pancake syrup 170 51 51 0 0 0 0 0 0 honey 172 51 51 0 0 0 0 0 0 tomato catsup 173 51 51 0 0 0 0 0 0 chocolate pudding, from instant mix 175 39 39 0 0 0 0 0 0 vanilla flavored light ice cream 177 49 49 0 0 0 0 0 0 chocolate cake with chocolate icing, commercial 178 51 51 0 0 0 0 0 0
yellow cake with white icing, prepared from cake and icing mixes 179 39 39 0 0 0 0 0 0
sweet roll/Danish, commercial 182 51 49 2 0.001 0.006 0 0.039 0 chocolate chip cookies, commercial 183 51 51 0 0 0 0 0 0 sandwich cookies with creme filling, commercial 184 51 49 2 0.001 0.005 0 0.024 0
apple pie, fresh/frozen, commercial 185 51 50 1 0.001 0.004 0 0.032 0 pumpkin pie, fresh/frozen, commercial 186 51 51 0 0 0 0 0 0 milk chocolate candy bar, plain 187 51 51 0 0 0 0 0 0 caramel candy 188 39 39 0 0 0 0 0 0 gelatin dessert, any flavor 190 51 50 1 0 0.003 0 0.018 0 cola carbonated beverage 191 51 51 0 0 0 0 0 0 fruit drink, from powder 193 51 51 0 0 0 0 0 0 low-calorie cola carbonated beverage 194 51 51 0 0 0 0 0 0 coffee, decaffeinated, from instant 196 39 39 0 0 0 0 0 0 tea, from tea bag 197 51 51 0 0 0 0 0 0 beer 198 51 49 2 0 0.002 0 0.014 0 dry table wine 199 51 20 28 0.007 0.008 0 0.038 0.008 whiskey 200 39 39 0 0 0 0 0 0 tap water 201 33 31 2 0 0.001 0 0.003 0 milk-based infant formula, high iron, ready-to-feed 202 51 50 1 0 0.002 0 0.015 0
Page 8 of 211 Rev 4.1
US Food and Drug Administration — Total Diet Study — Market Baskets 1991-3 through 2005-4
Arsenic - Summary of Results TDS Number Number Not Number Mean Std Dev Minimum Maximum Median
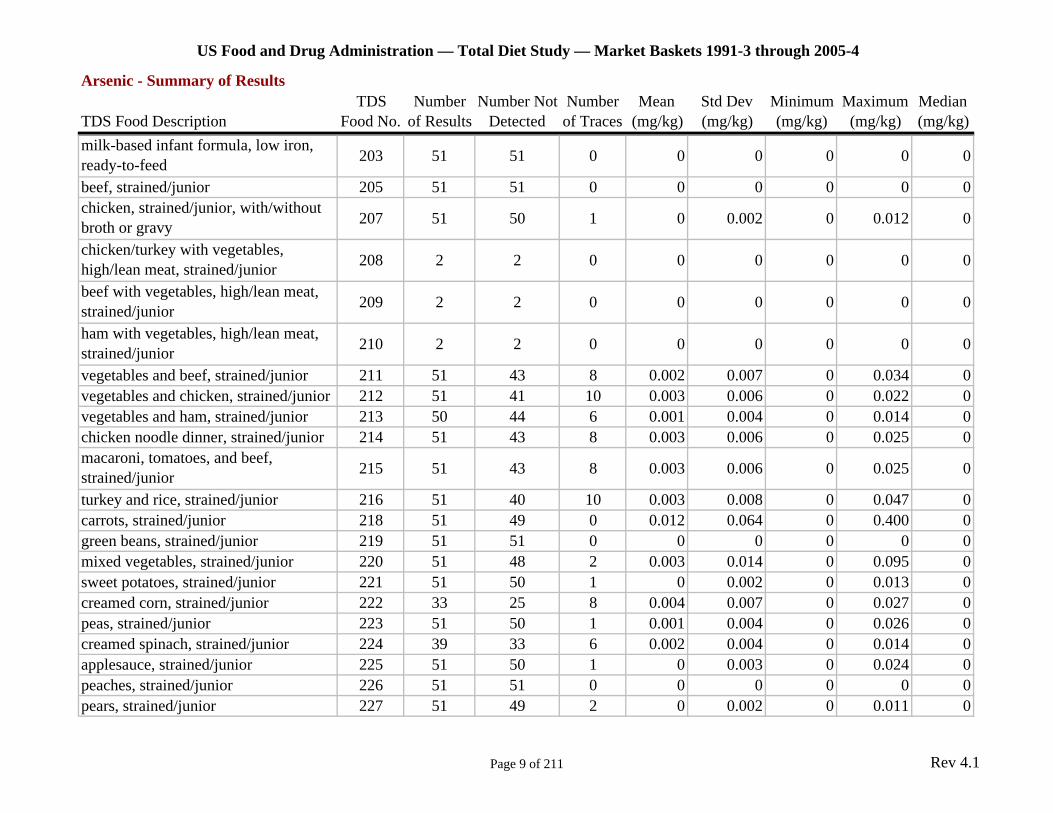
TDS Food Description Food No. of Results Detected of Traces (mg/kg) (mg/kg) (mg/kg) (mg/kg) (mg/kg) milk-based infant formula, low iron, ready-to-feed 203 51 51 0 0 0 0 0 0
beef, strained/junior 205 51 51 0 0 0 0 0 0 chicken, strained/junior, with/without broth or gravy 207 51 50 1 0 0.002 0 0.012 0
chicken/turkey with vegetables, high/lean meat, strained/junior 208 2 2 0 0 0 0 0 0
beef with vegetables, high/lean meat, strained/junior 209 2 2 0 0 0 0 0 0
ham with vegetables, high/lean meat, strained/junior 210 2 2 0 0 0 0 0 0
vegetables and beef, strained/junior 211 51 43 8 0.002 0.007 0 0.034 0 vegetables and chicken, strained/junior 212 51 41 10 0.003 0.006 0 0.022 0 vegetables and ham, strained/junior 213 50 44 6 0.001 0.004 0 0.014 0 chicken noodle dinner, strained/junior 214 51 43 8 0.003 0.006 0 0.025 0 macaroni, tomatoes, and beef, strained/junior 215 51 43 8 0.003 0.006 0 0.025 0
turkey and rice, strained/junior 216 51 40 10 0.003 0.008 0 0.047 0 carrots, strained/junior 218 51 49 0 0.012 0.064 0 0.400 0 green beans, strained/junior 219 51 51 0 0 0 0 0 0 mixed vegetables, strained/junior 220 51 48 2 0.003 0.014 0 0.095 0 sweet potatoes, strained/junior 221 51 50 1 0 0.002 0 0.013 0 creamed corn, strained/junior 222 33 25 8 0.004 0.007 0 0.027 0 peas, strained/junior 223 51 50 1 0.001 0.004 0 0.026 0 creamed spinach, strained/junior 224 39 33 6 0.002 0.004 0 0.014 0 applesauce, strained/junior 225 51 50 1 0 0.003 0 0.024 0 peaches, strained/junior 226 51 51 0 0 0 0 0 0 pears, strained/junior 227 51 49 2 0 0.002 0 0.011 0
Page 9 of 211 Rev 4.1
US Food and Drug Administration — Total Diet Study — Market Baskets 1991-3 through 2005-4
Arsenic - Summary of Results TDS Number Number Not Number Mean Std Dev Minimum Maximum Median
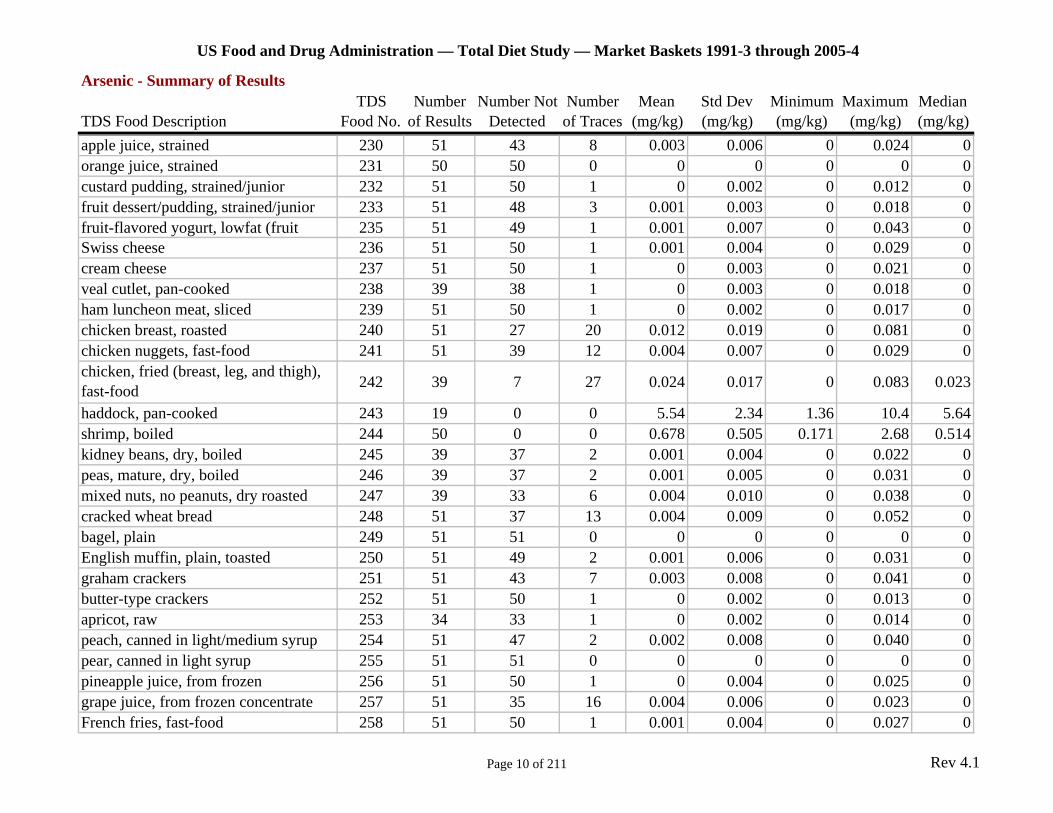
TDS Food Description Food No. of Results Detected of Traces (mg/kg) (mg/kg) (mg/kg) (mg/kg) (mg/kg) apple juice, strained 230 51 43 8 0.003 0.006 0 0.024 0 orange juice, strained 231 50 50 0 0 0 0 0 0 custard pudding, strained/junior 232 51 50 1 0 0.002 0 0.012 0 fruit dessert/pudding, strained/junior 233 51 48 3 0.001 0.003 0 0.018 0 fruit-flavored yogurt, lowfat (fruit 235 51 49 1 0.001 0.007 0 0.043 0 Swiss cheese 236 51 50 1 0.001 0.004 0 0.029 0 cream cheese 237 51 50 1 0 0.003 0 0.021 0 veal cutlet, pan-cooked 238 39 38 1 0 0.003 0 0.018 0 ham luncheon meat, sliced 239 51 50 1 0 0.002 0 0.017 0 chicken breast, roasted 240 51 27 20 0.012 0.019 0 0.081 0 chicken nuggets, fast-food 241 51 39 12 0.004 0.007 0 0.029 0 chicken, fried (breast, leg, and thigh), fast-food 242 39 7 27 0.024 0.017 0 0.083 0.023
haddock, pan-cooked 243 19 0 0 5.54 2.34 1.36 10.4 5.64 shrimp, boiled 244 50 0 0 0.678 0.505 0.171 2.68 0.514 kidney beans, dry, boiled 245 39 37 2 0.001 0.004 0 0.022 0 peas, mature, dry, boiled 246 39 37 2 0.001 0.005 0 0.031 0 mixed nuts, no peanuts, dry roasted 247 39 33 6 0.004 0.010 0 0.038 0 cracked wheat bread 248 51 37 13 0.004 0.009 0 0.052 0 bagel, plain 249 51 51 0 0 0 0 0 0 English muffin, plain, toasted 250 51 49 2 0.001 0.006 0 0.031 0 graham crackers 251 51 43 7 0.003 0.008 0 0.041 0 butter-type crackers 252 51 50 1 0 0.002 0 0.013 0 apricot, raw 253 34 33 1 0 0.002 0 0.014 0 peach, canned in light/medium syrup 254 51 47 2 0.002 0.008 0 0.040 0 pear, canned in light syrup 255 51 51 0 0 0 0 0 0 pineapple juice, from frozen 256 51 50 1 0 0.004 0 0.025 0 grape juice, from frozen concentrate 257 51 35 16 0.004 0.006 0 0.023 0 French fries, fast-food 258 51 50 1 0.001 0.004 0 0.027 0
Page 10 of 211 Rev 4.1
US Food and Drug Administration — Total Diet Study — Market Baskets 1991-3 through 2005-4
Arsenic - Summary of Results TDS Number Number Not Number Mean Std Dev Minimum Maximum Median
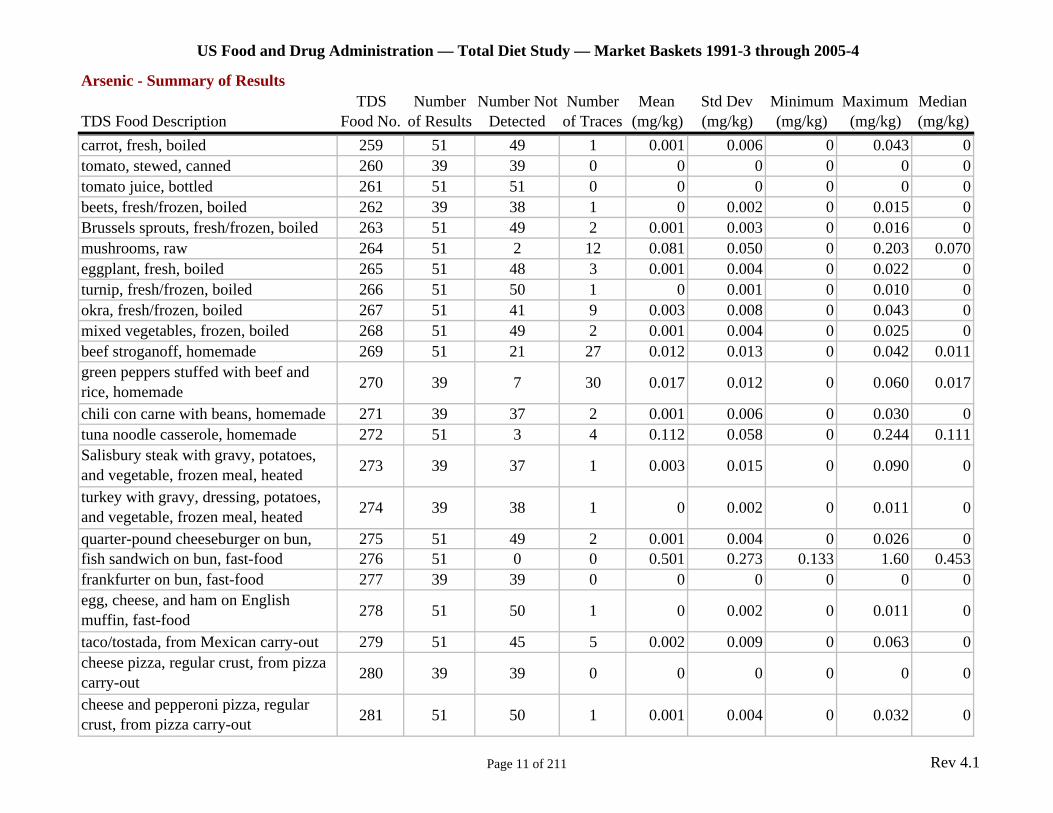
TDS Food Description Food No. of Results Detected of Traces (mg/kg) (mg/kg) (mg/kg) (mg/kg) (mg/kg) carrot, fresh, boiled 259 51 49 1 0.001 0.006 0 0.043 0 tomato, stewed, canned 260 39 39 0 0 0 0 0 0 tomato juice, bottled 261 51 51 0 0 0 0 0 0 beets, fresh/frozen, boiled 262 39 38 1 0 0.002 0 0.015 0 Brussels sprouts, fresh/frozen, boiled 263 51 49 2 0.001 0.003 0 0.016 0 mushrooms, raw 264 51 2 12 0.081 0.050 0 0.203 0.070 eggplant, fresh, boiled 265 51 48 3 0.001 0.004 0 0.022 0 turnip, fresh/frozen, boiled 266 51 50 1 0 0.001 0 0.010 0 okra, fresh/frozen, boiled 267 51 41 9 0.003 0.008 0 0.043 0 mixed vegetables, frozen, boiled 268 51 49 2 0.001 0.004 0 0.025 0 beef stroganoff, homemade 269 51 21 27 0.012 0.013 0 0.042 0.011 green peppers stuffed with beef and rice, homemade 270 39 7 30 0.017 0.012 0 0.060 0.017
chili con carne with beans, homemade 271 39 37 2 0.001 0.006 0 0.030 0 tuna noodle casserole, homemade 272 51 3 4 0.112 0.058 0 0.244 0.111 Salisbury steak with gravy, potatoes, and vegetable, frozen meal, heated 273 39 37 1 0.003 0.015 0 0.090 0
turkey with gravy, dressing, potatoes, and vegetable, frozen meal, heated 274 39 38 1 0 0.002 0 0.011 0
quarter-pound cheeseburger on bun, 275 51 49 2 0.001 0.004 0 0.026 0 fish sandwich on bun, fast-food 276 51 0 0 0.501 0.273 0.133 1.60 0.453 frankfurter on bun, fast-food 277 39 39 0 0 0 0 0 0 egg, cheese, and ham on English muffin, fast-food 278 51 50 1 0 0.002 0 0.011 0
taco/tostada, from Mexican carry-out 279 51 45 5 0.002 0.009 0 0.063 0 cheese pizza, regular crust, from pizza carry-out 280 39 39 0 0 0 0 0 0
cheese and pepperoni pizza, regular crust, from pizza carry-out 281 51 50 1 0.001 0.004 0 0.032 0
Page 11 of 211 Rev 4.1
US Food and Drug Administration — Total Diet Study — Market Baskets 1991-3 through 2005-4
Arsenic - Summary of Results TDS Number Number Not Number Mean Std Dev Minimum Maximum Median
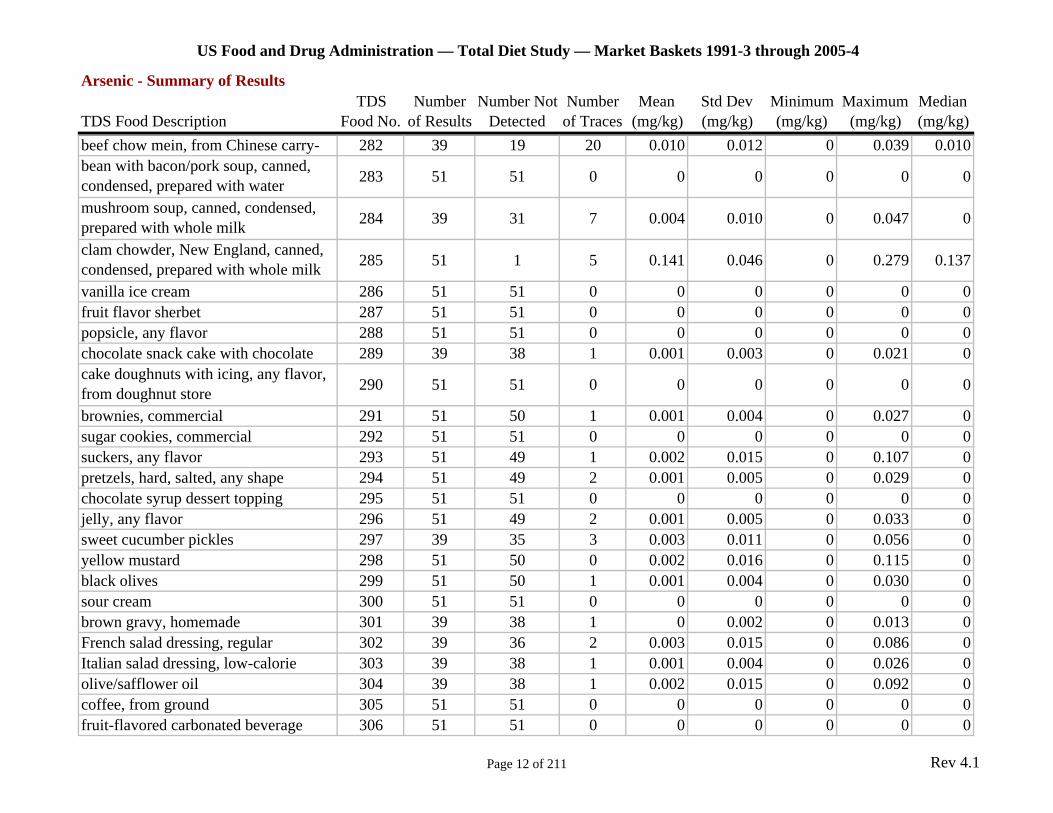
TDS Food Description Food No. of Results Detected of Traces (mg/kg) (mg/kg) (mg/kg) (mg/kg) (mg/kg) beef chow mein, from Chinese carry- 282 39 19 20 0.010 0.012 0 0.039 0.010 bean with bacon/pork soup, canned, condensed, prepared with water 283 51 51 0 0 0 0 0 0
mushroom soup, canned, condensed, prepared with whole milk 284 39 31 7 0.004 0.010 0 0.047 0
clam chowder, New England, canned, condensed, prepared with whole milk 285 51 1 5 0.141 0.046 0 0.279 0.137
vanilla ice cream 286 51 51 0 0 0 0 0 0 fruit flavor sherbet 287 51 51 0 0 0 0 0 0 popsicle, any flavor 288 51 51 0 0 0 0 0 0 chocolate snack cake with chocolate 289 39 38 1 0.001 0.003 0 0.021 0 cake doughnuts with icing, any flavor, from doughnut store 290 51 51 0 0 0 0 0 0
brownies, commercial 291 51 50 1 0.001 0.004 0 0.027 0 sugar cookies, commercial 292 51 51 0 0 0 0 0 0 suckers, any flavor 293 51 49 1 0.002 0.015 0 0.107 0 pretzels, hard, salted, any shape 294 51 49 2 0.001 0.005 0 0.029 0 chocolate syrup dessert topping 295 51 51 0 0 0 0 0 0 jelly, any flavor 296 51 49 2 0.001 0.005 0 0.033 0 sweet cucumber pickles 297 39 35 3 0.003 0.011 0 0.056 0 yellow mustard 298 51 50 0 0.002 0.016 0 0.115 0 black olives 299 51 50 1 0.001 0.004 0 0.030 0 sour cream 300 51 51 0 0 0 0 0 0 brown gravy, homemade 301 39 38 1 0 0.002 0 0.013 0 French salad dressing, regular 302 39 36 2 0.003 0.015 0 0.086 0 Italian salad dressing, low-calorie 303 39 38 1 0.001 0.004 0 0.026 0 olive/safflower oil 304 39 38 1 0.002 0.015 0 0.092 0 coffee, from ground 305 51 51 0 0 0 0 0 0 fruit-flavored carbonated beverage 306 51 51 0 0 0 0 0 0
Page 12 of 211 Rev 4.1
US Food and Drug Administration — Total Diet Study — Market Baskets 1991-3 through 2005-4
Arsenic - Summary of Results TDS Number Number Not Number Mean Std Dev Minimum Maximum Median
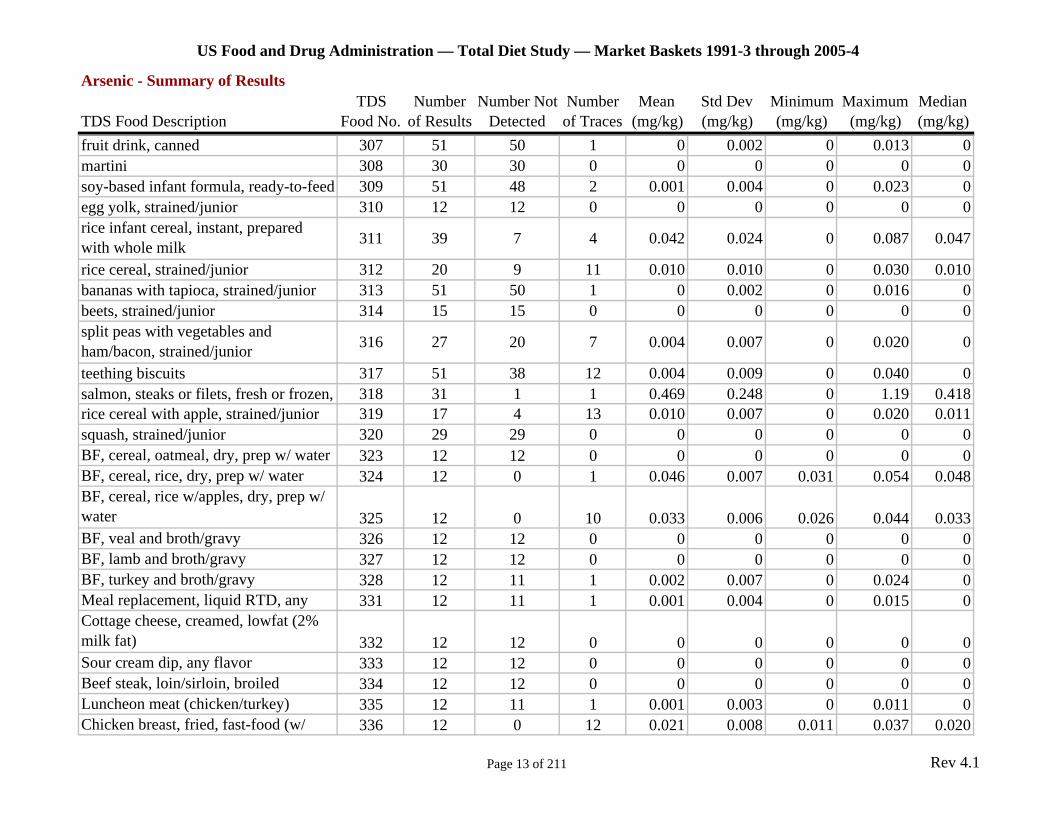
TDS Food Description Food No. of Results Detected of Traces (mg/kg) (mg/kg) (mg/kg) (mg/kg) (mg/kg) fruit drink, canned 307 51 50 1 0 0.002 0 0.013 0 martini 308 30 30 0 0 0 0 0 0 soy-based infant formula, ready-to-feed 309 51 48 2 0.001 0.004 0 0.023 0 egg yolk, strained/junior 310 12 12 0 0 0 0 0 0 rice infant cereal, instant, prepared with whole milk 311 39 7 4 0.042 0.024 0 0.087 0.047
rice cereal, strained/junior 312 20 9 11 0.010 0.010 0 0.030 0.010 bananas with tapioca, strained/junior 313 51 50 1 0 0.002 0 0.016 0 beets, strained/junior 314 15 15 0 0 0 0 0 0 split peas with vegetables and ham/bacon, strained/junior 316 27 20 7 0.004 0.007 0 0.020 0
teething biscuits 317 51 38 12 0.004 0.009 0 0.040 0 salmon, steaks or filets, fresh or frozen, 318 31 1 1 0.469 0.248 0 1.19 0.418 rice cereal with apple, strained/junior 319 17 4 13 0.010 0.007 0 0.020 0.011 squash, strained/junior 320 29 29 0 0 0 0 0 0 BF, cereal, oatmeal, dry, prep w/ water 323 12 12 0 0 0 0 0 0 BF, cereal, rice, dry, prep w/ water 324 12 0 1 0.046 0.007 0.031 0.054 0.048 BF, cereal, rice w/apples, dry, prep w/ water 325 12 0 10 0.033 0.006 0.026 0.044 0.033 BF, veal and broth/gravy 326 12 12 0 0 0 0 0 0 BF, lamb and broth/gravy 327 12 12 0 0 0 0 0 0 BF, turkey and broth/gravy 328 12 11 1 0.002 0.007 0 0.024 0 Meal replacement, liquid RTD, any 331 12 11 1 0.001 0.004 0 0.015 0 Cottage cheese, creamed, lowfat (2% milk fat) 332 12 12 0 0 0 0 0 0 Sour cream dip, any flavor 333 12 12 0 0 0 0 0 0 Beef steak, loin/sirloin, broiled 334 12 12 0 0 0 0 0 0 Luncheon meat (chicken/turkey) 335 12 11 1 0.001 0.003 0 0.011 0 Chicken breast, fried, fast-food (w/ 336 12 0 12 0.021 0.008 0.011 0.037 0.020
Page 13 of 211 Rev 4.1
US Food and Drug Administration — Total Diet Study — Market Baskets 1991-3 through 2005-4
Arsenic - Summary of Results TDS Number Number Not Number Mean Std Dev Minimum Maximum Median
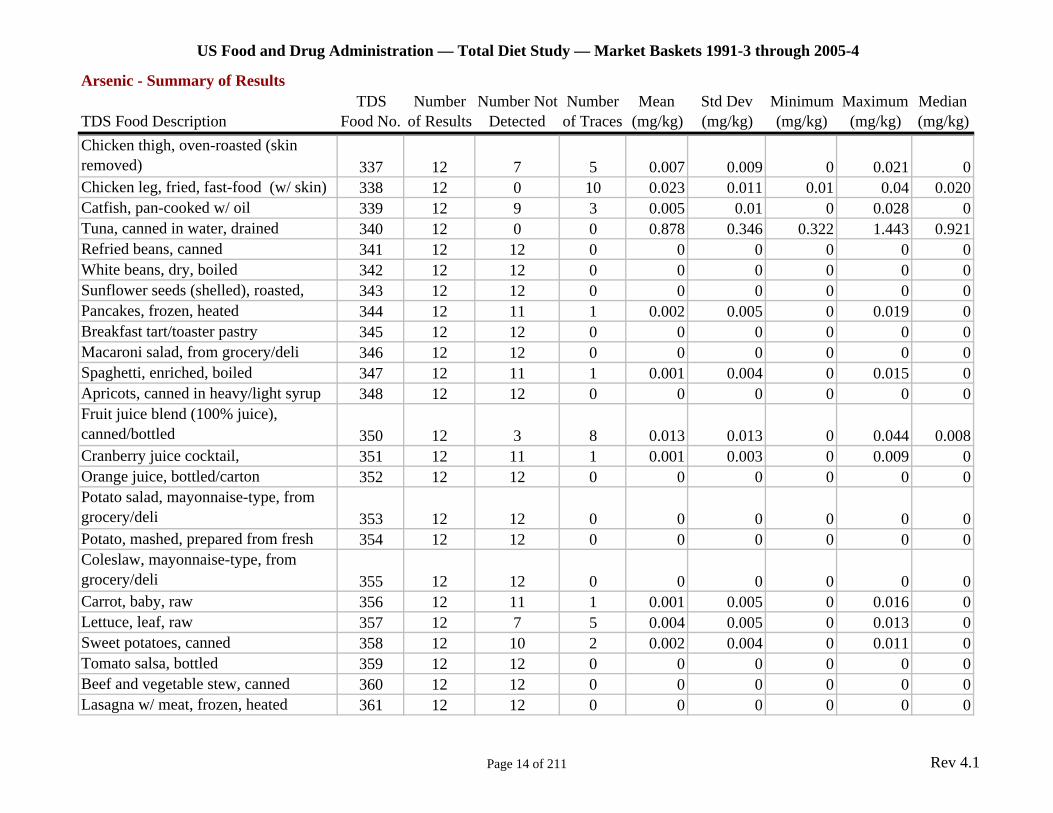
TDS Food Description Food No. of Results Detected of Traces (mg/kg) (mg/kg) (mg/kg) (mg/kg) (mg/kg) Chicken thigh, oven-roasted (skin removed) 337 12 7 5 0.007 0.009 0 0.021 0 Chicken leg, fried, fast-food (w/ skin) 338 12 0 10 0.023 0.011 0.01 0.04 0.020 Catfish, pan-cooked w/ oil 339 12 9 3 0.005 0.01 0 0.028 0 Tuna, canned in water, drained 340 12 0 0 0.878 0.346 0.322 1.443 0.921 Refried beans, canned 341 12 12 0 0 0 0 0 0 White beans, dry, boiled 342 12 12 0 0 0 0 0 0 Sunflower seeds (shelled), roasted, 343 12 12 0 0 0 0 0 0 Pancakes, frozen, heated 344 12 11 1 0.002 0.005 0 0.019 0 Breakfast tart/toaster pastry 345 12 12 0 0 0 0 0 0 Macaroni salad, from grocery/deli 346 12 12 0 0 0 0 0 0 Spaghetti, enriched, boiled 347 12 11 1 0.001 0.004 0 0.015 0 Apricots, canned in heavy/light syrup 348 12 12 0 0 0 0 0 0 Fruit juice blend (100% juice), canned/bottled 350 12 3 8 0.013 0.013 0 0.044 0.008 Cranberry juice cocktail, 351 12 11 1 0.001 0.003 0 0.009 0 Orange juice, bottled/carton 352 12 12 0 0 0 0 0 0 Potato salad, mayonnaise-type, from grocery/deli 353 12 12 0 0 0 0 0 0 Potato, mashed, prepared from fresh 354 12 12 0 0 0 0 0 0 Coleslaw, mayonnaise-type, from grocery/deli 355 12 12 0 0 0 0 0 0 Carrot, baby, raw 356 12 11 1 0.001 0.005 0 0.016 0 Lettuce, leaf, raw 357 12 7 5 0.004 0.005 0 0.013 0 Sweet potatoes, canned 358 12 10 2 0.002 0.004 0 0.011 0 Tomato salsa, bottled 359 12 12 0 0 0 0 0 0 Beef and vegetable stew, canned 360 12 12 0 0 0 0 0 0 Lasagna w/ meat, frozen, heated 361 12 12 0 0 0 0 0 0
Page 14 of 211 Rev 4.1
US Food and Drug Administration — Total Diet Study — Market Baskets 1991-3 through 2005-4
Arsenic - Summary of Results TDS Number Number Not Number Mean Std Dev Minimum Maximum Median
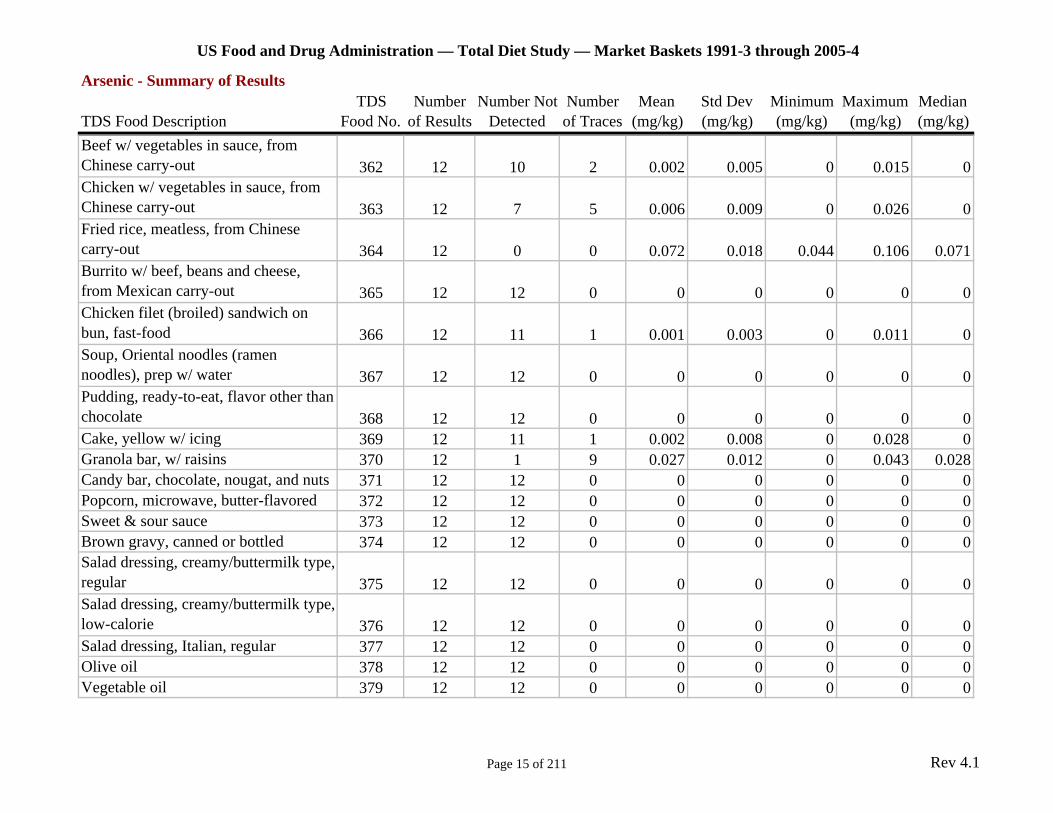
TDS Food Description Food No. of Results Detected of Traces (mg/kg) (mg/kg) (mg/kg) (mg/kg) (mg/kg) Beef w/ vegetables in sauce, from Chinese carry-out 362 12 10 2 0.002 0.005 0 0.015 0 Chicken w/ vegetables in sauce, from Chinese carry-out 363 12 7 5 0.006 0.009 0 0.026 0 Fried rice, meatless, from Chinese carry-out 364 12 0 0 0.072 0.018 0.044 0.106 0.071 Burrito w/ beef, beans and cheese, from Mexican carry-out 365 12 12 0 0 0 0 0 0 Chicken filet (broiled) sandwich on bun, fast-food 366 12 11 1 0.001 0.003 0 0.011 0 Soup, Oriental noodles (ramen noodles), prep w/ water 367 12 12 0 0 0 0 0 0 Pudding, ready-to-eat, flavor other than chocolate 368 12 12 0 0 0 0 0 0 Cake, yellow w/ icing 369 12 11 1 0.002 0.008 0 0.028 0 Granola bar, w/ raisins 370 12 1 9 0.027 0.012 0 0.043 0.028 Candy bar, chocolate, nougat, and nuts 371 12 12 0 0 0 0 0 0 Popcorn, microwave, butter-flavored 372 12 12 0 0 0 0 0 0 Sweet & sour sauce 373 12 12 0 0 0 0 0 0 Brown gravy, canned or bottled 374 12 12 0 0 0 0 0 0 Salad dressing, creamy/buttermilk type, regular 375 12 12 0 0 0 0 0 0 Salad dressing, creamy/buttermilk type, low-calorie 376 12 12 0 0 0 0 0 0 Salad dressing, Italian, regular 377 12 12 0 0 0 0 0 0 Olive oil 378 12 12 0 0 0 0 0 0 Vegetable oil 379 12 12 0 0 0 0 0 0
Page 15 of 211 Rev 4.1
US Food and Drug Administration — Total Diet Study — Market Baskets 1991-3 through 2005-4
Arsenic - Summary of Results TDS Number Number Not Number Mean Std Dev Minimum Maximum Median
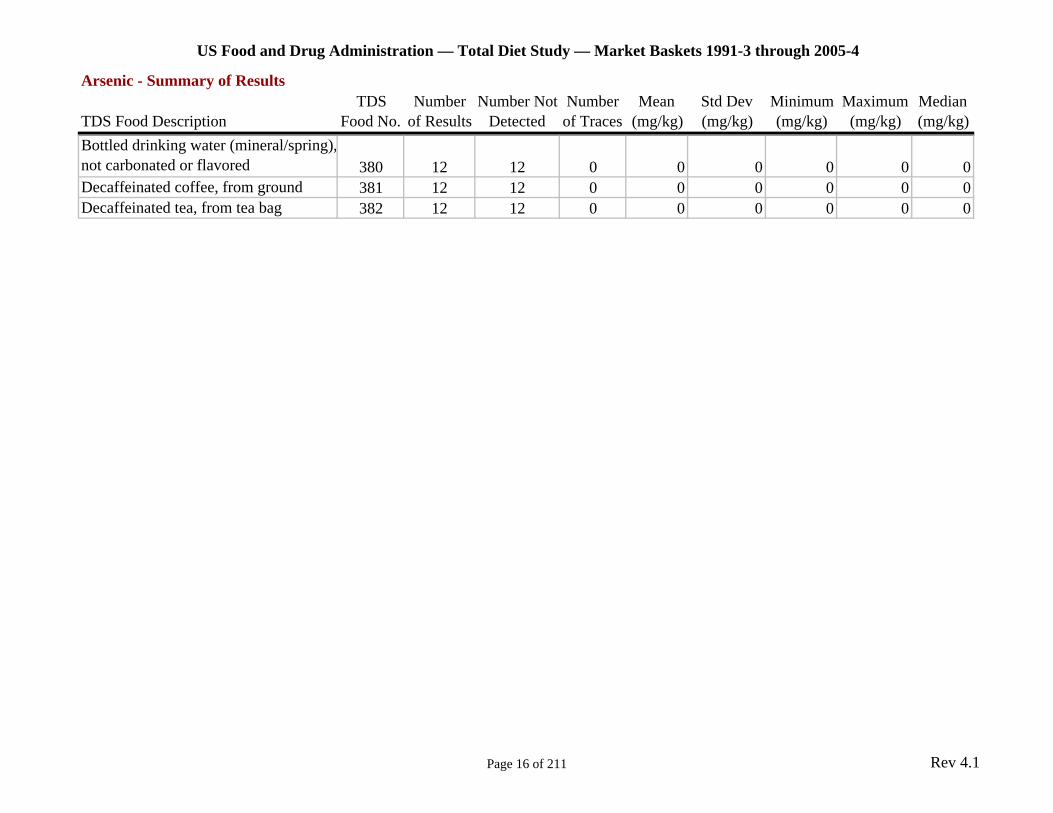
TDS Food Description Food No. of Results Detected of Traces (mg/kg) (mg/kg) (mg/kg) (mg/kg) (mg/kg) Bottled drinking water (mineral/spring), not carbonated or flavored 380 12 12 0 0 0 0 0 0 Decaffeinated coffee, from ground 381 12 12 0 0 0 0 0 0 Decaffeinated tea, from tea bag 382 12 12 0 0 0 0 0 0
Page 16 of 211 Rev 4.1
US Food and Drug Administration — Total Diet Study — Market Baskets 1991-3 through 2005-4
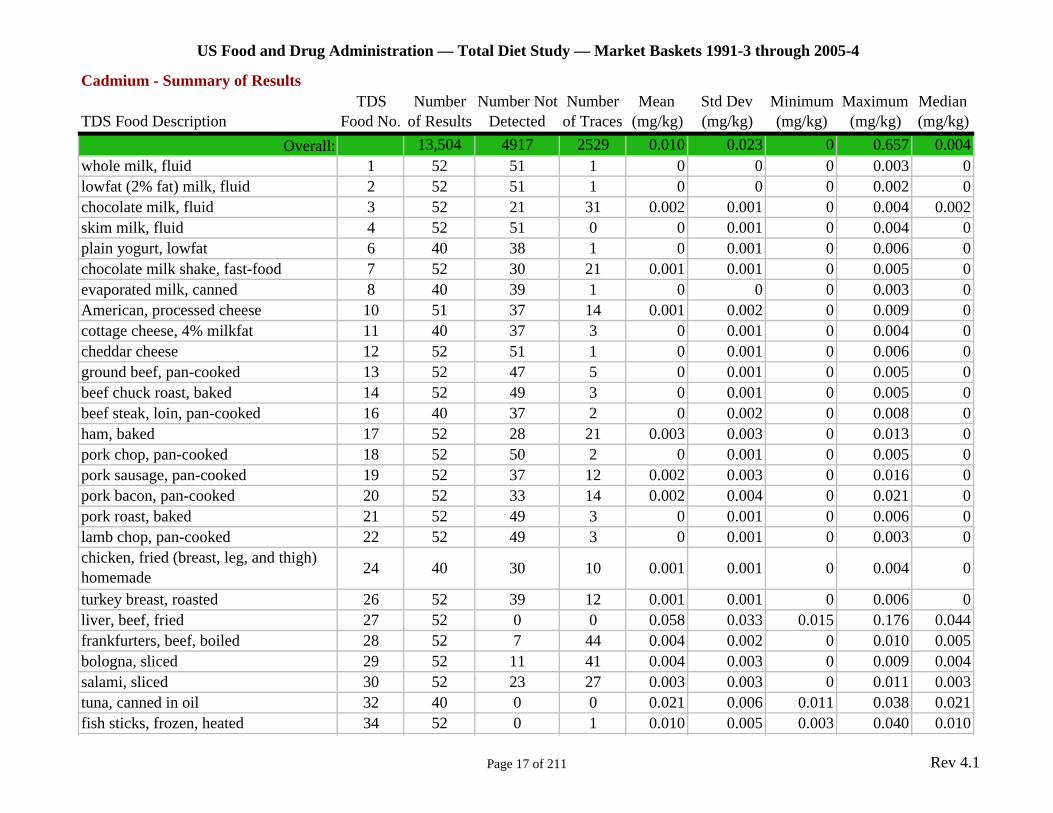
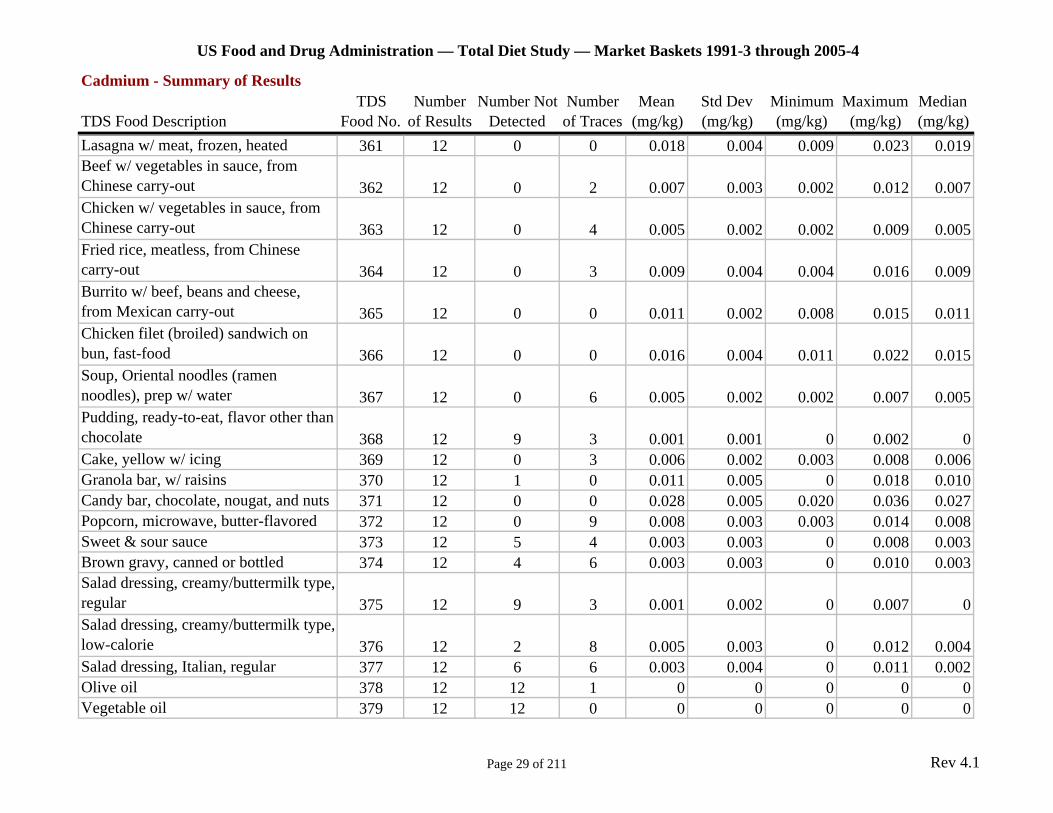
Cadmium - Summary of Results TDS Number Number Not Number Mean Std Dev Minimum Maximum Median
TDS Food Description Food No. of Results Detected of Traces (mg/kg) (mg/kg) (mg/kg) (mg/kg) (mg/kg) Overall: 13,504 4917 2529 0.010 0.023 0 0.657 0.004
whole milk, fluid 1 52 51 1 0 0 0 0.003 0 lowfat (2% fat) milk, fluid 2 52 51 1 0 0 0 0.002 0 chocolate milk, fluid 3 52 21 31 0.002 0.001 0 0.004 0.002 skim milk, fluid 4 52 51 0 0 0.001 0 0.004 0 plain yogurt, lowfat 6 40 38 1 0 0.001 0 0.006 0 chocolate milk shake, fast-food 7 52 30 21 0.001 0.001 0 0.005 0 evaporated milk, canned 8 40 39 1 0 0 0 0.003 0 American, processed cheese 10 51 37 14 0.001 0.002 0 0.009 0 cottage cheese, 4% milkfat 11 40 37 3 0 0.001 0 0.004 0 cheddar cheese 12 52 51 1 0 0.001 0 0.006 0 ground beef, pan-cooked 13 52 47 5 0 0.001 0 0.005 0 beef chuck roast, baked 14 52 49 3 0 0.001 0 0.005 0 beef steak, loin, pan-cooked 16 40 37 2 0 0.002 0 0.008 0 ham, baked 17 52 28 21 0.003 0.003 0 0.013 0 pork chop, pan-cooked 18 52 50 2 0 0.001 0 0.005 0 pork sausage, pan-cooked 19 52 37 12 0.002 0.003 0 0.016 0 pork bacon, pan-cooked 20 52 33 14 0.002 0.004 0 0.021 0 pork roast, baked 21 52 49 3 0 0.001 0 0.006 0 lamb chop, pan-cooked 22 52 49 3 0 0.001 0 0.003 0 chicken, fried (breast, leg, and thigh) homemade 24 40 30 10 0.001 0.001 0 0.004 0
turkey breast, roasted 26 52 39 12 0.001 0.001 0 0.006 0 liver, beef, fried 27 52 0 0 0.058 0.033 0.015 0.176 0.044 frankfurters, beef, boiled 28 52 7 44 0.004 0.002 0 0.010 0.005 bologna, sliced 29 52 11 41 0.004 0.003 0 0.009 0.004 salami, sliced 30 52 23 27 0.003 0.003 0 0.011 0.003 tuna, canned in oil 32 40 0 0 0.021 0.006 0.011 0.038 0.021 fish sticks, frozen, heated 34 52 0 1 0.010 0.005 0.003 0.040 0.010
Page 17 of 211 Rev 4.1
US Food and Drug Administration — Total Diet Study — Market Baskets 1991-3 through 2005-4
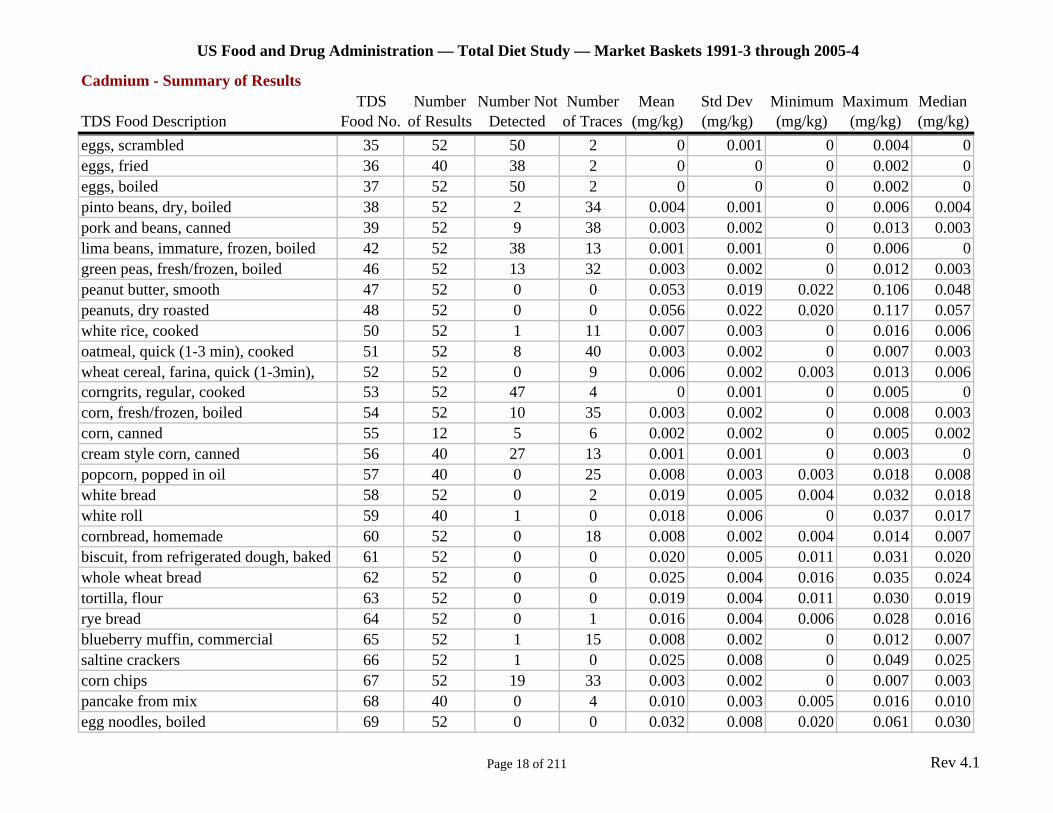
Cadmium - Summary of Results TDS Number Number Not Number Mean Std Dev Minimum Maximum Median
TDS Food Description Food No. of Results Detected of Traces (mg/kg) (mg/kg) (mg/kg) (mg/kg) (mg/kg) eggs, scrambled 35 52 50 2 0 0.001 0 0.004 0 eggs, fried 36 40 38 2 0 0 0 0.002 0 eggs, boiled 37 52 50 2 0 0 0 0.002 0 pinto beans, dry, boiled 38 52 2 34 0.004 0.001 0 0.006 0.004 pork and beans, canned 39 52 9 38 0.003 0.002 0 0.013 0.003 lima beans, immature, frozen, boiled 42 52 38 13 0.001 0.001 0 0.006 0 green peas, fresh/frozen, boiled 46 52 13 32 0.003 0.002 0 0.012 0.003 peanut butter, smooth 47 52 0 0 0.053 0.019 0.022 0.106 0.048 peanuts, dry roasted 48 52 0 0 0.056 0.022 0.020 0.117 0.057 white rice, cooked 50 52 1 11 0.007 0.003 0 0.016 0.006 oatmeal, quick (1-3 min), cooked 51 52 8 40 0.003 0.002 0 0.007 0.003 wheat cereal, farina, quick (1-3min), 52 52 0 9 0.006 0.002 0.003 0.013 0.006 corngrits, regular, cooked 53 52 47 4 0 0.001 0 0.005 0 corn, fresh/frozen, boiled 54 52 10 35 0.003 0.002 0 0.008 0.003 corn, canned 55 12 5 6 0.002 0.002 0 0.005 0.002 cream style corn, canned 56 40 27 13 0.001 0.001 0 0.003 0 popcorn, popped in oil 57 40 0 25 0.008 0.003 0.003 0.018 0.008 white bread 58 52 0 2 0.019 0.005 0.004 0.032 0.018 white roll 59 40 1 0 0.018 0.006 0 0.037 0.017 cornbread, homemade 60 52 0 18 0.008 0.002 0.004 0.014 0.007 biscuit, from refrigerated dough, baked 61 52 0 0 0.020 0.005 0.011 0.031 0.020 whole wheat bread 62 52 0 0 0.025 0.004 0.016 0.035 0.024 tortilla, flour 63 52 0 0 0.019 0.004 0.011 0.030 0.019 rye bread 64 52 0 1 0.016 0.004 0.006 0.028 0.016 blueberry muffin, commercial 65 52 1 15 0.008 0.002 0 0.012 0.007 saltine crackers 66 52 1 0 0.025 0.008 0 0.049 0.025 corn chips 67 52 19 33 0.003 0.002 0 0.007 0.003 pancake from mix 68 40 0 4 0.010 0.003 0.005 0.016 0.010 egg noodles, boiled 69 52 0 0 0.032 0.008 0.020 0.061 0.030
Page 18 of 211 Rev 4.1
US Food and Drug Administration — Total Diet Study — Market Baskets 1991-3 through 2005-4
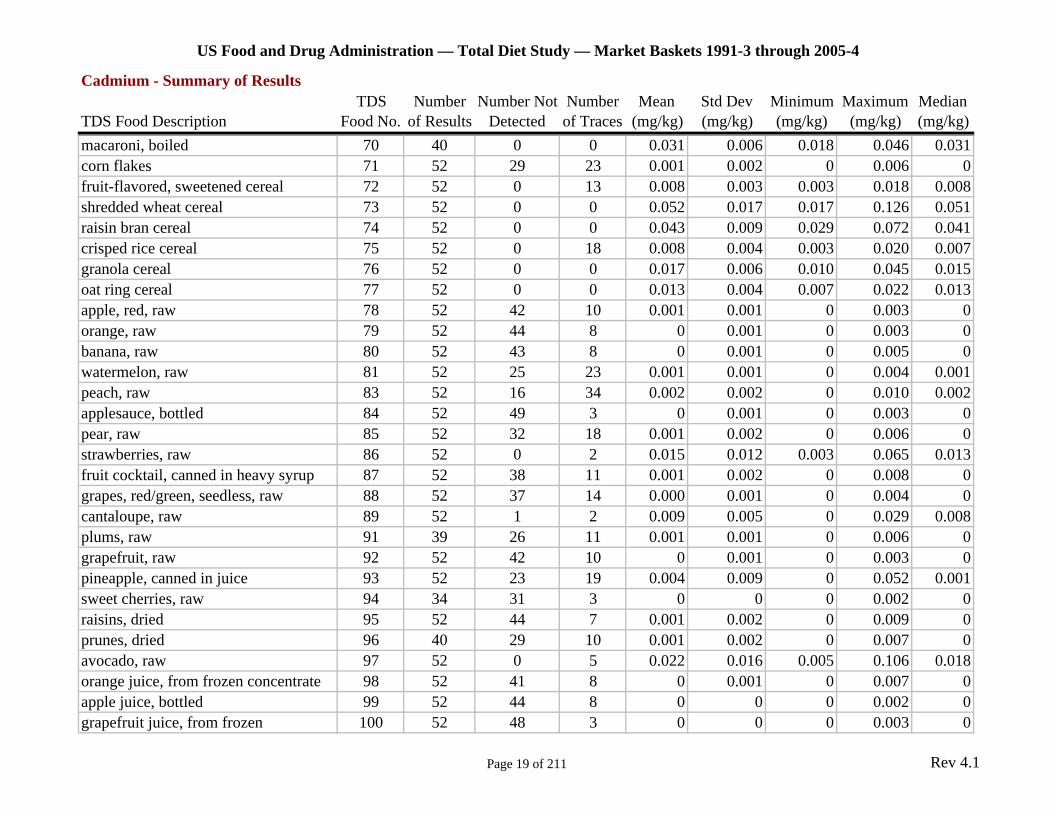
Cadmium - Summary of Results TDS Number Number Not Number Mean Std Dev Minimum Maximum Median
TDS Food Description Food No. of Results Detected of Traces (mg/kg) (mg/kg) (mg/kg) (mg/kg) (mg/kg) macaroni, boiled 70 40 0 0 0.031 0.006 0.018 0.046 0.031 corn flakes 71 52 29 23 0.001 0.002 0 0.006 0 fruit-flavored, sweetened cereal 72 52 0 13 0.008 0.003 0.003 0.018 0.008 shredded wheat cereal 73 52 0 0 0.052 0.017 0.017 0.126 0.051 raisin bran cereal 74 52 0 0 0.043 0.009 0.029 0.072 0.041 crisped rice cereal 75 52 0 18 0.008 0.004 0.003 0.020 0.007 granola cereal 76 52 0 0 0.017 0.006 0.010 0.045 0.015 oat ring cereal 77 52 0 0 0.013 0.004 0.007 0.022 0.013 apple, red, raw 78 52 42 10 0.001 0.001 0 0.003 0 orange, raw 79 52 44 8 0 0.001 0 0.003 0 banana, raw 80 52 43 8 0 0.001 0 0.005 0 watermelon, raw 81 52 25 23 0.001 0.001 0 0.004 0.001 peach, raw 83 52 16 34 0.002 0.002 0 0.010 0.002 applesauce, bottled 84 52 49 3 0 0.001 0 0.003 0 pear, raw 85 52 32 18 0.001 0.002 0 0.006 0 strawberries, raw 86 52 0 2 0.015 0.012 0.003 0.065 0.013 fruit cocktail, canned in heavy syrup 87 52 38 11 0.001 0.002 0 0.008 0 grapes, red/green, seedless, raw 88 52 37 14 0.000 0.001 0 0.004 0 cantaloupe, raw 89 52 1 2 0.009 0.005 0 0.029 0.008 plums, raw 91 39 26 11 0.001 0.001 0 0.006 0 grapefruit, raw 92 52 42 10 0 0.001 0 0.003 0 pineapple, canned in juice 93 52 23 19 0.004 0.009 0 0.052 0.001 sweet cherries, raw 94 34 31 3 0 0 0 0.002 0 raisins, dried 95 52 44 7 0.001 0.002 0 0.009 0 prunes, dried 96 40 29 10 0.001 0.002 0 0.007 0 avocado, raw 97 52 0 5 0.022 0.016 0.005 0.106 0.018 orange juice, from frozen concentrate 98 52 41 8 0 0.001 0 0.007 0 apple juice, bottled 99 52 44 8 0 0 0 0.002 0 grapefruit juice, from frozen 100 52 48 3 0 0 0 0.003 0
Page 19 of 211 Rev 4.1
US Food and Drug Administration — Total Diet Study — Market Baskets 1991-3 through 2005-4
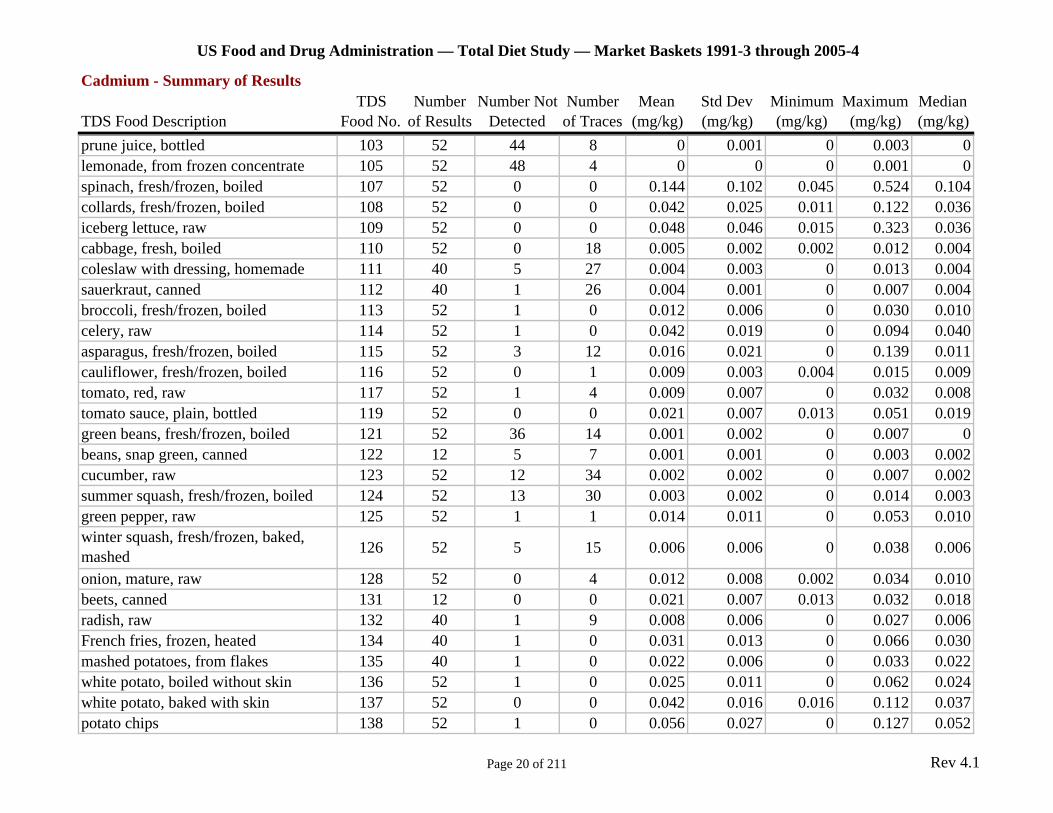
Cadmium - Summary of Results TDS Number Number Not Number Mean Std Dev Minimum Maximum Median
TDS Food Description Food No. of Results Detected of Traces (mg/kg) (mg/kg) (mg/kg) (mg/kg) (mg/kg) prune juice, bottled 103 52 44 8 0 0.001 0 0.003 0 lemonade, from frozen concentrate 105 52 48 4 0 0 0 0.001 0 spinach, fresh/frozen, boiled 107 52 0 0 0.144 0.102 0.045 0.524 0.104 collards, fresh/frozen, boiled 108 52 0 0 0.042 0.025 0.011 0.122 0.036 iceberg lettuce, raw 109 52 0 0 0.048 0.046 0.015 0.323 0.036 cabbage, fresh, boiled 110 52 0 18 0.005 0.002 0.002 0.012 0.004 coleslaw with dressing, homemade 111 40 5 27 0.004 0.003 0 0.013 0.004 sauerkraut, canned 112 40 1 26 0.004 0.001 0 0.007 0.004 broccoli, fresh/frozen, boiled 113 52 1 0 0.012 0.006 0 0.030 0.010 celery, raw 114 52 1 0 0.042 0.019 0 0.094 0.040 asparagus, fresh/frozen, boiled 115 52 3 12 0.016 0.021 0 0.139 0.011 cauliflower, fresh/frozen, boiled 116 52 0 1 0.009 0.003 0.004 0.015 0.009 tomato, red, raw 117 52 1 4 0.009 0.007 0 0.032 0.008 tomato sauce, plain, bottled 119 52 0 0 0.021 0.007 0.013 0.051 0.019 green beans, fresh/frozen, boiled 121 52 36 14 0.001 0.002 0 0.007 0 beans, snap green, canned 122 12 5 7 0.001 0.001 0 0.003 0.002 cucumber, raw 123 52 12 34 0.002 0.002 0 0.007 0.002 summer squash, fresh/frozen, boiled 124 52 13 30 0.003 0.002 0 0.014 0.003 green pepper, raw 125 52 1 1 0.014 0.011 0 0.053 0.010 winter squash, fresh/frozen, baked, mashed 126 52 5 15 0.006 0.006 0 0.038 0.006
onion, mature, raw 128 52 0 4 0.012 0.008 0.002 0.034 0.010 beets, canned 131 12 0 0 0.021 0.007 0.013 0.032 0.018 radish, raw 132 40 1 9 0.008 0.006 0 0.027 0.006 French fries, frozen, heated 134 40 1 0 0.031 0.013 0 0.066 0.030 mashed potatoes, from flakes 135 40 1 0 0.022 0.006 0 0.033 0.022 white potato, boiled without skin 136 52 1 0 0.025 0.011 0 0.062 0.024 white potato, baked with skin 137 52 0 0 0.042 0.016 0.016 0.112 0.037 potato chips 138 52 1 0 0.056 0.027 0 0.127 0.052
Page 20 of 211 Rev 4.1
US Food and Drug Administration — Total Diet Study — Market Baskets 1991-3 through 2005-4
Cadmium - Summary of Results TDS Number Number Not Number Mean Std Dev Minimum Maximum Median
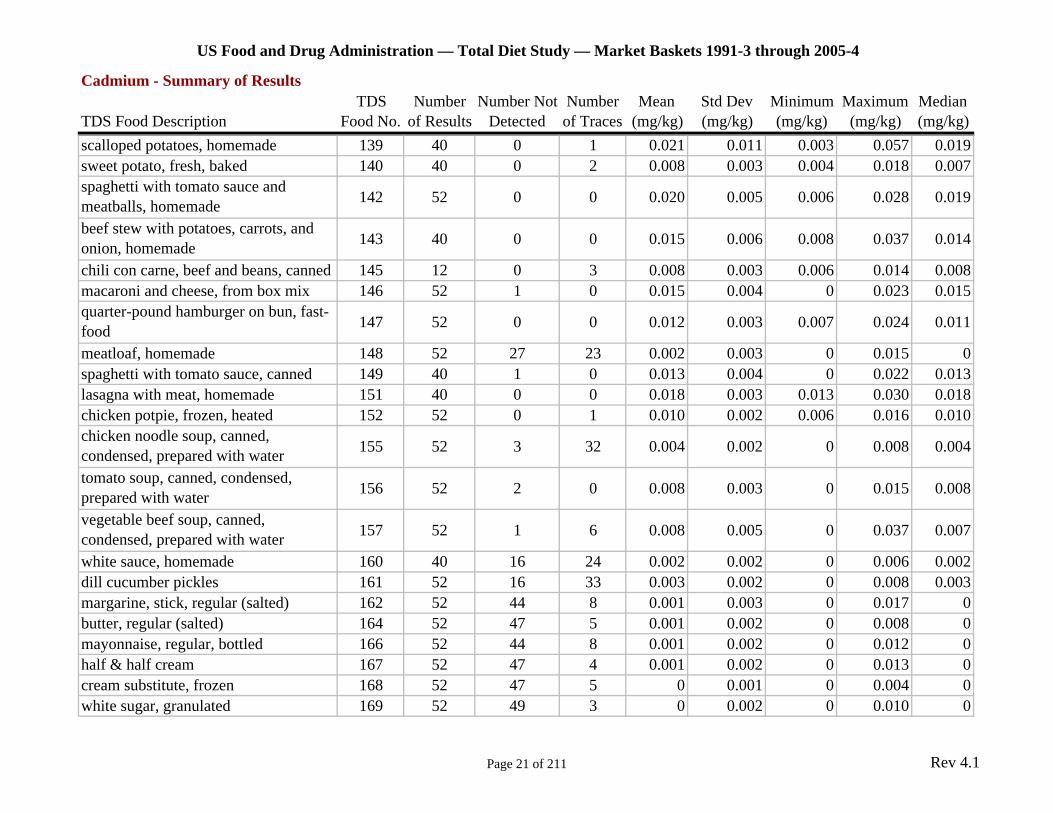
TDS Food Description Food No. of Results Detected of Traces (mg/kg) (mg/kg) (mg/kg) (mg/kg) (mg/kg) scalloped potatoes, homemade 139 40 0 1 0.021 0.011 0.003 0.057 0.019 sweet potato, fresh, baked 140 40 0 2 0.008 0.003 0.004 0.018 0.007 spaghetti with tomato sauce and meatballs, homemade 142 52 0 0 0.020 0.005 0.006 0.028 0.019
beef stew with potatoes, carrots, and onion, homemade 143 40 0 0 0.015 0.006 0.008 0.037 0.014
chili con carne, beef and beans, canned 145 12 0 3 0.008 0.003 0.006 0.014 0.008 macaroni and cheese, from box mix 146 52 1 0 0.015 0.004 0 0.023 0.015 quarter-pound hamburger on bun, fast-food 147 52 0 0 0.012 0.003 0.007 0.024 0.011
meatloaf, homemade 148 52 27 23 0.002 0.003 0 0.015 0 spaghetti with tomato sauce, canned 149 40 1 0 0.013 0.004 0 0.022 0.013 lasagna with meat, homemade 151 40 0 0 0.018 0.003 0.013 0.030 0.018 chicken potpie, frozen, heated 152 52 0 1 0.010 0.002 0.006 0.016 0.010 chicken noodle soup, canned, condensed, prepared with water 155 52 3 32 0.004 0.002 0 0.008 0.004
tomato soup, canned, condensed, prepared with water 156 52 2 0 0.008 0.003 0 0.015 0.008
vegetable beef soup, canned, condensed, prepared with water 157 52 1 6 0.008 0.005 0 0.037 0.007
white sauce, homemade 160 40 16 24 0.002 0.002 0 0.006 0.002 dill cucumber pickles 161 52 16 33 0.003 0.002 0 0.008 0.003 margarine, stick, regular (salted) 162 52 44 8 0.001 0.003 0 0.017 0 butter, regular (salted) 164 52 47 5 0.001 0.002 0 0.008 0 mayonnaise, regular, bottled 166 52 44 8 0.001 0.002 0 0.012 0 half & half cream 167 52 47 4 0.001 0.002 0 0.013 0 cream substitute, frozen 168 52 47 5 0 0.001 0 0.004 0 white sugar, granulated 169 52 49 3 0 0.002 0 0.010 0
Page 21 of 211 Rev 4.1
US Food and Drug Administration — Total Diet Study — Market Baskets 1991-3 through 2005-4
Cadmium - Summary of Results TDS Number Number Not Number Mean Std Dev Minimum Maximum Median
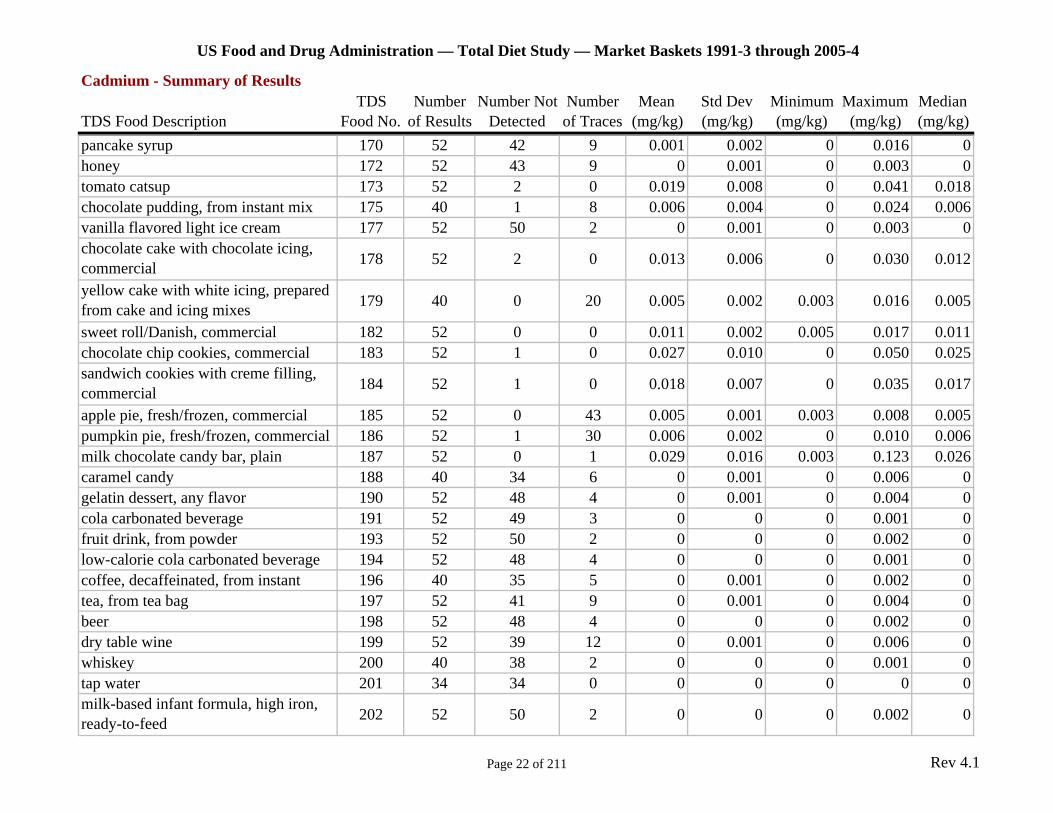
TDS Food Description Food No. of Results Detected of Traces (mg/kg) (mg/kg) (mg/kg) (mg/kg) (mg/kg) pancake syrup 170 52 42 9 0.001 0.002 0 0.016 0 honey 172 52 43 9 0 0.001 0 0.003 0 tomato catsup 173 52 2 0 0.019 0.008 0 0.041 0.018 chocolate pudding, from instant mix 175 40 1 8 0.006 0.004 0 0.024 0.006 vanilla flavored light ice cream 177 52 50 2 0 0.001 0 0.003 0 chocolate cake with chocolate icing, commercial 178 52 2 0 0.013 0.006 0 0.030 0.012
yellow cake with white icing, prepared from cake and icing mixes 179 40 0 20 0.005 0.002 0.003 0.016 0.005
sweet roll/Danish, commercial 182 52 0 0 0.011 0.002 0.005 0.017 0.011 chocolate chip cookies, commercial 183 52 1 0 0.027 0.010 0 0.050 0.025 sandwich cookies with creme filling, commercial 184 52 1 0 0.018 0.007 0 0.035 0.017
apple pie, fresh/frozen, commercial 185 52 0 43 0.005 0.001 0.003 0.008 0.005 pumpkin pie, fresh/frozen, commercial 186 52 1 30 0.006 0.002 0 0.010 0.006 milk chocolate candy bar, plain 187 52 0 1 0.029 0.016 0.003 0.123 0.026 caramel candy 188 40 34 6 0 0.001 0 0.006 0 gelatin dessert, any flavor 190 52 48 4 0 0.001 0 0.004 0 cola carbonated beverage 191 52 49 3 0 0 0 0.001 0 fruit drink, from powder 193 52 50 2 0 0 0 0.002 0 low-calorie cola carbonated beverage 194 52 48 4 0 0 0 0.001 0 coffee, decaffeinated, from instant 196 40 35 5 0 0.001 0 0.002 0 tea, from tea bag 197 52 41 9 0 0.001 0 0.004 0 beer 198 52 48 4 0 0 0 0.002 0 dry table wine 199 52 39 12 0 0.001 0 0.006 0 whiskey 200 40 38 2 0 0 0 0.001 0 tap water 201 34 34 0 0 0 0 0 0 milk-based infant formula, high iron, ready-to-feed 202 52 50 2 0 0 0 0.002 0
Page 22 of 211 Rev 4.1
US Food and Drug Administration — Total Diet Study — Market Baskets 1991-3 through 2005-4
Cadmium - Summary of Results TDS Number Number Not Number Mean Std Dev Minimum Maximum Median
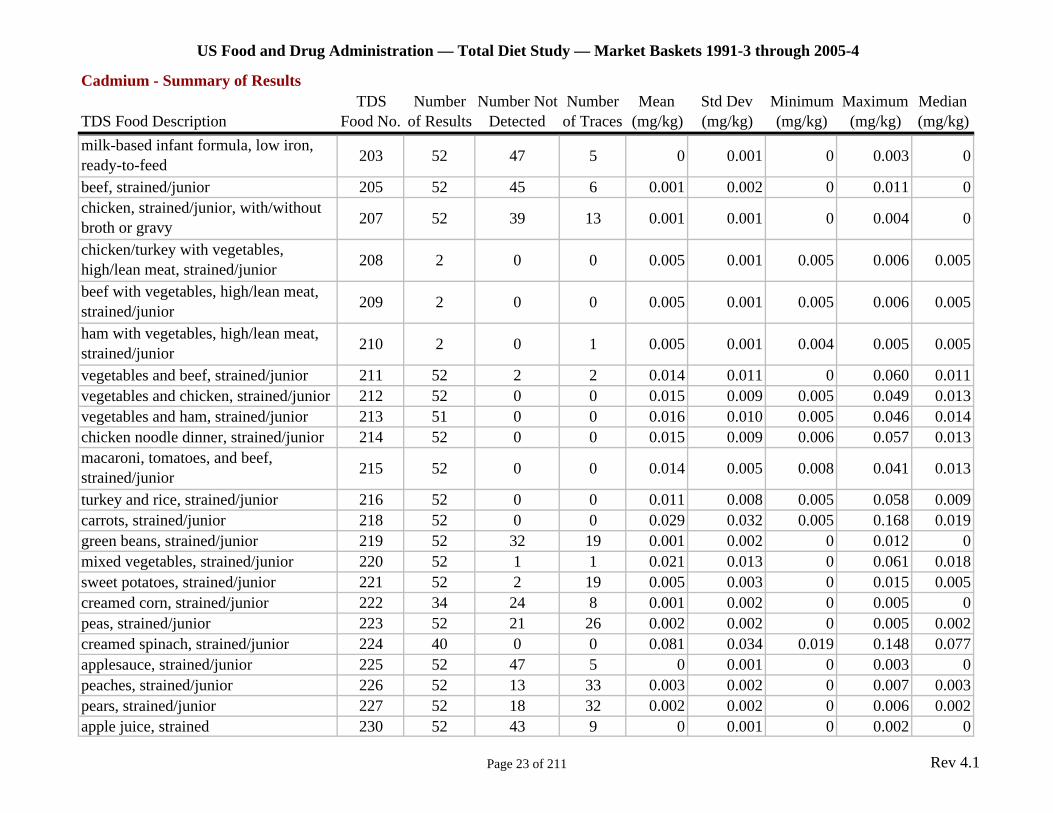
TDS Food Description Food No. of Results Detected of Traces (mg/kg) (mg/kg) (mg/kg) (mg/kg) (mg/kg) milk-based infant formula, low iron, ready-to-feed 203 52 47 5 0 0.001 0 0.003 0
beef, strained/junior 205 52 45 6 0.001 0.002 0 0.011 0 chicken, strained/junior, with/without broth or gravy 207 52 39 13 0.001 0.001 0 0.004 0
chicken/turkey with vegetables, high/lean meat, strained/junior 208 2 0 0 0.005 0.001 0.005 0.006 0.005
beef with vegetables, high/lean meat, strained/junior 209 2 0 0 0.005 0.001 0.005 0.006 0.005
ham with vegetables, high/lean meat, strained/junior 210 2 0 1 0.005 0.001 0.004 0.005 0.005
vegetables and beef, strained/junior 211 52 2 2 0.014 0.011 0 0.060 0.011 vegetables and chicken, strained/junior 212 52 0 0 0.015 0.009 0.005 0.049 0.013 vegetables and ham, strained/junior 213 51 0 0 0.016 0.010 0.005 0.046 0.014 chicken noodle dinner, strained/junior 214 52 0 0 0.015 0.009 0.006 0.057 0.013 macaroni, tomatoes, and beef, strained/junior 215 52 0 0 0.014 0.005 0.008 0.041 0.013
turkey and rice, strained/junior 216 52 0 0 0.011 0.008 0.005 0.058 0.009 carrots, strained/junior 218 52 0 0 0.029 0.032 0.005 0.168 0.019 green beans, strained/junior 219 52 32 19 0.001 0.002 0 0.012 0 mixed vegetables, strained/junior 220 52 1 1 0.021 0.013 0 0.061 0.018 sweet potatoes, strained/junior 221 52 2 19 0.005 0.003 0 0.015 0.005 creamed corn, strained/junior 222 34 24 8 0.001 0.002 0 0.005 0 peas, strained/junior 223 52 21 26 0.002 0.002 0 0.005 0.002 creamed spinach, strained/junior 224 40 0 0 0.081 0.034 0.019 0.148 0.077 applesauce, strained/junior 225 52 47 5 0 0.001 0 0.003 0 peaches, strained/junior 226 52 13 33 0.003 0.002 0 0.007 0.003 pears, strained/junior 227 52 18 32 0.002 0.002 0 0.006 0.002 apple juice, strained 230 52 43 9 0 0.001 0 0.002 0
Page 23 of 211 Rev 4.1
US Food and Drug Administration — Total Diet Study — Market Baskets 1991-3 through 2005-4
Cadmium - Summary of Results TDS Number Number Not Number Mean Std Dev Minimum Maximum Median
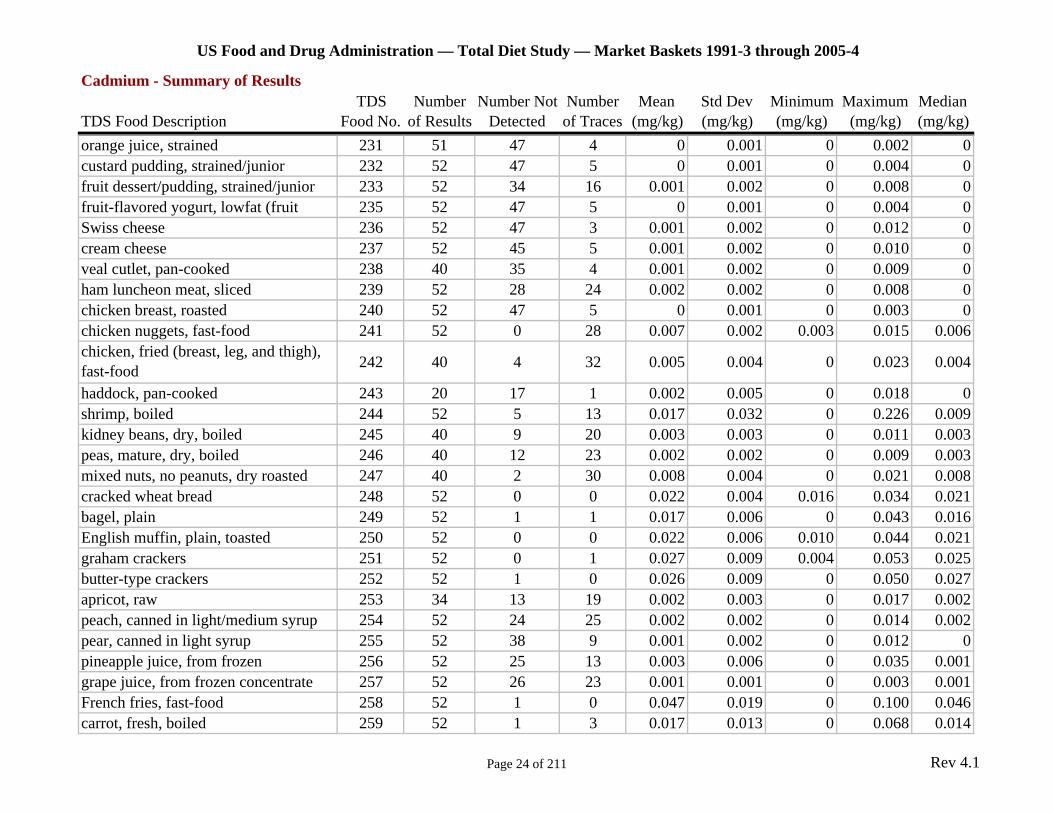
TDS Food Description Food No. of Results Detected of Traces (mg/kg) (mg/kg) (mg/kg) (mg/kg) (mg/kg) orange juice, strained 231 51 47 4 0 0.001 0 0.002 0 custard pudding, strained/junior 232 52 47 5 0 0.001 0 0.004 0 fruit dessert/pudding, strained/junior 233 52 34 16 0.001 0.002 0 0.008 0 fruit-flavored yogurt, lowfat (fruit 235 52 47 5 0 0.001 0 0.004 0 Swiss cheese 236 52 47 3 0.001 0.002 0 0.012 0 cream cheese 237 52 45 5 0.001 0.002 0 0.010 0 veal cutlet, pan-cooked 238 40 35 4 0.001 0.002 0 0.009 0 ham luncheon meat, sliced 239 52 28 24 0.002 0.002 0 0.008 0 chicken breast, roasted 240 52 47 5 0 0.001 0 0.003 0 chicken nuggets, fast-food 241 52 0 28 0.007 0.002 0.003 0.015 0.006 chicken, fried (breast, leg, and thigh), fast-food 242 40 4 32 0.005 0.004 0 0.023 0.004
haddock, pan-cooked 243 20 17 1 0.002 0.005 0 0.018 0 shrimp, boiled 244 52 5 13 0.017 0.032 0 0.226 0.009 kidney beans, dry, boiled 245 40 9 20 0.003 0.003 0 0.011 0.003 peas, mature, dry, boiled 246 40 12 23 0.002 0.002 0 0.009 0.003 mixed nuts, no peanuts, dry roasted 247 40 2 30 0.008 0.004 0 0.021 0.008 cracked wheat bread 248 52 0 0 0.022 0.004 0.016 0.034 0.021 bagel, plain 249 52 1 1 0.017 0.006 0 0.043 0.016 English muffin, plain, toasted 250 52 0 0 0.022 0.006 0.010 0.044 0.021 graham crackers 251 52 0 1 0.027 0.009 0.004 0.053 0.025 butter-type crackers 252 52 1 0 0.026 0.009 0 0.050 0.027 apricot, raw 253 34 13 19 0.002 0.003 0 0.017 0.002 peach, canned in light/medium syrup 254 52 24 25 0.002 0.002 0 0.014 0.002 pear, canned in light syrup 255 52 38 9 0.001 0.002 0 0.012 0 pineapple juice, from frozen 256 52 25 13 0.003 0.006 0 0.035 0.001 grape juice, from frozen concentrate 257 52 26 23 0.001 0.001 0 0.003 0.001 French fries, fast-food 258 52 1 0 0.047 0.019 0 0.100 0.046 carrot, fresh, boiled 259 52 1 3 0.017 0.013 0 0.068 0.014
Page 24 of 211 Rev 4.1
US Food and Drug Administration — Total Diet Study — Market Baskets 1991-3 through 2005-4
Cadmium - Summary of Results TDS Number Number Not Number Mean Std Dev Minimum Maximum Median
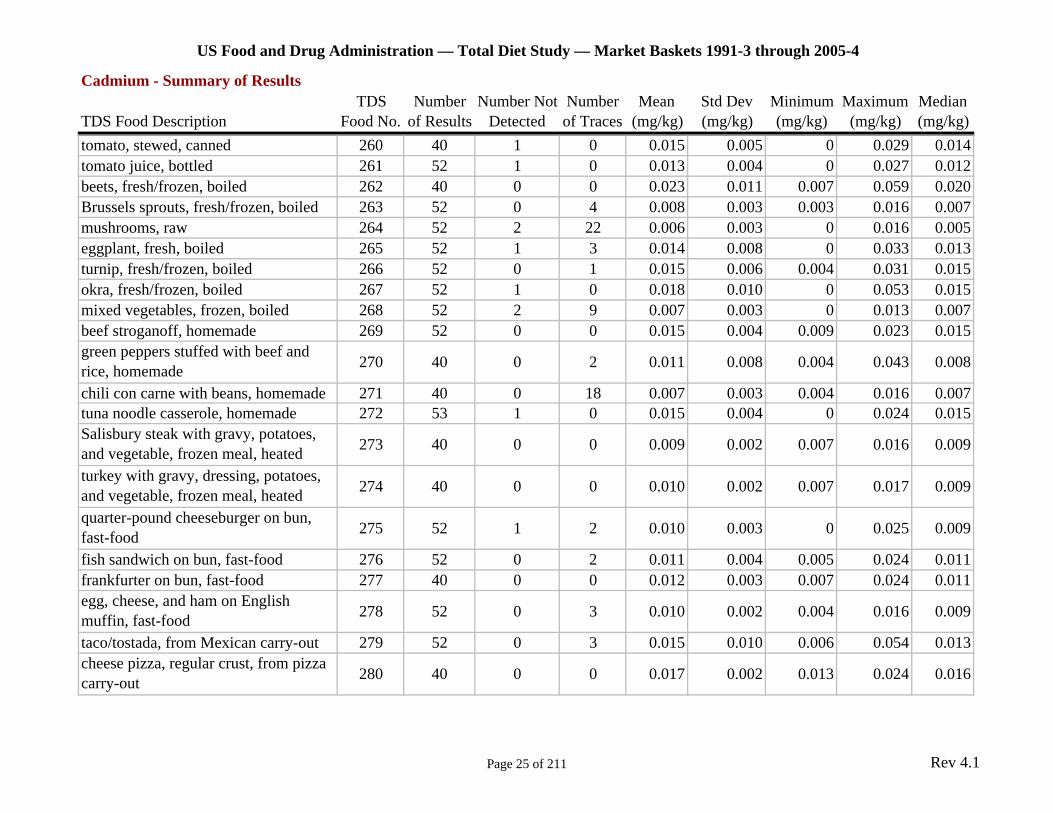
TDS Food Description Food No. of Results Detected of Traces (mg/kg) (mg/kg) (mg/kg) (mg/kg) (mg/kg) tomato, stewed, canned 260 40 1 0 0.015 0.005 0 0.029 0.014 tomato juice, bottled 261 52 1 0 0.013 0.004 0 0.027 0.012 beets, fresh/frozen, boiled 262 40 0 0 0.023 0.011 0.007 0.059 0.020 Brussels sprouts, fresh/frozen, boiled 263 52 0 4 0.008 0.003 0.003 0.016 0.007 mushrooms, raw 264 52 2 22 0.006 0.003 0 0.016 0.005 eggplant, fresh, boiled 265 52 1 3 0.014 0.008 0 0.033 0.013 turnip, fresh/frozen, boiled 266 52 0 1 0.015 0.006 0.004 0.031 0.015 okra, fresh/frozen, boiled 267 52 1 0 0.018 0.010 0 0.053 0.015 mixed vegetables, frozen, boiled 268 52 2 9 0.007 0.003 0 0.013 0.007 beef stroganoff, homemade 269 52 0 0 0.015 0.004 0.009 0.023 0.015 green peppers stuffed with beef and rice, homemade 270 40 0 2 0.011 0.008 0.004 0.043 0.008
chili con carne with beans, homemade 271 40 0 18 0.007 0.003 0.004 0.016 0.007 tuna noodle casserole, homemade 272 53 1 0 0.015 0.004 0 0.024 0.015 Salisbury steak with gravy, potatoes, and vegetable, frozen meal, heated 273 40 0 0 0.009 0.002 0.007 0.016 0.009
turkey with gravy, dressing, potatoes, and vegetable, frozen meal, heated 274 40 0 0 0.010 0.002 0.007 0.017 0.009
quarter-pound cheeseburger on bun, fast-food 275 52 1 2 0.010 0.003 0 0.025 0.009
fish sandwich on bun, fast-food 276 52 0 2 0.011 0.004 0.005 0.024 0.011 frankfurter on bun, fast-food 277 40 0 0 0.012 0.003 0.007 0.024 0.011 egg, cheese, and ham on English muffin, fast-food 278 52 0 3 0.010 0.002 0.004 0.016 0.009
taco/tostada, from Mexican carry-out 279 52 0 3 0.015 0.010 0.006 0.054 0.013 cheese pizza, regular crust, from pizza carry-out 280 40 0 0 0.017 0.002 0.013 0.024 0.016
Page 25 of 211 Rev 4.1
US Food and Drug Administration — Total Diet Study — Market Baskets 1991-3 through 2005-4
Cadmium - Summary of Results TDS Number Number Not Number Mean Std Dev Minimum Maximum Median
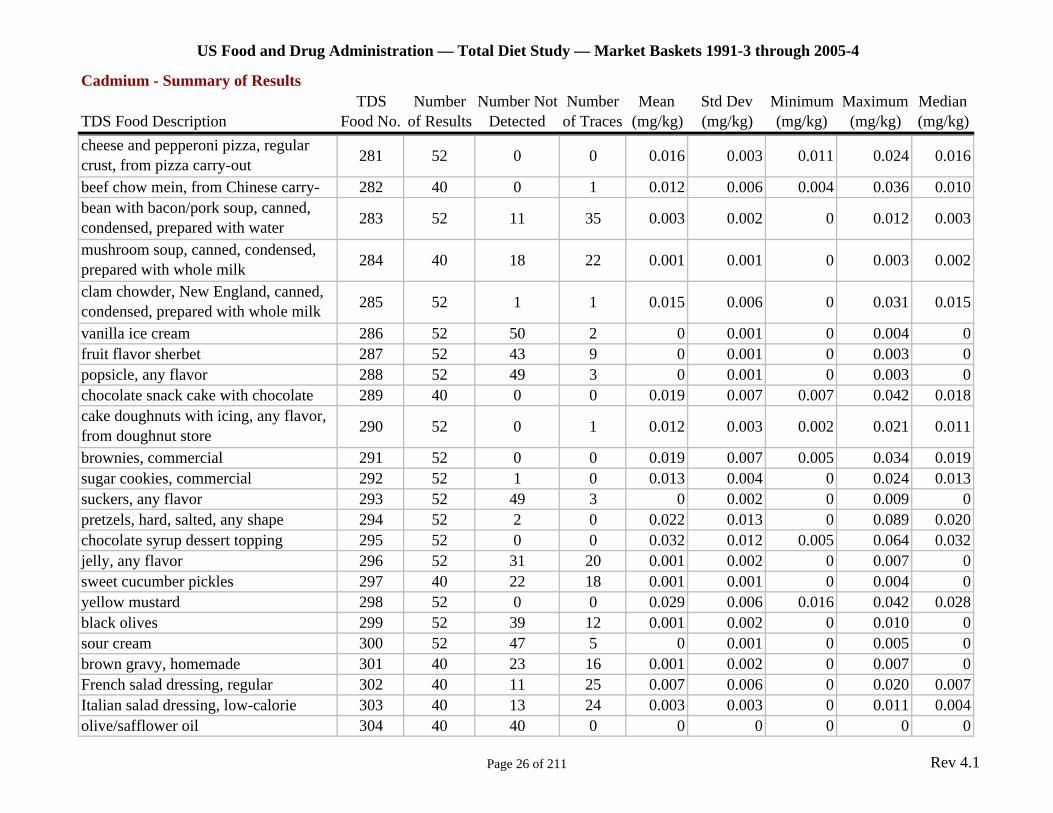
TDS Food Description Food No. of Results Detected of Traces (mg/kg) (mg/kg) (mg/kg) (mg/kg) (mg/kg) cheese and pepperoni pizza, regular crust, from pizza carry-out 281 52 0 0 0.016 0.003 0.011 0.024 0.016
beef chow mein, from Chinese carry- 282 40 0 1 0.012 0.006 0.004 0.036 0.010 bean with bacon/pork soup, canned, condensed, prepared with water 283 52 11 35 0.003 0.002 0 0.012 0.003
mushroom soup, canned, condensed, prepared with whole milk 284 40 18 22 0.001 0.001 0 0.003 0.002
clam chowder, New England, canned, condensed, prepared with whole milk 285 52 1 1 0.015 0.006 0 0.031 0.015
vanilla ice cream 286 52 50 2 0 0.001 0 0.004 0 fruit flavor sherbet 287 52 43 9 0 0.001 0 0.003 0 popsicle, any flavor 288 52 49 3 0 0.001 0 0.003 0 chocolate snack cake with chocolate 289 40 0 0 0.019 0.007 0.007 0.042 0.018 cake doughnuts with icing, any flavor, from doughnut store 290 52 0 1 0.012 0.003 0.002 0.021 0.011
brownies, commercial 291 52 0 0 0.019 0.007 0.005 0.034 0.019 sugar cookies, commercial 292 52 1 0 0.013 0.004 0 0.024 0.013 suckers, any flavor 293 52 49 3 0 0.002 0 0.009 0 pretzels, hard, salted, any shape 294 52 2 0 0.022 0.013 0 0.089 0.020 chocolate syrup dessert topping 295 52 0 0 0.032 0.012 0.005 0.064 0.032 jelly, any flavor 296 52 31 20 0.001 0.002 0 0.007 0 sweet cucumber pickles 297 40 22 18 0.001 0.001 0 0.004 0 yellow mustard 298 52 0 0 0.029 0.006 0.016 0.042 0.028 black olives 299 52 39 12 0.001 0.002 0 0.010 0 sour cream 300 52 47 5 0 0.001 0 0.005 0 brown gravy, homemade 301 40 23 16 0.001 0.002 0 0.007 0 French salad dressing, regular 302 40 11 25 0.007 0.006 0 0.020 0.007 Italian salad dressing, low-calorie 303 40 13 24 0.003 0.003 0 0.011 0.004 olive/safflower oil 304 40 40 0 0 0 0 0 0
Page 26 of 211 Rev 4.1
US Food and Drug Administration — Total Diet Study — Market Baskets 1991-3 through 2005-4
Cadmium - Summary of Results TDS Number Number Not Number Mean Std Dev Minimum Maximum Median
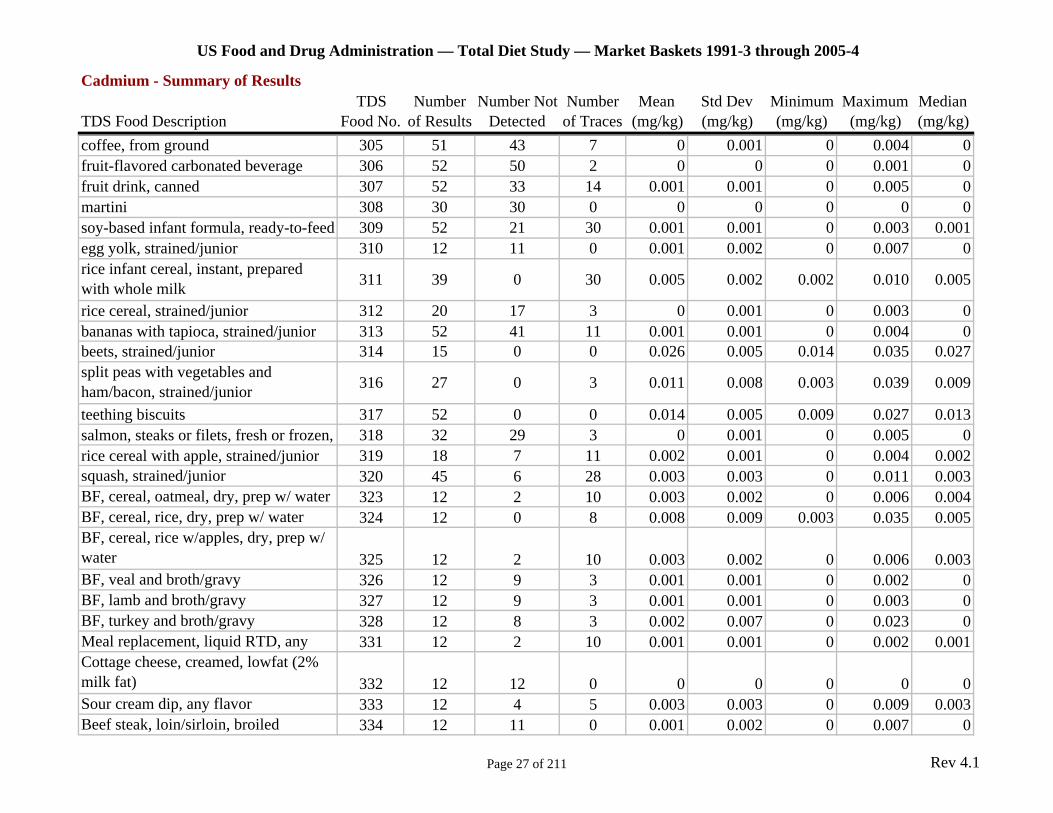
TDS Food Description Food No. of Results Detected of Traces (mg/kg) (mg/kg) (mg/kg) (mg/kg) (mg/kg) coffee, from ground 305 51 43 7 0 0.001 0 0.004 0 fruit-flavored carbonated beverage 306 52 50 2 0 0 0 0.001 0 fruit drink, canned 307 52 33 14 0.001 0.001 0 0.005 0 martini 308 30 30 0 0 0 0 0 0 soy-based infant formula, ready-to-feed 309 52 21 30 0.001 0.001 0 0.003 0.001 egg yolk, strained/junior 310 12 11 0 0.001 0.002 0 0.007 0 rice infant cereal, instant, prepared with whole milk 311 39 0 30 0.005 0.002 0.002 0.010 0.005
rice cereal, strained/junior 312 20 17 3 0 0.001 0 0.003 0 bananas with tapioca, strained/junior 313 52 41 11 0.001 0.001 0 0.004 0 beets, strained/junior 314 15 0 0 0.026 0.005 0.014 0.035 0.027 split peas with vegetables and ham/bacon, strained/junior 316 27 0 3 0.011 0.008 0.003 0.039 0.009
teething biscuits 317 52 0 0 0.014 0.005 0.009 0.027 0.013 salmon, steaks or filets, fresh or frozen, 318 32 29 3 0 0.001 0 0.005 0 rice cereal with apple, strained/junior 319 18 7 11 0.002 0.001 0 0.004 0.002 squash, strained/junior 320 45 6 28 0.003 0.003 0 0.011 0.003 BF, cereal, oatmeal, dry, prep w/ water 323 12 2 10 0.003 0.002 0 0.006 0.004 BF, cereal, rice, dry, prep w/ water 324 12 0 8 0.008 0.009 0.003 0.035 0.005 BF, cereal, rice w/apples, dry, prep w/ water 325 12 2 10 0.003 0.002 0 0.006 0.003 BF, veal and broth/gravy 326 12 9 3 0.001 0.001 0 0.002 0 BF, lamb and broth/gravy 327 12 9 3 0.001 0.001 0 0.003 0 BF, turkey and broth/gravy 328 12 8 3 0.002 0.007 0 0.023 0 Meal replacement, liquid RTD, any 331 12 2 10 0.001 0.001 0 0.002 0.001 Cottage cheese, creamed, lowfat (2% milk fat) 332 12 12 0 0 0 0 0 0 Sour cream dip, any flavor 333 12 4 5 0.003 0.003 0 0.009 0.003 Beef steak, loin/sirloin, broiled 334 12 11 0 0.001 0.002 0 0.007 0
Page 27 of 211 Rev 4.1
US Food and Drug Administration — Total Diet Study — Market Baskets 1991-3 through 2005-4
Cadmium - Summary of Results TDS Number Number Not Number Mean Std Dev Minimum Maximum Median
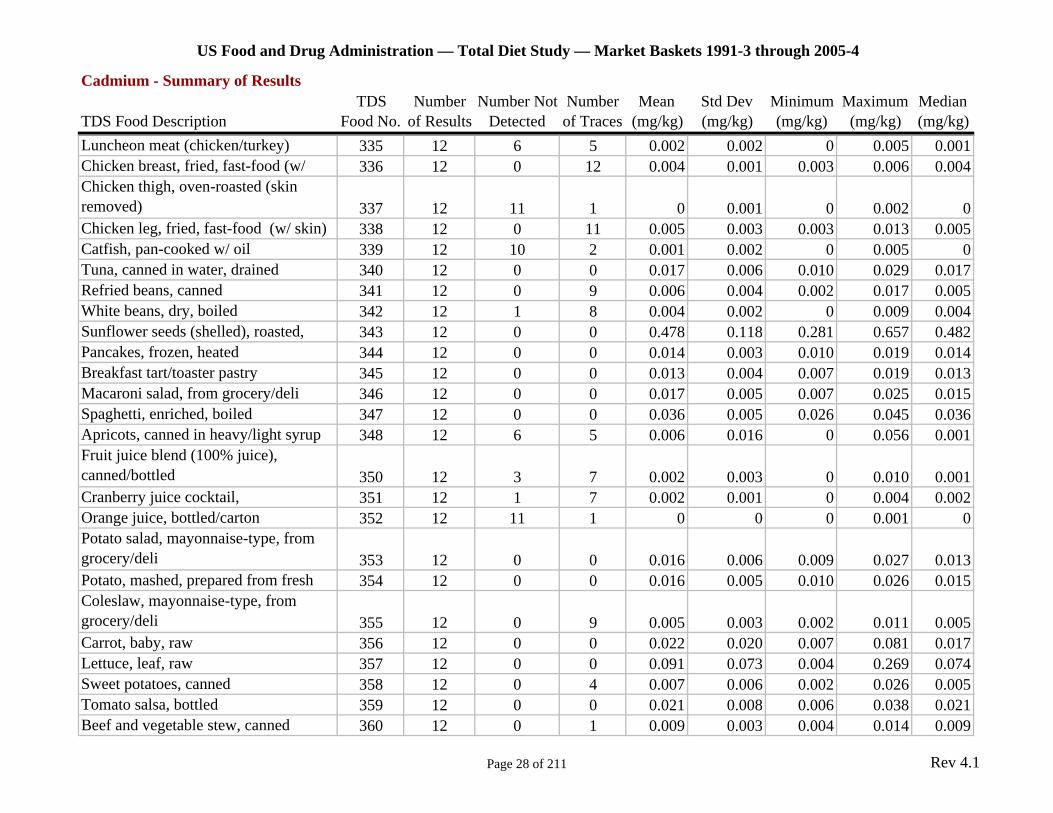
TDS Food Description Food No. of Results Detected of Traces (mg/kg) (mg/kg) (mg/kg) (mg/kg) (mg/kg) Luncheon meat (chicken/turkey) 335 12 6 5 0.002 0.002 0 0.005 0.001 Chicken breast, fried, fast-food (w/ 336 12 0 12 0.004 0.001 0.003 0.006 0.004 Chicken thigh, oven-roasted (skin removed) 337 12 11 1 0 0.001 0 0.002 0 Chicken leg, fried, fast-food (w/ skin) 338 12 0 11 0.005 0.003 0.003 0.013 0.005 Catfish, pan-cooked w/ oil 339 12 10 2 0.001 0.002 0 0.005 0 Tuna, canned in water, drained 340 12 0 0 0.017 0.006 0.010 0.029 0.017 Refried beans, canned 341 12 0 9 0.006 0.004 0.002 0.017 0.005 White beans, dry, boiled 342 12 1 8 0.004 0.002 0 0.009 0.004 Sunflower seeds (shelled), roasted, 343 12 0 0 0.478 0.118 0.281 0.657 0.482 Pancakes, frozen, heated 344 12 0 0 0.014 0.003 0.010 0.019 0.014 Breakfast tart/toaster pastry 345 12 0 0 0.013 0.004 0.007 0.019 0.013 Macaroni salad, from grocery/deli 346 12 0 0 0.017 0.005 0.007 0.025 0.015 Spaghetti, enriched, boiled 347 12 0 0 0.036 0.005 0.026 0.045 0.036 Apricots, canned in heavy/light syrup 348 12 6 5 0.006 0.016 0 0.056 0.001 Fruit juice blend (100% juice), canned/bottled 350 12 3 7 0.002 0.003 0 0.010 0.001 Cranberry juice cocktail, 351 12 1 7 0.002 0.001 0 0.004 0.002 Orange juice, bottled/carton 352 12 11 1 0 0 0 0.001 0 Potato salad, mayonnaise-type, from grocery/deli 353 12 0 0 0.016 0.006 0.009 0.027 0.013 Potato, mashed, prepared from fresh 354 12 0 0 0.016 0.005 0.010 0.026 0.015 Coleslaw, mayonnaise-type, from grocery/deli 355 12 0 9 0.005 0.003 0.002 0.011 0.005 Carrot, baby, raw 356 12 0 0 0.022 0.020 0.007 0.081 0.017 Lettuce, leaf, raw 357 12 0 0 0.091 0.073 0.004 0.269 0.074 Sweet potatoes, canned 358 12 0 4 0.007 0.006 0.002 0.026 0.005 Tomato salsa, bottled 359 12 0 0 0.021 0.008 0.006 0.038 0.021 Beef and vegetable stew, canned 360 12 0 1 0.009 0.003 0.004 0.014 0.009
Page 28 of 211 Rev 4.1
US Food and Drug Administration — Total Diet Study — Market Baskets 1991-3 through 2005-4
Cadmium - Summary of Results TDS Number Number Not Number Mean Std Dev Minimum Maximum Median
TDS Food Description Food No. of Results Detected of Traces (mg/kg) (mg/kg) (mg/kg) (mg/kg) (mg/kg) Lasagna w/ meat, frozen, heated 361 12 0 0 0.018 0.004 0.009 0.023 0.019 Beef w/ vegetables in sauce, from Chinese carry-out 362 12 0 2 0.007 0.003 0.002 0.012 0.007 Chicken w/ vegetables in sauce, from Chinese carry-out 363 12 0 4 0.005 0.002 0.002 0.009 0.005 Fried rice, meatless, from Chinese carry-out 364 12 0 3 0.009 0.004 0.004 0.016 0.009 Burrito w/ beef, beans and cheese, from Mexican carry-out 365 12 0 0 0.011 0.002 0.008 0.015 0.011 Chicken filet (broiled) sandwich on bun, fast-food 366 12 0 0 0.016 0.004 0.011 0.022 0.015 Soup, Oriental noodles (ramen noodles), prep w/ water 367 12 0 6 0.005 0.002 0.002 0.007 0.005 Pudding, ready-to-eat, flavor other than chocolate 368 12 9 3 0.001 0.001 0 0.002 0 Cake, yellow w/ icing 369 12 0 3 0.006 0.002 0.003 0.008 0.006 Granola bar, w/ raisins 370 12 1 0 0.011 0.005 0 0.018 0.010 Candy bar, chocolate, nougat, and nuts 371 12 0 0 0.028 0.005 0.020 0.036 0.027 Popcorn, microwave, butter-flavored 372 12 0 9 0.008 0.003 0.003 0.014 0.008 Sweet & sour sauce 373 12 5 4 0.003 0.003 0 0.008 0.003 Brown gravy, canned or bottled 374 12 4 6 0.003 0.003 0 0.010 0.003 Salad dressing, creamy/buttermilk type, regular 375 12 9 3 0.001 0.002 0 0.007 0 Salad dressing, creamy/buttermilk type, low-calorie 376 12 2 8 0.005 0.003 0 0.012 0.004 Salad dressing, Italian, regular 377 12 6 6 0.003 0.004 0 0.011 0.002 Olive oil 378 12 12 1 0 0 0 0 0 Vegetable oil 379 12 12 0 0 0 0 0 0
Page 29 of 211 Rev 4.1

US Food and Drug Administration — Total Diet Study — Market Baskets 1991-3 through 2005-4
Cadmium - Summary of Results TDS Number Number Not Number Mean Std Dev Minimum Maximum Median
TDS Food Description Food No. of Results Detected of Traces (mg/kg) (mg/kg) (mg/kg) (mg/kg) (mg/kg) Bottled drinking water (mineral/spring), not carbonated or flavored 380 12 11 1 0 0 0 0.001 0 Decaffeinated coffee, from ground 381 12 10 2 0 0.001 0 0.002 0 Decaffeinated tea, from tea bag 382 12 8 4 0 0.001 0 0.002 0
Page 30 of 211 Rev 4.1
US Food and Drug Administration — Total Diet Study — Market Baskets 1991-3 through 2005-4
Calcium - Summary of Results TDS Number Number Not Number Mean Std Dev Minimum Maximum Median
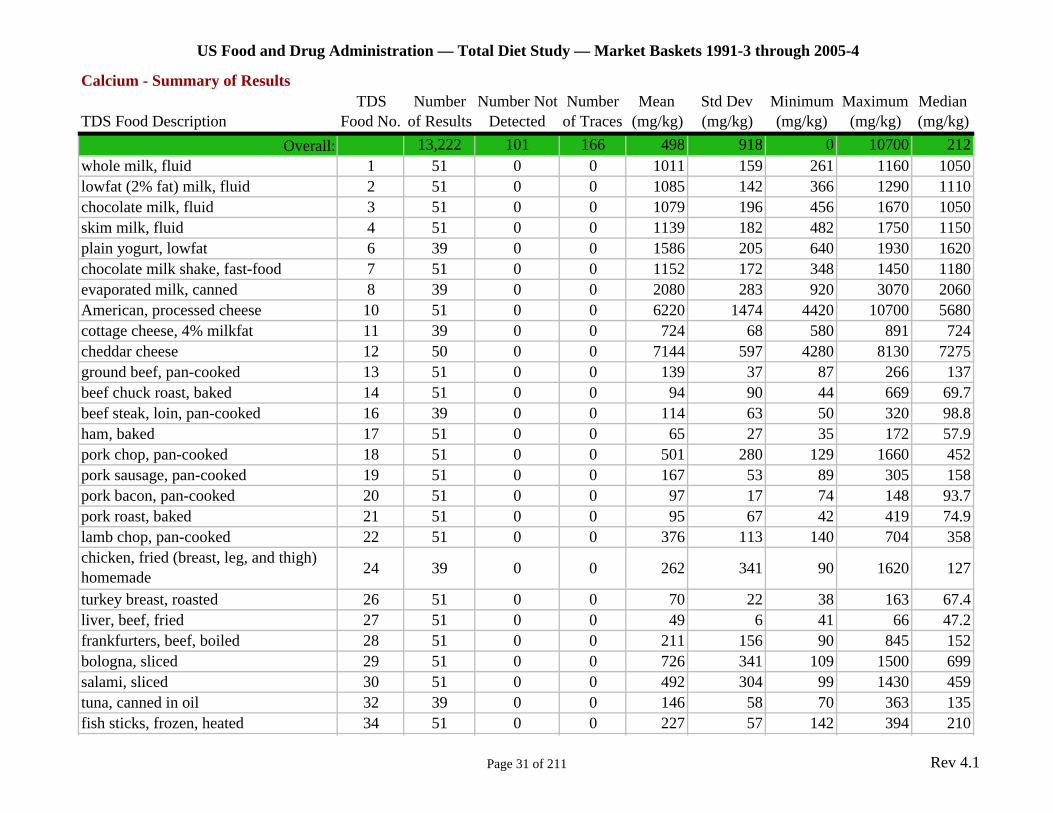
TDS Food Description Food No. of Results Detected of Traces (mg/kg) (mg/kg) (mg/kg) (mg/kg) (mg/kg) Overall: 13,222 101 166 498 918 0 10700 212
whole milk, fluid 1 51 0 0 1011 159 261 1160 1050 lowfat (2% fat) milk, fluid 2 51 0 0 1085 142 366 1290 1110 chocolate milk, fluid 3 51 0 0 1079 196 456 1670 1050 skim milk, fluid 4 51 0 0 1139 182 482 1750 1150 plain yogurt, lowfat 6 39 0 0 1586 205 640 1930 1620 chocolate milk shake, fast-food 7 51 0 0 1152 172 348 1450 1180 evaporated milk, canned 8 39 0 0 2080 283 920 3070 2060 American, processed cheese 10 51 0 0 6220 1474 4420 10700 5680 cottage cheese, 4% milkfat 11 39 0 0 724 68 580 891 724 cheddar cheese 12 50 0 0 7144 597 4280 8130 7275 ground beef, pan-cooked 13 51 0 0 139 37 87 266 137 beef chuck roast, baked 14 51 0 0 94 90 44 669 69.7 beef steak, loin, pan-cooked 16 39 0 0 114 63 50 320 98.8 ham, baked 17 51 0 0 65 27 35 172 57.9 pork chop, pan-cooked 18 51 0 0 501 280 129 1660 452 pork sausage, pan-cooked 19 51 0 0 167 53 89 305 158 pork bacon, pan-cooked 20 51 0 0 97 17 74 148 93.7 pork roast, baked 21 51 0 0 95 67 42 419 74.9 lamb chop, pan-cooked 22 51 0 0 376 113 140 704 358 chicken, fried (breast, leg, and thigh) homemade 24 39 0 0 262 341 90 1620 127
turkey breast, roasted 26 51 0 0 70 22 38 163 67.4 liver, beef, fried 27 51 0 0 49 6 41 66 47.2 frankfurters, beef, boiled 28 51 0 0 211 156 90 845 152 bologna, sliced 29 51 0 0 726 341 109 1500 699 salami, sliced 30 51 0 0 492 304 99 1430 459 tuna, canned in oil 32 39 0 0 146 58 70 363 135 fish sticks, frozen, heated 34 51 0 0 227 57 142 394 210
Page 31 of 211 Rev 4.1
US Food and Drug Administration — Total Diet Study — Market Baskets 1991-3 through 2005-4
Calcium - Summary of Results TDS Number Number Not Number Mean Std Dev Minimum Maximum Median
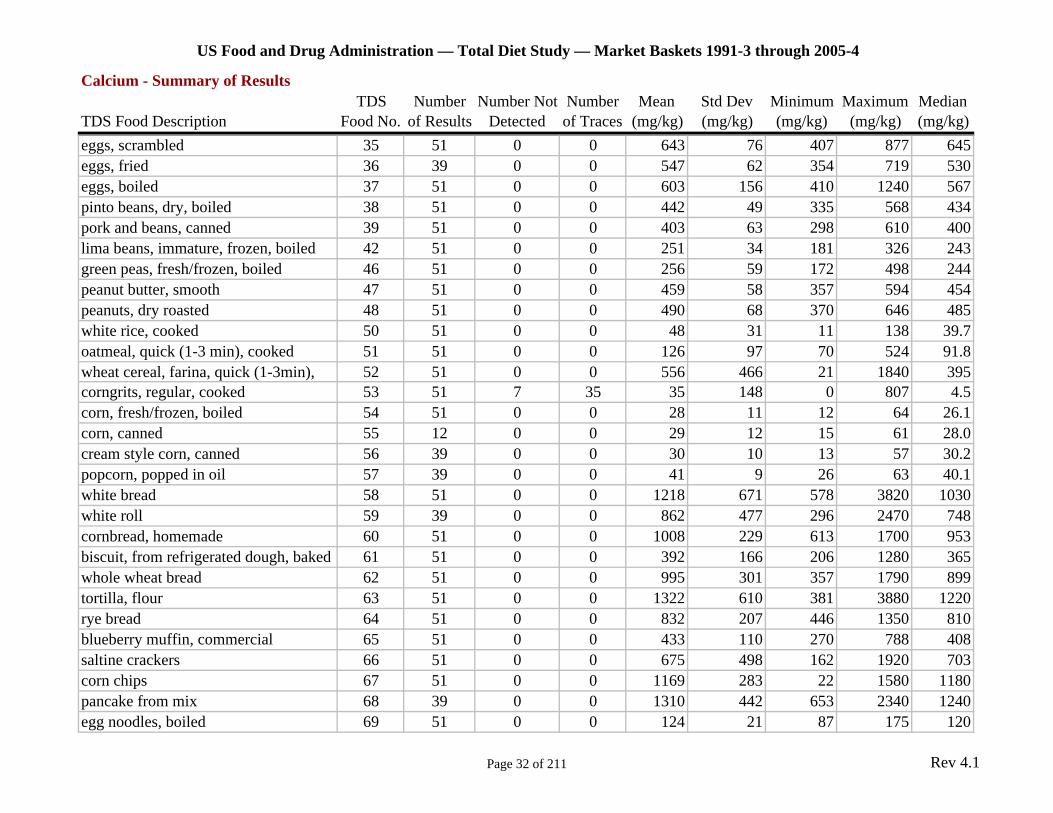
TDS Food Description Food No. of Results Detected of Traces (mg/kg) (mg/kg) (mg/kg) (mg/kg) (mg/kg) eggs, scrambled 35 51 0 0 643 76 407 877 645 eggs, fried 36 39 0 0 547 62 354 719 530 eggs, boiled 37 51 0 0 603 156 410 1240 567 pinto beans, dry, boiled 38 51 0 0 442 49 335 568 434 pork and beans, canned 39 51 0 0 403 63 298 610 400 lima beans, immature, frozen, boiled 42 51 0 0 251 34 181 326 243 green peas, fresh/frozen, boiled 46 51 0 0 256 59 172 498 244 peanut butter, smooth 47 51 0 0 459 58 357 594 454 peanuts, dry roasted 48 51 0 0 490 68 370 646 485 white rice, cooked 50 51 0 0 48 31 11 138 39.7 oatmeal, quick (1-3 min), cooked 51 51 0 0 126 97 70 524 91.8 wheat cereal, farina, quick (1-3min), 52 51 0 0 556 466 21 1840 395 corngrits, regular, cooked 53 51 7 35 35 148 0 807 4.5 corn, fresh/frozen, boiled 54 51 0 0 28 11 12 64 26.1 corn, canned 55 12 0 0 29 12 15 61 28.0 cream style corn, canned 56 39 0 0 30 10 13 57 30.2 popcorn, popped in oil 57 39 0 0 41 9 26 63 40.1 white bread 58 51 0 0 1218 671 578 3820 1030 white roll 59 39 0 0 862 477 296 2470 748 cornbread, homemade 60 51 0 0 1008 229 613 1700 953 biscuit, from refrigerated dough, baked 61 51 0 0 392 166 206 1280 365 whole wheat bread 62 51 0 0 995 301 357 1790 899 tortilla, flour 63 51 0 0 1322 610 381 3880 1220 rye bread 64 51 0 0 832 207 446 1350 810 blueberry muffin, commercial 65 51 0 0 433 110 270 788 408 saltine crackers 66 51 0 0 675 498 162 1920 703 corn chips 67 51 0 0 1169 283 22 1580 1180 pancake from mix 68 39 0 0 1310 442 653 2340 1240 egg noodles, boiled 69 51 0 0 124 21 87 175 120
Page 32 of 211 Rev 4.1
US Food and Drug Administration — Total Diet Study — Market Baskets 1991-3 through 2005-4
Calcium - Summary of Results TDS Number Number Not Number Mean Std Dev Minimum Maximum Median
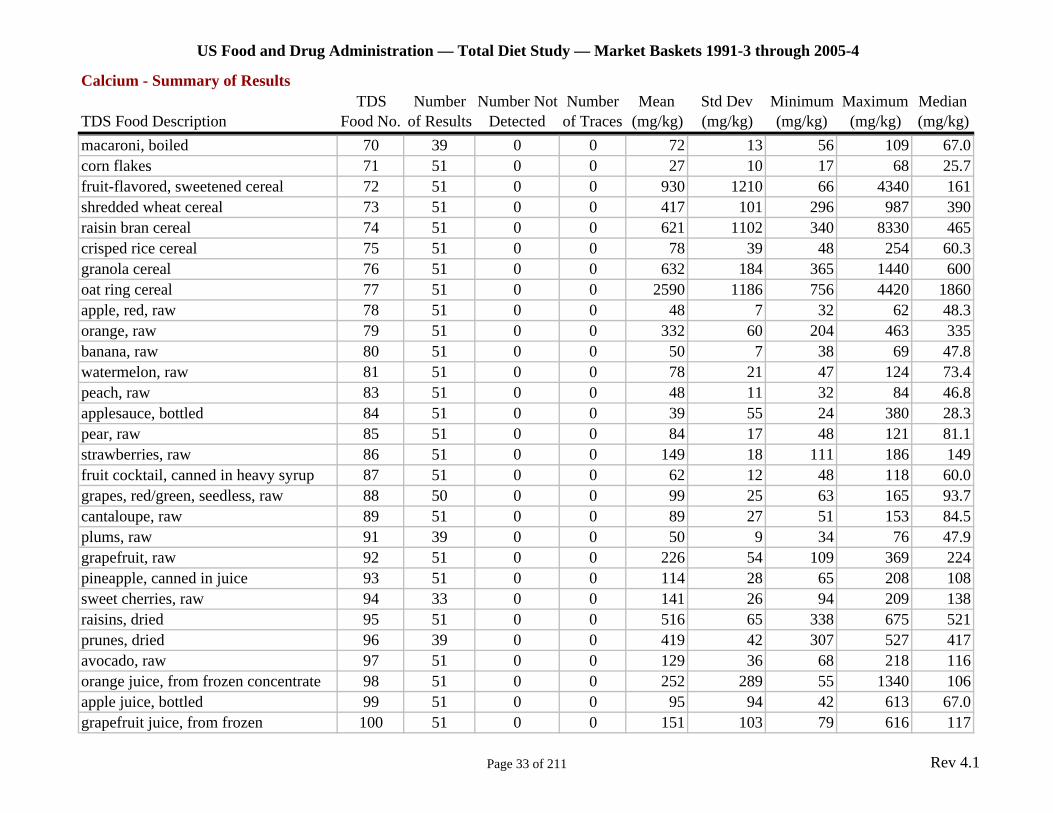
TDS Food Description Food No. of Results Detected of Traces (mg/kg) (mg/kg) (mg/kg) (mg/kg) (mg/kg) macaroni, boiled 70 39 0 0 72 13 56 109 67.0 corn flakes 71 51 0 0 27 10 17 68 25.7 fruit-flavored, sweetened cereal 72 51 0 0 930 1210 66 4340 161 shredded wheat cereal 73 51 0 0 417 101 296 987 390 raisin bran cereal 74 51 0 0 621 1102 340 8330 465 crisped rice cereal 75 51 0 0 78 39 48 254 60.3 granola cereal 76 51 0 0 632 184 365 1440 600 oat ring cereal 77 51 0 0 2590 1186 756 4420 1860 apple, red, raw 78 51 0 0 48 7 32 62 48.3 orange, raw 79 51 0 0 332 60 204 463 335 banana, raw 80 51 0 0 50 7 38 69 47.8 watermelon, raw 81 51 0 0 78 21 47 124 73.4 peach, raw 83 51 0 0 48 11 32 84 46.8 applesauce, bottled 84 51 0 0 39 55 24 380 28.3 pear, raw 85 51 0 0 84 17 48 121 81.1 strawberries, raw 86 51 0 0 149 18 111 186 149 fruit cocktail, canned in heavy syrup 87 51 0 0 62 12 48 118 60.0 grapes, red/green, seedless, raw 88 50 0 0 99 25 63 165 93.7 cantaloupe, raw 89 51 0 0 89 27 51 153 84.5 plums, raw 91 39 0 0 50 9 34 76 47.9 grapefruit, raw 92 51 0 0 226 54 109 369 224 pineapple, canned in juice 93 51 0 0 114 28 65 208 108 sweet cherries, raw 94 33 0 0 141 26 94 209 138 raisins, dried 95 51 0 0 516 65 338 675 521 prunes, dried 96 39 0 0 419 42 307 527 417 avocado, raw 97 51 0 0 129 36 68 218 116 orange juice, from frozen concentrate 98 51 0 0 252 289 55 1340 106 apple juice, bottled 99 51 0 0 95 94 42 613 67.0 grapefruit juice, from frozen 100 51 0 0 151 103 79 616 117
Page 33 of 211 Rev 4.1
US Food and Drug Administration — Total Diet Study — Market Baskets 1991-3 through 2005-4
Calcium - Summary of Results TDS Number Number Not Number Mean Std Dev Minimum Maximum Median
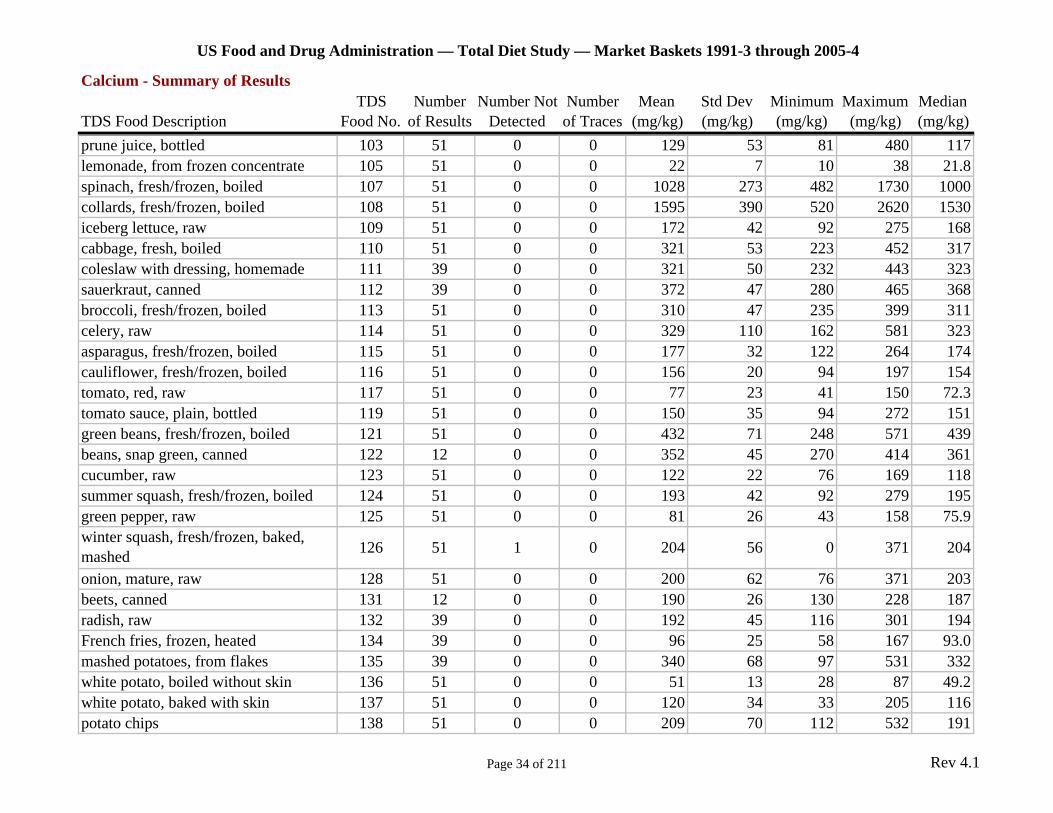
TDS Food Description Food No. of Results Detected of Traces (mg/kg) (mg/kg) (mg/kg) (mg/kg) (mg/kg) prune juice, bottled 103 51 0 0 129 53 81 480 117 lemonade, from frozen concentrate 105 51 0 0 22 7 10 38 21.8 spinach, fresh/frozen, boiled 107 51 0 0 1028 273 482 1730 1000 collards, fresh/frozen, boiled 108 51 0 0 1595 390 520 2620 1530 iceberg lettuce, raw 109 51 0 0 172 42 92 275 168 cabbage, fresh, boiled 110 51 0 0 321 53 223 452 317 coleslaw with dressing, homemade 111 39 0 0 321 50 232 443 323 sauerkraut, canned 112 39 0 0 372 47 280 465 368 broccoli, fresh/frozen, boiled 113 51 0 0 310 47 235 399 311 celery, raw 114 51 0 0 329 110 162 581 323 asparagus, fresh/frozen, boiled 115 51 0 0 177 32 122 264 174 cauliflower, fresh/frozen, boiled 116 51 0 0 156 20 94 197 154 tomato, red, raw 117 51 0 0 77 23 41 150 72.3 tomato sauce, plain, bottled 119 51 0 0 150 35 94 272 151 green beans, fresh/frozen, boiled 121 51 0 0 432 71 248 571 439 beans, snap green, canned 122 12 0 0 352 45 270 414 361 cucumber, raw 123 51 0 0 122 22 76 169 118 summer squash, fresh/frozen, boiled 124 51 0 0 193 42 92 279 195 green pepper, raw 125 51 0 0 81 26 43 158 75.9 winter squash, fresh/frozen, baked, mashed 126 51 1 0 204 56 0 371 204
onion, mature, raw 128 51 0 0 200 62 76 371 203 beets, canned 131 12 0 0 190 26 130 228 187 radish, raw 132 39 0 0 192 45 116 301 194 French fries, frozen, heated 134 39 0 0 96 25 58 167 93.0 mashed potatoes, from flakes 135 39 0 0 340 68 97 531 332 white potato, boiled without skin 136 51 0 0 51 13 28 87 49.2 white potato, baked with skin 137 51 0 0 120 34 33 205 116 potato chips 138 51 0 0 209 70 112 532 191
Page 34 of 211 Rev 4.1

US Food and Drug Administration — Total Diet Study — Market Baskets 1991-3 through 2005-4
Calcium - Summary of Results TDS Number Number Not Number Mean Std Dev Minimum Maximum Median
TDS Food Description Food No. of Results Detected of Traces (mg/kg) (mg/kg) (mg/kg) (mg/kg) (mg/kg) scalloped potatoes, homemade 139 39 0 0 498 82 311 724 484 sweet potato, fresh, baked 140 39 0 0 247 62 136 442 235 spaghetti with tomato sauce and meatballs, homemade 142 51 0 0 263 76 138 418 283
beef stew with potatoes, carrots, and onion, homemade 143 39 0 0 129 22 97 185 124
chili con carne, beef and beans, canned 145 12 0 0 319 44 245 389 327 macaroni and cheese, from box mix 146 51 0 0 638 169 293 1220 609 quarter-pound hamburger on bun, fast-food 147 51 0 0 793 205 286 1480 800
meatloaf, homemade 148 51 0 0 253 64 135 430 236 spaghetti with tomato sauce, canned 149 39 0 0 140 20 97 187 141 lasagna with meat, homemade 151 39 0 0 1145 373 490 2440 1140 chicken potpie, frozen, heated 152 51 0 0 213 51 121 339 196 chicken noodle soup, canned, condensed, prepared with water 155 51 0 0 50 15 31 111 47.8
tomato soup, canned, condensed, prepared with water 156 51 0 0 66 13 39 111 65.2
vegetable beef soup, canned, condensed, prepared with water 157 51 0 0 79 16 47 110 75.6
white sauce, homemade 160 39 0 0 906 92 617 1020 916 dill cucumber pickles 161 51 0 0 542 177 86 1020 534 margarine, stick, regular (salted) 162 51 0 1 51 22 11 129 47.0 butter, regular (salted) 164 51 0 0 229 36 91 299 233 mayonnaise, regular, bottled 166 51 0 0 81 13 57 110 81.0 half & half cream 167 51 0 0 911 106 550 1130 925 cream substitute, frozen 168 51 0 0 38 9 20 65 38.3 white sugar, granulated 169 51 10 29 12 12 0 56 8.1
Page 35 of 211 Rev 4.1
US Food and Drug Administration — Total Diet Study — Market Baskets 1991-3 through 2005-4
Calcium - Summary of Results TDS Number Number Not Number Mean Std Dev Minimum Maximum Median
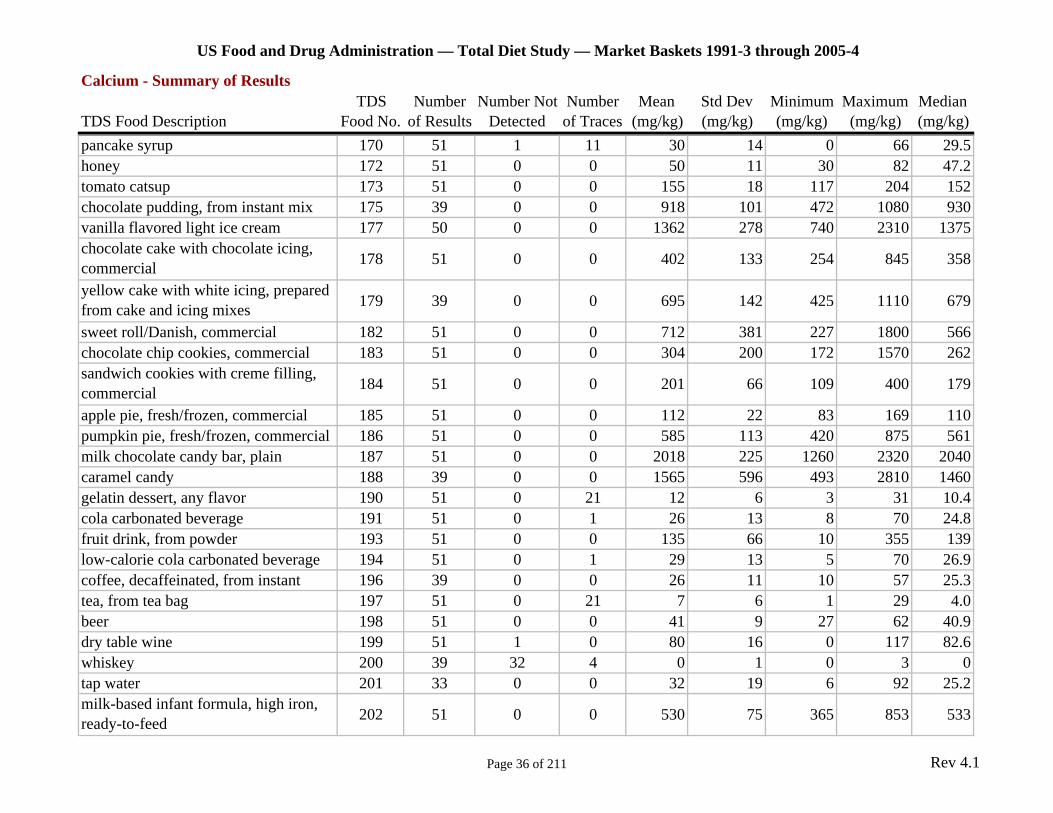
TDS Food Description Food No. of Results Detected of Traces (mg/kg) (mg/kg) (mg/kg) (mg/kg) (mg/kg) pancake syrup 170 51 1 11 30 14 0 66 29.5 honey 172 51 0 0 50 11 30 82 47.2 tomato catsup 173 51 0 0 155 18 117 204 152 chocolate pudding, from instant mix 175 39 0 0 918 101 472 1080 930 vanilla flavored light ice cream 177 50 0 0 1362 278 740 2310 1375 chocolate cake with chocolate icing, commercial 178 51 0 0 402 133 254 845 358
yellow cake with white icing, prepared from cake and icing mixes 179 39 0 0 695 142 425 1110 679
sweet roll/Danish, commercial 182 51 0 0 712 381 227 1800 566 chocolate chip cookies, commercial 183 51 0 0 304 200 172 1570 262 sandwich cookies with creme filling, commercial 184 51 0 0 201 66 109 400 179
apple pie, fresh/frozen, commercial 185 51 0 0 112 22 83 169 110 pumpkin pie, fresh/frozen, commercial 186 51 0 0 585 113 420 875 561 milk chocolate candy bar, plain 187 51 0 0 2018 225 1260 2320 2040 caramel candy 188 39 0 0 1565 596 493 2810 1460 gelatin dessert, any flavor 190 51 0 21 12 6 3 31 10.4 cola carbonated beverage 191 51 0 1 26 13 8 70 24.8 fruit drink, from powder 193 51 0 0 135 66 10 355 139 low-calorie cola carbonated beverage 194 51 0 1 29 13 5 70 26.9 coffee, decaffeinated, from instant 196 39 0 0 26 11 10 57 25.3 tea, from tea bag 197 51 0 21 7 6 1 29 4.0 beer 198 51 0 0 41 9 27 62 40.9 dry table wine 199 51 1 0 80 16 0 117 82.6 whiskey 200 39 32 4 0 1 0 3 0 tap water 201 33 0 0 32 19 6 92 25.2 milk-based infant formula, high iron, ready-to-feed 202 51 0 0 530 75 365 853 533
Page 36 of 211 Rev 4.1

US Food and Drug Administration — Total Diet Study — Market Baskets 1991-3 through 2005-4
Calcium - Summary of Results TDS Number Number Not Number Mean Std Dev Minimum Maximum Median
TDS Food Description Food No. of Results Detected of Traces (mg/kg) (mg/kg) (mg/kg) (mg/kg) (mg/kg) milk-based infant formula, low iron, ready-to-feed 203 51 0 0 533 84 204 770 528
beef, strained/junior 205 51 0 0 53 19 32 171 50.2 chicken, strained/junior, with/without broth or gravy 207 51 0 0 888 268 426 1550 857
chicken/turkey with vegetables, high/lean meat, strained/junior 208 2 0 0 210 20 196 224 210
beef with vegetables, high/lean meat, strained/junior 209 2 0 0 72 4 69 75 72.0
ham with vegetables, high/lean meat, strained/junior 210 2 0 0 79 1 78 80 79.0
vegetables and beef, strained/junior 211 51 0 0 140 39 57 224 147 vegetables and chicken, strained/junior 212 51 0 0 260 55 157 431 263 vegetables and ham, strained/junior 213 50 0 0 139 38 65 193 145 chicken noodle dinner, strained/junior 214 51 0 0 280 53 184 400 280 macaroni, tomatoes, and beef, strained/junior 215 51 0 0 177 33 97 230 182
turkey and rice, strained/junior 216 51 0 0 202 44 118 308 201 carrots, strained/junior 218 51 0 0 238 27 163 316 240 green beans, strained/junior 219 51 0 0 391 75 231 569 391 mixed vegetables, strained/junior 220 51 0 0 176 49 95 302 167 sweet potatoes, strained/junior 221 51 0 0 166 22 107 207 168 creamed corn, strained/junior 222 33 0 0 174 23 120 208 174 peas, strained/junior 223 51 0 0 173 26 132 237 167 creamed spinach, strained/junior 224 39 0 0 1003 205 611 1410 1020 applesauce, strained/junior 225 51 0 0 42 5 30 53 42.1 peaches, strained/junior 226 51 0 0 57 16 28 95 57.2 pears, strained/junior 227 50 0 0 96 14 68 136 95.1 apple juice, strained 230 51 0 0 71 59 20 307 56.0
Page 37 of 211 Rev 4.1
US Food and Drug Administration — Total Diet Study — Market Baskets 1991-3 through 2005-4
Calcium - Summary of Results TDS Number Number Not Number Mean Std Dev Minimum Maximum Median
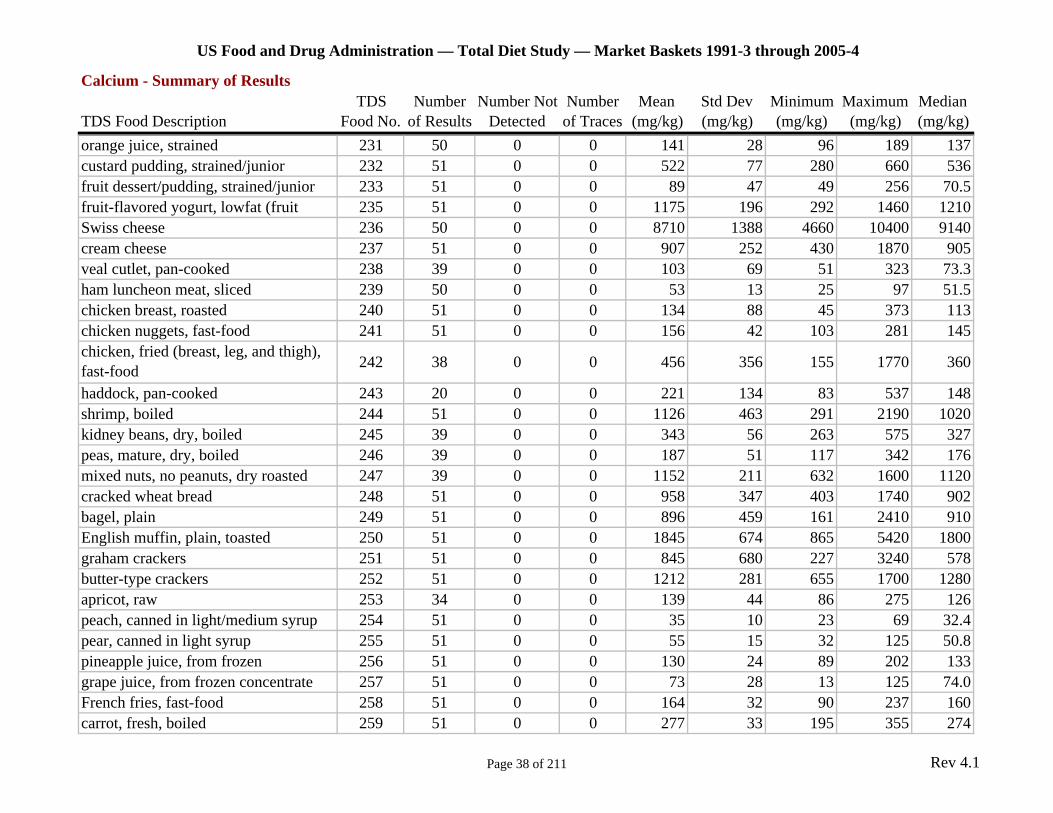
TDS Food Description Food No. of Results Detected of Traces (mg/kg) (mg/kg) (mg/kg) (mg/kg) (mg/kg) orange juice, strained 231 50 0 0 141 28 96 189 137 custard pudding, strained/junior 232 51 0 0 522 77 280 660 536 fruit dessert/pudding, strained/junior 233 51 0 0 89 47 49 256 70.5 fruit-flavored yogurt, lowfat (fruit 235 51 0 0 1175 196 292 1460 1210 Swiss cheese 236 50 0 0 8710 1388 4660 10400 9140 cream cheese 237 51 0 0 907 252 430 1870 905 veal cutlet, pan-cooked 238 39 0 0 103 69 51 323 73.3 ham luncheon meat, sliced 239 50 0 0 53 13 25 97 51.5 chicken breast, roasted 240 51 0 0 134 88 45 373 113 chicken nuggets, fast-food 241 51 0 0 156 42 103 281 145 chicken, fried (breast, leg, and thigh), fast-food 242 38 0 0 456 356 155 1770 360
haddock, pan-cooked 243 20 0 0 221 134 83 537 148 shrimp, boiled 244 51 0 0 1126 463 291 2190 1020 kidney beans, dry, boiled 245 39 0 0 343 56 263 575 327 peas, mature, dry, boiled 246 39 0 0 187 51 117 342 176 mixed nuts, no peanuts, dry roasted 247 39 0 0 1152 211 632 1600 1120 cracked wheat bread 248 51 0 0 958 347 403 1740 902 bagel, plain 249 51 0 0 896 459 161 2410 910 English muffin, plain, toasted 250 51 0 0 1845 674 865 5420 1800 graham crackers 251 51 0 0 845 680 227 3240 578 butter-type crackers 252 51 0 0 1212 281 655 1700 1280 apricot, raw 253 34 0 0 139 44 86 275 126 peach, canned in light/medium syrup 254 51 0 0 35 10 23 69 32.4 pear, canned in light syrup 255 51 0 0 55 15 32 125 50.8 pineapple juice, from frozen 256 51 0 0 130 24 89 202 133 grape juice, from frozen concentrate 257 51 0 0 73 28 13 125 74.0 French fries, fast-food 258 51 0 0 164 32 90 237 160 carrot, fresh, boiled 259 51 0 0 277 33 195 355 274
Page 38 of 211 Rev 4.1
US Food and Drug Administration — Total Diet Study — Market Baskets 1991-3 through 2005-4
Calcium - Summary of Results TDS Number Number Not Number Mean Std Dev Minimum Maximum Median
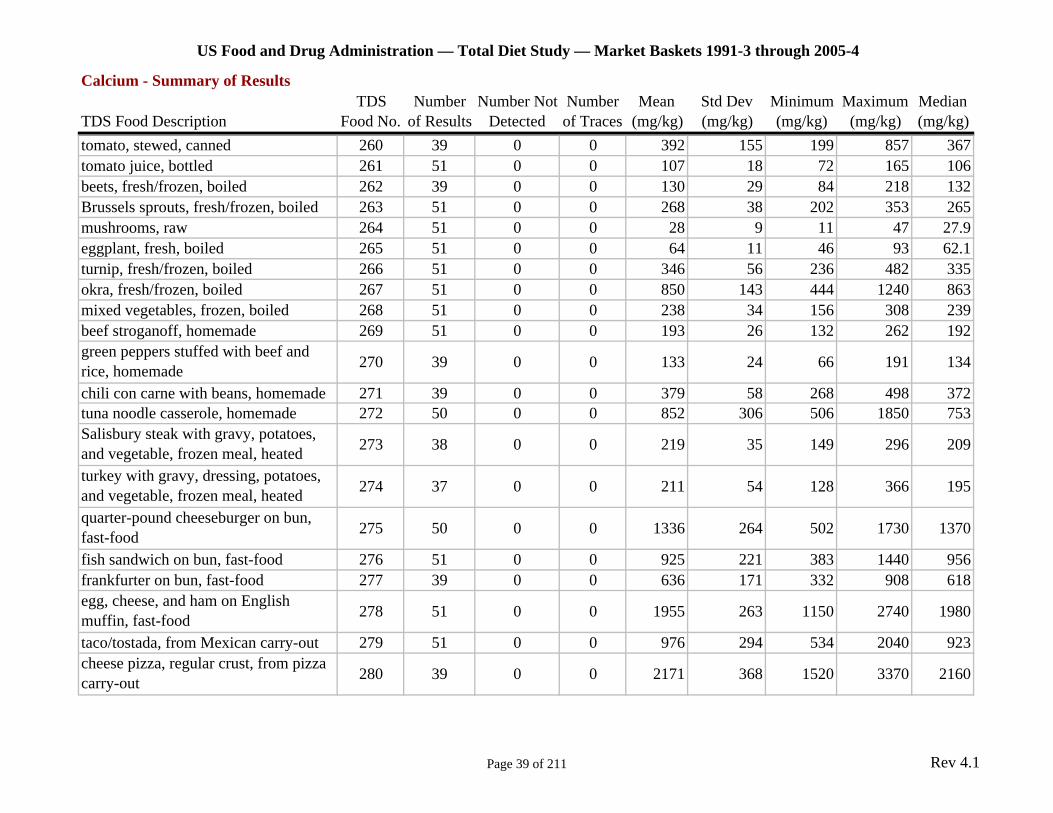
TDS Food Description Food No. of Results Detected of Traces (mg/kg) (mg/kg) (mg/kg) (mg/kg) (mg/kg) tomato, stewed, canned 260 39 0 0 392 155 199 857 367 tomato juice, bottled 261 51 0 0 107 18 72 165 106 beets, fresh/frozen, boiled 262 39 0 0 130 29 84 218 132 Brussels sprouts, fresh/frozen, boiled 263 51 0 0 268 38 202 353 265 mushrooms, raw 264 51 0 0 28 9 11 47 27.9 eggplant, fresh, boiled 265 51 0 0 64 11 46 93 62.1 turnip, fresh/frozen, boiled 266 51 0 0 346 56 236 482 335 okra, fresh/frozen, boiled 267 51 0 0 850 143 444 1240 863 mixed vegetables, frozen, boiled 268 51 0 0 238 34 156 308 239 beef stroganoff, homemade 269 51 0 0 193 26 132 262 192 green peppers stuffed with beef and rice, homemade 270 39 0 0 133 24 66 191 134
chili con carne with beans, homemade 271 39 0 0 379 58 268 498 372 tuna noodle casserole, homemade 272 50 0 0 852 306 506 1850 753 Salisbury steak with gravy, potatoes, and vegetable, frozen meal, heated 273 38 0 0 219 35 149 296 209
turkey with gravy, dressing, potatoes, and vegetable, frozen meal, heated 274 37 0 0 211 54 128 366 195
quarter-pound cheeseburger on bun, fast-food 275 50 0 0 1336 264 502 1730 1370
fish sandwich on bun, fast-food 276 51 0 0 925 221 383 1440 956 frankfurter on bun, fast-food 277 39 0 0 636 171 332 908 618 egg, cheese, and ham on English muffin, fast-food 278 51 0 0 1955 263 1150 2740 1980
taco/tostada, from Mexican carry-out 279 51 0 0 976 294 534 2040 923 cheese pizza, regular crust, from pizza carry-out 280 39 0 0 2171 368 1520 3370 2160
Page 39 of 211 Rev 4.1
US Food and Drug Administration — Total Diet Study — Market Baskets 1991-3 through 2005-4
Calcium - Summary of Results TDS Number Number Not Number Mean Std Dev Minimum Maximum Median
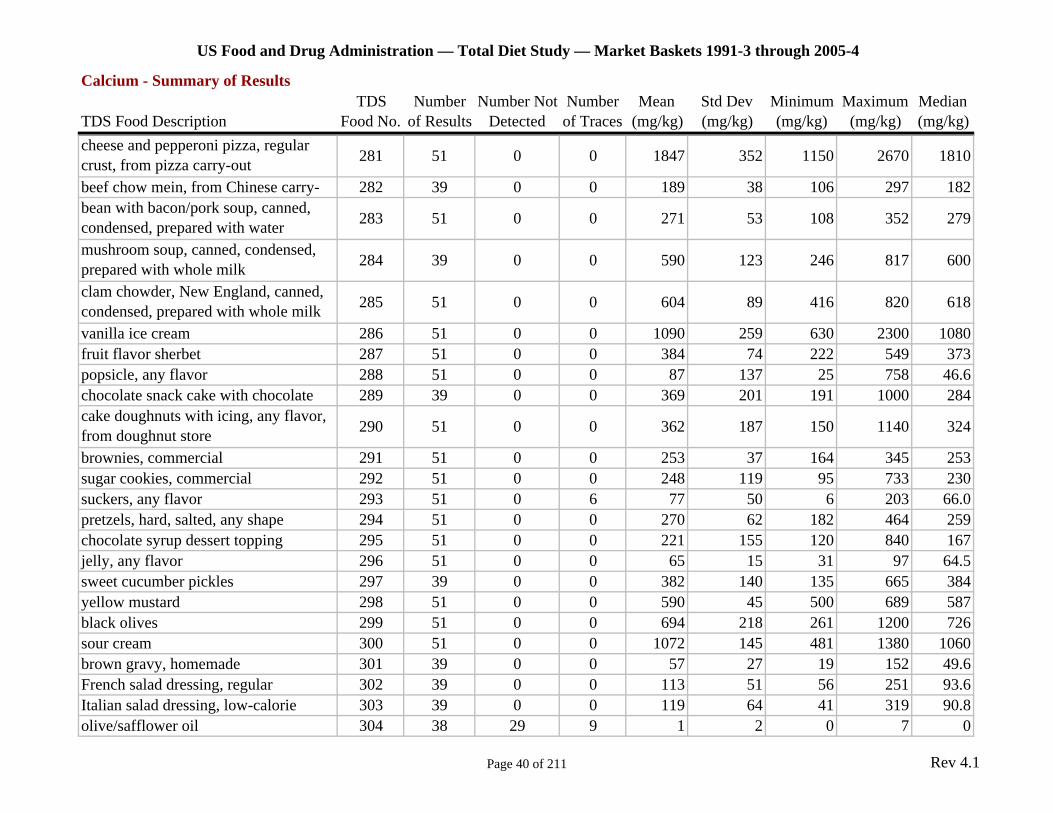
TDS Food Description Food No. of Results Detected of Traces (mg/kg) (mg/kg) (mg/kg) (mg/kg) (mg/kg) cheese and pepperoni pizza, regular crust, from pizza carry-out 281 51 0 0 1847 352 1150 2670 1810
beef chow mein, from Chinese carry- 282 39 0 0 189 38 106 297 182 bean with bacon/pork soup, canned, condensed, prepared with water 283 51 0 0 271 53 108 352 279
mushroom soup, canned, condensed, prepared with whole milk 284 39 0 0 590 123 246 817 600
clam chowder, New England, canned, condensed, prepared with whole milk 285 51 0 0 604 89 416 820 618
vanilla ice cream 286 51 0 0 1090 259 630 2300 1080 fruit flavor sherbet 287 51 0 0 384 74 222 549 373 popsicle, any flavor 288 51 0 0 87 137 25 758 46.6 chocolate snack cake with chocolate 289 39 0 0 369 201 191 1000 284 cake doughnuts with icing, any flavor, from doughnut store 290 51 0 0 362 187 150 1140 324
brownies, commercial 291 51 0 0 253 37 164 345 253 sugar cookies, commercial 292 51 0 0 248 119 95 733 230 suckers, any flavor 293 51 0 6 77 50 6 203 66.0 pretzels, hard, salted, any shape 294 51 0 0 270 62 182 464 259 chocolate syrup dessert topping 295 51 0 0 221 155 120 840 167 jelly, any flavor 296 51 0 0 65 15 31 97 64.5 sweet cucumber pickles 297 39 0 0 382 140 135 665 384 yellow mustard 298 51 0 0 590 45 500 689 587 black olives 299 51 0 0 694 218 261 1200 726 sour cream 300 51 0 0 1072 145 481 1380 1060 brown gravy, homemade 301 39 0 0 57 27 19 152 49.6 French salad dressing, regular 302 39 0 0 113 51 56 251 93.6 Italian salad dressing, low-calorie 303 39 0 0 119 64 41 319 90.8 olive/safflower oil 304 38 29 9 1 2 0 7 0
Page 40 of 211 Rev 4.1

US Food and Drug Administration — Total Diet Study — Market Baskets 1991-3 through 2005-4
Calcium - Summary of Results TDS Number Number Not Number Mean Std Dev Minimum Maximum Median
TDS Food Description Food No. of Results Detected of Traces (mg/kg) (mg/kg) (mg/kg) (mg/kg) (mg/kg) coffee, from ground 305 51 0 8 15 7 5 33 13.0 fruit-flavored carbonated beverage 306 51 0 0 28 16 9 100 26.0 fruit drink, canned 307 51 0 0 81 90 15 391 48.0 martini 308 30 0 10 5 2 2 11 4.3 soy-based infant formula, ready-to-feed 309 51 0 0 708 130 340 999 723 egg yolk, strained/junior 310 12 0 0 778 115 469 870 818 rice infant cereal, instant, prepared with whole milk 311 39 0 0 2394 587 1030 3610 2390
rice cereal, strained/junior 312 20 0 0 156 91 62 398 126 bananas with tapioca, strained/junior 313 51 0 0 57 42 30 248 46.4 beets, strained/junior 314 15 0 0 139 19 108 175 143 split peas with vegetables and ham/bacon, strained/junior 316 27 0 0 130 29 67 179 129
teething biscuits 317 51 0 0 1153 1359 260 10100 913 salmon, steaks or filets, fresh or frozen, 318 31 0 0 170 121 55.3 606 120 rice cereal with apple, strained/junior 319 17 0 0 296 100 69.9 451 330 squash, strained/junior 320 29 0 0 183 27 133 227 177 BF, cereal, oatmeal, dry, prep w/ water 323 12 0 0 1742 392 1020 2140 1850 BF, cereal, rice, dry, prep w/ water 324 12 0 0 1825 577 1140 3120 1790 BF, cereal, rice w/apples, dry, prep w/ water 325 12 0 0 1638 319 1130 2400 1645 BF, veal and broth/gravy 326 12 0 0 71 13 57 96 64.7 BF, lamb and broth/gravy 327 12 0 0 93 34 70 187 80 BF, turkey and broth/gravy 328 12 0 0 576 151 152 697 618 Meal replacement, liquid RTD, any 331 12 0 0 1339 146 1150 1550 1360 Cottage cheese, creamed, lowfat (2% milk fat) 332 12 0 0 1048 613 638 2510 802 Sour cream dip, any flavor 333 12 0 0 995 210 732 1350 986 Beef steak, loin/sirloin, broiled 334 12 0 0 66 21 45 118 61.2
Page 41 of 211 Rev 4.1
US Food and Drug Administration — Total Diet Study — Market Baskets 1991-3 through 2005-4
Calcium - Summary of Results TDS Number Number Not Number Mean Std Dev Minimum Maximum Median
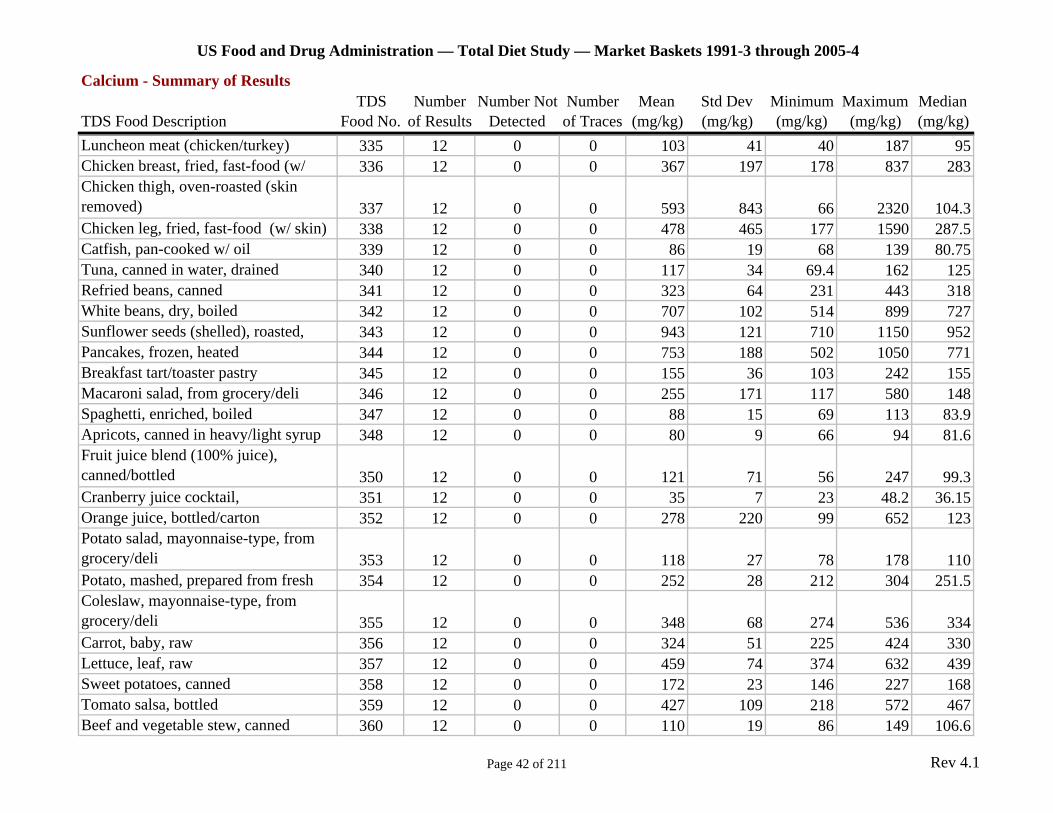
TDS Food Description Food No. of Results Detected of Traces (mg/kg) (mg/kg) (mg/kg) (mg/kg) (mg/kg) Luncheon meat (chicken/turkey) 335 12 0 0 103 41 40 187 95 Chicken breast, fried, fast-food (w/ 336 12 0 0 367 197 178 837 283 Chicken thigh, oven-roasted (skin removed) 337 12 0 0 593 843 66 2320 104.3 Chicken leg, fried, fast-food (w/ skin) 338 12 0 0 478 465 177 1590 287.5 Catfish, pan-cooked w/ oil 339 12 0 0 86 19 68 139 80.75 Tuna, canned in water, drained 340 12 0 0 117 34 69.4 162 125 Refried beans, canned 341 12 0 0 323 64 231 443 318 White beans, dry, boiled 342 12 0 0 707 102 514 899 727 Sunflower seeds (shelled), roasted, 343 12 0 0 943 121 710 1150 952 Pancakes, frozen, heated 344 12 0 0 753 188 502 1050 771 Breakfast tart/toaster pastry 345 12 0 0 155 36 103 242 155 Macaroni salad, from grocery/deli 346 12 0 0 255 171 117 580 148 Spaghetti, enriched, boiled 347 12 0 0 88 15 69 113 83.9 Apricots, canned in heavy/light syrup 348 12 0 0 80 9 66 94 81.6 Fruit juice blend (100% juice), canned/bottled 350 12 0 0 121 71 56 247 99.3 Cranberry juice cocktail, 351 12 0 0 35 7 23 48.2 36.15 Orange juice, bottled/carton 352 12 0 0 278 220 99 652 123 Potato salad, mayonnaise-type, from grocery/deli 353 12 0 0 118 27 78 178 110 Potato, mashed, prepared from fresh 354 12 0 0 252 28 212 304 251.5 Coleslaw, mayonnaise-type, from grocery/deli 355 12 0 0 348 68 274 536 334 Carrot, baby, raw 356 12 0 0 324 51 225 424 330 Lettuce, leaf, raw 357 12 0 0 459 74 374 632 439 Sweet potatoes, canned 358 12 0 0 172 23 146 227 168 Tomato salsa, bottled 359 12 0 0 427 109 218 572 467 Beef and vegetable stew, canned 360 12 0 0 110 19 86 149 106.6
Page 42 of 211 Rev 4.1
US Food and Drug Administration — Total Diet Study — Market Baskets 1991-3 through 2005-4
Calcium - Summary of Results TDS Number Number Not Number Mean Std Dev Minimum Maximum Median
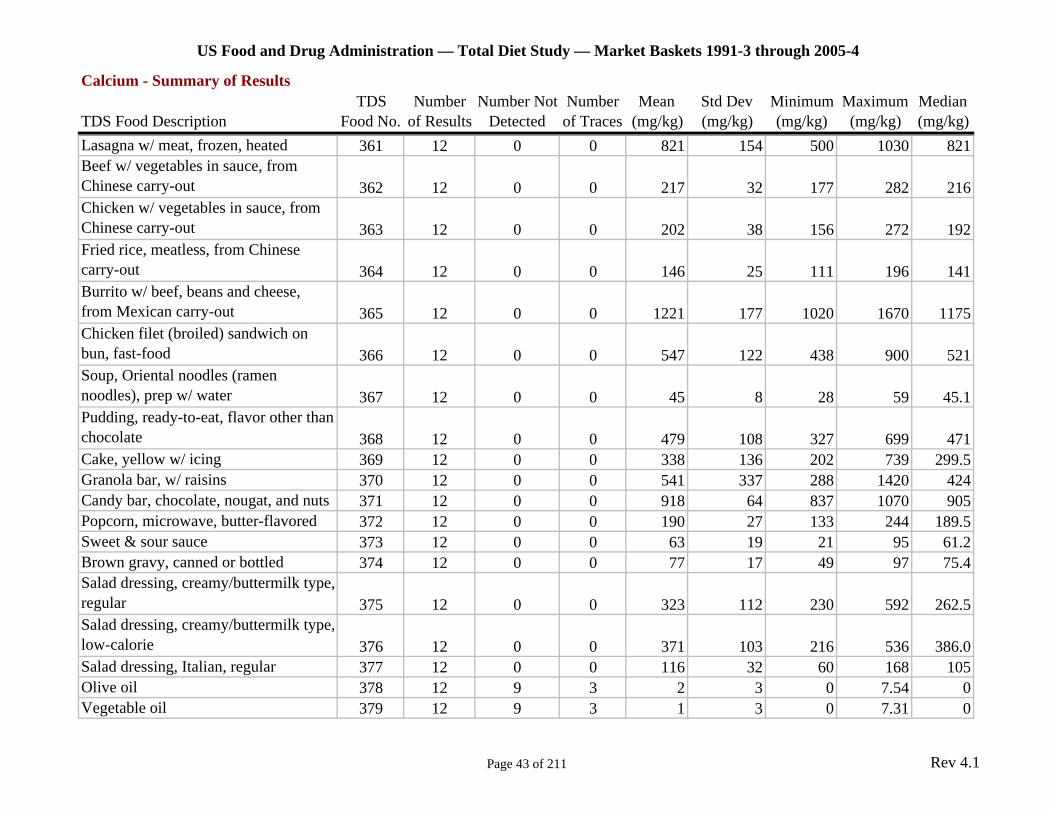
TDS Food Description Food No. of Results Detected of Traces (mg/kg) (mg/kg) (mg/kg) (mg/kg) (mg/kg) Lasagna w/ meat, frozen, heated 361 12 0 0 821 154 500 1030 821 Beef w/ vegetables in sauce, from Chinese carry-out 362 12 0 0 217 32 177 282 216 Chicken w/ vegetables in sauce, from Chinese carry-out 363 12 0 0 202 38 156 272 192 Fried rice, meatless, from Chinese carry-out 364 12 0 0 146 25 111 196 141 Burrito w/ beef, beans and cheese, from Mexican carry-out 365 12 0 0 1221 177 1020 1670 1175 Chicken filet (broiled) sandwich on bun, fast-food 366 12 0 0 547 122 438 900 521 Soup, Oriental noodles (ramen noodles), prep w/ water 367 12 0 0 45 8 28 59 45.1 Pudding, ready-to-eat, flavor other than chocolate 368 12 0 0 479 108 327 699 471 Cake, yellow w/ icing 369 12 0 0 338 136 202 739 299.5 Granola bar, w/ raisins 370 12 0 0 541 337 288 1420 424 Candy bar, chocolate, nougat, and nuts 371 12 0 0 918 64 837 1070 905 Popcorn, microwave, butter-flavored 372 12 0 0 190 27 133 244 189.5 Sweet & sour sauce 373 12 0 0 63 19 21 95 61.2 Brown gravy, canned or bottled 374 12 0 0 77 17 49 97 75.4 Salad dressing, creamy/buttermilk type, regular 375 12 0 0 323 112 230 592 262.5 Salad dressing, creamy/buttermilk type, low-calorie 376 12 0 0 371 103 216 536 386.0 Salad dressing, Italian, regular 377 12 0 0 116 32 60 168 105 Olive oil 378 12 9 3 2 3 0 7.54 0 Vegetable oil 379 12 9 3 1 3 0 7.31 0
Page 43 of 211 Rev 4.1

US Food and Drug Administration — Total Diet Study — Market Baskets 1991-3 through 2005-4
Calcium - Summary of Results TDS Number Number Not Number Mean Std Dev Minimum Maximum Median
TDS Food Description Food No. of Results Detected of Traces (mg/kg) (mg/kg) (mg/kg) (mg/kg) (mg/kg) Bottled drinking water (mineral/spring), not carbonated or flavored 380 12 1 0 18 11 0 33 17.6 Decaffeinated coffee, from ground 381 12 0 0 13 7 4 27 11.6 Decaffeinated tea, from tea bag 382 12 1 3 6 7 0 29 4.4
Page 44 of 211 Rev 4.1
US Food and Drug Administration — Total Diet Study — Market Baskets 1991-3 through 2005-4
Copper - Summary of Results TDS Number Number Not Number Mean Std Dev Minimum Maximum Median
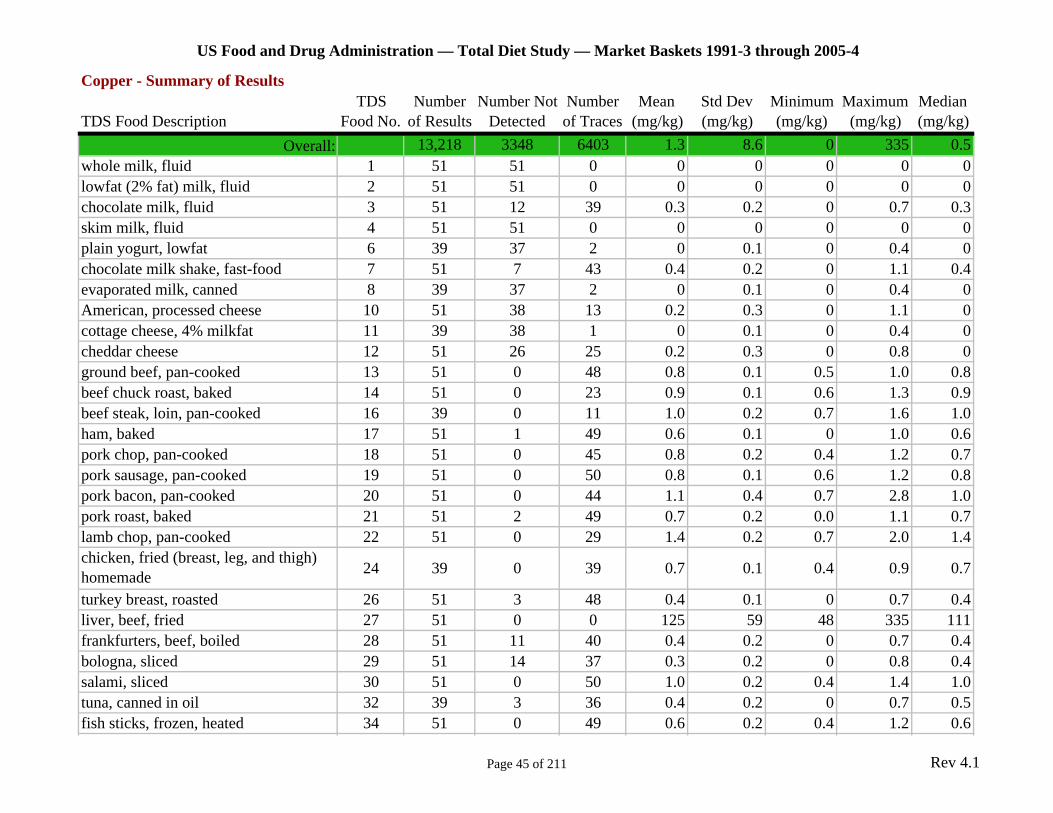
TDS Food Description Food No. of Results Detected of Traces (mg/kg) (mg/kg) (mg/kg) (mg/kg) (mg/kg) Overall: 13,218 3348 6403 1.3 8.6 0 335 0.5
whole milk, fluid 1 51 51 0 0 0 0 0 0 lowfat (2% fat) milk, fluid 2 51 51 0 0 0 0 0 0 chocolate milk, fluid 3 51 12 39 0.3 0.2 0 0.7 0.3 skim milk, fluid 4 51 51 0 0 0 0 0 0 plain yogurt, lowfat 6 39 37 2 0 0.1 0 0.4 0 chocolate milk shake, fast-food 7 51 7 43 0.4 0.2 0 1.1 0.4 evaporated milk, canned 8 39 37 2 0 0.1 0 0.4 0 American, processed cheese 10 51 38 13 0.2 0.3 0 1.1 0 cottage cheese, 4% milkfat 11 39 38 1 0 0.1 0 0.4 0 cheddar cheese 12 51 26 25 0.2 0.3 0 0.8 0 ground beef, pan-cooked 13 51 0 48 0.8 0.1 0.5 1.0 0.8 beef chuck roast, baked 14 51 0 23 0.9 0.1 0.6 1.3 0.9 beef steak, loin, pan-cooked 16 39 0 11 1.0 0.2 0.7 1.6 1.0 ham, baked 17 51 1 49 0.6 0.1 0 1.0 0.6 pork chop, pan-cooked 18 51 0 45 0.8 0.2 0.4 1.2 0.7 pork sausage, pan-cooked 19 51 0 50 0.8 0.1 0.6 1.2 0.8 pork bacon, pan-cooked 20 51 0 44 1.1 0.4 0.7 2.8 1.0 pork roast, baked 21 51 2 49 0.7 0.2 0.0 1.1 0.7 lamb chop, pan-cooked 22 51 0 29 1.4 0.2 0.7 2.0 1.4 chicken, fried (breast, leg, and thigh) homemade 24 39 0 39 0.7 0.1 0.4 0.9 0.7
turkey breast, roasted 26 51 3 48 0.4 0.1 0 0.7 0.4 liver, beef, fried 27 51 0 0 125 59 48 335 111 frankfurters, beef, boiled 28 51 11 40 0.4 0.2 0 0.7 0.4 bologna, sliced 29 51 14 37 0.3 0.2 0 0.8 0.4 salami, sliced 30 51 0 50 1.0 0.2 0.4 1.4 1.0 tuna, canned in oil 32 39 3 36 0.4 0.2 0 0.7 0.5 fish sticks, frozen, heated 34 51 0 49 0.6 0.2 0.4 1.2 0.6
Page 45 of 211 Rev 4.1
US Food and Drug Administration — Total Diet Study — Market Baskets 1991-3 through 2005-4
Copper - Summary of Results TDS Number Number Not Number Mean Std Dev Minimum Maximum Median
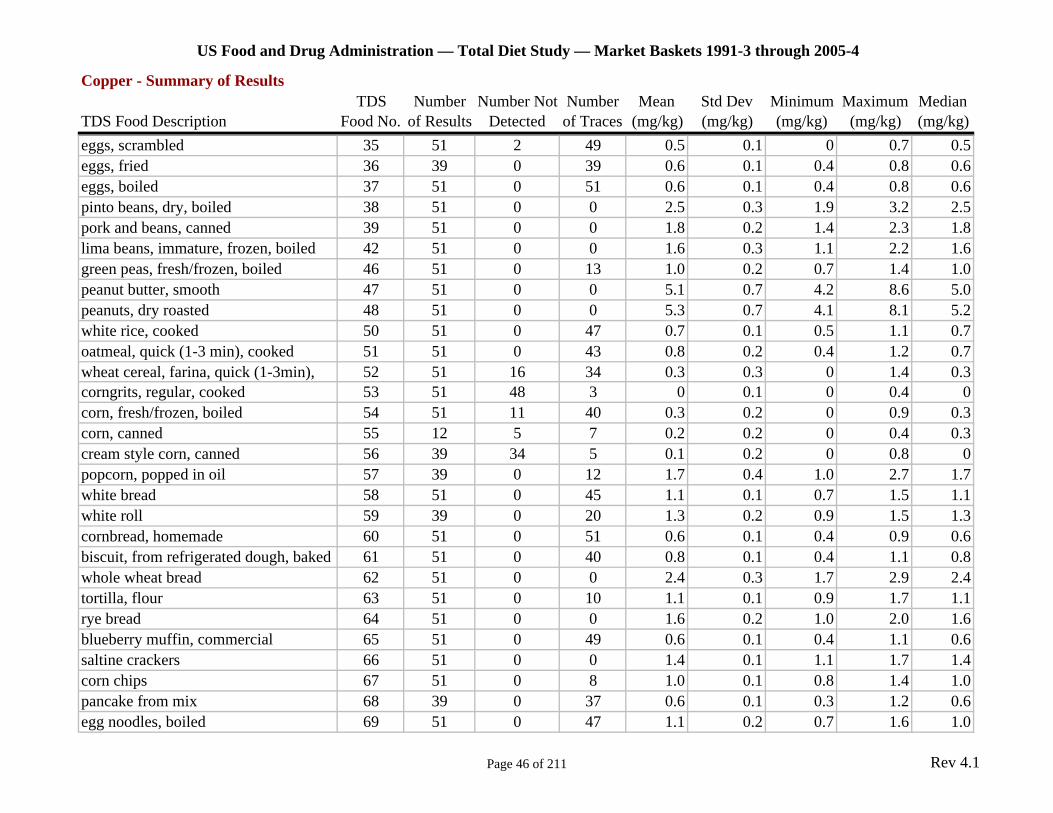
TDS Food Description Food No. of Results Detected of Traces (mg/kg) (mg/kg) (mg/kg) (mg/kg) (mg/kg) eggs, scrambled 35 51 2 49 0.5 0.1 0 0.7 0.5 eggs, fried 36 39 0 39 0.6 0.1 0.4 0.8 0.6 eggs, boiled 37 51 0 51 0.6 0.1 0.4 0.8 0.6 pinto beans, dry, boiled 38 51 0 0 2.5 0.3 1.9 3.2 2.5 pork and beans, canned 39 51 0 0 1.8 0.2 1.4 2.3 1.8 lima beans, immature, frozen, boiled 42 51 0 0 1.6 0.3 1.1 2.2 1.6 green peas, fresh/frozen, boiled 46 51 0 13 1.0 0.2 0.7 1.4 1.0 peanut butter, smooth 47 51 0 0 5.1 0.7 4.2 8.6 5.0 peanuts, dry roasted 48 51 0 0 5.3 0.7 4.1 8.1 5.2 white rice, cooked 50 51 0 47 0.7 0.1 0.5 1.1 0.7 oatmeal, quick (1-3 min), cooked 51 51 0 43 0.8 0.2 0.4 1.2 0.7 wheat cereal, farina, quick (1-3min), 52 51 16 34 0.3 0.3 0 1.4 0.3 corngrits, regular, cooked 53 51 48 3 0 0.1 0 0.4 0 corn, fresh/frozen, boiled 54 51 11 40 0.3 0.2 0 0.9 0.3 corn, canned 55 12 5 7 0.2 0.2 0 0.4 0.3 cream style corn, canned 56 39 34 5 0.1 0.2 0 0.8 0 popcorn, popped in oil 57 39 0 12 1.7 0.4 1.0 2.7 1.7 white bread 58 51 0 45 1.1 0.1 0.7 1.5 1.1 white roll 59 39 0 20 1.3 0.2 0.9 1.5 1.3 cornbread, homemade 60 51 0 51 0.6 0.1 0.4 0.9 0.6 biscuit, from refrigerated dough, baked 61 51 0 40 0.8 0.1 0.4 1.1 0.8 whole wheat bread 62 51 0 0 2.4 0.3 1.7 2.9 2.4 tortilla, flour 63 51 0 10 1.1 0.1 0.9 1.7 1.1 rye bread 64 51 0 0 1.6 0.2 1.0 2.0 1.6 blueberry muffin, commercial 65 51 0 49 0.6 0.1 0.4 1.1 0.6 saltine crackers 66 51 0 0 1.4 0.1 1.1 1.7 1.4 corn chips 67 51 0 8 1.0 0.1 0.8 1.4 1.0 pancake from mix 68 39 0 37 0.6 0.1 0.3 1.2 0.6 egg noodles, boiled 69 51 0 47 1.1 0.2 0.7 1.6 1.0
Page 46 of 211 Rev 4.1
US Food and Drug Administration — Total Diet Study — Market Baskets 1991-3 through 2005-4
Copper - Summary of Results TDS Number Number Not Number Mean Std Dev Minimum Maximum Median
TDS Food Description Food No. of Results Detected of Traces (mg/kg) (mg/kg) (mg/kg) (mg/kg) (mg/kg) macaroni, boiled 70 39 0 11 1.0 0.2 0.7 1.5 1.0 corn flakes 71 51 0 51 0.5 0.1 0.4 0.8 0.5 fruit-flavored, sweetened cereal 72 51 0 9 1.0 0.2 0.7 1.6 1.0 shredded wheat cereal 73 51 0 0 3.7 0.5 2.5 5.3 3.7 raisin bran cereal 74 51 0 0 4.3 0.5 3.4 5.7 4.3 crisped rice cereal 75 51 0 0 1.9 0.2 1.5 2.4 1.9 granola cereal 76 51 0 0 3.1 0.4 2.4 3.9 3.0 oat ring cereal 77 51 0 0 3.4 0.4 2.7 4.3 3.4 apple, red, raw 78 51 16 35 0.2 0.2 0 0.6 0.3 orange, raw 79 51 0 51 0.4 0.1 0.3 0.6 0.4 banana, raw 80 51 0 0 1.1 0.2 0.8 1.5 1.1 watermelon, raw 81 51 3 46 0.4 0.2 0 0.7 0.4 peach, raw 83 51 0 36 0.6 0.2 0.4 1.1 0.6 applesauce, bottled 84 51 4 47 0.3 0.1 0 0.6 0.3 pear, raw 85 51 0 13 0.8 0.1 0.6 1.0 0.8 strawberries, raw 86 51 1 46 0.4 0.2 0 1.6 0.4 fruit cocktail, canned in heavy syrup 87 51 1 49 0.5 0.2 0 1.9 0.5 grapes, red/green, seedless, raw 88 50 0 10 1.1 0.5 0.4 2.4 1.0 cantaloupe, raw 89 51 5 46 0.3 0.1 0 0.5 0.3 plums, raw 91 39 0 35 0.5 0.1 0.3 0.8 0.5 grapefruit, raw 92 51 1 50 0.4 0.1 0 0.7 0.4 pineapple, canned in juice 93 51 1 50 0.5 0.1 0 0.9 0.5 sweet cherries, raw 94 33 0 20 0.9 0.4 0.5 2.7 0.8 raisins, dried 95 51 0 0 3.4 0.4 2.5 4.3 3.3 prunes, dried 96 39 0 1 2.8 0.3 1.9 3.7 2.9 avocado, raw 97 51 0 13 2.2 0.6 0.7 3.5 2.2 orange juice, from frozen concentrate 98 51 1 50 0.3 0.1 0 0.5 0.4 apple juice, bottled 99 51 49 2 0 0.04 0 0.2 0 grapefruit juice, from frozen 100 51 2 49 0.3 0.1 0 0.5 0.3
Page 47 of 211 Rev 4.1
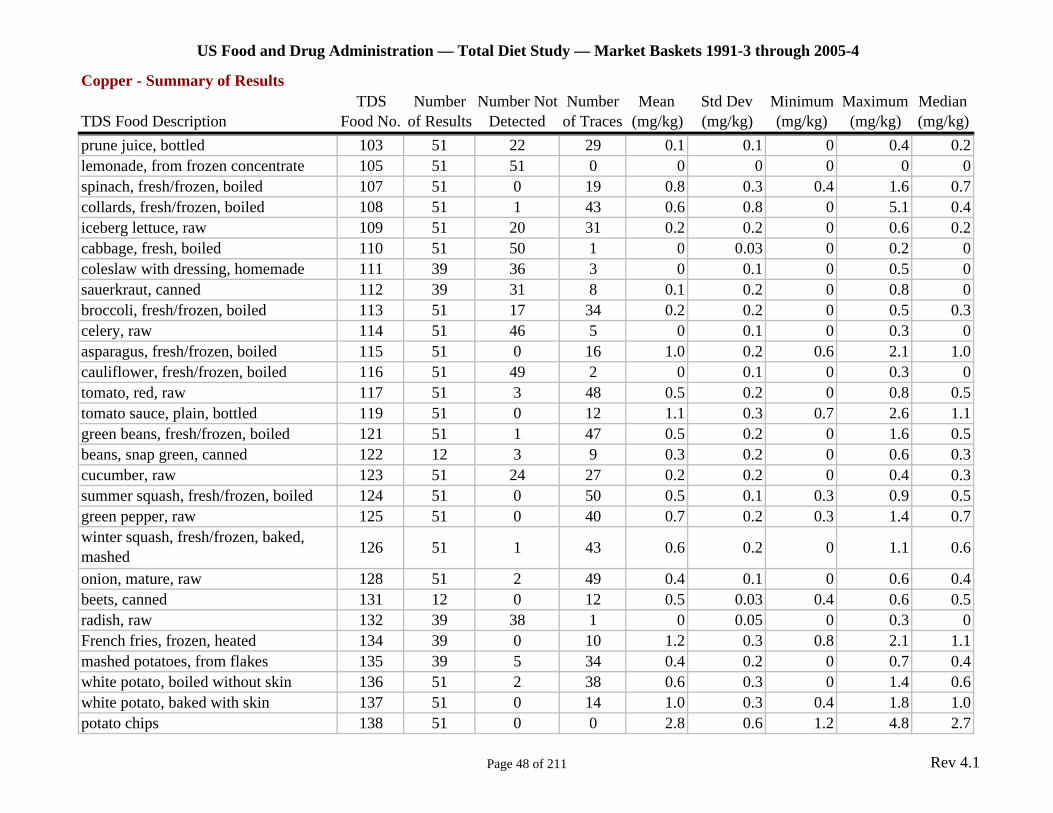
US Food and Drug Administration — Total Diet Study — Market Baskets 1991-3 through 2005-4
Copper - Summary of Results TDS Number Number Not Number Mean Std Dev Minimum Maximum Median
TDS Food Description Food No. of Results Detected of Traces (mg/kg) (mg/kg) (mg/kg) (mg/kg) (mg/kg) prune juice, bottled 103 51 22 29 0.1 0.1 0 0.4 0.2 lemonade, from frozen concentrate 105 51 51 0 0 0 0 0 0 spinach, fresh/frozen, boiled 107 51 0 19 0.8 0.3 0.4 1.6 0.7 collards, fresh/frozen, boiled 108 51 1 43 0.6 0.8 0 5.1 0.4 iceberg lettuce, raw 109 51 20 31 0.2 0.2 0 0.6 0.2 cabbage, fresh, boiled 110 51 50 1 0 0.03 0 0.2 0 coleslaw with dressing, homemade 111 39 36 3 0 0.1 0 0.5 0 sauerkraut, canned 112 39 31 8 0.1 0.2 0 0.8 0 broccoli, fresh/frozen, boiled 113 51 17 34 0.2 0.2 0 0.5 0.3 celery, raw 114 51 46 5 0 0.1 0 0.3 0 asparagus, fresh/frozen, boiled 115 51 0 16 1.0 0.2 0.6 2.1 1.0 cauliflower, fresh/frozen, boiled 116 51 49 2 0 0.1 0 0.3 0 tomato, red, raw 117 51 3 48 0.5 0.2 0 0.8 0.5 tomato sauce, plain, bottled 119 51 0 12 1.1 0.3 0.7 2.6 1.1 green beans, fresh/frozen, boiled 121 51 1 47 0.5 0.2 0 1.6 0.5 beans, snap green, canned 122 12 3 9 0.3 0.2 0 0.6 0.3 cucumber, raw 123 51 24 27 0.2 0.2 0 0.4 0.3 summer squash, fresh/frozen, boiled 124 51 0 50 0.5 0.1 0.3 0.9 0.5 green pepper, raw 125 51 0 40 0.7 0.2 0.3 1.4 0.7 winter squash, fresh/frozen, baked, mashed 126 51 1 43 0.6 0.2 0 1.1 0.6
onion, mature, raw 128 51 2 49 0.4 0.1 0 0.6 0.4 beets, canned 131 12 0 12 0.5 0.03 0.4 0.6 0.5 radish, raw 132 39 38 1 0 0.05 0 0.3 0 French fries, frozen, heated 134 39 0 10 1.2 0.3 0.8 2.1 1.1 mashed potatoes, from flakes 135 39 5 34 0.4 0.2 0 0.7 0.4 white potato, boiled without skin 136 51 2 38 0.6 0.3 0 1.4 0.6 white potato, baked with skin 137 51 0 14 1.0 0.3 0.4 1.8 1.0 potato chips 138 51 0 0 2.8 0.6 1.2 4.8 2.7
Page 48 of 211 Rev 4.1

US Food and Drug Administration — Total Diet Study — Market Baskets 1991-3 through 2005-4
Copper - Summary of Results TDS Number Number Not Number Mean Std Dev Minimum Maximum Median
TDS Food Description Food No. of Results Detected of Traces (mg/kg) (mg/kg) (mg/kg) (mg/kg) (mg/kg) scalloped potatoes, homemade 139 39 2 36 0.5 0.2 0 1.0 0.5 sweet potato, fresh, baked 140 39 0 3 1.4 0.4 0.6 2.3 1.5 spaghetti with tomato sauce and meatballs, homemade 142 51 0 13 1.0 0.1 0.6 1.3 1.0
beef stew with potatoes, carrots, and onion, homemade 143 39 0 36 0.7 0.1 0.5 1.1 0.7
chili con carne, beef and beans, canned 145 12 0 0 1.4 0.2 1.2 1.6 1.4 macaroni and cheese, from box mix 146 51 0 50 0.7 0.1 0.3 1.1 0.7 quarter-pound hamburger on bun, fast-food 147 51 0 19 0.9 0.1 0.6 1.1 0.9
meatloaf, homemade 148 51 0 48 0.7 0.1 0.4 1.0 0.7 spaghetti with tomato sauce, canned 149 39 0 38 0.6 0.1 0.4 1.2 0.6 lasagna with meat, homemade 151 39 0 10 1.0 0.1 0.8 1.5 1.0 chicken potpie, frozen, heated 152 51 0 50 0.5 0.1 0.3 0.9 0.5 chicken noodle soup, canned, condensed, prepared with water 155 51 42 9 0.1 0.2 0 0.7 0
tomato soup, canned, condensed, prepared with water 156 51 3 48 0.4 0.1 0 0.6 0.4
vegetable beef soup, canned, condensed, prepared with water 157 51 22 29 0.2 0.2 0 0.6 0.3
white sauce, homemade 160 39 33 6 0 0.1 0 0.3 0 dill cucumber pickles 161 51 8 42 0.3 0.2 0 0.9 0.4 margarine, stick, regular (salted) 162 51 51 0 0 0 0 0 0 butter, regular (salted) 164 51 51 0 0 0 0 0 0 mayonnaise, regular, bottled 166 51 51 0 0 0 0 0 0 half & half cream 167 51 51 0 0 0 0 0 0 cream substitute, frozen 168 51 51 0 0 0 0 0 0 white sugar, granulated 169 51 51 0 0 0 0 0 0
Page 49 of 211 Rev 4.1

US Food and Drug Administration — Total Diet Study — Market Baskets 1991-3 through 2005-4
Copper - Summary of Results TDS Number Number Not Number Mean Std Dev Minimum Maximum Median
TDS Food Description Food No. of Results Detected of Traces (mg/kg) (mg/kg) (mg/kg) (mg/kg) (mg/kg) pancake syrup 170 51 51 0 0 0 0 0 0 honey 172 51 51 0 0 0 0 0 0.0 tomato catsup 173 51 0 0 1.4 0.3 0.9 2.5 1.3 chocolate pudding, from instant mix 175 39 0 34 0.8 0.1 0.3 1.1 0.8 vanilla flavored light ice cream 177 50 48 2 0 0.1 0 0.4 0 chocolate cake with chocolate icing, commercial 178 51 0 5 2.3 0.5 1.5 4.0 2.1
yellow cake with white icing, prepared from cake and icing mixes 179 39 23 16 0.2 0.2 0 0.6 0
sweet roll/Danish, commercial 182 51 0 50 0.9 0.1 0.6 1.3 0.8 chocolate chip cookies, commercial 183 51 0 0 2.7 0.5 1.6 4.0 2.7 sandwich cookies with creme filling, commercial 184 51 0 9 1.9 0.8 0.5 3.6 1.9
apple pie, fresh/frozen, commercial 185 51 2 49 0.4 0.1 0 0.6 0.5 pumpkin pie, fresh/frozen, commercial 186 51 0 51 0.5 0.1 0.4 0.6 0.5 milk chocolate candy bar, plain 187 51 0 0 4.1 0.7 3.2 7.8 4.0 caramel candy 188 39 32 7 0.1 0.1 0 0.5 0 gelatin dessert, any flavor 190 51 51 0 0 0 0 0 0 cola carbonated beverage 191 51 51 0 0 0 0 0 0 fruit drink, from powder 193 51 51 0 0 0 0 0 0 low-calorie cola carbonated beverage 194 51 51 0 0 0 0 0 0 coffee, decaffeinated, from instant 196 39 38 1 0 0.04 0 0.2 0 tea, from tea bag 197 51 49 2 0 0.04 0 0.3 0 beer 198 51 51 0 0 0 0 0 0 dry table wine 199 51 44 7 0 0.1 0 0.4 0 whiskey 200 39 33 5 0 0.1 0 0.5 0 tap water 201 33 13 13 0.1 0.2 0 1.1 0.1 milk-based infant formula, high iron, ready-to-feed 202 51 0 50 0.6 0.1 0.4 1.0 0.6
Page 50 of 211 Rev 4.1
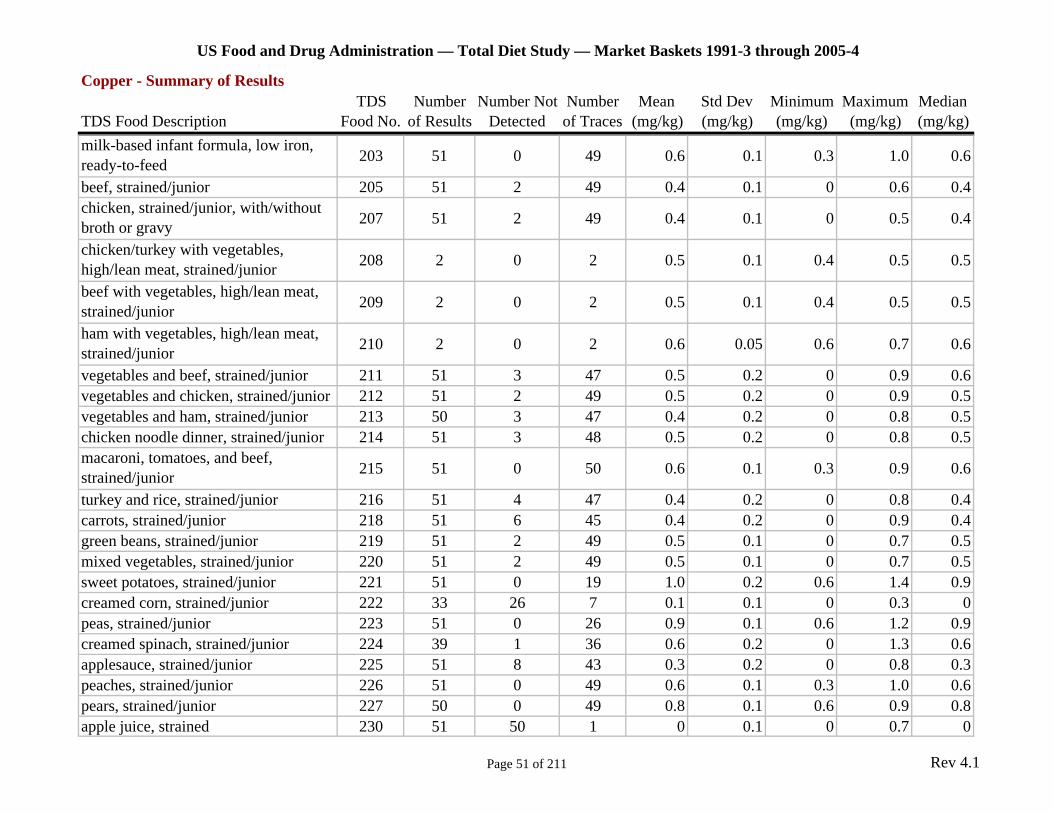
US Food and Drug Administration — Total Diet Study — Market Baskets 1991-3 through 2005-4
Copper - Summary of Results TDS Number Number Not Number Mean Std Dev Minimum Maximum Median
TDS Food Description Food No. of Results Detected of Traces (mg/kg) (mg/kg) (mg/kg) (mg/kg) (mg/kg) milk-based infant formula, low iron, ready-to-feed 203 51 0 49 0.6 0.1 0.3 1.0 0.6
beef, strained/junior 205 51 2 49 0.4 0.1 0 0.6 0.4 chicken, strained/junior, with/without broth or gravy 207 51 2 49 0.4 0.1 0 0.5 0.4
chicken/turkey with vegetables, high/lean meat, strained/junior 208 2 0 2 0.5 0.1 0.4 0.5 0.5
beef with vegetables, high/lean meat, strained/junior 209 2 0 2 0.5 0.1 0.4 0.5 0.5
ham with vegetables, high/lean meat, strained/junior 210 2 0 2 0.6 0.05 0.6 0.7 0.6
vegetables and beef, strained/junior 211 51 3 47 0.5 0.2 0 0.9 0.6 vegetables and chicken, strained/junior 212 51 2 49 0.5 0.2 0 0.9 0.5 vegetables and ham, strained/junior 213 50 3 47 0.4 0.2 0 0.8 0.5 chicken noodle dinner, strained/junior 214 51 3 48 0.5 0.2 0 0.8 0.5 macaroni, tomatoes, and beef, strained/junior 215 51 0 50 0.6 0.1 0.3 0.9 0.6
turkey and rice, strained/junior 216 51 4 47 0.4 0.2 0 0.8 0.4 carrots, strained/junior 218 51 6 45 0.4 0.2 0 0.9 0.4 green beans, strained/junior 219 51 2 49 0.5 0.1 0 0.7 0.5 mixed vegetables, strained/junior 220 51 2 49 0.5 0.1 0 0.7 0.5 sweet potatoes, strained/junior 221 51 0 19 1.0 0.2 0.6 1.4 0.9 creamed corn, strained/junior 222 33 26 7 0.1 0.1 0 0.3 0 peas, strained/junior 223 51 0 26 0.9 0.1 0.6 1.2 0.9 creamed spinach, strained/junior 224 39 1 36 0.6 0.2 0 1.3 0.6 applesauce, strained/junior 225 51 8 43 0.3 0.2 0 0.8 0.3 peaches, strained/junior 226 51 0 49 0.6 0.1 0.3 1.0 0.6 pears, strained/junior 227 50 0 49 0.8 0.1 0.6 0.9 0.8 apple juice, strained 230 51 50 1 0 0.1 0 0.7 0
Page 51 of 211 Rev 4.1
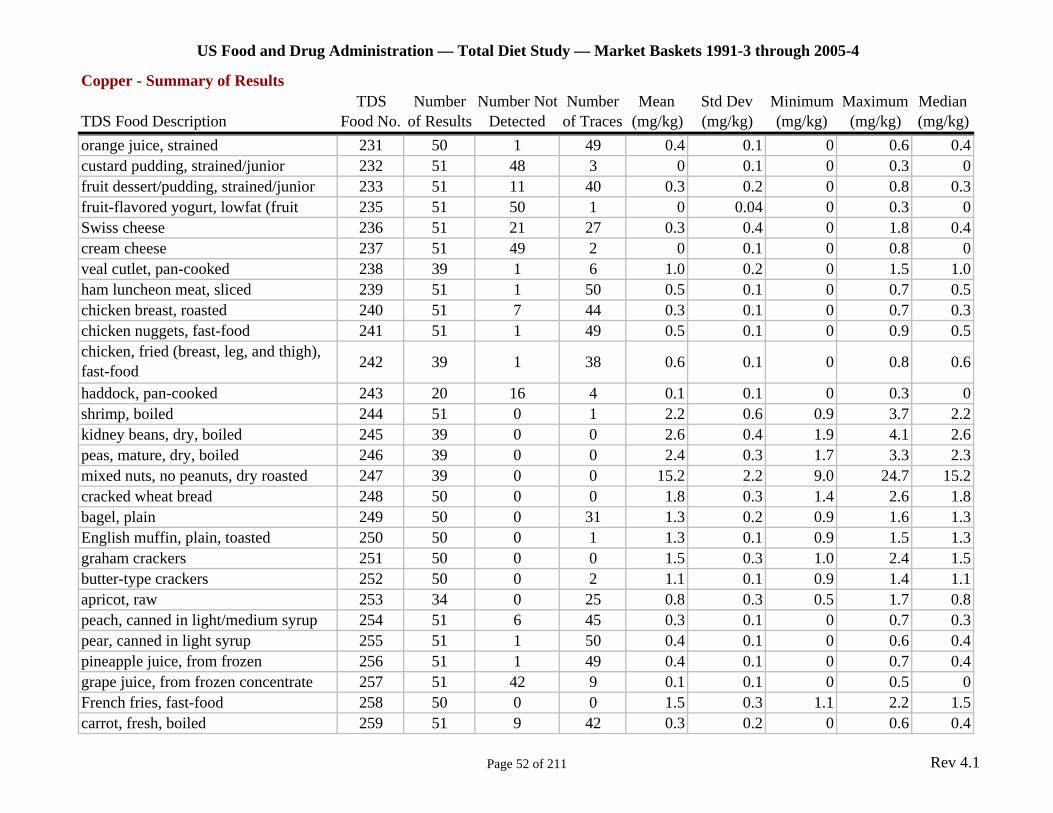
US Food and Drug Administration — Total Diet Study — Market Baskets 1991-3 through 2005-4
Copper - Summary of Results TDS Number Number Not Number Mean Std Dev Minimum Maximum Median
TDS Food Description Food No. of Results Detected of Traces (mg/kg) (mg/kg) (mg/kg) (mg/kg) (mg/kg) orange juice, strained 231 50 1 49 0.4 0.1 0 0.6 0.4 custard pudding, strained/junior 232 51 48 3 0 0.1 0 0.3 0 fruit dessert/pudding, strained/junior 233 51 11 40 0.3 0.2 0 0.8 0.3 fruit-flavored yogurt, lowfat (fruit 235 51 50 1 0 0.04 0 0.3 0 Swiss cheese 236 51 21 27 0.3 0.4 0 1.8 0.4 cream cheese 237 51 49 2 0 0.1 0 0.8 0 veal cutlet, pan-cooked 238 39 1 6 1.0 0.2 0 1.5 1.0 ham luncheon meat, sliced 239 51 1 50 0.5 0.1 0 0.7 0.5 chicken breast, roasted 240 51 7 44 0.3 0.1 0 0.7 0.3 chicken nuggets, fast-food 241 51 1 49 0.5 0.1 0 0.9 0.5 chicken, fried (breast, leg, and thigh), fast-food 242 39 1 38 0.6 0.1 0 0.8 0.6
haddock, pan-cooked 243 20 16 4 0.1 0.1 0 0.3 0 shrimp, boiled 244 51 0 1 2.2 0.6 0.9 3.7 2.2 kidney beans, dry, boiled 245 39 0 0 2.6 0.4 1.9 4.1 2.6 peas, mature, dry, boiled 246 39 0 0 2.4 0.3 1.7 3.3 2.3 mixed nuts, no peanuts, dry roasted 247 39 0 0 15.2 2.2 9.0 24.7 15.2 cracked wheat bread 248 50 0 0 1.8 0.3 1.4 2.6 1.8 bagel, plain 249 50 0 31 1.3 0.2 0.9 1.6 1.3 English muffin, plain, toasted 250 50 0 1 1.3 0.1 0.9 1.5 1.3 graham crackers 251 50 0 0 1.5 0.3 1.0 2.4 1.5 butter-type crackers 252 50 0 2 1.1 0.1 0.9 1.4 1.1 apricot, raw 253 34 0 25 0.8 0.3 0.5 1.7 0.8 peach, canned in light/medium syrup 254 51 6 45 0.3 0.1 0 0.7 0.3 pear, canned in light syrup 255 51 1 50 0.4 0.1 0 0.6 0.4 pineapple juice, from frozen 256 51 1 49 0.4 0.1 0 0.7 0.4 grape juice, from frozen concentrate 257 51 42 9 0.1 0.1 0 0.5 0 French fries, fast-food 258 50 0 0 1.5 0.3 1.1 2.2 1.5 carrot, fresh, boiled 259 51 9 42 0.3 0.2 0 0.6 0.4
Page 52 of 211 Rev 4.1
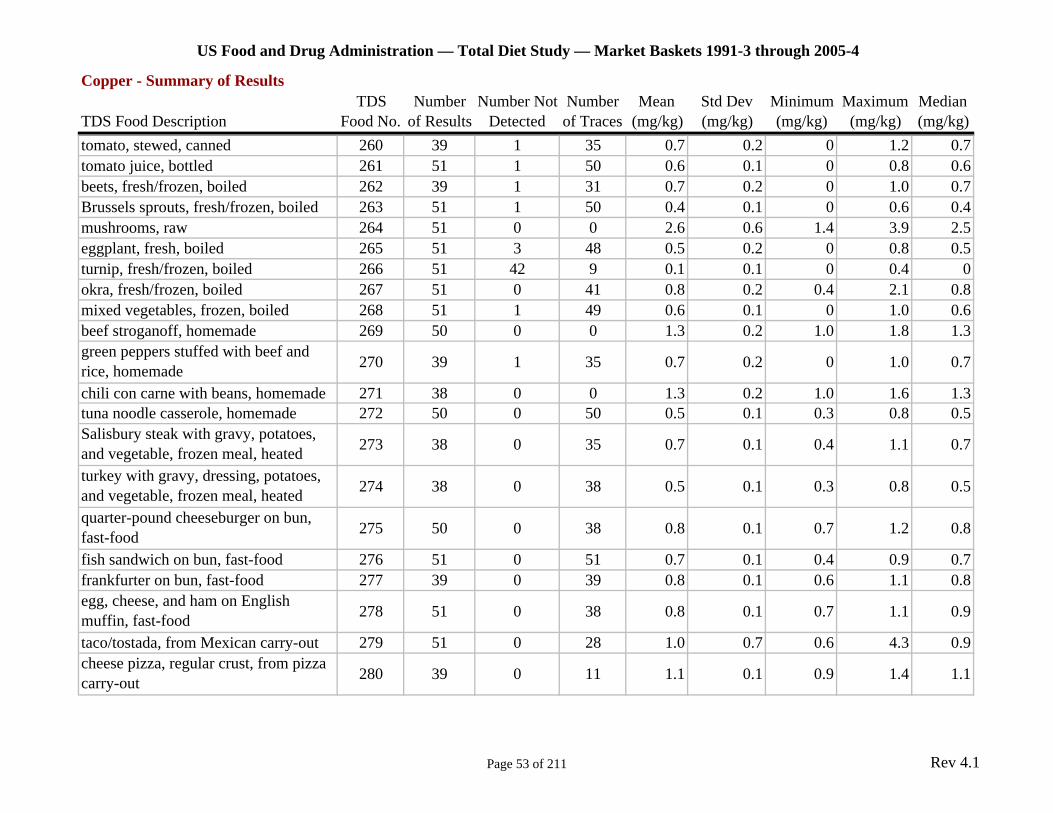
US Food and Drug Administration — Total Diet Study — Market Baskets 1991-3 through 2005-4
Copper - Summary of Results TDS Number Number Not Number Mean Std Dev Minimum Maximum Median
TDS Food Description Food No. of Results Detected of Traces (mg/kg) (mg/kg) (mg/kg) (mg/kg) (mg/kg) tomato, stewed, canned 260 39 1 35 0.7 0.2 0 1.2 0.7 tomato juice, bottled 261 51 1 50 0.6 0.1 0 0.8 0.6 beets, fresh/frozen, boiled 262 39 1 31 0.7 0.2 0 1.0 0.7 Brussels sprouts, fresh/frozen, boiled 263 51 1 50 0.4 0.1 0 0.6 0.4 mushrooms, raw 264 51 0 0 2.6 0.6 1.4 3.9 2.5 eggplant, fresh, boiled 265 51 3 48 0.5 0.2 0 0.8 0.5 turnip, fresh/frozen, boiled 266 51 42 9 0.1 0.1 0 0.4 0 okra, fresh/frozen, boiled 267 51 0 41 0.8 0.2 0.4 2.1 0.8 mixed vegetables, frozen, boiled 268 51 1 49 0.6 0.1 0 1.0 0.6 beef stroganoff, homemade 269 50 0 0 1.3 0.2 1.0 1.8 1.3 green peppers stuffed with beef and rice, homemade 270 39 1 35 0.7 0.2 0 1.0 0.7
chili con carne with beans, homemade 271 38 0 0 1.3 0.2 1.0 1.6 1.3 tuna noodle casserole, homemade 272 50 0 50 0.5 0.1 0.3 0.8 0.5 Salisbury steak with gravy, potatoes, and vegetable, frozen meal, heated 273 38 0 35 0.7 0.1 0.4 1.1 0.7
turkey with gravy, dressing, potatoes, and vegetable, frozen meal, heated 274 38 0 38 0.5 0.1 0.3 0.8 0.5
quarter-pound cheeseburger on bun, fast-food 275 50 0 38 0.8 0.1 0.7 1.2 0.8
fish sandwich on bun, fast-food 276 51 0 51 0.7 0.1 0.4 0.9 0.7 frankfurter on bun, fast-food 277 39 0 39 0.8 0.1 0.6 1.1 0.8 egg, cheese, and ham on English muffin, fast-food 278 51 0 38 0.8 0.1 0.7 1.1 0.9
taco/tostada, from Mexican carry-out 279 51 0 28 1.0 0.7 0.6 4.3 0.9 cheese pizza, regular crust, from pizza carry-out 280 39 0 11 1.1 0.1 0.9 1.4 1.1
Page 53 of 211 Rev 4.1
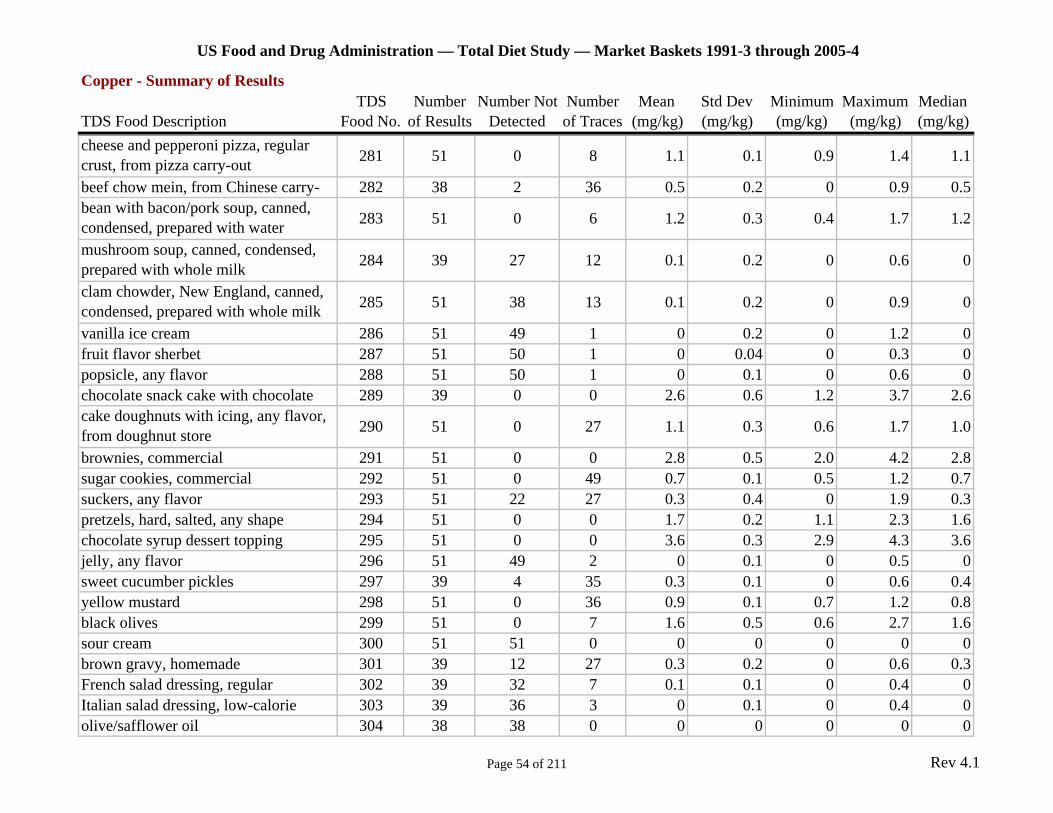
US Food and Drug Administration — Total Diet Study — Market Baskets 1991-3 through 2005-4
Copper - Summary of Results TDS Number Number Not Number Mean Std Dev Minimum Maximum Median
TDS Food Description Food No. of Results Detected of Traces (mg/kg) (mg/kg) (mg/kg) (mg/kg) (mg/kg) cheese and pepperoni pizza, regular crust, from pizza carry-out 281 51 0 8 1.1 0.1 0.9 1.4 1.1
beef chow mein, from Chinese carry- 282 38 2 36 0.5 0.2 0 0.9 0.5 bean with bacon/pork soup, canned, condensed, prepared with water 283 51 0 6 1.2 0.3 0.4 1.7 1.2
mushroom soup, canned, condensed, prepared with whole milk 284 39 27 12 0.1 0.2 0 0.6 0
clam chowder, New England, canned, condensed, prepared with whole milk 285 51 38 13 0.1 0.2 0 0.9 0
vanilla ice cream 286 51 49 1 0 0.2 0 1.2 0 fruit flavor sherbet 287 51 50 1 0 0.04 0 0.3 0 popsicle, any flavor 288 51 50 1 0 0.1 0 0.6 0 chocolate snack cake with chocolate 289 39 0 0 2.6 0.6 1.2 3.7 2.6 cake doughnuts with icing, any flavor, from doughnut store 290 51 0 27 1.1 0.3 0.6 1.7 1.0
brownies, commercial 291 51 0 0 2.8 0.5 2.0 4.2 2.8 sugar cookies, commercial 292 51 0 49 0.7 0.1 0.5 1.2 0.7 suckers, any flavor 293 51 22 27 0.3 0.4 0 1.9 0.3 pretzels, hard, salted, any shape 294 51 0 0 1.7 0.2 1.1 2.3 1.6 chocolate syrup dessert topping 295 51 0 0 3.6 0.3 2.9 4.3 3.6 jelly, any flavor 296 51 49 2 0 0.1 0 0.5 0 sweet cucumber pickles 297 39 4 35 0.3 0.1 0 0.6 0.4 yellow mustard 298 51 0 36 0.9 0.1 0.7 1.2 0.8 black olives 299 51 0 7 1.6 0.5 0.6 2.7 1.6 sour cream 300 51 51 0 0 0 0 0 0 brown gravy, homemade 301 39 12 27 0.3 0.2 0 0.6 0.3 French salad dressing, regular 302 39 32 7 0.1 0.1 0 0.4 0 Italian salad dressing, low-calorie 303 39 36 3 0 0.1 0 0.4 0 olive/safflower oil 304 38 38 0 0 0 0 0 0
Page 54 of 211 Rev 4.1
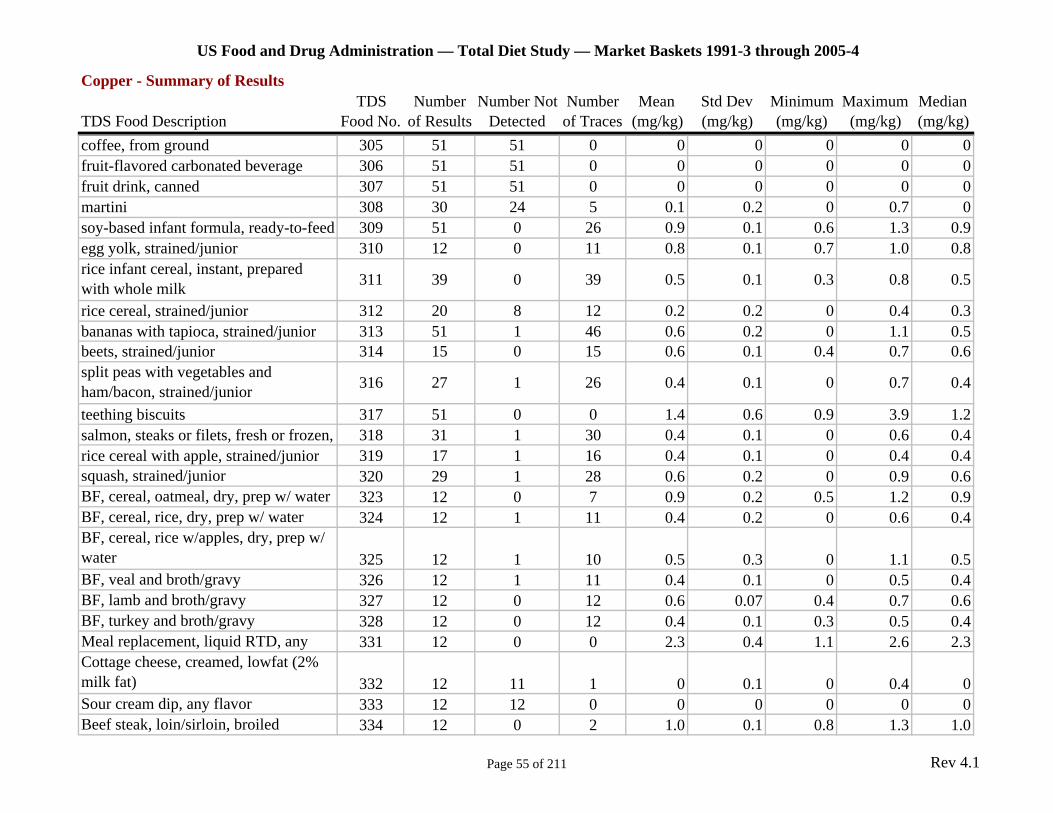
US Food and Drug Administration — Total Diet Study — Market Baskets 1991-3 through 2005-4
Copper - Summary of Results TDS Number Number Not Number Mean Std Dev Minimum Maximum Median
TDS Food Description Food No. of Results Detected of Traces (mg/kg) (mg/kg) (mg/kg) (mg/kg) (mg/kg) coffee, from ground 305 51 51 0 0 0 0 0 0 fruit-flavored carbonated beverage 306 51 51 0 0 0 0 0 0 fruit drink, canned 307 51 51 0 0 0 0 0 0 martini 308 30 24 5 0.1 0.2 0 0.7 0 soy-based infant formula, ready-to-feed 309 51 0 26 0.9 0.1 0.6 1.3 0.9 egg yolk, strained/junior 310 12 0 11 0.8 0.1 0.7 1.0 0.8 rice infant cereal, instant, prepared with whole milk 311 39 0 39 0.5 0.1 0.3 0.8 0.5
rice cereal, strained/junior 312 20 8 12 0.2 0.2 0 0.4 0.3 bananas with tapioca, strained/junior 313 51 1 46 0.6 0.2 0 1.1 0.5 beets, strained/junior 314 15 0 15 0.6 0.1 0.4 0.7 0.6 split peas with vegetables and ham/bacon, strained/junior 316 27 1 26 0.4 0.1 0 0.7 0.4
teething biscuits 317 51 0 0 1.4 0.6 0.9 3.9 1.2 salmon, steaks or filets, fresh or frozen, 318 31 1 30 0.4 0.1 0 0.6 0.4 rice cereal with apple, strained/junior 319 17 1 16 0.4 0.1 0 0.4 0.4 squash, strained/junior 320 29 1 28 0.6 0.2 0 0.9 0.6 BF, cereal, oatmeal, dry, prep w/ water 323 12 0 7 0.9 0.2 0.5 1.2 0.9 BF, cereal, rice, dry, prep w/ water 324 12 1 11 0.4 0.2 0 0.6 0.4 BF, cereal, rice w/apples, dry, prep w/ water 325 12 1 10 0.5 0.3 0 1.1 0.5 BF, veal and broth/gravy 326 12 1 11 0.4 0.1 0 0.5 0.4 BF, lamb and broth/gravy 327 12 0 12 0.6 0.07 0.4 0.7 0.6 BF, turkey and broth/gravy 328 12 0 12 0.4 0.1 0.3 0.5 0.4 Meal replacement, liquid RTD, any 331 12 0 0 2.3 0.4 1.1 2.6 2.3 Cottage cheese, creamed, lowfat (2% milk fat) 332 12 11 1 0 0.1 0 0.4 0 Sour cream dip, any flavor 333 12 12 0 0 0 0 0 0 Beef steak, loin/sirloin, broiled 334 12 0 2 1.0 0.1 0.8 1.3 1.0
Page 55 of 211 Rev 4.1
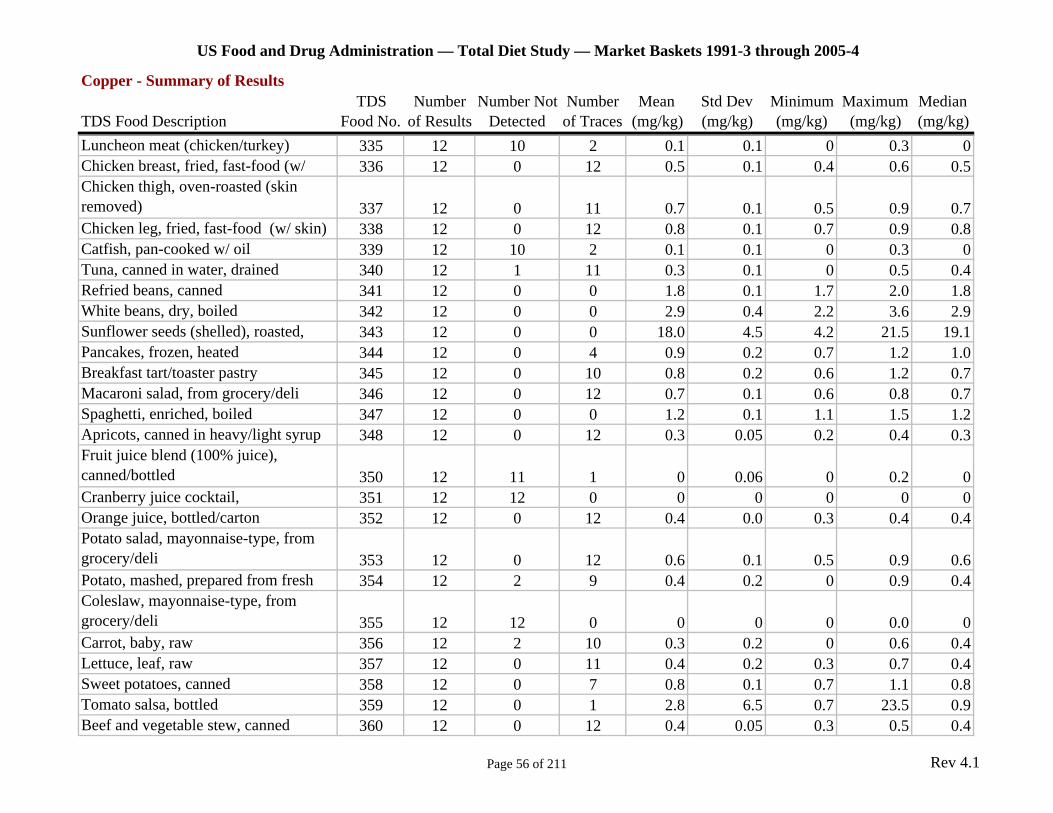
US Food and Drug Administration — Total Diet Study — Market Baskets 1991-3 through 2005-4
Copper - Summary of Results TDS Number Number Not Number Mean Std Dev Minimum Maximum Median
TDS Food Description Food No. of Results Detected of Traces (mg/kg) (mg/kg) (mg/kg) (mg/kg) (mg/kg) Luncheon meat (chicken/turkey) 335 12 10 2 0.1 0.1 0 0.3 0 Chicken breast, fried, fast-food (w/ 336 12 0 12 0.5 0.1 0.4 0.6 0.5 Chicken thigh, oven-roasted (skin removed) 337 12 0 11 0.7 0.1 0.5 0.9 0.7 Chicken leg, fried, fast-food (w/ skin) 338 12 0 12 0.8 0.1 0.7 0.9 0.8 Catfish, pan-cooked w/ oil 339 12 10 2 0.1 0.1 0 0.3 0 Tuna, canned in water, drained 340 12 1 11 0.3 0.1 0 0.5 0.4 Refried beans, canned 341 12 0 0 1.8 0.1 1.7 2.0 1.8 White beans, dry, boiled 342 12 0 0 2.9 0.4 2.2 3.6 2.9 Sunflower seeds (shelled), roasted, 343 12 0 0 18.0 4.5 4.2 21.5 19.1 Pancakes, frozen, heated 344 12 0 4 0.9 0.2 0.7 1.2 1.0 Breakfast tart/toaster pastry 345 12 0 10 0.8 0.2 0.6 1.2 0.7 Macaroni salad, from grocery/deli 346 12 0 12 0.7 0.1 0.6 0.8 0.7 Spaghetti, enriched, boiled 347 12 0 0 1.2 0.1 1.1 1.5 1.2 Apricots, canned in heavy/light syrup 348 12 0 12 0.3 0.05 0.2 0.4 0.3 Fruit juice blend (100% juice), canned/bottled 350 12 11 1 0 0.06 0 0.2 0 Cranberry juice cocktail, 351 12 12 0 0 0 0 0 0 Orange juice, bottled/carton 352 12 0 12 0.4 0.0 0.3 0.4 0.4 Potato salad, mayonnaise-type, from grocery/deli 353 12 0 12 0.6 0.1 0.5 0.9 0.6 Potato, mashed, prepared from fresh 354 12 2 9 0.4 0.2 0 0.9 0.4 Coleslaw, mayonnaise-type, from grocery/deli 355 12 12 0 0 0 0 0.0 0 Carrot, baby, raw 356 12 2 10 0.3 0.2 0 0.6 0.4 Lettuce, leaf, raw 357 12 0 11 0.4 0.2 0.3 0.7 0.4 Sweet potatoes, canned 358 12 0 7 0.8 0.1 0.7 1.1 0.8 Tomato salsa, bottled 359 12 0 1 2.8 6.5 0.7 23.5 0.9 Beef and vegetable stew, canned 360 12 0 12 0.4 0.05 0.3 0.5 0.4
Page 56 of 211 Rev 4.1
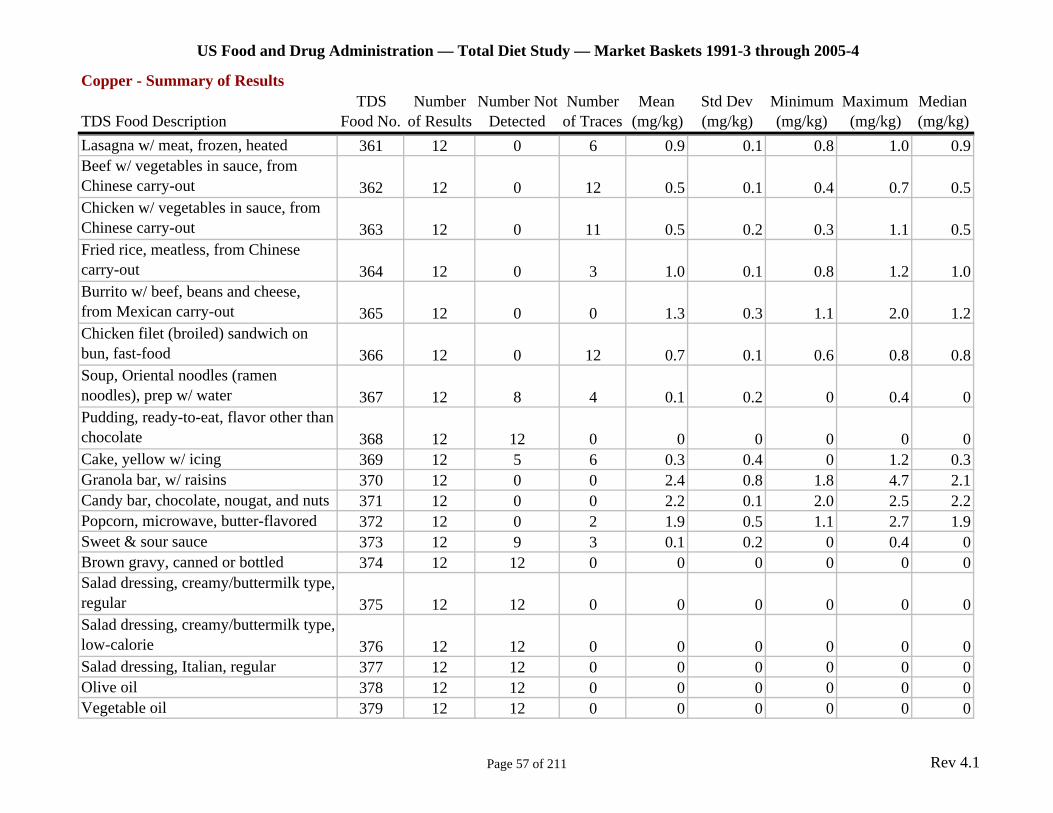
US Food and Drug Administration — Total Diet Study — Market Baskets 1991-3 through 2005-4
Copper - Summary of Results TDS Number Number Not Number Mean Std Dev Minimum Maximum Median
TDS Food Description Food No. of Results Detected of Traces (mg/kg) (mg/kg) (mg/kg) (mg/kg) (mg/kg) Lasagna w/ meat, frozen, heated 361 12 0 6 0.9 0.1 0.8 1.0 0.9 Beef w/ vegetables in sauce, from Chinese carry-out 362 12 0 12 0.5 0.1 0.4 0.7 0.5 Chicken w/ vegetables in sauce, from Chinese carry-out 363 12 0 11 0.5 0.2 0.3 1.1 0.5 Fried rice, meatless, from Chinese carry-out 364 12 0 3 1.0 0.1 0.8 1.2 1.0 Burrito w/ beef, beans and cheese, from Mexican carry-out 365 12 0 0 1.3 0.3 1.1 2.0 1.2 Chicken filet (broiled) sandwich on bun, fast-food 366 12 0 12 0.7 0.1 0.6 0.8 0.8 Soup, Oriental noodles (ramen noodles), prep w/ water 367 12 8 4 0.1 0.2 0 0.4 0 Pudding, ready-to-eat, flavor other than chocolate 368 12 12 0 0 0 0 0 0 Cake, yellow w/ icing 369 12 5 6 0.3 0.4 0 1.2 0.3 Granola bar, w/ raisins 370 12 0 0 2.4 0.8 1.8 4.7 2.1 Candy bar, chocolate, nougat, and nuts 371 12 0 0 2.2 0.1 2.0 2.5 2.2 Popcorn, microwave, butter-flavored 372 12 0 2 1.9 0.5 1.1 2.7 1.9 Sweet & sour sauce 373 12 9 3 0.1 0.2 0 0.4 0 Brown gravy, canned or bottled 374 12 12 0 0 0 0 0 0 Salad dressing, creamy/buttermilk type, regular 375 12 12 0 0 0 0 0 0 Salad dressing, creamy/buttermilk type, low-calorie 376 12 12 0 0 0 0 0 0 Salad dressing, Italian, regular 377 12 12 0 0 0 0 0 0 Olive oil 378 12 12 0 0 0 0 0 0 Vegetable oil 379 12 12 0 0 0 0 0 0
Page 57 of 211 Rev 4.1

US Food and Drug Administration — Total Diet Study — Market Baskets 1991-3 through 2005-4
Copper - Summary of Results TDS Number Number Not Number Mean Std Dev Minimum Maximum Median
TDS Food Description Food No. of Results Detected of Traces (mg/kg) (mg/kg) (mg/kg) (mg/kg) (mg/kg) Bottled drinking water (mineral/spring), not carbonated or flavored 380 12 12 0 0 0 0 0 0 Decaffeinated coffee, from ground 381 12 12 0 0 0 0 0 0 Decaffeinated tea, from tea bag 382 12 12 0 0 0 0 0 0
Page 58 of 211 Rev 4.1
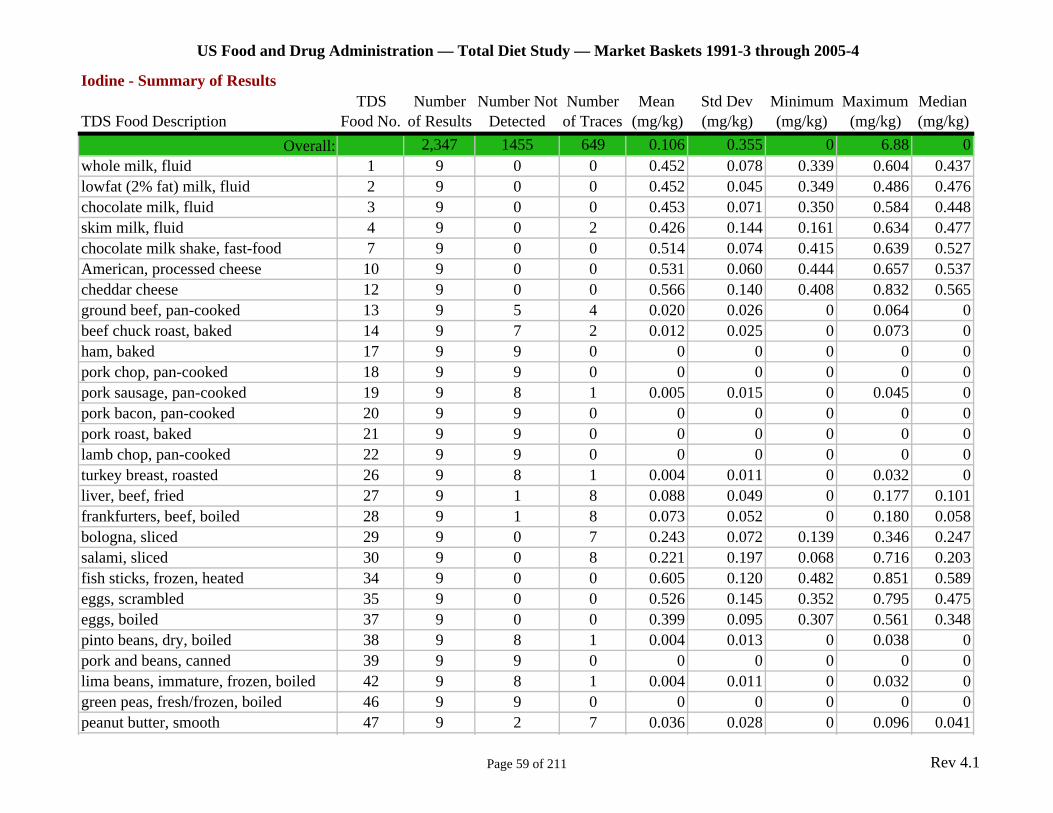
US Food and Drug Administration — Total Diet Study — Market Baskets 1991-3 through 2005-4
Iodine - Summary of Results TDS Number Number Not Number Mean Std Dev Minimum Maximum Median
TDS Food Description Food No. of Results Detected of Traces (mg/kg) (mg/kg) (mg/kg) (mg/kg) (mg/kg) Overall: 2,347 1455 649 0.106 0.355 0 6.88 0
whole milk, fluid 1 9 0 0 0.452 0.078 0.339 0.604 0.437 lowfat (2% fat) milk, fluid 2 9 0 0 0.452 0.045 0.349 0.486 0.476 chocolate milk, fluid 3 9 0 0 0.453 0.071 0.350 0.584 0.448 skim milk, fluid 4 9 0 2 0.426 0.144 0.161 0.634 0.477 chocolate milk shake, fast-food 7 9 0 0 0.514 0.074 0.415 0.639 0.527 American, processed cheese 10 9 0 0 0.531 0.060 0.444 0.657 0.537 cheddar cheese 12 9 0 0 0.566 0.140 0.408 0.832 0.565 ground beef, pan-cooked 13 9 5 4 0.020 0.026 0 0.064 0 beef chuck roast, baked 14 9 7 2 0.012 0.025 0 0.073 0 ham, baked 17 9 9 0 0 0 0 0 0 pork chop, pan-cooked 18 9 9 0 0 0 0 0 0 pork sausage, pan-cooked 19 9 8 1 0.005 0.015 0 0.045 0 pork bacon, pan-cooked 20 9 9 0 0 0 0 0 0 pork roast, baked 21 9 9 0 0 0 0 0 0 lamb chop, pan-cooked 22 9 9 0 0 0 0 0 0 turkey breast, roasted 26 9 8 1 0.004 0.011 0 0.032 0 liver, beef, fried 27 9 1 8 0.088 0.049 0 0.177 0.101 frankfurters, beef, boiled 28 9 1 8 0.073 0.052 0 0.180 0.058 bologna, sliced 29 9 0 7 0.243 0.072 0.139 0.346 0.247 salami, sliced 30 9 0 8 0.221 0.197 0.068 0.716 0.203 fish sticks, frozen, heated 34 9 0 0 0.605 0.120 0.482 0.851 0.589 eggs, scrambled 35 9 0 0 0.526 0.145 0.352 0.795 0.475 eggs, boiled 37 9 0 0 0.399 0.095 0.307 0.561 0.348 pinto beans, dry, boiled 38 9 8 1 0.004 0.013 0 0.038 0 pork and beans, canned 39 9 9 0 0 0 0 0 0 lima beans, immature, frozen, boiled 42 9 8 1 0.004 0.011 0 0.032 0 green peas, fresh/frozen, boiled 46 9 9 0 0 0 0 0 0 peanut butter, smooth 47 9 2 7 0.036 0.028 0 0.096 0.041
Page 59 of 211 Rev 4.1
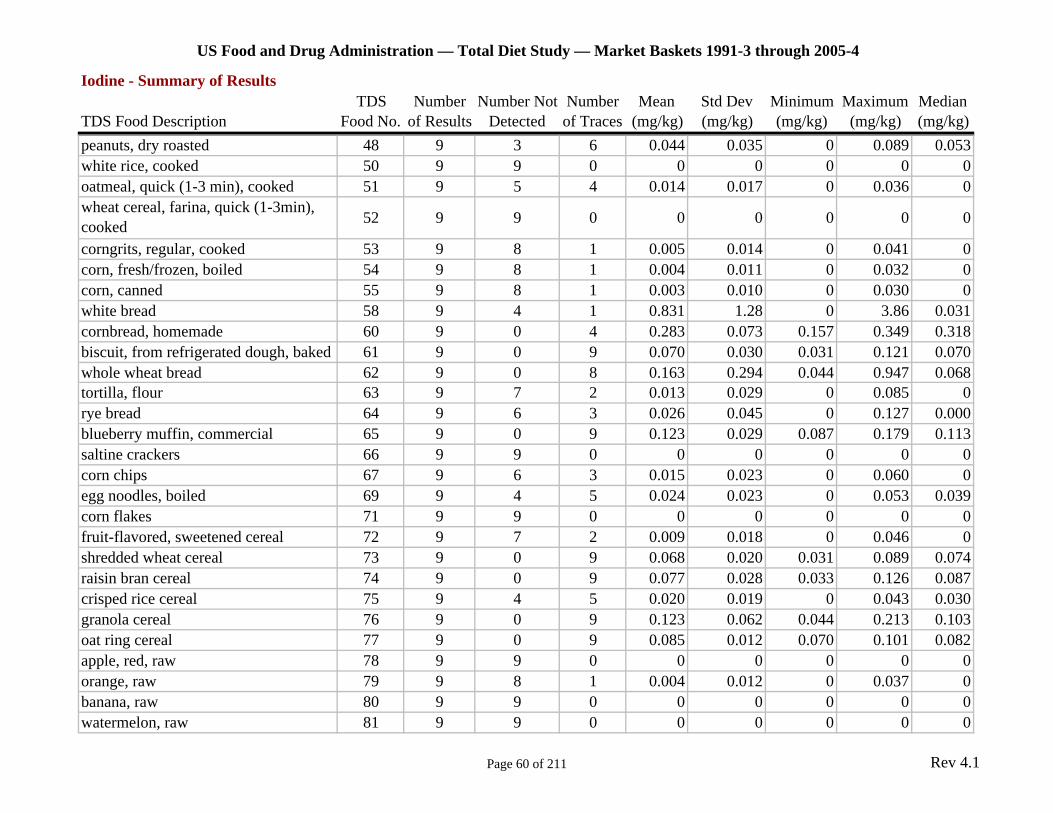
US Food and Drug Administration — Total Diet Study — Market Baskets 1991-3 through 2005-4
Iodine - Summary of Results TDS Number Number Not Number Mean Std Dev Minimum Maximum Median
TDS Food Description Food No. of Results Detected of Traces (mg/kg) (mg/kg) (mg/kg) (mg/kg) (mg/kg) peanuts, dry roasted 48 9 3 6 0.044 0.035 0 0.089 0.053 white rice, cooked 50 9 9 0 0 0 0 0 0 oatmeal, quick (1-3 min), cooked 51 9 5 4 0.014 0.017 0 0.036 0 wheat cereal, farina, quick (1-3min), cooked 52 9 9 0 0 0 0 0 0
corngrits, regular, cooked 53 9 8 1 0.005 0.014 0 0.041 0 corn, fresh/frozen, boiled 54 9 8 1 0.004 0.011 0 0.032 0 corn, canned 55 9 8 1 0.003 0.010 0 0.030 0 white bread 58 9 4 1 0.831 1.28 0 3.86 0.031 cornbread, homemade 60 9 0 4 0.283 0.073 0.157 0.349 0.318 biscuit, from refrigerated dough, baked 61 9 0 9 0.070 0.030 0.031 0.121 0.070 whole wheat bread 62 9 0 8 0.163 0.294 0.044 0.947 0.068 tortilla, flour 63 9 7 2 0.013 0.029 0 0.085 0 rye bread 64 9 6 3 0.026 0.045 0 0.127 0.000 blueberry muffin, commercial 65 9 0 9 0.123 0.029 0.087 0.179 0.113 saltine crackers 66 9 9 0 0 0 0 0 0 corn chips 67 9 6 3 0.015 0.023 0 0.060 0 egg noodles, boiled 69 9 4 5 0.024 0.023 0 0.053 0.039 corn flakes 71 9 9 0 0 0 0 0 0 fruit-flavored, sweetened cereal 72 9 7 2 0.009 0.018 0 0.046 0 shredded wheat cereal 73 9 0 9 0.068 0.020 0.031 0.089 0.074 raisin bran cereal 74 9 0 9 0.077 0.028 0.033 0.126 0.087 crisped rice cereal 75 9 4 5 0.020 0.019 0 0.043 0.030 granola cereal 76 9 0 9 0.123 0.062 0.044 0.213 0.103 oat ring cereal 77 9 0 9 0.085 0.012 0.070 0.101 0.082 apple, red, raw 78 9 9 0 0 0 0 0 0 orange, raw 79 9 8 1 0.004 0.012 0 0.037 0 banana, raw 80 9 9 0 0 0 0 0 0 watermelon, raw 81 9 9 0 0 0 0 0 0
Page 60 of 211 Rev 4.1
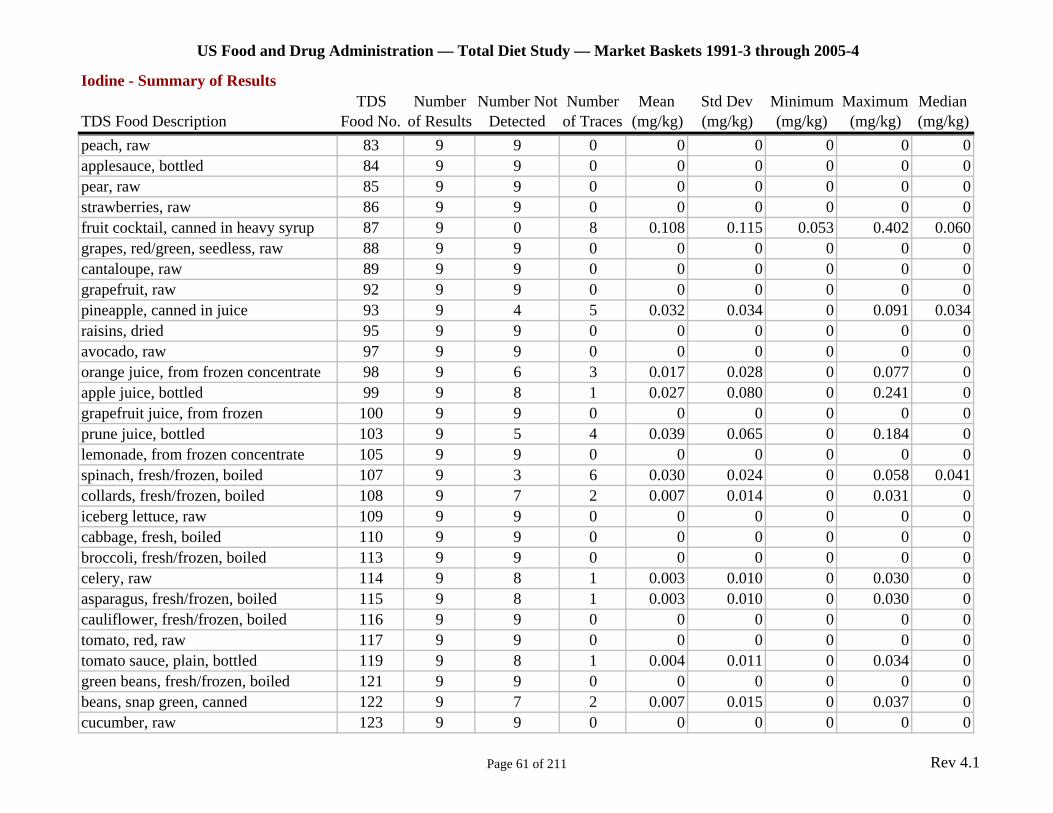
US Food and Drug Administration — Total Diet Study — Market Baskets 1991-3 through 2005-4
Iodine - Summary of Results TDS Number Number Not Number Mean Std Dev Minimum Maximum Median
TDS Food Description Food No. of Results Detected of Traces (mg/kg) (mg/kg) (mg/kg) (mg/kg) (mg/kg) peach, raw 83 9 9 0 0 0 0 0 0 applesauce, bottled 84 9 9 0 0 0 0 0 0 pear, raw 85 9 9 0 0 0 0 0 0 strawberries, raw 86 9 9 0 0 0 0 0 0 fruit cocktail, canned in heavy syrup 87 9 0 8 0.108 0.115 0.053 0.402 0.060 grapes, red/green, seedless, raw 88 9 9 0 0 0 0 0 0 cantaloupe, raw 89 9 9 0 0 0 0 0 0 grapefruit, raw 92 9 9 0 0 0 0 0 0 pineapple, canned in juice 93 9 4 5 0.032 0.034 0 0.091 0.034 raisins, dried 95 9 9 0 0 0 0 0 0 avocado, raw 97 9 9 0 0 0 0 0 0 orange juice, from frozen concentrate 98 9 6 3 0.017 0.028 0 0.077 0 apple juice, bottled 99 9 8 1 0.027 0.080 0 0.241 0 grapefruit juice, from frozen 100 9 9 0 0 0 0 0 0 prune juice, bottled 103 9 5 4 0.039 0.065 0 0.184 0 lemonade, from frozen concentrate 105 9 9 0 0 0 0 0 0 spinach, fresh/frozen, boiled 107 9 3 6 0.030 0.024 0 0.058 0.041 collards, fresh/frozen, boiled 108 9 7 2 0.007 0.014 0 0.031 0 iceberg lettuce, raw 109 9 9 0 0 0 0 0 0 cabbage, fresh, boiled 110 9 9 0 0 0 0 0 0 broccoli, fresh/frozen, boiled 113 9 9 0 0 0 0 0 0 celery, raw 114 9 8 1 0.003 0.010 0 0.030 0 asparagus, fresh/frozen, boiled 115 9 8 1 0.003 0.010 0 0.030 0 cauliflower, fresh/frozen, boiled 116 9 9 0 0 0 0 0 0 tomato, red, raw 117 9 9 0 0 0 0 0 0 tomato sauce, plain, bottled 119 9 8 1 0.004 0.011 0 0.034 0 green beans, fresh/frozen, boiled 121 9 9 0 0 0 0 0 0 beans, snap green, canned 122 9 7 2 0.007 0.015 0 0.037 0 cucumber, raw 123 9 9 0 0 0 0 0 0
Page 61 of 211 Rev 4.1
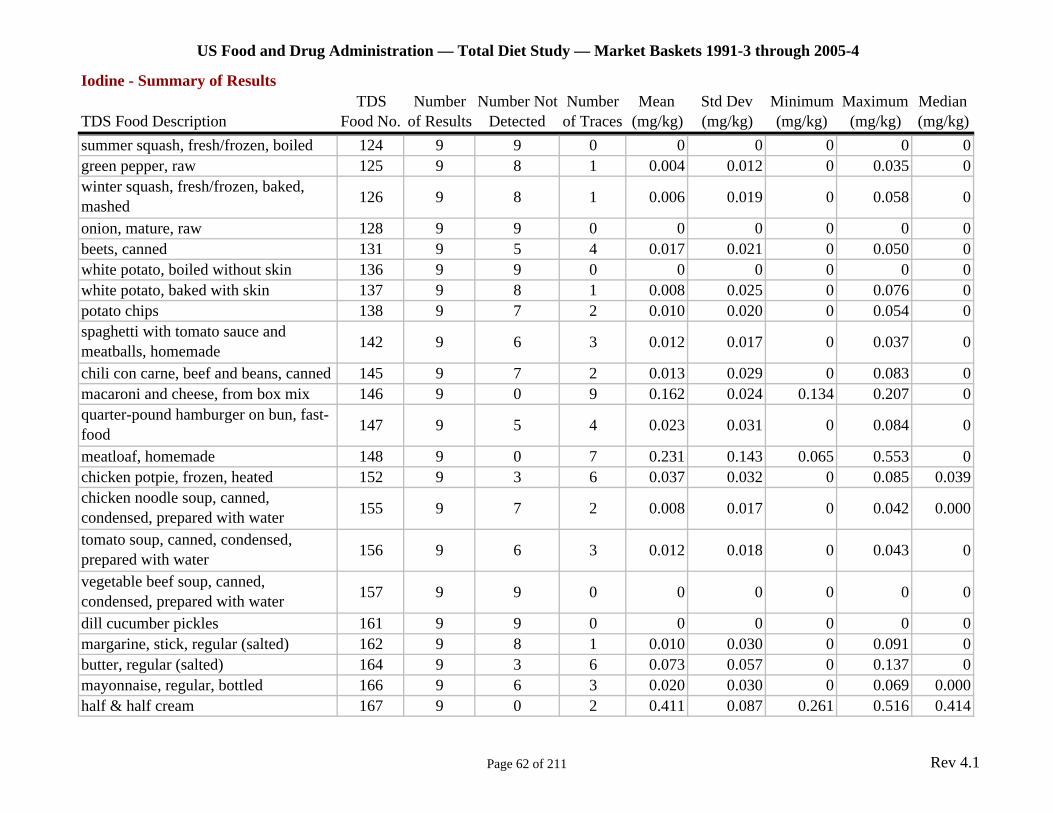
US Food and Drug Administration — Total Diet Study — Market Baskets 1991-3 through 2005-4
Iodine - Summary of Results TDS Number Number Not Number Mean Std Dev Minimum Maximum Median
TDS Food Description Food No. of Results Detected of Traces (mg/kg) (mg/kg) (mg/kg) (mg/kg) (mg/kg) summer squash, fresh/frozen, boiled 124 9 9 0 0 0 0 0 0 green pepper, raw 125 9 8 1 0.004 0.012 0 0.035 0 winter squash, fresh/frozen, baked, mashed 126 9 8 1 0.006 0.019 0 0.058 0
onion, mature, raw 128 9 9 0 0 0 0 0 0 beets, canned 131 9 5 4 0.017 0.021 0 0.050 0 white potato, boiled without skin 136 9 9 0 0 0 0 0 0 white potato, baked with skin 137 9 8 1 0.008 0.025 0 0.076 0 potato chips 138 9 7 2 0.010 0.020 0 0.054 0 spaghetti with tomato sauce and meatballs, homemade 142 9 6 3 0.012 0.017 0 0.037 0
chili con carne, beef and beans, canned 145 9 7 2 0.013 0.029 0 0.083 0 macaroni and cheese, from box mix 146 9 0 9 0.162 0.024 0.134 0.207 0 quarter-pound hamburger on bun, fast-food 147 9 5 4 0.023 0.031 0 0.084 0
meatloaf, homemade 148 9 0 7 0.231 0.143 0.065 0.553 0 chicken potpie, frozen, heated 152 9 3 6 0.037 0.032 0 0.085 0.039 chicken noodle soup, canned, condensed, prepared with water 155 9 7 2 0.008 0.017 0 0.042 0.000
tomato soup, canned, condensed, prepared with water 156 9 6 3 0.012 0.018 0 0.043 0
vegetable beef soup, canned, condensed, prepared with water 157 9 9 0 0 0 0 0 0
dill cucumber pickles 161 9 9 0 0 0 0 0 0 margarine, stick, regular (salted) 162 9 8 1 0.010 0.030 0 0.091 0 butter, regular (salted) 164 9 3 6 0.073 0.057 0 0.137 0 mayonnaise, regular, bottled 166 9 6 3 0.020 0.030 0 0.069 0.000 half & half cream 167 9 0 2 0.411 0.087 0.261 0.516 0.414
Page 62 of 211 Rev 4.1
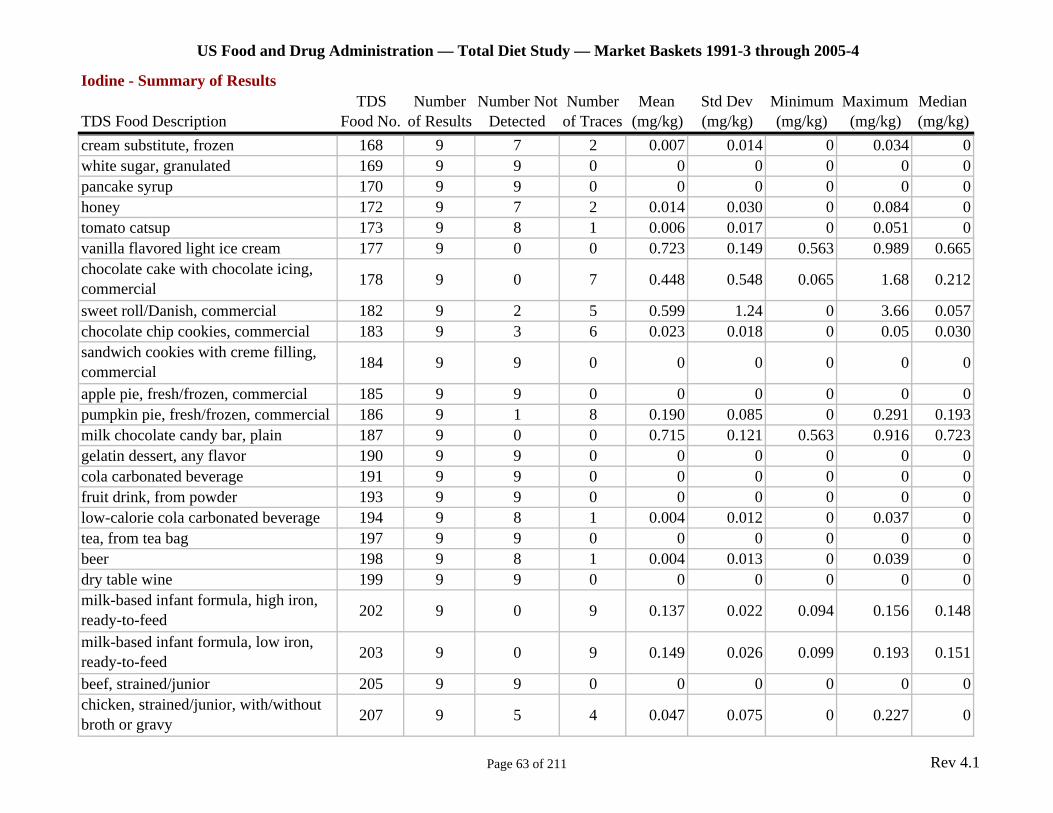
US Food and Drug Administration — Total Diet Study — Market Baskets 1991-3 through 2005-4
Iodine - Summary of Results TDS Number Number Not Number Mean Std Dev Minimum Maximum Median
TDS Food Description Food No. of Results Detected of Traces (mg/kg) (mg/kg) (mg/kg) (mg/kg) (mg/kg) cream substitute, frozen 168 9 7 2 0.007 0.014 0 0.034 0 white sugar, granulated 169 9 9 0 0 0 0 0 0 pancake syrup 170 9 9 0 0 0 0 0 0 honey 172 9 7 2 0.014 0.030 0 0.084 0 tomato catsup 173 9 8 1 0.006 0.017 0 0.051 0 vanilla flavored light ice cream 177 9 0 0 0.723 0.149 0.563 0.989 0.665 chocolate cake with chocolate icing, commercial 178 9 0 7 0.448 0.548 0.065 1.68 0.212
sweet roll/Danish, commercial 182 9 2 5 0.599 1.24 0 3.66 0.057 chocolate chip cookies, commercial 183 9 3 6 0.023 0.018 0 0.05 0.030 sandwich cookies with creme filling, commercial 184 9 9 0 0 0 0 0 0
apple pie, fresh/frozen, commercial 185 9 9 0 0 0 0 0 0 pumpkin pie, fresh/frozen, commercial 186 9 1 8 0.190 0.085 0 0.291 0.193 milk chocolate candy bar, plain 187 9 0 0 0.715 0.121 0.563 0.916 0.723 gelatin dessert, any flavor 190 9 9 0 0 0 0 0 0 cola carbonated beverage 191 9 9 0 0 0 0 0 0 fruit drink, from powder 193 9 9 0 0 0 0 0 0 low-calorie cola carbonated beverage 194 9 8 1 0.004 0.012 0 0.037 0 tea, from tea bag 197 9 9 0 0 0 0 0 0 beer 198 9 8 1 0.004 0.013 0 0.039 0 dry table wine 199 9 9 0 0 0 0 0 0 milk-based infant formula, high iron, ready-to-feed 202 9 0 9 0.137 0.022 0.094 0.156 0.148
milk-based infant formula, low iron, ready-to-feed 203 9 0 9 0.149 0.026 0.099 0.193 0.151
beef, strained/junior 205 9 9 0 0 0 0 0 0 chicken, strained/junior, with/without broth or gravy 207 9 5 4 0.047 0.075 0 0.227 0
Page 63 of 211 Rev 4.1
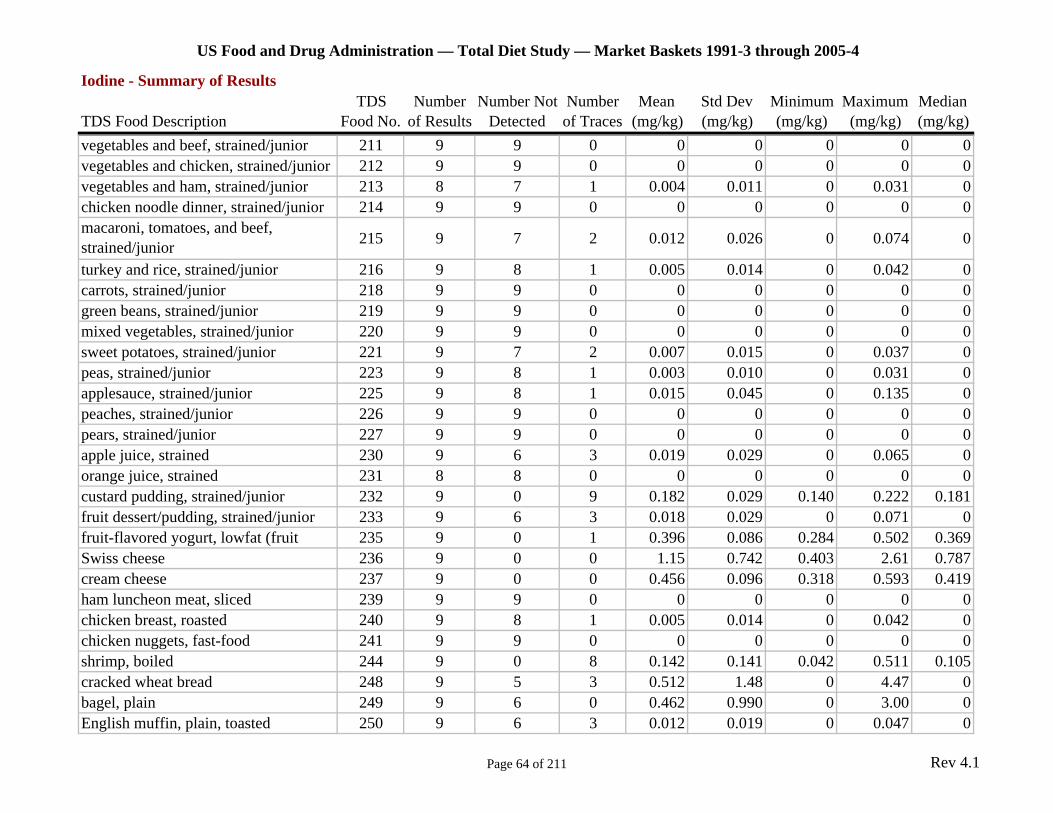
US Food and Drug Administration — Total Diet Study — Market Baskets 1991-3 through 2005-4
Iodine - Summary of Results TDS Number Number Not Number Mean Std Dev Minimum Maximum Median
TDS Food Description Food No. of Results Detected of Traces (mg/kg) (mg/kg) (mg/kg) (mg/kg) (mg/kg) vegetables and beef, strained/junior 211 9 9 0 0 0 0 0 0 vegetables and chicken, strained/junior 212 9 9 0 0 0 0 0 0 vegetables and ham, strained/junior 213 8 7 1 0.004 0.011 0 0.031 0 chicken noodle dinner, strained/junior 214 9 9 0 0 0 0 0 0 macaroni, tomatoes, and beef, strained/junior 215 9 7 2 0.012 0.026 0 0.074 0
turkey and rice, strained/junior 216 9 8 1 0.005 0.014 0 0.042 0 carrots, strained/junior 218 9 9 0 0 0 0 0 0 green beans, strained/junior 219 9 9 0 0 0 0 0 0 mixed vegetables, strained/junior 220 9 9 0 0 0 0 0 0 sweet potatoes, strained/junior 221 9 7 2 0.007 0.015 0 0.037 0 peas, strained/junior 223 9 8 1 0.003 0.010 0 0.031 0 applesauce, strained/junior 225 9 8 1 0.015 0.045 0 0.135 0 peaches, strained/junior 226 9 9 0 0 0 0 0 0 pears, strained/junior 227 9 9 0 0 0 0 0 0 apple juice, strained 230 9 6 3 0.019 0.029 0 0.065 0 orange juice, strained 231 8 8 0 0 0 0 0 0 custard pudding, strained/junior 232 9 0 9 0.182 0.029 0.140 0.222 0.181 fruit dessert/pudding, strained/junior 233 9 6 3 0.018 0.029 0 0.071 0 fruit-flavored yogurt, lowfat (fruit 235 9 0 1 0.396 0.086 0.284 0.502 0.369 Swiss cheese 236 9 0 0 1.15 0.742 0.403 2.61 0.787 cream cheese 237 9 0 0 0.456 0.096 0.318 0.593 0.419 ham luncheon meat, sliced 239 9 9 0 0 0 0 0 0 chicken breast, roasted 240 9 8 1 0.005 0.014 0 0.042 0 chicken nuggets, fast-food 241 9 9 0 0 0 0 0 0 shrimp, boiled 244 9 0 8 0.142 0.141 0.042 0.511 0.105 cracked wheat bread 248 9 5 3 0.512 1.48 0 4.47 0 bagel, plain 249 9 6 0 0.462 0.990 0 3.00 0 English muffin, plain, toasted 250 9 6 3 0.012 0.019 0 0.047 0
Page 64 of 211 Rev 4.1
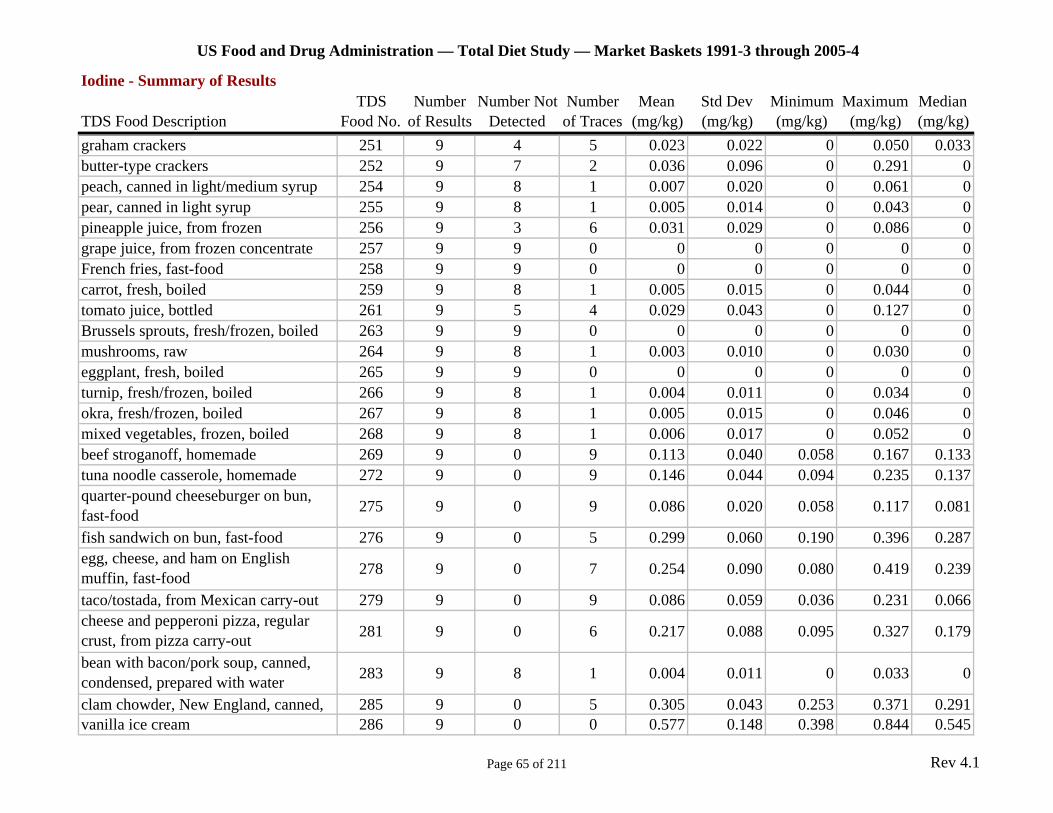
US Food and Drug Administration — Total Diet Study — Market Baskets 1991-3 through 2005-4
Iodine - Summary of Results TDS Number Number Not Number Mean Std Dev Minimum Maximum Median
TDS Food Description Food No. of Results Detected of Traces (mg/kg) (mg/kg) (mg/kg) (mg/kg) (mg/kg) graham crackers 251 9 4 5 0.023 0.022 0 0.050 0.033 butter-type crackers 252 9 7 2 0.036 0.096 0 0.291 0 peach, canned in light/medium syrup 254 9 8 1 0.007 0.020 0 0.061 0 pear, canned in light syrup 255 9 8 1 0.005 0.014 0 0.043 0 pineapple juice, from frozen 256 9 3 6 0.031 0.029 0 0.086 0 grape juice, from frozen concentrate 257 9 9 0 0 0 0 0 0 French fries, fast-food 258 9 9 0 0 0 0 0 0 carrot, fresh, boiled 259 9 8 1 0.005 0.015 0 0.044 0 tomato juice, bottled 261 9 5 4 0.029 0.043 0 0.127 0 Brussels sprouts, fresh/frozen, boiled 263 9 9 0 0 0 0 0 0 mushrooms, raw 264 9 8 1 0.003 0.010 0 0.030 0 eggplant, fresh, boiled 265 9 9 0 0 0 0 0 0 turnip, fresh/frozen, boiled 266 9 8 1 0.004 0.011 0 0.034 0 okra, fresh/frozen, boiled 267 9 8 1 0.005 0.015 0 0.046 0 mixed vegetables, frozen, boiled 268 9 8 1 0.006 0.017 0 0.052 0 beef stroganoff, homemade 269 9 0 9 0.113 0.040 0.058 0.167 0.133 tuna noodle casserole, homemade 272 9 0 9 0.146 0.044 0.094 0.235 0.137 quarter-pound cheeseburger on bun, fast-food 275 9 0 9 0.086 0.020 0.058 0.117 0.081
fish sandwich on bun, fast-food 276 9 0 5 0.299 0.060 0.190 0.396 0.287 egg, cheese, and ham on English muffin, fast-food 278 9 0 7 0.254 0.090 0.080 0.419 0.239
taco/tostada, from Mexican carry-out 279 9 0 9 0.086 0.059 0.036 0.231 0.066 cheese and pepperoni pizza, regular crust, from pizza carry-out 281 9 0 6 0.217 0.088 0.095 0.327 0.179
bean with bacon/pork soup, canned, condensed, prepared with water 283 9 8 1 0.004 0.011 0 0.033 0
clam chowder, New England, canned, 285 9 0 5 0.305 0.043 0.253 0.371 0.291 vanilla ice cream 286 9 0 0 0.577 0.148 0.398 0.844 0.545
Page 65 of 211 Rev 4.1
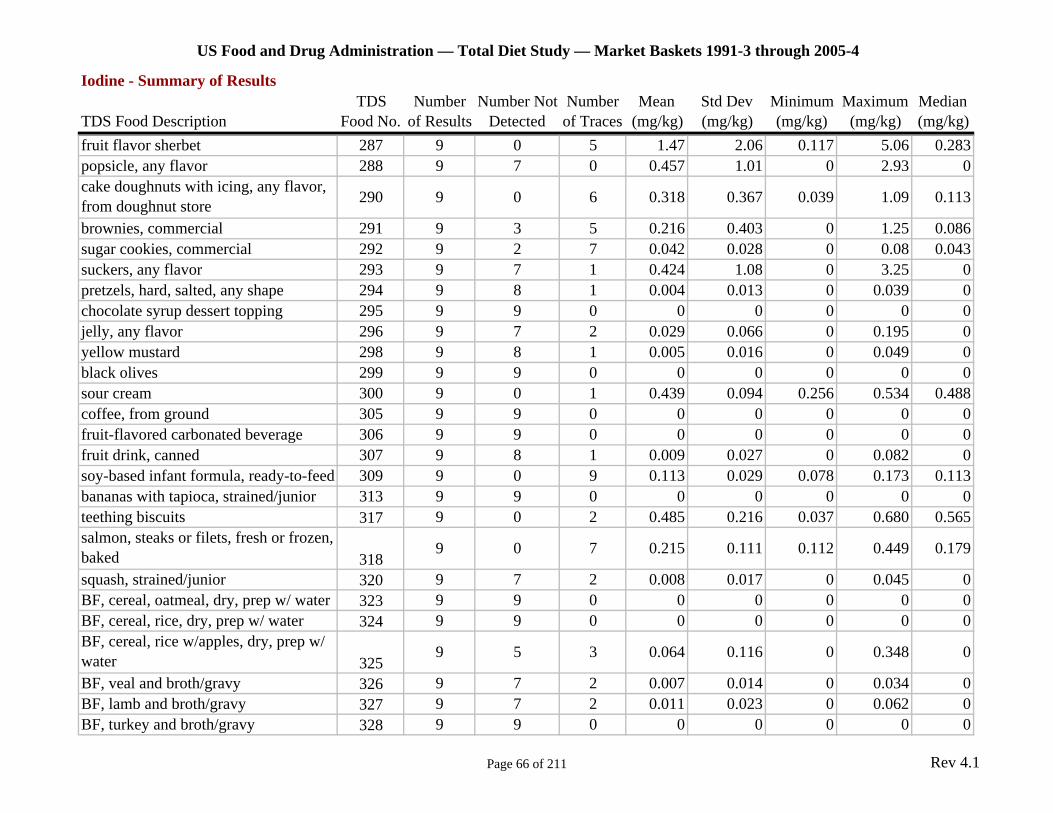
US Food and Drug Administration — Total Diet Study — Market Baskets 1991-3 through 2005-4
Iodine - Summary of Results TDS Number Number Not Number Mean Std Dev Minimum Maximum Median
TDS Food Description Food No. of Results Detected of Traces (mg/kg) (mg/kg) (mg/kg) (mg/kg) (mg/kg) fruit flavor sherbet 287 9 0 5 1.47 2.06 0.117 5.06 0.283 popsicle, any flavor 288 9 7 0 0.457 1.01 0 2.93 0 cake doughnuts with icing, any flavor, from doughnut store 290 9 0 6 0.318 0.367 0.039 1.09 0.113
brownies, commercial 291 9 3 5 0.216 0.403 0 1.25 0.086 sugar cookies, commercial 292 9 2 7 0.042 0.028 0 0.08 0.043 suckers, any flavor 293 9 7 1 0.424 1.08 0 3.25 0 pretzels, hard, salted, any shape 294 9 8 1 0.004 0.013 0 0.039 0 chocolate syrup dessert topping 295 9 9 0 0 0 0 0 0 jelly, any flavor 296 9 7 2 0.029 0.066 0 0.195 0 yellow mustard 298 9 8 1 0.005 0.016 0 0.049 0 black olives 299 9 9 0 0 0 0 0 0 sour cream 300 9 0 1 0.439 0.094 0.256 0.534 0.488 coffee, from ground 305 9 9 0 0 0 0 0 0 fruit-flavored carbonated beverage 306 9 9 0 0 0 0 0 0 fruit drink, canned 307 9 8 1 0.009 0.027 0 0.082 0 soy-based infant formula, ready-to-feed 309 9 0 9 0.113 0.029 0.078 0.173 0.113 bananas with tapioca, strained/junior 313 9 9 0 0 0 0 0 0 teething biscuits 317 9 0 2 0.485 0.216 0.037 0.680 0.565 salmon, steaks or filets, fresh or frozen, baked 318
9 0 7 0.215 0.111 0.112 0.449 0.179
squash, strained/junior 320 9 7 2 0.008 0.017 0 0.045 0 BF, cereal, oatmeal, dry, prep w/ water 323 9 9 0 0 0 0 0 0 BF, cereal, rice, dry, prep w/ water 324 9 9 0 0 0 0 0 0 BF, cereal, rice w/apples, dry, prep w/ water 325
9 5 3 0.064 0.116 0 0.348 0
BF, veal and broth/gravy 326 9 7 2 0.007 0.014 0 0.034 0 BF, lamb and broth/gravy 327 9 7 2 0.011 0.023 0 0.062 0 BF, turkey and broth/gravy 328 9 9 0 0 0 0 0 0
Page 66 of 211 Rev 4.1
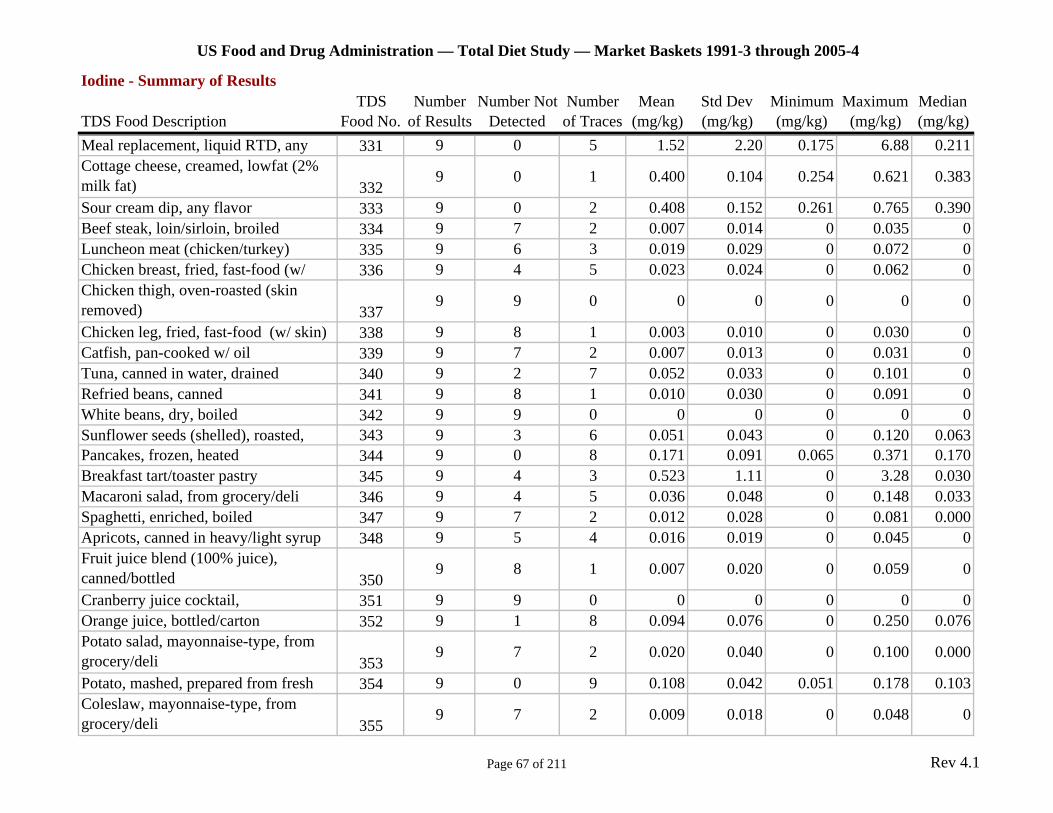
US Food and Drug Administration — Total Diet Study — Market Baskets 1991-3 through 2005-4
Iodine - Summary of Results TDS Number Number Not Number Mean Std Dev Minimum Maximum Median
TDS Food Description Food No. of Results Detected of Traces (mg/kg) (mg/kg) (mg/kg) (mg/kg) (mg/kg) Meal replacement, liquid RTD, any 331 9 0 5 1.52 2.20 0.175 6.88 0.211 Cottage cheese, creamed, lowfat (2% milk fat) 332
9 0 1 0.400 0.104 0.254 0.621 0.383
Sour cream dip, any flavor 333 9 0 2 0.408 0.152 0.261 0.765 0.390 Beef steak, loin/sirloin, broiled 334 9 7 2 0.007 0.014 0 0.035 0 Luncheon meat (chicken/turkey) 335 9 6 3 0.019 0.029 0 0.072 0 Chicken breast, fried, fast-food (w/ 336 9 4 5 0.023 0.024 0 0.062 0 Chicken thigh, oven-roasted (skin removed) 337
9 9 0 0 0 0 0 0
Chicken leg, fried, fast-food (w/ skin) 338 9 8 1 0.003 0.010 0 0.030 0 Catfish, pan-cooked w/ oil 339 9 7 2 0.007 0.013 0 0.031 0 Tuna, canned in water, drained 340 9 2 7 0.052 0.033 0 0.101 0 Refried beans, canned 341 9 8 1 0.010 0.030 0 0.091 0 White beans, dry, boiled 342 9 9 0 0 0 0 0 0 Sunflower seeds (shelled), roasted, 343 9 3 6 0.051 0.043 0 0.120 0.063 Pancakes, frozen, heated 344 9 0 8 0.171 0.091 0.065 0.371 0.170 Breakfast tart/toaster pastry 345 9 4 3 0.523 1.11 0 3.28 0.030 Macaroni salad, from grocery/deli 346 9 4 5 0.036 0.048 0 0.148 0.033 Spaghetti, enriched, boiled 347 9 7 2 0.012 0.028 0 0.081 0.000 Apricots, canned in heavy/light syrup 348 9 5 4 0.016 0.019 0 0.045 0 Fruit juice blend (100% juice), canned/bottled 350
9 8 1 0.007 0.020 0 0.059 0
Cranberry juice cocktail, 351 9 9 0 0 0 0 0 0 Orange juice, bottled/carton 352 9 1 8 0.094 0.076 0 0.250 0.076 Potato salad, mayonnaise-type, from grocery/deli 353
9 7 2 0.020 0.040 0 0.100 0.000
Potato, mashed, prepared from fresh 354 9 0 9 0.108 0.042 0.051 0.178 0.103 Coleslaw, mayonnaise-type, from grocery/deli 355
9 7 2 0.009 0.018 0 0.048 0
Page 67 of 211 Rev 4.1
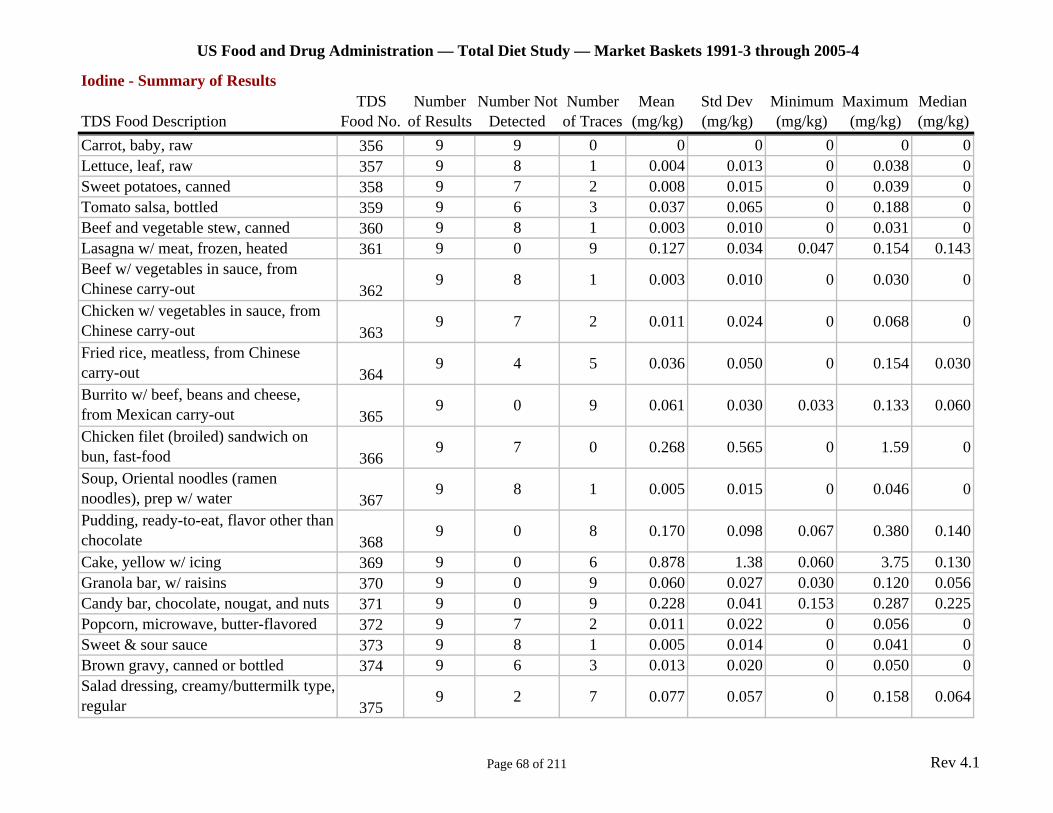
US Food and Drug Administration — Total Diet Study — Market Baskets 1991-3 through 2005-4
Iodine - Summary of Results TDS Number Number Not Number Mean Std Dev Minimum Maximum Median
TDS Food Description Food No. of Results Detected of Traces (mg/kg) (mg/kg) (mg/kg) (mg/kg) (mg/kg) Carrot, baby, raw 356 9 9 0 0 0 0 0 0 Lettuce, leaf, raw 357 9 8 1 0.004 0.013 0 0.038 0 Sweet potatoes, canned 358 9 7 2 0.008 0.015 0 0.039 0 Tomato salsa, bottled 359 9 6 3 0.037 0.065 0 0.188 0 Beef and vegetable stew, canned 360 9 8 1 0.003 0.010 0 0.031 0 Lasagna w/ meat, frozen, heated 361 9 0 9 0.127 0.034 0.047 0.154 0.143 Beef w/ vegetables in sauce, from Chinese carry-out 362
9 8 1 0.003 0.010 0 0.030 0
Chicken w/ vegetables in sauce, from Chinese carry-out 363
9 7 2 0.011 0.024 0 0.068 0
Fried rice, meatless, from Chinese carry-out 364
9 4 5 0.036 0.050 0 0.154 0.030
Burrito w/ beef, beans and cheese, from Mexican carry-out 365
9 0 9 0.061 0.030 0.033 0.133 0.060
Chicken filet (broiled) sandwich on bun, fast-food 366
9 7 0 0.268 0.565 0 1.59 0
Soup, Oriental noodles (ramen noodles), prep w/ water 367
9 8 1 0.005 0.015 0 0.046 0
Pudding, ready-to-eat, flavor other than chocolate 368
9 0 8 0.170 0.098 0.067 0.380 0.140
Cake, yellow w/ icing 369 9 0 6 0.878 1.38 0.060 3.75 0.130 Granola bar, w/ raisins 370 9 0 9 0.060 0.027 0.030 0.120 0.056 Candy bar, chocolate, nougat, and nuts 371 9 0 9 0.228 0.041 0.153 0.287 0.225 Popcorn, microwave, butter-flavored 372 9 7 2 0.011 0.022 0 0.056 0 Sweet & sour sauce 373 9 8 1 0.005 0.014 0 0.041 0 Brown gravy, canned or bottled 374 9 6 3 0.013 0.020 0 0.050 0 Salad dressing, creamy/buttermilk type, regular 375
9 2 7 0.077 0.057 0 0.158 0.064
Page 68 of 211 Rev 4.1
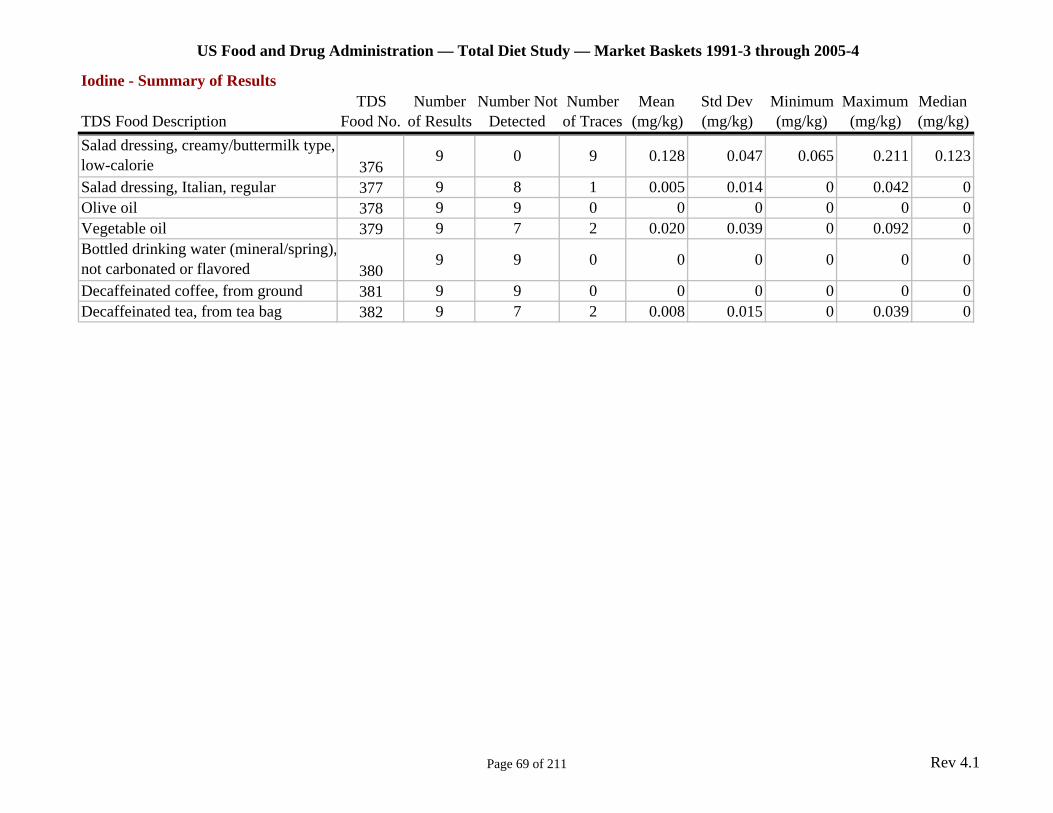
US Food and Drug Administration — Total Diet Study — Market Baskets 1991-3 through 2005-4
Iodine - Summary of Results TDS Number Number Not Number Mean Std Dev Minimum Maximum Median
TDS Food Description Food No. of Results Detected of Traces (mg/kg) (mg/kg) (mg/kg) (mg/kg) (mg/kg) Salad dressing, creamy/buttermilk type, low-calorie 376
9 0 9 0.128 0.047 0.065 0.211 0.123
Salad dressing, Italian, regular 377 9 8 1 0.005 0.014 0 0.042 0 Olive oil 378 9 9 0 0 0 0 0 0 Vegetable oil 379 9 7 2 0.020 0.039 0 0.092 0 Bottled drinking water (mineral/spring), not carbonated or flavored 380
9 9 0 0 0 0 0 0
Decaffeinated coffee, from ground 381 9 9 0 0 0 0 0 0 Decaffeinated tea, from tea bag 382 9 7 2 0.008 0.015 0 0.039 0
Page 69 of 211 Rev 4.1
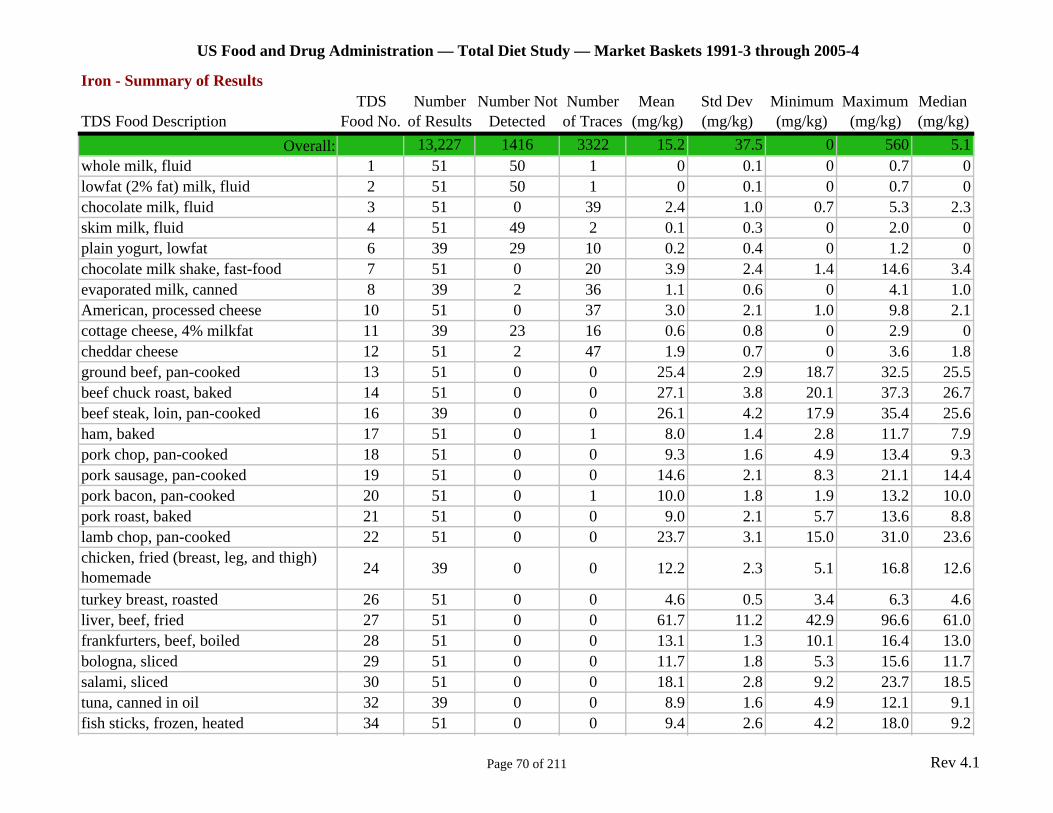
US Food and Drug Administration — Total Diet Study — Market Baskets 1991-3 through 2005-4
Iron - Summary of Results TDS Number Number Not Number Mean Std Dev Minimum Maximum Median
TDS Food Description Food No. of Results Detected of Traces (mg/kg) (mg/kg) (mg/kg) (mg/kg) (mg/kg) Overall: 13,227 1416 3322 15.2 37.5 0 560 5.1
whole milk, fluid 1 51 50 1 0 0.1 0 0.7 0 lowfat (2% fat) milk, fluid 2 51 50 1 0 0.1 0 0.7 0 chocolate milk, fluid 3 51 0 39 2.4 1.0 0.7 5.3 2.3 skim milk, fluid 4 51 49 2 0.1 0.3 0 2.0 0 plain yogurt, lowfat 6 39 29 10 0.2 0.4 0 1.2 0 chocolate milk shake, fast-food 7 51 0 20 3.9 2.4 1.4 14.6 3.4 evaporated milk, canned 8 39 2 36 1.1 0.6 0 4.1 1.0 American, processed cheese 10 51 0 37 3.0 2.1 1.0 9.8 2.1 cottage cheese, 4% milkfat 11 39 23 16 0.6 0.8 0 2.9 0 cheddar cheese 12 51 2 47 1.9 0.7 0 3.6 1.8 ground beef, pan-cooked 13 51 0 0 25.4 2.9 18.7 32.5 25.5 beef chuck roast, baked 14 51 0 0 27.1 3.8 20.1 37.3 26.7 beef steak, loin, pan-cooked 16 39 0 0 26.1 4.2 17.9 35.4 25.6 ham, baked 17 51 0 1 8.0 1.4 2.8 11.7 7.9 pork chop, pan-cooked 18 51 0 0 9.3 1.6 4.9 13.4 9.3 pork sausage, pan-cooked 19 51 0 0 14.6 2.1 8.3 21.1 14.4 pork bacon, pan-cooked 20 51 0 1 10.0 1.8 1.9 13.2 10.0 pork roast, baked 21 51 0 0 9.0 2.1 5.7 13.6 8.8 lamb chop, pan-cooked 22 51 0 0 23.7 3.1 15.0 31.0 23.6 chicken, fried (breast, leg, and thigh) homemade 24 39 0 0 12.2 2.3 5.1 16.8 12.6
turkey breast, roasted 26 51 0 0 4.6 0.5 3.4 6.3 4.6 liver, beef, fried 27 51 0 0 61.7 11.2 42.9 96.6 61.0 frankfurters, beef, boiled 28 51 0 0 13.1 1.3 10.1 16.4 13.0 bologna, sliced 29 51 0 0 11.7 1.8 5.3 15.6 11.7 salami, sliced 30 51 0 0 18.1 2.8 9.2 23.7 18.5 tuna, canned in oil 32 39 0 0 8.9 1.6 4.9 12.1 9.1 fish sticks, frozen, heated 34 51 0 0 9.4 2.6 4.2 18.0 9.2
Page 70 of 211 Rev 4.1
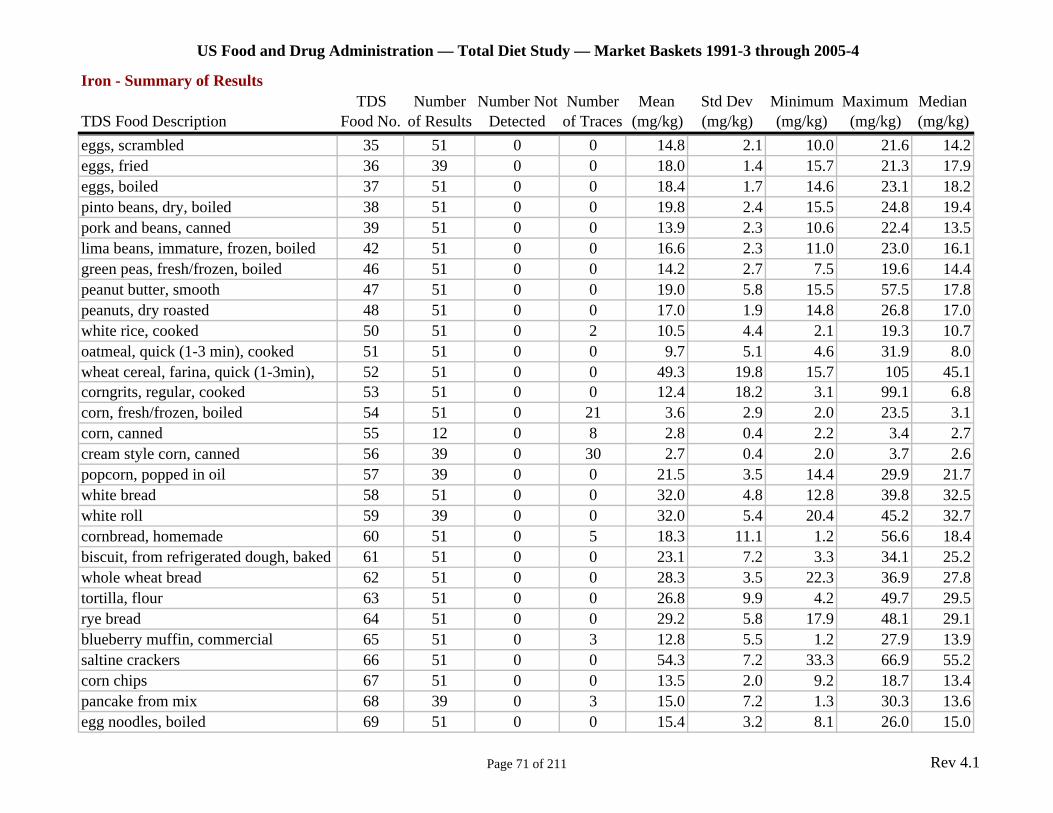
US Food and Drug Administration — Total Diet Study — Market Baskets 1991-3 through 2005-4
Iron - Summary of Results TDS Number Number Not Number Mean Std Dev Minimum Maximum Median
TDS Food Description Food No. of Results Detected of Traces (mg/kg) (mg/kg) (mg/kg) (mg/kg) (mg/kg) eggs, scrambled 35 51 0 0 14.8 2.1 10.0 21.6 14.2 eggs, fried 36 39 0 0 18.0 1.4 15.7 21.3 17.9 eggs, boiled 37 51 0 0 18.4 1.7 14.6 23.1 18.2 pinto beans, dry, boiled 38 51 0 0 19.8 2.4 15.5 24.8 19.4 pork and beans, canned 39 51 0 0 13.9 2.3 10.6 22.4 13.5 lima beans, immature, frozen, boiled 42 51 0 0 16.6 2.3 11.0 23.0 16.1 green peas, fresh/frozen, boiled 46 51 0 0 14.2 2.7 7.5 19.6 14.4 peanut butter, smooth 47 51 0 0 19.0 5.8 15.5 57.5 17.8 peanuts, dry roasted 48 51 0 0 17.0 1.9 14.8 26.8 17.0 white rice, cooked 50 51 0 2 10.5 4.4 2.1 19.3 10.7 oatmeal, quick (1-3 min), cooked 51 51 0 0 9.7 5.1 4.6 31.9 8.0 wheat cereal, farina, quick (1-3min), 52 51 0 0 49.3 19.8 15.7 105 45.1 corngrits, regular, cooked 53 51 0 0 12.4 18.2 3.1 99.1 6.8 corn, fresh/frozen, boiled 54 51 0 21 3.6 2.9 2.0 23.5 3.1 corn, canned 55 12 0 8 2.8 0.4 2.2 3.4 2.7 cream style corn, canned 56 39 0 30 2.7 0.4 2.0 3.7 2.6 popcorn, popped in oil 57 39 0 0 21.5 3.5 14.4 29.9 21.7 white bread 58 51 0 0 32.0 4.8 12.8 39.8 32.5 white roll 59 39 0 0 32.0 5.4 20.4 45.2 32.7 cornbread, homemade 60 51 0 5 18.3 11.1 1.2 56.6 18.4 biscuit, from refrigerated dough, baked 61 51 0 0 23.1 7.2 3.3 34.1 25.2 whole wheat bread 62 51 0 0 28.3 3.5 22.3 36.9 27.8 tortilla, flour 63 51 0 0 26.8 9.9 4.2 49.7 29.5 rye bread 64 51 0 0 29.2 5.8 17.9 48.1 29.1 blueberry muffin, commercial 65 51 0 3 12.8 5.5 1.2 27.9 13.9 saltine crackers 66 51 0 0 54.3 7.2 33.3 66.9 55.2 corn chips 67 51 0 0 13.5 2.0 9.2 18.7 13.4 pancake from mix 68 39 0 3 15.0 7.2 1.3 30.3 13.6 egg noodles, boiled 69 51 0 0 15.4 3.2 8.1 26.0 15.0
Page 71 of 211 Rev 4.1
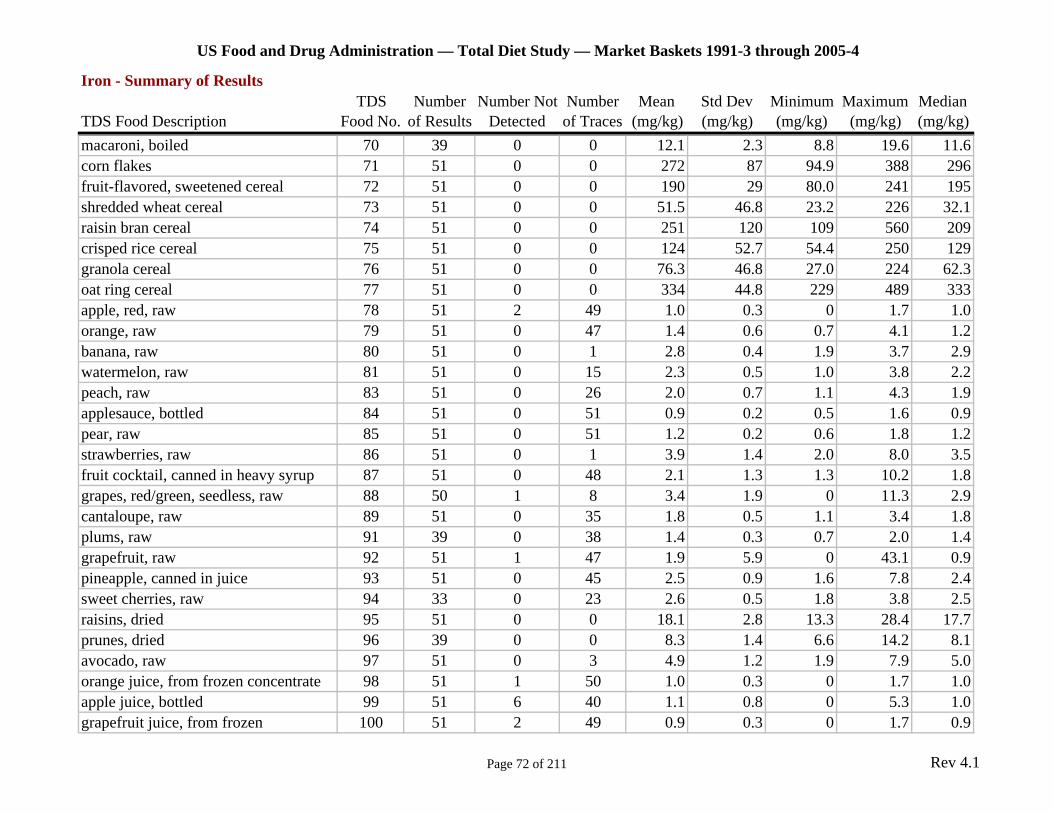
US Food and Drug Administration — Total Diet Study — Market Baskets 1991-3 through 2005-4
Iron - Summary of Results TDS Number Number Not Number Mean Std Dev Minimum Maximum Median
TDS Food Description Food No. of Results Detected of Traces (mg/kg) (mg/kg) (mg/kg) (mg/kg) (mg/kg) macaroni, boiled 70 39 0 0 12.1 2.3 8.8 19.6 11.6 corn flakes 71 51 0 0 272 87 94.9 388 296 fruit-flavored, sweetened cereal 72 51 0 0 190 29 80.0 241 195 shredded wheat cereal 73 51 0 0 51.5 46.8 23.2 226 32.1 raisin bran cereal 74 51 0 0 251 120 109 560 209 crisped rice cereal 75 51 0 0 124 52.7 54.4 250 129 granola cereal 76 51 0 0 76.3 46.8 27.0 224 62.3 oat ring cereal 77 51 0 0 334 44.8 229 489 333 apple, red, raw 78 51 2 49 1.0 0.3 0 1.7 1.0 orange, raw 79 51 0 47 1.4 0.6 0.7 4.1 1.2 banana, raw 80 51 0 1 2.8 0.4 1.9 3.7 2.9 watermelon, raw 81 51 0 15 2.3 0.5 1.0 3.8 2.2 peach, raw 83 51 0 26 2.0 0.7 1.1 4.3 1.9 applesauce, bottled 84 51 0 51 0.9 0.2 0.5 1.6 0.9 pear, raw 85 51 0 51 1.2 0.2 0.6 1.8 1.2 strawberries, raw 86 51 0 1 3.9 1.4 2.0 8.0 3.5 fruit cocktail, canned in heavy syrup 87 51 0 48 2.1 1.3 1.3 10.2 1.8 grapes, red/green, seedless, raw 88 50 1 8 3.4 1.9 0 11.3 2.9 cantaloupe, raw 89 51 0 35 1.8 0.5 1.1 3.4 1.8 plums, raw 91 39 0 38 1.4 0.3 0.7 2.0 1.4 grapefruit, raw 92 51 1 47 1.9 5.9 0 43.1 0.9 pineapple, canned in juice 93 51 0 45 2.5 0.9 1.6 7.8 2.4 sweet cherries, raw 94 33 0 23 2.6 0.5 1.8 3.8 2.5 raisins, dried 95 51 0 0 18.1 2.8 13.3 28.4 17.7 prunes, dried 96 39 0 0 8.3 1.4 6.6 14.2 8.1 avocado, raw 97 51 0 3 4.9 1.2 1.9 7.9 5.0 orange juice, from frozen concentrate 98 51 1 50 1.0 0.3 0 1.7 1.0 apple juice, bottled 99 51 6 40 1.1 0.8 0 5.3 1.0 grapefruit juice, from frozen 100 51 2 49 0.9 0.3 0 1.7 0.9
Page 72 of 211 Rev 4.1
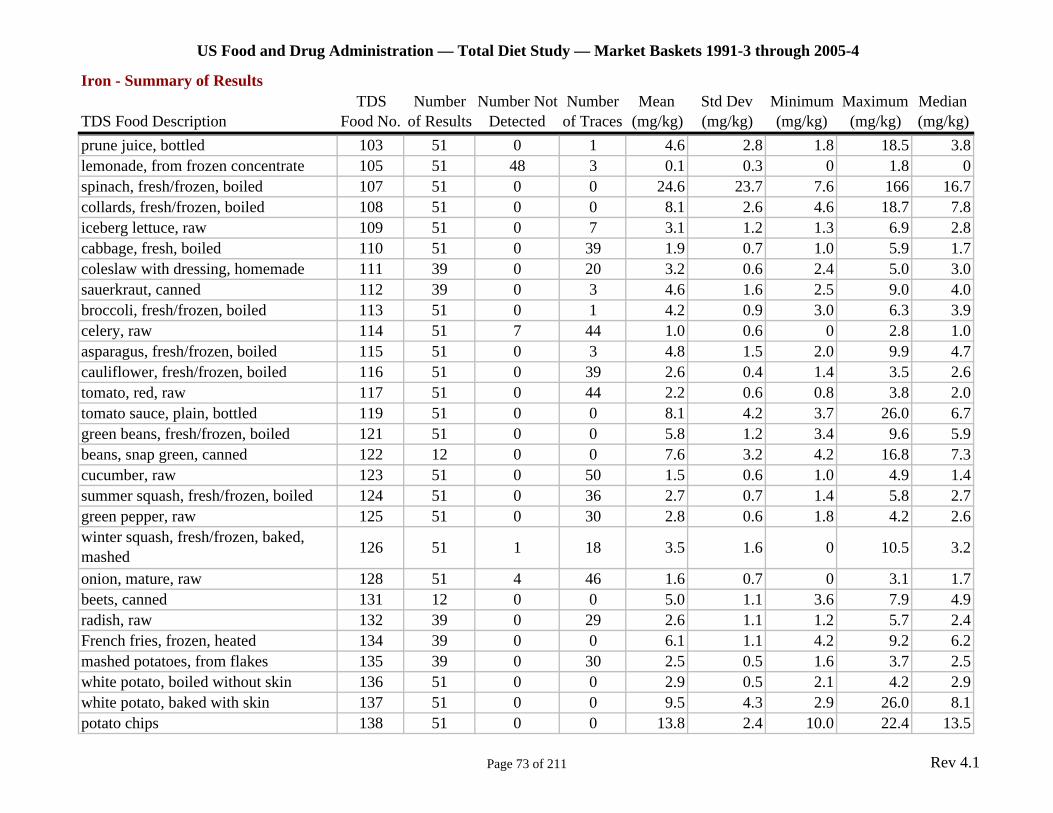
US Food and Drug Administration — Total Diet Study — Market Baskets 1991-3 through 2005-4
Iron - Summary of Results TDS Number Number Not Number Mean Std Dev Minimum Maximum Median
TDS Food Description Food No. of Results Detected of Traces (mg/kg) (mg/kg) (mg/kg) (mg/kg) (mg/kg) prune juice, bottled 103 51 0 1 4.6 2.8 1.8 18.5 3.8 lemonade, from frozen concentrate 105 51 48 3 0.1 0.3 0 1.8 0 spinach, fresh/frozen, boiled 107 51 0 0 24.6 23.7 7.6 166 16.7 collards, fresh/frozen, boiled 108 51 0 0 8.1 2.6 4.6 18.7 7.8 iceberg lettuce, raw 109 51 0 7 3.1 1.2 1.3 6.9 2.8 cabbage, fresh, boiled 110 51 0 39 1.9 0.7 1.0 5.9 1.7 coleslaw with dressing, homemade 111 39 0 20 3.2 0.6 2.4 5.0 3.0 sauerkraut, canned 112 39 0 3 4.6 1.6 2.5 9.0 4.0 broccoli, fresh/frozen, boiled 113 51 0 1 4.2 0.9 3.0 6.3 3.9 celery, raw 114 51 7 44 1.0 0.6 0 2.8 1.0 asparagus, fresh/frozen, boiled 115 51 0 3 4.8 1.5 2.0 9.9 4.7 cauliflower, fresh/frozen, boiled 116 51 0 39 2.6 0.4 1.4 3.5 2.6 tomato, red, raw 117 51 0 44 2.2 0.6 0.8 3.8 2.0 tomato sauce, plain, bottled 119 51 0 0 8.1 4.2 3.7 26.0 6.7 green beans, fresh/frozen, boiled 121 51 0 0 5.8 1.2 3.4 9.6 5.9 beans, snap green, canned 122 12 0 0 7.6 3.2 4.2 16.8 7.3 cucumber, raw 123 51 0 50 1.5 0.6 1.0 4.9 1.4 summer squash, fresh/frozen, boiled 124 51 0 36 2.7 0.7 1.4 5.8 2.7 green pepper, raw 125 51 0 30 2.8 0.6 1.8 4.2 2.6 winter squash, fresh/frozen, baked, mashed 126 51 1 18 3.5 1.6 0 10.5 3.2
onion, mature, raw 128 51 4 46 1.6 0.7 0 3.1 1.7 beets, canned 131 12 0 0 5.0 1.1 3.6 7.9 4.9 radish, raw 132 39 0 29 2.6 1.1 1.2 5.7 2.4 French fries, frozen, heated 134 39 0 0 6.1 1.1 4.2 9.2 6.2 mashed potatoes, from flakes 135 39 0 30 2.5 0.5 1.6 3.7 2.5 white potato, boiled without skin 136 51 0 0 2.9 0.5 2.1 4.2 2.9 white potato, baked with skin 137 51 0 0 9.5 4.3 2.9 26.0 8.1 potato chips 138 51 0 0 13.8 2.4 10.0 22.4 13.5
Page 73 of 211 Rev 4.1
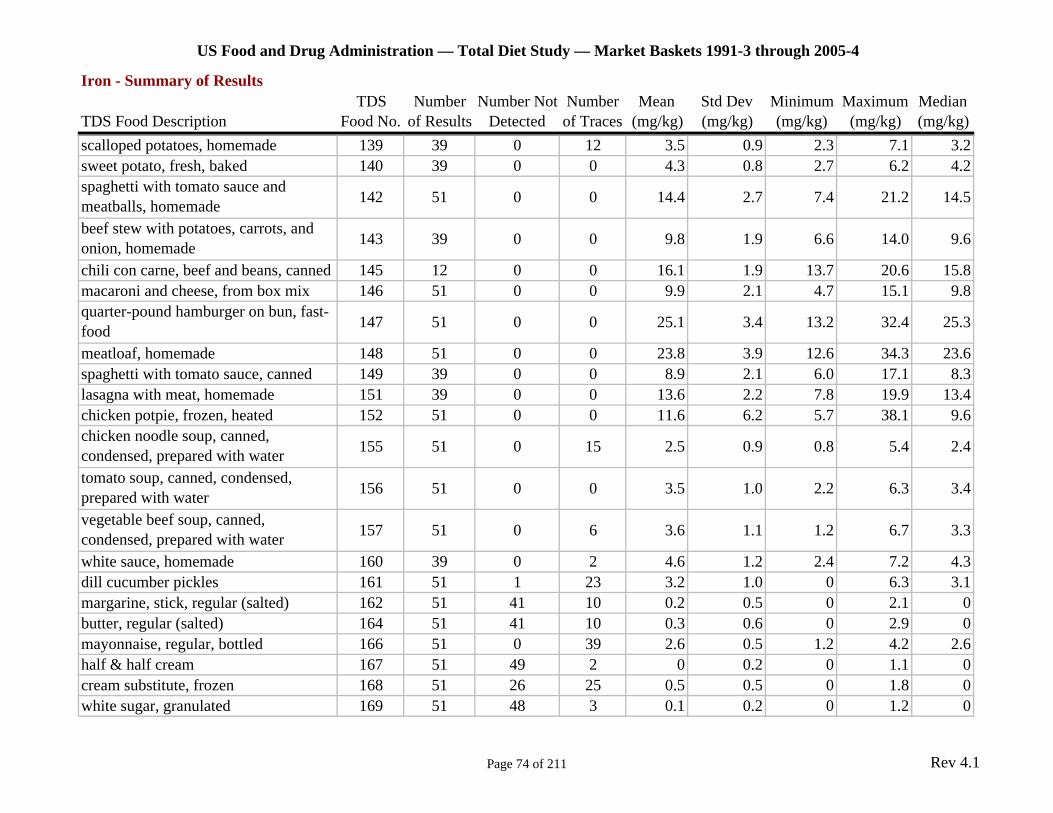
US Food and Drug Administration — Total Diet Study — Market Baskets 1991-3 through 2005-4
Iron - Summary of Results TDS Number Number Not Number Mean Std Dev Minimum Maximum Median
TDS Food Description Food No. of Results Detected of Traces (mg/kg) (mg/kg) (mg/kg) (mg/kg) (mg/kg) scalloped potatoes, homemade 139 39 0 12 3.5 0.9 2.3 7.1 3.2 sweet potato, fresh, baked 140 39 0 0 4.3 0.8 2.7 6.2 4.2 spaghetti with tomato sauce and meatballs, homemade 142 51 0 0 14.4 2.7 7.4 21.2 14.5
beef stew with potatoes, carrots, and onion, homemade 143 39 0 0 9.8 1.9 6.6 14.0 9.6
chili con carne, beef and beans, canned 145 12 0 0 16.1 1.9 13.7 20.6 15.8 macaroni and cheese, from box mix 146 51 0 0 9.9 2.1 4.7 15.1 9.8 quarter-pound hamburger on bun, fast-food 147 51 0 0 25.1 3.4 13.2 32.4 25.3
meatloaf, homemade 148 51 0 0 23.8 3.9 12.6 34.3 23.6 spaghetti with tomato sauce, canned 149 39 0 0 8.9 2.1 6.0 17.1 8.3 lasagna with meat, homemade 151 39 0 0 13.6 2.2 7.8 19.9 13.4 chicken potpie, frozen, heated 152 51 0 0 11.6 6.2 5.7 38.1 9.6 chicken noodle soup, canned, condensed, prepared with water 155 51 0 15 2.5 0.9 0.8 5.4 2.4
tomato soup, canned, condensed, prepared with water 156 51 0 0 3.5 1.0 2.2 6.3 3.4
vegetable beef soup, canned, condensed, prepared with water 157 51 0 6 3.6 1.1 1.2 6.7 3.3
white sauce, homemade 160 39 0 2 4.6 1.2 2.4 7.2 4.3 dill cucumber pickles 161 51 1 23 3.2 1.0 0 6.3 3.1 margarine, stick, regular (salted) 162 51 41 10 0.2 0.5 0 2.1 0 butter, regular (salted) 164 51 41 10 0.3 0.6 0 2.9 0 mayonnaise, regular, bottled 166 51 0 39 2.6 0.5 1.2 4.2 2.6 half & half cream 167 51 49 2 0 0.2 0 1.1 0 cream substitute, frozen 168 51 26 25 0.5 0.5 0 1.8 0 white sugar, granulated 169 51 48 3 0.1 0.2 0 1.2 0
Page 74 of 211 Rev 4.1
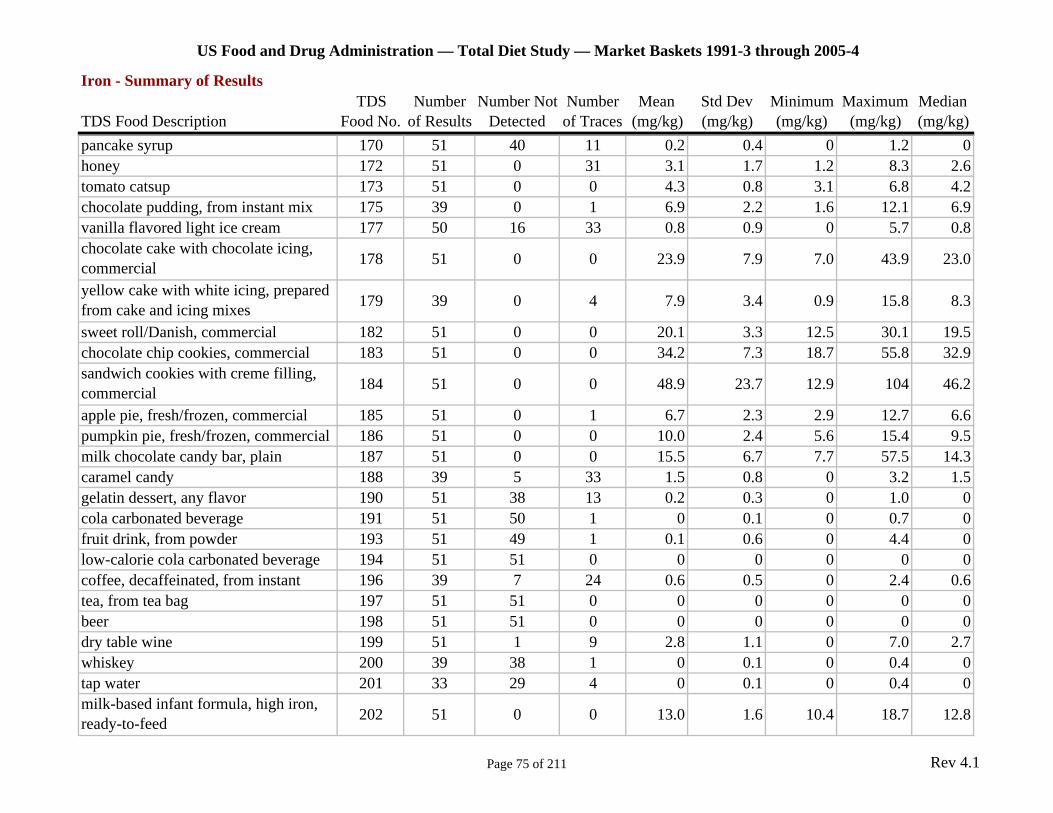
US Food and Drug Administration — Total Diet Study — Market Baskets 1991-3 through 2005-4
Iron - Summary of Results TDS Number Number Not Number Mean Std Dev Minimum Maximum Median
TDS Food Description Food No. of Results Detected of Traces (mg/kg) (mg/kg) (mg/kg) (mg/kg) (mg/kg) pancake syrup 170 51 40 11 0.2 0.4 0 1.2 0 honey 172 51 0 31 3.1 1.7 1.2 8.3 2.6 tomato catsup 173 51 0 0 4.3 0.8 3.1 6.8 4.2 chocolate pudding, from instant mix 175 39 0 1 6.9 2.2 1.6 12.1 6.9 vanilla flavored light ice cream 177 50 16 33 0.8 0.9 0 5.7 0.8 chocolate cake with chocolate icing, commercial 178 51 0 0 23.9 7.9 7.0 43.9 23.0
yellow cake with white icing, prepared from cake and icing mixes 179 39 0 4 7.9 3.4 0.9 15.8 8.3
sweet roll/Danish, commercial 182 51 0 0 20.1 3.3 12.5 30.1 19.5 chocolate chip cookies, commercial 183 51 0 0 34.2 7.3 18.7 55.8 32.9 sandwich cookies with creme filling, commercial 184 51 0 0 48.9 23.7 12.9 104 46.2
apple pie, fresh/frozen, commercial 185 51 0 1 6.7 2.3 2.9 12.7 6.6 pumpkin pie, fresh/frozen, commercial 186 51 0 0 10.0 2.4 5.6 15.4 9.5 milk chocolate candy bar, plain 187 51 0 0 15.5 6.7 7.7 57.5 14.3 caramel candy 188 39 5 33 1.5 0.8 0 3.2 1.5 gelatin dessert, any flavor 190 51 38 13 0.2 0.3 0 1.0 0 cola carbonated beverage 191 51 50 1 0 0.1 0 0.7 0 fruit drink, from powder 193 51 49 1 0.1 0.6 0 4.4 0 low-calorie cola carbonated beverage 194 51 51 0 0 0 0 0 0 coffee, decaffeinated, from instant 196 39 7 24 0.6 0.5 0 2.4 0.6 tea, from tea bag 197 51 51 0 0 0 0 0 0 beer 198 51 51 0 0 0 0 0 0 dry table wine 199 51 1 9 2.8 1.1 0 7.0 2.7 whiskey 200 39 38 1 0 0.1 0 0.4 0 tap water 201 33 29 4 0 0.1 0 0.4 0 milk-based infant formula, high iron, ready-to-feed 202 51 0 0 13.0 1.6 10.4 18.7 12.8
Page 75 of 211 Rev 4.1

US Food and Drug Administration — Total Diet Study — Market Baskets 1991-3 through 2005-4
Iron - Summary of Results TDS Number Number Not Number Mean Std Dev Minimum Maximum Median
TDS Food Description Food No. of Results Detected of Traces (mg/kg) (mg/kg) (mg/kg) (mg/kg) (mg/kg) milk-based infant formula, low iron, ready-to-feed 203 51 0 16 3.9 1.3 1.3 6.3 3.9
beef, strained/junior 205 51 0 0 12.7 2.0 8.2 16.5 12.4 chicken, strained/junior, with/without broth or gravy 207 51 0 0 10.7 1.6 5.7 14.5 11.0
chicken/turkey with vegetables, high/lean meat, strained/junior 208 2 0 0 7.0 0 7.0 7.0 7.0
beef with vegetables, high/lean meat, strained/junior 209 2 0 0 7.2 1.4 6 8.2 7.2
ham with vegetables, high/lean meat, strained/junior 210 2 0 0 6.0 1.6 4.8 7.1 6.0
vegetables and beef, strained/junior 211 51 0 6 4.2 0.9 2.1 5.6 4.4 vegetables and chicken, strained/junior 212 51 0 7 4.0 0.9 2.1 7.2 4.0 vegetables and ham, strained/junior 213 50 1 30 2.8 0.7 0 4.2 2.8 chicken noodle dinner, strained/junior 214 51 0 2 4.6 0.9 2.0 7.0 4.6 macaroni, tomatoes, and beef, strained/junior 215 51 0 2 4.4 0.8 2.0 6.9 4.2
turkey and rice, strained/junior 216 51 0 23 3.0 0.5 2.0 4.0 3.0 carrots, strained/junior 218 51 1 44 2.3 0.6 0 3.4 2.3 green beans, strained/junior 219 51 0 0 6.0 1.1 3.8 8.4 6.1 mixed vegetables, strained/junior 220 51 0 11 3.7 1.1 1.0 6.1 3.6 sweet potatoes, strained/junior 221 51 0 36 2.8 0.4 2.0 3.8 2.8 creamed corn, strained/junior 222 33 1 32 1.5 0.5 0 2.8 1.4 peas, strained/junior 223 51 0 0 10.0 1.1 7.2 12.6 10.0 creamed spinach, strained/junior 224 39 0 0 9.1 2.6 4.5 18.6 9 applesauce, strained/junior 225 51 2 49 1.1 0.3 0 1.8 1.0 peaches, strained/junior 226 51 0 50 2.0 0.5 0.9 3.4 2.0 pears, strained/junior 227 50 0 50 1.5 0.5 0.8 2.9 1.4 apple juice, strained 230 51 25 26 0.6 0.6 0 1.9 0.6
Page 76 of 211 Rev 4.1

US Food and Drug Administration — Total Diet Study — Market Baskets 1991-3 through 2005-4
Iron - Summary of Results TDS Number Number Not Number Mean Std Dev Minimum Maximum Median
TDS Food Description Food No. of Results Detected of Traces (mg/kg) (mg/kg) (mg/kg) (mg/kg) (mg/kg) orange juice, strained 231 50 0 50 1.2 0.2 0.8 1.6 1.2 custard pudding, strained/junior 232 51 1 44 2.3 0.8 0 4.3 2.5 fruit dessert/pudding, strained/junior 233 51 0 48 1.9 2.5 0.9 19.2 1.4 fruit-flavored yogurt, lowfat (fruit 235 51 23 28 0.6 0.6 0 2.2 0.7 Swiss cheese 236 51 0 44 2.1 0.6 1.3 3.3 2.0 cream cheese 237 51 21 28 0.8 0.9 0 4.3 1.0 veal cutlet, pan-cooked 238 39 0 0 9.7 2.0 4.3 14.1 9.4 ham luncheon meat, sliced 239 51 0 0 7.2 1.2 3.7 10.2 7.1 chicken breast, roasted 240 51 0 0 5.0 1.2 3.7 10.0 4.8 chicken nuggets, fast-food 241 51 0 0 7.8 1.5 4.0 11.9 8.0 chicken, fried (breast, leg, and thigh), fast-food 242 39 0 0 9.4 2.5 5.8 19.0 9.2
haddock, pan-cooked 243 20 0 20 1.7 0.4 1.0 2.5 1.7 shrimp, boiled 244 51 0 13 10.6 11.2 1.5 51.9 6.6 kidney beans, dry, boiled 245 39 0 0 19.6 3.3 13.1 30.6 19.4 peas, mature, dry, boiled 246 39 0 0 17.0 2.6 12.9 28.2 16.6 mixed nuts, no peanuts, dry roasted 247 39 0 0 40.9 5.3 25.5 63.0 41.6 cracked wheat bread 248 51 0 0 31.7 3.6 24.4 38.6 32.3 bagel, plain 249 51 0 0 33.1 5.7 16.9 42.4 33.3 English muffin, plain, toasted 250 51 0 0 32.5 5.4 14.3 43.4 31.8 graham crackers 251 51 0 0 40.1 7.2 23.1 57.0 40.5 butter-type crackers 252 51 0 0 41.0 4.9 30.8 49.9 41.6 apricot, raw 253 34 0 5 3.7 0.8 1.6 6.2 3.8 peach, canned in light/medium syrup 254 51 0 46 3.1 7.0 1.1 51.5 2.1 pear, canned in light syrup 255 51 0 44 2.7 4.7 0.9 34.9 1.8 pineapple juice, from frozen 256 51 0 45 1.6 0.4 1.1 3.5 1.5 grape juice, from frozen concentrate 257 51 8 36 1.1 0.9 0 4.1 0.9 French fries, fast-food 258 51 0 0 9.1 1.4 6.1 13.6 9.0 carrot, fresh, boiled 259 51 0 45 2.2 0.6 1.2 4.0 2.1
Page 77 of 211 Rev 4.1
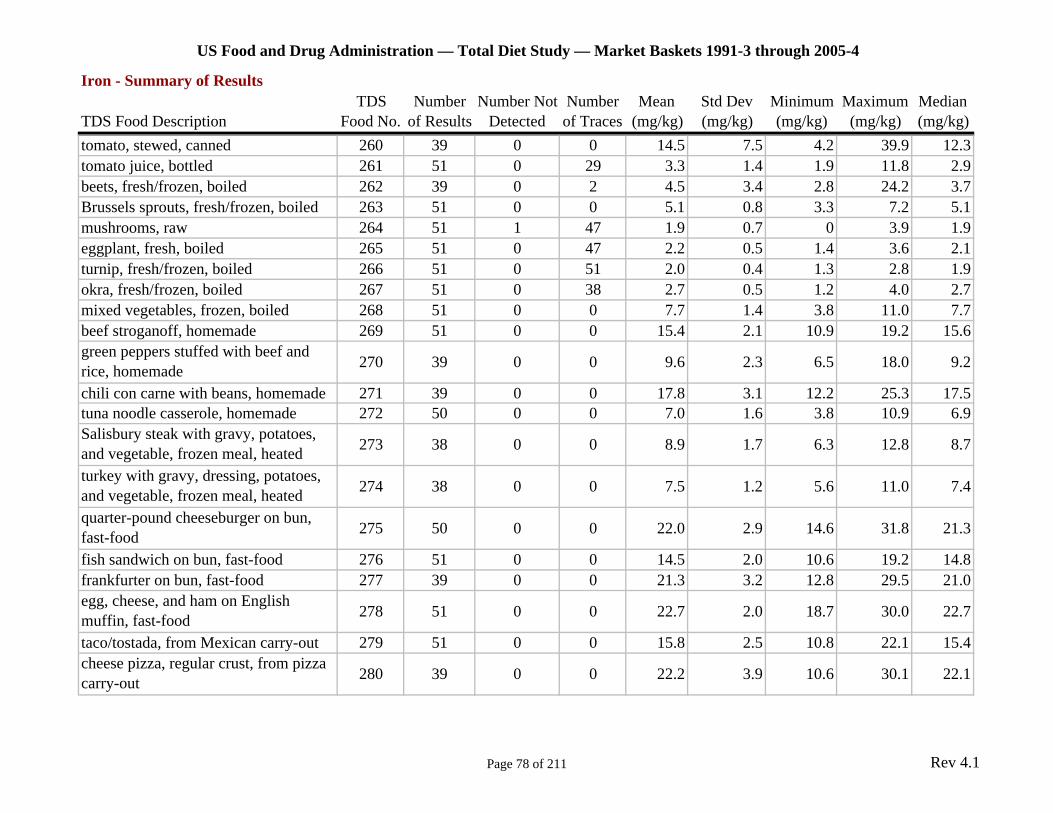
US Food and Drug Administration — Total Diet Study — Market Baskets 1991-3 through 2005-4
Iron - Summary of Results TDS Number Number Not Number Mean Std Dev Minimum Maximum Median
TDS Food Description Food No. of Results Detected of Traces (mg/kg) (mg/kg) (mg/kg) (mg/kg) (mg/kg) tomato, stewed, canned 260 39 0 0 14.5 7.5 4.2 39.9 12.3 tomato juice, bottled 261 51 0 29 3.3 1.4 1.9 11.8 2.9 beets, fresh/frozen, boiled 262 39 0 2 4.5 3.4 2.8 24.2 3.7 Brussels sprouts, fresh/frozen, boiled 263 51 0 0 5.1 0.8 3.3 7.2 5.1 mushrooms, raw 264 51 1 47 1.9 0.7 0 3.9 1.9 eggplant, fresh, boiled 265 51 0 47 2.2 0.5 1.4 3.6 2.1 turnip, fresh/frozen, boiled 266 51 0 51 2.0 0.4 1.3 2.8 1.9 okra, fresh/frozen, boiled 267 51 0 38 2.7 0.5 1.2 4.0 2.7 mixed vegetables, frozen, boiled 268 51 0 0 7.7 1.4 3.8 11.0 7.7 beef stroganoff, homemade 269 51 0 0 15.4 2.1 10.9 19.2 15.6 green peppers stuffed with beef and rice, homemade 270 39 0 0 9.6 2.3 6.5 18.0 9.2
chili con carne with beans, homemade 271 39 0 0 17.8 3.1 12.2 25.3 17.5 tuna noodle casserole, homemade 272 50 0 0 7.0 1.6 3.8 10.9 6.9 Salisbury steak with gravy, potatoes, and vegetable, frozen meal, heated 273 38 0 0 8.9 1.7 6.3 12.8 8.7
turkey with gravy, dressing, potatoes, and vegetable, frozen meal, heated 274 38 0 0 7.5 1.2 5.6 11.0 7.4
quarter-pound cheeseburger on bun, fast-food 275 50 0 0 22.0 2.9 14.6 31.8 21.3
fish sandwich on bun, fast-food 276 51 0 0 14.5 2.0 10.6 19.2 14.8 frankfurter on bun, fast-food 277 39 0 0 21.3 3.2 12.8 29.5 21.0 egg, cheese, and ham on English muffin, fast-food 278 51 0 0 22.7 2.0 18.7 30.0 22.7
taco/tostada, from Mexican carry-out 279 51 0 0 15.8 2.5 10.8 22.1 15.4 cheese pizza, regular crust, from pizza carry-out 280 39 0 0 22.2 3.9 10.6 30.1 22.1
Page 78 of 211 Rev 4.1
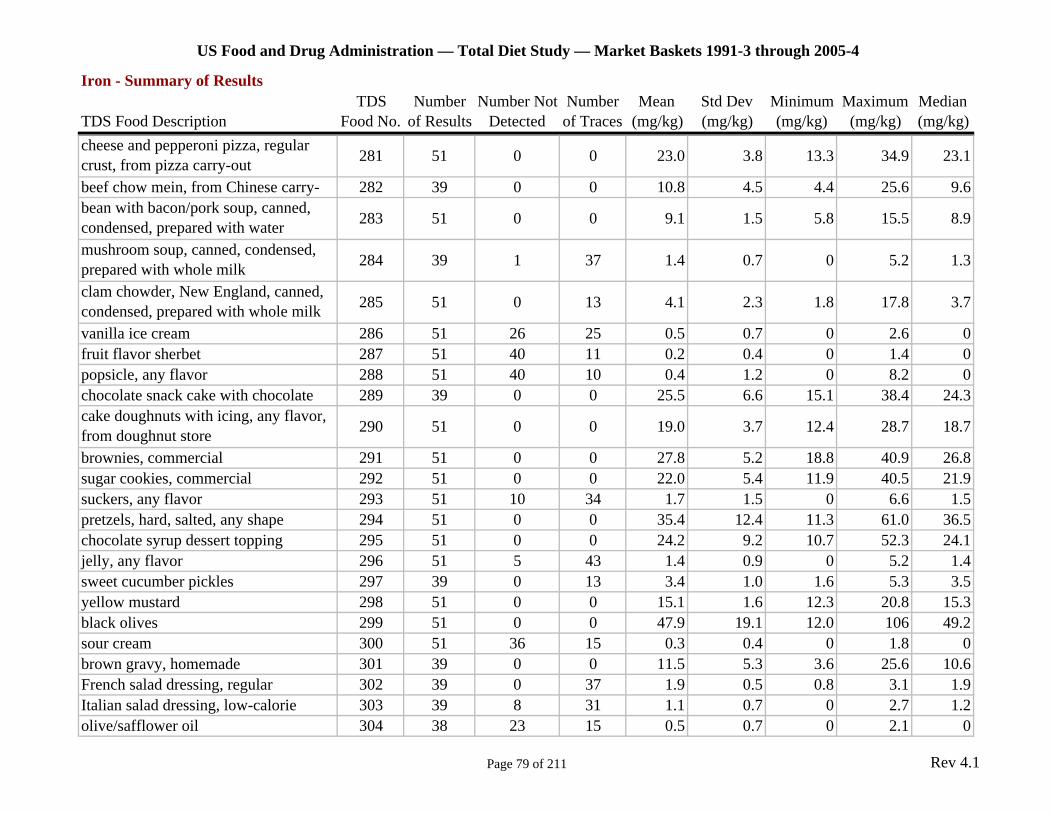
US Food and Drug Administration — Total Diet Study — Market Baskets 1991-3 through 2005-4
Iron - Summary of Results TDS Number Number Not Number Mean Std Dev Minimum Maximum Median
TDS Food Description Food No. of Results Detected of Traces (mg/kg) (mg/kg) (mg/kg) (mg/kg) (mg/kg) cheese and pepperoni pizza, regular crust, from pizza carry-out 281 51 0 0 23.0 3.8 13.3 34.9 23.1
beef chow mein, from Chinese carry- 282 39 0 0 10.8 4.5 4.4 25.6 9.6 bean with bacon/pork soup, canned, condensed, prepared with water 283 51 0 0 9.1 1.5 5.8 15.5 8.9
mushroom soup, canned, condensed, prepared with whole milk 284 39 1 37 1.4 0.7 0 5.2 1.3
clam chowder, New England, canned, condensed, prepared with whole milk 285 51 0 13 4.1 2.3 1.8 17.8 3.7
vanilla ice cream 286 51 26 25 0.5 0.7 0 2.6 0 fruit flavor sherbet 287 51 40 11 0.2 0.4 0 1.4 0 popsicle, any flavor 288 51 40 10 0.4 1.2 0 8.2 0 chocolate snack cake with chocolate 289 39 0 0 25.5 6.6 15.1 38.4 24.3 cake doughnuts with icing, any flavor, from doughnut store 290 51 0 0 19.0 3.7 12.4 28.7 18.7
brownies, commercial 291 51 0 0 27.8 5.2 18.8 40.9 26.8 sugar cookies, commercial 292 51 0 0 22.0 5.4 11.9 40.5 21.9 suckers, any flavor 293 51 10 34 1.7 1.5 0 6.6 1.5 pretzels, hard, salted, any shape 294 51 0 0 35.4 12.4 11.3 61.0 36.5 chocolate syrup dessert topping 295 51 0 0 24.2 9.2 10.7 52.3 24.1 jelly, any flavor 296 51 5 43 1.4 0.9 0 5.2 1.4 sweet cucumber pickles 297 39 0 13 3.4 1.0 1.6 5.3 3.5 yellow mustard 298 51 0 0 15.1 1.6 12.3 20.8 15.3 black olives 299 51 0 0 47.9 19.1 12.0 106 49.2 sour cream 300 51 36 15 0.3 0.4 0 1.8 0 brown gravy, homemade 301 39 0 0 11.5 5.3 3.6 25.6 10.6 French salad dressing, regular 302 39 0 37 1.9 0.5 0.8 3.1 1.9 Italian salad dressing, low-calorie 303 39 8 31 1.1 0.7 0 2.7 1.2 olive/safflower oil 304 38 23 15 0.5 0.7 0 2.1 0
Page 79 of 211 Rev 4.1

US Food and Drug Administration — Total Diet Study — Market Baskets 1991-3 through 2005-4
Iron - Summary of Results TDS Number Number Not Number Mean Std Dev Minimum Maximum Median
TDS Food Description Food No. of Results Detected of Traces (mg/kg) (mg/kg) (mg/kg) (mg/kg) (mg/kg) coffee, from ground 305 51 51 0 0 0 0 0 0 fruit-flavored carbonated beverage 306 51 51 0 0 0 0 0 0 fruit drink, canned 307 51 28 20 0.6 0.8 0 3.1 0 martini 308 30 28 2 0 0.1 0 0.4 0 soy-based infant formula, ready-to-feed 309 51 0 0 13.2 2.2 5.8 19.7 13.2 egg yolk, strained/junior 310 12 0 0 29.7 3.4 19.9 32.9 30.6 rice infant cereal, instant, prepared with whole milk 311 39 0 0 114 27.9 54.0 191 113
rice cereal, strained/junior 312 20 0 0 60.1 10.7 36.1 74.0 60.1 bananas with tapioca, strained/junior 313 51 0 51 1.7 0.5 0.8 2.9 1.6 beets, strained/junior 314 15 0 6 3.1 0.5 2.2 3.7 3.2 split peas with vegetables and ham/bacon, strained/junior 316 27 0 12 3.1 0.9 1.7 4.8 3.1
teething biscuits 317 51 0 0 28.5 13.2 18.6 116 25.9 salmon, steaks or filets, fresh or frozen, baked 318 31 0 8 3.5 0.6 2.3 4.7 3.4 rice cereal with apple, strained/junior 319 17 0 0 57.0 4.7 50.1 65.6 56.1 squash, strained/junior 320 29 0 20 2.9 0.7 1.6 5.0 2.8 BF, cereal, oatmeal, dry, prep w/ water 323 12 0 0 123 22.9 74.6 155 124 BF, cereal, rice, dry, prep w/ water 324 12 0 0 126 24.7 87.8 169 132 BF, cereal, rice w/apples, dry, prep w/ water 325 12 0 0 126 23.5 88.0 167 127 BF, veal and broth/gravy 326 12 0 0 6.8 1.5 4.4 9.0 6.9 BF, lamb and broth/gravy 327 12 0 0 10.2 0.9 8.7 11.7 10.1 BF, turkey and broth/gravy 328 12 0 0 7.8 0.6 6.8 8.7 7.8 Meal replacement, liquid RTD, any 331 12 0 0 21.3 2.3 16.5 24.0 22.3 Cottage cheese, creamed, lowfat (2% milk fat) 332 12 7 5 0.5 0.6 0 1.4 0.0 Sour cream dip, any flavor 333 12 0 10 1.9 1.1 0.7 4.2 1.5
Page 80 of 211 Rev 4.1
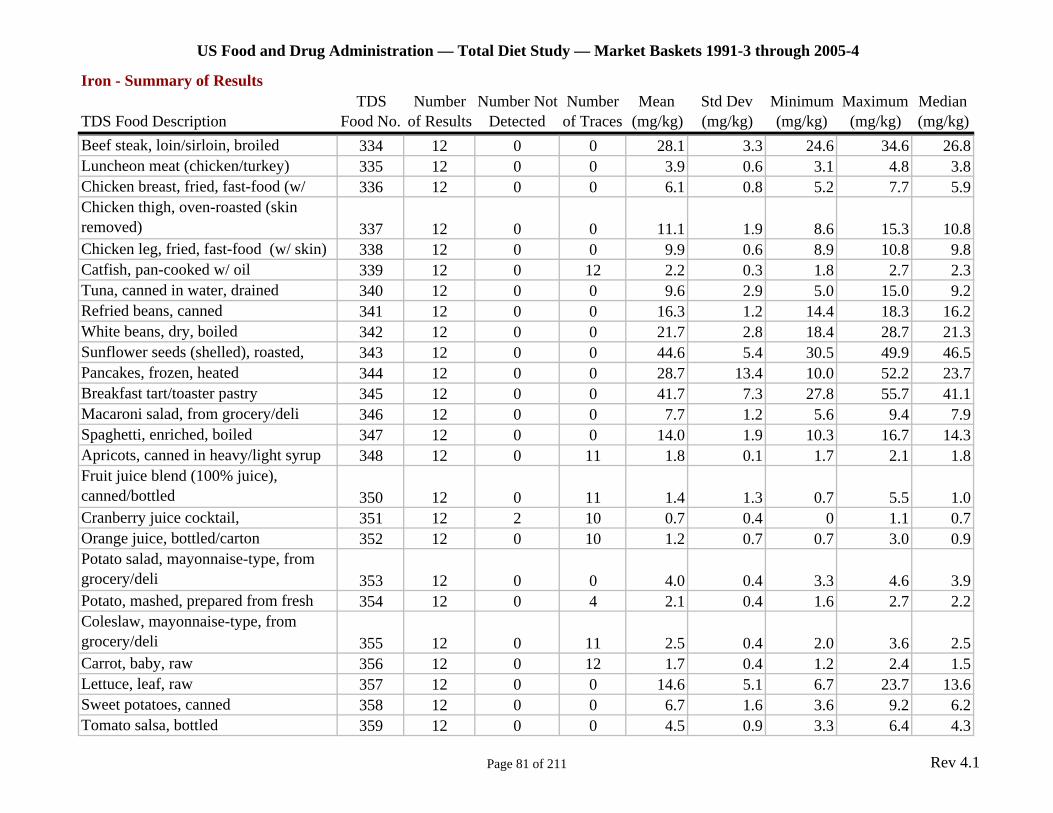
US Food and Drug Administration — Total Diet Study — Market Baskets 1991-3 through 2005-4
Iron - Summary of Results TDS Number Number Not Number Mean Std Dev Minimum Maximum Median
TDS Food Description Food No. of Results Detected of Traces (mg/kg) (mg/kg) (mg/kg) (mg/kg) (mg/kg) Beef steak, loin/sirloin, broiled 334 12 0 0 28.1 3.3 24.6 34.6 26.8 Luncheon meat (chicken/turkey) 335 12 0 0 3.9 0.6 3.1 4.8 3.8 Chicken breast, fried, fast-food (w/ 336 12 0 0 6.1 0.8 5.2 7.7 5.9 Chicken thigh, oven-roasted (skin removed) 337 12 0 0 11.1 1.9 8.6 15.3 10.8 Chicken leg, fried, fast-food (w/ skin) 338 12 0 0 9.9 0.6 8.9 10.8 9.8 Catfish, pan-cooked w/ oil 339 12 0 12 2.2 0.3 1.8 2.7 2.3 Tuna, canned in water, drained 340 12 0 0 9.6 2.9 5.0 15.0 9.2 Refried beans, canned 341 12 0 0 16.3 1.2 14.4 18.3 16.2 White beans, dry, boiled 342 12 0 0 21.7 2.8 18.4 28.7 21.3 Sunflower seeds (shelled), roasted, 343 12 0 0 44.6 5.4 30.5 49.9 46.5 Pancakes, frozen, heated 344 12 0 0 28.7 13.4 10.0 52.2 23.7 Breakfast tart/toaster pastry 345 12 0 0 41.7 7.3 27.8 55.7 41.1 Macaroni salad, from grocery/deli 346 12 0 0 7.7 1.2 5.6 9.4 7.9 Spaghetti, enriched, boiled 347 12 0 0 14.0 1.9 10.3 16.7 14.3 Apricots, canned in heavy/light syrup 348 12 0 11 1.8 0.1 1.7 2.1 1.8 Fruit juice blend (100% juice), canned/bottled 350 12 0 11 1.4 1.3 0.7 5.5 1.0 Cranberry juice cocktail, 351 12 2 10 0.7 0.4 0 1.1 0.7 Orange juice, bottled/carton 352 12 0 10 1.2 0.7 0.7 3.0 0.9 Potato salad, mayonnaise-type, from grocery/deli 353 12 0 0 4.0 0.4 3.3 4.6 3.9 Potato, mashed, prepared from fresh 354 12 0 4 2.1 0.4 1.6 2.7 2.2 Coleslaw, mayonnaise-type, from grocery/deli 355 12 0 11 2.5 0.4 2.0 3.6 2.5 Carrot, baby, raw 356 12 0 12 1.7 0.4 1.2 2.4 1.5 Lettuce, leaf, raw 357 12 0 0 14.6 5.1 6.7 23.7 13.6 Sweet potatoes, canned 358 12 0 0 6.7 1.6 3.6 9.2 6.2 Tomato salsa, bottled 359 12 0 0 4.5 0.9 3.3 6.4 4.3
Page 81 of 211 Rev 4.1
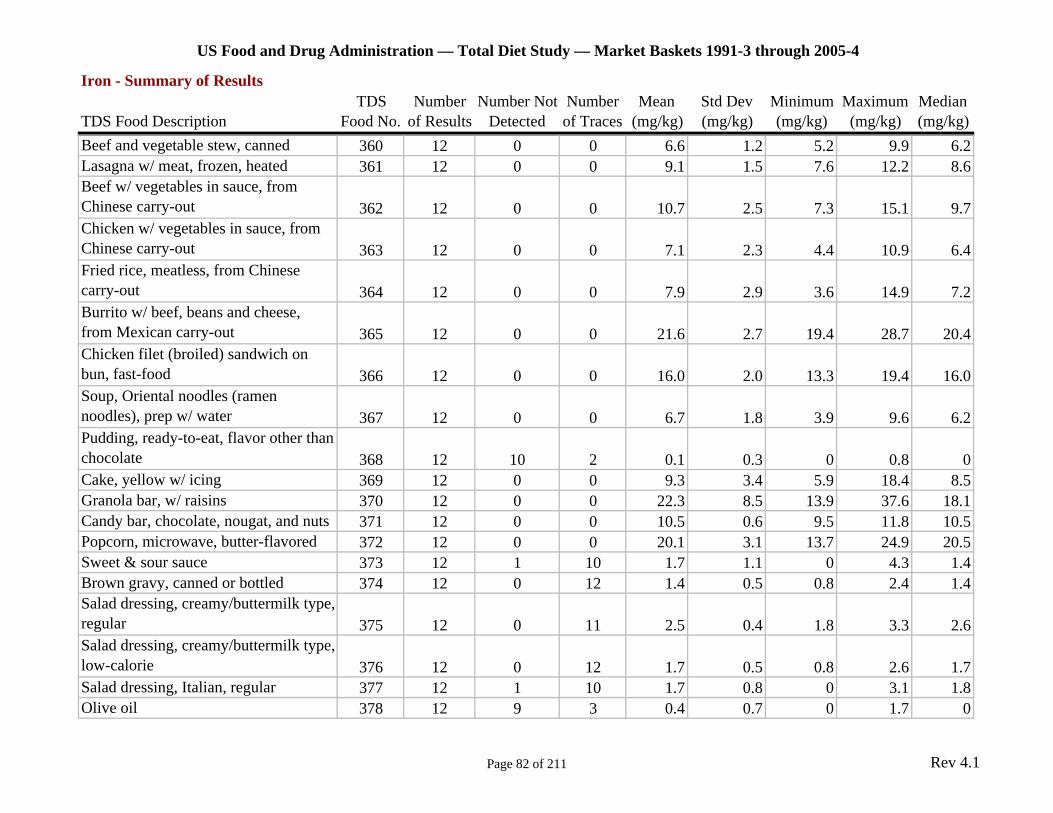
US Food and Drug Administration — Total Diet Study — Market Baskets 1991-3 through 2005-4
Iron - Summary of Results TDS Number Number Not Number Mean Std Dev Minimum Maximum Median
TDS Food Description Food No. of Results Detected of Traces (mg/kg) (mg/kg) (mg/kg) (mg/kg) (mg/kg) Beef and vegetable stew, canned 360 12 0 0 6.6 1.2 5.2 9.9 6.2 Lasagna w/ meat, frozen, heated 361 12 0 0 9.1 1.5 7.6 12.2 8.6 Beef w/ vegetables in sauce, from Chinese carry-out 362 12 0 0 10.7 2.5 7.3 15.1 9.7 Chicken w/ vegetables in sauce, from Chinese carry-out 363 12 0 0 7.1 2.3 4.4 10.9 6.4 Fried rice, meatless, from Chinese carry-out 364 12 0 0 7.9 2.9 3.6 14.9 7.2 Burrito w/ beef, beans and cheese, from Mexican carry-out 365 12 0 0 21.6 2.7 19.4 28.7 20.4 Chicken filet (broiled) sandwich on bun, fast-food 366 12 0 0 16.0 2.0 13.3 19.4 16.0 Soup, Oriental noodles (ramen noodles), prep w/ water 367 12 0 0 6.7 1.8 3.9 9.6 6.2 Pudding, ready-to-eat, flavor other than chocolate 368 12 10 2 0.1 0.3 0 0.8 0 Cake, yellow w/ icing 369 12 0 0 9.3 3.4 5.9 18.4 8.5 Granola bar, w/ raisins 370 12 0 0 22.3 8.5 13.9 37.6 18.1 Candy bar, chocolate, nougat, and nuts 371 12 0 0 10.5 0.6 9.5 11.8 10.5 Popcorn, microwave, butter-flavored 372 12 0 0 20.1 3.1 13.7 24.9 20.5 Sweet & sour sauce 373 12 1 10 1.7 1.1 0 4.3 1.4 Brown gravy, canned or bottled 374 12 0 12 1.4 0.5 0.8 2.4 1.4 Salad dressing, creamy/buttermilk type, regular 375 12 0 11 2.5 0.4 1.8 3.3 2.6 Salad dressing, creamy/buttermilk type, low-calorie 376 12 0 12 1.7 0.5 0.8 2.6 1.7 Salad dressing, Italian, regular 377 12 1 10 1.7 0.8 0 3.1 1.8 Olive oil 378 12 9 3 0.4 0.7 0 1.7 0
Page 82 of 211 Rev 4.1
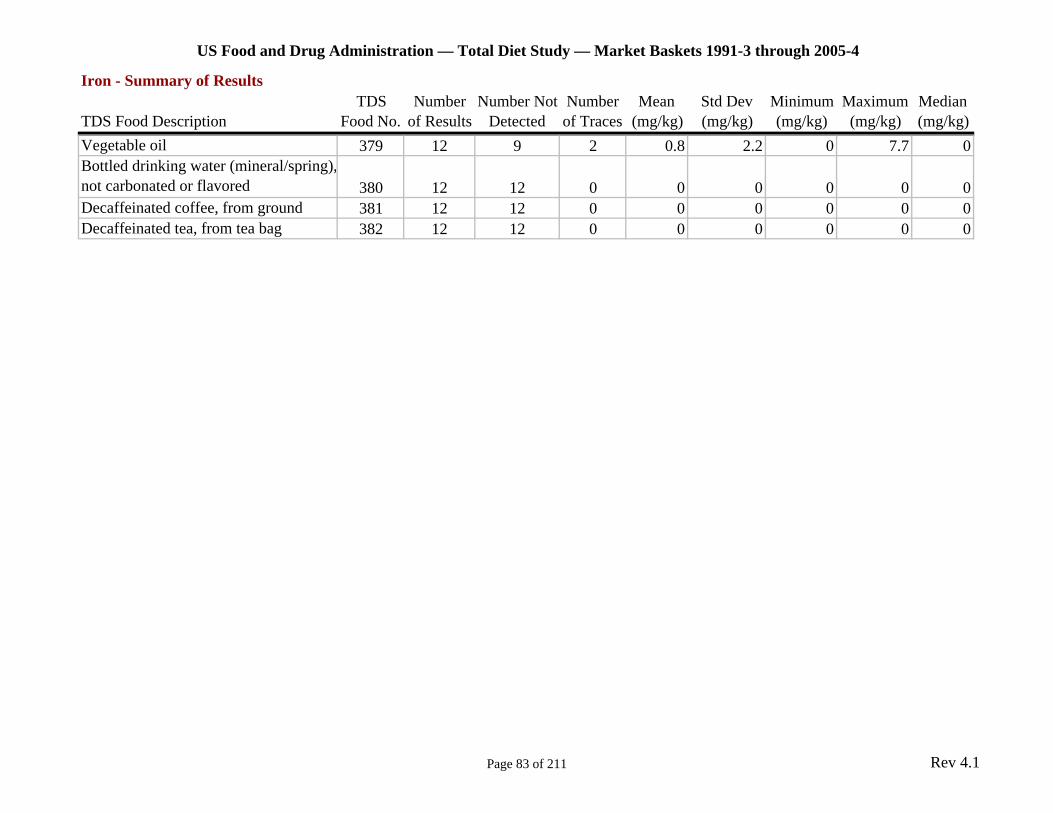
US Food and Drug Administration — Total Diet Study — Market Baskets 1991-3 through 2005-4
Iron - Summary of Results TDS Number Number Not Number Mean Std Dev Minimum Maximum Median
TDS Food Description Food No. of Results Detected of Traces (mg/kg) (mg/kg) (mg/kg) (mg/kg) (mg/kg) Vegetable oil 379 12 9 2 0.8 2.2 0 7.7 0 Bottled drinking water (mineral/spring), not carbonated or flavored 380 12 12 0 0 0 0 0 0 Decaffeinated coffee, from ground 381 12 12 0 0 0 0 0 0 Decaffeinated tea, from tea bag 382 12 12 0 0 0 0 0 0
Page 83 of 211 Rev 4.1
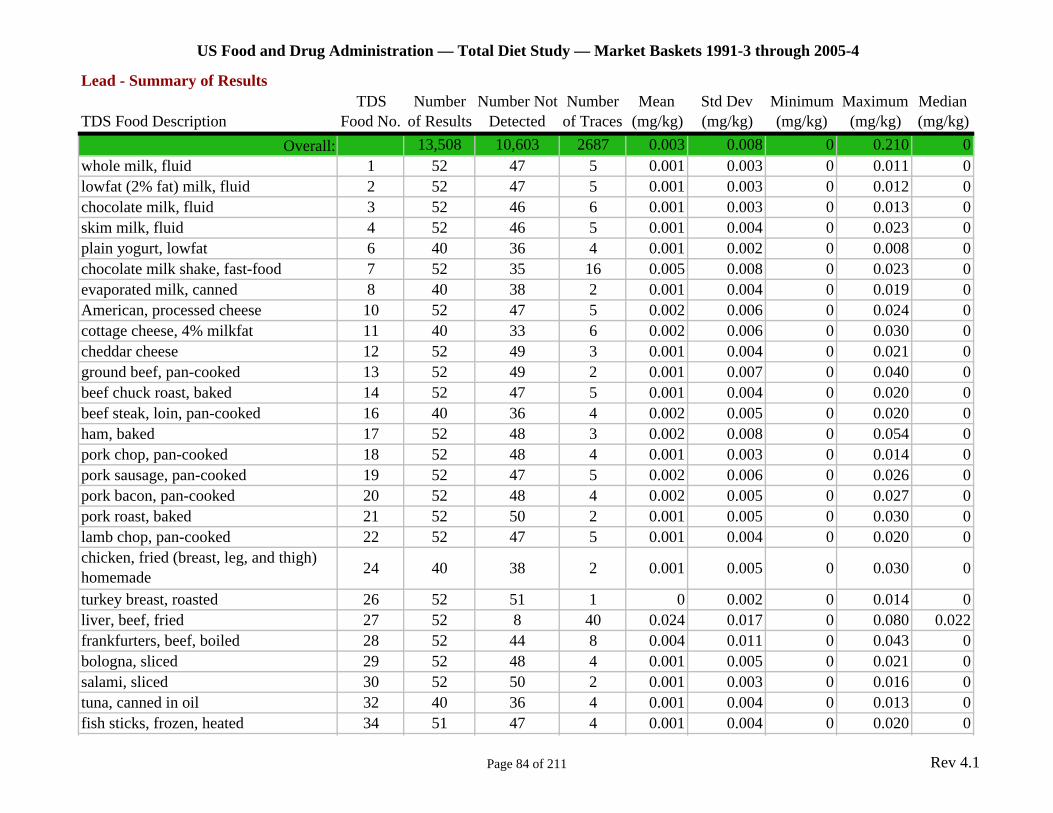
US Food and Drug Administration — Total Diet Study — Market Baskets 1991-3 through 2005-4
Lead - Summary of Results TDS Number Number Not Number Mean Std Dev Minimum Maximum Median
TDS Food Description Food No. of Results Detected of Traces (mg/kg) (mg/kg) (mg/kg) (mg/kg) (mg/kg) Overall: 13,508 10,603 2687 0.003 0.008 0 0.210 0
whole milk, fluid 1 52 47 5 0.001 0.003 0 0.011 0 lowfat (2% fat) milk, fluid 2 52 47 5 0.001 0.003 0 0.012 0 chocolate milk, fluid 3 52 46 6 0.001 0.003 0 0.013 0 skim milk, fluid 4 52 46 5 0.001 0.004 0 0.023 0 plain yogurt, lowfat 6 40 36 4 0.001 0.002 0 0.008 0 chocolate milk shake, fast-food 7 52 35 16 0.005 0.008 0 0.023 0 evaporated milk, canned 8 40 38 2 0.001 0.004 0 0.019 0 American, processed cheese 10 52 47 5 0.002 0.006 0 0.024 0 cottage cheese, 4% milkfat 11 40 33 6 0.002 0.006 0 0.030 0 cheddar cheese 12 52 49 3 0.001 0.004 0 0.021 0 ground beef, pan-cooked 13 52 49 2 0.001 0.007 0 0.040 0 beef chuck roast, baked 14 52 47 5 0.001 0.004 0 0.020 0 beef steak, loin, pan-cooked 16 40 36 4 0.002 0.005 0 0.020 0 ham, baked 17 52 48 3 0.002 0.008 0 0.054 0 pork chop, pan-cooked 18 52 48 4 0.001 0.003 0 0.014 0 pork sausage, pan-cooked 19 52 47 5 0.002 0.006 0 0.026 0 pork bacon, pan-cooked 20 52 48 4 0.002 0.005 0 0.027 0 pork roast, baked 21 52 50 2 0.001 0.005 0 0.030 0 lamb chop, pan-cooked 22 52 47 5 0.001 0.004 0 0.020 0 chicken, fried (breast, leg, and thigh) homemade 24 40 38 2 0.001 0.005 0 0.030 0
turkey breast, roasted 26 52 51 1 0 0.002 0 0.014 0 liver, beef, fried 27 52 8 40 0.024 0.017 0 0.080 0.022 frankfurters, beef, boiled 28 52 44 8 0.004 0.011 0 0.043 0 bologna, sliced 29 52 48 4 0.001 0.005 0 0.021 0 salami, sliced 30 52 50 2 0.001 0.003 0 0.016 0 tuna, canned in oil 32 40 36 4 0.001 0.004 0 0.013 0 fish sticks, frozen, heated 34 51 47 4 0.001 0.004 0 0.020 0
Page 84 of 211 Rev 4.1
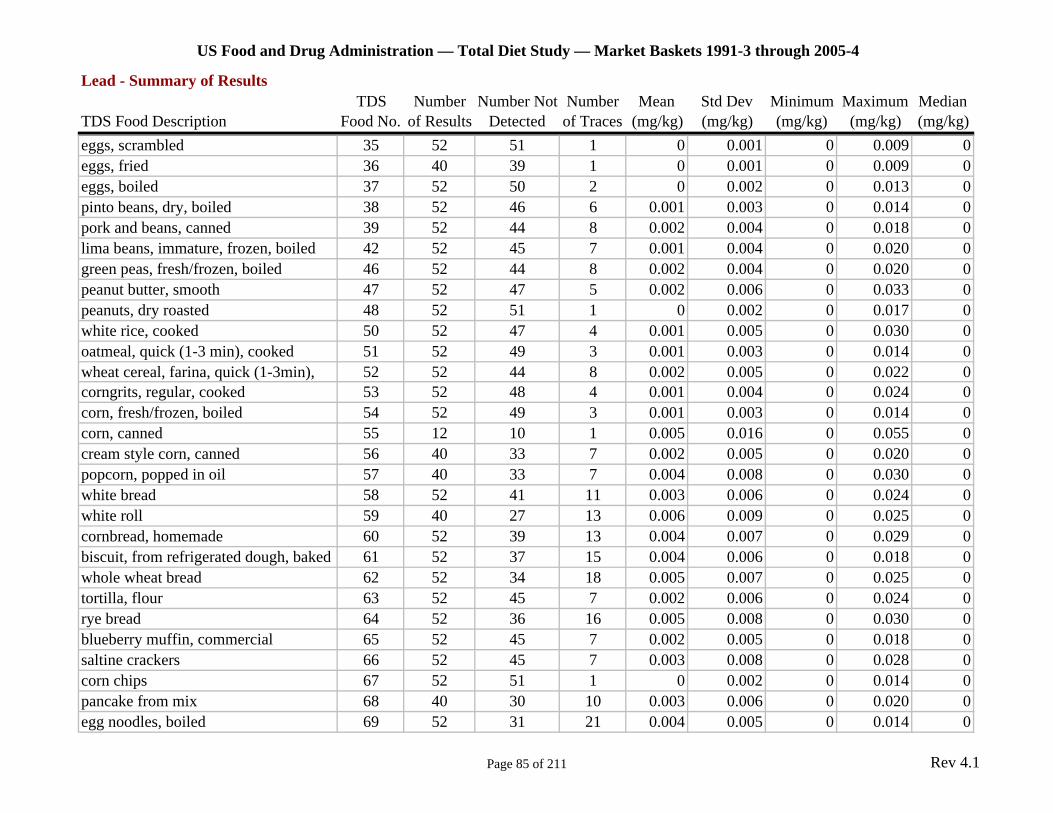
US Food and Drug Administration — Total Diet Study — Market Baskets 1991-3 through 2005-4
Lead - Summary of Results TDS Number Number Not Number Mean Std Dev Minimum Maximum Median
TDS Food Description Food No. of Results Detected of Traces (mg/kg) (mg/kg) (mg/kg) (mg/kg) (mg/kg) eggs, scrambled 35 52 51 1 0 0.001 0 0.009 0 eggs, fried 36 40 39 1 0 0.001 0 0.009 0 eggs, boiled 37 52 50 2 0 0.002 0 0.013 0 pinto beans, dry, boiled 38 52 46 6 0.001 0.003 0 0.014 0 pork and beans, canned 39 52 44 8 0.002 0.004 0 0.018 0 lima beans, immature, frozen, boiled 42 52 45 7 0.001 0.004 0 0.020 0 green peas, fresh/frozen, boiled 46 52 44 8 0.002 0.004 0 0.020 0 peanut butter, smooth 47 52 47 5 0.002 0.006 0 0.033 0 peanuts, dry roasted 48 52 51 1 0 0.002 0 0.017 0 white rice, cooked 50 52 47 4 0.001 0.005 0 0.030 0 oatmeal, quick (1-3 min), cooked 51 52 49 3 0.001 0.003 0 0.014 0 wheat cereal, farina, quick (1-3min), 52 52 44 8 0.002 0.005 0 0.022 0 corngrits, regular, cooked 53 52 48 4 0.001 0.004 0 0.024 0 corn, fresh/frozen, boiled 54 52 49 3 0.001 0.003 0 0.014 0 corn, canned 55 12 10 1 0.005 0.016 0 0.055 0 cream style corn, canned 56 40 33 7 0.002 0.005 0 0.020 0 popcorn, popped in oil 57 40 33 7 0.004 0.008 0 0.030 0 white bread 58 52 41 11 0.003 0.006 0 0.024 0 white roll 59 40 27 13 0.006 0.009 0 0.025 0 cornbread, homemade 60 52 39 13 0.004 0.007 0 0.029 0 biscuit, from refrigerated dough, baked 61 52 37 15 0.004 0.006 0 0.018 0 whole wheat bread 62 52 34 18 0.005 0.007 0 0.025 0 tortilla, flour 63 52 45 7 0.002 0.006 0 0.024 0 rye bread 64 52 36 16 0.005 0.008 0 0.030 0 blueberry muffin, commercial 65 52 45 7 0.002 0.005 0 0.018 0 saltine crackers 66 52 45 7 0.003 0.008 0 0.028 0 corn chips 67 52 51 1 0 0.002 0 0.014 0 pancake from mix 68 40 30 10 0.003 0.006 0 0.020 0 egg noodles, boiled 69 52 31 21 0.004 0.005 0 0.014 0
Page 85 of 211 Rev 4.1
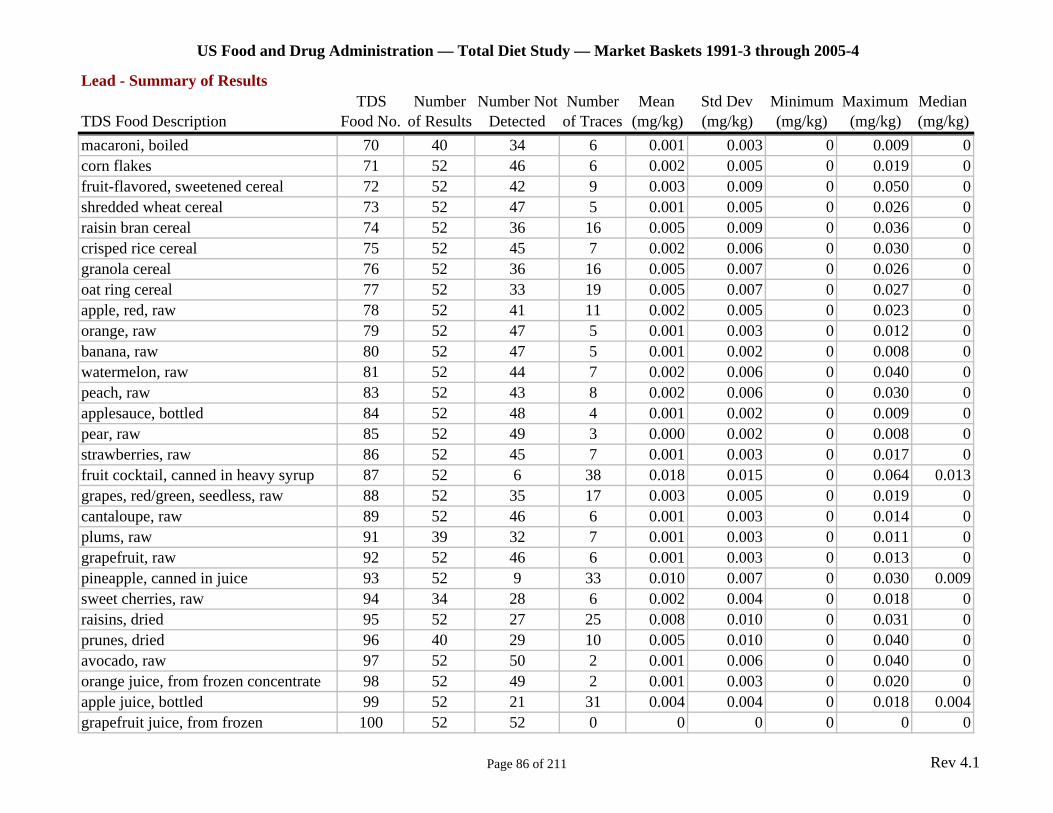
US Food and Drug Administration — Total Diet Study — Market Baskets 1991-3 through 2005-4
Lead - Summary of Results TDS Number Number Not Number Mean Std Dev Minimum Maximum Median
TDS Food Description Food No. of Results Detected of Traces (mg/kg) (mg/kg) (mg/kg) (mg/kg) (mg/kg) macaroni, boiled 70 40 34 6 0.001 0.003 0 0.009 0 corn flakes 71 52 46 6 0.002 0.005 0 0.019 0 fruit-flavored, sweetened cereal 72 52 42 9 0.003 0.009 0 0.050 0 shredded wheat cereal 73 52 47 5 0.001 0.005 0 0.026 0 raisin bran cereal 74 52 36 16 0.005 0.009 0 0.036 0 crisped rice cereal 75 52 45 7 0.002 0.006 0 0.030 0 granola cereal 76 52 36 16 0.005 0.007 0 0.026 0 oat ring cereal 77 52 33 19 0.005 0.007 0 0.027 0 apple, red, raw 78 52 41 11 0.002 0.005 0 0.023 0 orange, raw 79 52 47 5 0.001 0.003 0 0.012 0 banana, raw 80 52 47 5 0.001 0.002 0 0.008 0 watermelon, raw 81 52 44 7 0.002 0.006 0 0.040 0 peach, raw 83 52 43 8 0.002 0.006 0 0.030 0 applesauce, bottled 84 52 48 4 0.001 0.002 0 0.009 0 pear, raw 85 52 49 3 0.000 0.002 0 0.008 0 strawberries, raw 86 52 45 7 0.001 0.003 0 0.017 0 fruit cocktail, canned in heavy syrup 87 52 6 38 0.018 0.015 0 0.064 0.013 grapes, red/green, seedless, raw 88 52 35 17 0.003 0.005 0 0.019 0 cantaloupe, raw 89 52 46 6 0.001 0.003 0 0.014 0 plums, raw 91 39 32 7 0.001 0.003 0 0.011 0 grapefruit, raw 92 52 46 6 0.001 0.003 0 0.013 0 pineapple, canned in juice 93 52 9 33 0.010 0.007 0 0.030 0.009 sweet cherries, raw 94 34 28 6 0.002 0.004 0 0.018 0 raisins, dried 95 52 27 25 0.008 0.010 0 0.031 0 prunes, dried 96 40 29 10 0.005 0.010 0 0.040 0 avocado, raw 97 52 50 2 0.001 0.006 0 0.040 0 orange juice, from frozen concentrate 98 52 49 2 0.001 0.003 0 0.020 0 apple juice, bottled 99 52 21 31 0.004 0.004 0 0.018 0.004 grapefruit juice, from frozen 100 52 52 0 0 0 0 0 0
Page 86 of 211 Rev 4.1
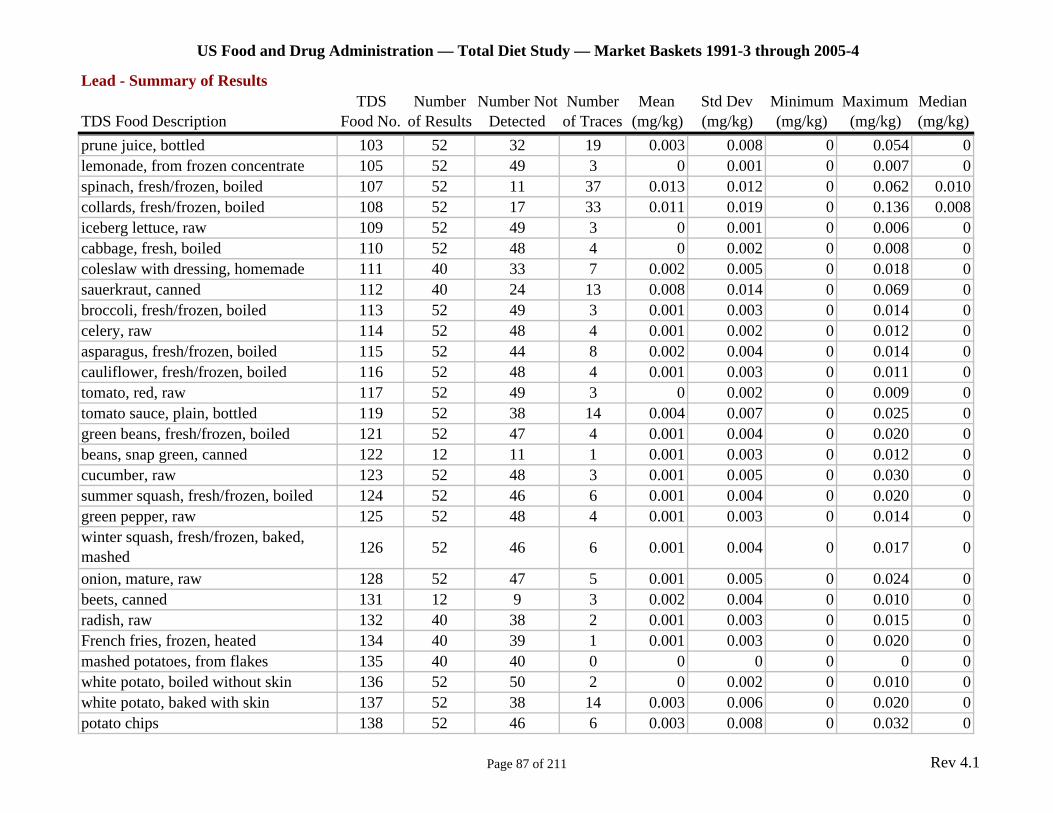
US Food and Drug Administration — Total Diet Study — Market Baskets 1991-3 through 2005-4
Lead - Summary of Results TDS Number Number Not Number Mean Std Dev Minimum Maximum Median
TDS Food Description Food No. of Results Detected of Traces (mg/kg) (mg/kg) (mg/kg) (mg/kg) (mg/kg) prune juice, bottled 103 52 32 19 0.003 0.008 0 0.054 0 lemonade, from frozen concentrate 105 52 49 3 0 0.001 0 0.007 0 spinach, fresh/frozen, boiled 107 52 11 37 0.013 0.012 0 0.062 0.010 collards, fresh/frozen, boiled 108 52 17 33 0.011 0.019 0 0.136 0.008 iceberg lettuce, raw 109 52 49 3 0 0.001 0 0.006 0 cabbage, fresh, boiled 110 52 48 4 0 0.002 0 0.008 0 coleslaw with dressing, homemade 111 40 33 7 0.002 0.005 0 0.018 0 sauerkraut, canned 112 40 24 13 0.008 0.014 0 0.069 0 broccoli, fresh/frozen, boiled 113 52 49 3 0.001 0.003 0 0.014 0 celery, raw 114 52 48 4 0.001 0.002 0 0.012 0 asparagus, fresh/frozen, boiled 115 52 44 8 0.002 0.004 0 0.014 0 cauliflower, fresh/frozen, boiled 116 52 48 4 0.001 0.003 0 0.011 0 tomato, red, raw 117 52 49 3 0 0.002 0 0.009 0 tomato sauce, plain, bottled 119 52 38 14 0.004 0.007 0 0.025 0 green beans, fresh/frozen, boiled 121 52 47 4 0.001 0.004 0 0.020 0 beans, snap green, canned 122 12 11 1 0.001 0.003 0 0.012 0 cucumber, raw 123 52 48 3 0.001 0.005 0 0.030 0 summer squash, fresh/frozen, boiled 124 52 46 6 0.001 0.004 0 0.020 0 green pepper, raw 125 52 48 4 0.001 0.003 0 0.014 0 winter squash, fresh/frozen, baked, mashed 126 52 46 6 0.001 0.004 0 0.017 0
onion, mature, raw 128 52 47 5 0.001 0.005 0 0.024 0 beets, canned 131 12 9 3 0.002 0.004 0 0.010 0 radish, raw 132 40 38 2 0.001 0.003 0 0.015 0 French fries, frozen, heated 134 40 39 1 0.001 0.003 0 0.020 0 mashed potatoes, from flakes 135 40 40 0 0 0 0 0 0 white potato, boiled without skin 136 52 50 2 0 0.002 0 0.010 0 white potato, baked with skin 137 52 38 14 0.003 0.006 0 0.020 0 potato chips 138 52 46 6 0.003 0.008 0 0.032 0
Page 87 of 211 Rev 4.1
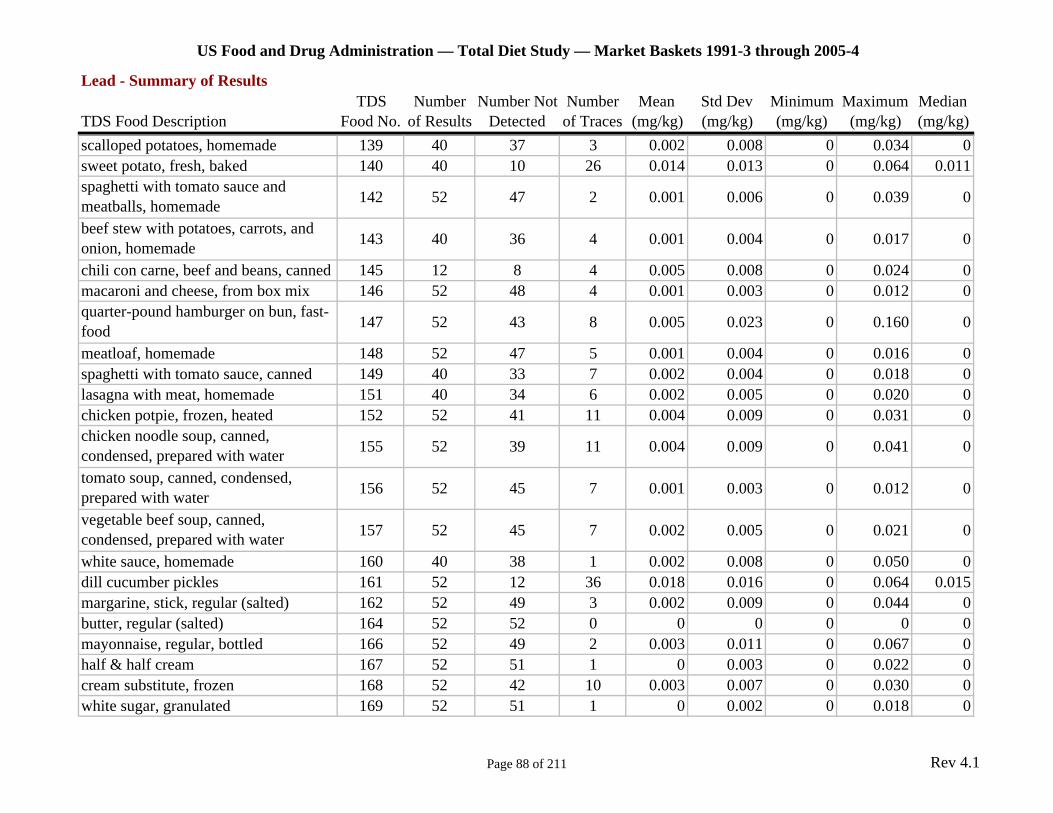
US Food and Drug Administration — Total Diet Study — Market Baskets 1991-3 through 2005-4
Lead - Summary of Results TDS Number Number Not Number Mean Std Dev Minimum Maximum Median
TDS Food Description Food No. of Results Detected of Traces (mg/kg) (mg/kg) (mg/kg) (mg/kg) (mg/kg) scalloped potatoes, homemade 139 40 37 3 0.002 0.008 0 0.034 0 sweet potato, fresh, baked 140 40 10 26 0.014 0.013 0 0.064 0.011 spaghetti with tomato sauce and meatballs, homemade 142 52 47 2 0.001 0.006 0 0.039 0
beef stew with potatoes, carrots, and onion, homemade 143 40 36 4 0.001 0.004 0 0.017 0
chili con carne, beef and beans, canned 145 12 8 4 0.005 0.008 0 0.024 0 macaroni and cheese, from box mix 146 52 48 4 0.001 0.003 0 0.012 0 quarter-pound hamburger on bun, fast-food 147 52 43 8 0.005 0.023 0 0.160 0
meatloaf, homemade 148 52 47 5 0.001 0.004 0 0.016 0 spaghetti with tomato sauce, canned 149 40 33 7 0.002 0.004 0 0.018 0 lasagna with meat, homemade 151 40 34 6 0.002 0.005 0 0.020 0 chicken potpie, frozen, heated 152 52 41 11 0.004 0.009 0 0.031 0 chicken noodle soup, canned, condensed, prepared with water 155 52 39 11 0.004 0.009 0 0.041 0
tomato soup, canned, condensed, prepared with water 156 52 45 7 0.001 0.003 0 0.012 0
vegetable beef soup, canned, condensed, prepared with water 157 52 45 7 0.002 0.005 0 0.021 0
white sauce, homemade 160 40 38 1 0.002 0.008 0 0.050 0 dill cucumber pickles 161 52 12 36 0.018 0.016 0 0.064 0.015 margarine, stick, regular (salted) 162 52 49 3 0.002 0.009 0 0.044 0 butter, regular (salted) 164 52 52 0 0 0 0 0 0 mayonnaise, regular, bottled 166 52 49 2 0.003 0.011 0 0.067 0 half & half cream 167 52 51 1 0 0.003 0 0.022 0 cream substitute, frozen 168 52 42 10 0.003 0.007 0 0.030 0 white sugar, granulated 169 52 51 1 0 0.002 0 0.018 0
Page 88 of 211 Rev 4.1
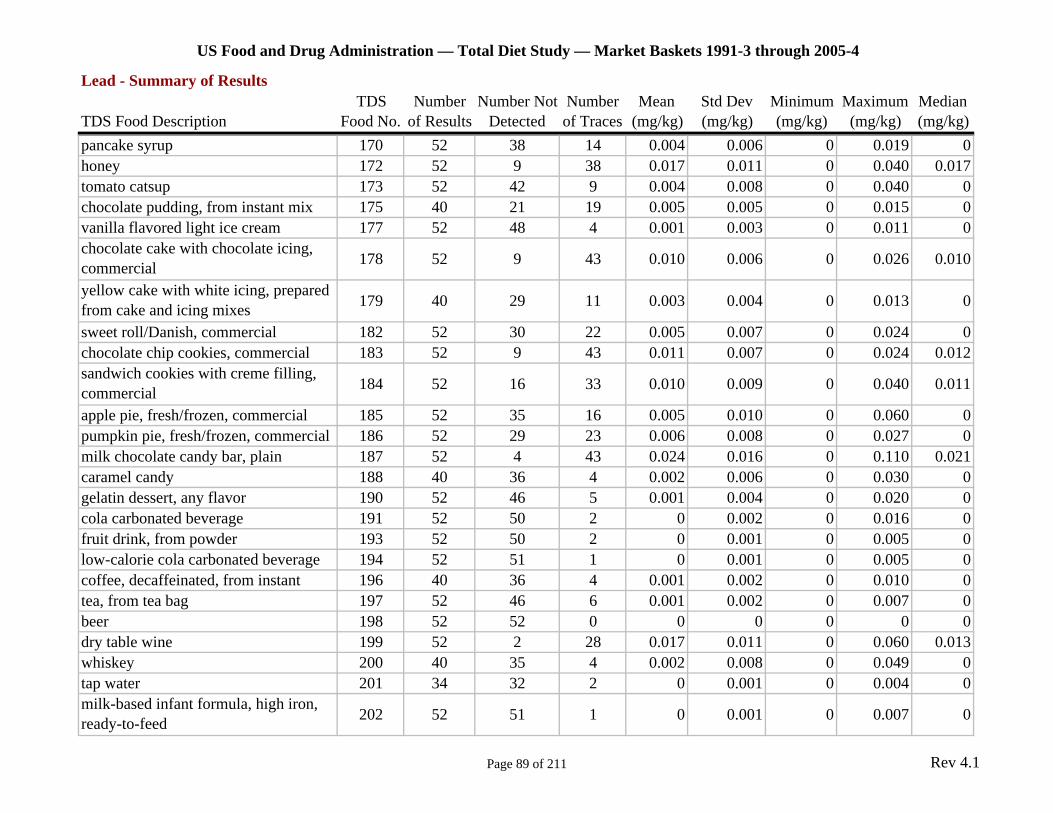
US Food and Drug Administration — Total Diet Study — Market Baskets 1991-3 through 2005-4
Lead - Summary of Results TDS Number Number Not Number Mean Std Dev Minimum Maximum Median
TDS Food Description Food No. of Results Detected of Traces (mg/kg) (mg/kg) (mg/kg) (mg/kg) (mg/kg) pancake syrup 170 52 38 14 0.004 0.006 0 0.019 0 honey 172 52 9 38 0.017 0.011 0 0.040 0.017 tomato catsup 173 52 42 9 0.004 0.008 0 0.040 0 chocolate pudding, from instant mix 175 40 21 19 0.005 0.005 0 0.015 0 vanilla flavored light ice cream 177 52 48 4 0.001 0.003 0 0.011 0 chocolate cake with chocolate icing, commercial 178 52 9 43 0.010 0.006 0 0.026 0.010
yellow cake with white icing, prepared from cake and icing mixes 179 40 29 11 0.003 0.004 0 0.013 0
sweet roll/Danish, commercial 182 52 30 22 0.005 0.007 0 0.024 0 chocolate chip cookies, commercial 183 52 9 43 0.011 0.007 0 0.024 0.012 sandwich cookies with creme filling, commercial 184 52 16 33 0.010 0.009 0 0.040 0.011
apple pie, fresh/frozen, commercial 185 52 35 16 0.005 0.010 0 0.060 0 pumpkin pie, fresh/frozen, commercial 186 52 29 23 0.006 0.008 0 0.027 0 milk chocolate candy bar, plain 187 52 4 43 0.024 0.016 0 0.110 0.021 caramel candy 188 40 36 4 0.002 0.006 0 0.030 0 gelatin dessert, any flavor 190 52 46 5 0.001 0.004 0 0.020 0 cola carbonated beverage 191 52 50 2 0 0.002 0 0.016 0 fruit drink, from powder 193 52 50 2 0 0.001 0 0.005 0 low-calorie cola carbonated beverage 194 52 51 1 0 0.001 0 0.005 0 coffee, decaffeinated, from instant 196 40 36 4 0.001 0.002 0 0.010 0 tea, from tea bag 197 52 46 6 0.001 0.002 0 0.007 0 beer 198 52 52 0 0 0 0 0 0 dry table wine 199 52 2 28 0.017 0.011 0 0.060 0.013 whiskey 200 40 35 4 0.002 0.008 0 0.049 0 tap water 201 34 32 2 0 0.001 0 0.004 0 milk-based infant formula, high iron, ready-to-feed 202 52 51 1 0 0.001 0 0.007 0
Page 89 of 211 Rev 4.1
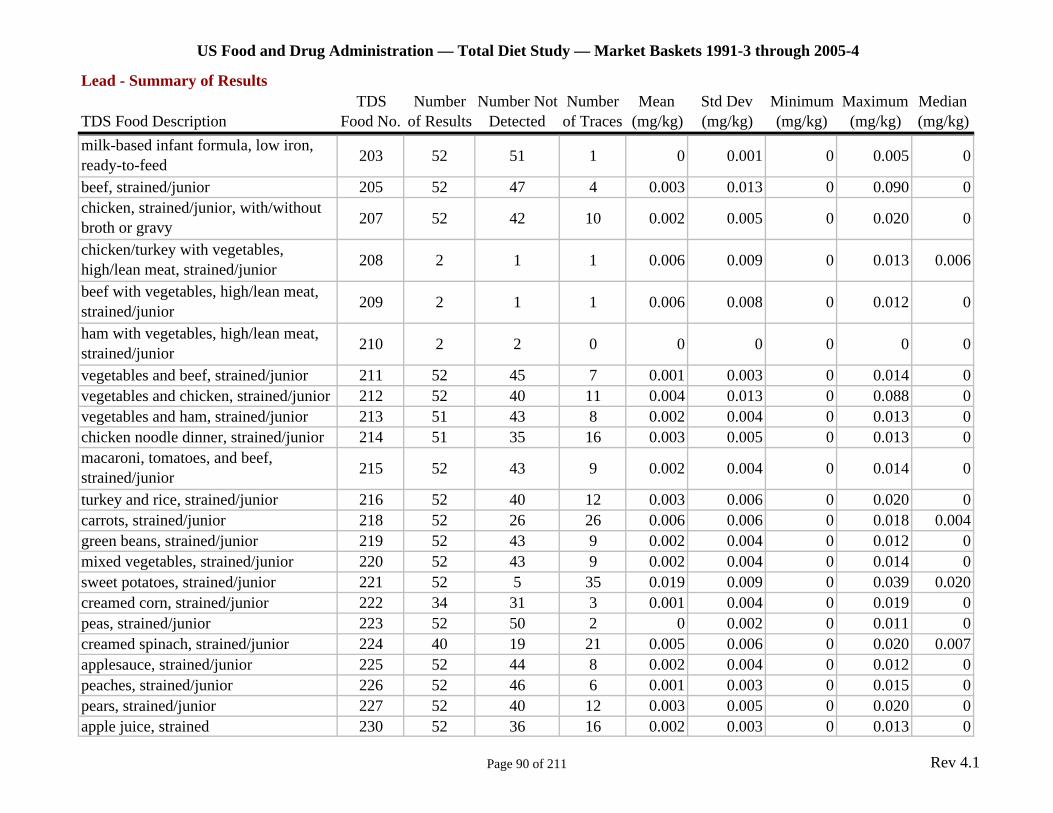
US Food and Drug Administration — Total Diet Study — Market Baskets 1991-3 through 2005-4
Lead - Summary of Results TDS Number Number Not Number Mean Std Dev Minimum Maximum Median
TDS Food Description Food No. of Results Detected of Traces (mg/kg) (mg/kg) (mg/kg) (mg/kg) (mg/kg) milk-based infant formula, low iron, ready-to-feed 203 52 51 1 0 0.001 0 0.005 0
beef, strained/junior 205 52 47 4 0.003 0.013 0 0.090 0 chicken, strained/junior, with/without broth or gravy 207 52 42 10 0.002 0.005 0 0.020 0
chicken/turkey with vegetables, high/lean meat, strained/junior 208 2 1 1 0.006 0.009 0 0.013 0.006
beef with vegetables, high/lean meat, strained/junior 209 2 1 1 0.006 0.008 0 0.012 0
ham with vegetables, high/lean meat, strained/junior 210 2 2 0 0 0 0 0 0
vegetables and beef, strained/junior 211 52 45 7 0.001 0.003 0 0.014 0 vegetables and chicken, strained/junior 212 52 40 11 0.004 0.013 0 0.088 0 vegetables and ham, strained/junior 213 51 43 8 0.002 0.004 0 0.013 0 chicken noodle dinner, strained/junior 214 51 35 16 0.003 0.005 0 0.013 0 macaroni, tomatoes, and beef, strained/junior 215 52 43 9 0.002 0.004 0 0.014 0
turkey and rice, strained/junior 216 52 40 12 0.003 0.006 0 0.020 0 carrots, strained/junior 218 52 26 26 0.006 0.006 0 0.018 0.004 green beans, strained/junior 219 52 43 9 0.002 0.004 0 0.012 0 mixed vegetables, strained/junior 220 52 43 9 0.002 0.004 0 0.014 0 sweet potatoes, strained/junior 221 52 5 35 0.019 0.009 0 0.039 0.020 creamed corn, strained/junior 222 34 31 3 0.001 0.004 0 0.019 0 peas, strained/junior 223 52 50 2 0 0.002 0 0.011 0 creamed spinach, strained/junior 224 40 19 21 0.005 0.006 0 0.020 0.007 applesauce, strained/junior 225 52 44 8 0.002 0.004 0 0.012 0 peaches, strained/junior 226 52 46 6 0.001 0.003 0 0.015 0 pears, strained/junior 227 52 40 12 0.003 0.005 0 0.020 0 apple juice, strained 230 52 36 16 0.002 0.003 0 0.013 0
Page 90 of 211 Rev 4.1
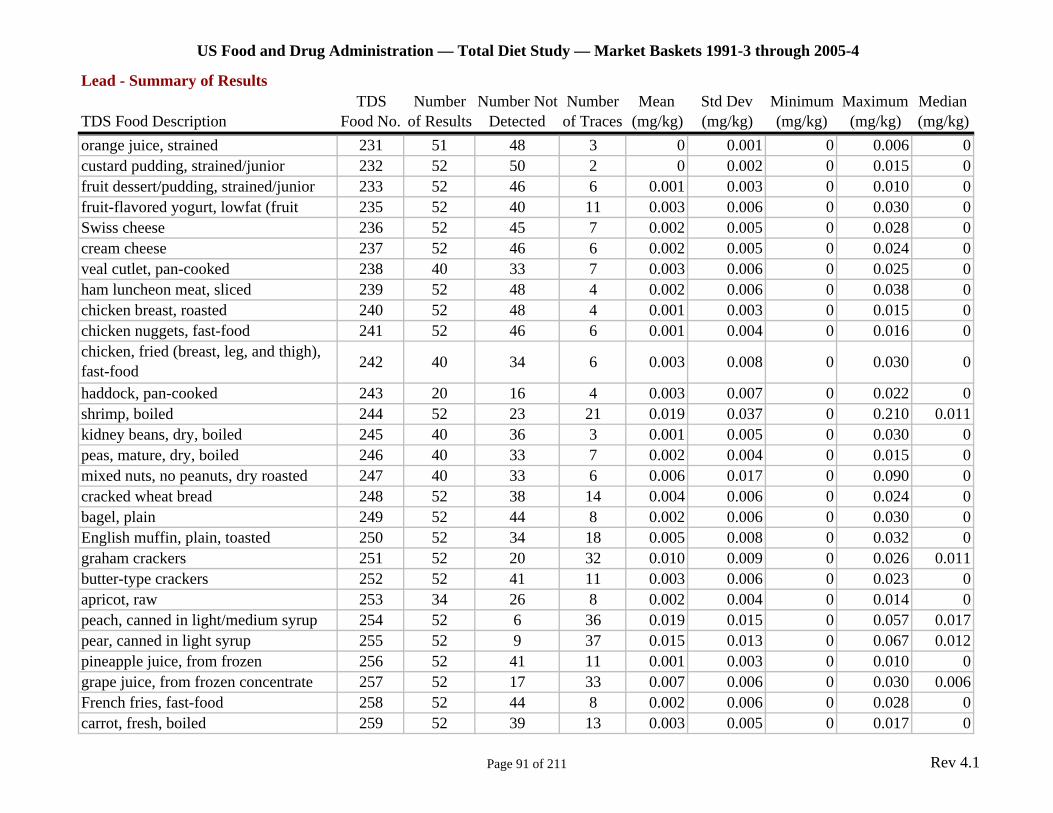
US Food and Drug Administration — Total Diet Study — Market Baskets 1991-3 through 2005-4
Lead - Summary of Results TDS Number Number Not Number Mean Std Dev Minimum Maximum Median
TDS Food Description Food No. of Results Detected of Traces (mg/kg) (mg/kg) (mg/kg) (mg/kg) (mg/kg) orange juice, strained 231 51 48 3 0 0.001 0 0.006 0 custard pudding, strained/junior 232 52 50 2 0 0.002 0 0.015 0 fruit dessert/pudding, strained/junior 233 52 46 6 0.001 0.003 0 0.010 0 fruit-flavored yogurt, lowfat (fruit 235 52 40 11 0.003 0.006 0 0.030 0 Swiss cheese 236 52 45 7 0.002 0.005 0 0.028 0 cream cheese 237 52 46 6 0.002 0.005 0 0.024 0 veal cutlet, pan-cooked 238 40 33 7 0.003 0.006 0 0.025 0 ham luncheon meat, sliced 239 52 48 4 0.002 0.006 0 0.038 0 chicken breast, roasted 240 52 48 4 0.001 0.003 0 0.015 0 chicken nuggets, fast-food 241 52 46 6 0.001 0.004 0 0.016 0 chicken, fried (breast, leg, and thigh), fast-food 242 40 34 6 0.003 0.008 0 0.030 0
haddock, pan-cooked 243 20 16 4 0.003 0.007 0 0.022 0 shrimp, boiled 244 52 23 21 0.019 0.037 0 0.210 0.011 kidney beans, dry, boiled 245 40 36 3 0.001 0.005 0 0.030 0 peas, mature, dry, boiled 246 40 33 7 0.002 0.004 0 0.015 0 mixed nuts, no peanuts, dry roasted 247 40 33 6 0.006 0.017 0 0.090 0 cracked wheat bread 248 52 38 14 0.004 0.006 0 0.024 0 bagel, plain 249 52 44 8 0.002 0.006 0 0.030 0 English muffin, plain, toasted 250 52 34 18 0.005 0.008 0 0.032 0 graham crackers 251 52 20 32 0.010 0.009 0 0.026 0.011 butter-type crackers 252 52 41 11 0.003 0.006 0 0.023 0 apricot, raw 253 34 26 8 0.002 0.004 0 0.014 0 peach, canned in light/medium syrup 254 52 6 36 0.019 0.015 0 0.057 0.017 pear, canned in light syrup 255 52 9 37 0.015 0.013 0 0.067 0.012 pineapple juice, from frozen 256 52 41 11 0.001 0.003 0 0.010 0 grape juice, from frozen concentrate 257 52 17 33 0.007 0.006 0 0.030 0.006 French fries, fast-food 258 52 44 8 0.002 0.006 0 0.028 0 carrot, fresh, boiled 259 52 39 13 0.003 0.005 0 0.017 0
Page 91 of 211 Rev 4.1
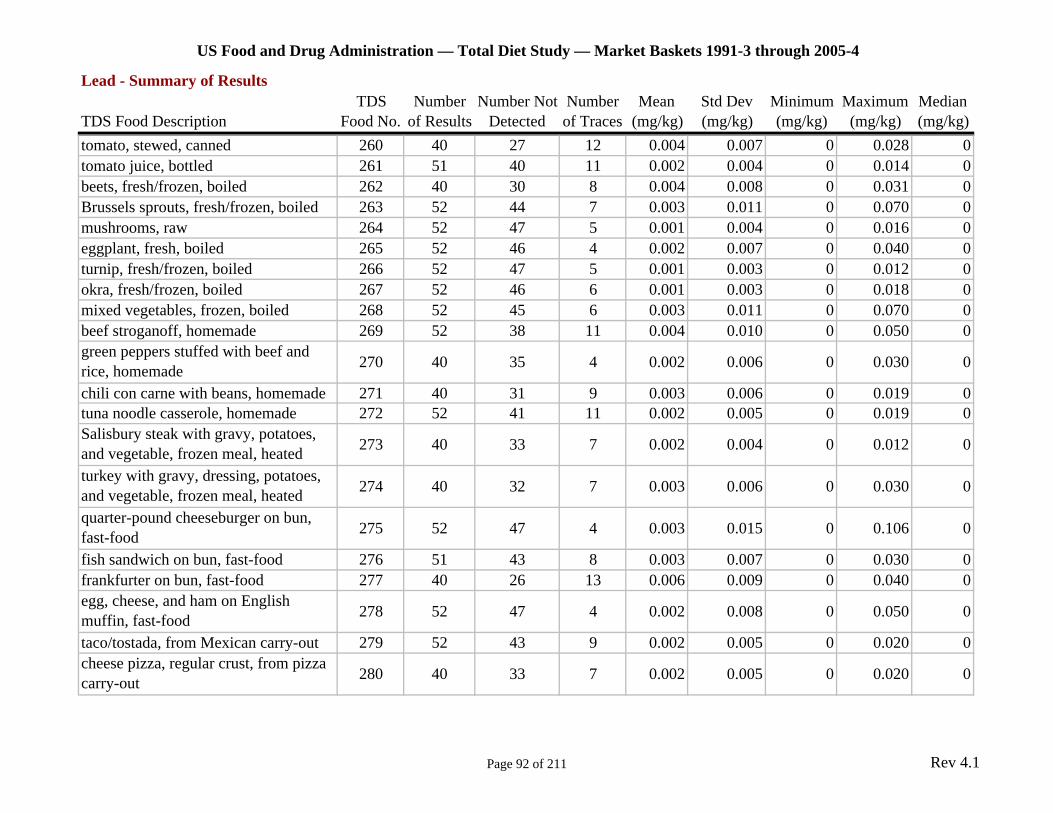
US Food and Drug Administration — Total Diet Study — Market Baskets 1991-3 through 2005-4
Lead - Summary of Results TDS Number Number Not Number Mean Std Dev Minimum Maximum Median
TDS Food Description Food No. of Results Detected of Traces (mg/kg) (mg/kg) (mg/kg) (mg/kg) (mg/kg) tomato, stewed, canned 260 40 27 12 0.004 0.007 0 0.028 0 tomato juice, bottled 261 51 40 11 0.002 0.004 0 0.014 0 beets, fresh/frozen, boiled 262 40 30 8 0.004 0.008 0 0.031 0 Brussels sprouts, fresh/frozen, boiled 263 52 44 7 0.003 0.011 0 0.070 0 mushrooms, raw 264 52 47 5 0.001 0.004 0 0.016 0 eggplant, fresh, boiled 265 52 46 4 0.002 0.007 0 0.040 0 turnip, fresh/frozen, boiled 266 52 47 5 0.001 0.003 0 0.012 0 okra, fresh/frozen, boiled 267 52 46 6 0.001 0.003 0 0.018 0 mixed vegetables, frozen, boiled 268 52 45 6 0.003 0.011 0 0.070 0 beef stroganoff, homemade 269 52 38 11 0.004 0.010 0 0.050 0 green peppers stuffed with beef and rice, homemade 270 40 35 4 0.002 0.006 0 0.030 0
chili con carne with beans, homemade 271 40 31 9 0.003 0.006 0 0.019 0 tuna noodle casserole, homemade 272 52 41 11 0.002 0.005 0 0.019 0 Salisbury steak with gravy, potatoes, and vegetable, frozen meal, heated 273 40 33 7 0.002 0.004 0 0.012 0
turkey with gravy, dressing, potatoes, and vegetable, frozen meal, heated 274 40 32 7 0.003 0.006 0 0.030 0
quarter-pound cheeseburger on bun, fast-food 275 52 47 4 0.003 0.015 0 0.106 0
fish sandwich on bun, fast-food 276 51 43 8 0.003 0.007 0 0.030 0 frankfurter on bun, fast-food 277 40 26 13 0.006 0.009 0 0.040 0 egg, cheese, and ham on English muffin, fast-food 278 52 47 4 0.002 0.008 0 0.050 0
taco/tostada, from Mexican carry-out 279 52 43 9 0.002 0.005 0 0.020 0 cheese pizza, regular crust, from pizza carry-out 280 40 33 7 0.002 0.005 0 0.020 0
Page 92 of 211 Rev 4.1
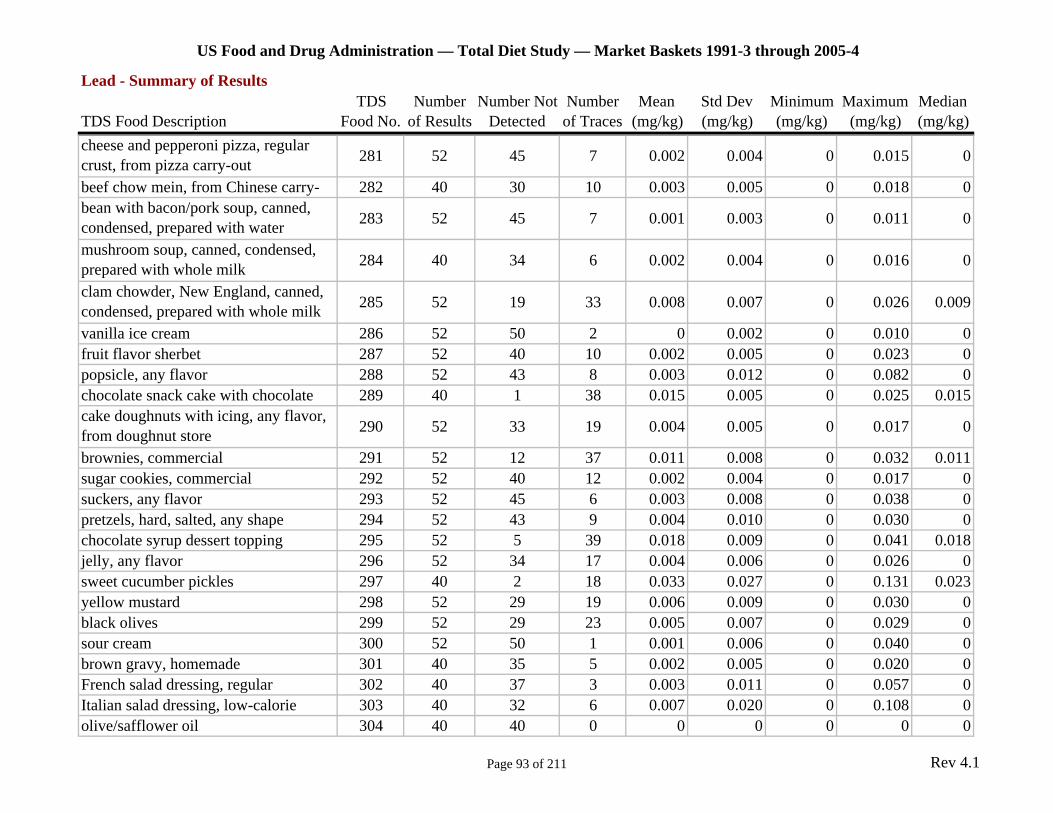
US Food and Drug Administration — Total Diet Study — Market Baskets 1991-3 through 2005-4
Lead - Summary of Results TDS Number Number Not Number Mean Std Dev Minimum Maximum Median
TDS Food Description Food No. of Results Detected of Traces (mg/kg) (mg/kg) (mg/kg) (mg/kg) (mg/kg) cheese and pepperoni pizza, regular crust, from pizza carry-out 281 52 45 7 0.002 0.004 0 0.015 0
beef chow mein, from Chinese carry- 282 40 30 10 0.003 0.005 0 0.018 0 bean with bacon/pork soup, canned, condensed, prepared with water 283 52 45 7 0.001 0.003 0 0.011 0
mushroom soup, canned, condensed, prepared with whole milk 284 40 34 6 0.002 0.004 0 0.016 0
clam chowder, New England, canned, condensed, prepared with whole milk 285 52 19 33 0.008 0.007 0 0.026 0.009
vanilla ice cream 286 52 50 2 0 0.002 0 0.010 0 fruit flavor sherbet 287 52 40 10 0.002 0.005 0 0.023 0 popsicle, any flavor 288 52 43 8 0.003 0.012 0 0.082 0 chocolate snack cake with chocolate 289 40 1 38 0.015 0.005 0 0.025 0.015 cake doughnuts with icing, any flavor, from doughnut store 290 52 33 19 0.004 0.005 0 0.017 0
brownies, commercial 291 52 12 37 0.011 0.008 0 0.032 0.011 sugar cookies, commercial 292 52 40 12 0.002 0.004 0 0.017 0 suckers, any flavor 293 52 45 6 0.003 0.008 0 0.038 0 pretzels, hard, salted, any shape 294 52 43 9 0.004 0.010 0 0.030 0 chocolate syrup dessert topping 295 52 5 39 0.018 0.009 0 0.041 0.018 jelly, any flavor 296 52 34 17 0.004 0.006 0 0.026 0 sweet cucumber pickles 297 40 2 18 0.033 0.027 0 0.131 0.023 yellow mustard 298 52 29 19 0.006 0.009 0 0.030 0 black olives 299 52 29 23 0.005 0.007 0 0.029 0 sour cream 300 52 50 1 0.001 0.006 0 0.040 0 brown gravy, homemade 301 40 35 5 0.002 0.005 0 0.020 0 French salad dressing, regular 302 40 37 3 0.003 0.011 0 0.057 0 Italian salad dressing, low-calorie 303 40 32 6 0.007 0.020 0 0.108 0 olive/safflower oil 304 40 40 0 0 0 0 0 0
Page 93 of 211 Rev 4.1
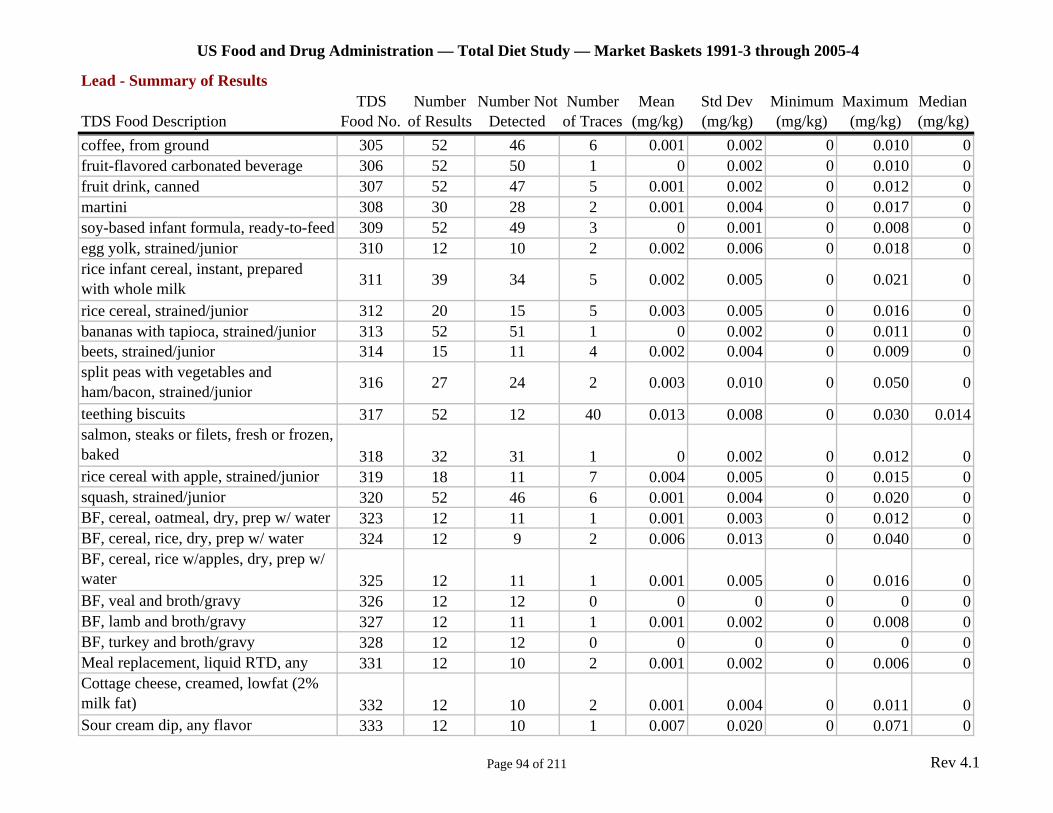
US Food and Drug Administration — Total Diet Study — Market Baskets 1991-3 through 2005-4
Lead - Summary of Results TDS Number Number Not Number Mean Std Dev Minimum Maximum Median
TDS Food Description Food No. of Results Detected of Traces (mg/kg) (mg/kg) (mg/kg) (mg/kg) (mg/kg) coffee, from ground 305 52 46 6 0.001 0.002 0 0.010 0 fruit-flavored carbonated beverage 306 52 50 1 0 0.002 0 0.010 0 fruit drink, canned 307 52 47 5 0.001 0.002 0 0.012 0 martini 308 30 28 2 0.001 0.004 0 0.017 0 soy-based infant formula, ready-to-feed 309 52 49 3 0 0.001 0 0.008 0 egg yolk, strained/junior 310 12 10 2 0.002 0.006 0 0.018 0 rice infant cereal, instant, prepared with whole milk 311 39 34 5 0.002 0.005 0 0.021 0
rice cereal, strained/junior 312 20 15 5 0.003 0.005 0 0.016 0 bananas with tapioca, strained/junior 313 52 51 1 0 0.002 0 0.011 0 beets, strained/junior 314 15 11 4 0.002 0.004 0 0.009 0 split peas with vegetables and ham/bacon, strained/junior 316 27 24 2 0.003 0.010 0 0.050 0
teething biscuits 317 52 12 40 0.013 0.008 0 0.030 0.014 salmon, steaks or filets, fresh or frozen, baked 318 32 31 1 0 0.002 0 0.012 0 rice cereal with apple, strained/junior 319 18 11 7 0.004 0.005 0 0.015 0 squash, strained/junior 320 52 46 6 0.001 0.004 0 0.020 0 BF, cereal, oatmeal, dry, prep w/ water 323 12 11 1 0.001 0.003 0 0.012 0 BF, cereal, rice, dry, prep w/ water 324 12 9 2 0.006 0.013 0 0.040 0 BF, cereal, rice w/apples, dry, prep w/ water 325 12 11 1 0.001 0.005 0 0.016 0 BF, veal and broth/gravy 326 12 12 0 0 0 0 0 0 BF, lamb and broth/gravy 327 12 11 1 0.001 0.002 0 0.008 0 BF, turkey and broth/gravy 328 12 12 0 0 0 0 0 0 Meal replacement, liquid RTD, any 331 12 10 2 0.001 0.002 0 0.006 0 Cottage cheese, creamed, lowfat (2% milk fat) 332 12 10 2 0.001 0.004 0 0.011 0 Sour cream dip, any flavor 333 12 10 1 0.007 0.020 0 0.071 0
Page 94 of 211 Rev 4.1
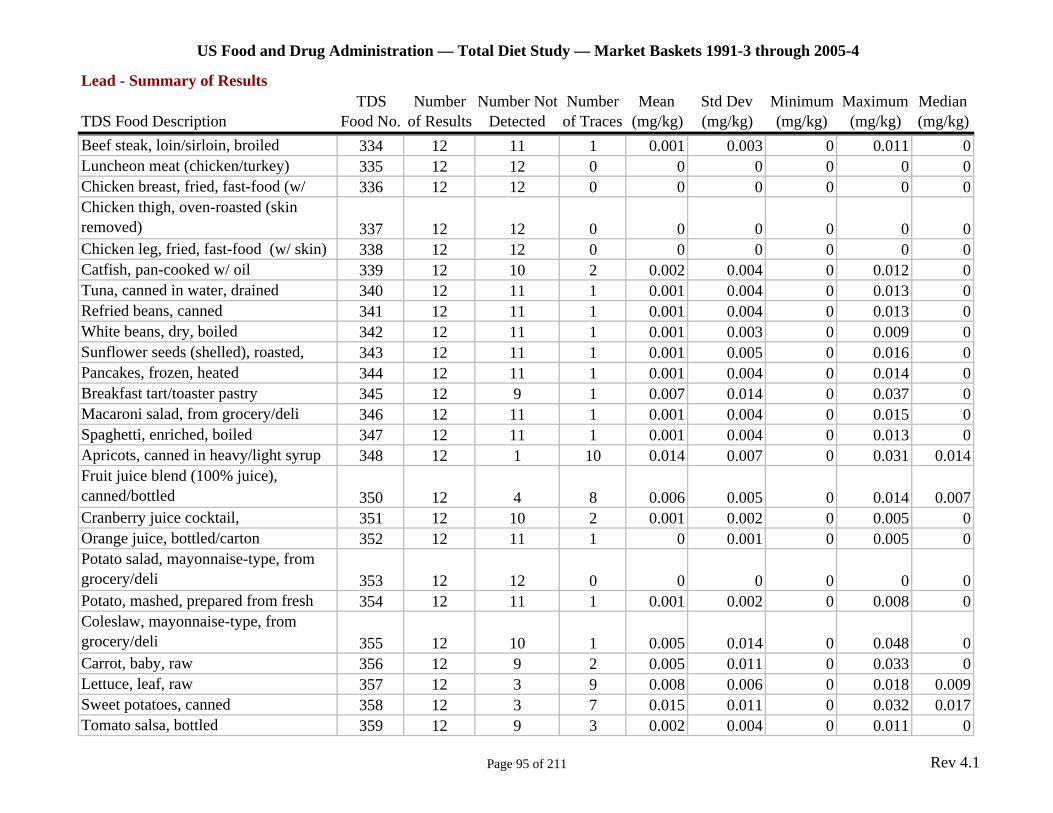
US Food and Drug Administration — Total Diet Study — Market Baskets 1991-3 through 2005-4
Lead - Summary of Results TDS Number Number Not Number Mean Std Dev Minimum Maximum Median
TDS Food Description Food No. of Results Detected of Traces (mg/kg) (mg/kg) (mg/kg) (mg/kg) (mg/kg) Beef steak, loin/sirloin, broiled 334 12 11 1 0.001 0.003 0 0.011 0 Luncheon meat (chicken/turkey) 335 12 12 0 0 0 0 0 0 Chicken breast, fried, fast-food (w/ 336 12 12 0 0 0 0 0 0 Chicken thigh, oven-roasted (skin removed) 337 12 12 0 0 0 0 0 0 Chicken leg, fried, fast-food (w/ skin) 338 12 12 0 0 0 0 0 0 Catfish, pan-cooked w/ oil 339 12 10 2 0.002 0.004 0 0.012 0 Tuna, canned in water, drained 340 12 11 1 0.001 0.004 0 0.013 0 Refried beans, canned 341 12 11 1 0.001 0.004 0 0.013 0 White beans, dry, boiled 342 12 11 1 0.001 0.003 0 0.009 0 Sunflower seeds (shelled), roasted, 343 12 11 1 0.001 0.005 0 0.016 0 Pancakes, frozen, heated 344 12 11 1 0.001 0.004 0 0.014 0 Breakfast tart/toaster pastry 345 12 9 1 0.007 0.014 0 0.037 0 Macaroni salad, from grocery/deli 346 12 11 1 0.001 0.004 0 0.015 0 Spaghetti, enriched, boiled 347 12 11 1 0.001 0.004 0 0.013 0 Apricots, canned in heavy/light syrup 348 12 1 10 0.014 0.007 0 0.031 0.014 Fruit juice blend (100% juice), canned/bottled 350 12 4 8 0.006 0.005 0 0.014 0.007 Cranberry juice cocktail, 351 12 10 2 0.001 0.002 0 0.005 0 Orange juice, bottled/carton 352 12 11 1 0 0.001 0 0.005 0 Potato salad, mayonnaise-type, from grocery/deli 353 12 12 0 0 0 0 0 0 Potato, mashed, prepared from fresh 354 12 11 1 0.001 0.002 0 0.008 0 Coleslaw, mayonnaise-type, from grocery/deli 355 12 10 1 0.005 0.014 0 0.048 0 Carrot, baby, raw 356 12 9 2 0.005 0.011 0 0.033 0 Lettuce, leaf, raw 357 12 3 9 0.008 0.006 0 0.018 0.009 Sweet potatoes, canned 358 12 3 7 0.015 0.011 0 0.032 0.017 Tomato salsa, bottled 359 12 9 3 0.002 0.004 0 0.011 0
Page 95 of 211 Rev 4.1
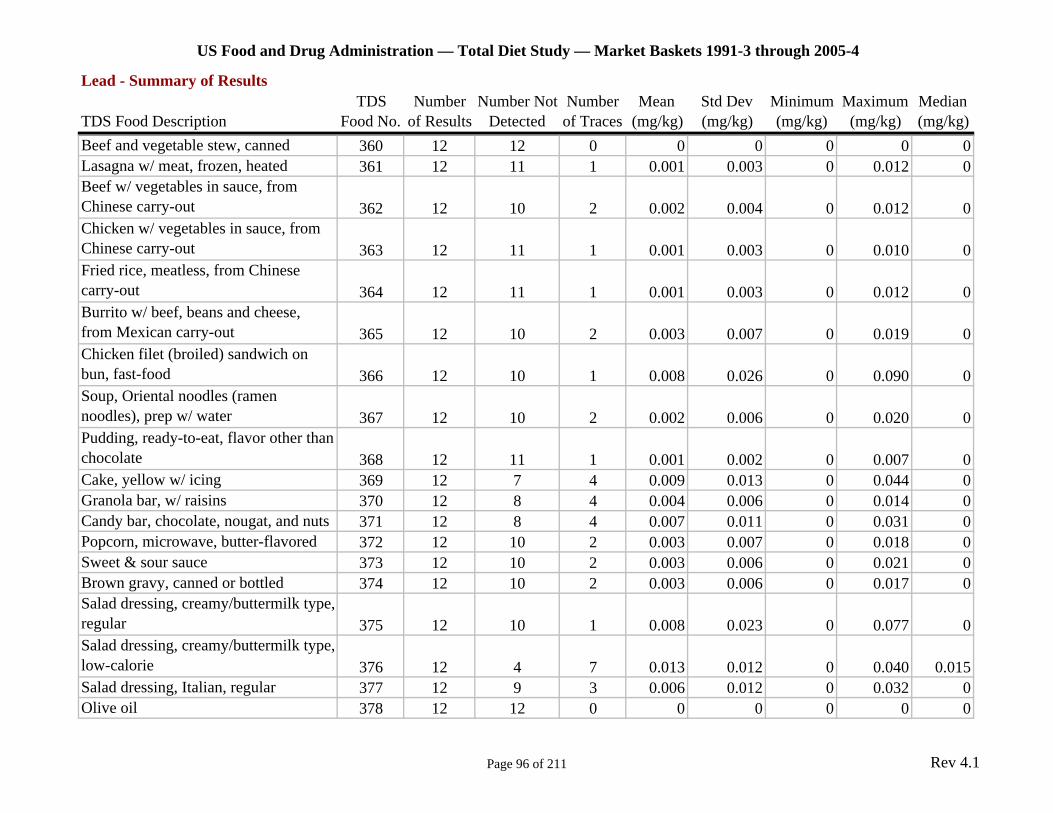
US Food and Drug Administration — Total Diet Study — Market Baskets 1991-3 through 2005-4
Lead - Summary of Results TDS Number Number Not Number Mean Std Dev Minimum Maximum Median
TDS Food Description Food No. of Results Detected of Traces (mg/kg) (mg/kg) (mg/kg) (mg/kg) (mg/kg) Beef and vegetable stew, canned 360 12 12 0 0 0 0 0 0 Lasagna w/ meat, frozen, heated 361 12 11 1 0.001 0.003 0 0.012 0 Beef w/ vegetables in sauce, from Chinese carry-out 362 12 10 2 0.002 0.004 0 0.012 0 Chicken w/ vegetables in sauce, from Chinese carry-out 363 12 11 1 0.001 0.003 0 0.010 0 Fried rice, meatless, from Chinese carry-out 364 12 11 1 0.001 0.003 0 0.012 0 Burrito w/ beef, beans and cheese, from Mexican carry-out 365 12 10 2 0.003 0.007 0 0.019 0 Chicken filet (broiled) sandwich on bun, fast-food 366 12 10 1 0.008 0.026 0 0.090 0 Soup, Oriental noodles (ramen noodles), prep w/ water 367 12 10 2 0.002 0.006 0 0.020 0 Pudding, ready-to-eat, flavor other than chocolate 368 12 11 1 0.001 0.002 0 0.007 0 Cake, yellow w/ icing 369 12 7 4 0.009 0.013 0 0.044 0 Granola bar, w/ raisins 370 12 8 4 0.004 0.006 0 0.014 0 Candy bar, chocolate, nougat, and nuts 371 12 8 4 0.007 0.011 0 0.031 0 Popcorn, microwave, butter-flavored 372 12 10 2 0.003 0.007 0 0.018 0 Sweet & sour sauce 373 12 10 2 0.003 0.006 0 0.021 0 Brown gravy, canned or bottled 374 12 10 2 0.003 0.006 0 0.017 0 Salad dressing, creamy/buttermilk type, regular 375 12 10 1 0.008 0.023 0 0.077 0 Salad dressing, creamy/buttermilk type, low-calorie 376 12 4 7 0.013 0.012 0 0.040 0.015 Salad dressing, Italian, regular 377 12 9 3 0.006 0.012 0 0.032 0 Olive oil 378 12 12 0 0 0 0 0 0
Page 96 of 211 Rev 4.1
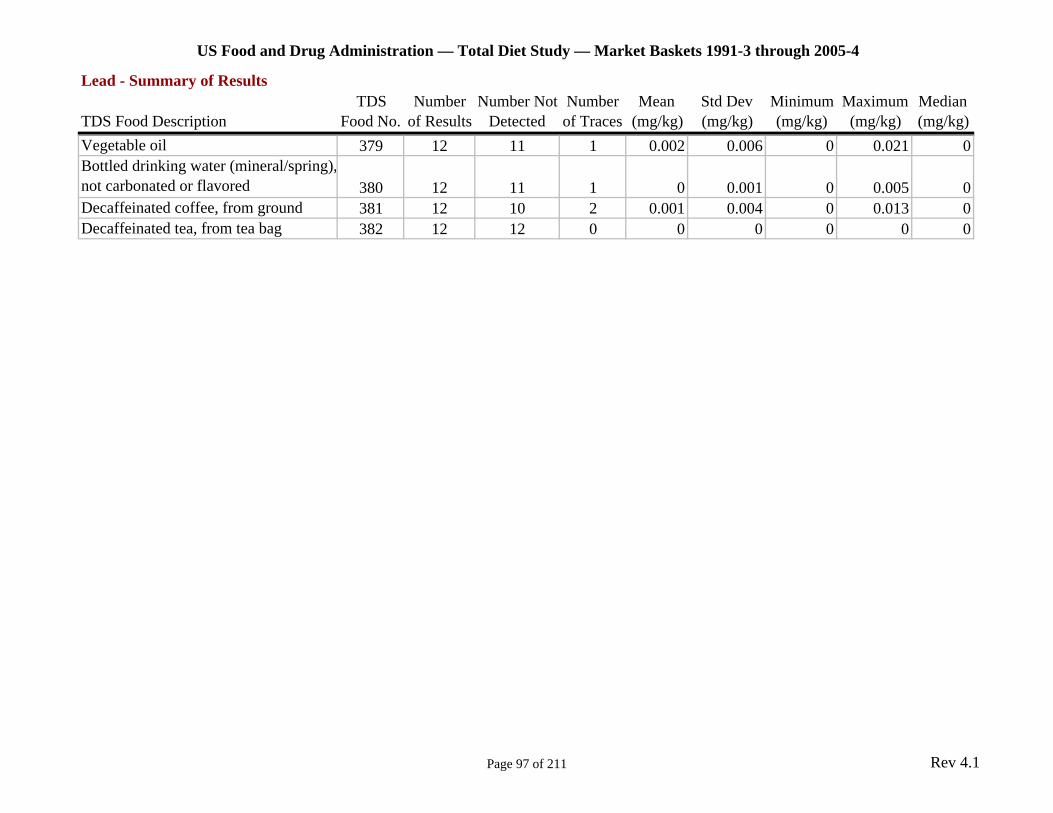
US Food and Drug Administration — Total Diet Study — Market Baskets 1991-3 through 2005-4
Lead - Summary of Results TDS Number Number Not Number Mean Std Dev Minimum Maximum Median
TDS Food Description Food No. of Results Detected of Traces (mg/kg) (mg/kg) (mg/kg) (mg/kg) (mg/kg) Vegetable oil 379 12 11 1 0.002 0.006 0 0.021 0 Bottled drinking water (mineral/spring), not carbonated or flavored 380 12 11 1 0 0.001 0 0.005 0 Decaffeinated coffee, from ground 381 12 10 2 0.001 0.004 0 0.013 0 Decaffeinated tea, from tea bag 382 12 12 0 0 0 0 0 0
Page 97 of 211 Rev 4.1
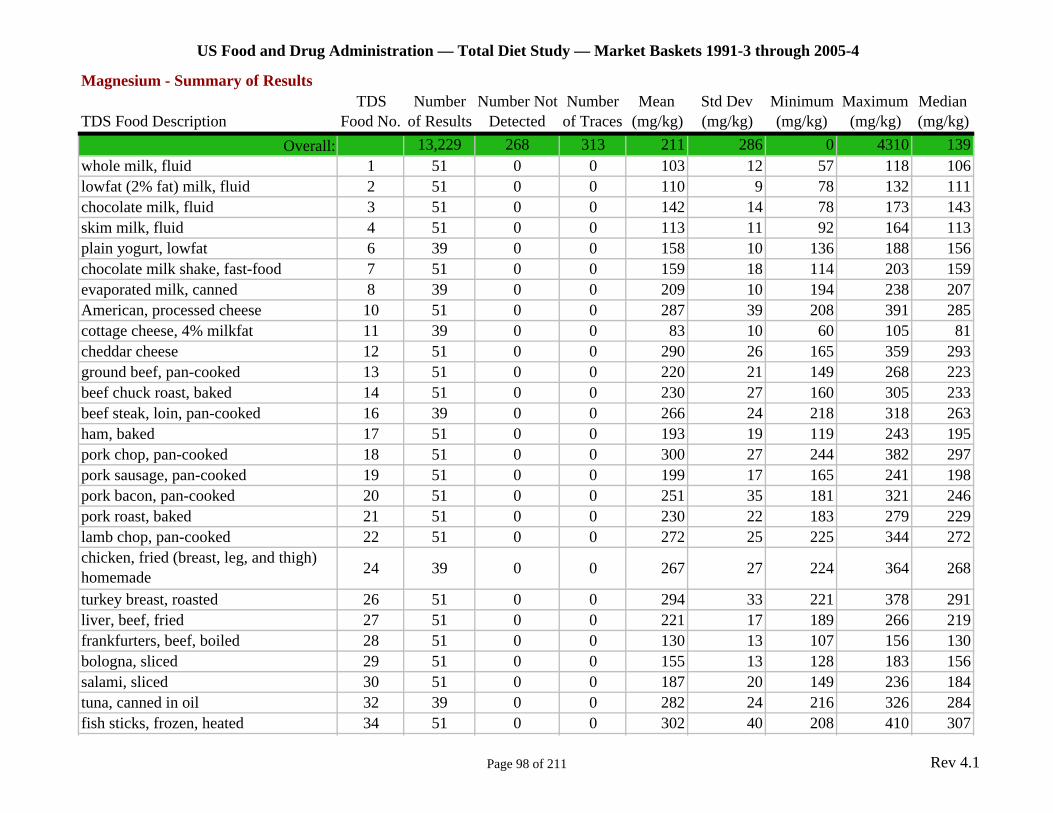
US Food and Drug Administration — Total Diet Study — Market Baskets 1991-3 through 2005-4
Magnesium - Summary of Results TDS Number Number Not Number Mean Std Dev Minimum Maximum Median
TDS Food Description Food No. of Results Detected of Traces (mg/kg) (mg/kg) (mg/kg) (mg/kg) (mg/kg) Overall: 13,229 268 313 211 286 0 4310 139
whole milk, fluid 1 51 0 0 103 12 57 118 106 lowfat (2% fat) milk, fluid 2 51 0 0 110 9 78 132 111 chocolate milk, fluid 3 51 0 0 142 14 78 173 143 skim milk, fluid 4 51 0 0 113 11 92 164 113 plain yogurt, lowfat 6 39 0 0 158 10 136 188 156 chocolate milk shake, fast-food 7 51 0 0 159 18 114 203 159 evaporated milk, canned 8 39 0 0 209 10 194 238 207 American, processed cheese 10 51 0 0 287 39 208 391 285 cottage cheese, 4% milkfat 11 39 0 0 83 10 60 105 81 cheddar cheese 12 51 0 0 290 26 165 359 293 ground beef, pan-cooked 13 51 0 0 220 21 149 268 223 beef chuck roast, baked 14 51 0 0 230 27 160 305 233 beef steak, loin, pan-cooked 16 39 0 0 266 24 218 318 263 ham, baked 17 51 0 0 193 19 119 243 195 pork chop, pan-cooked 18 51 0 0 300 27 244 382 297 pork sausage, pan-cooked 19 51 0 0 199 17 165 241 198 pork bacon, pan-cooked 20 51 0 0 251 35 181 321 246 pork roast, baked 21 51 0 0 230 22 183 279 229 lamb chop, pan-cooked 22 51 0 0 272 25 225 344 272 chicken, fried (breast, leg, and thigh) homemade 24 39 0 0 267 27 224 364 268
turkey breast, roasted 26 51 0 0 294 33 221 378 291 liver, beef, fried 27 51 0 0 221 17 189 266 219 frankfurters, beef, boiled 28 51 0 0 130 13 107 156 130 bologna, sliced 29 51 0 0 155 13 128 183 156 salami, sliced 30 51 0 0 187 20 149 236 184 tuna, canned in oil 32 39 0 0 282 24 216 326 284 fish sticks, frozen, heated 34 51 0 0 302 40 208 410 307
Page 98 of 211 Rev 4.1
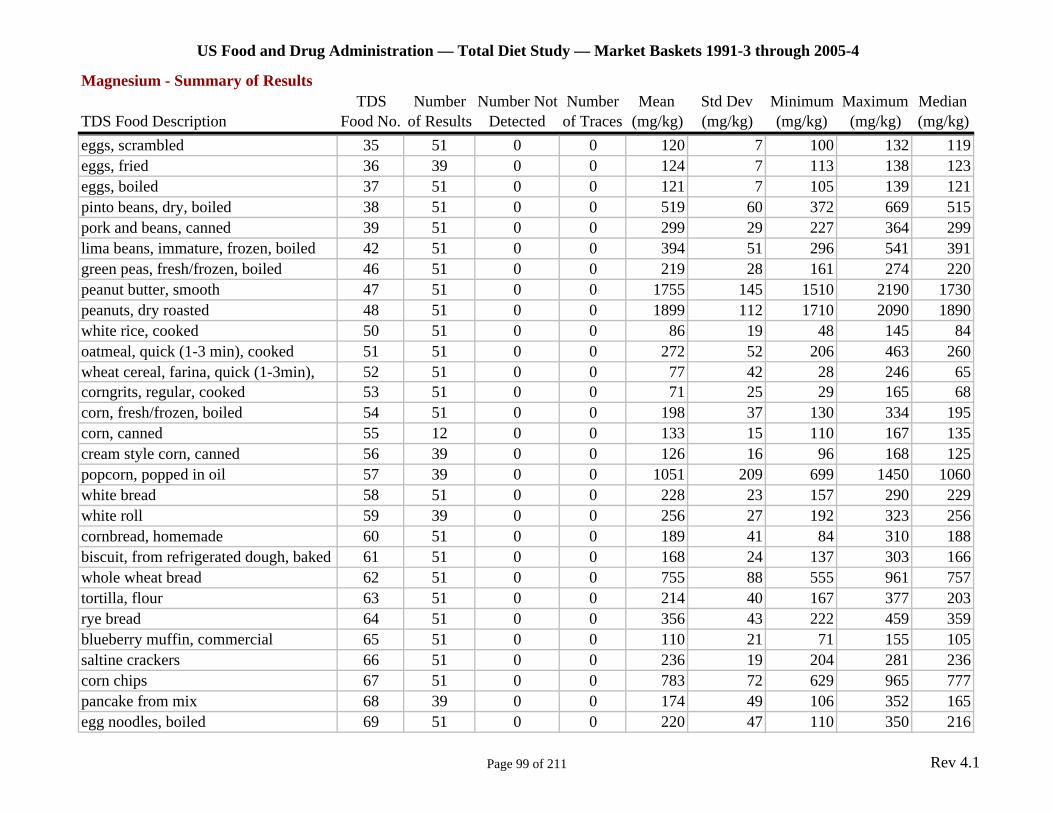
US Food and Drug Administration — Total Diet Study — Market Baskets 1991-3 through 2005-4
Magnesium - Summary of Results TDS Number Number Not Number Mean Std Dev Minimum Maximum Median
TDS Food Description Food No. of Results Detected of Traces (mg/kg) (mg/kg) (mg/kg) (mg/kg) (mg/kg) eggs, scrambled 35 51 0 0 120 7 100 132 119 eggs, fried 36 39 0 0 124 7 113 138 123 eggs, boiled 37 51 0 0 121 7 105 139 121 pinto beans, dry, boiled 38 51 0 0 519 60 372 669 515 pork and beans, canned 39 51 0 0 299 29 227 364 299 lima beans, immature, frozen, boiled 42 51 0 0 394 51 296 541 391 green peas, fresh/frozen, boiled 46 51 0 0 219 28 161 274 220 peanut butter, smooth 47 51 0 0 1755 145 1510 2190 1730 peanuts, dry roasted 48 51 0 0 1899 112 1710 2090 1890 white rice, cooked 50 51 0 0 86 19 48 145 84 oatmeal, quick (1-3 min), cooked 51 51 0 0 272 52 206 463 260 wheat cereal, farina, quick (1-3min), 52 51 0 0 77 42 28 246 65 corngrits, regular, cooked 53 51 0 0 71 25 29 165 68 corn, fresh/frozen, boiled 54 51 0 0 198 37 130 334 195 corn, canned 55 12 0 0 133 15 110 167 135 cream style corn, canned 56 39 0 0 126 16 96 168 125 popcorn, popped in oil 57 39 0 0 1051 209 699 1450 1060 white bread 58 51 0 0 228 23 157 290 229 white roll 59 39 0 0 256 27 192 323 256 cornbread, homemade 60 51 0 0 189 41 84 310 188 biscuit, from refrigerated dough, baked 61 51 0 0 168 24 137 303 166 whole wheat bread 62 51 0 0 755 88 555 961 757 tortilla, flour 63 51 0 0 214 40 167 377 203 rye bread 64 51 0 0 356 43 222 459 359 blueberry muffin, commercial 65 51 0 0 110 21 71 155 105 saltine crackers 66 51 0 0 236 19 204 281 236 corn chips 67 51 0 0 783 72 629 965 777 pancake from mix 68 39 0 0 174 49 106 352 165 egg noodles, boiled 69 51 0 0 220 47 110 350 216
Page 99 of 211 Rev 4.1
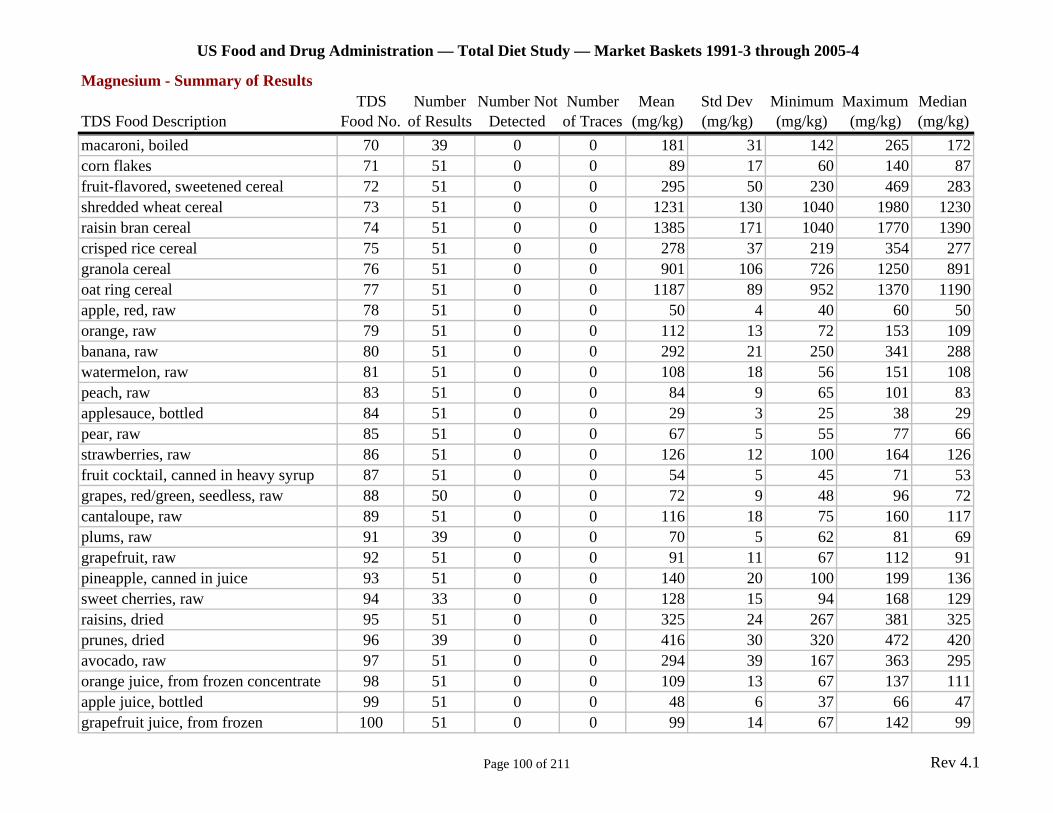
US Food and Drug Administration — Total Diet Study — Market Baskets 1991-3 through 2005-4
Magnesium - Summary of Results TDS Number Number Not Number Mean Std Dev Minimum Maximum Median
TDS Food Description Food No. of Results Detected of Traces (mg/kg) (mg/kg) (mg/kg) (mg/kg) (mg/kg) macaroni, boiled 70 39 0 0 181 31 142 265 172 corn flakes 71 51 0 0 89 17 60 140 87 fruit-flavored, sweetened cereal 72 51 0 0 295 50 230 469 283 shredded wheat cereal 73 51 0 0 1231 130 1040 1980 1230 raisin bran cereal 74 51 0 0 1385 171 1040 1770 1390 crisped rice cereal 75 51 0 0 278 37 219 354 277 granola cereal 76 51 0 0 901 106 726 1250 891 oat ring cereal 77 51 0 0 1187 89 952 1370 1190 apple, red, raw 78 51 0 0 50 4 40 60 50 orange, raw 79 51 0 0 112 13 72 153 109 banana, raw 80 51 0 0 292 21 250 341 288 watermelon, raw 81 51 0 0 108 18 56 151 108 peach, raw 83 51 0 0 84 9 65 101 83 applesauce, bottled 84 51 0 0 29 3 25 38 29 pear, raw 85 51 0 0 67 5 55 77 66 strawberries, raw 86 51 0 0 126 12 100 164 126 fruit cocktail, canned in heavy syrup 87 51 0 0 54 5 45 71 53 grapes, red/green, seedless, raw 88 50 0 0 72 9 48 96 72 cantaloupe, raw 89 51 0 0 116 18 75 160 117 plums, raw 91 39 0 0 70 5 62 81 69 grapefruit, raw 92 51 0 0 91 11 67 112 91 pineapple, canned in juice 93 51 0 0 140 20 100 199 136 sweet cherries, raw 94 33 0 0 128 15 94 168 129 raisins, dried 95 51 0 0 325 24 267 381 325 prunes, dried 96 39 0 0 416 30 320 472 420 avocado, raw 97 51 0 0 294 39 167 363 295 orange juice, from frozen concentrate 98 51 0 0 109 13 67 137 111 apple juice, bottled 99 51 0 0 48 6 37 66 47 grapefruit juice, from frozen 100 51 0 0 99 14 67 142 99
Page 100 of 211 Rev 4.1
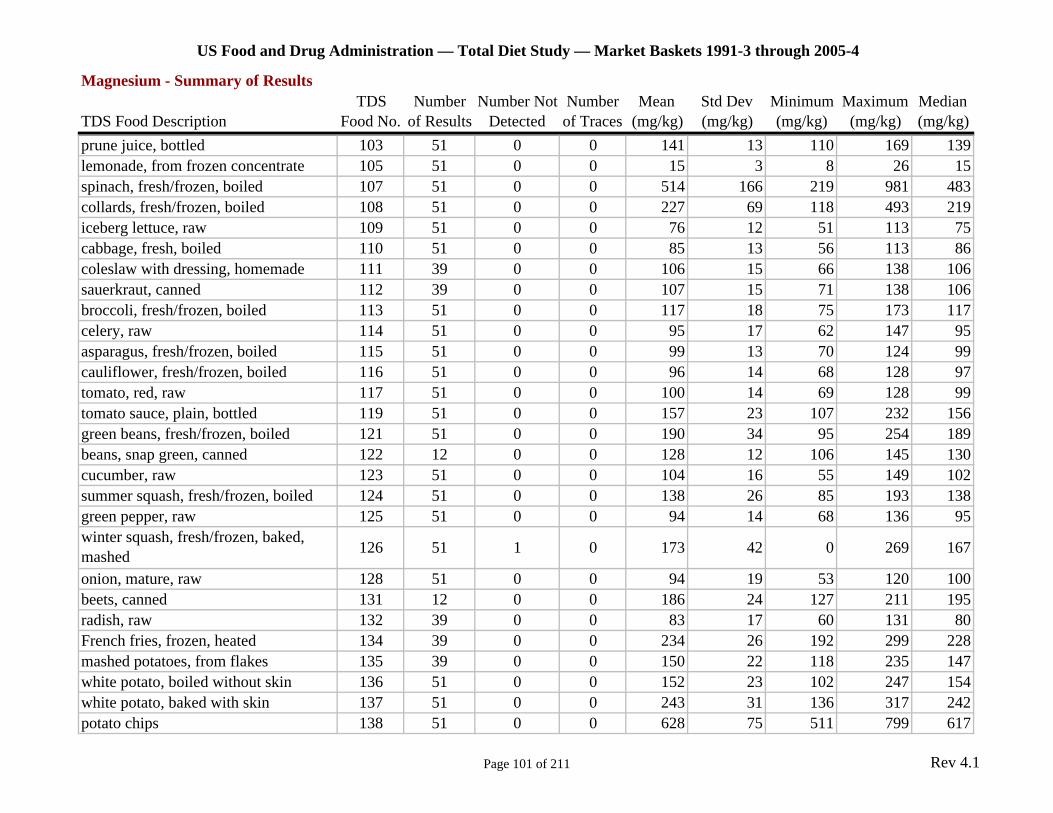
US Food and Drug Administration — Total Diet Study — Market Baskets 1991-3 through 2005-4
Magnesium - Summary of Results TDS Number Number Not Number Mean Std Dev Minimum Maximum Median
TDS Food Description Food No. of Results Detected of Traces (mg/kg) (mg/kg) (mg/kg) (mg/kg) (mg/kg) prune juice, bottled 103 51 0 0 141 13 110 169 139 lemonade, from frozen concentrate 105 51 0 0 15 3 8 26 15 spinach, fresh/frozen, boiled 107 51 0 0 514 166 219 981 483 collards, fresh/frozen, boiled 108 51 0 0 227 69 118 493 219 iceberg lettuce, raw 109 51 0 0 76 12 51 113 75 cabbage, fresh, boiled 110 51 0 0 85 13 56 113 86 coleslaw with dressing, homemade 111 39 0 0 106 15 66 138 106 sauerkraut, canned 112 39 0 0 107 15 71 138 106 broccoli, fresh/frozen, boiled 113 51 0 0 117 18 75 173 117 celery, raw 114 51 0 0 95 17 62 147 95 asparagus, fresh/frozen, boiled 115 51 0 0 99 13 70 124 99 cauliflower, fresh/frozen, boiled 116 51 0 0 96 14 68 128 97 tomato, red, raw 117 51 0 0 100 14 69 128 99 tomato sauce, plain, bottled 119 51 0 0 157 23 107 232 156 green beans, fresh/frozen, boiled 121 51 0 0 190 34 95 254 189 beans, snap green, canned 122 12 0 0 128 12 106 145 130 cucumber, raw 123 51 0 0 104 16 55 149 102 summer squash, fresh/frozen, boiled 124 51 0 0 138 26 85 193 138 green pepper, raw 125 51 0 0 94 14 68 136 95 winter squash, fresh/frozen, baked, mashed 126 51 1 0 173 42 0 269 167
onion, mature, raw 128 51 0 0 94 19 53 120 100 beets, canned 131 12 0 0 186 24 127 211 195 radish, raw 132 39 0 0 83 17 60 131 80 French fries, frozen, heated 134 39 0 0 234 26 192 299 228 mashed potatoes, from flakes 135 39 0 0 150 22 118 235 147 white potato, boiled without skin 136 51 0 0 152 23 102 247 154 white potato, baked with skin 137 51 0 0 243 31 136 317 242 potato chips 138 51 0 0 628 75 511 799 617
Page 101 of 211 Rev 4.1
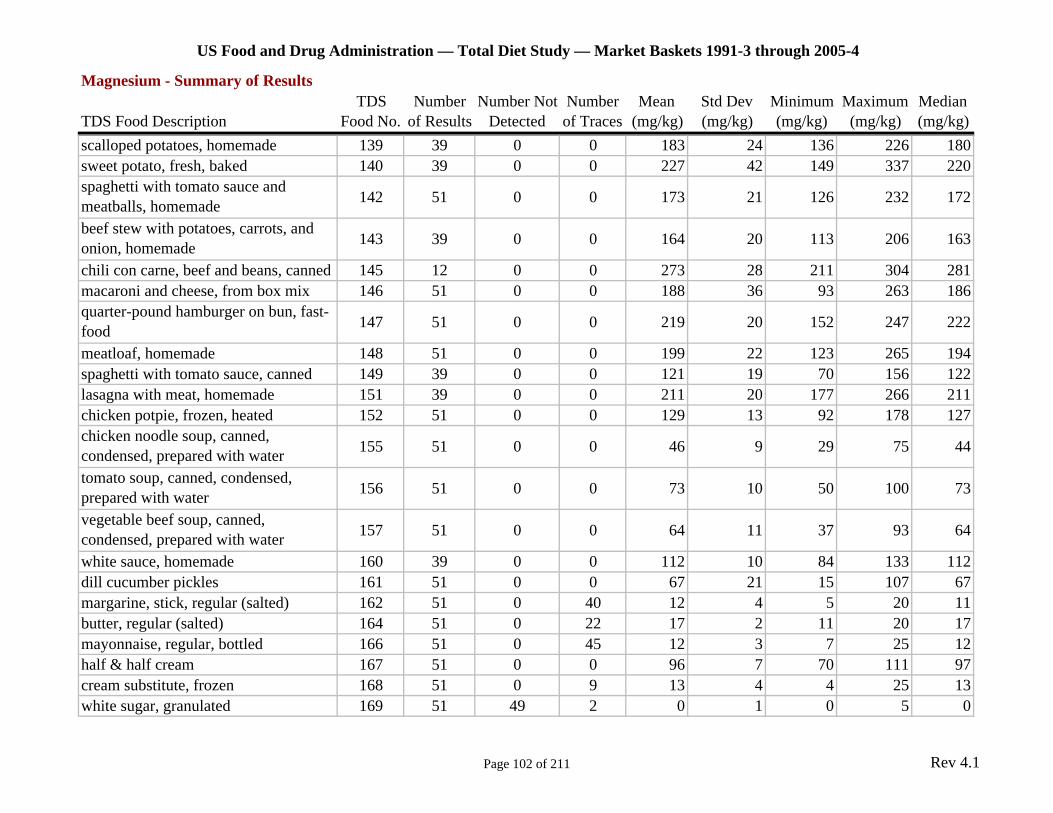
US Food and Drug Administration — Total Diet Study — Market Baskets 1991-3 through 2005-4
Magnesium - Summary of Results TDS Number Number Not Number Mean Std Dev Minimum Maximum Median
TDS Food Description Food No. of Results Detected of Traces (mg/kg) (mg/kg) (mg/kg) (mg/kg) (mg/kg) scalloped potatoes, homemade 139 39 0 0 183 24 136 226 180 sweet potato, fresh, baked 140 39 0 0 227 42 149 337 220 spaghetti with tomato sauce and meatballs, homemade 142 51 0 0 173 21 126 232 172
beef stew with potatoes, carrots, and onion, homemade 143 39 0 0 164 20 113 206 163
chili con carne, beef and beans, canned 145 12 0 0 273 28 211 304 281 macaroni and cheese, from box mix 146 51 0 0 188 36 93 263 186 quarter-pound hamburger on bun, fast-food 147 51 0 0 219 20 152 247 222
meatloaf, homemade 148 51 0 0 199 22 123 265 194 spaghetti with tomato sauce, canned 149 39 0 0 121 19 70 156 122 lasagna with meat, homemade 151 39 0 0 211 20 177 266 211 chicken potpie, frozen, heated 152 51 0 0 129 13 92 178 127 chicken noodle soup, canned, condensed, prepared with water 155 51 0 0 46 9 29 75 44
tomato soup, canned, condensed, prepared with water 156 51 0 0 73 10 50 100 73
vegetable beef soup, canned, condensed, prepared with water 157 51 0 0 64 11 37 93 64
white sauce, homemade 160 39 0 0 112 10 84 133 112 dill cucumber pickles 161 51 0 0 67 21 15 107 67 margarine, stick, regular (salted) 162 51 0 40 12 4 5 20 11 butter, regular (salted) 164 51 0 22 17 2 11 20 17 mayonnaise, regular, bottled 166 51 0 45 12 3 7 25 12 half & half cream 167 51 0 0 96 7 70 111 97 cream substitute, frozen 168 51 0 9 13 4 4 25 13 white sugar, granulated 169 51 49 2 0 1 0 5 0
Page 102 of 211 Rev 4.1
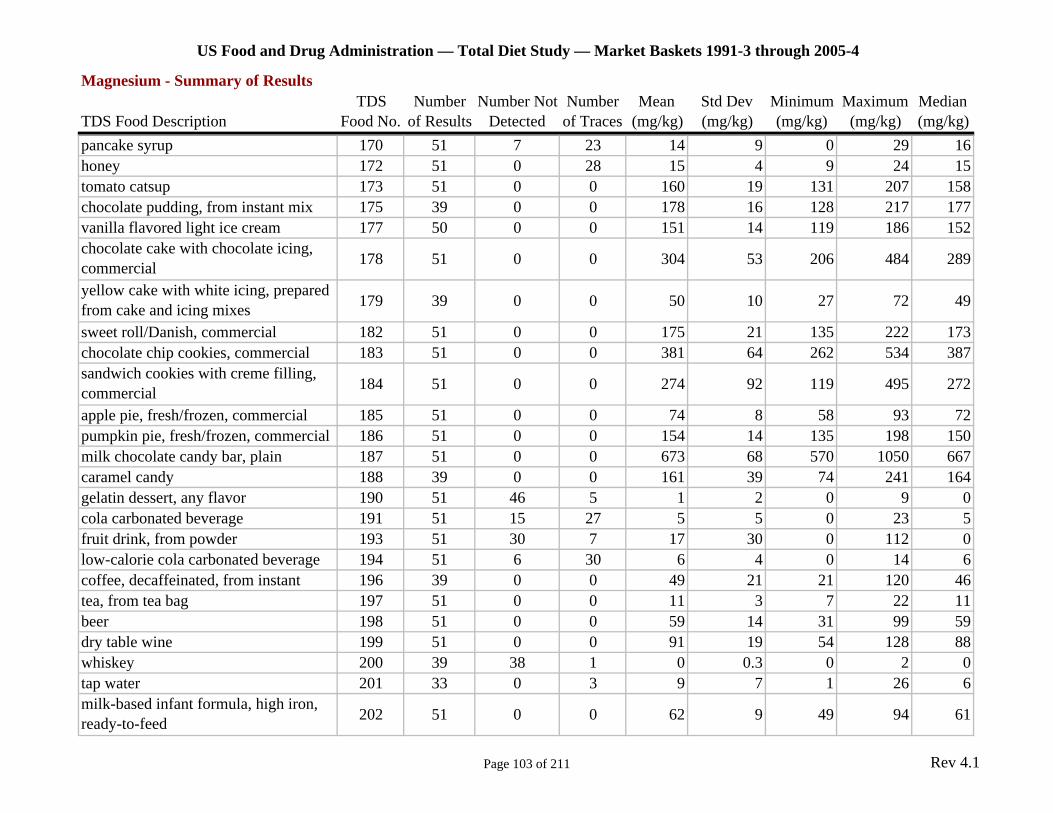
US Food and Drug Administration — Total Diet Study — Market Baskets 1991-3 through 2005-4
Magnesium - Summary of Results TDS Number Number Not Number Mean Std Dev Minimum Maximum Median
TDS Food Description Food No. of Results Detected of Traces (mg/kg) (mg/kg) (mg/kg) (mg/kg) (mg/kg) pancake syrup 170 51 7 23 14 9 0 29 16 honey 172 51 0 28 15 4 9 24 15 tomato catsup 173 51 0 0 160 19 131 207 158 chocolate pudding, from instant mix 175 39 0 0 178 16 128 217 177 vanilla flavored light ice cream 177 50 0 0 151 14 119 186 152 chocolate cake with chocolate icing, commercial 178 51 0 0 304 53 206 484 289
yellow cake with white icing, prepared from cake and icing mixes 179 39 0 0 50 10 27 72 49
sweet roll/Danish, commercial 182 51 0 0 175 21 135 222 173 chocolate chip cookies, commercial 183 51 0 0 381 64 262 534 387 sandwich cookies with creme filling, commercial 184 51 0 0 274 92 119 495 272
apple pie, fresh/frozen, commercial 185 51 0 0 74 8 58 93 72 pumpkin pie, fresh/frozen, commercial 186 51 0 0 154 14 135 198 150 milk chocolate candy bar, plain 187 51 0 0 673 68 570 1050 667 caramel candy 188 39 0 0 161 39 74 241 164 gelatin dessert, any flavor 190 51 46 5 1 2 0 9 0 cola carbonated beverage 191 51 15 27 5 5 0 23 5 fruit drink, from powder 193 51 30 7 17 30 0 112 0 low-calorie cola carbonated beverage 194 51 6 30 6 4 0 14 6 coffee, decaffeinated, from instant 196 39 0 0 49 21 21 120 46 tea, from tea bag 197 51 0 0 11 3 7 22 11 beer 198 51 0 0 59 14 31 99 59 dry table wine 199 51 0 0 91 19 54 128 88 whiskey 200 39 38 1 0 0.3 0 2 0 tap water 201 33 0 3 9 7 1 26 6 milk-based infant formula, high iron, ready-to-feed 202 51 0 0 62 9 49 94 61
Page 103 of 211 Rev 4.1

US Food and Drug Administration — Total Diet Study — Market Baskets 1991-3 through 2005-4
Magnesium - Summary of Results TDS Number Number Not Number Mean Std Dev Minimum Maximum Median
TDS Food Description Food No. of Results Detected of Traces (mg/kg) (mg/kg) (mg/kg) (mg/kg) (mg/kg) milk-based infant formula, low iron, ready-to-feed 203 51 0 0 62 10 43 98 59
beef, strained/junior 205 51 0 0 121 13 94 144 120 chicken, strained/junior, with/without broth or gravy 207 51 0 0 139 14 113 182 138
chicken/turkey with vegetables, high/lean meat, strained/junior 208 2 0 0 88 1 87 89 88
beef with vegetables, high/lean meat, strained/junior 209 2 0 0 90 4 87 93 90
ham with vegetables, high/lean meat, strained/junior 210 2 0 0 117 11 109 125 117
vegetables and beef, strained/junior 211 51 0 0 109 25 40 146 114 vegetables and chicken, strained/junior 212 51 0 0 105 24 46 148 111 vegetables and ham, strained/junior 213 50 0 0 93 21 46 125 99 chicken noodle dinner, strained/junior 214 51 0 0 110 23 59 144 118 macaroni, tomatoes, and beef, strained/junior 215 51 0 0 111 22 74 166 107
turkey and rice, strained/junior 216 51 0 0 89 18 43 129 87 carrots, strained/junior 218 51 0 0 105 19 71 147 102 green beans, strained/junior 219 51 0 0 196 38 101 266 197 mixed vegetables, strained/junior 220 51 0 0 124 26 61 184 122 sweet potatoes, strained/junior 221 51 0 0 147 12 120 178 147 creamed corn, strained/junior 222 33 0 0 93 13 62 120 91 peas, strained/junior 223 51 0 0 195 15 153 223 195 creamed spinach, strained/junior 224 39 0 0 405 88 223 582 396 applesauce, strained/junior 225 51 0 0 41 4 36 56 41 peaches, strained/junior 226 51 0 0 89 19 61 148 86 pears, strained/junior 227 50 0 0 78 11 63 110 75 apple juice, strained 230 51 0 0 49 11 31 82 50
Page 104 of 211 Rev 4.1

US Food and Drug Administration — Total Diet Study — Market Baskets 1991-3 through 2005-4
Magnesium - Summary of Results TDS Number Number Not Number Mean Std Dev Minimum Maximum Median
TDS Food Description Food No. of Results Detected of Traces (mg/kg) (mg/kg) (mg/kg) (mg/kg) (mg/kg) orange juice, strained 231 50 0 0 119 10 102 138 118 custard pudding, strained/junior 232 51 0 0 61 11 40 110 60 fruit dessert/pudding, strained/junior 233 51 0 0 72 25 37 153 66 fruit-flavored yogurt, lowfat (fruit 235 51 0 0 126 14 95 155 127 Swiss cheese 236 51 0 0 371 26 318 423 367 cream cheese 237 51 0 0 91 20 45 133 92 veal cutlet, pan-cooked 238 39 0 0 333 42 187 401 333 ham luncheon meat, sliced 239 51 0 0 184 21 114 235 187 chicken breast, roasted 240 51 0 0 299 28 233 386 300 chicken nuggets, fast-food 241 51 0 0 242 27 184 358 245 chicken, fried (breast, leg, and thigh), fast-food 242 39 0 0 238 25 142 306 236
haddock, pan-cooked 243 20 0 0 328 52 249 403 330 shrimp, boiled 244 51 0 0 345 137 135 880 344 kidney beans, dry, boiled 245 39 0 0 432 61 338 676 422 peas, mature, dry, boiled 246 39 0 0 418 53 284 509 406 mixed nuts, no peanuts, dry roasted 247 39 0 0 2413 251 1380 2940 2430 cracked wheat bread 248 51 0 0 487 99 347 768 467 bagel, plain 249 51 0 0 269 26 178 337 264 English muffin, plain, toasted 250 51 0 0 255 29 176 320 256 graham crackers 251 51 0 0 323 63 203 449 319 butter-type crackers 252 51 0 0 192 16 160 223 190 apricot, raw 253 34 0 0 103 11 86 137 100 peach, canned in light/medium syrup 254 51 0 0 54 8 41 80 52 pear, canned in light syrup 255 51 0 0 47 9 34 68 46 pineapple juice, from frozen 256 51 0 0 137 16 106 177 135 grape juice, from frozen concentrate 257 51 0 0 59 23 13 126 61 French fries, fast-food 258 51 0 0 344 36 250 420 349 carrot, fresh, boiled 259 51 0 0 85 18 56 134 83
Page 105 of 211 Rev 4.1
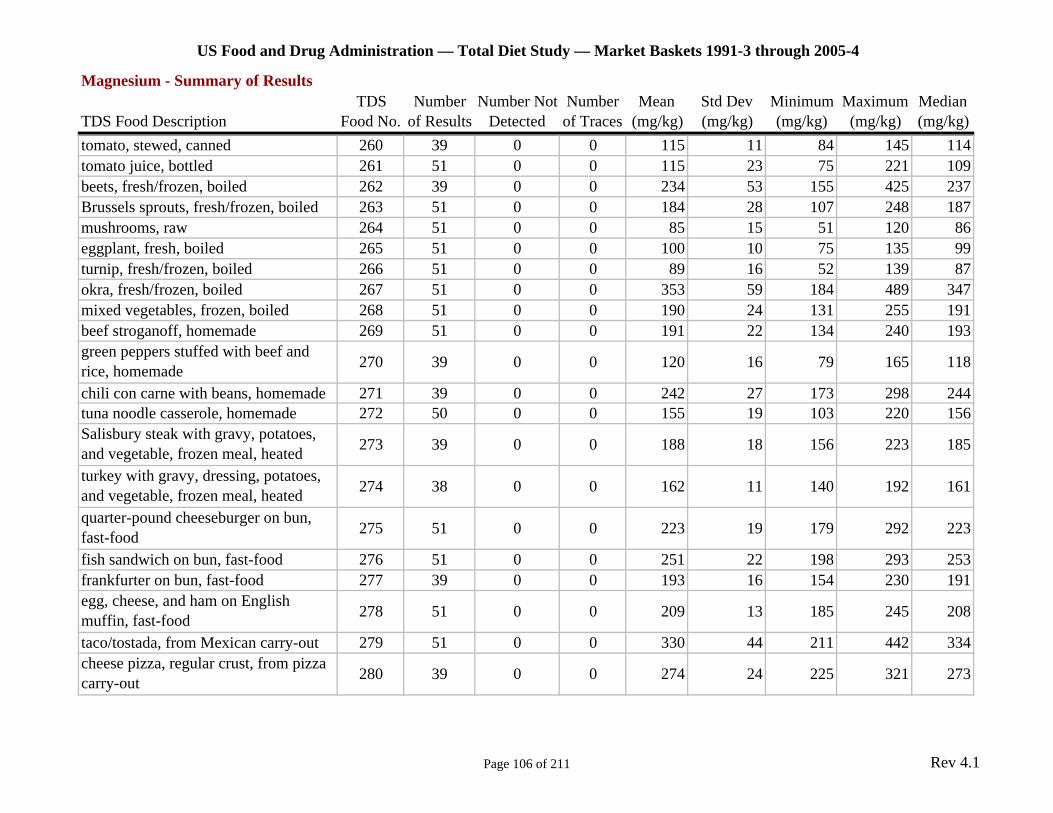
US Food and Drug Administration — Total Diet Study — Market Baskets 1991-3 through 2005-4
Magnesium - Summary of Results TDS Number Number Not Number Mean Std Dev Minimum Maximum Median
TDS Food Description Food No. of Results Detected of Traces (mg/kg) (mg/kg) (mg/kg) (mg/kg) (mg/kg) tomato, stewed, canned 260 39 0 0 115 11 84 145 114 tomato juice, bottled 261 51 0 0 115 23 75 221 109 beets, fresh/frozen, boiled 262 39 0 0 234 53 155 425 237 Brussels sprouts, fresh/frozen, boiled 263 51 0 0 184 28 107 248 187 mushrooms, raw 264 51 0 0 85 15 51 120 86 eggplant, fresh, boiled 265 51 0 0 100 10 75 135 99 turnip, fresh/frozen, boiled 266 51 0 0 89 16 52 139 87 okra, fresh/frozen, boiled 267 51 0 0 353 59 184 489 347 mixed vegetables, frozen, boiled 268 51 0 0 190 24 131 255 191 beef stroganoff, homemade 269 51 0 0 191 22 134 240 193 green peppers stuffed with beef and rice, homemade 270 39 0 0 120 16 79 165 118
chili con carne with beans, homemade 271 39 0 0 242 27 173 298 244 tuna noodle casserole, homemade 272 50 0 0 155 19 103 220 156 Salisbury steak with gravy, potatoes, and vegetable, frozen meal, heated 273 39 0 0 188 18 156 223 185
turkey with gravy, dressing, potatoes, and vegetable, frozen meal, heated 274 38 0 0 162 11 140 192 161
quarter-pound cheeseburger on bun, fast-food 275 51 0 0 223 19 179 292 223
fish sandwich on bun, fast-food 276 51 0 0 251 22 198 293 253 frankfurter on bun, fast-food 277 39 0 0 193 16 154 230 191 egg, cheese, and ham on English muffin, fast-food 278 51 0 0 209 13 185 245 208
taco/tostada, from Mexican carry-out 279 51 0 0 330 44 211 442 334 cheese pizza, regular crust, from pizza carry-out 280 39 0 0 274 24 225 321 273
Page 106 of 211 Rev 4.1
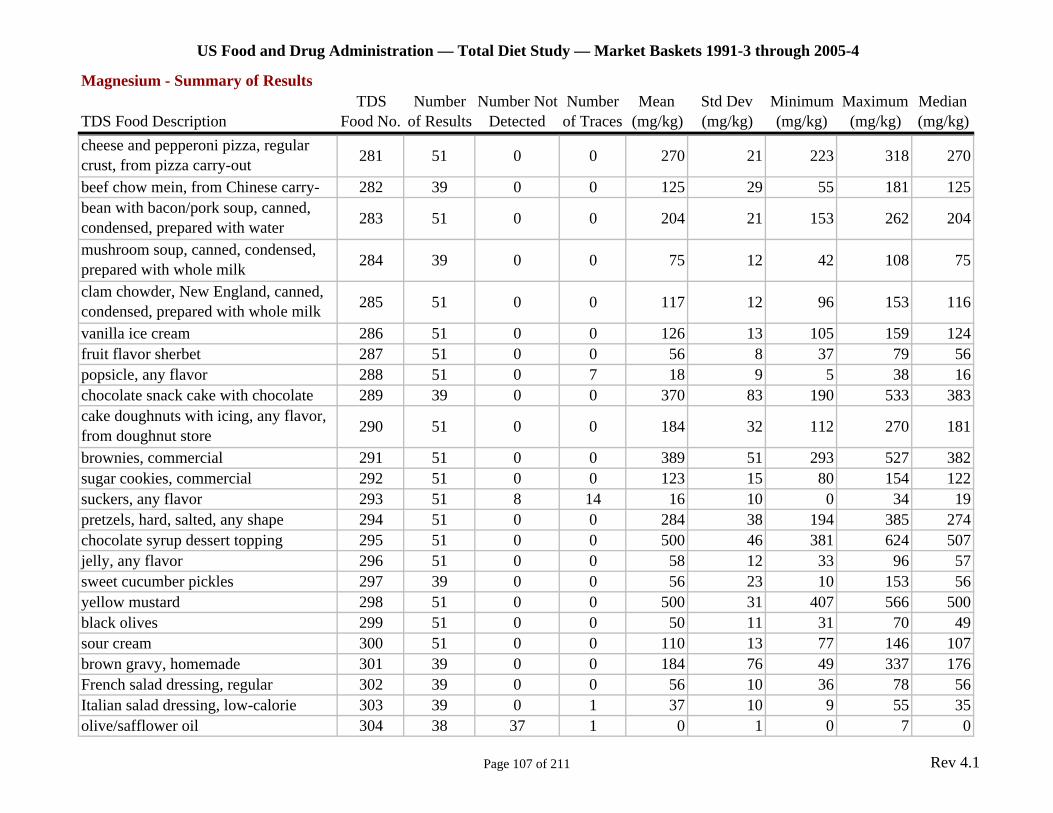
US Food and Drug Administration — Total Diet Study — Market Baskets 1991-3 through 2005-4
Magnesium - Summary of Results TDS Number Number Not Number Mean Std Dev Minimum Maximum Median
TDS Food Description Food No. of Results Detected of Traces (mg/kg) (mg/kg) (mg/kg) (mg/kg) (mg/kg) cheese and pepperoni pizza, regular crust, from pizza carry-out 281 51 0 0 270 21 223 318 270
beef chow mein, from Chinese carry- 282 39 0 0 125 29 55 181 125 bean with bacon/pork soup, canned, condensed, prepared with water 283 51 0 0 204 21 153 262 204
mushroom soup, canned, condensed, prepared with whole milk 284 39 0 0 75 12 42 108 75
clam chowder, New England, canned, condensed, prepared with whole milk 285 51 0 0 117 12 96 153 116
vanilla ice cream 286 51 0 0 126 13 105 159 124 fruit flavor sherbet 287 51 0 0 56 8 37 79 56 popsicle, any flavor 288 51 0 7 18 9 5 38 16 chocolate snack cake with chocolate 289 39 0 0 370 83 190 533 383 cake doughnuts with icing, any flavor, from doughnut store 290 51 0 0 184 32 112 270 181
brownies, commercial 291 51 0 0 389 51 293 527 382 sugar cookies, commercial 292 51 0 0 123 15 80 154 122 suckers, any flavor 293 51 8 14 16 10 0 34 19 pretzels, hard, salted, any shape 294 51 0 0 284 38 194 385 274 chocolate syrup dessert topping 295 51 0 0 500 46 381 624 507 jelly, any flavor 296 51 0 0 58 12 33 96 57 sweet cucumber pickles 297 39 0 0 56 23 10 153 56 yellow mustard 298 51 0 0 500 31 407 566 500 black olives 299 51 0 0 50 11 31 70 49 sour cream 300 51 0 0 110 13 77 146 107 brown gravy, homemade 301 39 0 0 184 76 49 337 176 French salad dressing, regular 302 39 0 0 56 10 36 78 56 Italian salad dressing, low-calorie 303 39 0 1 37 10 9 55 35 olive/safflower oil 304 38 37 1 0 1 0 7 0
Page 107 of 211 Rev 4.1
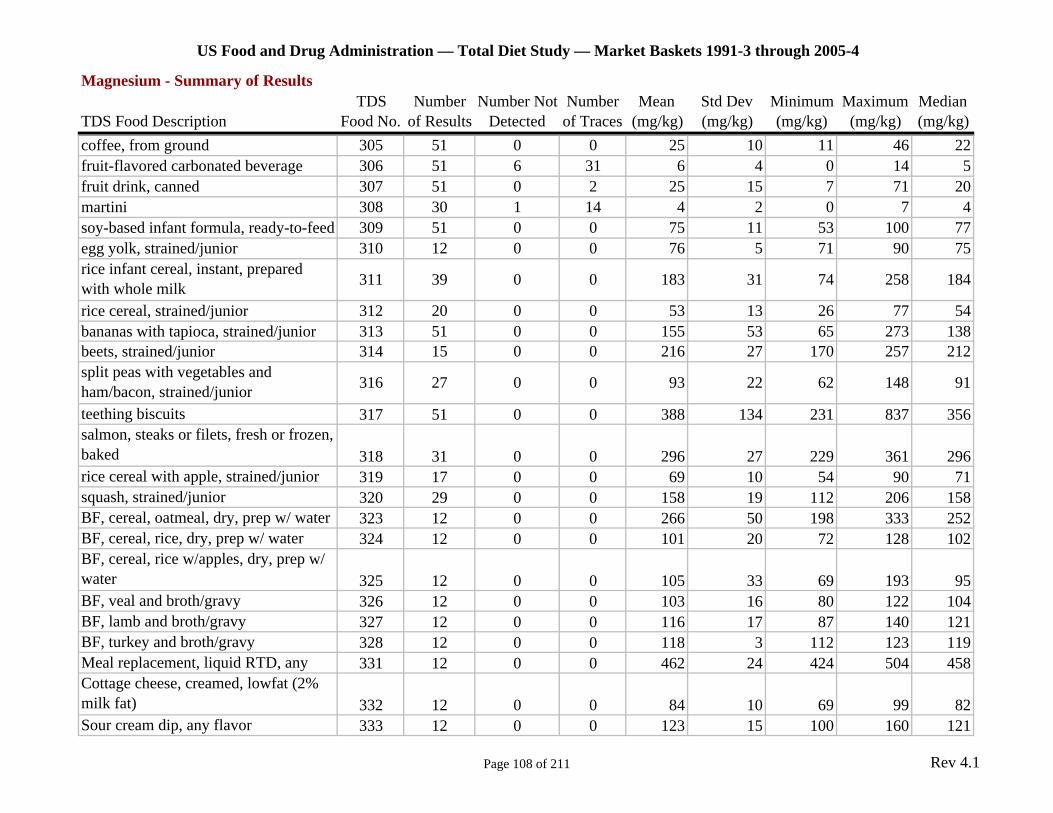
US Food and Drug Administration — Total Diet Study — Market Baskets 1991-3 through 2005-4
Magnesium - Summary of Results TDS Number Number Not Number Mean Std Dev Minimum Maximum Median
TDS Food Description Food No. of Results Detected of Traces (mg/kg) (mg/kg) (mg/kg) (mg/kg) (mg/kg) coffee, from ground 305 51 0 0 25 10 11 46 22 fruit-flavored carbonated beverage 306 51 6 31 6 4 0 14 5 fruit drink, canned 307 51 0 2 25 15 7 71 20 martini 308 30 1 14 4 2 0 7 4 soy-based infant formula, ready-to-feed 309 51 0 0 75 11 53 100 77 egg yolk, strained/junior 310 12 0 0 76 5 71 90 75 rice infant cereal, instant, prepared with whole milk 311 39 0 0 183 31 74 258 184
rice cereal, strained/junior 312 20 0 0 53 13 26 77 54 bananas with tapioca, strained/junior 313 51 0 0 155 53 65 273 138 beets, strained/junior 314 15 0 0 216 27 170 257 212 split peas with vegetables and ham/bacon, strained/junior 316 27 0 0 93 22 62 148 91
teething biscuits 317 51 0 0 388 134 231 837 356 salmon, steaks or filets, fresh or frozen, baked 318 31 0 0 296 27 229 361 296 rice cereal with apple, strained/junior 319 17 0 0 69 10 54 90 71 squash, strained/junior 320 29 0 0 158 19 112 206 158 BF, cereal, oatmeal, dry, prep w/ water 323 12 0 0 266 50 198 333 252 BF, cereal, rice, dry, prep w/ water 324 12 0 0 101 20 72 128 102 BF, cereal, rice w/apples, dry, prep w/ water 325 12 0 0 105 33 69 193 95 BF, veal and broth/gravy 326 12 0 0 103 16 80 122 104 BF, lamb and broth/gravy 327 12 0 0 116 17 87 140 121 BF, turkey and broth/gravy 328 12 0 0 118 3 112 123 119 Meal replacement, liquid RTD, any 331 12 0 0 462 24 424 504 458 Cottage cheese, creamed, lowfat (2% milk fat) 332 12 0 0 84 10 69 99 82 Sour cream dip, any flavor 333 12 0 0 123 15 100 160 121
Page 108 of 211 Rev 4.1
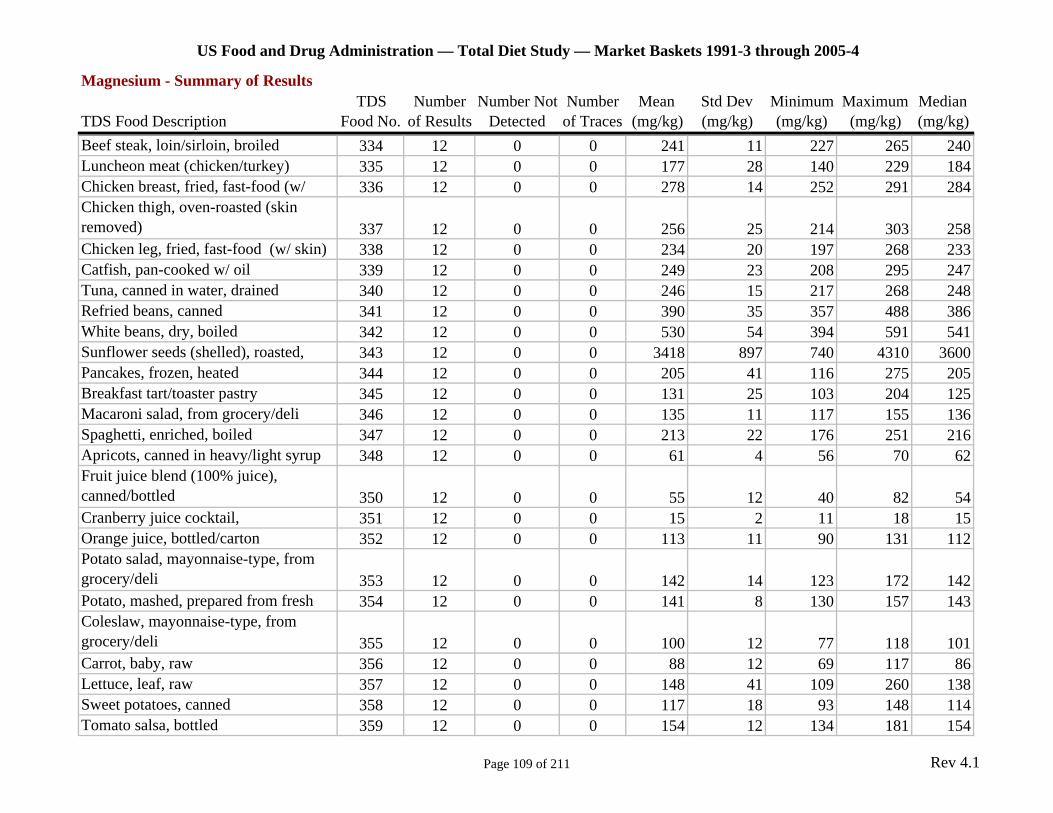
US Food and Drug Administration — Total Diet Study — Market Baskets 1991-3 through 2005-4
Magnesium - Summary of Results TDS Number Number Not Number Mean Std Dev Minimum Maximum Median
TDS Food Description Food No. of Results Detected of Traces (mg/kg) (mg/kg) (mg/kg) (mg/kg) (mg/kg) Beef steak, loin/sirloin, broiled 334 12 0 0 241 11 227 265 240 Luncheon meat (chicken/turkey) 335 12 0 0 177 28 140 229 184 Chicken breast, fried, fast-food (w/ 336 12 0 0 278 14 252 291 284 Chicken thigh, oven-roasted (skin removed) 337 12 0 0 256 25 214 303 258 Chicken leg, fried, fast-food (w/ skin) 338 12 0 0 234 20 197 268 233 Catfish, pan-cooked w/ oil 339 12 0 0 249 23 208 295 247 Tuna, canned in water, drained 340 12 0 0 246 15 217 268 248 Refried beans, canned 341 12 0 0 390 35 357 488 386 White beans, dry, boiled 342 12 0 0 530 54 394 591 541 Sunflower seeds (shelled), roasted, 343 12 0 0 3418 897 740 4310 3600 Pancakes, frozen, heated 344 12 0 0 205 41 116 275 205 Breakfast tart/toaster pastry 345 12 0 0 131 25 103 204 125 Macaroni salad, from grocery/deli 346 12 0 0 135 11 117 155 136 Spaghetti, enriched, boiled 347 12 0 0 213 22 176 251 216 Apricots, canned in heavy/light syrup 348 12 0 0 61 4 56 70 62 Fruit juice blend (100% juice), canned/bottled 350 12 0 0 55 12 40 82 54 Cranberry juice cocktail, 351 12 0 0 15 2 11 18 15 Orange juice, bottled/carton 352 12 0 0 113 11 90 131 112 Potato salad, mayonnaise-type, from grocery/deli 353 12 0 0 142 14 123 172 142 Potato, mashed, prepared from fresh 354 12 0 0 141 8 130 157 143 Coleslaw, mayonnaise-type, from grocery/deli 355 12 0 0 100 12 77 118 101 Carrot, baby, raw 356 12 0 0 88 12 69 117 86 Lettuce, leaf, raw 357 12 0 0 148 41 109 260 138 Sweet potatoes, canned 358 12 0 0 117 18 93 148 114 Tomato salsa, bottled 359 12 0 0 154 12 134 181 154
Page 109 of 211 Rev 4.1

US Food and Drug Administration — Total Diet Study — Market Baskets 1991-3 through 2005-4
Magnesium - Summary of Results TDS Number Number Not Number Mean Std Dev Minimum Maximum Median
TDS Food Description Food No. of Results Detected of Traces (mg/kg) (mg/kg) (mg/kg) (mg/kg) (mg/kg) Beef and vegetable stew, canned 360 12 0 0 97 4 89 104 96 Lasagna w/ meat, frozen, heated 361 12 0 0 188 12 171 212 186 Beef w/ vegetables in sauce, from Chinese carry-out 362 12 0 0 151 16 129 176 154 Chicken w/ vegetables in sauce, from Chinese carry-out 363 12 0 0 149 17 122 178 149 Fried rice, meatless, from Chinese carry-out 364 12 0 0 112 17 83 150 112 Burrito w/ beef, beans and cheese, from Mexican carry-out 365 12 0 0 303 46 254 422 295 Chicken filet (broiled) sandwich on bun, fast-food 366 12 0 0 246 18 225 282 241 Soup, Oriental noodles (ramen noodles), prep w/ water 367 12 0 0 42 9 26 60 43 Pudding, ready-to-eat, flavor other than chocolate 368 12 0 0 49 8 36 64 48 Cake, yellow w/ icing 369 12 0 0 73 33 44 166 64 Granola bar, w/ raisins 370 12 0 0 576 137 455 904 527 Candy bar, chocolate, nougat, and nuts 371 12 0 0 628 25 587 656 628 Popcorn, microwave, butter-flavored 372 12 0 0 942 248 539 1370 964 Sweet & sour sauce 373 12 0 0 58 22 14 91 58 Brown gravy, canned or bottled 374 12 0 0 34 7 25 44 36 Salad dressing, creamy/buttermilk type, regular 375 12 0 0 53 11 34 68 52 Salad dressing, creamy/buttermilk type, low-calorie 376 12 0 0 54 10 39 72 54 Salad dressing, Italian, regular 377 12 0 0 37 9 22 54 35 Olive oil 378 12 12 0 0 0 0 0 0
Page 110 of 211 Rev 4.1

US Food and Drug Administration — Total Diet Study — Market Baskets 1991-3 through 2005-4
Magnesium - Summary of Results TDS Number Number Not Number Mean Std Dev Minimum Maximum Median
TDS Food Description Food No. of Results Detected of Traces (mg/kg) (mg/kg) (mg/kg) (mg/kg) (mg/kg) Vegetable oil 379 12 12 0 0 0 0 0 0 Bottled drinking water (mineral/spring), not carbonated or flavored 380 12 0 1 5 3 2 12 4 Decaffeinated coffee, from ground 381 12 0 0 24 11 14 45 22 Decaffeinated tea, from tea bag 382 12 0 0 12 4 9 19 11
Page 111 of 211 Rev 4.1
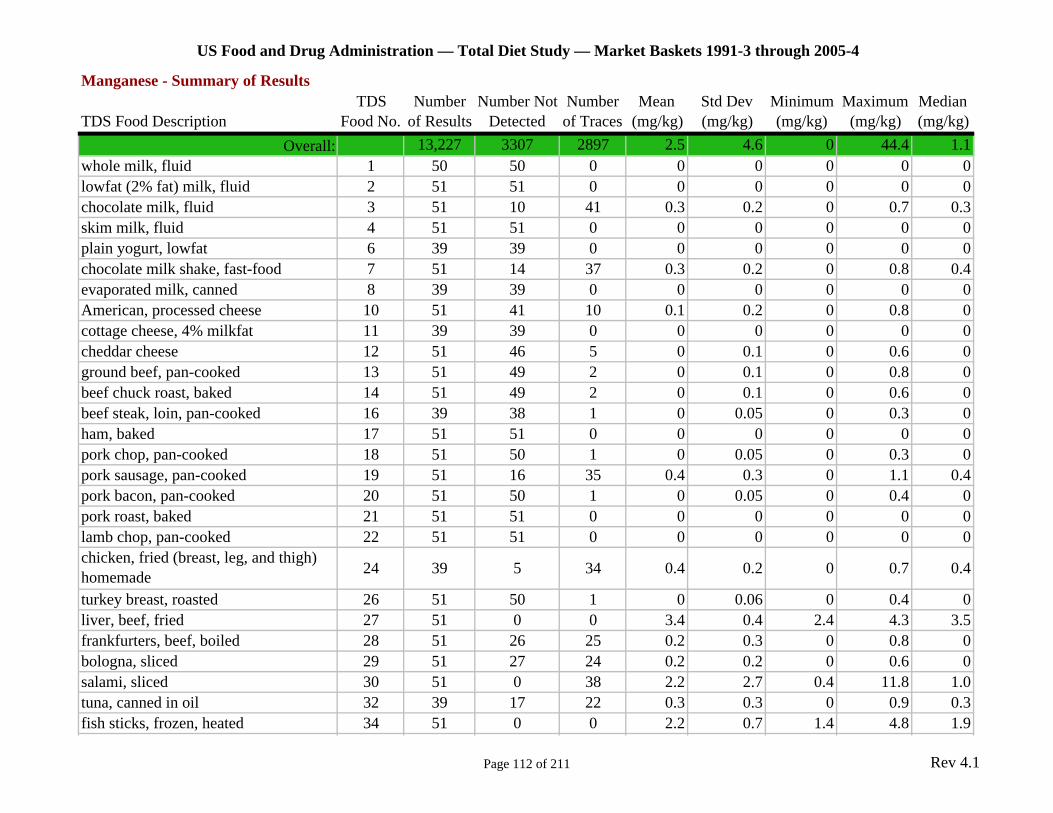
US Food and Drug Administration — Total Diet Study — Market Baskets 1991-3 through 2005-4
Manganese - Summary of Results TDS Number Number Not Number Mean Std Dev Minimum Maximum Median
TDS Food Description Food No. of Results Detected of Traces (mg/kg) (mg/kg) (mg/kg) (mg/kg) (mg/kg) Overall: 13,227 3307 2897 2.5 4.6 0 44.4 1.1
whole milk, fluid 1 50 50 0 0 0 0 0 0 lowfat (2% fat) milk, fluid 2 51 51 0 0 0 0 0 0 chocolate milk, fluid 3 51 10 41 0.3 0.2 0 0.7 0.3 skim milk, fluid 4 51 51 0 0 0 0 0 0 plain yogurt, lowfat 6 39 39 0 0 0 0 0 0 chocolate milk shake, fast-food 7 51 14 37 0.3 0.2 0 0.8 0.4 evaporated milk, canned 8 39 39 0 0 0 0 0 0 American, processed cheese 10 51 41 10 0.1 0.2 0 0.8 0 cottage cheese, 4% milkfat 11 39 39 0 0 0 0 0 0 cheddar cheese 12 51 46 5 0 0.1 0 0.6 0 ground beef, pan-cooked 13 51 49 2 0 0.1 0 0.8 0 beef chuck roast, baked 14 51 49 2 0 0.1 0 0.6 0 beef steak, loin, pan-cooked 16 39 38 1 0 0.05 0 0.3 0 ham, baked 17 51 51 0 0 0 0 0 0 pork chop, pan-cooked 18 51 50 1 0 0.05 0 0.3 0 pork sausage, pan-cooked 19 51 16 35 0.4 0.3 0 1.1 0.4 pork bacon, pan-cooked 20 51 50 1 0 0.05 0 0.4 0 pork roast, baked 21 51 51 0 0 0 0 0 0 lamb chop, pan-cooked 22 51 51 0 0 0 0 0 0 chicken, fried (breast, leg, and thigh) homemade 24 39 5 34 0.4 0.2 0 0.7 0.4
turkey breast, roasted 26 51 50 1 0 0.06 0 0.4 0 liver, beef, fried 27 51 0 0 3.4 0.4 2.4 4.3 3.5 frankfurters, beef, boiled 28 51 26 25 0.2 0.3 0 0.8 0 bologna, sliced 29 51 27 24 0.2 0.2 0 0.6 0 salami, sliced 30 51 0 38 2.2 2.7 0.4 11.8 1.0 tuna, canned in oil 32 39 17 22 0.3 0.3 0 0.9 0.3 fish sticks, frozen, heated 34 51 0 0 2.2 0.7 1.4 4.8 1.9
Page 112 of 211 Rev 4.1
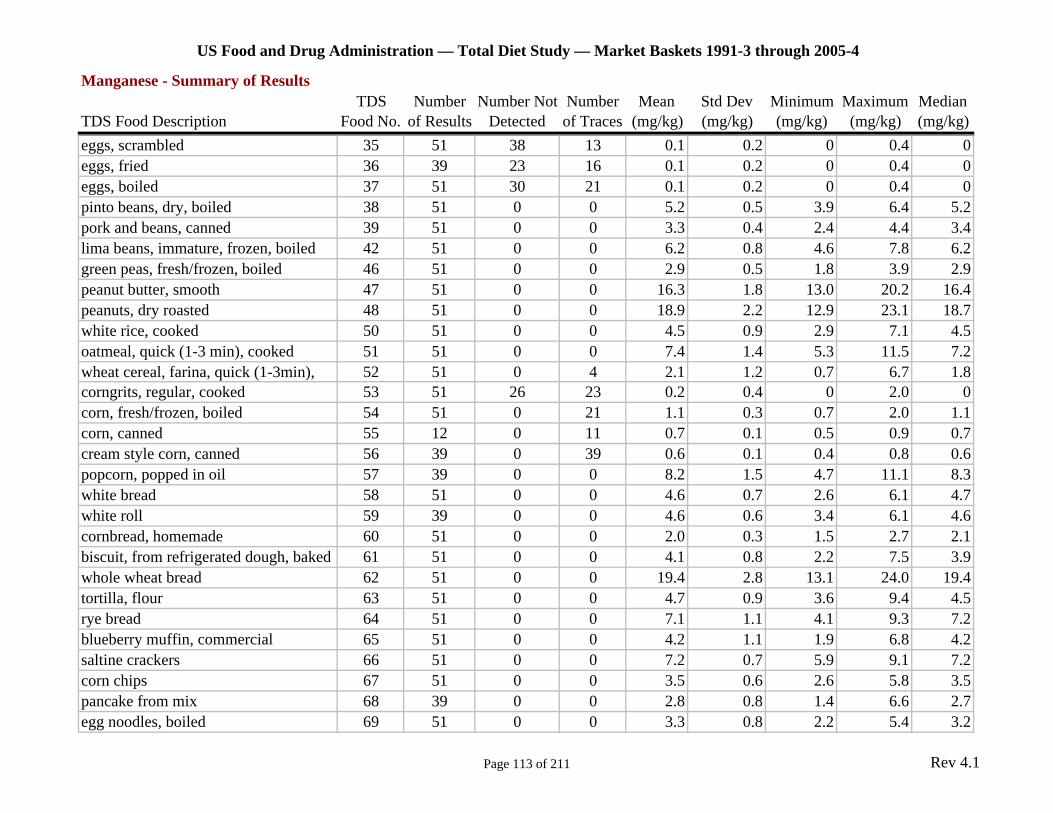
US Food and Drug Administration — Total Diet Study — Market Baskets 1991-3 through 2005-4
Manganese - Summary of Results TDS Number Number Not Number Mean Std Dev Minimum Maximum Median
TDS Food Description Food No. of Results Detected of Traces (mg/kg) (mg/kg) (mg/kg) (mg/kg) (mg/kg) eggs, scrambled 35 51 38 13 0.1 0.2 0 0.4 0 eggs, fried 36 39 23 16 0.1 0.2 0 0.4 0 eggs, boiled 37 51 30 21 0.1 0.2 0 0.4 0 pinto beans, dry, boiled 38 51 0 0 5.2 0.5 3.9 6.4 5.2 pork and beans, canned 39 51 0 0 3.3 0.4 2.4 4.4 3.4 lima beans, immature, frozen, boiled 42 51 0 0 6.2 0.8 4.6 7.8 6.2 green peas, fresh/frozen, boiled 46 51 0 0 2.9 0.5 1.8 3.9 2.9 peanut butter, smooth 47 51 0 0 16.3 1.8 13.0 20.2 16.4 peanuts, dry roasted 48 51 0 0 18.9 2.2 12.9 23.1 18.7 white rice, cooked 50 51 0 0 4.5 0.9 2.9 7.1 4.5 oatmeal, quick (1-3 min), cooked 51 51 0 0 7.4 1.4 5.3 11.5 7.2 wheat cereal, farina, quick (1-3min), 52 51 0 4 2.1 1.2 0.7 6.7 1.8 corngrits, regular, cooked 53 51 26 23 0.2 0.4 0 2.0 0 corn, fresh/frozen, boiled 54 51 0 21 1.1 0.3 0.7 2.0 1.1 corn, canned 55 12 0 11 0.7 0.1 0.5 0.9 0.7 cream style corn, canned 56 39 0 39 0.6 0.1 0.4 0.8 0.6 popcorn, popped in oil 57 39 0 0 8.2 1.5 4.7 11.1 8.3 white bread 58 51 0 0 4.6 0.7 2.6 6.1 4.7 white roll 59 39 0 0 4.6 0.6 3.4 6.1 4.6 cornbread, homemade 60 51 0 0 2.0 0.3 1.5 2.7 2.1 biscuit, from refrigerated dough, baked 61 51 0 0 4.1 0.8 2.2 7.5 3.9 whole wheat bread 62 51 0 0 19.4 2.8 13.1 24.0 19.4 tortilla, flour 63 51 0 0 4.7 0.9 3.6 9.4 4.5 rye bread 64 51 0 0 7.1 1.1 4.1 9.3 7.2 blueberry muffin, commercial 65 51 0 0 4.2 1.1 1.9 6.8 4.2 saltine crackers 66 51 0 0 7.2 0.7 5.9 9.1 7.2 corn chips 67 51 0 0 3.5 0.6 2.6 5.8 3.5 pancake from mix 68 39 0 0 2.8 0.8 1.4 6.6 2.7 egg noodles, boiled 69 51 0 0 3.3 0.8 2.2 5.4 3.2
Page 113 of 211 Rev 4.1

US Food and Drug Administration — Total Diet Study — Market Baskets 1991-3 through 2005-4
Manganese - Summary of Results TDS Number Number Not Number Mean Std Dev Minimum Maximum Median
TDS Food Description Food No. of Results Detected of Traces (mg/kg) (mg/kg) (mg/kg) (mg/kg) (mg/kg) macaroni, boiled 70 39 0 0 3.1 0.6 2.1 4.9 2.9 corn flakes 71 51 0 17 1.3 0.4 0.4 2.0 1.2 fruit-flavored, sweetened cereal 72 51 0 0 7.0 1.3 4.5 11.2 6.9 shredded wheat cereal 73 51 0 0 27.3 5.3 16.7 44.4 27.0 raisin bran cereal 74 51 0 0 29.7 4.7 19.8 39.2 29.5 crisped rice cereal 75 51 0 0 13.1 1.6 9.2 16.9 13.0 granola cereal 76 51 0 0 19.6 3.5 11.0 27.7 18.9 oat ring cereal 77 51 0 0 33.0 2.5 28.5 38.3 32.8 apple, red, raw 78 51 26 25 0.2 0.2 0 0.5 0 orange, raw 79 51 7 44 0.2 0.1 0 0.4 0.3 banana, raw 80 51 0 0 3.2 1.5 1.3 8.3 3.0 watermelon, raw 81 51 4 43 0.4 0.2 0 0.9 0.4 peach, raw 83 51 0 50 0.5 0.1 0.2 0.8 0.5 applesauce, bottled 84 51 24 27 0.1 0.1 0 0.3 0.2 pear, raw 85 51 0 50 0.5 0.1 0.3 0.7 0.4 strawberries, raw 86 51 0 0 3.8 1.4 2.0 8.1 3.4 fruit cocktail, canned in heavy syrup 87 51 0 33 0.9 0.4 0.4 2.5 0.8 grapes, red/green, seedless, raw 88 50 0 32 0.7 0.2 0.3 1.2 0.7 cantaloupe, raw 89 51 1 48 0.4 0.1 0 0.8 0.4 plums, raw 91 39 0 36 0.5 0.1 0.2 0.8 0.5 grapefruit, raw 92 51 26 25 0.1 0.1 0 0.6 0 pineapple, canned in juice 93 51 0 0 10.0 4.1 1.4 21.2 10.3 sweet cherries, raw 94 33 0 20 0.8 0.2 0.5 1.4 0.8 raisins, dried 95 51 0 0 3.0 0.2 2.4 3.5 3.0 prunes, dried 96 39 0 0 3.1 0.5 2.4 5.9 3.1 avocado, raw 97 51 0 33 1.7 0.4 0.6 2.9 1.6 orange juice, from frozen concentrate 98 51 9 42 0.2 0.1 0 0.6 0.2 apple juice, bottled 99 51 0 37 0.7 0.5 0.2 2.1 0.4 grapefruit juice, from frozen 100 51 40 10 0.1 0.7 0 5.1 0
Page 114 of 211 Rev 4.1
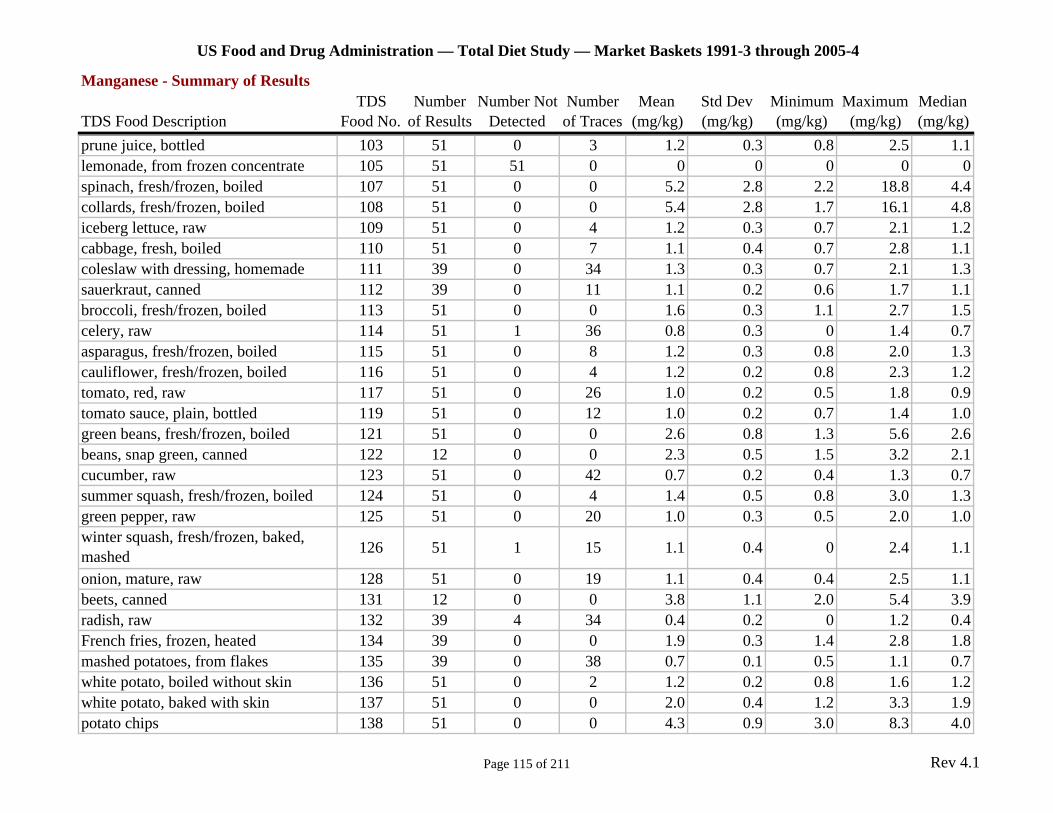
US Food and Drug Administration — Total Diet Study — Market Baskets 1991-3 through 2005-4
Manganese - Summary of Results TDS Number Number Not Number Mean Std Dev Minimum Maximum Median
TDS Food Description Food No. of Results Detected of Traces (mg/kg) (mg/kg) (mg/kg) (mg/kg) (mg/kg) prune juice, bottled 103 51 0 3 1.2 0.3 0.8 2.5 1.1 lemonade, from frozen concentrate 105 51 51 0 0 0 0 0 0 spinach, fresh/frozen, boiled 107 51 0 0 5.2 2.8 2.2 18.8 4.4 collards, fresh/frozen, boiled 108 51 0 0 5.4 2.8 1.7 16.1 4.8 iceberg lettuce, raw 109 51 0 4 1.2 0.3 0.7 2.1 1.2 cabbage, fresh, boiled 110 51 0 7 1.1 0.4 0.7 2.8 1.1 coleslaw with dressing, homemade 111 39 0 34 1.3 0.3 0.7 2.1 1.3 sauerkraut, canned 112 39 0 11 1.1 0.2 0.6 1.7 1.1 broccoli, fresh/frozen, boiled 113 51 0 0 1.6 0.3 1.1 2.7 1.5 celery, raw 114 51 1 36 0.8 0.3 0 1.4 0.7 asparagus, fresh/frozen, boiled 115 51 0 8 1.2 0.3 0.8 2.0 1.3 cauliflower, fresh/frozen, boiled 116 51 0 4 1.2 0.2 0.8 2.3 1.2 tomato, red, raw 117 51 0 26 1.0 0.2 0.5 1.8 0.9 tomato sauce, plain, bottled 119 51 0 12 1.0 0.2 0.7 1.4 1.0 green beans, fresh/frozen, boiled 121 51 0 0 2.6 0.8 1.3 5.6 2.6 beans, snap green, canned 122 12 0 0 2.3 0.5 1.5 3.2 2.1 cucumber, raw 123 51 0 42 0.7 0.2 0.4 1.3 0.7 summer squash, fresh/frozen, boiled 124 51 0 4 1.4 0.5 0.8 3.0 1.3 green pepper, raw 125 51 0 20 1.0 0.3 0.5 2.0 1.0 winter squash, fresh/frozen, baked, mashed 126 51 1 15 1.1 0.4 0 2.4 1.1
onion, mature, raw 128 51 0 19 1.1 0.4 0.4 2.5 1.1 beets, canned 131 12 0 0 3.8 1.1 2.0 5.4 3.9 radish, raw 132 39 4 34 0.4 0.2 0 1.2 0.4 French fries, frozen, heated 134 39 0 0 1.9 0.3 1.4 2.8 1.8 mashed potatoes, from flakes 135 39 0 38 0.7 0.1 0.5 1.1 0.7 white potato, boiled without skin 136 51 0 2 1.2 0.2 0.8 1.6 1.2 white potato, baked with skin 137 51 0 0 2.0 0.4 1.2 3.3 1.9 potato chips 138 51 0 0 4.3 0.9 3.0 8.3 4.0
Page 115 of 211 Rev 4.1

US Food and Drug Administration — Total Diet Study — Market Baskets 1991-3 through 2005-4
Manganese - Summary of Results TDS Number Number Not Number Mean Std Dev Minimum Maximum Median
TDS Food Description Food No. of Results Detected of Traces (mg/kg) (mg/kg) (mg/kg) (mg/kg) (mg/kg) scalloped potatoes, homemade 139 39 0 10 1.1 0.2 0.8 1.7 1.1 sweet potato, fresh, baked 140 39 0 0 4.7 2.4 1.4 14.1 4.3 spaghetti with tomato sauce and meatballs, homemade 142 51 0 0 1.8 0.4 1.2 3.6 1.8
beef stew with potatoes, carrots, and onion, homemade 143 39 0 19 0.9 0.2 0.5 1.3 0.9
chili con carne, beef and beans, canned 145 12 0 0 2.6 0.5 1.6 3.6 2.7 macaroni and cheese, from box mix 146 51 0 0 2.2 0.4 1.1 3.2 2.2 quarter-pound hamburger on bun, fast-food 147 51 0 0 1.9 0.3 1.4 2.6 2.0
meatloaf, homemade 148 51 3 38 0.7 0.4 0.0 1.8 0.6 spaghetti with tomato sauce, canned 149 39 0 2 1.4 0.3 0.9 2.0 1.5 lasagna with meat, homemade 151 39 0 0 1.6 0.2 1.1 2.1 1.6 chicken potpie, frozen, heated 152 51 0 0 2.0 0.4 1.4 3.4 1.9 chicken noodle soup, canned, condensed, prepared with water 155 51 1 46 0.5 0.2 0 1.3 0.5
tomato soup, canned, condensed, prepared with water 156 51 0 39 0.8 0.1 0.6 1.0 0.8
vegetable beef soup, canned, condensed, prepared with water 157 51 0 47 0.6 0.1 0.3 0.9 0.6
white sauce, homemade 160 39 0 35 0.6 0.2 0.3 1.3 0.5 dill cucumber pickles 161 51 13 38 0.4 0.2 0 0.8 0.4 margarine, stick, regular (salted) 162 51 51 0 0 0 0 0 0 butter, regular (salted) 164 51 51 0 0 0 0 0 0 mayonnaise, regular, bottled 166 51 51 0 0 0 0 0 0 half & half cream 167 51 51 0 0 0 0 0 0 cream substitute, frozen 168 51 51 0 0 0 0 0 0 white sugar, granulated 169 51 51 0 0 0 0 0 0
Page 116 of 211 Rev 4.1
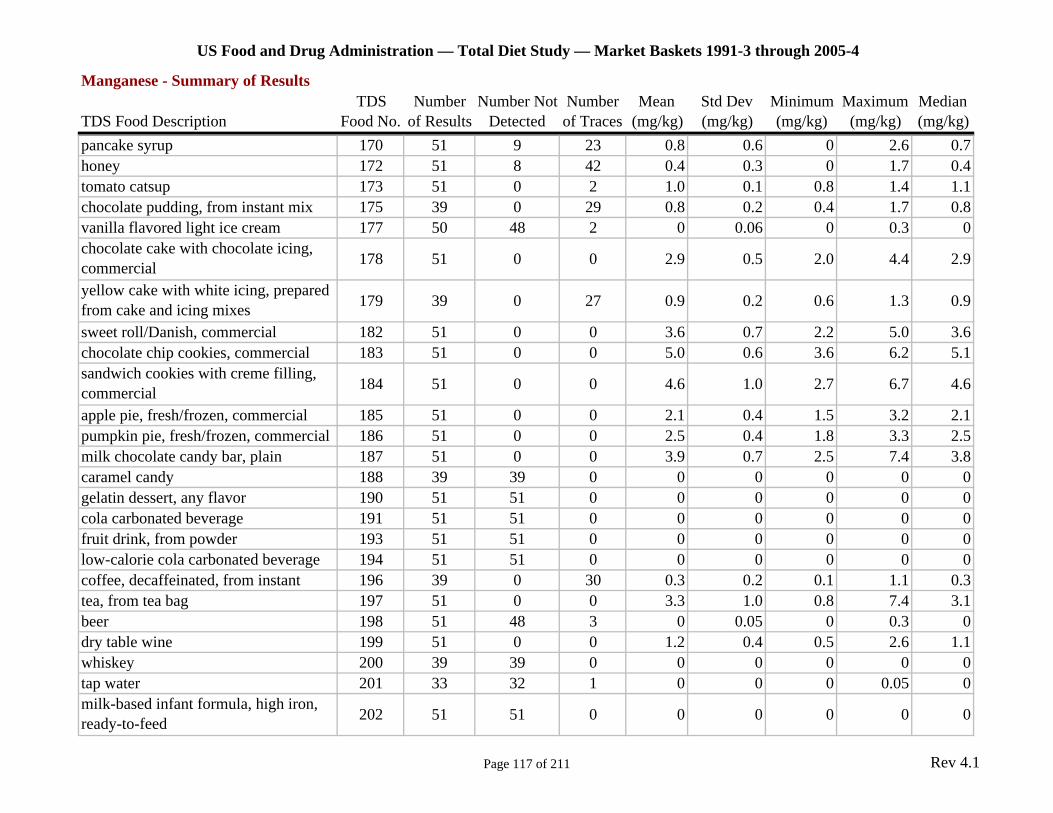
US Food and Drug Administration — Total Diet Study — Market Baskets 1991-3 through 2005-4
Manganese - Summary of Results TDS Number Number Not Number Mean Std Dev Minimum Maximum Median
TDS Food Description Food No. of Results Detected of Traces (mg/kg) (mg/kg) (mg/kg) (mg/kg) (mg/kg) pancake syrup 170 51 9 23 0.8 0.6 0 2.6 0.7 honey 172 51 8 42 0.4 0.3 0 1.7 0.4 tomato catsup 173 51 0 2 1.0 0.1 0.8 1.4 1.1 chocolate pudding, from instant mix 175 39 0 29 0.8 0.2 0.4 1.7 0.8 vanilla flavored light ice cream 177 50 48 2 0 0.06 0 0.3 0 chocolate cake with chocolate icing, commercial 178 51 0 0 2.9 0.5 2.0 4.4 2.9
yellow cake with white icing, prepared from cake and icing mixes 179 39 0 27 0.9 0.2 0.6 1.3 0.9
sweet roll/Danish, commercial 182 51 0 0 3.6 0.7 2.2 5.0 3.6 chocolate chip cookies, commercial 183 51 0 0 5.0 0.6 3.6 6.2 5.1 sandwich cookies with creme filling, commercial 184 51 0 0 4.6 1.0 2.7 6.7 4.6
apple pie, fresh/frozen, commercial 185 51 0 0 2.1 0.4 1.5 3.2 2.1 pumpkin pie, fresh/frozen, commercial 186 51 0 0 2.5 0.4 1.8 3.3 2.5 milk chocolate candy bar, plain 187 51 0 0 3.9 0.7 2.5 7.4 3.8 caramel candy 188 39 39 0 0 0 0 0 0 gelatin dessert, any flavor 190 51 51 0 0 0 0 0 0 cola carbonated beverage 191 51 51 0 0 0 0 0 0 fruit drink, from powder 193 51 51 0 0 0 0 0 0 low-calorie cola carbonated beverage 194 51 51 0 0 0 0 0 0 coffee, decaffeinated, from instant 196 39 0 30 0.3 0.2 0.1 1.1 0.3 tea, from tea bag 197 51 0 0 3.3 1.0 0.8 7.4 3.1 beer 198 51 48 3 0 0.05 0 0.3 0 dry table wine 199 51 0 0 1.2 0.4 0.5 2.6 1.1 whiskey 200 39 39 0 0 0 0 0 0 tap water 201 33 32 1 0 0 0 0.05 0 milk-based infant formula, high iron, ready-to-feed 202 51 51 0 0 0 0 0 0
Page 117 of 211 Rev 4.1

US Food and Drug Administration — Total Diet Study — Market Baskets 1991-3 through 2005-4
Manganese - Summary of Results TDS Number Number Not Number Mean Std Dev Minimum Maximum Median
TDS Food Description Food No. of Results Detected of Traces (mg/kg) (mg/kg) (mg/kg) (mg/kg) (mg/kg) milk-based infant formula, low iron, ready-to-feed 203 51 51 0 0 0 0 0 0
beef, strained/junior 205 51 50 1 0 0.09 0 0.6 0 chicken, strained/junior, with/without broth or gravy 207 51 51 0 0 0 0 0 0
chicken/turkey with vegetables, high/lean meat, strained/junior 208 2 0 2 0.9 0.1 0.9 1.0 0.9
beef with vegetables, high/lean meat, strained/junior 209 2 0 2 0.8 0.05 0.8 0.8 0.8
ham with vegetables, high/lean meat, strained/junior 210 2 0 2 0.9 0.06 0.9 1.0 0.9
vegetables and beef, strained/junior 211 51 0 5 1.3 0.4 0.5 2.5 1.3 vegetables and chicken, strained/junior 212 51 0 6 1.2 0.3 0.7 1.8 1.2 vegetables and ham, strained/junior 213 50 0 5 1.2 0.2 0.8 2.0 1.2 chicken noodle dinner, strained/junior 214 51 0 1 1.4 0.3 1.0 2.2 1.5 macaroni, tomatoes, and beef, strained/junior 215 51 0 2 1.4 0.3 0.9 2.0 1.4
turkey and rice, strained/junior 216 51 0 2 1.3 0.3 0.8 2.2 1.3 carrots, strained/junior 218 51 0 9 1.3 0.7 0.6 5.0 1.2 green beans, strained/junior 219 51 0 0 3.3 0.9 1.5 5.2 3.2 mixed vegetables, strained/junior 220 51 0 1 1.6 0.4 0.9 2.8 1.6 sweet potatoes, strained/junior 221 51 0 0 3.0 1.1 1.4 5.9 2.9 creamed corn, strained/junior 222 33 0 6 1.1 0.2 0.4 1.7 1.1 peas, strained/junior 223 51 0 0 2.3 0.4 1.6 3.4 2.3 creamed spinach, strained/junior 224 39 0 0 7.4 2.3 3.4 10.9 7.0 applesauce, strained/junior 225 51 15 36 0.3 0.2 0 0.6 0.3 peaches, strained/junior 226 51 0 50 0.6 0.1 0.4 1.0 0.6 pears, strained/junior 227 50 0 49 0.5 0.1 0.3 1.1 0.5 apple juice, strained 230 51 13 16 0.8 0.7 0 2.7 0.7
Page 118 of 211 Rev 4.1

US Food and Drug Administration — Total Diet Study — Market Baskets 1991-3 through 2005-4
Manganese - Summary of Results TDS Number Number Not Number Mean Std Dev Minimum Maximum Median
TDS Food Description Food No. of Results Detected of Traces (mg/kg) (mg/kg) (mg/kg) (mg/kg) (mg/kg) orange juice, strained 231 50 37 12 0.1 0.2 0 1.2 0 custard pudding, strained/junior 232 51 32 18 0.2 0.3 0 1.0 0 fruit dessert/pudding, strained/junior 233 51 1 21 1.3 0.7 0.0 3.2 1.1 fruit-flavored yogurt, lowfat (fruit 235 51 33 18 0.1 0.2 0 0.5 0 Swiss cheese 236 51 45 6 0.1 0.1 0 0.5 0 cream cheese 237 51 51 0 0 0 0 0 0 veal cutlet, pan-cooked 238 39 39 0 0 0 0 0 0 ham luncheon meat, sliced 239 51 50 1 0 0.06 0 0.4 0 chicken breast, roasted 240 51 50 1 0 0.05 0 0.4 0 chicken nuggets, fast-food 241 51 0 1 1.4 0.3 0.8 2.3 1.4 chicken, fried (breast, leg, and thigh), fast-food 242 39 0 9 1.1 0.2 0.7 1.9 1.1
haddock, pan-cooked 243 20 16 4 0.1 0.2 0 0.5 0 shrimp, boiled 244 51 8 36 0.5 0.4 0 1.7 0.4 kidney beans, dry, boiled 245 39 0 0 5.3 0.9 3.5 7.7 5.3 peas, mature, dry, boiled 246 39 0 0 4.2 0.5 3.3 5.7 4.1 mixed nuts, no peanuts, dry roasted 247 39 0 0 23.5 3.1 14.6 32.5 23.4 cracked wheat bread 248 51 0 0 11.2 2.4 7.3 18.4 10.6 bagel, plain 249 51 0 0 4.6 0.7 3.2 6.7 4.6 English muffin, plain, toasted 250 51 0 0 4.8 0.8 3.1 7.6 4.6 graham crackers 251 51 0 0 8.8 1.3 5.6 12.1 9.0 butter-type crackers 252 51 0 0 5.2 0.6 4.1 6.8 5.3 apricot, raw 253 34 0 31 0.8 0.1 0.4 1.0 0.7 peach, canned in light/medium syrup 254 51 25 24 0.2 0.3 0 1.3 0.3 pear, canned in light syrup 255 51 28 19 0.3 0.3 0 1.1 0 pineapple juice, from frozen 256 51 0 0 10.7 3.9 4.1 17.3 11.2 grape juice, from frozen concentrate 257 51 0 8 1.4 0.8 0.4 3.8 1.2 French fries, fast-food 258 51 0 0 2.5 0.5 1.9 4.1 2.4 carrot, fresh, boiled 259 51 0 17 1.2 0.8 0.7 6.1 1.1
Page 119 of 211 Rev 4.1
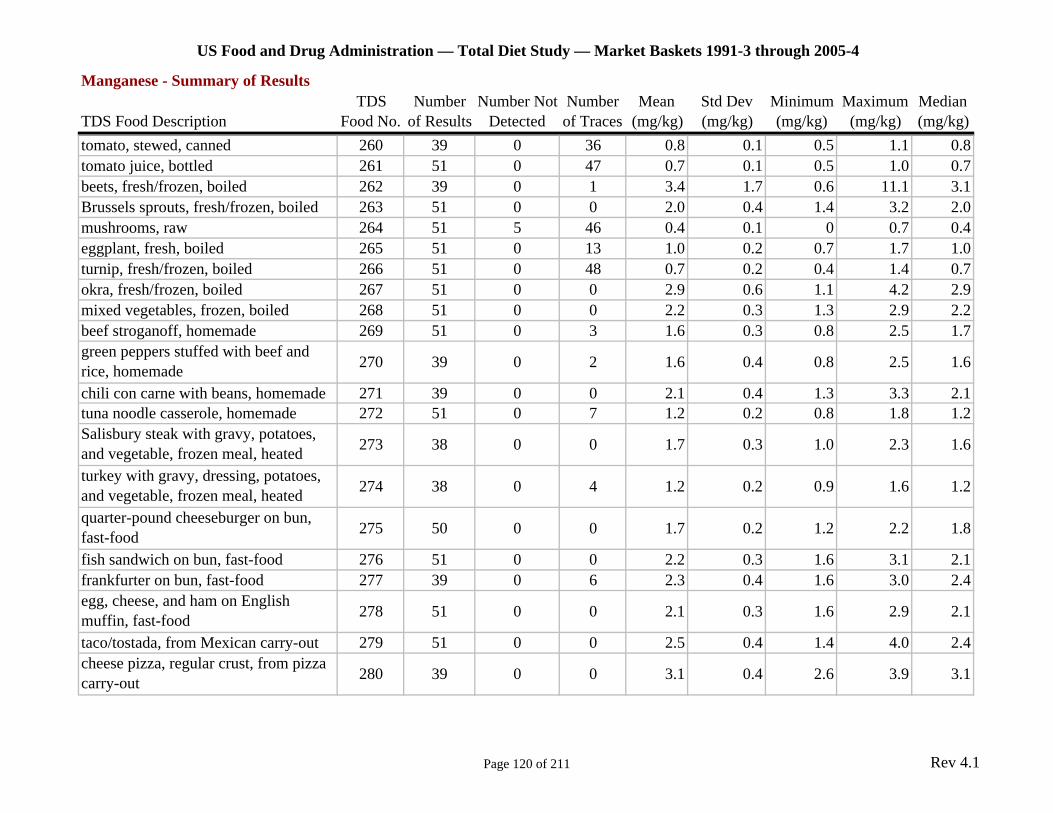
US Food and Drug Administration — Total Diet Study — Market Baskets 1991-3 through 2005-4
Manganese - Summary of Results TDS Number Number Not Number Mean Std Dev Minimum Maximum Median
TDS Food Description Food No. of Results Detected of Traces (mg/kg) (mg/kg) (mg/kg) (mg/kg) (mg/kg) tomato, stewed, canned 260 39 0 36 0.8 0.1 0.5 1.1 0.8 tomato juice, bottled 261 51 0 47 0.7 0.1 0.5 1.0 0.7 beets, fresh/frozen, boiled 262 39 0 1 3.4 1.7 0.6 11.1 3.1 Brussels sprouts, fresh/frozen, boiled 263 51 0 0 2.0 0.4 1.4 3.2 2.0 mushrooms, raw 264 51 5 46 0.4 0.1 0 0.7 0.4 eggplant, fresh, boiled 265 51 0 13 1.0 0.2 0.7 1.7 1.0 turnip, fresh/frozen, boiled 266 51 0 48 0.7 0.2 0.4 1.4 0.7 okra, fresh/frozen, boiled 267 51 0 0 2.9 0.6 1.1 4.2 2.9 mixed vegetables, frozen, boiled 268 51 0 0 2.2 0.3 1.3 2.9 2.2 beef stroganoff, homemade 269 51 0 3 1.6 0.3 0.8 2.5 1.7 green peppers stuffed with beef and rice, homemade 270 39 0 2 1.6 0.4 0.8 2.5 1.6
chili con carne with beans, homemade 271 39 0 0 2.1 0.4 1.3 3.3 2.1 tuna noodle casserole, homemade 272 51 0 7 1.2 0.2 0.8 1.8 1.2 Salisbury steak with gravy, potatoes, and vegetable, frozen meal, heated 273 38 0 0 1.7 0.3 1.0 2.3 1.6
turkey with gravy, dressing, potatoes, and vegetable, frozen meal, heated 274 38 0 4 1.2 0.2 0.9 1.6 1.2
quarter-pound cheeseburger on bun, fast-food 275 50 0 0 1.7 0.2 1.2 2.2 1.8
fish sandwich on bun, fast-food 276 51 0 0 2.2 0.3 1.6 3.1 2.1 frankfurter on bun, fast-food 277 39 0 6 2.3 0.4 1.6 3.0 2.4 egg, cheese, and ham on English muffin, fast-food 278 51 0 0 2.1 0.3 1.6 2.9 2.1
taco/tostada, from Mexican carry-out 279 51 0 0 2.5 0.4 1.4 4.0 2.4 cheese pizza, regular crust, from pizza carry-out 280 39 0 0 3.1 0.4 2.6 3.9 3.1
Page 120 of 211 Rev 4.1
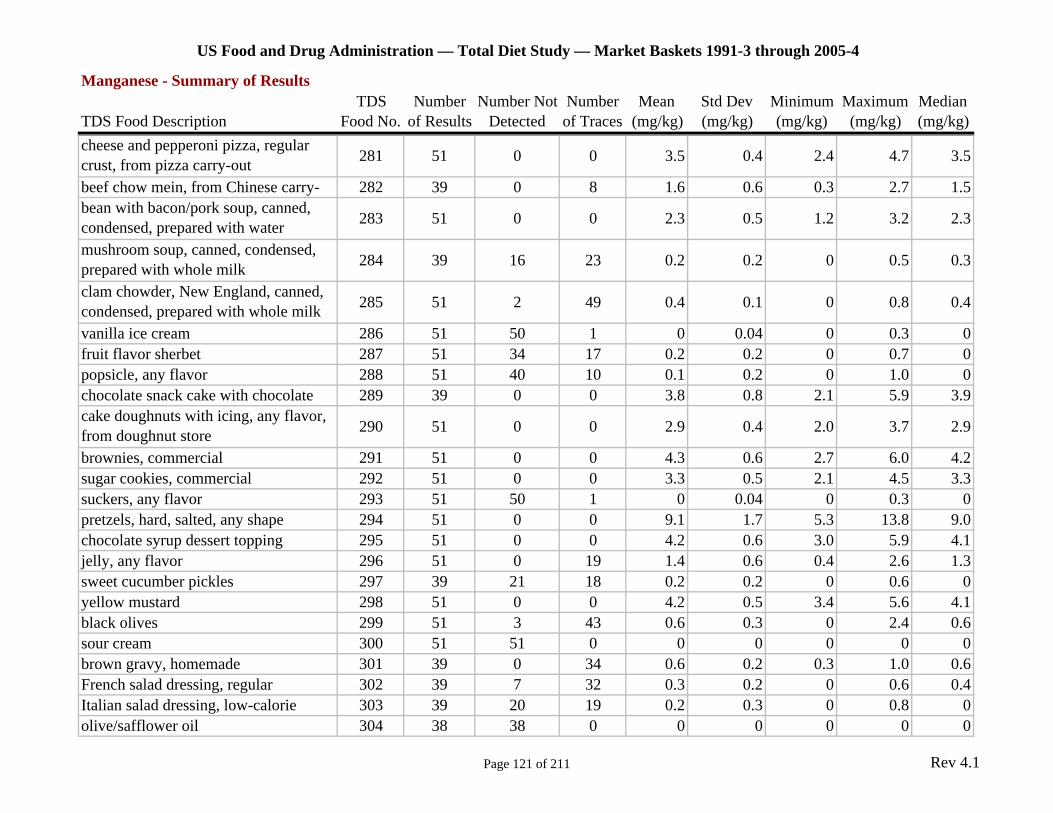
US Food and Drug Administration — Total Diet Study — Market Baskets 1991-3 through 2005-4
Manganese - Summary of Results TDS Number Number Not Number Mean Std Dev Minimum Maximum Median
TDS Food Description Food No. of Results Detected of Traces (mg/kg) (mg/kg) (mg/kg) (mg/kg) (mg/kg) cheese and pepperoni pizza, regular crust, from pizza carry-out 281 51 0 0 3.5 0.4 2.4 4.7 3.5
beef chow mein, from Chinese carry- 282 39 0 8 1.6 0.6 0.3 2.7 1.5 bean with bacon/pork soup, canned, condensed, prepared with water 283 51 0 0 2.3 0.5 1.2 3.2 2.3
mushroom soup, canned, condensed, prepared with whole milk 284 39 16 23 0.2 0.2 0 0.5 0.3
clam chowder, New England, canned, condensed, prepared with whole milk 285 51 2 49 0.4 0.1 0 0.8 0.4
vanilla ice cream 286 51 50 1 0 0.04 0 0.3 0 fruit flavor sherbet 287 51 34 17 0.2 0.2 0 0.7 0 popsicle, any flavor 288 51 40 10 0.1 0.2 0 1.0 0 chocolate snack cake with chocolate 289 39 0 0 3.8 0.8 2.1 5.9 3.9 cake doughnuts with icing, any flavor, from doughnut store 290 51 0 0 2.9 0.4 2.0 3.7 2.9
brownies, commercial 291 51 0 0 4.3 0.6 2.7 6.0 4.2 sugar cookies, commercial 292 51 0 0 3.3 0.5 2.1 4.5 3.3 suckers, any flavor 293 51 50 1 0 0.04 0 0.3 0 pretzels, hard, salted, any shape 294 51 0 0 9.1 1.7 5.3 13.8 9.0 chocolate syrup dessert topping 295 51 0 0 4.2 0.6 3.0 5.9 4.1 jelly, any flavor 296 51 0 19 1.4 0.6 0.4 2.6 1.3 sweet cucumber pickles 297 39 21 18 0.2 0.2 0 0.6 0 yellow mustard 298 51 0 0 4.2 0.5 3.4 5.6 4.1 black olives 299 51 3 43 0.6 0.3 0 2.4 0.6 sour cream 300 51 51 0 0 0 0 0 0 brown gravy, homemade 301 39 0 34 0.6 0.2 0.3 1.0 0.6 French salad dressing, regular 302 39 7 32 0.3 0.2 0 0.6 0.4 Italian salad dressing, low-calorie 303 39 20 19 0.2 0.3 0 0.8 0 olive/safflower oil 304 38 38 0 0 0 0 0 0
Page 121 of 211 Rev 4.1
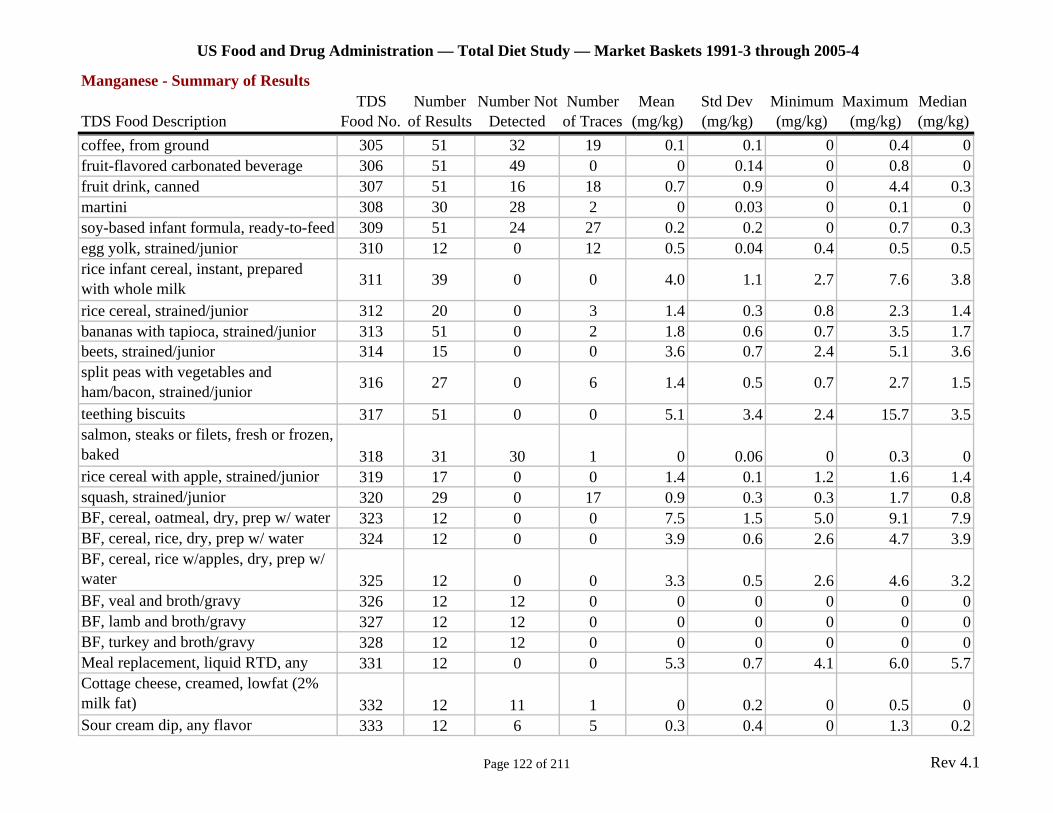
US Food and Drug Administration — Total Diet Study — Market Baskets 1991-3 through 2005-4
Manganese - Summary of Results TDS Number Number Not Number Mean Std Dev Minimum Maximum Median
TDS Food Description Food No. of Results Detected of Traces (mg/kg) (mg/kg) (mg/kg) (mg/kg) (mg/kg) coffee, from ground 305 51 32 19 0.1 0.1 0 0.4 0 fruit-flavored carbonated beverage 306 51 49 0 0 0.14 0 0.8 0 fruit drink, canned 307 51 16 18 0.7 0.9 0 4.4 0.3 martini 308 30 28 2 0 0.03 0 0.1 0 soy-based infant formula, ready-to-feed 309 51 24 27 0.2 0.2 0 0.7 0.3 egg yolk, strained/junior 310 12 0 12 0.5 0.04 0.4 0.5 0.5 rice infant cereal, instant, prepared with whole milk 311 39 0 0 4.0 1.1 2.7 7.6 3.8
rice cereal, strained/junior 312 20 0 3 1.4 0.3 0.8 2.3 1.4 bananas with tapioca, strained/junior 313 51 0 2 1.8 0.6 0.7 3.5 1.7 beets, strained/junior 314 15 0 0 3.6 0.7 2.4 5.1 3.6 split peas with vegetables and ham/bacon, strained/junior 316 27 0 6 1.4 0.5 0.7 2.7 1.5
teething biscuits 317 51 0 0 5.1 3.4 2.4 15.7 3.5 salmon, steaks or filets, fresh or frozen, baked 318 31 30 1 0 0.06 0 0.3 0 rice cereal with apple, strained/junior 319 17 0 0 1.4 0.1 1.2 1.6 1.4 squash, strained/junior 320 29 0 17 0.9 0.3 0.3 1.7 0.8 BF, cereal, oatmeal, dry, prep w/ water 323 12 0 0 7.5 1.5 5.0 9.1 7.9 BF, cereal, rice, dry, prep w/ water 324 12 0 0 3.9 0.6 2.6 4.7 3.9 BF, cereal, rice w/apples, dry, prep w/ water 325 12 0 0 3.3 0.5 2.6 4.6 3.2 BF, veal and broth/gravy 326 12 12 0 0 0 0 0 0 BF, lamb and broth/gravy 327 12 12 0 0 0 0 0 0 BF, turkey and broth/gravy 328 12 12 0 0 0 0 0 0 Meal replacement, liquid RTD, any 331 12 0 0 5.3 0.7 4.1 6.0 5.7 Cottage cheese, creamed, lowfat (2% milk fat) 332 12 11 1 0 0.2 0 0.5 0 Sour cream dip, any flavor 333 12 6 5 0.3 0.4 0 1.3 0.2
Page 122 of 211 Rev 4.1
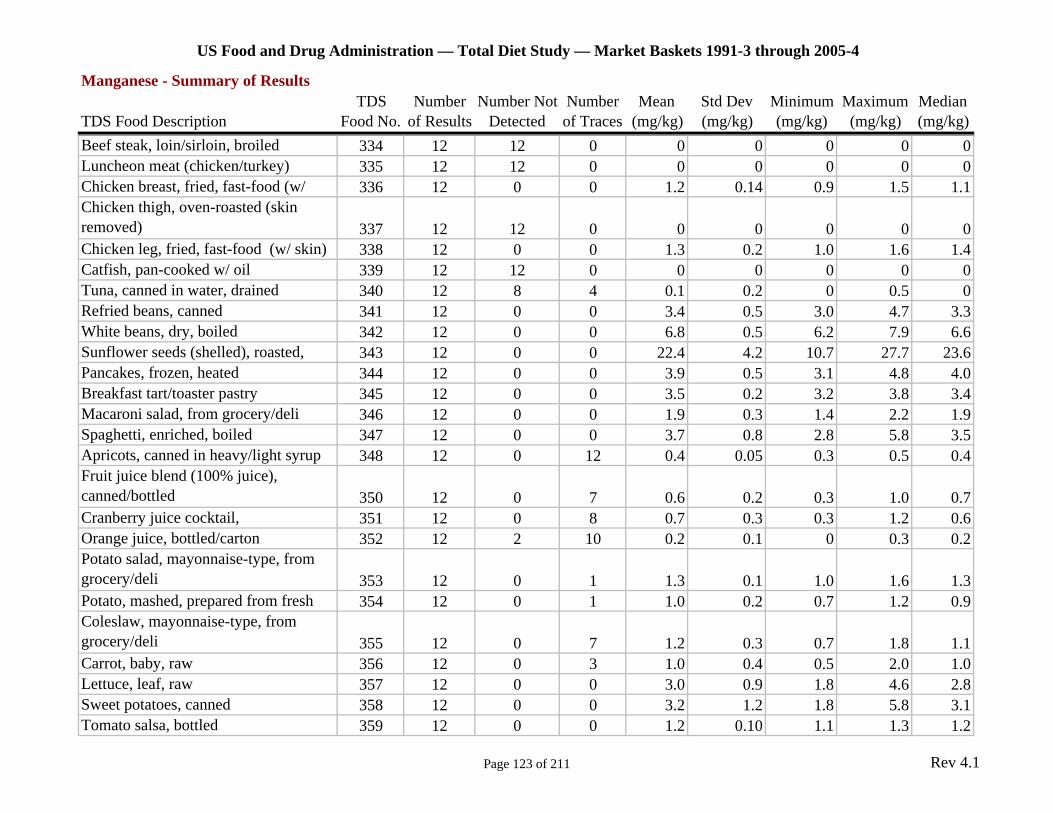
US Food and Drug Administration — Total Diet Study — Market Baskets 1991-3 through 2005-4
Manganese - Summary of Results TDS Number Number Not Number Mean Std Dev Minimum Maximum Median
TDS Food Description Food No. of Results Detected of Traces (mg/kg) (mg/kg) (mg/kg) (mg/kg) (mg/kg) Beef steak, loin/sirloin, broiled 334 12 12 0 0 0 0 0 0 Luncheon meat (chicken/turkey) 335 12 12 0 0 0 0 0 0 Chicken breast, fried, fast-food (w/ 336 12 0 0 1.2 0.14 0.9 1.5 1.1 Chicken thigh, oven-roasted (skin removed) 337 12 12 0 0 0 0 0 0 Chicken leg, fried, fast-food (w/ skin) 338 12 0 0 1.3 0.2 1.0 1.6 1.4 Catfish, pan-cooked w/ oil 339 12 12 0 0 0 0 0 0 Tuna, canned in water, drained 340 12 8 4 0.1 0.2 0 0.5 0 Refried beans, canned 341 12 0 0 3.4 0.5 3.0 4.7 3.3 White beans, dry, boiled 342 12 0 0 6.8 0.5 6.2 7.9 6.6 Sunflower seeds (shelled), roasted, 343 12 0 0 22.4 4.2 10.7 27.7 23.6 Pancakes, frozen, heated 344 12 0 0 3.9 0.5 3.1 4.8 4.0 Breakfast tart/toaster pastry 345 12 0 0 3.5 0.2 3.2 3.8 3.4 Macaroni salad, from grocery/deli 346 12 0 0 1.9 0.3 1.4 2.2 1.9 Spaghetti, enriched, boiled 347 12 0 0 3.7 0.8 2.8 5.8 3.5 Apricots, canned in heavy/light syrup 348 12 0 12 0.4 0.05 0.3 0.5 0.4 Fruit juice blend (100% juice), canned/bottled 350 12 0 7 0.6 0.2 0.3 1.0 0.7 Cranberry juice cocktail, 351 12 0 8 0.7 0.3 0.3 1.2 0.6 Orange juice, bottled/carton 352 12 2 10 0.2 0.1 0 0.3 0.2 Potato salad, mayonnaise-type, from grocery/deli 353 12 0 1 1.3 0.1 1.0 1.6 1.3 Potato, mashed, prepared from fresh 354 12 0 1 1.0 0.2 0.7 1.2 0.9 Coleslaw, mayonnaise-type, from grocery/deli 355 12 0 7 1.2 0.3 0.7 1.8 1.1 Carrot, baby, raw 356 12 0 3 1.0 0.4 0.5 2.0 1.0 Lettuce, leaf, raw 357 12 0 0 3.0 0.9 1.8 4.6 2.8 Sweet potatoes, canned 358 12 0 0 3.2 1.2 1.8 5.8 3.1 Tomato salsa, bottled 359 12 0 0 1.2 0.10 1.1 1.3 1.2
Page 123 of 211 Rev 4.1
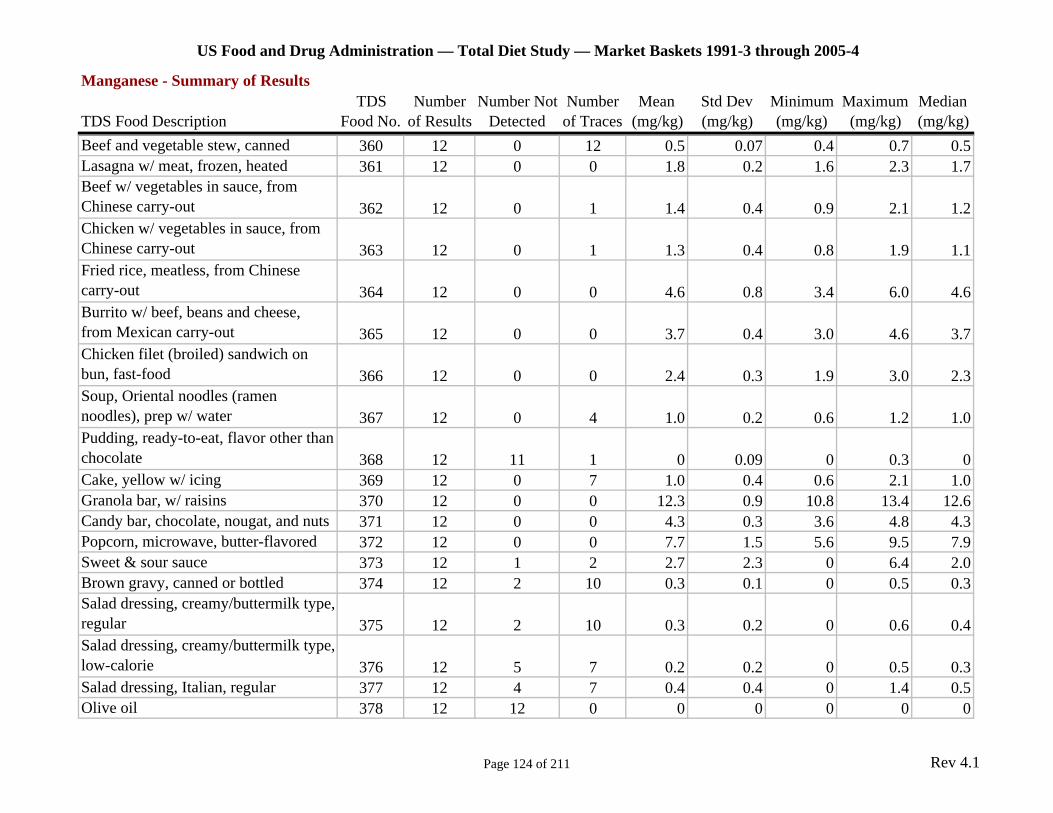
US Food and Drug Administration — Total Diet Study — Market Baskets 1991-3 through 2005-4
Manganese - Summary of Results TDS Number Number Not Number Mean Std Dev Minimum Maximum Median
TDS Food Description Food No. of Results Detected of Traces (mg/kg) (mg/kg) (mg/kg) (mg/kg) (mg/kg) Beef and vegetable stew, canned 360 12 0 12 0.5 0.07 0.4 0.7 0.5 Lasagna w/ meat, frozen, heated 361 12 0 0 1.8 0.2 1.6 2.3 1.7 Beef w/ vegetables in sauce, from Chinese carry-out 362 12 0 1 1.4 0.4 0.9 2.1 1.2 Chicken w/ vegetables in sauce, from Chinese carry-out 363 12 0 1 1.3 0.4 0.8 1.9 1.1 Fried rice, meatless, from Chinese carry-out 364 12 0 0 4.6 0.8 3.4 6.0 4.6 Burrito w/ beef, beans and cheese, from Mexican carry-out 365 12 0 0 3.7 0.4 3.0 4.6 3.7 Chicken filet (broiled) sandwich on bun, fast-food 366 12 0 0 2.4 0.3 1.9 3.0 2.3 Soup, Oriental noodles (ramen noodles), prep w/ water 367 12 0 4 1.0 0.2 0.6 1.2 1.0 Pudding, ready-to-eat, flavor other than chocolate 368 12 11 1 0 0.09 0 0.3 0 Cake, yellow w/ icing 369 12 0 7 1.0 0.4 0.6 2.1 1.0 Granola bar, w/ raisins 370 12 0 0 12.3 0.9 10.8 13.4 12.6 Candy bar, chocolate, nougat, and nuts 371 12 0 0 4.3 0.3 3.6 4.8 4.3 Popcorn, microwave, butter-flavored 372 12 0 0 7.7 1.5 5.6 9.5 7.9 Sweet & sour sauce 373 12 1 2 2.7 2.3 0 6.4 2.0 Brown gravy, canned or bottled 374 12 2 10 0.3 0.1 0 0.5 0.3 Salad dressing, creamy/buttermilk type, regular 375 12 2 10 0.3 0.2 0 0.6 0.4 Salad dressing, creamy/buttermilk type, low-calorie 376 12 5 7 0.2 0.2 0 0.5 0.3 Salad dressing, Italian, regular 377 12 4 7 0.4 0.4 0 1.4 0.5 Olive oil 378 12 12 0 0 0 0 0 0
Page 124 of 211 Rev 4.1
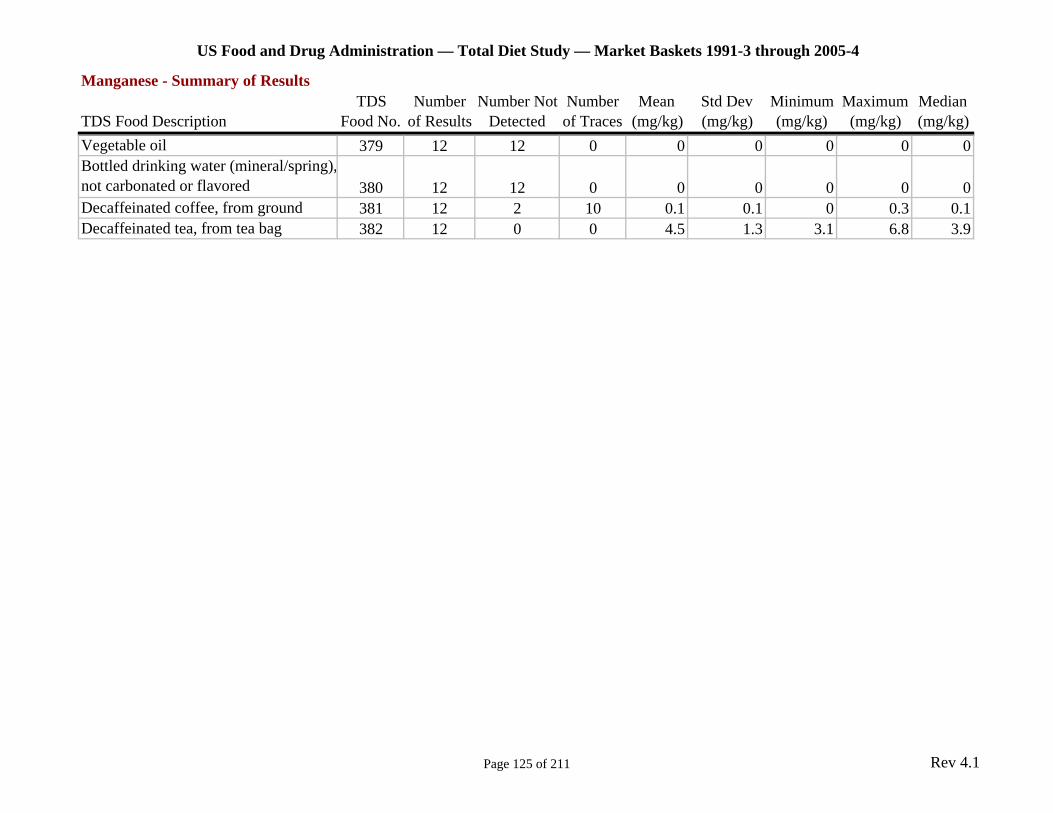
US Food and Drug Administration — Total Diet Study — Market Baskets 1991-3 through 2005-4
Manganese - Summary of Results TDS Number Number Not Number Mean Std Dev Minimum Maximum Median
TDS Food Description Food No. of Results Detected of Traces (mg/kg) (mg/kg) (mg/kg) (mg/kg) (mg/kg) Vegetable oil 379 12 12 0 0 0 0 0 0 Bottled drinking water (mineral/spring), not carbonated or flavored 380 12 12 0 0 0 0 0 0 Decaffeinated coffee, from ground 381 12 2 10 0.1 0.1 0 0.3 0.1 Decaffeinated tea, from tea bag 382 12 0 0 4.5 1.3 3.1 6.8 3.9
Page 125 of 211 Rev 4.1
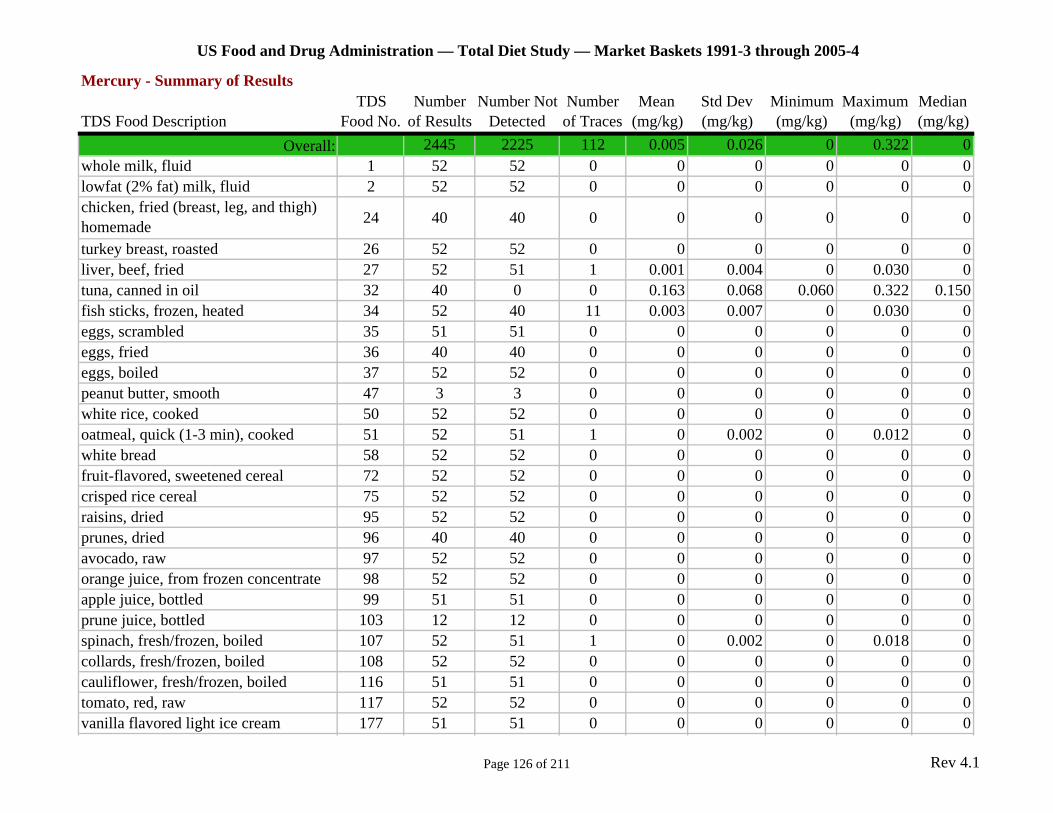
US Food and Drug Administration — Total Diet Study — Market Baskets 1991-3 through 2005-4
Mercury - Summary of Results TDS Number Number Not Number Mean Std Dev Minimum Maximum Median
TDS Food Description Food No. of Results Detected of Traces (mg/kg) (mg/kg) (mg/kg) (mg/kg) (mg/kg) Overall: 2445 2225 112 0.005 0.026 0 0.322 0
whole milk, fluid 1 52 52 0 0 0 0 0 0 lowfat (2% fat) milk, fluid 2 52 52 0 0 0 0 0 0 chicken, fried (breast, leg, and thigh) homemade 24 40 40 0 0 0 0 0 0
turkey breast, roasted 26 52 52 0 0 0 0 0 0 liver, beef, fried 27 52 51 1 0.001 0.004 0 0.030 0 tuna, canned in oil 32 40 0 0 0.163 0.068 0.060 0.322 0.150 fish sticks, frozen, heated 34 52 40 11 0.003 0.007 0 0.030 0 eggs, scrambled 35 51 51 0 0 0 0 0 0 eggs, fried 36 40 40 0 0 0 0 0 0 eggs, boiled 37 52 52 0 0 0 0 0 0 peanut butter, smooth 47 3 3 0 0 0 0 0 0 white rice, cooked 50 52 52 0 0 0 0 0 0 oatmeal, quick (1-3 min), cooked 51 52 51 1 0 0.002 0 0.012 0 white bread 58 52 52 0 0 0 0 0 0 fruit-flavored, sweetened cereal 72 52 52 0 0 0 0 0 0 crisped rice cereal 75 52 52 0 0 0 0 0 0 raisins, dried 95 52 52 0 0 0 0 0 0 prunes, dried 96 40 40 0 0 0 0 0 0 avocado, raw 97 52 52 0 0 0 0 0 0 orange juice, from frozen concentrate 98 52 52 0 0 0 0 0 0 apple juice, bottled 99 51 51 0 0 0 0 0 0 prune juice, bottled 103 12 12 0 0 0 0 0 0 spinach, fresh/frozen, boiled 107 52 51 1 0 0.002 0 0.018 0 collards, fresh/frozen, boiled 108 52 52 0 0 0 0 0 0 cauliflower, fresh/frozen, boiled 116 51 51 0 0 0 0 0 0 tomato, red, raw 117 52 52 0 0 0 0 0 0 vanilla flavored light ice cream 177 51 51 0 0 0 0 0 0
Page 126 of 211 Rev 4.1
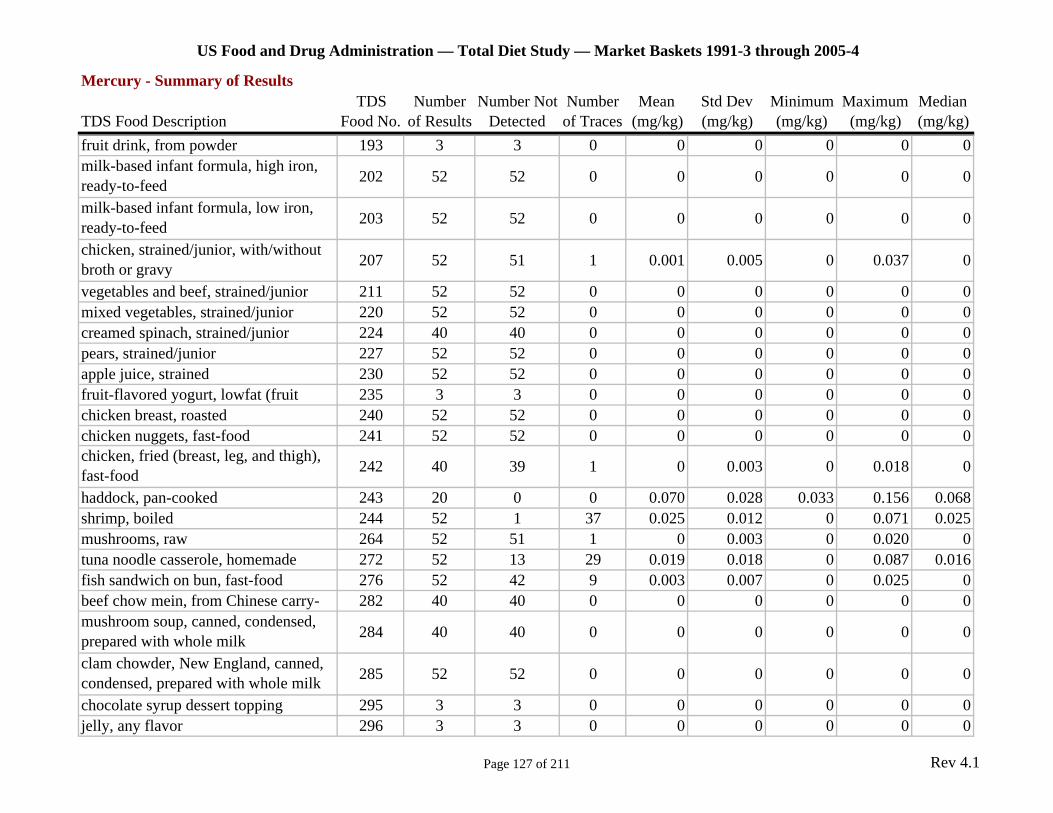
US Food and Drug Administration — Total Diet Study — Market Baskets 1991-3 through 2005-4
Mercury - Summary of Results TDS Number Number Not Number Mean Std Dev Minimum Maximum Median
TDS Food Description Food No. of Results Detected of Traces (mg/kg) (mg/kg) (mg/kg) (mg/kg) (mg/kg) fruit drink, from powder 193 3 3 0 0 0 0 0 0 milk-based infant formula, high iron, ready-to-feed 202 52 52 0 0 0 0 0 0
milk-based infant formula, low iron, ready-to-feed 203 52 52 0 0 0 0 0 0
chicken, strained/junior, with/without broth or gravy 207 52 51 1 0.001 0.005 0 0.037 0
vegetables and beef, strained/junior 211 52 52 0 0 0 0 0 0 mixed vegetables, strained/junior 220 52 52 0 0 0 0 0 0 creamed spinach, strained/junior 224 40 40 0 0 0 0 0 0 pears, strained/junior 227 52 52 0 0 0 0 0 0 apple juice, strained 230 52 52 0 0 0 0 0 0 fruit-flavored yogurt, lowfat (fruit 235 3 3 0 0 0 0 0 0 chicken breast, roasted 240 52 52 0 0 0 0 0 0 chicken nuggets, fast-food 241 52 52 0 0 0 0 0 0 chicken, fried (breast, leg, and thigh), fast-food 242 40 39 1 0 0.003 0 0.018 0
haddock, pan-cooked 243 20 0 0 0.070 0.028 0.033 0.156 0.068 shrimp, boiled 244 52 1 37 0.025 0.012 0 0.071 0.025 mushrooms, raw 264 52 51 1 0 0.003 0 0.020 0 tuna noodle casserole, homemade 272 52 13 29 0.019 0.018 0 0.087 0.016 fish sandwich on bun, fast-food 276 52 42 9 0.003 0.007 0 0.025 0 beef chow mein, from Chinese carry- 282 40 40 0 0 0 0 0 0 mushroom soup, canned, condensed, prepared with whole milk 284 40 40 0 0 0 0 0 0
clam chowder, New England, canned, condensed, prepared with whole milk 285 52 52 0 0 0 0 0 0
chocolate syrup dessert topping 295 3 3 0 0 0 0 0 0 jelly, any flavor 296 3 3 0 0 0 0 0 0
Page 127 of 211 Rev 4.1
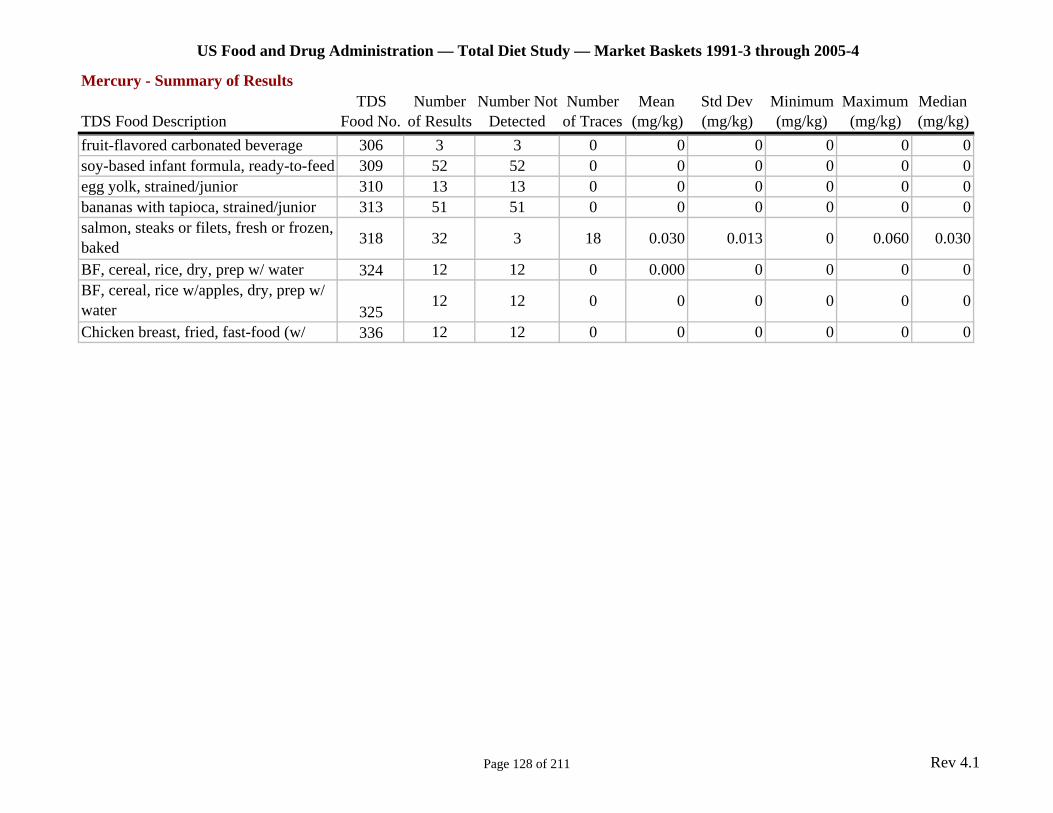
US Food and Drug Administration — Total Diet Study — Market Baskets 1991-3 through 2005-4
Mercury - Summary of Results TDS Number Number Not Number Mean Std Dev Minimum Maximum Median
TDS Food Description Food No. of Results Detected of Traces (mg/kg) (mg/kg) (mg/kg) (mg/kg) (mg/kg) fruit-flavored carbonated beverage 306 3 3 0 0 0 0 0 0 soy-based infant formula, ready-to-feed 309 52 52 0 0 0 0 0 0 egg yolk, strained/junior 310 13 13 0 0 0 0 0 0 bananas with tapioca, strained/junior 313 51 51 0 0 0 0 0 0 salmon, steaks or filets, fresh or frozen, baked 318 32 3 18 0.030 0.013 0 0.060 0.030
BF, cereal, rice, dry, prep w/ water 324 12 12 0 0.000 0 0 0 0 BF, cereal, rice w/apples, dry, prep w/ water 325
12 12 0 0 0 0 0 0
Chicken breast, fried, fast-food (w/ 336 12 12 0 0 0 0 0 0
Page 128 of 211 Rev 4.1
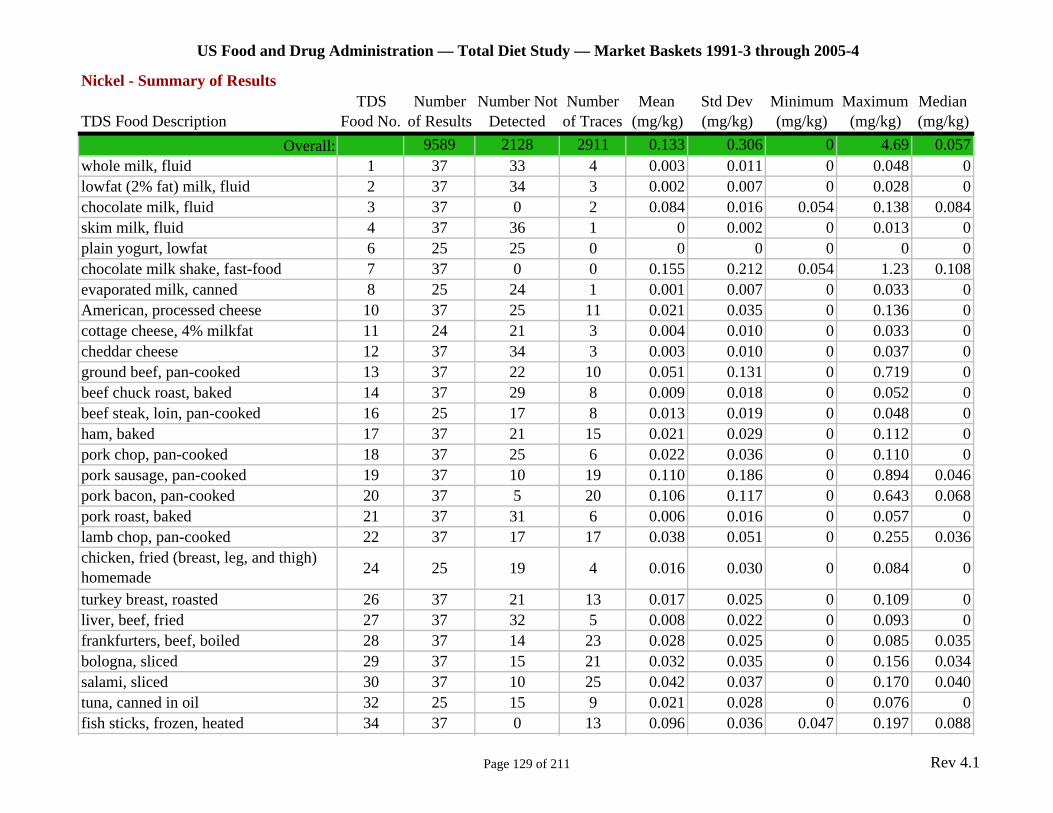
US Food and Drug Administration — Total Diet Study — Market Baskets 1991-3 through 2005-4
Nickel - Summary of Results TDS Number Number Not Number Mean Std Dev Minimum Maximum Median
TDS Food Description Food No. of Results Detected of Traces (mg/kg) (mg/kg) (mg/kg) (mg/kg) (mg/kg) Overall: 9589 2128 2911 0.133 0.306 0 4.69 0.057
whole milk, fluid 1 37 33 4 0.003 0.011 0 0.048 0 lowfat (2% fat) milk, fluid 2 37 34 3 0.002 0.007 0 0.028 0 chocolate milk, fluid 3 37 0 2 0.084 0.016 0.054 0.138 0.084 skim milk, fluid 4 37 36 1 0 0.002 0 0.013 0 plain yogurt, lowfat 6 25 25 0 0 0 0 0 0 chocolate milk shake, fast-food 7 37 0 0 0.155 0.212 0.054 1.23 0.108 evaporated milk, canned 8 25 24 1 0.001 0.007 0 0.033 0 American, processed cheese 10 37 25 11 0.021 0.035 0 0.136 0 cottage cheese, 4% milkfat 11 24 21 3 0.004 0.010 0 0.033 0 cheddar cheese 12 37 34 3 0.003 0.010 0 0.037 0 ground beef, pan-cooked 13 37 22 10 0.051 0.131 0 0.719 0 beef chuck roast, baked 14 37 29 8 0.009 0.018 0 0.052 0 beef steak, loin, pan-cooked 16 25 17 8 0.013 0.019 0 0.048 0 ham, baked 17 37 21 15 0.021 0.029 0 0.112 0 pork chop, pan-cooked 18 37 25 6 0.022 0.036 0 0.110 0 pork sausage, pan-cooked 19 37 10 19 0.110 0.186 0 0.894 0.046 pork bacon, pan-cooked 20 37 5 20 0.106 0.117 0 0.643 0.068 pork roast, baked 21 37 31 6 0.006 0.016 0 0.057 0 lamb chop, pan-cooked 22 37 17 17 0.038 0.051 0 0.255 0.036 chicken, fried (breast, leg, and thigh) homemade 24 25 19 4 0.016 0.030 0 0.084 0
turkey breast, roasted 26 37 21 13 0.017 0.025 0 0.109 0 liver, beef, fried 27 37 32 5 0.008 0.022 0 0.093 0 frankfurters, beef, boiled 28 37 14 23 0.028 0.025 0 0.085 0.035 bologna, sliced 29 37 15 21 0.032 0.035 0 0.156 0.034 salami, sliced 30 37 10 25 0.042 0.037 0 0.170 0.040 tuna, canned in oil 32 25 15 9 0.021 0.028 0 0.076 0 fish sticks, frozen, heated 34 37 0 13 0.096 0.036 0.047 0.197 0.088
Page 129 of 211 Rev 4.1
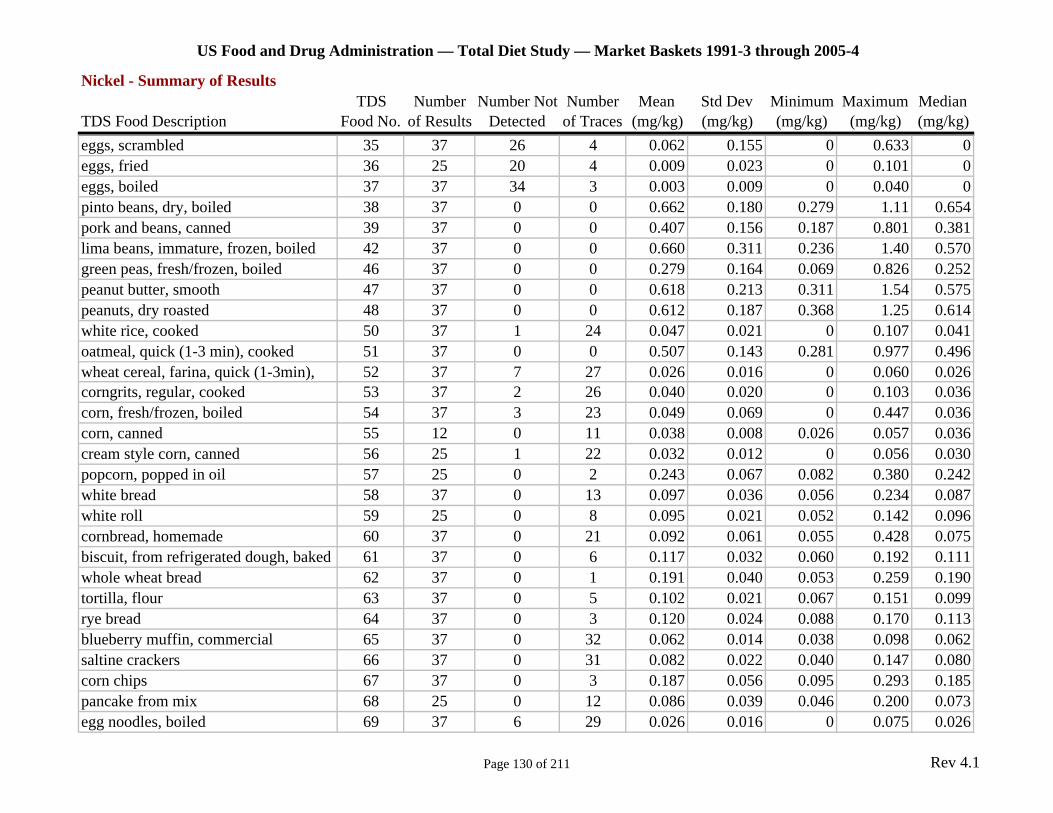
US Food and Drug Administration — Total Diet Study — Market Baskets 1991-3 through 2005-4
Nickel - Summary of Results TDS Number Number Not Number Mean Std Dev Minimum Maximum Median
TDS Food Description Food No. of Results Detected of Traces (mg/kg) (mg/kg) (mg/kg) (mg/kg) (mg/kg) eggs, scrambled 35 37 26 4 0.062 0.155 0 0.633 0 eggs, fried 36 25 20 4 0.009 0.023 0 0.101 0 eggs, boiled 37 37 34 3 0.003 0.009 0 0.040 0 pinto beans, dry, boiled 38 37 0 0 0.662 0.180 0.279 1.11 0.654 pork and beans, canned 39 37 0 0 0.407 0.156 0.187 0.801 0.381 lima beans, immature, frozen, boiled 42 37 0 0 0.660 0.311 0.236 1.40 0.570 green peas, fresh/frozen, boiled 46 37 0 0 0.279 0.164 0.069 0.826 0.252 peanut butter, smooth 47 37 0 0 0.618 0.213 0.311 1.54 0.575 peanuts, dry roasted 48 37 0 0 0.612 0.187 0.368 1.25 0.614 white rice, cooked 50 37 1 24 0.047 0.021 0 0.107 0.041 oatmeal, quick (1-3 min), cooked 51 37 0 0 0.507 0.143 0.281 0.977 0.496 wheat cereal, farina, quick (1-3min), 52 37 7 27 0.026 0.016 0 0.060 0.026 corngrits, regular, cooked 53 37 2 26 0.040 0.020 0 0.103 0.036 corn, fresh/frozen, boiled 54 37 3 23 0.049 0.069 0 0.447 0.036 corn, canned 55 12 0 11 0.038 0.008 0.026 0.057 0.036 cream style corn, canned 56 25 1 22 0.032 0.012 0 0.056 0.030 popcorn, popped in oil 57 25 0 2 0.243 0.067 0.082 0.380 0.242 white bread 58 37 0 13 0.097 0.036 0.056 0.234 0.087 white roll 59 25 0 8 0.095 0.021 0.052 0.142 0.096 cornbread, homemade 60 37 0 21 0.092 0.061 0.055 0.428 0.075 biscuit, from refrigerated dough, baked 61 37 0 6 0.117 0.032 0.060 0.192 0.111 whole wheat bread 62 37 0 1 0.191 0.040 0.053 0.259 0.190 tortilla, flour 63 37 0 5 0.102 0.021 0.067 0.151 0.099 rye bread 64 37 0 3 0.120 0.024 0.088 0.170 0.113 blueberry muffin, commercial 65 37 0 32 0.062 0.014 0.038 0.098 0.062 saltine crackers 66 37 0 31 0.082 0.022 0.040 0.147 0.080 corn chips 67 37 0 3 0.187 0.056 0.095 0.293 0.185 pancake from mix 68 25 0 12 0.086 0.039 0.046 0.200 0.073 egg noodles, boiled 69 37 6 29 0.026 0.016 0 0.075 0.026
Page 130 of 211 Rev 4.1
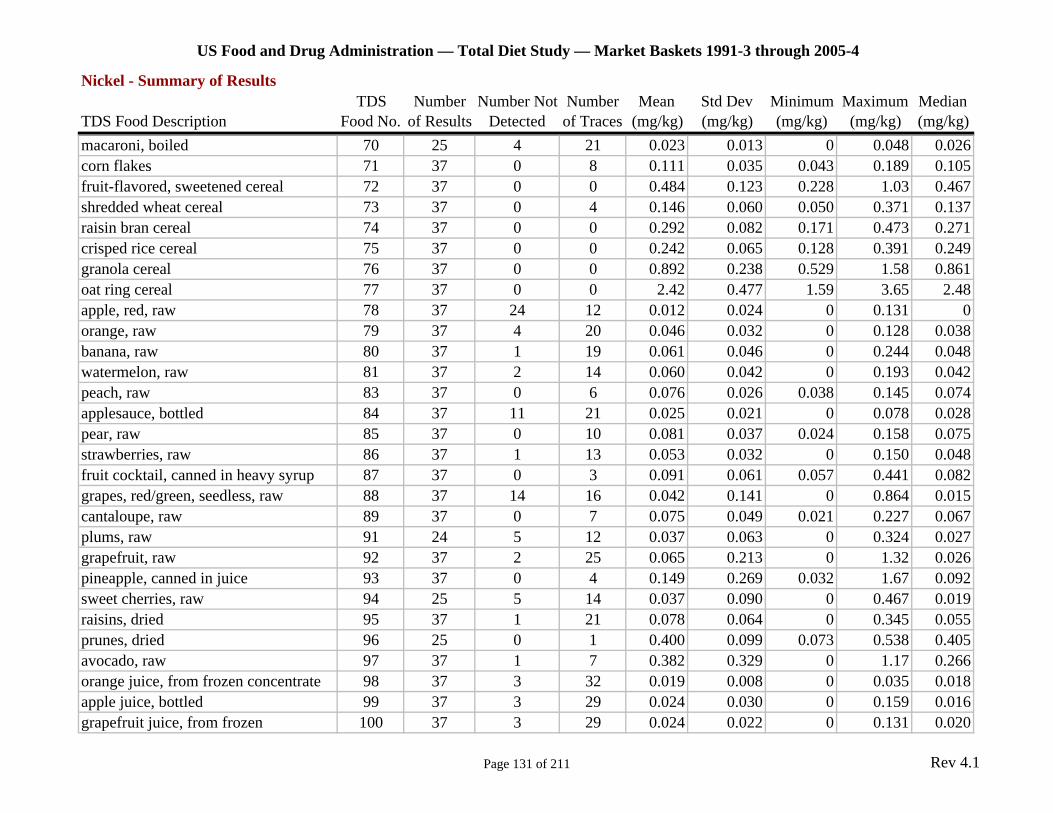
US Food and Drug Administration — Total Diet Study — Market Baskets 1991-3 through 2005-4
Nickel - Summary of Results TDS Number Number Not Number Mean Std Dev Minimum Maximum Median
TDS Food Description Food No. of Results Detected of Traces (mg/kg) (mg/kg) (mg/kg) (mg/kg) (mg/kg) macaroni, boiled 70 25 4 21 0.023 0.013 0 0.048 0.026 corn flakes 71 37 0 8 0.111 0.035 0.043 0.189 0.105 fruit-flavored, sweetened cereal 72 37 0 0 0.484 0.123 0.228 1.03 0.467 shredded wheat cereal 73 37 0 4 0.146 0.060 0.050 0.371 0.137 raisin bran cereal 74 37 0 0 0.292 0.082 0.171 0.473 0.271 crisped rice cereal 75 37 0 0 0.242 0.065 0.128 0.391 0.249 granola cereal 76 37 0 0 0.892 0.238 0.529 1.58 0.861 oat ring cereal 77 37 0 0 2.42 0.477 1.59 3.65 2.48 apple, red, raw 78 37 24 12 0.012 0.024 0 0.131 0 orange, raw 79 37 4 20 0.046 0.032 0 0.128 0.038 banana, raw 80 37 1 19 0.061 0.046 0 0.244 0.048 watermelon, raw 81 37 2 14 0.060 0.042 0 0.193 0.042 peach, raw 83 37 0 6 0.076 0.026 0.038 0.145 0.074 applesauce, bottled 84 37 11 21 0.025 0.021 0 0.078 0.028 pear, raw 85 37 0 10 0.081 0.037 0.024 0.158 0.075 strawberries, raw 86 37 1 13 0.053 0.032 0 0.150 0.048 fruit cocktail, canned in heavy syrup 87 37 0 3 0.091 0.061 0.057 0.441 0.082 grapes, red/green, seedless, raw 88 37 14 16 0.042 0.141 0 0.864 0.015 cantaloupe, raw 89 37 0 7 0.075 0.049 0.021 0.227 0.067 plums, raw 91 24 5 12 0.037 0.063 0 0.324 0.027 grapefruit, raw 92 37 2 25 0.065 0.213 0 1.32 0.026 pineapple, canned in juice 93 37 0 4 0.149 0.269 0.032 1.67 0.092 sweet cherries, raw 94 25 5 14 0.037 0.090 0 0.467 0.019 raisins, dried 95 37 1 21 0.078 0.064 0 0.345 0.055 prunes, dried 96 25 0 1 0.400 0.099 0.073 0.538 0.405 avocado, raw 97 37 1 7 0.382 0.329 0 1.17 0.266 orange juice, from frozen concentrate 98 37 3 32 0.019 0.008 0 0.035 0.018 apple juice, bottled 99 37 3 29 0.024 0.030 0 0.159 0.016 grapefruit juice, from frozen 100 37 3 29 0.024 0.022 0 0.131 0.020
Page 131 of 211 Rev 4.1
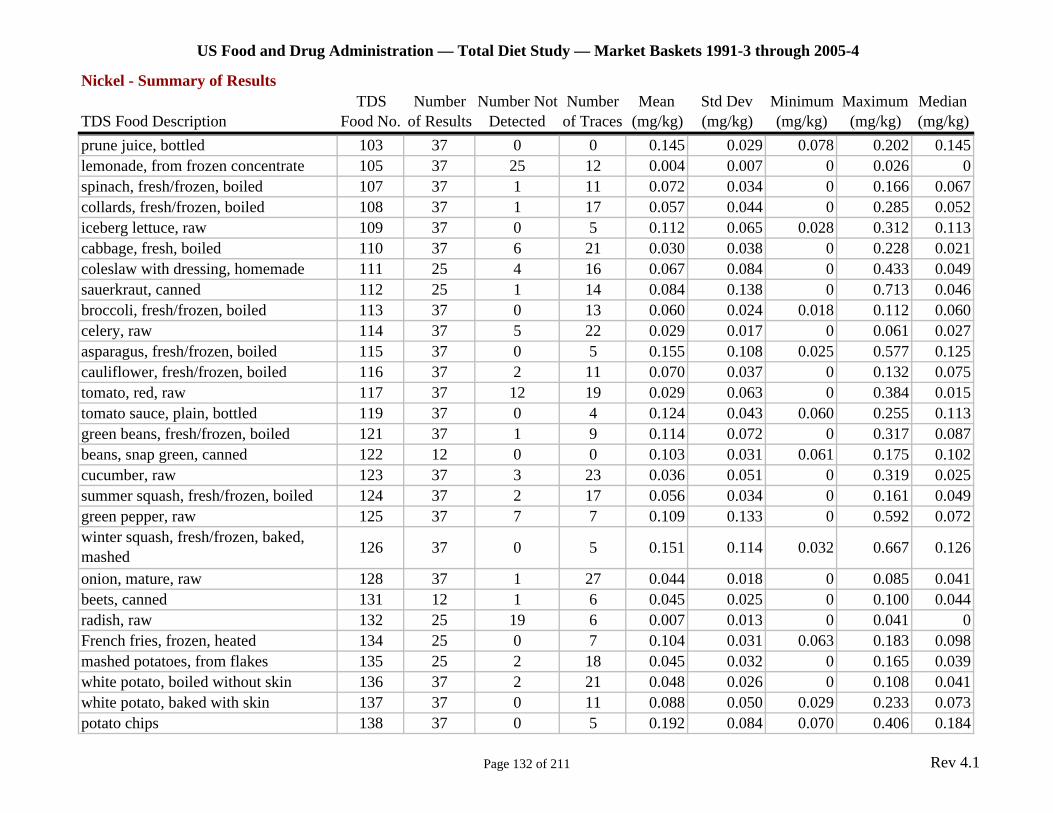
US Food and Drug Administration — Total Diet Study — Market Baskets 1991-3 through 2005-4
Nickel - Summary of Results TDS Number Number Not Number Mean Std Dev Minimum Maximum Median
TDS Food Description Food No. of Results Detected of Traces (mg/kg) (mg/kg) (mg/kg) (mg/kg) (mg/kg) prune juice, bottled 103 37 0 0 0.145 0.029 0.078 0.202 0.145 lemonade, from frozen concentrate 105 37 25 12 0.004 0.007 0 0.026 0 spinach, fresh/frozen, boiled 107 37 1 11 0.072 0.034 0 0.166 0.067 collards, fresh/frozen, boiled 108 37 1 17 0.057 0.044 0 0.285 0.052 iceberg lettuce, raw 109 37 0 5 0.112 0.065 0.028 0.312 0.113 cabbage, fresh, boiled 110 37 6 21 0.030 0.038 0 0.228 0.021 coleslaw with dressing, homemade 111 25 4 16 0.067 0.084 0 0.433 0.049 sauerkraut, canned 112 25 1 14 0.084 0.138 0 0.713 0.046 broccoli, fresh/frozen, boiled 113 37 0 13 0.060 0.024 0.018 0.112 0.060 celery, raw 114 37 5 22 0.029 0.017 0 0.061 0.027 asparagus, fresh/frozen, boiled 115 37 0 5 0.155 0.108 0.025 0.577 0.125 cauliflower, fresh/frozen, boiled 116 37 2 11 0.070 0.037 0 0.132 0.075 tomato, red, raw 117 37 12 19 0.029 0.063 0 0.384 0.015 tomato sauce, plain, bottled 119 37 0 4 0.124 0.043 0.060 0.255 0.113 green beans, fresh/frozen, boiled 121 37 1 9 0.114 0.072 0 0.317 0.087 beans, snap green, canned 122 12 0 0 0.103 0.031 0.061 0.175 0.102 cucumber, raw 123 37 3 23 0.036 0.051 0 0.319 0.025 summer squash, fresh/frozen, boiled 124 37 2 17 0.056 0.034 0 0.161 0.049 green pepper, raw 125 37 7 7 0.109 0.133 0 0.592 0.072 winter squash, fresh/frozen, baked, mashed 126 37 0 5 0.151 0.114 0.032 0.667 0.126
onion, mature, raw 128 37 1 27 0.044 0.018 0 0.085 0.041 beets, canned 131 12 1 6 0.045 0.025 0 0.100 0.044 radish, raw 132 25 19 6 0.007 0.013 0 0.041 0 French fries, frozen, heated 134 25 0 7 0.104 0.031 0.063 0.183 0.098 mashed potatoes, from flakes 135 25 2 18 0.045 0.032 0 0.165 0.039 white potato, boiled without skin 136 37 2 21 0.048 0.026 0 0.108 0.041 white potato, baked with skin 137 37 0 11 0.088 0.050 0.029 0.233 0.073 potato chips 138 37 0 5 0.192 0.084 0.070 0.406 0.184
Page 132 of 211 Rev 4.1
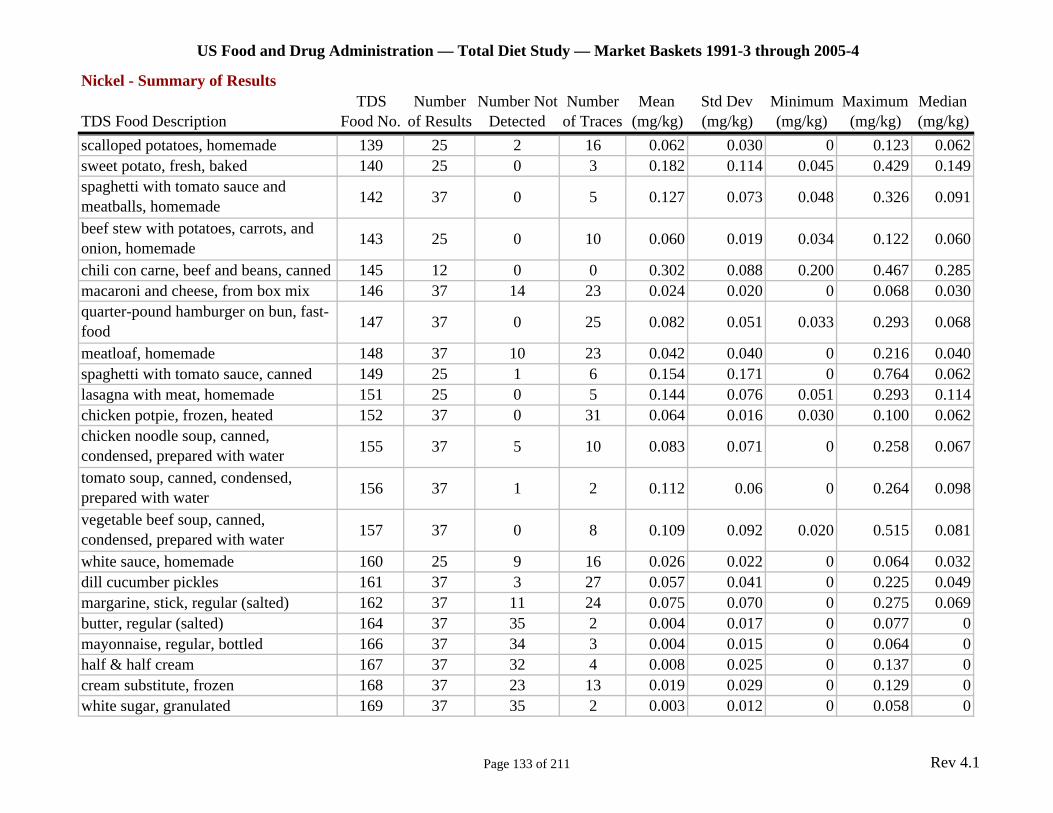
US Food and Drug Administration — Total Diet Study — Market Baskets 1991-3 through 2005-4
Nickel - Summary of Results TDS Number Number Not Number Mean Std Dev Minimum Maximum Median
TDS Food Description Food No. of Results Detected of Traces (mg/kg) (mg/kg) (mg/kg) (mg/kg) (mg/kg) scalloped potatoes, homemade 139 25 2 16 0.062 0.030 0 0.123 0.062 sweet potato, fresh, baked 140 25 0 3 0.182 0.114 0.045 0.429 0.149 spaghetti with tomato sauce and meatballs, homemade 142 37 0 5 0.127 0.073 0.048 0.326 0.091
beef stew with potatoes, carrots, and onion, homemade 143 25 0 10 0.060 0.019 0.034 0.122 0.060
chili con carne, beef and beans, canned 145 12 0 0 0.302 0.088 0.200 0.467 0.285 macaroni and cheese, from box mix 146 37 14 23 0.024 0.020 0 0.068 0.030 quarter-pound hamburger on bun, fast-food 147 37 0 25 0.082 0.051 0.033 0.293 0.068
meatloaf, homemade 148 37 10 23 0.042 0.040 0 0.216 0.040 spaghetti with tomato sauce, canned 149 25 1 6 0.154 0.171 0 0.764 0.062 lasagna with meat, homemade 151 25 0 5 0.144 0.076 0.051 0.293 0.114 chicken potpie, frozen, heated 152 37 0 31 0.064 0.016 0.030 0.100 0.062 chicken noodle soup, canned, condensed, prepared with water 155 37 5 10 0.083 0.071 0 0.258 0.067
tomato soup, canned, condensed, prepared with water 156 37 1 2 0.112 0.06 0 0.264 0.098
vegetable beef soup, canned, condensed, prepared with water 157 37 0 8 0.109 0.092 0.020 0.515 0.081
white sauce, homemade 160 25 9 16 0.026 0.022 0 0.064 0.032 dill cucumber pickles 161 37 3 27 0.057 0.041 0 0.225 0.049 margarine, stick, regular (salted) 162 37 11 24 0.075 0.070 0 0.275 0.069 butter, regular (salted) 164 37 35 2 0.004 0.017 0 0.077 0 mayonnaise, regular, bottled 166 37 34 3 0.004 0.015 0 0.064 0 half & half cream 167 37 32 4 0.008 0.025 0 0.137 0 cream substitute, frozen 168 37 23 13 0.019 0.029 0 0.129 0 white sugar, granulated 169 37 35 2 0.003 0.012 0 0.058 0
Page 133 of 211 Rev 4.1
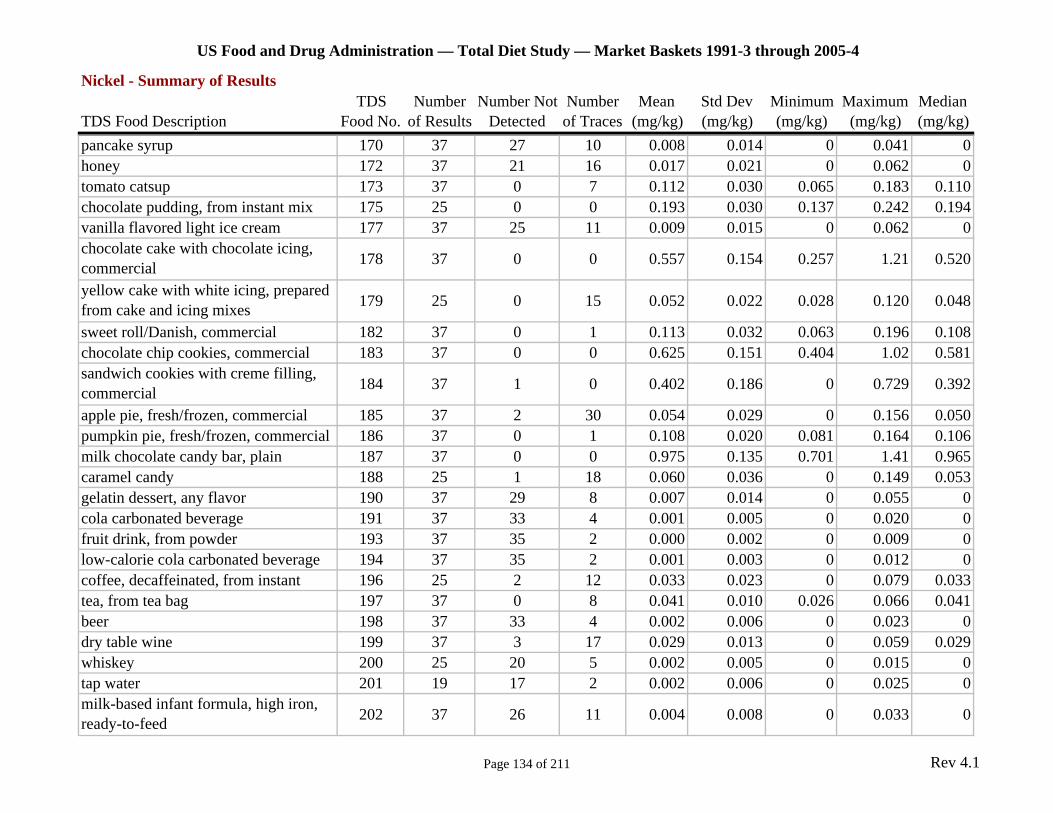
US Food and Drug Administration — Total Diet Study — Market Baskets 1991-3 through 2005-4
Nickel - Summary of Results TDS Number Number Not Number Mean Std Dev Minimum Maximum Median
TDS Food Description Food No. of Results Detected of Traces (mg/kg) (mg/kg) (mg/kg) (mg/kg) (mg/kg) pancake syrup 170 37 27 10 0.008 0.014 0 0.041 0 honey 172 37 21 16 0.017 0.021 0 0.062 0 tomato catsup 173 37 0 7 0.112 0.030 0.065 0.183 0.110 chocolate pudding, from instant mix 175 25 0 0 0.193 0.030 0.137 0.242 0.194 vanilla flavored light ice cream 177 37 25 11 0.009 0.015 0 0.062 0 chocolate cake with chocolate icing, commercial 178 37 0 0 0.557 0.154 0.257 1.21 0.520
yellow cake with white icing, prepared from cake and icing mixes 179 25 0 15 0.052 0.022 0.028 0.120 0.048
sweet roll/Danish, commercial 182 37 0 1 0.113 0.032 0.063 0.196 0.108 chocolate chip cookies, commercial 183 37 0 0 0.625 0.151 0.404 1.02 0.581 sandwich cookies with creme filling, commercial 184 37 1 0 0.402 0.186 0 0.729 0.392
apple pie, fresh/frozen, commercial 185 37 2 30 0.054 0.029 0 0.156 0.050 pumpkin pie, fresh/frozen, commercial 186 37 0 1 0.108 0.020 0.081 0.164 0.106 milk chocolate candy bar, plain 187 37 0 0 0.975 0.135 0.701 1.41 0.965 caramel candy 188 25 1 18 0.060 0.036 0 0.149 0.053 gelatin dessert, any flavor 190 37 29 8 0.007 0.014 0 0.055 0 cola carbonated beverage 191 37 33 4 0.001 0.005 0 0.020 0 fruit drink, from powder 193 37 35 2 0.000 0.002 0 0.009 0 low-calorie cola carbonated beverage 194 37 35 2 0.001 0.003 0 0.012 0 coffee, decaffeinated, from instant 196 25 2 12 0.033 0.023 0 0.079 0.033 tea, from tea bag 197 37 0 8 0.041 0.010 0.026 0.066 0.041 beer 198 37 33 4 0.002 0.006 0 0.023 0 dry table wine 199 37 3 17 0.029 0.013 0 0.059 0.029 whiskey 200 25 20 5 0.002 0.005 0 0.015 0 tap water 201 19 17 2 0.002 0.006 0 0.025 0 milk-based infant formula, high iron, ready-to-feed 202 37 26 11 0.004 0.008 0 0.033 0
Page 134 of 211 Rev 4.1
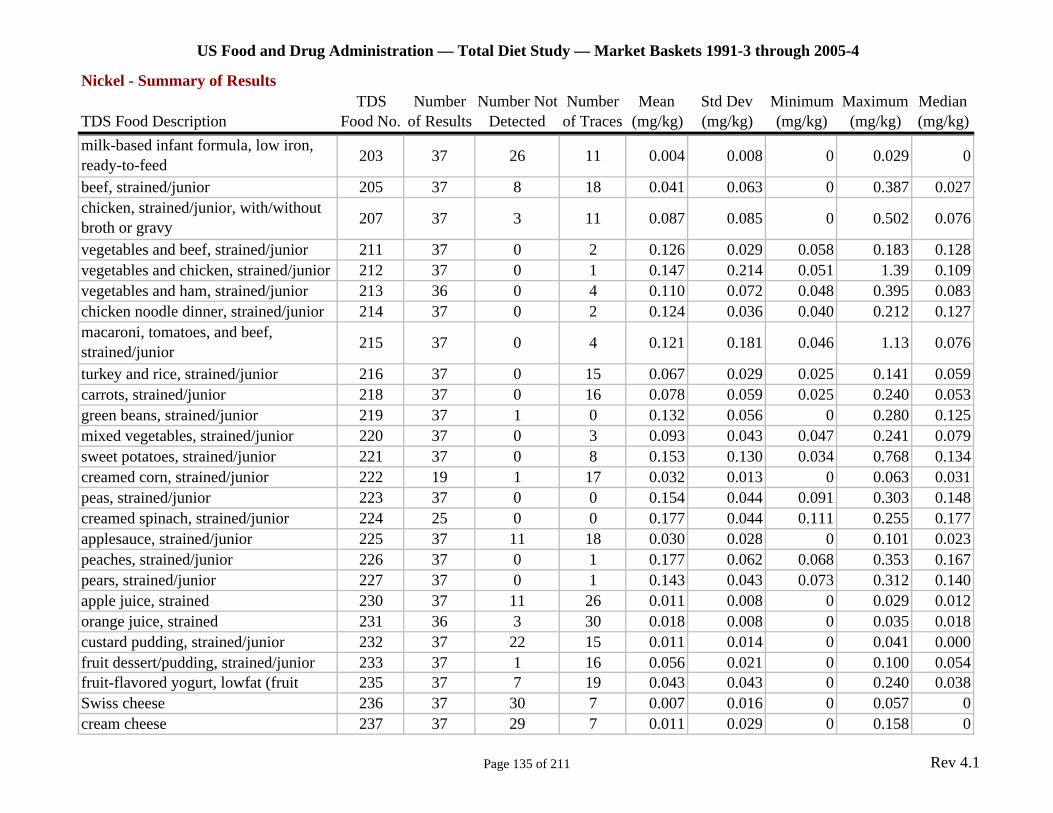
US Food and Drug Administration — Total Diet Study — Market Baskets 1991-3 through 2005-4
Nickel - Summary of Results TDS Number Number Not Number Mean Std Dev Minimum Maximum Median
TDS Food Description Food No. of Results Detected of Traces (mg/kg) (mg/kg) (mg/kg) (mg/kg) (mg/kg) milk-based infant formula, low iron, ready-to-feed 203 37 26 11 0.004 0.008 0 0.029 0
beef, strained/junior 205 37 8 18 0.041 0.063 0 0.387 0.027 chicken, strained/junior, with/without broth or gravy 207 37 3 11 0.087 0.085 0 0.502 0.076
vegetables and beef, strained/junior 211 37 0 2 0.126 0.029 0.058 0.183 0.128 vegetables and chicken, strained/junior 212 37 0 1 0.147 0.214 0.051 1.39 0.109 vegetables and ham, strained/junior 213 36 0 4 0.110 0.072 0.048 0.395 0.083 chicken noodle dinner, strained/junior 214 37 0 2 0.124 0.036 0.040 0.212 0.127 macaroni, tomatoes, and beef, strained/junior 215 37 0 4 0.121 0.181 0.046 1.13 0.076
turkey and rice, strained/junior 216 37 0 15 0.067 0.029 0.025 0.141 0.059 carrots, strained/junior 218 37 0 16 0.078 0.059 0.025 0.240 0.053 green beans, strained/junior 219 37 1 0 0.132 0.056 0 0.280 0.125 mixed vegetables, strained/junior 220 37 0 3 0.093 0.043 0.047 0.241 0.079 sweet potatoes, strained/junior 221 37 0 8 0.153 0.130 0.034 0.768 0.134 creamed corn, strained/junior 222 19 1 17 0.032 0.013 0 0.063 0.031 peas, strained/junior 223 37 0 0 0.154 0.044 0.091 0.303 0.148 creamed spinach, strained/junior 224 25 0 0 0.177 0.044 0.111 0.255 0.177 applesauce, strained/junior 225 37 11 18 0.030 0.028 0 0.101 0.023 peaches, strained/junior 226 37 0 1 0.177 0.062 0.068 0.353 0.167 pears, strained/junior 227 37 0 1 0.143 0.043 0.073 0.312 0.140 apple juice, strained 230 37 11 26 0.011 0.008 0 0.029 0.012 orange juice, strained 231 36 3 30 0.018 0.008 0 0.035 0.018 custard pudding, strained/junior 232 37 22 15 0.011 0.014 0 0.041 0.000 fruit dessert/pudding, strained/junior 233 37 1 16 0.056 0.021 0 0.100 0.054 fruit-flavored yogurt, lowfat (fruit 235 37 7 19 0.043 0.043 0 0.240 0.038 Swiss cheese 236 37 30 7 0.007 0.016 0 0.057 0 cream cheese 237 37 29 7 0.011 0.029 0 0.158 0
Page 135 of 211 Rev 4.1
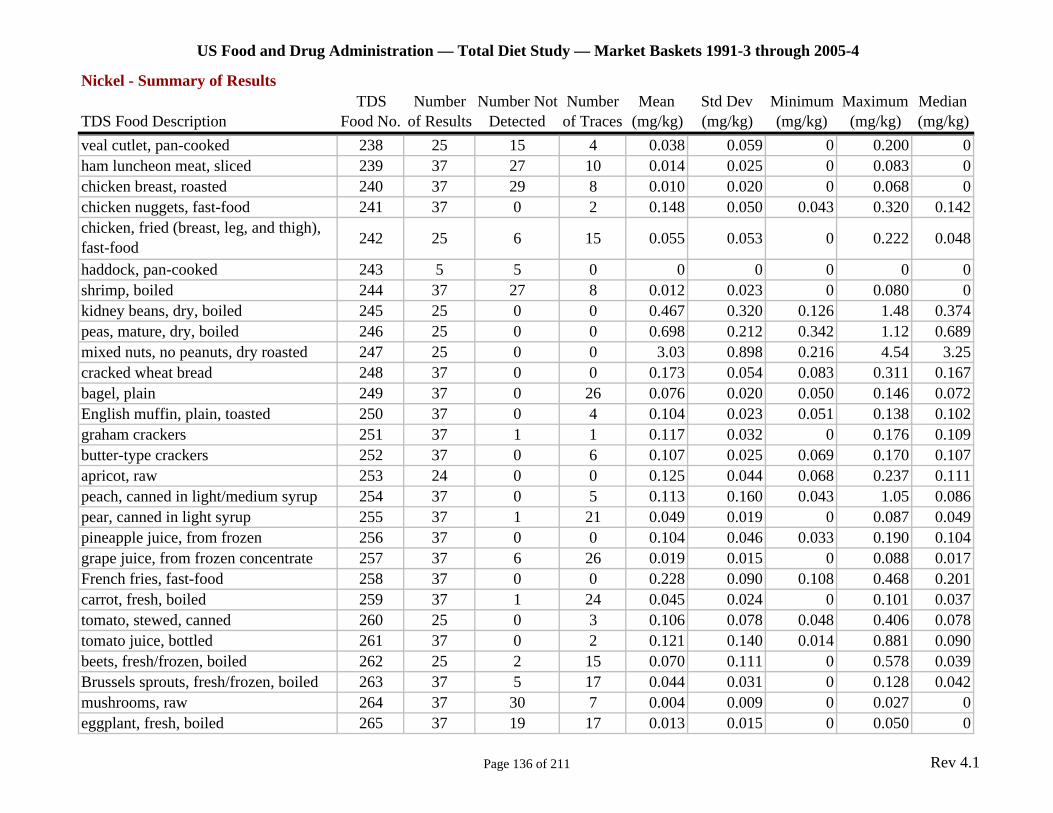
US Food and Drug Administration — Total Diet Study — Market Baskets 1991-3 through 2005-4
Nickel - Summary of Results TDS Number Number Not Number Mean Std Dev Minimum Maximum Median
TDS Food Description Food No. of Results Detected of Traces (mg/kg) (mg/kg) (mg/kg) (mg/kg) (mg/kg) veal cutlet, pan-cooked 238 25 15 4 0.038 0.059 0 0.200 0 ham luncheon meat, sliced 239 37 27 10 0.014 0.025 0 0.083 0 chicken breast, roasted 240 37 29 8 0.010 0.020 0 0.068 0 chicken nuggets, fast-food 241 37 0 2 0.148 0.050 0.043 0.320 0.142 chicken, fried (breast, leg, and thigh), fast-food 242 25 6 15 0.055 0.053 0 0.222 0.048
haddock, pan-cooked 243 5 5 0 0 0 0 0 0 shrimp, boiled 244 37 27 8 0.012 0.023 0 0.080 0 kidney beans, dry, boiled 245 25 0 0 0.467 0.320 0.126 1.48 0.374 peas, mature, dry, boiled 246 25 0 0 0.698 0.212 0.342 1.12 0.689 mixed nuts, no peanuts, dry roasted 247 25 0 0 3.03 0.898 0.216 4.54 3.25 cracked wheat bread 248 37 0 0 0.173 0.054 0.083 0.311 0.167 bagel, plain 249 37 0 26 0.076 0.020 0.050 0.146 0.072 English muffin, plain, toasted 250 37 0 4 0.104 0.023 0.051 0.138 0.102 graham crackers 251 37 1 1 0.117 0.032 0 0.176 0.109 butter-type crackers 252 37 0 6 0.107 0.025 0.069 0.170 0.107 apricot, raw 253 24 0 0 0.125 0.044 0.068 0.237 0.111 peach, canned in light/medium syrup 254 37 0 5 0.113 0.160 0.043 1.05 0.086 pear, canned in light syrup 255 37 1 21 0.049 0.019 0 0.087 0.049 pineapple juice, from frozen 256 37 0 0 0.104 0.046 0.033 0.190 0.104 grape juice, from frozen concentrate 257 37 6 26 0.019 0.015 0 0.088 0.017 French fries, fast-food 258 37 0 0 0.228 0.090 0.108 0.468 0.201 carrot, fresh, boiled 259 37 1 24 0.045 0.024 0 0.101 0.037 tomato, stewed, canned 260 25 0 3 0.106 0.078 0.048 0.406 0.078 tomato juice, bottled 261 37 0 2 0.121 0.140 0.014 0.881 0.090 beets, fresh/frozen, boiled 262 25 2 15 0.070 0.111 0 0.578 0.039 Brussels sprouts, fresh/frozen, boiled 263 37 5 17 0.044 0.031 0 0.128 0.042 mushrooms, raw 264 37 30 7 0.004 0.009 0 0.027 0 eggplant, fresh, boiled 265 37 19 17 0.013 0.015 0 0.050 0
Page 136 of 211 Rev 4.1
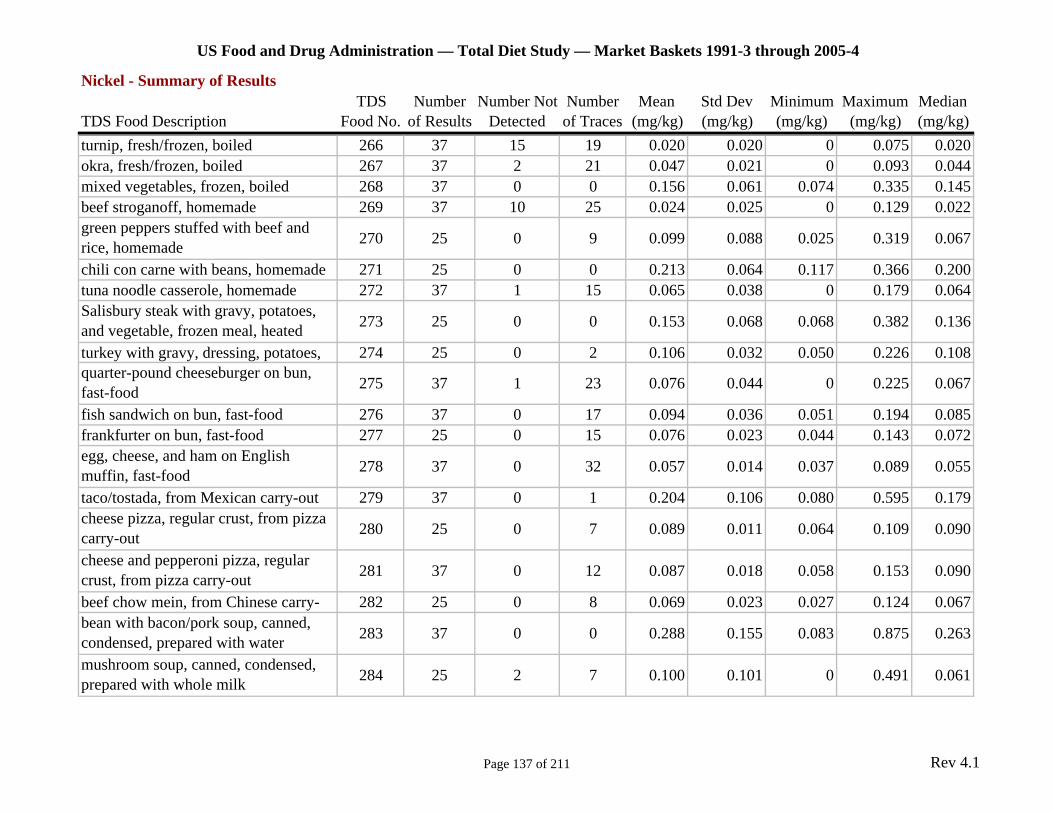
US Food and Drug Administration — Total Diet Study — Market Baskets 1991-3 through 2005-4
Nickel - Summary of Results TDS Number Number Not Number Mean Std Dev Minimum Maximum Median
TDS Food Description Food No. of Results Detected of Traces (mg/kg) (mg/kg) (mg/kg) (mg/kg) (mg/kg) turnip, fresh/frozen, boiled 266 37 15 19 0.020 0.020 0 0.075 0.020 okra, fresh/frozen, boiled 267 37 2 21 0.047 0.021 0 0.093 0.044 mixed vegetables, frozen, boiled 268 37 0 0 0.156 0.061 0.074 0.335 0.145 beef stroganoff, homemade 269 37 10 25 0.024 0.025 0 0.129 0.022 green peppers stuffed with beef and rice, homemade 270 25 0 9 0.099 0.088 0.025 0.319 0.067
chili con carne with beans, homemade 271 25 0 0 0.213 0.064 0.117 0.366 0.200 tuna noodle casserole, homemade 272 37 1 15 0.065 0.038 0 0.179 0.064 Salisbury steak with gravy, potatoes, and vegetable, frozen meal, heated 273 25 0 0 0.153 0.068 0.068 0.382 0.136
turkey with gravy, dressing, potatoes, 274 25 0 2 0.106 0.032 0.050 0.226 0.108 quarter-pound cheeseburger on bun, fast-food 275 37 1 23 0.076 0.044 0 0.225 0.067
fish sandwich on bun, fast-food 276 37 0 17 0.094 0.036 0.051 0.194 0.085 frankfurter on bun, fast-food 277 25 0 15 0.076 0.023 0.044 0.143 0.072 egg, cheese, and ham on English muffin, fast-food 278 37 0 32 0.057 0.014 0.037 0.089 0.055
taco/tostada, from Mexican carry-out 279 37 0 1 0.204 0.106 0.080 0.595 0.179 cheese pizza, regular crust, from pizza carry-out 280 25 0 7 0.089 0.011 0.064 0.109 0.090
cheese and pepperoni pizza, regular crust, from pizza carry-out 281 37 0 12 0.087 0.018 0.058 0.153 0.090
beef chow mein, from Chinese carry- 282 25 0 8 0.069 0.023 0.027 0.124 0.067 bean with bacon/pork soup, canned, condensed, prepared with water 283 37 0 0 0.288 0.155 0.083 0.875 0.263
mushroom soup, canned, condensed, prepared with whole milk 284 25 2 7 0.100 0.101 0 0.491 0.061
Page 137 of 211 Rev 4.1
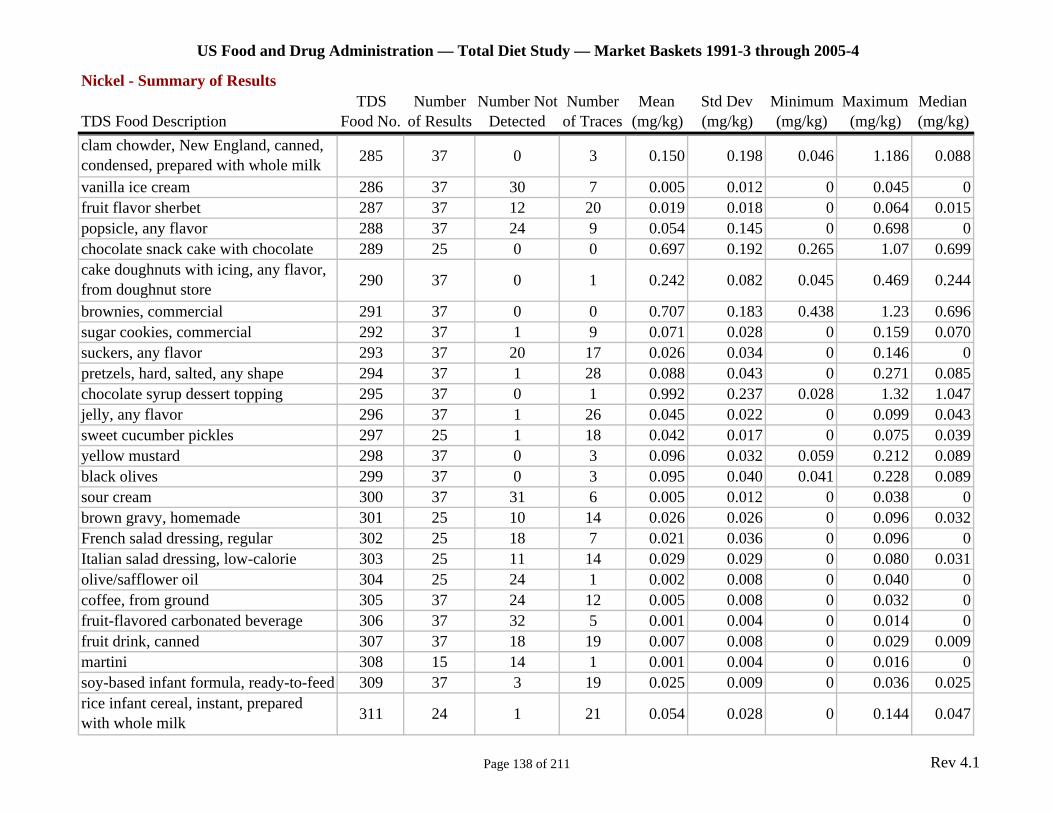
US Food and Drug Administration — Total Diet Study — Market Baskets 1991-3 through 2005-4
Nickel - Summary of Results TDS Number Number Not Number Mean Std Dev Minimum Maximum Median
TDS Food Description Food No. of Results Detected of Traces (mg/kg) (mg/kg) (mg/kg) (mg/kg) (mg/kg) clam chowder, New England, canned, condensed, prepared with whole milk 285 37 0 3 0.150 0.198 0.046 1.186 0.088
vanilla ice cream 286 37 30 7 0.005 0.012 0 0.045 0 fruit flavor sherbet 287 37 12 20 0.019 0.018 0 0.064 0.015 popsicle, any flavor 288 37 24 9 0.054 0.145 0 0.698 0 chocolate snack cake with chocolate 289 25 0 0 0.697 0.192 0.265 1.07 0.699 cake doughnuts with icing, any flavor, from doughnut store 290 37 0 1 0.242 0.082 0.045 0.469 0.244
brownies, commercial 291 37 0 0 0.707 0.183 0.438 1.23 0.696 sugar cookies, commercial 292 37 1 9 0.071 0.028 0 0.159 0.070 suckers, any flavor 293 37 20 17 0.026 0.034 0 0.146 0 pretzels, hard, salted, any shape 294 37 1 28 0.088 0.043 0 0.271 0.085 chocolate syrup dessert topping 295 37 0 1 0.992 0.237 0.028 1.32 1.047 jelly, any flavor 296 37 1 26 0.045 0.022 0 0.099 0.043 sweet cucumber pickles 297 25 1 18 0.042 0.017 0 0.075 0.039 yellow mustard 298 37 0 3 0.096 0.032 0.059 0.212 0.089 black olives 299 37 0 3 0.095 0.040 0.041 0.228 0.089 sour cream 300 37 31 6 0.005 0.012 0 0.038 0 brown gravy, homemade 301 25 10 14 0.026 0.026 0 0.096 0.032 French salad dressing, regular 302 25 18 7 0.021 0.036 0 0.096 0 Italian salad dressing, low-calorie 303 25 11 14 0.029 0.029 0 0.080 0.031 olive/safflower oil 304 25 24 1 0.002 0.008 0 0.040 0 coffee, from ground 305 37 24 12 0.005 0.008 0 0.032 0 fruit-flavored carbonated beverage 306 37 32 5 0.001 0.004 0 0.014 0 fruit drink, canned 307 37 18 19 0.007 0.008 0 0.029 0.009 martini 308 15 14 1 0.001 0.004 0 0.016 0 soy-based infant formula, ready-to-feed 309 37 3 19 0.025 0.009 0 0.036 0.025 rice infant cereal, instant, prepared with whole milk 311 24 1 21 0.054 0.028 0 0.144 0.047
Page 138 of 211 Rev 4.1
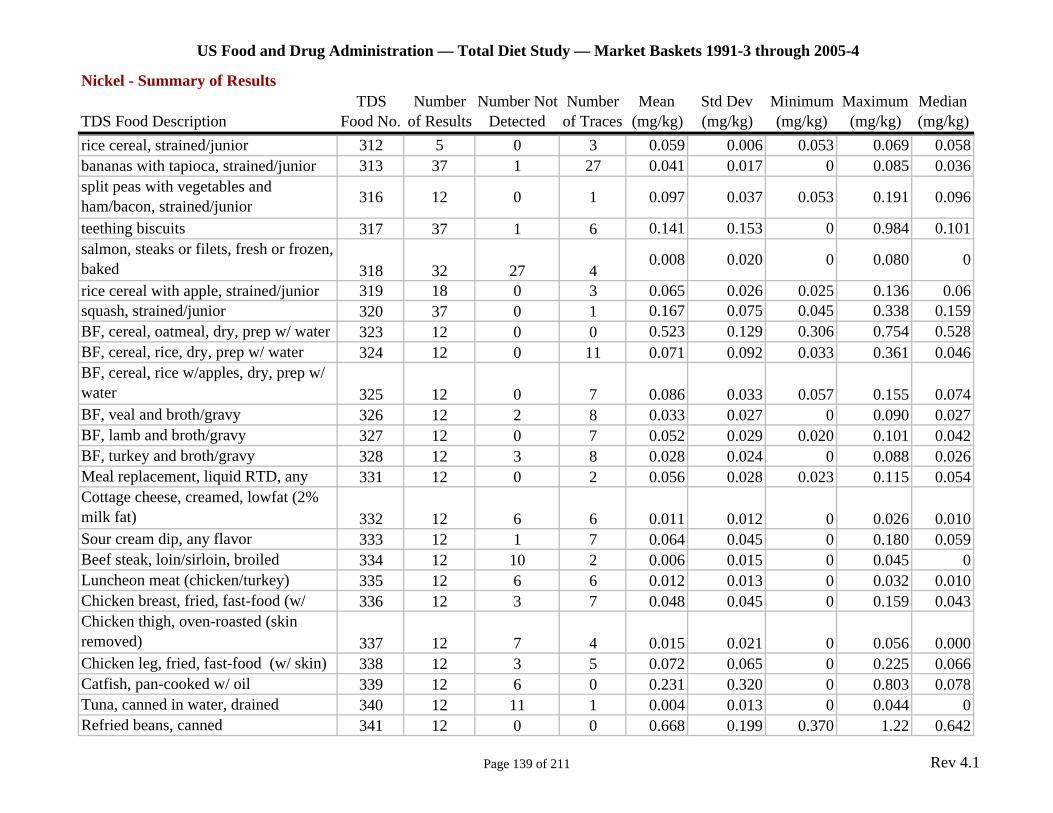
US Food and Drug Administration — Total Diet Study — Market Baskets 1991-3 through 2005-4
Nickel - Summary of Results TDS Number Number Not Number Mean Std Dev Minimum Maximum Median
TDS Food Description Food No. of Results Detected of Traces (mg/kg) (mg/kg) (mg/kg) (mg/kg) (mg/kg) rice cereal, strained/junior 312 5 0 3 0.059 0.006 0.053 0.069 0.058 bananas with tapioca, strained/junior 313 37 1 27 0.041 0.017 0 0.085 0.036 split peas with vegetables and ham/bacon, strained/junior 316 12 0 1 0.097 0.037 0.053 0.191 0.096
teething biscuits 317 37 1 6 0.141 0.153 0 0.984 0.101 salmon, steaks or filets, fresh or frozen, baked 318 32 27 4
0.008 0.020 0 0.080 0
rice cereal with apple, strained/junior 319 18 0 3 0.065 0.026 0.025 0.136 0.06 squash, strained/junior 320 37 0 1 0.167 0.075 0.045 0.338 0.159 BF, cereal, oatmeal, dry, prep w/ water 323 12 0 0 0.523 0.129 0.306 0.754 0.528 BF, cereal, rice, dry, prep w/ water 324 12 0 11 0.071 0.092 0.033 0.361 0.046 BF, cereal, rice w/apples, dry, prep w/ water 325 12 0 7 0.086 0.033 0.057 0.155 0.074 BF, veal and broth/gravy 326 12 2 8 0.033 0.027 0 0.090 0.027 BF, lamb and broth/gravy 327 12 0 7 0.052 0.029 0.020 0.101 0.042 BF, turkey and broth/gravy 328 12 3 8 0.028 0.024 0 0.088 0.026 Meal replacement, liquid RTD, any 331 12 0 2 0.056 0.028 0.023 0.115 0.054 Cottage cheese, creamed, lowfat (2% milk fat) 332 12 6 6 0.011 0.012 0 0.026 0.010 Sour cream dip, any flavor 333 12 1 7 0.064 0.045 0 0.180 0.059 Beef steak, loin/sirloin, broiled 334 12 10 2 0.006 0.015 0 0.045 0 Luncheon meat (chicken/turkey) 335 12 6 6 0.012 0.013 0 0.032 0.010 Chicken breast, fried, fast-food (w/ 336 12 3 7 0.048 0.045 0 0.159 0.043 Chicken thigh, oven-roasted (skin removed) 337 12 7 4 0.015 0.021 0 0.056 0.000 Chicken leg, fried, fast-food (w/ skin) 338 12 3 5 0.072 0.065 0 0.225 0.066 Catfish, pan-cooked w/ oil 339 12 6 0 0.231 0.320 0 0.803 0.078 Tuna, canned in water, drained 340 12 11 1 0.004 0.013 0 0.044 0 Refried beans, canned 341 12 0 0 0.668 0.199 0.370 1.22 0.642
Page 139 of 211 Rev 4.1
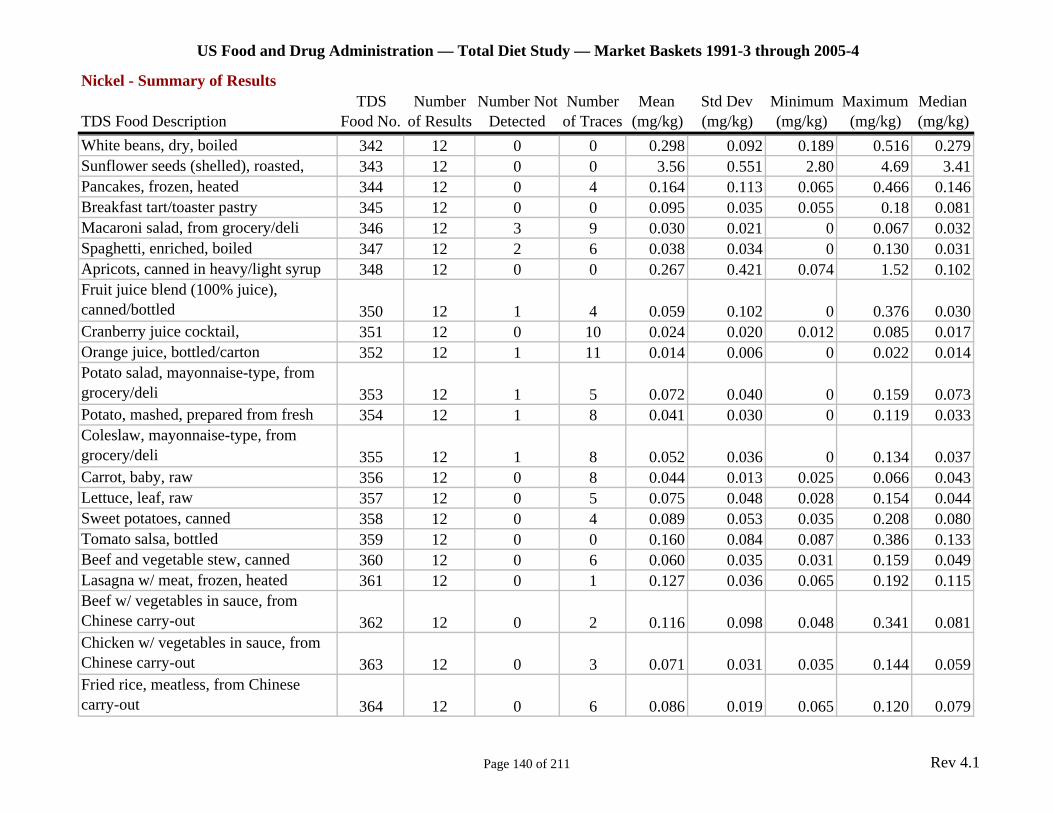
US Food and Drug Administration — Total Diet Study — Market Baskets 1991-3 through 2005-4
Nickel - Summary of Results TDS Number Number Not Number Mean Std Dev Minimum Maximum Median
TDS Food Description Food No. of Results Detected of Traces (mg/kg) (mg/kg) (mg/kg) (mg/kg) (mg/kg) White beans, dry, boiled 342 12 0 0 0.298 0.092 0.189 0.516 0.279 Sunflower seeds (shelled), roasted, 343 12 0 0 3.56 0.551 2.80 4.69 3.41 Pancakes, frozen, heated 344 12 0 4 0.164 0.113 0.065 0.466 0.146 Breakfast tart/toaster pastry 345 12 0 0 0.095 0.035 0.055 0.18 0.081 Macaroni salad, from grocery/deli 346 12 3 9 0.030 0.021 0 0.067 0.032 Spaghetti, enriched, boiled 347 12 2 6 0.038 0.034 0 0.130 0.031 Apricots, canned in heavy/light syrup 348 12 0 0 0.267 0.421 0.074 1.52 0.102 Fruit juice blend (100% juice), canned/bottled 350 12 1 4 0.059 0.102 0 0.376 0.030 Cranberry juice cocktail, 351 12 0 10 0.024 0.020 0.012 0.085 0.017 Orange juice, bottled/carton 352 12 1 11 0.014 0.006 0 0.022 0.014 Potato salad, mayonnaise-type, from grocery/deli 353 12 1 5 0.072 0.040 0 0.159 0.073 Potato, mashed, prepared from fresh 354 12 1 8 0.041 0.030 0 0.119 0.033 Coleslaw, mayonnaise-type, from grocery/deli 355 12 1 8 0.052 0.036 0 0.134 0.037 Carrot, baby, raw 356 12 0 8 0.044 0.013 0.025 0.066 0.043 Lettuce, leaf, raw 357 12 0 5 0.075 0.048 0.028 0.154 0.044 Sweet potatoes, canned 358 12 0 4 0.089 0.053 0.035 0.208 0.080 Tomato salsa, bottled 359 12 0 0 0.160 0.084 0.087 0.386 0.133 Beef and vegetable stew, canned 360 12 0 6 0.060 0.035 0.031 0.159 0.049 Lasagna w/ meat, frozen, heated 361 12 0 1 0.127 0.036 0.065 0.192 0.115 Beef w/ vegetables in sauce, from Chinese carry-out 362 12 0 2 0.116 0.098 0.048 0.341 0.081 Chicken w/ vegetables in sauce, from Chinese carry-out 363 12 0 3 0.071 0.031 0.035 0.144 0.059 Fried rice, meatless, from Chinese carry-out 364 12 0 6 0.086 0.019 0.065 0.120 0.079
Page 140 of 211 Rev 4.1
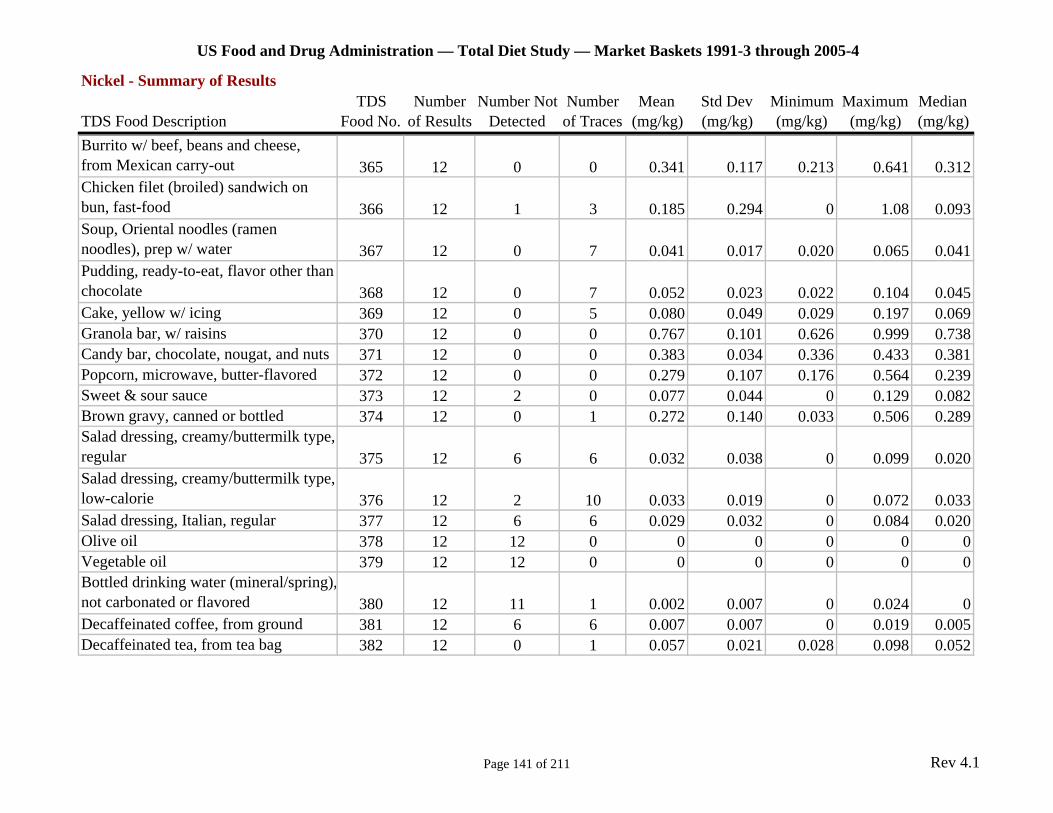
US Food and Drug Administration — Total Diet Study — Market Baskets 1991-3 through 2005-4
Nickel - Summary of Results TDS Number Number Not Number Mean Std Dev Minimum Maximum Median
TDS Food Description Food No. of Results Detected of Traces (mg/kg) (mg/kg) (mg/kg) (mg/kg) (mg/kg) Burrito w/ beef, beans and cheese, from Mexican carry-out 365 12 0 0 0.341 0.117 0.213 0.641 0.312 Chicken filet (broiled) sandwich on bun, fast-food 366 12 1 3 0.185 0.294 0 1.08 0.093 Soup, Oriental noodles (ramen noodles), prep w/ water 367 12 0 7 0.041 0.017 0.020 0.065 0.041 Pudding, ready-to-eat, flavor other than chocolate 368 12 0 7 0.052 0.023 0.022 0.104 0.045 Cake, yellow w/ icing 369 12 0 5 0.080 0.049 0.029 0.197 0.069 Granola bar, w/ raisins 370 12 0 0 0.767 0.101 0.626 0.999 0.738 Candy bar, chocolate, nougat, and nuts 371 12 0 0 0.383 0.034 0.336 0.433 0.381 Popcorn, microwave, butter-flavored 372 12 0 0 0.279 0.107 0.176 0.564 0.239 Sweet & sour sauce 373 12 2 0 0.077 0.044 0 0.129 0.082 Brown gravy, canned or bottled 374 12 0 1 0.272 0.140 0.033 0.506 0.289 Salad dressing, creamy/buttermilk type, regular 375 12 6 6 0.032 0.038 0 0.099 0.020 Salad dressing, creamy/buttermilk type, low-calorie 376 12 2 10 0.033 0.019 0 0.072 0.033 Salad dressing, Italian, regular 377 12 6 6 0.029 0.032 0 0.084 0.020 Olive oil 378 12 12 0 0 0 0 0 0 Vegetable oil 379 12 12 0 0 0 0 0 0 Bottled drinking water (mineral/spring), not carbonated or flavored 380 12 11 1 0.002 0.007 0 0.024 0 Decaffeinated coffee, from ground 381 12 6 6 0.007 0.007 0 0.019 0.005 Decaffeinated tea, from tea bag 382 12 0 1 0.057 0.021 0.028 0.098 0.052
Page 141 of 211 Rev 4.1
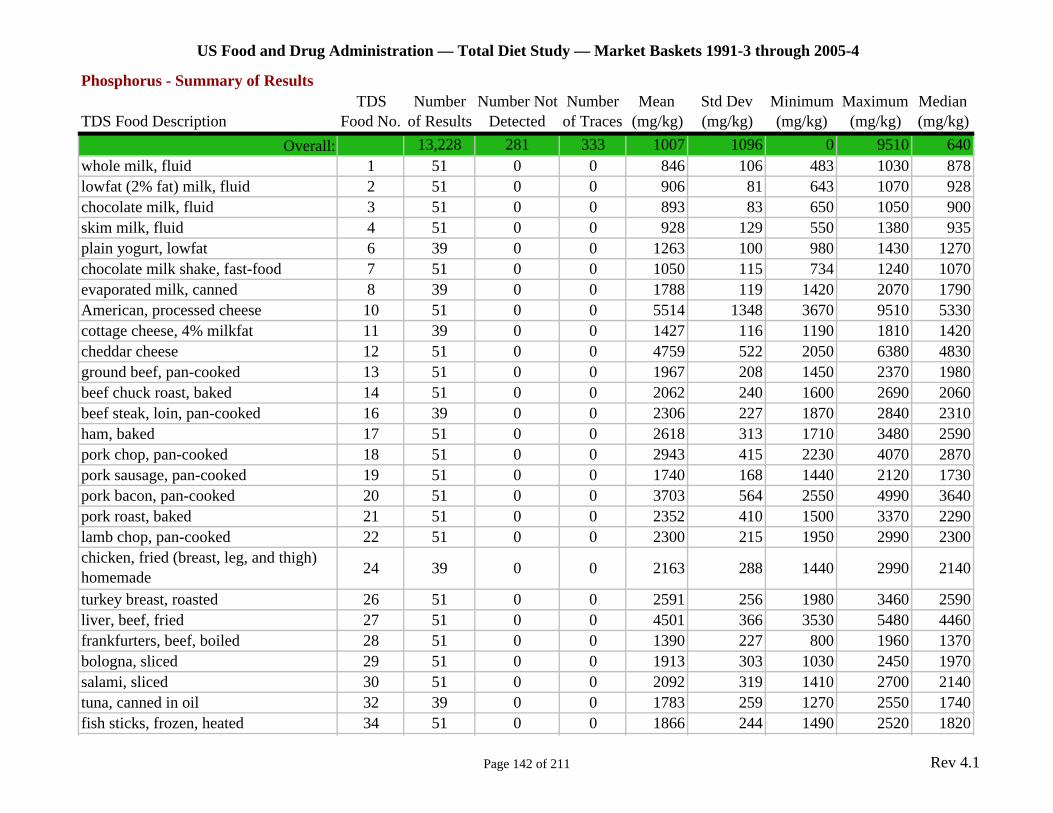
US Food and Drug Administration — Total Diet Study — Market Baskets 1991-3 through 2005-4
Phosphorus - Summary of Results TDS Number Number Not Number Mean Std Dev Minimum Maximum Median
TDS Food Description Food No. of Results Detected of Traces (mg/kg) (mg/kg) (mg/kg) (mg/kg) (mg/kg) Overall: 13,228 281 333 1007 1096 0 9510 640
whole milk, fluid 1 51 0 0 846 106 483 1030 878 lowfat (2% fat) milk, fluid 2 51 0 0 906 81 643 1070 928 chocolate milk, fluid 3 51 0 0 893 83 650 1050 900 skim milk, fluid 4 51 0 0 928 129 550 1380 935 plain yogurt, lowfat 6 39 0 0 1263 100 980 1430 1270 chocolate milk shake, fast-food 7 51 0 0 1050 115 734 1240 1070 evaporated milk, canned 8 39 0 0 1788 119 1420 2070 1790 American, processed cheese 10 51 0 0 5514 1348 3670 9510 5330 cottage cheese, 4% milkfat 11 39 0 0 1427 116 1190 1810 1420 cheddar cheese 12 51 0 0 4759 522 2050 6380 4830 ground beef, pan-cooked 13 51 0 0 1967 208 1450 2370 1980 beef chuck roast, baked 14 51 0 0 2062 240 1600 2690 2060 beef steak, loin, pan-cooked 16 39 0 0 2306 227 1870 2840 2310 ham, baked 17 51 0 0 2618 313 1710 3480 2590 pork chop, pan-cooked 18 51 0 0 2943 415 2230 4070 2870 pork sausage, pan-cooked 19 51 0 0 1740 168 1440 2120 1730 pork bacon, pan-cooked 20 51 0 0 3703 564 2550 4990 3640 pork roast, baked 21 51 0 0 2352 410 1500 3370 2290 lamb chop, pan-cooked 22 51 0 0 2300 215 1950 2990 2300 chicken, fried (breast, leg, and thigh) homemade 24 39 0 0 2163 288 1440 2990 2140
turkey breast, roasted 26 51 0 0 2591 256 1980 3460 2590 liver, beef, fried 27 51 0 0 4501 366 3530 5480 4460 frankfurters, beef, boiled 28 51 0 0 1390 227 800 1960 1370 bologna, sliced 29 51 0 0 1913 303 1030 2450 1970 salami, sliced 30 51 0 0 2092 319 1410 2700 2140 tuna, canned in oil 32 39 0 0 1783 259 1270 2550 1740 fish sticks, frozen, heated 34 51 0 0 1866 244 1490 2520 1820
Page 142 of 211 Rev 4.1
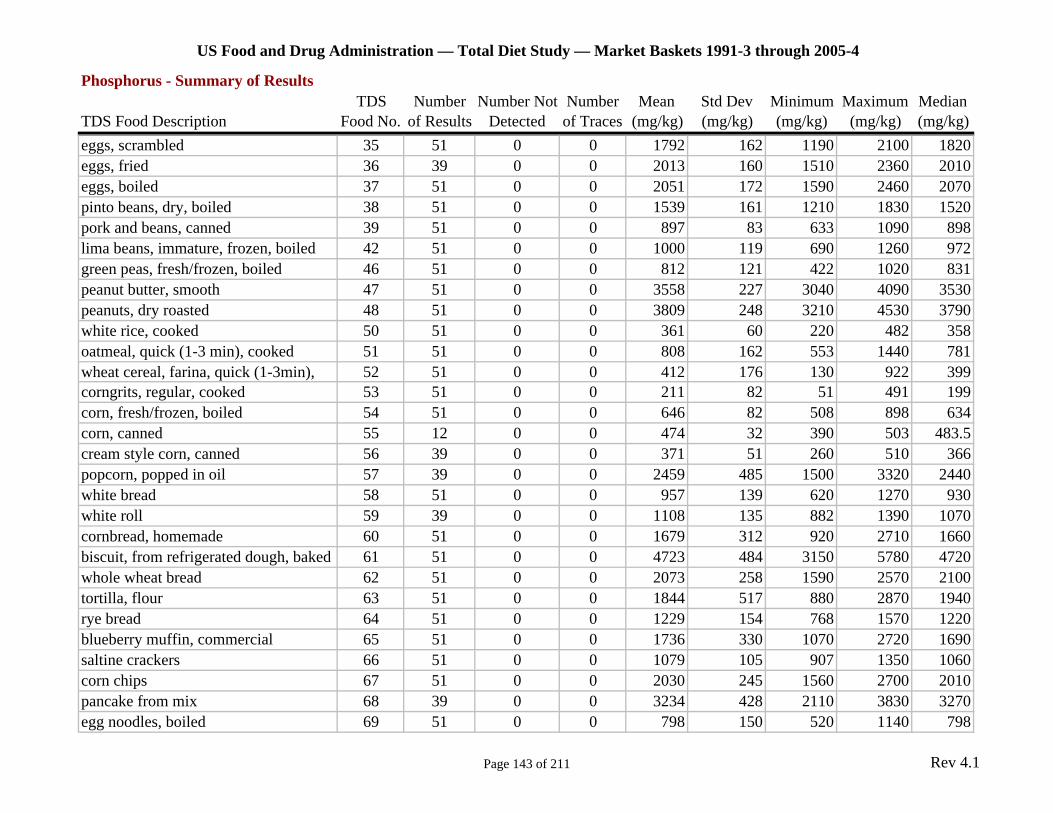
US Food and Drug Administration — Total Diet Study — Market Baskets 1991-3 through 2005-4
Phosphorus - Summary of Results TDS Number Number Not Number Mean Std Dev Minimum Maximum Median
TDS Food Description Food No. of Results Detected of Traces (mg/kg) (mg/kg) (mg/kg) (mg/kg) (mg/kg) eggs, scrambled 35 51 0 0 1792 162 1190 2100 1820 eggs, fried 36 39 0 0 2013 160 1510 2360 2010 eggs, boiled 37 51 0 0 2051 172 1590 2460 2070 pinto beans, dry, boiled 38 51 0 0 1539 161 1210 1830 1520 pork and beans, canned 39 51 0 0 897 83 633 1090 898 lima beans, immature, frozen, boiled 42 51 0 0 1000 119 690 1260 972 green peas, fresh/frozen, boiled 46 51 0 0 812 121 422 1020 831 peanut butter, smooth 47 51 0 0 3558 227 3040 4090 3530 peanuts, dry roasted 48 51 0 0 3809 248 3210 4530 3790 white rice, cooked 50 51 0 0 361 60 220 482 358 oatmeal, quick (1-3 min), cooked 51 51 0 0 808 162 553 1440 781 wheat cereal, farina, quick (1-3min), 52 51 0 0 412 176 130 922 399 corngrits, regular, cooked 53 51 0 0 211 82 51 491 199 corn, fresh/frozen, boiled 54 51 0 0 646 82 508 898 634 corn, canned 55 12 0 0 474 32 390 503 483.5 cream style corn, canned 56 39 0 0 371 51 260 510 366 popcorn, popped in oil 57 39 0 0 2459 485 1500 3320 2440 white bread 58 51 0 0 957 139 620 1270 930 white roll 59 39 0 0 1108 135 882 1390 1070 cornbread, homemade 60 51 0 0 1679 312 920 2710 1660 biscuit, from refrigerated dough, baked 61 51 0 0 4723 484 3150 5780 4720 whole wheat bread 62 51 0 0 2073 258 1590 2570 2100 tortilla, flour 63 51 0 0 1844 517 880 2870 1940 rye bread 64 51 0 0 1229 154 768 1570 1220 blueberry muffin, commercial 65 51 0 0 1736 330 1070 2720 1690 saltine crackers 66 51 0 0 1079 105 907 1350 1060 corn chips 67 51 0 0 2030 245 1560 2700 2010 pancake from mix 68 39 0 0 3234 428 2110 3830 3270 egg noodles, boiled 69 51 0 0 798 150 520 1140 798
Page 143 of 211 Rev 4.1

US Food and Drug Administration — Total Diet Study — Market Baskets 1991-3 through 2005-4
Phosphorus - Summary of Results TDS Number Number Not Number Mean Std Dev Minimum Maximum Median
TDS Food Description Food No. of Results Detected of Traces (mg/kg) (mg/kg) (mg/kg) (mg/kg) (mg/kg) macaroni, boiled 70 39 0 0 579 106 369 866 551 corn flakes 71 51 0 0 433 100 304 746 400 fruit-flavored, sweetened cereal 72 51 0 0 1077 267 700 1850 985 shredded wheat cereal 73 51 0 0 3591 427 2710 5740 3550 raisin bran cereal 74 51 0 0 3763 351 2710 4550 3810 crisped rice cereal 75 51 0 0 1109 87 915 1330 1110 granola cereal 76 51 0 0 2646 366 2090 3860 2560 oat ring cereal 77 51 0 0 4303 433 3380 5180 4270 apple, red, raw 78 51 0 0 102 17 63 143 101 orange, raw 79 51 0 0 209 30 105 286 213 banana, raw 80 51 0 0 238 23 174 292 236 watermelon, raw 81 51 0 0 141 47 39 255 135 peach, raw 83 51 0 0 203 18 157 256 205 applesauce, bottled 84 51 0 0 66 9 41 87 65.8 pear, raw 85 51 0 0 116 16 75 152 115 strawberries, raw 86 51 0 0 254 47 178 388 250 fruit cocktail, canned in heavy syrup 87 51 0 0 105 13 47 131 107 grapes, red/green, seedless, raw 88 50 0 0 210 36 140 273 208.5 cantaloupe, raw 89 51 0 0 156 37 87 244 153 plums, raw 91 39 0 0 170 32 104 251 168 grapefruit, raw 92 51 0 0 176 24 111 219 176 pineapple, canned in juice 93 51 0 3 60 11 19 85 61.1 sweet cherries, raw 94 33 0 0 240 29 174 309 243 raisins, dried 95 51 0 0 1032 69 842 1160 1030 prunes, dried 96 39 0 0 728 71 531 832 736 avocado, raw 97 51 0 0 533 109 274 751 528 orange juice, from frozen concentrate 98 51 0 0 230 98 92 513 194 apple juice, bottled 99 51 0 0 71 12 52 102 70.0 grapefruit juice, from frozen 100 51 0 0 166 25 112 227 164
Page 144 of 211 Rev 4.1
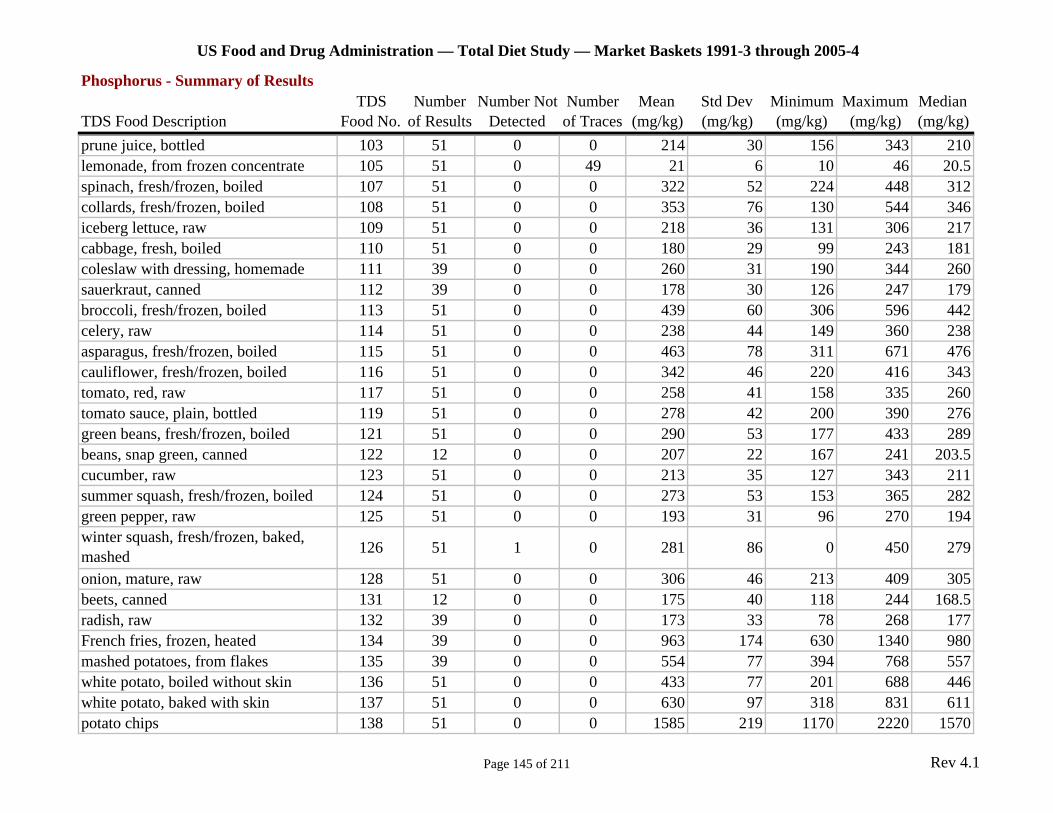
US Food and Drug Administration — Total Diet Study — Market Baskets 1991-3 through 2005-4
Phosphorus - Summary of Results TDS Number Number Not Number Mean Std Dev Minimum Maximum Median
TDS Food Description Food No. of Results Detected of Traces (mg/kg) (mg/kg) (mg/kg) (mg/kg) (mg/kg) prune juice, bottled 103 51 0 0 214 30 156 343 210 lemonade, from frozen concentrate 105 51 0 49 21 6 10 46 20.5 spinach, fresh/frozen, boiled 107 51 0 0 322 52 224 448 312 collards, fresh/frozen, boiled 108 51 0 0 353 76 130 544 346 iceberg lettuce, raw 109 51 0 0 218 36 131 306 217 cabbage, fresh, boiled 110 51 0 0 180 29 99 243 181 coleslaw with dressing, homemade 111 39 0 0 260 31 190 344 260 sauerkraut, canned 112 39 0 0 178 30 126 247 179 broccoli, fresh/frozen, boiled 113 51 0 0 439 60 306 596 442 celery, raw 114 51 0 0 238 44 149 360 238 asparagus, fresh/frozen, boiled 115 51 0 0 463 78 311 671 476 cauliflower, fresh/frozen, boiled 116 51 0 0 342 46 220 416 343 tomato, red, raw 117 51 0 0 258 41 158 335 260 tomato sauce, plain, bottled 119 51 0 0 278 42 200 390 276 green beans, fresh/frozen, boiled 121 51 0 0 290 53 177 433 289 beans, snap green, canned 122 12 0 0 207 22 167 241 203.5 cucumber, raw 123 51 0 0 213 35 127 343 211 summer squash, fresh/frozen, boiled 124 51 0 0 273 53 153 365 282 green pepper, raw 125 51 0 0 193 31 96 270 194 winter squash, fresh/frozen, baked, mashed 126 51 1 0 281 86 0 450 279
onion, mature, raw 128 51 0 0 306 46 213 409 305 beets, canned 131 12 0 0 175 40 118 244 168.5 radish, raw 132 39 0 0 173 33 78 268 177 French fries, frozen, heated 134 39 0 0 963 174 630 1340 980 mashed potatoes, from flakes 135 39 0 0 554 77 394 768 557 white potato, boiled without skin 136 51 0 0 433 77 201 688 446 white potato, baked with skin 137 51 0 0 630 97 318 831 611 potato chips 138 51 0 0 1585 219 1170 2220 1570
Page 145 of 211 Rev 4.1
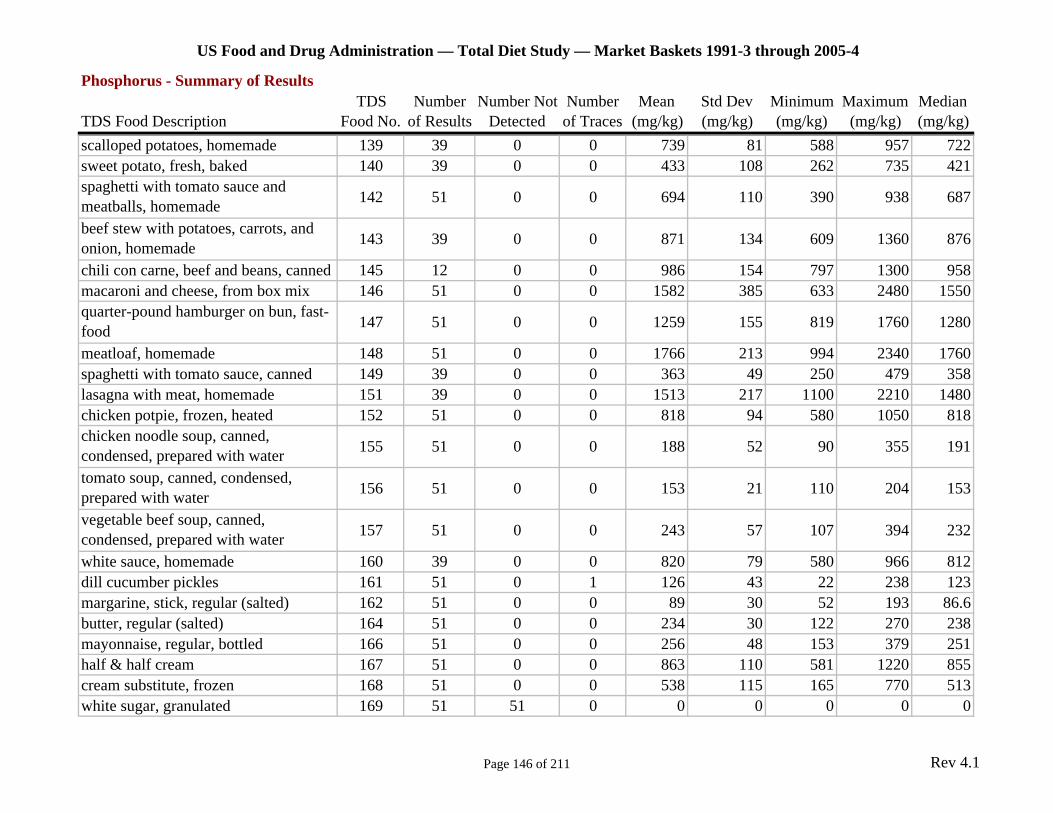
US Food and Drug Administration — Total Diet Study — Market Baskets 1991-3 through 2005-4
Phosphorus - Summary of Results TDS Number Number Not Number Mean Std Dev Minimum Maximum Median
TDS Food Description Food No. of Results Detected of Traces (mg/kg) (mg/kg) (mg/kg) (mg/kg) (mg/kg) scalloped potatoes, homemade 139 39 0 0 739 81 588 957 722 sweet potato, fresh, baked 140 39 0 0 433 108 262 735 421 spaghetti with tomato sauce and meatballs, homemade 142 51 0 0 694 110 390 938 687
beef stew with potatoes, carrots, and onion, homemade 143 39 0 0 871 134 609 1360 876
chili con carne, beef and beans, canned 145 12 0 0 986 154 797 1300 958 macaroni and cheese, from box mix 146 51 0 0 1582 385 633 2480 1550 quarter-pound hamburger on bun, fast-food 147 51 0 0 1259 155 819 1760 1280
meatloaf, homemade 148 51 0 0 1766 213 994 2340 1760 spaghetti with tomato sauce, canned 149 39 0 0 363 49 250 479 358 lasagna with meat, homemade 151 39 0 0 1513 217 1100 2210 1480 chicken potpie, frozen, heated 152 51 0 0 818 94 580 1050 818 chicken noodle soup, canned, condensed, prepared with water 155 51 0 0 188 52 90 355 191
tomato soup, canned, condensed, prepared with water 156 51 0 0 153 21 110 204 153
vegetable beef soup, canned, condensed, prepared with water 157 51 0 0 243 57 107 394 232
white sauce, homemade 160 39 0 0 820 79 580 966 812 dill cucumber pickles 161 51 0 1 126 43 22 238 123 margarine, stick, regular (salted) 162 51 0 0 89 30 52 193 86.6 butter, regular (salted) 164 51 0 0 234 30 122 270 238 mayonnaise, regular, bottled 166 51 0 0 256 48 153 379 251 half & half cream 167 51 0 0 863 110 581 1220 855 cream substitute, frozen 168 51 0 0 538 115 165 770 513 white sugar, granulated 169 51 51 0 0 0 0 0 0
Page 146 of 211 Rev 4.1
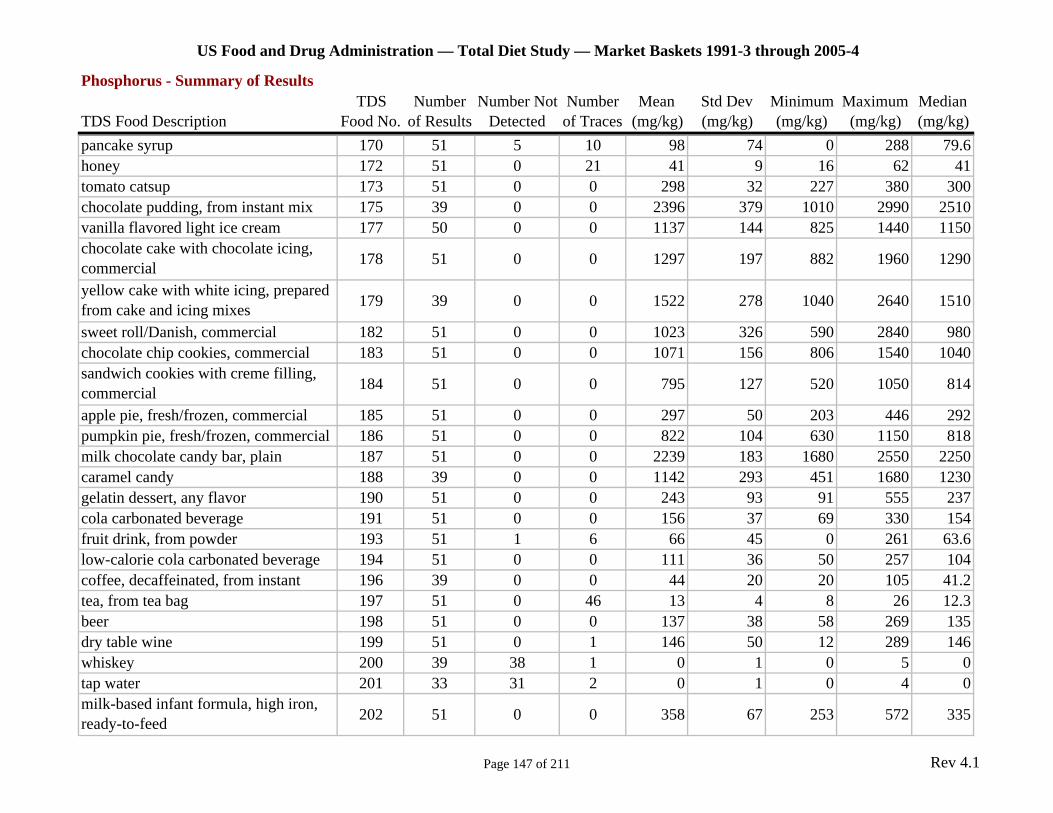
US Food and Drug Administration — Total Diet Study — Market Baskets 1991-3 through 2005-4
Phosphorus - Summary of Results TDS Number Number Not Number Mean Std Dev Minimum Maximum Median
TDS Food Description Food No. of Results Detected of Traces (mg/kg) (mg/kg) (mg/kg) (mg/kg) (mg/kg) pancake syrup 170 51 5 10 98 74 0 288 79.6 honey 172 51 0 21 41 9 16 62 41 tomato catsup 173 51 0 0 298 32 227 380 300 chocolate pudding, from instant mix 175 39 0 0 2396 379 1010 2990 2510 vanilla flavored light ice cream 177 50 0 0 1137 144 825 1440 1150 chocolate cake with chocolate icing, commercial 178 51 0 0 1297 197 882 1960 1290
yellow cake with white icing, prepared from cake and icing mixes 179 39 0 0 1522 278 1040 2640 1510
sweet roll/Danish, commercial 182 51 0 0 1023 326 590 2840 980 chocolate chip cookies, commercial 183 51 0 0 1071 156 806 1540 1040 sandwich cookies with creme filling, commercial 184 51 0 0 795 127 520 1050 814
apple pie, fresh/frozen, commercial 185 51 0 0 297 50 203 446 292 pumpkin pie, fresh/frozen, commercial 186 51 0 0 822 104 630 1150 818 milk chocolate candy bar, plain 187 51 0 0 2239 183 1680 2550 2250 caramel candy 188 39 0 0 1142 293 451 1680 1230 gelatin dessert, any flavor 190 51 0 0 243 93 91 555 237 cola carbonated beverage 191 51 0 0 156 37 69 330 154 fruit drink, from powder 193 51 1 6 66 45 0 261 63.6 low-calorie cola carbonated beverage 194 51 0 0 111 36 50 257 104 coffee, decaffeinated, from instant 196 39 0 0 44 20 20 105 41.2 tea, from tea bag 197 51 0 46 13 4 8 26 12.3 beer 198 51 0 0 137 38 58 269 135 dry table wine 199 51 0 1 146 50 12 289 146 whiskey 200 39 38 1 0 1 0 5 0 tap water 201 33 31 2 0 1 0 4 0 milk-based infant formula, high iron, ready-to-feed 202 51 0 0 358 67 253 572 335
Page 147 of 211 Rev 4.1

US Food and Drug Administration — Total Diet Study — Market Baskets 1991-3 through 2005-4
Phosphorus - Summary of Results TDS Number Number Not Number Mean Std Dev Minimum Maximum Median
TDS Food Description Food No. of Results Detected of Traces (mg/kg) (mg/kg) (mg/kg) (mg/kg) (mg/kg) milk-based infant formula, low iron, ready-to-feed 203 51 0 0 360 67 241 542 335
beef, strained/junior 205 51 0 0 1021 103 754 1210 1040 chicken, strained/junior, with/without broth or gravy 207 51 0 0 1424 154 1180 1790 1410
chicken/turkey with vegetables, high/lean meat, strained/junior 208 2 0 0 545 21 530 560 545
beef with vegetables, high/lean meat, strained/junior 209 2 0 0 520 14 510 530 520
ham with vegetables, high/lean meat, strained/junior 210 2 0 0 665 49 630 700 665
vegetables and beef, strained/junior 211 51 0 0 357 70 209 496 367 vegetables and chicken, strained/junior 212 51 0 0 402 69 200 533 410 vegetables and ham, strained/junior 213 50 0 0 327 64 168 430 327 chicken noodle dinner, strained/junior 214 51 0 0 433 66 213 553 446 macaroni, tomatoes, and beef, strained/junior 215 51 0 0 364 52 230 545 360
turkey and rice, strained/junior 216 51 0 0 368 43 216 449 369 carrots, strained/junior 218 51 0 0 245 37 178 354 243 green beans, strained/junior 219 51 0 0 276 42 180 392 272 mixed vegetables, strained/junior 220 51 0 0 298 51 161 422 299 sweet potatoes, strained/junior 221 51 0 0 248 24 174 313 245 creamed corn, strained/junior 222 33 0 0 376 55 219 439 395 peas, strained/junior 223 51 0 0 583 70 369 706 580 creamed spinach, strained/junior 224 39 0 0 589 78 415 698 610 applesauce, strained/junior 225 51 0 1 78 14 38 115 78.5 peaches, strained/junior 226 51 0 0 202 52 72 312 203 pears, strained/junior 227 51 0 0 121 23 62 174 119 apple juice, strained 230 51 0 0 69 13 46 104 68.5
Page 148 of 211 Rev 4.1
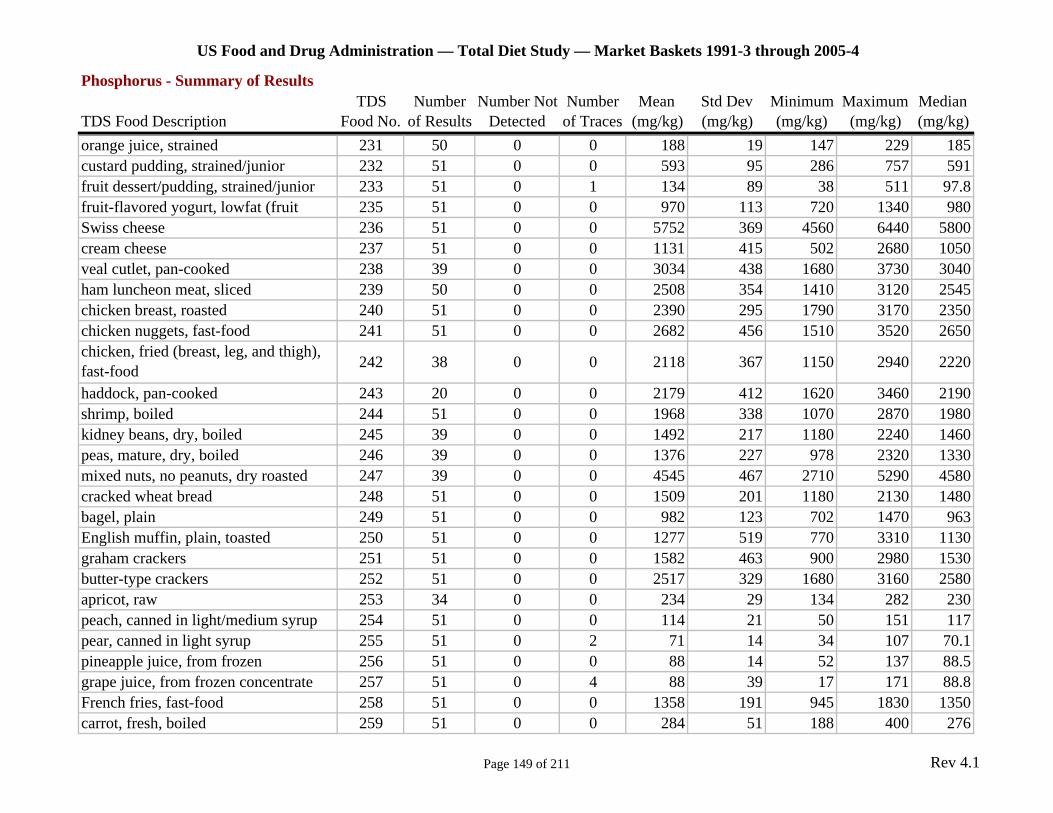
US Food and Drug Administration — Total Diet Study — Market Baskets 1991-3 through 2005-4
Phosphorus - Summary of Results TDS Number Number Not Number Mean Std Dev Minimum Maximum Median
TDS Food Description Food No. of Results Detected of Traces (mg/kg) (mg/kg) (mg/kg) (mg/kg) (mg/kg) orange juice, strained 231 50 0 0 188 19 147 229 185 custard pudding, strained/junior 232 51 0 0 593 95 286 757 591 fruit dessert/pudding, strained/junior 233 51 0 1 134 89 38 511 97.8 fruit-flavored yogurt, lowfat (fruit 235 51 0 0 970 113 720 1340 980 Swiss cheese 236 51 0 0 5752 369 4560 6440 5800 cream cheese 237 51 0 0 1131 415 502 2680 1050 veal cutlet, pan-cooked 238 39 0 0 3034 438 1680 3730 3040 ham luncheon meat, sliced 239 50 0 0 2508 354 1410 3120 2545 chicken breast, roasted 240 51 0 0 2390 295 1790 3170 2350 chicken nuggets, fast-food 241 51 0 0 2682 456 1510 3520 2650 chicken, fried (breast, leg, and thigh), fast-food 242 38 0 0 2118 367 1150 2940 2220
haddock, pan-cooked 243 20 0 0 2179 412 1620 3460 2190 shrimp, boiled 244 51 0 0 1968 338 1070 2870 1980 kidney beans, dry, boiled 245 39 0 0 1492 217 1180 2240 1460 peas, mature, dry, boiled 246 39 0 0 1376 227 978 2320 1330 mixed nuts, no peanuts, dry roasted 247 39 0 0 4545 467 2710 5290 4580 cracked wheat bread 248 51 0 0 1509 201 1180 2130 1480 bagel, plain 249 51 0 0 982 123 702 1470 963 English muffin, plain, toasted 250 51 0 0 1277 519 770 3310 1130 graham crackers 251 51 0 0 1582 463 900 2980 1530 butter-type crackers 252 51 0 0 2517 329 1680 3160 2580 apricot, raw 253 34 0 0 234 29 134 282 230 peach, canned in light/medium syrup 254 51 0 0 114 21 50 151 117 pear, canned in light syrup 255 51 0 2 71 14 34 107 70.1 pineapple juice, from frozen 256 51 0 0 88 14 52 137 88.5 grape juice, from frozen concentrate 257 51 0 4 88 39 17 171 88.8 French fries, fast-food 258 51 0 0 1358 191 945 1830 1350 carrot, fresh, boiled 259 51 0 0 284 51 188 400 276
Page 149 of 211 Rev 4.1
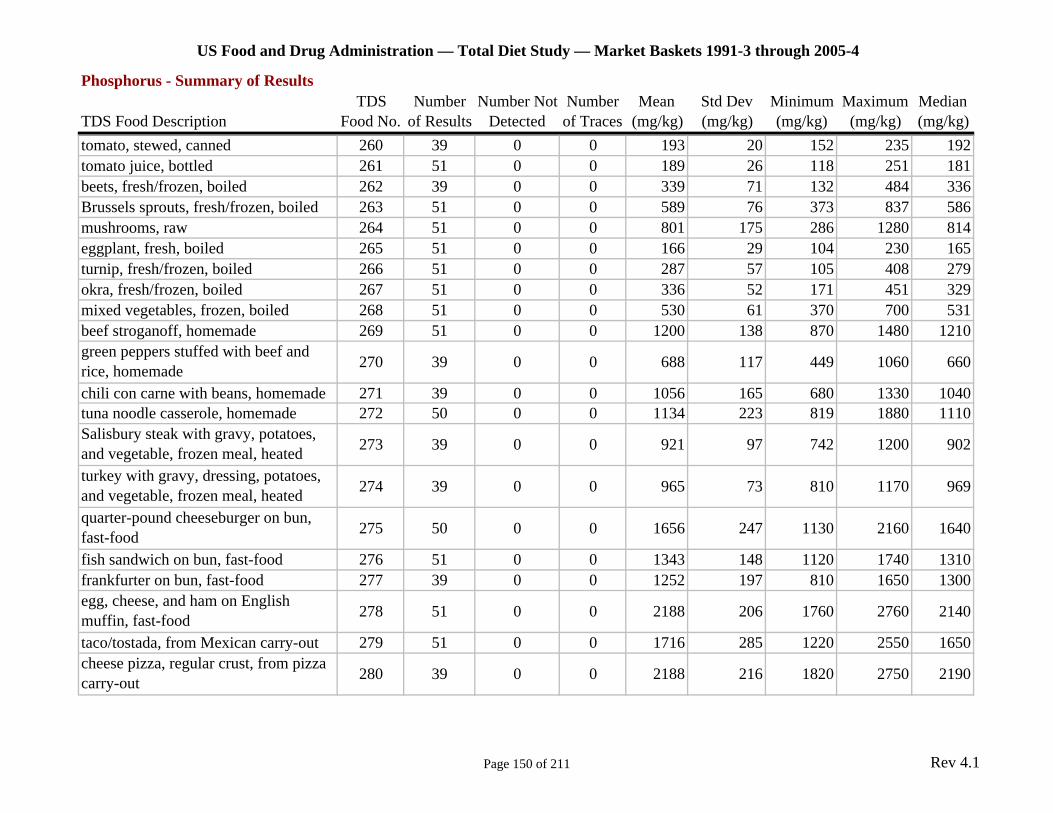
US Food and Drug Administration — Total Diet Study — Market Baskets 1991-3 through 2005-4
Phosphorus - Summary of Results TDS Number Number Not Number Mean Std Dev Minimum Maximum Median
TDS Food Description Food No. of Results Detected of Traces (mg/kg) (mg/kg) (mg/kg) (mg/kg) (mg/kg) tomato, stewed, canned 260 39 0 0 193 20 152 235 192 tomato juice, bottled 261 51 0 0 189 26 118 251 181 beets, fresh/frozen, boiled 262 39 0 0 339 71 132 484 336 Brussels sprouts, fresh/frozen, boiled 263 51 0 0 589 76 373 837 586 mushrooms, raw 264 51 0 0 801 175 286 1280 814 eggplant, fresh, boiled 265 51 0 0 166 29 104 230 165 turnip, fresh/frozen, boiled 266 51 0 0 287 57 105 408 279 okra, fresh/frozen, boiled 267 51 0 0 336 52 171 451 329 mixed vegetables, frozen, boiled 268 51 0 0 530 61 370 700 531 beef stroganoff, homemade 269 51 0 0 1200 138 870 1480 1210 green peppers stuffed with beef and rice, homemade 270 39 0 0 688 117 449 1060 660
chili con carne with beans, homemade 271 39 0 0 1056 165 680 1330 1040 tuna noodle casserole, homemade 272 50 0 0 1134 223 819 1880 1110 Salisbury steak with gravy, potatoes, and vegetable, frozen meal, heated 273 39 0 0 921 97 742 1200 902
turkey with gravy, dressing, potatoes, and vegetable, frozen meal, heated 274 39 0 0 965 73 810 1170 969
quarter-pound cheeseburger on bun, fast-food 275 50 0 0 1656 247 1130 2160 1640
fish sandwich on bun, fast-food 276 51 0 0 1343 148 1120 1740 1310 frankfurter on bun, fast-food 277 39 0 0 1252 197 810 1650 1300 egg, cheese, and ham on English muffin, fast-food 278 51 0 0 2188 206 1760 2760 2140
taco/tostada, from Mexican carry-out 279 51 0 0 1716 285 1220 2550 1650 cheese pizza, regular crust, from pizza carry-out 280 39 0 0 2188 216 1820 2750 2190
Page 150 of 211 Rev 4.1

US Food and Drug Administration — Total Diet Study — Market Baskets 1991-3 through 2005-4
Phosphorus - Summary of Results TDS Number Number Not Number Mean Std Dev Minimum Maximum Median
TDS Food Description Food No. of Results Detected of Traces (mg/kg) (mg/kg) (mg/kg) (mg/kg) (mg/kg) cheese and pepperoni pizza, regular crust, from pizza carry-out 281 51 0 0 2070 229 1420 2560 2070
beef chow mein, from Chinese carry- 282 39 0 0 521 102 311 707 543 bean with bacon/pork soup, canned, condensed, prepared with water 283 51 0 0 639 77 459 818 644
mushroom soup, canned, condensed, prepared with whole milk 284 39 0 0 567 92 278 731 567
clam chowder, New England, canned, condensed, prepared with whole milk 285 51 0 0 664 79 441 856 653
vanilla ice cream 286 51 0 0 954 130 673 1300 933 fruit flavor sherbet 287 51 0 0 319 69 150 492 316 popsicle, any flavor 288 51 21 20 28 61 0 401 12.6 chocolate snack cake with chocolate 289 39 0 0 1063 171 745 1380 1080 cake doughnuts with icing, any flavor, from doughnut store 290 51 0 0 2070 355 1110 2820 2150
brownies, commercial 291 51 0 0 1136 202 625 1590 1160 sugar cookies, commercial 292 51 0 0 993 355 581 2100 895 suckers, any flavor 293 51 15 31 22 17 0 74 24.1 pretzels, hard, salted, any shape 294 51 0 0 1233 161 910 1800 1240 chocolate syrup dessert topping 295 51 0 0 728 137 495 1170 690 jelly, any flavor 296 51 0 1 73 15 39 99 74.8 sweet cucumber pickles 297 39 0 0 106 31 48 183 106 yellow mustard 298 51 0 0 1103 113 878 1350 1090 black olives 299 51 0 17 51 17 19 96 51 sour cream 300 51 0 0 1053 239 530 1740 1020 brown gravy, homemade 301 39 0 0 1416 621 393 2750 1260 French salad dressing, regular 302 39 0 0 163 78 84 455 138 Italian salad dressing, low-calorie 303 39 0 1 225 272 33 1170 136 olive/safflower oil 304 38 33 2 6 20 0 109 0
Page 151 of 211 Rev 4.1
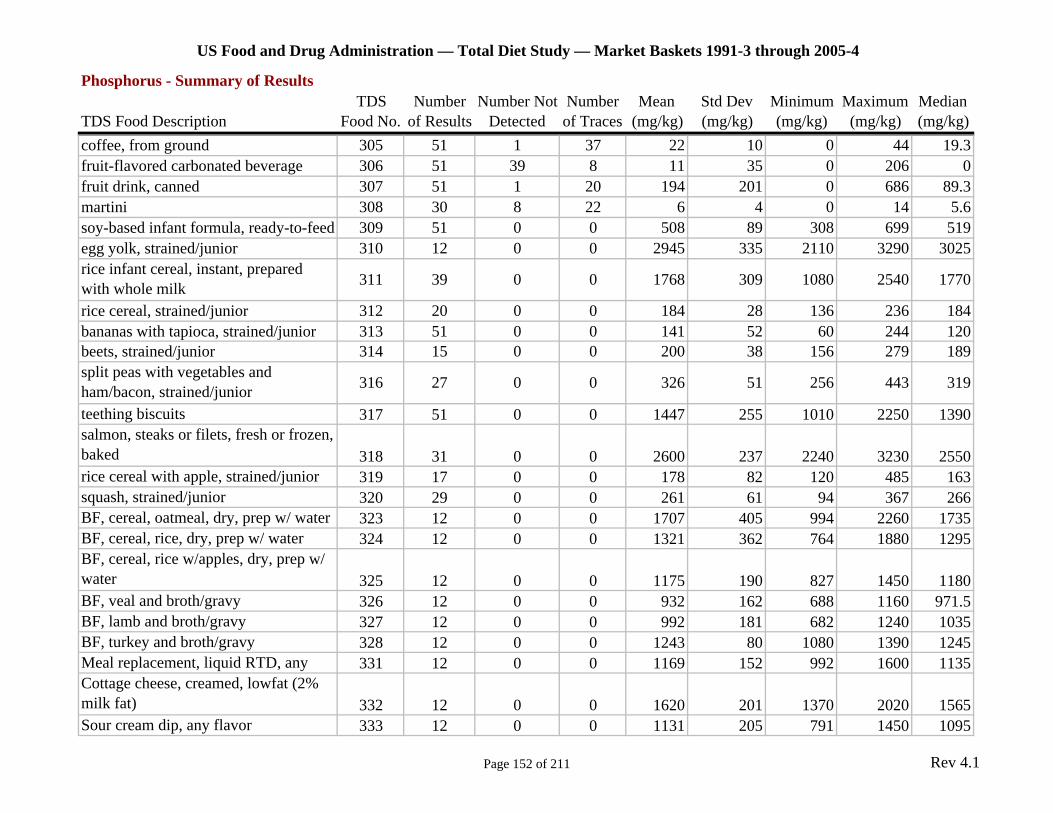
US Food and Drug Administration — Total Diet Study — Market Baskets 1991-3 through 2005-4
Phosphorus - Summary of Results TDS Number Number Not Number Mean Std Dev Minimum Maximum Median
TDS Food Description Food No. of Results Detected of Traces (mg/kg) (mg/kg) (mg/kg) (mg/kg) (mg/kg) coffee, from ground 305 51 1 37 22 10 0 44 19.3 fruit-flavored carbonated beverage 306 51 39 8 11 35 0 206 0 fruit drink, canned 307 51 1 20 194 201 0 686 89.3 martini 308 30 8 22 6 4 0 14 5.6 soy-based infant formula, ready-to-feed 309 51 0 0 508 89 308 699 519 egg yolk, strained/junior 310 12 0 0 2945 335 2110 3290 3025 rice infant cereal, instant, prepared with whole milk 311 39 0 0 1768 309 1080 2540 1770
rice cereal, strained/junior 312 20 0 0 184 28 136 236 184 bananas with tapioca, strained/junior 313 51 0 0 141 52 60 244 120 beets, strained/junior 314 15 0 0 200 38 156 279 189 split peas with vegetables and ham/bacon, strained/junior 316 27 0 0 326 51 256 443 319
teething biscuits 317 51 0 0 1447 255 1010 2250 1390 salmon, steaks or filets, fresh or frozen, baked 318 31 0 0 2600 237 2240 3230 2550 rice cereal with apple, strained/junior 319 17 0 0 178 82 120 485 163 squash, strained/junior 320 29 0 0 261 61 94 367 266 BF, cereal, oatmeal, dry, prep w/ water 323 12 0 0 1707 405 994 2260 1735 BF, cereal, rice, dry, prep w/ water 324 12 0 0 1321 362 764 1880 1295 BF, cereal, rice w/apples, dry, prep w/ water 325 12 0 0 1175 190 827 1450 1180 BF, veal and broth/gravy 326 12 0 0 932 162 688 1160 971.5 BF, lamb and broth/gravy 327 12 0 0 992 181 682 1240 1035 BF, turkey and broth/gravy 328 12 0 0 1243 80 1080 1390 1245 Meal replacement, liquid RTD, any 331 12 0 0 1169 152 992 1600 1135 Cottage cheese, creamed, lowfat (2% milk fat) 332 12 0 0 1620 201 1370 2020 1565 Sour cream dip, any flavor 333 12 0 0 1131 205 791 1450 1095
Page 152 of 211 Rev 4.1
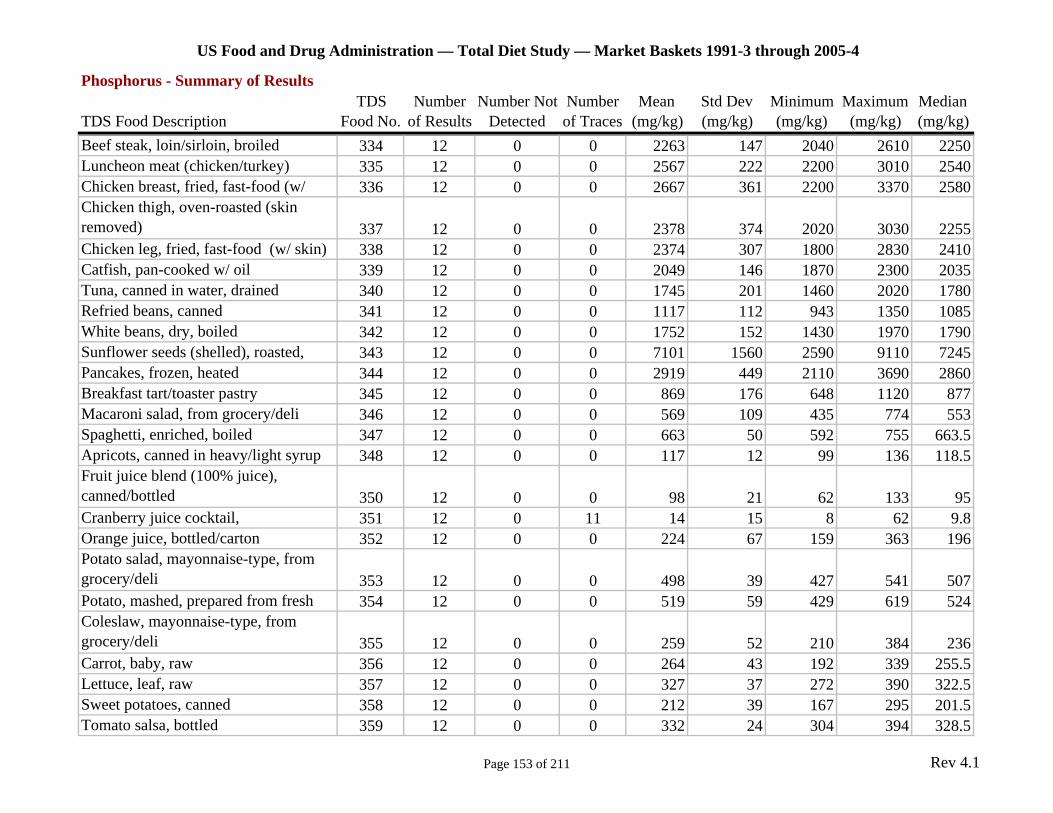
US Food and Drug Administration — Total Diet Study — Market Baskets 1991-3 through 2005-4
Phosphorus - Summary of Results TDS Number Number Not Number Mean Std Dev Minimum Maximum Median
TDS Food Description Food No. of Results Detected of Traces (mg/kg) (mg/kg) (mg/kg) (mg/kg) (mg/kg) Beef steak, loin/sirloin, broiled 334 12 0 0 2263 147 2040 2610 2250 Luncheon meat (chicken/turkey) 335 12 0 0 2567 222 2200 3010 2540 Chicken breast, fried, fast-food (w/ 336 12 0 0 2667 361 2200 3370 2580 Chicken thigh, oven-roasted (skin removed) 337 12 0 0 2378 374 2020 3030 2255 Chicken leg, fried, fast-food (w/ skin) 338 12 0 0 2374 307 1800 2830 2410 Catfish, pan-cooked w/ oil 339 12 0 0 2049 146 1870 2300 2035 Tuna, canned in water, drained 340 12 0 0 1745 201 1460 2020 1780 Refried beans, canned 341 12 0 0 1117 112 943 1350 1085 White beans, dry, boiled 342 12 0 0 1752 152 1430 1970 1790 Sunflower seeds (shelled), roasted, 343 12 0 0 7101 1560 2590 9110 7245 Pancakes, frozen, heated 344 12 0 0 2919 449 2110 3690 2860 Breakfast tart/toaster pastry 345 12 0 0 869 176 648 1120 877 Macaroni salad, from grocery/deli 346 12 0 0 569 109 435 774 553 Spaghetti, enriched, boiled 347 12 0 0 663 50 592 755 663.5 Apricots, canned in heavy/light syrup 348 12 0 0 117 12 99 136 118.5 Fruit juice blend (100% juice), canned/bottled 350 12 0 0 98 21 62 133 95 Cranberry juice cocktail, 351 12 0 11 14 15 8 62 9.8 Orange juice, bottled/carton 352 12 0 0 224 67 159 363 196 Potato salad, mayonnaise-type, from grocery/deli 353 12 0 0 498 39 427 541 507 Potato, mashed, prepared from fresh 354 12 0 0 519 59 429 619 524 Coleslaw, mayonnaise-type, from grocery/deli 355 12 0 0 259 52 210 384 236 Carrot, baby, raw 356 12 0 0 264 43 192 339 255.5 Lettuce, leaf, raw 357 12 0 0 327 37 272 390 322.5 Sweet potatoes, canned 358 12 0 0 212 39 167 295 201.5 Tomato salsa, bottled 359 12 0 0 332 24 304 394 328.5
Page 153 of 211 Rev 4.1

US Food and Drug Administration — Total Diet Study — Market Baskets 1991-3 through 2005-4
Phosphorus - Summary of Results TDS Number Number Not Number Mean Std Dev Minimum Maximum Median
TDS Food Description Food No. of Results Detected of Traces (mg/kg) (mg/kg) (mg/kg) (mg/kg) (mg/kg) Beef and vegetable stew, canned 360 12 0 0 450 34 393 514 454 Lasagna w/ meat, frozen, heated 361 12 0 0 1256 188 880 1530 1250 Beef w/ vegetables in sauce, from Chinese carry-out 362 12 0 0 781 267 612 1600 709.5 Chicken w/ vegetables in sauce, from Chinese carry-out 363 12 0 0 768 161 544 1160 729 Fried rice, meatless, from Chinese carry-out 364 12 0 0 572 107 459 791 532.5 Burrito w/ beef, beans and cheese, from Mexican carry-out 365 12 0 0 1755 220 1390 2200 1730 Chicken filet (broiled) sandwich on bun, fast-food 366 12 0 0 1823 165 1590 2040 1825 Soup, Oriental noodles (ramen noodles), prep w/ water 367 12 0 0 214 28 166 247 224 Pudding, ready-to-eat, flavor other than chocolate 368 12 0 0 480 82 357 621 478 Cake, yellow w/ icing 369 12 0 0 1361 145 1160 1570 1325 Granola bar, w/ raisins 370 12 0 0 1838 308 1560 2600 1750 Candy bar, chocolate, nougat, and nuts 371 12 0 0 1735 66 1640 1840 1740 Popcorn, microwave, butter-flavored 372 12 0 0 2480 540 1650 3450 2455 Sweet & sour sauce 373 12 0 1 116 58 30 236 103.8 Brown gravy, canned or bottled 374 12 0 0 191 53 117 257 198.5 Salad dressing, creamy/buttermilk type, regular 375 12 0 0 1873 575 1140 2750 1675 Salad dressing, creamy/buttermilk type, low-calorie 376 12 0 0 1808 576 898 2620 1895 Salad dressing, Italian, regular 377 12 0 0 337 291 84 859 152.5 Olive oil 378 12 12 0 0 0 0 0 0
Page 154 of 211 Rev 4.1
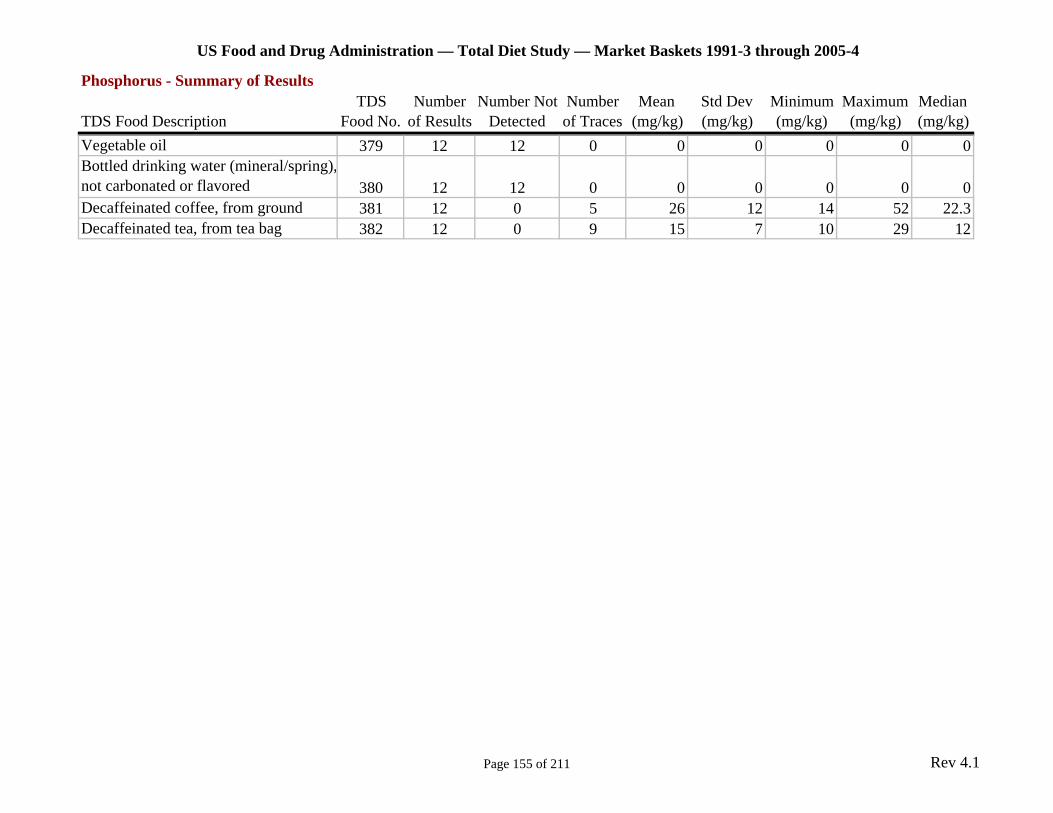
US Food and Drug Administration — Total Diet Study — Market Baskets 1991-3 through 2005-4
Phosphorus - Summary of Results TDS Number Number Not Number Mean Std Dev Minimum Maximum Median
TDS Food Description Food No. of Results Detected of Traces (mg/kg) (mg/kg) (mg/kg) (mg/kg) (mg/kg) Vegetable oil 379 12 12 0 0 0 0 0 0 Bottled drinking water (mineral/spring), not carbonated or flavored 380 12 12 0 0 0 0 0 0 Decaffeinated coffee, from ground 381 12 0 5 26 12 14 52 22.3 Decaffeinated tea, from tea bag 382 12 0 9 15 7 10 29 12
Page 155 of 211 Rev 4.1
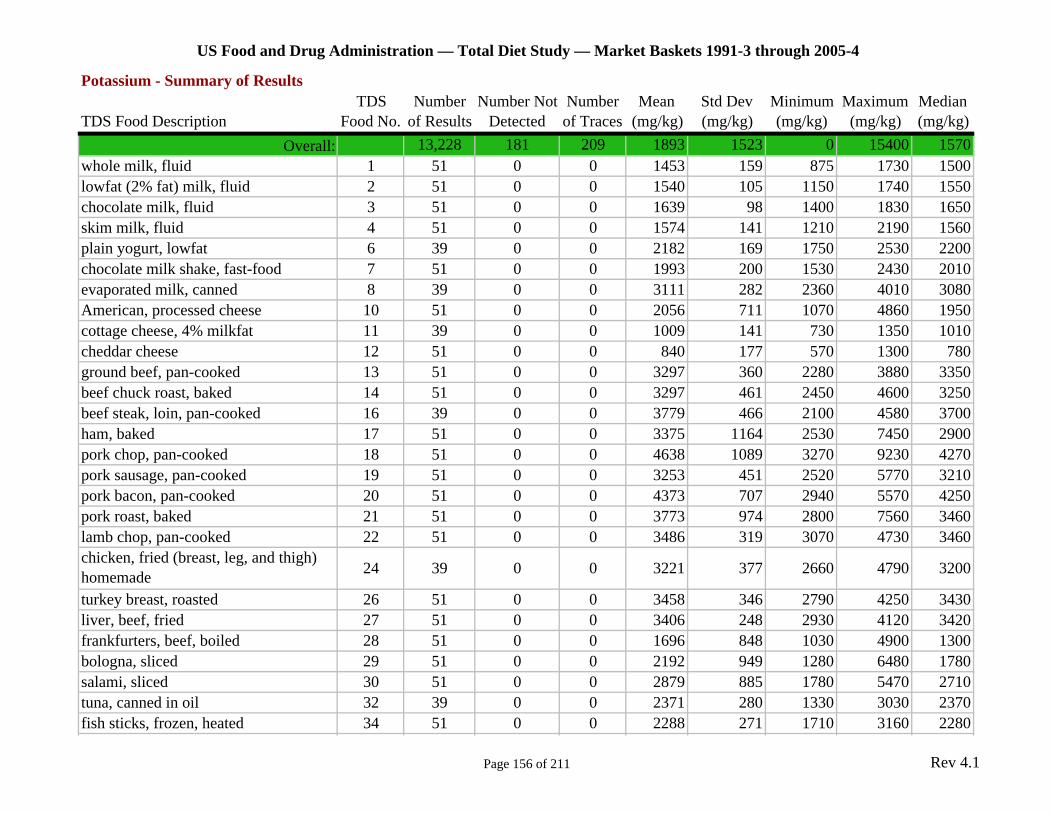
US Food and Drug Administration — Total Diet Study — Market Baskets 1991-3 through 2005-4
Potassium - Summary of Results TDS Number Number Not Number Mean Std Dev Minimum Maximum Median
TDS Food Description Food No. of Results Detected of Traces (mg/kg) (mg/kg) (mg/kg) (mg/kg) (mg/kg) Overall: 13,228 181 209 1893 1523 0 15400 1570
whole milk, fluid 1 51 0 0 1453 159 875 1730 1500 lowfat (2% fat) milk, fluid 2 51 0 0 1540 105 1150 1740 1550 chocolate milk, fluid 3 51 0 0 1639 98 1400 1830 1650 skim milk, fluid 4 51 0 0 1574 141 1210 2190 1560 plain yogurt, lowfat 6 39 0 0 2182 169 1750 2530 2200 chocolate milk shake, fast-food 7 51 0 0 1993 200 1530 2430 2010 evaporated milk, canned 8 39 0 0 3111 282 2360 4010 3080 American, processed cheese 10 51 0 0 2056 711 1070 4860 1950 cottage cheese, 4% milkfat 11 39 0 0 1009 141 730 1350 1010 cheddar cheese 12 51 0 0 840 177 570 1300 780 ground beef, pan-cooked 13 51 0 0 3297 360 2280 3880 3350 beef chuck roast, baked 14 51 0 0 3297 461 2450 4600 3250 beef steak, loin, pan-cooked 16 39 0 0 3779 466 2100 4580 3700 ham, baked 17 51 0 0 3375 1164 2530 7450 2900 pork chop, pan-cooked 18 51 0 0 4638 1089 3270 9230 4270 pork sausage, pan-cooked 19 51 0 0 3253 451 2520 5770 3210 pork bacon, pan-cooked 20 51 0 0 4373 707 2940 5570 4250 pork roast, baked 21 51 0 0 3773 974 2800 7560 3460 lamb chop, pan-cooked 22 51 0 0 3486 319 3070 4730 3460 chicken, fried (breast, leg, and thigh) homemade 24 39 0 0 3221 377 2660 4790 3200
turkey breast, roasted 26 51 0 0 3458 346 2790 4250 3430 liver, beef, fried 27 51 0 0 3406 248 2930 4120 3420 frankfurters, beef, boiled 28 51 0 0 1696 848 1030 4900 1300 bologna, sliced 29 51 0 0 2192 949 1280 6480 1780 salami, sliced 30 51 0 0 2879 885 1780 5470 2710 tuna, canned in oil 32 39 0 0 2371 280 1330 3030 2370 fish sticks, frozen, heated 34 51 0 0 2288 271 1710 3160 2280
Page 156 of 211 Rev 4.1
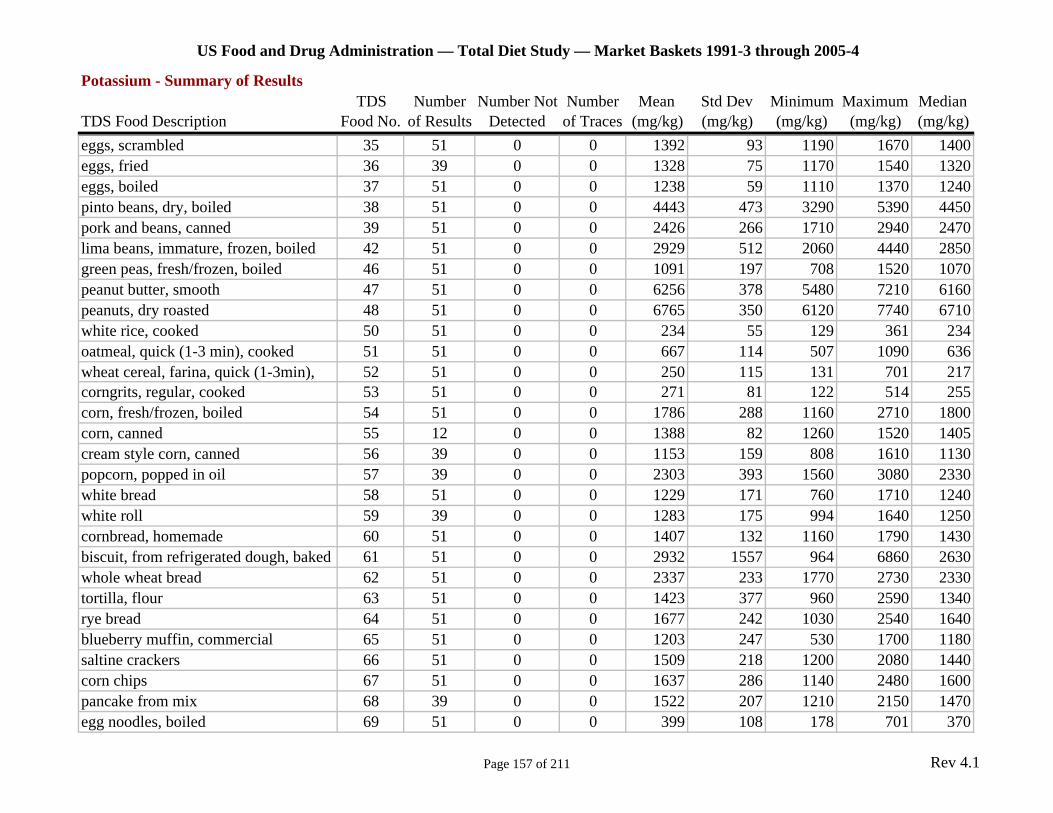
US Food and Drug Administration — Total Diet Study — Market Baskets 1991-3 through 2005-4
Potassium - Summary of Results TDS Number Number Not Number Mean Std Dev Minimum Maximum Median
TDS Food Description Food No. of Results Detected of Traces (mg/kg) (mg/kg) (mg/kg) (mg/kg) (mg/kg) eggs, scrambled 35 51 0 0 1392 93 1190 1670 1400 eggs, fried 36 39 0 0 1328 75 1170 1540 1320 eggs, boiled 37 51 0 0 1238 59 1110 1370 1240 pinto beans, dry, boiled 38 51 0 0 4443 473 3290 5390 4450 pork and beans, canned 39 51 0 0 2426 266 1710 2940 2470 lima beans, immature, frozen, boiled 42 51 0 0 2929 512 2060 4440 2850 green peas, fresh/frozen, boiled 46 51 0 0 1091 197 708 1520 1070 peanut butter, smooth 47 51 0 0 6256 378 5480 7210 6160 peanuts, dry roasted 48 51 0 0 6765 350 6120 7740 6710 white rice, cooked 50 51 0 0 234 55 129 361 234 oatmeal, quick (1-3 min), cooked 51 51 0 0 667 114 507 1090 636 wheat cereal, farina, quick (1-3min), 52 51 0 0 250 115 131 701 217 corngrits, regular, cooked 53 51 0 0 271 81 122 514 255 corn, fresh/frozen, boiled 54 51 0 0 1786 288 1160 2710 1800 corn, canned 55 12 0 0 1388 82 1260 1520 1405 cream style corn, canned 56 39 0 0 1153 159 808 1610 1130 popcorn, popped in oil 57 39 0 0 2303 393 1560 3080 2330 white bread 58 51 0 0 1229 171 760 1710 1240 white roll 59 39 0 0 1283 175 994 1640 1250 cornbread, homemade 60 51 0 0 1407 132 1160 1790 1430 biscuit, from refrigerated dough, baked 61 51 0 0 2932 1557 964 6860 2630 whole wheat bread 62 51 0 0 2337 233 1770 2730 2330 tortilla, flour 63 51 0 0 1423 377 960 2590 1340 rye bread 64 51 0 0 1677 242 1030 2540 1640 blueberry muffin, commercial 65 51 0 0 1203 247 530 1700 1180 saltine crackers 66 51 0 0 1509 218 1200 2080 1440 corn chips 67 51 0 0 1637 286 1140 2480 1600 pancake from mix 68 39 0 0 1522 207 1210 2150 1470 egg noodles, boiled 69 51 0 0 399 108 178 701 370
Page 157 of 211 Rev 4.1
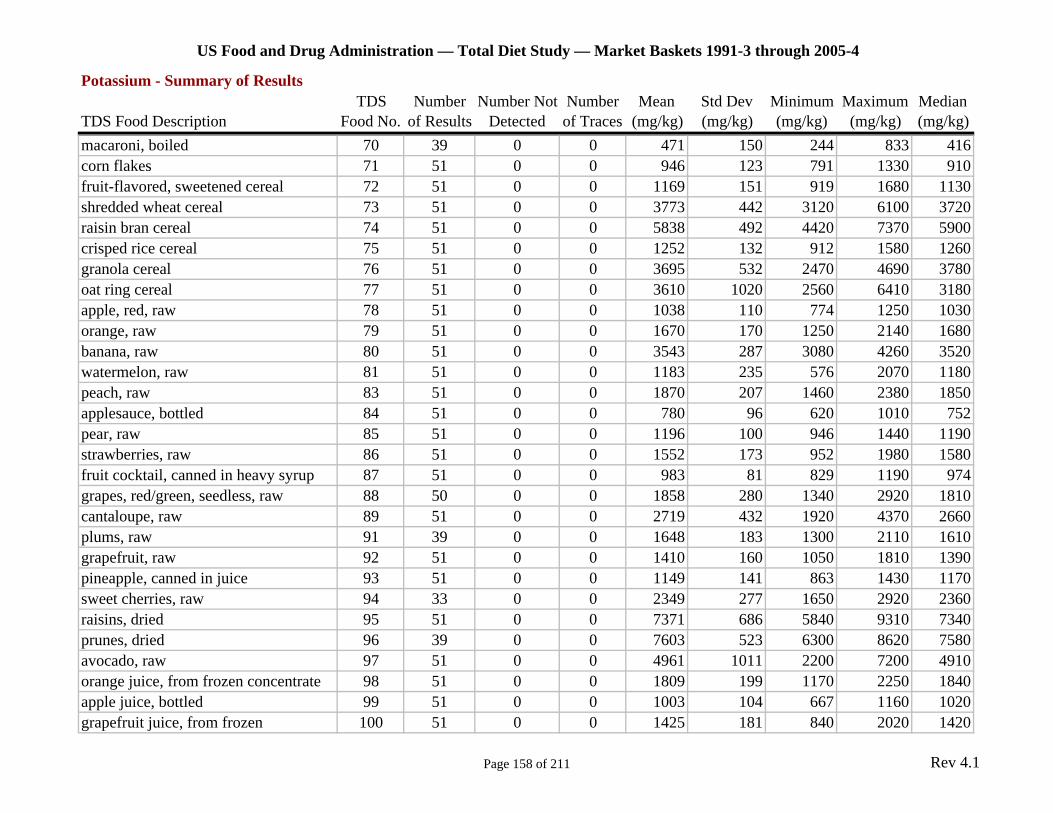
US Food and Drug Administration — Total Diet Study — Market Baskets 1991-3 through 2005-4
Potassium - Summary of Results TDS Number Number Not Number Mean Std Dev Minimum Maximum Median
TDS Food Description Food No. of Results Detected of Traces (mg/kg) (mg/kg) (mg/kg) (mg/kg) (mg/kg) macaroni, boiled 70 39 0 0 471 150 244 833 416 corn flakes 71 51 0 0 946 123 791 1330 910 fruit-flavored, sweetened cereal 72 51 0 0 1169 151 919 1680 1130 shredded wheat cereal 73 51 0 0 3773 442 3120 6100 3720 raisin bran cereal 74 51 0 0 5838 492 4420 7370 5900 crisped rice cereal 75 51 0 0 1252 132 912 1580 1260 granola cereal 76 51 0 0 3695 532 2470 4690 3780 oat ring cereal 77 51 0 0 3610 1020 2560 6410 3180 apple, red, raw 78 51 0 0 1038 110 774 1250 1030 orange, raw 79 51 0 0 1670 170 1250 2140 1680 banana, raw 80 51 0 0 3543 287 3080 4260 3520 watermelon, raw 81 51 0 0 1183 235 576 2070 1180 peach, raw 83 51 0 0 1870 207 1460 2380 1850 applesauce, bottled 84 51 0 0 780 96 620 1010 752 pear, raw 85 51 0 0 1196 100 946 1440 1190 strawberries, raw 86 51 0 0 1552 173 952 1980 1580 fruit cocktail, canned in heavy syrup 87 51 0 0 983 81 829 1190 974 grapes, red/green, seedless, raw 88 50 0 0 1858 280 1340 2920 1810 cantaloupe, raw 89 51 0 0 2719 432 1920 4370 2660 plums, raw 91 39 0 0 1648 183 1300 2110 1610 grapefruit, raw 92 51 0 0 1410 160 1050 1810 1390 pineapple, canned in juice 93 51 0 0 1149 141 863 1430 1170 sweet cherries, raw 94 33 0 0 2349 277 1650 2920 2360 raisins, dried 95 51 0 0 7371 686 5840 9310 7340 prunes, dried 96 39 0 0 7603 523 6300 8620 7580 avocado, raw 97 51 0 0 4961 1011 2200 7200 4910 orange juice, from frozen concentrate 98 51 0 0 1809 199 1170 2250 1840 apple juice, bottled 99 51 0 0 1003 104 667 1160 1020 grapefruit juice, from frozen 100 51 0 0 1425 181 840 2020 1420
Page 158 of 211 Rev 4.1
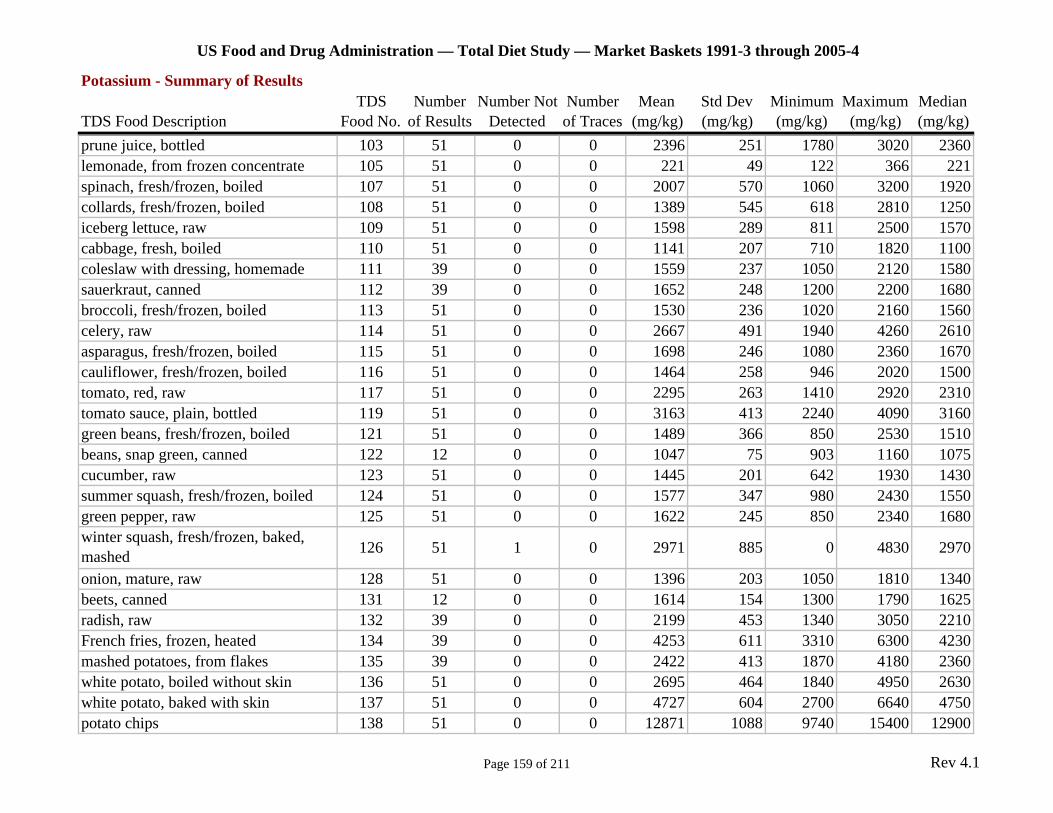
US Food and Drug Administration — Total Diet Study — Market Baskets 1991-3 through 2005-4
Potassium - Summary of Results TDS Number Number Not Number Mean Std Dev Minimum Maximum Median
TDS Food Description Food No. of Results Detected of Traces (mg/kg) (mg/kg) (mg/kg) (mg/kg) (mg/kg) prune juice, bottled 103 51 0 0 2396 251 1780 3020 2360 lemonade, from frozen concentrate 105 51 0 0 221 49 122 366 221 spinach, fresh/frozen, boiled 107 51 0 0 2007 570 1060 3200 1920 collards, fresh/frozen, boiled 108 51 0 0 1389 545 618 2810 1250 iceberg lettuce, raw 109 51 0 0 1598 289 811 2500 1570 cabbage, fresh, boiled 110 51 0 0 1141 207 710 1820 1100 coleslaw with dressing, homemade 111 39 0 0 1559 237 1050 2120 1580 sauerkraut, canned 112 39 0 0 1652 248 1200 2200 1680 broccoli, fresh/frozen, boiled 113 51 0 0 1530 236 1020 2160 1560 celery, raw 114 51 0 0 2667 491 1940 4260 2610 asparagus, fresh/frozen, boiled 115 51 0 0 1698 246 1080 2360 1670 cauliflower, fresh/frozen, boiled 116 51 0 0 1464 258 946 2020 1500 tomato, red, raw 117 51 0 0 2295 263 1410 2920 2310 tomato sauce, plain, bottled 119 51 0 0 3163 413 2240 4090 3160 green beans, fresh/frozen, boiled 121 51 0 0 1489 366 850 2530 1510 beans, snap green, canned 122 12 0 0 1047 75 903 1160 1075 cucumber, raw 123 51 0 0 1445 201 642 1930 1430 summer squash, fresh/frozen, boiled 124 51 0 0 1577 347 980 2430 1550 green pepper, raw 125 51 0 0 1622 245 850 2340 1680 winter squash, fresh/frozen, baked, mashed 126 51 1 0 2971 885 0 4830 2970
onion, mature, raw 128 51 0 0 1396 203 1050 1810 1340 beets, canned 131 12 0 0 1614 154 1300 1790 1625 radish, raw 132 39 0 0 2199 453 1340 3050 2210 French fries, frozen, heated 134 39 0 0 4253 611 3310 6300 4230 mashed potatoes, from flakes 135 39 0 0 2422 413 1870 4180 2360 white potato, boiled without skin 136 51 0 0 2695 464 1840 4950 2630 white potato, baked with skin 137 51 0 0 4727 604 2700 6640 4750 potato chips 138 51 0 0 12871 1088 9740 15400 12900
Page 159 of 211 Rev 4.1

US Food and Drug Administration — Total Diet Study — Market Baskets 1991-3 through 2005-4
Potassium - Summary of Results TDS Number Number Not Number Mean Std Dev Minimum Maximum Median
TDS Food Description Food No. of Results Detected of Traces (mg/kg) (mg/kg) (mg/kg) (mg/kg) (mg/kg) scalloped potatoes, homemade 139 39 0 0 3174 379 2320 4080 3200 sweet potato, fresh, baked 140 39 0 0 4263 521 3060 5490 4210 spaghetti with tomato sauce and meatballs, homemade 142 51 0 0 2055 277 1430 2790 2030
beef stew with potatoes, carrots, and onion, homemade 143 39 0 0 2846 386 1840 3510 2860
chili con carne, beef and beans, canned 145 12 0 0 3042 255 2600 3430 3015 macaroni and cheese, from box mix 146 51 0 0 1142 274 485 1800 1140 quarter-pound hamburger on bun, fast-food 147 51 0 0 2222 188 1430 2620 2200
meatloaf, homemade 148 51 0 0 2945 304 1730 3730 2950 spaghetti with tomato sauce, canned 149 39 0 0 1052 218 510 1870 1030 lasagna with meat, homemade 151 39 0 0 2359 384 1390 3570 2450 chicken potpie, frozen, heated 152 51 0 0 1225 152 984 1530 1190 chicken noodle soup, canned, condensed, prepared with water 155 51 0 0 308 163 143 877 245
tomato soup, canned, condensed, prepared with water 156 51 0 0 1291 201 867 1780 1300
vegetable beef soup, canned, condensed, prepared with water 157 51 0 0 895 204 468 1330 840
white sauce, homemade 160 39 0 0 1416 150 885 1730 1410 dill cucumber pickles 161 51 0 0 897 300 326 1510 904 margarine, stick, regular (salted) 162 51 0 0 209 111 48 455 173 butter, regular (salted) 164 51 0 0 262 59 168 401 246 mayonnaise, regular, bottled 166 51 0 0 119 33 69 233 110 half & half cream 167 51 0 0 1429 144 1050 1940 1430 cream substitute, frozen 168 51 0 0 881 445 141 1680 810 white sugar, granulated 169 51 0 39 25 8 13 53 23.0
Page 160 of 211 Rev 4.1
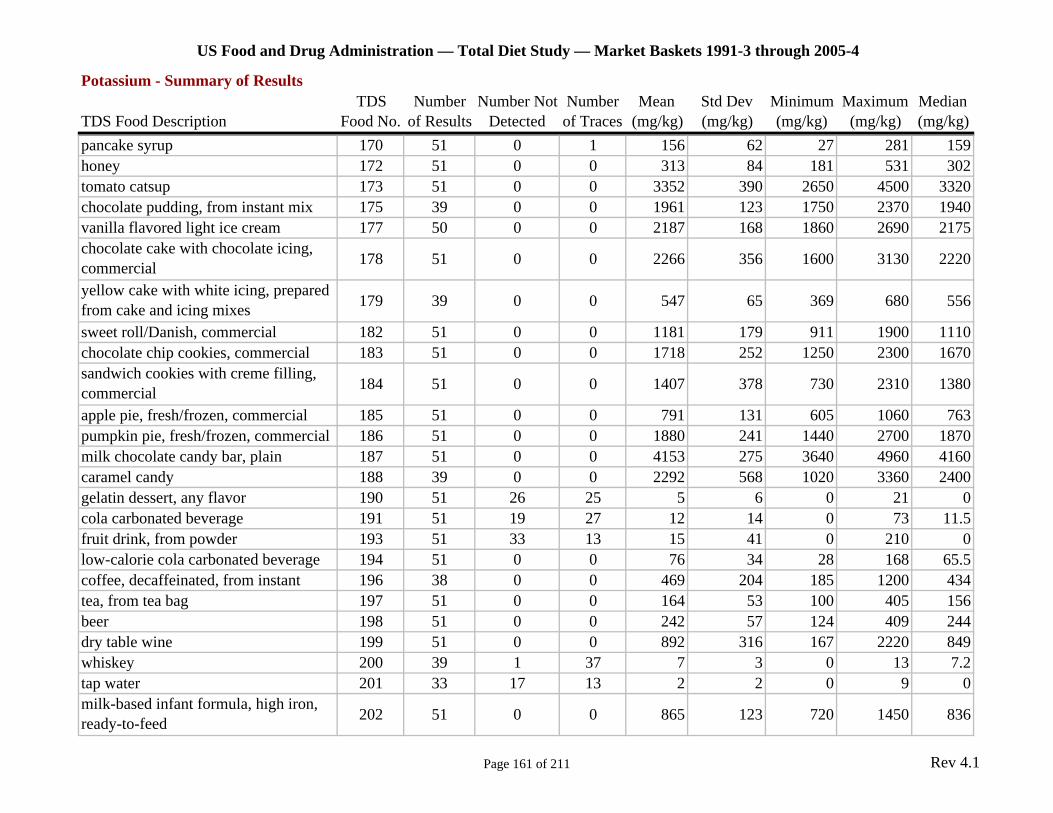
US Food and Drug Administration — Total Diet Study — Market Baskets 1991-3 through 2005-4
Potassium - Summary of Results TDS Number Number Not Number Mean Std Dev Minimum Maximum Median
TDS Food Description Food No. of Results Detected of Traces (mg/kg) (mg/kg) (mg/kg) (mg/kg) (mg/kg) pancake syrup 170 51 0 1 156 62 27 281 159 honey 172 51 0 0 313 84 181 531 302 tomato catsup 173 51 0 0 3352 390 2650 4500 3320 chocolate pudding, from instant mix 175 39 0 0 1961 123 1750 2370 1940 vanilla flavored light ice cream 177 50 0 0 2187 168 1860 2690 2175 chocolate cake with chocolate icing, commercial 178 51 0 0 2266 356 1600 3130 2220
yellow cake with white icing, prepared from cake and icing mixes 179 39 0 0 547 65 369 680 556
sweet roll/Danish, commercial 182 51 0 0 1181 179 911 1900 1110 chocolate chip cookies, commercial 183 51 0 0 1718 252 1250 2300 1670 sandwich cookies with creme filling, commercial 184 51 0 0 1407 378 730 2310 1380
apple pie, fresh/frozen, commercial 185 51 0 0 791 131 605 1060 763 pumpkin pie, fresh/frozen, commercial 186 51 0 0 1880 241 1440 2700 1870 milk chocolate candy bar, plain 187 51 0 0 4153 275 3640 4960 4160 caramel candy 188 39 0 0 2292 568 1020 3360 2400 gelatin dessert, any flavor 190 51 26 25 5 6 0 21 0 cola carbonated beverage 191 51 19 27 12 14 0 73 11.5 fruit drink, from powder 193 51 33 13 15 41 0 210 0 low-calorie cola carbonated beverage 194 51 0 0 76 34 28 168 65.5 coffee, decaffeinated, from instant 196 38 0 0 469 204 185 1200 434 tea, from tea bag 197 51 0 0 164 53 100 405 156 beer 198 51 0 0 242 57 124 409 244 dry table wine 199 51 0 0 892 316 167 2220 849 whiskey 200 39 1 37 7 3 0 13 7.2 tap water 201 33 17 13 2 2 0 9 0 milk-based infant formula, high iron, ready-to-feed 202 51 0 0 865 123 720 1450 836
Page 161 of 211 Rev 4.1
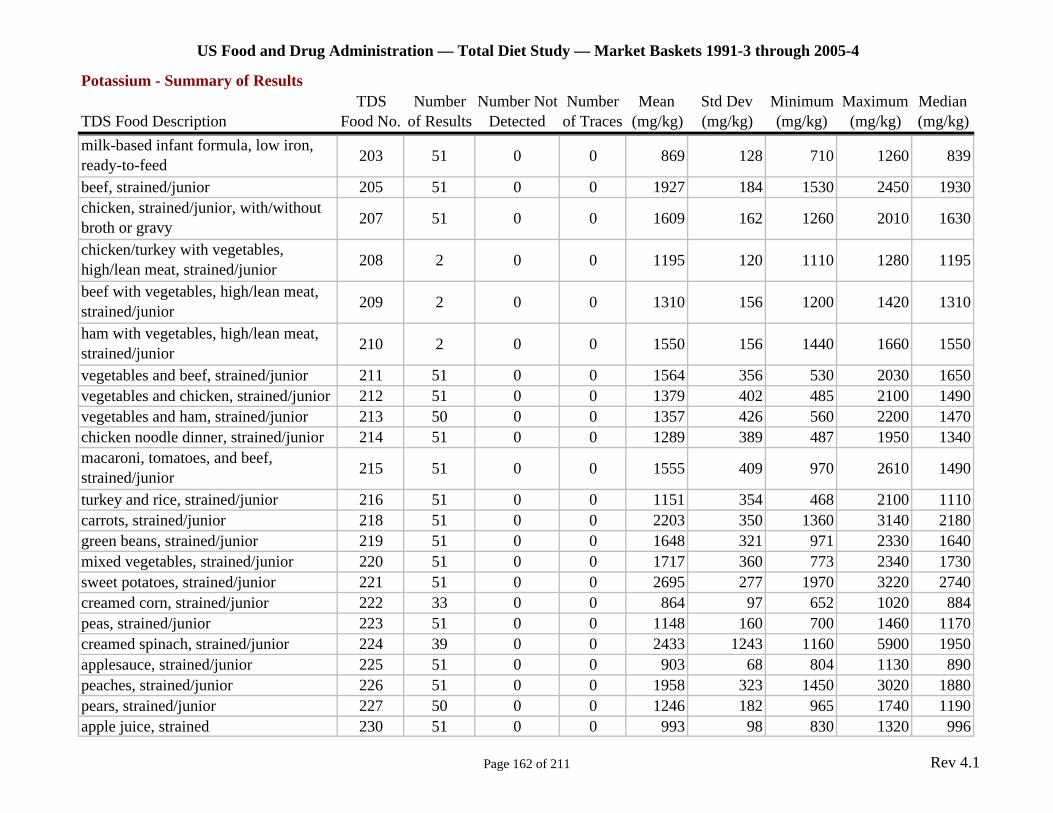
US Food and Drug Administration — Total Diet Study — Market Baskets 1991-3 through 2005-4
Potassium - Summary of Results TDS Number Number Not Number Mean Std Dev Minimum Maximum Median
TDS Food Description Food No. of Results Detected of Traces (mg/kg) (mg/kg) (mg/kg) (mg/kg) (mg/kg) milk-based infant formula, low iron, ready-to-feed 203 51 0 0 869 128 710 1260 839
beef, strained/junior 205 51 0 0 1927 184 1530 2450 1930 chicken, strained/junior, with/without broth or gravy 207 51 0 0 1609 162 1260 2010 1630
chicken/turkey with vegetables, high/lean meat, strained/junior 208 2 0 0 1195 120 1110 1280 1195
beef with vegetables, high/lean meat, strained/junior 209 2 0 0 1310 156 1200 1420 1310
ham with vegetables, high/lean meat, strained/junior 210 2 0 0 1550 156 1440 1660 1550
vegetables and beef, strained/junior 211 51 0 0 1564 356 530 2030 1650 vegetables and chicken, strained/junior 212 51 0 0 1379 402 485 2100 1490 vegetables and ham, strained/junior 213 50 0 0 1357 426 560 2200 1470 chicken noodle dinner, strained/junior 214 51 0 0 1289 389 487 1950 1340 macaroni, tomatoes, and beef, strained/junior 215 51 0 0 1555 409 970 2610 1490
turkey and rice, strained/junior 216 51 0 0 1151 354 468 2100 1110 carrots, strained/junior 218 51 0 0 2203 350 1360 3140 2180 green beans, strained/junior 219 51 0 0 1648 321 971 2330 1640 mixed vegetables, strained/junior 220 51 0 0 1717 360 773 2340 1730 sweet potatoes, strained/junior 221 51 0 0 2695 277 1970 3220 2740 creamed corn, strained/junior 222 33 0 0 864 97 652 1020 884 peas, strained/junior 223 51 0 0 1148 160 700 1460 1170 creamed spinach, strained/junior 224 39 0 0 2433 1243 1160 5900 1950 applesauce, strained/junior 225 51 0 0 903 68 804 1130 890 peaches, strained/junior 226 51 0 0 1958 323 1450 3020 1880 pears, strained/junior 227 50 0 0 1246 182 965 1740 1190 apple juice, strained 230 51 0 0 993 98 830 1320 996
Page 162 of 211 Rev 4.1

US Food and Drug Administration — Total Diet Study — Market Baskets 1991-3 through 2005-4
Potassium - Summary of Results TDS Number Number Not Number Mean Std Dev Minimum Maximum Median
TDS Food Description Food No. of Results Detected of Traces (mg/kg) (mg/kg) (mg/kg) (mg/kg) (mg/kg) orange juice, strained 231 50 0 0 1847 147 1340 2280 1840 custard pudding, strained/junior 232 51 0 0 724 138 549 1400 698 fruit dessert/pudding, strained/junior 233 51 0 0 1024 304 563 1860 949 fruit-flavored yogurt, lowfat (fruit 235 51 0 0 1753 198 1270 2140 1750 Swiss cheese 236 51 0 0 865 168 690 1620 810 cream cheese 237 51 0 0 1300 309 688 1840 1320 veal cutlet, pan-cooked 238 39 0 0 4937 731 2450 6350 4900 ham luncheon meat, sliced 239 50 0 0 3312 979 1590 5670 3000 chicken breast, roasted 240 51 0 0 3309 389 2560 4490 3330 chicken nuggets, fast-food 241 51 0 0 2718 289 1680 3530 2720 chicken, fried (breast, leg, and thigh), fast-food 242 39 0 0 2572 234 1570 2940 2580
haddock, pan-cooked 243 20 0 0 3679 510 2660 4720 3810 shrimp, boiled 244 51 0 0 764 341 180 1760 684 kidney beans, dry, boiled 245 39 0 0 4301 662 3170 6910 4220 peas, mature, dry, boiled 246 39 0 0 3162 623 1760 5500 3130 mixed nuts, no peanuts, dry roasted 247 39 0 0 5957 556 3580 6610 6000 cracked wheat bread 248 51 0 0 1787 256 1220 2400 1750 bagel, plain 249 51 0 0 1080 183 688 1490 1060 English muffin, plain, toasted 250 51 0 0 1367 185 1030 1840 1340 graham crackers 251 51 0 0 1763 413 1000 2700 1680 butter-type crackers 252 51 0 0 1145 211 188 1540 1100 apricot, raw 253 34 0 0 2636 237 2140 3220 2610 peach, canned in light/medium syrup 254 51 0 0 1108 147 820 1410 1130 pear, canned in light syrup 255 51 0 0 736 124 538 1070 736 pineapple juice, from frozen 256 51 0 0 1325 213 816 1800 1280 grape juice, from frozen concentrate 257 51 0 0 360 121 119 609 371 French fries, fast-food 258 51 0 0 5879 686 3710 7300 5900 carrot, fresh, boiled 259 51 0 0 2156 455 1300 3780 2190
Page 163 of 211 Rev 4.1
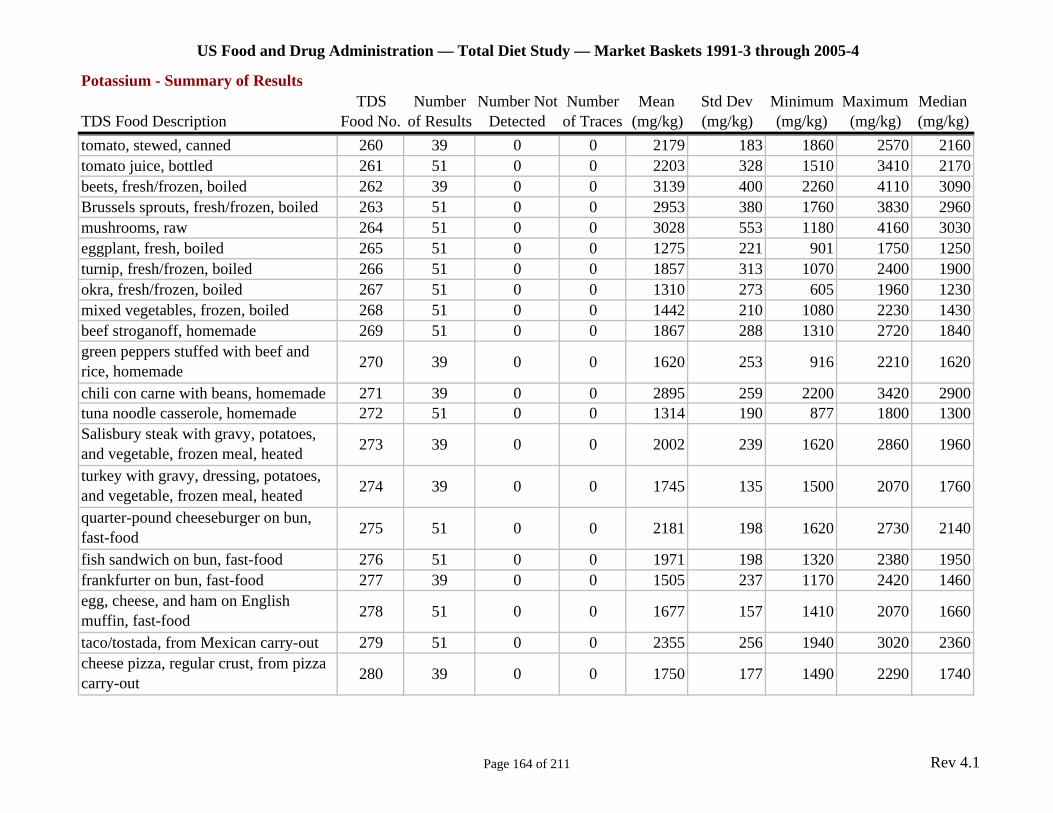
US Food and Drug Administration — Total Diet Study — Market Baskets 1991-3 through 2005-4
Potassium - Summary of Results TDS Number Number Not Number Mean Std Dev Minimum Maximum Median
TDS Food Description Food No. of Results Detected of Traces (mg/kg) (mg/kg) (mg/kg) (mg/kg) (mg/kg) tomato, stewed, canned 260 39 0 0 2179 183 1860 2570 2160 tomato juice, bottled 261 51 0 0 2203 328 1510 3410 2170 beets, fresh/frozen, boiled 262 39 0 0 3139 400 2260 4110 3090 Brussels sprouts, fresh/frozen, boiled 263 51 0 0 2953 380 1760 3830 2960 mushrooms, raw 264 51 0 0 3028 553 1180 4160 3030 eggplant, fresh, boiled 265 51 0 0 1275 221 901 1750 1250 turnip, fresh/frozen, boiled 266 51 0 0 1857 313 1070 2400 1900 okra, fresh/frozen, boiled 267 51 0 0 1310 273 605 1960 1230 mixed vegetables, frozen, boiled 268 51 0 0 1442 210 1080 2230 1430 beef stroganoff, homemade 269 51 0 0 1867 288 1310 2720 1840 green peppers stuffed with beef and rice, homemade 270 39 0 0 1620 253 916 2210 1620
chili con carne with beans, homemade 271 39 0 0 2895 259 2200 3420 2900 tuna noodle casserole, homemade 272 51 0 0 1314 190 877 1800 1300 Salisbury steak with gravy, potatoes, and vegetable, frozen meal, heated 273 39 0 0 2002 239 1620 2860 1960
turkey with gravy, dressing, potatoes, and vegetable, frozen meal, heated 274 39 0 0 1745 135 1500 2070 1760
quarter-pound cheeseburger on bun, fast-food 275 51 0 0 2181 198 1620 2730 2140
fish sandwich on bun, fast-food 276 51 0 0 1971 198 1320 2380 1950 frankfurter on bun, fast-food 277 39 0 0 1505 237 1170 2420 1460 egg, cheese, and ham on English muffin, fast-food 278 51 0 0 1677 157 1410 2070 1660
taco/tostada, from Mexican carry-out 279 51 0 0 2355 256 1940 3020 2360 cheese pizza, regular crust, from pizza carry-out 280 39 0 0 1750 177 1490 2290 1740
Page 164 of 211 Rev 4.1
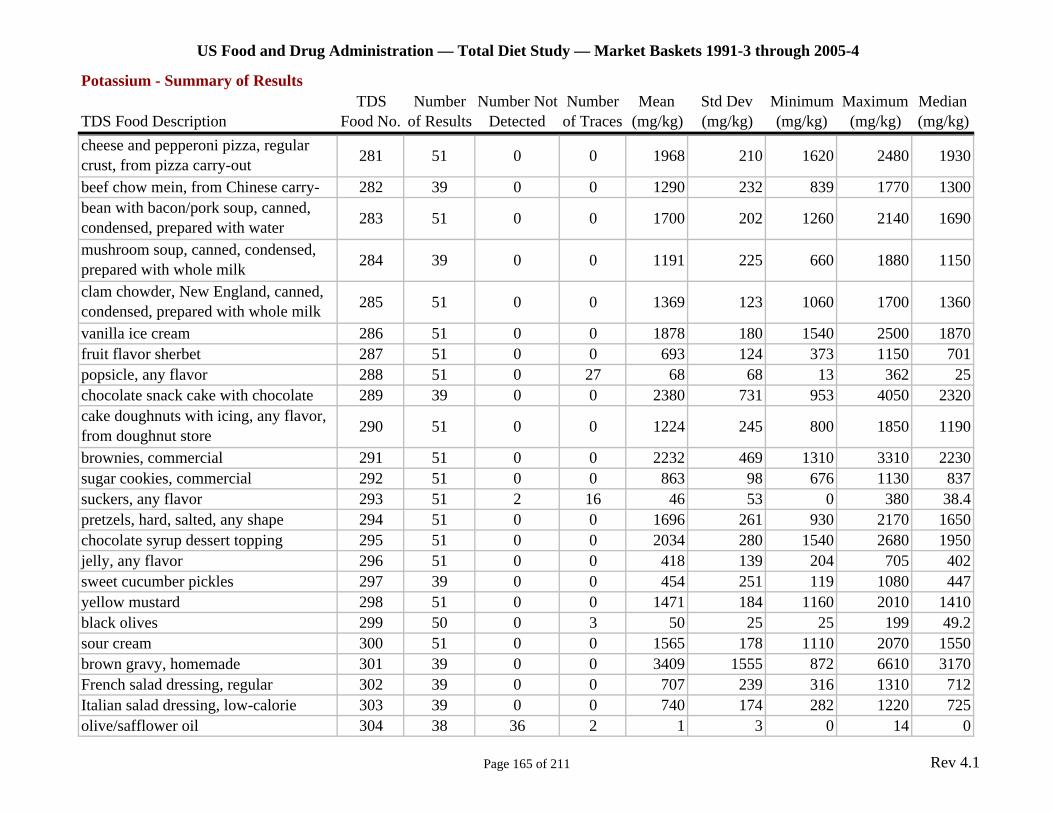
US Food and Drug Administration — Total Diet Study — Market Baskets 1991-3 through 2005-4
Potassium - Summary of Results TDS Number Number Not Number Mean Std Dev Minimum Maximum Median
TDS Food Description Food No. of Results Detected of Traces (mg/kg) (mg/kg) (mg/kg) (mg/kg) (mg/kg) cheese and pepperoni pizza, regular crust, from pizza carry-out 281 51 0 0 1968 210 1620 2480 1930
beef chow mein, from Chinese carry- 282 39 0 0 1290 232 839 1770 1300 bean with bacon/pork soup, canned, condensed, prepared with water 283 51 0 0 1700 202 1260 2140 1690
mushroom soup, canned, condensed, prepared with whole milk 284 39 0 0 1191 225 660 1880 1150
clam chowder, New England, canned, condensed, prepared with whole milk 285 51 0 0 1369 123 1060 1700 1360
vanilla ice cream 286 51 0 0 1878 180 1540 2500 1870 fruit flavor sherbet 287 51 0 0 693 124 373 1150 701 popsicle, any flavor 288 51 0 27 68 68 13 362 25 chocolate snack cake with chocolate 289 39 0 0 2380 731 953 4050 2320 cake doughnuts with icing, any flavor, from doughnut store 290 51 0 0 1224 245 800 1850 1190
brownies, commercial 291 51 0 0 2232 469 1310 3310 2230 sugar cookies, commercial 292 51 0 0 863 98 676 1130 837 suckers, any flavor 293 51 2 16 46 53 0 380 38.4 pretzels, hard, salted, any shape 294 51 0 0 1696 261 930 2170 1650 chocolate syrup dessert topping 295 51 0 0 2034 280 1540 2680 1950 jelly, any flavor 296 51 0 0 418 139 204 705 402 sweet cucumber pickles 297 39 0 0 454 251 119 1080 447 yellow mustard 298 51 0 0 1471 184 1160 2010 1410 black olives 299 50 0 3 50 25 25 199 49.2 sour cream 300 51 0 0 1565 178 1110 2070 1550 brown gravy, homemade 301 39 0 0 3409 1555 872 6610 3170 French salad dressing, regular 302 39 0 0 707 239 316 1310 712 Italian salad dressing, low-calorie 303 39 0 0 740 174 282 1220 725 olive/safflower oil 304 38 36 2 1 3 0 14 0
Page 165 of 211 Rev 4.1
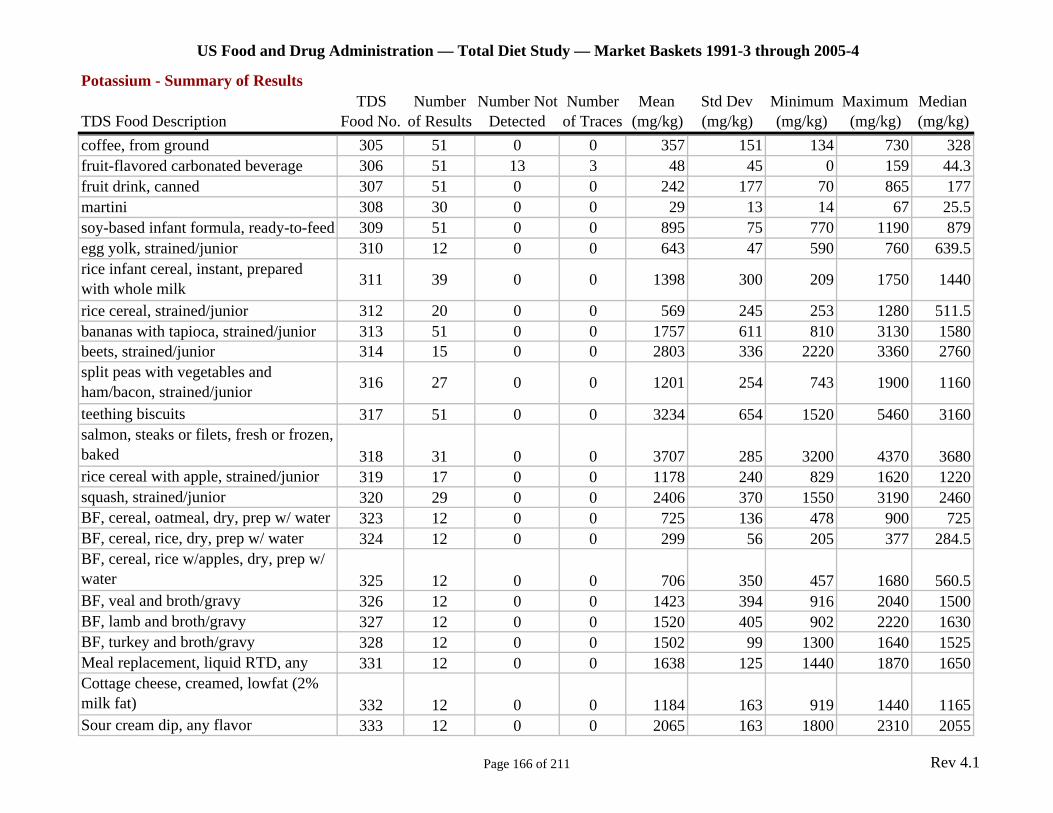
US Food and Drug Administration — Total Diet Study — Market Baskets 1991-3 through 2005-4
Potassium - Summary of Results TDS Number Number Not Number Mean Std Dev Minimum Maximum Median
TDS Food Description Food No. of Results Detected of Traces (mg/kg) (mg/kg) (mg/kg) (mg/kg) (mg/kg) coffee, from ground 305 51 0 0 357 151 134 730 328 fruit-flavored carbonated beverage 306 51 13 3 48 45 0 159 44.3 fruit drink, canned 307 51 0 0 242 177 70 865 177 martini 308 30 0 0 29 13 14 67 25.5 soy-based infant formula, ready-to-feed 309 51 0 0 895 75 770 1190 879 egg yolk, strained/junior 310 12 0 0 643 47 590 760 639.5 rice infant cereal, instant, prepared with whole milk 311 39 0 0 1398 300 209 1750 1440
rice cereal, strained/junior 312 20 0 0 569 245 253 1280 511.5 bananas with tapioca, strained/junior 313 51 0 0 1757 611 810 3130 1580 beets, strained/junior 314 15 0 0 2803 336 2220 3360 2760 split peas with vegetables and ham/bacon, strained/junior 316 27 0 0 1201 254 743 1900 1160
teething biscuits 317 51 0 0 3234 654 1520 5460 3160 salmon, steaks or filets, fresh or frozen, baked 318 31 0 0 3707 285 3200 4370 3680 rice cereal with apple, strained/junior 319 17 0 0 1178 240 829 1620 1220 squash, strained/junior 320 29 0 0 2406 370 1550 3190 2460 BF, cereal, oatmeal, dry, prep w/ water 323 12 0 0 725 136 478 900 725 BF, cereal, rice, dry, prep w/ water 324 12 0 0 299 56 205 377 284.5 BF, cereal, rice w/apples, dry, prep w/ water 325 12 0 0 706 350 457 1680 560.5 BF, veal and broth/gravy 326 12 0 0 1423 394 916 2040 1500 BF, lamb and broth/gravy 327 12 0 0 1520 405 902 2220 1630 BF, turkey and broth/gravy 328 12 0 0 1502 99 1300 1640 1525 Meal replacement, liquid RTD, any 331 12 0 0 1638 125 1440 1870 1650 Cottage cheese, creamed, lowfat (2% milk fat) 332 12 0 0 1184 163 919 1440 1165 Sour cream dip, any flavor 333 12 0 0 2065 163 1800 2310 2055
Page 166 of 211 Rev 4.1
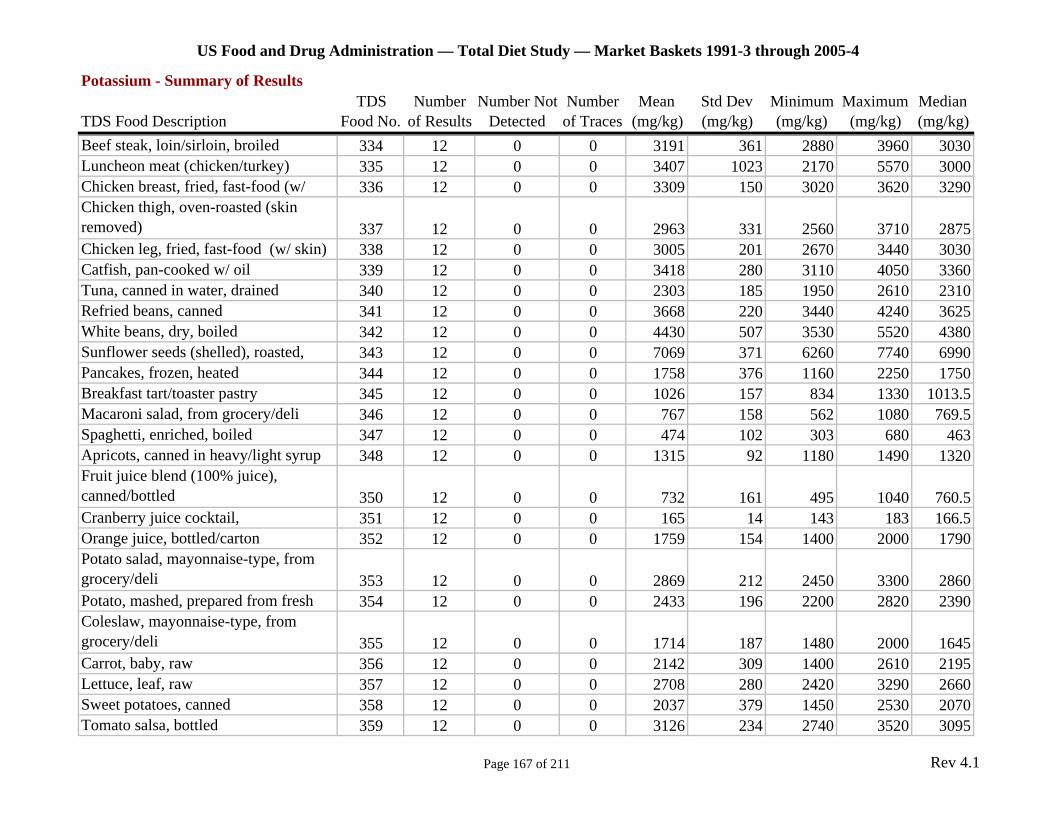
US Food and Drug Administration — Total Diet Study — Market Baskets 1991-3 through 2005-4
Potassium - Summary of Results TDS Number Number Not Number Mean Std Dev Minimum Maximum Median
TDS Food Description Food No. of Results Detected of Traces (mg/kg) (mg/kg) (mg/kg) (mg/kg) (mg/kg) Beef steak, loin/sirloin, broiled 334 12 0 0 3191 361 2880 3960 3030 Luncheon meat (chicken/turkey) 335 12 0 0 3407 1023 2170 5570 3000 Chicken breast, fried, fast-food (w/ 336 12 0 0 3309 150 3020 3620 3290 Chicken thigh, oven-roasted (skin removed) 337 12 0 0 2963 331 2560 3710 2875 Chicken leg, fried, fast-food (w/ skin) 338 12 0 0 3005 201 2670 3440 3030 Catfish, pan-cooked w/ oil 339 12 0 0 3418 280 3110 4050 3360 Tuna, canned in water, drained 340 12 0 0 2303 185 1950 2610 2310 Refried beans, canned 341 12 0 0 3668 220 3440 4240 3625 White beans, dry, boiled 342 12 0 0 4430 507 3530 5520 4380 Sunflower seeds (shelled), roasted, 343 12 0 0 7069 371 6260 7740 6990 Pancakes, frozen, heated 344 12 0 0 1758 376 1160 2250 1750 Breakfast tart/toaster pastry 345 12 0 0 1026 157 834 1330 1013.5 Macaroni salad, from grocery/deli 346 12 0 0 767 158 562 1080 769.5 Spaghetti, enriched, boiled 347 12 0 0 474 102 303 680 463 Apricots, canned in heavy/light syrup 348 12 0 0 1315 92 1180 1490 1320 Fruit juice blend (100% juice), canned/bottled 350 12 0 0 732 161 495 1040 760.5 Cranberry juice cocktail, 351 12 0 0 165 14 143 183 166.5 Orange juice, bottled/carton 352 12 0 0 1759 154 1400 2000 1790 Potato salad, mayonnaise-type, from grocery/deli 353 12 0 0 2869 212 2450 3300 2860 Potato, mashed, prepared from fresh 354 12 0 0 2433 196 2200 2820 2390 Coleslaw, mayonnaise-type, from grocery/deli 355 12 0 0 1714 187 1480 2000 1645 Carrot, baby, raw 356 12 0 0 2142 309 1400 2610 2195 Lettuce, leaf, raw 357 12 0 0 2708 280 2420 3290 2660 Sweet potatoes, canned 358 12 0 0 2037 379 1450 2530 2070 Tomato salsa, bottled 359 12 0 0 3126 234 2740 3520 3095
Page 167 of 211 Rev 4.1
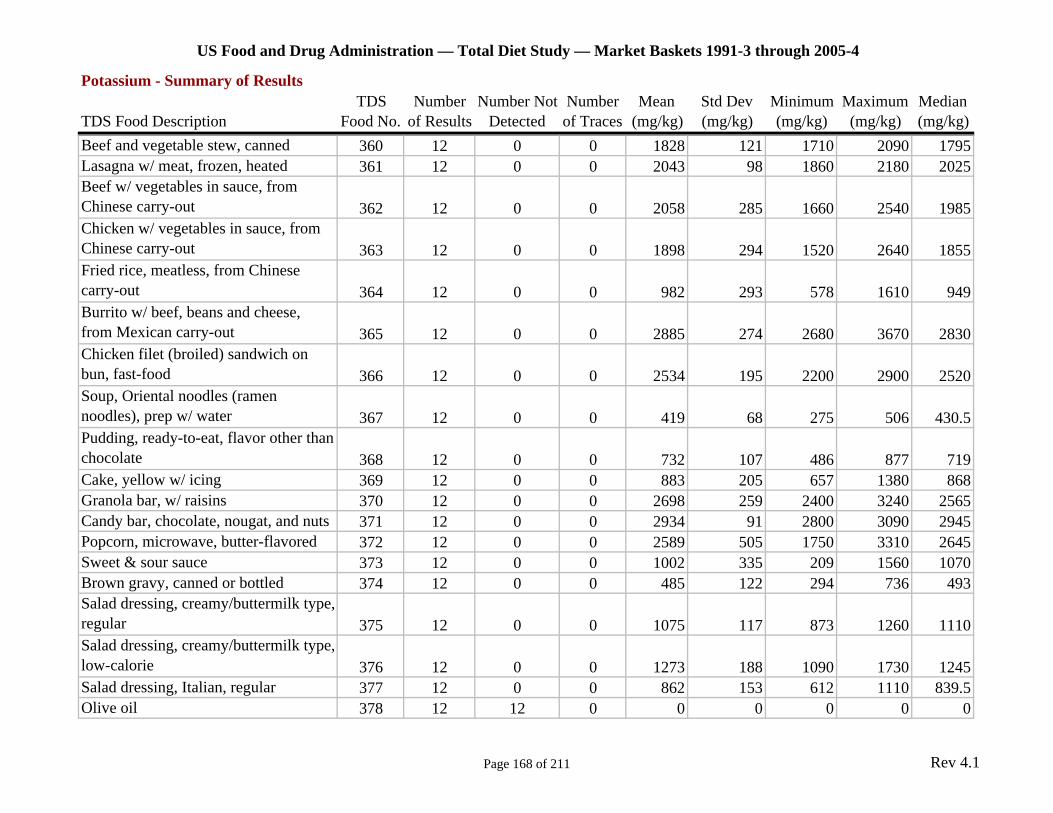
US Food and Drug Administration — Total Diet Study — Market Baskets 1991-3 through 2005-4
Potassium - Summary of Results TDS Number Number Not Number Mean Std Dev Minimum Maximum Median
TDS Food Description Food No. of Results Detected of Traces (mg/kg) (mg/kg) (mg/kg) (mg/kg) (mg/kg) Beef and vegetable stew, canned 360 12 0 0 1828 121 1710 2090 1795 Lasagna w/ meat, frozen, heated 361 12 0 0 2043 98 1860 2180 2025 Beef w/ vegetables in sauce, from Chinese carry-out 362 12 0 0 2058 285 1660 2540 1985 Chicken w/ vegetables in sauce, from Chinese carry-out 363 12 0 0 1898 294 1520 2640 1855 Fried rice, meatless, from Chinese carry-out 364 12 0 0 982 293 578 1610 949 Burrito w/ beef, beans and cheese, from Mexican carry-out 365 12 0 0 2885 274 2680 3670 2830 Chicken filet (broiled) sandwich on bun, fast-food 366 12 0 0 2534 195 2200 2900 2520 Soup, Oriental noodles (ramen noodles), prep w/ water 367 12 0 0 419 68 275 506 430.5 Pudding, ready-to-eat, flavor other than chocolate 368 12 0 0 732 107 486 877 719 Cake, yellow w/ icing 369 12 0 0 883 205 657 1380 868 Granola bar, w/ raisins 370 12 0 0 2698 259 2400 3240 2565 Candy bar, chocolate, nougat, and nuts 371 12 0 0 2934 91 2800 3090 2945 Popcorn, microwave, butter-flavored 372 12 0 0 2589 505 1750 3310 2645 Sweet & sour sauce 373 12 0 0 1002 335 209 1560 1070 Brown gravy, canned or bottled 374 12 0 0 485 122 294 736 493 Salad dressing, creamy/buttermilk type, regular 375 12 0 0 1075 117 873 1260 1110 Salad dressing, creamy/buttermilk type, low-calorie 376 12 0 0 1273 188 1090 1730 1245 Salad dressing, Italian, regular 377 12 0 0 862 153 612 1110 839.5 Olive oil 378 12 12 0 0 0 0 0 0
Page 168 of 211 Rev 4.1
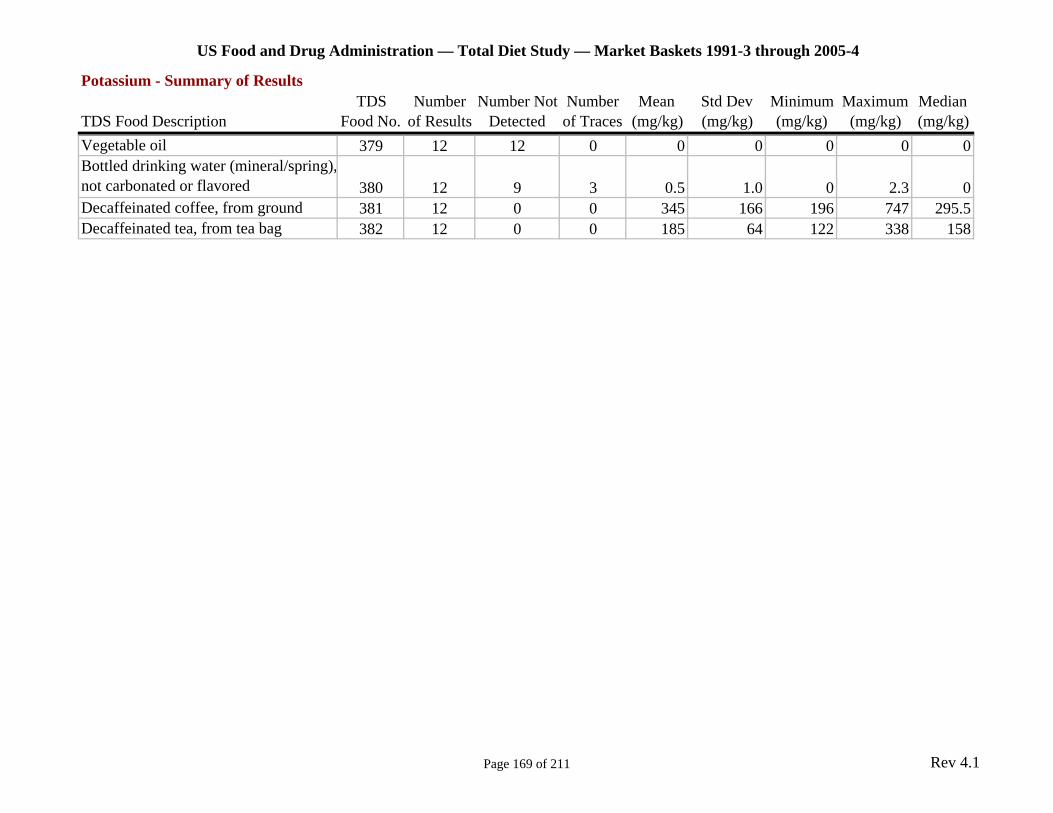
US Food and Drug Administration — Total Diet Study — Market Baskets 1991-3 through 2005-4
Potassium - Summary of Results TDS Number Number Not Number Mean Std Dev Minimum Maximum Median
TDS Food Description Food No. of Results Detected of Traces (mg/kg) (mg/kg) (mg/kg) (mg/kg) (mg/kg) Vegetable oil 379 12 12 0 0 0 0 0 0 Bottled drinking water (mineral/spring), not carbonated or flavored 380 12 9 3 0.5 1.0 0 2.3 0 Decaffeinated coffee, from ground 381 12 0 0 345 166 196 747 295.5 Decaffeinated tea, from tea bag 382 12 0 0 185 64 122 338 158
Page 169 of 211 Rev 4.1
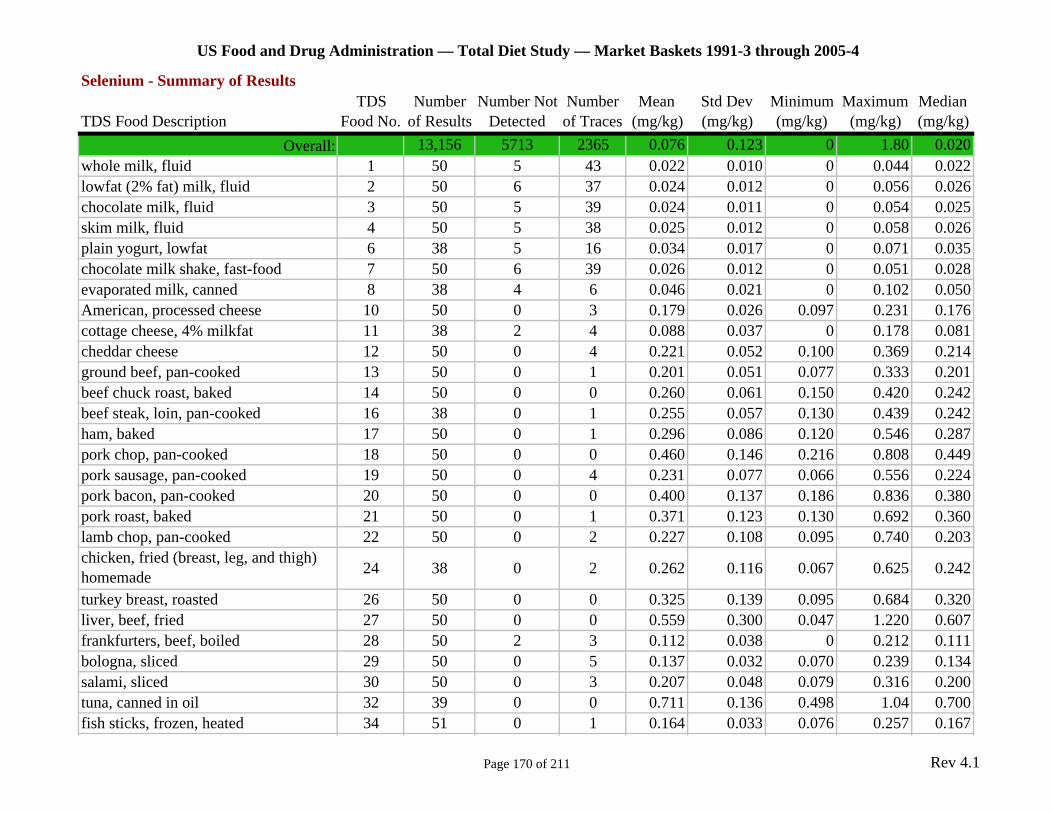
US Food and Drug Administration — Total Diet Study — Market Baskets 1991-3 through 2005-4
Selenium - Summary of Results TDS Number Number Not Number Mean Std Dev Minimum Maximum Median
TDS Food Description Food No. of Results Detected of Traces (mg/kg) (mg/kg) (mg/kg) (mg/kg) (mg/kg) Overall: 13,156 5713 2365 0.076 0.123 0 1.80 0.020
whole milk, fluid 1 50 5 43 0.022 0.010 0 0.044 0.022 lowfat (2% fat) milk, fluid 2 50 6 37 0.024 0.012 0 0.056 0.026 chocolate milk, fluid 3 50 5 39 0.024 0.011 0 0.054 0.025 skim milk, fluid 4 50 5 38 0.025 0.012 0 0.058 0.026 plain yogurt, lowfat 6 38 5 16 0.034 0.017 0 0.071 0.035 chocolate milk shake, fast-food 7 50 6 39 0.026 0.012 0 0.051 0.028 evaporated milk, canned 8 38 4 6 0.046 0.021 0 0.102 0.050 American, processed cheese 10 50 0 3 0.179 0.026 0.097 0.231 0.176 cottage cheese, 4% milkfat 11 38 2 4 0.088 0.037 0 0.178 0.081 cheddar cheese 12 50 0 4 0.221 0.052 0.100 0.369 0.214 ground beef, pan-cooked 13 50 0 1 0.201 0.051 0.077 0.333 0.201 beef chuck roast, baked 14 50 0 0 0.260 0.061 0.150 0.420 0.242 beef steak, loin, pan-cooked 16 38 0 1 0.255 0.057 0.130 0.439 0.242 ham, baked 17 50 0 1 0.296 0.086 0.120 0.546 0.287 pork chop, pan-cooked 18 50 0 0 0.460 0.146 0.216 0.808 0.449 pork sausage, pan-cooked 19 50 0 4 0.231 0.077 0.066 0.556 0.224 pork bacon, pan-cooked 20 50 0 0 0.400 0.137 0.186 0.836 0.380 pork roast, baked 21 50 0 1 0.371 0.123 0.130 0.692 0.360 lamb chop, pan-cooked 22 50 0 2 0.227 0.108 0.095 0.740 0.203 chicken, fried (breast, leg, and thigh) homemade 24 38 0 2 0.262 0.116 0.067 0.625 0.242
turkey breast, roasted 26 50 0 0 0.325 0.139 0.095 0.684 0.320 liver, beef, fried 27 50 0 0 0.559 0.300 0.047 1.220 0.607 frankfurters, beef, boiled 28 50 2 3 0.112 0.038 0 0.212 0.111 bologna, sliced 29 50 0 5 0.137 0.032 0.070 0.239 0.134 salami, sliced 30 50 0 3 0.207 0.048 0.079 0.316 0.200 tuna, canned in oil 32 39 0 0 0.711 0.136 0.498 1.04 0.700 fish sticks, frozen, heated 34 51 0 1 0.164 0.033 0.076 0.257 0.167
Page 170 of 211 Rev 4.1

US Food and Drug Administration — Total Diet Study — Market Baskets 1991-3 through 2005-4
Selenium - Summary of Results TDS Number Number Not Number Mean Std Dev Minimum Maximum Median
TDS Food Description Food No. of Results Detected of Traces (mg/kg) (mg/kg) (mg/kg) (mg/kg) (mg/kg) eggs, scrambled 35 51 0 1 0.225 0.063 0.076 0.405 0.213 eggs, fried 36 38 0 0 0.279 0.073 0.149 0.454 0.272 eggs, boiled 37 50 0 2 0.283 0.092 0.023 0.513 0.279 pinto beans, dry, boiled 38 50 3 8 0.079 0.038 0 0.145 0.081 pork and beans, canned 39 50 5 24 0.036 0.019 0 0.081 0.038 lima beans, immature, frozen, boiled 42 50 29 21 0.007 0.010 0 0.037 0 green peas, fresh/frozen, boiled 46 50 38 9 0.006 0.013 0 0.057 0 peanut butter, smooth 47 50 2 14 0.109 0.092 0 0.464 0.073 peanuts, dry roasted 48 50 6 11 0.117 0.114 0 0.509 0.079 white rice, cooked 50 50 3 7 0.059 0.030 0 0.170 0.057 oatmeal, quick (1-3 min), cooked 51 50 2 8 0.060 0.029 0 0.180 0.057 wheat cereal, farina, quick (1-3min), 52 50 3 4 0.078 0.042 0 0.205 0.069 corngrits, regular, cooked 53 50 10 31 0.024 0.021 0 0.095 0.019 corn, fresh/frozen, boiled 54 50 37 11 0.006 0.011 0 0.037 0 corn, canned 55 12 5 5 0.016 0.018 0 0.055 0.013 cream style corn, canned 56 38 30 8 0.004 0.008 0 0.029 0 popcorn, popped in oil 57 39 5 11 0.079 0.062 0 0.267 0.064 white bread 58 50 0 4 0.209 0.070 0.021 0.363 0.198 white roll 59 38 0 0 0.254 0.067 0.144 0.410 0.244 cornbread, homemade 60 50 1 3 0.124 0.031 0 0.194 0.119 biscuit, from refrigerated dough, baked 61 49 0 3 0.132 0.036 0.073 0.225 0.128 whole wheat bread 62 50 0 0 0.313 0.088 0.156 0.511 0.309 tortilla, flour 63 50 0 1 0.225 0.097 0.032 0.564 0.203 rye bread 64 50 0 0 0.249 0.065 0.133 0.404 0.233 blueberry muffin, commercial 65 50 0 4 0.105 0.035 0.026 0.246 0.107 saltine crackers 66 51 1 6 0.083 0.034 0 0.197 0.078 corn chips 67 50 5 19 0.049 0.038 0 0.196 0.040 pancake from mix 68 38 0 5 0.129 0.061 0.050 0.390 0.119 egg noodles, boiled 69 50 0 1 0.246 0.088 0.052 0.438 0.248
Page 171 of 211 Rev 4.1
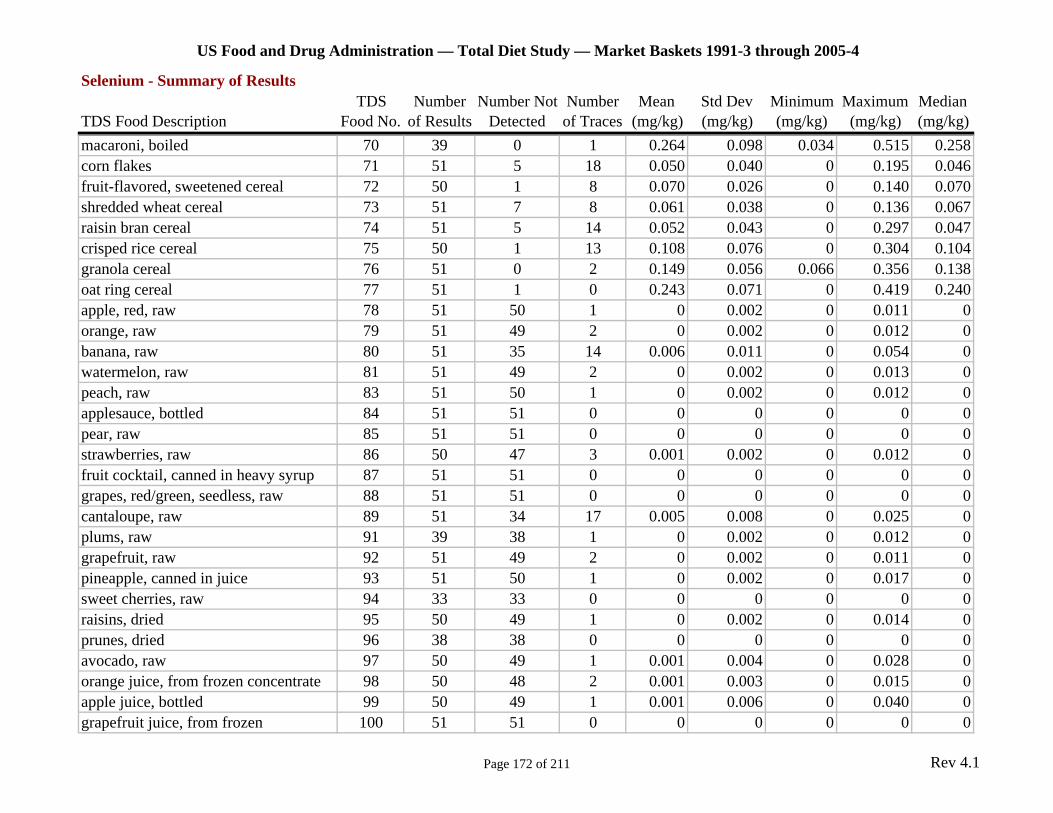
US Food and Drug Administration — Total Diet Study — Market Baskets 1991-3 through 2005-4
Selenium - Summary of Results TDS Number Number Not Number Mean Std Dev Minimum Maximum Median
TDS Food Description Food No. of Results Detected of Traces (mg/kg) (mg/kg) (mg/kg) (mg/kg) (mg/kg) macaroni, boiled 70 39 0 1 0.264 0.098 0.034 0.515 0.258 corn flakes 71 51 5 18 0.050 0.040 0 0.195 0.046 fruit-flavored, sweetened cereal 72 50 1 8 0.070 0.026 0 0.140 0.070 shredded wheat cereal 73 51 7 8 0.061 0.038 0 0.136 0.067 raisin bran cereal 74 51 5 14 0.052 0.043 0 0.297 0.047 crisped rice cereal 75 50 1 13 0.108 0.076 0 0.304 0.104 granola cereal 76 51 0 2 0.149 0.056 0.066 0.356 0.138 oat ring cereal 77 51 1 0 0.243 0.071 0 0.419 0.240 apple, red, raw 78 51 50 1 0 0.002 0 0.011 0 orange, raw 79 51 49 2 0 0.002 0 0.012 0 banana, raw 80 51 35 14 0.006 0.011 0 0.054 0 watermelon, raw 81 51 49 2 0 0.002 0 0.013 0 peach, raw 83 51 50 1 0 0.002 0 0.012 0 applesauce, bottled 84 51 51 0 0 0 0 0 0 pear, raw 85 51 51 0 0 0 0 0 0 strawberries, raw 86 50 47 3 0.001 0.002 0 0.012 0 fruit cocktail, canned in heavy syrup 87 51 51 0 0 0 0 0 0 grapes, red/green, seedless, raw 88 51 51 0 0 0 0 0 0 cantaloupe, raw 89 51 34 17 0.005 0.008 0 0.025 0 plums, raw 91 39 38 1 0 0.002 0 0.012 0 grapefruit, raw 92 51 49 2 0 0.002 0 0.011 0 pineapple, canned in juice 93 51 50 1 0 0.002 0 0.017 0 sweet cherries, raw 94 33 33 0 0 0 0 0 0 raisins, dried 95 50 49 1 0 0.002 0 0.014 0 prunes, dried 96 38 38 0 0 0 0 0 0 avocado, raw 97 50 49 1 0.001 0.004 0 0.028 0 orange juice, from frozen concentrate 98 50 48 2 0.001 0.003 0 0.015 0 apple juice, bottled 99 50 49 1 0.001 0.006 0 0.040 0 grapefruit juice, from frozen 100 51 51 0 0 0 0 0 0
Page 172 of 211 Rev 4.1
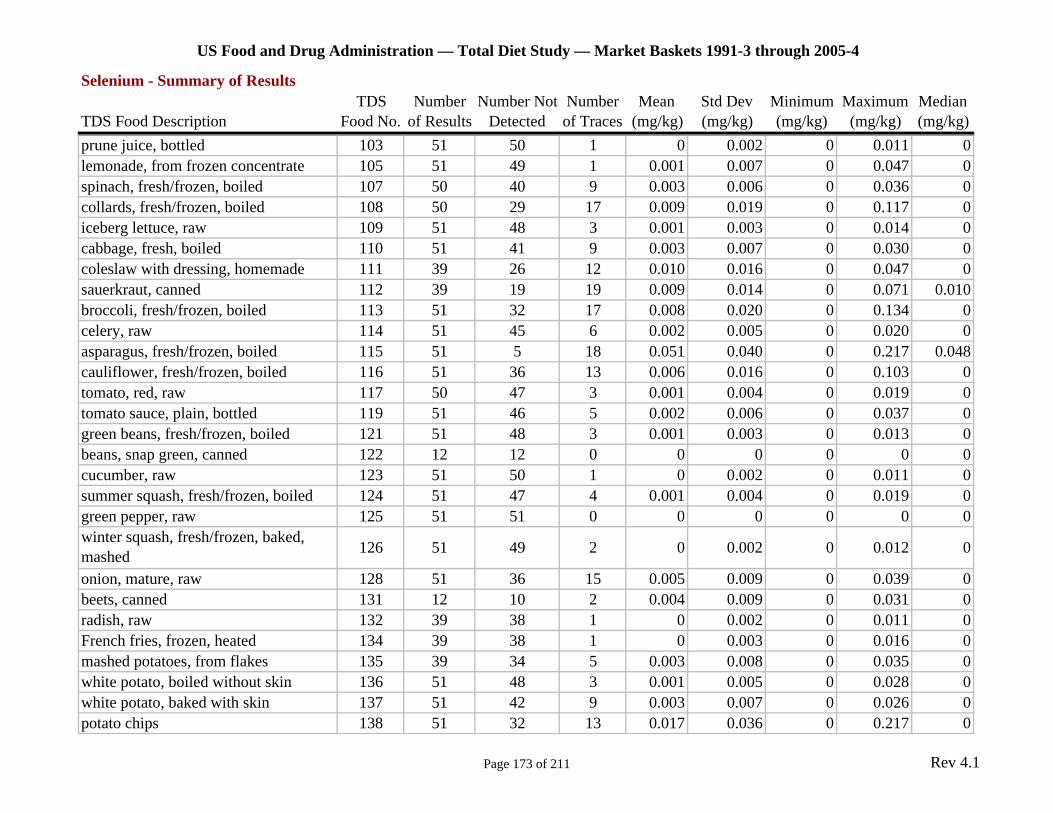
US Food and Drug Administration — Total Diet Study — Market Baskets 1991-3 through 2005-4
Selenium - Summary of Results TDS Number Number Not Number Mean Std Dev Minimum Maximum Median
TDS Food Description Food No. of Results Detected of Traces (mg/kg) (mg/kg) (mg/kg) (mg/kg) (mg/kg) prune juice, bottled 103 51 50 1 0 0.002 0 0.011 0 lemonade, from frozen concentrate 105 51 49 1 0.001 0.007 0 0.047 0 spinach, fresh/frozen, boiled 107 50 40 9 0.003 0.006 0 0.036 0 collards, fresh/frozen, boiled 108 50 29 17 0.009 0.019 0 0.117 0 iceberg lettuce, raw 109 51 48 3 0.001 0.003 0 0.014 0 cabbage, fresh, boiled 110 51 41 9 0.003 0.007 0 0.030 0 coleslaw with dressing, homemade 111 39 26 12 0.010 0.016 0 0.047 0 sauerkraut, canned 112 39 19 19 0.009 0.014 0 0.071 0.010 broccoli, fresh/frozen, boiled 113 51 32 17 0.008 0.020 0 0.134 0 celery, raw 114 51 45 6 0.002 0.005 0 0.020 0 asparagus, fresh/frozen, boiled 115 51 5 18 0.051 0.040 0 0.217 0.048 cauliflower, fresh/frozen, boiled 116 51 36 13 0.006 0.016 0 0.103 0 tomato, red, raw 117 50 47 3 0.001 0.004 0 0.019 0 tomato sauce, plain, bottled 119 51 46 5 0.002 0.006 0 0.037 0 green beans, fresh/frozen, boiled 121 51 48 3 0.001 0.003 0 0.013 0 beans, snap green, canned 122 12 12 0 0 0 0 0 0 cucumber, raw 123 51 50 1 0 0.002 0 0.011 0 summer squash, fresh/frozen, boiled 124 51 47 4 0.001 0.004 0 0.019 0 green pepper, raw 125 51 51 0 0 0 0 0 0 winter squash, fresh/frozen, baked, mashed 126 51 49 2 0 0.002 0 0.012 0
onion, mature, raw 128 51 36 15 0.005 0.009 0 0.039 0 beets, canned 131 12 10 2 0.004 0.009 0 0.031 0 radish, raw 132 39 38 1 0 0.002 0 0.011 0 French fries, frozen, heated 134 39 38 1 0 0.003 0 0.016 0 mashed potatoes, from flakes 135 39 34 5 0.003 0.008 0 0.035 0 white potato, boiled without skin 136 51 48 3 0.001 0.005 0 0.028 0 white potato, baked with skin 137 51 42 9 0.003 0.007 0 0.026 0 potato chips 138 51 32 13 0.017 0.036 0 0.217 0
Page 173 of 211 Rev 4.1
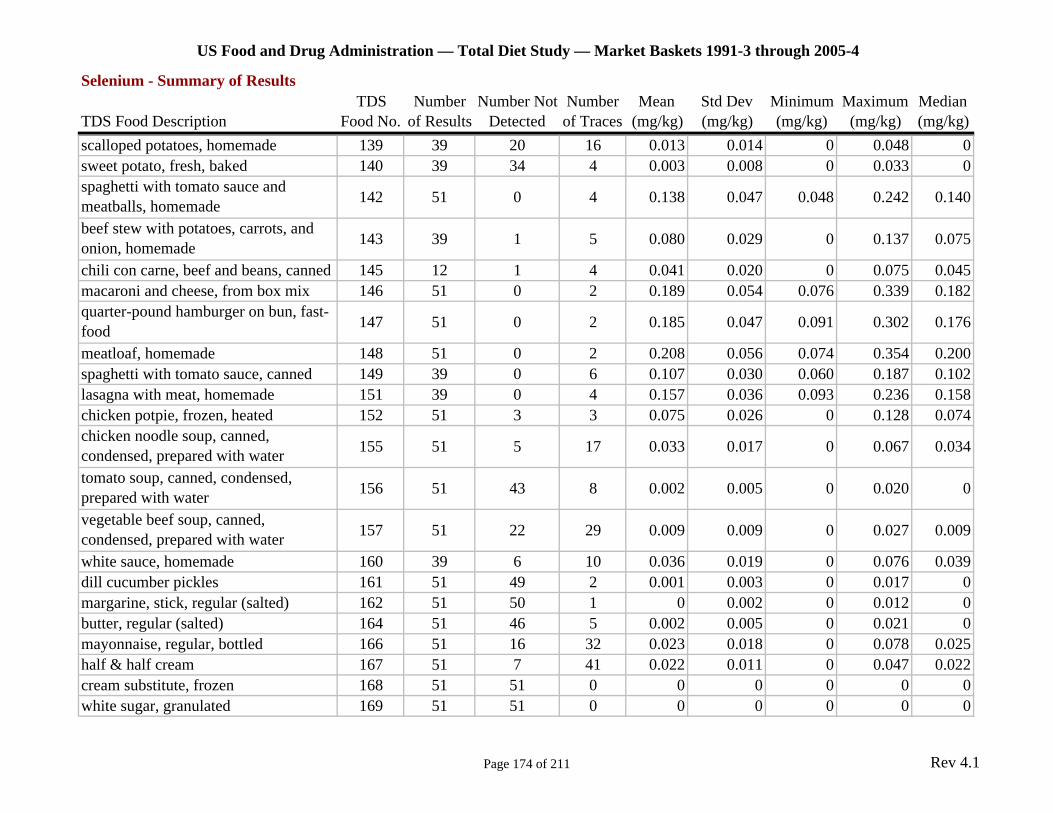
US Food and Drug Administration — Total Diet Study — Market Baskets 1991-3 through 2005-4
Selenium - Summary of Results TDS Number Number Not Number Mean Std Dev Minimum Maximum Median
TDS Food Description Food No. of Results Detected of Traces (mg/kg) (mg/kg) (mg/kg) (mg/kg) (mg/kg) scalloped potatoes, homemade 139 39 20 16 0.013 0.014 0 0.048 0 sweet potato, fresh, baked 140 39 34 4 0.003 0.008 0 0.033 0 spaghetti with tomato sauce and meatballs, homemade 142 51 0 4 0.138 0.047 0.048 0.242 0.140
beef stew with potatoes, carrots, and onion, homemade 143 39 1 5 0.080 0.029 0 0.137 0.075
chili con carne, beef and beans, canned 145 12 1 4 0.041 0.020 0 0.075 0.045 macaroni and cheese, from box mix 146 51 0 2 0.189 0.054 0.076 0.339 0.182 quarter-pound hamburger on bun, fast-food 147 51 0 2 0.185 0.047 0.091 0.302 0.176
meatloaf, homemade 148 51 0 2 0.208 0.056 0.074 0.354 0.200 spaghetti with tomato sauce, canned 149 39 0 6 0.107 0.030 0.060 0.187 0.102 lasagna with meat, homemade 151 39 0 4 0.157 0.036 0.093 0.236 0.158 chicken potpie, frozen, heated 152 51 3 3 0.075 0.026 0 0.128 0.074 chicken noodle soup, canned, condensed, prepared with water 155 51 5 17 0.033 0.017 0 0.067 0.034
tomato soup, canned, condensed, prepared with water 156 51 43 8 0.002 0.005 0 0.020 0
vegetable beef soup, canned, condensed, prepared with water 157 51 22 29 0.009 0.009 0 0.027 0.009
white sauce, homemade 160 39 6 10 0.036 0.019 0 0.076 0.039 dill cucumber pickles 161 51 49 2 0.001 0.003 0 0.017 0 margarine, stick, regular (salted) 162 51 50 1 0 0.002 0 0.012 0 butter, regular (salted) 164 51 46 5 0.002 0.005 0 0.021 0 mayonnaise, regular, bottled 166 51 16 32 0.023 0.018 0 0.078 0.025 half & half cream 167 51 7 41 0.022 0.011 0 0.047 0.022 cream substitute, frozen 168 51 51 0 0 0 0 0 0 white sugar, granulated 169 51 51 0 0 0 0 0 0
Page 174 of 211 Rev 4.1
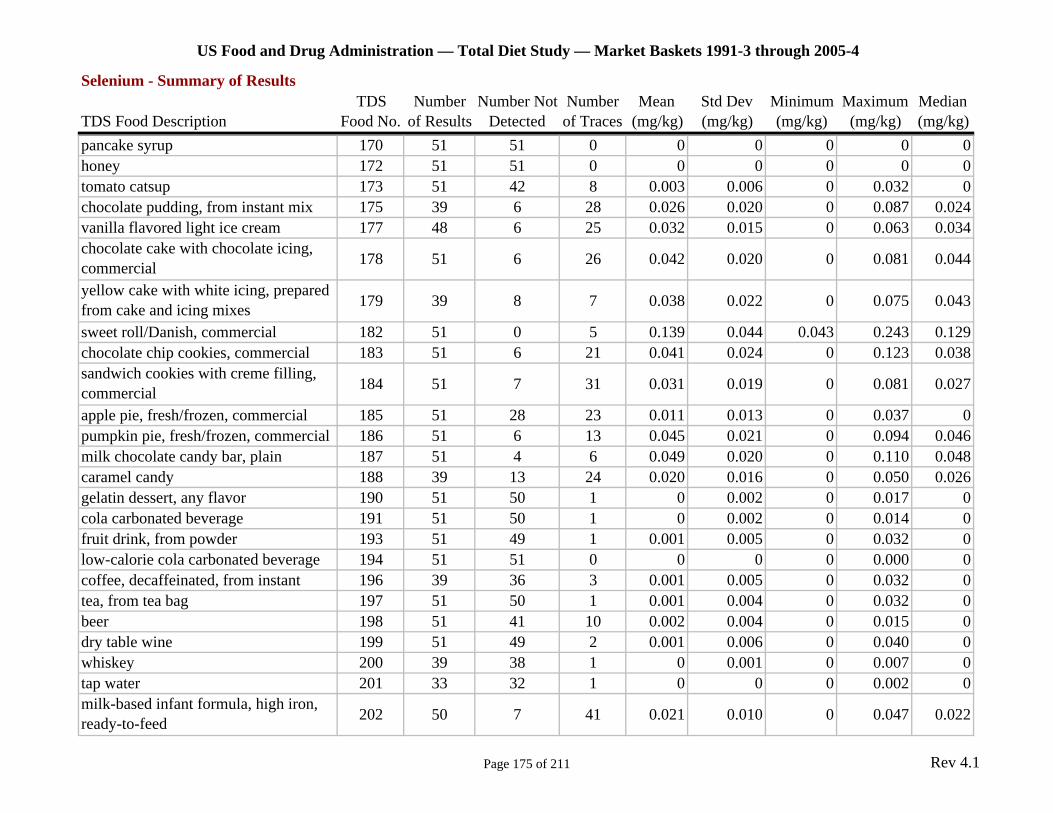
US Food and Drug Administration — Total Diet Study — Market Baskets 1991-3 through 2005-4
Selenium - Summary of Results TDS Number Number Not Number Mean Std Dev Minimum Maximum Median
TDS Food Description Food No. of Results Detected of Traces (mg/kg) (mg/kg) (mg/kg) (mg/kg) (mg/kg) pancake syrup 170 51 51 0 0 0 0 0 0 honey 172 51 51 0 0 0 0 0 0 tomato catsup 173 51 42 8 0.003 0.006 0 0.032 0 chocolate pudding, from instant mix 175 39 6 28 0.026 0.020 0 0.087 0.024 vanilla flavored light ice cream 177 48 6 25 0.032 0.015 0 0.063 0.034 chocolate cake with chocolate icing, commercial 178 51 6 26 0.042 0.020 0 0.081 0.044
yellow cake with white icing, prepared from cake and icing mixes 179 39 8 7 0.038 0.022 0 0.075 0.043
sweet roll/Danish, commercial 182 51 0 5 0.139 0.044 0.043 0.243 0.129 chocolate chip cookies, commercial 183 51 6 21 0.041 0.024 0 0.123 0.038 sandwich cookies with creme filling, commercial 184 51 7 31 0.031 0.019 0 0.081 0.027
apple pie, fresh/frozen, commercial 185 51 28 23 0.011 0.013 0 0.037 0 pumpkin pie, fresh/frozen, commercial 186 51 6 13 0.045 0.021 0 0.094 0.046 milk chocolate candy bar, plain 187 51 4 6 0.049 0.020 0 0.110 0.048 caramel candy 188 39 13 24 0.020 0.016 0 0.050 0.026 gelatin dessert, any flavor 190 51 50 1 0 0.002 0 0.017 0 cola carbonated beverage 191 51 50 1 0 0.002 0 0.014 0 fruit drink, from powder 193 51 49 1 0.001 0.005 0 0.032 0 low-calorie cola carbonated beverage 194 51 51 0 0 0 0 0.000 0 coffee, decaffeinated, from instant 196 39 36 3 0.001 0.005 0 0.032 0 tea, from tea bag 197 51 50 1 0.001 0.004 0 0.032 0 beer 198 51 41 10 0.002 0.004 0 0.015 0 dry table wine 199 51 49 2 0.001 0.006 0 0.040 0 whiskey 200 39 38 1 0 0.001 0 0.007 0 tap water 201 33 32 1 0 0 0 0.002 0 milk-based infant formula, high iron, ready-to-feed 202 50 7 41 0.021 0.010 0 0.047 0.022
Page 175 of 211 Rev 4.1
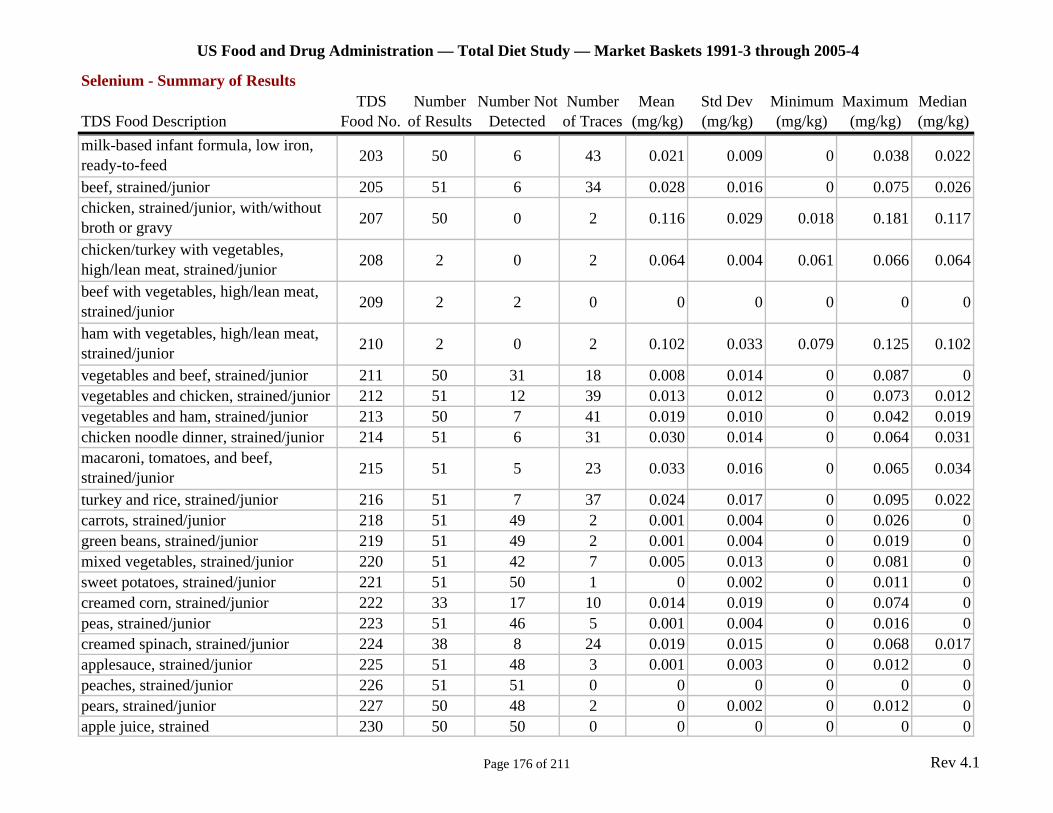
US Food and Drug Administration — Total Diet Study — Market Baskets 1991-3 through 2005-4
Selenium - Summary of Results TDS Number Number Not Number Mean Std Dev Minimum Maximum Median
TDS Food Description Food No. of Results Detected of Traces (mg/kg) (mg/kg) (mg/kg) (mg/kg) (mg/kg) milk-based infant formula, low iron, ready-to-feed 203 50 6 43 0.021 0.009 0 0.038 0.022
beef, strained/junior 205 51 6 34 0.028 0.016 0 0.075 0.026 chicken, strained/junior, with/without broth or gravy 207 50 0 2 0.116 0.029 0.018 0.181 0.117
chicken/turkey with vegetables, high/lean meat, strained/junior 208 2 0 2 0.064 0.004 0.061 0.066 0.064
beef with vegetables, high/lean meat, strained/junior 209 2 2 0 0 0 0 0 0
ham with vegetables, high/lean meat, strained/junior 210 2 0 2 0.102 0.033 0.079 0.125 0.102
vegetables and beef, strained/junior 211 50 31 18 0.008 0.014 0 0.087 0 vegetables and chicken, strained/junior 212 51 12 39 0.013 0.012 0 0.073 0.012 vegetables and ham, strained/junior 213 50 7 41 0.019 0.010 0 0.042 0.019 chicken noodle dinner, strained/junior 214 51 6 31 0.030 0.014 0 0.064 0.031 macaroni, tomatoes, and beef, strained/junior 215 51 5 23 0.033 0.016 0 0.065 0.034
turkey and rice, strained/junior 216 51 7 37 0.024 0.017 0 0.095 0.022 carrots, strained/junior 218 51 49 2 0.001 0.004 0 0.026 0 green beans, strained/junior 219 51 49 2 0.001 0.004 0 0.019 0 mixed vegetables, strained/junior 220 51 42 7 0.005 0.013 0 0.081 0 sweet potatoes, strained/junior 221 51 50 1 0 0.002 0 0.011 0 creamed corn, strained/junior 222 33 17 10 0.014 0.019 0 0.074 0 peas, strained/junior 223 51 46 5 0.001 0.004 0 0.016 0 creamed spinach, strained/junior 224 38 8 24 0.019 0.015 0 0.068 0.017 applesauce, strained/junior 225 51 48 3 0.001 0.003 0 0.012 0 peaches, strained/junior 226 51 51 0 0 0 0 0 0 pears, strained/junior 227 50 48 2 0 0.002 0 0.012 0 apple juice, strained 230 50 50 0 0 0 0 0 0
Page 176 of 211 Rev 4.1
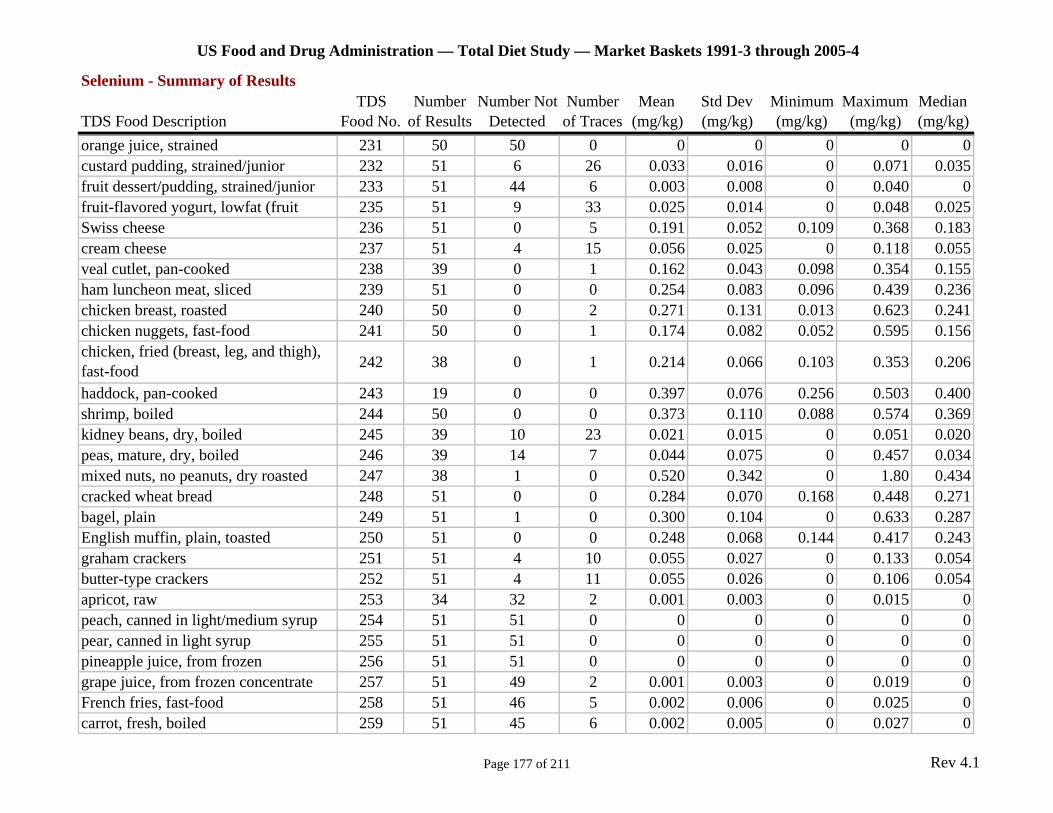
US Food and Drug Administration — Total Diet Study — Market Baskets 1991-3 through 2005-4
Selenium - Summary of Results TDS Number Number Not Number Mean Std Dev Minimum Maximum Median
TDS Food Description Food No. of Results Detected of Traces (mg/kg) (mg/kg) (mg/kg) (mg/kg) (mg/kg) orange juice, strained 231 50 50 0 0 0 0 0 0 custard pudding, strained/junior 232 51 6 26 0.033 0.016 0 0.071 0.035 fruit dessert/pudding, strained/junior 233 51 44 6 0.003 0.008 0 0.040 0 fruit-flavored yogurt, lowfat (fruit 235 51 9 33 0.025 0.014 0 0.048 0.025 Swiss cheese 236 51 0 5 0.191 0.052 0.109 0.368 0.183 cream cheese 237 51 4 15 0.056 0.025 0 0.118 0.055 veal cutlet, pan-cooked 238 39 0 1 0.162 0.043 0.098 0.354 0.155 ham luncheon meat, sliced 239 51 0 0 0.254 0.083 0.096 0.439 0.236 chicken breast, roasted 240 50 0 2 0.271 0.131 0.013 0.623 0.241 chicken nuggets, fast-food 241 50 0 1 0.174 0.082 0.052 0.595 0.156 chicken, fried (breast, leg, and thigh), fast-food 242 38 0 1 0.214 0.066 0.103 0.353 0.206
haddock, pan-cooked 243 19 0 0 0.397 0.076 0.256 0.503 0.400 shrimp, boiled 244 50 0 0 0.373 0.110 0.088 0.574 0.369 kidney beans, dry, boiled 245 39 10 23 0.021 0.015 0 0.051 0.020 peas, mature, dry, boiled 246 39 14 7 0.044 0.075 0 0.457 0.034 mixed nuts, no peanuts, dry roasted 247 38 1 0 0.520 0.342 0 1.80 0.434 cracked wheat bread 248 51 0 0 0.284 0.070 0.168 0.448 0.271 bagel, plain 249 51 1 0 0.300 0.104 0 0.633 0.287 English muffin, plain, toasted 250 51 0 0 0.248 0.068 0.144 0.417 0.243 graham crackers 251 51 4 10 0.055 0.027 0 0.133 0.054 butter-type crackers 252 51 4 11 0.055 0.026 0 0.106 0.054 apricot, raw 253 34 32 2 0.001 0.003 0 0.015 0 peach, canned in light/medium syrup 254 51 51 0 0 0 0 0 0 pear, canned in light syrup 255 51 51 0 0 0 0 0 0 pineapple juice, from frozen 256 51 51 0 0 0 0 0 0 grape juice, from frozen concentrate 257 51 49 2 0.001 0.003 0 0.019 0 French fries, fast-food 258 51 46 5 0.002 0.006 0 0.025 0 carrot, fresh, boiled 259 51 45 6 0.002 0.005 0 0.027 0
Page 177 of 211 Rev 4.1
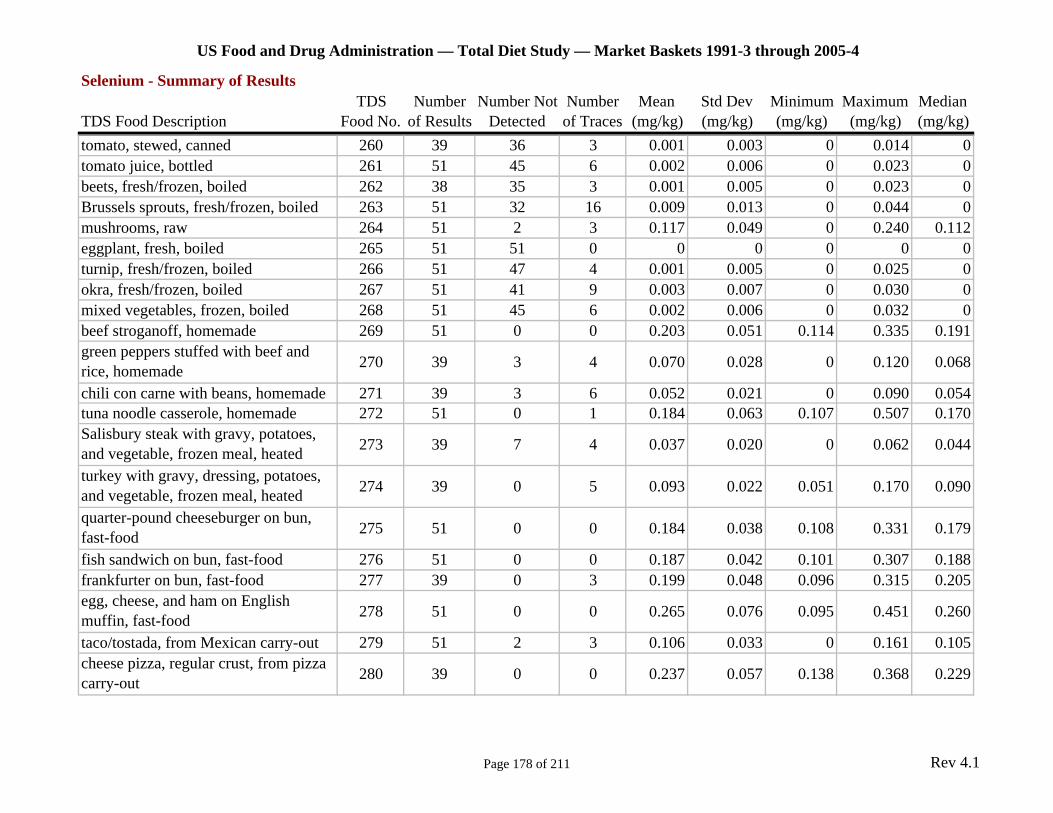
US Food and Drug Administration — Total Diet Study — Market Baskets 1991-3 through 2005-4
Selenium - Summary of Results TDS Number Number Not Number Mean Std Dev Minimum Maximum Median
TDS Food Description Food No. of Results Detected of Traces (mg/kg) (mg/kg) (mg/kg) (mg/kg) (mg/kg) tomato, stewed, canned 260 39 36 3 0.001 0.003 0 0.014 0 tomato juice, bottled 261 51 45 6 0.002 0.006 0 0.023 0 beets, fresh/frozen, boiled 262 38 35 3 0.001 0.005 0 0.023 0 Brussels sprouts, fresh/frozen, boiled 263 51 32 16 0.009 0.013 0 0.044 0 mushrooms, raw 264 51 2 3 0.117 0.049 0 0.240 0.112 eggplant, fresh, boiled 265 51 51 0 0 0 0 0 0 turnip, fresh/frozen, boiled 266 51 47 4 0.001 0.005 0 0.025 0 okra, fresh/frozen, boiled 267 51 41 9 0.003 0.007 0 0.030 0 mixed vegetables, frozen, boiled 268 51 45 6 0.002 0.006 0 0.032 0 beef stroganoff, homemade 269 51 0 0 0.203 0.051 0.114 0.335 0.191 green peppers stuffed with beef and rice, homemade 270 39 3 4 0.070 0.028 0 0.120 0.068
chili con carne with beans, homemade 271 39 3 6 0.052 0.021 0 0.090 0.054 tuna noodle casserole, homemade 272 51 0 1 0.184 0.063 0.107 0.507 0.170 Salisbury steak with gravy, potatoes, and vegetable, frozen meal, heated 273 39 7 4 0.037 0.020 0 0.062 0.044
turkey with gravy, dressing, potatoes, and vegetable, frozen meal, heated 274 39 0 5 0.093 0.022 0.051 0.170 0.090
quarter-pound cheeseburger on bun, fast-food 275 51 0 0 0.184 0.038 0.108 0.331 0.179
fish sandwich on bun, fast-food 276 51 0 0 0.187 0.042 0.101 0.307 0.188 frankfurter on bun, fast-food 277 39 0 3 0.199 0.048 0.096 0.315 0.205 egg, cheese, and ham on English muffin, fast-food 278 51 0 0 0.265 0.076 0.095 0.451 0.260
taco/tostada, from Mexican carry-out 279 51 2 3 0.106 0.033 0 0.161 0.105 cheese pizza, regular crust, from pizza carry-out 280 39 0 0 0.237 0.057 0.138 0.368 0.229
Page 178 of 211 Rev 4.1
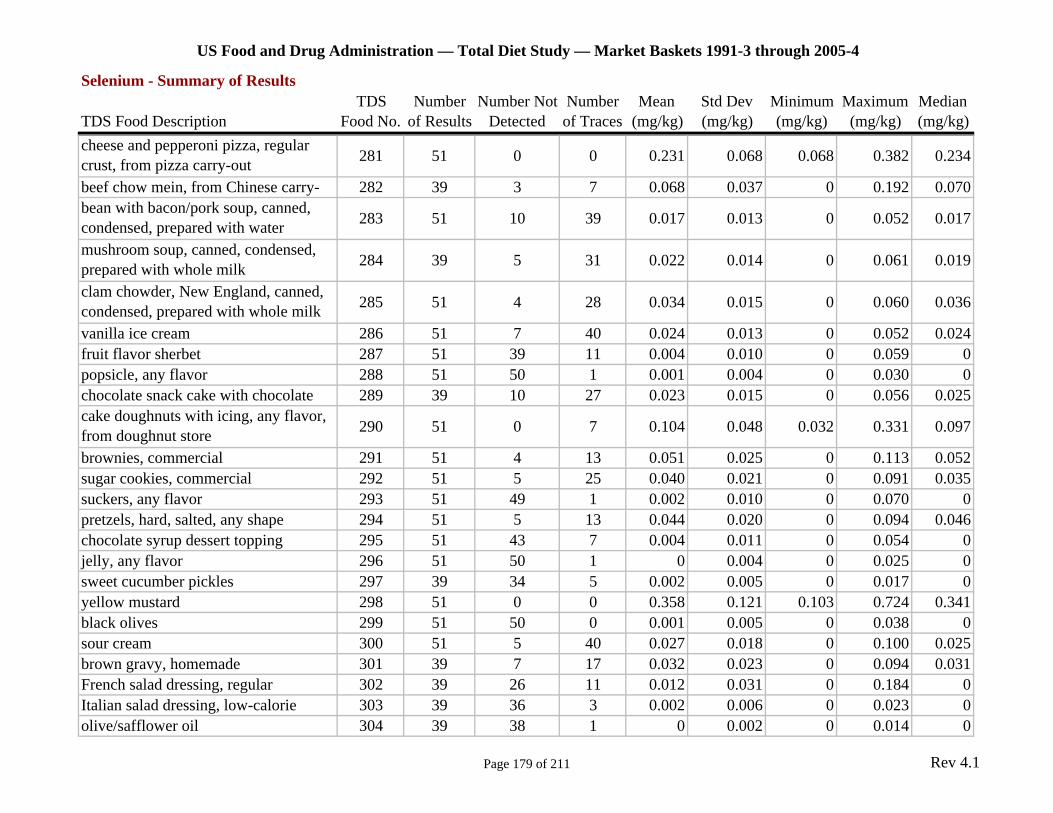
US Food and Drug Administration — Total Diet Study — Market Baskets 1991-3 through 2005-4
Selenium - Summary of Results TDS Number Number Not Number Mean Std Dev Minimum Maximum Median
TDS Food Description Food No. of Results Detected of Traces (mg/kg) (mg/kg) (mg/kg) (mg/kg) (mg/kg) cheese and pepperoni pizza, regular crust, from pizza carry-out 281 51 0 0 0.231 0.068 0.068 0.382 0.234
beef chow mein, from Chinese carry- 282 39 3 7 0.068 0.037 0 0.192 0.070 bean with bacon/pork soup, canned, condensed, prepared with water 283 51 10 39 0.017 0.013 0 0.052 0.017
mushroom soup, canned, condensed, prepared with whole milk 284 39 5 31 0.022 0.014 0 0.061 0.019
clam chowder, New England, canned, condensed, prepared with whole milk 285 51 4 28 0.034 0.015 0 0.060 0.036
vanilla ice cream 286 51 7 40 0.024 0.013 0 0.052 0.024 fruit flavor sherbet 287 51 39 11 0.004 0.010 0 0.059 0 popsicle, any flavor 288 51 50 1 0.001 0.004 0 0.030 0 chocolate snack cake with chocolate 289 39 10 27 0.023 0.015 0 0.056 0.025 cake doughnuts with icing, any flavor, from doughnut store 290 51 0 7 0.104 0.048 0.032 0.331 0.097
brownies, commercial 291 51 4 13 0.051 0.025 0 0.113 0.052 sugar cookies, commercial 292 51 5 25 0.040 0.021 0 0.091 0.035 suckers, any flavor 293 51 49 1 0.002 0.010 0 0.070 0 pretzels, hard, salted, any shape 294 51 5 13 0.044 0.020 0 0.094 0.046 chocolate syrup dessert topping 295 51 43 7 0.004 0.011 0 0.054 0 jelly, any flavor 296 51 50 1 0 0.004 0 0.025 0 sweet cucumber pickles 297 39 34 5 0.002 0.005 0 0.017 0 yellow mustard 298 51 0 0 0.358 0.121 0.103 0.724 0.341 black olives 299 51 50 0 0.001 0.005 0 0.038 0 sour cream 300 51 5 40 0.027 0.018 0 0.100 0.025 brown gravy, homemade 301 39 7 17 0.032 0.023 0 0.094 0.031 French salad dressing, regular 302 39 26 11 0.012 0.031 0 0.184 0 Italian salad dressing, low-calorie 303 39 36 3 0.002 0.006 0 0.023 0 olive/safflower oil 304 39 38 1 0 0.002 0 0.014 0
Page 179 of 211 Rev 4.1
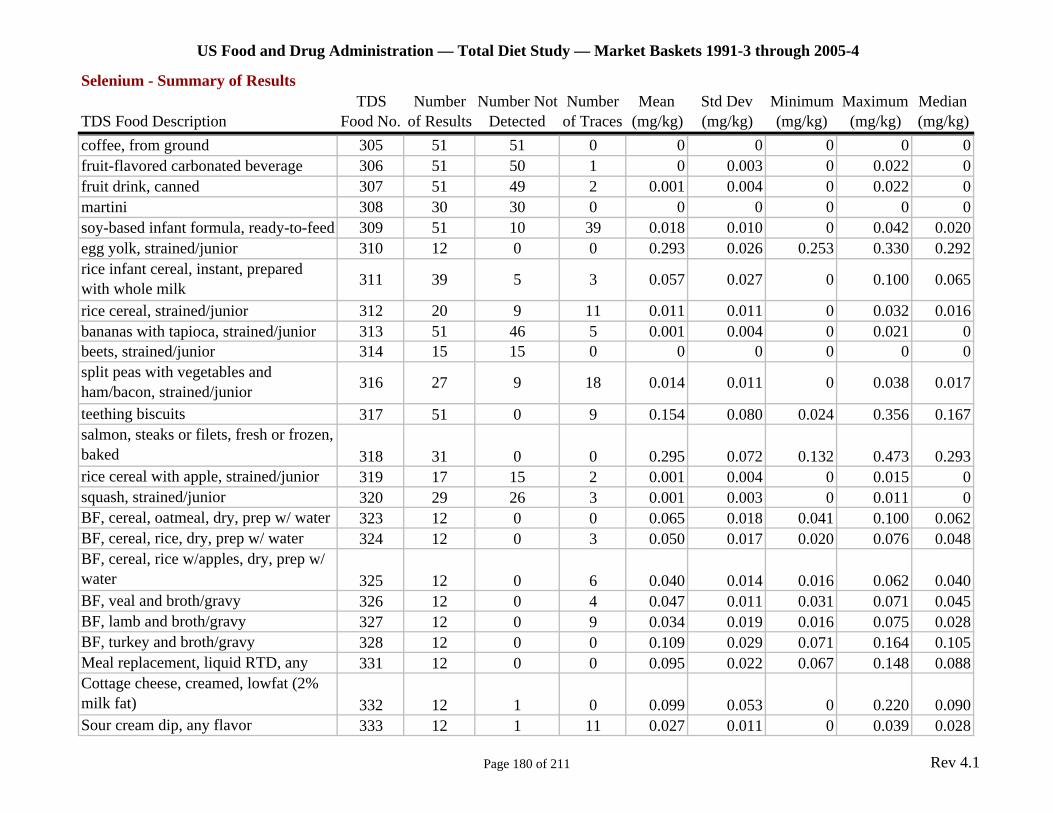
US Food and Drug Administration — Total Diet Study — Market Baskets 1991-3 through 2005-4
Selenium - Summary of Results TDS Number Number Not Number Mean Std Dev Minimum Maximum Median
TDS Food Description Food No. of Results Detected of Traces (mg/kg) (mg/kg) (mg/kg) (mg/kg) (mg/kg) coffee, from ground 305 51 51 0 0 0 0 0 0 fruit-flavored carbonated beverage 306 51 50 1 0 0.003 0 0.022 0 fruit drink, canned 307 51 49 2 0.001 0.004 0 0.022 0 martini 308 30 30 0 0 0 0 0 0 soy-based infant formula, ready-to-feed 309 51 10 39 0.018 0.010 0 0.042 0.020 egg yolk, strained/junior 310 12 0 0 0.293 0.026 0.253 0.330 0.292 rice infant cereal, instant, prepared with whole milk 311 39 5 3 0.057 0.027 0 0.100 0.065
rice cereal, strained/junior 312 20 9 11 0.011 0.011 0 0.032 0.016 bananas with tapioca, strained/junior 313 51 46 5 0.001 0.004 0 0.021 0 beets, strained/junior 314 15 15 0 0 0 0 0 0 split peas with vegetables and ham/bacon, strained/junior 316 27 9 18 0.014 0.011 0 0.038 0.017
teething biscuits 317 51 0 9 0.154 0.080 0.024 0.356 0.167 salmon, steaks or filets, fresh or frozen, baked 318 31 0 0 0.295 0.072 0.132 0.473 0.293 rice cereal with apple, strained/junior 319 17 15 2 0.001 0.004 0 0.015 0 squash, strained/junior 320 29 26 3 0.001 0.003 0 0.011 0 BF, cereal, oatmeal, dry, prep w/ water 323 12 0 0 0.065 0.018 0.041 0.100 0.062 BF, cereal, rice, dry, prep w/ water 324 12 0 3 0.050 0.017 0.020 0.076 0.048 BF, cereal, rice w/apples, dry, prep w/ water 325 12 0 6 0.040 0.014 0.016 0.062 0.040 BF, veal and broth/gravy 326 12 0 4 0.047 0.011 0.031 0.071 0.045 BF, lamb and broth/gravy 327 12 0 9 0.034 0.019 0.016 0.075 0.028 BF, turkey and broth/gravy 328 12 0 0 0.109 0.029 0.071 0.164 0.105 Meal replacement, liquid RTD, any 331 12 0 0 0.095 0.022 0.067 0.148 0.088 Cottage cheese, creamed, lowfat (2% milk fat) 332 12 1 0 0.099 0.053 0 0.220 0.090 Sour cream dip, any flavor 333 12 1 11 0.027 0.011 0 0.039 0.028
Page 180 of 211 Rev 4.1
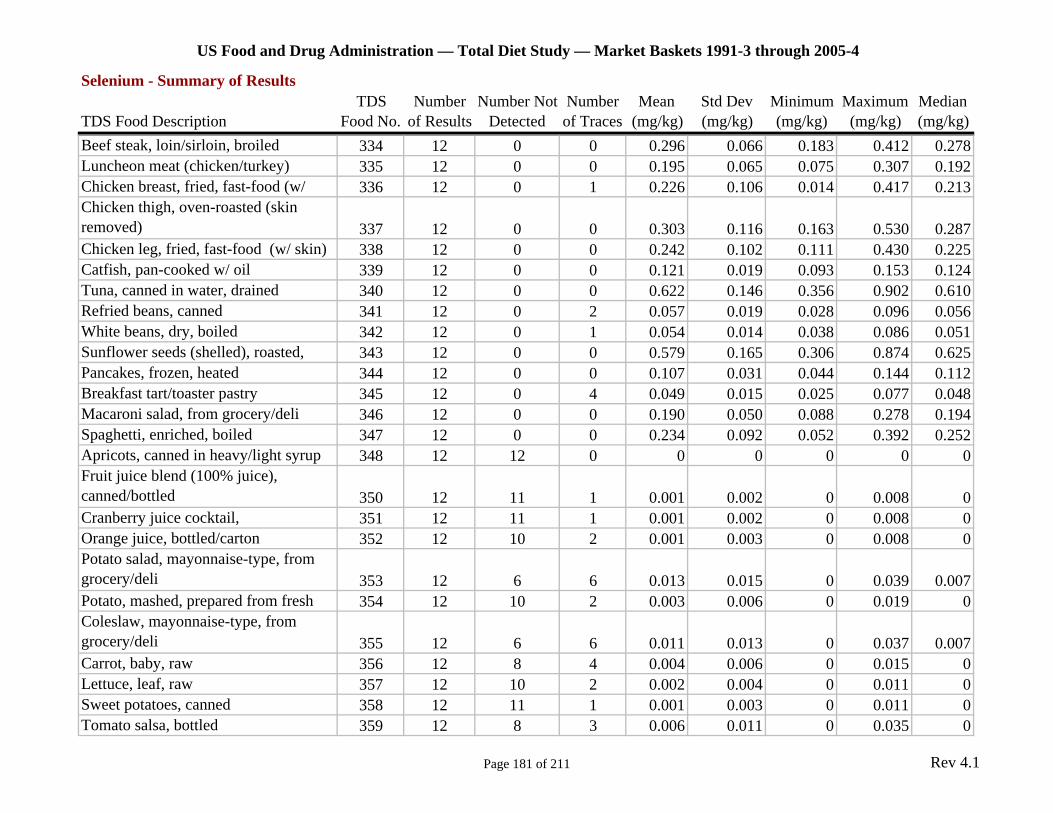
US Food and Drug Administration — Total Diet Study — Market Baskets 1991-3 through 2005-4
Selenium - Summary of Results TDS Number Number Not Number Mean Std Dev Minimum Maximum Median
TDS Food Description Food No. of Results Detected of Traces (mg/kg) (mg/kg) (mg/kg) (mg/kg) (mg/kg) Beef steak, loin/sirloin, broiled 334 12 0 0 0.296 0.066 0.183 0.412 0.278 Luncheon meat (chicken/turkey) 335 12 0 0 0.195 0.065 0.075 0.307 0.192 Chicken breast, fried, fast-food (w/ 336 12 0 1 0.226 0.106 0.014 0.417 0.213 Chicken thigh, oven-roasted (skin removed) 337 12 0 0 0.303 0.116 0.163 0.530 0.287 Chicken leg, fried, fast-food (w/ skin) 338 12 0 0 0.242 0.102 0.111 0.430 0.225 Catfish, pan-cooked w/ oil 339 12 0 0 0.121 0.019 0.093 0.153 0.124 Tuna, canned in water, drained 340 12 0 0 0.622 0.146 0.356 0.902 0.610 Refried beans, canned 341 12 0 2 0.057 0.019 0.028 0.096 0.056 White beans, dry, boiled 342 12 0 1 0.054 0.014 0.038 0.086 0.051 Sunflower seeds (shelled), roasted, 343 12 0 0 0.579 0.165 0.306 0.874 0.625 Pancakes, frozen, heated 344 12 0 0 0.107 0.031 0.044 0.144 0.112 Breakfast tart/toaster pastry 345 12 0 4 0.049 0.015 0.025 0.077 0.048 Macaroni salad, from grocery/deli 346 12 0 0 0.190 0.050 0.088 0.278 0.194 Spaghetti, enriched, boiled 347 12 0 0 0.234 0.092 0.052 0.392 0.252 Apricots, canned in heavy/light syrup 348 12 12 0 0 0 0 0 0 Fruit juice blend (100% juice), canned/bottled 350 12 11 1 0.001 0.002 0 0.008 0 Cranberry juice cocktail, 351 12 11 1 0.001 0.002 0 0.008 0 Orange juice, bottled/carton 352 12 10 2 0.001 0.003 0 0.008 0 Potato salad, mayonnaise-type, from grocery/deli 353 12 6 6 0.013 0.015 0 0.039 0.007 Potato, mashed, prepared from fresh 354 12 10 2 0.003 0.006 0 0.019 0 Coleslaw, mayonnaise-type, from grocery/deli 355 12 6 6 0.011 0.013 0 0.037 0.007 Carrot, baby, raw 356 12 8 4 0.004 0.006 0 0.015 0 Lettuce, leaf, raw 357 12 10 2 0.002 0.004 0 0.011 0 Sweet potatoes, canned 358 12 11 1 0.001 0.003 0 0.011 0 Tomato salsa, bottled 359 12 8 3 0.006 0.011 0 0.035 0
Page 181 of 211 Rev 4.1

US Food and Drug Administration — Total Diet Study — Market Baskets 1991-3 through 2005-4
Selenium - Summary of Results TDS Number Number Not Number Mean Std Dev Minimum Maximum Median
TDS Food Description Food No. of Results Detected of Traces (mg/kg) (mg/kg) (mg/kg) (mg/kg) (mg/kg) Beef and vegetable stew, canned 360 12 0 10 0.026 0.011 0.016 0.047 0.022 Lasagna w/ meat, frozen, heated 361 12 0 0 0.156 0.040 0.100 0.246 0.148 Beef w/ vegetables in sauce, from Chinese carry-out 362 12 0 1 0.072 0.022 0.036 0.120 0.069 Chicken w/ vegetables in sauce, from Chinese carry-out 363 12 0 0 0.065 0.024 0.041 0.117 0.054 Fried rice, meatless, from Chinese carry-out 364 12 0 0 0.083 0.027 0.045 0.128 0.084 Burrito w/ beef, beans and cheese, from Mexican carry-out 365 12 0 0 0.132 0.016 0.112 0.160 0.129 Chicken filet (broiled) sandwich on bun, fast-food 366 12 0 0 0.209 0.034 0.153 0.262 0.201 Soup, Oriental noodles (ramen noodles), prep w/ water 367 12 0 5 0.047 0.017 0.018 0.071 0.050 Pudding, ready-to-eat, flavor other than chocolate 368 12 2 10 0.011 0.006 0 0.017 0.013 Cake, yellow w/ icing 369 12 0 2 0.055 0.017 0.028 0.090 0.053 Granola bar, w/ raisins 370 12 0 0 0.114 0.025 0.082 0.175 0.105 Candy bar, chocolate, nougat, and nuts 371 12 0 0 0.120 0.034 0.081 0.183 0.106 Popcorn, microwave, butter-flavored 372 12 1 6 0.049 0.035 0 0.140 0.038 Sweet & sour sauce 373 12 11 1 0.001 0.003 0 0.011 0 Brown gravy, canned or bottled 374 12 11 1 0.001 0.004 0 0.014 0 Salad dressing, creamy/buttermilk type, regular 375 12 1 9 0.026 0.012 0 0.046 0.024 Salad dressing, creamy/buttermilk type, low-calorie 376 12 0 12 0.020 0.005 0.013 0.026 0.021 Salad dressing, Italian, regular 377 12 10 2 0.002 0.005 0 0.015 0 Olive oil 378 12 11 1 0.001 0.004 0 0.013 0
Page 182 of 211 Rev 4.1
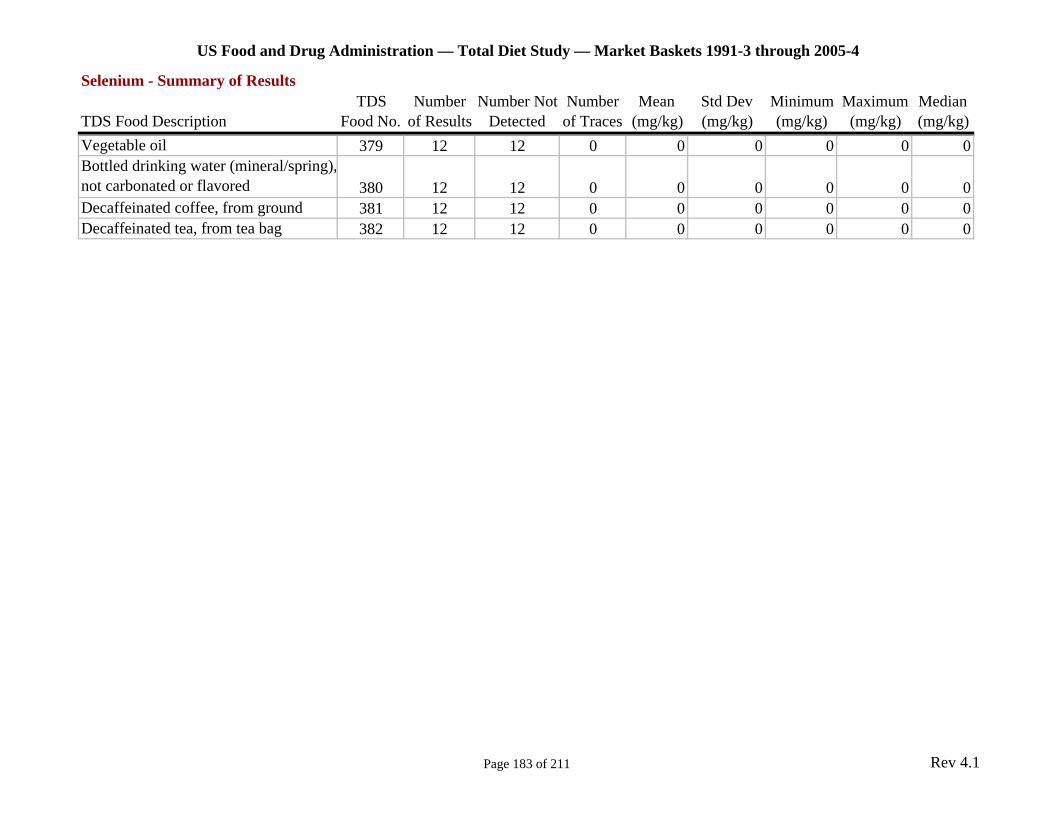
US Food and Drug Administration — Total Diet Study — Market Baskets 1991-3 through 2005-4
Selenium - Summary of Results TDS Number Number Not Number Mean Std Dev Minimum Maximum Median
TDS Food Description Food No. of Results Detected of Traces (mg/kg) (mg/kg) (mg/kg) (mg/kg) (mg/kg) Vegetable oil 379 12 12 0 0 0 0 0 0 Bottled drinking water (mineral/spring), not carbonated or flavored 380 12 12 0 0 0 0 0 0 Decaffeinated coffee, from ground 381 12 12 0 0 0 0 0 0 Decaffeinated tea, from tea bag 382 12 12 0 0 0 0 0 0
Page 183 of 211 Rev 4.1
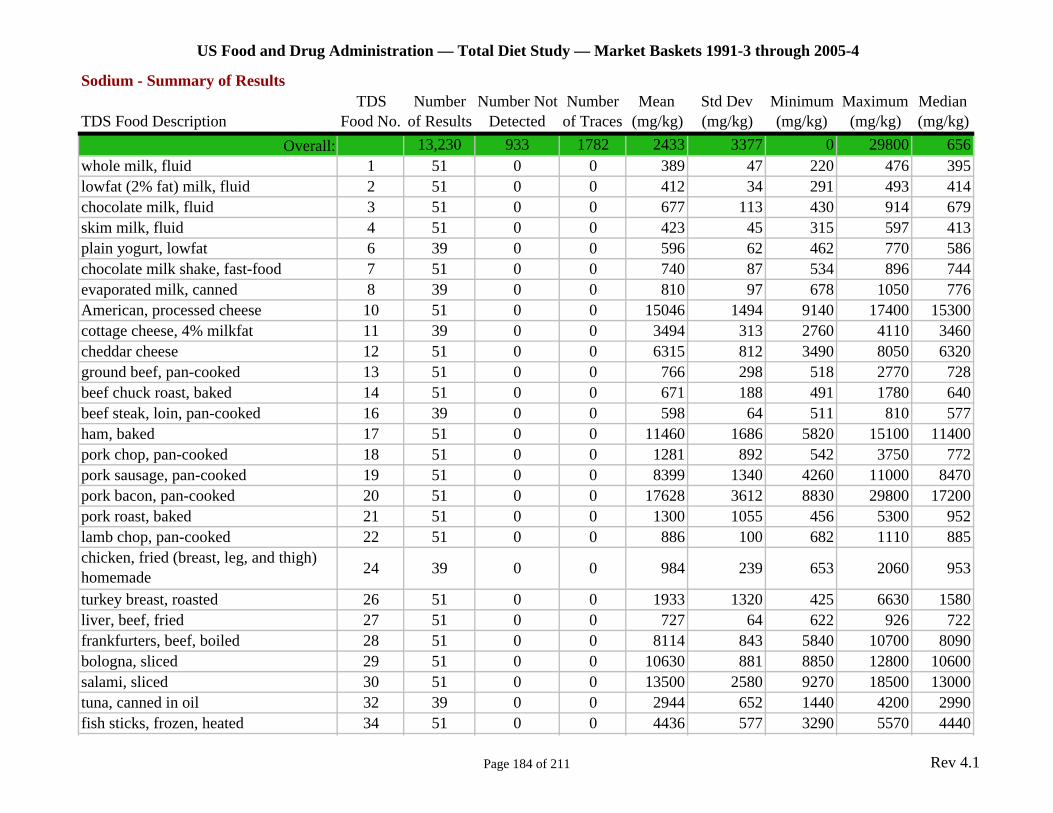
US Food and Drug Administration — Total Diet Study — Market Baskets 1991-3 through 2005-4
Sodium - Summary of Results TDS Number Number Not Number Mean Std Dev Minimum Maximum Median
TDS Food Description Food No. of Results Detected of Traces (mg/kg) (mg/kg) (mg/kg) (mg/kg) (mg/kg) Overall: 13,230 933 1782 2433 3377 0 29800 656
whole milk, fluid 1 51 0 0 389 47 220 476 395 lowfat (2% fat) milk, fluid 2 51 0 0 412 34 291 493 414 chocolate milk, fluid 3 51 0 0 677 113 430 914 679 skim milk, fluid 4 51 0 0 423 45 315 597 413 plain yogurt, lowfat 6 39 0 0 596 62 462 770 586 chocolate milk shake, fast-food 7 51 0 0 740 87 534 896 744 evaporated milk, canned 8 39 0 0 810 97 678 1050 776 American, processed cheese 10 51 0 0 15046 1494 9140 17400 15300 cottage cheese, 4% milkfat 11 39 0 0 3494 313 2760 4110 3460 cheddar cheese 12 51 0 0 6315 812 3490 8050 6320 ground beef, pan-cooked 13 51 0 0 766 298 518 2770 728 beef chuck roast, baked 14 51 0 0 671 188 491 1780 640 beef steak, loin, pan-cooked 16 39 0 0 598 64 511 810 577 ham, baked 17 51 0 0 11460 1686 5820 15100 11400 pork chop, pan-cooked 18 51 0 0 1281 892 542 3750 772 pork sausage, pan-cooked 19 51 0 0 8399 1340 4260 11000 8470 pork bacon, pan-cooked 20 51 0 0 17628 3612 8830 29800 17200 pork roast, baked 21 51 0 0 1300 1055 456 5300 952 lamb chop, pan-cooked 22 51 0 0 886 100 682 1110 885 chicken, fried (breast, leg, and thigh) homemade 24 39 0 0 984 239 653 2060 953
turkey breast, roasted 26 51 0 0 1933 1320 425 6630 1580 liver, beef, fried 27 51 0 0 727 64 622 926 722 frankfurters, beef, boiled 28 51 0 0 8114 843 5840 10700 8090 bologna, sliced 29 51 0 0 10630 881 8850 12800 10600 salami, sliced 30 51 0 0 13500 2580 9270 18500 13000 tuna, canned in oil 32 39 0 0 2944 652 1440 4200 2990 fish sticks, frozen, heated 34 51 0 0 4436 577 3290 5570 4440
Page 184 of 211 Rev 4.1

US Food and Drug Administration — Total Diet Study — Market Baskets 1991-3 through 2005-4
Sodium - Summary of Results TDS Number Number Not Number Mean Std Dev Minimum Maximum Median
TDS Food Description Food No. of Results Detected of Traces (mg/kg) (mg/kg) (mg/kg) (mg/kg) (mg/kg) eggs, scrambled 35 51 0 0 2550 1191 1080 9280 2410 eggs, fried 36 39 0 0 1330 76 1140 1530 1330 eggs, boiled 37 51 0 0 1232 65 1060 1360 1250 pinto beans, dry, boiled 38 51 40 11 2 5 0 18 0 pork and beans, canned 39 51 0 0 3290 281 2490 4060 3290 lima beans, immature, frozen, boiled 42 51 0 0 398 265 47 1240 301 green peas, fresh/frozen, boiled 46 51 0 10 367 321 8 1590 307 peanut butter, smooth 47 51 0 0 4202 597 2890 5950 4200 peanuts, dry roasted 48 51 0 0 5133 1452 1430 8240 5280 white rice, cooked 50 51 33 15 13 47 0 308 0 oatmeal, quick (1-3 min), cooked 51 51 34 10 21 53 0 270 0 wheat cereal, farina, quick (1-3min), 52 51 8 3 224 211 0 1150 211 corngrits, regular, cooked 53 51 38 3 238 771 0 4470 0 corn, fresh/frozen, boiled 54 51 38 13 4 7 0 24 0 corn, canned 55 12 0 1 1861 752 30 2750 2120 cream style corn, canned 56 39 0 0 2721 460 1420 3420 2790 popcorn, popped in oil 57 39 35 2 3 9 0 40 0 white bread 58 51 0 0 5398 470 3950 6270 5430 white roll 59 39 0 0 5230 478 4360 6300 5200 cornbread, homemade 60 51 0 0 4904 1455 1690 10500 4800 biscuit, from refrigerated dough, baked 61 51 0 0 9769 998 6970 11400 9770 whole wheat bread 62 51 0 0 5105 505 3480 6920 5090 tortilla, flour 63 51 0 0 6755 1210 3040 8440 7080 rye bread 64 51 0 0 6349 796 3550 7640 6460 blueberry muffin, commercial 65 51 0 0 3772 587 2500 5180 3730 saltine crackers 66 51 0 0 10998 1239 8420 15100 10800 corn chips 67 51 1 0 4369 1252 0 7140 4590 pancake from mix 68 39 0 0 5750 730 4210 7570 5800 egg noodles, boiled 69 51 0 17 45 54 11 402 36
Page 185 of 211 Rev 4.1
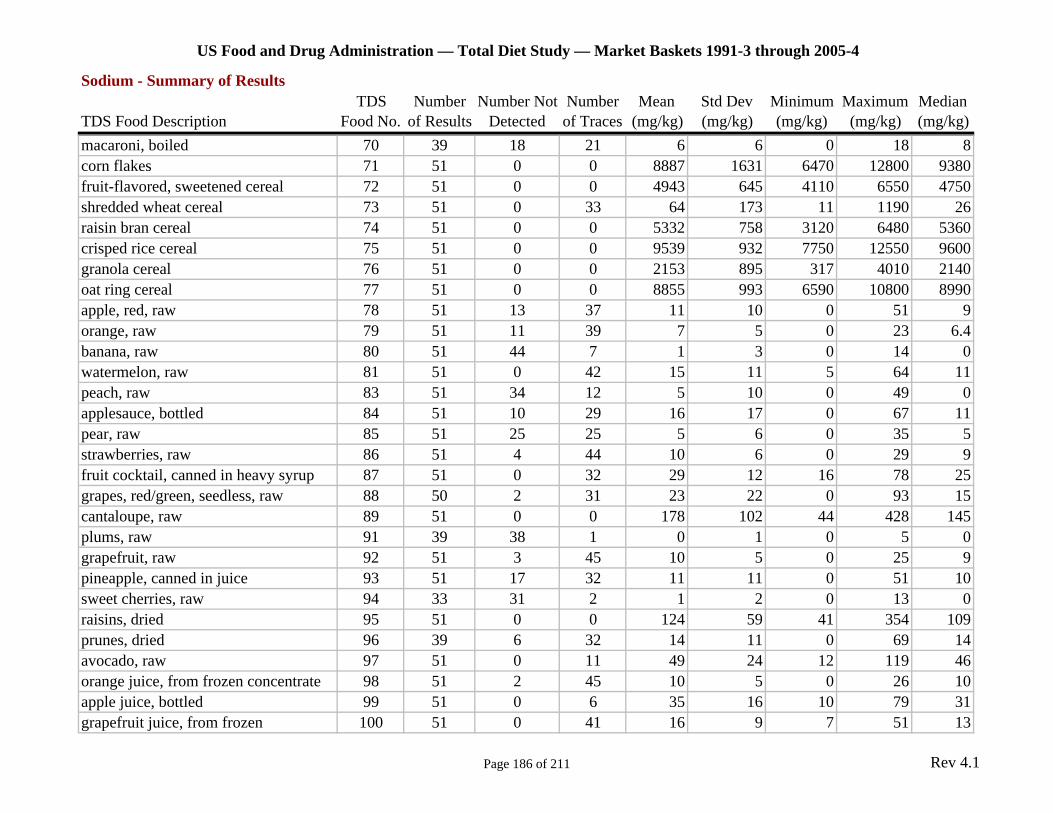
US Food and Drug Administration — Total Diet Study — Market Baskets 1991-3 through 2005-4
Sodium - Summary of Results TDS Number Number Not Number Mean Std Dev Minimum Maximum Median
TDS Food Description Food No. of Results Detected of Traces (mg/kg) (mg/kg) (mg/kg) (mg/kg) (mg/kg) macaroni, boiled 70 39 18 21 6 6 0 18 8 corn flakes 71 51 0 0 8887 1631 6470 12800 9380 fruit-flavored, sweetened cereal 72 51 0 0 4943 645 4110 6550 4750 shredded wheat cereal 73 51 0 33 64 173 11 1190 26 raisin bran cereal 74 51 0 0 5332 758 3120 6480 5360 crisped rice cereal 75 51 0 0 9539 932 7750 12550 9600 granola cereal 76 51 0 0 2153 895 317 4010 2140 oat ring cereal 77 51 0 0 8855 993 6590 10800 8990 apple, red, raw 78 51 13 37 11 10 0 51 9 orange, raw 79 51 11 39 7 5 0 23 6.4 banana, raw 80 51 44 7 1 3 0 14 0 watermelon, raw 81 51 0 42 15 11 5 64 11 peach, raw 83 51 34 12 5 10 0 49 0 applesauce, bottled 84 51 10 29 16 17 0 67 11 pear, raw 85 51 25 25 5 6 0 35 5 strawberries, raw 86 51 4 44 10 6 0 29 9 fruit cocktail, canned in heavy syrup 87 51 0 32 29 12 16 78 25 grapes, red/green, seedless, raw 88 50 2 31 23 22 0 93 15 cantaloupe, raw 89 51 0 0 178 102 44 428 145 plums, raw 91 39 38 1 0 1 0 5 0 grapefruit, raw 92 51 3 45 10 5 0 25 9 pineapple, canned in juice 93 51 17 32 11 11 0 51 10 sweet cherries, raw 94 33 31 2 1 2 0 13 0 raisins, dried 95 51 0 0 124 59 41 354 109 prunes, dried 96 39 6 32 14 11 0 69 14 avocado, raw 97 51 0 11 49 24 12 119 46 orange juice, from frozen concentrate 98 51 2 45 10 5 0 26 10 apple juice, bottled 99 51 0 6 35 16 10 79 31 grapefruit juice, from frozen 100 51 0 41 16 9 7 51 13
Page 186 of 211 Rev 4.1
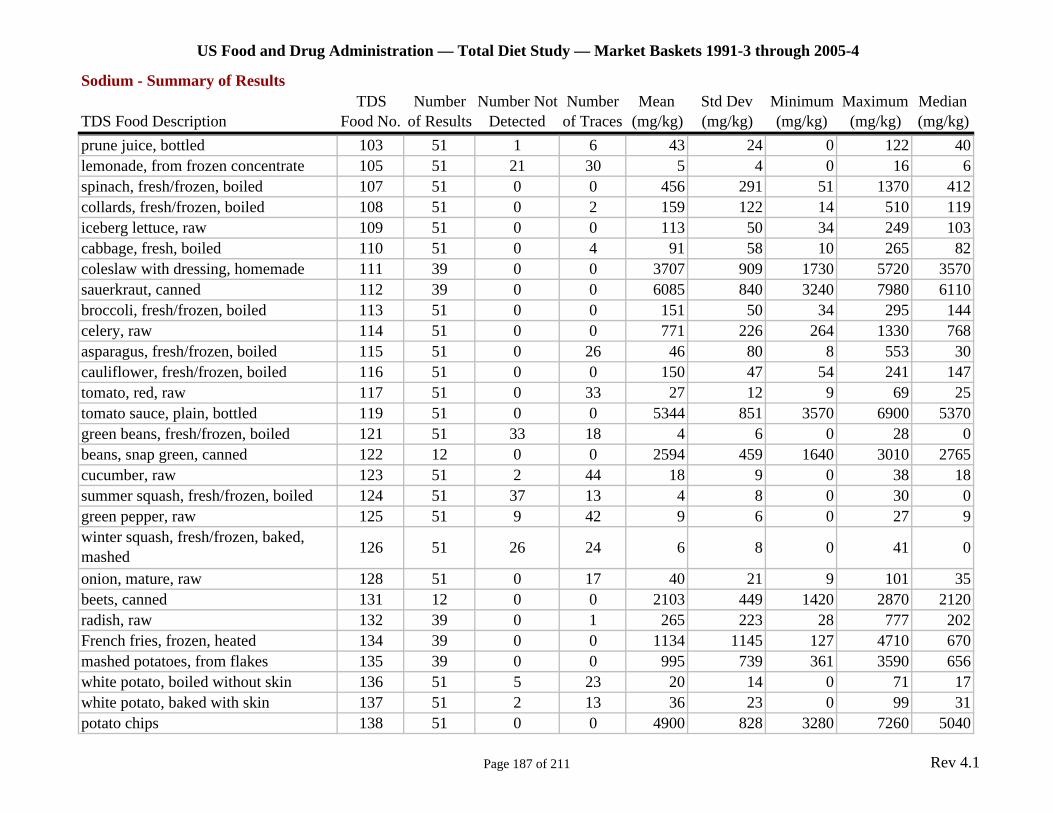
US Food and Drug Administration — Total Diet Study — Market Baskets 1991-3 through 2005-4
Sodium - Summary of Results TDS Number Number Not Number Mean Std Dev Minimum Maximum Median
TDS Food Description Food No. of Results Detected of Traces (mg/kg) (mg/kg) (mg/kg) (mg/kg) (mg/kg) prune juice, bottled 103 51 1 6 43 24 0 122 40 lemonade, from frozen concentrate 105 51 21 30 5 4 0 16 6 spinach, fresh/frozen, boiled 107 51 0 0 456 291 51 1370 412 collards, fresh/frozen, boiled 108 51 0 2 159 122 14 510 119 iceberg lettuce, raw 109 51 0 0 113 50 34 249 103 cabbage, fresh, boiled 110 51 0 4 91 58 10 265 82 coleslaw with dressing, homemade 111 39 0 0 3707 909 1730 5720 3570 sauerkraut, canned 112 39 0 0 6085 840 3240 7980 6110 broccoli, fresh/frozen, boiled 113 51 0 0 151 50 34 295 144 celery, raw 114 51 0 0 771 226 264 1330 768 asparagus, fresh/frozen, boiled 115 51 0 26 46 80 8 553 30 cauliflower, fresh/frozen, boiled 116 51 0 0 150 47 54 241 147 tomato, red, raw 117 51 0 33 27 12 9 69 25 tomato sauce, plain, bottled 119 51 0 0 5344 851 3570 6900 5370 green beans, fresh/frozen, boiled 121 51 33 18 4 6 0 28 0 beans, snap green, canned 122 12 0 0 2594 459 1640 3010 2765 cucumber, raw 123 51 2 44 18 9 0 38 18 summer squash, fresh/frozen, boiled 124 51 37 13 4 8 0 30 0 green pepper, raw 125 51 9 42 9 6 0 27 9 winter squash, fresh/frozen, baked, mashed 126 51 26 24 6 8 0 41 0
onion, mature, raw 128 51 0 17 40 21 9 101 35 beets, canned 131 12 0 0 2103 449 1420 2870 2120 radish, raw 132 39 0 1 265 223 28 777 202 French fries, frozen, heated 134 39 0 0 1134 1145 127 4710 670 mashed potatoes, from flakes 135 39 0 0 995 739 361 3590 656 white potato, boiled without skin 136 51 5 23 20 14 0 71 17 white potato, baked with skin 137 51 2 13 36 23 0 99 31 potato chips 138 51 0 0 4900 828 3280 7260 5040
Page 187 of 211 Rev 4.1
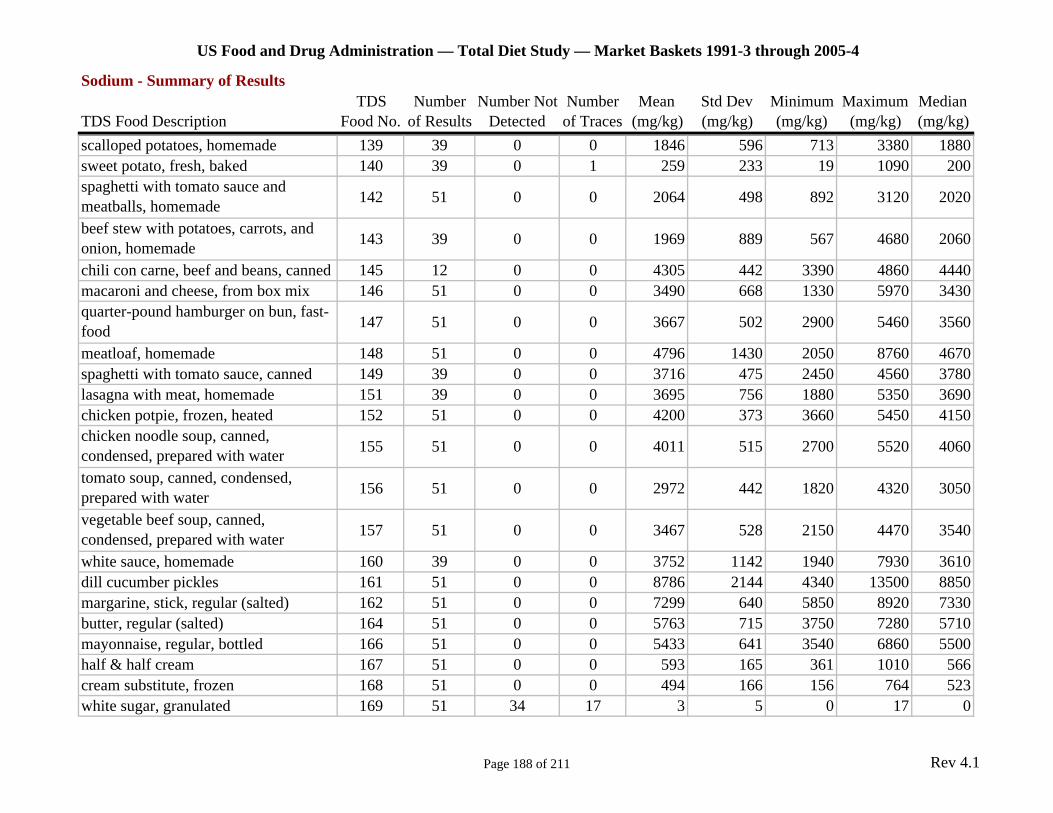
US Food and Drug Administration — Total Diet Study — Market Baskets 1991-3 through 2005-4
Sodium - Summary of Results TDS Number Number Not Number Mean Std Dev Minimum Maximum Median
TDS Food Description Food No. of Results Detected of Traces (mg/kg) (mg/kg) (mg/kg) (mg/kg) (mg/kg) scalloped potatoes, homemade 139 39 0 0 1846 596 713 3380 1880 sweet potato, fresh, baked 140 39 0 1 259 233 19 1090 200 spaghetti with tomato sauce and meatballs, homemade 142 51 0 0 2064 498 892 3120 2020
beef stew with potatoes, carrots, and onion, homemade 143 39 0 0 1969 889 567 4680 2060
chili con carne, beef and beans, canned 145 12 0 0 4305 442 3390 4860 4440 macaroni and cheese, from box mix 146 51 0 0 3490 668 1330 5970 3430 quarter-pound hamburger on bun, fast-food 147 51 0 0 3667 502 2900 5460 3560
meatloaf, homemade 148 51 0 0 4796 1430 2050 8760 4670 spaghetti with tomato sauce, canned 149 39 0 0 3716 475 2450 4560 3780 lasagna with meat, homemade 151 39 0 0 3695 756 1880 5350 3690 chicken potpie, frozen, heated 152 51 0 0 4200 373 3660 5450 4150 chicken noodle soup, canned, condensed, prepared with water 155 51 0 0 4011 515 2700 5520 4060
tomato soup, canned, condensed, prepared with water 156 51 0 0 2972 442 1820 4320 3050
vegetable beef soup, canned, condensed, prepared with water 157 51 0 0 3467 528 2150 4470 3540
white sauce, homemade 160 39 0 0 3752 1142 1940 7930 3610 dill cucumber pickles 161 51 0 0 8786 2144 4340 13500 8850 margarine, stick, regular (salted) 162 51 0 0 7299 640 5850 8920 7330 butter, regular (salted) 164 51 0 0 5763 715 3750 7280 5710 mayonnaise, regular, bottled 166 51 0 0 5433 641 3540 6860 5500 half & half cream 167 51 0 0 593 165 361 1010 566 cream substitute, frozen 168 51 0 0 494 166 156 764 523 white sugar, granulated 169 51 34 17 3 5 0 17 0
Page 188 of 211 Rev 4.1
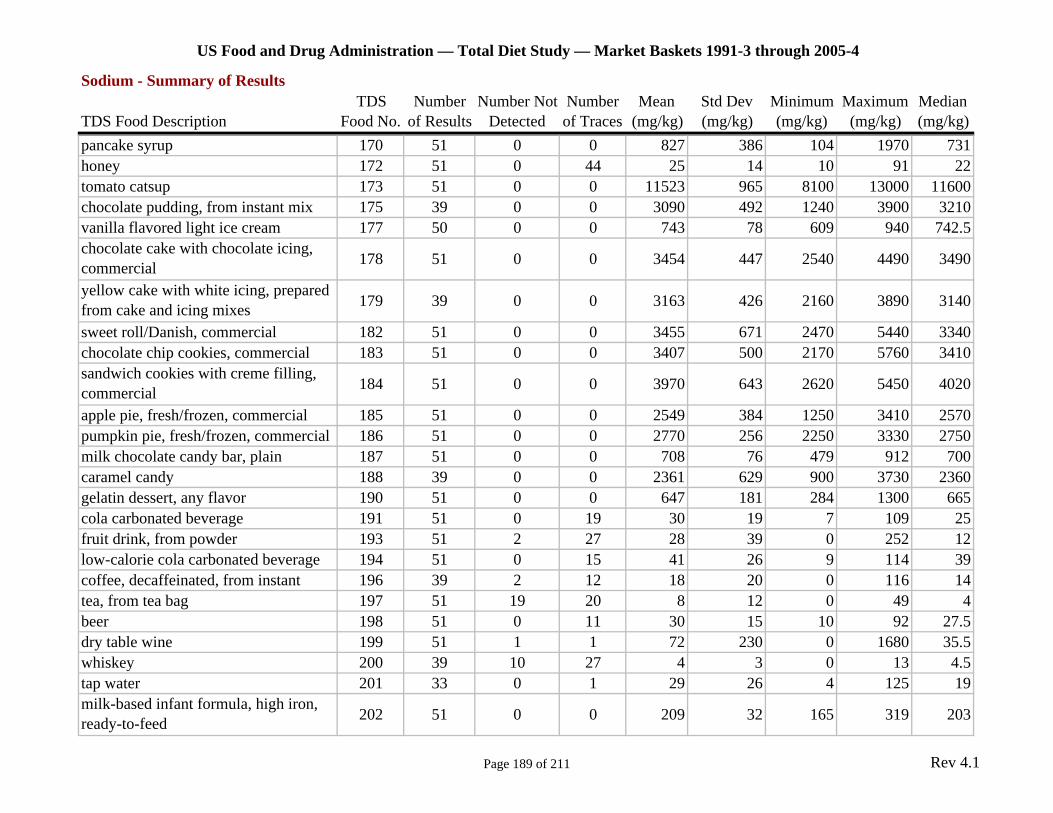
US Food and Drug Administration — Total Diet Study — Market Baskets 1991-3 through 2005-4
Sodium - Summary of Results TDS Number Number Not Number Mean Std Dev Minimum Maximum Median
TDS Food Description Food No. of Results Detected of Traces (mg/kg) (mg/kg) (mg/kg) (mg/kg) (mg/kg) pancake syrup 170 51 0 0 827 386 104 1970 731 honey 172 51 0 44 25 14 10 91 22 tomato catsup 173 51 0 0 11523 965 8100 13000 11600 chocolate pudding, from instant mix 175 39 0 0 3090 492 1240 3900 3210 vanilla flavored light ice cream 177 50 0 0 743 78 609 940 742.5 chocolate cake with chocolate icing, commercial 178 51 0 0 3454 447 2540 4490 3490
yellow cake with white icing, prepared from cake and icing mixes 179 39 0 0 3163 426 2160 3890 3140
sweet roll/Danish, commercial 182 51 0 0 3455 671 2470 5440 3340 chocolate chip cookies, commercial 183 51 0 0 3407 500 2170 5760 3410 sandwich cookies with creme filling, commercial 184 51 0 0 3970 643 2620 5450 4020
apple pie, fresh/frozen, commercial 185 51 0 0 2549 384 1250 3410 2570 pumpkin pie, fresh/frozen, commercial 186 51 0 0 2770 256 2250 3330 2750 milk chocolate candy bar, plain 187 51 0 0 708 76 479 912 700 caramel candy 188 39 0 0 2361 629 900 3730 2360 gelatin dessert, any flavor 190 51 0 0 647 181 284 1300 665 cola carbonated beverage 191 51 0 19 30 19 7 109 25 fruit drink, from powder 193 51 2 27 28 39 0 252 12 low-calorie cola carbonated beverage 194 51 0 15 41 26 9 114 39 coffee, decaffeinated, from instant 196 39 2 12 18 20 0 116 14 tea, from tea bag 197 51 19 20 8 12 0 49 4 beer 198 51 0 11 30 15 10 92 27.5 dry table wine 199 51 1 1 72 230 0 1680 35.5 whiskey 200 39 10 27 4 3 0 13 4.5 tap water 201 33 0 1 29 26 4 125 19 milk-based infant formula, high iron, ready-to-feed 202 51 0 0 209 32 165 319 203
Page 189 of 211 Rev 4.1
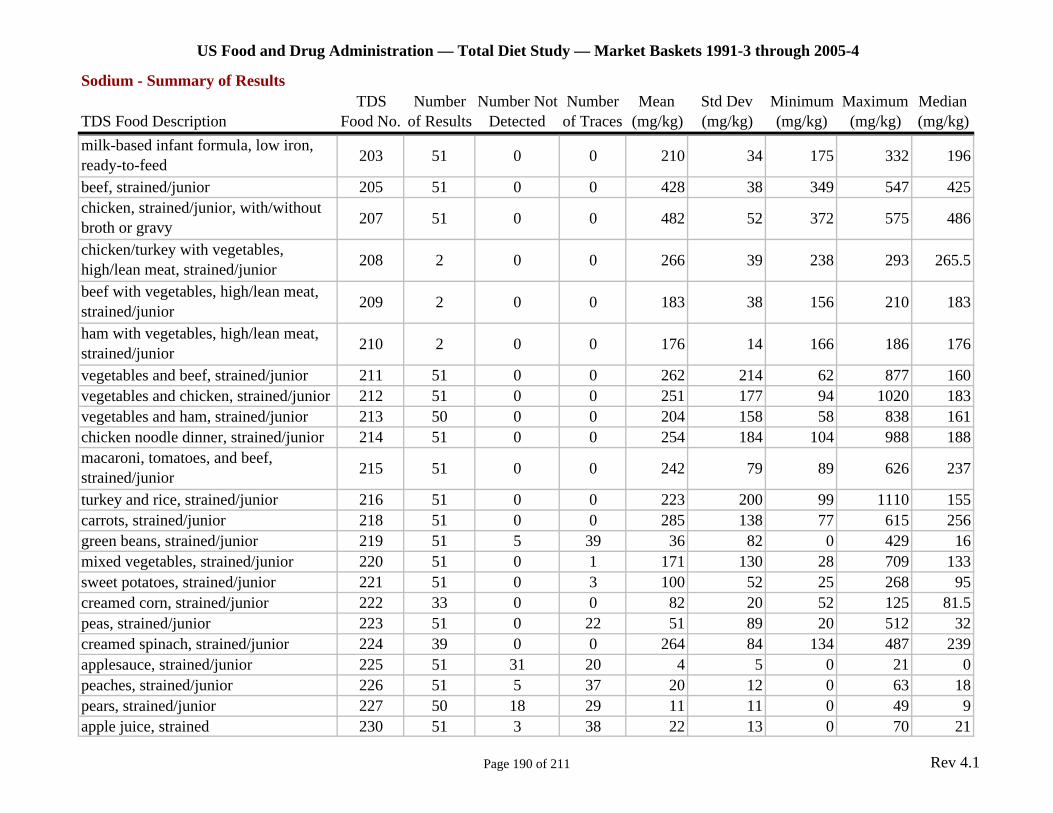
US Food and Drug Administration — Total Diet Study — Market Baskets 1991-3 through 2005-4
Sodium - Summary of Results TDS Number Number Not Number Mean Std Dev Minimum Maximum Median
TDS Food Description Food No. of Results Detected of Traces (mg/kg) (mg/kg) (mg/kg) (mg/kg) (mg/kg) milk-based infant formula, low iron, ready-to-feed 203 51 0 0 210 34 175 332 196
beef, strained/junior 205 51 0 0 428 38 349 547 425 chicken, strained/junior, with/without broth or gravy 207 51 0 0 482 52 372 575 486
chicken/turkey with vegetables, high/lean meat, strained/junior 208 2 0 0 266 39 238 293 265.5
beef with vegetables, high/lean meat, strained/junior 209 2 0 0 183 38 156 210 183
ham with vegetables, high/lean meat, strained/junior 210 2 0 0 176 14 166 186 176
vegetables and beef, strained/junior 211 51 0 0 262 214 62 877 160 vegetables and chicken, strained/junior 212 51 0 0 251 177 94 1020 183 vegetables and ham, strained/junior 213 50 0 0 204 158 58 838 161 chicken noodle dinner, strained/junior 214 51 0 0 254 184 104 988 188 macaroni, tomatoes, and beef, strained/junior 215 51 0 0 242 79 89 626 237
turkey and rice, strained/junior 216 51 0 0 223 200 99 1110 155 carrots, strained/junior 218 51 0 0 285 138 77 615 256 green beans, strained/junior 219 51 5 39 36 82 0 429 16 mixed vegetables, strained/junior 220 51 0 1 171 130 28 709 133 sweet potatoes, strained/junior 221 51 0 3 100 52 25 268 95 creamed corn, strained/junior 222 33 0 0 82 20 52 125 81.5 peas, strained/junior 223 51 0 22 51 89 20 512 32 creamed spinach, strained/junior 224 39 0 0 264 84 134 487 239 applesauce, strained/junior 225 51 31 20 4 5 0 21 0 peaches, strained/junior 226 51 5 37 20 12 0 63 18 pears, strained/junior 227 50 18 29 11 11 0 49 9 apple juice, strained 230 51 3 38 22 13 0 70 21
Page 190 of 211 Rev 4.1

US Food and Drug Administration — Total Diet Study — Market Baskets 1991-3 through 2005-4
Sodium - Summary of Results TDS Number Number Not Number Mean Std Dev Minimum Maximum Median
TDS Food Description Food No. of Results Detected of Traces (mg/kg) (mg/kg) (mg/kg) (mg/kg) (mg/kg) orange juice, strained 231 50 0 41 22 10 10 57 19 custard pudding, strained/junior 232 51 0 0 248 39 171 347 237 fruit dessert/pudding, strained/junior 233 51 1 14 45 22 0 102 44 fruit-flavored yogurt, lowfat (fruit 235 51 0 0 514 57 376 658 511 Swiss cheese 236 51 0 0 2180 1083 1410 7080 1890 cream cheese 237 51 0 0 3139 528 1810 4660 3170 veal cutlet, pan-cooked 238 39 0 0 749 105 438 928 740 ham luncheon meat, sliced 239 51 0 0 11396 1747 5780 14600 11700 chicken breast, roasted 240 51 0 0 716 543 393 3490 560 chicken nuggets, fast-food 241 51 0 0 6606 1334 4100 9660 6240 chicken, fried (breast, leg, and thigh), fast-food 242 39 0 0 6096 1142 4140 8340 6070
haddock, pan-cooked 243 20 0 0 1367 418 669 2090 1255 shrimp, boiled 244 51 0 0 3208 1201 1150 7510 3180 kidney beans, dry, boiled 245 39 26 12 4 7 0 30 0 peas, mature, dry, boiled 246 39 5 31 12 12 0 63 9 mixed nuts, no peanuts, dry roasted 247 39 0 0 2991 560 1330 4240 3030 cracked wheat bread 248 51 0 0 5079 539 3930 6400 5060 bagel, plain 249 51 0 0 4897 429 3900 6000 4900 English muffin, plain, toasted 250 51 0 0 4892 871 3600 8380 4620 graham crackers 251 51 0 0 5444 600 3890 6830 5380 butter-type crackers 252 51 0 0 7989 922 5700 10500 7930 apricot, raw 253 34 29 4 4 16 0 96 0 peach, canned in light/medium syrup 254 51 0 25 36 23 11 144 31.2 pear, canned in light syrup 255 51 3 33 21 16 0 71 18 pineapple juice, from frozen 256 51 1 41 13 7 0 32 11 grape juice, from frozen concentrate 257 51 0 14 37 22 10 107 30 French fries, fast-food 258 51 0 0 2542 1537 669 7080 2120 carrot, fresh, boiled 259 51 0 0 513 208 109 995 459
Page 191 of 211 Rev 4.1
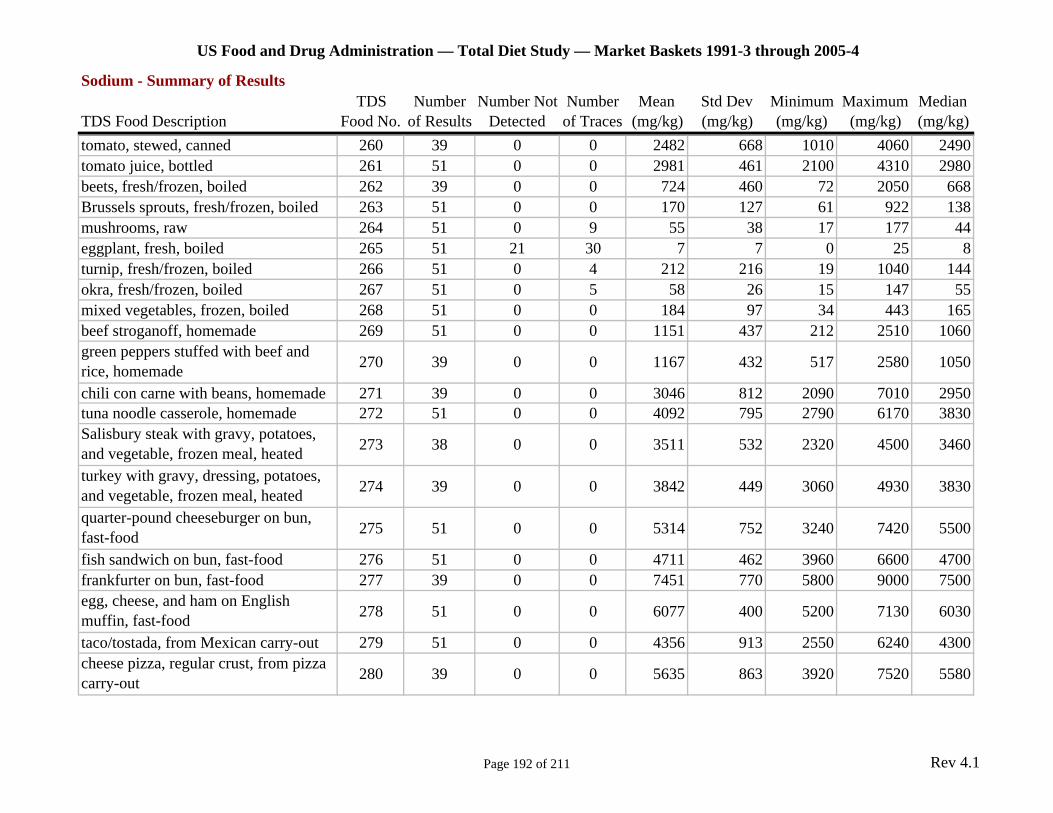
US Food and Drug Administration — Total Diet Study — Market Baskets 1991-3 through 2005-4
Sodium - Summary of Results TDS Number Number Not Number Mean Std Dev Minimum Maximum Median
TDS Food Description Food No. of Results Detected of Traces (mg/kg) (mg/kg) (mg/kg) (mg/kg) (mg/kg) tomato, stewed, canned 260 39 0 0 2482 668 1010 4060 2490 tomato juice, bottled 261 51 0 0 2981 461 2100 4310 2980 beets, fresh/frozen, boiled 262 39 0 0 724 460 72 2050 668 Brussels sprouts, fresh/frozen, boiled 263 51 0 0 170 127 61 922 138 mushrooms, raw 264 51 0 9 55 38 17 177 44 eggplant, fresh, boiled 265 51 21 30 7 7 0 25 8 turnip, fresh/frozen, boiled 266 51 0 4 212 216 19 1040 144 okra, fresh/frozen, boiled 267 51 0 5 58 26 15 147 55 mixed vegetables, frozen, boiled 268 51 0 0 184 97 34 443 165 beef stroganoff, homemade 269 51 0 0 1151 437 212 2510 1060 green peppers stuffed with beef and rice, homemade 270 39 0 0 1167 432 517 2580 1050
chili con carne with beans, homemade 271 39 0 0 3046 812 2090 7010 2950 tuna noodle casserole, homemade 272 51 0 0 4092 795 2790 6170 3830 Salisbury steak with gravy, potatoes, and vegetable, frozen meal, heated 273 38 0 0 3511 532 2320 4500 3460
turkey with gravy, dressing, potatoes, and vegetable, frozen meal, heated 274 39 0 0 3842 449 3060 4930 3830
quarter-pound cheeseburger on bun, fast-food 275 51 0 0 5314 752 3240 7420 5500
fish sandwich on bun, fast-food 276 51 0 0 4711 462 3960 6600 4700 frankfurter on bun, fast-food 277 39 0 0 7451 770 5800 9000 7500 egg, cheese, and ham on English muffin, fast-food 278 51 0 0 6077 400 5200 7130 6030
taco/tostada, from Mexican carry-out 279 51 0 0 4356 913 2550 6240 4300 cheese pizza, regular crust, from pizza carry-out 280 39 0 0 5635 863 3920 7520 5580
Page 192 of 211 Rev 4.1
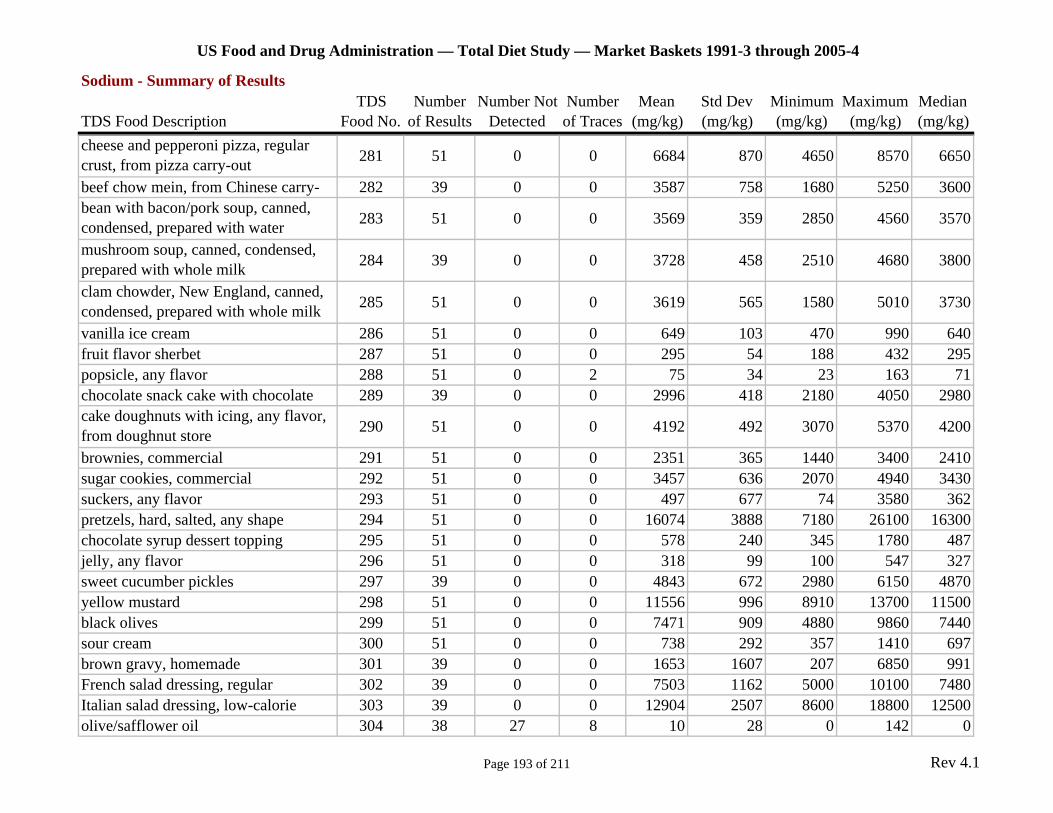
US Food and Drug Administration — Total Diet Study — Market Baskets 1991-3 through 2005-4
Sodium - Summary of Results TDS Number Number Not Number Mean Std Dev Minimum Maximum Median
TDS Food Description Food No. of Results Detected of Traces (mg/kg) (mg/kg) (mg/kg) (mg/kg) (mg/kg) cheese and pepperoni pizza, regular crust, from pizza carry-out 281 51 0 0 6684 870 4650 8570 6650
beef chow mein, from Chinese carry- 282 39 0 0 3587 758 1680 5250 3600 bean with bacon/pork soup, canned, condensed, prepared with water 283 51 0 0 3569 359 2850 4560 3570
mushroom soup, canned, condensed, prepared with whole milk 284 39 0 0 3728 458 2510 4680 3800
clam chowder, New England, canned, condensed, prepared with whole milk 285 51 0 0 3619 565 1580 5010 3730
vanilla ice cream 286 51 0 0 649 103 470 990 640 fruit flavor sherbet 287 51 0 0 295 54 188 432 295 popsicle, any flavor 288 51 0 2 75 34 23 163 71 chocolate snack cake with chocolate 289 39 0 0 2996 418 2180 4050 2980 cake doughnuts with icing, any flavor, from doughnut store 290 51 0 0 4192 492 3070 5370 4200
brownies, commercial 291 51 0 0 2351 365 1440 3400 2410 sugar cookies, commercial 292 51 0 0 3457 636 2070 4940 3430 suckers, any flavor 293 51 0 0 497 677 74 3580 362 pretzels, hard, salted, any shape 294 51 0 0 16074 3888 7180 26100 16300 chocolate syrup dessert topping 295 51 0 0 578 240 345 1780 487 jelly, any flavor 296 51 0 0 318 99 100 547 327 sweet cucumber pickles 297 39 0 0 4843 672 2980 6150 4870 yellow mustard 298 51 0 0 11556 996 8910 13700 11500 black olives 299 51 0 0 7471 909 4880 9860 7440 sour cream 300 51 0 0 738 292 357 1410 697 brown gravy, homemade 301 39 0 0 1653 1607 207 6850 991 French salad dressing, regular 302 39 0 0 7503 1162 5000 10100 7480 Italian salad dressing, low-calorie 303 39 0 0 12904 2507 8600 18800 12500 olive/safflower oil 304 38 27 8 10 28 0 142 0
Page 193 of 211 Rev 4.1
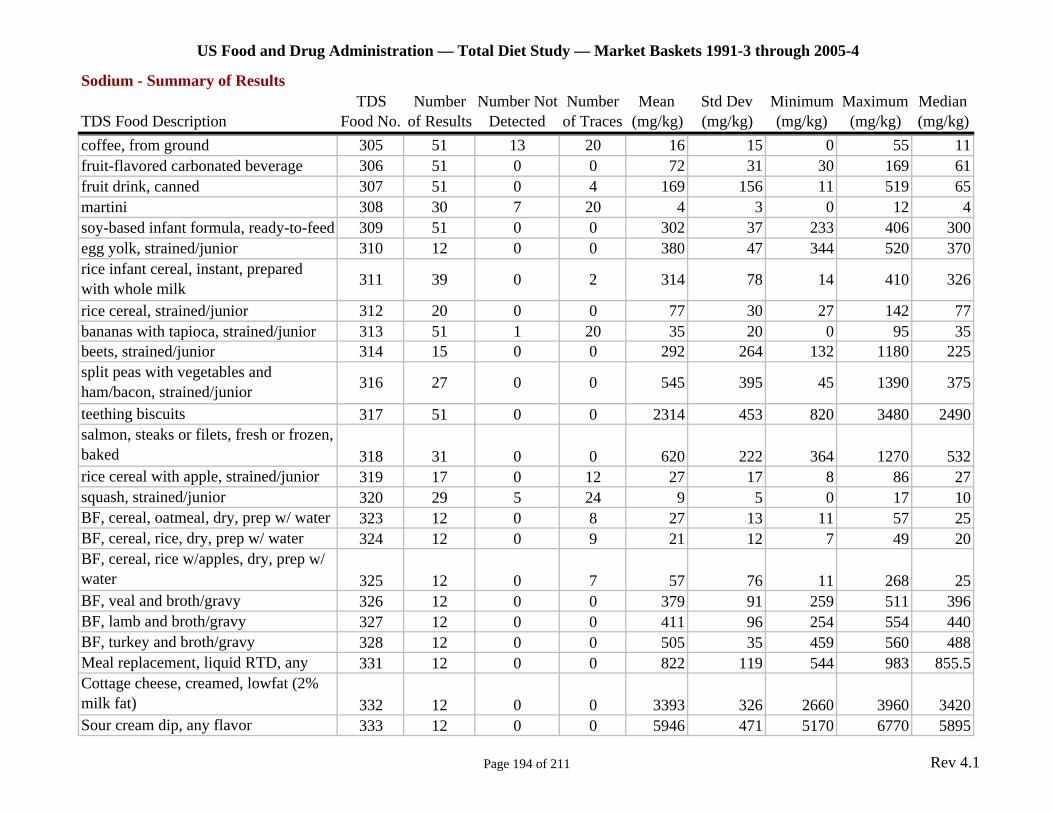
US Food and Drug Administration — Total Diet Study — Market Baskets 1991-3 through 2005-4
Sodium - Summary of Results TDS Number Number Not Number Mean Std Dev Minimum Maximum Median
TDS Food Description Food No. of Results Detected of Traces (mg/kg) (mg/kg) (mg/kg) (mg/kg) (mg/kg) coffee, from ground 305 51 13 20 16 15 0 55 11 fruit-flavored carbonated beverage 306 51 0 0 72 31 30 169 61 fruit drink, canned 307 51 0 4 169 156 11 519 65 martini 308 30 7 20 4 3 0 12 4 soy-based infant formula, ready-to-feed 309 51 0 0 302 37 233 406 300 egg yolk, strained/junior 310 12 0 0 380 47 344 520 370 rice infant cereal, instant, prepared with whole milk 311 39 0 2 314 78 14 410 326
rice cereal, strained/junior 312 20 0 0 77 30 27 142 77 bananas with tapioca, strained/junior 313 51 1 20 35 20 0 95 35 beets, strained/junior 314 15 0 0 292 264 132 1180 225 split peas with vegetables and ham/bacon, strained/junior 316 27 0 0 545 395 45 1390 375
teething biscuits 317 51 0 0 2314 453 820 3480 2490 salmon, steaks or filets, fresh or frozen, baked 318 31 0 0 620 222 364 1270 532 rice cereal with apple, strained/junior 319 17 0 12 27 17 8 86 27 squash, strained/junior 320 29 5 24 9 5 0 17 10 BF, cereal, oatmeal, dry, prep w/ water 323 12 0 8 27 13 11 57 25 BF, cereal, rice, dry, prep w/ water 324 12 0 9 21 12 7 49 20 BF, cereal, rice w/apples, dry, prep w/ water 325 12 0 7 57 76 11 268 25 BF, veal and broth/gravy 326 12 0 0 379 91 259 511 396 BF, lamb and broth/gravy 327 12 0 0 411 96 254 554 440 BF, turkey and broth/gravy 328 12 0 0 505 35 459 560 488 Meal replacement, liquid RTD, any 331 12 0 0 822 119 544 983 855.5 Cottage cheese, creamed, lowfat (2% milk fat) 332 12 0 0 3393 326 2660 3960 3420 Sour cream dip, any flavor 333 12 0 0 5946 471 5170 6770 5895
Page 194 of 211 Rev 4.1

US Food and Drug Administration — Total Diet Study — Market Baskets 1991-3 through 2005-4
Sodium - Summary of Results TDS Number Number Not Number Mean Std Dev Minimum Maximum Median
TDS Food Description Food No. of Results Detected of Traces (mg/kg) (mg/kg) (mg/kg) (mg/kg) (mg/kg) Beef steak, loin/sirloin, broiled 334 12 0 0 696 213 486 1140 611 Luncheon meat (chicken/turkey) 335 12 0 0 9660 1321 7610 11800 9840 Chicken breast, fried, fast-food (w/ 336 12 0 0 6303 536 5080 6910 6420 Chicken thigh, oven-roasted (skin removed) 337 12 0 0 1217 749 648 3010 885.5 Chicken leg, fried, fast-food (w/ skin) 338 12 0 0 6198 396 5250 6650 6260 Catfish, pan-cooked w/ oil 339 12 0 0 654 243 415 1170 546 Tuna, canned in water, drained 340 12 0 0 2657 487 1660 3330 2690 Refried beans, canned 341 12 0 0 4003 339 3410 4370 4080 White beans, dry, boiled 342 12 8 4 3 5 0 14 0 Sunflower seeds (shelled), roasted, 343 12 1 0 5785 2145 0 8760 6110 Pancakes, frozen, heated 344 12 0 0 5473 626 4290 6560 5340 Breakfast tart/toaster pastry 345 12 0 0 3473 418 3130 4650 3375 Macaroni salad, from grocery/deli 346 12 0 0 4677 814 3400 6290 4575 Spaghetti, enriched, boiled 347 12 4 8 7 6 0 15 8 Apricots, canned in heavy/light syrup 348 12 0 0 35 16 21 69 28 Fruit juice blend (100% juice), canned/bottled 350 12 0 0 61 16 37 88 64 Cranberry juice cocktail, 351 12 0 9 17 5 11 29 16 Orange juice, bottled/carton 352 12 0 5 34 28 8 110 29 Potato salad, mayonnaise-type, from grocery/deli 353 12 0 0 4021 378 3250 4570 3950 Potato, mashed, prepared from fresh 354 12 0 0 1381 590 747 2400 1088 Coleslaw, mayonnaise-type, from grocery/deli 355 12 0 0 2545 636 1560 3290 2440 Carrot, baby, raw 356 12 0 0 675 236 397 1130 627 Lettuce, leaf, raw 357 12 0 0 232 92 102 381 256 Sweet potatoes, canned 358 12 0 0 148 161 48 636 93 Tomato salsa, bottled 359 12 0 0 6121 575 5270 7130 6085
Page 195 of 211 Rev 4.1
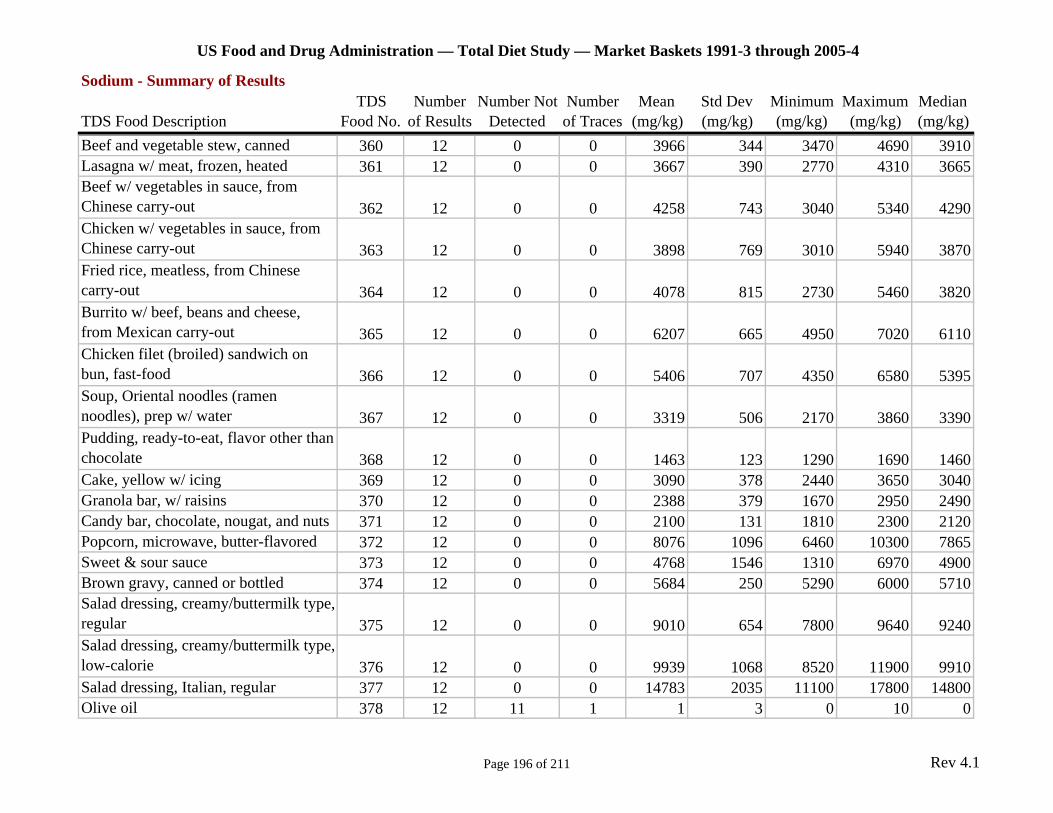
US Food and Drug Administration — Total Diet Study — Market Baskets 1991-3 through 2005-4
Sodium - Summary of Results TDS Number Number Not Number Mean Std Dev Minimum Maximum Median
TDS Food Description Food No. of Results Detected of Traces (mg/kg) (mg/kg) (mg/kg) (mg/kg) (mg/kg) Beef and vegetable stew, canned 360 12 0 0 3966 344 3470 4690 3910 Lasagna w/ meat, frozen, heated 361 12 0 0 3667 390 2770 4310 3665 Beef w/ vegetables in sauce, from Chinese carry-out 362 12 0 0 4258 743 3040 5340 4290 Chicken w/ vegetables in sauce, from Chinese carry-out 363 12 0 0 3898 769 3010 5940 3870 Fried rice, meatless, from Chinese carry-out 364 12 0 0 4078 815 2730 5460 3820 Burrito w/ beef, beans and cheese, from Mexican carry-out 365 12 0 0 6207 665 4950 7020 6110 Chicken filet (broiled) sandwich on bun, fast-food 366 12 0 0 5406 707 4350 6580 5395 Soup, Oriental noodles (ramen noodles), prep w/ water 367 12 0 0 3319 506 2170 3860 3390 Pudding, ready-to-eat, flavor other than chocolate 368 12 0 0 1463 123 1290 1690 1460 Cake, yellow w/ icing 369 12 0 0 3090 378 2440 3650 3040 Granola bar, w/ raisins 370 12 0 0 2388 379 1670 2950 2490 Candy bar, chocolate, nougat, and nuts 371 12 0 0 2100 131 1810 2300 2120 Popcorn, microwave, butter-flavored 372 12 0 0 8076 1096 6460 10300 7865 Sweet & sour sauce 373 12 0 0 4768 1546 1310 6970 4900 Brown gravy, canned or bottled 374 12 0 0 5684 250 5290 6000 5710 Salad dressing, creamy/buttermilk type, regular 375 12 0 0 9010 654 7800 9640 9240 Salad dressing, creamy/buttermilk type, low-calorie 376 12 0 0 9939 1068 8520 11900 9910 Salad dressing, Italian, regular 377 12 0 0 14783 2035 11100 17800 14800 Olive oil 378 12 11 1 1 3 0 10 0
Page 196 of 211 Rev 4.1
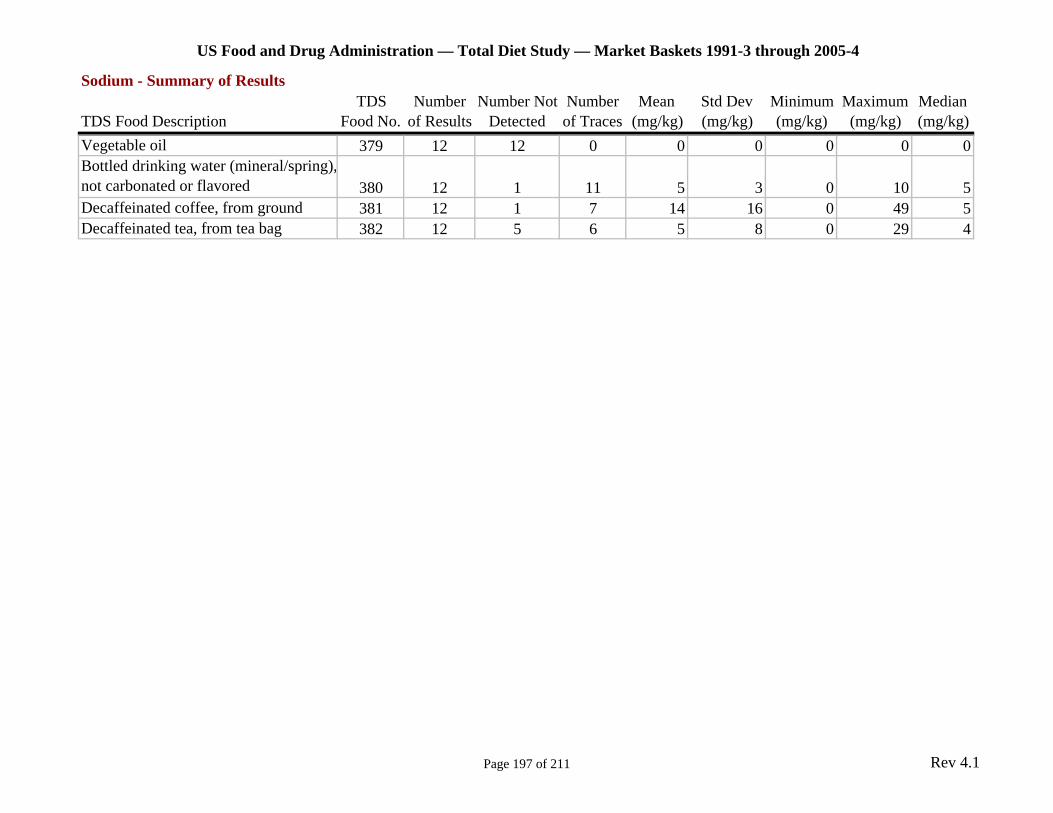
US Food and Drug Administration — Total Diet Study — Market Baskets 1991-3 through 2005-4
Sodium - Summary of Results TDS Number Number Not Number Mean Std Dev Minimum Maximum Median
TDS Food Description Food No. of Results Detected of Traces (mg/kg) (mg/kg) (mg/kg) (mg/kg) (mg/kg) Vegetable oil 379 12 12 0 0 0 0 0 0 Bottled drinking water (mineral/spring), not carbonated or flavored 380 12 1 11 5 3 0 10 5 Decaffeinated coffee, from ground 381 12 1 7 14 16 0 49 5 Decaffeinated tea, from tea bag 382 12 5 6 5 8 0 29 4
Page 197 of 211 Rev 4.1
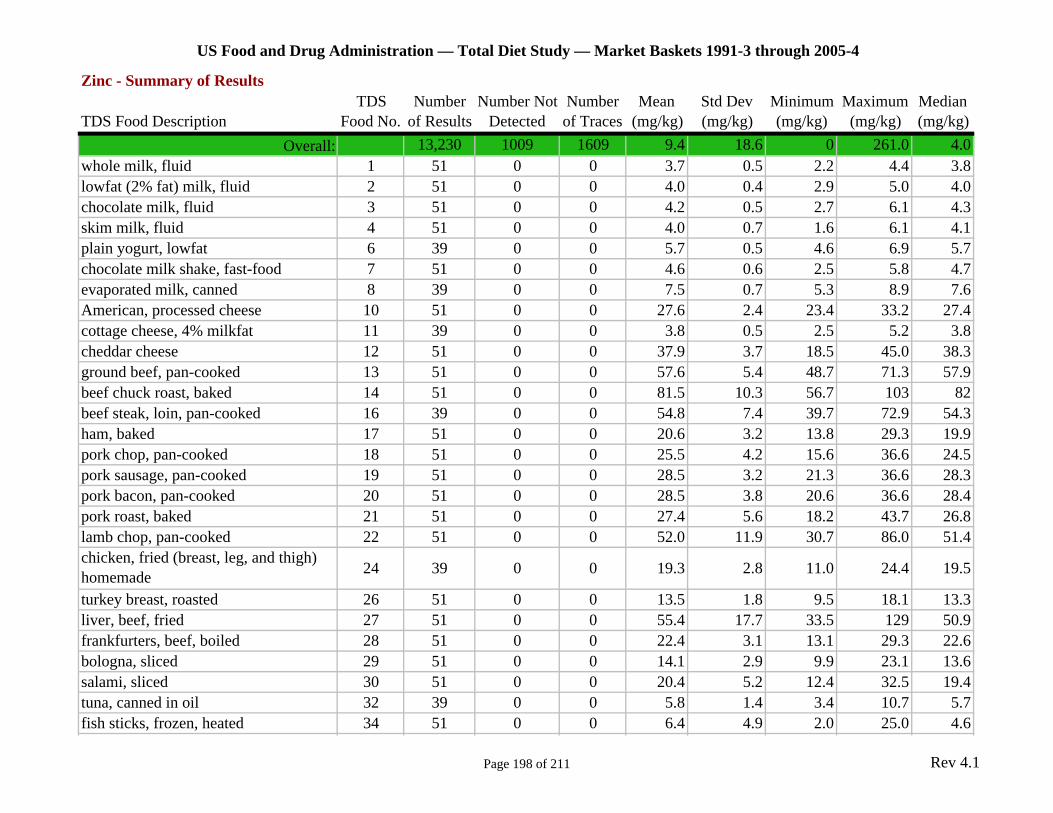
US Food and Drug Administration — Total Diet Study — Market Baskets 1991-3 through 2005-4
Zinc - Summary of Results TDS Number Number Not Number Mean Std Dev Minimum Maximum Median
TDS Food Description Food No. of Results Detected of Traces (mg/kg) (mg/kg) (mg/kg) (mg/kg) (mg/kg) Overall: 13,230 1009 1609 9.4 18.6 0 261.0 4.0
whole milk, fluid 1 51 0 0 3.7 0.5 2.2 4.4 3.8 lowfat (2% fat) milk, fluid 2 51 0 0 4.0 0.4 2.9 5.0 4.0 chocolate milk, fluid 3 51 0 0 4.2 0.5 2.7 6.1 4.3 skim milk, fluid 4 51 0 0 4.0 0.7 1.6 6.1 4.1 plain yogurt, lowfat 6 39 0 0 5.7 0.5 4.6 6.9 5.7 chocolate milk shake, fast-food 7 51 0 0 4.6 0.6 2.5 5.8 4.7 evaporated milk, canned 8 39 0 0 7.5 0.7 5.3 8.9 7.6 American, processed cheese 10 51 0 0 27.6 2.4 23.4 33.2 27.4 cottage cheese, 4% milkfat 11 39 0 0 3.8 0.5 2.5 5.2 3.8 cheddar cheese 12 51 0 0 37.9 3.7 18.5 45.0 38.3 ground beef, pan-cooked 13 51 0 0 57.6 5.4 48.7 71.3 57.9 beef chuck roast, baked 14 51 0 0 81.5 10.3 56.7 103 82 beef steak, loin, pan-cooked 16 39 0 0 54.8 7.4 39.7 72.9 54.3 ham, baked 17 51 0 0 20.6 3.2 13.8 29.3 19.9 pork chop, pan-cooked 18 51 0 0 25.5 4.2 15.6 36.6 24.5 pork sausage, pan-cooked 19 51 0 0 28.5 3.2 21.3 36.6 28.3 pork bacon, pan-cooked 20 51 0 0 28.5 3.8 20.6 36.6 28.4 pork roast, baked 21 51 0 0 27.4 5.6 18.2 43.7 26.8 lamb chop, pan-cooked 22 51 0 0 52.0 11.9 30.7 86.0 51.4 chicken, fried (breast, leg, and thigh) homemade 24 39 0 0 19.3 2.8 11.0 24.4 19.5
turkey breast, roasted 26 51 0 0 13.5 1.8 9.5 18.1 13.3 liver, beef, fried 27 51 0 0 55.4 17.7 33.5 129 50.9 frankfurters, beef, boiled 28 51 0 0 22.4 3.1 13.1 29.3 22.6 bologna, sliced 29 51 0 0 14.1 2.9 9.9 23.1 13.6 salami, sliced 30 51 0 0 20.4 5.2 12.4 32.5 19.4 tuna, canned in oil 32 39 0 0 5.8 1.4 3.4 10.7 5.7 fish sticks, frozen, heated 34 51 0 0 6.4 4.9 2.0 25.0 4.6
Page 198 of 211 Rev 4.1
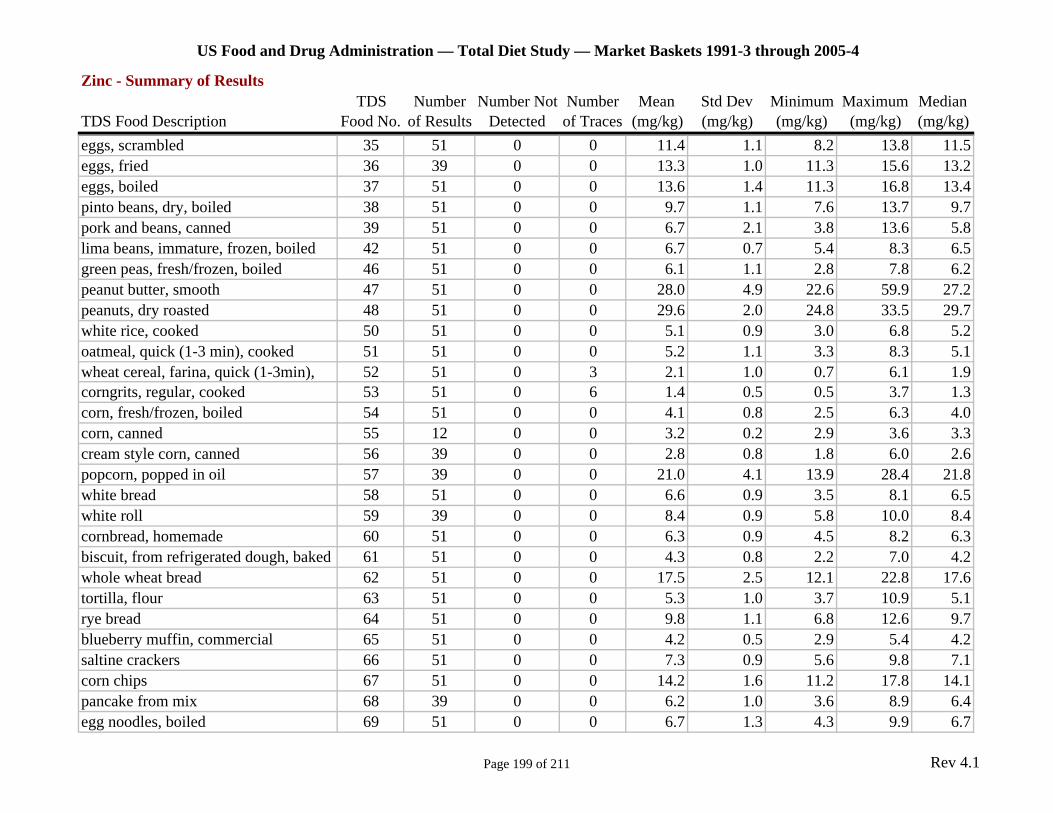
US Food and Drug Administration — Total Diet Study — Market Baskets 1991-3 through 2005-4
Zinc - Summary of Results TDS Number Number Not Number Mean Std Dev Minimum Maximum Median
TDS Food Description Food No. of Results Detected of Traces (mg/kg) (mg/kg) (mg/kg) (mg/kg) (mg/kg) eggs, scrambled 35 51 0 0 11.4 1.1 8.2 13.8 11.5 eggs, fried 36 39 0 0 13.3 1.0 11.3 15.6 13.2 eggs, boiled 37 51 0 0 13.6 1.4 11.3 16.8 13.4 pinto beans, dry, boiled 38 51 0 0 9.7 1.1 7.6 13.7 9.7 pork and beans, canned 39 51 0 0 6.7 2.1 3.8 13.6 5.8 lima beans, immature, frozen, boiled 42 51 0 0 6.7 0.7 5.4 8.3 6.5 green peas, fresh/frozen, boiled 46 51 0 0 6.1 1.1 2.8 7.8 6.2 peanut butter, smooth 47 51 0 0 28.0 4.9 22.6 59.9 27.2 peanuts, dry roasted 48 51 0 0 29.6 2.0 24.8 33.5 29.7 white rice, cooked 50 51 0 0 5.1 0.9 3.0 6.8 5.2 oatmeal, quick (1-3 min), cooked 51 51 0 0 5.2 1.1 3.3 8.3 5.1 wheat cereal, farina, quick (1-3min), 52 51 0 3 2.1 1.0 0.7 6.1 1.9 corngrits, regular, cooked 53 51 0 6 1.4 0.5 0.5 3.7 1.3 corn, fresh/frozen, boiled 54 51 0 0 4.1 0.8 2.5 6.3 4.0 corn, canned 55 12 0 0 3.2 0.2 2.9 3.6 3.3 cream style corn, canned 56 39 0 0 2.8 0.8 1.8 6.0 2.6 popcorn, popped in oil 57 39 0 0 21.0 4.1 13.9 28.4 21.8 white bread 58 51 0 0 6.6 0.9 3.5 8.1 6.5 white roll 59 39 0 0 8.4 0.9 5.8 10.0 8.4 cornbread, homemade 60 51 0 0 6.3 0.9 4.5 8.2 6.3 biscuit, from refrigerated dough, baked 61 51 0 0 4.3 0.8 2.2 7.0 4.2 whole wheat bread 62 51 0 0 17.5 2.5 12.1 22.8 17.6 tortilla, flour 63 51 0 0 5.3 1.0 3.7 10.9 5.1 rye bread 64 51 0 0 9.8 1.1 6.8 12.6 9.7 blueberry muffin, commercial 65 51 0 0 4.2 0.5 2.9 5.4 4.2 saltine crackers 66 51 0 0 7.3 0.9 5.6 9.8 7.1 corn chips 67 51 0 0 14.2 1.6 11.2 17.8 14.1 pancake from mix 68 39 0 0 6.2 1.0 3.6 8.9 6.4 egg noodles, boiled 69 51 0 0 6.7 1.3 4.3 9.9 6.7
Page 199 of 211 Rev 4.1

US Food and Drug Administration — Total Diet Study — Market Baskets 1991-3 through 2005-4
Zinc - Summary of Results TDS Number Number Not Number Mean Std Dev Minimum Maximum Median
TDS Food Description Food No. of Results Detected of Traces (mg/kg) (mg/kg) (mg/kg) (mg/kg) (mg/kg) macaroni, boiled 70 39 0 0 4.9 0.8 3.6 6.7 4.7 corn flakes 71 51 0 0 5 10.6 1.2 55 2 fruit-flavored, sweetened cereal 72 51 0 0 145 37.3 41.2 211 149 shredded wheat cereal 73 51 0 0 30.0 7.0 22.3 61 28 raisin bran cereal 74 51 0 0 91 37 33.3 261 91.6 crisped rice cereal 75 51 0 0 18.7 18.2 9.1 100 12.8 granola cereal 76 51 0 0 62 41 18 191 48 oat ring cereal 77 51 0 0 151 41.8 26 226 164 apple, red, raw 78 51 40 11 0.1 0.2 0 0.8 0 orange, raw 79 51 0 42 0.6 0.1 0.4 1.0 0.6 banana, raw 80 51 0 0 1.6 0.1 1.4 2.0 1.7 watermelon, raw 81 51 0 24 0.8 0.3 0.3 1.5 0.8 peach, raw 83 51 0 8 1.3 0.9 0.7 5.2 1.1 applesauce, bottled 84 51 29 22 0.1 0.2 0 0.6 0 pear, raw 85 51 0 13 1.0 0.2 0.5 1.5 1.0 strawberries, raw 86 51 0 8 1.0 0.2 0.7 1.7 1.0 fruit cocktail, canned in heavy syrup 87 51 1 48 0.6 0.2 0 1.0 0.6 grapes, red/green, seedless, raw 88 50 0 42 0.5 0.2 0.2 1.1 0.5 cantaloupe, raw 89 51 0 5 1.4 0.4 0.6 2.1 1.4 plums, raw 91 39 0 23 0.8 0.2 0.5 1.2 0.8 grapefruit, raw 92 51 0 48 0.5 0.1 0.3 0.9 0.5 pineapple, canned in juice 93 51 0 45 0.7 0.1 0.5 1.2 0.8 sweet cherries, raw 94 33 0 22 0.8 0.3 0.4 1.5 0.7 raisins, dried 95 51 0 25 2.0 0.4 1.1 3.1 1.9 prunes, dried 96 39 0 0 4.4 0.5 3.3 5.4 4.3 avocado, raw 97 51 0 0 6.3 1.6 2.8 9.2 6.2 orange juice, from frozen concentrate 98 51 2 47 0.4 0.3 0 2.7 0.4 apple juice, bottled 99 51 22 28 0.2 0.2 0 0.9 0.2 grapefruit juice, from frozen 100 51 0 48 0.4 0.1 0.2 0.8 0.4
Page 200 of 211 Rev 4.1
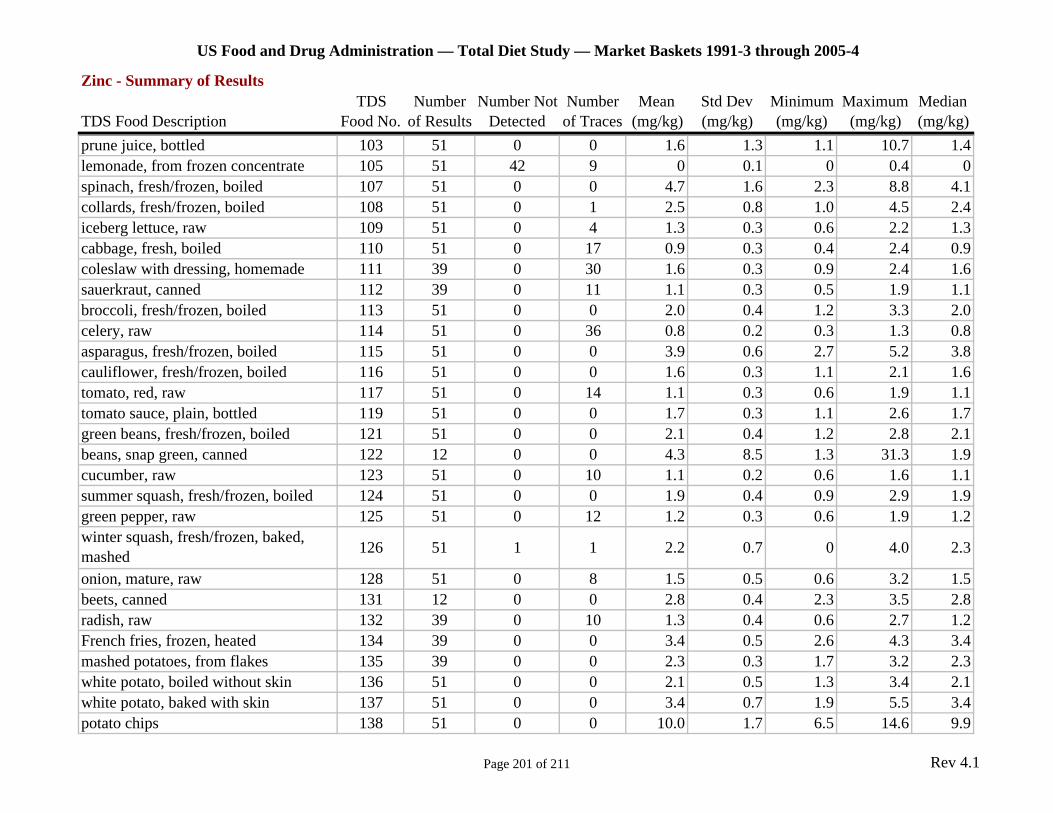
US Food and Drug Administration — Total Diet Study — Market Baskets 1991-3 through 2005-4
Zinc - Summary of Results TDS Number Number Not Number Mean Std Dev Minimum Maximum Median
TDS Food Description Food No. of Results Detected of Traces (mg/kg) (mg/kg) (mg/kg) (mg/kg) (mg/kg) prune juice, bottled 103 51 0 0 1.6 1.3 1.1 10.7 1.4 lemonade, from frozen concentrate 105 51 42 9 0 0.1 0 0.4 0 spinach, fresh/frozen, boiled 107 51 0 0 4.7 1.6 2.3 8.8 4.1 collards, fresh/frozen, boiled 108 51 0 1 2.5 0.8 1.0 4.5 2.4 iceberg lettuce, raw 109 51 0 4 1.3 0.3 0.6 2.2 1.3 cabbage, fresh, boiled 110 51 0 17 0.9 0.3 0.4 2.4 0.9 coleslaw with dressing, homemade 111 39 0 30 1.6 0.3 0.9 2.4 1.6 sauerkraut, canned 112 39 0 11 1.1 0.3 0.5 1.9 1.1 broccoli, fresh/frozen, boiled 113 51 0 0 2.0 0.4 1.2 3.3 2.0 celery, raw 114 51 0 36 0.8 0.2 0.3 1.3 0.8 asparagus, fresh/frozen, boiled 115 51 0 0 3.9 0.6 2.7 5.2 3.8 cauliflower, fresh/frozen, boiled 116 51 0 0 1.6 0.3 1.1 2.1 1.6 tomato, red, raw 117 51 0 14 1.1 0.3 0.6 1.9 1.1 tomato sauce, plain, bottled 119 51 0 0 1.7 0.3 1.1 2.6 1.7 green beans, fresh/frozen, boiled 121 51 0 0 2.1 0.4 1.2 2.8 2.1 beans, snap green, canned 122 12 0 0 4.3 8.5 1.3 31.3 1.9 cucumber, raw 123 51 0 10 1.1 0.2 0.6 1.6 1.1 summer squash, fresh/frozen, boiled 124 51 0 0 1.9 0.4 0.9 2.9 1.9 green pepper, raw 125 51 0 12 1.2 0.3 0.6 1.9 1.2 winter squash, fresh/frozen, baked, mashed 126 51 1 1 2.2 0.7 0 4.0 2.3
onion, mature, raw 128 51 0 8 1.5 0.5 0.6 3.2 1.5 beets, canned 131 12 0 0 2.8 0.4 2.3 3.5 2.8 radish, raw 132 39 0 10 1.3 0.4 0.6 2.7 1.2 French fries, frozen, heated 134 39 0 0 3.4 0.5 2.6 4.3 3.4 mashed potatoes, from flakes 135 39 0 0 2.3 0.3 1.7 3.2 2.3 white potato, boiled without skin 136 51 0 0 2.1 0.5 1.3 3.4 2.1 white potato, baked with skin 137 51 0 0 3.4 0.7 1.9 5.5 3.4 potato chips 138 51 0 0 10.0 1.7 6.5 14.6 9.9
Page 201 of 211 Rev 4.1
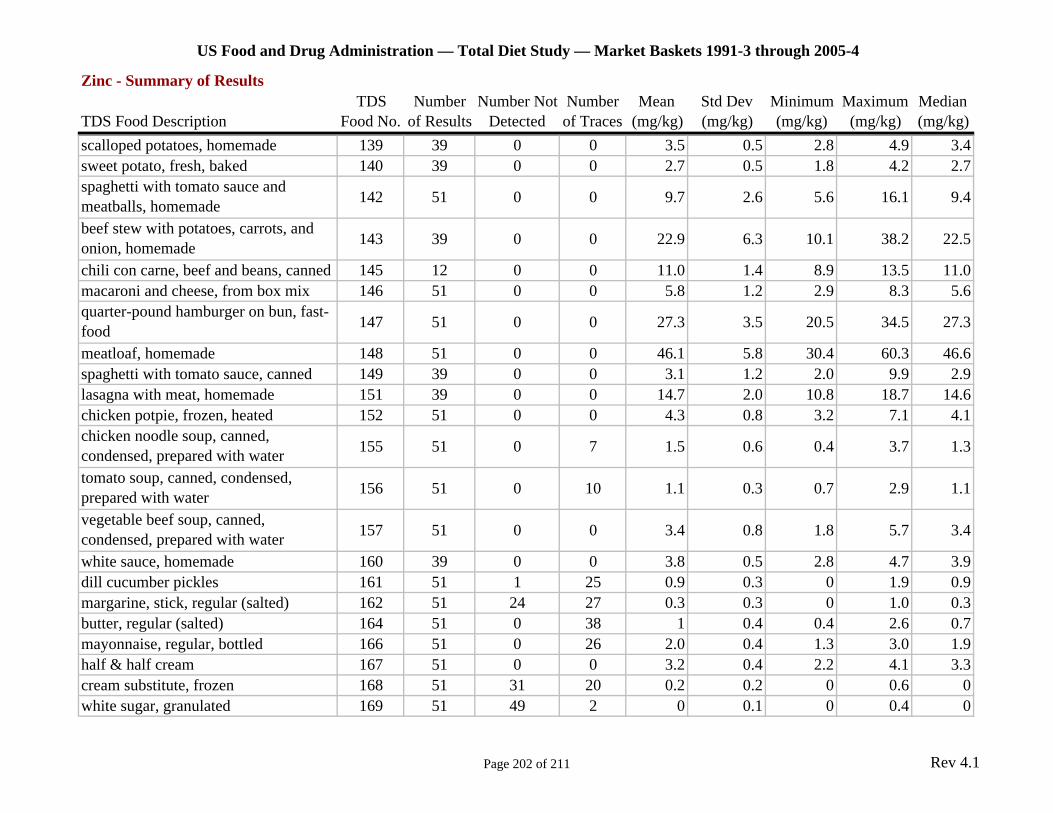
US Food and Drug Administration — Total Diet Study — Market Baskets 1991-3 through 2005-4
Zinc - Summary of Results TDS Number Number Not Number Mean Std Dev Minimum Maximum Median
TDS Food Description Food No. of Results Detected of Traces (mg/kg) (mg/kg) (mg/kg) (mg/kg) (mg/kg) scalloped potatoes, homemade 139 39 0 0 3.5 0.5 2.8 4.9 3.4 sweet potato, fresh, baked 140 39 0 0 2.7 0.5 1.8 4.2 2.7 spaghetti with tomato sauce and meatballs, homemade 142 51 0 0 9.7 2.6 5.6 16.1 9.4
beef stew with potatoes, carrots, and onion, homemade 143 39 0 0 22.9 6.3 10.1 38.2 22.5
chili con carne, beef and beans, canned 145 12 0 0 11.0 1.4 8.9 13.5 11.0 macaroni and cheese, from box mix 146 51 0 0 5.8 1.2 2.9 8.3 5.6 quarter-pound hamburger on bun, fast-food 147 51 0 0 27.3 3.5 20.5 34.5 27.3
meatloaf, homemade 148 51 0 0 46.1 5.8 30.4 60.3 46.6 spaghetti with tomato sauce, canned 149 39 0 0 3.1 1.2 2.0 9.9 2.9 lasagna with meat, homemade 151 39 0 0 14.7 2.0 10.8 18.7 14.6 chicken potpie, frozen, heated 152 51 0 0 4.3 0.8 3.2 7.1 4.1 chicken noodle soup, canned, condensed, prepared with water 155 51 0 7 1.5 0.6 0.4 3.7 1.3
tomato soup, canned, condensed, prepared with water 156 51 0 10 1.1 0.3 0.7 2.9 1.1
vegetable beef soup, canned, condensed, prepared with water 157 51 0 0 3.4 0.8 1.8 5.7 3.4
white sauce, homemade 160 39 0 0 3.8 0.5 2.8 4.7 3.9 dill cucumber pickles 161 51 1 25 0.9 0.3 0 1.9 0.9 margarine, stick, regular (salted) 162 51 24 27 0.3 0.3 0 1.0 0.3 butter, regular (salted) 164 51 0 38 1 0.4 0.4 2.6 0.7 mayonnaise, regular, bottled 166 51 0 26 2.0 0.4 1.3 3.0 1.9 half & half cream 167 51 0 0 3.2 0.4 2.2 4.1 3.3 cream substitute, frozen 168 51 31 20 0.2 0.2 0 0.6 0 white sugar, granulated 169 51 49 2 0 0.1 0 0.4 0
Page 202 of 211 Rev 4.1
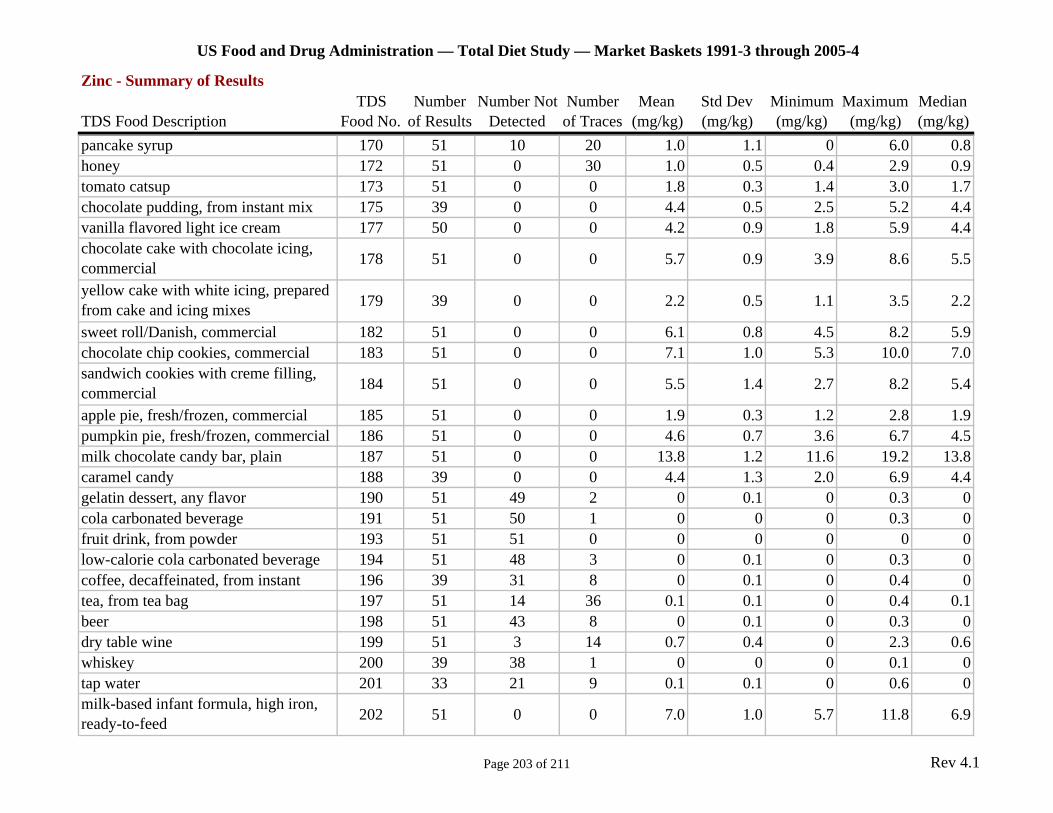
US Food and Drug Administration — Total Diet Study — Market Baskets 1991-3 through 2005-4
Zinc - Summary of Results TDS Number Number Not Number Mean Std Dev Minimum Maximum Median
TDS Food Description Food No. of Results Detected of Traces (mg/kg) (mg/kg) (mg/kg) (mg/kg) (mg/kg) pancake syrup 170 51 10 20 1.0 1.1 0 6.0 0.8 honey 172 51 0 30 1.0 0.5 0.4 2.9 0.9 tomato catsup 173 51 0 0 1.8 0.3 1.4 3.0 1.7 chocolate pudding, from instant mix 175 39 0 0 4.4 0.5 2.5 5.2 4.4 vanilla flavored light ice cream 177 50 0 0 4.2 0.9 1.8 5.9 4.4 chocolate cake with chocolate icing, commercial 178 51 0 0 5.7 0.9 3.9 8.6 5.5
yellow cake with white icing, prepared from cake and icing mixes 179 39 0 0 2.2 0.5 1.1 3.5 2.2
sweet roll/Danish, commercial 182 51 0 0 6.1 0.8 4.5 8.2 5.9 chocolate chip cookies, commercial 183 51 0 0 7.1 1.0 5.3 10.0 7.0 sandwich cookies with creme filling, commercial 184 51 0 0 5.5 1.4 2.7 8.2 5.4
apple pie, fresh/frozen, commercial 185 51 0 0 1.9 0.3 1.2 2.8 1.9 pumpkin pie, fresh/frozen, commercial 186 51 0 0 4.6 0.7 3.6 6.7 4.5 milk chocolate candy bar, plain 187 51 0 0 13.8 1.2 11.6 19.2 13.8 caramel candy 188 39 0 0 4.4 1.3 2.0 6.9 4.4 gelatin dessert, any flavor 190 51 49 2 0 0.1 0 0.3 0 cola carbonated beverage 191 51 50 1 0 0 0 0.3 0 fruit drink, from powder 193 51 51 0 0 0 0 0 0 low-calorie cola carbonated beverage 194 51 48 3 0 0.1 0 0.3 0 coffee, decaffeinated, from instant 196 39 31 8 0 0.1 0 0.4 0 tea, from tea bag 197 51 14 36 0.1 0.1 0 0.4 0.1 beer 198 51 43 8 0 0.1 0 0.3 0 dry table wine 199 51 3 14 0.7 0.4 0 2.3 0.6 whiskey 200 39 38 1 0 0 0 0.1 0 tap water 201 33 21 9 0.1 0.1 0 0.6 0 milk-based infant formula, high iron, ready-to-feed 202 51 0 0 7.0 1.0 5.7 11.8 6.9
Page 203 of 211 Rev 4.1
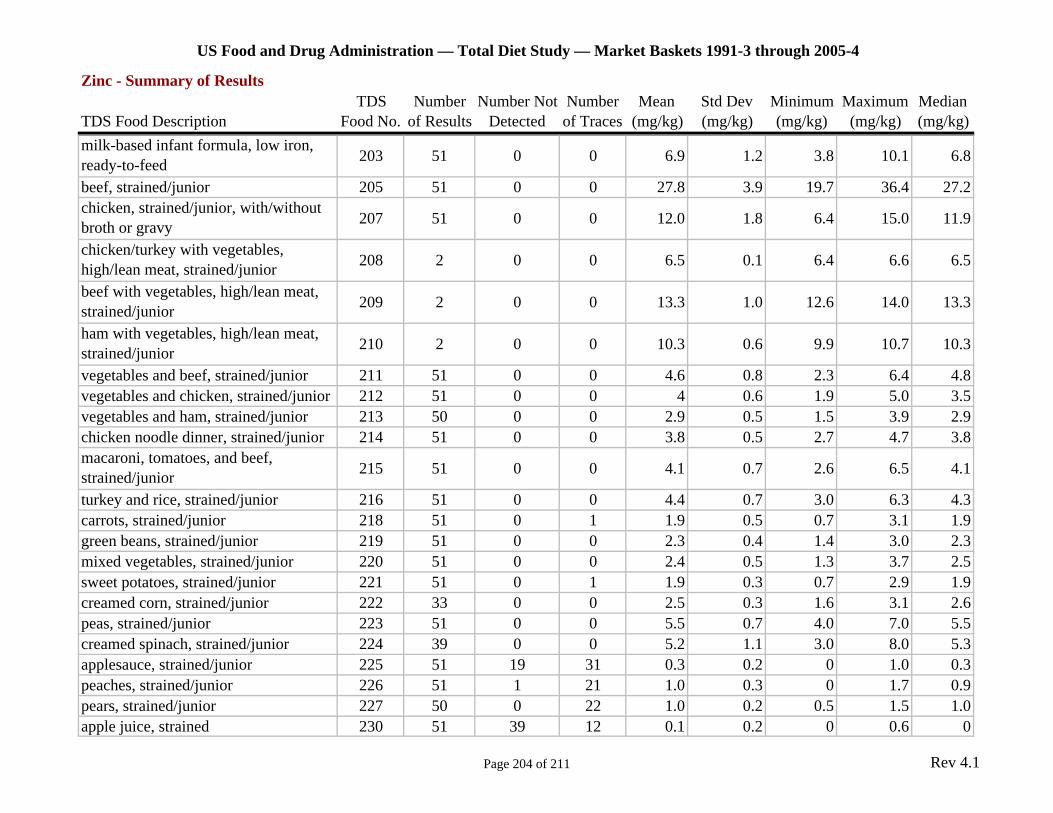
US Food and Drug Administration — Total Diet Study — Market Baskets 1991-3 through 2005-4
Zinc - Summary of Results TDS Number Number Not Number Mean Std Dev Minimum Maximum Median
TDS Food Description Food No. of Results Detected of Traces (mg/kg) (mg/kg) (mg/kg) (mg/kg) (mg/kg) milk-based infant formula, low iron, ready-to-feed 203 51 0 0 6.9 1.2 3.8 10.1 6.8
beef, strained/junior 205 51 0 0 27.8 3.9 19.7 36.4 27.2 chicken, strained/junior, with/without broth or gravy 207 51 0 0 12.0 1.8 6.4 15.0 11.9
chicken/turkey with vegetables, high/lean meat, strained/junior 208 2 0 0 6.5 0.1 6.4 6.6 6.5
beef with vegetables, high/lean meat, strained/junior 209 2 0 0 13.3 1.0 12.6 14.0 13.3
ham with vegetables, high/lean meat, strained/junior 210 2 0 0 10.3 0.6 9.9 10.7 10.3
vegetables and beef, strained/junior 211 51 0 0 4.6 0.8 2.3 6.4 4.8 vegetables and chicken, strained/junior 212 51 0 0 4 0.6 1.9 5.0 3.5 vegetables and ham, strained/junior 213 50 0 0 2.9 0.5 1.5 3.9 2.9 chicken noodle dinner, strained/junior 214 51 0 0 3.8 0.5 2.7 4.7 3.8 macaroni, tomatoes, and beef, strained/junior 215 51 0 0 4.1 0.7 2.6 6.5 4.1
turkey and rice, strained/junior 216 51 0 0 4.4 0.7 3.0 6.3 4.3 carrots, strained/junior 218 51 0 1 1.9 0.5 0.7 3.1 1.9 green beans, strained/junior 219 51 0 0 2.3 0.4 1.4 3.0 2.3 mixed vegetables, strained/junior 220 51 0 0 2.4 0.5 1.3 3.7 2.5 sweet potatoes, strained/junior 221 51 0 1 1.9 0.3 0.7 2.9 1.9 creamed corn, strained/junior 222 33 0 0 2.5 0.3 1.6 3.1 2.6 peas, strained/junior 223 51 0 0 5.5 0.7 4.0 7.0 5.5 creamed spinach, strained/junior 224 39 0 0 5.2 1.1 3.0 8.0 5.3 applesauce, strained/junior 225 51 19 31 0.3 0.2 0 1.0 0.3 peaches, strained/junior 226 51 1 21 1.0 0.3 0 1.7 0.9 pears, strained/junior 227 50 0 22 1.0 0.2 0.5 1.5 1.0 apple juice, strained 230 51 39 12 0.1 0.2 0 0.6 0
Page 204 of 211 Rev 4.1
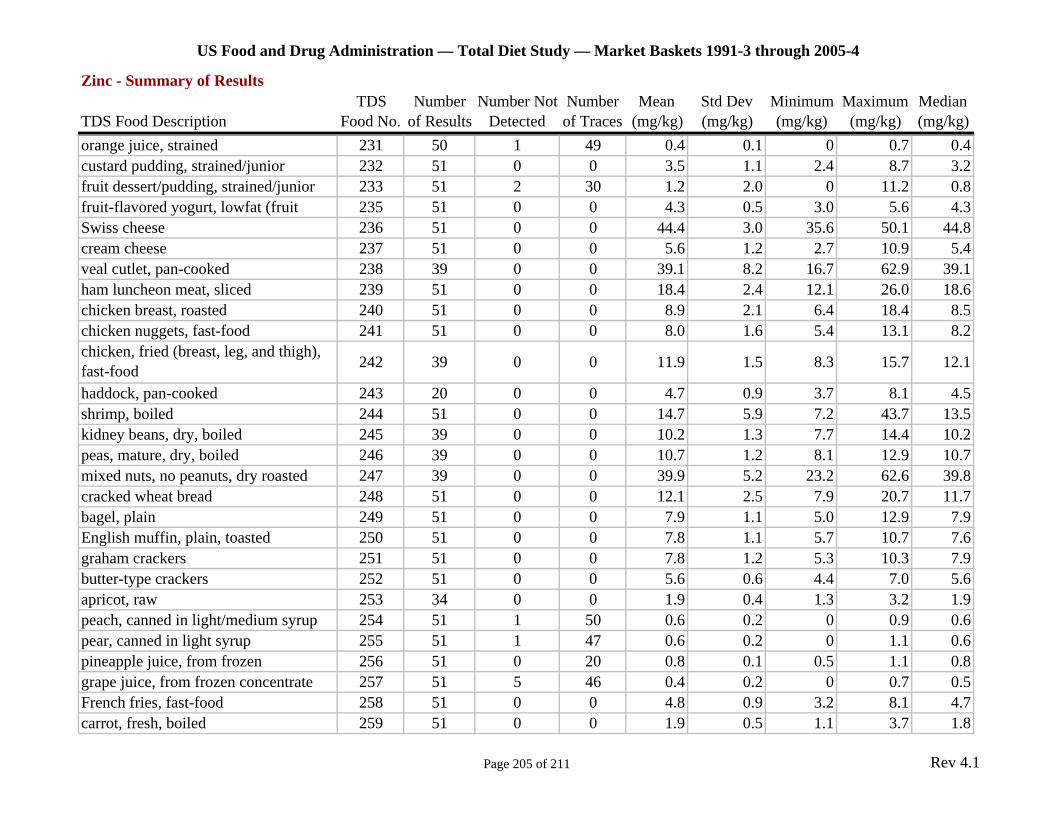
US Food and Drug Administration — Total Diet Study — Market Baskets 1991-3 through 2005-4
Zinc - Summary of Results TDS Number Number Not Number Mean Std Dev Minimum Maximum Median
TDS Food Description Food No. of Results Detected of Traces (mg/kg) (mg/kg) (mg/kg) (mg/kg) (mg/kg) orange juice, strained 231 50 1 49 0.4 0.1 0 0.7 0.4 custard pudding, strained/junior 232 51 0 0 3.5 1.1 2.4 8.7 3.2 fruit dessert/pudding, strained/junior 233 51 2 30 1.2 2.0 0 11.2 0.8 fruit-flavored yogurt, lowfat (fruit 235 51 0 0 4.3 0.5 3.0 5.6 4.3 Swiss cheese 236 51 0 0 44.4 3.0 35.6 50.1 44.8 cream cheese 237 51 0 0 5.6 1.2 2.7 10.9 5.4 veal cutlet, pan-cooked 238 39 0 0 39.1 8.2 16.7 62.9 39.1 ham luncheon meat, sliced 239 51 0 0 18.4 2.4 12.1 26.0 18.6 chicken breast, roasted 240 51 0 0 8.9 2.1 6.4 18.4 8.5 chicken nuggets, fast-food 241 51 0 0 8.0 1.6 5.4 13.1 8.2 chicken, fried (breast, leg, and thigh), fast-food 242 39 0 0 11.9 1.5 8.3 15.7 12.1
haddock, pan-cooked 243 20 0 0 4.7 0.9 3.7 8.1 4.5 shrimp, boiled 244 51 0 0 14.7 5.9 7.2 43.7 13.5 kidney beans, dry, boiled 245 39 0 0 10.2 1.3 7.7 14.4 10.2 peas, mature, dry, boiled 246 39 0 0 10.7 1.2 8.1 12.9 10.7 mixed nuts, no peanuts, dry roasted 247 39 0 0 39.9 5.2 23.2 62.6 39.8 cracked wheat bread 248 51 0 0 12.1 2.5 7.9 20.7 11.7 bagel, plain 249 51 0 0 7.9 1.1 5.0 12.9 7.9 English muffin, plain, toasted 250 51 0 0 7.8 1.1 5.7 10.7 7.6 graham crackers 251 51 0 0 7.8 1.2 5.3 10.3 7.9 butter-type crackers 252 51 0 0 5.6 0.6 4.4 7.0 5.6 apricot, raw 253 34 0 0 1.9 0.4 1.3 3.2 1.9 peach, canned in light/medium syrup 254 51 1 50 0.6 0.2 0 0.9 0.6 pear, canned in light syrup 255 51 1 47 0.6 0.2 0 1.1 0.6 pineapple juice, from frozen 256 51 0 20 0.8 0.1 0.5 1.1 0.8 grape juice, from frozen concentrate 257 51 5 46 0.4 0.2 0 0.7 0.5 French fries, fast-food 258 51 0 0 4.8 0.9 3.2 8.1 4.7 carrot, fresh, boiled 259 51 0 0 1.9 0.5 1.1 3.7 1.8
Page 205 of 211 Rev 4.1
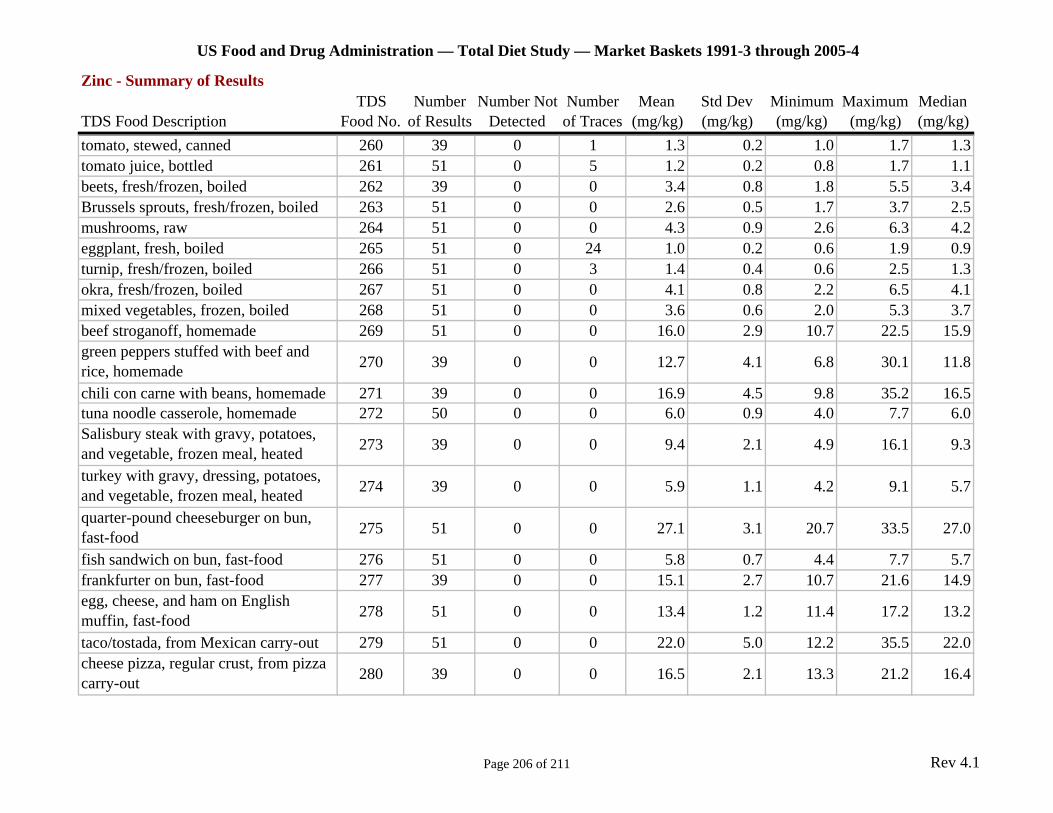
US Food and Drug Administration — Total Diet Study — Market Baskets 1991-3 through 2005-4
Zinc - Summary of Results TDS Number Number Not Number Mean Std Dev Minimum Maximum Median
TDS Food Description Food No. of Results Detected of Traces (mg/kg) (mg/kg) (mg/kg) (mg/kg) (mg/kg) tomato, stewed, canned 260 39 0 1 1.3 0.2 1.0 1.7 1.3 tomato juice, bottled 261 51 0 5 1.2 0.2 0.8 1.7 1.1 beets, fresh/frozen, boiled 262 39 0 0 3.4 0.8 1.8 5.5 3.4 Brussels sprouts, fresh/frozen, boiled 263 51 0 0 2.6 0.5 1.7 3.7 2.5 mushrooms, raw 264 51 0 0 4.3 0.9 2.6 6.3 4.2 eggplant, fresh, boiled 265 51 0 24 1.0 0.2 0.6 1.9 0.9 turnip, fresh/frozen, boiled 266 51 0 3 1.4 0.4 0.6 2.5 1.3 okra, fresh/frozen, boiled 267 51 0 0 4.1 0.8 2.2 6.5 4.1 mixed vegetables, frozen, boiled 268 51 0 0 3.6 0.6 2.0 5.3 3.7 beef stroganoff, homemade 269 51 0 0 16.0 2.9 10.7 22.5 15.9 green peppers stuffed with beef and rice, homemade 270 39 0 0 12.7 4.1 6.8 30.1 11.8
chili con carne with beans, homemade 271 39 0 0 16.9 4.5 9.8 35.2 16.5 tuna noodle casserole, homemade 272 50 0 0 6.0 0.9 4.0 7.7 6.0 Salisbury steak with gravy, potatoes, and vegetable, frozen meal, heated 273 39 0 0 9.4 2.1 4.9 16.1 9.3
turkey with gravy, dressing, potatoes, and vegetable, frozen meal, heated 274 39 0 0 5.9 1.1 4.2 9.1 5.7
quarter-pound cheeseburger on bun, fast-food 275 51 0 0 27.1 3.1 20.7 33.5 27.0
fish sandwich on bun, fast-food 276 51 0 0 5.8 0.7 4.4 7.7 5.7 frankfurter on bun, fast-food 277 39 0 0 15.1 2.7 10.7 21.6 14.9 egg, cheese, and ham on English muffin, fast-food 278 51 0 0 13.4 1.2 11.4 17.2 13.2
taco/tostada, from Mexican carry-out 279 51 0 0 22.0 5.0 12.2 35.5 22.0 cheese pizza, regular crust, from pizza carry-out 280 39 0 0 16.5 2.1 13.3 21.2 16.4
Page 206 of 211 Rev 4.1

US Food and Drug Administration — Total Diet Study — Market Baskets 1991-3 through 2005-4
Zinc - Summary of Results TDS Number Number Not Number Mean Std Dev Minimum Maximum Median
TDS Food Description Food No. of Results Detected of Traces (mg/kg) (mg/kg) (mg/kg) (mg/kg) (mg/kg) cheese and pepperoni pizza, regular crust, from pizza carry-out 281 51 0 0 16.9 2.1 13.0 21.8 17.0
beef chow mein, from Chinese carry- 282 39 0 0 11.2 2.2 7.0 16.0 10.8 bean with bacon/pork soup, canned, condensed, prepared with water 283 51 0 0 3.9 0.7 2.0 5.5 4.0
mushroom soup, canned, condensed, prepared with whole milk 284 39 0 0 2.68 0.6 1.2 4.1 2.7
clam chowder, New England, canned, condensed, prepared with whole milk 285 51 0 0 3.8 0.7 2.2 7.5 3.7
vanilla ice cream 286 51 0 0 3.5 0.9 1.0 5.3 3.5 fruit flavor sherbet 287 51 0 12 1.2 0.4 0.4 2.6 1.2 popsicle, any flavor 288 51 45 6 0.1 0.2 0 0.6 0 chocolate snack cake with chocolate 289 39 0 0 5.8 1.2 3.8 8.4 5.9 cake doughnuts with icing, any flavor, from doughnut store 290 51 0 0 4.9 0.8 3.0 6.9 4.8
brownies, commercial 291 51 0 0 6.8 1.3 4.8 10.2 6.6 sugar cookies, commercial 292 51 0 0 4.1 0.6 3.1 6.1 4.2 suckers, any flavor 293 51 39 12 0.1 0.2 0 1.0 0 pretzels, hard, salted, any shape 294 51 0 0 9.6 1.4 5.7 12.8 9.5 chocolate syrup dessert topping 295 51 0 0 6.7 0.6 5.4 8.4 6.7 jelly, any flavor 296 51 15 36 0.3 0.2 0 1.0 0.4 sweet cucumber pickles 297 39 5 28 0.6 0.4 0 1.7 0.7 yellow mustard 298 51 0 0 6.7 0.7 5.1 8.2 6.7 black olives 299 51 0 8 1.4 0.4 0.5 2.2 1.5 sour cream 300 51 0 0 3.8 0.5 2.9 6.2 3.8 brown gravy, homemade 301 39 0 0 4.5 2.1 1.7 9.5 4.0 French salad dressing, regular 302 39 0 24 0.9 0.3 0.3 2.2 0.9 Italian salad dressing, low-calorie 303 39 2 26 0.9 0.7 0 3.9 0.7 olive/safflower oil 304 38 16 19 0.4 0.5 0 2.1 0.3
Page 207 of 211 Rev 4.1
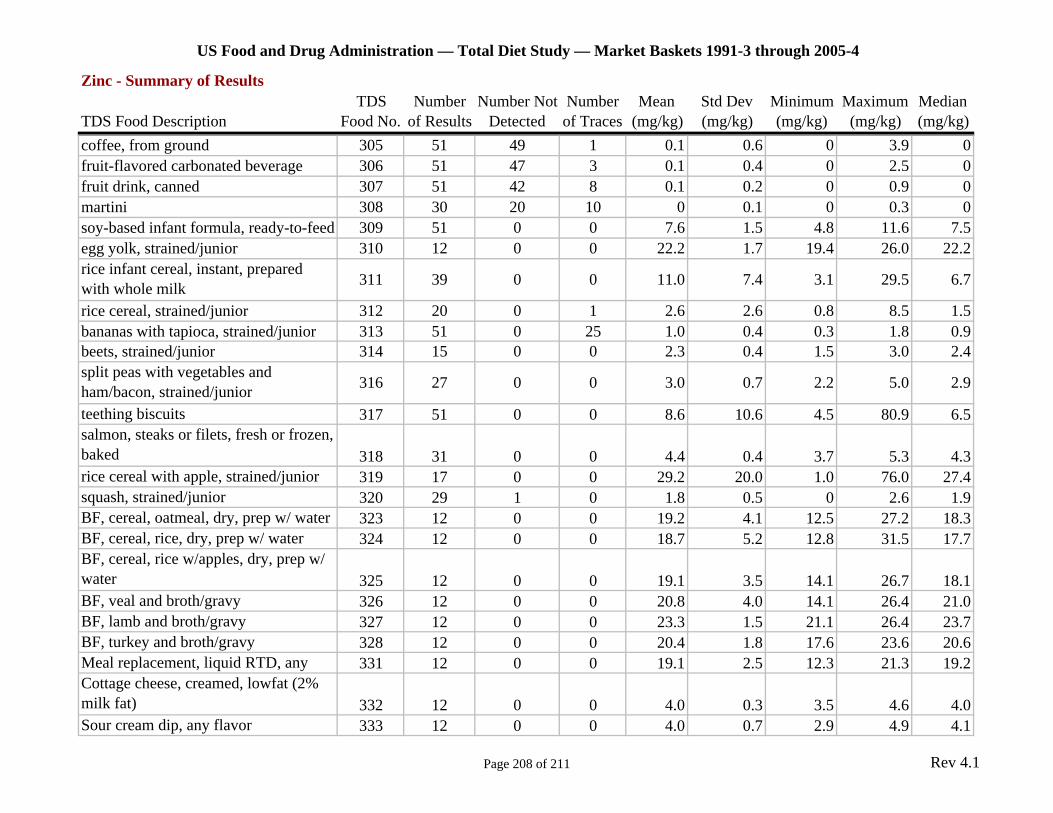
US Food and Drug Administration — Total Diet Study — Market Baskets 1991-3 through 2005-4
Zinc - Summary of Results TDS Number Number Not Number Mean Std Dev Minimum Maximum Median
TDS Food Description Food No. of Results Detected of Traces (mg/kg) (mg/kg) (mg/kg) (mg/kg) (mg/kg) coffee, from ground 305 51 49 1 0.1 0.6 0 3.9 0 fruit-flavored carbonated beverage 306 51 47 3 0.1 0.4 0 2.5 0 fruit drink, canned 307 51 42 8 0.1 0.2 0 0.9 0 martini 308 30 20 10 0 0.1 0 0.3 0 soy-based infant formula, ready-to-feed 309 51 0 0 7.6 1.5 4.8 11.6 7.5 egg yolk, strained/junior 310 12 0 0 22.2 1.7 19.4 26.0 22.2 rice infant cereal, instant, prepared with whole milk 311 39 0 0 11.0 7.4 3.1 29.5 6.7
rice cereal, strained/junior 312 20 0 1 2.6 2.6 0.8 8.5 1.5 bananas with tapioca, strained/junior 313 51 0 25 1.0 0.4 0.3 1.8 0.9 beets, strained/junior 314 15 0 0 2.3 0.4 1.5 3.0 2.4 split peas with vegetables and ham/bacon, strained/junior 316 27 0 0 3.0 0.7 2.2 5.0 2.9
teething biscuits 317 51 0 0 8.6 10.6 4.5 80.9 6.5 salmon, steaks or filets, fresh or frozen, baked 318 31 0 0 4.4 0.4 3.7 5.3 4.3 rice cereal with apple, strained/junior 319 17 0 0 29.2 20.0 1.0 76.0 27.4 squash, strained/junior 320 29 1 0 1.8 0.5 0 2.6 1.9 BF, cereal, oatmeal, dry, prep w/ water 323 12 0 0 19.2 4.1 12.5 27.2 18.3 BF, cereal, rice, dry, prep w/ water 324 12 0 0 18.7 5.2 12.8 31.5 17.7 BF, cereal, rice w/apples, dry, prep w/ water 325 12 0 0 19.1 3.5 14.1 26.7 18.1 BF, veal and broth/gravy 326 12 0 0 20.8 4.0 14.1 26.4 21.0 BF, lamb and broth/gravy 327 12 0 0 23.3 1.5 21.1 26.4 23.7 BF, turkey and broth/gravy 328 12 0 0 20.4 1.8 17.6 23.6 20.6 Meal replacement, liquid RTD, any 331 12 0 0 19.1 2.5 12.3 21.3 19.2 Cottage cheese, creamed, lowfat (2% milk fat) 332 12 0 0 4.0 0.3 3.5 4.6 4.0 Sour cream dip, any flavor 333 12 0 0 4.0 0.7 2.9 4.9 4.1
Page 208 of 211 Rev 4.1
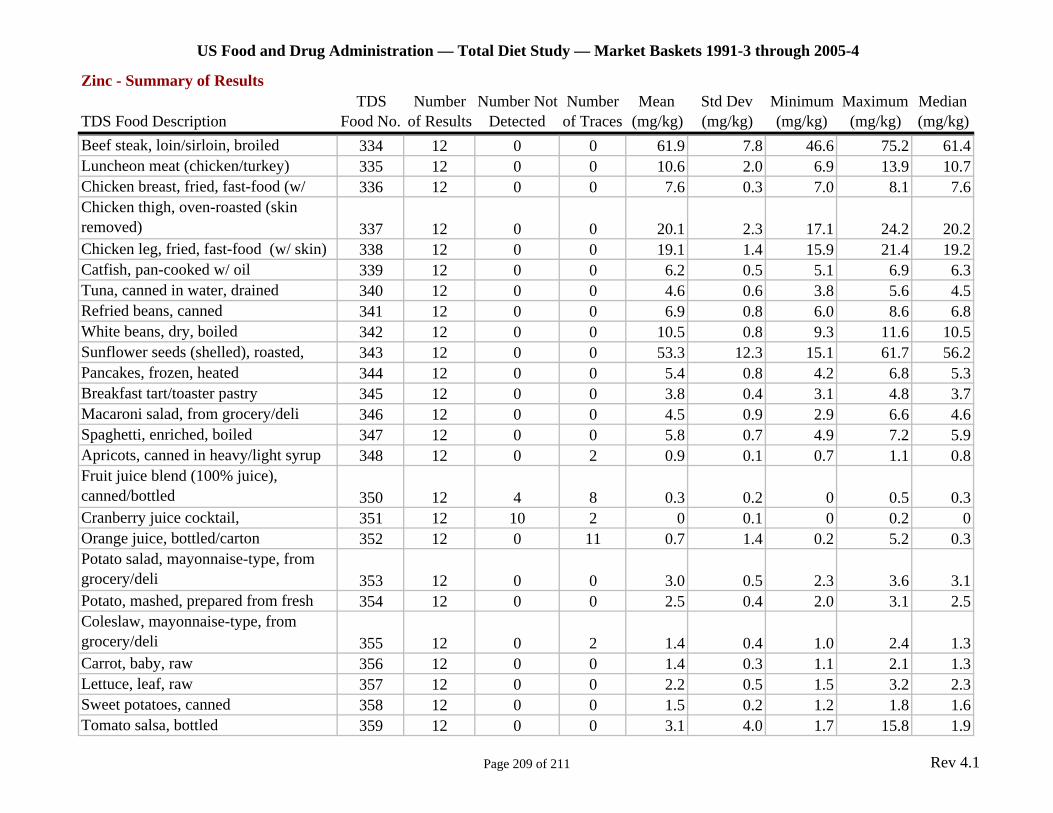
US Food and Drug Administration — Total Diet Study — Market Baskets 1991-3 through 2005-4
Zinc - Summary of Results TDS Number Number Not Number Mean Std Dev Minimum Maximum Median
TDS Food Description Food No. of Results Detected of Traces (mg/kg) (mg/kg) (mg/kg) (mg/kg) (mg/kg) Beef steak, loin/sirloin, broiled 334 12 0 0 61.9 7.8 46.6 75.2 61.4 Luncheon meat (chicken/turkey) 335 12 0 0 10.6 2.0 6.9 13.9 10.7 Chicken breast, fried, fast-food (w/ 336 12 0 0 7.6 0.3 7.0 8.1 7.6 Chicken thigh, oven-roasted (skin removed) 337 12 0 0 20.1 2.3 17.1 24.2 20.2 Chicken leg, fried, fast-food (w/ skin) 338 12 0 0 19.1 1.4 15.9 21.4 19.2 Catfish, pan-cooked w/ oil 339 12 0 0 6.2 0.5 5.1 6.9 6.3 Tuna, canned in water, drained 340 12 0 0 4.6 0.6 3.8 5.6 4.5 Refried beans, canned 341 12 0 0 6.9 0.8 6.0 8.6 6.8 White beans, dry, boiled 342 12 0 0 10.5 0.8 9.3 11.6 10.5 Sunflower seeds (shelled), roasted, 343 12 0 0 53.3 12.3 15.1 61.7 56.2 Pancakes, frozen, heated 344 12 0 0 5.4 0.8 4.2 6.8 5.3 Breakfast tart/toaster pastry 345 12 0 0 3.8 0.4 3.1 4.8 3.7 Macaroni salad, from grocery/deli 346 12 0 0 4.5 0.9 2.9 6.6 4.6 Spaghetti, enriched, boiled 347 12 0 0 5.8 0.7 4.9 7.2 5.9 Apricots, canned in heavy/light syrup 348 12 0 2 0.9 0.1 0.7 1.1 0.8 Fruit juice blend (100% juice), canned/bottled 350 12 4 8 0.3 0.2 0 0.5 0.3 Cranberry juice cocktail, 351 12 10 2 0 0.1 0 0.2 0 Orange juice, bottled/carton 352 12 0 11 0.7 1.4 0.2 5.2 0.3 Potato salad, mayonnaise-type, from grocery/deli 353 12 0 0 3.0 0.5 2.3 3.6 3.1 Potato, mashed, prepared from fresh 354 12 0 0 2.5 0.4 2.0 3.1 2.5 Coleslaw, mayonnaise-type, from grocery/deli 355 12 0 2 1.4 0.4 1.0 2.4 1.3 Carrot, baby, raw 356 12 0 0 1.4 0.3 1.1 2.1 1.3 Lettuce, leaf, raw 357 12 0 0 2.2 0.5 1.5 3.2 2.3 Sweet potatoes, canned 358 12 0 0 1.5 0.2 1.2 1.8 1.6 Tomato salsa, bottled 359 12 0 0 3.1 4.0 1.7 15.8 1.9
Page 209 of 211 Rev 4.1
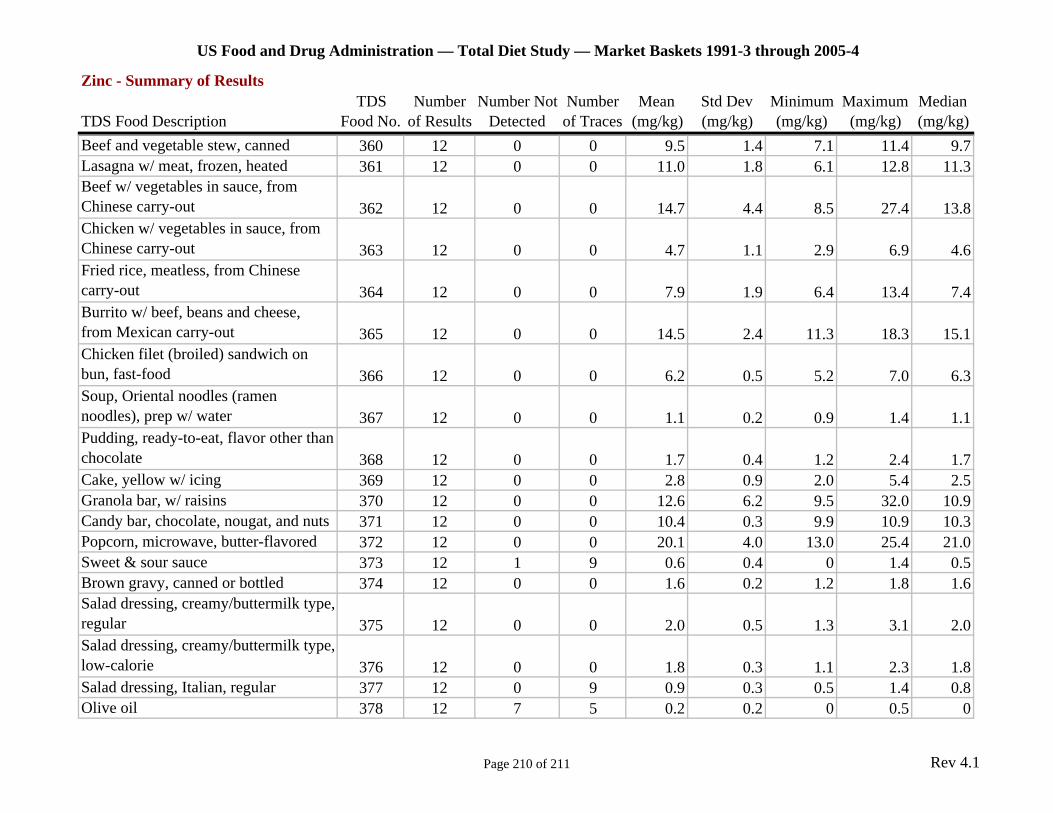
US Food and Drug Administration — Total Diet Study — Market Baskets 1991-3 through 2005-4
Zinc - Summary of Results TDS Number Number Not Number Mean Std Dev Minimum Maximum Median
TDS Food Description Food No. of Results Detected of Traces (mg/kg) (mg/kg) (mg/kg) (mg/kg) (mg/kg) Beef and vegetable stew, canned 360 12 0 0 9.5 1.4 7.1 11.4 9.7 Lasagna w/ meat, frozen, heated 361 12 0 0 11.0 1.8 6.1 12.8 11.3 Beef w/ vegetables in sauce, from Chinese carry-out 362 12 0 0 14.7 4.4 8.5 27.4 13.8 Chicken w/ vegetables in sauce, from Chinese carry-out 363 12 0 0 4.7 1.1 2.9 6.9 4.6 Fried rice, meatless, from Chinese carry-out 364 12 0 0 7.9 1.9 6.4 13.4 7.4 Burrito w/ beef, beans and cheese, from Mexican carry-out 365 12 0 0 14.5 2.4 11.3 18.3 15.1 Chicken filet (broiled) sandwich on bun, fast-food 366 12 0 0 6.2 0.5 5.2 7.0 6.3 Soup, Oriental noodles (ramen noodles), prep w/ water 367 12 0 0 1.1 0.2 0.9 1.4 1.1 Pudding, ready-to-eat, flavor other than chocolate 368 12 0 0 1.7 0.4 1.2 2.4 1.7 Cake, yellow w/ icing 369 12 0 0 2.8 0.9 2.0 5.4 2.5 Granola bar, w/ raisins 370 12 0 0 12.6 6.2 9.5 32.0 10.9 Candy bar, chocolate, nougat, and nuts 371 12 0 0 10.4 0.3 9.9 10.9 10.3 Popcorn, microwave, butter-flavored 372 12 0 0 20.1 4.0 13.0 25.4 21.0 Sweet & sour sauce 373 12 1 9 0.6 0.4 0 1.4 0.5 Brown gravy, canned or bottled 374 12 0 0 1.6 0.2 1.2 1.8 1.6 Salad dressing, creamy/buttermilk type, regular 375 12 0 0 2.0 0.5 1.3 3.1 2.0 Salad dressing, creamy/buttermilk type, low-calorie 376 12 0 0 1.8 0.3 1.1 2.3 1.8 Salad dressing, Italian, regular 377 12 0 9 0.9 0.3 0.5 1.4 0.8 Olive oil 378 12 7 5 0.2 0.2 0 0.5 0
Page 210 of 211 Rev 4.1

US Food and Drug Administration — Total Diet Study — Market Baskets 1991-3 through 2005-4
Zinc - Summary of Results TDS Number Number Not Number Mean Std Dev Minimum Maximum Median
TDS Food Description Food No. of Results Detected of Traces (mg/kg) (mg/kg) (mg/kg) (mg/kg) (mg/kg) Vegetable oil 379 12 8 4 0.1 0.2 0 0.5 0 Bottled drinking water (mineral/spring), not carbonated or flavored 380 12 12 0 0 0 0 0 0 Decaffeinated coffee, from ground 381 12 12 0 0 0 0 0 0 Decaffeinated tea, from tea bag 382 12 5 7 0.1 0.1 0 0.2 0.1
Page 211 of 211 Rev 4.1