Embed Size (px)
Citation preview

The Magazine of MR
Issue no. 1/2007ISMRM Edition
MAGNETOM Flash
syngo Maplt
Clinical Ortho-pedic ImagingOverview Biochemical ImagingPage 6
Molecular Imaging of Articular Cartilage and Cartilage RepairPage 18
TechnologyMetamorphosis of MRI: Seamless Move-During-Scan with syngo TimCTPage 61
Pushing the Boundaries of MR with Siemens MAGNETOM 7TPage 70
MR Imaging with an 8-Channel RF Transmit ArrayPage 75
SUBSCRIBE NOW!
– and get your free copy of future
MAGNETOM Flash! Interesting information from
the world of magnetic resonance – gratis to your
desk. Send us this postcard, or subscribe online at
www.siemens.com/MAGNETOM-World
Siem
ens
AG
Med
ical
Sol
uti
ons
Mag
net
ic R
eson
ance
Mar
keti
ng
P.O
. Box
32
60
D-9
10
50
Erl
ange
n
Ger
man
y
Inst
itu
tion
Titl
e
Nam
e*
Stre
et/P
.O. B
ox*
Zip/
Post
al C
ode*
Cit
y*
Stat
e/Pr
ovin
ce*
Cou
ntr
y*
E-m
ail
Yes,
I co
nse
nt
to t
he
abov
e in
form
atio
n b
ein
g u
sed
for
futu
re c
onta
ct r
egar
din
g pr
odu
ct u
pdat
es a
nd
oth
er
impo
rtan
t n
ews
from
Sie
men
s M
R.
Please print clearly!
MA
GN
ET
OM
Fla
sh
MA
GN
ET
OM
Fla
shIs
sue
no
. 1/2
00
7
35
35
© 05.2007, Siemens AG
Order No. A91MR-1000-32C-7600
Printed in Germany
CC MR 01000 WS 050720.
Headquarters Siemens AG, Medical SolutionsHenkestr. 127, D-91052 ErlangenGermanyTelephone: +49 9131 84-0www.siemens.com/medical
Contact Addresses
In the USA:Siemens Medical Solutions USA, Inc.51 Valley Stream ParkwayMalvern, PA 19355Tel.: +1 888-826-9702Tel.: 610-448-4500Fax: 610-448-2254
In Japan:Siemens-AsahiMedical Technologies Ltd.Takanawa Park Tower 14 F20-14, Higashi-Gotanda 3-chomeShinagawa-kuTokyo 141-8644(+81) 354238489
In Asia:Siemens Medical SolutionsAsia Pacific HeadquartersThe Siemens Center60 MacPherson RoadSingapore 348615(+65) 9622-2026
In Germany:Siemens AG, Medical SolutionsMagnetic ResonanceHenkestr. 127, D-91052 ErlangenGermanyTelephone: +49 9131 84-0
www.siemens.com/medical
On account of certain regional limitations of sales rights and service availability, we cannot guarantee that all products included in this brochure are available through the Siemens sales organization worldwide. Availability and packaging may vary by country and is subject to change without prior notice. Some/All of the features and products described herein may not be available in the United States.
The information in this document contains general technical descriptions of specifications and options as well as standard and optional features which do not always have to be present in individual cases.
Siemens reserves the right to modify the design, packaging, specifications and options described herein without prior notice. Please contact your local Siemens sales representative for the most current information.
Note: Any technical data contained in this document may vary within defined tolerances. Original images always lose a certain amount of detail when reproduced.
Flash_Cover_DD.indd 1 Flash_Cover_DD.indd 1 26.04.2007 16:11:41 Uhr26.04.2007 16:11:41 Uhr
MAGNETOM Flash offers product news, clinical methods, application tips, MR technology and information on Life.
Life
Innovations ’07 Siemens Education Symposium for Medical Technologists and IT CustomersAugust 12 – 15, 2007Pennsylvania Convention Center and Philadelphia Marriott HotelPhiladelphia, Pennsylvania, USA
Register now for Innovations ’07 and take advantage
of this education opportunity to sharpen your skills,
share experiences with your colleagues, and learn
new techniques to enhance patient care and optimize
system efficiency.
This program offers a total of 16.5 Category A ASRT
continuing education credits.
Sessions will allow you to experience the latest inno-
vations in MR for 3T, Breast MR, Cardiac MR, func-
tional MRI (fMRI), and the newest hybrid technology,
MR-PET. You will learn how to improve your work-
flow, optimize image quality, and troubleshoot arti-
facts with the “Tips and Tricks”, Siemens Uptime,
iPAT (integrated Parallel Acquisition Techniques) and
Tim (Total imaging matrix) sessions. An update on
MR Safety will also be highlighted.
For more information and to register, visit
www.usa.siemens.com/med-innovations/eNewsletter.
Early registration fee and hotel reservation
deadline date: July 20, 2007.
MAGNETOM Flash · 1/2007 · www.siemens.com/magnetom-world 87
Philadelphia, Pennsylvania, USA.
All Siemens Medical Solutions customers are invited to participate.
Musculoskeletal (MSK) diseases are a major problem in our society, affecting millions and resulting in lost working hours and restricted functioning. MRI is increasingly important for the precise diagnosis and monitoring of therapy as it allows non-invasive morphological diag-nosis. Furthermore, recent developments are making possible the biochemical assessment of pathologies. Siemens MAGNETOM MR systems offer a comprehensive solution in Musculoskele-tal imaging with special emphasis in four areas: 1. High-resolution fast imaging: using the extra imaging power of Tim (Total imaging matrix) to deliver extremely high in-plane 2D resolution within clinically acceptable examination times. The scan time can also be drastically reduced for users who require increased throughput.2. 3D Isotropic imaging: a means of delivering enhanced workflow and better diagnosis.3. Biochemical imaging: for improved di-agnostic capability and therapy planning.4. Orthopedic imaging with dedicated coils: to fully capitalize on the benefits of MAGNETOM systems and indicate new areas of study not previously possible e.g. biochemical imaging of the cartilage in the wrist, ankle or knee. Our aim in this issue of MAGNETOM Flash is to include articles that give an over-view of current approaches in Orthopedic
Dear MAGNETOM user,
Tallal Charles Mamisch, M.D. Inselspital, University Bern,
SwitzerlandTimothy Hughes, Ph.D.
Siemens Medical Solutions, Erlangen, Germany
imaging, from routine clinical protocols to new research work. The articles focus on improvements in diagnostic imaging and follow-up of therapy. Our special thanks are due to Prof. Dr. Siegfried Trattnig (University Vienna, Austria), Dr. Thaddeus Laird (UC Davis Medical Center, Sacramento, USA) and Dr. Stefan Werlen (Sonnenhof Clinics Bern, Switzerland) for all their efforts in bringing the ideas and topics together for this issue. We are aware that the content of this MAGNETOM Flash can only cover a few selected topics from the wide spectrum of applications for MSK imaging. We encourage MAGNETOM users to give us feedback on these articles and on other approaches they consider of significance. With your help, we can tap into a wide range of experiences, develop new tech-niques and translate these techniques into the clinical routine of the future.
Tallal Charles Mamisch, M.D. Timothy Hughes, Ph.D.
[email protected] [email protected]
Editorial
2 MAGNETOM Flash · 1/2007 · www.siemens.com/magnetom-world
Flash_Cover_DD.indd 2 Flash_Cover_DD.indd 2 26.04.2007 16:11:51 Uhr26.04.2007 16:11:51 Uhr
MAGNETOM Flash · 1/2007 · www.siemens.com/magnetom-world 3
Editorial
Cécile Mohr, Ph.D Head of Market Segment Management, Erlangen
Dagmar Thomsik-Schröpfer,Ph.D., MR Marketing- Products, Erlangen
Antje HellwichAssociate Editor
A. Nejat Bengi, M.D.Editor in Chief
Dr. Sunil Kumar S.L. Manager Applications MRI, Siemens Medical Solutions, India
Bernhard Baden,Clinical Data Manager, Erlangen
Peter Kreisler, Ph.D. Collaborations & Applications, Erlangen
Heike Weh,Clinical Data Manager, Erlangen
Gary R. McNeal, MS (BME) Advanced Application Specialist,Cardiovascular MR Imaging Siemens Medical Solutions USA
Kathleen Giannini, US Installed Base Manager, Malvern, PA, USA
Milind Dhamankar, M.D.Manager Clinical MR Research Collaborations, USA
Tony Enright, Ph.D. Asia Pacific Collaborations, Australia
The Editorial TeamWe appreciate your comments.Please contact us at [email protected]

4 MAGNETOM Flash · 1/2007 · www.siemens.com/magnetom-world
Content
Content
48 In this issue of MAGNETOM Flash we launch a “How I do it“ section with application tips.
Orthopedic Imaging
6 High-resolution T2*-map of the elbow
14 8-channel knee coil
Clinical Orthopedic Imaging
6 Overview: Biochemical Imaging
8 Overview: High-Resolution (Fast-) Imaging
10 Overview: Isotropic 3D Imaging
14 Overview: Orthopedic Coils
18 Molecular Imaging of Articular Cartilage and Cartilage Repair
22 Delayed Gadolinium Enhanced MRI of Cartilage (dGEMRIC) in Hip Dysplasia
24 T2 Mapping of Articular Cartilage in Hip Joint
26 3D-T1�-Mapping of Cartilage at 3T with integrated Parallel Imaging Technique (syngo GRAPPA)
Content

MAGNETOM Flash · 1/2007 · www.siemens.com/magnetom-world 5
Content
Clinical Gastro- intestinal Imaging
55 syngo REVEAL Images
56 MRI with MR Fistulogram for Perianal Fistula: A Successful Combination
Technology
61 Metamorphosis of MRI: Seamless Move-During-Scan with syngo TimCT
70 Pushing the Boundaries of MR with Siemens MAGNETOM 7T
75 Parallel Transmission (pTX) Technology
81 MAGNETOM Symphony: A Tim System
70MAGNETOM 7T
Content
28 Image Gallery Orthopedic Imaging
36 Isotropic MR Arthrography of the Shoulder. Case Reports
38 MR-Arthrography of the Hip
40 Direct MR-Arthrography
42 Wrist Imaging with MAGNETOM Espree: Changing a Practice
44 Water Excitation in Musculoskeletal Low-Field MR Imaging
Orthopedic Imaging kHow I do it
48 Application Hints for MR Orthopedic Imaging: The Knee Examination
50 MR Imaging of the Carpometacarpal Joint of the Thumb
52 MRI of the Forefoot
The information presented in MAGNETOM Flash is for illustration only and is not intended to be relied upon by the reader for instruction as to the practice of medicine. Any health care practitioner reading this information is reminded that they must use their own learning, training and expertise in dealing with their individual patients. This material does not substitute for that duty and is not intended by Siemens Medical Solutions to be used for any purpose in that regard. The drugs and doses mentioned in MAGNETOM Flash are consistent with the approval labeling for uses and/or indications of the drug. The treating physician bears the sole responsibility for the diagnosis and treatment of patients, including drugs and doses prescribed in connection with such use. The Operating Instructions must always be strictly followed when operating the MR System. The source for the technical data is the corresponding data sheets.
Product News
81 Image Gallery MAGNETOM Symphony, A Tim System
82 MAGNETOM Symphony With New Applications. Power-class with syngo MR A30
Life
86 Your verdict: “Great job – keep doing what you’re doing!”
87 Innovations ‘07: Siemens Education Symposium for Medical Technologists and IT Customers
75 Parallel Transmission (pTx) Technology
Biochemical Imaging
Besides improvements in morphological imaging, the ability to assess and quantify biomarkers is increasingly important in MSK imaging. The use of biochemical im-aging instead of morphological imaging is gaining importance as a means of both improving accuracy of diagnosis and of planning and monitoring the effective-ness of therapy. Based on the different biomarkers, there are several approaches to biochemical imaging described and used for clinical imaging. The different biomarkers can be obtained by contrast and non-contrast examination techniques resulting in T1-,
T2- and T2*-maps. Thanks to syngo MapIt today it is possible to obtain parametric mapping results automatically. syngo MapIt can be used fro all joints in the body (Figs. 1–5). All of the images were prepared within the syngo environment from maps which were created automati-cally, using Inline Technology. These maps can then be retrieved and post-pro-cessed using any of the standard syngo tools, such as Region of Interest (ROI), pixel lens, etc. Furthermore, it is possible to use syngo Fusion to overlay these maps with their corresponding anatomi-cal image and to conduct manual carti-
Clinical Orthopedics
6 MAGNETOM Flash · 1/2007 · www.siemens.com/magnetom-world
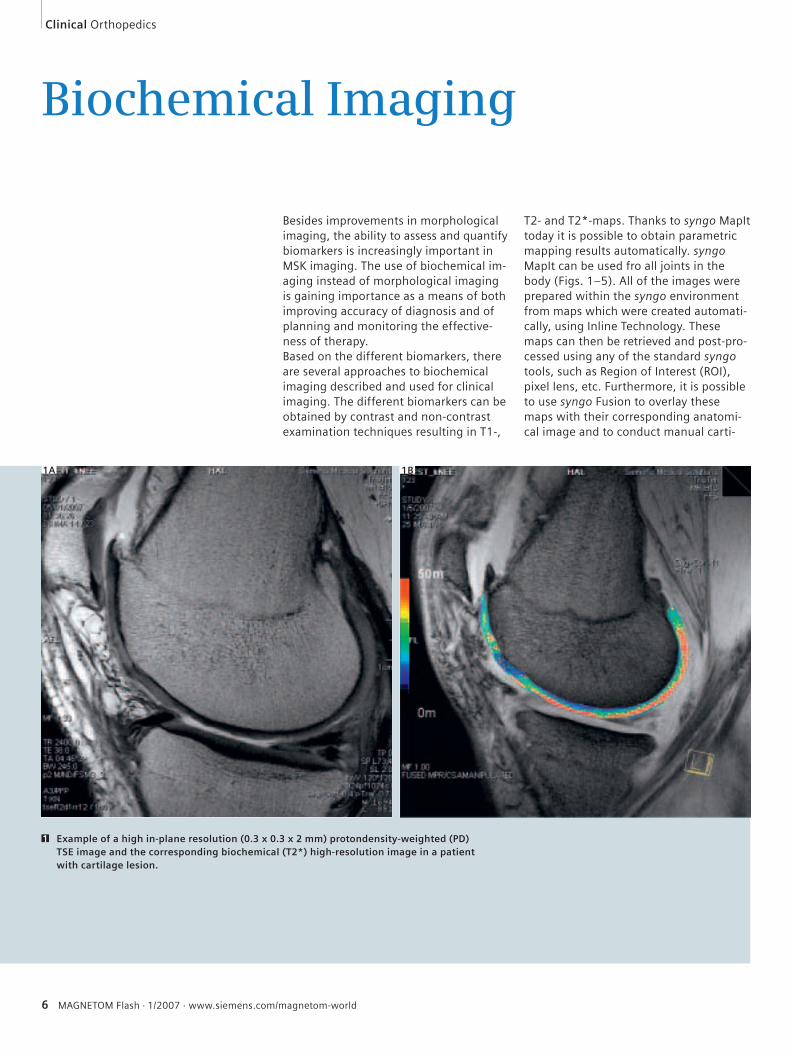
Example of a high in-plane resolution (0.3 x 0.3 x 2 mm) protondensity-weighted (PD) TSE image and the corresponding biochemical (T2*) high-resolution image in a patient with cartilage lesion.
1
1A 1B
MAGNETOM Flash · 1/2007 · www.siemens.com/magnetom-world 7
Orthopedics Clinical
lage segmentation. There is now no need to transfer any data offline, as everything can be accomplished on the measure-ment console.It is also necessary to expand the bio-chemical imaging capabilities. To this end new sequence techniques are being ex-
amined to evaluate the cartilage. One of the most promising candidates for this is Steady State Free Procession (SSFP) diffu-sion imaging using a PSIF sequence, with of course Inline mapping. An alternative approach is to use Echo Planar Imaging (EPI) diffusion which has also delivered
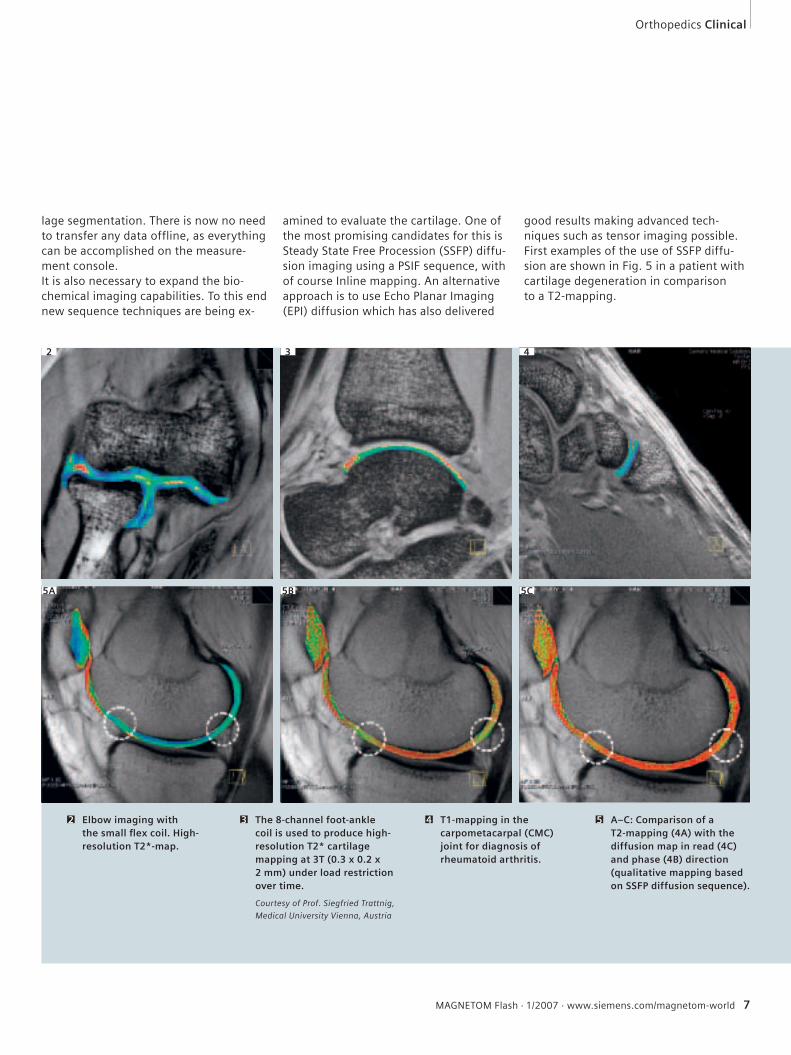
good results making advanced tech-niques such as tensor imaging possible. First examples of the use of SSFP diffu-sion are shown in Fig. 5 in a patient with cartilage degeneration in comparison to a T2-mapping.
Elbow imaging with the small fl ex coil. High-resolution T2*-map.
2 The 8-channel foot-ankle coil is used to produce high-resolution T2* cartilage mapping at 3T (0.3 x 0.2 x 2 mm) under load restriction over time.
Courtesy of Prof. Siegfried Trattnig,
Medical University Vienna, Austria
3
4
5A 5B 5C
T1-mapping in the carpometacarpal (CMC) joint for diagnosis of rheumatoid arthritis.
4 A–C: Comparison of a T2-mapping (4A) with the diffusion map in read (4C) and phase (4B) direction (qualitative mapping based on SSFP diffusion sequence).
5
32
8 MAGNETOM Flash · 1/2007 · www.siemens.com/magnetom-world
Clinical Orthopedics
High-Resolution (Fast-) Imaging
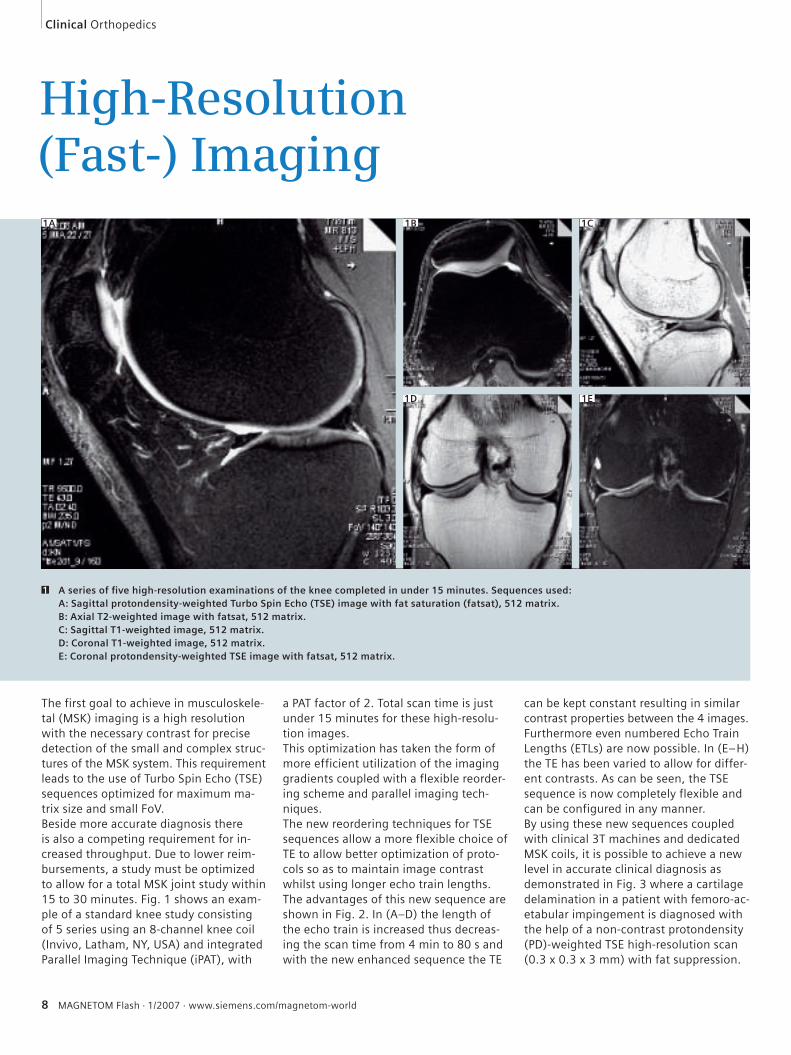
The first goal to achieve in musculoskele-tal (MSK) imaging is a high resolution with the necessary contrast for precise detection of the small and complex struc-tures of the MSK system. This requirement leads to the use of Turbo Spin Echo (TSE) sequences optimized for maximum ma-trix size and small FoV. Beside more accurate diagnosis there is also a competing requirement for in-creased throughput. Due to lower reim-bursements, a study must be optimized to allow for a total MSK joint study within 15 to 30 minutes. Fig. 1 shows an exam-ple of a standard knee study consisting of 5 series using an 8-channel knee coil (Invivo, Latham, NY, USA) and integrated Parallel Imaging Technique (iPAT), with
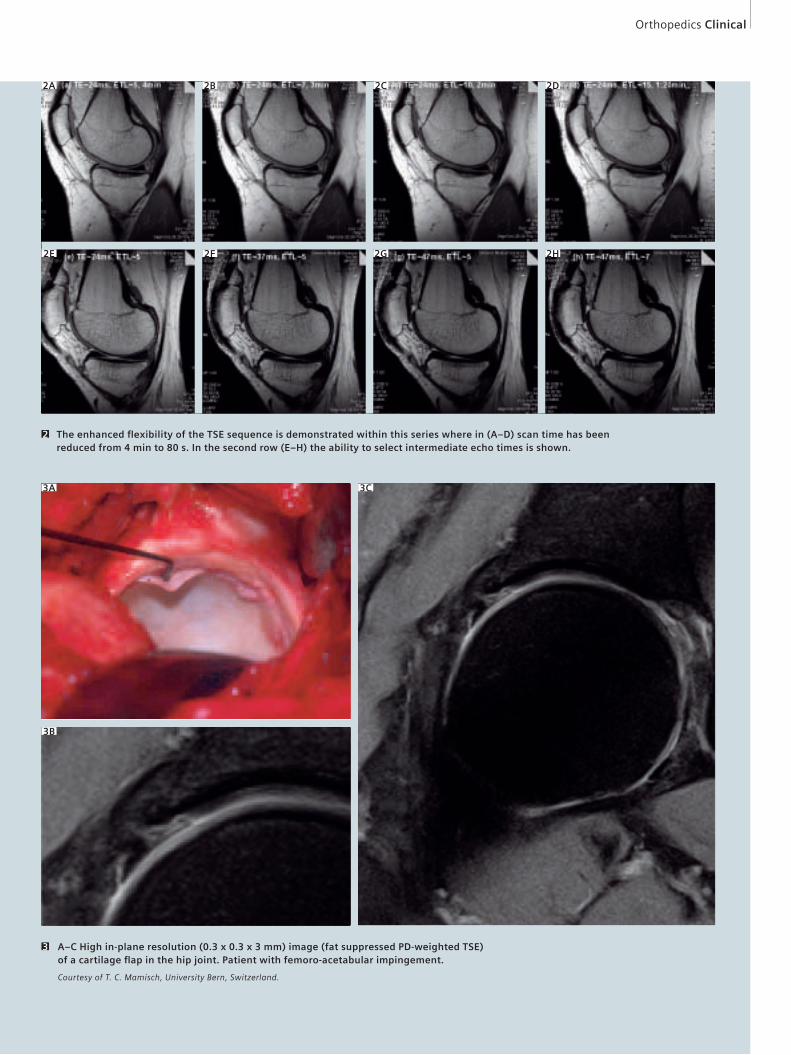
a PAT factor of 2. Total scan time is just under 15 minutes for these high-resolu-tion images.This optimization has taken the form of more efficient utilization of the imaging gradients coupled with a flexible reorder-ing scheme and parallel imaging tech-niques.The new reordering techniques for TSE sequences allow a more flexible choice of TE to allow better optimization of proto-cols so as to maintain image contrast whilst using longer echo train lengths.The advantages of this new sequence are shown in Fig. 2. In (A–D) the length of the echo train is increased thus decreas-ing the scan time from 4 min to 80 s and with the new enhanced sequence the TE
can be kept constant resulting in similar contrast properties between the 4 images. Furthermore even numbered Echo Train Lengths (ETLs) are now possible. In (E–H) the TE has been varied to allow for differ-ent contrasts. As can be seen, the TSE sequence is now completely flexible and can be configured in any manner.By using these new sequences coupled with clinical 3T machines and dedicated MSK coils, it is possible to achieve a new level in accurate clinical diagnosis as demonstrated in Fig. 3 where a cartilage delamination in a patient with femoro-ac-etabular impingement is diagnosed with the help of a non-contrast protondensity (PD)-weighted TSE high-resolution scan (0.3 x 0.3 x 3 mm) with fat suppression.
1A
A series of fi ve high-resolution examinations of the knee completed in under 15 minutes. Sequences used:A: Sagittal protondensity-weighted Turbo Spin Echo (TSE) image with fat saturation (fatsat), 512 matrix.B: Axial T2-weighted image with fatsat, 512 matrix.C: Sagittal T1-weighted image, 512 matrix.D: Coronal T1-weighted image, 512 matrix.E: Coronal protondensity-weighted TSE image with fatsat, 512 matrix.
1
1B 1C
1D 1E
Orthopedics Clinical
The enhanced fl exibility of the TSE sequence is demonstrated within this series where in (A–D) scan time has been reduced from 4 min to 80 s. In the second row (E–H) the ability to select intermediate echo times is shown.
2
2A 2B 2C 2D
2E 2F 2G 2H
3A
3B
3C
A–C High in-plane resolution (0.3 x 0.3 x 3 mm) image (fat suppressed PD-weighted TSE) of a cartilage fl ap in the hip joint. Patient with femoro-acetabular impingement.
Courtesy of T. C. Mamisch, University Bern, Switzerland.
3
10 MAGNETOM Flash · 1/2007 · www.siemens.com/magnetom-world
Clinical Orthopedics
Isotropic 3D Imaging
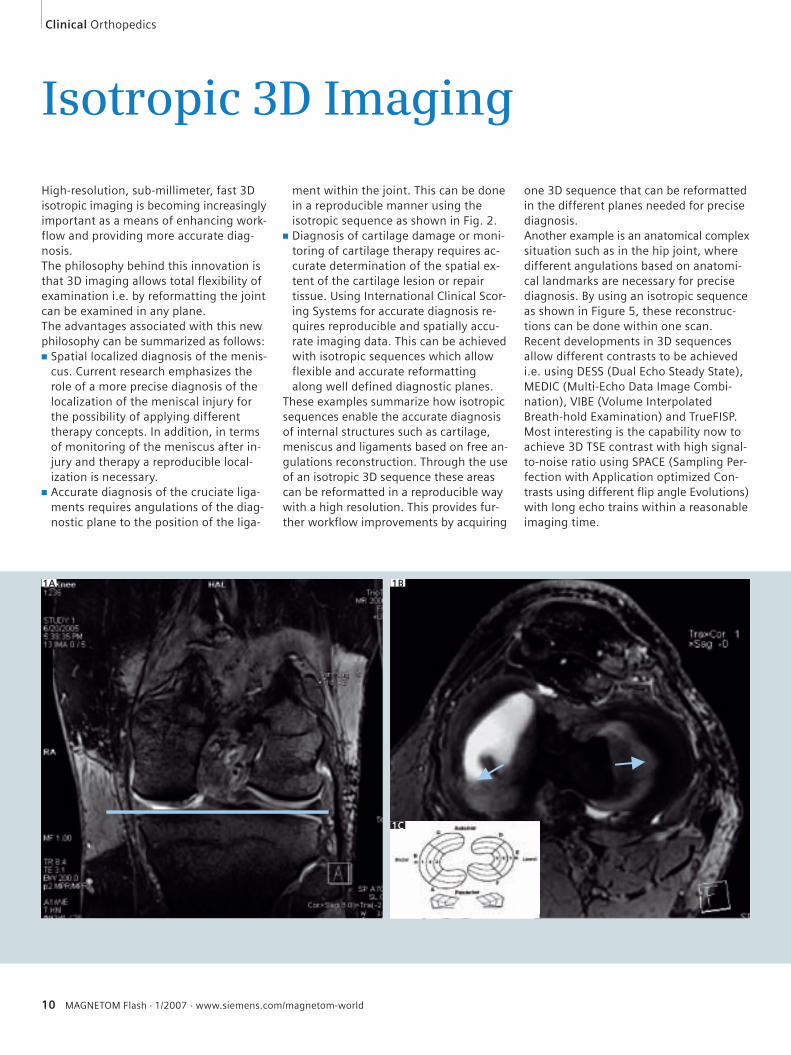
High-resolution, sub-millimeter, fast 3D isotropic imaging is becoming increasingly important as a means of enhancing work-flow and providing more accurate diag-nosis.The philosophy behind this innovation is that 3D imaging allows total flexibility of examination i.e. by reformatting the joint can be examined in any plane. The advantages associated with this new philosophy can be summarized as follows:■ Spatial localized diagnosis of the menis-
cus. Current research emphasizes the role of a more precise diagnosis of the localization of the meniscal injury for the possibility of applying different therapy concepts. In addition, in terms of monitoring of the meniscus after in-jury and therapy a reproducible local-ization is necessary.
■ Accurate diagnosis of the cruciate liga-ments requires angulations of the diag-nostic plane to the position of the liga-
ment within the joint. This can be done in a reproducible manner using the isotropic sequence as shown in Fig. 2.
■ Diagnosis of cartilage damage or moni-toring of cartilage therapy requires ac-curate determination of the spatial ex-tent of the cartilage lesion or repair tissue. Using International Clinical Scor-ing Systems for accurate diagnosis re-quires reproducible and spatially accu-rate imaging data. This can be achieved with isotropic sequences which allow flexible and accurate reformatting along well defined diagnostic planes.
These examples summarize how isotropic sequences enable the accurate diagnosis of internal structures such as cartilage, meniscus and ligaments based on free an-gulations reconstruction. Through the use of an isotropic 3D sequence these areas can be reformatted in a reproducible way with a high resolution. This provides fur-ther workflow improvements by acquiring
one 3D sequence that can be reformatted in the different planes needed for precise diagnosis.Another example is an anatomical complex situation such as in the hip joint, where different angulations based on anatomi-cal landmarks are necessary for precise diagnosis. By using an isotropic sequence as shown in Figure 5, these reconstruc-tions can be done within one scan.Recent developments in 3D sequences allow different contrasts to be achieved i.e. using DESS (Dual Echo Steady State), MEDIC (Multi-Echo Data Image Combi-nation), VIBE (Volume Interpolated Breath-hold Examination) and TrueFISP. Most interesting is the capability now to achieve 3D TSE contrast with high signal-to-noise ratio using SPACE (Sampling Per-fection with Application optimized Con-trasts using different flip angle Evolutions) with long echo trains within a reasonable imaging time.
1A 1B
1C
MAGNETOM Flash · 1/2007 · www.siemens.com/magnetom-world 11
Orthopedics Clinical
A–C: Example of patient after partial lateral meniscal resection after trauma. Oblique axial plane reconstruction of the meniscus for precise localization for follow up and diagnosis.
1
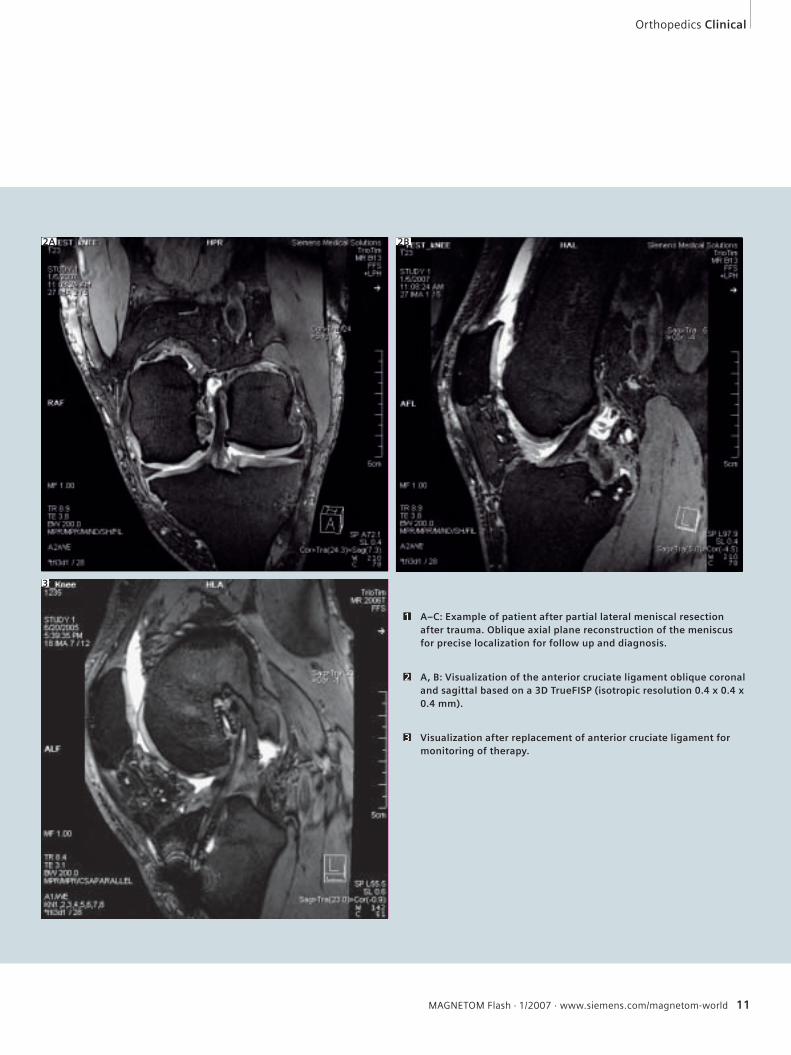
A, B: Visualization of the anterior cruciate ligament oblique coronal and sagittal based on a 3D TrueFISP (isotropic resolution 0.4 x 0.4 x 0.4 mm).
2
Visualization after replacement of anterior cruciate ligament for monitoring of therapy.
3
2A 2B
3
12 MAGNETOM Flash · 1/2007 · www.siemens.com/magnetom-world
Clinical Orthopedics
late
ral
cen
tral
med
ial
med
ial
cen
tral
late
ral
trochlear
anterior
central
posterior
condyle
R L
lat. cent. med. med. cent. lat. lat. cent. med. cent. lat.med.
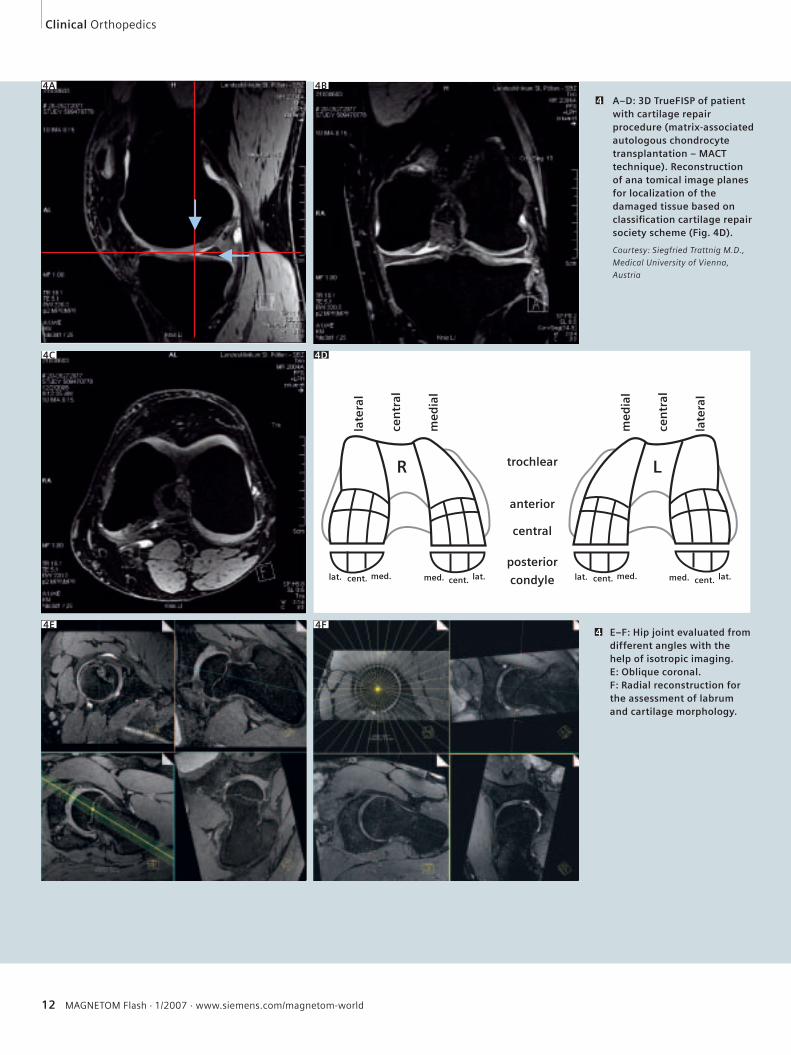
A–D: 3D TrueFISP of patient with cartilage repair procedure (matrix-associated autologous chondrocyte transplantation – MACT technique). Reconstruction of ana tomical image planes for localization of the damaged tissue based on classifi cation cartilage repair society scheme (Fig. 4D).
Courtesy: Siegfried Trattnig M.D.,
Medical University of Vienna,
Austria
4
4A 4B
E–F: Hip joint evaluated from different angles with the help of isotropic imaging.E: Oblique coronal. F: Radial reconstruction for the assessment of labrum and cartilage morphology.
44E
4C 4D
4F
MAGNETOM Flash · 1/2007 · www.siemens.com/magnetom-world 13
Orthopedics Clinical
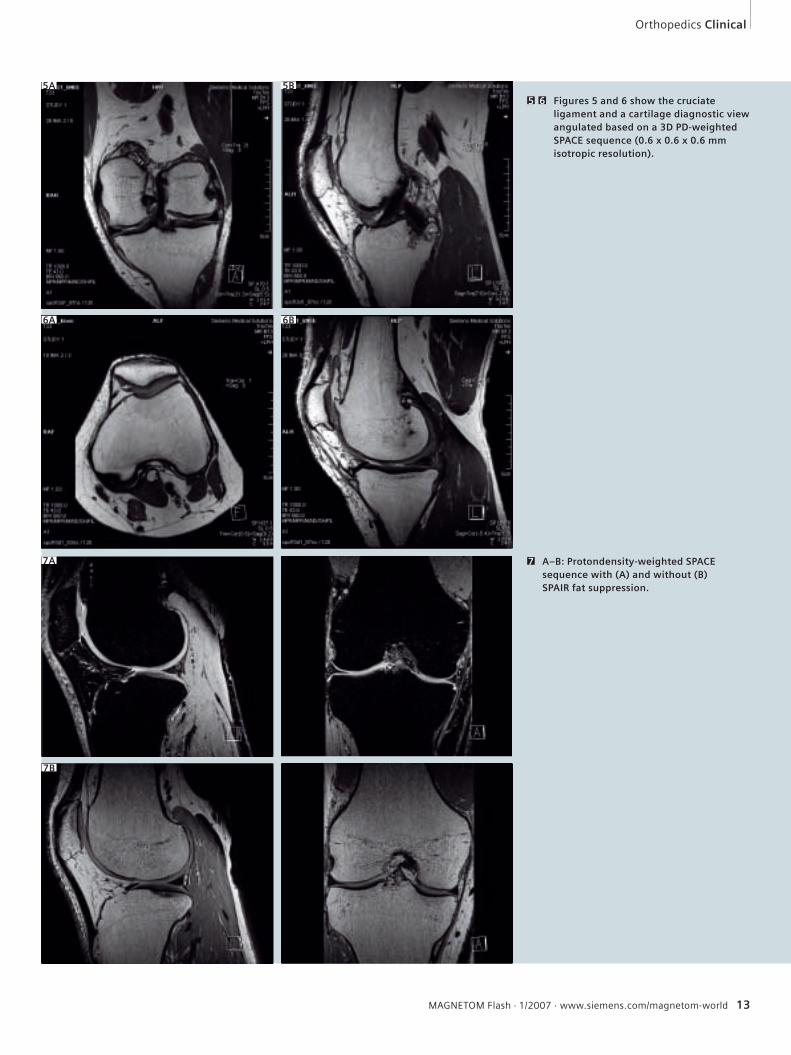
Figures 5 and 6 show the cruciate ligament and a cartilage diagnostic view angulated based on a 3D PD-weighted SPACE sequence (0.6 x 0.6 x 0.6 mm isotropic resolution).
5 6
5A
6A 6B
A–B: Protondensity-weighted SPACE sequence with (A) and without (B) SPAIR fat suppression.
7
5B
7A
7B
14 MAGNETOM Flash · 1/2007 · www.siemens.com/magnetom-world
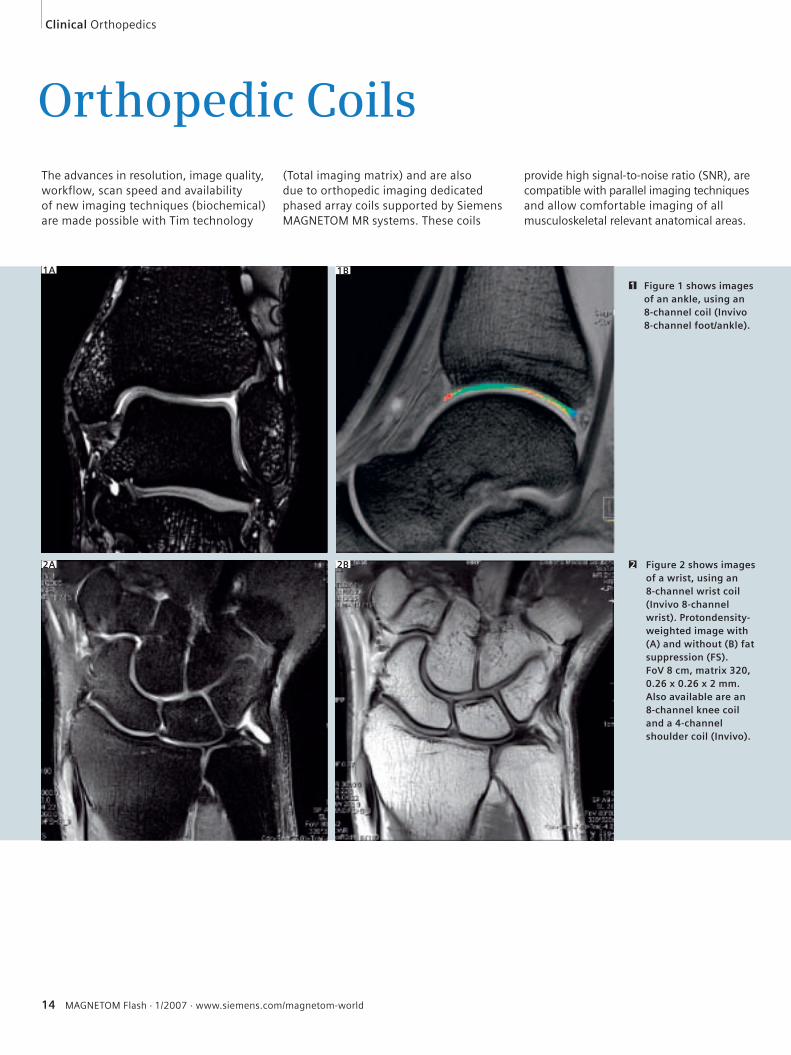
Orthopedic CoilsThe advances in resolution, image quality, workflow, scan speed and availability of new imaging techniques (biochemical) are made possible with Tim technology
(Total imaging matrix) and are also due to orthopedic imaging dedicated phased array coils supported by Siemens MAGNETOM MR systems. These coils
provide high signal-to-noise ratio (SNR), are compatible with parallel imaging techniques and allow comfortable imaging of all musculoskeletal relevant anatomical areas.
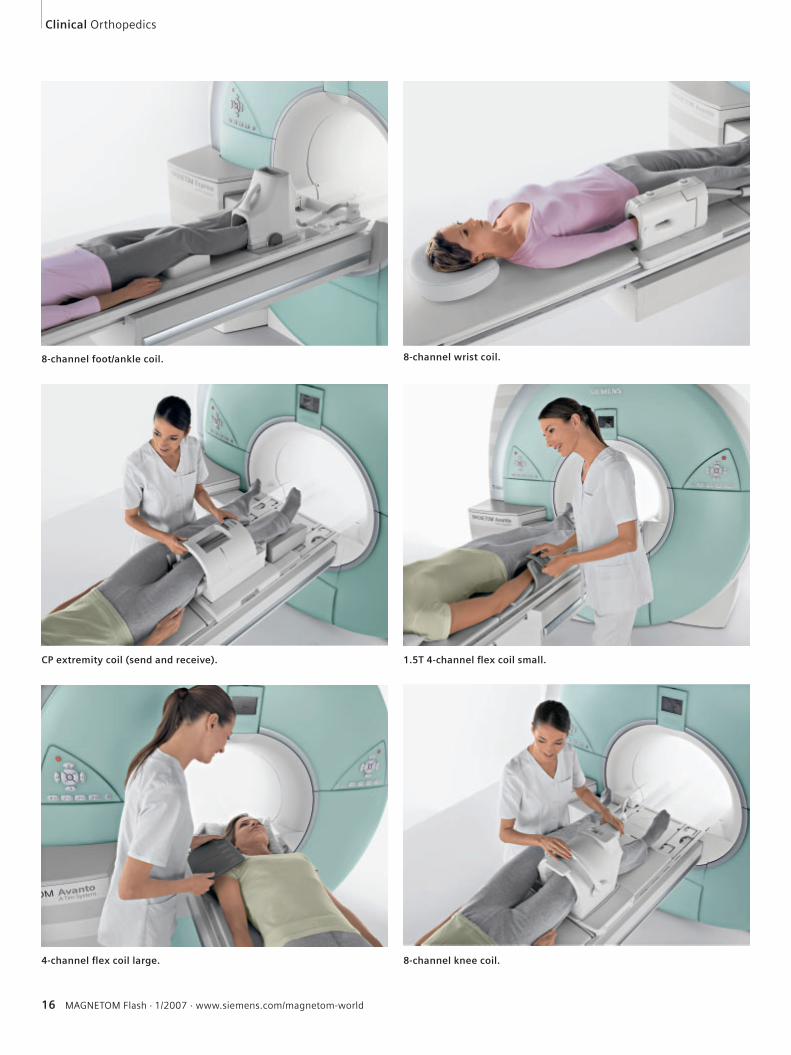
Figure 1 shows images of an ankle, using an 8-channel coil (Invivo 8-channel foot/ankle).
1
Figure 2 shows images of a wrist, using an 8-channel wrist coil (Invivo 8-channel wrist). Protondensity-weighted image with (A) and without (B) fat suppression (FS). FoV 8 cm, matrix 320, 0.26 x 0.26 x 2 mm. Also available are an 8-channel knee coil and a 4-channel shoulder coil (Invivo).
2
1A 1B
2A 2B
Clinical Orthopedics
MAGNETOM Flash · 1/2007 · www.siemens.com/magnetom-world 15
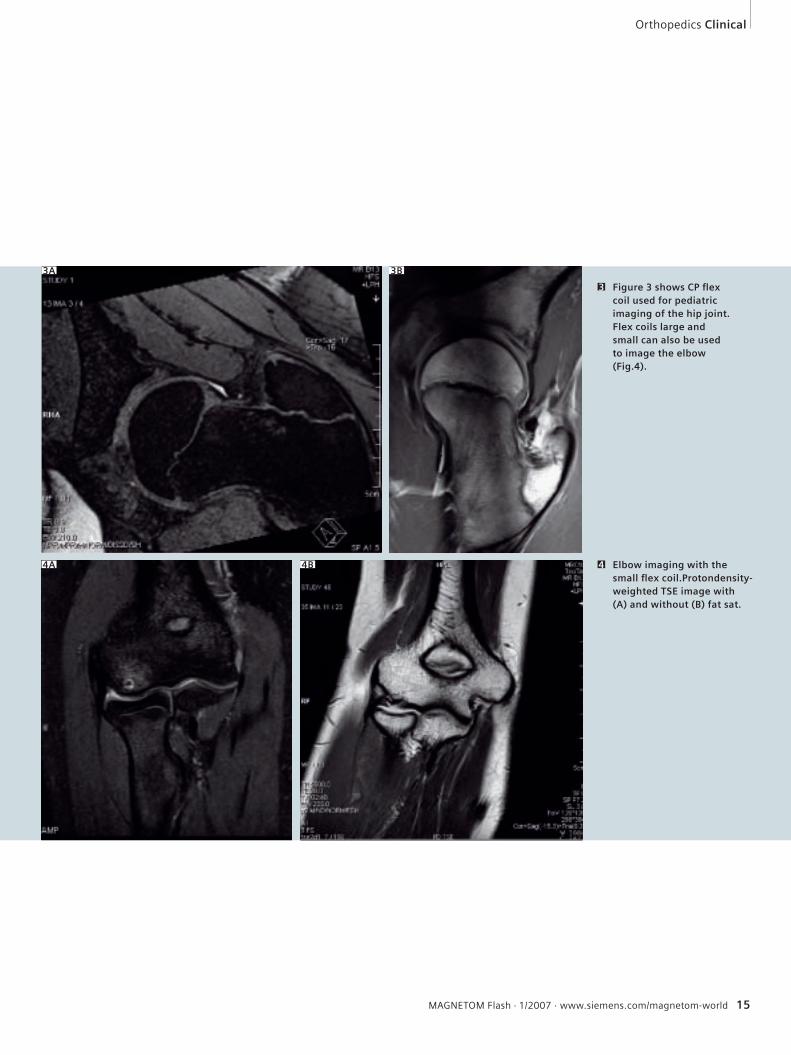
Figure 3 shows CP fl ex coil used for pediatric imaging of the hip joint. Flex coils large and small can also be used to image the elbow (Fig.4).
3
Elbow imaging with the small fl ex coil.Protondensity-weighted TSE image with (A) and without (B) fat sat.
4
3A 3B
4A 4B
Orthopedics Clinical
16 MAGNETOM Flash · 1/2007 · www.siemens.com/magnetom-world
Clinical Orthopedics
1.5T 4-channel fl ex coil small.CP extremity coil (send and receive).
8-channel knee coil.4-channel fl ex coil large.
8-channel wrist coil.8-channel foot/ankle coil.
Proven Outcomes in Magnetic Resonance.
Get ready for T-class, the next generation of MRI. With syngo® TimCT™ –Continuous Table move – the new MAGNETOM® T-class shifts the paradigm to CT-like scanning. No stops. Just continuous scanning. And not a single second wasted. Powered by Tim®, T-class combines increased diagnostic confidence with dramatically increased throughput. Find out more at our website. And see for yourselfwhy at Siemens, the innovation never stops.
MR-Z998-2-7600
syngo TimCT. MR – more advanced than ever.
18 MAGNETOM Flash · 1/2007 · www.siemens.com/magnetom-world
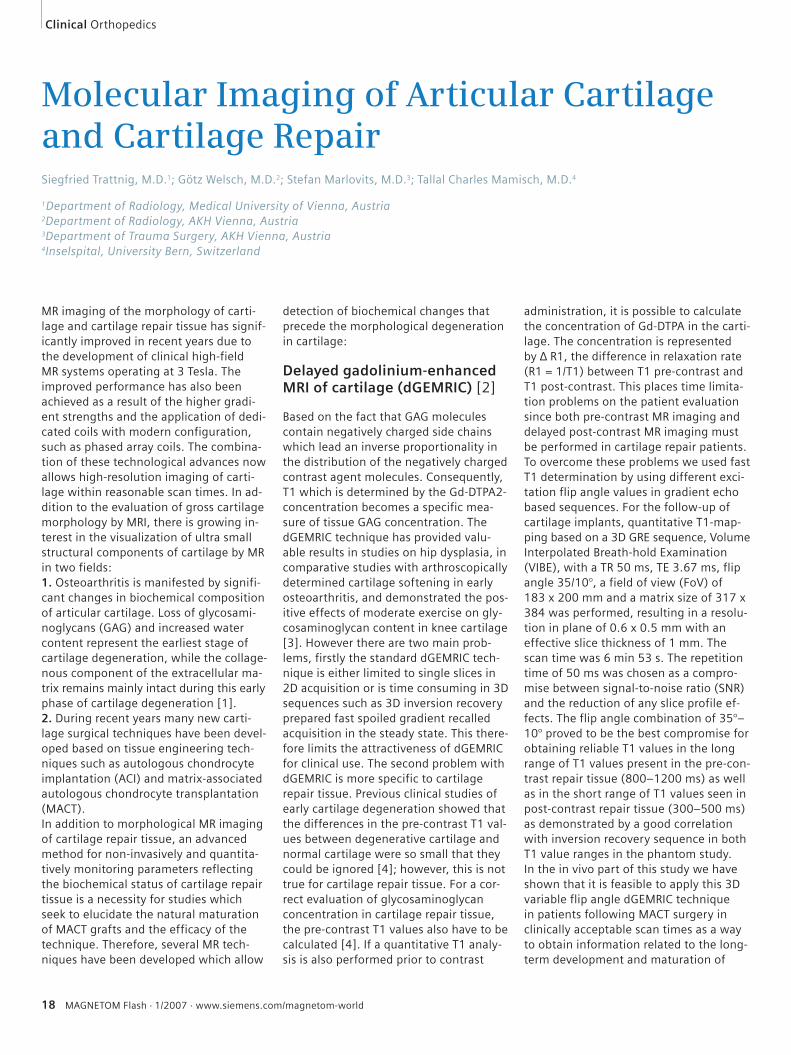
Molecular Imaging of Articular Cartilage and Cartilage RepairSiegfried Trattnig, M.D.1; Götz Welsch, M.D.2; Stefan Marlovits, M.D.3; Tallal Charles Mamisch, M.D.4
1Department of Radiology, Medical University of Vienna, Austria2Department of Radiology, AKH Vienna, Austria3Department of Trauma Surgery, AKH Vienna, Austria4Inselspital, University Bern, Switzerland
detection of biochemical changes that precede the morphological degeneration in cartilage:
Delayed gadolinium-enhanced MRI of cartilage (dGEMRIC) [2]
Based on the fact that GAG molecules contain negatively charged side chains which lead an inverse proportionality in the distribution of the negatively charged contrast agent molecules. Consequently, T1 which is determined by the Gd-DTPA2- concentration becomes a specific mea-sure of tissue GAG concentration. The dGEMRIC technique has provided valu-able results in studies on hip dysplasia, in comparative studies with arthroscopically determined cartilage softening in early osteoarthritis, and demonstrated the pos-itive effects of moderate exercise on gly-cosaminoglycan content in knee cartilage [3]. However there are two main prob-lems, firstly the standard dGEMRIC tech-nique is either limited to single slices in 2D acquisition or is time consuming in 3D sequences such as 3D inversion recovery prepared fast spoiled gradient recalled acquisition in the steady state. This there-fore limits the attractiveness of dGEMRIC for clinical use. The second problem with dGEMRIC is more specific to cartilage repair tissue. Previous clinical studies of early cartilage degeneration showed that the differences in the pre-contrast T1 val-ues between degenerative cartilage and normal cartilage were so small that they could be ignored [4]; however, this is not true for cartilage repair tissue. For a cor-rect evaluation of glycosaminoglycan concentration in cartilage repair tissue, the pre-contrast T1 values also have to be calculated [4]. If a quantitative T1 analy-sis is also performed prior to contrast
administration, it is possible to calculate the concentration of Gd-DTPA in the carti-lage. The concentration is represented by ∆ R1, the difference in relaxation rate (R1 = 1/T1) between T1 pre-contrast and T1 post-contrast. This places time limita-tion problems on the patient evaluation since both pre-contrast MR imaging and delayed post-contrast MR imaging must be performed in cartilage repair patients.To overcome these problems we used fast T1 determination by using different exci-tation flip angle values in gradient echo based sequences. For the follow-up of cartilage implants, quantitative T1-map-ping based on a 3D GRE sequence, Volume Interpolated Breath-hold Examination (VIBE), with a TR 50 ms, TE 3.67 ms, flip angle 35/10°, a field of view (FoV) of 183 x 200 mm and a matrix size of 317 x 384 was performed, resulting in a resolu-tion in plane of 0.6 x 0.5 mm with an effective slice thickness of 1 mm. The scan time was 6 min 53 s. The repetition time of 50 ms was chosen as a compro-mise between signal-to-noise ratio (SNR) and the reduction of any slice profile ef-fects. The flip angle combination of 35°–10° proved to be the best compromise for obtaining reliable T1 values in the long range of T1 values present in the pre-con-trast repair tissue (800–1200 ms) as well as in the short range of T1 values seen in post-contrast repair tissue (300–500 ms) as demonstrated by a good correlation with inversion recovery sequence in both T1 value ranges in the phantom study. In the in vivo part of this study we have shown that it is feasible to apply this 3D variable flip angle dGEMRIC technique in patients following MACT surgery in clinically acceptable scan times as a way to obtain information related to the long-term development and maturation of
MR imaging of the morphology of carti-lage and cartilage repair tissue has signif-icantly improved in recent years due to the development of clinical high-field MR systems operating at 3 Tesla. The improved performance has also been achieved as a result of the higher gradi-ent strengths and the application of dedi-cated coils with modern configuration, such as phased array coils. The combina-tion of these technological advances now allows high-resolution imaging of carti-lage within reasonable scan times. In ad-dition to the evaluation of gross cartilage morphology by MRI, there is growing in-terest in the visualization of ultra small structural components of cartilage by MR in two fields: 1. Osteoarthritis is manifested by signifi-cant changes in biochemical composition of articular cartilage. Loss of glycosami-noglycans (GAG) and increased water content represent the earliest stage of cartilage degeneration, while the collage-nous component of the extracellular ma-trix remains mainly intact during this early phase of cartilage degeneration [1]. 2. During recent years many new carti-lage surgical techniques have been devel-oped based on tissue engineering tech-niques such as autologous chondrocyte implantation (ACI) and matrix-associated autologous chondrocyte transplantation (MACT). In addition to morphological MR imaging of cartilage repair tissue, an advanced method for non-invasively and quantita-tively monitoring parameters reflecting the biochemical status of cartilage repair tissue is a necessity for studies which seek to elucidate the natural maturation of MACT grafts and the efficacy of the technique. Therefore, several MR tech-niques have been developed which allow
Clinical Orthopedics
MAGNETOM Flash · 1/2007 · www.siemens.com/magnetom-world 19
the tissue. Conventional DWI based on spin-echo (SE) sequences is relatively in-sensitive to susceptibility effects, but dif-fusion-weighted SE sequences require a long acquisition time which, for practical reasons, in a clinical examination is inap-plicable. Echo planar imaging (EPI)-based diffusion sequences, the gold standard of DWI in neuro applications, suffer from image distortions due to susceptibility changes as well as from limitations in contrast due to the rather long echo times needed. Both render them imprac-ticable for low T2 tissues like cartilage and muscles. Alternatively, diffusion im-aging can be based on steady state free precession sequences (SSFP) which real-ize a diffusion weighting in relatively short echo times. This is achieved by the application of a mono-polar diffusion sensitizing gradient which, under steady state conditions, leads to a diffusion weighting of consecutive echoes (spin
0.63 x 0.63 x 1 mm. Using quantitative T2-mapping of patients at different post operative intervals after MACT surgery, we found significantly higher T2 values in cartilage repair tissue in the early stage (3–6 months) compared to native hyaline cartilage. Furthermore, we found a de-crease in repair tissue T2 values over time with the T2 values becoming similar to na-tive healthy cartilage by approximately one year. One encouraging alternative to these sequence modalities for the evaluation of cartilage microstructure is the use of DWI.
DWI: Diffusion-weighted sequences [8]
Diffusion-Weighted Imaging (DWI) is based on molecular motion that is influ-enced by intra- and extra-cellular barriers. Consequently, it is possible, by measuring the molecular movement, to reflect bio-chemical structure and architecture of
grafts. Thus, we found that the GAG con-tent is significantly lower in repair tissue than in normal hyaline cartilage and does not change even after 3 to 4 years.While GAG content reflects stiffness prop-erties of repair tissue, the organisation of the collagen matrix in repair tissue over time is important too, as failure within the collageneous fibre network is considered to entail further cartilage breakdown.
Quantitative T2-mapping
Reported to be sensitive to collagen con-tent and organization. In our examinations the T2 relaxation times were obtained from T2-maps reconstructed using a multi-echo spin echo (SE) measurement with a repetition time (TR) of 1.650 s and six echo times (TE) of 12.9 ms, 25.8 ms, 38.7 ms, 51.6 ms, 65.5 ms and 77.4 ms. Field of View (FoV) was 200 x 200 mm, pixel matrix 320 x 320 and voxel size of
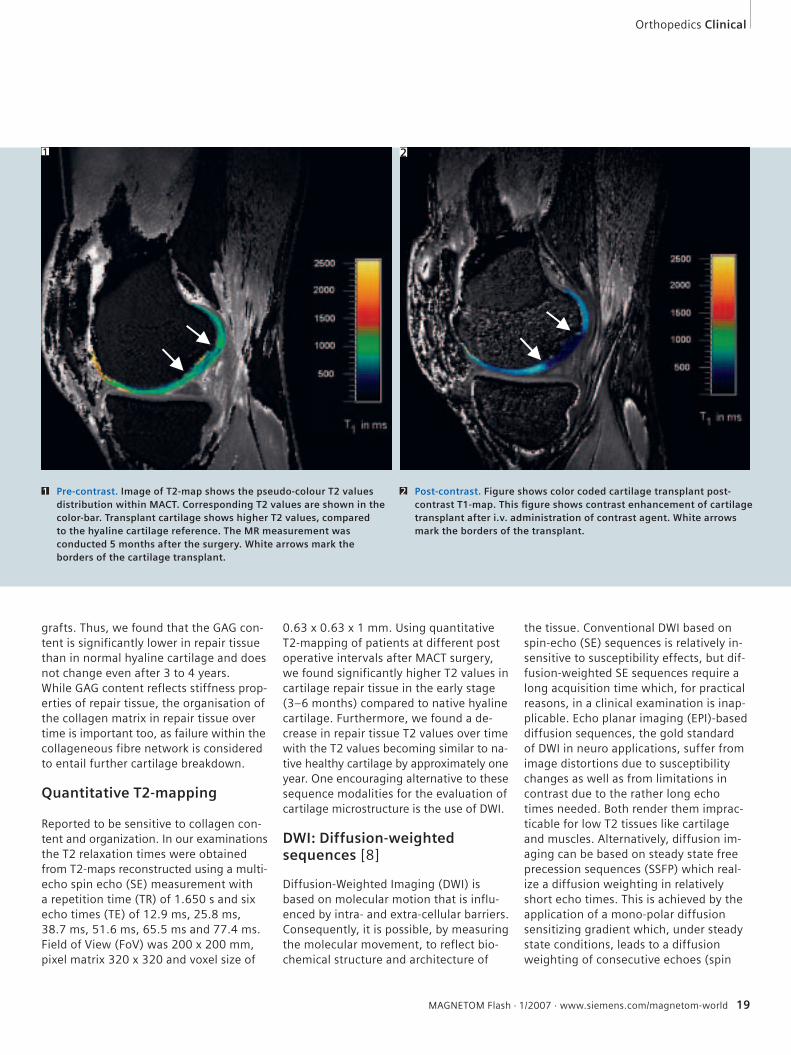
Pre-contrast. Image of T2-map shows the pseudo-colour T2 values distribution within MACT. Corresponding T2 values are shown in the color-bar. Transplant cartilage shows higher T2 values, compared to the hyaline cartilage reference. The MR measurement was conducted 5 months after the surgery. White arrows mark the borders of the cartilage transplant.
1 Post-contrast. Figure shows color coded cartilage transplant post-contrast T1-map. This fi gure shows contrast enhancement of cartilage transplant after i.v. administration of contrast agent. White arrows mark the borders of the transplant.
2
Orthopedics Clinical
1 2
20 MAGNETOM Flash · 1/2007 · www.siemens.com/magnetom-world
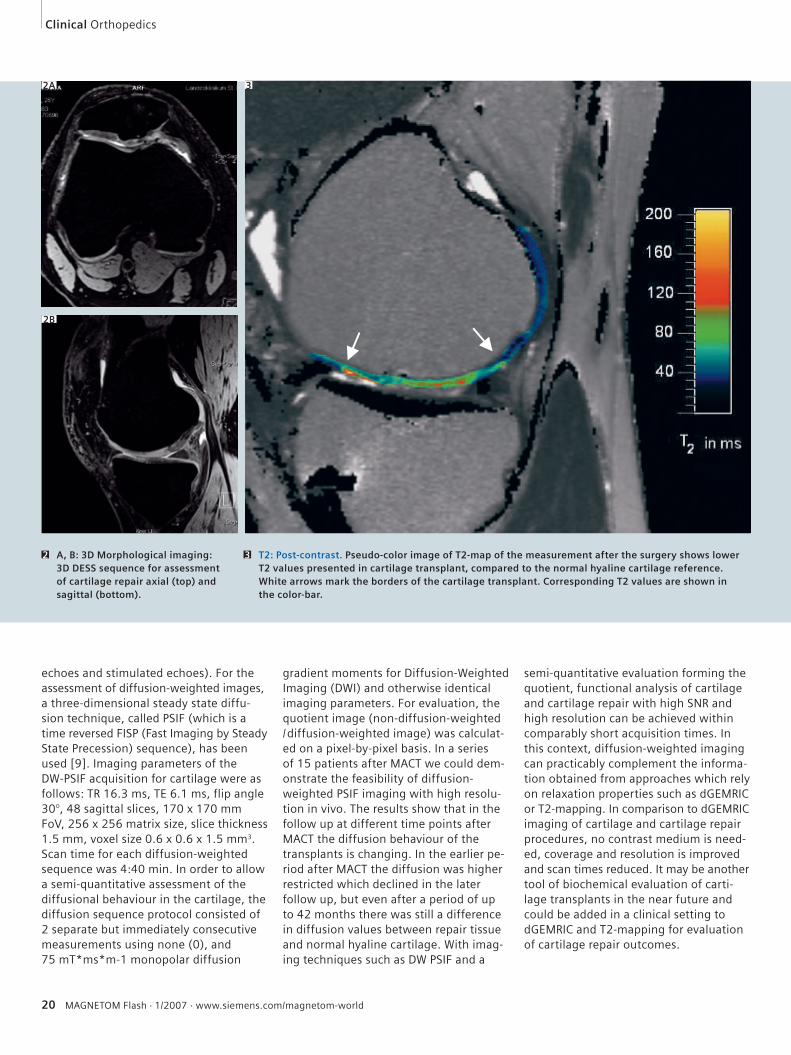
A, B: 3D Morphological imaging: 3D DESS sequence for assessment of cartilage repair axial (top) and sagittal (bottom).
2 3 T2: Post-contrast. Pseudo-color image of T2-map of the measurement after the surgery shows lower T2 values presented in cartilage transplant, compared to the normal hyaline cartilage reference. White arrows mark the borders of the cartilage transplant. Corresponding T2 values are shown in the color-bar.
echoes and stimulated echoes). For the assessment of diffusion-weighted images, a three-dimensional steady state diffu-sion technique, called PSIF (which is a time reversed FISP (Fast Imaging by Steady State Precession) sequence), has been used [9]. Imaging parameters of the DW-PSIF acquisition for cartilage were as follows: TR 16.3 ms, TE 6.1 ms, flip angle 30°, 48 sagittal slices, 170 x 170 mm FoV, 256 x 256 matrix size, slice thickness 1.5 mm, voxel size 0.6 x 0.6 x 1.5 mm3. Scan time for each diffusion-weighted sequence was 4:40 min. In order to allow a semi-quantitative assessment of the diffusional behaviour in the cartilage, the diffusion sequence protocol consisted of 2 separate but immediately consecutive measurements using none (0), and 75 mT*ms*m-1 monopolar diffusion
gradient moments for Diffusion-Weighted Imaging (DWI) and otherwise identical imaging parameters. For evaluation, the quotient image (non-diffusion-weighted / diffusion-weighted image) was calculat-ed on a pixel-by-pixel basis. In a series of 15 patients after MACT we could dem-onstrate the feasibility of diffusion-weighted PSIF imaging with high resolu-tion in vivo. The results show that in the follow up at different time points after MACT the diffusion behaviour of the transplants is changing. In the earlier pe-riod after MACT the diffusion was higher restricted which declined in the later follow up, but even after a period of up to 42 months there was still a difference in diffusion values between repair tissue and normal hyaline cartilage. With imag-ing techniques such as DW PSIF and a
semi-quantitative evaluation forming the quotient, functional analysis of cartilage and cartilage repair with high SNR and high resolution can be achieved within comparably short acquisition times. In this context, diffusion-weighted imaging can practicably complement the informa-tion obtained from approaches which rely on relaxation properties such as dGEMRIC or T2-mapping. In comparison to dGEMRIC imaging of cartilage and cartilage repair procedures, no contrast medium is need-ed, coverage and resolution is improved and scan times reduced. It may be another tool of biochemical evaluation of carti-lage transplants in the near future and could be added in a clinical setting to dGEMRIC and T2-mapping for evaluation of cartilage repair outcomes.
2A
2B
3
Clinical Orthopedics
MAGNETOM Flash · 1/2007 · www.siemens.com/magnetom-world 21
References
1 Grushko G, Schneiderman R, Maroudas A. Some
biochemical and biophysical parameters for the
study of the pathogenesis of osteoarthritis: a com-
parison between the processes of aging and degen-
eration in human hip cartilage Connect Tissue Res
1989; 19: 149–76.
2 Brittberg M, Lindahl A, Nilsson A, Ohlsson C, Isaks-
son O, Peterson L. Treatment of Deep Cartilage De-
fects in the Knee with Autologous Chondrocyte
Transplantation. New Engl J Med 1994; 331(14):
889–895.
3 Bashir A, Gray ML, Burstein D. Gd-DTPA2- as a
measure of cartilage degradation. Magn Reson Med
1996; 36: 665–73.
4 Burstein D, Velyvis J, Scott KT et al. Protocol issues
for delayed Gd(DTPA) (2-) enhanced MRI (dGEMRIC)
for clinical evaluation of articular cartilage.
Magn Reson Med 2001; 45: 36–41.
5 Watanabe A, Wada Y, Obata T, et al. Delayed gado-
linium-enhanced MR to determine glycosaminogly-
can concentration in reparative cartilage after autol-
ogous chondrocyte implantation: Preliminary
results. Radiology 2006; 239(1): 201–208.
6 Miller KL, Hargreaves BA, Gold GE, et al. Steady-
state diffusion-weighted imaging of in vivo knee
cartilage. Magn Reson Med. Feb 2004; 51(2):
394–398.
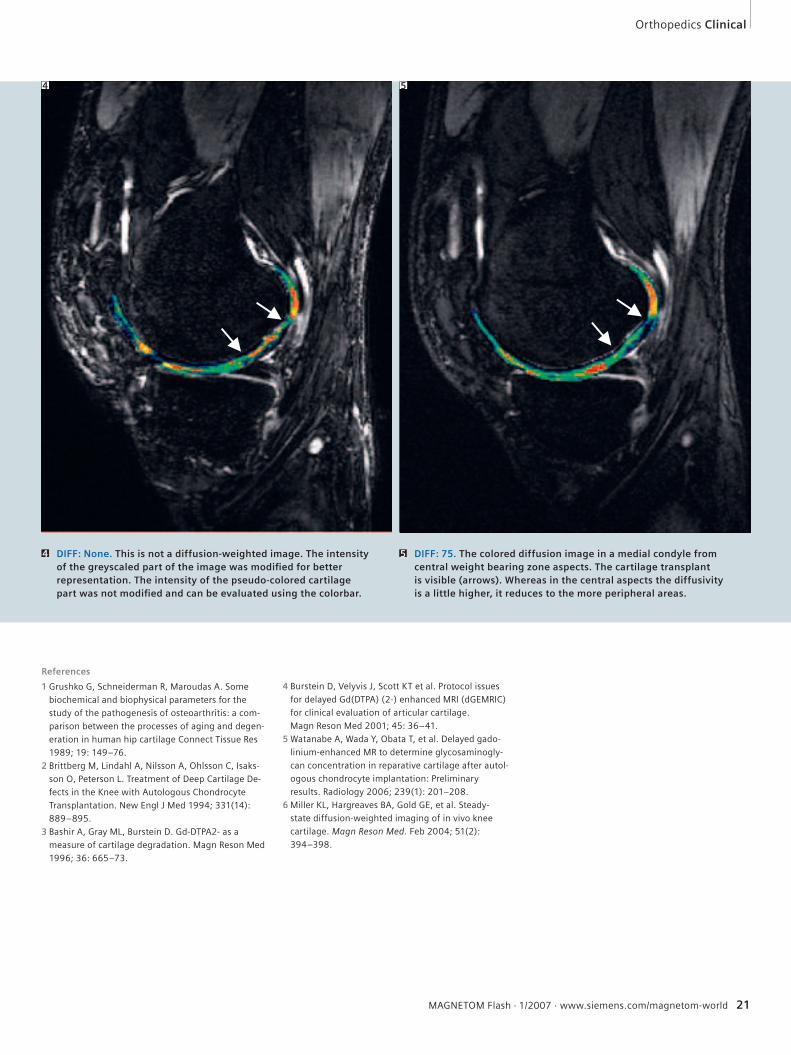
DIFF: None. This is not a diffusion-weighted image. The intensity of the greyscaled part of the image was modifi ed for better representation. The intensity of the pseudo-colored cartilage part was not modifi ed and can be evaluated using the colorbar.
4 DIFF: 75. The colored diffusion image in a medial condyle from central weight bearing zone aspects. The cartilage transplant is visible (arrows). Whereas in the central aspects the diffusivityis a little higher, it reduces to the more peripheral areas.
5
4 5
Orthopedics Clinical
22 MAGNETOM Flash · 1/2007 · www.siemens.com/magnetom-world
Clinical Orthopedics
Delayed Gadolinium Enhanced MRI of Cartilage (dGEMRIC) in Hip DysplasiaMarcel Dudda, M.D.1, 2; Young Jo Kim, M.D., Ph.D.1
1 Dept. of Orthopaedic Surgery, Children’s Hospital Boston, Harvard Medical School, Boston, USA2 Dept. of Surgery, University Hospital Bergmannsheil, Ruhr-University-Bochum, Germany
Developmental dysplasia of the hip re-sults in a shallow and unstable hip joint that leads to early osteoarthritis (OA) be-cause of an increased mechanical stress of the cartilage [1–3]. It is estimated in some clinical series that up to 20 % of hips undergoing total hip replacement is due to this developmental disorder [4].The delayed Gadolinium Enhanced MRI of Cartilage (dGEMRIC) is a non-invasive im-aging technique that is able to monitor the loss of charge density in articular car-tilage seen in early OA. dGEMRIC is a better marker of OA in hip dysplasia than tradi-tional X-Ray measurements, such as mini-mal joint space width. Only dGEMRIC cor-relates with the patient’s symptoms and with the severity of dysplasia [5].dGEMRIC examines the cartilage’s fixed-
negative-charge density comprised of negatively charged glycosaminoglycans (GAG) [6, 7]. GAG provide the cartilage with its compressive stiffness and are lost early in the course of osteoarthritis [8]. In dGEMRIC, the anionic contrast agent gadopentetate (Gd-DTPA2-), is given intra-venously and distributes in cartilage in an inversely proportional manner to the concentration of negatively charged GAG.The concentration of Gd-DTPA2- will be relatively low in normal cartilage with abundant GAG and will be relatively high in degraded cartilage from which GAG have been lost. The concentration of Gd-DTPA2- in tissues can be determined from magnetic resonance measurements of T1, with T1 being proportional to the cartilage GAG content. Several in vitro
and in vivo validation studies have been performed in the past [6, 9–13].The dGEMRIC scans are performed with a 1.5T Siemens MAGNETOM Avanto scan-ner after administration of a double dose (0.4 mL/kg) of intravenous Magnevist (Gd-DTPA2-; Berlex Laboratories, Wayne, NJ, USA) thirty minutes prior to the study [12]. Patients are required to walk for 10 to 15 minutes. The dGEMRIC value is calculated as the average of the T1 values of the acetabu-lar and femoral head articular cartilages in the weight-bearing zone (as designat-ed from the edge of the acetabular rim to the indentation at the site of fovea’s attachment to the femoral head) across all 3 coronal slices. Figs. 1 and 2 illustrate examples of dGEMRIC scans. The three
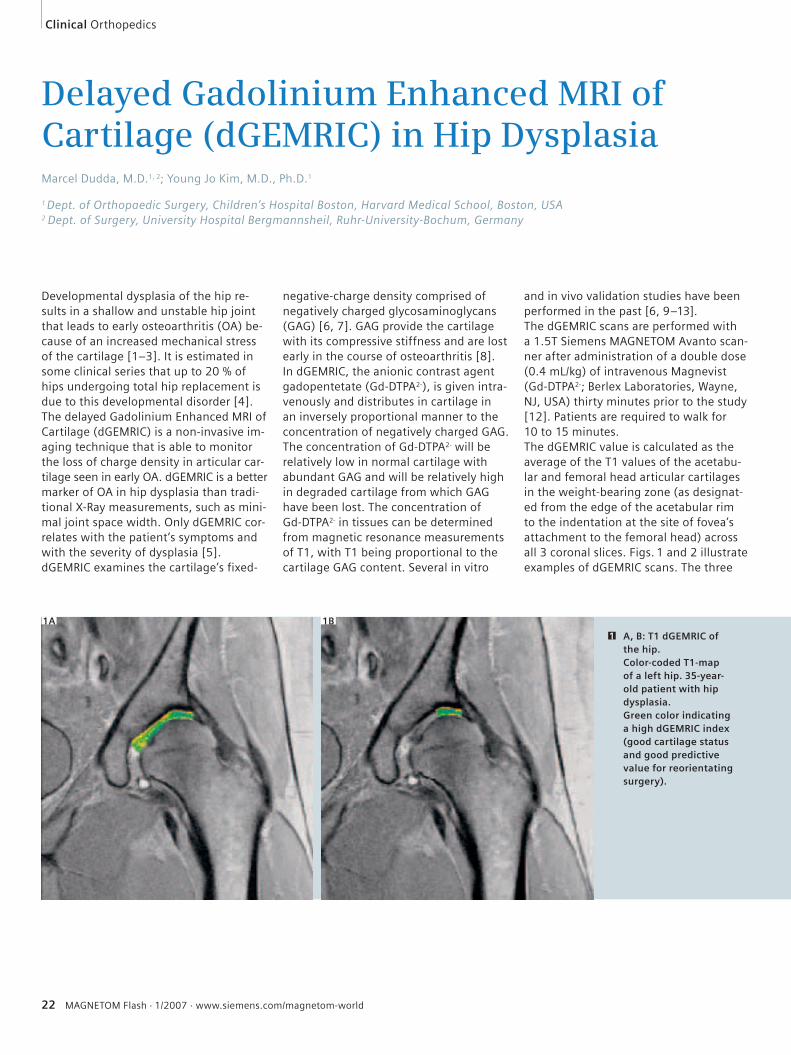
1A 1B
A, B: T1 dGEMRIC of the hip.Color-coded T1-map of a left hip. 35-year-old patient with hip dysplasia. Green color indicating a high dGEMRIC index (good cartilage status and good predictive value for reorientating surgery).
1
MAGNETOM Flash · 1/2007 · www.siemens.com/magnetom-world 23
Sequences Time
Fast T1 localizer TA 0.13 min
T2 truefi 3d we sag TA 1.42 min
T2 star map 2d cor TA 5.59 min
DESS cor TA 6.42 min
Psif 2d sag we r75 384 TA 9.02 min
Psif 2d sag we n384 TA 9.02 min
T2 truefi 3d we sag 0.6 iso TA 7.45 min
Pd tse cor TA 4.58 min
Pd tse sag TA 4.58 min
Fl 3d vibe T1 Map 4 mm cor TA 5.46 min
Fl 3d vibe T1 Map 4 mm sag TA 5.46 min
7 Bashir, A., et al. MRI of Glycosaminoglycan distribu-
tion in Cartilage Using Gd(DTPA)2- in vivo. in Fifth
Annual Meeting of the International Society for
Magnetic Resonance in Medicine. 1997.
Berkeley, CA.
8 Venn, M. and A. Maroudas, Chemical composition
and swelling of normal and osteoarthrotic femoral
head cartilage. I. Chemical composition. Ann
Rheum Dis, 1977. 36(2): p. 121–9.
9 Tiderius, C.J., et al., Gd-DTPA2)-enhanced MRI
of femoral knee cartilage: a dose-response study
in healthy volunteers. Magn Reson Med, 2001.
46(6): p. 1067–71.
10 Bashir, A., et al., Glycosaminoglycan in articular
cartilage: in vivo assessment with delayed
Gd(DTPA)(2-)-enhanced MR imaging. Radiology,
1997. 205(2): p. 551–8.
11 Bashir, A., et al., Nondestructive imaging of human
cartilage glycosaminoglycan concentration by
MRI. Magn Reson Med, 1999. 41(5): p. 857–65.
12 Burstein, D., et al., Protocol issues for delayed
Gd(DTPA)(2-)-enhanced MRI (dGEMRIC) for clinical
evaluation of articular cartilage. Magn Reson Med,
2001. 45(1): p. 36–41.
13 Mlynarik, V., et al., The role of relaxation times
in monitoring proteoglycan depletion in articular
cartilage. J Magn Reson Imaging, 1999. 10(4):
p. 497–502.
14 Cunningham, T., et al., Delayed Gadolinium En-
hanced MRI of Cartilage (dGEMRIC) as a Predictor
of Early Failure after Bernese Periacetabular Oste-
otomy for Hip Dysplasia. J Bone Joint Surg, 2006.
technique is a better predictor of surgical outcome after periacetabular osteotomy (PAO) than plain radiographic and clinical measurements [14]. The T1 value does correlate with severity of dysplasia which is consistent with the increased incidence of early osteoarthritis in severe dysplasia.It is very important for the surgical treat-ment and outcome in periacetabular os-teotomies to know the status of degener-ated cartilage and integrity of cartilage in hips with developmental dysplasia to identify poor candidates for this proce-dure.
References 1 Murphy, S.B., R. Ganz, and M.E. Muller,
The prognosis in untreated dysplasia of the hip.
A study of radiographic factors that predict the
outcome. J Bone Joint Surg Am, 1995. 77(7):
p. 985–9.
2 Harris, W.H., Etiology of osteoarthritis of the hip.
Clin Orthop Relat Res, 1986(213): p. 20–33.
3 Murray, R.O., The aetiology of primary osteoarthri-
tis of the hip. Br J Radiol, 1965. 38(455):
p. 810–24.
4 Solomon, L., Patterns of osteoarthritis of the hip.
J Bone Joint Surg Br, 1976. 58(2): p. 176–83.
5 Kim, Y.J., et al., Assessment of early osteoarthritis
in hip dysplasia with delayed gadolinium-en-
hanced magnetic resonance imaging of cartilage.
J Bone Joint Surg Am, 2003. 85–A(10): p. 1987–92.
6 Bashir, A., M.L. Gray, and D. Burstein, Gd-DTPA2-
as a measure of cartilage degradation.
Magn Reson Med, 1996. 36(5): p. 665–73.
Orthopedics Clinical
coronal slices cover most of the weight bearing surface of the hip joint. The fem-oral and acetabular cartilages from the labral edge to the acetabular fossa were included in the analysis.The scans are performed under the fol-lowing protocol:
Conclusion
Kim et al. demonstrated that the dGEMRIC index correlates with pain and severity of hip dysplasia as a sign of the biochemical integrity in cartilage [5]. In addition it has been shown that this
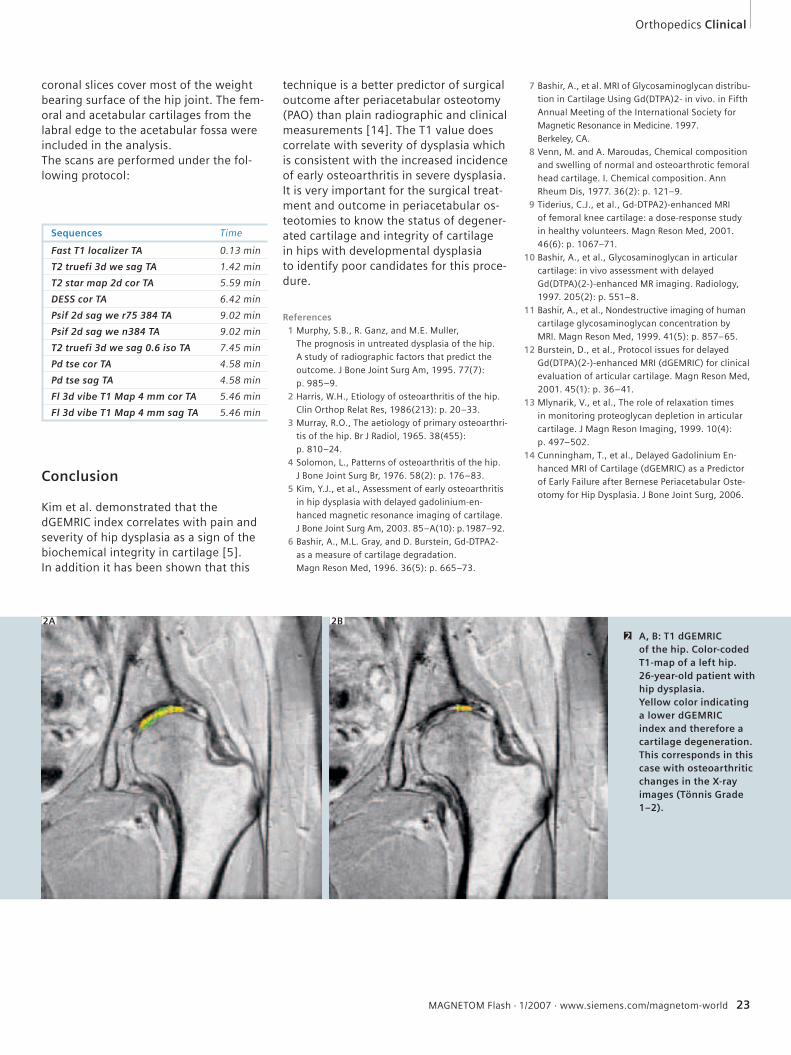
2A 2B
A, B: T1 dGEMRIC of the hip. Color-coded T1-map of a left hip. 26-year-old patient with hip dysplasia. Yellow color indicating a lower dGEMRIC index and therefore a cartilage degeneration. This corresponds in this case with osteoarthritic changes in the X-ray images (Tönnis Grade 1–2).
2
24 MAGNETOM Flash · 1/2007 · www.siemens.com/magnetom-world
T2 Mapping of Articular Cartilage in Hip JointAtsuya Watanabe, M.D.1, 2; Chris Boesch, M.D.1; Tallal C. Mamisch, M.D.3; Suzanne E. Anderson, M.D.1, 2
1Department of Clinical Research, Unit for MR Spectroscopy and Methodology, University of Bern, Switzerland2Department of Diagnostic, Interventional and Pediatric Radiology, Inselspital, University of Bern, Switzerland3University Hospital Bochum, Bergmannsheil Clinics, Department of Trauma Surgery, Bochum, Germany
Introduction
T2 (transverse relaxation time) mapping is an MR imaging technique which is able to evaluate the cartilage matrix status, such as collagen fiber integrity and hy-dration in cartilage [1]. As early degener-ation of cartilage is characterized by dete-rioration of the extracellular matrix components, T2 mapping has the poten-tial to identify cartilage degeneration in an early stage.It has been known that there is a varia-tion of cartilage matrix composition in the joint, and that T2 of cartilage is sensi-tive to the relationship between the colla-gen network and orientation of the static magnetic field (B0) due to the orientation dependent dipolar interaction [2, 3]. To inspect the cartilage degeneration, it is important to understand the regional dif-ferences of T2 in a specific joint. There have been several clinical studies of T2 mapping in knee joints; however, few studies of T2 mapping have involved the hip joint.The aim of this study is to demonstrate the ability of T2 mapping in detecting early degeneration of cartilage in the hip joint.
Examination and Analysis
Healthy volunteers and patients with femoro-acetabular impingement (FAI) syndrome diagnosed by previous exami-nations were evaluated.MR imaging was performed with a 3.0 Tesla system (MAGNETOM Trio, A Tim System; Siemens, Erlangen, Germany). A dedicated Body Matrix coil (Tim system) was used to image both hip joints. T2 measurement was performed at
Clinical Orthopedics
an oblique coronal plane, which was parallel to the femoral neck and passed through the center of the femoral head. A multi-spin-echo sequence was used for T2 measurements. The scanning parame-ters were 1500 msec repetition time, 10 echo times of 10.3–103 msec, 150×150 mm field of view, 4.0 mm slice thickness, 512×512 matrix, and 1 excita-tion. Color-coded T2-calculated maps were generated using MATLAB software (Mathworks, Natick, MA, USA) with a mono-exponential curve fit. The appear-ance of cartilage T2 maps in healthy hip joints were compared with that in hips with FAI syndrome.
Findings
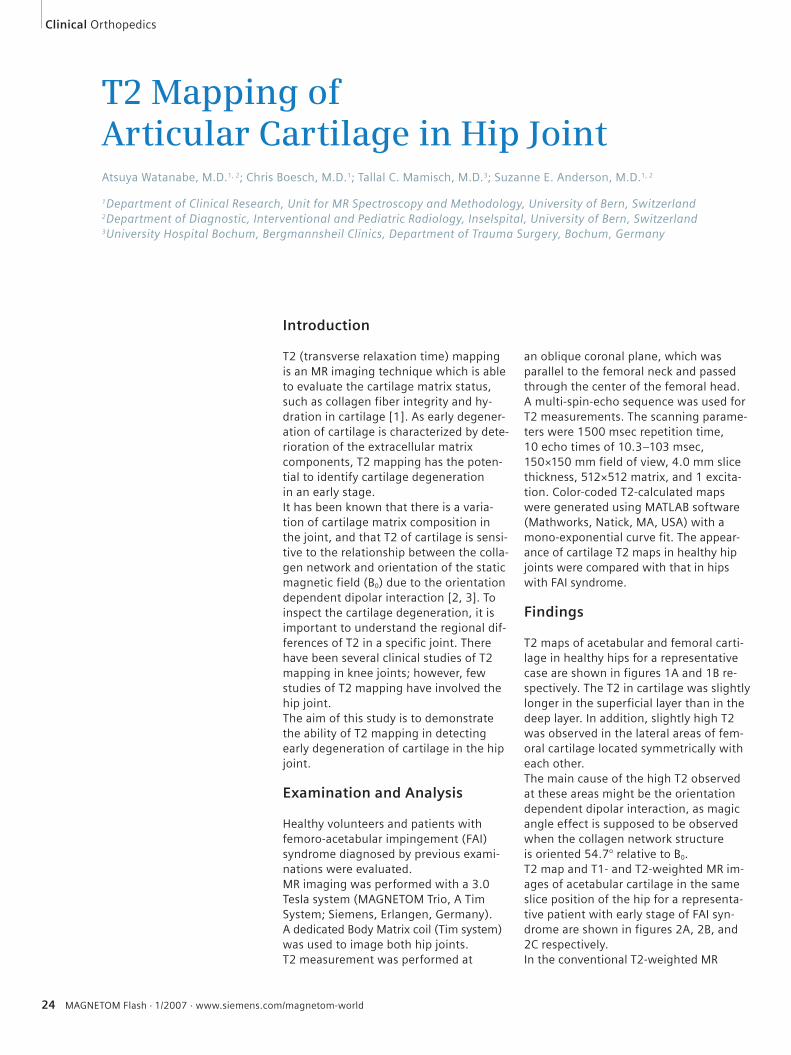
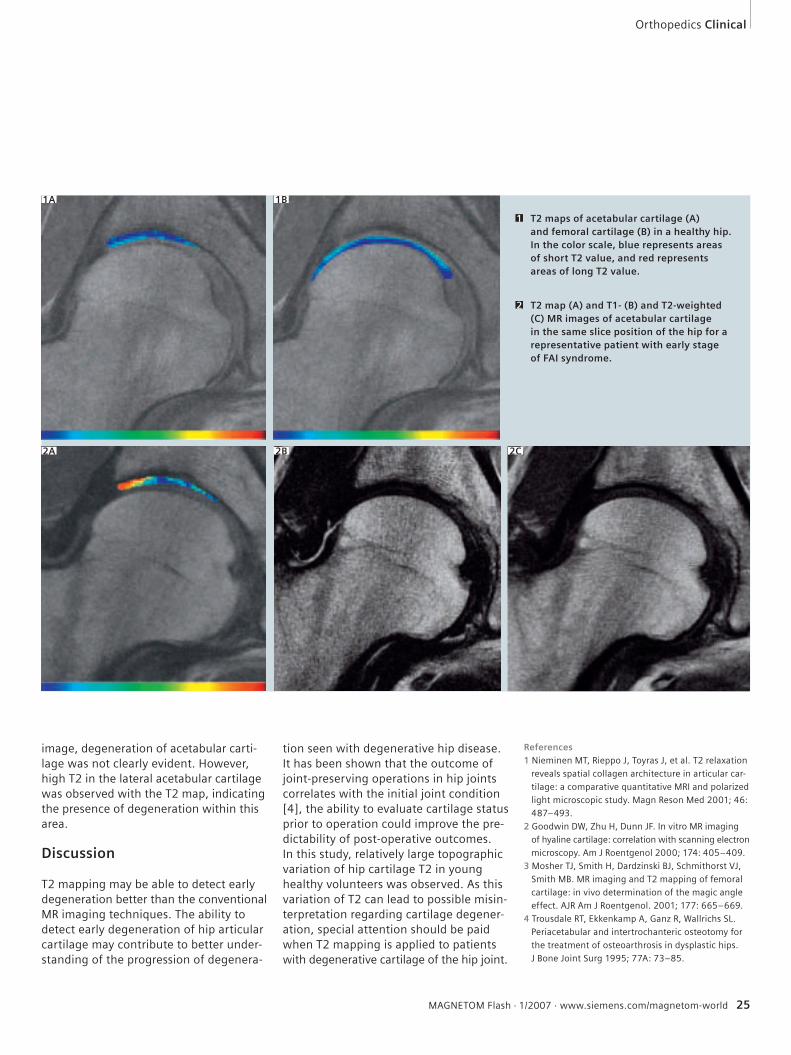
T2 maps of acetabular and femoral carti-lage in healthy hips for a representative case are shown in figures 1A and 1B re-spectively. The T2 in cartilage was slightly longer in the superficial layer than in the deep layer. In addition, slightly high T2 was observed in the lateral areas of fem-oral cartilage located symmetrically with each other. The main cause of the high T2 observed at these areas might be the orientation dependent dipolar interaction, as magic angle effect is supposed to be observed when the collagen network structure is oriented 54.7° relative to B0.T2 map and T1- and T2-weighted MR im-ages of acetabular cartilage in the same slice position of the hip for a representa-tive patient with early stage of FAI syn-drome are shown in figures 2A, 2B, and 2C respectively. In the conventional T2-weighted MR
MAGNETOM Flash · 1/2007 · www.siemens.com/magnetom-world 25
Orthopedics Clinical
image, degeneration of acetabular carti-lage was not clearly evident. However, high T2 in the lateral acetabular cartilage was observed with the T2 map, indicating the presence of degeneration within this area.
Discussion
T2 mapping may be able to detect early degeneration better than the conventional MR imaging techniques. The ability to detect early degeneration of hip articular cartilage may contribute to better under-standing of the progression of degenera-
References1 Nieminen MT, Rieppo J, Toyras J, et al. T2 relaxation
reveals spatial collagen architecture in articular car-
tilage: a comparative quantitative MRI and polarized
light microscopic study. Magn Reson Med 2001; 46:
487–493.
2 Goodwin DW, Zhu H, Dunn JF. In vitro MR imaging
of hyaline cartilage: correlation with scanning electron
microscopy. Am J Roentgenol 2000; 174: 405–409.
3 Mosher TJ, Smith H, Dardzinski BJ, Schmithorst VJ,
Smith MB. MR imaging and T2 mapping of femoral
cartilage: in vivo determination of the magic angle
effect. AJR Am J Roentgenol. 2001; 177: 665–669.
4 Trousdale RT, Ekkenkamp A, Ganz R, Wallrichs SL.
Periacetabular and intertrochanteric osteotomy for
the treatment of osteoarthrosis in dysplastic hips.
J Bone Joint Surg 1995; 77A: 73–85.
tion seen with degenerative hip disease. It has been shown that the outcome of joint-preserving operations in hip joints correlates with the initial joint condition [4], the ability to evaluate cartilage status prior to operation could improve the pre-dictability of post-operative outcomes.In this study, relatively large topographic variation of hip cartilage T2 in young healthy volunteers was observed. As this variation of T2 can lead to possible misin-terpretation regarding cartilage degener-ation, special attention should be paid when T2 mapping is applied to patients with degenerative cartilage of the hip joint.
1A 1B
T2 maps of acetabular cartilage (A) and femoral cartilage (B) in a healthy hip. In the color scale, blue represents areas of short T2 value, and red represents areas of long T2 value.
1
T2 map (A) and T1- (B) and T2-weighted (C) MR images of acetabular cartilage in the same slice position of the hip for a representative patient with early stage of FAI syndrome.
2
2A 2B 2C
26 MAGNETOM Flash · 1/2007 · www.siemens.com/magnetom-world
Clinical Orthopedics
3D-T1�-Mapping of Cartilage at 3T with integrated Parallel Imaging Technique (syngo GRAPPA) Ravinder R. Regatte, Ph.D.; Mark E. Schweitzer, M.D.
Center for Biomedical Imaging, Department of Radiology, New York University School of Medicine, New York, USA
Introduction
Osteoarthritis (OA) affects over 50 mil-lion Americans and has a substantial im-pact on the economy and the health care system. Currently, there is no cure for this debilitating chronic disease and the ef-fective treatment is, at best, focused on symptomatic relief. The conventional im-aging techniques have shown promise for the identification of more subtle morpho-logic alterations as determined by carti-lage thickness, volume, or surface fibrilla-tion. However, even the more innovative of these conventional techniques have not been consistent in detecting the earli-est stages (biochemical/functional integ-rity) of cartilage degeneration. The loss of proteoglycan content (PG) is an initiating event in the early stages of OA. Currently, the loss of PG can be mea-sured via contrast enhanced MRI of carti-lage (dGEMRIC) or T1�-MRI (spin-lattice relaxation time in the rotating frame) or 23Na-MRI. For clinical applications, dGEM-RIC requires an exogenous contrast agent (Gd-DTPA2-) with long temporal delay after intravenous injection (~90 minutes). However, sodium MRI is highly specific to PG but it requires RF hardware modifica-tion and high static magnetic fields (Bo) and has inherently low sensitivity, all of which limit this techniques clinical utility. Alternatively, T1� relaxation mapping has been shown to be sensitive to early bio-chemical changes in cartilage especially PG. It is well suited for probing low-fre-quency interactions between macro mo-lecular protons (e.g. –NH and –OH sites) and bulk water protons. In cartilage, T1�
is strongly correlated with PG content and is being studied for its potential as a biochemical marker of early OA. How-ever, the clinical applications of 3D-T1�
-relaxation mapping at high field systems (e.g. 3T and above) are currently limited due to the long imaging times as well as significant radio-frequency (RF) energy deposition. The combination of 3D-T1�-weighted MRI with multi-coil RF technolo-gy and parallel imaging (GRAPPA) should be able to address both of these problems (total imaging time and RF energy depo-sition). The main purpose of the article is to demonstrate the feasibility of rapid T1�- relaxation mapping of cartilage in early OA subjects at 3T clinical scanner with parallel imaging.
Examination and Data Analysis
Osteoarthritis subjects were recruited based on clinical symptoms and Kellgren-Lawrence grades. 3D-T1�-relaxation map-ping with parallel imaging was performed employing 3.0 Tesla clinical MRI system (MAGNETOM Trio, A Tim System; Siemens Medical Solutions, Erlangen, Germany). All the MRI experiments were performed employing a phased-array (PA) RF coil (18 cm diameter, 8-channel transmit-receive). We utilized a 3D-FLASH se-quence in combination with parallel im-aging (GRAPPA with 24 reference k-space lines) to acquire 3D-T1�-weighted images. In order to achieve T1� magnetization preparation, we used a “self-compensat-ing” spin-lock pulse cluster (duration of
each 90º pulse = 200 μs). Four 3D- T1�-weighted images with varying spin-lock pulse lengths (TSL = 2, 10, 20 and 30 ms) were acquired in order to construct T1� maps. Color coded T1�-maps were gener-ated using MATLAB software (Mathworks, Natick, MA, USA).
Results and Discussion
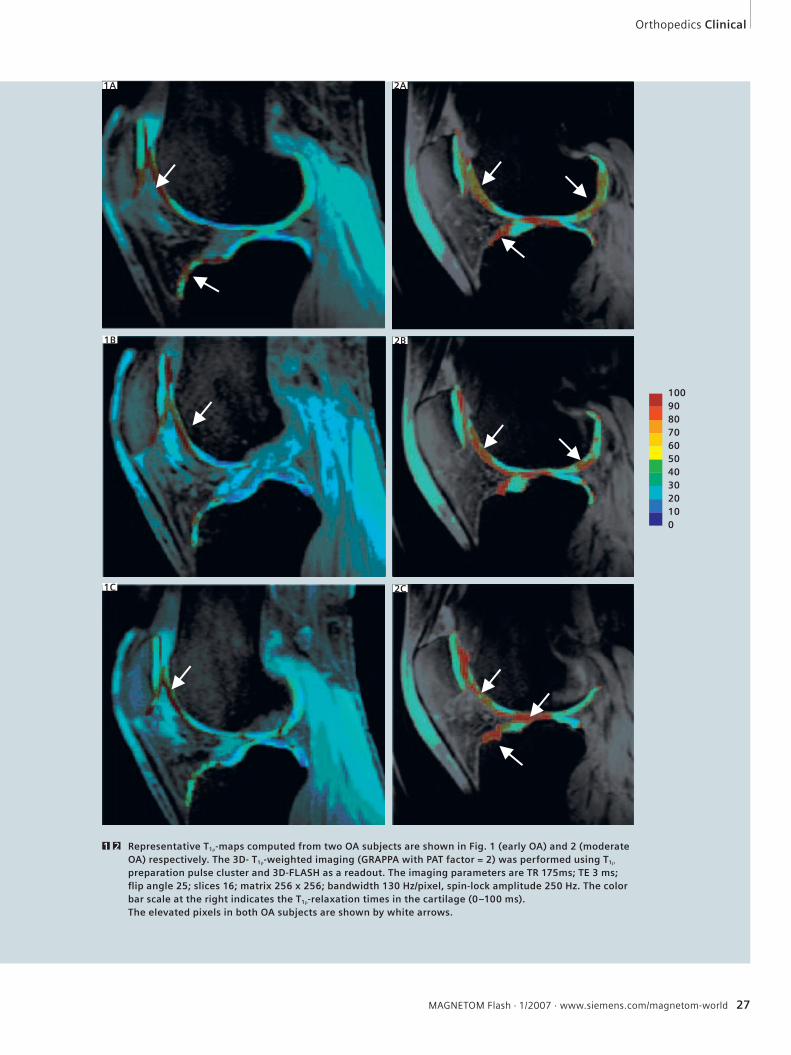
Representative T1� maps from a data set of 16 slices obtained with parallel imaging (PAT factor = 2) from two osteoarthritis subjects are shown in Fig. 1 (early OA, 35-year-old female volunteer) and Fig. 2 (moderate OA, 45-year-old male volun-teer). In the group of early OA subjects studied, there is an approximately 15–20% elevation in T1� relaxation times (shown by white arrows) when compared to age-matched asymptomatic subjects. However in the case of moderate OA (Fig. 2), there is ~20–45% increase in T1� numbers as well as more compartments are involved in the progression of OA (shown by white arrows). The 3D-T1� in combination with parallel imaging (PAT factor = 2) show excellent in-vivo repro-ducibility for cartilage imaging (data not shown). Therefore, these preliminary studies clearly demonstrate the potential of rapid T1� with parallel imaging as a non-invasive biochemical marker of pro-teoglycan loss as well as early degenera-tion at high field systems (3T) without exceeding the RF energy deposition.
MAGNETOM Flash · 1/2007 · www.siemens.com/magnetom-world 27
Orthopedics Clinical
Representative T1�-maps computed from two OA subjects are shown in Fig. 1 (early OA) and 2 (moderate OA) respectively. The 3D- T1�-weighted imaging (GRAPPA with PAT factor = 2) was performed using T1� preparation pulse cluster and 3D-FLASH as a readout. The imaging parameters are TR 175ms; TE 3 ms; fl ip angle 25; slices 16; matrix 256 x 256; bandwidth 130 Hz/pixel, spin-lock amplitude 250 Hz. The color bar scale at the right indicates the T1�-relaxation times in the cartilage (0–100 ms). The elevated pixels in both OA subjects are shown by white arrows.
1 2
1A
1B
1C
1009080706050403020100
2A
2B
2C
28 MAGNETOM Flash · 1/2007 · www.siemens.com/magnetom-world
Clinical Orthopedics
Orthopedic ImagingThaddeus Laird, M.D.
UC Davis Medical Center, Dept. of Radiology, MSK Division, Sacramento, USA
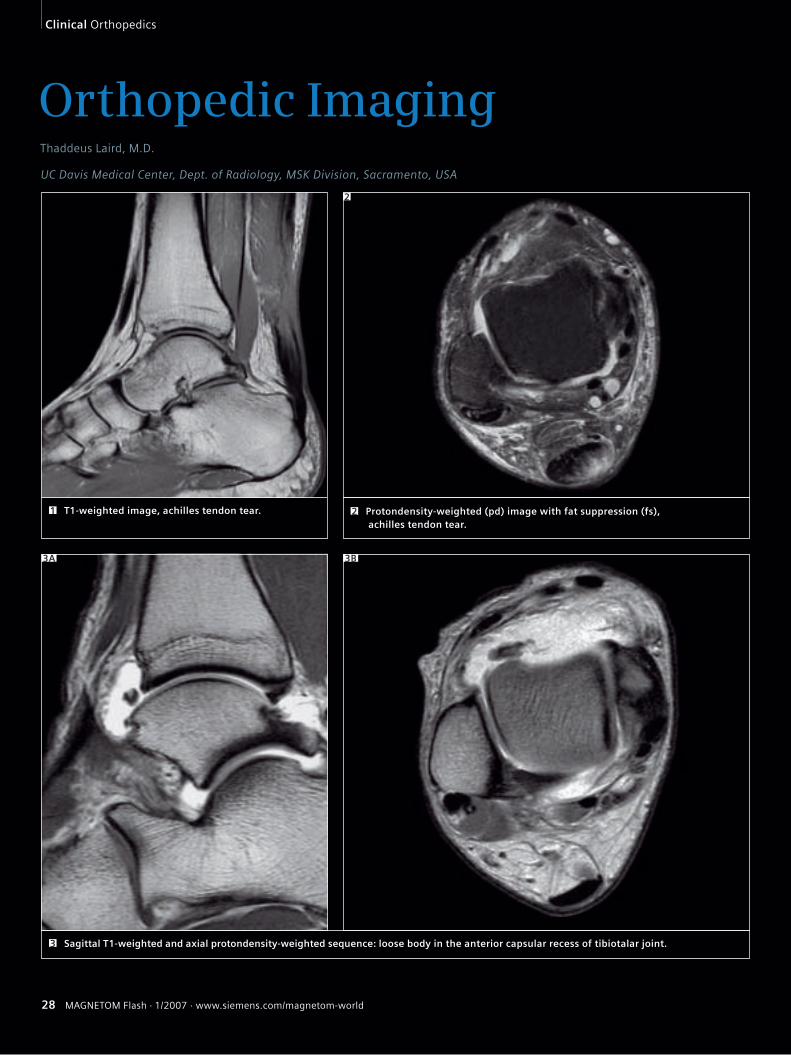
T1-weighted image, achilles tendon tear.1 Protondensity-weighted (pd) image with fat suppression (fs), achilles tendon tear.
2
1 2
Sagittal T1-weighted and axial protondensity-weighted sequence: loose body in the anterior capsular recess of tibiotalar joint.3
3A 3B
Orthopedics Clinical
MAGNETOM Flash · 1/2007 · www.siemens.com/magnetom-world 29
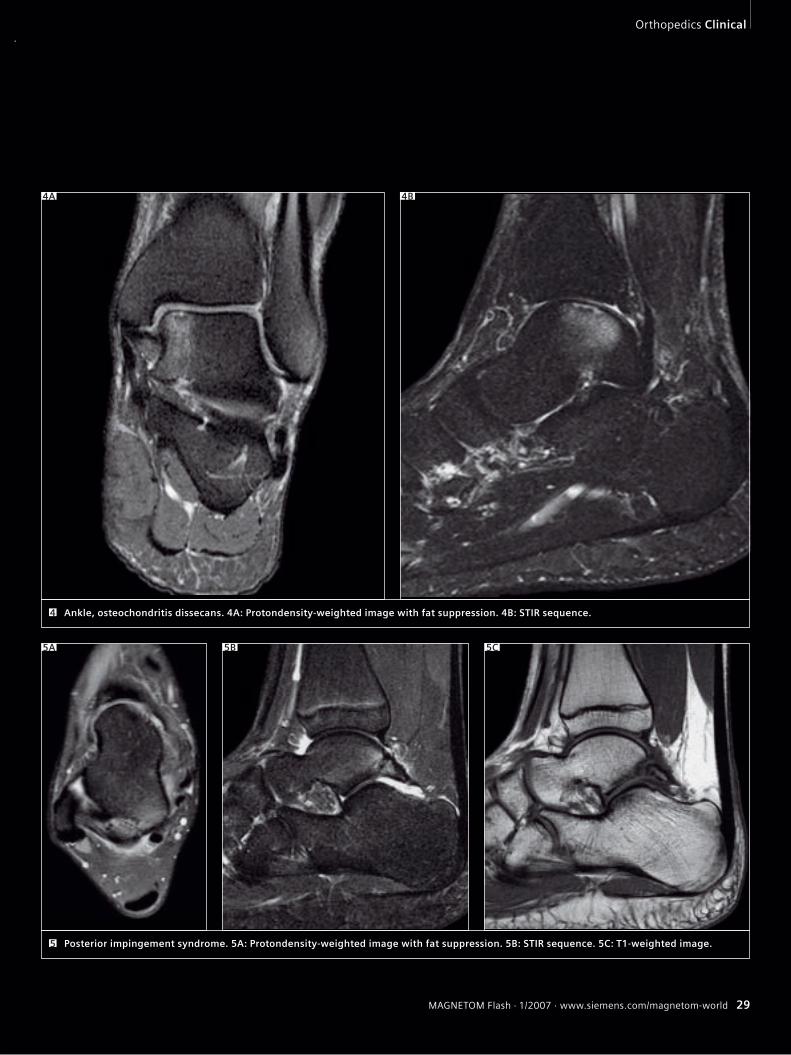
Posterior impingement syndrome. 5A: Protondensity-weighted image with fat suppression. 5B: STIR sequence. 5C: T1-weighted image. 5
Ankle, osteochondritis dissecans. 4A: Protondensity-weighted image with fat suppression. 4B: STIR sequence. 4
5A 5B 5C
4A 4B
30 MAGNETOM Flash · 1/2007 · www.siemens.com/magnetom-world
Clinical Orthopedics
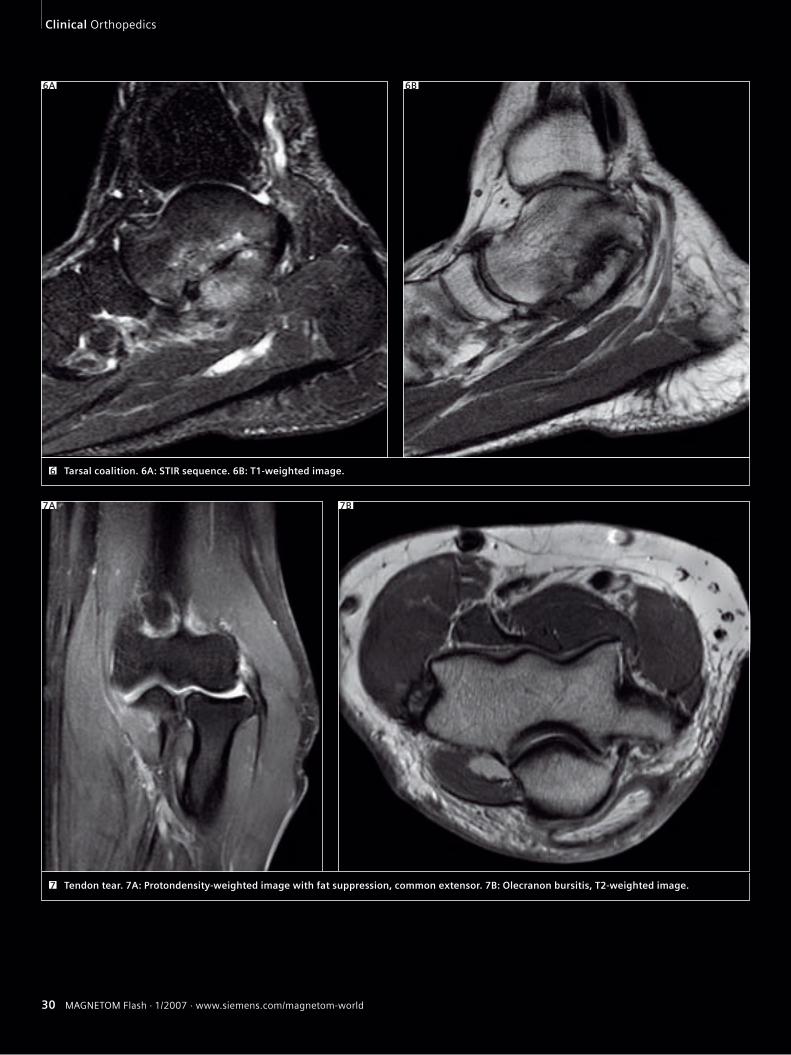
Tarsal coalition. 6A: STIR sequence. 6B: T1-weighted image.6
6A 6B
Tendon tear. 7A: Protondensity-weighted image with fat suppression, common extensor. 7B: Olecranon bursitis, T2-weighted image.7
7A 7B
Orthopedics Clinical
MAGNETOM Flash · 1/2007 · www.siemens.com/magnetom-world 31
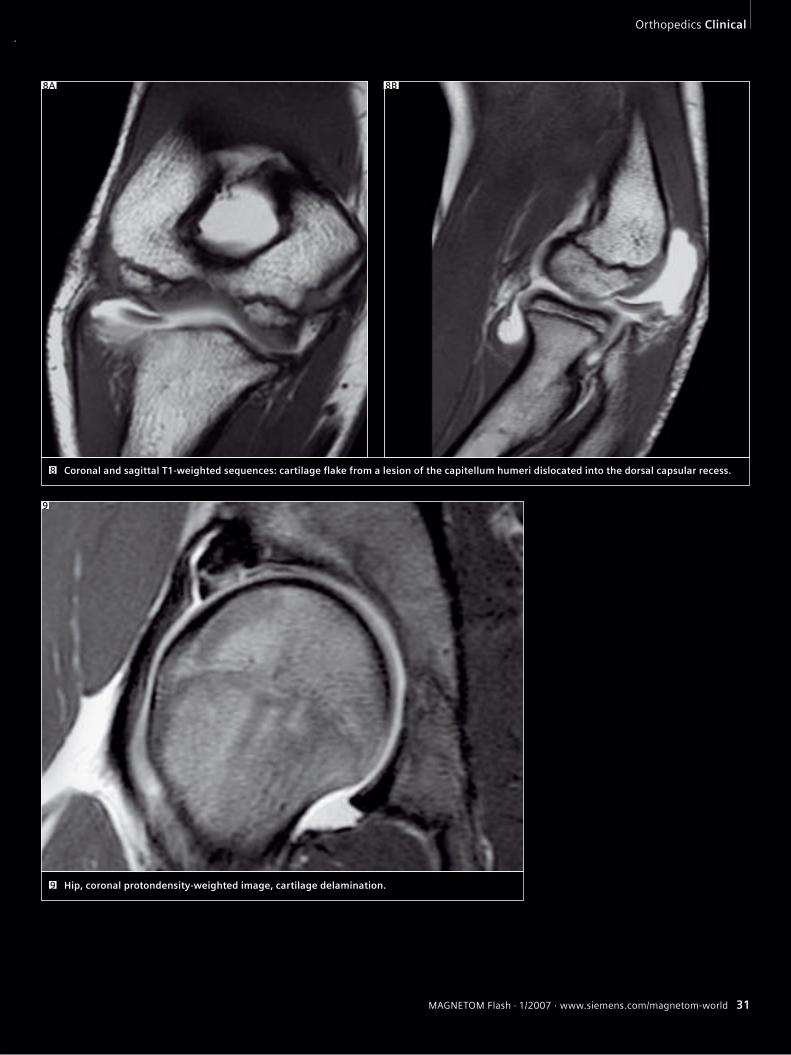
Coronal and sagittal T1-weighted sequences: cartilage fl ake from a lesion of the capitellum humeri dislocated into the dorsal capsular recess.8
8A 8B
Hip, coronal protondensity-weighted image, cartilage delamination. 9
9
32 MAGNETOM Flash · 1/2007 · www.siemens.com/magnetom-world32 MAGNETOM Flash · 1/2007 · www.siemens.com/magnetom-world
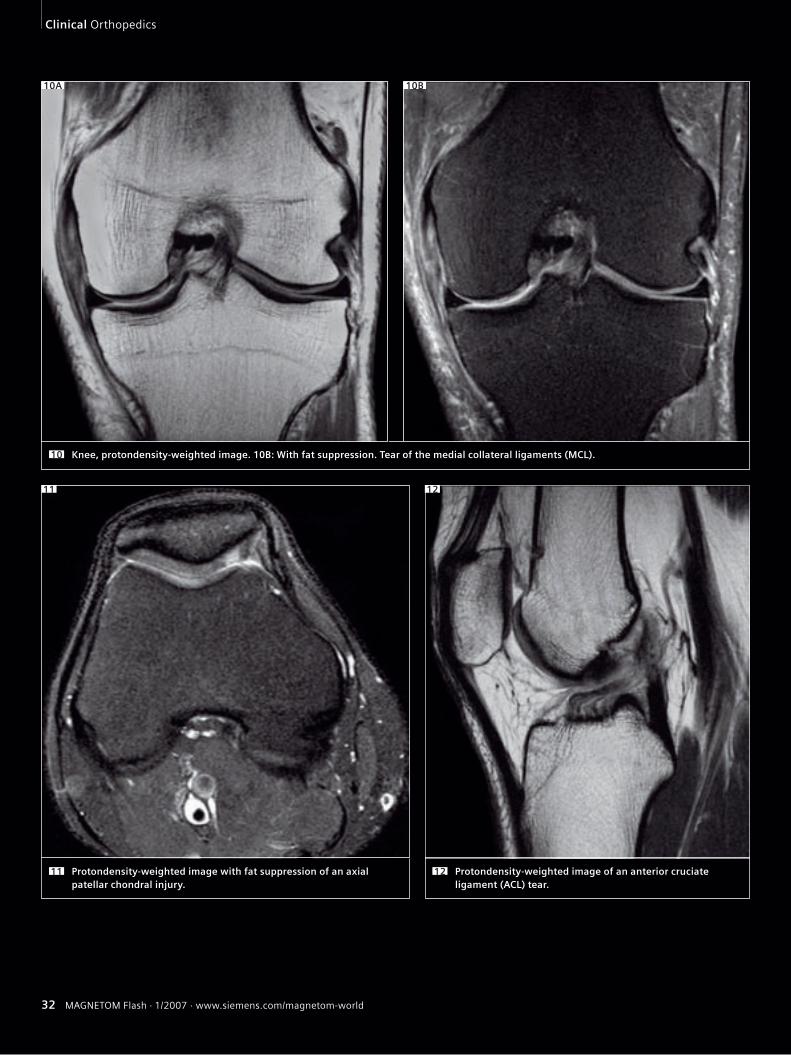
Knee, protondensity-weighted image. 10B: With fat suppression. Tear of the medial collateral ligaments (MCL).10
Protondensity-weighted image with fat suppression of an axial patellar chondral injury.
11
12
Protondensity-weighted image of an anterior cruciate ligament (ACL) tear.
12
10B10A
11
Clinical Orthopedics
MAGNETOM Flash · 1/2007 · www.siemens.com/magnetom-world 33MAGNETOM Flash · 1/2007 · www.siemens.com/magnetom-world 33
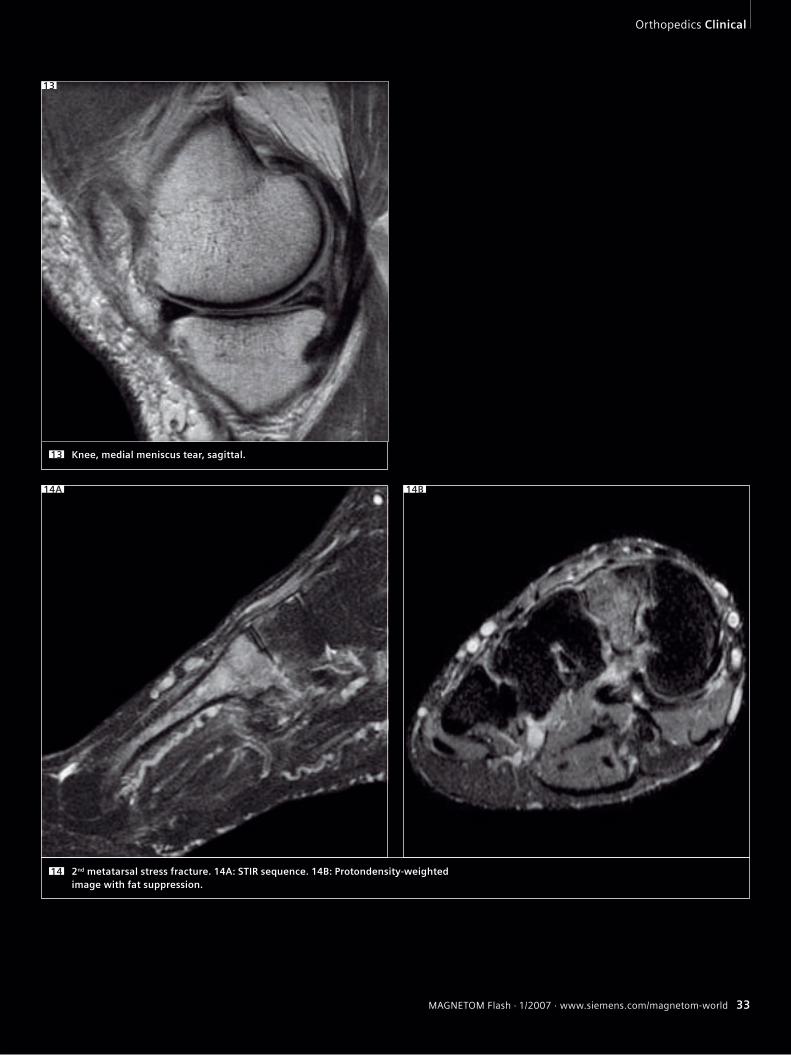
Knee, medial meniscus tear, sagittal.13
13
14B14A
2nd metatarsal stress fracture. 14A: STIR sequence. 14B: Protondensity-weighted image with fat suppression.
14
Orthopedics Clinical
34 MAGNETOM Flash · 1/2007 · www.siemens.com/magnetom-world34 MAGNETOM Flash · 1/2007 · www.siemens.com/magnetom-world
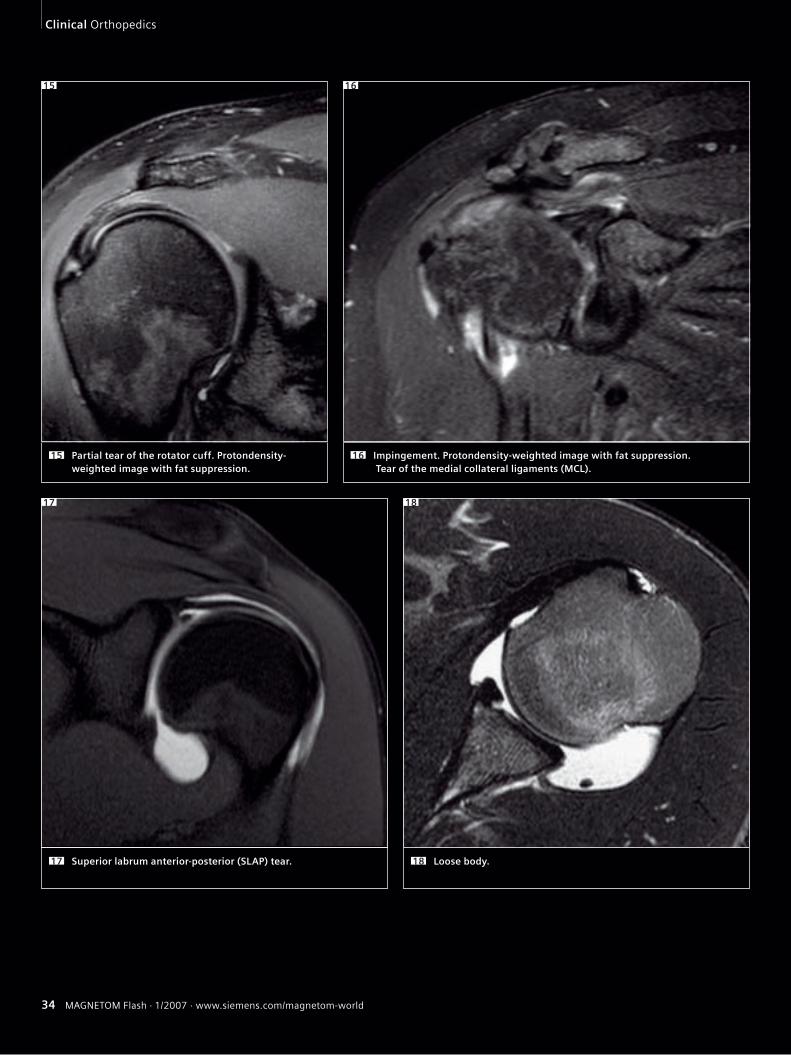
Partial tear of the rotator cuff. Protondensity-weighted image with fat suppression.
15
Superior labrum anterior-posterior (SLAP) tear.17 Loose body.18
Impingement. Protondensity-weighted image with fat suppression. Tear of the medial collateral ligaments (MCL).
16
17 18
15 16
Clinical Orthopedics
MAGNETOM Flash · 1/2007 · www.siemens.com/magnetom-world 35MAGNETOM Flash · 1/2007 · www.siemens.com/magnetom-world 35
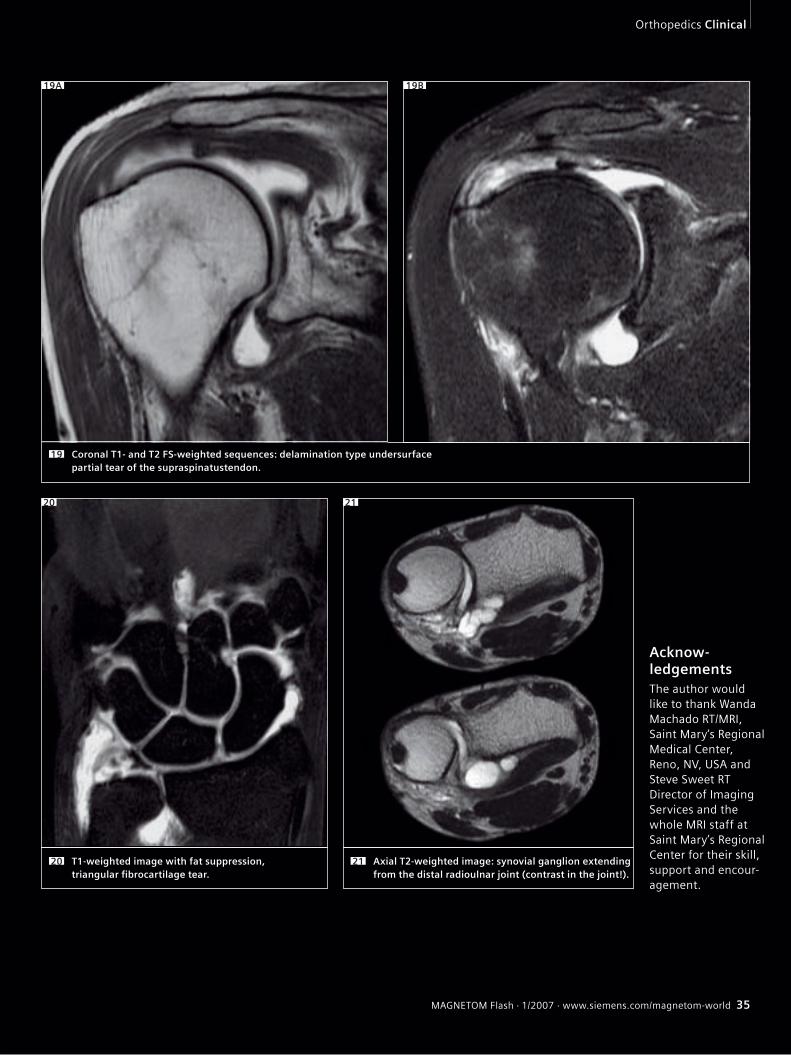
Coronal T1- and T2 FS-weighted sequences: delamination type undersurface partial tear of the supraspinatustendon.
19
T1-weighted image with fat suppression, triangular fi brocartilage tear.
20
20 21
Axial T2-weighted image: synovial ganglion extending from the distal radioulnar joint (contrast in the joint!).
21
Acknow-ledgementsThe author would like to thank Wanda Machado RT/MRI, Saint Mary‘s Regional Medical Center, Reno, NV, USA and Steve Sweet RT Director of Imaging Services and the whole MRI staff at Saint Mary’s Regional Center for their skill, support and encour-agement.
19A 19B
Orthopedics Clinical
36 MAGNETOM Flash · 1/2007 · www.siemens.com/magnetom-world
Isotropic MR Arthrography of the Shoulder Case ReportsKunihiko Fukuda1, Daichi Hayashi1, Hiroki Funasaki2
1Department of Radiology, The Jikei University School of Medicine, Tokyo, Japan2Department of Orthopaedic Surgery, The Jikei University School of Medicine, Tokyo, Japan
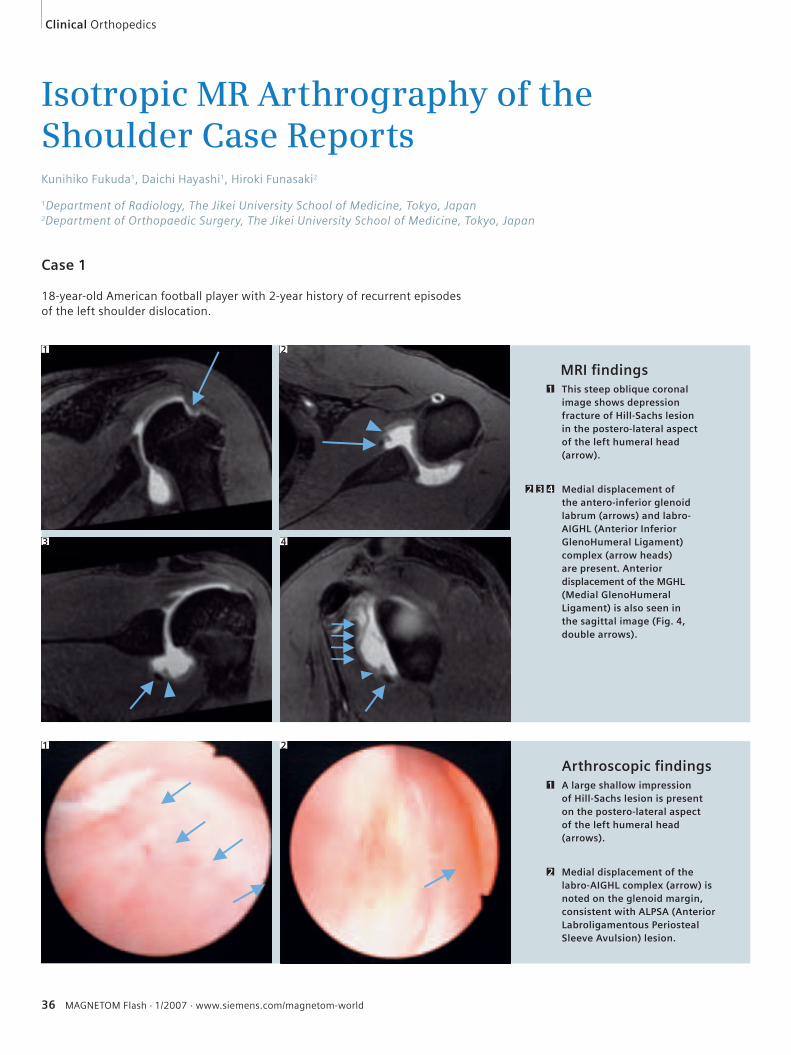
Case 1
18-year-old American football player with 2-year history of recurrent episodes of the left shoulder dislocation.
MRI fi ndings
Arthroscopic fi ndings
This steep oblique coronal image shows depression fracture of Hill-Sachs lesion in the postero-lateral aspect of the left humeral head (arrow).
1
Medial displacement of the antero-inferior glenoid labrum (arrows) and labro-AIGHL (Anterior Inferior GlenoHumeral Ligament) complex (arrow heads) are present. Anterior displacement of the MGHL (Medial GlenoHumeral Ligament) is also seen in the sagittal image (Fig. 4, double arrows).
2 3 4
1 2
3 4
A large shallow impression of Hill-Sachs lesion is present on the postero-lateral aspect of the left humeral head (arrows).
1
Medial displacement of the labro-AIGHL complex (arrow) is noted on the glenoid margin, consistent with ALPSA (Anterior Labroligamentous Periosteal Sleeve Avulsion) lesion.
2
1
Clinical Orthopedics
2
MAGNETOM Flash · 1/2007 · www.siemens.com/magnetom-world 37
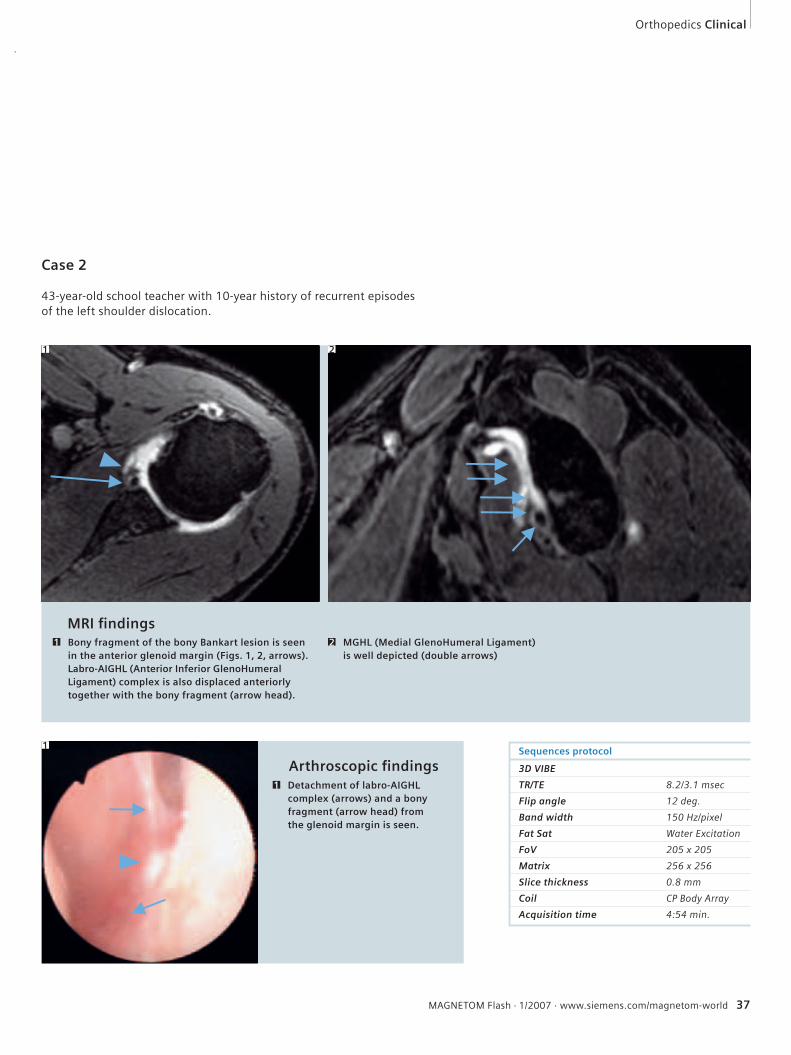
Case 2
43-year-old school teacher with 10-year history of recurrent episodes of the left shoulder dislocation.
Sequences protocol
3D VIBE
TR/TE 8.2/3.1 msec
Flip angle 12 deg.
Band width 150 Hz/pixel
Fat Sat Water Excitation
FoV 205 x 205
Matrix 256 x 256
Slice thickness 0.8 mm
Coil CP Body Array
Acquisition time 4:54 min.
MRI fi ndings
Arthroscopic fi ndingsDetachment of labro-AIGHL complex (arrows) and a bony fragment (arrow head) from the glenoid margin is seen.
1
Bony fragment of the bony Bankart lesion is seen in the anterior glenoid margin (Figs. 1, 2, arrows). Labro-AIGHL (Anterior Inferior GlenoHumeral Ligament) complex is also displaced anteriorly together with the bony fragment (arrow head).
1 MGHL (Medial GlenoHumeral Ligament) is well depicted (double arrows)
2
1
1 2
Orthopedics Clinical
38 MAGNETOM Flash · 1/2007 · www.siemens.com/magnetom-world
MR-Arthrography of the Hip Stefan F. Werlen, M.D.
Klinik Sonnenhof, Radiology Dept., Bern, Switzerland
the broader the no signal line becomes. To reduce this artifact, this sequence is split into two sequences with 8 slices each. The whole examination, including the hip injection, lasts approximately 50 to 60 min.
Findings
In the impingement patients we found osseous changes, like retroversion of ace-tabulum and acetabular cysts. Osseous bumps and deformation of the femoral head/neck junction.Often labral tears and ganglions are detected.The PDW sequences showed nicely various cartilage defects and capsular thickening or scarring after surgical procedures.
References1 Leunig M, Podeszwa D, Beck M, Werlen S, Ganz R,
Magnetic resonance arthrography of labral disorders
in hips with dysplasia and impingement., Clin
Orthop 418, 74–80, Jan, 2004.
2 Locher S, Werlen S, Leunig M, Ganz R, [MR-Arthrog-
raphy with radial sequences for visualization of early
hip pathology not visible on plain radiographs],
(Arthro-MRI mit radiarer Schnittsequenz zur Darstel-
lung der praradiologischen Huftpathologie.), Z
Orthop Ihre Grenzgeb 140: 1, 52–7, Jan–Feb 2002.
3 Magnetic Resonance Arthrography of the Hip
in Femoroacetabular Impingement: Technique and
Findings Stefan Werlen MD, Michael Leunig MD†,
and Reinhold Ganz MD† Operative Techniques in
Orthopaedics Volume 15, Issue 3 , July 2005, pages
191–203.
4 Werlen S, Porcellini B, Ungersböck A, Magnetic
resonance Imaging of the hip joint. Seminars in
Arthroplasty, Vol 8, Jan 1997.
Introduction
This article describes the technique and findings of MR-Arthrography (MRA) of the hip joint, with special regard to the clinical setting of femoro-acetabular im-pingement.MRA of the hip joint is a technique that uses intra-articular contrast medium, high field scanners and dedicated coils and sequences. With this technique only, one is able to detect subtle, but important changes of labrum, cartilage and bone of the hip joint. Today the direct MRA technique is widely used among musculoskeletal radiologists.
Examination Technique
Under fluoroscopic control, a 22-gauge spinal needle is introduced from ventral into the joint in the outer third of the head/neck-junction. Then 10 to 20 cc of diluted Gadolinium is injected.All examinations are performed with a 1.5T Magnet (MAGNETOM Avanto, Siemens Medical Solutions, Erlangen, Germany). On the MR table a flex coil is positioned over the joint. After a short localizer in three planes the following sequences are used:1. Axial T1-weighted sequence to assess bony structures and pathologies and also capsule configuration and thickness, as well as periarticular soft tissue changes (TR 650, TE 20, 200 mm field of view, 224 x 512 matrix, 4 mm slice thickness section thickness with a 0.2 mm section gap, 17 slices, 3 min).2. Axial FLASH-sequence with a few thin slices, centered on the upper joint-space.
This sequence is used to evaluate the version of the acetabulum and subcortical hypersclerosis and cystic changes of the acetabular rim (TR 550, TE 10, Flip angle 90°, 120 mm field of view, 256 x 256 matrix, 2 mm section thickness with a 0.1 mm section gap, 11 slices, 3:06 min).3. Coronal-oblique protondensity-weighted (PDW) thin-slice sequence especially for the evaluation of the carti-lage and its damages (TR 3200, TE 15, 120 mm field of view, 256 x 256 matrix, 2 mm section thickness with a 0.1 mm section gap, 23 slices, 5 min). This sequence is aligned perpendicular to the femoral neck and is marked on the axial T1-weighted sequence.4. PDW sequence in sagittal direction also for cartilage assessment (TR 3200, TE 196 15, 120 mm field of view, 256 x 256 matrix, 2 mm section thickness with a 0.2 mm section gap, 23 slices, 5:37 min).5. Radial PDW sequence is used in which all slices are oriented basically orthogonal to the acetabular rim and labrum. This sequence is based on a sagittal oblique localizer, which is marked on the PDW coronal sequence, and runs parallel to the sagittal oblique course of the ace-tabulum (TR 2000, TE 15, 260 mm field of view, 266 x 512 matrix, 4 mm section thickness, 16 slices, 4:43 min). In the center of the radial sequence, where the slices cross over, the signal wipes out. This produces a broad line without signal on the image, which affects the quality of the image. The more slices cross over,
Clinical Orthopedics
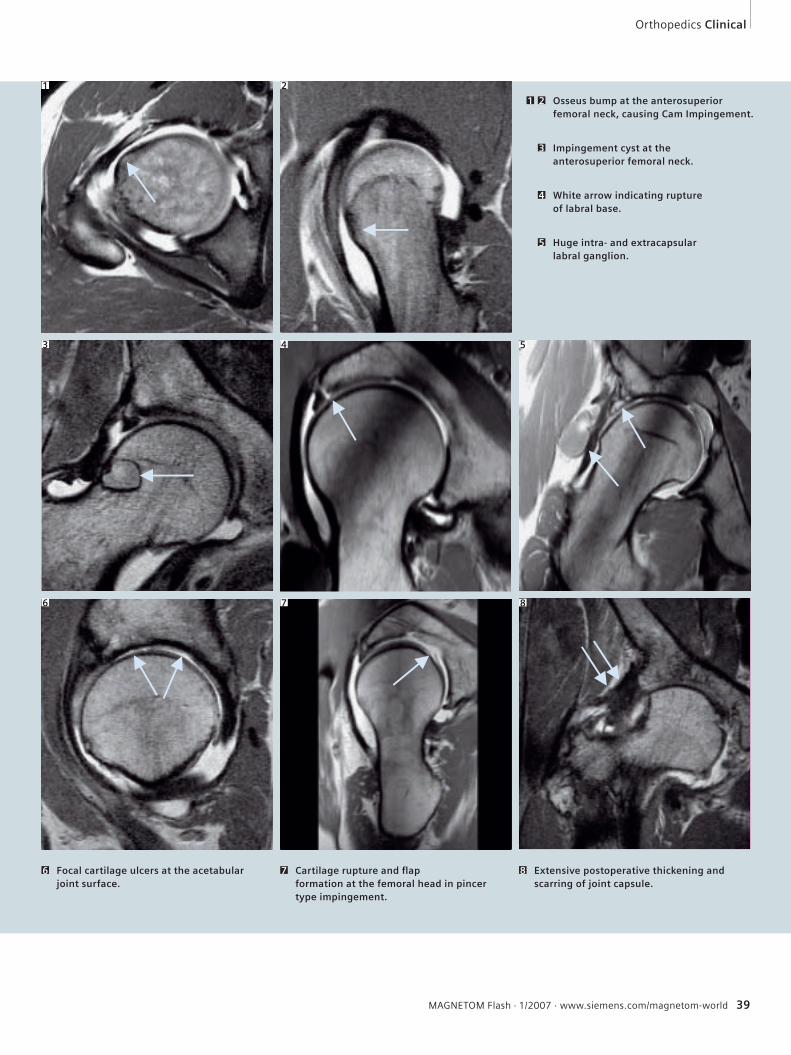
Impingement cyst at the anterosuperior femoral neck.
3
White arrow indicating rupture of labral base.
4
Huge intra- and extracapsular labral ganglion.
5
Focal cartilage ulcers at the acetabular joint surface.
6 Cartilage rupture and fl ap formation at the femoral head in pincer type impingement.
7 Extensive postoperative thickening and scarring of joint capsule.
8
Osseus bump at the anterosuperior femoral neck, causing Cam Impingement.
1 2
1 2
3 4
6 7 8
Orthopedics Clinical
5
MAGNETOM Flash · 1/2007 · www.siemens.com/magnetom-world 39
40 MAGNETOM Flash · 1/2007 · www.siemens.com/magnetom-world
Clinical Orthopedics
Direct MR-ArthrographyStefan F. Werlen, M.D.
Klinik Sonnenhof, Radiology Dept., Bern, Switzerland
Introduction
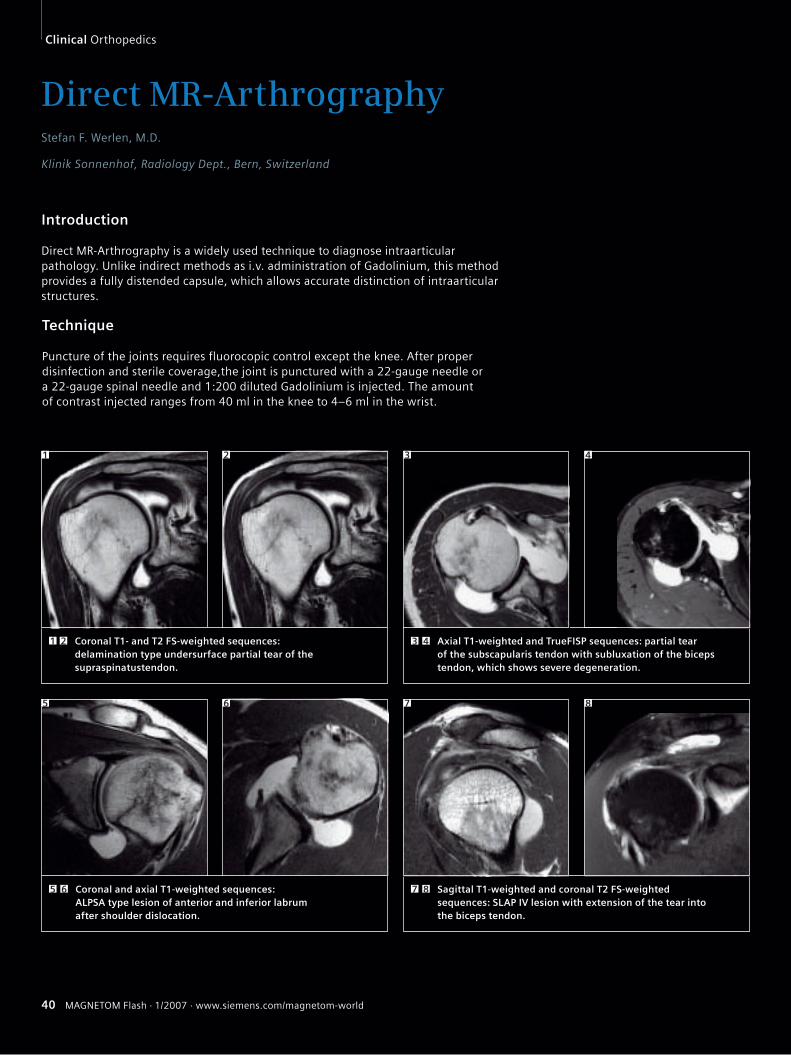
Direct MR-Arthrography is a widely used technique to diagnose intraarticular pathology. Unlike indirect methods as i.v. administration of Gadolinium, this method provides a fully distended capsule, which allows accurate distinction of intraarticular structures.
Technique
Puncture of the joints requires fluorocopic control except the knee. After proper disinfection and sterile coverage,the joint is punctured with a 22-gauge needle or a 22-gauge spinal needle and 1:200 diluted Gadolinium is injected. The amount of contrast injected ranges from 40 ml in the knee to 4–6 ml in the wrist.
Coronal T1- and T2 FS-weighted sequences: delamination type undersurface partial tear of the supraspinatustendon.
1 2 Axial T1-weighted and TrueFISP sequences: partial tear of the subscapularis tendon with subluxation of the biceps tendon, which shows severe degeneration.
3 4
1 2 3 4
Coronal and axial T1-weighted sequences: ALPSA type lesion of anterior and inferior labrum after shoulder dislocation.
5 6 Sagittal T1-weighted and coronal T2 FS-weighted sequences: SLAP IV lesion with extension of the tear into the biceps tendon.
7 8
865 7
MAGNETOM Flash · 1/2007 · www.siemens.com/magnetom-world 41
Orthopedics Clinical
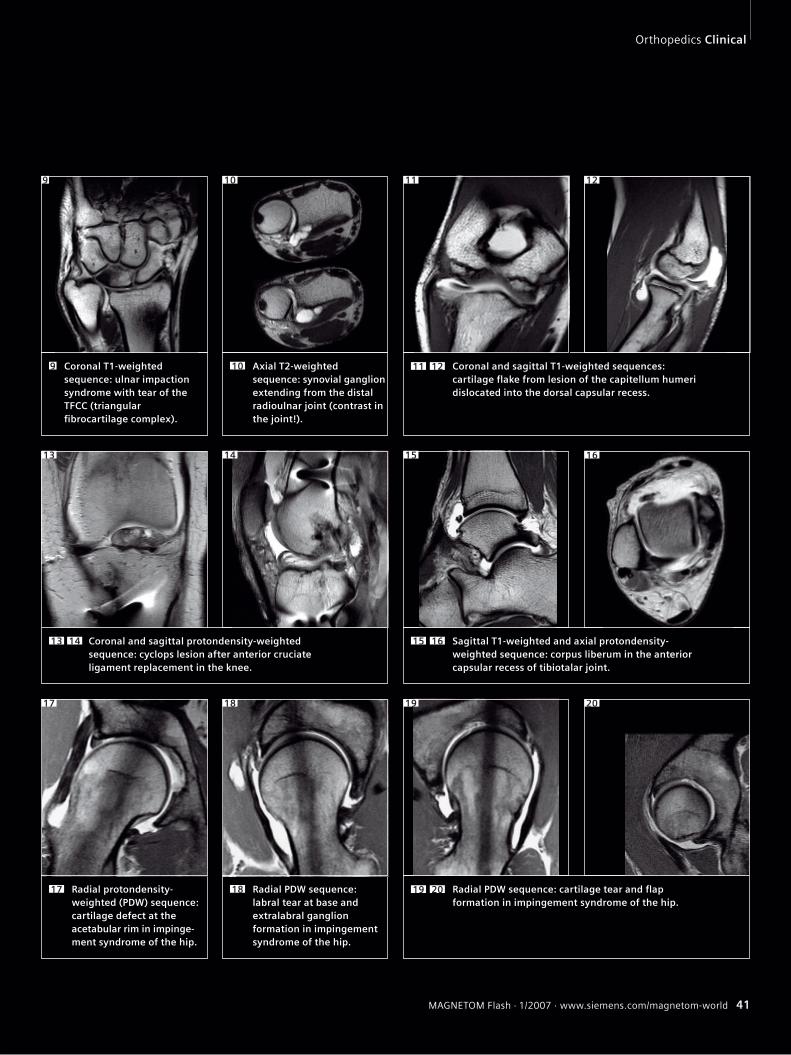
Coronal T1-weighted sequence: ulnar impaction syndrome with tear of the TFCC (triangular fi brocartilage complex).
9 Axial T2-weighted sequence: synovial ganglion extending from the distal radioulnar joint (contrast in the joint!).
10 Coronal and sagittal T1-weighted sequences: cartilage fl ake from lesion of the capitellum humeri dislocated into the dorsal capsular recess.
11 12
Coronal and sagittal protondensity-weighted sequence: cyclops lesion after anterior cruciate ligament replacement in the knee.
13 14
16
Sagittal T1-weighted and axial protondensity-weighted sequence: corpus liberum in the anterior capsular recess of tibiotalar joint.
15 16
Radial PDW sequence: labral tear at base and extralabral ganglion formation in impingement syndrome of the hip.
18Radial protondensity-weighted (PDW) sequence: cartilage defect at the acetabular rim in im pinge-ment syndrome of the hip.
17
20
Radial PDW sequence: cartilage tear and fl ap formation in impingement syndrome of the hip.
19 20
151413
17 18 19
9 10 11 12
42 MAGNETOM Flash · 1/2007 · www.siemens.com/magnetom-world
Wrist Imaging with MAGNETOM Espree: Changing a PracticeRobert W. Prost, Ph.D.1; Bradley D. Bolster, Jr., Ph.D.2
1Department of Radiology, Medical College of Wisconsin, Milwaukee, WI, USA2Siemens Medical Solutions, USA
Background
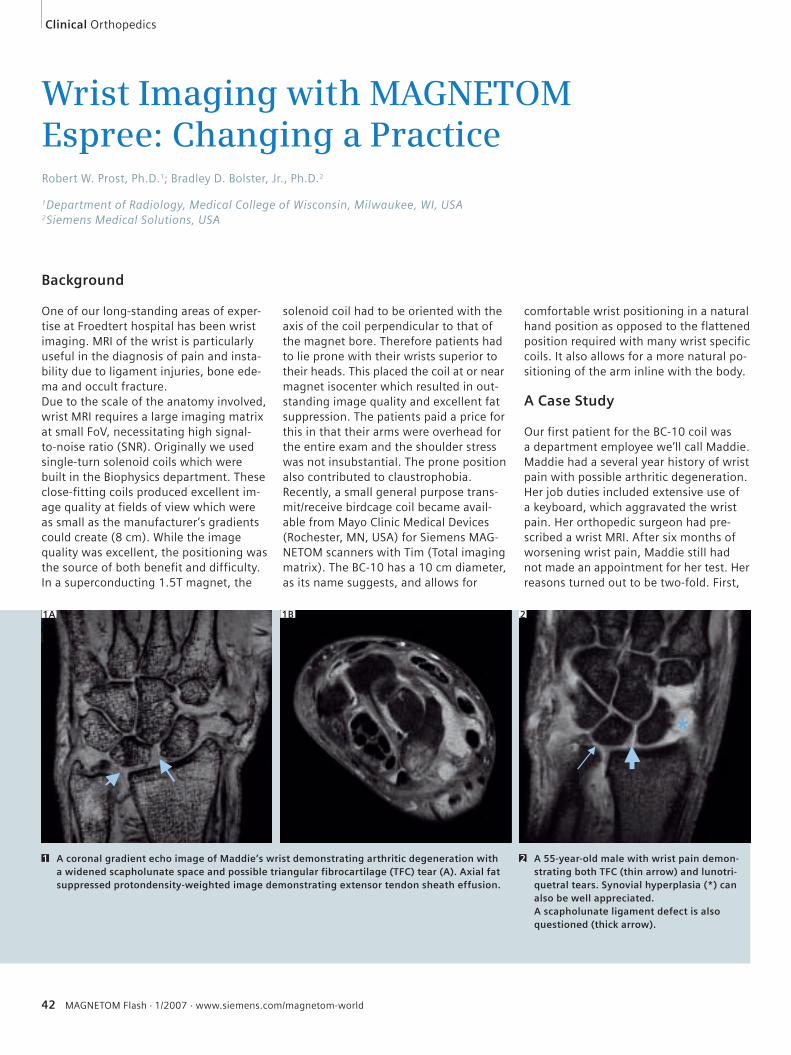
One of our long-standing areas of exper-tise at Froedtert hospital has been wrist imaging. MRI of the wrist is particularly useful in the diagnosis of pain and insta-bility due to ligament injuries, bone ede-ma and occult fracture. Due to the scale of the anatomy involved, wrist MRI requires a large imaging matrix at small FoV, necessitating high signal-to-noise ratio (SNR). Originally we used single-turn solenoid coils which were built in the Biophysics department. These close-fitting coils produced excellent im-age quality at fields of view which were as small as the manufacturer’s gradients could create (8 cm). While the image quality was excellent, the positioning was the source of both benefit and difficulty. In a superconducting 1.5T magnet, the
solenoid coil had to be oriented with the axis of the coil perpendicular to that of the magnet bore. Therefore patients had to lie prone with their wrists superior to their heads. This placed the coil at or near magnet isocenter which resulted in out-standing image quality and excellent fat suppression. The patients paid a price for this in that their arms were overhead for the entire exam and the shoulder stress was not insubstantial. The prone position also contributed to claustrophobia. Recently, a small general purpose trans-mit/receive birdcage coil became avail-able from Mayo Clinic Medical Devices (Rochester, MN, USA) for Siemens MAG-NETOM scanners with Tim (Total imaging matrix). The BC-10 has a 10 cm diameter, as its name suggests, and allows for
comfortable wrist positioning in a natural hand position as opposed to the flattened position required with many wrist specific coils. It also allows for a more natural po-sitioning of the arm inline with the body.
A Case Study
Our first patient for the BC-10 coil was a department employee we’ll call Maddie. Maddie had a several year history of wrist pain with possible arthritic degeneration. Her job duties included extensive use of a keyboard, which aggravated the wrist pain. Her orthopedic surgeon had pre-scribed a wrist MRI. After six months of worsening wrist pain, Maddie still had not made an appointment for her test. Her reasons turned out to be two-fold. First,
1A 1B 2
A coronal gradient echo image of Maddie’s wrist demonstrating arthritic degeneration with a widened scapholunate space and possible triangular fibrocartilage (TFC) tear (A). Axial fat suppressed protondensity-weighted image demonstrating extensor tendon sheath effusion.
1 A 55-year-old male with wrist pain demon-strating both TFC (thin arrow) and lunotri-quetral tears. Synovial hyperplasia (*) can also be well appreciated.A scapholunate ligament defect is also questioned (thick arrow).
2
Clinical Orthopedics
*
MAGNETOM Flash · 1/2007 · www.siemens.com/magnetom-world 43
she was claustrophobic and did not want to lie in the magnet, especially in the prone position. Second, she had a previous shoulder injury ipsilateral to the painful wrist. She was unable to lift her arm straight over her head and so did not want to endure what was certain to be a painful and unsettling exam. The MAGNETOM Espree, combined with the BC-10 resulted in an optimal solution. Maddie was placed in the decubitus position with the affected wrist on the padded table surface. The coil was placed over the wrist, and sandbagged against her thigh. Once in the magnet, Maddie was able to lean back against the bore wall with a cushion behind her knees for the comfort of her back. Maddie did not suffer any claustrophobia as her head was entirely out of the magnet, despite her being only 5’ 4” (1.64 m) tall. She also did not suffer any shoulder pain. The wrist was very close to isocenter, and the image quality was outstanding. As a result of the MRI, her pain has been dis-
covered to be primarily arthritic in nature and she has avoided surgery.In addition to wrist injuries, the BC-10 coil has also been used to image fingers as shown in Fig. 3. The very small fields of view which are achievable with this coil enable high resolution images of the small ligaments found in the fingers. Small FoV images are inherently more sensitive to motion than are large FoV images. The patient comfort achievable with the BC-10 coil in the decubitus position has improved patient comfort and cooperation which are key to obtain-ing motion-free images.
Discussion and Conclusions
In the last four months, we have scanned approximately 25 patients for wrist, finger, thumb and elbow indications. The decubitus position is used for nearly all of these patients. Image quality is equal to or better than that which we obtain with our solenoid coil. Patient scans can
be completed in 30-45 minutes rather than the 45 minutes to 1 hour slots on the conventional scanners. The BC-10 is a birdcage coil rather than phased array. As a result we are not able to use integrated Parallel Acqusition Technique (iPAT) in our sequences. This has not been a problem in wrist imaging. We image almost exclusively at an 8 cm FoV and our objectives are to achieve maximum signal-to-noise with maximum spatial resolution. With the huge im-provement in patient comfort afforded by the combination of MAGNETOM Espree, BC-10 and decubitus position, the exam does not require further hastening.
Literature1 Kocharian, A., Adkins, MC., Amrami, KK, et. al. Wrist:
Improved MR Imaging with Optimized Transmit-Re-
ceive Coil Design. Radiology 2002; 223: 870–876.
2 Zlatkin, MB., Rosner, J. MR imaging of ligaments and
triangular fibrocartilage complex of the wrist. Radio-
logic Clinics of North America. 44(4): 595–623, ix,
2006 Jul.
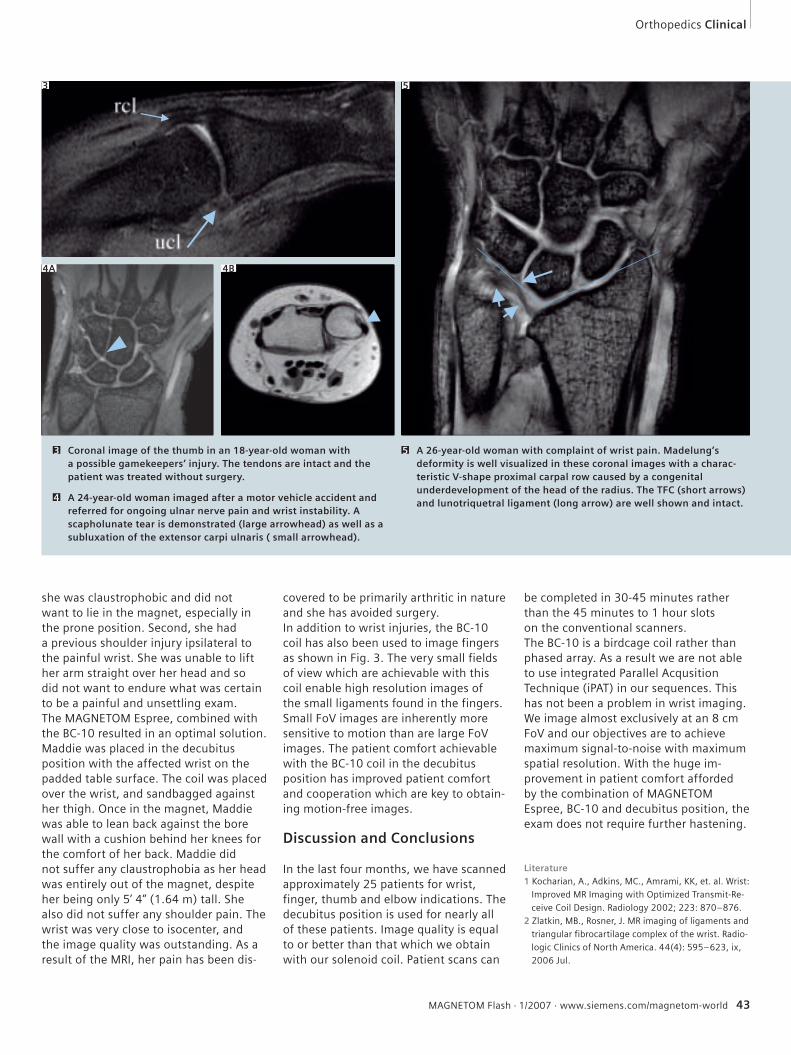
Coronal image of the thumb in an 18-year-old woman with a possible gamekeepers’ injury. The tendons are intact and the patient was treated without surgery.
3
A 24-year-old woman imaged after a motor vehicle accident and referred for ongoing ulnar nerve pain and wrist instability. A scapholunate tear is demonstrated (large arrowhead) as well as a subluxation of the extensor carpi ulnaris ( small arrowhead).
4
4A 4B
3
A 26-year-old woman with complaint of wrist pain. Madelung’s deformity is well visualized in these coronal images with a charac-teristic V-shape proximal carpal row caused by a congenital underdevelopment of the head of the radius. The TFC (short arrows) and lunotriquetral ligament (long arrow) are well shown and intact.
5
5
Orthopedics Clinical
44 MAGNETOM Flash · 1/2007 · www.siemens.com/magnetom-world
Water Excitation in Musculoskeletal Low-Field MR Imaging (0.2 Tesla)Wallabh D. Upasani, M.D.; Priti Upasani, M.D., D.N.B., D.M.R.E.
Thane Scan Center, Mumbai, India
Introduction
MR imaging is an important component of musculoskeletal (MSK) imaging. With new developments in RF coils, high-field magnets and new techniques like carti-lage mapping, MSK imaging is getting better.For the low-field systems (0.2T) Water Excitation (WE) has proven to be very beneficial. This article will give the reader an insight into advantages and limita-tions of the water excitation technique on a 0.2T system.
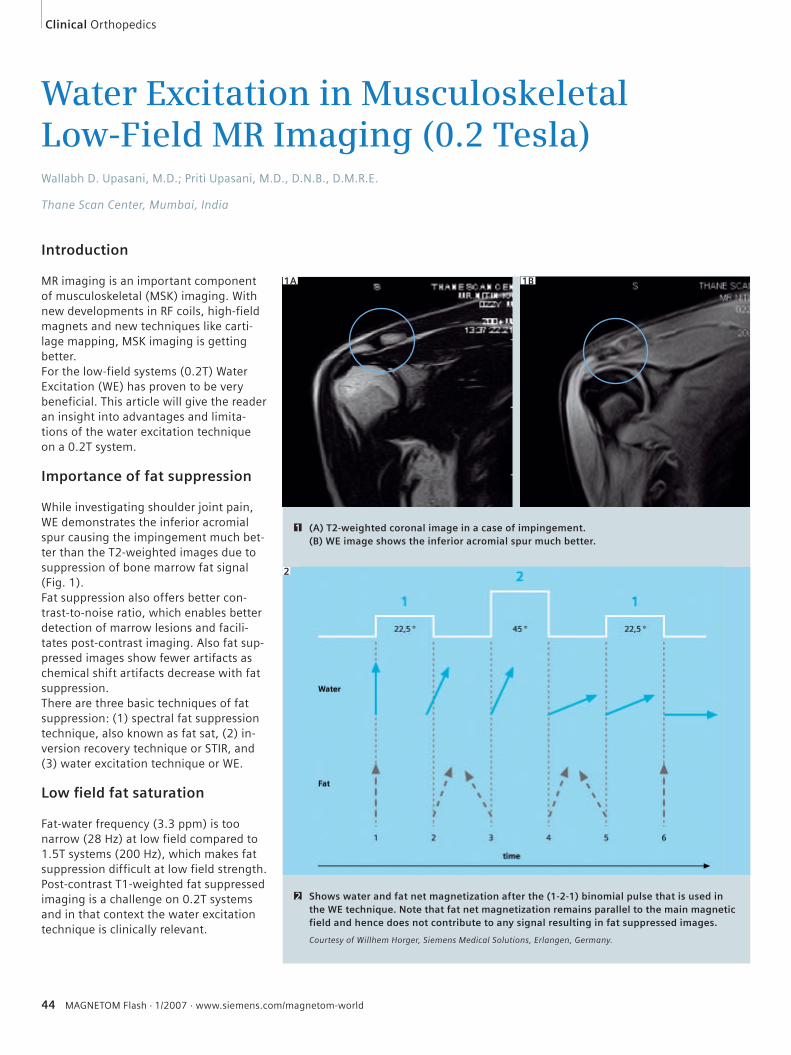
Importance of fat suppression
While investigating shoulder joint pain, WE demonstrates the inferior acromial spur causing the impingement much bet-ter than the T2-weighted images due to suppression of bone marrow fat signal (Fig. 1).Fat suppression also offers better con-trast-to-noise ratio, which enables better detection of marrow lesions and facili-tates post-contrast imaging. Also fat sup-pressed images show fewer artifacts as chemical shift artifacts decrease with fat suppression. There are three basic techniques of fat suppression: (1) spectral fat suppression technique, also known as fat sat, (2) in-version recovery technique or STIR, and (3) water excitation technique or WE.
Low fi eld fat saturation
Fat-water frequency (3.3 ppm) is too narrow (28 Hz) at low field compared to 1.5T systems (200 Hz), which makes fat suppression difficult at low field strength. Post-contrast T1-weighted fat suppressed imaging is a challenge on 0.2T systems and in that context the water excitation technique is clinically relevant.
1A 1B
(A) T2-weighted coronal image in a case of impingement. (B) WE image shows the inferior acromial spur much better.
1
Shows water and fat net magnetization after the (1-2-1) binomial pulse that is used in the WE technique. Note that fat net magnetization remains parallel to the main magnetic field and hence does not contribute to any signal resulting in fat suppressed images.
Courtesy of Willhem Horger, Siemens Medical Solutions, Erlangen, Germany.
2
2
Clinical Orthopedics
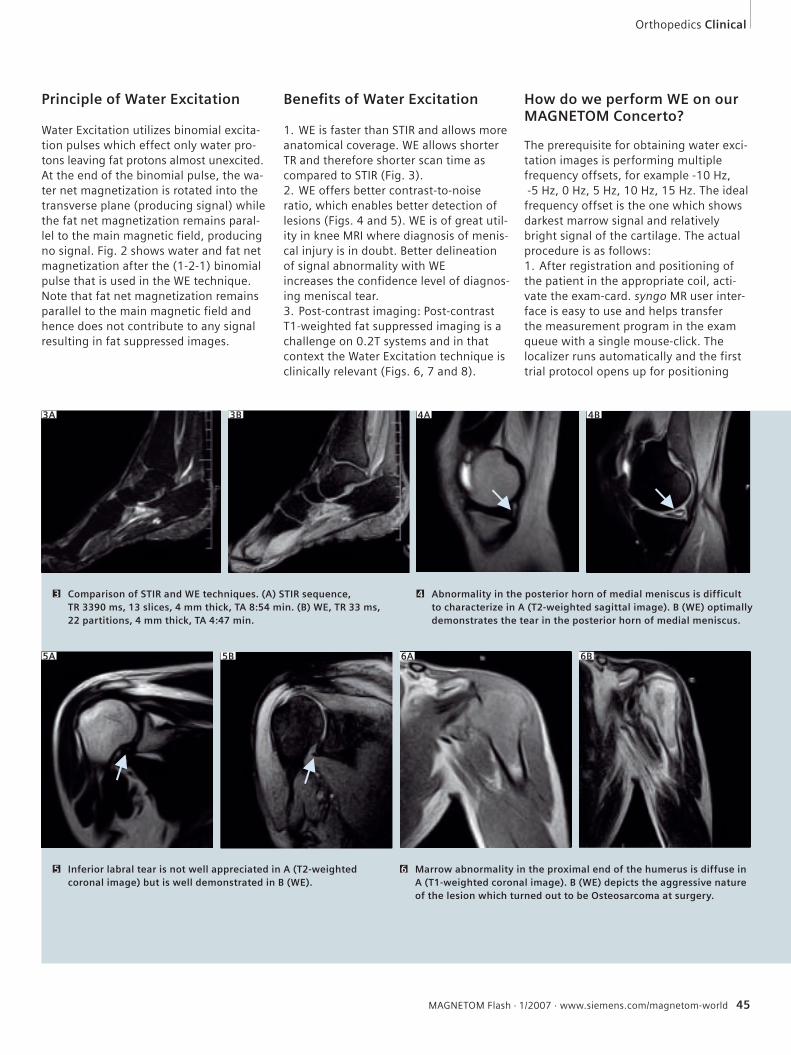
MAGNETOM Flash · 1/2007 · www.siemens.com/magnetom-world 45
Principle of Water Excitation
Water Excitation utilizes binomial excita-tion pulses which effect only water pro-tons leaving fat protons almost unexcited. At the end of the binomial pulse, the wa-ter net magnetization is rotated into the transverse plane (producing signal) while the fat net magnetization remains paral-lel to the main magnetic field, producing no signal. Fig. 2 shows water and fat net magnetization after the (1-2-1) binomial pulse that is used in the WE technique. Note that fat net magnetization remains parallel to the main magnetic field and hence does not contribute to any signal resulting in fat suppressed images.
Benefi ts of Water Excitation
1. WE is faster than STIR and allows more anatomical coverage. WE allows shorter TR and therefore shorter scan time as compared to STIR (Fig. 3).2. WE offers better contrast-to-noise ratio, which enables better detection of lesions (Figs. 4 and 5). WE is of great util-ity in knee MRI where diagnosis of menis-cal injury is in doubt. Better delineation of signal abnormality with WE increases the confidence level of diagnos-ing meniscal tear.3. Post-contrast imaging: Post-contrast T1-weighted fat suppressed imaging is a challenge on 0.2T systems and in that context the Water Excitation technique is clinically relevant (Figs. 6, 7 and 8).
How do we perform WE on our MAGNETOM Concerto?
The prerequisite for obtaining water exci-tation images is performing multiple frequency offsets, for example -10 Hz, -5 Hz, 0 Hz, 5 Hz, 10 Hz, 15 Hz. The ideal frequency offset is the one which shows darkest marrow signal and relatively bright signal of the cartilage. The actual procedure is as follows:1. After registration and positioning of the patient in the appropriate coil, acti-vate the exam-card. syngo MR user inter-face is easy to use and helps transfer the measurement program in the exam queue with a single mouse-click. The localizer runs automatically and the first trial protocol opens up for positioning
3A 3B
Comparison of STIR and WE techniques. (A) STIR sequence, TR 3390 ms, 13 slices, 4 mm thick, TA 8:54 min. (B) WE, TR 33 ms, 22 partitions, 4 mm thick, TA 4:47 min.
3
4B
Abnormality in the posterior horn of medial meniscus is difficult to characterize in A (T2-weighted sagittal image). B (WE) optimally demonstrates the tear in the posterior horn of medial meniscus.
4
Inferior labral tear is not well appreciated in A (T2-weighted coronal image) but is well demonstrated in B (WE).
5 Marrow abnormality in the proximal end of the humerus is diffuse in A (T1-weighted coronal image). B (WE) depicts the aggressive nature of the lesion which turned out to be Osteosarcoma at surgery.
6
5A 5B 6A 6B
4A
Orthopedics Clinical
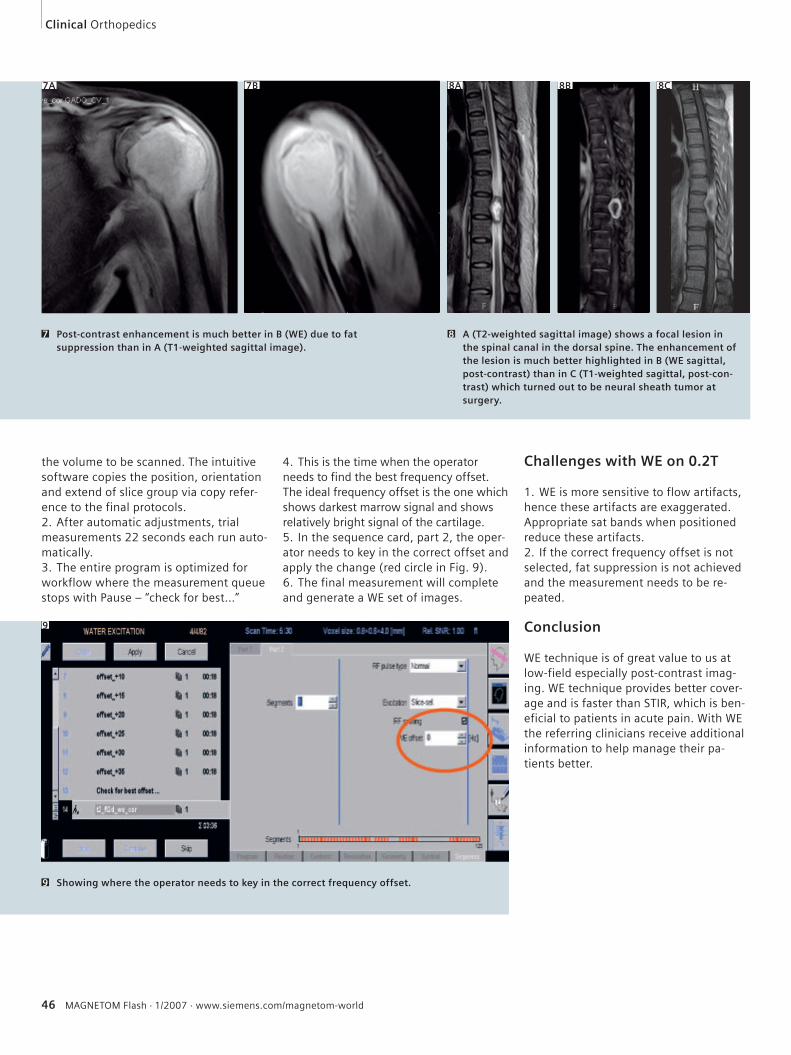
46 MAGNETOM Flash · 1/2007 · www.siemens.com/magnetom-world
the volume to be scanned. The intuitive software copies the position, orientation and extend of slice group via copy refer-ence to the final protocols.2. After automatic adjustments, trial measurements 22 seconds each run auto-matically.3. The entire program is optimized for workflow where the measurement queue stops with Pause – “check for best…”
4. This is the time when the operator needs to find the best frequency offset. The ideal frequency offset is the one which shows darkest marrow signal and shows relatively bright signal of the cartilage.5. In the sequence card, part 2, the oper-ator needs to key in the correct offset and apply the change (red circle in Fig. 9).6. The final measurement will complete and generate a WE set of images.
Challenges with WE on 0.2T
1. WE is more sensitive to flow artifacts, hence these artifacts are exaggerated. Appropriate sat bands when positioned reduce these artifacts.2. If the correct frequency offset is not selected, fat suppression is not achieved and the measurement needs to be re-peated.
Conclusion
WE technique is of great value to us at low-field especially post-contrast imag-ing. WE technique provides better cover-age and is faster than STIR, which is ben-eficial to patients in acute pain. With WE the referring clinicians receive additional information to help manage their pa-tients better.
7A 7B
Post-contrast enhancement is much better in B (WE) due to fat suppression than in A (T1-weighted sagittal image).
7
8A 8B 8C
A (T2-weighted sagittal image) shows a focal lesion in the spinal canal in the dorsal spine. The enhancement of the lesion is much better highlighted in B (WE sagittal, post-contrast) than in C (T1-weighted sagittal, post-con-trast) which turned out to be neural sheath tumor at surgery.
8
9
Showing where the operator needs to key in the correct frequency offset.9
Clinical Orthopedics
Small footprint
giant steps
www.siemens.com/medical
Proven Outcomes in Magnetic Resonance.
Discover the changing face of midfield MRI with MAGNETOM® C!. Work that flows, image quality that convinces and patient comfort that satisfies. Distilled into the most compact C-shaped magnet with a pole diameter of only 137cm. High-field technology and superior workflow support deliver high diagnostic confidence in a cost-friendly package. MAGNETOM C! – small footprint, small investment, giant steps in quality health care.
MR-Z884-10-7600
We see a way to seamlessly image up to 100 cm FoV within a single exam
Results may vary. Data on file.
We see a way to position up to 4 coils simultaneously for true multi channel imaging
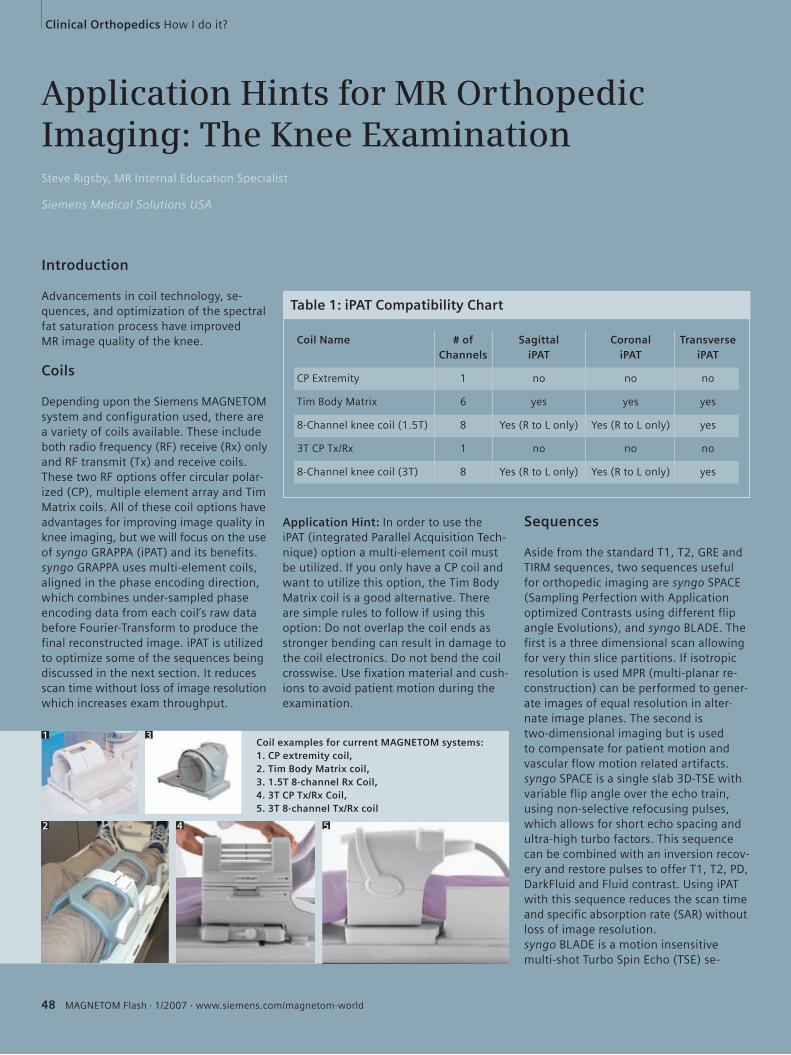
Clinical Orthopedics How I do it?
48 MAGNETOM Flash · 1/2007 · www.siemens.com/magnetom-world
Coil examples for current MAGNETOM systems: 1. CP extremity coil, 2. Tim Body Matrix coil, 3. 1.5T 8-channel Rx Coil, 4. 3T CP Tx/Rx Coil, 5. 3T 8-channel Tx/Rx coil
Application Hints for MR Orthopedic Imaging: The Knee ExaminationSteve Rigsby, MR Internal Education Specialist
Siemens Medical Solutions USA
Introduction
Advancements in coil technology, se-quences, and optimization of the spectral fat saturation process have improved MR image quality of the knee.
Coils
Depending upon the Siemens MAGNETOM system and configuration used, there are a variety of coils available. These include both radio frequency (RF) receive (Rx) only and RF transmit (Tx) and receive coils. These two RF options offer circular polar-ized (CP), multiple element array and Tim Matrix coils. All of these coil options have advantages for improving image quality in knee imaging, but we will focus on the use of syngo GRAPPA (iPAT) and its benefits.syngo GRAPPA uses multi-element coils, aligned in the phase encoding direction, which combines under-sampled phase encoding data from each coil’s raw data before Fourier-Transform to produce the final reconstructed image. iPAT is utilized to optimize some of the sequences being discussed in the next section. It reduces scan time without loss of image resolution which increases exam throughput.
Application Hint: In order to use the iPAT (integrated Parallel Acquisition Tech-nique) option a multi-element coil must be utilized. If you only have a CP coil and want to utilize this option, the Tim Body Matrix coil is a good alternative. There are simple rules to follow if using this option: Do not overlap the coil ends as stronger bending can result in damage to the coil electronics. Do not bend the coil crosswise. Use fixation material and cush-ions to avoid patient motion during the examination.
Sequences
Aside from the standard T1, T2, GRE and TIRM sequences, two sequences useful for orthopedic imaging are syngo SPACE (Sampling Perfection with Application optimized Contrasts using different flip angle Evolutions), and syngo BLADE. The first is a three dimensional scan allowing for very thin slice partitions. If isotropic resolution is used MPR (multi-planar re-construction) can be performed to gener-ate images of equal resolution in alter-nate image planes. The second is two-dimensional imaging but is used to compensate for patient motion and vascular flow motion related artifacts.syngo SPACE is a single slab 3D-TSE with variable flip angle over the echo train, using non-selective refocusing pulses, which allows for short echo spacing and ultra-high turbo factors. This sequence can be combined with an inversion recov-ery and restore pulses to offer T1, T2, PD, DarkFluid and Fluid contrast. Using iPAT with this sequence reduces the scan time and specific absorption rate (SAR) without loss of image resolution.syngo BLADE is a motion insensitive multi-shot Turbo Spin Echo (TSE) se-
1 3
2 4 5
Table 1: iPAT Compatibility Chart
Coil Name # of Sagittal Coronal Transverse Channels iPAT iPAT iPAT
CP Extremity 1 no no no
Tim Body Matrix 6 yes yes yes
8-Channel knee coil (1.5T) 8 Yes (R to L only) Yes (R to L only) yes
3T CP Tx/Rx 1 no no no
8-Channel knee coil (3T) 8 Yes (R to L only) Yes (R to L only) yes
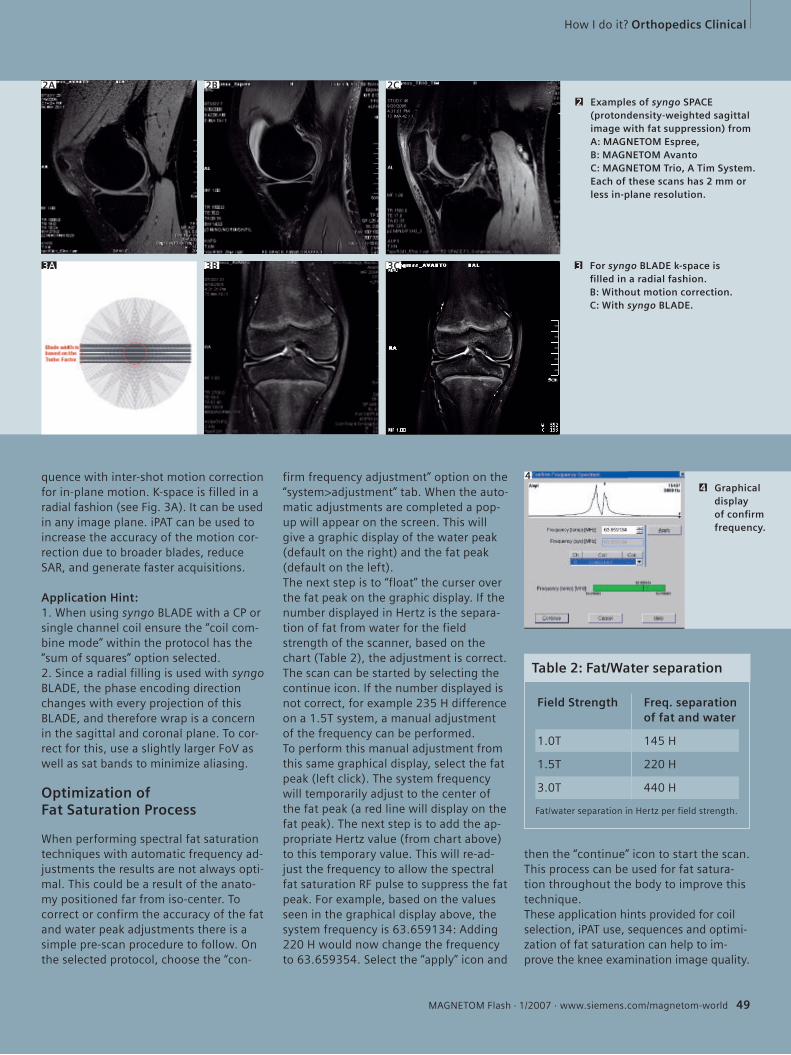
How I do it? Orthopedics Clinical
MAGNETOM Flash · 1/2007 · www.siemens.com/magnetom-world 49
quence with inter-shot motion correction for in-plane motion. K-space is filled in a radial fashion (see Fig. 3A). It can be used in any image plane. iPAT can be used to increase the accuracy of the motion cor-rection due to broader blades, reduce SAR, and generate faster acquisitions.
Application Hint: 1. When using syngo BLADE with a CP or single channel coil ensure the “coil com-bine mode” within the protocol has the “sum of squares” option selected. 2. Since a radial filling is used with syngo BLADE, the phase encoding direction changes with every projection of this BLADE, and therefore wrap is a concern in the sagittal and coronal plane. To cor-rect for this, use a slightly larger FoV as well as sat bands to minimize aliasing.
Optimization of Fat Saturation Process
When performing spectral fat saturation techniques with automatic frequency ad-justments the results are not always opti-mal. This could be a result of the anato-my positioned far from iso-center. To correct or confirm the accuracy of the fat and water peak adjustments there is a simple pre-scan procedure to follow. On the selected protocol, choose the “con-
firm frequency adjustment” option on the “system>adjustment” tab. When the auto-matic adjustments are completed a pop-up will appear on the screen. This will give a graphic display of the water peak (default on the right) and the fat peak (default on the left).The next step is to “float” the curser over the fat peak on the graphic display. If the number displayed in Hertz is the separa-tion of fat from water for the field strength of the scanner, based on the chart (Table 2), the adjustment is correct. The scan can be started by selecting the continue icon. If the number displayed is not correct, for example 235 H difference on a 1.5T system, a manual adjustment of the frequency can be performed.To perform this manual adjustment from this same graphical display, select the fat peak (left click). The system frequency will temporarily adjust to the center of the fat peak (a red line will display on the fat peak). The next step is to add the ap-propriate Hertz value (from chart above) to this temporary value. This will re-ad-just the frequency to allow the spectral fat saturation RF pulse to suppress the fat peak. For example, based on the values seen in the graphical display above, the system frequency is 63.659134: Adding 220 H would now change the frequency to 63.659354. Select the “apply” icon and
then the “continue” icon to start the scan. This process can be used for fat satura-tion throughout the body to improve this technique.These application hints provided for coil selection, iPAT use, sequences and optimi-zation of fat saturation can help to im-prove the knee examination image quality.
Examples of syngo SPACE (protondensity-weighted sagittal image with fat suppression) from A: MAGNETOM Espree,B: MAGNETOM Avanto C: MAGNETOM Trio, A Tim System. Each of these scans has 2 mm or less in-plane resolution.
2
For syngo BLADE k-space is fi lled in a radial fashion.B: Without motion correction.C: With syngo BLADE.
3
2A 2B 2C
3A 3B 3C
Table 2: Fat/Water separation
Field Strength Freq. separation of fat and water
1.0T 145 H
1.5T 220 H
3.0T 440 H
Fat/water separation in Hertz per field strength.
Graphical display of confi rm frequency.
44
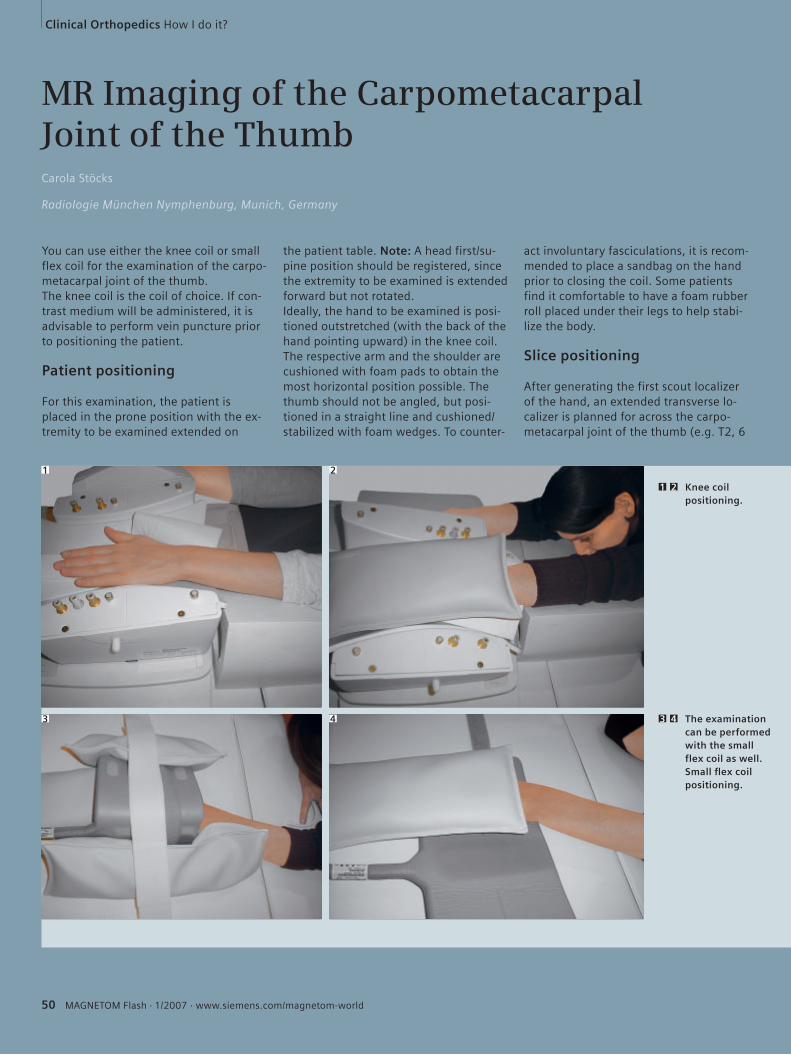
Clinical Orthopedics How I do it?
50 MAGNETOM Flash · 1/2007 · www.siemens.com/magnetom-world
You can use either the knee coil or small flex coil for the examination of the carpo-metacarpal joint of the thumb. The knee coil is the coil of choice. If con-trast medium will be administered, it is advisable to perform vein puncture prior to positioning the patient.
Patient positioning
For this examination, the patient is placed in the prone position with the ex-tremity to be examined extended on
the patient table. Note: A head first/su-pine position should be registered, since the extremity to be examined is extended forward but not rotated.Ideally, the hand to be examined is posi-tioned outstretched (with the back of the hand pointing upward) in the knee coil. The respective arm and the shoulder are cushioned with foam pads to obtain the most horizontal position possible. The thumb should not be angled, but posi-tioned in a straight line and cushioned/stabilized with foam wedges. To counter-
act involuntary fasciculations, it is recom-mended to place a sandbag on the hand prior to closing the coil. Some patients find it comfortable to have a foam rubber roll placed under their legs to help stabi-lize the body.
Slice positioning
After generating the first scout localizer of the hand, an extended transverse lo-calizer is planned for across the carpo-metacarpal joint of the thumb (e.g. T2, 6
Knee coil positioning.
1 2
The examination can be performed with the small flex coil as well.Small fl ex coil positioning.
3 4
1 2
3 4
MR Imaging of the Carpometacarpal Joint of the ThumbCarola Stöcks
Radiologie München Nymphenburg, Munich, Germany
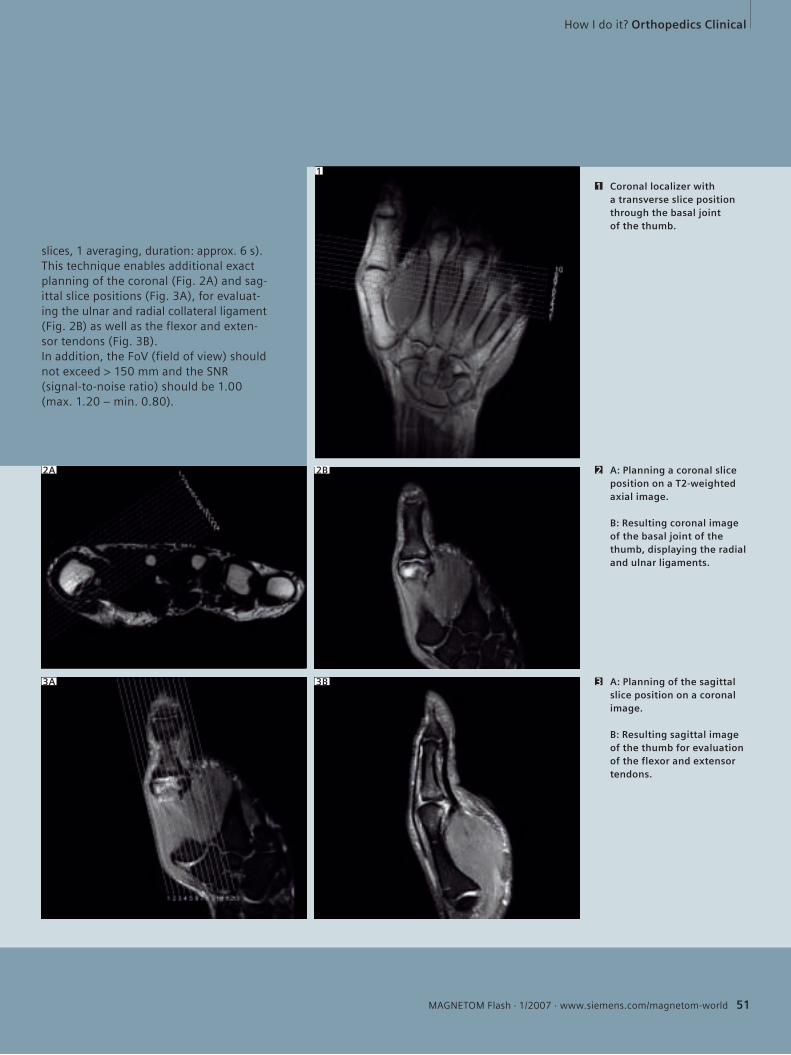
How I do it? Orthopedics Clinical
MAGNETOM Flash · 1/2007 · www.siemens.com/magnetom-world 51
slices, 1 averaging, duration: approx. 6 s).This technique enables additional exact planning of the coronal (Fig. 2A) and sag-ittal slice positions (Fig. 3A), for evaluat-ing the ulnar and radial collateral ligament (Fig. 2B) as well as the flexor and exten-sor tendons (Fig. 3B).In addition, the FoV (field of view) should not exceed > 150 mm and the SNR (signal-to-noise ratio) should be 1.00 (max. 1.20 – min. 0.80).
1
2A 2B
3A 3B
Coronal localizer with a transverse slice position through the basal joint of the thumb.
1
A: Planning a coronal slice position on a T2-weighted axial image.
B: Resulting coronal image of the basal joint of the thumb, displaying the radial and ulnar ligaments.
2
A: Planning of the sagittal slice position on a coronal image.
B: Resulting sagittal image of the thumb for evaluation of the flexor and extensor tendons.
3
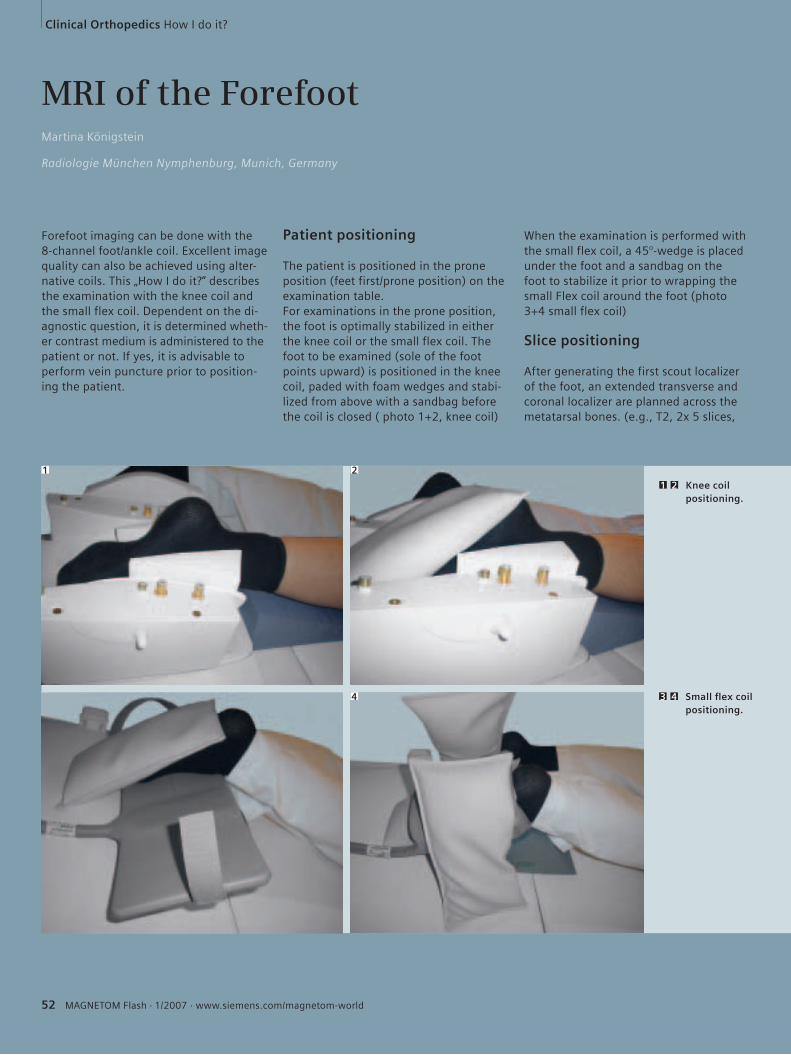
Clinical Orthopedics How I do it?
52 MAGNETOM Flash · 1/2007 · www.siemens.com/magnetom-world
When the examination is performed with the small flex coil, a 45°-wedge is placed under the foot and a sandbag on the foot to stabilize it prior to wrapping the small Flex coil around the foot (photo 3+4 small flex coil)
Slice positioning
After generating the first scout localizer of the foot, an extended transverse and coronal localizer are planned across the metatarsal bones. (e.g., T2, 2x 5 slices,
MRI of the ForefootMartina Königstein
Radiologie München Nymphenburg, Munich, Germany
Forefoot imaging can be done with the 8-channel foot/ankle coil. Excellent image quality can also be achieved using alter-native coils. This „How I do it?“ describes the examination with the knee coil and the small flex coil. Dependent on the di-agnostic question, it is determined wheth-er contrast medium is administered to the patient or not. If yes, it is advisable to perform vein puncture prior to position-ing the patient.
Patient positioning
The patient is positioned in the prone position (feet first/prone position) on the examination table.For examinations in the prone position, the foot is optimally stabilized in either the knee coil or the small flex coil. The foot to be examined (sole of the foot points upward) is positioned in the knee coil, paded with foam wedges and stabi-lized from above with a sandbag before the coil is closed ( photo 1+2, knee coil)
Knee coil positioning.
1 2
Small fl ex coil positioning.
3 4
1 2
3 4
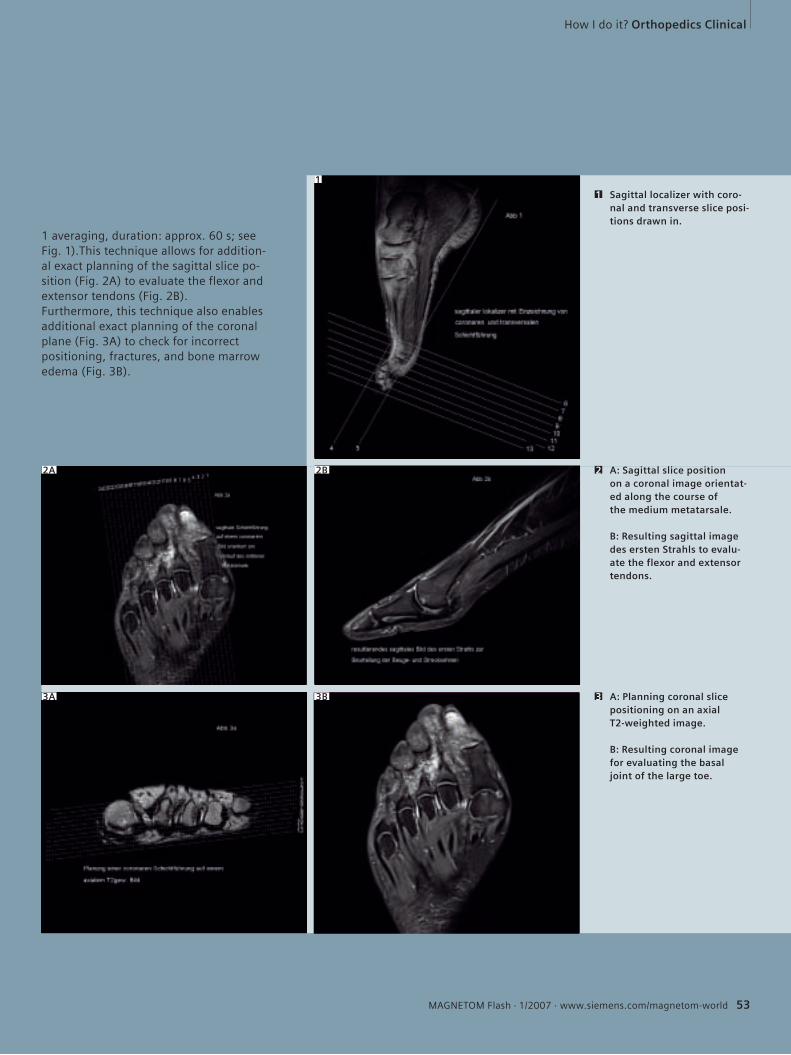
How I do it? Orthopedics Clinical
MAGNETOM Flash · 1/2007 · www.siemens.com/magnetom-world 53
1
2A 2B
3A 3B
Sagittal localizer with coro-nal and transverse slice posi-tions drawn in.
1
A: Sagittal slice position on a coronal image orientat-ed along the course of the medium metatarsale.
B: Resulting sagittal image des ersten Strahls to evalu-ate the flexor and extensor tendons.
2
A: Planning coronal slice positioning on an axial T2-weighted image.
B: Resulting coronal image for evaluating the basal joint of the large toe.
3
1 averaging, duration: approx. 60 s; see Fig. 1).This technique allows for addition-al exact planning of the sagittal slice po-sition (Fig. 2A) to evaluate the flexor and extensor tendons (Fig. 2B).Furthermore, this technique also enables additional exact planning of the coronal plane (Fig. 3A) to check for incorrect positioning, fractures, and bone marrow edema (Fig. 3B).
www.siemens.com/mr
Proven Outcomes in Clinical 3T MRI.
It’s time to think differently about 3T. MAGNETOM Trio™ is the only 3T with the power of Tim®, Total imaging matrix technology. For 3T that works hard and works fast. Tim makes 3T simple to use for all clinical applications and all body parts. Available with up to 102 seamlessly integrated coils and up to 32 RF channels for ultra-fast scan times and high image resolution. MAGNETOM Trio. From the most routine to the most challenging. It’s time to let it take you to the next level.
3T Racehorse? 3T Workhorse?It‘s all of the above!
MR-Z1007-1-7600
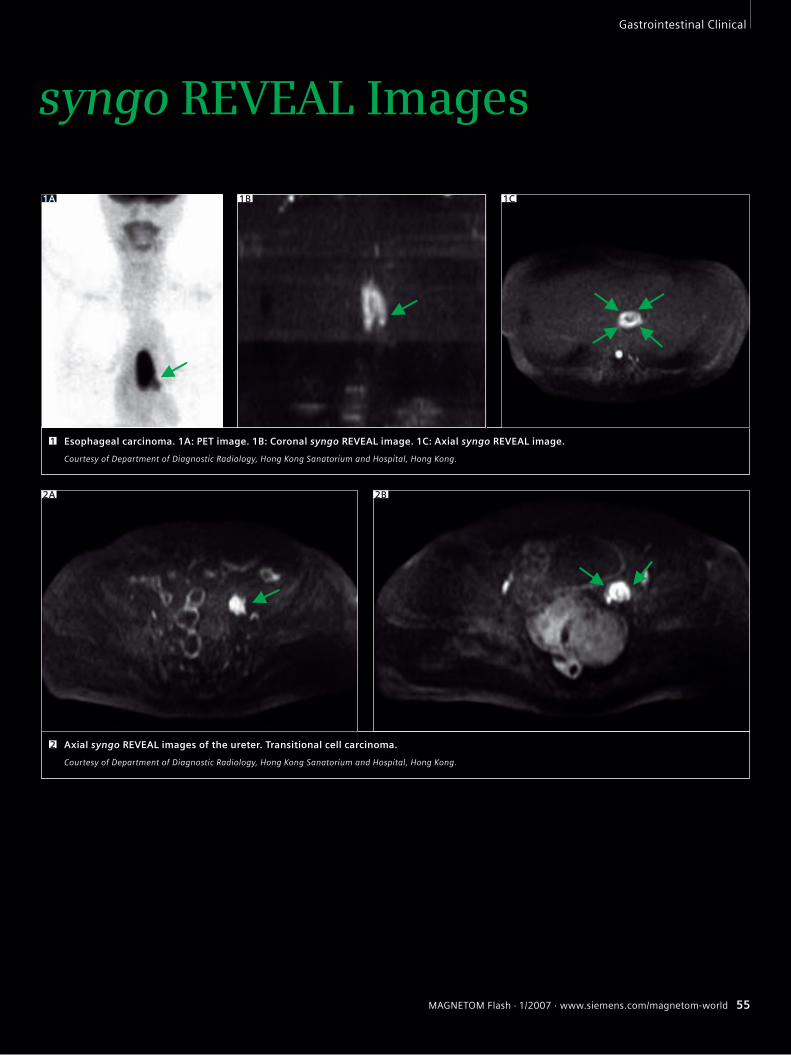
MAGNETOM Flash · 1/2007 · www.siemens.com/magnetom-world 55
Gastrointestinal Clinical
syngo REVEAL Images
Esophageal carcinoma. 1A: PET image. 1B: Coronal syngo REVEAL image. 1C: Axial syngo REVEAL image.
Courtesy of Department of Diagnostic Radiology, Hong Kong Sanatorium and Hospital, Hong Kong.
1
1A 1B 1C
Axial syngo REVEAL images of the ureter. Transitional cell carcinoma.
Courtesy of Department of Diagnostic Radiology, Hong Kong Sanatorium and Hospital, Hong Kong.
2A 2B
2
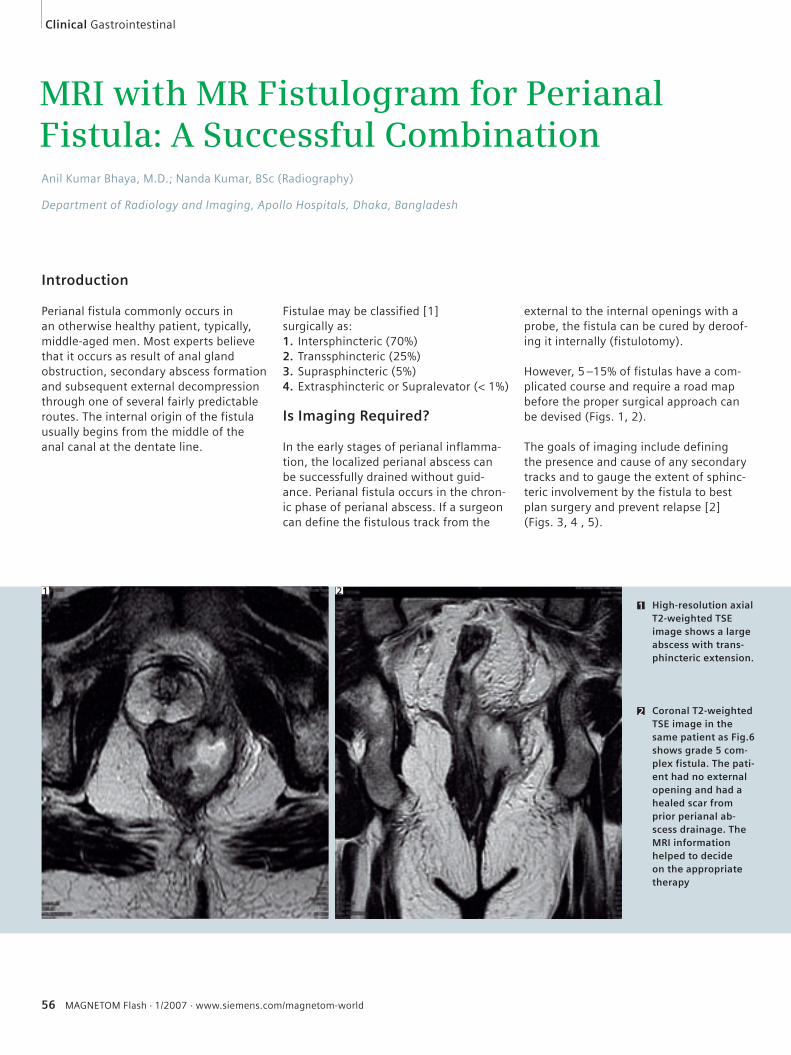
56 MAGNETOM Flash · 1/2007 · www.siemens.com/magnetom-world
MRI with MR Fistulogram for Perianal Fistula: A Successful CombinationAnil Kumar Bhaya, M.D.; Nanda Kumar, BSc (Radiography)
Department of Radiology and Imaging, Apollo Hospitals, Dhaka, Bangladesh
Introduction
Perianal fistula commonly occurs in an otherwise healthy patient, typically, middle-aged men. Most experts believe that it occurs as result of anal gland obstruction, secondary abscess formation and subsequent external decompression through one of several fairly predictable routes. The internal origin of the fistula usually begins from the middle of the anal canal at the dentate line.
Fistulae may be classified [1] surgically as:1. Intersphincteric (70%)2. Transsphincteric (25%)3. Suprasphincteric (5%)4. Extrasphincteric or Supralevator (< 1%)
Is Imaging Required?
In the early stages of perianal inflamma-tion, the localized perianal abscess can be successfully drained without guid-ance. Perianal fistula occurs in the chron-ic phase of perianal abscess. If a surgeon can define the fistulous track from the
1 High-resolution axial T2-weighted TSE image shows a large abscess with trans-phincteric extension.
1
2 Coronal T2-weighted TSE image in the same patient as Fig.6 shows grade 5 com-plex fistula. The pati-ent had no external opening and had a healed scar from prior perianal ab-scess drainage. The MRI information helped to decide on the appropriate therapy
2
external to the internal openings with a probe, the fistula can be cured by deroof-ing it internally (fistulotomy).
However, 5 –15% of fistulas have a com-plicated course and require a road map before the proper surgical approach can be devised (Figs. 1, 2).
The goals of imaging include defining the presence and cause of any secondary tracks and to gauge the extent of sphinc-teric involvement by the fistula to best plan surgery and prevent relapse [2] (Figs. 3, 4 , 5).
Clinical Gastrointestinal
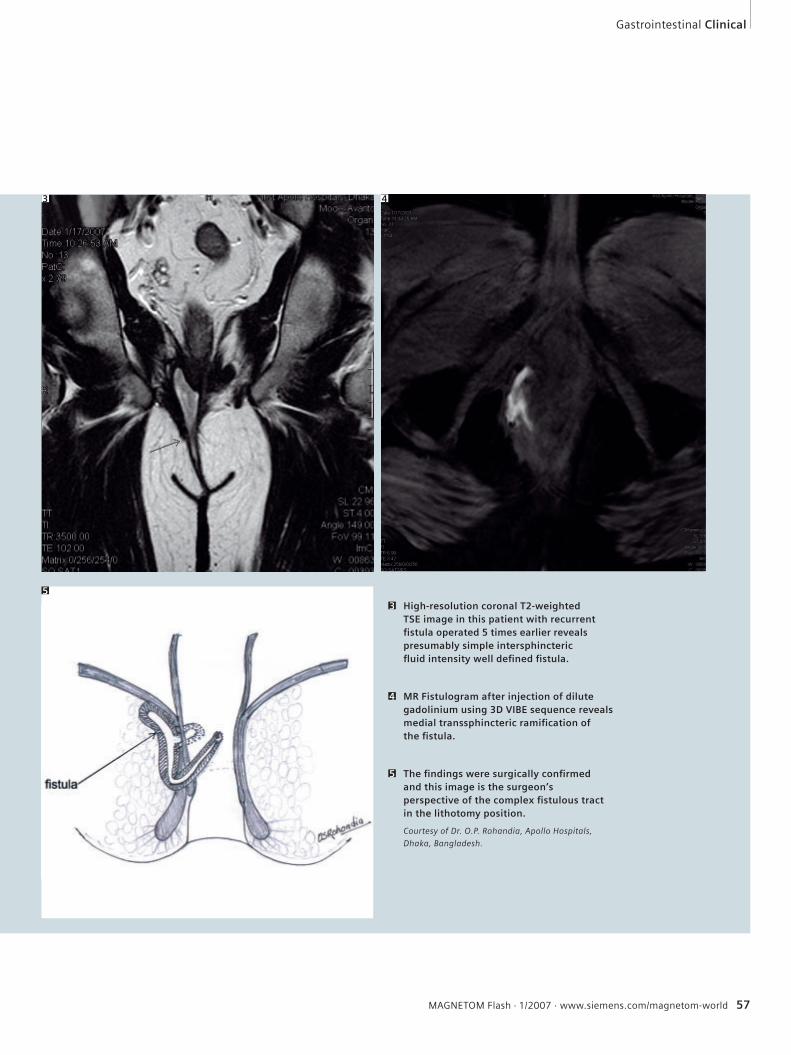
High-resolution coronal T2-weighted TSE image in this patient with recurrent fi stula operated 5 times earlier reveals presumably simple intersphincteric fl uid intensity well defi ned fi stula.
3
MR Fistulogram after injection of dilute gadolinium using 3D VIBE sequence reveals medial transsphincteric ramifi cation of the fi stula.
4
The fi ndings were surgically confi rmed and this image is the surgeon’s perspective of the complex fi stulous tract in the lithotomy position.
Courtesy of Dr. O.P. Rohandia, Apollo Hospitals,
Dhaka, Bangladesh.
5
Gastrointestinal Clinical
3 4
5
MAGNETOM Flash · 1/2007 · www.siemens.com/magnetom-world 57
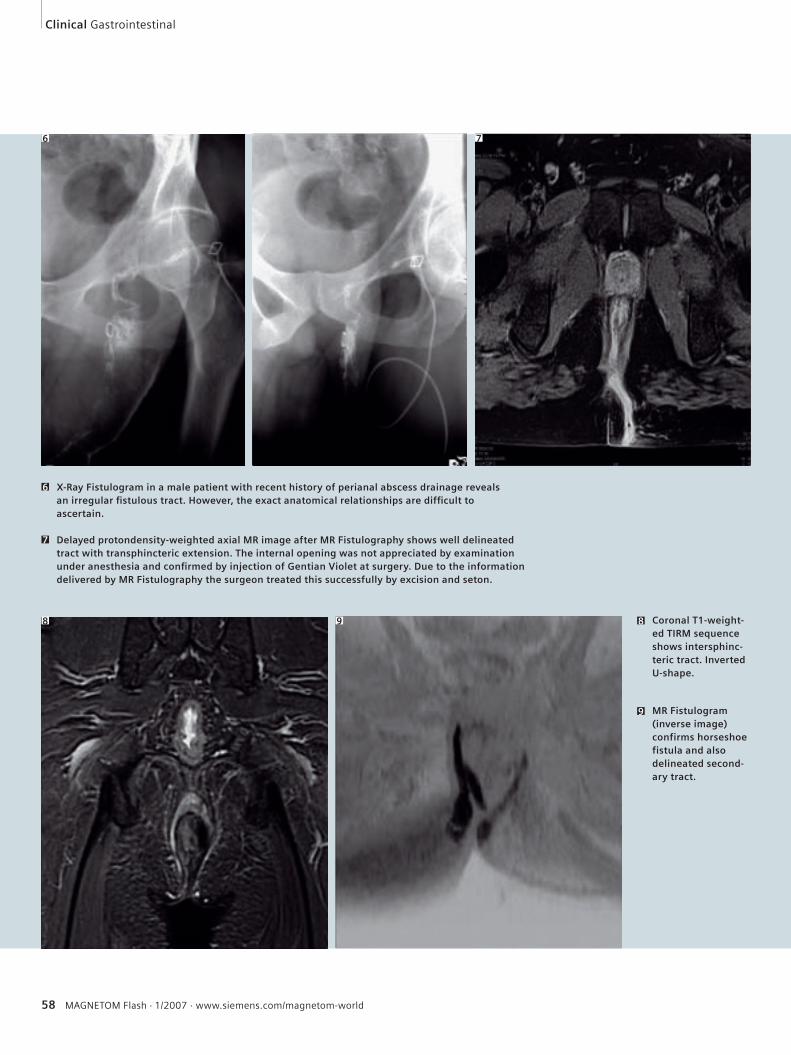
58 MAGNETOM Flash · 1/2007 · www.siemens.com/magnetom-world
X-Ray Fistulogram in a male patient with recent history of perianal abscess drainage reveals an irregular fi stulous tract. However, the exact anatomical relationships are diffi cult to ascertain.
6
Delayed protondensity-weighted axial MR image after MR Fistulography shows well delineated tract with transphincteric extension. The internal opening was not appreciated by examination under anesthesia and confi rmed by injection of Gentian Violet at surgery. Due to the information delivered by MR Fistulography the surgeon treated this successfully by excision and seton.
7
8 Coronal T1-weight-ed TIRM sequence shows intersphinc-teric tract. Inverted U-shape.
9 MR Fistulogram (inverse image) confirms horseshoe fistula and also delineated second-ary tract.
Clinical Gastrointestinal
6 7
8 9
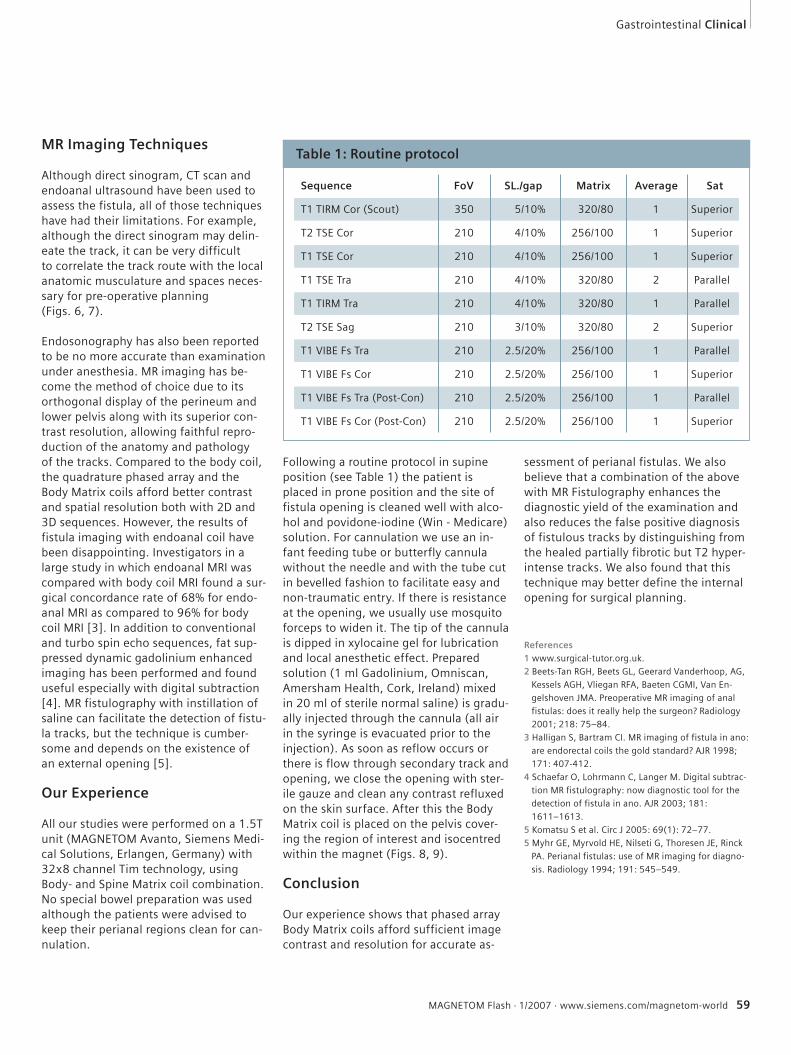
MAGNETOM Flash · 1/2007 · www.siemens.com/magnetom-world 59
MR Imaging Techniques
Although direct sinogram, CT scan and endoanal ultrasound have been used to assess the fistula, all of those techniques have had their limitations. For example, although the direct sinogram may delin-eate the track, it can be very difficultto correlate the track route with the local anatomic musculature and spaces neces-sary for pre-operative planning (Figs. 6, 7).
Endosonography has also been reported to be no more accurate than examination under anesthesia. MR imaging has be-come the method of choice due to its orthogonal display of the perineum and lower pelvis along with its superior con-trast resolution, allowing faithful repro-duction of the anatomy and pathology of the tracks. Compared to the body coil, the quadrature phased array and the Body Matrix coils afford better contrast and spatial resolution both with 2D and 3D sequences. However, the results of fistula imaging with endoanal coil have been disappointing. Investigators in a large study in which endoanal MRI was compared with body coil MRI found a sur-gical concordance rate of 68% for endo-anal MRI as compared to 96% for body coil MRI [3]. In addition to conventional and turbo spin echo sequences, fat sup-pressed dynamic gadolinium enhanced imaging has been performed and found useful especially with digital subtraction [4]. MR fistulography with instillation of saline can facilitate the detection of fistu-la tracks, but the technique is cumber-some and depends on the existence of an external opening [5].
Our Experience
All our studies were performed on a 1.5T unit (MAGNETOM Avanto, Siemens Medi-cal Solutions, Erlangen, Germany) with 32x8 channel Tim technology, using Body- and Spine Matrix coil combination. No special bowel preparation was used although the patients were advised to keep their perianal regions clean for can-nulation.
Following a routine protocol in supine position (see Table 1) the patient is placed in prone position and the site of fistula opening is cleaned well with alco-hol and povidone-iodine (Win - Medicare) solution. For cannulation we use an in-fant feeding tube or butterfly cannula without the needle and with the tube cut in bevelled fashion to facilitate easy and non-traumatic entry. If there is resistance at the opening, we usually use mosquito forceps to widen it. The tip of the cannula is dipped in xylocaine gel for lubrication and local anesthetic effect. Prepared solution (1 ml Gadolinium, Omniscan, Amersham Health, Cork, Ireland) mixed in 20 ml of sterile normal saline) is gradu-ally injected through the cannula (all air in the syringe is evacuated prior to the injection). As soon as reflow occurs or there is flow through secondary track and opening, we close the opening with ster-ile gauze and clean any contrast refluxed on the skin surface. After this the Body Matrix coil is placed on the pelvis cover-ing the region of interest and isocentred within the magnet (Figs. 8, 9).
Conclusion
Our experience shows that phased array Body Matrix coils afford sufficient image contrast and resolution for accurate as-
sessment of perianal fistulas. We also believe that a combination of the above with MR Fistulography enhances the diagnostic yield of the examination and also reduces the false positive diagnosis of fistulous tracks by distinguishing from the healed partially fibrotic but T2 hyper-intense tracks. We also found that this technique may better define the internal opening for surgical planning.
References1 www.surgical-tutor.org.uk.
2 Beets-Tan RGH, Beets GL, Geerard Vanderhoop, AG,
Kessels AGH, Vliegan RFA, Baeten CGMI, Van En-
gelshoven JMA. Preoperative MR imaging of anal
fistulas: does it really help the surgeon? Radiology
2001; 218: 75–84.
3 Halligan S, Bartram CI. MR imaging of fistula in ano:
are endorectal coils the gold standard? AJR 1998;
171: 407-412.
4 Schaefar O, Lohrmann C, Langer M. Digital subtrac-
tion MR fistulography: now diagnostic tool for the
detection of fistula in ano. AJR 2003; 181:
1611–1613.
5 Komatsu S et al. Circ J 2005: 69(1): 72–77.
5 Myhr GE, Myrvold HE, Nilseti G, Thoresen JE, Rinck
PA. Perianal fistulas: use of MR imaging for diagno-
sis. Radiology 1994; 191: 545–549.
Gastrointestinal Clinical
Table 1: Routine protocol
Sequence FoV SL./gap Matrix Average Sat
T1 TIRM Cor (Scout) 350 5/10% 320/80 1 Superior
T2 TSE Cor 210 4/10% 256/100 1 Superior
T1 TSE Cor 210 4/10% 256/100 1 Superior
T1 TSE Tra 210 4/10% 320/80 2 Parallel
T1 TIRM Tra 210 4/10% 320/80 1 Parallel
T2 TSE Sag 210 3/10% 320/80 2 Superior
T1 VIBE Fs Tra 210 2.5/20% 256/100 1 Parallel
T1 VIBE Fs Cor 210 2.5/20% 256/100 1 Superior
T1 VIBE Fs Tra (Post-Con) 210 2.5/20% 256/100 1 Parallel
T1 VIBE Fs Cor (Post-Con) 210 2.5/20% 256/100 1 Superior
60 MAGNETOM Flash · 1/2007 · www.siemens.com/magnetom-world
Technology
Subheadline ...
“syngo TimCT – this innovative fascinating MRI technique will set future trends concerning workflow and scan efficiency. Current oncologic staging strategies will experience substantial changes beneficial for the patient.”
Arnd-Oliver Schaefer M.D.
University Hospital Freiburg, Germany
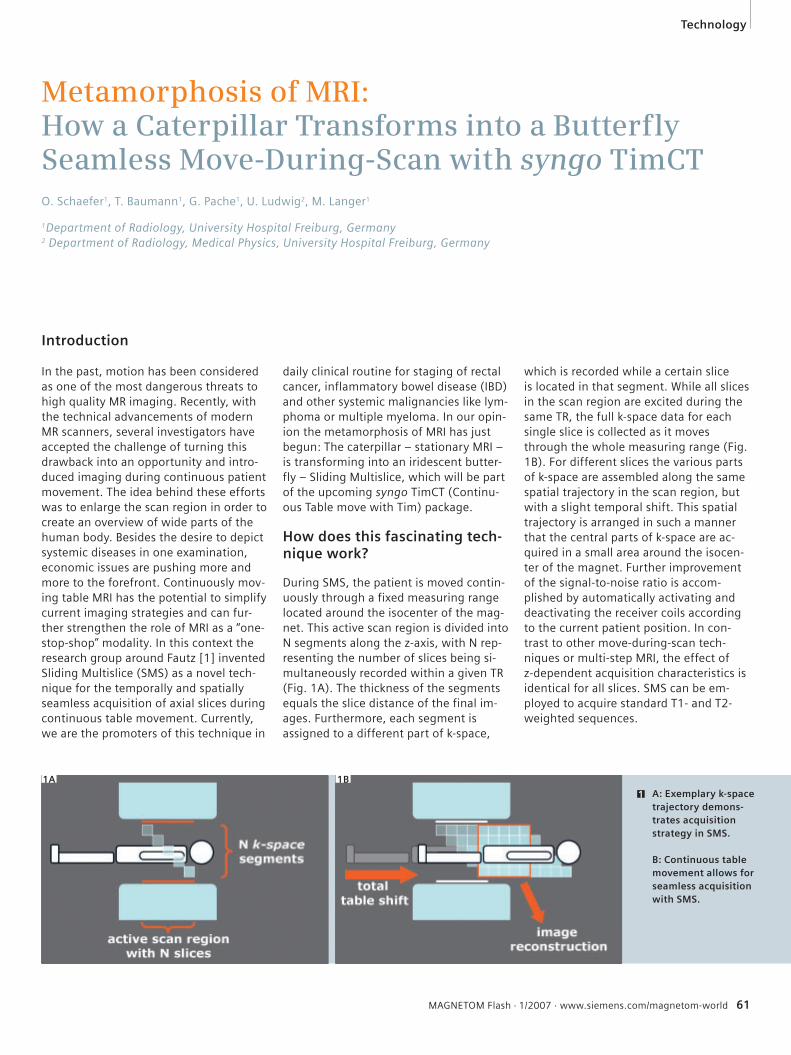
MAGNETOM Flash · 1/2007 · www.siemens.com/magnetom-world 61
Technology
Introduction
In the past, motion has been considered as one of the most dangerous threats to high quality MR imaging. Recently, with the technical advancements of modern MR scanners, several investigators have accepted the challenge of turning this drawback into an opportunity and intro-duced imaging during continuous patient movement. The idea behind these efforts was to enlarge the scan region in order to create an overview of wide parts of the human body. Besides the desire to depict systemic diseases in one examination, economic issues are pushing more and more to the forefront. Continuously mov-ing table MRI has the potential to simplify current imaging strategies and can fur-ther strengthen the role of MRI as a “one-stop-shop” modality. In this context the research group around Fautz [1] invented Sliding Multislice (SMS) as a novel tech-nique for the temporally and spatially seamless acquisition of axial slices during continuous table movement. Currently, we are the promoters of this technique in
daily clinical routine for staging of rectal cancer, inflammatory bowel disease (IBD) and other systemic malignancies like lym-phoma or multiple myeloma. In our opin-ion the metamorphosis of MRI has just begun: The caterpillar – stationary MRI – is transforming into an iridescent butter-fly – Sliding Multislice, which will be part of the upcoming syngo TimCT (Continu-ous Table move with Tim) package.
How does this fascinating tech-nique work?
During SMS, the patient is moved contin-uously through a fixed measuring range located around the isocenter of the mag-net. This active scan region is divided into N segments along the z-axis, with N rep-resenting the number of slices being si-multaneously recorded within a given TR (Fig. 1A). The thickness of the segments equals the slice distance of the final im-ages. Furthermore, each segment is assigned to a different part of k-space,
which is recorded while a certain slice is located in that segment. While all slices in the scan region are excited during the same TR, the full k-space data for each single slice is collected as it moves through the whole measuring range (Fig. 1B). For different slices the various parts of k-space are assembled along the same spatial trajectory in the scan region, but with a slight temporal shift. This spatial trajectory is arranged in such a manner that the central parts of k-space are ac-quired in a small area around the isocen-ter of the magnet. Further improvement of the signal-to-noise ratio is accom-plished by automatically activating and deactivating the receiver coils according to the current patient position. In con-trast to other move-during-scan tech-niques or multi-step MRI, the effect of z-dependent acquisition characteristics is identical for all slices. SMS can be em-ployed to acquire standard T1- and T2-weighted sequences.
Metamorphosis of MRI:How a Caterpillar Transforms into a Butterfly Seamless Move-During-Scan with syngo TimCTO. Schaefer1, T. Baumann1, G. Pache1, U. Ludwig2, M. Langer1
1Department of Radiology, University Hospital Freiburg, Germany2 Department of Radiology, Medical Physics, University Hospital Freiburg, Germany
1 A: Exemplary k-space trajectory demons-trates acquisition strategy in SMS.
B: Continuous table movement allows for seamless acquisition with SMS.
1A 1B
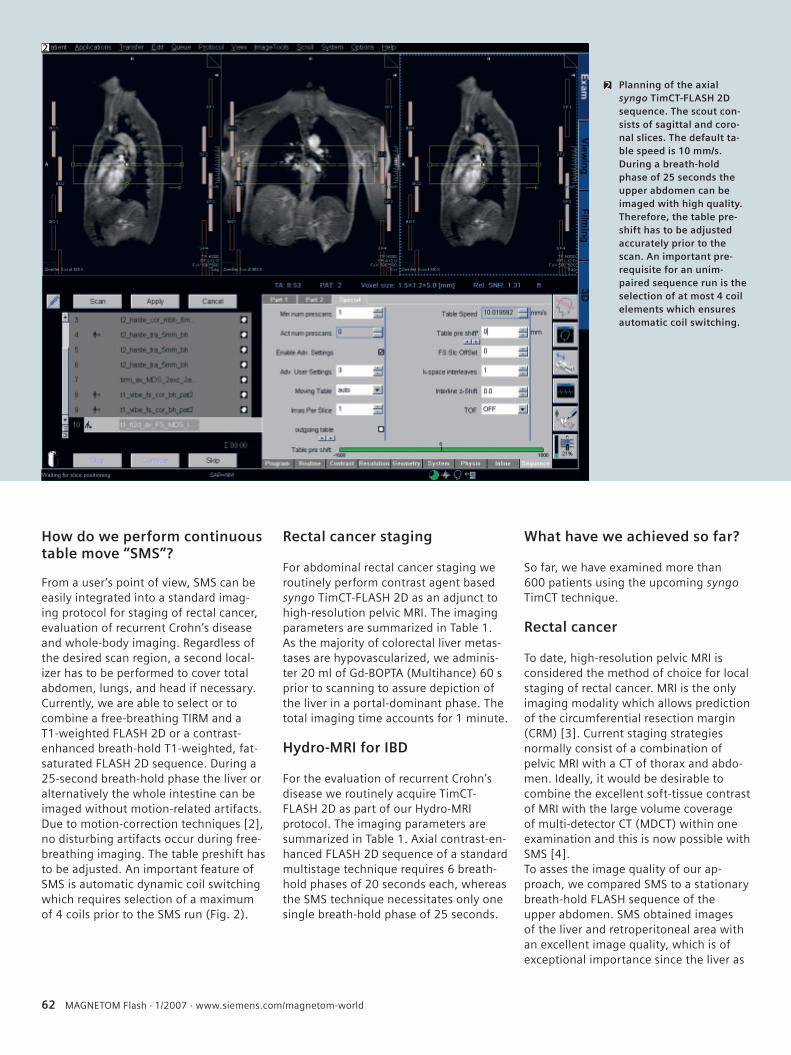
62 MAGNETOM Flash · 1/2007 · www.siemens.com/magnetom-world
How do we perform continuous table move “SMS”?
From a user’s point of view, SMS can be easily integrated into a standard imag-ing protocol for staging of rectal cancer, evaluation of recurrent Crohn’s disease and whole-body imaging. Regardless of the desired scan region, a second local-izer has to be performed to cover total abdomen, lungs, and head if necessary. Currently, we are able to select or to combine a free-breathing TIRM and a T1-weighted FLASH 2D or a contrast-enhanced breath-hold T1-weighted, fat-saturated FLASH 2D sequence. During a 25-second breath-hold phase the liver or alternatively the whole intestine can be imaged without motion-related artifacts. Due to motion-correction techniques [2], no disturbing artifacts occur during free-breathing imaging. The table preshift has to be adjusted. An important feature of SMS is automatic dynamic coil switching which requires selection of a maximum of 4 coils prior to the SMS run (Fig. 2).
Rectal cancer staging
For abdominal rectal cancer staging we routinely perform contrast agent based syngo TimCT-FLASH 2D as an adjunct to high-resolution pelvic MRI. The imaging parameters are summarized in Table 1. As the majority of colorectal liver metas-tases are hypovascularized, we adminis-ter 20 ml of Gd-BOPTA (Multihance) 60 s prior to scanning to assure depiction of the liver in a portal-dominant phase. The total imaging time accounts for 1 minute.
Hydro-MRI for IBD
For the evaluation of recurrent Crohn’s disease we routinely acquire TimCT-FLASH 2D as part of our Hydro-MRI protocol. The imaging parameters are summarized in Table 1. Axial contrast-en-hanced FLASH 2D sequence of a standard multistage technique requires 6 breath-hold phases of 20 seconds each, whereas the SMS technique necessitates only one single breath-hold phase of 25 seconds.
What have we achieved so far?
So far, we have examined more than 600 patients using the upcoming syngo TimCT technique.
Rectal cancer
To date, high-resolution pelvic MRI is considered the method of choice for local staging of rectal cancer. MRI is the only imaging modality which allows prediction of the circumferential resection margin (CRM) [3]. Current staging strategies normally consist of a combination of pelvic MRI with a CT of thorax and abdo-men. Ideally, it would be desirable to combine the excellent soft-tissue contrast of MRI with the large volume coverage of multi-detector CT (MDCT) within one examination and this is now possible with SMS [4].To asses the image quality of our ap-proach, we compared SMS to a stationary breath-hold FLASH sequence of the upper abdomen. SMS obtained images of the liver and retroperitoneal area with an excellent image quality, which is of exceptional importance since the liver as
2
Planning of the axialsyngo TimCT-FLASH 2D sequence. The scout con-sists of sagittal and coro-nal slices. The default ta-ble speed is 10 mm/s. During a breath-hold phase of 25 seconds the upper abdomen can be imaged with high quality. Therefore, the table pre-shift has to be adjusted accurately prior to the scan. An important pre-requisite for an unim-paired sequence run is the selection of at most 4 coil elements which ensures automatic coil switching.
2
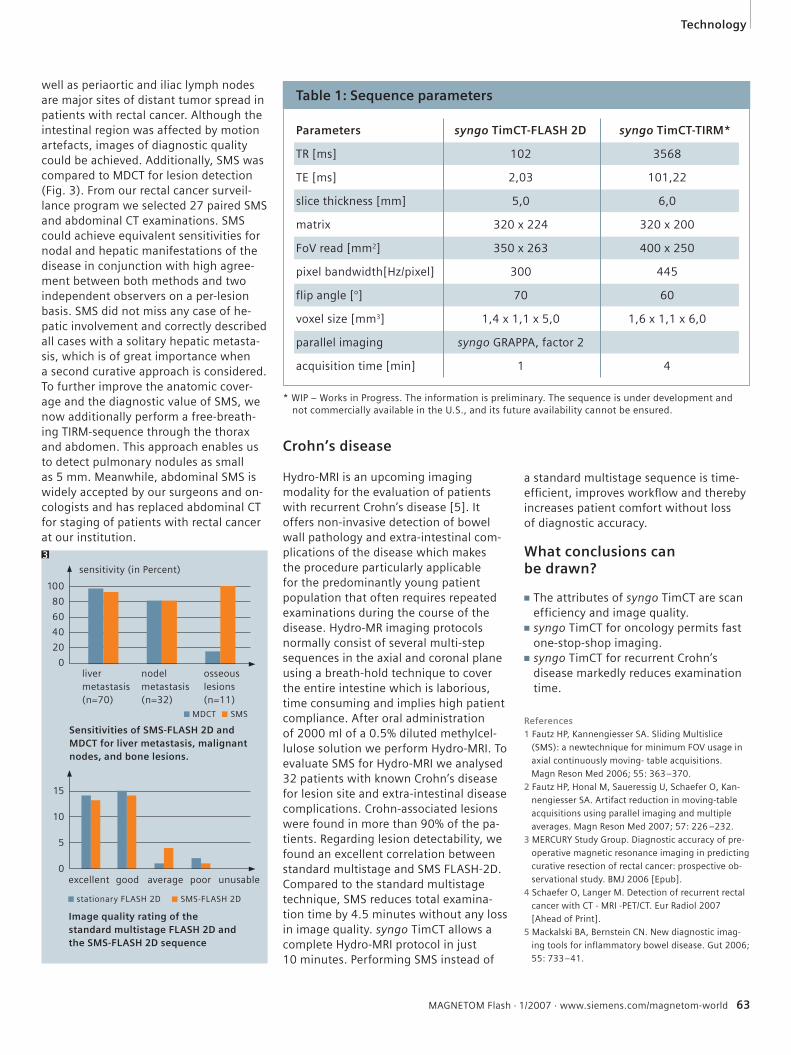
MAGNETOM Flash · 1/2007 · www.siemens.com/magnetom-world 63
Technology
References1 Fautz HP, Kannengiesser SA. Sliding Multislice
(SMS): a newtechnique for minimum FOV usage in
axial continuously moving- table acquisitions.
Magn Reson Med 2006; 55: 363–370.
2 Fautz HP, Honal M, Saueressig U, Schaefer O, Kan-
nengiesser SA. Artifact reduction in moving-table
acquisitions using parallel imaging and multiple
averages. Magn Reson Med 2007; 57: 226 –232.
3 MERCURY Study Group. Diagnostic accuracy of pre-
operative magnetic resonance imaging in predicting
curative resection of rectal cancer: prospective ob-
servational study. BMJ 2006 [Epub].
4 Schaefer O, Langer M. Detection of recurrent rectal
cancer with CT - MRI -PET/CT. Eur Radiol 2007
[Ahead of Print].
5 Mackalski BA, Bernstein CN. New diagnostic imag-
ing tools for inflammatory bowel disease. Gut 2006;
55: 733–41.
well as periaortic and iliac lymph nodes are major sites of distant tumor spread in patients with rectal cancer. Although the intestinal region was affected by motion artefacts, images of diagnostic quality could be achieved. Additionally, SMS was compared to MDCT for lesion detection (Fig. 3). From our rectal cancer surveil-lance program we selected 27 paired SMS and abdominal CT examinations. SMS could achieve equivalent sensitivities for nodal and hepatic manifestations of the disease in conjunction with high agree-ment between both methods and two independent observers on a per-lesion basis. SMS did not miss any case of he-patic involvement and correctly described all cases with a solitary hepatic metasta-sis, which is of great importance when a second curative approach is considered. To further improve the anatomic cover-age and the diagnostic value of SMS, we now additionally perform a free-breath-ing TIRM-sequence through the thorax and abdomen. This approach enables us to detect pulmonary nodules as small as 5 mm. Meanwhile, abdominal SMS is widely accepted by our surgeons and on-cologists and has replaced abdominal CT for staging of patients with rectal cancer at our institution.
* WIP – Works in Progress. The information is preliminary. The sequence is under development and not commercially available in the U.S., and its future availability cannot be ensured.
Crohn’s disease
Hydro-MRI is an upcoming imaging modality for the evaluation of patients with recurrent Crohn’s disease [5]. It offers non-invasive detection of bowel wall pathology and extra-intestinal com-plications of the disease which makes the procedure particularly applicable for the predominantly young patient population that often requires repeated examinations during the course of the disease. Hydro-MR imaging protocols normally consist of several multi-step sequences in the axial and coronal plane using a breath-hold technique to cover the entire intestine which is laborious, time consuming and implies high patient compliance. After oral administration of 2000 ml of a 0.5% diluted methylcel-lulose solution we perform Hydro-MRI. To evaluate SMS for Hydro-MRI we analysed 32 patients with known Crohn’s disease for lesion site and extra-intestinal disease complications. Crohn-associated lesions were found in more than 90% of the pa-tients. Regarding lesion detectability, we found an excellent correlation between standard multistage and SMS FLASH-2D. Compared to the standard multistage technique, SMS reduces total examina-tion time by 4.5 minutes without any loss in image quality. syngo TimCT allows a complete Hydro-MRI protocol in just 10 minutes. Performing SMS instead of
Sensitivities of SMS-FLASH 2D and MDCT for liver metastasis, malignant nodes, and bone lesions.
Image quality rating of the standard multistage FLASH 2D and the SMS-FLASH 2D sequence
100
80
60
40
20
0osseous lesions (n=11)
liver metastasis (n=70)
nodel metastasis (n=32)
a standard multistage sequence is time-effi cient, improves workfl ow and thereby increases patient comfort without loss of diagnostic accuracy.
What conclusions can be drawn?
■ The attributes of syngo TimCT are scan efficiency and image quality.
■ syngo TimCT for oncology permits fast one-stop-shop imaging.
■ syngo TimCT for recurrent Crohn’s disease markedly reduces examination time.
■ MDCT ■ SMS
poorexcellent good average
15
10
5
0
■ stationary FLASH 2D ■ SMS-FLASH 2D
unusable
sensitivity (in Percent)
Parameters syngo TimCT-FLASH 2D syngo TimCT-TIRM*
TR [ms] 102 3568
TE [ms] 2,03 101,22
slice thickness [mm] 5,0 6,0
matrix 320 x 224 320 x 200
FoV read [mm2] 350 x 263 400 x 250
pixel bandwidth[Hz/pixel] 300 445
flip angle [°] 70 60
voxel size [mm3] 1,4 x 1,1 x 5,0 1,6 x 1,1 x 6,0
parallel imaging syngo GRAPPA, factor 2
acquisition time [min] 1 4
Table 1: Sequence parameters
3
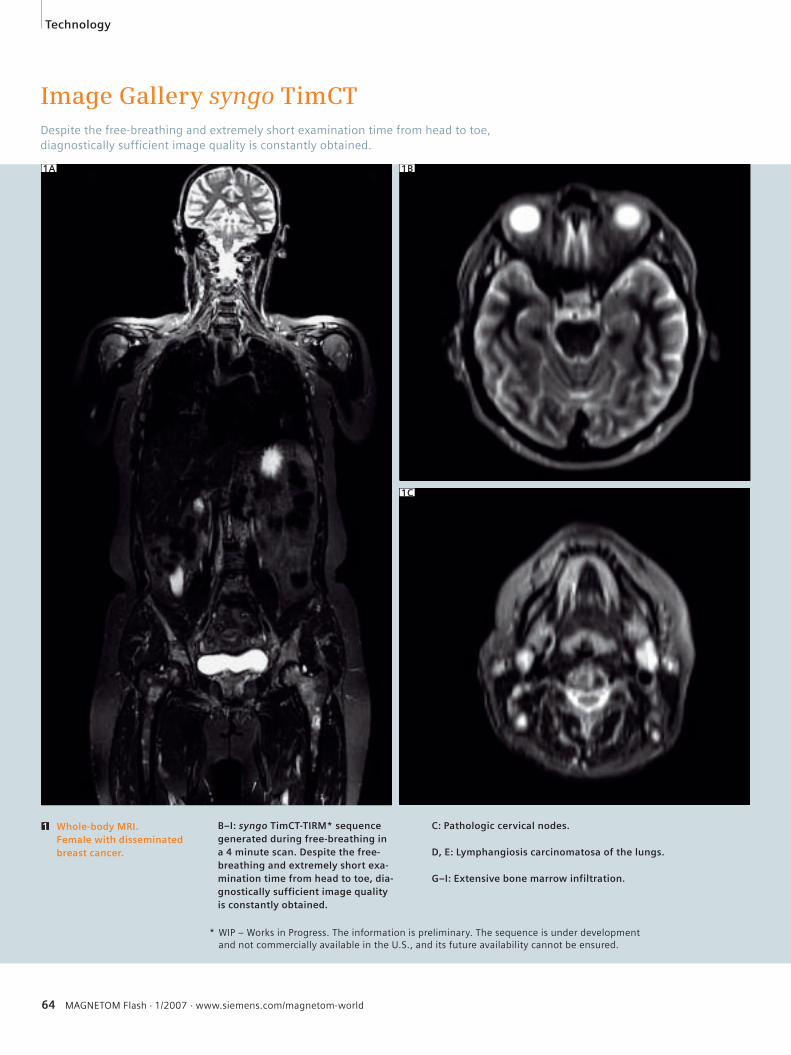
64 MAGNETOM Flash · 1/2007 · www.siemens.com/magnetom-world
Image Gallery syngo TimCTDespite the free-breathing and extremely short examination time from head to toe, diagnostically sufficient image quality is constantly obtained.
B–I: syngo TimCT-TIRM* sequence generated during free-breathing in a 4 minute scan. Despite the free-breathing and extremely short exa-mination time from head to toe, dia-gnostically sufficient image quality is constantly obtained.
1B
1C
Whole-body MRI. Female with disseminated breast cancer.
C: Pathologic cervical nodes.
D, E: Lymphangiosis carcinomatosa of the lungs.
G–I: Extensive bone marrow infiltration.
1
Technology
1A
* WIP – Works in Progress. The information is preliminary. The sequence is under development and not commercially available in the U.S., and its future availability cannot be ensured.
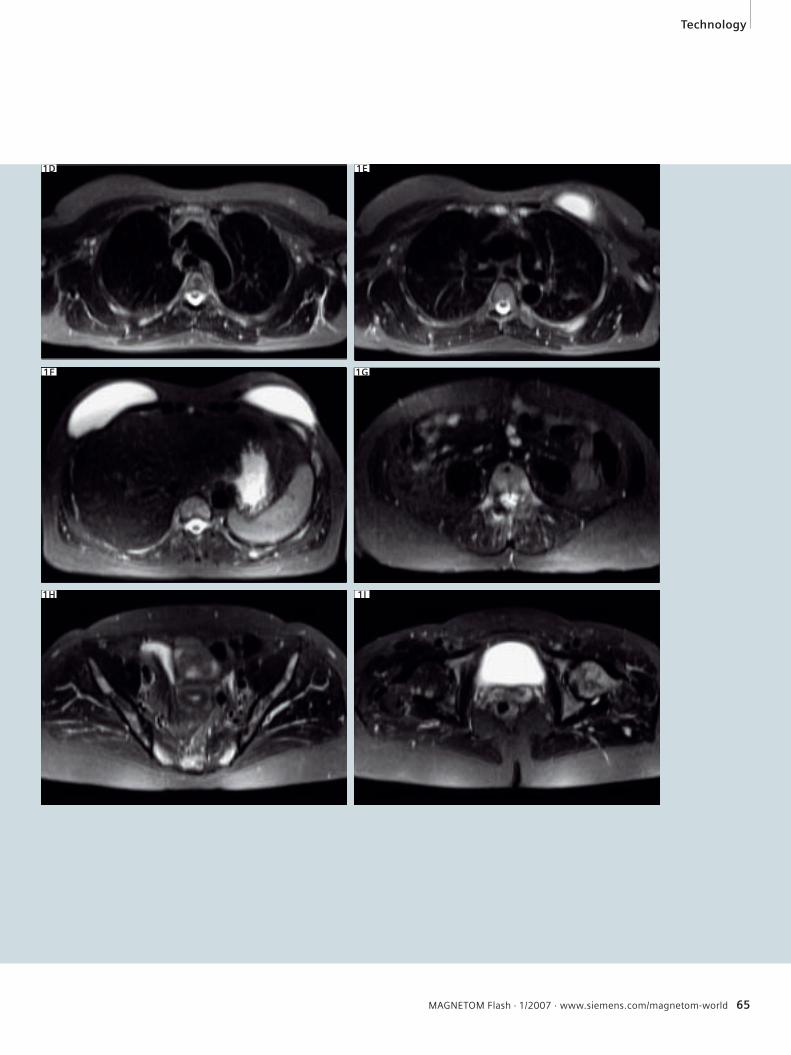
MAGNETOM Flash · 1/2007 · www.siemens.com/magnetom-world 65
1E
1F
Technology
1D
1G
1I1H
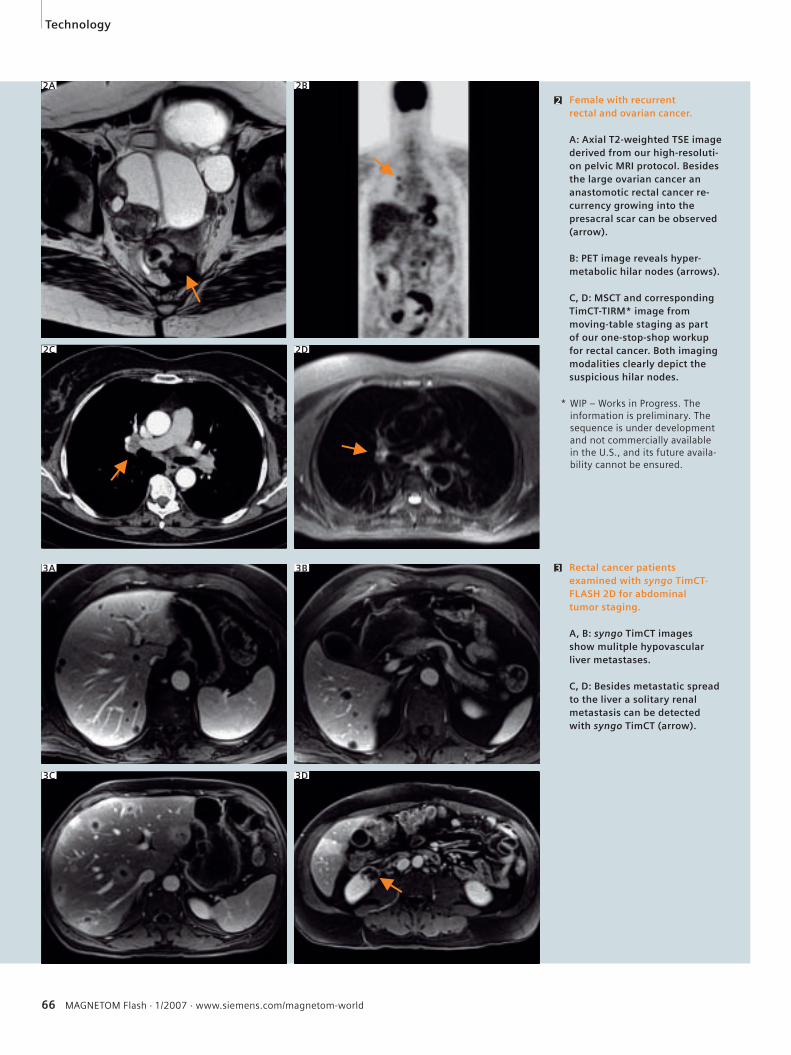
66 MAGNETOM Flash · 1/2007 · www.siemens.com/magnetom-world
2 Female with recurrent rectal and ovarian cancer.
A: Axial T2-weighted TSE image derived from our high-resoluti-on pelvic MRI protocol. Besides the large ovarian cancer an anastomotic rectal cancer re-currency growing into the presacral scar can be observed (arrow).
B: PET image reveals hyper-metabolic hilar nodes (arrows).
C, D: MSCT and corresponding TimCT-TIRM* image from moving-table staging as part of our one-stop-shop workup for rectal cancer. Both imaging modalities clearly depict the suspicious hilar nodes.
Rectal cancer patients examined with syngo TimCT-FLASH 2D for abdominal tumor staging.
A, B: syngo TimCT images show mulitple hypovascular liver metastases.
C, D: Besides metastatic spread to the liver a solitary renal metastasis can be detected with syngo TimCT (arrow).
3A 3B
2B2A
3
Technology
2C 2D
3C 3D
* WIP – Works in Progress. The information is preliminary. The sequence is under development and not commercially available in the U.S., and its future availa-bility cannot be ensured.
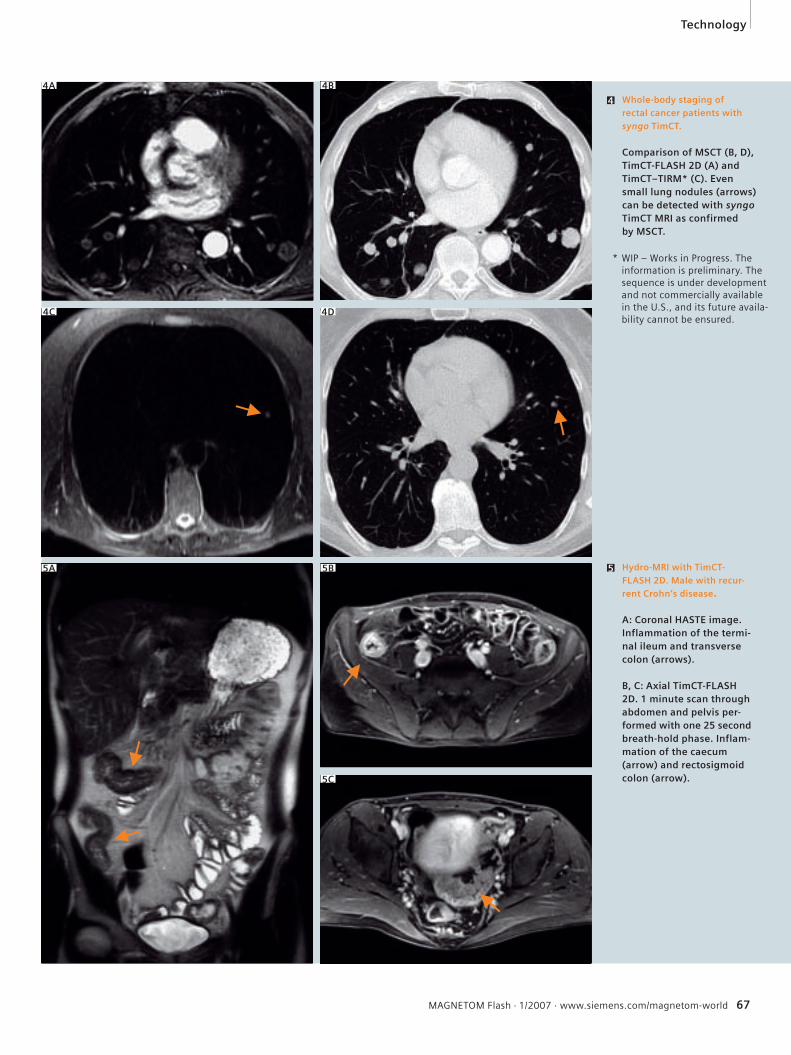
MAGNETOM Flash · 1/2007 · www.siemens.com/magnetom-world 67
5 Hydro-MRI with TimCT-FLASH 2D. Male with recur-rent Crohn’s disease.
A: Coronal HASTE image.Inflammation of the termi-nal ileum and transverse colon (arrows).
B, C: Axial TimCT-FLASH 2D. 1 minute scan through abdomen and pelvis per-formed with one 25 second breath-hold phase. Inflam-mation of the caecum (arrow) and rectosigmoid colon (arrow).
Whole-body staging of rectal cancer patients with syngo TimCT.
Comparison of MSCT (B, D), TimCT-FLASH 2D (A) and TimCT–TIRM* (C). Even small lung nodules (arrows) can be detected with syngo TimCT MRI as confirmed by MSCT.
4
4B4A
4D4C
5B5A
Technology
5C
* WIP – Works in Progress. The information is preliminary. The sequence is under development and not commercially available in the U.S., and its future availa-bility cannot be ensured.
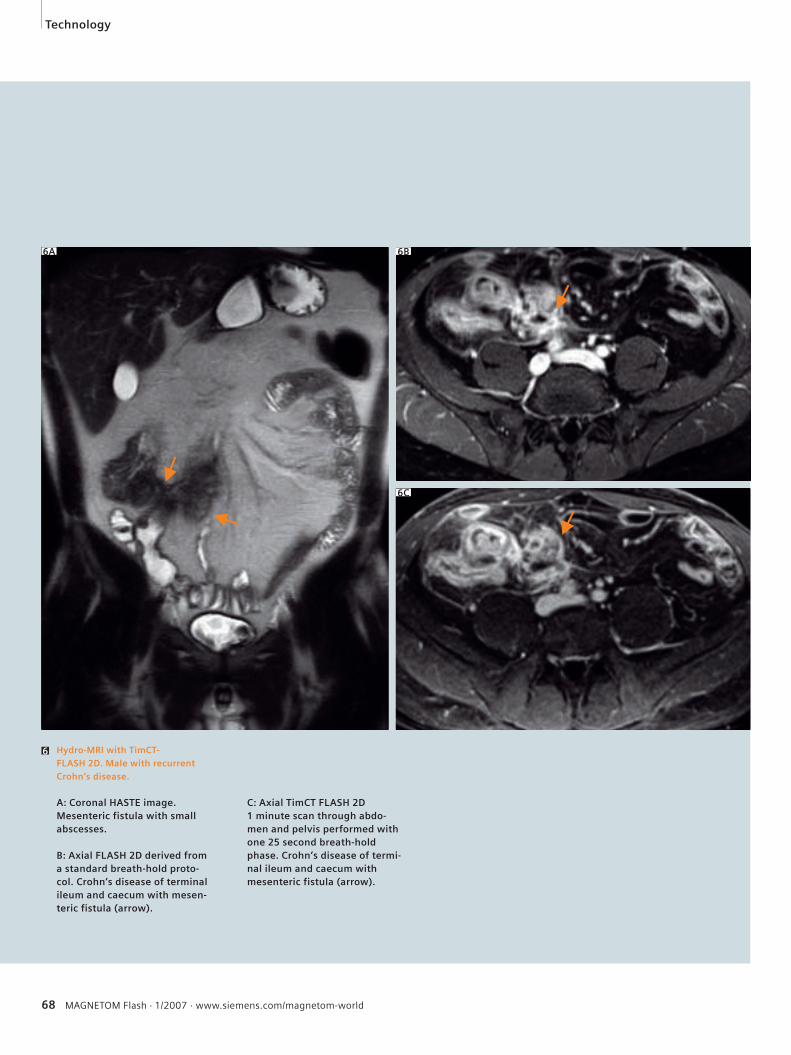
68 MAGNETOM Flash · 1/2007 · www.siemens.com/magnetom-world
6 Hydro-MRI with TimCT-FLASH 2D. Male with recurrent Crohn’s disease.
A: Coronal HASTE image.Mesenteric fistula with small abscesses.
B: Axial FLASH 2D derived from a standard breath-hold proto-col. Crohn‘s disease of terminal ileum and caecum with mesen-teric fistula (arrow).
C: Axial TimCT FLASH 2D1 minute scan through abdo-men and pelvis performed with one 25 second breath-hold phase. Crohn’s disease of termi-nal ileum and caecum with mesenteric fistula (arrow).
6A 6B
6C
Technology
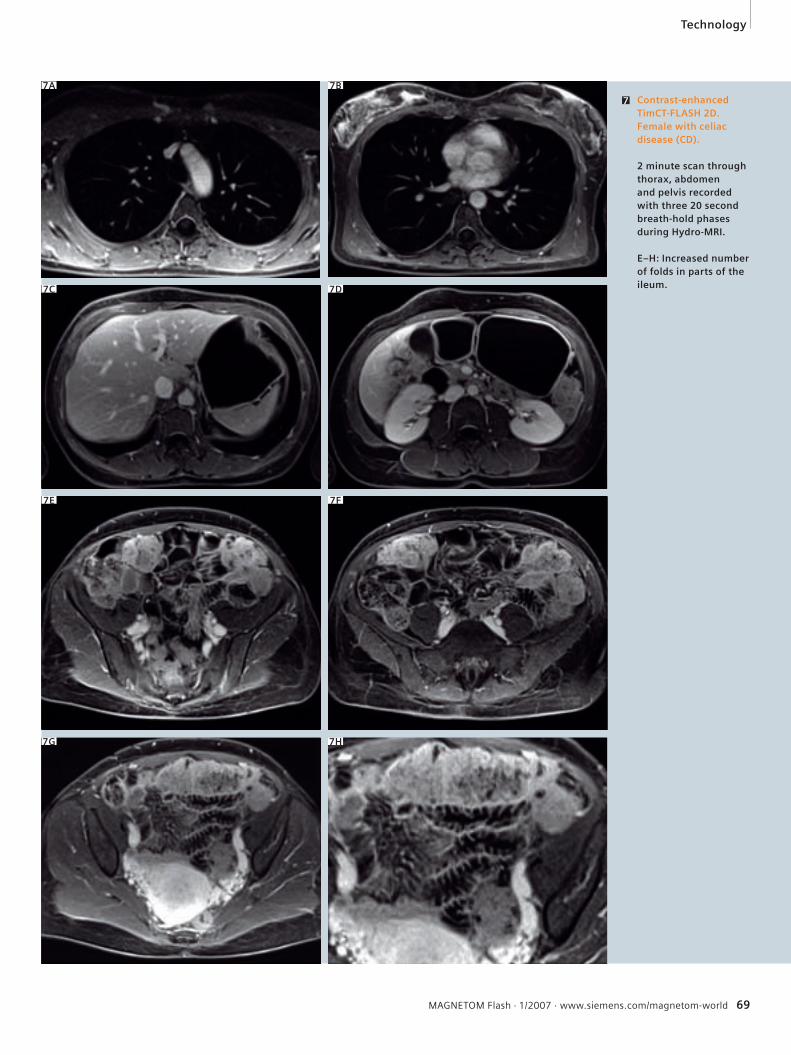
MAGNETOM Flash · 1/2007 · www.siemens.com/magnetom-world 69
7 Contrast-enhanced TimCT-FLASH 2D. Female with celiac disease (CD).
2 minute scan through thorax, abdomen and pelvis recorded with three 20 second breath-hold phases during Hydro-MRI.
E–H: Increased number of folds in parts of the ileum.
7A 7B
7C 7D
7G 7H
Technology
7F7E
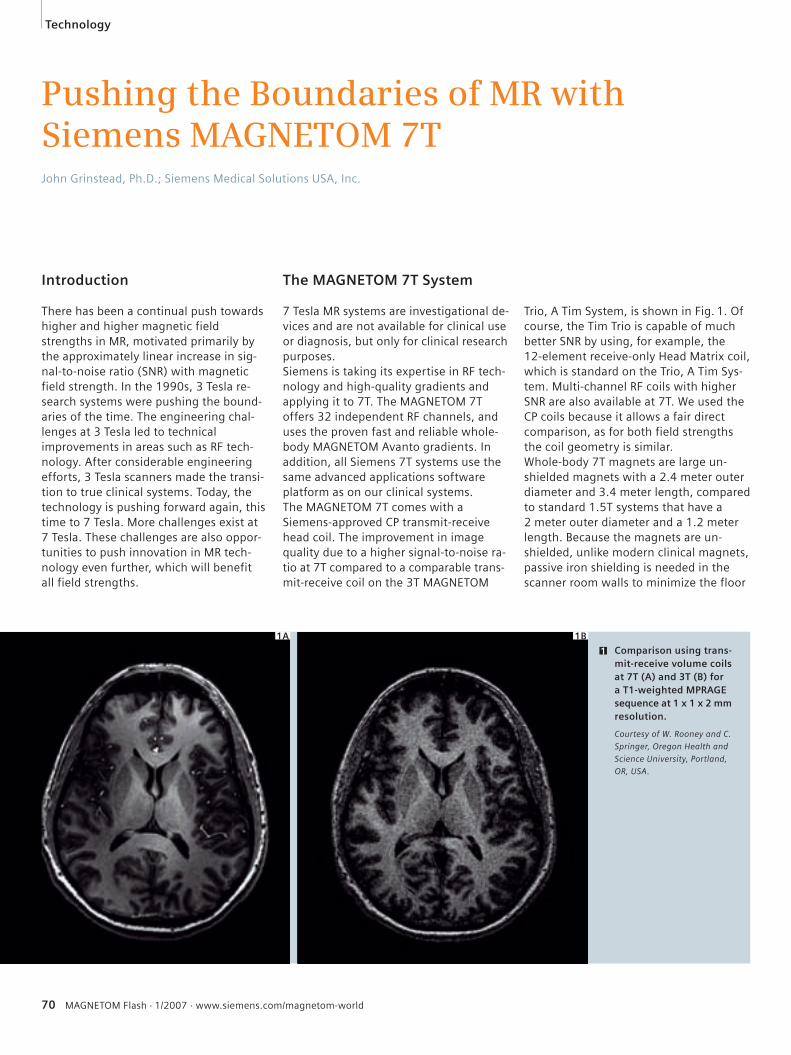
70 MAGNETOM Flash · 1/2007 · www.siemens.com/magnetom-world
Pushing the Boundaries of MR with Siemens MAGNETOM 7TJohn Grinstead, Ph.D.; Siemens Medical Solutions USA, Inc.
Introduction
There has been a continual push towards higher and higher magnetic field strengths in MR, motivated primarily by the approximately linear increase in sig-nal-to-noise ratio (SNR) with magnetic field strength. In the 1990s, 3 Tesla re-search systems were pushing the bound-aries of the time. The engineering chal-lenges at 3 Tesla led to technical improvements in areas such as RF tech-nology. After considerable engineering efforts, 3 Tesla scanners made the transi-tion to true clinical systems. Today, the technology is pushing forward again, this time to 7 Tesla. More challenges exist at 7 Tesla. These challenges are also oppor-tunities to push innovation in MR tech-nology even further, which will benefit all field strengths.
The MAGNETOM 7T System
7 Tesla MR systems are investigational de-vices and are not available for clinical use or diagnosis, but only for clinical research purposes. Siemens is taking its expertise in RF tech-nology and high-quality gradients and applying it to 7T. The MAGNETOM 7T offers 32 independent RF channels, and uses the proven fast and reliable whole-body MAGNETOM Avanto gradients. In addition, all Siemens 7T systems use the same advanced applications software platform as on our clinical systems.The MAGNETOM 7T comes with a Siemens-approved CP transmit-receive head coil. The improvement in image quality due to a higher signal-to-noise ra-tio at 7T compared to a comparable trans-mit-receive coil on the 3T MAGNETOM
Trio, A Tim System, is shown in Fig. 1. Of course, the Tim Trio is capable of much better SNR by using, for example, the 12-element receive-only Head Matrix coil, which is standard on the Trio, A Tim Sys-tem. Multi-channel RF coils with higher SNR are also available at 7T. We used the CP coils because it allows a fair direct comparison, as for both field strengths the coil geometry is similar.Whole-body 7T magnets are large un-shielded magnets with a 2.4 meter outer diameter and 3.4 meter length, compared to standard 1.5T systems that have a 2 meter outer diameter and a 1.2 meter length. Because the magnets are un-shielded, unlike modern clinical magnets, passive iron shielding is needed in the scanner room walls to minimize the floor
1 Comparison using trans-mit-receive volume coils at 7T (A) and 3T (B) for a T1-weighted MPRAGE sequence at 1 x 1 x 2 mm resolution.
Courtesy of W. Rooney and C.
Springer, Oregon Health and
Science University, Portland,
OR, USA.
1B
Technology
1A
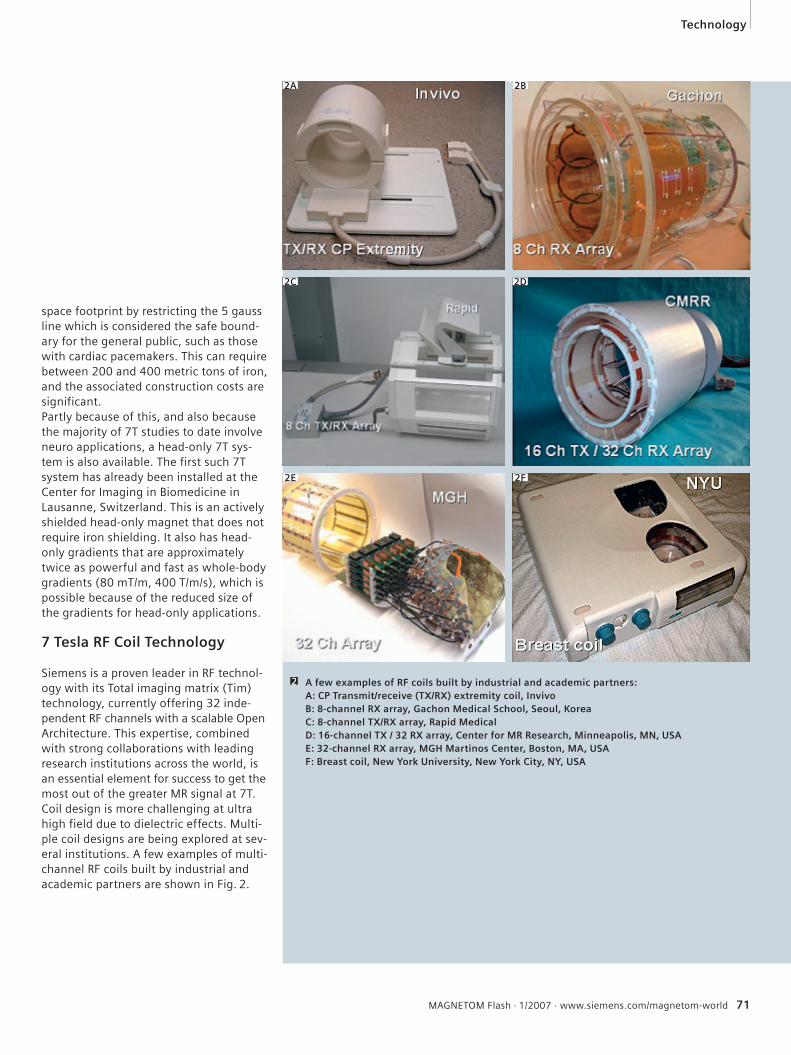
MAGNETOM Flash · 1/2007 · www.siemens.com/magnetom-world 71
space footprint by restricting the 5 gauss line which is considered the safe bound-ary for the general public, such as those with cardiac pacemakers. This can require between 200 and 400 metric tons of iron, and the associated construction costs are significant. Partly because of this, and also because the majority of 7T studies to date involve neuro applications, a head-only 7T sys-tem is also available. The first such 7T system has already been installed at the Center for Imaging in Biomedicine in Lausanne, Switzerland. This is an actively shielded head-only magnet that does not require iron shielding. It also has head-only gradients that are approximately twice as powerful and fast as whole-body gradients (80 mT/m, 400 T/m/s), which is possible because of the reduced size of the gradients for head-only applications.
7 Tesla RF Coil Technology
Siemens is a proven leader in RF technol-ogy with its Total imaging matrix (Tim) technology, currently offering 32 inde-pendent RF channels with a scalable Open Architecture. This expertise, combined with strong collaborations with leading research institutions across the world, is an essential element for success to get the most out of the greater MR signal at 7T. Coil design is more challenging at ultra high field due to dielectric effects. Multi-ple coil designs are being explored at sev-eral institutions. A few examples of multi-channel RF coils built by industrial and academic partners are shown in Fig. 2.
A few examples of RF coils built by industrial and academic partners: A: CP Transmit/receive (TX/RX) extremity coil, Invivo B: 8-channel RX array, Gachon Medical School, Seoul, Korea C: 8-channel TX/RX array, Rapid Medical D: 16-channel TX / 32 RX array, Center for MR Research, Minneapolis, MN, USA E: 32-channel RX array, MGH Martinos Center, Boston, MA, USAF: Breast coil, New York University, New York City, NY, USA
2
Technology
2A 2B
2C 2D
2E 2F
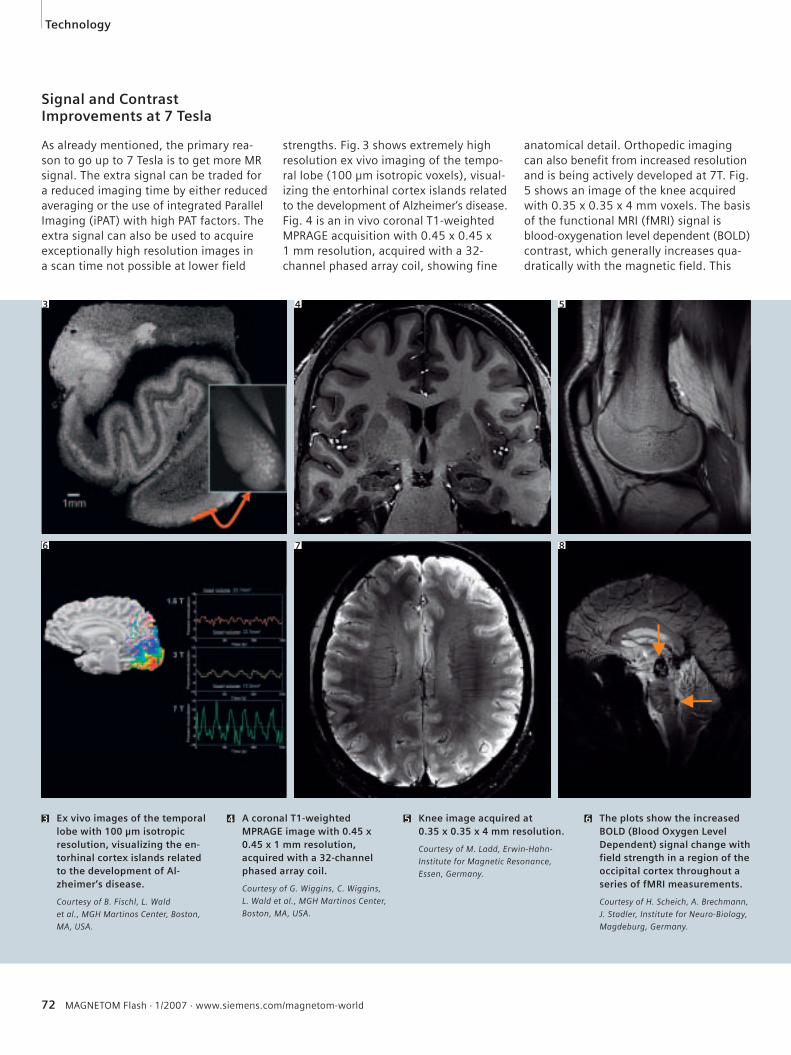
72 MAGNETOM Flash · 1/2007 · www.siemens.com/magnetom-world
Technology
6 The plots show the increased BOLD (Blood Oxygen Level Dependent) signal change with field strength in a region of the occipital cortex throughout a series of fMRI measurements.
Courtesy of H. Scheich, A. Brechmann,
J. Stadler, Institute for Neuro-Biology,
Magdeburg, Germany.
5 Knee image acquired at 0.35 x 0.35 x 4 mm resolution.
Courtesy of M. Ladd, Erwin-Hahn-
Institute for Magnetic Resonance,
Essen, Germany.
4 A coronal T1-weighted MPRAGE image with 0.45 x 0.45 x 1 mm resolution, acquired with a 32-channel phased array coil.
Courtesy of G. Wiggins, C. Wiggins,
L. Wald et al., MGH Martinos Center,
Boston, MA, USA.
3 Ex vivo images of the temporal lobe with 100 μm isotropic resolution, visualizing the en-torhinal cortex islands related to the development of Al-zheimer‘s disease.
Courtesy of B. Fischl, L. Wald
et al., MGH Martinos Center, Boston,
MA, USA.
Signal and Contrast Improvements at 7 Tesla
As already mentioned, the primary rea-son to go up to 7 Tesla is to get more MR signal. The extra signal can be traded for a reduced imaging time by either reduced averaging or the use of integrated Parallel Imaging (iPAT) with high PAT factors. The extra signal can also be used to acquire exceptionally high resolution images in a scan time not possible at lower field
strengths. Fig. 3 shows extremely high resolution ex vivo imaging of the tempo-ral lobe (100 μm isotropic voxels), visual-izing the entorhinal cortex islands related to the development of Alzheimer‘s disease. Fig. 4 is an in vivo coronal T1-weighted MPRAGE acquisition with 0.45 x 0.45 x 1 mm resolution, acquired with a 32-channel phased array coil, showing fine
anatomical detail. Orthopedic imaging can also benefit from increased resolution and is being actively developed at 7T. Fig. 5 shows an image of the knee acquired with 0.35 x 0.35 x 4 mm voxels. The basis of the functional MRI (fMRI) signal is blood-oxygenation level dependent (BOLD) contrast, which generally increases qua-dratically with the magnetic field. This
3 4 5
6 7 8
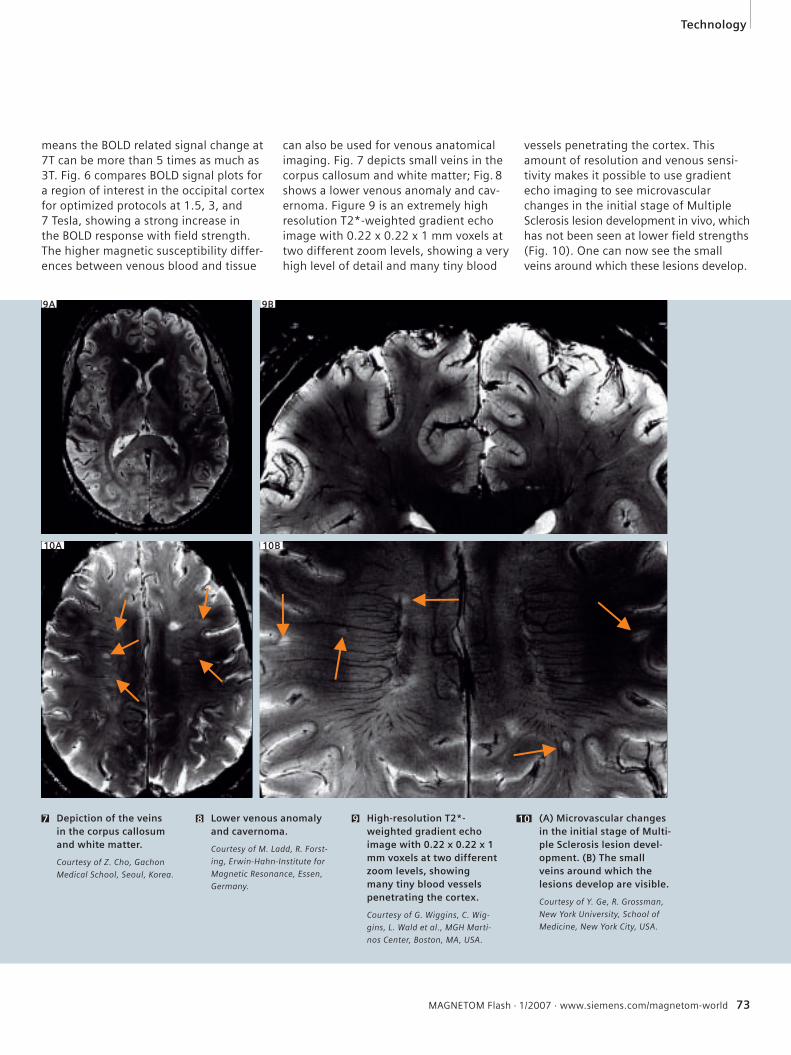
MAGNETOM Flash · 1/2007 · www.siemens.com/magnetom-world 73
Technology
7 Depiction of the veins in the corpus callosum and white matter.
Courtesy of Z. Cho, Gachon
Medical School, Seoul, Korea.
(A) Microvascular changes in the initial stage of Multi-ple Sclerosis lesion devel-opment. (B) The small veins around which the lesions develop are visible.
Courtesy of Y. Ge, R. Grossman,
New York University, School of
Medicine, New York City, USA.
109 High-resolution T2*-weighted gradient echo image with 0.22 x 0.22 x 1 mm voxels at two different zoom levels, showing many tiny blood vessels penetrating the cortex.
Courtesy of G. Wiggins, C. Wig-
gins, L. Wald et al., MGH Marti-
nos Center, Boston, MA, USA.
8 Lower venous anomaly and cavernoma.
Courtesy of M. Ladd, R. Forst-
ing, Erwin-Hahn-Institute for
Magnetic Resonance, Essen,
Germany.
means the BOLD related signal change at 7T can be more than 5 times as much as 3T. Fig. 6 compares BOLD signal plots for a region of interest in the occipital cortex for optimized protocols at 1.5, 3, and 7 Tesla, showing a strong increase in the BOLD response with field strength.The higher magnetic susceptibility differ-ences between venous blood and tissue
can also be used for venous anatomical imaging. Fig. 7 depicts small veins in the corpus callosum and white matter; Fig. 8 shows a lower venous anomaly and cav-ernoma. Figure 9 is an extremely high resolution T2*-weighted gradient echo image with 0.22 x 0.22 x 1 mm voxels at two different zoom levels, showing a very high level of detail and many tiny blood
vessels penetrating the cortex. This amount of resolution and venous sensi-tivity makes it possible to use gradient echo imaging to see microvascular changes in the initial stage of Multiple Sclerosis lesion development in vivo, which has not been seen at lower field strengths (Fig. 10). One can now see the small veins around which these lesions develop.
9A 9B
10A 10B
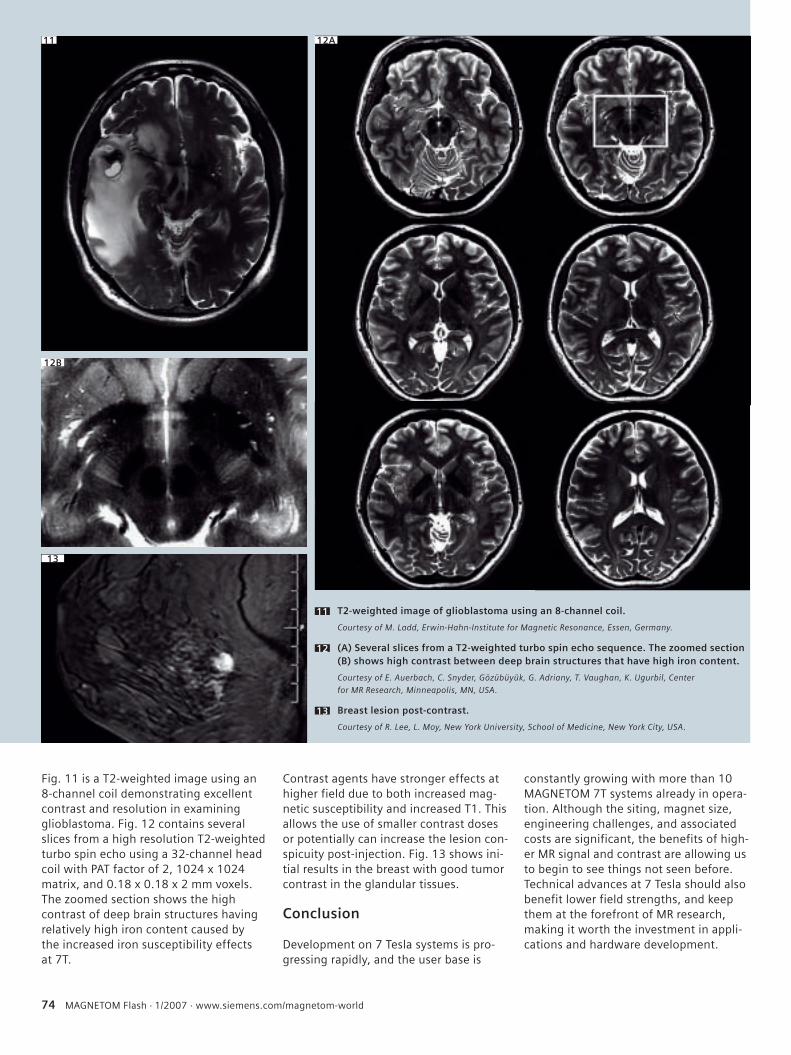
74 MAGNETOM Flash · 1/2007 · www.siemens.com/magnetom-world
Fig. 11 is a T2-weighted image using an 8-channel coil demonstrating excellent contrast and resolution in examining glioblastoma. Fig. 12 contains several slices from a high resolution T2-weighted turbo spin echo using a 32-channel head coil with PAT factor of 2, 1024 x 1024 matrix, and 0.18 x 0.18 x 2 mm voxels. The zoomed section shows the high contrast of deep brain structures having relatively high iron content caused by the increased iron susceptibility effects at 7T.
Contrast agents have stronger effects at higher field due to both increased mag-netic susceptibility and increased T1. This allows the use of smaller contrast doses or potentially can increase the lesion con-spicuity post-injection. Fig. 13 shows ini-tial results in the breast with good tumor contrast in the glandular tissues.
Conclusion
Development on 7 Tesla systems is pro-gressing rapidly, and the user base is
constantly growing with more than 10 MAGNETOM 7T systems already in opera-tion. Although the siting, magnet size, engineering challenges, and associated costs are significant, the benefits of high-er MR signal and contrast are allowing us to begin to see things not seen before. Technical advances at 7 Tesla should also benefit lower field strengths, and keep them at the forefront of MR research, making it worth the investment in appli-cations and hardware development.
T2-weighted image of glioblastoma using an 8-channel coil.
Courtesy of M. Ladd, Erwin-Hahn-Institute for Magnetic Resonance, Essen, Germany.
(A) Several slices from a T2-weighted turbo spin echo sequence. The zoomed section (B) shows high contrast between deep brain structures that have high iron content.
Courtesy of E. Auerbach, C. Snyder, Gözübüyük, G. Adriany, T. Vaughan, K. Ugurbil, Center
for MR Research, Minneapolis, MN, USA.
Breast lesion post-contrast.
Courtesy of R. Lee, L. Moy, New York University, School of Medicine, New York City, USA.
11
12
13
11 12A
12B
13
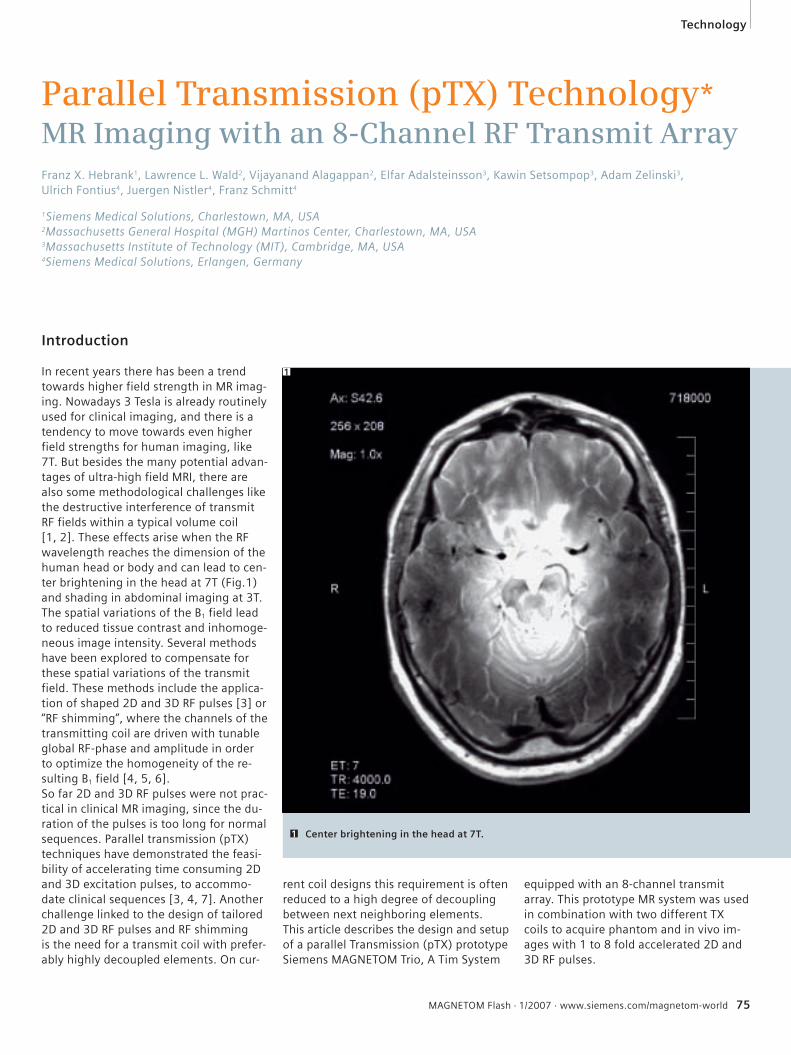
MAGNETOM Flash · 1/2007 · www.siemens.com/magnetom-world 75
Parallel Transmission (pTX) Technology*MR Imaging with an 8-Channel RF Transmit Array
Franz X. Hebrank1, Lawrence L. Wald2, Vijayanand Alagappan2, Elfar Adalsteinsson3, Kawin Setsompop3, Adam Zelinski3, Ulrich Fontius4, Juergen Nistler4, Franz Schmitt4
1Siemens Medical Solutions, Charlestown, MA, USA 2Massachusetts General Hospital (MGH) Martinos Center, Charlestown, MA, USA 3Massachusetts Institute of Technology (MIT), Cambridge, MA, USA4Siemens Medical Solutions, Erlangen, Germany
Introduction
In recent years there has been a trend towards higher field strength in MR imag-ing. Nowadays 3 Tesla is already routinely used for clinical imaging, and there is a tendency to move towards even higher field strengths for human imaging, like 7T. But besides the many potential advan-tages of ultra-high field MRI, there are also some methodological challenges like the destructive interference of transmit RF fields within a typical volume coil [1, 2]. These effects arise when the RF wavelength reaches the dimension of the human head or body and can lead to cen-ter brightening in the head at 7T (Fig. 1) and shading in abdominal imaging at 3T.The spatial variations of the B1 field lead to reduced tissue contrast and inhomoge-neous image intensity. Several methods have been explored to compensate for these spatial variations of the transmit field. These methods include the applica-tion of shaped 2D and 3D RF pulses [3] or “RF shimming”, where the channels of the transmitting coil are driven with tunable global RF-phase and amplitude in order to optimize the homogeneity of the re-sulting B1 field [4, 5, 6].So far 2D and 3D RF pulses were not prac-tical in clinical MR imaging, since the du-ration of the pulses is too long for normal sequences. Parallel transmission (pTX) techniques have demonstrated the feasi-bility of accelerating time consuming 2D and 3D excitation pulses, to accommo-date clinical sequences [3, 4, 7]. Another challenge linked to the design of tailored 2D and 3D RF pulses and RF shimming is the need for a transmit coil with prefer-ably highly decoupled elements. On cur-
rent coil designs this requirement is often reduced to a high degree of decoupling between next neighboring elements.This article describes the design and setup of a parallel Transmission (pTX) prototype Siemens MAGNETOM Trio, A Tim System
equipped with an 8-channel transmit array. This prototype MR system was used in combination with two different TX coils to acquire phantom and in vivo im-ages with 1 to 8 fold accelerated 2D and 3D RF pulses.
Center brightening in the head at 7T.1
1
Technology
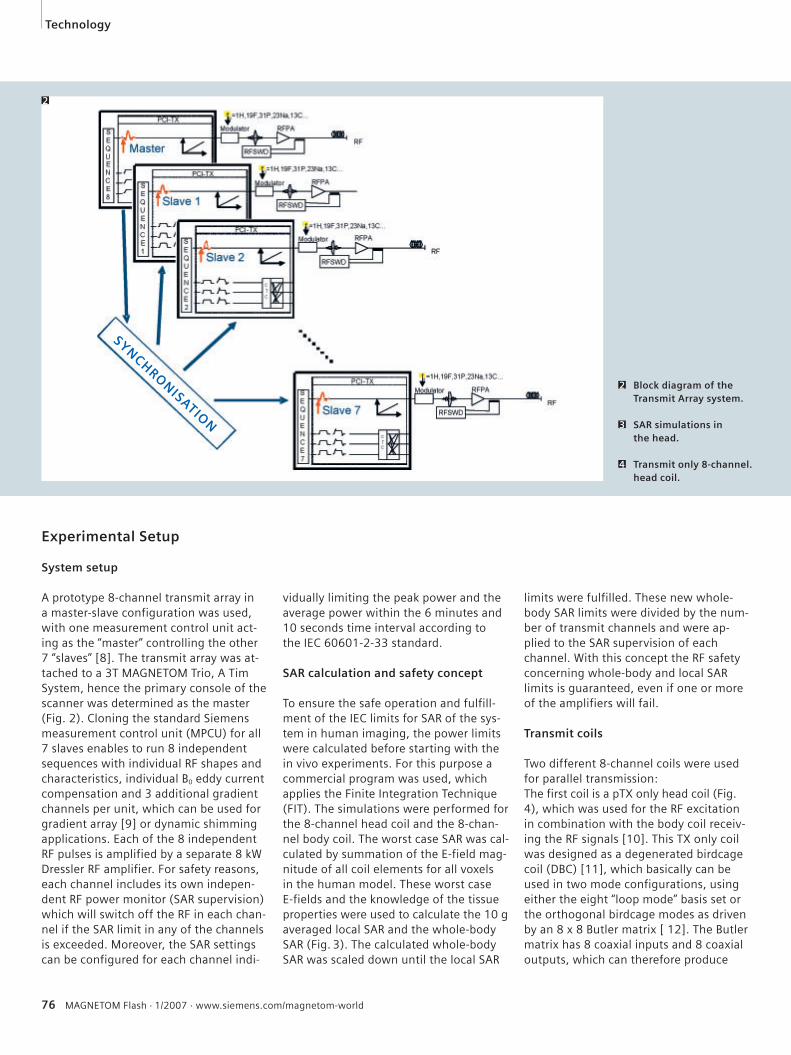
76 MAGNETOM Flash · 1/2007 · www.siemens.com/magnetom-world
limits were fulfilled. These new whole-body SAR limits were divided by the num-ber of transmit channels and were ap-plied to the SAR supervision of each channel. With this concept the RF safety concerning whole-body and local SAR limits is guaranteed, even if one or more of the amplifiers will fail.
Transmit coils
Two different 8-channel coils were used for parallel transmission: The first coil is a pTX only head coil (Fig. 4), which was used for the RF excitation in combination with the body coil receiv-ing the RF signals [10]. This TX only coil was designed as a degenerated birdcage coil (DBC) [11], which basically can be used in two mode configurations, using either the eight “loop mode” basis set or the orthogonal birdcage modes as driven by an 8 x 8 Butler matrix [ 12]. The Butler matrix has 8 coaxial inputs and 8 coaxial outputs, which can therefore produce
Experimental Setup
System setup
A prototype 8-channel transmit array in a master-slave configuration was used, with one measurement control unit act-ing as the “master” controlling the other 7 “slaves” [8]. The transmit array was at-tached to a 3T MAGNETOM Trio, A Tim System, hence the primary console of the scanner was determined as the master (Fig. 2). Cloning the standard Siemens measurement control unit (MPCU) for all 7 slaves enables to run 8 independent sequences with individual RF shapes and characteristics, individual B0 eddy current compensation and 3 additional gradient channels per unit, which can be used for gradient array [9] or dynamic shimming applications. Each of the 8 independent RF pulses is amplified by a separate 8 kW Dressler RF amplifier. For safety reasons, each channel includes its own indepen-dent RF power monitor (SAR supervision) which will switch off the RF in each chan-nel if the SAR limit in any of the channels is exceeded. Moreover, the SAR settings can be configured for each channel indi-
vidually limiting the peak power and the average power within the 6 minutes and 10 seconds time interval according to the IEC 60601-2-33 standard.
SAR calculation and safety concept
To ensure the safe operation and fulfill-ment of the IEC limits for SAR of the sys-tem in human imaging, the power limits were calculated before starting with the in vivo experiments. For this purpose a commercial program was used, which applies the Finite Integration Technique (FIT). The simulations were performed for the 8-channel head coil and the 8-chan-nel body coil. The worst case SAR was cal-culated by summation of the E-field mag-nitude of all coil elements for all voxels in the human model. These worst case E-fields and the knowledge of the tissue properties were used to calculate the 10 g averaged local SAR and the whole-body SAR (Fig. 3). The calculated whole-body SAR was scaled down until the local SAR
Block diagram of the Transmit Array system.
SAR simulations in the head.
Transmit only 8-channel. head coil.
2
3
4
2
SYNCHRONISATION
Technology
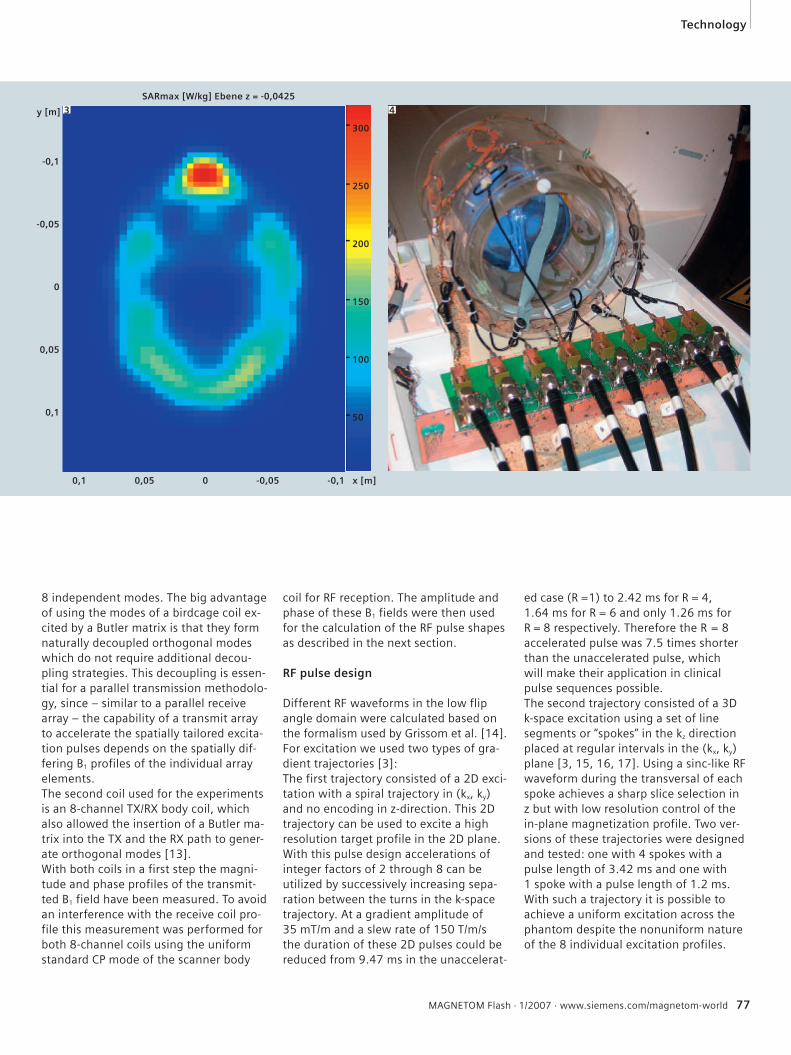
MAGNETOM Flash · 1/2007 · www.siemens.com/magnetom-world 77
8 independent modes. The big advantage of using the modes of a birdcage coil ex-cited by a Butler matrix is that they form naturally decoupled orthogonal modes which do not require additional decou-pling strategies. This decoupling is essen-tial for a parallel transmission methodolo-gy, since – similar to a parallel receive array – the capability of a transmit array to accelerate the spatially tailored excita-tion pulses depends on the spatially dif-fering B1 profiles of the individual array elements.The second coil used for the experiments is an 8-channel TX/RX body coil, which also allowed the insertion of a Butler ma-trix into the TX and the RX path to gener-ate orthogonal modes [13]. With both coils in a first step the magni-tude and phase profiles of the transmit-ted B1 field have been measured. To avoid an interference with the receive coil pro-file this measurement was performed for both 8-channel coils using the uniform standard CP mode of the scanner body
coil for RF reception. The amplitude and phase of these B1 fields were then used for the calculation of the RF pulse shapes as described in the next section.
RF pulse design
Different RF waveforms in the low flip angle domain were calculated based on the formalism used by Grissom et al. [14]. For excitation we used two types of gra-dient trajectories [3]: The first trajectory consisted of a 2D exci-tation with a spiral trajectory in (kx, ky) and no encoding in z-direction. This 2D trajectory can be used to excite a high resolution target profile in the 2D plane. With this pulse design accelerations of integer factors of 2 through 8 can be utilized by successively increasing sepa-ration between the turns in the k-space trajectory. At a gradient amplitude of 35 mT/m and a slew rate of 150 T/m/s the duration of these 2D pulses could be reduced from 9.47 ms in the unaccelerat-
ed case (R =1) to 2.42 ms for R = 4, 1.64 ms for R = 6 and only 1.26 ms for R = 8 respectively. Therefore the R = 8 accelerated pulse was 7.5 times shorter than the unaccelerated pulse, which will make their application in clinical pulse sequences possible.The second trajectory consisted of a 3D k-space excitation using a set of line segments or “spokes” in the kz direction placed at regular intervals in the (kx, ky) plane [3, 15, 16, 17]. Using a sinc-like RF waveform during the transversal of each spoke achieves a sharp slice selection in z but with low resolution control of the in-plane magnetization profile. Two ver-sions of these trajectories were designed and tested: one with 4 spokes with a pulse length of 3.42 ms and one with 1 spoke with a pulse length of 1.2 ms. With such a trajectory it is possible to achieve a uniform excitation across the phantom despite the nonuniform nature of the 8 individual excitation profiles.
4
Technology
SARmax [W/kg] Ebene z = -0,0425
-0,1
-0,05
0
0,05
0,1
0,1 0,05 0 -0,05 -0,1
300
250
200
150
100
50
x [m]
y [m] 3
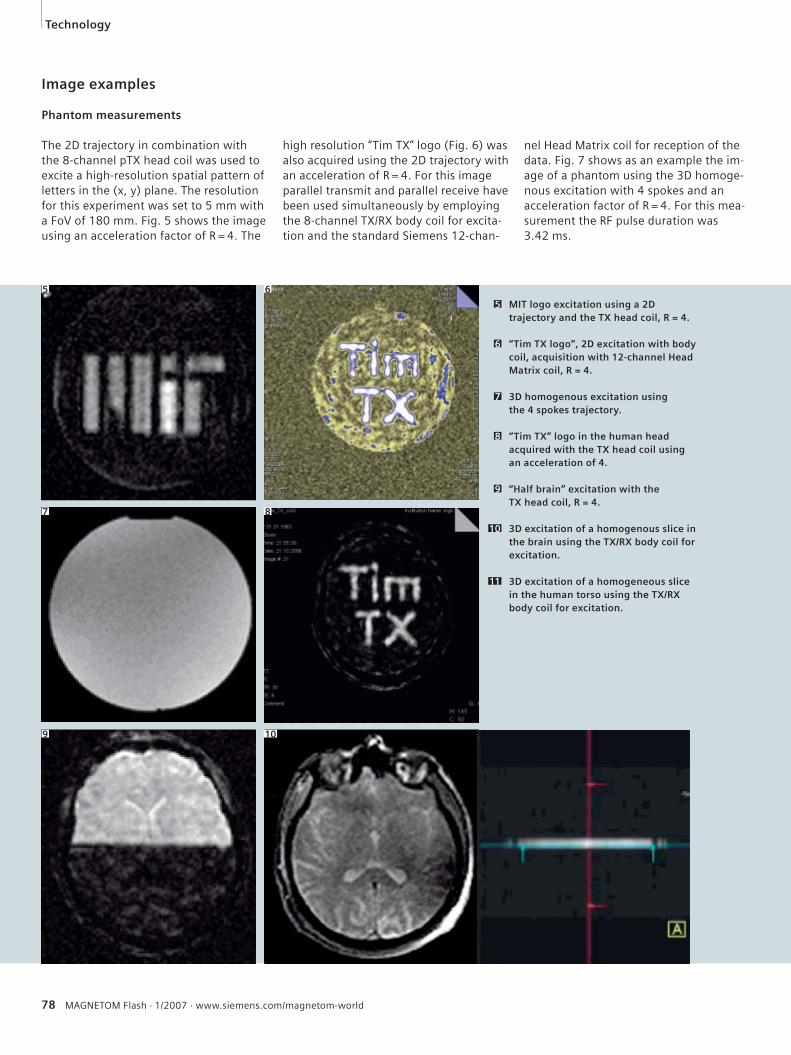
78 MAGNETOM Flash · 1/2007 · www.siemens.com/magnetom-world
Image examples
Phantom measurements
The 2D trajectory in combination with the 8-channel pTX head coil was used to excite a high-resolution spatial pattern of letters in the (x, y) plane. The resolution for this experiment was set to 5 mm with a FoV of 180 mm. Fig. 5 shows the image using an acceleration factor of R = 4. The
high resolution “Tim TX” logo (Fig. 6) was also acquired using the 2D trajectory with an acceleration of R = 4. For this image parallel transmit and parallel receive have been used simultaneously by employing the 8-channel TX/RX body coil for excita-tion and the standard Siemens 12-chan-
nel Head Matrix coil for reception of the data. Fig. 7 shows as an example the im-age of a phantom using the 3D homoge-nous excitation with 4 spokes and an acceleration factor of R = 4. For this mea-surement the RF pulse duration was 3.42 ms.
MIT logo excitation using a 2D trajectory and the TX head coil, R = 4.
“Tim TX logo”, 2D excitation with body coil, acquisition with 12-channel Head Matrix coil, R = 4.
3D homogenous excitation using the 4 spokes trajectory.
“Tim TX” logo in the human head acquired with the TX head coil using an acceleration of 4.
“Half brain” excitation with the TX head coil, R = 4.
3D excitation of a homogenous slice in the brain using the TX/RX body coil for excitation.
3D excitation of a homogeneous slice in the human torso using the TX/RX body coil for excitation.
5
6
7
8
9
10
11
5 6
7 8
9 10
Technology
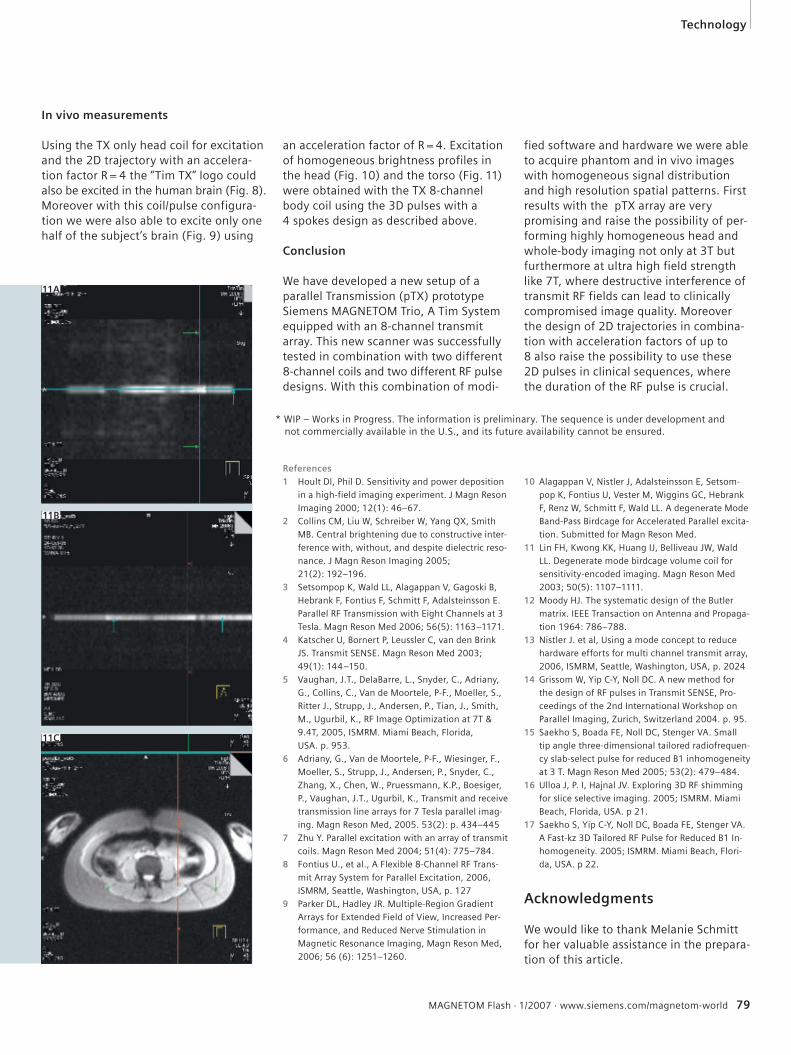
References1 Hoult DI, Phil D. Sensitivity and power deposition
in a high-field imaging experiment. J Magn Reson
Imaging 2000; 12(1): 46–67.
2 Collins CM, Liu W, Schreiber W, Yang QX, Smith
MB. Central brightening due to constructive inter-
ference with, without, and despite dielectric reso-
nance. J Magn Reson Imaging 2005;
21(2): 192–196.
3 Setsompop K, Wald LL, Alagappan V, Gagoski B,
Hebrank F, Fontius F, Schmitt F, Adalsteinsson E.
Parallel RF Transmission with Eight Channels at 3
Tesla. Magn Reson Med 2006; 56(5): 1163–1171.
4 Katscher U, Bornert P, Leussler C, van den Brink
JS. Transmit SENSE. Magn Reson Med 2003;
49(1): 144–150.
5 Vaughan, J.T., DelaBarre, L., Snyder, C., Adriany,
G., Collins, C., Van de Moortele, P-F., Moeller, S.,
Ritter J., Strupp, J., Andersen, P., Tian, J., Smith,
M., Ugurbil, K., RF Image Optimization at 7T &
9.4T, 2005, ISMRM. Miami Beach, Florida,
USA. p. 953.
6 Adriany, G., Van de Moortele, P-F., Wiesinger, F.,
Moeller, S., Strupp, J., Andersen, P., Snyder, C.,
Zhang, X., Chen, W., Pruessmann, K.P., Boesiger,
P., Vaughan, J.T., Ugurbil, K., Transmit and receive
transmission line arrays for 7 Tesla parallel imag-
ing. Magn Reson Med, 2005. 53(2): p. 434–445
7 Zhu Y. Parallel excitation with an array of transmit
coils. Magn Reson Med 2004; 51(4): 775–784.
8 Fontius U., et al., A Flexible 8-Channel RF Trans-
mit Array System for Parallel Excitation, 2006,
ISMRM, Seattle, Washington, USA, p. 127
9 Parker DL, Hadley JR. Multiple-Region Gradient
Arrays for Extended Field of View, Increased Per-
formance, and Reduced Nerve Stimulation in
Magnetic Resonance Imaging, Magn Reson Med,
2006; 56 (6): 1251–1260.
10 Alagappan V, Nistler J, Adalsteinsson E, Setsom-
pop K, Fontius U, Vester M, Wiggins GC, Hebrank
F, Renz W, Schmitt F, Wald LL. A degenerate Mode
Band-Pass Birdcage for Accelerated Parallel excita-
tion. Submitted for Magn Reson Med.
11 Lin FH, Kwong KK, Huang IJ, Belliveau JW, Wald
LL. Degenerate mode birdcage volume coil for
sensitivity-encoded imaging. Magn Reson Med
2003; 50(5): 1107–1111.
12 Moody HJ. The systematic design of the Butler
matrix. IEEE Transaction on Antenna and Propaga-
tion 1964: 786–788.
13 Nistler J. et al, Using a mode concept to reduce
hardware efforts for multi channel transmit array,
2006, ISMRM, Seattle, Washington, USA, p. 2024
14 Grissom W, Yip C-Y, Noll DC. A new method for
the design of RF pulses in Transmit SENSE, Pro-
ceedings of the 2nd International Workshop on
Parallel Imaging, Zurich, Switzerland 2004. p. 95.
15 Saekho S, Boada FE, Noll DC, Stenger VA. Small
tip angle three-dimensional tailored radiofrequen-
cy slab-select pulse for reduced B1 inhomogeneity
at 3 T. Magn Reson Med 2005; 53(2): 479–484.
16 Ulloa J, P. I, Hajnal JV. Exploring 3D RF shimming
for slice selective imaging. 2005; ISMRM. Miami
Beach, Florida, USA. p 21.
17 Saekho S, Yip C-Y, Noll DC, Boada FE, Stenger VA.
A Fast-kz 3D Tailored RF Pulse for Reduced B1 In-
homogeneity. 2005; ISMRM. Miami Beach, Flori-
da, USA. p 22.
Acknowledgments
We would like to thank Melanie Schmitt for her valuable assistance in the prepara-tion of this article.
In vivo measurements
Using the TX only head coil for excitation and the 2D trajectory with an accelera-tion factor R = 4 the “Tim TX” logo could also be excited in the human brain (Fig. 8). Moreover with this coil/pulse configura-tion we were also able to excite only one half of the subject’s brain (Fig. 9) using
an acceleration factor of R = 4. Excitation of homogeneous brightness profiles in the head (Fig. 10) and the torso (Fig. 11) were obtained with the TX 8-channel body coil using the 3D pulses with a 4 spokes design as described above.
Conclusion We have developed a new setup of a parallel Transmission (pTX) prototype Siemens MAGNETOM Trio, A Tim System equipped with an 8-channel transmit array. This new scanner was successfully tested in combination with two different 8-channel coils and two different RF pulse designs. With this combination of modi-
fied software and hardware we were able to acquire phantom and in vivo images with homogeneous signal distribution and high resolution spatial patterns. First results with the pTX array are very promising and raise the possibility of per-forming highly homogeneous head and whole-body imaging not only at 3T but furthermore at ultra high field strength like 7T, where destructive interference of transmit RF fields can lead to clinically compromised image quality. Moreover the design of 2D trajectories in combina-tion with acceleration factors of up to 8 also raise the possibility to use these 2D pulses in clinical sequences, where the duration of the RF pulse is crucial.
11A
11B
11C
Technology
MAGNETOM Flash · 1/2007 · www.siemens.com/magnetom-world 79
* WIP – Works in Progress. The information is preliminary. The sequence is under development and not commercially available in the U.S., and its future availability cannot be ensured.


Cover Story
MAGNETOM Flash · 1/2007 · www.siemens.com/magnetom-world 81
Product News
Dr. Cheng from VGH-Healthtech Interna-tional in Taiwan made these artistic images of flowers on a MAGNETOM Symphony, A Tim System, using the VIBE sequence.
The flowers had Gd for one day to give enhancement for the fine detail of fiber.High-resolution images (512 x 512) with about 0.3–0.5 mm resolution have been
acquired using the knee coil. Postprocess-ing was done using VRT (Volume Render-ing Technique) or MIP (Maximum Intensity Projection).
Image GalleryMAGNETOM Symphony, A Tim System
MAGNETOM Flash · 1/2007 · www.siemens.com/magnetom-world 81
82 MAGNETOM Flash · 1/2007 · www.siemens.com/magnetom-world
Product News
MAGNETOM Symphony With New Applications Power-class with syngo MR A30
With more than 2,000 installations world-wide – constantly maintained at the lead-ing edge of MRI technology – MAGNETOM
Symphony now has been powered with the latest applications thanks to new soft-ware syngo MR A30. For further up-to-date
information please visit our internet pages at www.siemens.com/mr and select MAGNETOM Family.
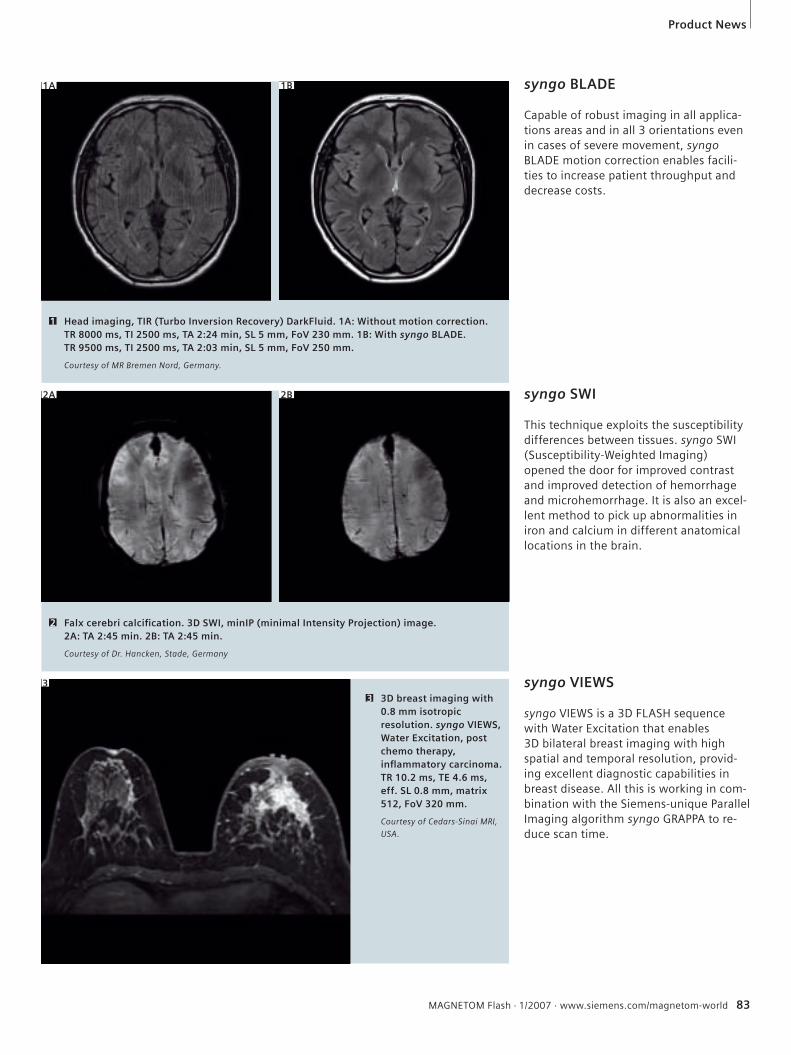
MAGNETOM Flash · 1/2007 · www.siemens.com/magnetom-world 83
Product News
syngo BLADE
Capable of robust imaging in all applica-tions areas and in all 3 orientations even in cases of severe movement, syngo BLADE motion correction enables facili-ties to increase patient throughput and decrease costs.
Head imaging, TIR (Turbo Inversion Recovery) DarkFluid. 1A: Without motion correction. TR 8000 ms, TI 2500 ms, TA 2:24 min, SL 5 mm, FoV 230 mm. 1B: With syngo BLADE. TR 9500 ms, TI 2500 ms, TA 2:03 min, SL 5 mm, FoV 250 mm.
Courtesy of MR Bremen Nord, Germany.
1
syngo SWI
This technique exploits the susceptibility differences between tissues. syngo SWI (Susceptibility-Weighted Imaging) opened the door for improved contrast and improved detection of hemorrhage and microhemorrhage. It is also an excel-lent method to pick up abnormalities in iron and calcium in different anatomical locations in the brain.
syngo VIEWS
syngo VIEWS is a 3D FLASH sequence with Water Excitation that enables3D bilateral breast imaging with high spatial and temporal resolution, provid-ing excellent diagnostic capabilities in breast disease. All this is working in com-bination with the Siemens-unique Parallel Imaging algorithm syngo GRAPPA to re-duce scan time.
3D breast imaging with 0.8 mm isotropic resolution. syngo VIEWS, Water Excitation, post chemo therapy, infl ammatory carcinoma. TR 10.2 ms, TE 4.6 ms, eff. SL 0.8 mm, matrix 512, FoV 320 mm.
Courtesy of Cedars-Sinai MRI,
USA.
3
1A
Falx cerebri calcifi cation. 3D SWI, minIP (minimal Intensity Projection) image.2A: TA 2:45 min. 2B: TA 2:45 min.
Courtesy of Dr. Hancken, Stade, Germany
2
1B
2A 2B
3
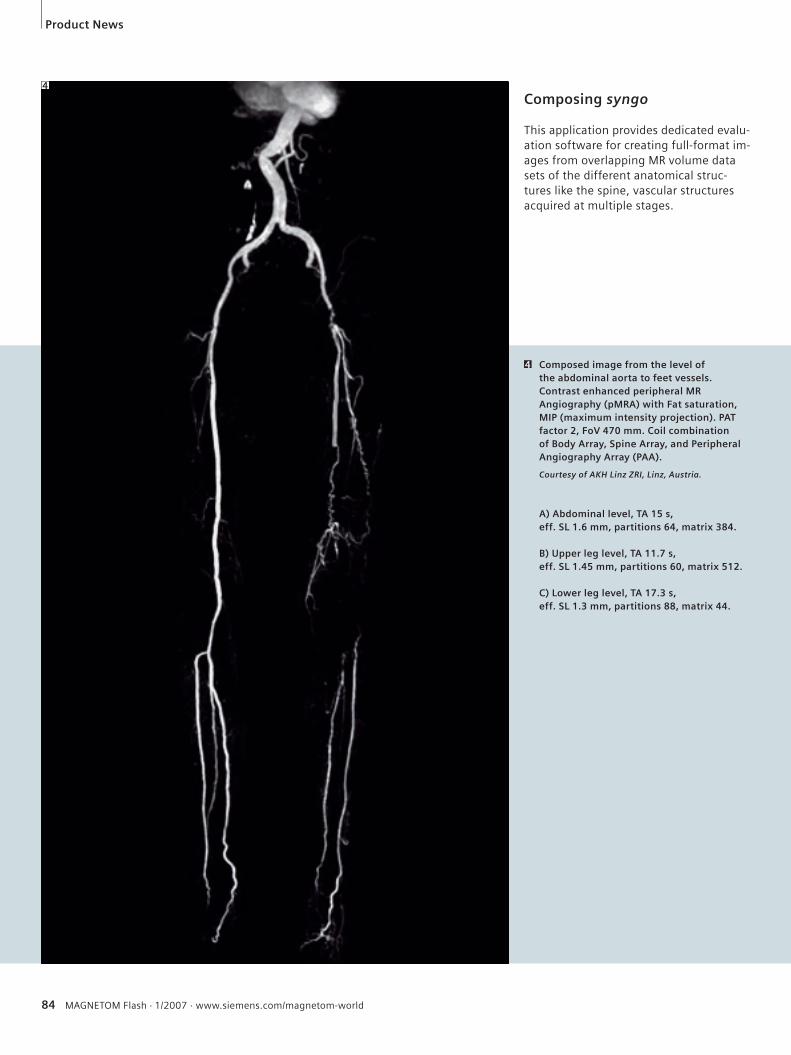
84 MAGNETOM Flash · 1/2007 · www.siemens.com/magnetom-world
Composed image from the level of the abdominal aorta to feet vessels. Contrast enhanced peripheral MR Angiography (pMRA) with Fat saturation, MIP (maximum intensity projection). PAT factor 2, FoV 470 mm. Coil combination of Body Array, Spine Array, and Peripheral Angiography Array (PAA).
Courtesy of AKH Linz ZRI, Linz, Austria.
A) Abdominal level, TA 15 s, eff. SL 1.6 mm, partitions 64, matrix 384.
B) Upper leg level, TA 11.7 s, eff. SL 1.45 mm, partitions 60, matrix 512.
C) Lower leg level, TA 17.3 s, eff. SL 1.3 mm, partitions 88, matrix 44.
4
Composing syngo
This application provides dedicated evalu-ation software for creating full-format im-ages from overlapping MR volume data sets of the different anatomical struc-tures like the spine, vascular structures acquired at multiple stages.
4
Product News
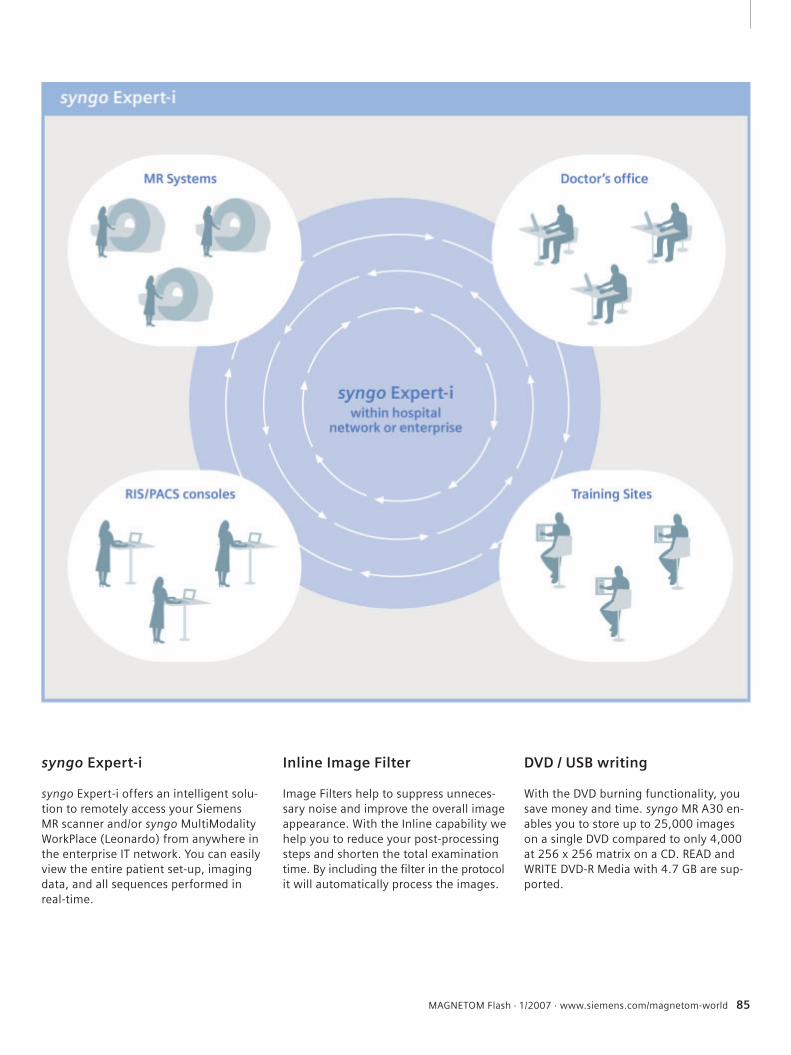
MAGNETOM Flash · 1/2007 · www.siemens.com/magnetom-world 85
syngo Expert-i
syngo Expert-i offers an intelligent solu-tion to remotely access your Siemens MR scanner and/or syngo MultiModality WorkPlace (Leonardo) from anywhere in the enterprise IT network. You can easily view the entire patient set-up, imaging data, and all sequences performed in real-time.
Inline Image Filter
Image Filters help to suppress unneces-sary noise and improve the overall image appearance. With the Inline capability we help you to reduce your post-processing steps and shorten the total examination time. By including the filter in the protocol it will automatically process the images.
DVD / USB writing
With the DVD burning functionality, you save money and time. syngo MR A30 en-ables you to store up to 25,000 images on a single DVD compared to only 4,000 at 256 x 256 matrix on a CD. READ andWRITE DVD-R Media with 4.7 GB are sup-ported.
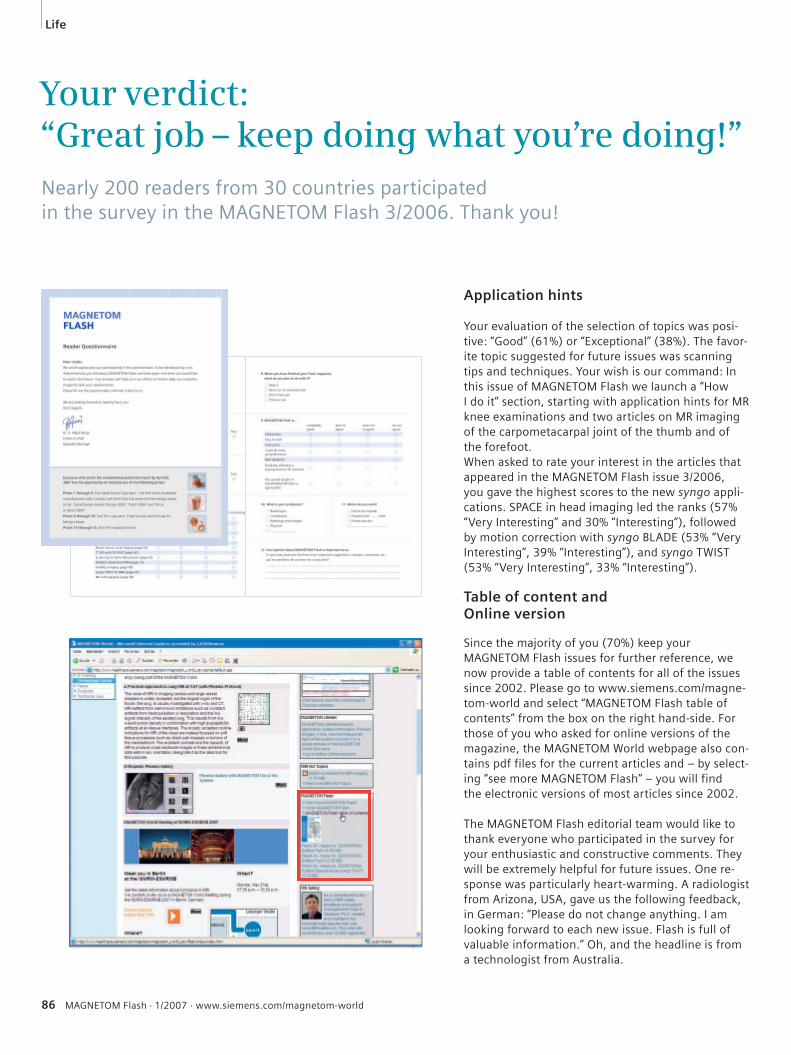
86 MAGNETOM Flash · 1/2007 · www.siemens.com/magnetom-world
Life
Your verdict: “Great job – keep doing what you’re doing!”Nearly 200 readers from 30 countries participated in the survey in the MAGNETOM Flash 3/2006. Thank you!
Application hints
Your evaluation of the selection of topics was posi-tive: “Good” (61%) or “Exceptional” (38%). The favor-ite topic suggested for future issues was scanning tips and techniques. Your wish is our command: In this issue of MAGNETOM Flash we launch a “How I do it” section, starting with application hints for MR knee examinations and two articles on MR imaging of the carpometacarpal joint of the thumb and of the forefoot. When asked to rate your interest in the articles that appeared in the MAGNETOM Flash issue 3/2006, you gave the highest scores to the new syngo appli-cations. SPACE in head imaging led the ranks (57% “Very Interesting” and 30% “Interesting”), followed by motion correction with syngo BLADE (53% “Very Interesting”, 39% “Interesting”), and syngo TWIST (53% “Very Interesting”, 33% “Interest ing”).
Table of content andOnline version
Since the majority of you (70%) keep your MAGNETOM Flash issues for further reference, we now provide a table of contents for all of the issues since 2002. Please go to www.siemens.com/magne-tom-world and select “MAGNETOM Flash table of contents” from the box on the right hand-side. For those of you who asked for online versions of the magazine, the MAGNETOM World webpage also con-tains pdf files for the current articles and – by select-ing “see more MAGNETOM Flash” – you will find the electronic versions of most articles since 2002.
The MAGNETOM Flash editorial team would like to thank everyone who participated in the survey for your enthusiastic and constructive comments. They will be extremely helpful for future issues. One re-sponse was particularly heart-warming. A radiologist from Arizona, USA, gave us the following feedback, in German: “Please do not change anything. I am looking forward to each new issue. Flash is full of valuable information.” Oh, and the headline is from a technologist from Australia.
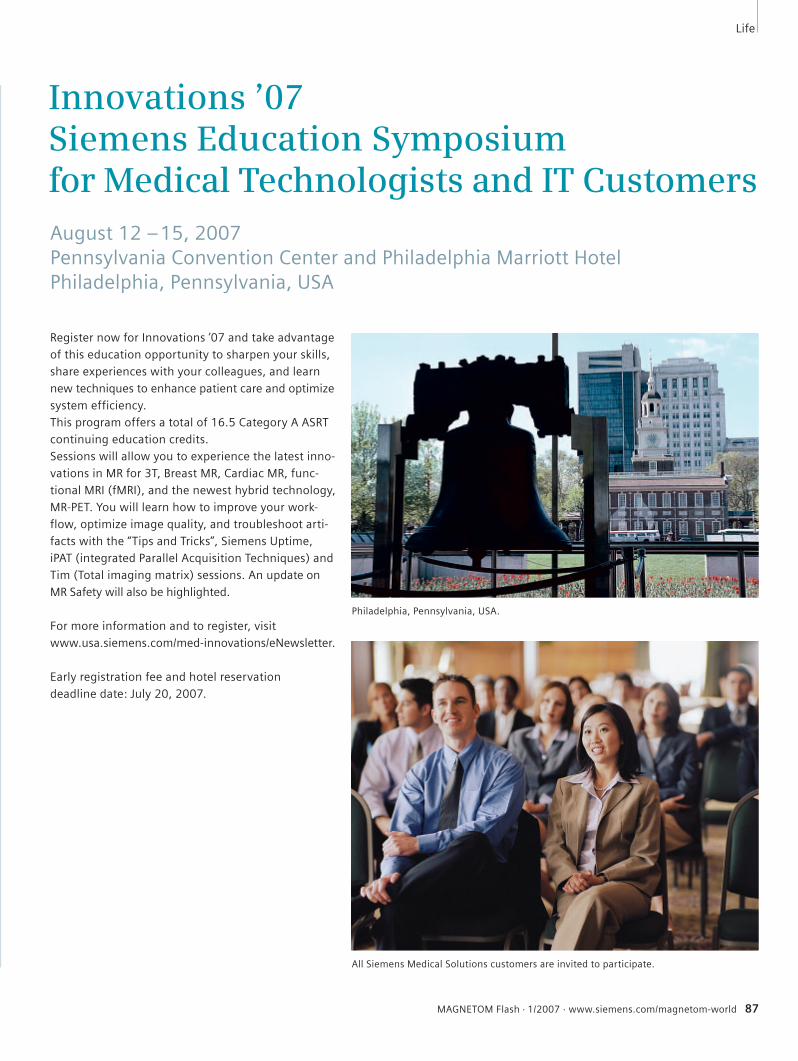
MAGNETOM Flash offers product news, clinical methods, application tips, MR technology and information on Life.
Life
Innovations ’07 Siemens Education Symposium for Medical Technologists and IT CustomersAugust 12 – 15, 2007Pennsylvania Convention Center and Philadelphia Marriott HotelPhiladelphia, Pennsylvania, USA
Register now for Innovations ’07 and take advantage
of this education opportunity to sharpen your skills,
share experiences with your colleagues, and learn
new techniques to enhance patient care and optimize
system efficiency.
This program offers a total of 16.5 Category A ASRT
continuing education credits.
Sessions will allow you to experience the latest inno-
vations in MR for 3T, Breast MR, Cardiac MR, func-
tional MRI (fMRI), and the newest hybrid technology,
MR-PET. You will learn how to improve your work-
flow, optimize image quality, and troubleshoot arti-
facts with the “Tips and Tricks”, Siemens Uptime,
iPAT (integrated Parallel Acquisition Techniques) and
Tim (Total imaging matrix) sessions. An update on
MR Safety will also be highlighted.
For more information and to register, visit
www.usa.siemens.com/med-innovations/eNewsletter.
Early registration fee and hotel reservation
deadline date: July 20, 2007.
MAGNETOM Flash · 1/2007 · www.siemens.com/magnetom-world 87
Philadelphia, Pennsylvania, USA.
All Siemens Medical Solutions customers are invited to participate.
Musculoskeletal (MSK) diseases are a major problem in our society, affecting millions and resulting in lost working hours and restricted functioning. MRI is increasingly important for the precise diagnosis and monitoring of therapy as it allows non-invasive morphological diag-nosis. Furthermore, recent developments are making possible the biochemical assessment of pathologies. Siemens MAGNETOM MR systems offer a comprehensive solution in Musculoskele-tal imaging with special emphasis in four areas: 1. High-resolution fast imaging: using the extra imaging power of Tim (Total imaging matrix) to deliver extremely high in-plane 2D resolution within clinically acceptable examination times. The scan time can also be drastically reduced for users who require increased throughput.2. 3D Isotropic imaging: a means of delivering enhanced workflow and better diagnosis.3. Biochemical imaging: for improved di-agnostic capability and therapy planning.4. Orthopedic imaging with dedicated coils: to fully capitalize on the benefits of MAGNETOM systems and indicate new areas of study not previously possible e.g. biochemical imaging of the cartilage in the wrist, ankle or knee. Our aim in this issue of MAGNETOM Flash is to include articles that give an over-view of current approaches in Orthopedic
Dear MAGNETOM user,
Tallal Charles Mamisch, M.D. Inselspital, University Bern,
SwitzerlandTimothy Hughes, Ph.D.
Siemens Medical Solutions, Erlangen, Germany
imaging, from routine clinical protocols to new research work. The articles focus on improvements in diagnostic imaging and follow-up of therapy. Our special thanks are due to Prof. Dr. Siegfried Trattnig (University Vienna, Austria), Dr. Thaddeus Laird (UC Davis Medical Center, Sacramento, USA) and Dr. Stefan Werlen (Sonnenhof Clinics Bern, Switzerland) for all their efforts in bringing the ideas and topics together for this issue. We are aware that the content of this MAGNETOM Flash can only cover a few selected topics from the wide spectrum of applications for MSK imaging. We encourage MAGNETOM users to give us feedback on these articles and on other approaches they consider of significance. With your help, we can tap into a wide range of experiences, develop new tech-niques and translate these techniques into the clinical routine of the future.
Tallal Charles Mamisch, M.D. Timothy Hughes, Ph.D.
[email protected] [email protected]
Editorial
2 MAGNETOM Flash · 1/2007 · www.siemens.com/magnetom-world
Flash_Cover_DD.indd 2 Flash_Cover_DD.indd 2 26.04.2007 16:11:51 Uhr26.04.2007 16:11:51 Uhr
The Magazine of MR
Issue no. 1/2007ISMRM Edition
MAGNETOM Flash
syngo Maplt
Clinical Ortho-pedic ImagingOverview Biochemical ImagingPage 6
Molecular Imaging of Articular Cartilage and Cartilage RepairPage 18
TechnologyMetamorphosis of MRI: Seamless Move-During-Scan with syngo TimCTPage 61
Pushing the Boundaries of MR with Siemens MAGNETOM 7TPage 70
MR Imaging with an 8-Channel RF Transmit ArrayPage 75
SUBSCRIBE NOW!
– and get your free copy of future
MAGNETOM Flash! Interesting information from
the world of magnetic resonance – gratis to your
desk. Send us this postcard, or subscribe online at
www.siemens.com/MAGNETOM-World
Siem
ens
AG
Med
ical
Sol
uti
ons
Mag
net
ic R
eson
ance
Mar
keti
ng
P.O
. Box
32
60
D-9
10
50
Erl
ange
n
Ger
man
y
Inst
itu
tion
Titl
e
Nam
e*
Stre
et/P
.O. B
ox*
Zip/
Post
al C
ode*
Cit
y*
Stat
e/Pr
ovin
ce*
Cou
ntr
y*
E-m
ail
Yes,
I co
nse
nt
to t
he
abov
e in
form
atio
n b
ein
g u
sed
for
futu
re c
onta
ct r
egar
din
g pr
odu
ct u
pdat
es a
nd
oth
er
impo
rtan
t n
ews
from
Sie
men
s M
R.
Please print clearly!
MA
GN
ET
OM
Fla
sh
MA
GN
ET
OM
Fla
shIs
sue
no
. 1/2
00
7
3535
© 05.2007, Siemens AG
Order No. A91MR-1000-32C-7600
Printed in Germany
CC MR 01000 WS 050720.
Headquarters Siemens AG, Medical SolutionsHenkestr. 127, D-91052 ErlangenGermanyTelephone: +49 9131 84-0www.siemens.com/medical
Contact Addresses
In the USA:Siemens Medical Solutions USA, Inc.51 Valley Stream ParkwayMalvern, PA 19355Tel.: +1 888-826-9702Tel.: 610-448-4500Fax: 610-448-2254
In Japan:Siemens-AsahiMedical Technologies Ltd.Takanawa Park Tower 14 F20-14, Higashi-Gotanda 3-chomeShinagawa-kuTokyo 141-8644(+81) 354238489
In Asia:Siemens Medical SolutionsAsia Pacific HeadquartersThe Siemens Center60 MacPherson RoadSingapore 348615(+65) 9622-2026
In Germany:Siemens AG, Medical SolutionsMagnetic ResonanceHenkestr. 127, D-91052 ErlangenGermanyTelephone: +49 9131 84-0
www.siemens.com/medical
On account of certain regional limitations of sales rights and service availability, we cannot guarantee that all products included in this brochure are available through the Siemens sales organization worldwide. Availability and packaging may vary by country and is subject to change without prior notice. Some/All of the features and products described herein may not be available in the United States.
The information in this document contains general technical descriptions of specifications and options as well as standard and optional features which do not always have to be present in individual cases.
Siemens reserves the right to modify the design, packaging, specifications and options described herein without prior notice. Please contact your local Siemens sales representative for the most current information.
Note: Any technical data contained in this document may vary within defined tolerances. Original images always lose a certain amount of detail when reproduced.
Flash_Cover_DD.indd 1 Flash_Cover_DD.indd 1 26.04.2007 16:11:41 Uhr26.04.2007 16:11:41 Uhr


![[28] Magnetom Flash_28_Jan 2004](https://img.pdfslide.us/doc/110x75/55cf9d8b550346d033ae1705/28-magnetom-flash28jan-2004.jpg)


![[1] Magnetom Flash_Jan 2001](https://img.pdfslide.us/doc/110x75/577cdc331a28ab9e78aa1b8e/1-magnetom-flashjan-2001.jpg)


![[32] Magnetom Flash_32_apr 2006](https://img.pdfslide.us/doc/110x75/55cf9d8b550346d033ae170f/32-magnetom-flash32apr-2006.jpg)