Embed Size (px)
Citation preview

Walter A. (Tony) Maull, Jr.703-747-1838
Paul Feeko703-747-1274
Steve Glover202-955-8593
Anita Antenucci703-714-1707
Greg Ager703-736-0020
2007 M&A Hot Topics Briefing2007 M&A Hot Topics BriefingBest Practices Forum – Part 1

0704-0823629_MCL
1
TopicsSlide Number
State of M&A Market 4Trends in Valuation, Deal Pricing and Financing 26Sell Side Strategies 46Buy Side Strategies 56

0704-0823629_MCL
2
Introductions
Gibson, DunnLegal due diligenceStructuringM&A and securities lawContractingLitigation
Houlihan LokeyUpdata Advisors
Transaction strategyPricingMarketing (Offering Memo)NegotiationFinancing
Independent AuditorsAudited financials
Ernst & YoungBuy/Sell-side diligenceFinancial carve-outTax planning and structuringOperational separationValuation and modeling

0704-0823629_MCL
3
State of the M&A MarketState of the M&A Market
0704-0823629_MCL
4
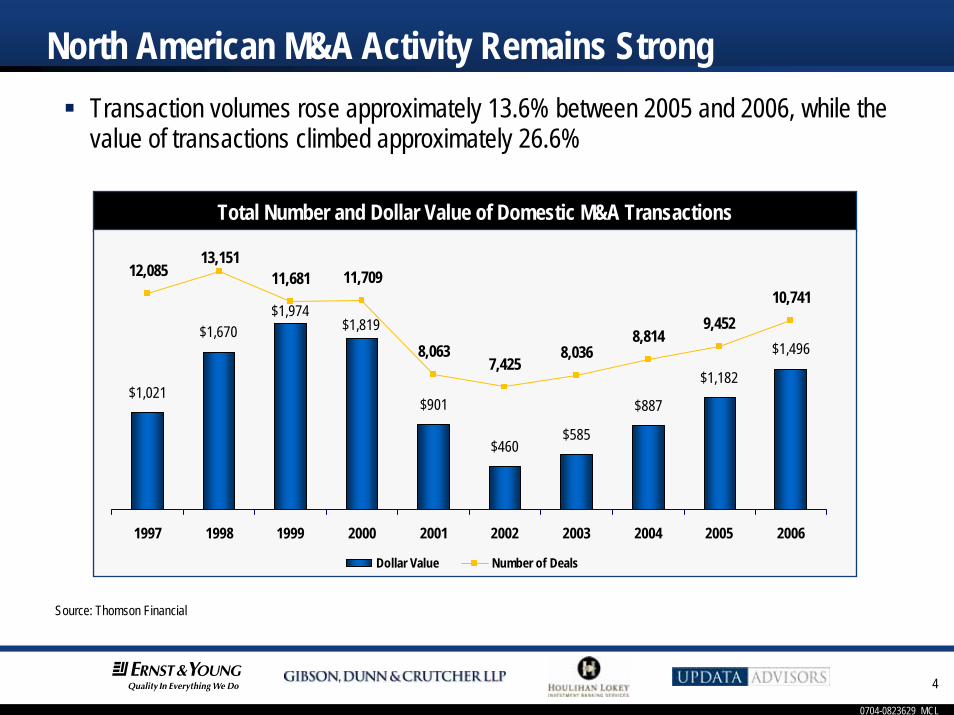
North American M&A Activity Remains StrongTransaction volumes rose approximately 13.6% between 2005 and 2006, while the value of transactions climbed approximately 26.6%
Total Number and Dollar Value of Domestic M&A Transactions
$1,021
$1,670
$901
$460$585
$887
$1,182
$1,496$1,819
$1,974
12,08513,151
11,681 11,709
8,0637,425
8,0368,814
9,45210,741
1997 1998 1999 2000 2001 2002 2003 2004 2005 2006
Dollar Value Number of Deals
Source: Thomson Financial

0704-0823629_MCL
5
North American Deal Size IncreasingAverage transaction size has risen by 162% from $138 million to $362 million in 2006. Average transaction size rose 17.5% from 2005 to 2006
Average Size of Announced M&A Deals
$171
$283
$348
$252
$138$170
$258$308
$362$383
$0
$100
$200
$300
$400
$500
1997 1998 1999 2000 2001 2002 2003 2004 2005 2006
162%
In M
illion
s
Source: Thomson Financial
0704-0823629_MCL
6
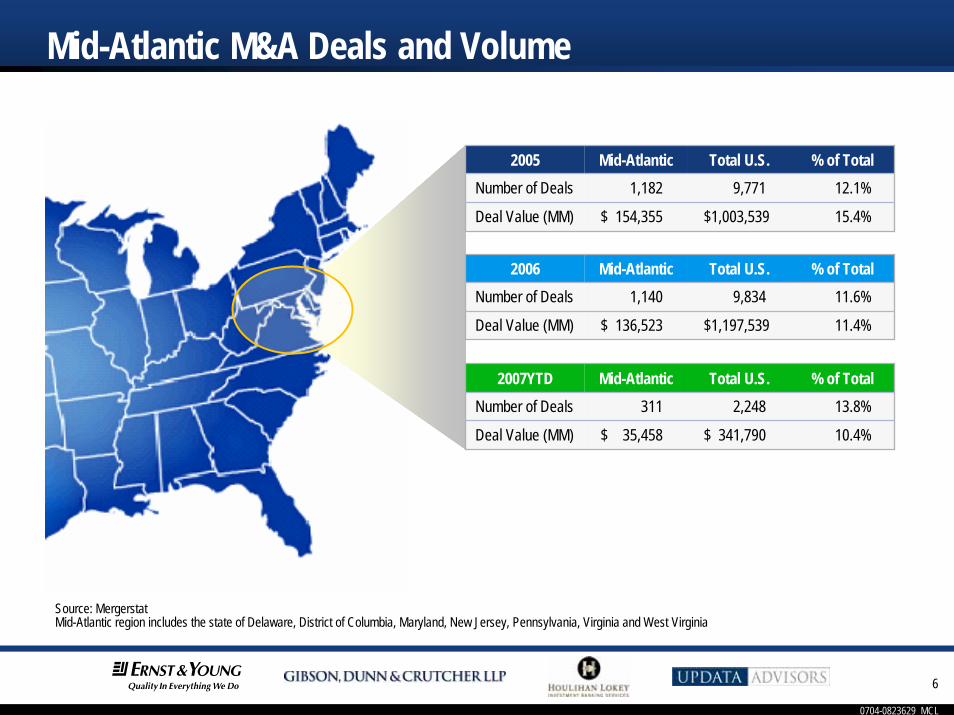
Source: MergerstatMid-Atlantic region includes the state of Delaware, District of Columbia, Maryland, New Jersey, Pennsylvania, Virginia and West Virginia
Mid-Atlantic M&A Deals and Volume
2005 Mid-Atlantic Total U.S. % of TotalNumber of Deals 1,182 9,771 12.1%
Deal Value (MM) $ 154,355 $1,003,539 15.4%
2007YTD Mid-Atlantic Total U.S. % of TotalNumber of Deals 311 2,248 13.8%
Deal Value (MM) $ 35,458 $ 341,790 10.4%
2006 Mid-Atlantic Total U.S. % of TotalNumber of Deals 1,140 9,834 11.6%
Deal Value (MM) $ 136,523 $1,197,539 11.4%

0704-0823629_MCL
7
2006 M&A Market HighlightsMega-Deals Get the Headlines, but Middle-Market Transactions Predominate– Over 90% of all M&A transactions since 1997 have been under $500 million.– However, the percentage of transactions in excess of $500 million has increased from 5.4% in 2002
to 11.4% in 2006.
Total Number of U.S. M&A Transactions by Deal Size
5,620 6,146
4,4203,212 2,914 2,906 2,815 3,083 3,182
1,0281,126
1,0821,039
669 616 710 781893 980
448479
531531
296204 232 357
458 537
4,998
0
2,000
4,000
6,000
8,000
1997 1998 1999 2000 2001 2002 2003 2004 2005 2006
Under $100.0 Million $100.0 - $499.9 Million Over $500.0 Million
Deals
Ann
ounc
ed
Source: Mergerstat
0704-0823629_MCL
8
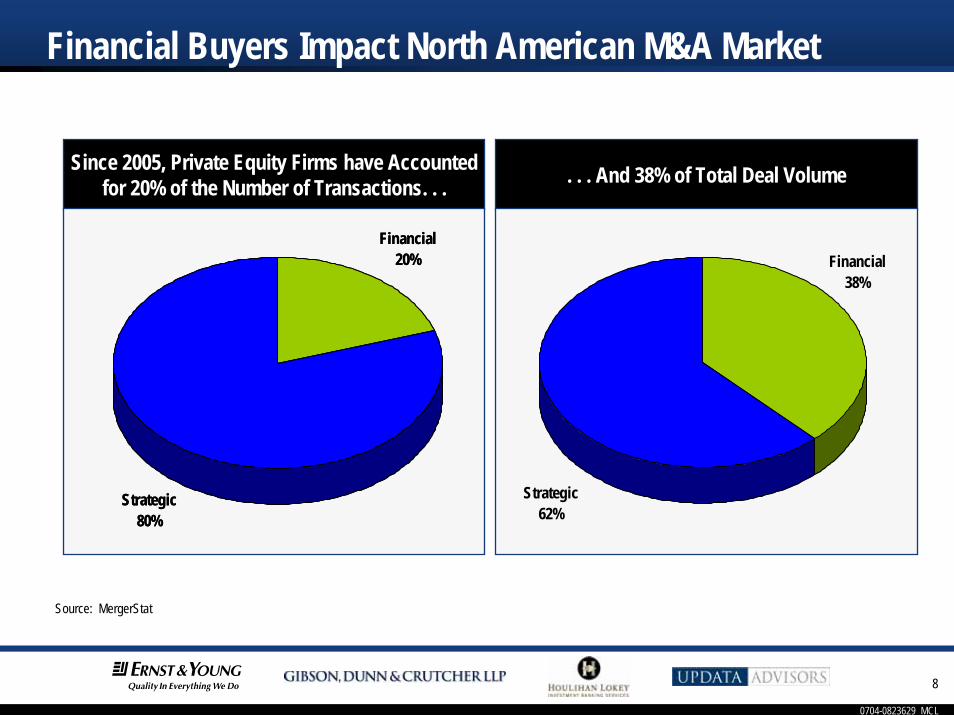
Financial Buyers Impact North American M&A Market
Source: MergerStat
Since 2005, Private Equity Firms have Accounted for 20% of the Number of Transactions. . .
Since 2005, Private Equity Firms have Accounted for 20% of the Number of Transactions. . . . . . And 38% of Total Deal Volume. . . And 38% of Total Deal Volume
Financial20%
Strategic80%
Financial20%
Strategic80%
Financial38%
Strategic62%

0704-0823629_MCL
9
Favorable Interest Rate Environment Means Easy Credit
10-Year Treasury Note Rate10-Year Treasury Note Rate
0
2
4
6
8
10
12
14
16
18
70 72 74 76 78 80 82 84 86 88 90 92 94 96 98 00 02 04 06
Avg 7.55%
%
0704-0823629_MCL
10
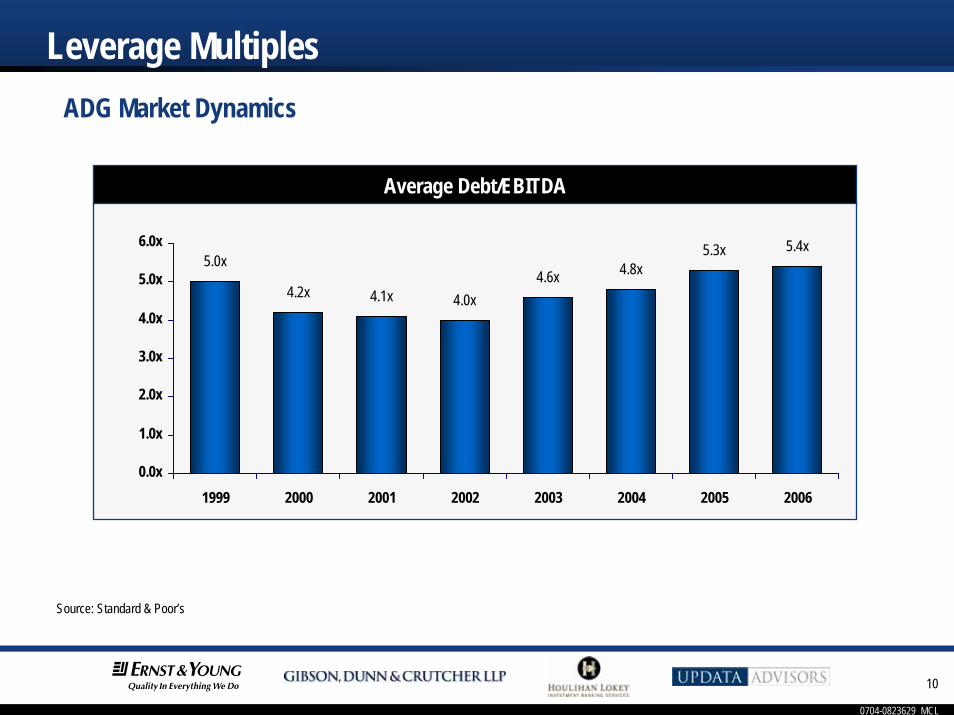
Leverage MultiplesADG Market Dynamics
Source: Standard & Poor’s
Average Debt/EBITDA
5.0x
4.2x 4.1x 4.0x4.6x 4.8x
5.3x 5.4x
0.0x
1.0x
2.0x
3.0x
4.0x
5.0x
6.0x
1999 2000 2001 2002 2003 2004 2005 2006

0704-0823629_MCL
11
Strong Supply of Aggressive Private Capital in the USSince 2000, there has been nearly $900 billion in capital committed to U.S. private equity funds, yet only $480 billion of this equity has been invested.There remains a capital overhang of over $400 billion.
Source: VentureXpert
Average Size of Announced M&A DealsAverage Size of Announced M&A Deals
$52$76
$143
$60
$99
$218
$185
$149$125
$60
$121
$56$52$54
$25 $28$45
$90
$146
$63$47
$63
$0
$50
$100
$150
$200
$250
1996 1997 1998 1999 2000 2001 2002 2003 2004 2005 2006
PE Funds Raised Invested Capital
$ Billi
ons
$ Billi
ons

0704-0823629_MCL
12
Driving Today’s M&A ActivityHedge Fund Growth– Hedge fund growth has been unrelenting over the past decade. Assets now exceed $1.3 trillion
Hedge Fund Growth (1997– 2006)
Source: HFRI.*Data is YTD Q3 2006.
0
1,000
2,000
3,000
4,000
5,000
6,000
7,000
8,000
9,000
10,000
1997 1998 1999 2000 2001 2002 2003 2004 2005 2006
0
200
400
600
800
1,000
1,200
1,400
1,600
Num
ber o
f Hed
ge F
unds Assets, $Billions

0704-0823629_MCL
13
Top 15 Megadeals in 2006
Note: PE Deals are highlightedSource: Mergerstat
Date Seller Name Buyer NameEnterprise Value ($B)
04/03/06 General Motors/ GMAC General Motors Acceptance Corp. /Private Group led by Cerberus Capital Management
253.4$
08/28/06 SanPaolo-IMI Banca Intesa 106.3$
03/05/06 BellSouth AT&T 102.2$
05/07/06 Golden West Financial Wachovia 73.2$
02/27/06 SUEZ Gaz de France 61.7$
11/19/06 Equity Office The Blackstone Group 34.7$
11/07/06 America Telecom America Movil 34.0$
01/27/06 Arcelor Mittal Steel 33.2$
07/24/06 HCA HCA /Private Group led by Bain Capital, Kohlberg Kravis Roberts & Co, Merrill Lynch Global Private Equity and HCA founder
31.8$
11/10/06 Daewoo Engineering & Construction Daewoo Engineering & Construction /Consortium led by South Korean airline Kumho Asiana Group
30.8$
04/03/06 Banca Nazionale del Lavoro BNP Paribas 28.7$
11/28/06 Scottish Power Iberdrola 28.2$
10/02/06 Harrah's Entertainment Texas Pacific Group/ Apollo Management 27.2$
11/16/06 Clear Channel Communications Thomas H. Lee Partners/ Bain Capital 26.6$
04/07/06 British Airports Authority Airport Development & Investment 24.9$
896.8$

0704-0823629_MCL
14
Date Seller Name Buyer NameEnterprise Value ($B)
06/12/05 Bayerische Hypo- und Vereinsbank UniCredito Italiano 146.4$
01/28/05 Gillette Procter & Gamble 61.1$
06/30/05 MBNA Bank of America 47.4$
12/12/05 Burlington Resources ConocoPhillips 36.0$
10/31/05 O2 Telefonica 33.6$
09/12/05 Ford Motor/Hertz The Carlyle Group / Clayton, Dubilier & Rice / Merrill Lynch Global Private Equity
25.1$
12/05/05 Guidant Boston Scientific 25.0$
01/31/05 AT&T SBC Communications 23.0$
08/23/05 Autoroutes du Sud de la France Vinci SA 22.9$
11/13/05 Georgia-Pacific Koch Industries 20.3$
04/21/05 Allied Domecq Pernod Ricard 18.2$
09/28/05 Millhouse Capital/Siberian Oil Gazprom 18.0$
02/28/05 May Department Stores Federated Department Stores 17.7$
04/04/05 Unocal CHEVRONTEXACO 17.6$
11/30/05 TDC TDC/Consortium led by Apax Partners 15.3$
527.7$
Top 15 Megadeals in 2005
Note: PE Deals are highlightedSource: Mergerstat

0704-0823629_MCL
15
Source: Factset*
North American Software & Services M&A Activity
*Only North American sellers in the computer software, supplies and services sector are included in the Technology M&A statistics. *Based on deals closed in a given year. *Deal size refers to target enterprise value
Tech M&A Total Deal Value vs. NASDAQ Composite
$24 $28
$145
$33$25
$39 $42
$69$65
$134
$62
$0
$20
$40
$60
$80
$100
$120
$140
$160
1996 1997 1998 1999 2000 2001 2002 2003 2004 2005 20060
500
1,000
1,500
2,000
2,500
3,000
3,500
4,000Deal Value NASDAQ Composite
Total # of Deals 575 745 897 1592 2731 1645 1229 1167 1334 1456 1364
Ave Deal Value $MM $87 $90 $156 $197 $140 $61 $60 $103 $99 $134 $170
Tota
l Tra
nsac
tion
Valu
e ($B
) NASDAQ Composite Level

0704-0823629_MCL
16
Source: Mergerstat and company SEC filings
Mega-Buyer: IBM Corp Spent Nearly $7B on Acquisitions Since 2005Date Seller Name Sector Ent Value EV/Rev EV/ EBITDA
29-Jan-2007 Softek Storage Solutions Corp. Storage NA NA NA08-Dec-2006 Ementor ASA Hardware NA NA NA05-Dec-2006 Consul Risk Management, Inc. Security NA NA NA28-Nov-2006 Vallent Corp. Application Software NA NA NA20-Oct-2006 Palisades Technology Partners FinTech NA NA NA29-Sep-2006 Valchemy, Inc. Specialty Consulting NA NA NA07-Sep-2006 Global Value Solutions SA IT Services NA NA NA23-Aug-2006 Internet Security Systems, Inc. Security 1,050$ 3$ 13$ 10-Aug-2006 FileNet Corp. Application Software 1,172$ 3$ 16$ 03-Aug-2006 MRO Software, Inc. Application Software 563$ 3$ 15$ 02-Aug-2006 Webify Solutions, Inc. Infrastructure NA NA NA18-May-2006 Rembo Technology SARL Infrastructure NA NA NA02-May-2006 BuildForge, Inc. Infrastructure NA NA NA21-Apr-2006 Unicorn Solutions, Inc. Infrastructure NA NA NA16-Mar-2006 Language Analysis Systems, Inc. Application Software NA NA NA08-Feb-2006 Viacore, Inc. IT Services NA NA NA25-Jan-2006 CIMS Lab, Inc. Application Software NA NA NA10-Jan-2006 Classic Blue IT Services NA NA NA21-Dec-2005 Micromuse, Inc. Infrastructure 743$ 5$ 36$ 20-Dec-2005 Bowstreet, Inc. Infrastructure NA NA NA16-Nov-2005 Collation, Inc. Infrastructure 46$ 9$ NA09-Nov-2005 Network Solutions Pvt Ltd. IT Services 39$ 1$ NA01-Nov-2005 iPhrase Systems, Inc. Application Software NA NA NA18-Oct-2005 DataPower Technology, Inc. Application Software NA NA NA30-Sep-2005 Adaptec, Inc. Hardware 23$ NA NA02-Aug-2005 DWL, Inc. Application Software 104$ 4$ NA19-Jul-2005 PureEdge Solutions, Inc. Application Software NA NA NA29-Jun-2005 Global Value Services Application Software NA NA NA23-Jun-2005 Meiosys, Inc. Infrastructure NA NA NA16-Jun-2005 Isogon Corp. Infrastructure 75$ NA NA10-May-2005 Gluecode Software, Inc. Application Software NA NA NA26-Apr-2005 Healthlink, Inc. Infrastructure NA NA NA14-Mar-2005 Ascential Software Corp. Application Software 938$ 3$ 30$ 02-Feb-2005 Equitant FinTech 40$ NA NA25-Jan-2005 Corio, Inc. IT Services 184$ 3$ (41)$ 07-Jan-2005 SRD, Inc. Application Software 69$ NA NA
5,045$
0704-0823629_MCL
17
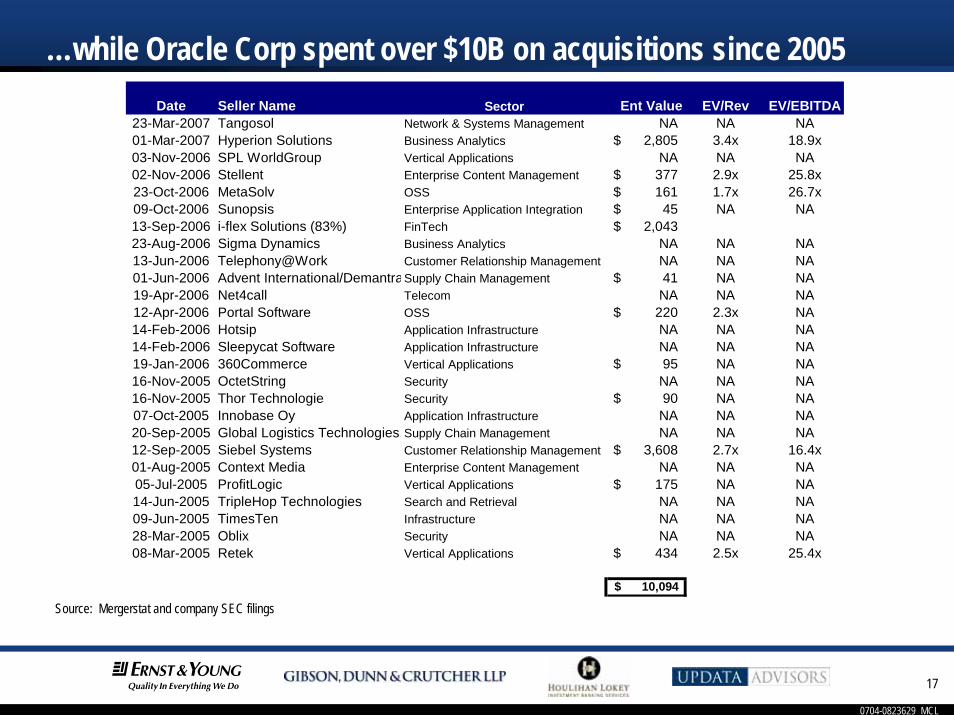
Date Seller Name Sector Ent Value EV/Rev EV/EBITDA23-Mar-2007 Tangosol Network & Systems Management NA NA NA01-Mar-2007 Hyperion Solutions Business Analytics 2,805$ 3.4x 18.9x03-Nov-2006 SPL WorldGroup Vertical Applications NA NA NA02-Nov-2006 Stellent Enterprise Content Management 377$ 2.9x 25.8x23-Oct-2006 MetaSolv OSS 161$ 1.7x 26.7x09-Oct-2006 Sunopsis Enterprise Application Integration 45$ NA NA13-Sep-2006 i-flex Solutions (83%) FinTech 2,043$ 23-Aug-2006 Sigma Dynamics Business Analytics NA NA NA13-Jun-2006 Telephony@Work Customer Relationship Management NA NA NA01-Jun-2006 Advent International/DemantraSupply Chain Management 41$ NA NA19-Apr-2006 Net4call Telecom NA NA NA12-Apr-2006 Portal Software OSS 220$ 2.3x NA14-Feb-2006 Hotsip Application Infrastructure NA NA NA14-Feb-2006 Sleepycat Software Application Infrastructure NA NA NA19-Jan-2006 360Commerce Vertical Applications 95$ NA NA16-Nov-2005 OctetString Security NA NA NA16-Nov-2005 Thor Technologie Security 90$ NA NA07-Oct-2005 Innobase Oy Application Infrastructure NA NA NA20-Sep-2005 Global Logistics Technologies,Supply Chain Management NA NA NA12-Sep-2005 Siebel Systems Customer Relationship Management 3,608$ 2.7x 16.4x01-Aug-2005 Context Media Enterprise Content Management NA NA NA05-Jul-2005 ProfitLogic Vertical Applications 175$ NA NA14-Jun-2005 TripleHop Technologies Search and Retrieval NA NA NA09-Jun-2005 TimesTen Infrastructure NA NA NA28-Mar-2005 Oblix Security NA NA NA08-Mar-2005 Retek Vertical Applications 434$ 2.5x 25.4x
10,094$
Source: Mergerstat and company SEC filings
…while Oracle Corp spent over $10B on acquisitions since 2005

0704-0823629_MCL
18
Source: Updata Proprietary Tech M&A DatabasePrivate Equity deals are highlighted
Date Seller BuyerDeal Value
($B) Sector02-Apr-07 First Data Corp Kohlberg Kravis Roberts $26.2 Financial Technology23-Mar-07 Kronos Hellman & Friedman $1.8 Application Software20-Mar-07 Affiliated Computer Services Cerberus Capital $5.9 IT Services15-Mar-07 WebEx Cisco $3.2 Application Software01-Mar-07 Hyperion Solutions Oracle $3.3 Application Software14-Feb-07 TALX Equifax $1.2 IT Services12-Feb-07 Witness Systems Verint Systems $1.1 Application Software05-Feb-07 Investors Financial Services State Street Corp $4.4 Financial Technology29-Jan-07 Egg Banking Citigroup $1.1 Financial Technology29-Jan-07 Altiris Symantec $1.0 Infrastructure Software25-Jan-07 UGS Siemens $2.1 Application Software10-Jan-07 Kodak Health Group Onex Healthcare $2.4 Application Software
Megadeals: 12 Global Software & Services Deals in 2007 YTD >$1 Billion

0704-0823629_MCL
19
Source: Updata Proprietary Tech M&A Database
Date Seller BuyerDeal Value
($B) Sector20-Dec-06 Digitas Publicis Groupe $1.3 IT Services20-Dec-06 John H. Harland M&F Worldwide $1.5 Financial Technology
12-Dec-06 Sabre HoldingsSilver Lake Partners and Texas Pacific Group $4.3 Internet
07-Dec-06 Worldspan Travelport $1.4 Internet30-Nov-06 Digital Insight Intuit $1.4 Financial Technology06-Nov-06 Per-Se Technologies McKesson $1.3 IT Healthcare26-Oct-06 Kanbay Capgemini $1.3 IT Services10-Oct-06 YouTube Google $1.7 Internet26-Sep-06 Emdeon Business Services General Atlantic $1.5 IT Services01-Sep-06 Intergraph Corporation Texas Pacific Group $1.3 Application Software23-Aug-06 Internet Security Systems, Inc IBM $1.3 Security21-Aug-06 WM-data LogicaCMG $1.7 IT Services10-Aug-06 FileNet IBM $1.6 Application Software25-Jul-06 Mercury Interactive Hewlett-Packard $5.0 Infrastructure Software30-Jun-06 Travelport Blackstone Group $4.3 Internet29-Jun-06 RSA Security EMC Corporation $2.3 Security
31-May-06 West CorporationThomas H. Lee Partners and Quadrangle Group $3.3 IT Services
15-May-06 SSA Global Technologies Infor $1.4 Application Software
17-Apr-06 Flextronics Software Dev Business Kohlberg Kravis Roberts $1.1 IT Services
Megadeals: 19 Global Software & Services Deals in 2006 >$1 Billion

0704-0823629_MCL
20
Sustained Heightened Level of ADG M&A Activity
* LTM as of March 31, 2007SOURCE: Press Releases, Publicly Available Information
ADG M&A Market Overview
Aerospace-Defense-GovernmentM&A Activity
84 77 80 87 86 110 121 12135 42 39
58 76 10298
143 12957 71
4764
7992
90
87 93
670
50
100
150
200
250
300
350
400
1999 2000 2001 2002 2003 2004 2005 2006 LTM
Aerospace Defense Government Services
176 190153
202
242280 298
351 343
0704-0823629_MCL
21
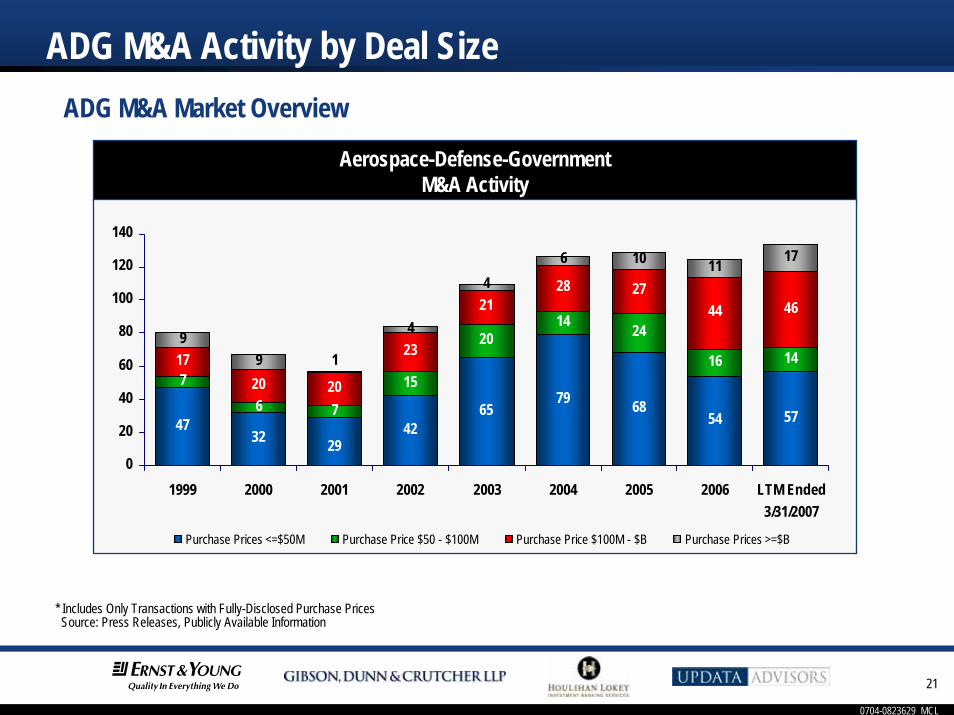
ADG M&A Activity by Deal Size
* Includes Only Transactions with Fully-Disclosed Purchase PricesSource: Press Releases, Publicly Available Information
ADG M&A Market Overview
Aerospace-Defense-GovernmentM&A Activity
4732 42
6579 68
54 57
76 7
15
2014 24
16 141720 20
23
2128 27
44 46
99
4
6 10 11 17
29
4
1
0
20
40
60
80
100
120
140
1999 2000 2001 2002 2003 2004 2005 2006 LTM Ended3/31/2007
Purchase Prices <=$50M Purchase Price $50 - $100M Purchase Price $100M - $B Purchase Prices >=$B

0704-0823629_MCL
22
2006 ADG Transaction AnalysisADG Market Dynamics
Source: Press Releases, Company Filings Source: Press Releases, Company Filings
Transactions by Buyer TypeTransactions by Buyer Type Transactions by Form of ConsiderationTransactions by Form of Consideration
Domestic Private Buyer24%
Foreign Buyer11%
Private Equity
12%
Domestic Public Buyer53%
Stock12%
Cash69%
Mixed19%

0704-0823629_MCL
23
Most Active ADG Acquirers
Source: Press Releases, Publicly Available Information
10 Most Active ADG Buyers
0 2 4 6 8 10 12 14 16 18 20 22 24 26 28 30 32 34 36 38 40 42 44 46
QinetiQ
CACI
Smiths Group plc
DRS Technologies
BAE Systems
Lockheed Martin
Curtiss-Wright
General Dynamics
Cobham plc
SAIC
L-3 Communications
Number of Transactions Announced
2002 2003 2004 2005 2006 2007
ADG M&A Market Overview

0704-0823629_MCL
24
Top Government Services AcquirersADG M&A Market Overview
Source: Press Releases, Publicly Available Information
Top Government Services Acquirers
0 2 4 6 8 10 12 14
ManTech International
SRA International
MTC Technologies
CACI International
General Dynamics
BAE Systems
Alion Science & Technology
QinetiQ Group plc
SAIC
Number of Transactions2004 2005 2006 2007

0704-0823629_MCL
25
Trends in Valuation, Deal Pricing and FinancingTrends in Valuation, Deal Pricing and Financing

0704-0823629_MCL
26
Trends In AuctionsBuyers are more cautious:– Heightened level of due diligence– Buyers are becoming very selective in pursuing deals
Active M&A market:– More books, more rounds, more participants
Resulting Process Trends:– Harder to get exclusivity, if granted at all – generally requires commitment of time, money and
resources including significant diligence, contract markup– Pricing is higher and deal terms are more seller favorable– Although overall process is longer, time from selection to execution of contract is short

0704-0823629_MCL
27
2006 M&A Market HighlightsTransaction Multiples on the Rise– Enterprise Value/EBITDA transaction multiples remain well above historical averages.– Competition among private equity and strategic buyers has driven the multiples being paid for
attractive targets.
Median EV/EBITDA Multiples
Medi
an E
V/EB
ITDA
Mul
tiples
Source: FactSet Mergerstat, LLCExcludes negative EV/EBITDA multiples and multiples larger than 25.0x.
9.7x8.9x 8.7x 8.6x
7.7x 7.6x8.4x
9.9x 10.5x 10.2x
0.0x
4.0x
8.0x
12.0x
16.0x
1997 1998 1999 2000 2001 2002 2003 2004 2005 2006

0704-0823629_MCL
28
Driving Today’s M&A ActivityAbundant Capital Lowers Equity Contributions and Enhances Returns– Given the steady increase in available leverage, private equity firms have been able to reduce the
amount of equity contributed to transactions.
Average Equity Contribution to Leveraged Buyouts1997 – 2006
3.3% 3.5% 4.1% 3.9% 5.5% 2.7% 4.7% 2.7% 2.3% 2.5%
30.0% 31.7%35.7% 37.8%
40.6%40.0% 39.5%
35.1%32.1%
36.1%
0%
10%
20%
30%
40%
50%
1997 1998 1999 2000 2001 2002 2003 2004 2005 2006
Rollover Equity Contributed Equity
Equi
ty at
a Pe
rcen
t of T
otal
Serv
ices
Equi
ty at
a Pe
rcen
t of T
otal
Serv
ices
Source: Standard & Poor’s Q4 2006 Leveraged Buyout Review.

0704-0823629_MCL
29
2006 M&A Market HighlightsBut Acquisition Premiums have Moderated– Though transaction multiples have risen, premiums paid remain below the 1997-2001 period
Average Acquisition Premiums
32.7% 32.1%
40.8%
34.1%
24.5%30.3%
25.3%22.9%
25.4%
34.8%
0.0%
10.0%
20.0%
30.0%
40.0%
50.0%
1997 1998 1999 2000 2001 2002 2003 2004 2005 2006
Acqu
isitio
n Pr
emiu
m
Source: FactSet Mergerstat, LLCPremium is relative to target share price 4 weeks prior to announcement for deals with U.S. targets valued over $50 million.Excludes negative premiums and premiums over 100%.

0704-0823629_MCL
30
2006 M&A Market HighlightsCash Continues to be the Favored form of Consideration– High corporate cash balances, coupled with the relatively low cost and ready availability of debt
financing and the demise of “pooling-of-interests” accounting, have reduced the attractiveness of stock-for-stock deals.
M&A Consideration by Dollar Volume Activity
27% 26%18%
27% 21% 22% 24% 26% 23%
33% 30% 30%32%
27%22% 18% 18% 19%
16%
40% 44% 46% 49% 45%56% 59% 57% 55% 61%
24%0%
20%
40%
60%
80%
100%
1997 1998 1999 2000 2001 2002 2003 2004 2005 2006
Cash/Stock Stock Cash
Source: FactSet Mergerstat, LLC

0704-0823629_MCL
31
Size MattersLarger companies continue to be valued at a significant premium to middle-market companies
Median EV/EBITDA Multiples
Source: FactSet Mergerstat, LLCExcludes negative EV/EBITDA multiples and multiples larger than 25.0x.
8.4x9.5x
8.9x
7.7x6.9x6.9x
7.7x8.2x9.0x
8.1x
10.5x11.4x11.5x
9.2x8.3x
10.3x
8.9x9.4x10.2x
11.1x11.9x11.8x
11.4x11.1x
9.0x8.7x
11.1x10.3x
11.3x12.2x
0.0
2.0
4.0
6.0
8.0
10.0
12.0
14.0
1997 1998 1999 2000 2001 2002 2003 2004 2005 2006
Under $250.0 Million $250.0 - $499.9 Million Over $500.0 Million
35.6%
37.8%27.2% 44.2%
26.1%
30.4%
44.2%
28.1% 24.2%41.7%

0704-0823629_MCL
32
ADG M&A Transaction Pricing DynamicsADG Market Dynamics
*Quartile information based on 262 ADG transactions from 1/1/01 - 3/31/2007 that disclosed pricing information
Transaction Dynamics• Targets offered access to “systems” credentials and specific programs/customers• Involvement in high percentage of classified work and/or many high level clearances• Deals involve larger and more highly-valued strategic buyers• Larger targets (rev > $100 million)• Consideration often involves stock• Targets had distinguished capabilities and/or IP• Differentiated technical depth, delivery model and solutions orientation
• Targets have focused business and often have above average growth and performance attributes
• Customer base is more varied but with some involvement in priority markets• Strong technical qualifications/technology/intellectual property• Larger percentage of cash transactions• Targets most often have had > $50 million in revenue• Predominately strategic acquisitions by larger/public buyers
• Less IT or engineering focused, more “staffing” oriented work• Smaller acquisition targets• Predominately cash or mixture cash and stock (some with earn-outs)• 8(a) and SDB companies as targets• Unrepresented sellers• Private buyers
13.4x
9.9x
8.3x
5.5x
EBITDA Multiple*
9.1x

0704-0823629_MCL
33
ADG Deal Pricing TrendsADG Market Dynamics
ADG Median EBITDA MultiplesADG Median EBITDA Multiples
7.9x
5.0x
7.8x8.3x 8.5x
0.0x1.0x2.0x3.0x4.0x5.0x6.0x7.0x8.0x9.0x
1986-1989 1990-1995 1996-1999 2000-2004 2005-Present*
EV/E
BITD
A

0704-0823629_MCL
34
ADG prices off of adjusted EBITDA ADG Buyer Pricing Driven off of EBITDA
“Adjusted” EBITDA takes into account:– Forward-looking performance (i.e. NFY/run rate)– Pro forma performance (acquisitions, discontinued ops)– Removal of non-recurring or extraordinary items
• One-time expenses• Costs eliminated post transaction (i.e. owner compensation)• Normalized expenses (i.e. R&D, marketing, etc.)
Subtract price associated strictly with tax benefits (e.g. 338(h)10)

0704-0823629_MCL
35
Transaction Size Impacts Deal PricingADG Market Dynamics
* Includes Only Fully-Disclosed TransactionsSource: Press Releases, Publicly Available Information
Median Revenue Multiples for ADG M&A Announced DealsMedian Revenue Multiples for ADG M&A Announced Deals
0.54x 0.57x0.81x 0.81x
1.04x 0.94x
1.22x1.09x
1.96x
1.39x1.19x
2.71x
1.94x
0.73x
1.22x1.16x
1.41x
0.78x
0.90x
1.22x1.00x
1.00x0.75x0.88x
1.00x1.32x
1.31x
0.97x1.19x
1.44x1.50x
1.02x1.49x
1.94x
1.29x1.18x
0.00x
0.50x
1.00x
1.50x
2.00x
2.50x
3.00x
1999 2000 2001 2002 2003 2004 2005 2006 LTM Ended4/17/2006
Purchased Price<$50M Purchase Price $50M - $100M Purchase Price $100M - $1B Purchase Price >=$1B
EV/R
even
ue

0704-0823629_MCL
36
Most Active ADG SubsectorsADG M&A Market Dynamics
January 2006 - March 2007 M&A Announcements by Subsector
0 5 10 15 20 25 30 35 40 45 50 55 60 65 70 75 80
Land Vehicles
MOW
Federal IT
Aviation & Airport Services
MRO
ISR
Homeland Security
C4
Professional Services
Tier 3
Number of Transactions
2006 2007Source: Press Releases, Publicly Available Information

0704-0823629_MCL
37
Historical Valuation: Aerospace & DefenseADG Market Dynamics
* LTM as of March 31, 2007
10.6x 10.9x 10.9x 10.8x
6.5x
8.0x7.9x 8.1x
11.0x 10.8x10.3x
9.2x
7.9x
10.2x10.2x10.1x10.6x
9.3x
7.3x7.7x
9.3x
7.5x
8.5x
7.7x
6.6x7.1x
0.0x
2.0x
4.0x
6.0x
8.0x
10.0x
12.0x
1995 1996 1997 1998 1999 2000 2001 2002 2003 2004 2005 2006 2007*
EV/E
BITD
AEV
/EBI
TDA
Average Defense = 9.5xAverage Aerospace = 8.6x

0704-0823629_MCL
38
Historical Valuation: Federal ITADG Market Dynamics
* LTM as of March 31, 2007
EV/E
BITD
A
7.0x
9.4x 8.8x7.9x 7.5x
10.6x
13.1x14.3x 14.7x
16.2x
13.5x
10.5x9.2x
0.0x
2.0x
4.0x
6.0x
8.0x
10.0x
12.0x
14.0x
16.0x
18.0x
1995 1996 1997 1998 1999 2000 2001 2002 2003 2004 2005 2006 2007*
Average Government = 11.0x

0704-0823629_MCL
39
Other Considerations Impact Deal Pricing338(h)10 Example
Source: Houlihan Lokey Howard & Zukin
Buyer TargetTransaction EBITDA
MultipleAdjusted “Operating”
EBITDA MultipleSRA International Galaxy 11.8x 9.6x
Mantech Gray Hawk 16.3x 12.3x
MTC Technologies Management Technology Inc. 12.5x 10.1x
Pro Forma Acquisition Example
Buyer TargetTransaction EBITDA
MultipleAdjusted “Operating”
EBITDA MultipleQinetiQ Apogen 12.5x 11.1x
0704-0823629_MCL
40
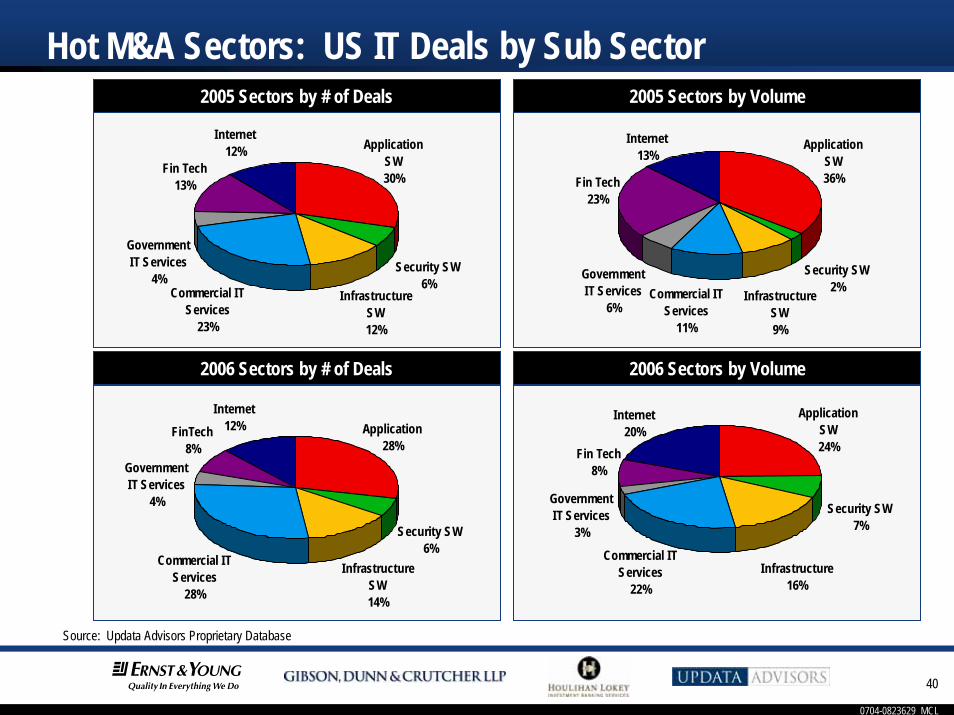
Hot M&A Sectors: US IT Deals by Sub Sector
2006 Sectors by # of Deals
2005 Sectors by # of Deals 2005 Sectors by Volume
2006 Sectors by Volume
Source: Updata Advisors Proprietary Database
Security SW6%
Fin Tech13%
Internet12% Application
SW30%
Infrastructure SW12%
Commercial IT Services
23%
Government IT Services
4% Security SW2%
Fin Tech23%
Internet13%
Application SW36%
Infrastructure SW9%
Commercial IT Services
11%
Government IT Services
6%
Security SW6%
FinTech8%
Internet12% Application
28%
Infrastructure SW14%
Commercial IT Services
28%
Government IT Services
4% Security SW7%
Fin Tech8%
Internet20%
Application SW24%
Infrastructure16%
Commercial IT Services
22%
Government IT Services
3%

0704-0823629_MCL
41
Source: Factset**Only North American sellers in the computer software, supplies and services sector are included in the Technology M&A statistics. All divestitures and minority sales are excluded. Based on deals announced in a given year
Software M&A Valuations in North America
Computer Software and ServicesMedian EV / Revenue Multiples
1.9x2.2x
3.4x
5.1x
1.6x 1.4x 1.5x 1.7x
2.5x 2.4x2.1x
0.0x
1.0x
2.0x
3.0x
4.0x
5.0x
6.0x
1996 1997 1998 1999 2000 2001 2002 2003 2004 2005 2006
1,3641,4561,3341,1671,2291,6452,7311,592897745575

0704-0823629_MCL
42
Source: Updata Proprietary Tech M&A Database
333 68 139
262 50
146 130299 60 147
295 42
82 129278 58 129
281 37
75 150
Valuation Metrics: IT Deals by Sub Sector
Global IT: Median Transaction Multiple
4.0x 3.8x
2.0x 2.0x1.7x
1.2x0.9x
5.0x 5.0x
3.5x 3.5x
2.4x
1.5x1.2x
0.9x
5.0x 4.9x
3.8x 3.6x
2.6x
1.6x1.1x 0.9x
2.8x
0.0x
1.0x
2.0x
3.0x
4.0x
5.0x
6.0x
Security SW InfrastructureSW
Interne FIN Tech SWand Services
Application SW Telecom Government ITServices
Commercial ITServices
CY 2005 CY 2006 LTM Q1/07
Medi
an E
V / R
even
ue

0704-0823629_MCL
43
North America Technology Deals—Method of Payment
North America Technology Deals—Method of Payment
26%
48%
26%25%
57%
18%
0%
10%
20%
30%
40%
50%
60%
Combo Cash Stock
2005 2006
Source: FactSet*Only North American sellers in the computer software, supplies and services sector are included in the Technology M&A statistics. All divestitures and minority sales are excluded. Based on deals announced in a given year
Public Company Premiums and Methods of Payment
Source: FactSet1 Day, 5 Day and 30 Day columns represent the premium calculated based on the offer price to the target’s share price 1 day, 5 days and 30 days prior to the date the transaction was announced.*Only North American sellers in the computer software, supplies and services sector are included in the Technology M&A statistics. All divestitures and minority sales are excluded. Based on deals announced in a given year
North America Technology M&A PremiumsNorth America Technology M&A Premiums
22%
32%
26%
19%25%
21%
0%
10%
20%
30%
40%
50%
60%
1 Day 5 Day 30 Day
2005 2006

0704-0823629_MCL
44
Source: Factset*
Valuation Multiples Paid By Financial Sponsors In Software and Services
* Only North American sellers in the computer software, supplies and services sector are included in the Technology M&A statistics. * Acquisition purpose is financial. Based on deals closed in a given year.* NASDAQ composite is based on the first trading day in July.
Median EV / Revenue Multiples Paid for Computer Software and Services Companies in North America
0.8x
1.8x
1.6x
0.6x
0.9x
1.7x1.8x 1.9x
1.5x
0.0x
0.2x
0.4x0.6x
0.8x
1.0x
1.2x
1.4x1.6x
1.8x
2.0x
1998 1999 2000 2001 2002 2003 2004 2005 2006
Medi
an E
V / R
even
ue

0704-0823629_MCL
45
Sell Side StrategiesSell Side Strategies

0704-0823629_MCL
46
Sell Side StrategiesIncrease competitive tensionAvoid surprises from bidders’ diligenceControl information releaseMeet public timetables and manage shareholder expectationsLimit reps, warranties, indemnificationsOptimize Transition Services Agreement (TSA) structureStay focused on businessGet it done quicklyJudicious on who you spend time with

0704-0823629_MCL
47
Sellside DynamicAttractive valuationsAging Venture Capital portfoliosDesire to boost returns to aid fundraisingPrivate company with a need to satisfy shareholder liquidity requirements and succession and estate-planning issuesSubsidiaries of public companies that are shedding non-core operationsBusiness owners now educated as to the value of competitive processPublic companies that are better off private

0704-0823629_MCL
48
Example Sale Process TimelineAuction Process
Pre-Market Preparation
Marketing Phase I
Marketing Phase II Documentation Closing
Months 1-2 Months 2-3 1/2 Months 3-5 Months 4-7 Months 5-9
Strategy Phase & Preparation Marketing Evaluate Offers Signing Oversight & Closing
Review shareholder objectivesReview sequencing & timingConfirmatory due diligenceDevelop positioning strategyPrepare information memorandumCompile data room materialsFinalize prospective buyers list
Contact prospective buyersPrepare management presentationDistribute information memorandum to interested partiesEvaluate preliminary indications
Give management presentationsLaunch online data roomEvaluate proposalsSelect final candidatesDiligence
Final DiligenceNegotiate transactionExecute contract
HSRITARFCCFOCIClosingCFIUSFinancing
4-8 Weeks 4-6 Weeks 4-6 Weeks 1-6 Weeks 4-8 Weeks

0704-0823629_MCL
49
Sale Strategy AlternativesAuction Process
Potential StrategiesOne-Off Preemptive
3-6 MonthsControlled Auction
6-9 MonthsBroad Auction
6-9 Months
Exchange informationCommence negotiations
Develop positioning strategyPrepare targeted list of buyersMake discrete inquiriesSolicit indications of interestOrchestrate due diligenceNegotiate and close
Public announcement about alternatives explorationActive and passive approach to evaluating interest
Maximize confidentialityMay limit full value exploration
Prioritizes confidentialityFull exploration of valueEfficient, orchestrated process through transaction closeMaximize flexibility of soft terms
Employees & customers’ knowledge must be managed throughout processLarger process consumes more time and resources

0704-0823629_MCL
50
Process Overview Stages & ExampleAuction Process
Source: Houlihan Lokey Howard & Zukin
Number of Buyers Participating in Various Stages of the Deal ProcessHigh Low Mean Median
Initial Contact
Sent Teaser
Sent NDA
Sent Book
1st Round Bids
2nd Round Bids
100% 100% 100% 100%
94% 53% 76% 81%
78% 36% 62% 63%
78% 26% 45% 45%
22% 4% 12% 13%
15% 1% 4% 3%

0704-0823629_MCL
51
Preparation for SaleLong lead time planning issues– Documentation of internal controls– Audited financials– Other accounting issues– Options backdating problems– Stockholder disputes– Other litigation– Capital structure problems– Personal financial planning– Tax: 338(h)10, 380(g), NOL Transferability, Dividend vs. capital gain treatment– Assign ability of contracts

0704-0823629_MCL
52
AuctionsWhen do you organize a formal auction, and when do you take a less formal approach?

0704-0823629_MCL
53
Trends in Structuring AuctionsShortening the time frame for bids, shortening the number of rounds. What do you do when the auction is going slowly? What if the business underperforms during the sales process?How do you deal with low ball bids, contingent bids and requests for additional information?

0704-0823629_MCL
54
Sell Side Communications and InformationHow do you protect your confidential information during the sales process? How do you maintain good customer relations and employee morale during a sales process?When can the selling management team talk to a buyer about employment arrangements? If I get close with a buyer and it doesn’t go through – how do I protect my employees and my customers? How do I protect myself from this becoming a competitive intelligence exercise for others? How should I handle communications to the rank and file about what management is undertaking?

0704-0823629_MCL
55
Buy Side StrategiesBuy Side Strategies

0704-0823629_MCL
56
Buy Side StrategiesHighlight liabilities and risksChallenge run rates and forecastsUnderstand sustainabilityMaximize reps, warranties, indemnificationsDevelop advantage versus other biddersFocus resources on high probability outcomesEarnoutsLeave room to adjust bid
0704-0823629_MCL
57
Buyside DynamicsUndervalued middle-market targets (barbell market)Return of strategic buyersGeneral Partners at funds make more money when they put money to workConsortium deals reduce exposure and increase the universe of obtainable targetsDeliver growthOrganic growth is slowingLow cost of capital

0704-0823629_MCL
58
Short Circuiting an AuctionExclusivesShow stopper bids

0704-0823629_MCL
59
Buyside Due DiligenceBain & Company surveyed 250 senior managers with M&A responsibilities. And reported the following in November of 2006. – 50% reported that due diligence overlooked significant problems– 50% reported that targets had been dressed up– 66% overestimated the synergies available from acquisitions– Only 30% were satisfied with their due diligence process– 33% acknowledged they had not walked away from deals despite nagging doubts

Walter A. (Tony) Maull, Jr.703-747-1838
Paul Feeko703-747-1274
Steve Glover202-955-8593
Anita Antenucci703-714-1707
Greg Ager703-736-0020
2007 M&A Hot Topics Briefing2007 M&A Hot Topics BriefingBest Practices Forum – Part 2

0704-0823629_MCL
1
TopicsSlide Number
Special Public Company Issues 3

0704-0823629_MCL
2
Special Public Company IssuesSpecial Public Company Issues

0704-0823629_MCL
3
Special Public Company IssuesThe seller's board has a duty to consider offers and explore alternatives. But it does not have a duty to sell the company. Once it decides to sell, it has a duty to maximize sales proceeds. An auction is not required. But board decisions about how to structure sales process are coming under increasing scrutiny.
Duty to Auction(“Revlon duty”)
If directors decide to sell the company, they must act reasonably and on a fully informed basis to ensure that the transaction offers the greatest value reasonably obtainable for the stockholders (the “Revlon duty”). – The crux of the duty to maximize stockholder value is that the directors play a direct and active role in
investigating all reasonable alternatives, make a fully informed decision and have a reasonable basis to conclude that the selected transaction offers stockholders the greatest value reasonably obtainable for their shares.
There is flexibility in deciding best way to accomplish this:– Formal auction– Informal market check– Post-signing market check
0704-0823629_MCL
4
Special Public Company IssuesIf management will participate in a buy-out, the target company should establish a special committee to consider the proposed transaction. The special committee should control decision-making. What should the special committee do if a buyer and a management team attempt to pre-empt the process?What is the role of fiduciary outs, no shops, go shops and break-up fees? Can the buyer lock-up target stockholders in advance?
Special Committee Considerations in a Management Buy-out If the board decides to sell the company after receiving a management buy-out offer, it should consider how to make the playing field as level as possible for other interested parties.Issues to consider in this regard:– Management will likely have a head start on other bidders– Has management already signed an exclusivity arrangement?– Management change in control provisions– Management may be unwilling to work with/for other interested parties
• Management has a fiduciary obligation to assist in a sale process and to provide information, but might not have an obligation to remain employed with the company.
0704-0823629_MCL
5
Special Public Company IssuesReverse break-up fees.How should the target respond to arbitrageur and hedge fund pressure? Role of the public relations firm. How should the parties deal with the threat of litigation by stockholders? What about other litigation threats?As legal matter, obligations of private company board are very similar to those of public company board. So the same issues can come up in that context as well.
0704-0823629_MCL
6
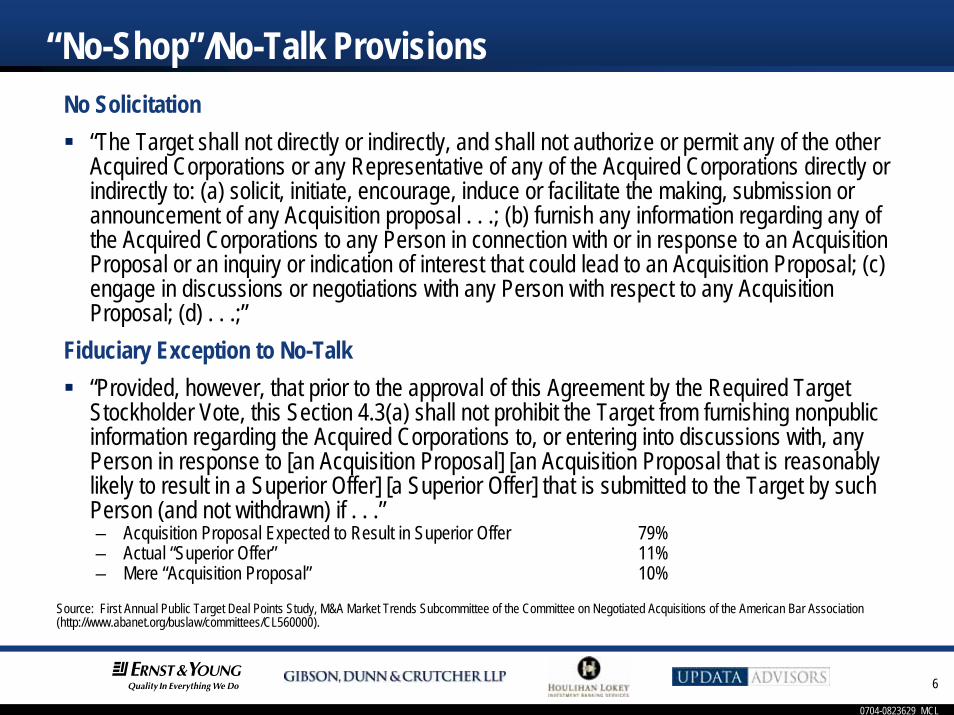
“No-Shop”/No-Talk ProvisionsNo Solicitation
“The Target shall not directly or indirectly, and shall not authorize or permit any of the other Acquired Corporations or any Representative of any of the Acquired Corporations directly or indirectly to: (a) solicit, initiate, encourage, induce or facilitate the making, submission or announcement of any Acquisition proposal . . .; (b) furnish any information regarding any of the Acquired Corporations to any Person in connection with or in response to an Acquisition Proposal or an inquiry or indication of interest that could lead to an Acquisition Proposal; (c) engage in discussions or negotiations with any Person with respect to any Acquisition Proposal; (d) . . .;”
Fiduciary Exception to No-Talk“Provided, however, that prior to the approval of this Agreement by the Required Target Stockholder Vote, this Section 4.3(a) shall not prohibit the Target from furnishing nonpublic information regarding the Acquired Corporations to, or entering into discussions with, any Person in response to [an Acquisition Proposal] [an Acquisition Proposal that is reasonably likely to result in a Superior Offer] [a Superior Offer] that is submitted to the Target by such Person (and not withdrawn) if . . .”– Acquisition Proposal Expected to Result in Superior Offer 79%– Actual “Superior Offer” 11%– Mere “Acquisition Proposal” 10%
Source: First Annual Public Target Deal Points Study, M&A Market Trends Subcommittee of the Committee on Negotiated Acquisitions of the American Bar Association (http://www.abanet.org/buslaw/committees/CL560000).

0704-0823629_MCL
7
Target Fiduciary (Superior Offer) Termination Right (“FTR”)The board of a company being sold should consider whether it should have the right to terminate the purchase agreement in favor of a superior offer.
Source: First Annual Public Target Deal Points Study, M&A Market Trends Subcommittee of the Committee on Negotiated Acquisitions of the American Bar Association (http://www.abanet.org/buslaw/committees/CL560000).
FTR No FTRAll Cash Public Target 86% 14%
Part Cash/Part Stock Public Target 74% 26%
All Stock 63% 37%

0704-0823629_MCL
8
Termination FeesThe purchase agreement may provide that the acquirer has the right to a termination or break-up fee if the target exercises its fiduciary out and terminates the agreement in favor of a superior offer.
Transaction Size 2004 2005$50 Million to $250 Million 3.6% 3.4%
$250 Million to $500 Million 2.9% 6.5%
$500 Million to $1 Billion 3.3% 3.2%
Over $1 Billion 3.1% 2.8%
Median Transaction Fees
Source: Houlihan Lokey Termination Fee Study

0704-0823629_MCL
9
Go-Shop Provisions“Go-Shop” provisions have been used in an increasing number of recent deals.– Buyer receives exclusivity in exchange for agreeing to a “Go-Shop” period.– Affords target 20-30 days after signing definitive agreement to find a superior offer.– Smaller break-up fee payable during the “Go-Shop” period (1/2 to 1/3 the full break-up fee).– Do they work? Private equity buyers may not want to “jump” another sponsor's deal.

0704-0823629_MCL
10
Reverse Break-Up FeesReverse break-up fees have also been used in recent transactions.– Compensates seller for a failed transaction or failure to secure funding– Increasingly common in larger/higher profile transactions– Reverse break-up fees are often tied to HSR/regulatory approval in similar industry transactions.

Walter A. (Tony) Maull, Jr.703-747-1838
Paul Feeko703-747-1274
Steve Glover202-955-8593
Anita Antenucci703-714-1707
Greg Ager703-736-0020
2007 M&A Hot Topics Briefing2007 M&A Hot Topics BriefingBest Practices Forum – Part 3

0704-0823629_MCL
1
TopicsSlide Number
Structuring and Papering the Deal 13Case Studies (discussion only)Biographies 37

0704-0823629_MCL
2
Structuring and Papering the DealStructuring and Papering the Deal
0704-0823629_MCL
3
Structuring and Papering the DealPrice adjustments and working capital adjustments Special representation and warranty problems. Defense contractors and FCPA issues. Adequacy of ownership of intellectual property. Sarbanes Oxley problems. Financial statement inadequacies. Defenses against sand-bagging. Indemnification and escrow provisions. Caps, baskets, time limitations and carve-outs. Is there really such a thing as a market standard? How is the market changing?

0704-0823629_MCL
4
Structuring and Papering the DealConditions to closing: MAC outs; HSR and antitrust issues; comfort regarding customers, suppliers. Negotiating employment arrangements with the management team. When do you lock them in? How do you deal with options and other employment benefits?How do you deal with targets that have complicated and arcane capital structures? What if it is not clear how to allocate purchase price among different classes of equity and options?

0704-0823629_MCL
5
Principal IndemnificationBuyers and sellers often debate scope of D&O indemnification. One big issue—should the buyer indemnify the target’s directors and officers directly?“Indemnification of Officers and Directors. – All rights to indemnification existing in favor of those Persons who are directors and officers of the Target
as of the date of this Agreement (the “Indemnified Persons”) for their acts and omissions occurring prior to the Effective Time, as provided in the Target’s bylaws (as in effect as of the date of this Agreement) and as provided in the indemnification agreements between the Target and said Indemnified Persons (as in effect as of the date of this Agreement) in the forms disclosed by the Target to the Buyer prior to the date of this Agreement, shall survive the Merger and shall be observed by the Surviving Corporation to the fullest extent available under Delaware law for a period of __ years from the Effective Time.
Direct Buyer Indemnity– Without limiting the foregoing provisions, during the period ending on the ___ anniversary of the Effective
Time, the Buyer will indemnify and hold harmless each Indemnified Person against and from any costs, expenses, judgments … in connection with any Proceeding … to the extent such Proceeding arises out of or pertains to: (i) any action or omission or alleged action or omission in such Indemnified Person’s capacity as a director, officer or employee of the Target or any of its Subsidiaries; or (ii) any of the transactions contemplated by this Agreement.”
*100% of the deals in the sample included some form of director and officer indemnification First Annual Public Target Deal Points Study, M&A Market Trends Subcommittee of the Committee on Negotiated Acquisitions of the American Bar Association (http://www.abanet.org/buslaw/committees/CL560000).
No “Direct Buyer Indemnity” 75%Includes “Direct Buyer Indemnity” 25%

0704-0823629_MCL
6
Indemnification—BasketsTrue Deductible– Seller is only responsible for amounts exceeding the basket amount
First Dollar/Tipping Basket– Seller is responsible for all damages once the damages reach the threshold basket amount
Hybrid ApproachesExclusions– Breaches of covenants– Specific Indemnities– Fundamental representations and warranties– Fraud and intentional misrepresentation
Source: Houlihan Lokey

0704-0823629_MCL
7
Indemnification—BasketsBaskets
96% of transactions had baskets– Deductible Form 56%– First Dollar Form 38%– Hybrid 2%– None 4%
Mean basket as percentage of purchase price was 0.69% and median 0.60%
Source: First Annual Private Target Deal Points Study, M&A Market Trends Subcommittee of the Committee on Negotiated Acquisitions of the American Bar Association (http://www.abanet.org/dch/committee.cfm?com=CL560000).

0704-0823629_MCL
8
Indemnification—Basket Carveouts
Source: First Annual Private Target Deal Points Study, M&A Market Trends Subcommittee of the Committee on Negotiated Acquisitions of the American Bar Association (http://www.abanet.org/dch/committee.cfm?com=CL560000).
Taxes (Rep) 26%
Intentional Misrepresentation 18%
Fraud 41%
Due Authority (Rep) 11%
Capitalization (Rep) 21%
Broker’s/Finder’s Fees (Rep) 14%

0704-0823629_MCL
9
Indemnification—Caps
Yes – Less Than Purchase Price 74%
Yes, But Amount Not Determinable 14%
Silent 8%
Yes – Equal or Greater Than Purchase Price 3%
Express “No Cap” 1%
Source: First Annual Private Target Deal Points Study, M&A Market Trends Subcommittee of the Committee on Negotiated Acquisitions of the American Bar Association (http://www.abanet.org/dch/committee.cfm?com=CL560000).

0704-0823629_MCL
10
Indemnification—Cap Carveouts
Taxes (Rep) 27%
Intentional Misrepresentation 28%
Fraud 77%
Due Authority (Rep) 14%
Capitalization (Rep) 26%
Source: First Annual Private Target Deal Points Study, M&A Market Trends Subcommittee of the Committee on Negotiated Acquisitions of the American Bar Association (http://www.abanet.org/dch/committee.cfm?com=CL560000).
0704-0823629_MCL
11
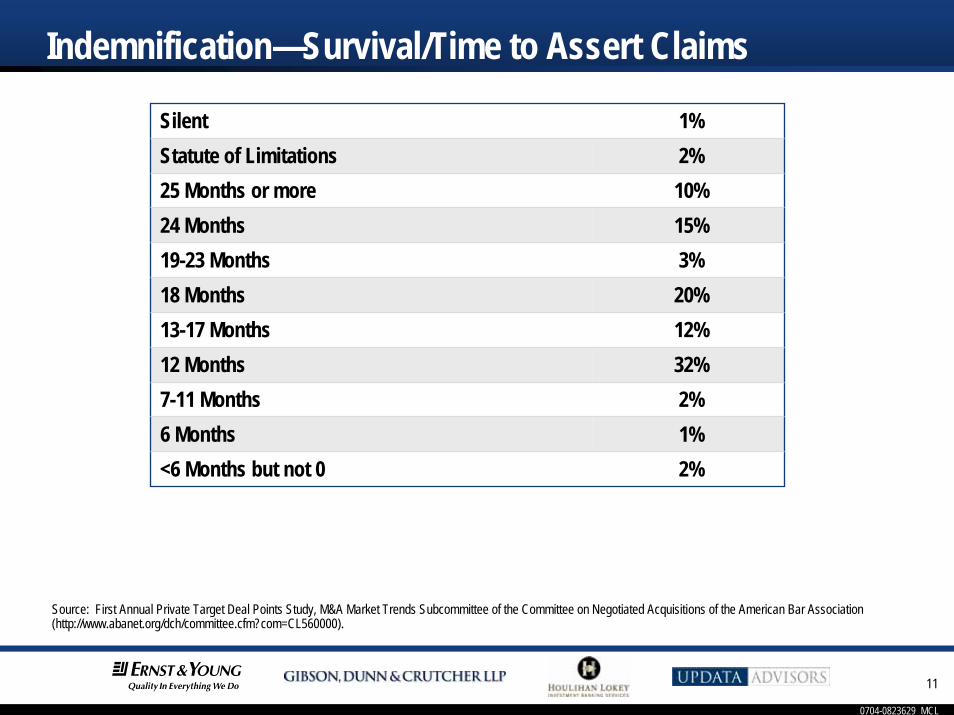
Indemnification—Survival/Time to Assert Claims
Source: First Annual Private Target Deal Points Study, M&A Market Trends Subcommittee of the Committee on Negotiated Acquisitions of the American Bar Association (http://www.abanet.org/dch/committee.cfm?com=CL560000).
Silent 1%Statute of Limitations 2%25 Months or more 10%24 Months 15%19-23 Months 3%18 Months 20%13-17 Months 12%12 Months 32%7-11 Months 2%6 Months 1%<6 Months but not 0 2%
0704-0823629_MCL
12
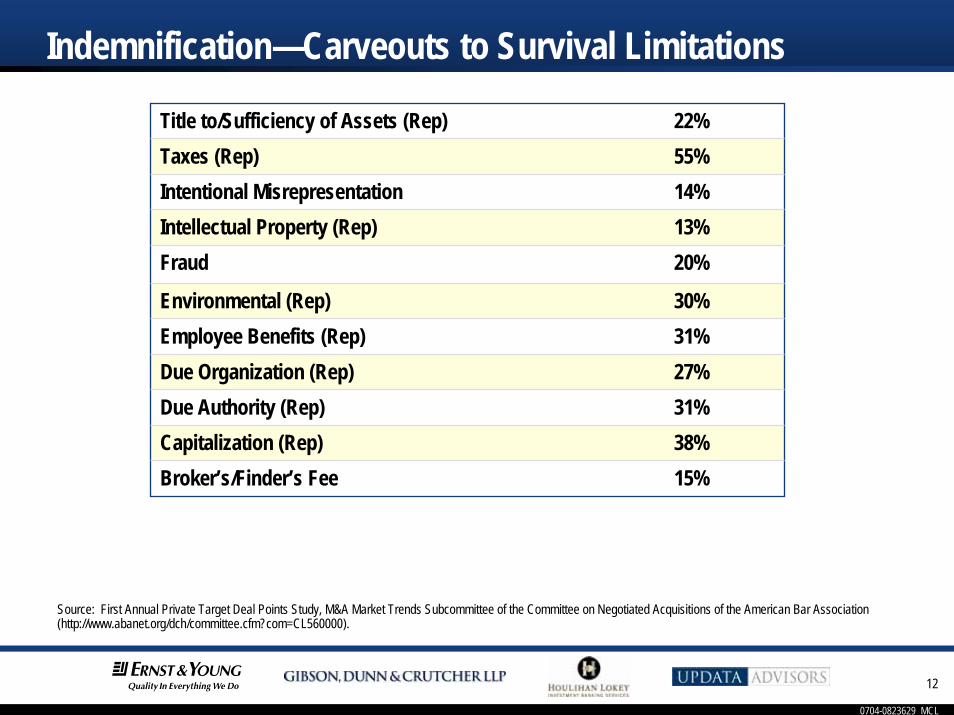
Indemnification—Carveouts to Survival Limitations
Title to/Sufficiency of Assets (Rep) 22%Taxes (Rep) 55%Intentional Misrepresentation 14%Intellectual Property (Rep) 13%Fraud 20%
Environmental (Rep) 30%Employee Benefits (Rep) 31%Due Organization (Rep) 27%Due Authority (Rep) 31%Capitalization (Rep) 38%Broker’s/Finder’s Fee 15%
Source: First Annual Private Target Deal Points Study, M&A Market Trends Subcommittee of the Committee on Negotiated Acquisitions of the American Bar Association (http://www.abanet.org/dch/committee.cfm?com=CL560000).

0704-0823629_MCL
13
Indemnification—Exclusive Remedy and EscrowsHoulihan Lokey Study
74% of deals with representations and warranties surviving closing had escrowsMedian percentage of purchase price equaled 6.8%Median length of escrow agreement equaled 18 months
ABA StudyIndemnification exclusive remedy in 76% of deals (with 14% silent, 8% expressly non-exclusive and 2% redacted)
Source: [Houlihan Lokey slides;] First Annual Private Target Deal Points Study, M&A Market Trends Subcommittee of the Committee on Negotiated Acquisitions of the American Bar Association (http://www.abanet.org/dch/committee.cfm?com=CL560000).

0704-0823629_MCL
14
Indemnification as Exclusive Remedy—Carveouts
Intentional Misrepresentation 29%
Fraud 85%
Equitable Remedies 27%
Capitalization (Rep) 3%
Breach of Covenant 19%
Source: First Annual Private Target Deal Points Study, M&A Market Trends Subcommittee of the Committee on Negotiated Acquisitions of the American Bar Association (http://www.abanet.org/dch/committee.cfm?com=CL560000).

0704-0823629_MCL
15
Closing Conditions—Right to Walk from Deal if There Has Been a Material Adverse Change
Stand alone vs. Back-doorQuantified MACsProspectsMAC Carveouts

0704-0823629_MCL
16
Material Adverse Change (MAC) ConditionStand-Alone:
“No Material Adverse Change” (Since the Date of This Agreement, there has not been any Target Material Adverse Change)
“Back-Door”:“Absence of Changes” representation (Since the Balance Sheet Date, there has not been any Target Material Adverse Change)
Source: First Annual Private Target Deal Points Study, M&A Market Trends Subcommittee of the Committee on Negotiated Acquisitions of the American Bar Association (http://www.abanet.org/dch/committee.cfm?com=CL560000).

0704-0823629_MCL
17
Frequency of Buyer’s MAC Condition
Source: First Annual Private Target Deal Points Study, M&A Market Trends Subcommittee of the Committee on Negotiated Acquisitions of the American Bar Association (http://www.abanet.org/dch/committee.cfm?com=CL560000).
Stand-Alone MAC Condition 75%
“Back-Door MAC” Without Stand-Alone MAC Condition 20%
No MAC Condition 5%

0704-0823629_MCL
18
Example of MAC That Includes Quantitative Standard“Material Adverse Effect” means any change or effect that is or would reasonably be expected to be materially adverse to the assets, properties, Business, operations, liabilities, results of operation or financial condition of [Target] and its Subsidiaries, taken as a whole; including, without limitation, the occurrence prior to Closing of any single event, or any series of related events, or set of related circumstances, which could reasonably be expected to cause an actual, direct net decrease in EBITDA for either the 12 month period ending January 31, 2004 or EBITDA for any 12 month periods ending after the Closing Date but prior to the first anniversary of the Closing Date, in excess of [****] (after giving effect to any other offsetting increases or decreases affecting EBITDA); [****]
(Language from Global Imaging Systems acquisition of Imagine Technology Group)

0704-0823629_MCL
19
Example of MAC that Includes Reference to Change in Target’s Prospects
“[Target] Material Adverse Effect” shall mean any change, event, occurrence or condition which has had, or could reasonably be expected to have, individually or in the aggregate, a material adverse effect on the business, assets, liabilities, financial condition, results of operations or prospects of the [Target], taken as a whole…
(Language from CNET Networks Inc. Inc acquisition of Twofolds Photos Inc.)

0704-0823629_MCL
20
Frequency of Quantified and Prospects MAC Conditions
MAC Defined to Include Specified Dollar Amount or Other Metric (“Quantified MAC”) 8%
Includes MAC on Target’s Prospects 23%
Source: First Annual Private Target Deal Points Study, M&A Market Trends Subcommittee of the Committee on Negotiated Acquisitions of the American Bar Association (http://www.abanet.org/dch/committee.cfm?com=CL560000).

0704-0823629_MCL
21
Examples of MAC Carveouts"MATERIAL ADVERSE CHANGE" means, when used in connection with a Person, any change, event, violation, inaccuracy, circumstance or effect that is materially adverse to the business, assets, liabilities, financial condition, results of operations or prospects of such Person taken as a whole, other than as a result of (i) changes generally adversely affecting the United States economy (so long as such Target is not disproportionately affected thereby) (ii) performance by such Person of its obligations under this Agreement or, with respect to [Target] only, the failure of Target to consent to actions reasonably requested by [Target] pursuant to Section 4.1 of this Agreement, (iii) the announcement or pendency of the transactions contemplated by this Agreement, or (iv) war or the outbreak of hostilities…
No MAC Carveouts 20%Includes MAC Carveouts 80%
Source: First Annual Private Target Deal Points Study, M&A Market Trends Subcommittee of the Committee on Negotiated Acquisitions of the American Bar Association (http://www.abanet.org/dch/committee.cfm?com=CL560000).

0704-0823629_MCL
22
Data on Use of MAC CarveoutsNo General Economic Conditions Carveout 35%Includes General Economic Conditions Carveout 65%
Of those that include the General Economic Conditions Carveout:Disregards Disproportionate Effect 39%Does Not Disregard Disproportionate Effect 61%
Source: First Annual Private Target Deal Points Study, M&A Market Trends Subcommittee of the Committee on Negotiated Acquisitions of the American Bar Association (http://www.abanet.org/dch/committee.cfm?com=CL560000).

0704-0823629_MCL
23
More Data on MAC CarveoutsNo “Industry Conditions Carveout” 41%Includes “Industry Conditions Carveout” 59%
Of those that include the “Industry Conditions Carveout”:Disregards Disproportionate Effect 45%Does Not Disregard Disproportionate Effect 54%
Source: First Annual Private Target Deal Points Study, M&A Market Trends Subcommittee of the Committee on Negotiated Acquisitions of the American Bar Association (http://www.abanet.org/dch/committee.cfm?com=CL560000).

0704-0823629_MCL
24
Other Common MAC Carveouts
Source: First Annual Private Target Deal Points Study, M&A Market Trends Subcommittee of the Committee on Negotiated Acquisitions of the American Bar Association (http://www.abanet.org/dch/committee.cfm?com=CL560000); First Annual Public Target Deal Points Study, M&A Market Trends Subcommittee of the Committee on Negotiated Acquisitions of the American Bar Association (http://www.abanet.org/buslaw/committees/CL560000).
Private Targets:Acts of war or terrorismChange in law or accounting principleDownturn in financial marketsTaking of action contemplated or required by the agreementAnnouncement of pendency of deal
17%28%30%32%44%
Public Targets:Failure to meet projectionsActs of war or terrorismChange in accountingChange in lawAnnouncement or Pendency
15%24%42%43%69%

0704-0823629_MCL
25
SOX Impact on Reps and Warranties
Sources: First Annual Private Target Deal Points Study, M&A Market Trends Subcommittee of the Committee on Negotiated Acquisitions of the American Bar Association (http://www.abanet.org/dch/committee.cfm?com=CL560000); First Annual Public Target Deal Points Study, M&A Market Trends Subcommittee of the Committee on Negotiated Acquisitions of the American Bar Association (http://www.abanet.org/buslaw/committees/CL560000).
Financial Statements of Target Private PublicFair presentation of the financial position of the Company
Qualified by GAAPNot qualified by GAAPNo representation
17%84%2%
33%67%–%
Non-Audit Services 3%
Auditor Independence 4%
Off-Balance Sheet Transactions 9%
Internal Controls 32%

0704-0823629_MCL
26
Case StudiesCase Studies

0704-0823629_MCL
27
BiographiesBiographies

0704-0823629_MCL
28
BiographiesWalter A. Maull, Jr., Moderator, Director, Ernst & Young– Tony has over 20 years of finance experience with the world’s largest financial institutions. Prior to
joining E&Y, Tony was the VP of Marketing for Experian-Scorex Americas. Experian-Scorex, the technology and risk analytics arm of Experian, is a worldwide provider of software and professional services to over 2,000 financial services companies across 63 countries. Tony was responsible for the identification and integration of acquisitions and the comprehensive go to market strategy of the combined organizations. Prior to Experian-Scorex, Tony was with CIBC World Markets in their Technology Investment Banking Group where he led CIBC’s expansion into the Southeast. He focused on mid to late stage enterprise software and outsourced business services equity financing and mergers and acquisitions. Tony earned his BS in Accounting from George Mason University.
Greg Ager, Partner, Updata Advisors– Greg has 17 years of investment banking experience, having completed approximately 60 transactions
aggregating over $7 billion in value for emerging and middle market technology companies. Prior to joining Updata Advisors, Greg was the senior East Coast Technology Investment Banker at Wachovia Securities, Managing Director and Head of East Coast Software, where he completed transactions for clients such as Computer Associates, INFOR Global Solutions, Aspen Technology, Safeguard, Unica, Blackbaud and Vocus. Previously, Greg spent ten years in Silicon Valley where he completed transactions for many industry leaders including Oracle, Novell, Silicon Graphics and AnswerThink. Prior to joining TWP, Greg held various roles with the Business Services Investment Banking Group at Montgomery Securities, and with the technology investment banking groups at Smith Barney and Morgan Stanley. Greg received an M.B.A. from the J.L. Kellogg Graduate School of Management at Northwestern University and a B.A. in economics and political science from Yale University.

0704-0823629_MCL
29
BiographiesAnita M. Antenucci, Managing Director Washington, D.C. office, Houlihan Lokey– Anita is co-head of the Aerospace•Defense•Government (ADG) industry group and head of its
Aerospace and Defense segment. Over the past thirteen years, a period of significant consolidation in the aerospace and defense industries, she has grown a leading middle-market practice in aerospace and defense mergers and acquisitions. Her transactional experience has spanned the industry’s diverse makeup, with multiple transactions in such segments as defense electronics, aircraft systems, combat vehicles, satellite manufacturing, and engineering services. Her client base has included the industry’s leading prime contractors, as well as dozens of small and mid-sized companies in the industry’s second and third tiers. Prior to joining Houlihan Lokey, Anita served as co-President and Managing Director of Quarterdeck Investment Partners, LLC. Anita holds degrees from the School of Advanced International Studies (SAIS) of The Johns Hopkins University and from Northwestern University in the United States and studied at the Institut d’Etudes Politiques in France.
Paul Feeko, Partner & TAS Leader for the Mid-Atlantic– Paul is a CPA with over 20 years experience. E&Y’s TAS group includes over 70 full-time transaction
professionals in disciplines such as due diligence, transaction tax and valuation. He has also led Ernst & Young’s TAS services to The Carlyle Group since joining the firm in 2002. Prior to joining Ernst & Young, Paul led local transaction support practices at Arthur Andersen and PwC. He has been a full-time transaction support professional since 1995. Prior to that he was with the audit practice of Coopers & Lybrand, where he specialized in public company filings and registrations. Paul has significant experience in transactions across a wide range of industries including services, manufacturing and distribution industries, real estate and hospitality, telecommunications and technology, media and publishing, engineering and communications, and aerospace/defense. He has assisted in all phases of the transaction process, including strategy and development, identifying acquisition candidates or potential buyers, conducting business reviews, evaluating proposed structures and financing alternatives, pricing, negotiating and documenting transactions. Paul received a B.A. in Accounting from Penn State.

0704-0823629_MCL
30
BiographiesStephen I. Glover, Partner, Gibson, Dunn & Crutcher LLP– Steve has an extensive practice representing public and private companies in complex mergers
and acquisitions, joint ventures and other corporate transactions. His clients include large, nationally recognized public companies; locally based companies that are active participants in the mergers and acquisitions market; and private equity groups. The transactions involve many different industries and include both domestic and cross-border deals. Steve was named by the 2006 International Financial Law Review as a Leading Lawyer in US Mergers & Acquisitions. He was also identified among "Ten of the D.C. Area's Top Deal-Making Attorneys" by Legal Times in 2006, was selected as the top Commercial/Corporate Transactions attorney in Washington, D.C. by The Washington Business Journal in 2004, and was ranked one of the top three corporate/commercial transactions attorneys in the District of Columbia by Chambers USA America’s Leading Business Lawyers in both 2006 and 2005. Steve served as a law clerk to Justice Thurgood Marshall in the United States Supreme Court and to J. Skelly Wright, Chief Judge of the U.S. Court of Appeals for the District of Columbia Circuit. He earned his law degree cum laude from Harvard Law School, and received his undergraduate degree summa cum laude from Amherst College.