Embed Size (px)
Citation preview

8/14/2019 2007-EOR_Survey.pdf
http://slidepdf.com/reader/full/2007-eorsurveypdf 1/16
Greg Croft and Tay Feder
5/8/2007
IMPACT OF ENHANCED
OIL RECOVERY AND
UNCONVENTIONALRESERVOIRS ON OIL
SUPPLY
ER291: Transportation Energy, Spring 2007
The goal of this project was to assess the impact of enhanced oil
recovery and unconventional reservoirs on oil supply. Historical oil production data sequences for enhanced oil recovery by various methods
and production from unconventional reservoirs demonstrate a trend
toward increasing carbon dioxide injection in the United States and rapid
growth of steam injection and oil mining in Canada. If cost-effective,
these technologies could significantly enhance the future of global oil
supply if used as widely outside the United States as they are currently
used within it.

8/14/2019 2007-EOR_Survey.pdf
http://slidepdf.com/reader/full/2007-eorsurveypdf 2/16
5/8/2007
1
IMPACT OF ENHANCED OIL RECOVERY
AND UNCONVENTIONAL RESERVOIRS ON
OIL SUPPLY
ER291: Transportation Energy, Spring 2007
IntroductionEnhanced oil recovery (EOR) refers to oil production techniques during the tertiary stage of
recovery utilizing 'enhanced' technologies such as carbon dioxide flooding or horizontal
drilling subsequent to primary or secondary production.
Primary Recovery – oil and gas recovery where natural pressure of the reservoir
acts as the driving force for collection.
Secondary Recovery – flooding of water and natural (methane) gas improve
recovery factors subsequent decreases in the reservoir's natural pressure
Tertiary Recovery – enhanced techniques such as horizontal drilling or injection of
thermal, chemical, or carbon dioxide gas to ensure pressure, as well as optimum
levels of rock and fluid properties.
Implementation of EOR projects can vastly improve recovery factors of struggling reservoirs – for a price. In comparison to conventional production, there are minimal exploration costs
and fewer uncertainties. Nonetheless, these projects require large capital investments paired
with higher operating costs for long periods of time. Given this and the variability of global
crude oil prices, "companies tend to use long-term price forecasts to justify initiating [EOR
projects.]" (EOR OGJ 2006).
New investments may be inhibited by increasing cost of natural (methane) gas, tightened
supplies of CO2, and the fact that contracts for carbon dioxide in EOR projects explicitly link
quantity to the price of crude. Implementation of carbon capture and sequestration
technologies may open up new supplies of carbon dioxide from electricity-generation
facilities. Given such uncertainty, there is a high option value present in deferring planned
EOR projects until these long-run crude price forecasts and environmental regulations meet
the constraints of firm's internal financial policies. This may be a lurking force pulling down
EOR production figures below what "might be expected" (id.) from sources such as the Oil
and Gas Journal's EOR Survey that "tend to reflect the industry's economic perceptions from
several years ago" (id.)

8/14/2019 2007-EOR_Survey.pdf
http://slidepdf.com/reader/full/2007-eorsurveypdf 3/16
5/8/2007
2
DefinitionsThermal enhanced oil recovery involves application of heat, usually in the form of steam,
to reduce oil viscosity and increase recovery factors. There are two kinds of steam injection;
cyclic steam and steamflood. Cyclic steam injection, called huff and puff or CSS in Canada,
involves injecting steam into a well for several days, then producing oil from the same well.
The only part of the reservoir that is filled with a steam phase is the immediate area of thewellbore. Steamflood, called ICV in Venezuela, involves dedicated injection and production
wells. Steam flows from injector to producer, filling the reservoir. A special form of
steamflood called steam-assisted gravity drainage (SAGD) is used extensively in Canada.
SAGD uses a horizontal steam injector in the middle of the oil sand and a horizontal
producer near the base of it. This method requires a hundred-foot sand with no vertical
permeability barriers. This requirement rules out SAGD in almost all heavy oil reservoirs in
California and Venezuela.
For steam injection to be viable, porosity should be at least 25% because the whole reservoir
must be heated. Depths from 500 to 1500 feet are best because too shallow does not allow
enough reservoir pressure and too deep results in problems with corrosion and heat loss.Steam injection works best when there is a large drop in oil viscosity with increasing
temperature so heavy crudes are better, especially if they are high in wax content as in
Indonesia.
In-situ combustion is a form of thermal EOR that is broken out separately. This involves
injecting air to combust some of the oil in place. The steam, heat and carbon dioxide
generated increase the oil recovery. Combustion fronts are notoriously difficult to control and
this method is of only minor importance in spite of decades of research.
Miscible hydrocarbon injection is mostly used in Canada, the north slope of Alaska, and
the Furrial-Musipan trend in the Venezuelan state of Monagas. This involves injection of a
hydrocarbon solvent, usually propane or wet gas, to reduce the viscosity of the oil andincrease recovery. Increases in the price of propane have discouraged this approach and
production is declining. If the gas is not miscible, gas injection is simply pressure
maintenance and is outside the scope of this study.
Miscible carbon dioxide injection takes advantage of the fact that liquid carbon dioxide
is the cheapest nonpolar solvent available. It will dissolve in light oil, thereby increasing its
volume and decreasing its viscosity. Carbon dioxide liquefies at 67 atmospheres at 25˚ C, so
carbon dioxide injection projects tend to be at least 2,000 feet deep where it will be a miscible
liquid at reservoir conditions. Miscibility is greater for light oil, so most carbon dioxide
injection projects produce oil that is 30˚ API or lighter. Most carbon dioxide projects are in
Texas and have been limited by carbon dioxide availability. Concerns about atmosphericcarbon dioxide levels have increased interest in this technology. There is only one natural
carbon dioxide field east of the Mississippi, so there could be a market in the Gulf Coast, the
Illinois Basin and other areas for carbon dioxide from Midwestern industrial sources.
Immiscible carbon dioxide and nitrogen injection involve injection of gas that does not
dissolve in the oil. This increases reservoir pressure and increases recovery by means of
gravity drainage in zones where gas has become the dominant phase. Nitrogen injection and

8/14/2019 2007-EOR_Survey.pdf
http://slidepdf.com/reader/full/2007-eorsurveypdf 4/16
5/8/2007
3
immiscible carbon dioxide injection are listed in the EOR survey of the Oil and Gas Journal,
but in fact are pressure maintenance similar to natural gas or water injection, which are not
listed. The world’s largest nitrogen injection project, Mexico’s Cantarrell Field, is listed
without production figures in the Oil and Gas Journal survey, we presume this is because
Pemex did not respond to the survey. As these methods represent an incomplete list of
pressure maintenance methods, they were excluded from this study.
Polymer and microbial enhanced oil recovery are similar in that both involve creating an
obstacle to water flow by means of a waterflood in order to forcing water into previously
bypassed zones. In polymer floods, a polymer is injected into the high-flow zone where it
forms a gel. In microbial enhanced oil recovery, culture and nutrients are injected and the
microbes secrete viscous material that blocks the high-flow zone. Several projects of both
kinds are currently producing about 15,000 barrels per day in China, but all US polymer
projects have been abandoned. The alternative to these approaches is to isolate high-flow
zones by selectively blocking perforations. These techniques are a subset of waterflooding
and were excluded from this study.
Unconventional reservoirs are oil shales and similar rocks that have been buried deeplyenough for earth heat to generate oil and gas. For a long time they were considered too
costly, but improvements in drilling and fracturing technology have increased US natural
gas supply to the point that onshore US lower-48 gas production increased 4% in 2006
relative to 2005. Unconventional oil reservoirs present an even greater technical challenge,
but they contain enormous volumes of hydrocarbons in place.
Although it is very difficult to assign reserves to unconventional light oil reservoirs, the
volume of oil in place is thought to be very large. The United States Geological Survey
estimates that the Bakken Shale in North Dakota and Montana contains 416 billion barrels
of oil in place. The low recovery factor provides incentives for future technological
improvements.
Table 1 World Enhanced Oil Recovery
2006 Barrels per Day USA Rest of World Global
Thermal 286,668 860,629 1,147,297
Hydrocarbon miscible 95,800 191,514 287,314
CO2 immiscible 237,013 237,013
Low-permeability 232,860 232,860
Oil Mining 625,000 625,000
Total 852,341 1,677,143 2,529,484 Data sources: Oil and Gas Journal, Alberta Energy and Utilities Board

8/14/2019 2007-EOR_Survey.pdf
http://slidepdf.com/reader/full/2007-eorsurveypdf 5/16
5/8/2007
4
Data Sources: Oil and Gas Journal, Alberta Energy and Utilities Board
Looking at the US (right pie graph) in Figure 2 below, the picture is quite different with no
oil mining and a major role played by carbon dioxide injection and unconventional reservoirs.
These last two categories are still less important than steam injection, but will probably
exceed it in the next few years as major California steamflood projects decline. Miscible
hydrocarbon injection shown in the figure is entirely in Alaska and two deep-water Gulf of
Mexico fields.
Data Source: Oil and Gas Journal
Figure 1
Figure 2

8/14/2019 2007-EOR_Survey.pdf
http://slidepdf.com/reader/full/2007-eorsurveypdf 6/16
5/8/2007
5
Termal EOR Barrels per Day
US 286,668 Canada 274,250
Indonesia 220,000
Venezuela 199,578
China 151,651
Colombia 8,000
Trinidad 1,650
Data Sources and ConsistencyOur cornerstone source for this study is biennial EOR survey in the Oil and Gas Journal.
This survey has the advantage of covering the world and including a range of technologies,
but participation is voluntary, so the survey underreports EOR activity. The survey also does
not include mine production of heavy oil in Alberta, which is available from the annual
report of the Alberta Energy and Utilities Board. Production from Venezuela’s heavy oil beltis not included in the Oil and Gas Journal survey except for a small steam pilot project
because the commercial production does not involve any EOR technology. Another problem
with the Oil and Gas Journal survey’s Venezuela data is that it shows the same production
increment (199,578 barrels per day) from thermal EOR in 2000, 2002, 2004 and 2006. This
cannot be true, and we predict it is likely that these projects are declining.
Compiling data from difference sources for this study was complicated in that our sources
incorporate varying degrees of data aggregation. For example, the Alberta Energy and
Utilities Board disaggregates oil sands production between mine production and in-situ
production, but does not separate steam-enhanced production such as is reported in the Oil
and Gas Journal.
Data for unconventional reservoirs is based upon the US Energy Information Administration
and state regulatory agencies. Unconventional reservoirs are not usually singled out as a
separate category, but continuous accumulations in the US are usually listed as single fields,
such as Wattenberg or Spraberry. The data from the Energy Information Administration
does not agree with the state data. We found it intriguing that, in all cases, the federal
production figures are higher.
EOR Trends
Thermal enhanced oil recovery is an importanttechnology for developing the huge heavy oil resources of
Canada and Venezuela. Most of the thermal enhanced oil
recovery projects listed in the oil and gas journal survey
are located in five areas; California, Alberta, Sumatra,
China or western Venezuela.
Incremental production from thermal EOR in the United States showed a declining trend
due to the depletion of major California fields since 1985. The Oil and Gas Journal survey
shows a decline of 34.7% from 1998 to 2006. Data from the California Division of Oil and Gas
show the same trend, declining 29.9% from 1998 to 2005. Total US incremental production
from steam injection was 286,668 barrels per day in 2006 according to the Oil and Gas
Journal.
Most of the growth in steam-enhanced oil production in recent years has come from Canada.
The largest part of this growth has been SAGD and cyclic steam projects in the oil sands.
Incremental production from steam injection in Canada was 274,250 barrels per day in 2006
according to the Oil and Gas Journal.
Table 2

8/14/2019 2007-EOR_Survey.pdf
http://slidepdf.com/reader/full/2007-eorsurveypdf 7/16
5/8/2007
6
Indonesia’s thermal enhanced oil recovery comes from only one project, but it is the world’s
largest. The Duri Field in central Sumatra is an ideal candidate for steamflood; it is shallow
and it contains high-wax crude that is almost solid at reservoir conditions. A modest
elevation in reservoir temperature causes a dramatic reduction in the viscosity of the waxy
crude. Incremental production from steam injection at Duri was estimated at 220,000 barrels
per day in 2006.
Data Source: Oil and Gas Journal
Thermal enhanced oil recovery in Venezuela is concentrated along the eastern shore of
Lake Maracaibo in Zulia state. According to the Oil and Gas Journal, Zulia accounted for89% of Venezuelan thermal EOR in 2006. The heavy oil belt in Eastern Venezuela includes
the 400 barrels per day of steam-enhanced production at Cerro Negro that is reported in the
Oil and Gas Journal survey. The incremental production from steam in Venezuela is the
same (199,578 barrels per day) in all of the Oil and Gas Journal surveys from 2000 through
2006. This cannot be the case, so looking for production trends is meaningless. All steam
injection in Venezuela is cyclic and huge steamflood potential in the Lake Maracaibo area
remains untapped.
China uses steam injection in several fields in Liaohe (eastern China) and Xinjiang (western
China). Incremental production from steam injection in China was 151,851 barrels per day in
2006 according to the Oil and Gas Journal.
Miscible carbon dioxide injection shows rapid growth in the US. Between 1998 and
2006, incremental production from carbon dioxide grew 31.7% to 237,000 barrels per day
according to the Oil and Gas Journal surveys. This technique is almost unique to the US,
where it is used on a large scale in the Permian Basin of Texas and New Mexico, the Bighorn
Basin of Wyoming, and the Rangely Field of Colorado. Denbury Resources uses carbon
dioxide injection in the Mississippi Salt Basin because they own the only carbon dioxide field
in the area. Carbon dioxide availability is greatest in the Rocky Mountains, where it occurs
Figure 3

8/14/2019 2007-EOR_Survey.pdf
http://slidepdf.com/reader/full/2007-eorsurveypdf 8/16
5/8/2007
7
naturally, and the Permian Basin, where it is separated from natural gas. Carbon dioxide
from the Great Plains Coal Gasification project is injected into the light oil field at Weyburn
in Saskatchewan.
The potential for carbon dioxide injection in the Middle East and North Africa is very large.
Carbon dioxide fields are present in Iran, but have not been developed for enhanced oil
recovery yet. The potential for carbon dioxide injection worldwide is so large that petroleum
engineers are puzzled to read climate science journal articles mentioning other methods of
sequestering carbon dioxide emissions when there is plenty of demand in the oil sector.
Table 3: Carbon dioxide EOR
CO2 Injection Barrels per Day
Texas, USA 167,956
Canada 7,200
Turkey 7,000
Wyoming, USA 17,640
New Mexico, USA 14,950
Mississippi, USA 11,745
Colorado, USA 11,600
Oklahoma, USA 9,548
Rest of USA 3,574
Data Source: Oil and Gas Journal
Miscible hydrocarbon injection is mostly used in Canada and Alaska. Also, deep oil fields
in the El Furrial, Carito and Musipan areas of eastern Venezuela. Alaska and Venezuela
have stranded gas of little value, and firms have found it worthwhile to inject the fields as
means to saves them for possible future use. Increases in the price of natural gas and
propane in Canada have discouraged this approach and production is declining.
Oil Mining in Alberta was one of the most important technologies, accounting for 625,000
barrels per day in 2005. This was a decline from 709,000 barrels per day in 2004, but there
Figure 4

8/14/2019 2007-EOR_Survey.pdf
http://slidepdf.com/reader/full/2007-eorsurveypdf 9/16
5/8/2007
8
has been a trend of steadily increasing production and several large mines are at the
planning and development stage. Oil mining has been tried on a pilot scale in California at
McKittrick and oil sands have been mined for asphalt in many areas, but mining as an oil
production method is unique to Alberta at present. Figure 5 below shows the dominance of
mining in Canada’s oil sands production. This dominance will have to change with time; of
the 174 billion barrels of oil estimated to be recoverable by the Alberta Energy and UtilitiesBoard, 25 billion are mineable and the rest must be recovered by in-situ methods, mostly
SAGD and cyclic steam.
Table 4: Alberta Oil Sands Production by Location and Method
Location Method Barrels per Day
Athabasca Mining 704777
Athabasca Primary 39165
Athabasca SAGD 71833
Cold Lake CSS 171967
Cold Lake Primary 64773
Cold Lake SAGD 794Peace River Primary 7087
Peace River SAGD 8080
Data Source: Alberta Department of Energy
Information source: Alberta Department of Energy
No discussion of oil mining is complete without addressing oil shale. Oil shale contains up to
20% organic matter by weight in individual specimens, but average organic matter content is
about 5% by weight. The normal cutoff for oil mining projects in Alberta is 10% heavy oil by
weight. No oil shale in the world makes the cut. Besides the lower oil yield per ton of rock, oil
shale must be heated to crack the large kerogen molecules into oil. Oil shale occurs in oil-
Figure 5

8/14/2019 2007-EOR_Survey.pdf
http://slidepdf.com/reader/full/2007-eorsurveypdf 10/16
5/8/2007
9
short countries such as Israel, Jordan and Thailand, but it has not been a commercial
success in spite of many pilot projects.
Primary production of heavy oil is an alternative approach for holders of extra-heavy oil
reserves, but it is not an enhanced recovery method. In 2005, Canada produced 111,000
barrels of bitumen per day from the oil sands by primary production and Venezuela produced
622,000 barrels per day from the Faja del Orinoco by primary production. The steam-
enhanced production in the Faja del Orinoco is limited to one project of 400 barrels per day.
The reasons for using primary production are low capital cost and low operating cost.
Numerous small operators in Alberta use primary production because SAGD or mines are
out of their price range. Petroleos de Venezuela (2005) reports that operating costs in the
Faja del Orinoco averaged $0.95 per barrel, down from $1.50 in 2000 and comparable to
onshore light oil production. PDVSA attributes the decline in operating cost to increased per-
well productivity from combining multilateral horizontal wells with progressing-cavity
pumps.
The direct operating costs in the Alberta oil sands are an order of magnitude higher than in
Venezuela. Since the Alberta and Venezuela heavy oil accumulations are the largesthydrocarbon deposits in the world and are of comparable size, the economic significance of
the Venezuelan heavy oil becomes clear. Because primary production is relatively simple, the
rate at which Venezuelan heavy oil can be brought on stream is limited by the rate of growth
of upgrading capacity, not production capacity.
Unconventional Oil Reservoir Trends
Production of oil from continuous accumulations is predominantly a US technology. This will
change with time because many continuous oil accumulations exist outside of the US.
Lopatin et al (2003) describe unconventional production from the Bazhenov Shale, which is
the source of nearly all of the oil and gas in the West Siberian Basin. This is the world’s
second most important oil-producing basin and the world’s most important gas-producingbasin, so it is potentially an important development. Production data were gathered for five
major US unconventional reservoirs; the Monterey Diatomite, the Spraberry, the Bakken
Shale, the Codell/Niobrara and the Austin Chalk.
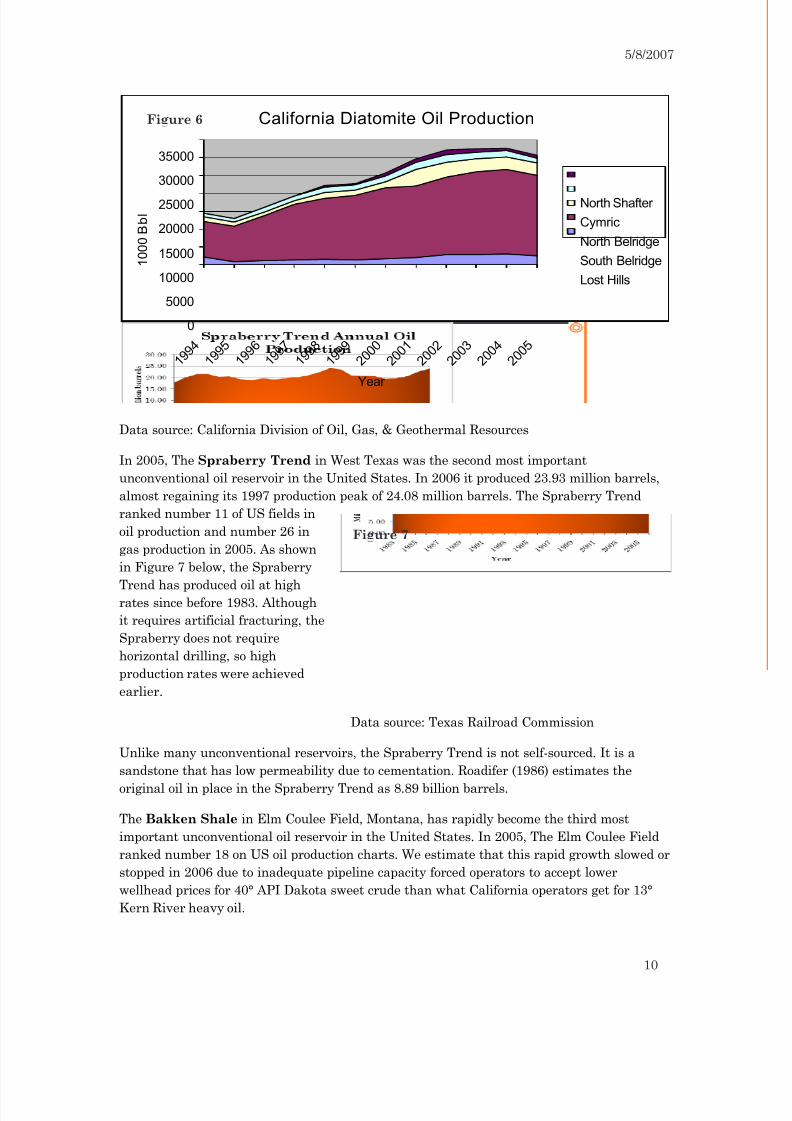
The Monterey Diatomite in California was the most important unconventional oil reservoir
in the United States in terms of 2005 production, accounting for 30.6 million barrels. This
study only includes production from the five largest fields; South Belridge, North Belridge,
Lost Hills, Cymric and North Shafter. Only the diatomite production is included. Naturally
fractured diatomaceous shales such as produce onshore at Orcutt or offshore at Hondo are
not included because they require no specialized technology for their production, rendering
them conventional. Diatomite oil production from the five fields showed strong growth from
1995 to 2004, but declined in 2005. The critical technologies for producing from the diatomite
are artificial fracturing and water or steam injection. Diatomite is characterized by high
porosity but low permeability.
The diatomite oil is light, typically around 30° API, so increased diatomite oil production
from 1995 to 2004 is reason that the proportion of light oil in California’s production
increased during that time. Preliminary 2006 production data suggest a continued decline in
those fields, but do the data is too aggregated for a more thorough review.
8/14/2019 2007-EOR_Survey.pdf
http://slidepdf.com/reader/full/2007-eorsurveypdf 11/16
5/8/2007
10
California Diatomite Oil Production
0
5000
10000
15000
20000
25000
30000
35000
1 9 9 4
1 9 9 5
1 9 9 6
1 9 9 7
1 9 9 8
1 9 9 9
2 0 0 0
2 0 0 1
2 0 0 2
2 0 0 3
2 0 0 4
2 0 0 5
Year
1 0 0 0
B b l
North Shafter
Cymric
North Belridge
South Belridge
Lost Hills
Data source: California Division of Oil, Gas, & Geothermal Resources
In 2005, The Spraberry Trend in West Texas was the second most important
unconventional oil reservoir in the United States. In 2006 it produced 23.93 million barrels,
almost regaining its 1997 production peak of 24.08 million barrels. The Spraberry Trend
ranked number 11 of US fields in
oil production and number 26 in
gas production in 2005. As shown
in Figure 7 below, the Spraberry
Trend has produced oil at highrates since before 1983. Although
it requires artificial fracturing, the
Spraberry does not require
horizontal drilling, so high
production rates were achieved
earlier.
Data source: Texas Railroad Commission
Unlike many unconventional reservoirs, the Spraberry Trend is not self-sourced. It is a
sandstone that has low permeability due to cementation. Roadifer (1986) estimates the
original oil in place in the Spraberry Trend as 8.89 billion barrels.
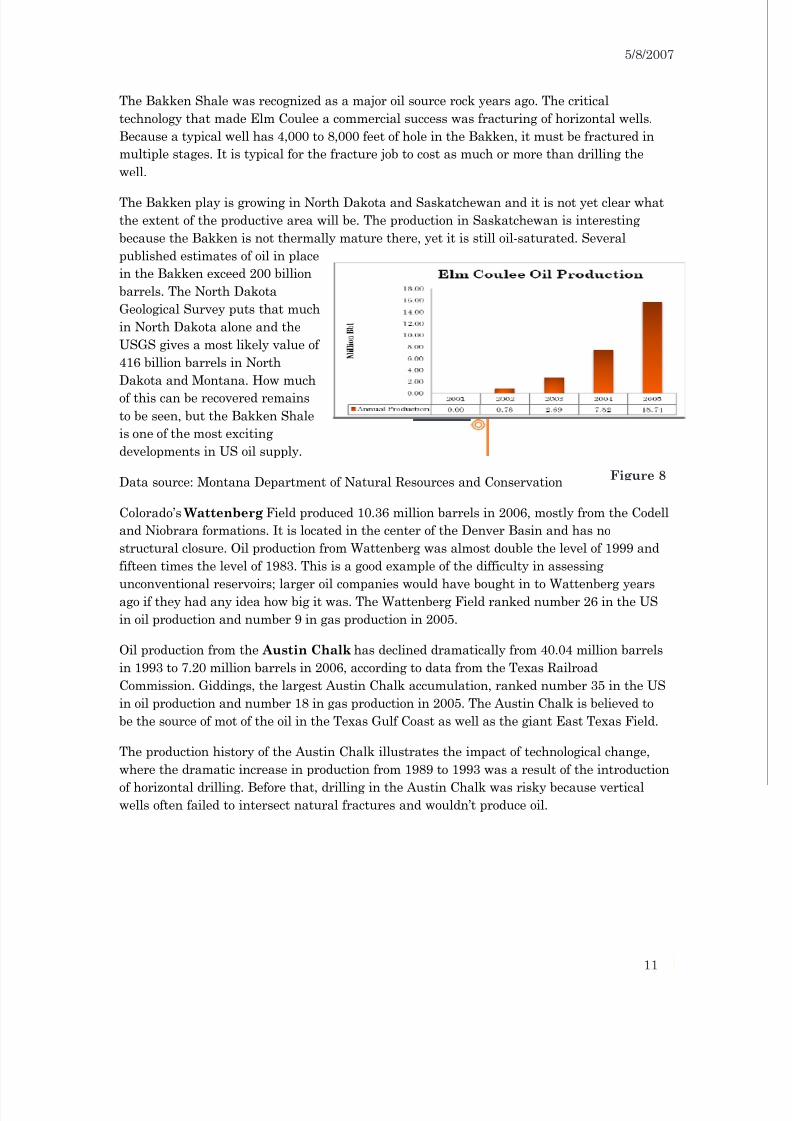
The Bakken Shale in Elm Coulee Field, Montana, has rapidly become the third most
important unconventional oil reservoir in the United States. In 2005, The Elm Coulee Field
ranked number 18 on US oil production charts. We estimate that this rapid growth slowed or
stopped in 2006 due to inadequate pipeline capacity forced operators to accept lower
wellhead prices for 40° API Dakota sweet crude than what California operators get for 13°
Kern River heavy oil.
Figure 6
Figure 7
8/14/2019 2007-EOR_Survey.pdf
http://slidepdf.com/reader/full/2007-eorsurveypdf 12/16
5/8/2007
11
The Bakken Shale was recognized as a major oil source rock years ago. The critical
technology that made Elm Coulee a commercial success was fracturing of horizontal wells.
Because a typical well has 4,000 to 8,000 feet of hole in the Bakken, it must be fractured in
multiple stages. It is typical for the fracture job to cost as much or more than drilling the
well.
The Bakken play is growing in North Dakota and Saskatchewan and it is not yet clear what
the extent of the productive area will be. The production in Saskatchewan is interesting
because the Bakken is not thermally mature there, yet it is still oil-saturated. Several
published estimates of oil in place
in the Bakken exceed 200 billion
barrels. The North Dakota
Geological Survey puts that much
in North Dakota alone and the
USGS gives a most likely value of
416 billion barrels in North
Dakota and Montana. How much
of this can be recovered remains
to be seen, but the Bakken Shale
is one of the most exciting
developments in US oil supply.
Data source: Montana Department of Natural Resources and Conservation
Colorado’s Wattenberg Field produced 10.36 million barrels in 2006, mostly from the Codell
and Niobrara formations. It is located in the center of the Denver Basin and has no
structural closure. Oil production from Wattenberg was almost double the level of 1999 and
fifteen times the level of 1983. This is a good example of the difficulty in assessing
unconventional reservoirs; larger oil companies would have bought in to Wattenberg yearsago if they had any idea how big it was. The Wattenberg Field ranked number 26 in the US
in oil production and number 9 in gas production in 2005.
Oil production from the Austin Chalk has declined dramatically from 40.04 million barrels
in 1993 to 7.20 million barrels in 2006, according to data from the Texas Railroad
Commission. Giddings, the largest Austin Chalk accumulation, ranked number 35 in the US
in oil production and number 18 in gas production in 2005. The Austin Chalk is believed to
be the source of mot of the oil in the Texas Gulf Coast as well as the giant East Texas Field.
The production history of the Austin Chalk illustrates the impact of technological change,
where the dramatic increase in production from 1989 to 1993 was a result of the introduction
of horizontal drilling. Before that, drilling in the Austin Chalk was risky because verticalwells often failed to intersect natural fractures and wouldn’t produce oil.
Figure 8

8/14/2019 2007-EOR_Survey.pdf
http://slidepdf.com/reader/full/2007-eorsurveypdf 13/16
5/8/2007
12
Data source: Texas Railroad Commission
Importance of Unconventional Gas ReservoirsIt is not a stretch to contribute production from unconventional reservoirs as the American
innovation that rescued the domestic US gas supply from depletion. Thus far,
unconventional gas reservoirs show greater successful than unconventional oil reservoirs.
Table 5 below shows the eight most important unconventional gas fields and their 2005
production rank among all US gas fields. Note that 8 of the top 11 gas fields are
unconventional. This is important for three reasons; it provides hope that unconventional oil
may also become more important, natural gas can also be used as a transportation fuel, and
natural gas liquids make excellent transportation fuels.
According to the EIA, two unconventional gas fields ranked among the top 100 US liquids
producing fields, Pinedale (#69, 3.5 million Bbl) and Jonah (#84, 2.6 million Bbl). Both are
located in Sublette County, Wyoming. Unconventional reservoirs are often difficult to
identify, which is why it took until 2002 to discover what is now the second largest gas field
in the United States even though it underlies much of the city of Fort Worth, Texas.
Table 5: Major US Unconventional Gas Fields
Rank Name State Discovery 2005 Production (Bcf.)
1 San Juan Basin NM, CO 1927 1397
2 Newark East TX 2002 496.54 Pinedale WY 1955 457.3
5 PRB Coalbed WY 1992 336.1
6 Jonah WY 1977 273.1
7 Carthage TX 1981 214.1
9 Wattenberg CO 1970 179.1
11 Antrim MI 1965 164.9
Data source: Energy Information Administration
Figure 9

8/14/2019 2007-EOR_Survey.pdf
http://slidepdf.com/reader/full/2007-eorsurveypdf 14/16
5/8/2007
13
CONCLUSIONS Enhanced oil recovery and unconventional reservoirs only account for a small part of world
oil production now. The methods described in this study produce a combined 2.5 million
barrels per day worldwide. Although total oil production from these sources is increasing,
trends within these broad categories range from rapid increase to rapid decline. Truly
impressive growth is seen from carbon dioxide injection, as well as the Elm Coulee and
Wattenberg unconventional oil reservoirs. The largest declines were in steam enhanced
recovery in the US and in the Austin Chalk unconventional reservoir.
Looking at the production histories suggests that new increments of US oil production occur
immediately after enabling technological developments, even in periods of low oil prices. An
example of this is the Austin Chalk, which was not generally economical until the
widespread use of horizontal drilling in the late eighties. Its production rapidly increased to
the 1993 peak and then declined.
On a more optimistic note, the almost complete absence of oil production from carbon dioxide
injection or from unconventional reservoirs outside the US indicates that these technologieshave a bright future as they expand to the rest of the world. Carbon dioxide injection may
still be at an early stage of development in the US, as many fields have passed basic
screening criteria and are waiting
for carbon dioxide supplies.
Additionally, many oil producing
countries have contract terms
that do not encourage costly
approaches such as carbon
dioxide injection or horizontal
drilling in low-permeability.
reservoirs.
To show the potential of
expanding these technologies
outside the United States, one can compare the technologies’ share of total US oil production
to their share of total world oil production, as in Figure 10 above. Using 2006 oil production
numbers from the Oil and Gas Journal, the US produced 5.143 million barrels per day in
2006. The rest of the world produced 67.43 million barrels per day. Thermal EOR contributed
5.6% of US oil production, but only 1.3% of the rest of the world. Carbon dioxide EOR
production contributed 4.6% of US oil production, but only 0.01% of the rest of the world.
Low permeability reservoirs accounted for 4.5% of US oil production in 2005. Increasing the
rest of the world to the same proportions as the US would add 2.9 million barrels per day of
thermal EOR production, 3.1 million barrels per day of carbon dioxide EOR production and
3.1 million barrels of production per day from low permeability reservoirs. In aggregate,
these three methods could equal Saudi Arabia’s conventional oil production.
This projection, however, is too conservative because the thermal EOR potential in Alberta
alone is at least 2.9 million barrels per day. Additionally, much of carbon dioxide potential
has yet to be developed in the US. The limits to carbon dioxide EOR and unconventional
reservoirs are still being explored in the US lower-48. Although unconventional reservoirs
Figure 10

8/14/2019 2007-EOR_Survey.pdf
http://slidepdf.com/reader/full/2007-eorsurveypdf 15/16
5/8/2007
14
outside the US are poorly documented, a well-known example is Mexico’s Chicontepec Trend.
Roadifer (1986) estimates the oil in place at Chicontepec to be 100 billion barrels. This is
much larger than Spraberry’s -- the unconventional reservoir examined in this study that
most resembles Mexico’s Chicontepec.
Table 6 below lists the world’s largest known hydrocarbon accumulations in order of original
oil in place. This shows the importance of heavy oil and tar sands, especially when one
considers that steamfloods often recover as much as 70% of the oil in place, more than most
light oil fields. Dr. Roadifer was the chief geologist of the Mobil Oil Corporation, and was
sure to have had an impressive data collection. Even so, the below list most likely
undercounts unconventional reservoirs given that his estimations were made in 1986.
Table 6: World’s Largest Hydrocarbon Accumulations by Oil in Place
Name Type Country OOIP (Billion Bbl)
Orinoco X-Heavy Oil Venezuela 1,200
Athabasca Tar Sand Canada 869
Cold Lake Tar Sand Canada 271Ghawar Oil Field Saudi Arabia 190
Burgan Oil Field Kuwait 190
Bolivar Coast Oil Field Venezuela 160
Melekess Tar Sand Russia 123
Wabasca Tar Sand Canada 119
Chicontepec Unconventional Mexico 100
Peace River Tar Sand Canada 92
Data source: Roadifer (1986)

8/14/2019 2007-EOR_Survey.pdf
http://slidepdf.com/reader/full/2007-eorsurveypdf 16/16
5/8/2007
15
BIBLIOGRAPHY Alberta Department of Energy, 2004 Oil Sands Projects Bitumen Production, February 2006
Alberta Energy and Utilities Board, Year in Review, 1999 through 2005
California Department of Conservation, Division of Oil, Gas, & Geothermal Resources, Annual
Report of The State Oil & Gas Supervisor, 1998 through 2005
Colorado Oil and Gas Conservation Commission, COGIS (online data retrieval),
http://www.oil-gas.state.co.us/cogis
Department of Energy, Energy Information Administration, U.S. Crude Oil, Natural Gas,
and Natural Gas Liquids Reserves, 1993 to 2005
Department of Energy, Energy Information Administration, Top 100 Oil and Gas Fields,
2005 Hallmark, Fred O., Unconventional Petroleum Resources in California, California
Department of Conservation, Division of Oil, Gas, & Geothermal Resources, 1982
Land, Paul E., Lost Hills Oil Field, California Department of Conservation, Division of Oil,
Gas, & Geothermal Resources, 1984
Lopatin, N.V., Zubairaev*,S.L., Kos, I. M., Emets, T. P., Romanov, E. A. and Malchikhina, O.
V., Unconventional Oil Accumulations In The Upper Jurassic Bazhenov Black Shale
Formation, West Siberian Basin: A Selfsourced Reservoir System, Journal of Petroleum
Geology, vol.26 (2), April 2003, pp 225-244
Montana Department of Natural Resources and Conservation, Oil and Gas Conservation
Division, Montana Oil and Gas Annual Review, 2000 through 2005
Oil and Gas Journal,, EOR/Heavy Oil Survey, 1998, 2000, 2002, 2004, 2006
Oil and Gas Journal, Worldwide Crude Oil and Gas Production, March 12, 2007
Petroleos de Venezuela S. A., Plan Estrategico del Faja del Orinoco, 2005
Roadifer, R. E., How Heavy Oil Occurs Worldwide, Oil and Gas Journal, March 3, 1986
Texas Railroad Comission, Interactive Data, http://www.rrc.state.tx.us/interactive_data.html