Embed Size (px)
Citation preview

2007 by The Education Trust-West
The Pipeline. To Where?Achievement in California
September 25, 2007En Banc Hearing: Growing California’s Leaders, The
Pipeline. Russlynn Ali, Executive Director
The Education Trust-West

2007 by The Education Trust-West
California’s Biggest Crisis:
Closing Achievement and Opportunity Gaps.

2007 by The Education Trust-West
The Gap Between California’s Young People and Their Peers in
Almost Every Other State.

2007 by The Education Trust-West
Latino 4th Grade Students – NAEP READING
Latino 4th Grade Students - 2005 NAEP ReadingAverage Scale Score (Latino) From Highest to Lowest
226
193
180
190
200
210
220
230
240
250
260
Source: National Center for Education Statistics, http://nces.ed.gov/nationsreportcard/

2007 by The Education Trust-West
African American 4th Grade Students – NAEP READING
African American 4th Grade Students - 2005 NAEP ReadingAverage Scale Score (African American) From Highest to Lowest
212
195
180
190
200
210
220
230
240
250
260
Source: National Center for Education Statistics, http://nces.ed.gov/nationsreportcard/

2007 by The Education Trust-West
Almost every other state does better than California in 8th grade reading
Source: NCES, National Assessment of Educational Progress, 2005

2007 by The Education Trust-West
Latino 8th Grade Students – NAEP READING
Source: National Center for Education Statistics, http://nces.ed.gov/nationsreportcard/
Latino 8th Grade Students - 2005 NAEP ReadingAverage Scale Score (Latino) From Highest to Lowest
259
239
225
230
235
240
245
250
255
260
265

2007 by The Education Trust-West
And Let’s Be Clear. It’s Not Our Demographics.

2007 by The Education Trust-West
California’s White 8th Grade Students Trail Behind Their Peers in Most States
Source: National Center for Education Statistics, http://nces.ed.gov/nationsreportcard/
White 8th Grade Students - 2005 NAEP ReadingAverage Scale Score (White) From Highest to Lowest
301
264
230
240
250
260
270
280
290
300
310

2007 by The Education Trust-West
A look closer to home.
LA County
The Gaps On Our Own Assessments.

2007 by The Education Trust-West
LOS ANGELES COUNTYEnglish Language Arts CST 2007
All Students
23
31
47
32
32
35
40
24
35
0%10%20%30%40%50%60%70%80%90%
100%
4th Grade 8th Grade 11 Grade
Prof/ Adv
Basic
Below Basic
Source: California Department of Education, 2007
20
29
51
27
31
41
39
24
37
0%10%20%30%40%50%60%70%80%90%
100%
4th Grade 8th Grade 11 Grade
STATEWIDE
Prof/ Adv
Basic
Below Basic

2007 by The Education Trust-West
LOS ANGELES COUNTYMATH CST 2007
All Students
22
23
56
46
34
20
0%10%20%30%40%50%60%70%80%90%
100%
4th Grade 8th GradeGeneral Math*
Prof/ Adv
Basic
Below Basic
*General Math – Tests Grades 6 & 7 Standards
Source: California Department of Education, 2007
19
23
56
41
36
23
0%
20%
40%
60%
80%
100%
4th Grade 8th GradeGeneral Math*
STATEWIDE
Prof/ Adv
Basic
Below Basic

2007 by The Education Trust-West
But underneath those averages. . . Achievement gaps start early, and get wider the longer students stay
in our schools.

2007 by The Education Trust-West
LOS ANGELES COUNTYEnglish (ELA) 4th Grade, By EthnicityCST 2007
STATEWIDE
27 289 9
34 36
20 17
39 37
71 74
0%
20%
40%
60%
80%
100%
Black Latino White Asian
Prof/ Adv
Basic
Below Basic
Source: California Department of Education, 2007
2937
8 7
3436
18 15
3727
73 78
0%10%20%30%40%50%60%70%80%90%
100%
Black Latino White Asian
Prof/ Adv
Basic
Below Basic

2007 by The Education Trust-West
LOS ANGELES COUNTYMath 4th Grade, By Economic StatusCST 2007
27
27
45
9
18
72
0%10%20%30%40%50%60%70%80%90%
100%
EconomicallyDisadvantaged
Non-Economically
Disadvantaged
STATEWIDE
Prof/ Adv
Basic
Below Basic
Source: California Department of Education, 2007
27
26
47
10
17
74
0%10%20%30%40%50%60%70%80%90%
100%
EconomicallyDisadvantaged
Non-Economically
Disadvantaged
Prof/ Adv
Basic
Below Basic

2007 by The Education Trust-West
By Middle and High School Gaps Grow Increasingly Wider.

2007 by The Education Trust-West
CA: African American and Latino 7th graders read at about the level of White 3rd graders
680
644 645640
575
600
625
650
675
White 3rd Grade White 7th Grade Black 7th Grade Latino 7th Grade
CA
T/6
re
ad
ing
sc
ore
(2
00
7)
CAT/6 2007
Source: California Department of Education, 2007

2007 by The Education Trust-West
LOS ANGELES COUNTY: Same story.
679
641 643640
575
600
625
650
675
White 3rd Grade White 7th Grade Black 7th Grade Latino 7th Grade
CA
T/6
re
ad
ing
sc
ore
(2
00
7)
CAT/6 2007
Source: California Department of Education, 2007

2007 by The Education Trust-West
LOS ANGELES COUNTYELA 11th Grade, By EthnicityCST 2007
STATEWIDE
55 5126 23
24 27
22 20
22 23
52 57
0%
20%
40%
60%
80%
100%
Black Latino White Asian
Prof/ Adv
Basic
Below Basic
Source: California Department of Education, 2007
53 49
24 19
25 27
2018
22 23
56 62
0%10%20%30%40%50%60%70%80%90%
100%
Black Latino White Asian
Prof/ Adv
Basic
Below Basic

2007 by The Education Trust-West
LOS ANGELES COUNTYELA 11th Grade, By Economic StatusCST 2007
52
26
22
29
23
49
0%10%20%30%40%50%60%70%80%90%
100%
EconomicallyDisadvantaged
Non-Economically
Disadvantaged
STATEWIDE
Prof/ Adv
Basic
Below Basic
Source: California Department of Education, 2007
49
27
24
31
22
47
0%10%20%30%40%50%60%70%80%90%
100%
EconomicallyDisadvantaged
Non-Economically
Disadvantaged
Prof/ Adv
Basic
Below Basic

2007 by The Education Trust-West
LOS ANGELES COUNTYAlgebra I (Grades 8-11), By EthnicityCST 2007
STATEWIDE
67 6136
21
22 25
29
23
11 1335
56
0%
20%
40%
60%
80%
100%
Black Latino White Asian
Prof/ Adv
Basic
Below Basic
71 65
3416
2023
29
21
37
64
9 12
0%10%20%30%40%50%60%70%80%90%
100%
Black Latino White Asian
Prof/ Adv
Basic
Below Basic
Source: California Department of Education, 2007

2007 by The Education Trust-West
LOS ANGELES COUNTYAlgebra I (Grades 8-11), By Economic StatusCST 2007
61
24
15
40
28
32
0%10%20%30%40%50%60%70%80%90%
100%
EconomicallyDisadvantaged
Non-Economically
Disadvantaged
STATEWIDE
Prof/ Adv
Basic
Below Basic
Source: California Department of Education, 2007
64
22
14
45
25
30
0%10%20%30%40%50%60%70%80%90%
100%
EconomicallyDisadvantaged
Non-Economically
Disadvantaged
Prof/ Adv
Basic
Below Basic
2007 by The Education Trust-West
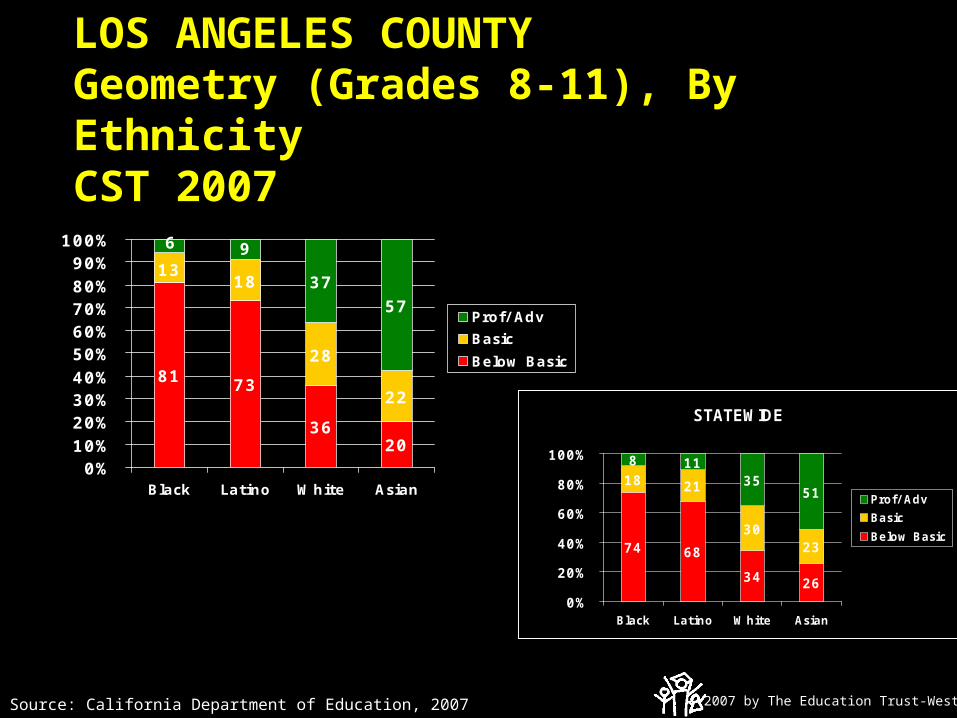
LOS ANGELES COUNTYGeometry (Grades 8-11), By EthnicityCST 2007
Source: California Department of Education, 2007
STATEWIDE
74 68
34 26
18 21
3023
8 1135
51
0%
20%
40%
60%
80%
100%
Black Latino White Asian
Prof/ Adv
Basic
Below Basic
81 73
3620
18
28
22
37
57
1396
0%10%20%30%40%50%60%70%80%90%
100%
Black Latino White Asian
Prof/ Adv
Basic
Below Basic

2007 by The Education Trust-West
LOS ANGELES COUNTYGeometry (Grades 8-11)CST 2007, By Economic Status
66
21
13
40
27
33
0%10%20%30%40%50%60%70%80%90%
100%
EconomicallyDisadvantaged
Non-Economically
Disadvantaged
STATEWIDE
Prof/ Adv
Basic
Below Basic
Source: California Department of Education, 2007
73
17
10
45
23
32
0%10%20%30%40%50%60%70%80%90%
100%
EconomicallyDisadvantaged
Non-Economically
Disadvantaged
Prof/ Adv
Basic
Below Basic
2007 by The Education Trust-West
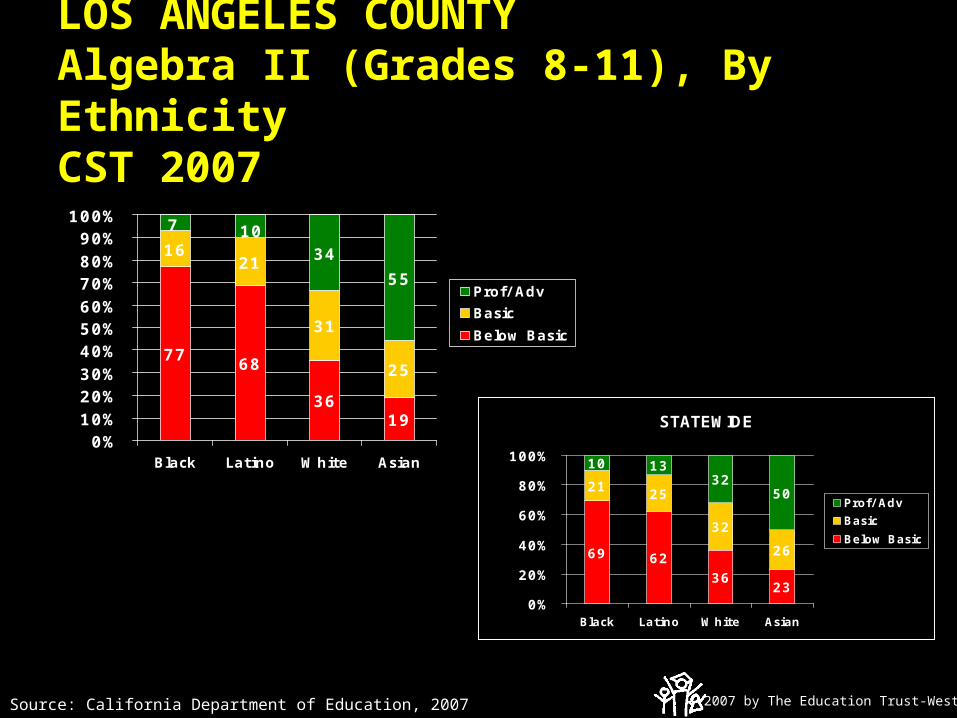
LOS ANGELES COUNTYAlgebra II (Grades 8-11), By EthnicityCST 2007
STATEWIDE
69 6236
23
21 25
32
26
10 1332
50
0%
20%
40%
60%
80%
100%
Black Latino White Asian
Prof/ Adv
Basic
Below Basic
7768
3619
1621
31
25
34
55
7 10
0%10%20%30%40%50%60%70%80%90%
100%
Black Latino White Asian
Prof/ Adv
Basic
Below Basic
Source: California Department of Education, 2007

2007 by The Education Trust-West
LOS ANGELES COUNTYAlgebra II (Grades 8-11)CST 2007, By Economic Status
60
24
16
38
30
33
0%10%20%30%40%50%60%70%80%90%
100%
EconomicallyDisadvantaged
Non-Economically
Disadvantaged
STATEWIDE
Prof/ Adv
Basic
Below Basic
Source: California Department of Education, 2007
65
21
14
41
27
32
0%10%20%30%40%50%60%70%80%90%
100%
EconomicallyDisadvantaged
Non-Economically
Disadvantaged
Prof/ Adv
Basic
Below Basic

2007 by The Education Trust-West
And these are for the students that stay in school.
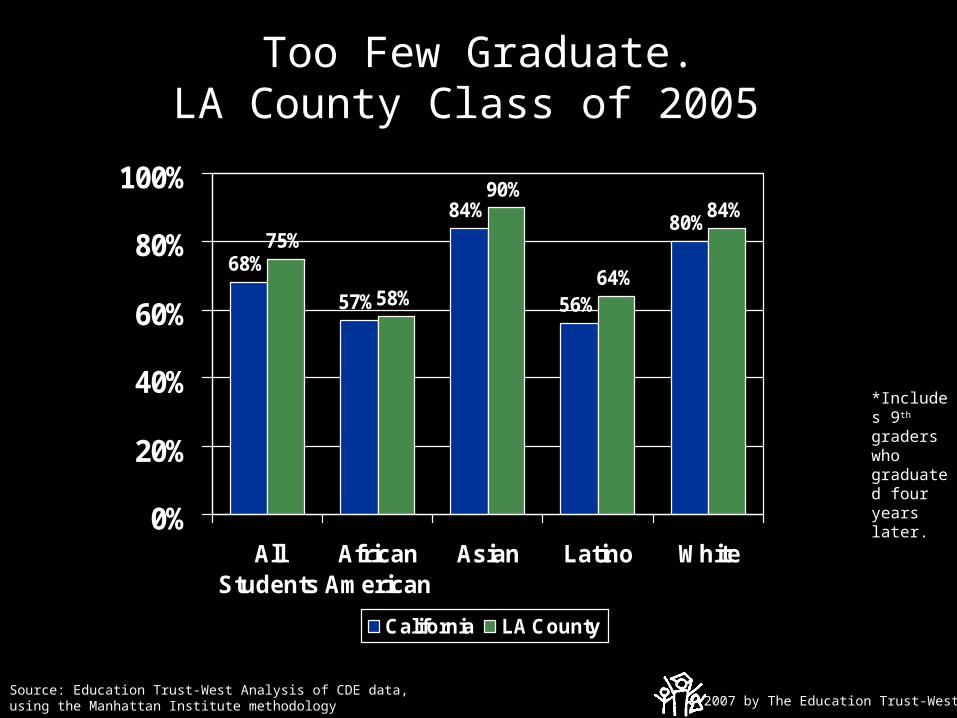
2007 by The Education Trust-West
Too Few Graduate.LA County Class of 2005
68%
57%
84%
56%
80%75%
58%
90%
64%
84%
0%
20%
40%
60%
80%
100%
AllStudents
AfricanAmerican
Asian Latino White
California LA County
Source: Education Trust-West Analysis of CDE data, using the Manhattan Institute methodology
*Includes 9th graders who graduated four years later.

2007 by The Education Trust-West
Scandalous Graduation Rates.Different Numbers. Different Truths?
From soon to be released EdTrust West Grad Rate Web Tool on www.edtrustwest.org.

2007 by The Education Trust-West
And Even Fewer Graduate College ReadyLA County vs. CA Class of 2005
25%
16%
52%
14%
35%30%
18%
60%
16%
38%
0%
20%
40%
60%
80%
100%
AllStudents
AfricanAmerican
Asian Latino White
California LA County
Source: Education Trust-West Analysis of CDE data, using the Manhattan Institute methodology
*Includes 9th graders who graduated four years later.

2007 by The Education Trust-West
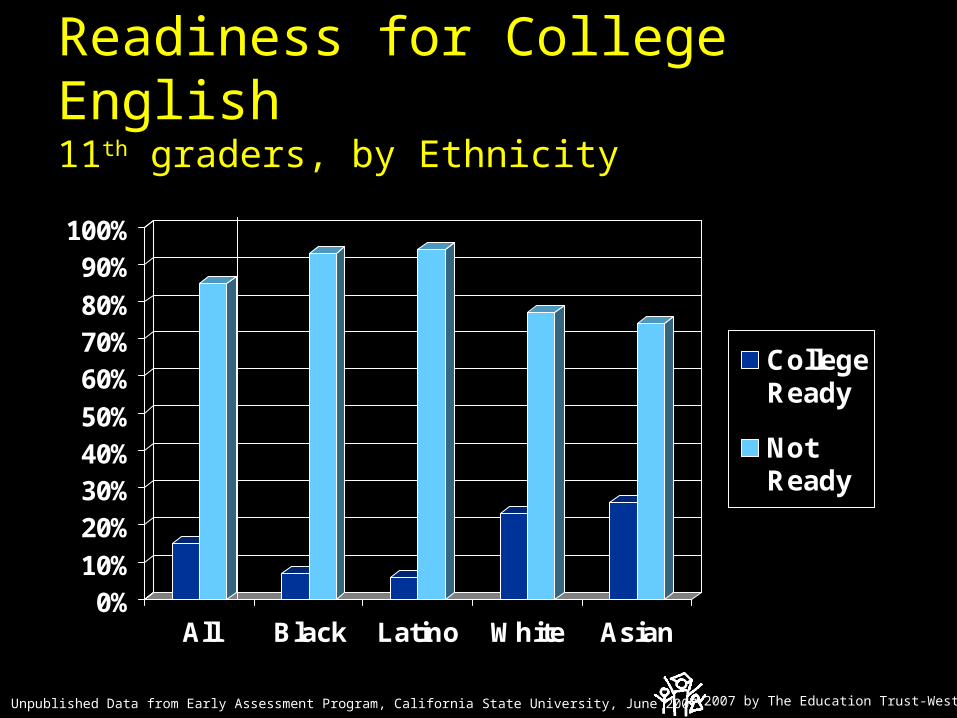
And even for those that are college ready, are they really ready?

2007 by The Education Trust-West
Readiness for College Mathematics 11th graders in Algebra II, by Ethnicity
0%
10%
20%
30%
40%
50%
60%
70%
80%
90%
All Black Latino White Asian
CollegeReady
AdditionalCourseworkNeeded
Not Ready
Source: Unpublished Data from Early Assessment Program, California State University, June 2007
2007 by The Education Trust-West
Readiness for College English11th graders, by Ethnicity
0%10%
20%30%40%50%
60%70%80%
90%100%
All Black Latino White Asian
CollegeReady
NotReady
Source: Unpublished Data from Early Assessment Program, California State University, June 2007

2007 by The Education Trust-West
Hormones?

2007 by The Education Trust-West
If so, we’d see the same pattern in other countries.
And we don’t.

2007 by The Education Trust-West
2003: U.S. Ranked 24th out of 29 OECD Countries in Mathematics
300
350
400
450
500
550
Fin
lan
dK
ore
aN
eth
erla
nds
Japa
nC
ana
daB
elgi
um
Sw
itzer
land
New
Ze
ala
ndA
ustr
alia
Cze
ch R
epu
blic
Icel
and
Den
mar
kF
ranc
eS
wed
en
Aus
tria
Ger
man
yIr
ela
ndO
EC
D A
vera
geS
lova
ck R
epu
blic
Nor
way
Luxe
mbo
urg
Pol
and
Hun
gar
yS
pain
Uni
ted
Sta
tes
Por
tuga
l
Italy
Gre
ece
Tu
rkey
Mex
ico
Ave
rag
e S
cale
Sco
re
Source: Organization for Economic Cooperation and Development (OECD), PISA 2003 Results , data available at http://www.oecd.org/

2007 by The Education Trust-West
Problems are not limited to our high-poverty and high-minority
schools . . .

2007 by The Education Trust-West
U.S. Ranks 23rd out of 29 OECD Countries in the Math Achievement of the Highest-
Performing Students*
300
350
400
450
500
550
600
650
700
Bel
giu
mJa
pan
Kor
ea
Sw
itzer
land
Net
her
land
sN
ew Z
eal
and
Fin
lan
dA
ustr
alia
Can
ada
Cze
ch R
epu
blic
Den
mar
kS
wed
en
Ger
man
yO
EC
D A
VE
RA
GE
Aus
tria
Icel
and
Fra
nce
Slo
vak
Rep
ublic
Nor
way
Hun
gar
yLu
xem
bour
gIr
ela
ndP
olan
dU
nite
d S
tate
sS
pain
Italy
Tu
rkey
Por
tuga
lG
reec
eM
exic
o
Ave
rag
e S
cale
Sco
re
* Students at the 95th PercentileSource: Organization for Economic Cooperation and Development (OECD), PISA 2003 Results , data available at http://www.oecd.org/

2007 by The Education Trust-West
U.S. Ranks 23rd out of 29OECD Countries in the Math Achievement
of High-SES Students
300
350
400
450
500
550
600
Bel
giu
mN
eth
erla
nds
Fin
lan
dC
zech
Re
pub
licC
ana
daJa
pan
Kor
ea
Sw
itzer
land
Aus
tral
iaG
erm
any
New
Ze
ala
ndF
ranc
eD
enm
ark
Sw
ede
nA
ustr
iaH
ung
ary
OE
CD
AV
ER
AG
ES
lova
k R
epub
licLu
xem
bour
gIr
ela
ndIc
ela
ndP
olan
dN
orw
ayU
nite
d S
tate
sS
pain
Por
tuga
lIta
lyG
reec
eT
urk
eyM
exic
o
Ave
rag
e S
cale
Sco
re
Source: Organization for Economic Cooperation and Development (OECD), PISA 2003 Results, data available at http://www.oecd.org/
2007 by The Education Trust-West
Where we rank high?The size of our achievement gap.

2007 by The Education Trust-West
*Of 29 OECD countries, based on scores of students at the 5th and 95th percentiles.
PISA 2003: Gaps in Performance Of U.S.15 Year-Olds Are Among the
Largest of OECD Countries
Rank in Performance Gaps Between Highest and Lowest Achieving
Students *
Mathematical Literacy 8th
Problem Solving 6th
Source: Organization for Economic Cooperation and Development (OECD), PISA 2003 Results, data available at http://www.oecd.org/

2007 by The Education Trust-West
Is the achievement gap all about poverty?
Turns out, No.

2007 by The Education Trust-West
Non-Poor Minority Students have the Same ELA Proficiency Rates as Poor White Students
2007 CST-ELA (All Students)
24
40 26
42 41
67
0
10
20
30
40
50
60
70
Black Latino White
EconomicallyDisadvantaged
Non-economicallyDisadvantaged
Source: 2007 CST Results News Release, State Superintendent Jack O’Connell

2007 by The Education Trust-West
Non-Poor Minority Students have Lower Math Proficiency Rates than Poor White Students
2007 CST-Math (All Students)
22 30
29 3638
56
0
10
20
30
40
50
60
Black Latino White
EconomicallyDisadvantaged
Non-economicallyDisadvantaged
Source: 2007 CST Results News Release, State Superintendent Jack O’Connell

2007 by The Education Trust-West
The Good News?
When we focus on changing those patterns, we get results.

2007 by The Education Trust-West
LOS ANGELES COUNTYMath 4th Grade, By English Proficiency
CST 2007
33
30
38
313
84
19
22
59
0%10%20%30%40%50%60%70%80%90%
100%
EnglishLearner
RedesignatedFluentEnglish
Proficient
English Only
Prof/ Adv
Basic
Below Basic
Source: California Department of Education, 2007
31
30
39
313
83
17
22
61
0%
20%
40%
60%
80%
100%
EnglishLearner
RedesignatedFluentEnglish
Proficient
English Only
STATEWIDE
Prof/ Adv
Basic
Below Basic

2007 by The Education Trust-West
Sustainable Improvement is Possible.A Model: Ralph Bunche Elementary - Compton Unified
• 48% African-American
• 50% Latino• 93% Low-income
• Outperforming District and State 2nd, 3rd, 4th, and 5th grade Math
38 35
79
27
43
93
3342
87
0102030405060708090
100
California ComptonUnified
RalphBunche
% a
t or
ab
ove
pro
ficie
nt i
n 4
th g
rad
e M
ath
African-American Latino Low-income
Source: California Department of Education, 2007

2007 by The Education Trust-West
Rapid Growth is Possible:A Model: Ralph Bunche Elementary - Compton Unified
English CST proficiency 2003-2007
200320032003 2007200720070%
10%20%30%40%50%60%70%80%90%
100%
California Compton Unified Ralph Bunche
4th
gra
ders
% p
rof/
ad
v 64%
51%
27%
Source: California Department of Education, 2007

2007 by The Education Trust-West
Rapid Growth is Possible:A Model: Ralph Bunche Elementary - Compton Unified
Math CST proficiency 2003-2007
200320032003 2007200720070%
10%20%30%40%50%60%70%80%90%
100%
California Compton Unified Ralph Bunche
4th
gra
ders
% p
rof/
ad
v
76%
56%
38%
Source: California Department of Education, 2007

2007 by The Education Trust-West
Hughes Middle – Long Beach Unified
• 55% African-American and Latino
• 48% Low-income
• Outperforming District and State 8th grade ELA
27 28
4729
26
48
2826
46
0102030405060708090
100
California LongBeach
Hughes% a
t or
ab
ove
pro
ficie
nt i
n 8
th g
rad
e E
LA
African-American Latino Low-income
Source: California Department of Education, 2007

2007 by The Education Trust-West
A Tale of Two High Schools in LA County
Source: California Department of Education http://www.cde.ca.gov
Garfield Senior High School Los Angeles UnifiedOver 4000 studentsOver 80% low-income
El Monte High El Monte Union High School DistrictOver 2000 studentsOver 75% low-income
2007 by The Education Trust-West
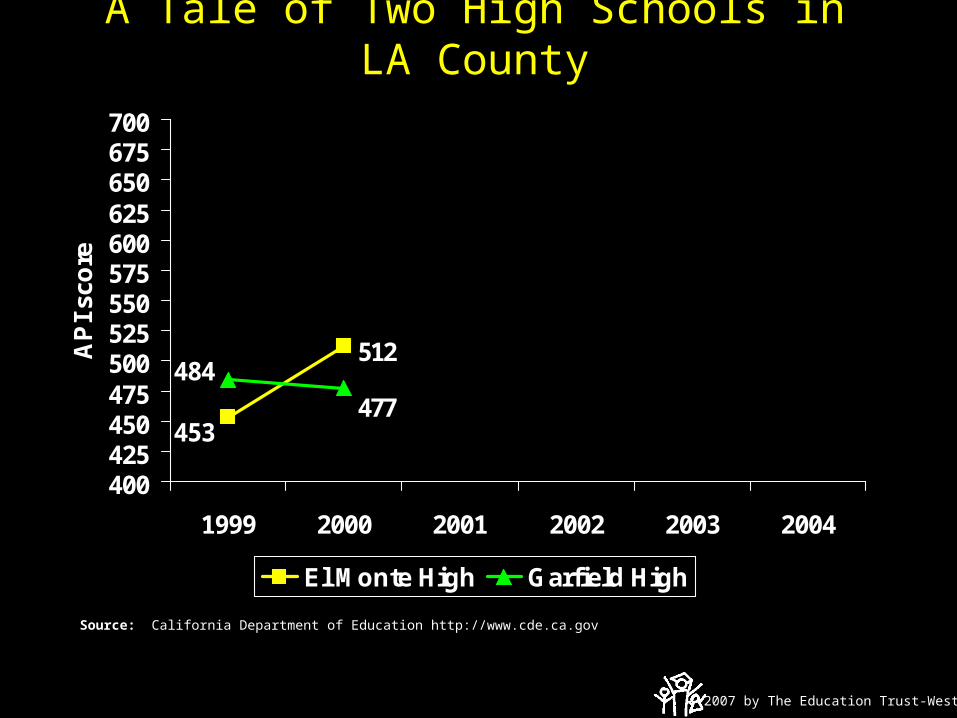
A Tale of Two High Schools in LA County
512
453
484
477
400425450475500525550575600625650675700
1999 2000 2001 2002 2003 2004
AP
I sc
ore
El Monte High Garfield High
Source: California Department of Education http://www.cde.ca.gov

2007 by The Education Trust-West
A Tale of Two High Schools in LA County
453
512538
567
490480477
484
400425450475500525550575600625650675700
1999 2000 2001 2002 2003 2004
AP
I sc
ore
El Monte High Garfield High
Source: California Department of Education http://www.cde.ca.gov
2007 by The Education Trust-West
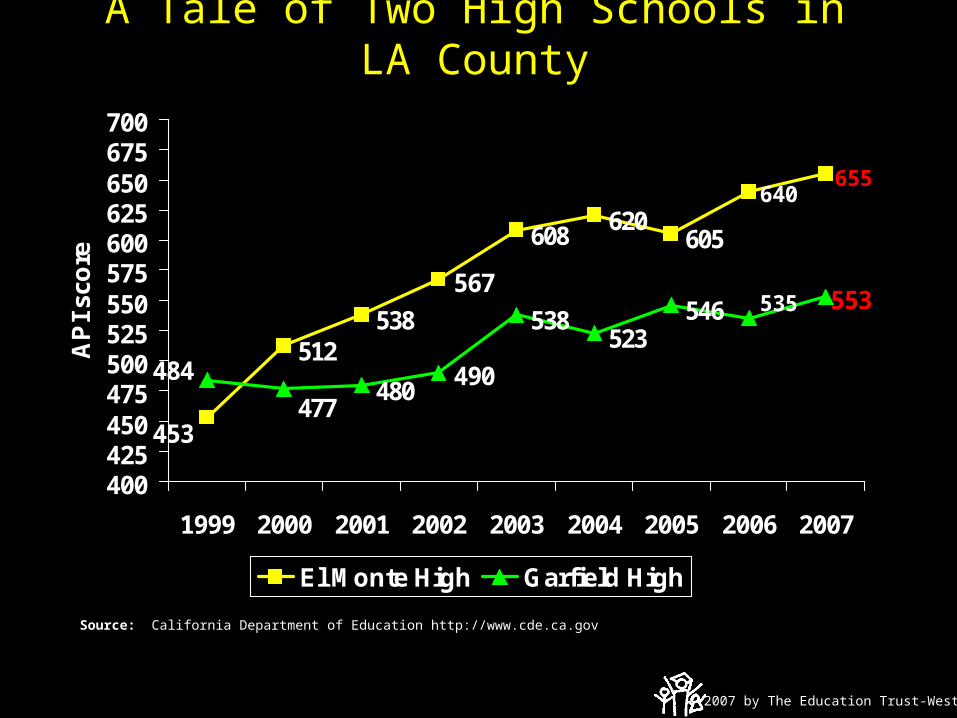
A Tale of Two High Schools in LA County
655
453
512538
567
608620
605
640
553535546523
538
490480
477
484
400425450475500525550575600625650675700
1999 2000 2001 2002 2003 2004 2005 2006 2007
AP
I sc
ore
El Monte High Garfield High
Source: California Department of Education http://www.cde.ca.gov

2007 by The Education Trust-West
Are districts in LA County who are closing gaps?
Source: Raising the Roof, 2007. Data collected are 2005 API Base Scores

2007 by The Education Trust-West
Are there High Schools in LA County closing gaps?
Source: Raising the Roof, 2007. Data collected are 2005 API Base Scores

2007 by The Education Trust-West
How?
• Equal Access to Rigor. With the right supports.

2007 by The Education Trust-West
Even though most students want to go to college, the truth is, many low income students and students of color aren’t getting the classes in the first place.

2007 by The Education Trust-West
Grade 7 Standards Based, Rigorous Writing Assignment
Source: Unnamed school district in California, 2002-03 school year.
Essay on Anne FrankEssay on Anne Frank
Your essay will consist of an opening paragraph which Your essay will consist of an opening paragraph which introduced the title, author and general background of the introduced the title, author and general background of the novel. novel. Your thesis will state specifically what Anne's overall Your thesis will state specifically what Anne's overall personality is, and what general psychological and personality is, and what general psychological and intellectual changes she exhibits over the course of the intellectual changes she exhibits over the course of the bookbookYou might organize your essay by grouping psychological You might organize your essay by grouping psychological and intellectual changes OR you might choose 3 or 4 and intellectual changes OR you might choose 3 or 4 characteristics (like friendliness, patience, optimism, self characteristics (like friendliness, patience, optimism, self doubt) and show how she changes in this area. doubt) and show how she changes in this area.

2007 by The Education Trust-West
Grade 7 Low-Level Writing Assignment
Source: Unnamed school district in California, 2002-03 school year.
•My Best Friend:My Best Friend:
•A chore I hate:A chore I hate:
•A car I want:A car I want:
•My heartthrob:My heartthrob:
2004 by The Education Trust-West

2007 by The Education Trust-West
Same Course & Text Book: High-Level college-prep assignment.
• Describe the fundamental problems in the economy that helped cause the Great Depression. Consider agriculture, consumer spending and debt, distribution of wealth, the stock market
• Describe how people struggled to survive during the Depression
• How did Hoover’s belief in “rugged individualism” shape his policies during the depression?

2007 by The Education Trust-West
Same Course & Text Book:Low Level college-prep assignment.• Role play (Meet the Press) & interview key
people of the era• Draw a political cartoon highlighting a
major event of the time• Share excerpts from noted literary
authors-Lewis, Fitzgerald, Hemingway, Hughes
• Listen to jazz artists of the 20’s• Construct a collage depicting new
inventions

2007 by The Education Trust-West
Be careful of courses that are supposed to prepare students for
the workforce. Are courses code language for old-style vocational education tracking?
Who gets access to the rigorous academies, and who gets courses
that lead to dead end jobs?

2007 by The Education Trust-West
How?
• Equal Access to Rigor. With the right supports.– Like MORE TIME!

2007 by The Education Trust-West
The Full Year Calendar
Most Administrators Don’t Realize How Little Time They Have For Teaching And Learning.
Analysis of One California Urban Middle School Calendar
Source: Ed Trust – West analysis of the master schedule of an unnamed school in CA

2007 by The Education Trust-West
Less Summer Vacation
Source: Ed Trust – West analysis of the master schedule of an unnamed school in CA

2007 by The Education Trust-West
Less Weekends, Holidays, & Summer Vacation
Source: Ed Trust – West analysis of the master schedule of an unnamed school in CA

2007 by The Education Trust-West
Less Professional Development Days & Early Dismissal/Parent Conferences
Source: Ed Trust – West analysis of the master schedule of an unnamed school in CA

2007 by The Education Trust-West
Less Class Picnic, Class Trip, Thanksgiving Feast, Christmas, Kwanzaa, Hanukkah, Awards, Assembles,
& Concerts
Source: Ed Trust – West analysis of the master schedule of an unnamed school in CA

2007 by The Education Trust-West
Less State and District Testing and Other Non-Instructional Time
Source: Ed Trust – West analysis of the master schedule of an unnamed school in CA

2007 by The Education Trust-West
BOTTOM LINE?
Teachers are left with about
24 School Days
OR
18 Eight Hour Days Per Subject
Per Year

2007 by The Education Trust-West
We can’t be serious about closing the achievement gap while letting the teacher quality gap persist.

2007 by The Education Trust-West
A Greater Percentage of Intern Teachers Work in High-Minority
Schools• 85% of all interns are
teaching in schools with over 50% minority students, compared to only 7% of interns in schools with less than 25% minority student population.
18%
31%
44%
7%
Lowest QuartileThird QuartileSecond QuartileHighest Quartile
Minority Quartiles
Guha, R., Campbell, A., Humphrey, D., Shields, P., Tiffany-Morales, J., & Wechsler, M. (2006). California’s teaching force 2006: Key issues and trends. Santa Cruz, CA: The Center for the Future of Teaching and Learning.

2007 by The Education Trust-West
The Teacher Quality Gap is about money too. We’re spending far
less on teaching the kids who need good teachers the most.

2007 by The Education Trust-West
A Tale of Two Schools
Granada Hills High SchoolLos Angeles Unified
• 32% Latino & African American • 27% of students receive free or
reduced price lunch• Academic Performance Index =
773
Locke High SchoolLos Angeles Unified
• 99% Latino & African American• 66% of students receive free or
reduced price lunch• Academic Performance Index =
440
Source: CA Department of Education, 2003-04 data

2007 by The Education Trust-West
The average teacher at Locke High School gets paid an estimated $8,034 less every year than his counterpart at Granada Hills High School.
If Locke spent as much as Granada Hills on teacher salaries for its 119 teachers, the
school budget would increase by nearly a million dollars ($956,056) every year.

2007 by The Education Trust-West
Tale of Two Schools: Bellflower Unified
Districtwide:
54% low-income
63% Latino and African American
2007 by The Education Trust-West
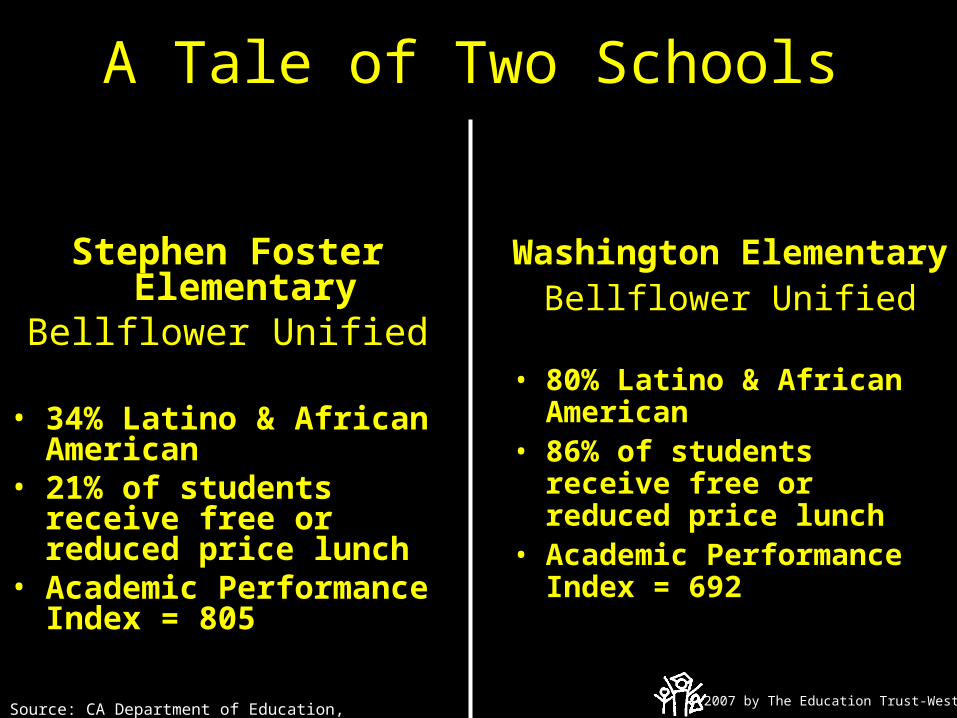
A Tale of Two Schools
Stephen Foster Elementary
Bellflower Unified
• 34% Latino & African American
• 21% of students receive free or reduced price lunch
• Academic Performance Index = 805
Washington ElementaryBellflower Unified
• 80% Latino & African American
• 86% of students receive free or reduced price lunch
• Academic Performance Index = 692
Source: CA Department of Education, 2003-04 data

2007 by The Education Trust-West
The average teacher at Washington Elementary gets paid an estimated
$11,343 less every year than his counterpart at Foster.
If Washington spent as much as Foster on teacher salaries for its 52 teachers, the school budget would increase by
$589,836 every year.

2007 by The Education Trust-West
If we had the courage and creativity to change these
patterns?

2007 by The Education Trust-West
“The Rivkin, Hanushek, and Kain estimates of teacher performance suggest that having five years of
good teachers in a row* could overcome the average seventh-
grade mathematics achievement gap […].”
* “1.0 standard deviation above average, or at the 85th quality percentile”SOURCE: Eric A. Hanushek and Steven G. Rivkin, “How to Improve the Supply of High-Quality Teachers,” In Brookings Papers on Education Policy: 2004,” Diane Ravitch, ed., Brrookings Institution Press, 2004.Estimates based on research using data from Texas described in “Teachers, Schools, and AcademicAchievement,” Working Paper Number 6691, National Bureau of Economic Research, revised July 2002.

2007 by The Education Trust-West
Would More Money Help?
Of course, but more money must be spent more wisely.
Advocates for more money must also be advocates for reform.

2007 by The Education Trust-West
Some districts that out-perform spend lessNAEP 2005 Grade 8 Math -Overall Scale Scores
220
230
240
250
260
270
280
290
Aus
tin
Cha
rlot
te
Bos
ton
San
Die
go
Hou
ston
New
Yor
k C
ity
Chi
cago
Los
Ang
eles
Cle
vela
nd
Atla
nta
Dis
tric
t of C
olum
bia
Ave
rag
e S
cale
Sco
re
Source: National Center for Education Statistics, http://nces.ed.gov/nationsreportcard/nde and Standard and Poor’s www.schoolmatters.com
$7,284
$7,132
$12,562
$8,311
$6,923
$11,920
$7,799
$8,283
$10,199
$11,312
$11,847

2007 by The Education Trust-West
Closing California’s Achievement Gaps is the Most Important Issue
Facing Our Public Schools.
The real question moving forward is how to develop the civic and
political heft to do what it takes.
We have the know how. But do we have the will?

2007 by The Education Trust-West
Registration Begins in the Fall.
SAVE THE DATE!
The Education Trust – West 510-465-6444www.edtrustwest.org


![Key Banc Conference Final[1]](https://img.pdfslide.us/doc/110x75/55b123b8bb61ebb1678b459b/key-banc-conference-final1.jpg)