Embed Size (px)
Citation preview

Status of the Lee’s Ferry Trout Fishery
2006 Annual Report
Andrew S. Makinster, Roland S. Rogers, and Bill Persons
Arizona Game and Fish Department Research Branch
2221 W. Greenway Rd. Phoenix, AZ 85023
Submitted to:
Grand Canyon Monitoring and Research Center 2255 North Gemini Drive
Flagstaff, AZ 86001 Cooperative Agreement No. 05WRAG0050 – Mod 2
April 2007

i
TABLE OF CONTENTS
TABLE OF CONTENTS…………………………………………………………………..i
LIST OF TABLES………………………………………………………………………...ii
LIST OF FIGURES………………………………………………………………………iii
EXECUTIVE SUMMARY……………………………………………………………….v
INTRODUCTION………………………………………………………………………...1
METHODS………………………………………………………………………………..2
Field collections…………………………………………………………………...2
Data analysis………………………………………………………………………4
Evaluation of data from fixed and random sites…………………………..4
Long term monitoring……………………………………………………..4
Age and growth evaluation…….…………..……………………………...5
RESULTS…………………………………………………………………………………6
Evaluation of data from fixed and random sites…………………………………..7
Long term monitoring……………………………………………………………..7
Age and growth evaluation………………...……………………………………...9
DISCUSSION……………………………………………………………………………..9
ACKNOWLEDGEMENTS……………………………………………………………...12
LITERATURE CITED…………………………………………………………………..13

ii
LIST OF TABLES
Table 1. Results of analysis of variance on rainbow trout (RBT) relative abundance
(CPUE; catch per minute), relative condition (Kn), and size structure (PSD;
proportional stock density) by size class between fixed and random transects in
the Lee’s Ferry tailwater fishery. Data represent similar time frames for each
transect type (June 2002 – October 2006). * denotes significance at the α = 0.05
level....……………………………………………………………………………16
Table 2. Number of each species captured per trip by transect type at Lee’s Ferry in
2006. RBT = rainbow trout; BNT = brown trout; CRP = common carp; FMS =
flannelmouth sucker; WAL = walleye; CCF = channel
catfish…………………………………………………………………………….17
Table 3. Mean back-calculated total length (TL, mm), total number of back-calculations,
and percent contribution of ages of rainbow trout derived from otoliths in the
Lee’s Ferry tailwater fishery, 2004-2006. Standard error of the mean is given in
parenthesis...……………………………………………………………………...18

iii
LIST OF FIGURES
Figure 1. Map showing the Lee’s Ferry tailwater fishery below Glen Canyon Dam, on
the Colorado River, Arizona. Fixed sampling locations are shaded gray……….19
Figure 2. Mean daily discharge (cfs) from Glen Canyon Dam during 2006……………20
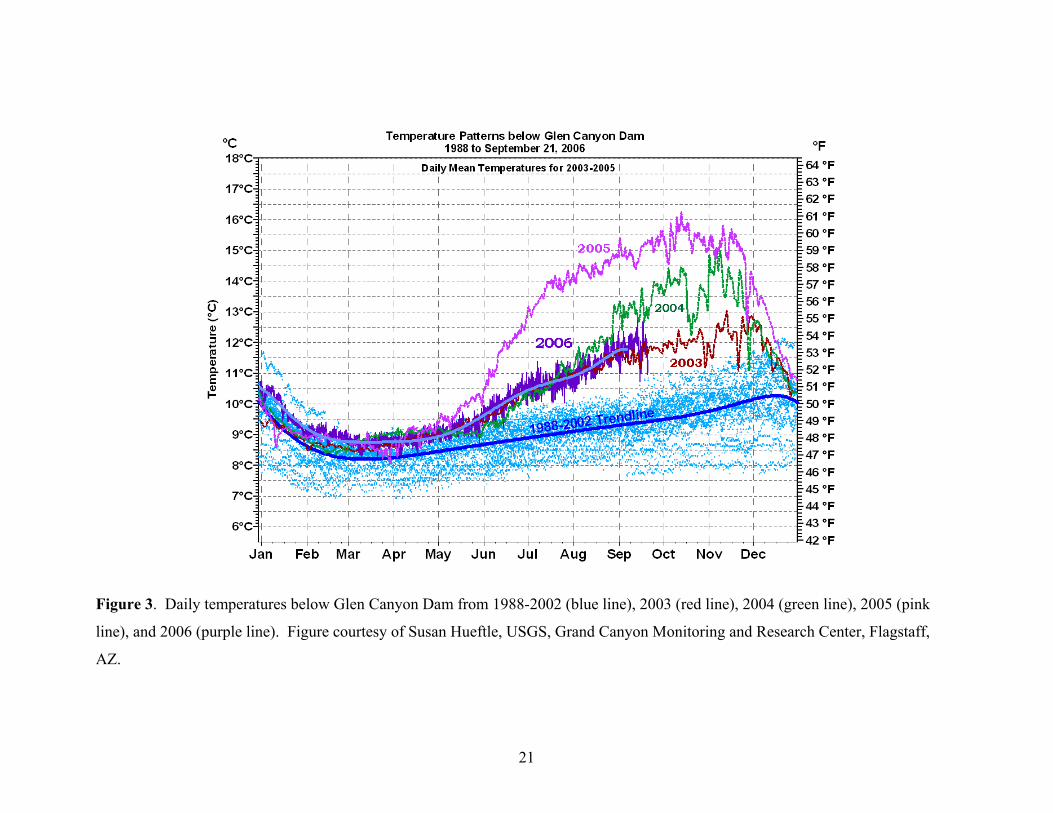
Figure 3. Daily temperatures below Glen Canyon Dam from 1988-2002 (blue line), 2003
(red line), 2004 (green line), 2005 (pink line), and 2006 (purple line). Figure
courtesy of Susan Hueftle, USGS, Grand Canyon Monitoring and Research
Center, Flagstaff, AZ…………………………………………………………….21
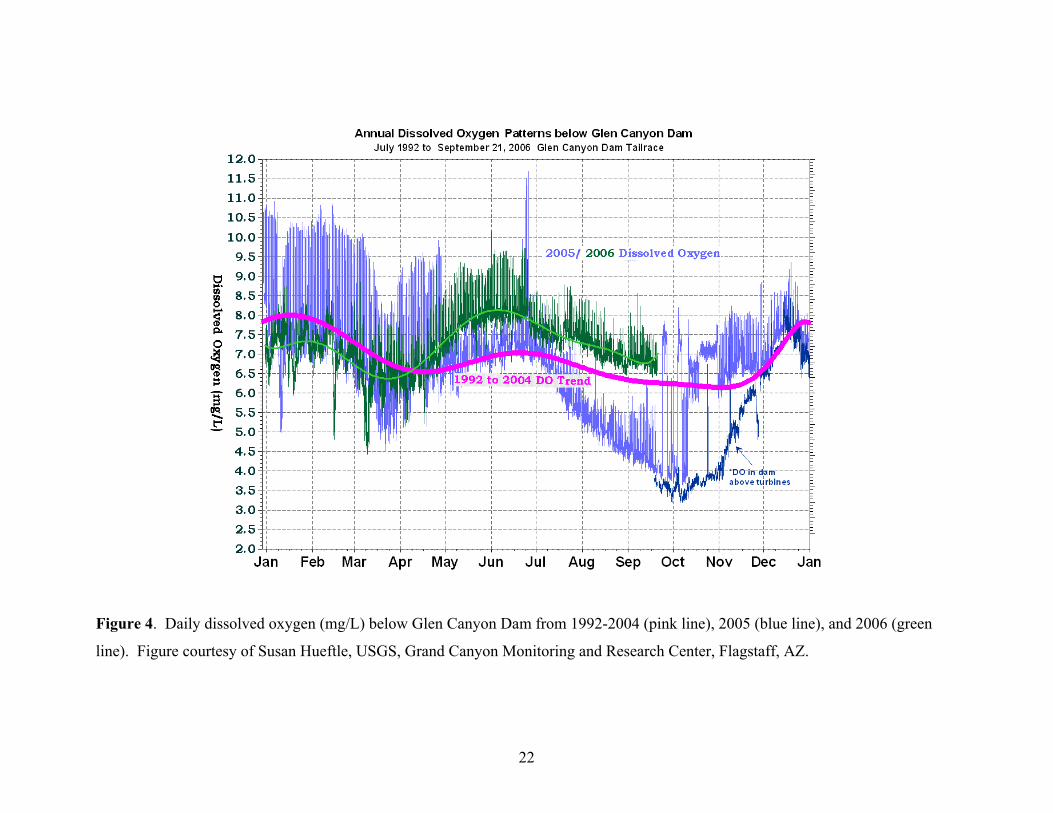
Figure 4. Daily dissolved oxygen (mg/L) below Glen Canyon Dam from 1992-2004
(pink line), 2005 (blue line), and 2006 (green line). Figure courtesy of Susan
Hueftle, USGS, Grand Canyon Monitoring and Research Center,
Flagstaff, AZ……………………………………………………………………..22
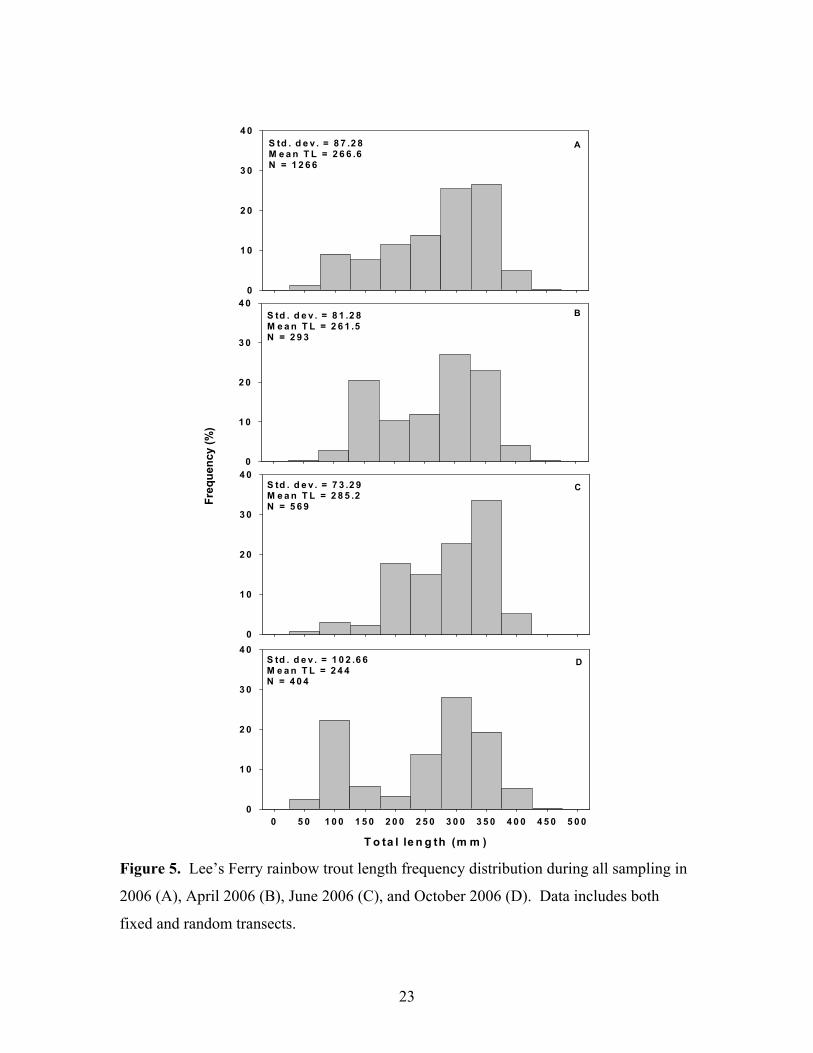
Figure 5. Lee’s Ferry rainbow trout length frequency distribution during all sampling in
2006 (A), April 2006 (B), June 2006 (C), and October 2006 (D). Data includes
both fixed and random transects....………………………………………………23
Figure 6. Rainbow trout mean relative abundance (catch per minute) in the Lee’s Ferry
tailwater fishery, 1991-2006. Figure represents data from all size classes in both
fixed and random transects. Bars represent ± 1 S.E. of the mean..……………...24
Figure 7. Rainbow trout mean relative abundance (catch per minute) for fish < 152 mm
total length (TL; A), 152-304 mm TL (B), 305-405 mm TL (C), and > 405 mm
TL (D) in the Lee’s Ferry tailwater fishery, 1991-2006. Figure represents data
from both fixed and random transects. Bars represent ± 1 S.E. of the mean……25
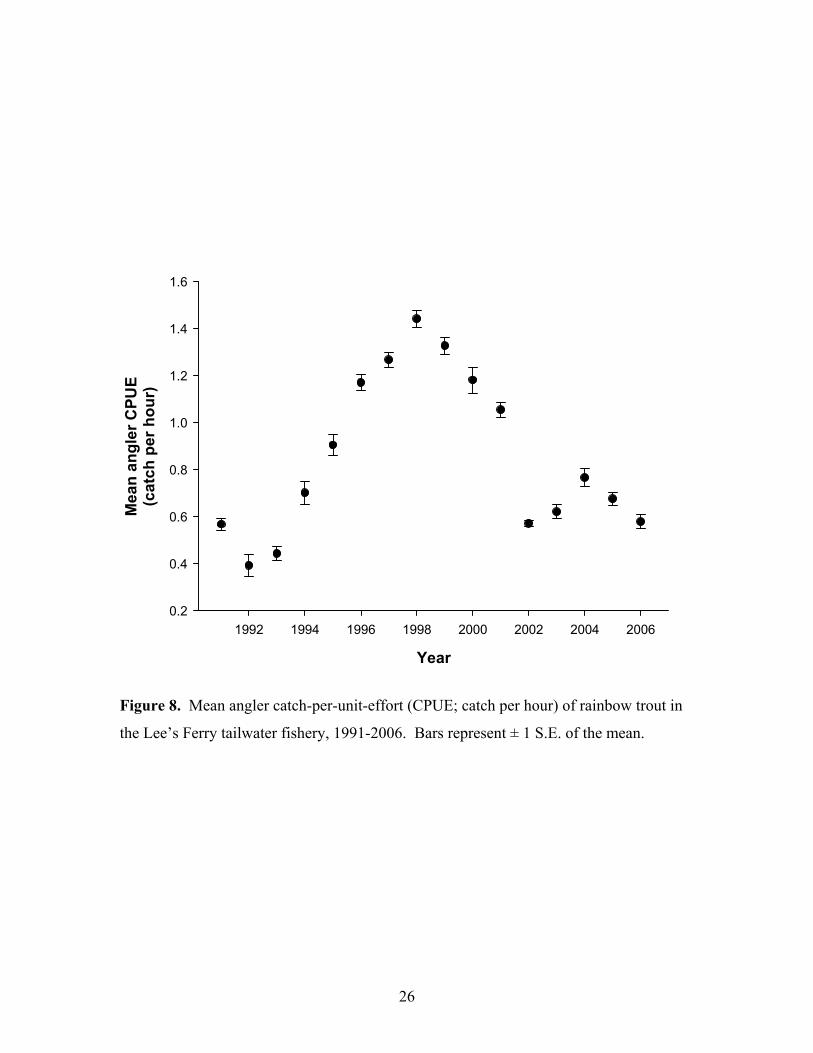
Figure 8. Mean angler catch-per-unit-effort (CPUE; catch per hour) of rainbow trout in

iv
the Lee’s Ferry tailwater fishery, 1991-2006. Bars represent ± 1 S.E. of the
mean…..………………………………………………………………………….26
Figure 9. Rainbow trout mean proportional stock density (PSD) in the Lee’s Ferry
tailwater fishery, 1991-2006. Figure represents data from both fixed and random
transects. Bars represent ± 1 S.E. of the mean………………………...………...27
Figure 10. Rainbow trout mean relative condition (Kn) in the Lee’s Ferry tailwater
fishery, 1991-2006. Figure represents data from all size classes in both fixed and
random transects. Bars represent ± 1 S.E. of the mean..………………………...28
Figure 11. Rainbow trout mean relative condition (Kn) for fish < 152 mm total length
(TL; A), 152-304 mm TL (B), 305-405 mm TL (C), and > 405 mm TL (D) in the
Lee’s Ferry tailwater fishery, 1991-2006. Figure represents data from both fixed
and random transects. Bars represent ± 1 S.E. of the mean……………………..29
Figure 12. Modeled Lee’s Ferry rainbow trout estimated length at age for fish captured
during 1990-1999 (Floy tag recapture data; blue line), and 2000-2006 (pittag
recapture data; red line). Pink triangles represent back-calculated lengths at age
from otolith analysis (2004-2006)..……………………………………………...30

v
EXECUTIVE SUMMARY
We present results of rainbow trout monitoring in the Lee’s Ferry
tailwater (Colorado River below Glen Canyon Dam, AZ) during 2006. We also describe
modifications made to monitoring strategies and techniques which were implemented to
improve long-term monitoring programs. Objectives and subsequent findings are as
follows:
Objective 1: Evaluate data from fixed and random transects to determine if data
can be pooled thereby increasing power to detect trends in the rainbow trout population.
Fixed sites provide long-term trend data for monitoring fish populations in the
Lee’s Ferry tailwater. Beginning in 2002, we implemented an augmented, serially
alternating sampling design which incorporates random sites with the fixed sites to
provide improved point estimates of fishery status. However, for statistical analyses it is
unclear as to whether the two types of data can be combined for more powerful
evaluation of long-term trends. To evaluate differences in means and variances of the
two types of data, we compared catch per unit effort (CPE), relative condition (Kn) and
size structure, (PSD; # fish ≥ 406 mm TL/# fish ≥ 305 mm TL)*100 from fixed and
random sites during similar time periods using one-way analysis of variance (ANOVA;
S. Urquhart, personal communication).
Objective 2: Monitor the trout fishery in the Lee’s Ferry reach to determine
status and trends in abundance (CPE), population structure (size composition and
proportional stock density, PSD), growth rate and relative condition (Kn).
Data collected during 2006 indicate the Lee’s Ferry fishery may be improving
after a period of high densities and low fish condition that occurred from 1998 to 2001.
Low relative abundance of all fish from 2006, particularly fish < 200 mm, appears to be
leading to increases in PSD and growth. Relative condition in 2006 was the highest
observed since 1996. Overrecruitment and density dependent growth from the past
appear to be alleviated. However, resource limitation (i.e. food, space) and water quality
(i.e. temperature, dissolved oxygen) now appear to be problematic. The New Zealand
mudsnail has proliferated throughout the tailwater and has been known to restructure
food webs. Drought conditions at Lake Powell have caused fluctuating cycles in the
vi
amount of dissolved oxygen coming through Glen Canyon Dam. This was especially
apparent during the fall of 2005 when DO levels reached the lower lethal limit for
rainbow trout in the fishery and likely caused further deterioration of the aquatic
foodbase.
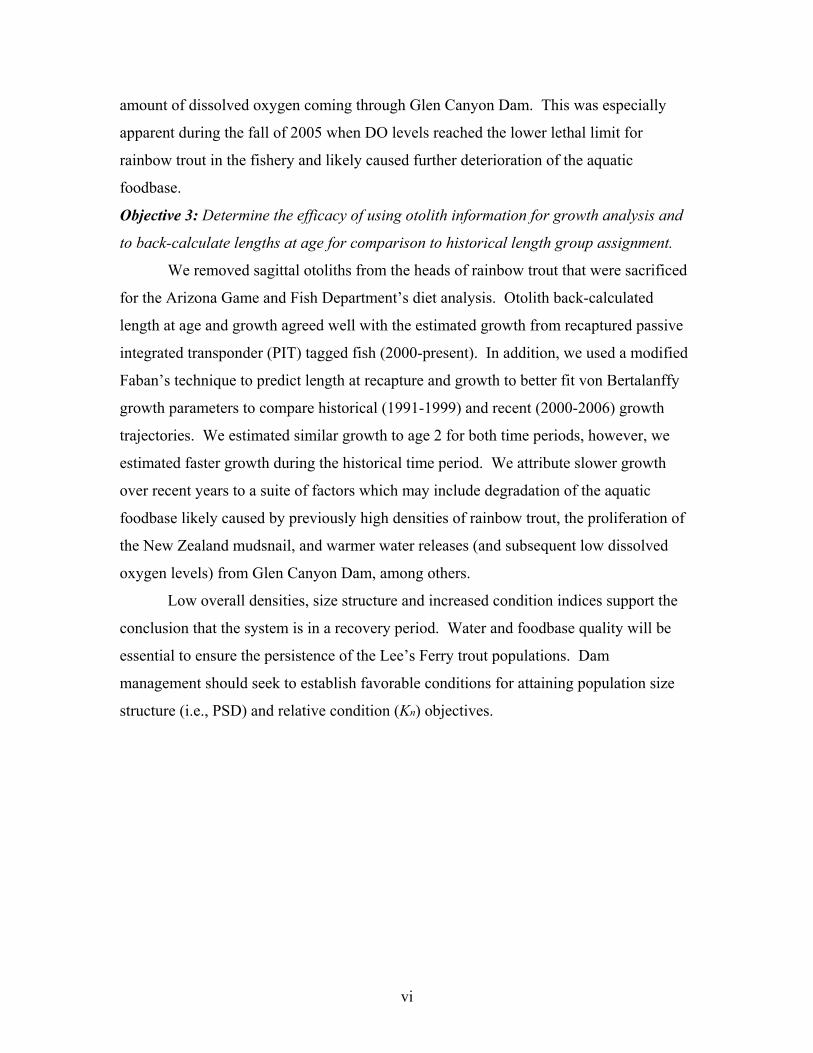
Objective 3: Determine the efficacy of using otolith information for growth analysis and
to back-calculate lengths at age for comparison to historical length group assignment.
We removed sagittal otoliths from the heads of rainbow trout that were sacrificed
for the Arizona Game and Fish Department’s diet analysis. Otolith back-calculated
length at age and growth agreed well with the estimated growth from recaptured passive
integrated transponder (PIT) tagged fish (2000-present). In addition, we used a modified
Faban’s technique to predict length at recapture and growth to better fit von Bertalanffy
growth parameters to compare historical (1991-1999) and recent (2000-2006) growth
trajectories. We estimated similar growth to age 2 for both time periods, however, we
estimated faster growth during the historical time period. We attribute slower growth
over recent years to a suite of factors which may include degradation of the aquatic
foodbase likely caused by previously high densities of rainbow trout, the proliferation of
the New Zealand mudsnail, and warmer water releases (and subsequent low dissolved
oxygen levels) from Glen Canyon Dam, among others.
Low overall densities, size structure and increased condition indices support the
conclusion that the system is in a recovery period. Water and foodbase quality will be
essential to ensure the persistence of the Lee’s Ferry trout populations. Dam
management should seek to establish favorable conditions for attaining population size
structure (i.e., PSD) and relative condition (Kn) objectives.

1
INTRODUCTION
The Arizona Game and Fish Department has been monitoring and performing
research on trout in Glen Canyon since the mid 1960's. Rainbow trout (Oncorhynchus
mykiss; RBT) were initially stocked in the Colorado River below Glen Canyon Dam
(GCD) in 1964 and since that time, fish management efforts, dam operations, and flow
regimes have interacted to influence the trout community (Arizona Game and Fish
Department [AGFD] 1996; Persons et al. 1985; Marzolf 1991; Reger et al. 1995;
McKinney and Persons 1999; McKinney et al. 1999 a, c, d). Impacts of regulated flow
on rainbow trout in the Lee’s Ferry tailwater has been a source of interest for resource
managers and the public for several decades (Persons et al. 1985; Maddux et al. 1987;
Reger et al. 1995, McKinney and Persons 1999, McKinney et al. 1999 a, d; McKinney et
al. 2001 a; McKinney and Speas 2001). Understanding fish ecology in relation to dam
operations is essential in order to integrate water, power, and fishery management goals.
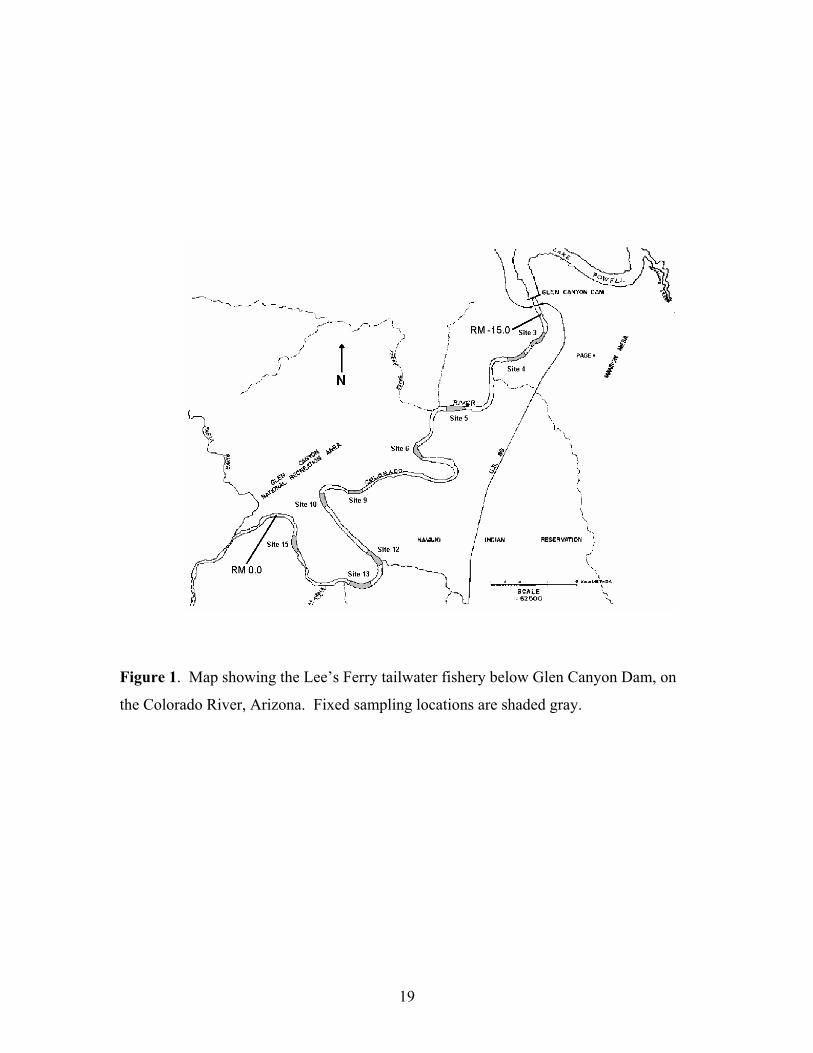
Ecology of non-native rainbow trout in the Lee's Ferry tailwater (river mile [RM]
-15 to RM 0; Figure 1) is strongly influenced by operations of Glen Canyon Dam
(McKinney and Persons 1999, McKinney and Speas 2001; McKinney et al. 1999 b, c;
McKinney et al. 2001 a, b). Rainbow trout in the tailwater provide a popular recreational
fishery and coexist with native flannelmouth sucker (Catostomus latipinnis; FMS) and
non-native common carp (Cyprinus carpio; CRP). From 1991 through 1997, higher
mean and less variable releases from GCD favored high standing stocks of rainbow trout,
but size-related changes occurred in relative condition and bioenergetics of fish
(McKinney et al. 1999a; McKinney and Speas 2001). Small fish (< 305 mm) were
strongly affected by low and variable releases from the dam, but not by biotic variables
which allowed them to meet maintenance energy requirements. In contrast, large fish (≥
305 mm) were not affected by flow variability but were strongly influenced by biotic
factors (i.e. density-dependence) associated with degradation of the aquatic foodbase.
Large fish rarely met maintenance energy requirements (McKinney and Speas 2001).
Relative condition of large fish peaked in 1994 and then fell 10 % by 1997, whereas
condition of small fish was generally stable between 1991 and 1997. From 1997 to 2000,
Speas et al. (2004b) noted a marked reduction in year-to-year variance in catch-per-unit-

2
effort (CPUE), relative condition (Kn) and proportional stock density (PSD; Speas et al.
2004b), likely caused by the impacts of increased densities on the foodbase in the mid
1990’s.
Standardized monitoring of the trout fishery using electrofishing (EF; Sharber et
al. 1994) at fixed sampling locations was initiated in 1991 and has provided data on
response of the RBT population to dam operations (McKinney and Persons 1999;
McKinney et al. 1999a, c, d; McKinney et al. 2001a). In recent years, the Grand Canyon
Monitoring and Research Center (GCMRC) sponsored a series of protocol evaluation
panels for external scientific review of Colorado River sampling protocols
(http://www.gcmrc.gov/pep/troutPEP.htm). This scientific review panel recommended
increasing the overall sample size through reduction in length of existing fixed transects
and addition of randomly selected sites. Random components of this augmented, serially
alternating sampling design (Urquhart et al. 1998) are intended to give representative
estimates of fishery status, whereas fixed components ensure continuity with existing
trend data. Increasing the number of sample transects per sampling occasion also
provides increased statistical power to detect changes in fishery variables on a yearly
time scale (Speas et al. 2004c).
In this report, we present results from fish monitoring activities in the Lee’s Ferry
tailwater during 2006. Our monitoring objectives have not changed since 2002 and
include evaluating the status and trends in relative abundance (CPUE), population
structure (size composition and PSD), growth rate, and relative condition (Kn) of rainbow
trout. In 2006 we also collected otoliths from a subsample of rainbow trout to determine
if they could be used to give accurate age estimates and to verify or reject age assignment
based on length categories established in previous years. In this report we will compare
and contrast data collected from fixed and random sites since 2002, and evaluate the
existing serially alternating sampling design.
METHODS
Field Collections
We collected electrofishing (EF) samples in the Lee’s Ferry tailwater (Figure 1)
during April 4-6, June 26-28, and October 10-12, 2006. For all sample occasions we

3
used two 16’ Achilles inflatable boats outfitted for electrofishing, applying pulsed DC
(~310 V, ~15 A; Sharber et al. 1994) to a 35-cm spherical electrode system. Sampling
commenced shortly after dusk and persisted 5-7 hours per night. Daily river discharge at
GCD ranged from ca. 7,000 to 12,000 cfs during April, 9,500 to 18,000 cfs during June,
and 7,000 to 13,000 cfs during October (Figure 2).
During each monitoring survey, we electrofished 9 fixed and 27 random sites
covering approximately 4 km of shoreline area (see Speas et al. 2004b). The 27 random
transects were selected without replacement from strata containing the remaining sample
units found in river kilometer (RK) 0.9 – 26.85. We stratified sample units in two ways:
1) by shoreline types / relative abundance combinations. This stratum was comprised of
talus/cobble bar shorelines, which are characterized by the highest CPE values observed
in 2001 (ca. 5.3 fish/min. EF; Speas et al. 2004b) and sand bar/cliff face shorelines
characterized by the lowest CPE values from 2001 (ca. 3.6 fish/min EF; Speas et al.
2004b); and 2) longitudinally, as upper (RK 0.9 – 8.15), middle (RK 8.15 - 19.05) and
lower (RK 19.05 – 26.85) subreaches of the tailwater below GCD. We selected specific
shoreline types according to their availability (percentage of shoreline length) within
river subreaches. Longitudinal stratification also allowed randomization while
maintaining safety and logistical integrity (i.e., boats visit the same section of the river on
each night) as well as among longitudinal gradients in fish density (Speas et al. 2004b).
We measured total length (TL; mm) for all fish captured and weight (g) for most
fish captured. We sexed fish based on manual extrusion of gametes. At fixed transects,
we implanted untagged RBT > 200 mm TL with 400 kHz passive integrated transponder
(PIT) tags and clipped adipose fins of all salmonids receiving PIT tags to monitor tag
loss. Untagged native species (i.e. FMS) > 150 mm TL were also implanted with 134.2
kHz PIT tags. This marking program is primarily intended to provide information on fish
growth. We injected PIT tags ventrally into the fish body cavity with the insertion point
immediately posterior to the pelvic fin.
A subsample of RBT, FMS, and CRP were sacrificed in the Lee’s Ferry tailwater
in 2006 for age and diet analysis (AGFD), foodbase analysis (Ted Kennedy, GCMRC,
April and October only), and disease determination. For the age and diet analysis, we
sacrificed 5 RBT from each fixed site varying in size from smallest to largest, removed

4
their stomachs, and extracted sagittal otoliths. For the foodbase analysis, we sacrificed a
subsample of the FMS and CRP captured, removed their stomachs, clipped a pelvic fin,
and extracted a muscle plug from the dorsal musculature. We also sacrificed RBT in
June 2006, removed and froze their heads, and shipped them to the AZ Game and Fish
Department Fish Health Laboratory (Pinetop, AZ) to test for whirling disease.
Additionally, whole RBT specimens were sacrificed, frozen, and shipped to Dr. Rebecca
Cole of the U.S. Geological Survey Biological Resources Division (BRD; Madison, WI)
for parasitological evaluations (Cole 2002). Unless sacrificed for BRD, whirling disease,
diet and age analysis, or foodbase analysis, we released all fish alive at the location of
capture.
Data Analysis
Evaluation of data from fixed and random sites
The role of fixed sites is primarily to provide long-term trend data to monitoring
programs while data from random sites are the best point estimates of fishery status
(Urquhart et al. 1998.) However, guidelines for statistical analyses of such data appear
ambiguous as to whether the two types of data can be combined for more powerful (i.e.
larger sample size) evaluation of long-term trends (S. Urquhart, personal
communication). To evaluate differences in means and variances of the two types of
data, we compared size-stratified data (CPE, Kn) and size structure (PSD) from fixed and
random sites since the onset of the current sampling design in June 2002 using one-way
analysis of variance (ANOVA; S. Urquhart, personal communication). We then used
Levene’s test of homogeneity of variance on site type (fixed vs. random) to test the null
hypothesis that error variance in fixed and random sites are equal. If significant
differences were not apparent, fixed and random site data were pooled to increase power
for long-term trend detection. All statistical tests were considered significant at the α =
0.05 level.
Long term monitoring
We computed CPE as fish captured per minute of EF, and indexed size structure
of the catch by calculating PSD (Anderson and Nuemann 1996; McKinney et al. 1999a)
as the ratio of “quality” sized fish to the sum of “quality” and “stock” sized fish, or
5
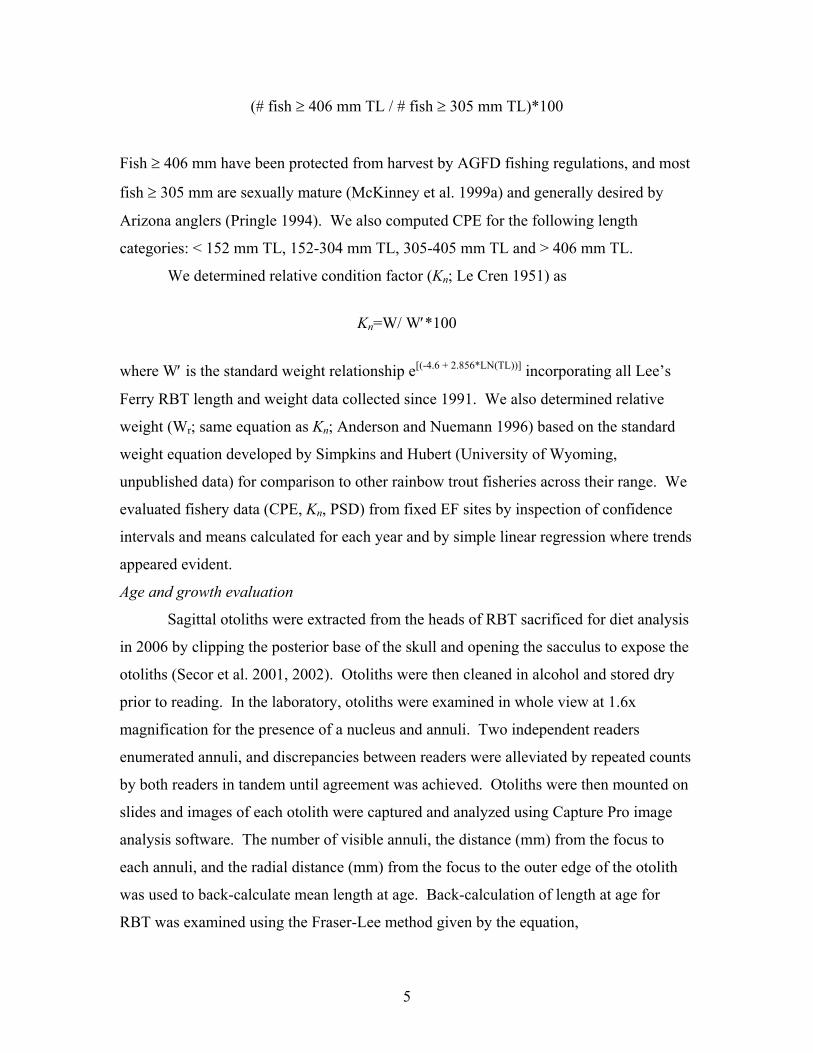
(# fish ≥ 406 mm TL / # fish ≥ 305 mm TL)*100
Fish ≥ 406 mm have been protected from harvest by AGFD fishing regulations, and most
fish ≥ 305 mm are sexually mature (McKinney et al. 1999a) and generally desired by
Arizona anglers (Pringle 1994). We also computed CPE for the following length
categories: < 152 mm TL, 152-304 mm TL, 305-405 mm TL and > 406 mm TL.
We determined relative condition factor (Kn; Le Cren 1951) as
Kn=W/ W′*100
where W′ is the standard weight relationship e[(-4.6 + 2.856*LN(TL))] incorporating all Lee’s
Ferry RBT length and weight data collected since 1991. We also determined relative
weight (Wr; same equation as Kn; Anderson and Nuemann 1996) based on the standard
weight equation developed by Simpkins and Hubert (University of Wyoming,
unpublished data) for comparison to other rainbow trout fisheries across their range. We
evaluated fishery data (CPE, Kn, PSD) from fixed EF sites by inspection of confidence
intervals and means calculated for each year and by simple linear regression where trends
appeared evident.
Age and growth evaluation
Sagittal otoliths were extracted from the heads of RBT sacrificed for diet analysis
in 2006 by clipping the posterior base of the skull and opening the sacculus to expose the
otoliths (Secor et al. 2001, 2002). Otoliths were then cleaned in alcohol and stored dry
prior to reading. In the laboratory, otoliths were examined in whole view at 1.6x
magnification for the presence of a nucleus and annuli. Two independent readers
enumerated annuli, and discrepancies between readers were alleviated by repeated counts
by both readers in tandem until agreement was achieved. Otoliths were then mounted on
slides and images of each otolith were captured and analyzed using Capture Pro image
analysis software. The number of visible annuli, the distance (mm) from the focus to
each annuli, and the radial distance (mm) from the focus to the outer edge of the otolith
was used to back-calculate mean length at age. Back-calculation of length at age for
RBT was examined using the Fraser-Lee method given by the equation,
6
Li = aSS
aLi
c
c +−
where Li was the back-calculated length of the fish at the ith age, Lc was the length of fish
at capture, Sc was the otolith radius at the time of capture, Si was the radius of the annuli
at the ith age, and a was the intercept of the regression of fish length at capture on the
otolith radius at capture (DeVries and Frie 1996). Rainbow trout ages were plotted
against corresponding length to calculate mean length at age and growth for comparison
to historical length-age relationships.
We compared historical (1991-1999) and recent (2000-2006) rainbow trout
growth using Floy tag and PIT tag recapture information, respectively, as well as otolith
information since 2004. Only fish at large for > 1 year were included in the recapture
analysis to alleviate fish measurement error. Observed growth (using observed length at
recapture) was determined by subtracting TL at the mark event from the TL at the
recapture event divided by the time (days) at large between the two events. We then used
a modified Faben’s technique to predict length at recapture and growth to better fit von
Bertalanffy growth parameters (Wang 1998; see Speas et al. 2004a, b). Data from both
time periods were then regressed using linear regression to compute von Bertalanffy
growth functions (theoretical maximum length [L∞], Brody growth coefficient [K]).
Mean length at age otolith data were plotted with data from both time periods to compare
to recent PIT tag recapture information.
RESULTS
Flows from Glen Canyon Dam were seasonally variable in 2006 (Figure 2). From
January through February 2006, flows ranged from about 9,500 to 18,000 cfs with a
mean daily discharge of approximately 14,071 cfs. Spring flows followed normal ROD
low monthly volumes in March-May, fluctuating between 6,000 and 15,000 cfs daily and
hovering around 8,000 cfs on Sundays. High monthly volume flows began again in June
and persisted through August, with daily fluctuations from 9,300 to 18,500 cfs. Lower
fluctuating flows characterized September through November, with daily flows

7
fluctuating between 6,500 and 12,500 cfs. December flows fluctuated between 9,500 to
17,000 cfs. Water temperatures below Glen Canyon Dam were between 9-10ºC in April
and June, and about 12 ºC in October (Figure 3). Dissolved oxygen below Glen Canyon
Dam was about 6.5 mg/L in April, peaked at about 8.0 mg/L in June, and was about 7.0
mg/L in October (Figure 4).
Whirling disease analyses were negative for all samples collected in 2006 (Jim
Thompson, AGFD Fish Health Laboratory, personal communication). Results of
parasitological evaluations (USGS-BRD, Madison, WI), GCMRC foodbase analyses for
2006, and AGFD diet analysis are incomplete at the time of submission of this report.
Evaluation of data from fixed and random sites
Analysis of size-stratified RBT data revealed no differences in CPE and PSD
among fixed and random sites (Table 1), during similar temporal scales (June 2002
through October 2006). Differences were observed, however, in RBT Kn between both
sites (Table 1), but these differences likely reflect associated large sample sizes and may
not be biologically significant. Thus, data from both fixed and random sites were pooled
to increase our ability to detect trends over time in Lee’s Ferry RBT population indices.
Long term monitoring
A total of 1290 fish from 6 species were captured at Lee’s Ferry in 2006.
Rainbow trout were the most prevalent species captured (98%) followed by flannelmouth
sucker (1%), common carp (1%), brown trout (Salmo trutta; 0.2%), channel catfish
(0.08%), and walleye (Sander vitreus; 0.08%; see Table 2). The captured walleye during
2006 represents the first occurrence of this species in the Lee’s Ferry tailwater since
AGFD monitoring efforts dating from 1991. A total of 148 RBT were implanted with
PIT tags and 13 PIT tagged fish were recaptured (1% recapture rate) during 2006
sampling. A total of 8 flannelmouth sucker were implanted with 134.2 kHz PIT tags; two
of these fish were recaptured with 400 kHz tags and thus given new 134.2 kHz tags.
The mean total length of RBT captured during 2006 was 267 ± 3.10 mm (mean ±
1 S.E.). This was significantly greater than the mean of all RBT captured in 2005 (255 ±
2.79 mm; P = 0.007) and is similar to the largest mean annual total length measured on
record in 1992 (265 ± 2.08 mm) and 2003 (263 ± 2.14 mm).

8
Length frequency analysis shows a RBT distribution skewed towards larger fish
in 2006 with the majority of fish captured being between 300 and 400 mm TL (Figure 5,
panel A). Relatively few fish were captured < 150 mm TL during 2006, especially in
April and June (Figure 5, panels B and C). Sampling effort in October, however, showed
a more typical bimodal distribution with about 30% of fish captured comprising a mode <
150 mm TL and about 60% of fish captured comprising a mode between 250 and 350
mm TL (Figure 5, panel D).
Overall, the CPE of RBT at Lee’s Ferry continued its decline since 2000 (Figure
6). Rainbow trout CPE for all sampling in 2006 was 1.47 ± 0.14 fish per minute of
electrofishing (mean ± 1 S.E.), which is similar to the densities of RBT in 1992 and 1993.
This overall decrease in density is largely attributable to the drastic decrease in numbers
of RBT < 152 mm TL since 2001 (Figure 7, panel A). Density of RBT in the 152 to 304
mm TL size class also decreased from 2005 to 2006, and is similar to densities for this
size class from 1994 to 1995 (Figure 7, panel B). Density of RBT in the 305 to 405 mm
TL size class has generally declined since 2001 and is similar to densities found in 1991,
1996, and 2005 (Figure 7, panel C). Estimated CPE of RBT > 406 mm TL in 2006 was
the lowest recorded since 1991 and has shown a declining trend since 2003 (Figure 7,
panel D).
Angler CPE from creel surveys (AGFD Region 2, unpublished data) reflected the
trend seen in the electrofishing CPE data for 305-405 mm TL RBT since 1991 (Figure 8).
Catch rates since 2002 were substantially lower than those observed from 1996 to 2001
and have declined precipitously since 2004. Angler catch rates in 2006 were about 0.58
± 0.03 fish per angler hour and were similar to those observed in 1994.
As indicated by the declining trend in abundance of RBT greater than 305 mm TL
since 2003, PSD in 2006 was the lowest recorded for the fishery since monitoring began
in 1991 (Figure 9). Proportional stock density in 2006 was 1.00 ± 0.46 (mean ± 1 S.E.)
which was most similar to PSD observed in 2005 (2.81 ± 0.70).
Rainbow trout Kn for all sizes of fish was greater in 2006 than that observed in
2005 (Figure 10). Mean Kn in 2006 was 82.48 ± 0.30, and was similar to trout condition
in 1995 and 1996. Size-stratified analysis of Kn did not show increases in trout condition
since 2005 in the < 152 mm TL and > 406 mm TL size classes as evidenced by
9
overlapping standard errors (Figure 11, panels A and D, respectively). Increasing trends
in trout condition were observed, however, in the 152 -304 mm TL and the 305 – 405
mm TL size classes (Figure 11, panels B and C, respectively).
Age and growth evaluation
A total of 164 RBT otoliths were removed and examined and ages of those
analyzed ranged between 0 and 5 years. Percent contributions of each age of trout
analyzed and corresponding mean TL at each age are given in Table 3.
Comparison of historical (1991-1999; Floy tag) and recent (2000-2006; PIT tag)
modeled recapture information for RBT growth suggested different growth trajectories
for the two time periods. Growth was relatively similar among the two periods for fish
up to 2 years old, but faster growth to ages 3 and above was seen in historical versus
recent data (Figure 12). For example, model predictions showed RBT from 1991 to 1999
reached 3 years of age around 336 mm TL, whereas RBT from 2000 to 2006 reached a
similar age around 291 mm TL. Estimates of L∞ and K also differed between historical
and recent periods with L∞ values of 446 mm and 355 mm and K values of 0.46 and 0.57,
respectively. Mean TL at age from back-calculated RBT otolith data showed similar
growth trajectories to recent modeled recapture data (up to age 5; Figure 12), suggesting
a validation of our growth model for current conditions in the fishery.
DISCUSSION
The GCMRC-sponsored protocol evaluation panel suggested increasing overall
sample size in the Lee’s Ferry tailwater by reducing the length of fixed electrofishing
transects and incorporating randomly selected transects. We initiated this augmented,
serially alternating sampling regime (Urquhart et al. 1998) in June 2002, where fixed
transects served to ensure comparison with historical data and random transects provided
representative estimates of fishery status. Our analysis of fixed and random transects
over similar temporal scales (June 2002 through October 2006) showed no differences in
size-stratified estimates of relative abundance and size structure. Differences were
observed in size-stratified relative condition among fixed and random transects.
However, we believe these differences likely reflect our large sample sizes and
10
biologically may not be significant. For example, anglers likely will not recognize minor
differences in relative condition for rainbow trout most vulnerable to angling (i.e. 305-
405 mm TL). Thus, we pooled data from both fixed and random transects to increase our
ability to detect rainbow trout population trends over time (Speas et al. 2004c). While
our analysis of this data consisted of relatively simple statistics (ANOVA; S. Urquhart,
personal communication), we recognize the potential for more robust statistical analysis
of this data. We hope additional input from future protocol evaluation panels will help
with this issue.
Overall catch rates of rainbow trout at Lee’s Ferry have declined since 2000. This
likely represents a decline in overall abundance of the rainbow trout population which
may be due to a suite of interacting factors including declining abundance of fish < 152
mm TL, low dissolved oxygen in 2005, and changes in the foodbase (i.e. New Zealand
mudsnail, Potamopyrgus antipodarum). Redd counts at Lee’s Ferry have declined by
orders of magnitude since 2004 (J. Korman, personal communication), suggesting limited
larval rainbow trout production in recent years. The low relative condition observed from
2002 to 2005 further suggests mature rainbow trout were unable to meet maintenance
energy requirements needed to spawn (McKinney and Speas 2001). During the fall of
2005, dissolved oxygen approached the lower lethal limit for rainbow trout (below 4
mg/L) for about a 3-week period which likely caused further declines in abundance. The
New Zealand mudsnail was first detected in Lee’s Ferry in 1995 and has been known to
restructure food webs in other systems (Hall et al. 2006). However, the absence of
baseline foodbase data limits our ability to relate rainbow trout population dynamics to
mudsnail presence.
Current conditions of the fishery, however, suggest the rainbow trout population
is relieved of the density-dependent constraints seen in previous years (1997-2000; Speas
et al. 2004a, b). The relative abundance of mature rainbow trout currently is similar to
the low densities observed in the early 1990’s. As a likely result of decreases in overall
rainbow trout relative abundance, relative condition increased significantly from 2005 to
2006. This, coupled with current high compensatory survival of rainbow trout fry (J.
Korman, personal communication), suggests successful spawn and recruitment for the
fishery in the near future. The size structure of the fishery currently is the lowest

11
observed on record. However, given current low rainbow trout densities, we expect size
structure, relative condition, and growth to increase.
Creel results confirm the changes seen in the electrofishing trends. Angler catch
rates in 2006 were the lowest observed since 1994. However, length frequency analysis
suggests high densities of rainbow trout > 250 mm TL during 2006. Lower densities
currently found in the fishery should allow these fish to reach sizes more vulnerable to
angling. Also, October data suggests a successful spawn occurred in early 2006. The
effects of lower densities should cause growth rates and size structure to increase thus
producing larger, more vulnerable fish for anglers in the near future.
The low recapture rate of PIT-carrying rainbow trout led us to use an additional
method to determine growth rates and approximate ages of rainbow trout at Lee’s Ferry.
We collected otoliths from rainbow trout from 2004 to 2006 to determine age of fish and
to back-calculate growth rates between/among years and cohorts. Despite concerns that
the stenothermic environment would not yield good annulus deposition, the otoliths were
readable. Analysis of otoliths collected indicates rainbow trout currently at Lee’s Ferry
are taking longer to reach maturity than historical (prior to 2000) recapture data
previously indicated. Also, given current conditions, it may take 5 years or more for
rainbow trout to reach quality size (> 405 mm TL). Again, with current low densities we
believe growth will increase allowing for successful spawn and recruitment and an
increased proportion of the population vulnerable to angling. Due to our confidence in
determining age and growth using otoliths, we have incorporated otolith removal and
analysis into our long-term protocol for the Lee’s Ferry fishery.
Our model comparing historical (1991-1999) and recent (2000-2006) growth from
recapture data suggests showed differing growth trajectories between the two time
periods. We suspect the faster historical growth is highly influenced by lower rainbow
trout densities in the early 1990’s, prior to the density-dependent effects likely caused by
the regimented flow regime (mid to late 1990’s; McKinney and Speas 2001; Speas et al.
2004a,b). However, current estimates of relative abundance (2004-2006) are similar to
those seen in the early 1990’s suggesting growth should be similar. Temperatures in
Lee’s Ferry since 2003 have been about 2ºC warmer from June through December than
1991 to 2002, suggesting higher daily energetic demands for the population currently.
12
Further, the New Zealand mudsnail was not discovered in the tailwater until 1995, and
literature suggests this invasive species has dominated secondary production in other
systems (Hall et al. 2006). Both increased temperature and establishment of the New
Zealand mudsnail serve as possible explanations for the differences observed between
historical and recent growth.
ACKNOWLEDGEMENTS
Grand Canyon Monitoring and Research Center provided funding for the present
studies. We wish to thank GCMRC personnel Stuart Reider, Peter Weiss, and Steve
Jones for all their hard work driving boats in the field and keeping clean, legible data.
We also thank Carol Fritzinger for coordinating trip schedules and equipment. Numerous
Game and Fish personnel volunteered their time to collect this data, and to them our
thanks are due. We thank David Ward, Clay Nelson, and Brian Clark for reviewing
earlier drafts of this report.

13
LITERATURE CITED
Anderson, R.O. and R.M. Neumann. 1996. Length, weight and associated structural
indices. Pp. 447-481 in B.R. Murphy and D.W. Willis (editors), Fisheries Techniques. American Fisheries Society, Bethesda, MD.
Arizona Game and Fish Department. 1996. The effects of an experimental flood on the
aquatic biota and their habitats in the Colorado River, Grand Canyon, Arizona. Final Report to the U.S. Bureau of Reclamation, Salt Lake City, Utah, Glen Canyon Environmental Studies. Arizona Game and Fish Department, Phoenix.
Cole, R.A., A. Choudhury, and T.L. Hoffnagle 2002. Parasites of Native and Non-native
Fishes of Lower Little Colorado River, Arizona: 2001 Annual Report. Submitted to the Arizona Game and Fish Department, Phoenix, Arizona. USGS National Wildlife Health Center, Biological Resources Division, Madison, Wisconsin
DeVries, D.R., and R.V. Frie. 1996. Determination of age and growth. Pp. 483-512 in
B.R. Murphy and D.W. Willis (editors), Fisheries Techniques. American Fisheries Society, Bethesda, MD.
Hall, R.O., M.F. Dybdahl, and M.C. Vanderloop. 2006. Extremely high secondary production of introduced snails in rivers. Ecological Applications 16(3): 1121-
1131. Le Cren, E.D. 1951. The length-weight relationship and seasonal cycle in gonad weight
and condition in the perch Perca fluviatilis. Journal of Animal Ecology 20:201-219.
Maddux, H.R., D.M. Kubly, J.C. deVos, Jr., W.R. Persons, R. Staedicke, and R.L.
Wright. 1987. Effects of varied flow regimes on aquatic resources of Glen and Grand Canyons. Technical Report to the U.S. Bureau of Reclamation, Salt Lake City, Utah, Glen Canyon Environmental Studies. Arizona Game and Fish Department, Phoenix.
Marzolf, G.R. 1991. The role of science in natural resource management: the case for the
Colorado River. In Colorado River ecology and dam management, edited by Committee on Glen Canyon Environmental Studies. National Academy Press, Washington, D.C., pp.28-39.
McKinney, T. and W.R. Persons. 1999a. Rainbow trout and lower tropic levels in the
Lee's Ferry tailwater below Glen Canyon Dam, Arizona: A Review. Final Report to U.S. Bureau of Reclamation, Grand Canyon Monitoring and Research Center, Flagstaff, Arizona. Arizona Game and Fish Department, Phoenix, AZ. Cooperative Agreement No. 1425-98-FC-40-22690.
14
McKinney, T., D.W. Speas, R.W. Rogers, and W.R. Persons. 1999b. Rainbow trout in the Lee's Ferry recreational fishery below Glen Canyon Dam, Arizona, following establishment of minimum flow requirements. Final Report to U.S. Bureau of Reclamation, Grand Canyon Monitoring and Research Center, Flagstaff, Arizona. Arizona Game and Fish Department, Phoenix, AZ. Cooperative Agreement No. 1425-98-FC-40-22690. 109 pp
McKinney, T.D., R.S. Rogers, A.D. Ayers, and W.R. Persons. 1999c. Lotic community
responses in the Lee’s Ferry reach. In R.H. Webb, J.S. Schmidt, G.R. Marzolf and R.A. Valdez (editors). The 1996 controlled flood in Grand Canyon: scientific experiment and management demonstration. Geophysical Monograph 110:249-258.
McKinney, T.D., R.S. Rogers, and W.R. Persons. 1999d. Effects of flow reduction on
aquatic biota of the Colorado River below Glen Canyon Dam, Arizona. North American Journal of Fisheries Management 19:984-991.
McKinney, T., D.W. Speas, R.S. Rogers, and W.R. Persons. 2001a. Rainbow trout in a
regulated river below Glen Canyon Dam, Arizona, following increased minimum flows and reduced discharge variability. North American Journal of Fisheries Management 21:216-222.
McKinney, T. and D.W. Speas. 2001b. Observations of size-related asymmetries in diet
and energy intake of rainbow trout in a regulated river. Environmental Biology of Fishes 61:435-444.
Persons, W.R., K. McCormack, and T. McCall. 1985. Fishery investigation of the
Colorado River from Glen Canyon Dam to the confluence of the Paria River: assessment of the impact of fluctuating flows in the Lee’s Ferry trout fishery. Final Report, Federal Aid in Sport Fish Restoration, Dingell Johnson Project F-14-R-14. Arizona Game and Fish Department, Phoenix.
Pringle, T. 1994. Statewide survey of 1986, 1989, and 1992 Arizona anglers. Arizona
Game and Fish Department, Phoenix, AZ. Reger, S., C. Benedict, and D. Wayne. 1995. Colorado River: Lee’s Ferry fish
management report, 1989-1993. Final Report, Federal Aid Project F-7-M-36. Arizona Game and Fish Department, Phoenix.
Sharber, N.G., S.W. Carothers, J.P. Sharber, J.C. deVos, Jr., and D.A. House. 1994.
Reducing electrofishing-induced injury of rainbow trout. North American Journal of Fisheries Management 14:340-346.
Speas, D.W., W.R. Persons, R.S. Rogers, D.L. Ward, A.S. Makinster, and J.E. Slaughter,
IV. 2004a. Effects of low steady summer flows on rainbow trout in the Lee’s Ferry tailwater, 2000. 2000 Annual Report, submitted to Grand Canyon
15
Monitoring and Research Center, Flagstaff, AZ. Arizona Game and Fish Department, Phoenix, AZ.
Speas, D.W., W.R. Persons, D.L. Ward, R.S. Rogers, and J.E. Slaughter, IV. 2004b.
2001 Fish investigations in the Lee’s Ferry tailwater. 2001 Annual Report, submitted to Grand Canyon Monitoring and Research Center, Flagstaff, AZ. Arizona Game and Fish Department, Phoenix, AZ.
Speas, D.W., C.J. Walters, D.L. Ward, and R.S. Rogers. 2004c. Effects of intraspecific
density and environmental variables on the electrofishing catchability of brown and rainbow trout in the Colorado River. North American Journal of Fisheries Management 24:586-596.
SPSS, Inc. 2000. SPSS for Windows Release 10.1.0. SPSS, Inc., Chicago, IL. Urquhart, N.S., S.G. Paulsen, and D.P. Larsen. 1998. Monitoring for policy-relevant
regional trends over time. Ecological Applications 8:246-257. Wang, You-Gan. 1998. An improved Fabens method for estimation of growth
parameters in the Von Bertalanffy model with individual asymptotes. Canadian Journal of Fisheries and Aquatic Sciences 55:397-400.
16
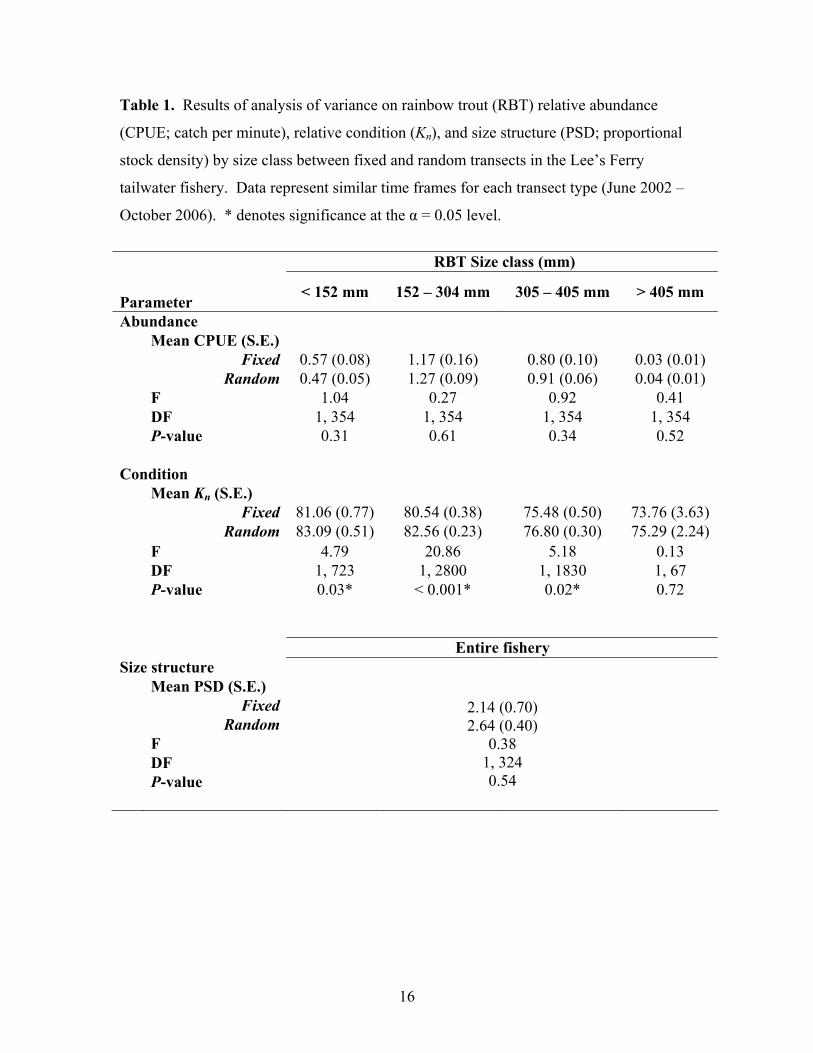
Table 1. Results of analysis of variance on rainbow trout (RBT) relative abundance
(CPUE; catch per minute), relative condition (Kn), and size structure (PSD; proportional
stock density) by size class between fixed and random transects in the Lee’s Ferry
tailwater fishery. Data represent similar time frames for each transect type (June 2002 –
October 2006). * denotes significance at the α = 0.05 level.
RBT Size class (mm)
Parameter < 152 mm 152 – 304 mm 305 – 405 mm > 405 mm
Abundance Mean CPUE (S.E.) Fixed 0.57 (0.08) 1.17 (0.16) 0.80 (0.10) 0.03 (0.01) Random 0.47 (0.05) 1.27 (0.09) 0.91 (0.06) 0.04 (0.01) F 1.04 0.27 0.92 0.41 DF 1, 354 1, 354 1, 354 1, 354 P-value 0.31 0.61 0.34 0.52 Condition Mean Kn (S.E.) Fixed 81.06 (0.77) 80.54 (0.38) 75.48 (0.50) 73.76 (3.63) Random 83.09 (0.51) 82.56 (0.23) 76.80 (0.30) 75.29 (2.24) F 4.79 20.86 5.18 0.13 DF 1, 723 1, 2800 1, 1830 1, 67 P-value 0.03* < 0.001* 0.02* 0.72 Entire fishery Size structure Mean PSD (S.E.) Fixed Random F DF P-value
2.14 (0.70) 2.64 (0.40)
0.38 1, 324 0.54

17
Table 2. Number of each species captured per trip by transect type at Lee’s Ferry in
2006. RBT = rainbow trout; BNT = brown trout; CRP = common carp; FMS =
flannelmouth sucker; WAL = walleye; CCF = channel catfish.
Trip ID Date Transect type Total catch
RBT BNT CRP FMS WAL CCFLF20060404 4/04 – 4/06 Fixed 81 2 Random 212 2 1 Total 293 2 3 LF20060626 6/26 – 6/28 Fixed 117 1 1 1 Random 453 1 Total 570 1 1 1 1 LF20061010 10/10 – 10/12 Fixed 102 5 1 Random 302 2 6 Total 404 7 7
Grand total 1267 2 8 11 1 1 Percent of catch (%) 98 0.2 1 1 0.08 0.08

18
Table 3. Mean back-calculated total length (TL, mm), total number of back-calculations,
and percent contribution of ages of rainbow trout derived from otoliths in the Lee’s Ferry
tailwater fishery, 2004-2006. Standard error of the mean is given in parenthesis.
Age (years)
0 1 2 3 4 5
Mean back-calculated TL 168.5 (2.7)
239.2 (3.9)
293.8 (5.5)
310.7 (9.8)
337.7 (28.3)
N 6 159 118 65 17 6
% contribution 4% 25% 32% 29% 7% 4%
19
Figure 1. Map showing the Lee’s Ferry tailwater fishery below Glen Canyon Dam, on
the Colorado River, Arizona. Fixed sampling locations are shaded gray.

20
2006
Jan Feb Mar Apr May Jun Jul Aug Sep Oct Nov Dec
Mea
n da
ily d
isch
arge
(ft3 /s
ec)
0
2000
4000
6000
8000
10000
12000
14000
16000
18000
Figure 2. Mean daily discharge (cfs) from Glen Canyon Dam during 2006.
21
Figure 3. Daily temperatures below Glen Canyon Dam from 1988-2002 (blue line), 2003 (red line), 2004 (green line), 2005 (pink
line), and 2006 (purple line). Figure courtesy of Susan Hueftle, USGS, Grand Canyon Monitoring and Research Center, Flagstaff,
AZ.
22
Figure 4. Daily dissolved oxygen (mg/L) below Glen Canyon Dam from 1992-2004 (pink line), 2005 (blue line), and 2006 (green
line). Figure courtesy of Susan Hueftle, USGS, Grand Canyon Monitoring and Research Center, Flagstaff, AZ.
23
Freq
uenc
y (%
)
0
1 0
2 0
3 0
4 0S td . d e v . = 8 7 .2 8M e a n T L = 2 6 6 .6N = 1 2 6 6
A
0
1 0
2 0
3 0
4 0S td . d e v . = 8 1 .2 8M e a n T L = 2 6 1 .5N = 2 9 3
B
0
1 0
2 0
3 0
4 0CS td . d e v . = 7 3 .2 9
M e a n T L = 2 8 5 .2N = 5 6 9
T o ta l le n g th (m m )
0 5 0 1 0 0 1 5 0 2 0 0 2 5 0 3 0 0 3 5 0 4 0 0 4 5 0 5 0 00
1 0
2 0
3 0
4 0S td . d e v . = 1 0 2 .6 6M e a n T L = 2 4 4N = 4 0 4
D
Figure 5. Lee’s Ferry rainbow trout length frequency distribution during all sampling in
2006 (A), April 2006 (B), June 2006 (C), and October 2006 (D). Data includes both
fixed and random transects.

24
Year
1992 1994 1996 1998 2000 2002 2004 2006
Mea
n re
lativ
e ab
unda
nce
(cat
ch p
er m
inut
e)
0
1
2
3
4
5
6
Figure 6. Rainbow trout mean relative abundance (catch per minute) in the Lee’s Ferry
tailwater fishery, 1991-2006. Figure represents data from all size classes in both fixed
and random transects. Bars represent ± 1 S.E. of the mean.

25
Year
1992 1994 1996 1998 2000 2002 2004 20060.0
0.5
1.0
1.5
2.0
2.5
3.0
RBT 305-405 mmC
1992 1994 1996 1998 2000 2002 2004 20060.0
0.5
1.0
1.5
2.0
2.5
3.0
RBT > 405 mmD
0.0
0.5
1.0
1.5
2.0
2.5
3.0RBT 152-304 mm
BRBT < 152 mm
A
Mea
n re
lativ
e ab
unda
nce
(cat
ch p
er m
inut
e)
0.0
0.5
1.0
1.5
2.0
2.5
3.0
Figure 7. Rainbow trout mean relative abundance (catch per minute) for fish < 152 mm
total length (TL; A), 152-304 mm TL (B), 305-405 mm TL (C), and > 405 mm TL (D) in
the Lee’s Ferry tailwater fishery, 1991-2006. Figure represents data from both fixed and
random transects. Bars represent ± 1 S.E. of the mean.
26
Year
1992 1994 1996 1998 2000 2002 2004 2006
Mea
n an
gler
CPU
E(c
atch
per
hou
r)
0.2
0.4
0.6
0.8
1.0
1.2
1.4
1.6
Figure 8. Mean angler catch-per-unit-effort (CPUE; catch per hour) of rainbow trout in
the Lee’s Ferry tailwater fishery, 1991-2006. Bars represent ± 1 S.E. of the mean.

27
Year
1992 1994 1996 1998 2000 2002 2004 2006
Mea
n P
SD
0
10
20
30
40
50
60
Figure 9. Rainbow trout mean proportional stock density (PSD) in the Lee’s Ferry
tailwater fishery, 1991-2006. Figure represents data from both fixed and random
transects. Bars represent ± 1 S.E. of the mean.

28
Year
1992 1994 1996 1998 2000 2002 2004 2006
Mea
n re
lativ
e co
nditi
on (K
n)
72
74
76
78
80
82
84
86
88
90
Figure 10. Rainbow trout mean relative condition (Kn) in the Lee’s Ferry tailwater
fishery, 1991-2006. Figure represents data from all size classes in both fixed and random
transects. Bars represent ± 1 S.E. of the mean.

29
65
70
75
80
85
90
95
100
RBT 152-304 mmB
Mea
n re
lativ
e co
nditi
on (Kn)
65
70
75
80
85
90
95
100
RBT < 152 mmA
Year
1992 1994 1996 1998 2000 2002 2004 200665
70
75
80
85
90
95
100
RBT 305-405 mmC
1992 1994 1996 1998 2000 2002 2004 200665
70
75
80
85
90
95
100
RBT > 405 mmD
Figure 11. Rainbow trout mean relative condition (Kn) for fish < 152 mm total length
(TL; A), 152-304 mm TL (B), 305-405 mm TL (C), and > 405 mm TL (D) in the Lee’s
Ferry tailwater fishery, 1991-2006. Figure represents data from both fixed and random
transects. Bars represent ± 1 S.E. of the mean.

30
von-Bertalanffy estimated length at age
0
50
100
150
200
250
300
350
400
450
500
0 1 2 3 4 5 6 7 8 9 10Age (years)
Tota
l len
gth
(mm
)
1990-1999 Wang Floy tag (K=0.46, Linf=446)
2000-2006 Wang pittag (K=0.57, Linf=355)
back-calculated otolith 2004-2006
Figure 12. Modeled Lee’s Ferry rainbow trout estimated length at age for fish captured
during 1990-1999 (Floy tag recapture data; blue line), and 2000-2006 (pittag recapture
data; red line). Pink triangles represent back-calculated lengths at age from otolith
analysis (2004-2006).