Embed Size (px)
Citation preview
2006 California Problem
Gambling Prevalence Survey
August 2006
Final Report
Submitted to:
California Department of Alcohol and Drug Programs Office of Problem and Pathological Gambling
Submitted by:
Rachel A. Volberg
Kari L. Nysse-Carris
Dean R. Gerstein

Table of Contents
List of Tables and Figures ................................................................................ iv
Acknowledgements ........................................................................................ vi Authorship ...........................................................................................vi
Overview of Study ........................................................................................viii
Executive Summary ........................................................................................ 1 Methods ................................................................................................... 2 Gambling in California.................................................................................. 2 Problem Gambling in California....................................................................... 2 Correlates of Problem Gambling ...................................................................... 4 Awareness of Problem Gambling Services and Barriers to Help Seeking ....................... 4 Directions for the Future............................................................................... 5
Introduction.................................................................................................. 7 The Mission of the OPG................................................................................. 8 Background to the 2006 Problem Gambling Prevalence Study ................................... 8 Definitions ................................................................................................ 9
Measuring Gambling Problems...................................................................12 The Role of Timeframe ...........................................................................13
Principal Study Questions .............................................................................14 Highlights of Previous Knowledge....................................................................15
Gambling Availability and Prevalence Rates: Is There a Link? .............................15 The Changing Face of Problem Gambling......................................................17 Natural Recovery ..................................................................................18
The Uses of Prevalence Research....................................................................19 Strengths and Limitations of the Study .............................................................20
Overview of Methods......................................................................................22 Ethical and Peer Review ..............................................................................22 Questionnaire ...........................................................................................23
Translation of the Questionnaire ...............................................................23 Language Line Interviewing ......................................................................23 Pretest...............................................................................................24
I 2006 CALIFORNIA PROBLEM GAMBLING PREVALENCE SURVEY
Survey Design ...........................................................................................24 Advance and Refusal Conversion Letters ......................................................24 Break-off Cases ....................................................................................25
Sample Disposition and Response Rate .............................................................25 Weighting and Imputation ............................................................................27 Statistical Analysis .....................................................................................28
Gambling in California ....................................................................................30 Gambling in the General Population ................................................................30 Patterns of Gambling Participation..................................................................32
The Demographics of Specific Gambling Activities ..........................................33 Considering Gender, Age and Ethnicity ........................................................38 Gambling Preferences.............................................................................38
Reasons for Gambling..................................................................................40 Attitudes Toward Gambling...........................................................................41 Gambling Expenditures ................................................................................42
The Relationship Between Expenditures and Revenues .....................................44 The Geography of Gambling in California ..........................................................45
Data Sources and Analytic Approach ...........................................................46 Geographic Distribution of Gambling ..........................................................48 Proximity and Awareness of Gambling Venues ...............................................50
Comparing Gambling in California with Other States ............................................51 Changes in Gambling Participation Since 1990 ....................................................52
Problem Gambling Prevalence in California..........................................................56 The NORC DSM-IV Screen for Gambling Problems (NODS) .......................................56 Prevalence Rates .......................................................................................59
Population Estimates..............................................................................60 Prevalence Rates Among Demographic Groups ...............................................61 Prevalence by Type of Gambling ................................................................63
Statistical Properties of the NODS...................................................................64 Item Analysis .......................................................................................65
The Geography of Problem Gambling in California ...............................................66 Comparing California with Other States ............................................................68 Changes in Problem Gambling Prevalence Since 1990 ...........................................69
Comparing Low-Risk, At-Risk, and Problem Gamblers: Univariate & Bivariate Analyses ...70 Demographics ...........................................................................................70
II 2006 CALIFORNIA PROBLEM GAMBLING PREVALENCE SURVEY
Gambling Participation ................................................................................72 Past Year Gambling................................................................................72 Monthly Gambling .................................................................................74 Problem Gambling as a Proportion of Total Participation..................................75
Gambling Preferences and Reasons for Gambling.................................................76 Venues, Activities and Company ................................................................76 Reasons for Gambling .............................................................................78
Expenditures Among Low-Risk, At-Risk and Problem Gamblers.................................78 Proportion of Losses by Problem Gambler Type..............................................80
Physical, Mental, and Emotional Correlates of Problem Gambling.............................81 Physical and Mental Health ......................................................................81 Tobacco, Alcohol and Illicit Drugs ..............................................................82
Identifying Risk Factors for Problem Gambling ......................................................85 Statistical Modeling Approach........................................................................85 Results of Statistical Modeling .......................................................................86
Attitudes Towards, Awareness of and Involvement in Problem Gambling Services..........89 Attitudes Towards Problem Gambling ..............................................................89 Awareness of Problem Gambling Services ..........................................................91 Barriers to Treatment .................................................................................93
Summary and Conclusion.................................................................................95 Summary .................................................................................................95 Directions for the Future..............................................................................96
How Many To Plan For? ...........................................................................97 General Conclusions...............................................................................98 The ‘Reno Model’ and Monitoring over Time .................................................98
References ................................................................................................ 100
III 2006 CALIFORNIA PROBLEM GAMBLING PREVALENCE SURVEY
List of Tables and Figures
Figure 1: OPGRC Problem Gambling Framework.......................................................10
Figure 2: Aggregated Regions in California .............................................................47
Figure 3: Casinos, Racetracks and Cardrooms in California..........................................49
Figure 4: Comparing Past-Year Gambling Participation, 1999 and 2006 ...........................54
Figure 5: Prevalence Rates of Problem and Pathological Gambling by Region ...................67
Figure 6: Comparing Lifetime NODS Rates Across States ..............................................68
Table 1: Diagnostic Criteria for Pathological Gambling ..............................................11
Table 2: Demographics of Achieved and Weighted Samples .........................................27
Table 3: Frequency of Gambling Participation in California by Gambling Venue ................31
Table 4: Past-Year Gambling Participation and Preferences ........................................39
Table 5: Reasons for Gambling Among California Gamblers .........................................40
Table 6: Average Past-Year Losses by Past-Year, Monthly and Weekly Gamblers................43
Table 7: Comparing Gross Revenues and Estimated Losses by Gambling Venue..................45
Table 8: Comparing Gambling Participation Across States...........................................52
Table 9: DSM-IV Criteria and Matched NODS Questions...............................................57
Table 10: NODS Classification Scheme ..................................................................58
Table 11: Scores on Lifetime and Past-Year NODS ....................................................59
Table 12: Number of Adult At-Risk, Problem and Pathological Gamblers in California .........60
Table 13: Differences in Problem Gambling Prevalence by Demographic Group.................62
Table 14: Differences in Problem Gambling Prevalence by Type of Gambling ...................63
Table 15: Lifetime NODS Principal Component Analysis..............................................65
Table 16: Comparing Endorsement of NODS Items Among Low-Risk, At-Risk and Problem Gamblers.........................................................................................66
Table 17: Demographics of Low-Risk, At-Risk and Problem Gamblers...............................70
Table 18: Past-Year Gambling Among Low-Risk, At-Risk and Problem Gamblers ................72
Table 19: Monthly Gambling Among Low-Risk, At-Risk and Problem Gamblers..................75
IV 2006 CALIFORNIA PROBLEM GAMBLING PREVALENCE SURVEY
Table 20: Proportion of Number of Days to Gambling Venues Accounted for by Problem Gamblers.........................................................................................76
Table 21: Comparing Favorite Gambling Venues and Activities by Problem Gambler Type ....77
Table 22: Comparing Reasons for Gambling by Problem Gambler Type ...........................78
Table 23: Average Past-Year Losses by Problem Gambler Type.....................................79
Table 24: Proportion of Losses Accounted for by Low-Risk, At-Risk and Problem Gamblers ...81
Table 25: Differences in Physical and Mental Health by Problem Gambler Type ................81
Table 26: Tobacco, Alcohol and Drug Use Among Low-Risk, At-Risk and Problem Gamblers...82
Table 27: Differences in Family, Financial and Criminal Justice Impacts by Problem Gambler Type ..............................................................................................84
Table 28: Logistic Regression Predicting Lifetime Problem/Pathological Gambling Status.....87
Table 29: Awareness of Toll-Free Helpline .............................................................92
V 2006 CALIFORNIA PROBLEM GAMBLING PREVALENCE SURVEY
Acknowledgements
Support for the 2006 California Problem Gambling Prevalence Survey came from the California Office of Problem and Pathological Gambling under Agreement No. 04-00235.
This study could not have been completed without the cooperation and good will of the thousands of California residents who consented to be interviewed for this survey. We are also grateful to the many interviewers at the National Opinion Research Center (NORC) at the University of Chicago who so ably collected the data. Special thanks are due to Sally Murphy, our NORC Project Director, who was responsible for overall resource management and implementation of the study. Sally kept us on schedule and within budget and still thinking imaginatively.
Other NORC staff contributed in important ways to the project. Jolynne Andal undertook a multitude of tasks, from analyzing data to ensuring that our project meetings were documented. Hee-Choon Shin oversaw our sampling design and strategy as well as the weighting of the data. Phil Panczuk and Kim Brown managed the information systems and Janice Ziemba monitored the budget. Tiffani Balok and Eric Lopez supervised the telephone interviewing effort with assistance from Kate Hobson and Jenny Kelly. Ned English contributed to the analysis with special attention to the geographic questions.
Drs. Tim Fong and Richard Rosenthal of the UCLA Gambling Studies Program served as consultants on the project and gave us help in designing the questionnaire and in improving our interviewing efforts. The independent peer review team—Drs. Tom Greenfield, Cheryl Cherpitel and Jason Bond from the Alcohol Research Group in Berkeley, CA—provided valuable feedback on the study plan and draft report, ensuring that the study would withstand the most careful scientific scrutiny.
Finally, we would like to thank Steve Hedrick, Kathryn Frost and Carol Camarillo of the California Office of Problem and Pathological Gambling (generally referred to as the Office of Problem Gambling or OPG) for their thoughtful input and clear guidance over the entire course of the project. Their vision of providing services to problem gamblers and their families in California and their commitment to the research needed to provide those services effectively and efficiently made this project possible.
Authorship Rachel Volberg, Senior Research Scientist at NORC, served as Principal Investigator for the project. She held lead scientific responsibility for the design, integrity, and analysis of the 2006 California Problem Gambling Prevalence Survey. Dr. Volberg, a graduate of the Department of Social and
VI 2006 CALIFORNIA PROBLEM GAMBLING PREVALENCE SURVEY
Behavioral Sciences at the University of California, San Francisco, wrote the bulk of the report. Kari Nysse-Carris, Survey Director at NORC, served as Questionnaire Design and Data Analysis Task Leader on the project. In addition to doing many of the analyses, Dr. Nysse-Carris wrote the report section on risk factors for problem gambling in California. Dean Gerstein, the project’s Senior Technical Consultant and now Vice Provost for Research at Claremont Graduate University in Claremont, CA, assisted with the analysis of the data and wrote the sections of the report on the geography of gambling and problem gambling in California.
VII 2006 CALIFORNIA PROBLEM GAMBLING PREVALENCE SURVEY
VIII
2006 CALIFORNIA PROBLEM GAMBLING PREVALENCE SURVEY
Overview of Study
The goals of the 2006 California Problem Gambling Survey were to assess the extent and impact of problem gambling among adults in California, identify the groups in the population most affected by the disorder, and provide information about the public’s knowledge of available resources for addressing gambling problems. A telephone survey of 7,121 Californians aged 18 and over was carried out between October, 2005 and April, 2006 to assess gambling behavior, gambling-related problems, and demographics as well as other correlates of gambling problems. Interviews were conducted in English, Spanish and other languages.
The results of the survey show that the majority of adults in California have gambled at some time in their lives. Playing the lottery is the most common gambling activity in California while casino gambling is the most preferred. The prevalence of problem and pathological gambling in California is at the higher end of the range of prevalence rates identified in other U.S. jurisdictions. Based on the most recent population estimates, there are nearly 300,000 pathological gamblers and another 450,000 problem gamblers living in California. The prevalence of problem and pathological gambling is particularly high in California among men, African Americans and among individuals who are disabled or unemployed.
Only one in five California adults is aware of the state’s problem gambling helpline. There is currently very little help available for problem gamblers and their families in California beyond Gamblers Anonymous. While barriers to treatment-seeking differ by gender, age and ethnicity, the most common reasons for not seeking help for a gambling problem are not wanting to stop gambling, followed by shame or embarrassment.
Given the relatively high rate of gambling problems in California, strong public policies and a public health approach are needed to modify environmental and other factors that foster the development of gambling problems. With regard to future research, there is a clear need for high-quality, purposive and theory-driven studies that enable incidence to be determined and risk and protective factors quantified.
1
2006 CALIFORNIA PROBLEM GAMBLING PREVALENCE SURVEY
Executive Summary
In 2003, the California Legislature established the Office of Problem and Pathological Gambling and charged the office with developing a statewide plan to address problem and pathological gambling. One important element of the mandated program was to conduct “empirically driven research programs focusing on epidemiology/prevalence, etiology/causation, and best practices in prevention and treatment” (Welfare & Institutions Code 4369.2(a)(3)).
This summary presents key findings from the first comprehensive survey of gambling participation and gambling-related problems among adult residents of California. The goals of the study, carried out by the National Opinion Research Center (NORC) at the University of Chicago, were to assess the extent and impact of problem gambling in the adult population of California, identify the groups in the population most affected by the disorder, and provide information about the public’s knowledge of available resources for addressing gambling problems.
Gambling problems exist on a continuum and vary in severity and duration. Pathological gambling lies at the most severe end of the continuum of gambling problems. Pathological gambling is a treatable mental disorder characterized by loss of control over gambling, chasing of losses, lies and deception, family and job disruption, financial bailouts and illegal acts. In prevalence surveys, such as the one reported here, gambling problems are assessed using one of several standard screening measures and the continuum of gambling problems is divided into categories of increasing severity. In this report, respondents are classified as low-risk, at-risk, problem and pathological gamblers depending on their scores on the problem gambling screen used in the survey.
The strengths of this survey are the size of the sample, assessment of a wide range of gambling behaviors and impacts, the use of standardized methods of data collection, and the strenuous efforts undertaken to recruit a fully representative sample of California adults. There are some limitations to the survey. Most significantly, the survey is restricted to adults living in households with telephones and does not include adolescents, adults living in group quarters, homeless persons or individuals with only cell-phone service. Another limitation is that the response rate for the survey was somewhat low and may limit the generalizability of the results. A third limitation is that the prevalence rates of problem and pathological gambling among African Americans (separately, but when not combined) are associated with a relatively large sampling error and should be treated with caution. A fourth limitation is that, despite our best efforts, participation by Asian and Hispanic respondents was lower than anticipated, based on population data. Finally, our ability to draw causal inferences from the results of the survey is limited by the cross-sectional design of the study.
Methods
The California survey was a random-digit-dial (RDD) telephone survey of residents aged 18 and over residing in households. The questionnaire was designed to assess gambling behavior, gambling-related problems, gambling treatment, family and marital issues, employment and finances, crime, physical and mental health, substance use and demographics. The study design was reviewed and approved by the California Health and Human Services Agency’s Committee for the Protection of Human Subjects and by NORC’s Institutional Review Board. Interviews were conducted by NORC interviewers in English and Spanish. Interpreters were used to interview eligible respondents who were unable to complete the interview in these two languages. Data collection was carried out between October, 2005 and April, 2006 and the final sample included 7,121 respondents. To ensure that the results could be generalized to the adult population of California, the sample was weighted to adjust for differences in household size and to reflect the known demographic characteristics of the population.
Gambling in California • Legal gambling venues are widely distributed throughout California. Racetracks and card
rooms are concentrated in the San Francisco/Bay area and Los Angeles County while tribal casinos are more likely to be located in rural areas in the Central Valley and Northern and Southern California.
• As in many other jurisdictions, the majority of adults in California (83%) have gambled at some time in their lives. While playing the lottery is the gambling activity that Californians are most likely to have done in the past year, casinos are actually much preferred as a favorite place to gamble. Beyond the lottery, casinos and private wagering, past year gambling participation and preferences are extremely low.
Problem Gambling in California • The NORC DSM-IV Screen for Gambling Problems (NODS) was used in the California
survey to provide a measure of gambling problems based on the most recent psychiatric criteria for pathological gambling, as well as comparability with other recent national and state-level surveys.
• In problem gambling prevalence surveys, individuals are classified as problem gamblers or pathological gamblers on the basis of their responses to the questions included in one of the standard problem gambling screens. As understanding of the distribution of gambling problems in the population improves, the characteristics of individuals who score even lower on problem gambling screens (at-risk gamblers) have gained importance. These individuals are of interest because they represent such a large proportion of the population, because of the possibility that their gambling-related difficulties may become more severe
2 2006 CALIFORNIA PROBLEM GAMBLING PREVALENCE SURVEY
over time, and because the prospects of changing their behavior through effective public awareness and education campaigns are better than for more troubled gamblers.
• In this report, respondents are classified as at-risk gamblers if they scored 1 or 2 on the lifetime NODS; as problem gamblers if they scored 3 or 4 on the lifetime NODS; and as pathological gamblers if they scored 5 or more on the lifetime NODS.
• Based on the NODS, the lifetime prevalence of pathological gambling in California is 1.5% and the lifetime prevalence of problem gambling is 2.2%. The prevalence of lifetime at-risk gambling in California is 9.5%. The overall lifetime prevalence rate of problem and pathological gambling in California (3.7%) is at the higher end of the range of prevalence rates identified using this screen in other states and nationally.
• The most recent census indicates that there are 26.3 million individuals aged 18 and over living in California. Based on these figures, there are between 296,500 and 490,000 California adults who can be classified as lifetime pathological gamblers. Another 450,000 to 713,400 California adults can be classified as lifetime problem gamblers. Finally, an additional 2.2 to 2.7 million California adults can be classified as lifetime at-risk gamblers.
• Differences in prevalence rates by gender, age, ethnicity and employment status are all statistically significant, meaning that the differences observed among subgroups in the population are greater than would be expected by chance. The lifetime prevalence of problem and pathological gambling is quite low among women, adults over 65 and Asian and Pacific Islanders. The lifetime prevalence of problem and pathological gambling is particularly high among African Americans and among individuals who are disabled or unemployed. Although lifetime rates of problem and pathological gambling are highly elevated in these three demographic groups, each comprises only a small percentage of the total population. As a result, in absolute numbers, the majority of problem and pathological gamblers are not in these groups.
• The prevalence of lifetime problem and pathological gambling has an inverse relationship to the popularity of gambling activities. Like gamblers in general, the majority of problem and pathological gamblers in California play the lottery and gamble at casinos. However, problem and pathological gamblers represent larger and larger proportions of participants in less-popular gambling activities because they tend to participate in more activities. Lifetime prevalence rates of problem and pathological gambling are highest among respondents who have gambled at commercial bingo halls and cardrooms and are especially high in the very small proportion of individuals who have gambled on the Internet.
• Based on service utilization in jurisdictions where problem gambling services are widely available and well-advertised, it is estimated that between 9,000 and 15,000 pathological gamblers would seek treatment on an annual basis if such services became available in California.
3 2006 CALIFORNIA PROBLEM GAMBLING PREVALENCE SURVEY
Correlates of Problem Gambling • Problem and pathological gamblers in California are significantly more likely than other
gamblers and non-gamblers to smoke cigarettes daily and to have used tranquilizers, cocaine or other illicit drugs in the past year. In general, gamblers are more likely than non-gamblers to consume alcoholic beverages on a regular basis with rates increasing with problem gambling severity. Use of marijuana in the past year is more closely correlated with problem gambling than with at-risk or pathological gambling. Illicit use of methamphetamine in the past year is clearly correlated with increasing severity of gambling problems among California residents—a relationship that has not previously been explored.
• While problem and pathological gamblers in California are more likely than others in the population to smoke, drink and use drugs, most problem and pathological gamblers do not smoke, drink often or use drugs. About three in ten problem and pathological gamblers (29%) smokes daily; about one in six (15%) drinks once a week or more often; and less than one in ten (6%) has used illicit drugs in the past year.
• In addition to substance use, problem and pathological gambling is significantly correlated with higher rates of past year and lifetime depression as well as mental and physical impairment, including hearing and vision loss and limitations to activity.
Awareness of Problem Gambling Services and Barriers to Help Seeking
• Overall awareness of the state’s problem gambling helpline is low, with only one in five California adults indicating that they are aware of this 24-hour, toll-free service. While overall awareness is low, problem gambling severity is significantly associated with higher levels of awareness. One in three problem gamblers and one in two pathological gamblers are aware of California’s problem gambling helpline.
• Awareness of the 12-step fellowship, Gamblers Anonymous, is higher than awareness of treatment services for problem gambling. Pathological gamblers in California are significantly more likely than problem gamblers to be aware of the availability of specialized outpatient services. Problem and pathological gamblers do not differ in their awareness of specialized inpatient treatment for problem gambling which, currently, is not available in California.
• While barriers to treatment seeking differ by gender, age and ethnicity, the most common reasons for not seeking help for a gambling problem are not wanting to stop gambling, followed by shame or embarrassment, denial that gambling was causing problems and assuming that treatment would not work.
4 2006 CALIFORNIA PROBLEM GAMBLING PREVALENCE SURVEY
Directions for the Future
The impacts of problem gambling can be substantial for communities, businesses, families, and individuals. Clinical and population research clearly shows that pathological gamblers experience physical and psychological stress and exhibit substantial rates of depression, alcohol and drug dependence and suicidal ideation. The families of problem and pathological gamblers experience physical and psychological abuse as well as extreme pressure from bill collectors and creditors. Other significant impacts include costs to employers, creditors, insurance companies, social service agencies and the civil and criminal justice systems.
While pathological gambling has long been viewed as an inevitably chronic or chronically relapsing disorder, a growing number of studies suggest that there are high rates of natural recovery among problem gamblers—particularly when problems are less severe, do not co-occur with alcohol problems and/or are associated with gaming machine participation. This small body of research indicates that subclinical problem gambling, in particular, is a highly transitional state. These findings are especially important in light of legislative and regulatory measures in many jurisdictions to control the numbers and accessibility of gaming machines and are further relevant to public health measures taken to prevent or reduce gambling-related harms. These research findings emphasize the importance of developing and testing the effectiveness of brief early interventions. The findings also underscore the importance of developing and assessing the effectiveness of preventive measures based on known precipitants of transitions from low-risk to at-risk to problem and pathological gambling.
Given what appears to be a relatively high rate of problem gambling prevalence in California, strong public policies and a public health approach are needed to modify environmental, agent and host factors that influence the development of problem gambling. With regard to future research in California, there is a clear need for high-quality, purposive and theory-driven studies that enable incidence to be determined and risk and protective factors quantified. These efforts should include prospective extensions to general population prevalence surveys, such as the one reported here, as well as more focused studies of subgroups in the population that are at particularly high risk.
5 2006 CALIFORNIA PROBLEM GAMBLING PREVALENCE SURVEY

THIS PAGE LEFT INTENTIONALLY BLANK
6 2006 CALIFORNIA PROBLEM GAMBLING PREVALENCE SURVEY
7
2006 CALIFORNIA PROBLEM GAMBLING PREVALENCE SURVEY
Introduction
Since the 1970s, the availability of gambling has grown ten-fold in the United States. Today, a person can make a legal wager of some sort in every state except Utah and Hawaii; 38 states have lotteries, 28 states have casinos and 22 states have off-track betting (National Gambling Impact Study Commission, 1999; North American Association of State & Provincial Lotteries, 2003). Just as telling as the expansion of gambling into new jurisdictions is the growth of the gambling industry. Between 1975 and 2001, revenues from legal wagering in the United States grew twenty-fold, from $3 billion to $64 billion while gambling expenditures more than doubled as a percentage of personal income (Christiansen, 2000; Christiansen & Sinclair, 2002; Kallick et al., 1976).
The main purpose of this study—funded by the California Office of Problem and Pathological Gambling—is to assess the extent and impact of problem gambling in the adult population of California and provide information about the public’s knowledge of available resources for addressing gambling problems. The study is intended for use by the State in its efforts to design general and targeted awareness and prevention programs for problem gamblers and their families in California and to develop strategies to provide help to the groups most affected by this disorder.
This report is organized into several sections for clarity of presentation. This Introduction includes an explanation of the rationale for the study, definitions of the terms used in the report, a brief review of the principal study questions and highlights of previous knowledge, and the policy issues and implications related to problem gambling prevalence research. This is followed by an Overview of Methods that provides some details of conducting the survey. The next five sections present findings from the survey in the following areas:
• gambling behavior in California;
• prevalence of problem gambling in California;
• comparing low-risk, at-risk and problem gamblers in California;
• identifying risk factors for problem gambling in California; and
• attitudes toward, awareness of, and involvement in problem gambling services in California.
The report concludes with a summary of the findings of the study and suggestions for the future development of services for problem gamblers and their families in California. There are three appendices to the report, available in a separate volume. These include additional descriptive tables, a detailed description of the study methodology, and a copy of the questionnaire.

The Mission of the OPG
Under provisions of Section 4369 of the Welfare and Institutions Code, the Department of Alcohol and Drug Programs (ADP) was authorized to establish the Office of Problem and Pathological Gambling (generally referred to as the Office of Problem Gambling or OPG) in 2004. The first priority of the OPG, as mandated by the Legislature, was to develop a problem gambling prevention program in California consisting of a toll-free telephone service for crisis management and referral, public awareness campaigns, empirically driven research programs—focusing on epidemiology and prevalence, etiology and causation, and best practices in prevention and treatment—and training of health care professionals, educators, law enforcement agencies, nonprofit organizations, and gambling industry personnel. Funding for the operations and services of OPG comes from the Indian Gaming Special Distribution Fund.
Background to the 2006 Problem Gambling Prevalence Study
Legal gambling in California includes pari-mutuel horse race wagering, a state lottery, commercial cardrooms, tribal casinos, and charitable gambling. Other types of gambling available to California residents include casino gambling in Nevada and other out-of-state locations, gambling on cruise ships, and remote gambling by telephone and on the Internet. The gambling industry in California has grown exponentially over the last twenty years and gambling revenues in California have risen five-fold since 1996, from $2.5 billion to an estimated $13 billion in 2004 (Dunstan, 1997; Simmons, 2006). Further expansion can be expected on several fronts, including pending re-negotiation of compacts between the State of California and numerous tribal governments, efforts by commercial cardrooms and racetracks around the State to expand their operations to include slot machines or similar devices, the possible legalization of casinos across the international border in Mexico, and increases in the availability of remote and Internet gambling.
Although legal gambling is well-established in California and promises continued rapid growth, very little is known about Californians who experience problems related to their gambling or what measures would most effectively minimize or mitigate their problems. California’s size, its uniquely diverse demographics, the large number of Indian gaming compacts and cardroom licensees, and the close proximity of long-established Nevada casino resorts provide a complicated matrix in which to interpret the findings and implications of a problem gambling prevalence survey.
As part of a statewide strategy to prevent and minimize problem gambling in California, an important early step is to determine the number and characteristics of specific subgroups in the population who are at risk of experiencing difficulties related to their gambling, so that available resources can be optimally targeted and awareness and prevention campaigns can be effectively designed. Information is also needed about the number and characteristics of individuals in need of clinical services, their awareness of treatment services, and likely barriers to accessing treatment.
8 2006 CALIFORNIA PROBLEM GAMBLING PREVALENCE SURVEY
This information is needed to provide a firm foundation for the development and provision of effective and efficient problem gambling services in California.
To establish an empirical base for implementing a Statewide plan for problem gambling services in California, OPG commissioned a problem gambling prevalence survey. Presentation of the conduct and findings of the first comprehensive prevalence survey in California is the primary aim of this report.
Definitions
Gambling is a broad concept that includes diverse activities, undertaken in a wide variety of settings, appealing to different sorts of people and perceived in various ways by participants and observers. Failure to appreciate this diversity can limit scientific understanding and investigation of gambling and gambling problems. Another reason to note the differences between various forms of gambling arises from accumulating evidence that some types of gambling are more strongly associated with gambling-related problems than others (Abbott & Volberg, 1999).
Gambling is an ancient form of recreation; there is archaeological and historical evidence of gambling in many ancient civilizations (Gabriel, 1996). The legal definition of gambling includes any activity in which a person pays something of value (consideration) to participate in an event that presents the possibility of winning something of value (prize) whose outcome is determined at least in part by chance (Rose, 1986). However, there is often disagreement about precisely which activities constitute gambling. As one researcher has noted:
Despite its apparent universality, the concept of gambling has no intrinsic meaning; rather, its meaning always depends on the socio-historical context in which it occurs … The convention is to define gambling narrowly in terms of financial transactions – the staking of money, or an item of economic value, on the uncertain outcome of a future event. It is significant that this definition excludes both informal private gambling, where money is merely circulated among players without generating a profit, and investment in the stock market, where speculation is for long-term financial or commercial gain (McMillen, 1996, pp. 6-7).
People take part in gambling activities because they enjoy them and obtain benefits from their participation. For most people, gambling is generally a positive experience. However, for a minority, gambling is associated with difficulties of varying severity and duration. Some regular gamblers develop significant, debilitating problems that also typically result in harm to people close to them and to the wider community (Abbott & Volberg, 1999).
Gambling problems exist on a continuum and there is mounting evidence that such problems may not necessarily be chronic and progressive (Abbott et al., 2004c). Gambling problems vary in duration and severity and a substantial proportion of these problems occur in persons who do not meet the criteria for the recognized psychiatric disorder of Pathological Gambling but who engage in
9 2006 CALIFORNIA PROBLEM GAMBLING PREVALENCE SURVEY
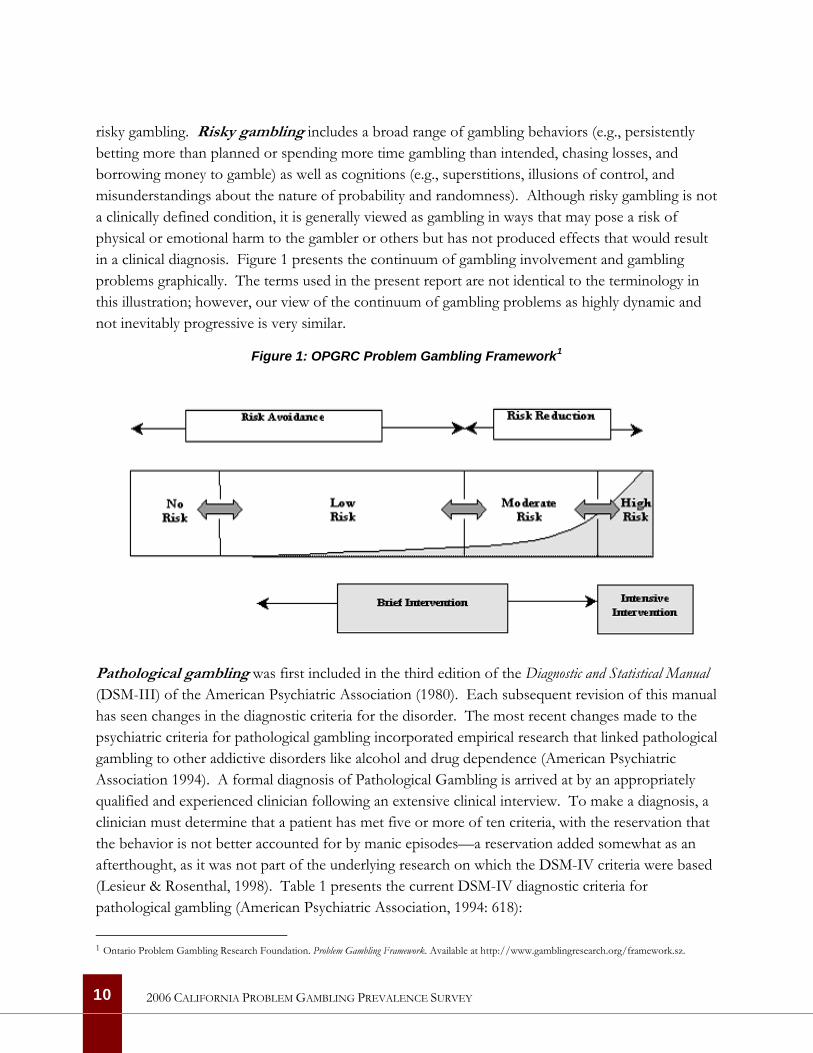
risky gambling. Risky gambling includes a broad range of gambling behaviors (e.g., persistently betting more than planned or spending more time gambling than intended, chasing losses, and borrowing money to gamble) as well as cognitions (e.g., superstitions, illusions of control, and misunderstandings about the nature of probability and randomness). Although risky gambling is not a clinically defined condition, it is generally viewed as gambling in ways that may pose a risk of physical or emotional harm to the gambler or others but has not produced effects that would result in a clinical diagnosis. Figure 1 presents the continuum of gambling involvement and gambling problems graphically. The terms used in the present report are not identical to the terminology in this illustration; however, our view of the continuum of gambling problems as highly dynamic and not inevitably progressive is very similar.
Figure 1: OPGRC Problem Gambling Framework1
Pathological gambling was first included in the third edition of the Diagnostic and Statistical Manual (DSM-III) of the American Psychiatric Association (1980). Each subsequent revision of this manual has seen changes in the diagnostic criteria for the disorder. The most recent changes made to the psychiatric criteria for pathological gambling incorporated empirical research that linked pathological gambling to other addictive disorders like alcohol and drug dependence (American Psychiatric Association 1994). A formal diagnosis of Pathological Gambling is arrived at by an appropriately qualified and experienced clinician following an extensive clinical interview. To make a diagnosis, a clinician must determine that a patient has met five or more of ten criteria, with the reservation that the behavior is not better accounted for by manic episodes—a reservation added somewhat as an afterthought, as it was not part of the underlying research on which the DSM-IV criteria were based (Lesieur & Rosenthal, 1998). Table 1 presents the current DSM-IV diagnostic criteria for pathological gambling (American Psychiatric Association, 1994: 618):
1 Ontario Problem Gambling Research Foundation. Problem Gambling Framework. Available at http://www.gamblingresearch.org/framework.sz.
10 2006 CALIFORNIA PROBLEM GAMBLING PREVALENCE SURVEY
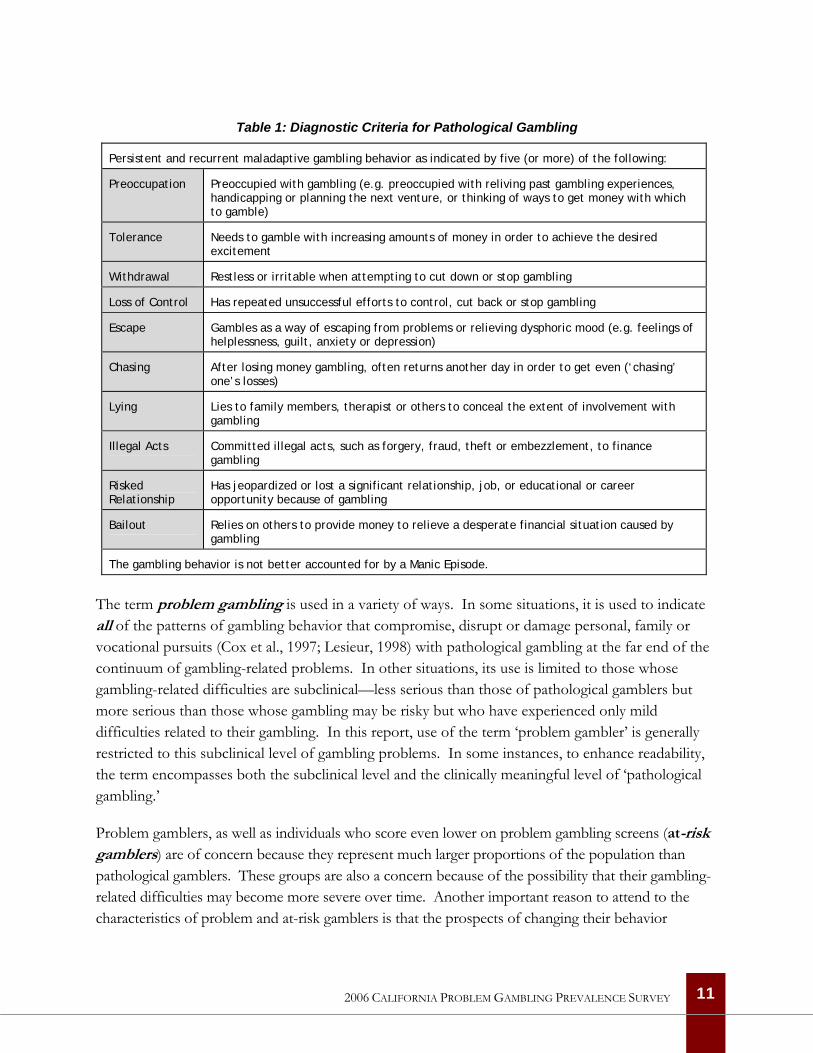
Table 1: Diagnostic Criteria for Pathological Gambling
Persistent and recurrent maladaptive gambling behavior as indicated by five (or more) of the following:
Preoccupation Preoccupied with gambling (e.g. preoccupied with reliving past gambling experiences, handicapping or planning the next venture, or thinking of ways to get money with which to gamble)
Tolerance Needs to gamble with increasing amounts of money in order to achieve the desired excitement
Withdrawal Restless or irritable when attempting to cut down or stop gambling
Loss of Control Has repeated unsuccessful efforts to control, cut back or stop gambling
Escape Gambles as a way of escaping from problems or relieving dysphoric mood (e.g. feelings of helplessness, guilt, anxiety or depression)
Chasing After losing money gambling, often returns another day in order to get even (‘chasing’ one’s losses)
Lying Lies to family members, therapist or others to conceal the extent of involvement with gambling
Illegal Acts Committed illegal acts, such as forgery, fraud, theft or embezzlement, to finance gambling
Risked Relationship
Has jeopardized or lost a significant relationship, job, or educational or career opportunity because of gambling
Bailout Relies on others to provide money to relieve a desperate financial situation caused by gambling
The gambling behavior is not better accounted for by a Manic Episode.
The term problem gambling is used in a variety of ways. In some situations, it is used to indicate all of the patterns of gambling behavior that compromise, disrupt or damage personal, family or vocational pursuits (Cox et al., 1997; Lesieur, 1998) with pathological gambling at the far end of the continuum of gambling-related problems. In other situations, its use is limited to those whose gambling-related difficulties are subclinical—less serious than those of pathological gamblers but more serious than those whose gambling may be risky but who have experienced only mild difficulties related to their gambling. In this report, use of the term ‘problem gambler’ is generally restricted to this subclinical level of gambling problems. In some instances, to enhance readability, the term encompasses both the subclinical level and the clinically meaningful level of ‘pathological gambling.’
Problem gamblers, as well as individuals who score even lower on problem gambling screens (at-risk gamblers) are of concern because they represent much larger proportions of the population than pathological gamblers. These groups are also a concern because of the possibility that their gambling-related difficulties may become more severe over time. Another important reason to attend to the characteristics of problem and at-risk gamblers is that the prospects of changing their behavior
11 2006 CALIFORNIA PROBLEM GAMBLING PREVALENCE SURVEY
through effective public awareness and education campaigns are likely to be better than for more troubled gamblers (Hodgins & el-Guebaly, 2000; Shaffer & Korn, 2002).
In considering the public health risks of problem gambling, it is important to note that not all of the features of pathological gambling need be present at one point in time (Abbott & Volberg, 1999; Gerstein et al., 1999). Some of the impacts that at-risk, problem and pathological gamblers may experience include psychological difficulties, such as anxiety, depression, guilt, exacerbation of alcohol and drug problems, attempts at suicide, and stress-related physical illnesses such as hypertension and heart disease. Interpersonal problems include arguments with family, friends and co-workers and breakdown of relationships, often culminating in separation or divorce. Job and school problems include poor performance, abuse of leave time, and loss of job. Financial effects loom large and include reliance on family and friends, substantial credit card debt, unpaid creditors, and bankruptcy. Finally, there may be legal problems as a result of criminal behavior undertaken to obtain money to gamble or pay gambling debts (Lesieur, 1998; Volberg, 2001a).
Measuring Gambling Problems State governments began funding services for individuals with gambling problems in the 1980s. As a first step toward establishing these services, policymakers sought information about the number of people who might seek help for their gambling problems and what they looked like. In responding to these questions, researchers adopted methods from the field of psychiatric epidemiology to investigate the prevalence of gambling problems in the general population.
In the 1980s, few tools existed to measure gambling problems, and only one—the South Oaks Gambling Screen (SOGS)—had been rigorously tested for performance (Lesieur & Blume, 1987). Closely based on the original psychiatric criteria for pathological gambling, the SOGS was developed to screen for gambling problems in clinical populations. Like other tools in psychiatric research, the SOGS was quickly adopted for use in population research as well as in clinical settings. The SOGS was first used in a prevalence survey in New York State (Volberg & Steadman, 1988). Since then, the SOGS—or one of several variants of the original screen, most often the SOGS-R (Abbott & Volberg, 1996)—has been used in population-based research in more than 50 jurisdictions in the United States, Canada, Europe, Asia, and Oceania (Abbott & Volberg, 1996, 2000; Bondolfi, Osiek & Ferrero, 2000; Duvarci et al., 1997; Lund & Nordlund, 2003; Orford et al., 2003; Productivity Commission, 1999; Shaffer, Hall & Vander Bilt, 1999; Volberg, 2001a; Volberg, Abbott et al., 2001; Welte et al., 2001).
As noted above, the fourth edition of the Diagnostic and Statistical Manual (DSM-IV) adopted a new set of criteria for the diagnosis of Pathological Gambling that linked the disorder conceptually to other addictive disorders like alcohol and drug dependence (American Psychiatric Association, 1994). One response to this and other, contemporaneous changes in the gambling studies field was
12 2006 CALIFORNIA PROBLEM GAMBLING PREVALENCE SURVEY
the development of a large number of new screens for problem and pathological gambling (Govoni, Frisch & Stinchfield, 2001). Some of these new screens are based on the most recent revision of the DSM; others use a broader definition of gambling ‘harms’ (see Abbott & Volberg, 2006 for a review). While performance on these various measures generally shows moderate to high levels of agreement, especially in the case of people with severe problems, they generate somewhat different prevalence estimates.
A detailed description of the problem gambling screen used in the present study is provided below (see The NORC DSM-IV Screen for Gambling Problems on Page 56).
The Role of Timeframe In the study of clinical disorders, pathological gambling is considered a chronic rather than an acute disorder. Acute disorders may be healed and leave no further mark or susceptibility. Chronic disorders are quite different. Once fully developed, chronic disorders strongly tend to recur, constituting a lifelong vulnerability—even in periods of remission or relative quiescence, the disorder may yield a continuing stream of disabilities. This vulnerability to relapse may be effectively treated and kept in check. However, a period in which the individual is relatively free of symptoms does not indicate that the person is free of the disorder.
The DSM-IV criteria for pathological gambling and for substance use disorders share many similarities, but differ in important details. The DSM-IV recognizes two substance use disorders—abuse and dependence—with the latter marked by the co-presence of three out of seven criteria across a 12-month period and the former by the co-presence of two criteria across a 6-month period except when a prior period of dependence exists. As noted above, the single diagnostic entity of pathological gambling is identified by the presence of any five of ten criteria, without temporal bracketing. That is, there is no requirement in the DSM-IV for the signs and symptoms of pathological gambling to occur within a particular time frame for a diagnosis to be made. Nor is there provision for an ‘in remission’ diagnosis, as there is for substance abuse and dependence.
One line of methodological criticism of problem gambling prevalence studies is based on temporal considerations. Shaffer, Hall and Vander Bilt (1997) note that the problem gambling screens used in many prevalence surveys do not assess the extent to which the criteria are concurrent (e.g., occur close together in time). Although concurrence is not an explicit part of the DSM-IV definition of pathological gambling, Shaffer and colleagues argue that estimates of pathological gambling in the general population based on lifetime measures are likely inflated, and they recommend that epidemiologists rely instead on past-year (or other ‘current’) timeframes “as the most accurate measure of the existence of clustered indicators of a gambling disorder” (1997, p. 64). While it is possible that an active case of pathological gambling is best defined as a person who meets five or more criteria within the past year, it is equally plausible and consistent with the DSM-IV to argue
13 2006 CALIFORNIA PROBLEM GAMBLING PREVALENCE SURVEY
that an active case should be defined as anyone with a lifetime history of pathological gambling who exhibits one or more criteria in the past year (Toce-Gerstein & Gerstein, 2004).
It is unclear whether a 12-month timeframe with a cut-off of five or more is the ideal method for representing the temporal dimension of pathological gambling. It is conceivable that pathological gambling is better defined as the co-presence of two or three criteria across a single 12-month period than by the accumulation of five or more criteria over a lifetime. Clearly, research is needed into both the question of symptom concurrence (i.e., the number of gambling-related difficulties that co-occur within the past-year timeframe) and the question of which symptoms tend to co-occur—potentially a more important indicator of an active case than simply the number of different symptoms reported in the past year.
Principal Study Questions
The present study aims to identify and evaluate the extent and impact of problem gambling in the adult population in California. Additional information on awareness of problem gambling services and resources as well as perceived barriers to help-seeking, was also collected. The results of this study will permit a better understanding of the relationships between gambling behavior, gambling-related difficulties, and a broad range of environmental and personal characteristics in California, including proximity and density of gambling venues as well as gender, age, ethnicity and place of residence.
Data were collected and analyzed to answer several specific research questions. Four principal questions guided our efforts. The first and foremost aim of this study is to estimate the prevalence and distribution of non-gambling, low-risk gambling and at-risk, problem, and pathological gambling within the adult population of California, differentiating among these subgroups by gender, age, ethnicity, geographic location, degree of alcohol or other drug use, employment status, household income, type of physical disability (if any), primary gambling venue, and primary language.
The second goal of the study is to determine whether a relationship exists between at-risk, problem, and pathological gambling and environmental factors, of which the most important for policy purposes are the proximity and density of licensed gaming venues. The third goal is to describe the relationship between at-risk, problem, and pathological gambling and a wide range of correlates apart from demographics and venues among adults in the general population in California. The fourth and final goal is to identify awareness of problem gambling services, current involvement with such services, and perceived barriers to seeking help among problem and pathological gamblers in California.
14 2006 CALIFORNIA PROBLEM GAMBLING PREVALENCE SURVEY
Highlights of Previous Knowledge
Epidemiology is the study of the distribution of physical and mental disorders within populations and the factors determining that distribution (Encyclopaedia Britannica, 2006). Epidemiological research has played a vital role in identifying factors that influence the development of disease and other health-related events. In this capacity, epidemiological research is a critical tool in public health and is central in the design of effective prevention programs and in the planning of treatment services.
When the results of new problem gambling prevalence studies are announced, policymakers and the media generally focus their attention on a single number—the overall rate of pathological gambling in the general population. Comparisons are made with prevalence rates in other jurisdictions and questions are asked about the number of people that this overall rate represents and how many of them may seek treatment if specialized services are made available. While these are important reasons for conducting prevalence research, there is much more to be learned by looking beyond the overall prevalence rate.
Gambling Availability and Prevalence Rates: Is There a Link? Some forms of gambling have a particularly strong association with problem gambling, most notably those that are continuous in nature and involve an element of skill or perceived skill (e.g., electronic gaming machines and casino table games). General population prevalence surveys in a number of countries have found that people with preferences for, frequent involvement in, and substantial expenditures on these forms of gambling have a high probability of being a problem gambler. For example, while it is generally estimated that between 2% and 5% of the adult population are problem or pathological gamblers in jurisdictions with ‘mature’ gambling markets, prevalence rates among regular machine players and track bettors can be as high as 25% (Abbott & Volberg, 2000; Gerstein et al., 1999; Productivity Commission, 1999; Schrans et al., 2000; Smith & Wynne, 2004). This has been documented across whole populations as well as within subpopulations that previously had low levels of gambling participation.
One hotly debated issue in the gambling studies field, as well as in legislative circles and the gambling industry, is the question of whether, and how closely, increases in opportunities to gamble are linked to increases in the prevalence of problem gambling. Hundreds of articles in the gambling literature assert the existence of a link between gambling availability and problems. Major reviews (e.g., Abbott & Volberg, 1999; Shaffer, Hall & Vander Bilt, 1997; Wildman, 1998) have, with varying degrees of qualification, concluded that research findings are generally consistent with the view that increased availability leads to more gambling and problem gambling. National official review bodies in Australia, Great Britain and the United States have reached the same conclusion (Gambling Review Body, 2001; National Research Council, 1999; Productivity Commission, 1999).
15 2006 CALIFORNIA PROBLEM GAMBLING PREVALENCE SURVEY
Results from a range of epidemiological studies support the existence of a link between the availability of legal opportunities to gamble and higher rates of problem and pathological gambling. In North America, a systematic review of problem gambling prevalence surveys carried out between 1975 and 1996 concluded that the prevalence of pathological gambling had increased significantly over time among adults in the general population (Shaffer et al., 1999). Past-year prevalence rates of pathological gambling among surveys conducted prior to 1993 averaged 0.8%; rates for post-1993 surveys averaged 1.3%. No changes were evident for youth, college students, and institutional populations—groups in the population with already high rates of problem gambling.
Two U.S. national surveys also found a relationship between the availability of casino gambling and problem gambling prevalence. In 1998, analysis of the national Gambling Impact and Behavior Study (GIBS) data set found that location of a casino within 50 miles (versus 50 to 250 miles) was associated with approximately double the rate of pathological gambling (Gerstein et al., 1999). In a separate national-level study, Welte et al. (2004) used census tract data and geographic information to determine that the location of a casino within ten miles of an individual’s home is independently associated with a 90% increase in the odds of being a problem or pathological gambler.
More recently, a statewide survey in Nevada found that the prevalence of pathological gambling in that state was substantially higher than in the United States as a whole (Volberg, 2002). Shaffer, LaBrie and LaPlante (2004) examined county level prevalence estimates from the survey in Nevada in relation to casino availability and found that the four counties with the greatest access to casinos had the highest problem gambling rates and the four with the least availability had the lowest rates.
Finally, a relationship between casino proximity and gambling problems was found in the most recent New Zealand national survey (Abbott & Volberg, 2000). In that study, although the overall prevalence of problem and pathological gambling declined from 1991, residence in the cities of Auckland and Christchurch, where large urban casinos opened in the interval between the two studies, emerged as a strong predictor of gambling problems even when controlling for other factors associated with such problems.
While many studies have corroborated this ‘availability’ or ‘exposure’ theory of problem gambling, others have failed to demonstrate the predicted relationship and the validity of the theory is becoming a focus of international debate (as illustrated by a commentary series in the September 2005 edition of the journal Addiction). Application of the alternative ‘adaptation’ theory to gambling is relatively new. While relevant research is in its infancy, findings from a number of studies are consistent with the view that adaptation takes place at individual and societal levels.
Stated tentatively, it appears that the introduction and expansion of new forms of gambling, most especially electronic gaming machines, initially results in substantially increased levels of problem gambling with particular population sectors, including males and youth, most affected. Over time
16 2006 CALIFORNIA PROBLEM GAMBLING PREVALENCE SURVEY
and in some jurisdictions, problems extend to groups that previously had low levels of participation and gambling problems, such as women and older adults. Over time in some jurisdictions that have experienced prolonged increased availability, prevalence rates have remained constant or declined. The reasons for such reductions have yet to be clearly delineated and the extent to which these changes are related to inherent properties of different forms of gambling rather than factors associated with the individuals and groups who develop problems remains to be determined (Abbott, in press; Abbott et al., 2004).
The Changing Face of Problem Gambling Early adult general population surveys conducted in the United States, Canada, Australia, Spain and New Zealand found that male gender, age under 30 years, low income and single marital status were, almost universally, risk factors for problem gambling. Low occupational status, less formal education, and non-Caucasian ethnicity were additional risk factors in a number of studies, as was residence in large cities. In most studies where they were asked, problem gamblers reported starting gambling at a younger age than non-problem gamblers. Youth surveys in North America found people in their mid to late teenage years had higher prevalence rates than adults.
Both of the recent U.S. national surveys found higher rates of problem gambling among men, non-Caucasians, and people on low incomes. Gerstein et al. (1999) found young people continued to have a higher rate. Welte et al. (2001), however, did not find significant age differences and, although males had a higher rate of problem gambling, they did not differ with respect to more severe pathological gambling. Some statewide studies (e.g., Oregon and Montana) have also found male and female rates no longer differ significantly (Volberg, 2003b). Both states have widespread access to electronic gaming machines, which appear to be particularly attractive to women. Similar findings come from Australia and New Zealand.
In some jurisdictions there has been a marked increase in the proportion of women problem gamblers while in others (e.g., Washington State and North Dakota) the male proportion has expanded. Washington State experienced a substantial increase in the availability of commercial cardroom gambling, which is favored by men. In these two states, as well as in Montana, proportions of non-Caucasian problem gamblers have also increased significantly. Many are Native Americans. These are jurisdictions that have had substantial growth in the number of tribal casinos and ‘casino-style’ charitable gambling operations. From these studies, it appears that change in the availability of particular types of gambling is instrumental in altering the sociodemographic characteristics of problem gamblers (Volberg, 2004b).
While research generally supports the notion that problem gambling prevalence is associated with greater exposure to high risk gambling activities, there are some groups in the population with interesting ‘bimodal’ gambling patterns. In comparison to other groups, they contain large
17 2006 CALIFORNIA PROBLEM GAMBLING PREVALENCE SURVEY

proportions of people who do not gamble or gamble infrequently, as well as moderate to large proportions of frequent, high spending gamblers. In other words, overall they are less likely to gamble, but those who do, gamble more heavily. Groups in this category include some ethnic minorities and recent immigrant groups (e.g., African Americans in the U.S., Pacific Islanders in New Zealand and Eastern European immigrants in Sweden). These appear to be sectors of the population in the early stages of introduction to high risk forms of gambling. Some of these groups have exceedingly high levels of problem gambling (Abbott, 2001; Abbott, Volberg & Rönnberg, 2004).
Although there are significant gaps in knowledge about problem gambling, what is known has some relevance to gambling policy and the development of interventions to prevent problems and assist gamblers with problems. For example, legislation and policies that significantly enhance access to electronic gaming machines, casino table games and other continuous gambling forms can be expected to generate increases in problem and pathological gambling. Risk profiles are also likely to change, with disproportionate increases among women and some other population sectors including ethnic and new immigrant minorities. Problem gambling may also move ‘up market,’ becoming somewhat more evenly distributed throughout socioeconomic strata and age groups.
While problem gambling prevalence is likely to rise in the wake of gambling expansion, research suggests it will eventually level out, even when accessibility continues to increase (Abbott, 2001). However, rates may rise three- or four-fold before this occurs and even then, active measures may be required to achieve stabilization. Raising public awareness of the risks of excessive gambling, expanding services for problem gamblers, and strengthening regulatory, industry and public health harm reduction measures can counteract some adverse effects from increased availability. What is not known is how quickly such efforts can have a significant impact and whether or not they can prevent increases in the prevalence of problem gambling entirely.
Natural Recovery Natural recovery refers to the process by which individuals with maladaptive behaviors are able to overcome their difficulties without the help of a formal treatment program or self-help. In the case of problem gambling, the exact number of individuals who recover on their own is unknown but is likely to be much higher than the number of problem gamblers who access professional treatment (Abbott & Volberg, 1996; Abbott, Williams & Volberg, 2004; Smith, Volberg & Wynne, 1994). Research has begun to shed some light on natural recovery from problem and pathological gambling.
Prospective studies of adolescents, college students, casino employees and problem gamblers in the community have all found high rates of ‘problem resolution’ over periods ranging from one to seven years (Abbott, Williams & Volberg, 2004; Hodgins & el-Guebaly, 2000; Shaffer & Hall, 2002;
18 2006 CALIFORNIA PROBLEM GAMBLING PREVALENCE SURVEY
Slutske, Jackson & Sher, 2003; Wiebe, Single & Falkowski-Ham, 2003). These studies challenge the notion, enshrined in the DSM, of pathological gambling as a chronic and inevitably progressive disorder. The data further suggest that natural recovery may be the rule rather than the exception, particularly among subclinical problem gamblers.
The likelihood that natural recovery is common among problem gamblers provides hope for effectively preventing gambling disorders in the community (Abbott et al., 2004). If problem gamblers’ behavior is as susceptible to change as these few studies indicate, prevention messages could be targeted to specific groups in the population most at-risk for progression to pathological gambling. It would also be possible to target specific behaviors associated with progression towards more problematic gambling. Finally, given the well-established relationship between problem gambling and hazardous drinking, treatment initiatives are needed to screen for gambling problems in alcohol treatment programs and either refer individuals for specialty gambling treatment or train providers in effective approaches to treating gambling problems among substance abusers.
The Uses of Prevalence Research
The gambling studies field has changed considerably over the last 20 years. In the 1980s and early 1990s, when the first surveys of gambling and problem gambling were being conducted, policymakers were rather narrowly interested in finding out how many problem gamblers there were in the population in order to fund and design treatment services for individuals with gambling-related difficulties. Since that time, the goals for problem gambling prevalence research have become more complex.
The rapid growth of legal, commercial gambling has been accompanied by an increase in stakeholders with interests in and concerns about the gambling industry and how this affects individuals, families, and communities. Policymakers, planners, and government agencies are concerned with a broad range of gambling behaviors in the population, as well as with the balance of positive and negative impacts that may accompany the increased availability of gambling. Gaming regulators and operators are interested in how to manage funds appropriately to address the issue of problem gambling while still maintaining viable businesses. Public health researchers, social scientists, and health care providers are interested in discovering ways to minimize risks to specific subgroups in the population. Other professionals, such as economists, law enforcement professionals and the banking, insurance, and credit card industries, are interested in the relationship between gambling and bankruptcy and crime. There is also interest in the gambling industry’s dependence on problem gamblers for profits. Treatment professionals and not-for-profit organizations are focused on developing appropriate treatment services and in judiciously allocating the resources that flow to the mental health and addictions field. Finally, there is growing interest in prevention techniques and strategies for minimizing gambling-related harms.
19 2006 CALIFORNIA PROBLEM GAMBLING PREVALENCE SURVEY
While the gambling studies field is relatively young, prevalence surveys have become an essential component in the establishment and monitoring of legal gambling (Volberg et al., 1996). Prevalence research is useful in the development of public awareness campaigns using targeted messages to prompt changes in attitudes and behavior in vulnerable subgroups in the population. Prevalence research is important for the development of treatment services for individuals with gambling problems, through identification of the number and characteristics of individuals likely to seek help. Prevalence research has the potential to improve how gambling problems are identified and how communities respond. Finally, prevalence research has value in advancing understanding of the risk factors associated with gambling problems—information needed in the development of evidence-based gambling regulation and policies.
The 2006 California Problem Gambling Prevalence Survey is not the first problem gambling prevalence survey carried out in California. The first prevalence survey in California was conducted in 1990 as part of a larger study funded by the National Institute of Mental Health (Volberg, 1994). The 1990 survey included 1,250 completed interviews with randomly selected adults aged 18 and over, using a sampling design stratified by county to ensure a representative sample of the population. Respondents were asked about their lifetime experiences with lotteries, casino table games, gaming machines, bingo, card games, dice games, pari-mutuel wagering, games of skill, sports and the stock market. Problem gambling was assessed using the South Oaks Gambling Screen (SOGS) (Lesieur & Blume, 1987). While it is possible to compare lifetime participation rates for some gambling activities across these two surveys (see Changes in Gambling Participation Since 1990 on Page 52), the use of different problem gambling screens in the surveys means that problem gambling prevalence rates cannot be compared.
In the future, it will be important to replicate the 2006 California Problem Gambling Prevalence Survey. Future replication surveys—measuring the same behaviors and using the same methods at subsequent points in time—will be useful in monitoring changes over time in gambling participation and problem gambling prevalence in California. Future replications surveys will permit more precise assessments of the impact of specific types of gambling in California and provide important information for the refinement of services for Californians with gambling problems.
Strengths and Limitations of the Study
With a sample of 7,121 respondents, the 2006 California Problem Gambling Prevalence Survey is the largest problem gambling survey ever conducted in the United States. The use of standardized methods of data collection, including CATI interviews and a highly-structured instrument, likely reduced potential bias and enhanced the validity of the results. Strenuous efforts were made to recruit a fully representative sample of California residents into the survey, including several mailings of advance and refusal conversion letters, and conducting interviews in multiple languages. An important feature of the survey relates to the possibility of eventually conducting prospective studies
20 2006 CALIFORNIA PROBLEM GAMBLING PREVALENCE SURVEY
of gambling problems in California—when queried at the end of the interview, 58% of the respondents were willing to be contacted to participate in future studies of gambling and problem gambling.
There are some limitations to the 2006 California Problem Gambling Prevalence Survey. Perhaps most significantly, the survey is restricted to adults living in households with telephones—the sample does not include adolescents, adults living in group quarters, homeless persons or individuals with only cell-phone service. Another limitation relates to response rates for telephone surveys in general, which have declined precipitously in recent years. The 2006 California prevalence survey is no exception and, as a consequence, generalization of our results may be limited. A third limitation relates to the small size of the subgroup of African American respondents in the survey such that the prevalence rates of problem and pathological gambling in this group (separately, but not when combined) are associated with a sampling error greater than 50%. These estimates should be viewed with caution since they may be unreliable. A fourth limitation is that, despite our best efforts, participation in the survey by Asian and Hispanic respondents was lower than anticipated, based on population data. Although participation by Asian and Hispanic respondents was low, the overall size of the study means that the survey includes the largest samples of Hispanics (N=1569) and Asians (N=504) ever interviewed for a problem gambling prevalence survey. Finally, it is important to emphasize that, like other prevalence surveys, the 2006 California Problem Gambling Prevalence Survey is a cross-sectional ‘snapshot’ of gambling and problem gambling at a single point in time. This severely limits our ability to draw any causal inferences from associations reported between gambling participation, gambling problems and other variables in California.
21 2006 CALIFORNIA PROBLEM GAMBLING PREVALENCE SURVEY
22
2006 CALIFORNIA PROBLEM GAMBLING PREVALENCE SURVEY
Overview of Methods
The survey of gambling and problem gambling in California was completed in several stages. In the first stage of the project, staff from NORC consulted with OPG regarding the final design of the questionnaire and the sample, obtained ethical approval for the study, conducted a pretest and programmed the questionnaire for computer-aided telephone interviewing (CATI) administration. In the second stage of the project, interviews were completed with 7,121 respondents between October, 2005 and April, 2006. To ensure that the results could be generalized to the adult population of California, the sample was weighted in the third stage of the project to adjust for differences in household size and to reflect the known demographic characteristics of the population. The data were then analyzed and this report prepared.
In this section, we present an overview of the methods used in the study. Additional information on the study methodology, including a timetable of key events, is provided in Appendix B.
Ethical and Peer Review
The research protocol for the 2006 California Problem Gambling Prevalence Survey was reviewed separately by NORC’s internal Institutional Review Board and the Committee for the Protection of Human Subjects (CPHS), which serves as the institutional review board for California’s Health and Human Services Agency. These reviews ensured that the selection of subjects was equitable, subjects’ privacy was protected, informed consent was obtained, and that appropriate safeguards were in place to protect the data.
In addition to ethical review, NORC was required to secure an independent party responsible for conducting a peer review and validation of the sampling strategy, study design, data collection instruments and methodology, data analysis, and interpretation. The Peer Review team, made up of senior members of the Alcohol Research Group (ARG) in Berkeley, California, completed reviews prior to the start of the survey, prior to the beginning of data analysis, and prior to finalizing the report. The Peer Review team sent written reports directly to OPG at these critical points in the project. These reports were reviewed with NORC project staff and responses to all queries and comments were included in the study.
Questionnaire
The questionnaire included sections on gambling behavior, gambling-related problems, gambling treatment, family and marital issues, employment and finances, crime, physical and mental health, substance use and demographics (see Appendix C for a copy of the questionnaire). Different sections of the questionnaire are described in more detail in Appendix B.
As noted above (see Measuring Gambling Problems on Page 12), several problem gambling screens based on the most recent psychiatric criteria for Pathological Gambling have recently been developed. The NORC DSM-IV Screen for Gambling Problems (NODS) was used in the present survey to provide a measure of gambling problems based on the most recent psychiatric criteria for pathological gambling, as well as comparability with recent national and statewide surveys. The NODS was developed in 1998 as part of a large program of research undertaken by NORC on behalf of the National Gambling Impact Study Commission (1999) and is designed specifically for administration in large population surveys (Gerstein et al., 1999).
Details on the development, content, and performance of the NODS are provided below (see The NORC DSM-IV Screen for Gambling Problems on Page 56).
Translation of the Questionnaire Census data show that 28% of the adult population of California is Hispanic or Latino. To enable interviews to be completed with Hispanic and Latino individuals who did not speak English, it was necessary to translate the questionnaire. The questionnaire was translated into Spanish by Research Support Services, an Evanston (IL)-based company that specializes in instrument translation into Spanish for health and social research. During data collection, interviewers were instructed to arrange to conduct the interview in Spanish if the person answering the telephone spoke Spanish or indicated that they wanted to complete the interview in that language. A total of 645 interviews (9% of the final sample) were conducted in Spanish by bi-lingual NORC interviewers.
Language Line Interviewing Given the diversity of the California population, NORC made provision to interview all non-English and non-Spanish respondents in their native language, using specially trained interpreters and interviewers. Interviewers followed specific procedures for engaging Language Line, a Monterey (CA)-based interpreter service, when a sample telephone number was answered by someone not speaking English or Spanish. Interpreter services were available in 150 languages and these services could be engaged to complete an interview immediately or to arrange to complete the interview at a later time. A subset of NORC interviewers were trained to administer the questionnaire using Language Line interpreters, and Language Line staff were trained to follow survey protocols and were bound by NORC’s confidentiality policy. A total of 82 interviews (1% of the final sample)
23 2006 CALIFORNIA PROBLEM GAMBLING PREVALENCE SURVEY
were conducted with a translator’s assistance. The majority of translator-assisted interviews were conducted in Cantonese or Mandarin, Korean, Vietnamese, and Russian.
Pretest The pretest served to refine training materials and job aids for the main data collection, test respondent comprehension of the questionnaire, evaluate responses to selected items, measure questionnaire administration times, and test the overall design and flow of the instrument. Interviewers completed 24 pretest interviews over the course of two weeks. Although results from the pretest led to extensive editing of the questionnaire to reduce administration time, there were few missing or implausible responses and all of the contact and consent procedures, as well as the sample delivery and management systems, worked well.
Survey Design
The main sample for this survey included 7,121 residents of California aged 18 and over. Participants in the survey were selected by means of random-digit dialing (RDD), a method that ensures that each telephone number in California had an equal probability of selection into the sample. This sampling approach ensures that the overall sample is representative of California residents within a known margin of error. As described in Appendix B, weights were included in the final data set that accounted for the greater probability that households with more than one telephone line would be contacted.
All interviews were conducted at the NORC facility in Chicago by trained interviewers under close supervision and with random monitoring for technique and adherence to procedures. In addition to general training in telephone interviewing techniques, interviewers received training in the specific requirements for this study. Interviews were conducted using a CATI system which minimizes the potential for interviewer errors by controlling progression through the questionnaire and preventing out-of-range responses.
Advance and Refusal Conversion Letters Advance letter mailings were possible through use of TARGUSinfo, a service that matches sampled telephone numbers and known addresses through a variety of databases.
One week prior to the beginning of data collection, NORC mailed advance letters in both English and Spanish to households with listed and unlisted telephone numbers that were identified through TARGUSinfo. The advance letters contained a summary of the project purpose and its goals. The letter also explained how the household was selected for the survey, provided assurances of confidentiality, contained a copy of the California Participant’s Bill of Rights for Non-Medical Research, and instructed addressees how to contact NORC with questions. Advance letter mail-outs continued throughout the data collection period prior to the release of new sample to the
24 2006 CALIFORNIA PROBLEM GAMBLING PREVALENCE SURVEY
interviewers. Nearly one-third of the respondents who completed the interview (31%) indicated that they had received the advance letter.
Over the course of data collection, several refusal conversion letters, written in English and Spanish, were mailed out to respondents who indicated they were reluctant to participate in the survey. In preparing these letters, interviewer notes on contacts with eligible respondents were analyzed to determine the most frequent reasons for refusing to participate. The most frequent reasons that eligible respondents gave for refusing to participate in the survey were that they were not interested in the topic, that they didn’t gamble or that they were unwilling to complete the interview. The letters that were mailed out were tailored to fit the respondents’ reason for refusal. Coupled with specialized training for interviewers in refusal conversion techniques, these letters resulted in 2,630 completed interviews representing 39% of the completed cases.
Break-off Cases Respondents who completed the interview up through the problem gambling section and subsequently stopped the interview were considered eligible for conversion to partial completed cases. Given that a key requirement of the study was to estimate the prevalence rate of problem and pathological gambling in the State of California, we considered these individuals to have completed the most important portion of the questionnaire.
A total of 521 respondents were re-contacted and asked to provide a small amount of additional information to allow their inclusion in the final sample. Interviewers were able to collect critical demographic information from 313 individuals or 60% of the eligible cases. These 313 cases were considered to be completes when calculating response rates and reporting the total number of completed cases. Such partial completes represented 4% of the final sample.
Sample Disposition and Response Rate
Response rates for telephone surveys in the general population have declined precipitously in recent years as individuals in the general population become increasingly reluctant to participate in survey research and as technological barriers proliferate. While there is uncertainty about the characteristics of individuals who choose not to participate in gambling surveys, it has generally been assumed that people who are not contacted or decline to be interviewed in gambling surveys include disproportionate numbers of problem gamblers (Lesieur, 1994). However, it has also been suggested that both people with little involvement and/or interest in gambling and problem gamblers may be over-represented among non-respondents in surveys with low to medium response rates (Abbott & Volberg, 1991). If this is the case, the effects of their omission may partially or totally cancel each other out (Abbott, Volberg & Rönnberg, 2004).
25 2006 CALIFORNIA PROBLEM GAMBLING PREVALENCE SURVEY
Abbott (2001) examined this possibility by comparing the most recent New Zealand prevalence estimate with those obtained from a large national Australian survey (Productivity Commission, 1999). Like many previous surveys, the Australian study was undertaken by a private research company and had a relatively low response rate. The New Zealand prevalence survey was carried out by the official statistics agency in that country and, as a result, attained an unusually high response rate. Nevertheless, the problem gambling prevalence estimate in New Zealand was very similar to those found in the two Australian states that had similar expenditures on continuous forms of gambling and markedly lower than those from Australian states and territories with higher expenditures. These findings are consistent with expectations based on known associations between gambling expenditures and problem gambling prevalence and support Shaffer, Hall and Vander Bilt’s (1997) contention that problem gambling is a robust phenomenon largely impervious to differences in researcher and research methodology and quality.
The California survey included a random sample of 10-digit telephone numbers purchased from GENESYS, a well-known vendor of telephone samples. The list from which the numbers were drawn included only actual California area codes and telephone banks (that is, blocks of 100 consecutive numbers within these area codes) that had been determined to contain a threshold number of active residential numbers. With some exceptions (see Appendix B), each number in the purchased sample was called numerous times over the 5-month data collection period to determine whether it was a working residential number (WRN) in contrast to a nonworking number, a commercial/business line, a cell phone, data or fax line, or a nonprimary household telephone.
NORC staff classified 35,745 numbers as working residential numbers eligible for interview. NORC interviewers successfully screened 15,140 of these households to establish the number of adults residing there and to randomly select one household adult for interview. A small number of these households (N=44) were determined to be ineligible because there were no adults aged 18 and over in the household. Usable interviews were subsequently completed with 7,121 adults.
One consequence of the decline in response rates for telephone surveys has been that these rates are now calculated in a variety of ways. Although all of these approaches involve dividing the number of respondents by the number of contacts believed to be eligible, substantial differences in response rates can result from different ways of calculating the denominator—that is, the number of individuals deemed eligible to respond. The most widely used method for calculating response rates includes in the denominator only the total valid sample (i.e., only households known to be eligible for inclusion in the sample). This approach is probably based on response rate calculations long accepted as the standard for face-to-face surveys. Using this approach—more properly called the completion rate in telephone surveys—the response rate for the California survey is 47.2%. While this rate is substantially lower than the completion rate for the national survey in 1998 (73.7%), it is identical to the completion rate achieved in a problem gambling prevalence survey conducted in the same timeframe in New Mexico (Gerstein et al., 1999; Volberg, 2006).
26 2006 CALIFORNIA PROBLEM GAMBLING PREVALENCE SURVEY
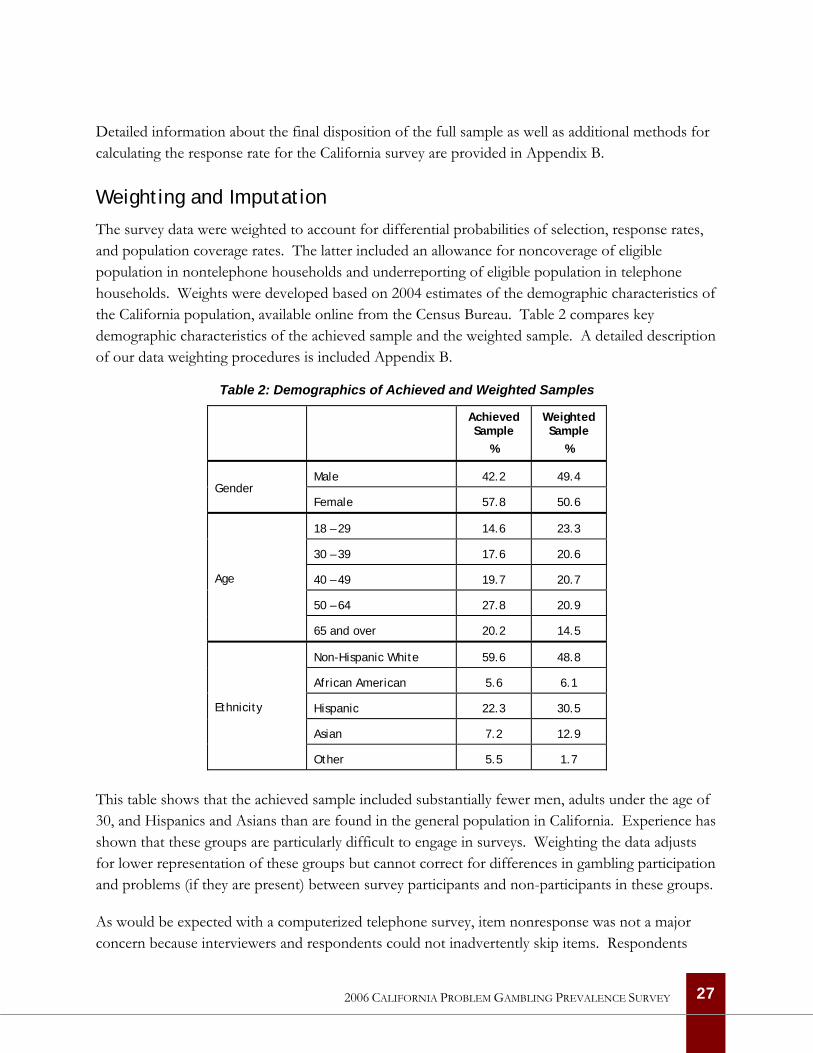
Detailed information about the final disposition of the full sample as well as additional methods for calculating the response rate for the California survey are provided in Appendix B.
Weighting and Imputation
The survey data were weighted to account for differential probabilities of selection, response rates, and population coverage rates. The latter included an allowance for noncoverage of eligible population in nontelephone households and underreporting of eligible population in telephone households. Weights were developed based on 2004 estimates of the demographic characteristics of the California population, available online from the Census Bureau. Table 2 compares key demographic characteristics of the achieved sample and the weighted sample. A detailed description of our data weighting procedures is included Appendix B.
Table 2: Demographics of Achieved and Weighted Samples
Achieved Sample
%
Weighted Sample
%
Male 42.2 49.4 Gender
Female 57.8 50.6
18 – 29 14.6 23.3
30 – 39 17.6 20.6
40 – 49 19.7 20.7
50 – 64 27.8 20.9
Age
65 and over 20.2 14.5
Non-Hispanic White 59.6 48.8
African American 5.6 6.1
Hispanic 22.3 30.5
Asian 7.2 12.9
Ethnicity
Other 5.5 1.7
This table shows that the achieved sample included substantially fewer men, adults under the age of 30, and Hispanics and Asians than are found in the general population in California. Experience has shown that these groups are particularly difficult to engage in surveys. Weighting the data adjusts for lower representation of these groups but cannot correct for differences in gambling participation and problems (if they are present) between survey participants and non-participants in these groups.
As would be expected with a computerized telephone survey, item nonresponse was not a major concern because interviewers and respondents could not inadvertently skip items. Respondents
27 2006 CALIFORNIA PROBLEM GAMBLING PREVALENCE SURVEY
were allowed to refuse to answer a question or to give a ‘don’t know’ response. The percentage of refused and don’t know responses was extremely low (less than 1%) for nearly all questionnaire items. Variables with more than 20% of the responses recorded as don’t know or refused (personal income and household income) were candidates for imputation. Because personal income was not included in any analysis, it was not imputed. However, annual household income was included in several analyses and missing values were imputed. Details concerning the imputation of missing values for household income are provided in Appendix B.
Statistical Analysis
Once the data were delivered to the analytic team, all of the variables were checked carefully for correct skip procedures. The data were primarily analyzed using the Statistical Package for the Social Sciences (SPSS 12.0). Numerous analytic variables were constructed from the raw data, including generalized gambling participation levels, scores on the problem gambling screen, levels of alcohol and drug use, experience of depression and help-seeking.
Chi-square analysis and other nonparametric techniques were used to test for statistical significance in the sections of the report addressing gambling behavior, problem gambling prevalence and correlates of problem gambling. Binary logistic regression was used to examine the relative strength of risk factors associated with at-risk, problem and pathological gambling in California.
28 2006 CALIFORNIA PROBLEM GAMBLING PREVALENCE SURVEY

THIS PAGE LEFT INTENTIONALLY BLANK
29 2006 CALIFORNIA PROBLEM GAMBLING PREVALENCE SURVEY
30
2006 CALIFORNIA PROBLEM GAMBLING PREVALENCE SURVEY
Gambling in California
This chapter examines gambling participation among adults in California. To assess the full range of gambling activities available to California residents, the questionnaire for the survey included questions about eight different wagering activities. At the beginning of the interview, all respondents were given the same definition of gambling to assure comprehension and comparability of the results. Respondents were told:
I would like to begin by asking about your experience with various kinds of wagering or betting … By “betting,” I mean placing a bet on the outcome of a game of skill or chance, or playing a game in which you might win or lose your money.
Respondents were then asked detailed questions about their participation in specific gambling activities, including whether they had gambled:
• at a casino, that is, a large hall with many different kinds of games
• in a commercially run bingo hall
• at a race track or off-track betting parlor
• in a cardroom, that is, a business with premises devoted to playing card games for money
• on a private game such as poker in someone’s home, dice, dominos, pool, golf, or bowling
• on the lottery
• on a computer over the Internet and World Wide Web
• on any other kind of betting – examples include Las Vegas nights, sports betting with friends or a bookmaker or playing slot machines in a local restaurant or bar
Gambling in the General Population
In every recent survey of gambling and problem gambling, the majority of respondents acknowledge participating in one or more gambling activities. Nationally, the proportion of the population that has ever gambled ranges from 81% in the Southern states to 89% in the Northeast (Gerstein et al., 1999). In 2006, 83% of the California respondents acknowledged ever participating in one or more of the activities included in the questionnaire. Nearly six in ten California adults (58%) have gambled in the past year and nearly one-quarter (22%) gamble once a month or more often. Only one in ten California adults (10%) gamble once a week or more often.
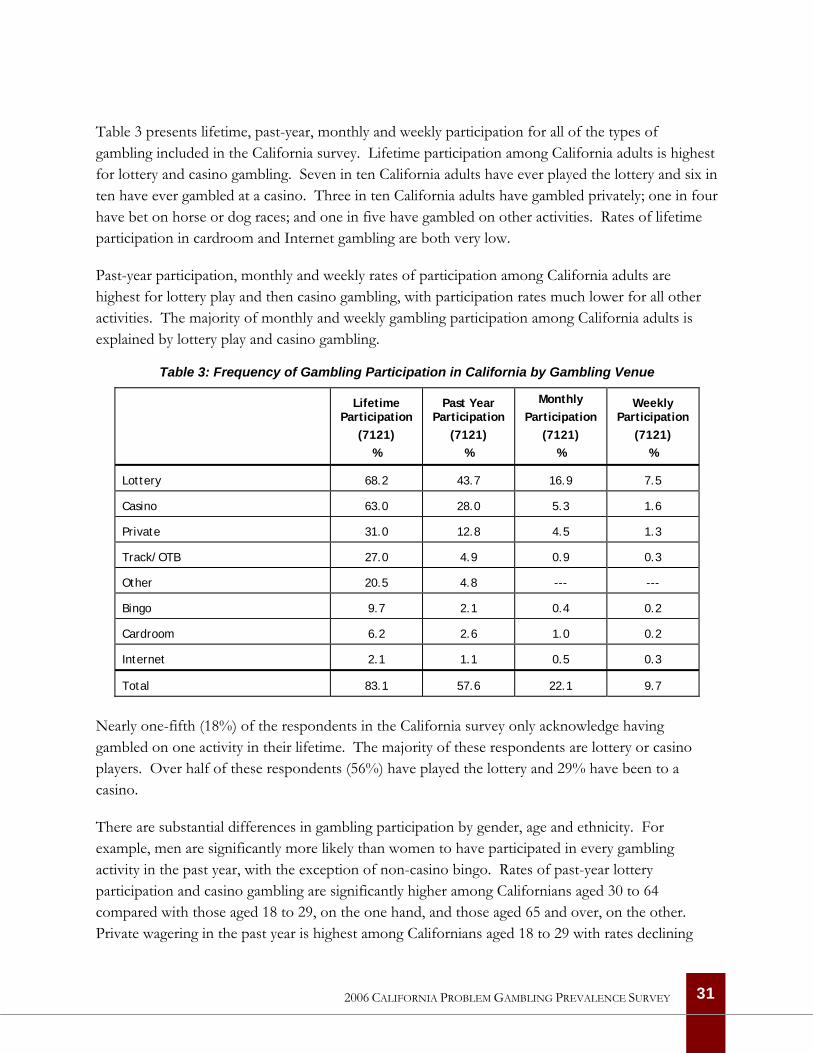
Table 3 presents lifetime, past-year, monthly and weekly participation for all of the types of gambling included in the California survey. Lifetime participation among California adults is highest for lottery and casino gambling. Seven in ten California adults have ever played the lottery and six in ten have ever gambled at a casino. Three in ten California adults have gambled privately; one in four have bet on horse or dog races; and one in five have gambled on other activities. Rates of lifetime participation in cardroom and Internet gambling are both very low.
Past-year participation, monthly and weekly rates of participation among California adults are highest for lottery play and then casino gambling, with participation rates much lower for all other activities. The majority of monthly and weekly gambling participation among California adults is explained by lottery play and casino gambling.
Table 3: Frequency of Gambling Participation in California by Gambling Venue
Lifetime Participation
(7121) %
Past Year Participation
(7121) %
Monthly Participation
(7121) %
Weekly Participation
(7121) %
Lottery 68.2 43.7 16.9 7.5
Casino 63.0 28.0 5.3 1.6
Private 31.0 12.8 4.5 1.3
Track/OTB 27.0 4.9 0.9 0.3
Other 20.5 4.8 --- ---
Bingo 9.7 2.1 0.4 0.2
Cardroom 6.2 2.6 1.0 0.2
Internet 2.1 1.1 0.5 0.3
Total 83.1 57.6 22.1 9.7
Nearly one-fifth (18%) of the respondents in the California survey only acknowledge having gambled on one activity in their lifetime. The majority of these respondents are lottery or casino players. Over half of these respondents (56%) have played the lottery and 29% have been to a casino.
There are substantial differences in gambling participation by gender, age and ethnicity. For example, men are significantly more likely than women to have participated in every gambling activity in the past year, with the exception of non-casino bingo. Rates of past-year lottery participation and casino gambling are significantly higher among Californians aged 30 to 64 compared with those aged 18 to 29, on the one hand, and those aged 65 and over, on the other. Private wagering in the past year is highest among Californians aged 18 to 29 with rates declining
31 2006 CALIFORNIA PROBLEM GAMBLING PREVALENCE SURVEY
steeply in older age groups in the population. Among different ethnic groups, past-year casino gambling and private wagering are significantly lower among Asians and Hispanics compared with Whites, African Americans and those in other racial and ethnic groups. Past-year lottery play is highest among African Americans and lowest among Asians. Finally, respondents born outside the United States are significantly less likely to have gambled in the past year on any of the activities included in the survey.
There are also substantial differences in the age at which respondents started gambling by gender, age and ethnicity. Over half of the men who have ever gambled recall that their first gambling experience occurred before the age of 21 compared with 36% of the women who have ever gambled. The proportion of respondents in different age groups who recall that their first gambling experience occurred before the age of 21 decreases significantly with age. While 76% of respondents aged 18 to 29 recall gambling before the age of 21, only 27% of respondents aged 65 and over recall doing so. Asian respondents are significantly less likely to recall that their first gambling experience occurred before the age of 21 compared with respondents from other racial and ethnic groups. Finally, respondents born outside the U.S. are significantly less likely than U.S.-born respondents to recall gambling before the age of 21.
As the Peer Review team noted, retrospective reports of age of gambling onset may be biased as a consequence of systematic degradation of recall accuracy among older groups in the population. Older adults are more distant from youthful events and self-reports of events that are substantially more distant in time among older adults—as well as potentially more stigmatized—are likely to contain considerable error.
Tables A-1 through A-4 in Appendix A provide details of the foregoing paragraphs.
Patterns of Gambling Participation
To understand patterns of gambling participation, it is helpful to examine the demographics of respondents who wager at increasing levels of frequency. To analyze levels of gambling participation, respondents were divided into five groups:
• non-gamblers who have never participated in any type of gambling (17% of the total sample);
• infrequent gamblers who have participated in one or more types of gambling but not in the past year (26% of the total sample);
• past year gamblers who have participated in one or more types of gambling in the past year but not on a monthly or weekly basis (35% of the total sample);
32 2006 CALIFORNIA PROBLEM GAMBLING PREVALENCE SURVEY
• monthly gamblers who participate in one or more types of gambling on a monthly basis (12% of the total sample); and
• weekly gamblers who participate in one or more types of gambling on a weekly basis (10% of the total sample).
Table A-5 in Appendix A presents detailed information about the demographic characteristics of these different groups. This table shows that there are significant differences in overall gambling participation associated with gender, age and ethnicity. There are also important differences in gambling participation associated with marital status, educational status, employment status, income, religion and immigrant status.
Non-gamblers in California are significantly more likely than gamblers to be female, to be under the age of 30, to be Hispanic, to have never married, to have less than a high school education and to have annual household incomes under $25,000. Non-gamblers in California are significantly less likely than gamblers to be employed and to have been born in the United States.
Infrequent and past-year gamblers in California are quite similar in demographic terms. These individuals are just as likely to be male as female and their ethnic distribution is similar. Infrequent gamblers are somewhat more likely to be aged 65 and over compared with more frequent gamblers. Infrequent gamblers are the group most likely to be widowed and most likely to have pursued graduate study. They are somewhat less likely to be employed and somewhat more likely to be keeping house than other gamblers. Past-year gamblers are the group most likely to be married and employed; this is the group least likely to be aged 65 and over or widowed.
Monthly and weekly gamblers in California are significantly more likely than less frequent gamblers to be male and to be divorced. Weekly gamblers are significantly more likely than monthly gamblers to be over the age of 65, to be African American or Hispanic, Weekly gamblers are significantly less likely than monthly gamblers to have gone to college or pursued graduate study. With regard to employment status, weekly gamblers are significantly less likely to be employed and more likely to be retired than monthly gamblers. Weekly gamblers are the group most likely to be disabled, to be Catholic and to have been born in the United States.
The Demographics of Specific Gambling Activities There are important differences in the demographic characteristics of individuals who have engaged in specific gambling activities in the past year. This section of the report summarizes information presented in detail in Table A-6 in Appendix A.
Lottery. Although respondents who have played the lottery in the past year are quite similar to the general population of California, there are nevertheless some interesting differences. Past-year lottery players in California are significantly more likely than the general population to be male,
33 2006 CALIFORNIA PROBLEM GAMBLING PREVALENCE SURVEY
married and between the ages of 30 and 64. Past-year lottery players are more likely than the general population to be White or African American. They are also significantly more likely than the general population to have attended college, to be employed and to have annual household incomes over $50,000.
Respondents who played the lottery in the past year have participated in an average of 1.9 other gambling activities in the same timeframe. The gambling activities that past-year lottery players are most likely to have done include going to a casino (43%) and wagering privately (17%).
Respondents who played the lottery in the past year were asked to identify their favorite lottery game. Over half of the respondents who had a favorite lottery game (53%) preferred large-jackpot games such as Mega-Millions and SuperLotto Plus, each with two drawings per week. Another 25% of the respondents who had a favorite lottery game preferred instant tickets, or Scratchers. A substantial number of respondents who had played the lottery in the past year (7%) did not identify a favorite game. Respondents who played the lottery in the past year were asked several other questions about their lottery purchasing habits. Six in ten of these respondents (62%) had made their most recent lottery purchase in their neighborhood and 13% had participated in a lottery pool rather than purchasing their tickets individually.
Casino. Like past-year lottery players, past-year casino gamblers in California are significantly more likely than the general population to be male, married and between the ages of 30 and 64. Past-year casino gamblers are also more likely than the general population to be White or African American and less likely to be Hispanic or Asian. Finally, like lottery players, past-year casino gamblers are significantly more likely than the general population to have attended and/or graduated from college, to be employed and to have annual household incomes over $50,000.
Respondents who gambled at a casino in the past year participated in an average of 2.3 other gambling activities in the same timeframe. The gambling activities that past-year casino gamblers are most likely to have done include buying lottery tickets (67%) and wagering privately (25%) followed by horse race betting (11%).
Respondents who gambled at a casino in the past year were asked what city or location they visited on the last occasion when they went to a casino. Nearly half of these respondents (47%) indicated that their last visit was to a casino in California and nearly all of the remaining respondents (49%) indicated that their last visit was to a casino in Nevada. Other locations where respondents had gambled at a casino in the past year included on a cruise ship, in Arizona, Atlantic City, Mississippi, Oregon and the Caribbean.
Respondents who gambled at a casino in the past year were also asked what casino games they played on their last visit to a casino. The majority (62%) said that they had played slot machines,
34 2006 CALIFORNIA PROBLEM GAMBLING PREVALENCE SURVEY
27% had played card games such as blackjack or poker and another 9% had played a casino table game besides blackjack or poker. Only 2% of these respondents had gambled on anything besides card games or machines at the casino. Other games included bingo, live keno, sports betting and wagering on horse races.
Private. Respondents who wagered privately in the past year are nearly two times more likely to be male than female. These respondents are significantly younger than the general population in California and, perhaps because of this, significantly less likely to be married. They are more likely than the general population in California to have attended college, to be employed or presently attending school, and to have annual household incomes over $75,000. These respondents are also significantly more likely to indicate that they do not have a religious affiliation.
Respondents who wagered privately in the past year participated in an average of 2.7 other gambling activities in the same timeframe. The gambling activities that past-year private gamblers are most likely to have done include buying lottery tickets (58%) and gambling at a casino (55%) followed by gambling on other activities (18%), horse races (14%) and at a cardroom (14%).
Respondents who wagered privately in the past year were asked what game they played on the last occasion when they gambled privately. Six in ten of these respondents (59%) indicated that they played poker when they gambled privately. Two in ten of these respondents (18%) indicated that they bet on sports when they gambled privately and 10% of these respondents gambled on a card game besides poker. Other private gambling activities included betting on dice games, golf and pool.
Track. Respondents who have wagered on horse races in the past year are, like those who have wagered privately, twice as likely to be male than female. Given the usually older age of track bettors, it is surprising that there are no significant differences between past-year track bettors and the general population in California with regard to age. However, past-year track bettors are 30% more likely than the general population to be White and significantly less likely to be Hispanic or Asian. Despite their age, these respondents are significantly less likely to be married presently and significantly more likely to have never married. These respondents tend to be quite well educated with seven in ten having attended and/or graduated college or graduate school. They are significantly more likely than the general population to be employed and to have annual household incomes over $75,000. Like past-year private gamblers, past-year track bettors are significantly more likely than the general population to indicate that they do not have a religious affiliation.
Respondents who gambled on horse races in the past year participated in an average of 3.2 other gambling activities in the same timeframe. The gambling activities that past-year track bettors are most likely to have done include buying lottery tickets (71%) and gambling at a casino (63%) followed by other activities (15%) and gambling at a cardroom (14%).
35 2006 CALIFORNIA PROBLEM GAMBLING PREVALENCE SURVEY
Other. Respondents who have gambled on something apart from the specific activities included in the survey are more than twice as likely to be male than female. These respondents are significantly younger than the general population with three-quarters (77%) under the age of 50. These respondents are significantly more likely than the general population to be African American or Hispanic rather than White or Asian. Perhaps because of their generally younger age, these respondents are significantly less likely to be married or widowed and significantly more likely to have never married. While these respondents are more likely to have attended and/or graduated from college, they are less likely than the general population to have pursued graduate study. These respondents are significantly more likely to be employed and less likely to be retired or keeping house.
Respondents who gambled on other activities in the past year participated in an average of 3.1 other gambling activities in the same timeframe. The gambling activities that these gamblers are most likely to have done include buying lottery tickets (69%) and gambling at a casino (52%) followed by betting on horse races (15%) and gambling at a cardroom (14%).
Respondents who gambled on other activities in the past year were asked what game or games they had bet on in the past 12 months. One-third of these respondents (33%) indicated that they gambled on sports events and another 28% indicated that they wagered on some sort of pool, including sports pools and baby pools at work. About one in ten of these respondents (8%) indicated that they gambled on an electronic gaming device in a non-casino location. The remaining respondents indicated that they gambled on charitable raffles, pulltabs, illegal numbers games, cockfights or dogfights, keno games and other private games.
Cardroom. Like private wagerers and track bettors, past-year cardroom gamblers are significantly more likely to be male than female. These respondents are also significantly younger than the general population of California with four in ten under the age of 30 and another three in ten under the age of 40. Again, due to their age, past-year cardroom gamblers are significantly more likely than the general population to have never married and to have attended college although not to have graduated from college or pursued graduate studies. Past-year cardroom gamblers are significantly more likely than the general population to be employed or disabled and less likely to be retired or keeping house. These respondents are significantly more likely than the general population to have annual household incomes over $75,000 and to indicate that they do not have a religious affiliation. It is interesting that past-year cardroom gamblers are the most likely group, after non-gamblers, to have been born outside the United States.
Respondents who gambled at cardrooms in the past year participated in an average of 4.1 other gambling activities in the same timeframe. The gambling activities that cardroom gamblers are most likely to have done include gambling at a casino (90%), buying lottery tickets (71%) and private
36 2006 CALIFORNIA PROBLEM GAMBLING PREVALENCE SURVEY

wagering (70%) followed by betting on horse races (26%) and other activities (26%). One in six past-year cardroom gamblers (16%) had also gambled on the Internet in the past year.
Respondents who gambled at a cardroom in the past year were asked what game they had played the last time they had gambled at a cardroom. Nearly eight in ten of these respondents indicated that they only played one game when they gambled at cardrooms; the majority (62%) played poker while another 32% played blackjack. Among the respondents who indicated that they played more than one game when they went to a cardroom, the majority played poker and blackjack. The remaining respondents played other games in addition to poker and blackjack, including Pai Gow poker and Super Pan Nine, games designed to appeal specifically to Asian players.
Internet. Like past-year cardroom gamblers, past-year Internet gamblers are significantly more likely to be male than female. These gamblers are also significantly younger than the general population with almost six in ten under the age of 40. Past-year Internet gamblers are significantly more likely than the general population to have never married and to have attended and/or graduated from college. These respondents are the group most likely to be employed (and they are no more likely than the general population to be in school) and they are significantly more likely than the general population to have annual household incomes over $125,000. In contrast to cardroom gamblers, past-year Internet gamblers are significantly more likely than the general population to be White. Oddly, after past-year bingo players, past-year Internet gamblers are the group most likely to indicate that their religious affiliation is Christian.
Like past-year cardroom gamblers, respondents who gambled on the Internet in the past year participated in an average of 4.1 other gambling activities in the same timeframe. The gambling activities that Internet gamblers are most likely to have done include gambling at a casino (85%), buying lottery tickets (70%) and private wagering (57%) followed by cardroom gambling (37%), betting on horse races (32%) and gambling on other activities (22%).
Respondents who gambled on the Internet in the past year were asked what game or games they had played on the last occasion they gambled on the Internet. Six in ten of these respondents (65%) indicated that they played poker on the Internet and 22% of these respondents indicated that they gambled on sports. Other gambling activities that these respondents had done on the Internet included blackjack, slot machines and betting on horse or dog races.
Bingo. In contrast to all of the other gamblers in the survey, respondents who played bingo in a bingo hall (as opposed to a casino) in the past year are significantly more likely to be female than male. These respondents also tend to be older than the general population in California with over half (56%) over the age of 40. Differences between past-year bingo players and the general population for ethnicity, marital status, employment status and annual household income are all
37 2006 CALIFORNIA PROBLEM GAMBLING PREVALENCE SURVEY
non-significant. However, this may be due to the small size of the group of past-year bingo players and the relatively small differences in demographic characteristics.
Past-year bingo players participated in an average of 3.3 other gambling activities in the same timeframe. The gambling activities that bingo players are most likely to have done include gambling at a casino (77%), buying lottery tickets (75%) and private wagering (27%).
Considering Gender, Age and Ethnicity There are interesting differences in patterns of gambling participation by gender and age (see Table A-7 in Appendix A for detailed results). For example, while men and women aged 18 to 29 are equally likely to have purchased lottery tickets in the past year, men aged 30 and over are significantly more likely than women of the same age to have engaged in this activity. Past-year casino gambling is significantly higher among men than among women aged 18 to 39 and a similar pattern is seen among men and women aged 65 and over. However, men and women aged 40 to 64 are equally likely to have gambled at a casino in the past year. Although overall participation rates are substantially lower, men in every age group are significantly more likely than women of the same age to have wagered privately in the past year. Despite even lower overall participation rates, the same general pattern is true for horse race wagering and for gambling at cardrooms.
There are also interesting differences in patterns of gambling participation by gender and ethnicity (see Table A-8 in Appendix A for detailed results). For example, among Whites, Hispanics and Asians, men are significantly more likely than women to have played the lottery in the past year. While African American men are more likely than African American women to have played the lottery in the past year, the difference between the genders is smaller and does not achieve statistical significance. Past-year casino gambling is significantly higher among men than among women across all ethnic groups with the exception of Asians. Among Asians in California, significantly more women than men have gambled at a casino in the past year. Men are significantly more likely than women in every ethnic group except those classified as ‘Other’ to have wagered privately in the past year. While men are more likely than women to have wagered on horse races in the past year, the difference is only significant among Whites and Hispanics. Similarly, while men are more likely than women to have gambled in a cardroom in the past year, the difference is only significant among Whites, African Americans and Hispanics.
Gambling Preferences To understand patterns of gambling participation, it is also helpful to examine the relationship between participation and preferred gambling activities. Table 4 compares past-year participation in specific gambling activities with information from past-year gamblers about where they spent the greatest amount of time gambling in the past year. This table shows that while the lottery is the
38 2006 CALIFORNIA PROBLEM GAMBLING PREVALENCE SURVEY
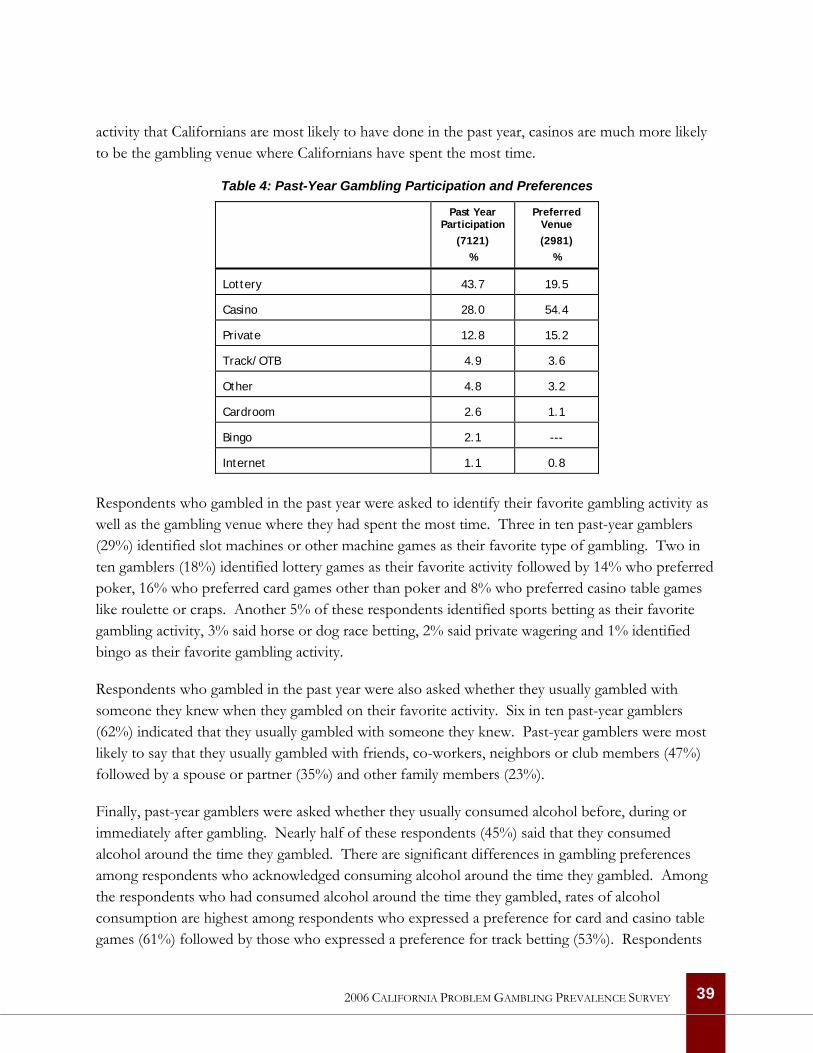
activity that Californians are most likely to have done in the past year, casinos are much more likely to be the gambling venue where Californians have spent the most time.
Table 4: Past-Year Gambling Participation and Preferences
Past Year Participation
(7121) %
Preferred Venue (2981)
%
Lottery 43.7 19.5
Casino 28.0 54.4
Private 12.8 15.2
Track/OTB 4.9 3.6
Other 4.8 3.2
Cardroom 2.6 1.1
Bingo 2.1 ---
Internet 1.1 0.8
Respondents who gambled in the past year were asked to identify their favorite gambling activity as well as the gambling venue where they had spent the most time. Three in ten past-year gamblers (29%) identified slot machines or other machine games as their favorite type of gambling. Two in ten gamblers (18%) identified lottery games as their favorite activity followed by 14% who preferred poker, 16% who preferred card games other than poker and 8% who preferred casino table games like roulette or craps. Another 5% of these respondents identified sports betting as their favorite gambling activity, 3% said horse or dog race betting, 2% said private wagering and 1% identified bingo as their favorite gambling activity.
Respondents who gambled in the past year were also asked whether they usually gambled with someone they knew when they gambled on their favorite activity. Six in ten past-year gamblers (62%) indicated that they usually gambled with someone they knew. Past-year gamblers were most likely to say that they usually gambled with friends, co-workers, neighbors or club members (47%) followed by a spouse or partner (35%) and other family members (23%).
Finally, past-year gamblers were asked whether they usually consumed alcohol before, during or immediately after gambling. Nearly half of these respondents (45%) said that they consumed alcohol around the time they gambled. There are significant differences in gambling preferences among respondents who acknowledged consuming alcohol around the time they gambled. Among the respondents who had consumed alcohol around the time they gambled, rates of alcohol consumption are highest among respondents who expressed a preference for card and casino table games (61%) followed by those who expressed a preference for track betting (53%). Respondents
39 2006 CALIFORNIA PROBLEM GAMBLING PREVALENCE SURVEY
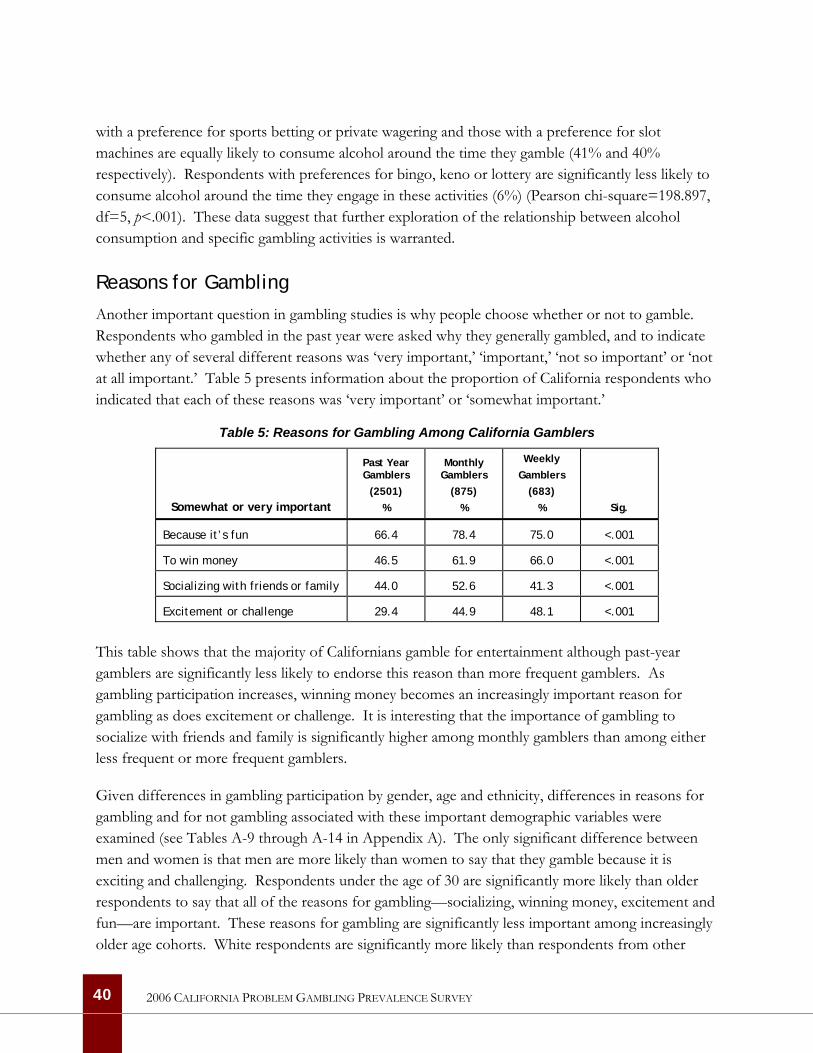
with a preference for sports betting or private wagering and those with a preference for slot machines are equally likely to consume alcohol around the time they gamble (41% and 40% respectively). Respondents with preferences for bingo, keno or lottery are significantly less likely to consume alcohol around the time they engage in these activities (6%) (Pearson chi-square=198.897, df=5, p<.001). These data suggest that further exploration of the relationship between alcohol consumption and specific gambling activities is warranted.
Reasons for Gambling
Another important question in gambling studies is why people choose whether or not to gamble. Respondents who gambled in the past year were asked why they generally gambled, and to indicate whether any of several different reasons was ‘very important,’ ‘important,’ ‘not so important’ or ‘not at all important.’ Table 5 presents information about the proportion of California respondents who indicated that each of these reasons was ‘very important’ or ‘somewhat important.’
Table 5: Reasons for Gambling Among California Gamblers
Somewhat or very important
Past Year Gamblers
(2501) %
Monthly Gamblers
(875) %
Weekly Gamblers
(683) % Sig.
Because it’s fun 66.4 78.4 75.0 <.001
To win money 46.5 61.9 66.0 <.001
Socializing with friends or family 44.0 52.6 41.3 <.001
Excitement or challenge 29.4 44.9 48.1 <.001
This table shows that the majority of Californians gamble for entertainment although past-year gamblers are significantly less likely to endorse this reason than more frequent gamblers. As gambling participation increases, winning money becomes an increasingly important reason for gambling as does excitement or challenge. It is interesting that the importance of gambling to socialize with friends and family is significantly higher among monthly gamblers than among either less frequent or more frequent gamblers.
Given differences in gambling participation by gender, age and ethnicity, differences in reasons for gambling and for not gambling associated with these important demographic variables were examined (see Tables A-9 through A-14 in Appendix A). The only significant difference between men and women is that men are more likely than women to say that they gamble because it is exciting and challenging. Respondents under the age of 30 are significantly more likely than older respondents to say that all of the reasons for gambling—socializing, winning money, excitement and fun—are important. These reasons for gambling are significantly less important among increasingly older age cohorts. White respondents are significantly more likely than respondents from other
40 2006 CALIFORNIA PROBLEM GAMBLING PREVALENCE SURVEY
ethnic groups in California to say that socializing with friends and family is an important reason to gamble and African Americans and Hispanics are the least likely groups to endorse this reason for gambling. White and African American respondents are the most likely and Hispanic respondents are the least likely respondents to view excitement and challenge as an important reason to gamble. Winning money is a significantly more important reason for gambling among African Americans than among respondents from other racial and ethnic groups in California with Asians the least likely to endorse this as an important reason to gambling. Finally, White respondents are the most likely—and Hispanic and Asian respondents the least likely—to view entertainment as an important reason to gamble.
Respondents in the California survey who had never gambled or gambled infrequently2 were asked whether any of several different reasons to not gamble was ‘very important,’ ‘important,’ ‘not so important’ or ‘not at all important.’ Losing money was the most important reason for not gambling among these respondents, followed by moral or ethical concerns and then inconvenience or distance from betting opportunities.
Women were significantly more likely than men to say that the possibility of losing money and moral or ethical concerns were important reasons that they did not gamble. Men were more likely to say that inconvenience was an important reason why they did not gamble although the difference did not achieve statistical significance. Respondents under the age of 50 were significantly more likely than older respondents to say that losing money was an important reason not to gamble while those aged 40 and over were significantly more likely than respondents aged 18 to 29 to say that moral and ethical concerns are an important reason not to gamble. Respondents aged 18 to 29 were significantly more likely than older respondents to say that inconvenience was an important reason not to gamble. Asian respondents were significantly more likely than respondents from other racial and ethnic groups to say that moral and ethical concerns and inconvenience were important reasons for not gambling. Asians were the least likely group to say that losing money was an important reason for not gambling.
Attitudes Toward Gambling
All respondents in the California survey were asked for their views on the overall effects of legal gambling on society (see Table A-15 in Appendix A for detailed results). Not surprisingly, non-gamblers and infrequent gamblers are most likely to say that the overall effects of legal gambling on society is either bad or very bad. Two in three non-gamblers and half of infrequent gamblers express this view compared with only 22% of monthly gamblers and 20% of weekly gamblers. However, the proportion of monthly and weekly gamblers expressing the view that the overall effect
2 Respondents who had gambled in the past year but had not gambled five or more times in their lifetime were included in the group that was asked their reasons for not gambling.
41 2006 CALIFORNIA PROBLEM GAMBLING PREVALENCE SURVEY
of legal gambling is good or very good is not much higher than the proportion expressing the view that it is bad or very bad.
Women in California are significantly more likely to believe that the overall effect of legal gambling on society is bad and men are significantly more likely to believe that the overall effect is good. Respondents aged 18 to 29 are the age group most likely to believe that the overall effect of legal gambling on society is good while respondents aged 65 and over are significantly more likely to believe that the overall effect is bad. African Americans are significantly more likely than members of other ethnic groups in California to believe that the overall effect of legal gambling on society is good and Asians are the most likely to believe that the overall effect is bad. One in four African American respondents believe that the overall effect of legal gambling on society is good or very good compared with 51% of Asian respondents who say that the overall effect is bad or very bad.
Gambling Expenditures
Reported estimates of expenditures obtained in prevalence surveys are based on recollection and self-report. Research has shown that there are fundamental uncertainties about the tacit definitions that people use when they are asked to estimate ‘spending’ on different types of gambling (Blaszczynski, Dumlao & Lange 1997). There are questions about the impact that the social acceptability of different types of gambling may have on reports of expenditures as well as methodological issues related to sampling small groups of heavy users in general population surveys. Despite these challenges, there is continuing interest in assessing gambling expenditures with particular interest in the question of the proportion of gambling revenues accounted for by regular and problematic gamblers (Volberg et al., 1998; Volberg, Gerstein et al., 2001).
Experience has shown that survey respondents have great difficulty accurately computing mathematical sums or averages across stretches of time. This gives free rein to a well-established tendency—particularly where an answer is difficult to derive—to favor a more socially desirable answer. Players are also prone, when asked about results of gambling over a period of time, to remember winning their largest jackpots in disproportion to their more usual, but individually smaller, losses. Research suggests that the most plausible expenditure estimates will be obtained by asking respondents about their losses (rather than about spending) on the most recent occasion when they engaged in a specific gambling activity.
To assess expenditures on different gambling activities in California, respondents were asked a series of questions about their most recent gambling experiences. Respondents who had gambled in the past year at a casino, at a bingo hall, at a racetrack, at a cardroom and privately were first asked how much money they had taken with them for the purpose of gambling, then whether they had obtained additional money with which to gamble and, if so, how much. Finally, respondents were asked how much money they had lost on the last occasion they gambled, with responses that they
42 2006 CALIFORNIA PROBLEM GAMBLING PREVALENCE SURVEY
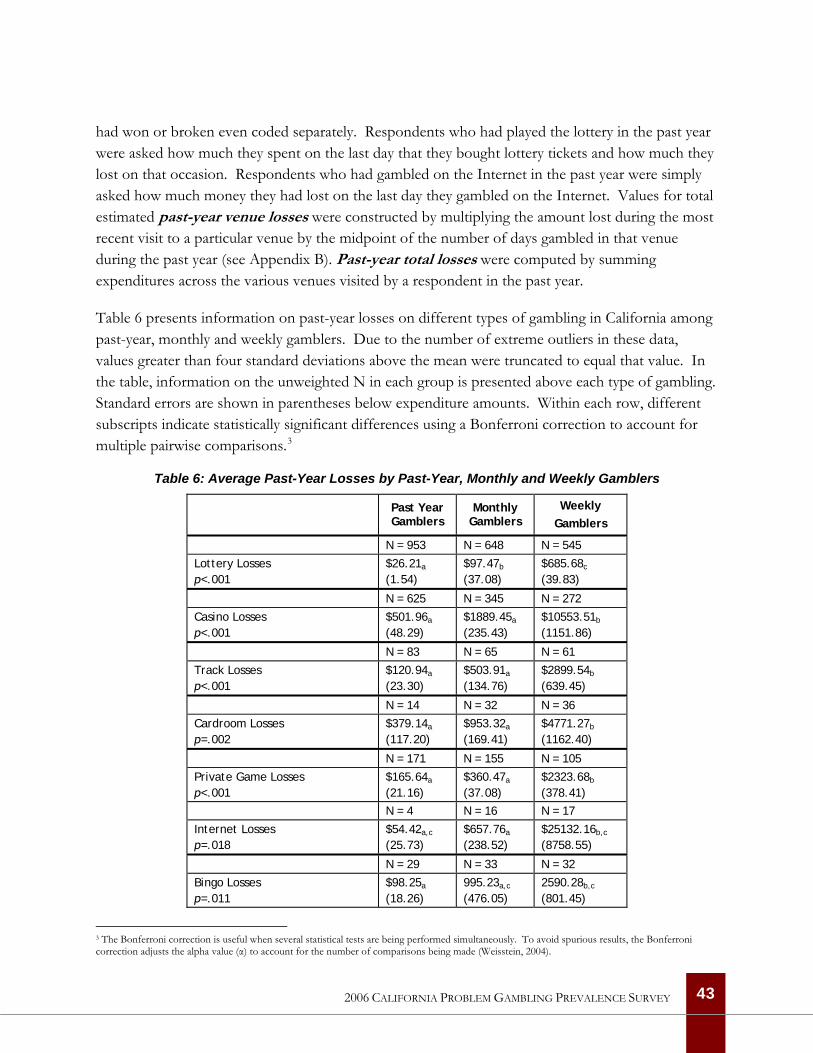
had won or broken even coded separately. Respondents who had played the lottery in the past year were asked how much they spent on the last day that they bought lottery tickets and how much they lost on that occasion. Respondents who had gambled on the Internet in the past year were simply asked how much money they had lost on the last day they gambled on the Internet. Values for total estimated past-year venue losses were constructed by multiplying the amount lost during the most recent visit to a particular venue by the midpoint of the number of days gambled in that venue during the past year (see Appendix B). Past-year total losses were computed by summing expenditures across the various venues visited by a respondent in the past year.
Table 6 presents information on past-year losses on different types of gambling in California among past-year, monthly and weekly gamblers. Due to the number of extreme outliers in these data, values greater than four standard deviations above the mean were truncated to equal that value. In the table, information on the unweighted N in each group is presented above each type of gambling. Standard errors are shown in parentheses below expenditure amounts. Within each row, different subscripts indicate statistically significant differences using a Bonferroni correction to account for multiple pairwise comparisons.3
Table 6: Average Past-Year Losses by Past-Year, Monthly and Weekly Gamblers
Past Year Gamblers
Monthly Gamblers
Weekly Gamblers
N = 953 N = 648 N = 545
Lottery Losses p<.001
$26.21a
(1.54) $97.47b
(37.08) $685.68c
(39.83)
N = 625 N = 345 N = 272
Casino Losses p<.001
$501.96a
(48.29) $1889.45a
(235.43) $10553.51b
(1151.86)
N = 83 N = 65 N = 61
Track Losses p<.001
$120.94a
(23.30) $503.91a
(134.76) $2899.54b
(639.45)
N = 14 N = 32 N = 36
Cardroom Losses p=.002
$379.14a
(117.20) $953.32a
(169.41) $4771.27b
(1162.40)
N = 171 N = 155 N = 105
Private Game Losses p<.001
$165.64a
(21.16) $360.47a
(37.08) $2323.68b
(378.41)
N = 4 N = 16 N = 17
Internet Losses p=.018
$54.42a,c
(25.73) $657.76a
(238.52) $25132.16b,c
(8758.55)
N = 29 N = 33 N = 32
Bingo Losses p=.011
$98.25a
(18.26) 995.23a,c
(476.05) 2590.28b,c
(801.45)
3 The Bonferroni correction is useful when several statistical tests are being performed simultaneously. To avoid spurious results, the Bonferroni correction adjusts the alpha value (α) to account for the number of comparisons being made (Weisstein, 2004).
43 2006 CALIFORNIA PROBLEM GAMBLING PREVALENCE SURVEY
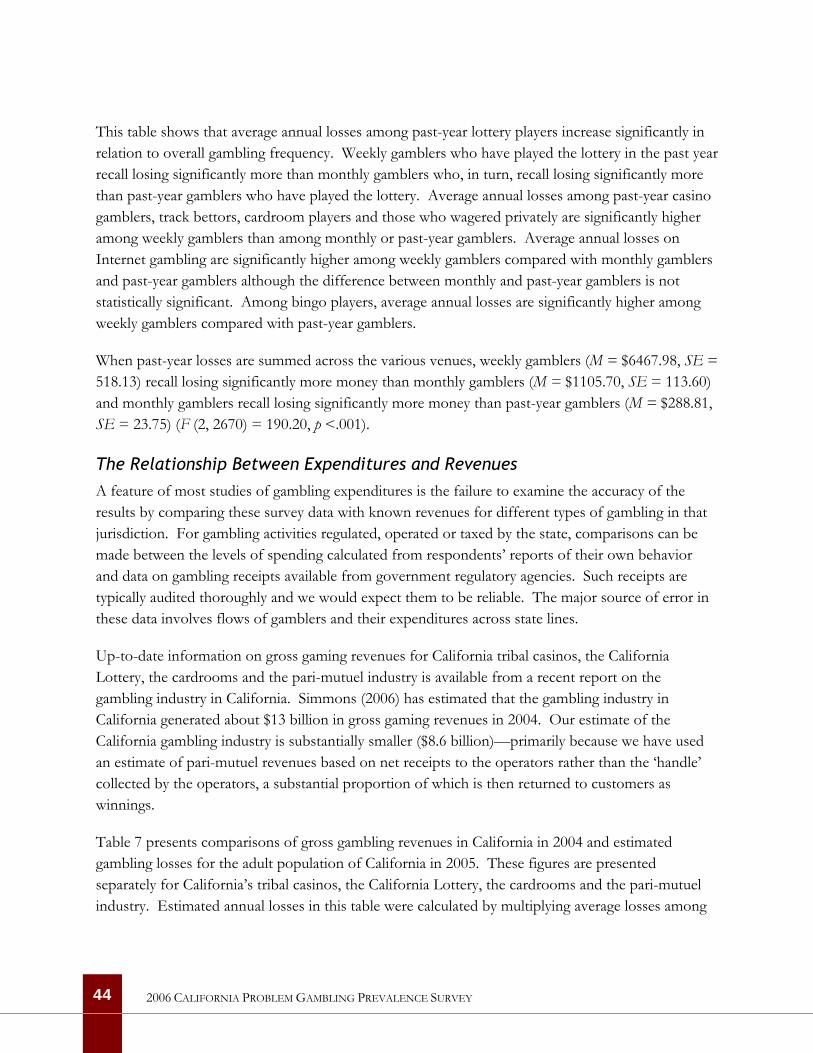
This table shows that average annual losses among past-year lottery players increase significantly in relation to overall gambling frequency. Weekly gamblers who have played the lottery in the past year recall losing significantly more than monthly gamblers who, in turn, recall losing significantly more than past-year gamblers who have played the lottery. Average annual losses among past-year casino gamblers, track bettors, cardroom players and those who wagered privately are significantly higher among weekly gamblers than among monthly or past-year gamblers. Average annual losses on Internet gambling are significantly higher among weekly gamblers compared with monthly gamblers and past-year gamblers although the difference between monthly and past-year gamblers is not statistically significant. Among bingo players, average annual losses are significantly higher among weekly gamblers compared with past-year gamblers.
When past-year losses are summed across the various venues, weekly gamblers (M = $6467.98, SE = 518.13) recall losing significantly more money than monthly gamblers (M = $1105.70, SE = 113.60) and monthly gamblers recall losing significantly more money than past-year gamblers (M = $288.81, SE = 23.75) (F (2, 2670) = 190.20, p <.001).
The Relationship Between Expenditures and Revenues A feature of most studies of gambling expenditures is the failure to examine the accuracy of the results by comparing these survey data with known revenues for different types of gambling in that jurisdiction. For gambling activities regulated, operated or taxed by the state, comparisons can be made between the levels of spending calculated from respondents’ reports of their own behavior and data on gambling receipts available from government regulatory agencies. Such receipts are typically audited thoroughly and we would expect them to be reliable. The major source of error in these data involves flows of gamblers and their expenditures across state lines.
Up-to-date information on gross gaming revenues for California tribal casinos, the California Lottery, the cardrooms and the pari-mutuel industry is available from a recent report on the gambling industry in California. Simmons (2006) has estimated that the gambling industry in California generated about $13 billion in gross gaming revenues in 2004. Our estimate of the California gambling industry is substantially smaller ($8.6 billion)—primarily because we have used an estimate of pari-mutuel revenues based on net receipts to the operators rather than the ‘handle’ collected by the operators, a substantial proportion of which is then returned to customers as winnings.
Table 7 presents comparisons of gross gambling revenues in California in 2004 and estimated gambling losses for the adult population of California in 2005. These figures are presented separately for California’s tribal casinos, the California Lottery, the cardrooms and the pari-mutuel industry. Estimated annual losses in this table were calculated by multiplying average losses among
44 2006 CALIFORNIA PROBLEM GAMBLING PREVALENCE SURVEY
past-year, monthly and weekly gamblers (see Table 6) by the number of adult Californians who participated in these activities at different rates in the past year (see Table 3).
Table 7: Comparing Gross Revenues and Estimated Losses by Gambling Venue
2004 Gross Revenues
2005 Estimated Losses
Casino $5.78 billion $9.1 billion
Lottery $1.4 billion $1.7 billion
Track/OTB $800 million $426 million
Cardroom $655 million $591 million
Table 7 shows that there is a distinct lack of fit between reported gross revenues for tribal casinos in California and estimated losses among casino patrons as well as for gross revenues and estimated losses among racetrack bettors. Conversely, the fit between reported gross revenues for the California Lottery and the cardrooms and estimated losses among lottery players and cardroom bettors is quite good.
There are at least two likely reasons for the lack of fit between reported revenues and estimated losses for tribal casinos and racetracks in California. One reason is the well-known tendency for survey respondents to over-state their expenditures on some gambling activities, particularly casino table games and pari-mutuel betting. Another reason is our inability—using survey methods—to account for sources of gambling revenues derived from out-of-state players and, separately, high-end players. A substantial fraction of gambling revenues, particularly from casino table games and some pari-mutuel betting pools, have historically been derived from a very small number of high-end players. Due to the amount of money that these individuals put into play at casinos (and to a lesser extent in other games), any denomination of gambling in monetary units based on survey data will likely be missing this component (Volberg, Gerstein et al, 2004).
The Geography of Gambling in California
The relationship between increased access to legal gambling and the prevalence of at-risk, problem, and pathological gambling is important in light of the remarkable expansion of gambling throughout the U.S. and internationally over the last 25 years. Increased gambling opportunities create more problem and pathological gamblers by increasing the risk of exposure. As more people gamble, the risks are greater that individuals with specific vulnerabilities will gamble and develop problems related to their gambling. Major government reviews in the United States, Great Britain, Australia, and New Zealand have all concluded that increased gambling availability has led to an increase in
45 2006 CALIFORNIA PROBLEM GAMBLING PREVALENCE SURVEY
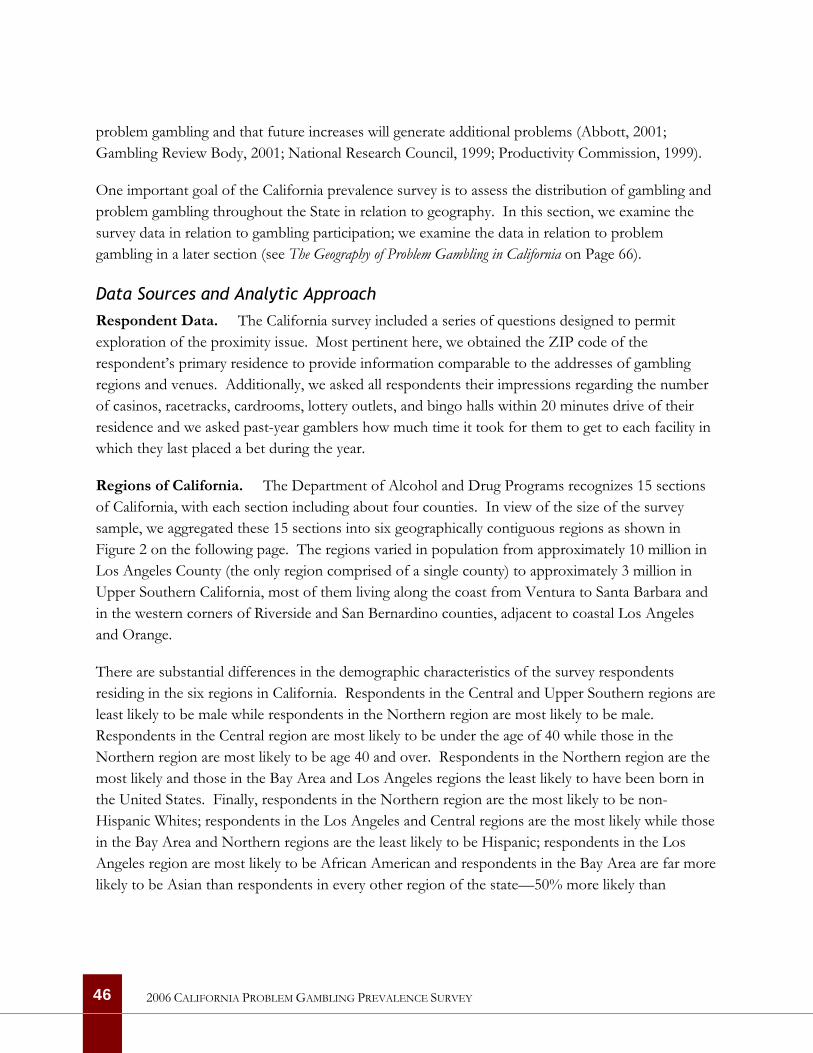
problem gambling and that future increases will generate additional problems (Abbott, 2001; Gambling Review Body, 2001; National Research Council, 1999; Productivity Commission, 1999).
One important goal of the California prevalence survey is to assess the distribution of gambling and problem gambling throughout the State in relation to geography. In this section, we examine the survey data in relation to gambling participation; we examine the data in relation to problem gambling in a later section (see The Geography of Problem Gambling in California on Page 66).
Data Sources and Analytic Approach Respondent Data. The California survey included a series of questions designed to permit exploration of the proximity issue. Most pertinent here, we obtained the ZIP code of the respondent’s primary residence to provide information comparable to the addresses of gambling regions and venues. Additionally, we asked all respondents their impressions regarding the number of casinos, racetracks, cardrooms, lottery outlets, and bingo halls within 20 minutes drive of their residence and we asked past-year gamblers how much time it took for them to get to each facility in which they last placed a bet during the year.
Regions of California. The Department of Alcohol and Drug Programs recognizes 15 sections of California, with each section including about four counties. In view of the size of the survey sample, we aggregated these 15 sections into six geographically contiguous regions as shown in Figure 2 on the following page. The regions varied in population from approximately 10 million in Los Angeles County (the only region comprised of a single county) to approximately 3 million in Upper Southern California, most of them living along the coast from Ventura to Santa Barbara and in the western corners of Riverside and San Bernardino counties, adjacent to coastal Los Angeles and Orange.
There are substantial differences in the demographic characteristics of the survey respondents residing in the six regions in California. Respondents in the Central and Upper Southern regions are least likely to be male while respondents in the Northern region are most likely to be male. Respondents in the Central region are most likely to be under the age of 40 while those in the Northern region are most likely to be age 40 and over. Respondents in the Northern region are the most likely and those in the Bay Area and Los Angeles regions the least likely to have been born in the United States. Finally, respondents in the Northern region are the most likely to be non-Hispanic Whites; respondents in the Los Angeles and Central regions are the most likely while those in the Bay Area and Northern regions are the least likely to be Hispanic; respondents in the Los Angeles region are most likely to be African American and respondents in the Bay Area are far more likely to be Asian than respondents in every other region of the state—50% more likely than
46 2006 CALIFORNIA PROBLEM GAMBLING PREVALENCE SURVEY
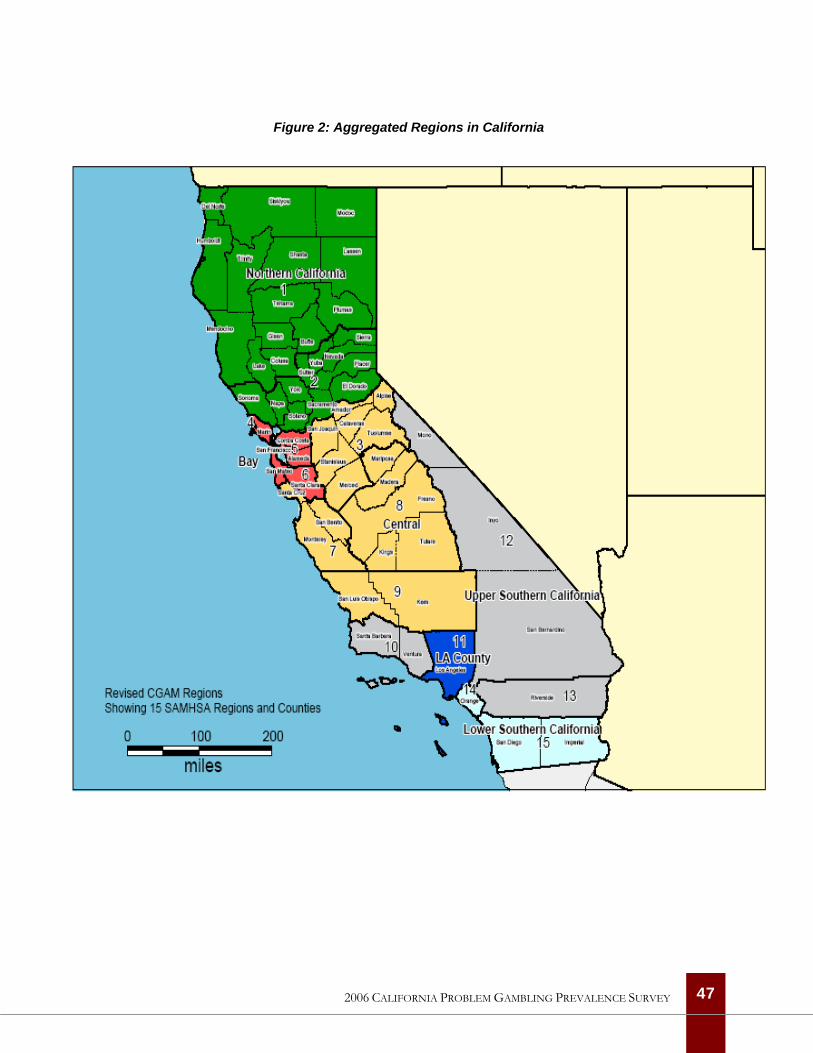
Figure 2: Aggregated Regions in California
47 2006 CALIFORNIA PROBLEM GAMBLING PREVALENCE SURVEY
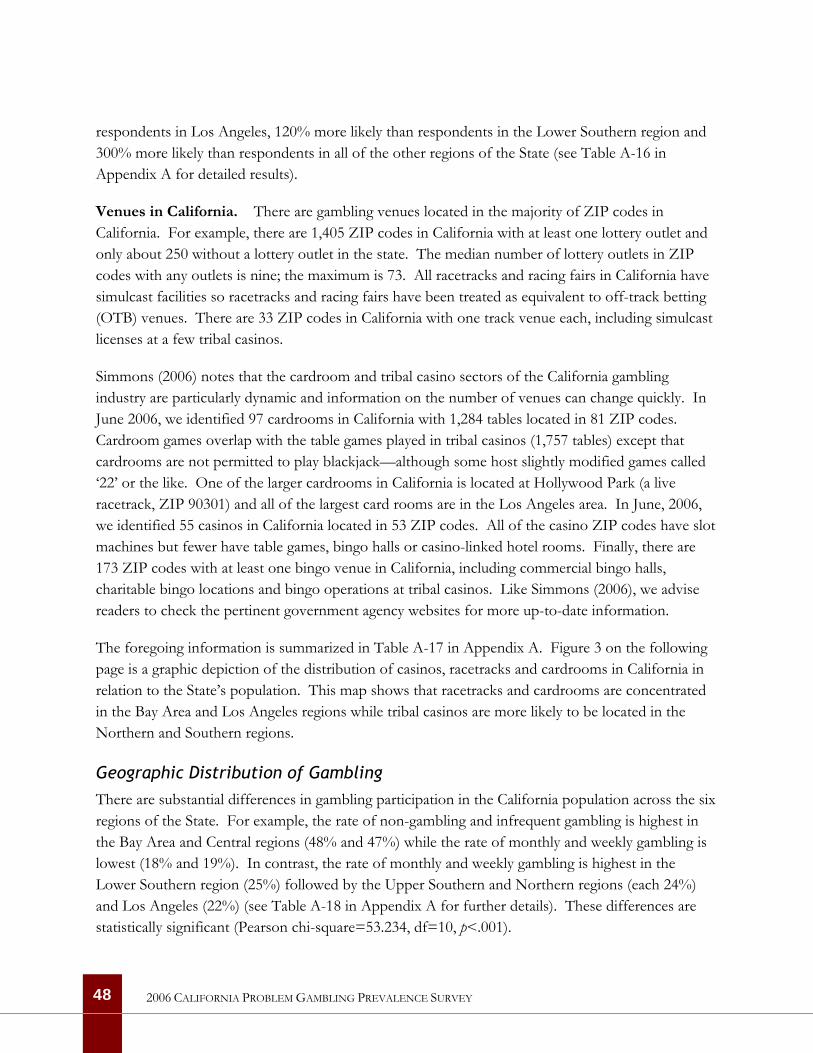
respondents in Los Angeles, 120% more likely than respondents in the Lower Southern region and 300% more likely than respondents in all of the other regions of the State (see Table A-16 in Appendix A for detailed results).
Venues in California. There are gambling venues located in the majority of ZIP codes in California. For example, there are 1,405 ZIP codes in California with at least one lottery outlet and only about 250 without a lottery outlet in the state. The median number of lottery outlets in ZIP codes with any outlets is nine; the maximum is 73. All racetracks and racing fairs in California have simulcast facilities so racetracks and racing fairs have been treated as equivalent to off-track betting (OTB) venues. There are 33 ZIP codes in California with one track venue each, including simulcast licenses at a few tribal casinos.
Simmons (2006) notes that the cardroom and tribal casino sectors of the California gambling industry are particularly dynamic and information on the number of venues can change quickly. In June 2006, we identified 97 cardrooms in California with 1,284 tables located in 81 ZIP codes. Cardroom games overlap with the table games played in tribal casinos (1,757 tables) except that cardrooms are not permitted to play blackjack—although some host slightly modified games called ‘22’ or the like. One of the larger cardrooms in California is located at Hollywood Park (a live racetrack, ZIP 90301) and all of the largest card rooms are in the Los Angeles area. In June, 2006, we identified 55 casinos in California located in 53 ZIP codes. All of the casino ZIP codes have slot machines but fewer have table games, bingo halls or casino-linked hotel rooms. Finally, there are 173 ZIP codes with at least one bingo venue in California, including commercial bingo halls, charitable bingo locations and bingo operations at tribal casinos. Like Simmons (2006), we advise readers to check the pertinent government agency websites for more up-to-date information.
The foregoing information is summarized in Table A-17 in Appendix A. Figure 3 on the following page is a graphic depiction of the distribution of casinos, racetracks and cardrooms in California in relation to the State’s population. This map shows that racetracks and cardrooms are concentrated in the Bay Area and Los Angeles regions while tribal casinos are more likely to be located in the Northern and Southern regions.
Geographic Distribution of Gambling There are substantial differences in gambling participation in the California population across the six regions of the State. For example, the rate of non-gambling and infrequent gambling is highest in the Bay Area and Central regions (48% and 47%) while the rate of monthly and weekly gambling is lowest (18% and 19%). In contrast, the rate of monthly and weekly gambling is highest in the Lower Southern region (25%) followed by the Upper Southern and Northern regions (each 24%) and Los Angeles (22%) (see Table A-18 in Appendix A for further details). These differences are statistically significant (Pearson chi-square=53.234, df=10, p<.001).
48 2006 CALIFORNIA PROBLEM GAMBLING PREVALENCE SURVEY
Figure 3: Casinos, Racetracks and Cardrooms in California
49 2006 CALIFORNIA PROBLEM GAMBLING PREVALENCE SURVEY
There are also statistically significant differences in past-year participation in specific types of gambling across the six regions of the State (see Table A-19 in Appendix A for further details). Past-year lottery play is highest in the Upper Southern region (49%) and lowest in the Bay Area region (38%). Past-year casino gambling is highest in the Northern region (36%) and lowest in the Bay Area region (22%). Past-year participation in other gambling activities is much lower but there are, nevertheless, statistically significant differences across the State’s regions. Past-year track betting is two times higher in the Lower Southern region (9%) compared with the Central region (3%). Past-year non-casino bingo participation is highest in the Upper Southern region (4%) and lowest in the Bay Area region (1%). Overall, past-year participation rates in private wagering, cardroom betting and Internet gambling are quite low and the differences across regions are not statistically significant.
Finally, there are substantial differences in the demographic characteristics of past-year gamblers across the six regions of the State (see Table A-20 in Appendix A for further details). Most of these differences mirror those in the population more generally, with the largest proportion of older past-year gamblers in the Northern region and the largest proportion of non-U.S.-born gamblers in the Los Angeles and Bay Area regions. Similarly, past-year gamblers in the Northern region are most likely to be non-Hispanic Whites while past-year gamblers in the Los Angeles region are more likely to be African American. Past-year gamblers in the Bay Area and Northern regions are significantly less likely to be Hispanic than past-year gamblers in the other regions. Finally, past-year gamblers in the Bay Area region are far more likely to be Asian than past-year gamblers in any other region of the State.
Proximity and Awareness of Gambling Venues We noted above that tribal casinos are clustered in the Northern and Southern regions. It is, therefore, not surprising that respondents in these regions are significantly more likely to be aware of one or more casinos within a 20-minute drive of their home. On average, 48% of respondents living in the Northern, Upper Southern and Lower Southern regions who have ever gambled in a casino are aware of one or more casinos within a 20-minute drive of their home compared with an average of 36% of respondents living in the Bay Area, Central and Los Angeles regions. It is interesting, however, that respondents living in the Los Angeles region who have ever gambled at a casino are almost as likely as respondents living in the two Southern regions to be aware of three or more casinos within a 20-minute drive of their home (11% vs. 14% and 15%).
Given the geographic location of most of the racetracks in California, it also not surprising that respondents in the Central and Upper Southern regions who have ever wagered on horse races are significantly less likely than respondents in other regions to be aware of one or more racetracks or OTB facilities within a 20-minute drive of their home. Cardrooms are more widely distributed in California than racetracks but it is nevertheless surprising that over half of respondents in every
50 2006 CALIFORNIA PROBLEM GAMBLING PREVALENCE SURVEY
region who have ever gambled at a cardroom are aware of one or more cardrooms within a 20-minute drive of their home. Three in four respondents who have ever gambled at a cardroom in the Bay Area and Central regions is aware of one or more cardrooms in their vicinity (78% and 76%) compared with 49% and 44% of respondents in the two Southern California regions. Awareness among respondents who have ever gambled at a cardroom in the Los Angeles and Northern regions is between these two extremes.
Although, overall, rates of participation are very low, respondents living in the Northern, Central and two Southern regions who have ever played bingo are significantly more likely than those living in the Bay Area or Los Angeles regions to be aware of one or more non-casino bingo halls within a 20-minute drive of their home. Respondents living in the Central and Los Angeles regions are the least likely to be aware of three or more non-casino bingo halls within a 20-minute drive of their home.
Comparing Gambling in California with Other States
Although each jurisdiction is unique demographically, as well as in the types of legal gambling that are available to the population, it is always interesting to compare gambling participation across states. Surveys similar to the present study have been completed in several Western states in recent years and direct comparisons are possible with Arizona, Nevada and New Mexico (Volberg, 2002, 2003a, 2006).
These four states have quite different demographic characteristics. Based on the 2000 Census, California stands out with the largest, most diverse and youngest population. California has the largest Asian subgroup in its population (12%) while New Mexico has the largest Hispanic subgroup (42%) and the largest Native American subgroup (11%). California has both the lowest proportion of high school graduates and the highest proportion of college graduates among the four states. The divorce rate is highest in Nevada and lowest in Arizona. Both the proportion of U.S. born population and median household income are highest in New Mexico and lowest in California.
When it comes to legal gambling, Nevada stands out with the oldest and largest casino industry. Nevada also stands out with extensive numbers of electronic gaming machines located outside of conventional gambling establishments. Finally, Nevada is unique among the four states because it does not operate a lottery. Like California, both Arizona and New Mexico have substantial numbers of tribal casinos. However, in Arizona—as in California—only the tribal casinos are permitted to operate slot machines. In New Mexico, tribal casinos, racetracks and fraternal and veterans clubs are permitted to operate slot machines. The ratio of machines per capita differs dramatically across the four states. Nevada has about 15 machines per 1,000 adults in the population while New Mexico has just over 1 machine per 1,000 adults and California and Arizona have approximately 0.2 and 0.3 machines per 1,000 adults in the population, respectively.
51 2006 CALIFORNIA PROBLEM GAMBLING PREVALENCE SURVEY
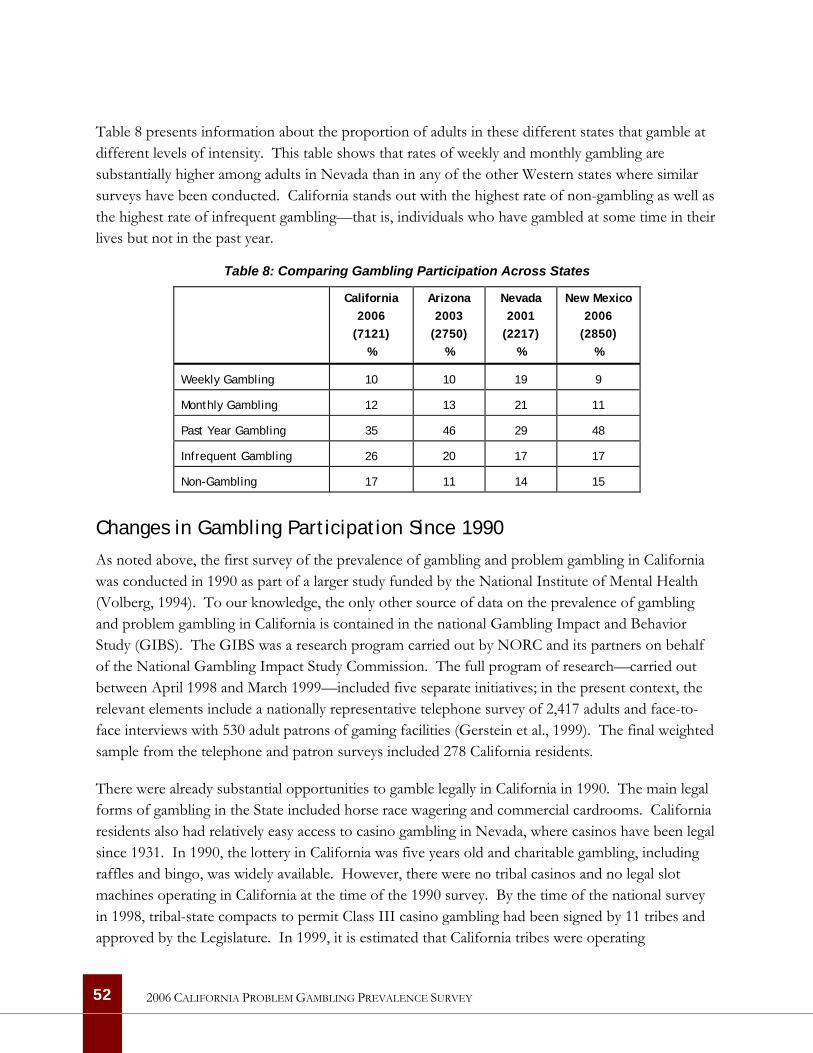
Table 8 presents information about the proportion of adults in these different states that gamble at different levels of intensity. This table shows that rates of weekly and monthly gambling are substantially higher among adults in Nevada than in any of the other Western states where similar surveys have been conducted. California stands out with the highest rate of non-gambling as well as the highest rate of infrequent gambling—that is, individuals who have gambled at some time in their lives but not in the past year.
Table 8: Comparing Gambling Participation Across States
California 2006
(7121) %
Arizona 2003
(2750) %
Nevada 2001
(2217) %
New Mexico 2006
(2850) %
Weekly Gambling 10 10 19 9
Monthly Gambling 12 13 21 11
Past Year Gambling 35 46 29 48
Infrequent Gambling 26 20 17 17
Non-Gambling 17 11 14 15
Changes in Gambling Participation Since 1990
As noted above, the first survey of the prevalence of gambling and problem gambling in California was conducted in 1990 as part of a larger study funded by the National Institute of Mental Health (Volberg, 1994). To our knowledge, the only other source of data on the prevalence of gambling and problem gambling in California is contained in the national Gambling Impact and Behavior Study (GIBS). The GIBS was a research program carried out by NORC and its partners on behalf of the National Gambling Impact Study Commission. The full program of research—carried out between April 1998 and March 1999—included five separate initiatives; in the present context, the relevant elements include a nationally representative telephone survey of 2,417 adults and face-to-face interviews with 530 adult patrons of gaming facilities (Gerstein et al., 1999). The final weighted sample from the telephone and patron surveys included 278 California residents.
There were already substantial opportunities to gamble legally in California in 1990. The main legal forms of gambling in the State included horse race wagering and commercial cardrooms. California residents also had relatively easy access to casino gambling in Nevada, where casinos have been legal since 1931. In 1990, the lottery in California was five years old and charitable gambling, including raffles and bingo, was widely available. However, there were no tribal casinos and no legal slot machines operating in California at the time of the 1990 survey. By the time of the national survey in 1998, tribal-state compacts to permit Class III casino gambling had been signed by 11 tribes and approved by the Legislature. In 1999, it is estimated that California tribes were operating
52 2006 CALIFORNIA PROBLEM GAMBLING PREVALENCE SURVEY

approximately 20,000 slot machines in about 40 casinos and generating between $800 million and $1 billion in gross revenues (Simmons, 2006).
Based on the survey data, it is possible to compare lifetime participation rates for several gambling activities in 1990, 1999 and 2006. Between 1990 and 2006, lifetime lottery participation declined from 73% to 68%. Casino gambling increased slightly between 1990 and 1999 but then decreased between 1999 and 2006. Racetrack betting shows a similar pattern with an increase between 1990 and 1999 and then a sharp decrease between 1999 and 2006. Private wagering decreased from 1990 to 1999 and remained stable between 1999 and 2006. Bingo is unusual in showing a decrease in lifetime participation between 1990 and 1999 and then an increase between 1999 and 2006. Cardroom and Internet gambling were not assessed in 1990. Between 1999 and 2006, lifetime cardroom gambling decreased while Internet gambling increased five-fold.
As in other jurisdictions, rates of past-year, monthly and weekly gambling participation declined in California between 1999 and 2006. While 65% of the California adults in the 1999 national survey had gambled in the past year, only 58% of the California adults surveyed in 2006 had gambled in the past year. Monthly gambling participation fell from 29% to 22% and weekly gambling participation fell from 15% to 10%.
While overall gambling participation rates fell, there are differences in participation across specific gambling activities. Figure 4 on the following page presents information on past-year participation rates for comparable gambling activities assessed in the 1999 and 2006 California prevalence surveys. The sample of California respondents from the 1999 survey is too small to permit comparisons of monthly and weekly participation in specific gambling activities. This figure shows that past-year lottery play, casino gambling and track betting all decreased between 1999 and 2006. Private wagering remained stable and bingo, cardroom and Internet gambling all increased during the same period.
53 2006 CALIFORNIA PROBLEM GAMBLING PREVALENCE SURVEY
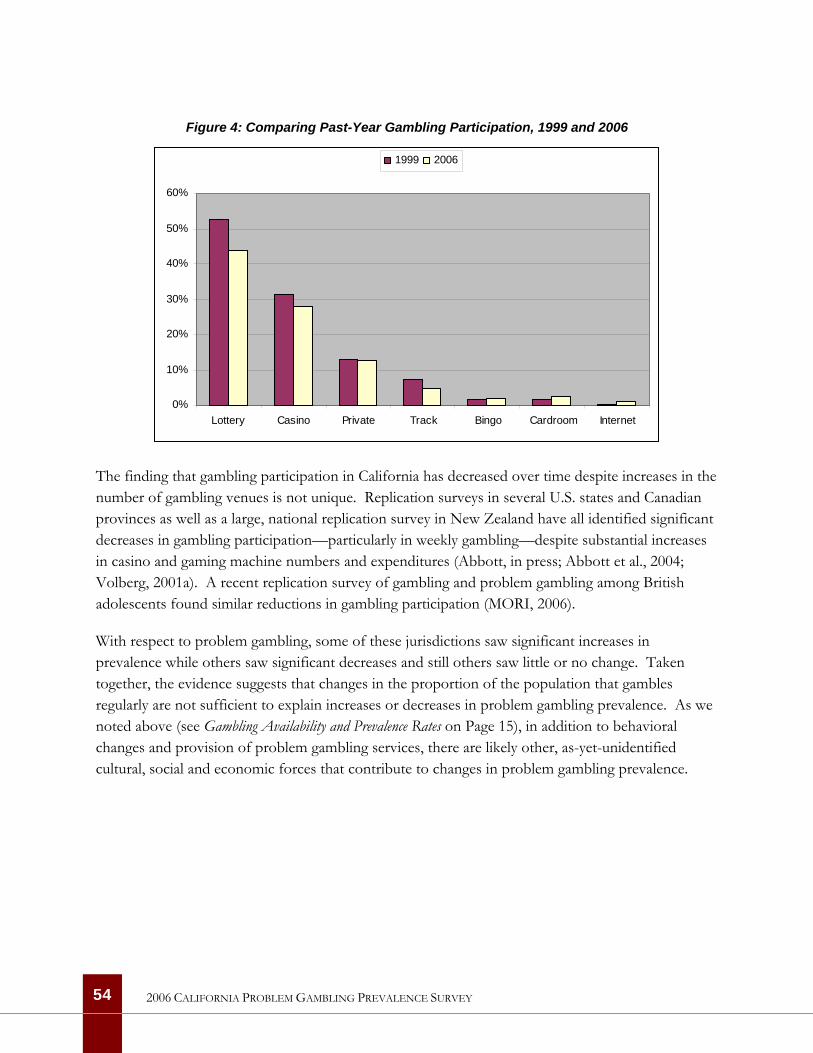
Figure 4: Comparing Past-Year Gambling Participation, 1999 and 2006
0%
10%
20%
30%
40%
50%
60%
Lottery Casino Private Track Bingo Cardroom Internet
1999 2006
The finding that gambling participation in California has decreased over time despite increases in the number of gambling venues is not unique. Replication surveys in several U.S. states and Canadian provinces as well as a large, national replication survey in New Zealand have all identified significant decreases in gambling participation—particularly in weekly gambling—despite substantial increases in casino and gaming machine numbers and expenditures (Abbott, in press; Abbott et al., 2004; Volberg, 2001a). A recent replication survey of gambling and problem gambling among British adolescents found similar reductions in gambling participation (MORI, 2006).
With respect to problem gambling, some of these jurisdictions saw significant increases in prevalence while others saw significant decreases and still others saw little or no change. Taken together, the evidence suggests that changes in the proportion of the population that gambles regularly are not sufficient to explain increases or decreases in problem gambling prevalence. As we noted above (see Gambling Availability and Prevalence Rates on Page 15), in addition to behavioral changes and provision of problem gambling services, there are likely other, as-yet-unidentified cultural, social and economic forces that contribute to changes in problem gambling prevalence.
54 2006 CALIFORNIA PROBLEM GAMBLING PREVALENCE SURVEY

THIS PAGE LEFT INTENTIONALLY BLANK
55 2006 CALIFORNIA PROBLEM GAMBLING PREVALENCE SURVEY
56
2006 CALIFORNIA PROBLEM GAMBLING PREVALENCE SURVEY
Problem Gambling Prevalence in California
The NORC DSM-IV Screen for Gambling Problems (NODS) was used in the California survey to provide a measure of problem gambling based on the most recent psychiatric criteria for the disorder of Pathological Gambling. Use of the NODS also means that the results of the California survey can be compared with the results of a growing number of recent international, national and state-level surveys.
The NORC DSM-IV Screen for Gambling Problems (NODS)
In 1998 the National Gambling Impact Study Commission contracted with NORC and its partner organizations to undertake a national survey of problem gambling in the United States. After reviewing the available screens, the research team elected to develop a new measure based closely on the most recent psychiatric criteria for Pathological Gambling and designed specifically for administration in large population surveys (Gerstein et al., 1999).
The NODS is composed of 17 lifetime items and 17 corresponding past-year items. Past-year items are only administered if the corresponding lifetime item is endorsed. Several complications had to be overcome in developing the NODS. For example, a number of the DSM–IV criteria are difficult to establish with a single question. In assessing these criteria (Preoccupation, Escape, and Risked Relationships), two or three questions were used, and respondents received a single point if they gave a positive response to any of the questions assessing that criterion domain. Another complication in constructing the NODS is that two of the DSM–IV criteria (Withdrawal and Loss of Control) assume that the questioner already knows that the individual has tried to “stop, cut down, or control” her or his gambling. This information is obtained with a preliminary screening question before asking whether the respondent has felt restless or irritable during these times (Withdrawal). The question of whether respondents have succeeded in stopping, cutting down or controlling their gambling (Loss of Control) is asked separately.
An important decision in developing the NODS was to place definite limits on several of the criteria, in keeping with the approach taken in alcohol and substance abuse research. For example, in assessing Preoccupation, the NODS asks if the periods when respondents spent a lot of time thinking about gambling or about getting money to gamble have lasted 2 weeks or longer. Similarly, the NODS asks whether respondents have tried to control their gambling three or more times without success (Loss of Control) and whether respondents have lied to others about their gambling three or more times (Lying). Only a positive response to the latter questions contributes to the respondent’s score on the NODS.
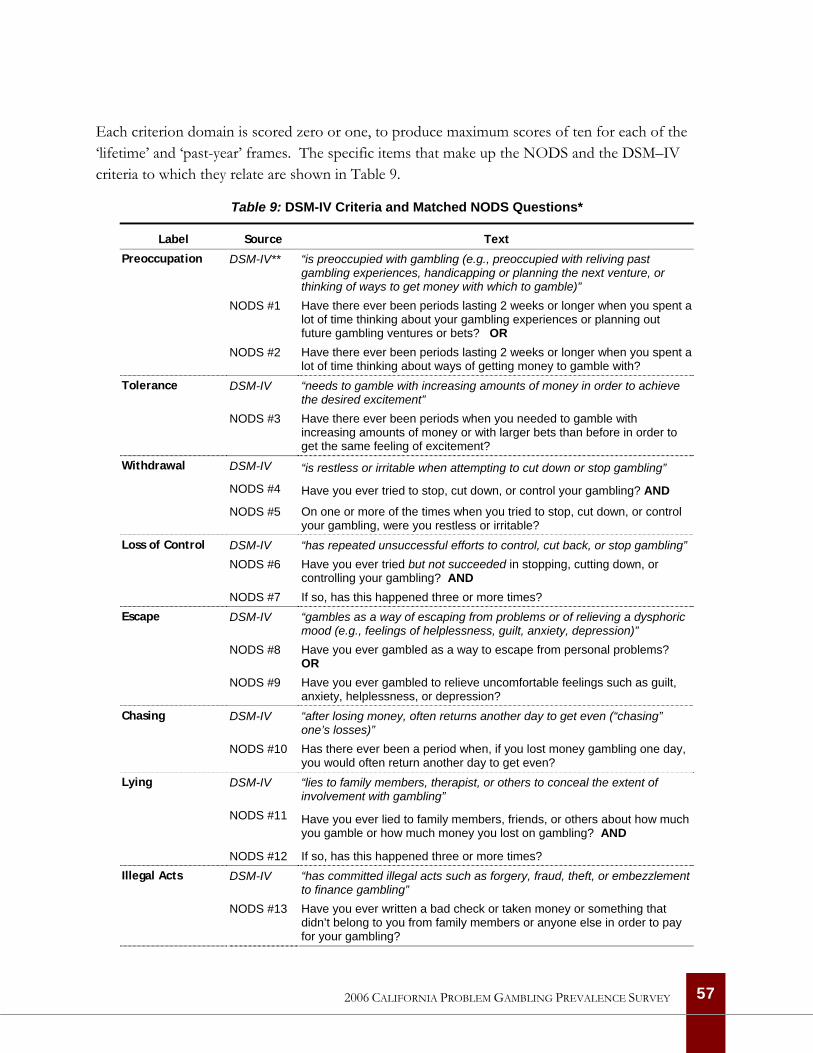
Each criterion domain is scored zero or one, to produce maximum scores of ten for each of the ‘lifetime’ and ‘past-year’ frames. The specific items that make up the NODS and the DSM–IV criteria to which they relate are shown in Table 9.
Table 9: DSM-IV Criteria and Matched NODS Questions*
Label Source Text
DSM-IV** “is preoccupied with gambling (e.g., preoccupied with reliving past gambling experiences, handicapping or planning the next venture, or thinking of ways to get money with which to gamble)”
NODS #1 Have there ever been periods lasting 2 weeks or longer when you spent a lot of time thinking about your gambling experiences or planning out future gambling ventures or bets? OR
Preoccupation
NODS #2 Have there ever been periods lasting 2 weeks or longer when you spent a lot of time thinking about ways of getting money to gamble with?
DSM-IV “needs to gamble with increasing amounts of money in order to achieve the desired excitement”
Tolerance
NODS #3 Have there ever been periods when you needed to gamble with increasing amounts of money or with larger bets than before in order to get the same feeling of excitement?
DSM-IV “is restless or irritable when attempting to cut down or stop gambling”
NODS #4 Have you ever tried to stop, cut down, or control your gambling? AND
Withdrawal
NODS #5 On one or more of the times when you tried to stop, cut down, or control your gambling, were you restless or irritable?
DSM-IV “has repeated unsuccessful efforts to control, cut back, or stop gambling” NODS #6 Have you ever tried but not succeeded in stopping, cutting down, or
controlling your gambling? AND
Loss of Control
NODS #7 If so, has this happened three or more times? DSM-IV “gambles as a way of escaping from problems or of relieving a dysphoric
mood (e.g., feelings of helplessness, guilt, anxiety, depression)” NODS #8 Have you ever gambled as a way to escape from personal problems?
OR
Escape
NODS #9 Have you ever gambled to relieve uncomfortable feelings such as guilt, anxiety, helplessness, or depression?
DSM-IV “after losing money, often returns another day to get even (“chasing” one’s losses)”
Chasing
NODS #10 Has there ever been a period when, if you lost money gambling one day, you would often return another day to get even?
DSM-IV “lies to family members, therapist, or others to conceal the extent of involvement with gambling”
NODS #11 Have you ever lied to family members, friends, or others about how much you gamble or how much money you lost on gambling? AND
Lying
NODS #12 If so, has this happened three or more times? DSM-IV “has committed illegal acts such as forgery, fraud, theft, or embezzlement
to finance gambling” Illegal Acts
NODS #13 Have you ever written a bad check or taken money or something that didn’t belong to you from family members or anyone else in order to pay for your gambling?
57 2006 CALIFORNIA PROBLEM GAMBLING PREVALENCE SURVEY
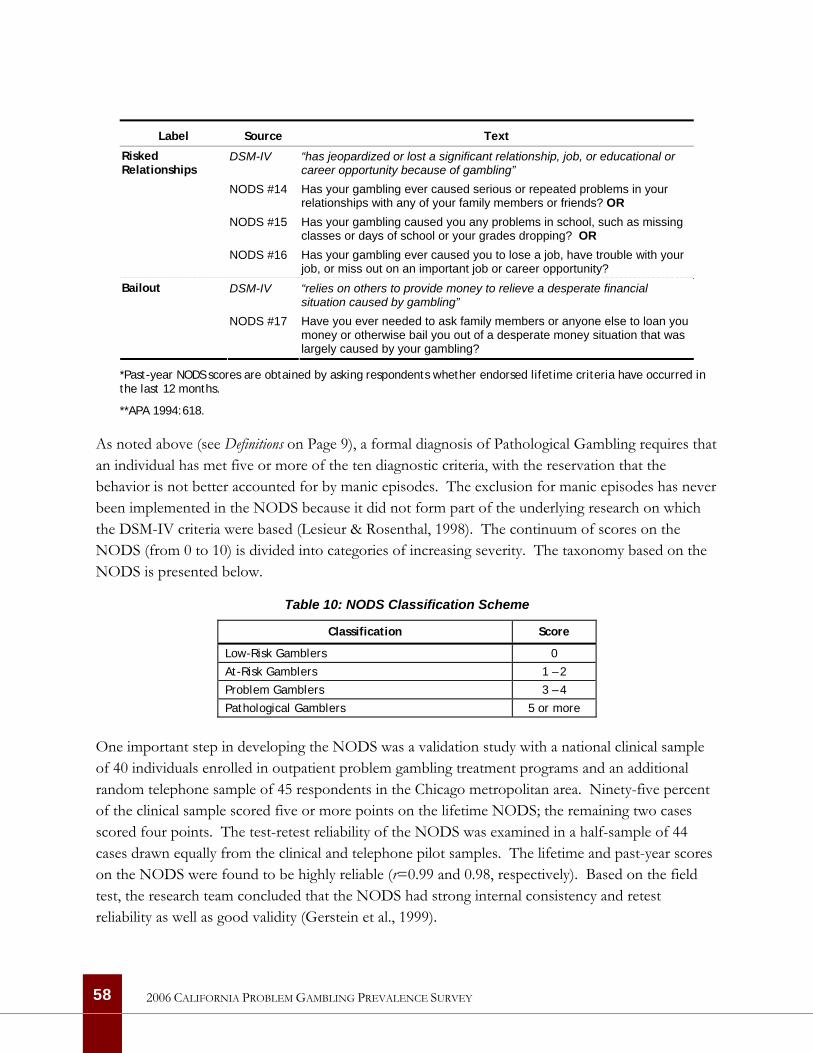
Label Source Text
DSM-IV “has jeopardized or lost a significant relationship, job, or educational or career opportunity because of gambling”
NODS #14 Has your gambling ever caused serious or repeated problems in your relationships with any of your family members or friends? OR
NODS #15 Has your gambling caused you any problems in school, such as missing classes or days of school or your grades dropping? OR
Risked Relationships
NODS #16 Has your gambling ever caused you to lose a job, have trouble with your job, or miss out on an important job or career opportunity?
DSM-IV “relies on others to provide money to relieve a desperate financial situation caused by gambling”
Bailout
NODS #17 Have you ever needed to ask family members or anyone else to loan you money or otherwise bail you out of a desperate money situation that was largely caused by your gambling?
*Past-year NODS scores are obtained by asking respondents whether endorsed lifetime criteria have occurred in the last 12 months.
**APA 1994:618.
As noted above (see Definitions on Page 9), a formal diagnosis of Pathological Gambling requires that an individual has met five or more of the ten diagnostic criteria, with the reservation that the behavior is not better accounted for by manic episodes. The exclusion for manic episodes has never been implemented in the NODS because it did not form part of the underlying research on which the DSM-IV criteria were based (Lesieur & Rosenthal, 1998). The continuum of scores on the NODS (from 0 to 10) is divided into categories of increasing severity. The taxonomy based on the NODS is presented below.
Table 10: NODS Classification Scheme
Classification Score
Low-Risk Gamblers 0
At-Risk Gamblers 1 – 2
Problem Gamblers 3 – 4
Pathological Gamblers 5 or more
One important step in developing the NODS was a validation study with a national clinical sample of 40 individuals enrolled in outpatient problem gambling treatment programs and an additional random telephone sample of 45 respondents in the Chicago metropolitan area. Ninety-five percent of the clinical sample scored five or more points on the lifetime NODS; the remaining two cases scored four points. The test-retest reliability of the NODS was examined in a half-sample of 44 cases drawn equally from the clinical and telephone pilot samples. The lifetime and past-year scores on the NODS were found to be highly reliable (r=0.99 and 0.98, respectively). Based on the field test, the research team concluded that the NODS had strong internal consistency and retest reliability as well as good validity (Gerstein et al., 1999).
58 2006 CALIFORNIA PROBLEM GAMBLING PREVALENCE SURVEY
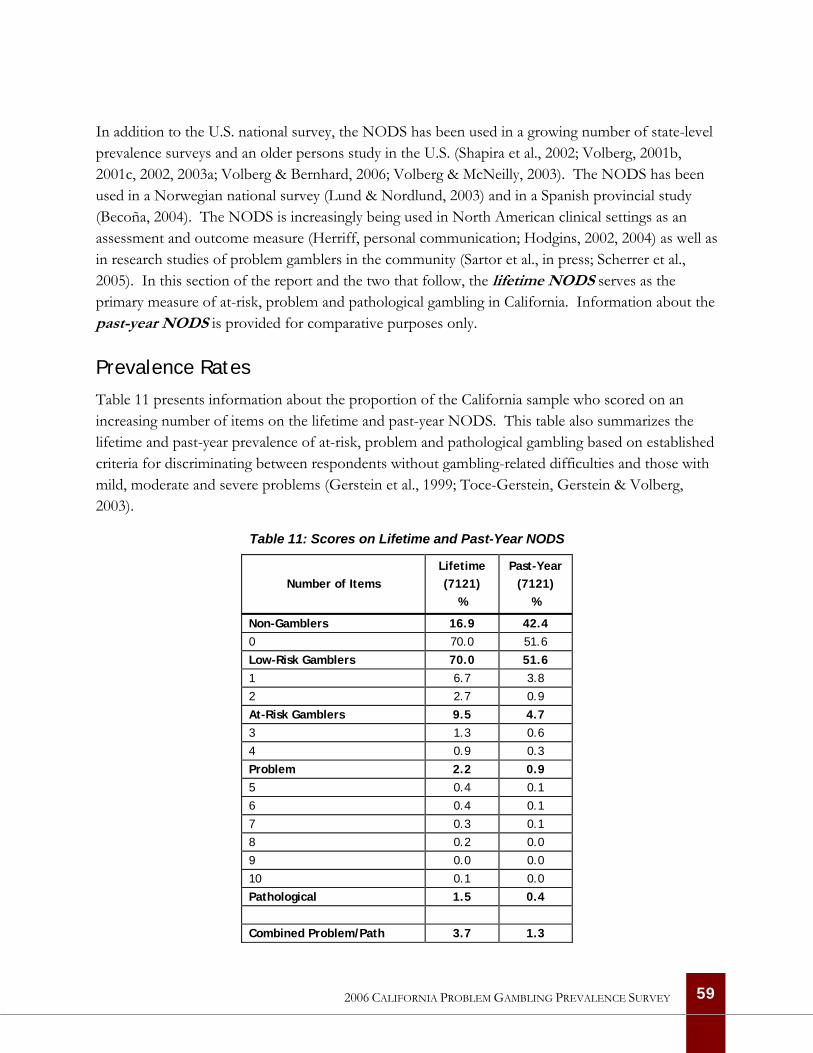
In addition to the U.S. national survey, the NODS has been used in a growing number of state-level prevalence surveys and an older persons study in the U.S. (Shapira et al., 2002; Volberg, 2001b, 2001c, 2002, 2003a; Volberg & Bernhard, 2006; Volberg & McNeilly, 2003). The NODS has been used in a Norwegian national survey (Lund & Nordlund, 2003) and in a Spanish provincial study (Becoña, 2004). The NODS is increasingly being used in North American clinical settings as an assessment and outcome measure (Herriff, personal communication; Hodgins, 2002, 2004) as well as in research studies of problem gamblers in the community (Sartor et al., in press; Scherrer et al., 2005). In this section of the report and the two that follow, the lifetime NODS serves as the primary measure of at-risk, problem and pathological gambling in California. Information about the past-year NODS is provided for comparative purposes only.
Prevalence Rates
Table 11 presents information about the proportion of the California sample who scored on an increasing number of items on the lifetime and past-year NODS. This table also summarizes the lifetime and past-year prevalence of at-risk, problem and pathological gambling based on established criteria for discriminating between respondents without gambling-related difficulties and those with mild, moderate and severe problems (Gerstein et al., 1999; Toce-Gerstein, Gerstein & Volberg, 2003).
Table 11: Scores on Lifetime and Past-Year NODS
Number of Items
Lifetime (7121)
%
Past-Year (7121)
%
Non-Gamblers 16.9 42.4 0 70.0 51.6
Low-Risk Gamblers 70.0 51.6 1 6.7 3.8
2 2.7 0.9
At-Risk Gamblers 9.5 4.7 3 1.3 0.6
4 0.9 0.3
Problem 2.2 0.9 5 0.4 0.1
6 0.4 0.1
7 0.3 0.1
8 0.2 0.0
9 0.0 0.0
10 0.1 0.0
Pathological 1.5 0.4 Combined Problem/Path 3.7 1.3
59 2006 CALIFORNIA PROBLEM GAMBLING PREVALENCE SURVEY
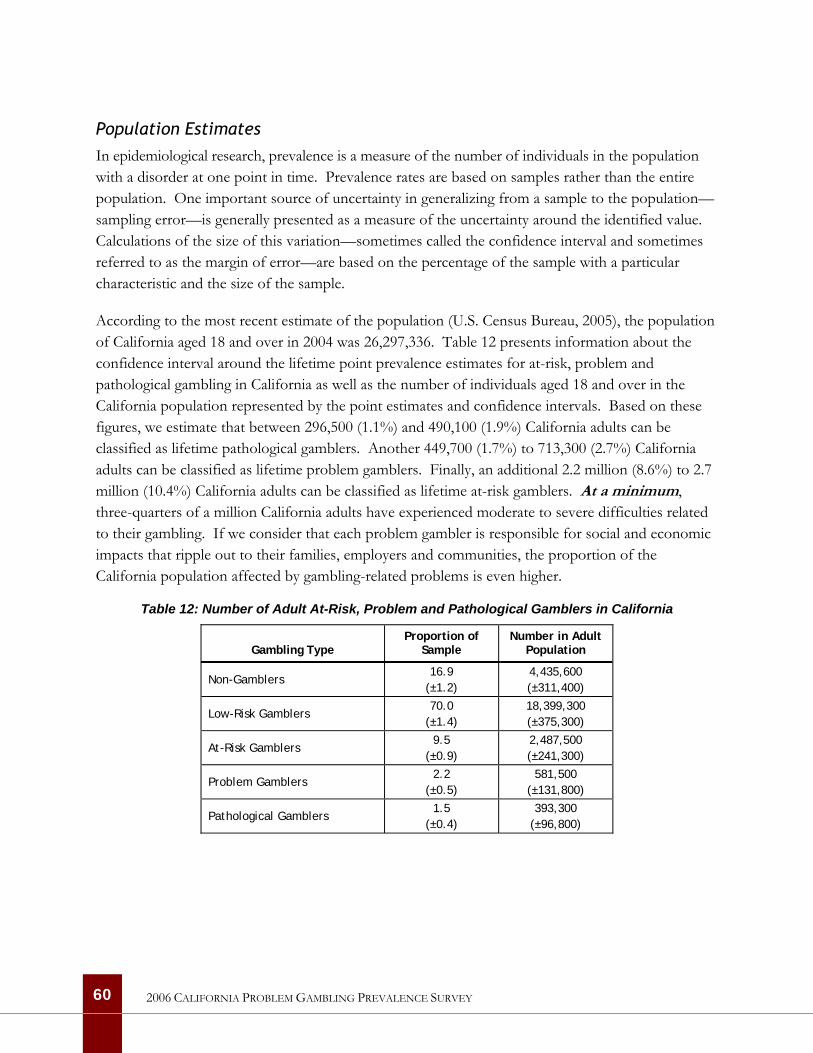
Population Estimates In epidemiological research, prevalence is a measure of the number of individuals in the population with a disorder at one point in time. Prevalence rates are based on samples rather than the entire population. One important source of uncertainty in generalizing from a sample to the population—sampling error—is generally presented as a measure of the uncertainty around the identified value. Calculations of the size of this variation—sometimes called the confidence interval and sometimes referred to as the margin of error—are based on the percentage of the sample with a particular characteristic and the size of the sample.
According to the most recent estimate of the population (U.S. Census Bureau, 2005), the population of California aged 18 and over in 2004 was 26,297,336. Table 12 presents information about the confidence interval around the lifetime point prevalence estimates for at-risk, problem and pathological gambling in California as well as the number of individuals aged 18 and over in the California population represented by the point estimates and confidence intervals. Based on these figures, we estimate that between 296,500 (1.1%) and 490,100 (1.9%) California adults can be classified as lifetime pathological gamblers. Another 449,700 (1.7%) to 713,300 (2.7%) California adults can be classified as lifetime problem gamblers. Finally, an additional 2.2 million (8.6%) to 2.7 million (10.4%) California adults can be classified as lifetime at-risk gamblers. At a minimum, three-quarters of a million California adults have experienced moderate to severe difficulties related to their gambling. If we consider that each problem gambler is responsible for social and economic impacts that ripple out to their families, employers and communities, the proportion of the California population affected by gambling-related problems is even higher.
Table 12: Number of Adult At-Risk, Problem and Pathological Gamblers in California
Gambling Type Proportion of
Sample Number in Adult
Population
Non-Gamblers 16.9
(±1.2) 4,435,600 (±311,400)
Low-Risk Gamblers 70.0
(±1.4) 18,399,300 (±375,300)
At-Risk Gamblers 9.5
(±0.9) 2,487,500 (±241,300)
Problem Gamblers 2.2
(±0.5) 581,500
(±131,800)
Pathological Gamblers 1.5
(±0.4) 393,300
(±96,800)
60 2006 CALIFORNIA PROBLEM GAMBLING PREVALENCE SURVEY
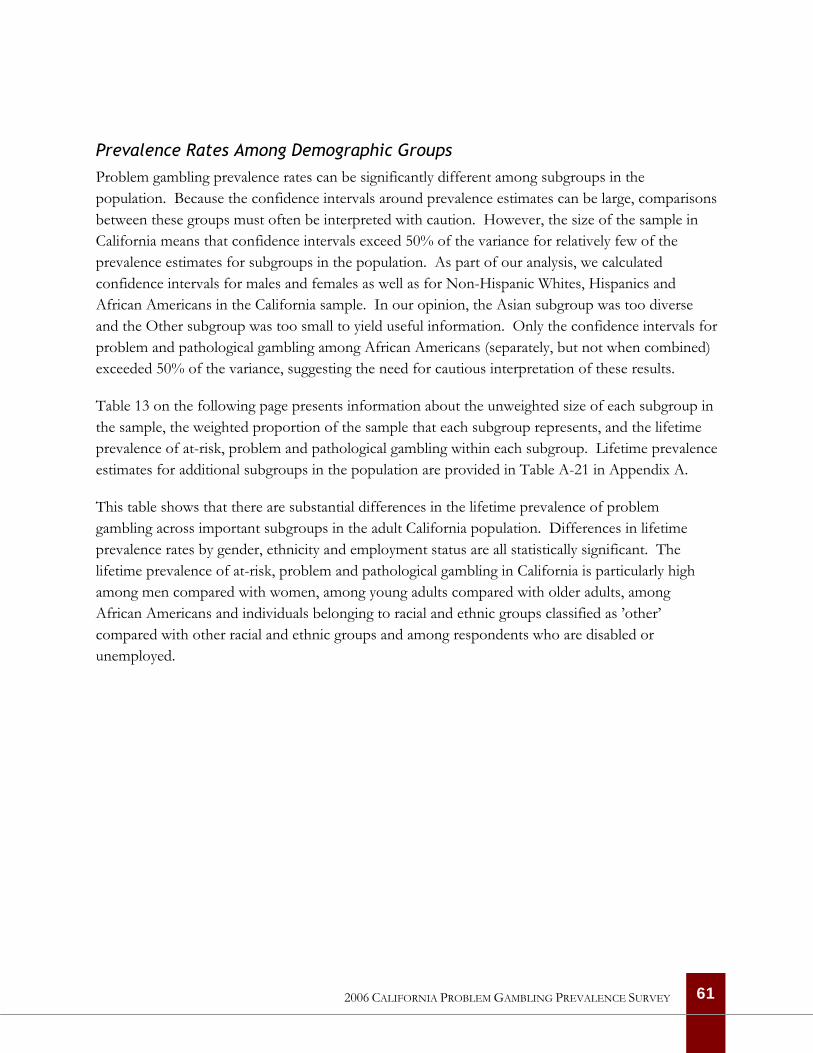
Prevalence Rates Among Demographic Groups Problem gambling prevalence rates can be significantly different among subgroups in the population. Because the confidence intervals around prevalence estimates can be large, comparisons between these groups must often be interpreted with caution. However, the size of the sample in California means that confidence intervals exceed 50% of the variance for relatively few of the prevalence estimates for subgroups in the population. As part of our analysis, we calculated confidence intervals for males and females as well as for Non-Hispanic Whites, Hispanics and African Americans in the California sample. In our opinion, the Asian subgroup was too diverse and the Other subgroup was too small to yield useful information. Only the confidence intervals for problem and pathological gambling among African Americans (separately, but not when combined) exceeded 50% of the variance, suggesting the need for cautious interpretation of these results.
Table 13 on the following page presents information about the unweighted size of each subgroup in the sample, the weighted proportion of the sample that each subgroup represents, and the lifetime prevalence of at-risk, problem and pathological gambling within each subgroup. Lifetime prevalence estimates for additional subgroups in the population are provided in Table A-21 in Appendix A.
This table shows that there are substantial differences in the lifetime prevalence of problem gambling across important subgroups in the adult California population. Differences in lifetime prevalence rates by gender, ethnicity and employment status are all statistically significant. The lifetime prevalence of at-risk, problem and pathological gambling in California is particularly high among men compared with women, among young adults compared with older adults, among African Americans and individuals belonging to racial and ethnic groups classified as ’other’ compared with other racial and ethnic groups and among respondents who are disabled or unemployed.
61 2006 CALIFORNIA PROBLEM GAMBLING PREVALENCE SURVEY
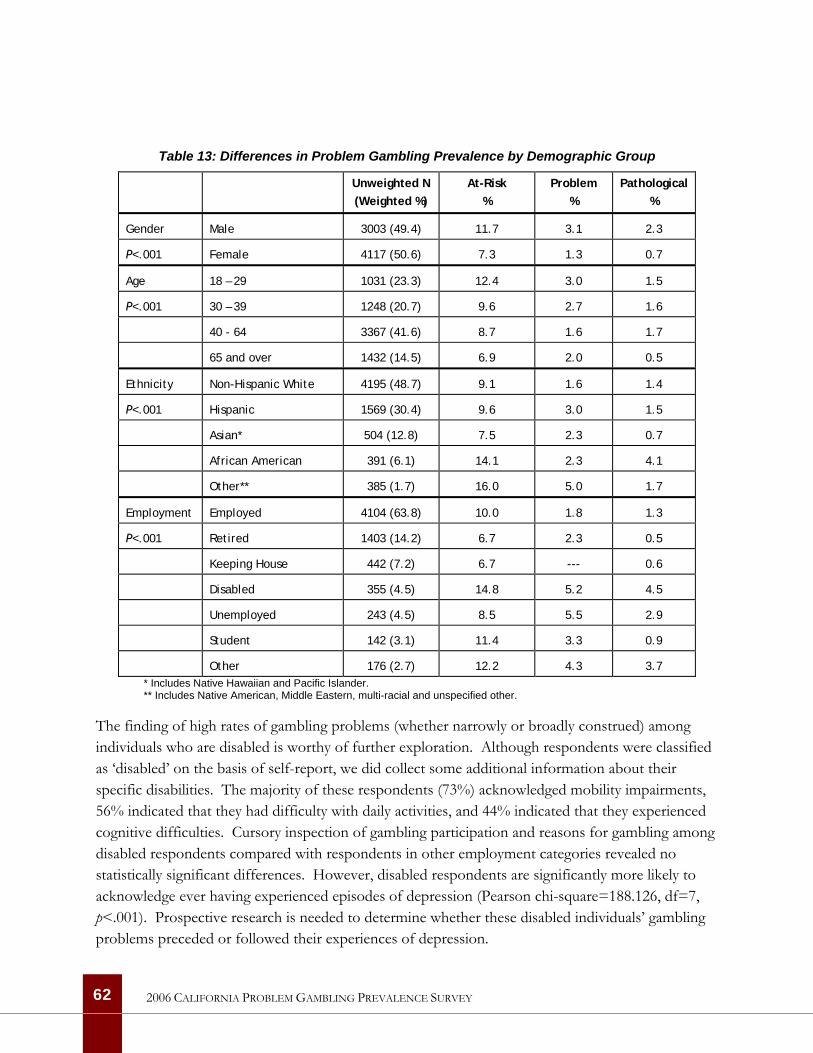
Table 13: Differences in Problem Gambling Prevalence by Demographic Group
Unweighted N (Weighted %)
At-Risk %
Problem %
Pathological %
Gender Male 3003 (49.4) 11.7 3.1 2.3
P<.001 Female 4117 (50.6) 7.3 1.3 0.7
Age 18 – 29 1031 (23.3) 12.4 3.0 1.5
P<.001 30 – 39 1248 (20.7) 9.6 2.7 1.6
40 - 64 3367 (41.6) 8.7 1.6 1.7
65 and over 1432 (14.5) 6.9 2.0 0.5
Ethnicity Non-Hispanic White 4195 (48.7) 9.1 1.6 1.4
P<.001 Hispanic 1569 (30.4) 9.6 3.0 1.5
Asian* 504 (12.8) 7.5 2.3 0.7
African American 391 (6.1) 14.1 2.3 4.1
Other** 385 (1.7) 16.0 5.0 1.7
Employment Employed 4104 (63.8) 10.0 1.8 1.3
P<.001 Retired 1403 (14.2) 6.7 2.3 0.5
Keeping House 442 (7.2) 6.7 --- 0.6
Disabled 355 (4.5) 14.8 5.2 4.5
Unemployed 243 (4.5) 8.5 5.5 2.9
Student 142 (3.1) 11.4 3.3 0.9
Other 176 (2.7) 12.2 4.3 3.7 * Includes Native Hawaiian and Pacific Islander. ** Includes Native American, Middle Eastern, multi-racial and unspecified other.
The finding of high rates of gambling problems (whether narrowly or broadly construed) among individuals who are disabled is worthy of further exploration. Although respondents were classified as ‘disabled’ on the basis of self-report, we did collect some additional information about their specific disabilities. The majority of these respondents (73%) acknowledged mobility impairments, 56% indicated that they had difficulty with daily activities, and 44% indicated that they experienced cognitive difficulties. Cursory inspection of gambling participation and reasons for gambling among disabled respondents compared with respondents in other employment categories revealed no statistically significant differences. However, disabled respondents are significantly more likely to acknowledge ever having experienced episodes of depression (Pearson chi-square=188.126, df=7, p<.001). Prospective research is needed to determine whether these disabled individuals’ gambling problems preceded or followed their experiences of depression.
62 2006 CALIFORNIA PROBLEM GAMBLING PREVALENCE SURVEY
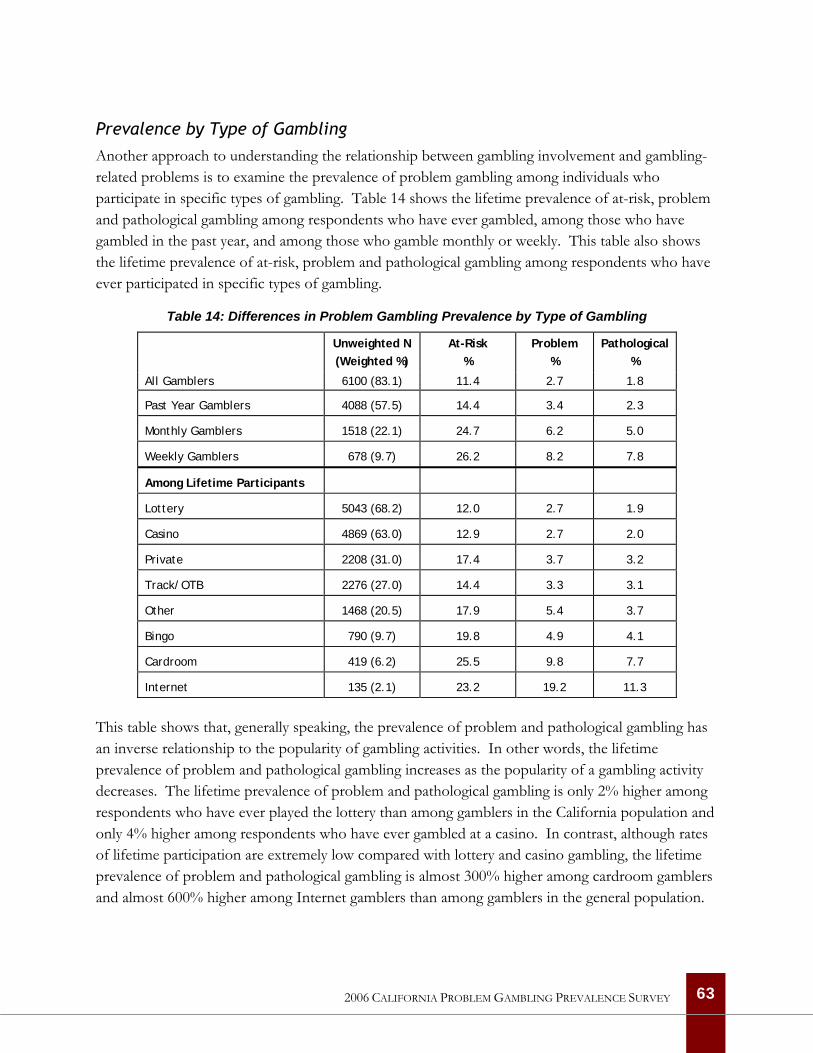
Prevalence by Type of Gambling Another approach to understanding the relationship between gambling involvement and gambling-related problems is to examine the prevalence of problem gambling among individuals who participate in specific types of gambling. Table 14 shows the lifetime prevalence of at-risk, problem and pathological gambling among respondents who have ever gambled, among those who have gambled in the past year, and among those who gamble monthly or weekly. This table also shows the lifetime prevalence of at-risk, problem and pathological gambling among respondents who have ever participated in specific types of gambling.
Table 14: Differences in Problem Gambling Prevalence by Type of Gambling
Unweighted N (Weighted %)
At-Risk %
Problem %
Pathological %
All Gamblers 6100 (83.1) 11.4 2.7 1.8
Past Year Gamblers 4088 (57.5) 14.4 3.4 2.3
Monthly Gamblers 1518 (22.1) 24.7 6.2 5.0
Weekly Gamblers 678 (9.7) 26.2 8.2 7.8
Among Lifetime Participants
Lottery 5043 (68.2) 12.0 2.7 1.9
Casino 4869 (63.0) 12.9 2.7 2.0
Private 2208 (31.0) 17.4 3.7 3.2
Track/OTB 2276 (27.0) 14.4 3.3 3.1
Other 1468 (20.5) 17.9 5.4 3.7
Bingo 790 (9.7) 19.8 4.9 4.1
Cardroom 419 (6.2) 25.5 9.8 7.7
Internet 135 (2.1) 23.2 19.2 11.3
This table shows that, generally speaking, the prevalence of problem and pathological gambling has an inverse relationship to the popularity of gambling activities. In other words, the lifetime prevalence of problem and pathological gambling increases as the popularity of a gambling activity decreases. The lifetime prevalence of problem and pathological gambling is only 2% higher among respondents who have ever played the lottery than among gamblers in the California population and only 4% higher among respondents who have ever gambled at a casino. In contrast, although rates of lifetime participation are extremely low compared with lottery and casino gambling, the lifetime prevalence of problem and pathological gambling is almost 300% higher among cardroom gamblers and almost 600% higher among Internet gamblers than among gamblers in the general population.
63 2006 CALIFORNIA PROBLEM GAMBLING PREVALENCE SURVEY
While problem gambling prevalence rates are far higher among players of the least popular gambling activities, it is important to note that—like gamblers in general—the majority of problem and pathological gamblers in California have played the lottery (85%) and gambled at casinos (80%). In contrast, only 18% of problem and pathological gamblers in California have gambled on the Internet. However, as the pool of players becomes smaller, problem and pathological gamblers represent larger and larger proportions of those groups in the population because they tend to participate in more gambling activities.
Given the much greater size of the at-risk group, some readers may argue that individuals who score only 1 or 2 on the NODS should not be considered in the same way as individuals with higher scores. It is certainly conceivable that social gamblers will, on occasion, minimize or conceal gambling losses from friends or family or lose more than they intended and have to borrow from a friend or colleague. There is, in fact, some evidence that impaired control and subsequent problem development are a common and predictable consequence of regular, high-intensity gaming machine play rather than something confined to a small minority of constitutionally predisposed or mentally disordered problem gamblers (Dickerson, Haw & Shepherd, 2003). For precisely these reasons—the size of the at-risk group and the common experience of loss of control—we would argue that particular attention should be paid to at-risk gamblers and how positive changes in their behavior can be fostered.
Statistical Properties of the NODS4
The accuracy of any instrument is measured by looking at the reliability and validity of the instrument (Litwin 1995). The reliability of an instrument refers to the ability to reproduce the results of the application of the test. The validity of an instrument refers to the ability of the instrument to measure what it is intended to measure. In examining the psychometric properties of the NODS among California respondents, we are limited primarily to assessing reliability since there is no ‘gold standard’ (such as a blood test) for Pathological Gambling against which to assess the results of our screen and since no other problem gambling screen was included in the questionnaire.
The most widely accepted test of reliability is a measure of the internal consistency of an instrument. The reliability of the lifetime NODS among California respondents who were administered the NODS (N=3889) is very good with Cronbach’s alpha of .83 for the full screen. This is substantially higher than the .70 that is generally accepted as representing good reliability. The reliability of the more limited set of items that are scored for the NODS (N=10) is lower than the full scale, with Cronbach’s alpha of .79. Given the diversity of the California sample, we examined the reliability of the NODS separately for respondents interviewed in English and Spanish. Among Spanish speakers (N=233), the reliability of the full lifetime screen was .79 and the reliability of the limited 10-item set 4 Only the performance of the lifetime NODS is examined here. It is also important to note that the unweighted data were used for this analysis since the purpose was to assess performance rather than generalize to the population.
64 2006 CALIFORNIA PROBLEM GAMBLING PREVALENCE SURVEY
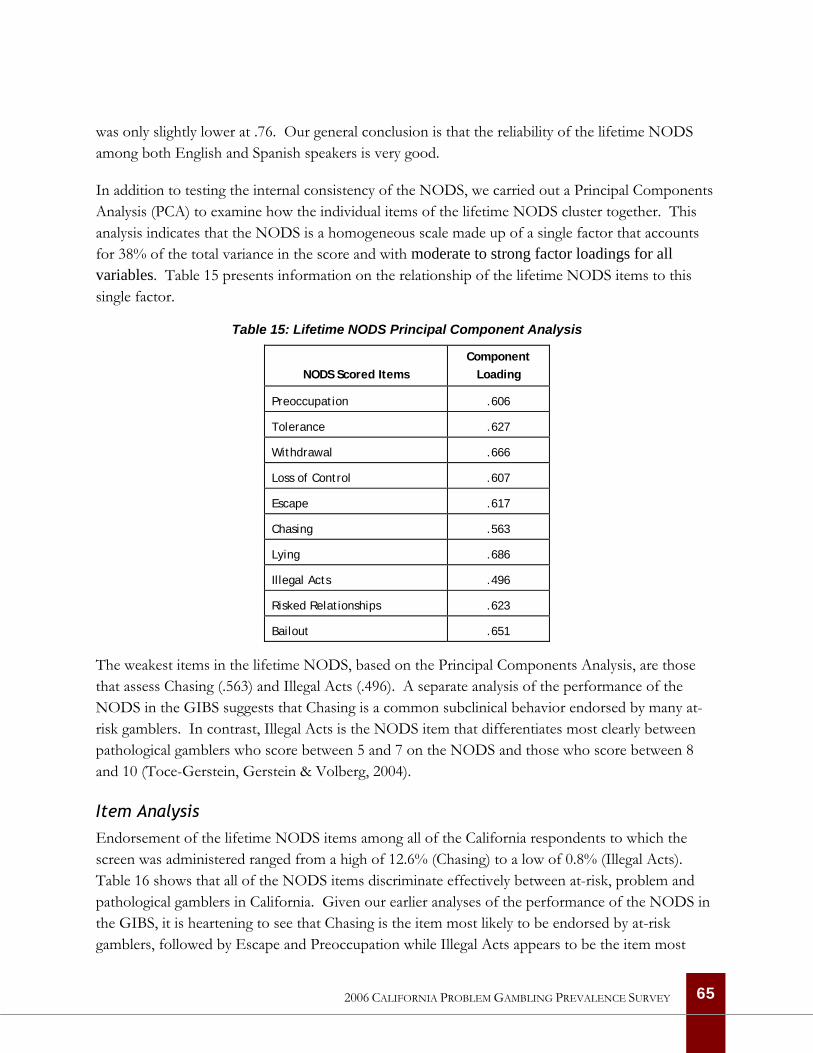
was only slightly lower at .76. Our general conclusion is that the reliability of the lifetime NODS among both English and Spanish speakers is very good.
In addition to testing the internal consistency of the NODS, we carried out a Principal Components Analysis (PCA) to examine how the individual items of the lifetime NODS cluster together. This analysis indicates that the NODS is a homogeneous scale made up of a single factor that accounts for 38% of the total variance in the score and with moderate to strong factor loadings for all variables. Table 15 presents information on the relationship of the lifetime NODS items to this single factor.
Table 15: Lifetime NODS Principal Component Analysis
NODS Scored Items
Component Loading
Preoccupation .606
Tolerance .627
Withdrawal .666
Loss of Control .607
Escape .617
Chasing .563
Lying .686
Illegal Acts .496
Risked Relationships .623
Bailout .651
The weakest items in the lifetime NODS, based on the Principal Components Analysis, are those that assess Chasing (.563) and Illegal Acts (.496). A separate analysis of the performance of the NODS in the GIBS suggests that Chasing is a common subclinical behavior endorsed by many at-risk gamblers. In contrast, Illegal Acts is the NODS item that differentiates most clearly between pathological gamblers who score between 5 and 7 on the NODS and those who score between 8 and 10 (Toce-Gerstein, Gerstein & Volberg, 2004).
Item Analysis Endorsement of the lifetime NODS items among all of the California respondents to which the screen was administered ranged from a high of 12.6% (Chasing) to a low of 0.8% (Illegal Acts). Table 16 shows that all of the NODS items discriminate effectively between at-risk, problem and pathological gamblers in California. Given our earlier analyses of the performance of the NODS in the GIBS, it is heartening to see that Chasing is the item most likely to be endorsed by at-risk gamblers, followed by Escape and Preoccupation while Illegal Acts appears to be the item most
65 2006 CALIFORNIA PROBLEM GAMBLING PREVALENCE SURVEY
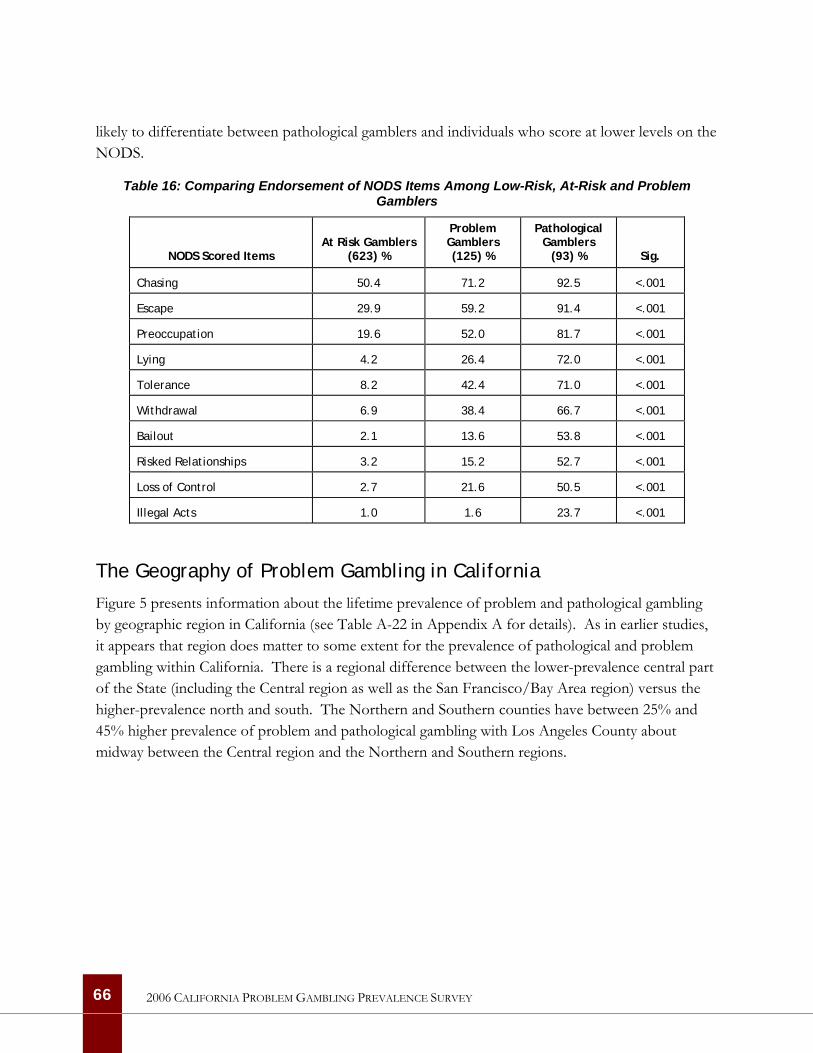
likely to differentiate between pathological gamblers and individuals who score at lower levels on the NODS.
Table 16: Comparing Endorsement of NODS Items Among Low-Risk, At-Risk and Problem Gamblers
NODS Scored Items
At Risk Gamblers (623) %
Problem Gamblers (125) %
Pathological Gamblers
(93) % Sig.
Chasing 50.4 71.2 92.5 <.001
Escape 29.9 59.2 91.4 <.001
Preoccupation 19.6 52.0 81.7 <.001
Lying 4.2 26.4 72.0 <.001
Tolerance 8.2 42.4 71.0 <.001
Withdrawal 6.9 38.4 66.7 <.001
Bailout 2.1 13.6 53.8 <.001
Risked Relationships 3.2 15.2 52.7 <.001
Loss of Control 2.7 21.6 50.5 <.001
Illegal Acts 1.0 1.6 23.7 <.001
The Geography of Problem Gambling in California
Figure 5 presents information about the lifetime prevalence of problem and pathological gambling by geographic region in California (see Table A-22 in Appendix A for details). As in earlier studies, it appears that region does matter to some extent for the prevalence of pathological and problem gambling within California. There is a regional difference between the lower-prevalence central part of the State (including the Central region as well as the San Francisco/Bay Area region) versus the higher-prevalence north and south. The Northern and Southern counties have between 25% and 45% higher prevalence of problem and pathological gambling with Los Angeles County about midway between the Central region and the Northern and Southern regions.
66 2006 CALIFORNIA PROBLEM GAMBLING PREVALENCE SURVEY
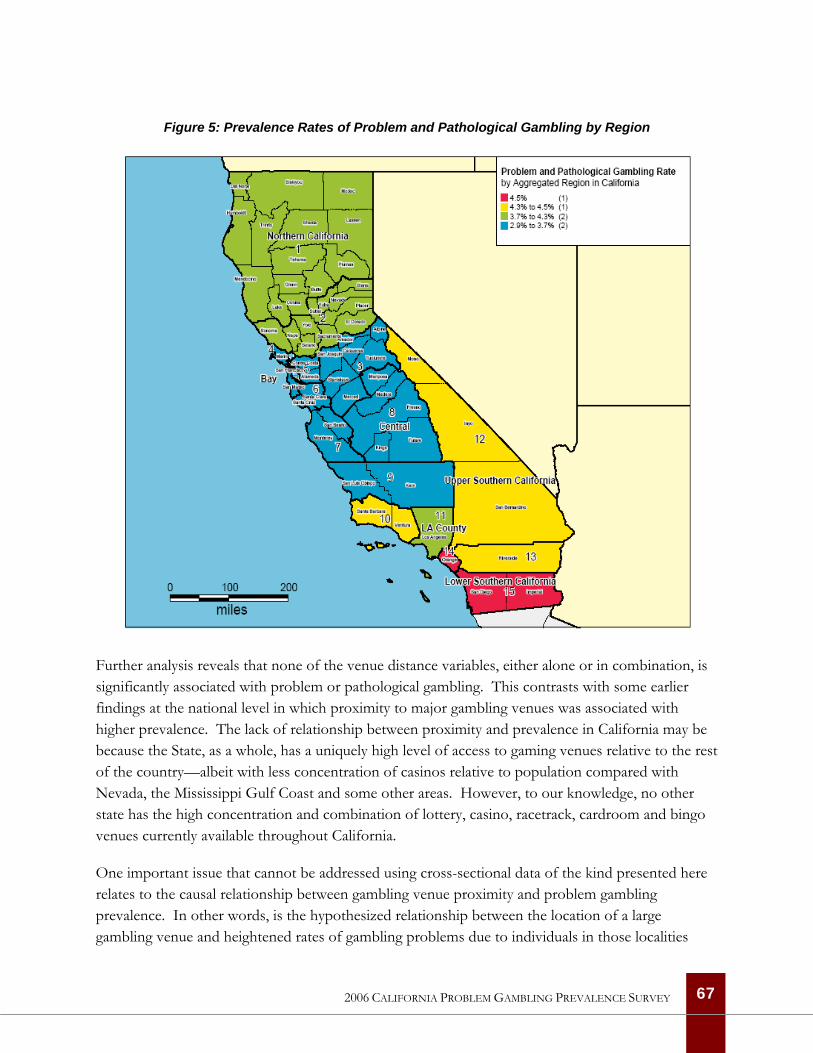
Figure 5: Prevalence Rates of Problem and Pathological Gambling by Region
Further analysis reveals that none of the venue distance variables, either alone or in combination, is significantly associated with problem or pathological gambling. This contrasts with some earlier findings at the national level in which proximity to major gambling venues was associated with higher prevalence. The lack of relationship between proximity and prevalence in California may be because the State, as a whole, has a uniquely high level of access to gaming venues relative to the rest of the country—albeit with less concentration of casinos relative to population compared with Nevada, the Mississippi Gulf Coast and some other areas. However, to our knowledge, no other state has the high concentration and combination of lottery, casino, racetrack, cardroom and bingo venues currently available throughout California.
One important issue that cannot be addressed using cross-sectional data of the kind presented here relates to the causal relationship between gambling venue proximity and problem gambling prevalence. In other words, is the hypothesized relationship between the location of a large gambling venue and heightened rates of gambling problems due to individuals in those localities
67 2006 CALIFORNIA PROBLEM GAMBLING PREVALENCE SURVEY
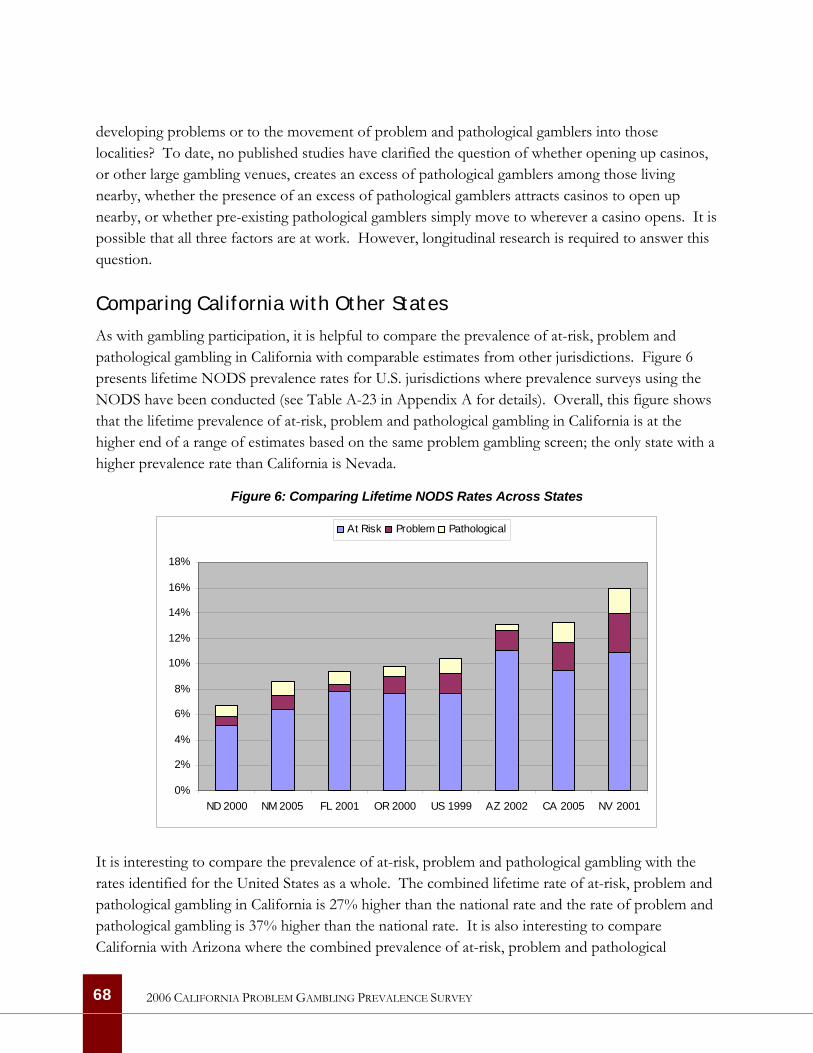
developing problems or to the movement of problem and pathological gamblers into those localities? To date, no published studies have clarified the question of whether opening up casinos, or other large gambling venues, creates an excess of pathological gamblers among those living nearby, whether the presence of an excess of pathological gamblers attracts casinos to open up nearby, or whether pre-existing pathological gamblers simply move to wherever a casino opens. It is possible that all three factors are at work. However, longitudinal research is required to answer this question.
Comparing California with Other States
As with gambling participation, it is helpful to compare the prevalence of at-risk, problem and pathological gambling in California with comparable estimates from other jurisdictions. Figure 6 presents lifetime NODS prevalence rates for U.S. jurisdictions where prevalence surveys using the NODS have been conducted (see Table A-23 in Appendix A for details). Overall, this figure shows that the lifetime prevalence of at-risk, problem and pathological gambling in California is at the higher end of a range of estimates based on the same problem gambling screen; the only state with a higher prevalence rate than California is Nevada.
Figure 6: Comparing Lifetime NODS Rates Across States
0%
2%
4%
6%
8%
10%
12%
14%
16%
18%
ND 2000 NM 2005 FL 2001 OR 2000 US 1999 AZ 2002 CA 2005 NV 2001
At Risk Problem Pathological
It is interesting to compare the prevalence of at-risk, problem and pathological gambling with the rates identified for the United States as a whole. The combined lifetime rate of at-risk, problem and pathological gambling in California is 27% higher than the national rate and the rate of problem and pathological gambling is 37% higher than the national rate. It is also interesting to compare California with Arizona where the combined prevalence of at-risk, problem and pathological
68 2006 CALIFORNIA PROBLEM GAMBLING PREVALENCE SURVEY
gambling is nearly identical. The proportion of the population with mild gambling-related problems is 16% higher in Arizona than in California while the proportion of individuals with moderate and severe gambling-related problems is 76% higher in California than in Arizona.
Changes in Problem Gambling Prevalence Since 1990
We have noted that only one other study of the prevalence of problem gambling has ever been carried out in California (Volberg, 1994). Problem and pathological gambling was assessed using the South Oaks Gambling Screen (SOGS), the earliest measure developed to screen for gambling problems (Lesieur & Blume, 1987). In 1990, the prevalence of problem and pathological gambling in California was similar to rates on the East Coast and significantly higher than rates in the Midwest (Volberg, 1994). Use of two different problem gambling screens in 1990 and 2006 prevents meaningful comparison problem gambling prevalence in California over time. Nor are we able to provide information about changes in problem gambling prevalence in California since 1999. This is because there were too few California respondents in the national sample to permit reliable comparisons.
69 2006 CALIFORNIA PROBLEM GAMBLING PREVALENCE SURVEY
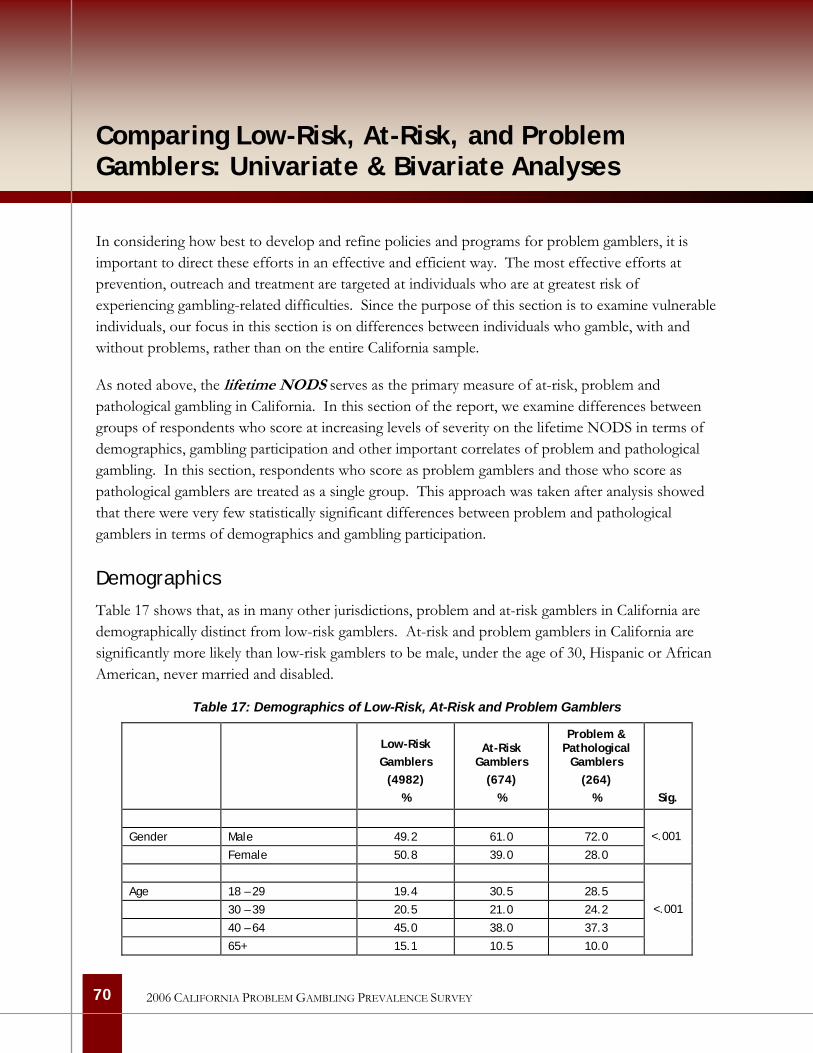
70
2006 CALIFORNIA PROBLEM GAMBLING PREVALENCE SURVEY
Comparing Low-Risk, At-Risk, and Problem Gamblers: Univariate & Bivariate Analyses
In considering how best to develop and refine policies and programs for problem gamblers, it is important to direct these efforts in an effective and efficient way. The most effective efforts at prevention, outreach and treatment are targeted at individuals who are at greatest risk of experiencing gambling-related difficulties. Since the purpose of this section is to examine vulnerable individuals, our focus in this section is on differences between individuals who gamble, with and without problems, rather than on the entire California sample.
As noted above, the lifetime NODS serves as the primary measure of at-risk, problem and pathological gambling in California. In this section of the report, we examine differences between groups of respondents who score at increasing levels of severity on the lifetime NODS in terms of demographics, gambling participation and other important correlates of problem and pathological gambling. In this section, respondents who score as problem gamblers and those who score as pathological gamblers are treated as a single group. This approach was taken after analysis showed that there were very few statistically significant differences between problem and pathological gamblers in terms of demographics and gambling participation.
Demographics
Table 17 shows that, as in many other jurisdictions, problem and at-risk gamblers in California are demographically distinct from low-risk gamblers. At-risk and problem gamblers in California are significantly more likely than low-risk gamblers to be male, under the age of 30, Hispanic or African American, never married and disabled.
Table 17: Demographics of Low-Risk, At-Risk and Problem Gamblers
Low-Risk Gamblers
(4982) %
At-Risk Gamblers
(674) %
Problem & Pathological
Gamblers (264)
% Sig.
Gender Male 49.2 61.0 72.0
Female 50.8 39.0 28.0
<.001
Age 18 – 29 19.4 30.5 28.5
30 – 39 20.5 21.0 24.2
40 – 64 45.0 38.0 37.3
65+ 15.1 10.5 10.0
<.001
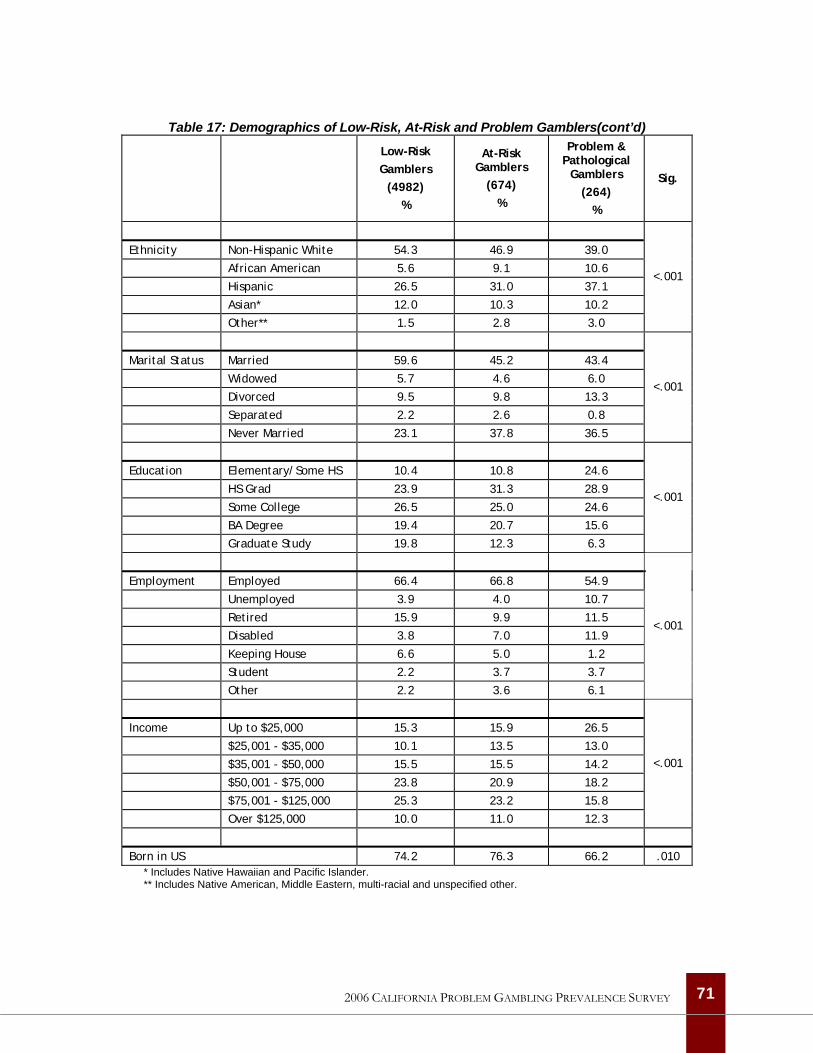
Table 17: Demographics of Low-Risk, At-Risk and Problem Gamblers(cont’d)
Low-Risk Gamblers
(4982) %
At-Risk Gamblers
(674) %
Problem & Pathological
Gamblers (264)
%
Sig.
Ethnicity Non-Hispanic White 54.3 46.9 39.0
African American 5.6 9.1 10.6
Hispanic 26.5 31.0 37.1
Asian* 12.0 10.3 10.2
Other** 1.5 2.8 3.0
<.001
Marital Status Married 59.6 45.2 43.4
Widowed 5.7 4.6 6.0
Divorced 9.5 9.8 13.3
Separated 2.2 2.6 0.8
Never Married 23.1 37.8 36.5
<.001
Education Elementary/Some HS 10.4 10.8 24.6
HS Grad 23.9 31.3 28.9
Some College 26.5 25.0 24.6
BA Degree 19.4 20.7 15.6
Graduate Study 19.8 12.3 6.3
<.001
Employment Employed 66.4 66.8 54.9
Unemployed 3.9 4.0 10.7
Retired 15.9 9.9 11.5
Disabled 3.8 7.0 11.9
Keeping House 6.6 5.0 1.2
Student 2.2 3.7 3.7
Other 2.2 3.6 6.1
<.001
Income Up to $25,000 15.3 15.9 26.5
$25,001 - $35,000 10.1 13.5 13.0
$35,001 - $50,000 15.5 15.5 14.2
$50,001 - $75,000 23.8 20.9 18.2
$75,001 - $125,000 25.3 23.2 15.8
Over $125,000 10.0 11.0 12.3
<.001
Born in US 74.2 76.3 66.2 .010 * Includes Native Hawaiian and Pacific Islander. ** Includes Native American, Middle Eastern, multi-racial and unspecified other.
71 2006 CALIFORNIA PROBLEM GAMBLING PREVALENCE SURVEY
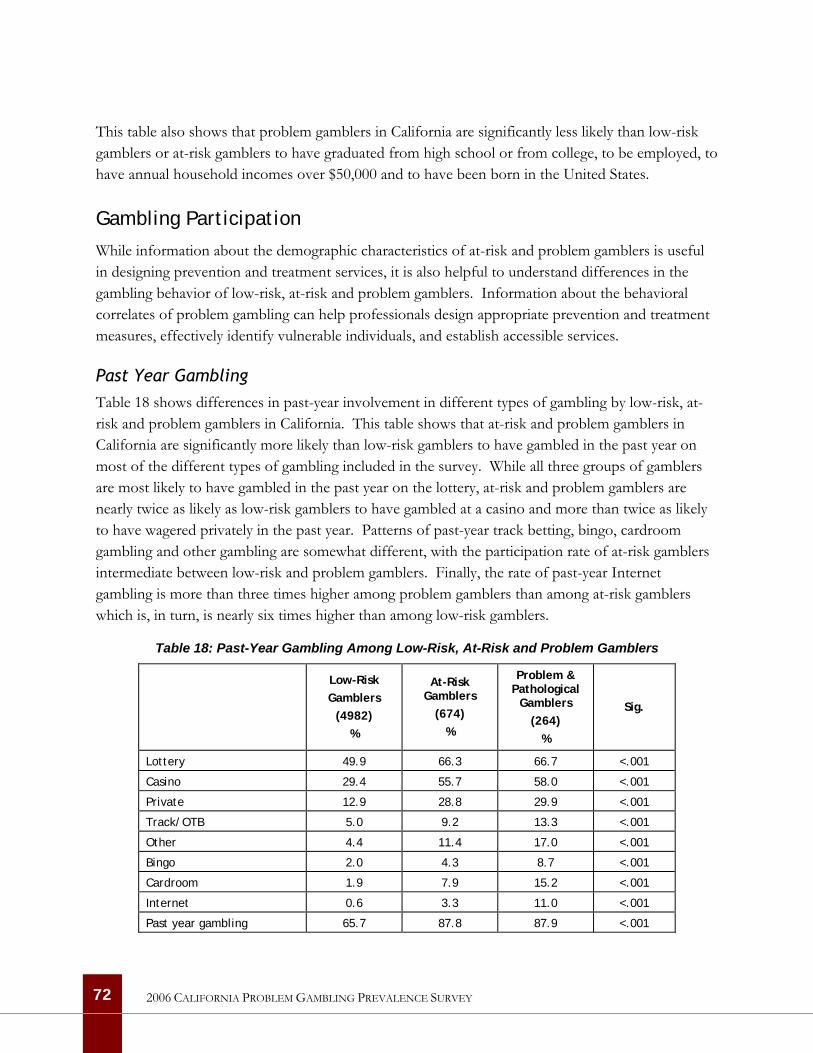
This table also shows that problem gamblers in California are significantly less likely than low-risk gamblers or at-risk gamblers to have graduated from high school or from college, to be employed, to have annual household incomes over $50,000 and to have been born in the United States.
Gambling Participation
While information about the demographic characteristics of at-risk and problem gamblers is useful in designing prevention and treatment services, it is also helpful to understand differences in the gambling behavior of low-risk, at-risk and problem gamblers. Information about the behavioral correlates of problem gambling can help professionals design appropriate prevention and treatment measures, effectively identify vulnerable individuals, and establish accessible services.
Past Year Gambling Table 18 shows differences in past-year involvement in different types of gambling by low-risk, at-risk and problem gamblers in California. This table shows that at-risk and problem gamblers in California are significantly more likely than low-risk gamblers to have gambled in the past year on most of the different types of gambling included in the survey. While all three groups of gamblers are most likely to have gambled in the past year on the lottery, at-risk and problem gamblers are nearly twice as likely as low-risk gamblers to have gambled at a casino and more than twice as likely to have wagered privately in the past year. Patterns of past-year track betting, bingo, cardroom gambling and other gambling are somewhat different, with the participation rate of at-risk gamblers intermediate between low-risk and problem gamblers. Finally, the rate of past-year Internet gambling is more than three times higher among problem gamblers than among at-risk gamblers which is, in turn, is nearly six times higher than among low-risk gamblers.
Table 18: Past-Year Gambling Among Low-Risk, At-Risk and Problem Gamblers
Low-Risk Gamblers
(4982) %
At-Risk Gamblers
(674) %
Problem & Pathological
Gamblers (264)
%
Sig.
Lottery 49.9 66.3 66.7 <.001
Casino 29.4 55.7 58.0 <.001
Private 12.9 28.8 29.9 <.001
Track/OTB 5.0 9.2 13.3 <.001
Other 4.4 11.4 17.0 <.001
Bingo 2.0 4.3 8.7 <.001
Cardroom 1.9 7.9 15.2 <.001
Internet 0.6 3.3 11.0 <.001
Past year gambling 65.7 87.8 87.9 <.001
72 2006 CALIFORNIA PROBLEM GAMBLING PREVALENCE SURVEY
Lottery. Past-year lottery players are most likely to have last purchased and to express a preference for large-jackpot lottery tickets, regardless of their problem gambling status. Instant tickets are the second preference and most likely last purchase for across all of these groups followed by multistate lottery tickets and daily number games. However, low-risk gamblers are significantly more likely to prefer large jackpot lottery games while problem gamblers are about three times more likely than low-risk or at-risk gamblers to prefer the daily numbers games. This information is summarized in Table 24 in Appendix A. Problem and pathological gamblers are significantly more likely than low-risk or at-risk gamblers to have made their last lottery purchase in their neighborhood (93% vs. 84% vs. 88%, p=.001).
Casino. Among respondents who have gambled at a casino in the past year, problem and pathological gamblers are significantly more likely to have visited a casino in California on the last occasion they gambled at a casino while low-risk and at-risk gamblers are more likely to have last visited a casino in Nevada. Low-risk gamblers in California are significantly more likely than at-risk or problem gamblers to have played slot machines on their last visit to a casino while problem gamblers are more likely than less troubled gamblers to have played poker on their last visit to a casino. Finally, at-risk and problem gamblers are significantly more likely than low-risk gamblers to have spent five or more hours gambling on the last occasion they gambled at a casino. This information is summarized in Table 25 in Appendix A.
Among respondents who have gambled at a casino in the past year, problem and pathological gamblers are significantly more likely than low-risk or at-risk gamblers to be aware of three or more casinos within a 20-minute drive of their home (20% vs. 9% and 11%, p<.001).
Private. Poker is by far the most popular private wagering activity among all past-year gamblers. Low-risk and at-risk gamblers are somewhat more likely than problem gamblers to prefer to bet on sports while problem gamblers are more likely than others to prefer to bet on ’other’ games as well as on craps or dice games. These differences are relatively small and do not achieve statistical significance. However, at-risk and problem gamblers are significantly more likely than low-risk gamblers to have spent five or more hours gambling on the last occasion they wagered privately (22% and 16% vs. 10%, p=.018). This information is summarized in Table 26 in Appendix A.
Track. At-risk and problem gamblers are significantly more likely than low-risk gamblers to have spent five or more hours gambling on the last occasion they wagered at the racetrack or at an off-track-betting (OTB) facility (28% and 34% vs. 16%, p=.046). At-risk and problem gamblers are also significantly more likely than low-risk gamblers to have participated in other kinds of gambling on their last visit to a racetrack (10% and 14% vs. 4%, p=.024).
Among respondents who have gambled at a racetrack in the past year, at-risk and problem gamblers are significantly more likely than low-risk gamblers to be aware of three or more racetracks within a
73 2006 CALIFORNIA PROBLEM GAMBLING PREVALENCE SURVEY
20-minute drive of their home. However, the proportions in all of these groups are extremely low and should be interpreted with caution (3% and 3% vs. 1%, p=.014).
Cardroom. Problem gamblers are much more likely than at-risk or low-risk gamblers to have spent five or more hours gambling on their last visit to a cardroom but the past-year cardroom gambling rate is so low that this difference does not achieve statistical significance. Preferences for specific card games are significantly different for low-risk, at-risk and problem gamblers who have gambled at a cardroom in the past year. Nearly half of the low-risk gamblers played poker on their last visit to a cardroom and another 40% played blackjack. Six in ten at-risk gamblers played poker on their last visit to a cardroom and another 25% played blackjack. In contrast, only 33% of problem and pathological gamblers played poker on their last visit to a cardroom; 45% played plackjack and 18% played Super Pan Nine, an Asian-style game that involves multiple decks of cards. This information is summarized in Table 27 in Appendix A.
Among respondents who have gambled at a cardroom in the past year, problem and pathological gamblers are significantly more likely than at-risk or low-risk gamblers to be aware of three or more cardrooms within a 20-minute drive of their home (32% vs. 16% and 16%, p=.027).
Internet. Problem gamblers are significantly more likely than at-risk or low-risk gamblers to have spent two or more hours gambling on the last occasion when they gambled on the Internet. Poker is by far the most frequent activity among past-year Internet gamblers, regardless of their problem status. Sports is also popular although problem gamblers are somewhat less likely to have gambled on sports in their last Internet gambling session than low-risk or at-risk gamblers. This information is summarized in Table 28 in Appendix A.
Monthly Gambling Table 19 shows differences in monthly involvement in different types of gambling by low-risk, at-risk and problem gamblers in California. Overall, this table shows that while only two in ten low-risk gamblers gamble once a month or more often, six in ten at-risk gamblers and nearly seven in ten problem and pathological gamblers in California gamble this frequently. Two in ten at-risk gamblers and three in ten problem gamblers in California gamble at a casino once a month or more often and monthly rates of private wagering are five times higher among at-risk and problem gamblers compared with low-risk gamblers. Nearly one in ten problem gamblers in California gambles once a month or more often at a cardroom or on the Internet.
74 2006 CALIFORNIA PROBLEM GAMBLING PREVALENCE SURVEY
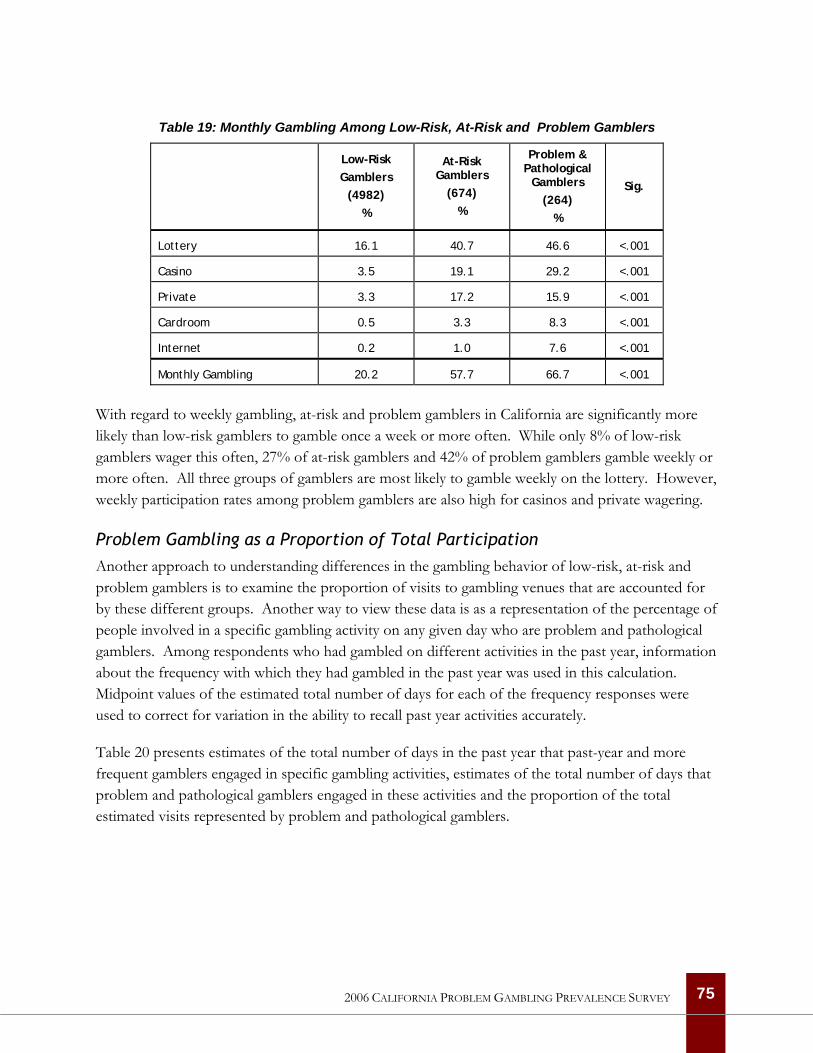
Table 19: Monthly Gambling Among Low-Risk, At-Risk and Problem Gamblers
Low-Risk Gamblers
(4982) %
At-Risk Gamblers
(674) %
Problem & Pathological
Gamblers (264)
%
Sig.
Lottery 16.1 40.7 46.6 <.001
Casino 3.5 19.1 29.2 <.001
Private 3.3 17.2 15.9 <.001
Cardroom 0.5 3.3 8.3 <.001
Internet 0.2 1.0 7.6 <.001
Monthly Gambling 20.2 57.7 66.7 <.001
With regard to weekly gambling, at-risk and problem gamblers in California are significantly more likely than low-risk gamblers to gamble once a week or more often. While only 8% of low-risk gamblers wager this often, 27% of at-risk gamblers and 42% of problem gamblers gamble weekly or more often. All three groups of gamblers are most likely to gamble weekly on the lottery. However, weekly participation rates among problem gamblers are also high for casinos and private wagering.
Problem Gambling as a Proportion of Total Participation Another approach to understanding differences in the gambling behavior of low-risk, at-risk and problem gamblers is to examine the proportion of visits to gambling venues that are accounted for by these different groups. Another way to view these data is as a representation of the percentage of people involved in a specific gambling activity on any given day who are problem and pathological gamblers. Among respondents who had gambled on different activities in the past year, information about the frequency with which they had gambled in the past year was used in this calculation. Midpoint values of the estimated total number of days for each of the frequency responses were used to correct for variation in the ability to recall past year activities accurately.
Table 20 presents estimates of the total number of days in the past year that past-year and more frequent gamblers engaged in specific gambling activities, estimates of the total number of days that problem and pathological gamblers engaged in these activities and the proportion of the total estimated visits represented by problem and pathological gamblers.
75 2006 CALIFORNIA PROBLEM GAMBLING PREVALENCE SURVEY
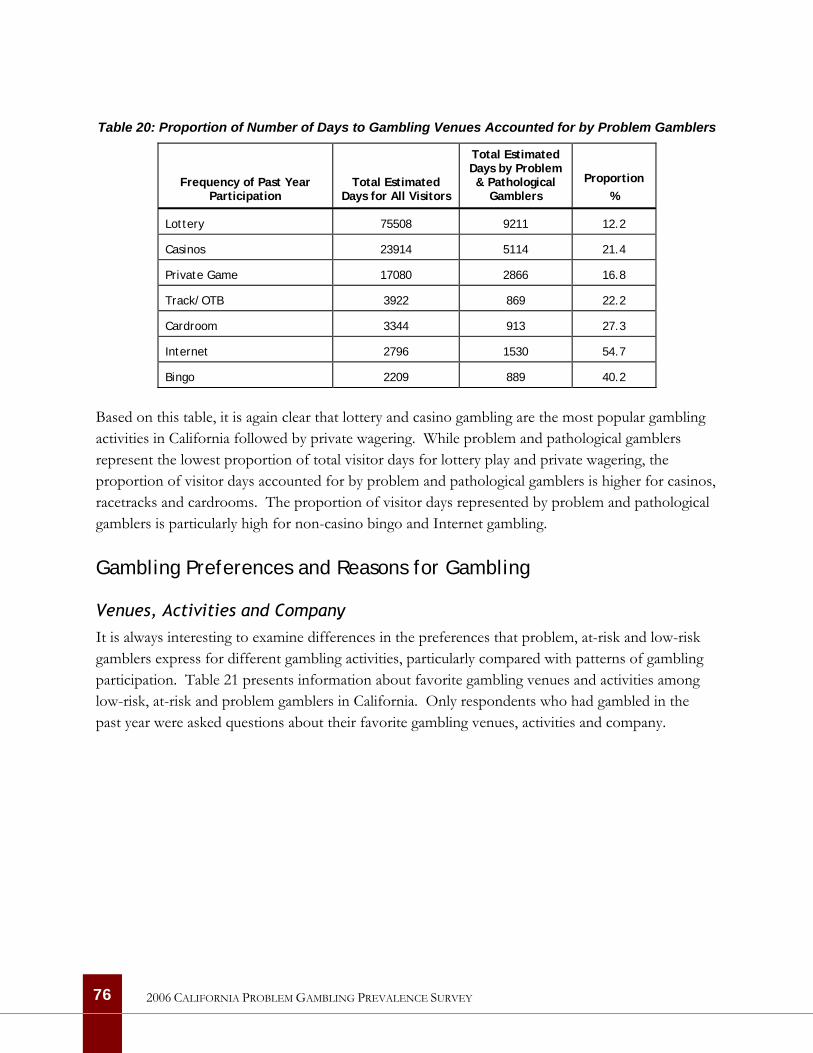
Table 20: Proportion of Number of Days to Gambling Venues Accounted for by Problem Gamblers
Frequency of Past Year Participation
Total Estimated Days for All Visitors
Total Estimated Days by Problem & Pathological
Gamblers
Proportion
%
Lottery 75508 9211 12.2
Casinos 23914 5114 21.4
Private Game 17080 2866 16.8
Track/OTB 3922 869 22.2
Cardroom 3344 913 27.3
Internet 2796 1530 54.7
Bingo 2209 889 40.2
Based on this table, it is again clear that lottery and casino gambling are the most popular gambling activities in California followed by private wagering. While problem and pathological gamblers represent the lowest proportion of total visitor days for lottery play and private wagering, the proportion of visitor days accounted for by problem and pathological gamblers is higher for casinos, racetracks and cardrooms. The proportion of visitor days represented by problem and pathological gamblers is particularly high for non-casino bingo and Internet gambling.
Gambling Preferences and Reasons for Gambling
Venues, Activities and Company It is always interesting to examine differences in the preferences that problem, at-risk and low-risk gamblers express for different gambling activities, particularly compared with patterns of gambling participation. Table 21 presents information about favorite gambling venues and activities among low-risk, at-risk and problem gamblers in California. Only respondents who had gambled in the past year were asked questions about their favorite gambling venues, activities and company.
76 2006 CALIFORNIA PROBLEM GAMBLING PREVALENCE SURVEY
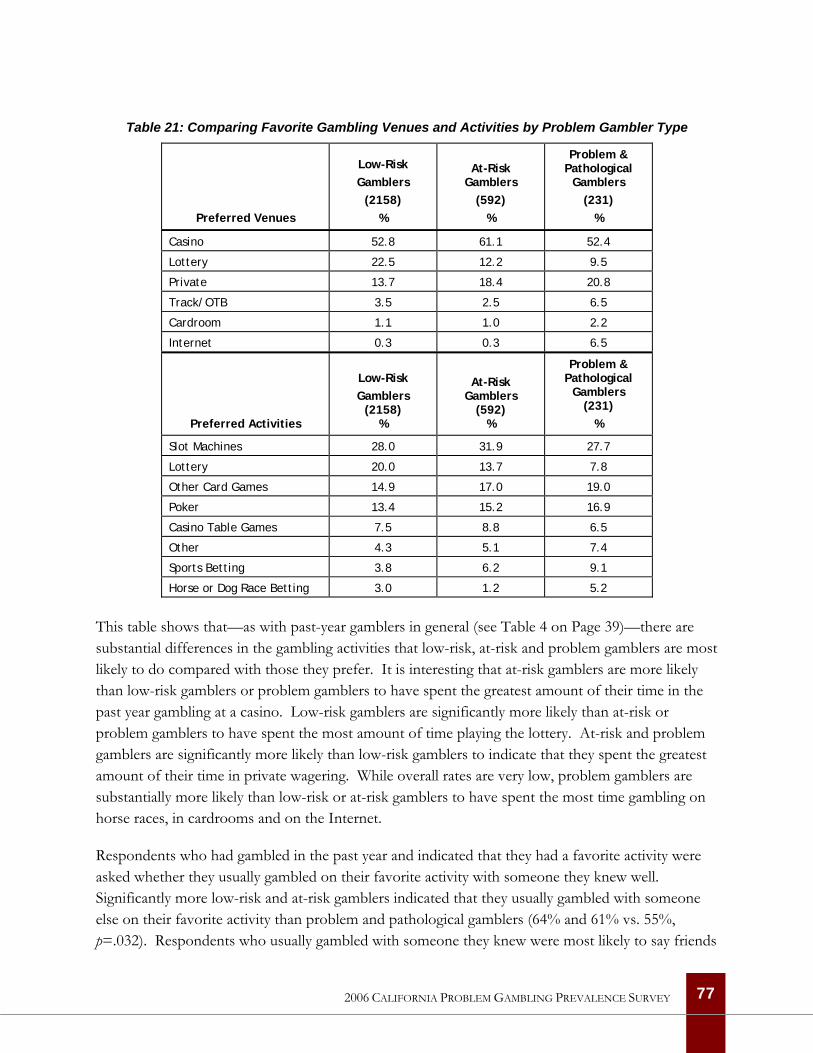
Table 21: Comparing Favorite Gambling Venues and Activities by Problem Gambler Type
Preferred Venues
Low-Risk Gamblers
(2158) %
At-Risk Gamblers
(592) %
Problem & Pathological
Gamblers (231)
%
Casino 52.8 61.1 52.4
Lottery 22.5 12.2 9.5
Private 13.7 18.4 20.8
Track/OTB 3.5 2.5 6.5
Cardroom 1.1 1.0 2.2
Internet 0.3 0.3 6.5
Preferred Activities
Low-Risk Gamblers
(2158) %
At-Risk Gamblers
(592) %
Problem & Pathological
Gamblers (231)
%
Slot Machines 28.0 31.9 27.7
Lottery 20.0 13.7 7.8
Other Card Games 14.9 17.0 19.0
Poker 13.4 15.2 16.9
Casino Table Games 7.5 8.8 6.5
Other 4.3 5.1 7.4
Sports Betting 3.8 6.2 9.1
Horse or Dog Race Betting 3.0 1.2 5.2
This table shows that—as with past-year gamblers in general (see Table 4 on Page 39)—there are substantial differences in the gambling activities that low-risk, at-risk and problem gamblers are most likely to do compared with those they prefer. It is interesting that at-risk gamblers are more likely than low-risk gamblers or problem gamblers to have spent the greatest amount of their time in the past year gambling at a casino. Low-risk gamblers are significantly more likely than at-risk or problem gamblers to have spent the most amount of time playing the lottery. At-risk and problem gamblers are significantly more likely than low-risk gamblers to indicate that they spent the greatest amount of their time in private wagering. While overall rates are very low, problem gamblers are substantially more likely than low-risk or at-risk gamblers to have spent the most time gambling on horse races, in cardrooms and on the Internet.
Respondents who had gambled in the past year and indicated that they had a favorite activity were asked whether they usually gambled on their favorite activity with someone they knew well. Significantly more low-risk and at-risk gamblers indicated that they usually gambled with someone else on their favorite activity than problem and pathological gamblers (64% and 61% vs. 55%, p=.032). Respondents who usually gambled with someone they knew were most likely to say friends
77 2006 CALIFORNIA PROBLEM GAMBLING PREVALENCE SURVEY
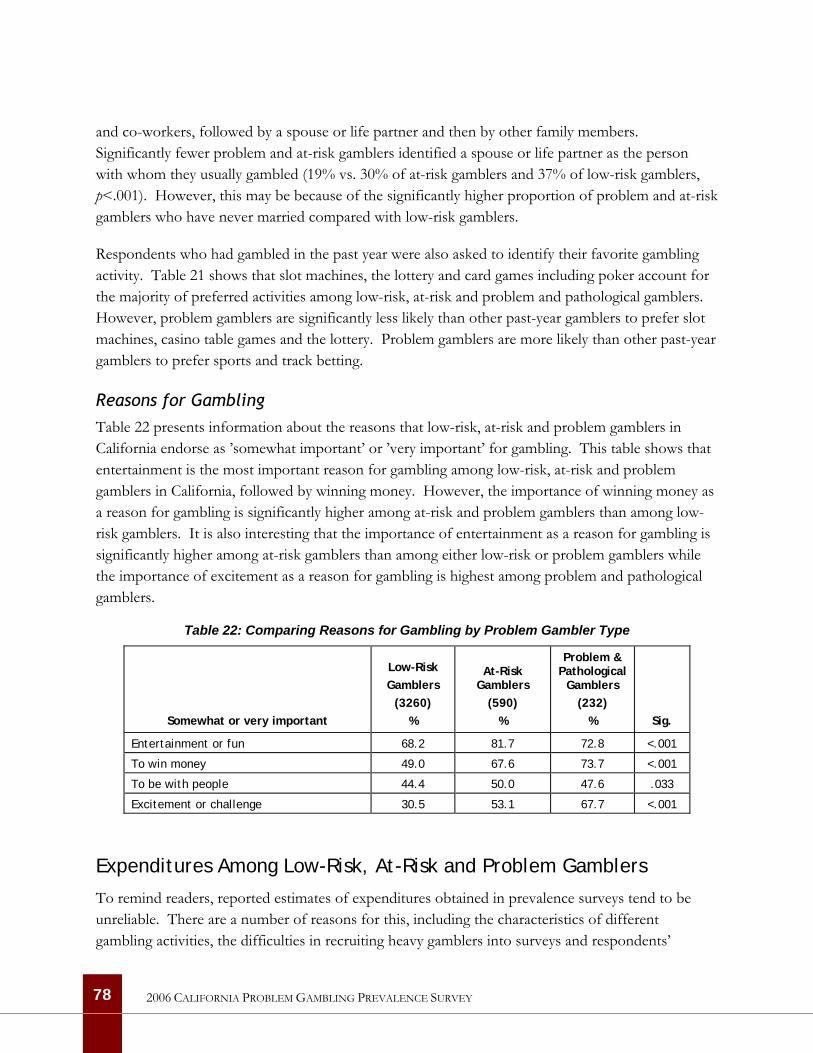
and co-workers, followed by a spouse or life partner and then by other family members. Significantly fewer problem and at-risk gamblers identified a spouse or life partner as the person with whom they usually gambled (19% vs. 30% of at-risk gamblers and 37% of low-risk gamblers, p<.001). However, this may be because of the significantly higher proportion of problem and at-risk gamblers who have never married compared with low-risk gamblers.
Respondents who had gambled in the past year were also asked to identify their favorite gambling activity. Table 21 shows that slot machines, the lottery and card games including poker account for the majority of preferred activities among low-risk, at-risk and problem and pathological gamblers. However, problem gamblers are significantly less likely than other past-year gamblers to prefer slot machines, casino table games and the lottery. Problem gamblers are more likely than other past-year gamblers to prefer sports and track betting.
Reasons for Gambling Table 22 presents information about the reasons that low-risk, at-risk and problem gamblers in California endorse as ’somewhat important’ or ’very important’ for gambling. This table shows that entertainment is the most important reason for gambling among low-risk, at-risk and problem gamblers in California, followed by winning money. However, the importance of winning money as a reason for gambling is significantly higher among at-risk and problem gamblers than among low-risk gamblers. It is also interesting that the importance of entertainment as a reason for gambling is significantly higher among at-risk gamblers than among either low-risk or problem gamblers while the importance of excitement as a reason for gambling is highest among problem and pathological gamblers.
Table 22: Comparing Reasons for Gambling by Problem Gambler Type
Somewhat or very important
Low-Risk Gamblers
(3260) %
At-Risk Gamblers
(590) %
Problem & Pathological
Gamblers (232)
% Sig.
Entertainment or fun 68.2 81.7 72.8 <.001
To win money 49.0 67.6 73.7 <.001
To be with people 44.4 50.0 47.6 .033
Excitement or challenge 30.5 53.1 67.7 <.001
Expenditures Among Low-Risk, At-Risk and Problem Gamblers
To remind readers, reported estimates of expenditures obtained in prevalence surveys tend to be unreliable. There are a number of reasons for this, including the characteristics of different gambling activities, the difficulties in recruiting heavy gamblers into surveys and respondents’
78 2006 CALIFORNIA PROBLEM GAMBLING PREVALENCE SURVEY
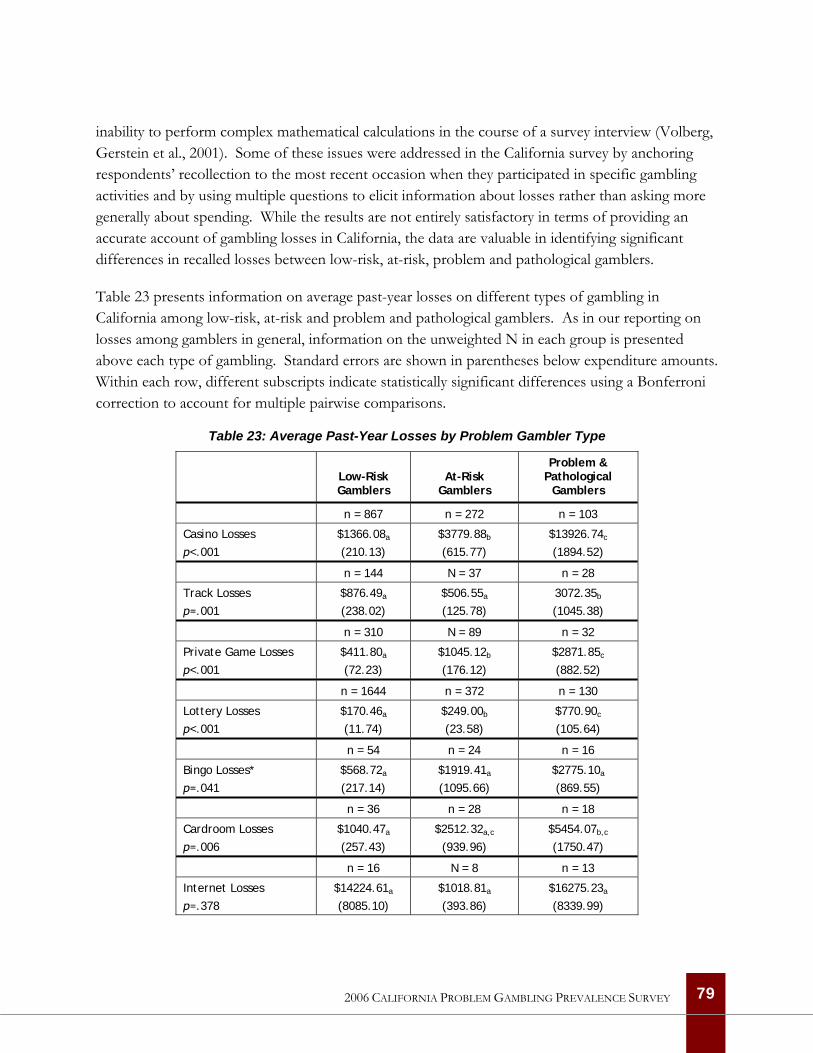
inability to perform complex mathematical calculations in the course of a survey interview (Volberg, Gerstein et al., 2001). Some of these issues were addressed in the California survey by anchoring respondents’ recollection to the most recent occasion when they participated in specific gambling activities and by using multiple questions to elicit information about losses rather than asking more generally about spending. While the results are not entirely satisfactory in terms of providing an accurate account of gambling losses in California, the data are valuable in identifying significant differences in recalled losses between low-risk, at-risk, problem and pathological gamblers.
Table 23 presents information on average past-year losses on different types of gambling in California among low-risk, at-risk and problem and pathological gamblers. As in our reporting on losses among gamblers in general, information on the unweighted N in each group is presented above each type of gambling. Standard errors are shown in parentheses below expenditure amounts. Within each row, different subscripts indicate statistically significant differences using a Bonferroni correction to account for multiple pairwise comparisons.
Table 23: Average Past-Year Losses by Problem Gambler Type
Low-Risk Gamblers
At-Risk Gamblers
Problem & Pathological
Gamblers
n = 867 n = 272 n = 103
Casino Losses p<.001
$1366.08a
(210.13) $3779.88b
(615.77) $13926.74c
(1894.52)
n = 144 N = 37 n = 28
Track Losses p=.001
$876.49a
(238.02) $506.55a
(125.78) 3072.35b
(1045.38)
n = 310 N = 89 n = 32
Private Game Losses p<.001
$411.80a
(72.23) $1045.12b
(176.12) $2871.85c
(882.52)
n = 1644 n = 372 n = 130
Lottery Losses p<.001
$170.46a
(11.74) $249.00b
(23.58) $770.90c
(105.64)
n = 54 n = 24 n = 16
Bingo Losses* p=.041
$568.72a
(217.14) $1919.41a
(1095.66) $2775.10a
(869.55)
n = 36 n = 28 n = 18
Cardroom Losses p=.006
$1040.47a
(257.43) $2512.32a,c
(939.96) $5454.07b,c
(1750.47)
n = 16 N = 8 n = 13
Internet Losses p=.378
$14224.61a
(8085.10) $1018.81a
(393.86) $16275.23a
(8339.99)
79 2006 CALIFORNIA PROBLEM GAMBLING PREVALENCE SURVEY
This table shows that average past-year casino losses increase significantly across the low-risk, at-risk and problem gambling groups with losses among problem and pathological gamblers just over ten times higher than among low-risk gamblers. Losses on private wagering and the lottery show a similar trend, increasing significantly as gambling problems increase. Past-year losses on horse race betting are significantly higher among problem gamblers compared with low-risk and at-risk gamblers. Past-year cardroom losses are significantly higher among problem gamblers compared with low-risk gamblers but the differences between low-risk and at-risk gamblers, on the one hand, and at-risk and problem gamblers, on the other, are not statistically significant. The differences in past-year losses on Internet gambling across gambler types are not statistically significant and none of the pairwise comparisons are significant for past-year losses on bingo.
When past-year losses are summed across the various venues, problem and pathological gamblers (M = $10831.80, SE = 1124.59) recall losing significantly more money than either at-risk gamblers (M = $2590.72, SE = 326.03) or low-risk gamblers (M =$ 918.22, SE = 95.35) and at-risk gamblers recall spending significantly more money than low-risk gamblers (F(2, 2670) = 210.85, p < .001).
Proportion of Losses by Problem Gambler Type We noted above that there is great interest among policymakers, regulators and other stakeholders in the question of the proportion of gambling revenues accounted for by problem and pathological gamblers. While there are difficulties in obtaining accurate information on gambling losses from survey respondents, it is possible to examine the proportion of reported losses accounted for by low-risk, at-risk and problem and pathological gamblers to obtain an approximation of how heavily different sectors of the legal gambling industry in California rely for revenues on problem and pathological gamblers.
Table 24 presents information about the proportion of losses accounted for by low-risk, at-risk and problem and pathological gamblers for the largest sectors of the gambling industry in California. This table shows that tribal casinos and cardrooms are the sectors of the gambling industry in California that rely most heavily on problem and pathological gamblers for revenues. As a group, problem and pathological gamblers account for over 50% of the losses reported by all of the respondents who gambled at a casino or cardroom in the past year. More generally, the data in this table indicate that problem and pathological gamblers account for much larger proportions of annual losses than their prevalence in the general population, or even among past-year participants in specific gambling activities, would suggest (see Table 14 on Page 63).
80 2006 CALIFORNIA PROBLEM GAMBLING PREVALENCE SURVEY
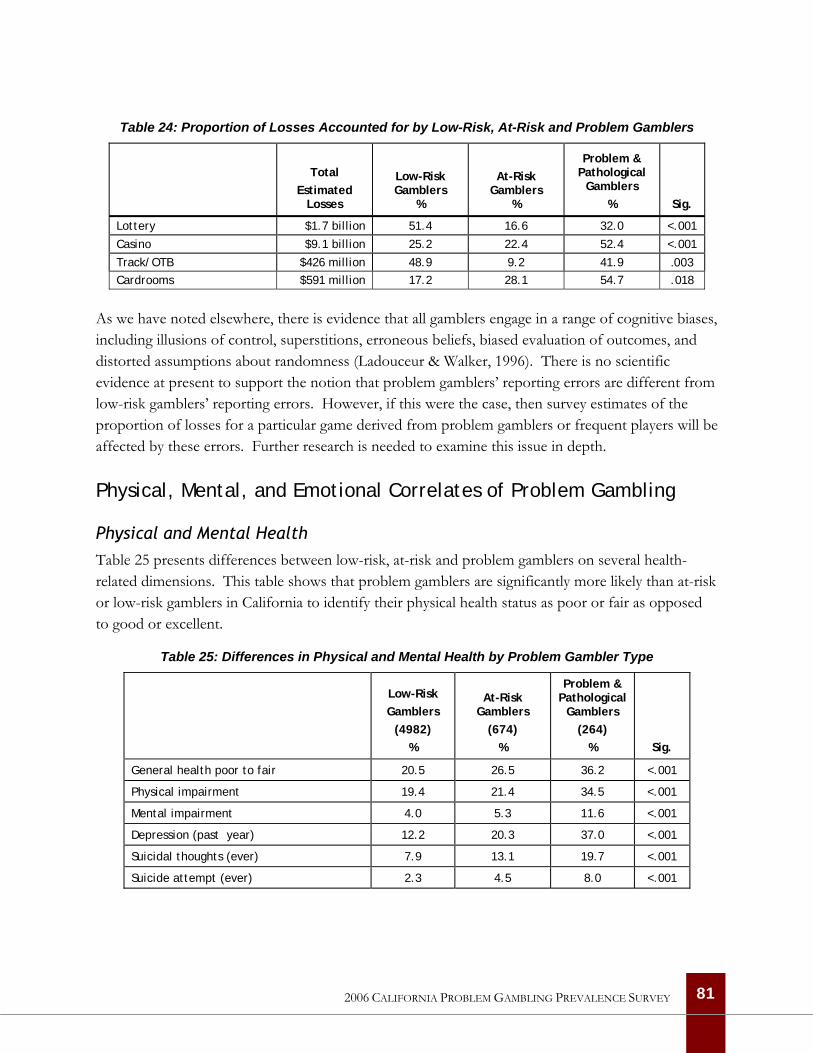
Table 24: Proportion of Losses Accounted for by Low-Risk, At-Risk and Problem Gamblers
Total
Estimated Losses
Low-Risk Gamblers
%
At-Risk Gamblers
%
Problem & Pathological
Gamblers % Sig.
Lottery $1.7 billion 51.4 16.6 32.0 <.001
Casino $9.1 billion 25.2 22.4 52.4 <.001
Track/OTB $426 million 48.9 9.2 41.9 .003 Cardrooms $591 million 17.2 28.1 54.7 .018
As we have noted elsewhere, there is evidence that all gamblers engage in a range of cognitive biases, including illusions of control, superstitions, erroneous beliefs, biased evaluation of outcomes, and distorted assumptions about randomness (Ladouceur & Walker, 1996). There is no scientific evidence at present to support the notion that problem gamblers’ reporting errors are different from low-risk gamblers’ reporting errors. However, if this were the case, then survey estimates of the proportion of losses for a particular game derived from problem gamblers or frequent players will be affected by these errors. Further research is needed to examine this issue in depth.
Physical, Mental, and Emotional Correlates of Problem Gambling
Physical and Mental Health Table 25 presents differences between low-risk, at-risk and problem gamblers on several health-related dimensions. This table shows that problem gamblers are significantly more likely than at-risk or low-risk gamblers in California to identify their physical health status as poor or fair as opposed to good or excellent.
Table 25: Differences in Physical and Mental Health by Problem Gambler Type
Low-Risk Gamblers
(4982) %
At-Risk Gamblers
(674) %
Problem & Pathological
Gamblers (264)
% Sig.
General health poor to fair 20.5 26.5 36.2 <.001
Physical impairment 19.4 21.4 34.5 <.001
Mental impairment 4.0 5.3 11.6 <.001
Depression (past year) 12.2 20.3 37.0 <.001
Suicidal thoughts (ever) 7.9 13.1 19.7 <.001
Suicide attempt (ever) 2.3 4.5 8.0 <.001
81 2006 CALIFORNIA PROBLEM GAMBLING PREVALENCE SURVEY
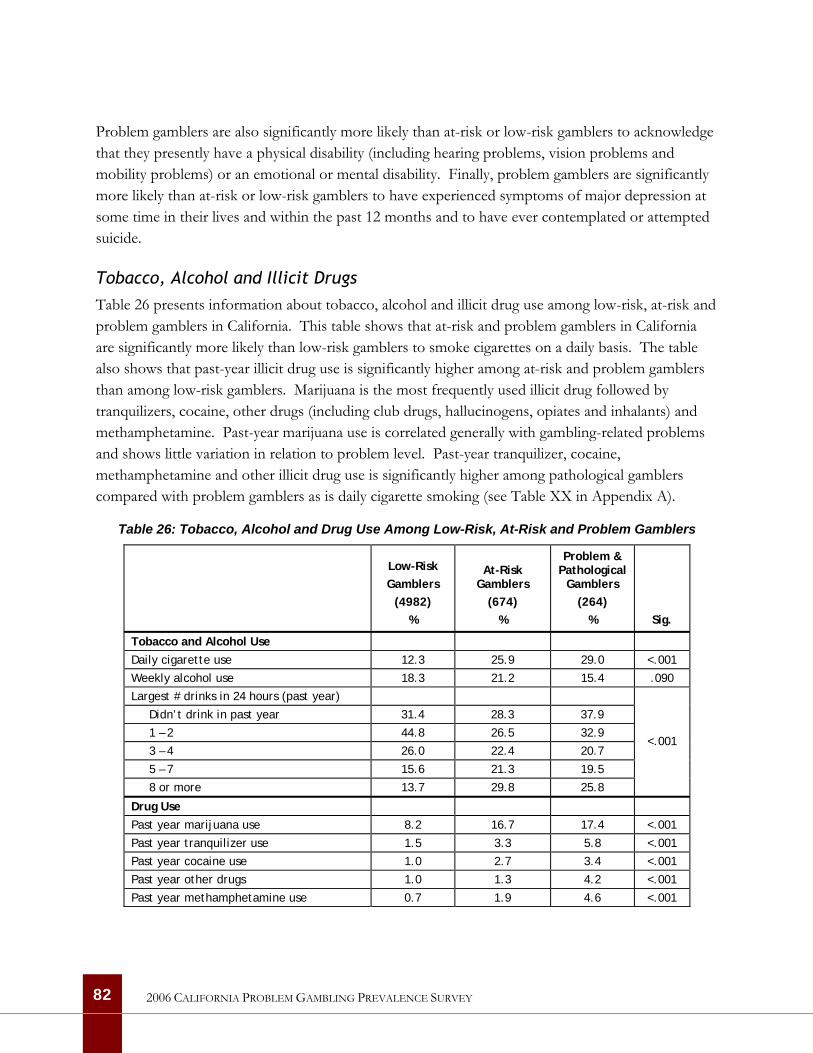
Problem gamblers are also significantly more likely than at-risk or low-risk gamblers to acknowledge that they presently have a physical disability (including hearing problems, vision problems and mobility problems) or an emotional or mental disability. Finally, problem gamblers are significantly more likely than at-risk or low-risk gamblers to have experienced symptoms of major depression at some time in their lives and within the past 12 months and to have ever contemplated or attempted suicide.
Tobacco, Alcohol and Illicit Drugs Table 26 presents information about tobacco, alcohol and illicit drug use among low-risk, at-risk and problem gamblers in California. This table shows that at-risk and problem gamblers in California are significantly more likely than low-risk gamblers to smoke cigarettes on a daily basis. The table also shows that past-year illicit drug use is significantly higher among at-risk and problem gamblers than among low-risk gamblers. Marijuana is the most frequently used illicit drug followed by tranquilizers, cocaine, other drugs (including club drugs, hallucinogens, opiates and inhalants) and methamphetamine. Past-year marijuana use is correlated generally with gambling-related problems and shows little variation in relation to problem level. Past-year tranquilizer, cocaine, methamphetamine and other illicit drug use is significantly higher among pathological gamblers compared with problem gamblers as is daily cigarette smoking (see Table XX in Appendix A).
Table 26: Tobacco, Alcohol and Drug Use Among Low-Risk, At-Risk and Problem Gamblers
Low-Risk Gamblers
(4982) %
At-Risk Gamblers
(674) %
Problem & Pathological
Gamblers (264)
% Sig.
Tobacco and Alcohol Use
Daily cigarette use 12.3 25.9 29.0 <.001
Weekly alcohol use 18.3 21.2 15.4 .090
Largest # drinks in 24 hours (past year)
Didn’t drink in past year 31.4 28.3 37.9
1 – 2 44.8 26.5 32.9
3 – 4 26.0 22.4 20.7
5 – 7 15.6 21.3 19.5
8 or more 13.7 29.8 25.8
<.001
Drug Use Past year marijuana use 8.2 16.7 17.4 <.001
Past year tranquilizer use 1.5 3.3 5.8 <.001
Past year cocaine use 1.0 2.7 3.4 <.001
Past year other drugs 1.0 1.3 4.2 <.001
Past year methamphetamine use 0.7 1.9 4.6 <.001
82 2006 CALIFORNIA PROBLEM GAMBLING PREVALENCE SURVEY
Given the abundance of research demonstrating a link between alcohol misuse and gambling-related problems, it is surprising that the relationship between weekly alcohol consumption and gambling-related problems in California is not statistically significant. An even more surprising finding is that problem gamblers in California are the least likely respondents to have consumed any alcoholic beverages in the past year. Despite significantly lower rates of past-year alcohol consumption, the lifetime rate of help-seeking for an alcohol or drug problem is significantly higher among problem gamblers than among low-risk or at-risk gamblers. Among respondents who had consumed alcohol in the past year, 4% of low-risk gamblers and 7% of at-risk gamblers have ever sought help for problems related to their drinking or drug use compared with 10% of problem gamblers and 23% of pathological gamblers (p<.001).
Family, Indebtedness and Criminal Justice Impacts Table 27 shows differences in the impacts of problematic gambling on family, indebtedness and the criminal justice system among low-risk, at-risk and problem gamblers in California. This table shows that problem gamblers in California are significantly more likely than low-risk or at-risk gamblers to have been troubled in the past year by the gambling involvement of someone they know. Respondents who have been concerned about the gambling of someone with whom they do not live are most likely to have been concerned about a friend or acquaintance (59%), followed by immediate family members (18%, primarily siblings and parents) and extended family members (15%). This table also shows that problem gamblers in California are significantly more likely than low-risk or at-risk gamblers to have been troubled by the gambling of someone they lived with in the past year. Respondents concerned about the gambling of someone they live with are most likely to have been concerned about a spouse or domestic partner (36%), followed by immediate family members (24%) and friends or acquaintances (23%). While low-risk and at-risk gamblers are most likely to have been concerned about a spouse or domestic partner, problem gamblers are most likely to have been concerned about a friend or family member.
In a further indication of the impact of problem gambling on families, respondents who answered the problem gambling questions in the survey were queried at the end of this section about whether they had ever argued with a family member about their gambling to the point where it became emotionally harmful. When asked if they had ever argued with a family member about their gambling, 2% of at-risk gamblers, 10% of problem gamblers and 29% of pathological gamblers replied that they had argued about their gambling to the point where it became emotionally harmful.
83 2006 CALIFORNIA PROBLEM GAMBLING PREVALENCE SURVEY
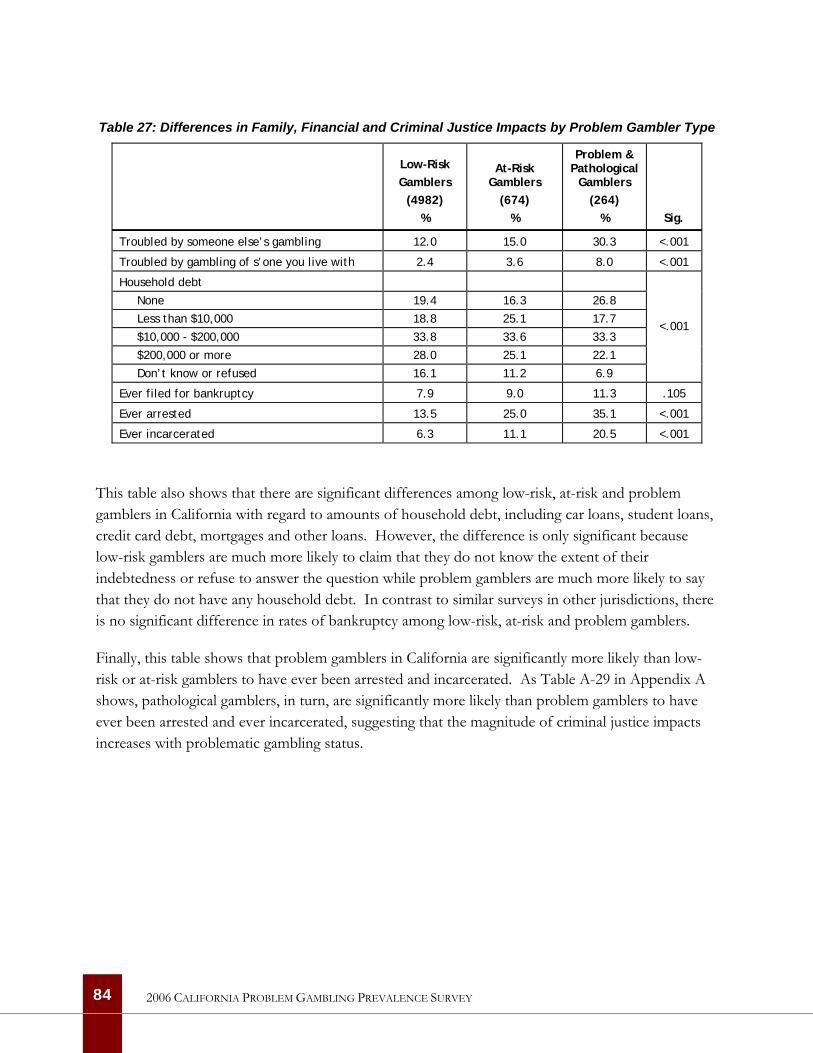
Table 27: Differences in Family, Financial and Criminal Justice Impacts by Problem Gambler Type
Low-Risk Gamblers
(4982) %
At-Risk Gamblers
(674) %
Problem & Pathological
Gamblers (264)
% Sig.
Troubled by someone else’s gambling 12.0 15.0 30.3 <.001
Troubled by gambling of s’one you live with 2.4 3.6 8.0 <.001
Household debt
None 19.4 16.3 26.8
Less than $10,000 18.8 25.1 17.7
$10,000 - $200,000 33.8 33.6 33.3
$200,000 or more 28.0 25.1 22.1
Don’t know or refused 16.1 11.2 6.9
<.001
Ever filed for bankruptcy 7.9 9.0 11.3 .105
Ever arrested 13.5 25.0 35.1 <.001
Ever incarcerated 6.3 11.1 20.5 <.001
This table also shows that there are significant differences among low-risk, at-risk and problem gamblers in California with regard to amounts of household debt, including car loans, student loans, credit card debt, mortgages and other loans. However, the difference is only significant because low-risk gamblers are much more likely to claim that they do not know the extent of their indebtedness or refuse to answer the question while problem gamblers are much more likely to say that they do not have any household debt. In contrast to similar surveys in other jurisdictions, there is no significant difference in rates of bankruptcy among low-risk, at-risk and problem gamblers.
Finally, this table shows that problem gamblers in California are significantly more likely than low-risk or at-risk gamblers to have ever been arrested and incarcerated. As Table A-29 in Appendix A shows, pathological gamblers, in turn, are significantly more likely than problem gamblers to have ever been arrested and ever incarcerated, suggesting that the magnitude of criminal justice impacts increases with problematic gambling status.
84 2006 CALIFORNIA PROBLEM GAMBLING PREVALENCE SURVEY
85
2006 CALIFORNIA PROBLEM GAMBLING PREVALENCE SURVEY
Identifying Risk Factors for Problem Gambling
Our overarching goal in carrying out the California prevalence survey was to identify and assess the relative strengths of the factors associated with at-risk, problem and pathological gambling in California. To this point, our report has sought to answer this question by scrutinizing many of the risk factors known to be associated with higher prevalence from other surveys, such as gender, age and ethnicity. By exploring the relationship between gambling activities of different kinds and problem gambling one factor at a time, we have been able to identify certain demographic groups and behaviors among California respondents that indicate greater risk of experiencing gambling problems.
Given that many of these predictor variables of gambling behavior are inter-related, it is important to employ multivariate analysis to examine their relative predictive and explanatory capacity. The great advantage of statistical modeling is the ability to summarize data and test hypotheses. Our task here is to examine the relationship between the dependent variable measuring problem gambling and a set of independent, predictor variables.
Statistical Modeling Approach
Binary logistic regression was used to examine the relationship between problem and pathological gambling, individual demographics, co-occurring behaviors and gambling participation in California. Problem and pathological gambling was the binary outcome (problem/pathological gamblers coded as 1 and all other respondents coded as 0). The sets of variables (i.e., individual demographics, co-occurring behaviors, and gambling participation) were chosen for theoretical and practical reasons. Bivariate correlations indicated that all of the variables entered into the logistic regression were significantly correlated with the outcome variable. Variables that were determined to have no significant relationship to problem gambling—for example, measures of household income, household debt, and census tract median household income—were not included in the logistic regression model.
The logistic regression was conducted by entering sets of variables into the model in three successive steps to determine if each set of variables significantly added to the predictive utility of the model. Within each set of variables, the odds ratio for individual predictors can be interpreted when the associated Wald test is significant. An odds ratio indicates the odds of being in one group of the outcome variable versus the other group as values of the individual predictor variables change. Odds ratios can range from 0 to 1 and then 1 to positive infinity with an odds ratio of 1 indicating equal odds or chances of being in either group. In the current analysis, the odds ratio indicates the odds of being in the problem/pathological gambler group versus the other group.
The first model predicting problem/pathological gambling from individual demographic variables was statistically significant and accounted for 8% of the variance. The second model, which was statistically significant and accounted for 15% of the variance, included all individual demographics variables plus the set of co-occurring behaviors. The final model included gambling participation variables in addition to the individual demographics and co-occurring behaviors. This final model was statistically significant and accounted for 37% of the variance.
Results of Statistical Modeling
Table 28 presents the results of our statistical modeling exercise. In the first model that we tested, five individual demographic variables significantly predicted problem and pathological gambling.
• Men were almost four times more likely than women to be problem and pathological gamblers.
• The odds of being a problem or pathological gambler decreased by 1% with increasing age, by 20% with higher levels of education, and by 40% if the respondent was employed.
• Finally, divorced persons were more than twice as likely to be problem or pathological gamblers as were non-divorced persons.
In the second model, five co-occurring behavior variables significantly predicted problem and pathological gambling. Persons were nearly two times more likely to be problem or pathological gamblers if they consumed alcohol around the time they gambled, smoked cigarettes daily, had a physical disability, or had ever been arrested. Persons who had ever been depressed in their lifetime were 2.5 times more likely to be problem or pathological gamblers than non-depressed persons. With the exception of age, the individual demographic predictors identified as significant in the first model remained significant in the second model.
In the final model, gender, education, employment, divorce, daily cigarette smoking, physical disability, and lifetime depression remained significant predictors of problem/pathological gambling. Several gambling participation variables were also statistically significant predictors of problem and pathological gambling. Most significantly, individuals who argued with a family member about their gambling were almost 54 times more likely to be problem or pathological gamblers than those who did not argue with family members. If a person perceived gambling to be a more serious family problem, they were 1.5 times more likely to be a problem or pathological gambler than those who perceived gambling to be a less serious family problem. Individuals who recalled beginning any form of gambling before age 21 were nearly two times more likely to be a problem or pathological gambler than those who did not gamble before age 21. Persons were almost three times more likely
86 2006 CALIFORNIA PROBLEM GAMBLING PREVALENCE SURVEY
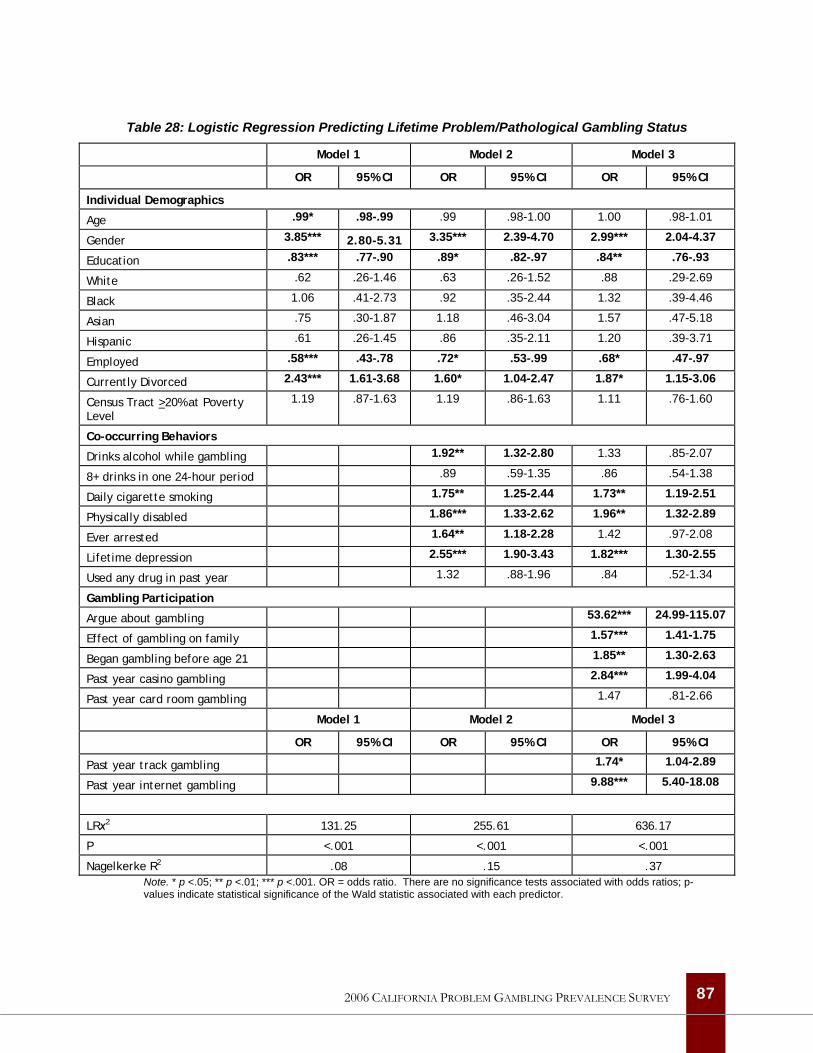
Table 28: Logistic Regression Predicting Lifetime Problem/Pathological Gambling Status
Model 1 Model 2 Model 3
OR 95% CI OR 95% CI OR 95% CI
Individual Demographics
Age .99* .98-.99 .99 .98-1.00 1.00 .98-1.01
Gender 3.85*** 2.80-5.31 3.35*** 2.39-4.70 2.99*** 2.04-4.37
Education .83*** .77-.90 .89* .82-.97 .84** .76-.93
White .62 .26-1.46 .63 .26-1.52 .88 .29-2.69
Black 1.06 .41-2.73 .92 .35-2.44 1.32 .39-4.46
Asian .75 .30-1.87 1.18 .46-3.04 1.57 .47-5.18
Hispanic .61 .26-1.45 .86 .35-2.11 1.20 .39-3.71
Employed .58*** .43-.78 .72* .53-.99 .68* .47-.97
Currently Divorced 2.43*** 1.61-3.68 1.60* 1.04-2.47 1.87* 1.15-3.06
Census Tract >20% at Poverty Level
1.19 .87-1.63 1.19 .86-1.63 1.11 .76-1.60
Co-occurring Behaviors
Drinks alcohol while gambling 1.92** 1.32-2.80 1.33 .85-2.07
8+ drinks in one 24-hour period .89 .59-1.35 .86 .54-1.38
Daily cigarette smoking 1.75** 1.25-2.44 1.73** 1.19-2.51
Physically disabled 1.86*** 1.33-2.62 1.96** 1.32-2.89
Ever arrested 1.64** 1.18-2.28 1.42 .97-2.08
Lifetime depression 2.55*** 1.90-3.43 1.82*** 1.30-2.55
Used any drug in past year 1.32 .88-1.96 .84 .52-1.34
Gambling Participation
Argue about gambling 53.62*** 24.99-115.07
Effect of gambling on family 1.57*** 1.41-1.75
Began gambling before age 21 1.85** 1.30-2.63
Past year casino gambling 2.84*** 1.99-4.04
Past year card room gambling 1.47 .81-2.66
Model 1 Model 2 Model 3
OR 95% CI OR 95% CI OR 95% CI
Past year track gambling 1.74* 1.04-2.89
Past year internet gambling 9.88*** 5.40-18.08
LRχ2 131.25 255.61 636.17
P <.001 <.001 <.001
Nagelkerke R2 .08 .15 .37 Note. * p <.05; ** p <.01; *** p <.001. OR = odds ratio. There are no significance tests associated with odds ratios; p-values indicate statistical significance of the Wald statistic associated with each predictor.
87 2006 CALIFORNIA PROBLEM GAMBLING PREVALENCE SURVEY
to be a problem or pathological gambler if they had gambled in a casino in the past year, nearly two times more likely to be a problem or pathological gambler if they had wagered at a track in the past year, and almost 10 times more likely to be a problem or pathological gambler if they had gambled on the Internet in the past year.
In conclusion, it is worth emphasizing that this model is not causal but correlational—that is, it does not differentiate between the causes and effects of problem gambling. However, this analysis provides important information about characteristics and behaviors that are associated with gambling-related problems and suggests some of the consequences of gambling-related problems. Given the extremely high odds ratio for “arguing with a family member” as a predictor of gambling problems, this analysis suggests one or more questions about such arguments might represent a fruitful new approach to screening for at-risk gamblers in a variety of settings and might eventually be incorporated more precisely into the official diagnostic criteria for Pathological Gambling.
88 2006 CALIFORNIA PROBLEM GAMBLING PREVALENCE SURVEY
Attitudes Towards, Awareness of and Involvement in Problem Gambling Services
An important goal of this study was to collect information about the public’s knowledge of available resources for addressing gambling problems in California, involvement with such services and perceived barriers to seeking help among problem and pathological gamblers in California. This information is important in the design of general and targeted awareness and prevention programs and in the development of strategies to provide help to groups affected by gambling-related problems.
Research indicates that many problem gamblers’ behavior is susceptible to change. The likelihood that natural recovery is common among problem gamblers highlights the importance of increasing public awareness and developing brief, targeted interventions to prompt changes in attitude and behavior among individuals experiencing mild or moderate difficulties to reduce their progression toward more severe gambling-related problems (Castellani, 2000; Shaffer et al., 1999). Although few evaluations of problem gambling awareness campaigns have been carried out, lessons from these studies include the importance of conducting research to identify the characteristics of at-risk groups and targeting messages to these groups (Abbott et al.., 2004).
In foregoing sections of this report, we have presented information about specific subgroups in the population who are at risk of experiencing difficulties related to their gambling or are already experiencing problems. In this section of the report, we present information about awareness of specialized services for problem gamblers and likely barriers to accessing such services. This information will provide a foundation for the development and provision of effective and efficient problem gambling services in California.
Attitudes Towards Problem Gambling
All of the respondents were asked for their views of the seriousness of gambling as an issue in their community and as an issue in their family. All of the respondents were also asked for their views on the most appropriate role for the State of California in addressing the issue of problem gambling. These questions were assessed using 5-point scales with one being ‘no problem’ or ‘not important’ and 5 being ‘the most serious problem’ or ‘extremely important.’
Overall, adults in California do not believe that problem gambling is an extremely serious problem, although they do believe that the issue affects their communities to a greater degree than their own families. On average, respondents in the survey rated the seriousness of gambling in their
89 2006 CALIFORNIA PROBLEM GAMBLING PREVALENCE SURVEY
community at 2.12 and the seriousness of gambling in their family at 1.43—both well below the midpoint of the scale.
There are significant differences between men and women, among older and younger adults and among different ethnic and racial groups in their views on the seriousness of gambling as a community and family issue. Women are significantly more likely than men to believe that gambling is a serious issue in their community but there is no difference in their views of gambling as a serious issue in their family. Adults aged 40 to 64 rate the issue of gambling in their community most seriously while those aged 18 to 29 rate the issue of gambling in their family most seriously. Asian respondents rate the issue of gambling in their community and in their families significantly more seriously than respondents from other racial and ethnic groups. Respondents not born in the United States also rate the seriousness of gambling as a problem in their communities and families higher than respondents born in the U.S. Finally, while non-gamblers are most likely to view gambling as a serious issue in their communities, problem and pathological gamblers are most likely to rate gambling as a serious issue in their families.
Prohibition Versus Prevention When it comes to their views on the most appropriate role for the State of California in addressing the issue of problem gambling, adults in California are least likely to support the notion of banning commercial gambling. Adults in California strongly support the importance of educating young people about how to avoid getting into trouble with gambling. There is also strong support for the notion of requiring the gambling industry to take steps to address the issue of problem gambling. Measures such as providing treatment for problem gamblers, working to prevent gambling problems and supporting research to better understand how gambling problems arise are viewed as important but less so than educating young people and requiring the industry to address these issues.
Again, there are significant differences in the views of men and women, older and younger adults and different racial and ethnic groups on these issues. Women rate all of the measures suggested for government action as significantly more important than men, including prohibition. Adults aged 18 to 39 rate the importance of government support for problem gambling treatment and research significantly higher than do older adults. Adults aged 18 to 29 rate the importance of requiring a response from the gambling industry significantly lower than older adults. In contrast, adults aged 65 and over rate the notion of banning commercial gambling significantly higher than younger adults. Hispanic and Asian respondents rate most of the measures suggested for government action as significantly more important than respondents from other racial and ethnic groups. Along with African Americans, Hispanic and Asian respondents rate the importance of educating young people about the risks of gambling significantly higher than non-Hispanic White respondents. Hispanic and Asian respondents rate the importance of requiring a response to problem gambling from the gambling industry and supporting problem gambling treatment significantly higher than respondents from other racial and ethnic groups. Support for government-funded research on problem
90 2006 CALIFORNIA PROBLEM GAMBLING PREVALENCE SURVEY
gambling is highest among Hispanic respondents while support for a ban on commercial gambling is highest among Asian respondents.
Finally, it is helpful to consider differences in the views of non-gamblers as well as low-risk, at-risk and problem gamblers on these issues. Non-gamblers rate all of the measures for government action as significantly more important than low-risk, at-risk or problem gamblers. Perhaps not surprisingly, non-gamblers rate prohibition of commercial gambling as significantly more important than any of the gambling groups while support for such measures is lowest among at-risk gamblers. Problem gamblers view government support for educating young people about the risks of gambling as substantially more important than other government measures.
Tables A-30 through A-34 in Appendix A present these data in detail.
Awareness of Problem Gambling Services
There are several problem gambling helpline numbers in California including one that provides assistance specifically for Chinese problem gamblers and their families (Volberg et al., 2004). All respondents in the survey were asked whether they were aware of a toll-free problem gambling helpline in California. Overall, 23% of respondents in the survey indicated that they were aware of a toll-free problem gambling helpline in California. Among the respondents who were not aware of such a service, 31% indicated that they or someone they knew would use such a service if it were available.
Table 29 presents information on differences in awareness of a toll-free problem gambling helpline by gender, age, ethnicity and problem gambling severity. This table shows that men are significantly more aware of a helpline than women and that awareness of a helpline is significantly lower among adults at the two ends of the age spectrum compared with those aged 30 to 64. Awareness of a toll-free helpline is significantly lower among Asians than among other racial and ethnic groups in the California population. Finally, awareness of a toll-free helpline increases significantly with problem gambling severity with only one in ten non-gamblers indicating an awareness of a problem gambling helpline compared with one in three problem gamblers and one in two pathological gamblers.
91 2006 CALIFORNIA PROBLEM GAMBLING PREVALENCE SURVEY
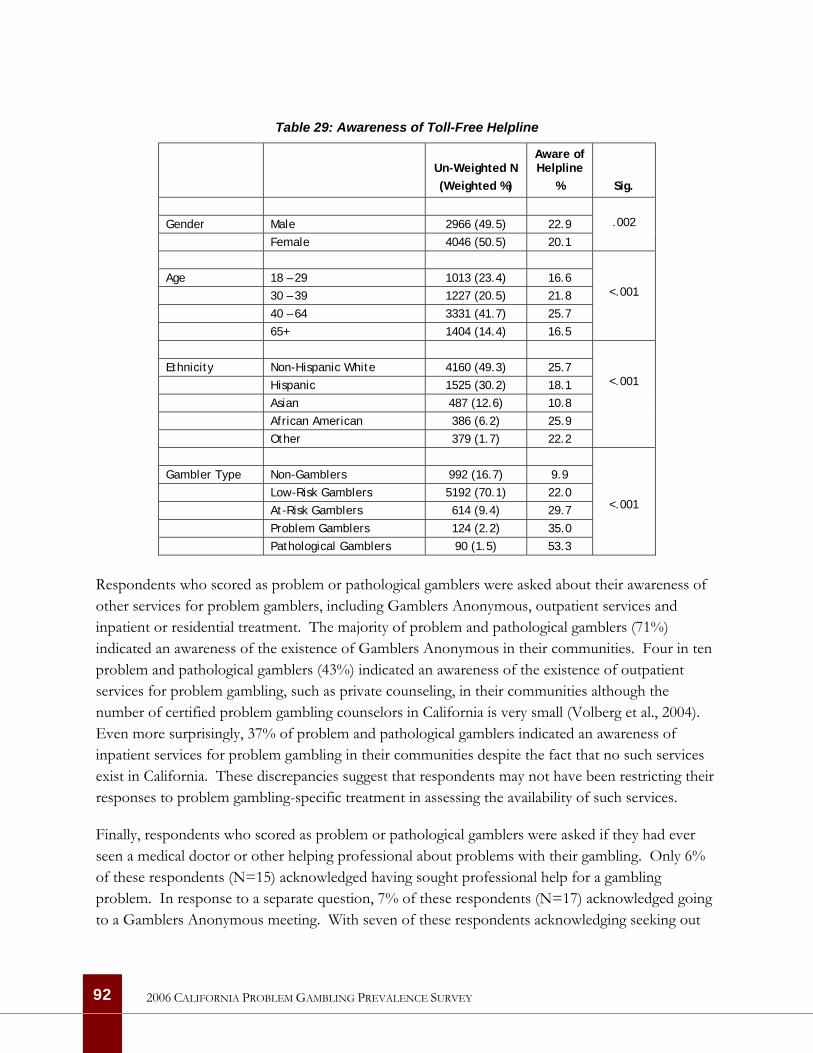
Table 29: Awareness of Toll-Free Helpline
Un-Weighted N (Weighted %)
Aware of Helpline
%
Sig.
Gender Male 2966 (49.5) 22.9 Female 4046 (50.5) 20.1
.002
Age 18 – 29 1013 (23.4) 16.6 30 – 39 1227 (20.5) 21.8 40 – 64 3331 (41.7) 25.7 65+ 1404 (14.4) 16.5
<.001
Ethnicity Non-Hispanic White 4160 (49.3) 25.7 Hispanic 1525 (30.2) 18.1 Asian 487 (12.6) 10.8 African American 386 (6.2) 25.9 Other 379 (1.7) 22.2
<.001
Gambler Type Non-Gamblers 992 (16.7) 9.9 Low-Risk Gamblers 5192 (70.1) 22.0 At-Risk Gamblers 614 (9.4) 29.7 Problem Gamblers 124 (2.2) 35.0 Pathological Gamblers 90 (1.5) 53.3
<.001
Respondents who scored as problem or pathological gamblers were asked about their awareness of other services for problem gamblers, including Gamblers Anonymous, outpatient services and inpatient or residential treatment. The majority of problem and pathological gamblers (71%) indicated an awareness of the existence of Gamblers Anonymous in their communities. Four in ten problem and pathological gamblers (43%) indicated an awareness of the existence of outpatient services for problem gambling, such as private counseling, in their communities although the number of certified problem gambling counselors in California is very small (Volberg et al., 2004). Even more surprisingly, 37% of problem and pathological gamblers indicated an awareness of inpatient services for problem gambling in their communities despite the fact that no such services exist in California. These discrepancies suggest that respondents may not have been restricting their responses to problem gambling-specific treatment in assessing the availability of such services.
Finally, respondents who scored as problem or pathological gamblers were asked if they had ever seen a medical doctor or other helping professional about problems with their gambling. Only 6% of these respondents (N=15) acknowledged having sought professional help for a gambling problem. In response to a separate question, 7% of these respondents (N=17) acknowledged going to a Gamblers Anonymous meeting. With seven of these respondents acknowledging seeking out
92 2006 CALIFORNIA PROBLEM GAMBLING PREVALENCE SURVEY
both professional and self-help for a gambling problem, the overlap between these two forms of help-seeking is substantial.
Barriers to Treatment
There is very little research on barriers to treatment for problem gambling. A recent study of problem gamblers in the community found that both ‘active’ and ‘resolved’ problem gamblers were most likely to indicate that a desire to handle the problem on their own was the greatest factor in not seeking formal treatment. Other reasons for not seeking treatment included ignorance of the availability of treatment, stigma, embarrassment or pride, and not feeling that they had a problem (Hodgins & el-Guebaly, 2000). Another recent study used a telephone survey to explore attitudes that might prevent a person from seeking treatment for a gambling problem among adults in Australia (Rockloff & Schofield, 2004). The authors used exploratory factor analysis to identify five potential barriers to treatment. These included availability of services, stigma, avoidance, cost, and uncertainty about the effectiveness of treatment.
The gambling treatment module in the California survey included items assessing barriers to treatment. Respondents who scored as problem and pathological gamblers and those who indicated that gambling was a serious problem in their family were asked whether there was ever a time when they thought that they or a family member should seek help for their gambling but did not. A follow-up question probed the reasons the respondent did not seek treatment. The number of respondents who were asked these questions is quite small (unweighted N=367) but, given how little is known about this topic, these results are particularly important.
Analysis of these data shows that there are significant differences in the reasons that men and women, adults of different ages, and respondents from different racial and ethnic groups give for not seeking help for a gambling problem. Women are significantly more likely to say that they (or a family member) did not want to stop gambling and to indicate that denial was an important reason for not seeking help. Men are significantly more likely to say that shame or embarrassment prevented them (or a family member) from seeking help and to endorse the belief that treatment would not be effective.
Respondents aged 30 to 39 are significantly less likely than other adults to say that not wanting to stop gambling was an important reason that they (or a family member) did not seek help and more likely to say that denial was an important reason. Shame and embarrassment was an important reason among adults of all ages for not seeking help for a gambling problem. Financial obstacles were greatest for adults aged 65 and over and lowest for those aged 40 to 64.
Finally, Asian respondents are significantly less likely than respondents from other racial and ethnic groups to say that not wanting to stop was an important reason that they (or a family member) did
93 2006 CALIFORNIA PROBLEM GAMBLING PREVALENCE SURVEY

not seek help for a gambling problem and more likely to say that shame or embarrassment was an important reason. Asian respondents were also the most likely to cite financial obstacles as a reason for not seeking help. Denial was lowest among African American and Asian respondents and highest among non-Hispanic White respondents. Hispanic respondents were the group most likely to indicate that they were unaware of the availability of treatment for problem gambling.
Tables A-35 through A-37 in Appendix A present these data in detail.
94 2006 CALIFORNIA PROBLEM GAMBLING PREVALENCE SURVEY
95
2006 CALIFORNIA PROBLEM GAMBLING PREVALENCE SURVEY
Summary and Conclusion
The main purpose of this study was to assess the extent and impact of problem gambling in the adult population of California and provide information about the public’s knowledge of available resources for addressing gambling problems. The results will be useful in designing awareness and prevention programs for problem gamblers and their families in California and in developing strategies to provide help to the groups most affected by this disorder.
Summary
As in many other jurisdictions, the majority of adults in California (83%) have gambled at some time in their lives. While playing the lottery is the activity that Californians are most likely to have done in the past year, casinos are actually much preferred as a favorite place to gamble. Beyond the lottery, casinos and private wagering, past year gambling participation and preferences are extremely low.
Non-gamblers in California are significantly more likely than gamblers to be female, to be under the age of 30, to be Hispanic, to have never married, to have less than a high school education and to have annual household incomes under $25,000. Non-gamblers in California are significantly less likely than gamblers to be employed and to have been born in the United States.
Monthly and weekly gamblers in California are significantly more likely than less frequent gamblers to be male and to be divorced. Weekly gamblers are significantly more likely than monthly gamblers to be over the age of 65, to be African American or Hispanic. Weekly gamblers are significantly less likely than monthly gamblers to have gone to college or pursued graduate study. Weekly gamblers are significantly less likely to be employed and more likely to be retired than monthly gamblers. Weekly gamblers are the group most likely to be disabled, to be Catholic and to have been born in the United States.
Based on the lifetime NODS, the prevalence of pathological gambling in California is 1.5% and the prevalence of problem gambling is 2.2%. The lifetime prevalence of at-risk gambling in California is 9.5%. The overall prevalence rate of problem and pathological gambling in California is at the higher end of the range of prevalence rates in other states and nationally identified using this screen. Based on the most recent census data, there are between 296,500 and 490,100 pathological gamblers and another 449,700 to 713,300 problem gamblers. An additional 2.2 million to 2.7 million California adults can be classified as at-risk gamblers.
The lifetime prevalence of problem and pathological gambling in California is particularly high among men, African Americans and respondents who are disabled or unemployed. Lifetime
problem and pathological gambling prevalence rates are highest among past-year Internet and cardroom gamblers. Problem gambling prevalence is also high among past-year bingo players, track bettors and those who have wagered privately.
Lifetime problem and pathological gamblers in California are significantly more likely than other gamblers and non-gamblers to smoke cigarettes daily and to have used tranquilizers, cocaine or other illicit drugs in the past year. In general, gamblers are more likely than non-gamblers to consume alcoholic beverages on a regular basis with rates increasing with problem gambling severity. While problem and pathological gamblers in California are more likely than others in the population to smoke, drink and use drugs, most problem and pathological gamblers do not smoke, drink often or use drugs. About one in four problem and pathological gamblers smokes daily; under two in ten drink once a week or more often; and less than one in ten has used illicit drugs in the past year. In addition to substance use, problem and pathological gambling is also significantly correlated with higher rates of lifetime and past year depression as well as mental and physical impairment, including hearing and vision loss and limitations to activity.
Overall awareness of the State’s problem gambling helpline is low with only one in five California adults indicating that they are aware of this 24-hour, toll-free service. While overall awareness is low, problem gambling severity is significantly associated with higher levels of awareness. One in three problem gamblers and one in two pathological gamblers are aware of California’s problem gambling helpline. While barriers to treatment seeking differ by gender, age and ethnicity, the most common reasons for not seeking help for a gambling problem are not wanting to stop gambling, followed by shame or embarrassment, denial that gambling is causing problems and assuming that treatment would not work.
Directions for the Future
The impacts of gambling-related problems can be high, not only for individuals but also for families and communities. Pathological gamblers experience physical and psychological stress and exhibit substantial rates of depression, alcohol and drug dependence and suicidal ideation. The families of pathological gamblers experience physical and psychological abuse as well as extreme pressure from bill collectors and creditors. Other significant impacts include costs to employers, creditors, insurance companies, social service agencies and the civil and criminal justice systems (Lesieur, 1998; Volberg, 2001a).
The impacts of gambling-related problems are not limited to those at the most severe end of the gambling problem continuum. Indeed, it is likely that problem and at-risk gamblers account for the largest proportion of the social costs of disordered gambling (Korn & Shaffer, 1999). It is also likely—if the addiction model applies—that problem and at-risk gamblers will be more responsive
96 2006 CALIFORNIA PROBLEM GAMBLING PREVALENCE SURVEY
than pathological gamblers to prevention and intervention efforts (Hodgins & el-Guebaly, 2000; Shaffer & Korn, 2002).
How Many To Plan For? One important purpose of prevalence surveys is to identify the number of individuals in a jurisdiction who may need treatment services for gambling-related difficulties at a given point in time. Experience in many jurisdictions suggests that not all of the individuals in need of treatment for a physical or psychological problem will seek out such treatment. From a policy perspective, the question is: How many individuals should we plan to provide for?
Research in the early 1990s suggested that approximately 3% of individuals with severe gambling-related problems would seek treatment in any one year (Dickerson, 1997; Volberg, 1997). This proportion was similar to the proportion of alcohol-dependent individuals in the general population who sought treatment on an annual basis (Smith, 1993). More recent research suggests that the proportion of individuals in the population with serious alcohol or substance abuse problems who seek specialized treatment in any one year is substantially higher—8% among alcohol abusers and 14% among substance abusers (SAMHSA, 2003). Increases in treatment seeking appear to be related to advances in pharmaceutical treatments, greater likelihood of reimbursement from insurance companies, and the destigmatization of addictive disorders (Fong, personal communication). Similarly, help-seeking for gambling problems is on the rise in jurisdictions where specialized services are widely available and well-publicized. Recent data from New Zealand indicate that approximately 10% of individuals with severe gambling-related problems in jurisdictions where services are widely available will seek help in any one year (Abbott, personal communication).
In calculating the number of problem and pathological gamblers who might seek treatment in California, we focus on the group of individuals who score as pathological gamblers (e.g., the 296,500 and 490,100 individuals represented by the confidence interval around the point estimate for pathological gambling in California). Based on this approach, we estimate that the number of individuals that would initially seek treatment for a gambling problem on an annual basis in California is between 9,000 and 15,000. If problem gambling treatment were to eventually become widely available in California, it is possible that the number of individuals that would seek help for a gambling problem in California would eventually increase to between 30,000 to 49,000 on an annual basis.
In considering the number of individuals who might seek treatment for a gambling problem in California, it is helpful to consider how many people have sought help for a gambling problem over a given year. Simmons (2006) reports that the California Council on Problem Gambling received 3,399 calls from individuals in crisis in 2004. Beyond Gamblers Anonymous and Gam-Anon, there are very few services for problem gamblers in California (Volberg et al., 2004) and it is not known
97 2006 CALIFORNIA PROBLEM GAMBLING PREVALENCE SURVEY
how many of these callers have accessed professional help of any kind. However, the number of callers seeking help represents about 1% of all of the pathological gamblers in California.
General Conclusions As the National Gambling Impact Study Commission (1999) pointed out some years ago, recent rapid growth in legal gambling in America has largely taken place in the absence of any deliberative process. While there are significant gaps in knowledge about problem gambling, what is known has some relevance to gambling policy and the development of interventions to prevent problems and assist problem gamblers in California.
Given the relatively high rate of problem gambling prevalence identified in California, it appears that greatly heightened access to electronic gambling machines, casino table games and other continuous gambling forms has already generated increases in problem gambling in the state as well as related costs to families and communities. Furthermore, although we now have substantial information about the contemporary risk profile for problem gambling in California, this is likely to change as the gambling market in California matures and as new gambling activities and technologies become available.
While the prevalence of problem gambling tends to rise when access to gambling increases, research suggests it will eventually level out, even when gambling accessibility continues to increase (Abbott, in press). However, rates may rise three- or four-fold before this occurs and even then, active measures may be required to achieve stabilization. Research suggests that a public health approach—one that includes raising public awareness of the risks of excessive gambling, expanding services for problem gamblers and strengthening regulatory, industry and public health harm reduction measures—can counteract some adverse effects from increased availability. What is not known is how quickly such endeavors can have a significant impact and whether or not they can prevent problem escalation entirely if introduced concurrently with increased access to gambling (Abbott et al, 2004).
The ‘Reno Model’ and Monitoring over Time Blaszczynski, Ladouceur and Shaffer (2004) describe a set of principles that they argue should guide health and social service agencies, industry operators, interested community groups, consumers and governments and their related agencies in the adoption and implementation of problem gambling prevention and harm minimization initiatives. This framework, which they dub the ‘Reno model,’ is needed because gambling markets are not yet characterized by socially responsible regulatory efforts with demonstrated effectiveness for targeted groups. The ‘Reno model’ consists of five principles:
• The key stakeholders will commit to reducing the incidence and ultimately the prevalence of gambling-related harms;
98 2006 CALIFORNIA PROBLEM GAMBLING PREVALENCE SURVEY
• Working collaboratively, the key stakeholders will inform and evaluate public policy aimed at reducing the incidence of gambling-related harms;
• Key stakeholders will collaboratively identify short- and long-term priorities thereby establishing an action plan to address these priorities within a recognized time frame;
• Key stakeholders will use scientific research to guide the development of public policies. In addition, the gambling industry will use this research as a guide to the development of industry-based strategic policies that will reduce the incidence and prevalence of gambling-related harms; and
• Once established, the action plan will be monitored and evaluated using scientific methods.
An essential element in this approach is a gambling monitoring system to provide policy makers, the gambling industry, health and social service agencies and other stakeholders with a neutral informational database for strategic analysis and decision-making. Internationally, a growing number of governments—including Australia, Canada, Great Britain, New Zealand and South Africa—have begun to establish systems to monitor the impacts of legal gambling on citizens and communities over extended periods of time (Volberg, 2004). However, these efforts are only a few years old and little is known about ‘best practices’ in this regard.
In our view, a model gambling monitoring system must include three basic elements. The first is an integrated database that includes information about gambling participation, expenditures and attitudes, gambling problems and other related data such as helpline calls and availability and effectiveness of services. It is essential that this integrated database be kept up-to-date, theoretically and methodologically, both to reflect changing conceptions of gambling and gambling problems and to incorporate new research data from other studies. The second element is a basic research effort that would include a variety of projects generating information to inform both policy and service development. There are several particularly critical basic research needs in the gambling field. These include longitudinal research on groups of people over time to improve our understanding of how gambling problems develop, studies of help-seeking by problem gamblers and studies of the effectiveness of problem gambling services. There is also a need for studies of gambling among vulnerable groups in the population. The third critical element to any such system is a process for dissemination so that responses to new developments or information can be made quickly (Abbott et al, 2004).
99 2006 CALIFORNIA PROBLEM GAMBLING PREVALENCE SURVEY
100
2006 CALIFORNIA PROBLEM GAMBLING PREVALENCE SURVEY
References
Abbott, M.W. (2001). What do we know about gambling and problem gambling in New Zealand? Report No. Seven of the New Zealand Gaming Survey. Wellington: Department of Internal Affairs. Available at http://www.dia.govt.nz.
Abbott, M.W. (In press). Do EGMs and problem gambling go together like a horse and carriage? Gambling Research.
Abbott, M.W. Pro-Vice Chancellor and Dean, Faculty of Health and Environmental Sciences, Auckland University of Technology. Personal communication to Dr. Volberg, May 25, 2006.
Abbott, M.W. & Volberg, R.A. (1991). Gambling and problem gambling in New Zealand: Report on Phase One of the National Survey. Research Series No. 12. Wellington: Department of Internal Affairs.
Abbott, M.W. & Volberg, R.A. (1996). The New Zealand National Survey of problem and pathological gambling. Journal of Gambling Studies, 12 (2), 143-160.
Abbott, M.W. & Volberg, R.A. (1999). Gambling and Problem Gambling in the Community: An International Overview and Critique. Report Number One of the New Zealand Gaming Survey. Wellington: Department of Internal Affairs. Available at http://www.dia.govt.nz.
Abbott, M.W. & Volberg, R.A. (2000). Taking the pulse on gambling and problem gambling in New Zealand: Phase One of the 1999 National Prevalence Survey. Report number three of the New Zealand Gaming Survey. Wellington: Department of Internal Affairs. Available at http://www.dia.govt.nz.
Abbott, M.W. & Volberg, R.A. (2006). The measurement of adult problem and pathological gambling. International Gambling Studies 6 (2): 175-200.
Abbott, M.W., Volberg, R.A. & Rönnberg, S. (2004). Comparing the New Zealand and Swedish National Surveys of gambling and problem gambling. Journal of Gambling Studies, 20 (3), 237-258.
Abbott, M.W., Williams, M. & Volberg, R.A. (2004). A prospective study of problem and regular non-problem gamblers living in the community. Substance Use and Misuse, 39 (6), 855-884.
Abbott, M.W., Volberg, R.A, Bellringer, M. & Reith, G. (2004). A Review of Research on Aspects of Problem Gambling. Report to the Responsibility in Gambling Trust. Auckland, NZ:
Gambling Research Centre, Auckland University of Technology. Available at http://www.rigt.org.uk/reports.asp.
American Psychiatric Association. (1980). Diagnostic and Statistical Manual of Mental Disorders, Third Edition. Washington, DC: Author.
American Psychiatric Association. (1994). Diagnostic and Statistical Manual of Mental Disorders, Fourth Edition. Washington, DC: Author.
Becoña, E. (2004). Pathological gambling today: Decrease or increase in prevalence? Paper presented at the First International Meeting on Gambling Research and Other Addictive Behaviours. Barcelona, Spain. October 2004.
Blaszczynski, A., Dumlao, V. & Lange, M. (1997). ’How much do you spend gambling?’ Ambiguities in survey questionnaire items. Journal of Gambling Studies 13 (3), 237-252.
Blaszczynski, A., Ladouceur, R. & Shaffer, H. J. (2004). A science-based framework for responsible gambling: The Reno model. Journal of Gambling Studies 20 (3): 301-317.
Bondolfi, G., Osiek, C. & Ferrero, F. (2000). Prevalence estimates of pathological gambling in Switzerland. Acta Psychiatrica Scandinavica 101 (6), 473-475.
Castellani, B. (2000). Pathological gambling: The making of a medical problem. Albany, NY: State University of New York Press.
Christiansen, E.M. (2000). Mixed results: The 1999 Gross Annual Wager. International Gaming & Wagering Business 21 (8), 15-17.
Christiansen, E.M. & Sinclair, S. (2001). 2000 Gross Annual Wager: U.S. growth rate disappoints. International Gaming & Wagering Business 22(8), 1, 32.
Cox, S., Lesieur, H.R., Rosenthal, R.J. & Volberg, R.A. (1997). Problem and Pathological Gambling in America: The National Picture. Columbia, MD: National Council on Problem Gambling.
Dickerson, M.G. (1997). The Australian experience of the development of strategies to address gambling related problems in the community: Implications for other jurisdictions. Paper presented at the 10th International Conference on Gambling and Risk Taking. Montreal, CANADA.
Dickerson, M., Haw, J., & Shepherd, L. (2003). The psychological causes of problem gambling: A longitudinal study of at risk recreational EGM players. Sydney: University of Western Sydney, School of Psychology, Bankstown Campus. Available at http://www.dgr.nsw.gov.au.
101 2006 CALIFORNIA PROBLEM GAMBLING PREVALENCE SURVEY
Dunstan, R. (1997). Gambling in California. Sacramento, CA: California Research Bureau.
Duvarci, I., Varan, A., Coskunol, H. & Ersoy, M.A. (1997). DSM-IV and the South Oaks Gambling Screen: Diagnosing and assessing pathological gambling in Turkey. Journal of Gambling Studies, 13 (3), 193-206.
Encyclopædia Britannica Online. (2006). Epidemiology. Available at http://www.britannica.com/eb/article-9032788.
Fong, T. Director, Gambling Studies Program, University of California, Los Angeles. Personal communication to Dr. Volberg, July 24, 2006.
Gabriel, K. (1996). Gambler way: Indian gaming in mythology, history and archaeology in North America. Boulder, CO: Johnson Books.
Gambling Review Body, Department for Culture, Media and Sport. (2001). Gambling review report. Norwich: HMSO.
Gerstein, D.R., Volberg, R.A., Toce, M.T., Harwood, H., Palmer, A., Johnson, R., Larison, C., Chuchro, L., Buie, T., Engelman, L. & Hill, M.A. (1999). Gambling impact and behavior study: Report to the National Gambling Impact Study Commission. Chicago, IL: National Opinion Research Center at the University of Chicago. Available at http://cloud9.norc.uchicago.edu/dlib/ngis.htm
Govoni, R., Frisch, G.R. & Stinchfield, R. (2001). A critical review of screening and assessment instruments for problem gambling. Windsor: University of Windsor Problem Gambling Research Group. Available at http://www.gamblingresearch.org/.
Herriff, J. Executive Director, Michigan Council on Problem Gambling. Personal communication to Dr. Volberg, 15 July 2005.
Hodgins, D.C. (2002). Using the NORC DSM Screen for gambling problems (NODS) as an outcome measure for pathological gambling: Reliability and validity. National Association for Gambling Studies Journal, 14 (1), 9-17.
Hodgins, D.C. (2004). Using the NORC DSM Screen for Gambling Problems as an outcome measure for pathological gambling: psychometric evaluation. Addictive Behaviors, 29 (8), 1685-1690.
Hodgins, D.C. & el-Guebaly, N. (2000). Natural and treatment-assisted recovery from gambling problems: a comparison of resolved and active gamblers. Addiction, 95, 777-789.
102 2006 CALIFORNIA PROBLEM GAMBLING PREVALENCE SURVEY
Kallick, M., Suits, D., Dielman, T. & Hybels, J. (1976). Survey of American gambling attitudes and behavior: Final report to the Commission on the Review of the National Policy Toward Gambling. Ann Arbor: Survey Research Center, Institute for Social Research.
Ladouceur, R. & Walker. M. (1996). A cognitive perspective on gambling. In Trends in cognitive and behavioural therapies, P.M. Salkovskis (ed). New York: John Wiley & Sons Ltd. (Pp. 89-120).
Lesieur, H.R. (1994). Epidemiological surveys of pathological gambling: Critique and suggestions for modification. Journal of Gambling Studies, 10 (4), 385-398.
Lesieur, H.R. (1998). Costs and treatment of pathological gambling. Annals of the American Academy of Political and Social Science, 556, 153-171.
Lesieur, H.R. & Blume, S.B. (1987). The South Oaks Gambling Screen (SOGS): A new instrument for the identification of pathological gamblers. American Journal of Psychiatry, 144, 1184-1188.
Lesieur, H.R. & Rosenthal, R.J. (1998). Analysis of pathological gambling. In DSM-IV Sourcebook, Volume 4, T.A. Widiger, A.J. Francis, H.A. Pincus, R. Ross, M.B. First, W. Davis & M. Kline (eds). Washington, DC: American Psychiatric Association. (Pp. 393-401).
Litwin, M.S. (1995). How to measure survey reliability and validity. Thousand Oaks: Sage Publications.
Lund, I. & Nordlund, S. (2003). Pengespill og Pengespillproblemer i Norge [Gambling and problem gambling in Norway]. Oslo: Norwegian Institute for Alcohol and Drug Research. Availabe at http://www.sirus.no/cwindex2_8e.html.
McMillen, J. (1996). Understanding gambling: History, concepts and theories. In Gambling cultures: Studies in history and interpretation, J. McMillen (ed.). London: Routledge. (Pp. 6-42).
MORI. (2006). Under 16s and the National Lottery: Final report. London: National Lottery Commission.
National Gambling Impact Study Commission. (1999). Final report. Washington, DC: Government Printing Office. Available at http://govinfo.library.unt.edu/ngisc/index.html.
National Research Council. (1999). Pathological gambling: A critical review. Washington, DC: National Academy Press.
North American Association of State & Provincial Lotteries. (2003). Directory of member lotteries. Available at http://www.naspl.org/directory.html.
Orford, J., Sproston, K., Erens, B., White, C. & Mitchell, L. (2003). Gambling and problem gambling in Britain. Hove: Brunner-Routledge.
103 2006 CALIFORNIA PROBLEM GAMBLING PREVALENCE SURVEY
Productivity Commission. (1999). Australia’s gambling industries, Report No. 10. Canberra: AusInfo. Available at http://www.pc.gov.au/.
Rockloff, M.J. & Schofield, G. (2004). Factor analysis of barriers to treatment for problem gambling. Journal of Gambling Studies, 20 (2), 121-126.
Rose, I.N. (1986). Gambling and the law. Hollywood, CA: Gambling Times, Inc.
Rosenthal, R.J. & Lesieur, H.R. (1992). Self-reported withdrawal symptoms and pathological gambling. American Journal on Addiction, 1, 150-154.
Sartor, C.E., Scherrer, J.F., Shah, K., Xian, H., Volberg, R.A. & Eisen, S.A. (in press). Course of pathological gambling symptoms and reliability of the Lifetime Gambling History measure. Psychiatry Research.
Scherrer, J.F., Xian, H., Shah, K.R., Volberg, R.A., Slutske, W. & Eisen, S.A. (2005). Effect of genes, environment, and lifetime co-occurring disorders on health-related quality of life in problem and pathological gamblers. Archives of General Psychiatry 62: 677-683.
Schrans, T., Schellinck, T. & Walsh, G. (2000). Technical report: 2000 regular VL players followup: A comparative analysis of problem development and resolution. Focal Research Consultants Ltd.
Shaffer, H.J. & Hall, M.N. (2002). The natural history of gambling and drinking problems among casino employees. Journal of Social Psychology, 142 (4), 405-424.
Shaffer, H.J. & Korn, D.A. (2002). Gambling and related mental disorders: A public health analysis. Annual Review of Public Health, 23, 171-212.
Shaffer, H.J., Hall, M.N. & Vander Bilt, J. (1997). Estimating the prevalence of disordered gambling behavior in the United States and Canada: A meta-analysis. Boston, MA: Harvard Medical School Division on Addictions.
Shaffer, H.J., Hall, M.N. & Vander Bilt, J. (1999). Estimating the prevalence of disordered gambling behavior in the United States and Canada: A research synthesis. American Journal of Public Health, 89 (9), 1369-1376.
Shaffer, H.J., LaBrie, R.A. & LaPlante, D. (2004). Laying the foundation for quantifying regional exposure to social phenomena: considering the case of legalized gambling as a public health toxin. Psychology of Addictive Behaviors, 18 (1), 40-48.
104 2006 CALIFORNIA PROBLEM GAMBLING PREVALENCE SURVEY
Shapira, N.A., Ferguson, M.A., Frost-Pineda, K. & Gold, M.S. (2002). Gambling and problem gambling prevalence among adults in Florida. Report to the Florida Council on Compulsive Gambling. Gainesville, FL: University of Florida.
Simmons, C.W. (2006). Gambling in the Golden State 1998 Forward. Sacramento, CA: California Research Bureau.
Slutske, W.S., Jackson, K.M. & Sher, K.J. (2003). The natural history of problem gambling from age 18 to 29. Journal of Abnormal Psychology, 112 (2), 263-274.
Smith, D.A.R. (1993). Treatment services for pathological gambling: A mental health perspective. In Papers from the problem gambling seminar. Wellington: Department of Internal Affairs. (Pp. 85-90).
Smith, Garry J. & Harold J. Wynne. 2004. VLT Gambling in Alberta: A Preliminary Analysis. Lethbridge: Alberta Gaming Research Institute. Study funded by AGRI.
Smith, G.J., Volberg, R.A. & Wynne, H.J. (1994). Leisure behavior on the edge: Differences between controlled and uncontrolled gambling practices. Society & Leisure, 17 (1), 233-248.
Substance Abuse and Mental Health Services Administration. (2003). 22 million in U.S. suffer from substance dependence or abuse. News release, September 5, 2003.
Tabachnick, B.G. & Fidell, L.S. (1996). Using multivariate statistics (3rd ed.). New York: Harper Collins.
Toce-Gerstein, M. & Gerstein, D.R. (2004). Of time and the chase: Lifetime versus past-year measures of pathological gambling. Electronic Journal of Gambling Issues: eGambling, Issue 10. Available at http://www.camh.net/egambling.
Toce-Gerstein, M., Gerstein, D.R. & Volberg, R.A. (2003). A hierarchy of gambling disorders in the general population. Addiction, 98, 1661-1672.
U.S. Census Bureau, 2005. Population estimates. Available at http://www.census.gov.
Volberg, R.A. (1994). The prevalence and demographics of pathological gamblers: Implications for public health. American Journal of Public Health, 84 (2), 237-241.
Volberg, R.A. (1997). Gambling and problem gambling in Oregon. Salem, OR: Oregon Gambling Addiction Treatment Foundation.
105 2006 CALIFORNIA PROBLEM GAMBLING PREVALENCE SURVEY
Volberg, R.A. (2001a). When the chips are down: Problem gambling in America. New York, NY: The Century Foundation.
Volberg, R.A. (2001b). Gambling and problem gambling in North Dakota: A replication study, 1992 to 2000. Bismarck, ND: Office of the Governor.
Volberg, R.A. (2001c). Changes in gambling and problem gambling in Oregon, 1997 to 2000. Salem, OR: Oregon Gambling Addiction Treatment Foundation.
Volberg, R.A. (2002). Gambling and problem gambling in Nevada. Report to the Nevada Department of Human Resources. Carson City, NV: Department of Human Resources. Available at http://www.hr.state.nv.us/.
Volberg, R.A. (2003a). Gambling and problem gambling in Arizona. Phoenix, AZ: Arizona Lottery. Available at http://www.problemgambling.az.gov/statistics.htm.
Volberg, R.A. (2003b). Has there been a ‘feminization’ of gambling and problem gambling in the United States? Electronic Journal of Gambling Issues Issue 8: Feature Article. Available at http://www.camh.net/egambling/.
Volberg, R.A. (2004). Fifteen years of problem gambling research: What do we know? Where do we go? Electronic Journal of Gambling Issues, eGambling Issue 10. Available at http://www.camh.net/egambling.
Volberg, R.A. & Bernhard, B.J. (2006). The 2006 survey of gambling and problem gambling in New Mexico. Albuquerque, NM: Responsible Gaming Association of New Mexico.
Volberg, R.A. & McNeilly, D. (2003). Gambling and problem gambling among seniors in Florida. Maitland: Florida Council on Compulsive Gambling.
Volberg, R.A. & Steadman, H.J. (1988). Refining prevalence estimates of pathological gambling. American Journal of Psychiatry, 145, 502-505.
Volberg, R.A., Abbott, M.W., Rönnberg, S. & Munck, I.M. (2001). Prevalence and risks of pathological gambling in Sweden. Acta Psychiatrica Scandinavica, 104 (4), 250-256.
Volberg, R.A., Dickerson, M.G., Ladouceur, R. & Abbott, M.W. (1996). Prevalence studies and the development of services for problem gamblers and their families. Journal of Gambling Studies, 12 (2), 215-231.
Volberg, R.A., Gerstein, D.R., Christiansen, E.M. & Baldridge, J. (2001). Assessing self-reported expenditures on gambling. Managerial and Decision Economics 22 (1-3), 77-96.
106 2006 CALIFORNIA PROBLEM GAMBLING PREVALENCE SURVEY
Volberg, R.A., Rugle, L., Rosenthal, R.J. & Fong, T. (2005). Situational assessment of problem gambling services in California. Sacramento, CA: California Department of Alcohol and Drug Programs.
Volberg, R.A., Moore, W.L., Christiansen, E.M., Cummings, W. & Banks, S.M. (1998). Unaffordable losses: Estimating the proportion of gambling revenues derived from problem gamblers. Gaming Law Review 2 (4), 349-360.
Weisstein, E.W. (2004). Bonferroni correction. MathWorld—A Wolfram Web Resource. CRC Press. Available at http://mathworld.wolfram.com/BonferroniCorrection.html.
Welte, J., Barnes, G., Wieczorek, W., Tidwell, M-C. & Parker, J. (2001). Alcohol and gambling among U.S. adults: Prevalence, demographic patterns and comorbidity. Journal of Studies on Alcohol, 62 (5), 706-712.
Welte, J.W., Barnes, G.M., Wieczorek, W.F., Tidwell, M-C. & Parker, J.C. (2004). Risk factors for pathological gambling. Addictive Behaviors, 29, 323-335.
Wiebe, J., Single, E., & Falkowski-Ham, A. (2003). Exploring the evolution of problem gambling: A one year follow-up study. Report to the Responsible Gambling Council (Ontario). Available at http://www.responsiblegambling.org.
Wildman, R.W. (1998). Gambling: an attempt at an integration. Edmonton: Wynne Resources.
107 2006 CALIFORNIA PROBLEM GAMBLING PREVALENCE SURVEY