Embed Size (px)
Citation preview

2006 August 24-28
Labour statistics
The usage of administrative data sources for Lithuanian data of earnings
Milda Šličkutė-Šeštokienė
Statistics Lithuania

2006 August 24-28
Labour statistics
Annual data calculated:
Until 2003 on the basis of complete enumeration of enterprises;
From 2004 on the basis of sample Quarterly Survey of Earnings (QSE) and data of Social Insurance.
The main reasons why two surveys with the same definitions used to be performed are the following:
Quarterly data is very important at national level;
Too detailed breakdown of annual data requires census of enterprises.

2006 August 24-28
Labour statistics
Distribution of coefficients of correlation, in percent
Variables in SI
Bands of
coeff. of corr.
Variables in QSE
Average number of employees
Average number of full-time
units
Gross remune- ration
Hours worked
Hours paid
Number insured persons
< 0.8 0.0 0.0 3.1 0.0 0.0
0.8 – 0.9 0.0 1.6 29.7 1.6 1.6
0.9 – 1.0 100.0 98.4 67.2 98.4 98.4
Taxable income
< 0.8 2.3 1.6 0.0 0.8 3.9
0.8 – 0.9 26.6 19.5 0.0 21.9 19.5
0.9 – 1.0 71.1 78.9 100.0 77.3 76.6
Days worked
< 0.8 0.0 0.0 2.3 0.0 0.0
0.8 – 0.9 0.0 0.0 28.1 0.0 0.8
0.9 – 1.0 100.0 100.0 69.5 100.0 99.2

2006 August 24-28
Labour statistics
GREG estimator chosen for calculation of annual results 2004 are expressed by the formula:
where i – sample; – calibrated weight of k-th enterprise; – variable of interest in k-th enterprise; – sample design weights of k-th element.
is expressed by the formula:
where:
– vector of auxiliary information; ;
i i
ˆk k
kkkkkwygdywt
k
1
iiik
ix
xxxxt1
i
ik
kkddg
ky kw
kd
kg
kx
N
kkxxt
1

2006 August 24-28
Labour statistics
Auxiliary variables analyzed:
Number of insured persons;
Gross remuneration;
Days worked.
Levels of auxiliary information analyzed:
NACE at section level;
NACE at section level & county.
Total 14 GREG estimators were calculated (7 combinations of 3 auxiliary variables multiplied by 2 levels of auxiliary information).

2006 August 24-28
Labour statistics
Breakdowns required for Annual Survey of Earnings:
NACE (two digits or sometimes even more detailed) & economic sector (total 49 economic activities and 2 economic sectors), it is also the breakdown of QSE;
NACE (section level) & size of enterprise & economic sector (total 15 economic activities, 6 sizes of enterprise and 2 economic sectors);
NACE (section level) & county (total 15 economic activities and 10 counties);
Municipality (total 60 municipalities).
Total 488 partly overlapping domains are required. The main problem is breakdown by regions because the quarterly survey does not aim at getting the data which represent regional unit.
2006 August 24-28
Labour statistics
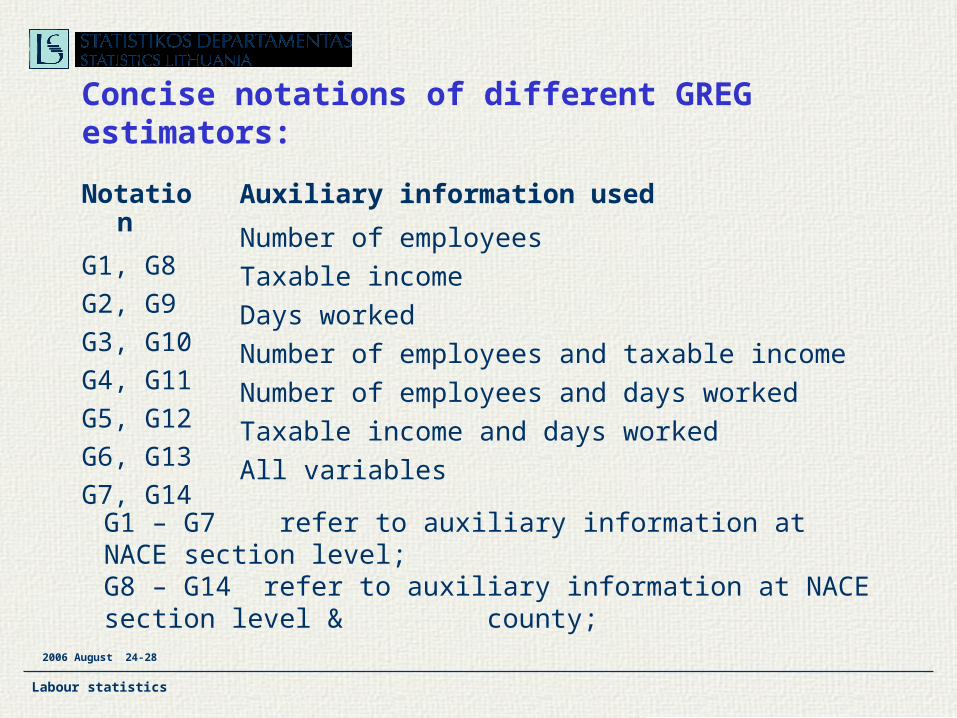
Concise notations of different GREG estimators:
Notation
G1, G8
G2, G9
G3, G10
G4, G11
G5, G12
G6, G13
G7, G14
Auxiliary information used
Number of employees
Taxable income
Days worked
Number of employees and taxable income
Number of employees and days worked
Taxable income and days worked
All variables
G1 – G7 refer to auxiliary information at NACE section level;G8 – G14 refer to auxiliary information at NACE section level &
county;
2006 August 24-28
Labour statistics
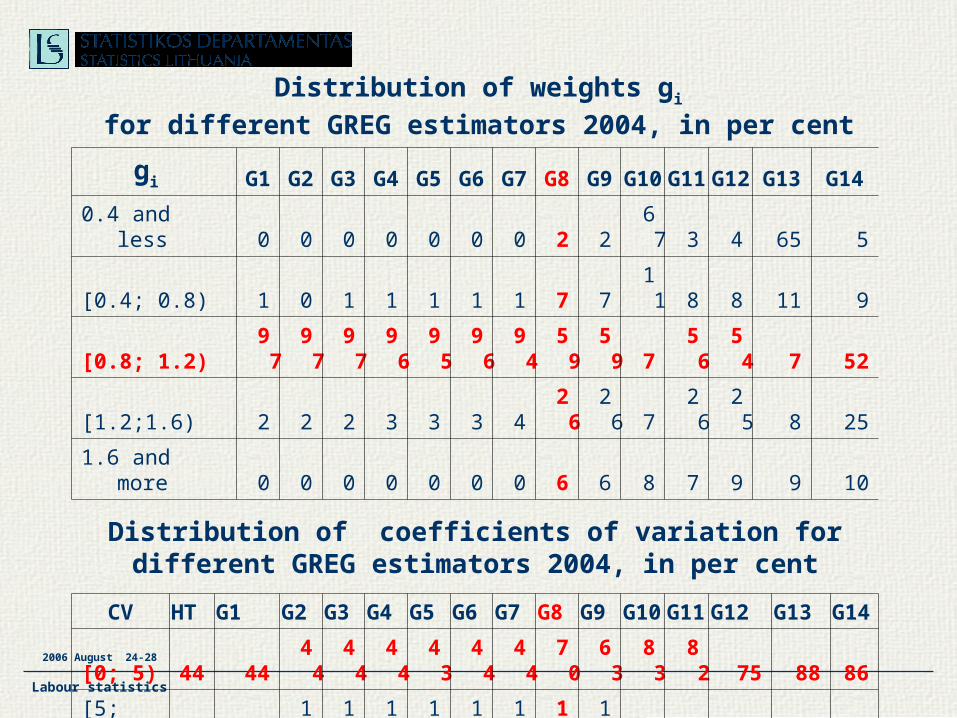
Distribution of weights gi
for different GREG estimators 2004, in per cent
gi G1 G2 G3 G4 G5 G6 G7 G8 G9 G10 G11 G12 G13 G14
0.4 and less 0 0 0 0 0 0 0 2 2 67 3 4 65 5
[0.4; 0.8) 1 0 1 1 1 1 1 7 7 11 8 8 11 9
[0.8; 1.2) 97 97 97 96 95 96 94 59 59 7 56 54 7 52
[1.2;1.6) 2 2 2 3 3 3 4 26 26 7 26 25 8 25
1.6 and more 0 0 0 0 0 0 0 6 6 8 7 9 9 10
Distribution of coefficients of variation for different GREG estimators 2004, in per cent
CV HT G1 G2 G3 G4 G5 G6 G7 G8 G9 G10 G11 G12 G13 G14
[0; 5) 44 44 44 44 44 43 44 44 70 63 83 82 75 88 86
[5; 10) 16 15 14 15 14 15 13 14 14 18 8 7 11 6 5
[10; 30) 26 26 26 26 27 27 26 26 11 13 6 7 10 3 5
30 and > 15 16 16 16 16 15 16 16 5 6 3 4 4 4 4
2006 August 24-28
Labour statistics
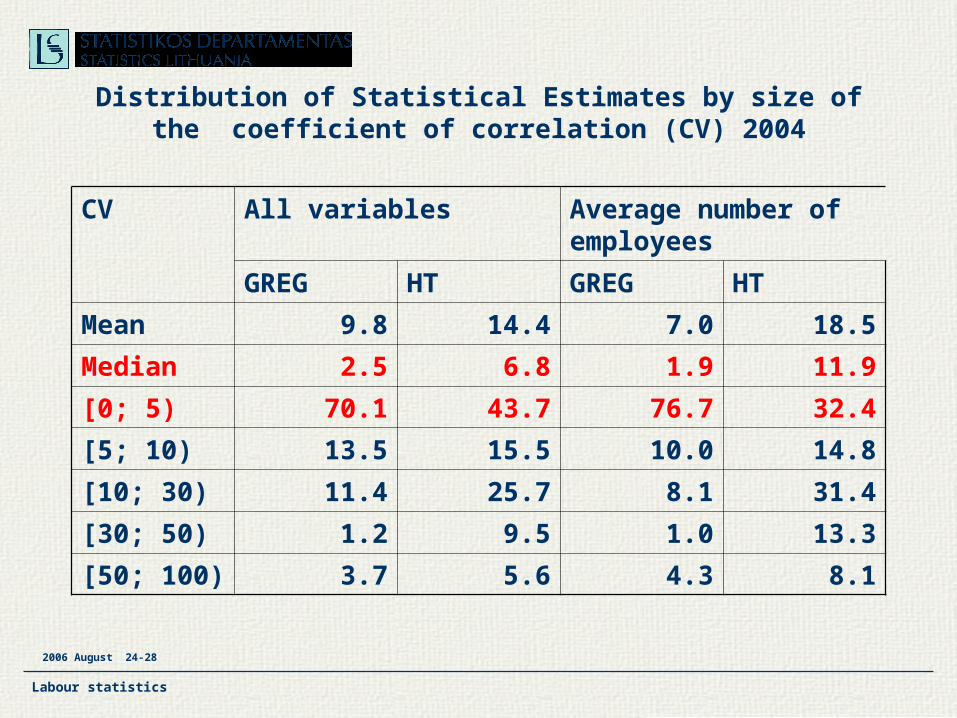
Distribution of Statistical Estimates by size of the coefficient of correlation (CV) 2004
CV All variables Average number of employees
GREG HT GREG HT
Mean 9.8 14.4 7.0 18.5
Median 2.5 6.8 1.9 11.9
[0; 5) 70.1 43.7 76.7 32.4
[5; 10) 13.5 15.5 10.0 14.8
[10; 30) 11.4 25.7 8.1 31.4
[30; 50) 1.2 9.5 1.0 13.3
[50; 100) 3.7 5.6 4.3 8.1

2006 August 24-28
Labour statistics
Deviation of estimates of Average Number of Employees 2003 compare to the figures from Annual Survey on Earnings, in %
0
10
20
30
40
50
60
Nu
mb
er o
f es
tim
ates
, in
%
[0; 5] (5; 10] (10; 20] (20; 50] 50 and >
Interval of deviation
GREG HT

2006 August 24-28
Labour statistics
Average number of full-time units
0
10
20
30
40
50
60
70
Nu
mb
er
of
sta
tis
tic
al
es
tim
ate
in
pe
r c
en
t
[0; 3] (3; 5] (5;10]
(10;30]
(30;100]
[0; 3] (3; 5] (5;10]
(10;30]
(30;100]
Interval of coefficient of variation
GREG HT
Average number of employees
Distribution of Statistical Estimates by size of the Coefficient of Variation (CV) 2004

2006 August 24-28
Labour statistics
0
5
10
15
20
25
30
35
40
Nu
mb
er
of
sta
tis
tic
al
es
tim
ate
in p
er
ce
nt
[0; 3] (3; 5] (5; 10] (10; 30] (30; 100]
Interval of coefficient of variation
GREG HT
Distribution of Statistical Estimates for Average Monthly Gross Earnings by size of the coefficient of variation (CV) 2004

2006 August 24-28
Labour statistics
Improvement foreseen for annual data 2005:
The auxiliary variables should be used to fix the totals in the enterprise size groups;
Maybe gross remuneration also should be used as auxiliary information;
Regression imputation may be implemented.

2006 August 24-28
Labour statistics
Usage of data of Social Insurance for other purpose than annual data of earnings:
From 2006 - estimation of data for small enterprises (9 and less employees) in QSE;
Planed for estimation for QSE;
Planed for SES 2006;
Planed for Labour Cost survey 2008.
2006 August 24-28
Labour statistics
Burden diminished for enterprises because of usage of administrative sources:
Rejection of Annual Survey of Earnings: about 40 000 enterprises and 21 variable, once per year;
Rejection of collecting data from small enterprises (4 or less employees) in QSE: about 1300 enterprises and 35 variables, every quarter;
Future plans to use administrative sources for SES 2006: 4 variables will be dropped, sample size in this survey approximately 8 000 local units and 150 000 employees, every four year.

2006 August 24-28
Labour statistics
Thank you for your attention !