Embed Size (px)
Citation preview

ITEM 8. Financial Statements and Supplementary Data
INDEX TO CONSOLIDATED FINANCIAL STATEMENTS
Page
Report of Independent Registered Chartered Accountants . . . . . . . . . . . . . . . . . . . . . . . . . . . . . . . . . . . . . . . . . . . . 89Consolidated Statements of Operations . . . . . . . . . . . . . . . . . . . . . . . . . . . . . . . . . . . . . . . . . . . . . . . . . . . . . . . . . . 90Consolidated Balance Sheets . . . . . . . . . . . . . . . . . . . . . . . . . . . . . . . . . . . . . . . . . . . . . . . . . . . . . . . . . . . . . . . . . 91Consolidated Statements of Changes in Equity and Comprehensive Income (Loss) . . . . . . . . . . . . . . . . . . . . . . . . . . 92Consolidated Statements of Cash Flows . . . . . . . . . . . . . . . . . . . . . . . . . . . . . . . . . . . . . . . . . . . . . . . . . . . . . . . . . 93Notes to Consolidated Financial Statements . . . . . . . . . . . . . . . . . . . . . . . . . . . . . . . . . . . . . . . . . . . . . . . . . . . . . . 94
************Quarterly Financial Data (Unaudited) . . . . . . . . . . . . . . . . . . . . . . . . . . . . . . . . . . . . . . . . . . . . . . . . . . . . . . . . . . . 170
Condensed Consolidated Statements of Operations . . . . . . . . . . . . . . . . . . . . . . . . . . . . . . . . . . . . . . . . . . . . . . . 171Condensed Consolidated Balance Sheets . . . . . . . . . . . . . . . . . . . . . . . . . . . . . . . . . . . . . . . . . . . . . . . . . . . . . . . 178Condensed Consolidated Statements of Cash Flows . . . . . . . . . . . . . . . . . . . . . . . . . . . . . . . . . . . . . . . . . . . . . . . 179Supplemental Information . . . . . . . . . . . . . . . . . . . . . . . . . . . . . . . . . . . . . . . . . . . . . . . . . . . . . . . . . . . . . . . . . . 181
88
REPORT OF INDEPENDENT REGISTERED CHARTERED ACCOUNTANTS
To the Shareholders and Board of Directors of Nortel Networks Corporation
We have audited the accompanying consolidated balance sheets of Nortel Networks Corporation and subsidiaries(“Nortel”) as of December 31, 2006 and 2005 and the related consolidated statements of operations, changes in equity andcomprehensive income (loss) and cash flows for each of the three years in the period ended December 31, 2006. Thesefinancial statements are the responsibility of Nortel’s management. Our responsibility is to express an opinion on thesefinancial statements based on our audits.
We conducted our audits in accordance with Canadian generally accepted auditing standards and the standards of thePublic Company Accounting Oversight Board (United States). Those standards require that we plan and perform the auditto obtain reasonable assurance about whether the financial statements are free of material misstatement. An audit includesexamining, on a test basis, evidence supporting the amounts and disclosures in the financial statements. An audit alsoincludes assessing the accounting principles used and significant estimates made by management, as well as evaluating theoverall financial statement presentation. We believe that our audits provide a reasonable basis for our opinion.
In our opinion, such consolidated financial statements present fairly, in all material respects, the financial position ofNortel as of December 31, 2006 and 2005 and the results of its operations and its cash flows for each of the three years inthe period ended December 31, 2006 in conformity with accounting principles generally accepted in the United States ofAmerica.
As described in Note 4 to the consolidated financial statements, the accompanying consolidated financial statements ofNortel as of December 31, 2005 and for the years ended December 31, 2005 and 2004 have been restated. We thereforewithdraw our previous report dated April 28, 2006 on those financial statements, as originally filed.
We have also audited, in accordance with the standards of the Public Company Accounting Oversight Board (UnitedStates), the effectiveness of Nortel’s internal control over financial reporting as of December 31, 2006, based on thecriteria established in Internal Control — Integrated Framework issued by the Committee of Sponsoring Organizations ofthe Treadway Commission, and our report dated March 15, 2007 expressed an unqualified opinion on management’sassessment of the effectiveness of Nortel’s internal control over financial reporting and an adverse opinion on theeffectiveness of Nortel’s internal control over financial reporting because of a material weakness.
/s/ Deloitte & Touche LLP
Independent Registered Chartered Accountants
Toronto, CanadaMarch 15, 2007
COMMENTS BY INDEPENDENT REGISTERED CHARTERED ACCOUNTANTS ON CANADA-UNITED STATESOF AMERICA REPORTING DIFFERENCE
The standards of the Public Company Accounting Oversight Board (United States) require the addition of an explanatoryparagraph (following the opinion paragraph) when there are changes in accounting principles that have a material effecton the comparability of the Company’s financial statements, such as the changes described in Note 3 to the financialstatements. Our report to the Shareholders and Board of Directors of Nortel dated March 15, 2007 with respect to theconsolidated financial statements is expressed in accordance with Canadian reporting standards which do not require areference to such changes in accounting principles in the auditors’ report when the change is properly accounted for andadequately disclosed in the financial statements.
/s/ Deloitte & Touche LLP
Independent Registered Chartered Accountants
Toronto, CanadaMarch 15, 2007
89

NORTEL NETWORKS CORPORATION
Consolidated Statements of Operations for the years ended December 31
2006 2005 2004As restated* As restated*
(Millions of U.S. dollars,except per share amounts)
Revenues:Products . . . . . . . . . . . . . . . . . . . . . . . . . . . . . . . . . . . . . . . . . . . . . . . . . . . . $10,158 $ 9,338 $8,511Services . . . . . . . . . . . . . . . . . . . . . . . . . . . . . . . . . . . . . . . . . . . . . . . . . . . . 1,260 1,171 967
Total Revenues. . . . . . . . . . . . . . . . . . . . . . . . . . . . . . . . . . . . . . . . . . . . . . . . . 11,418 10,509 9,478
Cost of revenues:Products . . . . . . . . . . . . . . . . . . . . . . . . . . . . . . . . . . . . . . . . . . . . . . . . . . . . 6,267 5,590 5,037Services . . . . . . . . . . . . . . . . . . . . . . . . . . . . . . . . . . . . . . . . . . . . . . . . . . . . 712 641 519
Total cost of revenues. . . . . . . . . . . . . . . . . . . . . . . . . . . . . . . . . . . . . . . . . . . . 6,979 6,231 5,556
Gross profit . . . . . . . . . . . . . . . . . . . . . . . . . . . . . . . . . . . . . . . . . . . . . . . . . . . 4,439 4,278 3,922Selling, general and administrative expense . . . . . . . . . . . . . . . . . . . . . . . . . . . . 2,503 2,429 2,146Research and development expense . . . . . . . . . . . . . . . . . . . . . . . . . . . . . . . . . . 1,939 1,874 1,975Amortization of intangibles . . . . . . . . . . . . . . . . . . . . . . . . . . . . . . . . . . . . . . . 26 17 9In-process research and development expense . . . . . . . . . . . . . . . . . . . . . . . . . . 22 — —Special charges . . . . . . . . . . . . . . . . . . . . . . . . . . . . . . . . . . . . . . . . . . . . . . . . 105 169 181(Gain) loss on sale of businesses and assets(a) . . . . . . . . . . . . . . . . . . . . . . . . . . (206) 47 (91)Shareholder litigation settlement expense (recovery) . . . . . . . . . . . . . . . . . . . . . (219) 2,474 —
Operating earnings (loss) . . . . . . . . . . . . . . . . . . . . . . . . . . . . . . . . . . . . . . . . . 269 (2,732) (298)Other income — net . . . . . . . . . . . . . . . . . . . . . . . . . . . . . . . . . . . . . . . . . . . . . 212 295 217Interest expense
Long-term debt . . . . . . . . . . . . . . . . . . . . . . . . . . . . . . . . . . . . . . . . . . . . . (272) (209) (192)Other . . . . . . . . . . . . . . . . . . . . . . . . . . . . . . . . . . . . . . . . . . . . . . . . . . . . (68) (10) (10)
Earnings (loss) from continuing operations before income taxes, minorityinterests and equity in net earnings (loss) of associated companies . . . . . . . . . 141 (2,656) (283)
Income tax benefit (expense) . . . . . . . . . . . . . . . . . . . . . . . . . . . . . . . . . . . . . . (60) 81 20
81 (2,575) (263)Minority interests — net of tax . . . . . . . . . . . . . . . . . . . . . . . . . . . . . . . . . . . . . (59) (39) (33)Equity in net earnings (loss) of associated companies — net of tax . . . . . . . . . . (3) 3 —
Net earnings (loss) from continuing operations . . . . . . . . . . . . . . . . . . . . . . . . . 19 (2,611) (296)Net earnings from discontinued operations — net of tax . . . . . . . . . . . . . . . . . . — 1 49
Net earnings (loss) before cumulative effect of accounting change . . . . . . . . . . . 19 (2,610) (247)Cumulative effect of accounting change — net of tax (note 3) . . . . . . . . . . . . . . 9 — —
Net earnings (loss) . . . . . . . . . . . . . . . . . . . . . . . . . . . . . . . . . . . . . . . . . . . . . . $ 28 $ (2,610) $ (247)
Basic and diluted earnings (loss) per common share— from continuing operations . . . . . . . . . . . . . . . . . . . . . . . . . . . . . . . . . . $ 0.06 $ (6.02) $ (0.68)— from discontinued operations . . . . . . . . . . . . . . . . . . . . . . . . . . . . . . . . 0.00 0.00 0.11
Basic and diluted earnings (loss) per common share . . . . . . . . . . . . . . . . . . . . . $ 0.06 $ (6.02) $ (0.57)
(a) Includes related costs.* See note 4
The accompanying notes are an integral part of these consolidated financial statements
90
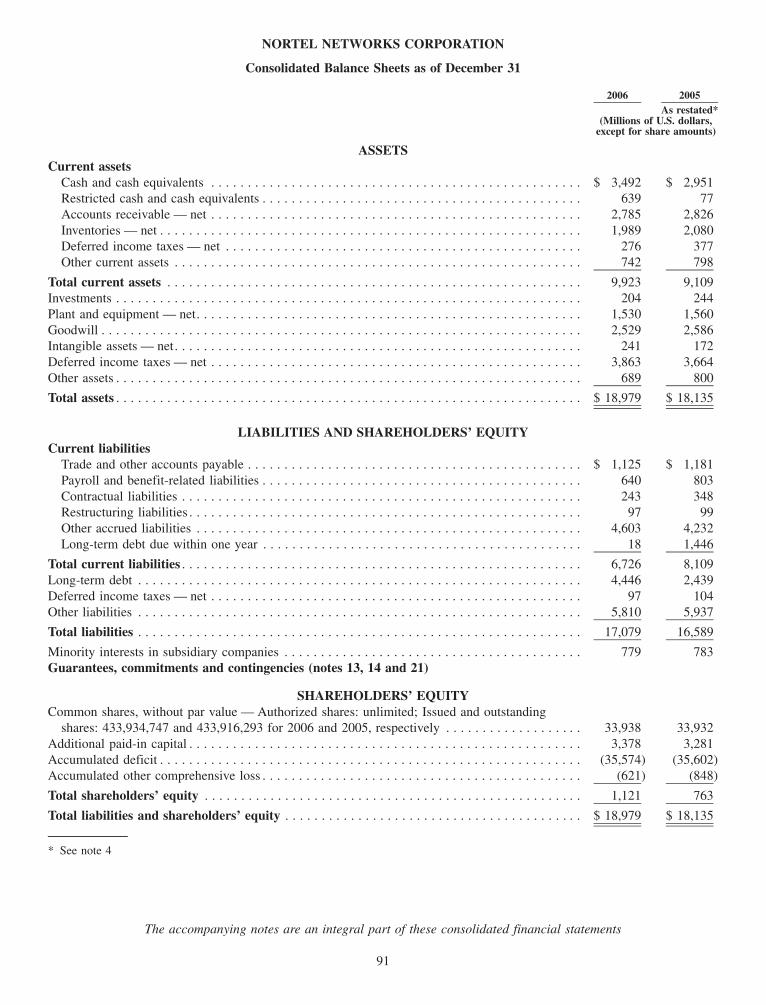
NORTEL NETWORKS CORPORATION
Consolidated Balance Sheets as of December 31
2006 2005As restated*
(Millions of U.S. dollars,except for share amounts)
ASSETSCurrent assets
Cash and cash equivalents . . . . . . . . . . . . . . . . . . . . . . . . . . . . . . . . . . . . . . . . . . . . . . . . . . . $ 3,492 $ 2,951Restricted cash and cash equivalents . . . . . . . . . . . . . . . . . . . . . . . . . . . . . . . . . . . . . . . . . . . . 639 77Accounts receivable — net . . . . . . . . . . . . . . . . . . . . . . . . . . . . . . . . . . . . . . . . . . . . . . . . . . . 2,785 2,826Inventories — net . . . . . . . . . . . . . . . . . . . . . . . . . . . . . . . . . . . . . . . . . . . . . . . . . . . . . . . . . . 1,989 2,080Deferred income taxes — net . . . . . . . . . . . . . . . . . . . . . . . . . . . . . . . . . . . . . . . . . . . . . . . . . 276 377Other current assets . . . . . . . . . . . . . . . . . . . . . . . . . . . . . . . . . . . . . . . . . . . . . . . . . . . . . . . . 742 798
Total current assets . . . . . . . . . . . . . . . . . . . . . . . . . . . . . . . . . . . . . . . . . . . . . . . . . . . . . . . . . 9,923 9,109Investments . . . . . . . . . . . . . . . . . . . . . . . . . . . . . . . . . . . . . . . . . . . . . . . . . . . . . . . . . . . . . . . . 204 244Plant and equipment — net. . . . . . . . . . . . . . . . . . . . . . . . . . . . . . . . . . . . . . . . . . . . . . . . . . . . . 1,530 1,560Goodwill . . . . . . . . . . . . . . . . . . . . . . . . . . . . . . . . . . . . . . . . . . . . . . . . . . . . . . . . . . . . . . . . . . 2,529 2,586Intangible assets — net. . . . . . . . . . . . . . . . . . . . . . . . . . . . . . . . . . . . . . . . . . . . . . . . . . . . . . . . 241 172Deferred income taxes — net . . . . . . . . . . . . . . . . . . . . . . . . . . . . . . . . . . . . . . . . . . . . . . . . . . . 3,863 3,664Other assets . . . . . . . . . . . . . . . . . . . . . . . . . . . . . . . . . . . . . . . . . . . . . . . . . . . . . . . . . . . . . . . . 689 800
Total assets . . . . . . . . . . . . . . . . . . . . . . . . . . . . . . . . . . . . . . . . . . . . . . . . . . . . . . . . . . . . . . . . $ 18,979 $ 18,135
LIABILITIES AND SHAREHOLDERS’ EQUITYCurrent liabilities
Trade and other accounts payable . . . . . . . . . . . . . . . . . . . . . . . . . . . . . . . . . . . . . . . . . . . . . . $ 1,125 $ 1,181Payroll and benefit-related liabilities . . . . . . . . . . . . . . . . . . . . . . . . . . . . . . . . . . . . . . . . . . . . 640 803Contractual liabilities . . . . . . . . . . . . . . . . . . . . . . . . . . . . . . . . . . . . . . . . . . . . . . . . . . . . . . . 243 348Restructuring liabilities . . . . . . . . . . . . . . . . . . . . . . . . . . . . . . . . . . . . . . . . . . . . . . . . . . . . . . 97 99Other accrued liabilities . . . . . . . . . . . . . . . . . . . . . . . . . . . . . . . . . . . . . . . . . . . . . . . . . . . . . 4,603 4,232Long-term debt due within one year . . . . . . . . . . . . . . . . . . . . . . . . . . . . . . . . . . . . . . . . . . . . 18 1,446
Total current liabilities . . . . . . . . . . . . . . . . . . . . . . . . . . . . . . . . . . . . . . . . . . . . . . . . . . . . . . . 6,726 8,109Long-term debt . . . . . . . . . . . . . . . . . . . . . . . . . . . . . . . . . . . . . . . . . . . . . . . . . . . . . . . . . . . . . 4,446 2,439Deferred income taxes — net . . . . . . . . . . . . . . . . . . . . . . . . . . . . . . . . . . . . . . . . . . . . . . . . . . . 97 104Other liabilities . . . . . . . . . . . . . . . . . . . . . . . . . . . . . . . . . . . . . . . . . . . . . . . . . . . . . . . . . . . . . 5,810 5,937
Total liabilities . . . . . . . . . . . . . . . . . . . . . . . . . . . . . . . . . . . . . . . . . . . . . . . . . . . . . . . . . . . . . 17,079 16,589
Minority interests in subsidiary companies . . . . . . . . . . . . . . . . . . . . . . . . . . . . . . . . . . . . . . . . . 779 783Guarantees, commitments and contingencies (notes 13, 14 and 21)
SHAREHOLDERS’ EQUITYCommon shares, without par value — Authorized shares: unlimited; Issued and outstanding
shares: 433,934,747 and 433,916,293 for 2006 and 2005, respectively . . . . . . . . . . . . . . . . . . . 33,938 33,932Additional paid-in capital . . . . . . . . . . . . . . . . . . . . . . . . . . . . . . . . . . . . . . . . . . . . . . . . . . . . . . 3,378 3,281Accumulated deficit . . . . . . . . . . . . . . . . . . . . . . . . . . . . . . . . . . . . . . . . . . . . . . . . . . . . . . . . . . (35,574) (35,602)Accumulated other comprehensive loss . . . . . . . . . . . . . . . . . . . . . . . . . . . . . . . . . . . . . . . . . . . . (621) (848)
Total shareholders’ equity . . . . . . . . . . . . . . . . . . . . . . . . . . . . . . . . . . . . . . . . . . . . . . . . . . . . 1,121 763
Total liabilities and shareholders’ equity . . . . . . . . . . . . . . . . . . . . . . . . . . . . . . . . . . . . . . . . . $ 18,979 $ 18,135
* See note 4
The accompanying notes are an integral part of these consolidated financial statements
91
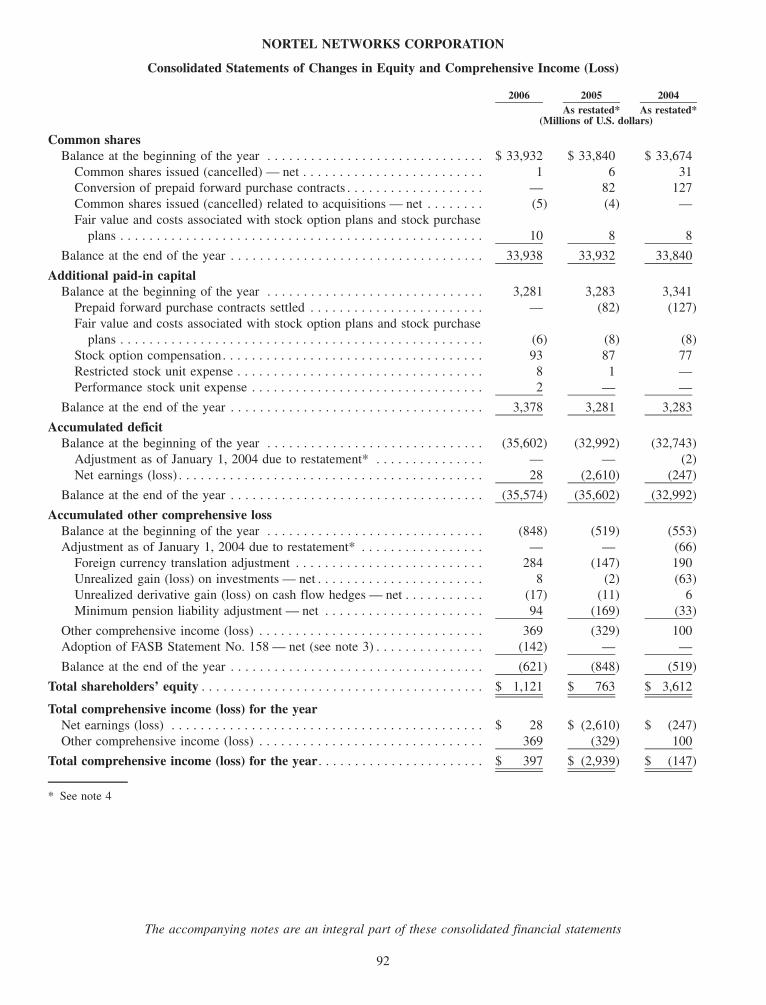
NORTEL NETWORKS CORPORATION
Consolidated Statements of Changes in Equity and Comprehensive Income (Loss)
2006 2005 2004As restated* As restated*
(Millions of U.S. dollars)
Common sharesBalance at the beginning of the year . . . . . . . . . . . . . . . . . . . . . . . . . . . . . . $ 33,932 $ 33,840 $ 33,674
Common shares issued (cancelled) — net . . . . . . . . . . . . . . . . . . . . . . . . . 1 6 31Conversion of prepaid forward purchase contracts . . . . . . . . . . . . . . . . . . . — 82 127Common shares issued (cancelled) related to acquisitions — net . . . . . . . . (5) (4) —Fair value and costs associated with stock option plans and stock purchase
plans . . . . . . . . . . . . . . . . . . . . . . . . . . . . . . . . . . . . . . . . . . . . . . . . . . 10 8 8
Balance at the end of the year . . . . . . . . . . . . . . . . . . . . . . . . . . . . . . . . . . . 33,938 33,932 33,840
Additional paid-in capitalBalance at the beginning of the year . . . . . . . . . . . . . . . . . . . . . . . . . . . . . . 3,281 3,283 3,341
Prepaid forward purchase contracts settled . . . . . . . . . . . . . . . . . . . . . . . . — (82) (127)Fair value and costs associated with stock option plans and stock purchase
plans . . . . . . . . . . . . . . . . . . . . . . . . . . . . . . . . . . . . . . . . . . . . . . . . . . (6) (8) (8)Stock option compensation. . . . . . . . . . . . . . . . . . . . . . . . . . . . . . . . . . . . 93 87 77Restricted stock unit expense . . . . . . . . . . . . . . . . . . . . . . . . . . . . . . . . . . 8 1 —Performance stock unit expense . . . . . . . . . . . . . . . . . . . . . . . . . . . . . . . . 2 — —
Balance at the end of the year . . . . . . . . . . . . . . . . . . . . . . . . . . . . . . . . . . . 3,378 3,281 3,283
Accumulated deficitBalance at the beginning of the year . . . . . . . . . . . . . . . . . . . . . . . . . . . . . . (35,602) (32,992) (32,743)
Adjustment as of January 1, 2004 due to restatement* . . . . . . . . . . . . . . . — — (2)Net earnings (loss) . . . . . . . . . . . . . . . . . . . . . . . . . . . . . . . . . . . . . . . . . . 28 (2,610) (247)
Balance at the end of the year . . . . . . . . . . . . . . . . . . . . . . . . . . . . . . . . . . . (35,574) (35,602) (32,992)
Accumulated other comprehensive lossBalance at the beginning of the year . . . . . . . . . . . . . . . . . . . . . . . . . . . . . . (848) (519) (553)Adjustment as of January 1, 2004 due to restatement* . . . . . . . . . . . . . . . . . — — (66)
Foreign currency translation adjustment . . . . . . . . . . . . . . . . . . . . . . . . . . 284 (147) 190Unrealized gain (loss) on investments — net . . . . . . . . . . . . . . . . . . . . . . . 8 (2) (63)Unrealized derivative gain (loss) on cash flow hedges — net . . . . . . . . . . . (17) (11) 6Minimum pension liability adjustment — net . . . . . . . . . . . . . . . . . . . . . . 94 (169) (33)
Other comprehensive income (loss) . . . . . . . . . . . . . . . . . . . . . . . . . . . . . . . 369 (329) 100Adoption of FASB Statement No. 158 — net (see note 3) . . . . . . . . . . . . . . . (142) — —
Balance at the end of the year . . . . . . . . . . . . . . . . . . . . . . . . . . . . . . . . . . . (621) (848) (519)
Total shareholders’ equity . . . . . . . . . . . . . . . . . . . . . . . . . . . . . . . . . . . . . . . $ 1,121 $ 763 $ 3,612
Total comprehensive income (loss) for the yearNet earnings (loss) . . . . . . . . . . . . . . . . . . . . . . . . . . . . . . . . . . . . . . . . . . . $ 28 $ (2,610) $ (247)Other comprehensive income (loss) . . . . . . . . . . . . . . . . . . . . . . . . . . . . . . . 369 (329) 100
Total comprehensive income (loss) for the year. . . . . . . . . . . . . . . . . . . . . . . $ 397 $ (2,939) $ (147)
* See note 4
The accompanying notes are an integral part of these consolidated financial statements
92

NORTEL NETWORKS CORPORATION
Consolidated Statements of Cash Flows for the years ended December 31
2006 2005 2004As restated* As restated*
(Millions of U.S. dollars)
Cash flows from (used in) operating activitiesNet earnings (loss) . . . . . . . . . . . . . . . . . . . . . . . . . . . . . . . . . . . . . . . . . . . . . . . . . . . . $ 28 $(2,610) $ (247)Adjustments to reconcile net earnings (loss) from continuing operations to net cash from
(used in) operating activities, net of effects from acquisitions and divestitures ofbusinesses:Amortization and depreciation. . . . . . . . . . . . . . . . . . . . . . . . . . . . . . . . . . . . . . . . . . 290 302 341Non-cash portion of shareholder litigation settlement expense (recovery) . . . . . . . . . . . (219) 1,899 —Non-cash portion of special charges and related asset write downs . . . . . . . . . . . . . . . . 3 38 6Non-cash portion of in-process research and development expense . . . . . . . . . . . . . . . . 22 — —Equity in net (earnings) loss of associated companies . . . . . . . . . . . . . . . . . . . . . . . . . 3 (3) —Stock based compensation expense . . . . . . . . . . . . . . . . . . . . . . . . . . . . . . . . . . . . . . 112 88 77Deferred income taxes . . . . . . . . . . . . . . . . . . . . . . . . . . . . . . . . . . . . . . . . . . . . . . . 31 (116) (47)Net (earnings) from discontinued operations . . . . . . . . . . . . . . . . . . . . . . . . . . . . . . . . — (1) (49)Cumulative effect of accounting change . . . . . . . . . . . . . . . . . . . . . . . . . . . . . . . . . . . (9) — —Pension and other accruals . . . . . . . . . . . . . . . . . . . . . . . . . . . . . . . . . . . . . . . . . . . . 346 299 220(Gain) loss on sale or write down of investments, businesses and assets . . . . . . . . . . . . (200) (20) (110)Minority interests . . . . . . . . . . . . . . . . . . . . . . . . . . . . . . . . . . . . . . . . . . . . . . . . . . . 59 39 33Other — net . . . . . . . . . . . . . . . . . . . . . . . . . . . . . . . . . . . . . . . . . . . . . . . . . . . . . . . 220 123 274Change in operating assets and liabilities . . . . . . . . . . . . . . . . . . . . . . . . . . . . . . . . . . (449) (217) (683)
Net cash from (used in) operating activities of continuing operations . . . . . . . . . . . . . . . . 237 (179) (185)
Cash flows from (used in) investing activitiesExpenditures for plant and equipment . . . . . . . . . . . . . . . . . . . . . . . . . . . . . . . . . . . . . . (316) (258) (276)Proceeds on disposals of plant and equipment . . . . . . . . . . . . . . . . . . . . . . . . . . . . . . . . 143 10 10Change in restricted cash and cash equivalents . . . . . . . . . . . . . . . . . . . . . . . . . . . . . . . . (557) 3 (11)Acquisitions of investments and businesses — net of cash acquired . . . . . . . . . . . . . . . . . (146) (651) (5)Proceeds from the sale of investments and businesses . . . . . . . . . . . . . . . . . . . . . . . . . . . 603 470 150
Net cash from (used in) investing activities of continuing operations . . . . . . . . . . . . . . . . (273) (426) (132)
Cash flows from (used in) financing activitiesDividends paid by subsidiaries to minority interests . . . . . . . . . . . . . . . . . . . . . . . . . . . . (60) (43) (33)Increase in notes payable . . . . . . . . . . . . . . . . . . . . . . . . . . . . . . . . . . . . . . . . . . . . . . . 105 70 92Decrease in notes payable . . . . . . . . . . . . . . . . . . . . . . . . . . . . . . . . . . . . . . . . . . . . . . (79) (83) (84)Proceeds from issuance of long-term debt . . . . . . . . . . . . . . . . . . . . . . . . . . . . . . . . . . . 3,300 — —Repayments of long-term debt . . . . . . . . . . . . . . . . . . . . . . . . . . . . . . . . . . . . . . . . . . . (2,725) — (107)Debt issuance cost . . . . . . . . . . . . . . . . . . . . . . . . . . . . . . . . . . . . . . . . . . . . . . . . . . . . (42) — —Increase in capital leases payable . . . . . . . . . . . . . . . . . . . . . . . . . . . . . . . . . . . . . . . . . 1 — —Decrease in capital leases payable . . . . . . . . . . . . . . . . . . . . . . . . . . . . . . . . . . . . . . . . . (17) (10) (9)Issuance of common shares . . . . . . . . . . . . . . . . . . . . . . . . . . . . . . . . . . . . . . . . . . . . . 1 6 31Common share consolidation cost . . . . . . . . . . . . . . . . . . . . . . . . . . . . . . . . . . . . . . . . . (1) — —
Net cash from (used in) financing activities of continuing operations . . . . . . . . . . . . . . . . 483 (60) (110)
Effect of foreign exchange rate changes on cash and cash equivalents . . . . . . . . . . . . . . . . . 94 (102) 88
Net cash from (used in) continuing operations . . . . . . . . . . . . . . . . . . . . . . . . . . . . . . . . . . 541 (767) (339)Net cash from (used in) operating activities of discontinued operations . . . . . . . . . . . . . . . . — 33 22
Net increase (decrease) in cash and cash equivalents . . . . . . . . . . . . . . . . . . . . . . . . . . . 541 (734) (317)
Cash and cash equivalents at beginning of year . . . . . . . . . . . . . . . . . . . . . . . . . . . . . . . 2,951 3,685 4,002
Cash and cash equivalents at end of year . . . . . . . . . . . . . . . . . . . . . . . . . . . . . . . . . . . . $ 3,492 $ 2,951 $3,685
* See note 4
The accompanying notes are an integral part of these consolidated financial statements
93

NORTEL NETWORKS CORPORATION
Notes to Consolidated Financial Statements(Millions of U.S. dollars, except per share amounts, unless otherwise stated)
1. Nortel Networks Corporation
Nortel Networks Corporation (“Nortel”) is a global supplier of end-to-end networking products and solutions serving bothservice providers and enterprise customers. Nortel’s technologies span access and core networks, support multimedia andbusiness-critical applications. Nortel’s networking solutions consist of hardware, software and services. Nortel’s businessactivities include the design, development, assembly, marketing, sale, licensing, installation, servicing and support of thesenetworking solutions.
The common shares of Nortel Networks Corporation are publicly traded on the New York Stock Exchange (“NYSE”) andToronto Stock Exchange (“TSX”) under the symbol “NT”. Nortel Networks Limited (“NNL”) is Nortel’s principal directoperating subsidiary and its results are consolidated into Nortel’s results. Nortel holds all of NNL’s outstanding commonshares but none of its outstanding preferred shares. NNL’s preferred shares are reported in minority interests in subsidiarycompanies in the consolidated balance sheets, and dividends on preferred shares are reported in minority interests — netof tax in the consolidated statements of operations.
2. Significant accounting policies
Basis of presentation
The consolidated financial statements of Nortel have been prepared in accordance with accounting principles generallyaccepted in the United States (“U.S. GAAP”) and the rules and regulations of the U.S. Securities and ExchangeCommission (the “SEC”) for the preparation of financial statements. Although Nortel is headquartered in Canada, theconsolidated financial statements are expressed in U.S. dollars as the greater part of the financial results and net assets ofNortel are denominated in U.S. dollars. Certain prior year amounts have been reclassified to conform to Nortel’s currentpresentation.
In conjunction with the establishment of Nortel’s Global Services operating segment in the third quarter of 2006, Nortelhas disclosed the revenues and related cost of revenues from both its products and services in its audited consolidatedstatements of operations.
On November 6, 2006, Nortel’s Board of Directors approved a consolidation of Nortel’s outstanding common shares at aratio of 1 consolidated share for 10 pre-consolidated shares in accordance with the authority given to the Board by theNortel shareholders at the annual and special meeting of shareholders held June 29, 2006. Nortel’s shares began tradingon the TSX and NYSE on a consolidated basis on December 1, 2006. All references to share and per share data for allperiods presented in the consolidated financial statements have been adjusted to give effect to the 1 for 10 common shareconsolidation.
(a) Principles of consolidation
The financial statements of entities which are controlled by Nortel through voting equity interests, referred to assubsidiaries, are consolidated into Nortel’s results. Entities which are controlled jointly with another entity, referred to asjoint ventures, and entities which are not controlled by Nortel but over which Nortel has the ability to exercise significantinfluence, referred to as associated companies, are accounted for using the equity method. Variable Interest Entities(“VIEs”) (which include, but are not limited to, special purpose entities, trusts, partnerships, certain joint ventures andother legal structures), as defined by the Financial Accounting Standards Board (“FASB”) in FASB Interpretation No.(“FIN”) 46 (revised December 2003), “Consolidation of Variable Interest Entities — an Interpretation of AccountingResearch Bulletin No. 51” (“FIN 46R”), are entities in which equity investors generally do not have the characteristics ofa “controlling financial interest” or there is not sufficient equity at risk for the entity to finance its activities withoutadditional subordinated financial support. VIEs are consolidated by Nortel when it is determined that it will, as theprimary beneficiary, absorb the majority of the VIEs’ expected losses and/or expected residual returns. Intercompanyaccounts and transactions are eliminated upon consolidation and unrealized intercompany gains and losses are eliminatedwhen accounting under the equity method.
94

(b) Use of estimates
Nortel makes estimates and assumptions that affect the reported amounts of assets and liabilities and disclosure ofcontingent assets and liabilities as of the date of the consolidated financial statements and the reported amounts ofrevenues and expenses during the reporting period. Actual results may differ from those estimates. Estimates are usedwhen accounting for items and matters such as revenue recognition and accruals for losses on contracts, allowances foruncollectible accounts receivable and customer financing, receivables sales, inventory obsolescence, product warranty,amortization, asset valuations, asset retirement obligations, impairment assessments, employee benefits including pensions,taxes and related valuation allowances and provisions, research and development provisions, restructuring and otherprovisions, stock-based compensation and contingencies.
(c) Translation of foreign currencies
The consolidated financial statements of Nortel are presented in U.S. dollars. The financial statements of Nortel’soperations whose functional currency is not the U.S. dollar (except for highly inflationary economies as described below)are translated into U.S. dollars at the exchange rates in effect at the balance sheet dates for assets and liabilities, and ataverage rates for the period for revenues and expenses. The unrealized translation gains and losses on Nortel’s netinvestment in these operations, including long-term intercompany advances considered to form part of the net investment,are accumulated as a component of other comprehensive income (loss) (“OCI”).
Transactions and financial statements for Nortel’s operations in countries considered to have highly inflationary economiesuse the U.S. dollar as their functional currency. Resulting translation gains or losses are reflected in net earnings (loss).
When appropriate, Nortel may hedge a designated portion of the exposure to foreign exchange gains and losses incurredon the translation of specific foreign operations. Derivative instruments used by Nortel can include foreign currency-denominated debt, foreign currency swaps and foreign currency forward and option contracts that are denominated in thesame currency as the hedged foreign operations. The translation gains and losses on the effective portion of the cash flowhedging instruments that qualify for hedge accounting are recorded in OCI; other translation gains and losses not relatedto cash flow hedges are recorded in net earnings (loss).
(d) Revenue recognition
Nortel’s products and services are generally sold pursuant to a contract and the terms of the contract, taken as a whole,determine the appropriate revenue recognition methods to be applied. Product revenue includes revenue from arrangementsthat include services such as installation, engineering and network planning where the services could not be separatedfrom the arrangement because the services are essential or fair value could not be established. Services revenue reportedin the audited consolidated statements of operations is comprised of revenue from Nortel’s Global Services segment(excluding services bundled with product sales).
Depending upon the terms of the contract and types of products and services sold, Nortel recognizes revenue underAmerican Institute of Certified Public Accountants Statement of Position (“SOP”) 81-1, “Accounting for Performance ofConstruction-Type and Certain Production-Type Contracts” (“SOP 81-1”), SOP 97-2, “Software Revenue Recognition”(“SOP 97-2”), and SEC Staff Accounting Bulletin (“SAB”) 104, “Revenue Recognition” (“SAB 104”), which waspreceded by SAB 101, “Revenue Recognition in Financial Statements” (“SAB 101”), prior to December 2003. Revenue isrecognized net of cash discounts and allowances.
Effective July 1, 2003, for contracts involving multiple deliverables, where the deliverables are governed by more thanone authoritative accounting standard, Nortel generally applies the FASB Emerging Issues Task Force (“EITF”) IssueNo. 00-21, “Revenue Arrangements with Multiple Deliverables” (“EITF 00-21”), and evaluates each deliverable todetermine whether it represents a separate unit of accounting based on the following criteria: (a) whether the delivereditem has value to the customer on a stand-alone basis, (b) whether there is objective and reliable evidence of the fair valueof the undelivered item(s), and (c) if the contract includes a general right of return relative to the delivered item, deliveryor performance of the undelivered item(s) is considered probable and substantially in the control of Nortel. If objectiveand reliable evidence of fair value exists for all units of accounting in the arrangement, revenue is allocated to each unitof accounting or element based on relative fair values. In situations where there is objective and reliable evidence of fairvalue for all undelivered elements, but not for delivered elements, the residual method is used to allocate the contract
95
NORTEL NETWORKS CORPORATION
Notes to Consolidated Financial Statements — (Continued)
consideration. Under the residual method, the amount of revenue allocated to delivered elements equals the totalarrangement consideration less the aggregate fair value of any undelivered elements. Each unit of accounting is thenaccounted for under the applicable revenue recognition guidance. So long as elements otherwise governed by separateauthoritative accounting standards cannot be treated as separate units of accounting under the guidance in EITF 00-21, theelements are combined into a single unit of accounting for revenue recognition purposes. In this case, revenue allocated tothe unit of accounting is deferred until all combined elements have been delivered or, once there is only one remainingelement to be delivered, based on the revenue recognition guidance applicable to the last delivered element within the unitof accounting.
For arrangements that include hardware and software where software is considered more than incidental to the hardware,provided that the software is not essential to the functionality of the hardware and the hardware and software representseparate units of accounting, revenue related to the software element is recognized under SOP 97-2 and revenue related tothe hardware element is recognized under SOP 81-1 or SAB 104. For arrangements where the software is consideredmore than incidental and essential to the functionality of the hardware, or where the hardware is not considered a separateunit of accounting from the software deliverables, revenue is recognized for the software and the hardware as a single unitof accounting pursuant to SOP 97-2 for off-the-shelf products and pursuant to SOP 81-1 for customized products.
Prior to July 1, 2003, for contracts involving multiple elements, Nortel allocated revenue to each element based on therelative fair value or the residual method, as applicable. Provided none of the undelivered elements were essential to thefunctionality of the delivered elements, revenue related to the software element was recognized under SOP 97-2 andrevenue related to the hardware element was recognized under SOP 81-1 or SAB 101.
For elements related to customized network solutions and certain network build-outs, revenues are recognized underSOP 81-1, generally using the percentage-of-completion method. In using the percentage-of-completion method, revenuesare generally recorded based on a measure of the percentage of costs incurred to date on a contract relative to theestimated total expected contract costs. Profit estimates on long-term contracts are revised periodically based on changesin circumstances and any losses on contracts are recognized in the period that such losses become known. Generally, theterms of long-term contracts provide for progress billing based on completion of certain phases of work. Contract revenuesrecognized, based on costs incurred toward the completion of the project, that are unbilled are accumulated in thecontracts in progress account included in accounts receivable — net. Billings in excess of revenues recognized to date onlong-term contracts are recorded as advance billings in excess of revenues recognized to date on contracts within otheraccrued liabilities. In circumstances where reasonably dependable cost estimates cannot be made for a customized networksolution or build-out element and there is no assurance that a loss will not be incurred on the element, all revenues andcertain costs are deferred until completion of the element (“completed contract accounting”).
Revenue for hardware that does not require significant customization, and where any software is considered incidental, isrecognized under SAB 104, provided, however, that revenue is recognized when persuasive evidence of an arrangementexists, delivery has occurred or services have been rendered, the fee is fixed or determinable and collectibility isreasonably assured.
For hardware, delivery is considered to have occurred upon shipment provided that risk of loss, and legal title in certainjurisdictions, have been transferred to the customer.
For arrangements where the criteria for revenue recognition have not been met because legal title or risk of loss onproducts does not transfer to the customer until final payment has been received or where delivery has not occurred,revenue is deferred to a later period when legal title or risk of loss passes either on delivery or on receipt of paymentfrom the customer. For arrangements where the customer agrees to purchase products but Nortel retains possession untilthe customer requests shipment (“bill and hold arrangements”), revenue is not recognized until delivery to the customerhas occurred and all other revenue recognition criteria have been met.
Services revenue is generally recognized according to the proportional performance method. The proportional performancemethod is used when the provision of services extends beyond an accounting period with more than one performance act,and permits the recognition of revenue ratably over the services period when no other pattern of performance isdiscernable. The nature of the service contract is reviewed to determine which revenue recognition method best reflectsthe nature of services performed. Provided all other revenue recognition criteria have been met, the revenue recognition
96
NORTEL NETWORKS CORPORATION
Notes to Consolidated Financial Statements — (Continued)
method selected reflects the pattern in which the obligations to the customers have been fulfilled. Engineering andinstallation revenues are generally recognized as the services are performed.
Nortel makes certain sales through multiple distribution channels, primarily resellers and distributors. These customers aregenerally given certain rights of return. For products sold through these distribution channels, revenue is recognized fromproduct sale at the time of shipment to the distribution channel when persuasive evidence of an arrangement exists,delivery has occurred, the fee is fixed or determinable and collectibility is reasonably assured. Accruals for estimated salesreturns and other allowances are recorded at the time of revenue recognition and are based on contract terms and priorclaims experience.
Software revenue is generally recognized under SOP 97-2. For software arrangements involving multiple elements, Nortelallocates revenue to each element based on the relative fair value or the residual method, as applicable, and using vendorspecific objective evidence of fair values, which is based on prices charged when the element is sold separately. Softwarerevenue accounted for under SOP 97-2 is recognized when persuasive evidence of an arrangement exists, the software isdelivered in accordance with all terms and conditions of the customer contracts, the fee is fixed or determinable andcollectibility is reasonably assured. Revenue related to post-contract support (“PCS”), including technical support andunspecified when-and-if available software upgrades, is recognized ratably over the PCS term.
Under SAB 104 or SOP 97-2, if fair value does not exist for any undelivered element, revenue is not recognized until theearlier of (i) the undelivered element is delivered or (ii) fair value of the undelivered element exists, unless the undeliveredelement is a service, in which case revenue is recognized as the service is performed once the service is the onlyundelivered element.
(e) Research and development
Research and development (“R&D”) costs are charged to net earnings (loss) in the periods in which they are incurred.However, costs incurred pursuant to specific contracts with third parties for which Nortel is obligated to deliver a productare charged to cost of revenues in the same period as the related revenue is recognized. Related global investment taxcredits are deducted from the income tax provision.
(f) Income taxes
Nortel provides for income taxes using the asset and liability method. This approach recognizes the amount of taxespayable or refundable for the current year as well as deferred tax assets and liabilities for the future tax consequence ofevents recognized in the consolidated financial statements and tax returns. Deferred income taxes are adjusted to reflectthe effects of changes in tax laws or enacted tax rates.
In establishing the appropriate income tax valuation allowances, Nortel assesses its net deferred tax assets quarterly andbased on all available evidence, both positive and negative, determines whether it is more likely than not that theremaining net deferred tax assets or a portion thereof will be realized.
(g) Earnings (loss) per common share
Basic earnings (loss) per common share, is calculated by dividing the net earnings (loss) by the weighted-average numberof Nortel Networks Corporation’s common shares outstanding during the period. Diluted earnings (loss) per common shareis calculated by dividing the applicable net earnings (loss) by the sum of the weighted-average number of Nortel commonshares outstanding and all additional common shares that would have been outstanding if potentially dilutive commonshares had been issued during the period. The treasury stock method is used to compute the dilutive effect of warrants,options and similar instruments. The if-converted method is used to compute the dilutive effect of convertible debt. Acomparison of the conditions required for issuance of shares compared to those existing at the end of the period is used tocompute the dilutive effect of contingently issuable shares.
97
NORTEL NETWORKS CORPORATION
Notes to Consolidated Financial Statements — (Continued)
(h) Cash and cash equivalents
Cash and cash equivalents consist of cash on hand, balances with banks and short-term investments. All highly liquidinvestments with original maturities of three months or less are classified as cash and cash equivalents. The amountspresented in the consolidated financial statements approximate the fair value of cash and cash equivalents.
(i) Restricted cash and cash equivalents
Cash and cash equivalents are considered restricted when they are subject to contingent rights of a third party customerunder bid, performance related, and other bonds associated with contracts that Nortel is not able to unilaterally revoke.Cash and cash equivalents collateral may be provided, often in addition to the payment of fees to the other party, as aresult of the general economic and industry environment, and of Nortel’s and NNL’s credit ratings.
(j) Provision for doubtful accounts
The provision for doubtful accounts for trade, notes and long-term receivables due from customers is established based onan assessment of a customer’s credit quality, as well as subjective factors and trends, including the aging of receivablebalances. Generally, these credit assessments occur prior to the inception of the credit exposure and at regular reviewsduring the life of the exposure.
Customer financing receivables include receivables from customers with deferred payment terms. Customer financingreceivables are considered impaired when they are classified as non-performing, payment arrears exceed 90 days or amajor credit event such as a material default has occurred, and management determines that collection of amounts dueaccording to the contractual terms is doubtful. Provisions for impaired customer financing receivables are recorded basedon the expected recovery of defaulted customer obligations, being the present value of expected cash flows, or therealizable value of the collateral if recovery of the receivables is dependent upon a liquidation of the assets. Interestincome on impaired customer finance receivables is recognized as the cash payments are collected.
(k) Inventories
Inventories are valued at the lower of cost (calculated generally on a first-in, first-out basis) or market value. The cost offinished goods and work in process is comprised of material, labor and manufacturing overhead. Provisions for inventoryare based on estimates of future customer demand for products, including general economic conditions, growth prospectswithin the customer’s ultimate marketplaces and market acceptance of current and pending products. In addition, fullprovisions are generally recorded for surplus inventory in excess of one year’s forecast demand or inventory deemedobsolete.
Inventory includes certain direct and incremental deferred costs associated with arrangements where title and risk of losswas transferred to customers but revenue was deferred due to other revenue recognition criteria not being met.
(l) Receivables sales
Transfers of accounts receivable that meet the criteria for surrender of control under FASB Statement of FinancialAccounting Standard (“SFAS”) No. 140, “Accounting for Transfers and Servicing of Financial Assets and Extinguishmentsof Liabilities”, are accounted for as sales. Generally, Nortel retains servicing rights and, in some cases, provides limitedrecourse when it sells receivables. A gain or loss is recorded as an operating expense (recovery) within selling, generaland administrative (“SG&A”), at the date of the receivables sale and is based upon, in part, the previous carrying amountof the receivables involved in the transfer allocated between the assets sold and the retained interests based on theirrelative fair values at the date of the transfer. Fair value is generally estimated based on the present value of the estimatedfuture cash flows expected under management’s assumptions, including discount rates assigned commensurate with risks.Retained interests are classified as available-for-sale securities.
Nortel, when acting as the servicing agent, generally does not record an asset or liability related to servicing as the annualservicing fees are equivalent to those that would be paid to a third party servicing agent.
Nortel reviews the fair value assigned to retained interests at each reporting date subsequent to the date of the transfer todetermine if there is an other-than-temporary impairment. Fair value is reviewed using similar valuation techniques as
98
NORTEL NETWORKS CORPORATION
Notes to Consolidated Financial Statements — (Continued)

those used to initially measure the retained interest and, if a change in events or circumstances warrants, the fair value isadjusted and any other-than-temporary impairments are recorded in other income (expense) — net.
(m) Investments
Investments in publicly traded equity securities of companies over which Nortel does not exert significant influence areaccounted for at fair value and are classified as available for sale. Unrealized holding gains and losses related to thesesecurities are excluded from net earnings (loss) and are included in OCI until such gains or losses are realized or another-than-temporary impairment is determined to have occurred.
Investments in equity securities of private companies over which Nortel does not exert significant influence are accountedfor using the cost method. Investments in associated companies and joint ventures are accounted for using the equitymethod. An impairment loss is recorded when there has been a loss in value of the investment that isother-than-temporary.
Nortel monitors its investments for factors indicating other-than-temporary impairment and records a charge to netearnings (loss) when appropriate.
(n) Plant and equipment
Plant and equipment are stated at cost less accumulated depreciation. Depreciation is generally calculated on a straight-line basis over the expected useful lives of the plant and equipment. The expected useful lives of buildings are twenty toforty years, and of machinery and equipment are three to ten years. Capitalized software is amortized over three years.
(o) Software development and business reengineering costs
Software development costs
Costs to develop, acquire or modify software solely for Nortel’s internal use are capitalized pursuant to SOP No. 98-1,“Accounting for Costs of Computer Software Developed or Obtained for Internal Use” (“SOP 98-1”). SOP 98-1 requiresqualified internal and external costs (related to such software) incurred during the application development stage to becapitalized and any preliminary project costs (related to such software) and post-implementation costs to be expensed asincurred.
Business reengineering costs
Internal and external costs of business process reengineering activities are expensed pursuant to EITF Issue No. 97-13,“Accounting for Costs Incurred in Connection with a Consulting Contract or an Internal Project that Combines BusinessProcess Reengineering and Information Technology Transformation” (“EITF 97-13”). Information technology transforma-tion projects typically involve implementation of enterprise software packages whereby entities must reengineer theirbusiness processes to connect into the software rather than modify the software to connect into their existing businessprocesses. Software development costs relating to the information technology transformation are capitalized underSOP 98-1 as described above.
(p) Impairment or disposal of long-lived assets (plant and equipment and acquired technology)
Long-lived assets held and used
Nortel tests long-lived assets or asset groups held and used for recoverability when events or changes in circumstancesindicate that their carrying amount may not be recoverable. Circumstances which could trigger a review include, but arenot limited to: significant decreases in the market price of the asset; significant adverse changes in the business climate orlegal factors; the accumulation of costs significantly in excess of the amount originally expected for the acquisition orconstruction of the asset; current period cash flow or operating losses combined with a history of losses or a forecast ofcontinuing losses associated with the use of the asset; and a current expectation that the asset will more likely than not besold or disposed of significantly before the end of its previously estimated useful life.
99
NORTEL NETWORKS CORPORATION
Notes to Consolidated Financial Statements — (Continued)
Recoverability is assessed based on the carrying amount of the asset and the sum of the undiscounted cash flows expectedto result from the use and the eventual disposal of the asset or asset group. An impairment loss is recognized when thecarrying amount is not recoverable and exceeds the fair value of the asset or asset group. The impairment loss is measuredas the amount by which the carrying amount exceeds fair value.
Long-lived assets held for sale
Long-lived assets are classified as held for sale when certain criteria are met, which include: management’s commitmentto a plan to sell the assets; the assets are available for immediate sale in their present condition; an active program tolocate buyers and other actions to sell the assets have been initiated; the sale of the assets is probable and their transfer isexpected to qualify for recognition as a completed sale within one year; the assets are being actively marketed atreasonable prices in relation to their fair value; and it is unlikely that significant changes will be made to the plan to sellthe assets or that the plan will be withdrawn.
Nortel measures long-lived assets to be disposed of by sale at the lower of carrying amount or fair value less cost to sell.These assets are not depreciated.
Long-lived assets to be disposed of other than by sale
Nortel classifies assets that will be disposed of other than by sale as held and used until the disposal transaction occurs.The assets continue to be depreciated based on revisions to their estimated useful lives until the date of disposal orabandonment.
Recoverability is assessed based on the carrying amount of the asset and the sum of the undiscounted cash flows expectedto result from the remaining period of use and the eventual disposal of the asset or asset group. An impairment loss isrecognized when the carrying amount is not recoverable and exceeds the fair value of the asset or asset group. Theimpairment loss is measured as the amount by which the carrying amount exceeds fair value.
Fair value for the purposes of measuring impairment or a planned disposal of long-lived assets is determined using quotedmarket prices or the anticipated cash flows discounted at a rate commensurate with the risk involved.
(q) Goodwill
Goodwill represents the excess of the purchase price of an acquired business over the fair value of the identifiable assetsacquired and liabilities assumed. Nortel tests for impairment of goodwill on an annual basis as of October 1, and at anyother time if events occur or circumstances change that would indicate that it is more likely than not that the fair value ofthe reporting unit has been reduced below its carrying amount.
Circumstances that could trigger an impairment test include: a significant adverse change in the business climate or legalfactors; an adverse action or assessment by a regulator; unanticipated competition; the loss of key personnel; a change inreportable segments; the likelihood that a reporting unit or significant portion of a reporting unit will be sold or otherwisedisposed of; the results of testing for recoverability of a significant asset group within a reporting unit; and the recognitionof a goodwill impairment loss in the financial statements of a subsidiary that is a component of a reporting unit.
The impairment test for goodwill is a two-step process. Step one consists of a comparison of the fair value of a reportingunit with its carrying amount, including the goodwill allocated to the reporting unit. Measurement of the fair value of areporting unit is based on one or more fair value measures including present value techniques of estimated future cashflows and estimated amounts at which the unit as a whole could be bought or sold in a current transaction between willingparties. Nortel also considers its market capitalization as of the date of the impairment test. If the carrying amount of thereporting unit exceeds the fair value, step two requires the fair value of the reporting unit to be allocated to the underlyingassets and liabilities of that reporting unit, resulting in an implied fair value of goodwill. If the carrying amount of thereporting unit goodwill exceeds the implied fair value of that goodwill, an impairment loss equal to the excess is recordedin net earnings (loss).
100
NORTEL NETWORKS CORPORATION
Notes to Consolidated Financial Statements — (Continued)
(r) Intangible assets
Intangible assets consist of acquired technology and other intangible assets. Acquired technology represents the value ofthe proprietary know-how which was technologically feasible as of the acquisition date and is charged to net earnings(loss) on a straight-line basis over its estimated useful life. Other intangible assets are amortized into net earnings (loss)based on their expected pattern of benefit to future periods using estimates of undiscounted cash flows.
(s) Warranty costs
As part of the normal sale of product, Nortel provides its customers with product warranties that extend for periodsgenerally ranging from one to six years from the date of sale. A liability for the expected cost of warranty-related claimsis established when the product is delivered and completed. In estimating warranty liability, historical material replacementcosts and the associated labor costs to correct the product defect are considered. Revisions are made when actualexperience differs materially from historical experience. Warranty related costs incurred before revenue is recognized arecapitalized and recognized as an expense when the related revenue is recognized. Known product defects are specificallyaccrued for as Nortel becomes aware of such defects.
(t) Pension, post-retirement and post-employment benefits
Pension expense, based on management’s assumptions, consists of: actuarially computed costs of pension benefits inrespect of the current year’s service; imputed returns on plan assets and imputed interest on pension obligations; andstraight-line amortization under the corridor approach of experience gains and losses, assumption changes and planamendments over the expected average remaining service life of the employee group.
The expected costs of post-retirement and certain post-employment benefits, other than pensions, for active employees areaccrued in the consolidated financial statements during the years employees provide service to Nortel. These costs arerecorded based on actuarial methods and assumptions. Other post-employment benefits are recognized when the eventtriggering the obligation occurs.
The over-funded or under-funded status of defined benefit pension and post-retirement plans is recognized as an asset orliability, respectively, on the balance sheet.
(u) Derivative financial instruments
Nortel records derivatives as assets and liabilities measured at fair value. The accounting for changes in the fair valuedepends on whether a derivative has been designated as a hedge under hedge accounting, and the type of hedgingrelationship designated. For a derivative designated as a fair value hedge, changes in the fair value of the derivative and ofthe hedged item attributable to the hedged risk are recognized in net earnings (loss) in the period in which the changesoccur. For a derivative designated as a cash flow hedge, the effective portions of changes in the fair value of the derivativeare recorded in OCI and are recognized in net earnings (loss) when the hedged item affects net earnings (loss). Ineffectiveportions of changes in the fair value of the derivative in a cash flow hedge are recognized in other income (expense) —net in the period in which the changes occur. If the derivative has not been designated as an accounting hedge relationshipor if a designated hedging relationship is no longer highly effective, changes in the fair value of the derivative arerecognized in net earnings (loss) in the period in which the changes occur.
When a fair value hedging relationship is terminated because the derivative is sold, terminated or the hedge relationship isde-designated the fair value basis adjustment recorded on the hedged item is recognized in the same manner as the othercomponents of the hedged item. For a cash flow hedge that is terminated because the derivative is sold, expired, or therelationship is de-designated, the amount in OCI continues to be recognized when the hedged item affects net earnings(loss). If a cash flow or fair value hedging relationship is terminated because the underlying hedged item is repaid or issold, or it is no longer probable that the hedged forecasted transaction will occur, the accumulated balance in OCI or thefair value basis adjustment recorded on the hedged item is recorded immediately in net earnings (loss).
Nortel’s policy is to formally document all material relationships between derivative instruments and hedged items, aswell as its risk management objectives and strategy for undertaking various hedge transactions. Where hedge accountingwill be applied, this process includes linking all derivatives to specific assets and liabilities on the consolidated balance
101
NORTEL NETWORKS CORPORATION
Notes to Consolidated Financial Statements — (Continued)

sheet or to specific firm commitments or forecasted transactions. Nortel also formally assesses, both at the hedge’sinception and on an ongoing basis, as applicable, whether the derivatives that are used in designated hedging transactionsare highly effective in offsetting changes in fair values or cash flows of hedged items.
Nortel generally classifies cash flows resulting from its derivative financial instruments in the same manner as the cashflows from the item that the derivative is hedging. Typically, this is within cash flows from (used in) operating activitiesin the consolidated statements of cash flows, or, for derivatives designated as hedges relating to the cash flows associatedwith settlement of the principal component of long-term debt, within cash flows from (used in) financing activities.
Nortel may also invest in warrants to purchase securities of other companies as a strategic investment or receive warrantsin various transactions. Warrants that relate to publicly traded companies or that can be net share settled are deemed to bederivative financial instruments. Such warrants, however, are generally not eligible to be designated as hedging instrumentsas there is no corresponding underlying exposure. In addition, Nortel may enter into certain commercial contractscontaining embedded derivative financial instruments. Generally, for these embedded derivatives, for which the economiccharacteristics and risks are not clearly and closely related to the economic characteristics and risks of the host contract,the changes in fair value are recorded in net earnings (loss).
(v) Stock-based compensation
Nortel employees participate in a number of stock-based compensation plans that are described in note 19. Nortel directorsparticipate in director stock unit plans.
Effective January 1, 2006, Nortel adopted SFAS No. 123R, “Share-Based Payment” (“SFAS 123R”) which revisesSFAS No. 123, “Accounting for Stock-Based Compensation” (“SFAS 123”). Nortel adopted SFAS 123R using themodified prospective transition method and, accordingly, the results of prior periods have not been restated. This methodrequires that the provisions of SFAS 123R are generally applied only to share-based awards granted, modified, repurchasedor cancelled on January 1, 2006 and thereafter. Nortel voluntarily adopted fair value accounting for share-based awardseffective January 1, 2003 (under SFAS 123, as amended by SFAS No. 148, “Accounting for Stock-Based Compensa-tion — Transition and Disclosure — an Amendment of SFAS 123”). Using the prospective method, Nortel measured thecost of share-based awards granted or modified on or after January 1, 2003, using the fair value of the award and beganrecognizing that cost in the consolidated statements of operations over the vesting period. Nortel will recognize theremaining cost of these awards over the remaining service period following the provisions of SFAS 123R. For those share-based awards granted prior to January 1, 2003 and not subsequently modified, that were nonvested and outstanding as ofJanuary 1, 2006, Nortel will recognize the remaining cost of these awards over the remaining service period as requiredby SFAS 123R.
The accounting for Nortel’s stock-based compensation plans under the fair value based method is as follows:
Stock Options
The fair value at grant date of stock options is estimated using the Black-Scholes-Merton option-pricing model.Compensation expense is recognized on a straight-line basis over the stock option vesting period based on the estimatednumber of stock options that are expected to vest.
Restricted Stock Units (“RSUs”), Performance Stock Units (“PSUs”), Deferred Stock Units (“DSUs”) and StockAppreciation Rights (“SARs”)
RSUs that are settled with common shares are valued using the grant date market price of the underlying shares. Thisvaluation is not subsequently adjusted for changes in the market price of the shares prior to settlement of the award.Compensation expense is recognized on a straight-line basis over the vesting period based on the estimated number ofRSU awards that are expected to vest. All RSUs granted have been classified as equity instruments based on thesettlement provisions of the stock-based compensation plans.
PSUs that are settled with common shares are valued using the grant date market price of the underlying shares. Theextent to which PSUs vest and settle at the end of a three year performance period will depend upon the level ofachievement of certain performance criteria based on the relative total shareholder return on the common shares of Nortel
102
NORTEL NETWORKS CORPORATION
Notes to Consolidated Financial Statements — (Continued)
compared to the total shareholder return on the common shares of a comparative group of companies included in the DowJones Technology Titans Index (the “Technology Index”). The number of common shares to be issued for the vested PSUsare determined based on Nortel’s ranking within the Technology Index and can range from 0% to 200%. The estimate ofthe number of common shares to be issued upon the settlement of vested PSUs is determined using a Monte Carlosimulation model. Compensation expense is recognized on a straight-line basis over the vesting period based on theestimated number of PSU awards that are expected to vest. All PSUs granted have been classified as equity instrumentsbased on the settlement provisions of the stock-based compensation plans.
Grants of SARs that are settled in cash at the option of employees are accounted for as liability awards. Grants of SARsthat are settled in stock are accounted for as equity awards.
Grants of DSUs that are settled with stock purchased on the open market are accounted for as liabilities. The value of theliability is remeasured each period based on the cumulative compensation expense recognized for the awards at eachperiod end. This is determined based on the current market price of the underlying stock at period end, the estimatednumber of DSU awards that are expected to vest calculated in the same manner as equity settled RSUs and the portion ofthe vesting period that has elapsed. Subsequent to vesting and prior to settlement of the award, changes in Nortel’spayment obligations are based on changes in the stock price and are recorded as compensation expense each period. Thepayment obligation is established for DSUs on the later of the date of termination of employment and/or directorship.
Stock-based awards, which are substantively discretionary in nature, are measured and recorded fully as compensationexpense in the period that the issuance and settlement of the award is approved.
Employee Stock Purchase Plans (“ESPPs”)
Nortel has stock purchase plans for eligible employees in eligible countries, and a stock purchase plan for eligibleunionized employees in Canada (collectively, the “ESPPs”), to facilitate the acquisition of common shares of NortelNetworks Corporation at a discount. The discount is such that the plans are considered compensatory under the fair valuebased method. Nortel’s contribution to the ESPPs is recorded as compensation expense on a quarterly basis as theobligation to contribute is incurred.
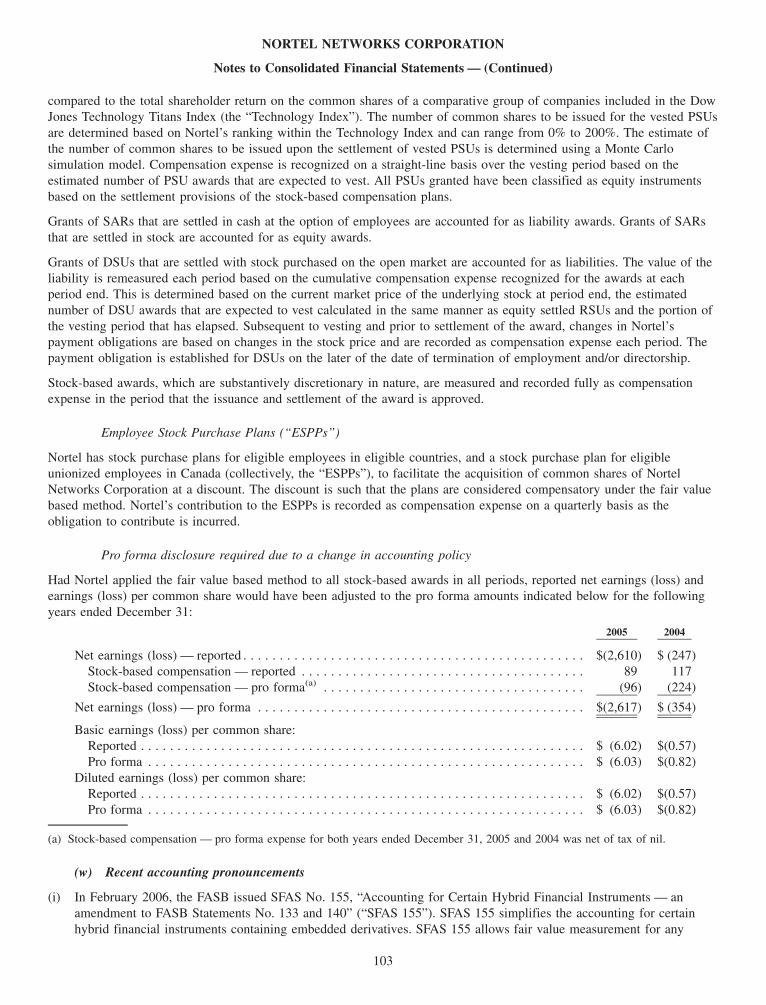
Pro forma disclosure required due to a change in accounting policy
Had Nortel applied the fair value based method to all stock-based awards in all periods, reported net earnings (loss) andearnings (loss) per common share would have been adjusted to the pro forma amounts indicated below for the followingyears ended December 31:
2005 2004
Net earnings (loss) — reported . . . . . . . . . . . . . . . . . . . . . . . . . . . . . . . . . . . . . . . . . . . . . . . $(2,610) $ (247)Stock-based compensation — reported . . . . . . . . . . . . . . . . . . . . . . . . . . . . . . . . . . . . . . . 89 117Stock-based compensation — pro forma(a) . . . . . . . . . . . . . . . . . . . . . . . . . . . . . . . . . . . . (96) (224)
Net earnings (loss) — pro forma . . . . . . . . . . . . . . . . . . . . . . . . . . . . . . . . . . . . . . . . . . . . . $(2,617) $ (354)
Basic earnings (loss) per common share:Reported . . . . . . . . . . . . . . . . . . . . . . . . . . . . . . . . . . . . . . . . . . . . . . . . . . . . . . . . . . . . . $ (6.02) $(0.57)Pro forma . . . . . . . . . . . . . . . . . . . . . . . . . . . . . . . . . . . . . . . . . . . . . . . . . . . . . . . . . . . . $ (6.03) $(0.82)
Diluted earnings (loss) per common share:Reported . . . . . . . . . . . . . . . . . . . . . . . . . . . . . . . . . . . . . . . . . . . . . . . . . . . . . . . . . . . . . $ (6.02) $(0.57)Pro forma . . . . . . . . . . . . . . . . . . . . . . . . . . . . . . . . . . . . . . . . . . . . . . . . . . . . . . . . . . . . $ (6.03) $(0.82)
(a) Stock-based compensation — pro forma expense for both years ended December 31, 2005 and 2004 was net of tax of nil.
(w) Recent accounting pronouncements
(i) In February 2006, the FASB issued SFAS No. 155, “Accounting for Certain Hybrid Financial Instruments — anamendment to FASB Statements No. 133 and 140” (“SFAS 155”). SFAS 155 simplifies the accounting for certainhybrid financial instruments containing embedded derivatives. SFAS 155 allows fair value measurement for any
103
NORTEL NETWORKS CORPORATION
Notes to Consolidated Financial Statements — (Continued)
hybrid financial instrument that contains an embedded derivative that otherwise would require bifurcation underSFAS 133. In addition, it amends SFAS No. 140, “Accounting for Transfers and Servicing of Financial Assets andExtinguishments of Liabilities” (“SFAS 140”), to eliminate certain restrictions on passive derivative financialinstruments that a qualifying special-purpose entity can hold. SFAS 155 is effective for all financial instrumentsacquired, issued or subject to a re-measurement event occurring after the beginning of an entity’s first fiscal year thatbegins after September 15, 2006. Nortel will adopt the provisions of SFAS 155 on January 1, 2007. Theimplementation of SFAS 155 is not expected to have a material impact on Nortel’s results of operations and financialcondition.
(ii) In March 2006, the FASB issued SFAS No. 156, “Accounting for Servicing of Financial Assets — an amendment ofFASB Statement No. 140” (“SFAS 156”). SFAS 156 simplifies the accounting for assets and liabilities arising fromloan servicing contracts. SFAS 156 requires that servicing rights be valued initially at fair value and subsequentlyeither (i) accounted for at fair value or (ii) amortized over the period of estimated net servicing income (loss), withan assessment for impairment or increased obligation each reporting period. SFAS 156 is effective for fiscal yearsbeginning after September 15, 2006. Nortel will adopt the provisions of SFAS 156 on January 1, 2007. Theimplementation of SFAS 156 is not expected to have a material impact on Nortel’s results of operations and financialcondition.
(iii) In June 2006, the FASB issued FIN No. 48, “Accounting for Uncertainty in Income Taxes, an interpretation of FASBStatement No. 109” (“FIN 48”). FIN 48 clarifies the accounting for uncertainty in income taxes recognized in anenterprise’s financial statements in accordance with FASB Statement No. 109, “Accounting for Income Taxes”(“SFAS 109”). The interpretation prescribes a recognition threshold and measurement attribute for the financialstatement recognition and measurement of a tax position taken or expected to be taken in a tax return. FIN 48 alsoprovides accounting guidance on de-recognition, classification, interest and penalties, accounting in interim periods,disclosure and transition. The evaluation of tax positions under FIN 48 will be a two-step process, whereby (1) Norteldetermines whether it is more likely than not that the tax positions will be sustained based on the technical merits ofthe position and (2) for those tax positions that meet the more-likely-than-not recognition threshold, Nortel wouldrecognize the largest amount of tax benefit that is greater than fifty percent likely of being realized upon ultimatesettlement with the related tax authority. FIN 48 is effective for fiscal years beginning after December 15, 2006.Nortel will adopt the provisions of FIN 48 on January 1, 2007. Nortel is currently in the process of assessing theimpact of FIN 48. Based on Nortel’s preliminary analysis, it does not expect a significant adjustment to openingaccumulated deficit as a result of the adoption of FIN 48. For additional information, see note 8.
(iv) In June 2006, the EITF reached a consensus on EITF Issue No. 06-2 “Accounting for Sabbatical Leave and OtherSimilar Benefits Pursuant to FASB Statement No. 43, Accounting for Compensated Absences” (“EITF 06-2”). EITF06-2 provides clarification surrounding the accounting for benefits in the form of compensated absences, whereby anemployee is entitled to paid time off after working for a specified period of time. EITF 06-2 is effective for fiscalyears beginning after December 15, 2006. Nortel will adopt the provisions of EITF 06-2 on January 1, 2007. Norteldoes not expect the adoption of EITF 06-2 to have a material impact on its results of operations and financialcondition.
(v) In June 2006, the EITF reached a consensus on EITF Issue No. 06-3 “How Taxes Collected from Customers andRemitted to Governmental Authorities Should Be Presented in the Income Statement (That Is, Gross Versus NetPresentation)” (“EITF 06-3”). EITF 06-3 provides guidance on how taxes directly imposed on revenue producingtransactions between a seller and customer that are remitted to governmental authorities should be presented in theincome statement (i.e. gross versus net presentation). EITF 06-3 is effective for interim and annual reporting periodsbeginning after December 15, 2006. Nortel will adopt the provisions of EITF 06-3 on January 1, 2007. Nortel doesnot expect the adoption of EITF 06-3 to have a material impact on the presentation of its results of operations andfinancial condition.
(vi) In September 2006, the FASB issued SFAS No. 157 “Fair Value Measurements” (“SFAS 157”). SFAS 157 providesaccounting guidance on the definition of fair value and establishes a framework for measuring fair value inU.S. GAAP and requires expanded disclosures about fair value measurements. SFAS 157 is effective for financialstatements issued for fiscal years beginning after November 15, 2007. Nortel plans to adopt the provisions of
104
NORTEL NETWORKS CORPORATION
Notes to Consolidated Financial Statements — (Continued)
SFAS 157 on January 1, 2008. Nortel is currently assessing the impact of the adoption of SFAS 157 on its results ofoperations and financial condition.
(vii) In September 2006, the EITF reached a consensus on EITF Issue No. 06-1 “Accounting for Consideration Given by aService Provider to Manufacturers or Resellers of Equipment Necessary for an End-Customer to Receive Servicefrom the Service Provider” (“EITF 06-1”). EITF 06-1 provides accounting guidance on the consideration given by aservice provider to a manufacturer or reseller of specialized equipment for the reduction of the price of suchequipment to an end-customer which is necessary for an end-customer to receive service from the service provider.EITF 06-1 is effective for fiscal years beginning after June 15, 2007. Nortel will adopt the provisions of EITF 06-1on January 1, 2008. Nortel does not expect the adoption of EITF 06-1 to have a material impact on its results ofoperations and financial condition.
3. Accounting changes
(a) The Effect of Contingently Convertible Debt on Diluted Earnings per Share
On September 30, 2004, the EITF reached a consensus on Issue No. 04-8, “The Effect of Contingently ConvertibleInstruments on Diluted Earnings per Share” (“EITF 04-8”), which addresses when the dilutive effect of contingentlyconvertible debt instruments should be included in diluted earnings (loss) per share. EITF 04-8 requires that contingentlyconvertible debt instruments be included in the computation of diluted earnings (loss) per share regardless of whether themarket price trigger has been met. EITF 04-8 also requires that prior period diluted earnings (loss) per share amountspresented for comparative purposes be restated. EITF 04-8 became effective for reporting periods ending afterDecember 15, 2004. The adoption of EITF 04-8 did not have a material impact on Nortel’s diluted earnings (loss) pershare.
(b) Implicit Variable Interests
In March 2005, the FASB issued FASB Staff Position (“FSP”), FIN No. 46(R)-5, “Implicit Variable Interests under FASBInterpretation No. 46 (revised December 2003), Consolidation of Variable Interest Entities” (“FSP FIN 46R-5”). FSPFIN 46R-5 provides guidance for a reporting enterprise on determining whether it holds an implicit variable interest inVIEs or potential VIEs when specific conditions exist. This FSP became effective in the first period beginning afterMarch 3, 2005 in accordance with the transition provisions of FIN 46. The adoption of FSP FIN 46R-5 had no materialimpact on Nortel’s results of operations and financial condition.
(c) Accounting for Electronic Equipment Waste Obligations
In June 2005, the FASB issued FSP FAS No. 143-1, “Accounting for Electronic Equipment Waste Obligations”(“FSP FAS 143-1”). FSP 143-1 provides guidance on how commercial users and producers of electronic equipment shouldrecognize and measure asset retirement obligations associated with the European Union (“EU”) Directive 2002/96/EC onWaste Electrical and Electronic Equipment. FSP FAS 143-1, along with the EU Directive, effectively obligates acommercial user to accrue costs associated with the retirement of a specified asset that qualifies as historical wasteequipment. FSP FAS 143-1 directs the commercial user to apply the provisions of FASB SFAS No. 143, “Accounting forAsset Retirement Obligations”, and the related FASB FIN No. 47, “Accounting for Conditional Asset RetirementObligations”, to an obligation associated with historical waste. FSP FAS 143-1 applies to the later of Nortel’s fiscalquarter ended June 30, 2005, or the date of the adoption of the law by the applicable EU-member country. In the second,third and fourth quarters of 2005, Nortel adopted FSP FAS 143-1 with respect to those EU-member countries that enactedthe directive into country specific laws. The adoption of FSP FAS 143-1 did not have a material impact on Nortel’s resultsof operations and financial condition for the fiscal years ended December 31, 2006 and 2005. Due to the fact that certainEU-member countries have not yet enacted country-specific laws, Nortel cannot estimate the impact of applying thisguidance in future periods.
(d) The Meaning of Other-than-Temporary Impairment and its Application to Certain Investments
As of January 1, 2006, Nortel adopted EITF Issue No. 03-1, “The Meaning of Other-Than-Temporary Impairment and ItsApplication to Certain Investments” (“EITF 03-1”), re-titled FSP FAS 115-1 and FAS 124-1, “The Meaning of
105
NORTEL NETWORKS CORPORATION
Notes to Consolidated Financial Statements — (Continued)
Other-Than-Temporary Impairment and Its Application to Certain Investments” (“FSP FAS 115-1 and FAS 124-1”). Theadoption of FSP FAS 115-1 and FAS 124-1 did not have a material impact on Nortel’s results of operations and financialcondition.
(e) Inventory Costs
As of January 1, 2006, Nortel adopted SFAS No. 151, “Inventory Costs” (“SFAS 151”). The adoption of SFAS 151 didnot have a material impact on Nortel’s results of operations and financial condition.
(f) Share-Based Payment
In December 2004, the FASB issued SFAS No. 123 (Revised 2004), “Share-Based Payment” (“SFAS 123R”), whichrequires all share-based payments to employees, including grants of employee stock options, to be recognized ascompensation expense in the consolidated financial statements based on their fair values. SFAS 123R also modifies certainmeasurement and expense recognition provisions of SFAS 123 that have an impact Nortel, including the requirement toestimate employee forfeitures each period when recognizing compensation expense and requiring that the initial andsubsequent measurement of the cost of liability-based awards each period be based on the fair value (instead of theintrinsic value) of the award. This statement is effective for Nortel as of January 1, 2006. Nortel previously elected toexpense employee stock-based compensation using the fair value method prospectively for all awards granted or modifiedon or after January 1, 2003, in accordance with SFAS No. 148, “Accounting for Stock Based Compensation — Transitionand Disclosure” (“SFAS 148”). SAB 107, “Share-Based Payment” (“SAB 107”), was issued by the SEC in March 2005and provides supplemental SFAS 123R application guidance based on the views of the SEC. As a result of the adoption ofSFAS 123R in the first quarter of 2006, Nortel recorded a gain of $9 or $0.02 per basic and diluted earnings (loss) percommon share as a cumulative effect of an accounting change. There were no other material impacts on Nortel’s resultsof operations and financial condition as a result of the adoption of SFAS 123R. For additional disclosure related toSFAS 123R, see note 19.
(g) Accounting Changes and Error Corrections
In May 2005, the FASB issued SFAS No. 154, “Accounting Changes and Error Corrections” (“SFAS 154”), whichreplaces Accounting Principles Board (“APB”) Opinion No. 20, “Accounting Changes”, and SFAS No. 3, “ReportingAccounting Changes in Interim Financial Statements — an Amendment of APB Opinion No. 28”. SFAS 154 providesguidance on the accounting for and reporting of changes in accounting principles and error corrections. SFAS 154 requiresretrospective application to prior period financial statements of voluntary changes in accounting principles and changesrequired by new accounting standards when the standard does not include specific transition provisions, unless it isimpracticable to do so. SFAS 154 also requires certain disclosures for restatements due to correction of an error. SFAS 154is effective for accounting changes and corrections of errors made in fiscal years beginning after December 15, 2005.Nortel has adopted SFAS 154 as of January 1, 2006. The impact that the adoption of SFAS 154 will have on Nortel’sconsolidated results of operations and financial condition will depend on the nature of future accounting changes adoptedby Nortel and the nature of transitional guidance provided in future accounting pronouncements. As of December 31,2006, Nortel adopted the provisions of SFAS 154 on Nortel’s results of operations and financial condition.
(h) Accounting for Purchases and Sales of Inventory with the same Counterparty
As of April 1, 2006, Nortel adopted EITF Issue No. 04-13, “Accounting for Purchases and Sales of Inventory with theSame Counterparty” (“EITF 04-13”). The adoption of EITF 04-13 did not have a material impact on Nortel’s results ofoperations and financial condition.
(i) Determining the Variability to be Considered in Applying FASB Interpretation No. 46(R)
As of July 1, 2006, Nortel adopted FSP FIN No. 46(R)-6, “Determining the Variability to be Considered in ApplyingFASB Interpretation No. 46(R)” (“FSP FIN 46(R)-6”). The adoption of FSP FIN 46(R)-6 did not have a material impacton Nortel’s results of operations and financial condition.
106
NORTEL NETWORKS CORPORATION
Notes to Consolidated Financial Statements — (Continued)
(j) Employers’ Accounting for Defined Benefit Pension and Other Postretirement Plans — an Amendment ofFASB Statements No. 87, 88, 106, and 132(R)
In September 2006, the FASB issued SFAS No. 158, “Employers’ Accounting for Defined Benefit Pension and OtherPostretirement Plans — an Amendment of FASB Statements No. 87, 88, 106, and 132(R)” (“SFAS 158”). SFAS 158requires an employer to recognize the overfunded or underfunded status of a defined benefit pension and post-retirementplan (other than a multiemployer plan) as an asset or liability in its statement of financial position and to recognizechanges in that funded status in the year in which the changes occur through comprehensive income of a business entityor changes in unrestricted net assets of a not-for-profit organization. SFAS 158 also requires an employer to measure thefunded status of a plan as of the date of its year-end statement of financial position, with limited exceptions. Nortel isrequired to initially recognize the funded status of its defined benefit pension and post-retirement plans, and to provide therequired disclosures as of December 31, 2006. The requirement to measure plan assets and benefit obligations as of thedate of the employer’s fiscal year-end statement of financial position is effective for Nortel for its fiscal year endingDecember 31, 2008. Nortel uses a measurement date of September 30 to measure plan assets and benefit obligationsannually for the pension plans and other post-retirement benefit plans that make up the majority of plan assets andobligations. Based on the funded status of Nortel’s pension and post-retirement benefit plans as of the measurement date,the adoption of SFAS 158 has had the effect of increasing Nortel’s net liabilities for pension and post-retirement benefitsand decreasing shareholders’ equity by approximately $142, net of taxes, as of December 31, 2006. For additionalinformation on Nortel’s pension and post-retirement plans, see note 9.
(k) SAB 108 An Interpretation by the SEC Regarding the Process of Quantifying Financial StatementMisstatements
In September 2006, the SEC staff issued SAB No. 108, “Considering the Effects of Prior Year Misstatements whenQuantifying Misstatements” (“SAB 108”). There are two recognized methods for quantifying the effects of financialstatement misstatements: the “roll-over” and “iron curtain” methods. The roll-over method, the method previously used byNortel, focuses primarily on the material impact of a misstatement on the statement of operations, which can lead to theaccumulation of misstatements on the balance sheet that may become material to the balance sheet. The iron curtainmethod focuses primarily on the effect of correcting for the accumulated misstatements as at the balance sheet date,essentially correcting the balance sheet with less emphasis on the reversing effects of prior year errors on the statement ofoperations. SAB 108 requires quantification of financial statement misstatements under both the roll-over and iron curtainapproaches, referred to as the “dual-approach”. SAB 108 permits companies to initially adopt its provisions by adjustingfor the cumulative effect of misstatements related to prior years, previously deemed to be immaterial, in the carryingamount of assets and liabilities as of the beginning of the current fiscal year, with an offsetting adjustment to the openingbalance of accumulated deficit. During the year of adoption, SAB 108 also provides the option of prospective correctionof immaterial errors in previously reported quarterly financial statements, that would be reported as comparativeinformation in future filings with the SEC. SAB 108 does not require financial statement reports previously filed with theSEC to be amended. SAB 108 became effective for Nortel’s fiscal year ended December 31, 2006. The provisions ofSAB 108 had no material impact to Nortel’s results of operations and financial condition for the year ended December 31,2006.
4. Restatement of previously issued financial statements
In the course of the preparation of Nortel’s 2006 financial statements, management identified certain errors primarilythrough discussions with the Company’s North American pension and post-retirement actuaries and through its ongoingremediation efforts with respect to its material weakness related to revenue recognition and its other previously reportedmaterial weaknesses and other internal control deficiencies. As a result, Nortel has restated its consolidated balance sheetas of December 31, 2005 and consolidated statements of operations, changes in equity and comprehensive income (loss)and cash flows for each of the years ended December 31, 2005 and 2004. The adjustments relate to:
• Pension and post-retirement benefits errors;• Revenue recognition errors;• A prior year tax error; and• Other errors.
107
NORTEL NETWORKS CORPORATION
Notes to Consolidated Financial Statements — (Continued)
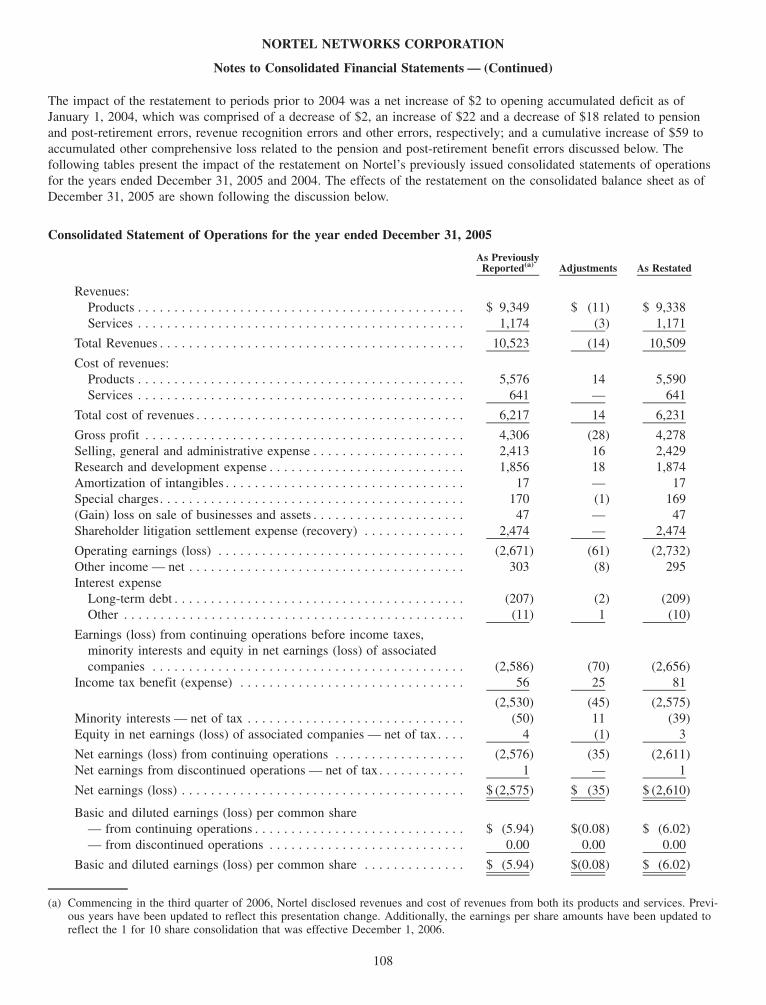
The impact of the restatement to periods prior to 2004 was a net increase of $2 to opening accumulated deficit as ofJanuary 1, 2004, which was comprised of a decrease of $2, an increase of $22 and a decrease of $18 related to pensionand post-retirement errors, revenue recognition errors and other errors, respectively; and a cumulative increase of $59 toaccumulated other comprehensive loss related to the pension and post-retirement benefit errors discussed below. Thefollowing tables present the impact of the restatement on Nortel’s previously issued consolidated statements of operationsfor the years ended December 31, 2005 and 2004. The effects of the restatement on the consolidated balance sheet as ofDecember 31, 2005 are shown following the discussion below.
Consolidated Statement of Operations for the year ended December 31, 2005
As PreviouslyReported(a) Adjustments As Restated
Revenues:Products . . . . . . . . . . . . . . . . . . . . . . . . . . . . . . . . . . . . . . . . . . . . . $ 9,349 $ (11) $ 9,338Services . . . . . . . . . . . . . . . . . . . . . . . . . . . . . . . . . . . . . . . . . . . . . 1,174 (3) 1,171
Total Revenues . . . . . . . . . . . . . . . . . . . . . . . . . . . . . . . . . . . . . . . . . . 10,523 (14) 10,509
Cost of revenues:Products . . . . . . . . . . . . . . . . . . . . . . . . . . . . . . . . . . . . . . . . . . . . . 5,576 14 5,590Services . . . . . . . . . . . . . . . . . . . . . . . . . . . . . . . . . . . . . . . . . . . . . 641 — 641
Total cost of revenues . . . . . . . . . . . . . . . . . . . . . . . . . . . . . . . . . . . . . 6,217 14 6,231
Gross profit . . . . . . . . . . . . . . . . . . . . . . . . . . . . . . . . . . . . . . . . . . . . 4,306 (28) 4,278Selling, general and administrative expense . . . . . . . . . . . . . . . . . . . . . 2,413 16 2,429Research and development expense . . . . . . . . . . . . . . . . . . . . . . . . . . . 1,856 18 1,874Amortization of intangibles . . . . . . . . . . . . . . . . . . . . . . . . . . . . . . . . . 17 — 17Special charges. . . . . . . . . . . . . . . . . . . . . . . . . . . . . . . . . . . . . . . . . . 170 (1) 169(Gain) loss on sale of businesses and assets . . . . . . . . . . . . . . . . . . . . . 47 — 47Shareholder litigation settlement expense (recovery) . . . . . . . . . . . . . . 2,474 — 2,474
Operating earnings (loss) . . . . . . . . . . . . . . . . . . . . . . . . . . . . . . . . . . (2,671) (61) (2,732)Other income — net . . . . . . . . . . . . . . . . . . . . . . . . . . . . . . . . . . . . . . 303 (8) 295Interest expense
Long-term debt . . . . . . . . . . . . . . . . . . . . . . . . . . . . . . . . . . . . . . . . (207) (2) (209)Other . . . . . . . . . . . . . . . . . . . . . . . . . . . . . . . . . . . . . . . . . . . . . . . (11) 1 (10)
Earnings (loss) from continuing operations before income taxes,minority interests and equity in net earnings (loss) of associatedcompanies . . . . . . . . . . . . . . . . . . . . . . . . . . . . . . . . . . . . . . . . . . . (2,586) (70) (2,656)
Income tax benefit (expense) . . . . . . . . . . . . . . . . . . . . . . . . . . . . . . . 56 25 81
(2,530) (45) (2,575)Minority interests — net of tax . . . . . . . . . . . . . . . . . . . . . . . . . . . . . . (50) 11 (39)Equity in net earnings (loss) of associated companies — net of tax. . . . 4 (1) 3
Net earnings (loss) from continuing operations . . . . . . . . . . . . . . . . . . (2,576) (35) (2,611)Net earnings from discontinued operations — net of tax . . . . . . . . . . . . 1 — 1
Net earnings (loss) . . . . . . . . . . . . . . . . . . . . . . . . . . . . . . . . . . . . . . . $ (2,575) $ (35) $ (2,610)
Basic and diluted earnings (loss) per common share— from continuing operations . . . . . . . . . . . . . . . . . . . . . . . . . . . . . $ (5.94) $(0.08) $ (6.02)— from discontinued operations . . . . . . . . . . . . . . . . . . . . . . . . . . . 0.00 0.00 0.00
Basic and diluted earnings (loss) per common share . . . . . . . . . . . . . . $ (5.94) $(0.08) $ (6.02)
(a) Commencing in the third quarter of 2006, Nortel disclosed revenues and cost of revenues from both its products and services. Previ-ous years have been updated to reflect this presentation change. Additionally, the earnings per share amounts have been updated toreflect the 1 for 10 share consolidation that was effective December 1, 2006.
108
NORTEL NETWORKS CORPORATION
Notes to Consolidated Financial Statements — (Continued)

Consolidated Statement of Operations for the year ended December 31, 2004As Previously
Reported(a) Adjustments As Restated
Revenues:Products . . . . . . . . . . . . . . . . . . . . . . . . . . . . . . . . . . . . . . . . . . . . . $8,548 $ (37) $8,511Services . . . . . . . . . . . . . . . . . . . . . . . . . . . . . . . . . . . . . . . . . . . . . 968 (1) 967
Total Revenues . . . . . . . . . . . . . . . . . . . . . . . . . . . . . . . . . . . . . . . . . . 9,516 (38) 9,478
Cost of revenues:Products . . . . . . . . . . . . . . . . . . . . . . . . . . . . . . . . . . . . . . . . . . . . . 5,055 (18) 5,037Services . . . . . . . . . . . . . . . . . . . . . . . . . . . . . . . . . . . . . . . . . . . . . 519 — 519
Total cost of revenues . . . . . . . . . . . . . . . . . . . . . . . . . . . . . . . . . . . . . 5,574 (18) 5,556
Gross profit . . . . . . . . . . . . . . . . . . . . . . . . . . . . . . . . . . . . . . . . . . . . 3,942 (20) 3,922Selling, general and administrative expense . . . . . . . . . . . . . . . . . . . . . 2,133 13 2,146Research and development expense . . . . . . . . . . . . . . . . . . . . . . . . . . . 1,960 15 1,975Amortization of intangibles . . . . . . . . . . . . . . . . . . . . . . . . . . . . . . . . . 9 — 9Special charges. . . . . . . . . . . . . . . . . . . . . . . . . . . . . . . . . . . . . . . . . . 181 — 181(Gain) loss on sale of businesses and assets . . . . . . . . . . . . . . . . . . . . . (91) — (91)
Operating earnings (loss) . . . . . . . . . . . . . . . . . . . . . . . . . . . . . . . . . . (250) (48) (298)Other income — net . . . . . . . . . . . . . . . . . . . . . . . . . . . . . . . . . . . . . . 212 5 217Interest expense
Long-term debt . . . . . . . . . . . . . . . . . . . . . . . . . . . . . . . . . . . . . . . . (192) — (192)Other . . . . . . . . . . . . . . . . . . . . . . . . . . . . . . . . . . . . . . . . . . . . . . . (10) — (10)
Earnings (loss) from continuing operations before income taxes,minority interests and equity in net earnings (loss) of associatedcompanies . . . . . . . . . . . . . . . . . . . . . . . . . . . . . . . . . . . . . . . . . . . (240) (43) (283)
Income tax benefit (expense) . . . . . . . . . . . . . . . . . . . . . . . . . . . . . . . 30 (10) 20
(210) (53) (263)Minority interests — net of tax . . . . . . . . . . . . . . . . . . . . . . . . . . . . . . (46) 13 (33)
Net earnings (loss) from continuing operations . . . . . . . . . . . . . . . . . . (256) (40) (296)Net earnings from discontinued operations — net of tax . . . . . . . . . . . . 49 — 49
Net earnings (loss) . . . . . . . . . . . . . . . . . . . . . . . . . . . . . . . . . . . . . . . $ (207) $ (40) $ (247)
Basic and diluted earnings (loss) per common share— from continuing operations . . . . . . . . . . . . . . . . . . . . . . . . . . . . . $ (0.59) $(0.09) $ (0.68)— from discontinued operations . . . . . . . . . . . . . . . . . . . . . . . . . . . 0.11 — 0.11
Basic and diluted earnings (loss) per common share . . . . . . . . . . . . . . $ (0.48) $(0.09) $ (0.57)
(a) Commencing in the third quarter of 2006, Nortel disclosed revenues and cost of revenues from both its products and services. Previ-ous years have been updated to reflect this presentation change. Additionally, the earnings per share amounts have been updated toreflect the 1 for 10 share consolidation that was effective December 1, 2006.
109
NORTEL NETWORKS CORPORATION
Notes to Consolidated Financial Statements — (Continued)
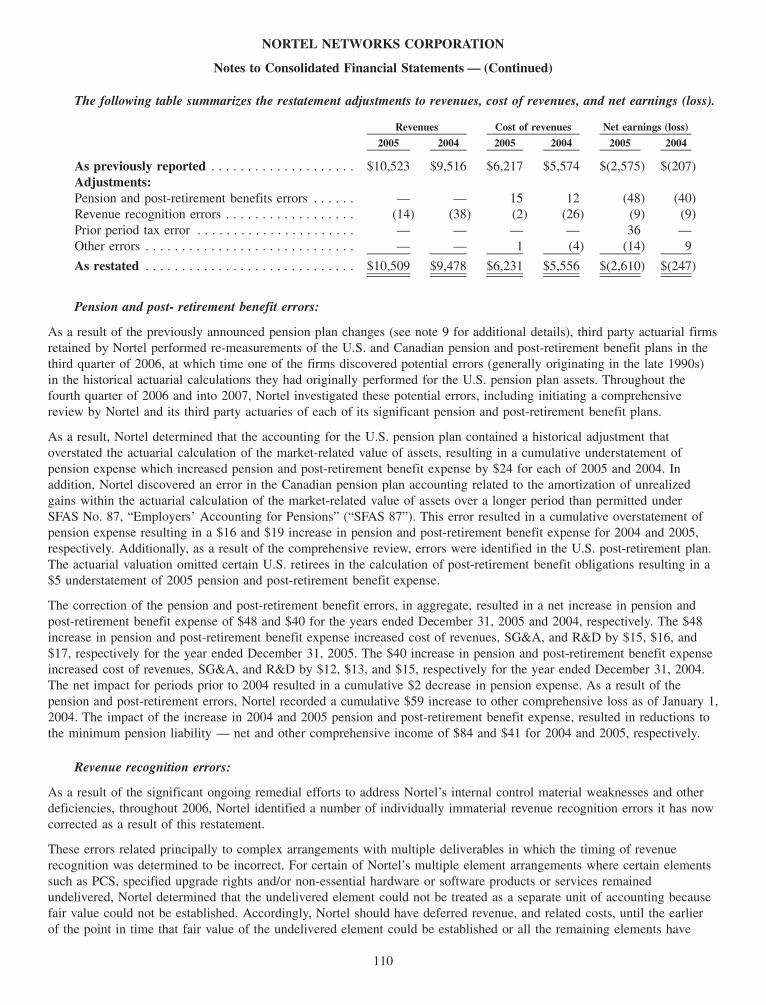
The following table summarizes the restatement adjustments to revenues, cost of revenues, and net earnings (loss).
2005 2004 2005 2004 2005 2004
Revenues Cost of revenues Net earnings (loss)
As previously reported . . . . . . . . . . . . . . . . . . . . $10,523 $9,516 $6,217 $5,574 $(2,575) $(207)Adjustments:Pension and post-retirement benefits errors . . . . . . — — 15 12 (48) (40)Revenue recognition errors . . . . . . . . . . . . . . . . . . (14) (38) (2) (26) (9) (9)Prior period tax error . . . . . . . . . . . . . . . . . . . . . . — — — — 36 —Other errors . . . . . . . . . . . . . . . . . . . . . . . . . . . . . — — 1 (4) (14) 9
As restated . . . . . . . . . . . . . . . . . . . . . . . . . . . . . $10,509 $9,478 $6,231 $5,556 $(2,610) $(247)
Pension and post- retirement benefit errors:
As a result of the previously announced pension plan changes (see note 9 for additional details), third party actuarial firmsretained by Nortel performed re-measurements of the U.S. and Canadian pension and post-retirement benefit plans in thethird quarter of 2006, at which time one of the firms discovered potential errors (generally originating in the late 1990s)in the historical actuarial calculations they had originally performed for the U.S. pension plan assets. Throughout thefourth quarter of 2006 and into 2007, Nortel investigated these potential errors, including initiating a comprehensivereview by Nortel and its third party actuaries of each of its significant pension and post-retirement benefit plans.
As a result, Nortel determined that the accounting for the U.S. pension plan contained a historical adjustment thatoverstated the actuarial calculation of the market-related value of assets, resulting in a cumulative understatement ofpension expense which increased pension and post-retirement benefit expense by $24 for each of 2005 and 2004. Inaddition, Nortel discovered an error in the Canadian pension plan accounting related to the amortization of unrealizedgains within the actuarial calculation of the market-related value of assets over a longer period than permitted underSFAS No. 87, “Employers’ Accounting for Pensions” (“SFAS 87”). This error resulted in a cumulative overstatement ofpension expense resulting in a $16 and $19 increase in pension and post-retirement benefit expense for 2004 and 2005,respectively. Additionally, as a result of the comprehensive review, errors were identified in the U.S. post-retirement plan.The actuarial valuation omitted certain U.S. retirees in the calculation of post-retirement benefit obligations resulting in a$5 understatement of 2005 pension and post-retirement benefit expense.
The correction of the pension and post-retirement benefit errors, in aggregate, resulted in a net increase in pension andpost-retirement benefit expense of $48 and $40 for the years ended December 31, 2005 and 2004, respectively. The $48increase in pension and post-retirement benefit expense increased cost of revenues, SG&A, and R&D by $15, $16, and$17, respectively for the year ended December 31, 2005. The $40 increase in pension and post-retirement benefit expenseincreased cost of revenues, SG&A, and R&D by $12, $13, and $15, respectively for the year ended December 31, 2004.The net impact for periods prior to 2004 resulted in a cumulative $2 decrease in pension expense. As a result of thepension and post-retirement errors, Nortel recorded a cumulative $59 increase to other comprehensive loss as of January 1,2004. The impact of the increase in 2004 and 2005 pension and post-retirement benefit expense, resulted in reductions tothe minimum pension liability — net and other comprehensive income of $84 and $41 for 2004 and 2005, respectively.
Revenue recognition errors:
As a result of the significant ongoing remedial efforts to address Nortel’s internal control material weaknesses and otherdeficiencies, throughout 2006, Nortel identified a number of individually immaterial revenue recognition errors it has nowcorrected as a result of this restatement.
These errors related principally to complex arrangements with multiple deliverables in which the timing of revenuerecognition was determined to be incorrect. For certain of Nortel’s multiple element arrangements where certain elementssuch as PCS, specified upgrade rights and/or non-essential hardware or software products or services remainedundelivered, Nortel determined that the undelivered element could not be treated as a separate unit of accounting becausefair value could not be established. Accordingly, Nortel should have deferred revenue, and related costs, until the earlierof the point in time that fair value of the undelivered element could be established or all the remaining elements have
110
NORTEL NETWORKS CORPORATION
Notes to Consolidated Financial Statements — (Continued)

been delivered. These corrections resulted in a reduction of revenue of $37 and $27 for 2005 and 2004, respectively, and adecrease to cost of revenues of $4 and $32 for 2005 and 2004, respectively.
Additionally, as part of this restatement, Nortel corrected other revenue recognition errors the most significant of whichare described below.
Previous misapplication of SOP 81-1 resulted in errors in revenues recognized in an arrangement between 2003 and 2005.The misapplication related to the calculation of liquidated damages estimated to be incurred as a result of contractualcommitments for network outages. Prior to the second quarter of 2006, Nortel estimated its liquidated damages based on aquarterly network outage estimate. In the second quarter of 2006, Nortel determined that it should have been recognizingproduct credits based on an estimate of the total expected outages for the arrangement. Nortel had previously correctedthe resulting revenue errors in the second quarter of 2006 and, as a result of this restatement, has now recorded thecorrection in the appropriate periods, resulting in an increase in both revenue and gross profit of $16 for 2005 anddecreases of $8 and $10 for 2004 and 2003, respectively.
During the fourth quarter of 2005, and throughout 2006, Nortel deferred revenue related to Enterprise products sold byLG-Nortel due to the fact that it believed that LG-Nortel had a practice of providing implicit PCS for which they did nothave fair value. A subsequent detailed review of the Enterprise products sold by LG-Nortel led to a conclusion in thesecond half of 2006 that LG-Nortel did not have a practice of providing implicit PCS for certain Enterprise products. As aresult, revenue should have been recognized upon delivery. Nortel has corrected these errors, resulting in an increase in2005 revenues and cost of revenues of $10, and $6, respectively.
In 2004, Nortel entered into a software arrangement where the customer had the right to suspend payments until deliveryof certain future products; therefore, the arrangement fee was not fixed or determinable. Pursuant to SOP 97-2, if at theoutset of the arrangement the fee is not fixed or determinable, once all other revenue recognition criteria have beensatisfied, revenue should be recognized as payments become due. Previously, the fee was recognized ratably over the term.Due to the lack of a fixed or determinable fee, the amount recognized ratably should have been capped at the amount thatwas due and payable from the customer. The correction of this error resulted in a decrease in each of 2004 revenues andgross profit of $5, and an increase in 2005 revenues and gross profit of $7.
An error related to the classification between inventories — net and other assets was identified in the fourth quarter of2006. Nortel identified certain deferred costs that were classified as long-term and included in other assets but that relatedto arrangements where the associated deferred revenue was recorded as a current liability. Nortel has corrected this errorand reclassified these deferred costs as a component of inventory — net, included in current assets. This correctionresulted in an increase in inventory — net of $253, and a corresponding decrease of $253 in other assets as atDecember 31, 2005.
Prior year tax error:
Nortel incorrectly recorded a $36 tax expense in the fourth quarter of 2005 as a consequence of the comparison of taxreturns to provisions for prior years. The error was discovered during an internal review of prior period tax returns, and asa result, Nortel’s fourth quarter 2005 tax expense has been restated to reflect the correction of this error, resulting in a $36increase in the 2005 income tax benefit and a corresponding increase in the 2005 deferred tax asset.
Other errors:
Other errors relate primarily to foreign exchange, certain expenses and misclassifications in the statement of operationsand resulted in an increase of $14 and a decrease of $9 to net loss for 2005 and 2004, respectively. The most significantitems are discussed in detail below.
In the first quarter of 2006, Nortel identified a foreign exchange translation error in which incorrect foreign exchangerates had been used to record a specific revenue arrangement, resulting in an overstatement of other income — net in2005 and an understatement in 2004. The correction was made initially in the first quarter of 2006, and, as a result of thisrestatement, has been recorded in the appropriate periods, resulting in a decrease to other income-net in 2005 of $6, andincreases to other income — net in 2004 and 2003 of $3 and $10, respectively.
111
NORTEL NETWORKS CORPORATION
Notes to Consolidated Financial Statements — (Continued)

Nortel previously recorded the impact of a property tax assessment reduction of $6 to special charges in 2006 whichrelated to 2005. As a result of this restatement, this error is being corrected and reported as a decrease to 2005 specialcharges with a corresponding decrease to the real estate restructuring provision. Additionally, Nortel corrected changes inreal estate restructuring provisions related to properties in EMEA and severance provisions which related to 2005 but hadpreviously been recorded in the first quarter of 2006. As a result of this restatement, these changes have been recorded in2005 resulting in a $5 increase in 2005 special charges.
Prior to the fourth quarter of 2006, the preferred share dividends paid by NNL, including the related Canadian taxes, wereincluded as a component of Nortel’s minority interest. Nortel has determined that these taxes should have been recordedas a component of income tax expense. As a result, Nortel has reclassified $11 from minority interest to income taxexpense for each of 2005 and 2004.
In 2006, classification errors related to lease expenses were corrected and are now being reversed in the correct reportingperiods. These errors involved lease costs that were originally recorded in other income — net and should have beencharged to SG&A. The correction of the classification error resulted in an increase of $7 to SG&A for the first quarter of2006, a reduction of $2 and $2 in 2005 and 2004, respectively, and the remaining correction of $3 to 2003 with offsettingadjustments to other income - net in each period.
Statements of cash flows
Nortel corrected an error related to the classification of cash attributable to an employee trust that should have beenclassified as restricted cash and cash equivalents. This balance sheet correction resulted in an increase in 2004 cash usedin operating activities of $6 for 2004 and a $1 decrease in 2005 cash used in operating activities, with offsettingadjustments to cash flows used in investing activities.
Other than this error, there were no other errors in the cash flow statements for the years ended December 31, 2005 and2004 other than conforming changes to the components of the reconciliation to net cash used in operating activities relatedto other restatement adjustments.
112
NORTEL NETWORKS CORPORATION
Notes to Consolidated Financial Statements — (Continued)
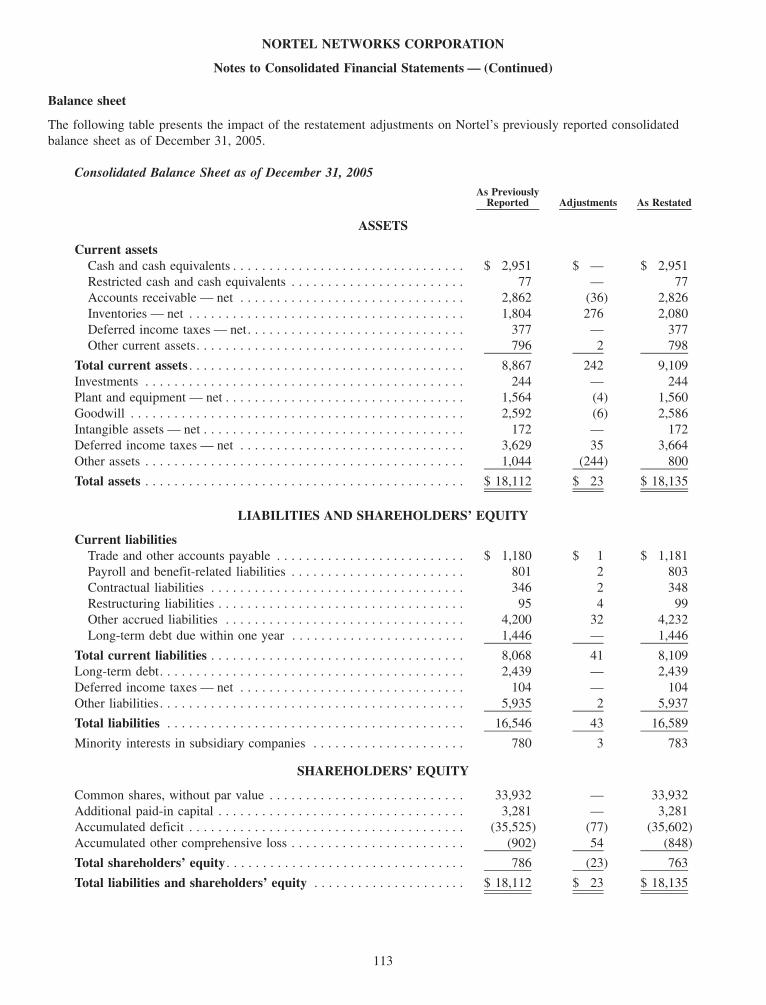
Balance sheet
The following table presents the impact of the restatement adjustments on Nortel’s previously reported consolidatedbalance sheet as of December 31, 2005.
Consolidated Balance Sheet as of December 31, 2005As Previously
Reported Adjustments As Restated
ASSETS
Current assetsCash and cash equivalents . . . . . . . . . . . . . . . . . . . . . . . . . . . . . . . . $ 2,951 $ — $ 2,951Restricted cash and cash equivalents . . . . . . . . . . . . . . . . . . . . . . . . 77 — 77Accounts receivable — net . . . . . . . . . . . . . . . . . . . . . . . . . . . . . . . 2,862 (36) 2,826Inventories — net . . . . . . . . . . . . . . . . . . . . . . . . . . . . . . . . . . . . . . 1,804 276 2,080Deferred income taxes — net. . . . . . . . . . . . . . . . . . . . . . . . . . . . . . 377 — 377Other current assets. . . . . . . . . . . . . . . . . . . . . . . . . . . . . . . . . . . . . 796 2 798
Total current assets . . . . . . . . . . . . . . . . . . . . . . . . . . . . . . . . . . . . . . 8,867 242 9,109Investments . . . . . . . . . . . . . . . . . . . . . . . . . . . . . . . . . . . . . . . . . . . . 244 — 244Plant and equipment — net . . . . . . . . . . . . . . . . . . . . . . . . . . . . . . . . . 1,564 (4) 1,560Goodwill . . . . . . . . . . . . . . . . . . . . . . . . . . . . . . . . . . . . . . . . . . . . . . 2,592 (6) 2,586Intangible assets — net . . . . . . . . . . . . . . . . . . . . . . . . . . . . . . . . . . . . 172 — 172Deferred income taxes — net . . . . . . . . . . . . . . . . . . . . . . . . . . . . . . . 3,629 35 3,664Other assets . . . . . . . . . . . . . . . . . . . . . . . . . . . . . . . . . . . . . . . . . . . . 1,044 (244) 800
Total assets . . . . . . . . . . . . . . . . . . . . . . . . . . . . . . . . . . . . . . . . . . . . $ 18,112 $ 23 $ 18,135
LIABILITIES AND SHAREHOLDERS’ EQUITY
Current liabilitiesTrade and other accounts payable . . . . . . . . . . . . . . . . . . . . . . . . . . $ 1,180 $ 1 $ 1,181Payroll and benefit-related liabilities . . . . . . . . . . . . . . . . . . . . . . . . 801 2 803Contractual liabilities . . . . . . . . . . . . . . . . . . . . . . . . . . . . . . . . . . . 346 2 348Restructuring liabilities . . . . . . . . . . . . . . . . . . . . . . . . . . . . . . . . . . 95 4 99Other accrued liabilities . . . . . . . . . . . . . . . . . . . . . . . . . . . . . . . . . 4,200 32 4,232Long-term debt due within one year . . . . . . . . . . . . . . . . . . . . . . . . 1,446 — 1,446
Total current liabilities . . . . . . . . . . . . . . . . . . . . . . . . . . . . . . . . . . . 8,068 41 8,109Long-term debt. . . . . . . . . . . . . . . . . . . . . . . . . . . . . . . . . . . . . . . . . . 2,439 — 2,439Deferred income taxes — net . . . . . . . . . . . . . . . . . . . . . . . . . . . . . . . 104 — 104Other liabilities. . . . . . . . . . . . . . . . . . . . . . . . . . . . . . . . . . . . . . . . . . 5,935 2 5,937
Total liabilities . . . . . . . . . . . . . . . . . . . . . . . . . . . . . . . . . . . . . . . . . 16,546 43 16,589
Minority interests in subsidiary companies . . . . . . . . . . . . . . . . . . . . . 780 3 783
SHAREHOLDERS’ EQUITY
Common shares, without par value . . . . . . . . . . . . . . . . . . . . . . . . . . . 33,932 — 33,932Additional paid-in capital . . . . . . . . . . . . . . . . . . . . . . . . . . . . . . . . . . 3,281 — 3,281Accumulated deficit . . . . . . . . . . . . . . . . . . . . . . . . . . . . . . . . . . . . . . (35,525) (77) (35,602)Accumulated other comprehensive loss . . . . . . . . . . . . . . . . . . . . . . . . (902) 54 (848)
Total shareholders’ equity . . . . . . . . . . . . . . . . . . . . . . . . . . . . . . . . . 786 (23) 763
Total liabilities and shareholders’ equity . . . . . . . . . . . . . . . . . . . . . $ 18,112 $ 23 $ 18,135
113
NORTEL NETWORKS CORPORATION
Notes to Consolidated Financial Statements — (Continued)

5. Consolidated financial statement details
The following consolidated financial statement details are presented as of December 31, 2006 and 2005 for theconsolidated balance sheets and for each of the three years ended December 31, 2006 for the consolidated statements ofoperations and consolidated statements of cash flows.
Consolidated statements of operations
Cost of revenues:
In August 2004, Nortel entered into a contract with Bharat Sanchar Nigam Limited (“BSNL”) to establish a wirelessnetwork in India. Nortel’s commitments for orders received as of December 31, 2006, 2005 and 2004 under this contracthave resulted in estimated project losses in each of these years of approximately $7, $148 and $160, respectively, whichwere recorded as a charge to cost of revenues and accrued within contractual liabilities in the years ended December 31,2006, 2005 and 2004.
Selling, general and administrative expense:
SG&A expense included bad debt (expense) recoveries of $(5), $10 and $118 in the years ended December 31, 2006,2005 and 2004, respectively.
Research and development expense:
2006 2005 2004
R&D expense . . . . . . . . . . . . . . . . . . . . . . . . . . . . . . . . . . . . . . . . . . . . . . . . . . . . $1,939 $1,874 $1,975R&D costs incurred on behalf of others(a) . . . . . . . . . . . . . . . . . . . . . . . . . . . . . . . 16 28 40
Total . . . . . . . . . . . . . . . . . . . . . . . . . . . . . . . . . . . . . . . . . . . . . . . . . . . . . . . . . . $1,955 $1,902 $2,015
(a) These costs included R&D costs charged to customers of Nortel pursuant to contracts that provided for full recovery of the esti-mated cost of development, material, engineering, installation and other applicable costs, which were accounted for as contractcosts.
Shareholder litigation settlement
Nortel recorded a recovery of $219 and an expense of $2,474 for the years ended December 31, 2006 and 2005,respectively, related to an agreement to settle certain shareholder class action litigation. For additional information seenote 21.
Other income — net:
2006 2005 2004
Interest and dividend income. . . . . . . . . . . . . . . . . . . . . . . . . . . . . . . . . . . . . . . . . . . . . $140 $115 $ 92Gain (loss) on sale or write down of investments . . . . . . . . . . . . . . . . . . . . . . . . . . . . . . (6) 67 19Currency exchange gains (losses) . . . . . . . . . . . . . . . . . . . . . . . . . . . . . . . . . . . . . . . . . (12) 59 65Other — net . . . . . . . . . . . . . . . . . . . . . . . . . . . . . . . . . . . . . . . . . . . . . . . . . . . . . . . . . 90 54 41
Other income — net . . . . . . . . . . . . . . . . . . . . . . . . . . . . . . . . . . . . . . . . . . . . . . . . . . . $212 $295 $217
114
NORTEL NETWORKS CORPORATION
Notes to Consolidated Financial Statements — (Continued)
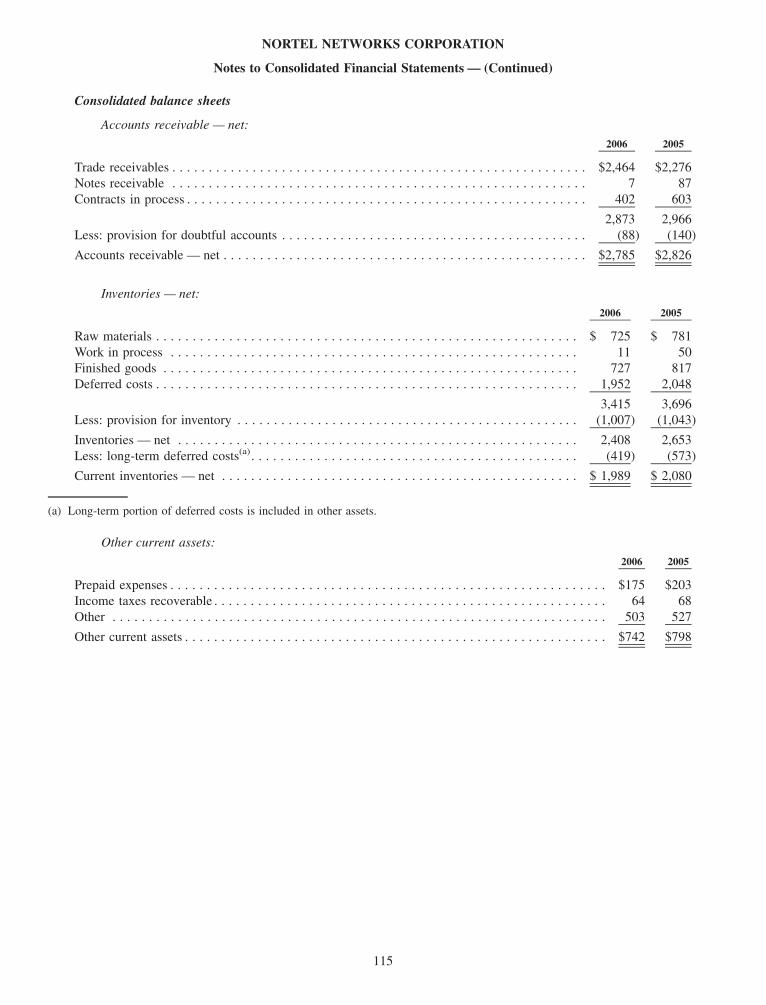
Consolidated balance sheets
Accounts receivable — net:
2006 2005
Trade receivables . . . . . . . . . . . . . . . . . . . . . . . . . . . . . . . . . . . . . . . . . . . . . . . . . . . . . . . . . $2,464 $2,276Notes receivable . . . . . . . . . . . . . . . . . . . . . . . . . . . . . . . . . . . . . . . . . . . . . . . . . . . . . . . . . 7 87Contracts in process . . . . . . . . . . . . . . . . . . . . . . . . . . . . . . . . . . . . . . . . . . . . . . . . . . . . . . . 402 603
2,873 2,966Less: provision for doubtful accounts . . . . . . . . . . . . . . . . . . . . . . . . . . . . . . . . . . . . . . . . . . (88) (140)
Accounts receivable — net . . . . . . . . . . . . . . . . . . . . . . . . . . . . . . . . . . . . . . . . . . . . . . . . . . $2,785 $2,826
Inventories — net:
2006 2005
Raw materials . . . . . . . . . . . . . . . . . . . . . . . . . . . . . . . . . . . . . . . . . . . . . . . . . . . . . . . . . . $ 725 $ 781Work in process . . . . . . . . . . . . . . . . . . . . . . . . . . . . . . . . . . . . . . . . . . . . . . . . . . . . . . . . 11 50Finished goods . . . . . . . . . . . . . . . . . . . . . . . . . . . . . . . . . . . . . . . . . . . . . . . . . . . . . . . . . 727 817Deferred costs . . . . . . . . . . . . . . . . . . . . . . . . . . . . . . . . . . . . . . . . . . . . . . . . . . . . . . . . . . 1,952 2,048
3,415 3,696Less: provision for inventory . . . . . . . . . . . . . . . . . . . . . . . . . . . . . . . . . . . . . . . . . . . . . . . (1,007) (1,043)
Inventories — net . . . . . . . . . . . . . . . . . . . . . . . . . . . . . . . . . . . . . . . . . . . . . . . . . . . . . . . 2,408 2,653Less: long-term deferred costs(a). . . . . . . . . . . . . . . . . . . . . . . . . . . . . . . . . . . . . . . . . . . . . (419) (573)
Current inventories — net . . . . . . . . . . . . . . . . . . . . . . . . . . . . . . . . . . . . . . . . . . . . . . . . . $ 1,989 $ 2,080
(a) Long-term portion of deferred costs is included in other assets.
Other current assets:
2006 2005
Prepaid expenses . . . . . . . . . . . . . . . . . . . . . . . . . . . . . . . . . . . . . . . . . . . . . . . . . . . . . . . . . . . . $175 $203Income taxes recoverable . . . . . . . . . . . . . . . . . . . . . . . . . . . . . . . . . . . . . . . . . . . . . . . . . . . . . . 64 68Other . . . . . . . . . . . . . . . . . . . . . . . . . . . . . . . . . . . . . . . . . . . . . . . . . . . . . . . . . . . . . . . . . . . . 503 527
Other current assets . . . . . . . . . . . . . . . . . . . . . . . . . . . . . . . . . . . . . . . . . . . . . . . . . . . . . . . . . . $742 $798
115
NORTEL NETWORKS CORPORATION
Notes to Consolidated Financial Statements — (Continued)

Plant and equipment — net:
2006 2005
Cost:Land . . . . . . . . . . . . . . . . . . . . . . . . . . . . . . . . . . . . . . . . . . . . . . . . . . . . . . . . . . . . . . . $ 35 $ 45Buildings . . . . . . . . . . . . . . . . . . . . . . . . . . . . . . . . . . . . . . . . . . . . . . . . . . . . . . . . . . . . 1,185 1,261Machinery and equipment . . . . . . . . . . . . . . . . . . . . . . . . . . . . . . . . . . . . . . . . . . . . . . . 2,048 2,191Capital lease assets . . . . . . . . . . . . . . . . . . . . . . . . . . . . . . . . . . . . . . . . . . . . . . . . . . . . 215 213Sale lease-back assets . . . . . . . . . . . . . . . . . . . . . . . . . . . . . . . . . . . . . . . . . . . . . . . . . . 92 80
3,575 3,790
Less accumulated depreciation:Buildings . . . . . . . . . . . . . . . . . . . . . . . . . . . . . . . . . . . . . . . . . . . . . . . . . . . . . . . . . . . . (444) (454)Machinery and equipment . . . . . . . . . . . . . . . . . . . . . . . . . . . . . . . . . . . . . . . . . . . . . . . (1,488) (1,681)Capital lease assets . . . . . . . . . . . . . . . . . . . . . . . . . . . . . . . . . . . . . . . . . . . . . . . . . . . . (96) (78)Sale lease-back assets . . . . . . . . . . . . . . . . . . . . . . . . . . . . . . . . . . . . . . . . . . . . . . . . . . (17) (17)
(2,045) (2,230)
Plant and equipment — net(a) . . . . . . . . . . . . . . . . . . . . . . . . . . . . . . . . . . . . . . . . . . . . . . . $ 1,530 $ 1,560
(a) Includes assets held for sale with a carrying value of $52 and $136 as of December 31, 2006 and 2005, respectively, related toowned facilities that were being actively marketed for sale. These assets were written down in the current and previous periods totheir estimated fair values less estimated costs to sell. The write downs were included in special charges. Nortel expects to disposeof all of these assets held for sale during 2007.
Goodwill:
The following table outlines goodwill by reportable segment:
EnterpriseSolutions
Mobility andConverged
CoreNetworks
MetroEthernetNetworks
GlobalServices Other Total
Balance — as of December 31, 2004 . . . . . . . . . . $413 $174 $782 $934 $ — $2,303Change:
Additions . . . . . . . . . . . . . . . . . . . . . . . . . . . . . 110 20 14 23 175 342Disposals . . . . . . . . . . . . . . . . . . . . . . . . . . . . . (8) — (14) (16) — (38)Foreign exchange . . . . . . . . . . . . . . . . . . . . . . . (3) (4) (4) (6) (4) (21)
Balance — as of December 31, 2005 . . . . . . . . . . $512 $190 $778 $935 $171 $2,586Change:
Additions(a) . . . . . . . . . . . . . . . . . . . . . . . . . . . 9 — 16 18 — 43Disposals(b) . . . . . . . . . . . . . . . . . . . . . . . . . . . (9) (11) (17) (19) — (56)Foreign exchange . . . . . . . . . . . . . . . . . . . . . . . 3 4 4 4 — 15Other . . . . . . . . . . . . . . . . . . . . . . . . . . . . . . . . (7) (18) (13) (21) — (59)(c)
Balance — as of December 31, 2006 . . . . . . . . . . $508 $165 $768 $917 $171 $2,529
(a) The addition of $43 relates to the goodwill acquired as a result of the acquisition of Tasman Networks, Inc. (“Tasman Networks”)in the first quarter of 2006. See note 10 for additional information.
(b) Includes a disposal of $42 related to the transfer of Nortel’s Calgary manufacturing plant assets to Flextronics International Ltd.(“Flextronics”) in the second quarter of 2006. See note 10 for additional information.
(c) Primarily relates to reclassifications in goodwill previously recorded as a result of the finalization of the purchase price allocationfor Nortel Government Solutions Incorporated (formerly PEC Solutions Inc.) (“NGS”), and LG-Nortel Co. Ltd. (“LG-Nortel”). Seenote 10 for additional information.
Due to the changes in operating segments and reporting segments in the first and third quarters of 2006 as described innote 6, a triggering event occurred requiring a goodwill impairment test in each of the first and third quarters of 2006 in
116
NORTEL NETWORKS CORPORATION
Notes to Consolidated Financial Statements — (Continued)

accordance with SFAS No. 142, “Goodwill and Other Intangible Assets”. Nortel performed these tests and concluded thatthere was no impairment.
Intangible assets:
2006 2005
Cost:Other intangible assets(a) . . . . . . . . . . . . . . . . . . . . . . . . . . . . . . . . . . . . . . . . . . . . . . . . . . . . $307 $164
Less accumulated amortization:Other intangible assets . . . . . . . . . . . . . . . . . . . . . . . . . . . . . . . . . . . . . . . . . . . . . . . . . . . . . . (66) (29)
Other intangible assets — net . . . . . . . . . . . . . . . . . . . . . . . . . . . . . . . . . . . . . . . . . . . . . . . . . . . 241 135Pension intangible assets — net . . . . . . . . . . . . . . . . . . . . . . . . . . . . . . . . . . . . . . . . . . . . . . . . . — 37
Intangible assets — net(b) . . . . . . . . . . . . . . . . . . . . . . . . . . . . . . . . . . . . . . . . . . . . . . . . . . . . . . $241 $172
(a) Other intangible assets are being amortized over a weighted-average period of approximately eight years ending in 2014. Amortiza-tion expense for the next five years commencing in 2007 is expected to be $55, $46, $41, $35 and $21, respectively. The majorityof amortization expense is denominated in a foreign currency and may fluctuate due to changes in foreign exchange rates.
(b) The increase related primarily to intangible assets acquired through various business acquisitions. See note 10.
The amortization expense recorded for intangible assets was $26, $17 and $9 for the years ended December 31, 2006,2005 and 2004, respectively.
Other accrued liabilities:
2006 2005
Outsourcing and selling, general and administrative related provisions . . . . . . . . . . . . . . . . . . $ 400 $ 298Customer deposits . . . . . . . . . . . . . . . . . . . . . . . . . . . . . . . . . . . . . . . . . . . . . . . . . . . . . . . . 78 38Product related provisions . . . . . . . . . . . . . . . . . . . . . . . . . . . . . . . . . . . . . . . . . . . . . . . . . . 93 51Warranty provisions (note 13). . . . . . . . . . . . . . . . . . . . . . . . . . . . . . . . . . . . . . . . . . . . . . . . 217 206Deferred revenue . . . . . . . . . . . . . . . . . . . . . . . . . . . . . . . . . . . . . . . . . . . . . . . . . . . . . . . . . 1,127 1,275Miscellaneous taxes . . . . . . . . . . . . . . . . . . . . . . . . . . . . . . . . . . . . . . . . . . . . . . . . . . . . . . . 75 61Income taxes payable . . . . . . . . . . . . . . . . . . . . . . . . . . . . . . . . . . . . . . . . . . . . . . . . . . . . . . 72 77Interest payable . . . . . . . . . . . . . . . . . . . . . . . . . . . . . . . . . . . . . . . . . . . . . . . . . . . . . . . . . . 114 67Advance billings in excess of revenues recognized to date on contracts(a). . . . . . . . . . . . . . . . 1,352 1,229Shareholder litigation settlement provision (note 21) . . . . . . . . . . . . . . . . . . . . . . . . . . . . . . . 814 804Other . . . . . . . . . . . . . . . . . . . . . . . . . . . . . . . . . . . . . . . . . . . . . . . . . . . . . . . . . . . . . . . . . . 261 126
Other accrued liabilities . . . . . . . . . . . . . . . . . . . . . . . . . . . . . . . . . . . . . . . . . . . . . . . . . . . . $4,603 $4,232
(a) Includes amounts which may be recognized beyond one year due to the duration of certain contracts.
Other liabilities:
2006 2005
Pension benefit liabilities . . . . . . . . . . . . . . . . . . . . . . . . . . . . . . . . . . . . . . . . . . . . . . . . . . . $1,965 $1,533Post-employment and post-retirement benefit liabilities . . . . . . . . . . . . . . . . . . . . . . . . . . . . . 794 936Restructuring liabilities (note 7) . . . . . . . . . . . . . . . . . . . . . . . . . . . . . . . . . . . . . . . . . . . . . . 177 198Deferred revenue . . . . . . . . . . . . . . . . . . . . . . . . . . . . . . . . . . . . . . . . . . . . . . . . . . . . . . . . . 919 1,081Shareholder litigation settlement provision (note 21) . . . . . . . . . . . . . . . . . . . . . . . . . . . . . . . 1,680 1,899Other long-term provisions . . . . . . . . . . . . . . . . . . . . . . . . . . . . . . . . . . . . . . . . . . . . . . . . . . 275 290
Other liabilities . . . . . . . . . . . . . . . . . . . . . . . . . . . . . . . . . . . . . . . . . . . . . . . . . . . . . . . . . . $5,810 $5,937
117
NORTEL NETWORKS CORPORATION
Notes to Consolidated Financial Statements — (Continued)

Minority interests in subsidiary companies:
2006 2005
Preferred shares of NNL (Authorized: unlimited number of Class A and Class B)Series 5, issued November 26, 1996 for consideration of Canadian $400(a) . . . . . . . . . . . . . . . $294 $294Series 7, issued November 28, 1997 for consideration of Canadian $350(b) . . . . . . . . . . . . . . . 242 242
Other(c) . . . . . . . . . . . . . . . . . . . . . . . . . . . . . . . . . . . . . . . . . . . . . . . . . . . . . . . . . . . . . . . . . . . 243 247
Minority interests in subsidiary companies . . . . . . . . . . . . . . . . . . . . . . . . . . . . . . . . . . . . . . . . . $779 $783
(a) As of December 31, 2006 and 2005, 16 million Class A Series 5 preferred shares were outstanding. Since December 1, 2001,holders of Series 5 preferred shares are entitled to, if declared, a monthly floating cumulative preferential cash dividend based onCanadian prime rates.
(b) As of December 31, 2006 and 2005, 14 million Class A Series 7 preferred shares were outstanding. Since December 1, 2002,holders of the Series 7 preferred shares are entitled to, if declared, a monthly floating non-cumulative preferential cash dividendbased on Canadian prime rates.
(c) Other includes minority interests in joint ventures primarily in Europe and Asia.
Consolidated statements of cash flows
Change in operating assets and liabilities:
2006 2005 2004
Accounts receivable — net . . . . . . . . . . . . . . . . . . . . . . . . . . . . . . . . . . . . . . . . . . . . $ 51 $(280) $ (16)Inventories — net . . . . . . . . . . . . . . . . . . . . . . . . . . . . . . . . . . . . . . . . . . . . . . . . . . . (42) 285 (241)Deferred costs . . . . . . . . . . . . . . . . . . . . . . . . . . . . . . . . . . . . . . . . . . . . . . . . . . . . . . 97 (538) (536)Income taxes. . . . . . . . . . . . . . . . . . . . . . . . . . . . . . . . . . . . . . . . . . . . . . . . . . . . . . . (20) (58) (63)Accounts payable . . . . . . . . . . . . . . . . . . . . . . . . . . . . . . . . . . . . . . . . . . . . . . . . . . . (79) 189 94Payroll, accrued and contractual liabilities . . . . . . . . . . . . . . . . . . . . . . . . . . . . . . . . . (257) 213 (664)Deferred revenue. . . . . . . . . . . . . . . . . . . . . . . . . . . . . . . . . . . . . . . . . . . . . . . . . . . . (229) 161 573Advance billings . . . . . . . . . . . . . . . . . . . . . . . . . . . . . . . . . . . . . . . . . . . . . . . . . . . . 120 102 331Restructuring liabilities . . . . . . . . . . . . . . . . . . . . . . . . . . . . . . . . . . . . . . . . . . . . . . . (21) (149) (57)Other . . . . . . . . . . . . . . . . . . . . . . . . . . . . . . . . . . . . . . . . . . . . . . . . . . . . . . . . . . . . (69) (142) (104)
Change in operating assets and liabilities . . . . . . . . . . . . . . . . . . . . . . . . . . . . . . . . . . $(449) $(217) $(683)
Cash and cash equivalents:
2006 2005 2004
Cash on hand and balances with banks . . . . . . . . . . . . . . . . . . . . . . . . . . . . . . . . . $ 748 $ 767 $ 773Short-term investments . . . . . . . . . . . . . . . . . . . . . . . . . . . . . . . . . . . . . . . . . . . . . 2,744 2,184 2,912
Cash and cash equivalents at end of year . . . . . . . . . . . . . . . . . . . . . . . . . . . . . . . . $3,492 $2,951 $3,685
Acquisitions of investments and businesses — net of cash acquired:
2006 2005 2004
Cash acquired . . . . . . . . . . . . . . . . . . . . . . . . . . . . . . . . . . . . . . . . . . . . . . . . . . . . . . . $ (1) $ (26) $ (6)Total net assets acquired other than cash . . . . . . . . . . . . . . . . . . . . . . . . . . . . . . . . . . . (146) (651) (5)
Total purchase price . . . . . . . . . . . . . . . . . . . . . . . . . . . . . . . . . . . . . . . . . . . . . . . . . . (147) (677) (11)Less:
Cash acquired . . . . . . . . . . . . . . . . . . . . . . . . . . . . . . . . . . . . . . . . . . . . . . . . . . . . . 1 26 6
Acquisitions of investments and businesses — net of cash acquired. . . . . . . . . . . . . . . . $(146) $(651) $ (5)
118
NORTEL NETWORKS CORPORATION
Notes to Consolidated Financial Statements — (Continued)
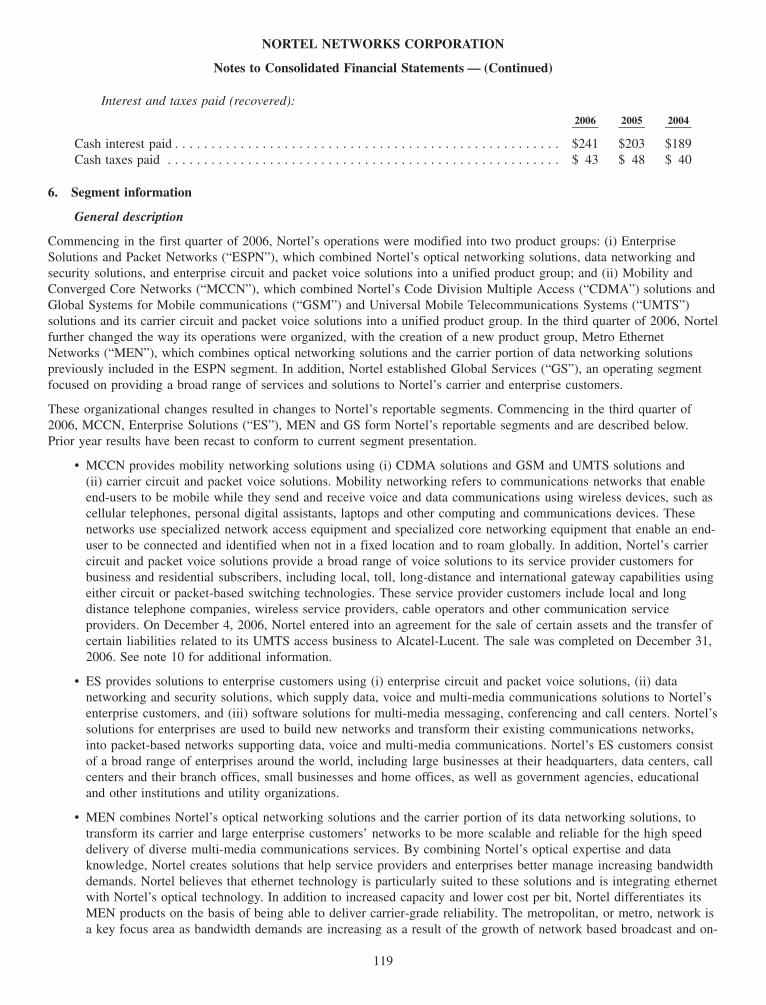
Interest and taxes paid (recovered):
2006 2005 2004
Cash interest paid . . . . . . . . . . . . . . . . . . . . . . . . . . . . . . . . . . . . . . . . . . . . . . . . . . . . . $241 $203 $189Cash taxes paid . . . . . . . . . . . . . . . . . . . . . . . . . . . . . . . . . . . . . . . . . . . . . . . . . . . . . . $ 43 $ 48 $ 40
6. Segment information
General description
Commencing in the first quarter of 2006, Nortel’s operations were modified into two product groups: (i) EnterpriseSolutions and Packet Networks (“ESPN”), which combined Nortel’s optical networking solutions, data networking andsecurity solutions, and enterprise circuit and packet voice solutions into a unified product group; and (ii) Mobility andConverged Core Networks (“MCCN”), which combined Nortel’s Code Division Multiple Access (“CDMA”) solutions andGlobal Systems for Mobile communications (“GSM”) and Universal Mobile Telecommunications Systems (“UMTS”)solutions and its carrier circuit and packet voice solutions into a unified product group. In the third quarter of 2006, Nortelfurther changed the way its operations were organized, with the creation of a new product group, Metro EthernetNetworks (“MEN”), which combines optical networking solutions and the carrier portion of data networking solutionspreviously included in the ESPN segment. In addition, Nortel established Global Services (“GS”), an operating segmentfocused on providing a broad range of services and solutions to Nortel’s carrier and enterprise customers.
These organizational changes resulted in changes to Nortel’s reportable segments. Commencing in the third quarter of2006, MCCN, Enterprise Solutions (“ES”), MEN and GS form Nortel’s reportable segments and are described below.Prior year results have been recast to conform to current segment presentation.
• MCCN provides mobility networking solutions using (i) CDMA solutions and GSM and UMTS solutions and(ii) carrier circuit and packet voice solutions. Mobility networking refers to communications networks that enableend-users to be mobile while they send and receive voice and data communications using wireless devices, such ascellular telephones, personal digital assistants, laptops and other computing and communications devices. Thesenetworks use specialized network access equipment and specialized core networking equipment that enable an end-user to be connected and identified when not in a fixed location and to roam globally. In addition, Nortel’s carriercircuit and packet voice solutions provide a broad range of voice solutions to its service provider customers forbusiness and residential subscribers, including local, toll, long-distance and international gateway capabilities usingeither circuit or packet-based switching technologies. These service provider customers include local and longdistance telephone companies, wireless service providers, cable operators and other communication serviceproviders. On December 4, 2006, Nortel entered into an agreement for the sale of certain assets and the transfer ofcertain liabilities related to its UMTS access business to Alcatel-Lucent. The sale was completed on December 31,2006. See note 10 for additional information.
• ES provides solutions to enterprise customers using (i) enterprise circuit and packet voice solutions, (ii) datanetworking and security solutions, which supply data, voice and multi-media communications solutions to Nortel’senterprise customers, and (iii) software solutions for multi-media messaging, conferencing and call centers. Nortel’ssolutions for enterprises are used to build new networks and transform their existing communications networks,into packet-based networks supporting data, voice and multi-media communications. Nortel’s ES customers consistof a broad range of enterprises around the world, including large businesses at their headquarters, data centers, callcenters and their branch offices, small businesses and home offices, as well as government agencies, educationaland other institutions and utility organizations.
• MEN combines Nortel’s optical networking solutions and the carrier portion of its data networking solutions, totransform its carrier and large enterprise customers’ networks to be more scalable and reliable for the high speeddelivery of diverse multi-media communications services. By combining Nortel’s optical expertise and dataknowledge, Nortel creates solutions that help service providers and enterprises better manage increasing bandwidthdemands. Nortel believes that ethernet technology is particularly suited to these solutions and is integrating ethernetwith Nortel’s optical technology. In addition to increased capacity and lower cost per bit, Nortel differentiates itsMEN products on the basis of being able to deliver carrier-grade reliability. The metropolitan, or metro, network isa key focus area as bandwidth demands are increasing as a result of the growth of network based broadcast and on-
119
NORTEL NETWORKS CORPORATION
Notes to Consolidated Financial Statements — (Continued)
demand video delivery, wireless “backhaul” for a variety of data services including video as well as traditionalbusiness, internet, private line and voice services. MEN serves the long haul optical market using common productsand technologies from the metro optical market. MEN also serves high performance, mission critical enterprisenetworks.
• GS provides a broad range of services to address the requirements of Nortel’s carrier and enterprise customersthroughout the entire lifecycle of their networks. The GS portfolio is organized into four main service productgroups: (i) network implementation services, including network integration, planning, installation, optimization andsecurity services, (ii) network support services, including technical support, hardware maintenance, equipmentspares logistics and on-site engineers, (iii) network managed services, including services related to the monitoringand management of customer networks and providing a range of network managed service options and (iv) networkapplication services, including applications development, integration and web services. Nortel’s GS market mirrorsthat of its carrier and enterprise markets along with a broad range of customers in all geographic regions whereNortel conducts business, including small and medium-sized businesses, to large global enterprises and all levels ofgovernment. Revenues from network implementation services including network planning, engineering andinstallation are generally bundled with product sales and are not currently included in the revenues of GS.
Other miscellaneous business activities and corporate functions including the operating results from the acquisition ofNGS do not meet the quantitative criteria to be disclosed separately as reportable segments and have been reported in“Other”. Costs associated with shared services and other corporate costs are allocated to Nortel’s reportable segmentsbased on usage determined generally by headcount. Costs not allocated to the segments are primarily related to Nortel’scorporate compliance, interest attributable to its long-term debt and other non-operational activities, and are included in“Other”.
Nortel’s president and chief executive officer (the “CEO”) has been identified as the Chief Operating Decision Maker inassessing the performance of the segments and the allocation of resources to the segments. The primary financial measureused by the CEO in assessing performance and allocating resources to the segments is management earnings (loss) beforeincome taxes (“Management EBT”), a measure that includes the cost of revenues, SG&A expense, R&D expense, interestexpense, other income (expense) — net, minority interests — net of tax and equity in net earnings (loss) of associatedcompanies — net of tax. Interest attributable to long-term debt is not allocated to a reportable segment and is included in“Other”. The CEO does not review asset information on a segmented basis in order to assess performance and allocateresources. The accounting policies of the reportable segments are the same as those applied to the consolidated financialstatements.
120
NORTEL NETWORKS CORPORATION
Notes to Consolidated Financial Statements — (Continued)

Segments
The following tables set forth information by segment for the years ended December 31:
2006 2005 2004
RevenuesMobility and Converged Core Networks . . . . . . . . . . . . . . . . . . . . . . . . . . . . . . $ 5,922 $ 5,680 $5,237Enterprise Solutions . . . . . . . . . . . . . . . . . . . . . . . . . . . . . . . . . . . . . . . . . . . . . 2,340 2,105 1,943Metro Ethernet Networks . . . . . . . . . . . . . . . . . . . . . . . . . . . . . . . . . . . . . . . . . 1,670 1,408 1,158Global Services. . . . . . . . . . . . . . . . . . . . . . . . . . . . . . . . . . . . . . . . . . . . . . . . . 1,242 1,170 1,129
Total reportable segments . . . . . . . . . . . . . . . . . . . . . . . . . . . . . . . . . . . . . . . . . 11,174 10,363 9,467Other . . . . . . . . . . . . . . . . . . . . . . . . . . . . . . . . . . . . . . . . . . . . . . . . . . . . . . . . 244 146 11
Total revenues . . . . . . . . . . . . . . . . . . . . . . . . . . . . . . . . . . . . . . . . . . . . . . . . . $11,418 $10,509 $9,478
Management EBTMobility and Converged Core Networks . . . . . . . . . . . . . . . . . . . . . . . . . . . . . . $ 517 $ 504 $ 269Enterprise Solutions . . . . . . . . . . . . . . . . . . . . . . . . . . . . . . . . . . . . . . . . . . . . . (75) 93 59Metro Ethernet Networks . . . . . . . . . . . . . . . . . . . . . . . . . . . . . . . . . . . . . . . . . 34 (102) (336)Global Services. . . . . . . . . . . . . . . . . . . . . . . . . . . . . . . . . . . . . . . . . . . . . . . . . 333 354 329
Total reportable segments . . . . . . . . . . . . . . . . . . . . . . . . . . . . . . . . . . . . . . . . . 809 849 321Other . . . . . . . . . . . . . . . . . . . . . . . . . . . . . . . . . . . . . . . . . . . . . . . . . . . . . . . . (1,002) (834) (538)
Total Management EBT . . . . . . . . . . . . . . . . . . . . . . . . . . . . . . . . . . . . . . . . . (193) 15 (217)
Amortization of intangibles . . . . . . . . . . . . . . . . . . . . . . . . . . . . . . . . . . . . . . . . (26) (17) (9)In-process research and development expense . . . . . . . . . . . . . . . . . . . . . . . . . . (22) — —Special charges . . . . . . . . . . . . . . . . . . . . . . . . . . . . . . . . . . . . . . . . . . . . . . . . . (105) (169) (181)Gain (loss) on sale of businesses and assets . . . . . . . . . . . . . . . . . . . . . . . . . . . . 206 (47) 91Shareholder litigation settlement (expense) recovery . . . . . . . . . . . . . . . . . . . . . . 219 (2,474) —Income tax benefit (expense) . . . . . . . . . . . . . . . . . . . . . . . . . . . . . . . . . . . . . . . (60) 81 20
Net earnings (loss) from continuing operations . . . . . . . . . . . . . . . . . . . . . . . . $ 19 $ (2,611) $ (296)
Product and service revenues
The following table sets forth external revenues by product and service for the years ended December 31:
2006 2005 2004
CDMA solutions . . . . . . . . . . . . . . . . . . . . . . . . . . . . . . . . . . . . . . . . . . . . . . . . $ 2,512 $ 2,181 $2,103GSM and UMTS solutions . . . . . . . . . . . . . . . . . . . . . . . . . . . . . . . . . . . . . . . . 2,413 2,615 2,203Circuit and packet voice solutions . . . . . . . . . . . . . . . . . . . . . . . . . . . . . . . . . . . 2,625 2,361 2,240Optical networking solutions . . . . . . . . . . . . . . . . . . . . . . . . . . . . . . . . . . . . . . . 1,186 1,008 805Data networking and security solutions . . . . . . . . . . . . . . . . . . . . . . . . . . . . . . . 1,196 1,028 987Global services . . . . . . . . . . . . . . . . . . . . . . . . . . . . . . . . . . . . . . . . . . . . . . . . . 1,242 1,170 1,129Other . . . . . . . . . . . . . . . . . . . . . . . . . . . . . . . . . . . . . . . . . . . . . . . . . . . . . . . . 244 146 11
Total . . . . . . . . . . . . . . . . . . . . . . . . . . . . . . . . . . . . . . . . . . . . . . . . . . . . . . . . $11,418 $10,509 $9,478
During the year ended December 31, 2006, Nortel had one customer, Verizon Communications Inc., which generatedrevenues of approximately $1,416 or 12.4% of total consolidated revenues. The revenues did not relate specifically to oneof Nortel’s reportable segments, but rather were generated throughout all of Nortel’s reportable segments. For the yearsended December 31, 2005 and 2004, no customer generated revenues greater than 10 percent of consolidated revenues.
121
NORTEL NETWORKS CORPORATION
Notes to Consolidated Financial Statements — (Continued)
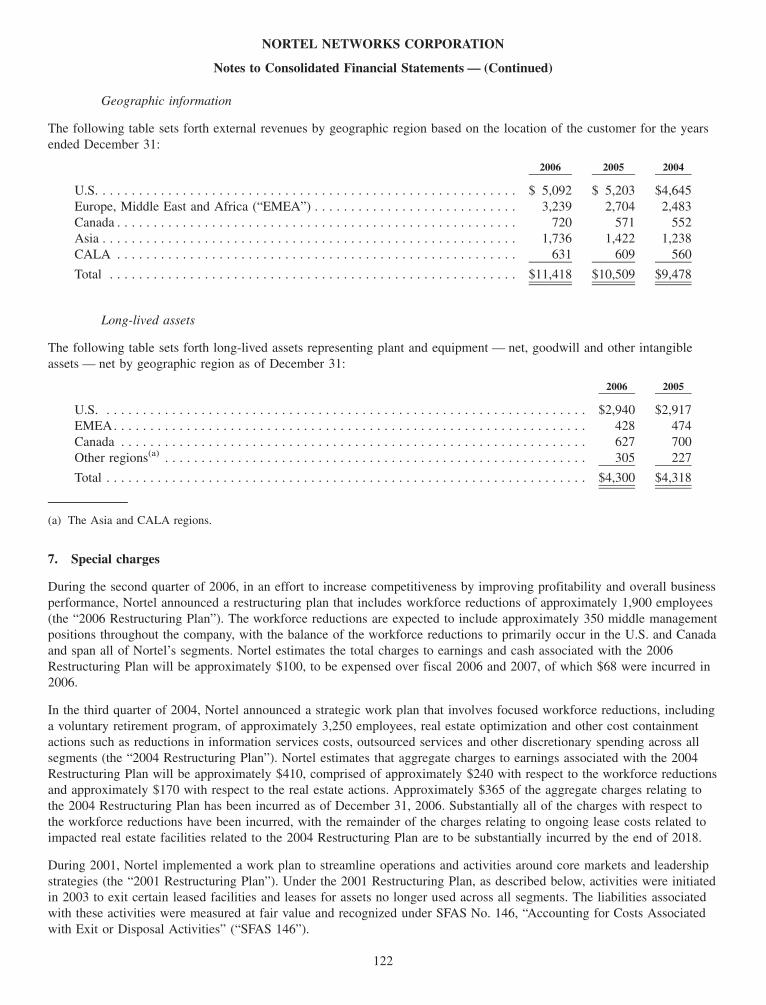
Geographic information
The following table sets forth external revenues by geographic region based on the location of the customer for the yearsended December 31:
2006 2005 2004
U.S. . . . . . . . . . . . . . . . . . . . . . . . . . . . . . . . . . . . . . . . . . . . . . . . . . . . . . . . . . $ 5,092 $ 5,203 $4,645Europe, Middle East and Africa (“EMEA”) . . . . . . . . . . . . . . . . . . . . . . . . . . . . 3,239 2,704 2,483Canada . . . . . . . . . . . . . . . . . . . . . . . . . . . . . . . . . . . . . . . . . . . . . . . . . . . . . . . 720 571 552Asia . . . . . . . . . . . . . . . . . . . . . . . . . . . . . . . . . . . . . . . . . . . . . . . . . . . . . . . . . 1,736 1,422 1,238CALA . . . . . . . . . . . . . . . . . . . . . . . . . . . . . . . . . . . . . . . . . . . . . . . . . . . . . . . 631 609 560
Total . . . . . . . . . . . . . . . . . . . . . . . . . . . . . . . . . . . . . . . . . . . . . . . . . . . . . . . . $11,418 $10,509 $9,478
Long-lived assets
The following table sets forth long-lived assets representing plant and equipment — net, goodwill and other intangibleassets — net by geographic region as of December 31:
2006 2005
U.S. . . . . . . . . . . . . . . . . . . . . . . . . . . . . . . . . . . . . . . . . . . . . . . . . . . . . . . . . . . . . . . . . . . $2,940 $2,917EMEA. . . . . . . . . . . . . . . . . . . . . . . . . . . . . . . . . . . . . . . . . . . . . . . . . . . . . . . . . . . . . . . . . 428 474Canada . . . . . . . . . . . . . . . . . . . . . . . . . . . . . . . . . . . . . . . . . . . . . . . . . . . . . . . . . . . . . . . . 627 700Other regions(a) . . . . . . . . . . . . . . . . . . . . . . . . . . . . . . . . . . . . . . . . . . . . . . . . . . . . . . . . . . 305 227
Total . . . . . . . . . . . . . . . . . . . . . . . . . . . . . . . . . . . . . . . . . . . . . . . . . . . . . . . . . . . . . . . . . . $4,300 $4,318
(a) The Asia and CALA regions.
7. Special charges
During the second quarter of 2006, in an effort to increase competitiveness by improving profitability and overall businessperformance, Nortel announced a restructuring plan that includes workforce reductions of approximately 1,900 employees(the “2006 Restructuring Plan”). The workforce reductions are expected to include approximately 350 middle managementpositions throughout the company, with the balance of the workforce reductions to primarily occur in the U.S. and Canadaand span all of Nortel’s segments. Nortel estimates the total charges to earnings and cash associated with the 2006Restructuring Plan will be approximately $100, to be expensed over fiscal 2006 and 2007, of which $68 were incurred in2006.
In the third quarter of 2004, Nortel announced a strategic work plan that involves focused workforce reductions, includinga voluntary retirement program, of approximately 3,250 employees, real estate optimization and other cost containmentactions such as reductions in information services costs, outsourced services and other discretionary spending across allsegments (the “2004 Restructuring Plan”). Nortel estimates that aggregate charges to earnings associated with the 2004Restructuring Plan will be approximately $410, comprised of approximately $240 with respect to the workforce reductionsand approximately $170 with respect to the real estate actions. Approximately $365 of the aggregate charges relating tothe 2004 Restructuring Plan has been incurred as of December 31, 2006. Substantially all of the charges with respect tothe workforce reductions have been incurred, with the remainder of the charges relating to ongoing lease costs related toimpacted real estate facilities related to the 2004 Restructuring Plan are to be substantially incurred by the end of 2018.
During 2001, Nortel implemented a work plan to streamline operations and activities around core markets and leadershipstrategies (the “2001 Restructuring Plan”). Under the 2001 Restructuring Plan, as described below, activities were initiatedin 2003 to exit certain leased facilities and leases for assets no longer used across all segments. The liabilities associatedwith these activities were measured at fair value and recognized under SFAS No. 146, “Accounting for Costs Associatedwith Exit or Disposal Activities” (“SFAS 146”).
122
NORTEL NETWORKS CORPORATION
Notes to Consolidated Financial Statements — (Continued)
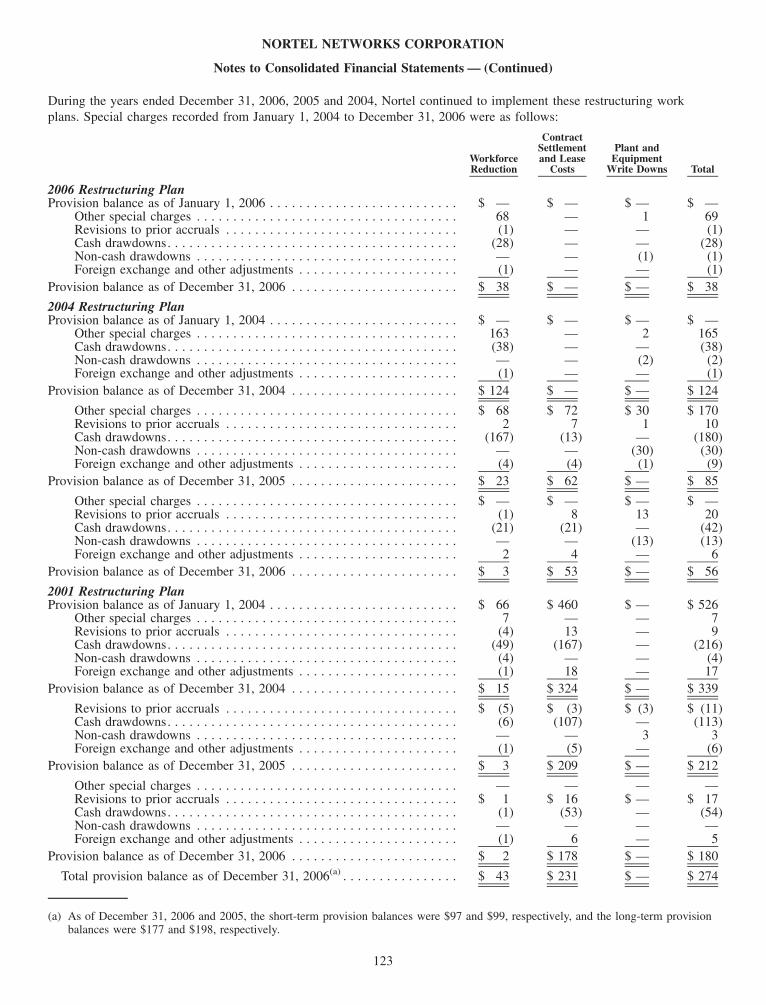
During the years ended December 31, 2006, 2005 and 2004, Nortel continued to implement these restructuring workplans. Special charges recorded from January 1, 2004 to December 31, 2006 were as follows:
WorkforceReduction
ContractSettlementand Lease
Costs
Plant andEquipment
Write Downs Total
2006 Restructuring PlanProvision balance as of January 1, 2006 . . . . . . . . . . . . . . . . . . . . . . . . . . $ — $ — $ — $ —
Other special charges . . . . . . . . . . . . . . . . . . . . . . . . . . . . . . . . . . . . 68 — 1 69Revisions to prior accruals . . . . . . . . . . . . . . . . . . . . . . . . . . . . . . . . (1) — — (1)Cash drawdowns. . . . . . . . . . . . . . . . . . . . . . . . . . . . . . . . . . . . . . . . (28) — — (28)Non-cash drawdowns . . . . . . . . . . . . . . . . . . . . . . . . . . . . . . . . . . . . — — (1) (1)Foreign exchange and other adjustments . . . . . . . . . . . . . . . . . . . . . . (1) — — (1)
Provision balance as of December 31, 2006 . . . . . . . . . . . . . . . . . . . . . . . $ 38 $ — $ — $ 38
2004 Restructuring PlanProvision balance as of January 1, 2004 . . . . . . . . . . . . . . . . . . . . . . . . . . $ — $ — $ — $ —
Other special charges . . . . . . . . . . . . . . . . . . . . . . . . . . . . . . . . . . . . 163 — 2 165Cash drawdowns. . . . . . . . . . . . . . . . . . . . . . . . . . . . . . . . . . . . . . . . (38) — — (38)Non-cash drawdowns . . . . . . . . . . . . . . . . . . . . . . . . . . . . . . . . . . . . — — (2) (2)Foreign exchange and other adjustments . . . . . . . . . . . . . . . . . . . . . . (1) — — (1)
Provision balance as of December 31, 2004 . . . . . . . . . . . . . . . . . . . . . . . $ 124 $ — $ — $ 124
Other special charges . . . . . . . . . . . . . . . . . . . . . . . . . . . . . . . . . . . . $ 68 $ 72 $ 30 $ 170Revisions to prior accruals . . . . . . . . . . . . . . . . . . . . . . . . . . . . . . . . 2 7 1 10Cash drawdowns. . . . . . . . . . . . . . . . . . . . . . . . . . . . . . . . . . . . . . . . (167) (13) — (180)Non-cash drawdowns . . . . . . . . . . . . . . . . . . . . . . . . . . . . . . . . . . . . — — (30) (30)Foreign exchange and other adjustments . . . . . . . . . . . . . . . . . . . . . . (4) (4) (1) (9)
Provision balance as of December 31, 2005 . . . . . . . . . . . . . . . . . . . . . . . $ 23 $ 62 $ — $ 85
Other special charges . . . . . . . . . . . . . . . . . . . . . . . . . . . . . . . . . . . . $ — $ — $ — $ —Revisions to prior accruals . . . . . . . . . . . . . . . . . . . . . . . . . . . . . . . . (1) 8 13 20Cash drawdowns. . . . . . . . . . . . . . . . . . . . . . . . . . . . . . . . . . . . . . . . (21) (21) — (42)Non-cash drawdowns . . . . . . . . . . . . . . . . . . . . . . . . . . . . . . . . . . . . — — (13) (13)Foreign exchange and other adjustments . . . . . . . . . . . . . . . . . . . . . . 2 4 — 6
Provision balance as of December 31, 2006 . . . . . . . . . . . . . . . . . . . . . . . $ 3 $ 53 $ — $ 56
2001 Restructuring PlanProvision balance as of January 1, 2004 . . . . . . . . . . . . . . . . . . . . . . . . . . $ 66 $ 460 $ — $ 526
Other special charges . . . . . . . . . . . . . . . . . . . . . . . . . . . . . . . . . . . . 7 — — 7Revisions to prior accruals . . . . . . . . . . . . . . . . . . . . . . . . . . . . . . . . (4) 13 — 9Cash drawdowns. . . . . . . . . . . . . . . . . . . . . . . . . . . . . . . . . . . . . . . . (49) (167) — (216)Non-cash drawdowns . . . . . . . . . . . . . . . . . . . . . . . . . . . . . . . . . . . . (4) — — (4)Foreign exchange and other adjustments . . . . . . . . . . . . . . . . . . . . . . (1) 18 — 17
Provision balance as of December 31, 2004 . . . . . . . . . . . . . . . . . . . . . . . $ 15 $ 324 $ — $ 339
Revisions to prior accruals . . . . . . . . . . . . . . . . . . . . . . . . . . . . . . . . $ (5) $ (3) $ (3) $ (11)Cash drawdowns. . . . . . . . . . . . . . . . . . . . . . . . . . . . . . . . . . . . . . . . (6) (107) — (113)Non-cash drawdowns . . . . . . . . . . . . . . . . . . . . . . . . . . . . . . . . . . . . — — 3 3Foreign exchange and other adjustments . . . . . . . . . . . . . . . . . . . . . . (1) (5) — (6)
Provision balance as of December 31, 2005 . . . . . . . . . . . . . . . . . . . . . . . $ 3 $ 209 $ — $ 212
Other special charges . . . . . . . . . . . . . . . . . . . . . . . . . . . . . . . . . . . . — — — —Revisions to prior accruals . . . . . . . . . . . . . . . . . . . . . . . . . . . . . . . . $ 1 $ 16 $ — $ 17Cash drawdowns. . . . . . . . . . . . . . . . . . . . . . . . . . . . . . . . . . . . . . . . (1) (53) — (54)Non-cash drawdowns . . . . . . . . . . . . . . . . . . . . . . . . . . . . . . . . . . . . — — — —Foreign exchange and other adjustments . . . . . . . . . . . . . . . . . . . . . . (1) 6 — 5
Provision balance as of December 31, 2006 . . . . . . . . . . . . . . . . . . . . . . . $ 2 $ 178 $ — $ 180
Total provision balance as of December 31, 2006(a) . . . . . . . . . . . . . . . . $ 43 $ 231 $ — $ 274
(a) As of December 31, 2006 and 2005, the short-term provision balances were $97 and $99, respectively, and the long-term provisionbalances were $177 and $198, respectively.
123
NORTEL NETWORKS CORPORATION
Notes to Consolidated Financial Statements — (Continued)

The following table summarizes the total special charges incurred for each of Nortel’s restructuring plans:
2006 2005 2004 Total
Special Charges by Restructuring Plan:2006 Restructuring Plan . . . . . . . . . . . . . . . . . . . . . . . . . . . . . . . . . . . . . . . . $ 68 $ — $ — $ 682004 Restructuring Plan . . . . . . . . . . . . . . . . . . . . . . . . . . . . . . . . . . . . . . . . 20 180 165 3652001 Restructuring Plan . . . . . . . . . . . . . . . . . . . . . . . . . . . . . . . . . . . . . . . . 17 (11) 16 22
Total . . . . . . . . . . . . . . . . . . . . . . . . . . . . . . . . . . . . . . . . . . . . . . . . . . . . . . . . $105 $169 $181 $455
Regular full-time (“RFT”) employee notifications resulting in special charges for all three restructuring plans were asfollows:
Direct(a) Indirect(b) TotalEmployees (approximate)
RFT employee notifications by period:During 2004 . . . . . . . . . . . . . . . . . . . . . . . . . . . . . . . . . . . . . . . . . . . . . . . . . . 200 1,700 1,900During 2005 . . . . . . . . . . . . . . . . . . . . . . . . . . . . . . . . . . . . . . . . . . . . . . . . . . 61 893 954During 2006 . . . . . . . . . . . . . . . . . . . . . . . . . . . . . . . . . . . . . . . . . . . . . . . . . . 22 520 542
RFT employee notifications for the three years ended December 31, 2006 . . . . . . . 283 3,113 3,396
(a) Direct employees included employees performing manufacturing, assembly, test and inspection activities associated with theproduction of Nortel’s products.
(b) Indirect employees included employees performing manufacturing, management, sales, marketing, research and development andadministrative activities.
2006 Restructuring Plan
Year ended December 31, 2006
For the year ended December 31, 2006, Nortel recorded special charges of $68 related to severance and benefit costsassociated with a workforce reduction of approximately 910 employees, of which 542 were notified of termination duringthe year ended December 31, 2006. The workforce reduction was primarily in the U.S. and Canada and extended acrossall of Nortel’s segments, with the majority of the reductions occurring in the MCCN and ES business segments. Theremaining provision is expected to be substantially drawn down by the end of 2007.
2006 Restructuring Plan — by Segment
The following table outlines special charges incurred by segment related to the 2006 Restructuring Plan for the year endedDecember 31, 2006:
WorkforceReduction
Plant andEquipment
Write Downs Total
2006 Restructuring PlanMobility and Converged Core Networks . . . . . . . . . . . . . . . . . . . . . . . . . . . $37 $ 1 $38Enterprise Solutions . . . . . . . . . . . . . . . . . . . . . . . . . . . . . . . . . . . . . . . . . . 14 — 14Metro Ethernet Networks . . . . . . . . . . . . . . . . . . . . . . . . . . . . . . . . . . . . . . 7 — 7Global Services . . . . . . . . . . . . . . . . . . . . . . . . . . . . . . . . . . . . . . . . . . . . . 3 — 3Other . . . . . . . . . . . . . . . . . . . . . . . . . . . . . . . . . . . . . . . . . . . . . . . . . . . . . 6 — 6
Total special charges for the year ended December 31, 2006 . . . . . . . . . . . . . . $67 $ 1 $68
2004 Restructuring Plan
Year ended December 31, 2006
During the year ended December 31, 2006, Nortel recorded revisions of $20 related to prior accruals.
124
NORTEL NETWORKS CORPORATION
Notes to Consolidated Financial Statements — (Continued)
Contract settlement and lease costs included revisions to prior accruals of $8 for the year ended December 31, 2006, andconsisted of negotiated settlements to cancel or renegotiate contracts, and net lease charges related to leased facilities(comprised of office space) and leased furniture that were identified as no longer required. These revisions occurredprimarily in the U.S. and EMEA and primarily in the MCCN segment. The lease costs component, net of anticipatedsublease income, included costs relating to non-cancelable lease terms from the date leased facilities ceased to be usedand any termination penalties. During the year ended December 31, 2006, the provision balance for workforce reductionand contract settlement and lease costs was drawn down by cash payments of $21 and $21, respectively. The remainingprovision, net of approximately $34 in estimated sublease income, is expected to be substantially drawn down by the endof 2018.
Year ended December 31, 2005
Workforce reduction charges of $70 including revisions to prior accruals of $2 were related to severance and benefit costsassociated with 954 employees notified of termination during the year ended December 31, 2005. The workforce reductionwas primarily in the U.S., Canada and EMEA, and extended across all of Nortel’s segments.
Contract settlement and lease costs of $79 included revisions to prior accruals of $7 and consisted of negotiatedsettlements to cancel or renegotiate contracts and net lease charges related to leased facilities (comprised of office space)and leased furniture that were identified as no longer required primarily in the U.S. and EMEA and in the MCCN and ESsegments. These lease costs, net of anticipated sublease income, included costs relating to non-cancelable lease terms fromthe date leased facilities ceased to be used and termination penalties.
Plant and equipment charges of $31 were related to current period write downs to fair value less costs to sell ownedfacilities and plant and manufacturing related equipment.
Year ended December 31, 2004
Workforce reduction charges of $163 were related to severance and benefit costs associated with approximately 1,850employees, of which 1,800 had been notified of termination during 2004. The remaining charge related to terminationbenefits attributable to ongoing employee benefit arrangements. The workforce reduction was primarily in the U.S.,Canada and EMEA and extended across all segments.
125
NORTEL NETWORKS CORPORATION
Notes to Consolidated Financial Statements — (Continued)
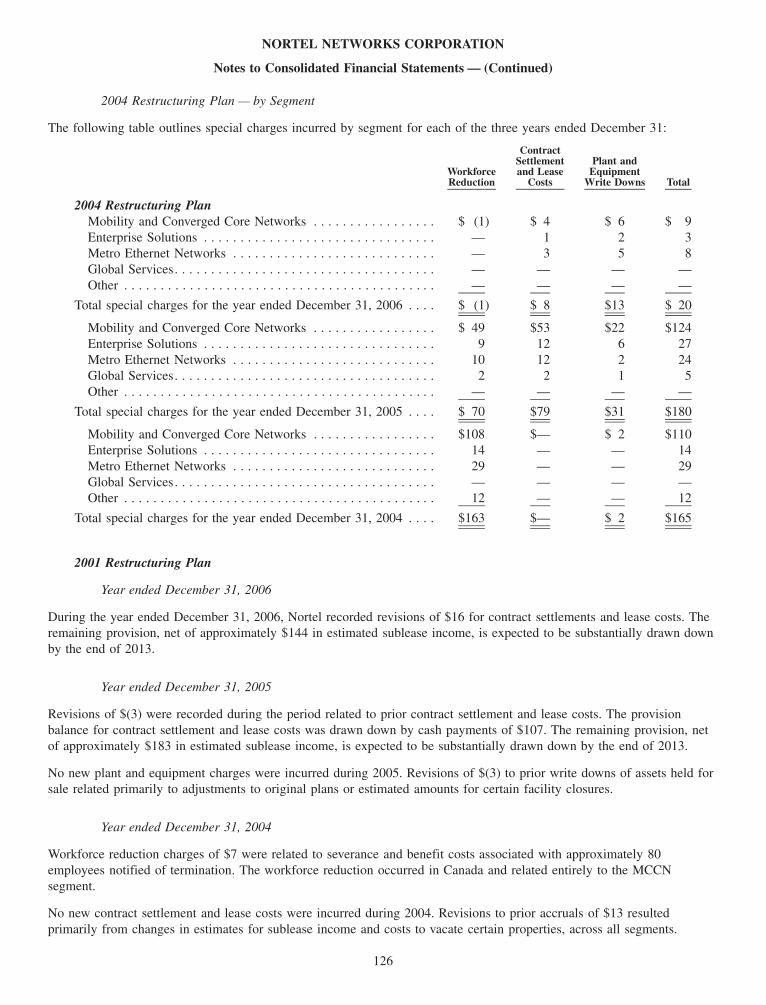
2004 Restructuring Plan — by Segment
The following table outlines special charges incurred by segment for each of the three years ended December 31:
WorkforceReduction
ContractSettlementand Lease
Costs
Plant andEquipment
Write Downs Total
2004 Restructuring PlanMobility and Converged Core Networks . . . . . . . . . . . . . . . . . $ (1) $ 4 $ 6 $ 9Enterprise Solutions . . . . . . . . . . . . . . . . . . . . . . . . . . . . . . . . — 1 2 3Metro Ethernet Networks . . . . . . . . . . . . . . . . . . . . . . . . . . . . — 3 5 8Global Services. . . . . . . . . . . . . . . . . . . . . . . . . . . . . . . . . . . . — — — —Other . . . . . . . . . . . . . . . . . . . . . . . . . . . . . . . . . . . . . . . . . . . — — — —
Total special charges for the year ended December 31, 2006 . . . . $ (1) $ 8 $13 $ 20
Mobility and Converged Core Networks . . . . . . . . . . . . . . . . . $ 49 $53 $22 $124Enterprise Solutions . . . . . . . . . . . . . . . . . . . . . . . . . . . . . . . . 9 12 6 27Metro Ethernet Networks . . . . . . . . . . . . . . . . . . . . . . . . . . . . 10 12 2 24Global Services. . . . . . . . . . . . . . . . . . . . . . . . . . . . . . . . . . . . 2 2 1 5Other . . . . . . . . . . . . . . . . . . . . . . . . . . . . . . . . . . . . . . . . . . . — — — —
Total special charges for the year ended December 31, 2005 . . . . $ 70 $79 $31 $180
Mobility and Converged Core Networks . . . . . . . . . . . . . . . . . $108 $— $ 2 $110Enterprise Solutions . . . . . . . . . . . . . . . . . . . . . . . . . . . . . . . . 14 — — 14Metro Ethernet Networks . . . . . . . . . . . . . . . . . . . . . . . . . . . . 29 — — 29Global Services. . . . . . . . . . . . . . . . . . . . . . . . . . . . . . . . . . . . — — — —Other . . . . . . . . . . . . . . . . . . . . . . . . . . . . . . . . . . . . . . . . . . . 12 — — 12
Total special charges for the year ended December 31, 2004 . . . . $163 $— $ 2 $165
2001 Restructuring Plan
Year ended December 31, 2006
During the year ended December 31, 2006, Nortel recorded revisions of $16 for contract settlements and lease costs. Theremaining provision, net of approximately $144 in estimated sublease income, is expected to be substantially drawn downby the end of 2013.
Year ended December 31, 2005
Revisions of $(3) were recorded during the period related to prior contract settlement and lease costs. The provisionbalance for contract settlement and lease costs was drawn down by cash payments of $107. The remaining provision, netof approximately $183 in estimated sublease income, is expected to be substantially drawn down by the end of 2013.
No new plant and equipment charges were incurred during 2005. Revisions of $(3) to prior write downs of assets held forsale related primarily to adjustments to original plans or estimated amounts for certain facility closures.
Year ended December 31, 2004
Workforce reduction charges of $7 were related to severance and benefit costs associated with approximately 80employees notified of termination. The workforce reduction occurred in Canada and related entirely to the MCCNsegment.
No new contract settlement and lease costs were incurred during 2004. Revisions to prior accruals of $13 resultedprimarily from changes in estimates for sublease income and costs to vacate certain properties, across all segments.
126
NORTEL NETWORKS CORPORATION
Notes to Consolidated Financial Statements — (Continued)
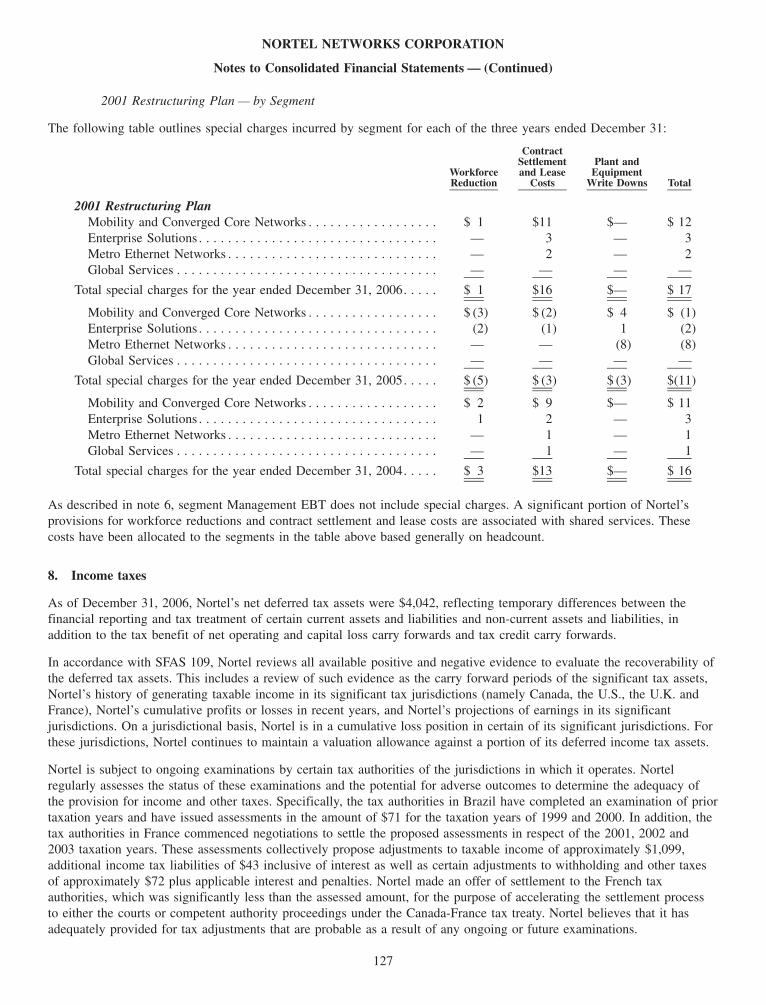
2001 Restructuring Plan — by Segment
The following table outlines special charges incurred by segment for each of the three years ended December 31:
WorkforceReduction
ContractSettlementand Lease
Costs
Plant andEquipment
Write Downs Total
2001 Restructuring PlanMobility and Converged Core Networks . . . . . . . . . . . . . . . . . . $ 1 $11 $— $ 12Enterprise Solutions . . . . . . . . . . . . . . . . . . . . . . . . . . . . . . . . . — 3 — 3Metro Ethernet Networks . . . . . . . . . . . . . . . . . . . . . . . . . . . . . — 2 — 2Global Services . . . . . . . . . . . . . . . . . . . . . . . . . . . . . . . . . . . . — — — —
Total special charges for the year ended December 31, 2006. . . . . $ 1 $16 $— $ 17
Mobility and Converged Core Networks . . . . . . . . . . . . . . . . . . $ (3) $ (2) $ 4 $ (1)Enterprise Solutions . . . . . . . . . . . . . . . . . . . . . . . . . . . . . . . . . (2) (1) 1 (2)Metro Ethernet Networks . . . . . . . . . . . . . . . . . . . . . . . . . . . . . — — (8) (8)Global Services . . . . . . . . . . . . . . . . . . . . . . . . . . . . . . . . . . . . — — — —
Total special charges for the year ended December 31, 2005. . . . . $ (5) $ (3) $ (3) $(11)
Mobility and Converged Core Networks . . . . . . . . . . . . . . . . . . $ 2 $ 9 $— $ 11Enterprise Solutions . . . . . . . . . . . . . . . . . . . . . . . . . . . . . . . . . 1 2 — 3Metro Ethernet Networks . . . . . . . . . . . . . . . . . . . . . . . . . . . . . — 1 — 1Global Services . . . . . . . . . . . . . . . . . . . . . . . . . . . . . . . . . . . . — 1 — 1
Total special charges for the year ended December 31, 2004. . . . . $ 3 $13 $— $ 16
As described in note 6, segment Management EBT does not include special charges. A significant portion of Nortel’sprovisions for workforce reductions and contract settlement and lease costs are associated with shared services. Thesecosts have been allocated to the segments in the table above based generally on headcount.
8. Income taxes
As of December 31, 2006, Nortel’s net deferred tax assets were $4,042, reflecting temporary differences between thefinancial reporting and tax treatment of certain current assets and liabilities and non-current assets and liabilities, inaddition to the tax benefit of net operating and capital loss carry forwards and tax credit carry forwards.
In accordance with SFAS 109, Nortel reviews all available positive and negative evidence to evaluate the recoverability ofthe deferred tax assets. This includes a review of such evidence as the carry forward periods of the significant tax assets,Nortel’s history of generating taxable income in its significant tax jurisdictions (namely Canada, the U.S., the U.K. andFrance), Nortel’s cumulative profits or losses in recent years, and Nortel’s projections of earnings in its significantjurisdictions. On a jurisdictional basis, Nortel is in a cumulative loss position in certain of its significant jurisdictions. Forthese jurisdictions, Nortel continues to maintain a valuation allowance against a portion of its deferred income tax assets.
Nortel is subject to ongoing examinations by certain tax authorities of the jurisdictions in which it operates. Nortelregularly assesses the status of these examinations and the potential for adverse outcomes to determine the adequacy ofthe provision for income and other taxes. Specifically, the tax authorities in Brazil have completed an examination of priortaxation years and have issued assessments in the amount of $71 for the taxation years of 1999 and 2000. In addition, thetax authorities in France commenced negotiations to settle the proposed assessments in respect of the 2001, 2002 and2003 taxation years. These assessments collectively propose adjustments to taxable income of approximately $1,099,additional income tax liabilities of $43 inclusive of interest as well as certain adjustments to withholding and other taxesof approximately $72 plus applicable interest and penalties. Nortel made an offer of settlement to the French taxauthorities, which was significantly less than the assessed amount, for the purpose of accelerating the settlement processto either the courts or competent authority proceedings under the Canada-France tax treaty. Nortel believes that it hasadequately provided for tax adjustments that are probable as a result of any ongoing or future examinations.
127
NORTEL NETWORKS CORPORATION
Notes to Consolidated Financial Statements — (Continued)

Nortel had previously entered into Advance Pricing Arrangements (each an “APA”) with the taxation authorities of theU.S. and Canada in connection with its intercompany transfer pricing and cost sharing arrangements between Canada andthe U.S. These arrangements expired in 1999 and 2000. In 2002, Nortel filed APA requests with the taxation authorities ofthe U.S., Canada and the U.K. that applied to the taxation years beginning in 2001. The APA requests are currently underconsideration and the tax authorities are in the process of negotiating the terms of the arrangements. Nortel continues tomonitor the progress of these negotiations, however Nortel is not a party to these negotiations. Nortel has applied thetransfer pricing methodology proposed in the APA requests in preparing its tax returns and accounts beginning in 2001.
Nortel has requested that the APAs apply to the 2001 through 2005 taxation years. Nortel is currently in discussions withthe tax authorities regarding the application of the APAs to the 2006 taxation year. Nortel continues to apply the transferpricing methodology proposed in the APAs to its current year financial statements and intends to file its 2006 corporateincome tax returns consistent with the methodology described in its APA requests.
The outcome of the APA applications is uncertain and possible additional losses, as they relate to the APA negotiations,cannot be determined at this time. However, Nortel does not believe it is probable that the ultimate resolution of thesenegotiations will have a material adverse effect on its consolidated financial position, results of operations or cash flows.Despite Nortel’s current belief, if this matter is resolved unfavorably, it could have a material adverse effect on Nortel’sconsolidated financial position, results of operations and cash flows.
128
NORTEL NETWORKS CORPORATION
Notes to Consolidated Financial Statements — (Continued)

The following is a reconciliation of income taxes, calculated at the Canadian combined federal and provincial income taxrate, to the income tax benefit (expense) included in the consolidated statements of operations for each of the years endedDecember 31:
2006 2005 2004
Income taxes at Canadian rates(2006 — 34%, 2005 — 34.5%, 2004 — 33.3%) . . . . . . . . . . . . . . . . . . . . . . . $ (48) $ 916 $ 94
Difference between Canadian rates and rates applicable to subsidiaries in theU.S. and other jurisdictions . . . . . . . . . . . . . . . . . . . . . . . . . . . . . . . . . . . . . . 2 34 (2)
Valuation allowances on tax benefits . . . . . . . . . . . . . . . . . . . . . . . . . . . . . . . . . (883) (163) (204)Utilization of losses . . . . . . . . . . . . . . . . . . . . . . . . . . . . . . . . . . . . . . . . . . . . . 36 18 2Tax benefit of investment tax credits, net of valuation allowance . . . . . . . . . . . . 47 39 43Shareholder litigation settlement . . . . . . . . . . . . . . . . . . . . . . . . . . . . . . . . . . . . 749 (854) —Adjustments to provisions and reserves . . . . . . . . . . . . . . . . . . . . . . . . . . . . . . . (2) 141 25Foreign withholding and other taxes . . . . . . . . . . . . . . . . . . . . . . . . . . . . . . . . . (28) (23) (24)Corporate minimum taxes . . . . . . . . . . . . . . . . . . . . . . . . . . . . . . . . . . . . . . . . . (3) (14) (8)Impact of non-taxable/(non-deductible) items and other differences . . . . . . . . . . 70 (13) 94
Income tax benefit (expense) . . . . . . . . . . . . . . . . . . . . . . . . . . . . . . . . . . . . . . . $ (60) $ 81 $ 20
Details of Nortel’s income (loss):Earnings (loss) from continuing operations before income taxes, minority
interests and equity in net loss of associated companies:Canadian, excluding gain (loss) on sale of businesses and assets . . . . . . . . . $ (434) $(2,652) $ (318)U.S. and other, excluding gain (loss) on sale of businesses and assets . . . . . 369 43 (56)Gain (loss) on sale of businesses and assets . . . . . . . . . . . . . . . . . . . . . . . . 206 (47) 91
$ 141 $(2,656) $ (283)
Income tax benefit (expense):Canadian, excluding gain (loss) on sale of businesses and assets . . . . . . . . . $ 16 $ 10 $ 5U.S. and other, excluding gain (loss) on sale of businesses and assets . . . . . (73) 71 15Gain (loss) on sale of businesses and assets . . . . . . . . . . . . . . . . . . . . . . . . (3) — —
$ (60) $ 81 $ 20
Income tax benefit (expense):Current . . . . . . . . . . . . . . . . . . . . . . . . . . . . . . . . . . . . . . . . . . . . . . . . . . . . . $ (29) $ (35) $ (27)Deferred . . . . . . . . . . . . . . . . . . . . . . . . . . . . . . . . . . . . . . . . . . . . . . . . . . . . (31) 116 47
Income tax benefit (expense) . . . . . . . . . . . . . . . . . . . . . . . . . . . . . . . . . . . . . . . $ (60) $ 81 $ 20
Details of movement in valuation allowanceOpening Valuation Allowance . . . . . . . . . . . . . . . . . . . . . . . . . . . . . . . . . . . . $(3,429) $(3,718) $(3,441)Amounts charged to income tax benefit (expense) . . . . . . . . . . . . . . . . . . . . . (847) (148) (202)Amounts charged to other comprehensive loss . . . . . . . . . . . . . . . . . . . . . . . . 66 (58) (32)Other (additions)/ deductions(a) . . . . . . . . . . . . . . . . . . . . . . . . . . . . . . . . . . . (221) 495 (43)
Closing Valuation Allowance. . . . . . . . . . . . . . . . . . . . . . . . . . . . . . . . . . . . . . . $(4,431) $(3,429) $(3,718)
(a) Other additions and deductions represent the net impacts of foreign exchange, deferred tax assets that expired during the period,tax rate changes, and tax return and other adjustments.
129
NORTEL NETWORKS CORPORATION
Notes to Consolidated Financial Statements — (Continued)

The following table shows the significant components included in deferred income taxes as of December 31:2006 2005
Assets:Tax benefit of loss carryforwards . . . . . . . . . . . . . . . . . . . . . . . . . . . . . . . . . . . . . . . . . . $ 4,609 $ 4,486Investment tax credits, net of deferred tax liability . . . . . . . . . . . . . . . . . . . . . . . . . . . . . 1,358 1,174Provisions and reserves . . . . . . . . . . . . . . . . . . . . . . . . . . . . . . . . . . . . . . . . . . . . . . . . . 750 786Post-retirement benefits other than pensions . . . . . . . . . . . . . . . . . . . . . . . . . . . . . . . . . . 288 306Plant and equipment . . . . . . . . . . . . . . . . . . . . . . . . . . . . . . . . . . . . . . . . . . . . . . . . . . . 216 96Pension plan liabilities . . . . . . . . . . . . . . . . . . . . . . . . . . . . . . . . . . . . . . . . . . . . . . . . . . 622 610Deferred compensation. . . . . . . . . . . . . . . . . . . . . . . . . . . . . . . . . . . . . . . . . . . . . . . . . . 153 256Shareholder lawsuit settlement . . . . . . . . . . . . . . . . . . . . . . . . . . . . . . . . . . . . . . . . . . . . 749 —
8,745 7,714Valuation allowance . . . . . . . . . . . . . . . . . . . . . . . . . . . . . . . . . . . . . . . . . . . . . . . . . . . . . . (4,431) (3,429)
4,314 4,285
Liabilities:Provisions and reserves . . . . . . . . . . . . . . . . . . . . . . . . . . . . . . . . . . . . . . . . . . . . . . . . . 104 108Plant and equipment . . . . . . . . . . . . . . . . . . . . . . . . . . . . . . . . . . . . . . . . . . . . . . . . . . . 35 34Unrealized foreign exchange and other . . . . . . . . . . . . . . . . . . . . . . . . . . . . . . . . . . . . . . 133 206
272 348
Net deferred income tax assets . . . . . . . . . . . . . . . . . . . . . . . . . . . . . . . . . . . . . . . . . . . . . . $ 4,042 $ 3,937
Nortel recorded no tax benefit in 2005 relating to the shareholder litigation settlement (see note 21) since at that time, thedetermination of the amount of the settlement that was deductible for income tax purposes could not be reasonablydetermined as the definitive agreements in respect of the settlement were not concluded. Such agreements were concludedin 2006, and although there continues to be some uncertainty as to the full extent of deductibility of the settlementamount, Nortel has included the full shareholder settlement expense in its components of deferred tax assets atDecember 31, 2006. Nortel has, however, provided a full valuation allowance against this asset since there is someuncertainty as to whether Nortel can generate sufficient profits in future years to sustain this benefit.
Nortel has not provided for foreign withholding taxes or deferred income tax liabilities for temporary differences relatedto the undistributed earnings of foreign subsidiaries since Nortel does not currently expect to repatriate these earnings. Itis not practical to reasonably estimate the amount of additional deferred income tax liabilities or foreign withholding taxesthat may be payable should these earnings be distributed in the future.
Nortel is in the process of amending a number of previously filed tax returns as a result of the restatements of ourfinancial statements. While most of the significant unamended tax returns reflected tax losses and Nortel does not expectany material impact to either tax expense or deferred tax liabilities, Nortel’s Canadian provincial tax returns could resultin an additional expense, when completed. Additionally, tax credit carryforward amounts of approximately $300 in respectof the 1994 through to 1996 taxation years have expired, and are not included in the deferred tax assets as of December 31,2006. Nortel can restore a significant amount of the deferred tax assets by executing a certain tax planning strategy thatinvolves filing amended tax returns.
130
NORTEL NETWORKS CORPORATION
Notes to Consolidated Financial Statements — (Continued)
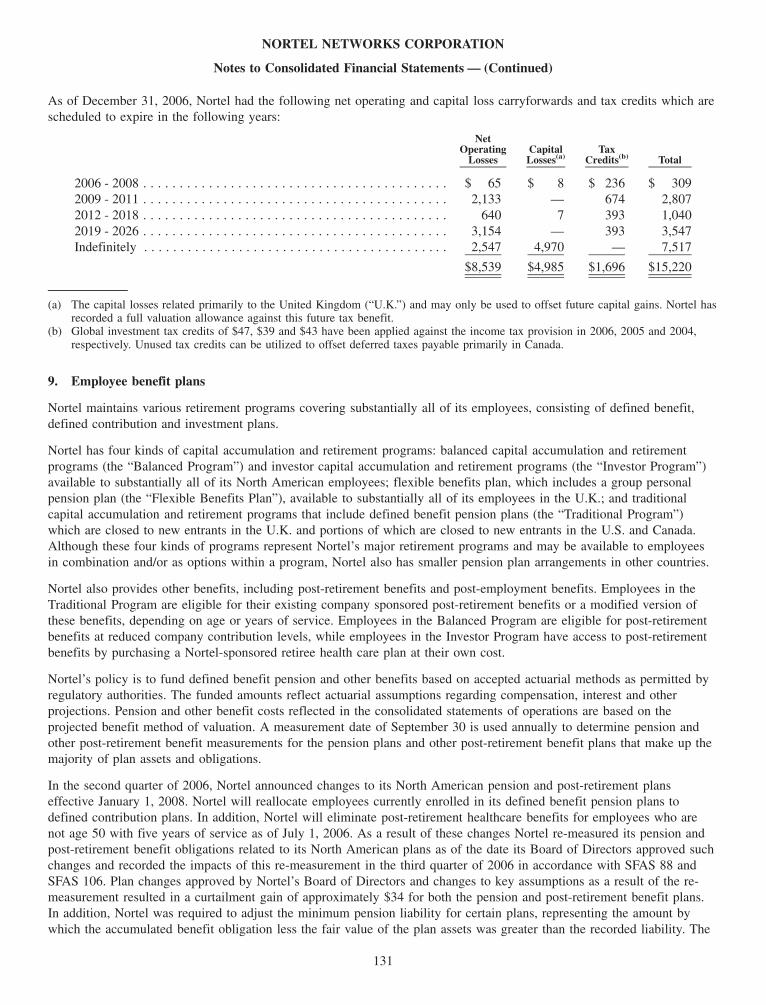
As of December 31, 2006, Nortel had the following net operating and capital loss carryforwards and tax credits which arescheduled to expire in the following years:
NetOperating
LossesCapitalLosses(a)
TaxCredits(b) Total
2006 - 2008 . . . . . . . . . . . . . . . . . . . . . . . . . . . . . . . . . . . . . . . . . . $ 65 $ 8 $ 236 $ 3092009 - 2011 . . . . . . . . . . . . . . . . . . . . . . . . . . . . . . . . . . . . . . . . . . 2,133 — 674 2,8072012 - 2018 . . . . . . . . . . . . . . . . . . . . . . . . . . . . . . . . . . . . . . . . . . 640 7 393 1,0402019 - 2026 . . . . . . . . . . . . . . . . . . . . . . . . . . . . . . . . . . . . . . . . . . 3,154 — 393 3,547Indefinitely . . . . . . . . . . . . . . . . . . . . . . . . . . . . . . . . . . . . . . . . . . 2,547 4,970 — 7,517
$8,539 $4,985 $1,696 $15,220
(a) The capital losses related primarily to the United Kingdom (“U.K.”) and may only be used to offset future capital gains. Nortel hasrecorded a full valuation allowance against this future tax benefit.
(b) Global investment tax credits of $47, $39 and $43 have been applied against the income tax provision in 2006, 2005 and 2004,respectively. Unused tax credits can be utilized to offset deferred taxes payable primarily in Canada.
9. Employee benefit plans
Nortel maintains various retirement programs covering substantially all of its employees, consisting of defined benefit,defined contribution and investment plans.
Nortel has four kinds of capital accumulation and retirement programs: balanced capital accumulation and retirementprograms (the “Balanced Program”) and investor capital accumulation and retirement programs (the “Investor Program”)available to substantially all of its North American employees; flexible benefits plan, which includes a group personalpension plan (the “Flexible Benefits Plan”), available to substantially all of its employees in the U.K.; and traditionalcapital accumulation and retirement programs that include defined benefit pension plans (the “Traditional Program”)which are closed to new entrants in the U.K. and portions of which are closed to new entrants in the U.S. and Canada.Although these four kinds of programs represent Nortel’s major retirement programs and may be available to employeesin combination and/or as options within a program, Nortel also has smaller pension plan arrangements in other countries.
Nortel also provides other benefits, including post-retirement benefits and post-employment benefits. Employees in theTraditional Program are eligible for their existing company sponsored post-retirement benefits or a modified version ofthese benefits, depending on age or years of service. Employees in the Balanced Program are eligible for post-retirementbenefits at reduced company contribution levels, while employees in the Investor Program have access to post-retirementbenefits by purchasing a Nortel-sponsored retiree health care plan at their own cost.
Nortel’s policy is to fund defined benefit pension and other benefits based on accepted actuarial methods as permitted byregulatory authorities. The funded amounts reflect actuarial assumptions regarding compensation, interest and otherprojections. Pension and other benefit costs reflected in the consolidated statements of operations are based on theprojected benefit method of valuation. A measurement date of September 30 is used annually to determine pension andother post-retirement benefit measurements for the pension plans and other post-retirement benefit plans that make up themajority of plan assets and obligations.
In the second quarter of 2006, Nortel announced changes to its North American pension and post-retirement planseffective January 1, 2008. Nortel will reallocate employees currently enrolled in its defined benefit pension plans todefined contribution plans. In addition, Nortel will eliminate post-retirement healthcare benefits for employees who arenot age 50 with five years of service as of July 1, 2006. As a result of these changes Nortel re-measured its pension andpost-retirement benefit obligations related to its North American plans as of the date its Board of Directors approved suchchanges and recorded the impacts of this re-measurement in the third quarter of 2006 in accordance with SFAS 88 andSFAS 106. Plan changes approved by Nortel’s Board of Directors and changes to key assumptions as a result of the re-measurement resulted in a curtailment gain of approximately $34 for both the pension and post-retirement benefit plans.In addition, Nortel was required to adjust the minimum pension liability for certain plans, representing the amount bywhich the accumulated benefit obligation less the fair value of the plan assets was greater than the recorded liability. The
131
NORTEL NETWORKS CORPORATION
Notes to Consolidated Financial Statements — (Continued)

effect of this adjustment and the related foreign currency translation adjustment was to decrease accumulated othercomprehensive loss (before tax) by $198, decrease intangible assets by $14 and decrease pension liabilities by $212.
For the year end measurement, the impact of changes in discount rates and other accounting assumptions more than offsetthe favorable impacts of strong pension asset returns and the contributions made by Nortel. As a result, Nortel wasrequired to adjust the minimum pension liability for certain plans, representing the amount by which the accumulatedbenefit obligation less the fair value of the plan assets was greater than the recorded liability. The effect of this adjustmentand the related foreign currency translation adjustment was to increase accumulated other comprehensive loss (before tax)by $68, decrease intangible assets by $4 and increase pension liabilities by $64.
In September 2006, the FASB issued SFAS No. 158, “Employers’ Accounting for Defined Benefit Pension and OtherPostretirement Plans — an Amendment of FASB Statements No. 87, 88, 106, and 132(R)” (“SFAS 158”). SFAS 158requires an employer to recognize the overfunded or underfunded status of a defined benefit pension and post-retirementplan (other than a multiemployer plan) as an asset or liability in its statement of financial position and to recognizechanges in that funded status in the year in which the changes occur through comprehensive income of a business entityor changes in unrestricted net assets of a not-for-profit organization. SFAS 158 also requires an employer to measure thefunded status of a plan as of the date of its year-end statement of financial position, with limited exceptions. Nortel isrequired to initially recognize the funded status of its defined benefit pension and post-retirement plans and to provide therequired disclosures as of December 31, 2006. The requirement to measure plan assets and benefit obligations as of thedate of the employer’s fiscal year end statement of financial position is effective for Nortel for its fiscal year endingDecember 31, 2008.
The effect of the initial adoption of SFAS 158 was as follows:
BeforeApplicationof SFAS 158 Adjustment
AfterApplicationof SFAS 158
Intangible assets — net . . . . . . . . . . . . . . . . . . . . . . . . . . . . . . . . . . . . . $ 262 $ (21) $ 241Other assets — long term . . . . . . . . . . . . . . . . . . . . . . . . . . . . . . . . . . . $ 686 $ 3 $ 689Deferred tax assets — long term . . . . . . . . . . . . . . . . . . . . . . . . . . . . . . $ 3,803 $ 60 $ 3,863Payroll and benefit liabilities — current . . . . . . . . . . . . . . . . . . . . . . . . . $ (868) $ 228 $ (640)Other liabilities — long term . . . . . . . . . . . . . . . . . . . . . . . . . . . . . . . . . $(5,398) $(412) $(5,810)Accumulated other comprehensive loss . . . . . . . . . . . . . . . . . . . . . . . . . $ 479 $ 142 $ 621
The amounts in accumulated other comprehensive income (loss) that are expected to be recognized as components ofpension expense (credit) during the next fiscal year are as follows:
Defined BenefitPension Plan
Post-RetirementBenefits Total
Prior service cost (credit) . . . . . . . . . . . . . . . . . . . . . . . . . . . . . . . . . . . $ 4 $(7) $ (3)Net actuarial loss (gain) . . . . . . . . . . . . . . . . . . . . . . . . . . . . . . . . . . . . $102 $(1) $101
The following table illustrates the amounts in accumulated other comprehensive income (loss) - before tax, that have notyet been recognized as components of pension expense:
Defined BenefitPension Plan
Post-RetirementBenefits Total
Amounts recognized in accumulated other comprehensive income(loss) — before tax — consists of:
Prior service cost (credit) . . . . . . . . . . . . . . . . . . . . . . . . . . . . . . $ 13 $(71) $ (58)Net actuarial loss (gain) . . . . . . . . . . . . . . . . . . . . . . . . . . . . . . . 1,475 (2) 1,473
Total amount recognized . . . . . . . . . . . . . . . . . . . . . . . . . . . . . . . . $1,488 $(73) $1,415
132
NORTEL NETWORKS CORPORATION
Notes to Consolidated Financial Statements — (Continued)

The following details the unfunded status of the defined benefit plans and post-retirement benefits other than pensions,and the associated amounts recognized in the consolidated balance sheets as of December 31:
2006 2005 2006 2005Defined Benefit Plans
Post-RetirementBenefits
Change in benefit obligation:Benefit obligation — beginning . . . . . . . . . . . . . . . . . . . . . . . . . . . . . . . $ 8,952 $ 8,311 $ 883 $ 761Service cost . . . . . . . . . . . . . . . . . . . . . . . . . . . . . . . . . . . . . . . . . . . . . . 130 123 6 8Interest cost . . . . . . . . . . . . . . . . . . . . . . . . . . . . . . . . . . . . . . . . . . . . . . 462 458 42 44Plan participants’ contributions . . . . . . . . . . . . . . . . . . . . . . . . . . . . . . . 6 6 10 8Plan amendments . . . . . . . . . . . . . . . . . . . . . . . . . . . . . . . . . . . . . . . . . . — 3 (63) —Actuarial loss (gain) . . . . . . . . . . . . . . . . . . . . . . . . . . . . . . . . . . . . . . . 40 835 (170) 87Acquisitions/divestitures/settlements . . . . . . . . . . . . . . . . . . . . . . . . . . . . — 9 — —Special and contractual termination benefits . . . . . . . . . . . . . . . . . . . . . . 13 21 — —Curtailments . . . . . . . . . . . . . . . . . . . . . . . . . . . . . . . . . . . . . . . . . . . . . (337) 9 — (1)Benefits paid . . . . . . . . . . . . . . . . . . . . . . . . . . . . . . . . . . . . . . . . . . . . . (599) (541) (42) (43)Foreign exchange. . . . . . . . . . . . . . . . . . . . . . . . . . . . . . . . . . . . . . . . . . 543 (282) 4 19
Benefit obligation — ending. . . . . . . . . . . . . . . . . . . . . . . . . . . . . . . . . . $ 9,210 $ 8,952 $ 670 $ 883
Change in plan assets:Fair value of plan assets — beginning. . . . . . . . . . . . . . . . . . . . . . . . . . . $ 6,456 $ 6,105 $ — $ —Actual return on plan assets . . . . . . . . . . . . . . . . . . . . . . . . . . . . . . . . . . 551 919 — —Employer contributions . . . . . . . . . . . . . . . . . . . . . . . . . . . . . . . . . . . . . 323 174 32 35Plan participants’ contributions . . . . . . . . . . . . . . . . . . . . . . . . . . . . . . . 6 6 10 8Acquisitions/divestitures/settlements . . . . . . . . . . . . . . . . . . . . . . . . . . . . — (4) — —Benefits paid . . . . . . . . . . . . . . . . . . . . . . . . . . . . . . . . . . . . . . . . . . . . . (599) (541) (42) (43)Foreign exchange. . . . . . . . . . . . . . . . . . . . . . . . . . . . . . . . . . . . . . . . . . 402 (203) — —
Fair value of plan assets — ending . . . . . . . . . . . . . . . . . . . . . . . . . . . . . $ 7,139 $ 6,456 $ — $ —
Funded status of the plans . . . . . . . . . . . . . . . . . . . . . . . . . . . . . . . . . . . $(2,071) $(2,496) $(670) $(883)Unrecognized prior service cost (credit) . . . . . . . . . . . . . . . . . . . . . . . . . — 16 — (44)Unrecognized net actuarial losses (gains) . . . . . . . . . . . . . . . . . . . . . . . . — 2,076 — 168Contributions after measurement date . . . . . . . . . . . . . . . . . . . . . . . . . . . 71 40 9 4
Net amount recognized . . . . . . . . . . . . . . . . . . . . . . . . . . . . . . . . . . . . . $(2,000) $ (364) $(661) $(755)
Amounts recognized in the accompanying consolidated balance sheetsconsist of:
Other liabilities — long-term . . . . . . . . . . . . . . . . . . . . . . . . . . . . . . . . . $(1,965) $(1,533) $(625) $(735)Other liabilities — current . . . . . . . . . . . . . . . . . . . . . . . . . . . . . . . . . . . (40) (332) (36) (20)Intangible assets — net . . . . . . . . . . . . . . . . . . . . . . . . . . . . . . . . . . . . . — 37 — —Other assets . . . . . . . . . . . . . . . . . . . . . . . . . . . . . . . . . . . . . . . . . . . . . . 5 2 — —Foreign currency translation adjustment . . . . . . . . . . . . . . . . . . . . . . . . . — 180 — —Accumulated other comprehensive loss. . . . . . . . . . . . . . . . . . . . . . . . . . — 1,282 — —
Net amount recognized . . . . . . . . . . . . . . . . . . . . . . . . . . . . . . . . . . . . . $(2,000) $ (364) $(661) $(755)
The following details selected information for defined benefit plans, all of which have accumulated benefit obligations inexcess of the fair value of plan assets as of December 31:
2006 2005
Projected benefit obligation . . . . . . . . . . . . . . . . . . . . . . . . . . . . . . . . . . . . . . . . . . . . . . . . . $9,194 $8,938Accumulated benefit obligation . . . . . . . . . . . . . . . . . . . . . . . . . . . . . . . . . . . . . . . . . . . . . . $8,914 $8,312Fair value of plan assets . . . . . . . . . . . . . . . . . . . . . . . . . . . . . . . . . . . . . . . . . . . . . . . . . . . . $7,117 $6,438
133
NORTEL NETWORKS CORPORATION
Notes to Consolidated Financial Statements — (Continued)
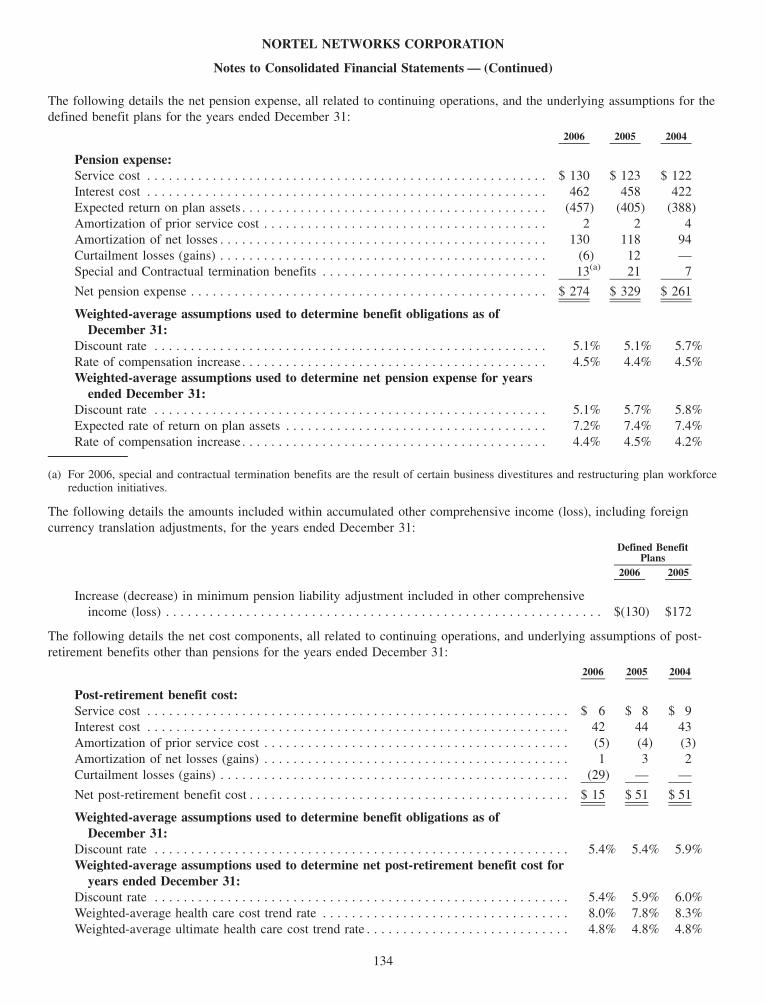
The following details the net pension expense, all related to continuing operations, and the underlying assumptions for thedefined benefit plans for the years ended December 31:
2006 2005 2004
Pension expense:Service cost . . . . . . . . . . . . . . . . . . . . . . . . . . . . . . . . . . . . . . . . . . . . . . . . . . . . . . . $ 130 $ 123 $ 122Interest cost . . . . . . . . . . . . . . . . . . . . . . . . . . . . . . . . . . . . . . . . . . . . . . . . . . . . . . . 462 458 422Expected return on plan assets . . . . . . . . . . . . . . . . . . . . . . . . . . . . . . . . . . . . . . . . . . (457) (405) (388)Amortization of prior service cost . . . . . . . . . . . . . . . . . . . . . . . . . . . . . . . . . . . . . . . 2 2 4Amortization of net losses . . . . . . . . . . . . . . . . . . . . . . . . . . . . . . . . . . . . . . . . . . . . . 130 118 94Curtailment losses (gains) . . . . . . . . . . . . . . . . . . . . . . . . . . . . . . . . . . . . . . . . . . . . . (6) 12 —Special and Contractual termination benefits . . . . . . . . . . . . . . . . . . . . . . . . . . . . . . . 13(a) 21 7
Net pension expense . . . . . . . . . . . . . . . . . . . . . . . . . . . . . . . . . . . . . . . . . . . . . . . . . $ 274 $ 329 $ 261
Weighted-average assumptions used to determine benefit obligations as ofDecember 31:
Discount rate . . . . . . . . . . . . . . . . . . . . . . . . . . . . . . . . . . . . . . . . . . . . . . . . . . . . . . 5.1% 5.1% 5.7%Rate of compensation increase . . . . . . . . . . . . . . . . . . . . . . . . . . . . . . . . . . . . . . . . . . 4.5% 4.4% 4.5%Weighted-average assumptions used to determine net pension expense for years
ended December 31:Discount rate . . . . . . . . . . . . . . . . . . . . . . . . . . . . . . . . . . . . . . . . . . . . . . . . . . . . . . 5.1% 5.7% 5.8%Expected rate of return on plan assets . . . . . . . . . . . . . . . . . . . . . . . . . . . . . . . . . . . . 7.2% 7.4% 7.4%Rate of compensation increase . . . . . . . . . . . . . . . . . . . . . . . . . . . . . . . . . . . . . . . . . . 4.4% 4.5% 4.2%
(a) For 2006, special and contractual termination benefits are the result of certain business divestitures and restructuring plan workforcereduction initiatives.
The following details the amounts included within accumulated other comprehensive income (loss), including foreigncurrency translation adjustments, for the years ended December 31:
2006 2005
Defined BenefitPlans
Increase (decrease) in minimum pension liability adjustment included in other comprehensiveincome (loss) . . . . . . . . . . . . . . . . . . . . . . . . . . . . . . . . . . . . . . . . . . . . . . . . . . . . . . . . . . . . $(130) $172
The following details the net cost components, all related to continuing operations, and underlying assumptions of post-retirement benefits other than pensions for the years ended December 31:
2006 2005 2004
Post-retirement benefit cost:Service cost . . . . . . . . . . . . . . . . . . . . . . . . . . . . . . . . . . . . . . . . . . . . . . . . . . . . . . . . . . $ 6 $ 8 $ 9Interest cost . . . . . . . . . . . . . . . . . . . . . . . . . . . . . . . . . . . . . . . . . . . . . . . . . . . . . . . . . . 42 44 43Amortization of prior service cost . . . . . . . . . . . . . . . . . . . . . . . . . . . . . . . . . . . . . . . . . . (5) (4) (3)Amortization of net losses (gains) . . . . . . . . . . . . . . . . . . . . . . . . . . . . . . . . . . . . . . . . . . 1 3 2Curtailment losses (gains) . . . . . . . . . . . . . . . . . . . . . . . . . . . . . . . . . . . . . . . . . . . . . . . . (29) — —
Net post-retirement benefit cost . . . . . . . . . . . . . . . . . . . . . . . . . . . . . . . . . . . . . . . . . . . . $ 15 $ 51 $ 51
Weighted-average assumptions used to determine benefit obligations as ofDecember 31:
Discount rate . . . . . . . . . . . . . . . . . . . . . . . . . . . . . . . . . . . . . . . . . . . . . . . . . . . . . . . . . 5.4% 5.4% 5.9%Weighted-average assumptions used to determine net post-retirement benefit cost for
years ended December 31:Discount rate . . . . . . . . . . . . . . . . . . . . . . . . . . . . . . . . . . . . . . . . . . . . . . . . . . . . . . . . . 5.4% 5.9% 6.0%Weighted-average health care cost trend rate . . . . . . . . . . . . . . . . . . . . . . . . . . . . . . . . . . 8.0% 7.8% 8.3%Weighted-average ultimate health care cost trend rate . . . . . . . . . . . . . . . . . . . . . . . . . . . . 4.8% 4.8% 4.8%
134
NORTEL NETWORKS CORPORATION
Notes to Consolidated Financial Statements — (Continued)

Assumed health care cost trend rates have a significant effect on the amounts reported for health care plans. A onepercentage point change in assumed health care cost trend rates would have the following effects for the years endedDecember 31:
2006 2005 2004
Effect on aggregate of service and interest costs1% increase . . . . . . . . . . . . . . . . . . . . . . . . . . . . . . . . . . . . . . . . . . . . . . . . . . . . . . . . $ 4 $ 5 $ 51% decrease . . . . . . . . . . . . . . . . . . . . . . . . . . . . . . . . . . . . . . . . . . . . . . . . . . . . . . . . $ (3) $ (4) $ (4)
Effect on accumulated post-retirement benefit obligations1% increase . . . . . . . . . . . . . . . . . . . . . . . . . . . . . . . . . . . . . . . . . . . . . . . . . . . . . . . . $ 43 $ 86 $ 671% decrease . . . . . . . . . . . . . . . . . . . . . . . . . . . . . . . . . . . . . . . . . . . . . . . . . . . . . . . . $(36) $(70) $(55)
As of December 31, 2006, the expected benefit payments for the next ten years for the defined benefit plans and the post-retirement benefits other than pensions are as follows, along with the expected reimbursement amounts related to theMedicare Prescription Drug, Improvement and Modernization Act of 2003 (the “MPDIM Act”):
Defined BenefitPlans
Post-RetirementBenefit Plans
Expected MPDIM Act Subsidy(Post-Retirement Benefit Plans)
2007 . . . . . . . . . . . . . . . . . . . . . . . . . . . . . . . . . . $ 496 $ 46 $ 22008 . . . . . . . . . . . . . . . . . . . . . . . . . . . . . . . . . . $ 495 $ 46 $ 22009 . . . . . . . . . . . . . . . . . . . . . . . . . . . . . . . . . . $ 505 $ 47 $ 22010 . . . . . . . . . . . . . . . . . . . . . . . . . . . . . . . . . . $ 518 $ 47 $ 32011 . . . . . . . . . . . . . . . . . . . . . . . . . . . . . . . . . . $ 532 $ 48 $ 32012-2016 . . . . . . . . . . . . . . . . . . . . . . . . . . . . . $2,894 $229 $20
The target allocation percentages and the year-end percentages based on actual asset balances of the defined benefit plansas of December 31 are as follows:
Target Actual Target Actual2006 2005
Debt instruments . . . . . . . . . . . . . . . . . . . . . . . . . . . . . . . . . . . . . . . . . . . . . 43% 43% 43% 41%Equity securities. . . . . . . . . . . . . . . . . . . . . . . . . . . . . . . . . . . . . . . . . . . . . . 56% 54% 56% 57%Other . . . . . . . . . . . . . . . . . . . . . . . . . . . . . . . . . . . . . . . . . . . . . . . . . . . . . . 1% 3% 1% 2%
The primary investment performance objective is to obtain competitive rates of return on investments at or above theirassigned benchmarks while minimizing risk and volatility by maintaining an appropriately diversified portfolio. Thebenchmarks selected are industry-standard and widely-accepted indices. The defined benefit plans maintain a long-termperspective in regard to investment philosophy and return expectations which are reflective of the fact that the liabilitiesof the defined benefit plans mature over an extended period of time. The investments have risk characteristics consistentwith underlying defined benefit plan demographics and liquidity requirements, and are consistent and compliant with allregulatory standards.
The primary method of managing risk within the portfolio is through diversification among and within asset categories,and through the utilization of a wide array of active and passive investment managers. Broadly, the assets are allocatedbetween debt and equity instruments. Included within the debt instruments are government and corporate fixed incomesecurities, money market securities, mortgage-backed securities and inflation indexed securities. Generally, these debtinstruments are considered investment grade. Included in equity securities are developed and emerging market stocks ofcompanies at a variety of capitalization levels. The securities are predominantly publicly traded. The amount of employerand related-party securities that the defined benefit plans may hold is governed by the statutory limitations of thejurisdictions of the applicable plans. Included in equity securities of the defined benefit plans are common shares of NortelNetworks Corporation, held directly or through pooled funds, with an aggregate market value of $4 (0.1 percent of totalplan assets) and $5 (0.1 percent of total plan assets) as of December 31, 2006 and 2005, respectively.
As a policy, assets within the defined benefit plans are reviewed to the target allocations at least on a quarterly basis andadjustments made as appropriate. The plans commission periodic asset and liability studies to determine the optimalallocation of the portfolio’s assets. These studies consider a variety of the plan characteristics, including membership,
135
NORTEL NETWORKS CORPORATION
Notes to Consolidated Financial Statements — (Continued)
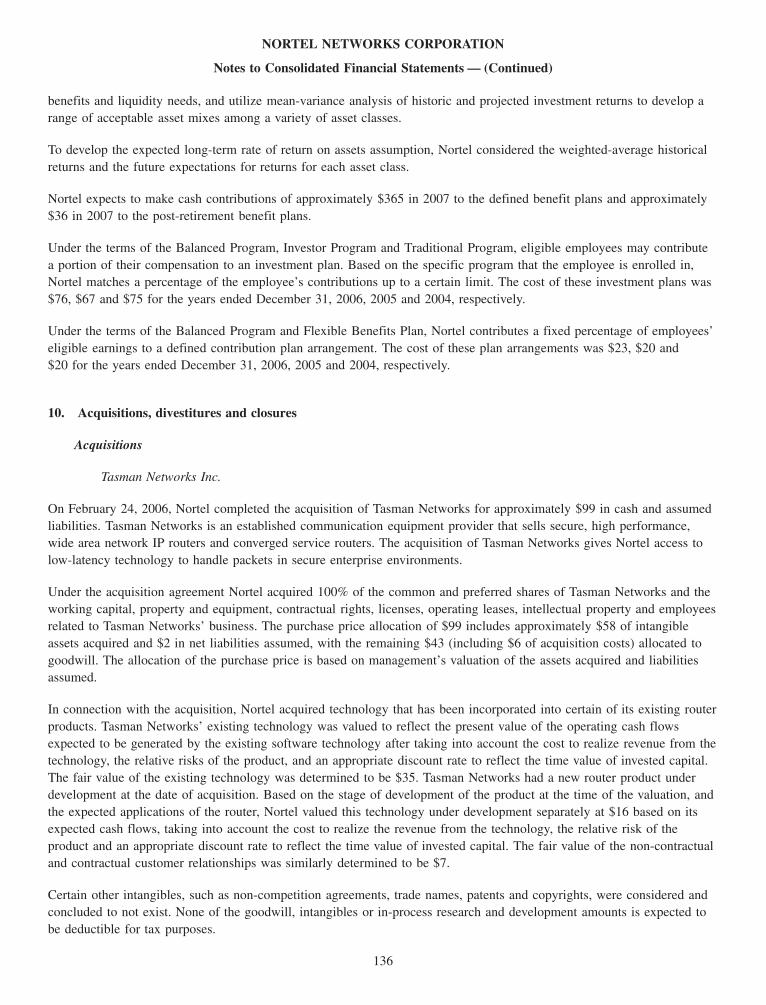
benefits and liquidity needs, and utilize mean-variance analysis of historic and projected investment returns to develop arange of acceptable asset mixes among a variety of asset classes.
To develop the expected long-term rate of return on assets assumption, Nortel considered the weighted-average historicalreturns and the future expectations for returns for each asset class.
Nortel expects to make cash contributions of approximately $365 in 2007 to the defined benefit plans and approximately$36 in 2007 to the post-retirement benefit plans.
Under the terms of the Balanced Program, Investor Program and Traditional Program, eligible employees may contributea portion of their compensation to an investment plan. Based on the specific program that the employee is enrolled in,Nortel matches a percentage of the employee’s contributions up to a certain limit. The cost of these investment plans was$76, $67 and $75 for the years ended December 31, 2006, 2005 and 2004, respectively.
Under the terms of the Balanced Program and Flexible Benefits Plan, Nortel contributes a fixed percentage of employees’eligible earnings to a defined contribution plan arrangement. The cost of these plan arrangements was $23, $20 and$20 for the years ended December 31, 2006, 2005 and 2004, respectively.
10. Acquisitions, divestitures and closures
Acquisitions
Tasman Networks Inc.
On February 24, 2006, Nortel completed the acquisition of Tasman Networks for approximately $99 in cash and assumedliabilities. Tasman Networks is an established communication equipment provider that sells secure, high performance,wide area network IP routers and converged service routers. The acquisition of Tasman Networks gives Nortel access tolow-latency technology to handle packets in secure enterprise environments.
Under the acquisition agreement Nortel acquired 100% of the common and preferred shares of Tasman Networks and theworking capital, property and equipment, contractual rights, licenses, operating leases, intellectual property and employeesrelated to Tasman Networks’ business. The purchase price allocation of $99 includes approximately $58 of intangibleassets acquired and $2 in net liabilities assumed, with the remaining $43 (including $6 of acquisition costs) allocated togoodwill. The allocation of the purchase price is based on management’s valuation of the assets acquired and liabilitiesassumed.
In connection with the acquisition, Nortel acquired technology that has been incorporated into certain of its existing routerproducts. Tasman Networks’ existing technology was valued to reflect the present value of the operating cash flowsexpected to be generated by the existing software technology after taking into account the cost to realize revenue from thetechnology, the relative risks of the product, and an appropriate discount rate to reflect the time value of invested capital.The fair value of the existing technology was determined to be $35. Tasman Networks had a new router product underdevelopment at the date of acquisition. Based on the stage of development of the product at the time of the valuation, andthe expected applications of the router, Nortel valued this technology under development separately at $16 based on itsexpected cash flows, taking into account the cost to realize the revenue from the technology, the relative risk of theproduct and an appropriate discount rate to reflect the time value of invested capital. The fair value of the non-contractualand contractual customer relationships was similarly determined to be $7.
Certain other intangibles, such as non-competition agreements, trade names, patents and copyrights, were considered andconcluded to not exist. None of the goodwill, intangibles or in-process research and development amounts is expected tobe deductible for tax purposes.
136
NORTEL NETWORKS CORPORATION
Notes to Consolidated Financial Statements — (Continued)
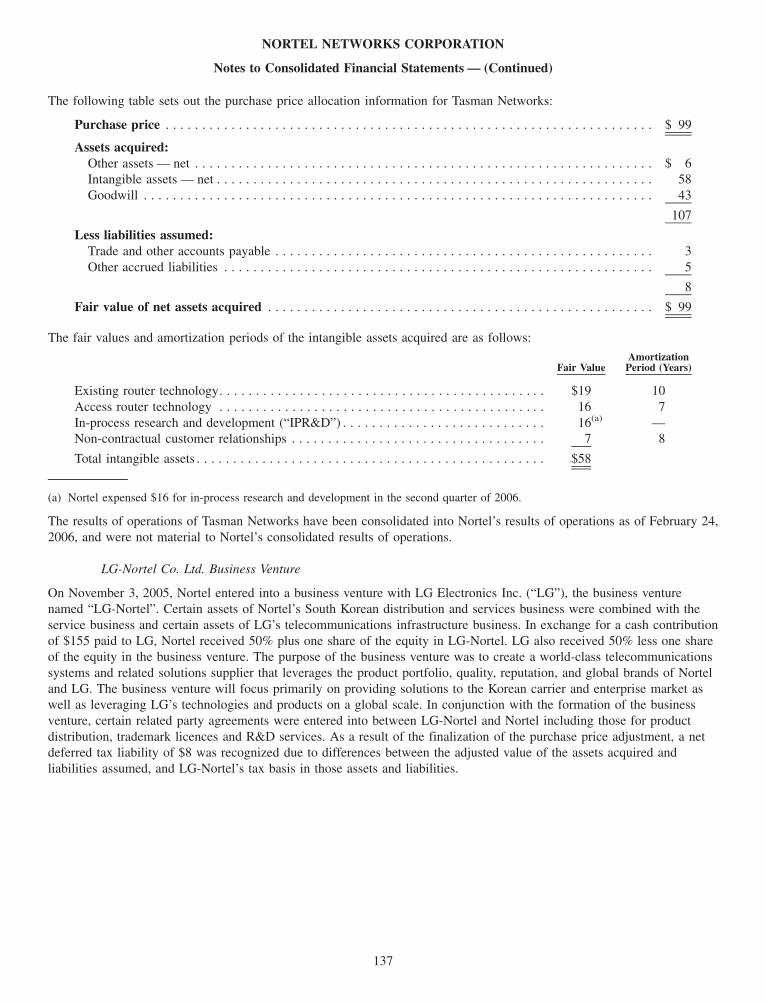
The following table sets out the purchase price allocation information for Tasman Networks:
Purchase price . . . . . . . . . . . . . . . . . . . . . . . . . . . . . . . . . . . . . . . . . . . . . . . . . . . . . . . . . . . . . . . . . . . $ 99
Assets acquired:Other assets — net . . . . . . . . . . . . . . . . . . . . . . . . . . . . . . . . . . . . . . . . . . . . . . . . . . . . . . . . . . . . . . . $ 6Intangible assets — net . . . . . . . . . . . . . . . . . . . . . . . . . . . . . . . . . . . . . . . . . . . . . . . . . . . . . . . . . . . . 58Goodwill . . . . . . . . . . . . . . . . . . . . . . . . . . . . . . . . . . . . . . . . . . . . . . . . . . . . . . . . . . . . . . . . . . . . . . 43
107
Less liabilities assumed:Trade and other accounts payable . . . . . . . . . . . . . . . . . . . . . . . . . . . . . . . . . . . . . . . . . . . . . . . . . . . . 3Other accrued liabilities . . . . . . . . . . . . . . . . . . . . . . . . . . . . . . . . . . . . . . . . . . . . . . . . . . . . . . . . . . . 5
8
Fair value of net assets acquired . . . . . . . . . . . . . . . . . . . . . . . . . . . . . . . . . . . . . . . . . . . . . . . . . . . . . $ 99
The fair values and amortization periods of the intangible assets acquired are as follows:
Fair ValueAmortizationPeriod (Years)
Existing router technology. . . . . . . . . . . . . . . . . . . . . . . . . . . . . . . . . . . . . . . . . . . . . $19 10Access router technology . . . . . . . . . . . . . . . . . . . . . . . . . . . . . . . . . . . . . . . . . . . . . 16 7In-process research and development (“IPR&D”) . . . . . . . . . . . . . . . . . . . . . . . . . . . . 16(a) —Non-contractual customer relationships . . . . . . . . . . . . . . . . . . . . . . . . . . . . . . . . . . . 7 8
Total intangible assets . . . . . . . . . . . . . . . . . . . . . . . . . . . . . . . . . . . . . . . . . . . . . . . . $58
(a) Nortel expensed $16 for in-process research and development in the second quarter of 2006.
The results of operations of Tasman Networks have been consolidated into Nortel’s results of operations as of February 24,2006, and were not material to Nortel’s consolidated results of operations.
LG-Nortel Co. Ltd. Business Venture
On November 3, 2005, Nortel entered into a business venture with LG Electronics Inc. (“LG”), the business venturenamed “LG-Nortel”. Certain assets of Nortel’s South Korean distribution and services business were combined with theservice business and certain assets of LG’s telecommunications infrastructure business. In exchange for a cash contributionof $155 paid to LG, Nortel received 50% plus one share of the equity in LG-Nortel. LG also received 50% less one shareof the equity in the business venture. The purpose of the business venture was to create a world-class telecommunicationssystems and related solutions supplier that leverages the product portfolio, quality, reputation, and global brands of Norteland LG. The business venture will focus primarily on providing solutions to the Korean carrier and enterprise market aswell as leveraging LG’s technologies and products on a global scale. In conjunction with the formation of the businessventure, certain related party agreements were entered into between LG-Nortel and Nortel including those for productdistribution, trademark licences and R&D services. As a result of the finalization of the purchase price adjustment, a netdeferred tax liability of $8 was recognized due to differences between the adjusted value of the assets acquired andliabilities assumed, and LG-Nortel’s tax basis in those assets and liabilities.
137
NORTEL NETWORKS CORPORATION
Notes to Consolidated Financial Statements — (Continued)

The following table sets out the purchase price allocation information for LG-Nortel.
Purchase price $155
Assets acquired:Accounts receivable — net . . . . . . . . . . . . . . . . . . . . . . . . . . . . . . . . . . . . . . . . . . . . . . . . . . . . . . . . . $165Other current assets . . . . . . . . . . . . . . . . . . . . . . . . . . . . . . . . . . . . . . . . . . . . . . . . . . . . . . . . . . . . . . 26Investments . . . . . . . . . . . . . . . . . . . . . . . . . . . . . . . . . . . . . . . . . . . . . . . . . . . . . . . . . . . . . . . . . . . . 14Plant and equipment — net . . . . . . . . . . . . . . . . . . . . . . . . . . . . . . . . . . . . . . . . . . . . . . . . . . . . . . . . . 17Intangible assets — net . . . . . . . . . . . . . . . . . . . . . . . . . . . . . . . . . . . . . . . . . . . . . . . . . . . . . . . . . . . . 126Deferred income taxes — net . . . . . . . . . . . . . . . . . . . . . . . . . . . . . . . . . . . . . . . . . . . . . . . . . . . . . . . 2Other assets — net . . . . . . . . . . . . . . . . . . . . . . . . . . . . . . . . . . . . . . . . . . . . . . . . . . . . . . . . . . . . . . . 24
374
Less liabilities assumed:Trade and other accounts payable . . . . . . . . . . . . . . . . . . . . . . . . . . . . . . . . . . . . . . . . . . . . . . . . . . . . 25Payroll and benefit-related liabilities . . . . . . . . . . . . . . . . . . . . . . . . . . . . . . . . . . . . . . . . . . . . . . . . . . 12Other accrued liabilities . . . . . . . . . . . . . . . . . . . . . . . . . . . . . . . . . . . . . . . . . . . . . . . . . . . . . . . . . . . 11Deferred income taxes — net . . . . . . . . . . . . . . . . . . . . . . . . . . . . . . . . . . . . . . . . . . . . . . . . . . . . . . . 10Other liabilities . . . . . . . . . . . . . . . . . . . . . . . . . . . . . . . . . . . . . . . . . . . . . . . . . . . . . . . . . . . . . . . . . 61Minority interest . . . . . . . . . . . . . . . . . . . . . . . . . . . . . . . . . . . . . . . . . . . . . . . . . . . . . . . . . . . . . . . . . 100
219
Fair value of net assets acquired $155
The estimated fair values and amortization periods of other intangible assets are as follows:
Fair ValueAmortizationPeriod (Years)
Customer relationships . . . . . . . . . . . . . . . . . . . . . . . . . . . . . . . . . . . . . . . . . . . . . . . $ 56 5 to 9Patents . . . . . . . . . . . . . . . . . . . . . . . . . . . . . . . . . . . . . . . . . . . . . . . . . . . . . . . . . . . 29 10Existing technologies . . . . . . . . . . . . . . . . . . . . . . . . . . . . . . . . . . . . . . . . . . . . . . . . 11 2 to 7Trademark licensing agreement . . . . . . . . . . . . . . . . . . . . . . . . . . . . . . . . . . . . . . . . . 9 5Goodwill . . . . . . . . . . . . . . . . . . . . . . . . . . . . . . . . . . . . . . . . . . . . . . . . . . . . . . . . . 8 —IPR&D. . . . . . . . . . . . . . . . . . . . . . . . . . . . . . . . . . . . . . . . . . . . . . . . . . . . . . . . . . . 5 1Other . . . . . . . . . . . . . . . . . . . . . . . . . . . . . . . . . . . . . . . . . . . . . . . . . . . . . . . . . . . . 8 5
Total intangible assets . . . . . . . . . . . . . . . . . . . . . . . . . . . . . . . . . . . . . . . . . . . . . . $126
Intangible assets acquired by Nortel relating to the business venture consisted of existing technology and related rights,customer contracts and relationships, in-process research and development, patents and trademark licensing agreements.Upon valuation of this acquisition, existing technology and customer relationships have been valued at $11 and $56,respectively, under the income approach which reflects the present value of the operating cash flows generated after takinginto account the cost to realize the revenue from the product, the relative risks of the product, and an appropriate discountrate to reflect the time value of invested capital. In-process research and development, which comprised a total of sixprojects expected to continue at the acquisition date was valued under the cost approach at $5. Patents were valued at anappraisal value of $29 under the income approach. There were two trademark licensing agreements granted to LG-Nortel:one from Nortel which allows the use of the ‘Nortel’ trademark and the other from LG which allows the use of the ‘LG’trademark. Both agreements grant the worldwide non-exclusive use of each respective company’s trademark. The expectedvalue of the benefits of selling products under the LG-Nortel trademark was established at $9 using the differentiallicensing fee approach. This difference in licensing rates was tax-affected and the after-tax cash flows were discounted atan appropriate rate.
Separately, LG will be entitled to payments from Nortel over a two-year period based on the achievement by LG-Nortelof certain business goals related to the 2006 and 2007 fiscal years, of up to a maximum of $80.
138
NORTEL NETWORKS CORPORATION
Notes to Consolidated Financial Statements — (Continued)

The consolidated financial statements of Nortel include LG-Nortel’s operating results from the date of Nortel’s acquisitionof its interest in the business venture. In previous quarters Nortel disclosed LG-Nortel as a VIE under FIN 46R. Thisinitial determination was based on a preliminary assessment that the manufacturing agreement between LG-Nortel and LGcontained below-market pricing, which was considered to be additional subordinated financial support under FIN 46R.Upon finalization of the valuations performed during 2006, it was determined that the pricing terms in this agreement areat fair value. Therefore, LG-Nortel is not a VIE, and accordingly is being consolidated under Accounting ResearchBulletin No. 51, “Consolidated Financial Statements”, based on Nortel’s voting interests.
Nortel Government Solutions Incorporated (formerly PEC Solutions, Inc.)
On June 3, 2005, Nortel Networks Inc. (“NNI”), an indirect subsidiary of Nortel, indirectly acquired approximately26,693,725 shares of NGS (formerly PEC Solutions, Inc.), representing approximately 95.6 percent of the outstandingshares of common stock of NGS, through a cash tender offer at a price of $15.50 per share. The aggregate cashconsideration in connection with the acquisition of NGS (including $33 paid on June 9, 2005, with respect to stockoptions) was approximately $449, including estimated costs of acquisition of $8. Nortel acquired more than 90 percent ofthe outstanding shares of NGS pursuant to the tender offer. Any shares that were not purchased in the tender offer ceasedto be outstanding and were converted into the right to receive cash in the amount of $15.50 per share.
NGS provides professional technology services that enable government entities to use the Internet to enhance productivityand improve services to the public. NGS’s primary customers are executive agencies and departments of the U.S. FederalGovernment, the U.S. Federal Judiciary and prime contractors to the U.S. government. Nortel expects the NGS acquisitionto allow Nortel to pursue opportunities in areas that complement Nortel’s existing products and to increase itscompetitiveness in the government market. In order to comply with the U.S. National Industrial Security Program and tomitigate foreign ownership, control or influence, voting control of NGS must be vested in citizens of the U.S. Accordingly,proxy holders for Nortel’s shares of NGS have been appointed and approved by the U.S. Defense Security Service. Inaccordance with a proxy agreement executed in July 2005, the proxy holders exercise all prerogatives of ownership withcomplete freedom to act independently and have assumed full responsibility for the voting stock. Notwithstanding, foraccounting purposes, Nortel has determined that NGS is a VIE and Nortel is the primary beneficiary (see note 15).
This acquisition was accounted for using the purchase method. Nortel has recorded approximately $278 of non-amortiz-able intangible assets associated with the acquisition of NGS, which assets consist solely of goodwill. The goodwill ofNGS is not deductible for tax purposes, and has been allocated to Nortel’s “Other” and “Enterprise Solutions” reportablesegments.
139
NORTEL NETWORKS CORPORATION
Notes to Consolidated Financial Statements — (Continued)
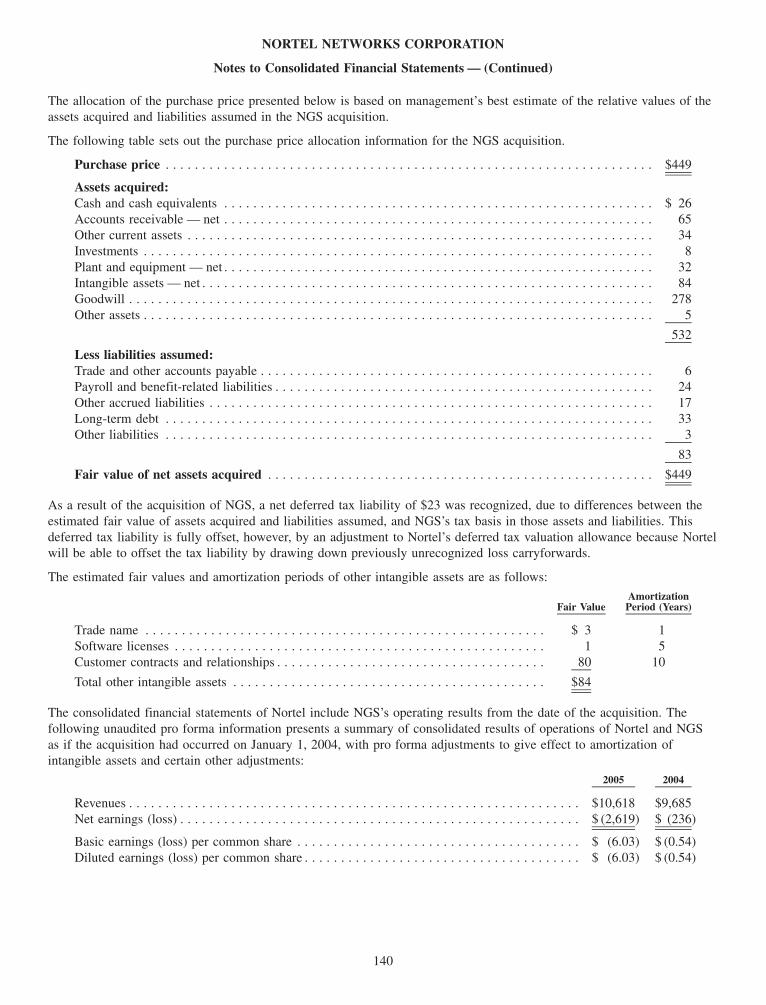
The allocation of the purchase price presented below is based on management’s best estimate of the relative values of theassets acquired and liabilities assumed in the NGS acquisition.
The following table sets out the purchase price allocation information for the NGS acquisition.
Purchase price . . . . . . . . . . . . . . . . . . . . . . . . . . . . . . . . . . . . . . . . . . . . . . . . . . . . . . . . . . . . . . . . . . . $449
Assets acquired:Cash and cash equivalents . . . . . . . . . . . . . . . . . . . . . . . . . . . . . . . . . . . . . . . . . . . . . . . . . . . . . . . . . . . $ 26Accounts receivable — net . . . . . . . . . . . . . . . . . . . . . . . . . . . . . . . . . . . . . . . . . . . . . . . . . . . . . . . . . . . 65Other current assets . . . . . . . . . . . . . . . . . . . . . . . . . . . . . . . . . . . . . . . . . . . . . . . . . . . . . . . . . . . . . . . . 34Investments . . . . . . . . . . . . . . . . . . . . . . . . . . . . . . . . . . . . . . . . . . . . . . . . . . . . . . . . . . . . . . . . . . . . . . 8Plant and equipment — net . . . . . . . . . . . . . . . . . . . . . . . . . . . . . . . . . . . . . . . . . . . . . . . . . . . . . . . . . . . 32Intangible assets — net . . . . . . . . . . . . . . . . . . . . . . . . . . . . . . . . . . . . . . . . . . . . . . . . . . . . . . . . . . . . . . 84Goodwill . . . . . . . . . . . . . . . . . . . . . . . . . . . . . . . . . . . . . . . . . . . . . . . . . . . . . . . . . . . . . . . . . . . . . . . . 278Other assets . . . . . . . . . . . . . . . . . . . . . . . . . . . . . . . . . . . . . . . . . . . . . . . . . . . . . . . . . . . . . . . . . . . . . . 5
532
Less liabilities assumed:Trade and other accounts payable . . . . . . . . . . . . . . . . . . . . . . . . . . . . . . . . . . . . . . . . . . . . . . . . . . . . . . 6Payroll and benefit-related liabilities . . . . . . . . . . . . . . . . . . . . . . . . . . . . . . . . . . . . . . . . . . . . . . . . . . . . 24Other accrued liabilities . . . . . . . . . . . . . . . . . . . . . . . . . . . . . . . . . . . . . . . . . . . . . . . . . . . . . . . . . . . . . 17Long-term debt . . . . . . . . . . . . . . . . . . . . . . . . . . . . . . . . . . . . . . . . . . . . . . . . . . . . . . . . . . . . . . . . . . . 33Other liabilities . . . . . . . . . . . . . . . . . . . . . . . . . . . . . . . . . . . . . . . . . . . . . . . . . . . . . . . . . . . . . . . . . . . 3
83
Fair value of net assets acquired . . . . . . . . . . . . . . . . . . . . . . . . . . . . . . . . . . . . . . . . . . . . . . . . . . . . . $449
As a result of the acquisition of NGS, a net deferred tax liability of $23 was recognized, due to differences between theestimated fair value of assets acquired and liabilities assumed, and NGS’s tax basis in those assets and liabilities. Thisdeferred tax liability is fully offset, however, by an adjustment to Nortel’s deferred tax valuation allowance because Nortelwill be able to offset the tax liability by drawing down previously unrecognized loss carryforwards.
The estimated fair values and amortization periods of other intangible assets are as follows:
Fair ValueAmortizationPeriod (Years)
Trade name . . . . . . . . . . . . . . . . . . . . . . . . . . . . . . . . . . . . . . . . . . . . . . . . . . . . . . . $ 3 1Software licenses . . . . . . . . . . . . . . . . . . . . . . . . . . . . . . . . . . . . . . . . . . . . . . . . . . . 1 5Customer contracts and relationships . . . . . . . . . . . . . . . . . . . . . . . . . . . . . . . . . . . . . 80 10
Total other intangible assets . . . . . . . . . . . . . . . . . . . . . . . . . . . . . . . . . . . . . . . . . . . $84
The consolidated financial statements of Nortel include NGS’s operating results from the date of the acquisition. Thefollowing unaudited pro forma information presents a summary of consolidated results of operations of Nortel and NGSas if the acquisition had occurred on January 1, 2004, with pro forma adjustments to give effect to amortization ofintangible assets and certain other adjustments:
2005 2004
Revenues . . . . . . . . . . . . . . . . . . . . . . . . . . . . . . . . . . . . . . . . . . . . . . . . . . . . . . . . . . . . . . $10,618 $9,685Net earnings (loss) . . . . . . . . . . . . . . . . . . . . . . . . . . . . . . . . . . . . . . . . . . . . . . . . . . . . . . . $ (2,619) $ (236)
Basic earnings (loss) per common share . . . . . . . . . . . . . . . . . . . . . . . . . . . . . . . . . . . . . . . $ (6.03) $ (0.54)Diluted earnings (loss) per common share . . . . . . . . . . . . . . . . . . . . . . . . . . . . . . . . . . . . . . $ (6.03) $ (0.54)
140
NORTEL NETWORKS CORPORATION
Notes to Consolidated Financial Statements — (Continued)

Divestitures
UMTS access business divestiture
On December 31, 2006, Nortel completed the sale of substantially all its assets and liabilities related to its UMTS accessproducts and services to Alcatel-Lucent. The sale, structured as an asset and share transaction, resulted in gross proceedsof $320, adjusted primarily for warranty liabilities, for net proceeds of $306 all of which were received in the fourthquarter of 2006. In addition, Nortel provided Alcatel-Lucent with a $23 promissory note in lieu of transferring workingcapital, which was paid in the first quarter of 2007. The proceeds are subject to post-closing adjustments for thefinalization of the book value of the assets transferred and liabilities assumed by Alcatel-Lucent which are not expected tobe significant.
As a result of the sale, Nortel transferred $65 in net assets comprised primarily of fixed assets and inventory, substantiallyall existing UMTS access contracts, intellectual property, and approximately 1,700 employees attributed to the UMTSaccess products. Additionally, Nortel wrote off net assets of $18 related primarily to unbilled receivables, goodwill,prepaid assets and deferred revenue and costs, and has recorded additional liabilities of $26, relating to transaction costspayable to Alcatel-Lucent. Nortel retained its existing LG-Nortel UMTS access customer contracts and will source theUMTS access products and services from Alcatel-Lucent.
Nortel and Alcatel-Lucent have also agreed to provide certain transitional services to each other in order to facilitate thevarious aspects of the divesture. Nortel has committed to provide R&D, manufacturing and real estate transition servicesin addition to providing Alcatel-Lucent the right to use all proprietary intellectual property used in Nortel UMTS accessproducts and services which are also common to other Nortel products and services. In addition, Alcatel-Lucent hasoptions to extend its license rights to other Nortel Long Term Evolution related and GSM technology for consideration of$50 and $15, respectively. These options expire December 31, 2008 and December 31, 2010, respectively.
Nortel has recorded a net gain of $166 and deferred income of $5 primarily due to contingent liabilities related to a loss-sharing arrangement based on 2007 operating results.
Manufacturing operations
In 2004, Nortel entered into an agreement with Flextronics for the divestiture of substantially all of Nortel’s remainingmanufacturing operations and related activities, including certain product integration, testing, repair operations, supplychain management, third party logistics operations and design assets. Nortel and Flextronics have also entered into a four-year supply agreement for manufacturing services (whereby after completion of the transaction, Flextronics will managein excess $2,000 of Nortel’s annual cost of revenues) and a three-year supply agreement for design services. Commencingin the fourth quarter of 2004 and throughout 2005, Nortel completed the transfer to Flextronics of certain of Nortel’soptical design activities in Ottawa, Canada and Monkstown, Northern Ireland and its manufacturing activities in Montreal,Canada and Chateaudun, France. In the second quarter of 2006, Nortel completed the transfer of the manufacturingoperations and related assets including product integration, testing, and repair and logistics operations of its Calgary,Canada manufacturing operations to Flextronics, representing the final transfer of substantially all of Nortel’s manufactur-ing and related operations to Flextronics.
The sale agreement with Flextronics resulted in the transfer of approximately 2,100 employees to Flextronics. Nortel hasreceived $599 of gross proceeds as of December 31, 2006. On October 18, 2006, Nortel signed amendments to variousagreements with Flextronics, including the sale agreement, and the supply and design services agreements to restructureNortel’s purchase commitments and increase Nortel’s obligation to reimburse Flextronics for certain costs associated withthe transaction. Nortel received the final payment of $79 from Flextronics during 2006, which has been offset by cashoutflows attributable to direct transaction costs and other costs associated with the transaction.
As of December 31, 2006, Nortel had transferred approximately $404 of inventory and equipment to Flextronics relatingto the transfer of the optical design activities in Ottawa and Monkstown and the manufacturing activities in Montreal,Chateaudun and Calgary. As Flextronics has the ability to exercise rights to sell back to Nortel certain inventory andequipment after the expiration of a specified period (up to fifteen months) following each respective transfer date, Nortelhas retained these assets on its balance sheet to the extent they have not been consumed as part of ongoing operations as
141
NORTEL NETWORKS CORPORATION
Notes to Consolidated Financial Statements — (Continued)
at December 31, 2006. Nortel does not expect that rights will be exercised with respect to any material amount ofinventory and/or equipment. Nortel does not expect to record any material gain on this transaction.
Directory and operator services business
On August 2, 2004, Nortel completed the contribution of certain fixed assets, intangible assets including customercontracts, software and other licenses, and liabilities of its directory and operator services (“DOS”) business to VoltDeltaResources LLC (“VoltDelta”), a wholly owned subsidiary of Volt Information Sciences, Inc. (“VIS”), in return for a24 percent interest in VoltDelta which was valued at $57. After a period of two years, Nortel and VIS each have an optionto cause Nortel to sell its VoltDelta shares to VIS for proceeds ranging from $25 to $70. As a result of this transaction,approximately 160 Nortel DOS employees in North America and Mexico joined VoltDelta. This non-monetary exchangewas recorded at fair value, and Nortel recorded a gain of $30 within sale of businesses and assets during 2004.
On December 28, 2005, VoltDelta entered into a Letter of Agreement to repurchase a 24% minority interest in it held byNortel for an aggregate purchase price of approximately $62. The terms of the Letter of Agreement included VoltDeltapaying Nortel $25 on December 29, 2005, and issuing a promissory note in the amount of $37 which was paid in full onFebruary 15, 2006. The sale resulted in a net gain of approximately $7 for the year ended December 31, 2005. As ofDecember 31, 2006, Nortel did not hold any ownership interest in VoltDelta. Nortel continues to provide transitionalservices to VoltDelta over the initial agreement period of ten years with no additional material financial impact to Nortel.
Optical components operations
In 2002, Nortel sold certain plant and equipment, inventory, patents and other intellectual property and trademarks relatingto its optical components business to Bookham, Inc. (“Bookham”). Included in the sale was the transfer of Nortel’stransmitter and receiver, pump laser and amplifier businesses located in Paignton, U.K., Harlow, U.K., Ottawa, Canada,Zurich, Switzerland and Poughkeepsie, New York. Nortel also transferred approximately 1,200 employees to Bookham inthe transaction. The transaction included a minimum purchase commitment with Bookham requiring Nortel to purchaseapproximately $120 of product from Bookham between November 8, 2002 and March 31, 2004.
On December 2, 2004, Nortel and Bookham entered into a restructuring agreement which, among other changes, extendedthe maturity date of a $25.9 principal amount senior secured note of Bookham (the “Series B Note”) by one year fromNovember 8, 2005 to November 8, 2006, and eliminated the conversion feature of a $20 principal amount seniorunsecured note of Bookham due November 2007 (the “Series A Note”). Bookham also agreed to secure the Series ANote, provide additional collateral for the Series A Note and the Series B Note, and provide Nortel with other debtprotection covenants. On January 13, 2006, Nortel received $20 in cash plus accrued interest from Bookham to retire theSeries A Note. In addition, Nortel sold the Series B Note for approximately $26 to a group of unrelated investors.
On January 13, 2006, Nortel announced that it had entered into an agreement with Bookham to amend the current supplyagreement and extend certain purchase commitments, which were scheduled to expire on April 29, 2006. Under the termsof the amended supply agreement, Nortel agreed to purchase a minimum of $72 of product from Bookham during thecalendar year of 2006. Nortel’s purchase commitment was substantially complete in 2006.
142
NORTEL NETWORKS CORPORATION
Notes to Consolidated Financial Statements — (Continued)
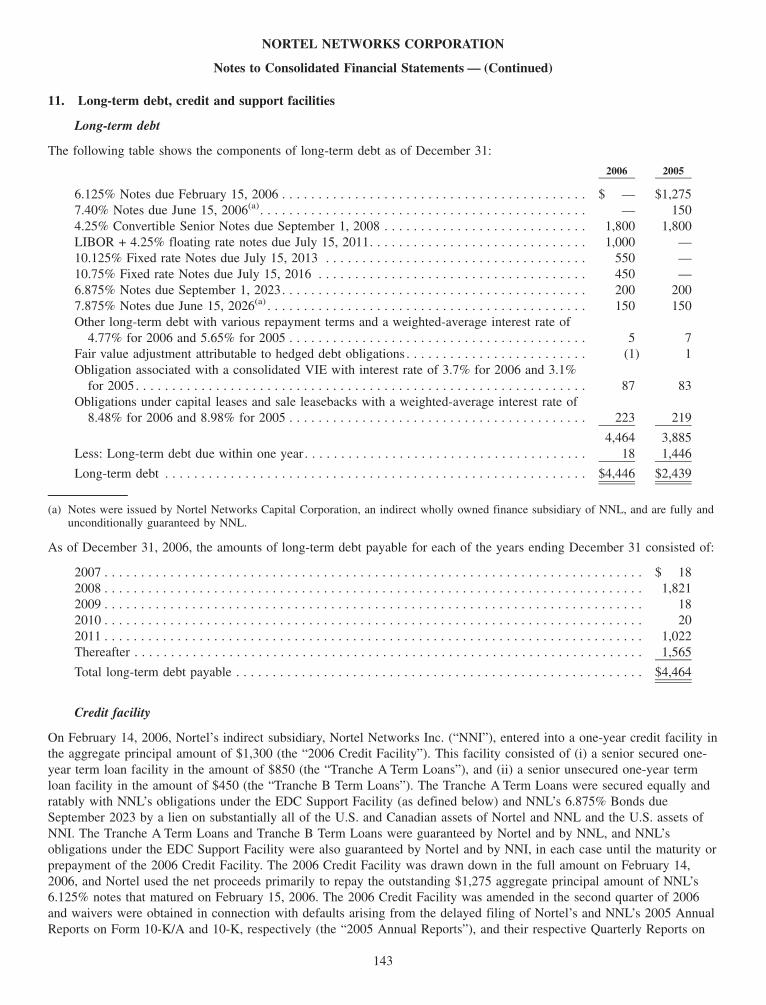
11. Long-term debt, credit and support facilities
Long-term debt
The following table shows the components of long-term debt as of December 31:
2006 2005
6.125% Notes due February 15, 2006 . . . . . . . . . . . . . . . . . . . . . . . . . . . . . . . . . . . . . . . . . . $ — $1,2757.40% Notes due June 15, 2006(a). . . . . . . . . . . . . . . . . . . . . . . . . . . . . . . . . . . . . . . . . . . . . — 1504.25% Convertible Senior Notes due September 1, 2008 . . . . . . . . . . . . . . . . . . . . . . . . . . . . 1,800 1,800LIBOR + 4.25% floating rate notes due July 15, 2011. . . . . . . . . . . . . . . . . . . . . . . . . . . . . . 1,000 —10.125% Fixed rate Notes due July 15, 2013 . . . . . . . . . . . . . . . . . . . . . . . . . . . . . . . . . . . . 550 —10.75% Fixed rate Notes due July 15, 2016 . . . . . . . . . . . . . . . . . . . . . . . . . . . . . . . . . . . . . 450 —6.875% Notes due September 1, 2023. . . . . . . . . . . . . . . . . . . . . . . . . . . . . . . . . . . . . . . . . . 200 2007.875% Notes due June 15, 2026(a) . . . . . . . . . . . . . . . . . . . . . . . . . . . . . . . . . . . . . . . . . . . . 150 150Other long-term debt with various repayment terms and a weighted-average interest rate of
4.77% for 2006 and 5.65% for 2005 . . . . . . . . . . . . . . . . . . . . . . . . . . . . . . . . . . . . . . . . . 5 7Fair value adjustment attributable to hedged debt obligations . . . . . . . . . . . . . . . . . . . . . . . . . (1) 1Obligation associated with a consolidated VIE with interest rate of 3.7% for 2006 and 3.1%
for 2005. . . . . . . . . . . . . . . . . . . . . . . . . . . . . . . . . . . . . . . . . . . . . . . . . . . . . . . . . . . . . . 87 83Obligations under capital leases and sale leasebacks with a weighted-average interest rate of
8.48% for 2006 and 8.98% for 2005 . . . . . . . . . . . . . . . . . . . . . . . . . . . . . . . . . . . . . . . . . 223 219
4,464 3,885Less: Long-term debt due within one year . . . . . . . . . . . . . . . . . . . . . . . . . . . . . . . . . . . . . . . 18 1,446
Long-term debt . . . . . . . . . . . . . . . . . . . . . . . . . . . . . . . . . . . . . . . . . . . . . . . . . . . . . . . . . . $4,446 $2,439
(a) Notes were issued by Nortel Networks Capital Corporation, an indirect wholly owned finance subsidiary of NNL, and are fully andunconditionally guaranteed by NNL.
As of December 31, 2006, the amounts of long-term debt payable for each of the years ending December 31 consisted of:
2007 . . . . . . . . . . . . . . . . . . . . . . . . . . . . . . . . . . . . . . . . . . . . . . . . . . . . . . . . . . . . . . . . . . . . . . . . . . $ 182008 . . . . . . . . . . . . . . . . . . . . . . . . . . . . . . . . . . . . . . . . . . . . . . . . . . . . . . . . . . . . . . . . . . . . . . . . . . 1,8212009 . . . . . . . . . . . . . . . . . . . . . . . . . . . . . . . . . . . . . . . . . . . . . . . . . . . . . . . . . . . . . . . . . . . . . . . . . . 182010 . . . . . . . . . . . . . . . . . . . . . . . . . . . . . . . . . . . . . . . . . . . . . . . . . . . . . . . . . . . . . . . . . . . . . . . . . . 202011 . . . . . . . . . . . . . . . . . . . . . . . . . . . . . . . . . . . . . . . . . . . . . . . . . . . . . . . . . . . . . . . . . . . . . . . . . . 1,022Thereafter . . . . . . . . . . . . . . . . . . . . . . . . . . . . . . . . . . . . . . . . . . . . . . . . . . . . . . . . . . . . . . . . . . . . . . 1,565
Total long-term debt payable . . . . . . . . . . . . . . . . . . . . . . . . . . . . . . . . . . . . . . . . . . . . . . . . . . . . . . . . $4,464
Credit facility
On February 14, 2006, Nortel’s indirect subsidiary, Nortel Networks Inc. (“NNI”), entered into a one-year credit facility inthe aggregate principal amount of $1,300 (the “2006 Credit Facility”). This facility consisted of (i) a senior secured one-year term loan facility in the amount of $850 (the “Tranche A Term Loans”), and (ii) a senior unsecured one-year termloan facility in the amount of $450 (the “Tranche B Term Loans”). The Tranche A Term Loans were secured equally andratably with NNL’s obligations under the EDC Support Facility (as defined below) and NNL’s 6.875% Bonds dueSeptember 2023 by a lien on substantially all of the U.S. and Canadian assets of Nortel and NNL and the U.S. assets ofNNI. The Tranche A Term Loans and Tranche B Term Loans were guaranteed by Nortel and by NNL, and NNL’sobligations under the EDC Support Facility were also guaranteed by Nortel and by NNI, in each case until the maturity orprepayment of the 2006 Credit Facility. The 2006 Credit Facility was drawn down in the full amount on February 14,2006, and Nortel used the net proceeds primarily to repay the outstanding $1,275 aggregate principal amount of NNL’s6.125% notes that matured on February 15, 2006. The 2006 Credit Facility was amended in the second quarter of 2006and waivers were obtained in connection with defaults arising from the delayed filing of Nortel’s and NNL’s 2005 AnnualReports on Form 10-K/A and 10-K, respectively (the “2005 Annual Reports”), and their respective Quarterly Reports on
143
NORTEL NETWORKS CORPORATION
Notes to Consolidated Financial Statements — (Continued)

Form 10-Q for the first quarter of 2006 (the “2006 First Quarter Reports”). On July 5, 2006, the total amount owing underthe 2006 Credit Facility was repaid using the net proceeds from the issuance of the Notes (as defined below) and thefacility, the guarantee agreement and all of the collateral arrangements securing it and Nortel’s and NNL’s public debtwere terminated.
Senior notes offering
On July 5, 2006, NNL completed an offering of $2,000 aggregate principal amount of senior notes (the “Notes”) toqualified institutional buyers pursuant to Rule 144A and to persons outside the United States pursuant to Regulation Sunder the U.S. Securities Act of 1933, as amended (the “Securities Act”). The Notes consist of $450 of senior fixed ratenotes due 2016 (the “2016 Fixed Rate Notes”), $550 of senior fixed rate notes due 2013 (the “2013 Fixed Rate Notes”)and $1,000 of floating rate senior notes due 2011 (the “Floating Rate Notes”). The 2016 Fixed Rate Notes bear interest ata rate per annum of 10.75% payable semi-annually, the 2013 Fixed Rate Notes bear interest at a rate per annum of10.125% payable semi-annually and the Floating Rate Notes bear interest at a rate per annum, reset quarterly, equal to thereserve-adjusted LIBOR plus 4.25%, payable quarterly. As of December 31, 2006, the Floating Rate Notes had an interestrate of 9.62% per annum.
NNL may redeem all or a portion of the 2016 Fixed Rate Notes at any time on or after July 15, 2011, at specifiedredemption prices ranging from 105.375% to 100% of the principal amount thereof plus accrued and unpaid interest. Inaddition, NNL may redeem all or a portion of the 2013 Fixed Rate Notes at any time and, prior to July 15, 2011, all or aportion of the 2016 Fixed Rates Notes, at a price equal to 100% of the principal amount thereof plus a “make-whole”premium. Prior to July 15, 2009, NNL may also redeem up to 35% of the original aggregate principal amount of anyseries of Notes with proceeds of certain equity offerings at a redemption price equal to (i) in the case of the 2016 FixedRate Notes, 110.750% of the principal amount thereof, (ii) in the case of the 2013 Fixed Rate Notes, 110.125% of theprincipal amount thereof and (iii) in the case of the Floating Rate Notes, 100% of the principal amount so redeemed plusa premium equal to the interest rate per annum of such Floating Rate Notes applicable on the date of redemption, in eachcase plus accrued and unpaid interest, if any. In the event of certain changes in applicable withholding taxes, NNL mayredeem each series of Notes in whole, but not in part.
Upon a change of control, NNL is required within 30 days to make an offer to purchase the Notes then outstanding at apurchase price equal to 101% of the principal amount of the Notes plus accrued and unpaid interest. A “change ofcontrol” is defined in the indenture governing the Notes (the “Note Indenture”) as, among other things, the filing of aSchedule 13D or Schedule TO under the Securities Exchange Act of 1934, as amended, by any person or groupunaffiliated with Nortel disclosing that such person or group has become the beneficial owner of a majority of the votingstock of Nortel or has the power to elect a majority of the members of the Board of Directors of Nortel, or Nortel ceasingto be the beneficial owner of 100% of the voting power of the common stock of NNL.
In connection with the issuance of the Notes, Nortel, NNL and NNI entered into a registration rights agreement with theinitial purchasers of the Notes and are obligated under that agreement to use their reasonable best efforts to file with theSEC, and cause to become effective, a registration statement relating to the exchange or resale of the Notes within certaintime periods, failing which holders of the Notes will be entitled to payment of certain additional interest.
The Note Indenture and related guarantees contain various covenants that limit Nortel’s and NNL’s ability to create liens(other than certain permitted liens) against assets of Nortel, NNL and its restricted subsidiaries to secure funded debt inexcess of certain permitted amounts without equally and ratably securing the Notes and to merge, consolidate and sell orotherwise dispose of substantially all of the assets of any of Nortel, NNL and, so long as NNI is a guarantor of the Notes,NNI unless the surviving entity or purchaser of such assets assumes the obligations of Nortel, NNL or NNI, as the casemay be, under the Notes and related guarantees and no default exists under the Note Indenture after giving effect to suchmerger, consolidation or sale.
In addition, the Note Indenture and related guarantees contain covenants that, at any time that the Notes do not have aninvestment grade rating, limit Nortel’s ability to incur, assume, issue or guarantee additional funded debt (including capitalleases) and certain types of preferred stock, or repurchase, redeem, retire or pay any dividends in respect of any Nortelstock or NNL preferred stock, in excess of certain permitted amounts or incur debt that is subordinated to any other debtof Nortel, NNL or NNI, without having that new debt be expressly subordinated to the Notes and the guarantees. At any
144
NORTEL NETWORKS CORPORATION
Notes to Consolidated Financial Statements — (Continued)

time that the Notes do not have an investment grade rating, Nortel’s ability to incur additional indebtedness is tied to anAdjusted EBITDA to fixed charges ratio of at least 2.00 to 1.00, except that Nortel may incur certain debt and makecertain restricted payments without regard to the ratio up to certain permitted amounts. “Adjusted EBITDA” is generallydefined as consolidated earnings before interest, taxes, depreciation and amortization, adjusted for certain restructuringcharges and other one-time charges and gains that will be excluded from the calculation of Adjusted EBITDA. “Fixedcharges” is defined in the Note Indenture as consolidated interest expense plus dividends paid on certain preferred stock.
Following the issuance of the Notes, Nortel entered into interest rate swaps to convert the fixed interest rate exposureunder the 2016 Fixed Rate Notes and the 2013 Fixed Rate Notes to a floating rate (see note 12 for further details).
NNL used $1,300 of the net proceeds from the issuance of the Notes to repay the 2006 Credit Facility and used theremainder for general corporate purposes, including to replenish cash outflows of $150 used to repay at maturity theoutstanding aggregate principal amount of the 7.40% Notes due June 15, 2006, and $575, plus accrued interest, depositedinto escrow on June 1, 2006, pursuant to the Global Class Action Settlement (as defined in note 21).
On August 15, 2001, Nortel completed an offering of $1,800 of 4.25% Convertible Senior Notes (the “Senior Notes”), dueon September 1, 2008. The Senior Notes pay interest on a semi-annual basis on March 1 and September 1, which beganMarch 1, 2002. The Senior Notes are convertible at any time by holders into common shares of Nortel NetworksCorporation, at an initial conversion price of $10 per common share, subject to adjustment upon the occurrence of certainevents. Nortel’s 1 for 10 common share consolidation on December 1, 2006 increased the initial conversion price to$100 from $10 and decreased the number of Nortel shares that could be issued upon the exercise of conversion rightsunder the Senior Notes from 180 million common shares to 18 million common shares. Nortel may redeem some or all ofthe Senior Notes in cash at any time at a redemption price of 100.708% until August 31, 2007, and 100% thereafter and100% of the principal amount of the Senior Notes, depending on the redemption date, plus accrued and unpaid interestand additional interest, if any, to the date of the redemption. In addition, Nortel may be required to redeem the SeniorNotes in cash and/or common shares of Nortel Networks Corporation under certain circumstances such as a change incontrol, or Nortel may redeem the Senior Notes at its option under certain circumstances such as a change in theapplicable Canadian withholding tax legislation. NNL is the full and unconditional guarantor of the Senior Notes in theevent Nortel does not make payments for the principal, interest, premium, if any, or other amounts, if any, as they are due.The guarantee is a direct, unconditional and unsubordinated obligation of NNL.
As a result of the delay in the filing of Nortel’s and NNL’s 2004 Quarterly Reports on Form 10-Q for the first, second andthird quarters of 2004 (the “2004 Quarterly Reports”), 2004 Annual Reports on Form 10-K (the “2004 Annual Reports”),2005 Quarterly Reports on Form 10-Q for the first quarter of 2005 (the “2005 First Quarter Reports”), the 2005 AnnualReports and the 2006 First Quarter Reports (together with the 2004 Quarterly Reports, 2004 Annual Reports, 2005 FirstQuarter Reports and the 2005 Annual Reports, the “Reports”), Nortel and NNL were not in compliance with theirobligations to deliver their respective SEC filings to the trustees under their then-existing public debt indentures. With thefiling of the 2006 First Quarter Reports with the SEC and the delivery of the 2006 First Quarter Reports to the trusteesunder the relevant public debt indentures, Nortel and NNL became compliant with their delivery obligations thereunder.There were $2,350 of notes of NNL (or its subsidiaries) and $1,800 of convertible debt securities of Nortel outstandingunder such indentures as of December 31, 2006.
Support facility
On February 14, 2003, NNL entered into an agreement with Export Development Canada (“EDC”) regarding arrangementsto provide for support of certain performance related obligations arising out of normal course business activities for thebenefit of Nortel (the “EDC Support Facility”). On December 10, 2004, NNL and EDC amended the terms of the EDCSupport Facility by extending the termination date of the EDC Support Facility to December 31, 2006 from December 31,2005.
Effective October 24, 2005, NNL and EDC amended and restated the EDC Support Facility to maintain the total EDCSupport Facility at up to $750, including the existing $300 of committed support for performance bonds and similarinstruments with individual amounts up to $10, and to extend the maturity date of the EDC Support Facility for anadditional year to December 31, 2007. In connection with this amendment, all guarantee and security agreementspreviously guaranteeing or securing the obligations of Nortel and its subsidiaries under the EDC Support Facility and the
145
NORTEL NETWORKS CORPORATION
Notes to Consolidated Financial Statements — (Continued)
public debt securities of Nortel and its subsidiaries at such time were terminated and the assets of Nortel and itssubsidiaries pledged under the security agreements were released in full. EDC also agreed to provide future support underthe EDC Support Facility on an unsecured basis and without the guarantees of NNL’s subsidiaries provided that, shouldNNL or its subsidiaries incur liens on its assets securing certain indebtedness, or should any subsidiary of NNL incur orguarantee certain indebtedness in the future above agreed thresholds of $25 in North America and $100 outside of NorthAmerica, equal and ratable security and/or guarantees of NNL’s obligations under the EDC Support Facility will berequired at that time.
Between February 14, 2006, when Nortel entered into the 2006 Credit Facility, and July 5, 2006, when Nortel issued theNotes and repaid the 2006 Credit Facility in full NNL’s obligations under the EDC Support Facility were equally andratably secured with the 2006 Credit Facility. In connection with the issuance of the Notes, NNL, NNI and EDC enteredinto a new guarantee agreement dated July 4, 2006, by which NNI agreed to guarantee NNL’s obligations under the EDCSupport Facility during such time that the Notes are guaranteed by NNI.
Effective December 14, 2006, NNL and EDC amended and restated the EDC Support Facility to maintain the total EDCSupport Facility at up to $750, including the existing $300 of committed support for performance bonds and similarinstruments with individual amounts up to $10 and to extend the maturity date of the EDC Support Facility for anadditional year to December 31, 2008.
The delayed filing of the 2005 Annual Reports and 2006 First Quarter Reports with the SEC, and the delayed delivery ofsuch reports to the trustees under Nortel’s and NNL’s public debt indentures, and to EDC under the EDC Support Facility,gave EDC the right to (i) terminate its commitments under the EDC Support Facility relating to certain of Nortel’sperformance related obligations arising out of normal course business activities, and (ii) exercise certain rights against thecollateral pledged under related security agreements or require NNL to cash collateralize all existing support.
In the second quarter of 2006, NNL obtained waivers from EDC with respect to these matters to permit Nortel’s continuedaccess to the EDC Support Facility in accordance with its terms while Nortel and NNL worked to complete their filingobligations. With the filing and delivery to EDC and to the trustees under Nortel’s and NNL’s public debt indentures ofthe 2005 Annual Reports and the 2006 First Quarter Reports, NNL became compliant with its obligations under the EDCSupport Facility under the terms of the waiver from EDC.
As a result of the delayed filing and restatement of Nortel’s and NNL’s 2006 Annual Reports on Form 10-K, an event ofdefault occurred under the EDC Support Facility. See note 22 for additional information.
As of December 31, 2006, there was approximately $166 of outstanding support utilized thereunder, approximately $140 ofwhich was outstanding under the revolving small bond sub-facility.
12. Financial instruments and hedging activities
Risk management
Nortel’s net earnings (loss) and cash flows may be negatively impacted by fluctuating interest rates, foreign exchangerates and equity prices. To effectively manage these market risks, Nortel may enter into foreign currency forwards, foreigncurrency swaps, foreign currency option contracts, interest rate swaps and equity forward contracts. Nortel does not holdor issue derivative financial instruments for trading purposes.
Foreign currency risk
Nortel enters into option contracts to limit its exposure to exchange fluctuations on future revenue or expenditure streamsexpected to occur within the next twelve months, and forward contracts, which are denominated in various currencies, tolimit its exposure to exchange fluctuations on existing assets and liabilities and on future revenue or expenditure streamsexpected to occur within the next twelve months. Some option and forward contracts used to hedge future revenue orexpenditure streams are designated as cash flow hedges and hedge specific exposures. The ineffective portions of thechange in fair value of derivatives in designated cash flow hedges recognized immediately in earnings for the years endedDecember 31, 2006 and 2005 has not been significant. Nortel expects all of the hedged items in the 2006 designated cashflow hedges to affect earnings within the next 12 months. Option and forward contracts that do not meet the criteria for
146
NORTEL NETWORKS CORPORATION
Notes to Consolidated Financial Statements — (Continued)
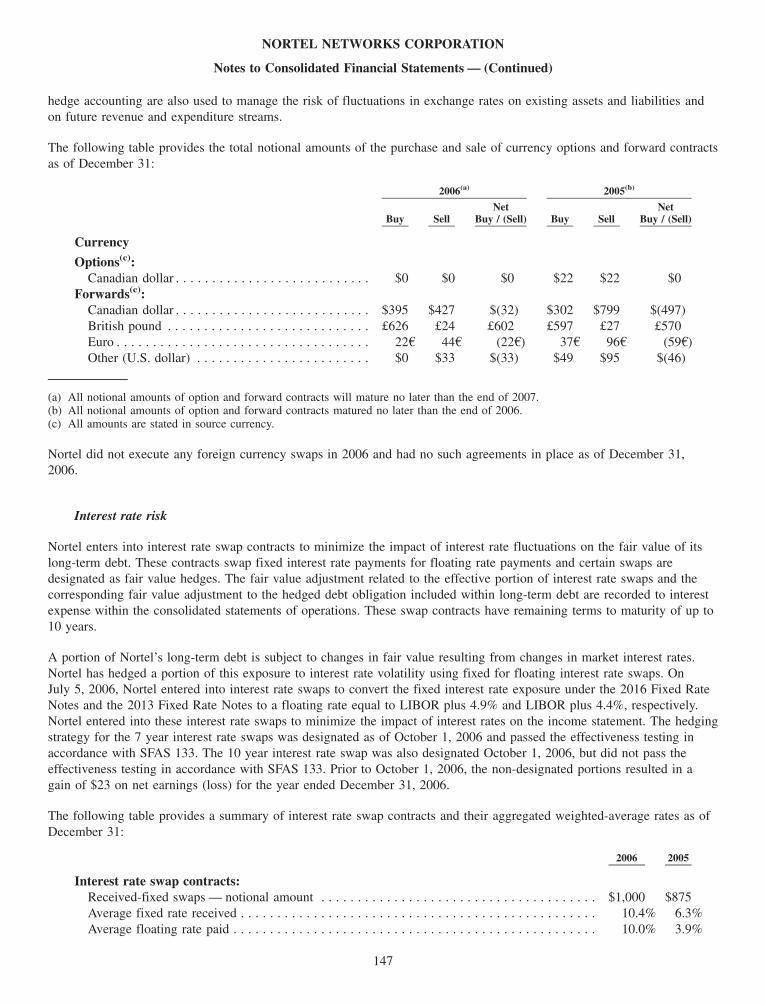
hedge accounting are also used to manage the risk of fluctuations in exchange rates on existing assets and liabilities andon future revenue and expenditure streams.
The following table provides the total notional amounts of the purchase and sale of currency options and forward contractsas of December 31:
Buy SellNet
Buy / (Sell) Buy SellNet
Buy / (Sell)
2006(a) 2005(b)
Currency
Options(c):Canadian dollar . . . . . . . . . . . . . . . . . . . . . . . . . . . $0 $0 $0 $22 $22 $0
Forwards(c):Canadian dollar . . . . . . . . . . . . . . . . . . . . . . . . . . . $395 $427 $(32) $302 $799 $(497)British pound . . . . . . . . . . . . . . . . . . . . . . . . . . . . £626 £24 £602 £597 £27 £570Euro . . . . . . . . . . . . . . . . . . . . . . . . . . . . . . . . . . . 22A 44A (22A) 37A 96A (59A)Other (U.S. dollar) . . . . . . . . . . . . . . . . . . . . . . . . $0 $33 $(33) $49 $95 $(46)
(a) All notional amounts of option and forward contracts will mature no later than the end of 2007.(b) All notional amounts of option and forward contracts matured no later than the end of 2006.(c) All amounts are stated in source currency.
Nortel did not execute any foreign currency swaps in 2006 and had no such agreements in place as of December 31,2006.
Interest rate risk
Nortel enters into interest rate swap contracts to minimize the impact of interest rate fluctuations on the fair value of itslong-term debt. These contracts swap fixed interest rate payments for floating rate payments and certain swaps aredesignated as fair value hedges. The fair value adjustment related to the effective portion of interest rate swaps and thecorresponding fair value adjustment to the hedged debt obligation included within long-term debt are recorded to interestexpense within the consolidated statements of operations. These swap contracts have remaining terms to maturity of up to10 years.
A portion of Nortel’s long-term debt is subject to changes in fair value resulting from changes in market interest rates.Nortel has hedged a portion of this exposure to interest rate volatility using fixed for floating interest rate swaps. OnJuly 5, 2006, Nortel entered into interest rate swaps to convert the fixed interest rate exposure under the 2016 Fixed RateNotes and the 2013 Fixed Rate Notes to a floating rate equal to LIBOR plus 4.9% and LIBOR plus 4.4%, respectively.Nortel entered into these interest rate swaps to minimize the impact of interest rates on the income statement. The hedgingstrategy for the 7 year interest rate swaps was designated as of October 1, 2006 and passed the effectiveness testing inaccordance with SFAS 133. The 10 year interest rate swap was also designated October 1, 2006, but did not pass theeffectiveness testing in accordance with SFAS 133. Prior to October 1, 2006, the non-designated portions resulted in again of $23 on net earnings (loss) for the year ended December 31, 2006.
The following table provides a summary of interest rate swap contracts and their aggregated weighted-average rates as ofDecember 31:
2006 2005
Interest rate swap contracts:Received-fixed swaps — notional amount . . . . . . . . . . . . . . . . . . . . . . . . . . . . . . . . . . . . . . $1,000 $875Average fixed rate received . . . . . . . . . . . . . . . . . . . . . . . . . . . . . . . . . . . . . . . . . . . . . . . . . 10.4% 6.3%Average floating rate paid . . . . . . . . . . . . . . . . . . . . . . . . . . . . . . . . . . . . . . . . . . . . . . . . . . 10.0% 3.9%
147
NORTEL NETWORKS CORPORATION
Notes to Consolidated Financial Statements — (Continued)
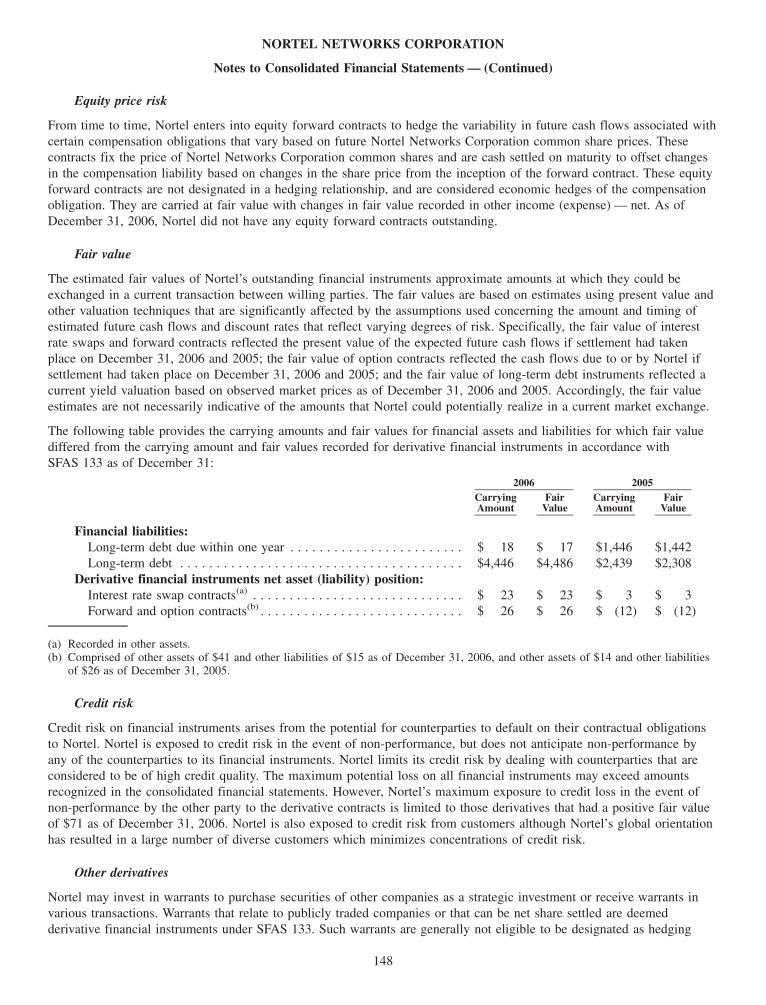
Equity price risk
From time to time, Nortel enters into equity forward contracts to hedge the variability in future cash flows associated withcertain compensation obligations that vary based on future Nortel Networks Corporation common share prices. Thesecontracts fix the price of Nortel Networks Corporation common shares and are cash settled on maturity to offset changesin the compensation liability based on changes in the share price from the inception of the forward contract. These equityforward contracts are not designated in a hedging relationship, and are considered economic hedges of the compensationobligation. They are carried at fair value with changes in fair value recorded in other income (expense) — net. As ofDecember 31, 2006, Nortel did not have any equity forward contracts outstanding.
Fair value
The estimated fair values of Nortel’s outstanding financial instruments approximate amounts at which they could beexchanged in a current transaction between willing parties. The fair values are based on estimates using present value andother valuation techniques that are significantly affected by the assumptions used concerning the amount and timing ofestimated future cash flows and discount rates that reflect varying degrees of risk. Specifically, the fair value of interestrate swaps and forward contracts reflected the present value of the expected future cash flows if settlement had takenplace on December 31, 2006 and 2005; the fair value of option contracts reflected the cash flows due to or by Nortel ifsettlement had taken place on December 31, 2006 and 2005; and the fair value of long-term debt instruments reflected acurrent yield valuation based on observed market prices as of December 31, 2006 and 2005. Accordingly, the fair valueestimates are not necessarily indicative of the amounts that Nortel could potentially realize in a current market exchange.
The following table provides the carrying amounts and fair values for financial assets and liabilities for which fair valuediffered from the carrying amount and fair values recorded for derivative financial instruments in accordance withSFAS 133 as of December 31:
CarryingAmount
FairValue
CarryingAmount
FairValue
2006 2005
Financial liabilities:Long-term debt due within one year . . . . . . . . . . . . . . . . . . . . . . . . $ 18 $ 17 $1,446 $1,442Long-term debt . . . . . . . . . . . . . . . . . . . . . . . . . . . . . . . . . . . . . . . $4,446 $4,486 $2,439 $2,308
Derivative financial instruments net asset (liability) position:Interest rate swap contracts(a) . . . . . . . . . . . . . . . . . . . . . . . . . . . . . $ 23 $ 23 $ 3 $ 3Forward and option contracts(b) . . . . . . . . . . . . . . . . . . . . . . . . . . . . $ 26 $ 26 $ (12) $ (12)
(a) Recorded in other assets.(b) Comprised of other assets of $41 and other liabilities of $15 as of December 31, 2006, and other assets of $14 and other liabilities
of $26 as of December 31, 2005.
Credit risk
Credit risk on financial instruments arises from the potential for counterparties to default on their contractual obligationsto Nortel. Nortel is exposed to credit risk in the event of non-performance, but does not anticipate non-performance byany of the counterparties to its financial instruments. Nortel limits its credit risk by dealing with counterparties that areconsidered to be of high credit quality. The maximum potential loss on all financial instruments may exceed amountsrecognized in the consolidated financial statements. However, Nortel’s maximum exposure to credit loss in the event ofnon-performance by the other party to the derivative contracts is limited to those derivatives that had a positive fair valueof $71 as of December 31, 2006. Nortel is also exposed to credit risk from customers although Nortel’s global orientationhas resulted in a large number of diverse customers which minimizes concentrations of credit risk.
Other derivatives
Nortel may invest in warrants to purchase securities of other companies as a strategic investment or receive warrants invarious transactions. Warrants that relate to publicly traded companies or that can be net share settled are deemedderivative financial instruments under SFAS 133. Such warrants are generally not eligible to be designated as hedging
148
NORTEL NETWORKS CORPORATION
Notes to Consolidated Financial Statements — (Continued)
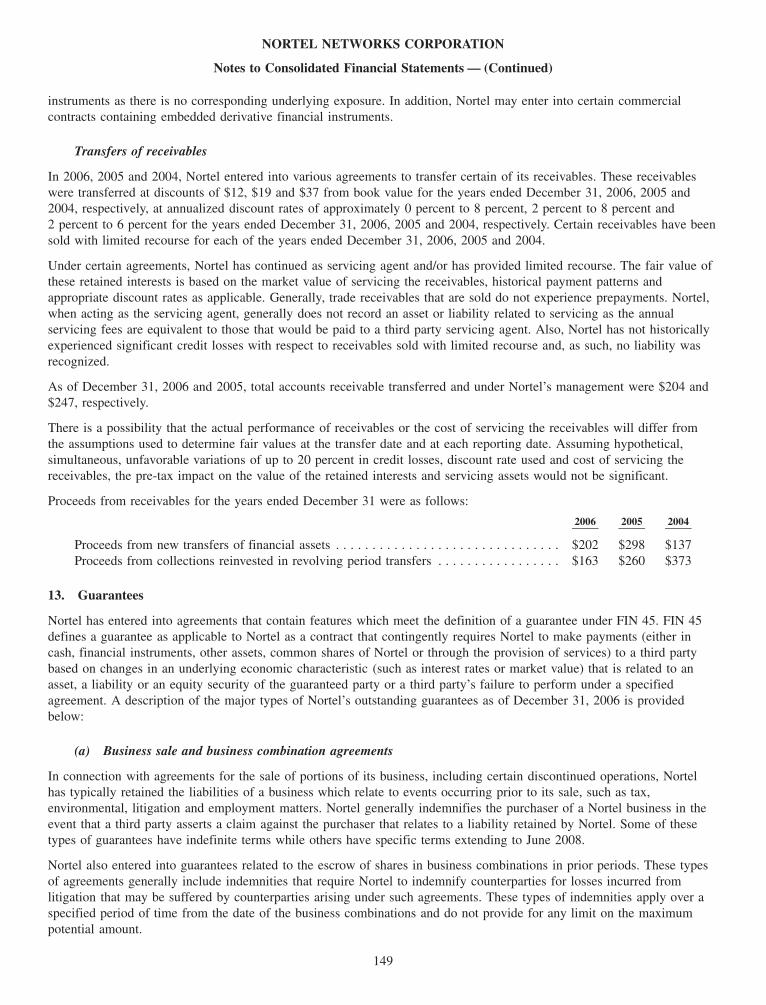
instruments as there is no corresponding underlying exposure. In addition, Nortel may enter into certain commercialcontracts containing embedded derivative financial instruments.
Transfers of receivables
In 2006, 2005 and 2004, Nortel entered into various agreements to transfer certain of its receivables. These receivableswere transferred at discounts of $12, $19 and $37 from book value for the years ended December 31, 2006, 2005 and2004, respectively, at annualized discount rates of approximately 0 percent to 8 percent, 2 percent to 8 percent and2 percent to 6 percent for the years ended December 31, 2006, 2005 and 2004, respectively. Certain receivables have beensold with limited recourse for each of the years ended December 31, 2006, 2005 and 2004.
Under certain agreements, Nortel has continued as servicing agent and/or has provided limited recourse. The fair value ofthese retained interests is based on the market value of servicing the receivables, historical payment patterns andappropriate discount rates as applicable. Generally, trade receivables that are sold do not experience prepayments. Nortel,when acting as the servicing agent, generally does not record an asset or liability related to servicing as the annualservicing fees are equivalent to those that would be paid to a third party servicing agent. Also, Nortel has not historicallyexperienced significant credit losses with respect to receivables sold with limited recourse and, as such, no liability wasrecognized.
As of December 31, 2006 and 2005, total accounts receivable transferred and under Nortel’s management were $204 and$247, respectively.
There is a possibility that the actual performance of receivables or the cost of servicing the receivables will differ fromthe assumptions used to determine fair values at the transfer date and at each reporting date. Assuming hypothetical,simultaneous, unfavorable variations of up to 20 percent in credit losses, discount rate used and cost of servicing thereceivables, the pre-tax impact on the value of the retained interests and servicing assets would not be significant.
Proceeds from receivables for the years ended December 31 were as follows:
2006 2005 2004
Proceeds from new transfers of financial assets . . . . . . . . . . . . . . . . . . . . . . . . . . . . . . . $202 $298 $137Proceeds from collections reinvested in revolving period transfers . . . . . . . . . . . . . . . . . $163 $260 $373
13. Guarantees
Nortel has entered into agreements that contain features which meet the definition of a guarantee under FIN 45. FIN 45defines a guarantee as applicable to Nortel as a contract that contingently requires Nortel to make payments (either incash, financial instruments, other assets, common shares of Nortel or through the provision of services) to a third partybased on changes in an underlying economic characteristic (such as interest rates or market value) that is related to anasset, a liability or an equity security of the guaranteed party or a third party’s failure to perform under a specifiedagreement. A description of the major types of Nortel’s outstanding guarantees as of December 31, 2006 is providedbelow:
(a) Business sale and business combination agreements
In connection with agreements for the sale of portions of its business, including certain discontinued operations, Nortelhas typically retained the liabilities of a business which relate to events occurring prior to its sale, such as tax,environmental, litigation and employment matters. Nortel generally indemnifies the purchaser of a Nortel business in theevent that a third party asserts a claim against the purchaser that relates to a liability retained by Nortel. Some of thesetypes of guarantees have indefinite terms while others have specific terms extending to June 2008.
Nortel also entered into guarantees related to the escrow of shares in business combinations in prior periods. These typesof agreements generally include indemnities that require Nortel to indemnify counterparties for losses incurred fromlitigation that may be suffered by counterparties arising under such agreements. These types of indemnities apply over aspecified period of time from the date of the business combinations and do not provide for any limit on the maximumpotential amount.
149
NORTEL NETWORKS CORPORATION
Notes to Consolidated Financial Statements — (Continued)
Nortel is unable to estimate the maximum potential liability for these types of indemnification guarantees as the businesssale agreements generally do not specify a maximum amount and the amounts are dependent upon the outcome of futurecontingent events, the nature and likelihood of which cannot be determined.
Historically, Nortel has not made any significant indemnification payments under such agreements and no significantliability has been accrued in the consolidated financial statements with respect to the obligations associated with theseguarantees.
In conjunction with the sale of a subsidiary to a third party, Nortel guaranteed to the purchaser that specified annualvolume levels would be achieved by the business sold over a ten year period ending December 31, 2007. The maximumamount that Nortel may be required to pay under the volume guarantee as of December 31, 2006 is $10. A liability of$8 has been accrued in the consolidated financial statements with respect to the obligation associated with this guaranteeas of December 31, 2006.
(b) Intellectual property indemnification obligations
Nortel has periodically entered into agreements with customers and suppliers which include intellectual propertyindemnification obligations that are customary in the industry. These types of guarantees typically have indefinite termsand generally require Nortel to compensate the other party for certain damages and costs incurred as a result of third partyintellectual property claims arising from these transactions.
The nature of the intellectual property indemnification obligations generally prevents Nortel from making a reasonableestimate of the maximum potential amount it could be required to pay to its customers and suppliers. Historically, Nortelhas not made any significant indemnification payments under such agreements. As of December 31, 2006, Nortel had nointellectual property indemnification obligations for which compensation would be required.
(c) Lease agreements
Nortel has entered into agreements with its lessors that guarantee the lease payments of certain assignees of its facilities tolessors. Generally, these lease agreements relate to facilities Nortel vacated prior to the end of the term of its lease. Theselease agreements require Nortel to make lease payments throughout the lease term if the assignee fails to make scheduledpayments. Most of these lease agreements also require Nortel to pay for facility restoration costs at the end of the leaseterm if the assignee fails to do so. These lease agreements have expiration dates through June 2015. The maximumamount that Nortel may be required to pay under these types of agreements is $38 as of December 31, 2006. Nortelgenerally has the ability to attempt to recover such lease payments from the defaulting party through rights ofsubrogation.
Historically, Nortel has not made any significant payments under these types of guarantees and no significant liability hasbeen accrued in the consolidated financial statements with respect to the obligations associated with these guarantees.
(d) Third party debt agreements
From time to time, Nortel guarantees the debt of certain customers. These third party debt agreements require Nortel tomake debt payments throughout the term of the related debt instrument if the customer fails to make scheduled debtpayments. Under most such arrangements, Nortel’s guarantee is secured, usually by the assets being purchased orfinanced. As of December 31, 2006, Nortel had no third party debt agreements that would require it to make any debtpayments for its customers.
(e) Indemnification of lenders and agents under credit facilities and EDC Support Facility
Nortel has agreed to indemnify the banks and their agents under its credit facilities against costs or losses resulting fromchanges in laws and regulations which would increase the banks’ costs or reduce their return and from any legal actionbrought against the banks or their agents related to the use of loan proceeds. Nortel has also agreed to indemnify EDCunder the EDC Support Facility against any legal action brought against EDC that relates to the provision of supportunder the EDC Support Facility. This indemnification generally applies to issues that arise during the term of the EDCSupport Facility. For additional information related to the recent amendment of the EDC Support Facility, see note 11.
150
NORTEL NETWORKS CORPORATION
Notes to Consolidated Financial Statements — (Continued)
Nortel is unable to estimate the maximum potential liability for these types of indemnification guarantees as theagreements typically do not specify a maximum amount and the amounts are dependent upon the outcome of futurecontingent events, the nature and likelihood of which cannot be determined at this time.
Historically, Nortel has not made any significant indemnification payments under such agreements and no significantliability has been accrued in the consolidated financial statements with respect to the obligations associated with theseindemnification guarantees.
Nortel has agreed to indemnify certain of its counterparties in certain receivables securitization transactions. Theindemnifications provided to counterparties in these types of transactions may require Nortel to compensate counterpartiesfor costs incurred as a result of changes in laws and regulations (including tax legislation) or in the interpretations of suchlaws and regulations, or as a result of regulatory penalties that may be suffered by the counterparty as a consequence ofthe transaction. Certain receivables securitization transactions include indemnifications requiring the repurchase of thereceivables, if the particular transaction becomes invalid. As of December 31, 2006, Nortel had approximately $204 ofsecuritized receivables which were subject to repurchase under this provision, in which case Nortel would assume allrights to collect such receivables. The indemnification provisions generally expire upon expiration of the securitizationagreements, which extend through 2007, or collection of the receivable amounts by the counterparty.
Nortel is generally unable to estimate the maximum potential liability for these types of indemnification guarantees ascertain agreements do not specify a maximum amount and the amounts are dependent upon the outcome of futurecontingent events, the nature and likelihood of which cannot be determined at this time.
Historically, Nortel has not made any significant indemnification payments under such agreements and no significantliability has been accrued in the consolidated financial statements with respect to the obligations associated with theseguarantees.
(f) Other indemnification agreements
Nortel has also entered into other agreements that provide indemnifications to counterparties in certain transactionsincluding investment banking agreements, guarantees related to the administration of capital trust accounts, guaranteesrelated to the administration of employee benefit plans, indentures for its outstanding public debt and asset saleagreements (other than the business sale agreements noted above). These indemnification agreements generally requireNortel to indemnify the counterparties for costs incurred as a result of changes in laws and regulations (including taxlegislation) or in the interpretations of such laws and regulations and/or as a result of losses from litigation that may besuffered by the counterparties arising from the transactions. These types of indemnification agreements normally extendover an unspecified period of time from the date of the transaction and do not typically provide for any limit on themaximum potential payment amount. In addition, Nortel has entered into indemnification agreements with certain of itsdirectors and officers for the costs reasonably incurred in any proceeding in which they become involved by reason oftheir position as directors or officers to the extent permitted under applicable law.
The nature of such agreements prevents Nortel from making a reasonable estimate of the maximum potential amount itcould be required to pay to its counterparties and directors and officers. The difficulties in assessing the amount ofliability result primarily from the unpredictability of future changes in laws, the inability to determine how laws apply tocounterparties and the lack of limitations on the potential liability.
Historically, Nortel has not made any significant indemnification payments under such agreements and no significantliability has been accrued in the consolidated financial statements with respect to the obligations associated with theseguarantees.
On March 17, 2006, in connection with the Global Class Action Settlement (as defined in note 21), Nortel announced thatit had reached an agreement with the lead plaintiffs on the related insurance and corporate governance matters includingNortel’s insurers agreeing to pay $228.5 in cash towards the settlement and Nortel agreeing with their insurers to certainindemnification obligations. Nortel believes that these indemnification obligations would be unlikely to materially increaseits total cash payment obligations under the Global Class Action Settlement. The insurance payments would not reducethe amounts payable by Nortel or NNL as disclosed in this report.
151
NORTEL NETWORKS CORPORATION
Notes to Consolidated Financial Statements — (Continued)

Product warranties
The following summarizes the accrual for product warranties that was recorded as part of other accrued liabilities in theconsolidated balance sheets as of December 31:
2006 2005
Balance at the beginning of the year . . . . . . . . . . . . . . . . . . . . . . . . . . . . . . . . . . . . . . . . . . . . $ 206 $ 271Payments . . . . . . . . . . . . . . . . . . . . . . . . . . . . . . . . . . . . . . . . . . . . . . . . . . . . . . . . . . . . . . (267) (179)Warranties issued . . . . . . . . . . . . . . . . . . . . . . . . . . . . . . . . . . . . . . . . . . . . . . . . . . . . . . . . 281 190Revisions . . . . . . . . . . . . . . . . . . . . . . . . . . . . . . . . . . . . . . . . . . . . . . . . . . . . . . . . . . . . . . (3) (76)
Balance at the end of the year . . . . . . . . . . . . . . . . . . . . . . . . . . . . . . . . . . . . . . . . . . . . . . . . . $ 217 $ 206
14. Commitments
Bid, performance related and other bonds
Nortel has entered into bid, performance related and other bonds associated with various contracts. Bid bonds generallyhave a term of less than twelve months, depending on the length of the bid period for the applicable contract. Other bondsprimarily relate to warranty, rental, real estate and customs contracts. Performance related and other bonds generally havea term of twelve months and are typically renewed, as required, over the term of the applicable contract. The variouscontracts to which these bonds apply generally have terms ranging from two to five years. Any potential payments whichmight become due under these bonds would be related to Nortel’s non-performance under the applicable contract.Historically, Nortel has not had to make material payments under these types of bonds and does not anticipate that anymaterial payments will be required in the future.
The following table sets forth the maximum potential amount of future payments under bid, performance related and otherbonds, net of the corresponding restricted cash and cash equivalents, as of December 31:
2006 2005
Bid and performance related bonds(a) . . . . . . . . . . . . . . . . . . . . . . . . . . . . . . . . . . . . . . . . . . . . . $231 $222Other bonds(b) . . . . . . . . . . . . . . . . . . . . . . . . . . . . . . . . . . . . . . . . . . . . . . . . . . . . . . . . . . . . . . 30 44
Total bid, performance related and other bonds. . . . . . . . . . . . . . . . . . . . . . . . . . . . . . . . . . . . . . $261 $266
(a) Net of restricted cash and cash equivalent amounts of $7 and $36 as of December 31, 2006 and 2005, respectively.(b) Net of restricted cash and cash equivalent amounts of $628 and $31 as of December 31, 2006 and 2005, respectively.
Venture capital financing
Nortel has entered into agreements with selected venture capital firms where the venture capital firms make and manageinvestments in start-ups and emerging enterprises. The agreements require Nortel to fund requests for additional capital upto its commitments when and if requests for additional capital are solicited by the venture capital firm. Nortel hadremaining commitments, if requested, of $30 as of December 31, 2006. These commitments expire at various datesthrough to 2016.
Purchase commitments
Nortel has entered into purchase commitments with certain suppliers under which it commits to buy a minimum amountor percentage of designated products or services in exchange for price guarantees or similar concessions. In certain ofthese agreements, Nortel may be required to acquire and pay for such products up to the prescribed minimum orforecasted purchases. As of December 31, 2006, Nortel had aggregate purchase commitments of $83. Significant purchasecommitments are described below.
During the third quarter of 2003, Nortel renegotiated a supply arrangement with a key supplier. The renegotiatedagreement requires that $2,800 in aggregate purchases with the supplier be made between June 2003 and June 2009. As ofDecember 31, 2005, the remaining purchase commitment under the agreement was $232. During the year endedDecember 31, 2006, Nortel fulfilled this commitment.
152
NORTEL NETWORKS CORPORATION
Notes to Consolidated Financial Statements — (Continued)
The following table sets forth the expected purchase commitments to be made over the next several years:
2007 2008 2009 ThereafterTotal
Obligations
Purchase commitments . . . . . . . . . . . . . . . . . . . . . . . . . . . . . . . . $69 $12 $2 $— $83
Amounts paid by Nortel under the above purchase commitments during the years ended December 31, 2006, 2005 and2004 were $470, $1,134 and $1,088, respectively.
Operating leases and other commitments
As of December 31, 2006, the future minimum payments under operating leases, outsourcing contracts, special chargesrelated to lease commitments accrued for as part of restructuring contract settlement and lease costs and related subleaserecoveries under contractual agreements consisted of:
OperatingLeases
OutsourcingContracts
SpecialCharges
SubleaseIncome
2007 . . . . . . . . . . . . . . . . . . . . . . . . . . . . . . . . . . . . . . . . . . . . . . $123 $10 $ 60 $(17)2008 . . . . . . . . . . . . . . . . . . . . . . . . . . . . . . . . . . . . . . . . . . . . . . 105 10 41 (14)2009 . . . . . . . . . . . . . . . . . . . . . . . . . . . . . . . . . . . . . . . . . . . . . . 90 11 29 (13)2010 . . . . . . . . . . . . . . . . . . . . . . . . . . . . . . . . . . . . . . . . . . . . . . 95 — 38 (12)2011 . . . . . . . . . . . . . . . . . . . . . . . . . . . . . . . . . . . . . . . . . . . . . . 84 — 33 (9)Thereafter . . . . . . . . . . . . . . . . . . . . . . . . . . . . . . . . . . . . . . . . . . 406 — 167 (21)
Total future minimum payments . . . . . . . . . . . . . . . . . . . . . . . . . . $903 $31 $368 $(86)
Rental expense on operating leases for the years ended December 31, 2006, 2005 and 2004, net of applicable subleaseincome, amounted to $196, $175 and $179, respectively.
Expenses related to outsourcing contracts for the years ended December 31, 2006, 2005 and 2004 amounted to $93, $96and $253, respectively, and were for services provided to Nortel primarily related to a portion of its information servicesfunction. The amount payable under Nortel’s outsourcing contracts is variable to the extent that Nortel’s workforcefluctuates from the baseline levels contained in the contracts. The table above shows the minimum commitment containedin the outsourcing contracts.
Nortel and Microsoft Corporation Alliance
In the third quarter of 2006, Nortel and Microsoft Corporation (“Microsoft”) entered into a four-year agreement, withprovisions for extension, to form a strategic alliance to jointly develop, market and sell communications solutions. Underthe agreement, Nortel and Microsoft agreed to form joint teams to collaborate on product development spanningenterprise, mobile and wireline carrier solutions. The agreement engages the companies at the technology, marketing andbusiness levels and includes joint product development, solutions and systems integration, and go-to-market initiatives.Both companies will invest resources in marketing, business development and delivery.
Microsoft will make available to Nortel up to $52 in marketing and telephony systems integration funds to be offsetagainst marketing costs incurred by Nortel, and $40 in research and development funds over the initial four year term ofthe agreement. Substantially all of the payments are scheduled to be received by Nortel beginning in fiscal year 2007 andare subject to Nortel achieving certain mutually agreed upon performance metrics. Microsoft will recoup its payment ofresearch and development funds by receiving payments from Nortel of five percent of revenue over a mutually agreedupon enterprise voice and application business base plan. Any research and development funds that have not beenrecouped must be repaid in full by Nortel to Microsoft by March 31, 2012. As of December 31, 2006, Nortel has notreceived any of the research and development funds from Microsoft.
Microsoft and Nortel will each retain all revenues from sales or licenses of each party’s respective software, sales orleasing of each party’s respective hardware and delivery of services to customers and partners in accordance with separateagreements with each parties’ respective channel partners and/or customers.
153
NORTEL NETWORKS CORPORATION
Notes to Consolidated Financial Statements — (Continued)
In addition, Nortel entered into a patent cross license agreement that establishes an alliance relationship between Norteland Microsoft. Nortel and Microsoft have agreed to exchange patent rights to certain products, services and technology. Inconsideration for access to Nortel’s developed technology, in the third quarter of 2006 Microsoft paid Nortel $40 that is tobe recognized over a 4 year period.
15. Financing arrangements and variable interest entities
Customer financing
Generally, Nortel facilitates customer financing agreements through customer loans, and Nortel’s commitment to extendfuture financing is generally subject to conditions related to funding, fixed expiration or termination dates, specific interestrates and qualified purposes. Nortel only provides direct customer financing where a compelling strategic customer ortechnology purpose supports such financing.
Total customer financing as of December 31, 2006 and 2005 was $10 and $66, respectively, which included undrawncommitments of $1 and $50, respectively. During the years ended December 31, 2006 and 2005, Nortel reduced undrawncustomer financing commitments by $49 and $19 ($8 relates to a VIE which Nortel began consolidating effective April 1,2005), respectively, as a result of the expiration or cancellation of commitments and changing customer business plans. Asof December 31, 2006, all undrawn commitments were available for funding under the terms of the financing agreements.
During the years ended December 31, 2006, 2005 and 2004, Nortel recorded net customer financing bad debt expense(recovery) of $4, $4 and $(45), respectively, as a result of settlements and adjustments to other existing provisions. Therecoveries and expense were included in the consolidated statements of operations within SG&A expense.
During the year ended December 31, 2006, Nortel did not enter into any new agreements to restructure and/or settlecustomer financing and related receivables. During the year ended December 31, 2005, Nortel entered into certainagreements to restructure and/or settle various customer financing and related receivables, including rights to accruedinterest. As a result of these transactions, Nortel received cash consideration of approximately $112 ($36 of the proceedswas included in discontinued operations) to settle outstanding receivables of approximately $102 with a net carrying valueof $101 ($33 of the net carrying value was included in discontinued operations).
Consolidation of variable interest entities
Certain lease financing transactions of Nortel were structured through single transaction VIEs that did not have sufficientequity at risk, as defined in FIN 46R. Effective July 1, 2003, Nortel prospectively began consolidating two VIEs for whichNortel was considered the primary beneficiary following the guidance of FIN 46, on the basis that Nortel retained certainrisks associated with guaranteeing recovery of the unamortized principal balance of the VIEs debt, which represented themajority of the risks associated with the respective VIEs activities. The amount of the guarantees will be adjusted overtime as the underlying debt matures. During 2004, the debt related to one of the VIEs was extinguished and as a resultconsolidation of this VIE was no longer required. As of December 31, 2006, Nortel’s consolidated balance sheet included$87 of long-term debt (see note 11) and $86 of plant and equipment — net related to the remaining VIE. These amountsrepresented both the collateral and maximum exposure to loss as a result of Nortel’s involvement with the VIE.
On June 3, 2005, Nortel acquired NGS, a VIE for which Nortel was considered the primary beneficiary under FIN 46R.The consolidated financial results of Nortel include NGS’s financial statements consolidated from the date of theacquisition (see note 10).
Nortel consolidates certain assets and liabilities held in certain employee benefit and life insurance trusts in Canada andthe U.K., VIEs for which Nortel is considered the primary beneficiary under FIN 46R.
Nortel has other financial interests and contractual arrangements which would meet the definition of a variable interestunder FIN 46R, including investments in other companies and joint ventures, customer financing arrangements, andguarantees and indemnification arrangements. As of December 31, 2006, none of these other interests or arrangementswere considered significant variable interests and, therefore, were not disclosed in Nortel’s financial statements.
154
NORTEL NETWORKS CORPORATION
Notes to Consolidated Financial Statements — (Continued)
16. Capital stock
Common Share Consolidation
On November 6, 2006, Nortel’s Board of Directors approved a 1 for 10 consolidation of its outstanding common shareseffective December 1, 2006. Nortel’s shares began trading on a consolidated basis on December 1, 2006. In connectionwith the common share consolidation, the number of shares of Nortel common stock outstanding as of December 31,2006 was reduced from 4,339,347,470 to 433,934,747, without any change in par value per common share.
All references to share and per-share data for all periods presented in the consolidated financial statements have beenadjusted to give effect to the 1 for 10 common share consolidation.
Common shares
Nortel Networks Corporation is authorized to issue an unlimited number of common shares without nominal or par value.The outstanding number of common shares and prepaid forward purchase contracts included in shareholders’ equityconsisted of the following as of December 31:
Number $ Number $ Number $2006 2005 2004
(Number of common shares in thousands)
Common shares:Balance at the beginning of the year . . . . . 433,916 $33,932 427,267 $33,840 416,671 $33,674Shares issued pursuant to:
Stock option plans . . . . . . . . . . . . . . . . 263 12 262 14 713 39Acquisition and acquisition related(a) . . — — — (1) — —Common share cancellations(b) . . . . . . . (244) (6) (97) (3) — —Prepaid forward purchase contracts(c) . . — — 6,484 82 9,883 127
Balance at the end of the year . . . . . . . . . . . 433,935 $33,938 433,916 $33,932 427,267 $33,840
(Number of prepaid forward purchasecontracts)
Prepaid forward purchase contracts:(c)
Balance at beginning of the year . . . . . . . — $ — 384 $ 82 969 $ 209Prepaid forward purchase contracts
settled . . . . . . . . . . . . . . . . . . . . . . . . . — — (384) (82) (585) (127)
Balance at the end of the year . . . . . . . . . . . — $ — — $ — 384 $ 82
(a) Common shares issued as part of the purchase price consideration. During the years ended December 31, 2006, 2005 and 2004, commonshares were cancelled as earn out provisions were forfeited pursuant to their applicable agreements.
(b) Relates to common shares of Nortel surrendered by members and former members of Nortel’s core executive team for cancellation inconnection with the voluntary undertaking by each such individual to pay over a three year period an amount equal to the return toprofitability bonus paid in 2003.
(c) Included in additional paid in capital in the consolidated balance sheets. During the years ended December 31, 2006, 2005 and 2004, nil,6,484 and 9,883 common shares were issued as a result of the early settlement of nil, 384 and 585 prepaid forward purchase contracts,respectively. The net proceeds from the settled contracts of nil, $82 and $127, respectively, were transferred from additional paid-in capitalto common shares.
Preferred shares
Nortel Networks Corporation is authorized to issue an unlimited number of Class A preferred shares, which rank senior tothe Class B preferred shares and the common shares upon a distribution of capital or assets, and an unlimited number ofClass B preferred shares, which rank junior to the Class A preferred shares and senior to the common shares upon adistribution of capital or assets, in each case without nominal or par value. Each of the Class A and Class B preferredshares is issuable in one or more series, each series having such rights, restrictions and provisions as determined by theBoard of Directors of Nortel Networks Corporation at the time of issue. None of the Class A or Class B preferred sharesof Nortel Networks Corporation has been issued.
155
NORTEL NETWORKS CORPORATION
Notes to Consolidated Financial Statements — (Continued)

Shareholder rights plan
At the Nortel annual and special shareholders’ meeting on June 29, 2006, shareholders approved the reconfirmation andamendment of Nortel’s shareholder rights plan, which will expire at the annual meeting of shareholders to be held in 2009unless it is reconfirmed at that time. Under the rights plan, Nortel issues one right for each Nortel Networks Corporationcommon share outstanding. These rights would become exercisable upon the occurrence of certain events associated withan unsolicited takeover bid and would, if exercised, permit shareholders that are not making an unsolicited takeover bid topurchase Nortel common shares at a significant discount.
17. Earnings (loss) per common share
The following table details the weighted-average number of Nortel Networks Corporation common shares outstanding forthe purposes of computing basic and diluted earnings (loss) per common share for the following periods:
2006 2005(a) 2004(a)
(Number of commonshares in millions)
Basic weighted-average shares outstanding:Issued and outstanding . . . . . . . . . . . . . . . . . . . . . . . . . . . . . . . . . . . . . . . . . . . . . . . 434 430 426Prepaid forward purchase contracts(b) . . . . . . . . . . . . . . . . . . . . . . . . . . . . . . . . . . . . — 4 8
Basic weighted-average shares outstanding . . . . . . . . . . . . . . . . . . . . . . . . . . . . . . . . . . 434 434 434
Weighted-average shares dilution adjustments:Dilutive stock options . . . . . . . . . . . . . . . . . . . . . . . . . . . . . . . . . . . . . . . . . . . . . . . . — — —
Diluted weighted-average shares outstanding. . . . . . . . . . . . . . . . . . . . . . . . . . . . . . . . . 434 434 434
Weighted-average shares dilution adjustments — exclusions:Stock options . . . . . . . . . . . . . . . . . . . . . . . . . . . . . . . . . . . . . . . . . . . . . . . . . . . . . . 30 30 304.25% Convertible Senior Notes . . . . . . . . . . . . . . . . . . . . . . . . . . . . . . . . . . . . . . . . 18 18 18
(a) As a result of the net loss from continuing operations for the years ended December 31, 2005 and 2004, all potential dilutive securitieswere considered anti-dilutive.
(b) The impact of the minimum number of common shares to be issued upon settlement of the prepaid forward purchase contracts on aweighted-average basis was nil and 4 for the years ended December 31, 2006 and 2005, respectively. As of December 31, 2006, allcommon shares to be issued pursuant to the prepaid forward purchase contracts had been settled.
156
NORTEL NETWORKS CORPORATION
Notes to Consolidated Financial Statements — (Continued)
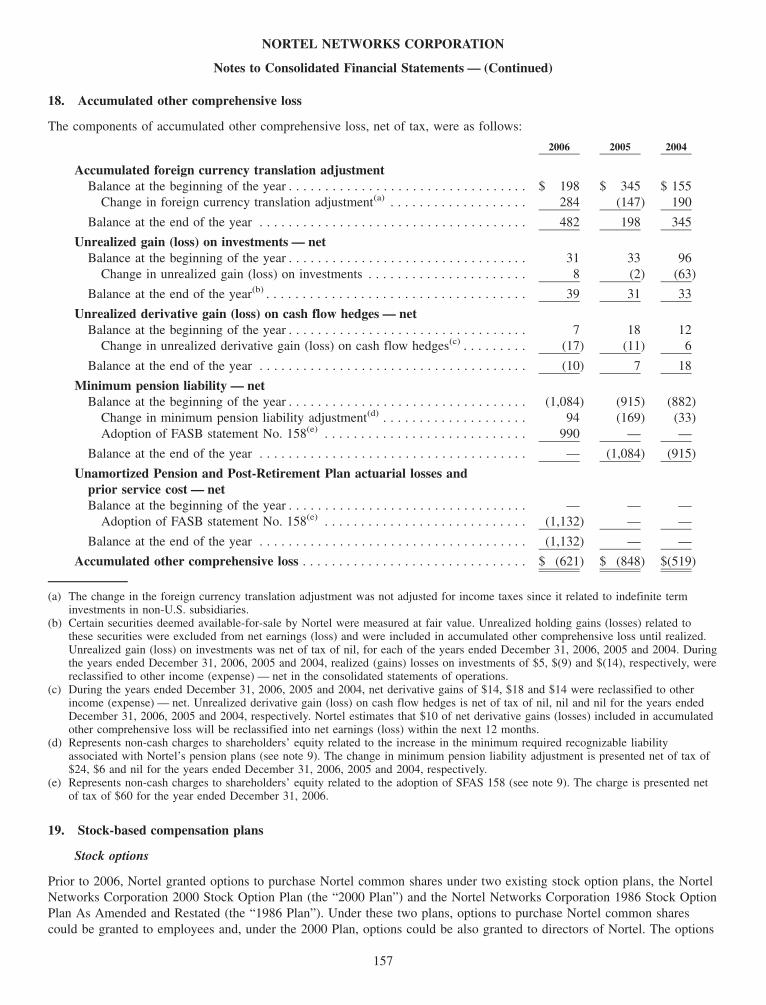
18. Accumulated other comprehensive loss
The components of accumulated other comprehensive loss, net of tax, were as follows:
2006 2005 2004
Accumulated foreign currency translation adjustmentBalance at the beginning of the year . . . . . . . . . . . . . . . . . . . . . . . . . . . . . . . . . $ 198 $ 345 $ 155
Change in foreign currency translation adjustment(a) . . . . . . . . . . . . . . . . . . . 284 (147) 190
Balance at the end of the year . . . . . . . . . . . . . . . . . . . . . . . . . . . . . . . . . . . . . 482 198 345
Unrealized gain (loss) on investments — netBalance at the beginning of the year . . . . . . . . . . . . . . . . . . . . . . . . . . . . . . . . . 31 33 96
Change in unrealized gain (loss) on investments . . . . . . . . . . . . . . . . . . . . . . 8 (2) (63)
Balance at the end of the year(b) . . . . . . . . . . . . . . . . . . . . . . . . . . . . . . . . . . . . 39 31 33
Unrealized derivative gain (loss) on cash flow hedges — netBalance at the beginning of the year . . . . . . . . . . . . . . . . . . . . . . . . . . . . . . . . . 7 18 12
Change in unrealized derivative gain (loss) on cash flow hedges(c) . . . . . . . . . (17) (11) 6
Balance at the end of the year . . . . . . . . . . . . . . . . . . . . . . . . . . . . . . . . . . . . . (10) 7 18
Minimum pension liability — netBalance at the beginning of the year . . . . . . . . . . . . . . . . . . . . . . . . . . . . . . . . . (1,084) (915) (882)
Change in minimum pension liability adjustment(d) . . . . . . . . . . . . . . . . . . . . 94 (169) (33)Adoption of FASB statement No. 158(e) . . . . . . . . . . . . . . . . . . . . . . . . . . . . 990 — —
Balance at the end of the year . . . . . . . . . . . . . . . . . . . . . . . . . . . . . . . . . . . . . — (1,084) (915)
Unamortized Pension and Post-Retirement Plan actuarial losses andprior service cost — netBalance at the beginning of the year . . . . . . . . . . . . . . . . . . . . . . . . . . . . . . . . . — — —
Adoption of FASB statement No. 158(e) . . . . . . . . . . . . . . . . . . . . . . . . . . . . (1,132) — —
Balance at the end of the year . . . . . . . . . . . . . . . . . . . . . . . . . . . . . . . . . . . . . (1,132) — —
Accumulated other comprehensive loss . . . . . . . . . . . . . . . . . . . . . . . . . . . . . . . $ (621) $ (848) $(519)
(a) The change in the foreign currency translation adjustment was not adjusted for income taxes since it related to indefinite terminvestments in non-U.S. subsidiaries.
(b) Certain securities deemed available-for-sale by Nortel were measured at fair value. Unrealized holding gains (losses) related tothese securities were excluded from net earnings (loss) and were included in accumulated other comprehensive loss until realized.Unrealized gain (loss) on investments was net of tax of nil, for each of the years ended December 31, 2006, 2005 and 2004. Duringthe years ended December 31, 2006, 2005 and 2004, realized (gains) losses on investments of $5, $(9) and $(14), respectively, werereclassified to other income (expense) — net in the consolidated statements of operations.
(c) During the years ended December 31, 2006, 2005 and 2004, net derivative gains of $14, $18 and $14 were reclassified to otherincome (expense) — net. Unrealized derivative gain (loss) on cash flow hedges is net of tax of nil, nil and nil for the years endedDecember 31, 2006, 2005 and 2004, respectively. Nortel estimates that $10 of net derivative gains (losses) included in accumulatedother comprehensive loss will be reclassified into net earnings (loss) within the next 12 months.
(d) Represents non-cash charges to shareholders’ equity related to the increase in the minimum required recognizable liabilityassociated with Nortel’s pension plans (see note 9). The change in minimum pension liability adjustment is presented net of tax of$24, $6 and nil for the years ended December 31, 2006, 2005 and 2004, respectively.
(e) Represents non-cash charges to shareholders’ equity related to the adoption of SFAS 158 (see note 9). The charge is presented netof tax of $60 for the year ended December 31, 2006.
19. Stock-based compensation plans
Stock options
Prior to 2006, Nortel granted options to purchase Nortel common shares under two existing stock option plans, the NortelNetworks Corporation 2000 Stock Option Plan (the “2000 Plan”) and the Nortel Networks Corporation 1986 Stock OptionPlan As Amended and Restated (the “1986 Plan”). Under these two plans, options to purchase Nortel common sharescould be granted to employees and, under the 2000 Plan, options could be also granted to directors of Nortel. The options
157
NORTEL NETWORKS CORPORATION
Notes to Consolidated Financial Statements — (Continued)
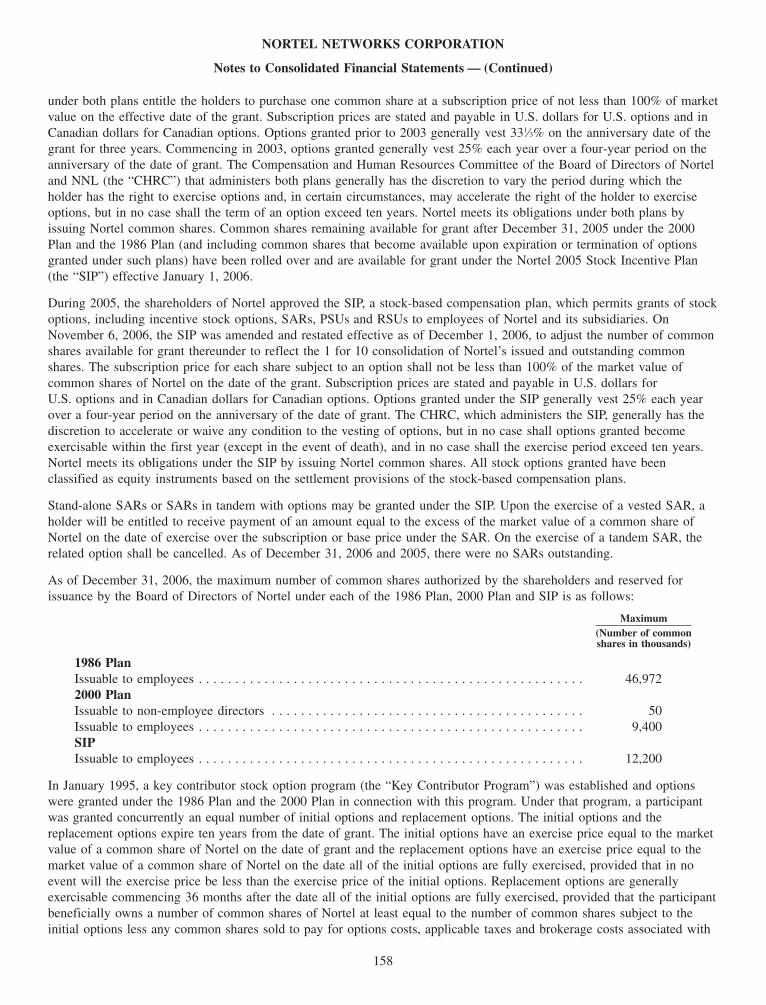
under both plans entitle the holders to purchase one common share at a subscription price of not less than 100% of marketvalue on the effective date of the grant. Subscription prices are stated and payable in U.S. dollars for U.S. options and inCanadian dollars for Canadian options. Options granted prior to 2003 generally vest 331⁄3% on the anniversary date of thegrant for three years. Commencing in 2003, options granted generally vest 25% each year over a four-year period on theanniversary of the date of grant. The Compensation and Human Resources Committee of the Board of Directors of Norteland NNL (the “CHRC”) that administers both plans generally has the discretion to vary the period during which theholder has the right to exercise options and, in certain circumstances, may accelerate the right of the holder to exerciseoptions, but in no case shall the term of an option exceed ten years. Nortel meets its obligations under both plans byissuing Nortel common shares. Common shares remaining available for grant after December 31, 2005 under the 2000Plan and the 1986 Plan (and including common shares that become available upon expiration or termination of optionsgranted under such plans) have been rolled over and are available for grant under the Nortel 2005 Stock Incentive Plan(the “SIP”) effective January 1, 2006.
During 2005, the shareholders of Nortel approved the SIP, a stock-based compensation plan, which permits grants of stockoptions, including incentive stock options, SARs, PSUs and RSUs to employees of Nortel and its subsidiaries. OnNovember 6, 2006, the SIP was amended and restated effective as of December 1, 2006, to adjust the number of commonshares available for grant thereunder to reflect the 1 for 10 consolidation of Nortel’s issued and outstanding commonshares. The subscription price for each share subject to an option shall not be less than 100% of the market value ofcommon shares of Nortel on the date of the grant. Subscription prices are stated and payable in U.S. dollars forU.S. options and in Canadian dollars for Canadian options. Options granted under the SIP generally vest 25% each yearover a four-year period on the anniversary of the date of grant. The CHRC, which administers the SIP, generally has thediscretion to accelerate or waive any condition to the vesting of options, but in no case shall options granted becomeexercisable within the first year (except in the event of death), and in no case shall the exercise period exceed ten years.Nortel meets its obligations under the SIP by issuing Nortel common shares. All stock options granted have beenclassified as equity instruments based on the settlement provisions of the stock-based compensation plans.
Stand-alone SARs or SARs in tandem with options may be granted under the SIP. Upon the exercise of a vested SAR, aholder will be entitled to receive payment of an amount equal to the excess of the market value of a common share ofNortel on the date of exercise over the subscription or base price under the SAR. On the exercise of a tandem SAR, therelated option shall be cancelled. As of December 31, 2006 and 2005, there were no SARs outstanding.
As of December 31, 2006, the maximum number of common shares authorized by the shareholders and reserved forissuance by the Board of Directors of Nortel under each of the 1986 Plan, 2000 Plan and SIP is as follows:
Maximum(Number of commonshares in thousands)
1986 PlanIssuable to employees . . . . . . . . . . . . . . . . . . . . . . . . . . . . . . . . . . . . . . . . . . . . . . . . . . . . . 46,9722000 PlanIssuable to non-employee directors . . . . . . . . . . . . . . . . . . . . . . . . . . . . . . . . . . . . . . . . . . . 50Issuable to employees . . . . . . . . . . . . . . . . . . . . . . . . . . . . . . . . . . . . . . . . . . . . . . . . . . . . . 9,400SIPIssuable to employees . . . . . . . . . . . . . . . . . . . . . . . . . . . . . . . . . . . . . . . . . . . . . . . . . . . . . 12,200
In January 1995, a key contributor stock option program (the “Key Contributor Program”) was established and optionswere granted under the 1986 Plan and the 2000 Plan in connection with this program. Under that program, a participantwas granted concurrently an equal number of initial options and replacement options. The initial options and thereplacement options expire ten years from the date of grant. The initial options have an exercise price equal to the marketvalue of a common share of Nortel on the date of grant and the replacement options have an exercise price equal to themarket value of a common share of Nortel on the date all of the initial options are fully exercised, provided that in noevent will the exercise price be less than the exercise price of the initial options. Replacement options are generallyexercisable commencing 36 months after the date all of the initial options are fully exercised, provided that the participantbeneficially owns a number of common shares of Nortel at least equal to the number of common shares subject to theinitial options less any common shares sold to pay for options costs, applicable taxes and brokerage costs associated with
158
NORTEL NETWORKS CORPORATION
Notes to Consolidated Financial Statements — (Continued)
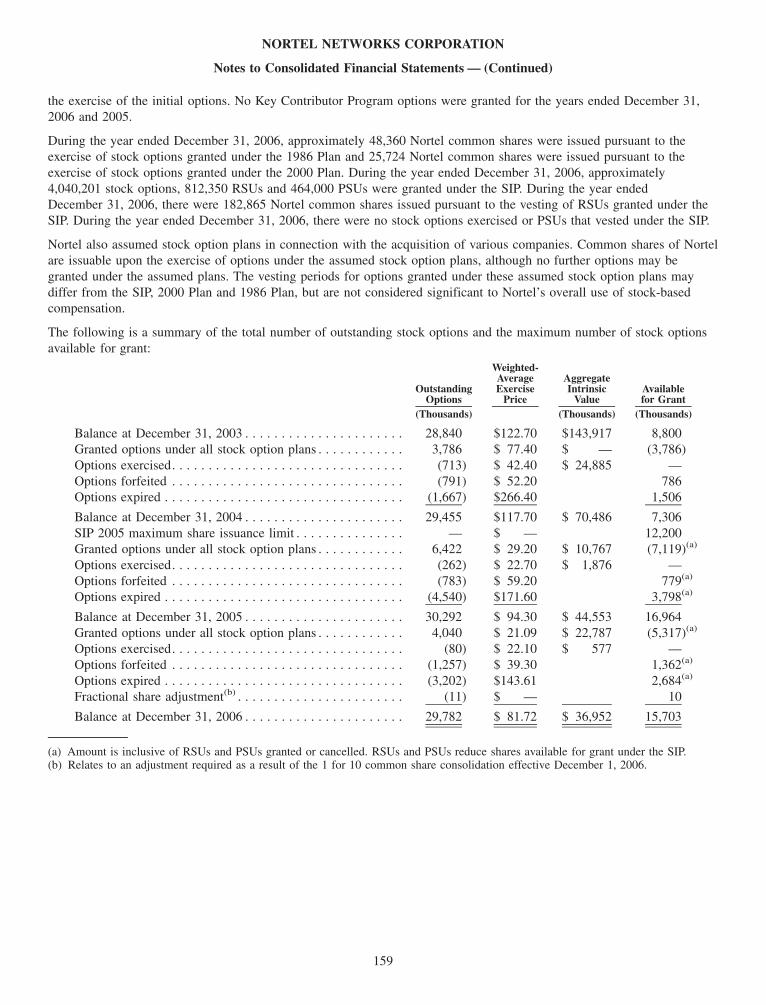
the exercise of the initial options. No Key Contributor Program options were granted for the years ended December 31,2006 and 2005.
During the year ended December 31, 2006, approximately 48,360 Nortel common shares were issued pursuant to theexercise of stock options granted under the 1986 Plan and 25,724 Nortel common shares were issued pursuant to theexercise of stock options granted under the 2000 Plan. During the year ended December 31, 2006, approximately4,040,201 stock options, 812,350 RSUs and 464,000 PSUs were granted under the SIP. During the year endedDecember 31, 2006, there were 182,865 Nortel common shares issued pursuant to the vesting of RSUs granted under theSIP. During the year ended December 31, 2006, there were no stock options exercised or PSUs that vested under the SIP.
Nortel also assumed stock option plans in connection with the acquisition of various companies. Common shares of Nortelare issuable upon the exercise of options under the assumed stock option plans, although no further options may begranted under the assumed plans. The vesting periods for options granted under these assumed stock option plans maydiffer from the SIP, 2000 Plan and 1986 Plan, but are not considered significant to Nortel’s overall use of stock-basedcompensation.
The following is a summary of the total number of outstanding stock options and the maximum number of stock optionsavailable for grant:
OutstandingOptions
Weighted-AverageExercise
Price
AggregateIntrinsic
ValueAvailablefor Grant
(Thousands) (Thousands) (Thousands)
Balance at December 31, 2003 . . . . . . . . . . . . . . . . . . . . . . 28,840 $122.70 $143,917 8,800Granted options under all stock option plans . . . . . . . . . . . . 3,786 $ 77.40 $ — (3,786)Options exercised. . . . . . . . . . . . . . . . . . . . . . . . . . . . . . . . (713) $ 42.40 $ 24,885 —Options forfeited . . . . . . . . . . . . . . . . . . . . . . . . . . . . . . . . (791) $ 52.20 786Options expired . . . . . . . . . . . . . . . . . . . . . . . . . . . . . . . . . (1,667) $266.40 1,506
Balance at December 31, 2004 . . . . . . . . . . . . . . . . . . . . . . 29,455 $117.70 $ 70,486 7,306SIP 2005 maximum share issuance limit . . . . . . . . . . . . . . . — $ — 12,200Granted options under all stock option plans . . . . . . . . . . . . 6,422 $ 29.20 $ 10,767 (7,119)(a)
Options exercised. . . . . . . . . . . . . . . . . . . . . . . . . . . . . . . . (262) $ 22.70 $ 1,876 —Options forfeited . . . . . . . . . . . . . . . . . . . . . . . . . . . . . . . . (783) $ 59.20 779(a)
Options expired . . . . . . . . . . . . . . . . . . . . . . . . . . . . . . . . . (4,540) $171.60 3,798(a)
Balance at December 31, 2005 . . . . . . . . . . . . . . . . . . . . . . 30,292 $ 94.30 $ 44,553 16,964Granted options under all stock option plans . . . . . . . . . . . . 4,040 $ 21.09 $ 22,787 (5,317)(a)
Options exercised. . . . . . . . . . . . . . . . . . . . . . . . . . . . . . . . (80) $ 22.10 $ 577 —Options forfeited . . . . . . . . . . . . . . . . . . . . . . . . . . . . . . . . (1,257) $ 39.30 1,362(a)
Options expired . . . . . . . . . . . . . . . . . . . . . . . . . . . . . . . . . (3,202) $143.61 2,684(a)
Fractional share adjustment(b) . . . . . . . . . . . . . . . . . . . . . . . (11) $ — 10
Balance at December 31, 2006 . . . . . . . . . . . . . . . . . . . . . . 29,782 $ 81.72 $ 36,952 15,703
(a) Amount is inclusive of RSUs and PSUs granted or cancelled. RSUs and PSUs reduce shares available for grant under the SIP.(b) Relates to an adjustment required as a result of the 1 for 10 common share consolidation effective December 1, 2006.
159
NORTEL NETWORKS CORPORATION
Notes to Consolidated Financial Statements — (Continued)
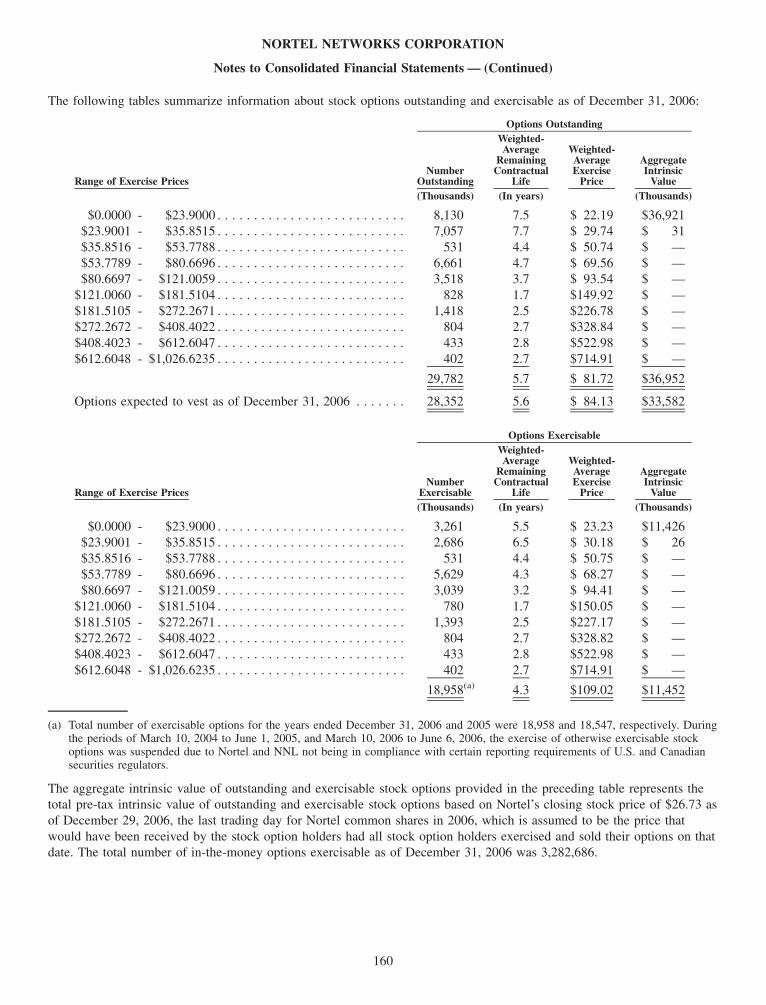
The following tables summarize information about stock options outstanding and exercisable as of December 31, 2006:
Range of Exercise PricesNumber
Outstanding
Weighted-Average
RemainingContractual
Life
Weighted-AverageExercise
Price
AggregateIntrinsic
Value
Options Outstanding
(Thousands) (In years) (Thousands)
$0.0000 - $23.9000 . . . . . . . . . . . . . . . . . . . . . . . . . . 8,130 7.5 $ 22.19 $36,921$23.9001 - $35.8515 . . . . . . . . . . . . . . . . . . . . . . . . . . 7,057 7.7 $ 29.74 $ 31$35.8516 - $53.7788 . . . . . . . . . . . . . . . . . . . . . . . . . . 531 4.4 $ 50.74 $ —$53.7789 - $80.6696 . . . . . . . . . . . . . . . . . . . . . . . . . . 6,661 4.7 $ 69.56 $ —$80.6697 - $121.0059 . . . . . . . . . . . . . . . . . . . . . . . . . . 3,518 3.7 $ 93.54 $ —
$121.0060 - $181.5104 . . . . . . . . . . . . . . . . . . . . . . . . . . 828 1.7 $149.92 $ —$181.5105 - $272.2671 . . . . . . . . . . . . . . . . . . . . . . . . . . 1,418 2.5 $226.78 $ —$272.2672 - $408.4022 . . . . . . . . . . . . . . . . . . . . . . . . . . 804 2.7 $328.84 $ —$408.4023 - $612.6047 . . . . . . . . . . . . . . . . . . . . . . . . . . 433 2.8 $522.98 $ —$612.6048 - $1,026.6235 . . . . . . . . . . . . . . . . . . . . . . . . . . 402 2.7 $714.91 $ —
29,782 5.7 $ 81.72 $36,952
Options expected to vest as of December 31, 2006 . . . . . . . 28,352 5.6 $ 84.13 $33,582
Range of Exercise PricesNumber
Exercisable
Weighted-Average
RemainingContractual
Life
Weighted-AverageExercise
Price
AggregateIntrinsic
Value
Options Exercisable
(Thousands) (In years) (Thousands)
$0.0000 - $23.9000 . . . . . . . . . . . . . . . . . . . . . . . . . . 3,261 5.5 $ 23.23 $11,426$23.9001 - $35.8515 . . . . . . . . . . . . . . . . . . . . . . . . . . 2,686 6.5 $ 30.18 $ 26$35.8516 - $53.7788 . . . . . . . . . . . . . . . . . . . . . . . . . . 531 4.4 $ 50.75 $ —$53.7789 - $80.6696 . . . . . . . . . . . . . . . . . . . . . . . . . . 5,629 4.3 $ 68.27 $ —$80.6697 - $121.0059 . . . . . . . . . . . . . . . . . . . . . . . . . . 3,039 3.2 $ 94.41 $ —
$121.0060 - $181.5104 . . . . . . . . . . . . . . . . . . . . . . . . . . 780 1.7 $150.05 $ —$181.5105 - $272.2671 . . . . . . . . . . . . . . . . . . . . . . . . . . 1,393 2.5 $227.17 $ —$272.2672 - $408.4022 . . . . . . . . . . . . . . . . . . . . . . . . . . 804 2.7 $328.82 $ —$408.4023 - $612.6047 . . . . . . . . . . . . . . . . . . . . . . . . . . 433 2.8 $522.98 $ —$612.6048 - $1,026.6235 . . . . . . . . . . . . . . . . . . . . . . . . . . 402 2.7 $714.91 $ —
18,958(a) 4.3 $109.02 $11,452
(a) Total number of exercisable options for the years ended December 31, 2006 and 2005 were 18,958 and 18,547, respectively. Duringthe periods of March 10, 2004 to June 1, 2005, and March 10, 2006 to June 6, 2006, the exercise of otherwise exercisable stockoptions was suspended due to Nortel and NNL not being in compliance with certain reporting requirements of U.S. and Canadiansecurities regulators.
The aggregate intrinsic value of outstanding and exercisable stock options provided in the preceding table represents thetotal pre-tax intrinsic value of outstanding and exercisable stock options based on Nortel’s closing stock price of $26.73 asof December 29, 2006, the last trading day for Nortel common shares in 2006, which is assumed to be the price thatwould have been received by the stock option holders had all stock option holders exercised and sold their options on thatdate. The total number of in-the-money options exercisable as of December 31, 2006 was 3,282,686.
160
NORTEL NETWORKS CORPORATION
Notes to Consolidated Financial Statements — (Continued)
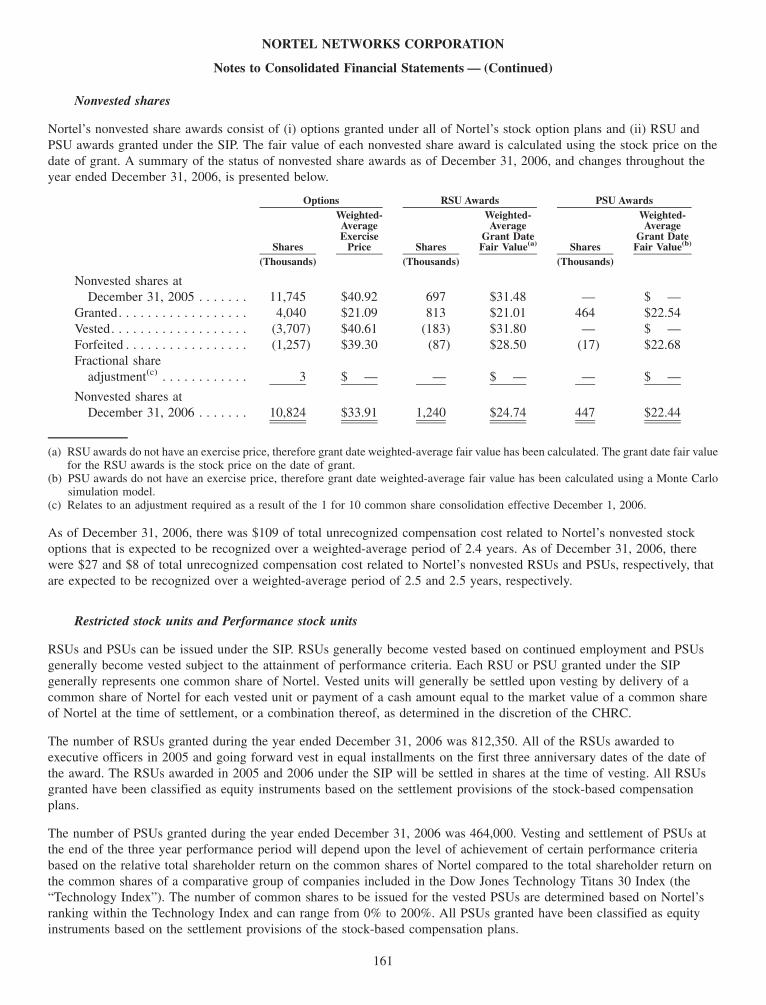
Nonvested shares
Nortel’s nonvested share awards consist of (i) options granted under all of Nortel’s stock option plans and (ii) RSU andPSU awards granted under the SIP. The fair value of each nonvested share award is calculated using the stock price on thedate of grant. A summary of the status of nonvested share awards as of December 31, 2006, and changes throughout theyear ended December 31, 2006, is presented below.
Shares
Weighted-AverageExercise
Price Shares
Weighted-Average
Grant DateFair Value(a) Shares
Weighted-Average
Grant DateFair Value(b)
Options RSU Awards PSU Awards
(Thousands) (Thousands) (Thousands)
Nonvested shares atDecember 31, 2005 . . . . . . . 11,745 $40.92 697 $31.48 — $ —
Granted. . . . . . . . . . . . . . . . . . 4,040 $21.09 813 $21.01 464 $22.54Vested. . . . . . . . . . . . . . . . . . . (3,707) $40.61 (183) $31.80 — $ —Forfeited . . . . . . . . . . . . . . . . . (1,257) $39.30 (87) $28.50 (17) $22.68Fractional share
adjustment(c) . . . . . . . . . . . . 3 $ — — $ — — $ —
Nonvested shares atDecember 31, 2006 . . . . . . . 10,824 $33.91 1,240 $24.74 447 $22.44
(a) RSU awards do not have an exercise price, therefore grant date weighted-average fair value has been calculated. The grant date fair valuefor the RSU awards is the stock price on the date of grant.
(b) PSU awards do not have an exercise price, therefore grant date weighted-average fair value has been calculated using a Monte Carlosimulation model.
(c) Relates to an adjustment required as a result of the 1 for 10 common share consolidation effective December 1, 2006.
As of December 31, 2006, there was $109 of total unrecognized compensation cost related to Nortel’s nonvested stockoptions that is expected to be recognized over a weighted-average period of 2.4 years. As of December 31, 2006, therewere $27 and $8 of total unrecognized compensation cost related to Nortel’s nonvested RSUs and PSUs, respectively, thatare expected to be recognized over a weighted-average period of 2.5 and 2.5 years, respectively.
Restricted stock units and Performance stock units
RSUs and PSUs can be issued under the SIP. RSUs generally become vested based on continued employment and PSUsgenerally become vested subject to the attainment of performance criteria. Each RSU or PSU granted under the SIPgenerally represents one common share of Nortel. Vested units will generally be settled upon vesting by delivery of acommon share of Nortel for each vested unit or payment of a cash amount equal to the market value of a common shareof Nortel at the time of settlement, or a combination thereof, as determined in the discretion of the CHRC.
The number of RSUs granted during the year ended December 31, 2006 was 812,350. All of the RSUs awarded toexecutive officers in 2005 and going forward vest in equal installments on the first three anniversary dates of the date ofthe award. The RSUs awarded in 2005 and 2006 under the SIP will be settled in shares at the time of vesting. All RSUsgranted have been classified as equity instruments based on the settlement provisions of the stock-based compensationplans.
The number of PSUs granted during the year ended December 31, 2006 was 464,000. Vesting and settlement of PSUs atthe end of the three year performance period will depend upon the level of achievement of certain performance criteriabased on the relative total shareholder return on the common shares of Nortel compared to the total shareholder return onthe common shares of a comparative group of companies included in the Dow Jones Technology Titans 30 Index (the“Technology Index”). The number of common shares to be issued for the vested PSUs are determined based on Nortel’sranking within the Technology Index and can range from 0% to 200%. All PSUs granted have been classified as equityinstruments based on the settlement provisions of the stock-based compensation plans.
161
NORTEL NETWORKS CORPORATION
Notes to Consolidated Financial Statements — (Continued)
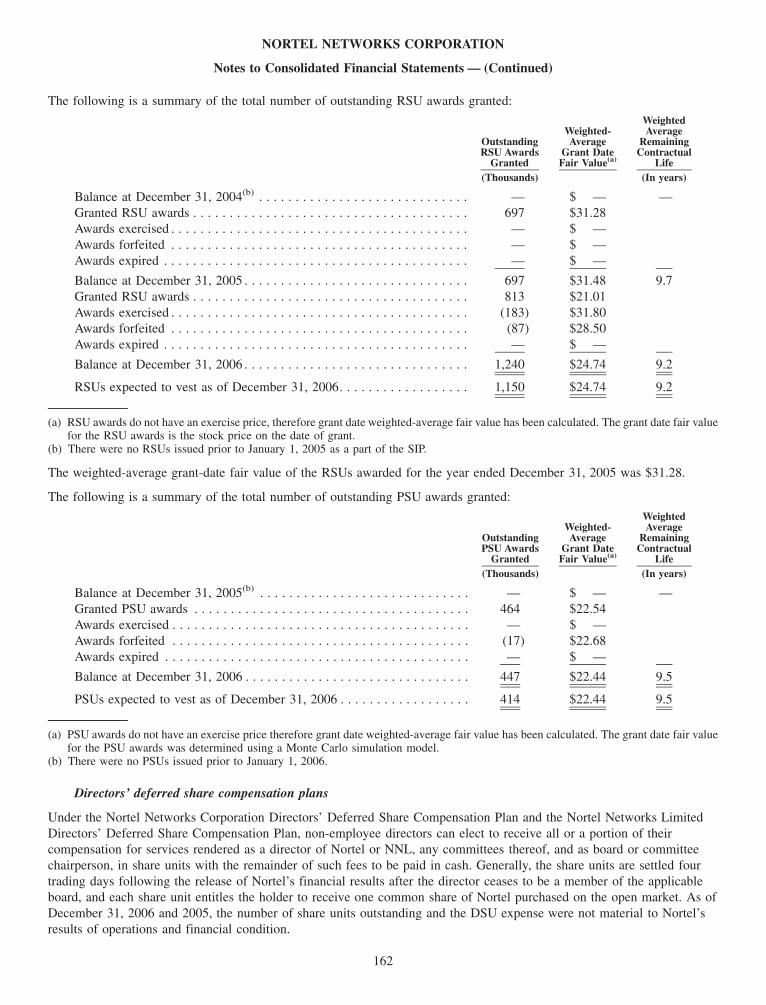
The following is a summary of the total number of outstanding RSU awards granted:
OutstandingRSU Awards
Granted
Weighted-Average
Grant DateFair Value(a)
WeightedAverage
RemainingContractual
Life(Thousands) (In years)
Balance at December 31, 2004(b) . . . . . . . . . . . . . . . . . . . . . . . . . . . . . — $ — —Granted RSU awards . . . . . . . . . . . . . . . . . . . . . . . . . . . . . . . . . . . . . . 697 $31.28Awards exercised . . . . . . . . . . . . . . . . . . . . . . . . . . . . . . . . . . . . . . . . . — $ —Awards forfeited . . . . . . . . . . . . . . . . . . . . . . . . . . . . . . . . . . . . . . . . . — $ —Awards expired . . . . . . . . . . . . . . . . . . . . . . . . . . . . . . . . . . . . . . . . . . — $ —
Balance at December 31, 2005 . . . . . . . . . . . . . . . . . . . . . . . . . . . . . . . 697 $31.48 9.7Granted RSU awards . . . . . . . . . . . . . . . . . . . . . . . . . . . . . . . . . . . . . . 813 $21.01Awards exercised . . . . . . . . . . . . . . . . . . . . . . . . . . . . . . . . . . . . . . . . . (183) $31.80Awards forfeited . . . . . . . . . . . . . . . . . . . . . . . . . . . . . . . . . . . . . . . . . (87) $28.50Awards expired . . . . . . . . . . . . . . . . . . . . . . . . . . . . . . . . . . . . . . . . . . — $ —
Balance at December 31, 2006 . . . . . . . . . . . . . . . . . . . . . . . . . . . . . . . 1,240 $24.74 9.2
RSUs expected to vest as of December 31, 2006. . . . . . . . . . . . . . . . . . 1,150 $24.74 9.2
(a) RSU awards do not have an exercise price, therefore grant date weighted-average fair value has been calculated. The grant date fair valuefor the RSU awards is the stock price on the date of grant.
(b) There were no RSUs issued prior to January 1, 2005 as a part of the SIP.
The weighted-average grant-date fair value of the RSUs awarded for the year ended December 31, 2005 was $31.28.
The following is a summary of the total number of outstanding PSU awards granted:
OutstandingPSU Awards
Granted
Weighted-Average
Grant DateFair Value(a)
WeightedAverage
RemainingContractual
Life(Thousands) (In years)
Balance at December 31, 2005(b) . . . . . . . . . . . . . . . . . . . . . . . . . . . . . — $ — —Granted PSU awards . . . . . . . . . . . . . . . . . . . . . . . . . . . . . . . . . . . . . . 464 $22.54Awards exercised . . . . . . . . . . . . . . . . . . . . . . . . . . . . . . . . . . . . . . . . . — $ —Awards forfeited . . . . . . . . . . . . . . . . . . . . . . . . . . . . . . . . . . . . . . . . . (17) $22.68Awards expired . . . . . . . . . . . . . . . . . . . . . . . . . . . . . . . . . . . . . . . . . . — $ —
Balance at December 31, 2006 . . . . . . . . . . . . . . . . . . . . . . . . . . . . . . . 447 $22.44 9.5
PSUs expected to vest as of December 31, 2006 . . . . . . . . . . . . . . . . . . 414 $22.44 9.5
(a) PSU awards do not have an exercise price therefore grant date weighted-average fair value has been calculated. The grant date fair valuefor the PSU awards was determined using a Monte Carlo simulation model.
(b) There were no PSUs issued prior to January 1, 2006.
Directors’ deferred share compensation plans
Under the Nortel Networks Corporation Directors’ Deferred Share Compensation Plan and the Nortel Networks LimitedDirectors’ Deferred Share Compensation Plan, non-employee directors can elect to receive all or a portion of theircompensation for services rendered as a director of Nortel or NNL, any committees thereof, and as board or committeechairperson, in share units with the remainder of such fees to be paid in cash. Generally, the share units are settled fourtrading days following the release of Nortel’s financial results after the director ceases to be a member of the applicableboard, and each share unit entitles the holder to receive one common share of Nortel purchased on the open market. As ofDecember 31, 2006 and 2005, the number of share units outstanding and the DSU expense were not material to Nortel’sresults of operations and financial condition.
162
NORTEL NETWORKS CORPORATION
Notes to Consolidated Financial Statements — (Continued)
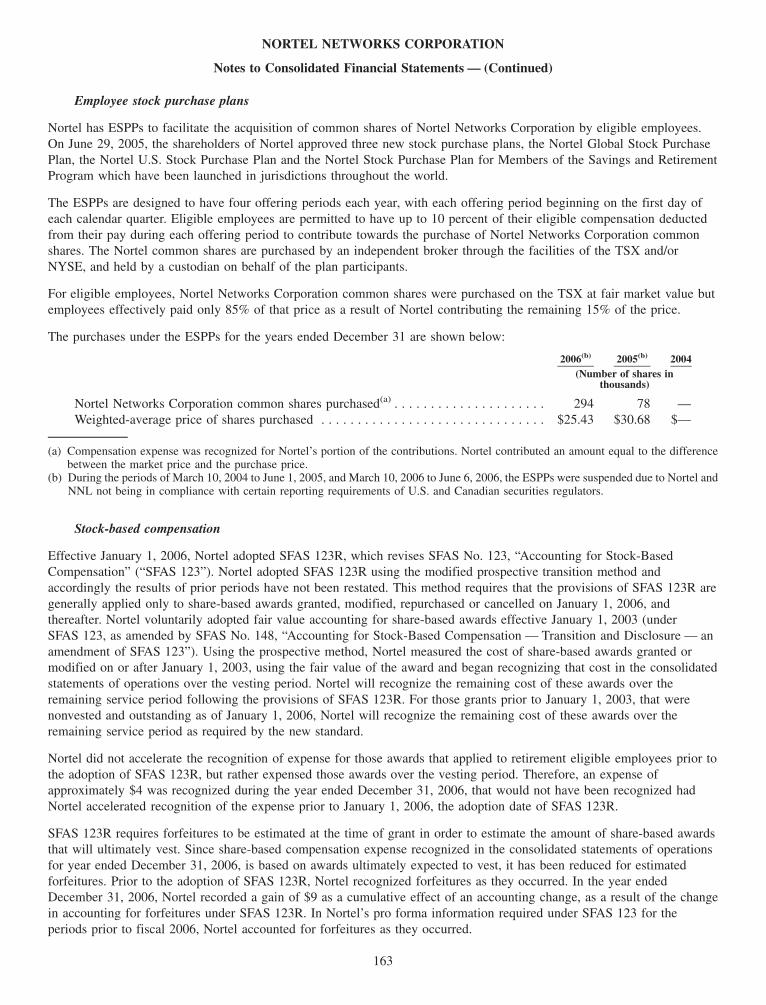
Employee stock purchase plans
Nortel has ESPPs to facilitate the acquisition of common shares of Nortel Networks Corporation by eligible employees.On June 29, 2005, the shareholders of Nortel approved three new stock purchase plans, the Nortel Global Stock PurchasePlan, the Nortel U.S. Stock Purchase Plan and the Nortel Stock Purchase Plan for Members of the Savings and RetirementProgram which have been launched in jurisdictions throughout the world.
The ESPPs are designed to have four offering periods each year, with each offering period beginning on the first day ofeach calendar quarter. Eligible employees are permitted to have up to 10 percent of their eligible compensation deductedfrom their pay during each offering period to contribute towards the purchase of Nortel Networks Corporation commonshares. The Nortel common shares are purchased by an independent broker through the facilities of the TSX and/orNYSE, and held by a custodian on behalf of the plan participants.
For eligible employees, Nortel Networks Corporation common shares were purchased on the TSX at fair market value butemployees effectively paid only 85% of that price as a result of Nortel contributing the remaining 15% of the price.
The purchases under the ESPPs for the years ended December 31 are shown below:
2006(b) 2005(b) 2004(Number of shares in
thousands)
Nortel Networks Corporation common shares purchased(a) . . . . . . . . . . . . . . . . . . . . . 294 78 —Weighted-average price of shares purchased . . . . . . . . . . . . . . . . . . . . . . . . . . . . . . . $25.43 $30.68 $—
(a) Compensation expense was recognized for Nortel’s portion of the contributions. Nortel contributed an amount equal to the differencebetween the market price and the purchase price.
(b) During the periods of March 10, 2004 to June 1, 2005, and March 10, 2006 to June 6, 2006, the ESPPs were suspended due to Nortel andNNL not being in compliance with certain reporting requirements of U.S. and Canadian securities regulators.
Stock-based compensation
Effective January 1, 2006, Nortel adopted SFAS 123R, which revises SFAS No. 123, “Accounting for Stock-BasedCompensation” (“SFAS 123”). Nortel adopted SFAS 123R using the modified prospective transition method andaccordingly the results of prior periods have not been restated. This method requires that the provisions of SFAS 123R aregenerally applied only to share-based awards granted, modified, repurchased or cancelled on January 1, 2006, andthereafter. Nortel voluntarily adopted fair value accounting for share-based awards effective January 1, 2003 (underSFAS 123, as amended by SFAS No. 148, “Accounting for Stock-Based Compensation — Transition and Disclosure — anamendment of SFAS 123”). Using the prospective method, Nortel measured the cost of share-based awards granted ormodified on or after January 1, 2003, using the fair value of the award and began recognizing that cost in the consolidatedstatements of operations over the vesting period. Nortel will recognize the remaining cost of these awards over theremaining service period following the provisions of SFAS 123R. For those grants prior to January 1, 2003, that werenonvested and outstanding as of January 1, 2006, Nortel will recognize the remaining cost of these awards over theremaining service period as required by the new standard.
Nortel did not accelerate the recognition of expense for those awards that applied to retirement eligible employees prior tothe adoption of SFAS 123R, but rather expensed those awards over the vesting period. Therefore, an expense ofapproximately $4 was recognized during the year ended December 31, 2006, that would not have been recognized hadNortel accelerated recognition of the expense prior to January 1, 2006, the adoption date of SFAS 123R.
SFAS 123R requires forfeitures to be estimated at the time of grant in order to estimate the amount of share-based awardsthat will ultimately vest. Since share-based compensation expense recognized in the consolidated statements of operationsfor year ended December 31, 2006, is based on awards ultimately expected to vest, it has been reduced for estimatedforfeitures. Prior to the adoption of SFAS 123R, Nortel recognized forfeitures as they occurred. In the year endedDecember 31, 2006, Nortel recorded a gain of $9 as a cumulative effect of an accounting change, as a result of the changein accounting for forfeitures under SFAS 123R. In Nortel’s pro forma information required under SFAS 123 for theperiods prior to fiscal 2006, Nortel accounted for forfeitures as they occurred.
163
NORTEL NETWORKS CORPORATION
Notes to Consolidated Financial Statements — (Continued)

In November 2005, the FASB issued FASB FSP No. 123R-3, “Transition Election Related to Accounting for the TaxEffects of Share-Based Payment Awards” (“FSP FAS 123R-3”). Nortel elected to adopt the alternative transition methodto SFAS 123R in accounting for the tax effects of share-based payment awards to employees. The elective methodcomprises a computational component that establishes a beginning balance of the Additional Paid In Capital (“APIC”)pool related to employee compensation and a simplified method to determine the subsequent impact on the APIC pool ofemployee awards that are fully vested and outstanding upon the adoption of SFAS 123R. As of December 31, 2006, theAPIC balance was nil, and there were no other material impacts as a result of the adoption of FSP FAS 123R-3.
Stock-based compensation recorded during the years ended December 31 was as follows:
2006 2005 2004
Stock-based compensation:Stock option expense . . . . . . . . . . . . . . . . . . . . . . . . . . . . . . . . . . . . . . . . . . . . . . . . . $ 93(b) $87 $ 77RSU expense(a) . . . . . . . . . . . . . . . . . . . . . . . . . . . . . . . . . . . . . . . . . . . . . . . . . . . . . . 8 1 41PSU expense . . . . . . . . . . . . . . . . . . . . . . . . . . . . . . . . . . . . . . . . . . . . . . . . . . . . . . . 2 — —DSU expense(a) . . . . . . . . . . . . . . . . . . . . . . . . . . . . . . . . . . . . . . . . . . . . . . . . . . . . . — 1 (1)
Total stock-based compensation reported — net of tax . . . . . . . . . . . . . . . . . . . . . . . . . . . $103 $89 $117
(a) Compensation related to employer portion of RSUs and DSUs was net of tax of nil in each period.(b) Includes a reduction of stock option expense of approximately $9, recognized during the first quarter of 2006, to align Nortel’s recognition
of stock option forfeitures with the adoption of SFAS 123R.
Nortel estimates the fair value of stock options using the Black-Scholes-Merton option-pricing model, consistent with theprovisions of SFAS 123R and SAB 107, and Nortel’s prior period pro forma disclosures of net earnings, including share-based compensation. The key input assumptions used to estimate the fair value of stock options include the grant price ofthe award, the expected term of the options, the volatility of Nortel’s stock, the risk-free rate, the annual forfeiture rateand Nortel’s dividend yield. Nortel believes that the Black-Scholes-Merton option-pricing model utilized to develop theunderlying assumptions is appropriate in calculating the fair values of Nortel’s stock options.
The following weighted-average assumptions were used in computing the fair value of stock options for purposes ofexpense recognition and pro forma disclosures, as applicable, for the following periods:
2006 2005 2004
Black-Scholes weighted-average assumptionsExpected dividend yield . . . . . . . . . . . . . . . . . . . . . . . . . . . . . . . . . . . . . . . . . . 0.00% 0.00% 0.00%Expected volatility(a) . . . . . . . . . . . . . . . . . . . . . . . . . . . . . . . . . . . . . . . . . . . . . 73.66% 86.26% 94.47%Risk-free interest rate(b) . . . . . . . . . . . . . . . . . . . . . . . . . . . . . . . . . . . . . . . . . . . 5.00% 4.11% 2.96%Expected option life in years(c) . . . . . . . . . . . . . . . . . . . . . . . . . . . . . . . . . . . . . 4 4 4
Weighted-average stock option fair value per option granted . . . . . . . . . . . . . . $12.21 $18.81 $52.08
(a) The expected volatility of Nortel’s stock is estimated using the daily historical stock prices over a period equal to the expected term.(b) Nortel used the five year government treasury bill rate to approximate the four year risk free rate.(c) The expected term of the stock options is estimated based on historical grants with similar vesting periods.
The fair value of RSU awards is the stock price on the date of grant. Nortel estimates the fair value of PSU awards usinga Monte Carlo simulation model, consistent with the provisions of SFAS 123R. Certain assumptions used in the modelinclude (but are not limited to) the following:
2006
Monte Carlo assumptionsBeta (range) . . . . . . . . . . . . . . . . . . . . . . . . . . . . . . . . . . . . . . . . . . . . . . . . . . . . . . . . . . . . . . 2.0 - 2.1Risk-free interest rate (range)(a) . . . . . . . . . . . . . . . . . . . . . . . . . . . . . . . . . . . . . . . . . . . . . . . . 4.79% - 5.10%Equity risk premium . . . . . . . . . . . . . . . . . . . . . . . . . . . . . . . . . . . . . . . . . . . . . . . . . . . . . . . . 5.00%
(a) The risk-free rate used was the three year government treasury bill rate.
164
NORTEL NETWORKS CORPORATION
Notes to Consolidated Financial Statements — (Continued)

As of December 31, 2006, the annual forfeiture rates applied to Nortel’s stock option plans were 13% and 7% for theRSU and PSU awards, respectively.
The compensation cost that has been charged against income for Nortel’s share-based award plans was $93, $87 and $77for the years ended December 31, 2006, 2005 and 2004, respectively. The total income tax benefit recognized in thestatements of operations for stock-based award compensation was nil for each of the years ended December 31, 2006,2005 and 2004.
As of December 31, 2006, there was $147 of total unrecognized compensation cost related to Nortel’s stock option plansthat is expected to be recognized over a weighted-average period of 1.6 years. As of December 31, 2006, there was $26 oftotal unrecognized compensation cost related to Nortel’s RSU awards granted which is expected to be recognized over aweighted-average period of 2.5 years. As of December 31, 2006, there was $8 of total unrecognized compensation costrelated to Nortel’s PSU awards granted which is expected to be recognized over a weighted-average period of 2.5 years.
Cash received from exercise under all share-based payment arrangements was $2 for the year ended December 31, 2006,and $6 for the year ended December 31, 2005. Tax benefits realized by Nortel related to these exercises were nil for eachof the years ended December 31, 2006 and 2005.
Suspension of Nortel stock based compensation plans
As a result of Nortel’s March 10, 2006 announcement that it and NNL would delay the filing of the 2005 Annual Reports,Nortel suspended, as of March 10, 2006, the grant of any new equity and exercise or settlement of previously outstandingawards under the SIP, the purchase of Nortel common shares under the ESPPs, the exercise of outstanding options grantedunder the 2000 Plan and the 1986 Plan, the exercise of outstanding options granted under employee stock option planspreviously assumed by Nortel in connection with mergers and acquisitions and the purchase of units in a Nortel stockfund or purchase of Nortel common shares under defined contribution and investment plans. In the second quarter of2006, Nortel lifted the suspension on the stock based compensation plans, upon its compliance with U.S. and Canadianregulatory securities filing requirements with the filing of Nortel’s and NNL’s 2006 First Quarter Reports.
20. Related party transactions
In the ordinary course of business, Nortel engages in transactions with certain of its equity-owned investees that are underor are subject to Nortel’s significant influence and with joint ventures of Nortel. These transactions are sales and purchasesof goods and services under usual trade terms and are measured at their exchange amounts.
165
NORTEL NETWORKS CORPORATION
Notes to Consolidated Financial Statements — (Continued)
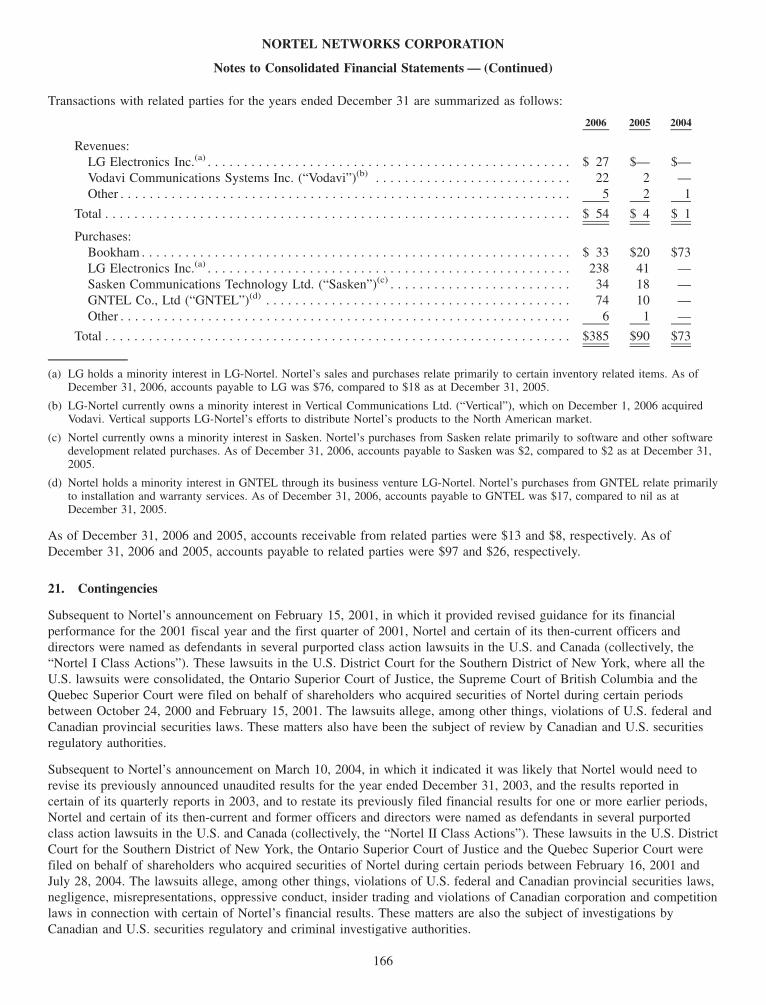
Transactions with related parties for the years ended December 31 are summarized as follows:
2006 2005 2004
Revenues:LG Electronics Inc.(a) . . . . . . . . . . . . . . . . . . . . . . . . . . . . . . . . . . . . . . . . . . . . . . . . . . $ 27 $— $—Vodavi Communications Systems Inc. (“Vodavi”)(b) . . . . . . . . . . . . . . . . . . . . . . . . . . . 22 2 —Other . . . . . . . . . . . . . . . . . . . . . . . . . . . . . . . . . . . . . . . . . . . . . . . . . . . . . . . . . . . . . . 5 2 1
Total . . . . . . . . . . . . . . . . . . . . . . . . . . . . . . . . . . . . . . . . . . . . . . . . . . . . . . . . . . . . . . . . $ 54 $ 4 $ 1
Purchases:Bookham . . . . . . . . . . . . . . . . . . . . . . . . . . . . . . . . . . . . . . . . . . . . . . . . . . . . . . . . . . . $ 33 $20 $73LG Electronics Inc.(a) . . . . . . . . . . . . . . . . . . . . . . . . . . . . . . . . . . . . . . . . . . . . . . . . . . 238 41 —Sasken Communications Technology Ltd. (“Sasken”)(c) . . . . . . . . . . . . . . . . . . . . . . . . . 34 18 —GNTEL Co., Ltd (“GNTEL”)(d) . . . . . . . . . . . . . . . . . . . . . . . . . . . . . . . . . . . . . . . . . . 74 10 —Other . . . . . . . . . . . . . . . . . . . . . . . . . . . . . . . . . . . . . . . . . . . . . . . . . . . . . . . . . . . . . . 6 1 —
Total . . . . . . . . . . . . . . . . . . . . . . . . . . . . . . . . . . . . . . . . . . . . . . . . . . . . . . . . . . . . . . . . $385 $90 $73
(a) LG holds a minority interest in LG-Nortel. Nortel’s sales and purchases relate primarily to certain inventory related items. As ofDecember 31, 2006, accounts payable to LG was $76, compared to $18 as at December 31, 2005.
(b) LG-Nortel currently owns a minority interest in Vertical Communications Ltd. (“Vertical”), which on December 1, 2006 acquiredVodavi. Vertical supports LG-Nortel’s efforts to distribute Nortel’s products to the North American market.
(c) Nortel currently owns a minority interest in Sasken. Nortel’s purchases from Sasken relate primarily to software and other softwaredevelopment related purchases. As of December 31, 2006, accounts payable to Sasken was $2, compared to $2 as at December 31,2005.
(d) Nortel holds a minority interest in GNTEL through its business venture LG-Nortel. Nortel’s purchases from GNTEL relate primarilyto installation and warranty services. As of December 31, 2006, accounts payable to GNTEL was $17, compared to nil as atDecember 31, 2005.
As of December 31, 2006 and 2005, accounts receivable from related parties were $13 and $8, respectively. As ofDecember 31, 2006 and 2005, accounts payable to related parties were $97 and $26, respectively.
21. Contingencies
Subsequent to Nortel’s announcement on February 15, 2001, in which it provided revised guidance for its financialperformance for the 2001 fiscal year and the first quarter of 2001, Nortel and certain of its then-current officers anddirectors were named as defendants in several purported class action lawsuits in the U.S. and Canada (collectively, the“Nortel I Class Actions”). These lawsuits in the U.S. District Court for the Southern District of New York, where all theU.S. lawsuits were consolidated, the Ontario Superior Court of Justice, the Supreme Court of British Columbia and theQuebec Superior Court were filed on behalf of shareholders who acquired securities of Nortel during certain periodsbetween October 24, 2000 and February 15, 2001. The lawsuits allege, among other things, violations of U.S. federal andCanadian provincial securities laws. These matters also have been the subject of review by Canadian and U.S. securitiesregulatory authorities.
Subsequent to Nortel’s announcement on March 10, 2004, in which it indicated it was likely that Nortel would need torevise its previously announced unaudited results for the year ended December 31, 2003, and the results reported incertain of its quarterly reports in 2003, and to restate its previously filed financial results for one or more earlier periods,Nortel and certain of its then-current and former officers and directors were named as defendants in several purportedclass action lawsuits in the U.S. and Canada (collectively, the “Nortel II Class Actions”). These lawsuits in the U.S. DistrictCourt for the Southern District of New York, the Ontario Superior Court of Justice and the Quebec Superior Court werefiled on behalf of shareholders who acquired securities of Nortel during certain periods between February 16, 2001 andJuly 28, 2004. The lawsuits allege, among other things, violations of U.S. federal and Canadian provincial securities laws,negligence, misrepresentations, oppressive conduct, insider trading and violations of Canadian corporation and competitionlaws in connection with certain of Nortel’s financial results. These matters are also the subject of investigations byCanadian and U.S. securities regulatory and criminal investigative authorities.
166
NORTEL NETWORKS CORPORATION
Notes to Consolidated Financial Statements — (Continued)

Nortel has entered into agreements to settle all of the Nortel I Class Actions and Nortel II Class Actions (the “GlobalClass Action Settlement”), except one related Canadian action described below. In December 2006 and January 2007, theGlobal Class Action Settlement was approved by the courts in New York, Ontario, British Columbia and Quebec, andremains conditioned on, among other things, securities regulatory and stock exchange approvals and finalizing the courtapproval orders.
Under the terms of the Global Class Action Settlement, Nortel will pay $575 in cash and issue approximately 62,866,775common shares of Nortel (representing approximately 14.5% of Nortel’s common shares outstanding as of February 7,2006, the date an agreement in principle was reached with the plaintiffs in the U.S. class action lawsuits), reflectingNortel’s 1 for 10 common share consolidation on December 1, 2006, to the plaintiffs, and Nortel will contribute to theplaintiffs one-half of any recovery from its ongoing litigation against certain of its former senior officers who wereterminated for cause in 2004, which seeks the return of payments made to them in 2003 under Nortel’s bonus plan. OnJune 1, 2006, Nortel placed $575 plus accrued interest of $5 into escrow and has classified this amount as restricted cash.The total settlement amount will include all plaintiffs’ court-approved attorneys’ fees. As a result of the GlobalClass Action Settlement, Nortel has established a litigation reserve and recorded a charge to its full-year 2005 financialresults of $2,474, $575 of which related to the cash portion of the Global Class Action Settlement, while $1,899 related tothe equity component. A recovery of $219 was recorded as at December 31, 2006, to reflect the fair value mark-to-marketadjustment of the Nortel common shares and the equity component of the litigation reserve will be adjusted in futurequarters, based on the fair value of the Nortel common shares issuable, until the settlement is finalized. The administrationof the settlement will be a complex and lengthy process. Once the securities regulatory and stock exchange approvalshave been obtained and the court approval orders are finalized following the exhaustion of any appeals and appeal periods,the claims administrator will submit a list of approved claims to the appropriate courts for approval. Once all the courtshave approved the claims, the process of distributing cash and share certificates to claimants can begin. It is not possibleto predict how long the process will take, although it likely will be many months.
Nortel’s insurers have agreed to pay $228.5 in cash toward the settlement and Nortel has agreed to certain indemnificationobligations with its insurers. Nortel believes that it is unlikely that these indemnification obligations will materiallyincrease its total cash payment obligations under the Global Class Action Settlement.
Under the terms of the Global Class Action Settlement, Nortel also agreed to certain corporate governance enhancements.These enhancements, which include the codification of certain of Nortel’s current governance practices in the writtenmandate for its Board of Directors and the inclusion in its Statement of Corporate Governance Practices contained inNortel’s annual proxy circular and proxy statement of disclosure regarding certain other governance practices.
In August 2006, Nortel reached a separate agreement in principle to settle a class action lawsuit in the Ontario SuperiorCourt of Justice that is not covered by the Global Class Action Settlement, subject to court approval (the “OntarioSettlement”). In February 2007, the court approved the settlement. The settlement did not have a material impact onNortel’s financial condition and an accrued liability was recorded in the third quarter of 2006.
In April 2004, Nortel announced that it was under investigation by each of the SEC and the Ontario SecuritiesCommission in connection with the restatements of its financial statements in 2003 and 2004. These investigations areongoing.
In May 2004, Nortel received a federal grand jury subpoena for the production of certain documents, including financialstatements and corporate, personnel and accounting records, in connection with an ongoing criminal investigation beingconducted by the U.S. Attorney’s Office for the Northern District of Texas, Dallas Division. In August 2005, Nortelreceived an additional federal grand jury subpoena seeking additional documents, including documents relating to theNortel Retirement Income Plan and the Nortel Long-Term Investment Plan. This investigation is ongoing. A criminalinvestigation into Nortel’s financial accounting situation by the Integrated Market Enforcement Team of the RoyalCanadian Mounted Police is also ongoing.
Beginning in December 2001, Nortel, together with certain of its then-current and former directors, officers andemployees, was named as a defendant in several purported class action lawsuits pursuant to the United States EmployeeRetirement Income Security Act. These lawsuits have been consolidated into a single proceeding in the U.S. District Courtfor the Middle District of Tennessee. This lawsuit is on behalf of participants and beneficiaries of the Nortel Long-TermInvestment Plan, who held shares of the Nortel Networks Stock Fund during the period from March 7, 2000, through
167
NORTEL NETWORKS CORPORATION
Notes to Consolidated Financial Statements — (Continued)

November 28, 2006. The lawsuit alleges, among other things, material misrepresentations and omissions to induceparticipants and beneficiaries to continue to invest in and maintain investments in Nortel’s common shares through theinvestment plan. A class of plaintiffs in this action has not yet been certified.
In January 2005, Nortel and NNL filed a Statement of Claim in the Ontario Superior Court of Justice against Messrs. FrankDunn, Douglas Beatty and Michael Gollogly, their former senior officers who were terminated for cause in April 2004,seeking the return of payments made to them under Nortel’s bonus plan in 2003.
In April 2006, Mr. Dunn filed a Notice of Action and Statement of Claim in the Ontario Superior Court of Justice againstNortel and NNL asserting claims for wrongful dismissal, defamation and mental distress, and seeking punitive, exemplaryand aggravated damages, out-of-pocket expenses and special damages, indemnity for legal expenses incurred as a result ofcivil and administrative proceedings brought against him by reason of his having been an officer or director of thedefendants, pre-judgement interest and costs.
In May and October 2006, respectively, Messrs. Gollogly and Beatty filed Statements of Claim in the Ontario SuperiorCourt of Justice against Nortel and NNL asserting claims for, among other things, wrongful dismissal and seekingcompensatory, aggravated and punitive damages, and pre- and post-judgment interest and costs.
Except as otherwise described herein, each of the matters described above, the plaintiffs are seeking an unspecifiedamount of monetary damages. Nortel is unable to ascertain the ultimate aggregate amount of monetary liability orfinancial impact to Nortel of the above matters, which, unless otherwise specified, seek damages from the defendants ofmaterial or indeterminate amounts or could result in fines and penalties. With the exception of $2,474 and the related fairvalue adjustments, which Nortel has recorded in its 2005 and 2006 financial results as a result of the Global Class ActionSettlement and the accrued liability for the Ontario Settlement, Nortel has not made any provisions for any potentialjudgments, fines, penalties or settlements that may result from these actions, suits, claims and investigations. Except forthe Global Class Action Settlement, Nortel cannot determine whether these actions, suits, claims and proceedings will,individually or collectively, have a material adverse effect on its business, results of operations, financial condition orliquidity. Except for matters encompassed by the Global Class Action Settlement and the Ontario Settlement, Nortelintends to defend these actions, suits, claims and proceedings, litigating or settling cases where in management’sjudgement it would be in the best interest of shareholders to do so. Nortel will continue to cooperate fully with allauthorities in connection with the regulatory and criminal investigations.
Nortel is also a defendant in various other suits, claims, proceedings and investigations which arise in the normal courseof business.
Environmental matters
Nortel’s business is subject to a wide range of continuously evolving environmental laws in various jurisdictions. Nortelseeks to operate its business in compliance with these changing laws and regularly evaluates their impact on operations,products and facilities. Existing and new laws may cause Nortel to incur additional costs. In some cases, environmentallaws affect Nortel’s ability to import or export certain products to or from, or produce or sell certain products in, somejurisdictions, or have caused it to redesign products to avoid use of regulated substances. Although costs relating toenvironmental compliance have not had a material adverse effect on the business, results of operations, financial conditionor liquidity to date, there can be no assurance that such costs will not have a material adverse effect going forward. Nortelcontinues to evolve compliance plans and risk mitigation strategies relating to the new laws and requirements. Nortelintends to design and manufacture products that are compliant with all applicable legislation and meet its quality andreliability requirements.
Nortel has a corporate environmental management system standard and an environmental program to promote suchcompliance. Moreover, Nortel has a periodic, risk-based, integrated environment, health and safety audit program. Nortel’senvironmental program focuses its activities on design for the environment, supply chain and packaging reduction issues.Nortel works with its suppliers and other external groups to encourage the sharing of non-proprietary information onenvironmental research.
Nortel is exposed to liabilities and compliance costs arising from its past and current generation, management and disposalof hazardous substances and wastes. As of December 31, 2006, the accruals on the consolidated balance sheet for
168
NORTEL NETWORKS CORPORATION
Notes to Consolidated Financial Statements — (Continued)
environmental matters were $27. Based on information available as of December 31, 2006, management believes that theexisting accruals are sufficient to satisfy probable and reasonably estimable environmental liabilities related to knownenvironmental matters. Any additional liabilities that may result from these matters, and any additional liabilities that mayresult in connection with other locations currently under investigation, are not expected to have a material adverse effecton the business, results of operations, financial condition and liquidity of Nortel.
Nortel has remedial activities under way at 14 sites which are either currently or previously owned or occupied facilities.An estimate of Nortel’s anticipated remediation costs associated with all such sites, to the extent probable and reasonablyestimable, is included in the environmental accruals referred to above in an approximate amount of $27.
Nortel is also listed as a potentially responsible party under the U.S. Comprehensive Environmental Response, Compen-sation and Liability Act (“CERCLA”) at four Superfund sites in the U.S. (at three of the Superfund sites, Nortel isconsidered a de minimis potentially responsible party). A potentially responsible party within the meaning of CERCLA isgenerally considered to be a major contributor to the total hazardous waste at a Superfund site (typically 10% or more,depending on the circumstances). A de minimis potentially responsible party is generally considered to have contributedless than 10% (depending on the circumstances) of the total hazardous waste at a Superfund site. An estimate of Nortel’sshare of the anticipated remediation costs associated with such Superfund sites is expected to be de minimis and isincluded in the environmental accruals of $27 referred to above.
Liability under CERCLA may be imposed on a joint and several basis, without regard to the extent of Nortel’sinvolvement. In addition, the accuracy of Nortel’s estimate of environmental liability is affected by several uncertaintiessuch as additional requirements which may be identified in connection with remedial activities, the complexity andevolution of environmental laws and regulations, and the identification of presently unknown remediation requirements.Consequently, Nortel’s liability could be greater than its current estimate.
22. Subsequent events
2007 Restructuring Plan
On February 7, 2007, Nortel announced a restructuring work plan (the “2007 Restructuring Plan”) that includes a netreduction of its global workforce by approximately 2,900 positions, as well as cost containment actions relating to itsglobal real estate assets. In addition, Nortel plans to shift approximately 1,000 positions to lower-cost locations. Themajority of the workforce reductions are expected to occur during the course of 2007 with the balance occurring in 2008.The 2007 Restructuring Plan will also reduce its global real-estate portfolio by approximately 500,000 square feet in2007. The estimated cost of the 2007 Restructuring Plan initiatives is expected to be approximately $390, of whichapproximately $300 relates to the workforce reductions and approximately $90 to the real estate cost containment actions.
Nortel restatement of previously issued financial statements
On March 1, 2007 Nortel announced that it and NNL would restate their financial results for 2005, 2004 and the first ninemonths of 2006, and would have adjustments prior to 2004. As a result, Nortel delayed its filing of its annual report onForm 10-K for the year ended December 31, 2006 beyond its regulatory filing deadline of March 1, 2007. As a result ofthe breach of certain provisions of NNL’s EDC Support Facility related to the required restatement by NNL of certain ofits prior period results, absent a waiver, EDC will have the right to refuse to issue additional support and to terminate itscommitments under the Support Facility, subject to a 30 day cure period with respect to certain provisions. On March 9,2007 NNL received a waiver from EDC in respect of its breaches.
As Nortel filed its 2006 Form 10-K within the 15-day period permitted by SEC Regulation 12B-25, and NNL filed its2006 Form 10-K by the applicable March 31, 2007 deadline, the delay did not result in a breach of provisions withrespect to Nortel’s outstanding indebtedness and related indentures.
* * * * *
169
NORTEL NETWORKS CORPORATION
Notes to Consolidated Financial Statements — (Continued)

Quarterly Financial Data (Unaudited)
The following financial data present the impact of the restatement on Nortel’s previously issued condensed consolidatedstatements of operations and cash flows for each of the quarters ended March 31, 2006; June 30, 2006; September 30,2006; March 31, 2005; June 30, 2005; September 30, 2005; and December 31, 2005 and condensed consolidated balancesheets as at March 31, 2006; June 30, 2006; and September 30, 2006 (refer to note 4 of the accompanying consolidatedfinancial statements for a description of the nature of the adjustments). The quarter ended December 31, 2006 has notbeen previously reported.
Nortel believes all adjustments necessary for a fair presentation of the results for the periods presented have been made.
170
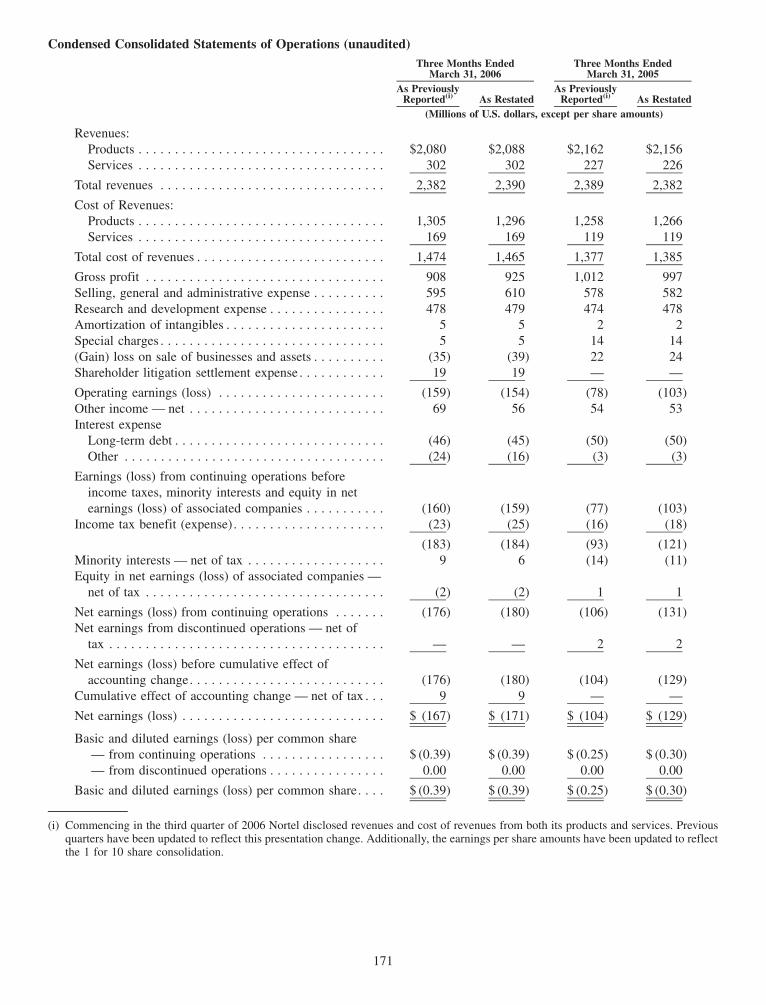
Condensed Consolidated Statements of Operations (unaudited)
As PreviouslyReported(i) As Restated
As PreviouslyReported(i) As Restated
Three Months EndedMarch 31, 2006
Three Months EndedMarch 31, 2005
(Millions of U.S. dollars, except per share amounts)
Revenues:Products . . . . . . . . . . . . . . . . . . . . . . . . . . . . . . . . . . $2,080 $2,088 $2,162 $2,156Services . . . . . . . . . . . . . . . . . . . . . . . . . . . . . . . . . . 302 302 227 226
Total revenues . . . . . . . . . . . . . . . . . . . . . . . . . . . . . . . 2,382 2,390 2,389 2,382
Cost of Revenues:Products . . . . . . . . . . . . . . . . . . . . . . . . . . . . . . . . . . 1,305 1,296 1,258 1,266Services . . . . . . . . . . . . . . . . . . . . . . . . . . . . . . . . . . 169 169 119 119
Total cost of revenues . . . . . . . . . . . . . . . . . . . . . . . . . . 1,474 1,465 1,377 1,385
Gross profit . . . . . . . . . . . . . . . . . . . . . . . . . . . . . . . . . 908 925 1,012 997Selling, general and administrative expense . . . . . . . . . . 595 610 578 582Research and development expense . . . . . . . . . . . . . . . . 478 479 474 478Amortization of intangibles . . . . . . . . . . . . . . . . . . . . . . 5 5 2 2Special charges . . . . . . . . . . . . . . . . . . . . . . . . . . . . . . . 5 5 14 14(Gain) loss on sale of businesses and assets . . . . . . . . . . (35) (39) 22 24Shareholder litigation settlement expense . . . . . . . . . . . . 19 19 — —
Operating earnings (loss) . . . . . . . . . . . . . . . . . . . . . . . (159) (154) (78) (103)Other income — net . . . . . . . . . . . . . . . . . . . . . . . . . . . 69 56 54 53Interest expense
Long-term debt . . . . . . . . . . . . . . . . . . . . . . . . . . . . . (46) (45) (50) (50)Other . . . . . . . . . . . . . . . . . . . . . . . . . . . . . . . . . . . . (24) (16) (3) (3)
Earnings (loss) from continuing operations beforeincome taxes, minority interests and equity in netearnings (loss) of associated companies . . . . . . . . . . . (160) (159) (77) (103)
Income tax benefit (expense). . . . . . . . . . . . . . . . . . . . . (23) (25) (16) (18)
(183) (184) (93) (121)Minority interests — net of tax . . . . . . . . . . . . . . . . . . . 9 6 (14) (11)Equity in net earnings (loss) of associated companies —
net of tax . . . . . . . . . . . . . . . . . . . . . . . . . . . . . . . . . (2) (2) 1 1
Net earnings (loss) from continuing operations . . . . . . . (176) (180) (106) (131)Net earnings from discontinued operations — net of
tax . . . . . . . . . . . . . . . . . . . . . . . . . . . . . . . . . . . . . . — — 2 2
Net earnings (loss) before cumulative effect ofaccounting change. . . . . . . . . . . . . . . . . . . . . . . . . . . (176) (180) (104) (129)
Cumulative effect of accounting change — net of tax . . . 9 9 — —
Net earnings (loss) . . . . . . . . . . . . . . . . . . . . . . . . . . . . $ (167) $ (171) $ (104) $ (129)
Basic and diluted earnings (loss) per common share— from continuing operations . . . . . . . . . . . . . . . . . $ (0.39) $ (0.39) $ (0.25) $ (0.30)— from discontinued operations . . . . . . . . . . . . . . . . 0.00 0.00 0.00 0.00
Basic and diluted earnings (loss) per common share. . . . $ (0.39) $ (0.39) $ (0.25) $ (0.30)
(i) Commencing in the third quarter of 2006 Nortel disclosed revenues and cost of revenues from both its products and services. Previousquarters have been updated to reflect this presentation change. Additionally, the earnings per share amounts have been updated to reflectthe 1 for 10 share consolidation.
171

Condensed Consolidated Statements of Operations (unaudited)
As PreviouslyReported(i) As Restated
As PreviouslyReported(i) As Restated
Three Months EndedJune 30, 2006
Six Months EndedJune 30, 2006
(Millions of U.S. dollars, except per share amounts)
Revenues:Products . . . . . . . . . . . . . . . . . . . . . . . . . . . . . . . . . . $2,421 $2,459 $4,501 $4,547Services . . . . . . . . . . . . . . . . . . . . . . . . . . . . . . . . . . 323 321 625 623
Total revenues . . . . . . . . . . . . . . . . . . . . . . . . . . . . . . . 2,744 2,780 5,126 5,170
Cost of revenues:Products . . . . . . . . . . . . . . . . . . . . . . . . . . . . . . . . . . 1,502 1,535 2,807 2,831Services . . . . . . . . . . . . . . . . . . . . . . . . . . . . . . . . . . 176 177 345 346
Total cost of revenues . . . . . . . . . . . . . . . . . . . . . . . . . . 1,678 1,712 3,152 3,177
Gross profit . . . . . . . . . . . . . . . . . . . . . . . . . . . . . . . . . 1,066 1,068 1,974 1,993Selling, general and administrative expense . . . . . . . . . . 596 614 1,191 1,224Research and development expense . . . . . . . . . . . . . . . . 489 498 967 977Amortization of intangibles . . . . . . . . . . . . . . . . . . . . . . 6 6 11 11In-process research and development expense . . . . . . . . 16 16 16 16Special charges . . . . . . . . . . . . . . . . . . . . . . . . . . . . . . . 45 49 50 54(Gain) loss on sale of businesses and assets . . . . . . . . . . 10 12 (25) (27)Shareholder litigation settlement recovery . . . . . . . . . . . (510) (510) (491) (491)
Operating earnings (loss) . . . . . . . . . . . . . . . . . . . . . . . 414 383 255 229Other income — net . . . . . . . . . . . . . . . . . . . . . . . . . . . 51 64 120 120Interest expense
Long-term debt . . . . . . . . . . . . . . . . . . . . . . . . . . . . . (59) (58) (105) (103)Other . . . . . . . . . . . . . . . . . . . . . . . . . . . . . . . . . . . . (11) (19) (35) (35)
Earnings (loss) from continuing operations beforeincome taxes, minority interests and equity in netearnings (loss) of associated companies . . . . . . . . . . . 395 370 235 211
Income tax benefit (expense). . . . . . . . . . . . . . . . . . . . . (27) (29) (50) (54)
368 341 185 157Minority interests — net of tax . . . . . . . . . . . . . . . . . . . 1 4 10 10Equity in net earnings (loss) of associated companies —
net of tax . . . . . . . . . . . . . . . . . . . . . . . . . . . . . . . . . (3) (3) (5) (5)
Net earnings (loss) from continuing operations . . . . . . . 366 342 190 162Net earnings from discontinued operations — net of
tax . . . . . . . . . . . . . . . . . . . . . . . . . . . . . . . . . . . . . . — — — —
Net earnings (loss) before cumulative effect ofaccounting change. . . . . . . . . . . . . . . . . . . . . . . . . . . 366 342 190 162
Cumulative effect of accounting change. . . . . . . . . . . . . — — 9 9
Net earnings (loss) . . . . . . . . . . . . . . . . . . . . . . . . . . . . $ 366 $ 342 $ 199 $ 171
Basic and diluted earnings (loss) per common share— from continuing operations . . . . . . . . . . . . . . . . . $ 0.84 $ 0.79 $ 0.46 $ 0.39— from discontinued operations . . . . . . . . . . . . . . . . 0.00 0.00 0.00 0.00
Basic and diluted earnings (loss) per common share. . . . $ 0.84 $ 0.79 $ 0.46 $ 0.39
(i) Commencing in the third quarter of 2006 Nortel disclosed revenues and cost of revenues from both its products and services. Previousquarters have been updated to reflect this presentation change. Additionally, the earnings per share amounts have been updated to reflectthe 1 for 10 share consolidation.
172
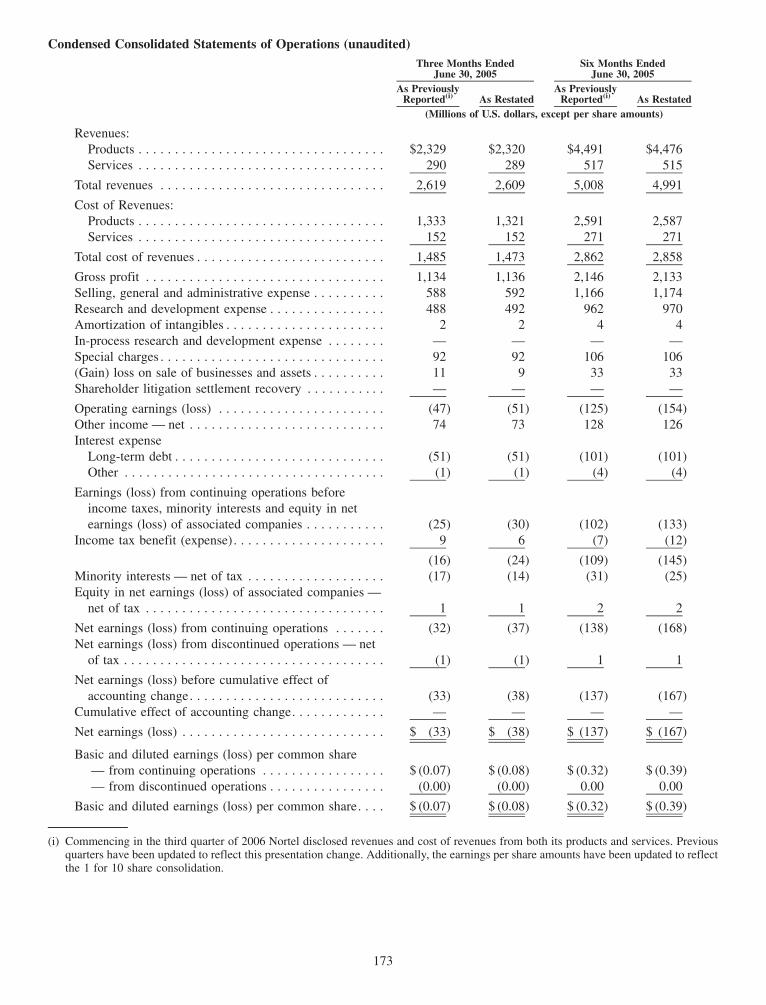
Condensed Consolidated Statements of Operations (unaudited)
As PreviouslyReported(i) As Restated
As PreviouslyReported(i) As Restated
Three Months EndedJune 30, 2005
Six Months EndedJune 30, 2005
(Millions of U.S. dollars, except per share amounts)
Revenues:Products . . . . . . . . . . . . . . . . . . . . . . . . . . . . . . . . . . $2,329 $2,320 $4,491 $4,476Services . . . . . . . . . . . . . . . . . . . . . . . . . . . . . . . . . . 290 289 517 515
Total revenues . . . . . . . . . . . . . . . . . . . . . . . . . . . . . . . 2,619 2,609 5,008 4,991
Cost of Revenues:Products . . . . . . . . . . . . . . . . . . . . . . . . . . . . . . . . . . 1,333 1,321 2,591 2,587Services . . . . . . . . . . . . . . . . . . . . . . . . . . . . . . . . . . 152 152 271 271
Total cost of revenues . . . . . . . . . . . . . . . . . . . . . . . . . . 1,485 1,473 2,862 2,858
Gross profit . . . . . . . . . . . . . . . . . . . . . . . . . . . . . . . . . 1,134 1,136 2,146 2,133Selling, general and administrative expense . . . . . . . . . . 588 592 1,166 1,174Research and development expense . . . . . . . . . . . . . . . . 488 492 962 970Amortization of intangibles . . . . . . . . . . . . . . . . . . . . . . 2 2 4 4In-process research and development expense . . . . . . . . — — — —Special charges . . . . . . . . . . . . . . . . . . . . . . . . . . . . . . . 92 92 106 106(Gain) loss on sale of businesses and assets . . . . . . . . . . 11 9 33 33Shareholder litigation settlement recovery . . . . . . . . . . . — — — —
Operating earnings (loss) . . . . . . . . . . . . . . . . . . . . . . . (47) (51) (125) (154)Other income — net . . . . . . . . . . . . . . . . . . . . . . . . . . . 74 73 128 126Interest expense
Long-term debt . . . . . . . . . . . . . . . . . . . . . . . . . . . . . (51) (51) (101) (101)Other . . . . . . . . . . . . . . . . . . . . . . . . . . . . . . . . . . . . (1) (1) (4) (4)
Earnings (loss) from continuing operations beforeincome taxes, minority interests and equity in netearnings (loss) of associated companies . . . . . . . . . . . (25) (30) (102) (133)
Income tax benefit (expense). . . . . . . . . . . . . . . . . . . . . 9 6 (7) (12)
(16) (24) (109) (145)Minority interests — net of tax . . . . . . . . . . . . . . . . . . . (17) (14) (31) (25)Equity in net earnings (loss) of associated companies —
net of tax . . . . . . . . . . . . . . . . . . . . . . . . . . . . . . . . . 1 1 2 2
Net earnings (loss) from continuing operations . . . . . . . (32) (37) (138) (168)Net earnings (loss) from discontinued operations — net
of tax . . . . . . . . . . . . . . . . . . . . . . . . . . . . . . . . . . . . (1) (1) 1 1
Net earnings (loss) before cumulative effect ofaccounting change. . . . . . . . . . . . . . . . . . . . . . . . . . . (33) (38) (137) (167)
Cumulative effect of accounting change. . . . . . . . . . . . . — — — —
Net earnings (loss) . . . . . . . . . . . . . . . . . . . . . . . . . . . . $ (33) $ (38) $ (137) $ (167)
Basic and diluted earnings (loss) per common share— from continuing operations . . . . . . . . . . . . . . . . . $ (0.07) $ (0.08) $ (0.32) $ (0.39)— from discontinued operations . . . . . . . . . . . . . . . . (0.00) (0.00) 0.00 0.00
Basic and diluted earnings (loss) per common share. . . . $ (0.07) $ (0.08) $ (0.32) $ (0.39)
(i) Commencing in the third quarter of 2006 Nortel disclosed revenues and cost of revenues from both its products and services. Previousquarters have been updated to reflect this presentation change. Additionally, the earnings per share amounts have been updated to reflectthe 1 for 10 share consolidation.
173
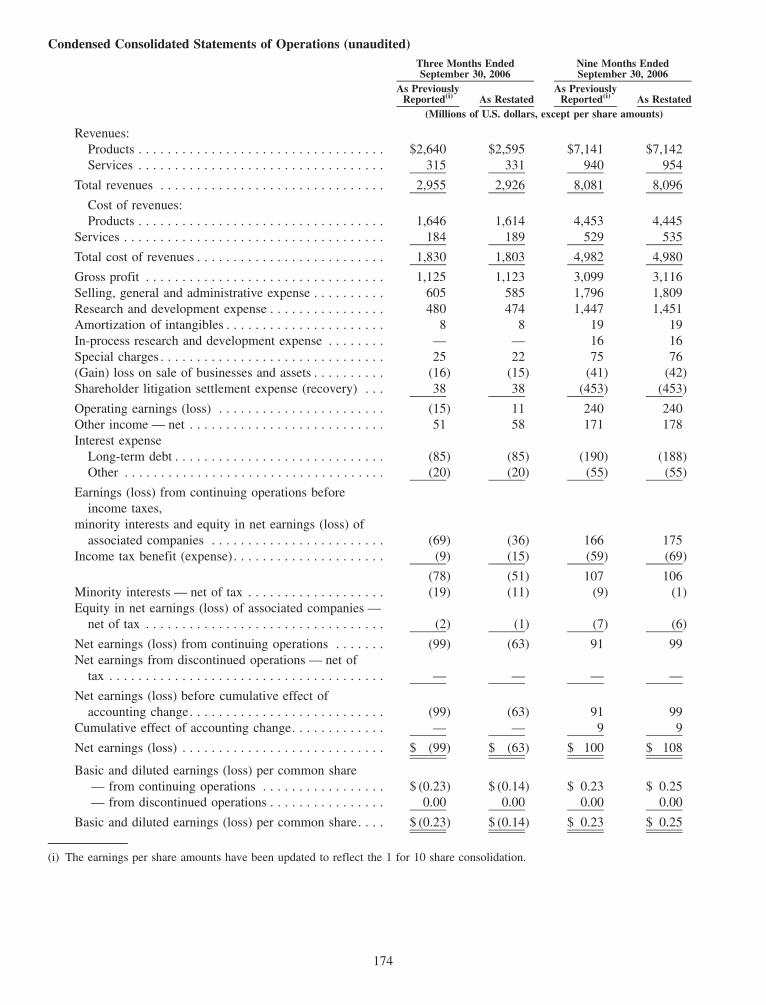
Condensed Consolidated Statements of Operations (unaudited)
As PreviouslyReported(i) As Restated
As PreviouslyReported(i) As Restated
Three Months EndedSeptember 30, 2006
Nine Months EndedSeptember 30, 2006
(Millions of U.S. dollars, except per share amounts)
Revenues:Products . . . . . . . . . . . . . . . . . . . . . . . . . . . . . . . . . . $2,640 $2,595 $7,141 $7,142Services . . . . . . . . . . . . . . . . . . . . . . . . . . . . . . . . . . 315 331 940 954
Total revenues . . . . . . . . . . . . . . . . . . . . . . . . . . . . . . . 2,955 2,926 8,081 8,096
Cost of revenues:Products . . . . . . . . . . . . . . . . . . . . . . . . . . . . . . . . . . 1,646 1,614 4,453 4,445
Services . . . . . . . . . . . . . . . . . . . . . . . . . . . . . . . . . . . . 184 189 529 535
Total cost of revenues . . . . . . . . . . . . . . . . . . . . . . . . . . 1,830 1,803 4,982 4,980
Gross profit . . . . . . . . . . . . . . . . . . . . . . . . . . . . . . . . . 1,125 1,123 3,099 3,116Selling, general and administrative expense . . . . . . . . . . 605 585 1,796 1,809Research and development expense . . . . . . . . . . . . . . . . 480 474 1,447 1,451Amortization of intangibles . . . . . . . . . . . . . . . . . . . . . . 8 8 19 19In-process research and development expense . . . . . . . . — — 16 16Special charges . . . . . . . . . . . . . . . . . . . . . . . . . . . . . . . 25 22 75 76(Gain) loss on sale of businesses and assets . . . . . . . . . . (16) (15) (41) (42)Shareholder litigation settlement expense (recovery) . . . 38 38 (453) (453)
Operating earnings (loss) . . . . . . . . . . . . . . . . . . . . . . . (15) 11 240 240Other income — net . . . . . . . . . . . . . . . . . . . . . . . . . . . 51 58 171 178Interest expense
Long-term debt . . . . . . . . . . . . . . . . . . . . . . . . . . . . . (85) (85) (190) (188)Other . . . . . . . . . . . . . . . . . . . . . . . . . . . . . . . . . . . . (20) (20) (55) (55)
Earnings (loss) from continuing operations beforeincome taxes,
minority interests and equity in net earnings (loss) ofassociated companies . . . . . . . . . . . . . . . . . . . . . . . . (69) (36) 166 175
Income tax benefit (expense). . . . . . . . . . . . . . . . . . . . . (9) (15) (59) (69)
(78) (51) 107 106Minority interests — net of tax . . . . . . . . . . . . . . . . . . . (19) (11) (9) (1)Equity in net earnings (loss) of associated companies —
net of tax . . . . . . . . . . . . . . . . . . . . . . . . . . . . . . . . . (2) (1) (7) (6)
Net earnings (loss) from continuing operations . . . . . . . (99) (63) 91 99Net earnings from discontinued operations — net of
tax . . . . . . . . . . . . . . . . . . . . . . . . . . . . . . . . . . . . . . — — — —
Net earnings (loss) before cumulative effect ofaccounting change. . . . . . . . . . . . . . . . . . . . . . . . . . . (99) (63) 91 99
Cumulative effect of accounting change. . . . . . . . . . . . . — — 9 9
Net earnings (loss) . . . . . . . . . . . . . . . . . . . . . . . . . . . . $ (99) $ (63) $ 100 $ 108
Basic and diluted earnings (loss) per common share— from continuing operations . . . . . . . . . . . . . . . . . $ (0.23) $ (0.14) $ 0.23 $ 0.25— from discontinued operations . . . . . . . . . . . . . . . . 0.00 0.00 0.00 0.00
Basic and diluted earnings (loss) per common share. . . . $ (0.23) $ (0.14) $ 0.23 $ 0.25
(i) The earnings per share amounts have been updated to reflect the 1 for 10 share consolidation.
174

Condensed Consolidated Statements of Operations (unaudited)
As PreviouslyReported(i) As Restated
As PreviouslyReported(i) As Restated
Three Months EndedSeptember 30, 2005
Nine Months EndedSeptember 30, 2005
(Millions of U.S. dollars, except per share amounts)
Revenues:Products . . . . . . . . . . . . . . . . . . . . . . . . . . . . . . . . . . $2,193 $2,165 $6,684 $6,641Services . . . . . . . . . . . . . . . . . . . . . . . . . . . . . . . . . . 325 325 842 840
Total revenues . . . . . . . . . . . . . . . . . . . . . . . . . . . . . . . 2,518 2,490 7,526 7,481
Cost of revenues:Products . . . . . . . . . . . . . . . . . . . . . . . . . . . . . . . . . . 1,350 1,338 3,941 3,925Services . . . . . . . . . . . . . . . . . . . . . . . . . . . . . . . . . . 190 190 461 461
Total cost of revenues . . . . . . . . . . . . . . . . . . . . . . . . . . 1,540 1,528 4,402 4,386
Gross profit . . . . . . . . . . . . . . . . . . . . . . . . . . . . . . . . . 978 962 3,124 3,095Selling, general and administrative expense . . . . . . . . . . 567 572 1,733 1,746Research and development expense . . . . . . . . . . . . . . . . 443 447 1,405 1,417Amortization of intangibles . . . . . . . . . . . . . . . . . . . . . . 7 7 11 11In-process research and development expense . . . . . . . . — — — —Special charges . . . . . . . . . . . . . . . . . . . . . . . . . . . . . . . 39 39 145 145(Gain) loss on sale of businesses and assets . . . . . . . . . . 3 3 36 36Shareholder litigation settlement expense (recovery) . . . — — — —
Operating earnings (loss) . . . . . . . . . . . . . . . . . . . . . . . (81) (106) (206) (260)Other income — net . . . . . . . . . . . . . . . . . . . . . . . . . . . 53 56 181 182Interest expense
Long-term debt . . . . . . . . . . . . . . . . . . . . . . . . . . . . . (54) (54) (155) (155)Other . . . . . . . . . . . . . . . . . . . . . . . . . . . . . . . . . . . . (3) (3) (7) (7)
Earnings (loss) from continuing operations beforeincome taxes, minority interests and equity in netearnings (loss) of associated companies . . . . . . . . . . . (85) (107) (187) (240)
Income tax benefit (expense). . . . . . . . . . . . . . . . . . . . . (39) (41) (46) (53)
(124) (148) (233) (293)Minority interests — net of tax . . . . . . . . . . . . . . . . . . . (15) (12) (46) (37)Equity in net earnings (loss) of associated companies —
net of tax . . . . . . . . . . . . . . . . . . . . . . . . . . . . . . . . . 1 1 3 3
Net earnings (loss) from continuing operations . . . . . . . (138) (159) (276) (327)Net earnings from discontinued operations — net of
tax . . . . . . . . . . . . . . . . . . . . . . . . . . . . . . . . . . . . . . 2 2 3 3
Net earnings (loss) before cumulative effect ofaccounting change. . . . . . . . . . . . . . . . . . . . . . . . . . . (136) (157) (273) (324)
Cumulative effect of accounting change. . . . . . . . . . . . . — — — —
Net earnings (loss) . . . . . . . . . . . . . . . . . . . . . . . . . . . . $ (136) $ (157) $ (273) $ (324)
Basic and diluted earnings (loss) per common share— from continuing operations . . . . . . . . . . . . . . . . . . $ (0.32) $ (0.37) $ (0.64) $ (0.75)— from discontinued operations . . . . . . . . . . . . . . . . 0.00 0.00 0.00 0.00
Basic and diluted earnings (loss) per common share. . . . $ (0.32) $ (0.37) $ (0.64) $ (0.75)
(i) The earnings per share amounts have been updated to reflect the 1 for 10 share consolidation.
175
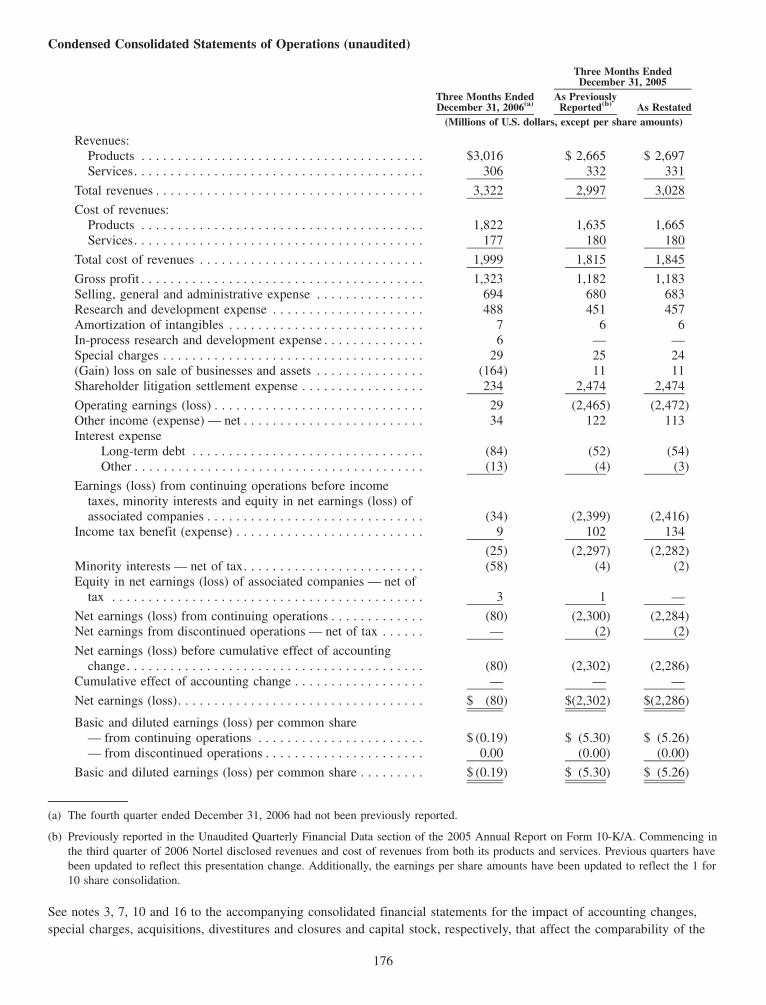
Condensed Consolidated Statements of Operations (unaudited)
Three Months EndedDecember 31, 2006(a)
As PreviouslyReported(b) As Restated
Three Months EndedDecember 31, 2005
(Millions of U.S. dollars, except per share amounts)
Revenues:Products . . . . . . . . . . . . . . . . . . . . . . . . . . . . . . . . . . . . . . . $3,016 $ 2,665 $ 2,697Services. . . . . . . . . . . . . . . . . . . . . . . . . . . . . . . . . . . . . . . . 306 332 331
Total revenues . . . . . . . . . . . . . . . . . . . . . . . . . . . . . . . . . . . . . 3,322 2,997 3,028
Cost of revenues:Products . . . . . . . . . . . . . . . . . . . . . . . . . . . . . . . . . . . . . . . 1,822 1,635 1,665Services. . . . . . . . . . . . . . . . . . . . . . . . . . . . . . . . . . . . . . . . 177 180 180
Total cost of revenues . . . . . . . . . . . . . . . . . . . . . . . . . . . . . . . 1,999 1,815 1,845
Gross profit . . . . . . . . . . . . . . . . . . . . . . . . . . . . . . . . . . . . . . . 1,323 1,182 1,183Selling, general and administrative expense . . . . . . . . . . . . . . . 694 680 683Research and development expense . . . . . . . . . . . . . . . . . . . . . 488 451 457Amortization of intangibles . . . . . . . . . . . . . . . . . . . . . . . . . . . 7 6 6In-process research and development expense . . . . . . . . . . . . . . 6 — —Special charges . . . . . . . . . . . . . . . . . . . . . . . . . . . . . . . . . . . . 29 25 24(Gain) loss on sale of businesses and assets . . . . . . . . . . . . . . . (164) 11 11Shareholder litigation settlement expense . . . . . . . . . . . . . . . . . 234 2,474 2,474
Operating earnings (loss) . . . . . . . . . . . . . . . . . . . . . . . . . . . . . 29 (2,465) (2,472)Other income (expense) — net . . . . . . . . . . . . . . . . . . . . . . . . . 34 122 113Interest expense
Long-term debt . . . . . . . . . . . . . . . . . . . . . . . . . . . . . . . . (84) (52) (54)Other . . . . . . . . . . . . . . . . . . . . . . . . . . . . . . . . . . . . . . . . (13) (4) (3)
Earnings (loss) from continuing operations before incometaxes, minority interests and equity in net earnings (loss) ofassociated companies . . . . . . . . . . . . . . . . . . . . . . . . . . . . . . (34) (2,399) (2,416)
Income tax benefit (expense) . . . . . . . . . . . . . . . . . . . . . . . . . . 9 102 134
(25) (2,297) (2,282)Minority interests — net of tax. . . . . . . . . . . . . . . . . . . . . . . . . (58) (4) (2)Equity in net earnings (loss) of associated companies — net of
tax . . . . . . . . . . . . . . . . . . . . . . . . . . . . . . . . . . . . . . . . . . . 3 1 —
Net earnings (loss) from continuing operations . . . . . . . . . . . . . (80) (2,300) (2,284)Net earnings from discontinued operations — net of tax . . . . . . — (2) (2)
Net earnings (loss) before cumulative effect of accountingchange. . . . . . . . . . . . . . . . . . . . . . . . . . . . . . . . . . . . . . . . . (80) (2,302) (2,286)
Cumulative effect of accounting change . . . . . . . . . . . . . . . . . . — — —
Net earnings (loss). . . . . . . . . . . . . . . . . . . . . . . . . . . . . . . . . . $ (80) $(2,302) $(2,286)
Basic and diluted earnings (loss) per common share— from continuing operations . . . . . . . . . . . . . . . . . . . . . . . $ (0.19) $ (5.30) $ (5.26)— from discontinued operations . . . . . . . . . . . . . . . . . . . . . . 0.00 (0.00) (0.00)
Basic and diluted earnings (loss) per common share . . . . . . . . . $ (0.19) $ (5.30) $ (5.26)
(a) The fourth quarter ended December 31, 2006 had not been previously reported.
(b) Previously reported in the Unaudited Quarterly Financial Data section of the 2005 Annual Report on Form 10-K/A. Commencing inthe third quarter of 2006 Nortel disclosed revenues and cost of revenues from both its products and services. Previous quarters havebeen updated to reflect this presentation change. Additionally, the earnings per share amounts have been updated to reflect the 1 for10 share consolidation.
See notes 3, 7, 10 and 16 to the accompanying consolidated financial statements for the impact of accounting changes,special charges, acquisitions, divestitures and closures and capital stock, respectively, that affect the comparability of the
176

above selected financial data. Additionally, the following significant items were recorded in the fourth quarters of 2006and 2005:
• During the fourth quarter of 2006 Nortel recorded $12 of revenues related to the contract with BSNL that wasentered into in 2004. The corresponding amount recorded in the fourth quarter of 2005 related to this contract was$228.
• During the fourth quarter of 2006 Nortel recorded a shareholder lawsuit expense of $234, to reflect the fair valuemark-to-market adjustment of the Nortel common shares issuable to the plaintiffs of the shareholder lawsuit, uponsettlement. In the fourth quarter of 2005, the shareholder lawsuit expense of $2,474 was initially recorded.
• During the fourth quarter of 2006, Nortel recorded a gain of $166 on the sale of assets and liabilities relating to itsUMTS access products and services.
177
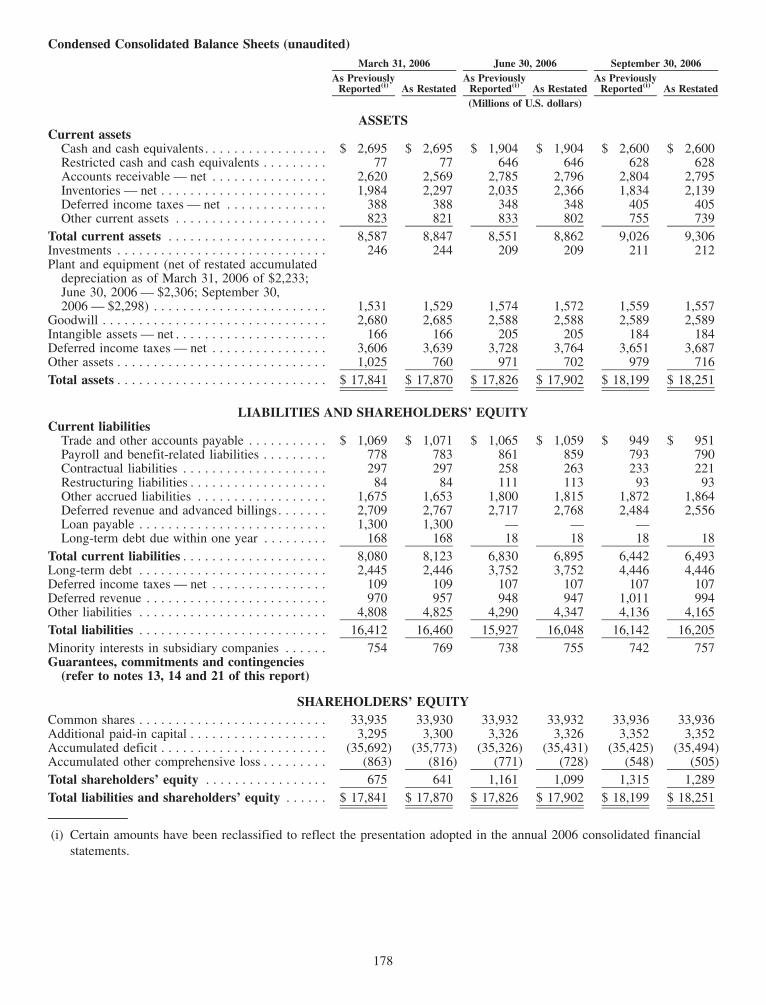
Condensed Consolidated Balance Sheets (unaudited)
As PreviouslyReported(i) As Restated
As PreviouslyReported(i) As Restated
As PreviouslyReported(i) As Restated
March 31, 2006 June 30, 2006 September 30, 2006
(Millions of U.S. dollars)
ASSETSCurrent assets
Cash and cash equivalents . . . . . . . . . . . . . . . . . $ 2,695 $ 2,695 $ 1,904 $ 1,904 $ 2,600 $ 2,600Restricted cash and cash equivalents . . . . . . . . . 77 77 646 646 628 628Accounts receivable — net . . . . . . . . . . . . . . . . 2,620 2,569 2,785 2,796 2,804 2,795Inventories — net . . . . . . . . . . . . . . . . . . . . . . . 1,984 2,297 2,035 2,366 1,834 2,139Deferred income taxes — net . . . . . . . . . . . . . . 388 388 348 348 405 405Other current assets . . . . . . . . . . . . . . . . . . . . . 823 821 833 802 755 739
Total current assets . . . . . . . . . . . . . . . . . . . . . . 8,587 8,847 8,551 8,862 9,026 9,306Investments . . . . . . . . . . . . . . . . . . . . . . . . . . . . . 246 244 209 209 211 212Plant and equipment (net of restated accumulated
depreciation as of March 31, 2006 of $2,233;June 30, 2006 — $2,306; September 30,2006 — $2,298) . . . . . . . . . . . . . . . . . . . . . . . . 1,531 1,529 1,574 1,572 1,559 1,557
Goodwill . . . . . . . . . . . . . . . . . . . . . . . . . . . . . . . 2,680 2,685 2,588 2,588 2,589 2,589Intangible assets — net . . . . . . . . . . . . . . . . . . . . . 166 166 205 205 184 184Deferred income taxes — net . . . . . . . . . . . . . . . . 3,606 3,639 3,728 3,764 3,651 3,687Other assets . . . . . . . . . . . . . . . . . . . . . . . . . . . . . 1,025 760 971 702 979 716Total assets . . . . . . . . . . . . . . . . . . . . . . . . . . . . . $ 17,841 $ 17,870 $ 17,826 $ 17,902 $ 18,199 $ 18,251
LIABILITIES AND SHAREHOLDERS’ EQUITYCurrent liabilities
Trade and other accounts payable . . . . . . . . . . . $ 1,069 $ 1,071 $ 1,065 $ 1,059 $ 949 $ 951Payroll and benefit-related liabilities . . . . . . . . . 778 783 861 859 793 790Contractual liabilities . . . . . . . . . . . . . . . . . . . . 297 297 258 263 233 221Restructuring liabilities . . . . . . . . . . . . . . . . . . . 84 84 111 113 93 93Other accrued liabilities . . . . . . . . . . . . . . . . . . 1,675 1,653 1,800 1,815 1,872 1,864Deferred revenue and advanced billings . . . . . . . 2,709 2,767 2,717 2,768 2,484 2,556Loan payable . . . . . . . . . . . . . . . . . . . . . . . . . . 1,300 1,300 — — —Long-term debt due within one year . . . . . . . . . 168 168 18 18 18 18
Total current liabilities . . . . . . . . . . . . . . . . . . . . 8,080 8,123 6,830 6,895 6,442 6,493Long-term debt . . . . . . . . . . . . . . . . . . . . . . . . . . 2,445 2,446 3,752 3,752 4,446 4,446Deferred income taxes — net . . . . . . . . . . . . . . . . 109 109 107 107 107 107Deferred revenue . . . . . . . . . . . . . . . . . . . . . . . . . 970 957 948 947 1,011 994Other liabilities . . . . . . . . . . . . . . . . . . . . . . . . . . 4,808 4,825 4,290 4,347 4,136 4,165Total liabilities . . . . . . . . . . . . . . . . . . . . . . . . . . 16,412 16,460 15,927 16,048 16,142 16,205Minority interests in subsidiary companies . . . . . . 754 769 738 755 742 757Guarantees, commitments and contingencies
(refer to notes 13, 14 and 21 of this report)
SHAREHOLDERS’ EQUITYCommon shares . . . . . . . . . . . . . . . . . . . . . . . . . . 33,935 33,930 33,932 33,932 33,936 33,936Additional paid-in capital . . . . . . . . . . . . . . . . . . . 3,295 3,300 3,326 3,326 3,352 3,352Accumulated deficit . . . . . . . . . . . . . . . . . . . . . . . (35,692) (35,773) (35,326) (35,431) (35,425) (35,494)Accumulated other comprehensive loss . . . . . . . . . (863) (816) (771) (728) (548) (505)Total shareholders’ equity . . . . . . . . . . . . . . . . . 675 641 1,161 1,099 1,315 1,289Total liabilities and shareholders’ equity . . . . . . $ 17,841 $ 17,870 $ 17,826 $ 17,902 $ 18,199 $ 18,251
(i) Certain amounts have been reclassified to reflect the presentation adopted in the annual 2006 consolidated financialstatements.
178
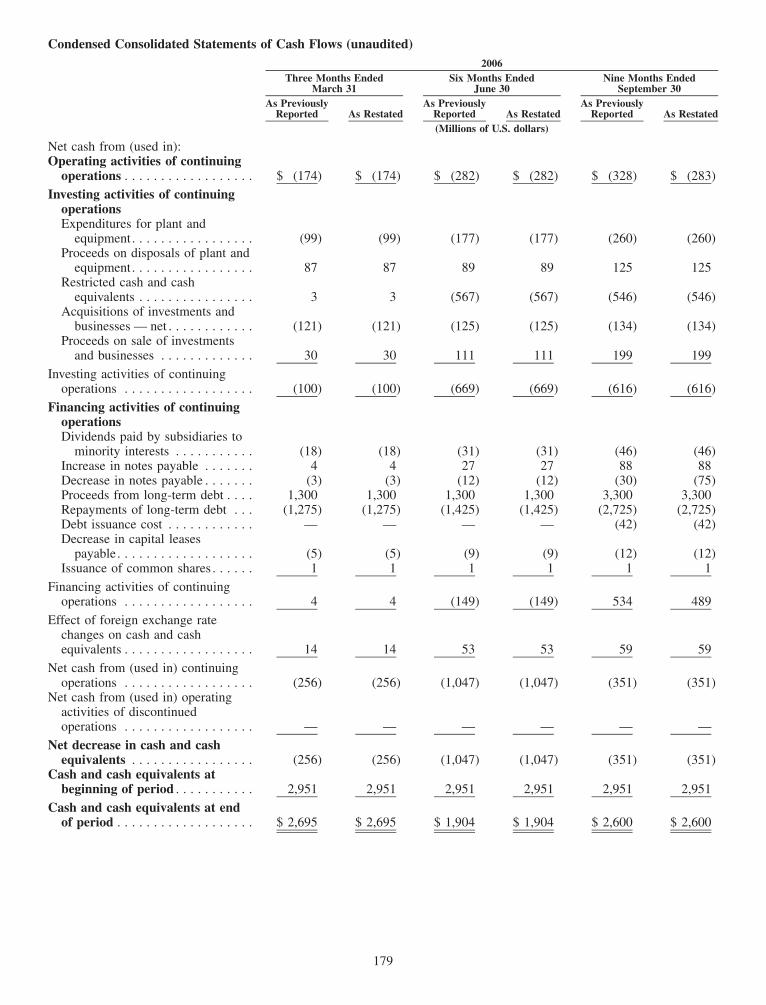
Condensed Consolidated Statements of Cash Flows (unaudited)
As PreviouslyReported As Restated
As PreviouslyReported As Restated
As PreviouslyReported As Restated
Three Months EndedMarch 31
Six Months EndedJune 30
Nine Months EndedSeptember 30
2006
(Millions of U.S. dollars)
Net cash from (used in):Operating activities of continuing
operations . . . . . . . . . . . . . . . . . . $ (174) $ (174) $ (282) $ (282) $ (328) $ (283)Investing activities of continuing
operationsExpenditures for plant and
equipment. . . . . . . . . . . . . . . . . (99) (99) (177) (177) (260) (260)Proceeds on disposals of plant and
equipment. . . . . . . . . . . . . . . . . 87 87 89 89 125 125Restricted cash and cash
equivalents . . . . . . . . . . . . . . . . 3 3 (567) (567) (546) (546)Acquisitions of investments and
businesses — net . . . . . . . . . . . . (121) (121) (125) (125) (134) (134)Proceeds on sale of investments
and businesses . . . . . . . . . . . . . 30 30 111 111 199 199
Investing activities of continuingoperations . . . . . . . . . . . . . . . . . . (100) (100) (669) (669) (616) (616)
Financing activities of continuingoperationsDividends paid by subsidiaries to
minority interests . . . . . . . . . . . (18) (18) (31) (31) (46) (46)Increase in notes payable . . . . . . . 4 4 27 27 88 88Decrease in notes payable . . . . . . . (3) (3) (12) (12) (30) (75)Proceeds from long-term debt . . . . 1,300 1,300 1,300 1,300 3,300 3,300Repayments of long-term debt . . . (1,275) (1,275) (1,425) (1,425) (2,725) (2,725)Debt issuance cost . . . . . . . . . . . . — — — — (42) (42)Decrease in capital leases
payable. . . . . . . . . . . . . . . . . . . (5) (5) (9) (9) (12) (12)Issuance of common shares . . . . . . 1 1 1 1 1 1
Financing activities of continuingoperations . . . . . . . . . . . . . . . . . . 4 4 (149) (149) 534 489
Effect of foreign exchange ratechanges on cash and cashequivalents . . . . . . . . . . . . . . . . . . 14 14 53 53 59 59
Net cash from (used in) continuingoperations . . . . . . . . . . . . . . . . . . (256) (256) (1,047) (1,047) (351) (351)
Net cash from (used in) operatingactivities of discontinuedoperations . . . . . . . . . . . . . . . . . . — — — — — —
Net decrease in cash and cashequivalents . . . . . . . . . . . . . . . . . (256) (256) (1,047) (1,047) (351) (351)
Cash and cash equivalents atbeginning of period . . . . . . . . . . . 2,951 2,951 2,951 2,951 2,951 2,951
Cash and cash equivalents at endof period . . . . . . . . . . . . . . . . . . . $ 2,695 $ 2,695 $ 1,904 $ 1,904 $ 2,600 $ 2,600
179
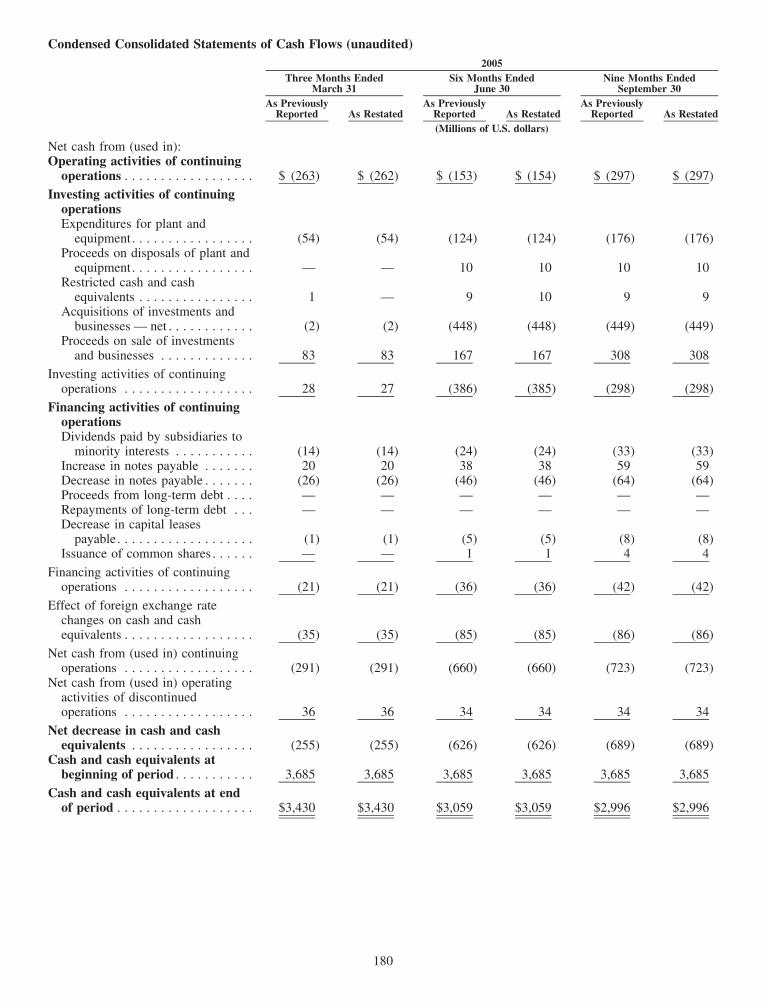
Condensed Consolidated Statements of Cash Flows (unaudited)
As PreviouslyReported As Restated
As PreviouslyReported As Restated
As PreviouslyReported As Restated
Three Months EndedMarch 31
Six Months EndedJune 30
Nine Months EndedSeptember 30
2005
(Millions of U.S. dollars)
Net cash from (used in):Operating activities of continuing
operations . . . . . . . . . . . . . . . . . . $ (263) $ (262) $ (153) $ (154) $ (297) $ (297)Investing activities of continuing
operationsExpenditures for plant and
equipment. . . . . . . . . . . . . . . . . (54) (54) (124) (124) (176) (176)Proceeds on disposals of plant and
equipment. . . . . . . . . . . . . . . . . — — 10 10 10 10Restricted cash and cash
equivalents . . . . . . . . . . . . . . . . 1 — 9 10 9 9Acquisitions of investments and
businesses — net . . . . . . . . . . . . (2) (2) (448) (448) (449) (449)Proceeds on sale of investments
and businesses . . . . . . . . . . . . . 83 83 167 167 308 308
Investing activities of continuingoperations . . . . . . . . . . . . . . . . . . 28 27 (386) (385) (298) (298)
Financing activities of continuingoperationsDividends paid by subsidiaries to
minority interests . . . . . . . . . . . (14) (14) (24) (24) (33) (33)Increase in notes payable . . . . . . . 20 20 38 38 59 59Decrease in notes payable . . . . . . . (26) (26) (46) (46) (64) (64)Proceeds from long-term debt . . . . — — — — — —Repayments of long-term debt . . . — — — — — —Decrease in capital leases
payable. . . . . . . . . . . . . . . . . . . (1) (1) (5) (5) (8) (8)Issuance of common shares . . . . . . — — 1 1 4 4
Financing activities of continuingoperations . . . . . . . . . . . . . . . . . . (21) (21) (36) (36) (42) (42)
Effect of foreign exchange ratechanges on cash and cashequivalents . . . . . . . . . . . . . . . . . . (35) (35) (85) (85) (86) (86)
Net cash from (used in) continuingoperations . . . . . . . . . . . . . . . . . . (291) (291) (660) (660) (723) (723)
Net cash from (used in) operatingactivities of discontinuedoperations . . . . . . . . . . . . . . . . . . 36 36 34 34 34 34
Net decrease in cash and cashequivalents . . . . . . . . . . . . . . . . . (255) (255) (626) (626) (689) (689)
Cash and cash equivalents atbeginning of period . . . . . . . . . . . 3,685 3,685 3,685 3,685 3,685 3,685
Cash and cash equivalents at endof period . . . . . . . . . . . . . . . . . . . $3,430 $3,430 $3,059 $3,059 $2,996 $2,996
180

Supplemental information (Millions of U.S. dollars) (unaudited)
(a) Adjustments
The following tables summarize the revenue adjustments and other adjustments to net earnings (loss) (refer to note 4 ofthe accompanying consolidated financial statements for a description of the nature of the adjustments).
ThreeMonthsEnded
March 31
ThreeMonthsEnded
June 30
ThreeMonthsEnded
September 30
ThreeMonthsEnded
March 31
ThreeMonthsEnded
June 30
ThreeMonthsEnded
September 30
Revenues Cost of Revenues2006
As previously reported . . . . . . . . . . . . . . . . . . . $2,382 $2,744 $2,955 $1,474 $1,678 $1,830Adjustments:Pension and post-retirement errors . . . . . . . . . . . — — — 3 3 1Revenue recognition errors. . . . . . . . . . . . . . . . . 8 36 (29) (15) 13 (4)Other errors . . . . . . . . . . . . . . . . . . . . . . . . . . . . — — — 3 18 (24)
As restated . . . . . . . . . . . . . . . . . . . . . . . . . . . . $2,390 $2,780 $2,926 $1,465 $1,712 $1,803
ThreeMonthsEnded
March 31
ThreeMonthsEnded
June 30
ThreeMonthsEnded
September 30
Net earnings (loss)2006
As previously reported . . . . . . . . . . . . . . . . . . . . . . . . . . . . . . . . . . . . . . . . . . . . . . . $(167) $366 $(99)Adjustments:Pension and post-retirement errors . . . . . . . . . . . . . . . . . . . . . . . . . . . . . . . . . . . . . . . (8) (8) (2)Revenue recognition errors . . . . . . . . . . . . . . . . . . . . . . . . . . . . . . . . . . . . . . . . . . . . . 19 20 (22)Other errors . . . . . . . . . . . . . . . . . . . . . . . . . . . . . . . . . . . . . . . . . . . . . . . . . . . . . . . . (15) (36) 60
As restated . . . . . . . . . . . . . . . . . . . . . . . . . . . . . . . . . . . . . . . . . . . . . . . . . . . . . . . . $(171) $342 $(63)
ThreeMonthsEnded
March 31
ThreeMonthsEnded
June 30
ThreeMonthsEnded
September 30
ThreeMonthsEnded
December 31
ThreeMonthsEnded
March 31
ThreeMonthsEnded
June 30
ThreeMonthsEnded
September 30
ThreeMonthsEnded
December 31
Revenues Cost of Revenues2005
As previously reported . . $2,389 $2,619 $2,518 $2,997 $1,377 $1,485 $1,540 $1,815Adjustments:Pension and post-
retirement errors . . . . . . — — — — 4 3 4 4Revenue recognition
errors . . . . . . . . . . . . . . (7) (10) (28) 31 5 (16) (19) 28Other errors . . . . . . . . . . . — — — — (1) 1 3 (2)
As restated . . . . . . . . . . . . $2,382 $2,609 $2,490 $3,028 $1,385 $1,473 $1,528 $1,845
ThreeMonthsEnded
March 31
ThreeMonthsEnded
June 30
ThreeMonthsEnded
September 30
ThreeMonthsEnded
December 31
Net earnings (loss)
2005
As previously reported . . . . . . . . . . . . . . . . . . . . . . . . . . . . . . . . . $(104) $(33) $(136) $(2,302)Adjustments:Pension and post-retirement errors . . . . . . . . . . . . . . . . . . . . . . . . . (12) (12) (12) (12)Revenue recognition errors . . . . . . . . . . . . . . . . . . . . . . . . . . . . . . . (11) 6 (8) 4Prior period tax error . . . . . . . . . . . . . . . . . . . . . . . . . . . . . . . . . . . — — — 36Other errors . . . . . . . . . . . . . . . . . . . . . . . . . . . . . . . . . . . . . . . . . . (2) 1 (1) (12)
As restated . . . . . . . . . . . . . . . . . . . . . . . . . . . . . . . . . . . . . . . . . . $(129) $(38) $(157) $(2,286)
181
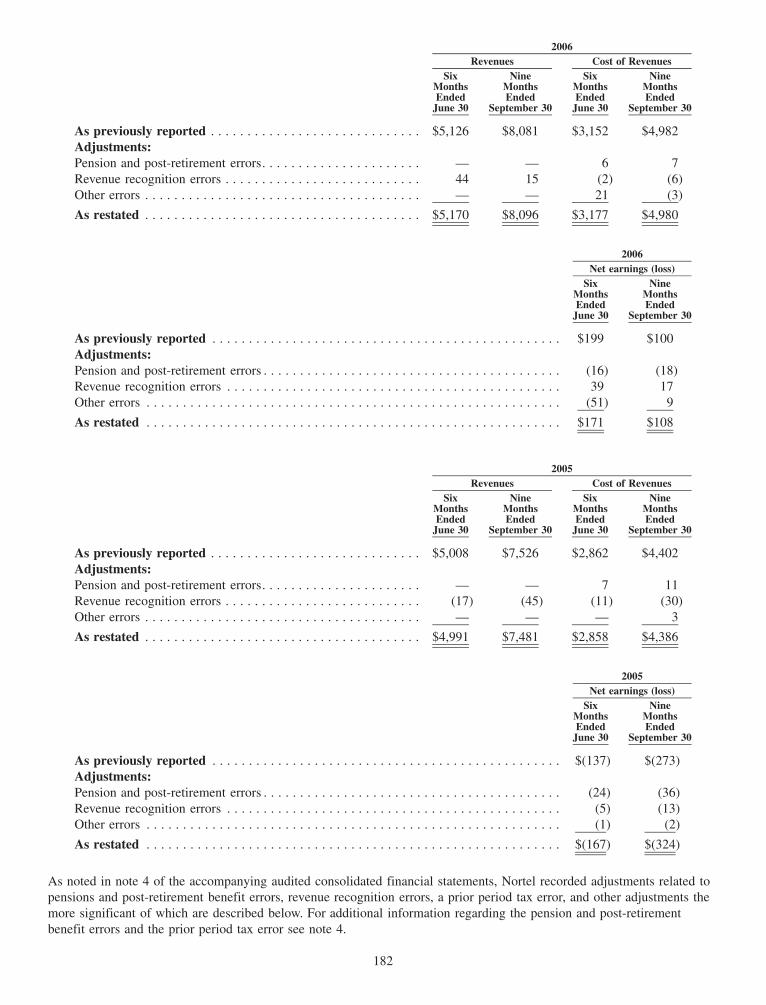
SixMonthsEnded
June 30
NineMonthsEnded
September 30
SixMonthsEnded
June 30
NineMonthsEnded
September 30
Revenues Cost of Revenues2006
As previously reported . . . . . . . . . . . . . . . . . . . . . . . . . . . . . $5,126 $8,081 $3,152 $4,982Adjustments:Pension and post-retirement errors. . . . . . . . . . . . . . . . . . . . . . — — 6 7Revenue recognition errors . . . . . . . . . . . . . . . . . . . . . . . . . . . 44 15 (2) (6)Other errors . . . . . . . . . . . . . . . . . . . . . . . . . . . . . . . . . . . . . . — — 21 (3)
As restated . . . . . . . . . . . . . . . . . . . . . . . . . . . . . . . . . . . . . . $5,170 $8,096 $3,177 $4,980
SixMonthsEnded
June 30
NineMonthsEnded
September 30
Net earnings (loss)2006
As previously reported . . . . . . . . . . . . . . . . . . . . . . . . . . . . . . . . . . . . . . . . . . . . . . . . $199 $100Adjustments:Pension and post-retirement errors . . . . . . . . . . . . . . . . . . . . . . . . . . . . . . . . . . . . . . . . . (16) (18)Revenue recognition errors . . . . . . . . . . . . . . . . . . . . . . . . . . . . . . . . . . . . . . . . . . . . . . 39 17Other errors . . . . . . . . . . . . . . . . . . . . . . . . . . . . . . . . . . . . . . . . . . . . . . . . . . . . . . . . . (51) 9
As restated . . . . . . . . . . . . . . . . . . . . . . . . . . . . . . . . . . . . . . . . . . . . . . . . . . . . . . . . . $171 $108
SixMonthsEnded
June 30
NineMonthsEnded
September 30
SixMonthsEnded
June 30
NineMonthsEnded
September 30
Revenues Cost of Revenues2005
As previously reported . . . . . . . . . . . . . . . . . . . . . . . . . . . . . $5,008 $7,526 $2,862 $4,402Adjustments:Pension and post-retirement errors. . . . . . . . . . . . . . . . . . . . . . — — 7 11Revenue recognition errors . . . . . . . . . . . . . . . . . . . . . . . . . . . (17) (45) (11) (30)Other errors . . . . . . . . . . . . . . . . . . . . . . . . . . . . . . . . . . . . . . — — — 3
As restated . . . . . . . . . . . . . . . . . . . . . . . . . . . . . . . . . . . . . . $4,991 $7,481 $2,858 $4,386
SixMonthsEnded
June 30
NineMonthsEnded
September 30
Net earnings (loss)2005
As previously reported . . . . . . . . . . . . . . . . . . . . . . . . . . . . . . . . . . . . . . . . . . . . . . . . $(137) $(273)Adjustments:Pension and post-retirement errors . . . . . . . . . . . . . . . . . . . . . . . . . . . . . . . . . . . . . . . . . (24) (36)Revenue recognition errors . . . . . . . . . . . . . . . . . . . . . . . . . . . . . . . . . . . . . . . . . . . . . . (5) (13)Other errors . . . . . . . . . . . . . . . . . . . . . . . . . . . . . . . . . . . . . . . . . . . . . . . . . . . . . . . . . (1) (2)
As restated . . . . . . . . . . . . . . . . . . . . . . . . . . . . . . . . . . . . . . . . . . . . . . . . . . . . . . . . . $(167) $(324)
As noted in note 4 of the accompanying audited consolidated financial statements, Nortel recorded adjustments related topensions and post-retirement benefit errors, revenue recognition errors, a prior period tax error, and other adjustments themore significant of which are described below. For additional information regarding the pension and post-retirementbenefit errors and the prior period tax error see note 4.
182
Revenue recognition errors:
Errors related principally to complex arrangements with multiple deliverables in which the timing of revenue recognitionwas determined to be incorrect. For certain of Nortel’s multiple element arrangements where certain elements such asPCS, specified upgrade rights and/or non-essential hardware or software products or services remained undelivered, Norteldetermined that the undelivered element could not be treated as a separate unit of accounting because fair value could notbe established. Accordingly, Nortel should have deferred revenue, and related costs, until the earlier of the point in timethat fair value of the undelivered element could be established or all the remaining elements have been delivered. Thesecorrections resulted in an increase/ (decrease) of revenue of ($1), $7, and $10 for the first three quarters of 2006 anddecreases in revenue of $10, $13, $10, and $4 for the four quarters of 2005. The related cost of revenue impact resulted inincreases/ (decreases) of ($13), $9 and $13 for the first three quarters of 2006 and ($8), ($8), ($4), and $16 for the fourquarters of 2005.
During the third quarter of 2006, Nortel previously recognized $40 of revenue that had been previously deferred byLG-Nortel due to the fact that it believed that LG-Nortel had a practice of providing implicit PCS for which they did nothave fair value. A subsequent detailed review of the Enterprise products sold by LG-Nortel led to a conclusion in the thirdquarter of 2006 that LG-Nortel did not have a practice of providing implicit PCS for certain Enterprise products. As aresult, revenue should have been recognized upon delivery. Nortel had previously recorded a cumulative correction of thiserror in the third quarter of 2006 and, as a result of this restatement, has now recorded it in the appropriate periods. Thecorrection of this error resulted in a $40 reduction in revenue in the third quarter of 2006, with corresponding increases of$10, $14, and $16 in the fourth quarter of 2005, and the first and second quarters of 2006 and a $17 reduction in cost ofrevenues in the third quarter of 2006, with corresponding increases of $6, $5, and $6 for the fourth quarter of 2005, andthe first and second quarters of 2006. Nortel also recorded reductions to minority interest to reflect the noncontrollinginterest’s share of the impact of these restatement adjustments.
Previous misapplication of SOP 81-1 resulted in errors on revenues recognized in an arrangement between 2003 and thefirst quarter of 2006. The misapplication related to the calculation of liquidated damages estimated to be incurred as aresult of contractual commitments related to network outages. Prior to the second quarter of 2006, Nortel estimated itsliquidated damages based on a quarterly network outage estimate. In the second quarter of 2006, Nortel determined that itshould have been recognizing product credits based on an estimate of the total expected outages for the arrangement.Nortel had previously corrected the resulting revenue errors in the second quarter of 2006 and, as a result of therestatement, has recorded the correction in the appropriate periods. The corrections have resulted in an increase/(decrease)in revenue and gross profit of $5, $8 and $5 for the first three quarters of 2006, and ($7), $8, nil and $15 for the fourquarters of 2005.
In 2004, Nortel entered into a software arrangement where the customer had the right to suspend payments until deliveryof certain future products; therefore, the arrangement fee was not fixed or determinable. Pursuant to SOP 97-2, if at theoutset of the arrangement the fee is not fixed or determinable, once all other revenue recognition criteria have beensatisfied, revenue should be recognized as payments become due. Previously, the fee was recognized ratably over the term.Due to the lack of a fixed or determinable fee, the amount recognized ratably should have been capped at the amount thatwas due and payable from the customer. The correction of this error resulted in an increase/(decrease) in both revenue andgross profit of $1, ($5), ($4) for the first three quarters of 2006, and ($3), $5, ($5), and $10 for the four quarters of 2005.
Other errors
As part of this restatement, Nortel corrected several individually immaterial adjustments relating to prior periods that hadbeen previously recorded in the third quarter of 2006. The errors related to errors in warranty calculations, inventoryvaluation and other errors. The correction of these errors resulted in a $24 reduction in cost of revenues in the thirdquarter of 2006, with an offsetting $24 increase in cost of revenues in the second quarter of 2006.
In the third quarter of 2006, Nortel corrected for royalty payments that should have been accrued in the second quarter of2006. As part of this restatement, Nortel recorded the royalty payments in the correct period, resulting in a $7 reductionin cost of revenues in the third quarter of 2006 with a corresponding $7 increase in the second quarter of 2006.
As part of this restatement, Nortel corrected for various individually immaterial expenses previously recorded in the thirdquarter of 2006 which related to the second quarter of 2006. The errors related to invoicing issues by certain suppliers andinvoicing cut-off errors, which resulted in delayed recognition of accruals. The correction of these errors resulted in an$18 reduction in SG&A expense in the third quarter of 2006, with an offsetting $18 increase in the second quarter of2006.
183
As part of this restatement, Nortel corrected for asset impairments that had been provided for previously under Nortel’srestructuring plans in the second quarter of 2006 and errors in the timing of accruals for special charges related to Nortel’s2006 Restructuring Plan. These corrections resulted in a $3 reduction in special charges in the third quarter of 2006, withan offsetting increase in the second quarter of 2006.
In the third quarter of 2006, Nortel expensed $4 in R&D costs related to inventory that had been previously incorrectlydeferred in the first and second quarters of 2006. As part of this restatement, Nortel recorded this correction in theappropriate period, resulting in a $4 reduction in R&D expense in the third quarter of 2006, with an offsetting $3 increasein the second quarter of 2006 and $1 increase in the first quarter of 2006.
Classification Errors
In the second quarter of 2006 Nortel corrected a classification error related to securitization charges incurred in the firstquarter of 2006, previously recorded in interest expense — other that should have been recorded in other income — net.As part of this restatement, Nortel has recorded this correction in the appropriate period. This correction resulted in an$8 increase in other income — net in the second quarter of 2006, and a corresponding $8 decrease in other income — netthe first quarter of 2006 and an $8 increase in interest expense — other in the second quarter of 2006, and a corresponding$8 decrease in interest expense in the first quarter of 2006.
Nortel corrected a classification error identified in the fourth quarter of 2006 related to the treatment of certain short-termpromissory notes classified as notes payable in the third quarter of 2006. Nortel determined that these notes should beclassified as trade payable and corrected this classification error as part of this restatement. As a result of thisclassification error, the movement of these balances had been recorded in cash flows from (used in) financing activities inthe third quarter consolidated statement of cash flows. The correction of the classification resulting in $45 reduction in netcash used in operating activities, with a $45 offsetting reduction in net cash from financing activities for the nine monthsended September 30, 2006.
An error related to the classification between inventories — net and other assets was identified in the fourth quarter of2006. Nortel identified certain deferred costs that were classified as long-term and included in other assets but that relatedto arrangements where the associated deferred revenue was recorded as a current liability. Nortel has corrected this errorand reclassified these deferred costs as a component of inventory — net, included in current assets. This correctionresulted in increases in inventory — net and corresponding decreases in other assets of $260, $265, and $265, respectivelyfor the March 31, June 30, and September 30, 2006 condensed consolidated balance sheets.
184
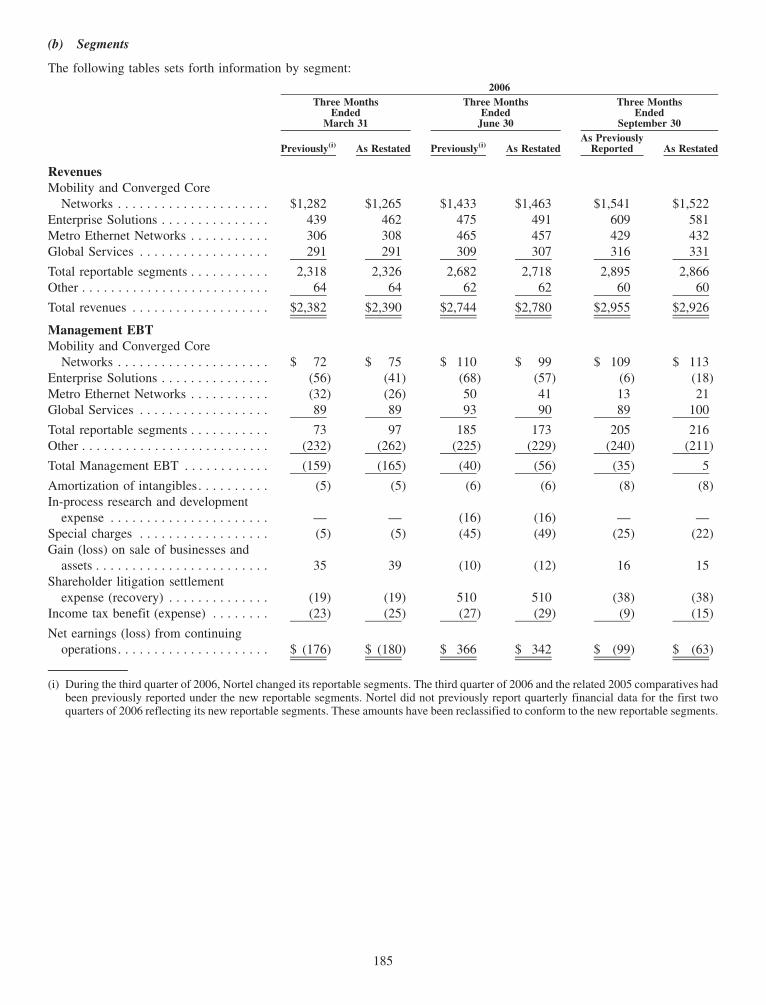
(b) Segments
The following tables sets forth information by segment:
Previously(i) As Restated Previously(i) As RestatedAs Previously
Reported As Restated
Three MonthsEnded
March 31
Three MonthsEnded
June 30
Three MonthsEnded
September 30
2006
RevenuesMobility and Converged Core
Networks . . . . . . . . . . . . . . . . . . . . . $1,282 $1,265 $1,433 $1,463 $1,541 $1,522Enterprise Solutions . . . . . . . . . . . . . . . 439 462 475 491 609 581Metro Ethernet Networks . . . . . . . . . . . 306 308 465 457 429 432Global Services . . . . . . . . . . . . . . . . . . 291 291 309 307 316 331
Total reportable segments . . . . . . . . . . . 2,318 2,326 2,682 2,718 2,895 2,866Other . . . . . . . . . . . . . . . . . . . . . . . . . . 64 64 62 62 60 60
Total revenues . . . . . . . . . . . . . . . . . . . $2,382 $2,390 $2,744 $2,780 $2,955 $2,926
Management EBTMobility and Converged Core
Networks . . . . . . . . . . . . . . . . . . . . . $ 72 $ 75 $ 110 $ 99 $ 109 $ 113Enterprise Solutions . . . . . . . . . . . . . . . (56) (41) (68) (57) (6) (18)Metro Ethernet Networks . . . . . . . . . . . (32) (26) 50 41 13 21Global Services . . . . . . . . . . . . . . . . . . 89 89 93 90 89 100
Total reportable segments . . . . . . . . . . . 73 97 185 173 205 216Other . . . . . . . . . . . . . . . . . . . . . . . . . . (232) (262) (225) (229) (240) (211)
Total Management EBT . . . . . . . . . . . . (159) (165) (40) (56) (35) 5
Amortization of intangibles. . . . . . . . . . (5) (5) (6) (6) (8) (8)In-process research and development
expense . . . . . . . . . . . . . . . . . . . . . . — — (16) (16) — —Special charges . . . . . . . . . . . . . . . . . . (5) (5) (45) (49) (25) (22)Gain (loss) on sale of businesses and
assets . . . . . . . . . . . . . . . . . . . . . . . . 35 39 (10) (12) 16 15Shareholder litigation settlement
expense (recovery) . . . . . . . . . . . . . . (19) (19) 510 510 (38) (38)Income tax benefit (expense) . . . . . . . . (23) (25) (27) (29) (9) (15)
Net earnings (loss) from continuingoperations. . . . . . . . . . . . . . . . . . . . . $ (176) $ (180) $ 366 $ 342 $ (99) $ (63)
(i) During the third quarter of 2006, Nortel changed its reportable segments. The third quarter of 2006 and the related 2005 comparatives hadbeen previously reported under the new reportable segments. Nortel did not previously report quarterly financial data for the first twoquarters of 2006 reflecting its new reportable segments. These amounts have been reclassified to conform to the new reportable segments.
185
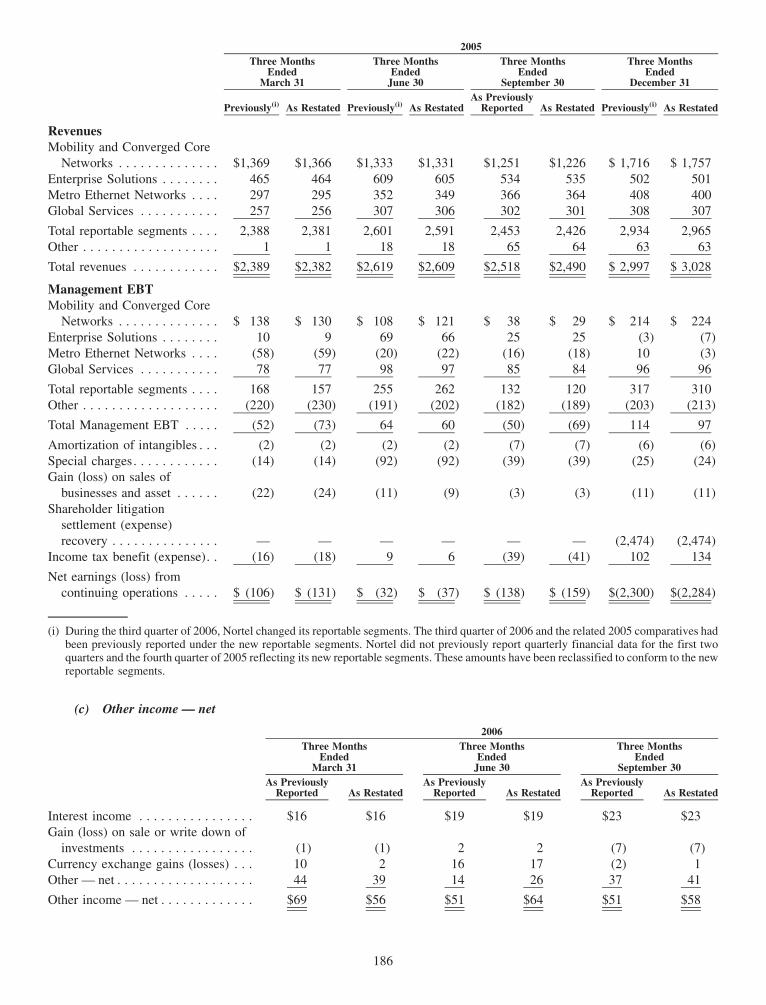
Previously(i) As Restated Previously(i) As RestatedAs Previously
Reported As Restated Previously(i) As Restated
Three MonthsEnded
March 31
Three MonthsEnded
June 30
Three MonthsEnded
September 30
Three MonthsEnded
December 31
2005
RevenuesMobility and Converged Core
Networks . . . . . . . . . . . . . . $1,369 $1,366 $1,333 $1,331 $1,251 $1,226 $ 1,716 $ 1,757Enterprise Solutions . . . . . . . . 465 464 609 605 534 535 502 501Metro Ethernet Networks . . . . 297 295 352 349 366 364 408 400Global Services . . . . . . . . . . . 257 256 307 306 302 301 308 307
Total reportable segments . . . . 2,388 2,381 2,601 2,591 2,453 2,426 2,934 2,965Other . . . . . . . . . . . . . . . . . . . 1 1 18 18 65 64 63 63
Total revenues . . . . . . . . . . . . $2,389 $2,382 $2,619 $2,609 $2,518 $2,490 $ 2,997 $ 3,028
Management EBTMobility and Converged Core
Networks . . . . . . . . . . . . . . $ 138 $ 130 $ 108 $ 121 $ 38 $ 29 $ 214 $ 224Enterprise Solutions . . . . . . . . 10 9 69 66 25 25 (3) (7)Metro Ethernet Networks . . . . (58) (59) (20) (22) (16) (18) 10 (3)Global Services . . . . . . . . . . . 78 77 98 97 85 84 96 96
Total reportable segments . . . . 168 157 255 262 132 120 317 310Other . . . . . . . . . . . . . . . . . . . (220) (230) (191) (202) (182) (189) (203) (213)
Total Management EBT . . . . . (52) (73) 64 60 (50) (69) 114 97
Amortization of intangibles . . . (2) (2) (2) (2) (7) (7) (6) (6)Special charges. . . . . . . . . . . . (14) (14) (92) (92) (39) (39) (25) (24)Gain (loss) on sales of
businesses and asset . . . . . . (22) (24) (11) (9) (3) (3) (11) (11)Shareholder litigation
settlement (expense)recovery . . . . . . . . . . . . . . . — — — — — — (2,474) (2,474)
Income tax benefit (expense). . (16) (18) 9 6 (39) (41) 102 134
Net earnings (loss) fromcontinuing operations . . . . . $ (106) $ (131) $ (32) $ (37) $ (138) $ (159) $(2,300) $(2,284)
(i) During the third quarter of 2006, Nortel changed its reportable segments. The third quarter of 2006 and the related 2005 comparatives hadbeen previously reported under the new reportable segments. Nortel did not previously report quarterly financial data for the first twoquarters and the fourth quarter of 2005 reflecting its new reportable segments. These amounts have been reclassified to conform to the newreportable segments.
(c) Other income — net
As PreviouslyReported As Restated
As PreviouslyReported As Restated
As PreviouslyReported As Restated
Three MonthsEnded
March 31
Three MonthsEnded
June 30
Three MonthsEnded
September 30
2006
Interest income . . . . . . . . . . . . . . . . $16 $16 $19 $19 $23 $23Gain (loss) on sale or write down of
investments . . . . . . . . . . . . . . . . . (1) (1) 2 2 (7) (7)Currency exchange gains (losses) . . . 10 2 16 17 (2) 1Other — net . . . . . . . . . . . . . . . . . . . 44 39 14 26 37 41
Other income — net . . . . . . . . . . . . . $69 $56 $51 $64 $51 $58
186

As PreviouslyReported As Restated
As PreviouslyReported As Restated
As PreviouslyReported As Restated
Three MonthsEnded
March 31
Three MonthsEnded
June 30
Three MonthsEnded
September 30
2005
Interest income . . . . . . . . . . . . . . . . $14 $16 $15 $17 $16 $18Gain (loss) on sale or write down of
investments . . . . . . . . . . . . . . . . . (5) (5) 21 21 — —Currency exchange gains (losses) . . . 28 26 19 16 16 17Other — net . . . . . . . . . . . . . . . . . . . 17 16 19 19 21 21
Other income — net . . . . . . . . . . . . . $54 $53 $74 $73 $53 $56
(d) Accounts receivable — net:
As PreviouslyReported As Restated
As PreviouslyReported As Restated
As PreviouslyReported As Restated
March 31, 2006 June 30, 2006 September 30, 2006
Trade receivables . . . . . . . . $2,044 $2,044 $2,076 $2,122 $2,237 $2,310Notes receivable . . . . . . . . 69 4 208 164 165 91Contracts in process. . . . . . 600 621 602 616 500 496
2,713 2,669 2,886 2,902 2,902 2,897Less: provision for
doubtful accounts . . . . . . (93) (100) (101) (106) (98) (102)
Accounts receivable —net. . . . . . . . . . . . . . . . . $2,620 $2,569 $2,785 $2,796 $2,804 $2,795
(e) Inventories — net:
As PreviouslyReported As Restated
As PreviouslyReported As Restated
As PreviouslyReported As Restated
March 31, 2006 June 30, 2006 September 30, 2006
Raw materials . . . . . . . . . . $ 781 $ 786 $ 744 $ 782 $ 772 $ 772Work in progress . . . . . . . . 56 54 44 16 8 8Finished goods . . . . . . . . . 856 858 894 906 790 788Deferred costs . . . . . . . . . . 2,110 2,157 2,153 2,191 2,050 2,094
3,803 3,855 3,835 3,895 3,620 3,662Less: provision for
inventory . . . . . . . . . . . . (1,033) (1,032) (1,070) (1,069) (1,067) (1,067)
Inventories — net. . . . . . . . 2,770 2,823 2,765 2,826 2,553 2,595Less: long term deferred
costs . . . . . . . . . . . . . . . (786) (526) (730) (460) (719) (456)
Current inventories —net. . . . . . . . . . . . . . . . . $ 1,984 $ 2,297 $ 2,035 $ 2,366 $ 1,834 $ 2,139
187
REPORT OF INDEPENDENT REGISTERED CHARTERED ACCOUNTANTS
To the Shareholders and Board of Directors of Nortel Networks Corporation
We have audited the consolidated financial statements of Nortel Networks Corporation and subsidiaries (“Nortel”) as ofDecember 31, 2006 and 2005 and for each of the three years in the period ended December 31, 2006, management’sassessment of the effectiveness of Nortel’s internal control over financial reporting as of December 31, 2006 and theeffectiveness of Nortel’s internal control over financial reporting as of December 31, 2006, and have issued our reportsthereon dated March 15, 2007 (which report on the consolidated financial statements expressed an unqualified opinion,includes an explanatory paragraph relating to the restatement of the consolidated financial statements as of December 31,2005 and for the years ended December 31, 2005 and 2004, and includes a separate report titled Comments byIndependent Registered Chartered Accountants on Canada-United States of America Reporting Difference referring tochanges in accounting principles that have a material effect on the comparability of the financial statements; and whichreport on the effectiveness of Nortel’s internal control over financial reporting expressed an unqualified opinion onmanagement’s assessment of the effectiveness of Nortel’s internal control over financial reporting and an adverse opinionon the effectiveness of Nortel’s internal control over financial reporting because of a material weakness); suchconsolidated financial statements and reports are included elsewhere in this Form 10-K and are incorporated herein byreference. Our audits also included the consolidated financial statement schedule of Nortel listed in Item 15. Thisconsolidated financial statement schedule is the responsibility of Nortel’s management. Our responsibility is to express anopinion based on our audits. In our opinion, such consolidated financial statement schedule, when considered in relationto the basic consolidated financial statements taken as a whole, presents fairly, in all material respects, the information setforth therein.
The consolidated financial statement schedule of Nortel as of December 31, 2005 and 2004 and for the years endedDecember 31, 2005 and 2004 has been restated. We therefore withdraw our previous report dated April 28, 2006 on thatfinancial statement schedule, as originally filed.
/s/ Deloitte & Touche LLP
Independent Registered Chartered Accountants
Toronto, CanadaMarch 15, 2007
188