Embed Size (px)
Citation preview

2006-2007 Statistics
Extension Youth Enrollment
Nancy Mordhorst, Program Coordinator
Washington State University Extension
February 2008
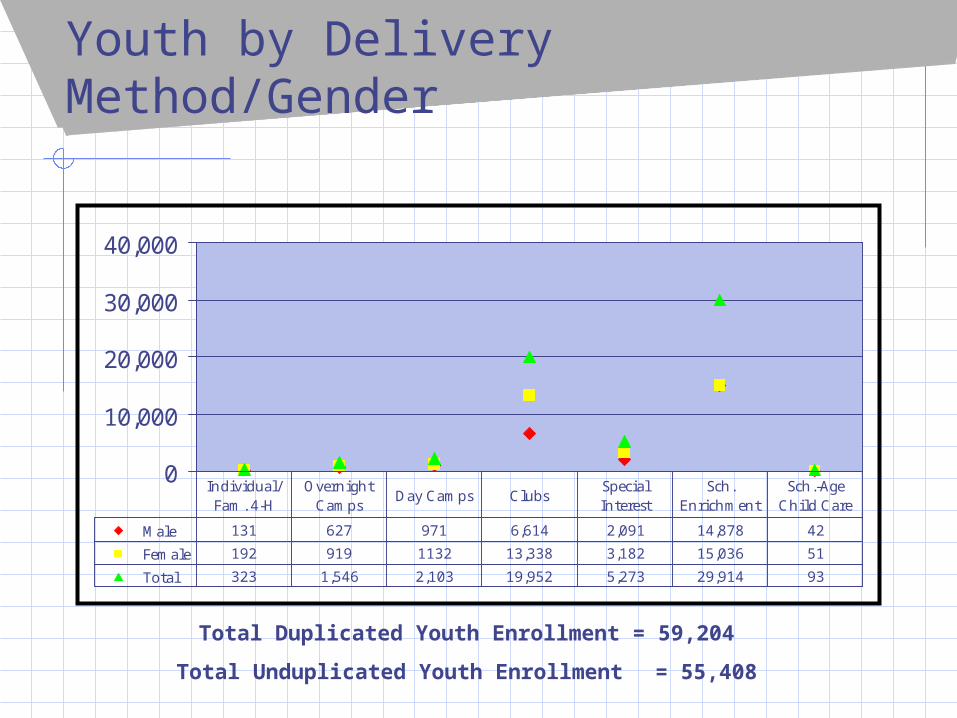
Youth by Delivery Method/Gender
0
10,000
20,000
30,000
40,000
Male 131 627 971 6,614 2,091 14,878 42
Female 192 919 1132 13,338 3,182 15,036 51
Total 323 1,546 2,103 19,952 5,273 29,914 93
Individual/ Fam. 4-H
Overnight Camps
Day Camps ClubsSpecial Interest
Sch. Enrichment
Sch.-Age Child Care
Total Duplicated Youth Enrollment = 59,204
Total Unduplicated Youth Enrollment = 55,408

Youth by Residence
0
5,000
10,000
15,000
20,000
25,000
4-H Youth 4,495 20,855 16,352 5,321 8,385
FarmTowns <10,000
Towns <50,000
Suburbs >50,000
Cities >50,000

Youth by Ethnic Distribution
13%
5%
5%6% 1%
70%
WhiteHispanicBlackAsian/Pac.I.Am. Ind.Other
White Hispanic Black Asian/Pac. Is.
Am. Ind.
Other
38,524 7,294 3,044
2,834 3,422 290
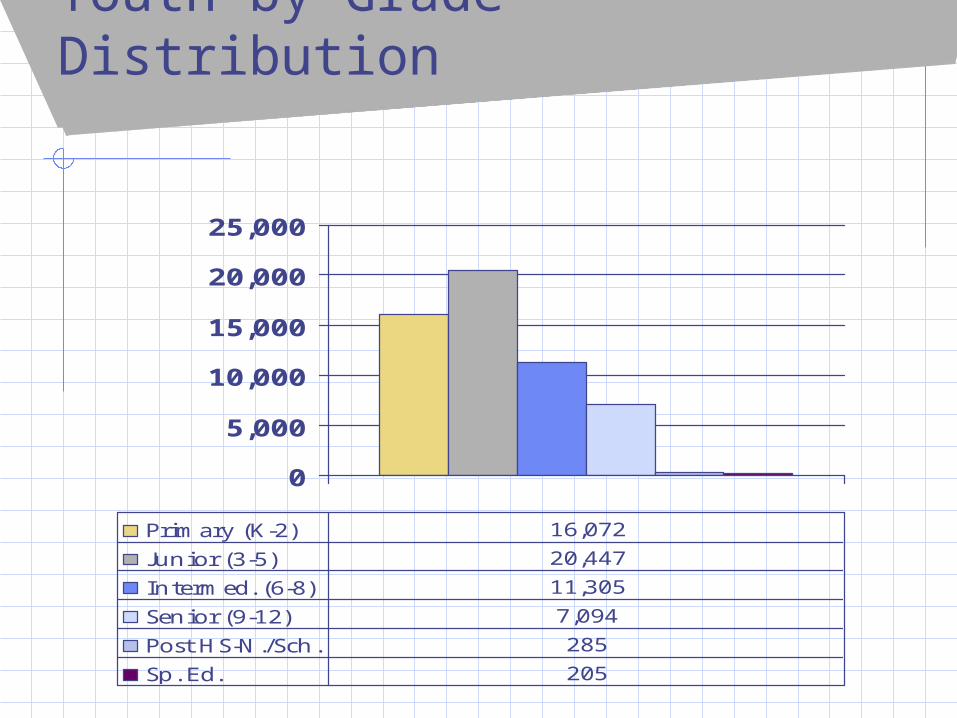
Youth by Grade Distribution
0
5,000
10,000
15,000
20,000
25,000
Primary (K-2) 16,072
Junior (3-5) 20,447
Intermed. (6-8) 11,305
Senior (9-12) 7,094
Post HS-N./Sch. 285
Sp. Ed. 205

Animal Science28%
Expressive Arts11%
Plant Science5%
Social Science6%
Engr. & Tech.3%
Interdisciplinary9%
Family Living32%
Envir. Steward.6%
Youth Project Enrollments
Total Youth Projects = 103,438
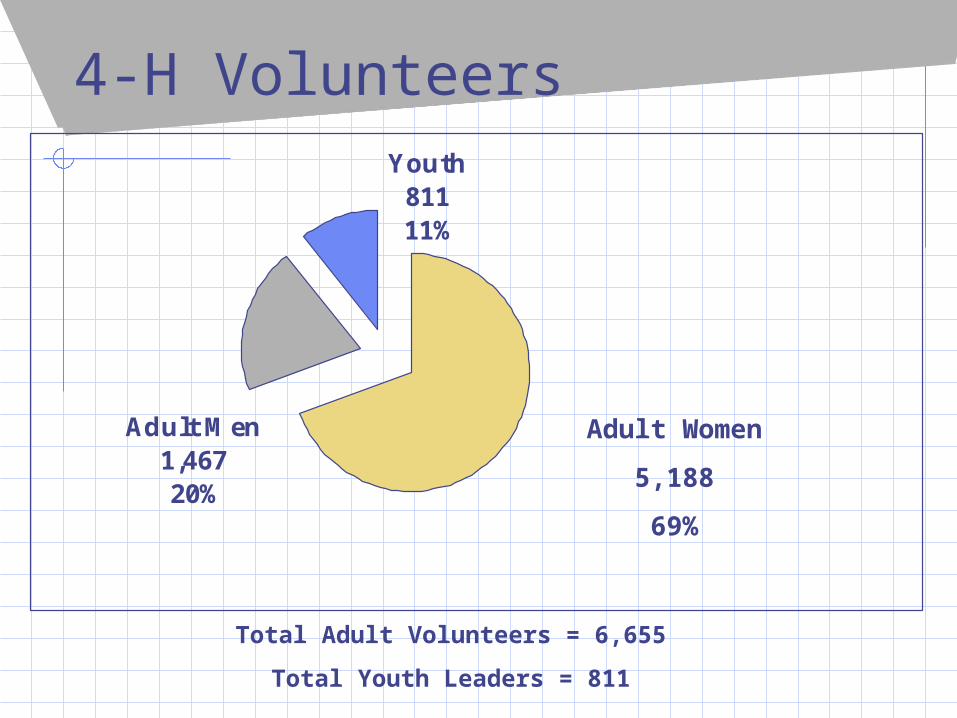
4-H VolunteersYouth811 11%
Adult Men1,467 20%
Total Adult Volunteers = 6,655
Total Youth Leaders = 811
Adult Women
5,188
69%
![Gr ninger Buchholz SI revised.docx) · Supplemental Information Chorismatases – the family is growing Mads J. Grüninger, [a,§] Patrick C. F. Buchholz, [b,§] Silja Mordhorst,](https://img.pdfslide.us/doc/110x75/603d539d66db4e10714a8e92/gr-ninger-buchholz-si-supplemental-information-chorismatases-a-the-family-is.jpg)


![Texas A&M AgriLIFE Extension Service · 2019-12-17 · Training Rep], Deb Rucker [barely visible behind Nancy], Michele Rawleigh, Dooley Rucker, Front next to Nancy: Barbara Beane,](https://img.pdfslide.us/doc/110x75/5ecfb92122a8b704ef773fcc/texas-am-agrilife-extension-service-2019-12-17-training-rep-deb-rucker.jpg)