Embed Size (px)
Citation preview

2005 Marketing and Outlook
February 2, 2005
Food and Agricultural Policy Research Institute
www.fapri.missouri.edu


Gas Fuels Price Index
0%
50%
100%
150%
200%
250%
300%
1996:1 1998:1 2000:1 2002:1 2004:1 2006:1 2008:1
Ind
ex (
1982
= 1
00)
Source: Global Insight

Interest Rates
0.00
1.00
2.00
3.00
4.00
5.00
6.00
7.00
8.00
9.00
1996:1 1998:1 2000:1 2002:1 2004:1 2006:1 2008:1
Per
cen
t
3-Month Treasury Bill 30-Year Conventional Fixed
Source: Global Insight
Corn outlook

U.S. Corn Supply and Utilization
FAPRI estimates USDA
02/03* 03/04* 04/05** 05/06** 04/05*
Area (Million Acres) Planted area 78.9 78.7 80.9 81.0 80.9 Harvested area 69.3 71.1 73.6 73.4 73.6
Yield (Bushels per Acre) Actual 129.3 142.2 160.4 146.2 160.4
(Million Bushels) Supply 10,578 11,214 12,780 12,693 12,780 Beginning stocks 1,596 1,087 958 1,941 958 Production 8,967 10,114 11,807 10,737 11,807 Imports 14 13 15 15 15
Domestic use 7,903 8,356 8,889 8,886 8,870 Feed and residual 5,563 5,781 6,077 5,934 6,075 Food, seed and industrial 2,340 2,575 2,812 2,952 2,795
Exports 1,588 1,900 1,950 2,194 1,950
Total use 9,491 10,256 10,839 11,080 10,820
Ending stocks 1,087 958 1,941 1,613 1,960
Stock-to-use ratio 11.4% 9.3% 17.9% 14.6% 18.1%
Prices (Dollars Per Bushel) Farm price 2.32 2.42 1.94 2.13 1.95 LDP Rate 0.00 0.01 0.24 0.02 CCP Rate 0.00 0.00 0.40 0.22
*Source: USDA's World Ag Supply and Demand Estimates, January 2005
**FAPRI January 2005 Estimates

Corn Feed & Residual Use and Corn Production
0
1,000
2,000
3,000
4,000
5,000
6,000
7,000
0 2,000 4,000 6,000 8,000 10,000 12,000 14,000
Corn Production (Million Bushels)
Fee
d a
nd
Res
idu
al U
se
(Mil
lio
n B
ush
els)
2004/05 level
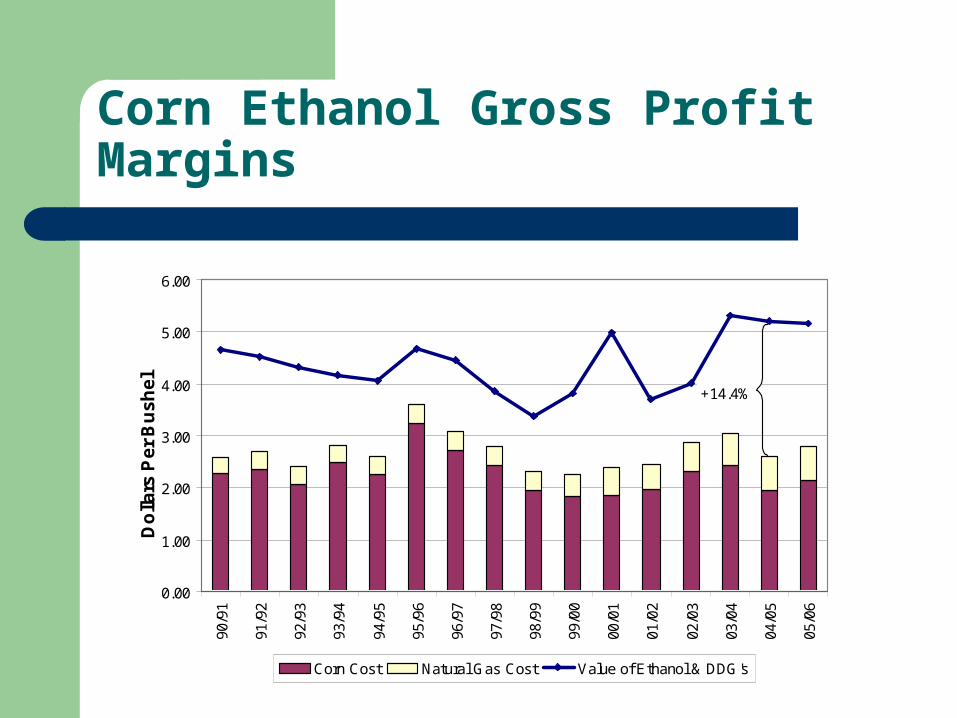
Corn Ethanol Gross Profit Margins
0.00
1.00
2.00
3.00
4.00
5.00
6.00
90/9
1
91/9
2
92/9
3
93/9
4
94/9
5
95/9
6
96/9
7
97/9
8
98/9
9
99/0
0
00/0
1
01/0
2
02/0
3
03/0
4
04/0
5
05/0
6
Do
llars
Pe
r B
us
he
l
Corn Cost Natural Gas Cost Value of Ethanol & DDG's
+14.4%
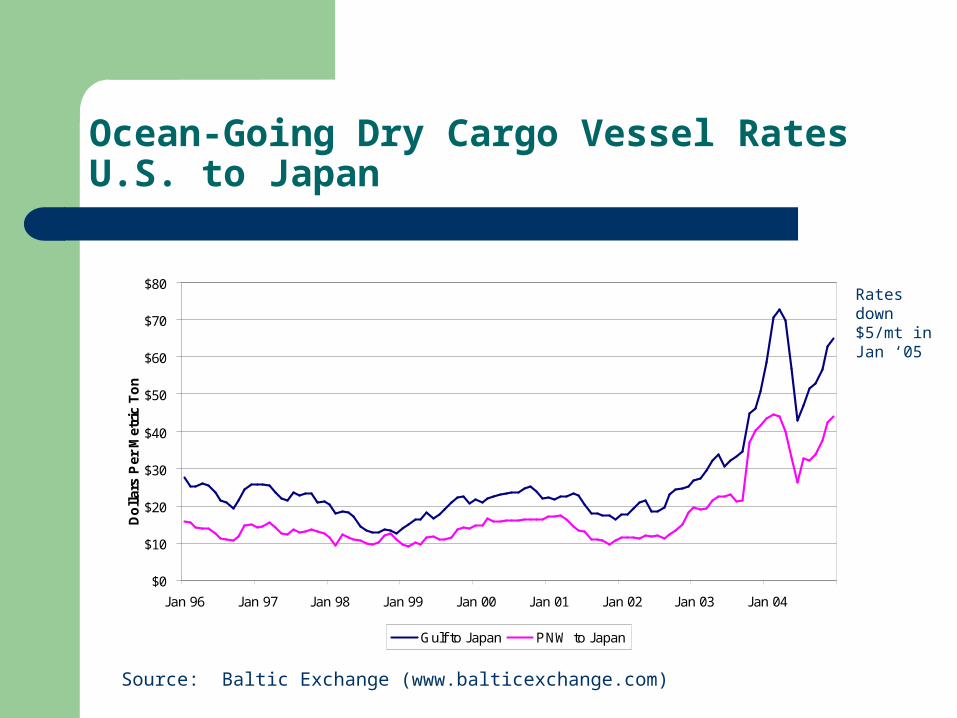
Ocean-Going Dry Cargo Vessel RatesU.S. to Japan
Source: Baltic Exchange (www.balticexchange.com)
$0
$10
$20
$30
$40
$50
$60
$70
$80
Jan 96 Jan 97 Jan 98 Jan 99 Jan 00 Jan 01 Jan 02 Jan 03 Jan 04
Do
llar
s P
er M
etri
c T
on
Gulf to Japan PNW to Japan
Rates down $5/mt in Jan ‘05
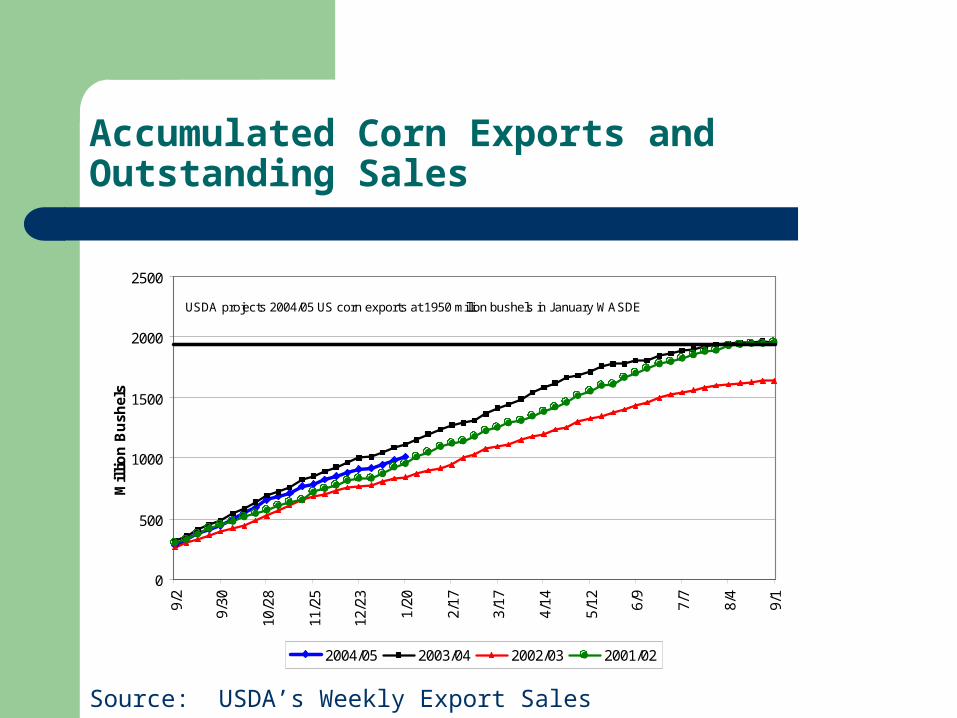
Accumulated Corn Exports and Outstanding Sales
Source: USDA’s Weekly Export Sales Report
0
500
1000
1500
2000
2500
9/2
9/30
10/2
8
11/2
5
12/2
3
1/20
2/17
3/17
4/14
5/12 6/9
7/7
8/4
9/1
Mil
lio
n B
ush
els
2004/05 2003/04 2002/03 2001/02
USDA projects 2004/05 US corn exports at 1950 million bushels in January WASDE

U.S. Corn Exports By Destination in 2003/04
Japan, 575 mil bu
Canada 79 mil bu
Mexico, 216 mil bu
Israel, 46 mil buS. Korea, 144 mil bu
Columbia, 66 mil bu
Total U.S. Corn Exports in 2003/04: 1.897 billion bu.The listed countries account for 80% of U.S. corn exports.
Source: USDA/ERS/FATUS, WASDE – November 2004
Algeria, 50 mil bu
Taiwan, 185 mil bu
Egypt, 125 mil bu
Others, 411 mil bu
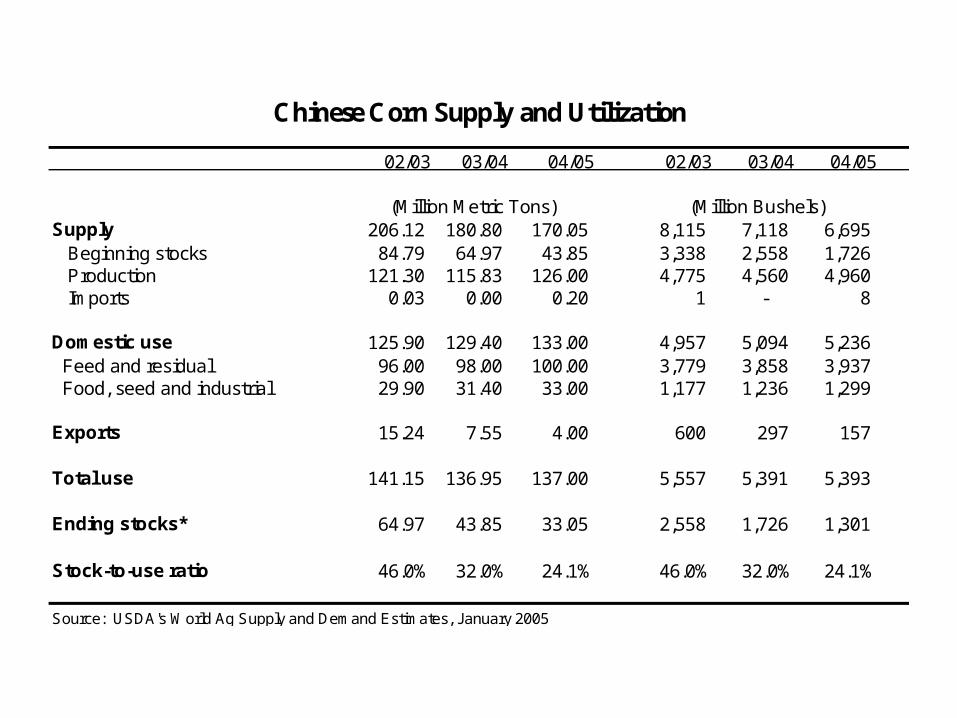
Chinese Corn Supply and Utilization
02/03 03/04 04/05 02/03 03/04 04/05
(Million Metric Tons) (Million Bushels)Supply 206.12 180.80 170.05 8,115 7,118 6,695 Beginning stocks 84.79 64.97 43.85 3,338 2,558 1,726 Production 121.30 115.83 126.00 4,775 4,560 4,960 Imports 0.03 0.00 0.20 1 - 8
Domestic use 125.90 129.40 133.00 4,957 5,094 5,236 Feed and residual 96.00 98.00 100.00 3,779 3,858 3,937 Food, seed and industrial 29.90 31.40 33.00 1,177 1,236 1,299
Exports 15.24 7.55 4.00 600 297 157
Total use 141.15 136.95 137.00 5,557 5,391 5,393
Ending stocks* 64.97 43.85 33.05 2,558 1,726 1,301
Stock-to-use ratio 46.0% 32.0% 24.1% 46.0% 32.0% 24.1%
Source: USDA's World Ag Supply and Demand Estimates, January 2005

U.S. and China Net Corn Trade
-500
0
500
1000
1500
2000
2500
3000
89/9
0
90/9
1
91/9
2
92/9
3
93/9
4
94/9
5
95/9
6
96/9
7
97/9
8
98/9
9
99/0
0
00/0
1
01/0
2
02/0
3
03/0
4
04/0
5
Mil
lio
n B
ush
els
U.S. Net Exports China Net Exports

Argentina Corn Production
0
100
200
300
400
500
600
700
800
900
1990
1991
1992
1993
1994
1995
1996
1997
1998
1999
2000
2001
2002
2003
US
DA
- 2
004
Arg
entin
a -
2004
Mill
ion
Bu
shel
s
Sources: USDA/FAS PSD Estimates 1-28-05 Secretaria de Agricultura, Argentina 1-14-05

Used with permission from Richard Brock and Associates. www.brockreport.com , Phone: 1-800-558-3431

Corn March 2005 Futures


Corn December 2005 Futures
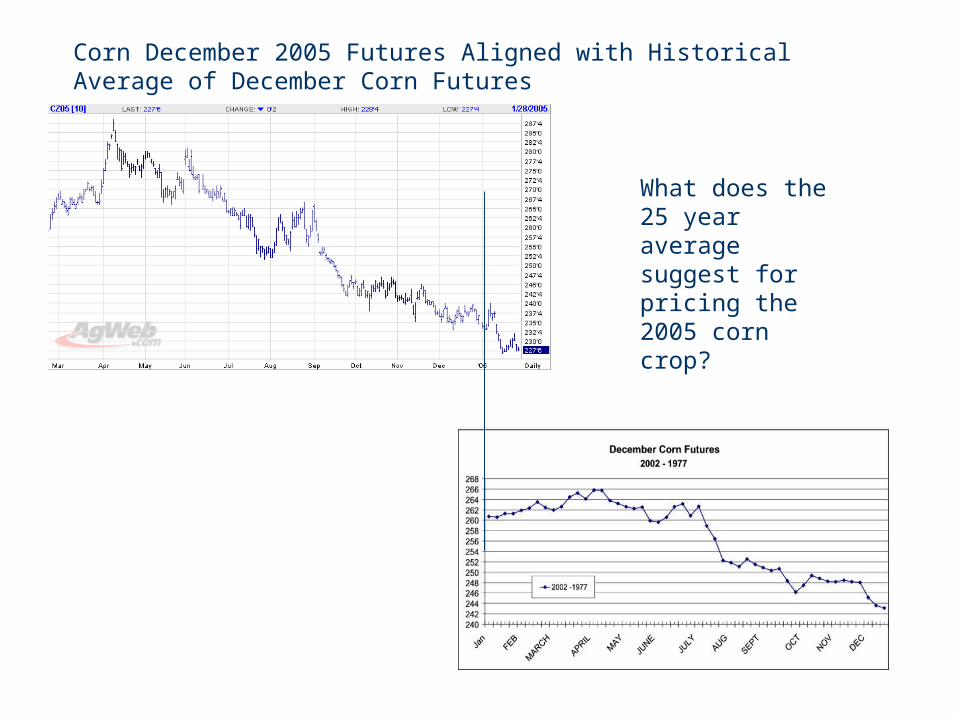
Corn December 2005 Futures Aligned with Historical Average of December Corn Futures
What does the 25 year average suggest for pricing the 2005 corn crop?

Corn Marketing – 2004 Crop
Sellers: If you’ve taken your LDP, but are still storing your crop without any futures
contracts, you have zero downside price protection. A possible trigger point for cash prices may be anything above $2.20 through
March. Weather scares may bring additional opportunities after May. Barring a weather shock or exports shock, prices above $2.40 appear unlikely. The March 31 Planting Intentions report could cause significant movement in
market prices depending on farmer reaction to Asian rust.
Buyers: Some recommending week to week corn purchases. Not much fundamental strength in the market to raise corn prices. Watch exports to and from China carefully.

Corn Marketing – 2005 Crop
Not many clear opportunities available.
Watch for pricing opportunities above $2.50
Program Opportunities– Revenue Assurance
default option - 100% of price, 70% of yield– Additional yield insurance may be as attractive as futures
options, depending on your proven yield level and the variability in yield you have experienced

Estimating the 2004/05 Season Average Farm Price for Corn
USDA est. $1.95
Source: USDA’s “Agricultural Prices”
Percent of Production Marketed
2004/05 Monthly Prices
Rest of the Marketing Year Average
Estimated Season Average Farm Price
$1.50 $1.75Sep 8.3% $2.20 $1.60 $1.81Oct 14.1% $2.15 $1.70 $1.87Nov 11.9% $2.05 $1.80 $1.93Dec 7.6% $1.99 $1.90 $1.98Jan 14.2% $2.00 $2.04Feb 6.2% $2.10 $2.10Mar 6.8% $2.20 $2.16Apr 5.8% $2.30 $2.22May 5.2% $2.40 $2.28Jun 5.9% $2.50 $2.33Jul 7.2% $2.60 $2.39Aug 7.0% $2.70 $2.45
$2.80 $2.51

0.00
0.50
1.00
1.50
2.00
2.50
3.00
3.50
4.00
4.50
0 1000 2000 3000 4000 5000 6000
Ending Stocks (Million Bushels)
Co
rn P
ric
e
(Do
llars
Pe
r B
us
he
l)
95
9683 80
82
8785
86
81
92
88
00
9899
01
84
9303
02 97
89
9094
Estimated 2004/05 ending stocks
Corn Price and Ending StocksMaximum corn price obtained over the Sept – June period
Bottom Line: Difficult to get to corn prices over $2.20 through June

Corn Price Outlook Risks
Upside Price Risks Ethanol demand U.S. feed & residual demand Weaker dollar Falling ocean shipping rates Low world stocks
Downside Price Risks Soybean Rust & Planting
Intentions Chinese exports Argentina exports U.S. Crop
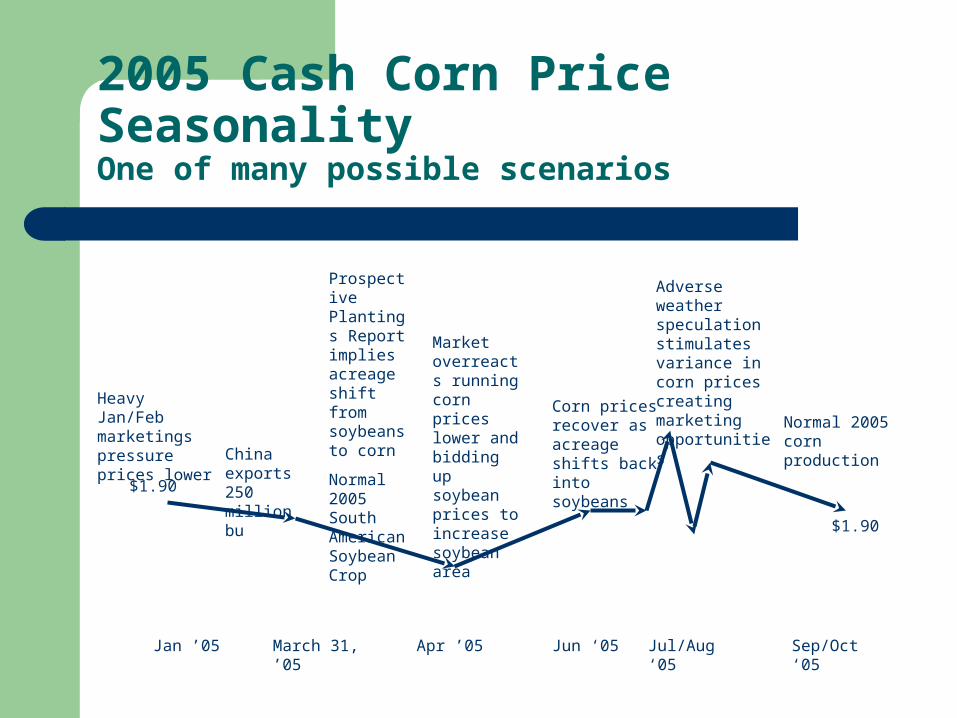
2005 Cash Corn Price Seasonality One of many possible scenarios
Jan ’05
$1.90
March 31, ’05
China exports 250 million bu
Market overreacts running corn prices lower and bidding up soybean prices to increase soybean area
Apr ’05 Jun ‘05
Heavy Jan/Feb marketings pressure prices lower
Corn prices recover as acreage shifts back into soybeans
Adverse weather speculation stimulates variance in corn prices creating marketing opportunities
Jul/Aug ‘05 Sep/Oct ‘05
Normal 2005 corn production
$1.90
Prospective Plantings Report implies acreage shift from soybeans to corn
Normal 2005 South American Soybean Crop

Soybean outlook

Asian Rust
Two types of soybean rust – most aggressive type (Asian rust) found in Missouri, South Carolina, Tennessee, Mississippi, Georgia, Alabama, Louisiana, Arkansas and Florida.
Thought to be transferred to the U.S. via the hurricanes in 2004.
Soybean rust is a fungus that is transferred via the wind and can survive and propagate on numerous host plants.
Soybean rust does not thrive in cold climates and may not be able to over winter in the northern states.
Ample supply of fungicides – 7 registered products, 6 additional products approved under EPA emergency exemptions.
Treatment cost of $15 - $30/acre, two treatments may be needed. USDA estimates $20 on average per treatment.
Extension personnel planning to use Sentinel plots with early soybeans as an early warning indicator of the presence of Asian rust.

Soybean Rust Locations

U.S. Soybean Supply and Utilization
FAPRI estimates USDA
02/03* 03/04* 04/05** 05/06** 04/05*
Area (Million Acres) Planted area 74.0 73.4 75.2 72.9 75.2 Harvested area 72.5 72.5 74.0 71.6 74.0
Yield (Bushels per Acre) Actual 38.0 33.9 42.5 39.3 42.5
(Million Bushels) Supply 2969 2638 3258 3245 3258 Beginning stocks 208 178 112 422 112 Production 2756 2454 3141 2817 3141 Imports 5 6 5 5 5
Domestic use 1747 1641 1825 1885 1813 Crush 1615 1530 1670 1734 1660 Seed and residual 132 111 155 151 153
Exports 1044 885 1011 967 1010
Total use 2791 2526 2836 2853 2823
Ending stocks 178 112 422 392 435
Stock-to-use ratio 6.4% 4.4% 14.9% 13.7% 15.4%
Prices (Dollars Per Bushel) Farm price 5.53 7.34 5.10 4.72 5.10 LDP Rate 0.01 0.00 0.14 0.50 CCP Rate 0.00 0.00 0.26 0.36
Source: USDA's World Ag Supply and Demand Estimates, January 2005**FAPRI January 2005 Estimates

U.S. Soybean Crush By Month
Source: U.S. Census Bureau
100
110
120
130
140
150
160
Sept
embe
r
Oct
ober
Nove
mbe
r
Dece
mbe
r
Jan
uary
Feb
ruar
y
Mar
ch A
pril
May
Jun
e J
uly
Augu
st
Mill
ion
Bu
shel
s
2001/02 2002/03 2003/04 2004/05

Soybean Crush and Gross Crush Margin
Sources: USDA’s Grain and Feed Market News and U.S. Census Bureau
100
110
120
130
140
150
160
Se
p-9
8
Jan
-99
Ma
y-9
9
Se
p-9
9
Jan
-00
Ma
y-0
0
Se
p-0
0
Jan
-01
Ma
y-0
1
Se
p-0
1
Jan
-02
Ma
y-0
2
Se
p-0
2
Jan
-03
Ma
y-0
3
Se
p-0
3
Jan
-04
Ma
y-0
4
Se
p-0
4
Jan
-05
Mil
lio
n B
us
he
ls
0.00
0.20
0.40
0.60
0.80
1.00
1.20
1.40
1.60
1.80
2.00
Do
lla
rs P
er
Bu
sh
el
Soybean Crush Soybean Crush Margin

Accumulated Soybean Exports and Outstanding Sales
Source: USDA’s Weekly Export Sales Report
0
200
400
600
800
1000
1200
9/2
9/30
10/2
8
11/2
5
12/2
3
1/20
2/17
3/17
4/14
5/12 6/9
7/7
8/4
9/1
2004/05 2003/04 2002/03 2001/02
USDA January WASDE projects 2004/05 exports to reach 1010 million bushels.
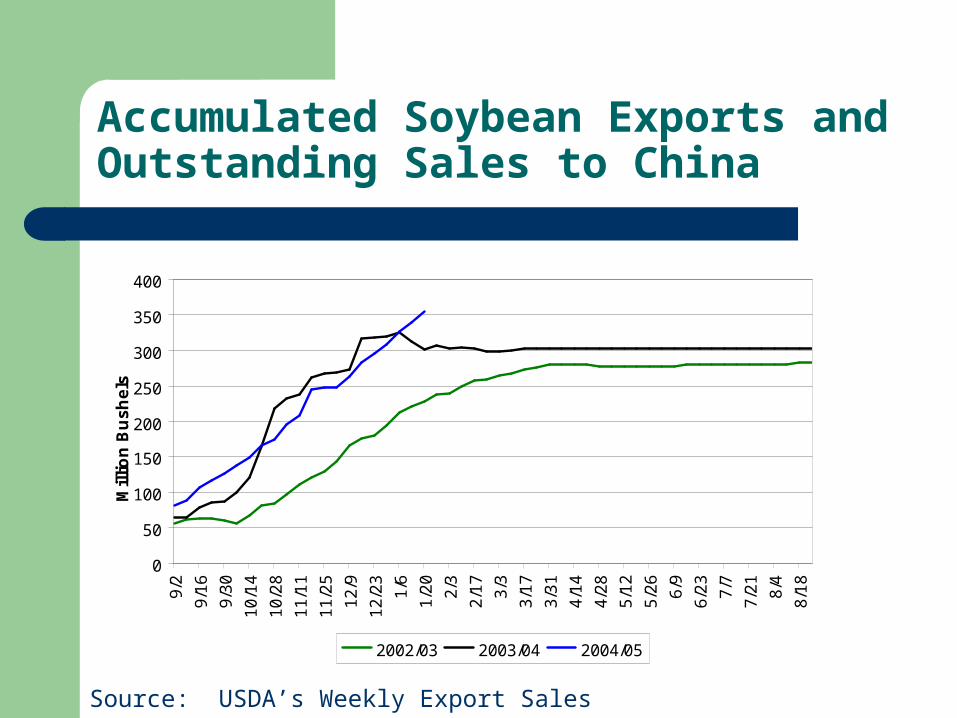
Accumulated Soybean Exports and Outstanding Sales to China
Source: USDA’s Weekly Export Sales Report
0
50
100
150
200
250
300
350
400
9/2
9/1
6
9/3
0
10
/14
10
/28
11
/11
11
/25
12
/9
12
/23
1/6
1/2
0
2/3
2/1
7
3/3
3/1
7
3/3
1
4/1
4
4/2
8
5/1
2
5/2
6
6/9
6/2
3
7/7
7/2
1
8/4
8/1
8
Mil
lio
n B
us
he
ls
2002/03 2003/04 2004/05

U.S. Soybean Exports By Destination in 2003/04
Japan, 131 mil bu
Canada 22 mil bu
Mexico, 117 mil bu
S. Korea, 42 mil bu
Total U.S. Soybean Exports in 2003/04: 885 million bu.The listed countries account for 92% of U.S. soybean exports.
Source: USDA/ERS/FATUS, WASDE – November 2004
Spain, 33 mil bu
Others, 73 mil bu
China: Mainland, 327 mil bu Taiwan, 50 mil bu
Indonesia, 40 mil bu
Germany, 28 mil bu
The Netherlands, 22 mil bu

Update on Brazilian Crop Size
2003 2004 2005 2004 - 2005Final Final Projections Percent Change
------------ million metric tons -----------Brazil Ministry of Ag, CONAB, Dec '04 52.0 49.8 61.4 23.4%Brazilian Crushers, ABIOVE, Nov '04 51.9 50.8 61.5 21.1%USDA, Dec '04 52.0 52.6 64.5 22.6%

USDA est. $5.10
Estimating the 2004/05 Season Average Farm Price for Soybeans
Source: USDA’s “Agricultural Prices”
Percent of Production Marketed
2004/05 Monthly Prices
Rest of the Marketing Year Average
Estimated Season Average Farm Price
$3.75 $4.62Sep 7.0% $5.84 $4.00 $4.75Oct 23.9% $5.56 $4.25 $4.88Nov 9.7% $5.36 $4.50 $5.00Dec 8.2% $5.41 $4.75 $5.13Jan 15.3% $5.00 $5.26Feb 7.0% $5.25 $5.39Mar 7.1% $5.50 $5.52Apr 5.4% $5.75 $5.65May 4.5% $6.00 $5.77Jun 3.9% $6.25 $5.90Jul 4.6% $6.50 $6.03Aug 3.6% $6.75 $6.16
$7.00 $6.29

2005 Cash Soybean Price Seasonality One of many possible scenarios
Jan ’05
$5.30
Feb/Mar ’05
Normal South American Production
Market overreacts running corn prices lower and bidding up soybean prices to increase soybean area
Apr ’05 Jun ‘05
Soybean prices fall as acreage shifts back into soybeans
Adverse weather and Asian Rust speculation stimulates variance in soybean prices creating marketing opportunities
Jul/Aug ‘05 Sep/Oct ‘05
Normal 2005 soybean production, minimal Asian Rust Impact
$4.50
Prospective Plantings Report implies acreage shift from soybeans to corn

Soybean March 2005 Futures
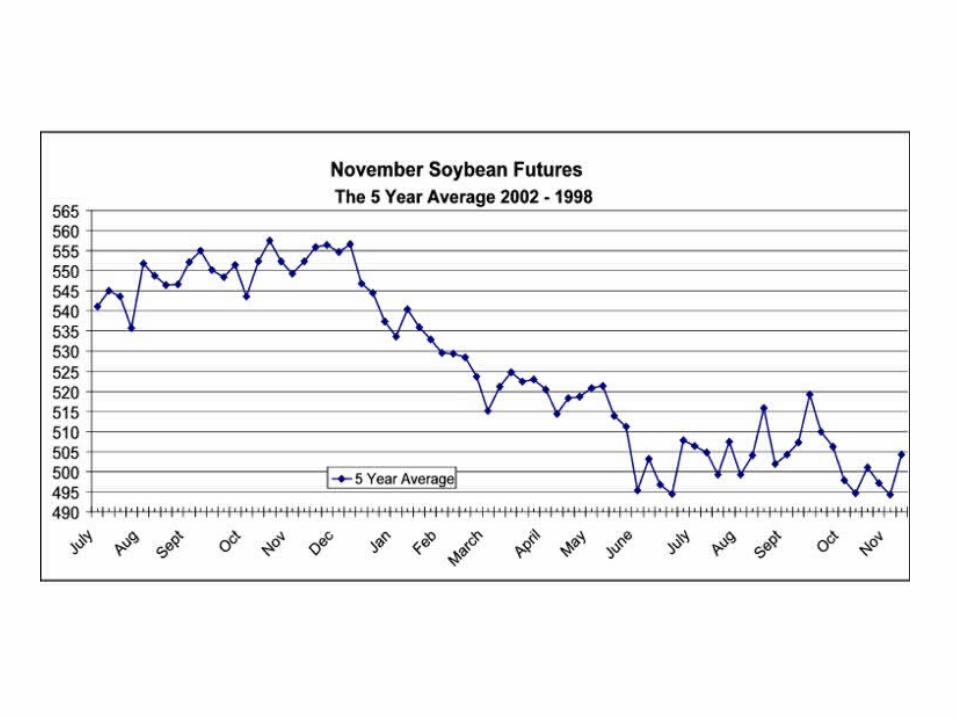

Soybean November 2005 Futures

Soybean November 2005 Futures Aligned with Historical Average of November Soybean Futures
What does the 5 year average suggest for pricing the 2005 soybean crop?

Soybean Prices and 2005 Marketing
0.00
2.00
4.00
6.00
8.00
10.00
12.00
Jan 80 Jan 82 Jan 84 Jan 86 Jan 88 Jan 90 Jan 92 Jan 94 Jan 96 Jan 98 Jan 00 Jan 02 Jan 04
Do
llars
Per
Bu
shel
U.S . P ric e Mis s ouri P ric e
5.47
6.22
O b jec t ive is to m arke t soybeansin the top third o f the p r ice range , but it 's no t a lw ays poss ib le .
A vo id m arke t ing soybeansin the bo ttom third o f the p r ice range w heneve r poss ib le .

Soybean Price Outlook Risks
Upside Price Risks Asian rust Harvesting losses Domestic crush
demand Weaker dollar Falling ocean shipping
rates
Downside Price Risks South American crop
size Chinese imports U.S. Crop

Soybean Marketing – 2004 Crop
Sellers: Very few opportunities to collect LDP’s so far, but assuming the large
projected South American crop is realized, additional opportunities may be available in Feb/Mar.
Soybean Meal Buyers: When meal prices edge below $160 per ton, it may be a good time to
consider some pricing options. Prices could be lower in the Feb/Mar timeframe with the South American crop.
Watch out for possible movement in soybean and soybean meal prices after the March 31 Planting Intentions report.

Soybean Marketing – 2005 Crop
Watch for volatility in bean prices with the South American crop and Asian rust and its impacts on planting intentions.
A November 2005 soybean futures above $5.70 may represent a good marketing opportunity to price some 2005 soybeans.
Do not speculate on a low U.S. soybean crop next year due to soybean rust.
Wheat Outlook

U.S. Wheat Supply and Utilization
FAPRI estimates USDA
02/03* 03/04* 04/05** 05/06** 04/05*
Area (Million Acres) Planted area 60.3 62.1 59.7 58.1 59.7 Harvested area 45.8 53.1 50.0 48.9 50.0
Yield (Bushels per Acre) Actual 35.0 44.2 43.2 41.6 43.2
(Million Bushels) Supply 2468 2909 2770 2688 2770 Beginning stocks 777 491 546 579 546 Production 1606 2345 2158 2034 2158 Imports 85 72 65 75 65
Domestic use 1126 1202 1191 1197 1187 Food 923 911 910 919 910 Seed 83 80 79 80 77 Feed and residual 120 211 202 198 200
Exports 850 1159 1000 902 1000
Total use 1977 2362 2191 2098 2187
Ending stocks 491 547 579 590 583
Stock-to-use ratio 24.8% 23.2% 26.4% 28.1% 26.7%
Prices (Dollars Per Bushel) Farm price 3.56 3.40 3.35 3.21 3.35 LDP Rate 0.01 0.04 0.03 0.00 CCP Rate 0.00 0.00 0.05 0.19
*Source: USDA's World Ag Supply and Demand Estimates, January 2005**FAPRI January 2005 Estimates

2005 Winter Wheat Planting
2004 2005 Change ------ mil. acres ------
Soft Red Winter Wheat 8.2 6.6 -19%Hard Red Winter Wheat 30.7 30.3 -1%White Winter Wheat 4.5 4.7 4%Source: "Winter Wheat Seedings" Report & Small Grains SummaryNote that the winter wheat acreage distribution is slightly different
than the distribution reported in the "Winter Wheat Seedings" report.

U.S. Wheat Accumulated Sales and Exports
0
200
400
600
800
1000
1200
6/3/
2004
7/1/
2004
7/29
/200
4
8/26
/200
4
9/23
/200
4
10/2
1/20
04
11/1
8/20
04
12/1
6/20
04
1/13
/200
5
2/10
/200
5
3/10
/200
5
4/7/
2005
5/5/
2005
6/2/
2005
Mil
lio
n B
ush
els
2004/05 2003/04 2002/03 2001/02
USDA projects US wheat exports at 1000 million bushels in January WASDE

World Wheat Supply and Use
02/03 03/04 04/05 02/03 03/04 04/05
(Million Metric Tons) (Million Bushels)Supply 876.88 823.05 856.06 32,220 30,242 31,455 Beginning stocks 202.06 167.58 130.91 7,425 6,157 4,810 Production 566.92 552.70 620.89 20,831 20,308 22,814 Imports 107.89 102.76 104.26 3,964 3,776 3,831
Domestic use 601.41 589.38 606.51 22,098 21,656 22,285 Feed and residual 112.67 99.00 108.90 4,140 3,637 4,001 Food, seed and industrial 488.75 490.38 497.61 17,958 18,018 18,284
Exports 108.48 109.82 107.91 3,986 4,035 3,965
Total use 709.89 699.19 714.42 26,084 25,691 26,250
Ending stocks* 167.58 130.91 145.29 6,157 4,810 5,338
Stock-to-use ratio 23.6% 18.7% 20.3% 23.6% 18.7% 20.3%
* Adjusted for differences in world imports and exports.Source: USDA's World Ag Supply and Demand Estimates, January 2005.

China Wheat Supply and Use
02/03 03/04 04/05 02/03 03/04 04/05
(Million Metric Tons) (Million Bushels)Supply 167.30 150.61 141.29 6,586 5,929 5,562 Beginning stocks 76.59 60.38 43.29 3,015 2,377 1,704 Production 90.29 86.49 90.00 3,555 3,405 3,543 Imports 0.42 3.75 8.00 17 148 315
Domestic use 105.20 104.50 102.00 4,142 4,114 4,016 Feed and residual 6.50 6.00 4.00 256 236 157 Food, seed and industrial 98.70 98.50 98.00 3,886 3,878 3,858
Exports 1.72 2.82 1.00 68 111 39
Total use 106.92 107.32 103.00 4,209 4,225 4,055
Ending stocks* 60.38 43.29 38.29 2,377 1,704 1,507
Stock-to-use ratio 56.5% 40.3% 37.2% 56.5% 40.3% 37.2%
Source: USDA's World Ag Supply and Demand Estimates, January 2005

Wheat July 2005 Futures

The 2005 Acreage Decision:What to plant?

Soybean Price $/Bu
3.07 3.37 3.67 3.97 4.27 4.57 4.87 5.17 5.471.90 1.0 4.5 8.0 11.6 15.1 18.6 22.1 25.7 29.22.00 0.2 1.0 1.8 2.6 3.3 4.1 4.9 5.7 6.52.10 0.1 0.6 1.0 1.4 1.9 2.3 2.8 3.2 3.62.20 0.1 0.4 0.7 1.0 1.3 1.6 1.9 2.2 2.52.30 0.1 0.3 0.5 0.8 1.0 1.2 1.5 1.7 1.92.40 0.1 0.2 0.4 0.6 0.8 1.0 1.2 1.4 1.62.50 0.0 0.2 0.4 0.5 0.7 0.8 1.0 1.2 1.32.60 0.0 0.2 0.3 0.5 0.6 0.7 0.9 1.0 1.12.70 0.0 0.2 0.3 0.4 0.5 0.6 0.8 0.9 1.0
* This table is based on 135 bu. corn yield, 45 bu. soybean yield,Corn variable cost of $252.67/acre, and soybean variable cost of $134.44/acre.
Cor
n P
rice
$/B
u
Ratio of Soybean Net Returns to Corn Net Returns - Missouri

With 2 Soybean Rust TreatmentsTable of Breakeven Soybean Prices - Highlighted Areas Correspond to Missouri Conditions
SoybeansVariable Cost 121 134 175
Yield 35 40 45 50 35 40 45 50 35 40 45 50Corn Price
Breakeven Soybean Prices1.9 2.93 2.56 2.28 2.05 3.32 2.90 2.58 2.32 4.47 3.91 3.47 3.132.1 3.56 3.11 2.77 2.49 3.94 3.45 3.07 2.76 5.10 4.46 3.96 3.572.3 4.19 3.66 3.26 2.93 4.57 4.00 3.56 3.20 5.72 5.01 4.45 4.01
1.9 4.29 3.75 3.34 3.00 4.67 4.09 3.63 3.27 5.82 5.10 4.53 4.082.1 5.06 4.43 3.94 3.54 5.44 4.76 4.23 3.81 6.60 5.77 5.13 4.622.3 5.83 5.10 4.54 4.08 6.22 5.44 4.83 4.35 7.37 6.45 5.73 5.16
1.9 5.10 4.46 3.97 3.57 5.49 4.80 4.27 3.84 6.64 5.81 5.16 4.652.1 5.96 5.21 4.64 4.17 6.34 5.55 4.93 4.44 7.50 6.56 5.83 5.252.3 6.82 5.96 5.30 4.77 7.20 6.30 5.60 5.04 8.35 7.31 6.50 5.85
1.9 6.19 5.41 4.81 4.33 6.57 5.75 5.11 4.60 7.72 6.76 6.01 5.412.1 7.16 6.26 5.57 5.01 7.54 6.60 5.87 5.28 8.70 7.61 6.76 6.092.3 8.13 7.11 6.32 5.69 8.52 7.45 6.62 5.96 9.67 8.46 7.52 6.77
1.9 2.21 1.93 1.72 1.55 2.59 2.27 2.02 1.82 3.75 3.28 2.91 2.622.1 2.84 2.48 2.21 1.99 3.22 2.82 2.51 2.26 4.37 3.83 3.40 3.062.3 3.47 3.03 2.70 2.43 3.85 3.37 2.99 2.70 5.00 4.38 3.89 3.50
1.9 3.57 3.12 2.77 2.50 3.95 3.46 3.07 2.77 5.10 4.47 3.97 3.572.1 4.34 3.80 3.37 3.04 4.72 4.13 3.67 3.31 5.87 5.14 4.57 4.112.3 5.11 4.47 3.97 3.58 5.49 4.81 4.27 3.85 6.65 5.82 5.17 4.65
1.9 4.38 3.83 3.41 3.07 4.76 4.17 3.71 3.34 5.92 5.18 4.60 4.142.1 5.24 4.58 4.07 3.67 5.62 4.92 4.37 3.94 6.77 5.93 5.27 4.742.3 6.10 5.33 4.74 4.27 6.48 5.67 5.04 4.54 7.63 6.68 5.94 5.34
1.9 5.47 4.78 4.25 3.83 5.85 5.12 4.55 4.10 7.00 6.13 5.45 4.902.1 6.44 5.63 5.01 4.51 6.82 5.97 5.31 4.78 7.97 6.98 6.20 5.582.3 7.41 6.48 5.76 5.19 7.79 6.82 6.06 5.46 8.95 7.83 6.96 6.26
1.9 1.49 1.30 1.16 1.04 1.87 1.64 1.46 1.31 3.02 2.65 2.35 2.122.1 2.12 1.85 1.65 1.48 2.50 2.19 1.94 1.75 3.65 3.20 2.84 2.562.3 2.74 2.40 2.13 1.92 3.13 2.74 2.43 2.19 4.28 3.75 3.33 3.00
1.9 2.84 2.49 2.21 1.99 3.23 2.83 2.51 2.26 4.38 3.83 3.41 3.072.1 3.62 3.16 2.81 2.53 4.00 3.50 3.11 2.80 5.15 4.51 4.01 3.612.3 4.39 3.84 3.41 3.07 4.77 4.18 3.71 3.34 5.92 5.18 4.61 4.15
1.9 3.66 3.20 2.85 2.56 4.04 3.54 3.14 2.83 5.20 4.55 4.04 3.642.1 4.52 3.95 3.51 3.16 4.90 4.29 3.81 3.43 6.05 5.30 4.71 4.242.3 5.37 4.70 4.18 3.76 5.76 5.04 4.48 4.03 6.91 6.05 5.37 4.84
1.9 4.74 4.15 3.69 3.32 5.13 4.49 3.99 3.59 6.28 5.50 4.89 4.402.1 5.72 5.00 4.45 4.00 6.10 5.34 4.74 4.27 7.25 6.35 5.64 5.082.3 6.69 5.85 5.20 4.68 7.07 6.19 5.50 4.95 8.22 7.20 6.40 5.76
170
278
110
135
150
170
Co
rn
227
110
135
150
170
253
110
135
150

Policy Update

Government Payments Are Important to Missouri Producers
• From 1998-2002, payments accounted for more than half of Missouri net farm income.
• Better prices in 2003 and increased production in 2004 made producers less reliant on payments.
• Current FAPRI projections indicate payments could again exceed 40% of Missouri net farm income in 2005.

Budget-Cutting Efforts Could Reduce Future Payments
• Federal deficit reached record levels in dollar terms in 2004.
• Some want to make significant cuts in spending to reduce the deficit.
• Congress may use “budget reconciliation” in 2005 to make cuts in many government programs, perhaps including farm programs.
• We cannot predict the mix or depth of farm program cuts (if any), but in the past, Congress has attempted to “share the pain” across programs.

WTO Decisions Could Also Affect U.S. Farm Programs
– A WTO panel found that aspects of U.S. cotton programs violate WTO rules. An appeals panel is expected to rule on the case this spring.
– If the U.S. loses the appeal, Congress may be under pressure to make changes in the Step 2 and export credit guarantee programs, and possibly the marketing loan and counter-cyclical payment programs as well.
– The principles used to challenge U.S. cotton programs could be used to challenge other U.S. farm programs.
– Separately, a “framework agreement” sets the stage for further negotiations on a larger WTO agreement that might eventually lead to changes in farm programs, trade restrictions, and other policies.
– No final WTO agreement is expected until at least 2006.