Embed Size (px)
Citation preview

©2005 Brooks/Cole - Thomson Learning
FIGURES FOR
CHAPTER 6
MATTERS OF FUNCTIONAL FORM
Click the mouse or use the arrow keys to move to the next page.Use the ESC key to exit this chapter.

©2005 Brooks/Cole - Thomson Learning
Figure 6.1
The log-log model.
©2005 Brooks/Cole - Thomson Learning
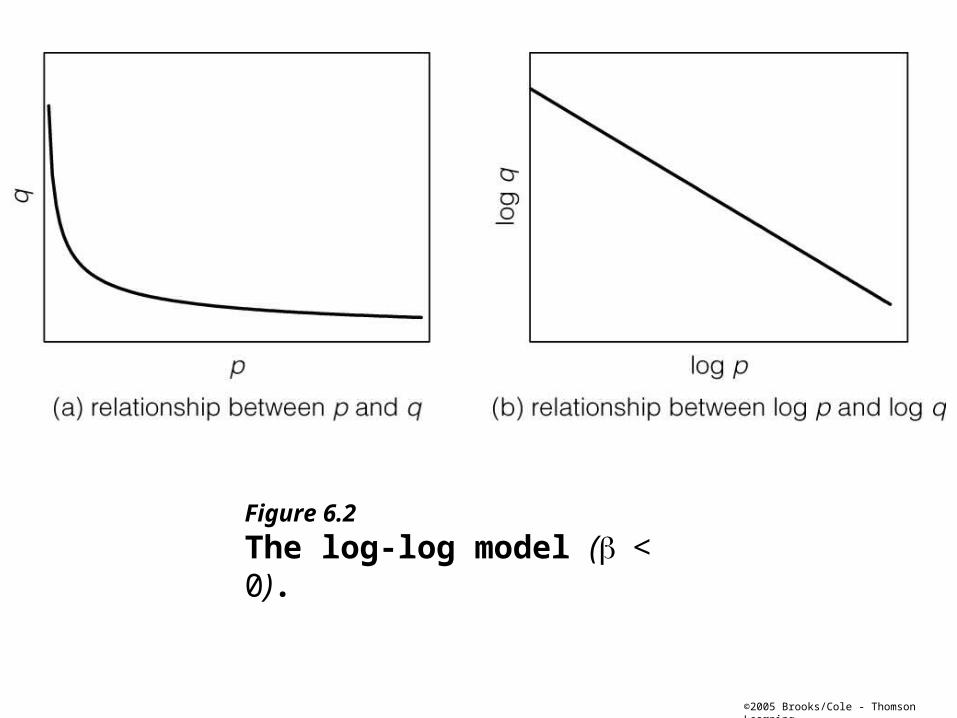
Figure 6.2
The log-log model (< 0).

©2005 Brooks/Cole - Thomson Learning
Figure 6.3
The constant growth model in discrete time(Y0 = 100, g = 0.05).

©2005 Brooks/Cole - Thomson Learning
Figure 6.4
U.S. GDP per capita, 1880–1987.

©2005 Brooks/Cole - Thomson Learning
Figure 6.5
The natural logarithmic function y = log x.
©2005 Brooks/Cole - Thomson Learning
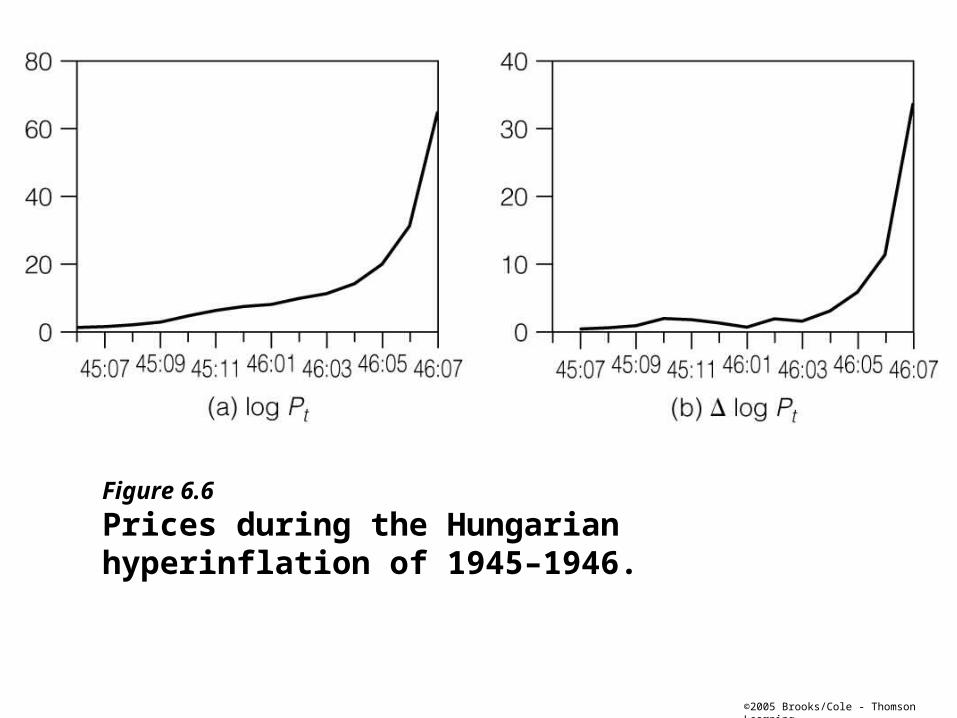
Figure 6.6
Prices during the Hungarian hyperinflation of 1945–1946.

©2005 Brooks/Cole - Thomson Learning
Figure 6.7The lin-log model: Y = + log X.

©2005 Brooks/Cole - Thomson Learning
Figure 6.8Prais and Houthakker’s Engel curve for meat consumption, based on a lin-log regression model.

©2005 Brooks/Cole - Thomson Learning
Figure 6.9
The reciprocal model: Y = + .

©2005 Brooks/Cole - Thomson Learning
Figure 6.10Prais and Houthakker’s Engel curve for meat consumption, based on a reciprocal regression model.

©2005 Brooks/Cole - Thomson Learning
Figure 6.12
Alternative functional forms for an Engel curve fitted to Houthakker’s electricity demand data.

©2005 Brooks/Cole - Thomson Learning
Figure 6.13Money and prices during the Germanhyperinflation,September 1920– November 1923 (Sept. 1920 = 1.0).

©2005 Brooks/Cole - Thomson Learning
Figure 6.14Money and pricesduring the Polishhyperinflation, April 1922– November 1923 (April 1922 = 1.0).

©2005 Brooks/Cole - Thomson Learning
Figure 6.15The velocity of money in the United States, 1869–1970.

©2005 Brooks/Cole - Thomson Learning
Figure 6.16
Real money holdings log(Mt/Pt ) decline during a hyperinflation.


![User Manual Search Engine.[OKI "SAVE CONF" [OK] "SAVE CONF" [Arrow Keys] Step 4 Use [Arrow Keys] to select "REBOOT" and press [OK]. .[OK] "REBOOT" 'Al [OK] , [Arrow Keys] Installation](https://img.pdfslide.us/doc/110x75/5f6613ce9bfad008633e448b/user-manual-search-engine-oki-save-conf-ok-save-conf.jpg)