Embed Size (px)
Citation preview

CARE - CONTAINS PRICE SENSITIVE INFORMATION
Investor Relations, Group Finance Division HAW - page 4
2005 Annual Results
Helen WeirGroup Finance Director
24 February 2006

CARE - CONTAINS PRICE SENSITIVE INFORMATION
Investor Relations, Group Finance Division HAW - page 5
Headline results – comparable basis*
Earnings per share 47.2p42.6p 11
Economic profit £1,620m£1,417m 14
Dividend per share 34.2p34.2p
* excluding impact of volatility, other IFRS adjustments applied from 1 January 2005 and discontinued operations in 2004. Also excludes customer redress provisions and strengthening of reserves for mortality
Profit before tax £3,726m£3,432m 9
Post-tax return on equity 23.3%22.2%
20052004 % Change
CARE - CONTAINS PRICE SENSITIVE INFORMATION
Investor Relations, Group Finance Division HAW - page 6
Overview – results highlights*
• Continued earnings momentum
• Accelerating revenue growth
• Positive jaws: cost income ratio improved again
• Satisfactory asset quality
• Robust capital ratios
• Post-tax return on equity remains strong
* comparable basis – excluding impact of volatility, other IFRS adjustments applied from 1 January 2005 and discontinued operations. Also excludes customer redress provisions and strengthening of reserves for mortality
CARE - CONTAINS PRICE SENSITIVE INFORMATION
Investor Relations, Group Finance Division HAW - page 7
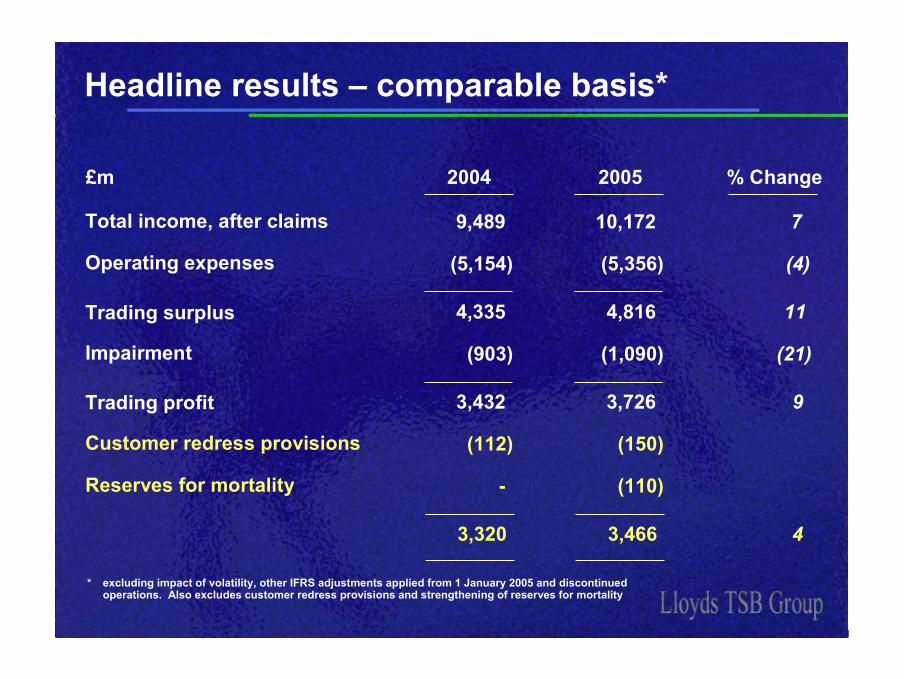
Headline results – comparable basis*
Total income, after claims 10,1729,489 7
Operating expenses (5,356)(5,154) (4)
3,4663,320 4
£m 20052004 % Change
Trading surplus 4,8164,335 11
Impairment (1,090)(903) (21)
Trading profit 3,7263,432 9
Reserves for mortality (110)-
Customer redress provisions (150)(112)
* excluding impact of volatility, other IFRS adjustments applied from 1 January 2005 and discontinued operations. Also excludes customer redress provisions and strengthening of reserves for mortality

CARE - CONTAINS PRICE SENSITIVE INFORMATION
Investor Relations, Group Finance Division HAW - page 8
Impact of IFRS adjustments applied from 1/1/05
(321)
UK Retail Banking (213) • Effective interest rates• Impairment
£m Key Drivers
Insurance & Investments (73) • FRS 27, including £45 million reserves for mortality
Wholesale & International Banking 20 • Financial Instruments and Development Capital mark-to-market
Central group items (55) • Minority interests reclassification from equity to debt
CARE - CONTAINS PRICE SENSITIVE INFORMATION
Investor Relations, Group Finance Division HAW - page 9
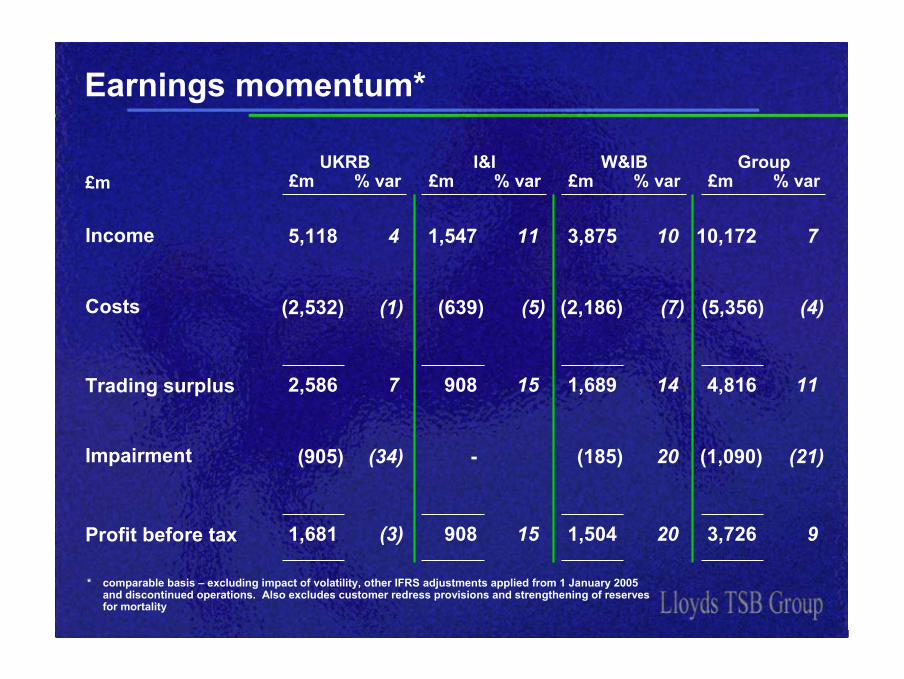
Earnings momentum*
* comparable basis – excluding impact of volatility, other IFRS adjustments applied from 1 January 2005 and discontinued operations. Also excludes customer redress provisions and strengthening of reserves for mortality
£mUKRB
£m % varW&IB
£m % varGroup
£m % varI&I
£m % var
Income 5,118 4 3,875 10 10,172 71,547 11
Costs (2,532) (1) (2,186) (7) (5,356) (4)(639) (5)
Impairment (905) (34) (185) 20 (1,090) (21)-
Trading surplus 2,586 7 1,689 14 4,816 11908 15
Profit before tax 1,681 (3) 1,504 20 3,726 9908 15

CARE - CONTAINS PRICE SENSITIVE INFORMATION
Investor Relations, Group Finance Division HAW - page 10
Income growth improving*
Net interest income 5,2034,901 6
£m 20052004 % Change
Other income, net of claims 4,9194,537 8
10,1729,489 7
Policyholder grossingadjustments 5051
Total income, net of claims 10,1229,438 7
Other income 5,1164,751
Insurance claims (197)(214)
* comparable basis – excluding impact of volatility, other IFRS adjustments applied from 1 January 2005 and discontinued operations. Also excludes customer redress provisions and strengthening of reserves for mortality

CARE - CONTAINS PRICE SENSITIVE INFORMATION
Investor Relations, Group Finance Division HAW - page 11
Good asset and deposit growth*
UK Retail Banking Wholesale & International Banking
* comparable basis – excluding impact of volatility, other IFRS adjustments applied from 1 January 2005and discontinued operations
+10%
+7%
+7%
Average interest earning assets
2004 2005
£89.9bn£98.5bn
Average customer deposits
2004 2005
£62.2bn £66.6bn
Average interest earning assets
2004 2005
£77.6bn£83.0bn

CARE - CONTAINS PRICE SENSITIVE INFORMATION
Investor Relations, Group Finance Division HAW - page 12
Net interest margin – stable*
* relating to the Group’s banking businesses, excluding impact of volatility, other IFRS adjustments applied from 1 January 2005 and discontinued operations
2.75%
2.89%
2.80%
2.80%
2004H1 2004H2 2005H1 2005H2
2004: 2.84%
2005: 2.78%
Product margin 8Funding effect (3)
5bp

CARE - CONTAINS PRICE SENSITIVE INFORMATION
Investor Relations, Group Finance Division HAW - page 13
Net interest income*
UK Retail Banking 3,3073,228 2
Insurance & Investments† 10194 7
Wholesale & InternationalBanking 2,1651,986 9
Central group items (370)(407)
5,5135,090 8
* comparable basis – excluding impact of volatility, other IFRS adjustments applied from 1 January 2005 and discontinued operations
† excluding policyholder grossing adjustments
£m 20052004 % Change
5,2034,901 6
Policyholder grossing adjustments 310189

CARE - CONTAINS PRICE SENSITIVE INFORMATION
Investor Relations, Group Finance Division HAW - page 14
Other income, net of insurance claims*
UK Retail Banking 1,8111,696 7
Insurance & Investments† 1,3961,252 12
Wholesale & InternationalBanking 1,7101,544 11
Central group items 245
4,6594,399 6
* comparable basis – excluding impact of volatility, other IFRS adjustments applied from 1 January 2005 and discontinued operations. Also excludes strengthening of reserves for mortality
† excluding policyholder grossing adjustments
£m 20052004 % Change
4,9194,537 8
Policyholder grossing adjustments (260)(138)

CARE - CONTAINS PRICE SENSITIVE INFORMATION
Investor Relations, Group Finance Division HAW - page 15
Strong cost control maintained*
UK Retail Banking 2,5322,509 (1)
Insurance & Investments† 607573 (6)
Wholesale & InternationalBanking 2,1862,047 (7)
Central group items (1)(12)
5,3565,154 (4)
* comparable basis – excluding impact of volatility, other IFRS adjustments applied from 1 January 2005 and discontinued operations. Also excludes customer redress provisions
† excluding policyholder grossing adjustments
£m 20052004 % Change
5,3245,117 (4)
Policyholder grossing adjustments 3237

CARE - CONTAINS PRICE SENSITIVE INFORMATION
Investor Relations, Group Finance Division HAW - page 16
Focus on costs
Operational principles
• Simplify
• Improve efficiency
• Leverage common systems/processes cross-group
– Transforming group wide procurement
– Consolidation of back office processes
– Organisational delayering/ simplification

CARE - CONTAINS PRICE SENSITIVE INFORMATION
Investor Relations, Group Finance Division HAW - page 17
Focus on costs
Financial principles
• Self funding
• Payback c. 2 years
• Reinvest c. 50% of benefits
• c. £40 million investment in 2005
• c. £20-30 million net benefit in 2006
• c. £100-150 million net benefit in 2007

CARE - CONTAINS PRICE SENSITIVE INFORMATION
Investor Relations, Group Finance Division HAW - page 18
4%
7%
5%
1%
7%
10%
11%
4%
Group
Wholesale &International
Banking
Insurance &Investments
UK RetailBanking
Income growth ahead of costs in all divisions*
* comparable basis – excluding impact of volatility, other IFRS adjustments applied from 1 January 2005 and discontinued operations. Also excludes customer redress provisions and strengthening of reserves for mortality
Group Cost:Income Ratio
Income Costs
54.3%52.7%
2004 2005

CARE - CONTAINS PRICE SENSITIVE INFORMATION
Investor Relations, Group Finance Division HAW - page 19
Impairment losses on loans and advances*
% of Average Lending2005
£mVariance
% 200520042004£m
Wholesale & International Banking 185 20 0.310.43230
UK Retail Banking 905 (34) 0.920.75676
Total 1,090 0.660.61903 (21)
* comparable basis – excluding other IFRS adjustments applied from 1 January 2005 and discontinued operations
- Credit cards 307 (27) 4.013.42242
- Personal loans/overdrafts 585 (24) 4.764.20473
- Mortgages 13 0.02(0.05)(39) -
Insurance & Investments - --(3) -

CARE - CONTAINS PRICE SENSITIVE INFORMATION
Investor Relations, Group Finance Division HAW - page 20
Impairment losses on loans and advances*
% of Average Lending2005
£mVariance
% 200520042004£m
Wholesale & International Banking 185 20 0.310.43230
UK Retail Banking 905 (34) 0.920.75676
Total 1,090 0.660.61903 (21)
* comparable basis – excluding other IFRS adjustments applied from 1 January 2005 and discontinued operations
- Credit cards 307 (27) 4.013.42242
- Personal loans/overdrafts 585 (24) 4.764.20473
- Mortgages 13 0.02(0.05)(39) -
Insurance & Investments - --(3) -

CARE - CONTAINS PRICE SENSITIVE INFORMATION
Investor Relations, Group Finance Division HAW - page 21
Impairment losses – UK Retail Banking*
* comparable basis – excluding other IFRS adjustments applied from 1 January 2005 and discontinued operations
Mortgageprovisionrelease
Volumegrowth
Assetquality
2004 2005
£905m£126m
£676m
£64m£715m£39m

CARE - CONTAINS PRICE SENSITIVE INFORMATION
Investor Relations, Group Finance Division HAW - page 22
New business – probability of default
Credit Cards
Personal Loans
100
Index
Jan-04
Feb-04
Mar-04
Apr-04
May-04
Jun-04Ju
l-04
Aug-04Sep
-04Oct-
04Nov-0
4Dec
-04Ja
n-05Feb
-05Mar-
05Apr-0
5May
-05Ju
n-05Ju
l-05
Aug-05Sep
-05Oct-
05Nov-0
5Dec
-05

CARE - CONTAINS PRICE SENSITIVE INFORMATION
Investor Relations, Group Finance Division HAW - page 23
Asset quality – impaired assets
Impaired Assets Impaired Assets as a Percentage of Total Lending
2.1%2.3% 2.3%
1 January2005
30 June2005
31 December2005
£3,515m£3,894m £4,122m
1 January2005
30 June2005
31 December2005

CARE - CONTAINS PRICE SENSITIVE INFORMATION
Investor Relations, Group Finance Division HAW - page 24
+14%
£1,417m
£1,620m
2004 2005
Economic Profit
Maintaining high returns*
* comparable basis – excluding impact of volatility, other IFRS adjustments applied from 1 January 2005 and discontinued operations. Also excludes customer redress provisions and strengthening of reserves for mortality
Post-tax Returnon Equity
22.2%23.3%
2004 2005
Post-tax Return on Risk-weighted Assets
1.98% 1.92%
2004 2005

CARE - CONTAINS PRICE SENSITIVE INFORMATION
Investor Relations, Group Finance Division HAW - page 25
Capital ratios remain robust
• £1 billion in dividends received from Scottish Widows
• Sufficient retained earnings to support expected risk-weighted asset growth
Total capitalratio
10.1% 10.9%
Risk-weightedassets
£131.8bn £144.9bn
1 January2005
31 December2005
Tier 1 ratio 7.9%8.2%

CARE - CONTAINS PRICE SENSITIVE INFORMATION
Investor Relations, Group Finance Division HAW - page 26
Scottish Widows – strong capital management
Available assets, including support account 22.0 23.2
Net surplus 4.2 4.1
Realistic value of liabilities (17.8) (19.1)
Long-Term Fund (£bn)31 December
2004
31 December2005
estimated
Working capital ratio 19.0% 17.8%
Risk capital margin cover 9.3x 11.5x

CARE - CONTAINS PRICE SENSITIVE INFORMATION
Investor Relations, Group Finance Division HAW - page 27
Improving our balance sheet management
• Moving from ‘buy and hold’ to ‘origination and distribution’
• During 2006, rolling mortgage securitisation programme
• Over time, programme expanded to include other asset classes
• Exploring ways to repatriate further capital from Scottish Widows

CARE - CONTAINS PRICE SENSITIVE INFORMATION
Investor Relations, Group Finance Division HAW - page 28
Reducing the pension schemes’ deficit
• During 2005, additional voluntary contributions of £220 million
• Triennial valuation currently being finalised
• Discussions underway with Trustees with objective of reducing the schemes’ deficit
IAS 19 pension deficit 2,9103,075
Deferred tax (873)(923)
£m 20052004
IAS 19 pension deficit, net of tax 2,0372,152
CARE - CONTAINS PRICE SENSITIVE INFORMATION
Investor Relations, Group Finance Division HAW - page 29
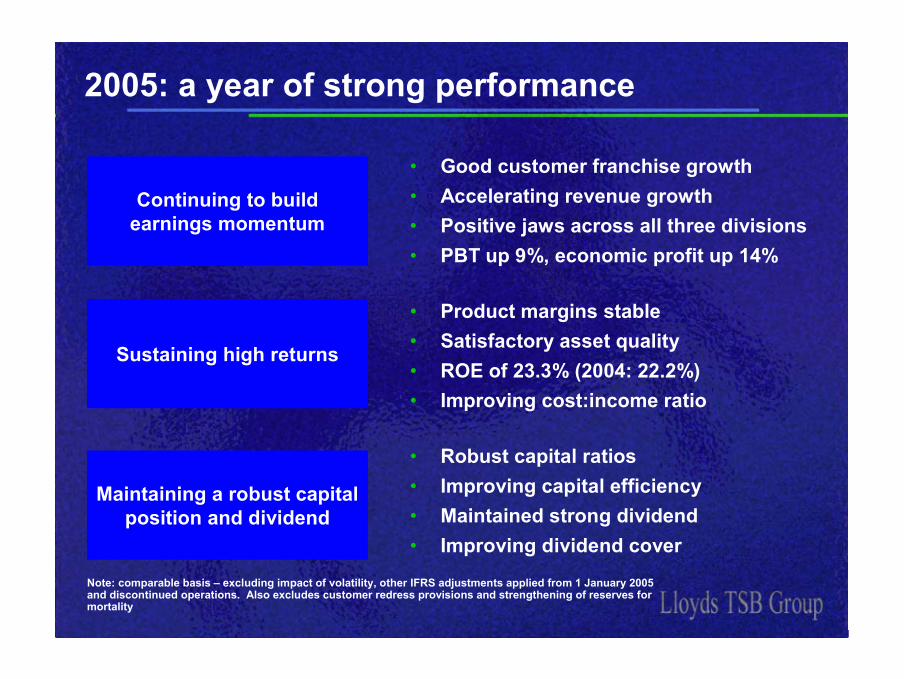
2005: a year of strong performance
Continuing to build earnings momentum
• Good customer franchise growth• Accelerating revenue growth• Positive jaws across all three divisions• PBT up 9%, economic profit up 14%
Sustaining high returns
• Product margins stable• Satisfactory asset quality• ROE of 23.3% (2004: 22.2%)• Improving cost:income ratio
Maintaining a robust capital position and dividend
• Robust capital ratios• Improving capital efficiency• Maintained strong dividend• Improving dividend cover
Note: comparable basis – excluding impact of volatility, other IFRS adjustments applied from 1 January 2005 and discontinued operations. Also excludes customer redress provisions and strengthening of reserves for mortality

CARE - CONTAINS PRICE SENSITIVE INFORMATION
Investor Relations, Group Finance Division HAW - page 32
2005 Annual Results
Eric DanielsGroup Chief Executive
24 February 2006

CARE - CONTAINS PRICE SENSITIVE INFORMATION
Investor Relations, Group Finance Division HAW - page 33
Four key messages
• We have significant potential in our franchises
• We can structurally improve our productivity
• We can manage capital to fund growth
• We are building the skills and financial strength to accelerate growth – in core businesses and from new markets

CARE - CONTAINS PRICE SENSITIVE INFORMATION
Investor Relations, Group Finance Division HAW - page 34
Reminder: our strategy
• Enhance earnings quality• Maintain profitability• Start growth
• Deepen relationships• Improve productivity• Build capabilities• Accelerate growth
• Leverage capabilities in new markets
Economic profit
Phase One
Phase Two
Phase Three
Focus on core markets
Build customer franchises
Expand from strength

CARE - CONTAINS PRICE SENSITIVE INFORMATION
Investor Relations, Group Finance Division HAW - page 35
Our financial progress
* 2002-4 figures on a UK GAAP basis excluding discontinued operations. 2004-5 figures are on an IFRS comparable basis excluding major one-offs
Income, £bn*
IFRS comparable
8.99.29.0
10.29.5
'02 '03 '04 '05
PBT, £bn*
3.2
3.4
3.1
3.7
3.4
'02 '03 '04 '05
ROE, %*
23.5%23.1%
25.2%
22.2%23.3%
'02 '03 '04 '05
Cost:income ratio, %*
53.5%
55.1%
51.9%
54.3%
52.7%
'02 '03 '04 '05

CARE - CONTAINS PRICE SENSITIVE INFORMATION
Investor Relations, Group Finance Division HAW - page 36
Our priorities for Phase 2
• Strong revenue growth
• A step change in operational efficiency
• Enhanced capital efficiency and dividend capacity
• Double digit economic profit growth
Build our franchise reach and depth
Enhance our product capabilities
Improve our productivity
Work our capital harder
Financial goals for Phase 2Strategic priorities

CARE - CONTAINS PRICE SENSITIVE INFORMATION
Investor Relations, Group Finance Division HAW - page 37
UK Retail Banking: driving growth
What we are doing in 2005-6Our objectives
• Growing sales volumes
• Changing product sales mix
• Increasing direct channel sales
• Increasing branch sales capacity and effectiveness
• Reducing overheads and back office costs
Grow income from existing customer base
Grow income from new customers
Improve productivity

CARE - CONTAINS PRICE SENSITIVE INFORMATION
Investor Relations, Group Finance Division HAW - page 38
UK Retail Banking: sales volumes
2005 sales volume growth, %
Indexed sales volumes as a % of prior year period
Indexed net recruitment, target
customers
… and driving target customer recruitment
… increasing direct channel sales …
Improving branch sales performance …
150
100
2004 2005
39
28
Internet TelephonyStart ‘05 Start Feb ‘06

CARE - CONTAINS PRICE SENSITIVE INFORMATION
Investor Relations, Group Finance Division HAW - page 39
UK Retail Banking: sales productivity
2004-2005 % change
• New strategic sales platform
• Improved customer leads
Indexed sales
… to increase sales productivity
… and improving sales effectiveness …
Increasing sales capacity …
145
100
LTSBtoday
Our goal
Tasks sent to branches
Faxes handled by branches
Time to process a loan sale
(15%)
(50%)
(30%)

CARE - CONTAINS PRICE SENSITIVE INFORMATION
Investor Relations, Group Finance Division HAW - page 40
UK Retail Banking: sales mix
H2 04-05 growth per customer,target customers
Total retail product sales volumes
… to drive higher non-lending income per customer
Changing the overall product sales mix …
* includes secured and unsecured lending and related protection products
Non-lending
Lending*59% 53%
41% 47%
2004 2005 (1.2%)
1.4%
Non-lending revenue
Total revenue
Lending revenue
6.1%

CARE - CONTAINS PRICE SENSITIVE INFORMATION
Investor Relations, Group Finance Division HAW - page 41
UK Retail Banking: the demographic opportunity
<0 0-10% >10%
<30 yrs 30 - 44 45 - 54 55 - 64 65+ yrs
10% (7%) 40% 23% 34%
Current accounts
Unsecured lending
Mortgages
Savings and investments
Market risk-adjusted revenue growth to 2010: share by age and product
Source: internal analysis
CARE - CONTAINS PRICE SENSITIVE INFORMATION
Investor Relations, Group Finance Division HAW - page 42
UK Retail Banking: growth outlook
• Against a weaker market in 2004 and 2005, we are improving the fundamentals of the business Improving customer acquisition Growing non-lending business Improving sales effectiveness Improving efficiency
• Going forward we will accelerate growth in the Retail Bank Attractive demographics Higher quality income Sales and back office productivity

CARE - CONTAINS PRICE SENSITIVE INFORMATION
Investor Relations, Group Finance Division HAW - page 43
W&IB: break-out growth
What we are doing in 2005-6Our objectives
• Growing product capabilities• Driving cross sell• Capturing relationship
headroom• Building asset distribution
Grow the Corporate Markets business
Build on the growth momentum in Business
Banking
• Winning higher value customers
• Improving productivity and service
• Simplifying our offer and our operations

CARE - CONTAINS PRICE SENSITIVE INFORMATION
Investor Relations, Group Finance Division HAW - page 44
W&IB: 2005 performance
Business unit performance
* comparable basis – excluding impact of volatility, other IFRS adjustments applied from 1 January 2005 and discontinued operations
Corporate Markets 958732 31
Profit before tax* (£m) 20052004 % Change
Business Banking 206153 35
Asset Finance 219240 (9)
International Banking 133120 11
Wholesale & InternationalBanking
+20%
CARE - CONTAINS PRICE SENSITIVE INFORMATION
Investor Relations, Group Finance Division HAW - page 45
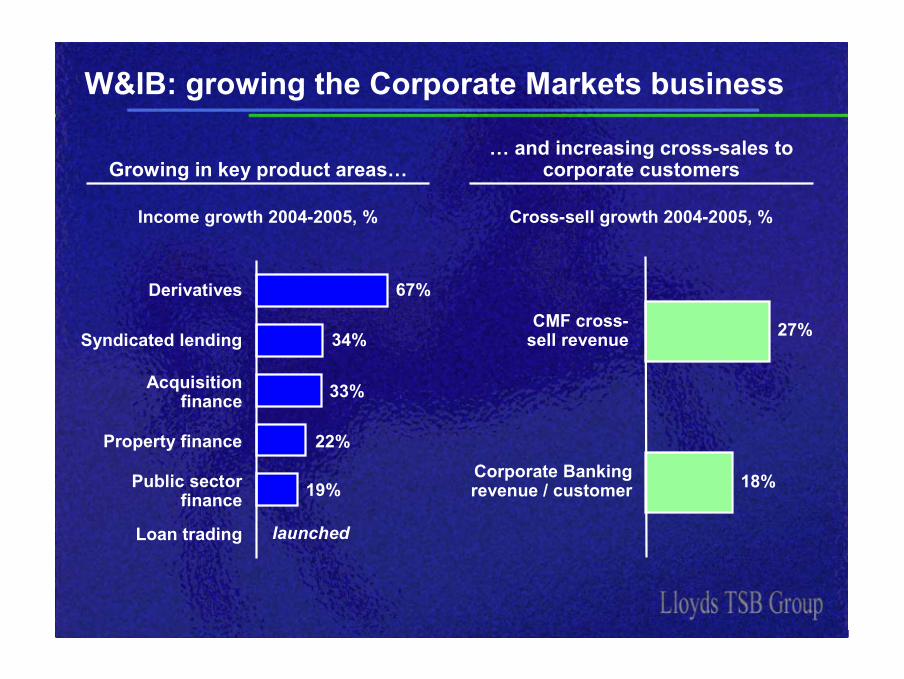
W&IB: growing the Corporate Markets business
Cross-sell growth 2004-2005, %Income growth 2004-2005, %
… and increasing cross-sales to corporate customersGrowing in key product areas…
CMF cross-sell revenue 27%
18%Corporate Banking revenue / customer
67%
19%
34%
22%
launched
33%
Derivatives
Syndicated lending
Acquisition finance
Property finance
Public sector finance
Loan trading

CARE - CONTAINS PRICE SENSITIVE INFORMATION
Investor Relations, Group Finance Division HAW - page 46
W&IB: growing the Corporate Markets business
• Excellent service• Creativity• Follow-up
Relationship quality
Relationship depth
Customer satisfaction
Recent surveys show improving customer perception of our capabilities*
• Syndications• Interest rate derivatives• Foreign exchange
• Overall satisfaction
+ 100%+ 30%+ 25%
+ 66%+ 50%+ 24%
+ 137%
* improvement in number of customers responding positively. Selected comparisons taken from major independent market surveys with our ‘larger corporate’ customer segment
% improvement 2004-5

CARE - CONTAINS PRICE SENSITIVE INFORMATION
Investor Relations, Group Finance Division HAW - page 47
W&IB: moving Business Banking to growth
• Relationship managers back in branches• Income generating contacts up• Improved customer satisfaction by 9% pts
Improving sales and service
• Growing market share• Gaining in switchers and start-ups
Growing the franchise
• Improved cost:income ratio by 4% ptsSimplifying operations

CARE - CONTAINS PRICE SENSITIVE INFORMATION
Investor Relations, Group Finance Division HAW - page 48
W&IB: 2005 cost growth
Around half of W&IB’s cost growth 2004-5 will deliver future profit growth – mainly in CMF and Business Banking
3.0% ‘jaws’
6.4% ‘jaws’
W&IB revenue growth
9.8%
6.8%
Total W&IB cost
growth
1.3%
Frontline staff
growth
1.4%
Investment in processing
improvements
Investment in growth initiatives
0.7%3.4%
Underlying W&IB cost
growth

CARE - CONTAINS PRICE SENSITIVE INFORMATION
Investor Relations, Group Finance Division HAW - page 49
W&IB: growth outlook
• We can continue our performance momentum
– Step up our share of ‘lead’ relationships
– Grow mid-market share in key regions
– Build our product range
– Accelerate revenue growth in Business Banking
– Increase back office productivity

CARE - CONTAINS PRICE SENSITIVE INFORMATION
Investor Relations, Group Finance Division HAW - page 50
Insurance & Investments: accelerating growth
What we are doing in 2005-6Our objectives
• Focusing on the most valuable IFA relationships and improving service
• Improving our bancassurance product range and sales effectiveness
• Improving investment performance
• Raising individual product IRRs
• Repatriating excess capital
Maximise distribution reach
Develop better products
Improve capital management

CARE - CONTAINS PRICE SENSITIVE INFORMATION
Investor Relations, Group Finance Division HAW - page 51
I&I: Scottish Widows IFA performance
Service improvements and more competitive products, will continue to drive sales and market share growth
Market share*Weighted sales, £m
5.9%6.8%
5.7%
2003 2004 2005* total LP&I market estimate
432
562
392
2003 2004 2005
+30%+10%

CARE - CONTAINS PRICE SENSITIVE INFORMATION
Investor Relations, Group Finance Division HAW - page 52
I&I: bancassurance performance
Revised offers and salesforce development have delivered overall sales growth of 13%, with particular success in OEICs
OEIC sales, £mOverall weighted sales, £m
+77%242
274
2004 2005
+13%
67
119
2004 2005

CARE - CONTAINS PRICE SENSITIVE INFORMATION
Investor Relations, Group Finance Division HAW - page 53
Insurance & Investments: growth outlook
• Strong LP&I performance – growing market share in a growing market
• We can continue to grow and improve profitability
IFA - improved investment performance and product mix
Bancassurance - simplified products, better salesforce productivity, attractive customer base
Capital efficiency

CARE - CONTAINS PRICE SENSITIVE INFORMATION
Investor Relations, Group Finance Division HAW - page 54
Achieving a step change in productivity
# 2002-4 figures on a UK GAAP basis excluding discontinued operations. 2004-5 figures are on an IFRS comparable basis excluding major one-offs
* 2002-3 underlying – excluding acquisitions and disposals† 2002-4 uses UK GAAP; 2004-5 uses comparable IFRS, excluding customer redress provisions and
strengthening of reserves for mortality
(1.6) (1.6)
UK GAAP IFRS
Our ‘jaws’ discipline has delivered results
Change in staff numbers (y/e FTE)Group cost:income ratio#
(1,624)(3,188)
200520042003*
(1,209)
Change in income per FTE†
+6%
+12%
200520042003*
+14%
200520042003
55.1%53.5%
54.3%52.7%
2004

CARE - CONTAINS PRICE SENSITIVE INFORMATION
Investor Relations, Group Finance Division HAW - page 55
Achieving a step change in productivity
What we are doingStrategic priorities
• Consolidating processes
• Applying ‘lean manufacturing’
• Transforming procurement
• Simplifying management structure
• Extending Sigma programme
Leverage our scale
Exploit our cost management skills
Match best in class efficiency standards

CARE - CONTAINS PRICE SENSITIVE INFORMATION
Investor Relations, Group Finance Division HAW - page 56
Working our capital harder
What we are doingStrategic priorities
• Focusing on economic profitability at a customer and product level
• Further improving capital efficiency in Scottish Widows
• Developing distribution capabilities in Corporate Markets
• Implementing asset securitisation
Maximise capital efficiency in each business
Shift lower yield risk off our balance sheet
Focus on our strength in origination
CARE - CONTAINS PRICE SENSITIVE INFORMATION
Investor Relations, Group Finance Division HAW - page 57
Phase 3: leveraging capabilities in new markets
• We are building the right capabilities– Customer and sales skills
– Manufacturing skills
– Cost management skills
– Capital management skills
• In a consolidating global FS market, value creation will be driven by the transfer of advantaged capabilities– Not through scale alone

CARE - CONTAINS PRICE SENSITIVE INFORMATION
Investor Relations, Group Finance Division HAW - page 58
Four key messages
• We have significant potential in our franchises
• We are structurally improving our productivity
• We are managing capital to fund growth
• We are building the skills and financial strength to accelerate growth – in core businesses and from new markets
CARE - CONTAINS PRICE SENSITIVE INFORMATION
Investor Relations, Group Finance Division PRH 1
Forward looking statements
This document is a summary only of certain information contained in the announcement dated 24 February 2006 and should be read in conjunction with the full text of the announcement.
This document contains forward looking statements with respect to the business, strategy and plans of the Lloyds TSB Group and its current goals and expectations relating to its future financial condition and performance. Statements that are not historical facts, including statements about Lloyds TSB Group’s or management’s beliefs and expectations, are forward looking statements. By their nature, forward looking statements involve risk and uncertainty because they relate to events and depend on circumstances that will occur in the future. Lloyds TSB Group’s actual future results may differ materially from the results expressed or implied in these forward looking statements as a result of a variety of factors, including UK domestic and global economic and business conditions, risks concerning borrower credit quality, market related risks such as interest rate risk and exchange rate risk in its banking businesses and equity risk in its insurance businesses, inherent risks regarding changing demographic developments, catastrophic weather and similar contingencies outside Lloyds TSB Group’s control, any adverse experience in inherent operational risks, any unexpected developments in regulation or regulatory actions, changes in customer preferences, competition, industry consolidation, acquisitions and other factors. For more information on these and other factors, please refer to Lloyds TSB Group’s Registration Statement on Form 20-F filed with the US Securities and Exchange Commission and to any subsequent reports furnished by Lloyds TSB Group to the US Securities and Exchange Commission or to the London Stock Exchange. The forward looking statements contained in this document are made as of the date hereof, and Lloyds TSB Group undertakes no obligation to update any of its forward looking statements.