Embed Size (px)
Citation preview
2005 Annual Statistics
Page 1 of 20 June 27, 2006
General Center Statistics:
Total Messages Processed
System Input Output
CAD 29,662,643 123,814,595
DBS 59,794,829 30,521,373
MSS 33,600,382 31,364,521
Total 123,057,854 185,700,489
System Statistics
System Total
MST Button Pushes 870,773
Sunpro/FireHouse Messages 52,137
Alpha Paging Messages 1,760,215
Web Paging Messages 65,463
CAD Faxes 10,976
HART Messages 6,565
CAD Email Messages 32,431
Zetron 25 Alerts 66,047
Zetron 26 Messages 3,574,965
ProQA Messages 130,733
RIMS Messages 1,571
Trunking Messages 1,756,408
Total Messages Processed 8,328,284 CAD Availability 99.97%
MSS Availability 99.95%
Incident Breakdown by Class
Law Enforcement,
56%
Fire, 25%
EMS, 20%
2005 Annual Statistics
Page 2 of 20 June 27, 2006
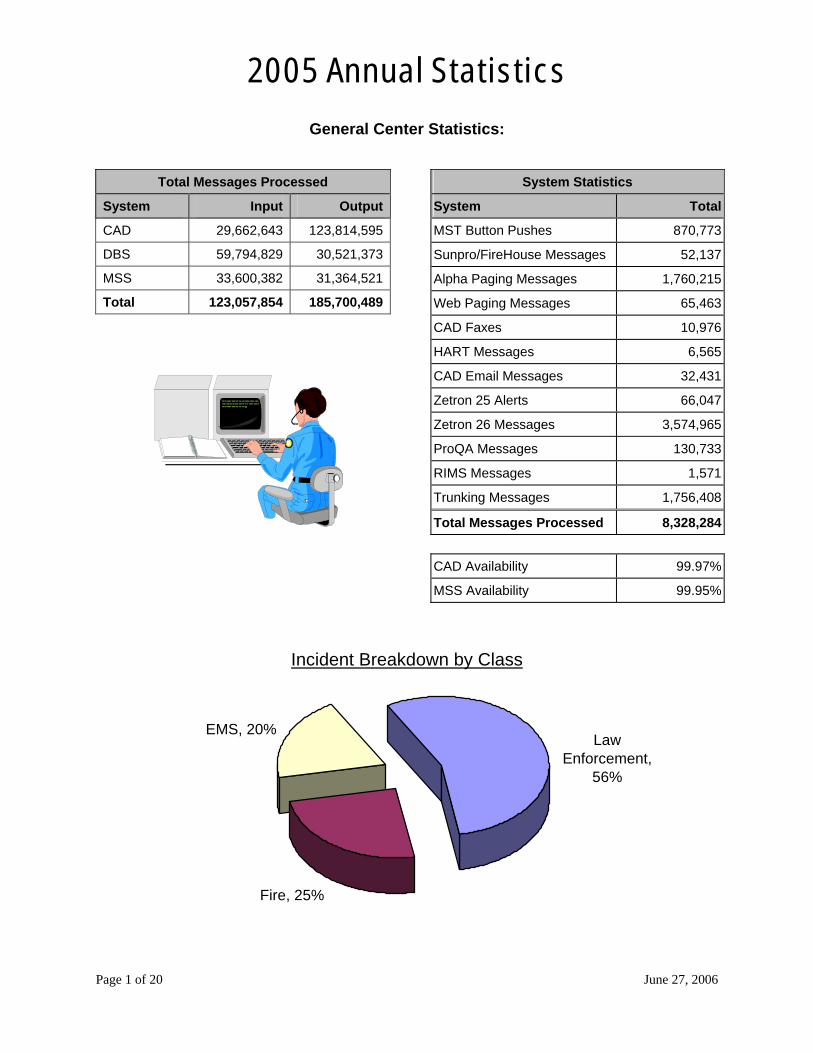
Incoming Telephone Statistics
Month Number of Calls
Fire/EMS DispatchersNumber of Calls
Law Dispatchers Total Calls
January 15,612 16,503 32,115
February 15,008 15,018 30,026
March 17,203 17,226 34,429
April 16,143 16,152 32,295
May 17,570 15,321 32,891
June 17,103 16,151 33,254
July 17,960 16,017 33,977
August 19,222 15,664 34,886
September 16,585 13,935 30,520
October 17,775 14,117 31,892
November 14,557 15,178 29,735
December 18,434 14,879 33,313
Totals 203,172 186,161 389,333
911 Calls Received:
Law Enforcement: 22,534
Fire: 5,135
EMS: 22,539
Telephone Call Summary: Busiest day of week: Wednesday Busiest hour of day: 17:00
2005 Annual Statistics
Page 3 of 20 June 27, 2006
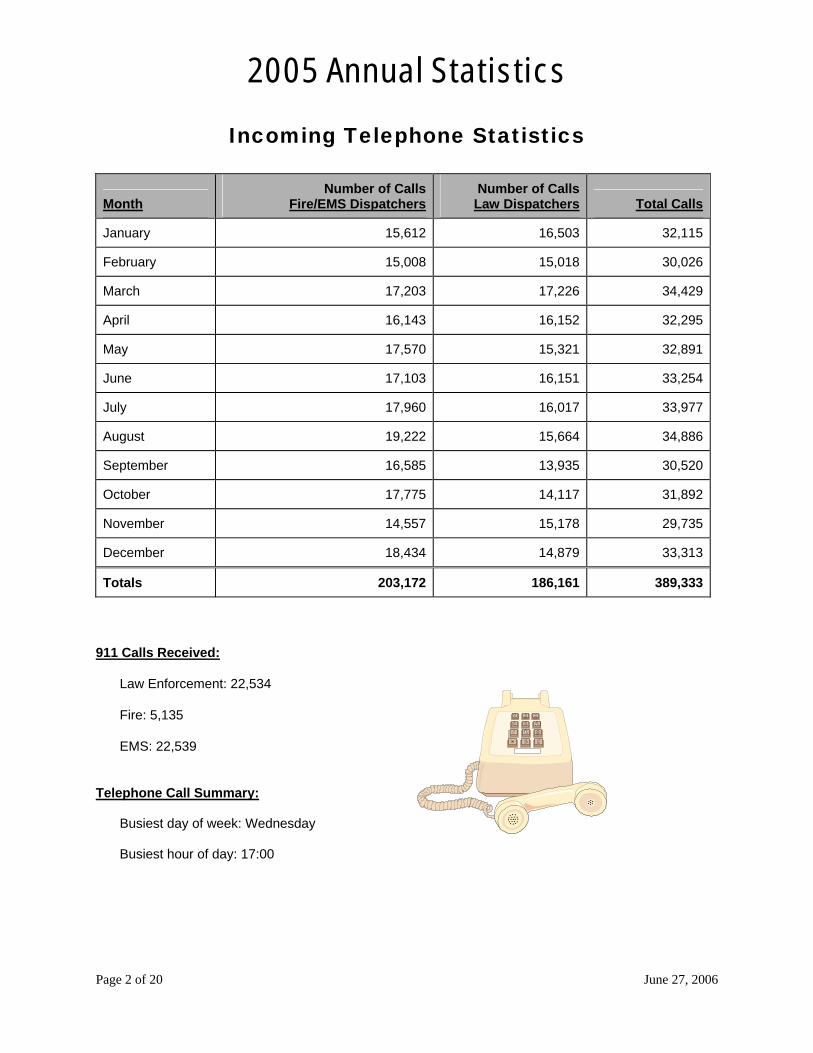
Number of Incidents by Jurisdiction
Agency Jan Feb Mar Apr May Jun Jul Aug Sep Oct Nov Dec Totals ------ ------- ------- ------- ------- ------- ------- ------- ------- ------- ------- ------- ------- -------- DPW 59 77 67 42 41 56 55 41 39 43 63 119 702 EMS 3,332 3,230 3,441 3,319 3,312 3,218 3,333 3,403 3,248 3,451 3,245 3,726 40,258 ESF 347 338 348 332 311 289 300 294 321 320 314 374 3,888 PHS 229 245 302 381 442 485 551 546 461 415 246 260 4,563 ------ ------- ------- ------- ------- ------- ------- ------- ------- ------- ------- ------- ------- -------- SubTotal 3,967 3,890 4,158 4,074 4,106 4,048 4,239 4,284 4,069 4,229 3,868 4,479 49,411 BIF 38 39 32 46 39 50 37 47 51 48 41 44 512 CCF 346 330 336 329 327 361 336 366 340 373 394 445 4,283 CDF 50 38 88 CLF 64 55 57 58 68 64 57 52 63 67 64 76 745 COF 85 72 162 124 137 126 135 136 113 142 116 171 1,519 DCF 471 457 535 458 478 450 496 490 483 526 467 576 5,887 FCF 154 125 137 166 150 196 181 178 144 157 150 156 1,894 FMA 145 141 159 112 105 153 169 155 166 161 143 145 1,754 HMF 189 169 199 170 161 156 203 160 146 194 150 190 2,087 MLF 192 149 176 162 150 140 161 193 184 169 156 193 2,025 MNF 721 629 708 630 703 707 702 692 603 721 638 770 8,224 PIF 205 162 186 187 214 194 192 206 205 217 219 263 2,450 RCF 590 646 690 646 619 585 642 651 706 671 610 753 7,809 SBF 270 262 244 259 222 275 268 254 258 271 263 334 3,180 SCF 367 372 404 359 339 359 337 376 355 361 364 406 4,399 SMF 651 658 668 639 636 631 643 671 610 653 637 829 7,926 SOF 420 412 461 413 397 384 387 391 409 387 401 524 4,986 WOF 129 104 120 120 147 159 144 139 138 133 143 207 1,683 ------ ------- ------- ------- ------- ------- ------- ------- ------- ------- ------- ------- ------- -------- SubTotal 5,087 4,820 5,274 4,878 4,892 4,990 5,090 5,157 4,974 5,251 4,956 6,082 61,451 BRD 622 504 503 527 543 662 711 637 618 596 521 590 7,034 EPA 3,791 3,501 3,689 3,427 3,727 3,540 3,616 3,769 3,205 3,098 2,886 2,797 41,046 HMB 1,141 1,040 1,232 1,108 1,193 1,115 1,307 1,124 1,045 1,185 901 874 13,265 LMA 967 896 1,042 1,025 959 1,045 1,131 1,199 1,037 1,182 878 1,029 12,390 SOS 4,423 4,291 4,709 4,623 4,842 5,152 5,227 5,302 4,633 5,002 4,342 4,814 57,360 SPL 157 47 51 33 16 200 121 161 651 504 973 2,914 TRA 343 400 496 380 499 421 464 502 496 404 391 496 5,292 ------ ------- ------- ------- ------- ------- ------- ------- ------- ------- ------- ------- ------- -------- SubTotal 11,444 10,632 11,718 11,141 11,796 11,951 12,656 12,654 11,195 12,118 10,423 11,573 139,301 ------ ------- ------- ------- ------- ------- ------- ------- ------- ------- ------- ------- ------- -------- Totals 20,498 19,342 21,150 20,093 20,794 20,989 21,985 22,095 20,238 21,598 19,247 22,134 250,163
2005 Annual Statistics
Page 4 of 20 June 27, 2006
EMS Specific Statistics:
Number of Hospital Transports
Peninsula 6,161
Kaiser South City 3,808
Stanford 3,571
Seton 3,275
Kaiser Redwood City 2,861
County General 2,828
Sequoia 2,157
San Francisco General 485
VA Palo Alto 251
Mills 246
Out of County 104
County General Psychiatric 31
Seton Coastside 30
Peninsula Psychiatric 21
Total 25,829
Number of Helicopter Dispatches
LifeFlight 21
Calstar 6
Number of MCI’s
Level 1 31
Level 2 2
EMD Pre-Arrival Statistics:
Sequence Count
Airway / Arrest - Infant 28
Airway / Arrest - Child 58
Airway / Arrest - Adult 1,975
Choking – Infant, Child, Adult 103
Childbirth 35
Tracheotomy Airway / Arrest 0
AED Support 2
Total sequences provided 2,201
2005 Annual Statistics
Page 5 of 20 June 27, 2006
24 Hour Unit Responses Unit Total Runs
301 2,758 107 2,543 R63 1,835 403 1,757 R61 1,438 440 1,109
Top 20 VSU Responses Unit Total Runs
265 1,223 263 1,218 264 1,198 262 1,147 261 1,096 160 1,061 112 1,050 285 997 111 976 114 951 281 886 284 864 283 862 189 853 282 836 187 791 186 762 188 743 214 195 287 122
Special Unit Responses Unit Total Runs
510 1,421 511 28 512 81
Chute TimesUnit Avg. Time
189 00:37 285 00:39 212 00:40 368 00:40 187 00:41 284 00:41 114 00:42 214 00:42 261 00:42 265 00:42 281 00:42 283 00:42 111 00:43 262 00:43 369 00:43 108 00:44 112 00:44 186 00:44 160 00:45 211 00:45 263 00:45 264 00:45 286 00:45 287 00:45 301 00:45 188 00:46 282 00:46 169 00:47 367 00:47 370 00:47 266 00:48 441 00:51 512 00:52 510 00:54 107 00:55 403 00:57 166 00:58 R61 01:05 440 01:08 R63 01:13 511 01:22
2005 Annual Statistics
Page 6 of 20 June 27, 2006
Fire Specific Statistics:
Battalion Chief Responses Unit Total Runs
BC3 727 BC1 600 BC4 455 BC17 437 BC16 406 BC6 401 BC5 284 BC2 283 BC20 265 BC9 254 BC8 218 BC10 201 BC18 176 BC19 69 BC11 52 BC15 21 BC13 13 BC12 6 BC10A 4 BC3C 4 BC3B 3 BC17A 2 BC17C 2
Truck Responses Unit Total Runs
PT9 1,258 PT13 1,197 PT21 915 PQ62 701 T28 570 PT1 565 PT34 531 PT51 517 T95 427 PQ65 279 T85 85
Top Fire Chief Responses
Unit Total Runs CH6 12 CH20A 11 CH20B 11 CH17A 9 CH8A 8 CH10 7 CH3 6 CH5 5
Fire Buffs Responses Unit Total Runs
SUP20 27 SUP61 14 SUP14 11 SUP23 5 SUP8 1
IDT Responses Unit Total Runs
COM32 13 COM59 11 COM47 10 COM1 9 COM81 4 COM2 2 COM62 2 COM76 2 COM57 1 COM61 1
2005 Annual Statistics
Page 7 of 20 June 27, 2006
Miscellaneous Units Unit Total Runs
RS7 95 HM13 24 BS61 20 BS17 18 BS9 15 WT57 5 AB1 4 WT8 2 BOAT28 2
EMS Coordinator Responses Unit Total Runs
MED19 159 MED20 10 MED8 9 MED17 8 MED2 7 MED9 2 MED1 1 MED11 1
Training Coordinator Unit Total Runs
TO11 19 TO3 12 TO5 11 TO20A 8 TO19 4 TO20 3 TO17 2 TO6 2
Prevention Responses
Unit Total Runs PR3B 52 PR4A 47 PR3A 32 PR4 28 PR3C 26 PR16 24 PR20D 20 PR8 18 PR3 15
2005 Annual Statistics
Page 8 of 20 June 27, 2006
Total Engine Response
Unit Total Runs E2 2,042 E10 1,941 E51 1,697 E24 1,686 E37 1,592 E92 1,572 E14 1,421 E34 1,388 E63 1,387 E23 1,358 E9 1,316 E61 1,284 E94 1,250 E26 1,231 E95 1,219 E1 1,180 E71 1,108 E91 1,098 E11 1,096 E72 1,091 E15 1,035 E40 1,028 E6 1,016 E64 985 E52 984 E77 976 E4 906 E25 868 E29 832 E36 796 BE16 773 E28 747 E3 747 E5 728 E21 711 E12 671 E86 652 E32 650 E20 601 E35 589 E7 550 E41 543
Total Engine Response
Unit Total Runs E38 522 E8 513 E81 492 E18 457 E33 433 E27 428 E44 425 E93 417 E17 305 E217 283 E58 224 E19 214 E59 175 BE85 60 BE57 51 E65 40 E62 29 BE357 25 BE356 21 E13 12 BE56 12 BE55 11 BE285 10
2005 Annual Statistics
Page 9 of 20 June 27, 2006
Responses by District District Count
FS02 2,367 FS10 1,988 FS09 1,946 FS51 1,858 FS37 1,801 FS92 1,644 FS24 1,612 FS63 1,493 FS23 1,384 FS21 1,363 FS26 1,246 FS61 1,222 FS01 1,212 FS14 1,207 FS40 1,175 FS13 1,121 FS34 1,099 FS94 1,090 FS95 1,070 FS91 1,022 FS06 1,015 FS72 1,014 FS15 988 FS11 908 FS52 871 FS71 864 FS29 861 FS04 853 FS64 779 FS28 737 FS86 689 FS36 652 FS07 647 FS62 647 FS25 631 FS08 624 FS05 604 FS35 601 FS77 574 FS31 571 FS20 540 FS03 520 FS16 500
Responses by District District Count
FS65 488 FS12 485 FS32 461 FS41 440 FS81 435 FS18 414 FS27 402 FS44 390 FS93 382 FS17 350 FS33 318 FS38 301 FS58 245 FS74 240 FS73 227 FS59 201 FS19 136 FS57 120 FS56 52 FS55 36
2005 Annual Statistics
Page 10 of 20 June 27, 2006
Best Chute Times
Unit Avg. Time R61 01:05 E10 01:07 E41 01:07 E81 01:08 BC1 01:09 E62 01:12 E40 01:12 E35 01:13 E8 01:13 E94 01:13 R63 01:13 PQ62 01:14 BC3 01:15 E63 01:15 E28 01:15 E61 01:16 E44 01:16 BC2 01:17 E18 01:17 E19 01:18 E91 01:18 E64 01:19 E6 01:19 E92 01:19 E2 01:20 E95 01:20 E7 01:21 E71 01:21 E9 01:21 BC17 01:22 E21 01:22 E33 01:22 E34 01:22 E36 01:22 E72 01:22 BC20 01:23 E24 01:23 E5 01:23 BC17 01:22 E21 01:22
Average County-wide chute time is 1:12
Worst Chute Times Unit Avg. Time
T85 03:52 BE55 03:18 R56 03:11 BE285 03:08 BE56 03:00 BE85 02:58 R57 02:53 BE57 02:50 E86 02:36 E58 02:20 BC15 02:06 E59 02:06 E93 02:04 PT51 01:57 PT21 01:50 BC5 01:43 BC18 01:41 BC19 01:41 E27 01:40 T28 01:40 E52 01:39 PT13 01:39 RS7 01:39 E17 01:38 E51 01:38 E65 01:37 PT1 01:36 E4 01:35 E14 01:34 PT34 01:34 BC10 01:31 BC11 01:31 BC4 01:31 BC6 01:31 BC9 01:31 E217 01:30 E25 01:30 SQ65 01:30 BC16 01:29 E3 01:29
Average County-wide chute time is 1:12
2005 Annual Statistics
Page 11 of 20 June 27, 2006
Most Runs after 2200 hrs Unit Total Dispatches
E2 448 E10 412 E24 404 R63 402 E92 385 E51 355 E37 346 E34 322 E9 295 E26 289 R61 289 E14 288 E63 277 E61 270 PT13 269 E95 255 E1 253 E94 253 E71 251 E91 250 PT9 244 PT21 242 E23 237 E72 220 E64 218 E11 215 E77 215 E15 211 PQ62 211 E6 188 E36 180 E40 179 E52 177 E25 159 E4 159 PT1 153 BE16 151 E5 151 E29 149 E28 146 E3 146 BC3 134
2005 Annual Statistics
Page 12 of 20 June 27, 2006
Number of Incidents By Alarm Level By Group Group 1st 2nd 3rd 4th 5th 6th 7th 8th 9th Total ----- ------ ---- ---- ---- ---- ---- ---- ---- ---- ------- BIF 514 1 1 516 CCF 4,260 2 1 1 4,264 CDF 86 86 CLF 745 1 746 COF 1,510 1 1 1 1,513 DCF 5,863 6 1 5,870 FCF 1,888 2 1,890 FMA 4 4 HMF 2,081 2 2,083 IAF 80 80 MLF 2,018 3 1 2,022 MNF 8,192 3 1 8,196 PAF 5 5 PIF 2,441 2 2,443 RCF 7,804 8 1 7,813 SBF 3,165 4 3,169 SCC 3 3 SCF 4,388 5 2 4,395 SMF 7,910 6 1 7,917 SOF 4,967 6 2 4,975 UNK 1,772 1 1,773 WOF 1,688 1,688 ------ ---- ---- ---- ---- ---- ---- ---- ---- ------- TOTAL 61,384 52 10 4 1 61,451
2005 Annual Statistics
Page 13 of 20 June 27, 2006
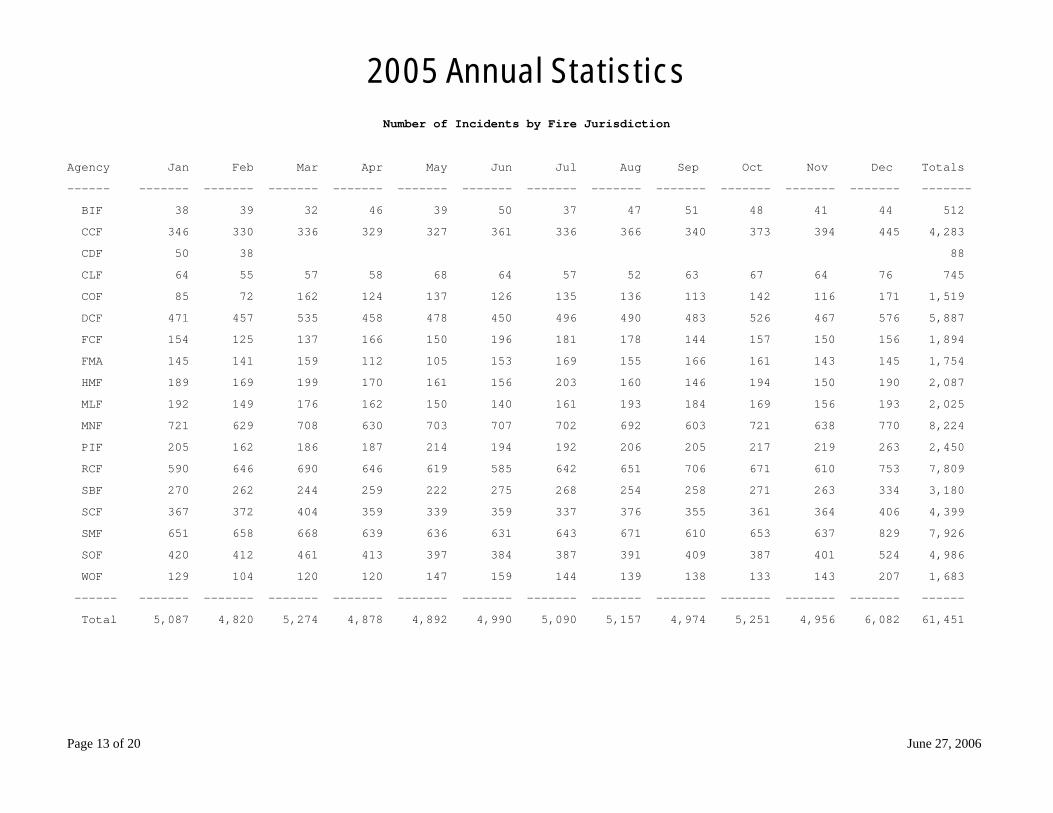
Number of Incidents by Fire Jurisdiction
Agency Jan Feb Mar Apr May Jun Jul Aug Sep Oct Nov Dec Totals
------ ------- ------- ------- ------- ------- ------- ------- ------- ------- ------- ------- ------- -------
BIF 38 39 32 46 39 50 37 47 51 48 41 44 512
CCF 346 330 336 329 327 361 336 366 340 373 394 445 4,283
CDF 50 38 88
CLF 64 55 57 58 68 64 57 52 63 67 64 76 745
COF 85 72 162 124 137 126 135 136 113 142 116 171 1,519
DCF 471 457 535 458 478 450 496 490 483 526 467 576 5,887
FCF 154 125 137 166 150 196 181 178 144 157 150 156 1,894
FMA 145 141 159 112 105 153 169 155 166 161 143 145 1,754
HMF 189 169 199 170 161 156 203 160 146 194 150 190 2,087
MLF 192 149 176 162 150 140 161 193 184 169 156 193 2,025
MNF 721 629 708 630 703 707 702 692 603 721 638 770 8,224
PIF 205 162 186 187 214 194 192 206 205 217 219 263 2,450
RCF 590 646 690 646 619 585 642 651 706 671 610 753 7,809
SBF 270 262 244 259 222 275 268 254 258 271 263 334 3,180
SCF 367 372 404 359 339 359 337 376 355 361 364 406 4,399
SMF 651 658 668 639 636 631 643 671 610 653 637 829 7,926
SOF 420 412 461 413 397 384 387 391 409 387 401 524 4,986
WOF 129 104 120 120 147 159 144 139 138 133 143 207 1,683
------ ------- ------- ------- ------- ------- ------- ------- ------- ------- ------- ------- ------- ------
Total 5,087 4,820 5,274 4,878 4,892 4,990 5,090 5,157 4,974 5,251 4,956 6,082 61,451
2005 Annual Statistics
Page 14 of 20 June 27, 2006
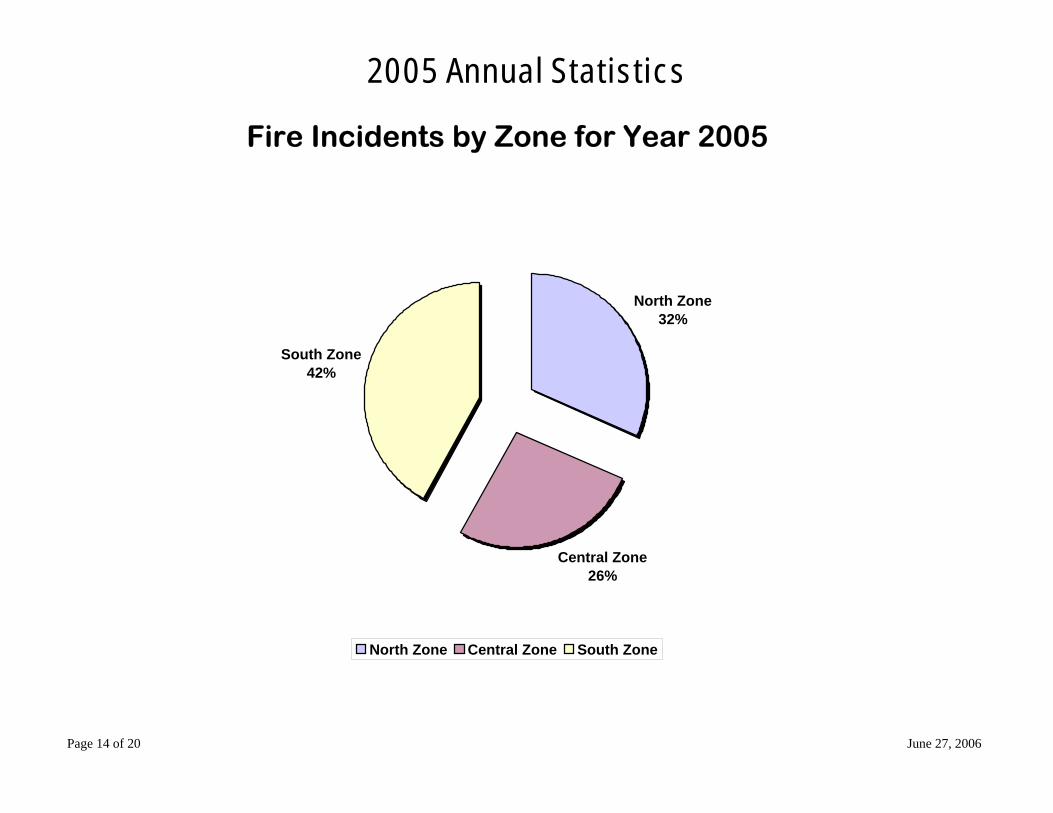
Fire Incidents by Zone for Year 2005
North Zone32%
Central Zone26%
South Zone42%
North Zone Central Zone South Zone
2005 Annual Statistics
Page 15 of 20 June 27, 2006
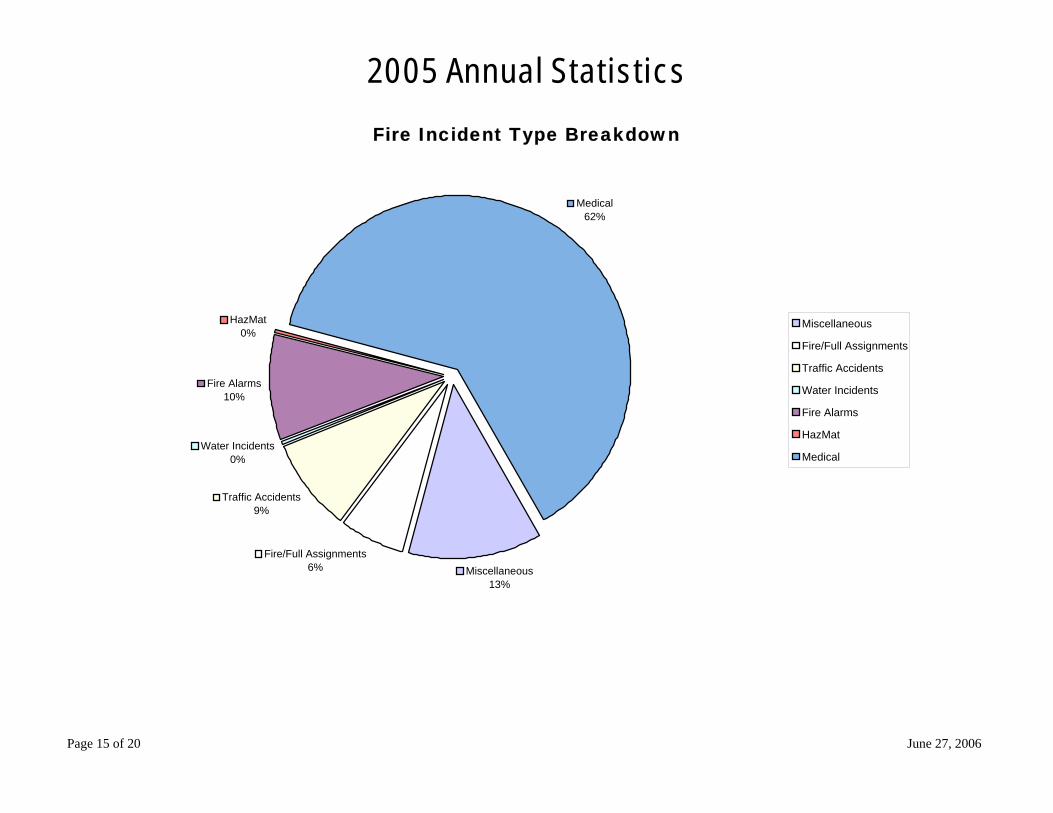
Fire Incident Type Breakdown
Miscellaneous13%
Fire/Full Assignments6%
Traffic Accidents9%
Water Incidents0%
Fire Alarms10%
HazMat0%
Medical62%
Miscellaneous
Fire/Full Assignments
Traffic Accidents
Water Incidents
Fire Alarms
HazMat
Medical
2005 Annual Statistics
Page 16 of 20 June 27, 2006
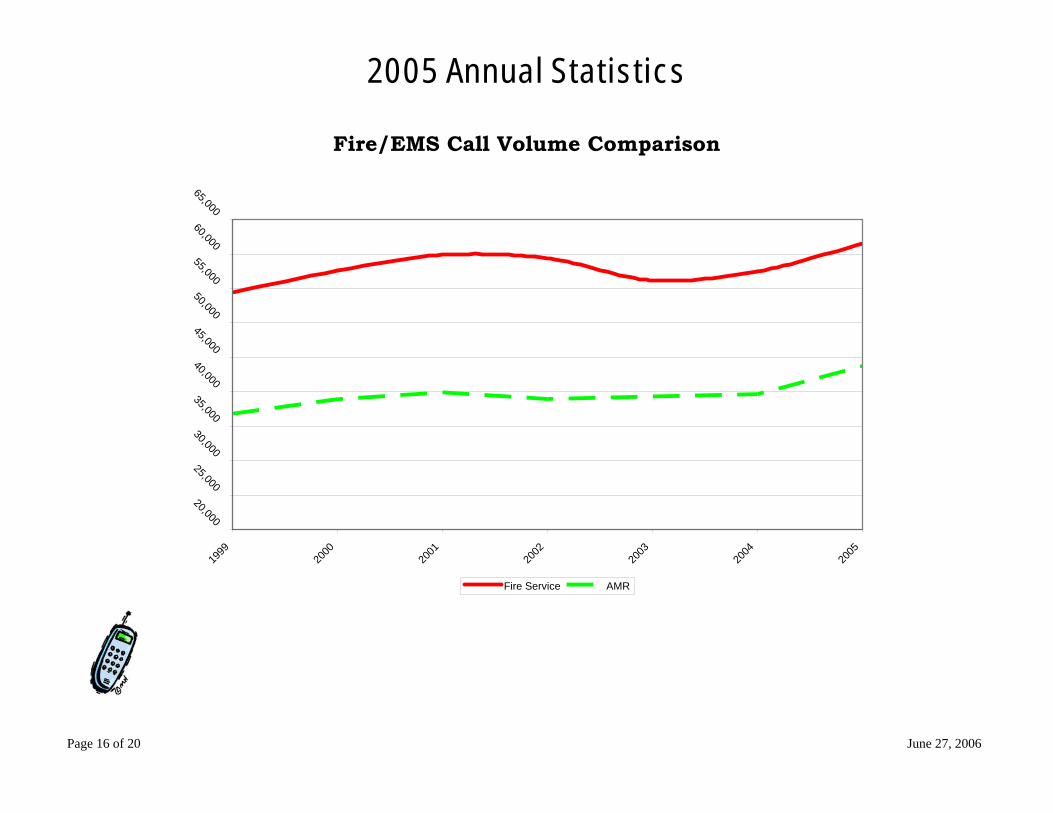
Fire/EMS Call Volume Comparison
20,000
25,000
30,000
35,000
40,000
45,000
50,000
55,000
60,000
65,00019
99
2000
2001
2002
2003
2004
2005
Fire Service AMR
2005 Annual Statistics
Page 17 of 20 June 27, 2006
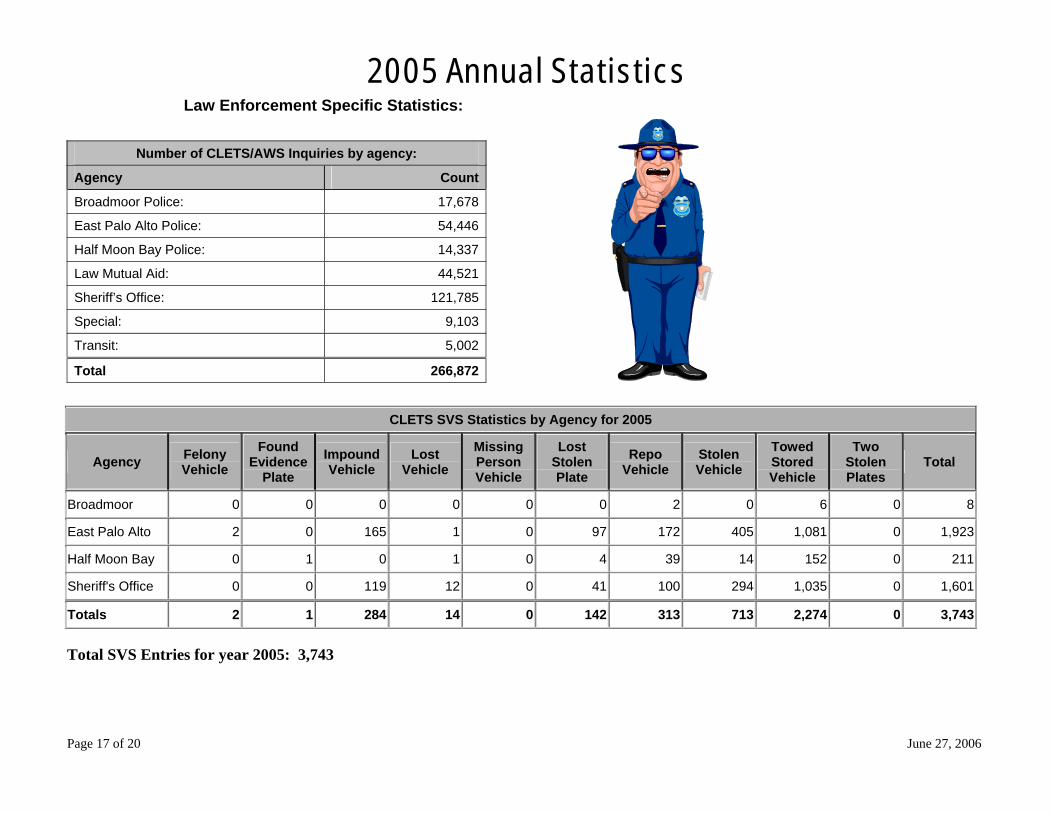
Law Enforcement Specific Statistics:
Number of CLETS/AWS Inquiries by agency:
Agency Count
Broadmoor Police: 17,678
East Palo Alto Police: 54,446
Half Moon Bay Police: 14,337
Law Mutual Aid: 44,521
Sheriff’s Office: 121,785
Special: 9,103
Transit: 5,002
Total 266,872
CLETS SVS Statistics by Agency for 2005
Agency Felony Vehicle
Found Evidence
Plate ImpoundVehicle
Lost Vehicle
Missing Person Vehicle
Lost Stolen Plate
Repo Vehicle
Stolen Vehicle
Towed Stored Vehicle
Two Stolen Plates
Total
Broadmoor 0 0 0 0 0 0 2 0 6 0 8
East Palo Alto 2 0 165 1 0 97 172 405 1,081 0 1,923
Half Moon Bay 0 1 0 1 0 4 39 14 152 0 211
Sheriff's Office 0 0 119 12 0 41 100 294 1,035 0 1,601
Totals 2 1 284 14 0 142 313 713 2,274 0 3,743
Total SVS Entries for year 2005: 3,743
2005 Annual Statistics
Page 18 of 20 June 27, 2006
Sheriff Beat Activity
Beat Total 10 844 11 15,545 20 7,882 31 5,511 32 2,595 40 1,263 60 2,175 70 9,811 80 3,888 OJ 7,846 Total 57,360
East Palo Alto Beat Activity
Beat Total 1 12,854 2 7,489 3 12,340 4 6,721 OJ 1,642 Total 41,046
Half Moon Bay Beat Activity
Beat Total 1 7,752 2 4,816 OJ 697 Total 13,265
Broadmoor Police Activity
Beat Total 1 2,696 2 956 OJ 3,382 Total 7,034
Activity Breakdown by Source of Incident
Agency Citizen Field Sheriff’s Office 31,164 (54%) 26,196 (46%)East Palo Alto Police 25,614 (62%) 15,432 (38%)Half Moon Bay Police 7,262 (55%) 6,003 (45%)Broadmoor Police 2,658 (38%) 4,376 (62%)Transit 2,323 (44%) 2,969 (56%)
Law Mutual Aid Incidents
Incident Type TotalAmber Alerts 0Code 2000 1Code 30 1Code 666 45Probation Hold Teletypes 163Tactical Alert Phase I 48Tactical Alert Phase II 4Special Details 2,914
ETS Incidents
Type TotalSignals Received 78Captures 1Robberies where no signal received 2
2005 Annual Statistics
Page 19 of 20 June 27, 2006
On Call Statistics:
Agency Number of Calls
ISD Radio Shop 66
Coroners Office 173
Probation 2,053
D.A.’s Office 189
Environmental Health 93
Judges 758
County Parks 125
County Road Department 132
County Sewer Department 277
County Water Department 62
Palo Alto Municipal Water 0
Coastside County Water 81
NTF 88
VTTF 46
Sheriff O.E.S. 110
Sheriff’s Office Bomb Unit 74
Sheriff’s Office EPA and EPA Detectives 83
Sheriff’s Office Crime Lab 67
Sheriff’s Office Major Crimes Unit 117
Sheriff’s Office SHOP 32
Sheriff’s Office SFIA 205
Sheriff’s Office Civil 1
2005 Annual Statistics
Page 20 of 20 June 27, 2006
Glossary of abbreviations:
BIF Brisbane Fire
BRD Broadmoor Police
BRF Burlingame Fire
BRS Brisbane Police
CAD Computer Aided Dispatch
CCF Central County Fire
CDF California Division of Forestry
CLF Colma Fire
COF County Fire
DBS Database System
DCF Daly City Fire
DPW Public Works
EMD Emergency Medical Dispatch
EMS County Emergency Medical System
EPA East Palo Alto Police
ESF South San Francisco EMS
FCF Foster City Fire
FMA Fire Mutual Aid
HIF Hillsborough Fire
HMB Half Moon Bay Police
HMF Half Moon Bay Fire
IAF San Francisco International Airport
LMA Law Mutual Aid
MCI Mass Causality Incident
MLF Millbrae Fire
MSS Message Switch System
MST Mobile Status Terminals
PAF Palo Alto Fire
PHS Peninsula Humane Society
PIF Pacifica Fire
RCF Redwood City Fire
SBF San Bruno Fire
SCC Santa Clara County
SCF South County Fire Authority
SMF San Mateo Fire (City of)
SOF South San Francisco Fire
SOS Sheriff’s Office
SPL Special Details
TRA Transit Police
UNK Unknown
WOF Woodside Fire


![[C-0942] · 2020. 1. 20. · Miscellaneous Order No. 129- 15 of 12 October 2015 granted the request for an extension of four months. (Page 1,438- 1,441, Volume III). Page 1,443, Volume](https://img.pdfslide.us/doc/110x75/614169b0a2f84929c3045fa3/c-0942-2020-1-20-miscellaneous-order-no-129-15-of-12-october-2015-granted.jpg)