Embed Size (px)
Citation preview

2005ADSA/ASAS/CSAS meeting (1)
Historical examination of culling of dairy cows from herds in the United StatesH. DUANE NORMAN, E. HARE, and J.R. WRIGHT
Animal Improvement Programs LaboratoryAgricultural Research Service, USDABeltsville, MD 20705-2350
[email protected] 301-504-8334
2005ADSA/ASAS/CSAS meeting (2)
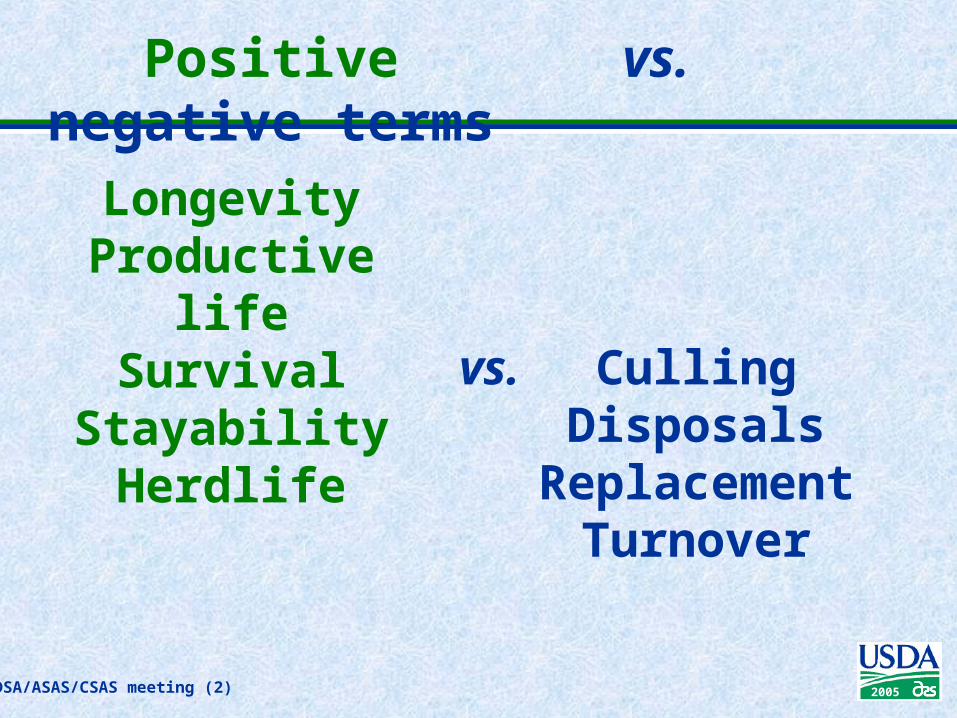
Positive vs. negative terms
LongevityProductive
lifeSurvival
StayabilityHerdlife
CullingDisposals
ReplacementTurnover
vs.

2005ADSA/ASAS/CSAS meeting (3)
Selection
Natural control vs. Human control
Bos primigenius
(extinct, 1672)
Bos taurus(Canadian Holstein true type, 1973)

2004
“Do we always do the right thing in selection?”
ADSA 8th DISCOVER Conference (4)
“We have created a bird that can’t mate naturally!”

2004ADSA 8th DISCOVER Conference (5)
“Let’s make sure our dairy animals can continue to reproduce naturally!”

2005ADSA/ASAS/CSAS meeting (6)
Cow population vs. production
5
10
15
20
25
40 50 60 70 80 90 00
Year
Cow
s (m
illio
ns)
4,000
7,000
10,000
13,000
16,000
19,000
Milk yield
(p
ounds/co
w)

2004ADSA 8th DISCOVER Conference (7)

2005ADSA/ASAS/CSAS meeting (8)
Production (quantity, quality)
Producers have largely emphasized milk and component yields and type traits
We could have selected for sustained production using more fitness traits (had more of the traits been recorded)
2005ADSA/ASAS/CSAS meeting (9)
Maturity rate vs. survival
“Has rate of maturity
changed over time? How has it affected
survival?”

2005ADSA/ASAS/CSAS meeting (10)
What impacts culling?
Milk production Reproduction Nutrition Conformation Overall health (e.g.
mastitis) Management practices Business economics

2005ADSA/ASAS/CSAS meeting (11)
Factors that impact culling rate Management style
(Hansen et al., 1998; Washburn et al., 2002; White et al., 2002)
Herd expansion(Faust et al., 2001)
bST
Culling decision software(Lehenbauer and Oltjen, 1998; Groenendaal et al., 2004; de Vries, 2004)
Replacement cost

2005ADSA/ASAS/CSAS meeting (12)
Low culling rates
Expanding herds (Weigel et al., 2003)
Type traits (Caraviello et al., 2003, 2004)
Bulk milk SCC (Barkema et al., 1998)
SCS (Samore et al., 2003)
Crossbreeding (Weigel and Barlass, 2003)
Theoretical analysis (Hill, 1980)
Economic evaluation (Korver and Remkena, 1979)

2005ADSA/ASAS/CSAS meeting (13)
Longevity definitions
True longevity =how long cows actually stay in the herd
Functional longevity = how long cows stay in the herd after an adjustment is enacted for milk yield, and perhaps other traits

2005ADSA/ASAS/CSAS meeting (14)
Longevity periods
Two phases:– Productive–Nonproductive
Nonproductive = Birth to first calving
Productive = First calving to disposal

2005ADSA/ASAS/CSAS meeting (15)
Productive life
Culling dates needed for all animals
Genetic evaluation
– First US national evaluation in 1994
– First international Holstein bull rankings for longevity in November 2004
Indirect response from correlated traits

2005ADSA/ASAS/CSAS meeting (16)
Days open phenotypic trend
100
120
140
160
65 70 75 80 85 90 95 00
Year
Day
s open
12345
Lactation
Holstein

2005ADSA/ASAS/CSAS meeting (17)
Economic value of longevity
Fewer replacement heifers needed to maintain herd size
Higher yield near maturity
Replacement heifers are better genetically
Higher proportion of cows in more profitable lactations

2005ADSA/ASAS/CSAS meeting (18)
Health disorders
Big impact on voluntary culling
Reproductive and udder problems most likely contributors
Risk factors (dystocia, displaced abomasum, mastitis)

2005ADSA/ASAS/CSAS meeting (19)
Reliable health information?

2005ADSA/ASAS/CSAS meeting (20)
Objectives
Examine survival rates over time
Document how long cows remain in the herd
Examine when in the lactation cows are culled
Examine why cows are culled
Assess the impact of culling

2005ADSA/ASAS/CSAS meeting (21)
Data edits
Herds participating in DHI testing for 1 yr prior to first calving and remaining on test throughout the cow’s lactations
Cows first calving 1980 to 1994 and remaining in same herd
Cows culled for dairy purposes excluded
No missing lactations (required 270–650 d between lactations)

2005ADSA/ASAS/CSAS meeting (22)
Opportunity group
Subgroups created based on opportunity of each cow to calve at each lactation
Cow’s herd must remain on test for an increment of 450 d per lactation after start of first lactation
e.g., 450 d for opportunity first group,
900 d for opportunity second group,
1350 d for opportunity third group, etc.

2005ADSA/ASAS/CSAS meeting (23)
Cows eligible for opportunity groups
BrownParity Ayrshire Swiss Guernsey Holstein
Jersey 1 71,952 120,158 173,260 12,773,403
654,024 2 63,931 106,273 158,650 11,319,316
570,973 3 56,576 93,592 137,555 9,971,550
494,967 4 49,736 81,815 143,649 8,738,975
429,201 5 43,684 71,802 129,092 7,602,286
372,088 6 38,487 62,759 115,606 6,576,598
322,992 7 33,596 54,798 102,869 5,693,402
279,335 8 29,172 47,251 91,234 4,883,776
239,510

2005ADSA/ASAS/CSAS meeting (24)
Survival rate
Defined as fraction of cows that had the opportunity to calve again that did
Survival to parity 1 assumed to be 100% as no information was available for heifers

2005ADSA/ASAS/CSAS meeting (25)
Survival to parity 2
BrownYear Ayrshire Swiss Guernsey Holstein Jersey1980 71.7 66.9 67.1 77.3 74.71984 69.8 65.0 66.4 74.6 73.61988 70.1 66.2 65.5 72.1 73.81992 69.5 63.6 60.8 72.4 74.51996 71.7 66.9 63.6 72.1 75.22000 71.8 68.8 66.3 74.1 76.2
2005ADSA/ASAS/CSAS meeting (26)
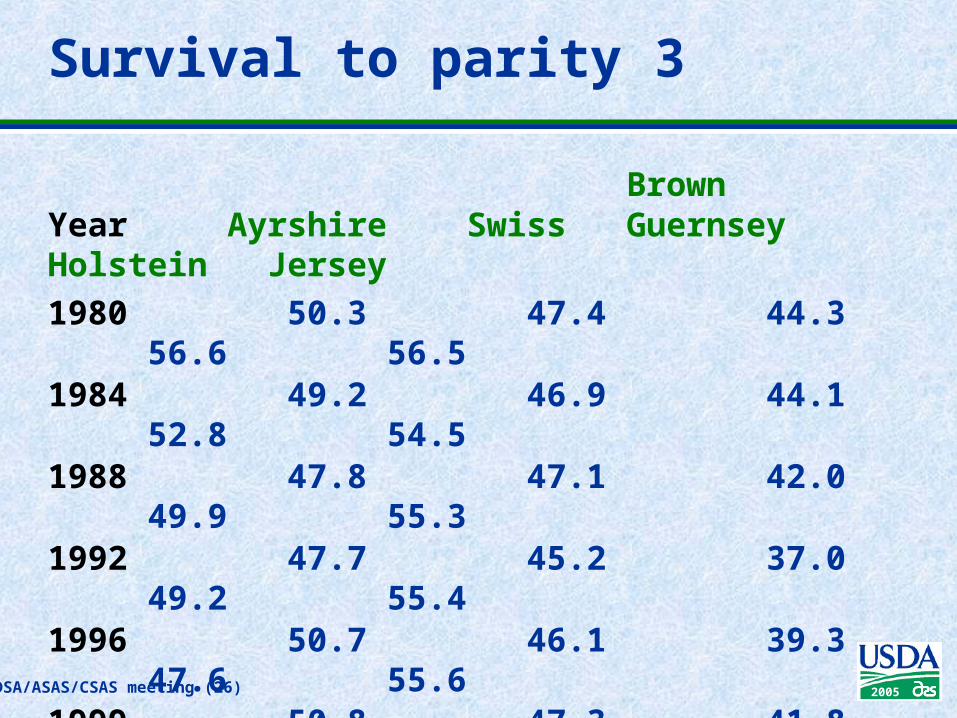
Survival to parity 3
BrownYear Ayrshire Swiss Guernsey Holstein Jersey1980 50.3 47.4 44.3 56.6 56.51984 49.2 46.9 44.1 52.8 54.51988 47.8 47.1 42.0 49.9 55.31992 47.7 45.2 37.0 49.2 55.41996 50.7 46.1 39.3 47.6 55.61999 50.8 47.3 41.8 49.0 56.7

2005ADSA/ASAS/CSAS meeting (27)
Survival to parity 4
BrownYear Ayrshire Swiss Guernsey Holstein Jersey1980 35.3 33.3 28.0 38.7 40.91984 33.3 33.5 27.8 35.4 39.51988 30.3 33.0 24.9 31.7 39.11992 31.1 32.0 21.3 30.2 39.01996 33.5 30.6 22.0 28.4 39.01998 34.8 31.6 21.8 28.4 38.1

2005ADSA/ASAS/CSAS meeting (28)
Survival to parity 7
BrownYear Ayrshire Swiss Guernsey Holstein Jersey1980 8.7 8.4 5.0 7.5 11.41984 7.3 8.2 4.1 6.1 9.81988 6.4 7.6 3.4 4.4 8.71992 6.7 6.0 2.6 3.5 7.71995 5.3 5.4 2.5 3.2 7.5

2005ADSA/ASAS/CSAS meeting (29)
Survival rates (1966–83)
0
20
40
60
80
2 3 4 5 6 7 8
Lactation
Surv
ival
rat
e (%
) AyrshireBrown SwissGuernseyHolsteinJersey
Nieuwhof et al., 1989

2005ADSA/ASAS/CSAS meeting (30)
Survival rates (1980-94)
0
20
40
60
80
2 3 4 5 6 7 8
Lactation
Surv
ival
rat
e (%
) AyrshireBrown SwissGuernseyHolsteinJersey

2005ADSA/ASAS/CSAS meeting (31)
Survival rates- Holstein (1980-94)
0
20
40
60
80
Year of first calving
Surv
ival
rat
e (%
)Parity 2
Parity 3
Parity 4
Parity 8

2005ADSA/ASAS/CSAS meeting (32)
Registered vs. grade survival
0
20
40
60
80
2 3 4 5 6 7 8
Lactation
Surv
ival
rat
e (%
) Holstein (registered)
Holstein (grade)Jersey (registered)
Jersey (grade)
Nieuwhof et al., 1989
2005ADSA/ASAS/CSAS meeting (33)
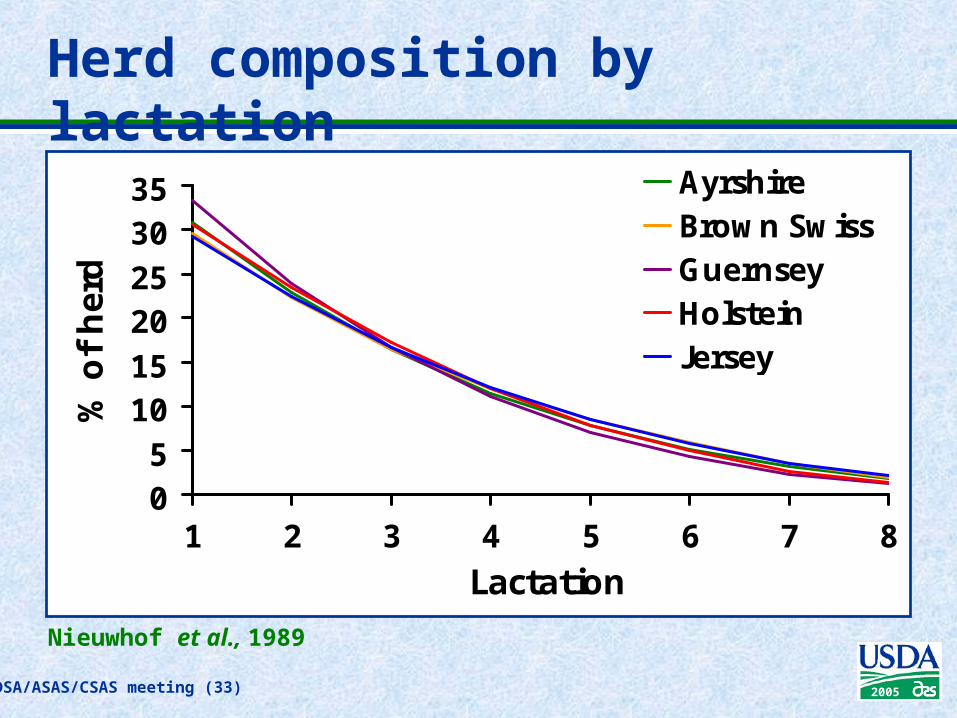
Herd composition by lactation
05
101520253035
1 2 3 4 5 6 7 8
Lactation
% o
f her
d
AyrshireBrown SwissGuernseyHolsteinJersey
Nieuwhof et al., 1989

2005ADSA/ASAS/CSAS meeting (34)
Herd composition by lactation
05
101520253035
1 2 3 4 5 6 7 8
Lactation
% o
f her
d
AyrshireBrown SwissGuernseyHolsteinJersey

2005ADSA/ASAS/CSAS meeting (35)
Holstein herd composition by parity
1966–76
Parity 6-88%Parity
58%
Parity 4
12%
Parity 3
17%Parity
224%
Parity 1
31%
Nieuwhof et al., 1989
1980–94
Parity 1
35%
Parity 3
17%
Parity 2
26%
Parity 4
11%
Parity 6-85%
Parity 5
6%

2005ADSA/ASAS/CSAS meeting (36)
Mean number of parities
Additional measure of survival
Sum of mean survival rates for parities 1 through 8 transformed to an overall indicator of number of parities (calvings)

2005ADSA/ASAS/CSAS meeting (37)
Mean parities through parity 8
2.50
3.00
3.50
Ayrshire BrownSwiss
Guernsey Holstein Jersey
Breed
Lact
atio
ns
(no.)
1966-83 1980-94
Nieuwhof et al., 1989
2005ADSA/ASAS/CSAS meeting (38)
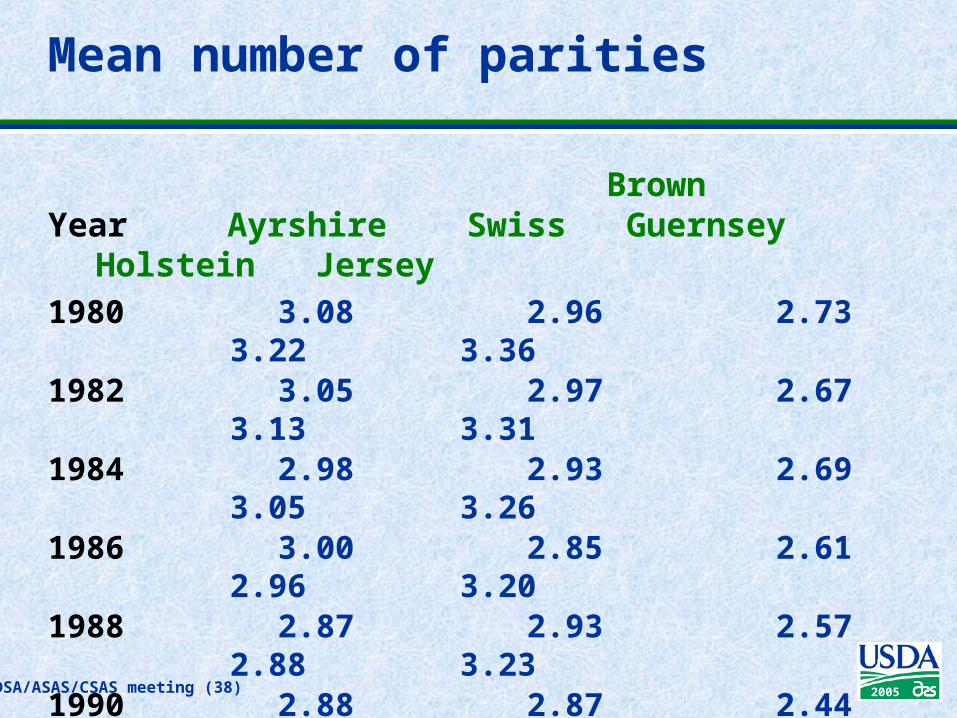
Mean number of parities
BrownYear Ayrshire Swiss Guernsey Holstein
Jersey1980 3.08 2.96 2.73 3.22
3.36 1982 3.05 2.97 2.67 3.13
3.311984 2.98 2.93 2.69 3.05
3.261986 3.00 2.85 2.61 2.96
3.201988 2.87 2.93 2.57 2.88
3.231990 2.88 2.87 2.44 2.85
3.191992 2.90 2.82 2.40 2.81
3.201994 2.89 2.86 2.41 2.79
3.20

2005ADSA/ASAS/CSAS meeting (39)
Mean Holstein parities by herd size
Cows (no.)
51– 101– 201– 501– 1001– 2001–Year 5–50 100 200 500 1000 2000 5000 1985 3.05 3.02 2.99 3.03 3.02 2.87 2.82 1987 2.95 2.94 2.92 2.95 2.96 2.86 2.60 1989 2.85 2.85 2.85 2.92 2.88 2.83 2.73 1991 2.83 2.82 2.82 2.85 2.89 2.80 2.68 1993 2.82 2.79 2.77 2.80 2.89 2.81 2.76 1994 2.83 2.80 2.75 2.79 2.83 2.79 2.74
2005ADSA/ASAS/CSAS meeting (40)
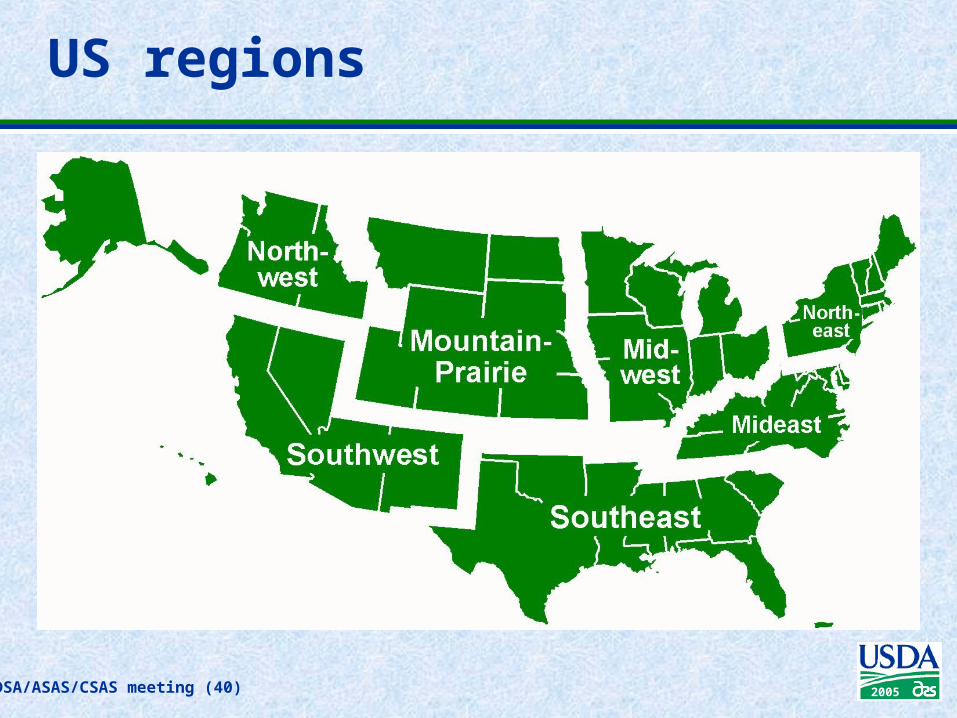
US regions

2005ADSA/ASAS/CSAS meeting (41)
Mean Holstein parities by region Mid- Mid- Mtn.- North- North- South- South-Year east west Prairie east west east west
1980 3.24 3.09 3.03 3.43 3.23 3.14 3.221982 3.16 2.99 2.96 3.32 3.11 3.13 3.171984 3.03 2.91 2.95 3.23 3.04 3.01 3.141986 2.97 2.83 2.89 3.14 2.99 2.89 3.031988 2.90 2.74 2.81 3.06 2.91 2.82 2.971990 2.88 2.73 2.78 3.02 2.90 2.74 2.911992 2.80 2.71 2.78 2.95 2.83 2.67 2.901994 2.74 2.70 2.74 2.92 2.84 2.59 2.89

2005ADSA/ASAS/CSAS meeting (42)
When are cows culled?
Delayed– Milking routine not
affected– Treated cows– Reproductive disorders
Immediate– Milking prevented– Teat injury– Downer cow

2005ADSA/ASAS/CSAS meeting (43)
DIM at lactation termination
150
200
250
300
350
0 2 3 4 5 6 7 8
Termination code
DIM
Termination codes:0 = Lactation in
progress or ended normally
2 = Sold for dairy purposes or testing discontinued
3 = Low production4 = Reproductive
problems5 = Not specified6 = Died7 = Mastitis or high
SCC8 = Abortion

2005ADSA/ASAS/CSAS meeting (44)
DIM at culling for Holsteins first calving 1998–99 by parity
Parity 1 2 3 4 5 >5 DIM % of total 1– 29 4.1 2.4 3.3 4.5 11.4 25.2 30– 89 13.0 10.7 12.8 14.8 17.9 22.0 90–179 14.0 15.3 16.2 18.7 20.622.9 180–299 20.2 26.0 25.6 25.8 25.318.4 300–449 30.0 32.7 30.5 27.8 20.1 10.4 >449 18.8 13.0 11.6 8.9 4.41.0
2005ADSA/ASAS/CSAS meeting (45)
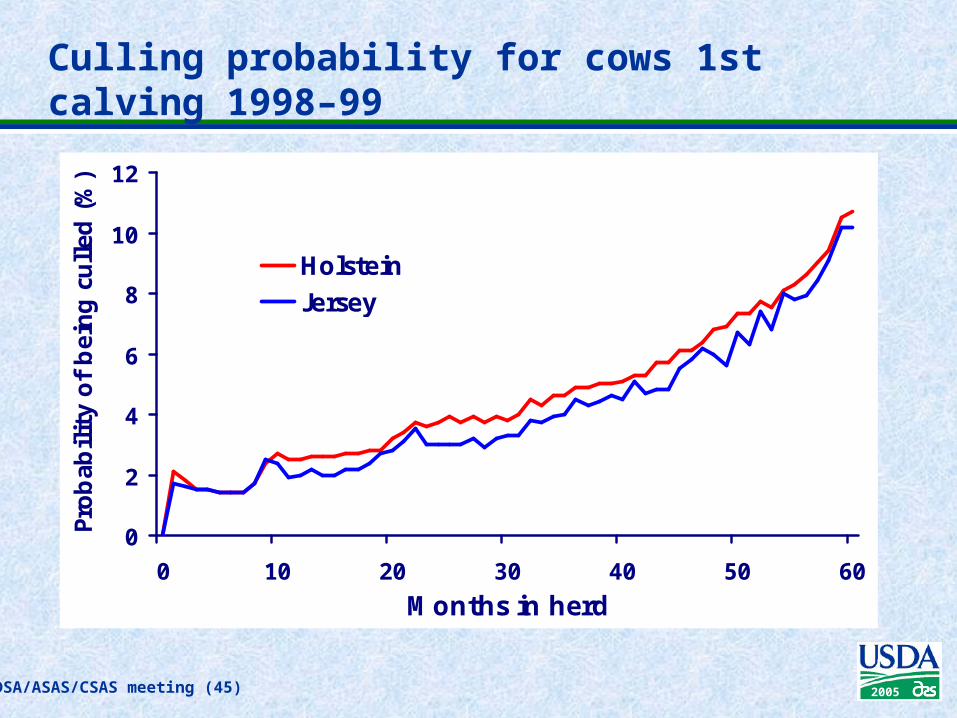
Culling probability for cows 1st calving 1998–99
0
2
4
6
8
10
12
0 10 20 30 40 50 60
Months in herd
Probab
ilit
y of
bei
ng c
ulled
(%
)
HolsteinJersey

2005ADSA/ASAS/CSAS meeting (46)
Why are cows culled?
Voluntary Involuntary

2005ADSA/ASAS/CSAS meeting (47)
USDA termination codes assigned to Holsteins not calving again by parity (first calving in 1998 or 1999)
Parity 1 2 3 4 5 >5Termination code % of total0 Lact. ended normally26.124.1 21.9 15.1 4.9 0.23 Low production 13.3 11.5 9.5 8.3 7.8 7.24 Reproductive 17.8 17.8 15.6 15.1 13.810.1 5 Sold for beef 26.1 26.3 28.8 33.1 38.239.6 6 Died 8.4 8.8 10.3 12.0 15.7 21.2 7 Mastitis, high SCC 9.4 11.6 13.9 16.5 19.621.7

2005ADSA/ASAS/CSAS meeting (48)
Impact of culling

2005ADSA/ASAS/CSAS meeting (49)
Mean calving age across all parities BrownYear Ayrshire Swiss Guernsey Holstein Jersey1980 57.2 58.9 54.3 51.8 54.61984 55.0 55.3 51.7 50.1 52.51988 53.9 55.8 49.8 49.5 51.71992 53.3 53.8 48.5 47.8 49.51996 53.4 53.1 49.1 46.9 50.12000 54.1 52.0 48.3 45.7 48.62004 54.3 51.0 48.5 44.6 46.6

2005ADSA/ASAS/CSAS meeting (50)
Conclusions
Cows are replaced sooner than before
Survival is primarily independent of herd size
Survival is highest in Northeast and Southwest, lowest in the Southeast

2005ADSA/ASAS/CSAS meeting (51)
Conclusions
Risk of exiting increases with parity
Most cows (69-72%) exit late (180 to 449 DIM) in early parities, but progressively earlier during later parities (50% by 149 DIM).
Need better information on health traits and reason for culling in DHI
Survival is highest in Northeast and Southwest, lowest in the Southeast
Overall breeding objective that includes but isn’t limited to survival

2005ADSA/ASAS/CSAS meeting (52)
What dairy producers need
Sound information so that producers can minimize cow losses
Effective communication so that producers use the information
Better software on who and when to cull
Overall breeding objective that includes but isn’t limited to survival

2005ADSA/ASAS/CSAS meeting (53)
Thank you

2005ADSA/ASAS/CSAS meeting (54)
Survival to parity 5
BrownYear Ayrshire Swiss Guernsey Holstein Jersey1980 23.5 21.8 16.6 24.2 27.91984 21.2 22.1 16.4 21.6 26.81988 18.4 21.9 13.5 18.4 25.91992 19.5 19.9 11.4 16.6 25.01996 21.1 18.0 11.5 14.7 24.11997 20.2 19.3 12.1 14.3 25.4

2005ADSA/ASAS/CSAS meeting (55)
Survival to parity 6
BrownYear Ayrshire Swiss Guernsey Holstein Jersey1980 14.7 13.8 9.9 14.3 18.41984 12.8 13.3 8.4 12.2 16.81988 10.8 13.5 6.6 9.5 15.61992 11.9 12.0 5.8 8.1 14.71996 11.9 9.7 5.2 6.9 13.8
2005ADSA/ASAS/CSAS meeting (56)
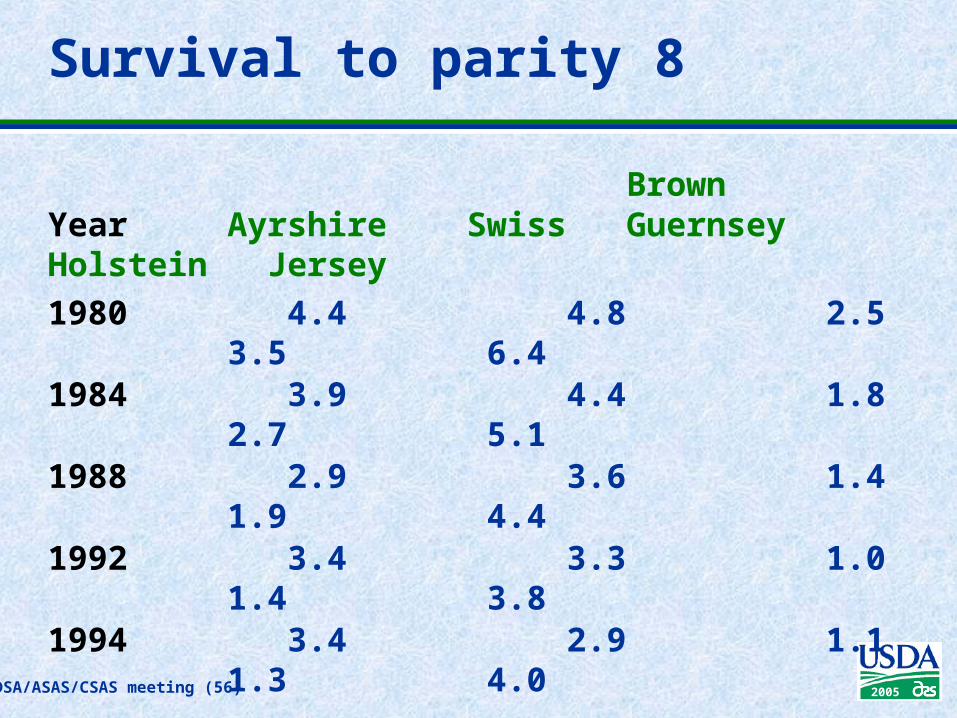
Survival to parity 8
BrownYear Ayrshire Swiss Guernsey Holstein Jersey1980 4.4 4.8 2.5 3.5 6.41984 3.9 4.4 1.8 2.7 5.11988 2.9 3.6 1.4 1.9 4.41992 3.4 3.3 1.0 1.4 3.81994 3.4 2.9 1.1 1.3 4.0

2005ADSA/ASAS/CSAS meeting (57)
Mean lactations through 8
2.75
3.25
3.75
Ayrshire BrownSwiss
Guernsey Holstein Jersey
Breed
Lact
atio
ns
(no.)
RegisteredGradeAll cows
Nieuwhof et al., 1989