Embed Size (px)
Citation preview

2005-11-04 Copyright Hallberg Independent Research
1
Mobile phones and health
Örjan Hallberg, Hallberg Independent ResearchPolkavägen 14B, 142 65 Trångsund [email protected]

2005-11-04 Copyright Hallberg Independent Research
2
The purpose of the study
To see if changes in health characteristics fit the roll-out of GSM 1800 in Sweden - Does it fit in time? - Does it fit geographically?

2005-11-04 Copyright Hallberg Independent Research
3
How much do we talk by the mobile phone each year?
0
5000
10000
15000
20000
25000
1975 1980 1985 1990 1995 2000 2005
Sp
eech
tim
e/ye
ar (
year
s)
NMT+GSM years Dual-band years

2005-11-04 Copyright Hallberg Independent Research
4
What is the average output pulse power from the phones?
0,0
0,5
1,0
1,5
2,0
1 10 100 1000
Population density (pers/km2)
Av
era
ge
ou
tpu
t p
ow
er
(W)
Telia/Ericsson: Mean W Median W

2005-11-04 Copyright Hallberg Independent Research
5
A GSM coverage model was tuned to the data from Telia/Ericsson
0,0
0,5
1,0
1,5
2,0
1 10 100 1000
Population density (pers/km2)
Av
era
ge
ou
tpu
t p
ow
er
(W)
Coverage model Telia/Ericsson: Mean W Median W

2005-11-04 Copyright Hallberg Independent Research
6
Sick-days statistics from 1981 looks different...
R2 = 0,1073
0,0
0,5
1,0
1,5
2,0
1 10 100 1000
Population density (pers/km2)
Av
era
ge
ou
tpu
t p
ow
er
(W)
15
20
25
30
35
Sic
k-d
ay
s
Coverage model Telia/Ericsson: Mean W Median W sick-days 1981
2005-11-04 Copyright Hallberg Independent Research
7
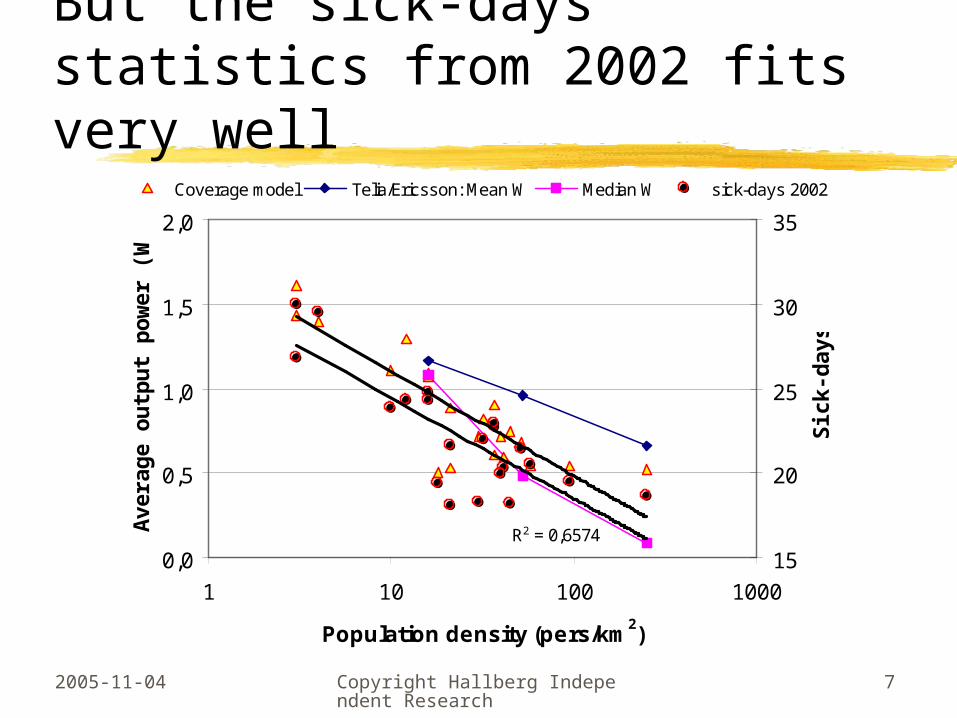
But the sick-days statistics from 2002 fits very well
R2 = 0,6574
0,0
0,5
1,0
1,5
2,0
1 10 100 1000
Population density (pers/km2)
Av
era
ge
ou
tpu
t p
ow
er
(W)
15
20
25
30
35
Sic
k-d
ay
s
Coverage model Telia/Ericsson: Mean W Median W sick-days 2002

2005-11-04 Copyright Hallberg Independent Research
8
So, the sickness in Sweden seems to relate to the GSM coverage
R2 = 0,7894
0
5
10
15
20
25
30
35
0 20 40 60 80 100
GSM fully covered (% of area)
Sic
kd
ay
s 2
00
2

2005-11-04 Copyright Hallberg Independent Research
9
And, funny enough, so it does also in Denmark and Norway
R2 = 0,4926
R2 = 0,4913
0
20
40
60
80
100
0 20 40 60 80 100
Fully covered area (%)Copyright Hallberg Independent Research, 2004
Hea
lth
co
st i
ncr
ease
(%
)
No Dk
2005-11-04 Copyright Hallberg Independent Research
10
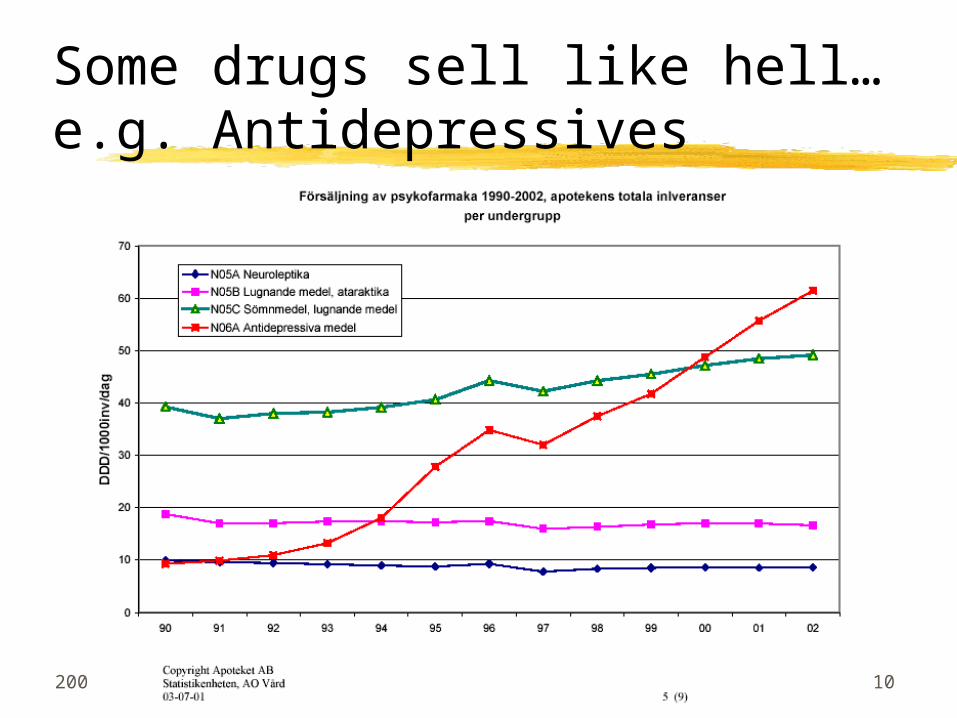
Some drugs sell like hell…e.g. Antidepressives

2005-11-04 Copyright Hallberg Independent Research
11
Pain killers on the rise...
0
50
100
150
200
250
1999 2000 2001 2002 2003 2004 2005
Da
y-d
os
es
/ye
ar
(M)

2005-11-04 Copyright Hallberg Independent Research
12
The mortality trend for the age group 10-39 years was broken in 1997
Mortality relative year 1950, age 10-39 years
0,0
0,1
0,2
0,3
0,4
0,5
0,6
0,7
1985 1990 1995 2000 2005
Rel
ativ
e m
ort
alit
y

2005-11-04 Copyright Hallberg Independent Research
13
The number of sick-registered started to increase in 1997
0
50
100
150
200
250
300
350
1985 1990 1995 2000 2005
Sic
k r
eg
iste
red
(k
)
0
5
10
15
20
25
30
35
Tota
l sp
each
tim
e p
er y
ear
(k y
ears
)
On sick leave Long term sick Dual band speach time

2005-11-04 Copyright Hallberg Independent Research
14
Exact when? August 1997 (?)
0
50 000
100 000
150 000
200 000
250 000
300 000
350 000
19
92
12
19
93
12
19
94
12
19
95
12
19
96
12
19
97
12
19
98
12
19
99
12
20
00
12
20
011
2
20
02
12
Sic
k-r
eg
iste
red

2005-11-04 Copyright Hallberg Independent Research
15
The trend-break is noticed all over Sweden...
0%
50%
100%
150%
200%
250%
19
92
19
93
19
94
19
95
19
96
19
97
19
98
19
99
20
00
20
01
Stockholm
Uppsala
Södermanland
Östergötland
Jönköping
Kronoberg
Kalmar
Gotland
Blekinge
Kristianstad
Malmöhus
Halland
Bohuslän
Älvsborg
Skaraborg
Värmland
Örebro
Västmanland
Kopparberg
Gävleborg
Västernorrland
Jämtland
Västerbotten
Norrbotten

2005-11-04 Copyright Hallberg Independent Research
16
For each county a specific break point was identified.
Stockholm
0
10000
20000
30000
40000
50000
60000
70000
jan
-96
ma
j-9
6
sep
-96
jan
-97
ma
j-9
7
sep
-97
jan
-98
ma
j-9
8
sep
-98
jan
-99
ma
j-9
9
sep
-99
jan
-00
ma
j-0
0
sep
-00
jan
-01
ma
j-0
1
sep
-01
jan
-02
ma
j-0
2
2005-11-04 Copyright Hallberg Independent Research
17
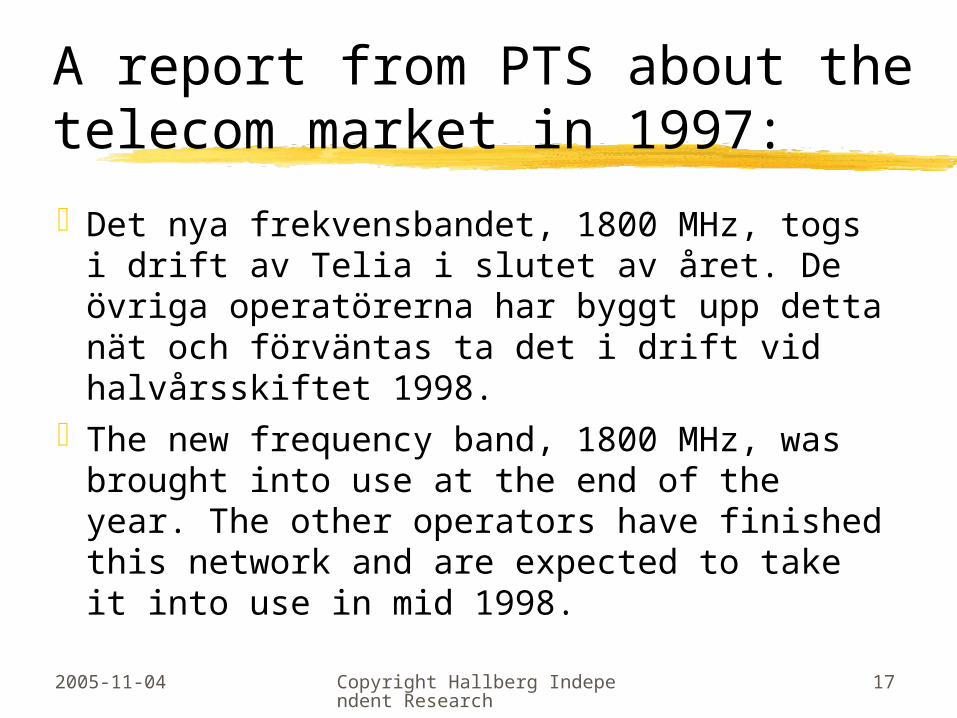
A report from PTS about the telecom market in 1997:
Det nya frekvensbandet, 1800 MHz, togs i drift av Telia i slutet av året. De övriga operatörerna har byggt upp detta nät och förväntas ta det i drift vid halvårsskiftet 1998.
The new frequency band, 1800 MHz, was brought into use at the end of the year. The other operators have finished this network and are expected to take it into use in mid 1998.
2005-11-04 Copyright Hallberg Independent Research
18
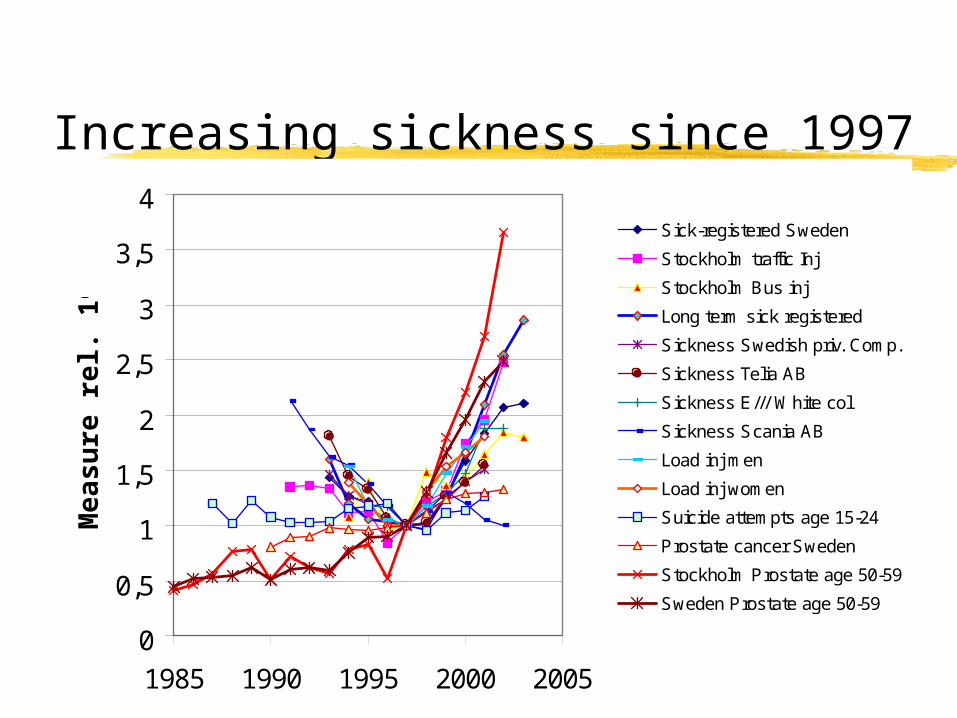
Increasing sickness since 1997
0
0,5
1
1,5
2
2,5
3
3,5
4
1985 1990 1995 2000 2005
Mea
sure
rel
. 19
97
Sick-registered Sweden
Stockholm traffic Inj
Stockholm Bus inj
Long term sick registered
Sickness Swedish priv. Comp.
Sickness Telia AB
Sickness E/// White col
Sickness Scania AB
Load inj men
Load inj women
Suicide attempts age 15-24
Prostate cancer Sweden
Stockholm Prostate age 50-59
Sweden Prostate age 50-59

2005-11-04 Copyright Hallberg Independent Research
19
A similar pattern was reported from Schweiz by Dr Lothar Geppert.
-20
-10
0
10
20
30
40
50
1993 1994 1995 1996 1997 1998 1999 2000 2001 2002
Psychological Diseases
Nerve Sys.& Sense Organs
Cardiovascular
Other Diagnoses
Total
Ch
an
ge
of
No
. Of
Dia
gn
os
es
re
lat.
To
19
93
in %

2005-11-04 Copyright Hallberg Independent Research
20
And more from Schweiz...

2005-11-04 Copyright Hallberg Independent Research
21
Company health statistics got worse in 1997
0
0,5
1
1,5
2
2,5
1990 1992 1994 1996 1998 2000 2002 2004
Wo
rkfo
rce
sic
kn
es
s r
el t
o 1
99
7
0
3
6
9
12
15
Gig
a E
ar-
he
ati
ng
Min
ute
s 1
80
0 M
Hz
Sw Enterpr. Telia AB Ericsson (white-collar) Scania AB GEM1800

2005-11-04 Copyright Hallberg Independent Research
22
Traffic injuries in Stockholm are increasing
0
200
400
600
800
1000
1200
1400
1985 1990 1995 2000 2005
Se
ve
rely
inju
red
in S
thlm
tra
ffic
0
2
4
6
8
10
12
14
1800
MH
z g
iga
ear
min
ute
s (G
EM
)
Traffic inj Sthlm 1800 GEM

2005-11-04 Copyright Hallberg Independent Research
23
Both handheld and hands-free phones increase the reaction time while driving

2005-11-04 Copyright Hallberg Independent Research
24
Work-load related injuries are increasing

2005-11-04 Copyright Hallberg Independent Research
25
And it takes longer time to recover from a work related sickness or accident in the high power counties!
R2 = 0,3694
R2 = 0,631
0
50
100
150
200
250
0 0,5 1 1,5 2
Average mobile phone output power (W)
Sic
knes
s (d
ays)
0
20
40
60
80
100
Inju
ry r
eco
very
(d
ays)
Sickness Injury

2005-11-04 Copyright Hallberg Independent Research
26
It also takes longer time to recover from a surgery operation in sparsely populated regions
0
100
200
300
400
500
600
0 0,5 1 1,5 2
Average output power (W)
Rec
ove
ry d
ays
afte
r su
rger
y
Heart infarct Breast

2005-11-04 Copyright Hallberg Independent Research
27
The mortality due to external causes is higher in the countryside
R2 = 0,5124p=0,00026
0
20
40
60
80
0 0,5 1 1,5 2
Average handset pulse power (W)
Mo
rtal
ity
(1/1
00,0
00)

2005-11-04 Copyright Hallberg Independent Research
28
Nerve system mortality
R2 = 0,3906p=0,0024
05
10
15202530
354045
0 0,5 1 1,5 2
Average pulse power (W)
Mo
rtal
ity
2001

2005-11-04 Copyright Hallberg Independent Research
29
The number of deaths per year in Alzheimer’s disease is accelerating!
Alzheimer deaths in Sweden
0
200
400
600
800
1000
1200
1960 1970 1980 1990 2000 2010
Dea
ths

2005-11-04 Copyright Hallberg Independent Research
30
And especially so in high power counties
Alzheimer mortality increase 1997-2001 vs mobile phone output power in Sweden
R2 = 0,3717p=0,0033
0
5
10
15
20
0 0,5 1 1,5 2
Average pulse power (W)
Mo
rtal
ity
incr
. (1
/100
,000
)

2005-11-04 Copyright Hallberg Independent Research
31
This is not the case for a completely different neuralgic disease, ALS.
R2 = 0,0072
-5
0
5
10
15
20
0 0,5 1 1,5 2
Average output pulse power (W)
Mo
rtal
ity
chan
ge
(1/1
00 0
00)

2005-11-04 Copyright Hallberg Independent Research
32
And ALS shows no trendbreak
R2 = 0,0355
0
1
2
3
4
1996 1997 1998 1999 2000 2001 2002
Mo
rtal
ity
(1/1
00,0
00)

2005-11-04 Copyright Hallberg Independent Research
33
Prostate cancer has been increasing in Stockholm since 1997
0
50
100
150
200
250
1985 1990 1995 2000 2005
Ne
w p
ros
tate
ca
nc
er
ca
se
s
Prost Sth 50-59

2005-11-04 Copyright Hallberg Independent Research
34
And so it does for all of Sweden - especially after 1997
0
50
100
150
200
250
1950 1960 1970 1980 1990 2000 2010
Inci
den
ce A
SR
(1/
100.
000)

2005-11-04 Copyright Hallberg Independent Research
35
But it has nothing to do with mobile phone output power!
Incidence change 1997-2002
R2 = 0,2088
-50
0
50
100
150
200
0 0,5 1 1,5 2
Average output power (W)
Inci
den
ce c
han
ge
(1/1
00,0
00)

2005-11-04 Copyright Hallberg Independent Research
36
So, if we look at leukemia, is there any trend-break? No - not at all!
Leukemia, annual new cases
0
200
400
600
800
1000
1200
1993 1995 1997 1999 2001 2003 2005
New
cas
es
0
4000
8000
12000
16000
20000
24000
Sp
eech
tim
e p
er y
ear
(yea
rs)

2005-11-04 Copyright Hallberg Independent Research
37
Does the incidence increase by mobile output power? No!
R2 = 0,0635
0
2
4
6
8
10
12
14
16
0 0,5 1 1,5 2
Average output power (W)
Leu
kem
ia i
nci
den
ce (
1/10
0,00
0)

2005-11-04 Copyright Hallberg Independent Research
38
Hearing problems have increased at country-side
R2 = 0,3601p=0,0055
R2 = 0,059
0
5
10
15
20
25
1 10 100 1000
Population density (pers/km2)
Hea
rin
g d
isab
led
(%
)
2000 1985

2005-11-04 Copyright Hallberg Independent Research
39
Acustic neuroma cancer has increased at country-side
0
0,2
0,4
0,6
0,8
1
1,2
1993-1996 1999-2002
Inci
den
ce (
1/10
0,00
0)
<40/km2 >40/km2

2005-11-04 Copyright Hallberg Independent Research
40
So, to summarize
Which health characteristics do fit with GSM1800?
And which ones don’t?

2005-11-04 Copyright Hallberg Independent Research
41
Can the mobile system possibly be accountable for all these problems?
Problem Trend break in 1997? Is it worse where highhandset power is used?
Logical explanation
Leukemia No No Not caused by RF-EMF
Population Sickness Yes Yes Impaired recovery
Traffic injuries Yes Yes - inside cars Delayed reaction timewhile driving
Surgery recoverytimes
Don't know Yes Impaired recovery
Work relatedaccidents
Yes Yes Impaired recovery
Externally causeddeaths
Increasing, most in2001
Yes Psychiatric, suicide,murders, accidents,reaction times etc
Prostate cancer Yes No - actually better! This needs to be looked at.
Alzheimer deaths Yes, but also before Yes Damaged BBB will speedup the death of the patient
ALS deaths No No Not caused by RF-EMF
Hearing problems Don't know Yes Irritated hearing nerves?
Neuroma cancer Don't know Yes Irritated hearing nerves?

2005-11-04 Copyright Hallberg Independent Research
42
Conclusions
The data shows that the health of the whole Swedish population is threatened
Sparsely populated counties are worse off
The responsible authorities must seriously consider possible health implications from the GSM 1800 MHz system

2005-11-04 Copyright Hallberg Independent Research
43
Thank you for listening!