Embed Size (px)
Citation preview
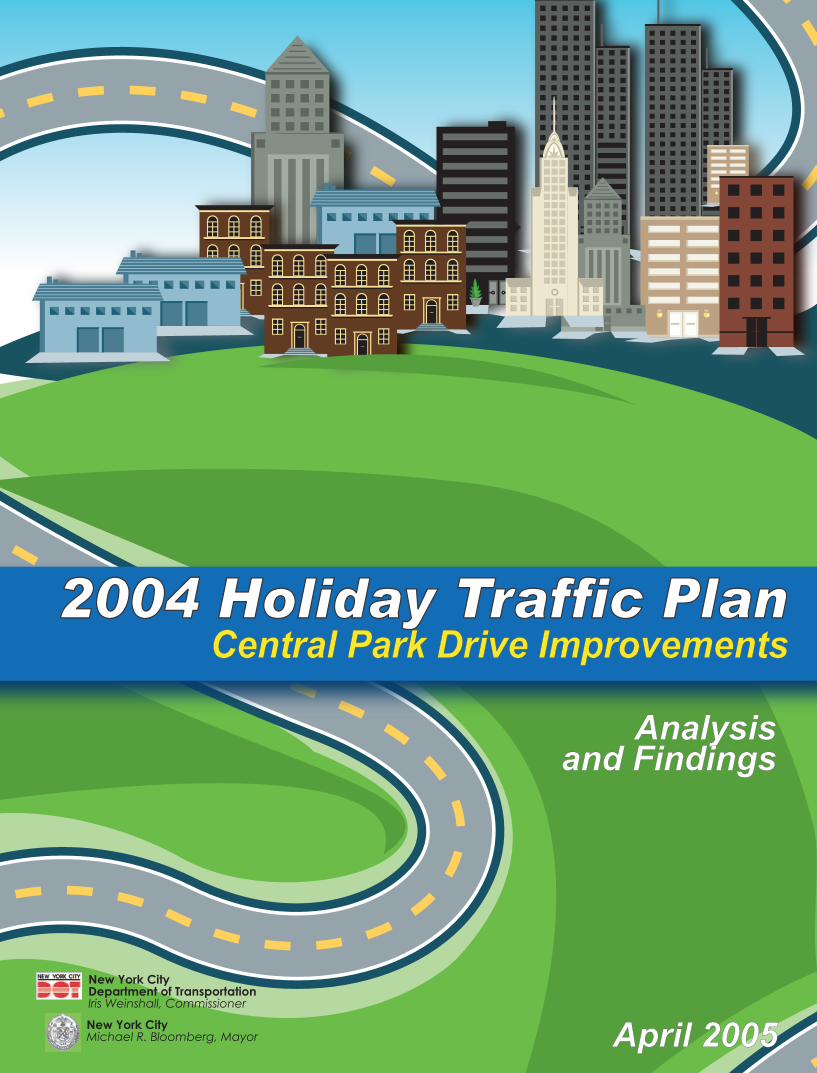
2004 Holiday Traffic Plan2004 Holiday Traffic PlanCentral Park Drive ImprovementsCentral Park Drive Improvements
Analysis Analysis and Findingsand Findings
New York CityDepartment of TransportationIris Weinshall, Commissioner
New York CityMichael R. Bloomberg, Mayor April 2005April 2005
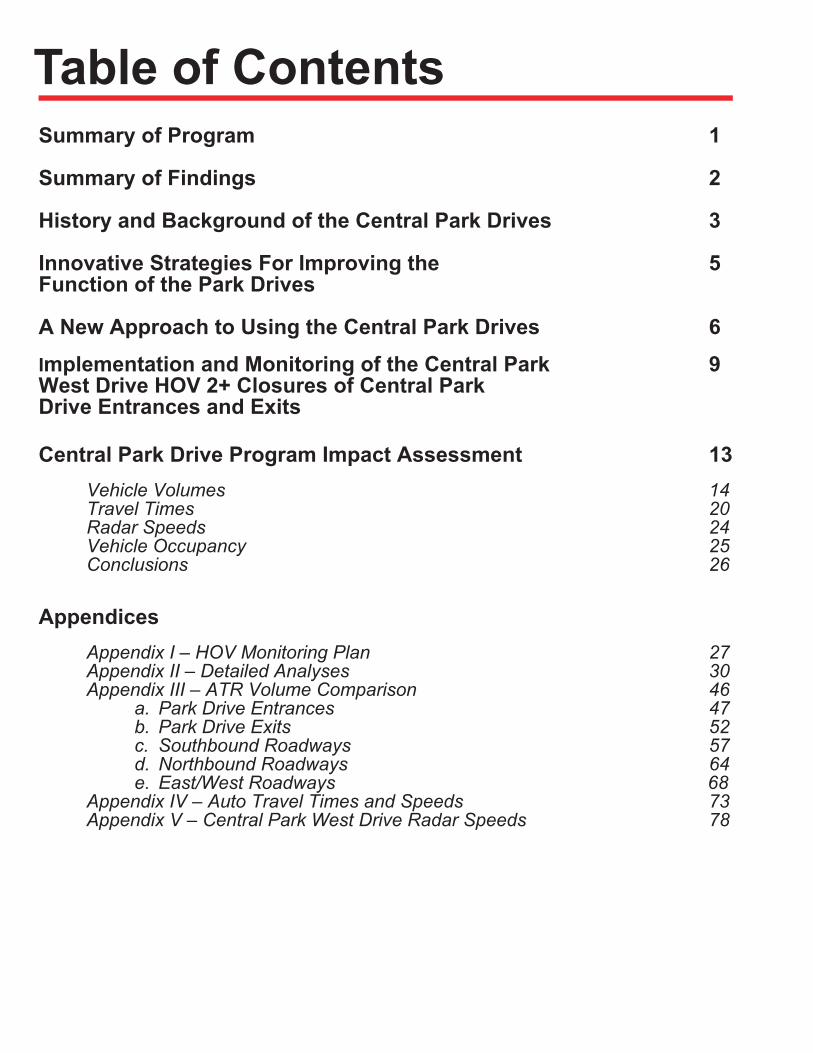
Table of ContentsSummary of Program 1
Summary of Findings 2 History and Background of the Central Park Drives 3
Innovative Strategies For Improving the 5Function of the Park Drives
A New Approach to Using the Central Park Drives 6
Implementation and Monitoring of the Central Park 9West Drive HOV 2+ Closures of Central ParkDrive Entrances and Exits
Central Park Drive Program Impact Assessment 13 Vehicle Volumes 14 Travel Times 20 Radar Speeds 24 Vehicle Occupancy 25
Conclusions 26
Appendices Appendix I – HOV Monitoring Plan 27 Appendix II – Detailed Analyses 30 Appendix III – ATR Volume Comparison 46
a. Park Drive Entrances 47b. Park Drive Exits 52c. Southbound Roadways 57d. Northbound Roadways 64e. East/West Roadways 68
Appendix IV – Auto Travel Times and Speeds 73Appendix V – Central Park West Drive Radar Speeds 78
New York City Department of Transportation
1
Summary of Program
Each year, during the winter holiday season, there is an influx of motorists and pedestrians in and around the City. As a result, a Holiday Traffic Plan is developed to facilitate the efficient and safe movement of motorists and pedestrians.
Traditionally, the Holiday Traffic Plan is in effect from the week before Thanksgiving to the Sunday after New Year’s Day. The plan is primarily focused on easing traffic and improving mobility within the Midtown core (34th Street to 59th Streets between Third and Eighth Avenues), as well as lower Manhattan. There are four primary components of the plan:
Mass Transit Traffic Management InitiativesIncreased Enforcement InitiativesPublic Outreach
One of the more traditional components of the annual program is the designation of “Gridlock Alert Days” when the Department of Transportation (DOT) anticipates high volumes of traffic and encourages individuals to utilize the many mass transit options that exist.
It is also during this Holiday Season that the Department introduces new and innovative approaches to address congestion and improve traffic flow. Previous examples of successful projects introduced as part of the Holiday Traffic Plan include the Midtown THRU Streets program in 2002, the Commercial Vehicle Parking Program, as well as several other innovative programs that continue to be successful.
For the 2004 Holiday Traffic Plan, the DOT, in conjunction with the New York City Department of Parks and Recreation, implemented an ambitious program to improve the overall usability of the Central Park Drives. This program consisted of the following elements:
Implementation of a HOV 2+ Lane on the West Drive between 7am and 10amClosure of several entrances and exits to the Park DrivesChanges to the Park Drive operating hours
••••
•
••
New York City Department of Transportation
2
Lowering of the speed limit on the Park Drives from 30 mph to 25 mph
Summary of FindingsAs part of the Holiday Plan, the Department closely monitored the impacts of this initiative to determine the impacts. Our assessment compared the pre-existing or “before” conditions with data collected during the implementation of the program between November 29, 2004 and January 2, 2005. Following are the highlights of our findings:
Central Park HOV 2+ and Closure of Select Park Drive Entrances and Exits
The project met or exceeded expectations for improving mobility, promoting alternative modes of transportation and improving safety without adversely affecting traffic conditions.
There were no significant impacts associated with either the HOV 2+ restriction on the West Drive or from the closure of the selected entrances and exits.
Travel times improved significantly on the West Drive, particularly during the HOV 2+ restriction in the AM peak period.
The number of single occupant vehicles on the West Drive decreased dramatically during the course of the program, improving significantly to an 88% reduction during Week 3 at West 95th/96th Street.
Due to the reduced speed limit on the Park Drives, both average speeds and 85th percentile speeds were significantly reduced.
Although volumes did not increase on Central Park West, travel times deteriorated by 25% in the AM peak and by 15% in the PM peak due to the diverted traffic from the HOV 2+ restriction and Park Drive entrance closures.
Most of the other roadways surrounding the park were minimally affected by the Central Park Program with travel times and volumes either decreasing slightly or remaining relatively unchanged.
•
•
•
•
•
•
•
•
New York City Department of Transportation
3
History and Background of the Central Park Drives
For over 150 years, Central Park has been considered to be “New York City’s Backyard”, an oasis for recreation, culture and tranquility. Over this course of history, Central Park has also seen numerous cycles of renewal and decline, as the advent of the automobile, city politics and changes to the urban landscape have molded the Park into its modern form. In recent times, the Park has undergone
a significant renaissance. With this renaissance, there have been increased efforts to reconcile the enormous variety of competing uses in Central Park (e.g., private vehicles, taxis, bicyclists, runners, pedestrians, horse drawn carriages and roller bladers) and attain a better balance between recreational and motorized traffic.
While the Park’s original design included transverse thoroughfares along four corridors (65th, 79th, 86th and 97th Street) to accommodate crosstown traffic, the Park is also characterized by the East and West Drives, a loop road that traverses around the fringes of the park. In its original form, these roadways were designed to accommodate horse drawn carriages. However, at the
end of the 19th Century and with the rise of the automobile, the Park Drives were increasingly used by both recreational and regular vehicular traffic. However, unlike the transverse roads, which are grade separated so as to not interfere with other Park uses and activities, the Park Drives are at grade and have evolved into shared use roadways that accommodate both motorists and recreational users.
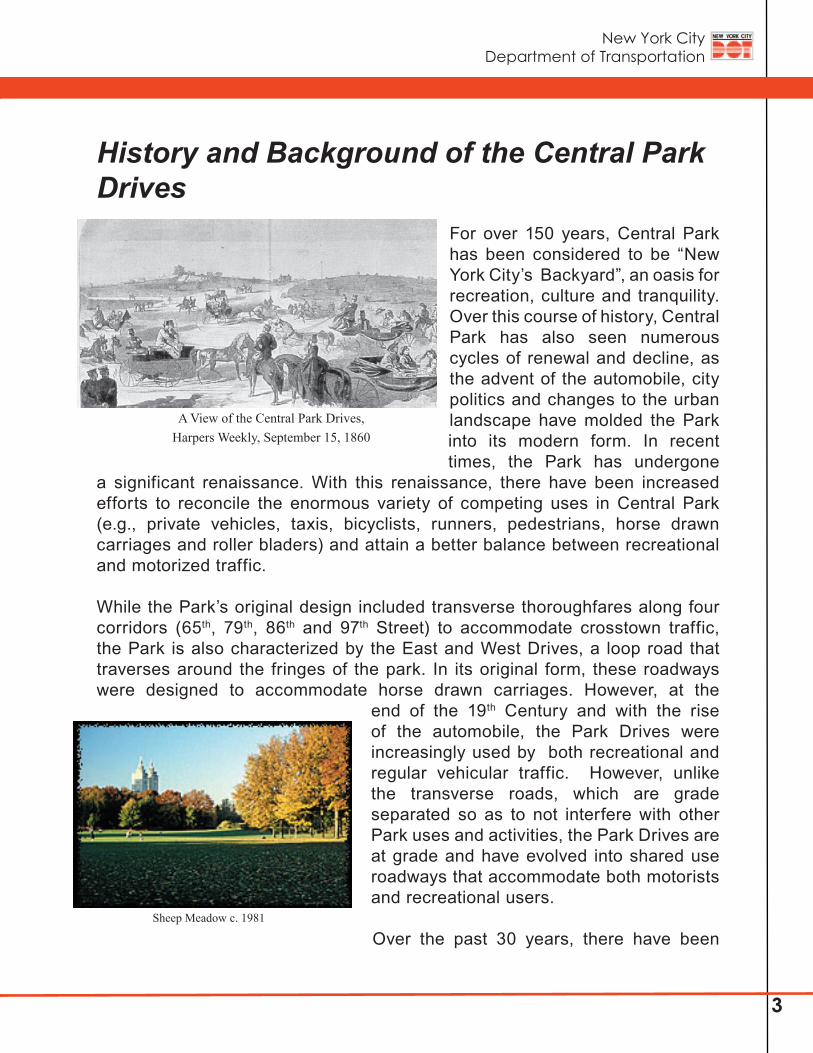
Over the past 30 years, there have been Sheep Meadow c. 1981
A View of the Central Park Drives,Harpers Weekly, September 15, 1860
New York City Department of Transportation
4
numerous initiatives aimed at reducing the number of motor vehicles using the Park Drives. Most of these efforts have focused on limiting motor vehicle access during specified time periods or during certain months of the year. While there had been previous efforts to reconcile the uses, it was in the early 1980’s that the operational characteristics of the Park Drives began to change. In 1980, based upon the success of the Prospect Park recreational lane (established in 1978), one traffic lane of the Park Drives was dedicated as a recreational lane for bikers and joggers on the Park Drives north of the 72nd Street Transpark Road. Recreational users south of 72nd Street were directed to a paved path that ran aside from the Park Drives. In 1990, the recreational lane was extended to the southern section of the park for bicyclists, while pedestrians, joggers and other recreational users continued to use the paved path.
Additional improvements made to the operation of the Park Drives in subsequent years included an extension of the summer closure season, shortening the weekday and evening closure hours, extending holiday and weekend closings to 7 PM the night before until 6 AM the morning after. However, since 1981, motor vehicles have been permitted to use the East Drive from 6th Avenue/Avenue of the Americas to East 72nd Street at all times, as this corridor provides a critical link for northbound vehicles leaving the Central Business District (CBD) of Manhattan.
New York City Department of Transportation
5
Innovative Strategies For Improving the Function of the Park DrivesOne of the most ambitious approaches for improving the operation of the Park Drives and providing additional space for non-vehicular uses was the Department’s 1990 Central Park Drives Alternate Use study which examined different operational scenarios that would provide for decreased vehicular use in Central Park. As part of the study, seven different scenarios were developed and studied for the roadway impacts on the surrounding roadway network and the Park’s transverse roads. The seven alternative scenarios included:
• No action – existing conditions• Close all Park Drive Roadways • Close “off peak” direction during peak hours• Implement year-round midday closing 10am-3pm• Close roadways north of 72nd Street• Allow motor vehicles in only one lane • Close selected entrances, exits, and/or roadway segments
In 1991, as part of the Earth Week initiatives, the Department implemented a HOV program on the Park Drives, which was successful in decreasing vehicular volumes while increasing vehicle occupancy for vehicles on the Drives.
In 1994, based upon the findings of the Central Park Alternative Use Study – Scenario 7, the Department implemented permanent closures on several exits and entrances to the Park drives. These closures included the Frederick Douglass Circle Entrance, the West 106th Street Exit and the Grand Army Plaza entrance at Fifth Avenue. The study also resulted in the experimental closure of the Columbus Circle entrance to the park in August 1994. Subsequently, the closure was made permanent in 1995 in conjunction with the Parks Department reconstruction of the southwest corner of the park.
New York City Department of Transportation
6
A New Approach to Using the Central Park DrivesOver the past several years, the Department has received numerous requests from area residents and community groups advocating for increasing roadway closure hours, closing additional entrances and/or exits or banning motor vehicle traffic from the park drives, while other advocates have voiced interest in increasing the availability of the park drives to reduce congestion and improve traffic flow on the surrounding street network.
Recently, the Central Park Conservancy expressed interest in pursuing additional closures on select Park Drive entrances and exits. A consultant study on behalf of the Conservancy was undertaken in 2004 to assess the feasibility of implementing these closures. Based upon the consultant findings, the Conservancy approached the Department to consider the following closures on the Park Drives:
• Lenox Avenue Exit• East 102nd Street Entrance• East 90th Street Entrance• West 90th Street Entrance • West 85th Street Entrance• West 777th Street Entrance• West 72nd Street Slip-off ramp at Strawberry Fields from Park Drive South
In July 2004, based upon the consultant report and data collected as part of their study, the Department collected additional vehicular volume at several Park Drive entrances and exits during both the AM and PM peak periods to determine the feasibility of implementing additional closures.
Based upon the findings of the Department’s data collection efforts at several of the exits and entrances, the Department determined the following closures would be feasible due to low volumes and little to no anticipated effects resulting from these closures. They included:
• West 90th Street Entrance and Exit• West 77th Street Entrance
New York City Department of Transportation
7
• East 102nd Street Entrance and Exit• East 90th Street Entrance• West 72nd Street Slip-off ramp at Strawberry Fields from Park Drive South
Although the Central Park Conservancy’s study did not propose the closure of the exits at West 90th and East 102nd Street, it was the Department’s belief that these additional closures would reduce potential pedestrian/vehicle conflicts in the Park without creating any significant impacts on the surrounding roadways due to the low number of vehicles that were currently using these exits on a daily basis.
Given these findings, the Department also revisited the HOV 2+ concept for the West Drive during the AM peak travel period. Based upon the successful outcome of the 1991 Earth Week project when the Department implemented an HOV 2+ program on the Park Drives, DOT believed that the implementation of a similar program at this time would further decrease volumes and encourage the use of more efficient vehicles such as carpools and taxis on the West Drive during the AM peak period. In essence, the program would maximize the people carrying, as opposed to the vehicle carrying capacity of the West Drive.
The specific elements of this HOV 2+ program would limit access to vehicles with two or more passengers on the West Drive during the AM peak travel period (7am to 10am), and would apply to all vehicles accessing the West Drive.
Another element of the program that was introduced as part of the Holiday Traffic Plan was the reduction of the speed limit on the Park Drives to 25 mph from 30 mph. This change was implemented at the request of the Parks Department and Central Park Conservancy, and would complement the anticipated benefits that would result from the overall Central Park program.
The final component of the Central Park program was a reduction in the hours that the Park Drives would be open to vehicular traffic. As part of the Holiday Traffic Plan, the Department typically relaxes the operating restrictions on the Park Drives to accommodate the influx of vehicles into and out of the Midtown
New York City Department of Transportation
8
core during the holiday season. Based upon the need to accommodate the flow of holiday traffic, the new operating hours took effect at the conclusion of the holiday season on January 3rd, 2005. Prior to these changes, both the East and West Drives remained open overnight on weekdays. Under the new program, given the low number of vehicles that are using the Drives during the overnight hours, the Department will close the Drives to all traffic between the hours of 7pm and 7am. As a result of these changes, early morning recreational users now have the exclusive use of the Drives.
New York City Department of Transportation
9
Implementation and Monitoring of the Central Park West Drive HOV 2+ and Closures of Central Park Drive Entrances and ExitsProgram Elements
The Department developed a work program incorporating the planning, design, operation and implementation of the Central Park closures and HOV 2+ program. In addition, the Department convened a working group comprised of the New York City Department of Transportation, Department of Parks and Recreation and the Central Park Conservancy to facilitate the development and implementation of the project as part of the 2004 Holiday Traffic Plan.
Data Collection
The Department undertook a comprehensive data collection effort on the Park Drives, entrances and exits to the Drives and on the surrounding roadway network. This effort included the collection of vehicle volumes, vehicle occupancy and classification counts, as well as travel times and speeds along primary corridors. While some data was collected to assess the feasibility of the closures in the summer of 2004, the Department conducted a program that collected “before” or pre-implementation data, as well as at various intervals during the Holiday Plan to assess the performance, impacts and effectiveness of the project. Details of the full monitoring plan including ATR locations can be found in Appendix I.
Driver Information Program
A comprehensive implementation program was developed to advise motorists of all the components of both the Holiday Plan and the Central Park program. The various elements included the distribution of information to the mass media, the development and posting of distinct signage, the use of ITS components and portable VMS boards to alert motorists of the changes and the distribution of informational flyers.
In terms of the mass media, all major news outlets including the local television and radio stations, as well as numerous local newspapers advised motorists
New York City Department of Transportation
10
of the changes to the operation of the Park Drives in the week prior to the implementation of the Central Park Drive program. In addition, the Department placed portable Variable Message Signs (VMS) signs at numerous entrance locations to the Park Drives advising motorists of the changes in operation to the drives. This information continued to be posted during the first week of the program to reinforce the changes in the regulations and operation of the Park Drives.
Another critical component was the design and manufacturing of signage to inform motorists of the changes to the operation of the Park Drive, most notably the HOV 2+ restriction, as well as the entrance and exit closures. These signs were placed on streets approaching the Drive entrances, at entrances to the Park Drives and along the East and West Drives. Both the HOV 2+ and closure signage is easily identifiable and distinctive to effectively inform and direct motorists. Physical Treatments and Markings
The final element in implementing the Central Park program was the development of temporary closure treatments at the entrances and exits that were to be closed. Currently, the Parks Department utilizes a variety of temporary closure treatments, including french barricades, flexible bollards, wooden barriers, and striping. Some of the semi-permanent closure treatments include swinging gates and/or arms. At some of the permanent closures
Portable VMS sign at West Drive entrance
Distinct and easily identifiable signage advising motorists of the HOV 2+ restriction were places on
surrounding roadways
High visibility signage notifying motorists of the new closures were posted on Central Park west, Fifth
Avenue- and on the Park Drives
New York City Department of Transportation
11
that have been implemented in the past, the roadways and entrances have undergone extensive capital improvements and were incorporated into the Central Park landscape.
The temporary treatments that were implemented as part of the Central Park program needed to ensure access for Parks Department and emergency vehicles to the Park Drives. Based upon this criteria, the Parks Department and Department of Transportation developed individual treatments at each of the closure locations that were easily identifiable and effective at limiting access to the Drives, while being contextually appropriate.
At most of the closure locations, the Department erected white, reflective flexible bollards and easily movable wooden barricades to prohibit vehicles from entering and exiting the roadway. Examples of the treatments are depicted to the left. In addition to the physical barriers, the Department improved the roadway markings at the entrances and exits to reinforce the closures and or diversions.
Enforcement
The enforcement component of the program was a joint effort between the Department of Transportation and the Parks Department. This program, especially at its outset, required a strong enforcement presence. The
West 90th Street Exit Closure
East 90th Street Entrance Closure
West 72nd Street Slip-Off Ramp Closure
New York City Department of Transportation
12
joint NYCDOT - Parks effort posted personnel at all entrances and approaches to the Park Drives during the AM peak period to interdict single occupant vehicles from the West Drive, as well as ensure compliance with the new restrictions. In addition, nearly 8,000 flyers were distributed during the first week of the program advising motorists of the changes to the operation of the Park Drives. This enforcement was in place for the first week of the program and was removed based upon increasing levels of compliance for the HOV 2+ regulations.
New York City Department of Transportation
13
Central Park Drive Program Impact Assessment
In order to assess the effectiveness and impacts of the Central Park Drive exit and entrance closures and the HOV 2+ restriction, it is necessary to understand vehicle trends for the Park Drives and surrounding roadways over the past 15 years.
In the analysis conducted during the evaluation to assess the feasibility of the entrance and exit closures, the Department determined that there was a substantial decline in the number of vehicles using the Park Drives during all times of
the day, especially the AM peak period. As the table to the above indicates, there has been a substantial decline at many of the Drive entrances. As a whole, entrance volumes have declined 23.5% since 1991. Based upon the overall findings from the Department’s assessment and the declining trend in vehicular volumes, the Department was confident that the proposed entrance and exit closures, as well as the HOV 2+ program on the West Drive would have limited impacts on both the Park Drives and the surrounding streets.
Overall, the Department believes the Central Park program met or exceeded expectations for the project. These positive improvements included improved travel times, lower vehicular volumes, a decrease in speeds on the Park Drives and improved safety. Finally, with the exception of Central Park West, there were only minimal impacts on the surrounding roadways as a result of the diversions, closures or restrictions.
Park Entrance Volume Comparison
Park Entrance Time Period 1991 Counts 2004 Counts Percent Difference7.00 - 8.00 508 232 -54.30%8.00 - 9.00 712 287 -59.70%
Combined Avg 610 260 -57.50%7.00 - 8.00 16 14 -12.50%8.00 - 9.00 44 13 -71.60%
Combined Avg 30 13 -55.80%7.00 - 8.00 15 9 -37.90%8.00 - 9.00 58 21 -64.00%
Combined Avg 36 15 -58.80%7.00 - 8.00 299 295 -1.50%8.00 - 9.00 410 350 -14.60%
Combined Avg 355 322 -9.10%7.00 - 8.00 136 166 21.70%8.00 - 9.00 195 188 -3.80%
Combined Avg 166 177 6.60%7.00 - 8.00 111 98 -11.70%8.00 - 9.00 188 115 -39.10%
Combined Avg 150 106 -28.90%7.00 - 8.00 81 102 25.90%8.00 - 9.00 149 149 0.00%
Combined Avg 115 126 9.10%7.00 - 8.00 118 162 37.30%8.00 - 9.00 166 254 53.00%
Combined Avg 142 208 46.50%7.00 - 8.00 1284 1078 -16.00%8.00 - 9.00 1922 1377 -28.40%
Combined Avg 1603 1227 -23.50%
Lenox Avenue at 110th Street
East 90th Street at 5th Avenue
East 102nd Street at 5th Avenue
West 72nd Street at Central Park West
Total
West 77th Street at Central Park West
West 85th Street at Central Park West
West 90th Street at Central Park West
West 100th Street at Central Park West
New York City Department of Transportation
14
Vehicle Volumes
AM Peak Period - 7AM – 10AM
Although the volumes decreased on the Park Drives in the AM peak, the adjacent southbound streets showed no significant changes and in most cases, volumes decreased.
Volumes on Central Park’s West Drive between West 102nd and 103rd Street decreased during the AM peak period by an average of 33%. Volumes decreased by an average of 10% between West 62nd and 63rd Streets. The volume at 62nd Street exhibited a decline of 21% during the first week but declines of only 3% and 5% on subsequent weeks. This variation may be attributable to motorists using the 72nd Street Transpark Road and continuing southbound on the Drive.
AM peak period (7am-10am) vehicular volume on Central Park West decreased by an average of 4%. However, there were variations at the three locations where counts were collected. On Central Park West between 95th and 96th Streets and between 62nd and 63rd Streets there were minor fluctuations with average volumes increasing by 1% and 3%, r e s p e c t i v e l y . However on Central Park West between 86th and 87th Streets, vehicular volume decreased by an average of 14%, which translates to nearly 400 fewer vehicles over the three-hour peak period, which is still not a significant impact. A detailed analysis is depicted in the graph above.
Central Park Drive Closure AnalysisEffect on Southbond Streets on the West Side
7 -10 AM
0
1000
2000
3000
4000
5000
6000
W 96thCPW
Columbus
Av
Broadway
W 86thCPW
Columbus
Av
Broadway
W 62ndCPW
Columbus
Av
Broadway
Volu
me
Before After (12/6) After (12/13) After (1/10)
New York City Department of Transportation
15
AM peak period vehicular volume on Columbus Avenue and Broadway showed minor fluctuations with no weekly fluctuation greater than 9%. Average volumes on Columbus Avenue decreased by 4% and average volumes on Broadway decreased by 3% during the three periods examined. This can be attributed to normal fluctuations in volume from week to week.
In analyzing total southbound volume at the 62nd Street “screenline”, which includes Central Park West, Columbus Avenue, Broadway and the West Drive at Tavern on the Green, average combined volume decreased by 4%. Most of this decrease is attributable to the 10% decrease in volume on the West Drive where the HOV restrictions were in effect. The combined volume on the three southbound streets at West 62nd Streets decreased by only 1%. The combined volume on the three southbound streets at West 96th Street and West 86th Street decreased by 3% and 7%, respectively.
Overall, no entrance on the West Side experienced an increase in volume as a result of the closures. This could be related to the HOV restrictions and enforcement presence at these entrances.
AM peak period entries at all entrances to the West Drive (including the entrances that were closed as part of the plan but not including those on the north side
of the park) decreased by 37% as compared to before conditions.
Total AM peak period entries at the four entrances that remained open (West 100th, 96th, 86th and 72nd) decreased by 19% as compared to before conditions. The closure of the two entrances did not result in increased volumes at the four entrances that remained open. This could be attributed to
the HOV restrictions and enforcement presence at the entrances. A weekly summary of these trends is depicted in the graph above.
Central Park Entrance Closure Analysis AM Peak
522 459 502 385 449
251 190 262218 223
211
427
322443
336 367
472
1252
775
1071
985 944
0
500
1000
1500
2000
2500
3000
3500
Before After (12/6) After (12/13) After (1/10) Average
Volu
me
West 100th Street West 96th Street West 90th Street West 86th Street West 77th Street West 72nd Street
New York City Department of Transportation
16
Fifth Avenue volumes between 95th and 96th Streets showed an average increase of 7%, while Fifth Avenue volumes between 62nd and 63rd Streets showed an average decrease of 9%. It is possible that motorists from points north of the park used Fifth Avenue as their southbound route and then used the 72nd Street Transpark Road to access points to the west and south.
This is evident when looking at the entrance at East 72nd Street, which showed an average increase of 12% (an additional 214 vehicles during the AM peak period). This far exceeds the 85 vehicle entries at the two entrances, (East 90th Street and East 102nd Street) to the East Drive north of East 72nd Street, when they were opened. Therefore, many more vehicles were utilizing the Transpark Road than in before conditions.
PM Peak Period - 3PM-7PM
Volumes on the southbound streets on the West Side were virtually unchanged as compared to before conditions. Central Park West and Columbus Avenue exhibited an average decrease of 6% and 2%, respectively while Broadway exhibited an average increase of 2%. The combined volumes at West 96th, West 86th and West 62nd Street were within 4% of the before volumes. The weekly trends are depicted in the graph to the right.
The average volume on the West Drive at Tavern on the Green decreased by an average of 6% (to 3,305 from 3,511) as compared to before conditions but exhibited significant variation. Volumes decreased by 15% during the week of December 6th
Central Park Drive Closure AnalysisEffect on Southbond Streets on the West Side
3-7 PM
0
1000
2000
3000
4000
5000
6000
W 96thCPW
Columbus
Av
Broadway
W 86thCPW
Columbus
Av
Broadway
W 62ndCPW
Columbus
Av
Broadway
Vo
lum
es
Before After (12/6) After (12/13) After (1/10)
New York City Department of Transportation
17
(to 2,969 vehicles) and increased by 11% (to 3,881 vehicles) during the week of December 13th, and decreased by 13% (to 3,064 vehicles) during the week of January 10th.
This variation may be a result of motorists learning alternate routes, such as the connection to the West Drive from the Transpark Road, after an adjustment period.
There was an average decrease of 6% in total volume at the 62nd Street screenline (including volumes on the West Drive at Tavern on the Green and Central Park West, Columbus Avenue and Broadway).
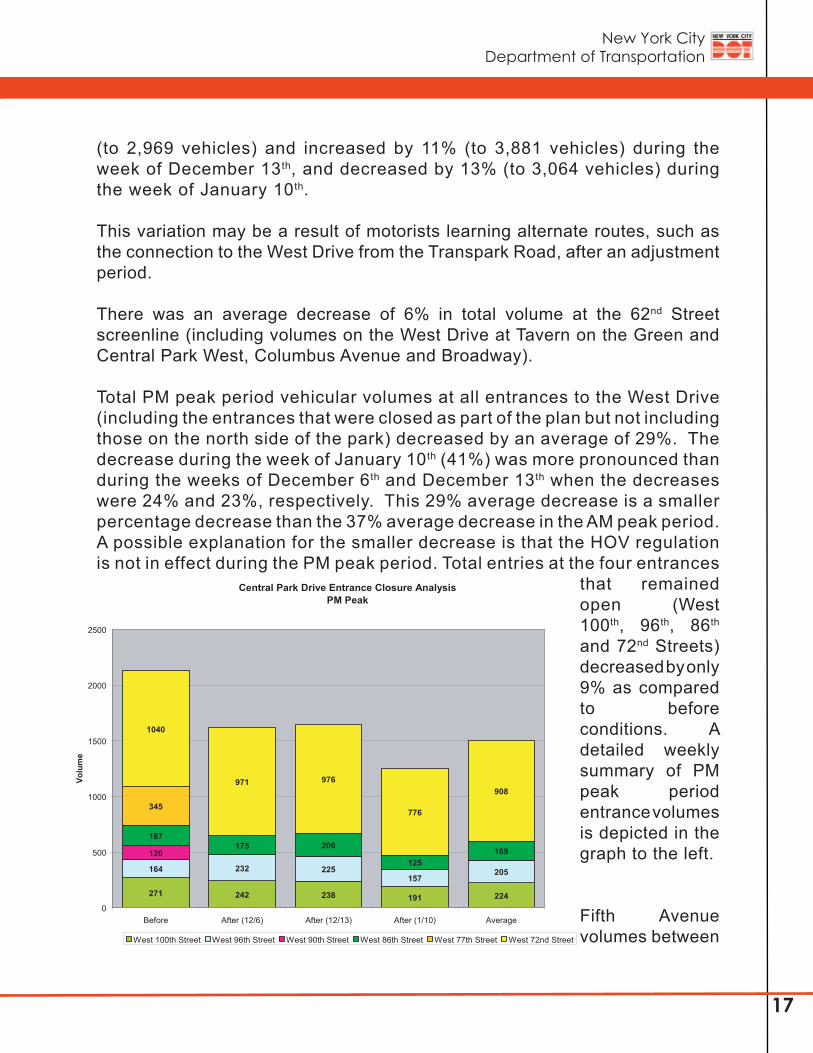
Total PM peak period vehicular volumes at all entrances to the West Drive (including the entrances that were closed as part of the plan but not including those on the north side of the park) decreased by an average of 29%. The decrease during the week of January 10th (41%) was more pronounced than during the weeks of December 6th and December 13th when the decreases were 24% and 23%, respectively. This 29% average decrease is a smaller percentage decrease than the 37% average decrease in the AM peak period. A possible explanation for the smaller decrease is that the HOV regulation is not in effect during the PM peak period. Total entries at the four entrances
that remained open (West 100th, 96th, 86th and 72nd Streets) decreased by only 9% as compared to before conditions. A detailed weekly summary of PM peak period entrance volumes is depicted in the graph to the left.
Fifth Avenue volumes between
Central Park Drive Entrance Closure AnalysisPM Peak
271 242 238 191 224
164 232 225157
205
120
187175 206
125169
345
1040
971 976
776
908
0
500
1000
1500
2000
2500
Before After (12/6) After (12/13) After (1/10) Average
Volu
me
West 100th Street West 96th Street West 90th Street West 86th Street West 77th Street West 72nd Street
New York City Department of Transportation
18
95th and 96th Streets showed an average increase of 7% while Fifth Avenue volumes between 62nd and 63rd Streets showed an average decrease of 8%. It is possible that motorists from points north of the park used Fifth Avenue as their southbound route and then used the Transpark Road to access points to the west and south.
The entrance at East 72nd Street showed an average increase of 23% (an additional 500 vehicles in the PM peak period). This far exceeds the 200 vehicle entries at the two entrances (East 90th Street and East 102nd Street) to the East Drive north of East 72nd Street when they were opened. Therefore, many more vehicles were utilizing the Transpark Road than in before conditions.
More detailed data is provided in the Appendix.
Park Drive Exit Volumes
AM Peak Period 7 AM-10 AM
The exit closures on the West Side did not result in increased volumes at the exits that remained open. On the West Side, the volumes at the West 100th Street Exit decreased by 6% (to 315 vehicles from 335 vehicles) and the volumes at the West 72nd Street Exit decreased by 12% (to 1,205 vehicles from 1,371) vehicles. This represents a combined decrease of only 186 vehicles during the 7-10 am peak period. Prior to the these closures, the volumes at the West 90th Street and Strawberry Field Slip-off exits were 171 and 436, respectively, for a total of 607 vehicles. Accordingly, 793 fewer vehicles are exiting to the West Side than in before conditions, a 34% reduction. This reduction can be attributed, in part, to the overall reduction in vehicles on the West Drive resulting from the HOV restrictions and entrance closures. The decrease in exiting volumes of 12% at 7th Avenue at Central Park South can be attributed, in part, to the overall reduction in volumes on the West Drive
On the East Side, the overall reduction was lower compared to the West Side as exit volumes decreased by 9% (to 1205 from 1292). The East 102nd Street exit, which had a total volume of 62 vehicles prior to the implementation of the plan, was closed. The adjacent exit at East 90th Street exhibited a reduction of 26% (to 345 vehicles from 466 vehicles). The East 72nd Street Exit exhibited an increase of 13% (to 860 vehicles from 764) vehicles. The combined exit
New York City Department of Transportation
19
volumes at East 90th and East 102nd Streets decreased by 35% (from 528 vehicles to 345 vehicles), a decrease similar to the West Side.
PM Peak Period 3 PM- 7 PM
The exit closures on the West Side resulted in a slight increase in overall exit volumes, including a significant increase at the West 72nd Street exit. The volumes at the West 100th Street Exit increased by 9% from (by 25 vehicles to 318 vehicles from 293 vehicles) and the volumes at the West 72nd Street Exit increased by 25% (+437 vehicles to 2,162 vehicles from 1,725 vehicles). This represents a combined increase of 462 vehicles during the 3-7 pm peak period. Prior to the these closures, the volumes at the West 90th Street and Strawberry Field Slip-off exits were 114 and 244, respectively, for a total of 358 vehicles. Accordingly, 104 additional vehicles are exiting to the West Side than before conditions, a 9% increase. This reduction maybe attributed, in part, to additional vehicles using the Transpark Road and exiting at West 72nd Street. The 17% decrease in exiting volumes at Seventh Avenue and Central Park South can be attributed, in part, to the overall reduction in volumes on the West Drive.
On the East Side, there was a minimal decrease in exiting volume of 4% (-85 vehicles to 2,027 from 2,112). The East 102nd Street exit, which had a total volume of 129 vehicles prior to the implementation of the plan, was closed. The adjacent exit at East 90th Street exhibited a reduction of 28% (-182 vehicles to 467 vehicles to 649 vehicles). The East 72nd Street Exit exhibited an increase of 17% (to 1,560 vehicles from 1,334 vehicles). The combined exit volumes at East 90th and East 102nd Streets decreased by 40% (-311 vehicles to 467 vehicles from 778 vehicles).
New York City Department of Transportation
20
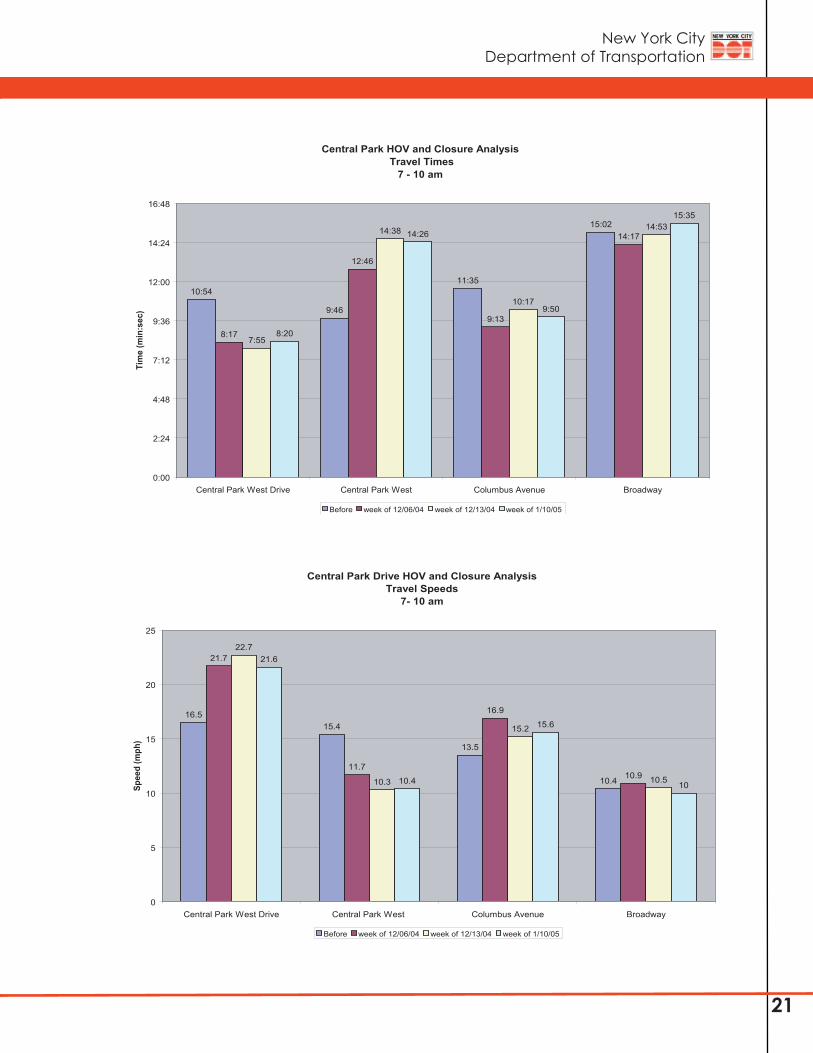
Travel Times
Travel time runs were conducted on the Central Park West Drive and on the roadways (to the west) adjacent to Central Park to determine the impacts of the HOV restrictions and the entrance closures.
AM Peak Period - 7AM -10 AM
Generally, southbound travel times showed improvement subsequent to the implementation of the HOV restrictions and the entrance closures. The major findings were as follows:
There was a significant improvement on the Central Park West Drive . Travel times decreased by 25% on the Central Park West Drive to 8 minutes 11 seconds from 10 minutes 54 seconds as speeds increased to 22.0 mph from 16.5 mph.
There was a significant impact on Central Park West. Travel times on Central Park West exhibited an increase of 43% to 13 minutes 56 seconds from 9 minutes 46 seconds as speeds decreased to 10.8 mph from 15.4 mph.
In addition:
Columbus Avenue demonstrated an improvement in travel times by 16% to 9 minutes 47 seconds from 11 minutes 35 seconds and speeds increased to 15.9 mph from 13.2 mph.
Travel times on Broadway remained relatively constant decreasing to 14 minutes 55 seconds from 15 minutes 2 seconds as speed increased to 10.5 mph from 10.4 mph.
Northbound travel times and speeds exhibited minor fluctuations. Travel times on Central Park West and Broadway each increased by 7% while travel times on Amsterdam Avenue decreased by 8%. This represents a 6% decrease of speed on both Central Park West and Broadway and a 9% increase of speed on Amsterdam Avenue.
A detailed summary of the travel times and travel speeds are depicted in the graphs on the following page, as well within the Appendix.
•
•
•
•
New York City Department of Transportation
21
Central Park HOV and Closure Analysis Travel Times
7 - 10 am
10:54
9:46
11:35
15:02
8:17
12:46
9:13
14:17
7:55
14:38
10:17
14:53
8:20
14:26
9:50
15:35
0:00
2:24
4:48
7:12
9:36
12:00
14:24
16:48
Central Park West Drive Central Park West Columbus Avenue Broadway
Tim
e (m
in:s
ec)
Before week of 12/06/04 week of 12/13/04 week of 1/10/05
Central Park Drive HOV and Closure Analysis Travel Speeds
7- 10 am
16.515.4
13.5
10.4
21.7
11.7
16.9
10.9
22.7
10.3
15.2
10.5
21.6
10.4
15.6
10
0
5
10
15
20
25
Central Park West Drive Central Park West Columbus Avenue Broadway
Spee
d (m
ph)
Before week of 12/06/04 week of 12/13/04 week of 1/10/05
New York City Department of Transportation
22
PM Peak Period - 3PM - 7PM
Southbound travel times improved on the Central Park West Drive but deteriorated on the streets adjacent to the park during the PM peak period when the HOV restrictions were not in effect. The major findings are as follows:
Travel times on the Central Park West Drive demonstrated significant improvement even though the HOV restrictions were not in effect.
Travel times increased and speed decreased on all roadways adjacent to the park despite decreases in vehicular volume.
Travel times were higher and speeds were lower in the PM peak than in the AM peak.
Specifically, travel times decreased by 15% on the Central Park West Drive to 8 minutes 11 seconds from 9 minutes 36 seconds as speeds increased to 22.0 mph from 18.8 mph. Columbus Avenue demonstrated a 7% increase in travel time to 10 minutes 44 seconds from 10 minutes 2 seconds with speeds decreasing to 14.2 mph from 15.3 mph. Travel times on Broadway increased by 21.5% to 16 minutes 32 seconds from 15 minutes 2 seconds as speed decreased to 9.4 mph from 11.5 mph. Travel times on Central Park West exhibited an increase of 9% to 15 minutes 28 seconds from 14 minutes 12 seconds as speeds decreased to 9.7 miles per hour from 10.6 miles per hour. This was a much smaller percentage decrease than the 43% decrease exhibited in the AM peak period. In all four cases, the PM peak period travel times were higher than in the AM peak period.
Northbound travel times exhibited slight increases on Amsterdam Avenue and a more pronounced increase on Central Park West. Travel times on Central Park West, Amsterdam Avenue and Broadway increased by 31%, 3% and 12%, respectively. This represents a decrease in speed of 24%, 3% and 10%, on Central Park West, Amsterdam Avenue and Broadway, respectively.
Vehicle Volume/Travel Time Findings
There was a concern prior to program implementation that the HOV restriction and the entrance closures would cause traffic diversions to avenues adjacent to the park and would result in increased travel times. This did not prove to
•
•
•
New York City Department of Transportation
23
be the case. In the AM peak period, Broadway exhibited a slight decrease in volume and a minimal decrease in travel time. Columbus Avenue exhibited a slight decrease in volume and a moderate decrease in travel time. On Central Park West, there was a significant increase in travel time. However, this was not accompanied by any marked increased in volume. The volumes along Central Park West exhibited slight increases at two of the three observed locations and a decrease at only one location. Possibly, there were bottleneck points along Central Park West which caused the travel time increases.
In the PM peak period, when the HOV restrictions were not in effect, all of the southbound streets adjacent to the Park experienced increases in travel times. Average volumes declined in a vast majority of the cases on the roadways adjacent to the park during the PM peak.
More detailed data is provided in the Appendix.
New York City Department of Transportation
24
Spee
d (M
PH)
West Drive Radar SpeedsBetween 62nd and 65th Streets
28.0
32.0
22.7
29.327.1
33.4
0
5
10
15
20
25
30
35
Before Week of Dec. 13-17 Week of Jan. 10-14
Average Speed 85th Percentile Speed
32.2
36.0
24.7
28.125.3
29.5
0
5
10
15
20
25
30
35
40
Before Week of Dec. 13-17 Week of Jan. 10-14
Average Speed 85th Percentile Speed
Spee
d (M
PH)
West Drive Radar SpeedsBetween 92nd and 96th Streets
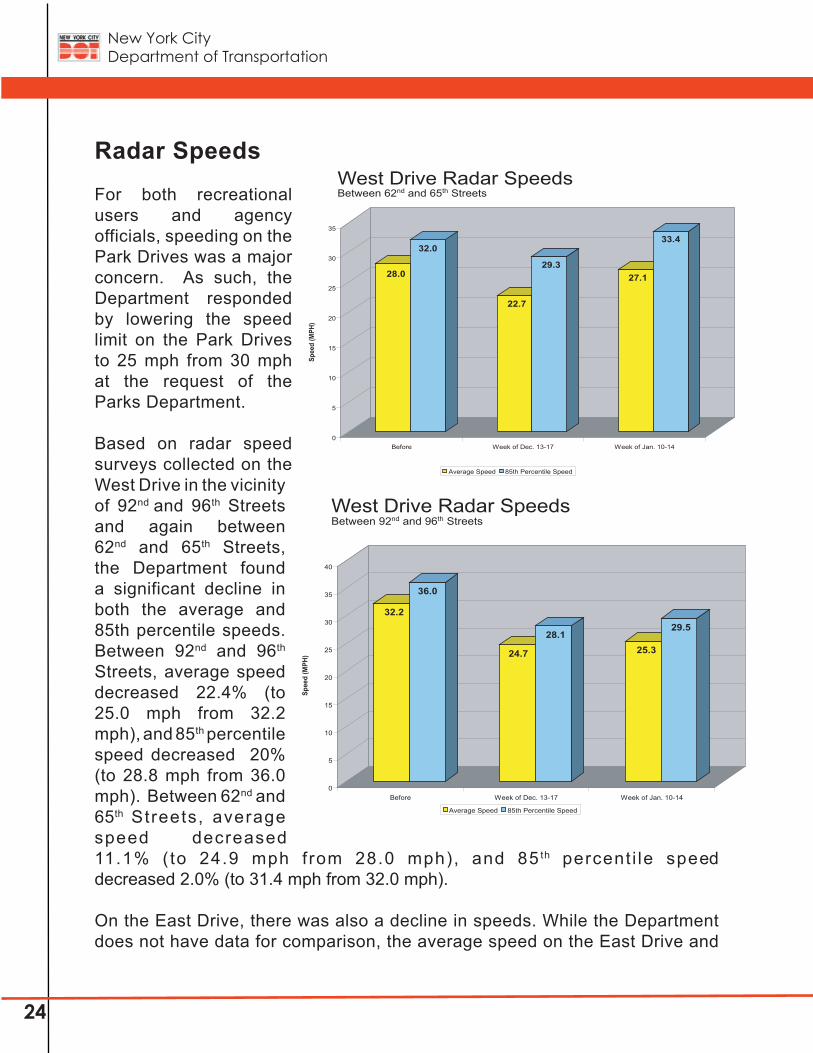
Radar Speeds
For both recreational users and agency officials, speeding on the Park Drives was a major concern. As such, the Department responded by lowering the speed limit on the Park Drives to 25 mph from 30 mph at the request of the Parks Department.
Based on radar speed surveys collected on the West Drive in the vicinity of 92nd and 96th Streets and again between 62nd and 65th Streets, the Department found a significant decline in both the average and 85th percentile speeds. Between 92nd and 96th Streets, average speed decreased 22.4% (to 25.0 mph from 32.2 mph), and 85th percentile speed decreased 20% (to 28.8 mph from 36.0 mph). Between 62nd and 65th Streets, average speed decreased 11.1% (to 24.9 mph from 28.0 mph), and 85 th percent i le speed decreased 2.0% (to 31.4 mph from 32.0 mph).
On the East Drive, there was also a decline in speeds. While the Department does not have data for comparison, the average speed on the East Drive and
New York City Department of Transportation
25
East 63rd Street was 25.2 mph and the 85th percentile speed was 28.6 mph. These numbers are encouraging on the East Drive as they are below the previous speed limit.
These results show that the program has been successful in reducing speeding while improving travel time. As a whole, the lower speeds and volumes provide for a safer shared use roadway that is not as threatening to recreational users.
Vehicle Occupancy
As part of the monitoring program, the Department monitored vehicle occupancy on the West Drives in both the northern and southern sections of the Park. While the program was envisioned to be self-enforcing, the progressive trends throughout the monitoring period were encouraging. Prior to the implementation, the Department found an average of 1379 single occupant vehicles on the West Drive between West 95th and 96th Streets. With the implementation of the HOV 2+, the number of single occupant vehicles (SOV’s) at this location fell dramatically. In week 1, the number of single occupant vehicles decreased by 43% to 784. In week 2, SOV’s declined by 62% to 518. In week 3, SOV’s declined by 88% from “before” numbers to 163.
In the southern portion of the Park, SOV’s rates were not as high but still showed a remarkable reduction in the number of single occupant vehicles. On the West Drive between 62nd and 63rd Streets, there were was an average of 1382 SOV’s on the West Drive between 62nd and 63rd Streets. In week 1, this number of SOV’s decreased by 49% to 702. In week 2, SOV’s decreased by 68% to 442 and in week 3, SOV’s returned to week one levels of 49% with 701 SOV’s. Taxis had the highest compliance rate with the SOV restriction, however, taxi SOV percentage was already low prior to implementation of the restriction. One of the reasons for the higher number of SOV’s in the southern portion of the West Drive is due to the 72nd Street Transpark, where westbound vehicles are able to directly enter the West Drive.
Based upon these findings, the HOV 2+ program has been successful in reducing the number of single occupant vehicles on the Park Drives. This trend has assisted in reducing the volume of vehicles on the West Drive during the AM period.
New York City Department of Transportation
26
Conclusions
Based upon the minimal impacts associated with the Central Park Program, it is recommended that the HOV 2+ program and specific entrance/exit closures remain permanent based upon the following findings:
There is no evidence of significant impacts associated with the HOV 2+ restriction and exit/entrance closures.
Travel times improved significantly on the West Drive, particularly during the HOV 2+ restriction in the AM peak period.
The number of single occupant vehicles on the West Drive decreased dramatically, improving significantly in week 3 to an 88% reduction at West 95/96th Streets.
Although the volumes did not increase on Central Park West, it is apparent by the travel time surveys that most of the traffic diverted to Central Park West where travel times deteriorated by 25% in the AM peak and less significantly (by 15%) in the PM peak period.
Columbus Avenue and Broadway were minimally affected by the Central Park Program. Both volumes and travel times either decreased slightly or remained relatively unchanged.
Due to the reduced speed limit on the park drives, both average speeds and 85th percentile speeds have been significantly reduced.
An improvement in safety due to the reduction in speed on the park drives and the elimination of pedestrian/vehicular conflicts at the entrances and exits that were closed.
•
•
•
•
•
•
•
New York City Department of Transportation
27
Appendix I
HOV Monitoring Plan
New York City Department of Transportation
28
Central Park HOVMonitoring PlanATR Volume Locations (within the West Drive, at Entrances and Exits to the West Drive, and on adjacent southbound roadways):
Central Park West Drive @ Tavern on the Green (67th Street)Central Park West Drive between West 102nd and West 103rd StreetsLenox Avenue Entrance/ExitEast 102nd Street Entrance/ExitEast 90th Street Entrance/ExitAdam Clayton Powell Jr. Boulevard Entrance/ExitWest 100th Street Entrance/ExitWest 96th Street EntranceWest 90th Street Entrance/ExitWest 77th Street EntranceWest 85th Street EntranceWest 72nd Street Entrance/ExitWest 72nd Street slip-off Ramp @ Strawberry FieldsCentral Park Exit from the West Drive to 7th Avenue/Central Park SouthCentral Park West (southbound) between West 62nd and West 63rd StreetsCentral Park West (southbound) between West 95th and West 96th StreetsColumbus Avenue between West 62nd and West 63rd StreetsColumbus Avenue between West 95th and West 96th StreetsBroadway (southbound) between West 62nd and West 63rd StreetsBroadway (southbound) between West 95th and West 96th Streets
Vehicle Travel Times (7-10 am and 3-7 pm)
Central Park West Drive between Adam Clayton Powell Jr. Boulevard and the 7th Avenue Exit. Checkpoints: 97th Street Transverse, 85th Street Transverse, 79th
Street Transverse, 65th Street Transverse.
Central Park West between 110th Street and 59th Street/Central Park South. Checkpoints: 97th, 85th, 79th and 65th Streets.
Columbus Avenue between 110th Street and 59th Street/Central Park South. Checkpoints: 97th, 85th, 79th and 65th Streets.
Broadway between 110th Street and 59th Street/Central Park South. Checkpoints: 97th, 85th, 79th and 65th Streets.
••••••••••••••••••••
•
•
•
•
New York City Department of Transportation
29
Vehicle Occupancy & Classification (Autos, Yellow Taxis, Limousines & Black Cars) Counts (7-10 am and 3-7 pm)
• West Drive between West 62nd and West 63rd Streets• West Drive between West 95th and West 96th Street
New York City Department of Transportation
30
Appendix II
Detailed Analyses
New York City Department of Transportation
31
As of November 29, 2004, four Central Park entrances and three exits were closed to motor vehicles during all hours.
The following entrances were closed.
Entrance at West 77th Street.
Entrance at East 90th Street
Entrance at West 90th Street.
Entrance at East 102nd Street.
The following exits were also closed.
Exit at West 90th Street.
Exit at East 102nd Street.
Slip-off along the west side of Strawberry Field to the exit at West 72nd Street (the West 72nd Street exit itself was not closed).
Extensive field data was collected both before and after these closures. This report presents the findings regarding the impacts of these closures on the Manhattan streets and avenues in the vicinity of Central Park.
ATR Volumes
Central Park Entrance ATR Volumes
Entrance at East 72nd Street.
- Week of Dec. 6-10, 2004: 7-10am volume up 15.5%, to 2,144 from 1,856.3-7pm volume up 41.0%, to 3,035 from 2,152.
- Week of Dec. 13-17, 2004: 7-10am volume up 20.9%, to 2,243 from 1,856.3-7pm volume up 38.0%, to 2,970 from 2,152.
- Week of Jan. 10-14, 2005: 7-10am volume down 1.8%, to 1,822 from 1,856.3-7pm volume down 9.3%, to 1,952 from 2,152.
Entrance at East 90th Street.
- This entrance was closed as of November 29, 2004. Before implementation, average volume was 23 vehicles between 7-10am, and 71 vehicles between 3-7pm.
New York City Department of Transportation
32
Entrance at East 102nd Street.
- This entrance was closed as of November 29, 2004. Before implementation, average volume was 62 vehicles between 7-10am, and 129 vehicles between 3-7pm.
Entrance at West 72nd Street.
- Week of Dec. 6-10, 2004: 7-10am volume down 38.1%, to 775 from 1,252.3-7pm volume down 6.6%, to 971 from 1,040.
- Week of Dec. 13-17, 2004: 7-10am volume down 14.5%, to 1,071 from 1,252.3-7pm volume down 4.2%, to 996 from 1,040.
- Week of Jan. 10-14, 2005: 7-10am volume down 21.3%, to 985 from 1,252.3-7pm volume down 25.4%, to 776 from 1,040.
Entrance at West 77th Street.
- This entrance was closed as of November 29, 2004. Before implementation, average volume was 472 vehicles between 7-10am, and 345 vehicles between 3-7pm.
Entrance at West 85th Street.
- Week of Dec. 6-10, 2004: 7-10am volume down 24.6%, to 322 from 427.3-7pm volume down 6.4%, to 175 from 187.
- Week of Dec. 13-17, 2004: 7-10am volume up 3.7%, to 443 from 427.3-7pm volume up 10.2%, to 206 from 187.
- Week of Jan. 10-14, 2005: 7-10am volume down 21.3%, to 336 from 427.3-7pm volume down 33.2%, to 125 from 187.
Entrance at West 90th Street.
- This entrance was closed as of November 29, 2004. Before implementation, average volume was 211 vehicles between 7-10am, and 120 vehicles between 3-7pm.
Entrance at West 96th Street (excludes vehicles headed for the eastbound transverse).
- Week of Dec. 6-10, 2004: 7-10am volume down 24.3%, to 190 from 251.3-7pm volume up 41.5%, to 232 from 164.
- Week of Dec. 13-17, 2004: 7-10am volume up 4.4%, to 262 from 251.3-7pm volume up 37.2%, to 225 from 164.
New York City Department of Transportation
33
- Week of Jan. 10-14, 2005: 7-10am volume down 13.1%, to 218 from 251.3-7pm volume down 4.3%, to 157 from 164.
Entrance at West 100th Street.
- Week of Dec. 6-10, 2004: 7-10am volume down 12.1%, to 459 from 522.3-7pm volume down 10.7%, to 242 from 271.
- Week of Dec. 13-17, 2004: 7-10am volume down 3.8%, to 502 from 522.3-7pm volume down 12.2%, to 238 from 271.
- Week of Jan. 10-14, 2005: 7-10am volume down 26.2%, to 385 from 522.3-7pm volume down 29.5%, to 191 from 271.
Entrance at Lenox Avenue.
- Week of Dec. 6-10, 2004: 7-10am volume down 34.9%, to 659 from 1,013.3-7pm volume up 1.8%, to 1,001 from 983.
- Week of Dec. 13-17, 2004: 7-10am volume down 24.6%, to 764 from 1,013.3-7pm volume up 12.8%, to 1,109 from 983.
- Week of Jan. 10-14, 2005: 7-10am volume down 47.0%, to 537 from 1,013.3-7pm volume down 33.9%, to 650 from 983.
Entrance at Adam C. Powell, Jr., Boulevard.
- Week of Dec. 6-10, 2004: 7-10am volume down 42.2%, to 810 from 1,401.3-7pm volume down 8.8%, to 478 from 524.
- Week of Dec. 13-17, 2004: 7-10am volume down 7.6%, to 1,294 from 1,401.3-7pm volume up 33.8%, to 701 from 524.
- Week of Jan. 10-14, 2005: 7-10am volume down 49.1%, to 713 from 1,401.3-7pm volume down 18.3%, to 428 from 524.
Central Park Exit ATR Volumes
Exit at East 72nd Street.
- Week of Dec. 6-10, 2004: 7-10am volume up 16.6%, to 891 from 764.3-7pm volume up 12.0%, to 1,494 from 1,334.
- Week of Dec. 13-17, 2004: 7-10am volume up 25.3%, to 957 from 764.3-7pm volume up 21.7%, to 1,624 from 1,334.
- Week of Jan. 10-14, 2005: 7-10am volume down 4.2%, to 732 from 764.3-7pm volume up 17.2%, to 1,563 from 1,334.
New York City Department of Transportation
34
Exit at East 90th Street.
- Week of Dec. 6-10, 2004: 7-10am volume down 18.9%, to 378 from 466.3-7pm volume down 21.9%, to 507 from 649.
- Week of Dec. 13-17, 2004: 7-10am volume down 33.3%, to 311 from 466.3-7pm volume down 34.4%, to 426 from 649.
Exit at East 102nd Street.
- This exit was closed as of November 29, 2004. Before implementation, average volume was 63 vehicles between 7-10am, and 124 vehicles between 3-7pm.
Exit at West 72nd Street.
- Week of Dec. 6-10, 2004: 7-10am volume down 12.6%, to 1,198 from 1,371.3-7pm volume up 28.2%, to 2,211 from 1,725.
- Week of Dec. 13-17, 2004: 7-10am volume up 0.8%, to 1,382 from 1,371.3-7pm volume up 36.2%, to 2,349 from 1,725.
- Week of Jan. 10-14, 2005: 7-10am volume down 24.5%, to 1,035 from 1,371.3-7pm volume up 11.6%, to 1,925 from 1,725.
Exit at Strawberry Field to West 72nd Street.
- The Strawberry Field slip-off to the West 72nd Street exit was closed as of November 29, 2004. Before implementation, average volume was 436 vehicles between 7-10am, and 244 vehicles between 3-7pm.
Exit at West 90th Street.
- This exit was closed as of November 29, 2004. Before implementation, average volume was 171 vehicles between 7-10am, and 114 vehicles between 3-7pm.
Exit at West 100th Street.
- Week of Dec. 6-10, 2004: 7-10am volume down 14.3%, to 287 from 335.3-7pm volume down 1.4%, to 289 from 293.
- Week of Dec. 13-17, 2004: 7-10am volume up 14.0%, to 382 from 335.3-7pm volume up 24.6%, to 365 from 293.
- Week of Jan. 10-14, 2005: 7-10am volume down 17.6%, to 276 from 335.3-7pm volume up 2.0%, to 299 from 293.
New York City Department of Transportation
35
Exit at 7th Avenue/Central Park South.
- Week of Dec. 6-10, 2004: 7-10am volume down 24.4%, to 3,050 from 4,033.3-7pm volume down 31.9%, to 1,977 from 2,904.
- Week of Dec. 13-17, 2004: 7-10am volume down 9.3%, to 3,657 from 4,033.3-7pm volume down 12.8%, to 2,532 from 2,904.
- Week of Jan. 10-14, 2005: 7-10am volume down 1.4%, to 3,978 from 4,033.3-7pm volume down 5.2%, to 2,754 from 2,904.
Exit at Lenox Avenue.
- Week of Dec. 6-10, 2004: 7-10am volume up 5.4%, to 273 from 259.3-7pm volume up 2.9%, to 769 from 747.
- Week of Dec. 13-17, 2004: 7-10am volume up 11.2%, to 288 from 259.3-7pm volume up 0.8%, to 753 from 747.
- Week of Jan. 10-14, 2005: 7-10am volume down 2.3%, to 253 from 259.3-7pm volume down 12.7%, to 652 from 747.
Exit at Adam C. Powell, Jr., Boulevard.
- Week of Dec. 6-10, 2004: 7-10am volume down 25.8%, to 141 from 190.3-7pm volume down 17.1%, to 664 from 801.
- Week of Dec. 13-17, 2004: 7-10am volume down 31.1%, to 131 from 190.3-7pm volume down 17.0%, to 665 from 801.
- Week of Jan. 10-14, 2005: 7-10am volume down 45.8%, to 103 from 190.3-7pm volume down 22.8%, to 618 from 801.
Northbound Avenue ATR Volumes
Park Avenue Northbound between East 62-63 Streets.
- Week of Dec. 6-10, 2004: 7-10am volume down 3.3%, to 3,814 from 3,945.3-7pm volume down 10.2%, to 4,678 from 5,211.
- Week of Dec. 13-17, 2004: 7-10am volume down 1.6%, to 3,882 from 3,945.3-7pm volume down 5.8%, to 4,910 from 5,211.
- Week of Jan. 10-14, 2005: 7-10am volume down 10.0%, to 3,551 from 3,945.3-7pm volume down 3.1%, to 5,049 from 5,211.
Park Avenue Northbound between East 95-96 Streets.
- Week of Dec. 6-10, 2004: 7-10am volume down 4.2%, to 1,610 from 1,680.3-7pm volume up 0.8%, to 2,893 from 2,870.
New York City Department of Transportation
36
- Week of Dec. 13-17, 2004: 7-10am volume up 6.8%, to 1,795 from 1,680.3-7pm volume up 12.1%, to 3,217 from 2,870.
- Week of Jan. 10-14, 2005: 7-10am volume up 2.1%, to 1,716 from 1,680.3-7pm volume up 1.0%, to 2,900 from 2,870.
Madison Avenue Northbound between East 62-63 Streets.
- Week of Dec. 13-17, 2004: 7-10am volume up 3.8%, to 3,828 from 3,688.3-7pm volume down 1.5%, to 5,188 from 5,266.
- Week of Jan. 10-14, 2005: 7-10am volume up 1.8%, to 3,755 from 3,688.3-7pm volume up 3.3%, to 5,439 from 5,266.
Madison Avenue Northbound between East 95-96 Streets.
- Week of Dec. 6-10, 2004: 7-10am volume down 24.6%, to 1,659 from 2,201.3-7pm volume down 4.3%, to 3,740 from 3,908.
- Week of Dec. 13-17, 2004: 7-10am volume down 29.6%, to 1,549 from 2,201.3-7pm volume down 16.9%, to 3,247 from 3,908.
- Week of Jan. 10-14, 2005: 7-10am volume down 15.8%, to 1,854 from 2,201.3-7pm volume down 14.4%, to 3,345 from 3,908.
Central Park West Northbound between West 86-87 Streets.
- Week of Dec. 6-10, 2004: 7-10am volume down 4.2%, to 1,964 from 2,050.3-7pm volume up 3.8%, to 3,872 from 3,729.
- Week of Dec. 13-17, 2004: 7-10am volume down 7.8%, to 1,890 from 2,050.3-7pm volume down 0.2%, to 3,722 from 3,729.
- Week of Jan. 10-14, 2005: 7-10am volume down 10.4%, to 1,837 from 2,050.3-7pm volume down 9.1%, to 3,390 from 3,729.
Southbound Avenue ATR Volumes
Fifth Avenue Southbound between East 62-63 Streets.
- Week of Dec. 6-10, 2004: 7-10am volume down 9.6%, to 4,305 from 4,762.3-7pm volume down 28.0%, to 3,475 from 4,829.
- Week of Dec. 13-17, 2004: 7-10am volume down 10.0%, to 4,287 from 4,762.3-7pm volume down 9.7%, to 4,362 from 4,829.
- Week of Jan. 10-14, 2005: 7-10am volume down 8.0%, to 4,379 from 4,762.3-7pm volume up 14.1%, to 5,508 from 4,829.
New York City Department of Transportation
37
Fifth Avenue Southbound between East 95-96 Streets.
- Week of Dec. 6-10, 2004: 7-10am volume up 12.4%, to 2,834 from 2,522.3-7pm volume up 9.7%, to 3,405 from 3,104.
- Week of Dec. 13-17, 2004: 7-10am volume up 7.9%, to 2,721 from 2,522.3-7pm volume up 12.6%, to 3,495 from 3,104.
- Week of Jan. 10-14, 2005: 7-10am volume down 0.2%, to 2,516 from 2,522.3-7pm volume down 0.1%, to 3,101 from 3,104.
Central Park West Southbound between West 62-63 Streets.
- Week of Dec. 6-10, 2004: 7-10am volume up 8.7%, to 1,028 from 946.3-7pm volume up 3.1%, to 1,427 from 1,384.
- Week of Dec. 13-17, 2004: 7-10am volume up 3.2%, to 976 from 946.3-7pm volume down 0.3%, to 1,380 from 1,384.
- Week of Jan. 10-14, 2005: 7-10am volume down 4.2%, to 906 from 946.3-7pm volume down 17.9%, to 1,136 from 1,384.
Central Park West Southbound between West 86-87 Streets.
- Week of Dec. 6-10, 2004: 7-10am volume down 13.9%, to 1,999 from 2,323.3-7pm volume down 16.1%, to 1,914 from 2,282.
- Week of Dec. 13-17, 2004: 7-10am volume down 12.9%, to 2,024 from 2,323.3-7pm volume down 10.9%, to 2,033 from 2,282.
- Week of Jan. 10-14, 2005: 7-10am volume down 16.8%, to 1,933 from 2,323.3-7pm volume down 12.6%, to 1,995 from 2,282.
Central Park West Southbound between West 95-96 Streets.
- Week of Dec. 6-10, 2004: 7-10am volume up 4.4%, to 1,869 from 1,791.3-7pm volume down 2.4%, to 1,745 from 1,788.
- Week of Dec. 13-17, 2004: 7-10am volume down 1.2%, to 1,770 from 1,791.3-7pm volume up 2.8%, to 1,838 from 1,788.
- Week of Jan. 10-14, 2005: 7-10am volume unchanged at 1,791.3-7pm volume up 1.1%, to 1,808 from 1,788.
Columbus Avenue Southbound between West 62-63 Streets.
- Week of Dec. 6-10, 2004: 7-10am volume down 1.0%, to 4,120 from 4,163.3-7pm volume up 1.6%, to 5,127 from 5,047.
- Week of Dec. 13-17, 2004: 7-10am volume down 3.8%, to 4,005 from 4,163.3-7pm volume down less than 0.1%, to 5,045 from
New York City Department of Transportation
38
5,047.
- Week of Jan. 10-14, 2005: 7-10am volume down 5.0%, to 3,954 from 4,163.3-7pm volume down 2.8%, to 4,904 from 5,047.
Columbus Avenue Southbound between West 86-87 Streets.
- Week of Dec. 6-10, 2004: 7-10am volume up 5.5%, to 4,767 from 4,518.3-7pm volume up 3.6%, to 4,856 from 4,686.
- Week of Dec. 13-17, 2004: 7-10am volume down 10.8%, to 4,032 from 4,518.3-7pm volume down 8.1%, to 4,306 from 4,686.
- Week of Jan. 10-14, 2005: 7-10am volume down 9.8%, to 4,073 from 4,518.3-7pm volume down 10.7%, to 4,185 from 4,686.
Columbus Avenue Southbound between West 95-96 Streets.
- Week of Dec. 6-10, 2004: 7-10am volume down 3.9%, to 3,650 from 3,798.3-7pm volume down 4.9%, to 3,545 from 3,728.
- Week of Dec. 13-17, 2004: 7-10am volume down 3.4%, to 3,667 from 3,798.3-7pm volume down 0.4%, to 3,713 from 3,728.
- Week of Jan. 10-14, 2005: 7-10am volume down 1.3%, to 3,747 from 3,798.3-7pm volume up 2.5%, to 3,821 from 3,728.
Broadway Southbound between West 62-63 Streets.
- Week of Dec. 6-10, 2004: 7-10am volume up 0.5%, to 3,192 from 3,175.3-7pm volume down 8.6%, to 3,293 from 3,602.
- Week of Dec. 13-17, 2004: 7-10am volume down 0.3%, to 3,167 from 3,175.3-7pm volume down 5.8%, to 3,393 from 3,602.
- Week of Jan. 10-14, 2005: 7-10am volume up 3.6%, to 3,289 from 3,175.3-7pm volume up 4.4%, to 3,762 from 3,602.
Broadway Southbound between West 86-87 Streets.
- Week of Dec. 6-10, 2004: 7-10am volume down 3.3%, to 2,416 from 2,499.3-7pm volume up 2.9%, to 3,442 from 3,344.
- Week of Dec. 13-17, 2004: 7-10am volume down 3.5%, to 2,411 from 2,499.3-7pm volume up 7.6%, to 3,599 from 3,344.
- Week of Jan. 10-14, 2005: 7-10am volume down 9.8%, to 2,254 from 2,499.3-7pm volume down 0.5%, to 3,327 from 3,344.
New York City Department of Transportation
39
Broadway Southbound between West 95-96 Streets.
- Week of Dec. 6-10, 2004: 7-10am volume down 8.8%, to 2,126 from 2,330.3-7pm volume up 3.7%, to 3,060 from 2,950.
- Week of Dec. 13-17, 2004: 7-10am volume up 1.2%, to 2,357 from 2,330.3-7pm volume up 10.6%, to 3,264 from 2,950.
- Week of Jan. 10-14, 2005: 7-10am volume down 8.6%, to 2,130 from 2,330.3-7pm volume up 2.2%, to 3,015 from 2,950.
Eastbound Cross Street ATR Volumes
West 77th Street Eastbound between Columbus Avenue and Central Park West.
- Week of Dec. 6-10, 2004: 7-10am volume down 20.3%, to 503 from 631.3-7pm volume down 5.7%, to 816 from 865.
- Week of Dec. 13-17, 2004: 7-10am volume down 18.1%, to 517 from 631.3-7pm volume up 3.2%, to 893 from 865.
- Week of Jan. 10-14, 2005: 7-10am volume down 22.7%, to 488 from 631.3-7pm volume down 12.5%, to 757 from 865.
West 86th Street Eastbound between Columbus Avenue and Central Park West.
- Week of Dec. 6-10, 2004: 7-10am volume unchanged at 1,491.3-7pm volume down 4.8%, to 2,131 from 2,238.
- Week of Dec. 13-17, 2004: 7-10am volume up 1.3%, to 1,511 from 1,491.3-7pm volume down 5.2%, to 2,121 from 2,238.
East 90th Street Eastbound between Fifth and Madison Avenues.
- Week of Dec. 6-10, 2004: 7-10am volume up 4.2%, to 664 from 637.3-7pm volume down 7.1%, to 920 from 990.
- Week of Dec. 13-17, 2004: 7-10am volume up 7.7%, to 686 from 637.3-7pm volume down 0.6%, to 984 from 990.
- Week of Jan. 10-14, 2005: 7-10am volume up 2.4%, to 652 from 637.3-7pm volume down 2.3%, to 967 from 990.
West 90th Street Eastbound between Columbus Avenue and Central Park West.
- Week of Dec. 6-10, 2004: 7-10am volume down 8.5%, to 453 from 495.3-7pm volume down 4.5%, to 640 from 670.
- Week of Dec. 13-17, 2004: 7-10am volume down 4.6%, to 472 from 495.3-7pm volume up 7.5%, to 720 from 670.
New York City Department of Transportation
40
- Week of Jan. 10-14, 2005: 7-10am volume down 13.7%, to 427 from 495.3-7pm volume down 10.6%, to 599 from 670.
Westbound Cross Street ATR Volumes
West 77th Street Westbound between Central Park West and Columbus Avenue.
- Week of Dec. 6-10, 2004: 7-10am volume down 22.6%, to 503 from 650.3-7pm volume down 7.1%, to 749 from 806.
- Week of Dec. 13-17, 2004: 7-10am volume down 21.4%, to 511 from 650.3-7pm volume up 0.1%, to 807 from 806.
- Week of Jan. 10-14, 2005: 7-10am volume down 17.4%, to 537 from 650.3-7pm volume down 2.6%, to 785 from 806.
West 86th Street Westbound between Central Park West and Columbus Avenue.
- Week of Dec. 6-10, 2004: 7-10am volume up 13.9%, to 2,037 from 1,788.3-7pm volume up 21.0%, to 3,352 from 2,770.
- Week of Dec. 13-17, 2004: 7-10am volume up 7.6%, to 1,924 from 1,788.3-7pm volume up 13.3%, to 3,138 from 2,770.
- Week of Jan. 10-14, 2005: 7-10am volume down 1.0%, to 1,770 from 1,788.3-7pm volume up 2.7%, to 2,844 from 2,770.
East 102nd Street Westbound between Madison and Fifth Avenues.
- Week of Dec. 6-10, 2004: 7-10am volume down 3.6%, to 351 from 364.3-7pm volume down 14.3%, to 245 from 286.
- Week of Dec. 13-17, 2004: 7-10am volume up 5.2%, to 383 from 364.3-7pm volume down 11.9%, to 252 from 286.
- Week of Jan. 10-14, 2005: 7-10am volume up 15.1%, to 419 from 364.3-7pm volume up 1.7%, to 291 from 286.
Central Park Drives ATR Volumes
East Drive between 72-79 Streets.
- Week of Dec. 6-10, 2004: 7-10am volume down 2.0%, to 976 from 996.3-7pm volume up 6.3%, to 2,040 from 1,919.
- Week of Dec. 13-17, 2004: 7-10am volume down 3.6%, to 960 from 996.3-7pm volume up 2.2%, to 1,962 from 1,919.
New York City Department of Transportation
41
- Week of Jan. 10-14, 2005: 7-10am volume down 0.6%, to 990 from 996.3-7pm volume up 6.0%, to 2,035 from 1,919.
West Drive at Tavern on The Green (vicinity of 67th Street).
- Week of Dec. 6-10, 2004: 7-10am volume down 21.4%, to 3,552 from 4,521.3-7pm volume down 15.4%%, to 2,969 from 3,511.
- Week of Dec. 13-17, 2004: 7-10am volume down 2.6%, to 4,403 from 4,521.3-7pm volume up 10.5%, to 3,881 from 3,511.
- Week of Jan. 10-14, 2005: 7-10am volume down 5.4%, to 4,277 from 4,521.3-7pm volume down 12.7%, to 3,064 from 3,511.
West Drive between 102-103 Streets.
- Week of Dec. 6-10, 2004: 7-10am volume down 37.5%, to 1,436 from 2,299.3-7pm volume down 4.5%, to 1,476 from 1,546.
- Week of Dec. 13-17, 2004: 7-10am volume down 25.2%, to 1,720 from 2,299.3-7pm volume up 9.6%, to 1,694 from 1,546.
- Week of Jan. 10-14, 2005: 7-10am volume down 36.0%, to 1,472 from 2,299.3-7pm volume down 19.7%, to 1,242 from 1,546.
Auto Travel Times and Speeds
Northbound Auto Travel Times and Speeds
Central Park East Drive Northbound from 6th Avenue Entrance to Adam C. Powell Blvd. Exit.
- Week of Dec. 6-10, 2004: 7-10am travel time 7.89 minutes; average speed 22.8 mph.3-7pm travel time 8.12 minutes; average speed 22.2 mph.
- Week of Dec. 13-17, 2004: 7-10am travel time 7.38 minutes; average speed 24.4 mph.3-7pm travel time 7.57 minutes; average speed 23.8 mph.
- Week of Jan. 10-14, 2005: 7-10am travel time 8.11 minutes; average speed 22.2 mph.3-7pm travel time 8.78 minutes; average speed 20.5 mph.
New York City Department of Transportation
42
Central Park West Northbound from 59th Street to 110th Street.
- Week of Dec. 6-10, 2004: 7-10am travel time up 15.5%, to 16.10 minutes from 13.94 minutes; average speed down 13.6%, to 9.5 mph from 11.0 mph.3-7pm travel time up 30.9%, to 13.89 minutes from 10.61 minutes; average speed down 23.6%, to 11.0 mph from 14.4 mph.
- Week of Dec. 13-17, 2004: 7-10am travel time up 12.1%, to 15.62 minutes from 13.94 minutes; average speed down 10.9%, to 9.8 mph from 11.0 mph.3-7pm travel time up 32.2%, to 14.03 minutes from 10.61 minutes; average speed down 24.3%, to 10.9 mph from 14.4 mph.
- Week of Jan. 10-14, 2005: 7-10am travel time down 7.5%, to 12.89 minutes from 13.94 minutes; average speed up 8.2%, to 11.9 mph from 11.0 mph.3-7pm travel time up 28.4%, to 13.62 minutes from 10.61 minutes; average speed down 22.2%, to 11.2 mph from 14.4 mph.
Amsterdam Avenue Northbound from 59th Street to 110th Street.
- Week of Dec. 6-10, 2004: 7-10am travel time down 15.4%, to 7.69 minutes from 9.09 minutes; average speed up 18.5%, to 19.9 mph from 16.8 mph.3-7pm travel time up 4.0%, to 10.89 minutes from 10.47 minutes; average speed down 4.1%, to 14.0 mph from 14.6 mph.
- Week of Dec. 13-17, 2004: 7-10am travel time down 1.3%, to 8.97 minutes from 9.09 minutes; average speed up 1.8%, to 17.1 mph from 16.8 mph.3-7pm travel time up 8.2%, to 11.33 minutes from 10.47 minutes; average speed down 7.5%, to 13.5 mph from 14.6 mph.
- Week of Jan. 10-14, 2005: 7-10am travel time down 6.8%, to 8.47 minutes from 9.09 minutes; average speed up 7.7%, to 18.1 mph from 16.8 mph.3-7pm travel time down 4.7%, to 9.98 minutes from 10.47 minutes; average speed up 4.8%, to 15.3 mph from 14.6 mph.
New York City Department of Transportation
43
Broadway Northbound from 59th Street/Columbus Circle to 110th Street.
- Week of Dec. 6-10, 2004: 7-10am travel time down 0.8%, to 12.77 minutes from 12.87 minutes; average speed up 0.8%, to 12.2 mph from 12.1 mph.3-7pm travel time up 12.9%, to 15.98 minutes from 14.15 minutes; average speed down 10.9%, to 9.8 mph from 11.0 mph.
- Week of Dec. 13-17, 2004: 7-10am travel time up 10.5%, to 14.22 minutes from 12.87 minutes; average speed down 9.1%, to 11.0 mph from 12.1 mph.3-7pm travel time up 14.8%, to 16.24 minutes from 14.15 minutes; average speed down 12.7%, to 9.6 mph from 11.0 mph.
- Week of Jan. 10-14, 2005: 7-10am travel time up 10.5%, to 14.22 minutes from 12.87 minutes; average speed down 9.1%, to 11.0 mph from 12.1 mph.3-7pm travel time up 7.6%, to 15.22 minutes from 14.15 minutes; average speed down 7.3%, to 10.2 mph from 11.0 mph.
Southbound Auto Travel Times and Speeds
Central Park West Drive Southbound from Adam C. Powell Blvd. Entrance to 7th Ave. Exit.
- Week of Dec. 6-10, 2004: 7-10am travel time down 24.0%, to 8.28 minutes from 10.90 minutes; average speed up 31.5%, to 21.7 mph from 16.5 mph.3-7pm travel time down 13.4%, to 8.31 minutes from 9.60 minutes; average speed up 15.4%, to 21.7 mph from 18.8 mph.
- Week of Dec. 13-17, 2004: 7-10am travel time down 27.3%, to 7.92 minutes from 10.90 minutes; average speed up 37.6%, to 22.7 mph from 16.5 mph.3-7pm travel time down 18.5%, to 7.82 minutes from 9.60 minutes; average speed up 22.3%, to 23.0 mph from 18.8 mph.
- Week of Jan. 10-14, 2005: 7-10am travel time down 23.5%, to 8.34 minutes from 10.90 minutes; average speed up 30.9%, to 21.6 mph from 16.5 mph.3-7pm travel time down 12.1%, to 8.44 minutes from
New York City Department of Transportation
44
9.60 minutes; average speed up 13.3%, to 21.3 mph from 18.8 mph.
Central Park West Southbound from 110th Street to Broadway.
- Week of Dec. 6-10, 2004: 7-10am travel time up 30.7%, to 12.77 minutes from 9.77 minutes; average speed down 24.0%, to 11.7 mph from 15.4 mph.3-7pm travel time up 15.5%, to 16.40 minutes from 14.20 minutes; average speed down 14.2%, to 9.1 mph from 10.6 mph.
- Week of Dec. 13-17, 2004: 7-10am travel time up 49.7%, to 14.63 minutes from 9.77 minutes; average speed down 33.1%, to 10.3 mph from 15.4 mph.3-7pm travel time up 9.6%, to 15.57 minutes from 14.20 minutes; average speed down 9.4%, to 9.6 mph from 10.6 mph.
- Week of Jan. 10-14, 2005: 7-10am travel time up 47.8%, to 14.44 minutes from 9.77 minutes; average speed down 32.5%, to 10.4 mph from 15.4 mph.3-7pm travel time up 1.6%, to 14.43 minutes from 14.20 minutes; average speed down 1.9%, to 10.4 mph from 10.6 mph.
Columbus Avenue Southbound from 110th Street to 59th Street.
- Week of Dec. 6-10, 2004: 7-10am travel time down 20.4%, to 9.22 minutes from 11.58 minutes; average speed up 25.8%, to 16.6 mph from 13.2 mph.3-7pm travel time up 1.5%, to 10.18 minutes from 10.03 minutes; average speed down 2.0%, to 15.0 mph from 15.3 mph.
- Week of Dec. 13-17, 2004: 7-10am travel time down 11.2%, to 10.28 minutes from 11.58 minutes; average speed up 12.9%, to 14.9 mph from 13.2 mph.3-7pm travel time up 15.0%, to 11.53 minutes from 10.03 minutes; average speed down 13.1%, to 13.3 mph from 15.3 mph.
- Week of Jan. 10-14, 2005: 7-10am travel time down 15.1%, to 9.83 minutes from 11.58 minutes; average speed up 18.2%, to 15.6 mph from 13.2 mph.3-7pm travel time up 4.7%, to 10.50 minutes from
New York City Department of Transportation
45
10.03 minutes; average speed down 4.6%, to 14.6 mph from 15.3 mph.
Broadway Southbound from 110th Street to 59th Street.
- Week of Dec. 6-10, 2004: 7-10am travel time down 5.1%, to 14.28 minutes from 15.04 minutes; average speed up 4.8%, to 10.9 mph from 10.4 mph.3-7pm travel time up 26.4%, to 17.19 minutes from 13.60 minutes; average speed down 20.9%, to 9.1 mph from 11.5 mph.
- Week of Dec. 13-17, 2004: 7-10am travel time down 1.1%, to 14.88 minutes from 15.04 minutes; average speed up 1.0%, to 10.5 mph from 10.4 mph.3-7pm travel time up 21.3%, to 16.50 minutes from 13.60 minutes; average speed down 17.4%, to 9.5 mph from 11.5 mph.
- Week of Jan. 10-14, 2005: 7-10am travel time up 3.6%, to 15.58 minutes from 15.04 minutes; average speed down 3.8%, to 10.0 mph from 10.4 mph.3-7pm travel time up 16.9%, to 15.90 minutes from 13.60 minutes; average speed down 14.8%, to 9.8 mph from 11.5 mph.
New York City Department of Transportation
46
Appendix III
ATR Volume Comparison
New York City Department of Transportation
47
A.
Park Drive Entrances
New York City Department of Transportation
48
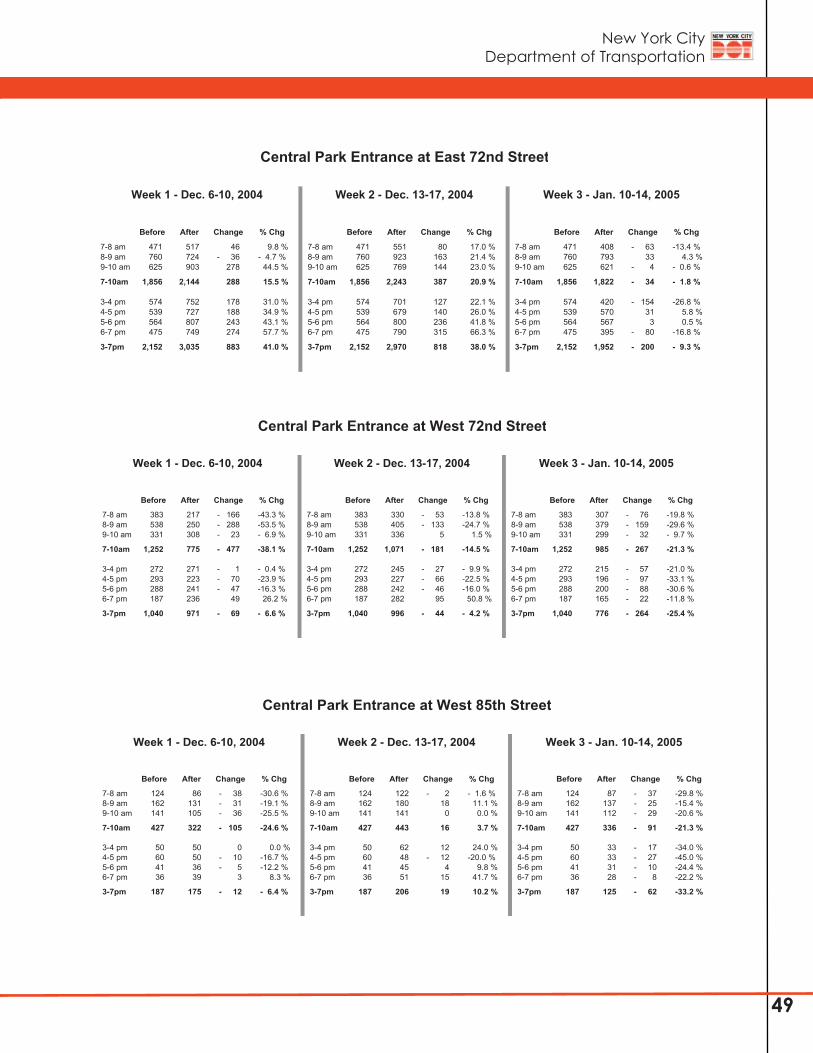
Park Entrance Time Dec 6-10 Percent Dec 13-17 Percent Jan 10-14 PercentPeriod Before 2004 Change 2004 Change 2005 Change
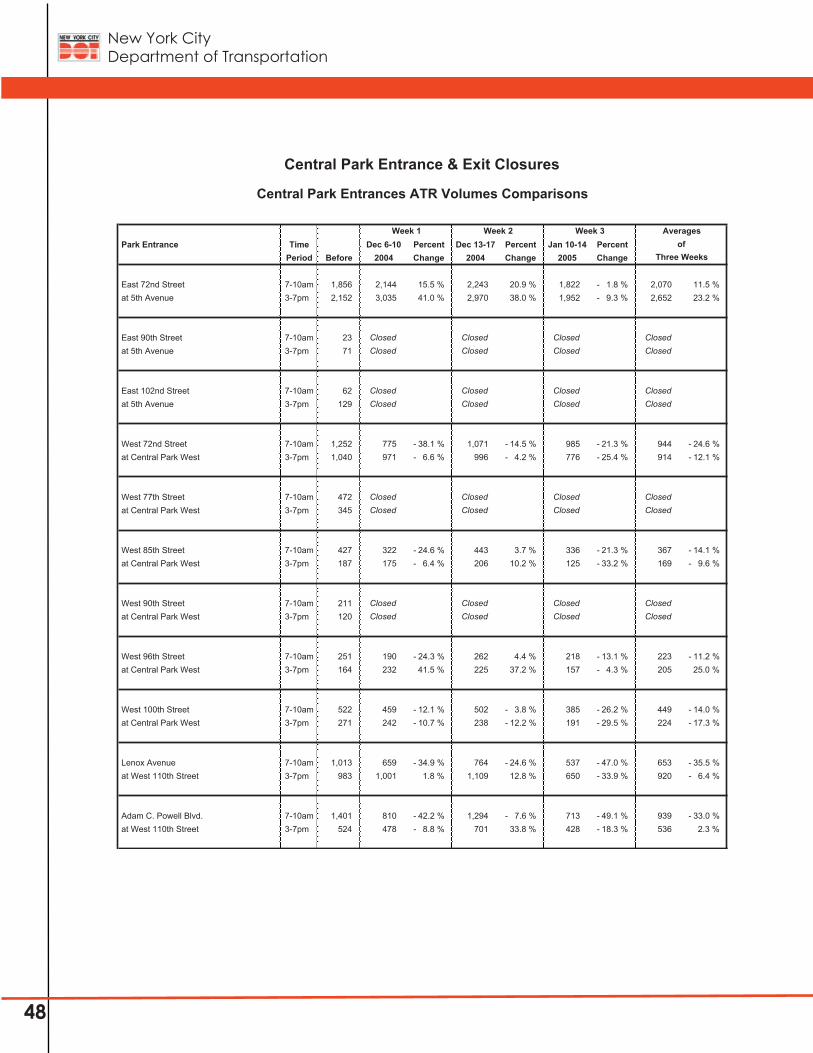
East 72nd Street 7-10am 1,856 2,144 15.5 % 2,243 20.9 % 1,822 - 1.8 % 2,070 11.5 % at 5th Avenue 3-7pm 2,152 3,035 41.0 % 2,970 38.0 % 1,952 - 9.3 % 2,652 23.2 %
East 90th Street 7-10am 23 Closed Closed Closed Closed at 5th Avenue 3-7pm 71 Closed Closed Closed Closed
East 102nd Street 7-10am 62 Closed Closed Closed Closed at 5th Avenue 3-7pm 129 Closed Closed Closed Closed
West 72nd Street 7-10am 1,252 775 - 38.1 % 1,071 - 14.5 % 985 - 21.3 % 944 - 24.6 % at Central Park West 3-7pm 1,040 971 - 6.6 % 996 - 4.2 % 776 - 25.4 % 914 - 12.1 %
West 77th Street 7-10am 472 Closed Closed Closed Closed at Central Park West 3-7pm 345 Closed Closed Closed Closed
West 85th Street 7-10am 427 322 - 24.6 % 443 3.7 % 336 - 21.3 % 367 - 14.1 % at Central Park West 3-7pm 187 175 - 6.4 % 206 10.2 % 125 - 33.2 % 169 - 9.6 %
West 90th Street 7-10am 211 Closed Closed Closed Closed at Central Park West 3-7pm 120 Closed Closed Closed Closed
West 96th Street 7-10am 251 190 - 24.3 % 262 4.4 % 218 - 13.1 % 223 - 11.2 % at Central Park West 3-7pm 164 232 41.5 % 225 37.2 % 157 - 4.3 % 205 25.0 %
West 100th Street 7-10am 522 459 - 12.1 % 502 - 3.8 % 385 - 26.2 % 449 - 14.0 % at Central Park West 3-7pm 271 242 - 10.7 % 238 - 12.2 % 191 - 29.5 % 224 - 17.3 %
Lenox Avenue 7-10am 1,013 659 - 34.9 % 764 - 24.6 % 537 - 47.0 % 653 - 35.5 % at West 110th Street 3-7pm 983 1,001 1.8 % 1,109 12.8 % 650 - 33.9 % 920 - 6.4 %
Adam C. Powell Blvd. 7-10am 1,401 810 - 42.2 % 1,294 - 7.6 % 713 - 49.1 % 939 - 33.0 % at West 110th Street 3-7pm 524 478 - 8.8 % 701 33.8 % 428 - 18.3 % 536 2.3 %
Averages
Three Weeksof
Central Park Entrance & Exit Closures
Central Park Entrances ATR Volumes Comparisons
Week 3Week 1 Week 2
New York City Department of Transportation
49
Before After Change % Chg Before After Change % Chg Before After Change % Chg
7-8 am 471 517 46 9.8 % 7-8 am 471 551 80 17.0 % 7-8 am 471 408 - 63 -13.4 %8-9 am 760 724 - 36 - 4.7 % 8-9 am 760 923 163 21.4 % 8-9 am 760 793 33 4.3 %9-10 am 625 903 278 44.5 % 9-10 am 625 769 144 23.0 % 9-10 am 625 621 - 4 - 0.6 %
7-10am 1,856 2,144 288 15.5 % 7-10am 1,856 2,243 387 20.9 % 7-10am 1,856 1,822 - 34 - 1.8 %
3-4 pm 574 752 178 31.0 % 3-4 pm 574 701 127 22.1 % 3-4 pm 574 420 - 154 -26.8 %4-5 pm 539 727 188 34.9 % 4-5 pm 539 679 140 26.0 % 4-5 pm 539 570 31 5.8 %5-6 pm 564 807 243 43.1 % 5-6 pm 564 800 236 41.8 % 5-6 pm 564 567 3 0.5 %6-7 pm 475 749 274 57.7 % 6-7 pm 475 790 315 66.3 % 6-7 pm 475 395 - 80 -16.8 %
3-7pm 2,152 3,035 883 41.0 % 3-7pm 2,152 2,970 818 38.0 % 3-7pm 2,152 1,952 - 200 - 9.3 %
Week 1 - Dec. 6-10, 2004 Week 2 - Dec. 13-17, 2004 Week 3 - Jan. 10-14, 2005
Central Park Entrance at East 72nd Street
Traffic Volumes Comparisons
Before After Change % Chg Before After Change % Chg Before After Change % Chg
7-8 am 383 217 - 166 -43.3 % 7-8 am 383 330 - 53 -13.8 % 7-8 am 383 307 - 76 -19.8 %8-9 am 538 250 - 288 -53.5 % 8-9 am 538 405 - 133 -24.7 % 8-9 am 538 379 - 159 -29.6 %9-10 am 331 308 - 23 - 6.9 % 9-10 am 331 336 5 1.5 % 9-10 am 331 299 - 32 - 9.7 %
7-10am 1,252 775 - 477 -38.1 % 7-10am 1,252 1,071 - 181 -14.5 % 7-10am 1,252 985 - 267 -21.3 %
3-4 pm 272 271 - 1 - 0.4 % 3-4 pm 272 245 - 27 - 9.9 % 3-4 pm 272 215 - 57 -21.0 %4-5 pm 293 223 - 70 -23.9 % 4-5 pm 293 227 - 66 -22.5 % 4-5 pm 293 196 - 97 -33.1 %5-6 pm 288 241 - 47 -16.3 % 5-6 pm 288 242 - 46 -16.0 % 5-6 pm 288 200 - 88 -30.6 %6-7 pm 187 236 49 26.2 % 6-7 pm 187 282 95 50.8 % 6-7 pm 187 165 - 22 -11.8 %
3-7pm 1,040 971 - 69 - 6.6 % 3-7pm 1,040 996 - 44 - 4.2 % 3-7pm 1,040 776 - 264 -25.4 %
Week 1 - Dec. 6-10, 2004 Week 2 - Dec. 13-17, 2004 Week 3 - Jan. 10-14, 2005
Central Park Entrance at West 72nd Street
Traffic Volumes Comparisons
Before After Change % Chg Before After Change % Chg Before After Change % Chg
7-8 am 124 86 - 38 -30.6 % 7-8 am 124 122 - 2 - 1.6 % 7-8 am 124 87 - 37 -29.8 %8-9 am 162 131 - 31 -19.1 % 8-9 am 162 180 18 11.1 % 8-9 am 162 137 - 25 -15.4 %9-10 am 141 105 - 36 -25.5 % 9-10 am 141 141 0 0.0 % 9-10 am 141 112 - 29 -20.6 %
7-10am 427 322 - 105 -24.6 % 7-10am 427 443 16 3.7 % 7-10am 427 336 - 91 -21.3 %
3-4 pm 50 50 0 0.0 % 3-4 pm 50 62 12 24.0 % 3-4 pm 50 33 - 17 -34.0 %4-5 pm 60 50 - 10 -16.7 % 4-5 pm 60 48 - 12 -20.0 % 4-5 pm 60 33 - 27 -45.0 %5-6 pm 41 36 - 5 -12.2 % 5-6 pm 41 45 4 9.8 % 5-6 pm 41 31 - 10 -24.4 %6-7 pm 36 39 3 8.3 % 6-7 pm 36 51 15 41.7 % 6-7 pm 36 28 - 8 -22.2 %
3-7pm 187 175 - 12 - 6.4 % 3-7pm 187 206 19 10.2 % 3-7pm 187 125 - 62 -33.2 %
Week 1 - Dec. 6-10, 2004 Week 2 - Dec. 13-17, 2004 Week 3 - Jan. 10-14, 2005
Central Park Entrance at West 85th Street
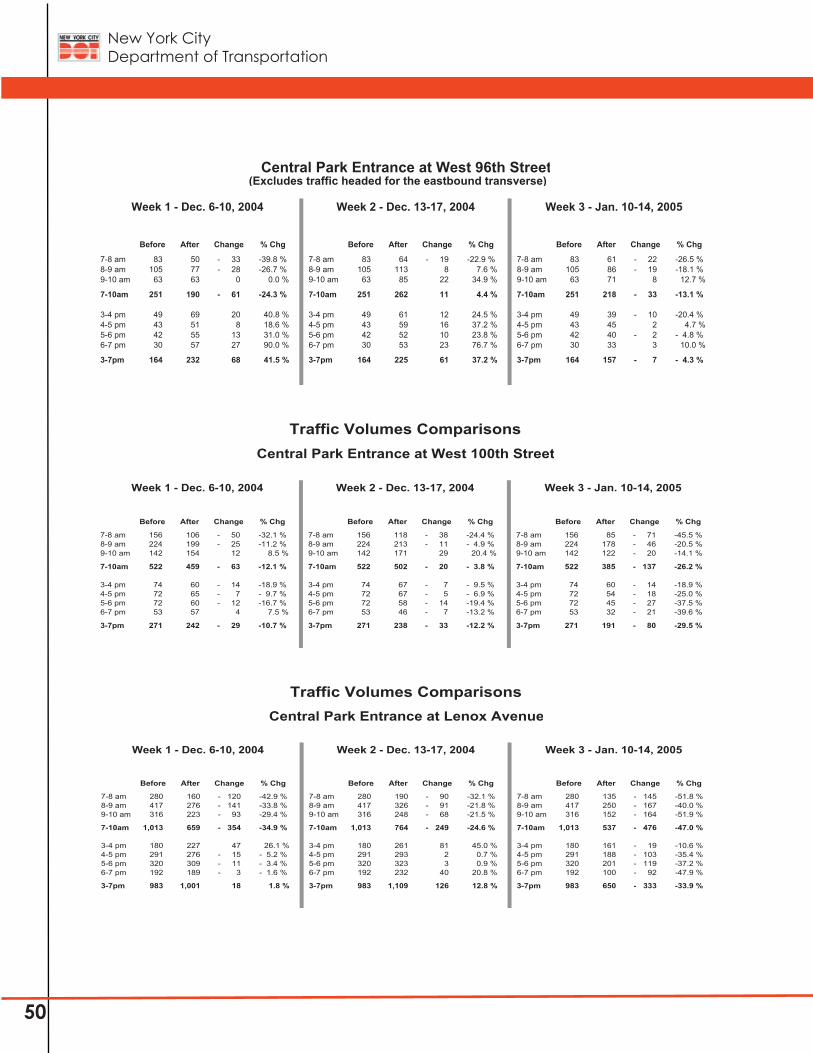
New York City Department of Transportation
50
(Excludes traffic headed for the eastbound transverse)
Before After Change % Chg Before After Change % Chg Before After Change % Chg
7-8 am 83 50 - 33 -39.8 % 7-8 am 83 64 - 19 -22.9 % 7-8 am 83 61 - 22 -26.5 %8-9 am 105 77 - 28 -26.7 % 8-9 am 105 113 8 7.6 % 8-9 am 105 86 - 19 -18.1 %9-10 am 63 63 0 0.0 % 9-10 am 63 85 22 34.9 % 9-10 am 63 71 8 12.7 %
7-10am 251 190 - 61 -24.3 % 7-10am 251 262 11 4.4 % 7-10am 251 218 - 33 -13.1 %
3-4 pm 49 69 20 40.8 % 3-4 pm 49 61 12 24.5 % 3-4 pm 49 39 - 10 -20.4 %4-5 pm 43 51 8 18.6 % 4-5 pm 43 59 16 37.2 % 4-5 pm 43 45 2 4.7 %5-6 pm 42 55 13 31.0 % 5-6 pm 42 52 10 23.8 % 5-6 pm 42 40 - 2 - 4.8 %6-7 pm 30 57 27 90.0 % 6-7 pm 30 53 23 76.7 % 6-7 pm 30 33 3 10.0 %
3-7pm 164 232 68 41.5 % 3-7pm 164 225 61 37.2 % 3-7pm 164 157 - 7 - 4.3 %
Week 1 - Dec. 6-10, 2004 Week 2 - Dec. 13-17, 2004 Week 3 - Jan. 10-14, 2005
Central Park Entrance at West 96th Street
Traffic Volumes Comparisons
Before After Change % Chg Before After Change % Chg Before After Change % Chg
7-8 am 156 106 - 50 -32.1 % 7-8 am 156 118 - 38 -24.4 % 7-8 am 156 85 - 71 -45.5 %8-9 am 224 199 - 25 -11.2 % 8-9 am 224 213 - 11 - 4.9 % 8-9 am 224 178 - 46 -20.5 %9-10 am 142 154 12 8.5 % 9-10 am 142 171 29 20.4 % 9-10 am 142 122 - 20 -14.1 %
7-10am 522 459 - 63 -12.1 % 7-10am 522 502 - 20 - 3.8 % 7-10am 522 385 - 137 -26.2 %
3-4 pm 74 60 - 14 -18.9 % 3-4 pm 74 67 - 7 - 9.5 % 3-4 pm 74 60 - 14 -18.9 %4-5 pm 72 65 - 7 - 9.7 % 4-5 pm 72 67 - 5 - 6.9 % 4-5 pm 72 54 - 18 -25.0 %5-6 pm 72 60 - 12 -16.7 % 5-6 pm 72 58 - 14 -19.4 % 5-6 pm 72 45 - 27 -37.5 %6-7 pm 53 57 4 7.5 % 6-7 pm 53 46 - 7 -13.2 % 6-7 pm 53 32 - 21 -39.6 %
3-7pm 271 242 - 29 -10.7 % 3-7pm 271 238 - 33 -12.2 % 3-7pm 271 191 - 80 -29.5 %
Week 1 - Dec. 6-10, 2004 Week 2 - Dec. 13-17, 2004 Week 3 - Jan. 10-14, 2005
Central Park Entrance at West 100th Street
Traffic Volumes Comparisons
Before After Change % Chg Before After Change % Chg Before After Change % Chg
7-8 am 280 160 - 120 -42.9 % 7-8 am 280 190 - 90 -32.1 % 7-8 am 280 135 - 145 -51.8 %8-9 am 417 276 - 141 -33.8 % 8-9 am 417 326 - 91 -21.8 % 8-9 am 417 250 - 167 -40.0 %9-10 am 316 223 - 93 -29.4 % 9-10 am 316 248 - 68 -21.5 % 9-10 am 316 152 - 164 -51.9 %
7-10am 1,013 659 - 354 -34.9 % 7-10am 1,013 764 - 249 -24.6 % 7-10am 1,013 537 - 476 -47.0 %
3-4 pm 180 227 47 26.1 % 3-4 pm 180 261 81 45.0 % 3-4 pm 180 161 - 19 -10.6 %4-5 pm 291 276 - 15 - 5.2 % 4-5 pm 291 293 2 0.7 % 4-5 pm 291 188 - 103 -35.4 %5-6 pm 320 309 - 11 - 3.4 % 5-6 pm 320 323 3 0.9 % 5-6 pm 320 201 - 119 -37.2 %6-7 pm 192 189 - 3 - 1.6 % 6-7 pm 192 232 40 20.8 % 6-7 pm 192 100 - 92 -47.9 %
3-7pm 983 1,001 18 1.8 % 3-7pm 983 1,109 126 12.8 % 3-7pm 983 650 - 333 -33.9 %
Week 1 - Dec. 6-10, 2004 Week 2 - Dec. 13-17, 2004 Week 3 - Jan. 10-14, 2005
Central Park Entrance at Lenox Avenue
Traffic Volumes Comparisons
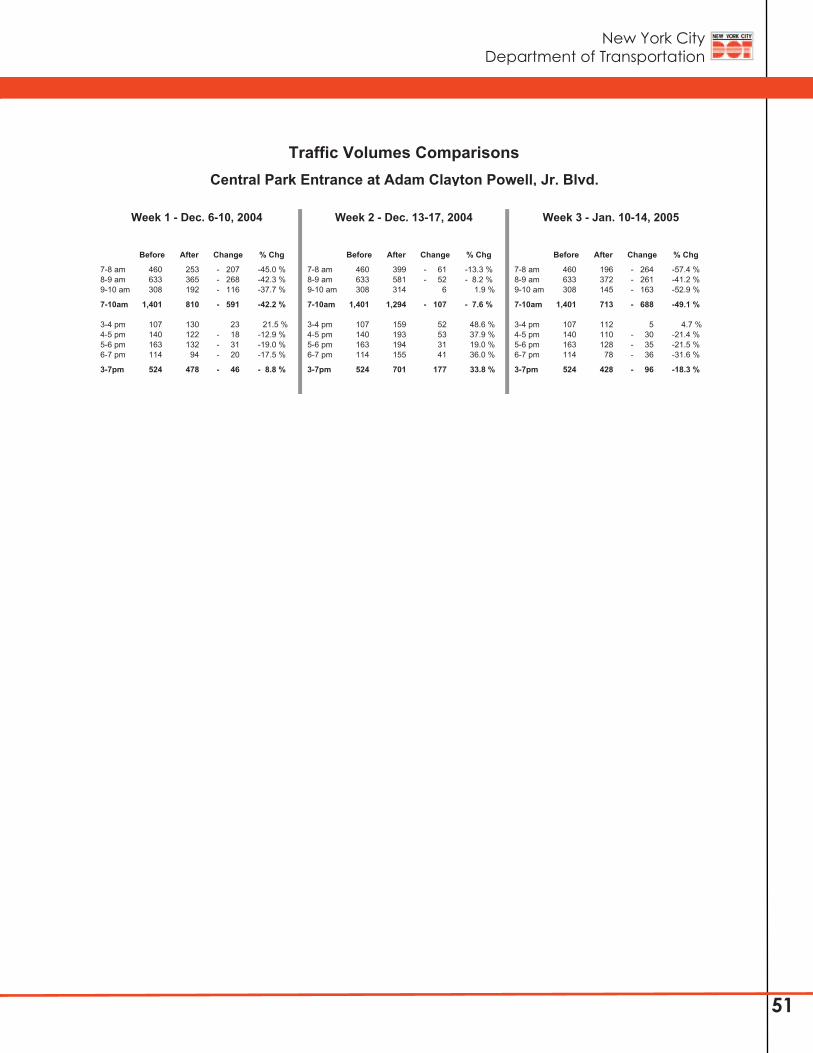
New York City Department of Transportation
51
Before After Change % Chg Before After Change % Chg Before After Change % Chg
7-8 am 460 253 - 207 -45.0 % 7-8 am 460 399 - 61 -13.3 % 7-8 am 460 196 - 264 -57.4 %8-9 am 633 365 - 268 -42.3 % 8-9 am 633 581 - 52 - 8.2 % 8-9 am 633 372 - 261 -41.2 %9-10 am 308 192 - 116 -37.7 % 9-10 am 308 314 6 1.9 % 9-10 am 308 145 - 163 -52.9 %
7-10am 1,401 810 - 591 -42.2 % 7-10am 1,401 1,294 - 107 - 7.6 % 7-10am 1,401 713 - 688 -49.1 %
3-4 pm 107 130 23 21.5 % 3-4 pm 107 159 52 48.6 % 3-4 pm 107 112 5 4.7 %4-5 pm 140 122 - 18 -12.9 % 4-5 pm 140 193 53 37.9 % 4-5 pm 140 110 - 30 -21.4 %5-6 pm 163 132 - 31 -19.0 % 5-6 pm 163 194 31 19.0 % 5-6 pm 163 128 - 35 -21.5 %6-7 pm 114 94 - 20 -17.5 % 6-7 pm 114 155 41 36.0 % 6-7 pm 114 78 - 36 -31.6 %
3-7pm 524 478 - 46 - 8.8 % 3-7pm 524 701 177 33.8 % 3-7pm 524 428 - 96 -18.3 %
Week 1 - Dec. 6-10, 2004 Week 2 - Dec. 13-17, 2004 Week 3 - Jan. 10-14, 2005
Central Park Entrance at Adam Clayton Powell, Jr. Blvd.
Traffic Volumes Comparisons
New York City Department of Transportation
52
B.
Park Drive Exits
New York City Department of Transportation
53
Park Exit Time Dec 6-10 Percent Dec 13-17 Percent Jan 10-14 PercentPeriod Before 2004 Change 2004 Change 2005 Change
East 72nd Street 7-10am 764 891 16.6 % 957 25.3 % 732 - 4.2 % 860 12.6 % at 5th Avenue 3-7pm 1,334 1,494 12.0 % 1,624 21.7 % 1,563 17.2 % 1,560 16.9 %
East 90th Street 7-10am 466 378 - 18.9 % 311 - 33.3 % N/A 345 - 26.0 % at 5th Avenue 3-7pm 649 507 - 21.9 % 426 - 34.4 % N/A 467 - 28.0 %
East 102nd Street 7-10am 62 Closed Closed Closed Closed at 5th Avenue 3-7pm 129 Closed Closed Closed Closed
West 72nd Street 7-10am 1,371 1,198 - 12.6 % 1,382 0.8 % 1,035 - 24.5 % 1,205 - 12.1 % at Central Park West 3-7pm 1,725 2,211 28.2 % 2,349 36.2 % 1,925 11.6 % 2,162 25.3 %
Strawberry Field Slip-of 7-10am 436 Closed Closed Closed Closed to West 72nd Street 3-7pm 244 Closed Closed Closed Closed
West 90th Street 7-10am 171 Closed Closed Closed Closed at Central Park West 3-7pm 114 Closed Closed Closed Closed
West 100th Street 7-10am 335 287 - 14.3 % 382 14.0 % 276 - 17.6 % 315 - 6.0 % at Central Park West 3-7pm 293 289 - 1.4 % 365 24.6 % 299 2.0 % 318 8.5 %
7th Avenue 7-10am 4,033 3,050 - 24.4 % 3,657 - 9.3 % 3,978 - 1.4 % 3,562 - 11.7 % at Central Park South 3-7pm 2,904 1,977 - 31.9 % 2,532 - 12.8 % 2,754 - 5.2 % 2,421 - 16.6 %
Lenox Avenue 7-10am 259 273 5.4 % 288 11.2 % 253 - 2.3 % 271 4.6 % at West 110th Street 3-7pm 747 769 2.9 % 753 0.8 % 652 - 12.7 % 725 - 2.9 %
Adam C. Powell Blvd. 7-10am 190 141 - 25.8 % 131 - 31.1 % 103 - 45.8 % 125 - 34.2 % at West 110th Street 3-7pm 801 664 - 17.1 % 665 - 17.0 % 618 - 22.8 % 649 - 19.0 %
Averagesof
Three Weeks
Central Park Entrance & Exit Closures
Central Park Exits ATR Volumes Comparisons
Week 3Week 1 Week 2
New York City Department of Transportation
54
Before After Change % Chg Before After Change % Chg Before After Change % Chg
7-8 am 1,089 745 - 344 -31.6 % 7-8 am 1,089 995 - 94 - 8.6 % 7-8 am 1,089 877 - 212 -19.5 %8-9 am 1,555 1,188 - 367 -23.6 % 8-9 am 1,555 1,438 - 117 - 7.5 % 8-9 am 1,555 1,665 110 7.1 %9-10 am 1,389 1,117 - 272 -19.6 % 9-10 am 1,389 1,224 - 165 -11.9 % 9-10 am 1,389 1,436 47 3.4 %
7-10am 4,033 3,050 - 983 -24.4 % 7-10am 4,033 3,657 - 376 - 9.3 % 7-10am 4,033 3,978 - 55 - 1.4 %
3-4 pm 639 476 - 163 -25.5 % 3-4 pm 639 562 - 77 -12.1 % 3-4 pm 639 580 - 59 - 9.2 %4-5 pm 779 483 - 296 -38.0 % 4-5 pm 779 572 - 207 -26.6 % 4-5 pm 779 745 - 34 - 4.4 %5-6 pm 823 518 - 305 -37.1 % 5-6 pm 823 688 - 135 -16.4 % 5-6 pm 823 786 - 37 - 4.5 %6-7 pm 663 500 - 163 -24.6 % 6-7 pm 663 710 47 7.1 % 6-7 pm 663 643 - 20 - 3.0 %
3-7pm 2,904 1,977 - 927 -31.9 % 3-7pm 2,904 2,532 - 372 -12.8 % 3-7pm 2,904 2,754 - 150 - 5.2 %
Week 1 - Dec. 6-10, 2004 Week 2 - Dec. 13-17, 2004 Week 3 - Jan. 10-14, 2005
Central Park Exit at 7th Avenue/Central Park South
Traffic Volumes Comparisons
Before After Change % Chg Before After Change % Chg Before After Change % Chg
7-8 am 31 25 - 6 -19.4 % 7-8 am 31 23 - 8 -25.8 % 7-8 am 31 17 - 14 -45.2 %8-9 am 89 67 - 22 -24.7 % 8-9 am 89 56 - 33 -37.1 % 8-9 am 89 49 - 40 -44.9 %9-10 am 70 49 - 21 -30.0 % 9-10 am 70 52 - 18 -25.7 % 9-10 am 70 37 - 33 -47.1 %
7-10am 190 141 - 49 -25.8 % 7-10am 190 131 - 59 -31.1 % 7-10am 190 103 - 87 -45.8 %
3-4 pm 119 117 - 2 - 1.7 % 3-4 pm 119 99 - 20 -16.8 % 3-4 pm 119 83 - 36 -30.3 %4-5 pm 213 129 - 84 -39.4 % 4-5 pm 213 150 - 63 -29.6 % 4-5 pm 213 158 - 55 -25.8 %5-6 pm 268 221 - 47 -17.5 % 5-6 pm 268 209 - 59 -22.0 % 5-6 pm 268 211 - 57 -21.3 %6-7 pm 201 197 - 4 - 2.0 % 6-7 pm 201 207 6 3.0 % 6-7 pm 201 166 - 35 -17.4 %
3-7pm 801 664 - 137 -17.1 % 3-7pm 801 665 - 136 -17.0 % 3-7pm 801 618 - 183 -22.8 %
Week 1 - Dec. 6-10, 2004 Week 2 - Dec. 13-17, 2004 Week 3 - Jan. 10-14, 2005
Central Park Exit at Adam Clayton Powell, Jr. Blvd.
Traffic Volumes Comparisons
Before After Change % Chg Before After Change % Chg Before After Change % Chg
7-8 am 181 235 54 29.8 % 7-8 am 181 230 49 27.1 % 7-8 am 181 117 - 64 -35.4 %8-9 am 294 344 50 17.0 % 8-9 am 294 388 94 32.0 % 8-9 am 294 307 13 4.4 %9-10 am 289 312 23 8.0 % 9-10 am 289 339 50 17.3 % 9-10 am 289 308 19 6.6 %
7-10am 764 891 127 16.6 % 7-10am 764 957 193 25.3 % 7-10am 764 732 - 32 - 4.2 %
3-4 pm 367 365 - 2 - 0.5 % 3-4 pm 367 366 - 1 - 0.3 % 3-4 pm 367 358 - 9 - 2.5 %4-5 pm 321 345 24 7.5 % 4-5 pm 321 392 71 22.1 % 4-5 pm 321 370 49 15.3 %5-6 pm 337 380 43 12.8 % 5-6 pm 337 414 77 22.8 % 5-6 pm 337 421 84 24.9 %6-7 pm 309 404 95 30.7 % 6-7 pm 309 452 143 46.3 % 6-7 pm 309 414 105 34.0 %
3-7pm 1,334 1,494 160 12.0 % 3-7pm 1,334 1,624 290 21.7 % 3-7pm 1,334 1,563 229 17.2 %
Week 1 - Dec. 6-10, 2004 Week 2 - Dec. 13-17, 2004 Week 3 - Jan. 10-14, 2005
Central Park Exit at East 72nd Street
Traffic Volumes Comparisons
New York City Department of Transportation
55
Before After Change % Chg Before After Change % Chg Before After Change % Chg
7-8 am 115 101 - 14 -12.2 % 7-8 am 115 84 - 31 -27.0 % 7-8 am 1158-9 am 182 144 - 38 -20.9 % 8-9 am 182 124 - 58 -31.9 % 8-9 am 1829-10 am 169 133 - 36 -21.3 % 9-10 am 169 103 - 66 -39.1 % 9-10 am 169
7-10am 466 378 - 88 -18.9 % 7-10am 466 311 - 155 -33.3 % 7-10am 466 0 0 -100.0 %
3-4 pm 142 120 - 22 -15.5 % 3-4 pm 142 104 - 38 -26.8 % 3-4 pm 1424-5 pm 164 127 - 37 -22.6 % 4-5 pm 164 93 - 71 -43.3 % 4-5 pm 1645-6 pm 182 134 - 48 -26.4 % 5-6 pm 182 111 - 71 -39.0 % 5-6 pm 1826-7 pm 161 126 - 35 -21.7 % 6-7 pm 161 118 - 43 -26.7 % 6-7 pm 161
3-7pm 649 507 - 142 -21.9 % 3-7pm 649 426 - 223 -34.4 % 3-7pm 649 0 0 -100.0 %
Week 1 - Dec. 6-10, 2004 Week 2 - Dec. 13-17, 2004 Week 3 - Jan. 10-14, 2005
Central Park Exit at East 90th Street
Traffic Volumes Comparisons
Appears Closed per TDM Note
Before After Change % Chg Before After Change % Chg Before After Change % Chg
7-8 am 308 277 - 31 -10.1 % 7-8 am 308 343 35 11.4 % 7-8 am 308 217 - 91 -29.5 %8-9 am 647 478 - 169 -26.1 % 8-9 am 647 574 - 73 -11.3 % 8-9 am 647 484 - 163 -25.2 %9-10 am 416 443 27 6.5 % 9-10 am 416 465 49 11.8 % 9-10 am 416 334 - 82 -19.7 %
7-10am 1,371 1,198 - 173 -12.6 % 7-10am 1,371 1,382 11 0.8 % 7-10am 1,371 1,035 - 336 -24.5 %
3-4 pm 410 546 136 33.2 % 3-4 pm 410 582 172 42.0 % 3-4 pm 410 405 - 5 - 1.2 %4-5 pm 401 539 138 34.4 % 4-5 pm 401 521 120 29.9 % 4-5 pm 401 513 112 27.9 %5-6 pm 502 591 89 17.7 % 5-6 pm 502 597 95 18.9 % 5-6 pm 502 544 42 8.4 %6-7 pm 412 535 123 29.9 % 6-7 pm 412 649 237 57.5 % 6-7 pm 412 463 51 12.4 %
3-7pm 1,725 2,211 486 28.2 % 3-7pm 1,725 2,349 624 36.2 % 3-7pm 1,725 1,925 200 11.6 %
Week 1 - Dec. 6-10, 2004 Week 2 - Dec. 13-17, 2004 Week 3 - Jan. 10-14, 2005
Central Park Exit at West 72nd Street
Traffic Volumes Comparisons
Before After Change % Chg Before After Change % Chg Before After Change % Chg
7-8 am 98 81 - 17 -17.3 % 7-8 am 98 100 2 2.0 % 7-8 am 98 79 - 19 -19.4 %8-9 am 160 155 - 5 - 3.1 % 8-9 am 160 200 40 25.0 % 8-9 am 160 150 - 10 - 6.3 %9-10 am 77 51 - 26 -33.8 % 9-10 am 77 82 5 6.5 % 9-10 am 77 47 - 30 -39.0 %
7-10am 335 287 - 48 -14.3 % 7-10am 335 382 47 14.0 % 7-10am 335 276 - 59 -17.6 %
3-4 pm 54 77 23 42.6 % 3-4 pm 54 104 50 92.6 % 3-4 pm 54 72 18 33.3 %4-5 pm 76 73 - 3 - 3.9 % 4-5 pm 76 88 12 15.8 % 4-5 pm 76 70 - 6 - 7.9 %5-6 pm 98 85 - 13 -13.3 % 5-6 pm 98 100 2 2.0 % 5-6 pm 98 98 0 0.0 %6-7 pm 65 54 - 11 -16.9 % 6-7 pm 65 73 8 12.3 % 6-7 pm 65 59 - 6 - 9.2 %
3-7pm 293 289 - 4 - 1.4 % 3-7pm 293 365 72 24.6 % 3-7pm 293 299 6 2.0 %
Week 1 - Dec. 6-10, 2004 Week 2 - Dec. 13-17, 2004 Week 3 - Jan. 10-14, 2005
Central Park Exit at West 100th Street
Traffic Volumes Comparisons

New York City Department of Transportation
56
Before After Change % Chg Before After Change % Chg Before After Change % Chg
7-8 am 50 69 19 38.0 % 7-8 am 50 68 18 36.0 % 7-8 am 50 40 - 10 -20.0 %8-9 am 104 97 - 7 - 6.7 % 8-9 am 104 107 3 2.9 % 8-9 am 104 105 1 1.0 %9-10 am 105 107 2 1.9 % 9-10 am 105 113 8 7.6 % 9-10 am 105 108 3 2.9 %
7-10am 259 273 14 5.4 % 7-10am 259 288 29 11.2 % 7-10am 259 253 - 6 - 2.3 %
3-4 pm 204 221 17 8.3 % 3-4 pm 204 208 4 2.0 % 3-4 pm 204 130 - 74 -36.3 %4-5 pm 188 207 19 10.1 % 4-5 pm 188 198 10 5.3 % 4-5 pm 188 203 15 8.0 %5-6 pm 214 198 - 16 - 7.5 % 5-6 pm 214 192 - 22 -10.3 % 5-6 pm 214 185 - 29 -13.6 %6-7 pm 141 143 2 1.4 % 6-7 pm 141 155 14 9.9 % 6-7 pm 141 134 - 7 - 5.0 %
3-7pm 747 769 22 2.9 % 3-7pm 747 753 6 0.8 % 3-7pm 747 652 - 95 -12.7 %
Week 1 - Dec. 6-10, 2004 Week 2 - Dec. 13-17, 2004 Week 3 - Jan. 10-14, 2005
Central Park Exit at Lenox Avenue
Traffic Volumes Comparisons
New York City Department of Transportation
57
C.
SouthboundRoadways
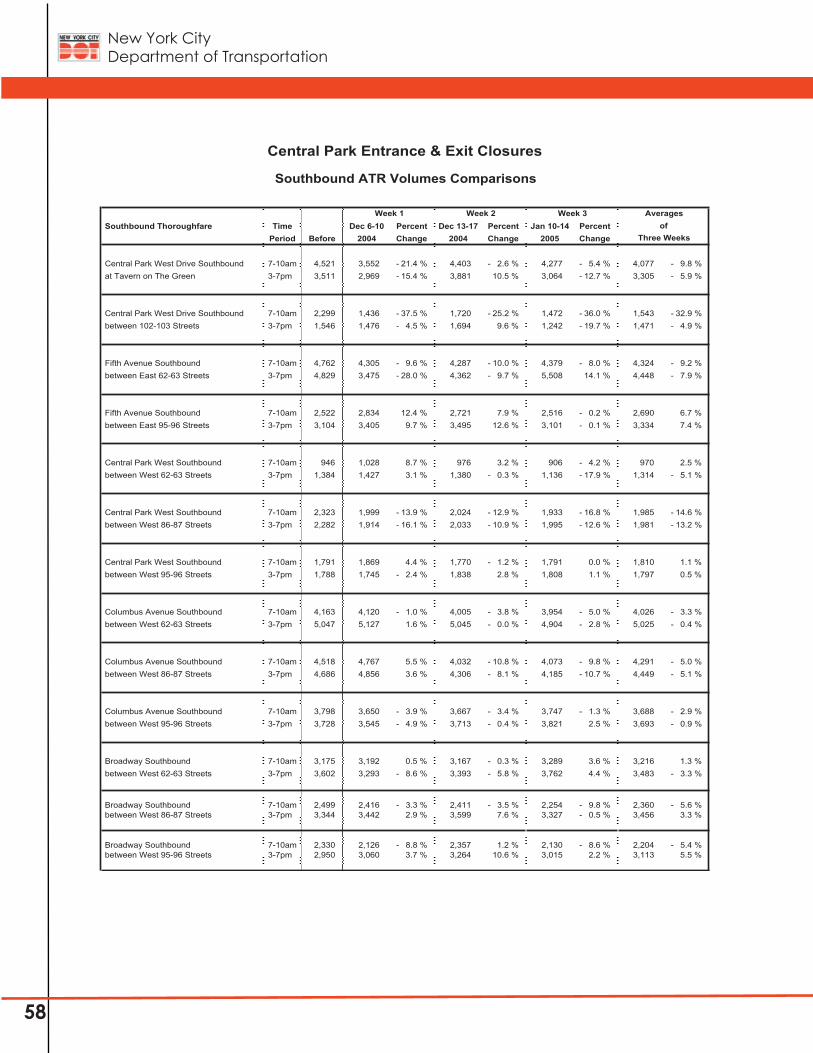
New York City Department of Transportation
58
Southbound Thoroughfare Time Dec 6-10 Percent Dec 13-17 Percent Jan 10-14 PercentPeriod Before 2004 Change 2004 Change 2005 Change
Central Park West Drive Southbound 7-10am 4,521 3,552 - 21.4 % 4,403 - 2.6 % 4,277 - 5.4 % 4,077 - 9.8 % at Tavern on The Green 3-7pm 3,511 2,969 - 15.4 % 3,881 10.5 % 3,064 - 12.7 % 3,305 - 5.9 %
Central Park West Drive Southbound 7-10am 2,299 1,436 - 37.5 % 1,720 - 25.2 % 1,472 - 36.0 % 1,543 - 32.9 % between 102-103 Streets 3-7pm 1,546 1,476 - 4.5 % 1,694 9.6 % 1,242 - 19.7 % 1,471 - 4.9 %
Fifth Avenue Southbound 7-10am 4,762 4,305 - 9.6 % 4,287 - 10.0 % 4,379 - 8.0 % 4,324 - 9.2 % between East 62-63 Streets 3-7pm 4,829 3,475 - 28.0 % 4,362 - 9.7 % 5,508 14.1 % 4,448 - 7.9 %
Fifth Avenue Southbound 7-10am 2,522 2,834 12.4 % 2,721 7.9 % 2,516 - 0.2 % 2,690 6.7 % between East 95-96 Streets 3-7pm 3,104 3,405 9.7 % 3,495 12.6 % 3,101 - 0.1 % 3,334 7.4 %
Central Park West Southbound 7-10am 946 1,028 8.7 % 976 3.2 % 906 - 4.2 % 970 2.5 % between West 62-63 Streets 3-7pm 1,384 1,427 3.1 % 1,380 - 0.3 % 1,136 - 17.9 % 1,314 - 5.1 %
Central Park West Southbound 7-10am 2,323 1,999 - 13.9 % 2,024 - 12.9 % 1,933 - 16.8 % 1,985 - 14.6 % between West 86-87 Streets 3-7pm 2,282 1,914 - 16.1 % 2,033 - 10.9 % 1,995 - 12.6 % 1,981 - 13.2 %
Central Park West Southbound 7-10am 1,791 1,869 4.4 % 1,770 - 1.2 % 1,791 0.0 % 1,810 1.1 % between West 95-96 Streets 3-7pm 1,788 1,745 - 2.4 % 1,838 2.8 % 1,808 1.1 % 1,797 0.5 %
Columbus Avenue Southbound 7-10am 4,163 4,120 - 1.0 % 4,005 - 3.8 % 3,954 - 5.0 % 4,026 - 3.3 % between West 62-63 Streets 3-7pm 5,047 5,127 1.6 % 5,045 - 0.0 % 4,904 - 2.8 % 5,025 - 0.4 %
Columbus Avenue Southbound 7-10am 4,518 4,767 5.5 % 4,032 - 10.8 % 4,073 - 9.8 % 4,291 - 5.0 % between West 86-87 Streets 3-7pm 4,686 4,856 3.6 % 4,306 - 8.1 % 4,185 - 10.7 % 4,449 - 5.1 %
Columbus Avenue Southbound 7-10am 3,798 3,650 - 3.9 % 3,667 - 3.4 % 3,747 - 1.3 % 3,688 - 2.9 % between West 95-96 Streets 3-7pm 3,728 3,545 - 4.9 % 3,713 - 0.4 % 3,821 2.5 % 3,693 - 0.9 %
Broadway Southbound 7-10am 3,175 3,192 0.5 % 3,167 - 0.3 % 3,289 3.6 % 3,216 1.3 % between West 62-63 Streets 3-7pm 3,602 3,293 - 8.6 % 3,393 - 5.8 % 3,762 4.4 % 3,483 - 3.3 %
Broadway Southbound 7-10am 2,499 2,416 - 3.3 % 2,411 - 3.5 % 2,254 - 9.8 % 2,360 - 5.6 % between West 86-87 Streets 3-7pm 3,344 3,442 2.9 % 3,599 7.6 % 3,327 - 0.5 % 3,456 3.3 %
Broadway Southbound 7-10am 2,330 2,126 - 8.8 % 2,357 1.2 % 2,130 - 8.6 % 2,204 - 5.4 % between West 95-96 Streets 3-7pm 2,950 3,060 3.7 % 3,264 10.6 % 3,015 2.2 % 3,113 5.5 %
Averagesof
Three Weeks
Central Park Entrance & Exit Closures
Southbound ATR Volumes Comparisons
Week 3Week 1 Week 2
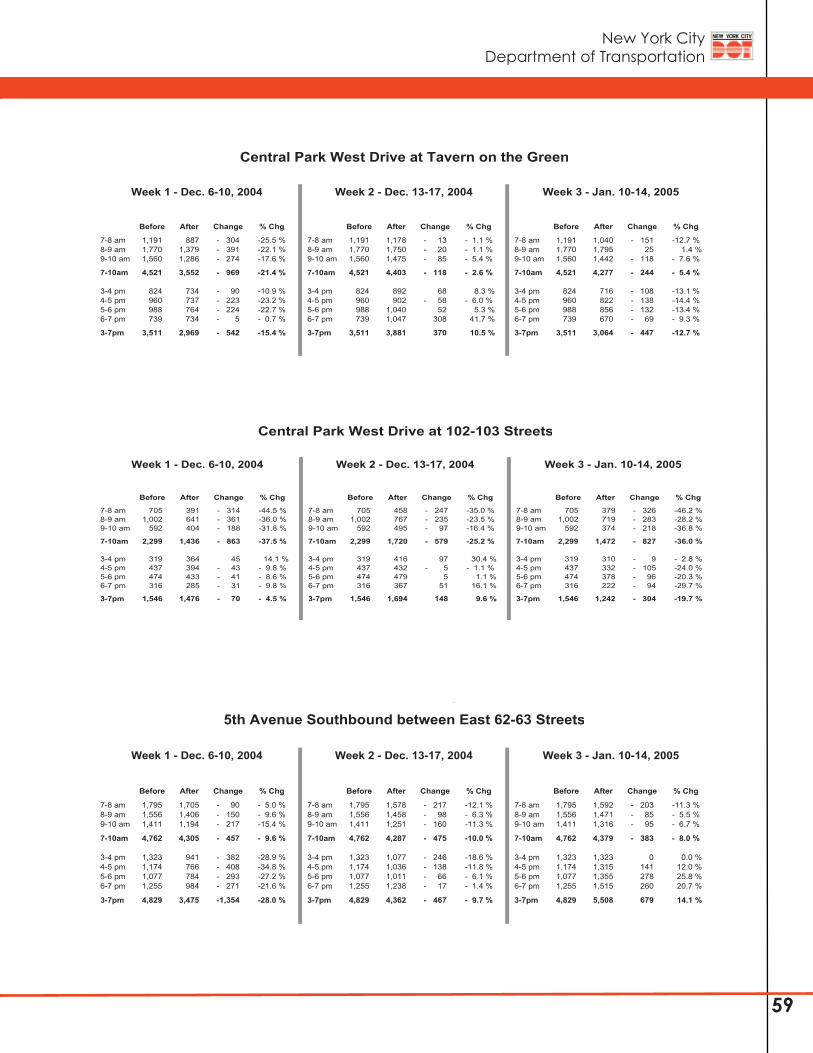
New York City Department of Transportation
59
Before After Change % Chg Before After Change % Chg Before After Change % Chg
7-8 am 1,191 887 - 304 -25.5 % 7-8 am 1,191 1,178 - 13 - 1.1 % 7-8 am 1,191 1,040 - 151 -12.7 %8-9 am 1,770 1,379 - 391 -22.1 % 8-9 am 1,770 1,750 - 20 - 1.1 % 8-9 am 1,770 1,795 25 1.4 %9-10 am 1,560 1,286 - 274 -17.6 % 9-10 am 1,560 1,475 - 85 - 5.4 % 9-10 am 1,560 1,442 - 118 - 7.6 %
7-10am 4,521 3,552 - 969 -21.4 % 7-10am 4,521 4,403 - 118 - 2.6 % 7-10am 4,521 4,277 - 244 - 5.4 %
3-4 pm 824 734 - 90 -10.9 % 3-4 pm 824 892 68 8.3 % 3-4 pm 824 716 - 108 -13.1 %4-5 pm 960 737 - 223 -23.2 % 4-5 pm 960 902 - 58 - 6.0 % 4-5 pm 960 822 - 138 -14.4 %5-6 pm 988 764 - 224 -22.7 % 5-6 pm 988 1,040 52 5.3 % 5-6 pm 988 856 - 132 -13.4 %6-7 pm 739 734 - 5 - 0.7 % 6-7 pm 739 1,047 308 41.7 % 6-7 pm 739 670 - 69 - 9.3 %
3-7pm 3,511 2,969 - 542 -15.4 % 3-7pm 3,511 3,881 370 10.5 % 3-7pm 3,511 3,064 - 447 -12.7 %
Week 1 - Dec. 6-10, 2004 Week 2 - Dec. 13-17, 2004 Week 3 - Jan. 10-14, 2005
Central Park West Drive at Tavern on the Green
Traffic Volumes Comparisons
Before After Change % Chg Before After Change % Chg Before After Change % Chg
7-8 am 705 391 - 314 -44.5 % 7-8 am 705 458 - 247 -35.0 % 7-8 am 705 379 - 326 -46.2 %8-9 am 1,002 641 - 361 -36.0 % 8-9 am 1,002 767 - 235 -23.5 % 8-9 am 1,002 719 - 283 -28.2 %9-10 am 592 404 - 188 -31.8 % 9-10 am 592 495 - 97 -16.4 % 9-10 am 592 374 - 218 -36.8 %
7-10am 2,299 1,436 - 863 -37.5 % 7-10am 2,299 1,720 - 579 -25.2 % 7-10am 2,299 1,472 - 827 -36.0 %
3-4 pm 319 364 45 14.1 % 3-4 pm 319 416 97 30.4 % 3-4 pm 319 310 - 9 - 2.8 %4-5 pm 437 394 - 43 - 9.8 % 4-5 pm 437 432 - 5 - 1.1 % 4-5 pm 437 332 - 105 -24.0 %5-6 pm 474 433 - 41 - 8.6 % 5-6 pm 474 479 5 1.1 % 5-6 pm 474 378 - 96 -20.3 %6-7 pm 316 285 - 31 - 9.8 % 6-7 pm 316 367 51 16.1 % 6-7 pm 316 222 - 94 -29.7 %
3-7pm 1,546 1,476 - 70 - 4.5 % 3-7pm 1,546 1,694 148 9.6 % 3-7pm 1,546 1,242 - 304 -19.7 %
Week 1 - Dec. 6-10, 2004 Week 2 - Dec. 13-17, 2004 Week 3 - Jan. 10-14, 2005
Central Park West Drive at 102-103 Streets
Traffic Volumes Comparisons
Before After Change % Chg Before After Change % Chg Before After Change % Chg
7-8 am 1,795 1,705 - 90 - 5.0 % 7-8 am 1,795 1,578 - 217 -12.1 % 7-8 am 1,795 1,592 - 203 -11.3 %8-9 am 1,556 1,406 - 150 - 9.6 % 8-9 am 1,556 1,458 - 98 - 6.3 % 8-9 am 1,556 1,471 - 85 - 5.5 %9-10 am 1,411 1,194 - 217 -15.4 % 9-10 am 1,411 1,251 - 160 -11.3 % 9-10 am 1,411 1,316 - 95 - 6.7 %
7-10am 4,762 4,305 - 457 - 9.6 % 7-10am 4,762 4,287 - 475 -10.0 % 7-10am 4,762 4,379 - 383 - 8.0 %
3-4 pm 1,323 941 - 382 -28.9 % 3-4 pm 1,323 1,077 - 246 -18.6 % 3-4 pm 1,323 1,323 0 0.0 %4-5 pm 1,174 766 - 408 -34.8 % 4-5 pm 1,174 1,036 - 138 -11.8 % 4-5 pm 1,174 1,315 141 12.0 %5-6 pm 1,077 784 - 293 -27.2 % 5-6 pm 1,077 1,011 - 66 - 6.1 % 5-6 pm 1,077 1,355 278 25.8 %6-7 pm 1,255 984 - 271 -21.6 % 6-7 pm 1,255 1,238 - 17 - 1.4 % 6-7 pm 1,255 1,515 260 20.7 %
3-7pm 4,829 3,475 -1,354 -28.0 % 3-7pm 4,829 4,362 - 467 - 9.7 % 3-7pm 4,829 5,508 679 14.1 %
Week 1 - Dec. 6-10, 2004 Week 2 - Dec. 13-17, 2004 Week 3 - Jan. 10-14, 2005
5th Avenue Southbound between East 62-63 Streets
Traffic Volumes Comparisons
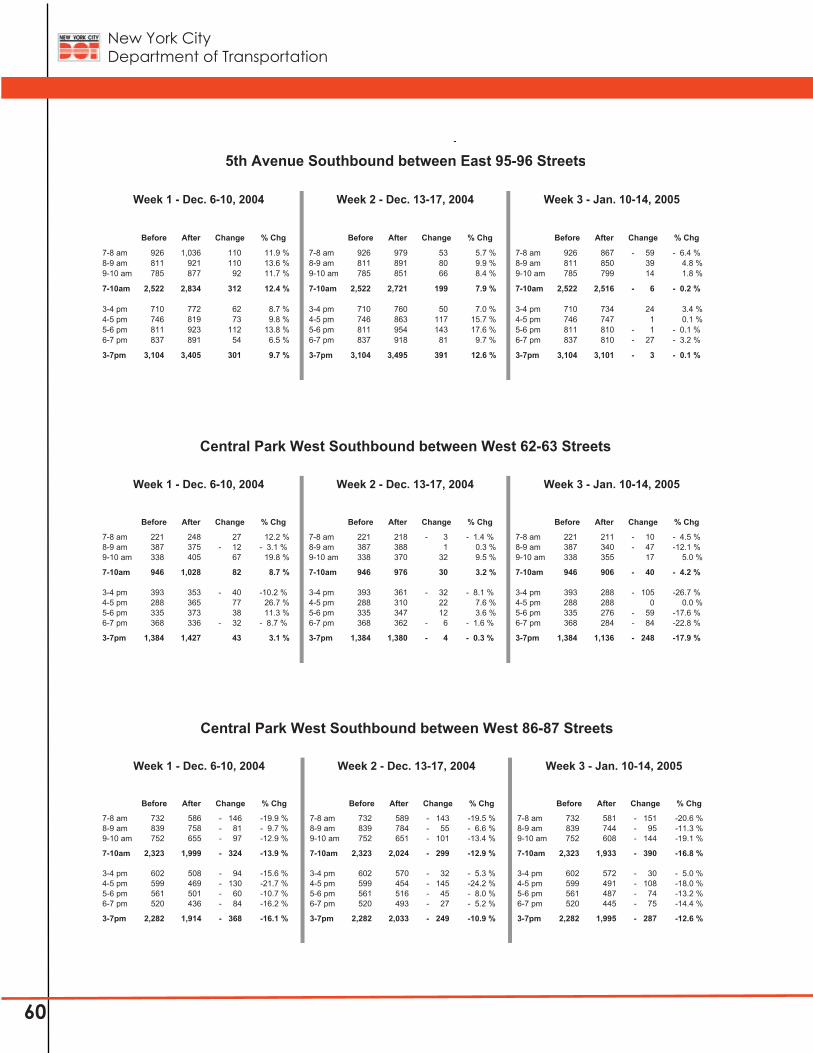
New York City Department of Transportation
60
Before After Change % Chg Before After Change % Chg Before After Change % Chg
7-8 am 926 1,036 110 11.9 % 7-8 am 926 979 53 5.7 % 7-8 am 926 867 - 59 - 6.4 %8-9 am 811 921 110 13.6 % 8-9 am 811 891 80 9.9 % 8-9 am 811 850 39 4.8 %9-10 am 785 877 92 11.7 % 9-10 am 785 851 66 8.4 % 9-10 am 785 799 14 1.8 %
7-10am 2,522 2,834 312 12.4 % 7-10am 2,522 2,721 199 7.9 % 7-10am 2,522 2,516 - 6 - 0.2 %
3-4 pm 710 772 62 8.7 % 3-4 pm 710 760 50 7.0 % 3-4 pm 710 734 24 3.4 %4-5 pm 746 819 73 9.8 % 4-5 pm 746 863 117 15.7 % 4-5 pm 746 747 1 0.1 %5-6 pm 811 923 112 13.8 % 5-6 pm 811 954 143 17.6 % 5-6 pm 811 810 - 1 - 0.1 %6-7 pm 837 891 54 6.5 % 6-7 pm 837 918 81 9.7 % 6-7 pm 837 810 - 27 - 3.2 %
3-7pm 3,104 3,405 301 9.7 % 3-7pm 3,104 3,495 391 12.6 % 3-7pm 3,104 3,101 - 3 - 0.1 %
Week 1 - Dec. 6-10, 2004 Week 2 - Dec. 13-17, 2004 Week 3 - Jan. 10-14, 2005
5th Avenue Southbound between East 95-96 Streets
Traffic Volumes Comparisons
Before After Change % Chg Before After Change % Chg Before After Change % Chg
7-8 am 221 248 27 12.2 % 7-8 am 221 218 - 3 - 1.4 % 7-8 am 221 211 - 10 - 4.5 %8-9 am 387 375 - 12 - 3.1 % 8-9 am 387 388 1 0.3 % 8-9 am 387 340 - 47 -12.1 %9-10 am 338 405 67 19.8 % 9-10 am 338 370 32 9.5 % 9-10 am 338 355 17 5.0 %
7-10am 946 1,028 82 8.7 % 7-10am 946 976 30 3.2 % 7-10am 946 906 - 40 - 4.2 %
3-4 pm 393 353 - 40 -10.2 % 3-4 pm 393 361 - 32 - 8.1 % 3-4 pm 393 288 - 105 -26.7 %4-5 pm 288 365 77 26.7 % 4-5 pm 288 310 22 7.6 % 4-5 pm 288 288 0 0.0 %5-6 pm 335 373 38 11.3 % 5-6 pm 335 347 12 3.6 % 5-6 pm 335 276 - 59 -17.6 %6-7 pm 368 336 - 32 - 8.7 % 6-7 pm 368 362 - 6 - 1.6 % 6-7 pm 368 284 - 84 -22.8 %
3-7pm 1,384 1,427 43 3.1 % 3-7pm 1,384 1,380 - 4 - 0.3 % 3-7pm 1,384 1,136 - 248 -17.9 %
Week 1 - Dec. 6-10, 2004 Week 2 - Dec. 13-17, 2004 Week 3 - Jan. 10-14, 2005
Central Park West Southbound between West 62-63 Streets
Traffic Volumes Comparisons
Before After Change % Chg Before After Change % Chg Before After Change % Chg
7-8 am 732 586 - 146 -19.9 % 7-8 am 732 589 - 143 -19.5 % 7-8 am 732 581 - 151 -20.6 %8-9 am 839 758 - 81 - 9.7 % 8-9 am 839 784 - 55 - 6.6 % 8-9 am 839 744 - 95 -11.3 %9-10 am 752 655 - 97 -12.9 % 9-10 am 752 651 - 101 -13.4 % 9-10 am 752 608 - 144 -19.1 %
7-10am 2,323 1,999 - 324 -13.9 % 7-10am 2,323 2,024 - 299 -12.9 % 7-10am 2,323 1,933 - 390 -16.8 %
3-4 pm 602 508 - 94 -15.6 % 3-4 pm 602 570 - 32 - 5.3 % 3-4 pm 602 572 - 30 - 5.0 %4-5 pm 599 469 - 130 -21.7 % 4-5 pm 599 454 - 145 -24.2 % 4-5 pm 599 491 - 108 -18.0 %5-6 pm 561 501 - 60 -10.7 % 5-6 pm 561 516 - 45 - 8.0 % 5-6 pm 561 487 - 74 -13.2 %6-7 pm 520 436 - 84 -16.2 % 6-7 pm 520 493 - 27 - 5.2 % 6-7 pm 520 445 - 75 -14.4 %
3-7pm 2,282 1,914 - 368 -16.1 % 3-7pm 2,282 2,033 - 249 -10.9 % 3-7pm 2,282 1,995 - 287 -12.6 %
Week 1 - Dec. 6-10, 2004 Week 2 - Dec. 13-17, 2004 Week 3 - Jan. 10-14, 2005
Central Park West Southbound between West 86-87 Streets
Traffic Volumes Comparisons

New York City Department of Transportation
61
Before After Change % Chg Before After Change % Chg Before After Change % Chg
7-8 am 589 563 - 26 - 4.4 % 7-8 am 589 569 - 20 - 3.4 % 7-8 am 589 552 - 37 - 6.3 %8-9 am 675 724 49 7.3 % 8-9 am 675 679 4 0.6 % 8-9 am 675 683 8 1.2 %9-10 am 527 582 55 10.4 % 9-10 am 527 522 - 5 - 0.9 % 9-10 am 527 556 29 5.5 %
7-10am 1,791 1,869 78 4.4 % 7-10am 1,791 1,770 - 21 - 1.2 % 7-10am 1,791 1,791 0 0.0 %
3-4 pm 458 491 33 7.2 % 3-4 pm 458 425 - 33 - 7.2 % 3-4 pm 458 489 31 6.8 %4-5 pm 425 417 - 8 - 1.9 % 4-5 pm 425 439 14 3.3 % 4-5 pm 425 420 - 5 - 1.2 %5-6 pm 481 450 - 31 - 6.4 % 5-6 pm 481 484 3 0.6 % 5-6 pm 481 483 2 0.4 %6-7 pm 424 387 - 37 - 8.7 % 6-7 pm 424 490 66 15.6 % 6-7 pm 424 416 - 8 - 1.9 %
3-7pm 1,788 1,745 - 43 - 2.4 % 3-7pm 1,788 1,838 50 2.8 % 3-7pm 1,788 1,808 20 1.1 %
Week 1 - Dec. 6-10, 2004 Week 2 - Dec. 13-17, 2004 Week 3 - Jan. 10-14, 2005
Central Park West Southbound between West 95-96 Streets
Traffic Volumes Comparisons
Before After Change % Chg Before After Change % Chg Before After Change % Chg
7-8 am 1,300 1,230 - 70 - 5.4 % 7-8 am 1,300 1,212 - 88 - 6.8 % 7-8 am 1,300 1,184 - 116 - 8.9 %8-9 am 1,501 1,513 12 0.8 % 8-9 am 1,501 1,445 - 56 - 3.7 % 8-9 am 1,501 1,432 - 69 - 4.6 %9-10 am 1,362 1,377 15 1.1 % 9-10 am 1,362 1,348 - 14 - 1.0 % 9-10 am 1,362 1,338 - 24 - 1.8 %
7-10am 4,163 4,120 - 43 - 1.0 % 7-10am 4,163 4,005 - 158 - 3.8 % 7-10am 4,163 3,954 - 209 - 5.0 %
3-4 pm 1,289 1,265 - 24 - 1.9 % 3-4 pm 1,289 1,257 - 32 - 2.5 % 3-4 pm 1,289 1,225 - 64 - 5.0 %4-5 pm 1,198 1,189 - 9 - 0.8 % 4-5 pm 1,198 1,143 - 55 - 4.6 % 4-5 pm 1,198 1,155 - 43 - 3.6 %5-6 pm 1,233 1,280 47 3.8 % 5-6 pm 1,233 1,261 28 2.3 % 5-6 pm 1,233 1,183 - 50 - 4.1 %6-7 pm 1,327 1,393 66 5.0 % 6-7 pm 1,327 1,384 57 4.3 % 6-7 pm 1,327 1,341 14 1.1 %
3-7pm 5,047 5,127 80 1.6 % 3-7pm 5,047 5,045 - 2 - 0.0 % 3-7pm 5,047 4,904 - 143 - 2.8 %
Week 1 - Dec. 6-10, 2004 Week 2 - Dec. 13-17, 2004 Week 3 - Jan. 10-14, 2005
Columbus Avenue Southbound between West 62-63 Streets
Traffic Volumes Comparisons
Before After Change % Chg Before After Change % Chg Before After Change % Chg
7-8 am 1,564 1,528 - 36 - 2.3 % 7-8 am 1,564 1,350 - 214 -13.7 % 7-8 am 1,564 1,240 - 324 -20.7 %8-9 am 1,656 1,903 247 14.9 % 8-9 am 1,656 1,563 - 93 - 5.6 % 8-9 am 1,656 1,653 - 3 - 0.2 %9-10 am 1,298 1,336 38 2.9 % 9-10 am 1,298 1,119 - 179 -13.8 % 9-10 am 1,298 1,180 - 118 - 9.1 %
7-10am 4,518 4,767 249 5.5 % 7-10am 4,518 4,032 - 486 -10.8 % 7-10am 4,518 4,073 - 445 - 9.8 %
3-4 pm 1,260 1,313 53 4.2 % 3-4 pm 1,260 1,092 - 168 -13.3 % 3-4 pm 1,260 1,140 - 120 - 9.5 %4-5 pm 1,112 1,140 28 2.5 % 4-5 pm 1,112 1,000 - 112 -10.1 % 4-5 pm 1,112 1,017 - 95 - 8.5 %5-6 pm 1,164 1,238 74 6.4 % 5-6 pm 1,164 1,063 - 101 - 8.7 % 5-6 pm 1,164 1,034 - 130 -11.2 %6-7 pm 1,150 1,165 15 1.3 % 6-7 pm 1,150 1,151 1 0.1 % 6-7 pm 1,150 994 - 156 -13.6 %
3-7pm 4,686 4,856 170 3.6 % 3-7pm 4,686 4,306 - 380 - 8.1 % 3-7pm 4,686 4,185 - 501 -10.7 %
Week 1 - Dec. 6-10, 2004 Week 2 - Dec. 13-17, 2004 Week 3 - Jan. 10-14, 2005
Columbus Avenue Southbound between West 86-87 Streets
Traffic Volumes Comparisons
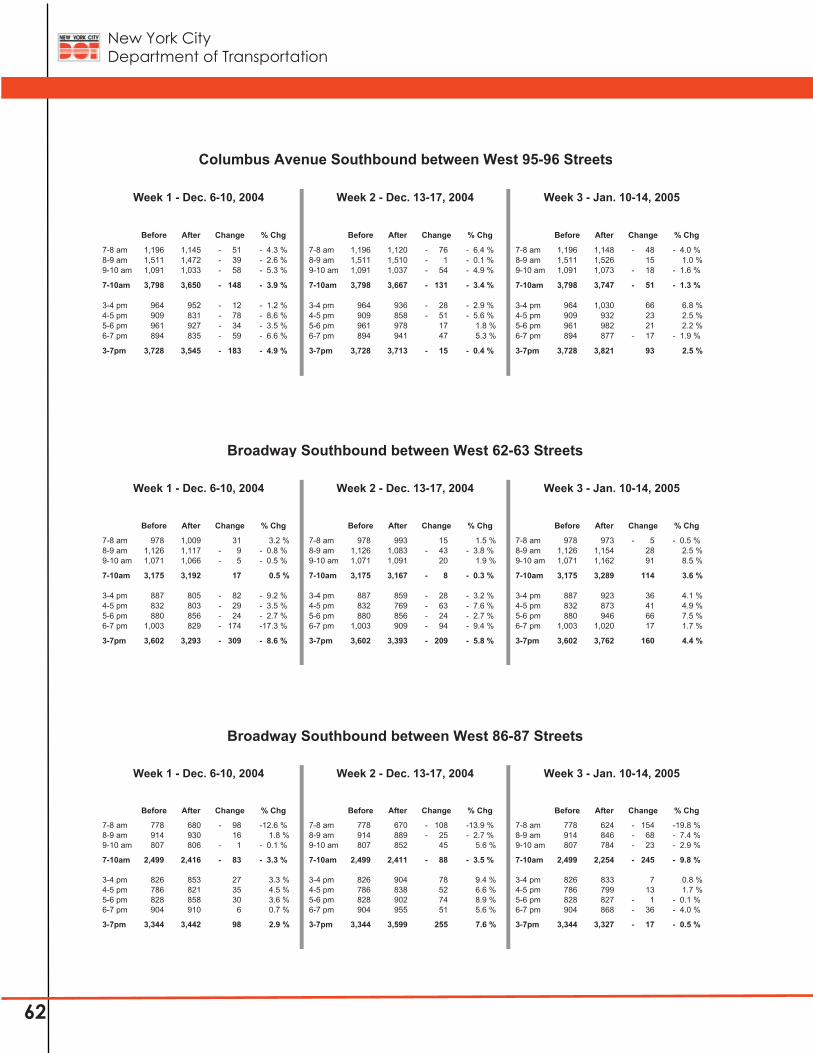
New York City Department of Transportation
62
Before After Change % Chg Before After Change % Chg Before After Change % Chg
7-8 am 1,196 1,145 - 51 - 4.3 % 7-8 am 1,196 1,120 - 76 - 6.4 % 7-8 am 1,196 1,148 - 48 - 4.0 %8-9 am 1,511 1,472 - 39 - 2.6 % 8-9 am 1,511 1,510 - 1 - 0.1 % 8-9 am 1,511 1,526 15 1.0 %9-10 am 1,091 1,033 - 58 - 5.3 % 9-10 am 1,091 1,037 - 54 - 4.9 % 9-10 am 1,091 1,073 - 18 - 1.6 %
7-10am 3,798 3,650 - 148 - 3.9 % 7-10am 3,798 3,667 - 131 - 3.4 % 7-10am 3,798 3,747 - 51 - 1.3 %
3-4 pm 964 952 - 12 - 1.2 % 3-4 pm 964 936 - 28 - 2.9 % 3-4 pm 964 1,030 66 6.8 %4-5 pm 909 831 - 78 - 8.6 % 4-5 pm 909 858 - 51 - 5.6 % 4-5 pm 909 932 23 2.5 %5-6 pm 961 927 - 34 - 3.5 % 5-6 pm 961 978 17 1.8 % 5-6 pm 961 982 21 2.2 %6-7 pm 894 835 - 59 - 6.6 % 6-7 pm 894 941 47 5.3 % 6-7 pm 894 877 - 17 - 1.9 %
3-7pm 3,728 3,545 - 183 - 4.9 % 3-7pm 3,728 3,713 - 15 - 0.4 % 3-7pm 3,728 3,821 93 2.5 %
Week 1 - Dec. 6-10, 2004 Week 2 - Dec. 13-17, 2004 Week 3 - Jan. 10-14, 2005
Columbus Avenue Southbound between West 95-96 Streets
Traffic Volumes Comparisons
Before After Change % Chg Before After Change % Chg Before After Change % Chg
7-8 am 978 1,009 31 3.2 % 7-8 am 978 993 15 1.5 % 7-8 am 978 973 - 5 - 0.5 %8-9 am 1,126 1,117 - 9 - 0.8 % 8-9 am 1,126 1,083 - 43 - 3.8 % 8-9 am 1,126 1,154 28 2.5 %9-10 am 1,071 1,066 - 5 - 0.5 % 9-10 am 1,071 1,091 20 1.9 % 9-10 am 1,071 1,162 91 8.5 %
7-10am 3,175 3,192 17 0.5 % 7-10am 3,175 3,167 - 8 - 0.3 % 7-10am 3,175 3,289 114 3.6 %
3-4 pm 887 805 - 82 - 9.2 % 3-4 pm 887 859 - 28 - 3.2 % 3-4 pm 887 923 36 4.1 %4-5 pm 832 803 - 29 - 3.5 % 4-5 pm 832 769 - 63 - 7.6 % 4-5 pm 832 873 41 4.9 %5-6 pm 880 856 - 24 - 2.7 % 5-6 pm 880 856 - 24 - 2.7 % 5-6 pm 880 946 66 7.5 %6-7 pm 1,003 829 - 174 -17.3 % 6-7 pm 1,003 909 - 94 - 9.4 % 6-7 pm 1,003 1,020 17 1.7 %
3-7pm 3,602 3,293 - 309 - 8.6 % 3-7pm 3,602 3,393 - 209 - 5.8 % 3-7pm 3,602 3,762 160 4.4 %
Week 1 - Dec. 6-10, 2004 Week 2 - Dec. 13-17, 2004 Week 3 - Jan. 10-14, 2005
Broadway Southbound between West 62-63 Streets
Traffic Volumes Comparisons
Before After Change % Chg Before After Change % Chg Before After Change % Chg
7-8 am 778 680 - 98 -12.6 % 7-8 am 778 670 - 108 -13.9 % 7-8 am 778 624 - 154 -19.8 %8-9 am 914 930 16 1.8 % 8-9 am 914 889 - 25 - 2.7 % 8-9 am 914 846 - 68 - 7.4 %9-10 am 807 806 - 1 - 0.1 % 9-10 am 807 852 45 5.6 % 9-10 am 807 784 - 23 - 2.9 %
7-10am 2,499 2,416 - 83 - 3.3 % 7-10am 2,499 2,411 - 88 - 3.5 % 7-10am 2,499 2,254 - 245 - 9.8 %
3-4 pm 826 853 27 3.3 % 3-4 pm 826 904 78 9.4 % 3-4 pm 826 833 7 0.8 %4-5 pm 786 821 35 4.5 % 4-5 pm 786 838 52 6.6 % 4-5 pm 786 799 13 1.7 %5-6 pm 828 858 30 3.6 % 5-6 pm 828 902 74 8.9 % 5-6 pm 828 827 - 1 - 0.1 %6-7 pm 904 910 6 0.7 % 6-7 pm 904 955 51 5.6 % 6-7 pm 904 868 - 36 - 4.0 %
3-7pm 3,344 3,442 98 2.9 % 3-7pm 3,344 3,599 255 7.6 % 3-7pm 3,344 3,327 - 17 - 0.5 %
Week 1 - Dec. 6-10, 2004 Week 2 - Dec. 13-17, 2004 Week 3 - Jan. 10-14, 2005
Broadway Southbound between West 86-87 Streets
Traffic Volumes Comparisons
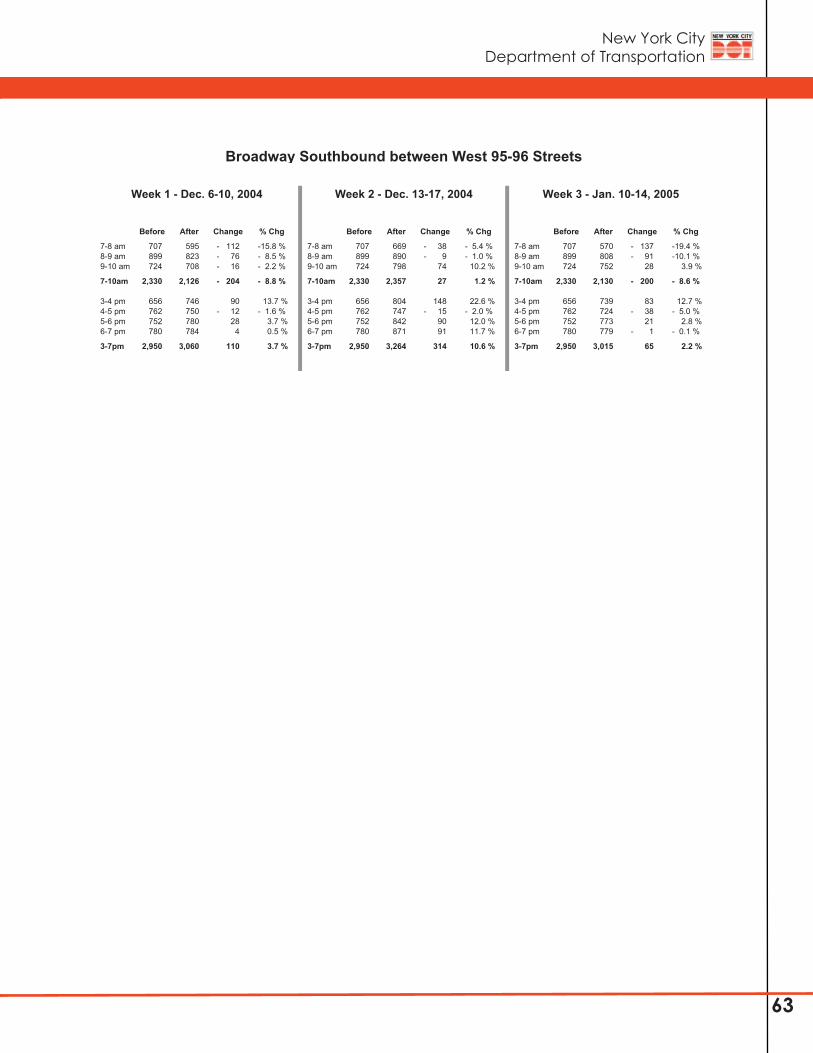
New York City Department of Transportation
63
Before After Change % Chg Before After Change % Chg Before After Change % Chg
7-8 am 707 595 - 112 -15.8 % 7-8 am 707 669 - 38 - 5.4 % 7-8 am 707 570 - 137 -19.4 %8-9 am 899 823 - 76 - 8.5 % 8-9 am 899 890 - 9 - 1.0 % 8-9 am 899 808 - 91 -10.1 %9-10 am 724 708 - 16 - 2.2 % 9-10 am 724 798 74 10.2 % 9-10 am 724 752 28 3.9 %
7-10am 2,330 2,126 - 204 - 8.8 % 7-10am 2,330 2,357 27 1.2 % 7-10am 2,330 2,130 - 200 - 8.6 %
3-4 pm 656 746 90 13.7 % 3-4 pm 656 804 148 22.6 % 3-4 pm 656 739 83 12.7 %4-5 pm 762 750 - 12 - 1.6 % 4-5 pm 762 747 - 15 - 2.0 % 4-5 pm 762 724 - 38 - 5.0 %5-6 pm 752 780 28 3.7 % 5-6 pm 752 842 90 12.0 % 5-6 pm 752 773 21 2.8 %6-7 pm 780 784 4 0.5 % 6-7 pm 780 871 91 11.7 % 6-7 pm 780 779 - 1 - 0.1 %
3-7pm 2,950 3,060 110 3.7 % 3-7pm 2,950 3,264 314 10.6 % 3-7pm 2,950 3,015 65 2.2 %
Week 1 - Dec. 6-10, 2004 Week 2 - Dec. 13-17, 2004 Week 3 - Jan. 10-14, 2005
Broadway Southbound between West 95-96 Streets
Traffic Volumes Comparisons
New York City Department of Transportation
64
D.
Northbound Roadways
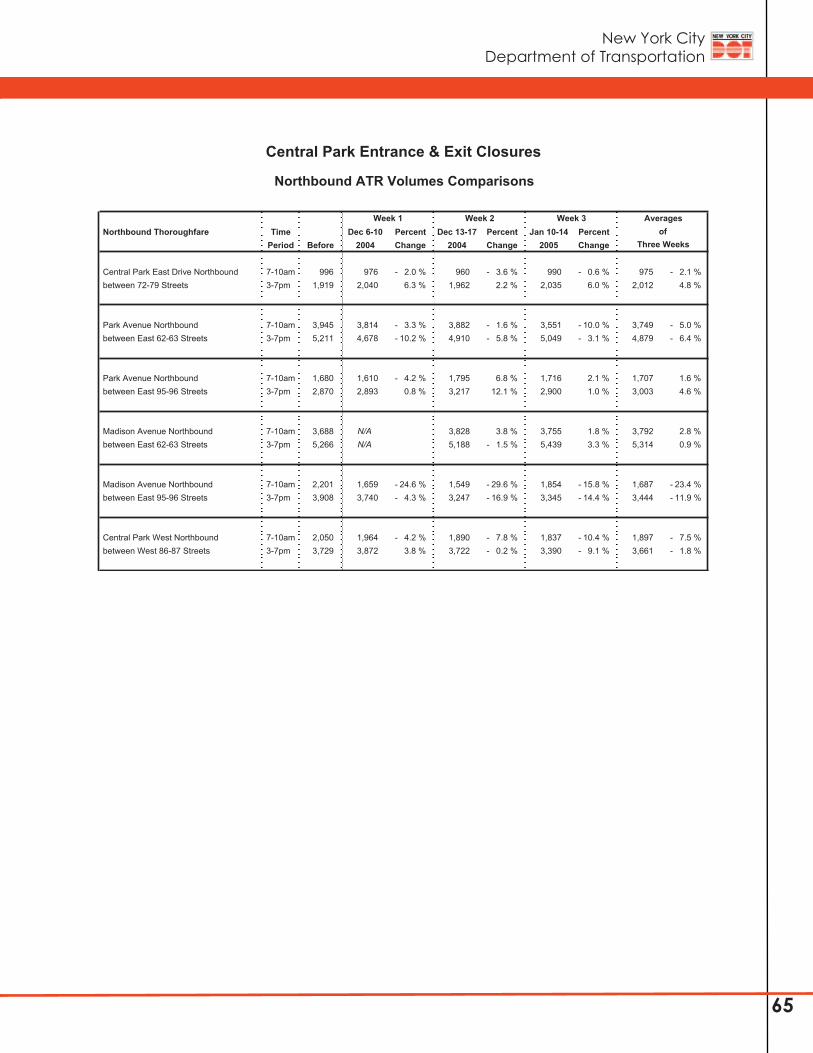
New York City Department of Transportation
65
Northbound Thoroughfare Time Dec 6-10 Percent Dec 13-17 Percent Jan 10-14 PercentPeriod Before 2004 Change 2004 Change 2005 Change
Central Park East Drive Northbound 7-10am 996 976 - 2.0 % 960 - 3.6 % 990 - 0.6 % 975 - 2.1 % between 72-79 Streets 3-7pm 1,919 2,040 6.3 % 1,962 2.2 % 2,035 6.0 % 2,012 4.8 %
Park Avenue Northbound 7-10am 3,945 3,814 - 3.3 % 3,882 - 1.6 % 3,551 - 10.0 % 3,749 - 5.0 % between East 62-63 Streets 3-7pm 5,211 4,678 - 10.2 % 4,910 - 5.8 % 5,049 - 3.1 % 4,879 - 6.4 %
Park Avenue Northbound 7-10am 1,680 1,610 - 4.2 % 1,795 6.8 % 1,716 2.1 % 1,707 1.6 % between East 95-96 Streets 3-7pm 2,870 2,893 0.8 % 3,217 12.1 % 2,900 1.0 % 3,003 4.6 %
Madison Avenue Northbound 7-10am 3,688 N/A 3,828 3.8 % 3,755 1.8 % 3,792 2.8 % between East 62-63 Streets 3-7pm 5,266 N/A 5,188 - 1.5 % 5,439 3.3 % 5,314 0.9 %
Madison Avenue Northbound 7-10am 2,201 1,659 - 24.6 % 1,549 - 29.6 % 1,854 - 15.8 % 1,687 - 23.4 % between East 95-96 Streets 3-7pm 3,908 3,740 - 4.3 % 3,247 - 16.9 % 3,345 - 14.4 % 3,444 - 11.9 %
Central Park West Northbound 7-10am 2,050 1,964 - 4.2 % 1,890 - 7.8 % 1,837 - 10.4 % 1,897 - 7.5 % between West 86-87 Streets 3-7pm 3,729 3,872 3.8 % 3,722 - 0.2 % 3,390 - 9.1 % 3,661 - 1.8 %
Averagesof
Three Weeks
Central Park Entrance & Exit Closures
Northbound ATR Volumes Comparisons
Week 3Week 1 Week 2
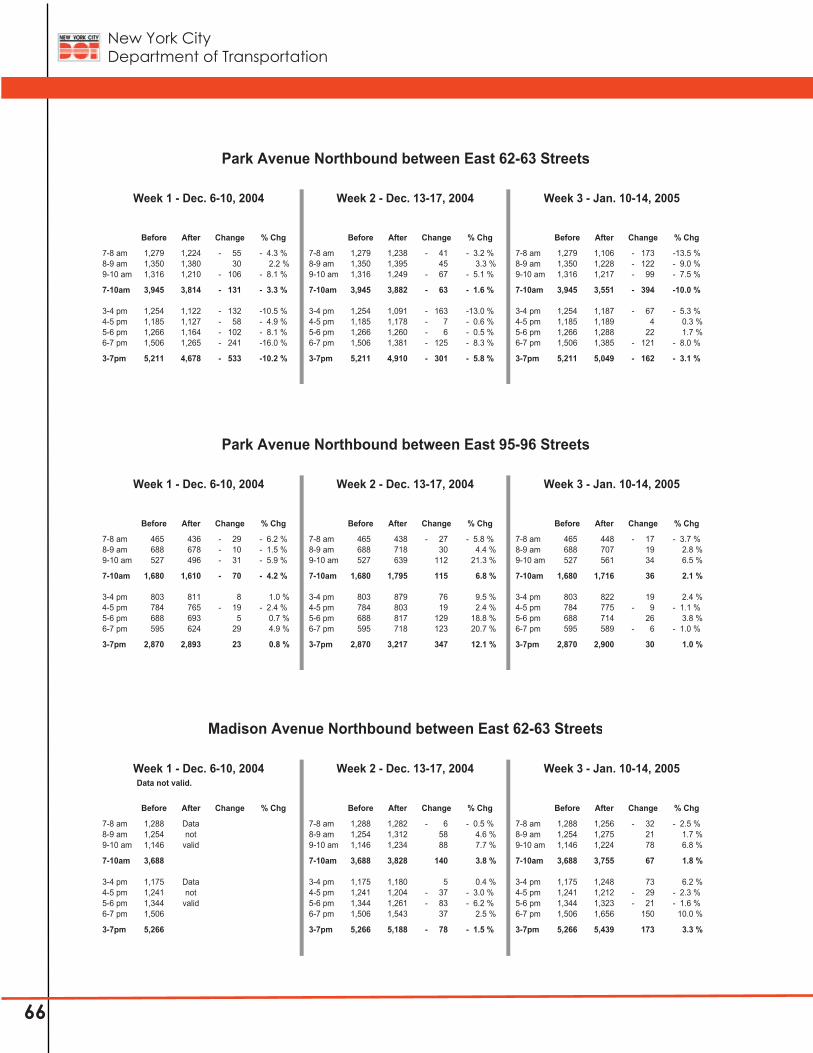
New York City Department of Transportation
66
Before After Change % Chg Before After Change % Chg Before After Change % Chg
7-8 am 1,279 1,224 - 55 - 4.3 % 7-8 am 1,279 1,238 - 41 - 3.2 % 7-8 am 1,279 1,106 - 173 -13.5 %8-9 am 1,350 1,380 30 2.2 % 8-9 am 1,350 1,395 45 3.3 % 8-9 am 1,350 1,228 - 122 - 9.0 %9-10 am 1,316 1,210 - 106 - 8.1 % 9-10 am 1,316 1,249 - 67 - 5.1 % 9-10 am 1,316 1,217 - 99 - 7.5 %
7-10am 3,945 3,814 - 131 - 3.3 % 7-10am 3,945 3,882 - 63 - 1.6 % 7-10am 3,945 3,551 - 394 -10.0 %
3-4 pm 1,254 1,122 - 132 -10.5 % 3-4 pm 1,254 1,091 - 163 -13.0 % 3-4 pm 1,254 1,187 - 67 - 5.3 %4-5 pm 1,185 1,127 - 58 - 4.9 % 4-5 pm 1,185 1,178 - 7 - 0.6 % 4-5 pm 1,185 1,189 4 0.3 %5-6 pm 1,266 1,164 - 102 - 8.1 % 5-6 pm 1,266 1,260 - 6 - 0.5 % 5-6 pm 1,266 1,288 22 1.7 %6-7 pm 1,506 1,265 - 241 -16.0 % 6-7 pm 1,506 1,381 - 125 - 8.3 % 6-7 pm 1,506 1,385 - 121 - 8.0 %
3-7pm 5,211 4,678 - 533 -10.2 % 3-7pm 5,211 4,910 - 301 - 5.8 % 3-7pm 5,211 5,049 - 162 - 3.1 %
Week 1 - Dec. 6-10, 2004 Week 2 - Dec. 13-17, 2004 Week 3 - Jan. 10-14, 2005
Park Avenue Northbound between East 62-63 Streets
Traffic Volumes Comparisons
Before After Change % Chg Before After Change % Chg Before After Change % Chg
7-8 am 465 436 - 29 - 6.2 % 7-8 am 465 438 - 27 - 5.8 % 7-8 am 465 448 - 17 - 3.7 %8-9 am 688 678 - 10 - 1.5 % 8-9 am 688 718 30 4.4 % 8-9 am 688 707 19 2.8 %9-10 am 527 496 - 31 - 5.9 % 9-10 am 527 639 112 21.3 % 9-10 am 527 561 34 6.5 %
7-10am 1,680 1,610 - 70 - 4.2 % 7-10am 1,680 1,795 115 6.8 % 7-10am 1,680 1,716 36 2.1 %
3-4 pm 803 811 8 1.0 % 3-4 pm 803 879 76 9.5 % 3-4 pm 803 822 19 2.4 %4-5 pm 784 765 - 19 - 2.4 % 4-5 pm 784 803 19 2.4 % 4-5 pm 784 775 - 9 - 1.1 %5-6 pm 688 693 5 0.7 % 5-6 pm 688 817 129 18.8 % 5-6 pm 688 714 26 3.8 %6-7 pm 595 624 29 4.9 % 6-7 pm 595 718 123 20.7 % 6-7 pm 595 589 - 6 - 1.0 %
3-7pm 2,870 2,893 23 0.8 % 3-7pm 2,870 3,217 347 12.1 % 3-7pm 2,870 2,900 30 1.0 %
Week 1 - Dec. 6-10, 2004 Week 2 - Dec. 13-17, 2004 Week 3 - Jan. 10-14, 2005
Park Avenue Northbound between East 95-96 Streets
Traffic Volumes Comparisons
Data not valid.
Before After Change % Chg Before After Change % Chg Before After Change % Chg
7-8 am 1,288 Data 7-8 am 1,288 1,282 - 6 - 0.5 % 7-8 am 1,288 1,256 - 32 - 2.5 %8-9 am 1,254 not 8-9 am 1,254 1,312 58 4.6 % 8-9 am 1,254 1,275 21 1.7 %9-10 am 1,146 valid 9-10 am 1,146 1,234 88 7.7 % 9-10 am 1,146 1,224 78 6.8 %
7-10am 3,688 7-10am 3,688 3,828 140 3.8 % 7-10am 3,688 3,755 67 1.8 %
3-4 pm 1,175 Data 3-4 pm 1,175 1,180 5 0.4 % 3-4 pm 1,175 1,248 73 6.2 %4-5 pm 1,241 not 4-5 pm 1,241 1,204 - 37 - 3.0 % 4-5 pm 1,241 1,212 - 29 - 2.3 %5-6 pm 1,344 valid 5-6 pm 1,344 1,261 - 83 - 6.2 % 5-6 pm 1,344 1,323 - 21 - 1.6 %6-7 pm 1,506 6-7 pm 1,506 1,543 37 2.5 % 6-7 pm 1,506 1,656 150 10.0 %
3-7pm 5,266 3-7pm 5,266 5,188 - 78 - 1.5 % 3-7pm 5,266 5,439 173 3.3 %
Week 1 - Dec. 6-10, 2004 Week 2 - Dec. 13-17, 2004 Week 3 - Jan. 10-14, 2005
Madison Avenue Northbound between East 62-63 Streets
Traffic Volumes Comparisons
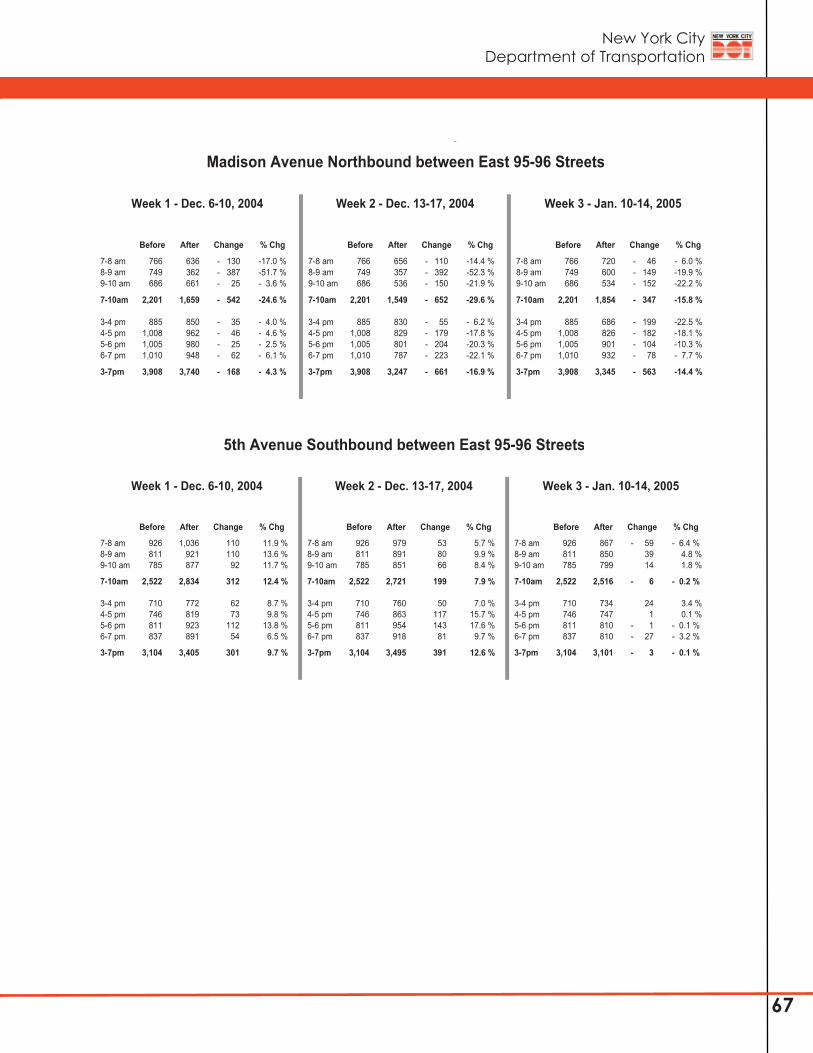
New York City Department of Transportation
67
Before After Change % Chg Before After Change % Chg Before After Change % Chg
7-8 am 766 636 - 130 -17.0 % 7-8 am 766 656 - 110 -14.4 % 7-8 am 766 720 - 46 - 6.0 %8-9 am 749 362 - 387 -51.7 % 8-9 am 749 357 - 392 -52.3 % 8-9 am 749 600 - 149 -19.9 %9-10 am 686 661 - 25 - 3.6 % 9-10 am 686 536 - 150 -21.9 % 9-10 am 686 534 - 152 -22.2 %
7-10am 2,201 1,659 - 542 -24.6 % 7-10am 2,201 1,549 - 652 -29.6 % 7-10am 2,201 1,854 - 347 -15.8 %
3-4 pm 885 850 - 35 - 4.0 % 3-4 pm 885 830 - 55 - 6.2 % 3-4 pm 885 686 - 199 -22.5 %4-5 pm 1,008 962 - 46 - 4.6 % 4-5 pm 1,008 829 - 179 -17.8 % 4-5 pm 1,008 826 - 182 -18.1 %5-6 pm 1,005 980 - 25 - 2.5 % 5-6 pm 1,005 801 - 204 -20.3 % 5-6 pm 1,005 901 - 104 -10.3 %6-7 pm 1,010 948 - 62 - 6.1 % 6-7 pm 1,010 787 - 223 -22.1 % 6-7 pm 1,010 932 - 78 - 7.7 %
3-7pm 3,908 3,740 - 168 - 4.3 % 3-7pm 3,908 3,247 - 661 -16.9 % 3-7pm 3,908 3,345 - 563 -14.4 %
Week 1 - Dec. 6-10, 2004 Week 2 - Dec. 13-17, 2004 Week 3 - Jan. 10-14, 2005
Madison Avenue Northbound between East 95-96 Streets
Traffic Volumes Comparisons
Before After Change % Chg Before After Change % Chg Before After Change % Chg
7-8 am 926 1,036 110 11.9 % 7-8 am 926 979 53 5.7 % 7-8 am 926 867 - 59 - 6.4 %8-9 am 811 921 110 13.6 % 8-9 am 811 891 80 9.9 % 8-9 am 811 850 39 4.8 %9-10 am 785 877 92 11.7 % 9-10 am 785 851 66 8.4 % 9-10 am 785 799 14 1.8 %
7-10am 2,522 2,834 312 12.4 % 7-10am 2,522 2,721 199 7.9 % 7-10am 2,522 2,516 - 6 - 0.2 %
3-4 pm 710 772 62 8.7 % 3-4 pm 710 760 50 7.0 % 3-4 pm 710 734 24 3.4 %4-5 pm 746 819 73 9.8 % 4-5 pm 746 863 117 15.7 % 4-5 pm 746 747 1 0.1 %5-6 pm 811 923 112 13.8 % 5-6 pm 811 954 143 17.6 % 5-6 pm 811 810 - 1 - 0.1 %6-7 pm 837 891 54 6.5 % 6-7 pm 837 918 81 9.7 % 6-7 pm 837 810 - 27 - 3.2 %
3-7pm 3,104 3,405 301 9.7 % 3-7pm 3,104 3,495 391 12.6 % 3-7pm 3,104 3,101 - 3 - 0.1 %
Week 1 - Dec. 6-10, 2004 Week 2 - Dec. 13-17, 2004 Week 3 - Jan. 10-14, 2005
5th Avenue Southbound between East 95-96 Streets
Traffic Volumes Comparisons
New York City Department of Transportation
68
E.
East/WestRoadways
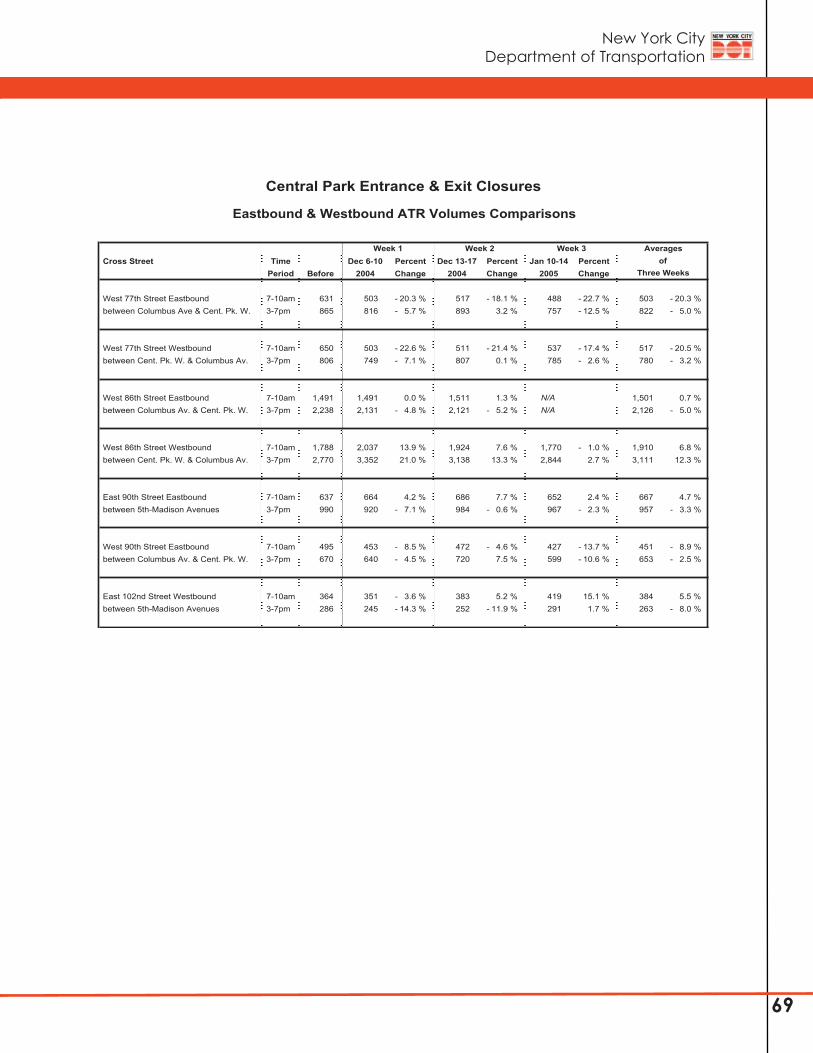
New York City Department of Transportation
69
Cross Street Time Dec 6-10 Percent Dec 13-17 Percent Jan 10-14 PercentPeriod Before 2004 Change 2004 Change 2005 Change
West 77th Street Eastbound 7-10am 631 503 - 20.3 % 517 - 18.1 % 488 - 22.7 % 503 - 20.3 % between Columbus Ave & Cent. Pk. W. 3-7pm 865 816 - 5.7 % 893 3.2 % 757 - 12.5 % 822 - 5.0 %
West 77th Street Westbound 7-10am 650 503 - 22.6 % 511 - 21.4 % 537 - 17.4 % 517 - 20.5 % between Cent. Pk. W. & Columbus Av. 3-7pm 806 749 - 7.1 % 807 0.1 % 785 - 2.6 % 780 - 3.2 %
West 86th Street Eastbound 7-10am 1,491 1,491 0.0 % 1,511 1.3 % N/A 1,501 0.7 % between Columbus Av. & Cent. Pk. W. 3-7pm 2,238 2,131 - 4.8 % 2,121 - 5.2 % N/A 2,126 - 5.0 %
West 86th Street Westbound 7-10am 1,788 2,037 13.9 % 1,924 7.6 % 1,770 - 1.0 % 1,910 6.8 % between Cent. Pk. W. & Columbus Av. 3-7pm 2,770 3,352 21.0 % 3,138 13.3 % 2,844 2.7 % 3,111 12.3 %
East 90th Street Eastbound 7-10am 637 664 4.2 % 686 7.7 % 652 2.4 % 667 4.7 % between 5th-Madison Avenues 3-7pm 990 920 - 7.1 % 984 - 0.6 % 967 - 2.3 % 957 - 3.3 %
West 90th Street Eastbound 7-10am 495 453 - 8.5 % 472 - 4.6 % 427 - 13.7 % 451 - 8.9 % between Columbus Av. & Cent. Pk. W. 3-7pm 670 640 - 4.5 % 720 7.5 % 599 - 10.6 % 653 - 2.5 %
East 102nd Street Westbound 7-10am 364 351 - 3.6 % 383 5.2 % 419 15.1 % 384 5.5 % between 5th-Madison Avenues 3-7pm 286 245 - 14.3 % 252 - 11.9 % 291 1.7 % 263 - 8.0 %
Central Park Entrance & Exit Closures
Eastbound & Westbound ATR Volumes Comparisons
Averagesof
Three Weeks
Week 3Week 1 Week 2
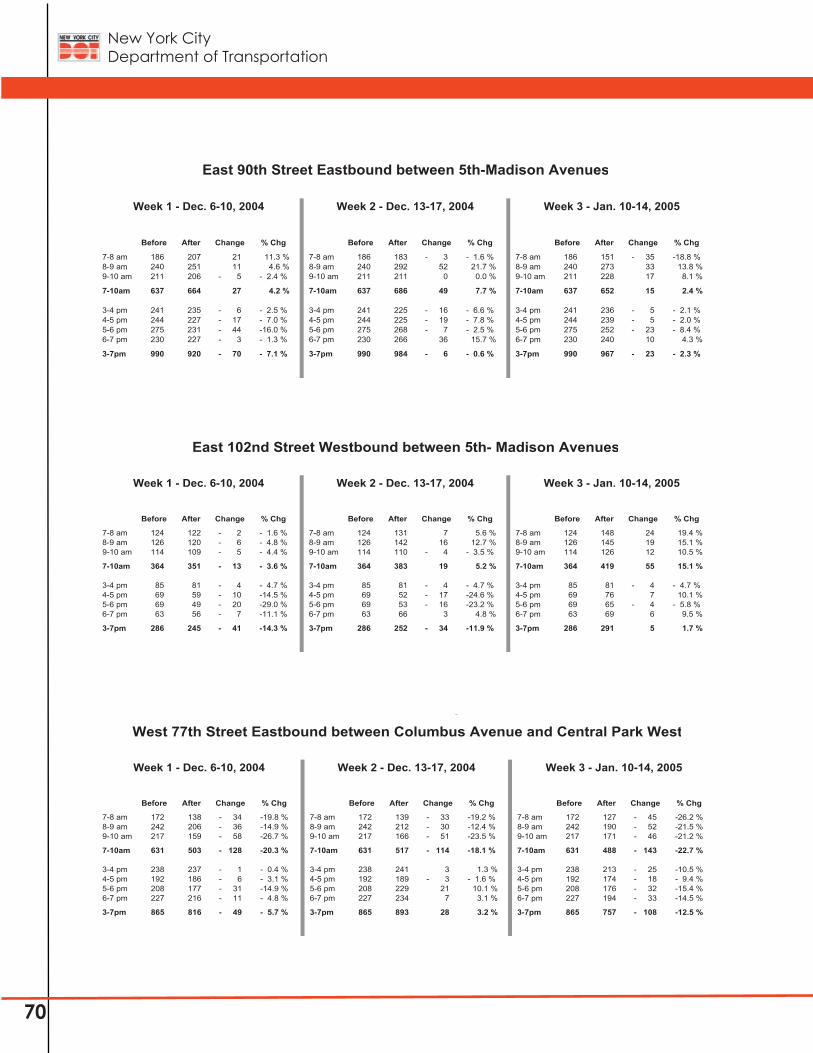
New York City Department of Transportation
70
Before After Change % Chg Before After Change % Chg Before After Change % Chg
7-8 am 186 207 21 11.3 % 7-8 am 186 183 - 3 - 1.6 % 7-8 am 186 151 - 35 -18.8 %8-9 am 240 251 11 4.6 % 8-9 am 240 292 52 21.7 % 8-9 am 240 273 33 13.8 %9-10 am 211 206 - 5 - 2.4 % 9-10 am 211 211 0 0.0 % 9-10 am 211 228 17 8.1 %
7-10am 637 664 27 4.2 % 7-10am 637 686 49 7.7 % 7-10am 637 652 15 2.4 %
3-4 pm 241 235 - 6 - 2.5 % 3-4 pm 241 225 - 16 - 6.6 % 3-4 pm 241 236 - 5 - 2.1 %4-5 pm 244 227 - 17 - 7.0 % 4-5 pm 244 225 - 19 - 7.8 % 4-5 pm 244 239 - 5 - 2.0 %5-6 pm 275 231 - 44 -16.0 % 5-6 pm 275 268 - 7 - 2.5 % 5-6 pm 275 252 - 23 - 8.4 %6-7 pm 230 227 - 3 - 1.3 % 6-7 pm 230 266 36 15.7 % 6-7 pm 230 240 10 4.3 %
3-7pm 990 920 - 70 - 7.1 % 3-7pm 990 984 - 6 - 0.6 % 3-7pm 990 967 - 23 - 2.3 %
Week 1 - Dec. 6-10, 2004 Week 2 - Dec. 13-17, 2004 Week 3 - Jan. 10-14, 2005
East 90th Street Eastbound between 5th-Madison Avenues
Traffic Volumes Comparisons
Before After Change % Chg Before After Change % Chg Before After Change % Chg
7-8 am 124 122 - 2 - 1.6 % 7-8 am 124 131 7 5.6 % 7-8 am 124 148 24 19.4 %8-9 am 126 120 - 6 - 4.8 % 8-9 am 126 142 16 12.7 % 8-9 am 126 145 19 15.1 %9-10 am 114 109 - 5 - 4.4 % 9-10 am 114 110 - 4 - 3.5 % 9-10 am 114 126 12 10.5 %
7-10am 364 351 - 13 - 3.6 % 7-10am 364 383 19 5.2 % 7-10am 364 419 55 15.1 %
3-4 pm 85 81 - 4 - 4.7 % 3-4 pm 85 81 - 4 - 4.7 % 3-4 pm 85 81 - 4 - 4.7 %4-5 pm 69 59 - 10 -14.5 % 4-5 pm 69 52 - 17 -24.6 % 4-5 pm 69 76 7 10.1 %5-6 pm 69 49 - 20 -29.0 % 5-6 pm 69 53 - 16 -23.2 % 5-6 pm 69 65 - 4 - 5.8 %6-7 pm 63 56 - 7 -11.1 % 6-7 pm 63 66 3 4.8 % 6-7 pm 63 69 6 9.5 %
3-7pm 286 245 - 41 -14.3 % 3-7pm 286 252 - 34 -11.9 % 3-7pm 286 291 5 1.7 %
Week 1 - Dec. 6-10, 2004 Week 2 - Dec. 13-17, 2004 Week 3 - Jan. 10-14, 2005
East 102nd Street Westbound between 5th- Madison Avenues
Traffic Volumes Comparisons
Before After Change % Chg Before After Change % Chg Before After Change % Chg
7-8 am 172 138 - 34 -19.8 % 7-8 am 172 139 - 33 -19.2 % 7-8 am 172 127 - 45 -26.2 %8-9 am 242 206 - 36 -14.9 % 8-9 am 242 212 - 30 -12.4 % 8-9 am 242 190 - 52 -21.5 %9-10 am 217 159 - 58 -26.7 % 9-10 am 217 166 - 51 -23.5 % 9-10 am 217 171 - 46 -21.2 %
7-10am 631 503 - 128 -20.3 % 7-10am 631 517 - 114 -18.1 % 7-10am 631 488 - 143 -22.7 %
3-4 pm 238 237 - 1 - 0.4 % 3-4 pm 238 241 3 1.3 % 3-4 pm 238 213 - 25 -10.5 %4-5 pm 192 186 - 6 - 3.1 % 4-5 pm 192 189 - 3 - 1.6 % 4-5 pm 192 174 - 18 - 9.4 %5-6 pm 208 177 - 31 -14.9 % 5-6 pm 208 229 21 10.1 % 5-6 pm 208 176 - 32 -15.4 %6-7 pm 227 216 - 11 - 4.8 % 6-7 pm 227 234 7 3.1 % 6-7 pm 227 194 - 33 -14.5 %
3-7pm 865 816 - 49 - 5.7 % 3-7pm 865 893 28 3.2 % 3-7pm 865 757 - 108 -12.5 %
Week 1 - Dec. 6-10, 2004 Week 2 - Dec. 13-17, 2004 Week 3 - Jan. 10-14, 2005
West 77th Street Eastbound between Columbus Avenue and Central Park West
Traffic Volumes Comparisons
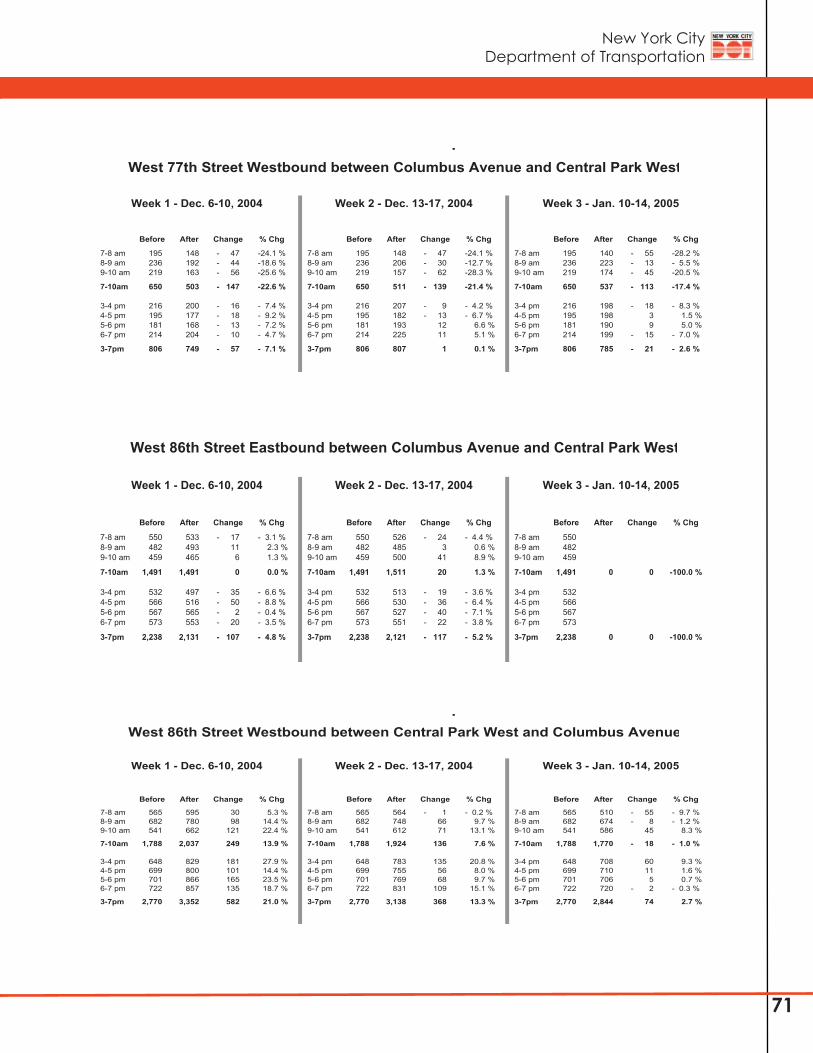
New York City Department of Transportation
71
Before After Change % Chg Before After Change % Chg Before After Change % Chg
7-8 am 195 148 - 47 -24.1 % 7-8 am 195 148 - 47 -24.1 % 7-8 am 195 140 - 55 -28.2 %8-9 am 236 192 - 44 -18.6 % 8-9 am 236 206 - 30 -12.7 % 8-9 am 236 223 - 13 - 5.5 %9-10 am 219 163 - 56 -25.6 % 9-10 am 219 157 - 62 -28.3 % 9-10 am 219 174 - 45 -20.5 %
7-10am 650 503 - 147 -22.6 % 7-10am 650 511 - 139 -21.4 % 7-10am 650 537 - 113 -17.4 %
3-4 pm 216 200 - 16 - 7.4 % 3-4 pm 216 207 - 9 - 4.2 % 3-4 pm 216 198 - 18 - 8.3 %4-5 pm 195 177 - 18 - 9.2 % 4-5 pm 195 182 - 13 - 6.7 % 4-5 pm 195 198 3 1.5 %5-6 pm 181 168 - 13 - 7.2 % 5-6 pm 181 193 12 6.6 % 5-6 pm 181 190 9 5.0 %6-7 pm 214 204 - 10 - 4.7 % 6-7 pm 214 225 11 5.1 % 6-7 pm 214 199 - 15 - 7.0 %
3-7pm 806 749 - 57 - 7.1 % 3-7pm 806 807 1 0.1 % 3-7pm 806 785 - 21 - 2.6 %
Week 1 - Dec. 6-10, 2004 Week 2 - Dec. 13-17, 2004 Week 3 - Jan. 10-14, 2005
West 77th Street Westbound between Columbus Avenue and Central Park West
Traffic Volumes Comparisons
Before After Change % Chg Before After Change % Chg Before After Change % Chg
7-8 am 550 533 - 17 - 3.1 % 7-8 am 550 526 - 24 - 4.4 % 7-8 am 5508-9 am 482 493 11 2.3 % 8-9 am 482 485 3 0.6 % 8-9 am 4829-10 am 459 465 6 1.3 % 9-10 am 459 500 41 8.9 % 9-10 am 459
7-10am 1,491 1,491 0 0.0 % 7-10am 1,491 1,511 20 1.3 % 7-10am 1,491 0 0 -100.0 %
3-4 pm 532 497 - 35 - 6.6 % 3-4 pm 532 513 - 19 - 3.6 % 3-4 pm 5324-5 pm 566 516 - 50 - 8.8 % 4-5 pm 566 530 - 36 - 6.4 % 4-5 pm 5665-6 pm 567 565 - 2 - 0.4 % 5-6 pm 567 527 - 40 - 7.1 % 5-6 pm 5676-7 pm 573 553 - 20 - 3.5 % 6-7 pm 573 551 - 22 - 3.8 % 6-7 pm 573
3-7pm 2,238 2,131 - 107 - 4.8 % 3-7pm 2,238 2,121 - 117 - 5.2 % 3-7pm 2,238 0 0 -100.0 %
Week 1 - Dec. 6-10, 2004 Week 2 - Dec. 13-17, 2004 Week 3 - Jan. 10-14, 2005
West 86th Street Eastbound between Columbus Avenue and Central Park West
Traffic Volumes Comparisons
Before After Change % Chg Before After Change % Chg Before After Change % Chg
7-8 am 565 595 30 5.3 % 7-8 am 565 564 - 1 - 0.2 % 7-8 am 565 510 - 55 - 9.7 %8-9 am 682 780 98 14.4 % 8-9 am 682 748 66 9.7 % 8-9 am 682 674 - 8 - 1.2 %9-10 am 541 662 121 22.4 % 9-10 am 541 612 71 13.1 % 9-10 am 541 586 45 8.3 %
7-10am 1,788 2,037 249 13.9 % 7-10am 1,788 1,924 136 7.6 % 7-10am 1,788 1,770 - 18 - 1.0 %
3-4 pm 648 829 181 27.9 % 3-4 pm 648 783 135 20.8 % 3-4 pm 648 708 60 9.3 %4-5 pm 699 800 101 14.4 % 4-5 pm 699 755 56 8.0 % 4-5 pm 699 710 11 1.6 %5-6 pm 701 866 165 23.5 % 5-6 pm 701 769 68 9.7 % 5-6 pm 701 706 5 0.7 %6-7 pm 722 857 135 18.7 % 6-7 pm 722 831 109 15.1 % 6-7 pm 722 720 - 2 - 0.3 %
3-7pm 2,770 3,352 582 21.0 % 3-7pm 2,770 3,138 368 13.3 % 3-7pm 2,770 2,844 74 2.7 %
Week 1 - Dec. 6-10, 2004 Week 2 - Dec. 13-17, 2004 Week 3 - Jan. 10-14, 2005
West 86th Street Westbound between Central Park West and Columbus Avenue
Traffic Volumes Comparisons
New York City Department of Transportation
72
Before After Change % Chg Before After Change % Chg Before After Change % Chg
7-8 am 138 136 - 2 - 1.4 % 7-8 am 138 140 2 1.4 % 7-8 am 138 118 - 20 -14.5 %8-9 am 202 192 - 10 - 5.0 % 8-9 am 202 198 - 4 - 2.0 % 8-9 am 202 182 - 20 - 9.9 %9-10 am 155 125 - 30 -19.4 % 9-10 am 155 134 - 21 -13.5 % 9-10 am 155 127 - 28 -18.1 %
7-10am 495 453 - 42 - 8.5 % 7-10am 495 472 - 23 - 4.6 % 7-10am 495 427 - 68 -13.7 %
3-4 pm 189 167 - 22 -11.6 % 3-4 pm 189 198 9 4.8 % 3-4 pm 189 171 - 18 - 9.5 %4-5 pm 156 158 2 1.3 % 4-5 pm 156 167 11 7.1 % 4-5 pm 156 144 - 12 - 7.7 %5-6 pm 165 158 - 7 - 4.2 % 5-6 pm 165 171 6 3.6 % 5-6 pm 165 143 - 22 -13.3 %6-7 pm 160 157 - 3 - 1.9 % 6-7 pm 160 184 24 15.0 % 6-7 pm 160 141 - 19 -11.9 %
3-7pm 670 640 - 30 - 4.5 % 3-7pm 670 720 50 7.5 % 3-7pm 670 599 - 71 -10.6 %
Week 1 - Dec. 6-10, 2004 Week 2 - Dec. 13-17, 2004 Week 3 - Jan. 10-14, 2005
West 90th Street Eastbound between Columbus Avenue and Central Park West
Traffic Volumes Comparisons
New York City Department of Transportation
73
Appendix IV
Auto Travel Times & Speeds
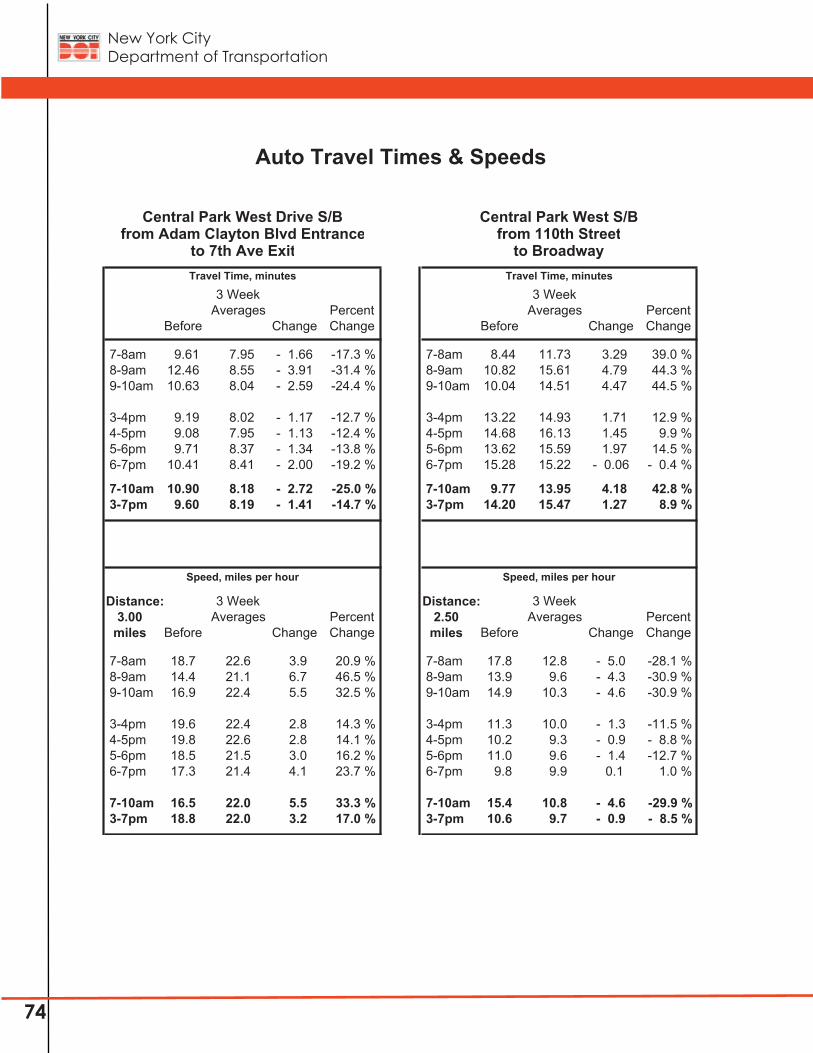
New York City Department of Transportation
74
3 Week 3 WeekAverages Percent Averages Percent
Before Change Change Before Change Change
7-8am 9.61 7.95 - 1.66 -17.3 % 7-8am 8.44 11.73 3.29 39.0 % 8-9am 12.46 8.55 - 3.91 -31.4 % 8-9am 10.82 15.61 4.79 44.3 % 9-10am 10.63 8.04 - 2.59 -24.4 % 9-10am 10.04 14.51 4.47 44.5 %
3-4pm 9.19 8.02 - 1.17 -12.7 % 3-4pm 13.22 14.93 1.71 12.9 % 4-5pm 9.08 7.95 - 1.13 -12.4 % 4-5pm 14.68 16.13 1.45 9.9 % 5-6pm 9.71 8.37 - 1.34 -13.8 % 5-6pm 13.62 15.59 1.97 14.5 % 6-7pm 10.41 8.41 - 2.00 -19.2 % 6-7pm 15.28 15.22 - 0.06 - 0.4 %
7-10am 10.90 8.18 - 2.72 -25.0 % 7-10am 9.77 13.95 4.18 42.8 % 3-7pm 9.60 8.19 - 1.41 -14.7 % 3-7pm 14.20 15.47 1.27 8.9 %
Distance: 3 Week Distance: 3 Week3.00 Averages Percent 2.50 Averages Percent
miles Before Change Change miles Before Change Change
7-8am 18.7 22.6 3.9 20.9 % 7-8am 17.8 12.8 - 5.0 -28.1 % 8-9am 14.4 21.1 6.7 46.5 % 8-9am 13.9 9.6 - 4.3 -30.9 % 9-10am 16.9 22.4 5.5 32.5 % 9-10am 14.9 10.3 - 4.6 -30.9 %
3-4pm 19.6 22.4 2.8 14.3 % 3-4pm 11.3 10.0 - 1.3 -11.5 % 4-5pm 19.8 22.6 2.8 14.1 % 4-5pm 10.2 9.3 - 0.9 - 8.8 % 5-6pm 18.5 21.5 3.0 16.2 % 5-6pm 11.0 9.6 - 1.4 -12.7 % 6-7pm 17.3 21.4 4.1 23.7 % 6-7pm 9.8 9.9 0.1 1.0 %
7-10am 16.5 22.0 5.5 33.3 % 7-10am 15.4 10.8 - 4.6 -29.9 % 3-7pm 18.8 22.0 3.2 17.0 % 3-7pm 10.6 9.7 - 0.9 - 8.5 %
Travel Time, minutes
Speed, miles per hourSpeed, miles per hour
Auto Travel Times & Speeds
Travel Time, minutes
Central Park West Drive S/Bfrom Adam Clayton Blvd Entrance
to 7th Ave Exit
Central Park West S/Bfrom 110th Street
to Broadway
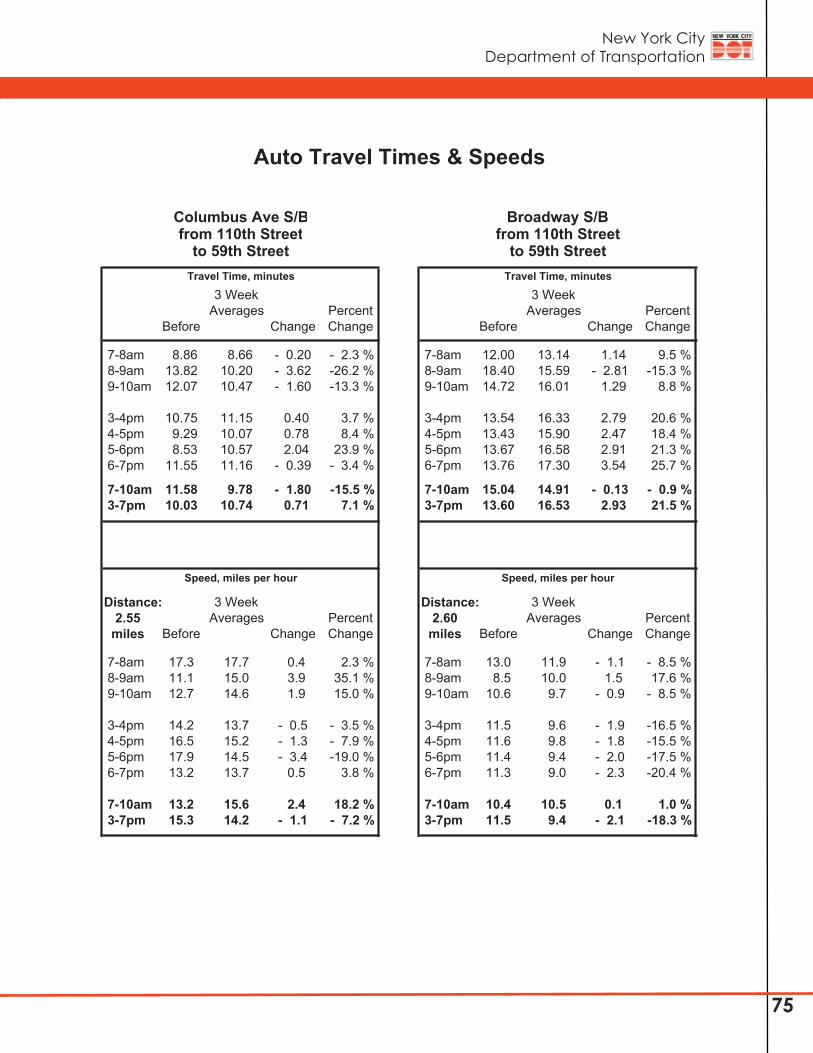
New York City Department of Transportation
75
3 Week 3 WeekAverages Percent Averages Percent
Before Change Change Before Change Change
7-8am 8.86 8.66 - 0.20 - 2.3 % 7-8am 12.00 13.14 1.14 9.5 % 8-9am 13.82 10.20 - 3.62 -26.2 % 8-9am 18.40 15.59 - 2.81 -15.3 % 9-10am 12.07 10.47 - 1.60 -13.3 % 9-10am 14.72 16.01 1.29 8.8 %
3-4pm 10.75 11.15 0.40 3.7 % 3-4pm 13.54 16.33 2.79 20.6 % 4-5pm 9.29 10.07 0.78 8.4 % 4-5pm 13.43 15.90 2.47 18.4 % 5-6pm 8.53 10.57 2.04 23.9 % 5-6pm 13.67 16.58 2.91 21.3 % 6-7pm 11.55 11.16 - 0.39 - 3.4 % 6-7pm 13.76 17.30 3.54 25.7 %
7-10am 11.58 9.78 - 1.80 -15.5 % 7-10am 15.04 14.91 - 0.13 - 0.9 % 3-7pm 10.03 10.74 0.71 7.1 % 3-7pm 13.60 16.53 2.93 21.5 %
Distance: 3 Week Distance: 3 Week2.55 Averages Percent 2.60 Averages Percent
miles Before Change Change miles Before Change Change
7-8am 17.3 17.7 0.4 2.3 % 7-8am 13.0 11.9 - 1.1 - 8.5 % 8-9am 11.1 15.0 3.9 35.1 % 8-9am 8.5 10.0 1.5 17.6 % 9-10am 12.7 14.6 1.9 15.0 % 9-10am 10.6 9.7 - 0.9 - 8.5 %
3-4pm 14.2 13.7 - 0.5 - 3.5 % 3-4pm 11.5 9.6 - 1.9 -16.5 % 4-5pm 16.5 15.2 - 1.3 - 7.9 % 4-5pm 11.6 9.8 - 1.8 -15.5 % 5-6pm 17.9 14.5 - 3.4 -19.0 % 5-6pm 11.4 9.4 - 2.0 -17.5 % 6-7pm 13.2 13.7 0.5 3.8 % 6-7pm 11.3 9.0 - 2.3 -20.4 %
7-10am 13.2 15.6 2.4 18.2 % 7-10am 10.4 10.5 0.1 1.0 % 3-7pm 15.3 14.2 - 1.1 - 7.2 % 3-7pm 11.5 9.4 - 2.1 -18.3 %
Travel Time, minutes Travel Time, minutes
Speed, miles per hour Speed, miles per hour
Auto Travel Times & Speeds
Columbus Ave S/B Broadway S/Bfrom 110th Street from 110th Street
to 59th Street to 59th Street
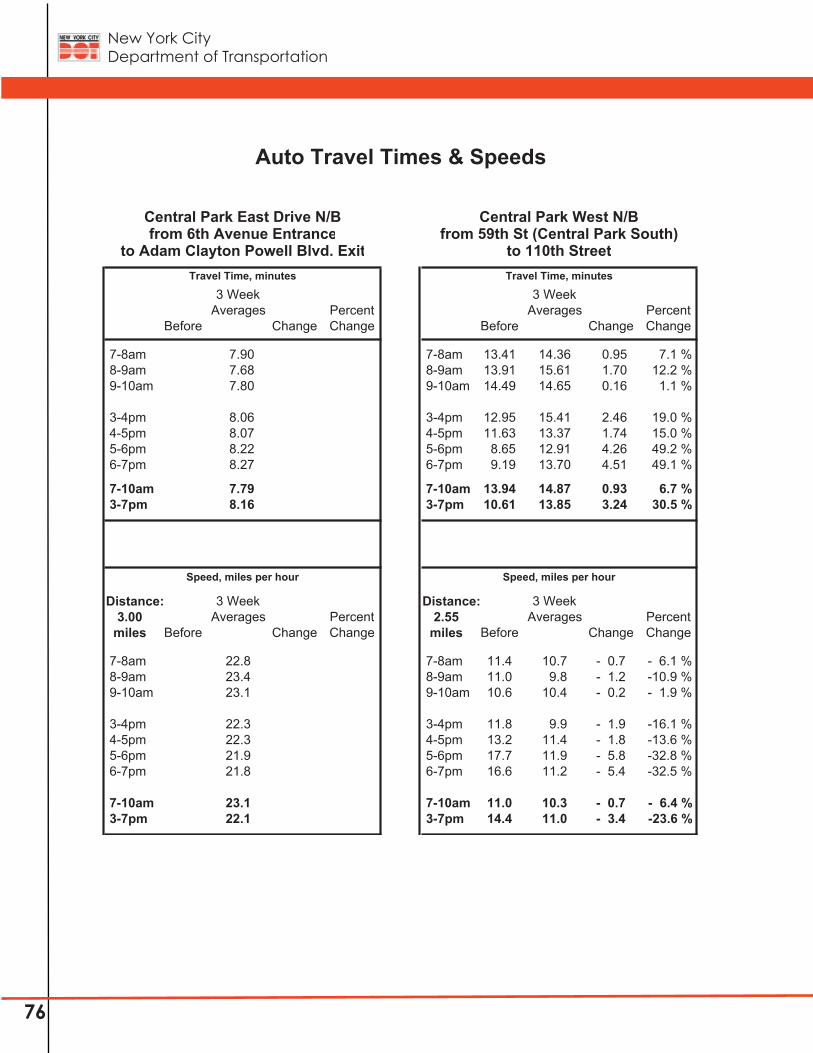
New York City Department of Transportation
76
3 Week 3 WeekAverages Percent Averages Percent
Before Change Change Before Change Change
7-8am 7.90 7-8am 13.41 14.36 0.95 7.1 % 8-9am 7.68 8-9am 13.91 15.61 1.70 12.2 % 9-10am 7.80 9-10am 14.49 14.65 0.16 1.1 %
3-4pm 8.06 3-4pm 12.95 15.41 2.46 19.0 % 4-5pm 8.07 4-5pm 11.63 13.37 1.74 15.0 % 5-6pm 8.22 5-6pm 8.65 12.91 4.26 49.2 % 6-7pm 8.27 6-7pm 9.19 13.70 4.51 49.1 %
7-10am 7.79 7-10am 13.94 14.87 0.93 6.7 % 3-7pm 8.16 3-7pm 10.61 13.85 3.24 30.5 %
Distance: 3 Week Distance: 3 Week3.00 Averages Percent 2.55 Averages Percent
miles Before Change Change miles Before Change Change
7-8am 22.8 7-8am 11.4 10.7 - 0.7 - 6.1 % 8-9am 23.4 8-9am 11.0 9.8 - 1.2 -10.9 % 9-10am 23.1 9-10am 10.6 10.4 - 0.2 - 1.9 %
3-4pm 22.3 3-4pm 11.8 9.9 - 1.9 -16.1 % 4-5pm 22.3 4-5pm 13.2 11.4 - 1.8 -13.6 % 5-6pm 21.9 5-6pm 17.7 11.9 - 5.8 -32.8 % 6-7pm 21.8 6-7pm 16.6 11.2 - 5.4 -32.5 %
7-10am 23.1 7-10am 11.0 10.3 - 0.7 - 6.4 % 3-7pm 22.1 3-7pm 14.4 11.0 - 3.4 -23.6 %
Auto Travel Times & Speeds
Central Park East Drive N/B Central Park West N/Bfrom 6th Avenue Entrance from 59th St (Central Park South)
to Adam Clayton Powell Blvd. Exit to 110th StreetTravel Time, minutes Travel Time, minutes
Speed, miles per hour Speed, miles per hour
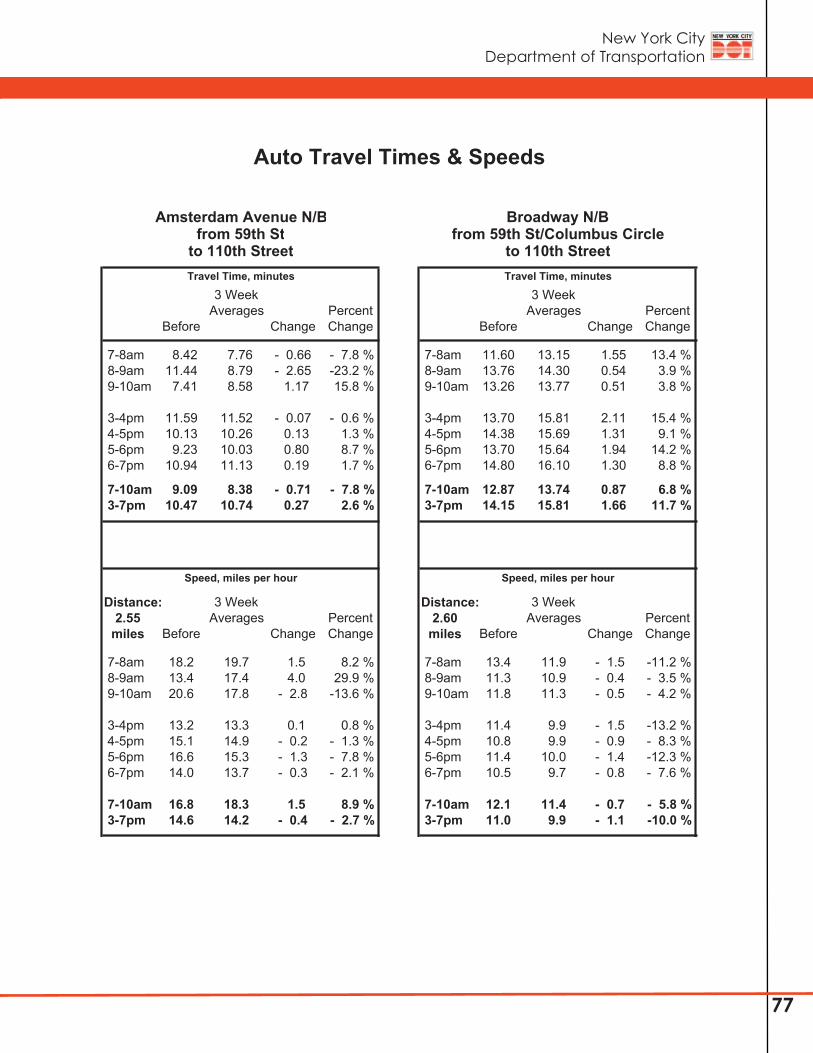
New York City Department of Transportation
77
3 Week 3 WeekAverages Percent Averages Percent
Before Change Change Before Change Change
7-8am 8.42 7.76 - 0.66 - 7.8 % 7-8am 11.60 13.15 1.55 13.4 % 8-9am 11.44 8.79 - 2.65 -23.2 % 8-9am 13.76 14.30 0.54 3.9 % 9-10am 7.41 8.58 1.17 15.8 % 9-10am 13.26 13.77 0.51 3.8 %
3-4pm 11.59 11.52 - 0.07 - 0.6 % 3-4pm 13.70 15.81 2.11 15.4 % 4-5pm 10.13 10.26 0.13 1.3 % 4-5pm 14.38 15.69 1.31 9.1 % 5-6pm 9.23 10.03 0.80 8.7 % 5-6pm 13.70 15.64 1.94 14.2 % 6-7pm 10.94 11.13 0.19 1.7 % 6-7pm 14.80 16.10 1.30 8.8 %
7-10am 9.09 8.38 - 0.71 - 7.8 % 7-10am 12.87 13.74 0.87 6.8 % 3-7pm 10.47 10.74 0.27 2.6 % 3-7pm 14.15 15.81 1.66 11.7 %
Distance: 3 Week Distance: 3 Week2.55 Averages Percent 2.60 Averages Percent
miles Before Change Change miles Before Change Change
7-8am 18.2 19.7 1.5 8.2 % 7-8am 13.4 11.9 - 1.5 -11.2 % 8-9am 13.4 17.4 4.0 29.9 % 8-9am 11.3 10.9 - 0.4 - 3.5 % 9-10am 20.6 17.8 - 2.8 -13.6 % 9-10am 11.8 11.3 - 0.5 - 4.2 %
3-4pm 13.2 13.3 0.1 0.8 % 3-4pm 11.4 9.9 - 1.5 -13.2 % 4-5pm 15.1 14.9 - 0.2 - 1.3 % 4-5pm 10.8 9.9 - 0.9 - 8.3 % 5-6pm 16.6 15.3 - 1.3 - 7.8 % 5-6pm 11.4 10.0 - 1.4 -12.3 % 6-7pm 14.0 13.7 - 0.3 - 2.1 % 6-7pm 10.5 9.7 - 0.8 - 7.6 %
7-10am 16.8 18.3 1.5 8.9 % 7-10am 12.1 11.4 - 0.7 - 5.8 % 3-7pm 14.6 14.2 - 0.4 - 2.7 % 3-7pm 11.0 9.9 - 1.1 -10.0 %
Auto Travel Times & Speeds
Amsterdam Avenue N/B Broadway N/Bfrom 59th St from 59th St/Columbus Circle
to 110th Street to 110th StreetTravel Time, minutes Travel Time, minutes
Speed, miles per hour Speed, miles per hour
New York City Department of Transportation
78
Appendix V
Central Park West Drive
Radar Speeds
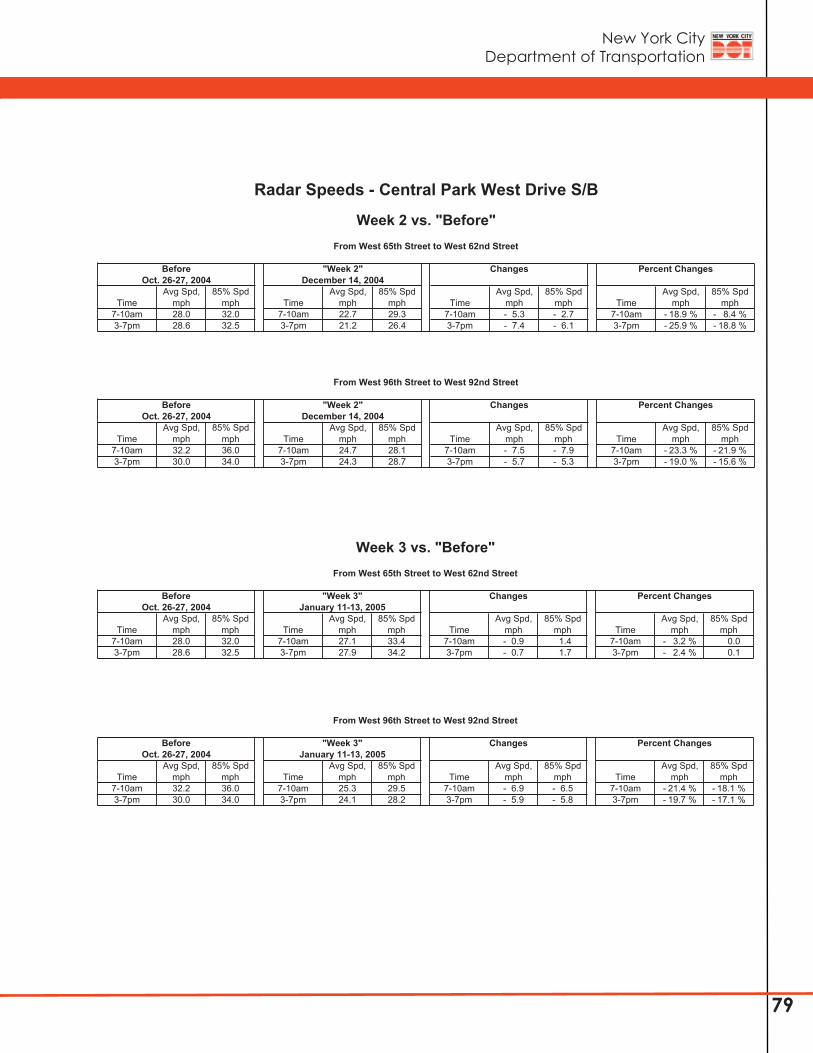
New York City Department of Transportation
79
Avg Spd, 85% Spd Avg Spd, 85% Spd Avg Spd, 85% Spd Avg Spd, 85% SpdTime mph mph Time mph mph Time mph mph Time mph mph
7-10am 28.0 32.0 7-10am 22.7 29.3 7-10am - 5.3 - 2.7 7-10am - 18.9 % - 8.4 %3-7pm 28.6 32.5 3-7pm 21.2 26.4 3-7pm - 7.4 - 6.1 3-7pm - 25.9 % - 18.8 %
Avg Spd, 85% Spd Avg Spd, 85% Spd Avg Spd, 85% Spd Avg Spd, 85% SpdTime mph mph Time mph mph Time mph mph Time mph mph
7-10am 32.2 36.0 7-10am 24.7 28.1 7-10am - 7.5 - 7.9 7-10am - 23.3 % - 21.9 %3-7pm 30.0 34.0 3-7pm 24.3 28.7 3-7pm - 5.7 - 5.3 3-7pm - 19.0 % - 15.6 %
Percent Changes
From West 96th Street to West 92nd Street
Before "Week 2" Changes Percent Changes
Radar Speeds - Central Park West Drive S/B
Week 2 vs. "Before"From West 65th Street to West 62nd Street
Before "Week 2" ChangesOct. 26-27, 2004 December 14, 2004
Oct. 26-27, 2004 December 14, 2004
Avg Spd, 85% Spd Avg Spd, 85% Spd Avg Spd, 85% Spd Avg Spd, 85% SpdTime mph mph Time mph mph Time mph mph Time mph mph
7-10am 28.0 32.0 7-10am 27.1 33.4 7-10am - 0.9 1.4 7-10am - 3.2 % 0.03-7pm 28.6 32.5 3-7pm 27.9 34.2 3-7pm - 0.7 1.7 3-7pm - 2.4 % 0.1
Avg Spd, 85% Spd Avg Spd, 85% Spd Avg Spd, 85% Spd Avg Spd, 85% SpdTime mph mph Time mph mph Time mph mph Time mph mph
7-10am 32.2 36.0 7-10am 25.3 29.5 7-10am - 6.9 - 6.5 7-10am - 21.4 % - 18.1 %3-7pm 30.0 34.0 3-7pm 24.1 28.2 3-7pm - 5.9 - 5.8 3-7pm - 19.7 % - 17.1 %
Oct. 26-27, 2004 January 11-13, 2005
Oct. 26-27, 2004 January 11-13, 2005
Radar Speeds - Central Park West Drive S/B
Week 3 vs. "Before"From West 65th Street to West 62nd Street
Before "Week 3" Changes Percent Changes
From West 96th Street to West 92nd Street
Before "Week 3" Changes Percent Changes