Embed Size (px)
Citation preview
2004 Gross Domestic Product
GNP statistics are also included in Section 6 of this report
Census and Statistics Department Hong Kong Special Administrative Region
March 2005
Enquiries on GDP by expenditure component can be directed to the National Income Branch (1) of the Census and Statistics Department
Address : 22/F., Wanchai Tower, 12 Harbour Road, Wan Chai, Hong Kong. Tel : (852) 2582 5077 Fax. No . : (852) 2157 9295 E-mail : [email protected]
Enquiries on GDP by economic activity can be directed to the National Income Branch (2) of the Census and Statistics Department
Address : Units 602-606, 6/F., Stelux House, 698 Prince Edward Road East, San Po Kong, Kowloon. Tel : (852) 2116 5115 Fax. No. : (852) 2116 0278 E-mail : [email protected]
Enquiries on GNP can be directed to the Balance of Payments Branch (2) of the Census and Statistics Department
Address : Unit 1001-1005, 10/F., Stelux House, 698 Prince Edward Road East, San Po Kong, Kowloon. Tel : (852) 2116 5103 Fax. No. : (852) 2116 0370 E-mail : [email protected]
Website of the Census and Statistics Department http://www.info.gov.hk/censtatd/
3
Contents Page
1. Introduction 7
Conceptual framework and methods of compiling GDP 7 Nomenclature, revision and publication of GDP statistics 9 Seasonally adjusted GDP 10
2. Statistical Tables 11
(A) Annual GDP by expenditure component 13
Table 1 GDP by major expenditure component, 1961-2004 (a) At current market prices 14
(b) Percentage changes in nominal terms 16 (c) Volume indices (2000=100) 18 (d) Percentage changes in real terms 20 Table 2 Implicit price deflators (2000=100) of GDP and of its expenditure components, 1961-2004
(a) Implicit price deflators 22 (b) Percentage changes of implicit price deflators 23
Table 3 Ratio of expenditure components to GDP at current market prices, 1961-2004 24 Table 4 Private consumption expenditure on food, consumer goods and services,
1966-2004 (a) At current market prices 25 (b) Volume indices (2000=100) 26 (c) Percentage changes in real terms 27 Table 5 Consumption expenditure in the domestic market by commodity group,
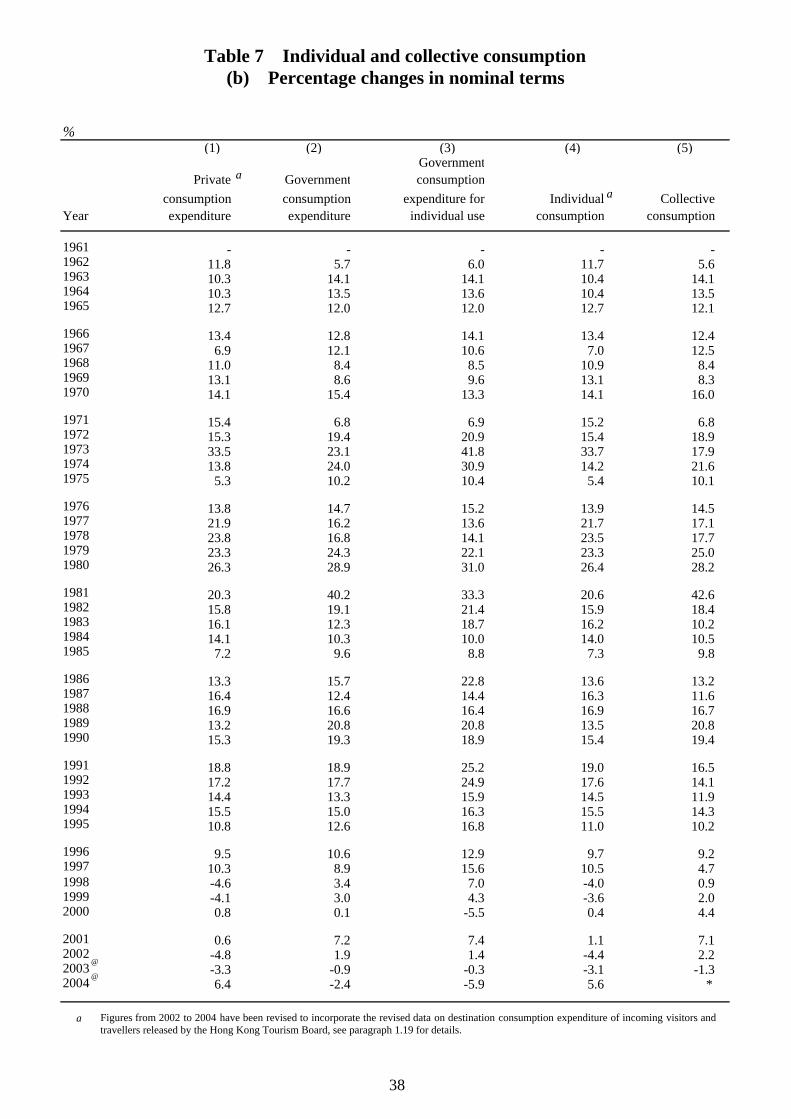
1966-2003 (a) At current market prices 28 (b) Percentage distribution at current market prices 30 (c) Volume indices (2000=100) 32 Table 6 Government consumption expenditure by component, 1966-2004 (a) At current market prices 34 (b) Volume indices (2000=100) 35 (c) Percentage changes in real terms 36 Table 7 Individual and collective consumption, 1961-2004 (a) At current market prices 37 (b) Percentage changes in nominal terms 38
Table 8 Gross domestic fixed capital formation by type of assets and by private/public sector, 1966-2004 (a) At current market prices 39 (b) Volume indices (2000=100) 40 (c) Percentage changes in real terms 41 Table 9 Exports and imports of services by major service group, 1980-2003 (a) At current market prices 42
(b) Volume indices (2000=100) 44 (c) Percentage changes in real terms 46
4
Contents ---- Continued Page
Table 10 GDP and its expenditure components at constant (2000) market prices, 48 2000-2004
(B) Quarterly GDP by expenditure component 49
Table 11 GDP by major expenditure component, first quarter 1973 to fourth quarter 2004 (a) At current market prices 50
(b) Year-on-year percentage changes in nominal terms 56 (c) Volume indices (2000=100) 62 (d) Year-on-year percentage changes in real terms 68 Table 12 GDP and its expenditure components at constant (2000) market prices, 74 first quarter 2000 to fourth quarter 2004 Table 13 Seasonally adjusted constant price GDP and implicit price deflator of GDP, 77 first quarter 1990 to fourth quarter 2004: Percentage changes over the preceding quarter
(C) Annual GDP by economic activity at current prices 79
Table 14 GDP by economic activity, 1980-2003 (a) At current prices 80 (b) Percentage contribution to GDP at current prices 82 (c) Percentage changes in nominal terms 84 Table 15 Gross output, intermediate consumption, value added and factor income 86 by economic activity at current prices, 1980-2003 Table 16 Value added of selected economic activities, 1980-2003 (a) At current prices 96 (b) Percentage changes in nominal terms 100
(D) Annual and quarterly GDP by economic activity at constant (2000) prices 105
Table 17 GDP by economic activity, first quarter 2000 to third quarter 2004 (a) At constant (2000) prices 106 (b) Year-on-year percentage changes in real terms 108
Table 18 Value added of selected economic activities, first quarter 2000 to third quarter 2004
(a) At constant (2000) prices 110 (b) Year-on-year percentage changes in real terms 112
3. Methods and Data Sources for Compilation of GDP by the Expenditure 115 Approach
Current Price GDP by Expenditure Component 115
Private consumption expenditure 115
Government consumption expenditure 119
Gross domestic capital formation 120
5
Contents ---- Continued Page
Building and construction 120
Costs of ownership transfer 121
Machinery, equipment and computer software 121
Changes in inventories 122
Imports and exports of goods and services 123
Imports and exports of goods 123
Imports and exports of services 123
Constant Price GDP by Expenditure Component and Implicit Price Deflators 124
Limitations of the Compilation Method 128
Private consumption expenditure 128
Government consumption expenditure 129
Gross domestic capital formation 129
Imports and exports of services 129
Seasonally Adjusted GDP and its Main Expenditure Components 130
Real Gross Domestic Income 130
4. Methods and Data Sources for Compilation of GDP by the Production 133 Approach
Current Price Annual GDP by Economic Activity 133
Agriculture and fishing 133
Mining and quarrying; manufacturing; electricity, gas and water 133
Construction 134
Wholesale, retail and import/export trades, restaurants and hotels 135
Transport, storage and communications 136
Financing, insurance, real estate and business services 137
Financial intermediation services 137
Other financial services 137
Insurance services 138
6
Contents ---- Continued Page
Real estate development, real estate leasing, brokerage and management services 139
Business services 140
Community, social and personal services 140
Ownership of premises 141
Adjustment for financial intermediation services indirectly measured 142
Constant Price GDP by Economic Activity 142
Single extrapolation by deflated gross output measures 142
Single extrapolation by volume/quantity indicators 143
Single extrapolation by input indicators 143
Double indicators method 143
Limitations of the Compilation Method 147
5. Annual Current Price GDP by Economic Activity and by Factor Income, 148 1970-1980
6. Gross National Product (GNP) 149
Introduction 149
Conceptual framework and method of compiling GNP 149
Major components of external factor income flows (EFIF) 150
Methods and Data Sources 151
Survey of External Claims, Liabilities and Income 151
Data reporting arrangements 151
Limitations of the EFIF Statistics 153
Real Gross National Income 153
Revision and Publication of GNP and EFIF Statistics 153
Table A Gross National Product (GNP) and External Factor Income Flows (EFIF) 154 by Income Component by Type of Transactor (At Current Market Prices), 2000 to 2004 and first quarter 2003 to fourth quarter 2004
Table B Real Gross National Income (2000-based), 2001 to 2004 and first quarter 156 2001 to fourth quarter 2004
7
1. Introduction 1.1 This report contains the latest statistics on Gross Domestic Product (GDP) for Hong Kong compiled by the Census and Statistics Department (C&SD). Data series of GDP by expenditure component and by economic activity are presented. GDP by expenditure component includes (1) annual series from 1961 to 2004 and (2) quarterly series from the first quarter of 1973 to the fourth quarter of 2004. As for GDP by economic activity, data presented in this report include (1) annual series at current prices from 1980 to 2003 and (2) annual and quarterly series at constant prices from the first quarter of 2000 to the third quarter of 2004. Statistics on Gross National Product (GNP) for 2000 to 2004 and the first quarter of 2003 to the fourth quarter of 2004 are also presented in Section 6 of this report. Conceptual framework and methods of compiling GDP 1.2 The compilation framework of GDP accords essentially with the international statistical standards as stipulated in the System of National Accounts. GDP is a measure of the total value of production of all resident producing units of a country or territory in a specified period, before deducting allowance for consumption of fixed capital. A producing unit is considered as resident in a country or territory if it maintains a centre of economic interest in the economic territory of that country or territory. The economic territory of a country or territory consists of the geographic territory administered by a government within which persons, goods and capital circulate freely. GDP can be measured using different approaches. In Hong Kong, annual GDP at current and constant prices are compiled using the expenditure approach and the production approach. For quarterly GDP, constant price figures are compiled using both approaches while quarterly GDP at current prices is compiled using the expenditure approach only. 1.3 The GDP compiled from the expenditure approach is computed as total final expenditures on goods and services (including private consumption expenditure, government consumption expenditure, gross domestic fixed capital formation, changes in inventories, and exports of goods and services), less imports of goods and services. It shows final demand for goods and services by type. Under the production approach, GDP is the sum of the value added of resident producing units, e.g. factories, shops, service organisations. Value added is defined as the value of gross output less the value of intermediate consumption (the value of goods and services used up in the course of production). From an alternative angle, value added can be seen as the sum of factor incomes, i.e. compensation of employees (wages, salaries, bonuses, employee benefits, etc.) and gross operating surplus (the value attributed to non-labour factors of production inclusive of the allowance for consumption of fixed capital). The GDP by economic activity shows the contribution of individual economic activities to the total GDP. 1.4 Under the expenditure approach, GDP is measured as the total value of goods and services produced for final use, net of their import content. Goods and services for final use include those consumed by households and government, those for capital formation and those for export. Domestically produced goods and services used as input in producing other domestically produced goods and services are excluded. The determination of which goods and services are for intermediate consumption in producing other goods and services would appear straightforward, but problems sometimes arise. For instance, cloth used in the manufacture of clothing is obviously input, but cloth bought by a household to be made into an article of clothing is for final use. Often there are problems in obtaining accurate data on how goods and services are used. As regards the removal of import content of goods and services for final use, it is not practical to do so in respect of individual items. Rather, the deduction is made at the aggregate level by deducting the value of all imports of goods and services from the value of all goods and services for final use.
8
1.5 The problem of classifying goods and services between final use and intermediate use does not arise under the production approach because of its use of the “value added” concept, under which that part of the value of a producing unit’s output attributable to other producers is excluded. Hence, the direct summation of value added of all producing units will give an unduplicated measure of output of the economy. 1.6 GDP can be valued either at market prices or at factor cost. At market prices it is valued at market or imputed prices and is thus inclusive of customs and excise duties and taxes on production. At factor cost it is valued at the cost of the various factors of production. Hence they differ by the amount of taxes on production and imports. 1.7 GDP figures may be expressed at current prices or at constant prices. In a constant price data series, the effects of price changes are eliminated and the series reflects the real changes (i.e. the changes in the volume) of goods and services produced from period to period. In Hong Kong, data series of GDP by expenditure component at constant prices are available since reference year 1961 while GDP by economic activity at constant prices are available since reference year 2000. The base year of the constant price series is 2000. 1.8 The compilation of GDP is a technical exercise. It follows basically the international standard as laid down in the System of National Accounts, being the results of research and consultations amongst statistical experts in many different countries or territories. Nevertheless, there are differences in economic structure and commercial practices in different economies so that the technical standard has to be adapted to suit local circumstances. 1.9 The compilation of GDP using the expenditure approach is based on many different sources of data including industrial and commercial establishment surveys, household expenditure surveys, government accounts, trade statistics and other administrative sources. Annual data series of GDP by expenditure component are presented in Tables 1 to 10, while quarterly series are presented in Tables 11 to 13. Annual figures in respect of 2004 are preliminary and are available for the major aggregates only. 1.10 Annual data series of GDP by economic activity at current prices are compiled mainly based on data collected from the Programme of Annual Economic Surveys (PAES) and administrative records. The PAES now covers all major economic activities. Data sources for compiling quarterly constant price GDP by economic activity mainly include quarterly and monthly surveys on industrial/business establishments and on households, government accounts and administrative data from government departments and other organisations. Annual constant price GDP by economic activity is the sum of the quarterly figures of the reference year. Annual data series of GDP by economic activity at current prices are presented in Tables 14 to 16 while annual and quarterly series at constant prices are presented in Tables 17 to 18. 1.11 Prior to 1980, annual GDP by economic activity at current prices and by factor income were compiled. The sources of information included tax statistics, population censuses, and employment and earnings surveys. There were, however, serious limitations in the data and in the methods of estimation. The estimates were produced, nevertheless, in the absence of anything better, to serve as a rough guide to the relative importance of different economic activities. Since the production approach has now been fully developed, this interim series is discontinued, but some data for selected years during 1970-1980 are presented in Section 5 of this report to give an idea of the changes in the economic structure of Hong Kong over that period. 1.12 On 1 July 1997, Hong Kong became a Special Administrative Region of the People’s Republic of China. In respect of statistics in this series of report, “Hong Kong” stands for the Hong Kong
9
Special Administrative Region with effect from July 1997. Data on transactions vis-à-vis the mainland of China are treated as international transactions (e.g. trade in goods and trade in services). Nomenclature, revision and publication of GDP statistics 1.13 To achieve a balance between timeliness and data quality, the C&SD follows the international practice to compile and release GDP figures at the earliest possible time by using partial data, and revise these figures as more information become available. In Hong Kong, the first released GDP statistics are called “Preliminary figures”. The subsequently revised GDP statistics are called “Revised figures”. GDP statistics with data from all regular sources incorporated are called “Final figures”. As an illustration, GDP by expenditure component for 2004 and 2003 in this report are respectively preliminary figures and revised figures, while those for 2002 and before are final figures. 1.14 At present, preliminary figures for annual GDP by expenditure component are released about two months after the reference year (i.e. in March of the following year). For annual GDP by economic activity at current prices, preliminary figures are available about eleven months after the reference year. Subsequently, both sets of annual GDP figures are revised based on latest information available until they become final figures around the third March after the reference year. 1.15 Preliminary figures for quarterly GDP by expenditure component are released about two months after the reference quarter. The quarterly data will be revised and released based on latest information available, in particular when the annual data are incorporated. Quarterly GDP statistics are published in the quarterly report on Gross Domestic Product. 1.16 Preliminary figures for quarterly GDP by economic activity at constant prices are released slightly less than three months after the reference quarter. The time lag for producing GDP by economic activity is longer than that of GDP by expenditure component. This is because the estimates of the quarterly GDP by economic activity at constant prices are mainly compiled from various surveys on firms, for which more time is normally required for the companies to report data to the C&SD. 1.17 In addition to the above routine revisions, major revisions are introduced once in a number of years to incorporate new data sources, improved estimation methods, and changes in definitions and classifications which are results of continuous research and development on the GDP compilation framework. This is in line with international practice to improve the quality and reliability of GDP statistics. 1.18 The C&SD has conducted six rounds of major revision of Hong Kong’s GDP so far. Results of these revisions were released in 1980, 1984, 1987, 1991, 1994 and 2002 respectively. 1.19 The estimates of exports of services and private consumption expenditure for 2002 to 2004 have been revised to incorporate the revised data series on destination consumption expenditure of incoming visitors and travellers released by the Hong Kong Tourism Board. The revision to the tourism data is mainly due to the adoption of enhanced estimates of spending of Mainland visitors. 1.20 With the introduction of the quarterly constant price GDP by economic activity in August 2002, the practice of using GDP compiled from the expenditure approach as the single measure of GDP is to continue. GDP compiled from the expenditure approach has been produced for a long time, providing a timely and accurate measure of economic growth in real terms. 1.21 GDP by economic activity in real terms is compiled to support sectoral analyses. In presenting GDP by economic activity, the sum of value added of respective economic activities plus taxes on production and imports plus statistical discrepancy is equal to the GDP.
10
1.22 Statistical discrepancy refers to the difference in values of GDP compiled using the expenditure and production approaches, as a result of the adoption of different data sources and estimation methods. The differences for the period 1980-2003 between the current price GDP compiled using the expenditure approach and the production approach are generally within 2% (Table 14). This is considered quite satisfactory by international standard. Ideally, if complete and accurate data were available, GDP figures using different approaches would be identical. In practice, however, data sources and methods of estimation are subject to limitations and imperfections. As a result, different approaches of compilation do not give identical results. When GDP figures using alternative approaches differ widely, the sources and methods of both approaches have to be thoroughly investigated. Nevertheless, if the sources and methods of compilation were reliable, close results would be expected. Seasonally adjusted GDP 1.23 Seasonally adjusted data series are currently compiled for the quarterly series of the aggregate GDP and some of its expenditure components, including private consumption expenditure, government consumption expenditure, exports of goods, exports of services, imports of goods and imports of services. However, seasonally adjusted data series is not compiled for gross domestic capital formation as no clear seasonal pattern is found in this component. Details are given in paragraphs 3.65-3.69.
11
2. Statistical Tables
Notes to statistical tables
The following symbols are used in statistical tables throughout this report:
@ Figures are subject to revision later on as more data become available * Change within ±0.05 % ** Percentage distribution/contribution less than 0.05 % § Statistical discrepancy within ±0.05 % — Not applicable N.A. Not available All values, unless otherwise indicated, are shown in Hong Kong dollars rounded to the nearest million. Where figures have been rounded, there may be slight discrepancies between the sum of individual items and the total. Percentage changes in real terms are calculated based on unrounded figures of the volume indices. For calculation of the growth rates of private consumption expenditure and government consumption expenditure for 1992, please refer to paragraphs 3.26 and 3.27. For reference periods before the base year of 2000, volume indices (2000=100) are published for measuring the volume movement and changes in real terms over time. For users who may also be interested in the constant dollar GDP figures, say for component i for jth quarter in year t, they may derive the linked value for component i by the following formula: Volume index of component i for jth quarter in year t Volume index of component i for jth quarter in 2000 Example: Private consumption expenditure (PCE) component of 1st quarter 1994 at constant (2000) prices Volume index of PCE for 1st quarter 1994 Volume index of PCE for 1st quarter 2000 87.5 97.1 = HK$ 166,213 million Nevertheless, it should be noted that the linked values of GDP components compiled in the above manner possess the non-additivity feature. In other words, for periods before 2000, the sum of the re-referenced values of components may not equal to the aggregate and the sum of the four quarters in the year may not equal to the annual value.
× Constant price figures of component i for jth quarter in 2000
× Constant price PCE for 1st quarter in 2000
×HK$184,449 million =
13
(A) Annual GDP by expenditure component
HK$ million(1) (2) (3) (4)
GrossGross Per Private Government domestic
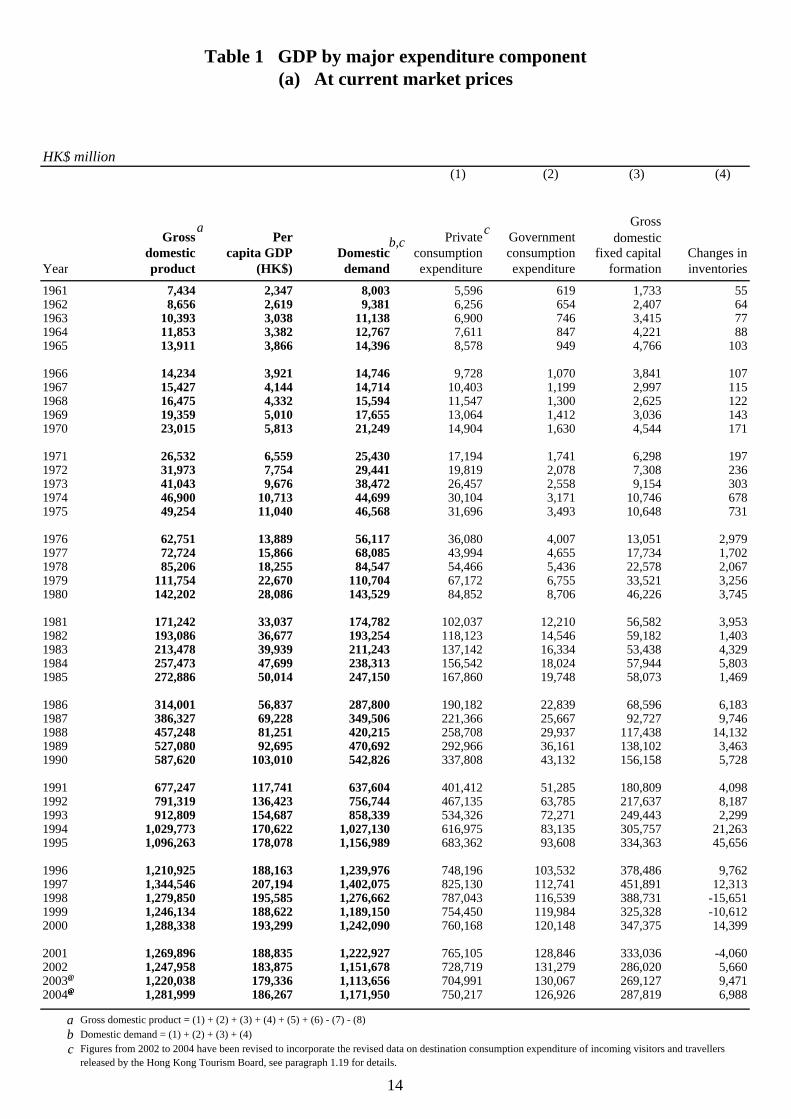
domestic capita GDP Domestic consumption consumption fixed capital Changes inYear product (HK$) demand expenditure expenditure formation inventories1961 7,434 2,347 8,003 5,596 619 1,733 551962 8,656 2,619 9,381 6,256 654 2,407 641963 10,393 3,038 11,138 6,900 746 3,415 771964 11,853 3,382 12,767 7,611 847 4,221 881965 13,911 3,866 14,396 8,578 949 4,766 103
1966 14,234 3,921 14,746 9,728 1,070 3,841 1071967 15,427 4,144 14,714 10,403 1,199 2,997 1151968 16,475 4,332 15,594 11,547 1,300 2,625 1221969 19,359 5,010 17,655 13,064 1,412 3,036 1431970 23,015 5,813 21,249 14,904 1,630 4,544 171
1971 26,532 6,559 25,430 17,194 1,741 6,298 1971972 31,973 7,754 29,441 19,819 2,078 7,308 2361973 41,043 9,676 38,472 26,457 2,558 9,154 3031974 46,900 10,713 44,699 30,104 3,171 10,746 6781975 49,254 11,040 46,568 31,696 3,493 10,648 731
1976 62,751 13,889 56,117 36,080 4,007 13,051 2,9791977 72,724 15,866 68,085 43,994 4,655 17,734 1,7021978 85,206 18,255 84,547 54,466 5,436 22,578 2,0671979 111,754 22,670 110,704 67,172 6,755 33,521 3,2561980 142,202 28,086 143,529 84,852 8,706 46,226 3,745
1981 171,242 33,037 174,782 102,037 12,210 56,582 3,9531982 193,086 36,677 193,254 118,123 14,546 59,182 1,4031983 213,478 39,939 211,243 137,142 16,334 53,438 4,3291984 257,473 47,699 238,313 156,542 18,024 57,944 5,8031985 272,886 50,014 247,150 167,860 19,748 58,073 1,469
1986 314,001 56,837 287,800 190,182 22,839 68,596 6,1831987 386,327 69,228 349,506 221,366 25,667 92,727 9,7461988 457,248 81,251 420,215 258,708 29,937 117,438 14,1321989 527,080 92,695 470,692 292,966 36,161 138,102 3,4631990 587,620 103,010 542,826 337,808 43,132 156,158 5,728
1991 677,247 117,741 637,604 401,412 51,285 180,809 4,0981992 791,319 136,423 756,744 467,135 63,785 217,637 8,1871993 912,809 154,687 858,339 534,326 72,271 249,443 2,2991994 1,029,773 170,622 1,027,130 616,975 83,135 305,757 21,2631995 1,096,263 178,078 1,156,989 683,362 93,608 334,363 45,656
1996 1,210,925 188,163 1,239,976 748,196 103,532 378,486 9,7621997 1,344,546 207,194 1,402,075 825,130 112,741 451,891 12,3131998 1,279,850 195,585 1,276,662 787,043 116,539 388,731 -15,6511999 1,246,134 188,622 1,189,150 754,450 119,984 325,328 -10,6122000 1,288,338 193,299 1,242,090 760,168 120,148 347,375 14,399
2001 1,269,896 188,835 1,222,927 765,105 128,846 333,036 -4,0602002 1,247,958 183,875 1,151,678 728,719 131,279 286,020 5,6602003 1,220,038 179,336 1,113,656 704,991 130,067 269,127 9,4712004 1,281,999 186,267 1,171,950 750,217 126,926 287,819 6,988
a Gross domestic product = (1) + (2) + (3) + (4) + (5) + (6) - (7) - (8)b Domestic demand = (1) + (2) + (3) + (4)c Figures from 2002 to 2004 have been revised to incorporate the revised data on destination consumption expenditure of incoming visitors and travellers
released by the Hong Kong Tourism Board, see paragraph 1.19 for details.
Table 1 GDP by major expenditure component(a) At current market prices
ab,c
@
c
@
@@@@
14
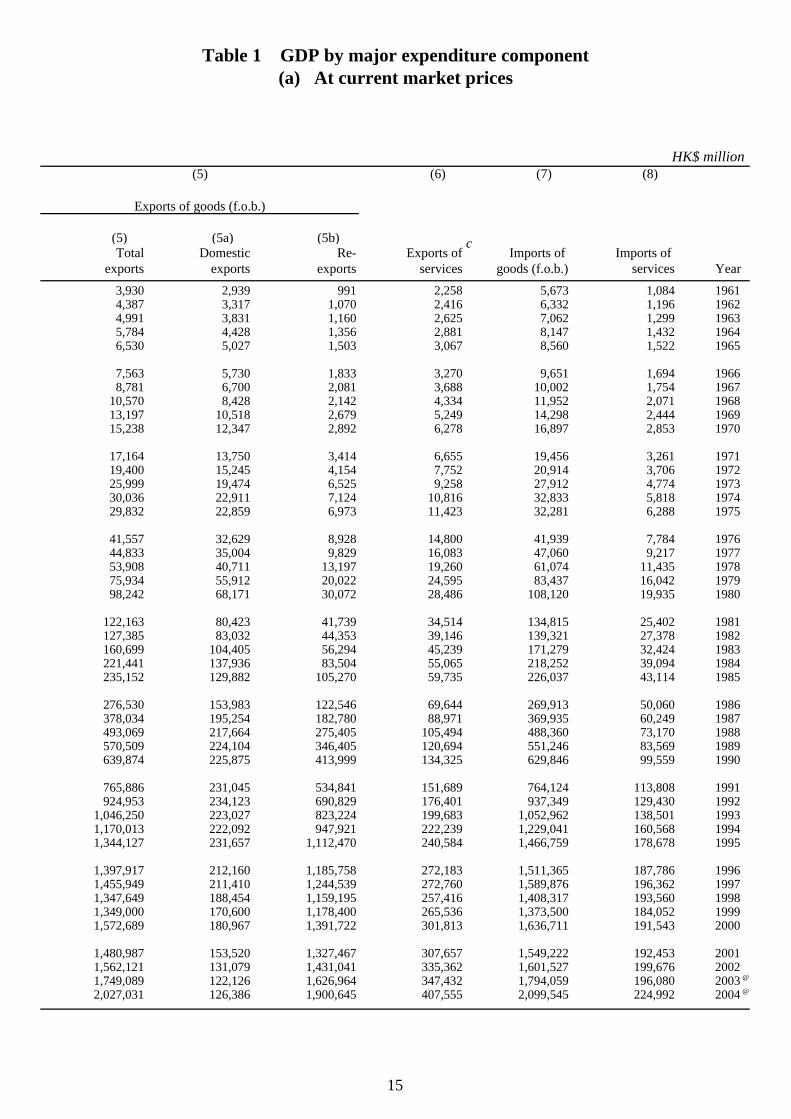
HK$ million(6) (7) (8)
Exports of goods (f.o.b.)
(5) (5a) (5b) Total Domestic Re- Exports of Imports of Imports of
exports exports exports services goods (f.o.b.) services Year3,930 2,939 991 2,258 5,673 1,084 19614,387 3,317 1,070 2,416 6,332 1,196 19624,991 3,831 1,160 2,625 7,062 1,299 19635,784 4,428 1,356 2,881 8,147 1,432 19646,530 5,027 1,503 3,067 8,560 1,522 1965
7,563 5,730 1,833 3,270 9,651 1,694 19668,781 6,700 2,081 3,688 10,002 1,754 1967
10,570 8,428 2,142 4,334 11,952 2,071 196813,197 10,518 2,679 5,249 14,298 2,444 196915,238 12,347 2,892 6,278 16,897 2,853 1970
17,164 13,750 3,414 6,655 19,456 3,261 197119,400 15,245 4,154 7,752 20,914 3,706 197225,999 19,474 6,525 9,258 27,912 4,774 197330,036 22,911 7,124 10,816 32,833 5,818 197429,832 22,859 6,973 11,423 32,281 6,288 1975
41,557 32,629 8,928 14,800 41,939 7,784 197644,833 35,004 9,829 16,083 47,060 9,217 197753,908 40,711 13,197 19,260 61,074 11,435 197875,934 55,912 20,022 24,595 83,437 16,042 197998,242 68,171 30,072 28,486 108,120 19,935 1980
122,163 80,423 41,739 34,514 134,815 25,402 1981127,385 83,032 44,353 39,146 139,321 27,378 1982160,699 104,405 56,294 45,239 171,279 32,424 1983221,441 137,936 83,504 55,065 218,252 39,094 1984235,152 129,882 105,270 59,735 226,037 43,114 1985
276,530 153,983 122,546 69,644 269,913 50,060 1986378,034 195,254 182,780 88,971 369,935 60,249 1987493,069 217,664 275,405 105,494 488,360 73,170 1988570,509 224,104 346,405 120,694 551,246 83,569 1989639,874 225,875 413,999 134,325 629,846 99,559 1990
765,886 231,045 534,841 151,689 764,124 113,808 1991924,953 234,123 690,829 176,401 937,349 129,430 1992
1,046,250 223,027 823,224 199,683 1,052,962 138,501 19931,170,013 222,092 947,921 222,239 1,229,041 160,568 19941,344,127 231,657 1,112,470 240,584 1,466,759 178,678 1995
1,397,917 212,160 1,185,758 272,183 1,511,365 187,786 19961,455,949 211,410 1,244,539 272,760 1,589,876 196,362 19971,347,649 188,454 1,159,195 257,416 1,408,317 193,560 19981,349,000 170,600 1,178,400 265,536 1,373,500 184,052 19991,572,689 180,967 1,391,722 301,813 1,636,711 191,543 2000
1,480,987 153,520 1,327,467 307,657 1,549,222 192,453 20011,562,121 131,079 1,431,041 335,362 1,601,527 199,676 20021,749,089 122,126 1,626,964 347,432 1,794,059 196,080 20032,027,031 126,386 1,900,645 407,555 2,099,545 224,992 2004
(5)
Table 1 GDP by major expenditure component(a) At current market prices
@
c
@
15
%(1) (2) (3)
Gross Private Government Gross domesticdomestic Per capita Domestic consumption consumption fixed capital
Year product GDP demand expenditure expenditure formation
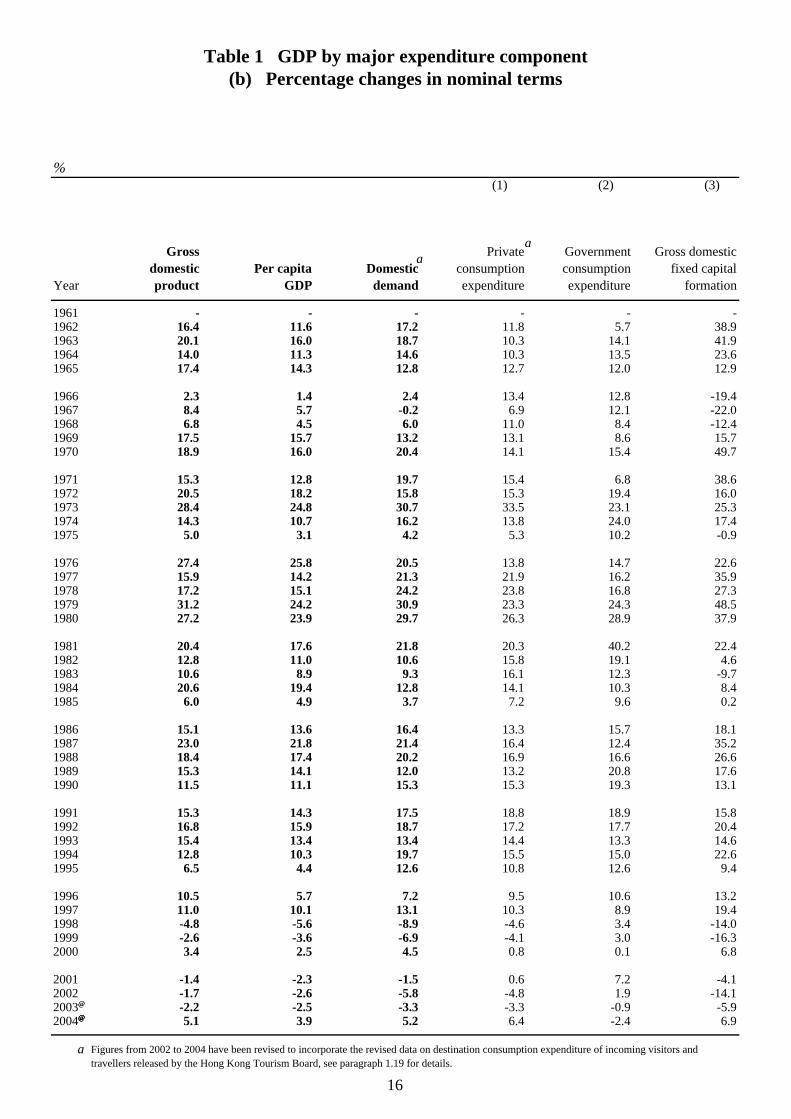
1961 - - - - - -1962 16.4 11.6 17.2 11.8 5.7 38.91963 20.1 16.0 18.7 10.3 14.1 41.91964 14.0 11.3 14.6 10.3 13.5 23.61965 17.4 14.3 12.8 12.7 12.0 12.9
1966 2.3 1.4 2.4 13.4 12.8 -19.41967 8.4 5.7 -0.2 6.9 12.1 -22.01968 6.8 4.5 6.0 11.0 8.4 -12.41969 17.5 15.7 13.2 13.1 8.6 15.71970 18.9 16.0 20.4 14.1 15.4 49.7
1971 15.3 12.8 19.7 15.4 6.8 38.61972 20.5 18.2 15.8 15.3 19.4 16.01973 28.4 24.8 30.7 33.5 23.1 25.31974 14.3 10.7 16.2 13.8 24.0 17.41975 5.0 3.1 4.2 5.3 10.2 -0.9
1976 27.4 25.8 20.5 13.8 14.7 22.61977 15.9 14.2 21.3 21.9 16.2 35.91978 17.2 15.1 24.2 23.8 16.8 27.31979 31.2 24.2 30.9 23.3 24.3 48.51980 27.2 23.9 29.7 26.3 28.9 37.9
1981 20.4 17.6 21.8 20.3 40.2 22.41982 12.8 11.0 10.6 15.8 19.1 4.61983 10.6 8.9 9.3 16.1 12.3 -9.71984 20.6 19.4 12.8 14.1 10.3 8.41985 6.0 4.9 3.7 7.2 9.6 0.2
1986 15.1 13.6 16.4 13.3 15.7 18.11987 23.0 21.8 21.4 16.4 12.4 35.21988 18.4 17.4 20.2 16.9 16.6 26.61989 15.3 14.1 12.0 13.2 20.8 17.61990 11.5 11.1 15.3 15.3 19.3 13.1
1991 15.3 14.3 17.5 18.8 18.9 15.81992 16.8 15.9 18.7 17.2 17.7 20.41993 15.4 13.4 13.4 14.4 13.3 14.61994 12.8 10.3 19.7 15.5 15.0 22.61995 6.5 4.4 12.6 10.8 12.6 9.4
1996 10.5 5.7 7.2 9.5 10.6 13.21997 11.0 10.1 13.1 10.3 8.9 19.41998 -4.8 -5.6 -8.9 -4.6 3.4 -14.01999 -2.6 -3.6 -6.9 -4.1 3.0 -16.32000 3.4 2.5 4.5 0.8 0.1 6.8
2001 -1.4 -2.3 -1.5 0.6 7.2 -4.12002 -1.7 -2.6 -5.8 -4.8 1.9 -14.12003 -2.2 -2.5 -3.3 -3.3 -0.9 -5.92004 5.1 3.9 5.2 6.4 -2.4 6.9
a Figures from 2002 to 2004 have been revised to incorporate the revised data on destination consumption expenditure of incoming visitors andtravellers released by the Hong Kong Tourism Board, see paragraph 1.19 for details.
Table 1 GDP by major expenditure component(b) Percentage changes in nominal terms
@@
aa
@@@@
16
%(4) (5) (6) (7)
Exports of goods (f.o.b.)
(4) (4a) (4b) Total Domestic Re- Exports of Imports of Imports of
exports exports exports services goods (f.o.b.) services Year
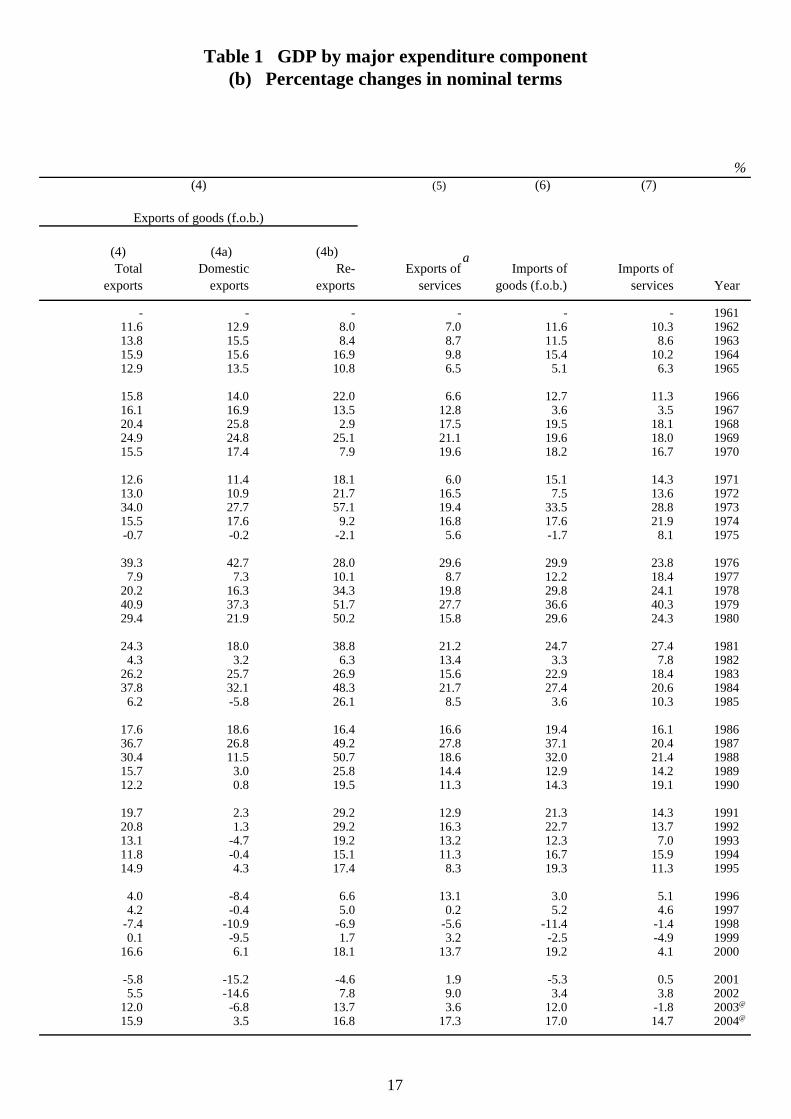
- - - - - - 196111.6 12.9 8.0 7.0 11.6 10.3 196213.8 15.5 8.4 8.7 11.5 8.6 196315.9 15.6 16.9 9.8 15.4 10.2 196412.9 13.5 10.8 6.5 5.1 6.3 1965
15.8 14.0 22.0 6.6 12.7 11.3 196616.1 16.9 13.5 12.8 3.6 3.5 196720.4 25.8 2.9 17.5 19.5 18.1 196824.9 24.8 25.1 21.1 19.6 18.0 196915.5 17.4 7.9 19.6 18.2 16.7 1970
12.6 11.4 18.1 6.0 15.1 14.3 197113.0 10.9 21.7 16.5 7.5 13.6 197234.0 27.7 57.1 19.4 33.5 28.8 197315.5 17.6 9.2 16.8 17.6 21.9 1974-0.7 -0.2 -2.1 5.6 -1.7 8.1 1975
39.3 42.7 28.0 29.6 29.9 23.8 19767.9 7.3 10.1 8.7 12.2 18.4 1977
20.2 16.3 34.3 19.8 29.8 24.1 197840.9 37.3 51.7 27.7 36.6 40.3 197929.4 21.9 50.2 15.8 29.6 24.3 1980
24.3 18.0 38.8 21.2 24.7 27.4 19814.3 3.2 6.3 13.4 3.3 7.8 1982
26.2 25.7 26.9 15.6 22.9 18.4 198337.8 32.1 48.3 21.7 27.4 20.6 1984
6.2 -5.8 26.1 8.5 3.6 10.3 1985
17.6 18.6 16.4 16.6 19.4 16.1 198636.7 26.8 49.2 27.8 37.1 20.4 198730.4 11.5 50.7 18.6 32.0 21.4 198815.7 3.0 25.8 14.4 12.9 14.2 198912.2 0.8 19.5 11.3 14.3 19.1 1990
19.7 2.3 29.2 12.9 21.3 14.3 199120.8 1.3 29.2 16.3 22.7 13.7 199213.1 -4.7 19.2 13.2 12.3 7.0 199311.8 -0.4 15.1 11.3 16.7 15.9 199414.9 4.3 17.4 8.3 19.3 11.3 1995
4.0 -8.4 6.6 13.1 3.0 5.1 19964.2 -0.4 5.0 0.2 5.2 4.6 1997
-7.4 -10.9 -6.9 -5.6 -11.4 -1.4 19980.1 -9.5 1.7 3.2 -2.5 -4.9 1999
16.6 6.1 18.1 13.7 19.2 4.1 2000
-5.8 -15.2 -4.6 1.9 -5.3 0.5 20015.5 -14.6 7.8 9.0 3.4 3.8 2002
12.0 -6.8 13.7 3.6 12.0 -1.8 200315.9 3.5 16.8 17.3 17.0 14.7 2004
Table 1 GDP by major expenditure component(b) Percentage changes in nominal terms
@
a
@
17
(1) (2) (3) (4)
Gross Private Government Gross domesticdomestic Per capita Domestic consumption consumption fixed capital Changes in
Year product GDP demand expenditure expenditure formation inventories
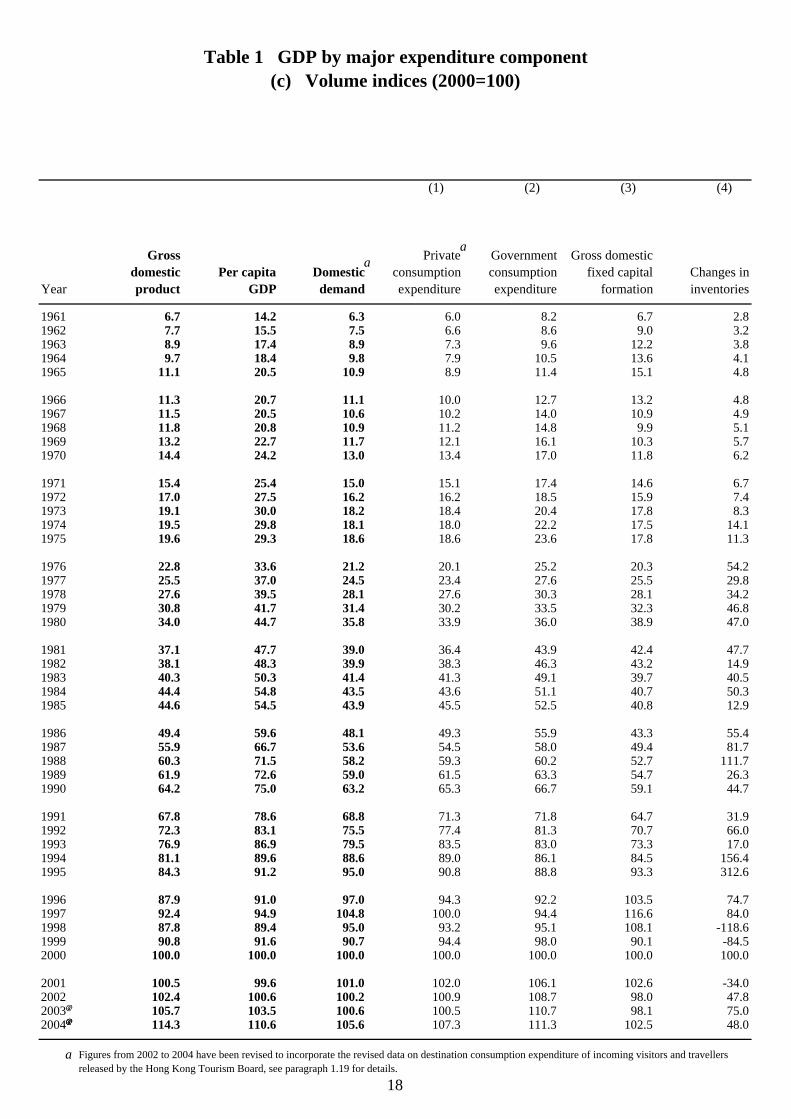
1961 6.7 14.2 6.3 6.0 8.2 6.7 2.81962 7.7 15.5 7.5 6.6 8.6 9.0 3.21963 8.9 17.4 8.9 7.3 9.6 12.2 3.81964 9.7 18.4 9.8 7.9 10.5 13.6 4.11965 11.1 20.5 10.9 8.9 11.4 15.1 4.8
1966 11.3 20.7 11.1 10.0 12.7 13.2 4.81967 11.5 20.5 10.6 10.2 14.0 10.9 4.91968 11.8 20.8 10.9 11.2 14.8 9.9 5.11969 13.2 22.7 11.7 12.1 16.1 10.3 5.71970 14.4 24.2 13.0 13.4 17.0 11.8 6.2
1971 15.4 25.4 15.0 15.1 17.4 14.6 6.71972 17.0 27.5 16.2 16.2 18.5 15.9 7.41973 19.1 30.0 18.2 18.4 20.4 17.8 8.31974 19.5 29.8 18.1 18.0 22.2 17.5 14.11975 19.6 29.3 18.6 18.6 23.6 17.8 11.3
1976 22.8 33.6 21.2 20.1 25.2 20.3 54.21977 25.5 37.0 24.5 23.4 27.6 25.5 29.81978 27.6 39.5 28.1 27.6 30.3 28.1 34.21979 30.8 41.7 31.4 30.2 33.5 32.3 46.81980 34.0 44.7 35.8 33.9 36.0 38.9 47.0
1981 37.1 47.7 39.0 36.4 43.9 42.4 47.71982 38.1 48.3 39.9 38.3 46.3 43.2 14.91983 40.3 50.3 41.4 41.3 49.1 39.7 40.51984 44.4 54.8 43.5 43.6 51.1 40.7 50.31985 44.6 54.5 43.9 45.5 52.5 40.8 12.9
1986 49.4 59.6 48.1 49.3 55.9 43.3 55.41987 55.9 66.7 53.6 54.5 58.0 49.4 81.71988 60.3 71.5 58.2 59.3 60.2 52.7 111.71989 61.9 72.6 59.0 61.5 63.3 54.7 26.31990 64.2 75.0 63.2 65.3 66.7 59.1 44.7
1991 67.8 78.6 68.8 71.3 71.8 64.7 31.91992 72.3 83.1 75.5 77.4 81.3 70.7 66.01993 76.9 86.9 79.5 83.5 83.0 73.3 17.01994 81.1 89.6 88.6 89.0 86.1 84.5 156.41995 84.3 91.2 95.0 90.8 88.8 93.3 312.6
1996 87.9 91.0 97.0 94.3 92.2 103.5 74.71997 92.4 94.9 104.8 100.0 94.4 116.6 84.01998 87.8 89.4 95.0 93.2 95.1 108.1 -118.61999 90.8 91.6 90.7 94.4 98.0 90.1 -84.52000 100.0 100.0 100.0 100.0 100.0 100.0 100.0
2001 100.5 99.6 101.0 102.0 106.1 102.6 -34.02002 102.4 100.6 100.2 100.9 108.7 98.0 47.82003 105.7 103.5 100.6 100.5 110.7 98.1 75.02004 114.3 110.6 105.6 107.3 111.3 102.5 48.0
a Figures from 2002 to 2004 have been revised to incorporate the revised data on destination consumption expenditure of incoming visitors and travellersreleased by the Hong Kong Tourism Board, see paragraph 1.19 for details.
Table 1 GDP by major expenditure component(c) Volume indices (2000=100)
@@
aa
@@@@
18
(6) (7) (8)
Exports of goods (f.o.b.)
(5) (5a) (5b) Total Domestic Re- Exports of Imports of Imports of
exports exports exports services goods (f.o.b.) services Year
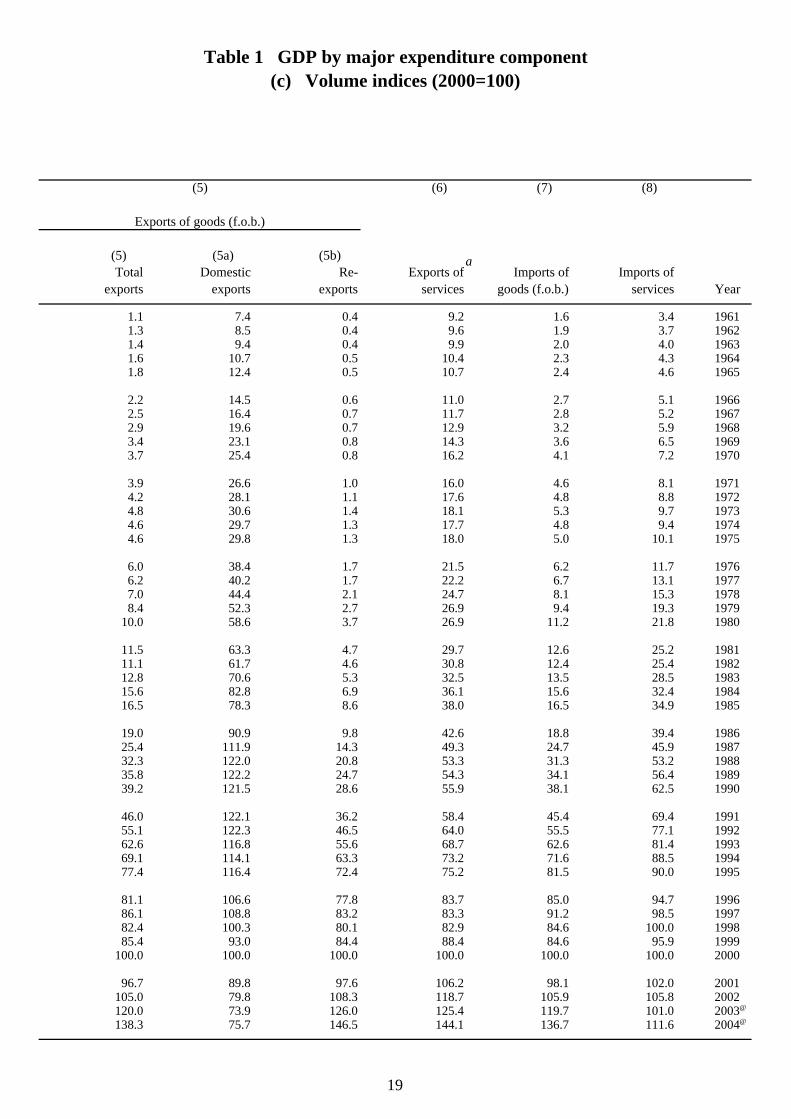
1.1 7.4 0.4 9.2 1.6 3.4 19611.3 8.5 0.4 9.6 1.9 3.7 19621.4 9.4 0.4 9.9 2.0 4.0 19631.6 10.7 0.5 10.4 2.3 4.3 19641.8 12.4 0.5 10.7 2.4 4.6 1965
2.2 14.5 0.6 11.0 2.7 5.1 19662.5 16.4 0.7 11.7 2.8 5.2 19672.9 19.6 0.7 12.9 3.2 5.9 19683.4 23.1 0.8 14.3 3.6 6.5 19693.7 25.4 0.8 16.2 4.1 7.2 1970
3.9 26.6 1.0 16.0 4.6 8.1 19714.2 28.1 1.1 17.6 4.8 8.8 19724.8 30.6 1.4 18.1 5.3 9.7 19734.6 29.7 1.3 17.7 4.8 9.4 19744.6 29.8 1.3 18.0 5.0 10.1 1975
6.0 38.4 1.7 21.5 6.2 11.7 19766.2 40.2 1.7 22.2 6.7 13.1 19777.0 44.4 2.1 24.7 8.1 15.3 19788.4 52.3 2.7 26.9 9.4 19.3 1979
10.0 58.6 3.7 26.9 11.2 21.8 1980
11.5 63.3 4.7 29.7 12.6 25.2 198111.1 61.7 4.6 30.8 12.4 25.4 198212.8 70.6 5.3 32.5 13.5 28.5 198315.6 82.8 6.9 36.1 15.6 32.4 198416.5 78.3 8.6 38.0 16.5 34.9 1985
19.0 90.9 9.8 42.6 18.8 39.4 198625.4 111.9 14.3 49.3 24.7 45.9 198732.3 122.0 20.8 53.3 31.3 53.2 198835.8 122.2 24.7 54.3 34.1 56.4 198939.2 121.5 28.6 55.9 38.1 62.5 1990
46.0 122.1 36.2 58.4 45.4 69.4 199155.1 122.3 46.5 64.0 55.5 77.1 199262.6 116.8 55.6 68.7 62.6 81.4 199369.1 114.1 63.3 73.2 71.6 88.5 199477.4 116.4 72.4 75.2 81.5 90.0 1995
81.1 106.6 77.8 83.7 85.0 94.7 199686.1 108.8 83.2 83.3 91.2 98.5 199782.4 100.3 80.1 82.9 84.6 100.0 199885.4 93.0 84.4 88.4 84.6 95.9 1999
100.0 100.0 100.0 100.0 100.0 100.0 2000
96.7 89.8 97.6 106.2 98.1 102.0 2001105.0 79.8 108.3 118.7 105.9 105.8 2002120.0 73.9 126.0 125.4 119.7 101.0 2003138.3 75.7 146.5 144.1 136.7 111.6 2004
Table 1 GDP by major expenditure component(c) Volume indices (2000=100)
(5)
@
a
@
19
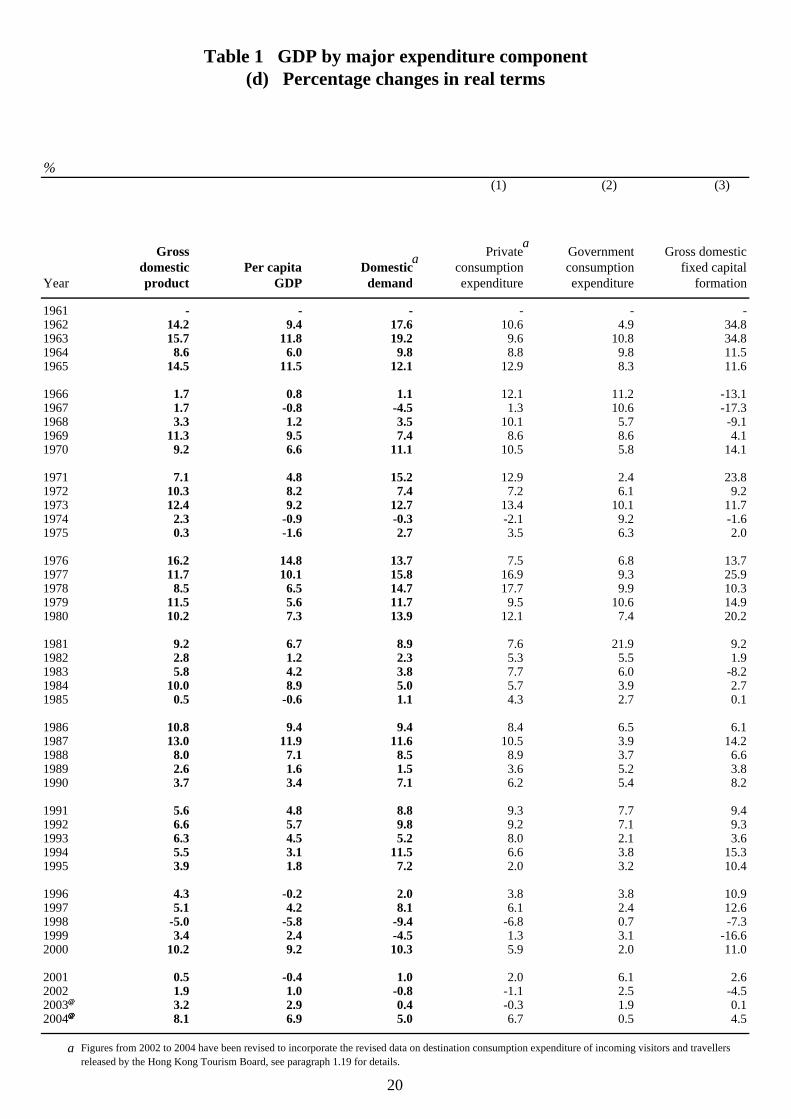
%(1) (2) (3)
Gross Private Government Gross domesticdomestic Per capita Domestic consumption consumption fixed capital
Year product GDP demand expenditure expenditure formation
1961 - - - - - -1962 14.2 9.4 17.6 10.6 4.9 34.81963 15.7 11.8 19.2 9.6 10.8 34.81964 8.6 6.0 9.8 8.8 9.8 11.51965 14.5 11.5 12.1 12.9 8.3 11.6
1966 1.7 0.8 1.1 12.1 11.2 -13.11967 1.7 -0.8 -4.5 1.3 10.6 -17.31968 3.3 1.2 3.5 10.1 5.7 -9.11969 11.3 9.5 7.4 8.6 8.6 4.11970 9.2 6.6 11.1 10.5 5.8 14.1
1971 7.1 4.8 15.2 12.9 2.4 23.81972 10.3 8.2 7.4 7.2 6.1 9.21973 12.4 9.2 12.7 13.4 10.1 11.71974 2.3 -0.9 -0.3 -2.1 9.2 -1.61975 0.3 -1.6 2.7 3.5 6.3 2.0
1976 16.2 14.8 13.7 7.5 6.8 13.71977 11.7 10.1 15.8 16.9 9.3 25.91978 8.5 6.5 14.7 17.7 9.9 10.31979 11.5 5.6 11.7 9.5 10.6 14.91980 10.2 7.3 13.9 12.1 7.4 20.2
1981 9.2 6.7 8.9 7.6 21.9 9.21982 2.8 1.2 2.3 5.3 5.5 1.91983 5.8 4.2 3.8 7.7 6.0 -8.21984 10.0 8.9 5.0 5.7 3.9 2.71985 0.5 -0.6 1.1 4.3 2.7 0.1
1986 10.8 9.4 9.4 8.4 6.5 6.11987 13.0 11.9 11.6 10.5 3.9 14.21988 8.0 7.1 8.5 8.9 3.7 6.61989 2.6 1.6 1.5 3.6 5.2 3.81990 3.7 3.4 7.1 6.2 5.4 8.2
1991 5.6 4.8 8.8 9.3 7.7 9.41992 6.6 5.7 9.8 9.2 7.1 9.31993 6.3 4.5 5.2 8.0 2.1 3.61994 5.5 3.1 11.5 6.6 3.8 15.31995 3.9 1.8 7.2 2.0 3.2 10.4
1996 4.3 -0.2 2.0 3.8 3.8 10.91997 5.1 4.2 8.1 6.1 2.4 12.61998 -5.0 -5.8 -9.4 -6.8 0.7 -7.31999 3.4 2.4 -4.5 1.3 3.1 -16.62000 10.2 9.2 10.3 5.9 2.0 11.0
2001 0.5 -0.4 1.0 2.0 6.1 2.62002 1.9 1.0 -0.8 -1.1 2.5 -4.52003 3.2 2.9 0.4 -0.3 1.9 0.12004 8.1 6.9 5.0 6.7 0.5 4.5
a Figures from 2002 to 2004 have been revised to incorporate the revised data on destination consumption expenditure of incoming visitors and travellersreleased by the Hong Kong Tourism Board, see paragraph 1.19 for details.
Table 1 GDP by major expenditure component(d) Percentage changes in real terms
@@
aa
@@@@
20

%(4) (5) (6) (7)
Exports of goods (f.o.b.)
(4) (4a) (4b) Total Domestic Re- Exports of Imports of Imports of
exports exports exports services goods (f.o.b.) services Year
- - - - - - 196113.8 14.8 7.7 3.8 16.4 11.5 1962
9.1 10.0 7.1 3.6 10.1 7.6 196313.9 14.3 6.7 4.7 11.0 7.5 196414.6 15.9 12.5 2.8 5.0 5.6 1965
19.2 16.7 22.2 2.7 14.2 11.2 196614.3 13.4 13.6 7.0 2.8 2.1 196714.1 19.3 -4.0 9.6 16.1 13.9 196817.8 18.0 16.7 11.5 11.6 10.5 1969
9.3 10.0 3.6 12.8 12.5 10.8 1970
6.4 4.8 17.2 -1.2 12.9 11.6 19718.0 5.5 14.7 10.4 4.2 9.1 1972
13.0 9.1 28.2 2.6 10.3 10.3 1973-4.1 -3.2 -8.0 -2.4 -8.4 -3.1 19740.9 0.4 * 1.6 3.2 6.9 1975
28.8 29.0 28.3 19.8 24.9 16.7 19764.6 4.7 3.4 3.0 7.3 11.7 1977
12.6 10.3 21.3 11.5 21.5 16.8 197820.1 17.8 27.0 8.8 15.9 25.7 197918.6 12.1 37.2 0.1 19.3 13.1 1980
14.5 8.1 27.9 10.2 12.2 15.5 1981-2.7 -2.5 -3.0 3.8 -2.0 0.9 198214.8 14.4 15.6 5.5 9.6 12.3 198322.1 17.2 30.3 11.1 14.9 13.5 1984
5.8 -5.4 24.5 5.4 6.2 7.9 1985
15.3 16.1 14.0 12.1 13.6 12.6 198633.5 23.1 45.9 15.6 31.7 16.5 198727.3 9.0 45.7 8.2 26.8 16.0 198810.6 0.1 18.6 1.8 8.9 6.0 1989
9.6 -0.5 16.0 2.9 11.5 10.8 1990
17.3 0.5 26.5 4.5 19.1 11.0 199119.8 0.2 28.3 9.6 22.2 11.1 199213.5 -4.5 19.6 7.4 12.9 5.6 199310.4 -2.3 13.8 6.5 14.2 8.7 199412.0 2.0 14.3 2.7 13.9 1.8 1995
4.8 -8.4 7.5 11.4 4.3 5.2 19966.1 2.1 6.8 -0.5 7.3 4.0 1997
-4.3 -7.9 -3.7 -0.4 -7.3 1.6 19983.7 -7.2 5.4 6.7 * -4.1 1999
17.1 7.5 18.5 13.1 18.2 4.2 2000
-3.3 -10.2 -2.4 6.2 -1.9 2.0 20018.7 -11.2 11.0 11.7 7.9 3.7 2002
14.2 -7.3 16.3 5.7 13.1 -4.6 200315.3 2.4 16.3 14.9 14.1 10.5 2004
Table 1 GDP by major expenditure component(d) Percentage changes in real terms
@
a
@
21
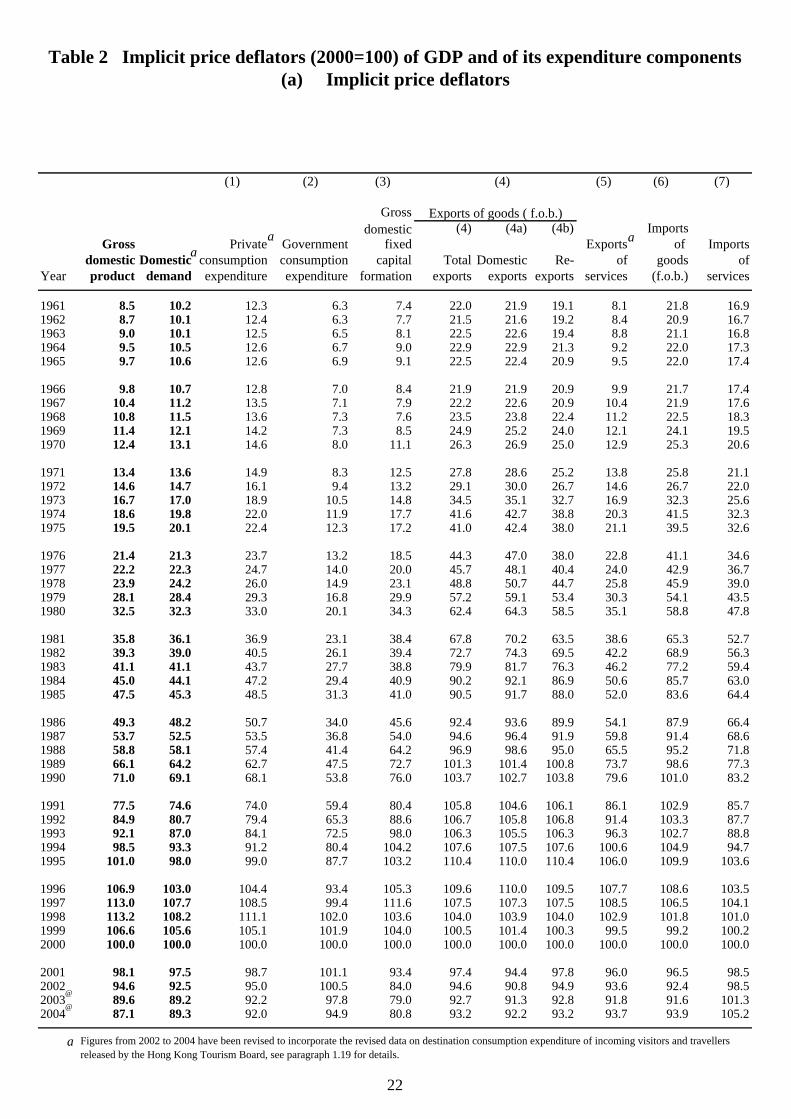
Table 2 Implicit price deflators (2000=100) of GDP and of its expenditure components(a) Implicit price deflators
(1) (2) (3) (4) (5) (6) (7)
Gross Exports of goods ( f.o.b.)domestic (4) (4a) (4b) Imports
Gross Private Government fixed Exports of Importsdomestic Domestic consumption consumption capital Total Domestic Re- of goods of
Year product demand expenditure expenditure formation exports exports exports services (f.o.b.) services
1961 8.5 10.2 12.3 6.3 7.4 22.0 21.9 19.1 8.1 21.8 16.91962 8.7 10.1 12.4 6.3 7.7 21.5 21.6 19.2 8.4 20.9 16.71963 9.0 10.1 12.5 6.5 8.1 22.5 22.6 19.4 8.8 21.1 16.81964 9.5 10.5 12.6 6.7 9.0 22.9 22.9 21.3 9.2 22.0 17.31965 9.7 10.6 12.6 6.9 9.1 22.5 22.4 20.9 9.5 22.0 17.4
1966 9.8 10.7 12.8 7.0 8.4 21.9 21.9 20.9 9.9 21.7 17.41967 10.4 11.2 13.5 7.1 7.9 22.2 22.6 20.9 10.4 21.9 17.61968 10.8 11.5 13.6 7.3 7.6 23.5 23.8 22.4 11.2 22.5 18.31969 11.4 12.1 14.2 7.3 8.5 24.9 25.2 24.0 12.1 24.1 19.51970 12.4 13.1 14.6 8.0 11.1 26.3 26.9 25.0 12.9 25.3 20.6
1971 13.4 13.6 14.9 8.3 12.5 27.8 28.6 25.2 13.8 25.8 21.11972 14.6 14.7 16.1 9.4 13.2 29.1 30.0 26.7 14.6 26.7 22.01973 16.7 17.0 18.9 10.5 14.8 34.5 35.1 32.7 16.9 32.3 25.61974 18.6 19.8 22.0 11.9 17.7 41.6 42.7 38.8 20.3 41.5 32.31975 19.5 20.1 22.4 12.3 17.2 41.0 42.4 38.0 21.1 39.5 32.6
1976 21.4 21.3 23.7 13.2 18.5 44.3 47.0 38.0 22.8 41.1 34.61977 22.2 22.3 24.7 14.0 20.0 45.7 48.1 40.4 24.0 42.9 36.71978 23.9 24.2 26.0 14.9 23.1 48.8 50.7 44.7 25.8 45.9 39.01979 28.1 28.4 29.3 16.8 29.9 57.2 59.1 53.4 30.3 54.1 43.51980 32.5 32.3 33.0 20.1 34.3 62.4 64.3 58.5 35.1 58.8 47.8
1981 35.8 36.1 36.9 23.1 38.4 67.8 70.2 63.5 38.6 65.3 52.71982 39.3 39.0 40.5 26.1 39.4 72.7 74.3 69.5 42.2 68.9 56.31983 41.1 41.1 43.7 27.7 38.8 79.9 81.7 76.3 46.2 77.2 59.41984 45.0 44.1 47.2 29.4 40.9 90.2 92.1 86.9 50.6 85.7 63.01985 47.5 45.3 48.5 31.3 41.0 90.5 91.7 88.0 52.0 83.6 64.4
1986 49.3 48.2 50.7 34.0 45.6 92.4 93.6 89.9 54.1 87.9 66.41987 53.7 52.5 53.5 36.8 54.0 94.6 96.4 91.9 59.8 91.4 68.61988 58.8 58.1 57.4 41.4 64.2 96.9 98.6 95.0 65.5 95.2 71.81989 66.1 64.2 62.7 47.5 72.7 101.3 101.4 100.8 73.7 98.6 77.31990 71.0 69.1 68.1 53.8 76.0 103.7 102.7 103.8 79.6 101.0 83.2
1991 77.5 74.6 74.0 59.4 80.4 105.8 104.6 106.1 86.1 102.9 85.71992 84.9 80.7 79.4 65.3 88.6 106.7 105.8 106.8 91.4 103.3 87.71993 92.1 87.0 84.1 72.5 98.0 106.3 105.5 106.3 96.3 102.7 88.81994 98.5 93.3 91.2 80.4 104.2 107.6 107.5 107.6 100.6 104.9 94.71995 101.0 98.0 99.0 87.7 103.2 110.4 110.0 110.4 106.0 109.9 103.6
1996 106.9 103.0 104.4 93.4 105.3 109.6 110.0 109.5 107.7 108.6 103.51997 113.0 107.7 108.5 99.4 111.6 107.5 107.3 107.5 108.5 106.5 104.11998 113.2 108.2 111.1 102.0 103.6 104.0 103.9 104.0 102.9 101.8 101.01999 106.6 105.6 105.1 101.9 104.0 100.5 101.4 100.3 99.5 99.2 100.22000 100.0 100.0 100.0 100.0 100.0 100.0 100.0 100.0 100.0 100.0 100.0
2001 98.1 97.5 98.7 101.1 93.4 97.4 94.4 97.8 96.0 96.5 98.52002 94.6 92.5 95.0 100.5 84.0 94.6 90.8 94.9 93.6 92.4 98.52003 89.6 89.2 92.2 97.8 79.0 92.7 91.3 92.8 91.8 91.6 101.32004 87.1 89.3 92.0 94.9 80.8 93.2 92.2 93.2 93.7 93.9 105.2
a Figures from 2002 to 2004 have been revised to incorporate the revised data on destination consumption expenditure of incoming visitors and travellersreleased by the Hong Kong Tourism Board, see paragraph 1.19 for details.
@
aa a
@
22
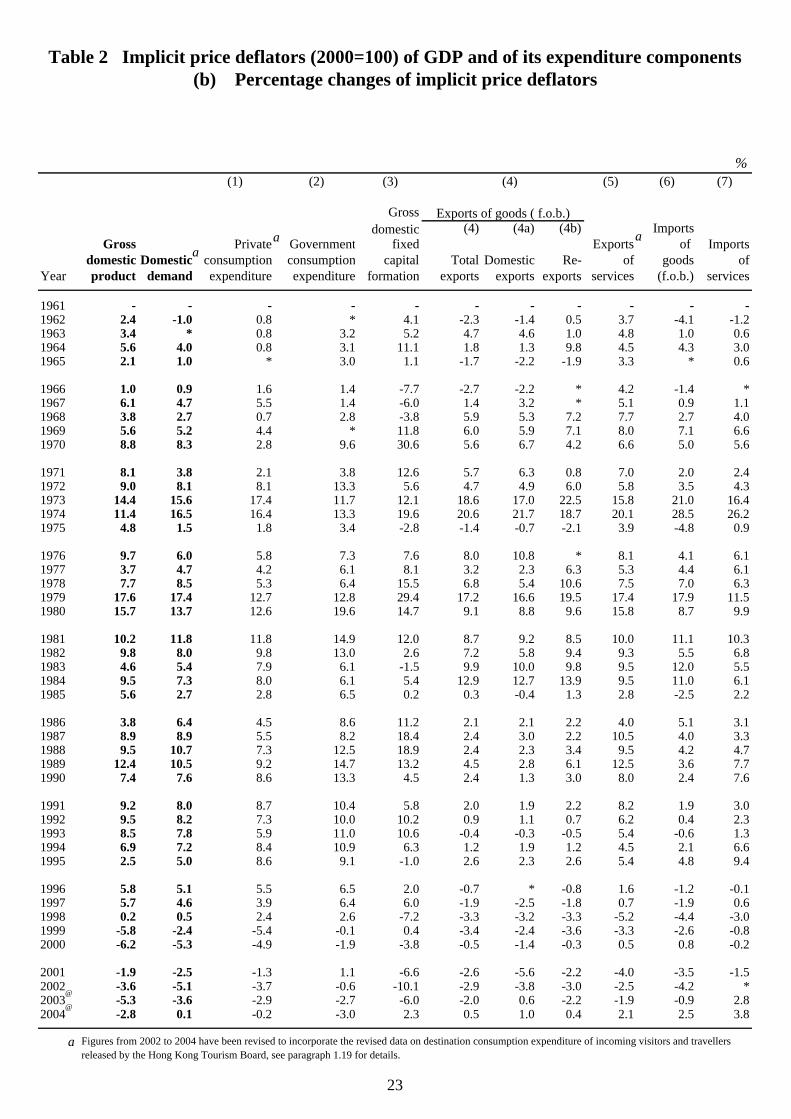
Table 2 Implicit price deflators (2000=100) of GDP and of its expenditure components(b) Percentage changes of implicit price deflators
%(1) (2) (3) (4) (5) (6) (7)
Gross Exports of goods ( f.o.b.)domestic (4) (4a) (4b) Imports
Gross Private Government fixed Exports of Importsdomestic Domestic consumption consumption capital Total Domestic Re- of goods of
Year product demand expenditure expenditure formation exports exports exports services (f.o.b.) services
1961 - - - - - - - - - - -1962 2.4 -1.0 0.8 * 4.1 -2.3 -1.4 0.5 3.7 -4.1 -1.21963 3.4 * 0.8 3.2 5.2 4.7 4.6 1.0 4.8 1.0 0.61964 5.6 4.0 0.8 3.1 11.1 1.8 1.3 9.8 4.5 4.3 3.01965 2.1 1.0 * 3.0 1.1 -1.7 -2.2 -1.9 3.3 * 0.6
1966 1.0 0.9 1.6 1.4 -7.7 -2.7 -2.2 * 4.2 -1.4 *1967 6.1 4.7 5.5 1.4 -6.0 1.4 3.2 * 5.1 0.9 1.11968 3.8 2.7 0.7 2.8 -3.8 5.9 5.3 7.2 7.7 2.7 4.01969 5.6 5.2 4.4 * 11.8 6.0 5.9 7.1 8.0 7.1 6.61970 8.8 8.3 2.8 9.6 30.6 5.6 6.7 4.2 6.6 5.0 5.6
1971 8.1 3.8 2.1 3.8 12.6 5.7 6.3 0.8 7.0 2.0 2.41972 9.0 8.1 8.1 13.3 5.6 4.7 4.9 6.0 5.8 3.5 4.31973 14.4 15.6 17.4 11.7 12.1 18.6 17.0 22.5 15.8 21.0 16.41974 11.4 16.5 16.4 13.3 19.6 20.6 21.7 18.7 20.1 28.5 26.21975 4.8 1.5 1.8 3.4 -2.8 -1.4 -0.7 -2.1 3.9 -4.8 0.9
1976 9.7 6.0 5.8 7.3 7.6 8.0 10.8 * 8.1 4.1 6.11977 3.7 4.7 4.2 6.1 8.1 3.2 2.3 6.3 5.3 4.4 6.11978 7.7 8.5 5.3 6.4 15.5 6.8 5.4 10.6 7.5 7.0 6.31979 17.6 17.4 12.7 12.8 29.4 17.2 16.6 19.5 17.4 17.9 11.51980 15.7 13.7 12.6 19.6 14.7 9.1 8.8 9.6 15.8 8.7 9.9
1981 10.2 11.8 11.8 14.9 12.0 8.7 9.2 8.5 10.0 11.1 10.31982 9.8 8.0 9.8 13.0 2.6 7.2 5.8 9.4 9.3 5.5 6.81983 4.6 5.4 7.9 6.1 -1.5 9.9 10.0 9.8 9.5 12.0 5.51984 9.5 7.3 8.0 6.1 5.4 12.9 12.7 13.9 9.5 11.0 6.11985 5.6 2.7 2.8 6.5 0.2 0.3 -0.4 1.3 2.8 -2.5 2.2
1986 3.8 6.4 4.5 8.6 11.2 2.1 2.1 2.2 4.0 5.1 3.11987 8.9 8.9 5.5 8.2 18.4 2.4 3.0 2.2 10.5 4.0 3.31988 9.5 10.7 7.3 12.5 18.9 2.4 2.3 3.4 9.5 4.2 4.71989 12.4 10.5 9.2 14.7 13.2 4.5 2.8 6.1 12.5 3.6 7.71990 7.4 7.6 8.6 13.3 4.5 2.4 1.3 3.0 8.0 2.4 7.6
1991 9.2 8.0 8.7 10.4 5.8 2.0 1.9 2.2 8.2 1.9 3.01992 9.5 8.2 7.3 10.0 10.2 0.9 1.1 0.7 6.2 0.4 2.31993 8.5 7.8 5.9 11.0 10.6 -0.4 -0.3 -0.5 5.4 -0.6 1.31994 6.9 7.2 8.4 10.9 6.3 1.2 1.9 1.2 4.5 2.1 6.61995 2.5 5.0 8.6 9.1 -1.0 2.6 2.3 2.6 5.4 4.8 9.4
1996 5.8 5.1 5.5 6.5 2.0 -0.7 * -0.8 1.6 -1.2 -0.11997 5.7 4.6 3.9 6.4 6.0 -1.9 -2.5 -1.8 0.7 -1.9 0.61998 0.2 0.5 2.4 2.6 -7.2 -3.3 -3.2 -3.3 -5.2 -4.4 -3.01999 -5.8 -2.4 -5.4 -0.1 0.4 -3.4 -2.4 -3.6 -3.3 -2.6 -0.82000 -6.2 -5.3 -4.9 -1.9 -3.8 -0.5 -1.4 -0.3 0.5 0.8 -0.2
2001 -1.9 -2.5 -1.3 1.1 -6.6 -2.6 -5.6 -2.2 -4.0 -3.5 -1.52002 -3.6 -5.1 -3.7 -0.6 -10.1 -2.9 -3.8 -3.0 -2.5 -4.2 *2003 -5.3 -3.6 -2.9 -2.7 -6.0 -2.0 0.6 -2.2 -1.9 -0.9 2.82004 -2.8 0.1 -0.2 -3.0 2.3 0.5 1.0 0.4 2.1 2.5 3.8
a Figures from 2002 to 2004 have been revised to incorporate the revised data on destination consumption expenditure of incoming visitors and travellersreleased by the Hong Kong Tourism Board, see paragraph 1.19 for details.
@
aa a
@
23
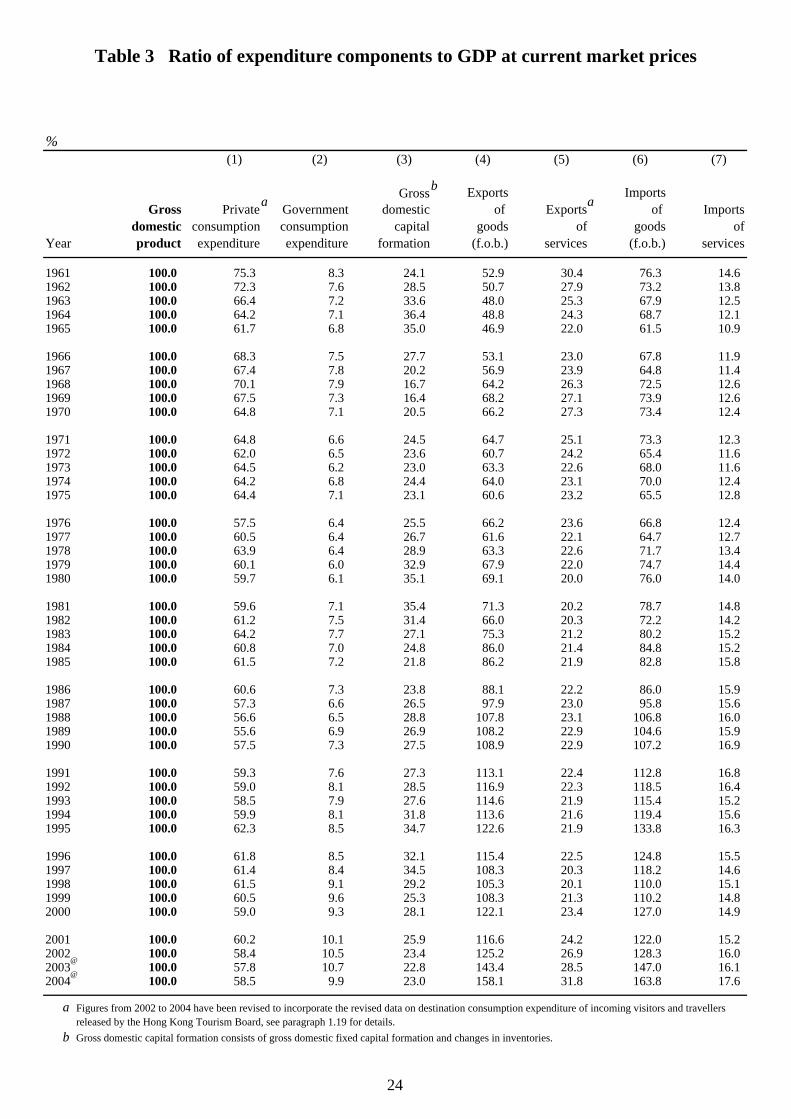
Table 3 Ratio of expenditure components to GDP at current market prices
%(1) (2) (3) (4) (5) (6) (7)
Gross Exports ImportsGross Private Government domestic of Exports of Imports
domestic consumption consumption capital goods of goods ofYear product expenditure expenditure formation (f.o.b.) services (f.o.b.) services
1961 100.0 75.3 8.3 24.1 52.9 30.4 76.3 14.61962 100.0 72.3 7.6 28.5 50.7 27.9 73.2 13.81963 100.0 66.4 7.2 33.6 48.0 25.3 67.9 12.51964 100.0 64.2 7.1 36.4 48.8 24.3 68.7 12.11965 100.0 61.7 6.8 35.0 46.9 22.0 61.5 10.9
1966 100.0 68.3 7.5 27.7 53.1 23.0 67.8 11.91967 100.0 67.4 7.8 20.2 56.9 23.9 64.8 11.41968 100.0 70.1 7.9 16.7 64.2 26.3 72.5 12.61969 100.0 67.5 7.3 16.4 68.2 27.1 73.9 12.61970 100.0 64.8 7.1 20.5 66.2 27.3 73.4 12.4
1971 100.0 64.8 6.6 24.5 64.7 25.1 73.3 12.31972 100.0 62.0 6.5 23.6 60.7 24.2 65.4 11.61973 100.0 64.5 6.2 23.0 63.3 22.6 68.0 11.61974 100.0 64.2 6.8 24.4 64.0 23.1 70.0 12.41975 100.0 64.4 7.1 23.1 60.6 23.2 65.5 12.8
1976 100.0 57.5 6.4 25.5 66.2 23.6 66.8 12.41977 100.0 60.5 6.4 26.7 61.6 22.1 64.7 12.71978 100.0 63.9 6.4 28.9 63.3 22.6 71.7 13.41979 100.0 60.1 6.0 32.9 67.9 22.0 74.7 14.41980 100.0 59.7 6.1 35.1 69.1 20.0 76.0 14.0
1981 100.0 59.6 7.1 35.4 71.3 20.2 78.7 14.81982 100.0 61.2 7.5 31.4 66.0 20.3 72.2 14.21983 100.0 64.2 7.7 27.1 75.3 21.2 80.2 15.21984 100.0 60.8 7.0 24.8 86.0 21.4 84.8 15.21985 100.0 61.5 7.2 21.8 86.2 21.9 82.8 15.8
1986 100.0 60.6 7.3 23.8 88.1 22.2 86.0 15.91987 100.0 57.3 6.6 26.5 97.9 23.0 95.8 15.61988 100.0 56.6 6.5 28.8 107.8 23.1 106.8 16.01989 100.0 55.6 6.9 26.9 108.2 22.9 104.6 15.91990 100.0 57.5 7.3 27.5 108.9 22.9 107.2 16.9
1991 100.0 59.3 7.6 27.3 113.1 22.4 112.8 16.81992 100.0 59.0 8.1 28.5 116.9 22.3 118.5 16.41993 100.0 58.5 7.9 27.6 114.6 21.9 115.4 15.21994 100.0 59.9 8.1 31.8 113.6 21.6 119.4 15.61995 100.0 62.3 8.5 34.7 122.6 21.9 133.8 16.3
1996 100.0 61.8 8.5 32.1 115.4 22.5 124.8 15.51997 100.0 61.4 8.4 34.5 108.3 20.3 118.2 14.61998 100.0 61.5 9.1 29.2 105.3 20.1 110.0 15.11999 100.0 60.5 9.6 25.3 108.3 21.3 110.2 14.82000 100.0 59.0 9.3 28.1 122.1 23.4 127.0 14.9
2001 100.0 60.2 10.1 25.9 116.6 24.2 122.0 15.22002 100.0 58.4 10.5 23.4 125.2 26.9 128.3 16.02003 100.0 57.8 10.7 22.8 143.4 28.5 147.0 16.12004 100.0 58.5 9.9 23.0 158.1 31.8 163.8 17.6
a
b Gross domestic capital formation consists of gross domestic fixed capital formation and changes in inventories.
Figures from 2002 to 2004 have been revised to incorporate the revised data on destination consumption expenditure of incoming visitors and travellersreleased by the Hong Kong Tourism Board, see paragraph 1.19 for details.
a
@
ab
@
24
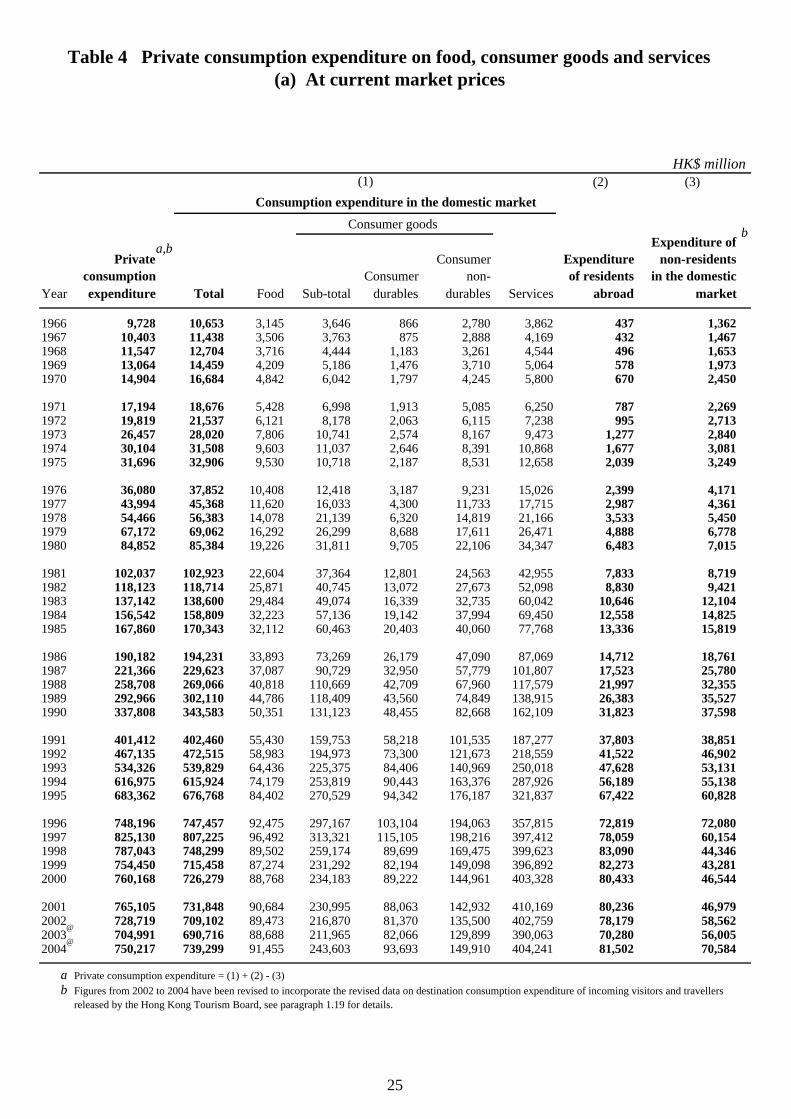
Table 4 Private consumption expenditure on food, consumer goods and services(a) At current market prices
HK$ million(2) (3)
Consumption expenditure in the domestic market
Consumer goodsExpenditure of
Private Consumer Expenditure non-residentsconsumption Consumer non- of residents in the domestic
Year expenditure Total Food Sub-total durables durables Services abroad market
1966 9,728 10,653 3,145 3,646 866 2,780 3,862 437 1,3621967 10,403 11,438 3,506 3,763 875 2,888 4,169 432 1,4671968 11,547 12,704 3,716 4,444 1,183 3,261 4,544 496 1,6531969 13,064 14,459 4,209 5,186 1,476 3,710 5,064 578 1,9731970 14,904 16,684 4,842 6,042 1,797 4,245 5,800 670 2,450
1971 17,194 18,676 5,428 6,998 1,913 5,085 6,250 787 2,2691972 19,819 21,537 6,121 8,178 2,063 6,115 7,238 995 2,7131973 26,457 28,020 7,806 10,741 2,574 8,167 9,473 1,277 2,8401974 30,104 31,508 9,603 11,037 2,646 8,391 10,868 1,677 3,0811975 31,696 32,906 9,530 10,718 2,187 8,531 12,658 2,039 3,249
1976 36,080 37,852 10,408 12,418 3,187 9,231 15,026 2,399 4,1711977 43,994 45,368 11,620 16,033 4,300 11,733 17,715 2,987 4,3611978 54,466 56,383 14,078 21,139 6,320 14,819 21,166 3,533 5,4501979 67,172 69,062 16,292 26,299 8,688 17,611 26,471 4,888 6,7781980 84,852 85,384 19,226 31,811 9,705 22,106 34,347 6,483 7,015
1981 102,037 102,923 22,604 37,364 12,801 24,563 42,955 7,833 8,7191982 118,123 118,714 25,871 40,745 13,072 27,673 52,098 8,830 9,4211983 137,142 138,600 29,484 49,074 16,339 32,735 60,042 10,646 12,1041984 156,542 158,809 32,223 57,136 19,142 37,994 69,450 12,558 14,8251985 167,860 170,343 32,112 60,463 20,403 40,060 77,768 13,336 15,819
1986 190,182 194,231 33,893 73,269 26,179 47,090 87,069 14,712 18,7611987 221,366 229,623 37,087 90,729 32,950 57,779 101,807 17,523 25,7801988 258,708 269,066 40,818 110,669 42,709 67,960 117,579 21,997 32,3551989 292,966 302,110 44,786 118,409 43,560 74,849 138,915 26,383 35,5271990 337,808 343,583 50,351 131,123 48,455 82,668 162,109 31,823 37,598
1991 401,412 402,460 55,430 159,753 58,218 101,535 187,277 37,803 38,8511992 467,135 472,515 58,983 194,973 73,300 121,673 218,559 41,522 46,9021993 534,326 539,829 64,436 225,375 84,406 140,969 250,018 47,628 53,1311994 616,975 615,924 74,179 253,819 90,443 163,376 287,926 56,189 55,1381995 683,362 676,768 84,402 270,529 94,342 176,187 321,837 67,422 60,828
1996 748,196 747,457 92,475 297,167 103,104 194,063 357,815 72,819 72,0801997 825,130 807,225 96,492 313,321 115,105 198,216 397,412 78,059 60,1541998 787,043 748,299 89,502 259,174 89,699 169,475 399,623 83,090 44,3461999 754,450 715,458 87,274 231,292 82,194 149,098 396,892 82,273 43,2812000 760,168 726,279 88,768 234,183 89,222 144,961 403,328 80,433 46,544
2001 765,105 731,848 90,684 230,995 88,063 142,932 410,169 80,236 46,9792002 728,719 709,102 89,473 216,870 81,370 135,500 402,759 78,179 58,5622003 704,991 690,716 88,688 211,965 82,066 129,899 390,063 70,280 56,0052004 750,217 739,299 91,455 243,603 93,693 149,910 404,241 81,502 70,584
a Private consumption expenditure = (1) + (2) - (3)b
(1)
Figures from 2002 to 2004 have been revised to incorporate the revised data on destination consumption expenditure of incoming visitors and travellersreleased by the Hong Kong Tourism Board, see paragraph 1.19 for details.
a,b
@
b
@
25
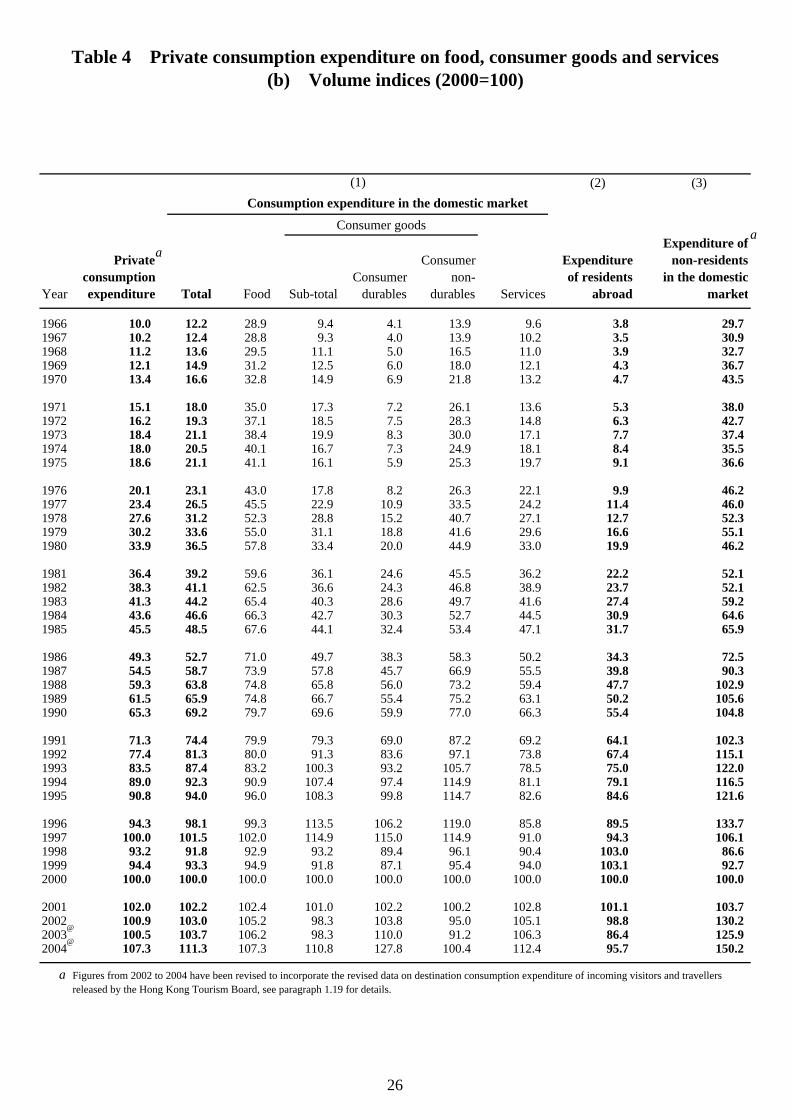
Table 4 Private consumption expenditure on food, consumer goods and services(b) Volume indices (2000=100)
(2) (3)Consumption expenditure in the domestic market
Consumer goodsExpenditure of
Private Consumer Expenditure non-residentsconsumption Consumer non- of residents in the domestic
Year expenditure Total Food Sub-total durables durables Services abroad market
1966 10.0 12.2 28.9 9.4 4.1 13.9 9.6 3.8 29.71967 10.2 12.4 28.8 9.3 4.0 13.9 10.2 3.5 30.91968 11.2 13.6 29.5 11.1 5.0 16.5 11.0 3.9 32.71969 12.1 14.9 31.2 12.5 6.0 18.0 12.1 4.3 36.71970 13.4 16.6 32.8 14.9 6.9 21.8 13.2 4.7 43.5
1971 15.1 18.0 35.0 17.3 7.2 26.1 13.6 5.3 38.01972 16.2 19.3 37.1 18.5 7.5 28.3 14.8 6.3 42.71973 18.4 21.1 38.4 19.9 8.3 30.0 17.1 7.7 37.41974 18.0 20.5 40.1 16.7 7.3 24.9 18.1 8.4 35.51975 18.6 21.1 41.1 16.1 5.9 25.3 19.7 9.1 36.6
1976 20.1 23.1 43.0 17.8 8.2 26.3 22.1 9.9 46.21977 23.4 26.5 45.5 22.9 10.9 33.5 24.2 11.4 46.01978 27.6 31.2 52.3 28.8 15.2 40.7 27.1 12.7 52.31979 30.2 33.6 55.0 31.1 18.8 41.6 29.6 16.6 55.11980 33.9 36.5 57.8 33.4 20.0 44.9 33.0 19.9 46.2
1981 36.4 39.2 59.6 36.1 24.6 45.5 36.2 22.2 52.11982 38.3 41.1 62.5 36.6 24.3 46.8 38.9 23.7 52.11983 41.3 44.2 65.4 40.3 28.6 49.7 41.6 27.4 59.21984 43.6 46.6 66.3 42.7 30.3 52.7 44.5 30.9 64.61985 45.5 48.5 67.6 44.1 32.4 53.4 47.1 31.7 65.9
1986 49.3 52.7 71.0 49.7 38.3 58.3 50.2 34.3 72.51987 54.5 58.7 73.9 57.8 45.7 66.9 55.5 39.8 90.31988 59.3 63.8 74.8 65.8 56.0 73.2 59.4 47.7 102.91989 61.5 65.9 74.8 66.7 55.4 75.2 63.1 50.2 105.61990 65.3 69.2 79.7 69.6 59.9 77.0 66.3 55.4 104.8
1991 71.3 74.4 79.9 79.3 69.0 87.2 69.2 64.1 102.31992 77.4 81.3 80.0 91.3 83.6 97.1 73.8 67.4 115.11993 83.5 87.4 83.2 100.3 93.2 105.7 78.5 75.0 122.01994 89.0 92.3 90.9 107.4 97.4 114.9 81.1 79.1 116.51995 90.8 94.0 96.0 108.3 99.8 114.7 82.6 84.6 121.6
1996 94.3 98.1 99.3 113.5 106.2 119.0 85.8 89.5 133.71997 100.0 101.5 102.0 114.9 115.0 114.9 91.0 94.3 106.11998 93.2 91.8 92.9 93.2 89.4 96.1 90.4 103.0 86.61999 94.4 93.3 94.9 91.8 87.1 95.4 94.0 103.1 92.72000 100.0 100.0 100.0 100.0 100.0 100.0 100.0 100.0 100.0
2001 102.0 102.2 102.4 101.0 102.2 100.2 102.8 101.1 103.72002 100.9 103.0 105.2 98.3 103.8 95.0 105.1 98.8 130.22003 100.5 103.7 106.2 98.3 110.0 91.2 106.3 86.4 125.92004 107.3 111.3 107.3 110.8 127.8 100.4 112.4 95.7 150.2
a
(1)
Figures from 2002 to 2004 have been revised to incorporate the revised data on destination consumption expenditure of incoming visitors and travellersreleased by the Hong Kong Tourism Board, see paragraph 1.19 for details.
@
aa
@
26
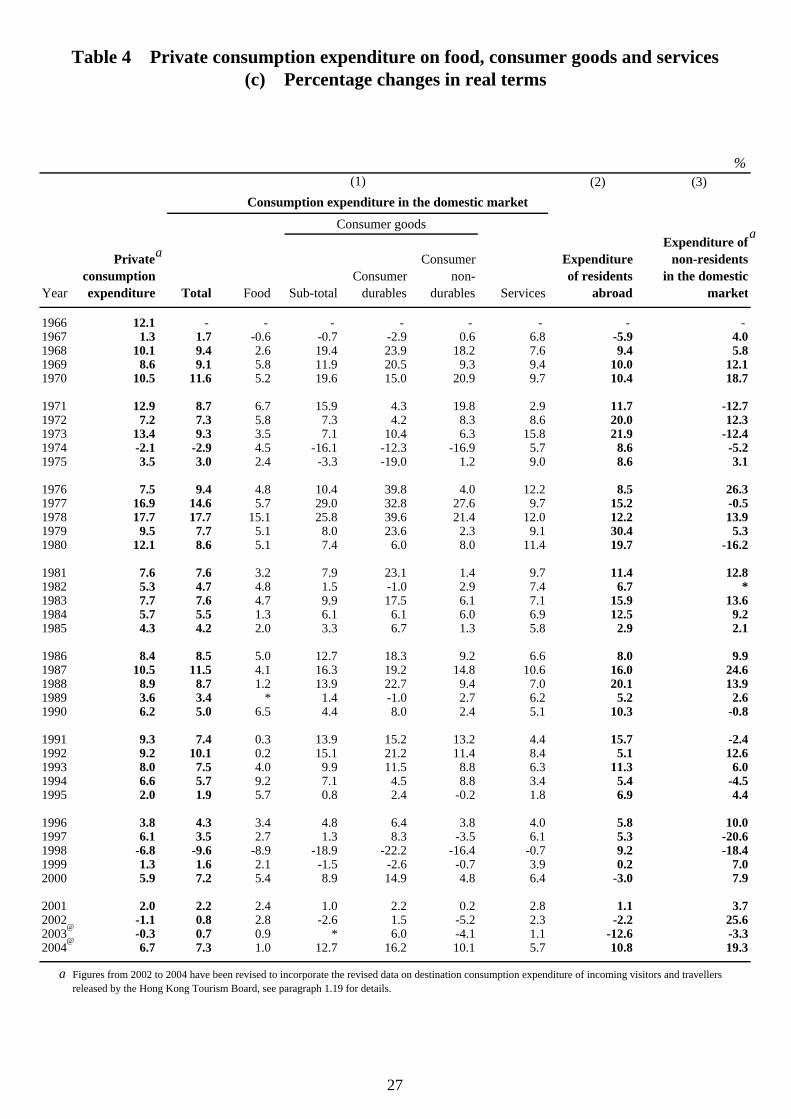
Table 4 Private consumption expenditure on food, consumer goods and services(c) Percentage changes in real terms
%(2) (3)
Consumption expenditure in the domestic market
Consumer goodsExpenditure of
Private Consumer Expenditure non-residentsconsumption Consumer non- of residents in the domestic
Year expenditure Total Food Sub-total durables durables Services abroad market
1966 12.1 - - - - - - - - 1967 1.3 1.7 -0.6 -0.7 -2.9 0.6 6.8 -5.9 4.01968 10.1 9.4 2.6 19.4 23.9 18.2 7.6 9.4 5.81969 8.6 9.1 5.8 11.9 20.5 9.3 9.4 10.0 12.11970 10.5 11.6 5.2 19.6 15.0 20.9 9.7 10.4 18.7
1971 12.9 8.7 6.7 15.9 4.3 19.8 2.9 11.7 -12.71972 7.2 7.3 5.8 7.3 4.2 8.3 8.6 20.0 12.31973 13.4 9.3 3.5 7.1 10.4 6.3 15.8 21.9 -12.41974 -2.1 -2.9 4.5 -16.1 -12.3 -16.9 5.7 8.6 -5.21975 3.5 3.0 2.4 -3.3 -19.0 1.2 9.0 8.6 3.1
1976 7.5 9.4 4.8 10.4 39.8 4.0 12.2 8.5 26.31977 16.9 14.6 5.7 29.0 32.8 27.6 9.7 15.2 -0.51978 17.7 17.7 15.1 25.8 39.6 21.4 12.0 12.2 13.91979 9.5 7.7 5.1 8.0 23.6 2.3 9.1 30.4 5.31980 12.1 8.6 5.1 7.4 6.0 8.0 11.4 19.7 -16.2
1981 7.6 7.6 3.2 7.9 23.1 1.4 9.7 11.4 12.81982 5.3 4.7 4.8 1.5 -1.0 2.9 7.4 6.7 *1983 7.7 7.6 4.7 9.9 17.5 6.1 7.1 15.9 13.61984 5.7 5.5 1.3 6.1 6.1 6.0 6.9 12.5 9.21985 4.3 4.2 2.0 3.3 6.7 1.3 5.8 2.9 2.1
1986 8.4 8.5 5.0 12.7 18.3 9.2 6.6 8.0 9.91987 10.5 11.5 4.1 16.3 19.2 14.8 10.6 16.0 24.61988 8.9 8.7 1.2 13.9 22.7 9.4 7.0 20.1 13.91989 3.6 3.4 * 1.4 -1.0 2.7 6.2 5.2 2.61990 6.2 5.0 6.5 4.4 8.0 2.4 5.1 10.3 -0.8
1991 9.3 7.4 0.3 13.9 15.2 13.2 4.4 15.7 -2.41992 9.2 10.1 0.2 15.1 21.2 11.4 8.4 5.1 12.61993 8.0 7.5 4.0 9.9 11.5 8.8 6.3 11.3 6.01994 6.6 5.7 9.2 7.1 4.5 8.8 3.4 5.4 -4.51995 2.0 1.9 5.7 0.8 2.4 -0.2 1.8 6.9 4.4
1996 3.8 4.3 3.4 4.8 6.4 3.8 4.0 5.8 10.01997 6.1 3.5 2.7 1.3 8.3 -3.5 6.1 5.3 -20.61998 -6.8 -9.6 -8.9 -18.9 -22.2 -16.4 -0.7 9.2 -18.41999 1.3 1.6 2.1 -1.5 -2.6 -0.7 3.9 0.2 7.02000 5.9 7.2 5.4 8.9 14.9 4.8 6.4 -3.0 7.9
2001 2.0 2.2 2.4 1.0 2.2 0.2 2.8 1.1 3.72002 -1.1 0.8 2.8 -2.6 1.5 -5.2 2.3 -2.2 25.62003 -0.3 0.7 0.9 * 6.0 -4.1 1.1 -12.6 -3.32004 6.7 7.3 1.0 12.7 16.2 10.1 5.7 10.8 19.3
a
(1)
Figures from 2002 to 2004 have been revised to incorporate the revised data on destination consumption expenditure of incoming visitors and travellersreleased by the Hong Kong Tourism Board, see paragraph 1.19 for details.
@
aa
@
27
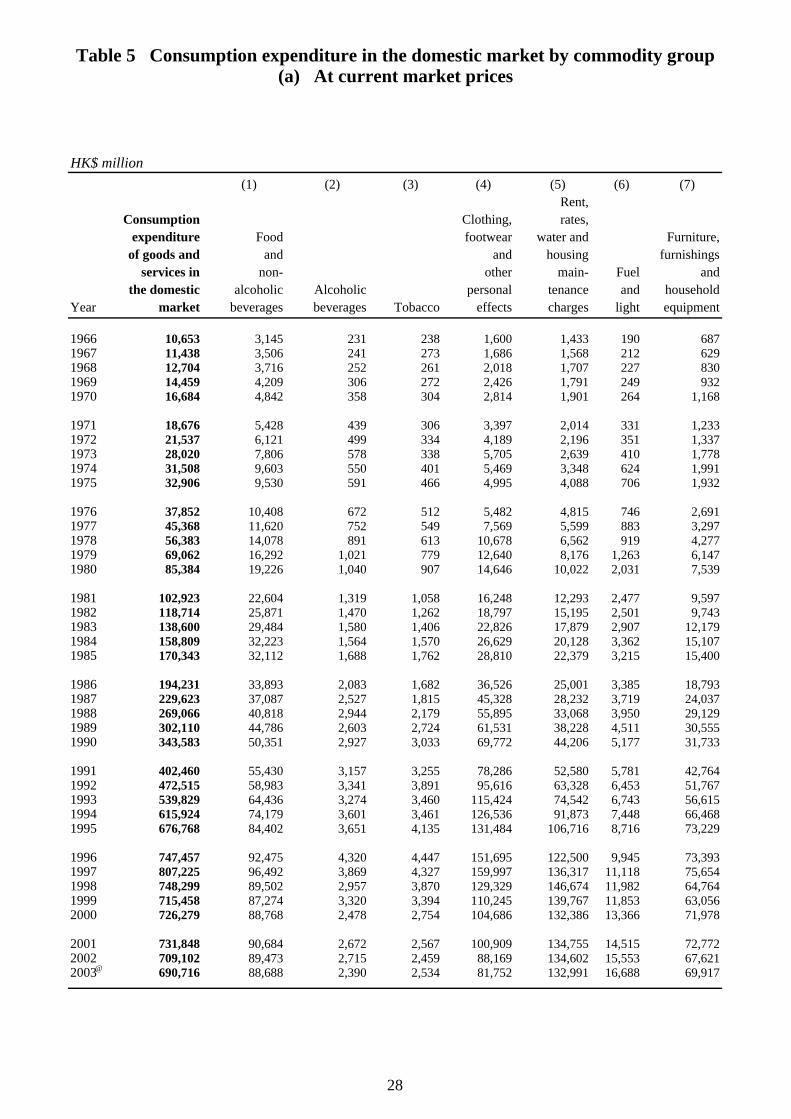
HK$ million(1) (2) (3) (4) (5) (6) (7)
Rent,Consumption Clothing, rates,
expenditure Food footwear water and Furniture,of goods and and and housing furnishings
services in non- other main- Fuel andthe domestic alcoholic Alcoholic personal tenance and household
Year market beverages beverages Tobacco effects charges light equipment
1966 10,653 3,145 231 238 1,600 1,433 190 6871967 11,438 3,506 241 273 1,686 1,568 212 6291968 12,704 3,716 252 261 2,018 1,707 227 8301969 14,459 4,209 306 272 2,426 1,791 249 9321970 16,684 4,842 358 304 2,814 1,901 264 1,168
1971 18,676 5,428 439 306 3,397 2,014 331 1,2331972 21,537 6,121 499 334 4,189 2,196 351 1,3371973 28,020 7,806 578 338 5,705 2,639 410 1,7781974 31,508 9,603 550 401 5,469 3,348 624 1,9911975 32,906 9,530 591 466 4,995 4,088 706 1,932
1976 37,852 10,408 672 512 5,482 4,815 746 2,6911977 45,368 11,620 752 549 7,569 5,599 883 3,2971978 56,383 14,078 891 613 10,678 6,562 919 4,2771979 69,062 16,292 1,021 779 12,640 8,176 1,263 6,1471980 85,384 19,226 1,040 907 14,646 10,022 2,031 7,539
1981 102,923 22,604 1,319 1,058 16,248 12,293 2,477 9,5971982 118,714 25,871 1,470 1,262 18,797 15,195 2,501 9,7431983 138,600 29,484 1,580 1,406 22,826 17,879 2,907 12,1791984 158,809 32,223 1,564 1,570 26,629 20,128 3,362 15,1071985 170,343 32,112 1,688 1,762 28,810 22,379 3,215 15,400
1986 194,231 33,893 2,083 1,682 36,526 25,001 3,385 18,7931987 229,623 37,087 2,527 1,815 45,328 28,232 3,719 24,0371988 269,066 40,818 2,944 2,179 55,895 33,068 3,950 29,1291989 302,110 44,786 2,603 2,724 61,531 38,228 4,511 30,5551990 343,583 50,351 2,927 3,033 69,772 44,206 5,177 31,733
1991 402,460 55,430 3,157 3,255 78,286 52,580 5,781 42,7641992 472,515 58,983 3,341 3,891 95,616 63,328 6,453 51,7671993 539,829 64,436 3,274 3,460 115,424 74,542 6,743 56,6151994 615,924 74,179 3,601 3,461 126,536 91,873 7,448 66,4681995 676,768 84,402 3,651 4,135 131,484 106,716 8,716 73,229
1996 747,457 92,475 4,320 4,447 151,695 122,500 9,945 73,3931997 807,225 96,492 3,869 4,327 159,997 136,317 11,118 75,6541998 748,299 89,502 2,957 3,870 129,329 146,674 11,982 64,7641999 715,458 87,274 3,320 3,394 110,245 139,767 11,853 63,0562000 726,279 88,768 2,478 2,754 104,686 132,386 13,366 71,978
2001 731,848 90,684 2,672 2,567 100,909 134,755 14,515 72,7722002 709,102 89,473 2,715 2,459 88,169 134,602 15,553 67,6212003 690,716 88,688 2,390 2,534 81,752 132,991 16,688 69,917
Table 5 Consumption expenditure in the domestic market by commodity group(a) At current market prices
@
28
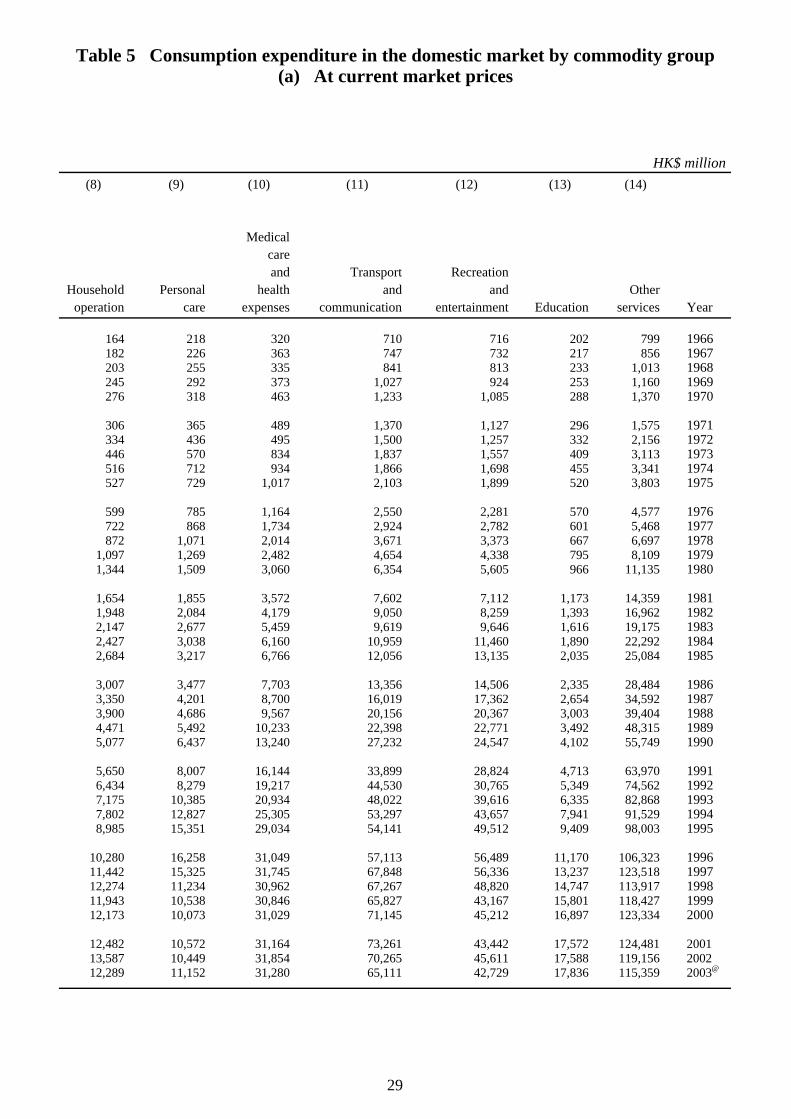
HK$ million(8) (9) (10) (11) (12) (13) (14)
Medicalcareand Transport Recreation
Household Personal health and and Otheroperation care expenses communication entertainment Education services Year
164 218 320 710 716 202 799 1966182 226 363 747 732 217 856 1967203 255 335 841 813 233 1,013 1968245 292 373 1,027 924 253 1,160 1969276 318 463 1,233 1,085 288 1,370 1970
306 365 489 1,370 1,127 296 1,575 1971334 436 495 1,500 1,257 332 2,156 1972446 570 834 1,837 1,557 409 3,113 1973516 712 934 1,866 1,698 455 3,341 1974527 729 1,017 2,103 1,899 520 3,803 1975
599 785 1,164 2,550 2,281 570 4,577 1976722 868 1,734 2,924 2,782 601 5,468 1977872 1,071 2,014 3,671 3,373 667 6,697 1978
1,097 1,269 2,482 4,654 4,338 795 8,109 19791,344 1,509 3,060 6,354 5,605 966 11,135 1980
1,654 1,855 3,572 7,602 7,112 1,173 14,359 19811,948 2,084 4,179 9,050 8,259 1,393 16,962 19822,147 2,677 5,459 9,619 9,646 1,616 19,175 19832,427 3,038 6,160 10,959 11,460 1,890 22,292 19842,684 3,217 6,766 12,056 13,135 2,035 25,084 1985
3,007 3,477 7,703 13,356 14,506 2,335 28,484 19863,350 4,201 8,700 16,019 17,362 2,654 34,592 19873,900 4,686 9,567 20,156 20,367 3,003 39,404 19884,471 5,492 10,233 22,398 22,771 3,492 48,315 19895,077 6,437 13,240 27,232 24,547 4,102 55,749 1990
5,650 8,007 16,144 33,899 28,824 4,713 63,970 19916,434 8,279 19,217 44,530 30,765 5,349 74,562 19927,175 10,385 20,934 48,022 39,616 6,335 82,868 19937,802 12,827 25,305 53,297 43,657 7,941 91,529 19948,985 15,351 29,034 54,141 49,512 9,409 98,003 1995
10,280 16,258 31,049 57,113 56,489 11,170 106,323 199611,442 15,325 31,745 67,848 56,336 13,237 123,518 199712,274 11,234 30,962 67,267 48,820 14,747 113,917 199811,943 10,538 30,846 65,827 43,167 15,801 118,427 199912,173 10,073 31,029 71,145 45,212 16,897 123,334 2000
12,482 10,572 31,164 73,261 43,442 17,572 124,481 200113,587 10,449 31,854 70,265 45,611 17,588 119,156 200212,289 11,152 31,280 65,111 42,729 17,836 115,359 2003
(a) At current market pricesTable 5 Consumption expenditure in the domestic market by commodity group
@
29
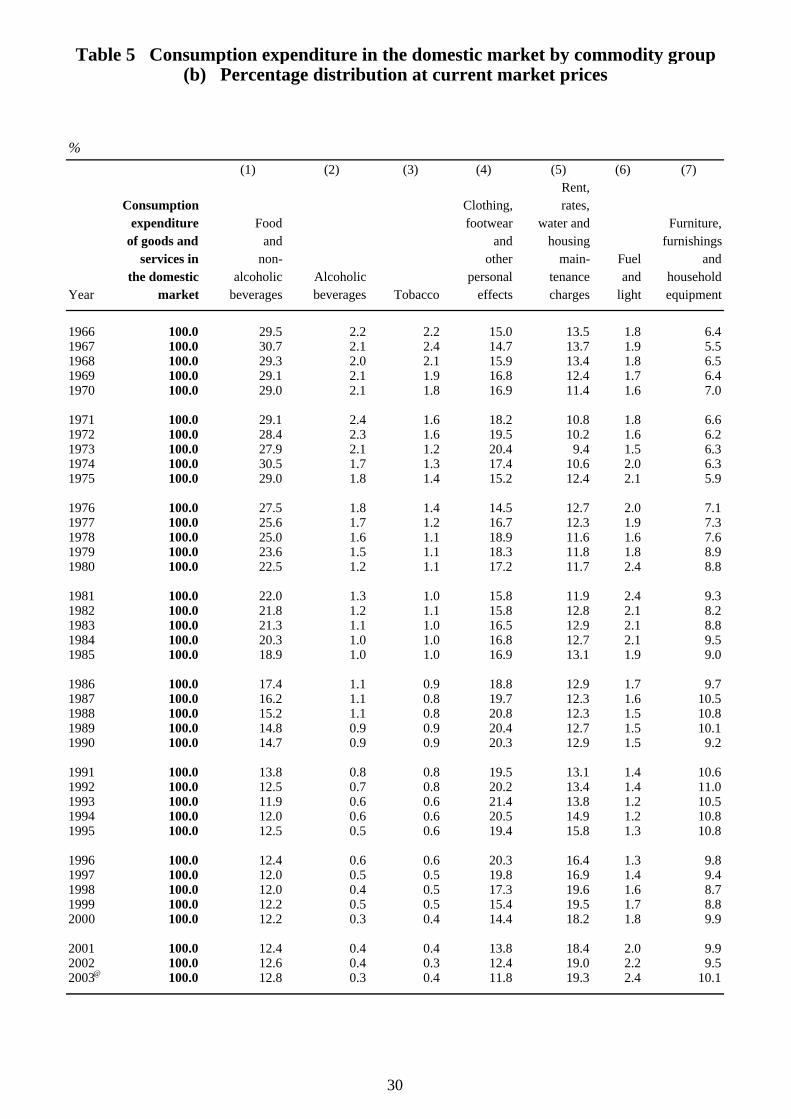
%(1) (2) (3) (4) (5) (6) (7)
Rent,Consumption Clothing, rates,
expenditure Food footwear water and Furniture,of goods and and and housing furnishings
services in non- other main- Fuel andthe domestic alcoholic Alcoholic personal tenance and household
Year market beverages beverages Tobacco effects charges light equipment
1966 100.0 29.5 2.2 2.2 15.0 13.5 1.8 6.41967 100.0 30.7 2.1 2.4 14.7 13.7 1.9 5.51968 100.0 29.3 2.0 2.1 15.9 13.4 1.8 6.51969 100.0 29.1 2.1 1.9 16.8 12.4 1.7 6.41970 100.0 29.0 2.1 1.8 16.9 11.4 1.6 7.0
1971 100.0 29.1 2.4 1.6 18.2 10.8 1.8 6.61972 100.0 28.4 2.3 1.6 19.5 10.2 1.6 6.21973 100.0 27.9 2.1 1.2 20.4 9.4 1.5 6.31974 100.0 30.5 1.7 1.3 17.4 10.6 2.0 6.31975 100.0 29.0 1.8 1.4 15.2 12.4 2.1 5.9
1976 100.0 27.5 1.8 1.4 14.5 12.7 2.0 7.11977 100.0 25.6 1.7 1.2 16.7 12.3 1.9 7.31978 100.0 25.0 1.6 1.1 18.9 11.6 1.6 7.61979 100.0 23.6 1.5 1.1 18.3 11.8 1.8 8.91980 100.0 22.5 1.2 1.1 17.2 11.7 2.4 8.8
1981 100.0 22.0 1.3 1.0 15.8 11.9 2.4 9.31982 100.0 21.8 1.2 1.1 15.8 12.8 2.1 8.21983 100.0 21.3 1.1 1.0 16.5 12.9 2.1 8.81984 100.0 20.3 1.0 1.0 16.8 12.7 2.1 9.51985 100.0 18.9 1.0 1.0 16.9 13.1 1.9 9.0
1986 100.0 17.4 1.1 0.9 18.8 12.9 1.7 9.71987 100.0 16.2 1.1 0.8 19.7 12.3 1.6 10.51988 100.0 15.2 1.1 0.8 20.8 12.3 1.5 10.81989 100.0 14.8 0.9 0.9 20.4 12.7 1.5 10.11990 100.0 14.7 0.9 0.9 20.3 12.9 1.5 9.2
1991 100.0 13.8 0.8 0.8 19.5 13.1 1.4 10.61992 100.0 12.5 0.7 0.8 20.2 13.4 1.4 11.01993 100.0 11.9 0.6 0.6 21.4 13.8 1.2 10.51994 100.0 12.0 0.6 0.6 20.5 14.9 1.2 10.81995 100.0 12.5 0.5 0.6 19.4 15.8 1.3 10.8
1996 100.0 12.4 0.6 0.6 20.3 16.4 1.3 9.81997 100.0 12.0 0.5 0.5 19.8 16.9 1.4 9.41998 100.0 12.0 0.4 0.5 17.3 19.6 1.6 8.71999 100.0 12.2 0.5 0.5 15.4 19.5 1.7 8.82000 100.0 12.2 0.3 0.4 14.4 18.2 1.8 9.9
2001 100.0 12.4 0.4 0.4 13.8 18.4 2.0 9.92002 100.0 12.6 0.4 0.3 12.4 19.0 2.2 9.52003 100.0 12.8 0.3 0.4 11.8 19.3 2.4 10.1
Table 5 Consumption expenditure in the domestic market by commodity group(b) Percentage distribution at current market prices
@
30
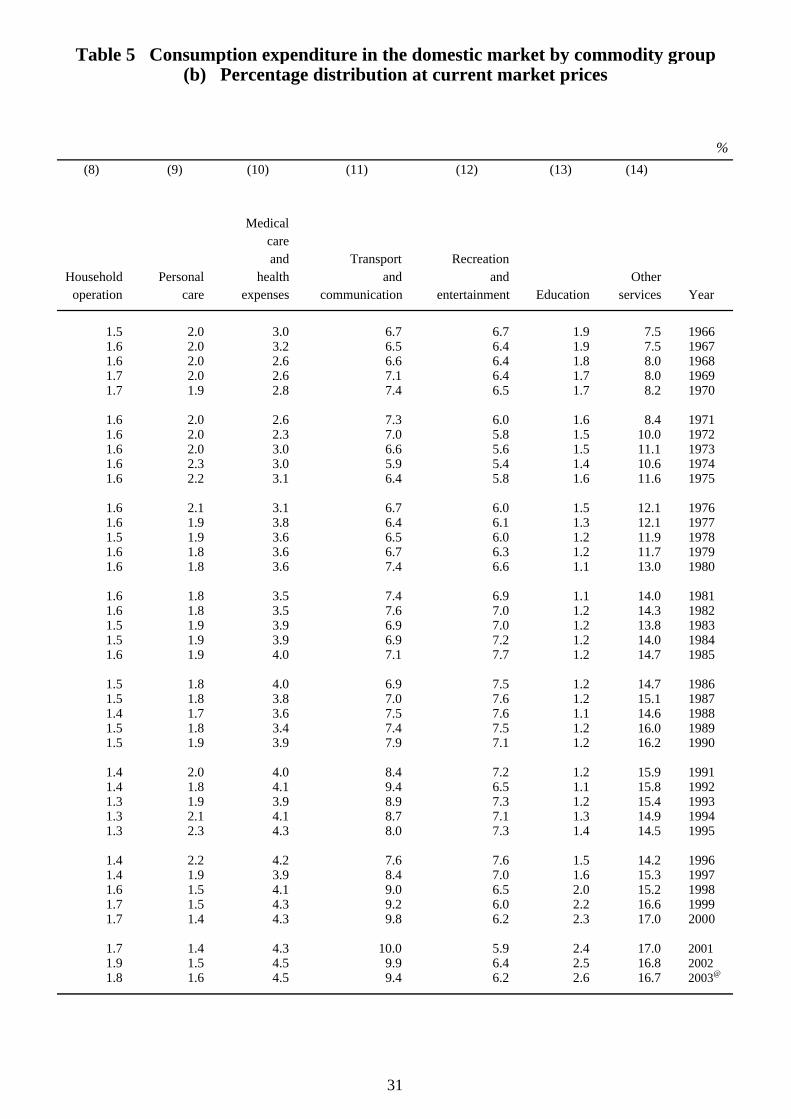
%(8) (9) (10) (11) (12) (13) (14)
Medicalcareand Transport Recreation
Household Personal health and and Otheroperation care expenses communication entertainment Education services Year
1.5 2.0 3.0 6.7 6.7 1.9 7.5 19661.6 2.0 3.2 6.5 6.4 1.9 7.5 19671.6 2.0 2.6 6.6 6.4 1.8 8.0 19681.7 2.0 2.6 7.1 6.4 1.7 8.0 19691.7 1.9 2.8 7.4 6.5 1.7 8.2 1970
1.6 2.0 2.6 7.3 6.0 1.6 8.4 19711.6 2.0 2.3 7.0 5.8 1.5 10.0 19721.6 2.0 3.0 6.6 5.6 1.5 11.1 19731.6 2.3 3.0 5.9 5.4 1.4 10.6 19741.6 2.2 3.1 6.4 5.8 1.6 11.6 1975
1.6 2.1 3.1 6.7 6.0 1.5 12.1 19761.6 1.9 3.8 6.4 6.1 1.3 12.1 19771.5 1.9 3.6 6.5 6.0 1.2 11.9 19781.6 1.8 3.6 6.7 6.3 1.2 11.7 19791.6 1.8 3.6 7.4 6.6 1.1 13.0 1980
1.6 1.8 3.5 7.4 6.9 1.1 14.0 19811.6 1.8 3.5 7.6 7.0 1.2 14.3 19821.5 1.9 3.9 6.9 7.0 1.2 13.8 19831.5 1.9 3.9 6.9 7.2 1.2 14.0 19841.6 1.9 4.0 7.1 7.7 1.2 14.7 1985
1.5 1.8 4.0 6.9 7.5 1.2 14.7 19861.5 1.8 3.8 7.0 7.6 1.2 15.1 19871.4 1.7 3.6 7.5 7.6 1.1 14.6 19881.5 1.8 3.4 7.4 7.5 1.2 16.0 19891.5 1.9 3.9 7.9 7.1 1.2 16.2 1990
1.4 2.0 4.0 8.4 7.2 1.2 15.9 19911.4 1.8 4.1 9.4 6.5 1.1 15.8 19921.3 1.9 3.9 8.9 7.3 1.2 15.4 19931.3 2.1 4.1 8.7 7.1 1.3 14.9 19941.3 2.3 4.3 8.0 7.3 1.4 14.5 1995
1.4 2.2 4.2 7.6 7.6 1.5 14.2 19961.4 1.9 3.9 8.4 7.0 1.6 15.3 19971.6 1.5 4.1 9.0 6.5 2.0 15.2 19981.7 1.5 4.3 9.2 6.0 2.2 16.6 19991.7 1.4 4.3 9.8 6.2 2.3 17.0 2000
1.7 1.4 4.3 10.0 5.9 2.4 17.0 20011.9 1.5 4.5 9.9 6.4 2.5 16.8 20021.8 1.6 4.5 9.4 6.2 2.6 16.7 2003
Table 5 Consumption expenditure in the domestic market by commodity group(b) Percentage distribution at current market prices
@
31
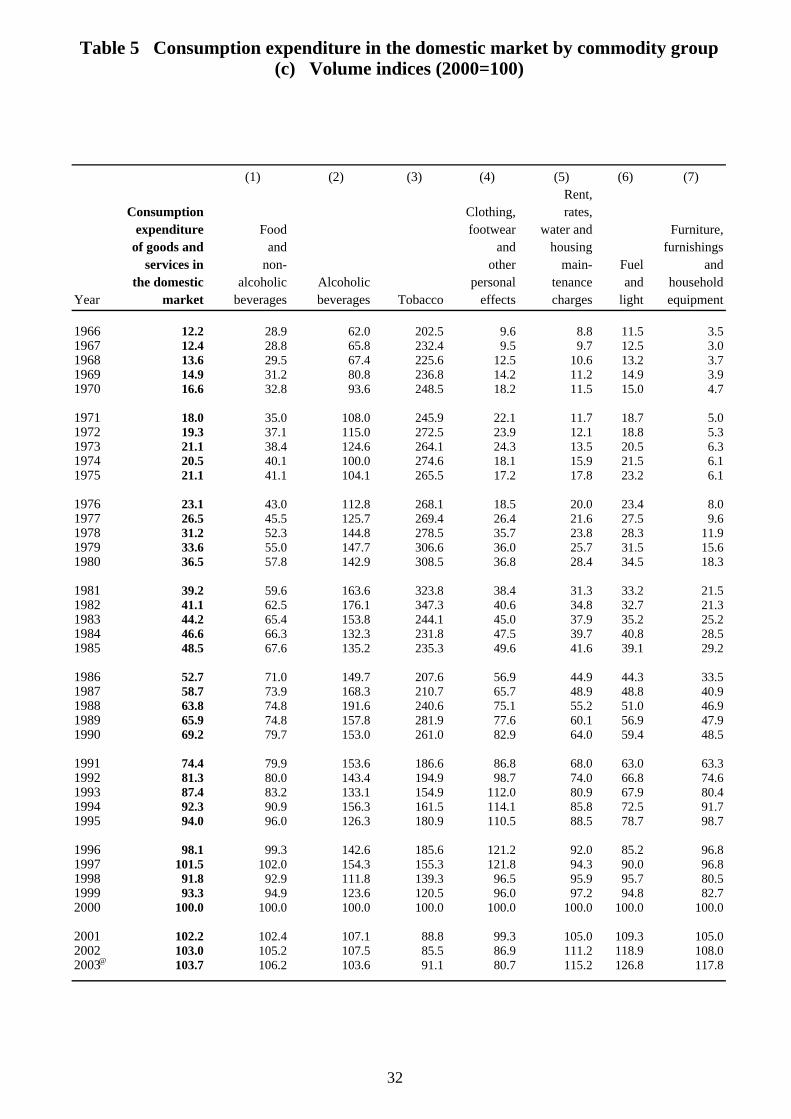
(1) (2) (3) (4) (5) (6) (7)Rent,
Consumption Clothing, rates,expenditure Food footwear water and Furniture,
of goods and and and housing furnishingsservices in non- other main- Fuel and
the domestic alcoholic Alcoholic personal tenance and householdYear market beverages beverages Tobacco effects charges light equipment
1966 12.2 28.9 62.0 202.5 9.6 8.8 11.5 3.51967 12.4 28.8 65.8 232.4 9.5 9.7 12.5 3.01968 13.6 29.5 67.4 225.6 12.5 10.6 13.2 3.71969 14.9 31.2 80.8 236.8 14.2 11.2 14.9 3.91970 16.6 32.8 93.6 248.5 18.2 11.5 15.0 4.7
1971 18.0 35.0 108.0 245.9 22.1 11.7 18.7 5.01972 19.3 37.1 115.0 272.5 23.9 12.1 18.8 5.31973 21.1 38.4 124.6 264.1 24.3 13.5 20.5 6.31974 20.5 40.1 100.0 274.6 18.1 15.9 21.5 6.11975 21.1 41.1 104.1 265.5 17.2 17.8 23.2 6.1
1976 23.1 43.0 112.8 268.1 18.5 20.0 23.4 8.01977 26.5 45.5 125.7 269.4 26.4 21.6 27.5 9.61978 31.2 52.3 144.8 278.5 35.7 23.8 28.3 11.91979 33.6 55.0 147.7 306.6 36.0 25.7 31.5 15.61980 36.5 57.8 142.9 308.5 36.8 28.4 34.5 18.3
1981 39.2 59.6 163.6 323.8 38.4 31.3 33.2 21.51982 41.1 62.5 176.1 347.3 40.6 34.8 32.7 21.31983 44.2 65.4 153.8 244.1 45.0 37.9 35.2 25.21984 46.6 66.3 132.3 231.8 47.5 39.7 40.8 28.51985 48.5 67.6 135.2 235.3 49.6 41.6 39.1 29.2
1986 52.7 71.0 149.7 207.6 56.9 44.9 44.3 33.51987 58.7 73.9 168.3 210.7 65.7 48.9 48.8 40.91988 63.8 74.8 191.6 240.6 75.1 55.2 51.0 46.91989 65.9 74.8 157.8 281.9 77.6 60.1 56.9 47.91990 69.2 79.7 153.0 261.0 82.9 64.0 59.4 48.5
1991 74.4 79.9 153.6 186.6 86.8 68.0 63.0 63.31992 81.3 80.0 143.4 194.9 98.7 74.0 66.8 74.61993 87.4 83.2 133.1 154.9 112.0 80.9 67.9 80.41994 92.3 90.9 156.3 161.5 114.1 85.8 72.5 91.71995 94.0 96.0 126.3 180.9 110.5 88.5 78.7 98.7
1996 98.1 99.3 142.6 185.6 121.2 92.0 85.2 96.81997 101.5 102.0 154.3 155.3 121.8 94.3 90.0 96.81998 91.8 92.9 111.8 139.3 96.5 95.9 95.7 80.51999 93.3 94.9 123.6 120.5 96.0 97.2 94.8 82.72000 100.0 100.0 100.0 100.0 100.0 100.0 100.0 100.0
2001 102.2 102.4 107.1 88.8 99.3 105.0 109.3 105.02002 103.0 105.2 107.5 85.5 86.9 111.2 118.9 108.02003 103.7 106.2 103.6 91.1 80.7 115.2 126.8 117.8
Table 5 Consumption expenditure in the domestic market by commodity group(c) Volume indices (2000=100)
@
32
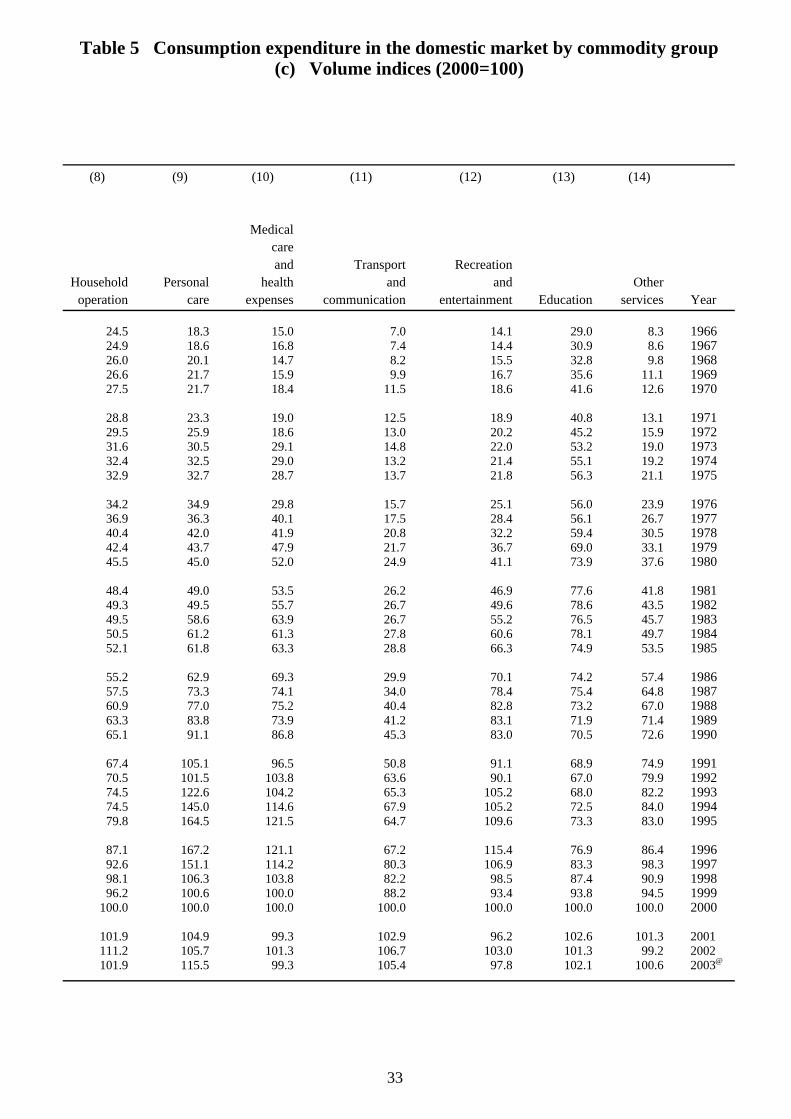
(8) (9) (10) (11) (12) (13) (14)
Medicalcareand Transport Recreation
Household Personal health and and Otheroperation care expenses communication entertainment Education services Year
24.5 18.3 15.0 7.0 14.1 29.0 8.3 196624.9 18.6 16.8 7.4 14.4 30.9 8.6 196726.0 20.1 14.7 8.2 15.5 32.8 9.8 196826.6 21.7 15.9 9.9 16.7 35.6 11.1 196927.5 21.7 18.4 11.5 18.6 41.6 12.6 1970
28.8 23.3 19.0 12.5 18.9 40.8 13.1 197129.5 25.9 18.6 13.0 20.2 45.2 15.9 197231.6 30.5 29.1 14.8 22.0 53.2 19.0 197332.4 32.5 29.0 13.2 21.4 55.1 19.2 197432.9 32.7 28.7 13.7 21.8 56.3 21.1 1975
34.2 34.9 29.8 15.7 25.1 56.0 23.9 197636.9 36.3 40.1 17.5 28.4 56.1 26.7 197740.4 42.0 41.9 20.8 32.2 59.4 30.5 197842.4 43.7 47.9 21.7 36.7 69.0 33.1 197945.5 45.0 52.0 24.9 41.1 73.9 37.6 1980
48.4 49.0 53.5 26.2 46.9 77.6 41.8 198149.3 49.5 55.7 26.7 49.6 78.6 43.5 198249.5 58.6 63.9 26.7 55.2 76.5 45.7 198350.5 61.2 61.3 27.8 60.6 78.1 49.7 198452.1 61.8 63.3 28.8 66.3 74.9 53.5 1985
55.2 62.9 69.3 29.9 70.1 74.2 57.4 198657.5 73.3 74.1 34.0 78.4 75.4 64.8 198760.9 77.0 75.2 40.4 82.8 73.2 67.0 198863.3 83.8 73.9 41.2 83.1 71.9 71.4 198965.1 91.1 86.8 45.3 83.0 70.5 72.6 1990
67.4 105.1 96.5 50.8 91.1 68.9 74.9 199170.5 101.5 103.8 63.6 90.1 67.0 79.9 199274.5 122.6 104.2 65.3 105.2 68.0 82.2 199374.5 145.0 114.6 67.9 105.2 72.5 84.0 199479.8 164.5 121.5 64.7 109.6 73.3 83.0 1995
87.1 167.2 121.1 67.2 115.4 76.9 86.4 199692.6 151.1 114.2 80.3 106.9 83.3 98.3 199798.1 106.3 103.8 82.2 98.5 87.4 90.9 199896.2 100.6 100.0 88.2 93.4 93.8 94.5 1999
100.0 100.0 100.0 100.0 100.0 100.0 100.0 2000
101.9 104.9 99.3 102.9 96.2 102.6 101.3 2001111.2 105.7 101.3 106.7 103.0 101.3 99.2 2002101.9 115.5 99.3 105.4 97.8 102.1 100.6 2003
(c) Volume indices (2000=100)Table 5 Consumption expenditure in the domestic market by commodity group
@
33
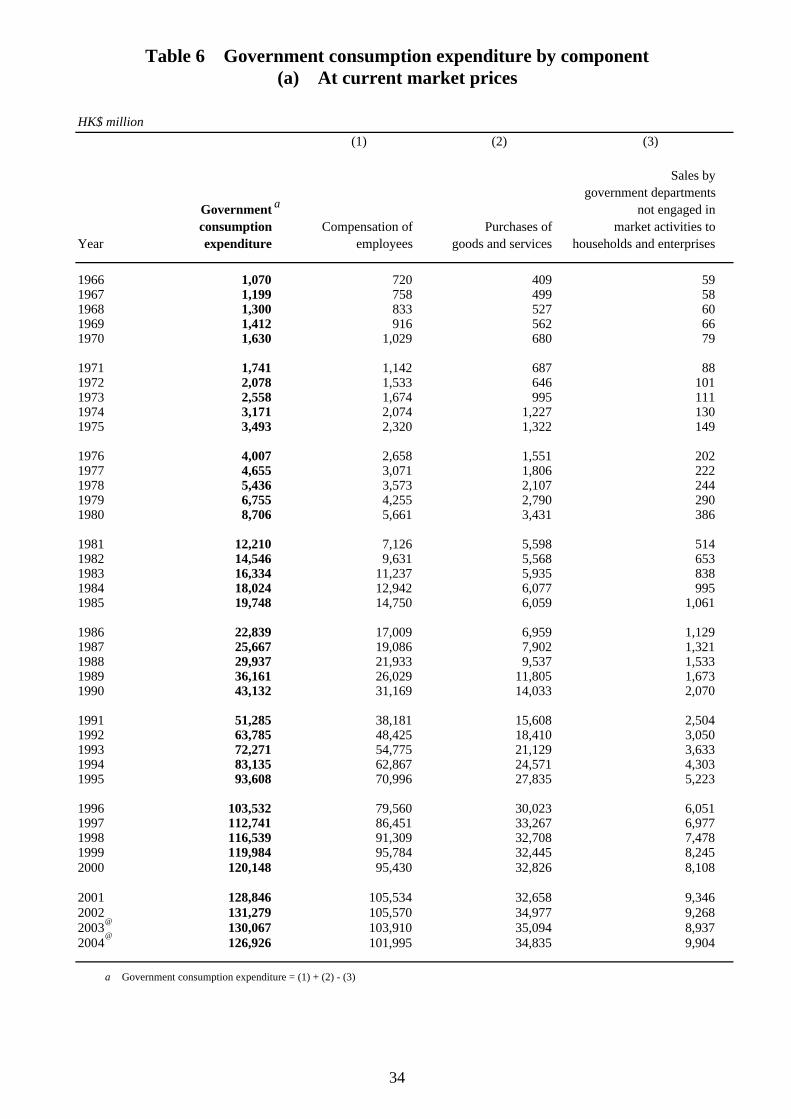
HK$ million(1) (2) (3)
Sales bygovernment departments
Government not engaged inconsumption Compensation of Purchases of market activities to
Year expenditure employees goods and services households and enterprises
1966 1,070 720 409 591967 1,199 758 499 581968 1,300 833 527 601969 1,412 916 562 661970 1,630 1,029 680 79
1971 1,741 1,142 687 881972 2,078 1,533 646 1011973 2,558 1,674 995 1111974 3,171 2,074 1,227 1301975 3,493 2,320 1,322 149
1976 4,007 2,658 1,551 2021977 4,655 3,071 1,806 2221978 5,436 3,573 2,107 2441979 6,755 4,255 2,790 2901980 8,706 5,661 3,431 386
1981 12,210 7,126 5,598 5141982 14,546 9,631 5,568 6531983 16,334 11,237 5,935 8381984 18,024 12,942 6,077 9951985 19,748 14,750 6,059 1,061
1986 22,839 17,009 6,959 1,1291987 25,667 19,086 7,902 1,3211988 29,937 21,933 9,537 1,5331989 36,161 26,029 11,805 1,6731990 43,132 31,169 14,033 2,070
1991 51,285 38,181 15,608 2,5041992 63,785 48,425 18,410 3,0501993 72,271 54,775 21,129 3,6331994 83,135 62,867 24,571 4,3031995 93,608 70,996 27,835 5,223
1996 103,532 79,560 30,023 6,0511997 112,741 86,451 33,267 6,9771998 116,539 91,309 32,708 7,4781999 119,984 95,784 32,445 8,2452000 120,148 95,430 32,826 8,108
2001 128,846 105,534 32,658 9,3462002 131,279 105,570 34,977 9,2682003 130,067 103,910 35,094 8,9372004 126,926 101,995 34,835 9,904
a Government consumption expenditure = (1) + (2) - (3)
Table 6 Government consumption expenditure by component(a) At current market prices
a
@
@
34

(1) (2) (3)
Sales bygovernment departments
Government not engaged inconsumption Compensation of Purchases of market activities to
Year expenditure employees goods and services households and enterprises
1966 12.7 14.9 9.6 20.21967 14.0 15.3 11.9 19.11968 14.8 15.9 12.9 18.61969 16.1 17.3 13.8 18.11970 17.0 17.8 15.5 21.9
1971 17.4 19.2 14.7 25.21972 18.5 22.5 12.6 27.91973 20.4 22.1 17.8 28.01974 22.2 23.9 19.6 30.01975 23.6 25.6 20.2 28.5
1976 25.2 27.0 22.5 33.61977 27.6 28.6 25.5 32.71978 30.3 30.9 29.1 35.81979 33.5 32.9 34.0 39.51980 36.0 36.2 34.7 37.3
1981 43.9 38.8 50.4 41.41982 46.3 45.5 46.1 44.81983 49.1 49.4 46.6 44.71984 51.1 52.5 46.4 43.21985 52.5 54.6 46.1 40.7
1986 55.9 56.8 50.9 39.21987 58.0 59.3 52.7 43.61988 60.2 61.5 54.8 45.91989 63.3 64.0 58.4 44.51990 66.7 67.1 62.9 50.3
1991 71.8 73.3 65.4 53.31992 81.3 83.6 72.0 57.11993 83.0 85.2 74.6 62.41994 86.1 88.7 76.7 64.81995 88.8 90.9 81.4 72.1
1996 92.2 94.0 85.9 77.91997 94.4 95.3 90.6 83.61998 95.1 95.0 94.3 90.61999 98.0 98.7 97.2 102.22000 100.0 100.0 100.0 100.0
2001 106.1 109.1 99.5 114.92002 108.7 109.3 109.6 119.52003 110.7 109.8 112.2 105.92004 111.3 111.3 110.8 109.9
Table 6 Government consumption expenditure by component(b) Volume indices (2000=100)
@
@
35
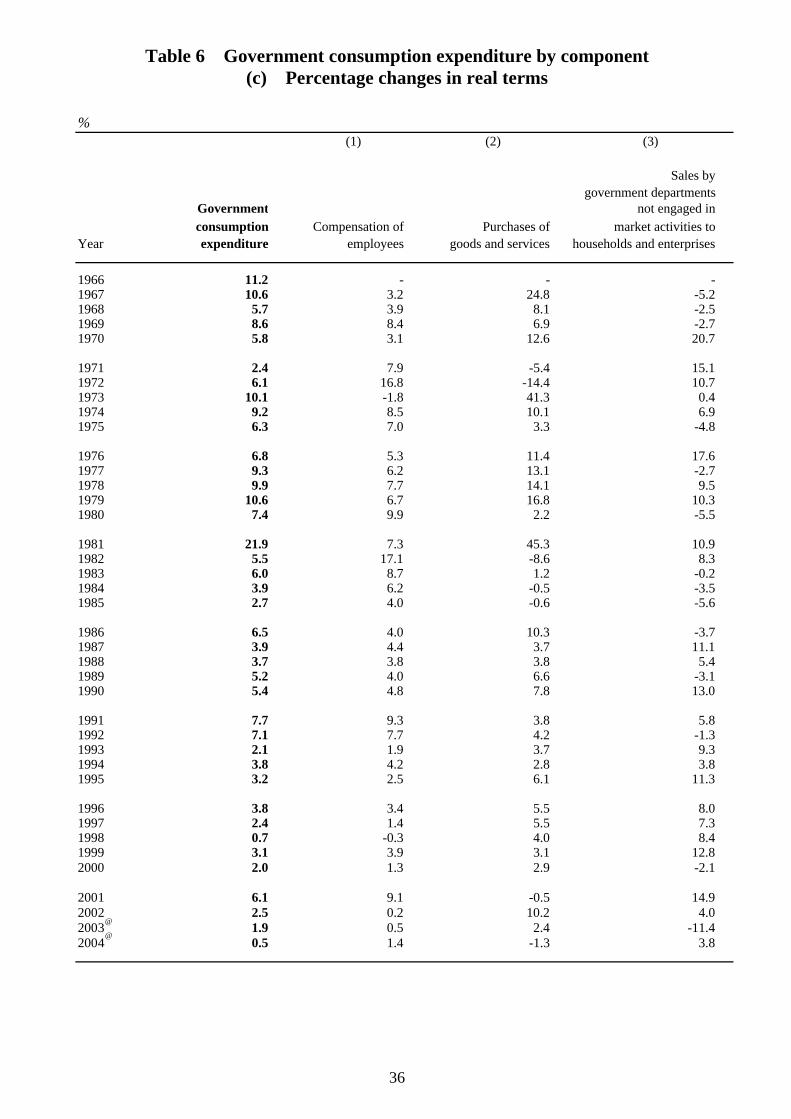
%(1) (2) (3)
Sales bygovernment departments
Government not engaged inconsumption Compensation of Purchases of market activities to
Year expenditure employees goods and services households and enterprises
1966 11.2 - - -1967 10.6 3.2 24.8 -5.21968 5.7 3.9 8.1 -2.51969 8.6 8.4 6.9 -2.71970 5.8 3.1 12.6 20.7
1971 2.4 7.9 -5.4 15.11972 6.1 16.8 -14.4 10.71973 10.1 -1.8 41.3 0.41974 9.2 8.5 10.1 6.91975 6.3 7.0 3.3 -4.8
1976 6.8 5.3 11.4 17.61977 9.3 6.2 13.1 -2.71978 9.9 7.7 14.1 9.51979 10.6 6.7 16.8 10.31980 7.4 9.9 2.2 -5.5
1981 21.9 7.3 45.3 10.91982 5.5 17.1 -8.6 8.31983 6.0 8.7 1.2 -0.21984 3.9 6.2 -0.5 -3.51985 2.7 4.0 -0.6 -5.6
1986 6.5 4.0 10.3 -3.71987 3.9 4.4 3.7 11.11988 3.7 3.8 3.8 5.41989 5.2 4.0 6.6 -3.11990 5.4 4.8 7.8 13.0
1991 7.7 9.3 3.8 5.81992 7.1 7.7 4.2 -1.31993 2.1 1.9 3.7 9.31994 3.8 4.2 2.8 3.81995 3.2 2.5 6.1 11.3
1996 3.8 3.4 5.5 8.01997 2.4 1.4 5.5 7.31998 0.7 -0.3 4.0 8.41999 3.1 3.9 3.1 12.82000 2.0 1.3 2.9 -2.1
2001 6.1 9.1 -0.5 14.92002 2.5 0.2 10.2 4.02003 1.9 0.5 2.4 -11.42004 0.5 1.4 -1.3 3.8
Table 6 Government consumption expenditure by component(c) Percentage changes in real terms
@
@
36
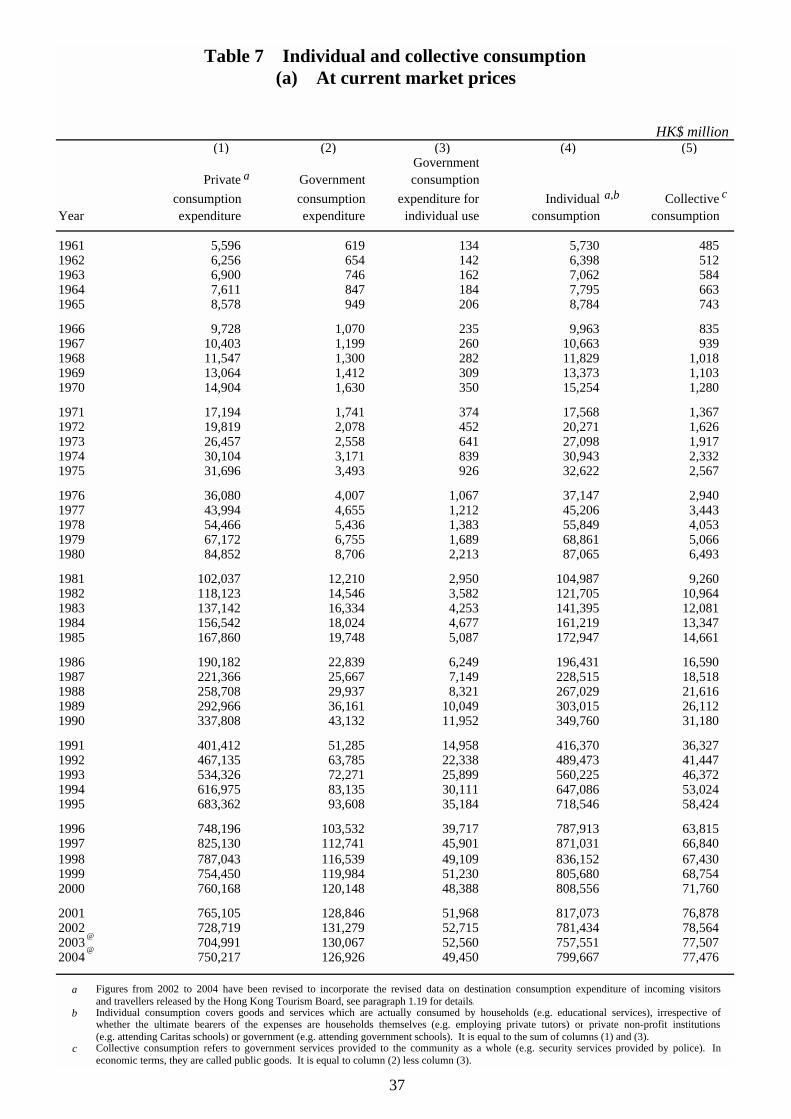
HK$ million (1) (2) (3) (4) (5)
GovernmentPrivate Government consumption
consumption consumption expenditure for Individual CollectiveYear expenditure expenditure individual use consumption consumption
1961 5,596 619 134 5,730 4851962 6,256 654 142 6,398 5121963 6,900 746 162 7,062 5841964 7,611 847 184 7,795 6631965 8,578 949 206 8,784 743
1966 9,728 1,070 235 9,963 8351967 10,403 1,199 260 10,663 9391968 11,547 1,300 282 11,829 1,0181969 13,064 1,412 309 13,373 1,1031970 14,904 1,630 350 15,254 1,280
1971 17,194 1,741 374 17,568 1,3671972 19,819 2,078 452 20,271 1,6261973 26,457 2,558 641 27,098 1,9171974 30,104 3,171 839 30,943 2,3321975 31,696 3,493 926 32,622 2,567
1976 36,080 4,007 1,067 37,147 2,9401977 43,994 4,655 1,212 45,206 3,4431978 54,466 5,436 1,383 55,849 4,0531979 67,172 6,755 1,689 68,861 5,0661980 84,852 8,706 2,213 87,065 6,493
1981 102,037 12,210 2,950 104,987 9,2601982 118,123 14,546 3,582 121,705 10,9641983 137,142 16,334 4,253 141,395 12,0811984 156,542 18,024 4,677 161,219 13,3471985 167,860 19,748 5,087 172,947 14,661
1986 190,182 22,839 6,249 196,431 16,5901987 221,366 25,667 7,149 228,515 18,5181988 258,708 29,937 8,321 267,029 21,6161989 292,966 36,161 10,049 303,015 26,1121990 337,808 43,132 11,952 349,760 31,180
1991 401,412 51,285 14,958 416,370 36,3271992 467,135 63,785 22,338 489,473 41,4471993 534,326 72,271 25,899 560,225 46,3721994 616,975 83,135 30,111 647,086 53,0241995 683,362 93,608 35,184 718,546 58,424
1996 748,196 103,532 39,717 787,913 63,8151997 825,130 112,741 45,901 871,031 66,8401998 787,043 116,539 49,109 836,152 67,4301999 754,450 119,984 51,230 805,680 68,7542000 760,168 120,148 48,388 808,556 71,760
2001 765,105 128,846 51,968 817,073 76,8782002 728,719 131,279 52,715 781,434 78,5642003 704,991 130,067 52,560 757,551 77,5072004 750,217 126,926 49,450 799,667 77,476
aand travellers released by the Hong Kong Tourism Board, see paragraph 1.19 for details.
b
ceconomic terms, they are called public goods. It is equal to column (2) less column (3).Collective consumption refers to government services provided to the community as a whole (e.g. security services provided by police). In(e.g. attending Caritas schools) or government (e.g. attending government schools). It is equal to the sum of columns (1) and (3).
Table 7 Individual and collective consumption(a) At current market prices
Figures from 2002 to 2004 have been revised to incorporate the revised data on destination consumption expenditure of incoming visitors
Individual consumption covers goods and services which are actually consumed by households (e.g. educational services), irrespective ofwhether the ultimate bearers of the expenses are households themselves (e.g. employing private tutors) or private non-profit institutions
aa,b c
@
@
37
% (1) (2) (3) (4) (5)
GovernmentPrivate Government consumption
consumption consumption expenditure for Individual CollectiveYear expenditure expenditure individual use consumption consumption
1961 - - - - -1962 11.8 5.7 6.0 11.7 5.61963 10.3 14.1 14.1 10.4 14.11964 10.3 13.5 13.6 10.4 13.51965 12.7 12.0 12.0 12.7 12.1
1966 13.4 12.8 14.1 13.4 12.41967 6.9 12.1 10.6 7.0 12.51968 11.0 8.4 8.5 10.9 8.41969 13.1 8.6 9.6 13.1 8.31970 14.1 15.4 13.3 14.1 16.0
1971 15.4 6.8 6.9 15.2 6.81972 15.3 19.4 20.9 15.4 18.91973 33.5 23.1 41.8 33.7 17.91974 13.8 24.0 30.9 14.2 21.61975 5.3 10.2 10.4 5.4 10.1
1976 13.8 14.7 15.2 13.9 14.51977 21.9 16.2 13.6 21.7 17.11978 23.8 16.8 14.1 23.5 17.71979 23.3 24.3 22.1 23.3 25.01980 26.3 28.9 31.0 26.4 28.2
1981 20.3 40.2 33.3 20.6 42.61982 15.8 19.1 21.4 15.9 18.41983 16.1 12.3 18.7 16.2 10.21984 14.1 10.3 10.0 14.0 10.51985 7.2 9.6 8.8 7.3 9.8
1986 13.3 15.7 22.8 13.6 13.21987 16.4 12.4 14.4 16.3 11.61988 16.9 16.6 16.4 16.9 16.71989 13.2 20.8 20.8 13.5 20.81990 15.3 19.3 18.9 15.4 19.4
1991 18.8 18.9 25.2 19.0 16.51992 17.2 17.7 24.9 17.6 14.11993 14.4 13.3 15.9 14.5 11.91994 15.5 15.0 16.3 15.5 14.31995 10.8 12.6 16.8 11.0 10.2
1996 9.5 10.6 12.9 9.7 9.21997 10.3 8.9 15.6 10.5 4.71998 -4.6 3.4 7.0 -4.0 0.91999 -4.1 3.0 4.3 -3.6 2.02000 0.8 0.1 -5.5 0.4 4.4
2001 0.6 7.2 7.4 1.1 7.12002 -4.8 1.9 1.4 -4.4 2.22003 -3.3 -0.9 -0.3 -3.1 -1.32004 6.4 -2.4 -5.9 5.6 *
atravellers released by the Hong Kong Tourism Board, see paragraph 1.19 for details.
Table 7 Individual and collective consumption(b) Percentage changes in nominal terms
Figures from 2002 to 2004 have been revised to incorporate the revised data on destination consumption expenditure of incoming visitors and
a
@
a
@
38
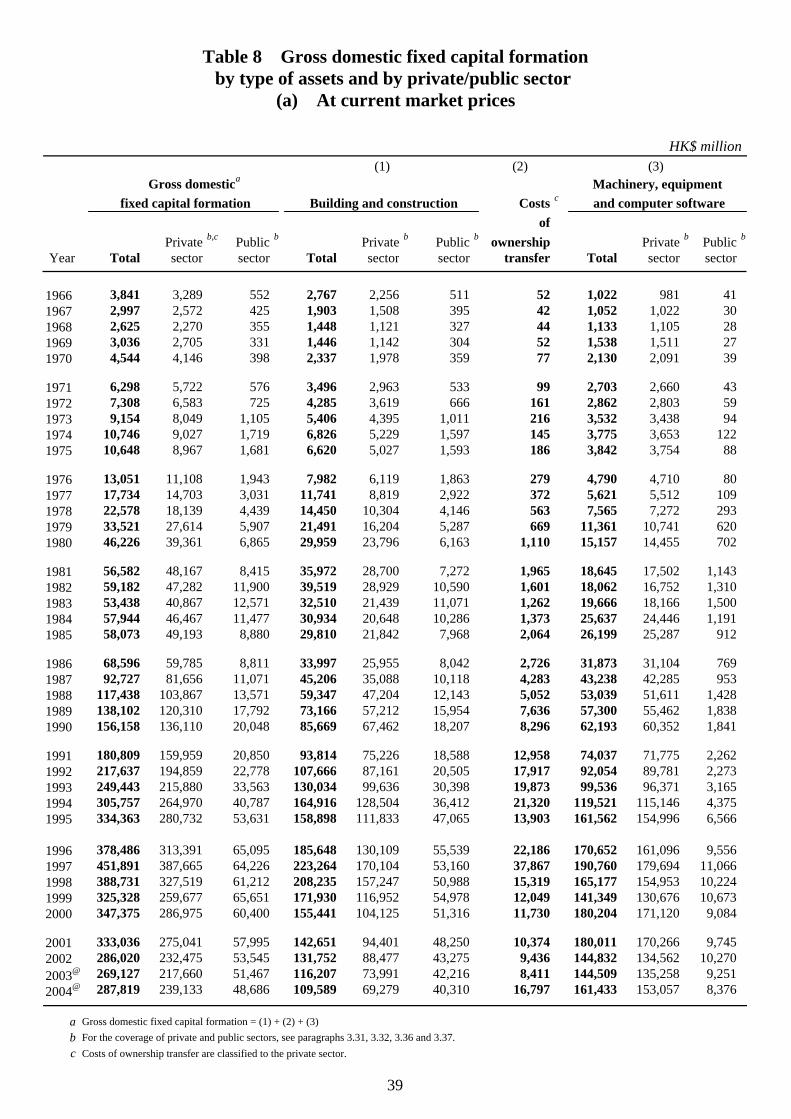
HK$ million (2)
Costs c
ofPrivate b,c Public b Private b Public b ownership Private b Public b
Year Total sector sector Total sector sector transfer Total sector sector
1966 3,841 3,289 552 2,767 2,256 511 52 1,022 981 411967 2,997 2,572 425 1,903 1,508 395 42 1,052 1,022 301968 2,625 2,270 355 1,448 1,121 327 44 1,133 1,105 281969 3,036 2,705 331 1,446 1,142 304 52 1,538 1,511 271970 4,544 4,146 398 2,337 1,978 359 77 2,130 2,091 39
1971 6,298 5,722 576 3,496 2,963 533 99 2,703 2,660 431972 7,308 6,583 725 4,285 3,619 666 161 2,862 2,803 591973 9,154 8,049 1,105 5,406 4,395 1,011 216 3,532 3,438 941974 10,746 9,027 1,719 6,826 5,229 1,597 145 3,775 3,653 1221975 10,648 8,967 1,681 6,620 5,027 1,593 186 3,842 3,754 88
1976 13,051 11,108 1,943 7,982 6,119 1,863 279 4,790 4,710 801977 17,734 14,703 3,031 11,741 8,819 2,922 372 5,621 5,512 1091978 22,578 18,139 4,439 14,450 10,304 4,146 563 7,565 7,272 2931979 33,521 27,614 5,907 21,491 16,204 5,287 669 11,361 10,741 6201980 46,226 39,361 6,865 29,959 23,796 6,163 1,110 15,157 14,455 702
1981 56,582 48,167 8,415 35,972 28,700 7,272 1,965 18,645 17,502 1,1431982 59,182 47,282 11,900 39,519 28,929 10,590 1,601 18,062 16,752 1,3101983 53,438 40,867 12,571 32,510 21,439 11,071 1,262 19,666 18,166 1,5001984 57,944 46,467 11,477 30,934 20,648 10,286 1,373 25,637 24,446 1,1911985 58,073 49,193 8,880 29,810 21,842 7,968 2,064 26,199 25,287 912
1986 68,596 59,785 8,811 33,997 25,955 8,042 2,726 31,873 31,104 7691987 92,727 81,656 11,071 45,206 35,088 10,118 4,283 43,238 42,285 9531988 117,438 103,867 13,571 59,347 47,204 12,143 5,052 53,039 51,611 1,4281989 138,102 120,310 17,792 73,166 57,212 15,954 7,636 57,300 55,462 1,8381990 156,158 136,110 20,048 85,669 67,462 18,207 8,296 62,193 60,352 1,841
1991 180,809 159,959 20,850 93,814 75,226 18,588 12,958 74,037 71,775 2,2621992 217,637 194,859 22,778 107,666 87,161 20,505 17,917 92,054 89,781 2,2731993 249,443 215,880 33,563 130,034 99,636 30,398 19,873 99,536 96,371 3,1651994 305,757 264,970 40,787 164,916 128,504 36,412 21,320 119,521 115,146 4,3751995 334,363 280,732 53,631 158,898 111,833 47,065 13,903 161,562 154,996 6,566
1996 378,486 313,391 65,095 185,648 130,109 55,539 22,186 170,652 161,096 9,5561997 451,891 387,665 64,226 223,264 170,104 53,160 37,867 190,760 179,694 11,0661998 388,731 327,519 61,212 208,235 157,247 50,988 15,319 165,177 154,953 10,2241999 325,328 259,677 65,651 171,930 116,952 54,978 12,049 141,349 130,676 10,6732000 347,375 286,975 60,400 155,441 104,125 51,316 11,730 180,204 171,120 9,084
2001 333,036 275,041 57,995 142,651 94,401 48,250 10,374 180,011 170,266 9,7452002 286,020 232,475 53,545 131,752 88,477 43,275 9,436 144,832 134,562 10,2702003@ 269,127 217,660 51,467 116,207 73,991 42,216 8,411 144,509 135,258 9,2512004@ 287,819 239,133 48,686 109,589 69,279 40,310 16,797 161,433 153,057 8,376
a Gross domestic fixed capital formation = (1) + (2) + (3) b For the coverage of private and public sectors, see paragraphs 3.31, 3.32, 3.36 and 3.37.c Costs of ownership transfer are classified to the private sector.
Table 8 Gross domestic fixed capital formationby type of assets and by private/public sector
(a) At current market prices
(3) (1) Machinery, equipment Gross domestica
Building and construction and computer software fixed capital formation
39
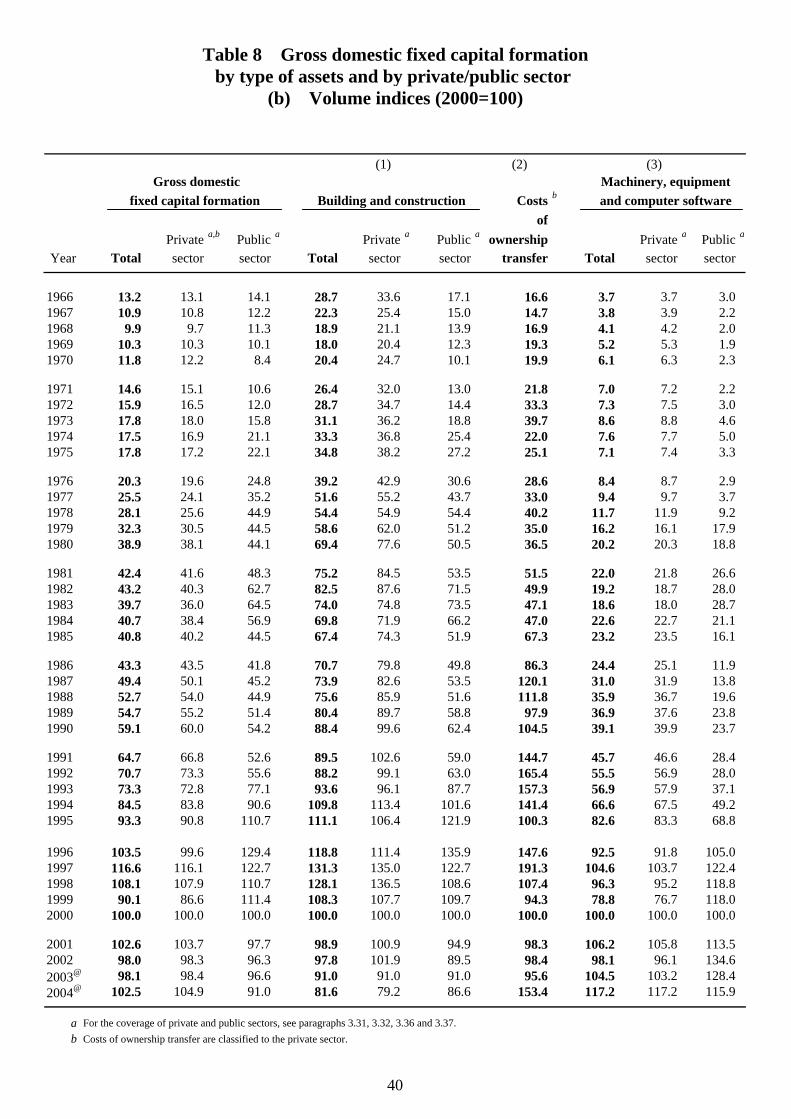
by type of assets and by private/public sector (b) Volume indices (2000=100)
(2)
Costs b
ofPrivate a,b Public a Private a Public a ownership Private a Public a
Year Total sector sector Total sector sector transfer Total sector sector
1966 13.2 13.1 14.1 28.7 33.6 17.1 16.6 3.7 3.7 3.01967 10.9 10.8 12.2 22.3 25.4 15.0 14.7 3.8 3.9 2.21968 9.9 9.7 11.3 18.9 21.1 13.9 16.9 4.1 4.2 2.01969 10.3 10.3 10.1 18.0 20.4 12.3 19.3 5.2 5.3 1.91970 11.8 12.2 8.4 20.4 24.7 10.1 19.9 6.1 6.3 2.3
1971 14.6 15.1 10.6 26.4 32.0 13.0 21.8 7.0 7.2 2.21972 15.9 16.5 12.0 28.7 34.7 14.4 33.3 7.3 7.5 3.01973 17.8 18.0 15.8 31.1 36.2 18.8 39.7 8.6 8.8 4.61974 17.5 16.9 21.1 33.3 36.8 25.4 22.0 7.6 7.7 5.01975 17.8 17.2 22.1 34.8 38.2 27.2 25.1 7.1 7.4 3.3
1976 20.3 19.6 24.8 39.2 42.9 30.6 28.6 8.4 8.7 2.91977 25.5 24.1 35.2 51.6 55.2 43.7 33.0 9.4 9.7 3.71978 28.1 25.6 44.9 54.4 54.9 54.4 40.2 11.7 11.9 9.21979 32.3 30.5 44.5 58.6 62.0 51.2 35.0 16.2 16.1 17.91980 38.9 38.1 44.1 69.4 77.6 50.5 36.5 20.2 20.3 18.8
1981 42.4 41.6 48.3 75.2 84.5 53.5 51.5 22.0 21.8 26.61982 43.2 40.3 62.7 82.5 87.6 71.5 49.9 19.2 18.7 28.01983 39.7 36.0 64.5 74.0 74.8 73.5 47.1 18.6 18.0 28.71984 40.7 38.4 56.9 69.8 71.9 66.2 47.0 22.6 22.7 21.11985 40.8 40.2 44.5 67.4 74.3 51.9 67.3 23.2 23.5 16.1
1986 43.3 43.5 41.8 70.7 79.8 49.8 86.3 24.4 25.1 11.91987 49.4 50.1 45.2 73.9 82.6 53.5 120.1 31.0 31.9 13.81988 52.7 54.0 44.9 75.6 85.9 51.6 111.8 35.9 36.7 19.61989 54.7 55.2 51.4 80.4 89.7 58.8 97.9 36.9 37.6 23.81990 59.1 60.0 54.2 88.4 99.6 62.4 104.5 39.1 39.9 23.7
1991 64.7 66.8 52.6 89.5 102.6 59.0 144.7 45.7 46.6 28.41992 70.7 73.3 55.6 88.2 99.1 63.0 165.4 55.5 56.9 28.01993 73.3 72.8 77.1 93.6 96.1 87.7 157.3 56.9 57.9 37.11994 84.5 83.8 90.6 109.8 113.4 101.6 141.4 66.6 67.5 49.21995 93.3 90.8 110.7 111.1 106.4 121.9 100.3 82.6 83.3 68.8
1996 103.5 99.6 129.4 118.8 111.4 135.9 147.6 92.5 91.8 105.01997 116.6 116.1 122.7 131.3 135.0 122.7 191.3 104.6 103.7 122.41998 108.1 107.9 110.7 128.1 136.5 108.6 107.4 96.3 95.2 118.81999 90.1 86.6 111.4 108.3 107.7 109.7 94.3 78.8 76.7 118.02000 100.0 100.0 100.0 100.0 100.0 100.0 100.0 100.0 100.0 100.0
2001 102.6 103.7 97.7 98.9 100.9 94.9 98.3 106.2 105.8 113.52002 98.0 98.3 96.3 97.8 101.9 89.5 98.4 98.1 96.1 134.62003@ 98.1 98.4 96.6 91.0 91.0 91.0 95.6 104.5 103.2 128.42004@ 102.5 104.9 91.0 81.6 79.2 86.6 153.4 117.2 117.2 115.9
a For the coverage of private and public sectors, see paragraphs 3.31, 3.32, 3.36 and 3.37.b Costs of ownership transfer are classified to the private sector.
fixed capital formation Building and construction and computer software
Table 8 Gross domestic fixed capital formation
Gross domestic Machinery, equipment (1) (3)
40
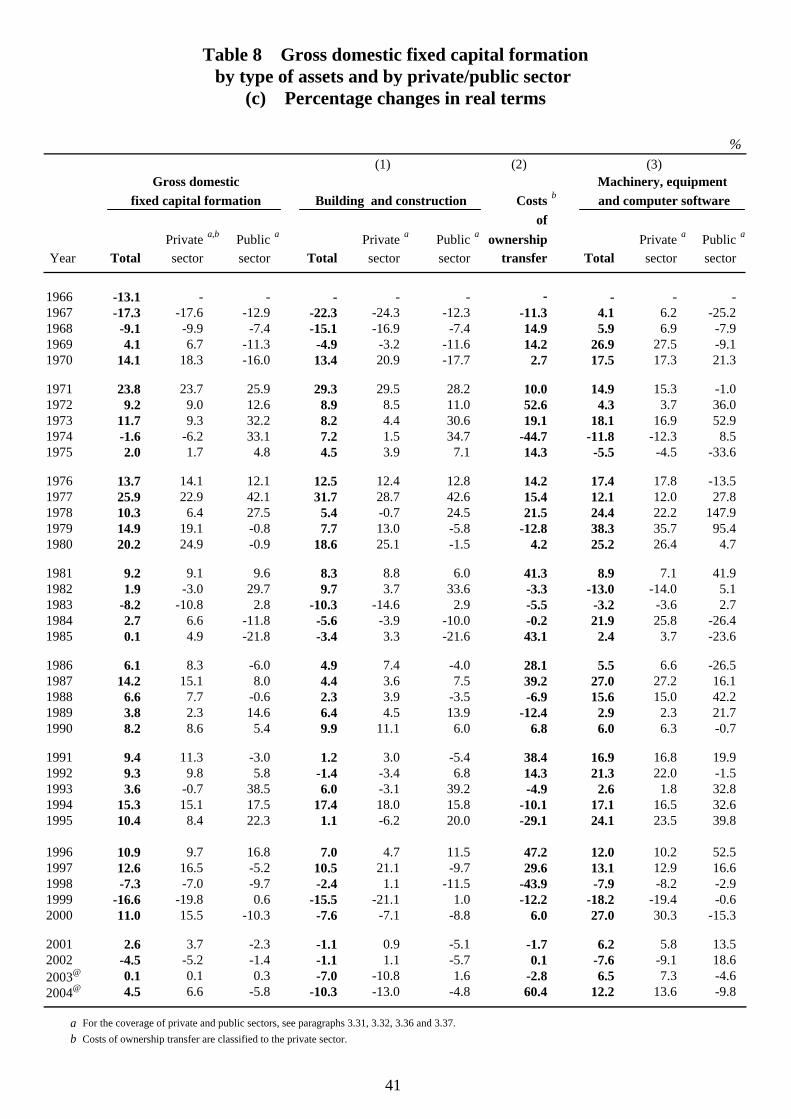
by type of assets and by private/public sector (c) Percentage changes in real terms
% (2)
Costs b
ofPrivate a,b Public a Private a Public a ownership Private a Public a
Year Total sector sector Total sector sector transfer Total sector sector
1966 -13.1 - - - - - - - - -1967 -17.3 -17.6 -12.9 -22.3 -24.3 -12.3 -11.3 4.1 6.2 -25.21968 -9.1 -9.9 -7.4 -15.1 -16.9 -7.4 14.9 5.9 6.9 -7.91969 4.1 6.7 -11.3 -4.9 -3.2 -11.6 14.2 26.9 27.5 -9.11970 14.1 18.3 -16.0 13.4 20.9 -17.7 2.7 17.5 17.3 21.3
1971 23.8 23.7 25.9 29.3 29.5 28.2 10.0 14.9 15.3 -1.01972 9.2 9.0 12.6 8.9 8.5 11.0 52.6 4.3 3.7 36.01973 11.7 9.3 32.2 8.2 4.4 30.6 19.1 18.1 16.9 52.91974 -1.6 -6.2 33.1 7.2 1.5 34.7 -44.7 -11.8 -12.3 8.51975 2.0 1.7 4.8 4.5 3.9 7.1 14.3 -5.5 -4.5 -33.6
1976 13.7 14.1 12.1 12.5 12.4 12.8 14.2 17.4 17.8 -13.51977 25.9 22.9 42.1 31.7 28.7 42.6 15.4 12.1 12.0 27.81978 10.3 6.4 27.5 5.4 -0.7 24.5 21.5 24.4 22.2 147.91979 14.9 19.1 -0.8 7.7 13.0 -5.8 -12.8 38.3 35.7 95.41980 20.2 24.9 -0.9 18.6 25.1 -1.5 4.2 25.2 26.4 4.7
1981 9.2 9.1 9.6 8.3 8.8 6.0 41.3 8.9 7.1 41.91982 1.9 -3.0 29.7 9.7 3.7 33.6 -3.3 -13.0 -14.0 5.11983 -8.2 -10.8 2.8 -10.3 -14.6 2.9 -5.5 -3.2 -3.6 2.71984 2.7 6.6 -11.8 -5.6 -3.9 -10.0 -0.2 21.9 25.8 -26.41985 0.1 4.9 -21.8 -3.4 3.3 -21.6 43.1 2.4 3.7 -23.6
1986 6.1 8.3 -6.0 4.9 7.4 -4.0 28.1 5.5 6.6 -26.51987 14.2 15.1 8.0 4.4 3.6 7.5 39.2 27.0 27.2 16.11988 6.6 7.7 -0.6 2.3 3.9 -3.5 -6.9 15.6 15.0 42.21989 3.8 2.3 14.6 6.4 4.5 13.9 -12.4 2.9 2.3 21.71990 8.2 8.6 5.4 9.9 11.1 6.0 6.8 6.0 6.3 -0.7
1991 9.4 11.3 -3.0 1.2 3.0 -5.4 38.4 16.9 16.8 19.91992 9.3 9.8 5.8 -1.4 -3.4 6.8 14.3 21.3 22.0 -1.51993 3.6 -0.7 38.5 6.0 -3.1 39.2 -4.9 2.6 1.8 32.81994 15.3 15.1 17.5 17.4 18.0 15.8 -10.1 17.1 16.5 32.61995 10.4 8.4 22.3 1.1 -6.2 20.0 -29.1 24.1 23.5 39.8
1996 10.9 9.7 16.8 7.0 4.7 11.5 47.2 12.0 10.2 52.51997 12.6 16.5 -5.2 10.5 21.1 -9.7 29.6 13.1 12.9 16.61998 -7.3 -7.0 -9.7 -2.4 1.1 -11.5 -43.9 -7.9 -8.2 -2.91999 -16.6 -19.8 0.6 -15.5 -21.1 1.0 -12.2 -18.2 -19.4 -0.62000 11.0 15.5 -10.3 -7.6 -7.1 -8.8 6.0 27.0 30.3 -15.3
2001 2.6 3.7 -2.3 -1.1 0.9 -5.1 -1.7 6.2 5.8 13.52002 -4.5 -5.2 -1.4 -1.1 1.1 -5.7 0.1 -7.6 -9.1 18.62003@ 0.1 0.1 0.3 -7.0 -10.8 1.6 -2.8 6.5 7.3 -4.62004@ 4.5 6.6 -5.8 -10.3 -13.0 -4.8 60.4 12.2 13.6 -9.8
a For the coverage of private and public sectors, see paragraphs 3.31, 3.32, 3.36 and 3.37.b Costs of ownership transfer are classified to the private sector.
and computer software fixed capital formation Building and construction Machinery, equipment
Table 8 Gross domestic fixed capital formation
Gross domestic (1) (3)
41
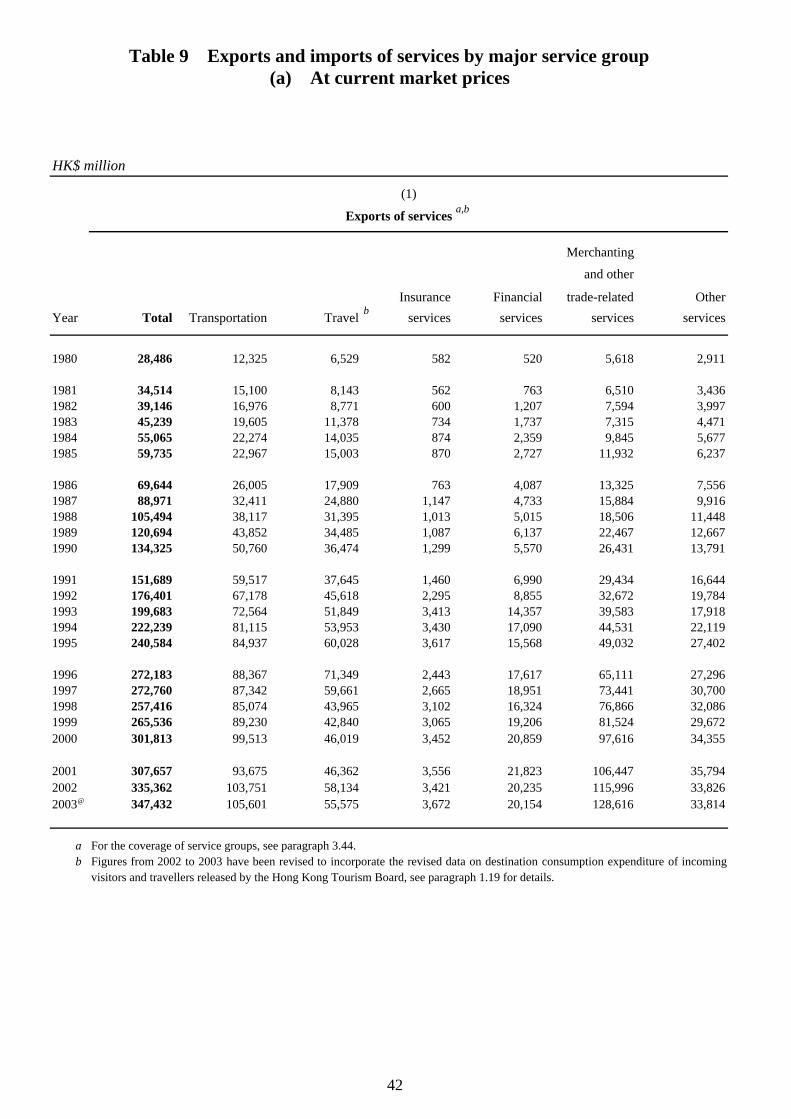
HK$ million
Merchanting
and other
Insurance Financial trade-related OtherYear Total Transportation Travel b services services services services
1980 28,486 12,325 6,529 582 520 5,618 2,911
1981 34,514 15,100 8,143 562 763 6,510 3,4361982 39,146 16,976 8,771 600 1,207 7,594 3,9971983 45,239 19,605 11,378 734 1,737 7,315 4,4711984 55,065 22,274 14,035 874 2,359 9,845 5,6771985 59,735 22,967 15,003 870 2,727 11,932 6,237
1986 69,644 26,005 17,909 763 4,087 13,325 7,5561987 88,971 32,411 24,880 1,147 4,733 15,884 9,9161988 105,494 38,117 31,395 1,013 5,015 18,506 11,4481989 120,694 43,852 34,485 1,087 6,137 22,467 12,6671990 134,325 50,760 36,474 1,299 5,570 26,431 13,791
1991 151,689 59,517 37,645 1,460 6,990 29,434 16,6441992 176,401 67,178 45,618 2,295 8,855 32,672 19,7841993 199,683 72,564 51,849 3,413 14,357 39,583 17,9181994 222,239 81,115 53,953 3,430 17,090 44,531 22,1191995 240,584 84,937 60,028 3,617 15,568 49,032 27,402
1996 272,183 88,367 71,349 2,443 17,617 65,111 27,2961997 272,760 87,342 59,661 2,665 18,951 73,441 30,7001998 257,416 85,074 43,965 3,102 16,324 76,866 32,0861999 265,536 89,230 42,840 3,065 19,206 81,524 29,6722000 301,813 99,513 46,019 3,452 20,859 97,616 34,355
2001 307,657 93,675 46,362 3,556 21,823 106,447 35,7942002 335,362 103,751 58,134 3,421 20,235 115,996 33,8262003@ 347,432 105,601 55,575 3,672 20,154 128,616 33,814
a For the coverage of service groups, see paragraph 3.44.b
Table 9 Exports and imports of services by major service group(a) At current market prices
(1)
visitors and travellers released by the Hong Kong Tourism Board, see paragraph 1.19 for details.
Exports of services a,b
Figures from 2002 to 2003 have been revised to incorporate the revised data on destination consumption expenditure of incoming
42
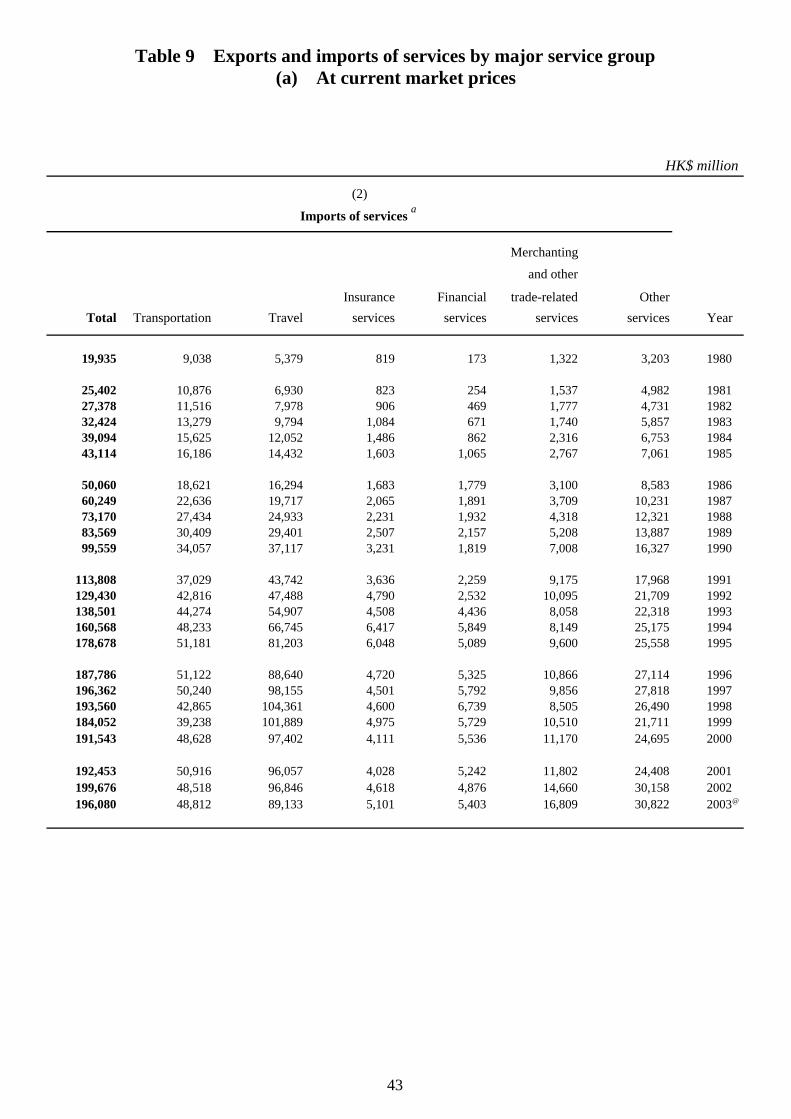
HK$ million
Merchanting
and other
Insurance Financial trade-related OtherTotal Transportation Travel services services services services Year
19,935 9,038 5,379 819 173 1,322 3,203 1980
25,402 10,876 6,930 823 254 1,537 4,982 198127,378 11,516 7,978 906 469 1,777 4,731 198232,424 13,279 9,794 1,084 671 1,740 5,857 198339,094 15,625 12,052 1,486 862 2,316 6,753 198443,114 16,186 14,432 1,603 1,065 2,767 7,061 1985
50,060 18,621 16,294 1,683 1,779 3,100 8,583 198660,249 22,636 19,717 2,065 1,891 3,709 10,231 198773,170 27,434 24,933 2,231 1,932 4,318 12,321 198883,569 30,409 29,401 2,507 2,157 5,208 13,887 198999,559 34,057 37,117 3,231 1,819 7,008 16,327 1990
113,808 37,029 43,742 3,636 2,259 9,175 17,968 1991129,430 42,816 47,488 4,790 2,532 10,095 21,709 1992138,501 44,274 54,907 4,508 4,436 8,058 22,318 1993160,568 48,233 66,745 6,417 5,849 8,149 25,175 1994178,678 51,181 81,203 6,048 5,089 9,600 25,558 1995
187,786 51,122 88,640 4,720 5,325 10,866 27,114 1996196,362 50,240 98,155 4,501 5,792 9,856 27,818 1997193,560 42,865 104,361 4,600 6,739 8,505 26,490 1998184,052 39,238 101,889 4,975 5,729 10,510 21,711 1999191,543 48,628 97,402 4,111 5,536 11,170 24,695 2000
192,453 50,916 96,057 4,028 5,242 11,802 24,408 2001199,676 48,518 96,846 4,618 4,876 14,660 30,158 2002196,080 48,812 89,133 5,101 5,403 16,809 30,822 2003@
Imports of services a
Table 9 Exports and imports of services by major service group(a) At current market prices
(2)
43
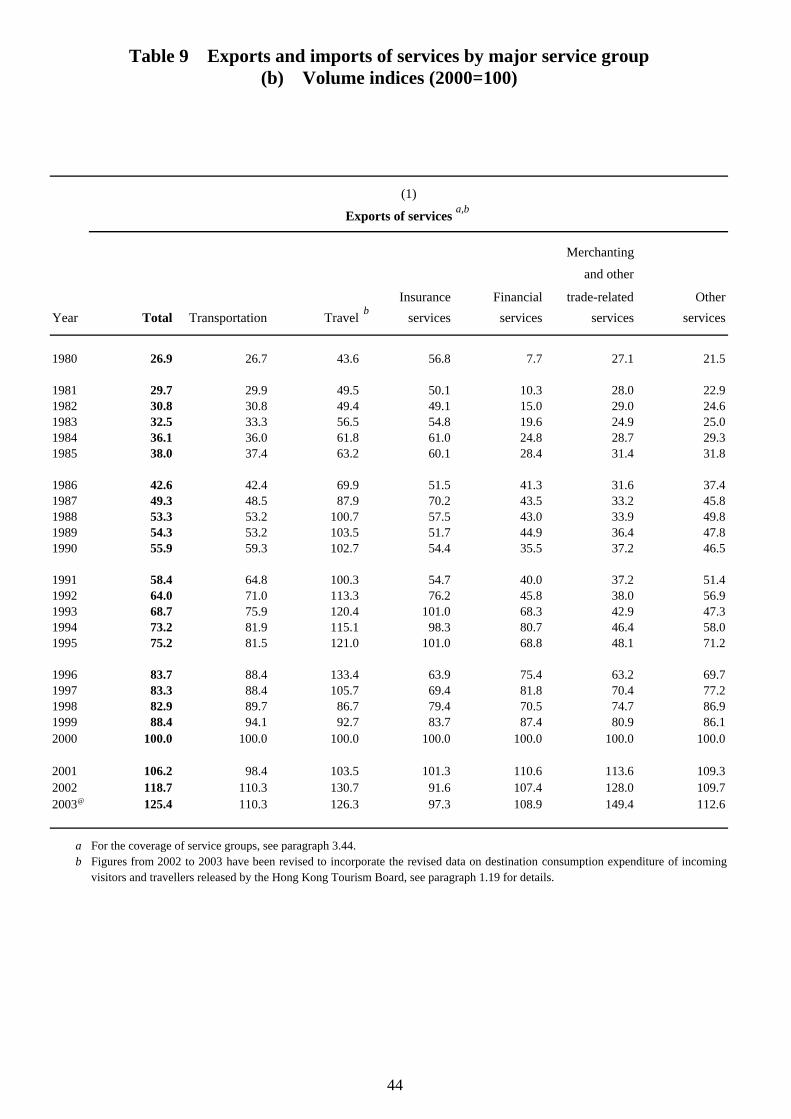
Merchanting
and other
Insurance Financial trade-related OtherYear Total Transportation Travel b services services services services
1980 26.9 26.7 43.6 56.8 7.7 27.1 21.5
1981 29.7 29.9 49.5 50.1 10.3 28.0 22.91982 30.8 30.8 49.4 49.1 15.0 29.0 24.61983 32.5 33.3 56.5 54.8 19.6 24.9 25.01984 36.1 36.0 61.8 61.0 24.8 28.7 29.31985 38.0 37.4 63.2 60.1 28.4 31.4 31.8
1986 42.6 42.4 69.9 51.5 41.3 31.6 37.41987 49.3 48.5 87.9 70.2 43.5 33.2 45.81988 53.3 53.2 100.7 57.5 43.0 33.9 49.81989 54.3 53.2 103.5 51.7 44.9 36.4 47.81990 55.9 59.3 102.7 54.4 35.5 37.2 46.5
1991 58.4 64.8 100.3 54.7 40.0 37.2 51.41992 64.0 71.0 113.3 76.2 45.8 38.0 56.91993 68.7 75.9 120.4 101.0 68.3 42.9 47.31994 73.2 81.9 115.1 98.3 80.7 46.4 58.01995 75.2 81.5 121.0 101.0 68.8 48.1 71.2
1996 83.7 88.4 133.4 63.9 75.4 63.2 69.71997 83.3 88.4 105.7 69.4 81.8 70.4 77.21998 82.9 89.7 86.7 79.4 70.5 74.7 86.91999 88.4 94.1 92.7 83.7 87.4 80.9 86.12000 100.0 100.0 100.0 100.0 100.0 100.0 100.0
2001 106.2 98.4 103.5 101.3 110.6 113.6 109.32002 118.7 110.3 130.7 91.6 107.4 128.0 109.72003@ 125.4 110.3 126.3 97.3 108.9 149.4 112.6
a For the coverage of service groups, see paragraph 3.44.b Figures from 2002 to 2003 have been revised to incorporate the revised data on destination consumption expenditure of incoming
visitors and travellers released by the Hong Kong Tourism Board, see paragraph 1.19 for details.
Table 9 Exports and imports of services by major service group(b) Volume indices (2000=100)
(1)
Exports of services a,b
44
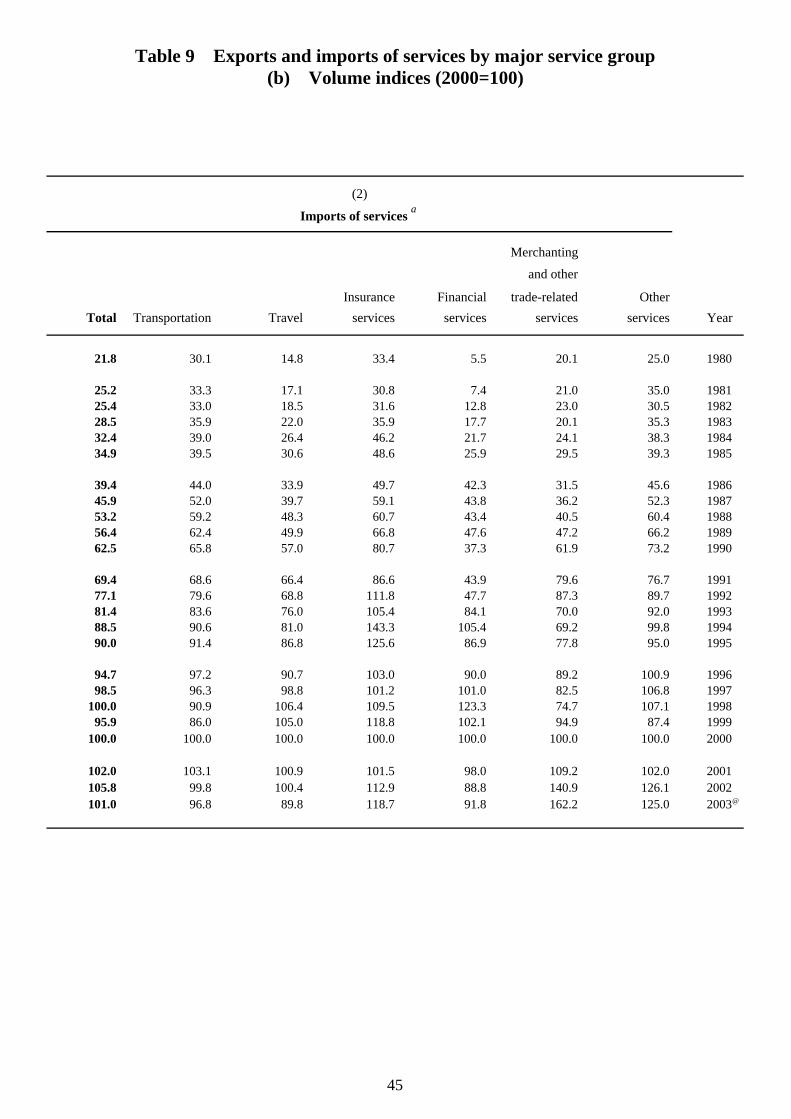
Merchanting
and other
Insurance Financial trade-related OtherTotal Transportation Travel services services services services Year
21.8 30.1 14.8 33.4 5.5 20.1 25.0 1980
25.2 33.3 17.1 30.8 7.4 21.0 35.0 198125.4 33.0 18.5 31.6 12.8 23.0 30.5 198228.5 35.9 22.0 35.9 17.7 20.1 35.3 198332.4 39.0 26.4 46.2 21.7 24.1 38.3 198434.9 39.5 30.6 48.6 25.9 29.5 39.3 1985
39.4 44.0 33.9 49.7 42.3 31.5 45.6 198645.9 52.0 39.7 59.1 43.8 36.2 52.3 198753.2 59.2 48.3 60.7 43.4 40.5 60.4 198856.4 62.4 49.9 66.8 47.6 47.2 66.2 198962.5 65.8 57.0 80.7 37.3 61.9 73.2 1990
69.4 68.6 66.4 86.6 43.9 79.6 76.7 199177.1 79.6 68.8 111.8 47.7 87.3 89.7 199281.4 83.6 76.0 105.4 84.1 70.0 92.0 199388.5 90.6 81.0 143.3 105.4 69.2 99.8 199490.0 91.4 86.8 125.6 86.9 77.8 95.0 1995
94.7 97.2 90.7 103.0 90.0 89.2 100.9 199698.5 96.3 98.8 101.2 101.0 82.5 106.8 1997
100.0 90.9 106.4 109.5 123.3 74.7 107.1 199895.9 86.0 105.0 118.8 102.1 94.9 87.4 1999
100.0 100.0 100.0 100.0 100.0 100.0 100.0 2000
102.0 103.1 100.9 101.5 98.0 109.2 102.0 2001105.8 99.8 100.4 112.9 88.8 140.9 126.1 2002101.0 96.8 89.8 118.7 91.8 162.2 125.0 2003@
Table 9 Exports and imports of services by major service group(b) Volume indices (2000=100)
(2)
Imports of services a
45
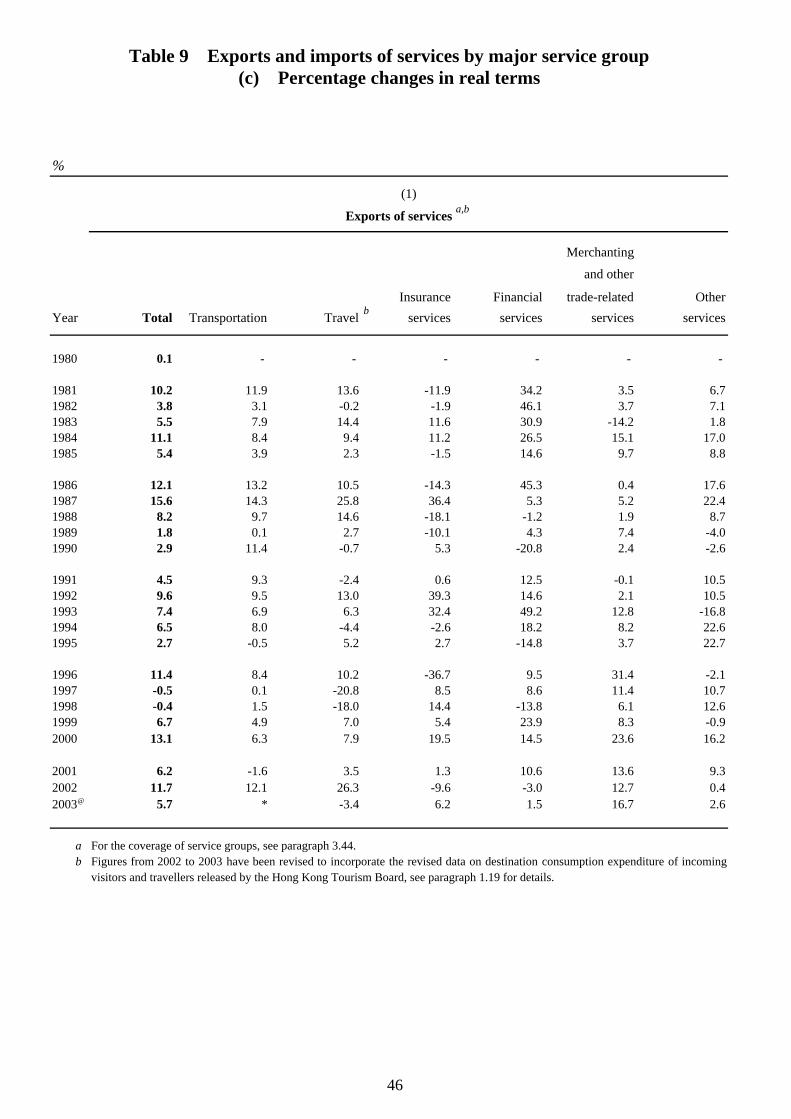
%
Merchanting
and other
Insurance Financial trade-related OtherYear Total Transportation Travel b services services services services
1980 0.1 - - - - - -
1981 10.2 11.9 13.6 -11.9 34.2 3.5 6.71982 3.8 3.1 -0.2 -1.9 46.1 3.7 7.11983 5.5 7.9 14.4 11.6 30.9 -14.2 1.81984 11.1 8.4 9.4 11.2 26.5 15.1 17.01985 5.4 3.9 2.3 -1.5 14.6 9.7 8.8
1986 12.1 13.2 10.5 -14.3 45.3 0.4 17.61987 15.6 14.3 25.8 36.4 5.3 5.2 22.41988 8.2 9.7 14.6 -18.1 -1.2 1.9 8.71989 1.8 0.1 2.7 -10.1 4.3 7.4 -4.01990 2.9 11.4 -0.7 5.3 -20.8 2.4 -2.6
1991 4.5 9.3 -2.4 0.6 12.5 -0.1 10.51992 9.6 9.5 13.0 39.3 14.6 2.1 10.51993 7.4 6.9 6.3 32.4 49.2 12.8 -16.81994 6.5 8.0 -4.4 -2.6 18.2 8.2 22.61995 2.7 -0.5 5.2 2.7 -14.8 3.7 22.7
1996 11.4 8.4 10.2 -36.7 9.5 31.4 -2.11997 -0.5 0.1 -20.8 8.5 8.6 11.4 10.71998 -0.4 1.5 -18.0 14.4 -13.8 6.1 12.61999 6.7 4.9 7.0 5.4 23.9 8.3 -0.92000 13.1 6.3 7.9 19.5 14.5 23.6 16.2
2001 6.2 -1.6 3.5 1.3 10.6 13.6 9.32002 11.7 12.1 26.3 -9.6 -3.0 12.7 0.42003@ 5.7 * -3.4 6.2 1.5 16.7 2.6
a For the coverage of service groups, see paragraph 3.44.b Figures from 2002 to 2003 have been revised to incorporate the revised data on destination consumption expenditure of incoming
visitors and travellers released by the Hong Kong Tourism Board, see paragraph 1.19 for details.
Exports of services a,b
Table 9 Exports and imports of services by major service group(c) Percentage changes in real terms
(1)
46
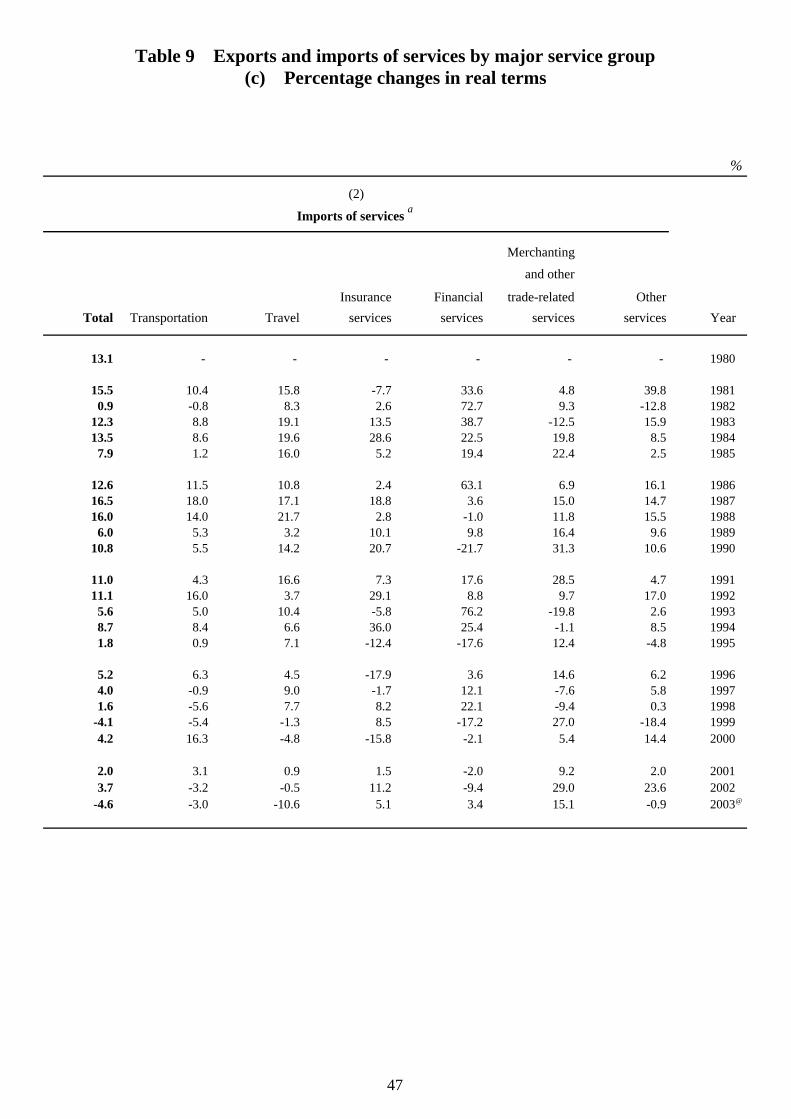
%
Merchanting
and other
Insurance Financial trade-related OtherTotal Transportation Travel services services services services Year
13.1 - - - - - - 1980
15.5 10.4 15.8 -7.7 33.6 4.8 39.8 19810.9 -0.8 8.3 2.6 72.7 9.3 -12.8 1982
12.3 8.8 19.1 13.5 38.7 -12.5 15.9 198313.5 8.6 19.6 28.6 22.5 19.8 8.5 1984
7.9 1.2 16.0 5.2 19.4 22.4 2.5 1985
12.6 11.5 10.8 2.4 63.1 6.9 16.1 198616.5 18.0 17.1 18.8 3.6 15.0 14.7 198716.0 14.0 21.7 2.8 -1.0 11.8 15.5 1988
6.0 5.3 3.2 10.1 9.8 16.4 9.6 198910.8 5.5 14.2 20.7 -21.7 31.3 10.6 1990
11.0 4.3 16.6 7.3 17.6 28.5 4.7 199111.1 16.0 3.7 29.1 8.8 9.7 17.0 1992
5.6 5.0 10.4 -5.8 76.2 -19.8 2.6 19938.7 8.4 6.6 36.0 25.4 -1.1 8.5 19941.8 0.9 7.1 -12.4 -17.6 12.4 -4.8 1995
5.2 6.3 4.5 -17.9 3.6 14.6 6.2 19964.0 -0.9 9.0 -1.7 12.1 -7.6 5.8 19971.6 -5.6 7.7 8.2 22.1 -9.4 0.3 1998
-4.1 -5.4 -1.3 8.5 -17.2 27.0 -18.4 19994.2 16.3 -4.8 -15.8 -2.1 5.4 14.4 2000
2.0 3.1 0.9 1.5 -2.0 9.2 2.0 20013.7 -3.2 -0.5 11.2 -9.4 29.0 23.6 2002
-4.6 -3.0 -10.6 5.1 3.4 15.1 -0.9 2003@
(2)
Imports of services a
Table 9 Exports and imports of services by major service group(c) Percentage changes in real terms
47
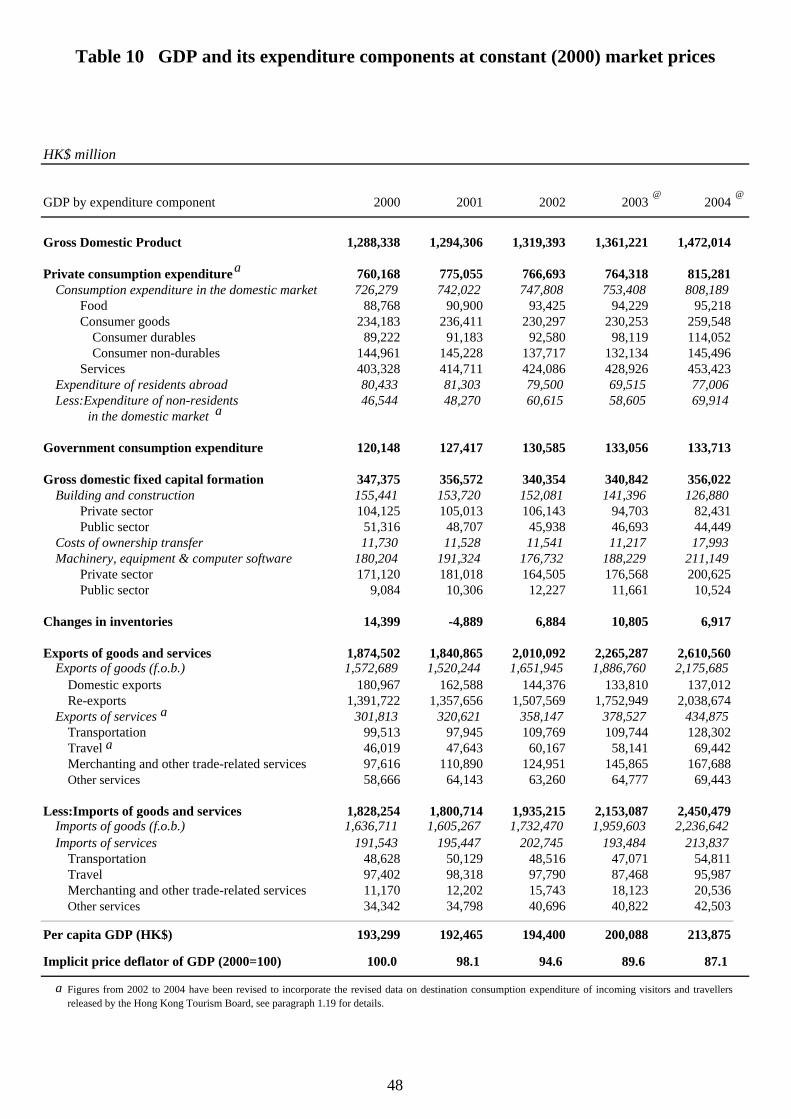
HK$ million
GDP by expenditure component 2000 2001 2002 2003 2004
Gross Domestic Product 1,288,338 1,294,306 1,319,393 1,361,221 1,472,014
Private consumption expenditure 760,168 775,055 766,693 764,318 815,281Consumption expenditure in the domestic market 726,279 742,022 747,808 753,408 808,189
Food 88,768 90,900 93,425 94,229 95,218Consumer goods 234,183 236,411 230,297 230,253 259,548
Consumer durables 89,222 91,183 92,580 98,119 114,052Consumer non-durables 144,961 145,228 137,717 132,134 145,496
Services 403,328 414,711 424,086 428,926 453,423Expenditure of residents abroad 80,433 81,303 79,500 69,515 77,006Less:Expenditure of non-residents 46,544 48,270 60,615 58,605 69,914
in the domestic market
Government consumption expenditure 120,148 127,417 130,585 133,056 133,713
Gross domestic fixed capital formation 347,375 356,572 340,354 340,842 356,022Building and construction 155,441 153,720 152,081 141,396 126,880
Private sector 104,125 105,013 106,143 94,703 82,431Public sector 51,316 48,707 45,938 46,693 44,449
Costs of ownership transfer 11,730 11,528 11,541 11,217 17,993Machinery, equipment & computer software 180,204 191,324 176,732 188,229 211,149
Private sector 171,120 181,018 164,505 176,568 200,625Public sector 9,084 10,306 12,227 11,661 10,524
Changes in inventories 14,399 -4,889 6,884 10,805 6,917
Exports of goods and services 1,874,502 1,840,865 2,010,092 2,265,287 2,610,560Exports of goods (f.o.b.) 1,572,689 1,520,244 1,651,945 1,886,760 2,175,685
Domestic exports 180,967 162,588 144,376 133,810 137,012Re-exports 1,391,722 1,357,656 1,507,569 1,752,949 2,038,674
Exports of services 301,813 320,621 358,147 378,527 434,875Transportation 99,513 97,945 109,769 109,744 128,302Travel 46,019 47,643 60,167 58,141 69,442Merchanting and other trade-related services 97,616 110,890 124,951 145,865 167,688Other services 58,666 64,143 63,260 64,777 69,443
Less:Imports of goods and services 1,828,254 1,800,714 1,935,215 2,153,087 2,450,479Imports of goods (f.o.b.) 1,636,711 1,605,267 1,732,470 1,959,603 2,236,642Imports of services 191,543 195,447 202,745 193,484 213,837
Transportation 48,628 50,129 48,516 47,071 54,811Travel 97,402 98,318 97,790 87,468 95,987Merchanting and other trade-related services 11,170 12,202 15,743 18,123 20,536Other services 34,342 34,798 40,696 40,822 42,503
Per capita GDP (HK$) 193,299 192,465 194,400 200,088 213,875
Implicit price deflator of GDP (2000=100) 100.0 98.1 94.6 89.6 87.1
a
Table 10 GDP and its expenditure components at constant (2000) market prices
Figures from 2002 to 2004 have been revised to incorporate the revised data on destination consumption expenditure of incoming visitors and travellersreleased by the Hong Kong Tourism Board, see paragraph 1.19 for details.
@ @
a
a
a
a
48
49
(B) Quarterly GDP by expenditure component
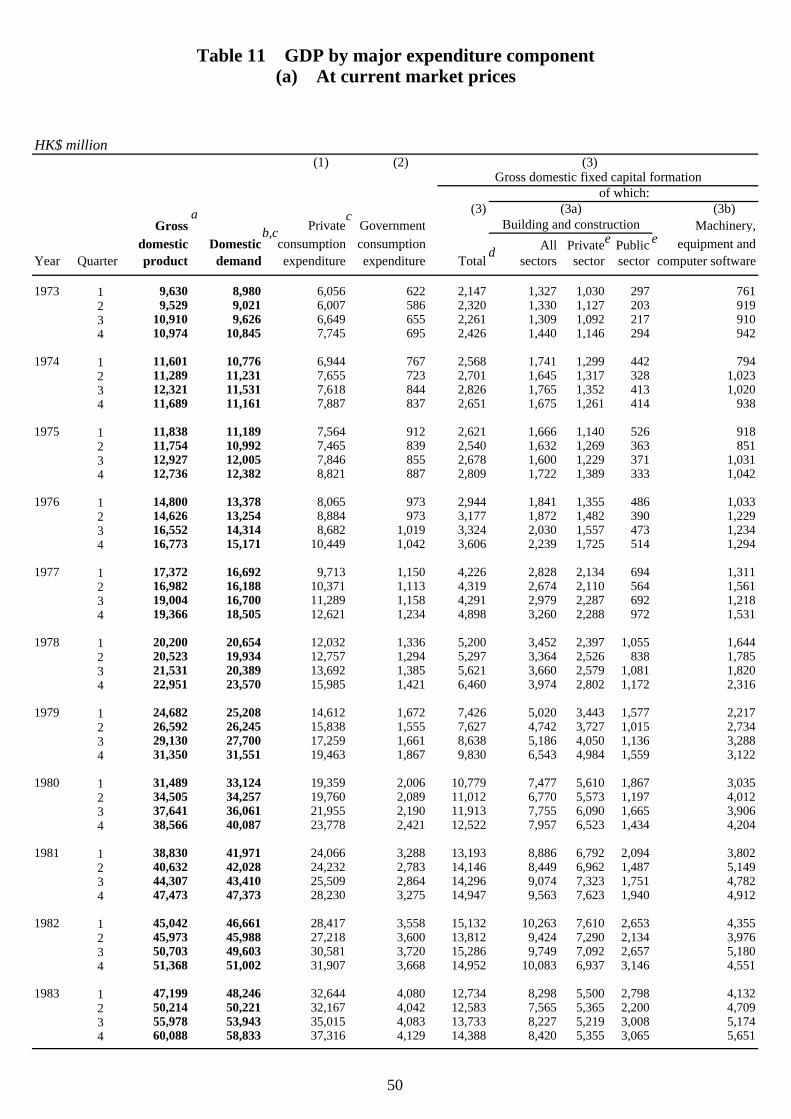
HK$ million(1) (2) (3)
Gross domestic fixed capital formationof which:
(3) (3a) (3b) Gross Private Government Building and construction Machinery,
domestic Domestic consumption consumption All Private Public equipment andYear Quarter product demand expenditure expenditure Total sectors sector sector computer software
1973 1 9,630 8,980 6,056 622 2,147 1,327 1,030 297 7612 9,529 9,021 6,007 586 2,320 1,330 1,127 203 9193 10,910 9,626 6,649 655 2,261 1,309 1,092 217 9104 10,974 10,845 7,745 695 2,426 1,440 1,146 294 942
1974 1 11,601 10,776 6,944 767 2,568 1,741 1,299 442 7942 11,289 11,231 7,655 723 2,701 1,645 1,317 328 1,0233 12,321 11,531 7,618 844 2,826 1,765 1,352 413 1,0204 11,689 11,161 7,887 837 2,651 1,675 1,261 414 938
1975 1 11,838 11,189 7,564 912 2,621 1,666 1,140 526 9182 11,754 10,992 7,465 839 2,540 1,632 1,269 363 8513 12,927 12,005 7,846 855 2,678 1,600 1,229 371 1,0314 12,736 12,382 8,821 887 2,809 1,722 1,389 333 1,042
1976 1 14,800 13,378 8,065 973 2,944 1,841 1,355 486 1,0332 14,626 13,254 8,884 973 3,177 1,872 1,482 390 1,2293 16,552 14,314 8,682 1,019 3,324 2,030 1,557 473 1,2344 16,773 15,171 10,449 1,042 3,606 2,239 1,725 514 1,294
1977 1 17,372 16,692 9,713 1,150 4,226 2,828 2,134 694 1,3112 16,982 16,188 10,371 1,113 4,319 2,674 2,110 564 1,5613 19,004 16,700 11,289 1,158 4,291 2,979 2,287 692 1,2184 19,366 18,505 12,621 1,234 4,898 3,260 2,288 972 1,531
1978 1 20,200 20,654 12,032 1,336 5,200 3,452 2,397 1,055 1,6442 20,523 19,934 12,757 1,294 5,297 3,364 2,526 838 1,7853 21,531 20,389 13,692 1,385 5,621 3,660 2,579 1,081 1,8204 22,951 23,570 15,985 1,421 6,460 3,974 2,802 1,172 2,316
1979 1 24,682 25,208 14,612 1,672 7,426 5,020 3,443 1,577 2,2172 26,592 26,245 15,838 1,555 7,627 4,742 3,727 1,015 2,7343 29,130 27,700 17,259 1,661 8,638 5,186 4,050 1,136 3,2884 31,350 31,551 19,463 1,867 9,830 6,543 4,984 1,559 3,122
1980 1 31,489 33,124 19,359 2,006 10,779 7,477 5,610 1,867 3,0352 34,505 34,257 19,760 2,089 11,012 6,770 5,573 1,197 4,0123 37,641 36,061 21,955 2,190 11,913 7,755 6,090 1,665 3,9064 38,566 40,087 23,778 2,421 12,522 7,957 6,523 1,434 4,204
1981 1 38,830 41,971 24,066 3,288 13,193 8,886 6,792 2,094 3,8022 40,632 42,028 24,232 2,783 14,146 8,449 6,962 1,487 5,1493 44,307 43,410 25,509 2,864 14,296 9,074 7,323 1,751 4,7824 47,473 47,373 28,230 3,275 14,947 9,563 7,623 1,940 4,912
1982 1 45,042 46,661 28,417 3,558 15,132 10,263 7,610 2,653 4,3552 45,973 45,988 27,218 3,600 13,812 9,424 7,290 2,134 3,9763 50,703 49,603 30,581 3,720 15,286 9,749 7,092 2,657 5,1804 51,368 51,002 31,907 3,668 14,952 10,083 6,937 3,146 4,551
1983 1 47,199 48,246 32,644 4,080 12,734 8,298 5,500 2,798 4,1322 50,214 50,221 32,167 4,042 12,583 7,565 5,365 2,200 4,7093 55,978 53,943 35,015 4,083 13,733 8,227 5,219 3,008 5,1744 60,088 58,833 37,316 4,129 14,388 8,420 5,355 3,065 5,651
Table 11 GDP by major expenditure component(a) At current market prices
ab,c
c
ed
e
50
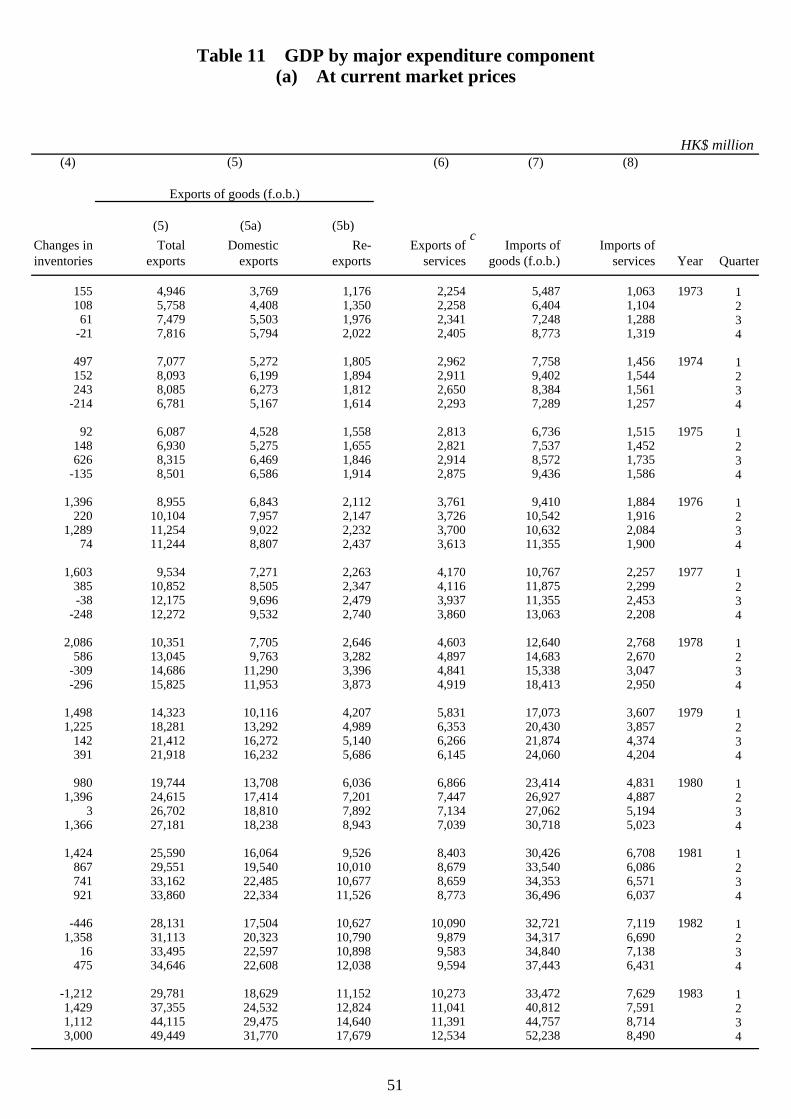
HK$ million(4) (6) (7) (8)
Exports of goods (f.o.b.)
(5) (5a) (5b) Changes in Total Domestic Re- Exports of Imports of Imports ofinventories exports exports exports services goods (f.o.b.) services Year Quarter
155 4,946 3,769 1,176 2,254 5,487 1,063 1973 1108 5,758 4,408 1,350 2,258 6,404 1,104 2
61 7,479 5,503 1,976 2,341 7,248 1,288 3-21 7,816 5,794 2,022 2,405 8,773 1,319 4
497 7,077 5,272 1,805 2,962 7,758 1,456 1974 1152 8,093 6,199 1,894 2,911 9,402 1,544 2243 8,085 6,273 1,812 2,650 8,384 1,561 3
-214 6,781 5,167 1,614 2,293 7,289 1,257 4
92 6,087 4,528 1,558 2,813 6,736 1,515 1975 1148 6,930 5,275 1,655 2,821 7,537 1,452 2626 8,315 6,469 1,846 2,914 8,572 1,735 3
-135 8,501 6,586 1,914 2,875 9,436 1,586 4
1,396 8,955 6,843 2,112 3,761 9,410 1,884 1976 1220 10,104 7,957 2,147 3,726 10,542 1,916 2
1,289 11,254 9,022 2,232 3,700 10,632 2,084 374 11,244 8,807 2,437 3,613 11,355 1,900 4
1,603 9,534 7,271 2,263 4,170 10,767 2,257 1977 1385 10,852 8,505 2,347 4,116 11,875 2,299 2-38 12,175 9,696 2,479 3,937 11,355 2,453 3
-248 12,272 9,532 2,740 3,860 13,063 2,208 4
2,086 10,351 7,705 2,646 4,603 12,640 2,768 1978 1586 13,045 9,763 3,282 4,897 14,683 2,670 2
-309 14,686 11,290 3,396 4,841 15,338 3,047 3-296 15,825 11,953 3,873 4,919 18,413 2,950 4
1,498 14,323 10,116 4,207 5,831 17,073 3,607 1979 11,225 18,281 13,292 4,989 6,353 20,430 3,857 2
142 21,412 16,272 5,140 6,266 21,874 4,374 3391 21,918 16,232 5,686 6,145 24,060 4,204 4
980 19,744 13,708 6,036 6,866 23,414 4,831 1980 11,396 24,615 17,414 7,201 7,447 26,927 4,887 2
3 26,702 18,810 7,892 7,134 27,062 5,194 31,366 27,181 18,238 8,943 7,039 30,718 5,023 4
1,424 25,590 16,064 9,526 8,403 30,426 6,708 1981 1867 29,551 19,540 10,010 8,679 33,540 6,086 2741 33,162 22,485 10,677 8,659 34,353 6,571 3921 33,860 22,334 11,526 8,773 36,496 6,037 4
-446 28,131 17,504 10,627 10,090 32,721 7,119 1982 11,358 31,113 20,323 10,790 9,879 34,317 6,690 2
16 33,495 22,597 10,898 9,583 34,840 7,138 3475 34,646 22,608 12,038 9,594 37,443 6,431 4
-1,212 29,781 18,629 11,152 10,273 33,472 7,629 1983 11,429 37,355 24,532 12,824 11,041 40,812 7,591 21,112 44,115 29,475 14,640 11,391 44,757 8,714 33,000 49,449 31,770 17,679 12,534 52,238 8,490 4
Table 11 GDP by major expenditure component(a) At current market prices
(5)
c
51
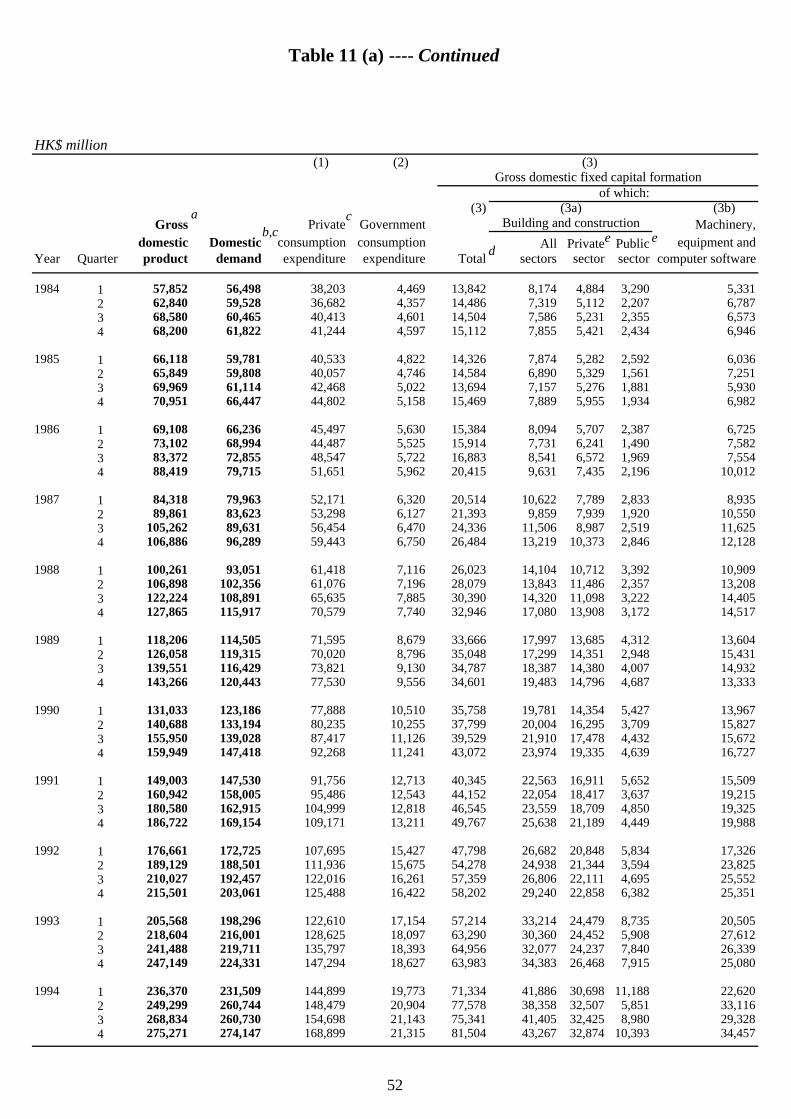
HK$ million(1) (2) (3)
Gross domestic fixed capital formationof which:
(3) (3a) (3b) Gross Private Government Building and construction Machinery,
domestic Domestic consumption consumption All Private Public equipment andYear Quarter product demand expenditure expenditure Total sectors sector sector computer software
1984 1 57,852 56,498 38,203 4,469 13,842 8,174 4,884 3,290 5,3312 62,840 59,528 36,682 4,357 14,486 7,319 5,112 2,207 6,7873 68,580 60,465 40,413 4,601 14,504 7,586 5,231 2,355 6,5734 68,200 61,822 41,244 4,597 15,112 7,855 5,421 2,434 6,946
1985 1 66,118 59,781 40,533 4,822 14,326 7,874 5,282 2,592 6,0362 65,849 59,808 40,057 4,746 14,584 6,890 5,329 1,561 7,2513 69,969 61,114 42,468 5,022 13,694 7,157 5,276 1,881 5,9304 70,951 66,447 44,802 5,158 15,469 7,889 5,955 1,934 6,982
1986 1 69,108 66,236 45,497 5,630 15,384 8,094 5,707 2,387 6,7252 73,102 68,994 44,487 5,525 15,914 7,731 6,241 1,490 7,5823 83,372 72,855 48,547 5,722 16,883 8,541 6,572 1,969 7,5544 88,419 79,715 51,651 5,962 20,415 9,631 7,435 2,196 10,012
1987 1 84,318 79,963 52,171 6,320 20,514 10,622 7,789 2,833 8,9352 89,861 83,623 53,298 6,127 21,393 9,859 7,939 1,920 10,5503 105,262 89,631 56,454 6,470 24,336 11,506 8,987 2,519 11,6254 106,886 96,289 59,443 6,750 26,484 13,219 10,373 2,846 12,128
1988 1 100,261 93,051 61,418 7,116 26,023 14,104 10,712 3,392 10,9092 106,898 102,356 61,076 7,196 28,079 13,843 11,486 2,357 13,2083 122,224 108,891 65,635 7,885 30,390 14,320 11,098 3,222 14,4054 127,865 115,917 70,579 7,740 32,946 17,080 13,908 3,172 14,517
1989 1 118,206 114,505 71,595 8,679 33,666 17,997 13,685 4,312 13,6042 126,058 119,315 70,020 8,796 35,048 17,299 14,351 2,948 15,4313 139,551 116,429 73,821 9,130 34,787 18,387 14,380 4,007 14,9324 143,266 120,443 77,530 9,556 34,601 19,483 14,796 4,687 13,333
1990 1 131,033 123,186 77,888 10,510 35,758 19,781 14,354 5,427 13,9672 140,688 133,194 80,235 10,255 37,799 20,004 16,295 3,709 15,8273 155,950 139,028 87,417 11,126 39,529 21,910 17,478 4,432 15,6724 159,949 147,418 92,268 11,241 43,072 23,974 19,335 4,639 16,727
1991 1 149,003 147,530 91,756 12,713 40,345 22,563 16,911 5,652 15,5092 160,942 158,005 95,486 12,543 44,152 22,054 18,417 3,637 19,2153 180,580 162,915 104,999 12,818 46,545 23,559 18,709 4,850 19,3254 186,722 169,154 109,171 13,211 49,767 25,638 21,189 4,449 19,988
1992 1 176,661 172,725 107,695 15,427 47,798 26,682 20,848 5,834 17,3262 189,129 188,501 111,936 15,675 54,278 24,938 21,344 3,594 23,8253 210,027 192,457 122,016 16,261 57,359 26,806 22,111 4,695 25,5524 215,501 203,061 125,488 16,422 58,202 29,240 22,858 6,382 25,351
1993 1 205,568 198,296 122,610 17,154 57,214 33,214 24,479 8,735 20,5052 218,604 216,001 128,625 18,097 63,290 30,360 24,452 5,908 27,6123 241,488 219,711 135,797 18,393 64,956 32,077 24,237 7,840 26,3394 247,149 224,331 147,294 18,627 63,983 34,383 26,468 7,915 25,080
1994 1 236,370 231,509 144,899 19,773 71,334 41,886 30,698 11,188 22,6202 249,299 260,744 148,479 20,904 77,578 38,358 32,507 5,851 33,1163 268,834 260,730 154,698 21,143 75,341 41,405 32,425 8,980 29,3284 275,271 274,147 168,899 21,315 81,504 43,267 32,874 10,393 34,457
Table 11 (a) ---- Continued
ab,c
ce
de
52
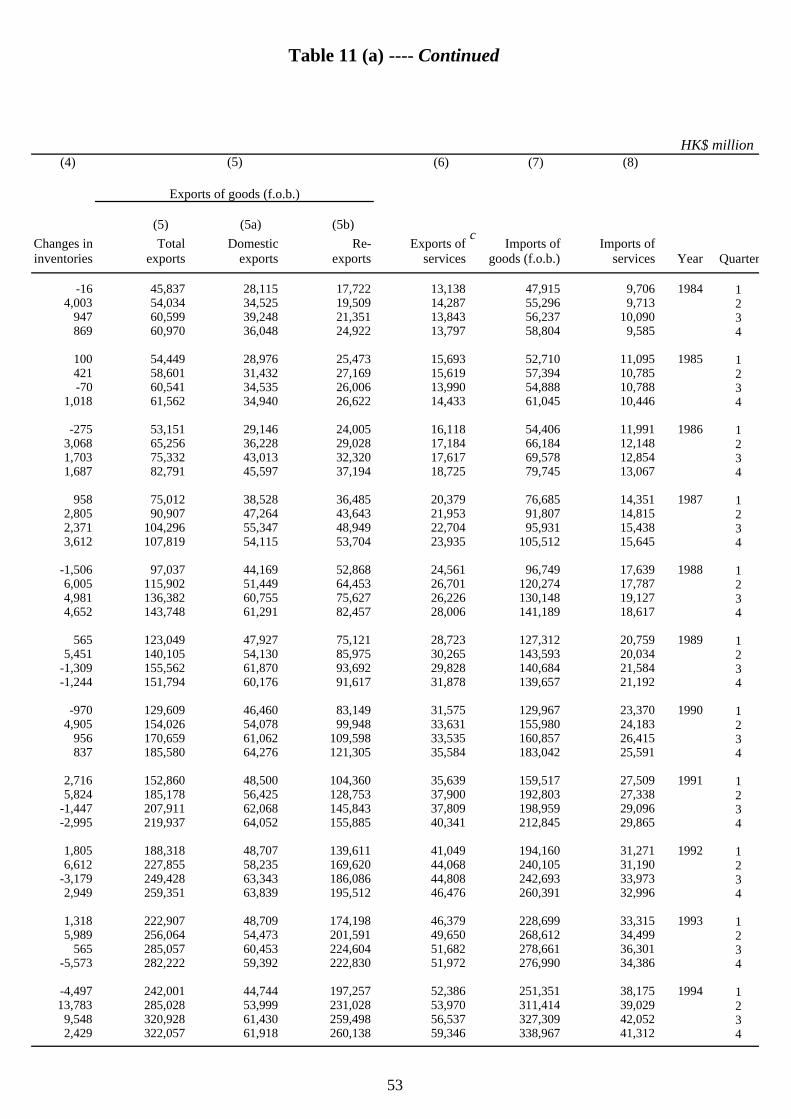
HK$ million(4) (6) (7) (8)
Exports of goods (f.o.b.)
(5) (5a) (5b) Changes in Total Domestic Re- Exports of Imports of Imports ofinventories exports exports exports services goods (f.o.b.) services Year Quarter
-16 45,837 28,115 17,722 13,138 47,915 9,706 1984 14,003 54,034 34,525 19,509 14,287 55,296 9,713 2
947 60,599 39,248 21,351 13,843 56,237 10,090 3869 60,970 36,048 24,922 13,797 58,804 9,585 4
100 54,449 28,976 25,473 15,693 52,710 11,095 1985 1421 58,601 31,432 27,169 15,619 57,394 10,785 2-70 60,541 34,535 26,006 13,990 54,888 10,788 3
1,018 61,562 34,940 26,622 14,433 61,045 10,446 4
-275 53,151 29,146 24,005 16,118 54,406 11,991 1986 13,068 65,256 36,228 29,028 17,184 66,184 12,148 21,703 75,332 43,013 32,320 17,617 69,578 12,854 31,687 82,791 45,597 37,194 18,725 79,745 13,067 4
958 75,012 38,528 36,485 20,379 76,685 14,351 1987 12,805 90,907 47,264 43,643 21,953 91,807 14,815 22,371 104,296 55,347 48,949 22,704 95,931 15,438 33,612 107,819 54,115 53,704 23,935 105,512 15,645 4
-1,506 97,037 44,169 52,868 24,561 96,749 17,639 1988 16,005 115,902 51,449 64,453 26,701 120,274 17,787 24,981 136,382 60,755 75,627 26,226 130,148 19,127 34,652 143,748 61,291 82,457 28,006 141,189 18,617 4
565 123,049 47,927 75,121 28,723 127,312 20,759 1989 15,451 140,105 54,130 85,975 30,265 143,593 20,034 2
-1,309 155,562 61,870 93,692 29,828 140,684 21,584 3-1,244 151,794 60,176 91,617 31,878 139,657 21,192 4
-970 129,609 46,460 83,149 31,575 129,967 23,370 1990 14,905 154,026 54,078 99,948 33,631 155,980 24,183 2
956 170,659 61,062 109,598 33,535 160,857 26,415 3837 185,580 64,276 121,305 35,584 183,042 25,591 4
2,716 152,860 48,500 104,360 35,639 159,517 27,509 1991 15,824 185,178 56,425 128,753 37,900 192,803 27,338 2
-1,447 207,911 62,068 145,843 37,809 198,959 29,096 3-2,995 219,937 64,052 155,885 40,341 212,845 29,865 4
1,805 188,318 48,707 139,611 41,049 194,160 31,271 1992 16,612 227,855 58,235 169,620 44,068 240,105 31,190 2
-3,179 249,428 63,343 186,086 44,808 242,693 33,973 32,949 259,351 63,839 195,512 46,476 260,391 32,996 4
1,318 222,907 48,709 174,198 46,379 228,699 33,315 1993 15,989 256,064 54,473 201,591 49,650 268,612 34,499 2
565 285,057 60,453 224,604 51,682 278,661 36,301 3-5,573 282,222 59,392 222,830 51,972 276,990 34,386 4
-4,497 242,001 44,744 197,257 52,386 251,351 38,175 1994 113,783 285,028 53,999 231,028 53,970 311,414 39,029 2
9,548 320,928 61,430 259,498 56,537 327,309 42,052 32,429 322,057 61,918 260,138 59,346 338,967 41,312 4
(5)
Table 11 (a) ---- Continued
c
53
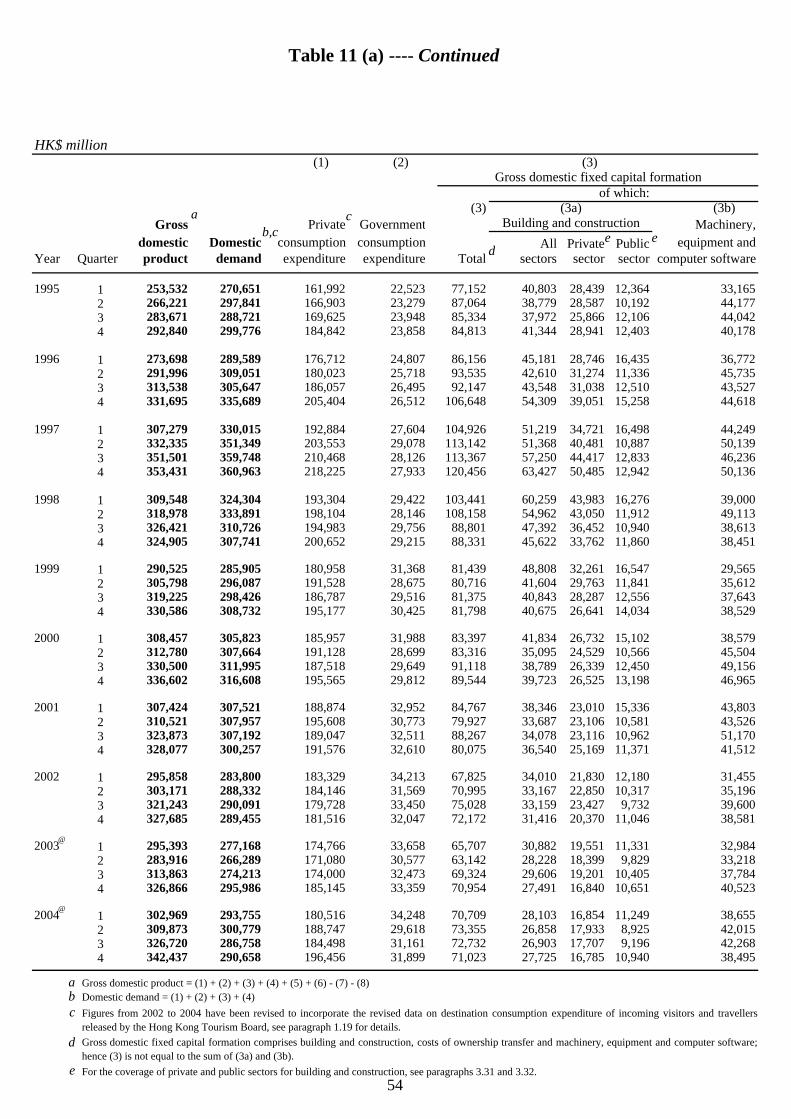
HK$ million(1) (2) (3)
Gross domestic fixed capital formationof which:
(3) (3a) (3b) Gross Private Government Building and construction Machinery,
domestic Domestic consumption consumption All Private Public equipment andYear Quarter product demand expenditure expenditure Total sectors sector sector computer software
1995 1 253,532 270,651 161,992 22,523 77,152 40,803 28,439 12,364 33,1652 266,221 297,841 166,903 23,279 87,064 38,779 28,587 10,192 44,1773 283,671 288,721 169,625 23,948 85,334 37,972 25,866 12,106 44,0424 292,840 299,776 184,842 23,858 84,813 41,344 28,941 12,403 40,178
1996 1 273,698 289,589 176,712 24,807 86,156 45,181 28,746 16,435 36,7722 291,996 309,051 180,023 25,718 93,535 42,610 31,274 11,336 45,7353 313,538 305,647 186,057 26,495 92,147 43,548 31,038 12,510 43,5274 331,695 335,689 205,404 26,512 106,648 54,309 39,051 15,258 44,618
1997 1 307,279 330,015 192,884 27,604 104,926 51,219 34,721 16,498 44,2492 332,335 351,349 203,553 29,078 113,142 51,368 40,481 10,887 50,1393 351,501 359,748 210,468 28,126 113,367 57,250 44,417 12,833 46,2364 353,431 360,963 218,225 27,933 120,456 63,427 50,485 12,942 50,136
1998 1 309,548 324,304 193,304 29,422 103,441 60,259 43,983 16,276 39,0002 318,978 333,891 198,104 28,146 108,158 54,962 43,050 11,912 49,1133 326,421 310,726 194,983 29,756 88,801 47,392 36,452 10,940 38,6134 324,905 307,741 200,652 29,215 88,331 45,622 33,762 11,860 38,451
1999 1 290,525 285,905 180,958 31,368 81,439 48,808 32,261 16,547 29,5652 305,798 296,087 191,528 28,675 80,716 41,604 29,763 11,841 35,6123 319,225 298,426 186,787 29,516 81,375 40,843 28,287 12,556 37,6434 330,586 308,732 195,177 30,425 81,798 40,675 26,641 14,034 38,529
2000 1 308,457 305,823 185,957 31,988 83,397 41,834 26,732 15,102 38,5792 312,780 307,664 191,128 28,699 83,316 35,095 24,529 10,566 45,5043 330,500 311,995 187,518 29,649 91,118 38,789 26,339 12,450 49,1564 336,602 316,608 195,565 29,812 89,544 39,723 26,525 13,198 46,965
2001 1 307,424 307,521 188,874 32,952 84,767 38,346 23,010 15,336 43,8032 310,521 307,957 195,608 30,773 79,927 33,687 23,106 10,581 43,5263 323,873 307,192 189,047 32,511 88,267 34,078 23,116 10,962 51,1704 328,077 300,257 191,576 32,610 80,075 36,540 25,169 11,371 41,512
2002 1 295,858 283,800 183,329 34,213 67,825 34,010 21,830 12,180 31,4552 303,171 288,332 184,146 31,569 70,995 33,167 22,850 10,317 35,1963 321,243 290,091 179,728 33,450 75,028 33,159 23,427 9,732 39,6004 327,685 289,455 181,516 32,047 72,172 31,416 20,370 11,046 38,581
2003 1 295,393 277,168 174,766 33,658 65,707 30,882 19,551 11,331 32,9842 283,916 266,289 171,080 30,577 63,142 28,228 18,399 9,829 33,2183 313,863 274,213 174,000 32,473 69,324 29,606 19,201 10,405 37,7844 326,866 295,986 185,145 33,359 70,954 27,491 16,840 10,651 40,523
2004 1 302,969 293,755 180,516 34,248 70,709 28,103 16,854 11,249 38,6552 309,873 300,779 188,747 29,618 73,355 26,858 17,933 8,925 42,0153 326,720 286,758 184,498 31,161 72,732 26,903 17,707 9,196 42,2684 342,437 290,658 196,456 31,899 71,023 27,725 16,785 10,940 38,495
a Gross domestic product = (1) + (2) + (3) + (4) + (5) + (6) - (7) - (8)b Domestic demand = (1) + (2) + (3) + (4)c
d
e For the coverage of private and public sectors for building and construction, see paragraphs 3.31 and 3.32.
Gross domestic fixed capital formation comprises building and construction, costs of ownership transfer and machinery, equipment and computer software;hence (3) is not equal to the sum of (3a) and (3b).
Figures from 2002 to 2004 have been revised to incorporate the revised data on destination consumption expenditure of incoming visitors and travellersreleased by the Hong Kong Tourism Board, see paragraph 1.19 for details.
Table 11 (a) ---- Continued
@
ab,c
ce
de
@
54
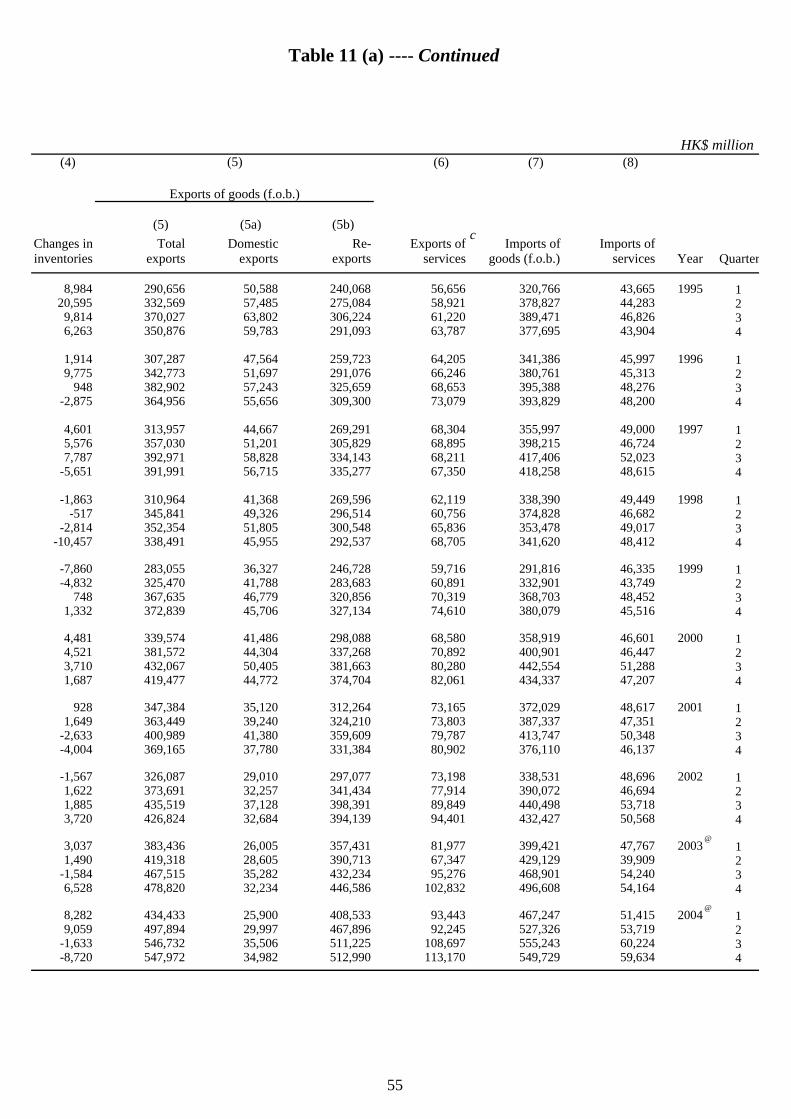
HK$ million(4) (6) (7) (8)
Exports of goods (f.o.b.)
(5) (5a) (5b) Changes in Total Domestic Re- Exports of Imports of Imports ofinventories exports exports exports services goods (f.o.b.) services Year Quarter
8,984 290,656 50,588 240,068 56,656 320,766 43,665 1995 120,595 332,569 57,485 275,084 58,921 378,827 44,283 2
9,814 370,027 63,802 306,224 61,220 389,471 46,826 36,263 350,876 59,783 291,093 63,787 377,695 43,904 4
1,914 307,287 47,564 259,723 64,205 341,386 45,997 1996 19,775 342,773 51,697 291,076 66,246 380,761 45,313 2
948 382,902 57,243 325,659 68,653 395,388 48,276 3-2,875 364,956 55,656 309,300 73,079 393,829 48,200 4
4,601 313,957 44,667 269,291 68,304 355,997 49,000 1997 15,576 357,030 51,201 305,829 68,895 398,215 46,724 27,787 392,971 58,828 334,143 68,211 417,406 52,023 3
-5,651 391,991 56,715 335,277 67,350 418,258 48,615 4
-1,863 310,964 41,368 269,596 62,119 338,390 49,449 1998 1-517 345,841 49,326 296,514 60,756 374,828 46,682 2
-2,814 352,354 51,805 300,548 65,836 353,478 49,017 3-10,457 338,491 45,955 292,537 68,705 341,620 48,412 4
-7,860 283,055 36,327 246,728 59,716 291,816 46,335 1999 1-4,832 325,470 41,788 283,683 60,891 332,901 43,749 2
748 367,635 46,779 320,856 70,319 368,703 48,452 31,332 372,839 45,706 327,134 74,610 380,079 45,516 4
4,481 339,574 41,486 298,088 68,580 358,919 46,601 2000 14,521 381,572 44,304 337,268 70,892 400,901 46,447 23,710 432,067 50,405 381,663 80,280 442,554 51,288 31,687 419,477 44,772 374,704 82,061 434,337 47,207 4
928 347,384 35,120 312,264 73,165 372,029 48,617 2001 11,649 363,449 39,240 324,210 73,803 387,337 47,351 2
-2,633 400,989 41,380 359,609 79,787 413,747 50,348 3-4,004 369,165 37,780 331,384 80,902 376,110 46,137 4
-1,567 326,087 29,010 297,077 73,198 338,531 48,696 2002 11,622 373,691 32,257 341,434 77,914 390,072 46,694 21,885 435,519 37,128 398,391 89,849 440,498 53,718 33,720 426,824 32,684 394,139 94,401 432,427 50,568 4
3,037 383,436 26,005 357,431 81,977 399,421 47,767 2003 11,490 419,318 28,605 390,713 67,347 429,129 39,909 2
-1,584 467,515 35,282 432,234 95,276 468,901 54,240 36,528 478,820 32,234 446,586 102,832 496,608 54,164 4
8,282 434,433 25,900 408,533 93,443 467,247 51,415 2004 19,059 497,894 29,997 467,896 92,245 527,326 53,719 2
-1,633 546,732 35,506 511,225 108,697 555,243 60,224 3-8,720 547,972 34,982 512,990 113,170 549,729 59,634 4
(5)
Table 11 (a) ---- Continued
@
c
@
55
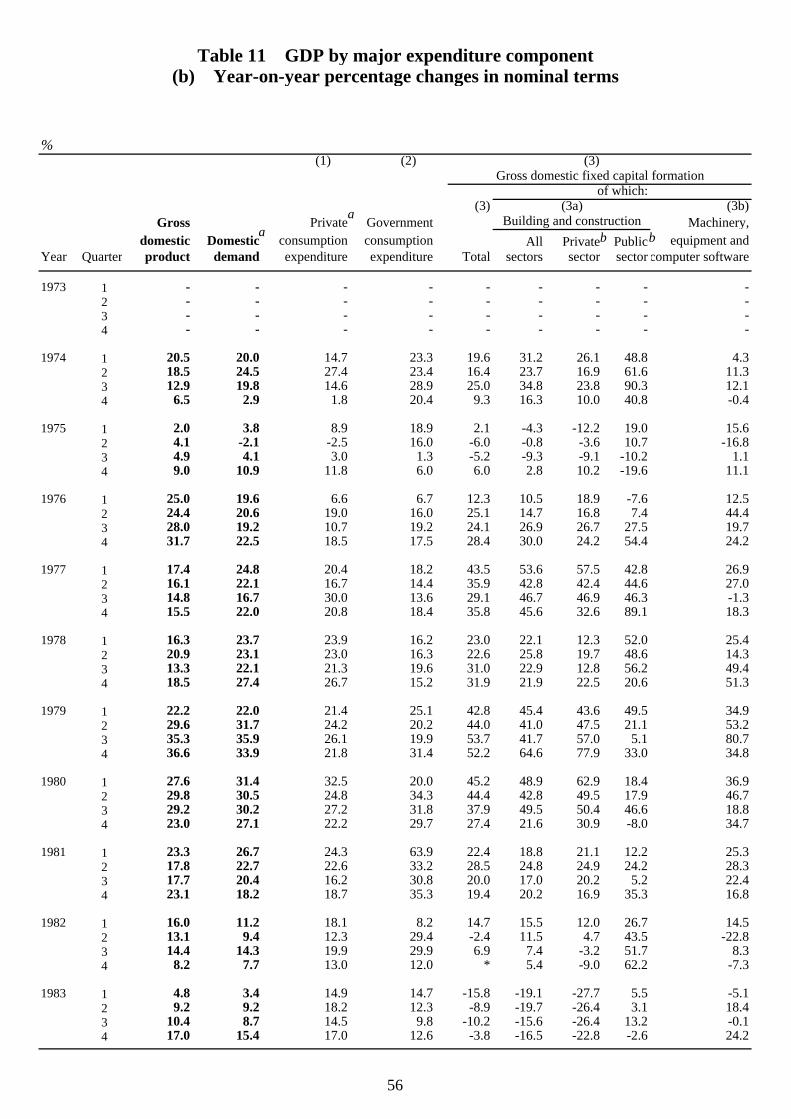
%(1) (2) (3)
Gross domestic fixed capital formationof which:
(3) (3a) (3b)Gross Private Government Building and construction Machinery,
domestic Domestic consumption consumption All Private Public equipment andYear Quarter product demand expenditure expenditure Total sectors sector sector computer software
1973 1 - - - - - - - - -2 - - - - - - - - -3 - - - - - - - - -4 - - - - - - - - -
1974 1 20.5 20.0 14.7 23.3 19.6 31.2 26.1 48.8 4.32 18.5 24.5 27.4 23.4 16.4 23.7 16.9 61.6 11.33 12.9 19.8 14.6 28.9 25.0 34.8 23.8 90.3 12.14 6.5 2.9 1.8 20.4 9.3 16.3 10.0 40.8 -0.4
1975 1 2.0 3.8 8.9 18.9 2.1 -4.3 -12.2 19.0 15.62 4.1 -2.1 -2.5 16.0 -6.0 -0.8 -3.6 10.7 -16.83 4.9 4.1 3.0 1.3 -5.2 -9.3 -9.1 -10.2 1.14 9.0 10.9 11.8 6.0 6.0 2.8 10.2 -19.6 11.1
1976 1 25.0 19.6 6.6 6.7 12.3 10.5 18.9 -7.6 12.52 24.4 20.6 19.0 16.0 25.1 14.7 16.8 7.4 44.43 28.0 19.2 10.7 19.2 24.1 26.9 26.7 27.5 19.74 31.7 22.5 18.5 17.5 28.4 30.0 24.2 54.4 24.2
1977 1 17.4 24.8 20.4 18.2 43.5 53.6 57.5 42.8 26.92 16.1 22.1 16.7 14.4 35.9 42.8 42.4 44.6 27.03 14.8 16.7 30.0 13.6 29.1 46.7 46.9 46.3 -1.34 15.5 22.0 20.8 18.4 35.8 45.6 32.6 89.1 18.3
1978 1 16.3 23.7 23.9 16.2 23.0 22.1 12.3 52.0 25.42 20.9 23.1 23.0 16.3 22.6 25.8 19.7 48.6 14.33 13.3 22.1 21.3 19.6 31.0 22.9 12.8 56.2 49.44 18.5 27.4 26.7 15.2 31.9 21.9 22.5 20.6 51.3
1979 1 22.2 22.0 21.4 25.1 42.8 45.4 43.6 49.5 34.92 29.6 31.7 24.2 20.2 44.0 41.0 47.5 21.1 53.23 35.3 35.9 26.1 19.9 53.7 41.7 57.0 5.1 80.74 36.6 33.9 21.8 31.4 52.2 64.6 77.9 33.0 34.8
1980 1 27.6 31.4 32.5 20.0 45.2 48.9 62.9 18.4 36.92 29.8 30.5 24.8 34.3 44.4 42.8 49.5 17.9 46.73 29.2 30.2 27.2 31.8 37.9 49.5 50.4 46.6 18.84 23.0 27.1 22.2 29.7 27.4 21.6 30.9 -8.0 34.7
1981 1 23.3 26.7 24.3 63.9 22.4 18.8 21.1 12.2 25.32 17.8 22.7 22.6 33.2 28.5 24.8 24.9 24.2 28.33 17.7 20.4 16.2 30.8 20.0 17.0 20.2 5.2 22.44 23.1 18.2 18.7 35.3 19.4 20.2 16.9 35.3 16.8
1982 1 16.0 11.2 18.1 8.2 14.7 15.5 12.0 26.7 14.52 13.1 9.4 12.3 29.4 -2.4 11.5 4.7 43.5 -22.83 14.4 14.3 19.9 29.9 6.9 7.4 -3.2 51.7 8.34 8.2 7.7 13.0 12.0 * 5.4 -9.0 62.2 -7.3
1983 1 4.8 3.4 14.9 14.7 -15.8 -19.1 -27.7 5.5 -5.12 9.2 9.2 18.2 12.3 -8.9 -19.7 -26.4 3.1 18.43 10.4 8.7 14.5 9.8 -10.2 -15.6 -26.4 13.2 -0.14 17.0 15.4 17.0 12.6 -3.8 -16.5 -22.8 -2.6 24.2
Table 11 GDP by major expenditure component(b) Year-on-year percentage changes in nominal terms
aa
b b
56
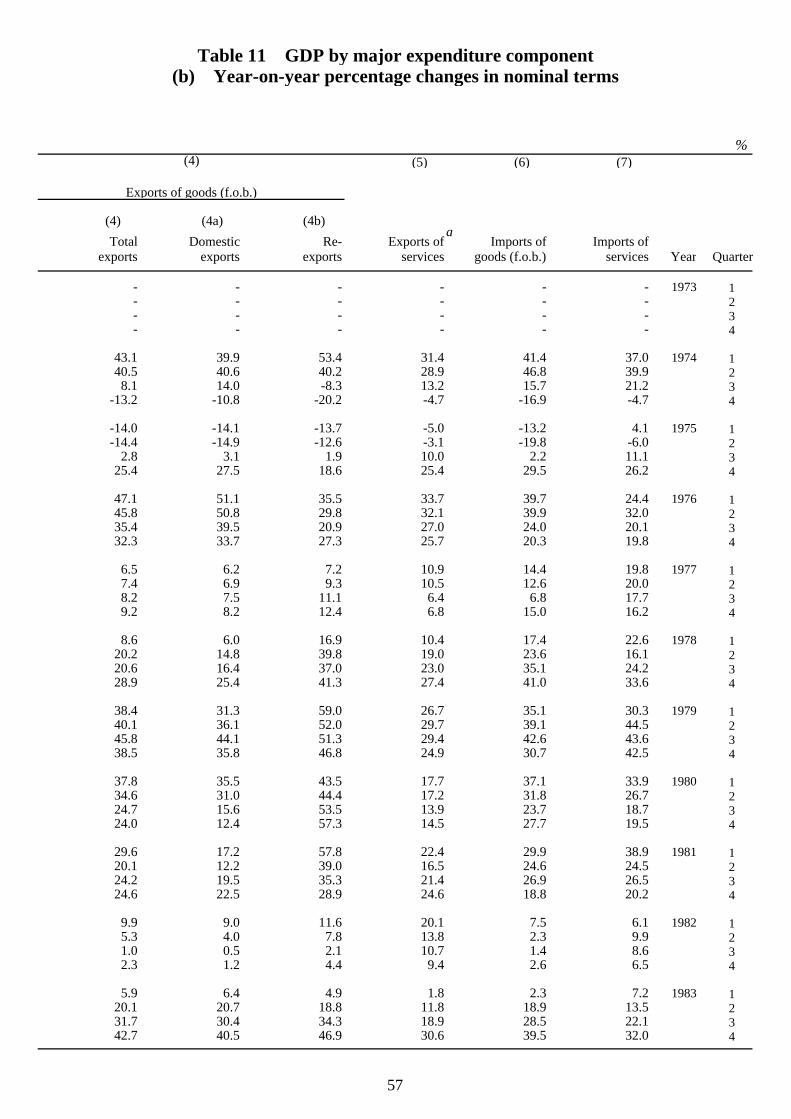
%(4) (5) (6) (7)
Exports of goods (f.o.b.)
(4) (4a) (4b) Total Domestic Re- Exports of Imports of Imports of
exports exports exports services goods (f.o.b.) services Year Quarter
- - - - - - 1973 1- - - - - - 2- - - - - - 3- - - - - - 4
43.1 39.9 53.4 31.4 41.4 37.0 1974 140.5 40.6 40.2 28.9 46.8 39.9 2
8.1 14.0 -8.3 13.2 15.7 21.2 3-13.2 -10.8 -20.2 -4.7 -16.9 -4.7 4
-14.0 -14.1 -13.7 -5.0 -13.2 4.1 1975 1-14.4 -14.9 -12.6 -3.1 -19.8 -6.0 2
2.8 3.1 1.9 10.0 2.2 11.1 325.4 27.5 18.6 25.4 29.5 26.2 4
47.1 51.1 35.5 33.7 39.7 24.4 1976 145.8 50.8 29.8 32.1 39.9 32.0 235.4 39.5 20.9 27.0 24.0 20.1 332.3 33.7 27.3 25.7 20.3 19.8 4
6.5 6.2 7.2 10.9 14.4 19.8 1977 17.4 6.9 9.3 10.5 12.6 20.0 28.2 7.5 11.1 6.4 6.8 17.7 39.2 8.2 12.4 6.8 15.0 16.2 4
8.6 6.0 16.9 10.4 17.4 22.6 1978 120.2 14.8 39.8 19.0 23.6 16.1 220.6 16.4 37.0 23.0 35.1 24.2 328.9 25.4 41.3 27.4 41.0 33.6 4
38.4 31.3 59.0 26.7 35.1 30.3 1979 140.1 36.1 52.0 29.7 39.1 44.5 245.8 44.1 51.3 29.4 42.6 43.6 338.5 35.8 46.8 24.9 30.7 42.5 4
37.8 35.5 43.5 17.7 37.1 33.9 1980 134.6 31.0 44.4 17.2 31.8 26.7 224.7 15.6 53.5 13.9 23.7 18.7 324.0 12.4 57.3 14.5 27.7 19.5 4
29.6 17.2 57.8 22.4 29.9 38.9 1981 120.1 12.2 39.0 16.5 24.6 24.5 224.2 19.5 35.3 21.4 26.9 26.5 324.6 22.5 28.9 24.6 18.8 20.2 4
9.9 9.0 11.6 20.1 7.5 6.1 1982 15.3 4.0 7.8 13.8 2.3 9.9 21.0 0.5 2.1 10.7 1.4 8.6 32.3 1.2 4.4 9.4 2.6 6.5 4
5.9 6.4 4.9 1.8 2.3 7.2 1983 120.1 20.7 18.8 11.8 18.9 13.5 231.7 30.4 34.3 18.9 28.5 22.1 342.7 40.5 46.9 30.6 39.5 32.0 4
Table 11 GDP by major expenditure component(b) Year-on-year percentage changes in nominal terms
a
57
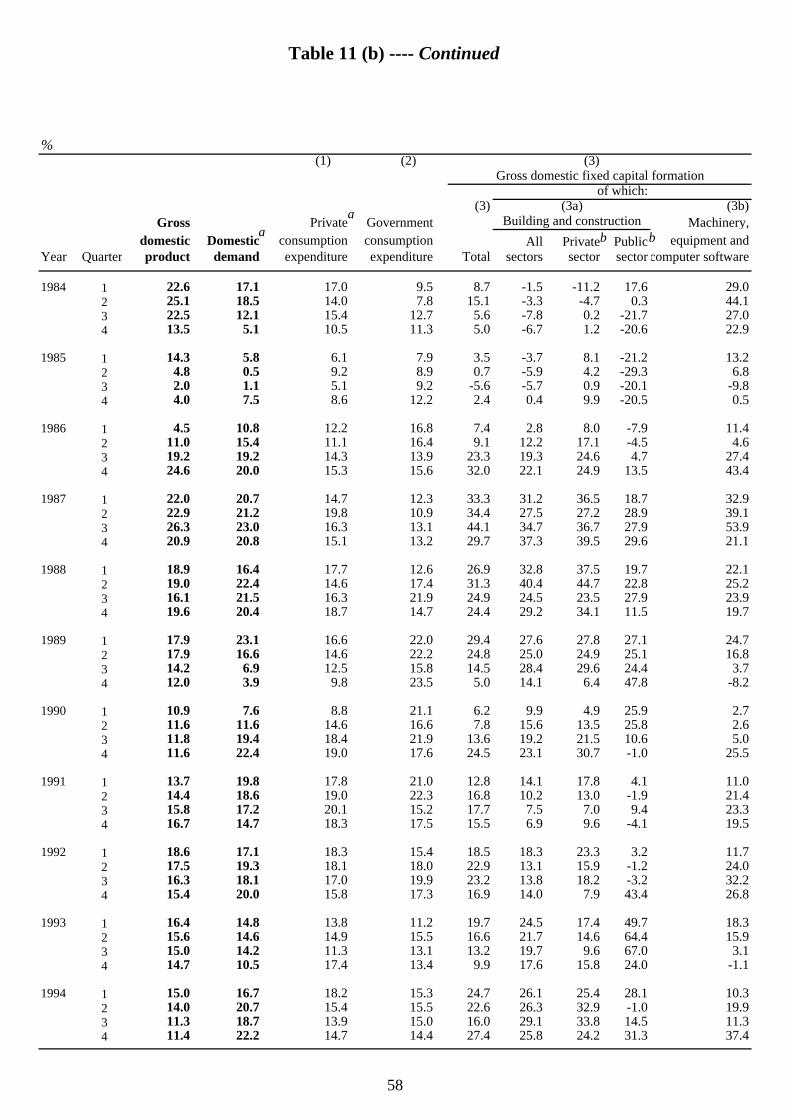
%(1) (2) (3)
Gross domestic fixed capital formationof which:
(3) (3a) (3b)Gross Private Government Building and construction Machinery,
domestic Domestic consumption consumption All Private Public equipment andYear Quarter product demand expenditure expenditure Total sectors sector sector computer software
1984 1 22.6 17.1 17.0 9.5 8.7 -1.5 -11.2 17.6 29.02 25.1 18.5 14.0 7.8 15.1 -3.3 -4.7 0.3 44.13 22.5 12.1 15.4 12.7 5.6 -7.8 0.2 -21.7 27.04 13.5 5.1 10.5 11.3 5.0 -6.7 1.2 -20.6 22.9
1985 1 14.3 5.8 6.1 7.9 3.5 -3.7 8.1 -21.2 13.22 4.8 0.5 9.2 8.9 0.7 -5.9 4.2 -29.3 6.83 2.0 1.1 5.1 9.2 -5.6 -5.7 0.9 -20.1 -9.84 4.0 7.5 8.6 12.2 2.4 0.4 9.9 -20.5 0.5
1986 1 4.5 10.8 12.2 16.8 7.4 2.8 8.0 -7.9 11.42 11.0 15.4 11.1 16.4 9.1 12.2 17.1 -4.5 4.63 19.2 19.2 14.3 13.9 23.3 19.3 24.6 4.7 27.44 24.6 20.0 15.3 15.6 32.0 22.1 24.9 13.5 43.4
1987 1 22.0 20.7 14.7 12.3 33.3 31.2 36.5 18.7 32.92 22.9 21.2 19.8 10.9 34.4 27.5 27.2 28.9 39.13 26.3 23.0 16.3 13.1 44.1 34.7 36.7 27.9 53.94 20.9 20.8 15.1 13.2 29.7 37.3 39.5 29.6 21.1
1988 1 18.9 16.4 17.7 12.6 26.9 32.8 37.5 19.7 22.12 19.0 22.4 14.6 17.4 31.3 40.4 44.7 22.8 25.23 16.1 21.5 16.3 21.9 24.9 24.5 23.5 27.9 23.94 19.6 20.4 18.7 14.7 24.4 29.2 34.1 11.5 19.7
1989 1 17.9 23.1 16.6 22.0 29.4 27.6 27.8 27.1 24.72 17.9 16.6 14.6 22.2 24.8 25.0 24.9 25.1 16.83 14.2 6.9 12.5 15.8 14.5 28.4 29.6 24.4 3.74 12.0 3.9 9.8 23.5 5.0 14.1 6.4 47.8 -8.2
1990 1 10.9 7.6 8.8 21.1 6.2 9.9 4.9 25.9 2.72 11.6 11.6 14.6 16.6 7.8 15.6 13.5 25.8 2.63 11.8 19.4 18.4 21.9 13.6 19.2 21.5 10.6 5.04 11.6 22.4 19.0 17.6 24.5 23.1 30.7 -1.0 25.5
1991 1 13.7 19.8 17.8 21.0 12.8 14.1 17.8 4.1 11.02 14.4 18.6 19.0 22.3 16.8 10.2 13.0 -1.9 21.43 15.8 17.2 20.1 15.2 17.7 7.5 7.0 9.4 23.34 16.7 14.7 18.3 17.5 15.5 6.9 9.6 -4.1 19.5
1992 1 18.6 17.1 18.3 15.4 18.5 18.3 23.3 3.2 11.72 17.5 19.3 18.1 18.0 22.9 13.1 15.9 -1.2 24.03 16.3 18.1 17.0 19.9 23.2 13.8 18.2 -3.2 32.24 15.4 20.0 15.8 17.3 16.9 14.0 7.9 43.4 26.8
1993 1 16.4 14.8 13.8 11.2 19.7 24.5 17.4 49.7 18.32 15.6 14.6 14.9 15.5 16.6 21.7 14.6 64.4 15.93 15.0 14.2 11.3 13.1 13.2 19.7 9.6 67.0 3.14 14.7 10.5 17.4 13.4 9.9 17.6 15.8 24.0 -1.1
1994 1 15.0 16.7 18.2 15.3 24.7 26.1 25.4 28.1 10.32 14.0 20.7 15.4 15.5 22.6 26.3 32.9 -1.0 19.93 11.3 18.7 13.9 15.0 16.0 29.1 33.8 14.5 11.34 11.4 22.2 14.7 14.4 27.4 25.8 24.2 31.3 37.4
Table 11 (b) ---- Continued
aa
b b
58
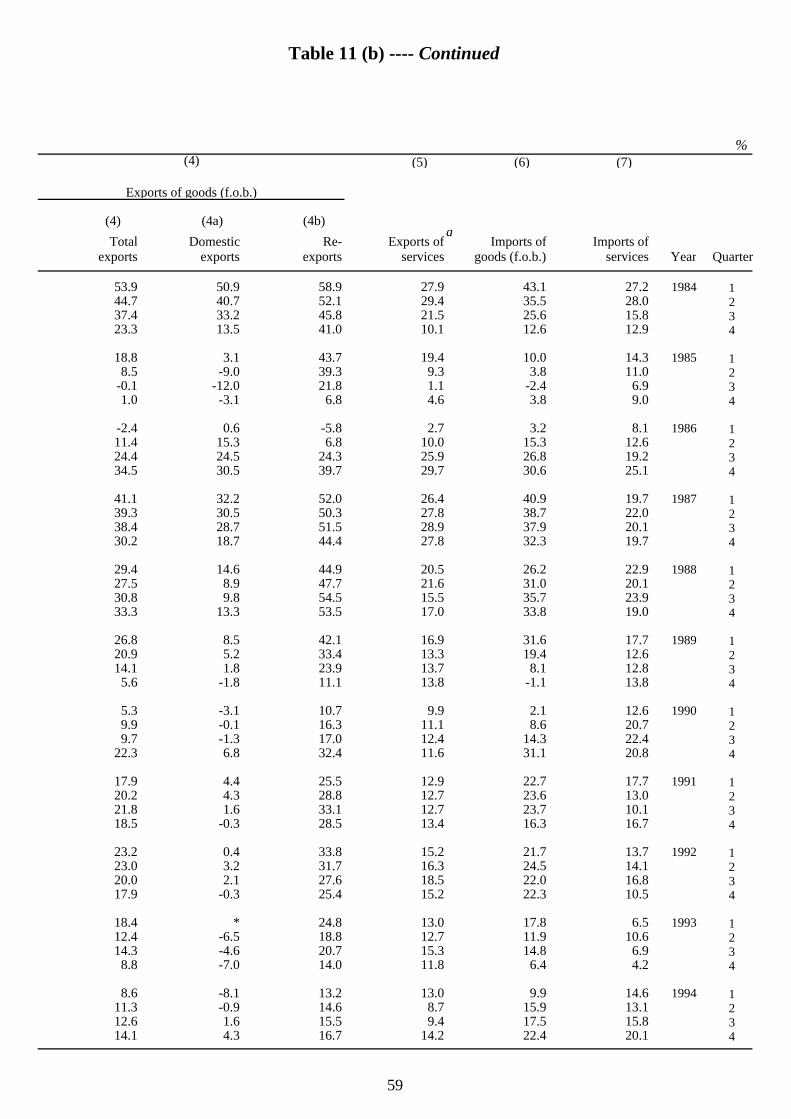
%(4) (5) (6) (7)
Exports of goods (f.o.b.)
(4) (4a) (4b) Total Domestic Re- Exports of Imports of Imports of
exports exports exports services goods (f.o.b.) services Year Quarter
53.9 50.9 58.9 27.9 43.1 27.2 1984 144.7 40.7 52.1 29.4 35.5 28.0 237.4 33.2 45.8 21.5 25.6 15.8 323.3 13.5 41.0 10.1 12.6 12.9 4
18.8 3.1 43.7 19.4 10.0 14.3 1985 18.5 -9.0 39.3 9.3 3.8 11.0 2
-0.1 -12.0 21.8 1.1 -2.4 6.9 31.0 -3.1 6.8 4.6 3.8 9.0 4
-2.4 0.6 -5.8 2.7 3.2 8.1 1986 111.4 15.3 6.8 10.0 15.3 12.6 224.4 24.5 24.3 25.9 26.8 19.2 334.5 30.5 39.7 29.7 30.6 25.1 4
41.1 32.2 52.0 26.4 40.9 19.7 1987 139.3 30.5 50.3 27.8 38.7 22.0 238.4 28.7 51.5 28.9 37.9 20.1 330.2 18.7 44.4 27.8 32.3 19.7 4
29.4 14.6 44.9 20.5 26.2 22.9 1988 127.5 8.9 47.7 21.6 31.0 20.1 230.8 9.8 54.5 15.5 35.7 23.9 333.3 13.3 53.5 17.0 33.8 19.0 4
26.8 8.5 42.1 16.9 31.6 17.7 1989 120.9 5.2 33.4 13.3 19.4 12.6 214.1 1.8 23.9 13.7 8.1 12.8 3
5.6 -1.8 11.1 13.8 -1.1 13.8 4
5.3 -3.1 10.7 9.9 2.1 12.6 1990 19.9 -0.1 16.3 11.1 8.6 20.7 29.7 -1.3 17.0 12.4 14.3 22.4 3
22.3 6.8 32.4 11.6 31.1 20.8 4
17.9 4.4 25.5 12.9 22.7 17.7 1991 120.2 4.3 28.8 12.7 23.6 13.0 221.8 1.6 33.1 12.7 23.7 10.1 318.5 -0.3 28.5 13.4 16.3 16.7 4
23.2 0.4 33.8 15.2 21.7 13.7 1992 123.0 3.2 31.7 16.3 24.5 14.1 220.0 2.1 27.6 18.5 22.0 16.8 317.9 -0.3 25.4 15.2 22.3 10.5 4
18.4 * 24.8 13.0 17.8 6.5 1993 112.4 -6.5 18.8 12.7 11.9 10.6 214.3 -4.6 20.7 15.3 14.8 6.9 3
8.8 -7.0 14.0 11.8 6.4 4.2 4
8.6 -8.1 13.2 13.0 9.9 14.6 1994 111.3 -0.9 14.6 8.7 15.9 13.1 212.6 1.6 15.5 9.4 17.5 15.8 314.1 4.3 16.7 14.2 22.4 20.1 4
Table 11 (b) ---- Continued
a
59
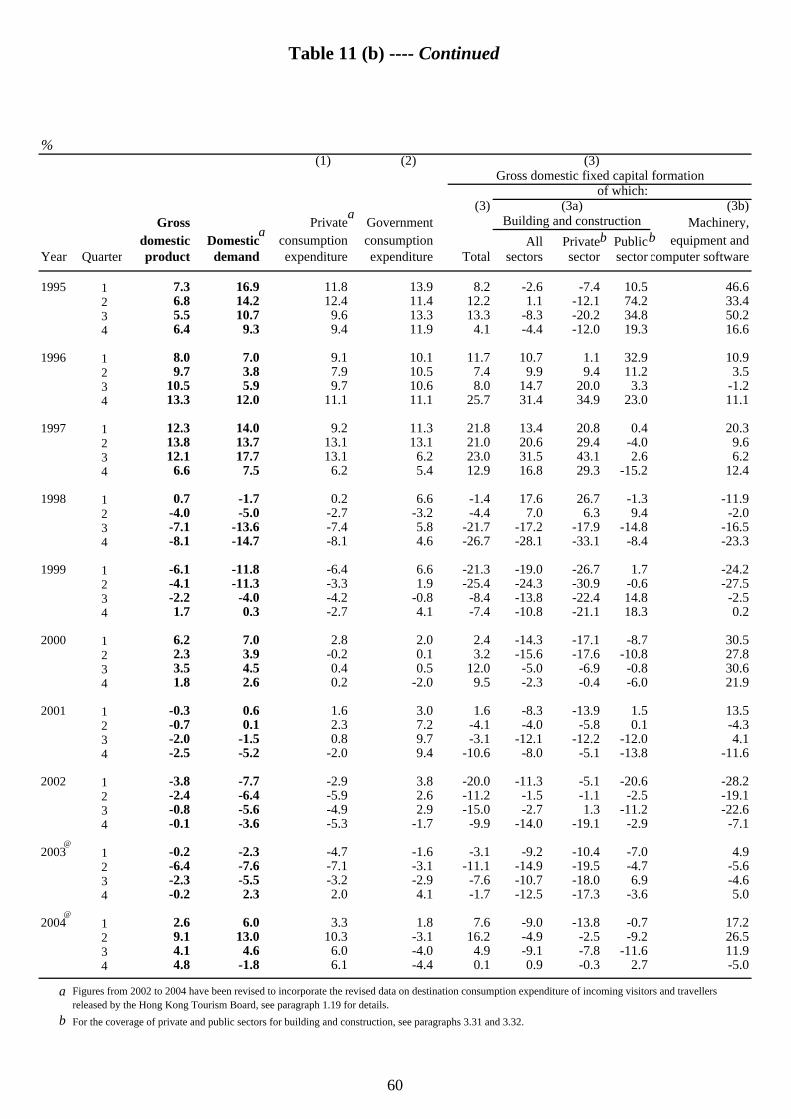
%(1) (2) (3)
Gross domestic fixed capital formationof which:
(3) (3a) (3b)Gross Private Government Building and construction Machinery,
domestic Domestic consumption consumption All Private Public equipment andYear Quarter product demand expenditure expenditure Total sectors sector sector computer software
1995 1 7.3 16.9 11.8 13.9 8.2 -2.6 -7.4 10.5 46.62 6.8 14.2 12.4 11.4 12.2 1.1 -12.1 74.2 33.43 5.5 10.7 9.6 13.3 13.3 -8.3 -20.2 34.8 50.24 6.4 9.3 9.4 11.9 4.1 -4.4 -12.0 19.3 16.6
1996 1 8.0 7.0 9.1 10.1 11.7 10.7 1.1 32.9 10.92 9.7 3.8 7.9 10.5 7.4 9.9 9.4 11.2 3.53 10.5 5.9 9.7 10.6 8.0 14.7 20.0 3.3 -1.24 13.3 12.0 11.1 11.1 25.7 31.4 34.9 23.0 11.1
1997 1 12.3 14.0 9.2 11.3 21.8 13.4 20.8 0.4 20.32 13.8 13.7 13.1 13.1 21.0 20.6 29.4 -4.0 9.63 12.1 17.7 13.1 6.2 23.0 31.5 43.1 2.6 6.24 6.6 7.5 6.2 5.4 12.9 16.8 29.3 -15.2 12.4
1998 1 0.7 -1.7 0.2 6.6 -1.4 17.6 26.7 -1.3 -11.92 -4.0 -5.0 -2.7 -3.2 -4.4 7.0 6.3 9.4 -2.03 -7.1 -13.6 -7.4 5.8 -21.7 -17.2 -17.9 -14.8 -16.54 -8.1 -14.7 -8.1 4.6 -26.7 -28.1 -33.1 -8.4 -23.3
1999 1 -6.1 -11.8 -6.4 6.6 -21.3 -19.0 -26.7 1.7 -24.22 -4.1 -11.3 -3.3 1.9 -25.4 -24.3 -30.9 -0.6 -27.53 -2.2 -4.0 -4.2 -0.8 -8.4 -13.8 -22.4 14.8 -2.54 1.7 0.3 -2.7 4.1 -7.4 -10.8 -21.1 18.3 0.2
2000 1 6.2 7.0 2.8 2.0 2.4 -14.3 -17.1 -8.7 30.52 2.3 3.9 -0.2 0.1 3.2 -15.6 -17.6 -10.8 27.83 3.5 4.5 0.4 0.5 12.0 -5.0 -6.9 -0.8 30.64 1.8 2.6 0.2 -2.0 9.5 -2.3 -0.4 -6.0 21.9
2001 1 -0.3 0.6 1.6 3.0 1.6 -8.3 -13.9 1.5 13.52 -0.7 0.1 2.3 7.2 -4.1 -4.0 -5.8 0.1 -4.33 -2.0 -1.5 0.8 9.7 -3.1 -12.1 -12.2 -12.0 4.14 -2.5 -5.2 -2.0 9.4 -10.6 -8.0 -5.1 -13.8 -11.6
2002 1 -3.8 -7.7 -2.9 3.8 -20.0 -11.3 -5.1 -20.6 -28.22 -2.4 -6.4 -5.9 2.6 -11.2 -1.5 -1.1 -2.5 -19.13 -0.8 -5.6 -4.9 2.9 -15.0 -2.7 1.3 -11.2 -22.64 -0.1 -3.6 -5.3 -1.7 -9.9 -14.0 -19.1 -2.9 -7.1
2003 1 -0.2 -2.3 -4.7 -1.6 -3.1 -9.2 -10.4 -7.0 4.92 -6.4 -7.6 -7.1 -3.1 -11.1 -14.9 -19.5 -4.7 -5.63 -2.3 -5.5 -3.2 -2.9 -7.6 -10.7 -18.0 6.9 -4.64 -0.2 2.3 2.0 4.1 -1.7 -12.5 -17.3 -3.6 5.0
2004 1 2.6 6.0 3.3 1.8 7.6 -9.0 -13.8 -0.7 17.22 9.1 13.0 10.3 -3.1 16.2 -4.9 -2.5 -9.2 26.53 4.1 4.6 6.0 -4.0 4.9 -9.1 -7.8 -11.6 11.94 4.8 -1.8 6.1 -4.4 0.1 0.9 -0.3 2.7 -5.0
a
b For the coverage of private and public sectors for building and construction, see paragraphs 3.31 and 3.32.
Table 11 (b) ---- Continued
Figures from 2002 to 2004 have been revised to incorporate the revised data on destination consumption expenditure of incoming visitors and travellersreleased by the Hong Kong Tourism Board, see paragraph 1.19 for details.
@
aa
b b
@
60
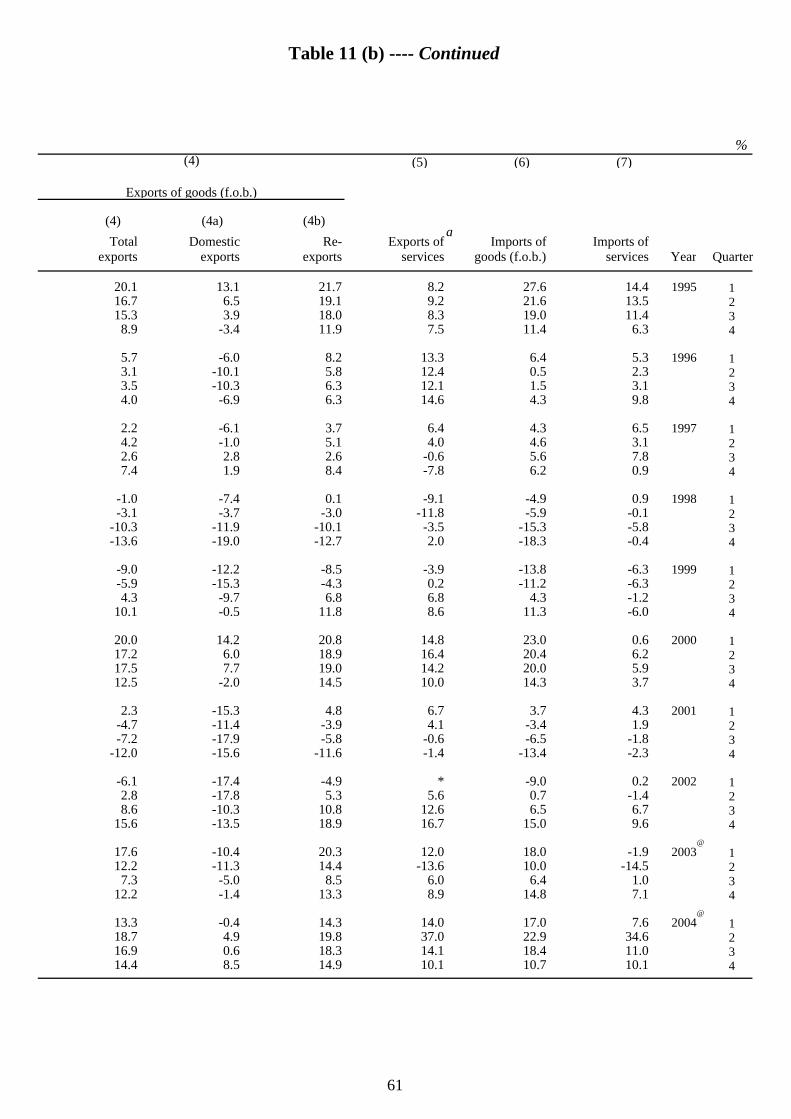
%(4) (5) (6) (7)
Exports of goods (f.o.b.)
(4) (4a) (4b) Total Domestic Re- Exports of Imports of Imports of
exports exports exports services goods (f.o.b.) services Year Quarter
20.1 13.1 21.7 8.2 27.6 14.4 1995 116.7 6.5 19.1 9.2 21.6 13.5 215.3 3.9 18.0 8.3 19.0 11.4 3
8.9 -3.4 11.9 7.5 11.4 6.3 4
5.7 -6.0 8.2 13.3 6.4 5.3 1996 13.1 -10.1 5.8 12.4 0.5 2.3 23.5 -10.3 6.3 12.1 1.5 3.1 34.0 -6.9 6.3 14.6 4.3 9.8 4
2.2 -6.1 3.7 6.4 4.3 6.5 1997 14.2 -1.0 5.1 4.0 4.6 3.1 22.6 2.8 2.6 -0.6 5.6 7.8 37.4 1.9 8.4 -7.8 6.2 0.9 4
-1.0 -7.4 0.1 -9.1 -4.9 0.9 1998 1-3.1 -3.7 -3.0 -11.8 -5.9 -0.1 2
-10.3 -11.9 -10.1 -3.5 -15.3 -5.8 3-13.6 -19.0 -12.7 2.0 -18.3 -0.4 4
-9.0 -12.2 -8.5 -3.9 -13.8 -6.3 1999 1-5.9 -15.3 -4.3 0.2 -11.2 -6.3 24.3 -9.7 6.8 6.8 4.3 -1.2 3
10.1 -0.5 11.8 8.6 11.3 -6.0 4
20.0 14.2 20.8 14.8 23.0 0.6 2000 117.2 6.0 18.9 16.4 20.4 6.2 217.5 7.7 19.0 14.2 20.0 5.9 312.5 -2.0 14.5 10.0 14.3 3.7 4
2.3 -15.3 4.8 6.7 3.7 4.3 2001 1-4.7 -11.4 -3.9 4.1 -3.4 1.9 2-7.2 -17.9 -5.8 -0.6 -6.5 -1.8 3
-12.0 -15.6 -11.6 -1.4 -13.4 -2.3 4
-6.1 -17.4 -4.9 * -9.0 0.2 2002 12.8 -17.8 5.3 5.6 0.7 -1.4 28.6 -10.3 10.8 12.6 6.5 6.7 3
15.6 -13.5 18.9 16.7 15.0 9.6 4
17.6 -10.4 20.3 12.0 18.0 -1.9 2003 112.2 -11.3 14.4 -13.6 10.0 -14.5 2
7.3 -5.0 8.5 6.0 6.4 1.0 312.2 -1.4 13.3 8.9 14.8 7.1 4
13.3 -0.4 14.3 14.0 17.0 7.6 2004 118.7 4.9 19.8 37.0 22.9 34.6 216.9 0.6 18.3 14.1 18.4 11.0 314.4 8.5 14.9 10.1 10.7 10.1 4
Table 11 (b) ---- Continued
@
a
@
61
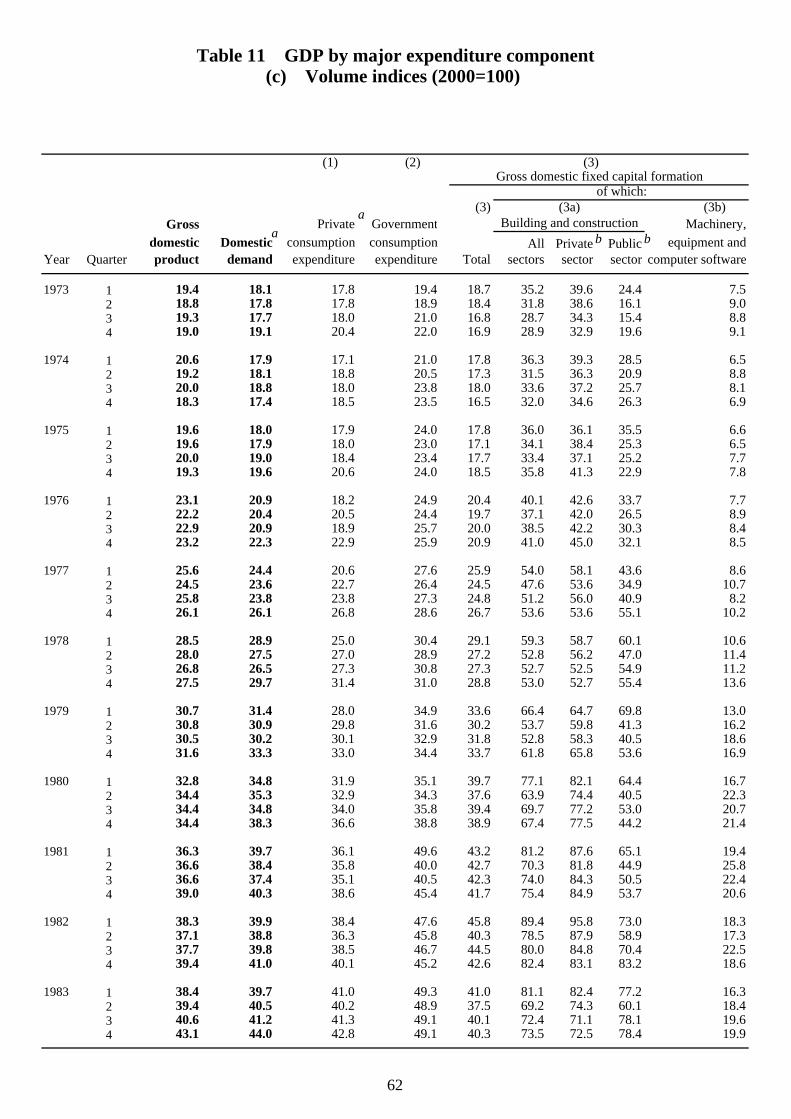
(1) (2) (3) Gross domestic fixed capital formation
of which:(3) (3a) (3b)
Gross Private Government Building and construction Machinery,domestic Domestic consumption consumption All Private Public equipment and
Year Quarter product demand expenditure expenditure Total sectors sector sector computer software
1973 1 19.4 18.1 17.8 19.4 18.7 35.2 39.6 24.4 7.52 18.8 17.8 17.8 18.9 18.4 31.8 38.6 16.1 9.03 19.3 17.7 18.0 21.0 16.8 28.7 34.3 15.4 8.84 19.0 19.1 20.4 22.0 16.9 28.9 32.9 19.6 9.1
1974 1 20.6 17.9 17.1 21.0 17.8 36.3 39.3 28.5 6.52 19.2 18.1 18.8 20.5 17.3 31.5 36.3 20.9 8.83 20.0 18.8 18.0 23.8 18.0 33.6 37.2 25.7 8.14 18.3 17.4 18.5 23.5 16.5 32.0 34.6 26.3 6.9
1975 1 19.6 18.0 17.9 24.0 17.8 36.0 36.1 35.5 6.62 19.6 17.9 18.0 23.0 17.1 34.1 38.4 25.3 6.53 20.0 19.0 18.4 23.4 17.7 33.4 37.1 25.2 7.74 19.3 19.6 20.6 24.0 18.5 35.8 41.3 22.9 7.8
1976 1 23.1 20.9 18.2 24.9 20.4 40.1 42.6 33.7 7.72 22.2 20.4 20.5 24.4 19.7 37.1 42.0 26.5 8.93 22.9 20.9 18.9 25.7 20.0 38.5 42.2 30.3 8.44 23.2 22.3 22.9 25.9 20.9 41.0 45.0 32.1 8.5
1977 1 25.6 24.4 20.6 27.6 25.9 54.0 58.1 43.6 8.62 24.5 23.6 22.7 26.4 24.5 47.6 53.6 34.9 10.73 25.8 23.8 23.8 27.3 24.8 51.2 56.0 40.9 8.24 26.1 26.1 26.8 28.6 26.7 53.6 53.6 55.1 10.2
1978 1 28.5 28.9 25.0 30.4 29.1 59.3 58.7 60.1 10.62 28.0 27.5 27.0 28.9 27.2 52.8 56.2 47.0 11.43 26.8 26.5 27.3 30.8 27.3 52.7 52.5 54.9 11.24 27.5 29.7 31.4 31.0 28.8 53.0 52.7 55.4 13.6
1979 1 30.7 31.4 28.0 34.9 33.6 66.4 64.7 69.8 13.02 30.8 30.9 29.8 31.6 30.2 53.7 59.8 41.3 16.23 30.5 30.2 30.1 32.9 31.8 52.8 58.3 40.5 18.64 31.6 33.3 33.0 34.4 33.7 61.8 65.8 53.6 16.9
1980 1 32.8 34.8 31.9 35.1 39.7 77.1 82.1 64.4 16.72 34.4 35.3 32.9 34.3 37.6 63.9 74.4 40.5 22.33 34.4 34.8 34.0 35.8 39.4 69.7 77.2 53.0 20.74 34.4 38.3 36.6 38.8 38.9 67.4 77.5 44.2 21.4
1981 1 36.3 39.7 36.1 49.6 43.2 81.2 87.6 65.1 19.42 36.6 38.4 35.8 40.0 42.7 70.3 81.8 44.9 25.83 36.6 37.4 35.1 40.5 42.3 74.0 84.3 50.5 22.44 39.0 40.3 38.6 45.4 41.7 75.4 84.9 53.7 20.6
1982 1 38.3 39.9 38.4 47.6 45.8 89.4 95.8 73.0 18.32 37.1 38.8 36.3 45.8 40.3 78.5 87.9 58.9 17.33 37.7 39.8 38.5 46.7 44.5 80.0 84.8 70.4 22.54 39.4 41.0 40.1 45.2 42.6 82.4 83.1 83.2 18.6
1983 1 38.4 39.7 41.0 49.3 41.0 81.1 82.4 77.2 16.32 39.4 40.5 40.2 48.9 37.5 69.2 74.3 60.1 18.43 40.6 41.2 41.3 49.1 40.1 72.4 71.1 78.1 19.64 43.1 44.0 42.8 49.1 40.3 73.5 72.5 78.4 19.9
Table 11 GDP by major expenditure component(c) Volume indices (2000=100)
aa
b b
62
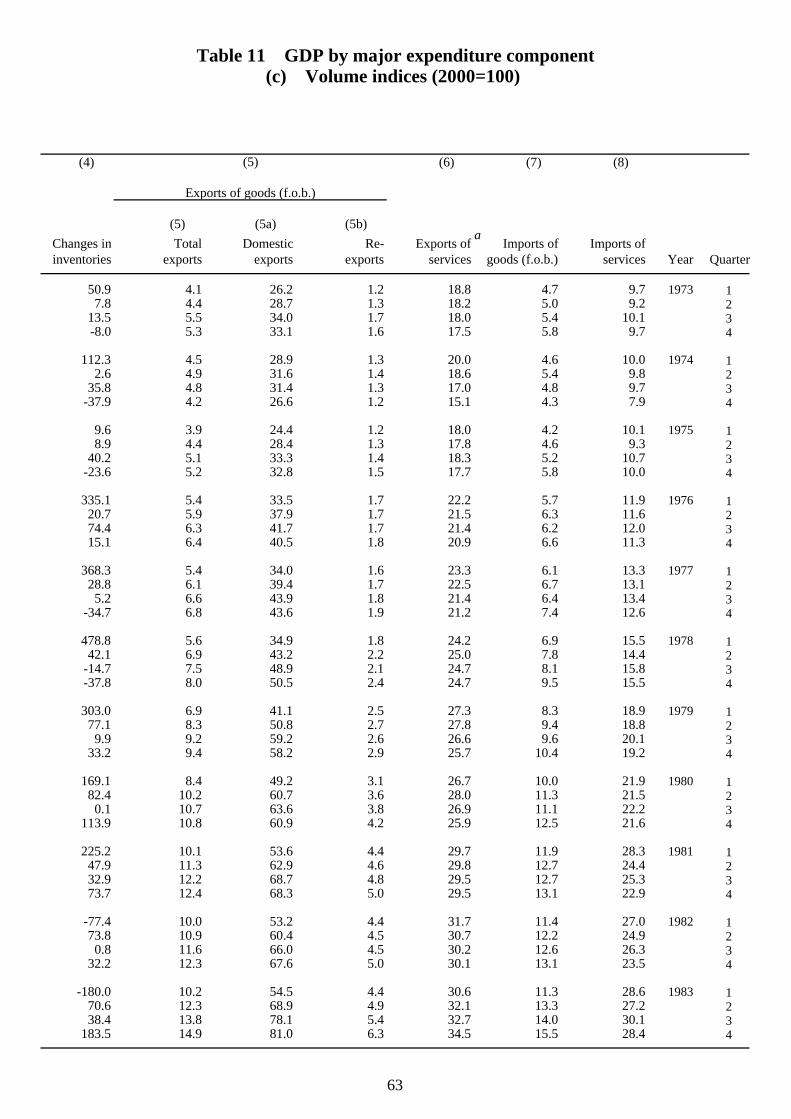
(4) (6) (7) (8)
Exports of goods (f.o.b.)
(5) (5a) (5b) Changes in Total Domestic Re- Exports of Imports of Imports ofinventories exports exports exports services goods (f.o.b.) services Year Quarter
50.9 4.1 26.2 1.2 18.8 4.7 9.7 1973 17.8 4.4 28.7 1.3 18.2 5.0 9.2 2
13.5 5.5 34.0 1.7 18.0 5.4 10.1 3-8.0 5.3 33.1 1.6 17.5 5.8 9.7 4
112.3 4.5 28.9 1.3 20.0 4.6 10.0 1974 12.6 4.9 31.6 1.4 18.6 5.4 9.8 2
35.8 4.8 31.4 1.3 17.0 4.8 9.7 3-37.9 4.2 26.6 1.2 15.1 4.3 7.9 4
9.6 3.9 24.4 1.2 18.0 4.2 10.1 1975 18.9 4.4 28.4 1.3 17.8 4.6 9.3 2
40.2 5.1 33.3 1.4 18.3 5.2 10.7 3-23.6 5.2 32.8 1.5 17.7 5.8 10.0 4
335.1 5.4 33.5 1.7 22.2 5.7 11.9 1976 120.7 5.9 37.9 1.7 21.5 6.3 11.6 274.4 6.3 41.7 1.7 21.4 6.2 12.0 315.1 6.4 40.5 1.8 20.9 6.6 11.3 4
368.3 5.4 34.0 1.6 23.3 6.1 13.3 1977 128.8 6.1 39.4 1.7 22.5 6.7 13.1 2
5.2 6.6 43.9 1.8 21.4 6.4 13.4 3-34.7 6.8 43.6 1.9 21.2 7.4 12.6 4
478.8 5.6 34.9 1.8 24.2 6.9 15.5 1978 142.1 6.9 43.2 2.2 25.0 7.8 14.4 2
-14.7 7.5 48.9 2.1 24.7 8.1 15.8 3-37.8 8.0 50.5 2.4 24.7 9.5 15.5 4
303.0 6.9 41.1 2.5 27.3 8.3 18.9 1979 177.1 8.3 50.8 2.7 27.8 9.4 18.8 2
9.9 9.2 59.2 2.6 26.6 9.6 20.1 333.2 9.4 58.2 2.9 25.7 10.4 19.2 4
169.1 8.4 49.2 3.1 26.7 10.0 21.9 1980 182.4 10.2 60.7 3.6 28.0 11.3 21.5 2
0.1 10.7 63.6 3.8 26.9 11.1 22.2 3113.9 10.8 60.9 4.2 25.9 12.5 21.6 4
225.2 10.1 53.6 4.4 29.7 11.9 28.3 1981 147.9 11.3 62.9 4.6 29.8 12.7 24.4 232.9 12.2 68.7 4.8 29.5 12.7 25.3 373.7 12.4 68.3 5.0 29.5 13.1 22.9 4
-77.4 10.0 53.2 4.4 31.7 11.4 27.0 1982 173.8 10.9 60.4 4.5 30.7 12.2 24.9 2
0.8 11.6 66.0 4.5 30.2 12.6 26.3 332.2 12.3 67.6 5.0 30.1 13.1 23.5 4
-180.0 10.2 54.5 4.4 30.6 11.3 28.6 1983 170.6 12.3 68.9 4.9 32.1 13.3 27.2 238.4 13.8 78.1 5.4 32.7 14.0 30.1 3
183.5 14.9 81.0 6.3 34.5 15.5 28.4 4
Table 11 GDP by major expenditure component(c) Volume indices (2000=100)
(5)
a
63
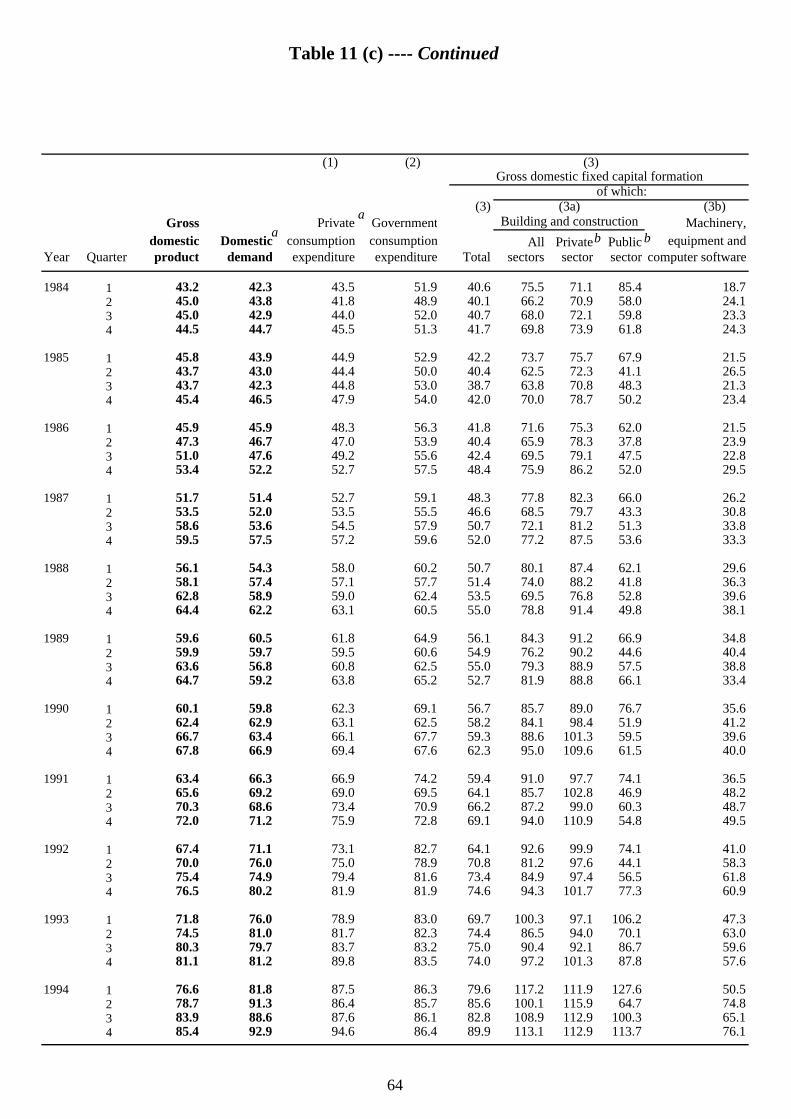
(1) (2) (3) Gross domestic fixed capital formation
of which:(3) (3a) (3b)
Gross Private Government Building and construction Machinery,domestic Domestic consumption consumption All Private Public equipment and
Year Quarter product demand expenditure expenditure Total sectors sector sector computer software
1984 1 43.2 42.3 43.5 51.9 40.6 75.5 71.1 85.4 18.72 45.0 43.8 41.8 48.9 40.1 66.2 70.9 58.0 24.13 45.0 42.9 44.0 52.0 40.7 68.0 72.1 59.8 23.34 44.5 44.7 45.5 51.3 41.7 69.8 73.9 61.8 24.3
1985 1 45.8 43.9 44.9 52.9 42.2 73.7 75.7 67.9 21.52 43.7 43.0 44.4 50.0 40.4 62.5 72.3 41.1 26.53 43.7 42.3 44.8 53.0 38.7 63.8 70.8 48.3 21.34 45.4 46.5 47.9 54.0 42.0 70.0 78.7 50.2 23.4
1986 1 45.9 45.9 48.3 56.3 41.8 71.6 75.3 62.0 21.52 47.3 46.7 47.0 53.9 40.4 65.9 78.3 37.8 23.93 51.0 47.6 49.2 55.6 42.4 69.5 79.1 47.5 22.84 53.4 52.2 52.7 57.5 48.4 75.9 86.2 52.0 29.5
1987 1 51.7 51.4 52.7 59.1 48.3 77.8 82.3 66.0 26.22 53.5 52.0 53.5 55.5 46.6 68.5 79.7 43.3 30.83 58.6 53.6 54.5 57.9 50.7 72.1 81.2 51.3 33.84 59.5 57.5 57.2 59.6 52.0 77.2 87.5 53.6 33.3
1988 1 56.1 54.3 58.0 60.2 50.7 80.1 87.4 62.1 29.62 58.1 57.4 57.1 57.7 51.4 74.0 88.2 41.8 36.33 62.8 58.9 59.0 62.4 53.5 69.5 76.8 52.8 39.64 64.4 62.2 63.1 60.5 55.0 78.8 91.4 49.8 38.1
1989 1 59.6 60.5 61.8 64.9 56.1 84.3 91.2 66.9 34.82 59.9 59.7 59.5 60.6 54.9 76.2 90.2 44.6 40.43 63.6 56.8 60.8 62.5 55.0 79.3 88.9 57.5 38.84 64.7 59.2 63.8 65.2 52.7 81.9 88.8 66.1 33.4
1990 1 60.1 59.8 62.3 69.1 56.7 85.7 89.0 76.7 35.62 62.4 62.9 63.1 62.5 58.2 84.1 98.4 51.9 41.23 66.7 63.4 66.1 67.7 59.3 88.6 101.3 59.5 39.64 67.8 66.9 69.4 67.6 62.3 95.0 109.6 61.5 40.0
1991 1 63.4 66.3 66.9 74.2 59.4 91.0 97.7 74.1 36.52 65.6 69.2 69.0 69.5 64.1 85.7 102.8 46.9 48.23 70.3 68.6 73.4 70.9 66.2 87.2 99.0 60.3 48.74 72.0 71.2 75.9 72.8 69.1 94.0 110.9 54.8 49.5
1992 1 67.4 71.1 73.1 82.7 64.1 92.6 99.9 74.1 41.02 70.0 76.0 75.0 78.9 70.8 81.2 97.6 44.1 58.33 75.4 74.9 79.4 81.6 73.4 84.9 97.4 56.5 61.84 76.5 80.2 81.9 81.9 74.6 94.3 101.7 77.3 60.9
1993 1 71.8 76.0 78.9 83.0 69.7 100.3 97.1 106.2 47.32 74.5 81.0 81.7 82.3 74.4 86.5 94.0 70.1 63.03 80.3 79.7 83.7 83.2 75.0 90.4 92.1 86.7 59.64 81.1 81.2 89.8 83.5 74.0 97.2 101.3 87.8 57.6
1994 1 76.6 81.8 87.5 86.3 79.6 117.2 111.9 127.6 50.52 78.7 91.3 86.4 85.7 85.6 100.1 115.9 64.7 74.83 83.9 88.6 87.6 86.1 82.8 108.9 112.9 100.3 65.14 85.4 92.9 94.6 86.4 89.9 113.1 112.9 113.7 76.1
Table 11 (c) ---- Continued
aa
b b
64
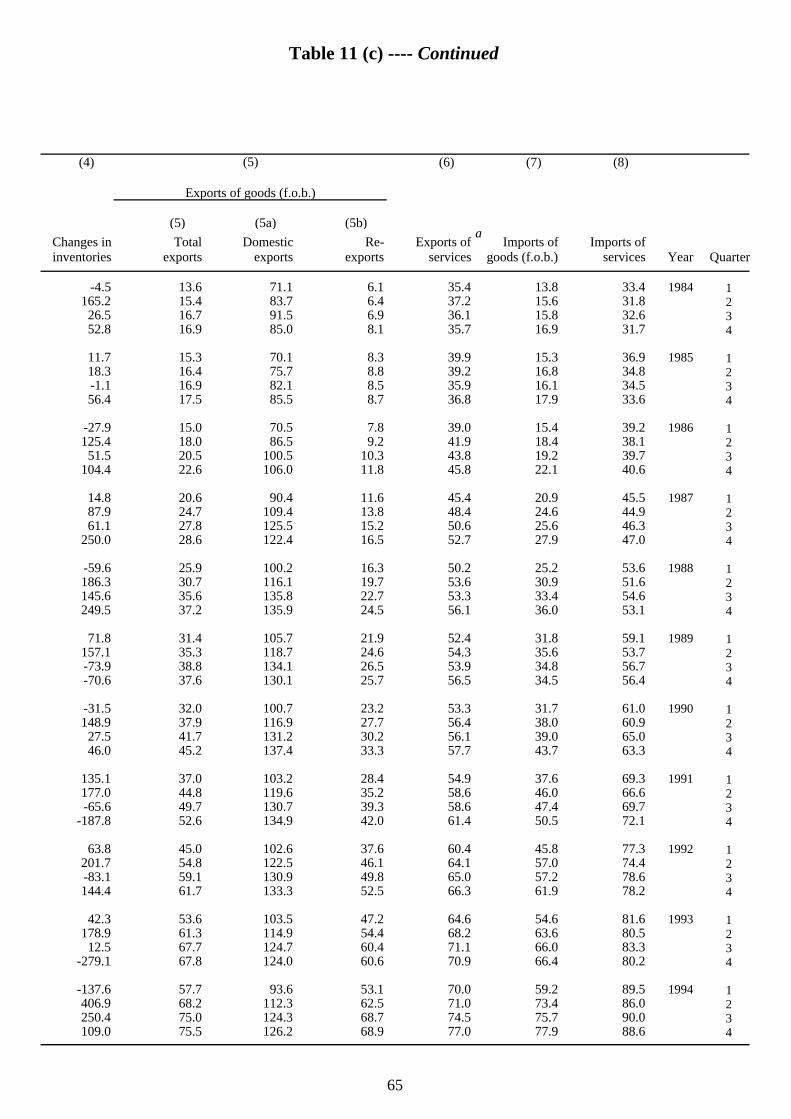
(4) (6) (7) (8)
Exports of goods (f.o.b.)
(5) (5a) (5b) Changes in Total Domestic Re- Exports of Imports of Imports ofinventories exports exports exports services goods (f.o.b.) services Year Quarter
-4.5 13.6 71.1 6.1 35.4 13.8 33.4 1984 1165.2 15.4 83.7 6.4 37.2 15.6 31.8 2
26.5 16.7 91.5 6.9 36.1 15.8 32.6 352.8 16.9 85.0 8.1 35.7 16.9 31.7 4
11.7 15.3 70.1 8.3 39.9 15.3 36.9 1985 118.3 16.4 75.7 8.8 39.2 16.8 34.8 2-1.1 16.9 82.1 8.5 35.9 16.1 34.5 356.4 17.5 85.5 8.7 36.8 17.9 33.6 4
-27.9 15.0 70.5 7.8 39.0 15.4 39.2 1986 1125.4 18.0 86.5 9.2 41.9 18.4 38.1 2
51.5 20.5 100.5 10.3 43.8 19.2 39.7 3104.4 22.6 106.0 11.8 45.8 22.1 40.6 4
14.8 20.6 90.4 11.6 45.4 20.9 45.5 1987 187.9 24.7 109.4 13.8 48.4 24.6 44.9 261.1 27.8 125.5 15.2 50.6 25.6 46.3 3
250.0 28.6 122.4 16.5 52.7 27.9 47.0 4
-59.6 25.9 100.2 16.3 50.2 25.2 53.6 1988 1186.3 30.7 116.1 19.7 53.6 30.9 51.6 2145.6 35.6 135.8 22.7 53.3 33.4 54.6 3249.5 37.2 135.9 24.5 56.1 36.0 53.1 4
71.8 31.4 105.7 21.9 52.4 31.8 59.1 1989 1157.1 35.3 118.7 24.6 54.3 35.6 53.7 2-73.9 38.8 134.1 26.5 53.9 34.8 56.7 3-70.6 37.6 130.1 25.7 56.5 34.5 56.4 4
-31.5 32.0 100.7 23.2 53.3 31.7 61.0 1990 1148.9 37.9 116.9 27.7 56.4 38.0 60.9 2
27.5 41.7 131.2 30.2 56.1 39.0 65.0 346.0 45.2 137.4 33.3 57.7 43.7 63.3 4
135.1 37.0 103.2 28.4 54.9 37.6 69.3 1991 1177.0 44.8 119.6 35.2 58.6 46.0 66.6 2-65.6 49.7 130.7 39.3 58.6 47.4 69.7 3
-187.8 52.6 134.9 42.0 61.4 50.5 72.1 4
63.8 45.0 102.6 37.6 60.4 45.8 77.3 1992 1201.7 54.8 122.5 46.1 64.1 57.0 74.4 2-83.1 59.1 130.9 49.8 65.0 57.2 78.6 3144.4 61.7 133.3 52.5 66.3 61.9 78.2 4
42.3 53.6 103.5 47.2 64.6 54.6 81.6 1993 1178.9 61.3 114.9 54.4 68.2 63.6 80.5 2
12.5 67.7 124.7 60.4 71.1 66.0 83.3 3-279.1 67.8 124.0 60.6 70.9 66.4 80.2 4
-137.6 57.7 93.6 53.1 70.0 59.2 89.5 1994 1406.9 68.2 112.3 62.5 71.0 73.4 86.0 2250.4 75.0 124.3 68.7 74.5 75.7 90.0 3109.0 75.5 126.2 68.9 77.0 77.9 88.6 4
(5)
Table 11 (c) ---- Continued
a
65
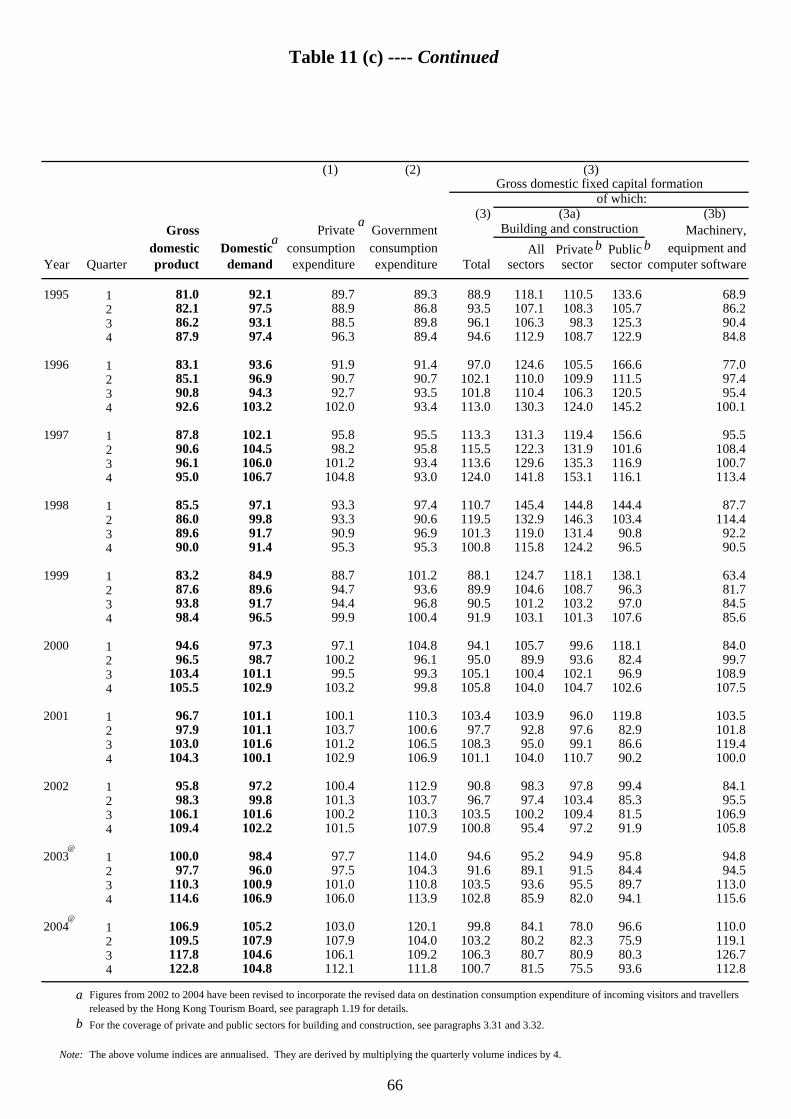
(1) (2) (3) Gross domestic fixed capital formation
of which:(3) (3a) (3b)
Gross Private Government Building and construction Machinery,domestic Domestic consumption consumption All Private Public equipment and
Year Quarter product demand expenditure expenditure Total sectors sector sector computer software
1995 1 81.0 92.1 89.7 89.3 88.9 118.1 110.5 133.6 68.92 82.1 97.5 88.9 86.8 93.5 107.1 108.3 105.7 86.23 86.2 93.1 88.5 89.8 96.1 106.3 98.3 125.3 90.44 87.9 97.4 96.3 89.4 94.6 112.9 108.7 122.9 84.8
1996 1 83.1 93.6 91.9 91.4 97.0 124.6 105.5 166.6 77.02 85.1 96.9 90.7 90.7 102.1 110.0 109.9 111.5 97.43 90.8 94.3 92.7 93.5 101.8 110.4 106.3 120.5 95.44 92.6 103.2 102.0 93.4 113.0 130.3 124.0 145.2 100.1
1997 1 87.8 102.1 95.8 95.5 113.3 131.3 119.4 156.6 95.52 90.6 104.5 98.2 95.8 115.5 122.3 131.9 101.6 108.43 96.1 106.0 101.2 93.4 113.6 129.6 135.3 116.9 100.74 95.0 106.7 104.8 93.0 124.0 141.8 153.1 116.1 113.4
1998 1 85.5 97.1 93.3 97.4 110.7 145.4 144.8 144.4 87.72 86.0 99.8 93.3 90.6 119.5 132.9 146.3 103.4 114.43 89.6 91.7 90.9 96.9 101.3 119.0 131.4 90.8 92.24 90.0 91.4 95.3 95.3 100.8 115.8 124.2 96.5 90.5
1999 1 83.2 84.9 88.7 101.2 88.1 124.7 118.1 138.1 63.42 87.6 89.6 94.7 93.6 89.9 104.6 108.7 96.3 81.73 93.8 91.7 94.4 96.8 90.5 101.2 103.2 97.0 84.54 98.4 96.5 99.9 100.4 91.9 103.1 101.3 107.6 85.6
2000 1 94.6 97.3 97.1 104.8 94.1 105.7 99.6 118.1 84.02 96.5 98.7 100.2 96.1 95.0 89.9 93.6 82.4 99.73 103.4 101.1 99.5 99.3 105.1 100.4 102.1 96.9 108.94 105.5 102.9 103.2 99.8 105.8 104.0 104.7 102.6 107.5
2001 1 96.7 101.1 100.1 110.3 103.4 103.9 96.0 119.8 103.52 97.9 101.1 103.7 100.6 97.7 92.8 97.6 82.9 101.83 103.0 101.6 101.2 106.5 108.3 95.0 99.1 86.6 119.44 104.3 100.1 102.9 106.9 101.1 104.0 110.7 90.2 100.0
2002 1 95.8 97.2 100.4 112.9 90.8 98.3 97.8 99.4 84.12 98.3 99.8 101.3 103.7 96.7 97.4 103.4 85.3 95.53 106.1 101.6 100.2 110.3 103.5 100.2 109.4 81.5 106.94 109.4 102.2 101.5 107.9 100.8 95.4 97.2 91.9 105.8
2003 1 100.0 98.4 97.7 114.0 94.6 95.2 94.9 95.8 94.82 97.7 96.0 97.5 104.3 91.6 89.1 91.5 84.4 94.53 110.3 100.9 101.0 110.8 103.5 93.6 95.5 89.7 113.04 114.6 106.9 106.0 113.9 102.8 85.9 82.0 94.1 115.6
2004 1 106.9 105.2 103.0 120.1 99.8 84.1 78.0 96.6 110.02 109.5 107.9 107.9 104.0 103.2 80.2 82.3 75.9 119.13 117.8 104.6 106.1 109.2 106.3 80.7 80.9 80.3 126.74 122.8 104.8 112.1 111.8 100.7 81.5 75.5 93.6 112.8
a
b For the coverage of private and public sectors for building and construction, see paragraphs 3.31 and 3.32.
Note: The above volume indices are annualised. They are derived by multiplying the quarterly volume indices by 4.
Figures from 2002 to 2004 have been revised to incorporate the revised data on destination consumption expenditure of incoming visitors and travellersreleased by the Hong Kong Tourism Board, see paragraph 1.19 for details.
Table 11 (c) ---- Continued
@
aa
b b
@
66
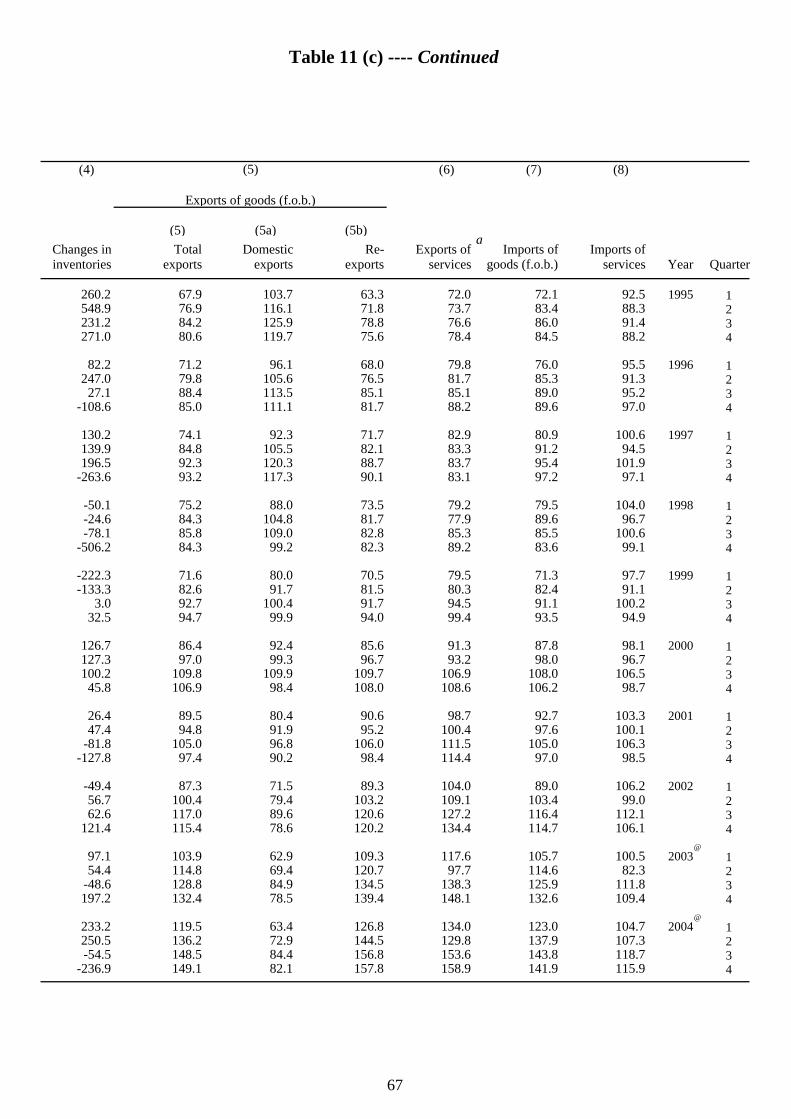
(4) (6) (7) (8)
Exports of goods (f.o.b.)
(5) (5a) (5b) Changes in Total Domestic Re- Exports of Imports of Imports ofinventories exports exports exports services goods (f.o.b.) services Year Quarter
260.2 67.9 103.7 63.3 72.0 72.1 92.5 1995 1548.9 76.9 116.1 71.8 73.7 83.4 88.3 2231.2 84.2 125.9 78.8 76.6 86.0 91.4 3271.0 80.6 119.7 75.6 78.4 84.5 88.2 4
82.2 71.2 96.1 68.0 79.8 76.0 95.5 1996 1247.0 79.8 105.6 76.5 81.7 85.3 91.3 2
27.1 88.4 113.5 85.1 85.1 89.0 95.2 3-108.6 85.0 111.1 81.7 88.2 89.6 97.0 4
130.2 74.1 92.3 71.7 82.9 80.9 100.6 1997 1139.9 84.8 105.5 82.1 83.3 91.2 94.5 2196.5 92.3 120.3 88.7 83.7 95.4 101.9 3
-263.6 93.2 117.3 90.1 83.1 97.2 97.1 4
-50.1 75.2 88.0 73.5 79.2 79.5 104.0 1998 1-24.6 84.3 104.8 81.7 77.9 89.6 96.7 2-78.1 85.8 109.0 82.8 85.3 85.5 100.6 3
-506.2 84.3 99.2 82.3 89.2 83.6 99.1 4
-222.3 71.6 80.0 70.5 79.5 71.3 97.7 1999 1-133.3 82.6 91.7 81.5 80.3 82.4 91.1 2
3.0 92.7 100.4 91.7 94.5 91.1 100.2 332.5 94.7 99.9 94.0 99.4 93.5 94.9 4
126.7 86.4 92.4 85.6 91.3 87.8 98.1 2000 1127.3 97.0 99.3 96.7 93.2 98.0 96.7 2100.2 109.8 109.9 109.7 106.9 108.0 106.5 3
45.8 106.9 98.4 108.0 108.6 106.2 98.7 4
26.4 89.5 80.4 90.6 98.7 92.7 103.3 2001 147.4 94.8 91.9 95.2 100.4 97.6 100.1 2
-81.8 105.0 96.8 106.0 111.5 105.0 106.3 3-127.8 97.4 90.2 98.4 114.4 97.0 98.5 4
-49.4 87.3 71.5 89.3 104.0 89.0 106.2 2002 156.7 100.4 79.4 103.2 109.1 103.4 99.0 262.6 117.0 89.6 120.6 127.2 116.4 112.1 3
121.4 115.4 78.6 120.2 134.4 114.7 106.1 4
97.1 103.9 62.9 109.3 117.6 105.7 100.5 2003 154.4 114.8 69.4 120.7 97.7 114.6 82.3 2
-48.6 128.8 84.9 134.5 138.3 125.9 111.8 3197.2 132.4 78.5 139.4 148.1 132.6 109.4 4
233.2 119.5 63.4 126.8 134.0 123.0 104.7 2004 1250.5 136.2 72.9 144.5 129.8 137.9 107.3 2-54.5 148.5 84.4 156.8 153.6 143.8 118.7 3
-236.9 149.1 82.1 157.8 158.9 141.9 115.9 4
(5)
Table 11 (c) ---- Continued
@
a
@
67
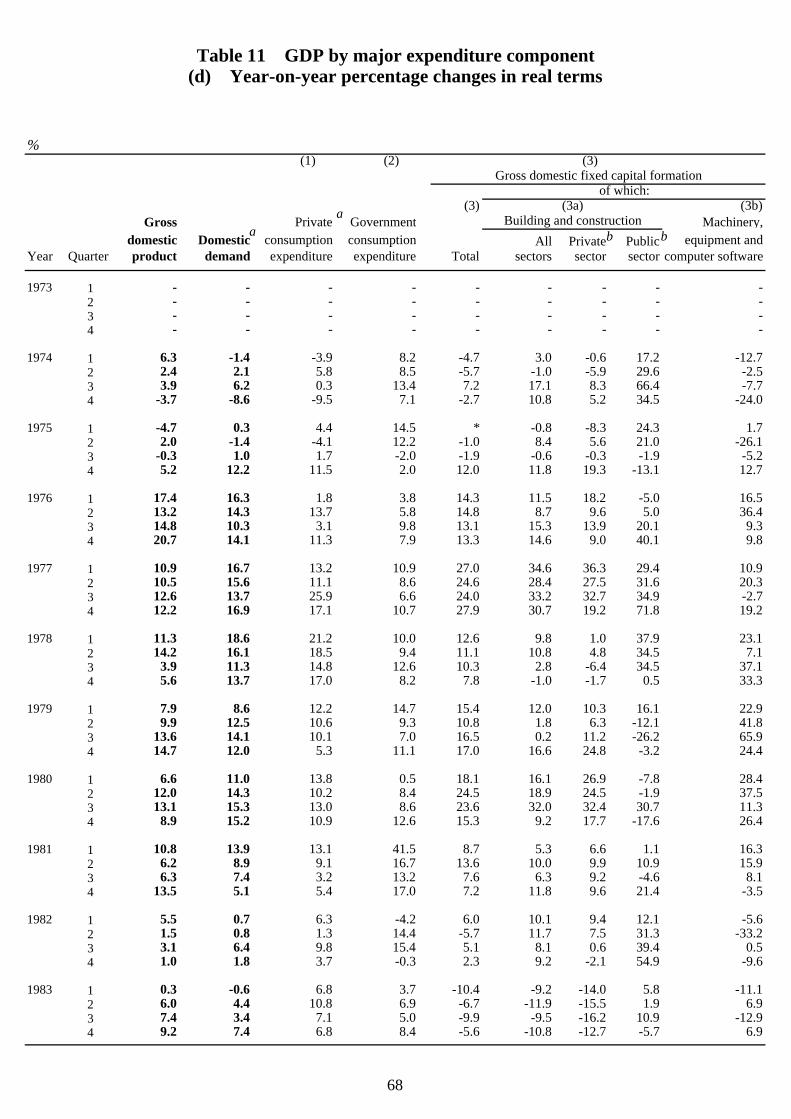
%(1) (2) (3)
Gross domestic fixed capital formationof which:
(3) (3a) (3b)Gross Private Government Building and construction Machinery,
domestic Domestic consumption consumption All Private Public equipment andYear Quarter product demand expenditure expenditure Total sectors sector sector computer software
1973 1 - - - - - - - - -2 - - - - - - - - -3 - - - - - - - - -4 - - - - - - - - -
1974 1 6.3 -1.4 -3.9 8.2 -4.7 3.0 -0.6 17.2 -12.72 2.4 2.1 5.8 8.5 -5.7 -1.0 -5.9 29.6 -2.53 3.9 6.2 0.3 13.4 7.2 17.1 8.3 66.4 -7.74 -3.7 -8.6 -9.5 7.1 -2.7 10.8 5.2 34.5 -24.0
1975 1 -4.7 0.3 4.4 14.5 * -0.8 -8.3 24.3 1.72 2.0 -1.4 -4.1 12.2 -1.0 8.4 5.6 21.0 -26.13 -0.3 1.0 1.7 -2.0 -1.9 -0.6 -0.3 -1.9 -5.24 5.2 12.2 11.5 2.0 12.0 11.8 19.3 -13.1 12.7
1976 1 17.4 16.3 1.8 3.8 14.3 11.5 18.2 -5.0 16.52 13.2 14.3 13.7 5.8 14.8 8.7 9.6 5.0 36.43 14.8 10.3 3.1 9.8 13.1 15.3 13.9 20.1 9.34 20.7 14.1 11.3 7.9 13.3 14.6 9.0 40.1 9.8
1977 1 10.9 16.7 13.2 10.9 27.0 34.6 36.3 29.4 10.92 10.5 15.6 11.1 8.6 24.6 28.4 27.5 31.6 20.33 12.6 13.7 25.9 6.6 24.0 33.2 32.7 34.9 -2.74 12.2 16.9 17.1 10.7 27.9 30.7 19.2 71.8 19.2
1978 1 11.3 18.6 21.2 10.0 12.6 9.8 1.0 37.9 23.12 14.2 16.1 18.5 9.4 11.1 10.8 4.8 34.5 7.13 3.9 11.3 14.8 12.6 10.3 2.8 -6.4 34.5 37.14 5.6 13.7 17.0 8.2 7.8 -1.0 -1.7 0.5 33.3
1979 1 7.9 8.6 12.2 14.7 15.4 12.0 10.3 16.1 22.92 9.9 12.5 10.6 9.3 10.8 1.8 6.3 -12.1 41.83 13.6 14.1 10.1 7.0 16.5 0.2 11.2 -26.2 65.94 14.7 12.0 5.3 11.1 17.0 16.6 24.8 -3.2 24.4
1980 1 6.6 11.0 13.8 0.5 18.1 16.1 26.9 -7.8 28.42 12.0 14.3 10.2 8.4 24.5 18.9 24.5 -1.9 37.53 13.1 15.3 13.0 8.6 23.6 32.0 32.4 30.7 11.34 8.9 15.2 10.9 12.6 15.3 9.2 17.7 -17.6 26.4
1981 1 10.8 13.9 13.1 41.5 8.7 5.3 6.6 1.1 16.32 6.2 8.9 9.1 16.7 13.6 10.0 9.9 10.9 15.93 6.3 7.4 3.2 13.2 7.6 6.3 9.2 -4.6 8.14 13.5 5.1 5.4 17.0 7.2 11.8 9.6 21.4 -3.5
1982 1 5.5 0.7 6.3 -4.2 6.0 10.1 9.4 12.1 -5.62 1.5 0.8 1.3 14.4 -5.7 11.7 7.5 31.3 -33.23 3.1 6.4 9.8 15.4 5.1 8.1 0.6 39.4 0.54 1.0 1.8 3.7 -0.3 2.3 9.2 -2.1 54.9 -9.6
1983 1 0.3 -0.6 6.8 3.7 -10.4 -9.2 -14.0 5.8 -11.12 6.0 4.4 10.8 6.9 -6.7 -11.9 -15.5 1.9 6.93 7.4 3.4 7.1 5.0 -9.9 -9.5 -16.2 10.9 -12.94 9.2 7.4 6.8 8.4 -5.6 -10.8 -12.7 -5.7 6.9
Table 11 GDP by major expenditure component(d) Year-on-year percentage changes in real terms
aa
b b
68
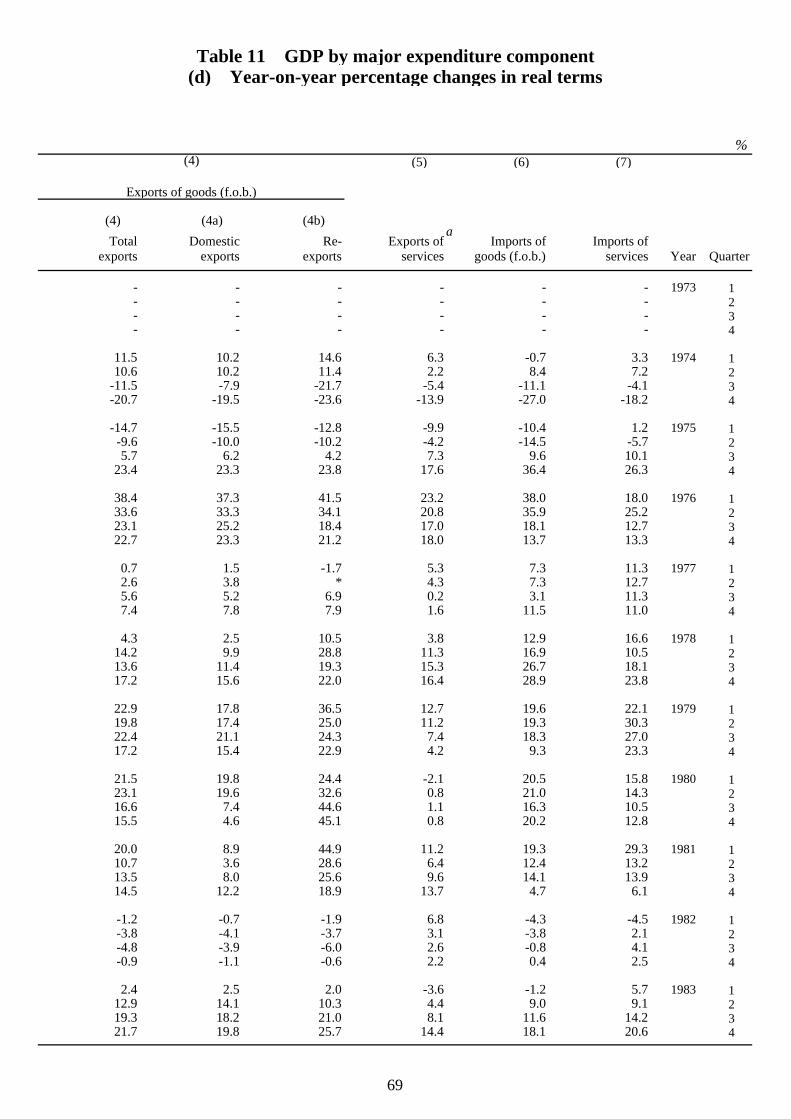
Table 11 GDP by major expenditure component(d) Year-on-year percentage changes in real terms
%(4) (5) (6) (7)
Exports of goods (f.o.b.)
(4) (4a) (4b) Total Domestic Re- Exports of Imports of Imports of
exports exports exports services goods (f.o.b.) services Year Quarter
- - - - - - 1973 1- - - - - - 2- - - - - - 3- - - - - - 4
11.5 10.2 14.6 6.3 -0.7 3.3 1974 110.6 10.2 11.4 2.2 8.4 7.2 2
-11.5 -7.9 -21.7 -5.4 -11.1 -4.1 3-20.7 -19.5 -23.6 -13.9 -27.0 -18.2 4
-14.7 -15.5 -12.8 -9.9 -10.4 1.2 1975 1-9.6 -10.0 -10.2 -4.2 -14.5 -5.7 25.7 6.2 4.2 7.3 9.6 10.1 3
23.4 23.3 23.8 17.6 36.4 26.3 4
38.4 37.3 41.5 23.2 38.0 18.0 1976 133.6 33.3 34.1 20.8 35.9 25.2 223.1 25.2 18.4 17.0 18.1 12.7 322.7 23.3 21.2 18.0 13.7 13.3 4
0.7 1.5 -1.7 5.3 7.3 11.3 1977 12.6 3.8 * 4.3 7.3 12.7 25.6 5.2 6.9 0.2 3.1 11.3 37.4 7.8 7.9 1.6 11.5 11.0 4
4.3 2.5 10.5 3.8 12.9 16.6 1978 114.2 9.9 28.8 11.3 16.9 10.5 213.6 11.4 19.3 15.3 26.7 18.1 317.2 15.6 22.0 16.4 28.9 23.8 4
22.9 17.8 36.5 12.7 19.6 22.1 1979 119.8 17.4 25.0 11.2 19.3 30.3 222.4 21.1 24.3 7.4 18.3 27.0 317.2 15.4 22.9 4.2 9.3 23.3 4
21.5 19.8 24.4 -2.1 20.5 15.8 1980 123.1 19.6 32.6 0.8 21.0 14.3 216.6 7.4 44.6 1.1 16.3 10.5 315.5 4.6 45.1 0.8 20.2 12.8 4
20.0 8.9 44.9 11.2 19.3 29.3 1981 110.7 3.6 28.6 6.4 12.4 13.2 213.5 8.0 25.6 9.6 14.1 13.9 314.5 12.2 18.9 13.7 4.7 6.1 4
-1.2 -0.7 -1.9 6.8 -4.3 -4.5 1982 1-3.8 -4.1 -3.7 3.1 -3.8 2.1 2-4.8 -3.9 -6.0 2.6 -0.8 4.1 3-0.9 -1.1 -0.6 2.2 0.4 2.5 4
2.4 2.5 2.0 -3.6 -1.2 5.7 1983 112.9 14.1 10.3 4.4 9.0 9.1 219.3 18.2 21.0 8.1 11.6 14.2 321.7 19.8 25.7 14.4 18.1 20.6 4
a
69
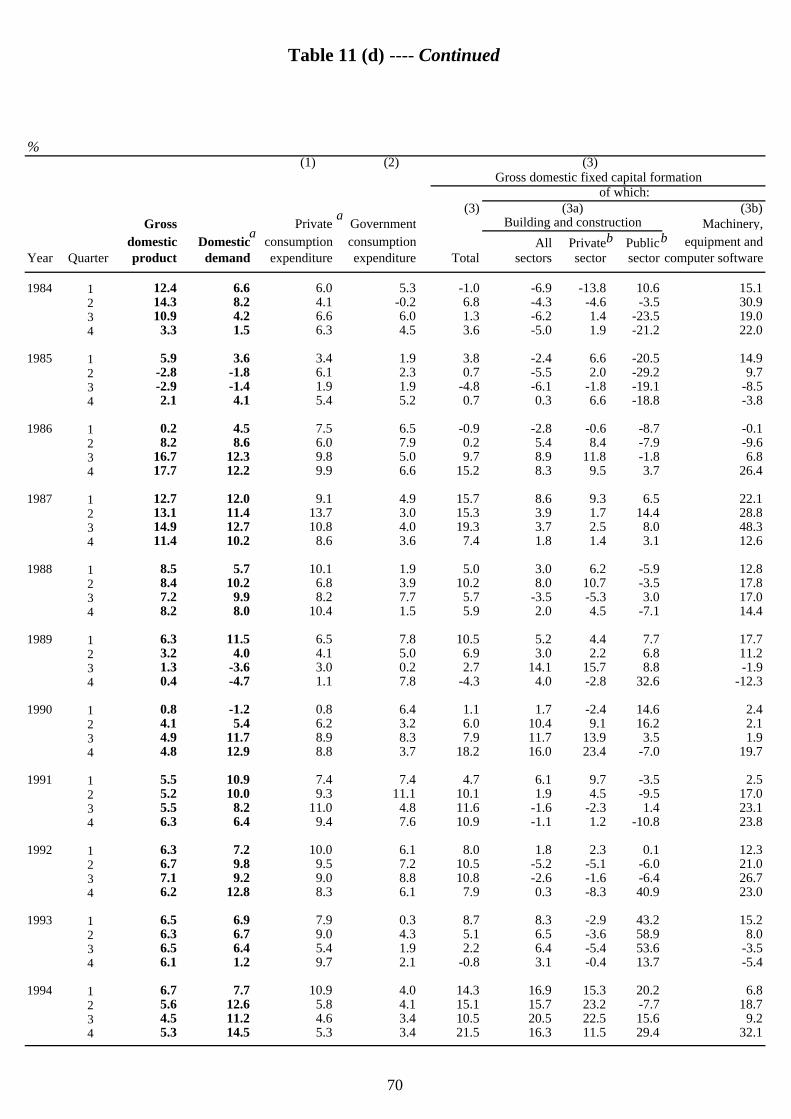
%(1) (2) (3)
Gross domestic fixed capital formationof which:
(3) (3a) (3b)Gross Private Government Building and construction Machinery,
domestic Domestic consumption consumption All Private Public equipment andYear Quarter product demand expenditure expenditure Total sectors sector sector computer software
1984 1 12.4 6.6 6.0 5.3 -1.0 -6.9 -13.8 10.6 15.12 14.3 8.2 4.1 -0.2 6.8 -4.3 -4.6 -3.5 30.93 10.9 4.2 6.6 6.0 1.3 -6.2 1.4 -23.5 19.04 3.3 1.5 6.3 4.5 3.6 -5.0 1.9 -21.2 22.0
1985 1 5.9 3.6 3.4 1.9 3.8 -2.4 6.6 -20.5 14.92 -2.8 -1.8 6.1 2.3 0.7 -5.5 2.0 -29.2 9.73 -2.9 -1.4 1.9 1.9 -4.8 -6.1 -1.8 -19.1 -8.54 2.1 4.1 5.4 5.2 0.7 0.3 6.6 -18.8 -3.8
1986 1 0.2 4.5 7.5 6.5 -0.9 -2.8 -0.6 -8.7 -0.12 8.2 8.6 6.0 7.9 0.2 5.4 8.4 -7.9 -9.63 16.7 12.3 9.8 5.0 9.7 8.9 11.8 -1.8 6.84 17.7 12.2 9.9 6.6 15.2 8.3 9.5 3.7 26.4
1987 1 12.7 12.0 9.1 4.9 15.7 8.6 9.3 6.5 22.12 13.1 11.4 13.7 3.0 15.3 3.9 1.7 14.4 28.83 14.9 12.7 10.8 4.0 19.3 3.7 2.5 8.0 48.34 11.4 10.2 8.6 3.6 7.4 1.8 1.4 3.1 12.6
1988 1 8.5 5.7 10.1 1.9 5.0 3.0 6.2 -5.9 12.82 8.4 10.2 6.8 3.9 10.2 8.0 10.7 -3.5 17.83 7.2 9.9 8.2 7.7 5.7 -3.5 -5.3 3.0 17.04 8.2 8.0 10.4 1.5 5.9 2.0 4.5 -7.1 14.4
1989 1 6.3 11.5 6.5 7.8 10.5 5.2 4.4 7.7 17.72 3.2 4.0 4.1 5.0 6.9 3.0 2.2 6.8 11.23 1.3 -3.6 3.0 0.2 2.7 14.1 15.7 8.8 -1.94 0.4 -4.7 1.1 7.8 -4.3 4.0 -2.8 32.6 -12.3
1990 1 0.8 -1.2 0.8 6.4 1.1 1.7 -2.4 14.6 2.42 4.1 5.4 6.2 3.2 6.0 10.4 9.1 16.2 2.13 4.9 11.7 8.9 8.3 7.9 11.7 13.9 3.5 1.94 4.8 12.9 8.8 3.7 18.2 16.0 23.4 -7.0 19.7
1991 1 5.5 10.9 7.4 7.4 4.7 6.1 9.7 -3.5 2.52 5.2 10.0 9.3 11.1 10.1 1.9 4.5 -9.5 17.03 5.5 8.2 11.0 4.8 11.6 -1.6 -2.3 1.4 23.14 6.3 6.4 9.4 7.6 10.9 -1.1 1.2 -10.8 23.8
1992 1 6.3 7.2 10.0 6.1 8.0 1.8 2.3 0.1 12.32 6.7 9.8 9.5 7.2 10.5 -5.2 -5.1 -6.0 21.03 7.1 9.2 9.0 8.8 10.8 -2.6 -1.6 -6.4 26.74 6.2 12.8 8.3 6.1 7.9 0.3 -8.3 40.9 23.0
1993 1 6.5 6.9 7.9 0.3 8.7 8.3 -2.9 43.2 15.22 6.3 6.7 9.0 4.3 5.1 6.5 -3.6 58.9 8.03 6.5 6.4 5.4 1.9 2.2 6.4 -5.4 53.6 -3.54 6.1 1.2 9.7 2.1 -0.8 3.1 -0.4 13.7 -5.4
1994 1 6.7 7.7 10.9 4.0 14.3 16.9 15.3 20.2 6.82 5.6 12.6 5.8 4.1 15.1 15.7 23.2 -7.7 18.73 4.5 11.2 4.6 3.4 10.5 20.5 22.5 15.6 9.24 5.3 14.5 5.3 3.4 21.5 16.3 11.5 29.4 32.1
Table 11 (d) ---- Continued
aa
b b
70
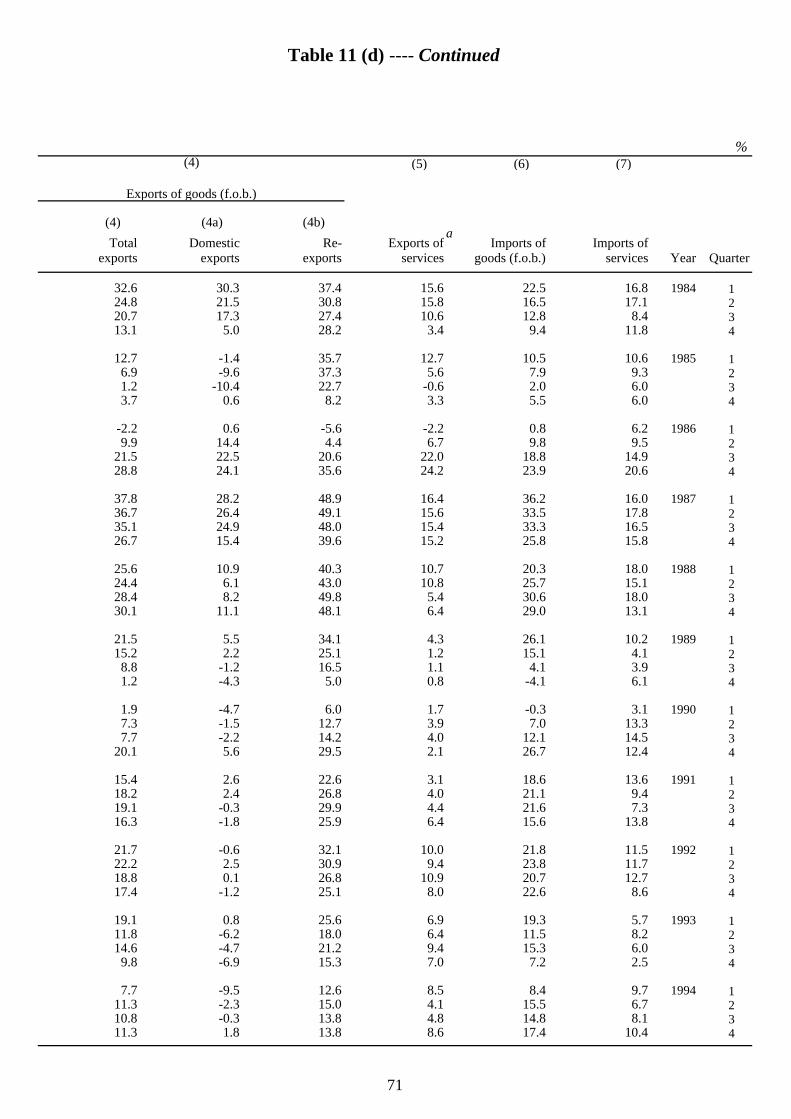
%(4) (5) (6) (7)
Exports of goods (f.o.b.)
(4) (4a) (4b) Total Domestic Re- Exports of Imports of Imports of
exports exports exports services goods (f.o.b.) services Year Quarter
32.6 30.3 37.4 15.6 22.5 16.8 1984 124.8 21.5 30.8 15.8 16.5 17.1 220.7 17.3 27.4 10.6 12.8 8.4 313.1 5.0 28.2 3.4 9.4 11.8 4
12.7 -1.4 35.7 12.7 10.5 10.6 1985 16.9 -9.6 37.3 5.6 7.9 9.3 21.2 -10.4 22.7 -0.6 2.0 6.0 33.7 0.6 8.2 3.3 5.5 6.0 4
-2.2 0.6 -5.6 -2.2 0.8 6.2 1986 19.9 14.4 4.4 6.7 9.8 9.5 2
21.5 22.5 20.6 22.0 18.8 14.9 328.8 24.1 35.6 24.2 23.9 20.6 4
37.8 28.2 48.9 16.4 36.2 16.0 1987 136.7 26.4 49.1 15.6 33.5 17.8 235.1 24.9 48.0 15.4 33.3 16.5 326.7 15.4 39.6 15.2 25.8 15.8 4
25.6 10.9 40.3 10.7 20.3 18.0 1988 124.4 6.1 43.0 10.8 25.7 15.1 228.4 8.2 49.8 5.4 30.6 18.0 330.1 11.1 48.1 6.4 29.0 13.1 4
21.5 5.5 34.1 4.3 26.1 10.2 1989 115.2 2.2 25.1 1.2 15.1 4.1 2
8.8 -1.2 16.5 1.1 4.1 3.9 31.2 -4.3 5.0 0.8 -4.1 6.1 4
1.9 -4.7 6.0 1.7 -0.3 3.1 1990 17.3 -1.5 12.7 3.9 7.0 13.3 27.7 -2.2 14.2 4.0 12.1 14.5 3
20.1 5.6 29.5 2.1 26.7 12.4 4
15.4 2.6 22.6 3.1 18.6 13.6 1991 118.2 2.4 26.8 4.0 21.1 9.4 219.1 -0.3 29.9 4.4 21.6 7.3 316.3 -1.8 25.9 6.4 15.6 13.8 4
21.7 -0.6 32.1 10.0 21.8 11.5 1992 122.2 2.5 30.9 9.4 23.8 11.7 218.8 0.1 26.8 10.9 20.7 12.7 317.4 -1.2 25.1 8.0 22.6 8.6 4
19.1 0.8 25.6 6.9 19.3 5.7 1993 111.8 -6.2 18.0 6.4 11.5 8.2 214.6 -4.7 21.2 9.4 15.3 6.0 3
9.8 -6.9 15.3 7.0 7.2 2.5 4
7.7 -9.5 12.6 8.5 8.4 9.7 1994 111.3 -2.3 15.0 4.1 15.5 6.7 210.8 -0.3 13.8 4.8 14.8 8.1 311.3 1.8 13.8 8.6 17.4 10.4 4
Table 11 (d) ---- Continued
a
71
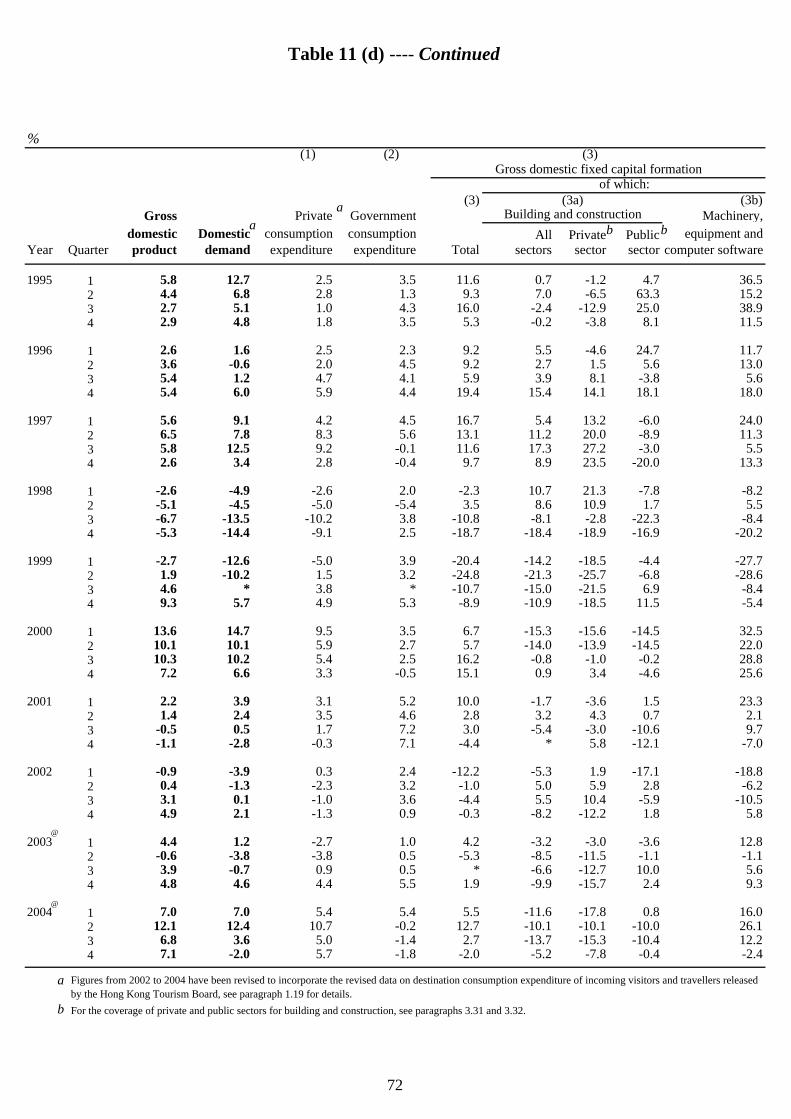
%(1) (2) (3)
Gross domestic fixed capital formationof which:
(3) (3a) (3b)Gross Private Government Building and construction Machinery,
domestic Domestic consumption consumption All Private Public equipment andYear Quarter product demand expenditure expenditure Total sectors sector sector computer software
1995 1 5.8 12.7 2.5 3.5 11.6 0.7 -1.2 4.7 36.52 4.4 6.8 2.8 1.3 9.3 7.0 -6.5 63.3 15.23 2.7 5.1 1.0 4.3 16.0 -2.4 -12.9 25.0 38.94 2.9 4.8 1.8 3.5 5.3 -0.2 -3.8 8.1 11.5
1996 1 2.6 1.6 2.5 2.3 9.2 5.5 -4.6 24.7 11.72 3.6 -0.6 2.0 4.5 9.2 2.7 1.5 5.6 13.03 5.4 1.2 4.7 4.1 5.9 3.9 8.1 -3.8 5.64 5.4 6.0 5.9 4.4 19.4 15.4 14.1 18.1 18.0
1997 1 5.6 9.1 4.2 4.5 16.7 5.4 13.2 -6.0 24.02 6.5 7.8 8.3 5.6 13.1 11.2 20.0 -8.9 11.33 5.8 12.5 9.2 -0.1 11.6 17.3 27.2 -3.0 5.54 2.6 3.4 2.8 -0.4 9.7 8.9 23.5 -20.0 13.3
1998 1 -2.6 -4.9 -2.6 2.0 -2.3 10.7 21.3 -7.8 -8.22 -5.1 -4.5 -5.0 -5.4 3.5 8.6 10.9 1.7 5.53 -6.7 -13.5 -10.2 3.8 -10.8 -8.1 -2.8 -22.3 -8.44 -5.3 -14.4 -9.1 2.5 -18.7 -18.4 -18.9 -16.9 -20.2
1999 1 -2.7 -12.6 -5.0 3.9 -20.4 -14.2 -18.5 -4.4 -27.72 1.9 -10.2 1.5 3.2 -24.8 -21.3 -25.7 -6.8 -28.63 4.6 * 3.8 * -10.7 -15.0 -21.5 6.9 -8.44 9.3 5.7 4.9 5.3 -8.9 -10.9 -18.5 11.5 -5.4
2000 1 13.6 14.7 9.5 3.5 6.7 -15.3 -15.6 -14.5 32.52 10.1 10.1 5.9 2.7 5.7 -14.0 -13.9 -14.5 22.03 10.3 10.2 5.4 2.5 16.2 -0.8 -1.0 -0.2 28.84 7.2 6.6 3.3 -0.5 15.1 0.9 3.4 -4.6 25.6
2001 1 2.2 3.9 3.1 5.2 10.0 -1.7 -3.6 1.5 23.32 1.4 2.4 3.5 4.6 2.8 3.2 4.3 0.7 2.13 -0.5 0.5 1.7 7.2 3.0 -5.4 -3.0 -10.6 9.74 -1.1 -2.8 -0.3 7.1 -4.4 * 5.8 -12.1 -7.0
2002 1 -0.9 -3.9 0.3 2.4 -12.2 -5.3 1.9 -17.1 -18.82 0.4 -1.3 -2.3 3.2 -1.0 5.0 5.9 2.8 -6.23 3.1 0.1 -1.0 3.6 -4.4 5.5 10.4 -5.9 -10.54 4.9 2.1 -1.3 0.9 -0.3 -8.2 -12.2 1.8 5.8
2003 1 4.4 1.2 -2.7 1.0 4.2 -3.2 -3.0 -3.6 12.82 -0.6 -3.8 -3.8 0.5 -5.3 -8.5 -11.5 -1.1 -1.13 3.9 -0.7 0.9 0.5 * -6.6 -12.7 10.0 5.64 4.8 4.6 4.4 5.5 1.9 -9.9 -15.7 2.4 9.3
2004 1 7.0 7.0 5.4 5.4 5.5 -11.6 -17.8 0.8 16.02 12.1 12.4 10.7 -0.2 12.7 -10.1 -10.1 -10.0 26.13 6.8 3.6 5.0 -1.4 2.7 -13.7 -15.3 -10.4 12.24 7.1 -2.0 5.7 -1.8 -2.0 -5.2 -7.8 -0.4 -2.4
a
b For the coverage of private and public sectors for building and construction, see paragraphs 3.31 and 3.32.
Table 11 (d) ---- Continued
Figures from 2002 to 2004 have been revised to incorporate the revised data on destination consumption expenditure of incoming visitors and travellers releasedby the Hong Kong Tourism Board, see paragraph 1.19 for details.
@
aa
b b
@
72
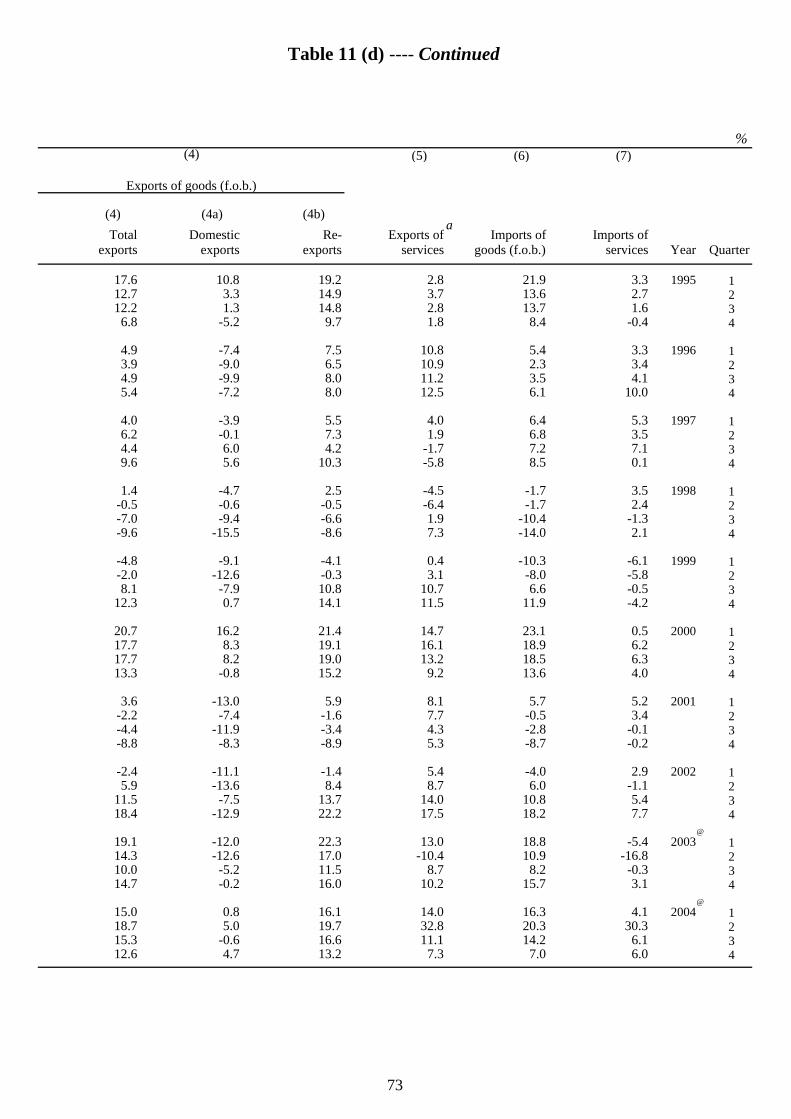
%(4) (5) (6) (7)
Exports of goods (f.o.b.)
(4) (4a) (4b) Total Domestic Re- Exports of Imports of Imports of
exports exports exports services goods (f.o.b.) services Year Quarter
17.6 10.8 19.2 2.8 21.9 3.3 1995 112.7 3.3 14.9 3.7 13.6 2.7 212.2 1.3 14.8 2.8 13.7 1.6 3
6.8 -5.2 9.7 1.8 8.4 -0.4 4
4.9 -7.4 7.5 10.8 5.4 3.3 1996 13.9 -9.0 6.5 10.9 2.3 3.4 24.9 -9.9 8.0 11.2 3.5 4.1 35.4 -7.2 8.0 12.5 6.1 10.0 4
4.0 -3.9 5.5 4.0 6.4 5.3 1997 16.2 -0.1 7.3 1.9 6.8 3.5 24.4 6.0 4.2 -1.7 7.2 7.1 39.6 5.6 10.3 -5.8 8.5 0.1 4
1.4 -4.7 2.5 -4.5 -1.7 3.5 1998 1-0.5 -0.6 -0.5 -6.4 -1.7 2.4 2-7.0 -9.4 -6.6 1.9 -10.4 -1.3 3-9.6 -15.5 -8.6 7.3 -14.0 2.1 4
-4.8 -9.1 -4.1 0.4 -10.3 -6.1 1999 1-2.0 -12.6 -0.3 3.1 -8.0 -5.8 28.1 -7.9 10.8 10.7 6.6 -0.5 3
12.3 0.7 14.1 11.5 11.9 -4.2 4
20.7 16.2 21.4 14.7 23.1 0.5 2000 117.7 8.3 19.1 16.1 18.9 6.2 217.7 8.2 19.0 13.2 18.5 6.3 313.3 -0.8 15.2 9.2 13.6 4.0 4
3.6 -13.0 5.9 8.1 5.7 5.2 2001 1-2.2 -7.4 -1.6 7.7 -0.5 3.4 2-4.4 -11.9 -3.4 4.3 -2.8 -0.1 3-8.8 -8.3 -8.9 5.3 -8.7 -0.2 4
-2.4 -11.1 -1.4 5.4 -4.0 2.9 2002 15.9 -13.6 8.4 8.7 6.0 -1.1 2
11.5 -7.5 13.7 14.0 10.8 5.4 318.4 -12.9 22.2 17.5 18.2 7.7 4
19.1 -12.0 22.3 13.0 18.8 -5.4 2003 114.3 -12.6 17.0 -10.4 10.9 -16.8 210.0 -5.2 11.5 8.7 8.2 -0.3 314.7 -0.2 16.0 10.2 15.7 3.1 4
15.0 0.8 16.1 14.0 16.3 4.1 2004 118.7 5.0 19.7 32.8 20.3 30.3 215.3 -0.6 16.6 11.1 14.2 6.1 312.6 4.7 13.2 7.3 7.0 6.0 4
Table 11 (d) ---- Continued
@
a
@
73
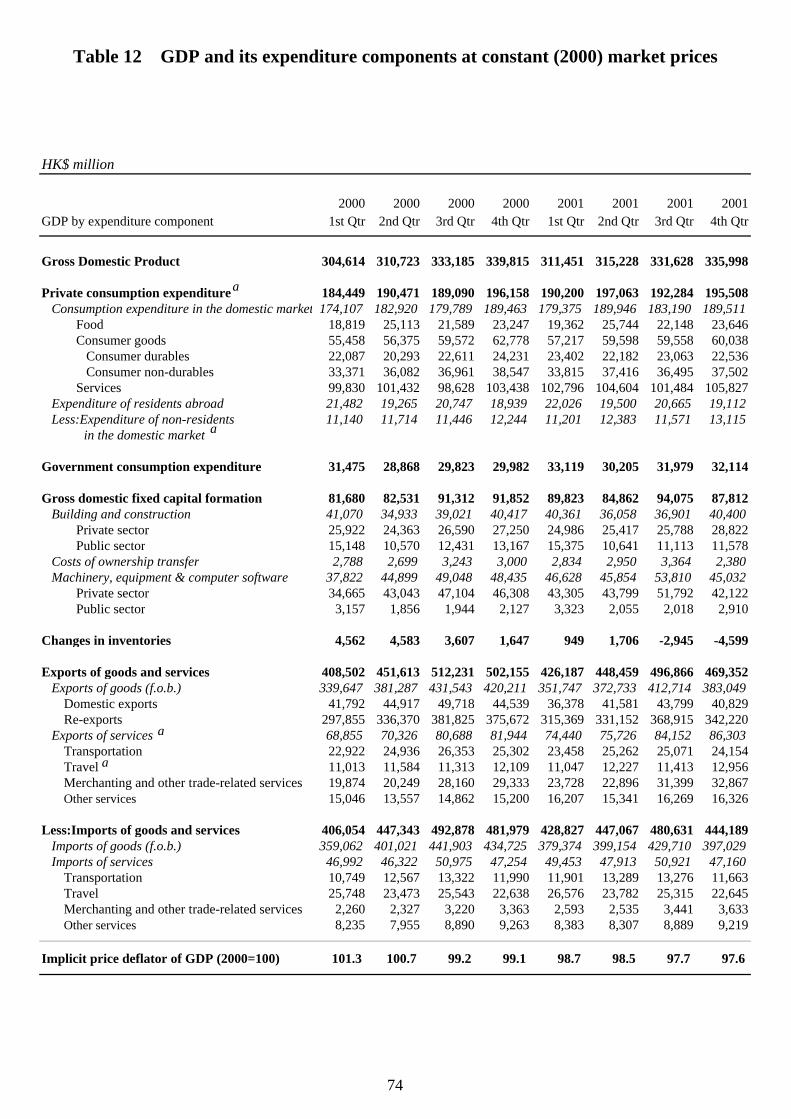
HK$ million
2000 2000 2000 2000 2001 2001 2001 2001GDP by expenditure component 1st Qtr 2nd Qtr 3rd Qtr 4th Qtr 1st Qtr 2nd Qtr 3rd Qtr 4th Qtr
Gross Domestic Product 304,614 310,723 333,185 339,815 311,451 315,228 331,628 335,998
Private consumption expenditure 184,449 190,471 189,090 196,158 190,200 197,063 192,284 195,508Consumption expenditure in the domestic market 174,107 182,920 179,789 189,463 179,375 189,946 183,190 189,511
Food 18,819 25,113 21,589 23,247 19,362 25,744 22,148 23,646Consumer goods 55,458 56,375 59,572 62,778 57,217 59,598 59,558 60,038
Consumer durables 22,087 20,293 22,611 24,231 23,402 22,182 23,063 22,536Consumer non-durables 33,371 36,082 36,961 38,547 33,815 37,416 36,495 37,502
Services 99,830 101,432 98,628 103,438 102,796 104,604 101,484 105,827Expenditure of residents abroad 21,482 19,265 20,747 18,939 22,026 19,500 20,665 19,112Less:Expenditure of non-residents 11,140 11,714 11,446 12,244 11,201 12,383 11,571 13,115
in the domestic market
Government consumption expenditure 31,475 28,868 29,823 29,982 33,119 30,205 31,979 32,114
Gross domestic fixed capital formation 81,680 82,531 91,312 91,852 89,823 84,862 94,075 87,812Building and construction 41,070 34,933 39,021 40,417 40,361 36,058 36,901 40,400
Private sector 25,922 24,363 26,590 27,250 24,986 25,417 25,788 28,822Public sector 15,148 10,570 12,431 13,167 15,375 10,641 11,113 11,578
Costs of ownership transfer 2,788 2,699 3,243 3,000 2,834 2,950 3,364 2,380Machinery, equipment & computer software 37,822 44,899 49,048 48,435 46,628 45,854 53,810 45,032
Private sector 34,665 43,043 47,104 46,308 43,305 43,799 51,792 42,122Public sector 3,157 1,856 1,944 2,127 3,323 2,055 2,018 2,910
Changes in inventories 4,562 4,583 3,607 1,647 949 1,706 -2,945 -4,599
Exports of goods and services 408,502 451,613 512,231 502,155 426,187 448,459 496,866 469,352Exports of goods (f.o.b.) 339,647 381,287 431,543 420,211 351,747 372,733 412,714 383,049
Domestic exports 41,792 44,917 49,718 44,539 36,378 41,581 43,799 40,829Re-exports 297,855 336,370 381,825 375,672 315,369 331,152 368,915 342,220
Exports of services 68,855 70,326 80,688 81,944 74,440 75,726 84,152 86,303Transportation 22,922 24,936 26,353 25,302 23,458 25,262 25,071 24,154Travel 11,013 11,584 11,313 12,109 11,047 12,227 11,413 12,956Merchanting and other trade-related services 19,874 20,249 28,160 29,333 23,728 22,896 31,399 32,867Other services 15,046 13,557 14,862 15,200 16,207 15,341 16,269 16,326
Less:Imports of goods and services 406,054 447,343 492,878 481,979 428,827 447,067 480,631 444,189Imports of goods (f.o.b.) 359,062 401,021 441,903 434,725 379,374 399,154 429,710 397,029Imports of services 46,992 46,322 50,975 47,254 49,453 47,913 50,921 47,160
Transportation 10,749 12,567 13,322 11,990 11,901 13,289 13,276 11,663Travel 25,748 23,473 25,543 22,638 26,576 23,782 25,315 22,645Merchanting and other trade-related services 2,260 2,327 3,220 3,363 2,593 2,535 3,441 3,633Other services 8,235 7,955 8,890 9,263 8,383 8,307 8,889 9,219
Implicit price deflator of GDP (2000=100) 101.3 100.7 99.2 99.1 98.7 98.5 97.7 97.6
Table 12 GDP and its expenditure components at constant (2000) market prices
a
a
a
a
74
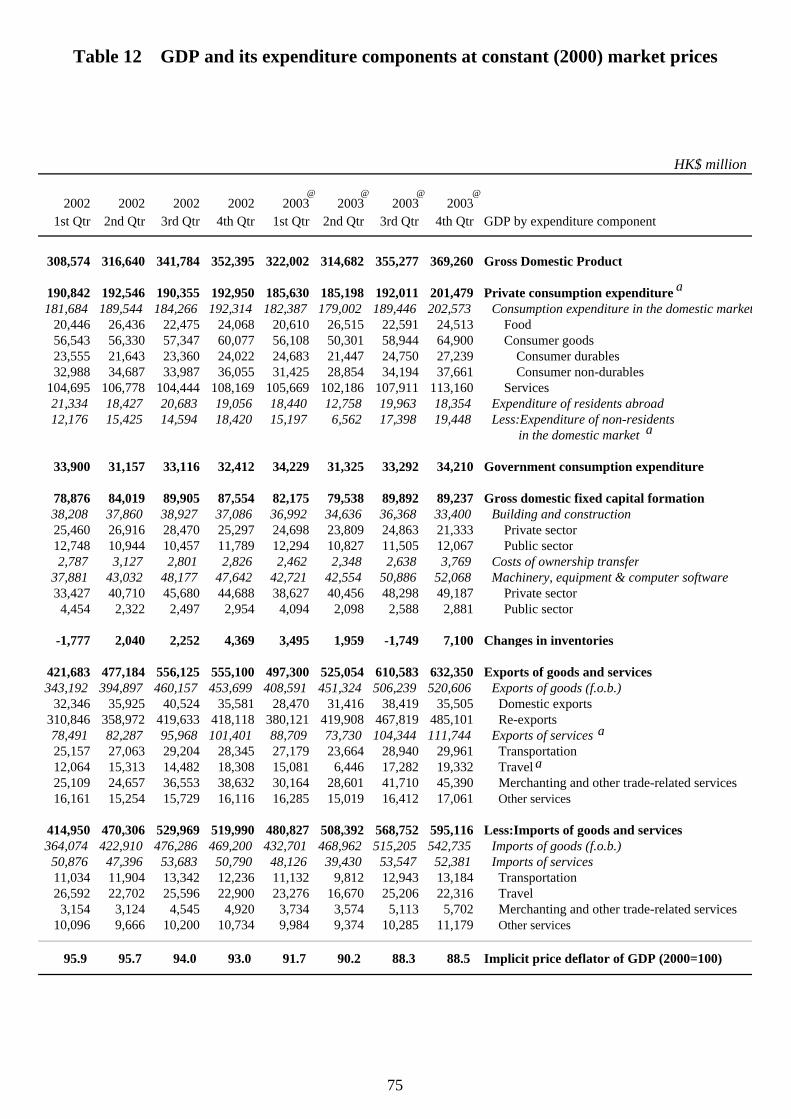
HK$ million
2002 2002 2002 2002 2003 2003 2003 20031st Qtr 2nd Qtr 3rd Qtr 4th Qtr 1st Qtr 2nd Qtr 3rd Qtr 4th Qtr GDP by expenditure component
308,574 316,640 341,784 352,395 322,002 314,682 355,277 369,260 Gross Domestic Product
190,842 192,546 190,355 192,950 185,630 185,198 192,011 201,479 Private consumption expenditure181,684 189,544 184,266 192,314 182,387 179,002 189,446 202,573 Consumption expenditure in the domestic market
20,446 26,436 22,475 24,068 20,610 26,515 22,591 24,513 Food56,543 56,330 57,347 60,077 56,108 50,301 58,944 64,900 Consumer goods23,555 21,643 23,360 24,022 24,683 21,447 24,750 27,239 Consumer durables32,988 34,687 33,987 36,055 31,425 28,854 34,194 37,661 Consumer non-durables
104,695 106,778 104,444 108,169 105,669 102,186 107,911 113,160 Services21,334 18,427 20,683 19,056 18,440 12,758 19,963 18,354 Expenditure of residents abroad12,176 15,425 14,594 18,420 15,197 6,562 17,398 19,448 Less:Expenditure of non-residents
in the domestic market
33,900 31,157 33,116 32,412 34,229 31,325 33,292 34,210 Government consumption expenditure
78,876 84,019 89,905 87,554 82,175 79,538 89,892 89,237 Gross domestic fixed capital formation38,208 37,860 38,927 37,086 36,992 34,636 36,368 33,400 Building and construction25,460 26,916 28,470 25,297 24,698 23,809 24,863 21,333 Private sector12,748 10,944 10,457 11,789 12,294 10,827 11,505 12,067 Public sector2,787 3,127 2,801 2,826 2,462 2,348 2,638 3,769 Costs of ownership transfer
37,881 43,032 48,177 47,642 42,721 42,554 50,886 52,068 Machinery, equipment & computer software33,427 40,710 45,680 44,688 38,627 40,456 48,298 49,187 Private sector
4,454 2,322 2,497 2,954 4,094 2,098 2,588 2,881 Public sector
-1,777 2,040 2,252 4,369 3,495 1,959 -1,749 7,100 Changes in inventories
421,683 477,184 556,125 555,100 497,300 525,054 610,583 632,350 Exports of goods and services343,192 394,897 460,157 453,699 408,591 451,324 506,239 520,606 Exports of goods (f.o.b.)
32,346 35,925 40,524 35,581 28,470 31,416 38,419 35,505 Domestic exports310,846 358,972 419,633 418,118 380,121 419,908 467,819 485,101 Re-exports78,491 82,287 95,968 101,401 88,709 73,730 104,344 111,744 Exports of services25,157 27,063 29,204 28,345 27,179 23,664 28,940 29,961 Transportation12,064 15,313 14,482 18,308 15,081 6,446 17,282 19,332 Travel25,109 24,657 36,553 38,632 30,164 28,601 41,710 45,390 Merchanting and other trade-related services16,161 15,254 15,729 16,116 16,285 15,019 16,412 17,061 Other services
414,950 470,306 529,969 519,990 480,827 508,392 568,752 595,116 Less:Imports of goods and services364,074 422,910 476,286 469,200 432,701 468,962 515,205 542,735 Imports of goods (f.o.b.)
50,876 47,396 53,683 50,790 48,126 39,430 53,547 52,381 Imports of services11,034 11,904 13,342 12,236 11,132 9,812 12,943 13,184 Transportation26,592 22,702 25,596 22,900 23,276 16,670 25,206 22,316 Travel
3,154 3,124 4,545 4,920 3,734 3,574 5,113 5,702 Merchanting and other trade-related services10,096 9,666 10,200 10,734 9,984 9,374 10,285 11,179 Other services
95.9 95.7 94.0 93.0 91.7 90.2 88.3 88.5 Implicit price deflator of GDP (2000=100)
Table 12 GDP and its expenditure components at constant (2000) market prices
a
a
a
a
@@@ @
75
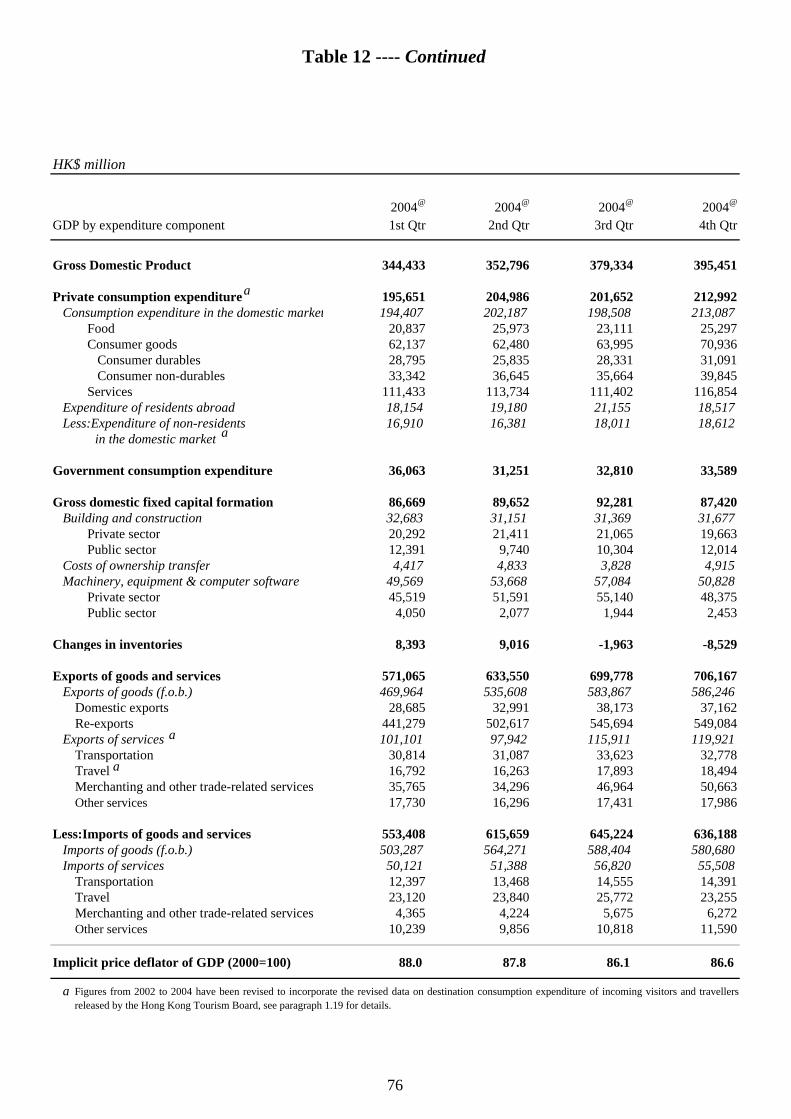
HK$ million
2004@ 2004@ 2004@ 2004@
GDP by expenditure component 1st Qtr 2nd Qtr 3rd Qtr 4th Qtr
Gross Domestic Product 344,433 352,796 379,334 395,451
Private consumption expenditure 195,651 204,986 201,652 212,992Consumption expenditure in the domestic market 194,407 202,187 198,508 213,087
Food 20,837 25,973 23,111 25,297Consumer goods 62,137 62,480 63,995 70,936
Consumer durables 28,795 25,835 28,331 31,091Consumer non-durables 33,342 36,645 35,664 39,845
Services 111,433 113,734 111,402 116,854Expenditure of residents abroad 18,154 19,180 21,155 18,517Less:Expenditure of non-residents 16,910 16,381 18,011 18,612
in the domestic market
Government consumption expenditure 36,063 31,251 32,810 33,589
Gross domestic fixed capital formation 86,669 89,652 92,281 87,420Building and construction 32,683 31,151 31,369 31,677
Private sector 20,292 21,411 21,065 19,663Public sector 12,391 9,740 10,304 12,014
Costs of ownership transfer 4,417 4,833 3,828 4,915Machinery, equipment & computer software 49,569 53,668 57,084 50,828
Private sector 45,519 51,591 55,140 48,375Public sector 4,050 2,077 1,944 2,453
Changes in inventories 8,393 9,016 -1,963 -8,529
Exports of goods and services 571,065 633,550 699,778 706,167Exports of goods (f.o.b.) 469,964 535,608 583,867 586,246
Domestic exports 28,685 32,991 38,173 37,162Re-exports 441,279 502,617 545,694 549,084
Exports of services 101,101 97,942 115,911 119,921Transportation 30,814 31,087 33,623 32,778Travel 16,792 16,263 17,893 18,494Merchanting and other trade-related services 35,765 34,296 46,964 50,663Other services 17,730 16,296 17,431 17,986
Less:Imports of goods and services 553,408 615,659 645,224 636,188Imports of goods (f.o.b.) 503,287 564,271 588,404 580,680Imports of services 50,121 51,388 56,820 55,508
Transportation 12,397 13,468 14,555 14,391Travel 23,120 23,840 25,772 23,255Merchanting and other trade-related services 4,365 4,224 5,675 6,272Other services 10,239 9,856 10,818 11,590
Implicit price deflator of GDP (2000=100) 88.0 87.8 86.1 86.6
a Figures from 2002 to 2004 have been revised to incorporate the revised data on destination consumption expenditure of incoming visitors and travellersreleased by the Hong Kong Tourism Board, see paragraph 1.19 for details.
Table 12 ---- Continued
a
a
a
a
76
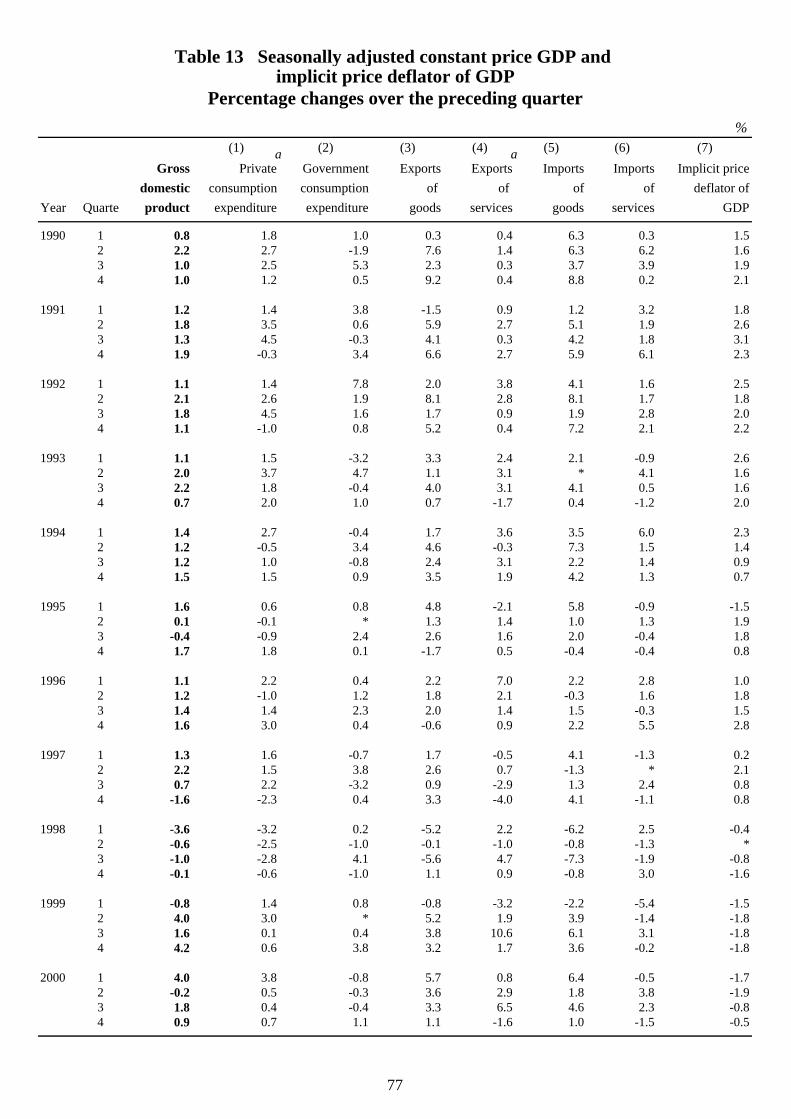
Table 13 Seasonally adjusted constant price GDP and implicit price deflator of GDP
─Percentage changes over the preceding quarter─%
(1) (2) (3) (4) (5) (6) (7)Gross Private Government Exports Exports Imports Imports Implicit price
domestic consumption consumption of of of of deflator ofYear Quarte product expenditure expenditure goods services goods services GDP
1990 1 0.8 1.8 1.0 0.3 0.4 6.3 0.3 1.52 2.2 2.7 -1.9 7.6 1.4 6.3 6.2 1.63 1.0 2.5 5.3 2.3 0.3 3.7 3.9 1.94 1.0 1.2 0.5 9.2 0.4 8.8 0.2 2.1
1991 1 1.2 1.4 3.8 -1.5 0.9 1.2 3.2 1.82 1.8 3.5 0.6 5.9 2.7 5.1 1.9 2.63 1.3 4.5 -0.3 4.1 0.3 4.2 1.8 3.14 1.9 -0.3 3.4 6.6 2.7 5.9 6.1 2.3
1992 1 1.1 1.4 7.8 2.0 3.8 4.1 1.6 2.52 2.1 2.6 1.9 8.1 2.8 8.1 1.7 1.83 1.8 4.5 1.6 1.7 0.9 1.9 2.8 2.04 1.1 -1.0 0.8 5.2 0.4 7.2 2.1 2.2
1993 1 1.1 1.5 -3.2 3.3 2.4 2.1 -0.9 2.62 2.0 3.7 4.7 1.1 3.1 * 4.1 1.63 2.2 1.8 -0.4 4.0 3.1 4.1 0.5 1.64 0.7 2.0 1.0 0.7 -1.7 0.4 -1.2 2.0
1994 1 1.4 2.7 -0.4 1.7 3.6 3.5 6.0 2.32 1.2 -0.5 3.4 4.6 -0.3 7.3 1.5 1.43 1.2 1.0 -0.8 2.4 3.1 2.2 1.4 0.94 1.5 1.5 0.9 3.5 1.9 4.2 1.3 0.7
1995 1 1.6 0.6 0.8 4.8 -2.1 5.8 -0.9 -1.52 0.1 -0.1 * 1.3 1.4 1.0 1.3 1.93 -0.4 -0.9 2.4 2.6 1.6 2.0 -0.4 1.84 1.7 1.8 0.1 -1.7 0.5 -0.4 -0.4 0.8
1996 1 1.1 2.2 0.4 2.2 7.0 2.2 2.8 1.02 1.2 -1.0 1.2 1.8 2.1 -0.3 1.6 1.83 1.4 1.4 2.3 2.0 1.4 1.5 -0.3 1.54 1.6 3.0 0.4 -0.6 0.9 2.2 5.5 2.8
1997 1 1.3 1.6 -0.7 1.7 -0.5 4.1 -1.3 0.22 2.2 1.5 3.8 2.6 0.7 -1.3 * 2.13 0.7 2.2 -3.2 0.9 -2.9 1.3 2.4 0.84 -1.6 -2.3 0.4 3.3 -4.0 4.1 -1.1 0.8
1998 1 -3.6 -3.2 0.2 -5.2 2.2 -6.2 2.5 -0.42 -0.6 -2.5 -1.0 -0.1 -1.0 -0.8 -1.3 *3 -1.0 -2.8 4.1 -5.6 4.7 -7.3 -1.9 -0.84 -0.1 -0.6 -1.0 1.1 0.9 -0.8 3.0 -1.6
1999 1 -0.8 1.4 0.8 -0.8 -3.2 -2.2 -5.4 -1.52 4.0 3.0 * 5.2 1.9 3.9 -1.4 -1.83 1.6 0.1 0.4 3.8 10.6 6.1 3.1 -1.84 4.2 0.6 3.8 3.2 1.7 3.6 -0.2 -1.8
2000 1 4.0 3.8 -0.8 5.7 0.8 6.4 -0.5 -1.72 -0.2 0.5 -0.3 3.6 2.9 1.8 3.8 -1.93 1.8 0.4 -0.4 3.3 6.5 4.6 2.3 -0.84 0.9 0.7 1.1 1.1 -1.6 1.0 -1.5 -0.5
a a
77
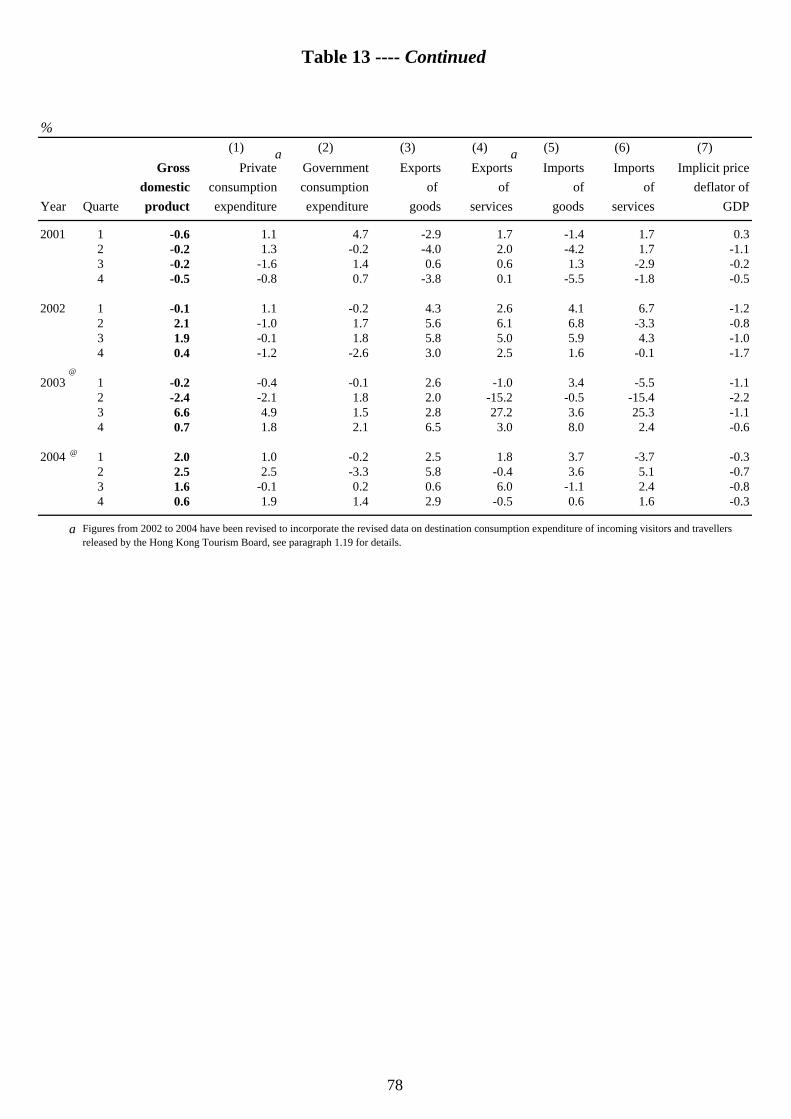
Table 13 ---- Continued
%(1) (2) (3) (4) (5) (6) (7)
Gross Private Government Exports Exports Imports Imports Implicit pricedomestic consumption consumption of of of of deflator of
Year Quarte product expenditure expenditure goods services goods services GDP
2001 1 -0.6 1.1 4.7 -2.9 1.7 -1.4 1.7 0.32 -0.2 1.3 -0.2 -4.0 2.0 -4.2 1.7 -1.13 -0.2 -1.6 1.4 0.6 0.6 1.3 -2.9 -0.24 -0.5 -0.8 0.7 -3.8 0.1 -5.5 -1.8 -0.5
2002 1 -0.1 1.1 -0.2 4.3 2.6 4.1 6.7 -1.22 2.1 -1.0 1.7 5.6 6.1 6.8 -3.3 -0.83 1.9 -0.1 1.8 5.8 5.0 5.9 4.3 -1.04 0.4 -1.2 -2.6 3.0 2.5 1.6 -0.1 -1.7
2003 1 -0.2 -0.4 -0.1 2.6 -1.0 3.4 -5.5 -1.12 -2.4 -2.1 1.8 2.0 -15.2 -0.5 -15.4 -2.23 6.6 4.9 1.5 2.8 27.2 3.6 25.3 -1.14 0.7 1.8 2.1 6.5 3.0 8.0 2.4 -0.6
2004 1 2.0 1.0 -0.2 2.5 1.8 3.7 -3.7 -0.32 2.5 2.5 -3.3 5.8 -0.4 3.6 5.1 -0.73 1.6 -0.1 0.2 0.6 6.0 -1.1 2.4 -0.84 0.6 1.9 1.4 2.9 -0.5 0.6 1.6 -0.3
a Figures from 2002 to 2004 have been revised to incorporate the revised data on destination consumption expenditure of incoming visitors and travellersreleased by the Hong Kong Tourism Board, see paragraph 1.19 for details.
@
@
a a
78
79
(C) Annual GDP by economic activity at current prices
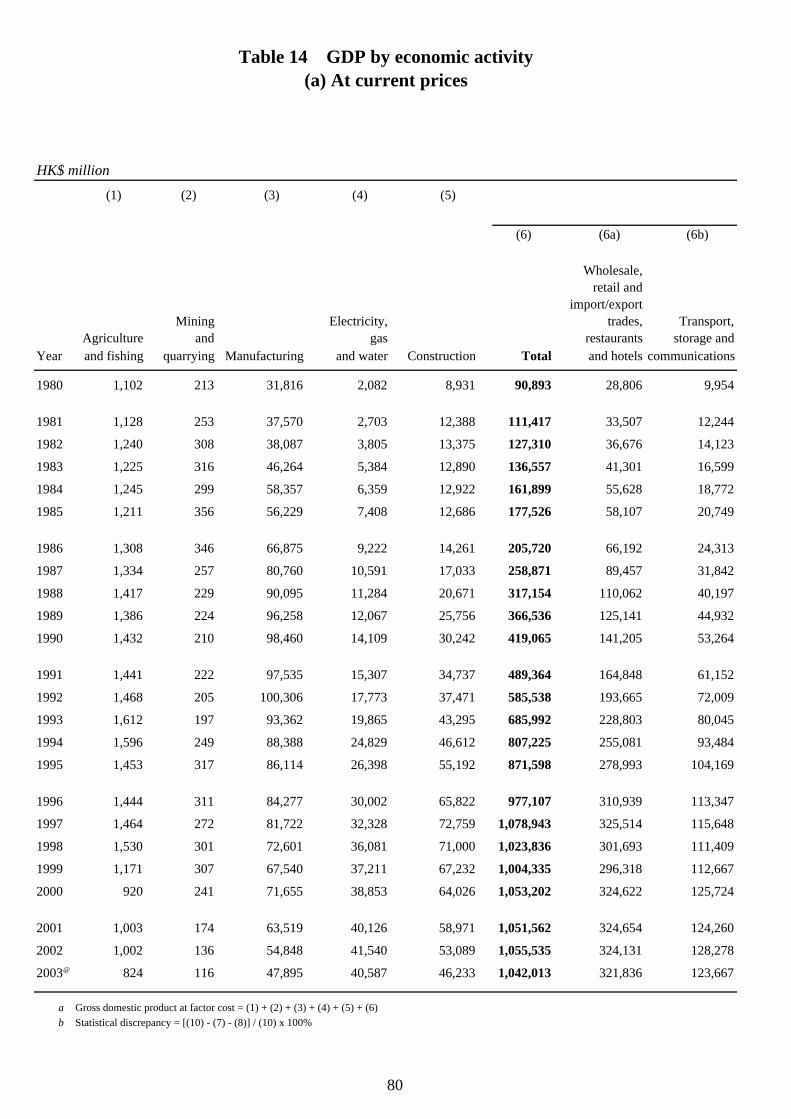
HK$ million(1) (2) (3) (4) (5)
(6) (6a) (6b)
Wholesale,retail and
import/exportMining Electricity, trades, Transport,
Agriculture and gas restaurants storage andYear and fishing quarrying Manufacturing and water Construction Total and hotels communications
1980 1,102 213 31,816 2,082 8,931 90,893 28,806 9,954
1981 1,128 253 37,570 2,703 12,388 111,417 33,507 12,244
1982 1,240 308 38,087 3,805 13,375 127,310 36,676 14,123
1983 1,225 316 46,264 5,384 12,890 136,557 41,301 16,599
1984 1,245 299 58,357 6,359 12,922 161,899 55,628 18,772
1985 1,211 356 56,229 7,408 12,686 177,526 58,107 20,749
1986 1,308 346 66,875 9,222 14,261 205,720 66,192 24,313
1987 1,334 257 80,760 10,591 17,033 258,871 89,457 31,842
1988 1,417 229 90,095 11,284 20,671 317,154 110,062 40,197
1989 1,386 224 96,258 12,067 25,756 366,536 125,141 44,932
1990 1,432 210 98,460 14,109 30,242 419,065 141,205 53,264
1991 1,441 222 97,535 15,307 34,737 489,364 164,848 61,152
1992 1,468 205 100,306 17,773 37,471 585,538 193,665 72,009
1993 1,612 197 93,362 19,865 43,295 685,992 228,803 80,045
1994 1,596 249 88,388 24,829 46,612 807,225 255,081 93,484
1995 1,453 317 86,114 26,398 55,192 871,598 278,993 104,169
1996 1,444 311 84,277 30,002 65,822 977,107 310,939 113,347
1997 1,464 272 81,722 32,328 72,759 1,078,943 325,514 115,648
1998 1,530 301 72,601 36,081 71,000 1,023,836 301,693 111,409
1999 1,171 307 67,540 37,211 67,232 1,004,335 296,318 112,667
2000 920 241 71,655 38,853 64,026 1,053,202 324,622 125,724
2001 1,003 174 63,519 40,126 58,971 1,051,562 324,654 124,260
2002 1,002 136 54,848 41,540 53,089 1,055,535 324,131 128,278
2003@ 824 116 47,895 40,587 46,233 1,042,013 321,836 123,667
a Gross domestic product at factor cost = (1) + (2) + (3) + (4) + (5) + (6)b Statistical discrepancy = [(10) - (7) - (8)] / (10) x 100%
Table 14 GDP by economic activity(a) At current prices
80
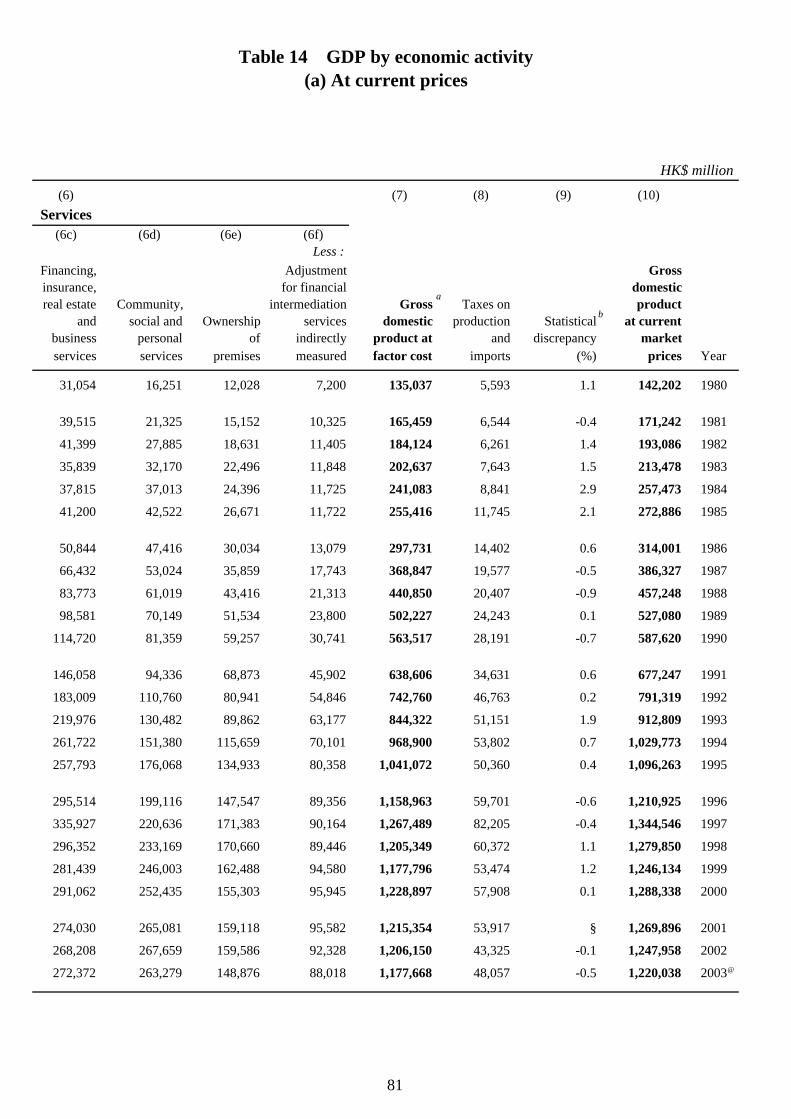
HK$ million(6) (7) (8) (9) (10)
Services(6c) (6d) (6e) (6f)
Less :Financing, Adjustment Grossinsurance, for financial domestic real estate Community, intermediation Gross Taxes on product
and social and Ownership services domestic production Statistical at currentbusiness personal of indirectly product at and discrepancy marketservices services premises measured factor cost imports (%) prices Year
31,054 16,251 12,028 7,200 135,037 5,593 1.1 142,202 1980
39,515 21,325 15,152 10,325 165,459 6,544 -0.4 171,242 1981
41,399 27,885 18,631 11,405 184,124 6,261 1.4 193,086 1982
35,839 32,170 22,496 11,848 202,637 7,643 1.5 213,478 1983
37,815 37,013 24,396 11,725 241,083 8,841 2.9 257,473 1984
41,200 42,522 26,671 11,722 255,416 11,745 2.1 272,886 1985
50,844 47,416 30,034 13,079 297,731 14,402 0.6 314,001 1986
66,432 53,024 35,859 17,743 368,847 19,577 -0.5 386,327 1987
83,773 61,019 43,416 21,313 440,850 20,407 -0.9 457,248 1988
98,581 70,149 51,534 23,800 502,227 24,243 0.1 527,080 1989
114,720 81,359 59,257 30,741 563,517 28,191 -0.7 587,620 1990
146,058 94,336 68,873 45,902 638,606 34,631 0.6 677,247 1991
183,009 110,760 80,941 54,846 742,760 46,763 0.2 791,319 1992
219,976 130,482 89,862 63,177 844,322 51,151 1.9 912,809 1993
261,722 151,380 115,659 70,101 968,900 53,802 0.7 1,029,773 1994
257,793 176,068 134,933 80,358 1,041,072 50,360 0.4 1,096,263 1995
295,514 199,116 147,547 89,356 1,158,963 59,701 -0.6 1,210,925 1996
335,927 220,636 171,383 90,164 1,267,489 82,205 -0.4 1,344,546 1997
296,352 233,169 170,660 89,446 1,205,349 60,372 1.1 1,279,850 1998
281,439 246,003 162,488 94,580 1,177,796 53,474 1.2 1,246,134 1999
291,062 252,435 155,303 95,945 1,228,897 57,908 0.1 1,288,338 2000
274,030 265,081 159,118 95,582 1,215,354 53,917 § 1,269,896 2001
268,208 267,659 159,586 92,328 1,206,150 43,325 -0.1 1,247,958 2002
272,372 263,279 148,876 88,018 1,177,668 48,057 -0.5 1,220,038 2003@
Table 14 GDP by economic activity(a) At current prices
a
b
81
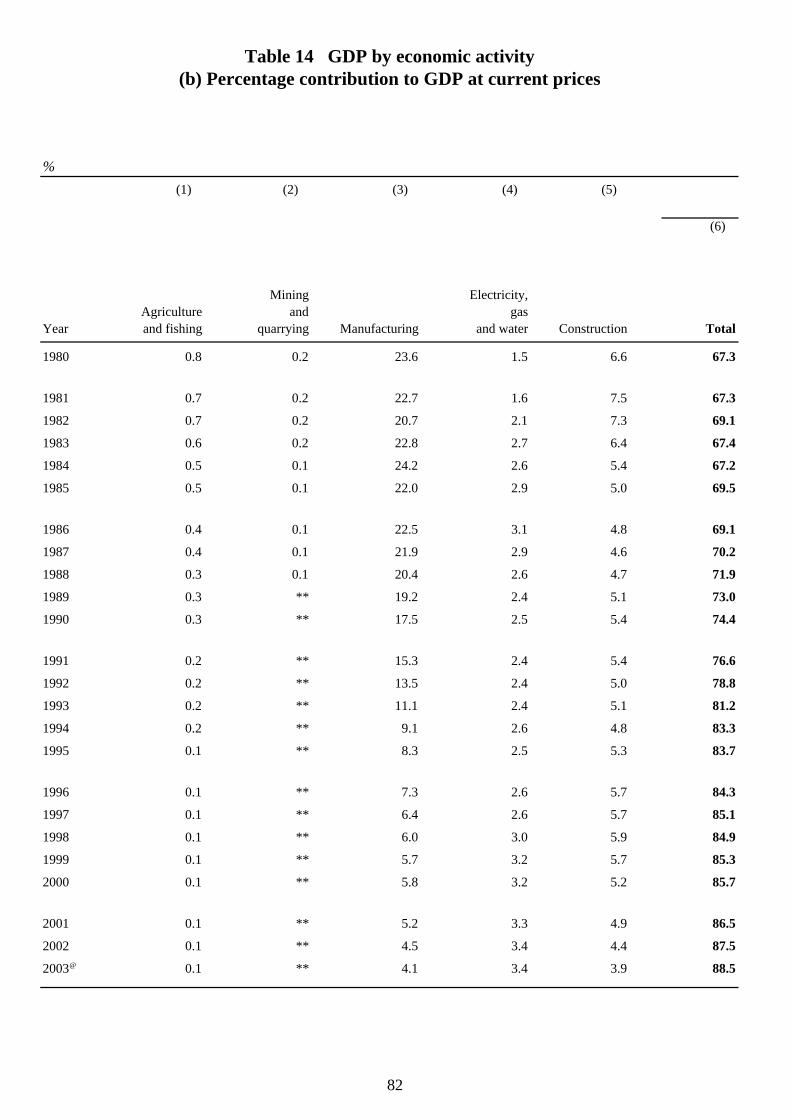
%(1) (2) (3) (4) (5)
(6)
Mining Electricity,Agriculture and gas
Year and fishing quarrying Manufacturing and water Construction Total
1980 0.8 0.2 23.6 1.5 6.6 67.3
1981 0.7 0.2 22.7 1.6 7.5 67.3
1982 0.7 0.2 20.7 2.1 7.3 69.1
1983 0.6 0.2 22.8 2.7 6.4 67.4
1984 0.5 0.1 24.2 2.6 5.4 67.2
1985 0.5 0.1 22.0 2.9 5.0 69.5
1986 0.4 0.1 22.5 3.1 4.8 69.1
1987 0.4 0.1 21.9 2.9 4.6 70.2
1988 0.3 0.1 20.4 2.6 4.7 71.9
1989 0.3 ** 19.2 2.4 5.1 73.0
1990 0.3 ** 17.5 2.5 5.4 74.4
1991 0.2 ** 15.3 2.4 5.4 76.6
1992 0.2 ** 13.5 2.4 5.0 78.8
1993 0.2 ** 11.1 2.4 5.1 81.2
1994 0.2 ** 9.1 2.6 4.8 83.3
1995 0.1 ** 8.3 2.5 5.3 83.7
1996 0.1 ** 7.3 2.6 5.7 84.3
1997 0.1 ** 6.4 2.6 5.7 85.1
1998 0.1 ** 6.0 3.0 5.9 84.9
1999 0.1 ** 5.7 3.2 5.7 85.3
2000 0.1 ** 5.8 3.2 5.2 85.7
2001 0.1 ** 5.2 3.3 4.9 86.5
2002 0.1 ** 4.5 3.4 4.4 87.5
2003@ 0.1 ** 4.1 3.4 3.9 88.5
Table 14 GDP by economic activity(b) Percentage contribution to GDP at current prices
82
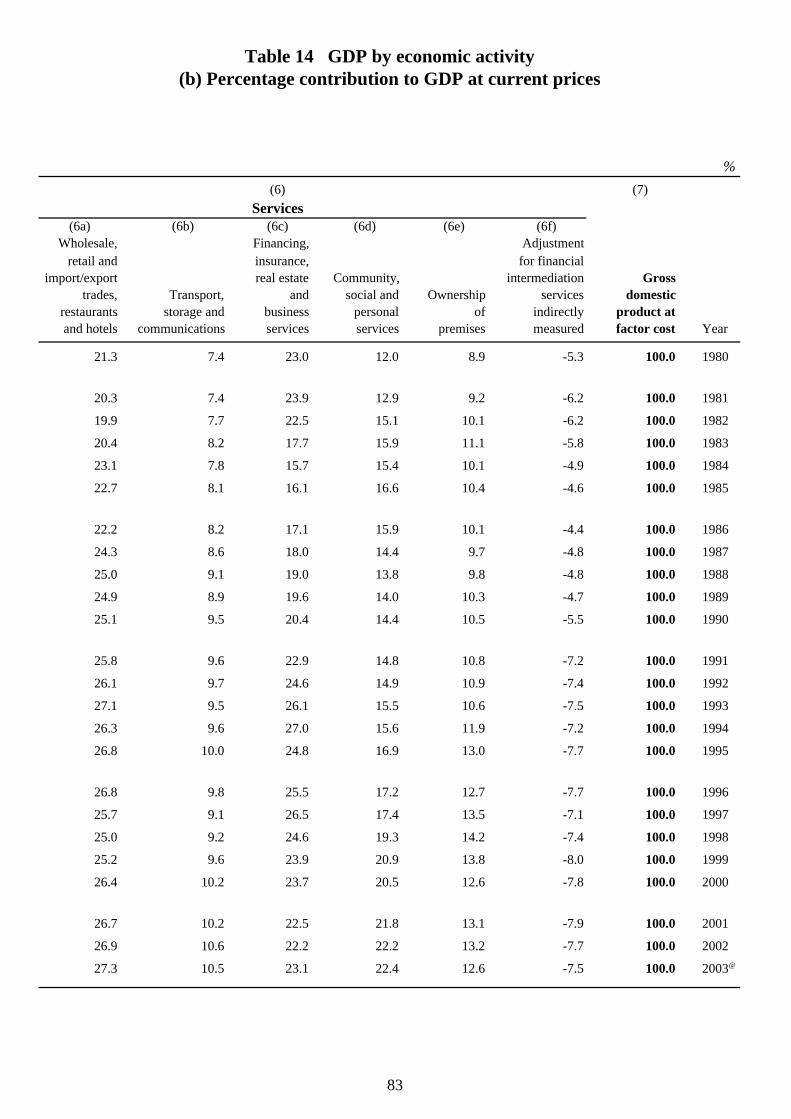
%(6) (7)
Services(6a) (6b) (6c) (6d) (6e) (6f)
Wholesale, Financing, Adjustmentretail and insurance, for financial
import/export real estate Community, intermediation Grosstrades, Transport, and social and Ownership services domestic
restaurants storage and business personal of indirectly product atand hotels communications services services premises measured factor cost Year
21.3 7.4 23.0 12.0 8.9 -5.3 100.0 1980
20.3 7.4 23.9 12.9 9.2 -6.2 100.0 1981
19.9 7.7 22.5 15.1 10.1 -6.2 100.0 1982
20.4 8.2 17.7 15.9 11.1 -5.8 100.0 1983
23.1 7.8 15.7 15.4 10.1 -4.9 100.0 1984
22.7 8.1 16.1 16.6 10.4 -4.6 100.0 1985
22.2 8.2 17.1 15.9 10.1 -4.4 100.0 1986
24.3 8.6 18.0 14.4 9.7 -4.8 100.0 1987
25.0 9.1 19.0 13.8 9.8 -4.8 100.0 1988
24.9 8.9 19.6 14.0 10.3 -4.7 100.0 1989
25.1 9.5 20.4 14.4 10.5 -5.5 100.0 1990
25.8 9.6 22.9 14.8 10.8 -7.2 100.0 1991
26.1 9.7 24.6 14.9 10.9 -7.4 100.0 1992
27.1 9.5 26.1 15.5 10.6 -7.5 100.0 1993
26.3 9.6 27.0 15.6 11.9 -7.2 100.0 1994
26.8 10.0 24.8 16.9 13.0 -7.7 100.0 1995
26.8 9.8 25.5 17.2 12.7 -7.7 100.0 1996
25.7 9.1 26.5 17.4 13.5 -7.1 100.0 1997
25.0 9.2 24.6 19.3 14.2 -7.4 100.0 1998
25.2 9.6 23.9 20.9 13.8 -8.0 100.0 1999
26.4 10.2 23.7 20.5 12.6 -7.8 100.0 2000
26.7 10.2 22.5 21.8 13.1 -7.9 100.0 2001
26.9 10.6 22.2 22.2 13.2 -7.7 100.0 2002
27.3 10.5 23.1 22.4 12.6 -7.5 100.0 2003@
Table 14 GDP by economic activity(b) Percentage contribution to GDP at current prices
83
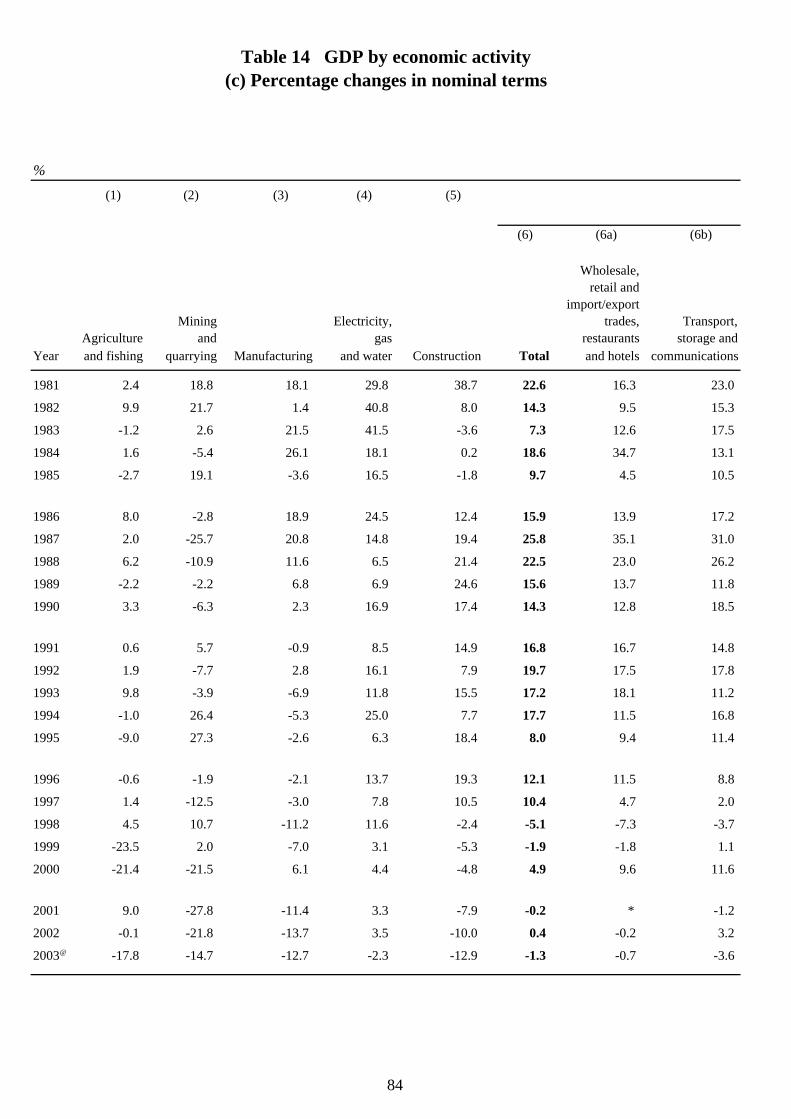
%(1) (2) (3) (4) (5)
(6) (6a) (6b)
Wholesale,retail and
import/exportMining Electricity, trades, Transport,
Agriculture and gas restaurants storage andYear and fishing quarrying Manufacturing and water Construction Total and hotels communications
1981 2.4 18.8 18.1 29.8 38.7 22.6 16.3 23.0
1982 9.9 21.7 1.4 40.8 8.0 14.3 9.5 15.3
1983 -1.2 2.6 21.5 41.5 -3.6 7.3 12.6 17.5
1984 1.6 -5.4 26.1 18.1 0.2 18.6 34.7 13.1
1985 -2.7 19.1 -3.6 16.5 -1.8 9.7 4.5 10.5
1986 8.0 -2.8 18.9 24.5 12.4 15.9 13.9 17.2
1987 2.0 -25.7 20.8 14.8 19.4 25.8 35.1 31.0
1988 6.2 -10.9 11.6 6.5 21.4 22.5 23.0 26.2
1989 -2.2 -2.2 6.8 6.9 24.6 15.6 13.7 11.8
1990 3.3 -6.3 2.3 16.9 17.4 14.3 12.8 18.5
1991 0.6 5.7 -0.9 8.5 14.9 16.8 16.7 14.8
1992 1.9 -7.7 2.8 16.1 7.9 19.7 17.5 17.8
1993 9.8 -3.9 -6.9 11.8 15.5 17.2 18.1 11.2
1994 -1.0 26.4 -5.3 25.0 7.7 17.7 11.5 16.8
1995 -9.0 27.3 -2.6 6.3 18.4 8.0 9.4 11.4
1996 -0.6 -1.9 -2.1 13.7 19.3 12.1 11.5 8.8
1997 1.4 -12.5 -3.0 7.8 10.5 10.4 4.7 2.0
1998 4.5 10.7 -11.2 11.6 -2.4 -5.1 -7.3 -3.7
1999 -23.5 2.0 -7.0 3.1 -5.3 -1.9 -1.8 1.1
2000 -21.4 -21.5 6.1 4.4 -4.8 4.9 9.6 11.6
2001 9.0 -27.8 -11.4 3.3 -7.9 -0.2 * -1.2
2002 -0.1 -21.8 -13.7 3.5 -10.0 0.4 -0.2 3.2
2003@ -17.8 -14.7 -12.7 -2.3 -12.9 -1.3 -0.7 -3.6
Table 14 GDP by economic activity(c) Percentage changes in nominal terms
84
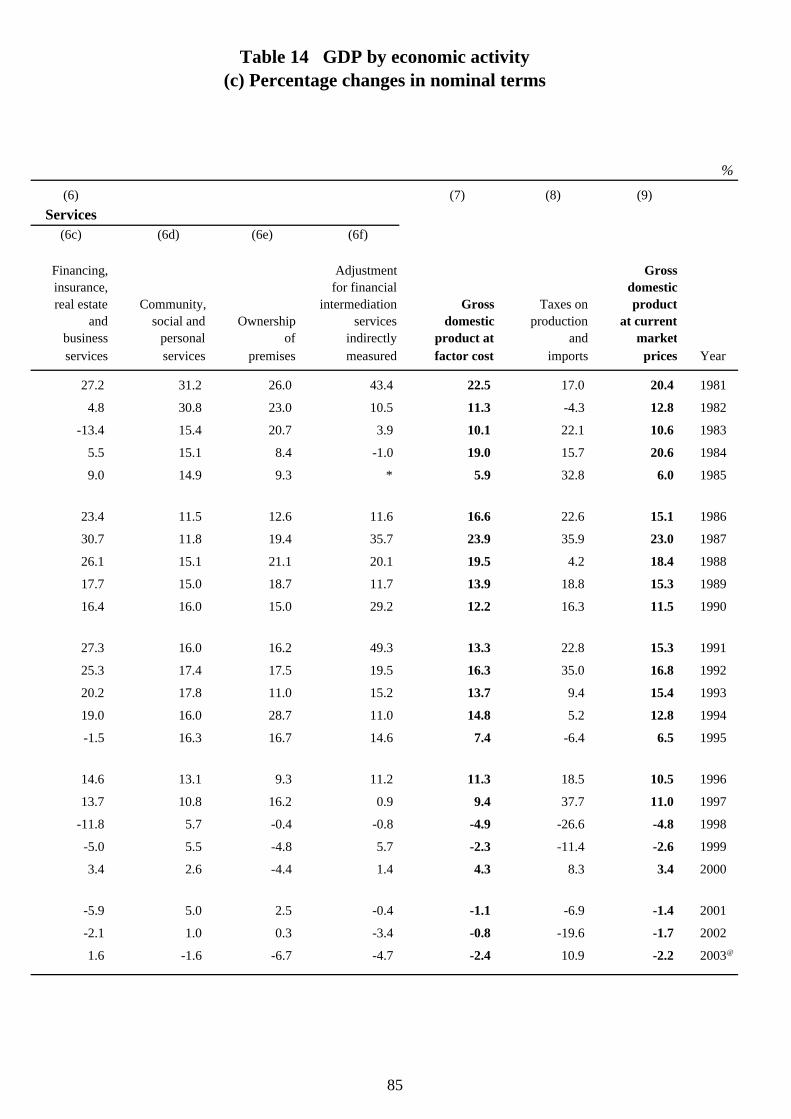
%(6) (7) (8) (9)
Services(6c) (6d) (6e) (6f)
Financing, Adjustment Grossinsurance, for financial domestic real estate Community, intermediation Gross Taxes on product
and social and Ownership services domestic production at currentbusiness personal of indirectly product at and marketservices services premises measured factor cost imports prices Year
27.2 31.2 26.0 43.4 22.5 17.0 20.4 1981
4.8 30.8 23.0 10.5 11.3 -4.3 12.8 1982
-13.4 15.4 20.7 3.9 10.1 22.1 10.6 1983
5.5 15.1 8.4 -1.0 19.0 15.7 20.6 1984
9.0 14.9 9.3 * 5.9 32.8 6.0 1985
23.4 11.5 12.6 11.6 16.6 22.6 15.1 1986
30.7 11.8 19.4 35.7 23.9 35.9 23.0 1987
26.1 15.1 21.1 20.1 19.5 4.2 18.4 1988
17.7 15.0 18.7 11.7 13.9 18.8 15.3 1989
16.4 16.0 15.0 29.2 12.2 16.3 11.5 1990
27.3 16.0 16.2 49.3 13.3 22.8 15.3 1991
25.3 17.4 17.5 19.5 16.3 35.0 16.8 1992
20.2 17.8 11.0 15.2 13.7 9.4 15.4 1993
19.0 16.0 28.7 11.0 14.8 5.2 12.8 1994
-1.5 16.3 16.7 14.6 7.4 -6.4 6.5 1995
14.6 13.1 9.3 11.2 11.3 18.5 10.5 1996
13.7 10.8 16.2 0.9 9.4 37.7 11.0 1997
-11.8 5.7 -0.4 -0.8 -4.9 -26.6 -4.8 1998
-5.0 5.5 -4.8 5.7 -2.3 -11.4 -2.6 1999
3.4 2.6 -4.4 1.4 4.3 8.3 3.4 2000
-5.9 5.0 2.5 -0.4 -1.1 -6.9 -1.4 2001
-2.1 1.0 0.3 -3.4 -0.8 -19.6 -1.7 2002
1.6 -1.6 -6.7 -4.7 -2.4 10.9 -2.2 2003@
Table 14 GDP by economic activity(c) Percentage changes in nominal terms
85
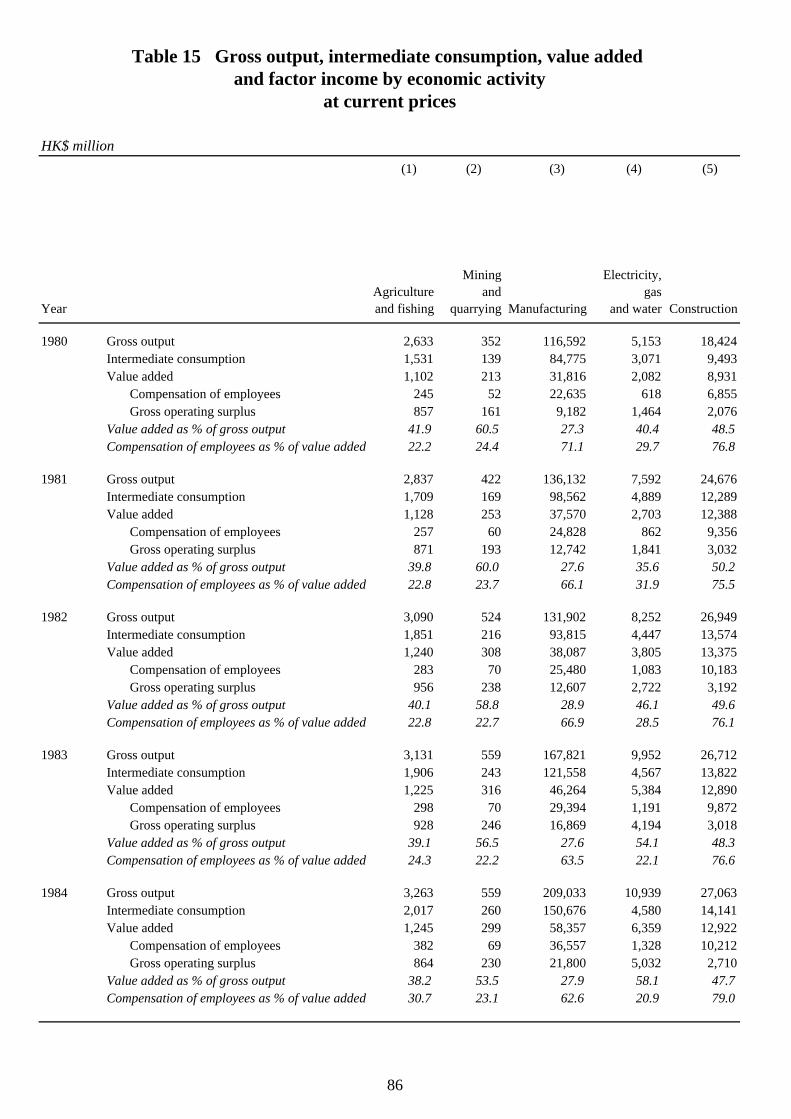
HK$ million(1) (2) (3) (4) (5)
Mining Electricity,Agriculture and gas
Year and fishing quarrying Manufacturing and water Construction
1980 Gross output 2,633 352 116,592 5,153 18,424Intermediate consumption 1,531 139 84,775 3,071 9,493Value added 1,102 213 31,816 2,082 8,931 Compensation of employees 245 52 22,635 618 6,855 Gross operating surplus 857 161 9,182 1,464 2,076Value added as % of gross output 41.9 60.5 27.3 40.4 48.5Compensation of employees as % of value added 22.2 24.4 71.1 29.7 76.8
1981 Gross output 2,837 422 136,132 7,592 24,676Intermediate consumption 1,709 169 98,562 4,889 12,289Value added 1,128 253 37,570 2,703 12,388 Compensation of employees 257 60 24,828 862 9,356 Gross operating surplus 871 193 12,742 1,841 3,032Value added as % of gross output 39.8 60.0 27.6 35.6 50.2Compensation of employees as % of value added 22.8 23.7 66.1 31.9 75.5
1982 Gross output 3,090 524 131,902 8,252 26,949Intermediate consumption 1,851 216 93,815 4,447 13,574Value added 1,240 308 38,087 3,805 13,375 Compensation of employees 283 70 25,480 1,083 10,183 Gross operating surplus 956 238 12,607 2,722 3,192Value added as % of gross output 40.1 58.8 28.9 46.1 49.6Compensation of employees as % of value added 22.8 22.7 66.9 28.5 76.1
1983 Gross output 3,131 559 167,821 9,952 26,712Intermediate consumption 1,906 243 121,558 4,567 13,822Value added 1,225 316 46,264 5,384 12,890 Compensation of employees 298 70 29,394 1,191 9,872 Gross operating surplus 928 246 16,869 4,194 3,018Value added as % of gross output 39.1 56.5 27.6 54.1 48.3Compensation of employees as % of value added 24.3 22.2 63.5 22.1 76.6
1984 Gross output 3,263 559 209,033 10,939 27,063Intermediate consumption 2,017 260 150,676 4,580 14,141Value added 1,245 299 58,357 6,359 12,922 Compensation of employees 382 69 36,557 1,328 10,212 Gross operating surplus 864 230 21,800 5,032 2,710Value added as % of gross output 38.2 53.5 27.9 58.1 47.7Compensation of employees as % of value added 30.7 23.1 62.6 20.9 79.0
Table 15 Gross output, intermediate consumption, value added and factor income by economic activity
at current prices
86
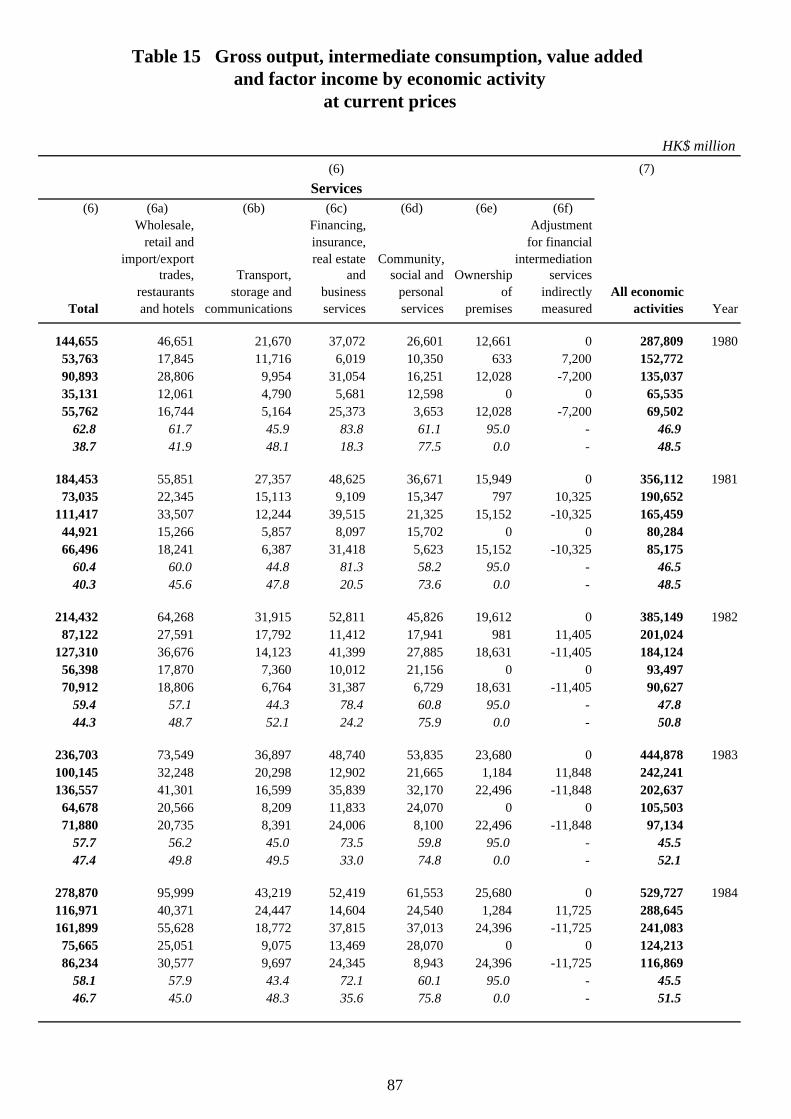
HK$ million(6) (7)
Services(6) (6a) (6b) (6c) (6d) (6e) (6f)
Wholesale, Financing, Adjustmentretail and insurance, for financial
import/export real estate Community, intermediationtrades, Transport, and social and Ownership services
restaurants storage and business personal of indirectly All economicTotal and hotels communications services services premises measured activities Year
144,655 46,651 21,670 37,072 26,601 12,661 0 287,809 198053,763 17,845 11,716 6,019 10,350 633 7,200 152,77290,893 28,806 9,954 31,054 16,251 12,028 -7,200 135,03735,131 12,061 4,790 5,681 12,598 0 0 65,53555,762 16,744 5,164 25,373 3,653 12,028 -7,200 69,502
62.8 61.7 45.9 83.8 61.1 95.0 - 46.938.7 41.9 48.1 18.3 77.5 0.0 - 48.5
184,453 55,851 27,357 48,625 36,671 15,949 0 356,112 198173,035 22,345 15,113 9,109 15,347 797 10,325 190,652
111,417 33,507 12,244 39,515 21,325 15,152 -10,325 165,45944,921 15,266 5,857 8,097 15,702 0 0 80,28466,496 18,241 6,387 31,418 5,623 15,152 -10,325 85,175
60.4 60.0 44.8 81.3 58.2 95.0 - 46.540.3 45.6 47.8 20.5 73.6 0.0 - 48.5
214,432 64,268 31,915 52,811 45,826 19,612 0 385,149 198287,122 27,591 17,792 11,412 17,941 981 11,405 201,024
127,310 36,676 14,123 41,399 27,885 18,631 -11,405 184,12456,398 17,870 7,360 10,012 21,156 0 0 93,49770,912 18,806 6,764 31,387 6,729 18,631 -11,405 90,627
59.4 57.1 44.3 78.4 60.8 95.0 - 47.844.3 48.7 52.1 24.2 75.9 0.0 - 50.8
236,703 73,549 36,897 48,740 53,835 23,680 0 444,878 1983100,145 32,248 20,298 12,902 21,665 1,184 11,848 242,241136,557 41,301 16,599 35,839 32,170 22,496 -11,848 202,637
64,678 20,566 8,209 11,833 24,070 0 0 105,50371,880 20,735 8,391 24,006 8,100 22,496 -11,848 97,134
57.7 56.2 45.0 73.5 59.8 95.0 - 45.547.4 49.8 49.5 33.0 74.8 0.0 - 52.1
278,870 95,999 43,219 52,419 61,553 25,680 0 529,727 1984116,971 40,371 24,447 14,604 24,540 1,284 11,725 288,645161,899 55,628 18,772 37,815 37,013 24,396 -11,725 241,083
75,665 25,051 9,075 13,469 28,070 0 0 124,21386,234 30,577 9,697 24,345 8,943 24,396 -11,725 116,869
58.1 57.9 43.4 72.1 60.1 95.0 - 45.546.7 45.0 48.3 35.6 75.8 0.0 - 51.5
Table 15 Gross output, intermediate consumption, value added and factor income by economic activity
at current prices
87

HK$ million(1) (2) (3) (4) (5)
Mining Electricity,Agriculture and gas
Year and fishing quarrying Manufacturing and water Construction
1985 Gross output 3,239 623 196,993 11,884 27,303Intermediate consumption 2,028 267 140,764 4,475 14,617Value added 1,211 356 56,229 7,408 12,686 Compensation of employees 427 70 38,063 1,534 10,664 Gross operating surplus 784 286 18,166 5,874 2,022Value added as % of gross output 37.4 57.1 28.5 62.3 46.5Compensation of employees as % of value added 35.3 19.7 67.7 20.7 84.1
1986 Gross output 3,457 589 241,293 12,784 30,972Intermediate consumption 2,149 243 174,419 3,563 16,711Value added 1,308 346 66,875 9,222 14,261 Compensation of employees 433 74 42,199 1,743 12,344 Gross operating surplus 876 272 24,676 7,478 1,917Value added as % of gross output 37.8 58.7 27.7 72.1 46.0Compensation of employees as % of value added 33.1 21.4 63.1 18.9 86.6
1987 Gross output 3,584 466 300,457 14,344 36,768Intermediate consumption 2,250 209 219,697 3,753 19,735Value added 1,334 257 80,760 10,591 17,033 Compensation of employees 476 66 48,536 1,952 15,015 Gross operating surplus 859 191 32,224 8,639 2,018Value added as % of gross output 37.2 55.2 26.9 73.8 46.3Compensation of employees as % of value added 35.7 25.7 60.1 18.4 88.2
1988 Gross output 3,764 418 340,505 15,340 44,272Intermediate consumption 2,347 189 250,410 4,056 23,601Value added 1,417 229 90,095 11,284 20,671 Compensation of employees 532 69 53,076 2,159 17,747 Gross operating surplus 886 160 37,019 9,125 2,924Value added as % of gross output 37.6 54.8 26.5 73.6 46.7Compensation of employees as % of value added 37.5 30.1 58.9 19.1 85.9
1989 Gross output 3,913 437 348,222 17,128 53,570Intermediate consumption 2,527 213 251,965 5,061 27,814Value added 1,386 224 96,258 12,067 25,756 Compensation of employees 607 72 56,718 2,497 20,958 Gross operating surplus 779 152 39,539 9,571 4,798Value added as % of gross output 35.4 51.3 27.6 70.5 48.1Compensation of employees as % of value added 43.8 32.1 58.9 20.7 81.4
Table 15 ---- Continued
88
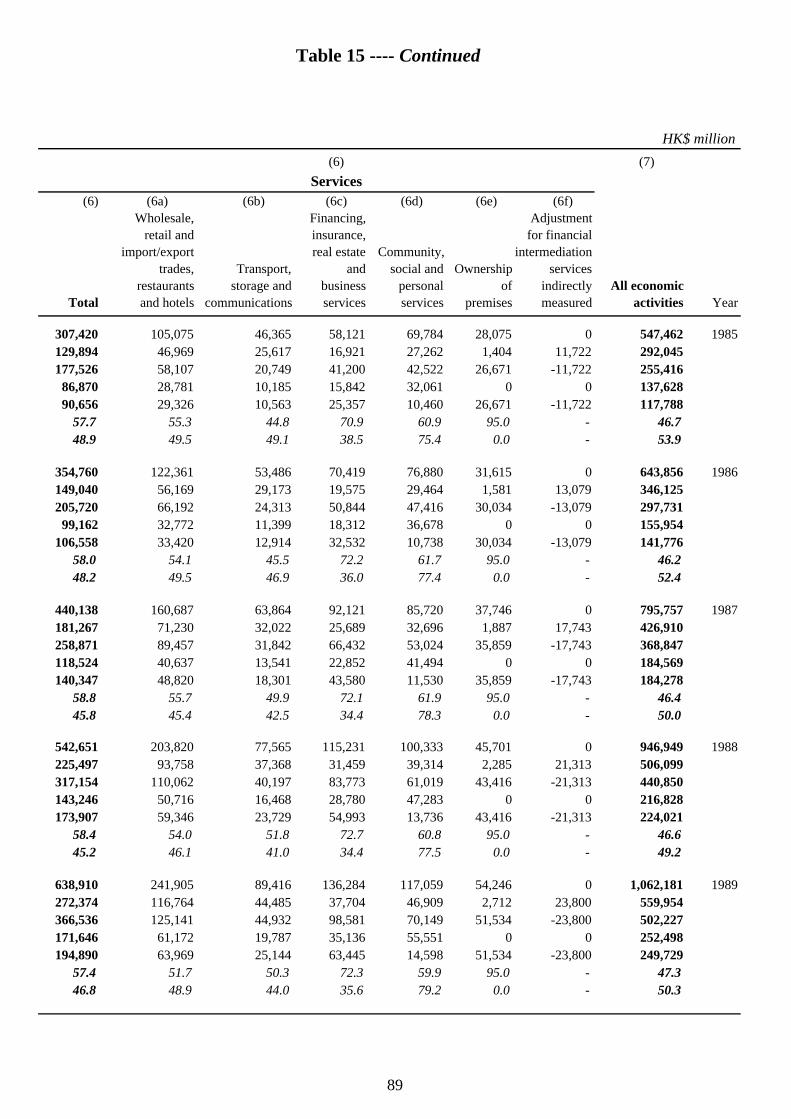
HK$ million(6) (7)
Services(6) (6a) (6b) (6c) (6d) (6e) (6f)
Wholesale, Financing, Adjustmentretail and insurance, for financial
import/export real estate Community, intermediationtrades, Transport, and social and Ownership services
restaurants storage and business personal of indirectly All economicTotal and hotels communications services services premises measured activities Year
307,420 105,075 46,365 58,121 69,784 28,075 0 547,462 1985129,894 46,969 25,617 16,921 27,262 1,404 11,722 292,045177,526 58,107 20,749 41,200 42,522 26,671 -11,722 255,416
86,870 28,781 10,185 15,842 32,061 0 0 137,62890,656 29,326 10,563 25,357 10,460 26,671 -11,722 117,788
57.7 55.3 44.8 70.9 60.9 95.0 - 46.748.9 49.5 49.1 38.5 75.4 0.0 - 53.9
354,760 122,361 53,486 70,419 76,880 31,615 0 643,856 1986149,040 56,169 29,173 19,575 29,464 1,581 13,079 346,125205,720 66,192 24,313 50,844 47,416 30,034 -13,079 297,731
99,162 32,772 11,399 18,312 36,678 0 0 155,954106,558 33,420 12,914 32,532 10,738 30,034 -13,079 141,776
58.0 54.1 45.5 72.2 61.7 95.0 - 46.248.2 49.5 46.9 36.0 77.4 0.0 - 52.4
440,138 160,687 63,864 92,121 85,720 37,746 0 795,757 1987181,267 71,230 32,022 25,689 32,696 1,887 17,743 426,910258,871 89,457 31,842 66,432 53,024 35,859 -17,743 368,847118,524 40,637 13,541 22,852 41,494 0 0 184,569140,347 48,820 18,301 43,580 11,530 35,859 -17,743 184,278
58.8 55.7 49.9 72.1 61.9 95.0 - 46.445.8 45.4 42.5 34.4 78.3 0.0 - 50.0
542,651 203,820 77,565 115,231 100,333 45,701 0 946,949 1988225,497 93,758 37,368 31,459 39,314 2,285 21,313 506,099317,154 110,062 40,197 83,773 61,019 43,416 -21,313 440,850143,246 50,716 16,468 28,780 47,283 0 0 216,828173,907 59,346 23,729 54,993 13,736 43,416 -21,313 224,021
58.4 54.0 51.8 72.7 60.8 95.0 - 46.645.2 46.1 41.0 34.4 77.5 0.0 - 49.2
638,910 241,905 89,416 136,284 117,059 54,246 0 1,062,181 1989272,374 116,764 44,485 37,704 46,909 2,712 23,800 559,954366,536 125,141 44,932 98,581 70,149 51,534 -23,800 502,227171,646 61,172 19,787 35,136 55,551 0 0 252,498194,890 63,969 25,144 63,445 14,598 51,534 -23,800 249,729
57.4 51.7 50.3 72.3 59.9 95.0 - 47.346.8 48.9 44.0 35.6 79.2 0.0 - 50.3
Table 15 ---- Continued
89

HK$ million(1) (2) (3) (4) (5)
Mining Electricity,Agriculture and gas
Year and fishing quarrying Manufacturing and water Construction
1990 Gross output 3,872 402 342,064 19,489 61,285Intermediate consumption 2,440 192 243,604 5,381 31,043Value added 1,432 210 98,460 14,109 30,242 Compensation of employees 607 77 57,592 3,153 24,797 Gross operating surplus 826 133 40,868 10,956 5,444Value added as % of gross output 37.0 52.2 28.8 72.4 49.3Compensation of employees as % of value added 42.4 36.7 58.5 22.3 82.0
1991 Gross output 3,796 405 339,371 22,010 70,492Intermediate consumption 2,355 183 241,836 6,703 35,756Value added 1,441 222 97,535 15,307 34,737 Compensation of employees 661 72 55,747 3,625 27,517 Gross operating surplus 780 150 41,789 11,683 7,219Value added as % of gross output 38.0 54.8 28.7 69.5 49.3Compensation of employees as % of value added 45.9 32.4 57.2 23.7 79.2
1992 Gross output 3,705 368 339,276 24,959 74,824Intermediate consumption 2,237 163 238,970 7,186 37,353Value added 1,468 205 100,306 17,773 37,471 Compensation of employees 603 81 55,355 4,115 30,099 Gross operating surplus 865 124 44,951 13,658 7,372Value added as % of gross output 39.6 55.7 29.6 71.2 50.1Compensation of employees as % of value added 41.1 39.5 55.2 23.2 80.3
1993 Gross output 3,696 413 318,315 26,988 88,031Intermediate consumption 2,085 216 224,953 7,122 44,736Value added 1,612 197 93,362 19,865 43,295 Compensation of employees 658 95 52,879 4,603 33,572 Gross operating surplus 954 102 40,483 15,262 9,723Value added as % of gross output 43.6 47.7 29.3 73.6 49.2Compensation of employees as % of value added 40.8 48.2 56.6 23.2 77.5
1994 Gross output 3,734 476 300,890 31,159 96,142Intermediate consumption 2,138 226 212,501 6,330 49,530Value added 1,596 249 88,388 24,829 46,612 Compensation of employees 510 114 50,618 5,105 35,679 Gross operating surplus 1,086 135 37,770 19,724 10,934Value added as % of gross output 42.7 52.3 29.4 79.7 48.5Compensation of employees as % of value added 32.0 45.8 57.3 20.6 76.5
Table 15 ---- Continued
90
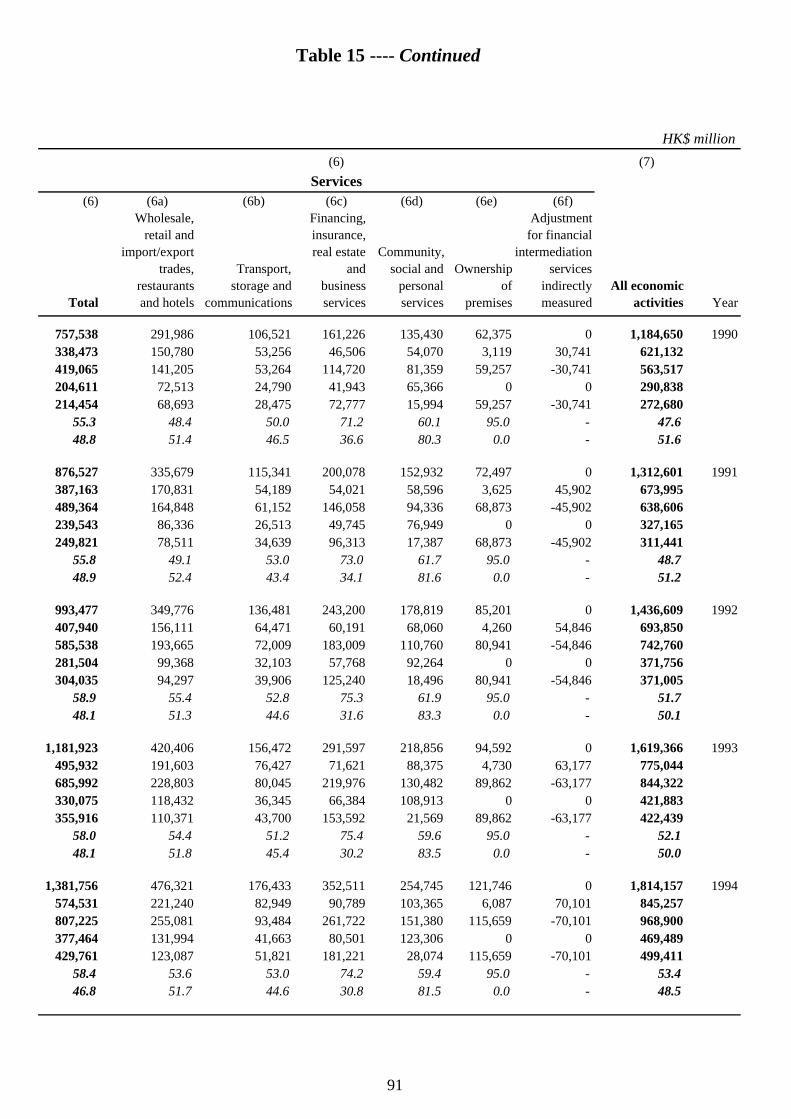
HK$ million(6) (7)
Services(6) (6a) (6b) (6c) (6d) (6e) (6f)
Wholesale, Financing, Adjustmentretail and insurance, for financial
import/export real estate Community, intermediationtrades, Transport, and social and Ownership services
restaurants storage and business personal of indirectly All economicTotal and hotels communications services services premises measured activities Year
757,538 291,986 106,521 161,226 135,430 62,375 0 1,184,650 1990338,473 150,780 53,256 46,506 54,070 3,119 30,741 621,132419,065 141,205 53,264 114,720 81,359 59,257 -30,741 563,517204,611 72,513 24,790 41,943 65,366 0 0 290,838214,454 68,693 28,475 72,777 15,994 59,257 -30,741 272,680
55.3 48.4 50.0 71.2 60.1 95.0 - 47.648.8 51.4 46.5 36.6 80.3 0.0 - 51.6
876,527 335,679 115,341 200,078 152,932 72,497 0 1,312,601 1991387,163 170,831 54,189 54,021 58,596 3,625 45,902 673,995489,364 164,848 61,152 146,058 94,336 68,873 -45,902 638,606239,543 86,336 26,513 49,745 76,949 0 0 327,165249,821 78,511 34,639 96,313 17,387 68,873 -45,902 311,441
55.8 49.1 53.0 73.0 61.7 95.0 - 48.748.9 52.4 43.4 34.1 81.6 0.0 - 51.2
993,477 349,776 136,481 243,200 178,819 85,201 0 1,436,609 1992407,940 156,111 64,471 60,191 68,060 4,260 54,846 693,850585,538 193,665 72,009 183,009 110,760 80,941 -54,846 742,760281,504 99,368 32,103 57,768 92,264 0 0 371,756304,035 94,297 39,906 125,240 18,496 80,941 -54,846 371,005
58.9 55.4 52.8 75.3 61.9 95.0 - 51.748.1 51.3 44.6 31.6 83.3 0.0 - 50.1
1,181,923 420,406 156,472 291,597 218,856 94,592 0 1,619,366 1993495,932 191,603 76,427 71,621 88,375 4,730 63,177 775,044685,992 228,803 80,045 219,976 130,482 89,862 -63,177 844,322330,075 118,432 36,345 66,384 108,913 0 0 421,883355,916 110,371 43,700 153,592 21,569 89,862 -63,177 422,439
58.0 54.4 51.2 75.4 59.6 95.0 - 52.148.1 51.8 45.4 30.2 83.5 0.0 - 50.0
1,381,756 476,321 176,433 352,511 254,745 121,746 0 1,814,157 1994574,531 221,240 82,949 90,789 103,365 6,087 70,101 845,257807,225 255,081 93,484 261,722 151,380 115,659 -70,101 968,900377,464 131,994 41,663 80,501 123,306 0 0 469,489429,761 123,087 51,821 181,221 28,074 115,659 -70,101 499,411
58.4 53.6 53.0 74.2 59.4 95.0 - 53.446.8 51.7 44.6 30.8 81.5 0.0 - 48.5
Table 15 ---- Continued
91
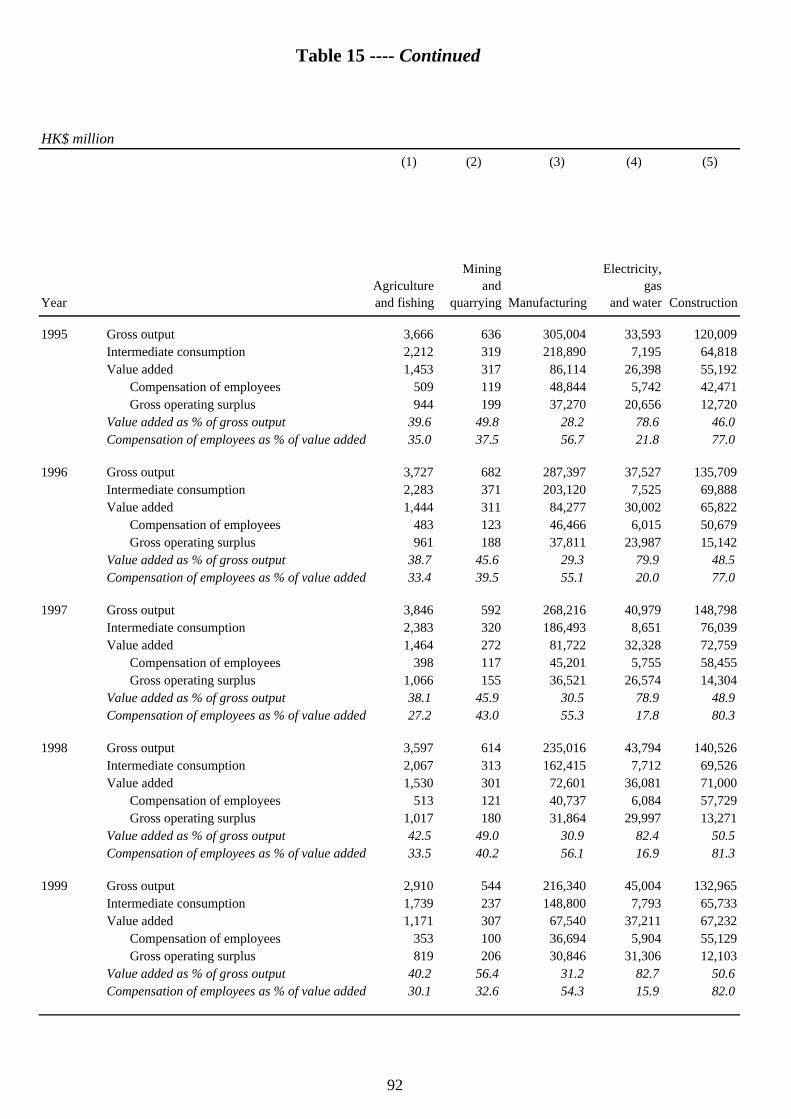
HK$ million(1) (2) (3) (4) (5)
Mining Electricity,Agriculture and gas
Year and fishing quarrying Manufacturing and water Construction
1995 Gross output 3,666 636 305,004 33,593 120,009Intermediate consumption 2,212 319 218,890 7,195 64,818Value added 1,453 317 86,114 26,398 55,192 Compensation of employees 509 119 48,844 5,742 42,471 Gross operating surplus 944 199 37,270 20,656 12,720Value added as % of gross output 39.6 49.8 28.2 78.6 46.0Compensation of employees as % of value added 35.0 37.5 56.7 21.8 77.0
1996 Gross output 3,727 682 287,397 37,527 135,709Intermediate consumption 2,283 371 203,120 7,525 69,888Value added 1,444 311 84,277 30,002 65,822 Compensation of employees 483 123 46,466 6,015 50,679 Gross operating surplus 961 188 37,811 23,987 15,142Value added as % of gross output 38.7 45.6 29.3 79.9 48.5Compensation of employees as % of value added 33.4 39.5 55.1 20.0 77.0
1997 Gross output 3,846 592 268,216 40,979 148,798Intermediate consumption 2,383 320 186,493 8,651 76,039Value added 1,464 272 81,722 32,328 72,759 Compensation of employees 398 117 45,201 5,755 58,455 Gross operating surplus 1,066 155 36,521 26,574 14,304Value added as % of gross output 38.1 45.9 30.5 78.9 48.9Compensation of employees as % of value added 27.2 43.0 55.3 17.8 80.3
1998 Gross output 3,597 614 235,016 43,794 140,526Intermediate consumption 2,067 313 162,415 7,712 69,526Value added 1,530 301 72,601 36,081 71,000 Compensation of employees 513 121 40,737 6,084 57,729 Gross operating surplus 1,017 180 31,864 29,997 13,271Value added as % of gross output 42.5 49.0 30.9 82.4 50.5Compensation of employees as % of value added 33.5 40.2 56.1 16.9 81.3
1999 Gross output 2,910 544 216,340 45,004 132,965Intermediate consumption 1,739 237 148,800 7,793 65,733Value added 1,171 307 67,540 37,211 67,232 Compensation of employees 353 100 36,694 5,904 55,129 Gross operating surplus 819 206 30,846 31,306 12,103Value added as % of gross output 40.2 56.4 31.2 82.7 50.6Compensation of employees as % of value added 30.1 32.6 54.3 15.9 82.0
Table 15 ---- Continued
92
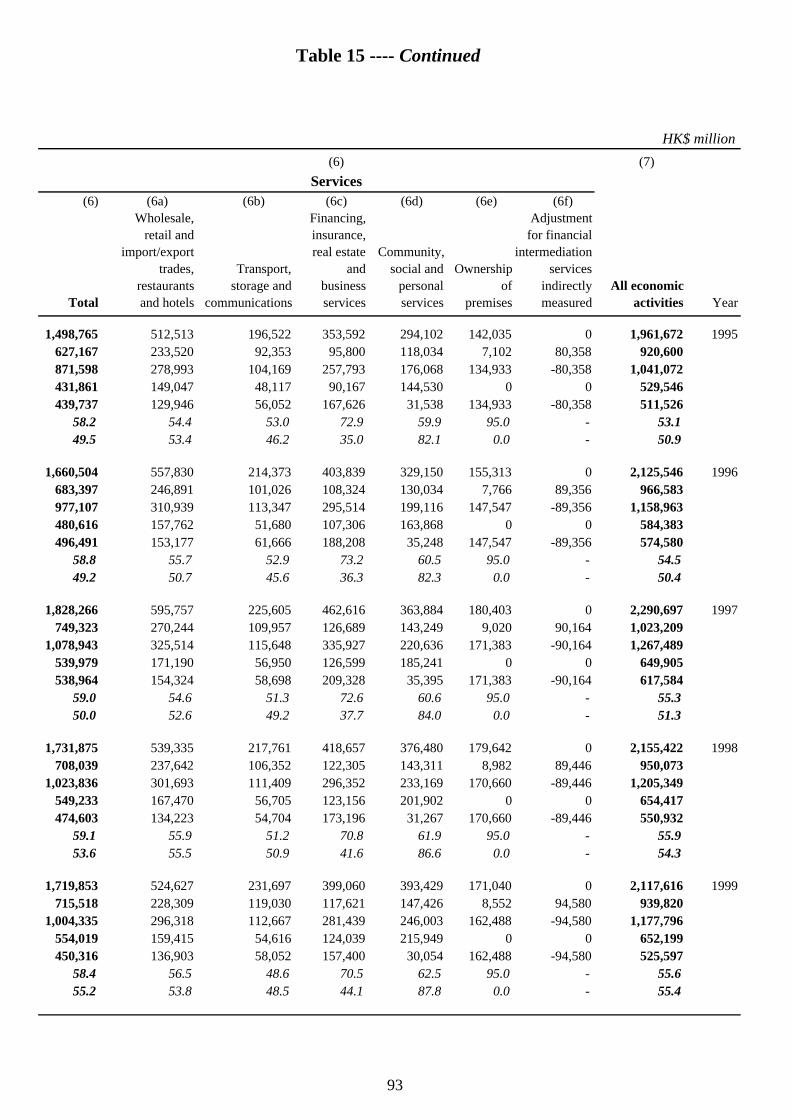
HK$ million(6) (7)
Services(6) (6a) (6b) (6c) (6d) (6e) (6f)
Wholesale, Financing, Adjustmentretail and insurance, for financial
import/export real estate Community, intermediationtrades, Transport, and social and Ownership services
restaurants storage and business personal of indirectly All economicTotal and hotels communications services services premises measured activities Year
1,498,765 512,513 196,522 353,592 294,102 142,035 0 1,961,672 1995627,167 233,520 92,353 95,800 118,034 7,102 80,358 920,600871,598 278,993 104,169 257,793 176,068 134,933 -80,358 1,041,072431,861 149,047 48,117 90,167 144,530 0 0 529,546439,737 129,946 56,052 167,626 31,538 134,933 -80,358 511,526
58.2 54.4 53.0 72.9 59.9 95.0 - 53.149.5 53.4 46.2 35.0 82.1 0.0 - 50.9
1,660,504 557,830 214,373 403,839 329,150 155,313 0 2,125,546 1996683,397 246,891 101,026 108,324 130,034 7,766 89,356 966,583977,107 310,939 113,347 295,514 199,116 147,547 -89,356 1,158,963480,616 157,762 51,680 107,306 163,868 0 0 584,383496,491 153,177 61,666 188,208 35,248 147,547 -89,356 574,580
58.8 55.7 52.9 73.2 60.5 95.0 - 54.549.2 50.7 45.6 36.3 82.3 0.0 - 50.4
1,828,266 595,757 225,605 462,616 363,884 180,403 0 2,290,697 1997749,323 270,244 109,957 126,689 143,249 9,020 90,164 1,023,209
1,078,943 325,514 115,648 335,927 220,636 171,383 -90,164 1,267,489539,979 171,190 56,950 126,599 185,241 0 0 649,905538,964 154,324 58,698 209,328 35,395 171,383 -90,164 617,584
59.0 54.6 51.3 72.6 60.6 95.0 - 55.350.0 52.6 49.2 37.7 84.0 0.0 - 51.3
1,731,875 539,335 217,761 418,657 376,480 179,642 0 2,155,422 1998708,039 237,642 106,352 122,305 143,311 8,982 89,446 950,073
1,023,836 301,693 111,409 296,352 233,169 170,660 -89,446 1,205,349549,233 167,470 56,705 123,156 201,902 0 0 654,417474,603 134,223 54,704 173,196 31,267 170,660 -89,446 550,932
59.1 55.9 51.2 70.8 61.9 95.0 - 55.953.6 55.5 50.9 41.6 86.6 0.0 - 54.3
1,719,853 524,627 231,697 399,060 393,429 171,040 0 2,117,616 1999715,518 228,309 119,030 117,621 147,426 8,552 94,580 939,820
1,004,335 296,318 112,667 281,439 246,003 162,488 -94,580 1,177,796554,019 159,415 54,616 124,039 215,949 0 0 652,199450,316 136,903 58,052 157,400 30,054 162,488 -94,580 525,597
58.4 56.5 48.6 70.5 62.5 95.0 - 55.655.2 53.8 48.5 44.1 87.8 0.0 - 55.4
Table 15 ---- Continued
93
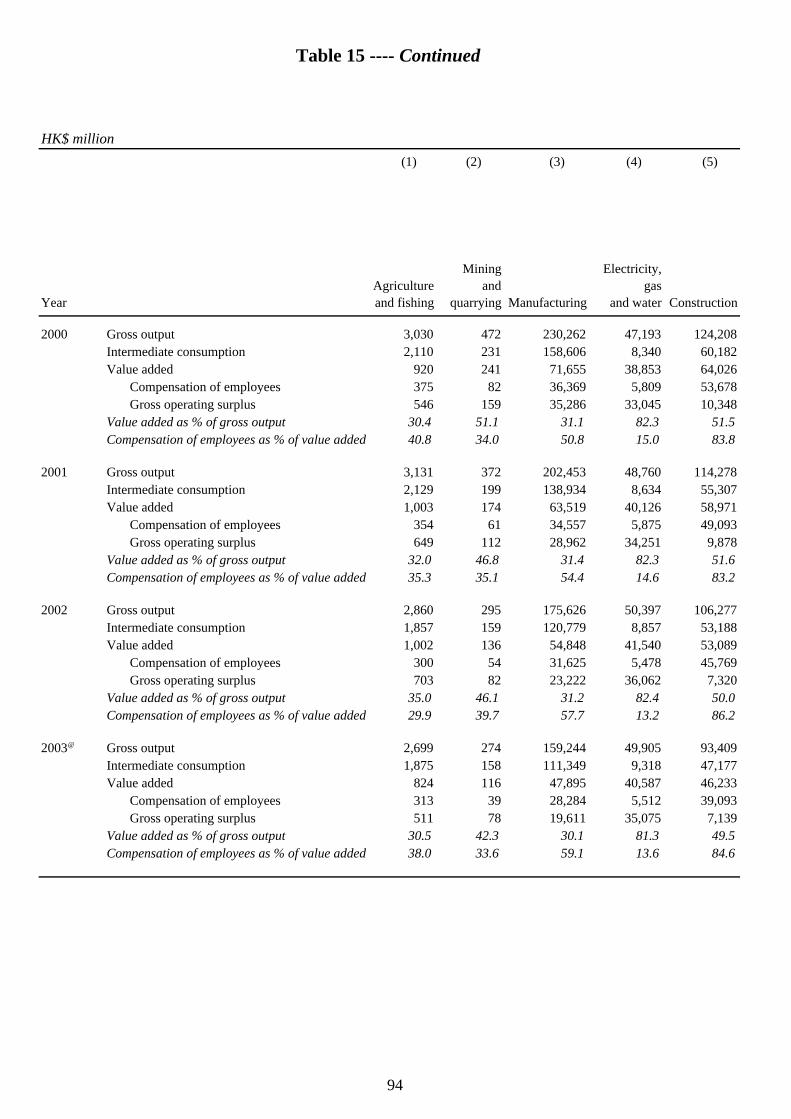
HK$ million(1) (2) (3) (4) (5)
Mining Electricity,Agriculture and gas
Year and fishing quarrying Manufacturing and water Construction
2000 Gross output 3,030 472 230,262 47,193 124,208Intermediate consumption 2,110 231 158,606 8,340 60,182Value added 920 241 71,655 38,853 64,026 Compensation of employees 375 82 36,369 5,809 53,678 Gross operating surplus 546 159 35,286 33,045 10,348Value added as % of gross output 30.4 51.1 31.1 82.3 51.5Compensation of employees as % of value added 40.8 34.0 50.8 15.0 83.8
2001 Gross output 3,131 372 202,453 48,760 114,278Intermediate consumption 2,129 199 138,934 8,634 55,307Value added 1,003 174 63,519 40,126 58,971 Compensation of employees 354 61 34,557 5,875 49,093 Gross operating surplus 649 112 28,962 34,251 9,878Value added as % of gross output 32.0 46.8 31.4 82.3 51.6Compensation of employees as % of value added 35.3 35.1 54.4 14.6 83.2
2002 Gross output 2,860 295 175,626 50,397 106,277Intermediate consumption 1,857 159 120,779 8,857 53,188Value added 1,002 136 54,848 41,540 53,089 Compensation of employees 300 54 31,625 5,478 45,769 Gross operating surplus 703 82 23,222 36,062 7,320Value added as % of gross output 35.0 46.1 31.2 82.4 50.0Compensation of employees as % of value added 29.9 39.7 57.7 13.2 86.2
2003@ Gross output 2,699 274 159,244 49,905 93,409Intermediate consumption 1,875 158 111,349 9,318 47,177Value added 824 116 47,895 40,587 46,233 Compensation of employees 313 39 28,284 5,512 39,093 Gross operating surplus 511 78 19,611 35,075 7,139Value added as % of gross output 30.5 42.3 30.1 81.3 49.5Compensation of employees as % of value added 38.0 33.6 59.1 13.6 84.6
Table 15 ---- Continued
94
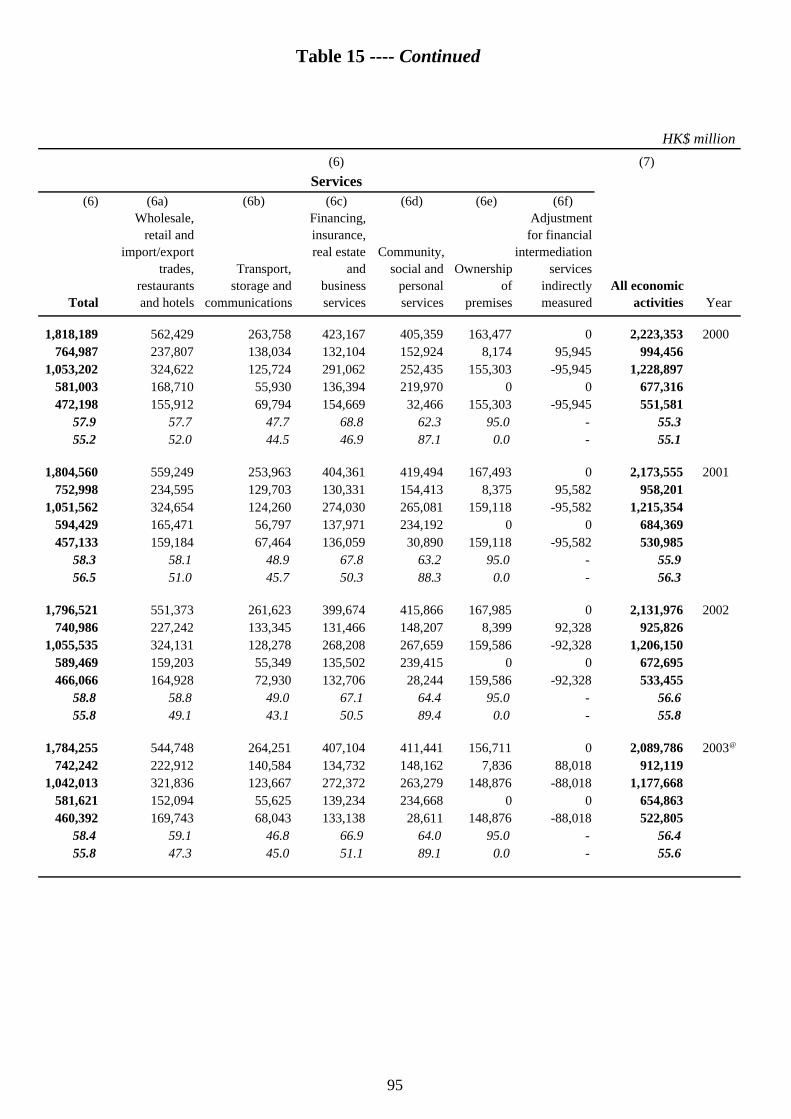
Table 15 ---- Continued
HK$ million(6) (7)
Services(6) (6a) (6b) (6c) (6d) (6e) (6f)
Wholesale, Financing, Adjustmentretail and insurance, for financial
import/export real estate Community, intermediationtrades, Transport, and social and Ownership services
restaurants storage and business personal of indirectly All economicTotal and hotels communications services services premises measured activities Year
1,818,189 562,429 263,758 423,167 405,359 163,477 0 2,223,353 2000764,987 237,807 138,034 132,104 152,924 8,174 95,945 994,456
1,053,202 324,622 125,724 291,062 252,435 155,303 -95,945 1,228,897581,003 168,710 55,930 136,394 219,970 0 0 677,316472,198 155,912 69,794 154,669 32,466 155,303 -95,945 551,581
57.9 57.7 47.7 68.8 62.3 95.0 - 55.355.2 52.0 44.5 46.9 87.1 0.0 - 55.1
1,804,560 559,249 253,963 404,361 419,494 167,493 0 2,173,555 2001752,998 234,595 129,703 130,331 154,413 8,375 95,582 958,201
1,051,562 324,654 124,260 274,030 265,081 159,118 -95,582 1,215,354594,429 165,471 56,797 137,971 234,192 0 0 684,369457,133 159,184 67,464 136,059 30,890 159,118 -95,582 530,985
58.3 58.1 48.9 67.8 63.2 95.0 - 55.956.5 51.0 45.7 50.3 88.3 0.0 - 56.3
1,796,521 551,373 261,623 399,674 415,866 167,985 0 2,131,976 2002740,986 227,242 133,345 131,466 148,207 8,399 92,328 925,826
1,055,535 324,131 128,278 268,208 267,659 159,586 -92,328 1,206,150589,469 159,203 55,349 135,502 239,415 0 0 672,695466,066 164,928 72,930 132,706 28,244 159,586 -92,328 533,455
58.8 58.8 49.0 67.1 64.4 95.0 - 56.655.8 49.1 43.1 50.5 89.4 0.0 - 55.8
1,784,255 544,748 264,251 407,104 411,441 156,711 0 2,089,786 2003@
742,242 222,912 140,584 134,732 148,162 7,836 88,018 912,1191,042,013 321,836 123,667 272,372 263,279 148,876 -88,018 1,177,668
581,621 152,094 55,625 139,234 234,668 0 0 654,863460,392 169,743 68,043 133,138 28,611 148,876 -88,018 522,805
58.4 59.1 46.8 66.9 64.0 95.0 - 56.455.8 47.3 45.0 51.1 89.1 0.0 - 55.6
95
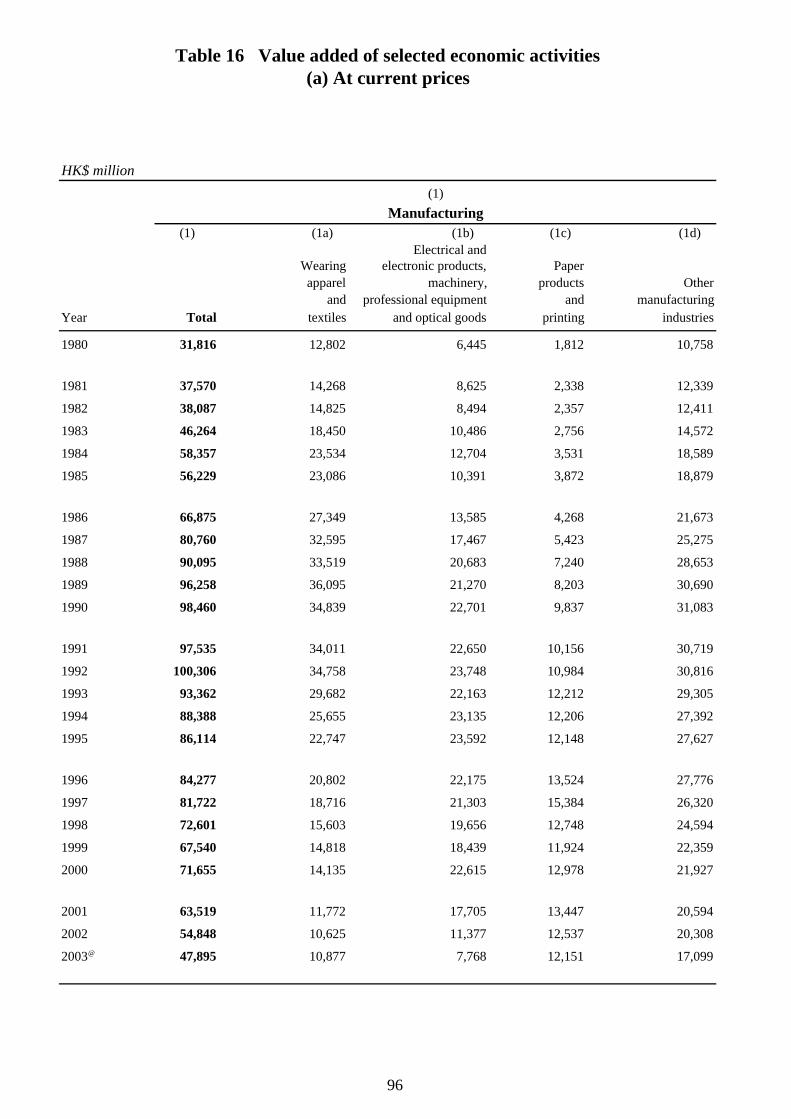
HK$ million(1)
Manufacturing(1) (1a) (1b) (1c) (1d)
Electrical andWearing electronic products, Paperapparel machinery, products Other
and professional equipment and manufacturingYear Total textiles and optical goods printing industries
1980 31,816 12,802 6,445 1,812 10,758
1981 37,570 14,268 8,625 2,338 12,339
1982 38,087 14,825 8,494 2,357 12,411
1983 46,264 18,450 10,486 2,756 14,572
1984 58,357 23,534 12,704 3,531 18,589
1985 56,229 23,086 10,391 3,872 18,879
1986 66,875 27,349 13,585 4,268 21,673
1987 80,760 32,595 17,467 5,423 25,275
1988 90,095 33,519 20,683 7,240 28,653
1989 96,258 36,095 21,270 8,203 30,690
1990 98,460 34,839 22,701 9,837 31,083
1991 97,535 34,011 22,650 10,156 30,719
1992 100,306 34,758 23,748 10,984 30,816
1993 93,362 29,682 22,163 12,212 29,305
1994 88,388 25,655 23,135 12,206 27,392
1995 86,114 22,747 23,592 12,148 27,627
1996 84,277 20,802 22,175 13,524 27,776
1997 81,722 18,716 21,303 15,384 26,320
1998 72,601 15,603 19,656 12,748 24,594
1999 67,540 14,818 18,439 11,924 22,359
2000 71,655 14,135 22,615 12,978 21,927
2001 63,519 11,772 17,705 13,447 20,594
2002 54,848 10,625 11,377 12,537 20,308
2003@ 47,895 10,877 7,768 12,151 17,099
Table 16 Value added of selected economic activities(a) At current prices
96
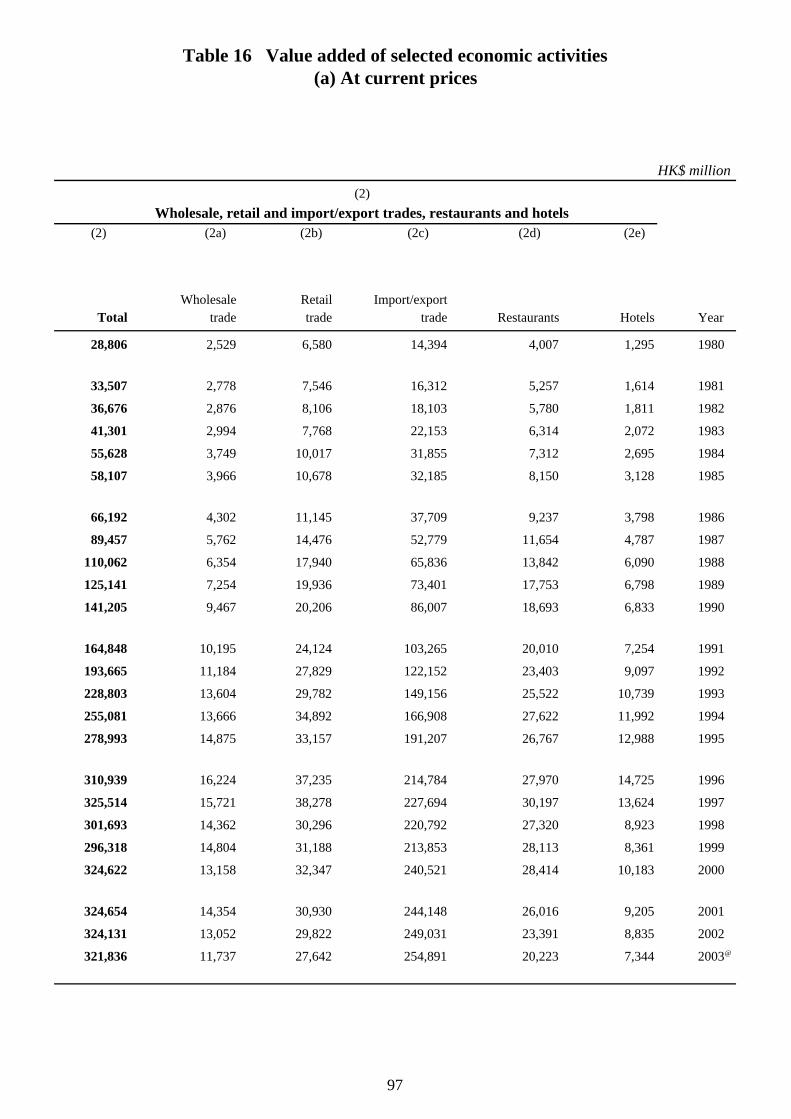
HK$ million(2)
Wholesale, retail and import/export trades, restaurants and hotels(2) (2a) (2b) (2c) (2d) (2e)
Wholesale Retail Import/exportTotal trade trade trade Restaurants Hotels Year
28,806 2,529 6,580 14,394 4,007 1,295 1980
33,507 2,778 7,546 16,312 5,257 1,614 1981
36,676 2,876 8,106 18,103 5,780 1,811 1982
41,301 2,994 7,768 22,153 6,314 2,072 1983
55,628 3,749 10,017 31,855 7,312 2,695 1984
58,107 3,966 10,678 32,185 8,150 3,128 1985
66,192 4,302 11,145 37,709 9,237 3,798 1986
89,457 5,762 14,476 52,779 11,654 4,787 1987
110,062 6,354 17,940 65,836 13,842 6,090 1988
125,141 7,254 19,936 73,401 17,753 6,798 1989
141,205 9,467 20,206 86,007 18,693 6,833 1990
164,848 10,195 24,124 103,265 20,010 7,254 1991
193,665 11,184 27,829 122,152 23,403 9,097 1992
228,803 13,604 29,782 149,156 25,522 10,739 1993
255,081 13,666 34,892 166,908 27,622 11,992 1994
278,993 14,875 33,157 191,207 26,767 12,988 1995
310,939 16,224 37,235 214,784 27,970 14,725 1996
325,514 15,721 38,278 227,694 30,197 13,624 1997
301,693 14,362 30,296 220,792 27,320 8,923 1998
296,318 14,804 31,188 213,853 28,113 8,361 1999
324,622 13,158 32,347 240,521 28,414 10,183 2000
324,654 14,354 30,930 244,148 26,016 9,205 2001
324,131 13,052 29,822 249,031 23,391 8,835 2002
321,836 11,737 27,642 254,891 20,223 7,344 2003@
Table 16 Value added of selected economic activities(a) At current prices
97
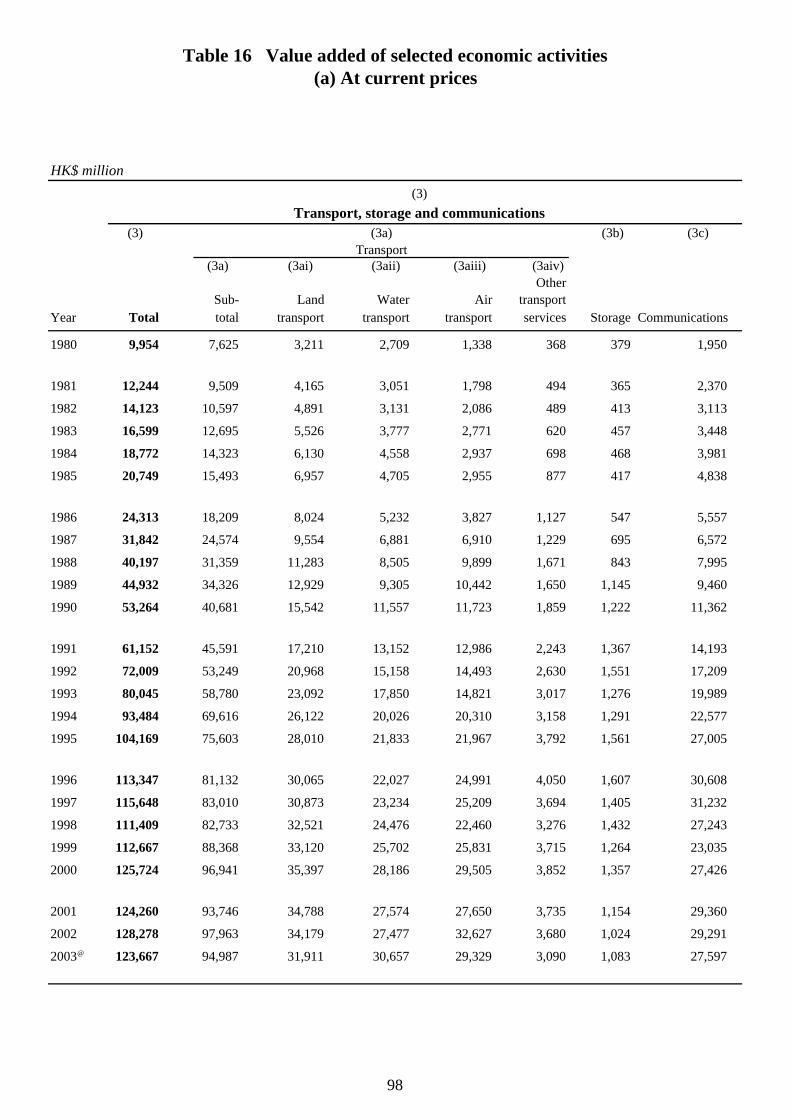
HK$ million(3)
Transport, storage and communications(3) (3a) (3b) (3c)
Transport(3a) (3ai) (3aii) (3aiii) (3aiv)
OtherSub- Land Water Air transport
Year Total total transport transport transport services Storage Communications
1980 9,954 7,625 3,211 2,709 1,338 368 379 1,950
1981 12,244 9,509 4,165 3,051 1,798 494 365 2,370
1982 14,123 10,597 4,891 3,131 2,086 489 413 3,113
1983 16,599 12,695 5,526 3,777 2,771 620 457 3,448
1984 18,772 14,323 6,130 4,558 2,937 698 468 3,981
1985 20,749 15,493 6,957 4,705 2,955 877 417 4,838
1986 24,313 18,209 8,024 5,232 3,827 1,127 547 5,557
1987 31,842 24,574 9,554 6,881 6,910 1,229 695 6,572
1988 40,197 31,359 11,283 8,505 9,899 1,671 843 7,995
1989 44,932 34,326 12,929 9,305 10,442 1,650 1,145 9,460
1990 53,264 40,681 15,542 11,557 11,723 1,859 1,222 11,362
1991 61,152 45,591 17,210 13,152 12,986 2,243 1,367 14,193
1992 72,009 53,249 20,968 15,158 14,493 2,630 1,551 17,209
1993 80,045 58,780 23,092 17,850 14,821 3,017 1,276 19,989
1994 93,484 69,616 26,122 20,026 20,310 3,158 1,291 22,577
1995 104,169 75,603 28,010 21,833 21,967 3,792 1,561 27,005
1996 113,347 81,132 30,065 22,027 24,991 4,050 1,607 30,608
1997 115,648 83,010 30,873 23,234 25,209 3,694 1,405 31,232
1998 111,409 82,733 32,521 24,476 22,460 3,276 1,432 27,243
1999 112,667 88,368 33,120 25,702 25,831 3,715 1,264 23,035
2000 125,724 96,941 35,397 28,186 29,505 3,852 1,357 27,426
2001 124,260 93,746 34,788 27,574 27,650 3,735 1,154 29,360
2002 128,278 97,963 34,179 27,477 32,627 3,680 1,024 29,291
2003@ 123,667 94,987 31,911 30,657 29,329 3,090 1,083 27,597
Table 16 Value added of selected economic activities(a) At current prices
98
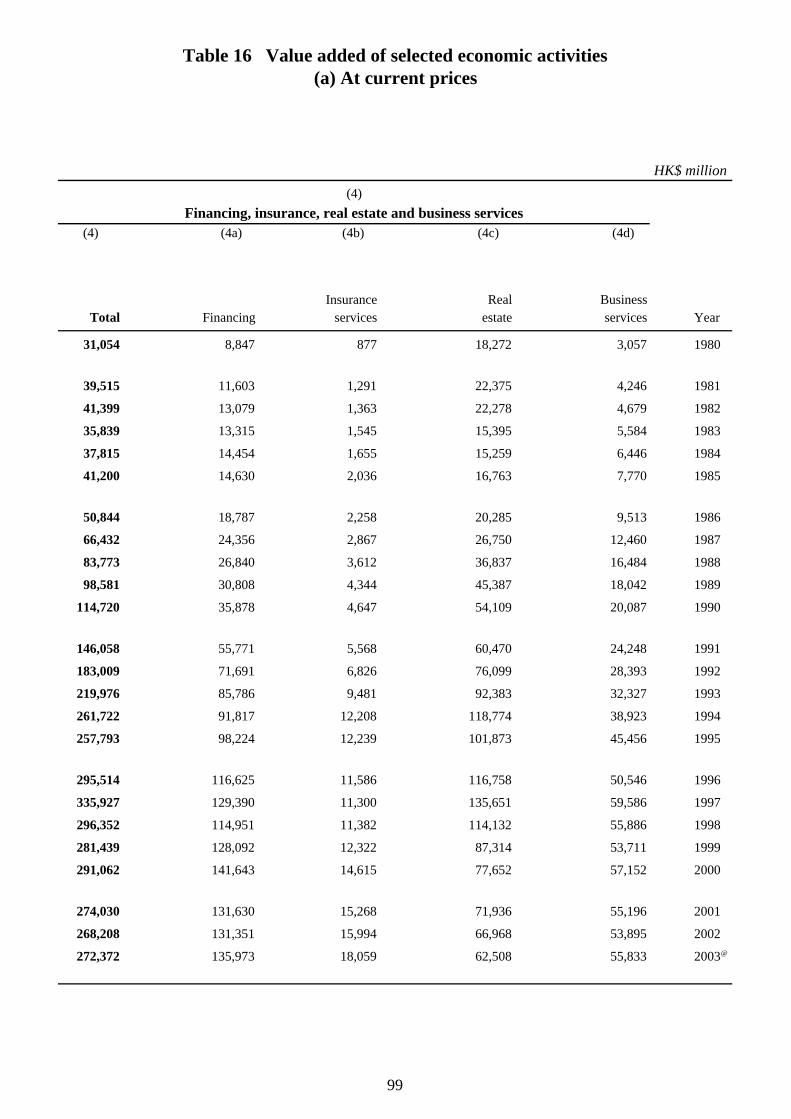
HK$ million(4)
Financing, insurance, real estate and business services(4) (4a) (4b) (4c) (4d)
Insurance Real BusinessTotal Financing services estate services Year
31,054 8,847 877 18,272 3,057 1980
39,515 11,603 1,291 22,375 4,246 1981
41,399 13,079 1,363 22,278 4,679 1982
35,839 13,315 1,545 15,395 5,584 1983
37,815 14,454 1,655 15,259 6,446 1984
41,200 14,630 2,036 16,763 7,770 1985
50,844 18,787 2,258 20,285 9,513 1986
66,432 24,356 2,867 26,750 12,460 1987
83,773 26,840 3,612 36,837 16,484 1988
98,581 30,808 4,344 45,387 18,042 1989
114,720 35,878 4,647 54,109 20,087 1990
146,058 55,771 5,568 60,470 24,248 1991
183,009 71,691 6,826 76,099 28,393 1992
219,976 85,786 9,481 92,383 32,327 1993
261,722 91,817 12,208 118,774 38,923 1994
257,793 98,224 12,239 101,873 45,456 1995
295,514 116,625 11,586 116,758 50,546 1996
335,927 129,390 11,300 135,651 59,586 1997
296,352 114,951 11,382 114,132 55,886 1998
281,439 128,092 12,322 87,314 53,711 1999
291,062 141,643 14,615 77,652 57,152 2000
274,030 131,630 15,268 71,936 55,196 2001
268,208 131,351 15,994 66,968 53,895 2002
272,372 135,973 18,059 62,508 55,833 2003@
Table 16 Value added of selected economic activities(a) At current prices
99
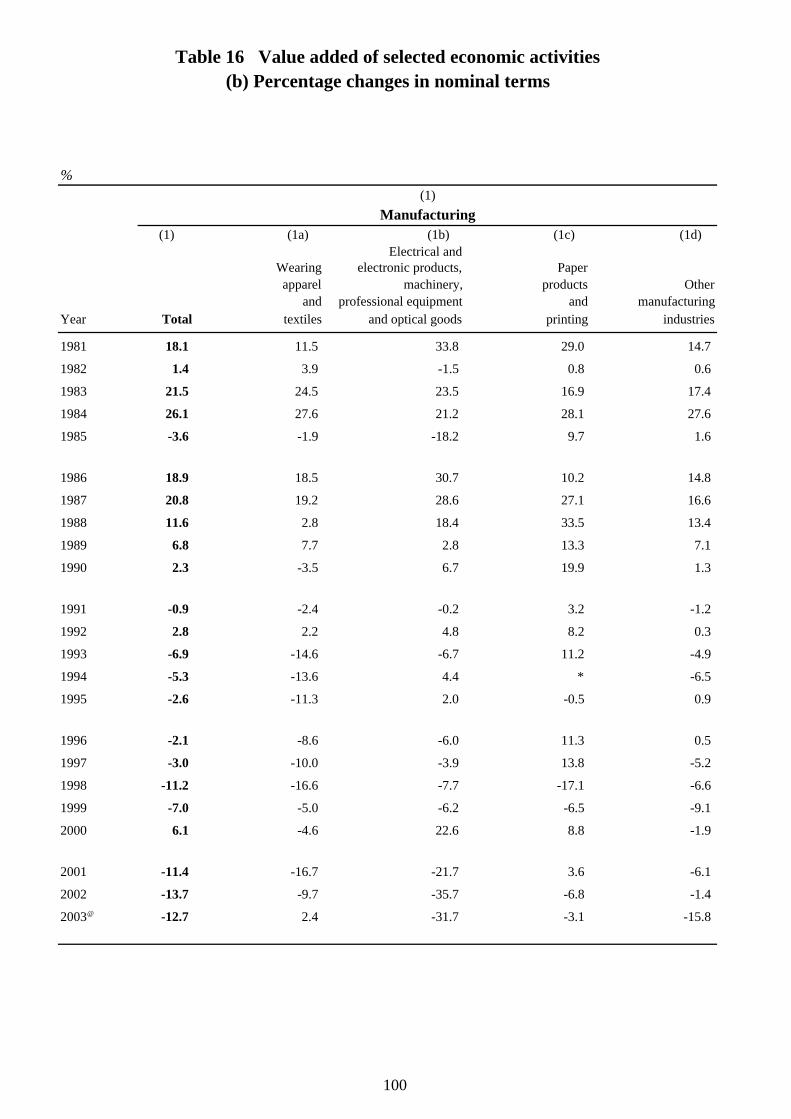
%(1)
Manufacturing(1) (1a) (1b) (1c) (1d)
Electrical andWearing electronic products, Paperapparel machinery, products Other
and professional equipment and manufacturingYear Total textiles and optical goods printing industries
1981 18.1 11.5 33.8 29.0 14.7
1982 1.4 3.9 -1.5 0.8 0.6
1983 21.5 24.5 23.5 16.9 17.4
1984 26.1 27.6 21.2 28.1 27.6
1985 -3.6 -1.9 -18.2 9.7 1.6
1986 18.9 18.5 30.7 10.2 14.8
1987 20.8 19.2 28.6 27.1 16.6
1988 11.6 2.8 18.4 33.5 13.4
1989 6.8 7.7 2.8 13.3 7.1
1990 2.3 -3.5 6.7 19.9 1.3
1991 -0.9 -2.4 -0.2 3.2 -1.2
1992 2.8 2.2 4.8 8.2 0.3
1993 -6.9 -14.6 -6.7 11.2 -4.9
1994 -5.3 -13.6 4.4 * -6.5
1995 -2.6 -11.3 2.0 -0.5 0.9
1996 -2.1 -8.6 -6.0 11.3 0.5
1997 -3.0 -10.0 -3.9 13.8 -5.2
1998 -11.2 -16.6 -7.7 -17.1 -6.6
1999 -7.0 -5.0 -6.2 -6.5 -9.1
2000 6.1 -4.6 22.6 8.8 -1.9
2001 -11.4 -16.7 -21.7 3.6 -6.1
2002 -13.7 -9.7 -35.7 -6.8 -1.4
2003@ -12.7 2.4 -31.7 -3.1 -15.8
Table 16 Value added of selected economic activities(b) Percentage changes in nominal terms
100
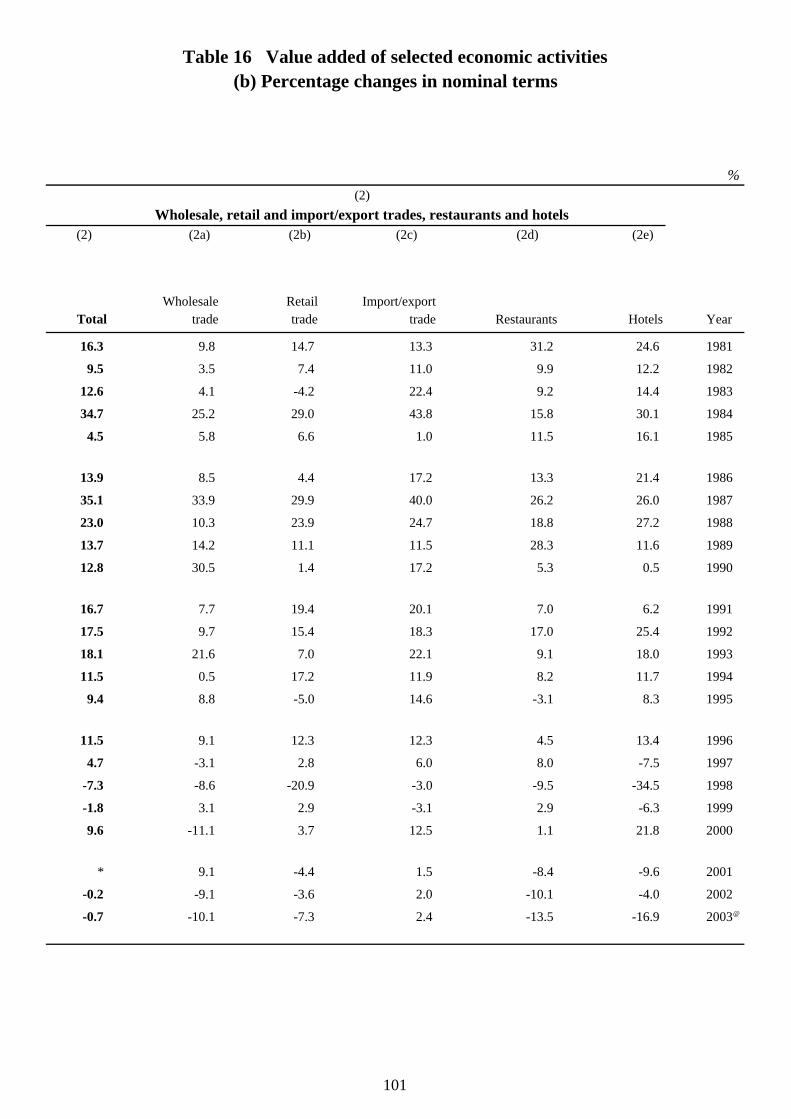
%(2)
Wholesale, retail and import/export trades, restaurants and hotels(2) (2a) (2b) (2c) (2d) (2e)
Wholesale Retail Import/exportTotal trade trade trade Restaurants Hotels Year
16.3 9.8 14.7 13.3 31.2 24.6 1981
9.5 3.5 7.4 11.0 9.9 12.2 1982
12.6 4.1 -4.2 22.4 9.2 14.4 1983
34.7 25.2 29.0 43.8 15.8 30.1 1984
4.5 5.8 6.6 1.0 11.5 16.1 1985
13.9 8.5 4.4 17.2 13.3 21.4 1986
35.1 33.9 29.9 40.0 26.2 26.0 1987
23.0 10.3 23.9 24.7 18.8 27.2 1988
13.7 14.2 11.1 11.5 28.3 11.6 1989
12.8 30.5 1.4 17.2 5.3 0.5 1990
16.7 7.7 19.4 20.1 7.0 6.2 1991
17.5 9.7 15.4 18.3 17.0 25.4 1992
18.1 21.6 7.0 22.1 9.1 18.0 1993
11.5 0.5 17.2 11.9 8.2 11.7 1994
9.4 8.8 -5.0 14.6 -3.1 8.3 1995
11.5 9.1 12.3 12.3 4.5 13.4 1996
4.7 -3.1 2.8 6.0 8.0 -7.5 1997
-7.3 -8.6 -20.9 -3.0 -9.5 -34.5 1998
-1.8 3.1 2.9 -3.1 2.9 -6.3 1999
9.6 -11.1 3.7 12.5 1.1 21.8 2000
* 9.1 -4.4 1.5 -8.4 -9.6 2001
-0.2 -9.1 -3.6 2.0 -10.1 -4.0 2002
-0.7 -10.1 -7.3 2.4 -13.5 -16.9 2003@
Table 16 Value added of selected economic activities(b) Percentage changes in nominal terms
101
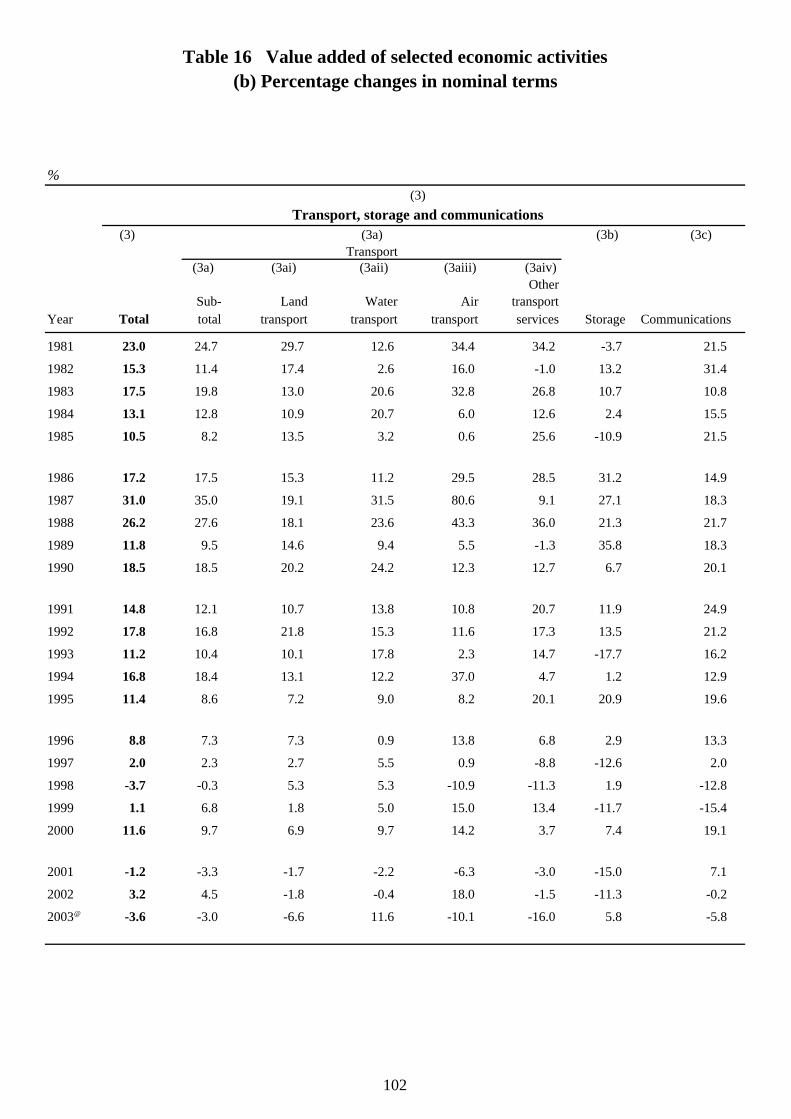
%(3)
Transport, storage and communications(3) (3a) (3b) (3c)
Transport(3a) (3ai) (3aii) (3aiii) (3aiv)
OtherSub- Land Water Air transport
Year Total total transport transport transport services Storage Communications
1981 23.0 24.7 29.7 12.6 34.4 34.2 -3.7 21.5
1982 15.3 11.4 17.4 2.6 16.0 -1.0 13.2 31.4
1983 17.5 19.8 13.0 20.6 32.8 26.8 10.7 10.8
1984 13.1 12.8 10.9 20.7 6.0 12.6 2.4 15.5
1985 10.5 8.2 13.5 3.2 0.6 25.6 -10.9 21.5
1986 17.2 17.5 15.3 11.2 29.5 28.5 31.2 14.9
1987 31.0 35.0 19.1 31.5 80.6 9.1 27.1 18.3
1988 26.2 27.6 18.1 23.6 43.3 36.0 21.3 21.7
1989 11.8 9.5 14.6 9.4 5.5 -1.3 35.8 18.3
1990 18.5 18.5 20.2 24.2 12.3 12.7 6.7 20.1
1991 14.8 12.1 10.7 13.8 10.8 20.7 11.9 24.9
1992 17.8 16.8 21.8 15.3 11.6 17.3 13.5 21.2
1993 11.2 10.4 10.1 17.8 2.3 14.7 -17.7 16.2
1994 16.8 18.4 13.1 12.2 37.0 4.7 1.2 12.9
1995 11.4 8.6 7.2 9.0 8.2 20.1 20.9 19.6
1996 8.8 7.3 7.3 0.9 13.8 6.8 2.9 13.3
1997 2.0 2.3 2.7 5.5 0.9 -8.8 -12.6 2.0
1998 -3.7 -0.3 5.3 5.3 -10.9 -11.3 1.9 -12.8
1999 1.1 6.8 1.8 5.0 15.0 13.4 -11.7 -15.4
2000 11.6 9.7 6.9 9.7 14.2 3.7 7.4 19.1
2001 -1.2 -3.3 -1.7 -2.2 -6.3 -3.0 -15.0 7.1
2002 3.2 4.5 -1.8 -0.4 18.0 -1.5 -11.3 -0.2
2003@ -3.6 -3.0 -6.6 11.6 -10.1 -16.0 5.8 -5.8
Table 16 Value added of selected economic activities(b) Percentage changes in nominal terms
102
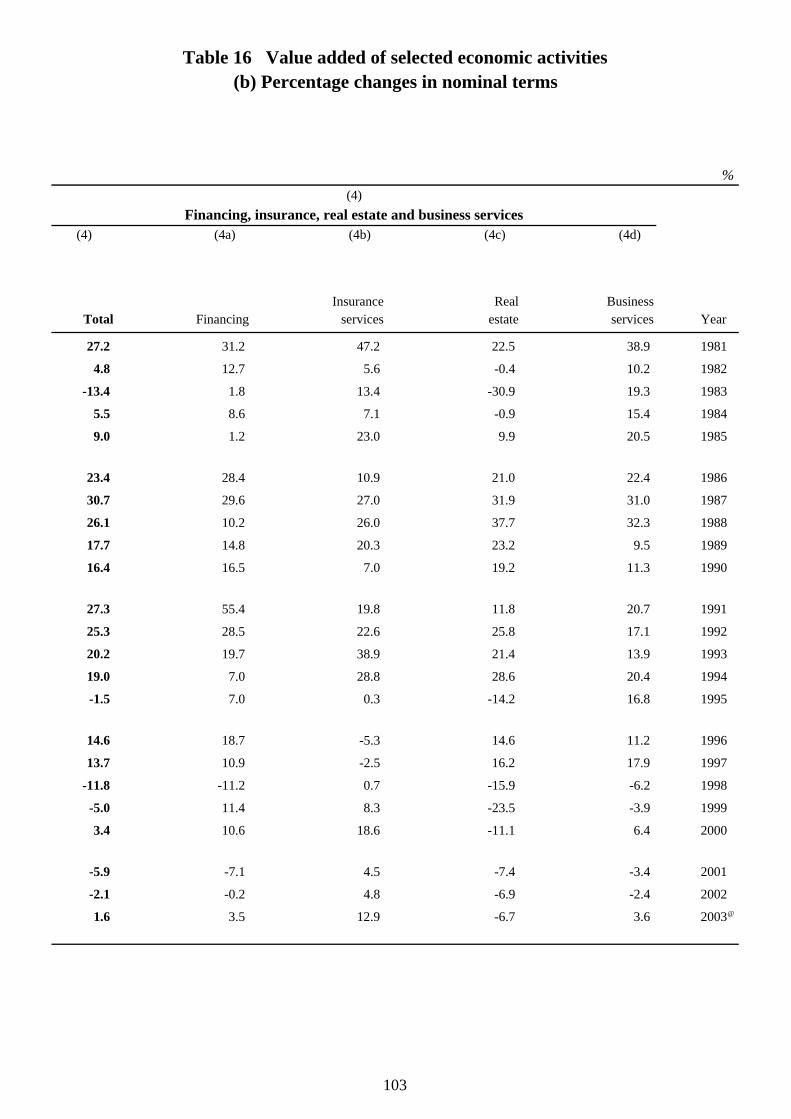
Table 16 Value added of selected economic activities(b) Percentage changes in nominal terms
%(4)
Financing, insurance, real estate and business services(4) (4a) (4b) (4c) (4d)
Insurance Real BusinessTotal Financing services estate services Year
27.2 31.2 47.2 22.5 38.9 1981
4.8 12.7 5.6 -0.4 10.2 1982
-13.4 1.8 13.4 -30.9 19.3 1983
5.5 8.6 7.1 -0.9 15.4 1984
9.0 1.2 23.0 9.9 20.5 1985
23.4 28.4 10.9 21.0 22.4 1986
30.7 29.6 27.0 31.9 31.0 1987
26.1 10.2 26.0 37.7 32.3 1988
17.7 14.8 20.3 23.2 9.5 1989
16.4 16.5 7.0 19.2 11.3 1990
27.3 55.4 19.8 11.8 20.7 1991
25.3 28.5 22.6 25.8 17.1 1992
20.2 19.7 38.9 21.4 13.9 1993
19.0 7.0 28.8 28.6 20.4 1994
-1.5 7.0 0.3 -14.2 16.8 1995
14.6 18.7 -5.3 14.6 11.2 1996
13.7 10.9 -2.5 16.2 17.9 1997
-11.8 -11.2 0.7 -15.9 -6.2 1998
-5.0 11.4 8.3 -23.5 -3.9 1999
3.4 10.6 18.6 -11.1 6.4 2000
-5.9 -7.1 4.5 -7.4 -3.4 2001
-2.1 -0.2 4.8 -6.9 -2.4 2002
1.6 3.5 12.9 -6.7 3.6 2003@
103
105
(D) Annual and quarterly GDP by economic activity at constant (2000) prices
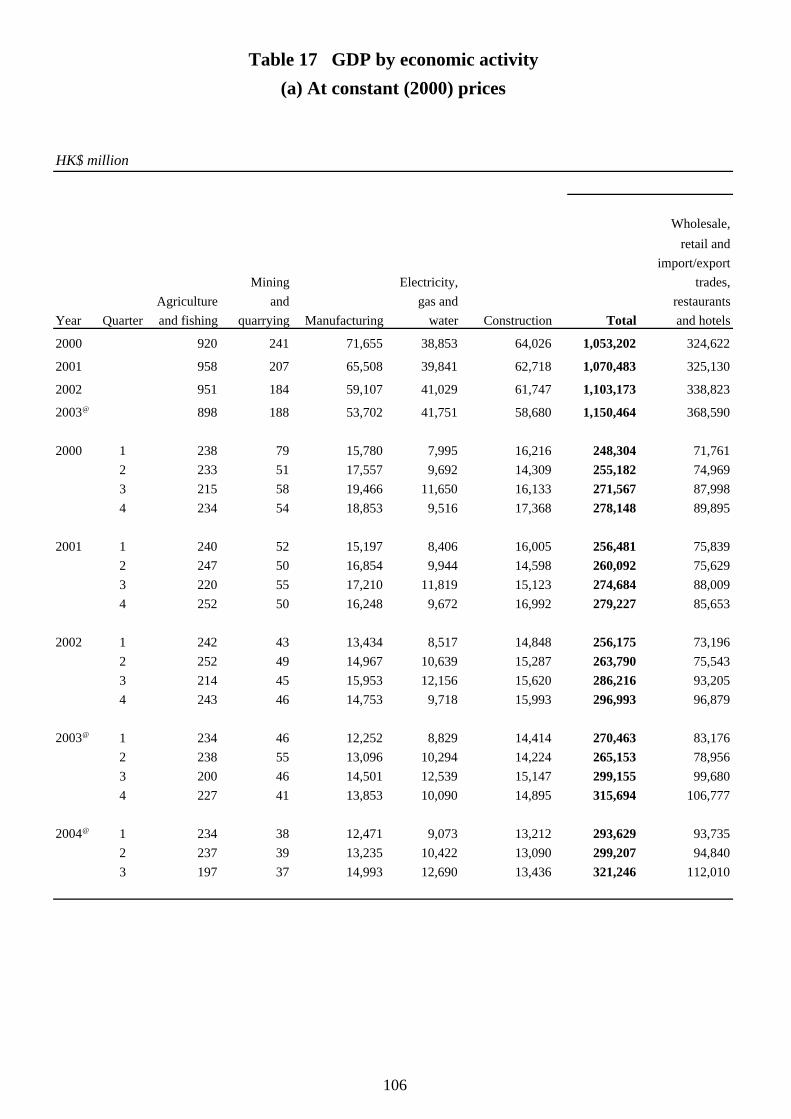
HK$ million
Wholesale,retail and
import/exportMining Electricity, trades,
Agriculture and gas and restaurantsYear Quarter and fishing quarrying Manufacturing water Construction Total and hotels
2000 920 241 71,655 38,853 64,026 1,053,202 324,622
2001 958 207 65,508 39,841 62,718 1,070,483 325,130
2002 951 184 59,107 41,029 61,747 1,103,173 338,823
2003@ 898 188 53,702 41,751 58,680 1,150,464 368,590
2000 1 238 79 15,780 7,995 16,216 248,304 71,7612 233 51 17,557 9,692 14,309 255,182 74,9693 215 58 19,466 11,650 16,133 271,567 87,9984 234 54 18,853 9,516 17,368 278,148 89,895
2001 1 240 52 15,197 8,406 16,005 256,481 75,8392 247 50 16,854 9,944 14,598 260,092 75,6293 220 55 17,210 11,819 15,123 274,684 88,0094 252 50 16,248 9,672 16,992 279,227 85,653
2002 1 242 43 13,434 8,517 14,848 256,175 73,1962 252 49 14,967 10,639 15,287 263,790 75,5433 214 45 15,953 12,156 15,620 286,216 93,2054 243 46 14,753 9,718 15,993 296,993 96,879
2003@ 1 234 46 12,252 8,829 14,414 270,463 83,1762 238 55 13,096 10,294 14,224 265,153 78,9563 200 46 14,501 12,539 15,147 299,155 99,6804 227 41 13,853 10,090 14,895 315,694 106,777
2004@ 1 234 38 12,471 9,073 13,212 293,629 93,7352 237 39 13,235 10,422 13,090 299,207 94,8403 197 37 14,993 12,690 13,436 321,246 112,010
Table 17 GDP by economic activity(a) At constant (2000) prices
106
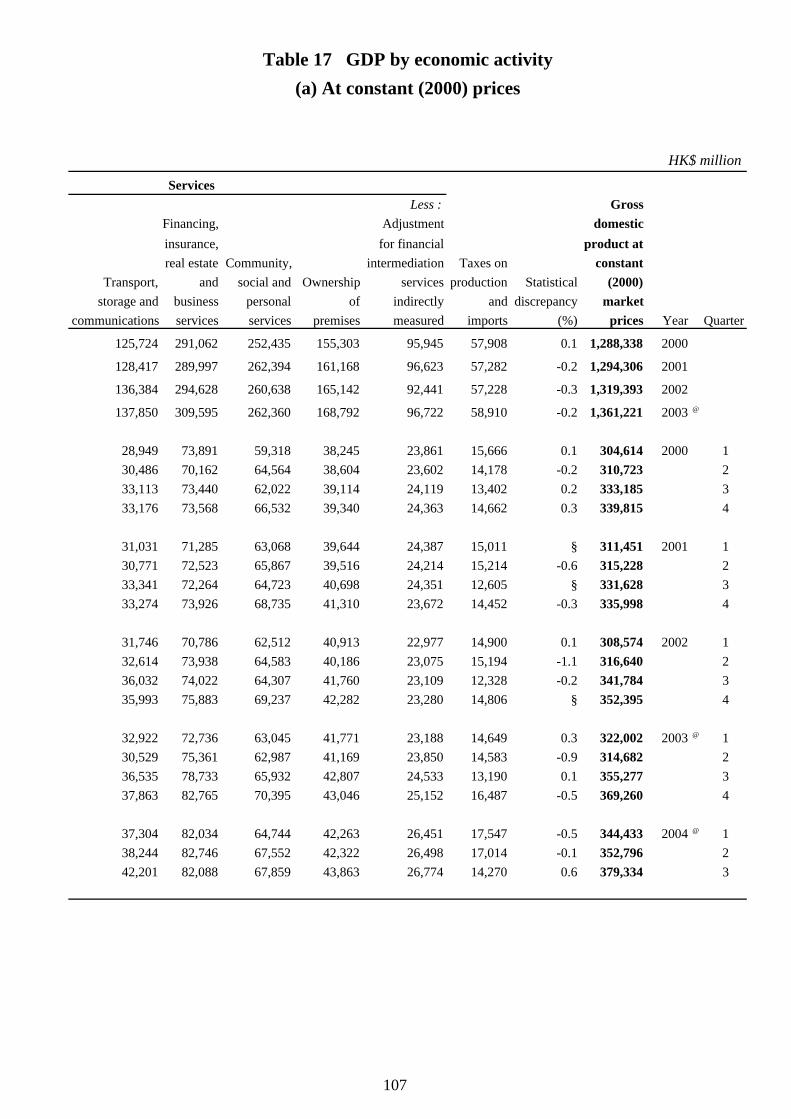
HK$ million
ServicesLess : Gross
Financing, Adjustment domesticinsurance, for financial product atreal estate Community, intermediation Taxes on constant
Transport, and social and Ownership services production Statistical (2000)storage and business personal of indirectly and discrepancy market
communications services services premises measured imports (%) prices Year Quarter
125,724 291,062 252,435 155,303 95,945 57,908 0.1 1,288,338 2000
128,417 289,997 262,394 161,168 96,623 57,282 -0.2 1,294,306 2001
136,384 294,628 260,638 165,142 92,441 57,228 -0.3 1,319,393 2002
137,850 309,595 262,360 168,792 96,722 58,910 -0.2 1,361,221 2003 @
28,949 73,891 59,318 38,245 23,861 15,666 0.1 304,614 2000 130,486 70,162 64,564 38,604 23,602 14,178 -0.2 310,723 233,113 73,440 62,022 39,114 24,119 13,402 0.2 333,185 333,176 73,568 66,532 39,340 24,363 14,662 0.3 339,815 4
31,031 71,285 63,068 39,644 24,387 15,011 § 311,451 2001 130,771 72,523 65,867 39,516 24,214 15,214 -0.6 315,228 233,341 72,264 64,723 40,698 24,351 12,605 § 331,628 333,274 73,926 68,735 41,310 23,672 14,452 -0.3 335,998 4
31,746 70,786 62,512 40,913 22,977 14,900 0.1 308,574 2002 132,614 73,938 64,583 40,186 23,075 15,194 -1.1 316,640 236,032 74,022 64,307 41,760 23,109 12,328 -0.2 341,784 335,993 75,883 69,237 42,282 23,280 14,806 § 352,395 4
32,922 72,736 63,045 41,771 23,188 14,649 0.3 322,002 2003 @ 130,529 75,361 62,987 41,169 23,850 14,583 -0.9 314,682 236,535 78,733 65,932 42,807 24,533 13,190 0.1 355,277 337,863 82,765 70,395 43,046 25,152 16,487 -0.5 369,260 4
37,304 82,034 64,744 42,263 26,451 17,547 -0.5 344,433 2004 @ 138,244 82,746 67,552 42,322 26,498 17,014 -0.1 352,796 242,201 82,088 67,859 43,863 26,774 14,270 0.6 379,334 3
Table 17 GDP by economic activity(a) At constant (2000) prices
107
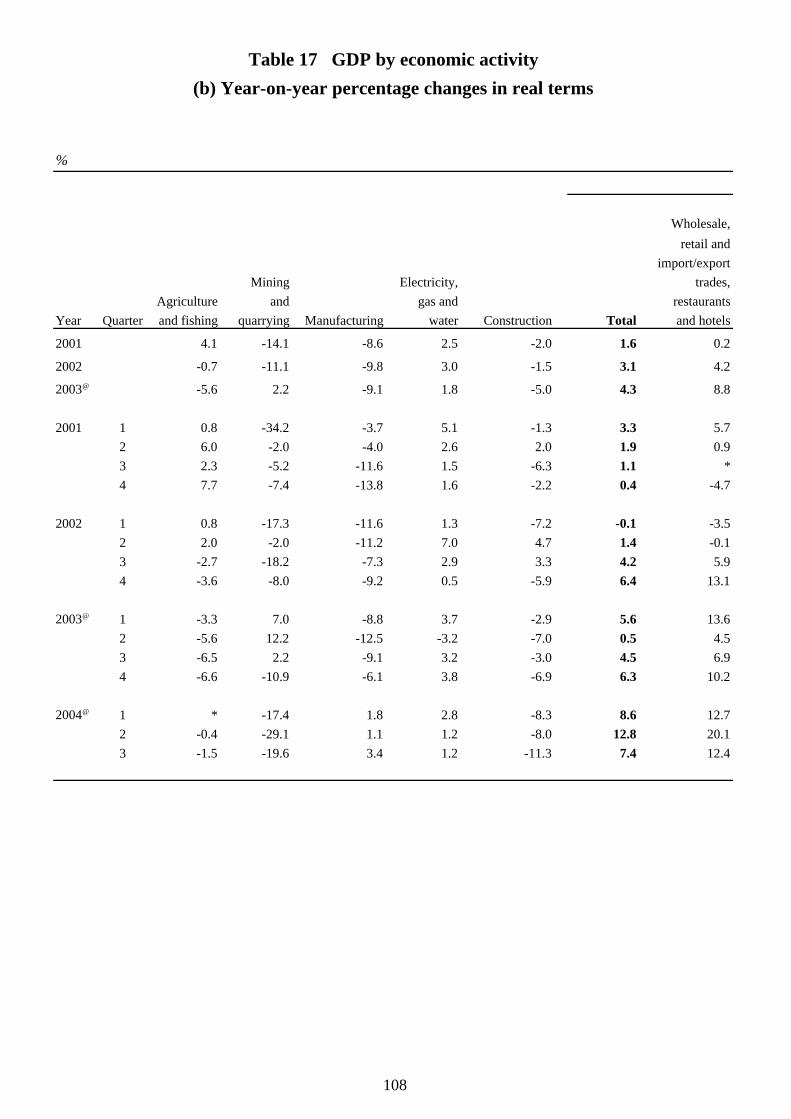
%
Wholesale,retail and
import/exportMining Electricity, trades,
Agriculture and gas and restaurantsYear Quarter and fishing quarrying Manufacturing water Construction Total and hotels
2001 4.1 -14.1 -8.6 2.5 -2.0 1.6 0.2
2002 -0.7 -11.1 -9.8 3.0 -1.5 3.1 4.2
2003@ -5.6 2.2 -9.1 1.8 -5.0 4.3 8.8
2001 1 0.8 -34.2 -3.7 5.1 -1.3 3.3 5.72 6.0 -2.0 -4.0 2.6 2.0 1.9 0.93 2.3 -5.2 -11.6 1.5 -6.3 1.1 *4 7.7 -7.4 -13.8 1.6 -2.2 0.4 -4.7
2002 1 0.8 -17.3 -11.6 1.3 -7.2 -0.1 -3.52 2.0 -2.0 -11.2 7.0 4.7 1.4 -0.13 -2.7 -18.2 -7.3 2.9 3.3 4.2 5.94 -3.6 -8.0 -9.2 0.5 -5.9 6.4 13.1
2003@ 1 -3.3 7.0 -8.8 3.7 -2.9 5.6 13.62 -5.6 12.2 -12.5 -3.2 -7.0 0.5 4.53 -6.5 2.2 -9.1 3.2 -3.0 4.5 6.94 -6.6 -10.9 -6.1 3.8 -6.9 6.3 10.2
2004@ 1 * -17.4 1.8 2.8 -8.3 8.6 12.72 -0.4 -29.1 1.1 1.2 -8.0 12.8 20.13 -1.5 -19.6 3.4 1.2 -11.3 7.4 12.4
Table 17 GDP by economic activity(b) Year-on-year percentage changes in real terms
108
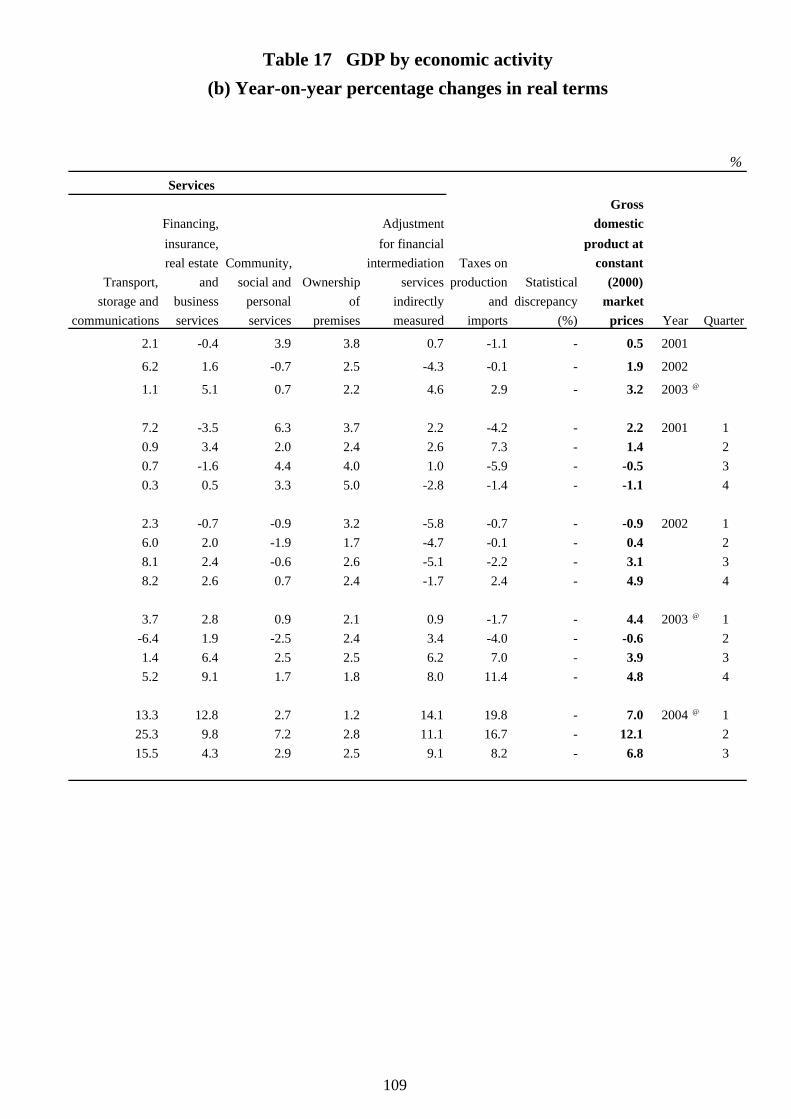
%Services
GrossFinancing, Adjustment domesticinsurance, for financial product atreal estate Community, intermediation Taxes on constant
Transport, and social and Ownership services production Statistical (2000)storage and business personal of indirectly and discrepancy market
communications services services premises measured imports (%) prices Year Quarter
2.1 -0.4 3.9 3.8 0.7 -1.1 - 0.5 2001
6.2 1.6 -0.7 2.5 -4.3 -0.1 - 1.9 2002
1.1 5.1 0.7 2.2 4.6 2.9 - 3.2 2003 @
7.2 -3.5 6.3 3.7 2.2 -4.2 - 2.2 2001 10.9 3.4 2.0 2.4 2.6 7.3 - 1.4 20.7 -1.6 4.4 4.0 1.0 -5.9 - -0.5 30.3 0.5 3.3 5.0 -2.8 -1.4 - -1.1 4
2.3 -0.7 -0.9 3.2 -5.8 -0.7 - -0.9 2002 16.0 2.0 -1.9 1.7 -4.7 -0.1 - 0.4 28.1 2.4 -0.6 2.6 -5.1 -2.2 - 3.1 38.2 2.6 0.7 2.4 -1.7 2.4 - 4.9 4
3.7 2.8 0.9 2.1 0.9 -1.7 - 4.4 2003 @ 1-6.4 1.9 -2.5 2.4 3.4 -4.0 - -0.6 21.4 6.4 2.5 2.5 6.2 7.0 - 3.9 35.2 9.1 1.7 1.8 8.0 11.4 - 4.8 4
13.3 12.8 2.7 1.2 14.1 19.8 - 7.0 2004 @ 125.3 9.8 7.2 2.8 11.1 16.7 - 12.1 215.5 4.3 2.9 2.5 9.1 8.2 - 6.8 3
Table 17 GDP by economic activity(b) Year-on-year percentage changes in real terms
109
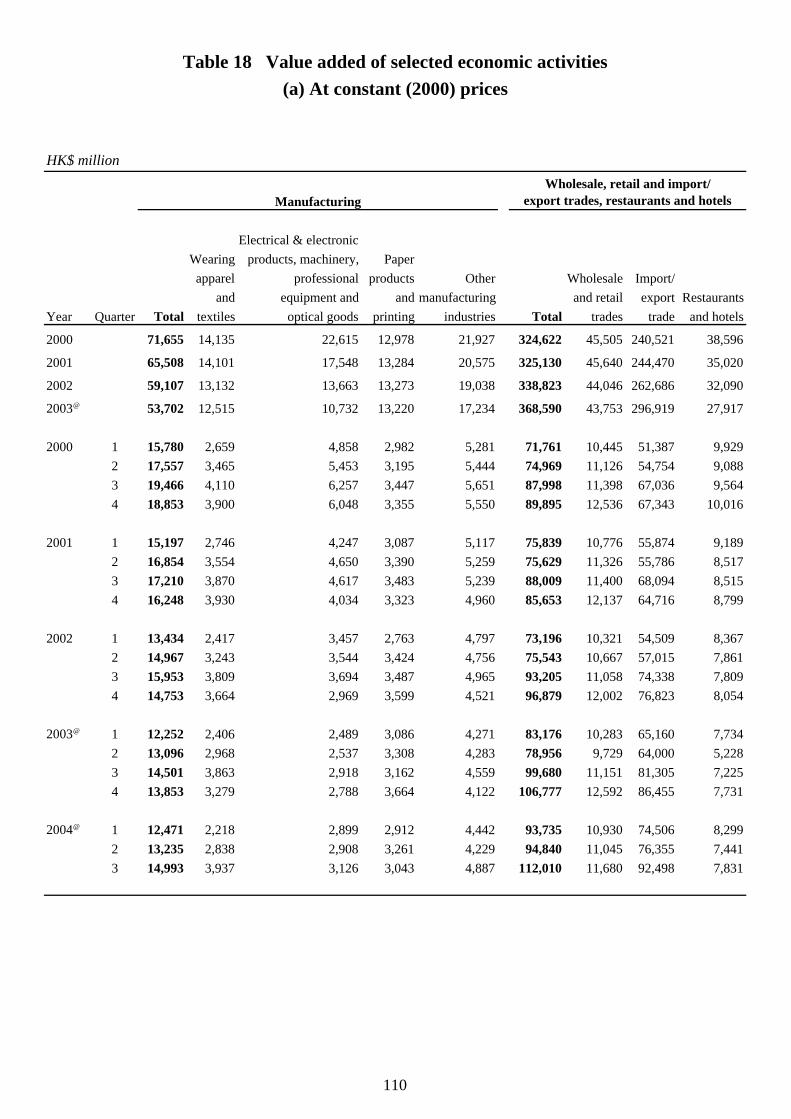
Table 18 Value added of selected economic activities(a) At constant (2000) prices
HK$ million
Manufacturing
Electrical & electronicWearing products, machinery, Paperapparel professional products Other Wholesale Import/
and equipment and and manufacturing and retail export RestaurantsYear Quarter Total textiles optical goods printing industries Total trades trade and hotels
2000 71,655 14,135 22,615 12,978 21,927 324,622 45,505 240,521 38,596
2001 65,508 14,101 17,548 13,284 20,575 325,130 45,640 244,470 35,020
2002 59,107 13,132 13,663 13,273 19,038 338,823 44,046 262,686 32,090
2003@ 53,702 12,515 10,732 13,220 17,234 368,590 43,753 296,919 27,917
2000 1 15,780 2,659 4,858 2,982 5,281 71,761 10,445 51,387 9,9292 17,557 3,465 5,453 3,195 5,444 74,969 11,126 54,754 9,0883 19,466 4,110 6,257 3,447 5,651 87,998 11,398 67,036 9,5644 18,853 3,900 6,048 3,355 5,550 89,895 12,536 67,343 10,016
2001 1 15,197 2,746 4,247 3,087 5,117 75,839 10,776 55,874 9,1892 16,854 3,554 4,650 3,390 5,259 75,629 11,326 55,786 8,5173 17,210 3,870 4,617 3,483 5,239 88,009 11,400 68,094 8,5154 16,248 3,930 4,034 3,323 4,960 85,653 12,137 64,716 8,799
2002 1 13,434 2,417 3,457 2,763 4,797 73,196 10,321 54,509 8,3672 14,967 3,243 3,544 3,424 4,756 75,543 10,667 57,015 7,8613 15,953 3,809 3,694 3,487 4,965 93,205 11,058 74,338 7,8094 14,753 3,664 2,969 3,599 4,521 96,879 12,002 76,823 8,054
2003@ 1 12,252 2,406 2,489 3,086 4,271 83,176 10,283 65,160 7,7342 13,096 2,968 2,537 3,308 4,283 78,956 9,729 64,000 5,2283 14,501 3,863 2,918 3,162 4,559 99,680 11,151 81,305 7,2254 13,853 3,279 2,788 3,664 4,122 106,777 12,592 86,455 7,731
2004@ 1 12,471 2,218 2,899 2,912 4,442 93,735 10,930 74,506 8,2992 13,235 2,838 2,908 3,261 4,229 94,840 11,045 76,355 7,4413 14,993 3,937 3,126 3,043 4,887 112,010 11,680 92,498 7,831
Wholesale, retail and import/export trades, restaurants and hotels
110
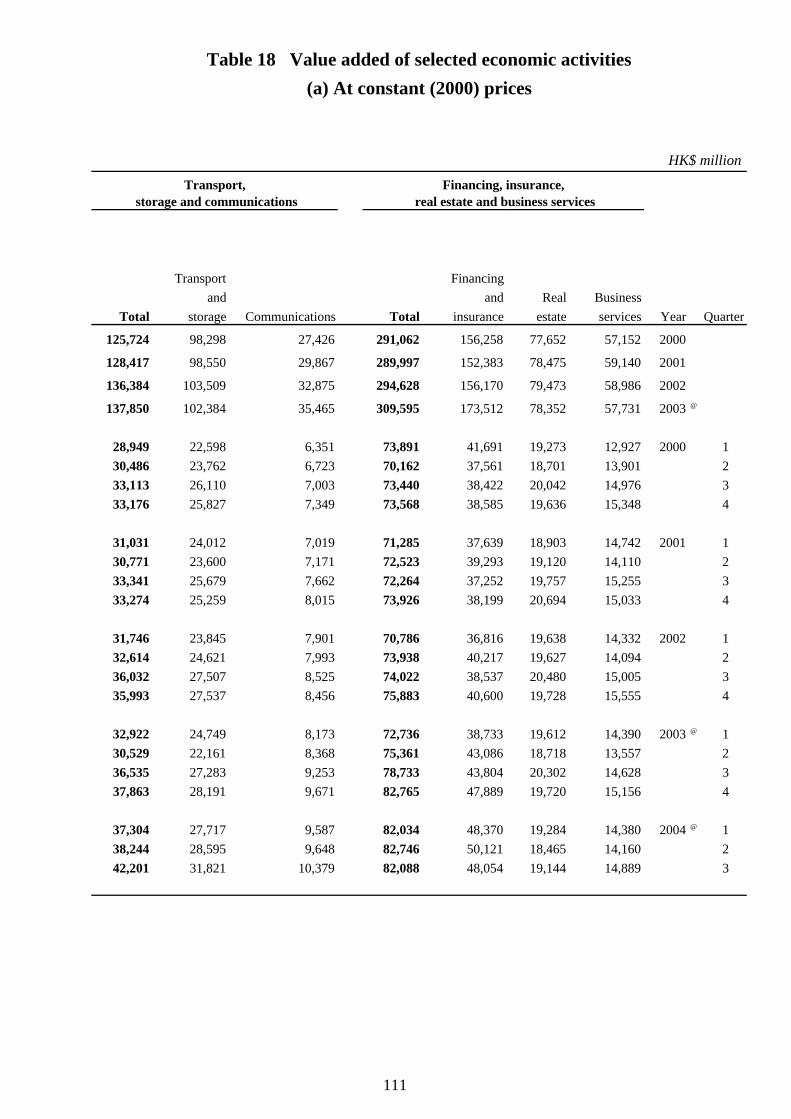
HK$ millionTransport,
storage and communicationsFinancing, insurance,
real estate and business services
Transport Financingand and Real Business
Total storage Communications Total insurance estate services Year Quarter
125,724 98,298 27,426 291,062 156,258 77,652 57,152 2000
128,417 98,550 29,867 289,997 152,383 78,475 59,140 2001
136,384 103,509 32,875 294,628 156,170 79,473 58,986 2002
137,850 102,384 35,465 309,595 173,512 78,352 57,731 2003 @
28,949 22,598 6,351 73,891 41,691 19,273 12,927 2000 130,486 23,762 6,723 70,162 37,561 18,701 13,901 233,113 26,110 7,003 73,440 38,422 20,042 14,976 333,176 25,827 7,349 73,568 38,585 19,636 15,348 4
31,031 24,012 7,019 71,285 37,639 18,903 14,742 2001 130,771 23,600 7,171 72,523 39,293 19,120 14,110 233,341 25,679 7,662 72,264 37,252 19,757 15,255 333,274 25,259 8,015 73,926 38,199 20,694 15,033 4
31,746 23,845 7,901 70,786 36,816 19,638 14,332 2002 132,614 24,621 7,993 73,938 40,217 19,627 14,094 236,032 27,507 8,525 74,022 38,537 20,480 15,005 335,993 27,537 8,456 75,883 40,600 19,728 15,555 4
32,922 24,749 8,173 72,736 38,733 19,612 14,390 2003 @ 130,529 22,161 8,368 75,361 43,086 18,718 13,557 236,535 27,283 9,253 78,733 43,804 20,302 14,628 337,863 28,191 9,671 82,765 47,889 19,720 15,156 4
37,304 27,717 9,587 82,034 48,370 19,284 14,380 2004 @ 138,244 28,595 9,648 82,746 50,121 18,465 14,160 242,201 31,821 10,379 82,088 48,054 19,144 14,889 3
Table 18 Value added of selected economic activities(a) At constant (2000) prices
111
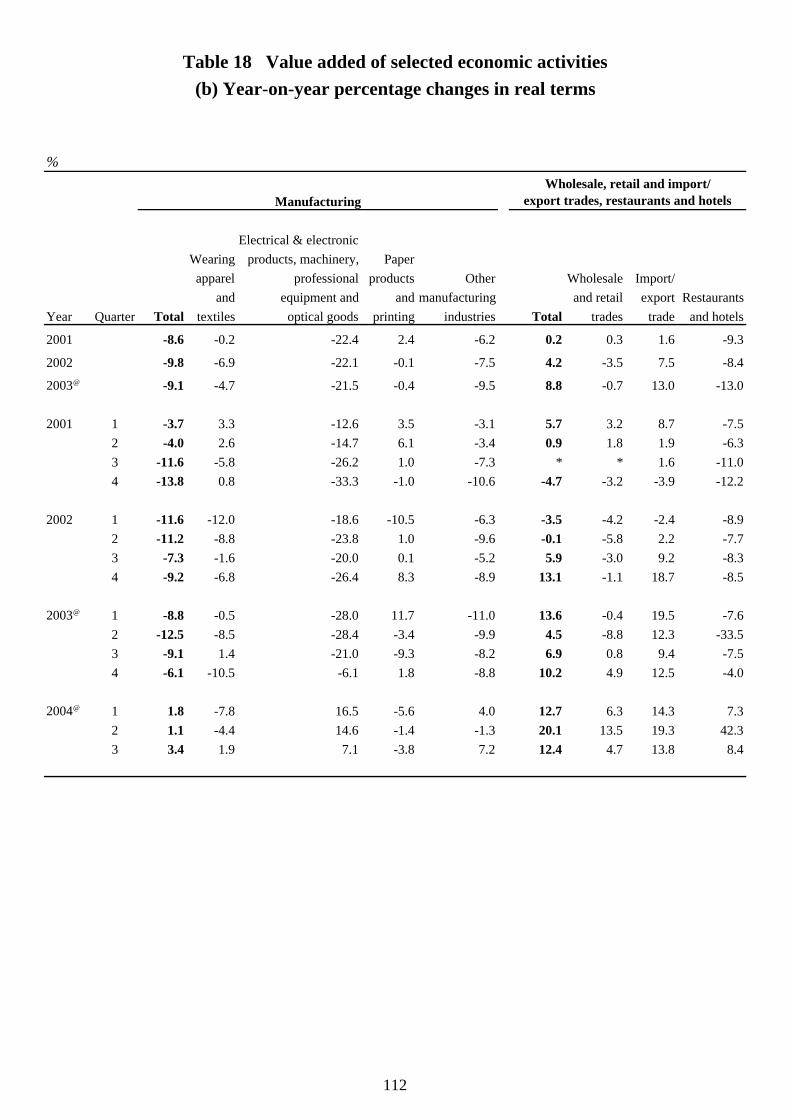
Table 18 Value added of selected economic activities(b) Year-on-year percentage changes in real terms
%
Manufacturing
Electrical & electronicWearing products, machinery, Paperapparel professional products Other Wholesale Import/
and equipment and and manufacturing and retail export RestaurantsYear Quarter Total textiles optical goods printing industries Total trades trade and hotels
2001 -8.6 -0.2 -22.4 2.4 -6.2 0.2 0.3 1.6 -9.3
2002 -9.8 -6.9 -22.1 -0.1 -7.5 4.2 -3.5 7.5 -8.4
2003@ -9.1 -4.7 -21.5 -0.4 -9.5 8.8 -0.7 13.0 -13.0
2001 1 -3.7 3.3 -12.6 3.5 -3.1 5.7 3.2 8.7 -7.52 -4.0 2.6 -14.7 6.1 -3.4 0.9 1.8 1.9 -6.33 -11.6 -5.8 -26.2 1.0 -7.3 * * 1.6 -11.04 -13.8 0.8 -33.3 -1.0 -10.6 -4.7 -3.2 -3.9 -12.2
2002 1 -11.6 -12.0 -18.6 -10.5 -6.3 -3.5 -4.2 -2.4 -8.92 -11.2 -8.8 -23.8 1.0 -9.6 -0.1 -5.8 2.2 -7.73 -7.3 -1.6 -20.0 0.1 -5.2 5.9 -3.0 9.2 -8.34 -9.2 -6.8 -26.4 8.3 -8.9 13.1 -1.1 18.7 -8.5
2003@ 1 -8.8 -0.5 -28.0 11.7 -11.0 13.6 -0.4 19.5 -7.62 -12.5 -8.5 -28.4 -3.4 -9.9 4.5 -8.8 12.3 -33.53 -9.1 1.4 -21.0 -9.3 -8.2 6.9 0.8 9.4 -7.54 -6.1 -10.5 -6.1 1.8 -8.8 10.2 4.9 12.5 -4.0
2004@ 1 1.8 -7.8 16.5 -5.6 4.0 12.7 6.3 14.3 7.32 1.1 -4.4 14.6 -1.4 -1.3 20.1 13.5 19.3 42.33 3.4 1.9 7.1 -3.8 7.2 12.4 4.7 13.8 8.4
Wholesale, retail and import/export trades, restaurants and hotels
112
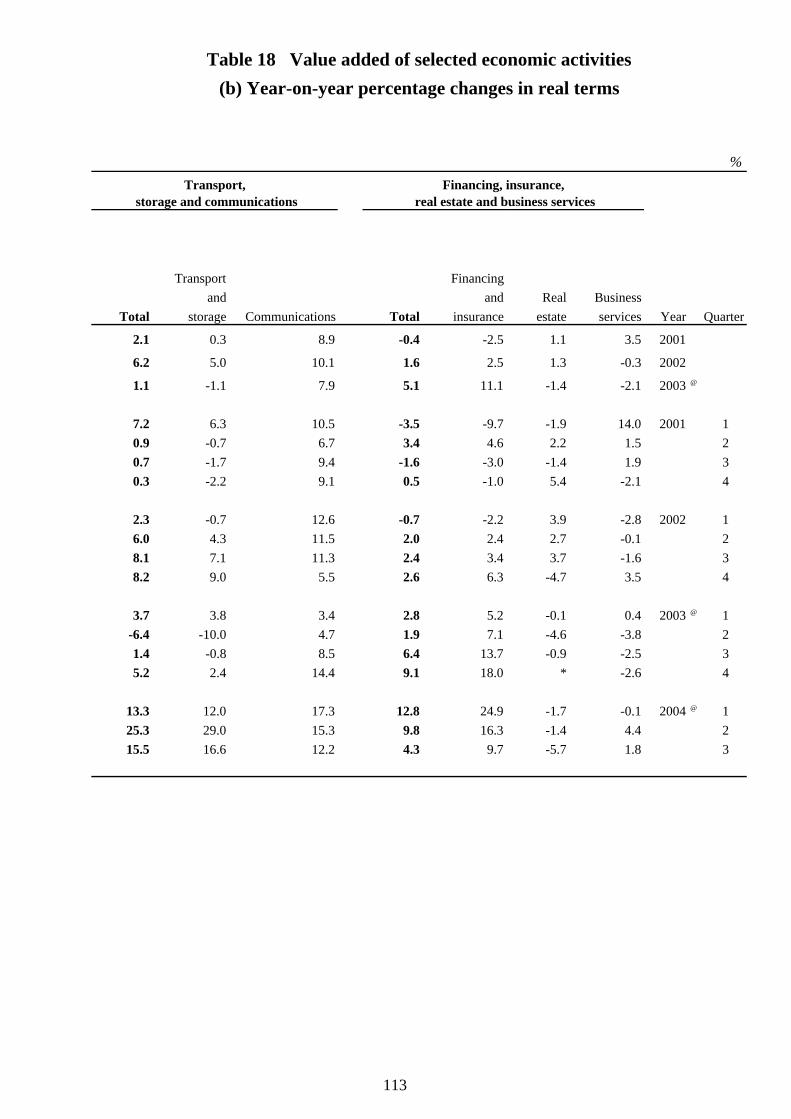
%Transport,
storage and communicationsFinancing, insurance,
real estate and business services
Transport Financingand and Real Business
Total storage Communications Total insurance estate services Year Quarter
2.1 0.3 8.9 -0.4 -2.5 1.1 3.5 2001
6.2 5.0 10.1 1.6 2.5 1.3 -0.3 2002
1.1 -1.1 7.9 5.1 11.1 -1.4 -2.1 2003 @
7.2 6.3 10.5 -3.5 -9.7 -1.9 14.0 2001 10.9 -0.7 6.7 3.4 4.6 2.2 1.5 20.7 -1.7 9.4 -1.6 -3.0 -1.4 1.9 30.3 -2.2 9.1 0.5 -1.0 5.4 -2.1 4
2.3 -0.7 12.6 -0.7 -2.2 3.9 -2.8 2002 16.0 4.3 11.5 2.0 2.4 2.7 -0.1 28.1 7.1 11.3 2.4 3.4 3.7 -1.6 38.2 9.0 5.5 2.6 6.3 -4.7 3.5 4
3.7 3.8 3.4 2.8 5.2 -0.1 0.4 2003 @ 1-6.4 -10.0 4.7 1.9 7.1 -4.6 -3.8 21.4 -0.8 8.5 6.4 13.7 -0.9 -2.5 35.2 2.4 14.4 9.1 18.0 * -2.6 4
13.3 12.0 17.3 12.8 24.9 -1.7 -0.1 2004 @ 125.3 29.0 15.3 9.8 16.3 -1.4 4.4 215.5 16.6 12.2 4.3 9.7 -5.7 1.8 3
Table 18 Value added of selected economic activities(b) Year-on-year percentage changes in real terms
113
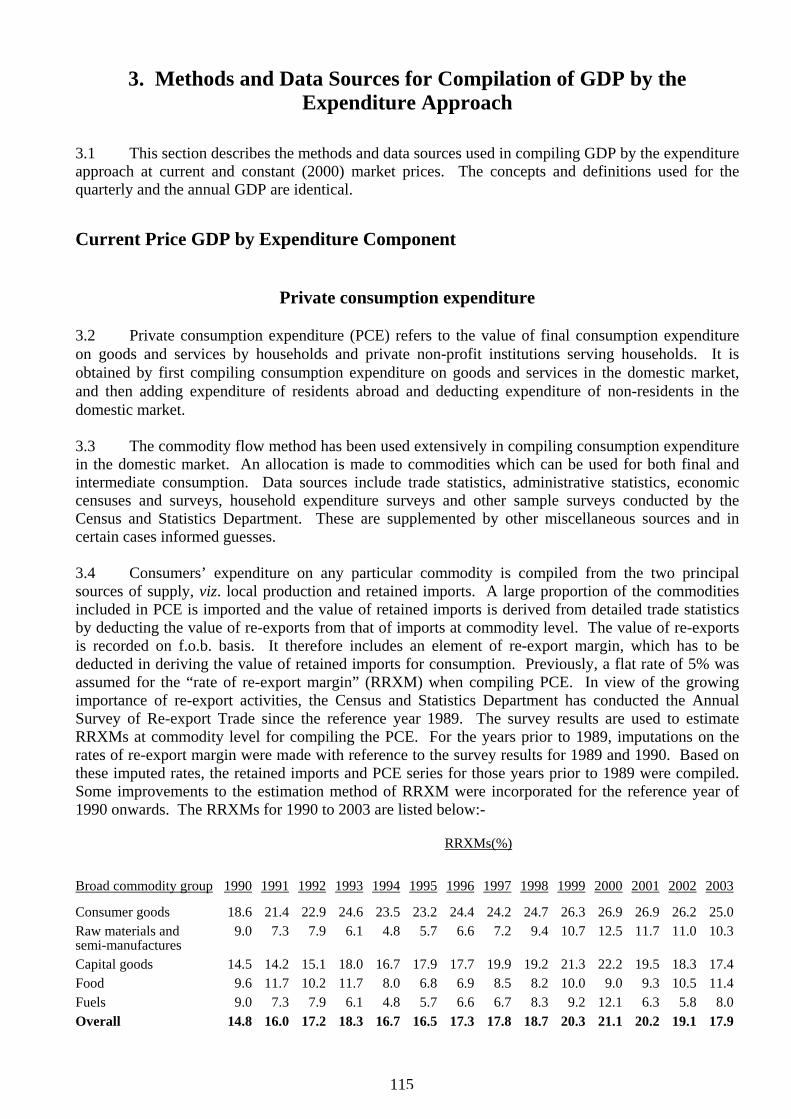
115
3. Methods and Data Sources for Compilation of GDP by the Expenditure Approach
3.1 This section describes the methods and data sources used in compiling GDP by the expenditure approach at current and constant (2000) market prices. The concepts and definitions used for the quarterly and the annual GDP are identical. Current Price GDP by Expenditure Component
Private consumption expenditure 3.2 Private consumption expenditure (PCE) refers to the value of final consumption expenditure on goods and services by households and private non-profit institutions serving households. It is obtained by first compiling consumption expenditure on goods and services in the domestic market, and then adding expenditure of residents abroad and deducting expenditure of non-residents in the domestic market. 3.3 The commodity flow method has been used extensively in compiling consumption expenditure in the domestic market. An allocation is made to commodities which can be used for both final and intermediate consumption. Data sources include trade statistics, administrative statistics, economic censuses and surveys, household expenditure surveys and other sample surveys conducted by the Census and Statistics Department. These are supplemented by other miscellaneous sources and in certain cases informed guesses. 3.4 Consumers’ expenditure on any particular commodity is compiled from the two principal sources of supply, viz. local production and retained imports. A large proportion of the commodities included in PCE is imported and the value of retained imports is derived from detailed trade statistics by deducting the value of re-exports from that of imports at commodity level. The value of re-exports is recorded on f.o.b. basis. It therefore includes an element of re-export margin, which has to be deducted in deriving the value of retained imports for consumption. Previously, a flat rate of 5% was assumed for the “rate of re-export margin” (RRXM) when compiling PCE. In view of the growing importance of re-export activities, the Census and Statistics Department has conducted the Annual Survey of Re-export Trade since the reference year 1989. The survey results are used to estimate RRXMs at commodity level for compiling the PCE. For the years prior to 1989, imputations on the rates of re-export margin were made with reference to the survey results for 1989 and 1990. Based on these imputed rates, the retained imports and PCE series for those years prior to 1989 were compiled. Some improvements to the estimation method of RRXM were incorporated for the reference year of 1990 onwards. The RRXMs for 1990 to 2003 are listed below:- RRXMs(%)
Broad commodity group 1990 1991 1992 1993 1994 1995 1996 1997 1998 1999 2000 2001 2002 2003 Consumer goods 18.6 21.4 22.9 24.6 23.5 23.2 24.4 24.2 24.7 26.3 26.9 26.9 26.2 25.0Raw materials and semi-manufactures
9.0 7.3 7.9 6.1 4.8 5.7 6.6 7.2 9.4 10.7 12.5 11.7 11.0 10.3
Capital goods 14.5 14.2 15.1 18.0 16.7 17.9 17.7 19.9 19.2 21.3 22.2 19.5 18.3 17.4Food 9.6 11.7 10.2 11.7 8.0 6.8 6.9 8.5 8.2 10.0 9.0 9.3 10.5 11.4Fuels 9.0 7.3 7.9 6.1 4.8 5.7 6.6 6.7 8.3 9.2 12.1 6.3 5.8 8.0Overall 14.8 16.0 17.2 18.3 16.7 16.5 17.3 17.8 18.7 20.3 21.1 20.2 19.1 17.9
116
In the revised estimation method, for those shipments which the survey respondents could not provide the actual import prices but could only report the prices at which they purchased the goods from other local enterprises, reference was made to auxiliary data including trade statistics for imputing the import prices of the shipments. 3.5 Statistics of local agricultural and fishery production for domestic consumption, both in value and in quantity terms, are regularly prepared by the Agriculture, Fisheries and Conservation Department. 3.6 Statistics for other domestically manufactured goods are based mainly on information collected from economic censuses/surveys conducted by the Census and Statistics Department, supplemented where necessary by other statistics. In the censuses/annual surveys conducted for the manufacturing sector for the years 1970, 1973 and 1976-2002, detailed information on commodity sales was collected. In compiling consumers’ expenditure on a commodity, one of the following two methods is used: (a) “S-X” method, under which statistics of local consumption are based on the difference between the total sales of manufacturers and total exports of the commodity concerned for a given period, or (b) “FP” method, under which a fixed percentage of total sales of manufacturers is taken as consumed locally. Of the two methods, (a) is preferred in general, except where there are difficulties in reconciling the sales statistics and exports statistics. 3.7 The compilation methods described above do not apply to years for which a census/annual survey was not conducted, and alternative procedures had then to be adopted in such cases. For 1966-1969, the estimates for a given commodity group were based on the benchmark estimate for 1970 and extrapolated using changes in population and prices. With benchmark estimates available for 1970 and 1973, the 1971 and 1972 estimates were obtained by interpolation, assuming the same growth rates for these two years. The 1974 and 1975 estimates were similarly derived based on the 1973 and 1976 benchmarks. 3.8 An annual economic census/survey is an operationally complicated project requiring a long time to complete. The availability of detailed data from economic census/survey is usually subject to a time lag of about one year. In the meantime, statistics of consumers’ expenditure on locally produced goods have been compiled based on production data collected from the Quarterly Survey of Industrial Production conducted by the Census and Statistics Department. Revisions are made to the statistics when results from the Annual Survey of Industrial Production become available. 3.9 After values of consumers’ expenditure on food and consumer goods have been compiled from the value of sales of producers and retained imports, they have to be adjusted. Since the commodities have to pass through distributive channels (i.e. wholesalers and retailers) before they ultimately reach final consumers, they may be temporarily held as inventories. Benchmark information for making adjustment for changes in inventories was obtained from the 1977 and 1979-2002 Census/Survey of Wholesale, Retail and Import/Export Trades, Restaurants and Hotels. Data on the physical changes in inventories of goods held by the distributive trades for 1977 and 1979-2002 were compiled based on statistics of changes in inventories by end-use. Since data on changes in inventories of the distributive trades were not available for years before 1977, a cruder basis had to be adopted for making adjustment for changes in inventories to data in respect of earlier years using proxy indicators available. 3.10 Apart from the adjustment for changes in inventories, a second type of adjustment is required. In compiling PCE at current market prices, the retail value is used and this is arrived at by adding distributors’ gross trade margins. The margin varies considerably among commodity groups and between years. The margins for 1977 and 1979-2002 were derived from results of the Census/Survey of Wholesale, Retail and Import/Export Trades, Restaurants and Hotels. The percentage margins for 1978 were taken to be the averages of those for 1977 and 1979, and those for 1966-1976 were imputed
117
by taking the averages of the margins for the period 1977-1981. The percentage margins for 2003 are provisional and will be revised based on the results of the Survey for 2003. The trade margins of the following product groups are available from the survey results: food, fuel, alcoholic drinks and tobacco, clothing and footwear, consumer goods, consumer durables and capital goods. 3.11 Consumers’ expenditure may also be compiled from government revenue statistics and other administrative statistics. Many service groups are compiled on this basis. Where such methods are used, the basic statistics provided are often expressed in purchasers’ prices already and adjustments for trade margins and inventories are not necessary. 3.12 To compile expenditure on certain groups, data from Household Expenditure Surveys conducted in 1963/64, 1973/74, 1979/80, 1984/85, 1989/90, 1994/95 and 1999/2000 by the Census and Statistics Department have also been used as benchmarks. Statistics for other years are compiled based on data from other sources. A household expenditure survey is usually a convenient source of information, since its data can be analysed by type of goods or services and by type of household. 3.13 For certain groups where data cannot be obtained from other sources, special surveys are conducted by the Census and Statistics Department. These include the Quarterly Survey of Restaurant Receipts and Purchases; expenditure surveys on hairdressing, taxi fares, photo-printing, cinemas and theatres, newspapers and periodicals, electronic games, and video tapes and video discs. 3.14 Consumption expenditure on goods and services in the domestic market is classified as follows:
Commodity group Expenditure coverage
(1) Food and non-alcoholic beverages
Bread and cereals; meat and poultry; fish and sea products; milk and eggs; oils and fats; vegetables and fruit; sugar and confectionery; non-alcoholic beverages and other food.
(2) Alcoholic beverages Beer and liquor.
(3) Tobacco Cigarettes, cigars and cut tobacco.
(4) Clothing, footwear
and other personal effects
Ready-made clothing; clothing materials and tailoring charges; footwear; watches, cameras and optical goods; travel and sports goods; stationery; jewellery and other personal effects.
(5) Rent, rates, water
and housing main-tenance charges
Rent and rates; water charges; house insurance and other housing charges.
(6) Fuel and light Kerosene; liquefied petroleum gas; coal gas; electricity and other
fuel (e.g. charcoal, candles, matches).
(7) Furniture, furnishing and household equipment
Furniture; soft furnishings; electrical household appliances, visual and sound equipment, personal computers and other consumer durables; cutlery and tableware, kitchenware, sanitary ware and household ornamental articles; and maintenance and repair charges on these items.
118
(8) Household operation Domestic help and non-durable household goods not elsewhere included.
(9) Personal care Perfumes, cosmetics, soaps and toilet requisites; laundry and dry
cleaning; shoe repairing; hairdressing and beauty shop services.
(10) Medical care and health expenses
Chinese and western medical, pharmaceutical and healthcare products; hospital care; services of physicians, nurses, dentists, herbalists and other related medical practitioners.
(11) Transport and
communication Expenditure on transport includes purchases of motor cars, cycles and other vehicles and their maintenance; petrol and oil; motor licences, insurance and fees for transfer of ownership, parking and driving instructors’ fees; railway, bus, tram and ferry fares and expenses on other forms of transport. Expenditure on communication includes postages, telephone (including mobile phone), telegram, paging and internet connection service charges.
(12) Recreation and
entertainment Newspapers and periodicals; books and other recreation goods (e.g. toys, fresh and artificial flowers and pets); video disc and tape rental, cinema entertainment; betting; hotel accommodation and other recreational expenses.
(13) Education Education fees and related expenditure (e.g. examination fees,
private tuition fees).
(14) Other services Life insurance; service charges in restaurants and cafes; brokers’ commissions and stamp duties in the transaction of stocks; service charges for pension funds; expenditure on other services; and expenditure of private non-profit bodies.
3.15 Summing the components described above gives the total consumption expenditure in the domestic market. Apart from the above classification, breakdowns of consumption expenditures for food, consumer goods and services are also compiled and published in this report. 3.16 PCE is obtained by adding expenditure of residents abroad to the total consumption expenditure in the domestic market, and then deducting expenditure of non-residents in Hong Kong. 3.17 Expenditure of non-residents in the domestic market is quite substantial. Expenditure of the following eight categories of non-residents is included in the calculation: overnight visitors; same-day in-town visitors; cruise passengers; military personnel and servicemen on rest and recreation; transit and transfer passengers; foreign crews stopping in Hong Kong; non-resident students studying in Hong Kong and employees of extra-territorial bodies and their dependents in Hong Kong. Extra-territorial bodies include foreign consulates and trade commissions (the UK troops were also included before July 1997). 3.18 Expenditure of residents abroad includes expenditure of residents travelling outside Hong Kong for personal purpose (including personal travel in package tour mode and non-package tour mode) and expenditure on passenger fare on international transportation services provided by non-resident transport operators. It also includes expenditure of resident students studying abroad. Whereas overseas expenditure of all residents travelling abroad comes under imports of services, only
119
expenditure of residents travelling abroad for non-business purposes comes under “expenditure of residents abroad” in PCE. 3.19 Following the latest recommendation in the System of National Accounts, supplementary statistics on actual consumption are also compiled and published in this report in addition to statistics on private consumption expenditure and government consumption expenditure. Actual final consumption of households covers goods and services which are effectively available to households, irrespective of whether the ultimate bearers of the expense are government, private non-profit institutions or households themselves. The actual consumption concept is based on the distinction between individual consumption (benefiting identifiable households) and collective consumption (benefiting society as a whole) of government consumption expenditure.
Government consumption expenditure
3.20 Government consumption expenditure (GCE), for the purposes of calculating the GDP, relates to current expenditure on goods and services by government departments which are not engaged in market activities. It also includes quasi-government non-profit institutions, in addition to that of government units in the narrower sense. According to the System of National Accounts, non-profit institutions which, by virtue of their relations with the government, are clearly instruments of the social or economic policies of the government, should be accounted for in government services, even though these institutions are not formally part of the government. Some examples of quasi-government institutions included in the GCE are the Hong Kong Trade Development Council, Hong Kong Productivity Council, Hong Kong Tourism Board, Consumer Council, Hospital Authority, Vocational Training Council, Hong Kong Monetary Authority and Employees Retraining Board. 3.21 The GCE does not cover government units which are engaged in market activities. These government units are distinguished from other government departments in that they are engaged in the production of goods and services principally for sale to the public. The criteria for distinguishing the market activities of the government from its other activities are: (i) that the activity consists of the production of goods and services of a kind which might be provided by a private business, and (ii) that sales to the public forms the major part of their activities. 3.22 Some examples of departments or sections of departments that are taken as being engaged in market activities include the Housing Department; the Ferry Terminals Section, the Cargo Handling Section and the Port Logistics Section of the Marine Department; Post Office; Water Supplies Department and the Tunnels Contract Management Team and the Parking Contract Management Team of the Transport Department. 3.23 The GCE also does not cover public corporations which are owned by government and engaged in market activities. These include the Mass Transit Railway Corporation Limited, Kowloon-Canton Railway Corporation and Airport Authority Hong Kong. 3.24 By convention, GCE is computed as the sum of:
(i) Compensation of employees: This comprises wages and salaries, pensions, expenditure on housing and quarters for its staff including imputed rent for all government-owned quarters, and other miscellaneous benefits.
(ii) Purchases of goods and services less sales: This refers to the expenses of the general government on goods and services in providing government services such as education, health services, services relating to fire fighting and protection, sanitation and social welfare, law and order enforcement and other general administration. Purchases of goods and services cover expenses on store and supplies, fuel and light, maintenance of
120
buildings and works, rents including imputed rent of non-residential buildings owned and occupied by the general government, and other services. Sales include school fees, sales of publications, medical and dental charges, ticket receipts from recreational and cultural programmes organised by the general government and revenue from other miscellaneous services rendered by the general government.
3.25 Expenditures incurred by the government in respect of subvention to private organisations are excluded in calculating GCE. Such expenditures are treated as transfer payments in the national accounting framework. Subvention expenditures are primarily utilised to finance the activities of private non-profit institutions serving households (NPISHs). The output of these institutions has been separately accounted for in the PCE. (See paragraph 3.2) 3.26 In view of the establishment of the Hospital Authority, the sectoral classification of the ex-subvented hospitals (now called public hospitals) has been reviewed in accordance with the guidelines published in the System of National Accounts. Ex-subvented hospitals, which were previously classified as “producers of private non-profit services”, are now classified as “producers of government services” because after the establishment of the Hospital Authority, ex-subvented hospitals started to function as instruments of the government to implement the provision of subsidised hospital services to the general public. 3.27 In calculating the year-on-year growth rate of GCE for 1992, the 1991 figure has been adjusted to include the expenditure of ex-subvented hospitals, so that it is comparable with the GCE figure for 1992. Similarly, in calculating the year-on-year growth rate of PCE for 1992, the expenditure of ex-subvented hospitals is excluded from the PCE figures for 1991 for comparability with the PCE figures for 1992. This avoids any distortion of the year-on-year growth rates due to the change in classification. 3.28 GCE data up to 1972 were obtained from the annual reports of Director of Accounting Services which give the actual expenditure of each department by financial years ending 31 March. The data were adjusted to a calendar year basis by assuming that expenditure by all departments was evenly spread throughout the financial year. Since 1973, quarterly figures have been available from the Treasury and such an adjustment was no longer required. Data in respect of quasi-government non-profit institutions were obtained from special enquiries on the income and expenditure of these institutions.
Gross domestic capital formation 3.29 Gross domestic capital formation (GDCF) consists of gross domestic fixed capital formation and the value of physical changes in inventories. 3.30 Gross domestic fixed capital formation is measured by the gross value of investment expenditure on building and construction as well as machinery, equipment and computer software. It represents the gross addition to fixed assets. Expenditure incurred in the acquisition of existing fixed assets which corresponds simply to the transfer of ownership of the assets is therefore not included. Costs incurred in the transfer of ownership of assets (including related taxes or duties paid), representing services used in the course of the transfer, are nevertheless included. Building and construction 3.31 Expenditure on building and construction relates to the value of construction work put in place (amounts payable to contractors, and other expenses directly related to property developments, such as
121
architectural design and technical consultancy services) in respect of residential buildings, non-residential buildings and other construction works as well as the real estate developers’ margin. Details of real estate developers’ margin are given in paragraph 3.33 to 3.34. The statistics of expenditure on building and construction are classified into private and public sectors. Real estate developers’ margin is applicable to the private sector only. 3.32 Statistics for the private sector from 1979 onwards are based on data from the Annual Survey of Building, Construction and Real Estate Sectors. Quarterly statistics are compiled using data collected from the Quarterly Survey of Construction Output. Revisions are made when annual data become available from the annual survey. For earlier years, the statistics were compiled on a much cruder basis, using information on construction cost data of newly completed buildings for which occupation permits had been issued as recorded in the monthly reports of the Buildings Ordinance Office. The public sector covers government departments (including Housing Department), quasi-government institutions and public corporations such as Mass Transit Railway Corporation Limited, Kowloon-Canton Railway Corporation and Airport Authority Hong Kong. According to the ownership criterion for classifying fixed assets into public and private sectors, construction expenditure on public rental housing is classified to the public sector whereas that on Home Ownership Scheme is classified to the private sector. 3.33 Real estate developers’ margin (REDM) measures the services rendered by developers to new building projects through acquiring land; arranging and co-ordinating architects, building contractors, engineers, designers and other related professionals to carry out the development of building and construction projects; financing the development of the projects either with their own capital or borrowed capital; and marketing the building units. The gross margin from selling newly developed property is taken as a measure of their economic activity and is included as a component of fixed capital formation. The value of REDM is compiled by taking the sales value of property less the sum of the current cost of the land which the property stands on and the project development outlays (including payments to contractors, architectural, engineering, other professional fees and project related expenses). Adjustments are made to discount gains due to appreciation in land value over the course of project development. 3.34 The estimates of REDM for the years 1979 and 1981-2002 were compiled based on the results of the Annual Survey of Building, Construction and Real Estate Sectors. Since no surveys were undertaken for 1980 and for years prior to 1979, the respective figures were derived from the 1979 benchmark data by applying the relevant volume and price changes. Costs of ownership transfer 3.35 Costs of ownership transfer are the expenditure incurred in connection with transfer of ownership of land and buildings, which includes stamp duties, legal fees and agents’ commissions. Expenditure on stamp duties is based on the amount of stamp duties collected by the government in connection with property transactions. The expenditure on legal fees and real estate agents’ commission is computed based on the number of property transfer cases registered with the Land Registry, the average property transaction value and the average rate of charge. Machinery, equipment and computer software 3.36 Investment expenditure on machinery and equipment is mainly compiled from the value of retained imports of capital goods. The method used is similar to that used to compile the consumption expenditure of commodities (see paragraph 3.4). A distributors’ margin is added to this value to allow for dealers’ profits, transport and assembly charges, installation and other expenses. The margin is derived from results of the Annual Survey of Wholesale, Retail and Import/Export Trades, Restaurants
122
and Hotels. Estimates of domestically manufactured machinery and equipment locally purchased are based on the results of the quarterly and annual economic surveys of the manufacturing industry where available, and extrapolation from the benchmark data for those years in which survey data were not available. Public sector expenditure on machinery and equipment comprises that of government departments, quasi-government institutions and public corporations (see paragraph 3.32). The data for government departments are derived from the accounts of government departments. Those for quasi-government institutions and public corporations are based on information supplied by the respective bodies. Private sector investment is taken to be the overall value, both imported and domestically produced, less the public sector figures. An adjustment for changes in distributors’ inventories of capital goods is also made, as in the case with final consumption of goods. 3.37 Computer software can be distinguished into purchased software (both pre-packaged and custom-design) and software developed in-house. Computer software bundled with the hardware is already captured in the estimate of fixed capital formation of machinery and equipment. Data on expenditure on computer software (including computer software purchased and developed in-house) by the private sector are mainly collected through annual economic surveys conducted by the Census and Statistics Department since the reference year of 1998. Backdating of data series to earlier years is made using proxy indicators. Data on investment expenditure on purchased computer software by the public sector, viz. government departments, quasi-government institutions and public corporations are obtained from records of government accounts and returns of respective bodies. For computer software developed in-house by the public sector, estimates of the compensation of employees to professional computer specialists for system design and programming and the corresponding non-labour costs are capitalised as public sector fixed capital formation. Changes in inventories 3.38 Changes in inventories (CIV) refer to the value of physical change, over an accounting period, in the inventories of work-in-progress and inventories of raw materials and all kinds of goods held by manufacturers and wholesalers, retailers and other distributors, and in fact all businesses in general. However, businesses other than manufacturing and distribution are not expected to hold significant level of inventories. 3.39 CIV is measured by the value of the entries into inventories less the value of withdrawals, with adjustment for appreciation (or depreciation) in the value of inventories due to price changes during the accounting period. In national accounting, transactions involving inventories are treated in the same way as transactions involving other assets. When a good is entered into inventories, it is acquired as an asset by the owner. The CIV is an integral part of economic activities and is recorded under capital formation in the GDP measured by the expenditure approach. 3.40 Estimates of CIV cover the following categories of goods: fuels, food, consumer goods, capital goods, raw materials and work-in-progress. For fuels, data on quantities of hydrocarbon oils kept as inventory by oil companies are obtained from the Electrical and Mechanical Services Department on a quarterly basis. For other kinds of goods, data for compiling the CIV estimates are mainly obtained from the annual economic censuses/surveys covering the manufacturing and distributive trade sectors. These include the Annual Survey of Industrial Production and the Annual Survey of Wholesale, Retail and Import/Export Trades, Restaurants and Hotels. For years in which data from economic surveys were not available, cruder methods of estimation were applied. 3.41 As data from annual economic surveys are available with a time lag, quarterly estimates of changes in manufacturers’ and distributors’ inventories are compiled based on data collected from the Monthly Survey of Retail Sales, the Quarterly Survey of Service Industries and the Quarterly Survey of Industrial Production.
123
3.42 Compilation of estimates of changes in inventories at current prices involves the elimination of increases in the book values of inventories between the beginning and the end of the period concerned due to appreciation of inventories, which is treated as purely a financial adjustment in national accounts. The adjustment for appreciation of inventories is made by revaluing the opening and closing book values of inventories at the average current prices of the period by means of appropriate price indices; the value of physical changes in inventories is then the difference of the two levels.
Imports and exports of goods and services Imports and exports of goods 3.43 Exports of goods include domestic exports and re-exports of goods recorded on f.o.b. basis. Imports of goods are valued on f.o.b. basis. External trade of non-monetary gold is also included. Imports and exports of services 3.44 Imports and exports of services represent transactions between residents of an economy and non-residents. The concept, definition and classification of imports and exports of services are based on international recommendations given in the Balance of Payments Manual and the System of National Accounts. The coverage of different service groups is as follows: (1) Transportation includes freight and passenger transportation by all modes of
transportation (air, sea and others) and other distributive and auxiliary services such as cargo forwarding, rentals of carriers with crew, container terminal and airport terminal services.
(2) Travel covers goods and services acquired from an economy by non-resident travellers for business and personal purposes during their visits in that economy. Exports of travel services cover mainly visitor spending whereas imports of travel services relate to expenditure on all goods and services acquired by Hong Kong residents travelling abroad.
(3) Insurance services include services provided for direct insurance and reinsurance in respect of life, freight and other non-life insurance such as accident and health insurance; marine, aviation and other transport insurance.
(4) Financial services include investment banking services; financial leasing services; financial asset dealing and brokerage services; portfolio management services, trust services, security custody services, foreign exchange services and other services auxiliary to financial intermediation.
(5) Merchanting and other trade-related services include merchanting, merchandising and other trade-related services. Merchanting relates to services associated with the trading of goods which are purchased and sold again without imported into and exported from Hong Kong. It also includes goods manufactured through sub-contract processing arrangement, which are subsequently sold to places outside Hong Kong without having been imported into Hong Kong after processing. Merchandising (also known as purchasing services) relates to services arranging on behalf of the buyers/sellers the purchase/sales of goods according to their specification, e.g. multiple sourcing, marketing, contract and price negotiation, volume and sample procurement, shipment, inspection and arrangement for follow-up order.
124
(6) Other services include a wide variety of services: communications services (postal, courier, and telecommunications services); computer and information services; construction, architectural, surveying and project engineering and other technical services; royalties and license fees; other business services (e.g. legal, accounting, tax consultancy, business and management consultancy, public relations, advertising, market research, operational leasing, real estate and other professional services); personal, cultural and recreational services (e.g. production, distribution and projection services of motion picture and videotapes; radio and television services) and government services (expenditure of employees of extra-territorial bodies and their dependents in Hong Kong and government expenditure abroad).
3.45 Estimates of residents’ expenditure abroad (an imported service) are based on administrative data and household surveys. Expenditure of visitors in Hong Kong (an exported service) is based on data provided by the Hong Kong Tourism Board. Expenditure of employees of extra-territorial bodies and their dependents in Hong Kong is estimated based on the number of such persons staying in Hong Kong and their average expenditure. Extra-territorial bodies include foreign consulates and trade commissions (the UK troops were also included before July 1997). Data on expenditure abroad of overseas offices and miscellaneous expenditure abroad of the government are obtained from the government accounts. The Annual Survey of Banks, Deposit-taking Companies, Restricted Licence Banks and Representative Offices of Foreign Banks has been conducted since the reference year 1980 to collect data on imports and exports of banking services. Estimates of the other services categories are mainly based on data collected from the Annual Survey of Imports and Exports of Services, supplemented by administrative data. The Annual Survey of Imports and Exports of Services was launched starting from the reference year 1978. For earlier years, the estimates were compiled with reference to imports and exports of goods and data from the Annual Survey of Imports and Exports of Services for reference year 1978. Because of limitations in the data, breakdowns by services cannot be provided. 3.46 The Census and Statistics Department has made continuous effort to improve the coverage of imports and exports of services in economic surveys and other administrative data sources. The Annual Survey of Imports and Exports of Services has been enhanced as from the reference year of 1995 to collect imports and exports of services data on a service basis. Benchmark data collected from the enhanced Annual Survey of Imports and Exports of Services are used for backdating the historical series to service basis. 3.47 Quarterly statistics of imports and exports of services are compiled with reference to external trade data, data from quarterly surveys conducted by the Census and Statistics Department, data from various government departments and the International Air Transport Association. For survey-based data, the preliminary figures are subsequently revised to incorporate latest available data from the Annual Survey of Imports and Exports of Services. Constant Price GDP by Expenditure Component and Implicit Price Deflators 3.48 Constant price figures of the components and sub-components of the GDP are prepared either by deflating current values by appropriate price indices, or by revaluing the current period quantities at base year prices. The constant price GDP is obtained by aggregating the constant price data of its components. In the constant price series, the effects of price changes have been eliminated and changes in GDP at constant prices reflect changes in the volume of economic activities.
125
3.49 Where revaluation at base year prices is used, the procedure is relatively straightforward. But where the deflation method is used, there are some problems associated with index numbers. For instance, current-weighted price indices, strictly speaking, are required for deflating current values. But price index series, e.g. the consumer price index, are usually available in base-weighted form and current-weighted series are not available. The index number problems, however, are unlikely to introduce serious problems in the constant price series. 3.50 In the 2002 round of the major revision, the base year for the constant price GDP is updated to year 2000 from 1990. The base year for the constant price GDP is the reference year in respect of which detailed price structure is used in calculating the values which provide weights for aggregating changes in volume of various types of goods and services produced or purchased. While the price structure changes only gradually from year to year, cumulative changes may become significant over a number of years. Thus, the base year of the constant price GDP needs to be updated from time to time in order to ensure that the weights underlying the measurement of volume changes reflect the more current price structure. The volume estimates of GDP and various expenditure components as from the new base year of 2000 and onwards are re-weighted according to the 2000 price structure. Rebasing of the historical series before the new base year of 2000 is not undertaken. 3.51 For the historical series prior to the new base year of 2000, the volume estimates compiled on the earlier base years at both the aggregate and component levels are linked by simple splicing to the re-weighted series. Thus, in the rebasing exercise, the real growth rates of GDP and its components for the earlier periods are not affected at all, except where data revisions and methodological changes have been made in the light of more comprehensive information and adoption of new international guidelines. 3.52 The methods for compiling the constant price expenditure components of GDP are summarised below:
Methods Private consumption expenditure
Consumption expenditure in the domestic market
For most items, the method used is deflation by consumer price indices (CPIs) at group level. For some items of expenditure, the constant price data are compiled by revaluation at base year prices. Expenditure of private non-profit institutions serving households is deflated by the salary rate index for government employees.
Expenditure of residents abroad
Deflated by a composite price index derived based on the CPIs of various countries.
Expenditure of non-residents in Hong Kong
Deflated by a tourist price index compiled by the Hong Kong Tourism Board, except for expenditure of non-resident students studying in Hong Kong and expenditure of employees of extra-territorial bodies and their dependents in Hong Kong which are obtained by multiplying the number of such persons and their corresponding average expenditure in the base year.
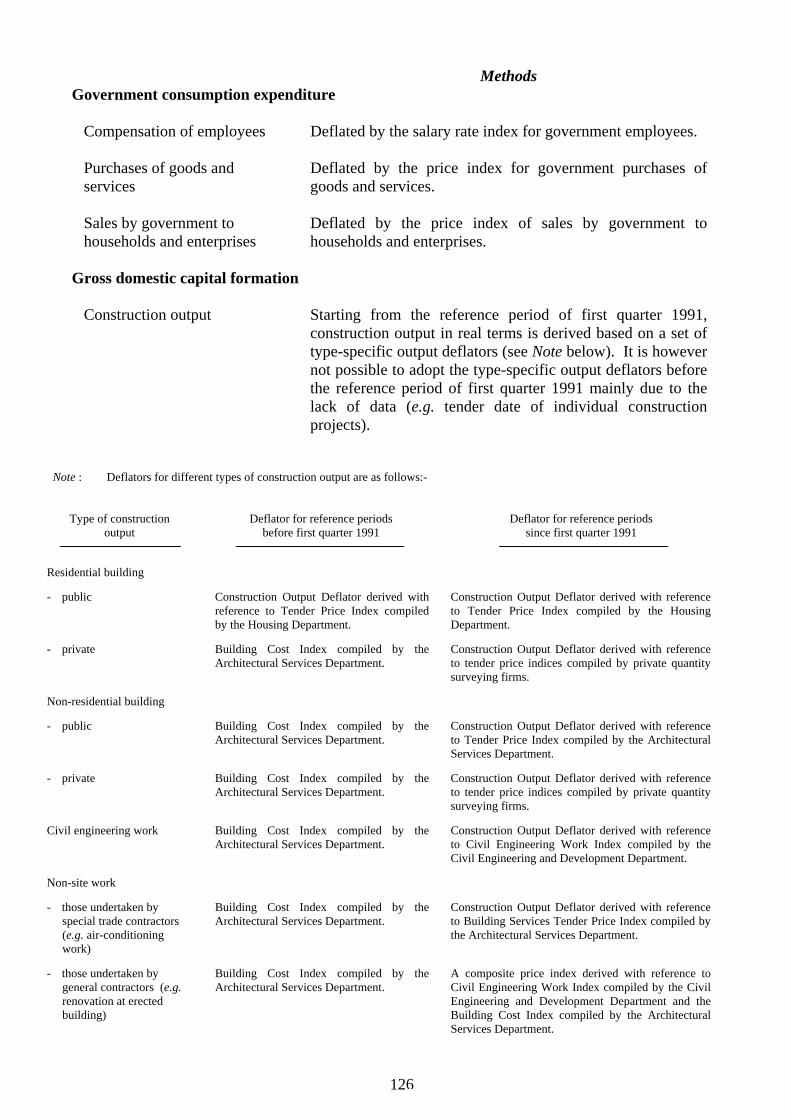
126
Methods Government consumption expenditure Compensation of employees Deflated by the salary rate index for government employees. Purchases of goods and services
Deflated by the price index for government purchases of goods and services.
Sales by government to households and enterprises
Deflated by the price index of sales by government to households and enterprises.
Gross domestic capital formation
Construction output Starting from the reference period of first quarter 1991,
construction output in real terms is derived based on a set of type-specific output deflators (see Note below). It is however not possible to adopt the type-specific output deflators before the reference period of first quarter 1991 mainly due to the lack of data (e.g. tender date of individual construction projects).
Note : Deflators for different types of construction output are as follows:-
Type of construction
output
Deflator for reference periods
before first quarter 1991
Deflator for reference periods
since first quarter 1991
Residential building
- public Construction Output Deflator derived with reference to Tender Price Index compiled by the Housing Department.
Construction Output Deflator derived with reference to Tender Price Index compiled by the Housing Department.
- private Building Cost Index compiled by the Architectural Services Department.
Construction Output Deflator derived with reference to tender price indices compiled by private quantity surveying firms.
Non-residential building
- public Building Cost Index compiled by the Architectural Services Department.
Construction Output Deflator derived with reference to Tender Price Index compiled by the Architectural Services Department.
- private Building Cost Index compiled by the Architectural Services Department.
Construction Output Deflator derived with reference to tender price indices compiled by private quantity surveying firms.
Civil engineering work Building Cost Index compiled by the Architectural Services Department.
Construction Output Deflator derived with reference to Civil Engineering Work Index compiled by the Civil Engineering and Development Department.
Non-site work
- those undertaken by special trade contractors (e.g. air-conditioning work)
Building Cost Index compiled by the Architectural Services Department.
Construction Output Deflator derived with reference to Building Services Tender Price Index compiled by the Architectural Services Department.
- those undertaken by general contractors (e.g. renovation at erected building)
Building Cost Index compiled by the Architectural Services Department.
A composite price index derived with reference to Civil Engineering Work Index compiled by the Civil Engineering and Development Department and the Building Cost Index compiled by the Architectural Services Department.
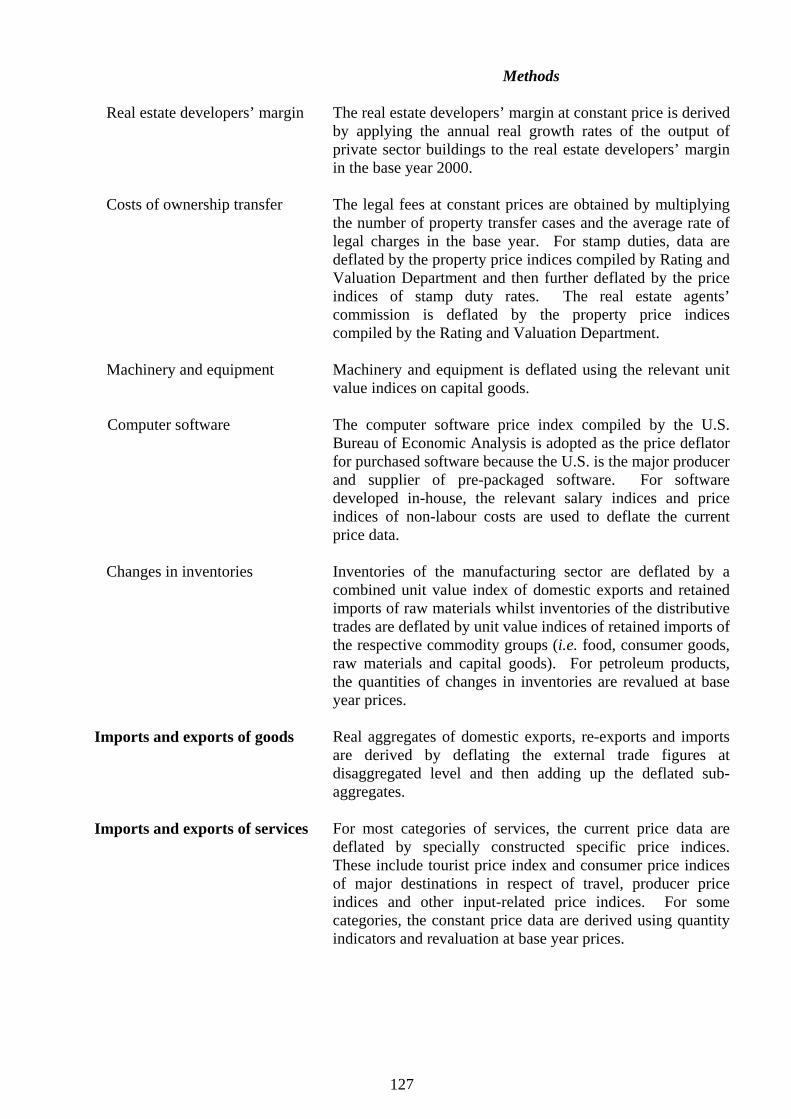
127
Methods Real estate developers’ margin The real estate developers’ margin at constant price is derived
by applying the annual real growth rates of the output of private sector buildings to the real estate developers’ margin in the base year 2000.
Costs of ownership transfer The legal fees at constant prices are obtained by multiplying
the number of property transfer cases and the average rate of legal charges in the base year. For stamp duties, data are deflated by the property price indices compiled by Rating and Valuation Department and then further deflated by the price indices of stamp duty rates. The real estate agents’ commission is deflated by the property price indices compiled by the Rating and Valuation Department.
Machinery and equipment Machinery and equipment is deflated using the relevant unit
value indices on capital goods. Computer software The computer software price index compiled by the U.S.
Bureau of Economic Analysis is adopted as the price deflator for purchased software because the U.S. is the major producer and supplier of pre-packaged software. For software developed in-house, the relevant salary indices and price indices of non-labour costs are used to deflate the current price data.
Changes in inventories Inventories of the manufacturing sector are deflated by a
combined unit value index of domestic exports and retained imports of raw materials whilst inventories of the distributive trades are deflated by unit value indices of retained imports of the respective commodity groups (i.e. food, consumer goods, raw materials and capital goods). For petroleum products, the quantities of changes in inventories are revalued at base year prices.
Imports and exports of goods Real aggregates of domestic exports, re-exports and imports
are derived by deflating the external trade figures at disaggregated level and then adding up the deflated sub-aggregates.
Imports and exports of services For most categories of services, the current price data are
deflated by specially constructed specific price indices. These include tourist price index and consumer price indices of major destinations in respect of travel, producer price indices and other input-related price indices. For some categories, the constant price data are derived using quantity indicators and revaluation at base year prices.
128
3.53 The implicit price deflators (IPDs) of GDP and its expenditure components are obtained by dividing the current price data by the corresponding constant (2000) price data and then multiplying by 100. Both the IPDs of GDP and domestic demand are measures of inflation. GDP is compiled as total final expenditures on goods and services (including private consumption expenditure (PCE), government consumption expenditure (GCE), gross domestic capital formation (GDCF) and exports of goods and services), less imports of goods and services. Domestic demand is the sum of PCE, GCE and GDCF. The deflators are similarly derived by dividing the sum of the respective components at current market prices by the sum of components at constant (2000) market prices and then multiplying by 100. Hence as it stands, the IPDs of GDP and its expenditure components are not used as input for compiling the corresponding constant price measures. By the same token, the growth rates in real terms of GDP and its main expenditure components are not derived from their corresponding growth rates in money terms using the rates of change in the respective IPDs. Rather, the growth rates in real terms are directly calculated by comparing the constant price measures at the two different periods. 3.54 The IPDs of GDP and its expenditure components are not direct measures of price change. They are derived measures of price change compiled based on the current price and constant price data. 3.55 The rates of change of the IPD of GDP and Consumer Price Index (CPI) are commonly used as measures of inflation (i.e. change in price levels) by data users. However, the movement of the IPD of GDP may at times differ from that of the CPI. The IPD of GDP is an economy-wide measure of inflation and takes into account all the price changes relating to consumption, investment, exports and imports. The CPI only measures the price changes encompassing goods and services purchased by households. Limitations of the Compilation Method 3.56 Compilation of GDP requires data from numerous sources. While the development of statistics in Hong Kong since the 1980 has provided many new data sources, there are still areas where estimates are less firmly based because of various limitations. In general, data sources for compiling quarterly GDP are less solidly based than those for compiling annual GDP. Quarterly surveys, which are one main source of data for the quarterly GDP, are normally smaller in sample size and less detailed in the information collected as compared with the annual surveys on which the annual GDP figures are based. In addition, some price deflators for compiling constant price GDP are only available on an annual basis but not on a quarterly basis. Limitations relating to the specific expenditure components of GDP are briefly described below. Private consumption expenditure 3.57 Although improvements have been made in valuing retained imports at market prices by introducing variable distributors’ margins for different commodity groups based on results of the Survey of Wholesale, Retail and Import/Export Trades, Restaurants and Hotels, there are certain underlying assumptions in the method of estimation. To ascertain the true value of distributors’ margin is very difficult, since strictly speaking the trade margins for each distributive channel of a given type of commodity have to be known. As the collection of this information is impracticable, the overall gross trading margins of the wholesalers and of the retailers are applied collectively to derive the distributors’ margin for a given commodity group. There are certain limitations in this method which is based on partial information at best. 3.58 As the compilation of the GDP using the expenditure approach is largely dependent on data from the trade statistics system, the value of retained imports derived from imports less re-exports is subject to time lag in recording, i.e. a given commodity imported for re-export may not be re-exported in the same period. Moreover, each commodity has to be allocated to its respective end-use categories
129
viz. final consumption, intermediate consumption or capital formation. The allocation of commodities cannot be very precise in practice unless full information is available on commodity flow. The present allocation adopted is based on knowledge about the relative disposition of the commodity and best judgement. Hence, this is subject to certain limitations. However, the scheme of allocation is constantly reviewed so as to account for necessary changes arising from structural developments in the economy. Government consumption expenditure 3.59 For government consumption expenditure, compilation is relatively straightforward. However, for years before 1973, data in respect of government departments were available only on a financial year basis, and expenditure was considered to be evenly spread out over the year so as to convert figures to a calendar year basis. As accounts data are used in compiling this component, the figures are derived on a cash-flow basis rather than accrual basis. To the extent that the cash-flow pattern varies from year to year, this component exhibits considerable short-term fluctuations in the quarterly series. Gross domestic capital formation 3.60 Figures prior to 1979 of the private sector investment in building and construction were based on information from the Buildings Ordinance Office’s monthly statistical returns on the cost of construction of newly completed buildings and construction work for which occupation permits were issued. The method by which the cost of completed projects was distributed uniformly over the duration of the project implicitly assumed that work put in place over the entire period was evenly spread out. As detailed information regarding the progress of work is not available, the statistics so derived are subject to estimation errors arising from fluctuations in the work progress. 3.61 The compilation of investment in machinery and equipment by the private sector is mainly based on statistics on imports and re-exports. They are therefore subject to the same problems as the PCE mentioned in paragraphs 3.57 and 3.58. 3.62 Changes in inventories, which are taken as the difference of the beginning and the ending values of inventories, always tend to be less reliable than other components as for most countries in the world. In particular, before results of annual economic surveys become available, quarterly and annual statistics are estimated based on results of surveys with rather small sample sizes. The error margin of this estimate can be large even with small estimation errors on both the beginning and the ending values of inventories. Revisions to this component can be substantial. The series of data on inventories must therefore be treated with particular caution. Imports and exports of services 3.63 Data quality of this component for the years before 1978 depends much on the validity of the use of imports and exports of goods as indicators, which are applied to the benchmark data of imports and exports, respectively, of certain services derived in 1978. To the extent that the indicators are inadequate, the statistics for the earlier years would be subject to error. The series of data on imports and exports of services for 1961-1977 should therefore be used with caution. Although various sources of information are used as far as possible to develop specific deflators for different categories of imports and exports of services, there are still limitations in the constant price measures. In deriving constant price measures of imports and exports of services, there are difficulties not only in the lack of data but also in defining the volume measures of various types of services. Hence, the constant price measures cannot be very precise.
130
3.64 Although most of the important sectors with significant trade in services transactions have been identified and included in the surveys, the coverage of the surveys requires regular reviews to identify any sectors which have grown in importance in respect of transactions in trade in services. Seasonally Adjusted GDP and its Main Expenditure Components 3.65 Seasonally adjusted data series are compiled for the aggregate GDP and some of its expenditure components including private consumption expenditure, government consumption expenditure, exports of goods, exports of services, imports of goods and imports of services. However, seasonally adjusted series is not compiled for gross domestic capital formation, as no clear seasonal pattern can be identified in this component. 3.66 In the seasonally adjusted series, seasonal effects have been removed statistically, thus enabling meaningful quarter-to-quarter comparison. When the year-on-year quarterly changes in the original GDP series and the quarter-to-quarter changes in the seasonally adjusted GDP series are analysed together, the trend of the GDP can be more clearly discerned, particularly in regard to turning points in the data series. 3.67 The statistical technique of X-11 ARIMA method, developed by Statistics Canada and used commonly worldwide, is the standard method employed in compiling seasonally adjusted data. 3.68 While the seasonally adjusted GDP series is more responsive to turns in economic cycle, there are some technical aspects that should be noted in the interpretation of the seasonally adjusted figures. There are some instances where the indicativeness of the seasonally adjusted series is reduced by the relatively significant extent of irregular factors at play in the original data series. Seasonal adjustment seeks to remove only the seasonal variations but not such irregularities. The presence of large irregularities could even disrupt the estimation of the underlying trend. Changes in the characteristics of the data series arising from structural changes in the economy may also affect the seasonally adjusted figures. 3.69 The seasonally adjusted series is subject to routine revision resulting from the updating of the seasonal factors when more new data are brought in over time. The extent of revision is normally more significant for the recent time points and less for earlier time points. Primarily, the degree of revision to the seasonally adjusted series is related to the extent of irregularity newly emerging in the original series, e.g. occurrence of new shocks and particular events. Apart from this, it should also be noted that part of the revision in the seasonally adjusted GDP data is due to routine revision in the original GDP data series brought about by the availability of updated and newly available data for GDP compilation. Real Gross Domestic Income 3.70 In the national accounts context, the most comprehensive measure of performance or real output in the local economy is the GDP. However, for certain analytical purposes, it may also be of interest to compute a measure of real gross domestic income (RGDI), which is GDP adjusted for trading gains and losses from changes in the terms of trade. In this specific measure, RGDI purports to reflect the external purchasing power of the real output, as the relative movements in import and export prices result in a varying volume of imports (which come from overseas output) being exchangeable for a given volume of exports (which come from domestic output). The growth rate of real income could show noticeable deviations from that of GDP if there is appreciable difference in the movement of import and export prices in an economy which has a substantial turnover of trade relative to overall economic activity.
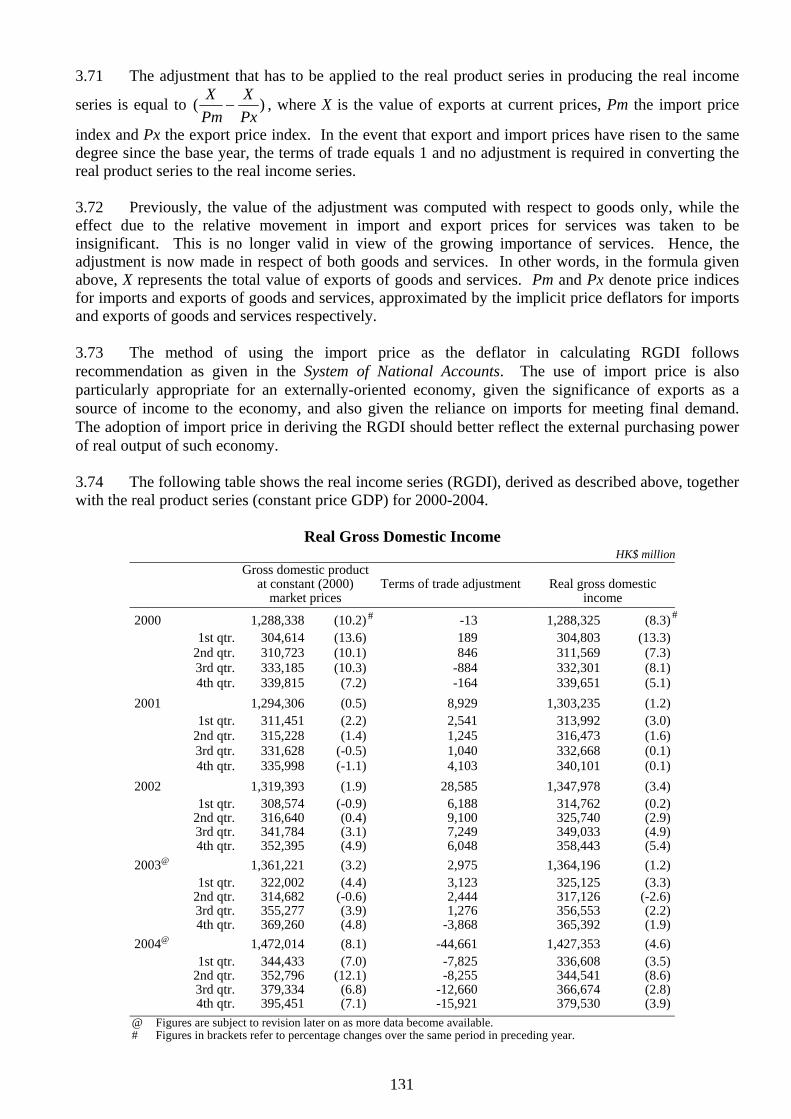
131
3.71 The adjustment that has to be applied to the real product series in producing the real income
series is equal to ( )XPm
XPx
− , where X is the value of exports at current prices, Pm the import price
index and Px the export price index. In the event that export and import prices have risen to the same degree since the base year, the terms of trade equals 1 and no adjustment is required in converting the real product series to the real income series. 3.72 Previously, the value of the adjustment was computed with respect to goods only, while the effect due to the relative movement in import and export prices for services was taken to be insignificant. This is no longer valid in view of the growing importance of services. Hence, the adjustment is now made in respect of both goods and services. In other words, in the formula given above, X represents the total value of exports of goods and services. Pm and Px denote price indices for imports and exports of goods and services, approximated by the implicit price deflators for imports and exports of goods and services respectively. 3.73 The method of using the import price as the deflator in calculating RGDI follows recommendation as given in the System of National Accounts. The use of import price is also particularly appropriate for an externally-oriented economy, given the significance of exports as a source of income to the economy, and also given the reliance on imports for meeting final demand. The adoption of import price in deriving the RGDI should better reflect the external purchasing power of real output of such economy. 3.74 The following table shows the real income series (RGDI), derived as described above, together with the real product series (constant price GDP) for 2000-2004.
Real Gross Domestic Income HK$ million Gross domestic product
at constant (2000) market prices
Terms of trade adjustment
Real gross domestic
income
2000 1,288,338 (10.2) -13 1,288,325 (8.3) 1st qtr. 304,614 (13.6) 189 304,803 (13.3) 2nd qtr. 310,723 (10.1) 846 311,569 (7.3) 3rd qtr. 333,185 (10.3) -884 332,301 (8.1) 4th qtr. 339,815 (7.2) -164 339,651 (5.1)2001 1,294,306 (0.5) 8,929 1,303,235 (1.2) 1st qtr. 311,451 (2.2) 2,541 313,992 (3.0) 2nd qtr. 315,228 (1.4) 1,245 316,473 (1.6) 3rd qtr. 331,628 (-0.5) 1,040 332,668 (0.1) 4th qtr. 335,998 (-1.1) 4,103 340,101 (0.1)2002 1,319,393 (1.9) 28,585 1,347,978 (3.4) 1st qtr. 308,574 (-0.9) 6,188 314,762 (0.2) 2nd qtr. 316,640 (0.4) 9,100 325,740 (2.9) 3rd qtr. 341,784 (3.1) 7,249 349,033 (4.9) 4th qtr. 352,395 (4.9) 6,048 358,443 (5.4)2003@ 1,361,221 (3.2) 2,975 1,364,196 (1.2) 1st qtr. 322,002 (4.4) 3,123 325,125 (3.3) 2nd qtr. 314,682 (-0.6) 2,444 317,126 (-2.6) 3rd qtr. 355,277 (3.9) 1,276 356,553 (2.2) 4th qtr. 369,260 (4.8) -3,868 365,392 (1.9)2004@ 1,472,014 (8.1) -44,661 1,427,353 (4.6) 1st qtr. 344,433 (7.0) -7,825 336,608 (3.5) 2nd qtr. 352,796 (12.1) -8,255 344,541 (8.6) 3rd qtr. 379,334 (6.8) -12,660 366,674 (2.8) 4th qtr. 395,451 (7.1) -15,921 379,530 (3.9)@ Figures are subject to revision later on as more data become available. # Figures in brackets refer to percentage changes over the same period in preceding year.
# #
132
3.75 The real income measure presented here is real gross domestic income (RGDI). For most applications, usually the preferred measure would be real gross national income (RGNI), which is given by RGDI plus net factor incomes from abroad. Data on factor incomes payable to and receivable from abroad are collected from the Survey of External Claims, Liabilities and Income (see paragraph 6.36).
133
4. Methods and Data Sources for Compilation of GDP by the Production Approach
4.1 This section describes the methods and data sources for compiling the GDP by economic activity at current and constant (2000) prices. Current Price Annual GDP by Economic Activity
Agriculture and fishing 4.2 The statistics are based on production data supplied regularly by the Agriculture, Fisheries and Conservation Department. The department also provides analysis of the input structure of production by major product, based on which statistics of intermediate and factor inputs are compiled.
Mining and quarrying; manufacturing; electricity, gas and water 4.3 The Survey of Industrial Production provides the data for compiling statistics for these economic activities. The first survey was conducted for the reference year 1973. The Survey has been conducted annually since the reference year 1976. 4.4 The major activity of manufacturing is the production of goods. In the Survey of Industrial Production, respondents reported the sales value of goods they produced. This is adjusted by the value of changes in inventories of finished goods and work-in-progress. In deriving the estimates for changes in inventories, price appreciation is removed to give the value of physical changes in inventories. The data for adjusting price appreciation are collected in the Survey. 4.5 Besides production of goods, manufacturing establishments are also engaged in other activities. In the case of manufacturing establishments performing contract work for other manufacturers, output is measured by their receipts for work performed. For sales of goods which have not been further processed by the selling establishment, such as sales of excess raw materials, output is measured by the resale margin, i.e. the difference between the sales value and the cost of goods resold. Rentals received from letting of premises, and commissions and fees received for services rendered are also included as components in gross output; such activities being considered as secondary activities of the manufacturing industry. 4.6 The intermediate consumption of manufacturing industries comprises rentals, expenses on materials and supplies consumed in production, repair and maintenance, transportation, etc. Payments for contract work done by others are included in intermediate consumption, while payments to outworkers are included in compensation of employees. Consumption of materials and supplies is obtained by adjusting the value of purchases for changes in inventories of raw materials and semi-manufacturers. 4.7 The treatment for the mining and quarrying, and electricity, gas and water industries is similar to that for the manufacturing industry. The Water Supplies Department is treated as a government unit engaged in market activities and is classified to the electricity, gas and water industry.
134
Construction 4.8 The construction industry here refers to construction contractors only. It does not cover the activities of property development. The construction of both buildings and other structures and facilities are covered. Construction contractors engaging in the erection of architectural superstructures, piling, demolition, site formation, civil engineering construction, electrical and mechanical installation work, etc. are included. Data for the construction industry are collected from construction contractors enumerated in the Survey of Building, Construction and Real Estate Sectors. The first benchmark survey was conducted for the reference year 1979. For 1980, a simplified enquiry covering only construction contractors was conducted. As only data on the value of construction output were collected, estimates of structural components were made using the structural ratios of 1979 and 1981. From 1981 onwards, annual surveys have been conducted to collect data for the construction industry. 4.9 The gross output of the construction industry is measured by the value of work put in place, or value of work performed during the reference period. The value of work put in place is derived from business accounting records of progress payments. It is equal to the value of progress payments received during the reporting period, less the value of work performed prior to the reporting period but only paid for subsequently, plus the value of work performed during the reporting period, but to be paid for thereafter. 4.10 In compiling the gross output from the survey results, the “net value of construction work performed” is applied. Sub-contracting is a common practice in the construction industry in Hong Kong. While main contractors are engaged by property developers for construction work, they may employ sub-contractors to do part of it. Moreover, a sub-contractor at a particular site may employ another sub-contractor. In addition, there are two types of sub-contractors, viz. fee sub-contractors and labour-only sub-contractors. Labour-only sub-contractors are responsible for supplying labour services only, in the form of site operatives. They are commonly known as “gang leaders” in the industry. Fee sub-contractors are responsible for completing a specified segment of work, including supplying the necessary materials. In the economic survey for the construction industry, the main contractor and all fee sub-contractors at a particular site are enumerated. They are required to report their “overall contract sum” from which all outgoings, including sub-contract payments, are to be met. Payments for sub-contract work are separately reported in the questionnaire. For main contractors employing fee sub-contractors for part of the site work, the value of work done by fee sub-contractors is thus reported more than once in the survey. Consequently, the net value of construction work performed in the economy is derived as the grand total of overall contract sum for all main contractors and fee sub-contractors less the value of payment for fee sub-contract work recorded. This is termed the “net value of construction work performed”. 4.11 Besides progress payments made in respect of construction work, a contractor may receive rentals for premises let out, or commissions and fees for consultancy or other services rendered. These are also included in the value of gross output. 4.12 The intermediate consumption of the construction industry comprises the expenses on consumption of building materials and supplies on sites and sundry supplies in business operation, rentals, expenses on repair and maintenance and other services such as transportation, technical consultancy, insurance, etc. Consumption of materials and supplies is obtained by adjusting the value of purchases by changes in inventories net of price appreciation. Payments to labour-only sub-contractors are included in compensation of employees.
135
Wholesale, retail and import/export trades, restaurants and hotels 4.13 The first benchmark economic survey for the activities of wholesale, retail and import/export trades, restaurants and hotels was conducted for the reference year 1977. Annual economic surveys have been conducted since the reference year 1979 to collect data for these activities. 4.14 The major activity involved in wholesale, retail and import/export trades is the distribution of goods. Output in respect of sales of goods is measured by the gross margin realised on trading, i.e. the sales value less the cost of goods sold. The cost of goods sold is obtained by adjusting the value of purchases for changes in inventories net of price appreciation. To remove the effects of price appreciation included in the book value of inventories collected in the economic surveys, special price indices are applied to re-value the book values at the beginning and the end of the reference year at the average prices of the year. The difference between the re-valued figures then gives the value of physical changes in inventories for calculating the cost of goods sold. 4.15 Besides making a margin on resales of goods, firms in the wholesale, retail and import/export trades may also provide other kinds of services, such as agency services to their clients, thus receiving commissions, fees and other service charges. These forms of income, together with rentals, are added to the margin on sales of goods to give the value of gross output. 4.16 The intermediate consumption of wholesale, retail and import/export trades comprises rentals, expenses on materials and supplies consumed in business operation and other services such as advertising, insurance, other transportation. Expenditures on purchases of goods for sale are not included in intermediate consumption because they are not consumed by these firms. Instead, these outlays are deducted from the sales value in calculating the gross margin on sales of goods. 4.17 As the activity of street hawking has not been included in the survey for the wholesale and retail trades, the contribution of hawkers is separately compiled using data on the number of hawkers from the Food and Environmental Hygiene Department and their earnings collected from the General Household Survey. 4.18 The output of restaurants and other eating places is measured by the value of sales receipts less food cost. The cost of food, beverages and other goods (e.g. cigarettes) sold is obtained by adjusting the value of purchases for changes in inventories. Receipts from other services rendered, rentals received, cash tips and other income such as fees and commissions are included to give the value of gross output of restaurants. 4.19 The intermediate consumption of restaurants comprises rentals, expenses on materials and supplies consumed in business operation and other services such as advertising and insurance. Expenditures on purchases of food, beverages and other goods which are served to customers are not included as intermediate consumption. 4.20 Chinese and other types of restaurants, fast food shops, bars and other eating and drinking places are covered in the above economic survey. Cooked food stalls are not included in the survey for restaurants. The contribution of these stalls is compiled from administrative records and survey data on the number of stalls and their earnings. 4.21 The output of hotels is measured mainly by receipts from room sales. This is supplemented by rentals received and other service charges. The intermediate consumption comprises rentals, expenses on materials and supplies consumed in business operation, fuel, electricity and water and other services such as advertising, insurance and management. The hotels industry also covers boarding houses.
136
Transport, storage and communications 4.22 The transport industry covers land, inland water, ocean and air transport, cargo forwarding agents, travel agents and other services relating to transport such as parking, packing and cargo measuring. Since the reference year 1980, annual surveys have been conducted to provide data for compiling statistics for this industry. 4.23 Firms engaged in the land, inland water, ocean and air transport activities provide services in carrying passengers and goods. The value of services provided or output of these firms is measured by the service charges received, viz. passenger and freight revenue. The output of owners of vessels who charter their vessels to other operators is measured by the charter revenue. The output of Hong Kong shipowners whose vessels are registered abroad may not be accounted for in the statistics. For cargo forwarding agents, their gross receipts from shippers often include freight charges to be paid to carriers. Freight charges which are paid on behalf of shippers are not included in measuring the output of cargo forwarding agents, as freight services are actually provided by the carriers. Similarly, for travel agents and airline ticket agents, their gross receipts from clients often include the value of tickets. In compiling output of cargo forwarding agents, travel agents and airline ticket agents, the freight charges/value of tickets have been deducted from their gross receipts. For similar reasons, the value of services provided by tour operators in organising a tour is measured by their total sales revenue (including cash tips) less the cost of the tour. For ship agents/managers and other services related to transport, the value of the services provided is measured by the service receipts or agency fees. 4.24 Branch offices set up in Hong Kong by foreign airlines and shipping companies are also covered in the transport industry. These offices provide services to their overseas parents and are considered to be operating without making an operating surplus. Thus the value of their output is imputed as the sum of all input costs i.e. expenses in maintaining the branch office, including compensation of employees. 4.25 The intermediate consumption of the transport industry comprises rentals, expenses on fuel, materials and supplies consumed in business operation, sub-contract work, repair and maintenance, and other services such as advertising, legal services, insurance. For cargo forwarding agents, travel agents and airline ticket agents and tour operators, expenditures on freight services and purchase of tickets and tour cost incurred on behalf of clients are not included as intermediate consumption. Instead, these expenditures are subtracted from the value of gross receipts in calculating gross output. For local branch offices in Hong Kong of foreign airlines and shipping companies, any expenditure incurred by their overseas parents in Hong Kong other than those expenditures for maintaining the branch offices are excluded in calculating the input costs, irrespective of whether these payments are settled in Hong Kong. 4.26 Several government units engaged in market activities are classified to the transport industry. These include the Ferry Terminals Section, the Cargo Handling Section and the Port Logistics Section of the Marine Department and the Tunnels Contract Management Team and the Parking Contract Management Team of the Transport Department. Data for compiling the estimates are supplied by the departments concerned. 4.27 Firms in the storage industry provide warehousing services and their output is measured by the warehousing rental. The communications industry comprises postal, courier, telephone and telegraph, radio-paging and other telecommunication services. Output of these firms is measured generally by the service charges received, including rentals received for letting telephone sets in the case of telephone services, margins from sales of radio-paging machines in the case of radio-paging services, and other fees and commissions received for services rendered. Post Office is treated as a government unit engaged in market activities and is classified to the communications industry.
137
4.28 The intermediate consumption of storage and communications comprises rentals, expenses on materials and supplies consumed in business operation, payments for contract work and other services such as advertising, transportation and insurance. For postal and telecommunication services which are jointly organised across international borders by operators from different countries, the payments made by Hong Kong companies to their overseas counterparts are included as payments for contract work.
Financing, insurance, real estate and business services 4.29 Annual economic surveys covering the financing, insurance, business services and banks, deposit-taking companies, and representative offices of foreign banks have been conducted since the reference year 1980. The activities of real estate developers, real estate leasing, brokerage and management firms and architectural, surveying, engineering and consultancy firms are covered by the Survey of Building, Construction and Real Estate Sectors. The first benchmark survey was conducted for the year 1979. No survey was conducted for 1980 and estimates in respect of these activities were compiled using the growth rate of output of private sector construction projects as an indicator. Since 1981, annual surveys have been conducted for compiling estimates for these activities. Financial intermediation services (formerly called banking services) 4.30 The major activity of banks, deposit-taking companies and other firms dealing with personal loans, mortgages, instalment credit, factoring and bill discounting, etc. is to provide financial intermediation services. These financial intermediaries provide the financial intermediation services for which they do not charge explicitly by paying and charging different interest rates to lenders and borrowers. They pay lower interest rates to those who lend them money and charge higher interest rates to those who borrow from them. The resulting net interest receipts (i.e. total interest received less total interest paid out) are used to compensate their expenses and provide the gross operating surplus. 4.31 The value of output of these services, namely “financial intermediation services indirectly measured (FISIM)” (formerly called imputed bank services charge) is measured by the net interest receipts (i.e. total interest received less total interest paid out). The value of FISIM, together with other explicit services charges, rentals, commissions and other fees received, constitutes the gross output of financial intermediaries. For personal loan companies and pawnshops, any bad debts written off are deducted from their net interest receipts. This treatment is adopted because bad debts are common in the business of personal loan companies and pawnshops. For pawnshops, the gross output also includes the receipts from sales of unclaimed goods less the corresponding loan granted. 4.32 For representative offices of foreign banks in Hong Kong, the value of the services they provide to their overseas parents is taken as the sum of all input costs, including compensation of employees and other operating expenses. 4.33 The intermediate consumption of the financial intermediation services comprises rentals, expenses on materials and supplies consumed in business operation, advertising, legal, accounting, communication, transportation and other services. Other financial services 4.34 Other financial services include investment and holding companies, stock and share brokers/dealers, brokers/dealers in commodity futures, foreign exchange, gold bullion, etc.
138
4.35 Investment and holding companies provide management services to their subsidiaries, with or without making a charge. They also receive interest and dividends from loans and advances, and from investment in subsidiaries, and other types of investment. The value of services provided by holding and management companies is measured by the amount of management fees received and other forms of business receipts such as rentals received, commissions and other service charges. 4.36 For stock and share brokers/dealers and brokers/dealers in other financial assets, the value of the services they provide to their clients is measured by their service charges, commissions and brokerages, and other fees received. Rentals received are also included in compiling the gross output. However, any gain/loss from trading in financial and other assets on own account is excluded in compiling the gross output. For firms providing miscellaneous financial services to customers, the value of services they provide is also measured by their service charges, commissions and fees. 4.37 The intermediate consumption of other financial services comprises rentals, expenses on materials and supplies and services consumed in business operation, advertising, insurance, legal, accounting and other professional services. Interest payments are not included as intermediate consumption. Insurance services 4.38 The producers of insurance services comprise life and general insurers, insurance agents, and specialist firms providing professional insurance services. Other than those companies specialising in life insurance policies, insurance companies underwriting all other types of policies are referred to as general insurance companies. 4.39 Life insurance companies provide some form of financial security for the policy holder, and look after and invest that part of any individual’s savings which are included in the premiums. The “payment” which life insurance companies receive for these services is difficult to measure. The United Nations recommends that the value of the services provided by life insurance companies should equal premiums less claims and net additions to life funds. The method was applied but resulted in a negative value added. Hence, other methods of compilation were investigated. After consulting a number of prominent insurance firms, a formula was devised based on methods of compiling the present values of future premiums and claims and net additions to life funds. The formula is believed to give the value of services rendered which are consistent with the actual practices of life insurance companies. The present data collected from the economic survey are however, not completed enough for using this formula. Recourse was therefore made to a method used by the U.S. Department of Commerce (See Readings in Concepts and Methods of National Income Statistics, p. 27, U.S. Bureau of Economic Analysis, 1976 issue). In this method, the imputed service charge of life insurance companies is the sum of operating expenses and compensation of employees. This method does not account for profits and no direct reference is made to additions to life funds. 4.40 For general insurance companies, the value of services rendered by general insurers to policy holders is measured by net retained premiums less net claims paid, plus income from investment of financial assets. Their receipts from agency or other services rendered (including reinsurance commission) and rentals received are also included in their gross output. 4.41 The value of services provided by insurance agents, brokers, and other specialist firms rendering professional insurance services to clients is measured by their service receipts, fees and commissions. 4.42 The intermediate consumption of insurance services comprises rentals, expenses on materials and supplies consumed in business operation, advertising, communication and other claim-handling services. Claim-handling services refer to investigatory and surveying services, etc. in processing applications for insurance compensation. For general insurers appointing agents in their underwriting business, the commissions paid to agents have been deducted from the value of gross premiums to
139
obtain the value of net retained premium. Consequently these commissions are not included in the value of their intermediate consumption. The payments made by an insurance company to individual agents employed by the company and serving solely the company are treated as compensation of employees. Real estate development, real estate leasing, brokerage and management services 4.43 Real estate developers provide services in arranging for contractors, architects, designers, etc. to construct residential and non-residential buildings and in financing the projects. Their reward in these activities is estimated by the difference between the selling prices of properties and the project outlays. In addition, real estate developers may lease out properties, act as estate agents and receive commissions or payments for the service of facilitating the transfer of property, or act as property managers. Any margin received from resales of existing properties must be excluded from the gross output. The resale margin of existing properties is not reckoned as an economic output. It is treated in the national accounts as a capital gain. 4.44 Practical difficulties arise in estimating the margin of real estate developers on property development. For buildings which are completely built within a year and sold in the same year, no major problems occur. The margin in this case would be equal to the selling price of the building less the value of the total costs incurred by the developer in respect of the project (excluding interest payments incurred). However, problems would arise if the buildings are not completely built and sold within the same year. The developer will then have incurred costs on the work-in-progress over the construction period but no sales receipts have been received as the building is still not yet completed or sold. Conceptually, this ambiguity (in the commercial accounting profit/loss sense) can be overcome in the national accounts by measuring the value of the work-in-progress to the real estate developer irrespective of whether payments have been made or received. This is a measure corresponding to the value of economic activity performed. However, there are practical difficulties in assessing the value of the work-in-progress to the real estate developer. In the economic survey for real estate developers, respondents are asked to give the actual or expected value of their properties at the beginning and the end of the reference period respectively. If the properties have actually been sold, the actual sales values are recorded, otherwise the catalogued selling prices of properties or other values given by the respondents are recorded. When the real estate market is good and properties are selling quickly, developers are well aware of the value of their properties. However when the market is falling and transactions are few, developers may not be able to give reasonable replies. For developers who fail to provide the data, property values are imputed from data on sales in similar areas by type and size of building. The property values as at the beginning and the end of the reference period are then expressed at current mid-year prices to reduce the effects of changes in prices on such values. Finally the property value at current mid-year prices is multiplied by the percentage of the property completed during the reference period, to give the value of the work-in-progress to the real estate developer. The developer’s margin is obtained as the value of the work-in-progress less all project outlays incurred during the year, excluding interest payments. The value of gross output of the real estate developers comprises the margin on property development, service charges, commissions and rentals received, etc. 4.45 For firms engaged in real estate leasing, brokerage and management services, the gross output corresponds to their service receipts which comprise rentals received from leased properties owned by these companies, commissions earned in respect of property transactions, real estate management fees and other service receipts. 4.46 The intermediate consumption of real estate developers and real estate leasing, brokerage and management firms comprises expenses on sundry supplies consumed in business, rentals, rates and expenses in relation to real estate activities like estate management expenses, advertising, professional fees and other overhead expenses.

140
Business services 4.47 Business services include activities such as accounting, auditing, legal, architectural design, engineering and other technical consultancy, data processing, advertising, market research, machinery and equipment rental and leasing services. 4.48 The value of business services provided by firms is generally measured by the fees, commissions and other charges received, including rentals from buildings and machinery. For advertising agents, their gross receipts from advertisements often include charges paid to the media. These charges which are paid on behalf of their clients are not included in measuring the gross output of advertising agents. Hence only the net receipt, i.e. gross receipts less any amounts paid to the third party, is included in the gross output of advertising agents. Similar treatment applies to market research and public relations firms. 4.49 The value of intermediate consumption of business services comprises expenses on materials and supplies consumed in business operation, rentals, rates, commissions and cost of contract work and other operating expenses such as advertising, transport and communications.
Community, social and personal services 4.50 Producers of community, social and personal services comprise organisations providing a wide range of services to individuals and households such as education, medical and health, sanitary, laundry, repair, hairdressing and photo-finishing services. The general administration, public order and safety services and other services provided by government departments which are not engaged in market activities, are also included. Services such as education, medical and health and welfare are mainly provided by the government and private non-profit institutions. Data sources for these services include government accounts and administrative records, accounts of private non-profit institutions and survey data collected from a small sample of commercial establishments rendering personal services. 4.51 Government services and services provided by private non-profit institutions are usually provided to the public free or at prices below their input costs of production. The value of services rendered by these organisations is estimated as the sum of the input costs, i.e. operating expenses (including imputed rentals, for which a fuller description is provided in paragraph 4.56) and compensation of employees. The operating expenses are treated as intermediate consumption, and compensation of employees as value added for such kind of services. 4.52 For government services, detailed expenditure accounts reclassified by purpose are used for compiling the output estimates. In view of the establishment of Hospital Authority in December 1991, ex-subvented hospitals, which were previously classified as “producers of private non-profit services”, are classified as “producers of government services” from 1992 (see paragraph 3.26). 4.53 Compilation of the value of services provided by private non-profit institutions is based on two sources of data. For government-subvented organisations, data on such activities are obtained from accounting records furnished by these institutions annually to government departments overseeing these subventions. These include the Education and Manpower Bureau overseeing subventions to schools, the Social Welfare Department overseeing subventions to activities such as community development, child-care and services organised for youths and the aged, and also the Department of Health overseeing subventions to clinics and health services. In addition, a survey on expenditure of private non-profit institutions was conducted for the year 1980 to provide benchmark data on output of other private non-profit institutions not receiving government subventions.
141
4.54 Statistics for commercial establishments are based on results from a small scale sample survey supplemented by data from other sources, including employment and earnings statistics and tax statistics. The survey has been conducted annually since 1980 to provide data for compiling the gross output of these commercial establishments, their intermediate consumption and compensation of employees. Gross output of these establishments comprises mainly receipts from services rendered in the form of fees, commissions and other service charges, margin on resale of goods and rentals received. 4.55 As in the case of other industries, the value of intermediate consumption for these services comprises expenses on materials and supplies consumed in business operation, rentals, rates and other operating expenses such as advertising, transport and communications.
Ownership of premises 4.56 Ownership of premises is treated as an economic activity in the national accounts. The rentals paid represent an expenditure for households or intermediate consumption for business firms, and the rentals received a sale of a commodity-type service or output derived from ownership of premises. For business firms letting out premises which they own, the services they provide are measured by rentals received, and are included in the gross output of the activity to which the firms belong. However, the leasing services provided to tenants by owners of premises in their individual capacity have not been accounted for in any of the activities described so far. Hence, a separate activity, viz. ownership of premises, is introduced for this purpose. Besides leasing services provided to tenants by owners of premises in their individual capacity, this activity also covers leasing services which owners of premises like households, government and private non-profit institutions, provide to themselves. An imputed figure on rentals for such properties is added to the national income calculations to reflect the value of the services rendered. Strictly speaking, any sums spent on maintenance and repair of such properties should be treated as a cost, or expenditure in the “owner-occupier” accounts, and the balance of imputed rentals over these sums taken to represent the operating surplus. In this way, the imputed expenditure on rentals by the owner-occupier is recorded in the expenditure approach and the imputed operating surplus in the production approach. Since data for compiling the cost of maintenance and repair of owner-occupied property are not available, a 5% allowance has been made for such expenditure in the figures compiled from the production approach to derive the value of operating surplus. 4.57 The estimate of ownership of private domestic premises includes both the rentals of private domestic premises received by households together with the imputed rentals of households occupying their own premises. It is estimated based on the rateable value of all private domestic premises supplied by the Rating and Valuation Department, after discounting the related rentals received by companies from households. 4.58 Similarly, for owner-occupied premises of government and private non-profit institutions, imputed rentals are compiled for the leasing services provided for their own consumption. The imputed rentals are also incorporated into the GDP figures compiled from the expenditure approach accordingly. The benchmark figures of imputed rentals for premises owned and used by government departments not engaged in market activities and private non-profit institutions were imputed for the reference years 1980, 1985 and 1990. The information of such premises was obtained from administrative records of the government, and a specially conducted survey on premises owned and occupied by private non-profit institutions. These buildings were broadly categorised into offices, quarters, schools, hospitals, and buildings for community, religious and recreational, public order and safety and other miscellaneous purposes. Structures and facilities for civil engineering and special purposes were excluded. Professional advice was sought from the Rating and Valuation Department in assessing the rentals for these properties. Based on the assessments, the imputed rentals were compiled. Notwithstanding the reasonably wide scope of data sources, the estimates still have
142
technical limitations as information on market transactions is not available for many types of properties, particularly special purpose buildings. Hence the imputation method is far from perfect but the results should be reasonably good for national accounts purpose. 4.59 For owner-occupiers of non-residential properties e.g. offices, factories, shops in the business sector, no imputation of rentals has been made. This is because any imputed rentals will simultaneously be an expense (intermediate consumption) and a receipt (gross output) of the owner-occupier firm. The omission will not in consequence affect the statistics on value added. 4.60 The figures of ownership of premises are updated based on information furnished by government departments and private non-profit institutions on additions and deletions to existing stocks of buildings and rental indices for different types of buildings.
Adjustment for financial intermediation services indirectly measured 4.61 “Financial intermediation services indirectly measured (FISIM)” has been described in paragraphs 4.30 and 4.31, with background reasons for including its value in the output of financial intermediaries. It, equal to net interest receipts, is added to the gross output, and consequently to the value added. Having done this, it is necessary to deduct such from the value added of other industries which are charged for the use of the services. However, in practice it is very difficult to establish a basis for this to be done, and the internationally accepted practice is to adjust the GDP by deducting the value of FISIM from the aggregated value added of all producers. Constant Price GDP by Economic Activity 4.62 With the development and enhancement of monthly and quarterly economic surveys conducted by the Census and Statistics Department in recent years, more economic data are available, including the availability of short-term economic indicators (e.g. quarterly business receipts of service industries) and producer price indices (PPIs) for selected services industries. PPI is a measure of the average change in prices of goods and services received by local producers. Producer prices are transacted prices, net of any discounts, rebates or allowances given to buyers but including surcharges received by producers. The availability of such data enables the compilation of quarterly GDP by economic activity at constant prices. 4.63 Constant price value added of economic activities in Hong Kong is generally compiled using four methods: (a) single extrapolation of base year value added by deflated gross output measures e.g. business receipts deflated by PPI; (b) single extrapolation of base year value added by volume/quantity measures such as volume of trade and physical units of outputs; (c) single extrapolation of base year value added by input indicators such as hours worked; (d) double indicators methods. The first two methods are most frequently applied in Hong Kong for compiling quarterly constant price value added, as in statistically advanced economies (e.g. Australia, New Zealand, and U.K.). Single extrapolation by deflated gross output measures 4.64 In calculating deflated gross output, relevant price deflators are needed. For manufacturing, relevant producer price indices (PPIs) are used as price deflators of gross output. For construction, price deflators employed include type-specific construction output deflators (e.g. offices, residential buildings, civil engineering works), the Civil Engineering Works Index (CEWI), Building Services Tender Price Index (BSTPI) and other price indices. For hotels and boarding houses; air, land and maritime transport activities, respective PPIs are also used.
143
Single extrapolation by volume/quantity indicators 4.65 The method of single extrapolation by volume/quantity indicators is commonly applied under two circumstances. The first circumstance is where the service prices of economic activities are both theoretically and practically very difficult to measure, as in the case of wholesale, retail and import/export trade services and financial intermediation services indirectly measured (FISIM). 4.66 The services provided by wholesale, retail and import/export traders are to make available goods at a location and time convenient for their customers. While the value of the services can be estimated by trade margin (which is calculated as sales of goods minus cost of goods sold), the prices of the services provided are not readily observable. To estimate the volume of the services, the recommended approach by the International Monetary Fund (IMF) and Eurostat is to construct a volume indicator by using the volume of goods passing through the distributive channels. Likewise, the prices of FISIM are not readily observable. This is because in providing financial intermediation services, banks do not charge their customers explicitly. The recommended approach by IMF and Organisation for Economic Co-operation and Development (OECD) is to use deflated stock of assets and liabilities of banks as volume indicator. 4.67 The second circumstance is where quantity indicators are highly correlated with volume of output and hence provide good proxies for estimating constant price value added (e.g. statistics on outward external telephone traffic volume is used as an indicator to extrapolate the constant price value added of international telephone services). Single extrapolation by input indicators 4.68 In extrapolation by input indicators, the commonly used indicators are deflated wages and hours worked. Deflated wages indicators are applied to economic activities of which the output is estimated by cost approach, viz. the government and private non-profit bodies output in Hong Kong. For indicators of hours worked, they are at present applied to selected business service industries. Double indicators method 4.69 In applying the double indicators method, constant price value added is calculated by subtracting constant price intermediate consumption from constant price gross output. Constant price intermediate consumption and gross output can be obtained by either deflation of current price figures or extrapolation by relevant indicators. Thus, the double indicators method requires detailed data on the outputs and inputs of respective economic activities and their prices. Owing to data availability problem, this method is not commonly used by statistically advanced economies in deriving quarterly constant price value added. In Hong Kong, double indicators method is applied to the electricity, gas and restaurants industries. 4.70 The methods for compiling the quarterly constant price value added of individual economic activities are summarised below:
Economic activity
Methods/Data sources
Agriculture and Fishing
Agriculture and fishing Single extrapolation by volume/quantity indicators. The quantities of local production of fish, vegetables, swine and poultry provided by the Agriculture, Fisheries and Conservation Department are used as the volume indicators.
144
Mining and Quarrying
Mining and quarrying Single extrapolation by volume/quantity indicator. The quantity of quarry production supplied by the Civil Engineering Department is used as the volume indicator.
Manufacturing
Manufacturing Single extrapolation by volume indicator. The Quarterly Index of Industrial Production (QIIP) which reflects changes of local manufacturing output in real terms is used as volume indicator. Statistics of QIIP are compiled from the Quarterly Survey of Industrial Production.
Electricity, Gas and Water
Electricity and gas Double indicators method.
The quantity of electricity/gas consumption supplied by the electricity companies/gas company is used as the volume indicator for constant price gross output. Constant price intermediate consumption is obtained by direct deflation. Deflators used include price indices of related raw materials, relevant rental index and relevant Composite Consumer Price Index (CCPI) components.
Water Single extrapolation by volume indicator.
The quantity of water consumption supplied by the Water Supplies Department is used as the volume indicator.
Construction
Construction Single extrapolation by deflated gross value of construction work. Statistics on deflated gross value of construction work are obtained from the GDP by expenditure approach.
Wholesale, Retail and Import/Export Trades, Restaurants and Hotels Wholesale, retail and
import/export trades Single extrapolation by volume indicators. Deflated wholesale and retail sales, volume of external trade in goods and constant price exports of merchanting and other trade-related services (mainly gross margin of merchanting and commissions from merchandising) are used as the volume indicators. Wholesale sales are obtained from the Quarterly Survey of Service Industries, while retail sales from the Monthly Survey of Retail Sales. Statistics on external trade in goods are obtained from monthly external trade statistics. Statistics on exports of merchanting and other trade-related services are obtained from GDP compiled by the expenditure approach. Deflators are relevant CCPI components and external trade unit value indices (UVI).
145
Restaurants Double indicators method. Constant price gross output and intermediate consumption are obtained by direct deflation. Statistics on restaurant receipts and purchases are obtained from the Quarterly Survey of Restaurant Receipts and Purchases. Deflators used for deflating gross output are relevant CCPI components. Deflators used for deflating intermediate consumption include rental indices and CCPI of electricity, fuels and water, etc.
Hotels and boarding
houses Single extrapolation by deflated business receipts. Business receipt deflated by producer price index (PPI) obtained from the Quarterly Survey of Service Industries is used as volume indicator.
Transport, Storage and Communications Transport and storage Single extrapolation by deflated business receipts.
Business receipts deflated by PPIs obtained from the Quarterly Survey of Service Industries are used as volume indicators.
Communications Single extrapolation by volume/quantity indicators.
Total air time of mobile network used, outward external telephone traffic volume and deflated business receipts of relevant industries are used as the volume indicators. Total air time of mobile network used and outward external telephone traffic volume are supplied by the Office of Telecommunications Authority. Statistics on business receipts of the relevant industries and the corresponding PPIs are obtained from the Quarterly Survey of Service Industries.
Financing, Insurance, Real Estate and Business Services Financing Single extrapolation by volume indicators/deflated business receipts.
For banking, deflated stock of financial assets and liabilities, deflated foreign currency positions and deflated income from fees and commissions are used as the volume indicators. Statistics on financial assets and liabilities and income are obtained from the Hong Kong Monetary Authority. The deflators used are the implicit price deflators of final demand and exports of banking services. For other financing services, the deflated business receipts are used as the volume indicators. Statistics on business receipts and relevant PPIsare obtained from the Quarterly Survey of Service Industries.
Insurance Single extrapolation by volume indicators.
Number of insurance policies and deflated net premiums obtained from the Office of the Commissioner of Insurance are used as the volume indicators. The implicit price deflator of final demand is used to deflate net premiums.
146
Real estate Single extrapolation by volume indicators. Real estate developers’ margin (REDM), occupied floor area of private offices and commercial buildings, deflated business receipts and deflated rental income of Housing Authority are used as the volume indicators. REDM is obtained from the GDP by expenditure approach, while data on floor area and vacancy rate are obtained from the Rating and Valuation Department. Statistics on business receipts and the relevant PPIs are obtained from the Quarterly Survey of Service Industries.
Business services Single extrapolation by deflated business receipts/input indicator.
Deflated business receipts are used for single extrapolation when business receipts and PPIs are available. For other business services, number of hours worked is used for single extrapolation.The number of hours worked is compiled based on statistics collected from the Survey of Employment and Vacancies and the General Household Survey.
Community, Social and Personal Services Community and social
services provided by government
Single extrapolation by input indicators. The input indicators are wages supplied by the Treasury. The deflator used is the salary rate index for government employees.
Community and social
services provided by private non-profit institutions
Single extrapolation by deflated value of government subventions. The value of government subventions is provided by the Treasury. The salary rate index for government employees is used as deflator.
Personal services
provided by commercial establishments
Single extrapolation by deflated private consumption expenditure on various services activities. Statistics of private consumption expenditure on personal care, medical, recreation and entertainment and domestic help are compiled based on results of a number of expenditure surveys conducted by the Census and Statistics Department and administrative data provided by the Hospital Authority, the Department of Health and the Hong Kong Jockey Club. The deflators used are relevant CCPI components.
Ownership of Premises Ownership of premises Single extrapolation by volume indicators.
Deflated ratable value of private domestic premises and total floor area of government/private non-profit institutions owned buildingsare used as the volume indicators. The data are mainly supplied by the Government Property Agency, the Rating and Valuation Department and private non-profit institutions.
Taxes on Production and Imports Taxes on production and
imports Direct deflation. Value of taxes on production and imports are obtained from the Treasury. The deflators used include indices of relevant tax rates, property price index and hotel bills index.
147
Limitations of the Compilation Method 4.71 Economic surveys are the main source of data for compiling GDP by economic activity. Information so collected may not be recorded on a calendar year basis, as quite a large number of respondents reported data on a fiscal year basis or for some other period, whilst annual GDP at current prices are compiled on a calendar year basis. Data on national accounts aggregates from economic surveys are therefore subject to imprecision arising from deviations from the calendar year basis of reporting. Under certain circumstances when deviations between data reported on calendar year basis and non-calendar year basis in economic surveys are considered to be significant, national accounting compilation procedures are needed to adjust the results from the surveys. 4.72 For commercial establishments in community, social and personal services, only a small scale survey was undertaken. In view of the diversity in the range of services provided by these establishments, coverage may be incomplete. Other related sources of data such as employment and earnings statistics and profits tax statistics are used to cross-check the survey data and adjustments are made where necessary. 4.73 Imputed rentals are subject to limitations due to incomplete coverage with regard to buildings owned and occupied by private non-profit institutions. Also, the procedure for assessing the market rentals of different types of properties is necessarily imprecise, since market information on special purpose buildings such as hospitals and schools is virtually non-existent.
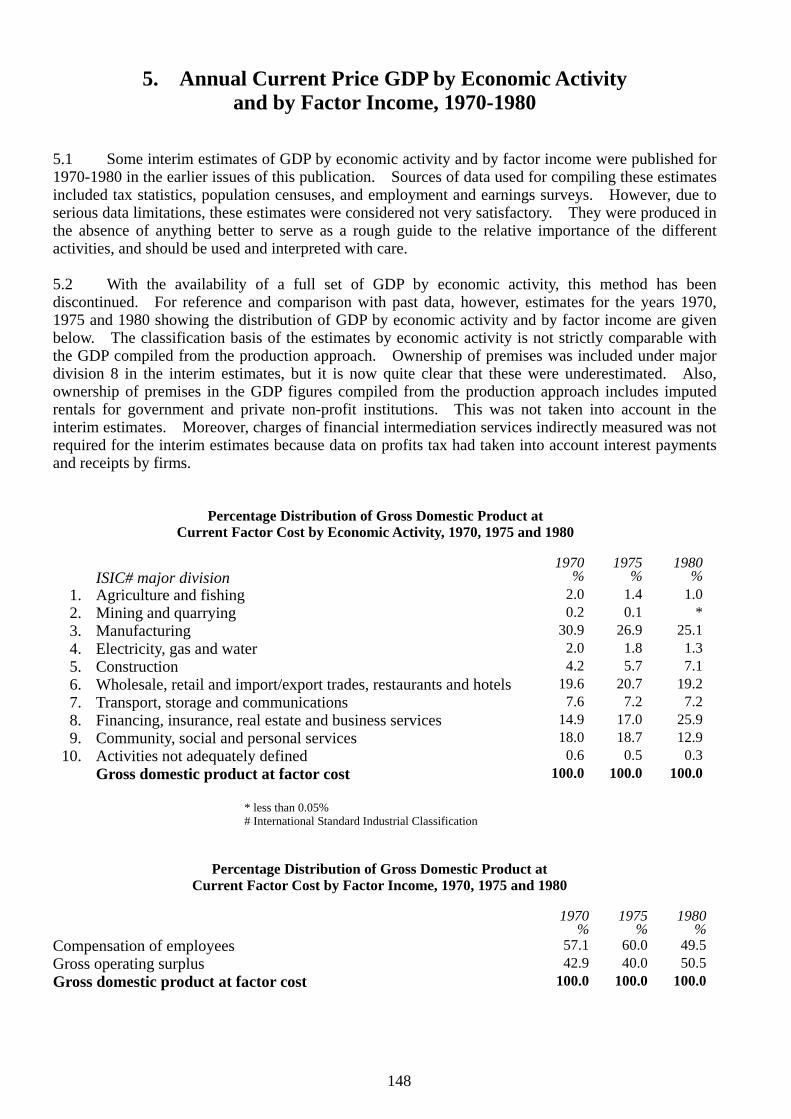
148
5. Annual Current Price GDP by Economic Activity and by Factor Income, 1970-1980
5.1 Some interim estimates of GDP by economic activity and by factor income were published for 1970-1980 in the earlier issues of this publication. Sources of data used for compiling these estimates included tax statistics, population censuses, and employment and earnings surveys. However, due to serious data limitations, these estimates were considered not very satisfactory. They were produced in the absence of anything better to serve as a rough guide to the relative importance of the different activities, and should be used and interpreted with care. 5.2 With the availability of a full set of GDP by economic activity, this method has been discontinued. For reference and comparison with past data, however, estimates for the years 1970, 1975 and 1980 showing the distribution of GDP by economic activity and by factor income are given below. The classification basis of the estimates by economic activity is not strictly comparable with the GDP compiled from the production approach. Ownership of premises was included under major division 8 in the interim estimates, but it is now quite clear that these were underestimated. Also, ownership of premises in the GDP figures compiled from the production approach includes imputed rentals for government and private non-profit institutions. This was not taken into account in the interim estimates. Moreover, charges of financial intermediation services indirectly measured was not required for the interim estimates because data on profits tax had taken into account interest payments and receipts by firms.
Percentage Distribution of Gross Domestic Product at Current Factor Cost by Economic Activity, 1970, 1975 and 1980
ISIC# major division 1970
% 1975
% 1980
%1. Agriculture and fishing 2.0 1.4 1.02. Mining and quarrying 0.2 0.1 *3. Manufacturing 30.9 26.9 25.14. Electricity, gas and water 2.0 1.8 1.35. Construction 4.2 5.7 7.16. Wholesale, retail and import/export trades, restaurants and hotels 19.6 20.7 19.27. Transport, storage and communications 7.6 7.2 7.28. Financing, insurance, real estate and business services 14.9 17.0 25.99. Community, social and personal services 18.0 18.7 12.9
10. Activities not adequately defined 0.6 0.5 0.3 Gross domestic product at factor cost 100.0 100.0 100.0
* less than 0.05% # International Standard Industrial Classification
Percentage Distribution of Gross Domestic Product at Current Factor Cost by Factor Income, 1970, 1975 and 1980
1970
% 1975
% 1980
%Compensation of employees 57.1 60.0 49.5Gross operating surplus 42.9 40.0 50.5Gross domestic product at factor cost 100.0 100.0 100.0
149
6. Gross National Product (GNP) Introduction 6.1 The Census and Statistics Department has started to compile Gross National Product (GNP) since the reference year of 1993 to meet a growing demand for such data to analyse the Hong Kong economy. This Section provides the basic concepts and compilation methods related to GNP.
Conceptual framework and method of compiling GNP
6.2 GDP is an aggregate measure of the total value of production of all resident producing units within the economic territory of an economy in a specified period, before deducting allowance for consumption of fixed capital. Since production is rewarded by income, GDP also measures the total income arising from such current production, irrespective of whether the factors (labour, capital) for producing the goods or providing the services are owned by residents or by non-residents. 6.3 GNP, on the other hand, is a measure of the total income earned by residents of an economy from engaging in various economic activities, irrespective of whether the economic activities are carried out within the economic territory or outside. In other words, in compiling GNP, earnings of residents from various economic activities within or outside the economic territory are included, whereas earnings of non-residents from economic activities within the economic territory are excluded. 6.4 GNP is compiled by the following formula:
GNP = GDP + Factor income earned by residents from outside the economic territory – Factor income earned by non-residents from within the economic territory
6.5 As can be seen above, the concept of “resident” is crucial to the compilation of both GDP and GNP. Practically, residents of an economy include individuals and organisations. According to international statistical standards, for individuals, residents refer to those who normally stay in the economic territory of the economy, irrespective of their nationality. For organisations, residents refer to those which ordinarily operate in the economic territory. The economic territory of an economy is the geographic territory administered by the government of the economy within which persons, goods and capital circulate freely. Conceptually, the residence status of individuals and organisations depends on their centre of economic interest. 6.6 GNP at constant market prices is obtained by adding to GDP at constant market prices the real net External Factor Income Flow (EFIF). Real net EFIF is obtained by deflating nominal EFIFs based on the implicit price deflator of domestic demand. 6.7 On 1 July 1997, Hong Kong became a Special Administrative Region of the People's Republic of China. Data on transactions, and assets and liabilities vis-à-vis the mainland of China (the Mainland) are treated as external transactions and external positions respectively. Hence, factor income flows between Hong Kong and the Mainland are treated as external factor income flows and are covered in Hong Kong's GNP figures.
150
Major components of external factor income flows (EFIF)
6.8 The classification of EFIF is basically similar to the classification of standard components of the Income Account of the Balance of Payments Manual (BPM) published by the International Monetary Fund in 1993. These income components are direct investment income (DII), portfolio investment income (PII), other investment income (OII) and compensation of employees (CE).
Direct investment income 6.9 DII refers to earnings of residents from direct investment in business outside the economic territory, in which they have a lasting interest and a degree of influence or control over the management. These earnings are in the form of net interest receipts on intercompany debts, receipts of distributed dividends, share of undistributed profits and gross rentals. 6.10 External investment in real estate, as specified by BPM, is also a form of direct investment. By statistical convention, land and other immovable structures and objects (e.g. building) in an economy can only be owned by residents of that economy. If a Hong Kong resident owns real estate outside the economic territory of Hong Kong, he should be regarded as owning a nominal company in the economy in question which in turn owns the real estate. The relationship between such nominal company and legal owner of the land and structures is then treated as a direct investment relationship. 6.11 In general, if a Hong Kong company creates a business entity outside the economic territory of Hong Kong for the purpose of holding some assets in Hong Kong, the income generated by those assets will be compiled as income outflow to the business entity, and then as income inflow from the entity back to the final owner(s) of the investment.
Portfolio investment income 6.12 PII refers to earnings of residents from investment in non-resident equities (i.e. stocks and shares) and debt securities (e.g. negotiable certificates of deposits, bonds and bills). Compared with investors making direct investment, portfolio investors in equity and debt securities of non-resident business enterprises have no lasting interest or influence in the management of the companies they invest. A holding of less than 10% of equity in a company is regarded as portfolio investment. 6.13 The residence status of securities is determined by the legal domicile and place of productive operation of the issuing company, irrespective of the place of listing. Therefore, shares that are issued by resident companies are regarded as resident shares. In a stock exchange of an economy, there may be both listings of resident and non-resident shares.
Other investment income 6.14 OII refers to external flows of interest incomes derived from other financial claims on and liabilities to non-residents that are not classified as DII or PII. Examples of these claims and liabilities include short-term and long-term non-marketable loans, deposits, financial leases and trade credit.
Compensation of employees 6.15 CE refers to labour income earned by non-residents from their employment within the economic territory of Hong Kong and labour income earned by residents from their employment outside the
151
economic territory of Hong Kong. It comprises wages, salaries and other remuneration whether paid in cash or in kind. 6.16 Labour income earned by Hong Kong residents from Mainland enterprises due to employment in personal capacity in the Mainland is classified as CE inflow of Hong Kong. For Hong Kong residents who frequently travel to and from the Mainland in their work, the labour income they earn from their employers in Hong Kong is, however, not included in CE inflow. On the contrary, for Hong Kong people who reside in the neighboring Mainland cities and commute daily from there to work in Hong Kong, they are regarded as residents of the Mainland under the principle of principal residence. Accordingly, the labour income they earn from their employers in Hong Kong is included in CE outflow. 6.17 According to international statistical standard, foreign embassies, consulates and government offices located in an economy are considered non-residents of the economy. Therefore, the labour income earned by Hong Kong residents working from employment in such organisations in Hong Kong is regarded as CE inflow. On the other hand, the labour income earned by local staff of Hong Kong government offices located in other economies is regarded as CE outflow. 6.18 Some Hong Kong people work outside the economic territory of Hong Kong in the capacity of freelance specialists (e.g. singers, lawyers, doctors). Usually they work as employees of Hong Kong companies owned by themselves which are created for signing legal binding contracts with non-residents and for receiving earnings. The earnings of these freelance specialists from outside the economic territory of Hong Kong are treated as trade in services and are already covered in GDP.
Methods and Data Sources
Survey of External Claims, Liabilities and Income 6.19 GNP is compiled based on GDP and data on EFIF collected from the Survey of External Claims, Liabilities and Income (SECLI), supplemented by data from other sources. The survey is conducted under the provision of the Census and Statistics ordinance.
Survey coverage and data collection method 6.20 The survey covers all business undertakings which are residents of Hong Kong. A business undertaking is an undertaking carrying on any business with or without a view to profit and includes any such undertaking carried on by the government or a statutory corporation. 6.21 An integrated inquiry form is used in the survey whereby data of all EFIF components are collected. Besides facilitating field work, the form also helps avoid any potential duplicate reporting of the same income flows under different income components.
Data reporting arrangements
Accounting units for data reporting 6.22 A business undertaking is required to report information on EFIF during the reference period, including EFIFs that it generates on its own account (own-account reporting), and EFIFs accrued to its clients on which it possesses the relevant information (pass-through reporting).
152
6.23 For own-account data reporting, the accounting unit is a Hong Kong Enterprise Group (HKEG) where the Hong Kong top company is the contact point for own-account reporting at the HKEG level. 6.24 For pass-through data reporting, the accounting unit is a single Hong Kong company. Very often income flows from portfolio investment are passed through local financial intermediaries or agents. These financial intermediaries or agents are thus able to report on behalf of their clients the relevant data required by the survey. Their clients include households, companies, government units and non-profit institutions.
Target companies for data reporting 6.25 Only those designated as target companies in the survey are responsible for completing questionnaires. Companies other than target companies are not required to complete any questionnaire because their EFIF data would be reported by target companies on their behalf. 6.26 Hong Kong top companies of HKEGs are designated as target companies for reporting DII inflow and outflow with reference to the consolidated account of the respective enterprise groups. Other companies are designated as target companies if they are any of the following:
(a) companies which are not top companies but owning foreign branches and/or subsidiaries; (b) companies listed on the Stock Exchange of Hong Kong (SEHK); (c) companies engaged in banking, insurance, share registration, fund management,
custodian or money lending businesses other than banks; and (d) companies which have external claims, liabilities and income transactions where no
Hong Kong agent is involved. 6.27 All target companies mentioned above form the target population of business undertakings for enumeration.
Dividend data reported by share registrars, fund management companies and custodians 6.28 Since many parties are involved in a financial transaction and there are agent-to-agent dealings, target companies of different business sectors are selected to report EFIF data with respect to different types of financial instruments, in order to ensure full coverage but to avoid duplications. 6.29 For example, share registrars are required to report dividends on resident shares listed on SEHK distributed to non-residents, and dividends received by residents on non-resident shares listed on SEHK. Local custodians and fund managers are asked to report dividends earned on behalf of non-resident clients or non-resident funds from investments in resident and non-resident shares listed on SEHK. Dividends earned from resident shares on behalf of non-residents are added to the dividend outflow figures obtained from share registrars, while those earned from non-resident shares on behalf of non-residents are deducted from the dividend inflow figures obtained from share registrars.
Investment income data versus investment position data 6.30 To help alleviate reporting burden of custodians and fund managers who usually only keep data on realised gains (i.e. capital gains plus investment income) from which income data cannot be identified separately, they are requested to report the market value of securities held by them at the beginning and end of the reference period. Income data are then derived from these investment position data by using representative market yields.
153
6.31 Banks are heavily involved in external placement of funds. These income transactions are voluminous and may not even be separately recorded in their accounts. To reduce their reporting burden, they are asked to report only their positions of external assets and liabilities, which they are already reporting to the Hong Kong Monetary Authority, as well as estimates of average interest rates, so that the corresponding EFIFs can be derived.
CE flows 6.32 In light of growing number of Hong Kong people working and/or residing in the Mainland, and offices set up outside the territory by the Hong Kong Government in recent years, enhancements to the methodology for compiling CE estimates have been made on the basis of more relevant data obtained from various sources. A revised series of CE estimates has also been backdated to 1993.
Limitations of the EFIF Statistics 6.33 Given the close economic links between Hong Kong and the mainland of China, it is common that some Hong Kong individuals have made direct investment in the mainland of China without setting up companies in Hong Kong. As individuals making direct investment outside Hong Kong without setting up a registered firm are not covered by SECLI, the income flows generated are estimated from other sources. 6.34 Local financial intermediaries and agents are the main data suppliers of PII on behalf of their clients. For those households making portfolio investment without involving local financial intermediaries and agents, the income flows generated are not captured under the present reporting arrangement, but the amount involved is expected to be insignificant. 6.35 Some resident households may have offshore deposits. The interest earnings generated by such deposits are not captured by SECLI, but estimated from other sources.
Real Gross National Income 6.36 While the real output of an economy is usually represented by GDP at constant market prices, the real purchasing power of the output of an economy may be represented by Real Gross Domestic Income (RGDI), as described in paragraphs 3.70-3.75. Corresponding to RGDI, the real purchasing power of the total income earned by residents of an economy may be represented by Real Gross National Income (RGNI), which is obtained by adding to RGDI the real net EFIF. RGNI is a useful explanatory variable in studies on various income related economic phenomena such as consumption demand, investment intention and inflation.
Revision and Publication of GNP and EFIF Statistics
6.37 Preliminary figures on quarterly GNP and EFIF, compiled from the corresponding GDP figures and results of SECLI, are released within 3 months after the reference quarter. GNP and EFIF at current market prices for 2000 to 2004 and the first quarter of 2003 to the fourth quarter of 2004 are presented in Table A. GNP at constant (2000) prices and RGNI (2000-based) for 2001 to 2004 and the first quarter of 2001 to the fourth quarter of 2004 are shown in Table B.
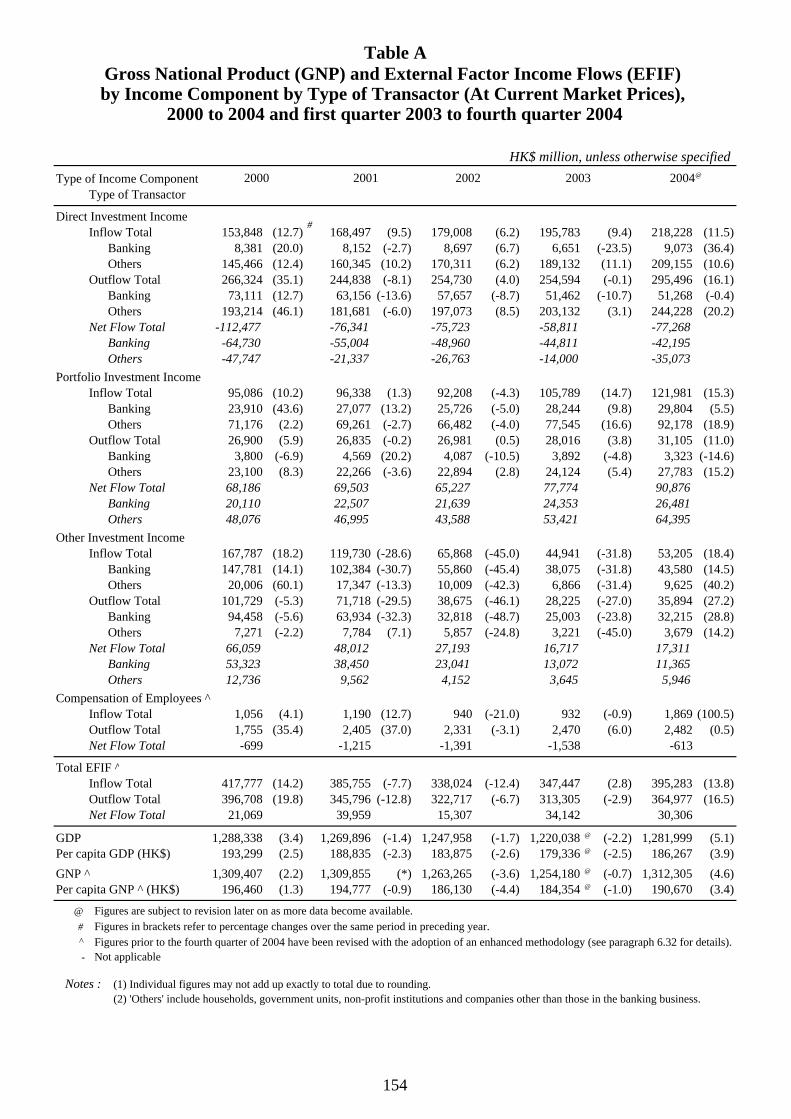
HK$ million, unless otherwise specifiedType of Income Component
Type of Transactor
Direct Investment IncomeInflow Total 153,848 (12.7) 168,497 (9.5) 179,008 (6.2) 195,783 (9.4) 218,228 (11.5)
Banking 8,381 (20.0) 8,152 (-2.7) 8,697 (6.7) 6,651 (-23.5) 9,073 (36.4)Others 145,466 (12.4) 160,345 (10.2) 170,311 (6.2) 189,132 (11.1) 209,155 (10.6)
Outflow Total 266,324 (35.1) 244,838 (-8.1) 254,730 (4.0) 254,594 (-0.1) 295,496 (16.1)Banking 73,111 (12.7) 63,156 (-13.6) 57,657 (-8.7) 51,462 (-10.7) 51,268 (-0.4)Others 193,214 (46.1) 181,681 (-6.0) 197,073 (8.5) 203,132 (3.1) 244,228 (20.2)
Net Flow Total -112,477 -76,341 -75,723 -58,811 -77,268Banking -64,730 -55,004 -48,960 -44,811 -42,195Others -47,747 -21,337 -26,763 -14,000 -35,073
Portfolio Investment IncomeInflow Total 95,086 (10.2) 96,338 (1.3) 92,208 (-4.3) 105,789 (14.7) 121,981 (15.3)
Banking 23,910 (43.6) 27,077 (13.2) 25,726 (-5.0) 28,244 (9.8) 29,804 (5.5)Others 71,176 (2.2) 69,261 (-2.7) 66,482 (-4.0) 77,545 (16.6) 92,178 (18.9)
Outflow Total 26,900 (5.9) 26,835 (-0.2) 26,981 (0.5) 28,016 (3.8) 31,105 (11.0)Banking 3,800 (-6.9) 4,569 (20.2) 4,087 (-10.5) 3,892 (-4.8) 3,323 (-14.6)Others 23,100 (8.3) 22,266 (-3.6) 22,894 (2.8) 24,124 (5.4) 27,783 (15.2)
Net Flow Total 68,186 69,503 65,227 77,774 90,876Banking 20,110 22,507 21,639 24,353 26,481Others 48,076 46,995 43,588 53,421 64,395
Other Investment IncomeInflow Total 167,787 (18.2) 119,730 (-28.6) 65,868 (-45.0) 44,941 (-31.8) 53,205 (18.4)
Banking 147,781 (14.1) 102,384 (-30.7) 55,860 (-45.4) 38,075 (-31.8) 43,580 (14.5)Others 20,006 (60.1) 17,347 (-13.3) 10,009 (-42.3) 6,866 (-31.4) 9,625 (40.2)
Outflow Total 101,729 (-5.3) 71,718 (-29.5) 38,675 (-46.1) 28,225 (-27.0) 35,894 (27.2)Banking 94,458 (-5.6) 63,934 (-32.3) 32,818 (-48.7) 25,003 (-23.8) 32,215 (28.8)Others 7,271 (-2.2) 7,784 (7.1) 5,857 (-24.8) 3,221 (-45.0) 3,679 (14.2)
Net Flow Total 66,059 48,012 27,193 16,717 17,311Banking 53,323 38,450 23,041 13,072 11,365Others 12,736 9,562 4,152 3,645 5,946
Compensation of Employees ^Inflow Total 1,056 (4.1) 1,190 (12.7) 940 (-21.0) 932 (-0.9) 1,869 (100.5)Outflow Total 1,755 (35.4) 2,405 (37.0) 2,331 (-3.1) 2,470 (6.0) 2,482 (0.5)Net Flow Total -699 -1,215 -1,391 -1,538 -613
Total EFIF ^Inflow Total 417,777 (14.2) 385,755 (-7.7) 338,024 (-12.4) 347,447 (2.8) 395,283 (13.8)Outflow Total 396,708 (19.8) 345,796 (-12.8) 322,717 (-6.7) 313,305 (-2.9) 364,977 (16.5)Net Flow Total 21,069 39,959 15,307 34,142 30,306
GDP 1,288,338 (3.4) 1,269,896 (-1.4) 1,247,958 (-1.7) 1,220,038 @ (-2.2) 1,281,999 (5.1)Per capita GDP (HK$) 193,299 (2.5) 188,835 (-2.3) 183,875 (-2.6) 179,336 @ (-2.5) 186,267 (3.9)GNP ^ 1,309,407 (2.2) 1,309,855 (*) 1,263,265 (-3.6) 1,254,180 @ (-0.7) 1,312,305 (4.6)Per capita GNP ^ (HK$) 196,460 (1.3) 194,777 (-0.9) 186,130 (-4.4) 184,354 @ (-1.0) 190,670 (3.4)
@#^-
Notes : (1) Individual figures may not add up exactly to total due to rounding. (2) 'Others' include households, government units, non-profit institutions and companies other than those in the banking business.
Table AGross National Product (GNP) and External Factor Income Flows (EFIF) by Income Component by Type of Transactor (At Current Market Prices),
2000 to 2004 and first quarter 2003 to fourth quarter 2004
#
20012000 2002 2003 2004@
Not applicable
Figures are subject to revision later on as more data become available. Figures in brackets refer to percentage changes over the same period in preceding year. Figures prior to the fourth quarter of 2004 have been revised with the adoption of an enhanced methodology (see paragraph 6.32 for details).
154
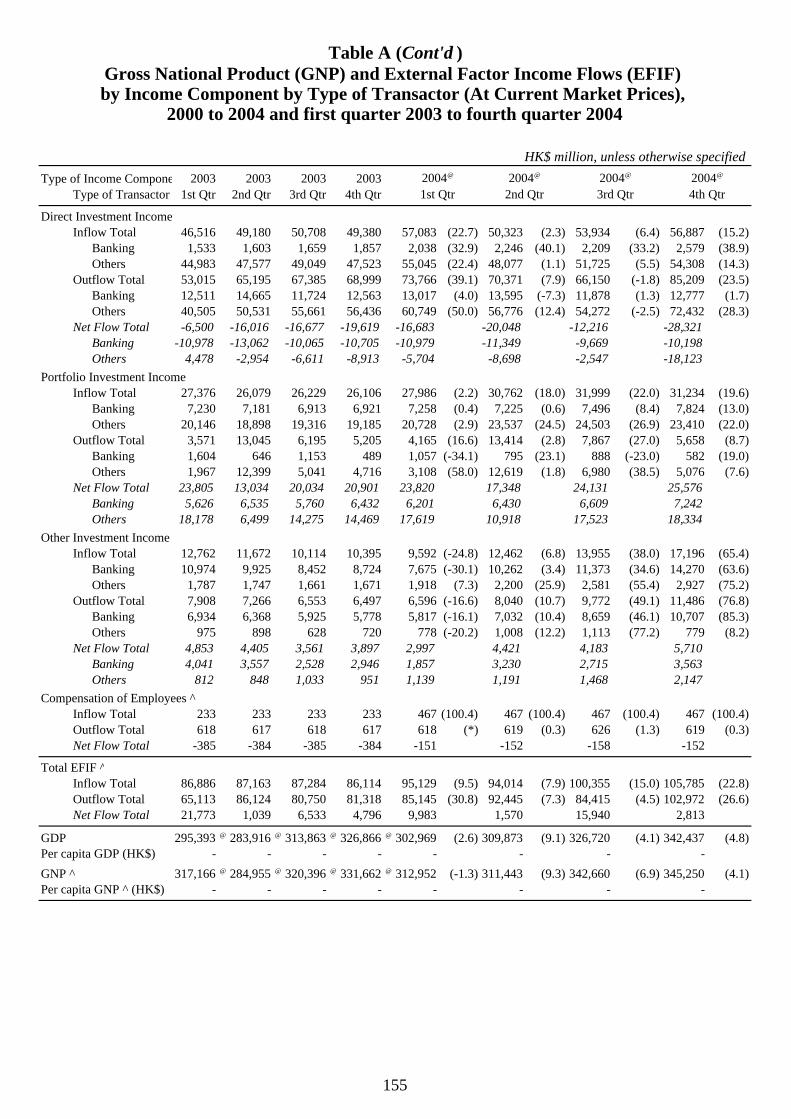
HK$ million, unless otherwise specifiedType of Income Compone 2003 2003 2003 2003
Type of Transactor 1st Qtr 2nd Qtr 3rd Qtr 4th Qtr
Direct Investment IncomeInflow Total 46,516 49,180 50,708 49,380 57,083 (22.7) 50,323 (2.3) 53,934 (6.4) 56,887 (15.2)
Banking 1,533 1,603 1,659 1,857 2,038 (32.9) 2,246 (40.1) 2,209 (33.2) 2,579 (38.9)Others 44,983 47,577 49,049 47,523 55,045 (22.4) 48,077 (1.1) 51,725 (5.5) 54,308 (14.3)
Outflow Total 53,015 65,195 67,385 68,999 73,766 (39.1) 70,371 (7.9) 66,150 (-1.8) 85,209 (23.5)Banking 12,511 14,665 11,724 12,563 13,017 (4.0) 13,595 (-7.3) 11,878 (1.3) 12,777 (1.7)Others 40,505 50,531 55,661 56,436 60,749 (50.0) 56,776 (12.4) 54,272 (-2.5) 72,432 (28.3)
Net Flow Total -6,500 -16,016 -16,677 -19,619 -16,683 -20,048 -12,216 -28,321Banking -10,978 -13,062 -10,065 -10,705 -10,979 -11,349 -9,669 -10,198Others 4,478 -2,954 -6,611 -8,913 -5,704 -8,698 -2,547 -18,123
Portfolio Investment IncomeInflow Total 27,376 26,079 26,229 26,106 27,986 (2.2) 30,762 (18.0) 31,999 (22.0) 31,234 (19.6)
Banking 7,230 7,181 6,913 6,921 7,258 (0.4) 7,225 (0.6) 7,496 (8.4) 7,824 (13.0)Others 20,146 18,898 19,316 19,185 20,728 (2.9) 23,537 (24.5) 24,503 (26.9) 23,410 (22.0)
Outflow Total 3,571 13,045 6,195 5,205 4,165 (16.6) 13,414 (2.8) 7,867 (27.0) 5,658 (8.7)Banking 1,604 646 1,153 489 1,057 (-34.1) 795 (23.1) 888 (-23.0) 582 (19.0)Others 1,967 12,399 5,041 4,716 3,108 (58.0) 12,619 (1.8) 6,980 (38.5) 5,076 (7.6)
Net Flow Total 23,805 13,034 20,034 20,901 23,820 17,348 24,131 25,576Banking 5,626 6,535 5,760 6,432 6,201 6,430 6,609 7,242Others 18,178 6,499 14,275 14,469 17,619 10,918 17,523 18,334
Other Investment IncomeInflow Total 12,762 11,672 10,114 10,395 9,592 (-24.8) 12,462 (6.8) 13,955 (38.0) 17,196 (65.4)
Banking 10,974 9,925 8,452 8,724 7,675 (-30.1) 10,262 (3.4) 11,373 (34.6) 14,270 (63.6)Others 1,787 1,747 1,661 1,671 1,918 (7.3) 2,200 (25.9) 2,581 (55.4) 2,927 (75.2)
Outflow Total 7,908 7,266 6,553 6,497 6,596 (-16.6) 8,040 (10.7) 9,772 (49.1) 11,486 (76.8)Banking 6,934 6,368 5,925 5,778 5,817 (-16.1) 7,032 (10.4) 8,659 (46.1) 10,707 (85.3)Others 975 898 628 720 778 (-20.2) 1,008 (12.2) 1,113 (77.2) 779 (8.2)
Net Flow Total 4,853 4,405 3,561 3,897 2,997 4,421 4,183 5,710Banking 4,041 3,557 2,528 2,946 1,857 3,230 2,715 3,563Others 812 848 1,033 951 1,139 1,191 1,468 2,147
Compensation of Employees ^Inflow Total 233 233 233 233 467 (100.4) 467 (100.4) 467 (100.4) 467 (100.4)Outflow Total 618 617 618 617 618 (*) 619 (0.3) 626 (1.3) 619 (0.3)Net Flow Total -385 -384 -385 -384 -151 -152 -158 -152
Total EFIF ^Inflow Total 86,886 87,163 87,284 86,114 95,129 (9.5) 94,014 (7.9) 100,355 (15.0) 105,785 (22.8)Outflow Total 65,113 86,124 80,750 81,318 85,145 (30.8) 92,445 (7.3) 84,415 (4.5) 102,972 (26.6)Net Flow Total 21,773 1,039 6,533 4,796 9,983 1,570 15,940 2,813
GDP 295,393 @ 283,916 @ 313,863 @ 326,866 @ 302,969 (2.6) 309,873 (9.1) 326,720 (4.1) 342,437 (4.8)Per capita GDP (HK$) - - - - - - - -GNP ^ 317,166 @ 284,955 @ 320,396 @ 331,662 @ 312,952 (-1.3) 311,443 (9.3) 342,660 (6.9) 345,250 (4.1)Per capita GNP ^ (HK$) - - - - - - - -
2004@
4th Qtr
Table A (Cont'd )Gross National Product (GNP) and External Factor Income Flows (EFIF) by Income Component by Type of Transactor (At Current Market Prices),
2000 to 2004 and first quarter 2003 to fourth quarter 2004
2004@
3rd Qtr2004@ 2004@
2nd Qtr1st Qtr
155
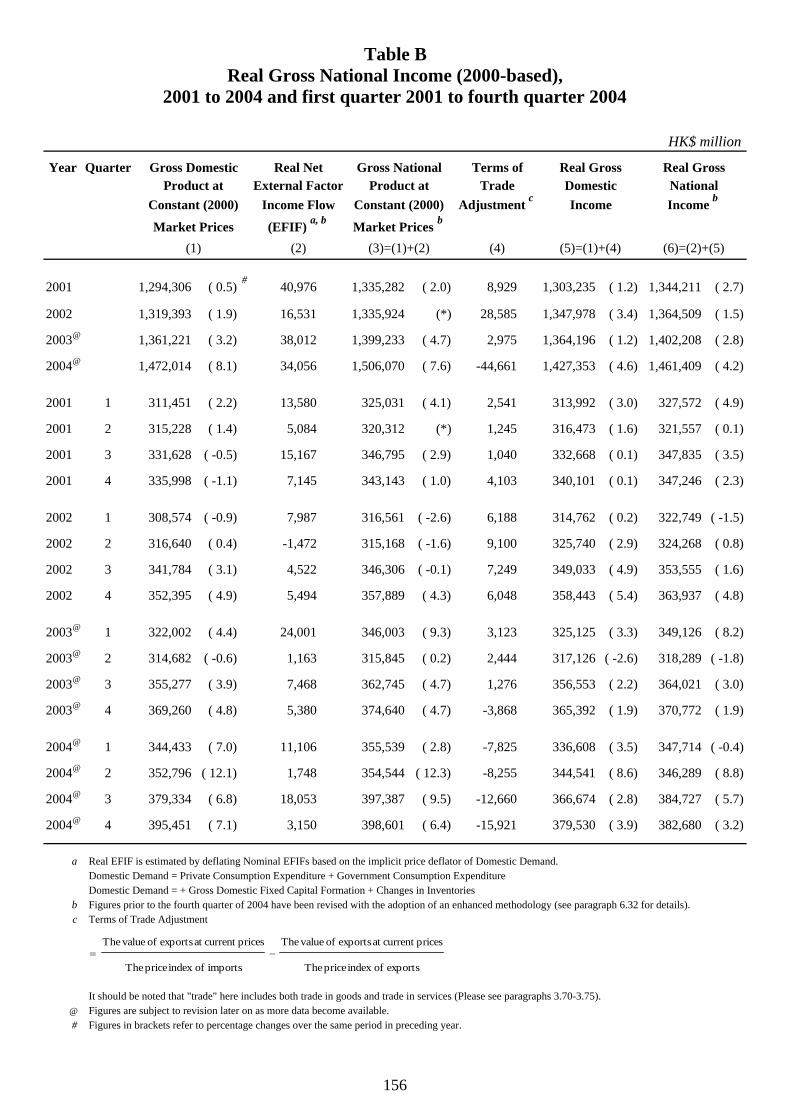
HK$ million
Year Gross Domestic Real Net Gross National Terms of Real Gross Real GrossProduct at External Factor Product at Trade Domestic National
Constant (2000) Income Flow Constant (2000) Adjustment c Income Income b
Market Prices (EFIF) a, b Market Prices b
(1) (2) (3)=(1)+(2) (4) (5)=(1)+(4) (6)=(2)+(5)
2001 1,294,306 ( 0.5) # 40,976 1,335,282 ( 2.0) 8,929 1,303,235 ( 1.2) 1,344,211 ( 2.7)
2002 1,319,393 ( 1.9) 16,531 1,335,924 (*) 28,585 1,347,978 ( 3.4) 1,364,509 ( 1.5)
2003@ 1,361,221 ( 3.2) 38,012 1,399,233 ( 4.7) 2,975 1,364,196 ( 1.2) 1,402,208 ( 2.8)
2004@ 1,472,014 ( 8.1) 34,056 1,506,070 ( 7.6) -44,661 1,427,353 ( 4.6) 1,461,409 ( 4.2)
2001 311,451 ( 2.2) 13,580 325,031 ( 4.1) 2,541 313,992 ( 3.0) 327,572 ( 4.9)
2001 315,228 ( 1.4) 5,084 320,312 (*) 1,245 316,473 ( 1.6) 321,557 ( 0.1)
2001 331,628 ( -0.5) 15,167 346,795 ( 2.9) 1,040 332,668 ( 0.1) 347,835 ( 3.5)
2001 335,998 ( -1.1) 7,145 343,143 ( 1.0) 4,103 340,101 ( 0.1) 347,246 ( 2.3)
2002 308,574 ( -0.9) 7,987 316,561 ( -2.6) 6,188 314,762 ( 0.2) 322,749 ( -1.5)
2002 316,640 ( 0.4) -1,472 315,168 ( -1.6) 9,100 325,740 ( 2.9) 324,268 ( 0.8)
2002 341,784 ( 3.1) 4,522 346,306 ( -0.1) 7,249 349,033 ( 4.9) 353,555 ( 1.6)
2002 352,395 ( 4.9) 5,494 357,889 ( 4.3) 6,048 358,443 ( 5.4) 363,937 ( 4.8)
2003@ 322,002 ( 4.4) 24,001 346,003 ( 9.3) 3,123 325,125 ( 3.3) 349,126 ( 8.2)
2003@ 314,682 ( -0.6) 1,163 315,845 ( 0.2) 2,444 317,126 ( -2.6) 318,289 ( -1.8)
2003@ 355,277 ( 3.9) 7,468 362,745 ( 4.7) 1,276 356,553 ( 2.2) 364,021 ( 3.0)
2003@ 369,260 ( 4.8) 5,380 374,640 ( 4.7) -3,868 365,392 ( 1.9) 370,772 ( 1.9)
2004@ 344,433 ( 7.0) 11,106 355,539 ( 2.8) -7,825 336,608 ( 3.5) 347,714 ( -0.4)
2004@ 352,796 ( 12.1) 1,748 354,544 ( 12.3) -8,255 344,541 ( 8.6) 346,289 ( 8.8)
2004@ 379,334 ( 6.8) 18,053 397,387 ( 9.5) -12,660 366,674 ( 2.8) 384,727 ( 5.7)
2004@ 395,451 ( 7.1) 3,150 398,601 ( 6.4) -15,921 379,530 ( 3.9) 382,680 ( 3.2)
a Real EFIF is estimated by deflating Nominal EFIFs based on the implicit price deflator of Domestic Demand. Domestic Demand = Private Consumption Expenditure + Government Consumption Expenditure Domestic Demand = + Gross Domestic Fixed Capital Formation + Changes in Inventories
bc Terms of Trade Adjustment
It should be noted that "trade" here includes both trade in goods and trade in services (Please see paragraphs 3.70-3.75).@ Figures are subject to revision later on as more data become available.# Figures in brackets refer to percentage changes over the same period in preceding year.
Figures prior to the fourth quarter of 2004 have been revised with the adoption of an enhanced methodology (see paragraph 6.32 for details).
1
2
3
4
4
Table BReal Gross National Income (2000-based),
2001 to 2004 and first quarter 2001 to fourth quarter 2004
4
Quarter
1
2
3
3
1
2
1
2
4
3
exports ofindex price The
pricescurrent at exports of valueThe
imports ofindex price The
pricescurrent at exports of valueThe−=
156