Embed Size (px)
Citation preview
2004 Results Presentation
7 March 2005
A
7 March 2005
Richard Nelson, Chief Executive Officer
Wolfhart Hauser, Chief Executive Officer
Bill Spencer, Chief Financial Officer
Bill Spencer
Chief Financial Officer
Financial Performance
A
2
Financial Performance
2004 Results Presentation – 7 March 2005
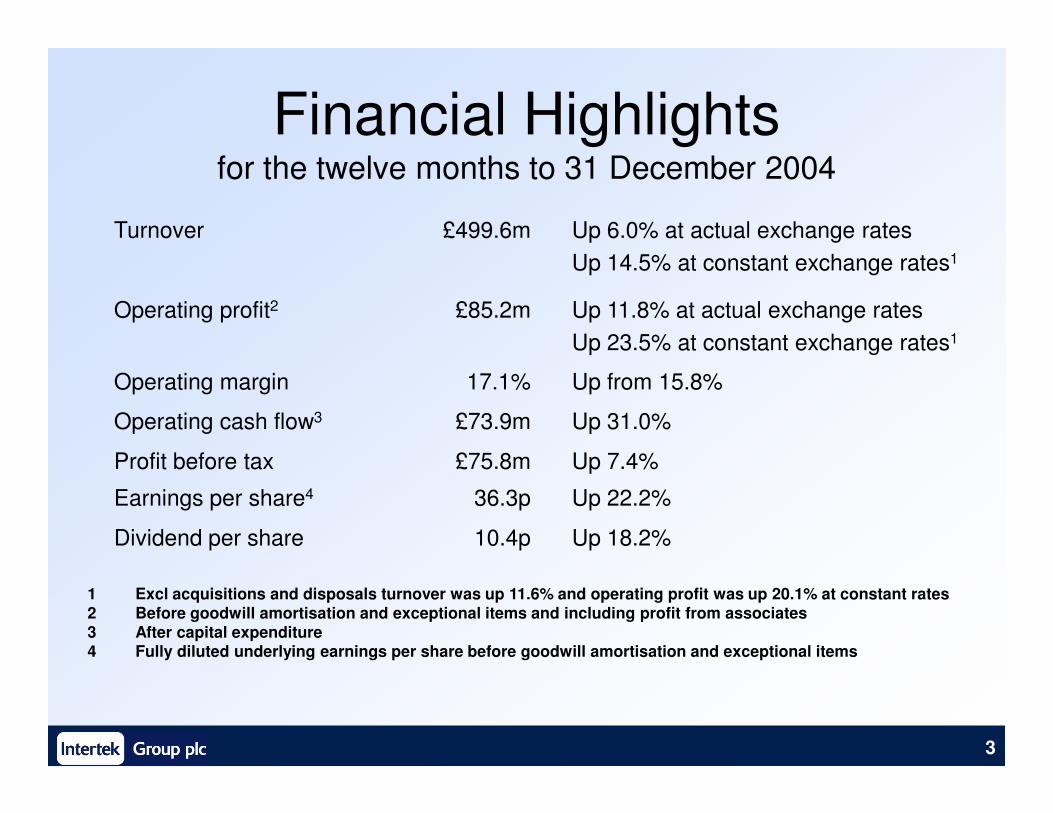
Financial Highlightsfor the twelve months to 31 December 2004
Turnover £499.6m Up 6.0% at actual exchange rates
Up 14.5% at constant exchange rates1
Operating profit2 £85.2m Up 11.8% at actual exchange rates
Up 23.5% at constant exchange rates1
Operating margin 17.1% Up from 15.8%
3
Operating cash flow3 £73.9m Up 31.0%
Profit before tax £75.8m Up 7.4%
Earnings per share4 36.3p Up 22.2%
Dividend per share 10.4p Up 18.2%
1 Excl acquisitions and disposals turnover was up 11.6% and operating profit was up 20.1% at constant rates2 Before goodwill amortisation and exceptional items and including profit from associates3 After capital expenditure4 Fully diluted underlying earnings per share before goodwill amortisation and exceptional items
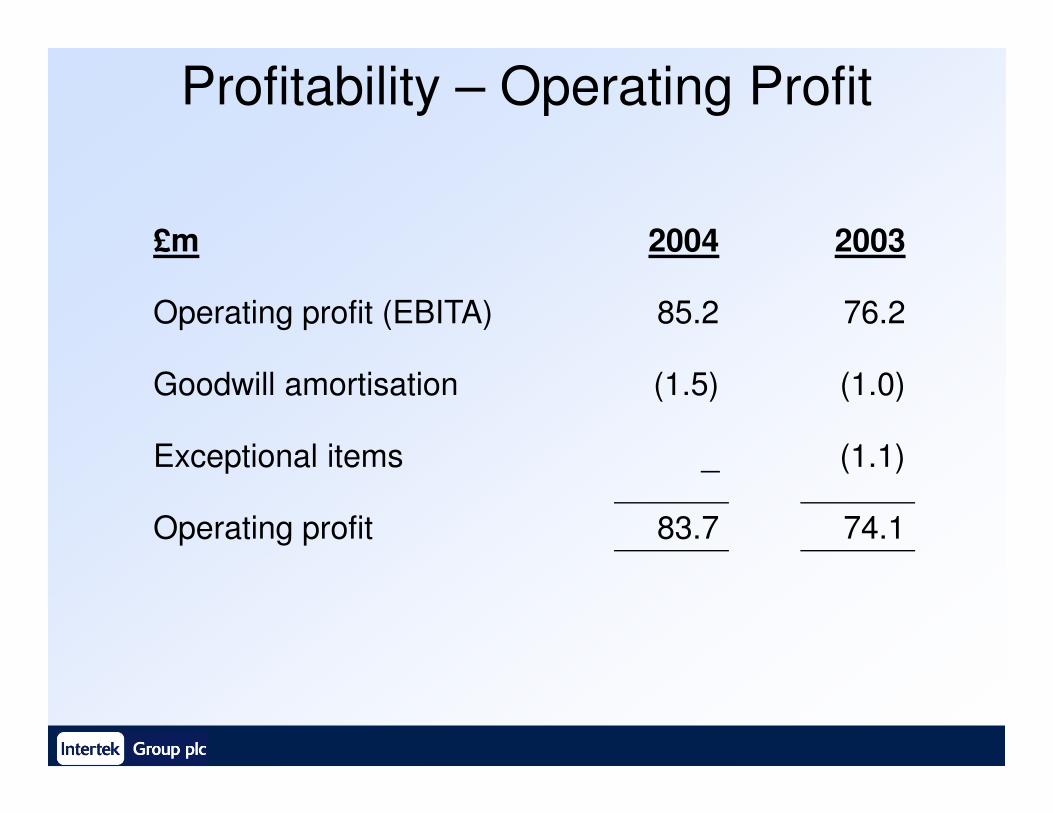
Profitability – Operating Profit
£m 2004 2003
Operating profit (EBITA) 85.2 76.2
Goodwill amortisation (1.5) (1.0)
Exceptional items _ (1.1)
Operating profit 83.7 74.1
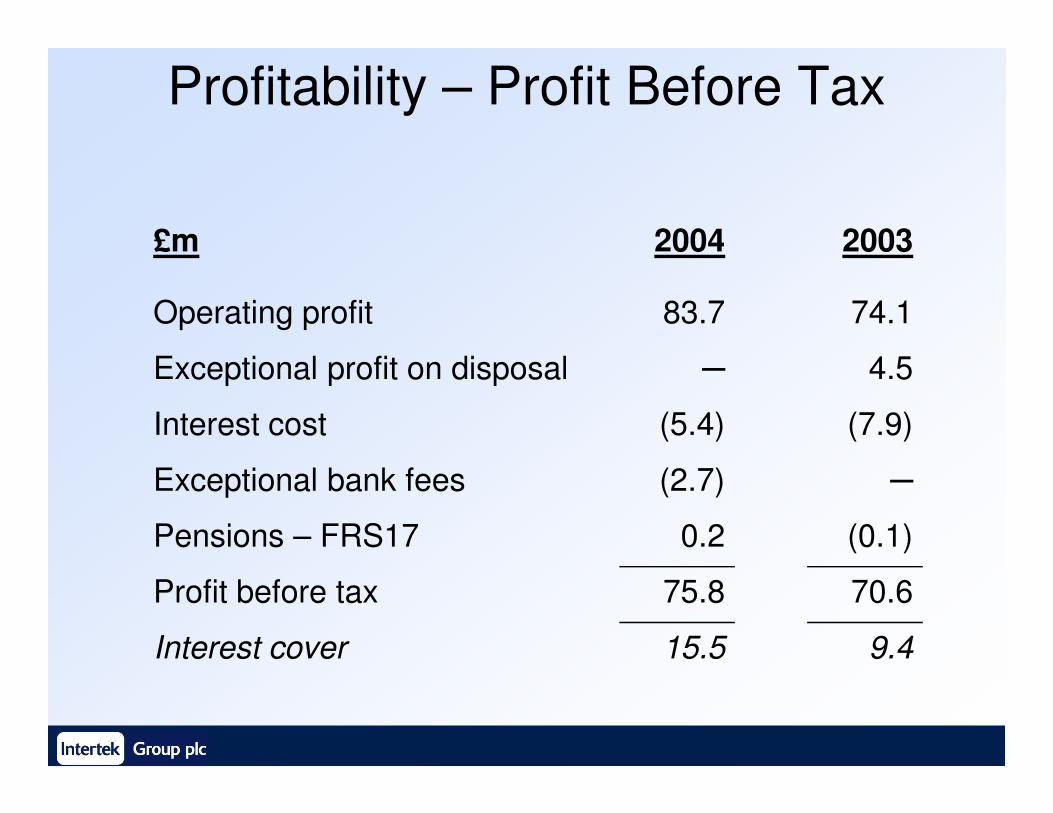
Profitability – Profit Before Tax
£m 2004 2003
Operating profit 83.7 74.1
Exceptional profit on disposal ─ 4.5
Interest cost (5.4) (7.9)Interest cost (5.4) (7.9)
Exceptional bank fees (2.7) ─
Pensions – FRS17 0.2 (0.1)
Profit before tax 75.8 70.6
Interest cover 15.5 9.4
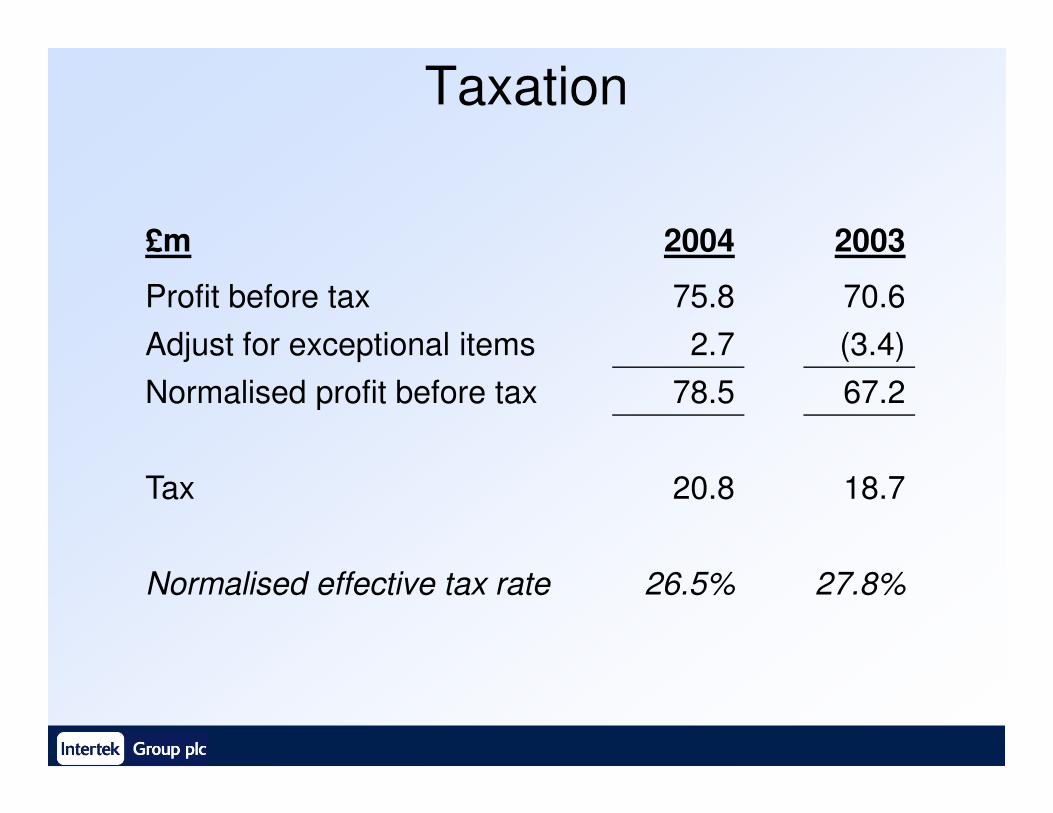
Taxation
£m 2004 2003
Profit before tax 75.8 70.6
Adjust for exceptional items 2.7 (3.4)
Normalised profit before tax 78.5 67.2Normalised profit before tax 78.5 67.2
Tax 20.8 18.7
Normalised effective tax rate 26.5% 27.8%
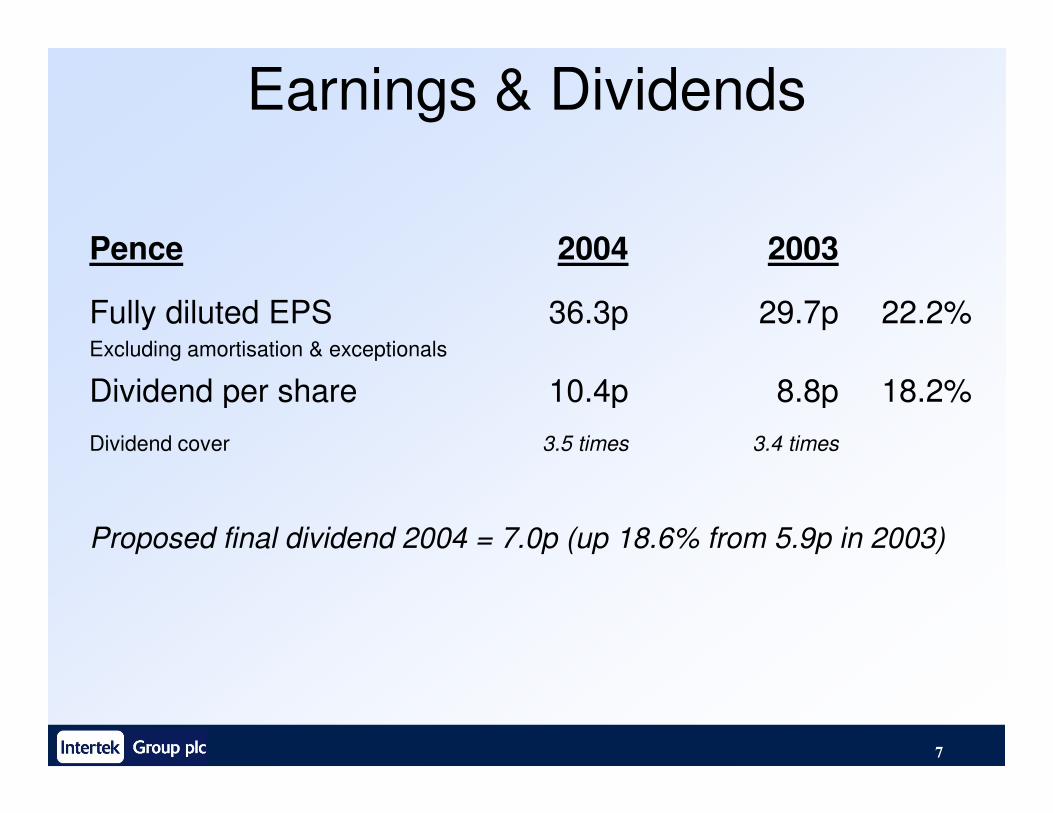
Earnings & Dividends
Pence 2004 2003
Fully diluted EPSExcluding amortisation & exceptionals
36.3p 29.7p 22.2%
Dividend per share 10.4p 8.8p 18.2%
7
Dividend per share 10.4p 8.8p 18.2%
Dividend cover 3.5 times 3.4 times
Proposed final dividend 2004 = 7.0p (up 18.6% from 5.9p in 2003)
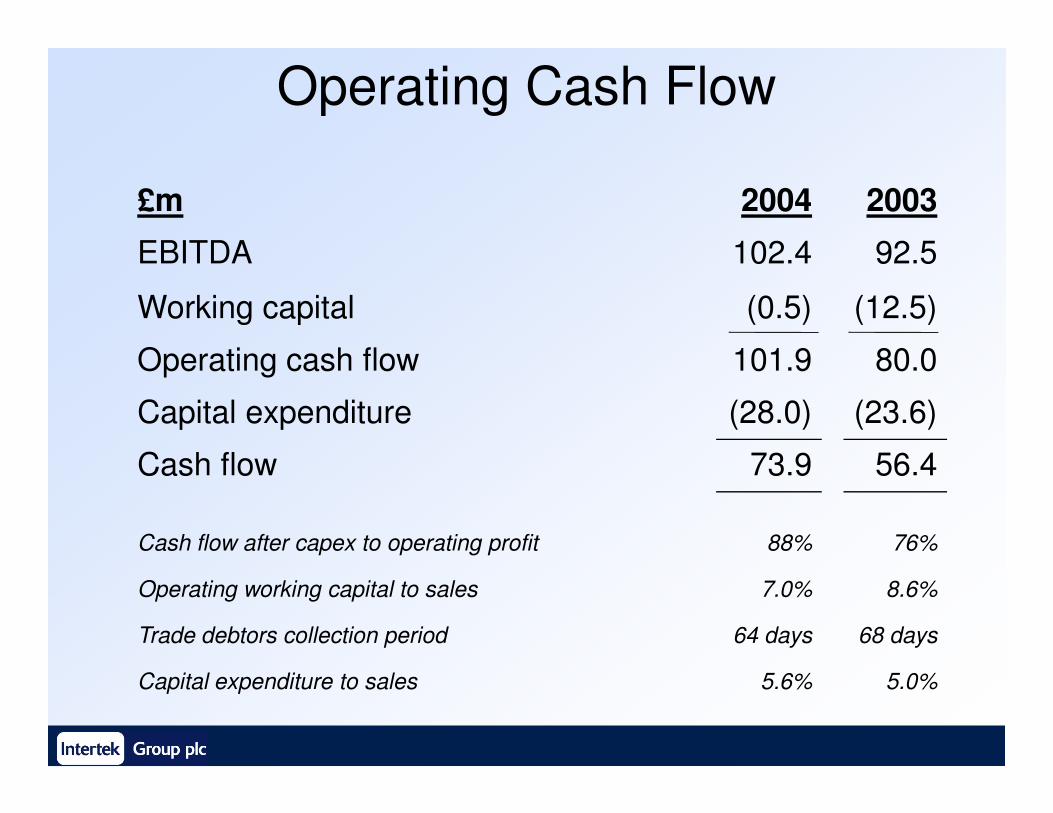
Operating Cash Flow
£m 2004 2003
EBITDA 102.4 92.5
Working capital (0.5) (12.5)
Operating cash flow 101.9 80.0
Capital expenditure (28.0) (23.6)Capital expenditure (28.0) (23.6)
Cash flow 73.9 56.4
Cash flow after capex to operating profit 88% 76%
Operating working capital to sales 7.0% 8.6%
Trade debtors collection period 64 days 68 days
Capital expenditure to sales 5.6% 5.0%
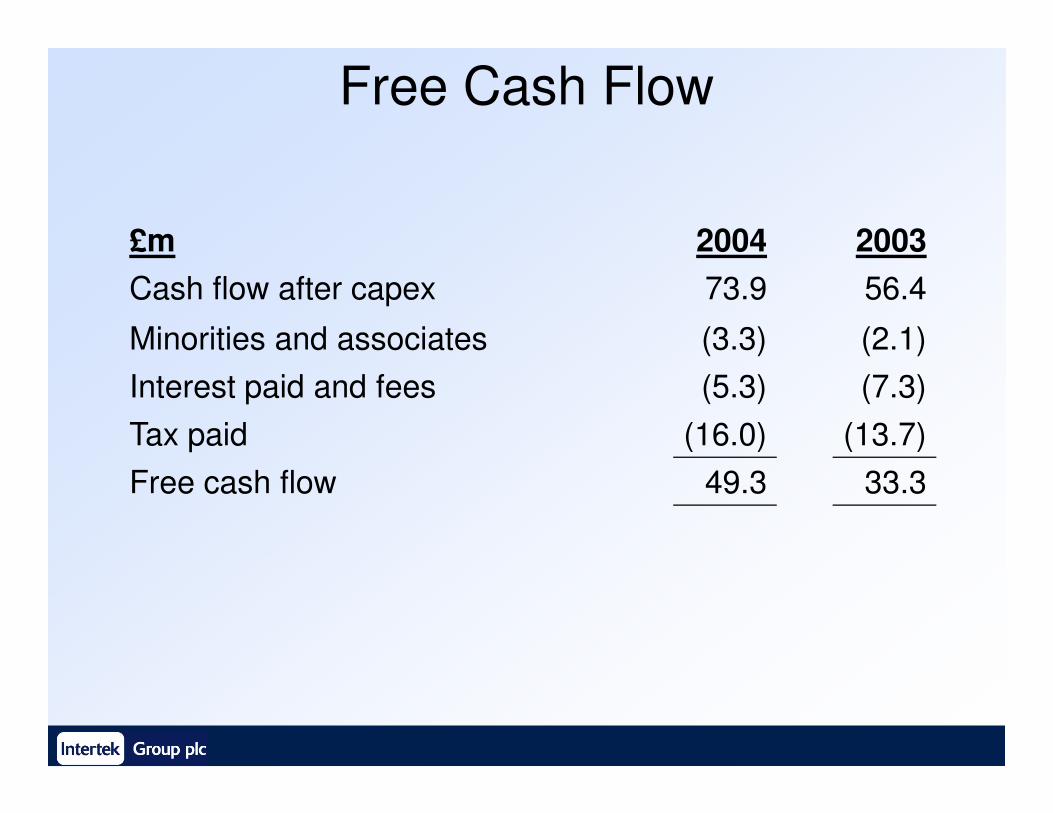
Free Cash Flow
£m 2004 2003
Cash flow after capex 73.9 56.4
Minorities and associates (3.3) (2.1)
Interest paid and fees (5.3) (7.3)
Tax paid (16.0) (13.7)
Free cash flow 49.3 33.3
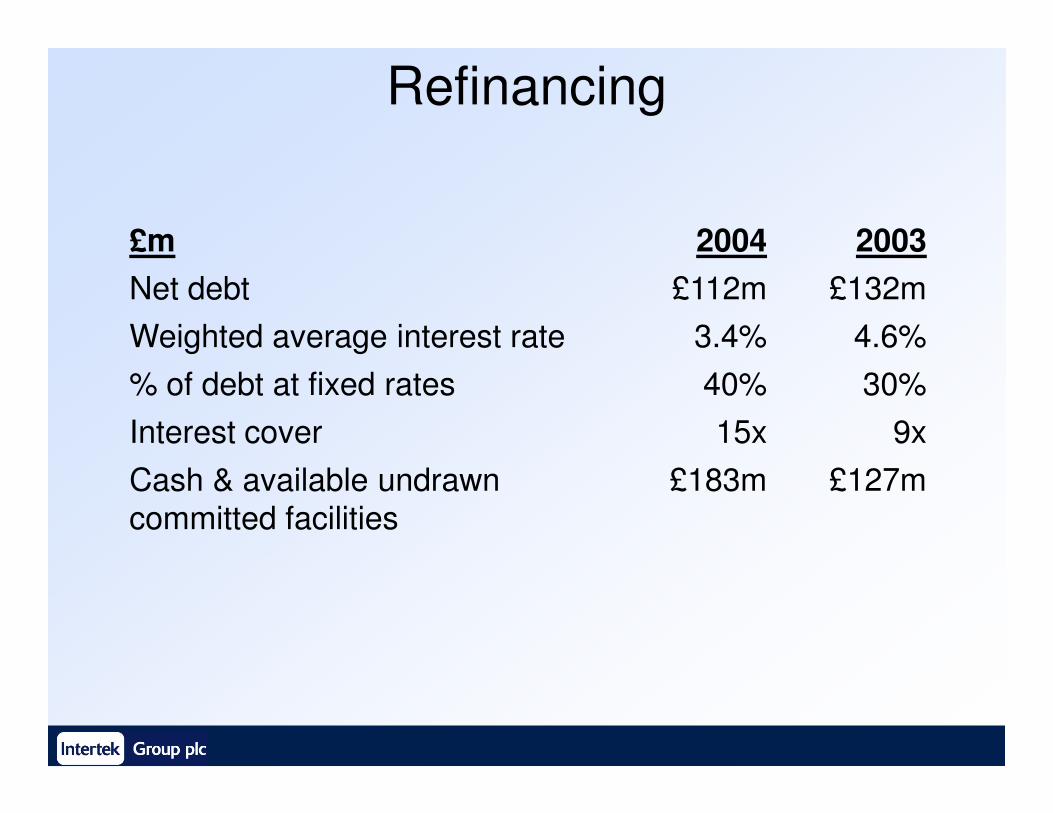
Refinancing
£m 2004 2003
Net debt £112m £132m
Weighted average interest rate 3.4% 4.6%
% of debt at fixed rates 40% 30%
Interest cover 15x 9x
Cash & available undrawn
committed facilities
£183m £127m
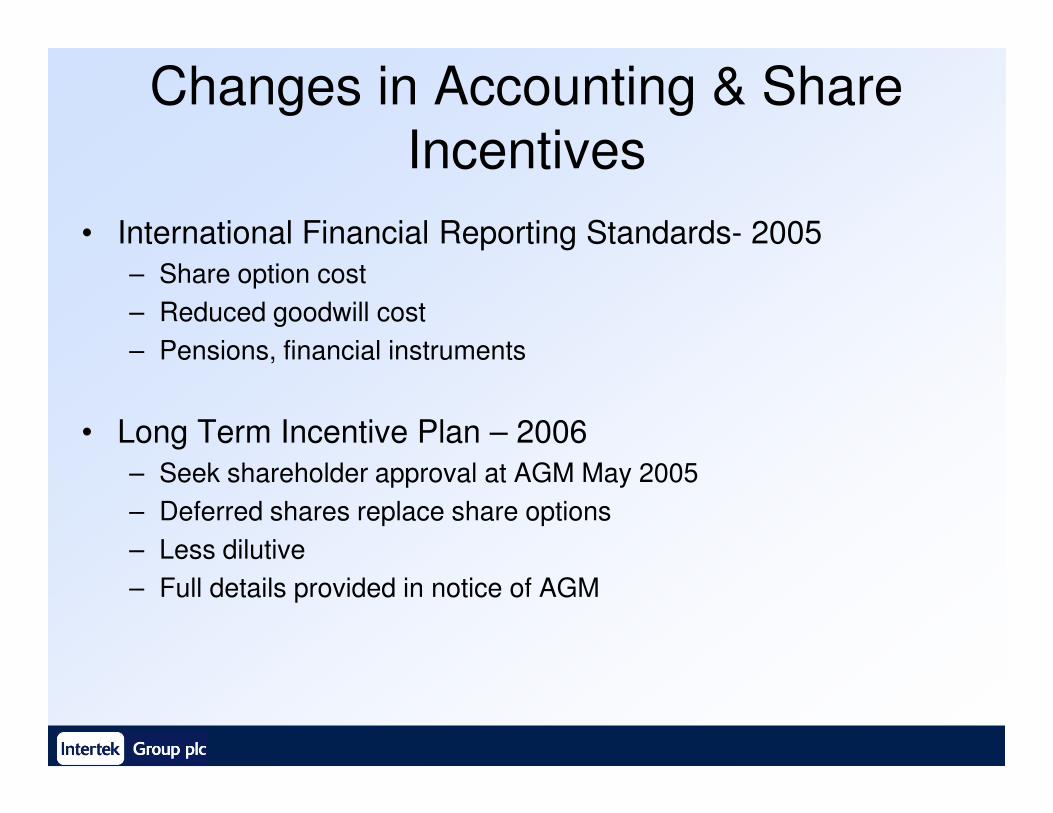
Changes in Accounting & Share
Incentives
• International Financial Reporting Standards- 2005
– Share option cost
– Reduced goodwill cost
– Pensions, financial instruments
• Long Term Incentive Plan – 2006
– Seek shareholder approval at AGM May 2005
– Deferred shares replace share options
– Less dilutive
– Full details provided in notice of AGM
Richard Nelson
Chief Executive Officerto 31 March 2005
Operating PerformanceOperating Performance
at constant exchange rates
2004 Results Presentation – 7 March 2005
Intertek Group plc
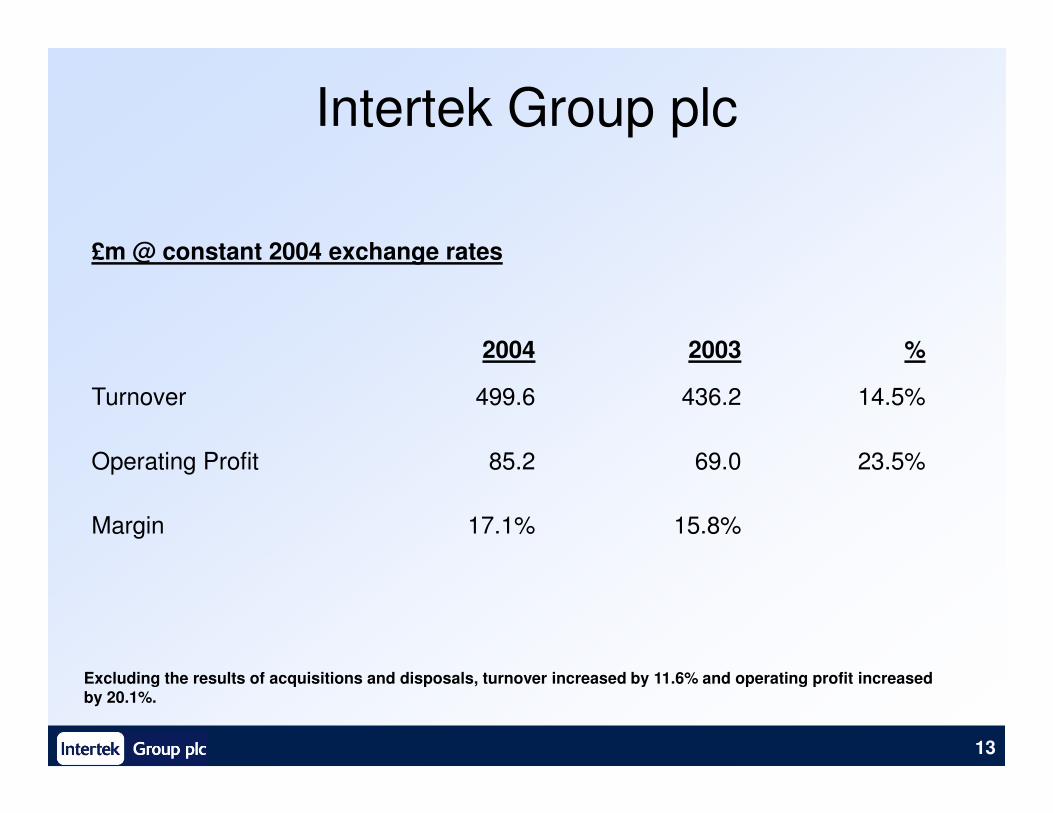
£m @ constant 2004 exchange rates
2004 2003 %
Turnover 499.6 436.2 14.5%
13
Turnover 499.6 436.2 14.5%
Operating Profit 85.2 69.0 23.5%
Margin 17.1% 15.8%
Excluding the results of acquisitions and disposals, turnover increased by 11.6% and operating profit increased by 20.1%.
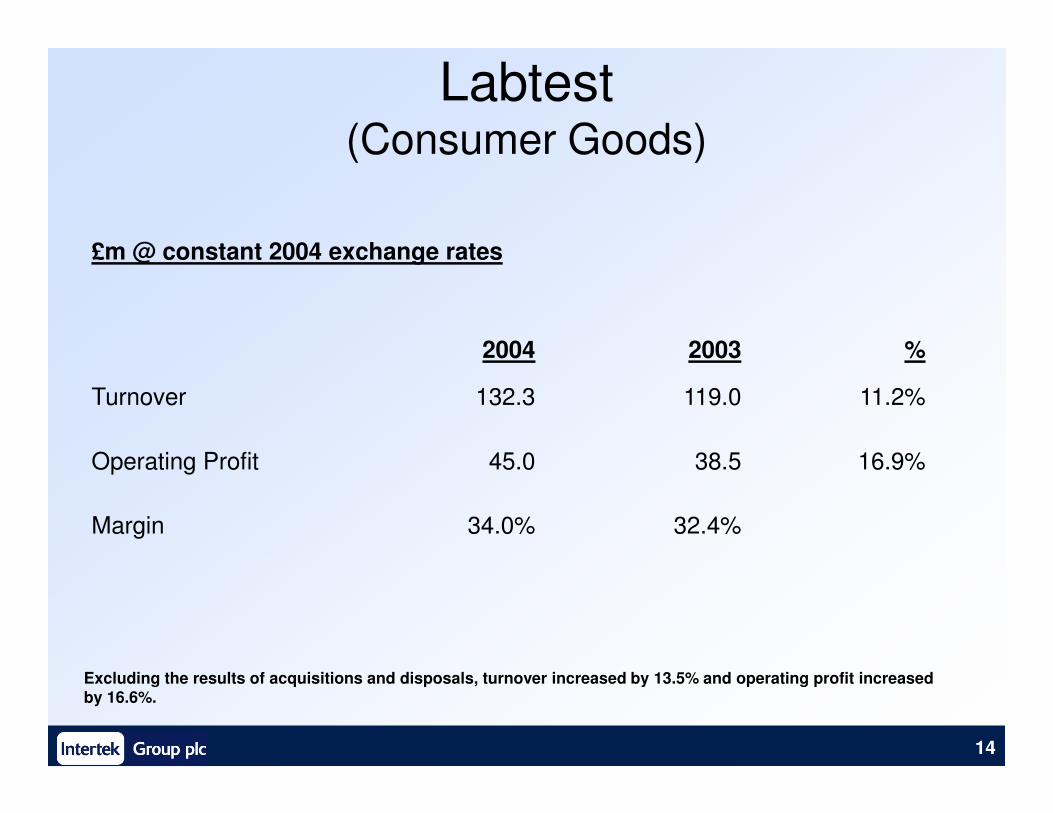
Labtest (Consumer Goods)
£m @ constant 2004 exchange rates
2004 2003 %
Turnover 132.3 119.0 11.2%
14
Turnover 132.3 119.0 11.2%
Operating Profit 45.0 38.5 16.9%
Margin 34.0% 32.4%
Excluding the results of acquisitions and disposals, turnover increased by 13.5% and operating profit increased by 16.6%.
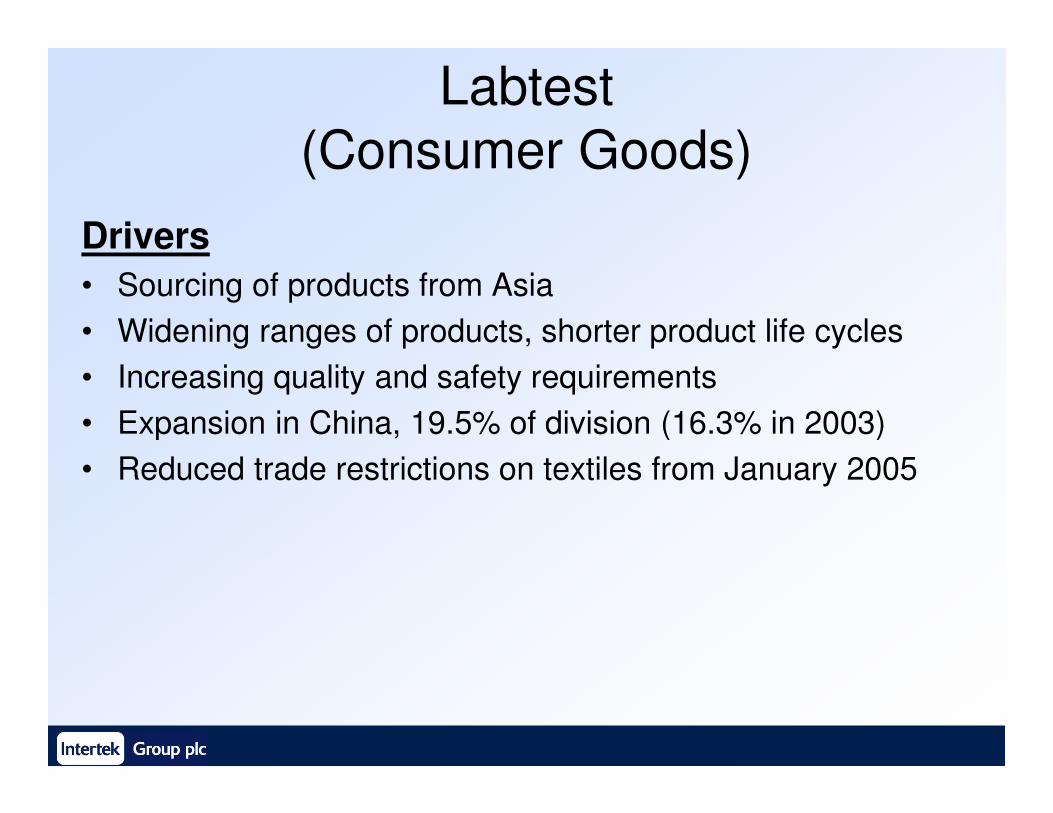
Labtest
(Consumer Goods)
Drivers
• Sourcing of products from Asia
• Widening ranges of products, shorter product life cycles
• Increasing quality and safety requirements
• Expansion in China, 19.5% of division (16.3% in 2003)• Expansion in China, 19.5% of division (16.3% in 2003)
• Reduced trade restrictions on textiles from January 2005
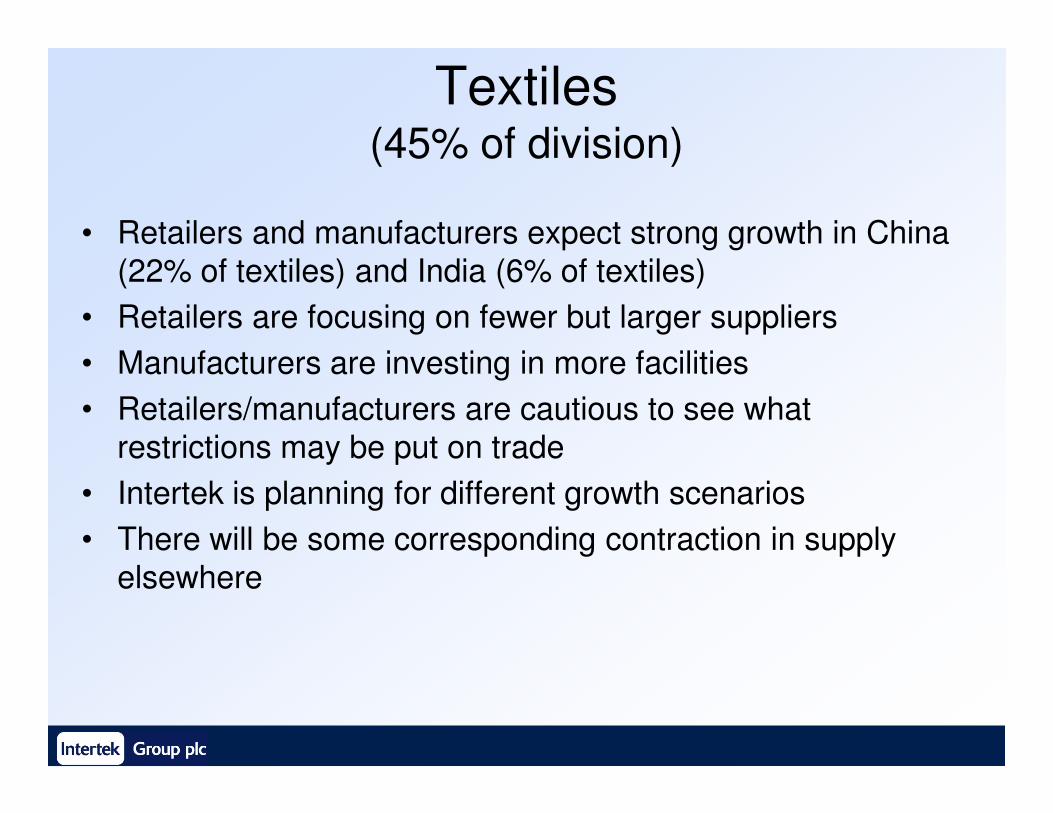
Textiles(45% of division)
• Retailers and manufacturers expect strong growth in China
(22% of textiles) and India (6% of textiles)
• Retailers are focusing on fewer but larger suppliers
• Manufacturers are investing in more facilities
• Retailers/manufacturers are cautious to see what • Retailers/manufacturers are cautious to see what
restrictions may be put on trade
• Intertek is planning for different growth scenarios
• There will be some corresponding contraction in supply
elsewhere
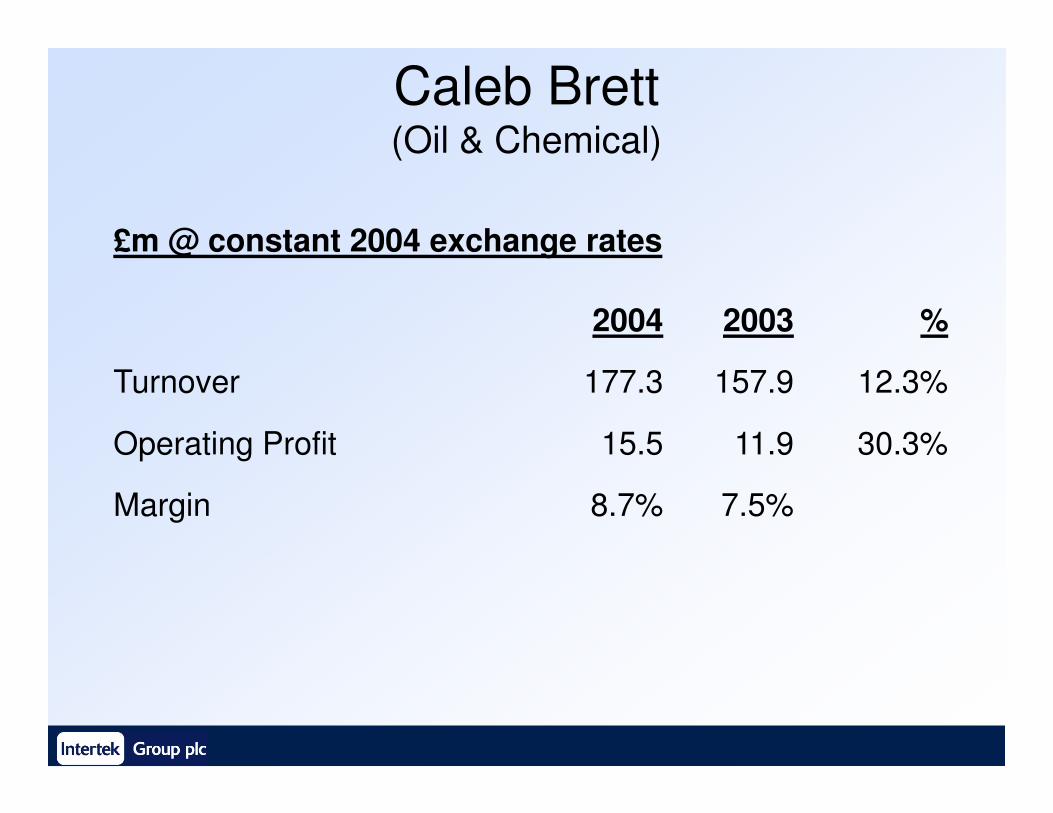
Caleb Brett(Oil & Chemical)
£m @ constant 2004 exchange rates
2004 2003 %
Turnover 177.3 157.9 12.3%
Operating Profit 15.5 11.9 30.3%
Margin 8.7% 7.5%
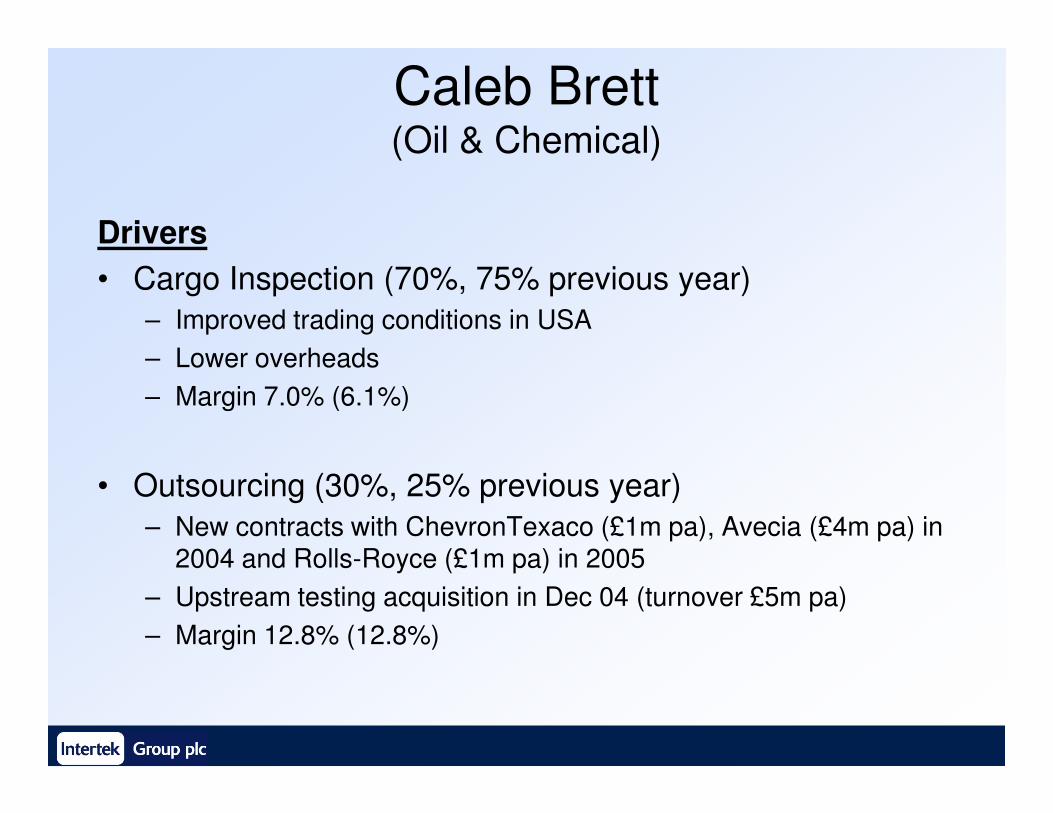
Caleb Brett(Oil & Chemical)
Drivers
• Cargo Inspection (70%, 75% previous year)
– Improved trading conditions in USA
– Lower overheads
– Margin 7.0% (6.1%)– Margin 7.0% (6.1%)
• Outsourcing (30%, 25% previous year)
– New contracts with ChevronTexaco (£1m pa), Avecia (£4m pa) in 2004 and Rolls-Royce (£1m pa) in 2005
– Upstream testing acquisition in Dec 04 (turnover £5m pa)
– Margin 12.8% (12.8%)
ETL SEMKO
(Electrical)
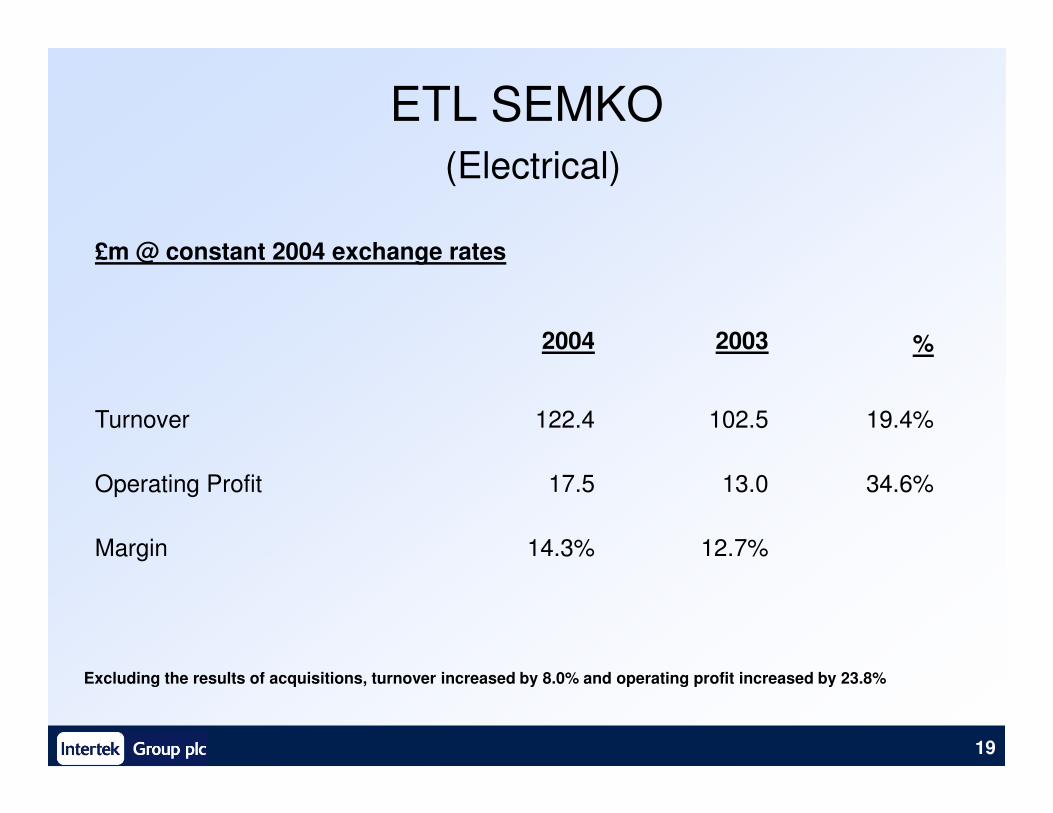
£m @ constant 2004 exchange rates
2004 2003 %
Turnover 122.4 102.5 19.4%
19
Turnover 122.4 102.5 19.4%
Operating Profit 17.5 13.0 34.6%
Margin 14.3% 12.7%
Excluding the results of acquisitions, turnover increased by 8.0% and operating profit increased by 23.8%
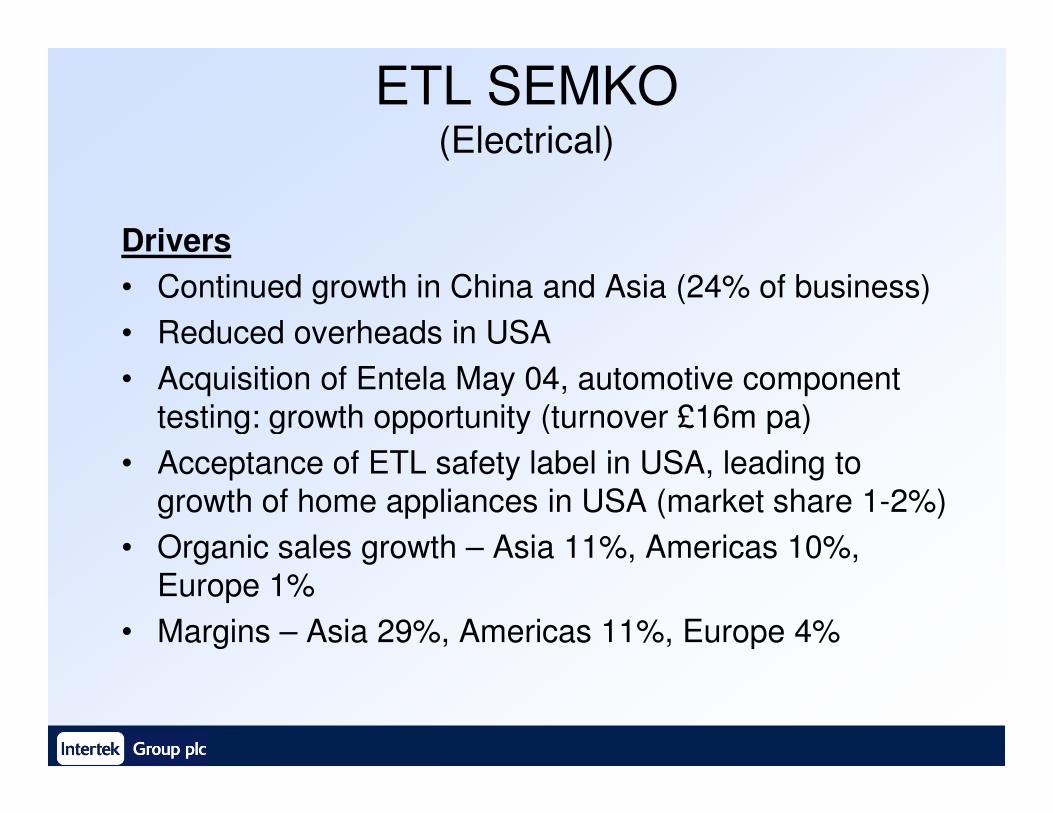
ETL SEMKO(Electrical)
Drivers
• Continued growth in China and Asia (24% of business)
• Reduced overheads in USA
• Acquisition of Entela May 04, automotive component
testing: growth opportunity (turnover £16m pa)testing: growth opportunity (turnover £16m pa)
• Acceptance of ETL safety label in USA, leading to
growth of home appliances in USA (market share 1-2%)
• Organic sales growth – Asia 11%, Americas 10%,
Europe 1%
• Margins – Asia 29%, Americas 11%, Europe 4%
FTS
(Foreign Trade Standards)
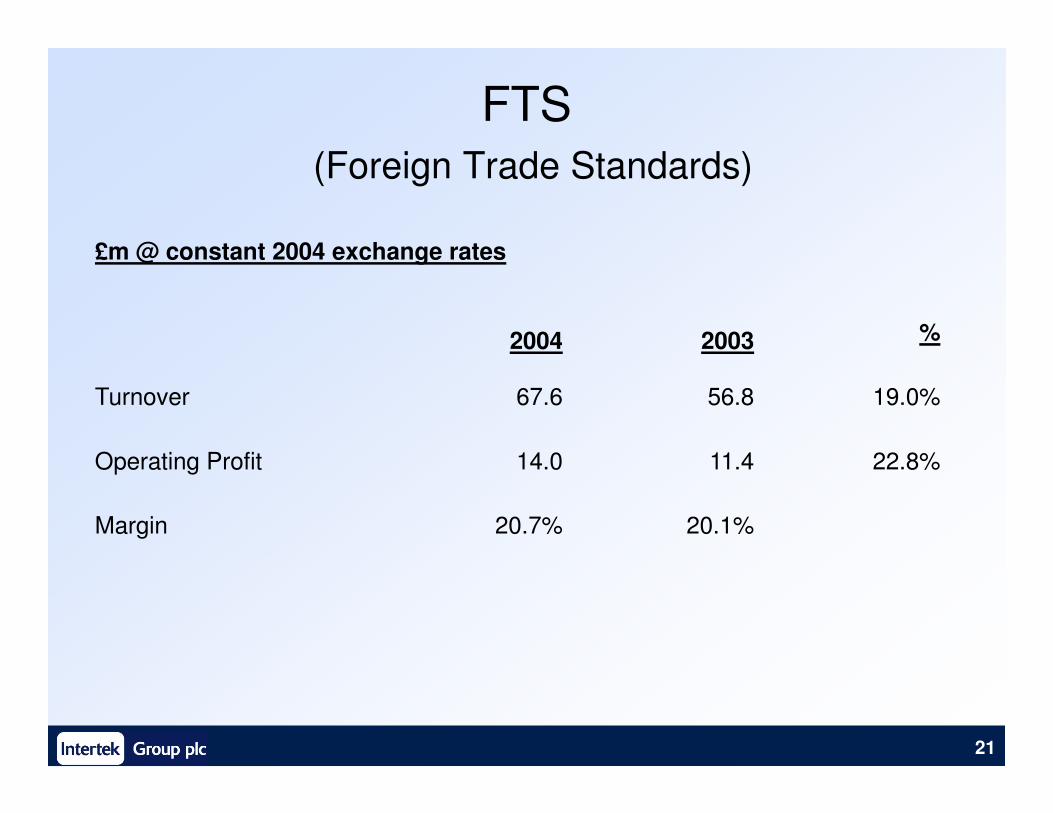
£m @ constant 2004 exchange rates
2004 2003 %
Turnover 67.6 56.8 19.0%
21
Turnover 67.6 56.8 19.0%
Operating Profit 14.0 11.4 22.8%
Margin 20.7% 20.1%
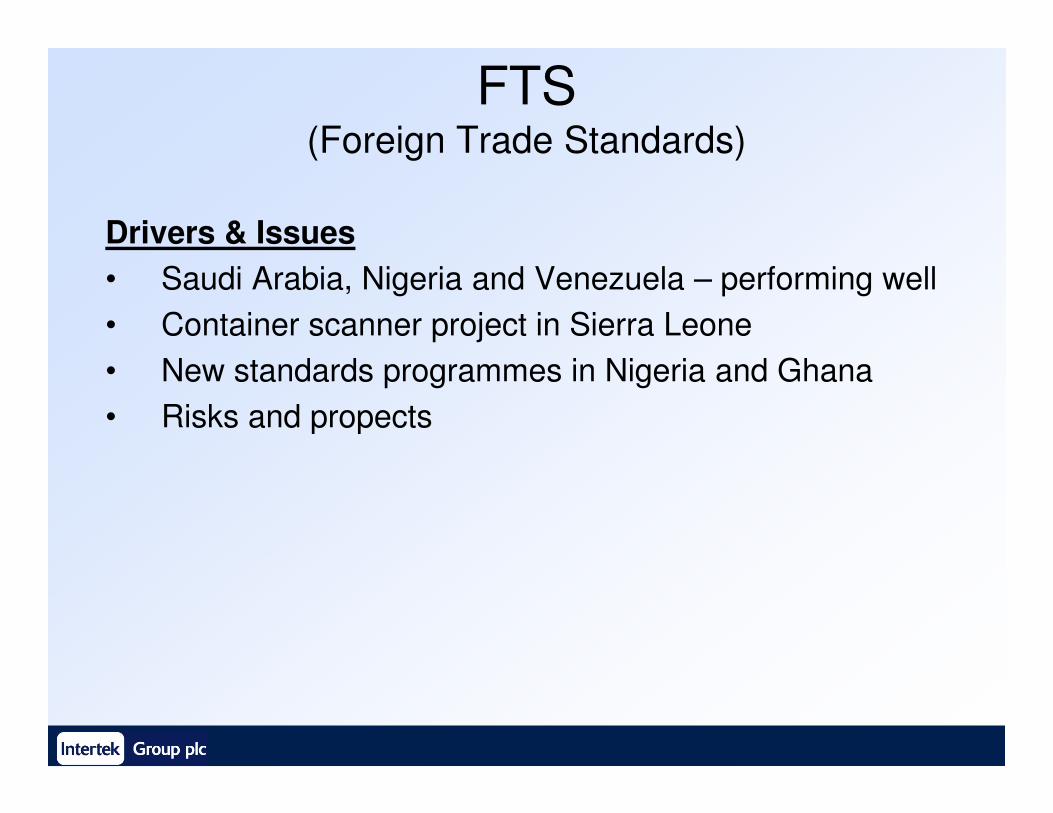
FTS(Foreign Trade Standards)
Drivers & Issues
• Saudi Arabia, Nigeria and Venezuela – performing well
• Container scanner project in Sierra Leone
• New standards programmes in Nigeria and Ghana
• Risks and propects• Risks and propects
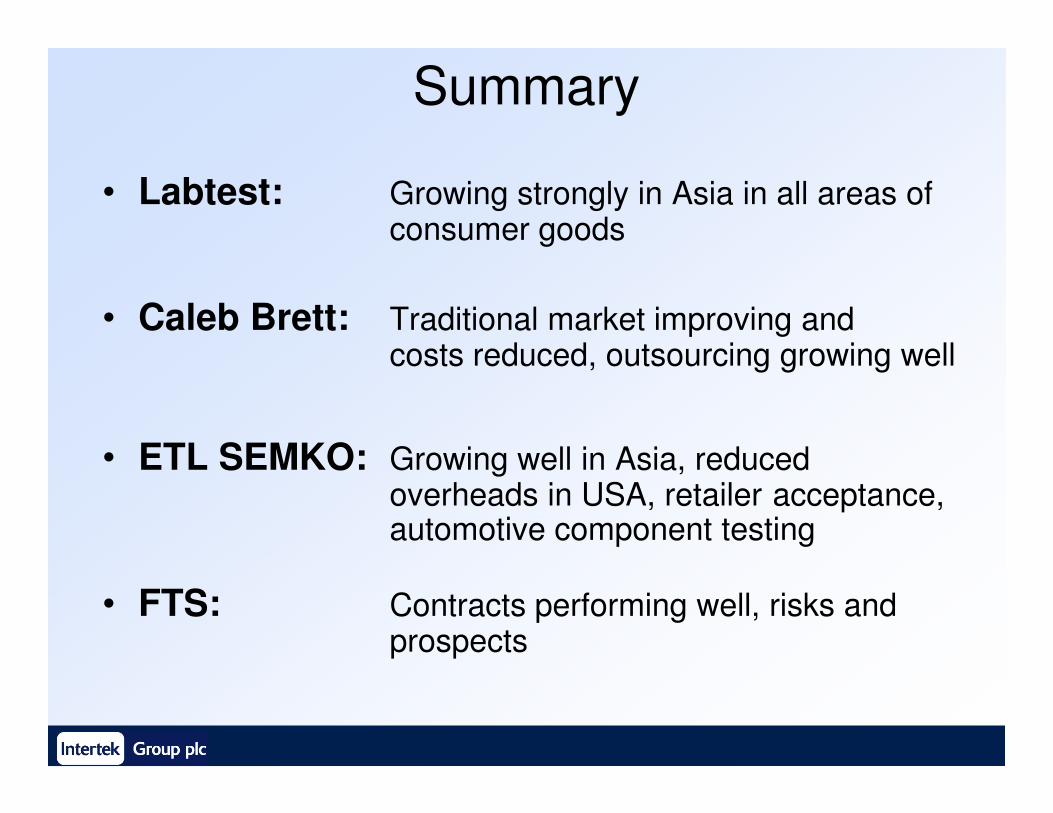
Summary
• Labtest: Growing strongly in Asia in all areas of consumer goods
• Caleb Brett: Traditional market improving and costs reduced, outsourcing growing well
• ETL SEMKO: Growing well in Asia, reduced overheads in USA, retailer acceptance, automotive component testing
• FTS: Contracts performing well, risks and prospects

Wolfhart Hauser
Chief Executive Officerfrom 1 March 2005
A
24
Medium Term Strategy
2004 Results Presentation – 7 March 2005
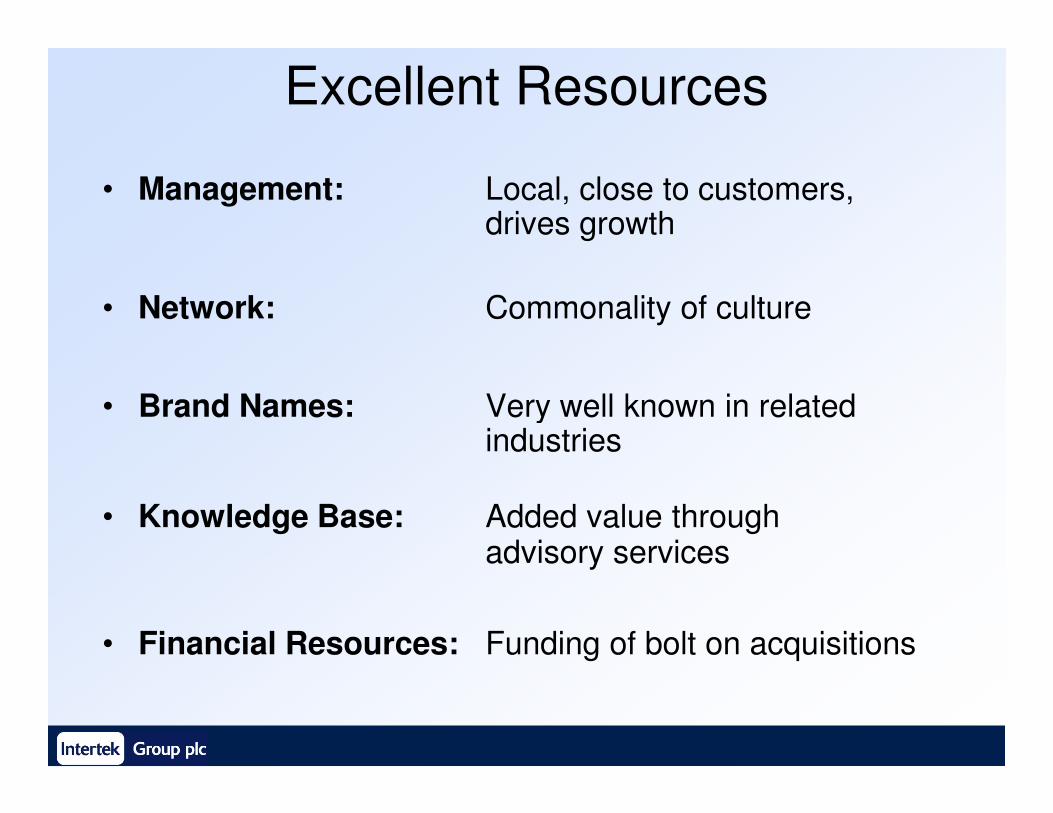
Excellent Resources
• Management: Local, close to customers, drives growth
• Network: Commonality of culture
• Brand Names: Very well known in related • Brand Names: Very well known in related industries
• Knowledge Base: Added value through advisory services
• Financial Resources: Funding of bolt on acquisitions
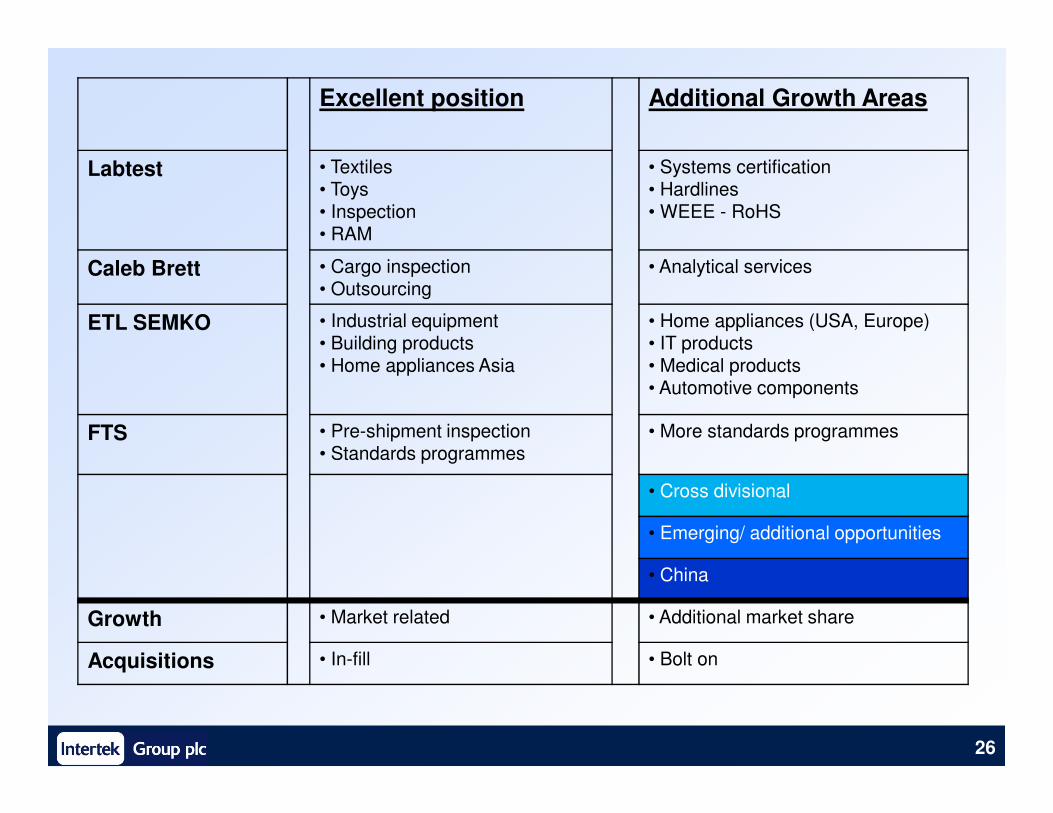
Excellent position Additional Growth Areas
Labtest • Textiles• Toys• Inspection• RAM
• Systems certification• Hardlines• WEEE - RoHS
Caleb Brett • Cargo inspection• Outsourcing
• Analytical services
ETL SEMKO • Industrial equipment• Building products• Home appliances Asia
• Home appliances (USA, Europe)• IT products• Medical products• Automotive components
26
FTS • Pre-shipment inspection• Standards programmes
• More standards programmes
• Cross divisional
• Emerging/ additional opportunities
• China
Growth • Market related • Additional market share
Acquisitions • In-fill • Bolt on