Embed Size (px)
Citation preview

APP.-B-1
THE PROGRESSIVE CORPORATION AND SUBSIDIARIES
APPENDIX B
2004 ANNUAL REPORT TO SHAREHOLDERS

APP.-B-2
THE PROGRESSIVE CORPORATION AND SUBSIDIARIES
CONSOLIDATED STATEMENTS OF INCOME
(millions – except per share amounts)
For the years ended December 31, 2004 2003 2002
RevenuesNet premiums earned $ 13,169.9 $ 11,341.0 $ 8,883.5Investment income 484.4 465.3 455.2Net realized gains (losses) on securities 79.3 12.7 (78.6)Service revenues 48.5 41.8 34.3Other income1 — 31.2 —
Total revenues 13,782.1 11,892.0 9,294.4
ExpensesLosses and loss adjustment expenses 8,555.0 7,640.4 6,299.1Policy acquisition costs 1,418.0 1,249.1 1,031.6Other underwriting expenses 1,238.6 1,010.1 874.2Investment expenses 13.9 11.5 11.5Service expenses 25.0 25.7 22.0Interest expense 80.8 95.5 74.6
Total expenses 11,331.3 10,032.3 8,313.0
Net IncomeIncome before income taxes 2,450.8 1,859.7 981.4Provision for income taxes 802.1 604.3 314.1Net income $ 1,648.7 $ 1,255.4 $ 667.3
Computation of Earnings Per ShareBasic:Average shares outstanding 212.9 216.8 219.0
Per share $ 7.74 $ 5.79 $ 3.05Diluted:Average shares outstanding 212.9 216.8 219.0Net effect of dilutive stock-based compensation 3.3 3.7 4.2
Total equivalent shares 216.2 220.5 223.2Per share $ 7.63 $ 5.69 $ 2.99
1See Note 3 — Income Taxes for discussion.
See notes to consolidated financial statements.

APP.-B-3
December 31, 2004 2003
AssetsInvestments:
Available-for-sale: Fixed maturities, at market (amortized cost: $8,972.6 and $8,899.0) $ 9,084.3 $ 9,133.4Equity securities, at market:
Preferred stocks (cost: $749.4 and $751.3) 768.9 778.8Common equities (cost: $1,314.0 and $1,590.6) 1,851.9 1,972.1
Short-term investments, at market (amortized cost: $1,376.6 and $648.0) 1,376.9 648.0Total investments 13,082.0 12,532.3
Cash 20.0 12.1Accrued investment income 103.5 97.4Premiums receivable, net of allowance for doubtful accounts of $83.8 and $66.8 2,287.2 2,079.6Reinsurance recoverables, including $44.5 and $41.4 on paid losses 381.6 271.3Prepaid reinsurance premiums 119.8 114.7Deferred acquisition costs 432.2 412.3Income taxes — 81.6Property and equipment, net of accumulated depreciation of $562.1 and $476.4 666.5 584.7Other assets 91.5 95.5
Total assets $ 17,184.3 $ 16,281.5
Liabilities and Shareholders’ EquityUnearned premiums $ 4,108.0 $ 3,894.7Loss and loss adjustment expense reserves 5,285.6 4,576.3Accounts payable, accrued expenses and other liabilities 1,325.0 1,290.1Income taxes 26.0 —Debt 1,284.3 1,489.8
Total liabilities 12,028.9 11,250.9Shareholders’ equity:
Common Shares, $1.00 par value (authorized 600.0, issued 213.2 and 230.1,including treasury shares of 12.8 and 13.7) 200.4 216.4
Paid-in capital 743.3 688.3Unamortized restricted stock (46.0) (28.9)Accumulated other comprehensive income (loss):
Net unrealized gains on investment securities 435.1 418.2Net unrealized gains on forecasted transactions 9.7 10.7Foreign currency translation adjustment — (3.9)
Retained earnings 3,812.9 3,729.8Total shareholders’ equity 5,155.4 5,030.6
Total liabilities and shareholders’ equity $ 17,184.3 $ 16,281.5
(millions)
See notes to consolidated financial statements.
THE PROGRESSIVE CORPORATION AND SUBSIDIARIES
CONSOLIDATED BALANCE SHEETS

APP.-B-4
For the years ended December 31, 2004 2003 2002
Retained EarningsBalance, Beginning of year $3,729.8 $ 2,796.0 $ 2,497.4
Net income 1,648.7 $1,648.7 1,255.4 $1,255.4 667.3 $ 667.3Cash dividends on Common Shares ($.110, $.100
and $.096 per share) (23.3) (21.7) (21.1)Treasury shares purchased1 (1,542.4) (297.5) (200.7)Capitalization of stock split — — (147.0)Other, net .1 (2.4) .1
Balance, End of year $3,812.9 $ 3,729.8 $ 2,796.0
Accumulated Other Comprehensive Income (Loss), Net of TaxBalance, Beginning of year $ 425.0 $ 169.3 $ 125.9
Changes in:Net unrealized gains on investment securities 16.9 255.8 40.9Net unrealized gains on forecasted transactions (1.0) (1.0) 2.5Foreign currency translation adjustment 3.9 .9 —
Other comprehensive income 19.8 19.8 255.7 255.7 43.4 43.4Balance, End of year $ 444.8 $ 425.0 $ 169.3
Comprehensive Income $1,668.5 $1,511.1 $ 710.7
Common Shares, $1.00 Par ValueBalance, Beginning of year $ 216.4 $ 218.0 $ 73.4
Stock options exercised 2.1 2.8 1.2Treasury shares purchased1, 2 (18.6) (5.0) (3.6)Restricted stock issued, net of forfeitures .5 .6 —Capitalization of stock split — — 147.0
Balance, End of year $ 200.4 $ 216.4 $ 218.0
Paid-In CapitalBalance, Beginning of year $ 688.3 $ 584.7 $ 554.0
Stock options exercised 49.6 47.2 21.4Tax benefits from exercise/vesting
of stock-based compensation 44.3 44.0 19.3Treasury shares purchased1 (67.5) (14.3) (10.0)Restricted stock issued, net of forfeitures 27.3 26.7 —Other 1.3 — —
Balance, End of year $ 743.3 $ 688.3 $ 584.7
Unamortized Restricted StockBalance, Beginning of year $ (28.9) $ — $ —
Restricted stock issued, net of forfeitures (40.6) (37.3) —Restricted stock market value adjustment (.3) (2.6) —Amortization of restricted stock 23.8 11.0 —
Balance, End of year $ (46.0) $ (28.9) $ —
Total Shareholders’ Equity $5,155.4 $ 5,030.6 $ 3,768.0
1Includes 16.9 million Common Shares purchased pursuant to a “Dutch auction” tender offer in 2004; these shares werepurchased at a price of $88 per share, for a total cost of $1.5 billion.
2The Company did not split treasury shares. In 2002, the Company repurchased 136,182 Common Shares prior to the stocksplit and 3,471,916 Common Shares subsequent to the stock split.There are 20.0 million Serial Preferred Shares authorized; no such shares are issued or outstanding.There are 5.0 million Voting Preference Shares authorized; no such shares have been issued.See notes to consolidated financial statements.
(millions – except per share amounts)
THE PROGRESSIVE CORPORATION AND SUBSIDIARIES
CONSOLIDATED STATEMENTS OF CHANGES IN SHAREHOLDERS’ EQUITY

APP.-B-5
(millions)
For the years ended December 31, 2004 2003 2002
Cash Flows From Operating ActivitiesNet income $ 1,648.7 $ 1,255.4 $ 667.3Adjustments to reconcile net income to net cash provided by operating activities:
Depreciation 99.4 89.3 83.9Amortization of fixed maturities 168.9 103.2 42.6Amortization of restricted stock 23.8 11.0 —Net realized (gains) losses on securities (79.3) (12.7) 78.6Changes in:
Unearned premiums 213.3 590.4 587.6Loss and loss adjustment expense reserves 709.3 763.3 575.0Accounts payable, accrued expenses and other liabilities 70.2 124.5 256.6Prepaid reinsurance premiums (5.1) (18.0) (19.1)Reinsurance recoverables (110.3) (55.6) (14.2)Premiums receivable (207.6) (336.8) (245.7)Deferred acquisition costs (19.9) (48.8) (46.9)Income taxes 98.5 (.1) (65.1)Tax benefits from exercise/vesting of stock-based compensation 44.3 44.0 19.3Other, net 8.3 (72.2) (7.9)
Net cash provided by operating activities 2,662.5 2,436.9 1,912.0
Cash Flows From Investing ActivitiesPurchases:
Available-for-sale: fixed maturities (6,686.3) (9,491.6) (7,924.9)equity securities (678.3) (771.2) (680.7)
Sales:Available-for-sale: fixed maturities 5,885.7 7,189.3 5,823.3
equity securities 876.3 337.8 412.0Maturities, paydowns, calls and other:
Available-for-sale: fixed maturities 639.7 779.2 594.0equity securities 78.2 91.7 —
Net purchases of short-term investments (728.6) (80.2) (340.4)Net unsettled security transactions (43.2) (37.1) 115.3Purchases of property and equipment (192.0) (171.1) (89.9)
Net cash used in investing activities (848.5) (2,153.2) (2,091.3)
Cash Flows From Financing ActivitiesProceeds from exercise of stock options 51.7 50.0 22.6Proceeds from debt — — 398.6Payments of debt (206.0) — (.8)Dividends paid to shareholders (23.3) (21.7) (21.1)Acquisition of treasury shares (1,628.5) (316.8) (214.3)
Net cash provided by (used in) financing activities (1,806.1) (288.5) 185.0Increase (decrease) in cash 7.9 (4.8) 5.7Cash, Beginning of year 12.1 16.9 11.2Cash, End of year $ 20.0 $ 12.1 $ 16.9
See notes to consolidated financial statements.
THE PROGRESSIVE CORPORATION AND SUBSIDIARIES
CONSOLIDATED STATEMENTS OF CASH FLOWS

APP.-B-6
1) Reporting and Accounting Policies
Nature of Operations The Progressive Corporation, an insurance holding company formed in 1965, owns 70 subsidiaries and has 1mutual insurance company affiliate (collectively, the “Company”) as of December 31, 2004. The insurance subsidiaries and affiliate providepersonal automobile insurance and other specialty property-casualty insurance and related services throughout the United States. TheCompany’s Personal Lines segment writes insurance for private passenger automobiles and recreation vehicles through both an independentagency channel and a direct channel. The Company’s Commercial Auto segment writes insurance for automobiles and trucks owned bysmall businesses primarily through the independent agency channel.
Basis of Consolidation and Reporting The accompanying consolidated financial statements include the accounts of The ProgressiveCorporation, its subsidiaries and affiliate. All of the subsidiaries and the affiliate are wholly owned or controlled. All intercompany accountsand transactions are eliminated in consolidation.
Estimates The Company is required to make estimates and assumptions when preparing its financial statements and accompanyingnotes in conformity with accounting principles generally accepted in the United States of America (GAAP). Actual results could differ fromthose estimates.
Investments Available-for-sale: fixed-maturity securities are debt securities, which may have fixed or variable principal payment schedules,may be held for indefinite periods of time, and may be used as a part of the Company’s asset/liability strategy or sold in response to changesin interest rates, anticipated prepayments, risk/reward characteristics, liquidity needs or similar economic factors. These securities arecarried at market value with the corresponding unrealized gains (losses), net of deferred income taxes, reported in accumulated othercomprehensive income. Market values are obtained from a recognized pricing service or other quoted sources. The asset-backed portfoliois accounted for under the retrospective method; prepayment assumptions are based on market expectations. The prospective method isused for interest only and non-investment-grade asset-backed securities.
Available-for-sale: equity securities include common equities and nonredeemable preferred stocks and are reported at quoted marketvalues. Changes in the market values of these securities, net of deferred income taxes, are reflected as unrealized gains (losses) inaccumulated other comprehensive income. Changes in value of foreign equities due to foreign currency exchange rates are limited byforeign currency hedges and would be recognized in income in the current period. The Company held no foreign equities or foreign currencyhedges during 2004 or 2003.
Trading securities are securities bought principally for the purpose of sale in the near term and, when not material to the Company’sfinancial position, cash flows or results of operations, are reported at market value within the available-for-sale portfolio. The Company hadno trading securities; derivatives used for trading are discussed below. In prior years, the net activity in trading securities was not materialto the Company’s financial position or cash flows; the effect on results of operations is separately disclosed in Note 2 — Investments. To theextent the Company has trading securities, changes in market value would be recognized in income in the current period.
Derivative instruments may include futures, options, forward positions, foreign currency forwards and interest rate swap agreementsand may be used in the portfolio for risk management or trading purposes or to hedge the exposure to: changes in fair value of an asset orliability (fair value hedge); foreign currency of an investment in a foreign operation (foreign currency hedge); or variable cash flows of aforecasted transaction (cash flow hedge). These derivative instruments would be recognized as either assets or liabilities and measured atfair value with changes in fair value recognized in income in the period of change. Changes in the fair value of the hedged items would berecognized in income while the hedge was in effect.
At December 31, 2004, the Company held no derivatives classified as trading securities. At December 31, 2003, the Company heldcredit default swaps. The Company matched the notional value of these positions with Treasury notes with an equivalent principal valueand maturity to replicate a cash bond position. Changes in the fair value of the credit default swaps and the Treasury notes were recognizedin income in the current period.
The Company held no derivatives classified as cash flow hedges. Changes in fair value of these hedges would be reported as a componentof accumulated other comprehensive income and subsequently amortized into earnings over the life of the hedged transaction. Gains andlosses on hedges on forecasted transactions are amortized over the life of the hedged item (see Note 4 — Debt). Hedges on forecastedtransactions that no longer qualify for hedge accounting due to lack of correlation would be considered derivatives used for risk managementpurposes.
THE PROGRESSIVE CORPORATION AND SUBSIDIARIES
NOTES TO CONSOLIDATED FINANCIAL STATEMENTS
December 31, 2004, 2003 and 2002
APP.-B-7
The Company had no fair value or foreign currency hedges or derivative instruments held or issued for risk management purposes. Tothe extent the Company held fair value hedges, changes in the hedge, along with the hedged items would be recognized in income in theperiod of change while the hedge was in effect. Gains and losses on foreign currency hedges would offset the foreign exchange gains andlosses on the foreign investments. Derivatives held or issued for risk management purposes would be recognized in income during theperiod of change.
Derivatives designated as hedges would also be evaluated on established criteria to determine the effectiveness of their correlation to,and ability to reduce risk of, specific securities or transactions; effectiveness would be reassessed regularly. If the effectiveness of a fairvalue hedge becomes non-compliant, the adjustment in the change in value of the hedged item would no longer be recognized in incomeduring the current period.
For all derivative positions, net cash requirements are limited to changes in market values, which may vary based upon changes ininterest rates, currency exchange rates and other factors. Exposure to credit risk is limited to the carrying value; collateral may be requiredto limit credit risk.
Short-term investments include eurodollar deposits, commercial paper and other securities maturing within one year and are reportedat market. Changes in the market values of these securities, net of deferred income taxes, are reflected as unrealized gains (losses) inaccumulated other comprehensive income.
Investment securities are exposed to various risks such as interest rate, market and credit risk. Market values of securities fluctuatebased on the magnitude of changing market conditions; significant changes in market conditions could materially affect portfolio value inthe near term. The Company continually monitors its portfolio for pricing changes, which might indicate potential impairments and performsdetailed reviews of securities with unrealized losses based on predetermined criteria. In such cases, changes in market value are evaluatedto determine the extent to which such changes are attributable to (i) fundamental factors specific to the issuer, such as financial conditions,business prospects or other factors or (ii) market-related factors, such as interest rates or equity market declines. When a security in theCompany’s investment portfolio has an unrealized loss in market value that is deemed to be other than temporary, the Company reducesthe book value of such security to its current market value, recognizing the decline as a realized loss in the income statement. Any futureincreases in the market value of securities written down are reflected as changes in unrealized gains as part of accumulated othercomprehensive income within shareholders’ equity.
Realized gains (losses) on securities are computed based on the first-in first-out method and include write-downs on available-for-salesecurities considered to have other-than-temporary declines in market value.
Property and Equipment Property and equipment are recorded at cost, less accumulated depreciation. Depreciation is provided over theestimated useful lives of the assets using accelerated methods for computer equipment and the straight-line method for all other fixedassets. The useful lives range from 3 to 4 years for computer equipment, 10 to 40 years for buildings and improvements, and 5 to 6 yearsfor all other property and equipment. Property and equipment includes software capitalized for internal use. Land and buildings comprised75% of total property and equipment at both December 31, 2004 and 2003.
Total interest capitalized was $3.9 million, $1.5 million and $.5 million in 2004, 2003 and 2002, respectively, relating to both theCompany’s construction projects and capitalized computer software costs.
Insurance Premiums and Receivables Insurance premiums written in 2004 and forward are being earned into income on a pro ratabasis over the period of risk, based on a daily earnings convention. Prior to 2004, insurance premiums were earned using a mid-monthconvention. Since the change to a daily earnings convention was prospective, it had no effect on amounts reported in prior periods andwas implemented to improve the precision of the Company’s premium recognition on a monthly basis. The Company provides insuranceand related services to individuals and small commercial accounts throughout the United States, and offers a variety of payment plans.Generally, premiums are collected prior to providing risk coverage, minimizing the Company’s exposure to credit risk. The Company performsa policy level evaluation to determine the extent the premiums receivable balance exceeds its unearned premiums balance. The Companythen ages this exposure to establish an allowance for doubtful accounts based on prior experience.
Income Taxes The income tax provision is calculated under the balance sheet approach. Deferred tax assets and liabilities are recordedbased on the difference between the financial statement and tax bases of assets and liabilities at the enacted tax rates. The principal assetsand liabilities giving rise to such differences are net unrealized gains (losses) on securities, loss reserves, unearned premiums reserves,deferred acquisition costs and non-deductible accruals. The Company reviews its deferred tax assets for recoverability. At December 31,2004, the Company is able to demonstrate that the benefit of its deferred tax assets is fully realizable and, therefore, no valuation allowanceis recorded.

APP.-B-8
Loss and Loss Adjustment Expense Reserves Loss reserves represent the estimated liability on claims reported to the Company, plusreserves for losses incurred but not recorded (IBNR). These estimates are reported net of amounts recoverable from salvage and subrogation.Loss adjustment expense reserves represent the estimated expenses required to settle these claims and losses. The methods of makingestimates and establishing these reserves are reviewed regularly, and resulting adjustments are reflected in income currently. Such lossand loss adjustment expense reserves could be susceptible to significant change in the near term.
Reinsurance The Company’s reinsurance transactions include premiums written under state-mandated involuntary plans for commercialvehicles (Commercial Auto Insurance Procedures/Plans- “CAIP”), for which the Company retains no loss indemnity risk (see Note 6 —Reinsurance for further discussion). In addition, the Company cedes auto premiums to state-provided reinsurance facilities. The Companyalso cedes premiums in its non-auto programs to limit its exposure in those particular markets. Beginning in 2004, prepaid reinsurancepremiums are being earned on a pro rata basis over the period of risk, based on a daily earnings convention, which is consistent withpremiums written. Prior to 2004, prepaid reinsurance premiums were recognized primarily using a mid-month convention, which wasconsistent with premiums written. Because the Company’s primary line of business, auto insurance, is written at relatively low limits ofliability, the Company does not believe that it needs to mitigate its risk through voluntary reinsurance.
Earnings Per Share Basic earnings per share are computed using the weighted average number of Common Shares outstanding. Dilutedearnings per share include common stock equivalents assumed outstanding during the period. The Company’s common stock equivalentsinclude stock options and qualified restricted stock awards.
Deferred Acquisition Costs Deferred acquisition costs include commissions, premium taxes and other variable underwriting and directsales costs incurred in connection with writing business. These costs are deferred and amortized over the policy period in which the relatedpremiums are earned. The Company considers anticipated investment income in determining the recoverability of these costs. Managementbelieves that these costs will be fully recoverable in the near term. The Company does not defer advertising costs.
Guaranty Fund Assessments The Company is subject to state guaranty fund assessments which provide for the payment of coveredclaims or other insurance obligations of insurance companies deemed insolvent. These assessments are accrued after a formal determinationof insolvency has occurred and the Company has written the premiums on which the assessments will be based.
Service Revenues and Expenses Service revenues consist primarily of fees generated from processing business for involuntary plans andare earned on a pro rata basis over the term of the related policies. Acquisition expenses are deferred and amortized over the period inwhich the related revenues are earned.
Stock Compensation The Company follows the provisions of Statement of Financial Accounting Standards (SFAS) 123, “Accounting forStock-Based Compensation,” to account for its stock compensation activity in the financial statements. Prior to January 1, 2003, theCompany followed the provisions of Accounting Principles Board (APB) Opinion No. 25, “Accounting for Stock Issued to Employees,” toaccount for its stock option activity.
The change to the fair value method of accounting under SFAS 123 was applied prospectively to all non-qualified stock option awardsgranted, modified, or settled after January 1, 2003. No stock options were granted after December 31, 2002. As a result, there is nocompensation cost for stock options included in net income for 2003 or 2004; however, compensation expense would have been recognizedif the fair value method had been used for all awards since the original effective date of SFAS 123 (January 1, 1995). Prior to 2003, theCompany granted all options currently outstanding at an exercise price equal to the market price of the Company’s Common Shares at thedate of grant and, therefore, under APB 25, no compensation expense was recorded.
In 2003, the Company began issuing restricted stock awards. Compensation expense for restricted stock awards is recognized over therespective vesting periods. The current year expense is not representative of the effect on net income for future years since each subsequentyear will reflect expense for additional awards.
The following table shows the effects on net income and earnings per share had the fair value method been applied to all outstandingand unvested stock option awards for the periods presented. The Company used the modified Black-Scholes pricing model to calculate thefair value of the options awarded as of the date of grant.

APP.-B-9
(millions, except per share amounts) 2004 2003 2002
Net income, as reported $ 1,648.7 $ 1,255.4 $ 667.3Deduct: Total stock-based employee compensation expense
determined under the fair value based method for all awards, net of related tax effects (6.3) (12.8) (16.9)
Net income, pro forma $ 1,642.4 $ 1,242.6 $ 650.4
Earnings per shareBasic – as reported $ 7.74 $ 5.79 $ 3.05Basic – pro forma 7.71 5.73 2.97
Diluted – as reported $ 7.63 $ 5.69 $ 2.99Diluted – pro forma 7.62 5.65 2.92
The current year pro forma expense is not representative of the effect on net income for future years since the Company stopped issuingnon-qualified stock option awards as of December 31, 2002.
Supplemental Cash Flow Information Cash includes only bank demand deposits. The Company paid income taxes of $709.0 million,$579.0 million and $392.0 million in 2004, 2003 and 2002, respectively. Total interest paid was $91.7 million during 2004, $99.0 millionduring 2003 and $64.4 million during 2002. Non-cash activity includes the liability for deferred restricted stock compensation and thechanges in net unrealized gains (losses) on investment securities.
The Company effected a 3-for-1 stock split in the form of a dividend to shareholders on April 22, 2002. The Company issued its CommonShares by transferring $147.0 million from retained earnings to the Common Share account. All share and per share amounts and stockprices were adjusted to give effect to the split. Treasury shares were not split.
New Accounting Standards The Financial Accounting Standards Board (FASB) issued SFAS 123 (revised 2004), “Share-Based Payment,”which requires the Company to expense the fair value at the grant date of unvested outstanding stock options. The Company intends to adoptthis statement using the modified prospective application. This new standard is effective for periods beginning after June 15, 2005, and is estimatedto reduce net income by approximately $1.5 million in 2005 and $1.0 million in 2006. The Company will not incur any additional expense relatingto stock options in years subsequent to 2006, since the latest vesting date of stock options previously granted is January 1, 2007.
Excluding the new standard discussed above, the other accounting standards recently issued by the FASB, Statements of Position andPractice Bulletins issued by the American Institute of Certified Public Accountants and consensus positions of the Emerging Issues TaskForce are currently not applicable to the Company and, therefore, would have no effect on the Company’s financial condition, cash flows orresults of operations.
Reclassifications Certain amounts in the financial statements for prior periods were reclassified to conform to the 2004 presentation.

APP.-B-10
The components of net investment income for the years ended December 31 were:
(millions) 2004 2003 2002
Available-for-sale: fixed maturities $ 374.6 $ 369.5 $ 379.4preferred stocks 49.3 53.0 45.1common equities 41.2 31.1 22.8
Short-term investments 19.3 11.7 7.9Investment income 484.4 465.3 455.2Investment expenses (13.9) (11.5) (11.5)
Net investment income $ 470.5 $ 453.8 $ 443.7
See Note 10 — Other Comprehensive Income for changes in the net unrealized gains (losses) during the period.
At December 31, 2004, bonds in the principal amount of $84.3 million were on deposit with various regulatory agencies to meet statutoryrequirements. The Company did not have any securities of one issuer with an aggregate cost or market value exceeding ten percent of totalshareholders’ equity at December 31, 2004 or 2003.
2) Investments
The composition of the investment portfolio at December 31 was:
Gross Gross % ofUnrealized Unrealized Market Total
(millions) Cost Gains Losses Value Portfolio
2004Available-for-sale:
U.S. government obligations $ 1,970.1 $ 5.7 $ (13.3) $ 1,962.5 15.0%State and local government obligations 2,873.2 71.2 (4.0) 2,940.4 22.5Foreign government obligations 30.8 .6 — 31.4 .2Corporate and U.S. agency debt securities 1,752.8 35.6 (7.1) 1,781.3 13.6Asset-backed securities 2,345.7 39.5 (16.5) 2,368.7 18.1
8,972.6 152.6 (40.9) 9,084.3 69.4Preferred stocks 749.4 24.5 (5.0) 768.9 5.9Common equities 1,314.0 541.8 (3.9) 1,851.9 14.2
Short-term investments 1,376.6 .3 — 1,376.9 10.5$ 12,412.6 $ 719.2 $ (49.8) $13,082.0 100.0%
2003Available-for-sale:
U.S. government obligations $ 1,307.9 $ 7.3 $ (3.0) $ 1,312.2 10.5%State and local government obligations 2,841.7 94.6 (6.1) 2,930.2 23.4Foreign government obligations 13.9 .7 — 14.6 .1Corporate and U.S. agency debt securities 1,763.1 73.9 (3.2) 1,833.8 14.6Asset-backed securities 2,972.4 83.4 (13.2) 3,042.6 24.3
8,899.0 259.9 (25.5) 9,133.4 72.9Preferred stocks 751.3 34.9 (7.4) 778.8 6.2Common equities 1,590.6 390.3 (8.8) 1,972.1 15.7
Short-term investments 648.0 — — 648.0 5.2$ 11,888.9 $ 685.1 $ (41.7) $ 12,532.3 100.0%

APP.-B-11
The components of net realized gains (losses) for the years ended December 31 were:
(millions) 2004 2003 2002
Gross realized gains:Available-for-sale: fixed maturities $ 105.5 $ 108.4 $ 159.4
preferred stocks 7.9 7.4 12.0common equities 56.1 19.0 35.3
Short-term investments .1 .1 —169.6 134.9 206.7
Gross realized losses:Available-for-sale: fixed maturities (23.8) (40.5) (85.6)
preferred stocks (9.7) (4.1) (.1)common equities (56.6) (77.6) (199.6)
Short-term investments (.2) — —(90.3) (122.2) (285.3)
Net realized gains (losses) on securities:Available-for-sale: fixed maturities 81.7 67.9 73.8
preferred stocks (1.8) 3.3 11.9common equities (.5) (58.6) (164.3)
Short-term investments (.1) .1 —$ 79.3 $ 12.7 $ (78.6)
Per share $ .24 $ .04 $ (.23)
For 2004, 2003 and 2002, net realized gains (losses) on securities include $7.8 million, $50.3 million and $136.5 million, respectively, ofwrite-downs in securities determined to have an other-than-temporary decline in market value for securities held at December 31.
None of the securities represented in the table above were deemed to have any fundamental issues that would lead the Company to believethat they were other-than-temporarily impaired. The Company has the intent and ability to hold the fixed-maturity securities and preferredstocks to maturity/redemption, and will do so, as long as the securities continue to remain consistent with its investment strategy. The Companymay retain the common stocks to maintain correlation to the Russell 1000 index as long as the portfolio and index correlation remain similar.If the Company’s strategy were to change and these securities were impaired, the Company would recognize a write-down in accordance withits stated policy.
The components of gross unrealized losses at December 31, 2004 and 2003 were:
Unrealized LossesTotal
Market Less than 12 months(millions) Value Total 12 Months or greater1
2004Available-for-sale: fixed maturities $ 3,909.8 $ (40.9) $ (30.6) $ (10.3)
preferred stocks 216.9 (5.0) (2.4) (2.6)common equities 86.0 (3.9) (3.7) (.2)
$ 4,212.7 $ (49.8) $ (36.7) $ (13.1)
2003Available-for-sale: fixed maturities $ 2,004.9 $ (25.5) $ (22.9) $ (2.6)
preferred stocks 132.3 (7.4) (2.2) (5.2)common equities 179.2 (8.8) (2.2) (6.6)
$ 2,316.4 $ (41.7) $ (27.3) $ (14.4)
1The market value for securities in an unrealized loss position for 12 months or greater was $547.3 million at December 31, 2004 and $165.1 million at December 31, 2003.

APP.-B-12
3) Income Taxes
The components of the Company’s income tax provision were as follows:
(millions) 2004 2003 2002
Current tax provision $ 794.0 $ 543.6 $ 404.9Deferred tax expense (benefit) 8.1 60.7 (90.8)
Total income tax provision $ 802.1 $ 604.3 $ 314.1
At December 31, 2004 and 2003, the Company did not hold any trading securities. Derivatives used for trading purposes are discussedbelow. Net realized gains (losses) on trading securities for the years ended December 31, 2004, 2003 and 2002 were $0, $.1 million and$0, respectively. Results from trading securities are not material to the Company’s financial condition, cash flows or results of operationsand are reported within the available-for-sale portfolio, rather than separately disclosed.
During 2002, the Company recognized a $1.5 million loss on a discontinued hedge in relation to its 2002 debt issuance as describedfurther in Note 4 — Debt, compared to $0 in both 2003 and 2004.
Derivative instruments may be used for trading purposes or classified as trading derivatives due to the characteristics of the transaction.During 2004, the Company closed all of its credit default protection derivatives, along with the underlying Treasury notes of the same maturityand principal value. As of December 31, 2003, the Company had two open derivative positions classified as trading, with a market value of$5.7 million. The Company matched the notional value of the positions with Treasury notes of an equivalent principal and maturity to replicatea cash bond position. The net market value of the derivatives and Treasury notes was $103.2 million as of December 31, 2003. The combinedTreasury and derivative positions generated $(1.4) million, $4.9 million and $(.1) million of net gains (losses) in 2004, 2003 and 2002,respectively. The results of the derivative and Treasury positions were immaterial to the financial condition, cash flows and results of operationsof the Company and were reported as part of the available-for-sale portfolio, with gains (losses) reported as a component of realized gains(losses) on securities.
The composition of fixed maturities by maturity at December 31, 2004 was:
Market(millions) Cost Value
Less than one year $ 729.1 $ 731.3One to five years 4,815.6 4,838.1Five to ten years 3,319.1 3,405.5Ten years or greater 108.8 109.4
$ 8,972.6 $ 9,084.3
Asset-backed securities are reported based upon their projected cash flows. All other securities which do not have a single maturity dateare reported at average maturity. Actual maturities may differ from expected maturities because the issuers of the securities may have theright to call or prepay obligations.

APP.-B-13
In July 2003, the Company received notice from the Internal Revenue Service that the Joint Committee of Taxation of Congress had com-pleted its review of a Federal income tax settlement agreed to by the Internal Revenue Service, primarily attributable to the amount of lossreserves deductible for tax purposes. As a result, the Company received an income tax refund of approximately $58 million during 2004,which was reflected as a tax recoverable as a component of the Company’s “Income Taxes” item on the balance sheet in 2003. In addi-tion, the Company received $31.2 million, or $.09 per share, of interest.
Deferred income taxes reflect the effect for financial statement reporting purposes of temporary differences between the financial state-ment carrying amounts and the tax bases of assets and liabilities. At December 31, 2004 and 2003, the components of the net deferredtax assets were as follows:
(millions) 2004 2003
Deferred tax assets:Unearned premiums reserve $ 282.4 $ 268.4Non-deductible accruals 100.7 84.5Loss reserves 123.4 113.1Write-downs on securities 12.7 34.7Other 2.2 —
Deferred tax liabilities:Deferred acquisition costs (151.3) (144.3)Net unrealized gains on investment securities (234.3) (225.2)Hedges on forecasted transactions (5.3) (5.8)Depreciable assets (35.4) (18.3)Other (14.9) (10.2)
Net deferred tax assets 80.2 96.9Net income taxes payable (106.2) (15.3)
Income taxes $ (26.0) $ 81.6
The provision for income taxes in the accompanying consolidated statements of income differed from the statutory rate as follows:
(millions) 2004 2003 2002
Income before income taxes $2,450.8 $1,859.7 $ 981.4Tax at statutory rate $ 857.8 35% $ 650.9 35% $ 343.5 35%Tax effect of:
Exempt interest income (29.8) (1) (26.9) (1) (15.6) (2)Dividends received deduction (19.1) (1) (16.6) (1) (12.9) (1)Other items, net (6.8) — (3.1) — (.9) —
$ 802.1 33% $ 604.3 33% $ 314.1 32%

APP.-B-14
Debt includes amounts the Company has borrowed and contributed to the capital of its insurance subsidiaries or borrowed for other long-term purposes. Market values are obtained from publicly quoted sources. Interest on all debt is payable semiannually and all principal is dueat maturity. There are no restrictive financial covenants.
The 6.25% Senior Notes, the 6.375% Senior Notes and the 6 5/8% Senior Notes (collectively, “Senior Notes”) may be redeemed in wholeor in part at any time, at the option of the Company, subject to a “make whole” provision. All other debt is noncallable.
Prior to issuance of the Senior Notes, the Company entered into forecasted debt issuance hedges against possible rises in interest rates.Upon issuance of the applicable debt securities, the hedges were closed. The Company recognized, as part of accumulated othercomprehensive income, a $5.1 million unrealized gain associated with the 6.25% Senior Notes, an $18.4 million unrealized gain associatedwith the 6.375% Senior Notes and a $4.2 million unrealized loss associated with the 6 5/8% Senior Notes. The gains (losses) on these hedgesare recognized as adjustments to interest expense over the life of the related debt issuances.
In June 2004, the Company entered into an uncommitted line of credit with National City Bank in the principal amount of $100 million.Interest on amounts borrowed accrues at a rate related to the London interbank offered rate (LIBOR). No commitment fees are required tobe paid. There are no rating triggers under this line of credit. The Company had no borrowings under this arrangement at December 31, 2004.
In January 2004, the Company entered into a revolving credit arrangement with National City Bank, replacing a prior credit facility withNational City Bank, which had the same material terms with the exception of additional interest rate options under the new arrangement.Under this agreement, the Company had the right to borrow up to $10.0 million. By selecting from available credit options, the Companycould elect to pay interest at the prime rate or rates related to LIBOR. A commitment fee was payable on any unused portion of the committedamount at the rate of .125% per annum. The Company had no borrowings under this arrangement at December 31, 2004 or 2003. In January2005, the Company elected to allow this revolving credit arrangement to expire at its contractual termination date, due to the fact that theCompany maintains the $100 million line of credit with National City Bank, as discussed above.
Aggregate principal payments on debt outstanding at December 31, 2004, are $0 for 2005, $100.0 million for 2006, $0 for 2007, 2008and 2009 and $1.2 billion thereafter.
4) Debt
Debt at December 31 consisted of:2004 2003
Market Market(millions) Cost Value Cost Value
6.60% Notes due 2004 (issued: $200.0, January 1994) $ — $ — $ 200.0 $ 200.37.30% Notes due 2006 (issued: $100.0, May 1996) 99.9 105.2 99.9 110.86.375% Senior Notes due 2012 (issued: $350.0, December 2001) 347.7 384.6 347.5 382.67% Notes due 2013 (issued: $150.0, October 1993) 148.9 171.1 148.8 171.065⁄8% Senior Notes due 2029 (issued: $300.0, March 1999) 294.1 324.2 294.0 312.56.25% Senior Notes due 2032 (issued: $400.0, November 2002) 393.7 417.0 393.6 408.8Other debt — — 6.0 6.0
$1,284.3 $ 1,402.1 $ 1,489.8 $ 1,592.0

APP.-B-15
The Company’s objective is to establish case and IBNR reserves that are adequate to cover all loss costs, while sustaining minimal variationfrom the date that the reserves are initially established until losses are fully developed. The Company’s reserves developed favorably in2004 and 2003. In addition to favorable claims settlement during 2003, the Company benefited from a change in its estimate of theCompany’s future operating losses due to business assigned from the New York Automobile Insurance Plan.
Because the Company is primarily an insurer of motor vehicles, it has limited exposure to environmental, asbestos and general liabilityclaims. The Company has established reserves for these exposures, in amounts which it believes to be adequate based on informationcurrently known. The Company does not believe that these claims will have a material effect on the Company’s liquidity, financial condition,cash flows or results of operations.
The Company writes personal and commercial auto insurance in the coastal states, which could be exposed to natural catastrophes.Although the occurrence of a major catastrophe could have a significant effect on the Company’s monthly or quarterly results, the Companybelieves such an event would not be so material as to disrupt the overall normal operations of the Company. The Company is unable topredict if any such events will occur in the near term.
6) Reinsurance
Reinsurance contracts do not relieve the Company from its obligations to policyholders. Failure of reinsurers to honor their obligations couldresult in losses to the Company. The Company evaluates the financial condition of its reinsurers and monitors concentrations of credit risk tominimize its exposure to significant losses from reinsurer insolvencies.
The primary difference between direct and net premiums written is attributable to premiums written under state-mandated involuntaryCommercial Auto Insurance Procedures/Plans (CAIP), for which the Company retains no loss indemnity risk, and premiums ceded to state-provided reinsurance facilities.
5) Loss and Loss Adjustment Expense Reserves
Activity in the loss and loss adjustment expense reserves, prepared in accordance with GAAP, is summarized as follows:
(millions) 2004 2003 2002
Balance at January 1 $ 4,576.3 $ 3,813.0 $ 3,238.0Less reinsurance recoverables on unpaid losses 229.9 180.9 168.3
Net balance at January 1 4,346.4 3,632.1 3,069.7Incurred related to:
Current year 8,664.1 7,696.5 6,295.6Prior years (109.1) (56.1) 3.5
Total incurred 8,555.0 7,640.4 6,299.1Paid related to:
Current year 5,719.2 5,065.4 4,135.0Prior years 2,233.7 1,860.7 1,601.7
Total paid 7,952.9 6,926.1 5,736.7Net balance at December 31 4,948.5 4,346.4 3,632.1
Plus reinsurance recoverables on unpaid losses 337.1 229.9 180.9Balance at December 31 $ 5,285.6 $ 4,576.3 $ 3,813.0

APP.-B-16
7) Statutory Financial Information
At December 31, 2004, $488.7 million of consolidated statutory policyholders’ surplus represents net admitted assets of the Company’sinsurance subsidiaries and affiliate that are required to meet minimum statutory surplus requirements in such entities’ states of domicile. Thecompanies may be licensed in states other than their states of domicile, which may have higher minimum statutory surplus requirements.Generally, the net admitted assets of insurance companies that, subject to other applicable insurance laws and regulations, are available fortransfer to the parent company cannot include the net admitted assets required to meet the minimum statutory surplus requirements of thestates where the companies are licensed.
During 2004, the insurance subsidiaries paid aggregate cash dividends of $2,123.8 million to the parent company. Based on the dividendlaws currently in effect, the insurance subsidiaries may pay aggregate dividends of $1,229.9 million in 2005 without prior approval fromregulatory authorities, provided the dividend payments are not within 12 months of previous dividends paid by the applicable subsidiary.
Consolidated statutory policyholders’ surplus was $4,671.8 million and $4,538.3 million at December 31, 2004 and 2003, respectively.Statutory net income was $1,659.4 million, $1,260.5 million and $557.4 million for the years ended December 31, 2004, 2003 and 2002,respectively.
8) Employee Benefit Plans
Retirement Plans The Company has a two-tiered Retirement Security Program. The first tier is a defined contribution pension plan coveringall employees who meet requirements as to age and length of service. Contributions vary from 1% to 5% of annual eligible compensationup to the Social Security wage base, based on years of eligible service. Company contributions were $17.2 million in 2004, $15.4 millionin 2003 and $13.0 million in 2002.
The second tier is a long-term savings plan under which the Company matches, up to a maximum of 3% of the employee’s eligiblecompensation, amounts contributed to the plan by an employee. Company matching contributions are not restricted and may be investedby a participant in any of the investment funds available under the plan. Company matching contributions were $23.4 million in 2004,$19.9 million in 2003 and $16.9 million in 2002.
Postemployment Benefits The Company provides various postemployment benefits to former or inactive employees who meet eligibilityrequirements, their beneficiaries and covered dependents. Postemployment benefits include salary continuation and disability-relatedbenefits, including workers’ compensation, and, if elected, continuation of health-care benefits. The Company’s liability was $15.5 millionat December 31, 2004, compared to $12.3 million in 2003.
Postretirement Benefits The Company provides postretirement health and life insurance benefits to all employees who met requirementsas to age and length of service at December 31, 1988. This group of employees represents less than one-half of one percent of the Company’scurrent workforce. The Company’s funding policy is to contribute annually the maximum amount that can be deducted for Federal incometax purposes. Contributions are intended to provide not only for benefits attributed to services to date, but also for those expected to beearned in the future.
The effect of reinsurance on premiums written and earned for the years ended December 31 was as follows:
2004 2003 2002
(millions) Written Earned Written Earned Written Earned
Direct premiums $13,694.1 $13,480.8 $ 12,187.9 $11,597.5 $ 9,665.7 $ 9,078.1Ceded (316.0) (310.9) (274.5) (256.5) (213.8) (194.7)Assumed — — — — .1 .1
Net premiums $13,378.1 $ 13,169.9 $ 11,913.4 $11,341.0 $ 9,452.0 $ 8,883.5
As of December 31, 2004 and 2003, almost 60% of the “prepaid reinsurance premiums” are comprised of CAIP. As of December 31, 2004,approximately 45% of the “reinsurance recoverables” are comprised of CAIP, compared to almost 55% in 2003. The remainder of the “rein-surance recoverables” are primarily comprised of reinsurance recoverables from state-mandated programs.
Losses and loss adjustment expenses are net of reinsurance ceded of $271.9 million in 2004, $185.8 million in 2003 and $131.8 million in 2002.

APP.-B-17
A summary of all employee restricted stock activity during the years ended December 31 follows:
2004 2003
Weighted WeightedNumber of Average Number of Average
Restricted Shares Shares Grant Price Shares Grant Price
Beginning of year 549,648 $ 65.81 — —Add (deduct):
Granted 492,416 84.16 553,290 $ 65.81Vested (99,868) 65.55 (655) 65.55Cancelled (26,355) 70.60 (2,987) 65.55
End of year 915,841 $ 75.57 549,648 $ 65.81
Deferred Compensation The Company maintains The Progressive Corporation Executive Deferred Compensation Plan (Deferral Plan),which permits eligible executives to defer receipt of some or all of their annual bonuses or all of their restricted stock awards. These deferredamounts are deemed invested in one or more investment funds, including Common Shares of the Company, offered under the DeferralPlan. All distributions from the Deferral Plan will be made in cash. Prior to February 2004, distributions representing amounts deemedinvested in Common Shares were made in Common Shares. The Company reserved 900,000 Common Shares for issuance under theDeferral Plan. Included in the Company’s balance sheets is an irrevocable grantor trust established to provide a source of funds to assistthe Company in meeting its liabilities under the Deferral Plan. At December 31, 2004 and 2003, the trust held assets of $59.3 million and$41.3 million, respectively, of which $12.4 million and $7.1 million were held in Common Shares, to cover its liabilities.
Incentive Compensation Plans The Company’s incentive compensation plans include executive cash bonus programs for key membersof management, a cash gainsharing program for all other employees and other stock-based compensation plans for key members ofmanagement and the non-employee directors. The amounts charged to income for cash incentive compensation plans were $260.7 millionin 2004, $233.5 million in 2003 and $169.4 million in 2002. The amount charged to income for time-based and performance-basedrestricted stock awards was $23.8 million and $11.0 million in 2004 and 2003, respectively.
The Company’s 2003 Incentive Plan and the Company’s 1995 Incentive Plan, which provide for the granting of stock-based awards,including stock options and restricted stock awards, to key employees of the Company, has 5.0 million and 15.0 million shares authorized,respectively. The 1989 Incentive Plan has expired; however, awards made under the plan prior to expiration are still in effect.
Beginning in 2003, the Company began issuing restricted stock awards in lieu of stock options. The restricted stock awards were issuedas either time-based or performance-based awards. The time-based awards vest in equal installments upon the lapse of a period of time,typically over three, four and five year periods. The restriction period must be a minimum of six months and one day. The performance-based awards vest upon the achievement of predetermined performance criteria. The restricted stock awards are expensed pro rata overthe vesting period based on the market value of the non-deferred awards at the time of grant, while the deferred awards are based on thecurrent market value at the end of the reporting period.
Prior to 2003, the Company issued nonqualified stock options, which were granted for periods up to ten years, become exercisable atvarious dates not earlier than six months after the date of grant, and remain exercisable for specified periods thereafter. All options grantedhad an exercise price equal to the market value of the Common Shares on the date of grant. All option exercises are settled in Common Shares.

APP.-B-18
The Company elected to account for terminations when they occur rather than include an attrition factor into its model.
The following employee stock options were outstanding or exercisable as of December 31, 2004:
Options Outstanding Options Exercisable
Weighted Average Weighted WeightedRange of Number of Remaining Average Number of AverageExercise Prices Shares Contractual Life Exercise Price Shares Exercise Price
$ 15 < 20 2,002,814 4.32 years $ 18.64 1,296,332 $ 18.3220 < 30 810,068 2.39 years 23.05 760,794 22.9830 < 40 1,548,969 5.95 years 30.76 574,340 30.8040 < 50 1,145,809 3.60 years 44.52 1,120,432 44.4950 < 60 1,081,841 6.99 years 52.22 174,316 52.11
$ 15 < 60 6,589,501 3,926,214
Under SFAS 123, the Company used the modified Black-Scholes pricing model to calculate the fair value of the options awarded as of thedate of grant, including 23,571 options awarded to the non-employee directors during 2002. The Company used the following assumptionsin relation to the option awards granted in 2002:
2002
Option Term 6 yearsAnnualized Volatility Rate 39.5%Risk-Free Rate of Return 4.66%Dividend Yield .25%
Black-Scholes Value 44.6%
In addition to the employee incentive plans disclosed above, the Company registered 350,000 Common Shares for the 2003 DirectorsEquity Incentive Plan, which provides for the granting of equity-based incentive awards to non-employee directors of the Company, and600,000 Common Shares under the 1998 Directors’ Stock Option Plan. During 2004 and 2003, the Company granted 12,242 and 16,102,respectively, time-based restricted stock awards, which vest within one year from the date of grant. During 2002, the Company grantedoptions for 23,571 shares to the non-employee directors. These awards have the same vesting, exercise and contract terms as the employeestock option awards. As of December 31, 2004, 2003 and 2002, the directors stock options outstanding and exercisable were 242,277shares, 311,061 shares and 343,044 shares, respectively.
A summary of all employee stock option activity during the years ended December 31 follows:
2004 2003 2002
Weighted Weighted WeightedNumber of Average Number of Average Number of Average
Options Outstanding Shares Exercise Price Shares Exercise Price Shares Exercise Price
Beginning of year 8,725,037 $ 30.43 11,947,271 $ 27.44 12,682,380 $ 23.81Add (deduct):
Granted — — — — 1,194,192 52.17Exercised (2,025,156) 24.94 (2,826,420) 17.47 (1,464,862) 15.11Cancelled (110,380) 35.42 (395,814) 32.66 (464,439) 30.81
End of year 6,589,501 $ 32.04 8,725,037 $ 30.43 11,947,271 $ 27.44Exercisable, end of year 3,926,214 $ 30.02 3,749,453 $ 25.49 4,542,722 $ 17.19Available, end of year1 11,443,867 11,825,903 6,988,479
1Represents 7,141,717 shares and 4,302,150 shares available under the 1995 and 2003 Incentive Plans, respectively, after the granting of stock options and restrictedstock awards. The 1995 Incentive Plan expired on February 10, 2005, and the remaining shares thereunder are no longer available for future issuance.

APP.-B-19
9) Segment Information
The Company writes personal automobile and other specialty property-casualty insurance and provides related services throughout theUnited States. The Company’s Personal Lines segment writes insurance for private passenger automobiles and recreation vehicles, whichis generated either by an agency or written directly by the Company. The Personal Lines-Agency channel includes business written by theCompany’s network of more than 30,000 independent insurance agencies and strategic alliance business relationships (other insurancecompanies, financial institutions, employers and national brokerage agencies). The Personal Lines-Direct channel includes business writtenthrough 1-800-PROGRESSIVE and online at progressive.com. The Personal Lines segment includes both the Agency and Direct channels.
The Personal Lines-Agency channel and the Personal Lines-Direct channel are each organized into six geographical regions. Currently,both the Agency channel and the Direct channel have three General Managers responsible for two regions each. Each channel has a GroupPresident and a process team, with local managers at the state level. Each of the six regions has a Claims business General Managerresponsible for claims handling in the region.
The Company’s Commercial Auto segment writes primary liability and physical damage insurance for automobiles and trucks ownedby small businesses.
The Company’s other businesses-indemnity primarily includes writing professional liability insurance for community banks and managingthe Company’s run-off businesses, including the wind-down of the Company’s lender’s collateral protection program. The Company’s otherbusinesses-service includes providing insurance-related services, primarily processing CAIP business.
All revenues are generated from external customers and the Company does not have a reliance on any major customer.The Company evaluates segment profitability based on pretax underwriting and service profit (loss). Pretax profit (loss) is defined as
underwriting profit (loss) for the Personal Lines, Commercial Auto and other businesses-indemnity as well as service profit (loss) for theother businesses-service. Underwriting profit (loss) is calculated as net premiums earned less loss and loss adjustment expenses, policyacquisition costs and other underwriting expenses. Service profit (loss) is the difference between service revenues and service expenses.Expense allocations are based on certain assumptions and estimates; stated segment operating results would change if different methodswere applied. The Company does not allocate assets or income taxes to operating segments. In addition, the Company does not separatelyidentify depreciation and amortization expense by segment and such disclosure would be impractical. Companywide depreciation expensewas $99.4 million in 2004, $89.3 million in 2003 and $83.9 million in 2002. The accounting policies of the operating segments are thesame as those described in Note 1 — Reporting and Accounting Policies.
Following are the operating results for the years ended December 31:
2004 2003 2002
Pretax Pretax Pretax(millions) Revenues Profit (Loss) Revenues Profit (Loss) Revenues Profit (Loss)
Personal Lines – Agency $ 7,893.7 $ 1,108.2 $ 6,948.0 $ 836.0 $ 5,542.7 $ 388.0Personal Lines – Direct 3,718.2 525.6 3,103.0 383.0 2,365.1 203.8
Total Personal Lines1 11,611.9 1,633.8 10,051.0 1,219.0 7,907.8 591.8Commercial Auto Business 1,524.1 321.4 1,226.7 214.2 880.0 80.0Other businesses – indemnity 33.9 3.1 63.3 8.2 95.7 6.8Total underwriting operations 13,169.9 1,958.3 11,341.0 1,441.4 8,883.5 678.6Other businesses – service 48.5 23.5 41.8 16.1 34.3 12.3Investments2 563.7 549.8 478.0 466.5 376.6 365.1Interest expense — (80.8) — (95.5) — (74.6)Other income3 — — 31.2 31.2 — —
$13,782.1 $ 2,450.8 $ 11,892.0 $ 1,859.7 $ 9,294.4 $ 981.4
1Personal automobile insurance accounted for 93% of the total Personal Lines segment net premiums earned in 2004, 2003 and 2002.2Revenues represent recurring investment income and net realized gains (losses) on securities; pretax profit is net of investment expenses.3Represents interest income related to an income tax refund the Company received in 2004. See Note 3 — Income Taxes for further discussion.

APP.-B-20
The components of other comprehensive income for the years ended December 31 were as follows:
2004 2003 2002
Tax Tax Tax(Provision) After (Provision) After (Provision) After
(millions) Pretax Benefit Tax Pretax Benefit Tax Pretax Benefit TaxUnrealized gains (losses)
arising during period:Available-for-sale:
fixed maturities $ (48.0) $ 16.8 $ (31.2) $ 2.8 $ (.9) $ 1.9 $ 240.9 $ (84.3) $ 156.6equity securities 241.4 (84.5) 156.9 431.6 (151.1) 280.5 (137.8) 48.2 (89.6)
Reclassification adjustment:1
Available-for-sale:fixed maturities (74.4) 26.0 (48.4) (71.5) 25.0 (46.5) (13.8) 4.7 (9.1)equity securities (93.0) 32.6 (60.4) 30.6 (10.7) 19.9 (26.2) 9.2 (17.0)
Net unrealized gains (losses) 26.0 (9.1) 16.9 393.5 (137.7) 255.8 63.1 (22.2) 40.9Net unrealized gains
on forecasted transactions2 (1.5) .5 (1.0) (1.5) .5 (1.0) 3.8 (1.3) 2.5Foreign currency
translation adjustment3 3.9 — 3.9 .9 — .9 — — —Other comprehensive
income $ 28.4 $ (8.6) $ 19.8 $ 392.9 $ (137.2) $ 255.7 $ 66.9 $ (23.5) $ 43.4
1Represents adjustments for gains (losses) realized in net income for securities held in the portfolio at December 31 of the preceding year.2Entered into for the purpose of managing interest rate risk associated with debt issuances. See Note 4 — Debt. The Company expects to reclassify $1.5 million into incomewithin the next 12 months.
3Foreign currency translation adjustments have no tax effect.
10) Other Comprehensive Income
The Company’s management uses underwriting margin and combined ratio as primary measures of underwriting profitability. The under-writing margin is the pretax profit (loss) expressed as a percent of net premiums earned (i.e., revenues). Combined ratio is the complementof the underwriting margin. Following are the underwriting margins/combined ratios for the Company’s underwriting operations as of De-cember 31:
2004 2003 2002
Underwriting Combined Underwriting Combined Underwriting Combined(millions) Margin Ratio Margin Ratio Margin Ratio
Personal Lines – Agency 14.0% 86.0 12.0% 88.0 7.0% 93.0Personal Lines – Direct 14.1 85.9 12.3 87.7 8.6 91.4
Total Personal Lines 14.1 85.9 12.1 87.9 7.5 92.5Commercial Auto Business 21.1 78.9 17.5 82.5 9.1 90.9Other businesses – indemnity 9.2 90.8 13.0 87.0 7.2 92.8Total underwriting operations 14.9 85.1 12.7 87.3 7.6 92.4

APP.-B-21
11) Litigation
The Company is named as defendant in various lawsuits arising out of its insurance operations. All legal actions relating to claims madeunder insurance policies are considered by the Company in establishing its loss and loss adjustment expense reserves.
In addition, the Company is named as defendant in a number of class action or individual lawsuits. Other insurance companies facemany of these same issues. The lawsuits discussed below are in various stages of development. The Company plans to contest these suitsvigorously, but may pursue settlement negotiations in appropriate cases. The outcomes of these cases are uncertain at this time. In accordancewith GAAP, the Company is only permitted to establish loss reserves for lawsuits when it is probable that a loss has been incurred and theCompany can reasonably estimate its potential exposure (referred to as a loss that is both “probable and estimable” in the discussionbelow). As to lawsuits that do not satisfy both parts of this GAAP standard, the Company has not established reserves at this time. However,in the event that any one or more of these cases results in a judgment against or settlement by the Company, the resulting liability couldhave a material effect on the Company’s financial condition, cash flows and results of operations.
As required by the GAAP standard, the Company has established loss reserves for lawsuits as to which the Company has determinedthat a loss is both probable and estimable. Certain of these cases are mentioned in the discussion below. Based on currently availableinformation, the Company believes that its reserves for these lawsuits are reasonable and that the amounts reserved did not have a materialeffect on the Company’s financial condition or results of operations. However, if any one or more of these cases results in a judgmentagainst or settlement by the Company for an amount that is significantly greater than the amount so reserved, the resulting liability couldhave a material effect on the Company’s financial condition, cash flows and results of operations.
Following is a discussion of the Company’s potentially significant pending cases at December 31, 2004.There are two putative class action lawsuits challenging the Company’s use of certain automated database vendors to assist in the
adjustment of bodily injury claims. Plaintiffs allege that these databases systematically undervalue the claims. The Company does notconsider a loss from these cases to be probable and estimable, and is unable to estimate a range of loss, if any, at this time.
There are three putative class action lawsuits challenging the Company’s installment fee programs. The Company has successfullydefended similar cases in the past and does not consider a loss to be probable and estimable, and is unable to estimate a range of loss, ifany, at this time.
There are three putative class action lawsuits challenging the Company’s practice of specifying aftermarket (non-original equipmentmanufacturer) replacement parts in the repair of insured or claimant vehicles. Plaintiffs in these cases generally allege that aftermarketparts are inferior to replacement parts manufactured by the vehicle’s original manufacturer and that the use of such parts fails to restorethe damaged vehicle to its “pre-loss” condition, as required by their insurance policies. The Company does not consider a loss from thesecases to be probable and estimable, and is unable to estimate a range of loss, if any, at this time.
There are three putative class action lawsuits pending against the Company in Florida challenging the legality of the Company’s paymentof preferred provider rates on personal injury protection (PIP) claims. The primary issue is whether the Company violated Florida law by payingPIP medical expense claims at preferred provider rates. The Company does not consider a loss to be probable and estimable, and is unableto estimate a range of loss, if any, at this time. During 2004, the Company settled an individual bad faith lawsuit in Florida, which allegedsimilar issues; the settlement did not have a material effect on the Company’s financial condition, cash flows or results of operations.
There are two putative class action lawsuits challenging the Company’s use of certain automated database vendors to assist in theevaluation of total loss claims. Plaintiffs allege that these databases systematically undervalue total loss claims to the detriment of insureds.The Company has been engaged in extensive settlement negotiations to resolve the claims raised in these cases and has established a lossreserve for this resolution.
There are five class action lawsuits challenging certain aspects of the Company’s use of credit information and notice requirementsunder the federal Fair Credit Reporting Act. The Company had entered into a settlement agreement to resolve these cases, had receivedpreliminary court approval of the settlement and had established a reserve accordingly. On February 24, 2005, the Company was advisedthat the court denied final approval of the proposed settlement, and the Company is now assessing the impact of this decision and reviewingavailable options, which may include further negotiations with counsel for the plaintiffs or a resumption of the litigation. During 2004, theCompany settled a state-specific case within the reserve amount established in prior years.
The Company has prevailed in four putative class action lawsuits, in various Texas state courts, alleging that the Company is obligatedto reimburse insureds, under their auto policies, for the inherent diminished value of their vehicles after they have been involved in anaccident. Plaintiffs define inherent diminished value as the difference between the market value of the insured automobile before an accidentand the market value after proper repair. The Supreme Court of Texas has ruled that diminished value recovery is not available under theTexas automobile policy. In February 2002, the Company reached an agreement to settle its Georgia diminution of value case for $19.8million, plus administrative costs. The claims process was completed in early 2003. The Company believes that Georgia law on diminutionof value is an anomaly and has successfully defended several of these cases in other jurisdictions.
In November 2002, the Company reached an agreement to settle for $10 million its lawsuit relating to the classification of the Company’sCalifornia claims employees as “exempt” workers for purposes of state wage and hour laws. The claims process for the settlement of theCalifornia case was completed in early 2003. That class action lawsuit was based on California-specific law.

APP.-B-22
12) Commitments and Contingencies
The Company has certain noncancelable operating lease commitments and service contracts with terms greater than one year. The minimum commitments under these agreements at December 31, 2004, are as follows:
(millions)Operating Service
Year Leases Contracts Total2005 $ 87.5 $ 58.1 $ 145.62006 74.2 20.3 94.52007 57.9 4.1 62.02008 36.4 1.6 38.02009 20.4 1.3 21.7Thereafter 31.7 1.2 32.9
Some of the agreements have options to renew at the end of the contract periods. The expense incurred by the Company for the agree-ments disclosed above, as well as other operating leases that may be cancelable or have terms less than one year, was:
(millions)Operating Service
Year Leases Contracts Total2004 $ 116.0 $ 89.4 $ 205.42003 101.6 80.1 181.72002 71.0 77.5 148.5
During 2004, the Company incurred $11.4 million of guaranty fund assessments, compared to $12.2 million in 2003 and $21.2 million in2002. At December 31, 2004 and 2003, the Company had $10.7 million and $10.1 million, respectively, reserved for future assessmentson current insolvencies. Management believes that any assessment in excess of its current reserves will not materially affect the Company’sfinancial condition, cash flows or results of operations.
As of December 31, 2004, the Company had open investment funding commitments of $7.3 million; the Company had no uncollateralizedlines or letters of credit as of December 31, 2004 or 2003.
During 2004, the Company settled a federal collective action lawsuit involving worker classification issues under the federal Fair LaborStandards Act (FLSA) and five state class actions, which were consolidated with the federal case. All of such lawsuits challenged theCompany’s classification of its claims representatives as “exempt” under the FLSA and/or various state laws. In October 2004, the Companyreached an agreement under which it funded an account for all potential claims of class member claims representatives and eligible claims representative trainees. This settlement did not have a material effect on the Company’s financial condition, cash flows or resultsof operations.
In July 2002, the Company settled a nationwide class action lawsuit challenging one of the Company’s claim adjustment practices,known as the charging of “betterment.” Specifically, it was alleged that the Company made improper adjustments for depreciation andphysical condition in the adjustment of first party physical damage claims. This settlement has received trial court approval and the claimsprocess was completed in early 2003.
In July 2002, the Company reached a nationwide settlement of a class action lawsuit challenging the Company’s alternative commissionprograms. Under these programs, independent insurance agents were able to offer the Company’s insurance products at different commissionlevels. The settlement resulted in the payment of approximately $60 million, including the costs of settlement and attorneys’ fees. Theclaims process for that settlement was completed in early 2003. During 2004, the Company settled two groups of individual cases, one inAlabama and one in Mississippi, which were filed by individuals who opted out of the nationwide class action settlement, within the reserveamount established in prior years for these groups of cases.
The Company is defending one putative class action lawsuit alleging that the Company’s rating practices at renewal are improper. TheCompany prevailed in a similar putative class action in December 2004. The Company does not consider a loss from this case to be probableand estimable, and is unable to estimate a range of loss, if any, at this time.
The Company is defending one national putative class action lawsuit brought on behalf of medical providers disputing the legality of theCompany’s practice of paying first party medical benefits pursuant to a preferred provider agreement. The Company does not consider aloss to be probable and estimable, and is unable to estimate a range of loss, if any, at this time.
APP.-B-23
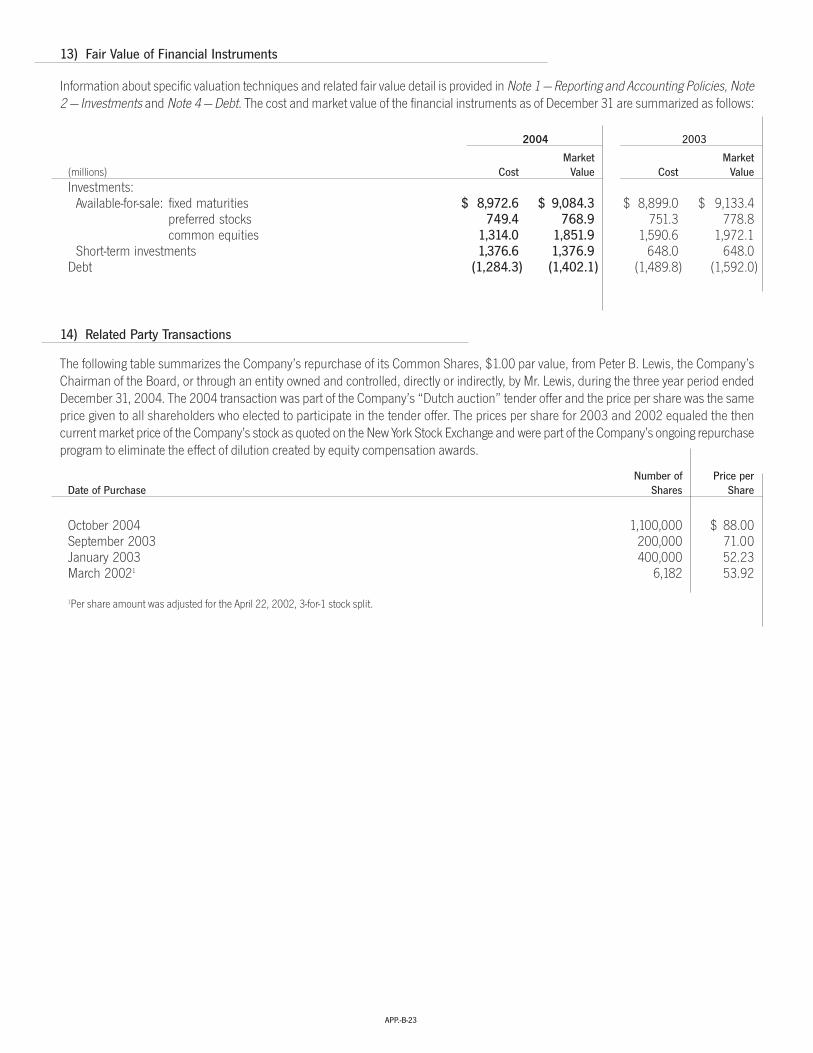
13) Fair Value of Financial Instruments
14) Related Party Transactions
The following table summarizes the Company’s repurchase of its Common Shares, $1.00 par value, from Peter B. Lewis, the Company’sChairman of the Board, or through an entity owned and controlled, directly or indirectly, by Mr. Lewis, during the three year period endedDecember 31, 2004. The 2004 transaction was part of the Company’s “Dutch auction” tender offer and the price per share was the sameprice given to all shareholders who elected to participate in the tender offer. The prices per share for 2003 and 2002 equaled the thencurrent market price of the Company’s stock as quoted on the New York Stock Exchange and were part of the Company’s ongoing repurchaseprogram to eliminate the effect of dilution created by equity compensation awards.
Information about specific valuation techniques and related fair value detail is provided in Note 1 — Reporting and Accounting Policies, Note2 — Investments and Note 4 — Debt. The cost and market value of the financial instruments as of December 31 are summarized as follows:
2004 2003
Market Market(millions) Cost Value Cost ValueInvestments:
Available-for-sale: fixed maturities $ 8,972.6 $ 9,084.3 $ 8,899.0 $ 9,133.4preferred stocks 749.4 768.9 751.3 778.8common equities 1,314.0 1,851.9 1,590.6 1,972.1
Short-term investments 1,376.6 1,376.9 648.0 648.0Debt (1,284.3) (1,402.1) (1,489.8) (1,592.0)
Number of Price perDate of Purchase Shares Share
October 2004 1,100,000 $ 88.00September 2003 200,000 71.00January 2003 400,000 52.23March 20021 6,182 53.92
1Per share amount was adjusted for the April 22, 2002, 3-for-1 stock split.

APP.-B-24
THE PROGRESSIVE CORPORATION AND SUBSIDIARIES
MANAGEMENT’S REPORT ON INTERNAL CONTROL OVER FINANCIAL REPORTING
The Company’s management is responsible for establishing and maintaining adequate internal control over financial reporting, as such termis defined in Exchange Act Rule 13a-15(f). The Company’s internal control structure was designed under the supervision of the Company’sChief Executive Officer and Chief Financial Officer to provide reasonable assurance regarding the reliability of financial reporting and thepreparation of financial statements for external purposes in accordance with accounting principles generally accepted in the United Statesof America.
Under the supervision and with the participation of the Company’s management, including its Chief Executive Officer and Chief FinancialOfficer, the Company conducted an evaluation of the effectiveness of its internal control over financial reporting based on the frameworkin Internal Control — Integrated Framework issued by the Committee of Sponsoring Organizations of the Treadway Commission (COSO).Based on the Company’s evaluation under the framework in Internal Control — Integrated Framework, management concluded that theCompany’s internal control over financial reporting was effective as of December 31, 2004. There were no material weaknesses identifiedduring the internal control review process.
Our internal control over financial reporting includes policies and procedures that pertain to the maintenance of records that, in reasonabledetail, accurately and fairly reflect transactions and dispositions of assets; provide reasonable assurances that transactions are recordedas necessary to permit preparation of financial statements in accordance with generally accepted accounting principles, and that receiptsand expenditures are being made only in accordance with authorizations of management and the directors of the Company; and providereasonable assurance regarding prevention or timely detection of unauthorized acquisition, use or disposition of the Company’s assetsthat could have a material effect on our financial statements.
PricewaterhouseCoopers LLP, an independent registered public accounting firm that audited the financial statements in this AnnualReport, has issued an attestation report on management’s assessment of the Company’s internal control over financial reporting as ofDecember 31, 2004, which is included herein.
CEO AND CFO CERTIFICATIONS
Glenn M. Renwick, President and Chief Executive Officer of The Progressive Corporation, and W. Thomas Forrester, Vice President and ChiefFinancial Officer of The Progressive Corporation, have issued the certifications required by Sections 302 and 906 of The Sarbanes-Oxley Actof 2002 and applicable SEC regulations with respect to the Company’s Annual Report on Form 10-K, including the financial statements providedin this Report. Among other matters required to be included in those certifications, Mr. Renwick and Mr. Forrester have each certified that, tothe best of his knowledge, the financial statements, and other financial information included in the Annual Report on Form 10-K, fairly presentin all material respects the financial condition, results of operations and cash flows of the Company as of, and for, the periods presented. SeeExhibits 31 and 32 to the Company’s Annual Report on Form 10-K for the complete Section 302 and 906 Certifications, respectively.
In addition, Mr. Renwick submitted his annual certification to the New York Stock Exchange (NYSE) on May 12, 2004, stating that hewas not aware of any violation by the Company of the NYSE corporate governance listing standards, as required by Section 303A.12(a) ofthe NYSE Listed Company Manual.

APP.-B-25
REPORT OF INDEPENDENT REGISTERED PUBLIC ACCOUNTING FIRM
To the Board of Directors and Shareholders of The Progressive Corporation:
We have completed an integrated audit of The Progressive Corporation’s 2004 consolidated financial statements and of its internal controlover financial reporting as of December 31, 2004 and audits of its 2003 and 2002 consolidated financial statements in accordance withthe standards of the Public Company Accounting Oversight Board (United States). Our opinions, based on our audits, are presented below.
Consolidated financial statements In our opinion, the accompanying consolidated balance sheets and the related consolidated statementsof income, changes in shareholders’ equity and cash flows present fairly, in all material respects, the financial position of The ProgressiveCorporation and its subsidiaries at December 31, 2004 and 2003, and the results of their operations and their cash flows for each of thethree years in the period ended December 31, 2004, in conformity with accounting principles generally accepted in the United States ofAmerica. These financial statements are the responsibility of the Company’s management. Our responsibility is to express an opinion onthese financial statements based on our audits. We conducted our audits of these statements in accordance with the standards of thePublic Company Accounting Oversight Board (United States). Those standards require that we plan and perform the audit to obtain reasonableassurance about whether the financial statements are free of material misstatement. An audit of financial statements includes examining,on a test basis, evidence supporting the amounts and disclosures in the financial statements, assessing the accounting principles usedand significant estimates made by management, and evaluating the overall financial statement presentation. We believe that our auditsprovide a reasonable basis for our opinion.
Internal control over financial reporting Also, in our opinion, management’s assessment, included in the accompanying Management’sReport on Internal Control over Financial Reporting, that the Company maintained effective internal control over financial reporting as ofDecember 31, 2004 based on criteria established in Internal Control — Integrated Framework issued by the Committee of SponsoringOrganizations of the Treadway Commission (COSO), is fairly stated, in all material respects, based on those criteria. Furthermore, in ouropinion, the Company maintained, in all material respects, effective internal control over financial reporting as of December 31, 2004,based on criteria established in Internal Control — Integrated Framework issued by COSO. The Company’s management is responsible formaintaining effective internal control over financial reporting and for its assessment of the effectiveness of internal control over financialreporting. Our responsibility is to express opinions on management’s assessment and on the effectiveness of the Company’s internal controlover financial reporting based on our audit. We conducted our audit of internal control over financial reporting in accordance with thestandards of the Public Company Accounting Oversight Board (United States). Those standards require that we plan and perform the auditto obtain reasonable assurance about whether effective internal control over financial reporting was maintained in all material respects. Anaudit of internal control over financial reporting includes obtaining an understanding of internal control over financial reporting, evaluatingmanagement’s assessment, testing and evaluating the design and operating effectiveness of internal control, and performing such otherprocedures as we consider necessary in the circumstances. We believe that our audit provides a reasonable basis for our opinions.
A company’s internal control over financial reporting is a process designed to provide reasonable assurance regarding the reliability offinancial reporting and the preparation of financial statements for external purposes in accordance with generally accepted accountingprinciples. A company’s internal control over financial reporting includes those policies and procedures that (i) pertain to the maintenanceof records that, in reasonable detail, accurately and fairly reflect the transactions and dispositions of the assets of the company; (ii) providereasonable assurance that transactions are recorded as necessary to permit preparation of financial statements in accordance with generallyaccepted accounting principles, and that receipts and expenditures of the company are being made only in accordance with authorizationsof management and directors of the company; and (iii) provide reasonable assurance regarding prevention or timely detection of unauthorizedacquisition, use, or disposition of the company’s assets that could have a material effect on the financial statements.
Because of its inherent limitations, internal control over financial reporting may not prevent or detect misstatements. Also, projectionsof any evaluation of effectiveness to future periods are subject to the risk that controls may become inadequate because of changes inconditions, or that the degree of compliance with the policies or procedures may deteriorate.
Cleveland, OhioMarch 1, 2005

APP.-B-26
The consolidated financial statements and the related notes, together with the supplemental information, should be read in conjunctionwith the following discussion of the consolidated financial condition and results of operations.
Overview The Progressive Corporation, a holding company that has insurance and non-insurance subsidiaries and one mutual insurancecompany affiliate (collectively, the “Company”), does not have any revenue producing operations of its own. Its insurance subsidiaries andaffiliate provide personal automobile insurance and other specialty property-casualty insurance and related services throughout the UnitedStates. The Company’s Personal Lines segment writes insurance for private passenger automobiles and recreation vehicles through boththe independent agency channel and the direct channel. The Company ranks third in the U.S. personal auto insurance market, based on2003 and estimated 2004 net premiums written, with an estimated 7.4% market share in 2004.
Although there are approximately 300 insurance companies/groups with annual premiums greater than $5 million competing in theestimated $158 billion U.S. personal auto market, the top 15 insurance groups account for approximately 72% of the premiums written. Inthe aggregate, these top 15 groups outperformed the industry in both growth and profitability, supporting the Company’s belief that themarket will continue to consolidate. The Company is the number one writer of private passenger auto insurance through independentagencies and the number three writer in the direct channel, based on net premiums written in the U.S. The Company also competes in theU.S. commercial auto insurance market where it is the third largest carrier, based on direct premiums written, with about 6% market share.The Company’s Commercial Auto segment writes insurance for automobiles and trucks (e.g., pick-up or panel trucks) owned by smallbusinesses primarily through the independent agency channel.
The holding company receives cash through borrowings, equity sales, subsidiary dividends and other transactions, and may use theproceeds to contribute to the capital of its insurance subsidiaries in order to support premium growth, pay interest on or retire its outstandingindebtedness, pay dividends and repurchase its Common Shares and for other business purposes. In 2004, the Company received $1.6billion of dividends from its subsidiaries, net of capital contributions, and used a portion of these dividends to fund the tender offer discussedbelow. At year-end 2004, the Company had $1.2 billion of readily marketable securities in a non-insurance subsidiary that can be used tosatisfy the holding company’s obligations.
During 2004, the Company repurchased 16,919,674 of its Common Shares at a purchase price of $88 per share for a total cost of $1.5billion pursuant to a “Dutch auction” tender offer. Outside of the tender offer, the Company repurchased 1,695,222 additional CommonShares during the year at a total cost of $139.5 million, with an average cost of $82.31 per share. The Company did not issue any debt orequity securities during 2004, but repaid $200 million of notes at maturity in January 2004 and $6 million of “other debt” in December 2004.
On a consolidated basis, the Company generated positive operating cash flows of $2.7 billion in 2004, portions of which were usedduring the year to repurchase Common Shares and to construct two new call centers and an office building, as well as lease additionalspace to support the Company’s growing operations. The Company opened one additional claims service center during the year, bringingthe total number of such centers to 20. These centers, which are designed to provide end-to-end resolution for auto physical damage losses,are expected to improve efficiency and customer convenience, increase accuracy, reduce rework, improve repair cycle time and providegreater brand distinction.
The Company’s goal is to grow as fast as possible, constrained only by its objective to produce an aggregate calendar year 4% underwritingprofit and its ability to provide high-quality customer service. During the year, in light of market conditions and its own favorable underwritingprofitability, the Company favored maintaining relatively robust margins without significantly impairing growth. Nevertheless, the Companyremains committed to its stated profit and growth objectives over rolling five-year periods.
The U.S. private passenger auto insurance market produced its second consecutive year of underwriting profitability as auto accidentfrequency rates continued to decline. Consequently, there was little rate pressure on consumers, leading to a natural reduction in consumershopping. While these market conditions and profitability levels are unusual and perhaps transitional, they offered opportunities for theCompany to improve its understanding and calibration of market responses to varying rate stimuli.
The Company had a 12% increase in net premiums written, an 85.1 combined ratio and net income of $1.65 billion in 2004. Policiesin force grew 11%. The Company continued to reap the benefits of the profitable growth phase of this insurance cycle and further benefitedfrom the lowest level of automobile accident frequency experienced by the industry in recent history. Rate stability, along with the Company’sadvancements in product design, brand and technology initiatives, also contributed to 2004 results. The Company performed 124 autorate and program revisions, which were designed to maintain rate adequacy and reflect the Company’s most accurate estimate of prospectiveloss costs based on available information.
THE PROGRESSIVE CORPORATION AND SUBSIDIARIES
MANAGEMENT’S DISCUSSION AND ANALYSIS OF FINANCIAL CONDITION AND RESULTS OF OPERATIONS

APP.-B-27
In 2004, the Company achieved underwriting profitability in all of the 49 Personal Lines markets in which it writes business, with onlyFlorida not meeting or exceeding its 4% underwriting profit objective due to hurricane-related losses. In Commercial Auto, two states, outof the 45 markets in which it conducts business, were unprofitable (these states represented less than 1% of the Commercial Auto premiumswritten).
During 2004, the Company experienced $109.1 million of favorable prior period loss and loss adjustment expense reserve development,or 2.5% of prior year’s reserves. This level of reserving accuracy allows the Company to have solid pricing data, which helps ensure rateadequacy. The low loss frequency, coupled with no notable escalating trends in claim costs and continuous improvement in claims settlementquality, helped contribute to the Company’s favorable results for the year (discussed further in the Loss and Loss Adjustment ExpenseReserves subsection).
The Company’s investment portfolio produced a fully taxable equivalent (FTE) total return of 5.2% for 2004. Short-term interest ratesincreased as the Federal Open Market Committee raised the overnight Federal Funds Rate by 1.25% to 2.25% during 2004, while yields onlong maturity U.S. Treasury bonds declined. The economy continued to expand at a solid pace, supporting growth in corporate profits,positive stock market returns and lower yield differential for non-U.S. Treasury securities compared to similar maturity U.S. Treasuries. TheCompany maintained its asset allocation strategy of investing approximately 85% of its total portfolio in fixed-income securities and 15%in common equities. Both asset classes contributed to the overall result, with FTE total returns of 11.6% and 4.2% in the common stockand fixed-income portfolios, respectively, for 2004. Late in the first quarter, the Company shortened the duration of the fixed-income portfolioand ended the year at 2.9 years, compared to 3.3 years at the end of 2003. The weighted average credit rating of the fixed-income portfolioranged from AA to AA+ during the year. Substantial cash flows from operations and positive investment returns provided modest portfoliogrowth, even after completion of the Company’s $1.5 billion “Dutch auction” tender offer for its Common Shares in 2004. The Companycontinues to maintain its fixed-income portfolio strategy of investing in high quality, shorter duration securities in the current investmentenvironment. The Company’s common equity investment strategy remains an index replication approach using the Russell 1000 Index asthe benchmark.
Financial Condition HOLDING COMPANY For the three-year period ended December 31, 2004, The Progressive Corporation received $1.8billion of dividends from its subsidiaries, net of cash capital contributions made to subsidiaries, including $1.6 billion received in 2004. Theregulatory restrictions on subsidiary dividends are described in Note 7 — Statutory Information, to the financial statements.
During 2004, after evaluating the Company’s financial condition, business prospects and capital needs, the Board of Directors determinedthat the Company had a significant amount of capital on hand in excess of what was needed to support its insurance operations, satisfyits corporate obligations and to prepare for various contingencies. In view of this situation and the Company’s policy to return capital toshareholders when appropriate, the Board determined that a tender offer for up to 17.1 million of its Common Shares would be a prudentuse of the Company’s excess capital. In connection with the tender offer, 16,919,674 Common Shares were repurchased at a total cost of$1.5 billion ($88 per share). During the three-year period ended December 31, 2004, the Company repurchased 27,173,356 of its CommonShares at a total cost of $2.2 billion (average cost of $78.69, on a split-adjusted basis). See Incentive Compensation Plans, a supplementaldisclosure provided in this Annual Report, for further discussion on the Company’s policy regarding share repurchases.
During the last three years, the Company issued $400 million, and repaid $206.8 million, principal amount of debt securities. See Note4 — Debt for further discussion on the Company’s current outstanding debt. The Company’s debt to total capital (debt plus equity) ratio atDecember 31, 2004 and 2003, was 20% and 23%, respectively.
CAPITAL RESOURCES AND LIQUIDITY The Company has substantial capital resources and is unaware of any trends, events or circumstancesnot disclosed herein that are reasonably likely to affect its capital resources in a material way. The Company has the ability to issue $250million of additional debt securities under a shelf registration statement filed with the Securities and Exchange Commission (SEC) in October2002 (see discussion below). In addition, during 2004, the Company entered into an uncommitted line of credit with National City Bankin the principal amount of $100 million. The Company entered into the line of credit as part of a contingency plan to help the Companymaintain liquidity in the unlikely event that it experiences conditions or circumstances that affect the Company’s ability to transfer or receivefunds. The Company has not borrowed under this arrangement to date. The Company’s financial policy is to maintain a debt to total capitalratio below 30%. The Company’s debt to total capital ratio was 20% at December 31, 2004, which provides the Company with substantialborrowing capacity.
In October 2002, the Company filed a shelf registration statement with the SEC for the issuance of up to $650 million of debt securities,which included $150 million of unissued debt securities from a shelf registration filed in November 2001. The registration statement wasdeclared effective in October 2002, and, in November 2002, the Company issued $400.0 million of 6.25% Senior Notes due 2032 underthe shelf. The net proceeds of $398.6 million, which included $5.1 million received under a hedge on forecasted transactions that theCompany entered into in anticipation of the debt issuance, were used, in part, to retire, at their January 2004 maturity, the Company’soutstanding 6.60% Notes in the principal amount of $200 million. The remaining proceeds were used for general corporate purposes. TheCompany’s existing debt covenants do not include any rating or credit triggers.

APP.-B-28
The Company’s insurance operations create liquidity by collecting and investing premiums from new and renewal business in advanceof paying claims. As an auto insurer, the Company’s claim liabilities, by their very nature, are short in duration. Approximately 50% of theCompany’s outstanding reserves are paid within one year and less than 20% are still outstanding after three years. See Claims PaymentPatterns, a supplemental disclosure provided in this Annual Report, for further discussion on the timing of the Company’s claims payments.For the three years ended December 31, 2004, operations generated positive cash flows of $7.0 billion, and cash flows are expected toremain positive in both the short-term and reasonably foreseeable future. In addition, the Company’s investment portfolio is highly liquidand consists substantially of readily marketable, investment-grade securities. As of December 31, 2004, 86% of the Company’s portfoliowas invested in fixed-income securities with a weighted average credit quality of AA and duration of 2.9 years. Management believes thatthe Company has sufficient readily marketable securities to cover its claims payments without having a negative effect on the Company’scash flows from operations.
The Company’s companywide net premiums written-to-surplus ratio was 2.9 to 1 at December 31, 2004. The Company intends overtime to increase operating leverage slowly through a higher rate of net premiums to surplus in its insurance subsidiaries where permitted.The Company believes that substituting operating leverage (higher premiums-to-surplus ratio) for financial leverage (lower debt to totalcapital ratio) reduces the Company’s risk profile. In the event of profitability problems, the Company could raise rates to slow growth, whichwould reduce the operating leverage, but would have little or no effect on the Company’s debt service obligations.
The Company maintains insurance on its real property and other physical assets, including coverage for losses due to businessinterruptions caused by covered property damage. However, the insurance will not compensate the Company for losses that may occurdue to disruptions in service as a result of a computer, data processing or telecommunications systems failure that is unrelated to coveredproperty damage, nor will the insurance necessarily compensate the Company for all losses resulting from covered events. To help maintainfunctionality and reduce the risk of significant interruptions of its operations, the Company maintains back-up systems or facilities for certainof its principal systems and services. The Company may still be exposed, however, should these measures prove to be unsuccessful orinadequate against severe, multiple or prolonged service interruptions or against interruptions of systems where no back-up currently exists.In addition, the Company has established emergency management teams, which are responsible for responding to business disruptionsand other risk events. The teams’ ability to respond successfully may be limited depending on the nature of the event, the completenessand effectiveness of the Company’s plans to maintain business continuity upon the occurrence of such an event, and other factors beyondthe Company’s control.
The Company seeks to deploy capital in a prudent manner and uses multiple data sources and modeling tools to estimate the frequency,severity and correlation of identified exposures, including, but not limited to, catastrophic losses and the business interruptions discussedabove, to estimate its potential capital need. Based on this analysis, as well as the information reported above, management believes thatthe Company has sufficient capital resources, cash flows from operations and borrowing capacity to support current and anticipated growth,scheduled debt payments and other capital requirements.
COMMITMENTS AND CONTINGENCIES During 2004, the Company completed construction of call centers in Colorado Springs, Coloradoand Tampa, Florida, and an office building in Mayfield Village, Ohio, at a total cost of $125 million. During 2004, the Company also announcedplans to construct a data center in Colorado Springs, Colorado, at an estimated cost of $57 million. Construction on this data center isexpected to begin in the second quarter 2005, with completion estimated for 2006. In addition, the Company has purchased a building inAustin, Texas, which it plans to convert to a call center. The project is scheduled to be completed in June 2005, at an estimated total costof $38 million. The Company is also currently pursuing the acquisition of additional land for future development to support corporateoperations. All such projects are funded through operating cash flows.
The Company currently has in operation a total of 20 centers that provide concierge-level claims service, compared to 19 in 2003 and7 in 2002. During 2004, the Company achieved the performance standards necessary to satisfy the expansion criteria established for itsconcierge claims strategy. As a result, the Company is looking for sites to open approximately 50 additional facilities over the next severalyears. The cost of these facilities, including the cost of land and building development, is estimated to average $3 to $4 million per center,depending on a number of variables, including the size and location of the center. The Company does not have a predefined sequencingof when each center will be opened, but will make that determination on a case-by-case basis. The cost of these centers will be fundedthrough operating cash flows.
Since October 22, 2004, the Company and various subsidiaries have received formal inquiries from eight states relating to the states’respective investigations into possible bid-rigging and other unlawful conduct by certain insurers, brokers or other industry participants.These eight formal inquiries include: a subpoena from the Connecticut Attorney General requesting interrogatory responses and documentsrelating to contingent commissions on all Connecticut business; a certification request from the North Carolina Department of Insuranceseeking certification from entities licensed to sell insurance in North Carolina that those entities were not involved in bid rigging; and formalletter inquiries from the departments of insurance of Pennsylvania, Washington, Arizona, Michigan, Colorado and Ohio, each of whichrequests information relating to agent and broker compensation arrangements that particular insurance subsidiaries have in each of thestates in which those subsidiaries conduct business. Many companies in the insurance industry have received such formal inquiries, andmore inquiries may be received from other states in the future. The Company has been cooperating, and intends to continue to cooperate,

APP.-B-29
Payments due by period
Less than More than(millions) Total 1 year 1-3 years 3-5 years 5 years
Debt $ 1,300.0 $ — $ 100.0 $ — $ 1,200.0Interest payments on debt 1,459.7 85.0 159.0 155.4 1,060.3Operating leases 308.1 87.5 132.1 56.8 31.7Service contracts 86.6 58.1 24.4 2.9 1.2Loss and loss adjustment expense reserves 5,285.6 2,837.0 1,643.3 624.8 180.5
Total $ 8,440.0 $ 3,067.6 $ 2,058.8 $ 839.9 $ 2,473.7
Results Of OperationsUNDERWRITING OPERATIONSGrowth
Growth over prior year
2004 2003 2002
Direct premiums written 12% 26% 31%Net premiums written 12% 26% 30%Net premiums earned 16% 28% 24%Policies in force 11% 19% 23%
fully with these investigations and has not been notified by any governmental or regulatory authority that it is the target of any suchinvestigation.
The Company understands that these investigations are focused, in part, on contingent commission arrangements between certaininsurers and brokers. Producers (agents and brokers) are due a base commission of approximately 10% on business written on the Company’sbehalf. This base commission is paid in full on a monthly basis. The Company’s insurance subsidiaries have contingent commissioncontracts with certain producers, which provide those producers with the opportunity to earn additional commission based on annualproduction, if specified goals are met. These goals may include the volume of business placed by the producer with the insurer, the profitabilityof such business or other criteria. Any such payments generally are made once per year.
The Company’s Personal and Commercial Auto Businesses market their products through approximately 34,000 independent agenciesthroughout the United States. The Company also markets products through approximately 2,000 brokerage firms in California and NewYork. All commissions paid by the Company’s insurance subsidiaries are reported in the financial data filed with the insurance departmentsof the various states in which they operate.
For 2004, the Company paid approximately $960 million in commissions to producers. Approximately $40 million, or 4% of the totalcommissions paid, was in the form of contingent commission payments. While the Company believes that its contingent commissionagreements comply with applicable laws, the Company has made a business decision to offer contingent commission contracts only toindependent agents, and not brokers, after January 1, 2005.
Off-Balance-Sheet Arrangements Other than the items disclosed in Note 12 — Commitments and Contingencies regarding open investmentfunding commitments and operating leases and service contracts the Company does not have any off-balance-sheet arrangements.
Contractual Obligations A summary of the Company’s noncancelable contracts obligations as of December 31, 2004, follows:
Unlike many other forms of contractual obligations, loss and loss adjustment expense (LAE) reserves do not have definitive due dates and theultimate payment dates are subject to a number of variables and uncertainties. As a result, the total loss and LAE reserve payments to be madeby period, as shown above, are estimates. To further understand the Company’s claims payments, see Claims Payment Patterns, a supplementaldisclosure provided in this Annual Report. In addition, the Company annually publishes a comprehensive Report on Loss Reserving Practices,which was filed with the SEC on a Form 8-K on June 29, 2004, that further discusses the Company’s paid development patterns.
As discussed in the Capital Resources and Liquidity section above, management believes that the Company has sufficient borrowing capacityand other capital resources to satisfy these contractual obligations.

APP.-B-30
The increase in written premium growth reflects strong renewal business growth supported by rate adequacy. In 2003 and 2002, theCompany also experienced a rapid increase in new applications. During 2004, the Company filed 124 auto rate revisions in various states,resulting in an approximate aggregate net decrease of 1% in rates. Despite the continued strong underwriting profitability the Companyexperienced in 2004 (discussed below), the Company does not plan to reduce rates as a primary strategy in 2005, although selective ratereductions may occur in some markets.
Another important element affecting growth is customer retention. The Company did not achieve the degree or speed of retentionimprovement during 2004 that it had originally expected. One measure of improvement in customer retention is policy life expectancy,which is the Company’s estimate of the average length of time that a policy will remain in force before cancellation or non-renewal. TheCompany experienced a modest decrease in policy life expectancy in its Personal Lines segment, in both the Agency channel and the Directchannel, during 2004.
Estimates of customer relationship life expectancy (i.e., focusing on the customer rather than the policy in force) are another way toanalyze retention. The Company is beginning to develop customer relationship life expectancy estimates for both new and renewal businessat a detailed segment level under varying market conditions. These retention measures, like loss reserves, are estimates of future outcomesbased on past behaviors. The Company will continue to focus on this issue into 2005, recognizing that good customer service, efficientoperations and fair pricing are necessary conditions for continued success.
Net premiums earned, which are a function of the premiums written in the current and prior periods, are recognized into income usinga daily earnings convention. Prior to 2004, premiums were earned using a mid-month convention. There was no effect from this changeon amounts reported in prior periods. The change to a daily earnings method improved the precision of the Company’s premium recognitionon a monthly basis.
Profitability Profitability for the Company’s underwriting operations is defined by pretax underwriting profit, which is calculated as netpremiums earned less loss and loss adjustment expenses, policy acquisition costs and other underwriting expenses. The Company alsouses underwriting profit margin, which is underwriting profit expressed as a percent of net premiums earned, to analyze the Company’sresults. For the three years ended December 31, the Company’s underwriting profitability measures were as follows:
2004 2003 2002
Underwriting Profit Underwriting Profit Underwriting Profit
(millions) $ Margin $ Margin $ Margin
Personal Lines – Agency $ 1,108.2 14.0% $ 836.0 12.0% $ 388.0 7.0%Personal Lines – Direct 525.6 14.1 383.0 12.3 203.8 8.6
Total Personal Lines 1,633.8 14.1 1,219.0 12.1 591.8 7.5Commercial Auto Business 321.4 21.1 214.2 17.5 80.0 9.1Other businesses – indemnity 3.1 9.2 8.2 13.0 6.8 7.2Total underwriting operations $ 1,958.3 14.9% $ 1,441.4 12.7% $ 678.6 7.6%

APP.-B-31
Further underwriting results for the Company’s Personal Lines Businesses, including its channel components, the Commercial Auto Business and other businesses-indemnity, as defined in Note 9 — Segment Information, were as follows (detailed discussions below):
(millions) 2004 2003 2002
Net Premiums WrittenPersonal Lines–Agency $ 7,933.6 $ 7,239.6 $ 5,832.7Personal Lines–Direct 3,802.2 3,263.2 2,529.8
Total Personal Lines 11,735.8 10,502.8 8,362.5Commercial Auto Business 1,616.6 1,357.7 1,002.9Other businesses — indemnity 25.7 52.9 86.6
Total underwriting operations $ 13,378.1 $ 11,913.4 $ 9,452.0
Net Premiums EarnedPersonal Lines–Agency $ 7,893.7 $ 6,948.0 $ 5,542.7Personal Lines–Direct 3,718.2 3,103.0 2,365.1
Total Personal Lines 11,611.9 10,051.0 7,907.8Commercial Auto Business 1,524.1 1,226.7 880.0Other businesses — indemnity 33.9 63.3 95.7
Total underwriting operations $ 13,169.9 $ 11,341.0 $ 8,883.5
Personal Lines–AgencyLoss & loss adjustment expense ratio 65.8 68.4 72.0Underwriting expense ratio 20.2 19.6 21.0
Combined ratio 86.0 88.0 93.0
Personal Lines–DirectLoss & loss adjustment expense ratio 65.5 67.4 69.1Underwriting expense ratio 20.4 20.3 22.3
Combined ratio 85.9 87.7 91.4
Personal Lines–TotalLoss & loss adjustment expense ratio 65.7 68.1 71.1Underwriting expense ratio 20.2 19.8 21.4
Combined ratio 85.9 87.9 92.5
Commercial Auto BusinessLoss & loss adjustment expense ratio 59.7 62.7 70.7Underwriting expense ratio 19.2 19.8 20.2
Combined ratio 78.9 82.5 90.9
Other Businesses — IndemnityLoss & loss adjustment expense ratio 46.7 48.2 56.7Underwriting expense ratio 44.1 38.8 36.1
Combined ratio 90.8 87.0 92.8
Total Underwriting OperationsLoss & loss adjustment expense ratio 64.9 67.4 70.9Underwriting expense ratio 20.2 19.9 21.5
Combined ratio 85.1 87.3 92.4
Accident year — Loss & loss adjustment expense ratio 65.7 67.9 70.9
Policies in Force(at December 31) (thousands)
Agency – Auto 4,245 3,966 3,386Direct – Auto 2,084 1,852 1,541Other Personal Lines1 2,351 1,990 1,642
Total Personal Lines 8,680 7,808 6,569Commercial Auto Business 420 365 289
1Includes insurance for motorcycles, recreation vehicles, mobile homes, watercraft, snowmobiles and similar items.

APP.-B-32
LOSS AND LOSS ADJUSTMENT EXPENSE RESERVES Claims costs, the Company’s most significant expense, represent payments made, andestimated future payments to be made, to or on behalf of its policyholders, including expenses needed to adjust or settle claims. Thesecosts include an estimate for costs related to assignments, based on current business, under state-mandated automobile insuranceprograms. Claims costs are influenced by loss severity and frequency and inflation, among other factors. Accordingly, anticipated changesin these factors are taken into account when the Company establishes premium rates and loss reserves.
The Company continued to report favorable loss ratios in 2004, as compared to those of prior years, despite the four major hurricanesduring the year. The Company saw a decline in frequency rates throughout 2004, similar to what the rest of the industry experienced. TheCompany analyzes trends to distinguish changes in its experience from external factors versus those resulting from shifts in the mix of itsbusiness.
The Company saw severity rise slightly during 2004, as expected. Comparing trailing 12-month information on a quarterly basis overthe prior year, the Company’s increase in severity was lower than that reported for the industry as a whole by the Property Casualty InsurersAssociation of America. For each quarter in 2004, the Company experienced a quarter over prior-year quarter increase in bodily injuryseverity, following a year in which the severity declined each quarter. Personal injury protection severity continued to increase as it had formost of 2003. The severity of property coverages was up slightly as compared with the prior year. The Company plans to continue to bediligent about recognizing trend when setting rates and establishing loss reserves.
The Company monitors physical damage trend in evaluating its claims handling performance and capacity. The Company’s claimsorganization continued to show steady and consistent improvement in claims handling quality throughout 2004, as indicated by theCompany’s internal audit of claims files. The Company believes that the overall results reflect claim file quality, a high degree of customersatisfaction and accurate payments.
During 2004, the Company experienced $109.1 million of favorable prior period loss reserve development, which equaled 2.5% of totalprior year’s loss and LAE reserves. The Company experienced $56.1 million, or 1.5%, of favorable development in 2003 and $3.5 million,or .1%, of unfavorable development in 2002. The favorable prior year development recognized in 2004 was attributable to both favorableactuarial adjustments and favorable “all other development” (e.g., claims settling for more or less than reserved, emergence of unreportedclaims at rates different than reserved and changes in reserve estimates by claims representatives). The favorable “all other development”reflects the continued recognition of lower severity for prior accident years than had been previously estimated.
The favorable development in 2003 was primarily due to favorable assigned risk development reflecting a change in the Company’sestimate of its future operating losses for assignments from the New York Automobile Insurance Plan for 2003. Starting in the second halfof 2002, the Company began participating in the expanded take-out program as designed by the governing committee of the plan and hasmanaged its writings to maximize their assigned risk credits. The realization of these changes, combined with a lower than expected overallplan size, has resulted in a much lower than expected number of assignments to the Company from the plan. The remaining developmentfor 2003 and 2002 was primarily attributable to the settlement of claims at amounts that differed from the established reserves.
The Company continues to increase the intensity of its loss reserves analysis to improve accuracy and further enhance the Company’sunderstanding of its loss costs. The Company conducts extensive reviews on a monthly basis on different portions of its business to helpensure that the Company is meeting its objective of always having reserves that are adequate, with minimal variation. Results would differif different assumptions were made. See Critical Accounting Policies for a discussion of the effect of changing estimates. A detailed discussionof the Company’s loss reserving practices can be found in its Report on Loss Reserving Practices, which was released via Form 8-K filed onJune 29, 2004.
Because the Company is primarily an insurer of motor vehicles, its exposure as an insurer of environmental, asbestos and general liabilityclaims is limited. The Company has established reserves for these exposures in amounts that it believes to be adequate based on informationcurrently known. These exposures are not expected to have a material effect on the Company’s liquidity, financial condition, cash flows orresults of operations.
UNDERWRITING EXPENSES Other underwriting expenses and policy acquisition costs as a percentage of premiums earned were 20.2% in2004, 19.9% in 2003 and 21.5% in 2002. The increase in “other underwriting expenses,” as shown in the income statement, primarilyreflects increases in salaries, incentive compensation and other infrastructure costs resulting from the growth in the business, as well asan increase in the Company’s advertising expenditures. Both 2004 and 2002 results included the cost of settling certain class actionlawsuits (see Note 11 — Litigation). Policy acquisition costs are amortized over the policy period in which the related premiums are earned(see Note 1 —Reporting and Accounting Policies). The Company benefited from the shift in its mix of business from new to renewal, whichhas lower acquisition costs.
During 2004, the Company incurred $11.4 million of guaranty fund assessments, compared to $12.2 million in 2003 and $21.2 millionin 2002. The 2004 and 2003 expense was spread across numerous states and was not attributable to any particular insolvency, while the2002 expense was primarily related to the Reliance Insurance Company and Aries Insurance Company insolvencies. The Company believesthat any assessment for known insolvencies in excess of its current reserves will not materially affect the Company’s financial condition,cash flows or results of operations.

APP.-B-33
New business applications for the Agency auto business were relatively flat for 2004, as compared to the prior year, partially due to fewercustomers being in the marketplace shopping for insurance, which may have resulted from competitors achieving more rate adequacy andnot seeking to impose additional rate increases on their customers. The rate of conversions (i.e., converting a quote to a sale) remainedfairly consistent with prior years.
During the second half of 2004, the Company announced a new brand, Drive Insurance from ProgressiveSM, designed expressly for itsindependent agencies. With the introduction of a new brand, the Company believes that it will enhance its positioning with agencies andwill be able to provide them with a more effective marketing voice by promoting their service proposition through advertising. The newadvertising campaign was launched near the end of 2004 to include television, directory listings and billboards, as well as other advertising.
The Company believes that continued growth in the Direct Business is dependent on (among other factors) price and customer retention,as well as the success of the Company’s advertising and other marketing efforts. Although retention did not improve during 2004, the DirectBusiness expense ratio remained relatively flat. During 2004, the Company increased the amount spent on advertising; however, its relativeshare of total voice fell as competitors made substantially greater investments in their consumer marketing. Nevertheless, new autoapplications continued to increase in 2004 (about 6%), as the Company experienced an increase in overall quotes as well as in the conversionrate. In addition, the Company has seen a greater proportion of its business generated via the Internet. The Company is advertising on anational basis and supplements its coverage by local market media campaigns in over 100 designated marketing areas. The Company’sDirect Business expense ratio benefited from business mix changes (i.e., a higher percentage of its business came from renewals).
THE AGENCY BUSINESSGrowth over prior year
2004 2003 2002
Net premiums written 10% 24% 26%Net premiums earned 14% 25% 18%Auto policies in force 7% 17% 22%
THE DIRECT BUSINESSGrowth over prior year
2004 2003 2002
Net premiums written1 17% 29% 39%Net premiums earned 20% 31% 32%Auto policies in force 13% 20% 27%
1Growth rates for 2002 were adjusted to exclude the effect of $37.7 million of previously ceded written premiums that were assumed by the Company upon thecommutation of a reinsurance agreement that was part of a strategic alliance relationship that was terminated in the first quarter 2001. This relationship was terminated bymutual agreement of the parties because their business interests were no longer aligned. In addition, the Company did not envision that this relationship would help theCompany in meeting its long-term profitability objectives. The commutation of the reinsurance agreement was the necessary result of terminating the relationship.
Personal Lines The Company’s Personal Lines business units write insurance for private passenger automobiles and recreation vehicles,and represented 88% of the Company’s total 2004 net premiums written. Personal Lines net premiums written grew 12% in 2004, 26% in2003 and 29% in 2002; net premiums earned grew 16% in 2004, 27% in 2003 and 22% in 2002. The Personal Lines business is comprisedof the Agency Business and the Direct Business. The Agency Business includes business written by the more than 30,000 independentinsurance agencies that represent the Company, as well as brokerages in New York and California. The Direct Business includes businesswritten directly by the Company through 1-800-PROGRESSIVE and online at progressive.com.

APP.-B-34
The Company’s Commercial Auto Business writes primary liability and physical damage insurance for automobiles and trucks owned bysmall businesses, with the majority of its customers insuring three or fewer vehicles. In 2004, the Commercial Auto Business represented12% of the Company’s total net premiums written. Although Commercial Auto differs from Personal Lines auto in its customer base andproducts written, both businesses require the same fundamental skills, including disciplined underwriting and pricing, as well as excellentclaims service. The Company’s Commercial Auto Business is primarily distributed through the independent agency channel. The Company’sCommercial Auto Business ranked third in market share on a national basis based on 2003 direct premiums written data reported by A.M.Best Company Inc., and the Company estimates that it will retain that position for 2004.
Despite the softening market, the Commercial Auto Business produced a strong underwriting profit and solid growth in 2004. During theyear, competitors began accepting risks that they previously avoided. In addition, rate levels remained stable. Nevertheless, new businessapplications in 2004 were slightly ahead of last year (about 5%) and the business experienced strong renewals. The Commercial AutoBusiness expanded into three new states during the year, bringing the total number of markets to 45, and plans on entering one or two morestates in 2005. The significant growth in 2003 and 2002 primarily reflected the benefit the Commercial Auto Business derived from actionstaken by competitors in 2002 to raise rates and restrict the business they wrote.
Approximately 50% of the Company’s 2004 Commercial Auto net premiums written were generated in the light and local commercialauto markets, which includes autos, vans and pick-up trucks used by contractors, such as artisans, landscapers and plumbers, and a varietyof other small businesses. The remainder of the business was written in the specialty commercial auto market, which includes dump trucks,logging trucks and other short-haul commercial vehicles. There are many similarities between the Company’s commercial and personalauto businesses; however, since the commercial auto policies have higher limits (up to $1 million) than personal auto, the Company analyzesthe limit differences in this product more closely.
Other Businesses — Indemnity The Company’s other businesses - indemnity, which represented less than 1% of the 2004 net premiumsearned, primarily include writing professional liability insurance for community banks and managing the wind-down of the Company’slender’s collateral protection program, which the Company ceased writing in 2003, and other run-off businesses. During 2002, the Companylost some key accounts for the lender’s collateral protection products and determined that this business was unable to meet its profitabilitytarget. Management believes that exiting this line of business does not materially affect the Company’s financial condition, results ofoperations or cash flows. The ongoing indemnity products in the Company’s other businesses are continuing to grow profitably.
Other Businesses — Service The other businesses–service primarily provide policy issuance and claims adjusting services for the stateCommercial Auto Insurance Procedures/Plans (CAIP) businesses, which are state-supervised plans serving the involuntary market, in 25states. The Company processes over 49% of the premiums in the CAIP market and competes with two other providers nationwide. As aservice provider, the Company collects fee revenue that is earned on a pro rata basis over the term of the related policies. The Companycedes 100% of premium and losses to the plans. Reimbursements to the Company from the CAIP plans are required by state laws andregulations. Material violations of contractual service standards can result in ceding restrictions for the affected business. The Companyhas maintained, and plans to continue to maintain, compliance with these standards. Any changes in the Company’s participation as aCAIP service provider would not materially affect the Company’s financial condition, results of operations or cash flows.
Litigation The Company is named as a defendant in a number of putative class action lawsuits, such as those alleging damages as a resultof the Company’s use of after-market parts, total loss evaluation methodology, use of credit in underwriting and related requirements underthe federal Fair Credit Reporting Act, installment fee programs, using preferred provider rates for payment of personal injury protection claimsor for paying first party medical benefits, use of third-party vendors to analyze the propriety of payment of medical bills, rating practices atrenewal and cases challenging other aspects of the Company’s claims and marketing practices and business operations. Other insurancecompanies face many of these same issues. During 2002, the Company settled several long-standing class action lawsuits relating todiminution of value, handling of betterment in claim settlements, use of alternative agent commissions programs and a California wage and
Commercial Auto BusinessGrowth over prior year
2004 2003 2002
Net premiums written 19% 35% 51%Net premiums earned 24% 39% 59%Auto policies in force 15% 26% 38%
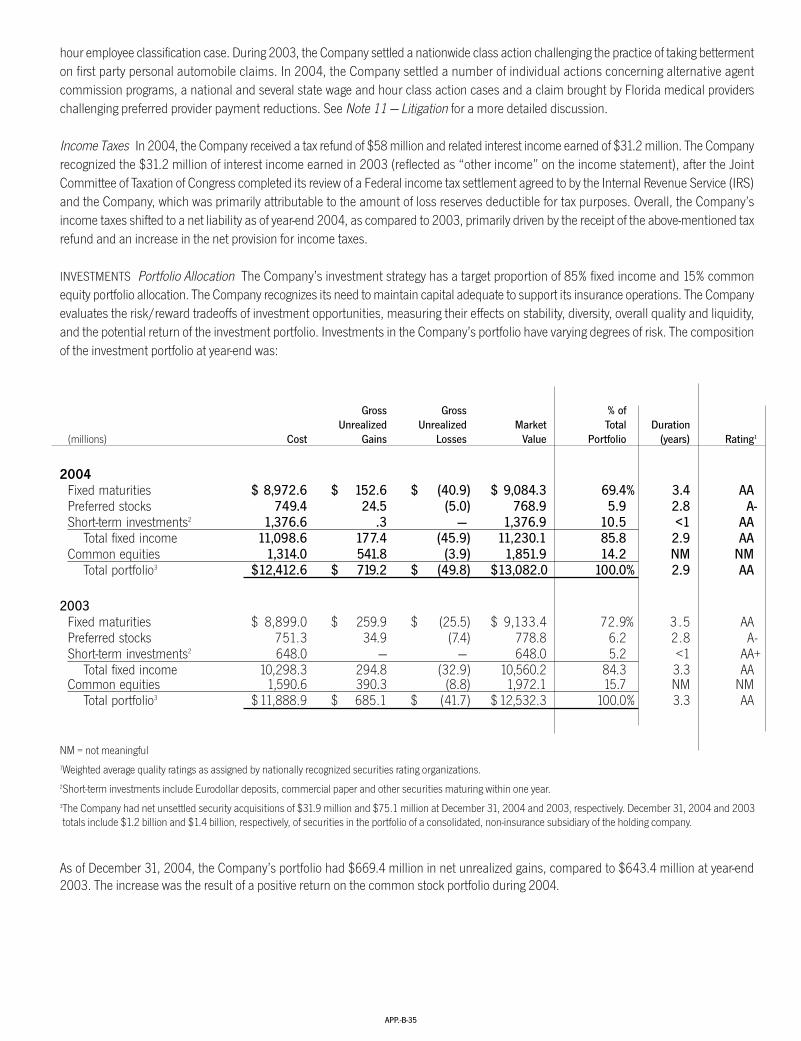
APP.-B-35
As of December 31, 2004, the Company’s portfolio had $669.4 million in net unrealized gains, compared to $643.4 million at year-end2003. The increase was the result of a positive return on the common stock portfolio during 2004.
Gross Gross % ofUnrealized Unrealized Market Total Duration
(millions) Cost Gains Losses Value Portfolio (years) Rating1
2004Fixed maturities $ 8,972.6 $ 152.6 $ (40.9) $ 9,084.3 69.4% 3.4 AAPreferred stocks 749.4 24.5 (5.0) 768.9 5.9 2.8 A-Short-term investments2 1,376.6 .3 — 1,376.9 10.5 <1 AA
Total fixed income 11,098.6 177.4 (45.9) 11,230.1 85.8 2.9 AACommon equities 1,314.0 541.8 (3.9) 1,851.9 14.2 NM NM
Total portfolio3 $12,412.6 $ 719.2 $ (49.8) $13,082.0 100.0% 2.9 AA
2003Fixed maturities $ 8,899.0 $ 259.9 $ (25.5) $ 9,133.4 72.9% 3 .5 AAPreferred stocks 751.3 34.9 (7.4) 778.8 6.2 2.8 A-Short-term investments2 648.0 — — 648.0 5.2 <1 AA+
Total fixed income 10,298.3 294.8 (32.9) 10,560.2 84.3 3.3 AACommon equities 1,590.6 390.3 (8.8) 1,972.1 15.7 NM NM
Total portfolio3 $ 11,888.9 $ 685.1 $ (41.7) $ 12,532.3 100.0% 3.3 AA
NM = not meaningful1Weighted average quality ratings as assigned by nationally recognized securities rating organizations. 2Short-term investments include Eurodollar deposits, commercial paper and other securities maturing within one year. 3The Company had net unsettled security acquisitions of $31.9 million and $75.1 million at December 31, 2004 and 2003, respectively. December 31, 2004 and 2003totals include $1.2 billion and $1.4 billion, respectively, of securities in the portfolio of a consolidated, non-insurance subsidiary of the holding company.
hour employee classification case. During 2003, the Company settled a nationwide class action challenging the practice of taking bettermenton first party personal automobile claims. In 2004, the Company settled a number of individual actions concerning alternative agentcommission programs, a national and several state wage and hour class action cases and a claim brought by Florida medical providerschallenging preferred provider payment reductions. See Note 11 — Litigation for a more detailed discussion.
Income Taxes In 2004, the Company received a tax refund of $58 million and related interest income earned of $31.2 million. The Companyrecognized the $31.2 million of interest income earned in 2003 (reflected as “other income” on the income statement), after the JointCommittee of Taxation of Congress completed its review of a Federal income tax settlement agreed to by the Internal Revenue Service (IRS)and the Company, which was primarily attributable to the amount of loss reserves deductible for tax purposes. Overall, the Company’sincome taxes shifted to a net liability as of year-end 2004, as compared to 2003, primarily driven by the receipt of the above-mentioned taxrefund and an increase in the net provision for income taxes.
INVESTMENTS Portfolio Allocation The Company’s investment strategy has a target proportion of 85% fixed income and 15% commonequity portfolio allocation. The Company recognizes its need to maintain capital adequate to support its insurance operations. The Companyevaluates the risk/reward tradeoffs of investment opportunities, measuring their effects on stability, diversity, overall quality and liquidity,and the potential return of the investment portfolio. Investments in the Company’s portfolio have varying degrees of risk. The compositionof the investment portfolio at year-end was:

APP.-B-36
FIXED-INCOME SECURITIES The fixed-income portfolio includes fixed-maturity securities, preferred stocks and short-term investments. Thefixed-maturity securities and short-term securities, as reported on the balance sheets, were comprised of the following:
The quality distribution of the fixed-income portfolio was as follows:
Rating December 31, 2004 December 31, 2003
AAA 61.0% 63.9%AA 14.6 10.7A 14.2 13.1BBB 9.5 9.5Non Rated/Other .7 2.8
100.0% 100.0%
(millions) December 31, 2004 December 31, 2003
Investment-grade fixed maturities:1
Short/intermediate term $ 10,285.0 98.3% $ 9,446.0 96.6%Long term 109.4 1.0 70.3 .7
Non-investment-grade fixed maturities2 66.8 .7 265.1 2.7Total $ 10,461.2 100.0% $ 9,781.4 100.0%
1Long term includes securities with maturities of 10 years or greater. Asset-backed securities are reported at their weighted average maturity based upon their projectedcash flows. All other securities that do not have a single expected maturity date are reported at average maturity. See Note 2 — Investments.
2Non-investment-grade fixed-maturity securities are non-rated or have a quality rating of an equivalent BB or lower, classified by the lowest rating from a nationallyrecognized rating agency.
Also included in fixed-maturity securities at December 31, 2004, are $2,368.7 million of asset-backed securities. These asset-backedsecurities are comprised of residential mortgage-backed ($637.6 million), commercial mortgage-backed ($959.6 million) and other asset-backed ($771.5 million) securities, with a duration of 2.3 years and a weighted average credit quality of AA+. The largest components ofthe other asset-backed securities are automobile receivable loans ($378.2 million) and home equity loans ($256.7 million). Substantiallyall of the asset-backed securities are liquid with available market quotes and contain no residual interest (i.e., the most subordinated classin a pool of securitized assets).
A primary exposure for the fixed-income portfolio is interest rate risk, which is managed by restricting the portfolio’s duration between1.8 to 5 years. Interest rate risk includes the change in value resulting from movements in the underlying market rates of debt securitiesheld. The fixed-income portfolio had a duration of 2.9 years at December 31, 2004, compared to 3.3 years at December 31, 2003. Thedistribution of duration and convexity (i.e., a measure of the speed at which the duration of a security will change market value based ona rise or fall in interest rates) are monitored on a regular basis. Excluding the unsettled securities transactions, the allocation to fixed-incomesecurities at December 31, 2004, was 85.8% of the portfolio, within the Company’s normal range of variation; at December 31, 2003, theallocation was 84.2%.
Another exposure related to the fixed-income portfolio is credit risk, which is managed by maintaining a minimum average portfolio creditquality rating of A+, as defined by nationally recognized rating agencies, and limiting non-investment-grade securities to a maximum of 5% ofthe fixed-income portfolio. Concentration in a single issuer’s bonds and preferred stocks is limited to no more than 6% of the Company’sshareholders’ equity, except for U.S. Treasury and agency bonds; any state’s general obligation bonds are limited to 12% of shareholders’ equity.

APP.-B-37
Total Return1
2004 2003
Common Stocks 11.6% 28.6%Russell 1000 Index 11.4% 29.9%
1Includes gross dividends reinvested and price appreciation/depreciation.
The Company’s common equity allocation is intended to enhance the return of and provide diversification for the total portfolio. To maintainhigh correlation with the Russell 1000, the Company held 656 of the 990 common stocks comprising the index at December 31, 2004. TheCompany’s individual holdings are selected based on their contribution to the correlation with the index. For 2003, the equity-indexedportfolio returns were outside the anticipated annual tracking error, partially due to rebalancing the portfolio in response to tax initiatedstrategies during the year.
Other risk investments include private equity investments and limited partnership interests in private equity and mezzanine investmentfunds which have no off-balance-sheet exposure or contingent obligations, except for the $7.3 million of open funding commitments discussedin Note 12 — Commitments and Contingencies. The Company is no longer initiating investments of these types and expects to continuereducing its current holdings over time.
The Company monitors the value at risk of the fixed-income and equity portfolios, as well as the total portfolio, to evaluate the potentialmaximum expected loss. For further information, see Quantitative Market Risk Disclosures, a supplemental schedule provided in this AnnualReport.
TRADING SECURITIES Trading securities are entered into for the purpose of near-term profit generation. At December 31, 2004 and 2003, theCompany did not hold any trading securities. Net realized gains on trading securities for the year ended December 31, 2004 were $0,compared to $.1 million in 2003 and $0 in 2002. Results from trading securities are immaterial to the Company’s financial condition, cashflows and results of operations and are reported within the available-for-sale portfolio with gains (losses) reported as a component of realizedgains (losses) on securities.
DERIVATIVE INSTRUMENTS During 2003 and 2002, the Company entered into hedges on forecasted transactions in anticipation of its debtissuances. See Note 2 — Investments and Note 4 — Debt for further discussion of these hedges. The Company had no open positions atDecember 31, 2004.
Derivative instruments may also be used for trading purposes or classified as trading due to the nature and characteristics of the transaction.During 2004, the Company closed all of its credit default protection derivatives, along with the underlying Treasury notes, which had anotional amount of $128.5 million. At December 31, 2003, these positions had a notional amount of $103.2 million. The net gain (loss)recognized in 2004 was $(1.4) million, compared to $4.9 million and $(.1) million in 2003 and 2002, respectively.
Common equities, which generally have greater risk and volatility of market value than fixed-income securities, have a target allocation of15% and may range from 0 to 25% of the investment portfolio. At December 31, 2004 and 2003, excluding the net unsettled securitytransactions, these securities comprised 14.2% and 15.8%, respectively, of the total portfolio. Common stocks are managed externally totrack the Russell 1000 index with an anticipated annual tracking error of +/- 50 basis points. The results achieved by the common stockportfolio relative to the benchmark index were as follows:
COMMON EQUITIES Common equities, as reported in the balance sheets, were comprised of the following:
(millions) December 31, 2004 December 31, 2003
Common Stocks $ 1,815.9 98.1% $ 1,929.7 97.9%Other Risk Investments 36.0 1.9 42.4 2.1
Total Common Equities $ 1,851.9 100.0% $ 1,972.1 100.0%
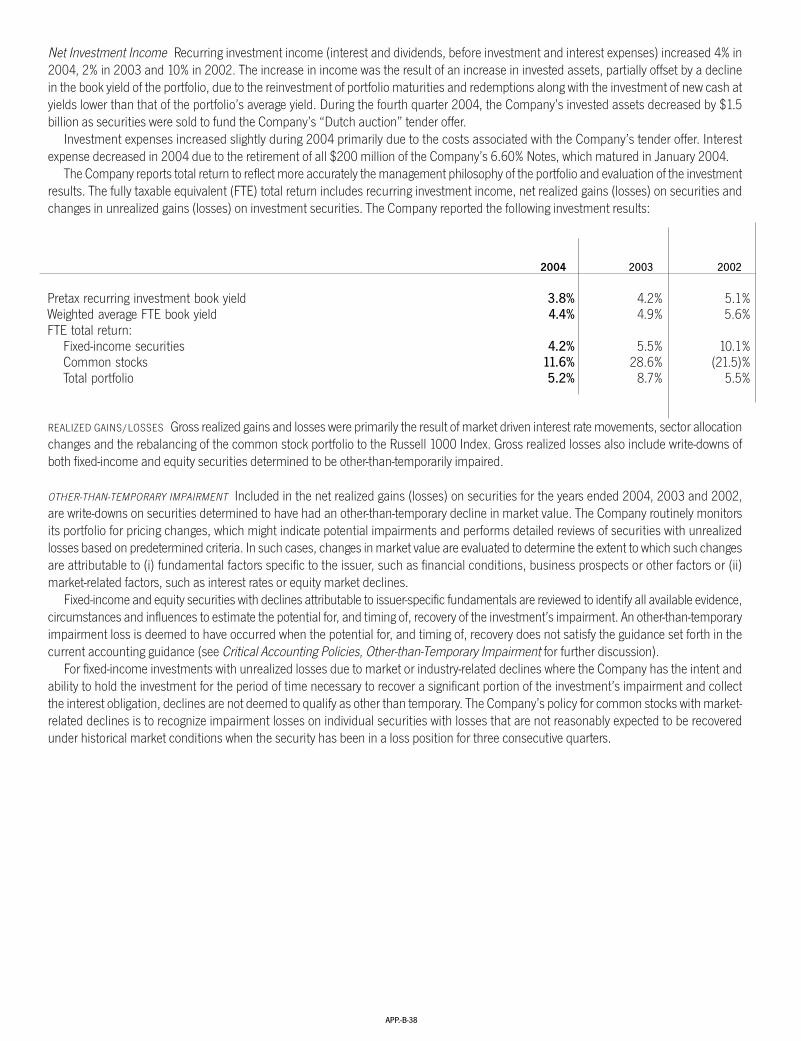
APP.-B-38
REALIZED GAINS/LOSSES Gross realized gains and losses were primarily the result of market driven interest rate movements, sector allocationchanges and the rebalancing of the common stock portfolio to the Russell 1000 Index. Gross realized losses also include write-downs ofboth fixed-income and equity securities determined to be other-than-temporarily impaired.
OTHER-THAN-TEMPORARY IMPAIRMENT Included in the net realized gains (losses) on securities for the years ended 2004, 2003 and 2002,are write-downs on securities determined to have had an other-than-temporary decline in market value. The Company routinely monitorsits portfolio for pricing changes, which might indicate potential impairments and performs detailed reviews of securities with unrealizedlosses based on predetermined criteria. In such cases, changes in market value are evaluated to determine the extent to which such changesare attributable to (i) fundamental factors specific to the issuer, such as financial conditions, business prospects or other factors or (ii)market-related factors, such as interest rates or equity market declines.
Fixed-income and equity securities with declines attributable to issuer-specific fundamentals are reviewed to identify all available evidence,circumstances and influences to estimate the potential for, and timing of, recovery of the investment’s impairment. An other-than-temporaryimpairment loss is deemed to have occurred when the potential for, and timing of, recovery does not satisfy the guidance set forth in thecurrent accounting guidance (see Critical Accounting Policies, Other-than-Temporary Impairment for further discussion).
For fixed-income investments with unrealized losses due to market or industry-related declines where the Company has the intent andability to hold the investment for the period of time necessary to recover a significant portion of the investment’s impairment and collectthe interest obligation, declines are not deemed to qualify as other than temporary. The Company’s policy for common stocks with market-related declines is to recognize impairment losses on individual securities with losses that are not reasonably expected to be recoveredunder historical market conditions when the security has been in a loss position for three consecutive quarters.
2004 2003 2002
Pretax recurring investment book yield 3.8% 4.2% 5.1%Weighted average FTE book yield 4.4% 4.9% 5.6%FTE total return:
Fixed-income securities 4.2% 5.5% 10.1%Common stocks 11.6% 28.6% (21.5)%Total portfolio 5.2% 8.7% 5.5%
Net Investment Income Recurring investment income (interest and dividends, before investment and interest expenses) increased 4% in2004, 2% in 2003 and 10% in 2002. The increase in income was the result of an increase in invested assets, partially offset by a declinein the book yield of the portfolio, due to the reinvestment of portfolio maturities and redemptions along with the investment of new cash atyields lower than that of the portfolio’s average yield. During the fourth quarter 2004, the Company’s invested assets decreased by $1.5billion as securities were sold to fund the Company’s “Dutch auction” tender offer.
Investment expenses increased slightly during 2004 primarily due to the costs associated with the Company’s tender offer. Interestexpense decreased in 2004 due to the retirement of all $200 million of the Company’s 6.60% Notes, which matured in January 2004.
The Company reports total return to reflect more accurately the management philosophy of the portfolio and evaluation of the investmentresults. The fully taxable equivalent (FTE) total return includes recurring investment income, net realized gains (losses) on securities andchanges in unrealized gains (losses) on investment securities. The Company reported the following investment results:

APP.-B-39
Write-downs Write-downsTotal On Securities On Securities
(millions) Write-downs Subsequently Sold Held at Period End
2004Fixed income $ .3 $ — $ .3Common equities 11.3 3.8 7.5
Total portfolio $ 11.6 $ 3.8 $ 7.8
2003Fixed income $ 17.5 $ 2.3 $ 15.2Common equities 47.7 12.6 35.1
Total portfolio $ 65.2 $ 14.9 $ 50.3
2002Fixed income $ 45.6 $ 19.7 $ 25.9Common equities 156.5 45.9 110.6
Total portfolio $ 202.1 $ 65.6 $ 136.5
The following is a summary of the 2004 equity security market write-downs by sector (both market-related and issuer specific):
Remaining(millions) Gross
Equity Portfolio Russell 1000 UnrealizedAllocation at Allocation at Loss at
Amount of December 31, December 31, Russell 1000 December 31,Sector Write-down 2004 2004 Sector Return 2004
Auto and Transportation $ — 2.5% 2.4% 15.2% $ —Consumer Discretionary — 14.2 15.7 13.3 .9Consumer Staples — 7.2 7.0 8.7 .9Financial Services .5 23.1 22.9 13.1 .1Health Care 9.0 12.8 12.7 2.4 .7Integrated Oil — 4.9 4.4 28.7 —Materials and Processing — 3.8 3.7 16.5 —Other Energy — 1.9 2.0 39.7 —Producer Durables — 4.7 4.2 11.0 —Technology — 13.6 13.8 1.8 .6Utilities — 7.1 6.7 18.3 —Other Equities — 4.2 4.5 15.5 —Total Common Stocks 9.5 100.0% 100.0% 11.4% 3.2Other Risk Assets 1.8 .7
Total Common Equities $ 11.3 $ 3.9
See Critical Accounting Policies, Other-than-Temporary Impairment section for a further discussion.
When a security in the Company’s investment portfolio has an unrealized loss in market value that is deemed to be other than temporary,the Company reduces the book value of such security to its current market value, recognizing the decline as a realized loss in the incomestatement. All other unrealized gains or losses are reflected in shareholders’ equity. The write-down activity for the years ended December31 was as follows:

APP.-B-40
Critical Accounting Policies The Company is required to make certain estimates and assumptions when preparing its financial statementsand accompanying notes in conformity with GAAP. Actual results could differ from those estimates in a variety of areas. The two areas thatthe Company views as most critical with respect to the application of estimates and assumptions are the establishment of its loss reservesand its method of determining impairments in its investment portfolio.
LOSS AND LAE RESERVES Loss and loss adjustment expense (LAE) reserves represent the Company’s best estimate of its ultimate liabilityfor losses and LAE relating to events that occurred prior to the end of any given accounting period but have not yet been paid. At December31, 2004, the Company had $4.9 billion of net loss and LAE reserves, which included $3.8 billion of case reserves and $1.1 billion ofincurred but not recorded (IBNR) reserves.
The Company’s actuarial staff reviews many subsets of the business, which are at a combined state, product and line coverage level(the “products”), to calculate the needed loss and LAE reserves. The Company begins its review of a set of data by producing six differentestimates of needed reserves, three using paid data and three using incurred data, to determine if a reserve change is required. In the eventof a wide variation between results generated by the different projections, the actuarial group will further analyze the data using additionaltechniques. Each review develops a point estimate for a relatively small subset of the business, which allows the Company to establishmeaningful reserve levels.
The Company reviews a large majority of its reserves by product/state combination on a quarterly time frame, with almost all theremaining reserves reviewed on a semiannual basis. A change in the Company’s scheduled reviews of a particular subset of the businessdepends on the size of the subset or emerging issues relating to the product or state. By reviewing the reserves at such a detailed level, theCompany has the ability to identify and measure variances in trend by state, product and line coverage that would not otherwise be seenon a consolidated basis. The Company’s intricate process of reviewing over 300 products makes compiling a companywide roll up to generatea range of needed loss reserves not meaningful. The Company does not review loss reserves on a macro level and, therefore, does notderive a companywide range of reserves to compare to a standard deviation.
In analyzing the ultimate accident year loss experience, the Company’s actuarial staff reviews in detail, at the subset level, frequency(number of losses per earned car year), severity (dollars of loss per each claim) and average premium (dollars of premium per earned caryear). The loss ratio, a primary measure of loss experience, is equal to the product of frequency times severity divided by the averagepremium. The average premium for personal and commercial auto businesses are known and, therefore, are not estimated. The projectionof frequency for these lines of business is usually very stable because injured parties generally report their claims within a reasonably shorttime period after the accident. The actual frequency experienced will vary depending on the change in mix of class of drivers written by theCompany, but the accuracy of the projected level is considered to be reliable. The severity experienced by the Company, which is muchmore difficult to estimate, is affected by changes in underlying costs, such as medical costs, jury verdicts, etc. In addition, severity will varyrelative to the change in the Company’s mix of business by limit.
Assumptions regarding needed reserve levels made by the actuarial staff consider influences on the historical data that reduce thepredictiveness of the Company’s projected future loss development. Internal considerations that are process-related, which may result fromchanges in the claims organization’s activities, include claim closure rates, the number of claims that are closed without payment and thelevel of estimated needed case reserves by claim that are set by claims representatives. The Company studies these changes and theireffect on the historical data at the state level versus on a larger, less indicative, countrywide basis.
External items considered include the litigation atmosphere, state-by-state changes in medical costs, the availability of services to resolveclaims, etc. These again are better understood at the state level versus at a more macro countrywide level.
The manner in which the Company considers and analyzes the multitude of influences on the historical data, as well as how loss reservesaffect the Company’s financial results, is discussed in more detail in the Company’s Report on Loss Reserving Practices, which was filedon June 29, 2004 via Form 8-K.
The Company’s carried reserve balance of $4.9 billion implicitly assumes the loss and LAE severity will increase for accident year 2004over accident year 2003 by 2.7% and 9.0% for personal auto liability and commercial auto liability, respectively. Personal auto liability and
Repurchase Transactions During 2004, the Company entered into repurchase commitment transactions, whereby the Company loanedU.S. Treasury or U.S. Government agency securities to accredited brokerage firms in exchange for cash equal to the fair market value ofthe securities. These internally managed transactions were typically overnight arrangements. The cash proceeds were invested in AA orhigher financial institution paper with yields that exceeded the Company’s interest obligation on the borrowed cash. The Company is ableto borrow the cash at low rates since the securities loaned are in short supply. The Company’s interest rate exposure does not increase ordecrease since the borrowing and investing periods match. During the year ended December 31, 2004, the Company’s largest singleoutstanding balance of repurchase commitments was $989.2 million, which was open for seven business days, with an average dailybalance of $452.5 million for the year. During 2003, the largest single outstanding balance of repurchase commitments was $1.2 billion,which was open for one business day, with an average daily balance of $524.3 million for the year. The Company had no open repurchasecommitments at December 31, 2004 and 2003. The Company earned income of $1.8 million, $2.1 million and $2.8 million on repurchasecommitments during 2004, 2003 and 2002, respectively.

APP.-B-41
commercial auto liability reserves represent over 97% of the Company’s total carried reserves. As discussed above, the severity estimatesare influenced by many variables that are difficult to quantify and which influence the final amount for claim settlement. That, coupled withchanges to internal claims practices and changes in the legal environment and in state regulatory requirements, requires significant judgmentin the reserve setting process.
The following table shows the Company’s original estimated changes in severity included when establishing its loss reserves, comparedto the Company’s estimated changes in severity one year later.
Personal Auto Liability Commercial Auto Liability
One Year One YearAccident Year Original Later Original Later
2003 2.1% 1.7% 9.1% 5.6%2004 2.7% 2.2%* 9.0% 5.5%*
*The estimated change for accident year 2004 assumes the same change in severity estimate as was realized for accident year 2003.
Assuming the change in the Company’s estimate of the severity for accident year 2004 is consistent with the change experienced for 2003,the effect to reserve levels could be a favorable $65 million in 2005. Applying this same rationale to the change in severity estimates forthe trailing three accident years experienced by the Company in 2003 and 2004, the Company’s reserve estimates could result in a rangeof development from $14 million to $135 million in 2005. Over the last several years, the Company has experienced favorable changes inits estimates of severity. The Company cannot predict if this trend will continue in the future.
The Company’s goal is to ensure that total reserves are adequate to cover all loss costs while sustaining minimal variation from the timereserves are initially established until losses are fully developed. During 2004, the Company’s estimate of the needed reserves at the endof 2003 decreased by only 2.5%. The following table shows how the Company has performed against this goal over the last ten years.
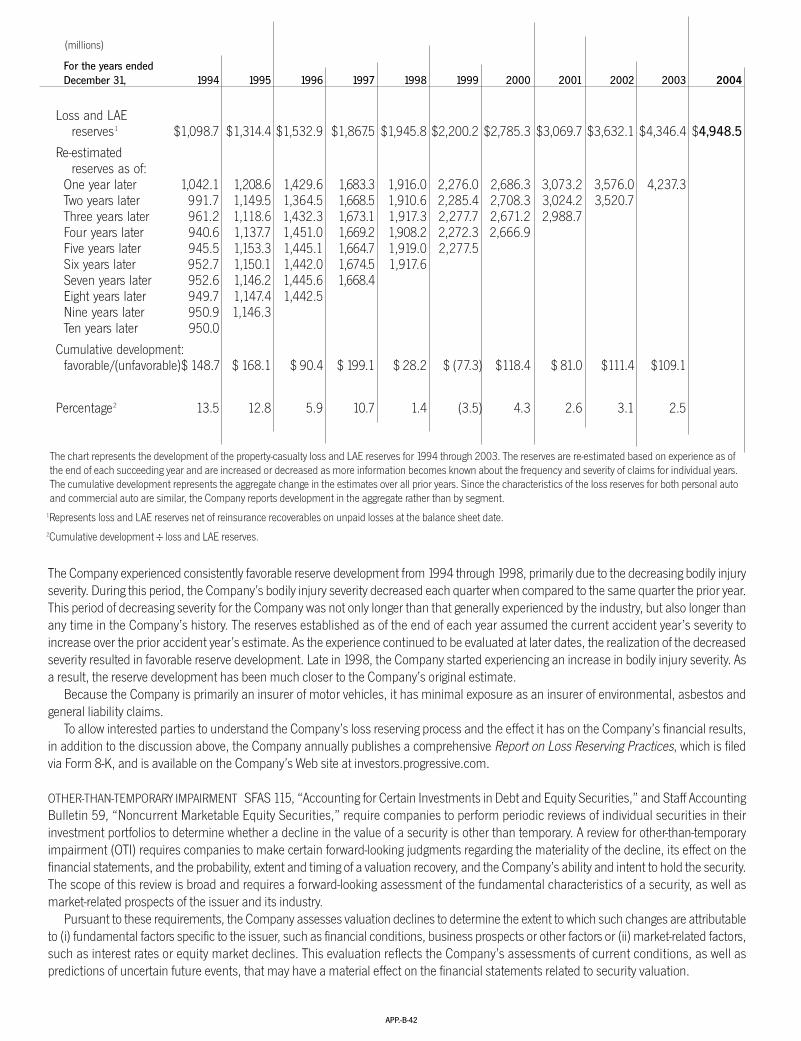
APP.-B-42
The Company experienced consistently favorable reserve development from 1994 through 1998, primarily due to the decreasing bodily injuryseverity. During this period, the Company’s bodily injury severity decreased each quarter when compared to the same quarter the prior year.This period of decreasing severity for the Company was not only longer than that generally experienced by the industry, but also longer thanany time in the Company’s history. The reserves established as of the end of each year assumed the current accident year’s severity toincrease over the prior accident year’s estimate. As the experience continued to be evaluated at later dates, the realization of the decreasedseverity resulted in favorable reserve development. Late in 1998, the Company started experiencing an increase in bodily injury severity. Asa result, the reserve development has been much closer to the Company’s original estimate.
Because the Company is primarily an insurer of motor vehicles, it has minimal exposure as an insurer of environmental, asbestos andgeneral liability claims.
To allow interested parties to understand the Company’s loss reserving process and the effect it has on the Company’s financial results,in addition to the discussion above, the Company annually publishes a comprehensive Report on Loss Reserving Practices, which is filedvia Form 8-K, and is available on the Company’s Web site at investors.progressive.com.
OTHER-THAN-TEMPORARY IMPAIRMENT SFAS 115, “Accounting for Certain Investments in Debt and Equity Securities,” and Staff AccountingBulletin 59, “Noncurrent Marketable Equity Securities,” require companies to perform periodic reviews of individual securities in theirinvestment portfolios to determine whether a decline in the value of a security is other than temporary. A review for other-than-temporaryimpairment (OTI) requires companies to make certain forward-looking judgments regarding the materiality of the decline, its effect on thefinancial statements, and the probability, extent and timing of a valuation recovery, and the Company’s ability and intent to hold the security.The scope of this review is broad and requires a forward-looking assessment of the fundamental characteristics of a security, as well asmarket-related prospects of the issuer and its industry.
Pursuant to these requirements, the Company assesses valuation declines to determine the extent to which such changes are attributableto (i) fundamental factors specific to the issuer, such as financial conditions, business prospects or other factors or (ii) market-related factors,such as interest rates or equity market declines. This evaluation reflects the Company’s assessments of current conditions, as well aspredictions of uncertain future events, that may have a material effect on the financial statements related to security valuation.
For the years endedDecember 31, 1994 1995 1996 1997 1998 1999 2000 2001 2002 2003 2004
Loss and LAE reserves1 $1,098.7 $1,314.4 $1,532.9 $1,867.5 $1,945.8 $2,200.2 $2,785.3 $3,069.7 $3,632.1 $4,346.4 $4,948.5
Re-estimatedreserves as of:
One year later 1,042.1 1,208.6 1,429.6 1,683.3 1,916.0 2,276.0 2,686.3 3,073.2 3,576.0 4,237.3Two years later 991.7 1,149.5 1,364.5 1,668.5 1,910.6 2,285.4 2,708.3 3,024.2 3,520.7Three years later 961.2 1,118.6 1,432.3 1,673.1 1,917.3 2,277.7 2,671.2 2,988.7Four years later 940.6 1,137.7 1,451.0 1,669.2 1,908.2 2,272.3 2,666.9Five years later 945.5 1,153.3 1,445.1 1,664.7 1,919.0 2,277.5Six years later 952.7 1,150.1 1,442.0 1,674.5 1,917.6Seven years later 952.6 1,146.2 1,445.6 1,668.4Eight years later 949.7 1,147.4 1,442.5Nine years later 950.9 1,146.3Ten years later 950.0
Cumulative development:favorable/(unfavorable)$ 148.7 $ 168.1 $ 90.4 $ 199.1 $ 28.2 $ (77.3) $118.4 $ 81.0 $111.4 $109.1
Percentage2 13.5 12.8 5.9 10.7 1.4 (3.5) 4.3 2.6 3.1 2.5
The chart represents the development of the property-casualty loss and LAE reserves for 1994 through 2003. The reserves are re-estimated based on experience as ofthe end of each succeeding year and are increased or decreased as more information becomes known about the frequency and severity of claims for individual years.The cumulative development represents the aggregate change in the estimates over all prior years. Since the characteristics of the loss reserves for both personal autoand commercial auto are similar, the Company reports development in the aggregate rather than by segment.
1Represents loss and LAE reserves net of reinsurance recoverables on unpaid losses at the balance sheet date. 2Cumulative development ÷ loss and LAE reserves.
(millions)

APP.-B-43
For example, if the Company decided to write down all securities in an unrealized loss position for one year or longer where the securitiesdecline in value exceeded 15%, the Company would recognize an additional $.1 million of OTI losses in the income statement. These OTIlosses would be $0 if the threshold for market decline was greater than 25%.
The $13.1 million of gross unrealized losses that have been impaired for one year or longer are primarily within the fixed-income portfolio.None of these securities were deemed to have any fundamental issues that would lead the Company to believe that they were other-than-temporarily impaired. The Company has the intent and ability to hold the fixed-income securities to maturity, and will do so, as long as thesecurities continue to meet duration, economic sector and interest rate exposure, as well as portfolio composition, that is consistent withthe current investment strategy. The Company will retain the common stocks to maintain correlation to the Russell 1000 index as long asthe portfolio and index correlation remain similar. If the Company’s strategy were to change and these securities were impaired, the Companywould recognize a write-down in accordance with its stated policy.
Since total unrealized losses are already a component of the Company’s shareholders’ equity, any recognition of additional OTI losseswould have no effect on the Company’s comprehensive income or book value.
Safe Harbor Statement Under the Private Securities Litigation Reform Act of 1995: Statements in this Annual Report that are not historical fact areforward-looking statements that are subject to certain risks and uncertainties that could cause actual events and results to differ materially from thosediscussed herein. These risks and uncertainties include, without limitation, uncertainties related to estimates, assumptions and projections generally;inflation and changes in economic conditions (including changes in interest rates and financial markets); the accuracy and adequacy of the Company’spricing and loss reserving methodologies; pricing competition and other initiatives by competitors; the Company’s ability to obtain regulatory approvalfor requested rate changes and the timing thereof; the effectiveness of the Company’s advertising campaigns; legislative and regulatory developments;disputes relating to intellectual property rights; the outcome of litigation pending or that may be filed against the Company; weather conditions(including the severity and frequency of storms, hurricanes, snowfalls, hail and winter conditions); changes in driving patterns and loss trends; actsof war and terrorist activities; the Company’s ability to maintain the uninterrupted operation of its facilities, systems (including information technologysystems) and business functions; court decisions and trends in litigation and health care and auto repair costs; and other matters described fromtime to time by the Company in releases and publications, and in periodic reports and other documents filed with the United States Securities andExchange Commission. In addition, investors should be aware that generally accepted accounting principles prescribe when a company may reservefor particular risks, including litigation exposures. Accordingly, results for a given reporting period could be significantly affected if and when a reserveis established for one or more contingencies. Reported results, therefore, may appear to be volatile in certain accounting periods.
Total Gross Decline of Investment ValueUnrealized
Total Portfolio Losses > 15% > 25% > 35% > 45%
Unrealized Loss for 1 Quarter $ 9.2 $ 1.5 $ 1.0 $ 1.0 $ 1.0Unrealized Loss for 2 Quarters 6.2 — — — —Unrealized Loss for 3 Quarters 21.3 — — — —Unrealized Loss for 1 Year or Longer 13.1 .1 — — —
Total $ 49.8 $ 1.6 $ 1.0 $ 1.0 $ 1.0
(millions)
For fixed-income investments with unrealized losses due to market- or industry-related declines, the declines are not deemed to qualifyas other than temporary where the Company has the intent and ability to hold the investment for the period of time necessary to recover asignificant portion of the investment’s original principal and interest obligation. The Company’s policy for equity securities with market-related declines is to recognize impairment losses on individual securities with losses that are not reasonably expected to be recoveredunder historical market conditions when the security has been in a loss position for three consecutive quarters.
When persuasive evidence exists that causes the Company to evaluate a decline in market value to be other than temporary, the Companyreduces the book value of such security to its current market value, recognizing the decline as a realized loss in the income statement. Allother unrealized gains (losses) are reflected in shareholders’ equity.
As of December 31, 2004, the Company’s total portfolio had $49.8 million in gross unrealized losses, compared to $41.7 million in grossunrealized losses at year-end 2003. The increase in the gross unrealized loss position from 2003 relates primarily to the fixed-maturityportfolio, the result of the rise in interest rates during 2004.
The following table stratifies the gross unrealized losses in the Company’s portfolio at December 31, 2004, by duration in a loss positionand magnitude of the loss as a percentage of the cost of the security. The individual amounts represent the additional OTI the Companywould have recognized in the income statement if its policy for market-related declines was different than that stated above.

APP.-B-44
(millions–except ratios, per share amounts and number of people employed) 2004 2003 2002 2001 2000
Insurance Companies Selected Financial Information and Operating Statistics—Statutory BasisNet premiums written $13,378.1 $ 11,913.4 $ 9,452.0 $ 7,260.1 $ 6,196.1
Growth 12% 26% 30% 17% 1%Policyholders’ surplus $ 4,671.8 $ 4,538.3 $ 3,370.2 $ 2,647.7 $ 2,177.0Net premiums written to policyholders’ surplus ratio 2.9 2.6 2.8 2.7 2.8
Loss and loss adjustment expense ratio 65.0 67.4 70.9 73.6 83.2Underwriting expense ratio 19.6 18.8 20.4 21.1 21.0Statutory combined ratio 84.6 86.2 91.3 94.7 104.2
Selected Consolidated Financial Information—GAAP BasisTotal assets $ 17,184.3 $ 16,281.5 $ 13,564.4 $ 11,122.4 $ 10,051.6Total shareholders’ equity 5,155.4 5,030.6 3,768.0 3,250.7 2,869.8Common Shares outstanding 200.4 216.4 218.0 220.3 220.6Common Share price:
High $ 97.29 $ 84.68 $ 60.49 $ 50.60 $ 37.00Low 73.10 46.25 44.75 27.38 15.00Close1 84.84 83.59 49.63 49.77 34.54
Market capitalization $ 17,001.9 $ 18,088.9 $ 10,819.3 $ 10,958.6 $ 7,616.8Book value per Common Share 25.73 23.25 17.28 14.76 13.01Return on average common shareholders’ equity2 30.0% 29.1% 19.3% 13.5% 1.7%Debt outstanding $ 1,284.3 $ 1,489.8 $ 1,489.0 $ 1,095.7 $ 748.8Ratios:
Debt to total capital 20% 23% 28% 25% 21%Earnings to fixed charges3 27.1x 18.8x 13.2x 10.7x 1.3xPrice to earnings4 11 15 17 27 164Price to book 3.3 3.6 2.9 3.4 2.7
Net premiums earned $ 13,169.9 $ 11,341.0 $ 8,883.5 $ 7,161.8 $ 6,348.4Total revenues 13,782.1 11,892.0 9,294.4 7,488.2 6,771.0Underwriting margins5
Personal Lines 14.1% 12.1% 7.5% 4.5% (5.2)%Commercial Auto 21.1% 17.5% 9.1% 8.3% 3.3%Other businesses — indemnity 9.2% 13.0% 7.2% 7.0% 13.6%Total underwriting operations 14.9% 12.7% 7.6% 4.8% (4.4)%
Net income $ 1,648.7 $ 1,255.4 $ 667.3 $ 411.4 $ 46.1Per share6 7.63 5.69 2.99 1.83 .21
Dividends per share .110 .100 .096 .093 .090Number of people employed 27,085 25,834 22,974 20,442 19,490
All share and per share amounts were adjusted for the April 22, 2002, 3-for-1 stock split.1Represents the closing price at December 31. 2For 1995, represents net income minus preferred share dividends ÷ average common shareholders’ equity. 3For 1995, represents the ratio of earnings to combined fixed charges and preferred share dividends.
THE PROGRESSIVE CORPORATION AND SUBSIDIARIES
TEN YEAR SUMMARY — FINANCIAL HIGHLIGHTS
(unaudited)
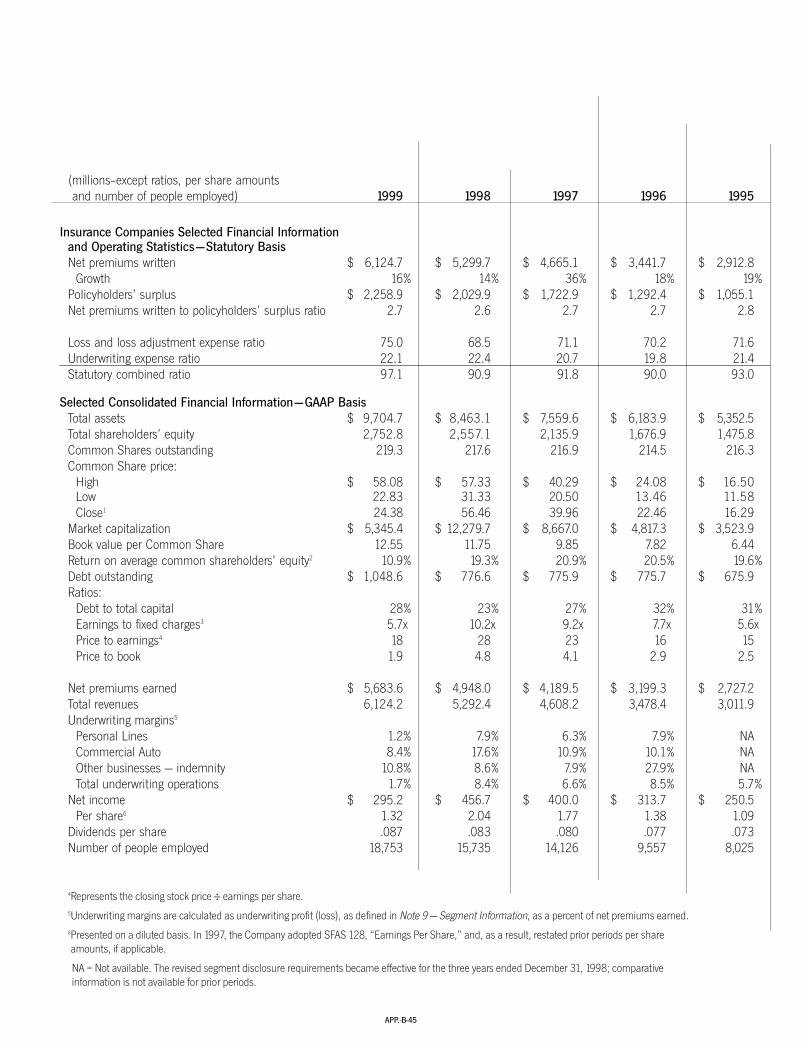
APP.-B-45
4Represents the closing stock price ÷ earnings per share.5Underwriting margins are calculated as underwriting profit (loss), as defined in Note 9 — Segment Information, as a percent of net premiums earned.6Presented on a diluted basis. In 1997, the Company adopted SFAS 128, “Earnings Per Share,” and, as a result, restated prior periods per shareamounts, if applicable.
NA = Not available. The revised segment disclosure requirements became effective for the three years ended December 31, 1998; comparativeinformation is not available for prior periods.
(millions–except ratios, per share amounts and number of people employed) 1999 1998 1997 1996 1995
Insurance Companies Selected Financial Information and Operating Statistics—Statutory BasisNet premiums written $ 6,124.7 $ 5,299.7 $ 4,665.1 $ 3,441.7 $ 2,912.8
Growth 16% 14% 36% 18% 19%Policyholders’ surplus $ 2,258.9 $ 2,029.9 $ 1,722.9 $ 1,292.4 $ 1,055.1Net premiums written to policyholders’ surplus ratio 2.7 2.6 2.7 2.7 2.8
Loss and loss adjustment expense ratio 75.0 68.5 71.1 70.2 71.6Underwriting expense ratio 22.1 22.4 20.7 19.8 21.4Statutory combined ratio 97.1 90.9 91.8 90.0 93.0
Selected Consolidated Financial Information—GAAP BasisTotal assets $ 9,704.7 $ 8,463.1 $ 7,559.6 $ 6,183.9 $ 5,352.5Total shareholders’ equity 2,752.8 2,557.1 2,135.9 1,676.9 1,475.8Common Shares outstanding 219.3 217.6 216.9 214.5 216.3Common Share price:
High $ 58.08 $ 57.33 $ 40.29 $ 24.08 $ 16.50Low 22.83 31.33 20.50 13.46 11.58Close1 24.38 56.46 39.96 22.46 16.29
Market capitalization $ 5,345.4 $ 12,279.7 $ 8,667.0 $ 4,817.3 $ 3,523.9Book value per Common Share 12.55 11.75 9.85 7.82 6.44Return on average common shareholders’ equity2 10.9% 19.3% 20.9% 20.5% 19.6%Debt outstanding $ 1,048.6 $ 776.6 $ 775.9 $ 775.7 $ 675.9Ratios:
Debt to total capital 28% 23% 27% 32% 31%Earnings to fixed charges3 5.7x 10.2x 9.2x 7.7x 5.6xPrice to earnings4 18 28 23 16 15Price to book 1.9 4.8 4.1 2.9 2.5
Net premiums earned $ 5,683.6 $ 4,948.0 $ 4,189.5 $ 3,199.3 $ 2,727.2Total revenues 6,124.2 5,292.4 4,608.2 3,478.4 3,011.9Underwriting margins5
Personal Lines 1.2% 7.9% 6.3% 7.9% NACommercial Auto 8.4% 17.6% 10.9% 10.1% NAOther businesses — indemnity 10.8% 8.6% 7.9% 27.9% NATotal underwriting operations 1.7% 8.4% 6.6% 8.5% 5.7%
Net income $ 295.2 $ 456.7 $ 400.0 $ 313.7 $ 250.5Per share6 1.32 2.04 1.77 1.38 1.09
Dividends per share .087 .083 .080 .077 .073Number of people employed 18,753 15,735 14,126 9,557 8,025

APP.-B-46
Quantitative market risk disclosures are only presented for market risk categories when risk is considered material. Materiality is deter-mined based on the fair value of the financial instruments at December 31, 2004, and the potential for near-term losses from reasonablypossible near-term changes in market rates or prices.
Other Than Trading Financial InstrumentsFinancial instruments subject to interest rate risk were:
Market Value
-200 bps -100 bps +100 bps +200 bps(millions) Change Change Actual Change Change
U.S. government obligations $ 2,083.6 $ 2,021.6 $ 1,962.5 $ 1,906.4 $ 1,852.9State and local government obligations 3,252.7 3,091.6 2,940.4 2,798.3 2,664.8Asset-backed securities 2,464.3 2,423.6 2,368.7 2,305.7 2,242.9Corporate securities 1,923.0 1,849.3 1,779.9 1,714.5 1,652.8Preferred stocks 806.3 787.1 768.9 751.9 735.7Other debt securities 34.2 33.5 32.8 32.0 31.2Short-term investments 1,376.9 1,376.9 1,376.9 1,376.9 1,376.9Balance as of December 31, 2004 $ 11,941.0 $ 11,583.6 $ 11,230.1 $ 10,885.7 $ 10,557.2Balance as of December 31, 2003 $ 11,270.0 $ 10,912.7 $ 10,560.2 $ 10,223.2 $ 9,899.9
Financial instruments subject to equity market risk were:
Hypothetical Market Changes
Market(millions) Value +10% -10%
Common equities as of December 31, 2004 $ 1,851.9 $ 2,037.1 $ 1,666.7Common equities as of December 31, 2003 $ 1,972.1 $ 2,169.3 $ 1,774.9
THE PROGRESSIVE CORPORATION AND SUBSIDIARIES
QUANTITATIVE MARKET RISK DISCLOSURES
(unaudited)
The model represents the estimated value of the Company’s common equity portfolio given a +/- 10% change in the market, based on thecommon stock portfolio’s weighted average beta of 1.0. The beta is derived from recent historical experience, using the S&P 500 as themarket surrogate. The historical relationship of the common stock portfolio’s beta to the S&P 500 is not necessarily indicative of futurecorrelation, as individual company or industry factors may affect price movement. Betas are not available for all securities. In such cases,the change in market value reflects a direct +/- 10% change; the number of securities without betas is less than 1%, and the remaining99% of the equity portfolio is indexed to the Russell 1000.
Exposure to risk is represented in terms of changes in fair value due to selected hypothetical movements in market rates. Bonds and preferredstocks are individually priced to yield to the worst case scenario. State and local government obligations, including lease deals and supersinkers, are assumed to hold their prepayment patterns. Asset-backed securities are priced assuming deal specific prepayment scenarios,considering the deal structure, prepayment penalties, yield maintenance agreements and the underlying collateral. Over 95% of the preferredstocks have mechanisms that are expected to provide an opportunity to liquidate at par.
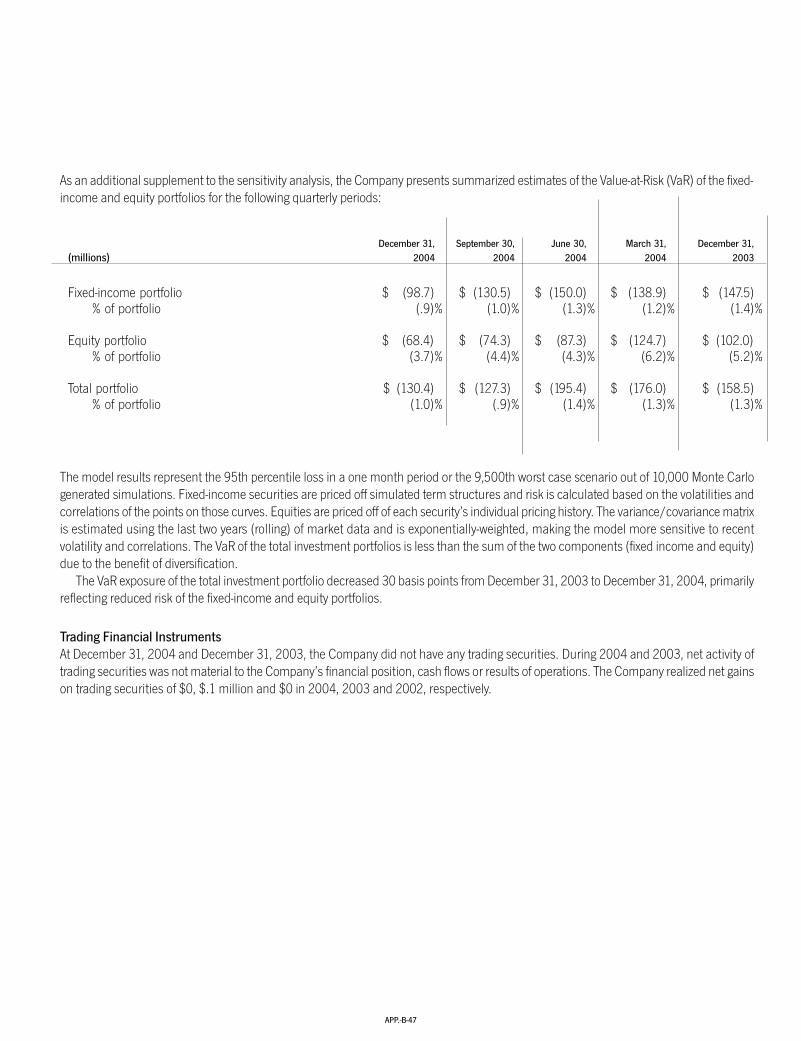
APP.-B-47
As an additional supplement to the sensitivity analysis, the Company presents summarized estimates of the Value-at-Risk (VaR) of the fixed-income and equity portfolios for the following quarterly periods:
December 31, September 30, June 30, March 31, December 31,(millions) 2004 2004 2004 2004 2003
Fixed-income portfolio $ (98.7) $ (130.5) $ (150.0) $ (138.9) $ (147.5)% of portfolio (.9)% (1.0)% (1.3)% (1.2)% (1.4)%
Equity portfolio $ (68.4) $ (74.3) $ (87.3) $ (124.7) $ (102.0)% of portfolio (3.7)% (4.4)% (4.3)% (6.2)% (5.2)%
Total portfolio $ (130.4) $ (127.3) $ (195.4) $ (176.0) $ (158.5)% of portfolio (1.0)% (.9)% (1.4)% (1.3)% (1.3)%
The model results represent the 95th percentile loss in a one month period or the 9,500th worst case scenario out of 10,000 Monte Carlogenerated simulations. Fixed-income securities are priced off simulated term structures and risk is calculated based on the volatilities andcorrelations of the points on those curves. Equities are priced off of each security’s individual pricing history. The variance/covariance matrixis estimated using the last two years (rolling) of market data and is exponentially-weighted, making the model more sensitive to recentvolatility and correlations. The VaR of the total investment portfolios is less than the sum of the two components (fixed income and equity)due to the benefit of diversification.
The VaR exposure of the total investment portfolio decreased 30 basis points from December 31, 2003 to December 31, 2004, primarilyreflecting reduced risk of the fixed-income and equity portfolios.
Trading Financial InstrumentsAt December 31, 2004 and December 31, 2003, the Company did not have any trading securities. During 2004 and 2003, net activity oftrading securities was not material to the Company’s financial position, cash flows or results of operations. The Company realized net gainson trading securities of $0, $.1 million and $0 in 2004, 2003 and 2002, respectively.

APP.-B-48
The Company believes that equity compensation awards align management interests with those of shareholders. Between 1989 and 2002,the Company awarded non-qualified stock options (NQSO) annually to key employees and to directors of the Company as the equitycomponent of total compensation. In 2003, the Company discontinued NQSO awards in favor of annual restricted stock (RS) grants. TheCompany believes that RS, which provides voting rights, dividend payments, an indefinite life and unleveraged returns, represents a superiortool in aligning interests.
The Company recognizes investor concerns about the dilutive effects of equity-based compensation. Beginning January 1, 2001, theCompany initiated a policy of share repurchases to neutralize the effect of dilution.
The following table shows the Common Share activity since this policy was established (all amounts are presented on a post-split basis):
CommonBeginning RS NQSOs Shares Ending
Year Balance Granted Exercised Repurchased Balance
2001 220.6 — 2.5 (2.8) 220.32002 220.3 — 1.3 (3.6) 218.02003 218.0 .6 2.8 (5.0) 216.42004 216.4 .5 2.1 (18.6) 200.4
Cumulative activity 220.6 1.1 8.7 (30.0) 200.4
THE PROGRESSIVE CORPORATION AND SUBSIDIARIES
INCENTIVE COMPENSATION PLANS
(unaudited)
As of January 1, 2005, there were 6.8 million options outstanding with 5.7 million options currently eligible for exercise, including .2 millionoptions for directors. On January 1, 2005, 1.6 million options became exercisable. The final expiration date for these outstanding optionsis December 31, 2011, with the exception of the directors’ options, which expire April 2012.
The Company anticipates that approximately 6.5 million of the currently outstanding options will have been exercised by the expirationdate. The difference between options currently outstanding and total projected exercises represents an estimate of the Company’s historicalexperience of option cancellations. Actual exercises can and will vary based on a number of factors, including variation in the market priceof Progressive stock.
In October 2004, the Company repurchased 16.9 million Common Shares pursuant to a “Dutch auction” tender offer. As a result of thetender offer, the Company believes that any dilution from stock option exercises has been fully neutralized. On a going forward basis, theCompany expects to repurchase shares to offset the dilution from the RS grants.
(millions)

APP.-B-49
During the year, the Company had the following RS awards outstanding, including awards granted to directors:
2004 2003
Weighted WeightedAverage Average
Shares Grant Value Shares Grant ValuePreviously issued awards 565,750 $ 65.80 — —Employees:1
Time-based 391,056 84.17 452,730 $ 65.86Performance-based 101,360 84.15 100,560 65.55
Directors time-based2 12,242 89.89 16,102 65.55Total granted 504,658 84.30 569,392 65.80
Cancelled (26,355) 70.60 (2,987) 65.55Vested (115,970) 65.55 (655) 65.55
Net unvested awards 928,083 $ 75.76 565,750 $ 65.80
1Includes 243,845 of unvested awards deferred pursuant to The Progressive Corporation Executive Deferred Compensation Plan.2Includes 6,678 shares deferred pursuant to The Progressive Corporation Directors Restricted Stock Deferral Plan.
The employee time-based awards typically vest in equal installments over approximately three, four and five year periods. The performance-based awards vest upon the attainment of preestablished profitability and growth objectives. The directors’ awards vest within a one-yearperiod. As of December 31, 2004, the remaining weighted average vesting period for the Company’s total unvested awards is 2.3 years.
The Company recognizes compensation expense on a pro rata basis over the vesting period for all non-deferred awards based on themarket value at the date of grant. The compensation expense on the deferred awards is based on the current market value at the end ofeach period. During 2004 and 2003, the Company recognized $23.8 million and $11.0 million, respectively, of compensation expenseassociated with RS awards.

APP.-B-50
THE PROGRESSIVE CORPORATION AND SUBSIDIARIES
CLAIMS PAYMENT PATTERNS
(unaudited)
The Company is primarily an insurer of automobiles, recreation vehicles and trucks owned by small businesses. As such, the Company’sclaim liabilities, by their very nature, are short in duration. Since the Company’s incurred losses consist of both payments and changes inthe reserve estimates, it is important to understand the Company’s paid development patterns. The charts below show the Company’s autoclaims payment patterns, reflecting both dollars and claims counts paid, for auto physical damage and bodily injury claims, as well as ona total auto basis. Since physical damage claims pay out so quickly, the chart is calibrated on a monthly basis, as compared to a quarterlybasis for the bodily injury and total auto payments.
0%
10%
20%
30%
40%
50%
60%
Physical Damage
Counts Dollars Months
Perc
ent P
aid
0 1 2 3 4 5 6 7 8 9 10 11 12
T
T
0%
5%
10%
15%
20%
25%
30%
Bodily Injury
Counts Dollars Quarters
Perc
ent P
aid
0 4 8 12 16
T
T
T
T
T
TT
TT T T T T T T T TT

APP.-B-51
Note: The above graphs are presented on an accident period basis.
0%
10%
20%
30%
40%
50%
60%
70%
Total Auto
Counts Dollars Quarters
Perc
ent P
aid
0 4 8 12 16
T
T
T
T
T T T T T T

APP.-B-52
Net Income Stock Price1
Operating Per Rate of DividendsQuarter Revenues2 Total Share3 High Low Close Return4 Per Share
20041 $ 3,106.1 $ 460.0 $ 2.09 $ 89.06 $ 80.68 $ 87.60 $ .0252 3,245.9 386.3 1.76 91.97 81.30 85.30 .0253 3,289.8 388.9 1.77 85.60 73.10 84.75 .0304 3,576.6 413.5 2.01 97.29 83.01 84.84 .030
$13,218.4 $ 1,648.7 $ 7.63 $ 97.29 $ 73.10 $ 84.84 1.6% $ .110
20031 $ 2,607.1 $ 291.5 $ 1.32 $ 60.41 $ 46.25 $ 59.31 $ .0252 2,785.4 286.3 1.29 76.38 59.66 73.10 .0253 2,938.6 319.8 1.45 75.81 64.25 69.11 .0254 3,051.7 357.8 1.63 84.68 69.11 83.59 .025
$ 11,382.8 $ 1,255.4 $ 5.69 $ 84.68 $ 46.25 $ 83.59 68.7% $ .100
20021 $ 1,975.3 $ 176.2 $ .78 $ 55.80 $ 46.75 $ 55.54 $ .0232 2,144.8 160.4 .71 60.49 54.64 57.85 .0233 2,325.7 178.5 .80 57.77 44.75 50.63 .0254 2,472.0 152.2 .69 58.30 48.79 49.63 .025
$ 8,917.8 $ 667.3 $ 2.99 $ 60.49 $ 44.75 $ 49.63 (.1)% $ .096
All per share amounts and stock prices were adjusted for the April 22, 2002, 3-for-1 stock split.1Prices as reported on the consolidated transaction reporting system. The Company’s Common Shares are listed on the New York Stock Exchange.2Represents premiums earned plus service revenues.3Presented on a diluted basis. The sum may not equal the total because the average equivalent shares differ in the periods.4Represents annual rate of return, including quarterly dividend reinvestment.
(millions — except per share amounts)
THE PROGRESSIVE CORPORATION AND SUBSIDIARIES
QUARTERLY FINANCIAL AND COMMON SHARE DATA
(unaudited)

APP.-B-53
THE PROGRESSIVE CORPORATION AND SUBSIDIARIES
NET PREMIUMS WRITTEN BY STATE
(unaudited)
(millions) 2004 2003 2002 2001 2000
Florida $ 1,522.6 11.4% $ 1,338.2 11.2% $ 1,040.7 11.0% $ 798.9 11.0% $ 750.0 12.1%Texas 1,181.1 8.8 1,126.4 9.4 858.6 9.1 571.5 7.9 526.3 8.5New York 935.7 7.0 808.3 6.8 662.0 7.0 554.1 7.6 417.9 6.7California 892.7 6.7 736.2 6.2 550.7 5.8 404.6 5.6 364.9 5.9Ohio 754.2 5.6 712.1 6.0 619.7 6.6 570.9 7.9 552.0 8.9Georgia 733.2 5.5 614.4 5.2 485.3 5.1 407.0 5.6 362.4 5.9Pennsylvania 634.4 4.7 589.3 4.9 491.0 5.2 367.5 5.0 308.7 5.0All other 6,724.2 50.3 5,988.5 50.3 4,744.0 50.2 3,585.6 49.4 2,913.9 47.0
Total $13,378.1 100.0% $11,913.4 100.0% $9,452.0 100.0% $ 7,260.1 100.0% $ 6,196.1 100.0%

APP.-B-54
Directors
*Milton N. Allen 1,2,6
Consultant, Director and Trustee,Profit and Not-for-profit Organizations
Charles A. Davis3,5,6
Chairman and Chief Executive Officer, MMC Capital, Inc.
(private equity investing)
Stephen R. Hardis2,4,5,6
Chairman of the Board,Axcelis Technologies, Inc.
(manufacturing)
Bernadine P. Healy, M.D.3,6
Medical & Science Columnist,U.S. News & World Report
(publishing)
Jeffrey D. Kelly4,6
Vice Chairmanand Chief Financial Officer,National City Corporation
(commercial banking)
*In April 2005, Milton N. Allen will retire after 27 years ofservice on Progressive’s Board. B. Charles Ames, after21 years of service, retired in April 2004. Progressivewould like to thank both Mr. Allen and Mr. Ames for theirdedicated service and the many contributions theymade during their tenure on the Board.
Philip A. Laskawy1,6
formerly Chairman andChief Executive Officer,Ernst & Young LLP
(professional services)
Peter B. Lewis2
Chairman of the Board
Norman S. Matthews3,5,6
Consultant,formerly President,Federated Department Stores, Inc.(retailing)
Patrick H. Nettles, Ph.D.6
Executive Chairman,Ciena Corporation(telecommunications)
Glenn M. Renwick2
President and Chief Executive Officer
Donald B. Shackelford4,6
Chairman,Fifth Third Bank, Central Ohio(commercial banking)
Bradley T. Sheares, Ph.D.1,6
President,U. S. Human Health Divisionof Merck & Co., Inc.(health care)
1Audit Committee member2Executive Committee member3Compensation Committee member4Investment and Capital Committee member5Nominating and Governance Committee member6Independent Director
Corporate Officers
Peter B. LewisChairman
Glenn M. RenwickPresident and Chief Executive Officer
W. Thomas ForresterVice President and Chief Financial Officer
Charles E. JarrettVice President, Secretary and Chief Legal Officer
Thomas A. KingVice President and Treasurer
Jeffrey W. BaschVice President and Chief Accounting Officer
Contact Non-Management Directors Interested parties have the ability to contact non-management directors as a group by sending awritten communication clearly addressed to the non-management directors and sent to any of the following:
Peter B. Lewis, Chairman of the Board, The Progressive Corporation, 6300 Wilson Mills Road, Mayfield Village, Ohio 44143 or e-mail:[email protected].
Philip A. Laskawy, Chairman of the Audit Committee, The Progressive Corporation, c/o Ernst & Young, 5 Times Square, New York, NewYork 10036 or e-mail: [email protected].
Charles E. Jarrett, Corporate Secretary, The Progressive Corporation, 6300 Wilson Mills Road, Mayfield Village, Ohio 44143 or e-mail:[email protected].
The recipient will forward communications so received to the non-management directors.

APP.-B-55
Accounting Complaint Procedure Any employee or otherinterested party with a complaint or concern regarding accounting,internal accounting controls or auditing matters relating to theCompany may report such complaint or concern directly to theChairman of the Audit Committee, as follows: Philip A. Laskawy,Audit Committee Chairman, c/o Ernst & Young, 5 Times Square,New York, New York 10036, Phone: 212-773-1300, e-mail:[email protected].
Any such complaint or concern also may be reported anonymouslyover the following toll-free Alert Line: 1-800-683-3604. The Companywill not retaliate against any individual by reason of his or her havingmade such a complaint or reported such a concern in good faith.View the complete procedures at progressive.com/governance.
Whistleblower Protections The Company will not retaliate againstany officer or employee of the Company because of any lawful actdone by the employee to provide information or otherwise assist ininvestigations regarding conduct that the employee reasonablybelieves to be a violation of Federal Securities Laws or of any ruleor regulation of the Securities and Exchange Commission or FederalSecurities Laws relating to fraud against shareholders. View thecomplete Whistleblower Protections at progressive.com/governance.
Annual Meeting The Annual Meeting of Shareholders will be held atthe offices of The Progressive Corporation, 6671 Beta Drive, MayfieldVillage, Ohio 44143 on April 15, 2005 at 10 a.m. eastern time. Therewere 3,913 shareholders of record on December 31, 2004.
Principal Office The principal office of The Progressive Corporationis at 6300 Wilson Mills Road, Mayfield Village, Ohio 44143.Phone: 440-461-5000Web site: progressive.com
Customer Service and Claims ContactsFor 24-hour customer service or to report a claim, contact:
Progressive DirectSM
Phone: 1-800-PROGRESSIVE (1-800-776-4737)Web site: progressivedirect.com
Drive Insurance from ProgressiveSM
Phone: 1-800-925-2886Web site: driveinsurance.com
Common Shares The Progressive Corporation’s Common Shares(symbol PGR) are traded on the New York Stock Exchange. Dividendsare customarily paid on the last day of each quarter. The 2005quarterly dividend record dates, subject to Board approval, are asfollows: March 11, June 10, September 9 and December 9.
Corporate Governance The Company’s Corporate GovernanceGuidelines and Board Committee Charters are available at:progressive.com/governance, or may be requested in print bywriting to: The Progressive Corporation, Investor Relations, 6300Wilson Mills Road, Box W33, Mayfield Village, Ohio 44143.
Charitable Contributions Progressive supports qualified not-for-profit organizations working to reduce the human trauma andeconomic cost of auto accidents. In addition, The ProgressiveInsurance Foundation, a private charitable foundation that receivescontributions from the Company, contributes to qualified tax-exemptorganizations that are financially supported by Progressive employees.
Counsel Baker & Hostetler LLP, Cleveland, Ohio
Transfer Agent and Registrar If you have questions about aspecific stock ownership account, write or call: National City Bank,Corporate Trust Operations, Dept. 5352, 4100 W. 150th St.,Cleveland, Ohio 44135. Phone: 1-800-622-6757 or e-mail:[email protected].
Shareholder/Investor Relations The Progressive Corporation doesnot maintain a mailing list for distribution of shareholders’ reports.To view Progressive’s publicly filed documents, shareholders canaccess the Company’s Web site: progressive.com/sec. To view itsearnings and other releases, access progressive.com/investors.
To request copies of public financial information on the Company,write to: The Progressive Corporation, Investor Relations, 6300Wilson Mills Road, Box W33, Mayfield Village, Ohio 44143, e-mail:[email protected] or call: 1-440-395-2258.
For financial-related information, call: 1-440-395-2222 or e-mail:[email protected].
For stock ownership account information, call: National City Bank at1-800-622-6757 or e-mail: [email protected].
For all other Company information, call: 1-440-461-5000 or e-mail:[email protected].
Interactive Annual Report The Progressive Corporation’s 2004 Annual Report, in an interactive format, can be found at:progressive.com/annualreport.
©2005 The Progressive Corporation