Embed Size (px)
Citation preview
PORTFOLIO STATEMENT
Presented by the Honourable Kevin Foley MPDeputy Premier and Treasurer of South Australia
on the Occasion of the Budget for 2007–08
2007 08
BUDGET PAPER 4 Volume 1B
UD
GE
T PAP
ER
4 Volume 1
PO
RTFO
LIO S
TATEM
EN
T 2007–08

Table of Contents
VOLUME ONE
Introduction
Portfolio – Premier and Cabinet ..........................................................................................................1
Portfolio – Trade and Economic Development ...................................................................................2
Portfolio – Treasury and Finance .........................................................................................................3
Portfolio – Justice ...................................................................................................................................4
Accounting Standards
VOLUME TWO
Introduction
Portfolio – Primary Industries and Resources ....................................................................................5
Portfolio – Transport, Energy and Infrastructure ..............................................................................6
Portfolio – Health ...................................................................................................................................7
Portfolio – Administrative and Information Services .........................................................................8
Portfolio – Education and Children’s Services....................................................................................9
Accounting Standards
VOLUME THREE
Introduction
Portfolio – Tourism ..............................................................................................................................10
Portfolio – Families and Communities ...............................................................................................11
Portfolio – Environment and Conservation and the River Murray ................................................12
Portfolio – Further Education, Employment, Science and Technology ..........................................13
Auditor-General ...................................................................................................................................14
Accounting Standards

INTRODUCTION
The Portfolio Statements outline financial and non-financial information about the services provided to, and on behalf of, the community by each portfolio. The following discussion outlines key aspects of the Statements.
FINANCIAL STATEMENTS
The financial statements included in the 2007-08 Portfolio Statements are special purpose financial reports.
Estimates in the Portfolio Statements have been prepared:
• on a basis that is consistent with Australian equivalents to International Financial Reporting Standards (AIFRS). Australian accounting standards and/or interpretations that have been issued or amended but are not yet effective have not been early adopted;
• on an accrual basis except for the Cash Flow Statement which has been derived from the Income Statement and Balance Sheet to reflect cash payments and receipts; and
• using the historical cost convention, except for certain assets and liabilities that are valued in accordance with the valuation policy applicable.
In the process of reporting on portfolios, agencies or other entities as single economic entities, transactions and balances between units within the economic entity are eliminated. The commentary at the commencement of the portfolio statement for each portfolio identifies which entities have been included in the consolidated reports for that portfolio.
The financial statements for each portfolio include separate presentation or classification of controlled activities and (where applicable) administered activities.
Portfolio statements typically reflect a consolidation of controlled items within each portfolio. Where a portfolio contains a single agency, only the agency statements are provided.
DEFINITIONS
Portfolio
A portfolio is an entity that provides management coordination and administrative support for a defined group of agencies. A portfolio may comprise a single agency.
Agency
An agency is an administrative unit created under the Public Sector Management Act 1995 (PSM) or a statutory authority that is accountable for the delivery of programs on behalf of the Government.
Programs and sub-programs
A program is a grouping of related sub-programs or activities that contributes to the achievement of a particular agency’s and, in turn, the government’s objectives. A sub-program is a grouping of activities that contribute to a more specific objective.
PORTFOLIO STATEMENT OVERVIEW
The Portfolio Statements outline details of projected portfolio activity and performance for 2007-08. Each Portfolio Statement conforms to the following standard presentation structure:
Portfolio Summary
• Ministerial Responsibilities
– details Minister, Agency, Program, Sub-Program and Administered items relationships and responsibilities
• Portfolio Cost of Service Summary (where the portfolio comprises more than one agency)
– a summary of total agency cost of services
• Investing Payments Summary (where the portfolio comprises more than one agency)
– total agency investing payments
• Portfolio Financial Statements (where the portfolio comprises more than one agency)
– budgeted financial statements for controlled items
• Workforce Summary
– total workforce details
• Ministerial Office(s) resources
– details of resources provided to Ministerial office(s)
Agency Summary
• Objective
– details of agency objectives
• Targets / Highlights
– targets for the budget year and highlights for the prior year
• Program Cost of Services Summary
– summary of the net cost of agency programs
• Investing Payments Summary
– the investing payments for the agency
• Program Information
– a description / objective and summary income statement
– commentary and performance measures for individual agency sub-programs
• Agency Financial Statements
– budgeted financial statements for controlled and administered items
• Agency Financial Commentary
– commentary on variances, trends, etc in the financial statements
PRESENTATION OF CHANGES IN PROGRAM STRUCTURES
Where an agency is transferred between portfolios, program information for previous years is reflected in the current program structure of the receiving portfolio. Similarly, where programs or sub-programs are transferred between agencies information is reflected in the receiving agency’s program structure.
In contrast, the agency financial statements line net cost of providing services (in the income statement) is based on the actual program structure for the agency as it operated or is expected to operate in each year. This distinction in treatment is drawn so that financial statements accurately reflect events while, at the same time, program information is comparable and not duplicated.
Reconciliation of the financial statements to the current program structure is contained in the program net cost of services summary located at the beginning of each relevant agency section.
CHANGES TO AGENCY WORKFORCE SUMMARY TABLES
The Full Time Equivalent (FTE) workforce data detailed in agency Workforce Summary tables use the former Office for Public Employment’s (OPE’s) 2005-06 actual figures as published in The South Australian Public Sector Workforce Information at June 2006: Summary Report.
The 2006-07 Estimated result and 2007-08 Budget estimate reflect the newly established FTE cap figures. The FTE caps are consistent with agency salaries and wages budgets. There are minor differences in the scope of the OPE actuals and the FTE cap figures.


Portfolio: Premier and Cabinet
Premier Minister for Social Inclusion Minister for the Arts Minister for Sustainability and Climate Change Minister for Industrial Relations Minister for Government Enterprises Minister for Recreation, Sport and Racing Minister for the City of Adelaide Minister for Aboriginal Affairs and Reconciliation

TABLE OF CONTENTS
PORTFOLIO SUMMARY
Ministerial Responsibilities..................................................................................................1.1
Workforce Summary ............................................................................................................1.3
Ministerial Office Resources ...............................................................................................1.3
Agency Summaries
Department of the Premier and Cabinet ...............................................................................1.4
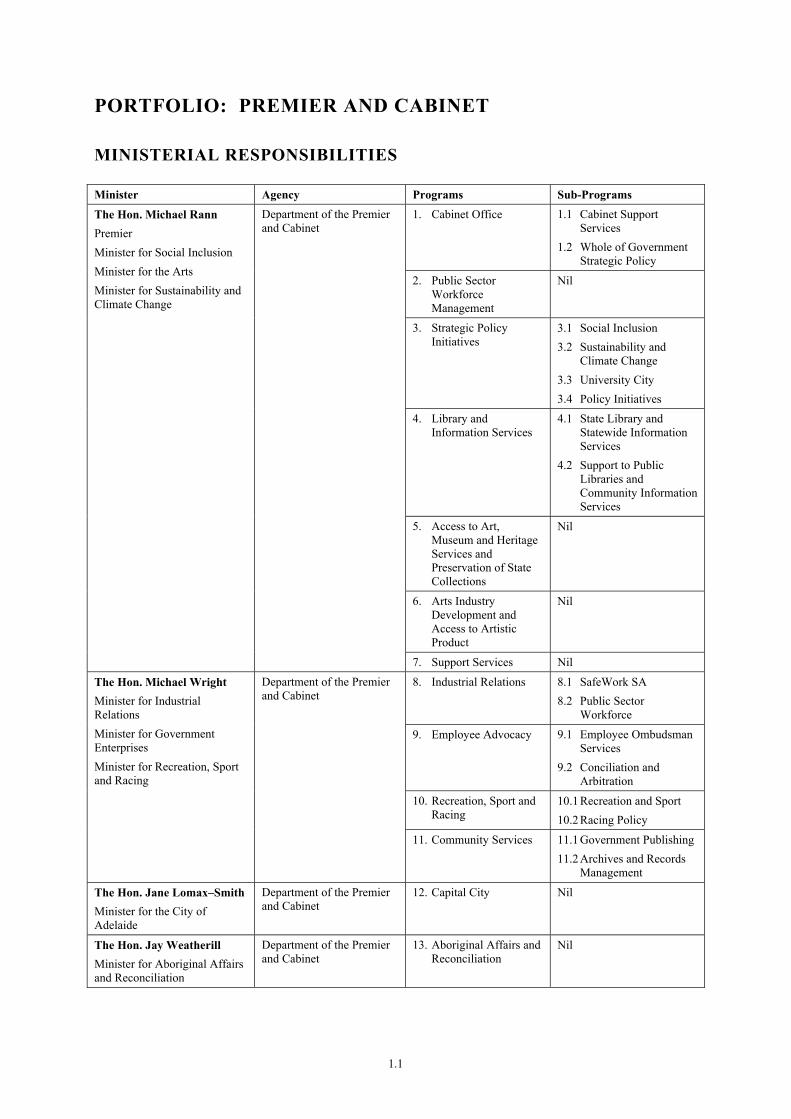
PORTFOLIO: PREMIER AND CABINET
MINISTERIAL RESPONSIBILITIES
Minister Agency Programs Sub-Programs 1. Cabinet Office 1.1 Cabinet Support
Services 1.2 Whole of Government
Strategic Policy
2. Public Sector Workforce Management
Nil
3. Strategic Policy Initiatives
3.1 Social Inclusion 3.2 Sustainability and
Climate Change 3.3 University City 3.4 Policy Initiatives
4. Library and Information Services
4.1 State Library and Statewide Information Services
4.2 Support to Public Libraries and Community Information Services
5. Access to Art, Museum and Heritage Services and Preservation of State Collections
Nil
6. Arts Industry Development and Access to Artistic Product
Nil
The Hon. Michael Rann Premier Minister for Social Inclusion Minister for the Arts Minister for Sustainability and Climate Change
Department of the Premier and Cabinet
7. Support Services Nil
8. Industrial Relations 8.1 SafeWork SA 8.2 Public Sector
Workforce
9. Employee Advocacy 9.1 Employee Ombudsman Services
9.2 Conciliation and Arbitration
10. Recreation, Sport and Racing
10.1 Recreation and Sport 10.2 Racing Policy
The Hon. Michael Wright Minister for Industrial Relations Minister for Government Enterprises Minister for Recreation, Sport and Racing
Department of the Premier and Cabinet
11. Community Services 11.1 Government Publishing 11.2 Archives and Records
Management
The Hon. Jane Lomax–Smith Minister for the City of Adelaide
Department of the Premier and Cabinet
12. Capital City Nil
The Hon. Jay Weatherill Minister for Aboriginal Affairs and Reconciliation
Department of the Premier and Cabinet
13. Aboriginal Affairs and Reconciliation
Nil
1.1

Administered items
In addition to the above responsibilities the Portfolio administers the following items on behalf of Minister(s).
• Targeted Voluntary Separation Package (TVSP) Fund
• Commonwealth Essential Service Capital Works Fund (formerly the Aboriginal and Torres Strait Islander Commission Capital Works Fund)
• Payments made from Consolidated Account
• Government Workers Rehabilitation and Compensation Fund
• Recreation and Sport Fund
• Sport and Recreation Fund
Statutes
The Department of the Premier and Cabinet maintains a list of statutes applicable to Ministers.
1.2
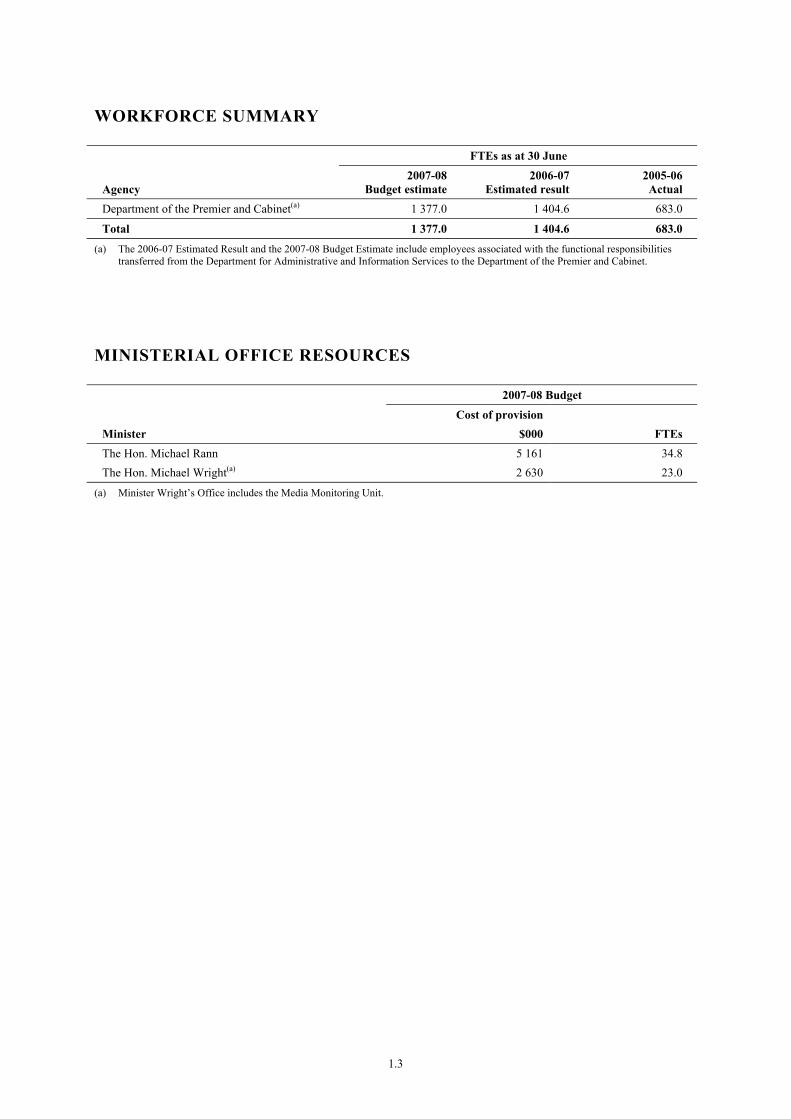
WORKFORCE SUMMARY
FTEs as at 30 June
Agency 2007-08
Budget estimate 2006-07
Estimated result 2005-06 Actual
Department of the Premier and Cabinet(a) 1 377.0 1 404.6 683.0
Total 1 377.0 1 404.6 683.0
(a) The 2006-07 Estimated Result and the 2007-08 Budget Estimate include employees associated with the functional responsibilities transferred from the Department for Administrative and Information Services to the Department of the Premier and Cabinet.
MINISTERIAL OFFICE RESOURCES
2007-08 Budget
Cost of provision Minister $000 FTEs The Hon. Michael Rann 5 161 34.8 The Hon. Michael Wright(a) 2 630 23.0
(a) Minister Wright’s Office includes the Media Monitoring Unit.
1.3

TABLE OF CONTENTS
AGENCY: DEPARTMENT OF THE PREMIER AND CABINET
Objective ........................................................................................................................................1.6
Targets / Highlights ........................................................................................................................1.7
Program Net Cost of Services Summary........................................................................................1.10
Investing Payments Summary ........................................................................................................1.11
Program Information — includes description/objective, Summary income statement and sub-program information including performance criteria
1. Cabinet Office...............................................................................................................1.12
2. Public Sector Workforce Management .........................................................................1.15
3. Strategic Policy Initiatives ............................................................................................1.17
4. Library and Information Services .................................................................................1.22
5. Access to Art, Museum and Heritage Services and Preservation of State Collections 1.24
6. Arts Industry Development and Access to Artistic Product .........................................1.26
7. Support Services ...........................................................................................................1.29
8. Industrial Relations .......................................................................................................1.31
9. Employee Advocacy .....................................................................................................1.34
10. Recreation, Sport and Racing .......................................................................................1.37
11. Community Services.....................................................................................................1.40
12. Capital City ...................................................................................................................1.43
13. Aboriginal Affairs and Reconciliation..........................................................................1.45
Financial Statements
Income statement .................................................................................................................1.47
Balance sheet........................................................................................................................1.48
Statement of changes in equity ............................................................................................1.49
Cash flow statement .............................................................................................................1.50
Income statement — Administered Items............................................................................1.52
Balance sheet — Administered Items ..................................................................................1.53
1.4

Statement of changes in equity — Administered Items.......................................................1.54
Cash flow statement — Administered Items .......................................................................1.55
Financial Commentary ...................................................................................................................1.56
Additional Information for Administered Items.............................................................................1.59
1.5
PORTFOLIO: PREMIER AND CABINET
AGENCY: DEPARTMENT OF THE PREMIER AND CABINET
Objective
The Department of the Premier and Cabinet (DPC) delivers high quality policy advice and support to the Premier and Ministers, provides direction and leadership to the South Australian public sector, and drives key government initiatives through a range of services benefiting the South Australian community. We do this by providing the Premier and Ministers with quick responses to emerging issues, taking a whole of government approach to policy development and implementation, driving reform in government services, managing and improving the government’s workforce, creating and developing innovative approaches and implementing specific programs.
We work closely with the community in developing policies and delivering programs in areas such as social inclusion, Aboriginal wellbeing, the arts, industrial relations, occupational health and safety, and sport and recreation.
1.6
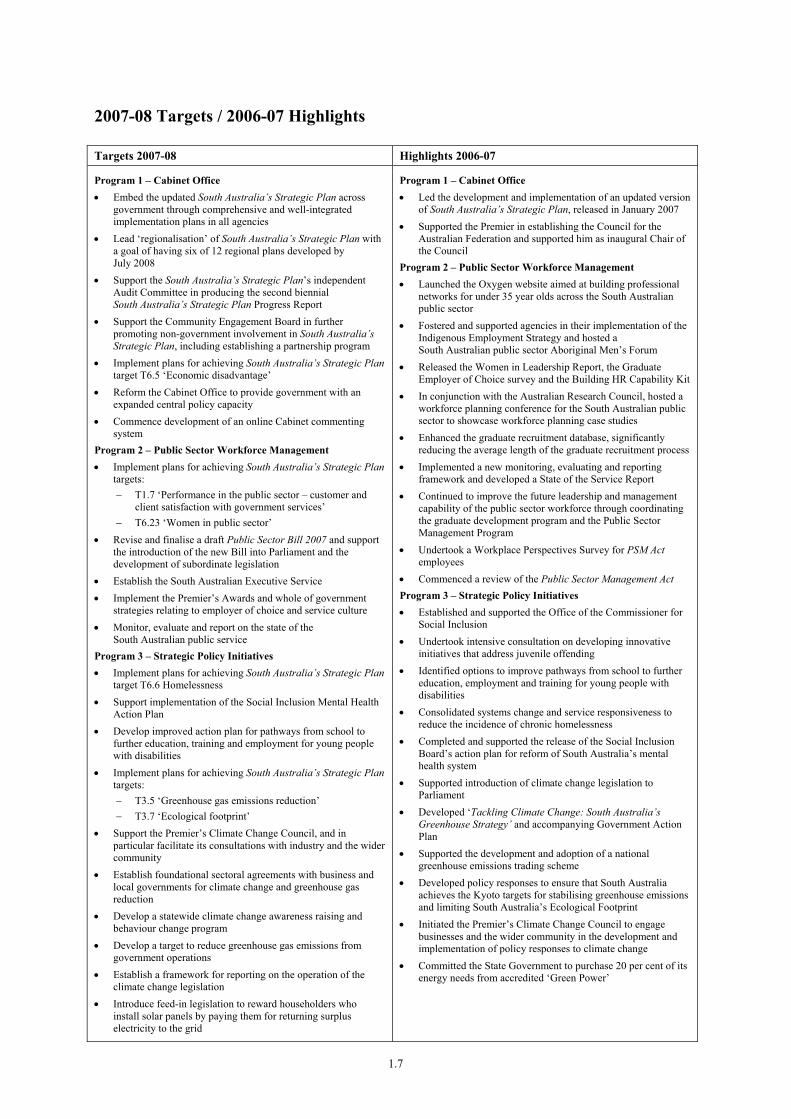
2007-08 Targets / 2006-07 Highlights
Targets 2007-08 Highlights 2006-07
Program 1 – Cabinet Office • Embed the updated South Australia’s Strategic Plan across
government through comprehensive and well-integrated implementation plans in all agencies
• Lead ‘regionalisation’ of South Australia’s Strategic Plan with a goal of having six of 12 regional plans developed by July 2008
• Support the South Australia’s Strategic Plan’s independent Audit Committee in producing the second biennial South Australia’s Strategic Plan Progress Report
• Support the Community Engagement Board in further promoting non-government involvement in South Australia’s Strategic Plan, including establishing a partnership program
• Implement plans for achieving South Australia’s Strategic Plan target T6.5 ‘Economic disadvantage’
• Reform the Cabinet Office to provide government with an expanded central policy capacity
• Commence development of an online Cabinet commenting system
Program 2 – Public Sector Workforce Management • Implement plans for achieving South Australia’s Strategic Plan
targets: − T1.7 ‘Performance in the public sector – customer and
client satisfaction with government services’ − T6.23 ‘Women in public sector’
• Revise and finalise a draft Public Sector Bill 2007 and support the introduction of the new Bill into Parliament and the development of subordinate legislation
• Establish the South Australian Executive Service • Implement the Premier’s Awards and whole of government
strategies relating to employer of choice and service culture • Monitor, evaluate and report on the state of the
South Australian public service Program 3 – Strategic Policy Initiatives • Implement plans for achieving South Australia’s Strategic Plan
target T6.6 Homelessness • Support implementation of the Social Inclusion Mental Health
Action Plan • Develop improved action plan for pathways from school to
further education, training and employment for young people with disabilities
• Implement plans for achieving South Australia’s Strategic Plan targets: − T3.5 ‘Greenhouse gas emissions reduction’ − T3.7 ‘Ecological footprint’
• Support the Premier’s Climate Change Council, and in particular facilitate its consultations with industry and the wider community
• Establish foundational sectoral agreements with business and local governments for climate change and greenhouse gas reduction
• Develop a statewide climate change awareness raising and behaviour change program
• Develop a target to reduce greenhouse gas emissions from government operations
• Establish a framework for reporting on the operation of the climate change legislation
• Introduce feed-in legislation to reward householders who install solar panels by paying them for returning surplus electricity to the grid
Program 1 – Cabinet Office • Led the development and implementation of an updated version
of South Australia’s Strategic Plan, released in January 2007 • Supported the Premier in establishing the Council for the
Australian Federation and supported him as inaugural Chair of the Council
Program 2 – Public Sector Workforce Management • Launched the Oxygen website aimed at building professional
networks for under 35 year olds across the South Australian public sector
• Fostered and supported agencies in their implementation of the Indigenous Employment Strategy and hosted a South Australian public sector Aboriginal Men’s Forum
• Released the Women in Leadership Report, the Graduate Employer of Choice survey and the Building HR Capability Kit
• In conjunction with the Australian Research Council, hosted a workforce planning conference for the South Australian public sector to showcase workforce planning case studies
• Enhanced the graduate recruitment database, significantly reducing the average length of the graduate recruitment process
• Implemented a new monitoring, evaluating and reporting framework and developed a State of the Service Report
• Continued to improve the future leadership and management capability of the public sector workforce through coordinating the graduate development program and the Public Sector Management Program
• Undertook a Workplace Perspectives Survey for PSM Act employees
• Commenced a review of the Public Sector Management Act Program 3 – Strategic Policy Initiatives • Established and supported the Office of the Commissioner for
Social Inclusion • Undertook intensive consultation on developing innovative
initiatives that address juvenile offending • Identified options to improve pathways from school to further
education, employment and training for young people with disabilities
• Consolidated systems change and service responsiveness to reduce the incidence of chronic homelessness
• Completed and supported the release of the Social Inclusion Board’s action plan for reform of South Australia’s mental health system
• Supported introduction of climate change legislation to Parliament
• Developed ‘Tackling Climate Change: South Australia’s Greenhouse Strategy’ and accompanying Government Action Plan
• Supported the development and adoption of a national greenhouse emissions trading scheme
• Developed policy responses to ensure that South Australia achieves the Kyoto targets for stabilising greenhouse emissions and limiting South Australia’s Ecological Footprint
• Initiated the Premier’s Climate Change Council to engage businesses and the wider community in the development and implementation of policy responses to climate change
• Committed the State Government to purchase 20 per cent of its energy needs from accredited ‘Green Power’
1.7

Targets 2007-08 Highlights 2006-07
• Provide assistance to the Adelaide and Monarto Zoos for redevelopment and deployment of renewable energy technology
• Increase the number of collaborative global partnerships in higher education, training and research to enhance the University City vision
• Implement plans for achieving South Australia’s Strategic Plan target T4.1 ‘Creative industries’
• Negotiate and drive proposed reform for management of the Murray Darling Basin
• Manage three residencies in the Adelaide Thinkers in Residence Program: Professor Ilona Kickbusch on Healthy Societies; Dr Geoff Mulgan on Social Innovation; and Dr Dennis Jaffe on Family Business
Program 4 – Library and Information Services • Implement plans for achieving South Australia’s Strategic Plan
target T4.3 ‘Cultural engagement– institutions’ by increasing the number of users and online users of library services
Program 5 – Access to Art, Museum and Heritage Services and Preservation of State Collections • Implement plans for achieving South Australia’s Strategic Plan
target T4.3 ‘Cultural engagement – institutions’ by increasing the number of visitors, including online visitors and young people
• Invest in cultural infrastructure through the creation of a Biodiversity Gallery at the South Australian Museum; upgrades of the Lion Arts Centre and the Dunstan Playhouse; the upgrade of the air-conditioning and lighting in the heritage wing of the Art Gallery of South Australia; and raising standards of safety for heritage collections, buildings and the public
Program 6 – Arts Industry Development and Access to Artistic Product • Implement plans for achieving South Australia’s Strategic Plan
targets: − T4.2 ‘Film industry’ − T4.4 ‘Cultural engagement – arts activities’
• Present an outstanding program of international, national and South Australian arts events, including a major free public event, to celebrate the 25th Adelaide Festival of Arts in 2008
• Implement a statewide strategy and initiate programs for the development of Indigenous arts and artists
• Provide support to Country Arts SA for delivery of the inaugural SA Regional Centre for Culture Program in Port Augusta, including completion of an infrastructure project plus a year of arts activities
Program 7 – Support Services • Make necessary progress within DPC on South Australia’s
Strategic Plan targets: − T1.8 ‘Government decision-making’ − T1.9 ‘Administrative efficiency’ − T3.13 ‘Energy efficiency of government buildings’ − T5.1 ‘Women on boards and committees’ − T5.2 ‘Women chairing boards and committees’ − T6.22 ‘Employing people with disabilities’
Program 8 – Industrial Relations • Implement plans for achieving South Australia’s Strategic
Plan targets: − T 1.4 ‘Industrial relations – working days lost’ − T 2.11 ‘Greater safety at work’ − T 2.12 ‘Work-life balance’
• Increase reach to deliver the Safe, Fair and Productive Working Lives message to the South Australian community
• Negotiated with Cranfield University (Defence College of Management and Technology Defence Academy of the United Kingdom) to run executive short courses in March 2007
• Substantially progressed plans to achieve the South Australia’s Strategic Plan targets assigned to DPC in the original South Australia’s Strategic Plan
• Supported the Premier to negotiate an agreed position with the Commonwealth on its National Plan for Water Security
• Successfully managed three residencies in the Adelaide Thinkers in Residence Program
• Supported the Government Reform Commission in developing proposals approved by Cabinet on strengthening Cabinet Office, establishing the South Australian Executive Service, creating the Premier's Awards for Excellence in the Public Sector, and establishing uniform regional boundaries
Program 4 – Library and Information Services • Signed a new five-year Memorandum of Understanding with
the Local Government Association confirming the government’s support for Public Libraries throughout the state
Program 5 – Access to Art, Museum and Heritage Services and Preservation of State Collections • Commenced the major upgrade of the Dunstan Playhouse,
Tutto Ku restaurant and Artspace at the Festival Centre • Completed refurbishment of Pacific Cultures Gallery at
South Australian Museum Program 6 – Arts Industry Development and Access to Artistic Product • Supported the Adelaide Symphony Orchestra by implementing
the recommendations of the 2005 Orchestras Review • Commenced consultation on a statewide Indigenous arts
strategy • Supported the Adelaide Festival Centre to present new
programming in 2006-07 and beyond • Supported the Fringe in becoming an annual celebration and
platform for emerging independent artists and companies • Reviewed the Artsmart Strategy and identified program
priorities for 2007-08, in association with the Department for Education and Children’s Services
• Reviewed Arts SA’s project assistance programs and established the new Independent Makers and Presenters program
• Established the SA Premier’s Arts Partnership Fund, in partnership with the Australia Business Arts Foundation and Harris Scarfe Pty Ltd
Program 8 – Industrial Relations • The Industrial Relations Strategic Framework for
South Australia was developed and endorsed by stakeholders for implementation
• Prepared the draft Dangerous Substances and Major Hazard Facilities Bill for introduction
• Implemented the Occupational Health and Safety Strategic Framework for South Australia encompassing advisory, education, intervention and enforcement initiatives for high-risk industries, priority risks, small business and major events
• Developed the Safety in the Public Sector 2007-2010 Strategy • Negotiated Enterprise Bargaining Agreements covering the
public sector workforce • Implemented a capability development program targeting
120 injury management and 90 injury prevention practitioners to achieve nationally accredited qualifications in government
Program 10 – Recreation, Sport and Racing • Opened Eagle Mountain Bike Park • Implemented the Sporting Dreams Talent Identification
1.8
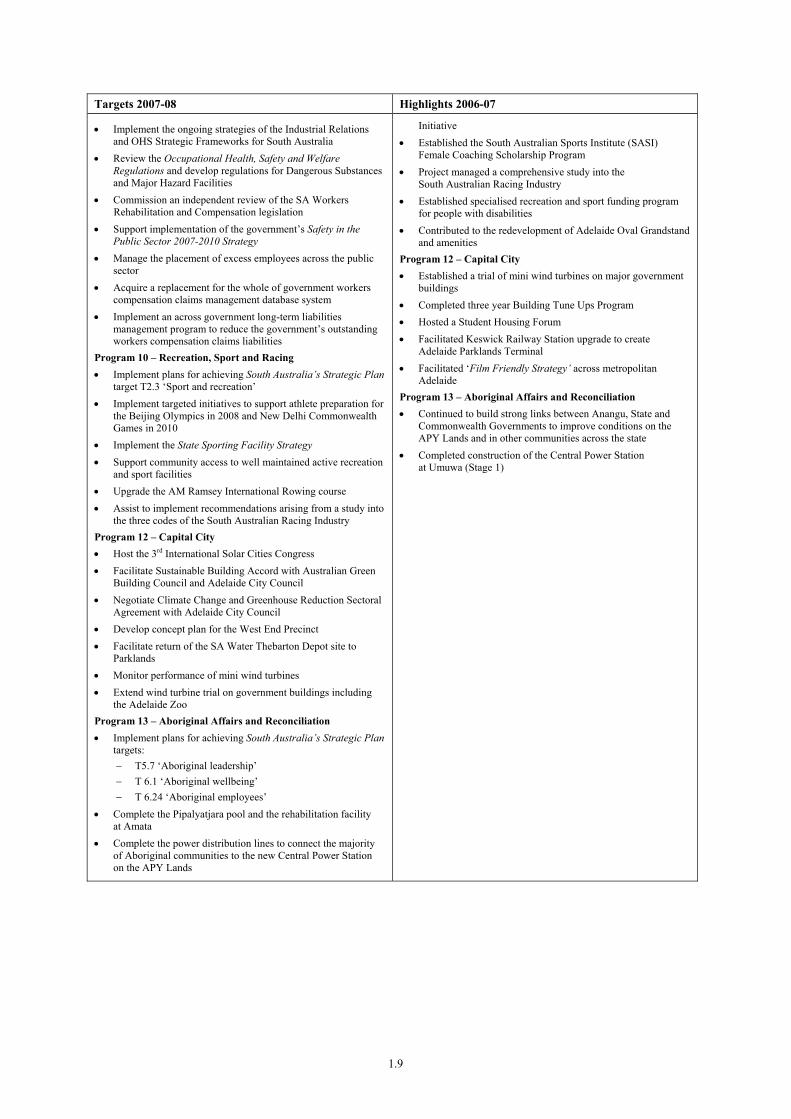
Targets 2007-08 Highlights 2006-07
• Implement the ongoing strategies of the Industrial Relations and OHS Strategic Frameworks for South Australia
• Review the Occupational Health, Safety and Welfare Regulations and develop regulations for Dangerous Substances and Major Hazard Facilities
• Commission an independent review of the SA Workers Rehabilitation and Compensation legislation
• Support implementation of the government’s Safety in the Public Sector 2007-2010 Strategy
• Manage the placement of excess employees across the public sector
• Acquire a replacement for the whole of government workers compensation claims management database system
• Implement an across government long-term liabilities management program to reduce the government’s outstanding workers compensation claims liabilities
Program 10 – Recreation, Sport and Racing • Implement plans for achieving South Australia’s Strategic Plan
target T2.3 ‘Sport and recreation’ • Implement targeted initiatives to support athlete preparation for
the Beijing Olympics in 2008 and New Delhi Commonwealth Games in 2010
• Implement the State Sporting Facility Strategy • Support community access to well maintained active recreation
and sport facilities • Upgrade the AM Ramsey International Rowing course • Assist to implement recommendations arising from a study into
the three codes of the South Australian Racing Industry Program 12 – Capital City • Host the 3rd International Solar Cities Congress • Facilitate Sustainable Building Accord with Australian Green
Building Council and Adelaide City Council • Negotiate Climate Change and Greenhouse Reduction Sectoral
Agreement with Adelaide City Council • Develop concept plan for the West End Precinct • Facilitate return of the SA Water Thebarton Depot site to
Parklands • Monitor performance of mini wind turbines • Extend wind turbine trial on government buildings including
the Adelaide Zoo Program 13 – Aboriginal Affairs and Reconciliation • Implement plans for achieving South Australia’s Strategic Plan
targets: − T5.7 ‘Aboriginal leadership’ − T 6.1 ‘Aboriginal wellbeing’ − T 6.24 ‘Aboriginal employees’
• Complete the Pipalyatjara pool and the rehabilitation facility at Amata
• Complete the power distribution lines to connect the majority of Aboriginal communities to the new Central Power Station on the APY Lands
Initiative • Established the South Australian Sports Institute (SASI)
Female Coaching Scholarship Program • Project managed a comprehensive study into the
South Australian Racing Industry • Established specialised recreation and sport funding program
for people with disabilities • Contributed to the redevelopment of Adelaide Oval Grandstand
and amenities Program 12 – Capital City • Established a trial of mini wind turbines on major government
buildings • Completed three year Building Tune Ups Program • Hosted a Student Housing Forum • Facilitated Keswick Railway Station upgrade to create
Adelaide Parklands Terminal • Facilitated ‘Film Friendly Strategy’ across metropolitan
Adelaide Program 13 – Aboriginal Affairs and Reconciliation • Continued to build strong links between Anangu, State and
Commonwealth Governments to improve conditions on the APY Lands and in other communities across the state
• Completed construction of the Central Power Station at Umuwa (Stage 1)
1.9
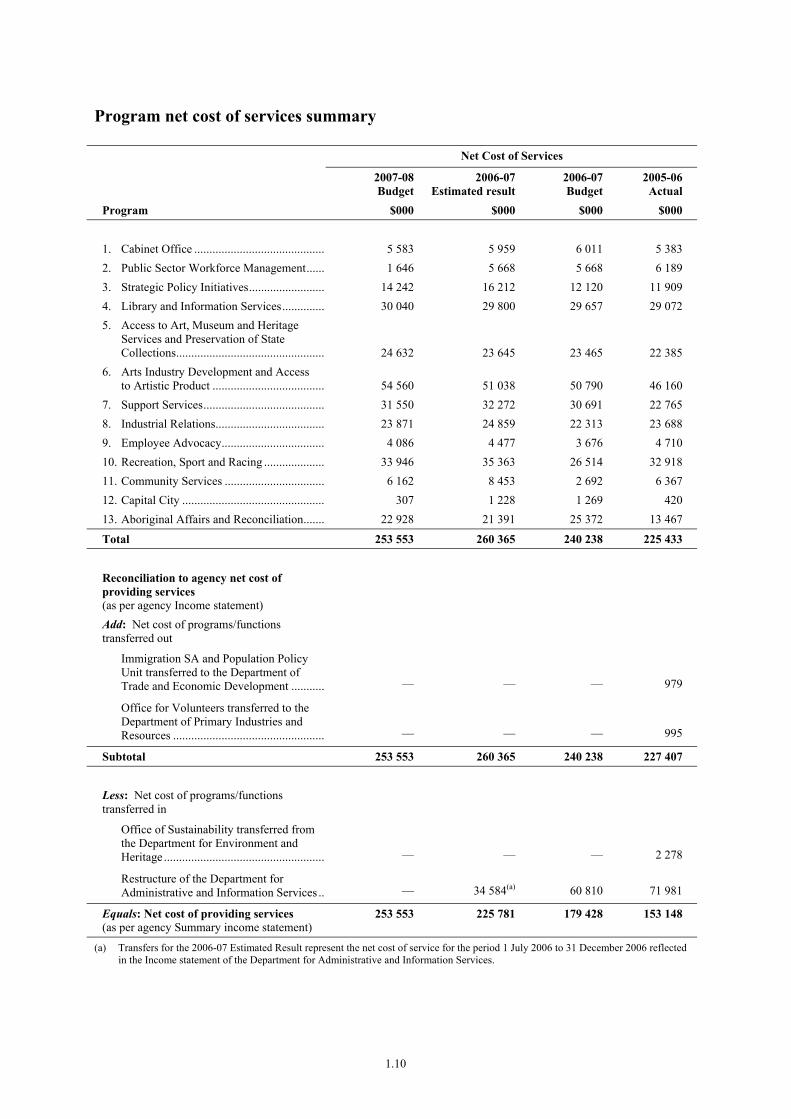
Program net cost of services summary
Net Cost of Services
2007-08Budget
2006-07Estimated result
2006-07 Budget
2005-06 Actual
Program $000 $000 $000 $000 1. Cabinet Office ............................................ 5 583 5 959 6 011 5 383 2. Public Sector Workforce Management....... 1 646 5 668 5 668 6 189 3. Strategic Policy Initiatives.......................... 14 242 16 212 12 120 11 909 4. Library and Information Services............... 30 040 29 800 29 657 29 072 5. Access to Art, Museum and Heritage
Services and Preservation of State Collections.................................................. 24 632 23 645 23 465 22 385
6. Arts Industry Development and Access to Artistic Product ...................................... 54 560 51 038 50 790 46 160
7. Support Services......................................... 31 550 32 272 30 691 22 765 8. Industrial Relations..................................... 23 871 24 859 22 313 23 688 9. Employee Advocacy................................... 4 086 4 477 3 676 4 710 10. Recreation, Sport and Racing ..................... 33 946 35 363 26 514 32 918 11. Community Services .................................. 6 162 8 453 2 692 6 367 12. Capital City ................................................ 307 1 228 1 269 420 13. Aboriginal Affairs and Reconciliation........ 22 928 21 391 25 372 13 467
Total 253 553 260 365 240 238 225 433
Reconciliation to agency net cost of providing services (as per agency Income statement)
Add: Net cost of programs/functions transferred out
Immigration SA and Population Policy Unit transferred to the Department of Trade and Economic Development ............ — — — 979
Office for Volunteers transferred to the Department of Primary Industries and Resources ................................................... — — — 995
Subtotal 253 553 260 365 240 238 227 407 Less: Net cost of programs/functions transferred in
Office of Sustainability transferred from the Department for Environment and Heritage ...................................................... — — — 2 278
Restructure of the Department for Administrative and Information Services ... — 34 584(a) 60 810 71 981
Equals: Net cost of providing services (as per agency Summary income statement)
253 553 225 781 179 428 153 148
(a) Transfers for the 2006-07 Estimated Result represent the net cost of service for the period 1 July 2006 to 31 December 2006 reflected in the Income statement of the Department for Administrative and Information Services.
1.10

Investing payments summary
2007-08Budget
2006-07Estimated result
2006-07 Budget
2005-06 Actual
Investments $000 $000 $000 $000
Works in Progress
Licensing Regime for Ammonium Nitrate in South Australia..................... — 111 — 70 Facilities for State Records................... — — — 50 Lion Arts Centre Upgrade .................... 800 300 300 —
Total Works in Progress 800 411 300 120
Minor Works
SASI Minor Works............................... — — — 209 Critical Public Safety Requirements and Protecting State Collections.................. 370 — — — Upgrade of the AM Ramsay International Rowing Course................ 1 218 — — — Construction of a criterium cycling track at State Sports Park............................... 635 — — —
Cabinet ICT Infrastructure ................... 738 — — — Purchase of Mini Wind Turbines.......... 363 — — — Annual Programs.................................. 2 091 514 1 628 831
Total Minor Works 5 415 514 1 628 1 040 Other Investing Payments
Purchase of land for the safe storage and destruction of explosives ...................... 5 000 — — —
Total Other Investing Payments — — — —
Total Investing Payments 11 215 925 1 928 1 160
Reconciliation to investing payments (as per agency Cash flow statement)
Less: Cost of projects transferred in from the Department for Administrative and Information Services
Facilities for State Records................... — — — 50 Licensing Regime for Ammonium Nitrate in South Australia..................... — — — 70 SASI Minor Work ................................ — — — 209 Annual Programs.................................. — 145(a) 1 512 815
Equals: Total Investing Payments (as per agency Cash flow statement)
11 215 780 416 16
(a) Transfers for the 2006–07 Estimated Result represent the payments for the period 1 July 2006 to 31 December 2006 reflected in the Cash flow statement of the Department for Administrative and Information Services.
1.11
AGENCY: DEPARTMENT OF THE PREMIER AND CABINET
Program Information
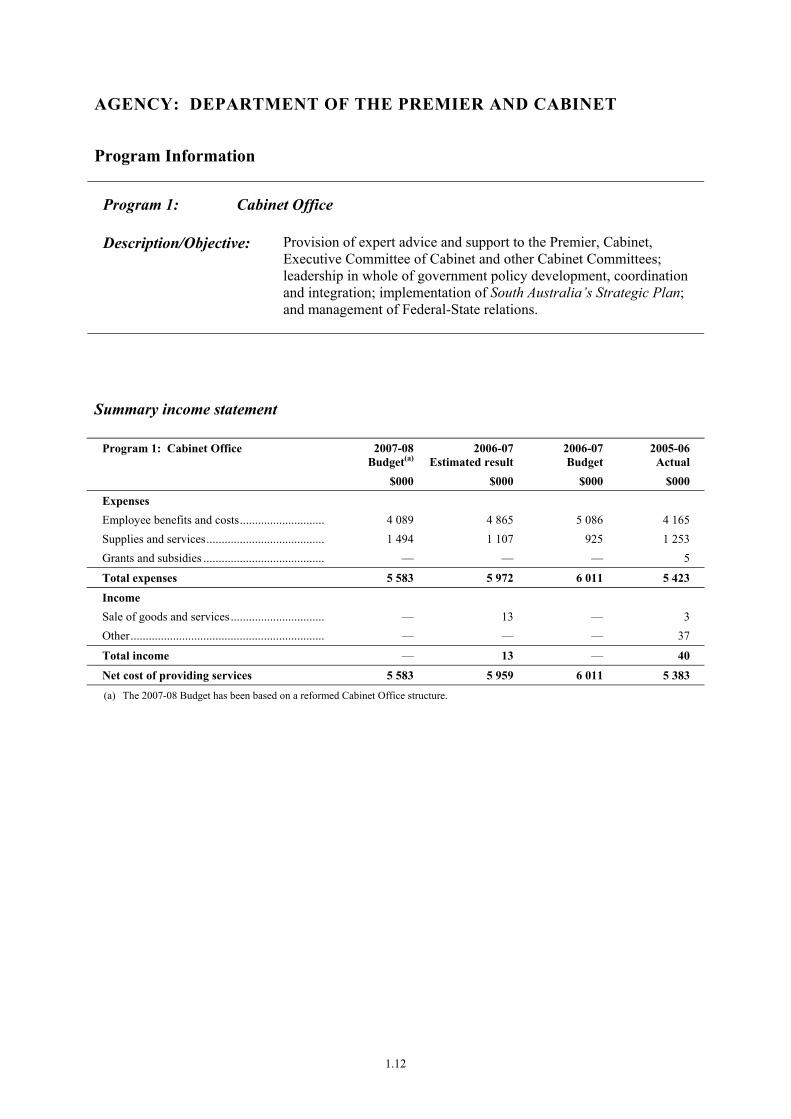
Program 1: Cabinet Office
Description/Objective: Provision of expert advice and support to the Premier, Cabinet, Executive Committee of Cabinet and other Cabinet Committees; leadership in whole of government policy development, coordination and integration; implementation of South Australia’s Strategic Plan; and management of Federal-State relations.
Summary income statement
Program 1: Cabinet Office 2007-08Budget(a)
2006-07Estimated result
2006-07 Budget
2005-06 Actual
$000 $000 $000 $000
Expenses Employee benefits and costs............................. 4 089 4 865 5 086 4 165 Supplies and services........................................ 1 494 1 107 925 1 253 Grants and subsidies ......................................... — — — 5
Total expenses 5 583 5 972 6 011 5 423
Income Sale of goods and services................................ — 13 — 3 Other................................................................. — — — 37
Total income — 13 — 40
Net cost of providing services 5 583 5 959 6 011 5 383 (a) The 2007-08 Budget has been based on a reformed Cabinet Office structure.
1.12

Sub-program information
Sub-program: 1.1 Cabinet Support Services
Provision of high quality secretariat service to Cabinet and Executive Council by ensuring all Cabinet members, the Premier (as Chair) and the Governor have all the necessary information in an accessible format to manage the Cabinet’s or Council’s deliberation. Includes working with other areas of DPC and other agencies to develop proposals for Cabinet consideration.
2007-08 Budget
2006-07 Estimated result
2006-07 Budget
2005-06 Actual
Net cost of sub-program(a) $2 951 000 $2 845 000 $2 903 000 $2 880 000
Performance Commentary In 2006-07, Cabinet Support Services provided consistent and high quality advice to the Premier; supported Cabinet Committee meetings throughout the year and delivered eight whole of government policy learning clusters in topics such as Federal-State relations; policy development and statistics for policy.
In 2007-08, Cabinet Support Services will continue to provide ongoing high quality advice to the Premier and Cabinet Ministers on matters being presented to Cabinet.
Footnotes (a) All indirect costs for this program are included within Program 7 Support Services. This presentation ensures consistency with the
department’s annual financial statements.
1.13
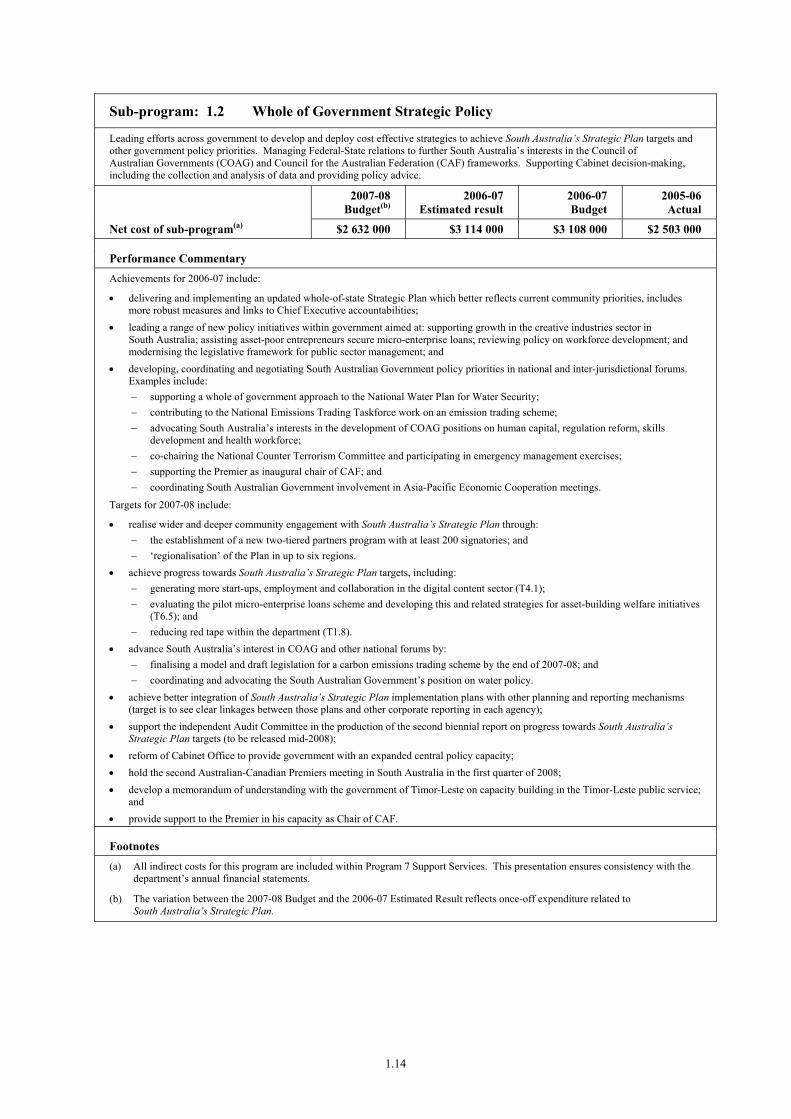
Sub-program: 1.2 Whole of Government Strategic Policy
Leading efforts across government to develop and deploy cost effective strategies to achieve South Australia’s Strategic Plan targets and other government policy priorities. Managing Federal-State relations to further South Australia’s interests in the Council of Australian Governments (COAG) and Council for the Australian Federation (CAF) frameworks. Supporting Cabinet decision-making, including the collection and analysis of data and providing policy advice.
2007-08 Budget(b)
2006-07 Estimated result
2006-07 Budget
2005-06 Actual
Net cost of sub-program(a) $2 632 000 $3 114 000 $3 108 000 $2 503 000
Performance Commentary Achievements for 2006-07 include:
• delivering and implementing an updated whole-of-state Strategic Plan which better reflects current community priorities, includes more robust measures and links to Chief Executive accountabilities;
• leading a range of new policy initiatives within government aimed at: supporting growth in the creative industries sector in South Australia; assisting asset-poor entrepreneurs secure micro-enterprise loans; reviewing policy on workforce development; and modernising the legislative framework for public sector management; and
• developing, coordinating and negotiating South Australian Government policy priorities in national and inter-jurisdictional forums. Examples include: − supporting a whole of government approach to the National Water Plan for Water Security; − contributing to the National Emissions Trading Taskforce work on an emission trading scheme; − advocating South Australia’s interests in the development of COAG positions on human capital, regulation reform, skills
development and health workforce; − co-chairing the National Counter Terrorism Committee and participating in emergency management exercises; − supporting the Premier as inaugural chair of CAF; and − coordinating South Australian Government involvement in Asia-Pacific Economic Cooperation meetings.
Targets for 2007-08 include:
• realise wider and deeper community engagement with South Australia’s Strategic Plan through: − the establishment of a new two-tiered partners program with at least 200 signatories; and − ‘regionalisation’ of the Plan in up to six regions.
• achieve progress towards South Australia’s Strategic Plan targets, including: − generating more start-ups, employment and collaboration in the digital content sector (T4.1); − evaluating the pilot micro-enterprise loans scheme and developing this and related strategies for asset-building welfare initiatives
(T6.5); and − reducing red tape within the department (T1.8).
• advance South Australia’s interest in COAG and other national forums by: − finalising a model and draft legislation for a carbon emissions trading scheme by the end of 2007-08; and − coordinating and advocating the South Australian Government’s position on water policy.
• achieve better integration of South Australia’s Strategic Plan implementation plans with other planning and reporting mechanisms (target is to see clear linkages between those plans and other corporate reporting in each agency);
• support the independent Audit Committee in the production of the second biennial report on progress towards South Australia’s Strategic Plan targets (to be released mid-2008);
• reform of Cabinet Office to provide government with an expanded central policy capacity; • hold the second Australian-Canadian Premiers meeting in South Australia in the first quarter of 2008; • develop a memorandum of understanding with the government of Timor-Leste on capacity building in the Timor-Leste public service;
and • provide support to the Premier in his capacity as Chair of CAF.
Footnotes (a) All indirect costs for this program are included within Program 7 Support Services. This presentation ensures consistency with the
department’s annual financial statements.
(b) The variation between the 2007-08 Budget and the 2006-07 Estimated Result reflects once-off expenditure related to South Australia’s Strategic Plan.
1.14
Program Information
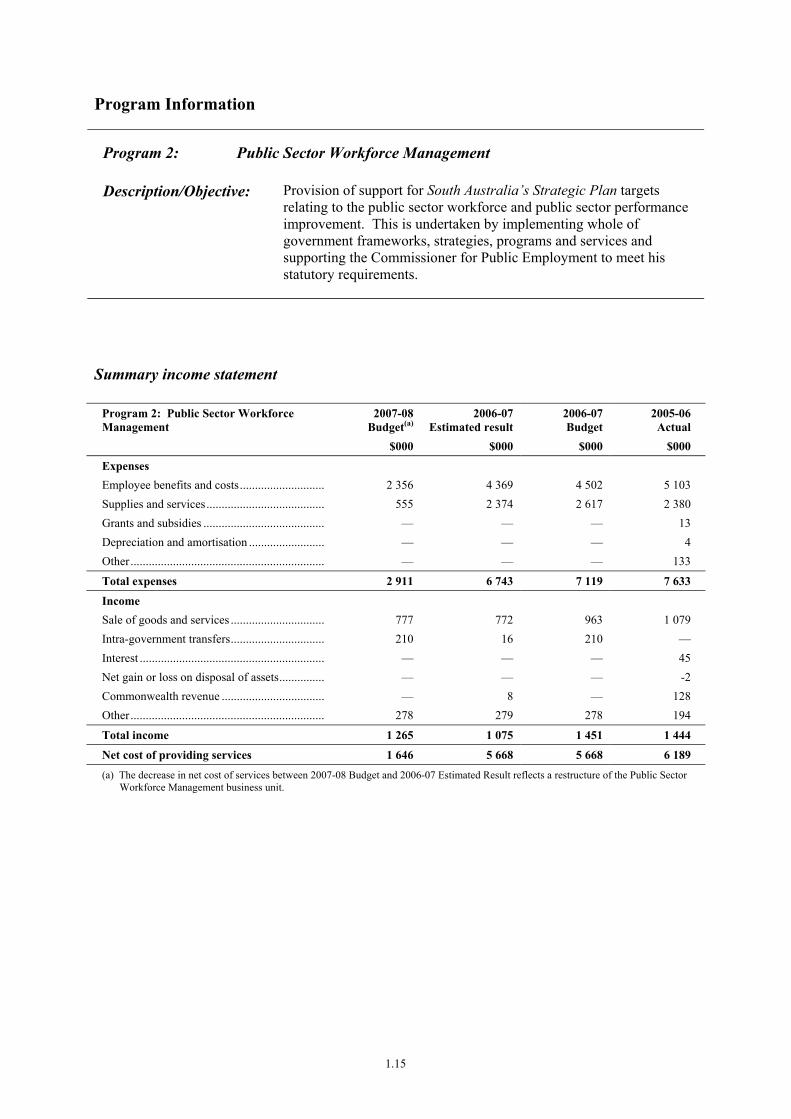
Program 2: Public Sector Workforce Management
Description/Objective: Provision of support for South Australia’s Strategic Plan targets relating to the public sector workforce and public sector performance improvement. This is undertaken by implementing whole of government frameworks, strategies, programs and services and supporting the Commissioner for Public Employment to meet his statutory requirements.
Summary income statement
Program 2: Public Sector Workforce Management
2007-08Budget(a)
2006-07Estimated result
2006-07 Budget
2005-06 Actual
$000 $000 $000 $000
Expenses Employee benefits and costs............................. 2 356 4 369 4 502 5 103 Supplies and services........................................ 555 2 374 2 617 2 380 Grants and subsidies ......................................... — — — 13 Depreciation and amortisation .......................... — — — 4 Other................................................................. — — — 133
Total expenses 2 911 6 743 7 119 7 633
Income Sale of goods and services ................................ 777 772 963 1 079 Intra-government transfers................................ 210 16 210 — Interest .............................................................. — — — 45 Net gain or loss on disposal of assets................ — — — -2 Commonwealth revenue ................................... — 8 — 128 Other................................................................. 278 279 278 194
Total income 1 265 1 075 1 451 1 444
Net cost of providing services 1 646 5 668 5 668 6 189 (a) The decrease in net cost of services between 2007-08 Budget and 2006-07 Estimated Result reflects a restructure of the Public Sector
Workforce Management business unit.
1.15

Program performance information
Program: 2 Public Sector Workforce Management
2007-08 Budget
2006-07 Estimated result
2006-07 Budget
2005-06 Actual
Net cost of program(a) $1 646 000(b) $5 668 000 $5 668 000 $6 189 000
Performance Commentary Public Sector Workforce Management was established following the structural reform of government announced in the 2006-07 State Budget. A range of initiatives and programs were implemented to support the South Australian public sector workforce including:
• building professional networks for under 35 year olds across the public sector through the Oxygen website; • delivering the State of the Service report; • undertaking a Workplace Perspectives Survey for Public Sector Management Act employees; • releasing the Women in Leadership Report, the Graduate Employer of Choice survey and the Building HR Capability Kit; • improving future leadership and management capability through graduate development program and the Public Sector Management
program; • reducing the average length of the graduate recruitment process by implementing an enhanced graduate recruitment database; and • supporting agencies in their implementation of the Indigenous Employment Strategy.
In 2007-08, significant targets include:
• supporting the achievement of South Australia’s Strategic Plan Targets 1.7 ‘Satisfaction with Government Services’ and Target 6.23 ‘Increasing the Percentage of Women at Executive Level’;
• establishing the South Australian Executive Service; • coordinating the Premier’s Awards; and • implementing customer service strategies and supporting the Commissioner for Public Employment statutory responsibilities,
including monitoring, evaluating and reporting of the South Australian public service.
Footnotes (a) All indirect costs for this program are included within Program 7 Support Services. This presentation ensures consistency with the
department’s annual financial statements.
(b) The 2007-08 Budget reflects the restructure of the Public Sector Workforce Management administrative unit. This restructure was announced in the 2006-07 Budget as part of the structural changes to government.
1.16

Program Information
Program 3: Strategic Policy Initiatives
Description/Objective: Provision of high-level support for strategic policy initiatives of the government.
Summary income statement
Program 3: Strategic Policy Initiatives 2007-08Budget
2006-07Estimated result
2006-07 Budget
2005-06 Actual
$000 $000 $000 $000
Expenses Employee benefits and costs............................. 5 720 5 573 5 604 4 934 Supplies and services........................................ 5 050 3 587 4 951 6 128 Grants and subsidies ......................................... 3 692 4 667 1 810 2 259 Other................................................................. — 4 317 — 7
Total expenses 14 462 18 144 12 365 13 328
Income Sale of goods and services................................ — — — 79 Intra-government transfers................................ — 999 — 42 Commonwealth revenue ................................... — 380 — — Other................................................................. 220 553 245 1 298
Total income 220 1 932 245 1 419
Net cost of providing services 14 242 16 212 12 120 11 909
1.17

Sub-program information
Sub-program: 3.1 Social Inclusion
Provision of high level support and policy advice to the Commissioner for Social Inclusion and the Social Inclusion Board. Includes research, coordination and analysis of initiatives and solutions to counter social issues that exclude sections of the community.
2007-08 Budget
2006-07 Estimated result
2006-07 Budget
2005-06 Actual
Net cost of sub-program(a) $4 625 000 $3 882 000 $3 919 000 $3 247 000
Performance Commentary In 2006-07 the Social Inclusion Unit supported the continuing implementation of action plans to reduce homelessness, increase school retention and address suicide in country South Australia. School retention rates continued to improve and people who have experienced long term homelessness have been housed and are successfully maintaining their tenancies. Activity also included monitoring two Social Inclusion programs established in 2005-06: the South Australian Indigenous Sports Training academy; and the Breaking the Cycle program, which seeks to reduce chronic youth offending. Finalisation of extensive research and consultation on ways to improve service delivery systems in mental health supported the delivery of the Social Inclusion Board’s mental health report Stepping Up. Work continued on identifying ways to assist young people with disabilities to better connect with learning and employment opportunities post secondary school. The Commissioner for Social Inclusion was supported in preparing a report on consultations regarding serious repeat young offenders.
In 2007-08, work will continue on identifying ways to assist young people with disabilities to better connect with learning and employment opportunities post secondary school. Monitoring the implementation of mental health reform will also be a focus.
Footnotes (a) All indirect costs for this program are included within Program 7 Support Services. This presentation ensures consistency with the
department’s annual financial statements.
1.18
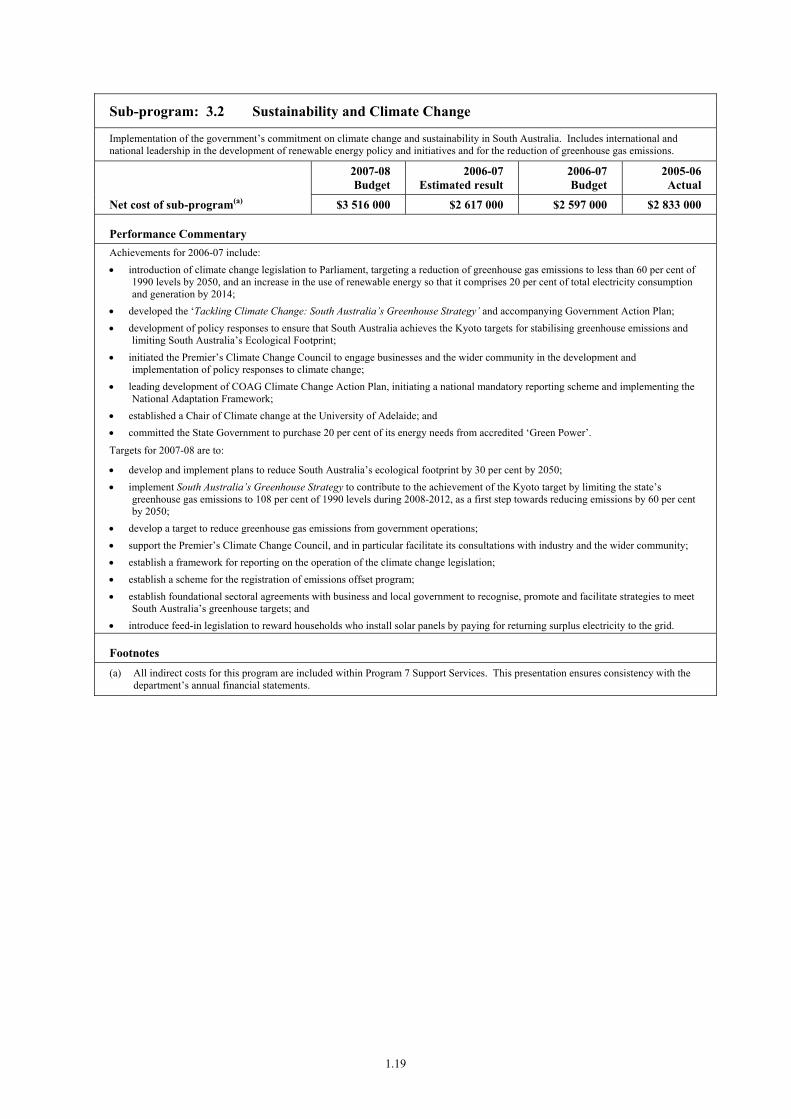
Sub-program: 3.2 Sustainability and Climate Change
Implementation of the government’s commitment on climate change and sustainability in South Australia. Includes international and national leadership in the development of renewable energy policy and initiatives and for the reduction of greenhouse gas emissions.
2007-08 Budget
2006-07 Estimated result
2006-07 Budget
2005-06 Actual
Net cost of sub-program(a) $3 516 000 $2 617 000 $2 597 000 $2 833 000
Performance Commentary Achievements for 2006-07 include: • introduction of climate change legislation to Parliament, targeting a reduction of greenhouse gas emissions to less than 60 per cent of
1990 levels by 2050, and an increase in the use of renewable energy so that it comprises 20 per cent of total electricity consumption and generation by 2014;
• developed the ‘Tackling Climate Change: South Australia’s Greenhouse Strategy’ and accompanying Government Action Plan; • development of policy responses to ensure that South Australia achieves the Kyoto targets for stabilising greenhouse emissions and
limiting South Australia’s Ecological Footprint; • initiated the Premier’s Climate Change Council to engage businesses and the wider community in the development and
implementation of policy responses to climate change; • leading development of COAG Climate Change Action Plan, initiating a national mandatory reporting scheme and implementing the
National Adaptation Framework; • established a Chair of Climate change at the University of Adelaide; and • committed the State Government to purchase 20 per cent of its energy needs from accredited ‘Green Power’.
Targets for 2007-08 are to:
• develop and implement plans to reduce South Australia’s ecological footprint by 30 per cent by 2050; • implement South Australia’s Greenhouse Strategy to contribute to the achievement of the Kyoto target by limiting the state’s
greenhouse gas emissions to 108 per cent of 1990 levels during 2008-2012, as a first step towards reducing emissions by 60 per cent by 2050;
• develop a target to reduce greenhouse gas emissions from government operations; • support the Premier’s Climate Change Council, and in particular facilitate its consultations with industry and the wider community; • establish a framework for reporting on the operation of the climate change legislation; • establish a scheme for the registration of emissions offset program; • establish foundational sectoral agreements with business and local government to recognise, promote and facilitate strategies to meet
South Australia’s greenhouse targets; and • introduce feed-in legislation to reward households who install solar panels by paying for returning surplus electricity to the grid.
Footnotes (a) All indirect costs for this program are included within Program 7 Support Services. This presentation ensures consistency with the
department’s annual financial statements.
1.19
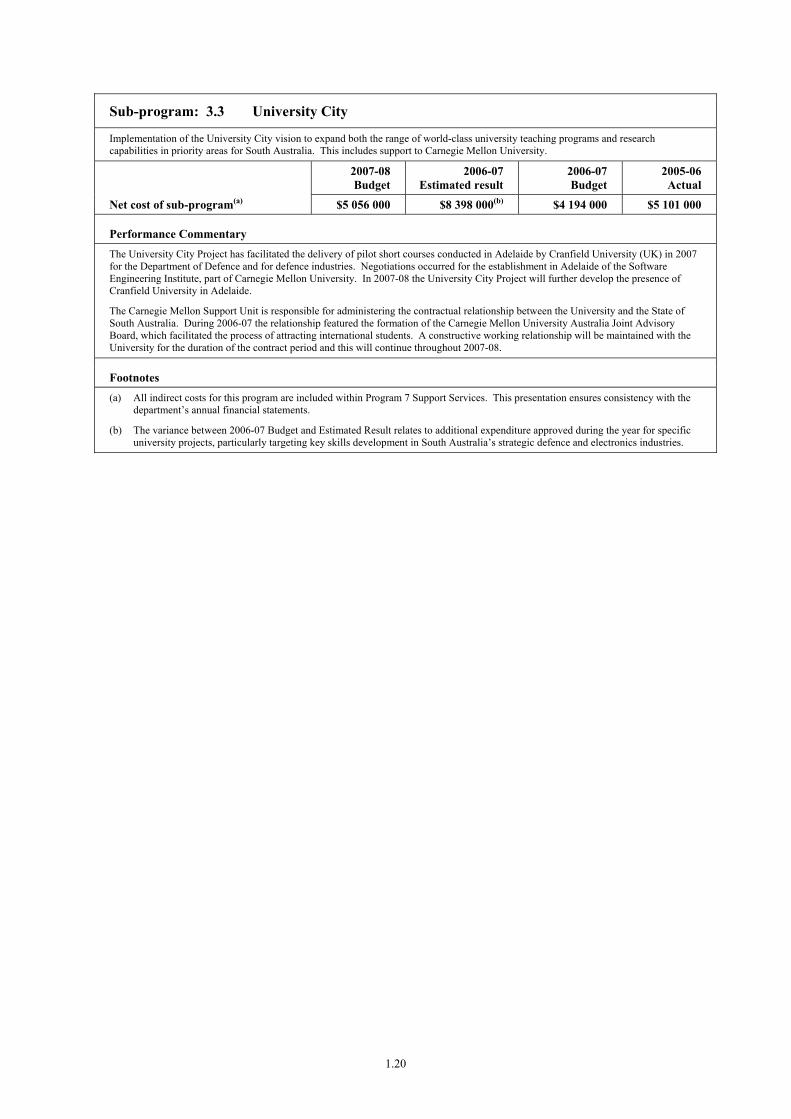
Sub-program: 3.3 University City
Implementation of the University City vision to expand both the range of world-class university teaching programs and research capabilities in priority areas for South Australia. This includes support to Carnegie Mellon University.
2007-08 Budget
2006-07 Estimated result
2006-07 Budget
2005-06 Actual
Net cost of sub-program(a) $5 056 000 $8 398 000(b) $4 194 000 $5 101 000
Performance Commentary The University City Project has facilitated the delivery of pilot short courses conducted in Adelaide by Cranfield University (UK) in 2007 for the Department of Defence and for defence industries. Negotiations occurred for the establishment in Adelaide of the Software Engineering Institute, part of Carnegie Mellon University. In 2007-08 the University City Project will further develop the presence of Cranfield University in Adelaide.
The Carnegie Mellon Support Unit is responsible for administering the contractual relationship between the University and the State of South Australia. During 2006-07 the relationship featured the formation of the Carnegie Mellon University Australia Joint Advisory Board, which facilitated the process of attracting international students. A constructive working relationship will be maintained with the University for the duration of the contract period and this will continue throughout 2007-08.
Footnotes (a) All indirect costs for this program are included within Program 7 Support Services. This presentation ensures consistency with the
department’s annual financial statements.
(b) The variance between 2006-07 Budget and Estimated Result relates to additional expenditure approved during the year for specific university projects, particularly targeting key skills development in South Australia’s strategic defence and electronics industries.
1.20

Sub-program: 3.4 Policy Initiatives
Implementation of the Adelaide Thinkers in Residence (ATIR) program, which brings world leading Thinkers to live and work in South Australia to assist in the development and promotion of the arts, science, social policy, sustainability and economic development in South Australia.
Implementation of the Bragg Initiative, which coordinates projects to increase awareness and understanding of science in South Australia.
2007-08 Budget
2006-07 Estimated result
2006-07 Budget
2005-06 Actual
Net cost of sub-program(a) $1 045 000 $1 315 000 $1 410 000 $728 000
Performance Commentary In 2006-07, the ATIR program coordinated five residencies (three completed and two commenced):
• Rosanne Haggerty addressed Housing the Homeless and established the Common Ground Adelaide Steering Group, managed by South Australian Business leaders. This group announced the redevelopment of a landmark building on Light Square to provide 60 long-term units for the homeless and low-income earners;
• Professor Stephen Schneider provided expert advice on the development of Climate Change legislation and the finalisation and implementation of the draft greenhouse strategy;
• Professor Ilona Kickbusch completed the first visit in her residency addressing Healthy Societies and strengthened the program’s reach to local government, involving Onkaparinga and Marion Councils as partners. Professor Kickbusch produced an interim report, stimulating and guiding strategic development in the state;
• Dr Fraser Mustard is currently finalising his report on Early Childhood Development; and • Dr Geoff Mulgan commenced his residency addressing social innovation, as a means to ‘meet unmet needs’, which incorporates
support for the work of the Social Inclusion Unit and South Australia’s Strategic Plan.
Legacies of the program were strengthened by attaching Project Catalyst positions to each residency, providing opportunities for mentoring and professional development for local personnel. The engagement of youth in the program was extended through the development of Youth Policy Action Teams, developed with the Office for Youth, providing young professionals with a development opportunity and bringing a youth perspective to policy issues within residencies.
In 2006-07 the Bragg Initiative successfully ran the Science Outside the Square program for over 4600 registrations for 14 events. 10 Spirit of Science Scholarships were awarded to students to travel to the Royal Institution of Great Britain in December 2006.
In 2007-08 Dr Geoff Mulgan will complete his residency and report. It is anticipated that three further residencies will take place during the year. ATIR aims to locate a residency within a country district as a support to the regionalisation of South Australia’s Strategic Plan and will strengthen links between the Thinkers and the Aboriginal Young Professional Future Leadership Group.
In 2007-08 the Bragg Initiative targets include establishing the first international branch of the Royal Institution of Great Britain, which will operate as the coordinating body for many of the Bragg projects.
Footnotes (a) All indirect costs for this program are included within Program 7 Support Services. This presentation ensures consistency with the
department’s annual financial statements.
1.21
Program Information
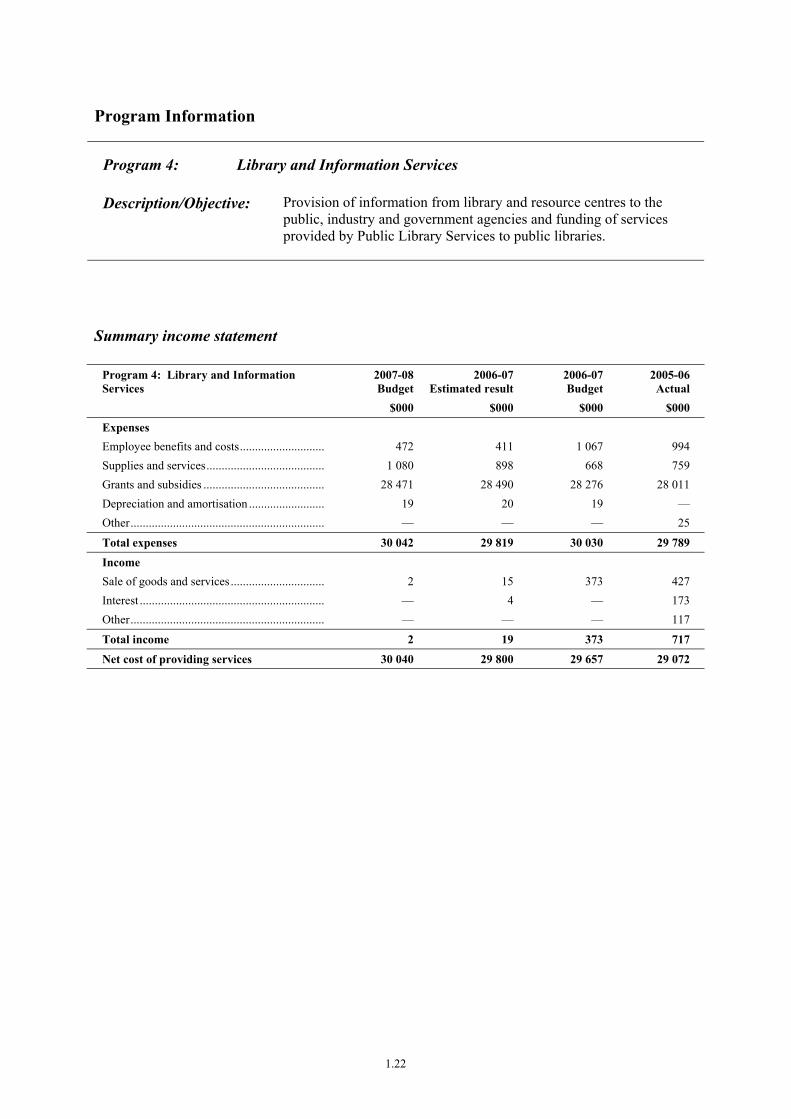
Program 4: Library and Information Services
Description/Objective: Provision of information from library and resource centres to the public, industry and government agencies and funding of services provided by Public Library Services to public libraries.
Summary income statement
Program 4: Library and Information Services
2007-08Budget
2006-07Estimated result
2006-07 Budget
2005-06 Actual
$000 $000 $000 $000
Expenses Employee benefits and costs............................. 472 411 1 067 994 Supplies and services........................................ 1 080 898 668 759 Grants and subsidies ......................................... 28 471 28 490 28 276 28 011 Depreciation and amortisation .......................... 19 20 19 — Other................................................................. — — — 25
Total expenses 30 042 29 819 30 030 29 789
Income Sale of goods and services................................ 2 15 373 427 Interest .............................................................. — 4 — 173 Other................................................................. — — — 117
Total income 2 19 373 717
Net cost of providing services 30 040 29 800 29 657 29 072
1.22

Sub-program information
Sub-program: 4.1 State Library and Statewide Information Services
To provide information to the public, industry and government agencies.
2007-08 Budget
2006-07 Estimated result
2006-07 Budget
2005-06 Actual
Net cost of sub-program $13 346 000 $13 490 000 $13 393 000 $12 865 000
Performance Commentary The State Library of South Australia, Community Information Strategies Australia and the Disability Information Resource Centre provide a range of information services across the state. Some key performance indicators for the State Library of South Australia are listed below.
Performance Indicators 2007-08 Target
2006-07 Estimated result
2006-07 Target
2005-06 Actual
No. of State Library visitors 1.100m 1.144m(a) 1.100m 1.081m
No. of State Library website visitors 2.0m 1.8m n.a. 1.26m
% of library reference enquiries resolved within customer agreed timeline
99% 100% 99% 100%
Amount of external revenue received and % this represents of total revenue
• State Library of South Australia $1.120m (8.7%)
$1.350m(b)
(10.5%) $1.100m
(8.3%) $1.978m (14.1%)
Footnotes (a) Once-off increase of 44 000 visitors in 2006-07 due to attendances at the National Treasures Exhibition 25 January to
25 March 2007.
(b) Estimated Result for 2006-07 includes a $250 000 donation from the State Library Foundation.
Sub-program: 4.2 Support to Public Libraries and Community Information Services
Services provided by Public Library Services to public libraries.
2007-08 Budget
2006-07 Estimated result
2006-07 Budget
2005-06 Actual
Net cost of sub-program $16 694 000 $16 310 000 $16 264 000 $16 207 000
Performance Commentary Public Library Services are funded to provide a range of services to public libraries across the state. Some key performance indicators for these services are listed below.
Performance Indicators 2007-08 Target
2006-07 Estimated result
2006-07 Target
2005-06 Actual
No. of items purchased and catalogued 258 000 257 850 256 086 246 805
% of help desk enquiries resolved or passed to Telstra Support on the first ‘call’
97% 95% 97% 95%
Average time taken to resolve help desk enquiries
25 minutes 30 minutes 24 minutes 26 minutes
1.23

Program Information
Program 5: Access to Art, Museum and Heritage Services and Preservation of State Collections
Description/Objective: Provision of museum, visual arts and preservation services that enable the State’s cultural, heritage and arts assets to be maintained and kept accessible to the community.
Summary income statement
Program 5: Access to Art, Museum and Heritage Services and Preservation of State Collections
2007-08Budget
2006-07Estimated result
2006-07 Budget
2005-06 Actual
$000 $000 $000 $000
Expenses Employee benefits and costs............................. 2 780 2 609 3 770 3 588 Supplies and services........................................ 2 170 1 940 1 609 1 765 Grants and subsidies ......................................... 20 390 20 276 19 917 19 119 Depreciation and amortisation .......................... 35 35 35 5 Other................................................................. — — — 147
Total expenses 25 375 24 860 25 331 24 624
Income Sale of goods and services................................ 743 804 1 466 1 744 Interest .............................................................. — 7 — 311 Intra-government transfer ................................. — 404 400 — Commonwealth revenue ................................... — — — 10 Other................................................................. — — — 174
Total income 743 1 215 1 866 2 239
Net cost of providing services 24 632 23 645 23 465 22 385
1.24
Program performance information
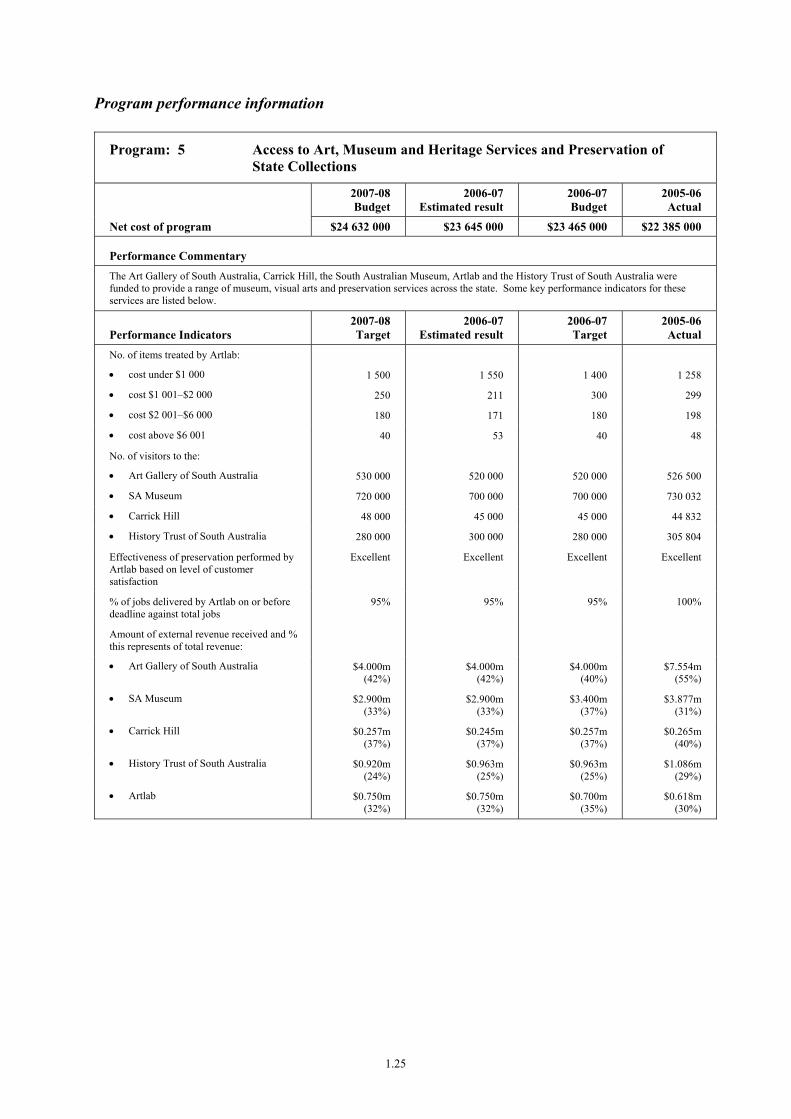
Program: 5 Access to Art, Museum and Heritage Services and Preservation of State Collections
2007-08 Budget
2006-07 Estimated result
2006-07 Budget
2005-06 Actual
Net cost of program $24 632 000 $23 645 000 $23 465 000 $22 385 000
Performance Commentary The Art Gallery of South Australia, Carrick Hill, the South Australian Museum, Artlab and the History Trust of South Australia were funded to provide a range of museum, visual arts and preservation services across the state. Some key performance indicators for these services are listed below.
Performance Indicators 2007-08 Target
2006-07 Estimated result
2006-07 Target
2005-06 Actual
No. of items treated by Artlab:
• cost under $1 000 1 500 1 550 1 400 1 258
• cost $1 001–$2 000 250 211 300 299
• cost $2 001–$6 000 180 171 180 198
• cost above $6 001 40 53 40 48
No. of visitors to the:
• Art Gallery of South Australia 530 000 520 000 520 000 526 500
• SA Museum 720 000 700 000 700 000 730 032
• Carrick Hill 48 000 45 000 45 000 44 832
• History Trust of South Australia 280 000 300 000 280 000 305 804
Effectiveness of preservation performed by Artlab based on level of customer satisfaction
Excellent Excellent Excellent Excellent
% of jobs delivered by Artlab on or before deadline against total jobs
95% 95% 95% 100%
Amount of external revenue received and % this represents of total revenue:
• Art Gallery of South Australia $4.000m (42%)
$4.000m (42%)
$4.000m (40%)
$7.554m (55%)
• SA Museum $2.900m (33%)
$2.900m (33%)
$3.400m (37%)
$3.877m (31%)
• Carrick Hill $0.257m (37%)
$0.245m (37%)
$0.257m (37%)
$0.265m (40%)
• History Trust of South Australia $0.920m (24%)
$0.963m (25%)
$0.963m (25%)
$1.086m (29%)
• Artlab $0.750m (32%)
$0.750m (32%)
$0.700m (35%)
$0.618m (30%)
1.25
Program Information
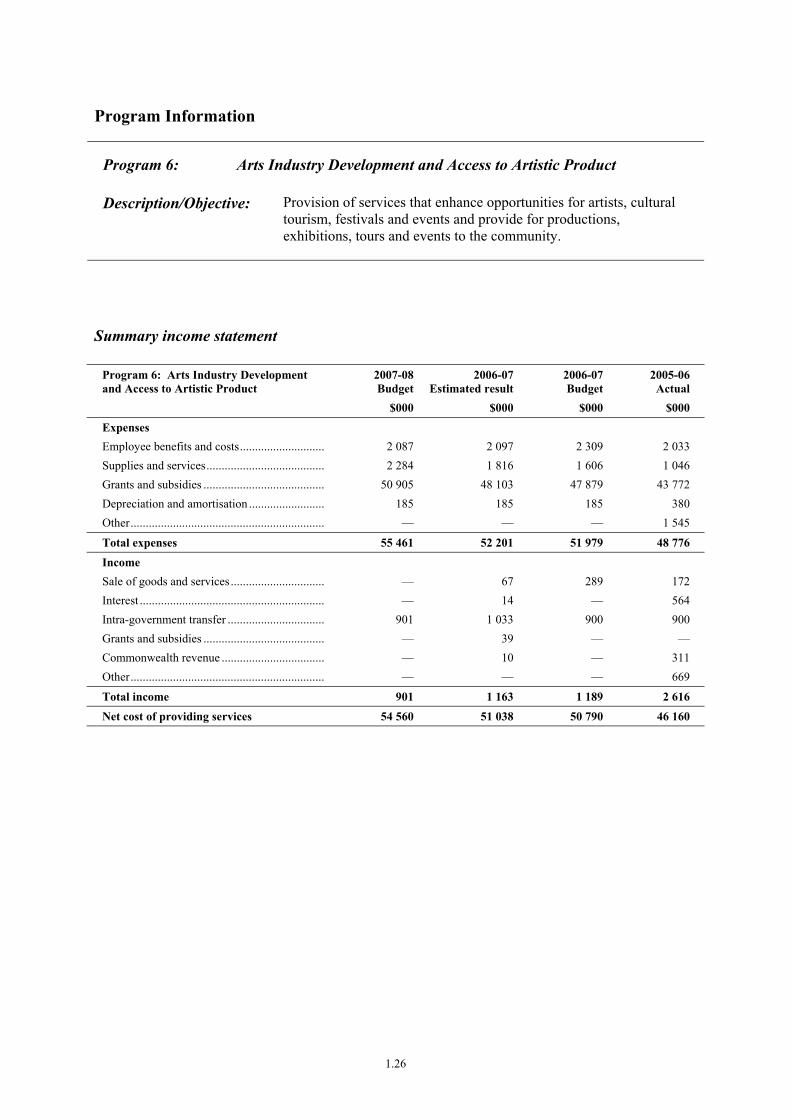
Program 6: Arts Industry Development and Access to Artistic Product
Description/Objective: Provision of services that enhance opportunities for artists, cultural tourism, festivals and events and provide for productions, exhibitions, tours and events to the community.
Summary income statement
Program 6: Arts Industry Development and Access to Artistic Product
2007-08Budget
2006-07Estimated result
2006-07 Budget
2005-06 Actual
$000 $000 $000 $000
Expenses Employee benefits and costs............................. 2 087 2 097 2 309 2 033 Supplies and services........................................ 2 284 1 816 1 606 1 046 Grants and subsidies ......................................... 50 905 48 103 47 879 43 772 Depreciation and amortisation .......................... 185 185 185 380 Other................................................................. — — — 1 545
Total expenses 55 461 52 201 51 979 48 776
Income Sale of goods and services................................ — 67 289 172 Interest .............................................................. — 14 — 564 Intra-government transfer ................................. 901 1 033 900 900 Grants and subsidies ......................................... — 39 — — Commonwealth revenue ................................... — 10 — 311 Other................................................................. — — — 669
Total income 901 1 163 1 189 2 616
Net cost of providing services 54 560 51 038 50 790 46 160
1.26
Program performance information
Program: 6 Arts Industry Development and Access to Artistic Product
2007-08 Budget
2006-07 Estimated result
2006-07 Budget
2005-06 Actual
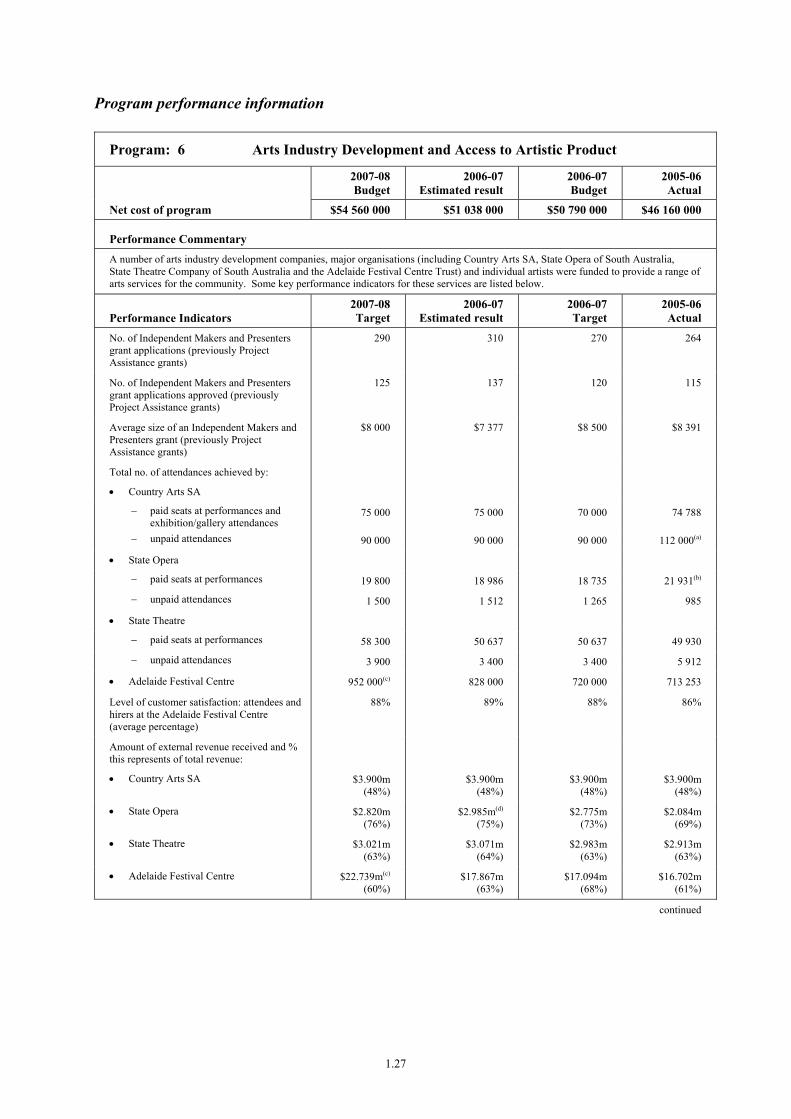
Net cost of program $54 560 000 $51 038 000 $50 790 000 $46 160 000
Performance Commentary A number of arts industry development companies, major organisations (including Country Arts SA, State Opera of South Australia, State Theatre Company of South Australia and the Adelaide Festival Centre Trust) and individual artists were funded to provide a range of arts services for the community. Some key performance indicators for these services are listed below.
Performance Indicators 2007-08 Target
2006-07 Estimated result
2006-07 Target
2005-06 Actual
No. of Independent Makers and Presenters grant applications (previously Project Assistance grants)
290 310 270 264
No. of Independent Makers and Presenters grant applications approved (previously Project Assistance grants)
125 137 120 115
Average size of an Independent Makers and Presenters grant (previously Project Assistance grants)
$8 000 $7 377 $8 500 $8 391
Total no. of attendances achieved by:
• Country Arts SA
− paid seats at performances and exhibition/gallery attendances
75 000 75 000 70 000 74 788
− unpaid attendances 90 000 90 000 90 000 112 000(a)
• State Opera
− paid seats at performances 19 800 18 986 18 735 21 931(b)
− unpaid attendances 1 500 1 512 1 265 985
• State Theatre
− paid seats at performances 58 300 50 637 50 637 49 930
− unpaid attendances 3 900 3 400 3 400 5 912
• Adelaide Festival Centre 952 000(c) 828 000 720 000 713 253
Level of customer satisfaction: attendees and hirers at the Adelaide Festival Centre (average percentage)
88% 89% 88% 86%
Amount of external revenue received and % this represents of total revenue:
• Country Arts SA $3.900m (48%)
$3.900m (48%)
$3.900m (48%)
$3.900m (48%)
• State Opera $2.820m (76%)
$2.985m(d)
(75%) $2.775m
(73%) $2.084m
(69%)
• State Theatre $3.021m (63%)
$3.071m (64%)
$2.983m (63%)
$2.913m (63%)
• Adelaide Festival Centre $22.739m(c)
(60%) $17.867m
(63%) $17.094m
(68%) $16.702m
(61%)
continued
1.27
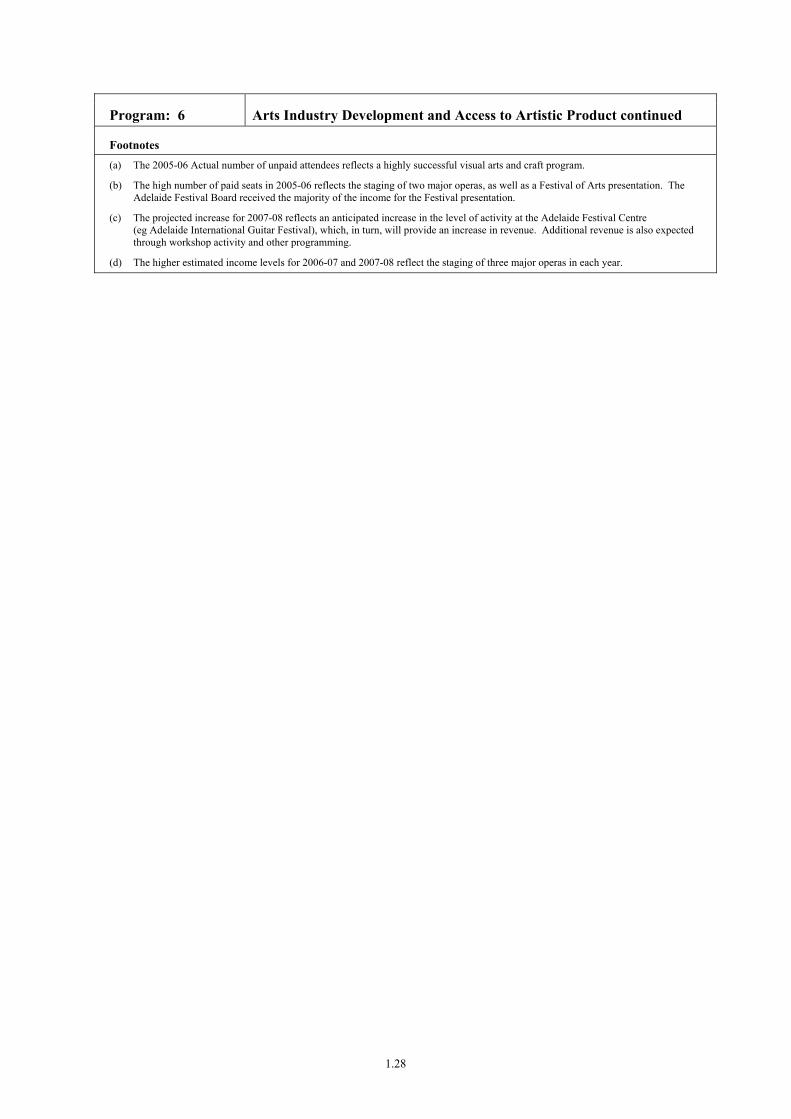
Program: 6 Arts Industry Development and Access to Artistic Product continued
Footnotes (a) The 2005-06 Actual number of unpaid attendees reflects a highly successful visual arts and craft program.
(b) The high number of paid seats in 2005-06 reflects the staging of two major operas, as well as a Festival of Arts presentation. The Adelaide Festival Board received the majority of the income for the Festival presentation.
(c) The projected increase for 2007-08 reflects an anticipated increase in the level of activity at the Adelaide Festival Centre (eg Adelaide International Guitar Festival), which, in turn, will provide an increase in revenue. Additional revenue is also expected through workshop activity and other programming.
(d) The higher estimated income levels for 2006-07 and 2007-08 reflect the staging of three major operas in each year.
1.28
Program Information
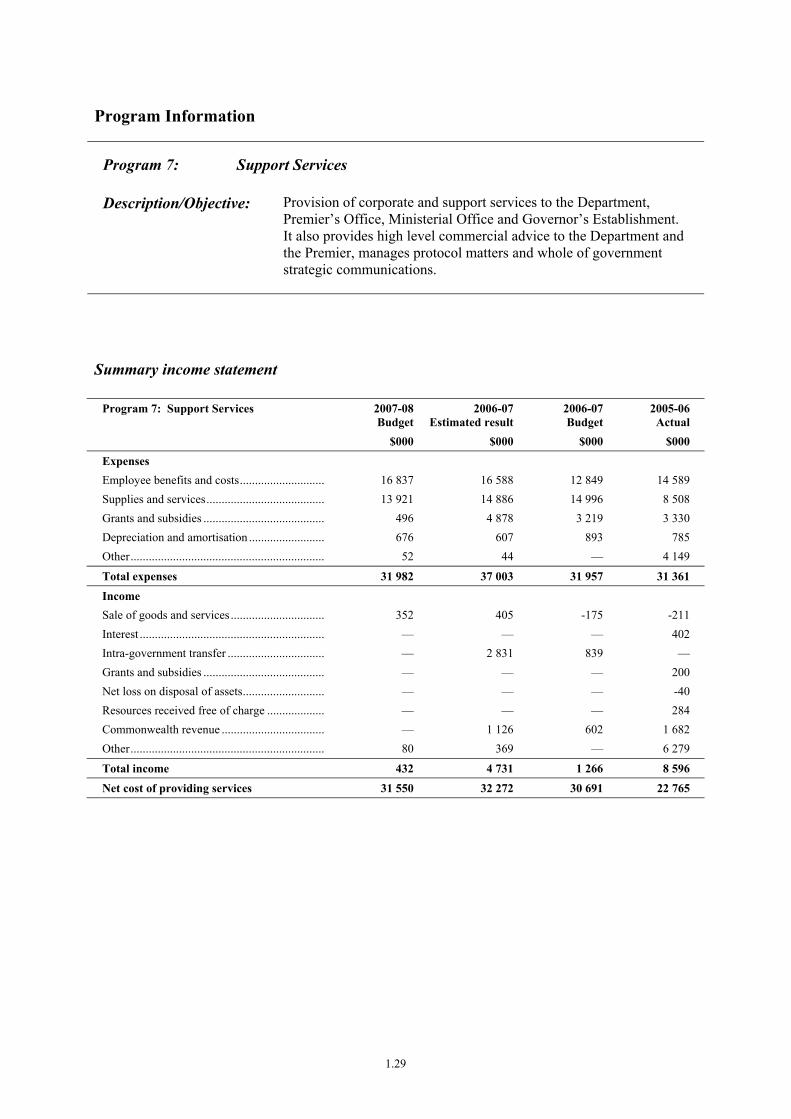
Program 7: Support Services
Description/Objective: Provision of corporate and support services to the Department, Premier’s Office, Ministerial Office and Governor’s Establishment. It also provides high level commercial advice to the Department and the Premier, manages protocol matters and whole of government strategic communications.
Summary income statement
Program 7: Support Services 2007-08Budget
2006-07Estimated result
2006-07 Budget
2005-06 Actual
$000 $000 $000 $000
Expenses Employee benefits and costs............................. 16 837 16 588 12 849 14 589 Supplies and services........................................ 13 921 14 886 14 996 8 508 Grants and subsidies ......................................... 496 4 878 3 219 3 330 Depreciation and amortisation .......................... 676 607 893 785 Other................................................................. 52 44 — 4 149
Total expenses 31 982 37 003 31 957 31 361
Income Sale of goods and services................................ 352 405 -175 -211 Interest .............................................................. — — — 402 Intra-government transfer ................................. — 2 831 839 — Grants and subsidies ......................................... — — — 200 Net loss on disposal of assets............................ — — — -40 Resources received free of charge .................... — — — 284 Commonwealth revenue ................................... — 1 126 602 1 682 Other................................................................. 80 369 — 6 279
Total income 432 4 731 1 266 8 596
Net cost of providing services 31 550 32 272 30 691 22 765
1.29

Program performance information
Program: 7 Support Services
2007-08 Budget
2006-07 Estimated result
2006-07 Budget
2005-06 Actual
Net cost of program(a) $31 550 000 $32 272 000 $30 691 000 $22 765 000
Performance Commentary Achievements for 2006-07 include the development of an Aboriginal Employment Plan that provides for coordinated and sustained Aboriginal employment to ensure that the department meets South Australia’s Strategic Plan Target 6.24 and a core competency training program that identifies core training needs for all employees.
In addition to the development and monitoring of the DPC Corporate Plan, this program is responsible for the department’s efforts in meeting government targets for disability, sustainability and reconciliation.
The department continued to lead negotiations between the state and BHP Billiton regarding the Roxby Downs Indenture.
A Project Management Framework was developed and implemented the across the department, including training over 140 employees.
The creation of the Premier’s Communication Advisory Group was coordinated, including the establishment of the terms of reference and operational procedures. This group has ensured strong coordination of government advertising and promotion activities by all entities.
Activities for 2007-08 will include the development of action plans to ensure DPC contributes to whole of government South Australia’s Strategic Plan targets, implementation of an Aboriginal Mentor Program and an Aboriginal Support Network to support indigenous workers in the department, conducting cultural awareness workshops to enhance DPC as a culturally inclusive organisation, and implementing a departmental workplace wellbeing strategy that will support improvements in work-life balance.
The department will coordinate significant protocol events including the change over of Governor and the visit of His Royal Highness the Duke of Kent.
Footnotes (a) Not all indirect costs are included in this program. A portion of Program 7 and all of Program 8 to Program 11 contain indirect costs
which transferred to the Department of the Premier and Cabinet on 1 January 2007.
1.30

Program Information
Program 8: Industrial Relations
Description/Objective: Provision of workplace industrial relations, safety advisory and regulatory services to the general community and the public sector.
Summary income statement
Program 8: Industrial Relations 2007-08Budget(a)
2006-07Estimated result(b)
2006-07 Budget(c)
2005-06 Actual(d)
$000 $000 $000 $000
Expenses Employee benefits and costs............................. 25 950 28 392 24 016 24 490 Supplies and services........................................ 15 421 14 042 6 349 6 851 Grants and subsidies ......................................... 1 817 2 749 573 369 Depreciation and amortisation .......................... — — — 182 Other................................................................. 1 808 1 242 — 34
Total expenses 44 996 46 425 30 938 31 926
Income Sale of goods and services................................ 7 294 2 209 — 214 Fees, fines and penalties ................................... 8 667 14 629 8 625 8 023 Other................................................................. 5 164 4 728 — 1
Total income 21 125 21 566 8 625 8 238
Net cost of providing services 23 871 24 859 22 313 23 688
(a) The 2007-08 Budget has been based on an allocation from the transfer of business functions from the Department for Administrative and Information Services (DAIS).
(b) The 2006-07 Estimated Result is based on an allocation from the transfer of business functions from DAIS. (c) The 2006-07 Budget reflects the realignment of the original DAIS budget for business functions transferred to DPC. (d) The 2005-06 Actuals have been adjusted to take into consideration inter-agency eliminations between transferred DAIS business
functions.
1.31

Sub-program information
Sub-program: 8.1 SafeWork SA
Provision of a range of services including information, education, assistance, compliance and enforcement activities through SafeWork SA to promote and encourage, safe, fair, productive workplaces and high standards of public safety for all South Australians.
2007-08 Budget
2006-07 Estimated result
2006-07 Budget
2005-06 Actual
Net cost of sub-program $17 382 000 $16 944 000 $14 999 000 $16 669 000
Performance Commentary SafeWork SA was launched in 2005-06 as the single agency in South Australia to manage occupational health safety and welfare (OHSW). SafeWork SA strategic plans include South Australia’s Strategic Plan Targets 1.4 ‘Industrial Relations’, 2.11 ‘Greater Safety at Work’, and 2.12 ‘Work Life Balance’. SafeWork SA continues towards the achievement of those targets through all programs.
Performance Indicators 2007-08 Target
2006-07 Estimated result
2006-07 Target
2005-06 Actual
No. of OHSW workplace inspections/visits 21 000 21 000 21 000 18 908
No. of OHSW investigations finalised 2 100 2 100 2 100 2 063
No. of industrial relations investigations finalised
1 100 1 100 1 100 1 213
% of advisory service telephone calls responded to in less than three minutes (a)
90% 86% 90% 81%
% of OHSW investigations finalised within six months (b)
85% 70%(c) 85% 73%
% of industrial relations compliance issues resolved within three months
80% 60%(d) 80% 72%
Footnotes (a) This performance indicator has been reworded to provide more information to users. In substance, it has not altered from the
previous year’s performance indicator (per cent of advisory service telephone calls that meet set performance standards).
(b) This performance indicator has been reworded to provide more information to users. In substance, it has not altered from the previous year’s performance indicator (per cent of OHSW investigations that meet defined customer quality standards).
(c) The target of 85 per cent of OHSW investigations finalised within six months remains a challenging target for SafeWork SA. The increased legal complexity of issues and the increasingly vigorous defence of cases (including challenges to evidence) have impacted this deliverable. Alternative organisational arrangements are being examined to offer improvements in investigation outcomes.
(d) The target of 80 per cent of industrial relations matters resolved within three months remains a challenging target for SafeWork SA. The WorkChoices amendments to the Federal Workplace Relations Act 1996 continue to complicate the industrial landscape and make achievement of the target difficult. A range of industrial relations interventions enabled by the amendments to the Fair Work Act 1994 are being delivered and include minimum wage audits and projects to protect the most vulnerable workers.
1.32

Sub-program: 8.2 Public Sector Workforce
Provision of the following services across the public sector:
• Industrial relations services which achieve, as far as possible, outcomes acceptable to government for the public sector workforce; • Occupational health, safety and injury management services, including a strategic monitoring and consulting role to the Minister for
Industrial Relations, Cabinet and agency Chief Executives; and • Strategic workforce policy, high-level human resource management policy advice, and significant projects involving public sector
wide outcomes.
2007-08 Budget
2006-07 Estimated result
2006-07 Budget
2005-06 Actual
Net cost of sub-program $6 489 000 $7 915 000(a) $7 314 000 $7 019 000
Performance Commentary Major legislative reform was enacted to provide certainty and industrial fairness for over 60 000 public sector employees in the public health and education sectors, as well as in a number of other public sector entities, who were potentially affected by the federal ‘Work Choices’ laws. Up to March 2007, five Enterprise Agreements had been negotiated, including major agreements for some 34 000 salaried employees and over 7000 weekly paid employees. Competency based qualifications were delivered to injury management and injury prevention practitioners in the public sector, with 33 injury management practitioners obtaining a Diploma level qualification. Workforce services were provided through managing the placement of excess employees across the public sector and undertaking workers compensation claims management and rehabilitation services for government agency clients. A new Safety in the Public Sector 2007-10 Strategy was developed to support the public sector contribution to the achievement of South Australia’s Strategic Plan Target 2.11 ‘Greater Safety at Work’. Agency workplace safety and injury management performance continued to be monitored and reported. Improved safety and injury management performance was achieved against the workplace safety management targets.
In 2007-08, Public Sector Workforce Division will continue to pursue various activities and initiatives aimed at providing responsive and safe working conditions by supporting the achievement of South Australia’s Strategic Plan Target 1.4 ‘Industrial Relations’ and Target 2.11 ‘Greater Safety at Work’, through negotiating public sector workforce Enterprise Bargaining agreements, supporting Chief Executives to implement the government’s Safety in the Public Sector 2007-10 Strategy, and acquiring a replacement for the whole of government workers compensation claims management database system.
Footnotes (a) Includes additional once-off expenditure for the Union Education Foundation.
1.33
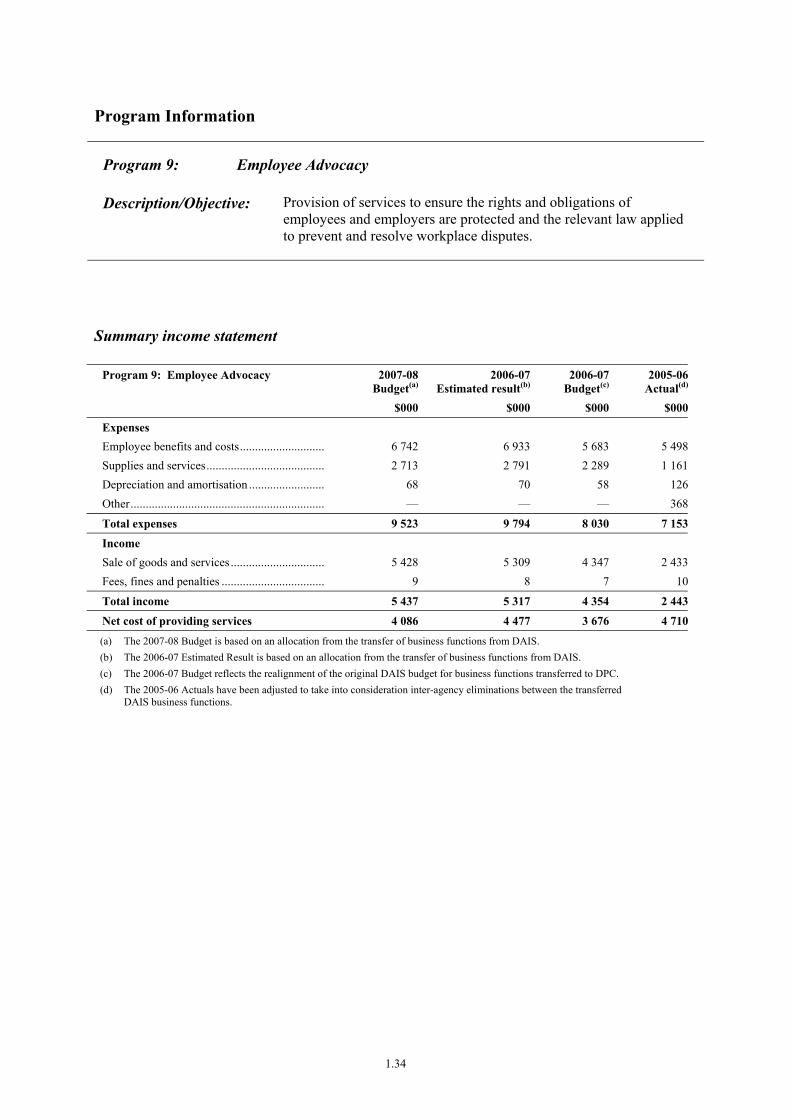
Program Information
Program 9: Employee Advocacy
Description/Objective: Provision of services to ensure the rights and obligations of employees and employers are protected and the relevant law applied to prevent and resolve workplace disputes.
Summary income statement
Program 9: Employee Advocacy 2007-08Budget(a)
2006-07Estimated result(b)
2006-07 Budget(c)
2005-06Actual(d)
$000 $000 $000 $000
Expenses Employee benefits and costs............................. 6 742 6 933 5 683 5 498Supplies and services........................................ 2 713 2 791 2 289 1 161Depreciation and amortisation .......................... 68 70 58 126Other................................................................. — — — 368
Total expenses 9 523 9 794 8 030 7 153
Income Sale of goods and services................................ 5 428 5 309 4 347 2 433Fees, fines and penalties ................................... 9 8 7 10
Total income 5 437 5 317 4 354 2 443
Net cost of providing services 4 086 4 477 3 676 4 710
(a) The 2007-08 Budget is based on an allocation from the transfer of business functions from DAIS. (b) The 2006-07 Estimated Result is based on an allocation from the transfer of business functions from DAIS. (c) The 2006-07 Budget reflects the realignment of the original DAIS budget for business functions transferred to DPC. (d) The 2005-06 Actuals have been adjusted to take into consideration inter-agency eliminations between the transferred
DAIS business functions.
1.34

Sub-program information
Sub-program: 9.1 Employee Ombudsman Services
The Employee Ombudsman is appointed to assist in ensuring that the rights of employees under South Australian law are protected. This entails promoting the principles of fairness, equity and justice for all employees.
2007-08 Budget
2006-07 Estimated result
2006-07 Budget
2005-06 Actual
Net cost of sub-program $520 000 $509 000 $453 000 $509 000
Performance Commentary The Office of the Employee Ombudsman is meeting the objectives set out in Section 62 of the Fair Work Act 1994, such as advising employees, including home based workers, on their rights and obligations under awards and Enterprise Agreements; investigating complaints; and scrutinising Enterprise Agreements lodged for approval and intervening where appropriate.
1.35

Sub-program: 9.2 Conciliation and Arbitration
Provision of industrial conciliation and arbitration services through the Industrial Relations Court and Commission and Workers Compensation Tribunal, for the resolution of workplace disputes.
2007-08 Budget
2006-07 Estimated result
2006-07 Budget
2005-06 Actual
Net cost of sub-program $3 566 000 $3 968 000 $3 223 000 $4 201 000
Performance Commentary The Industrial Relations Court and Commission and Workers Compensation Tribunal continued to improve dispute resolution processes such as streamlining the process of monetary claims for underpayment or overpayment of wages or other conditions by employees and employers. The Industrial Relations Court and Commission and Workers Compensation Tribunal do not control the number of matters lodged.
Performance Indicators 2007-08 Target
2006-07 Estimated result
2006-07 Target
2005-06 Actual
No. of industrial matters lodged, including prosecutions(a)
1 000 1 046 1 500 2 430
No. of workers compensation matters lodged 4 800 4 825 5 800 5 809
Time to closure for workers compensation dispute cases:
• % closed in 3 months 50% 45% 44% 44%
• % closed in 6 months 80% 76% 72% 72%
• % closed in 9 months 90% 88% 86% 86%
• % closed in 12 months 95% 95% 92% 92%
Time to closure for unfair dismissal cases:
• % closed in 3 months 50% 45%(b) 52% 52%
• % closed in 6 months 60% 60%(b) 78% 78%
• % closed in 9 months 70% 70%(b) 89% 89%
• % closed in 12 months 80% 80%(b) 94% 94%
Time to closure for monetary claims:(c)
• % closed in 3 months 50% — — —
• % closed in 6 months 60% — — —
• % closed in 9 months 70% — — —
• % closed in 12 months 80% — — —
Footnotes (a) The number of industrial matters lodged has decreased as a result of Work Choices legislation.
(b) Processes for dealing with unfair dismissal cases were amended to cater for jurisdictional issues that have arisen as a result of Work Choices legislation. This has impacted on the times for closure of unfair dismissal cases.
(c) This is a new performance indicator. Monetary claims are claims by employees or employers for underpayment or overpayment of wages or other conditions.
1.36
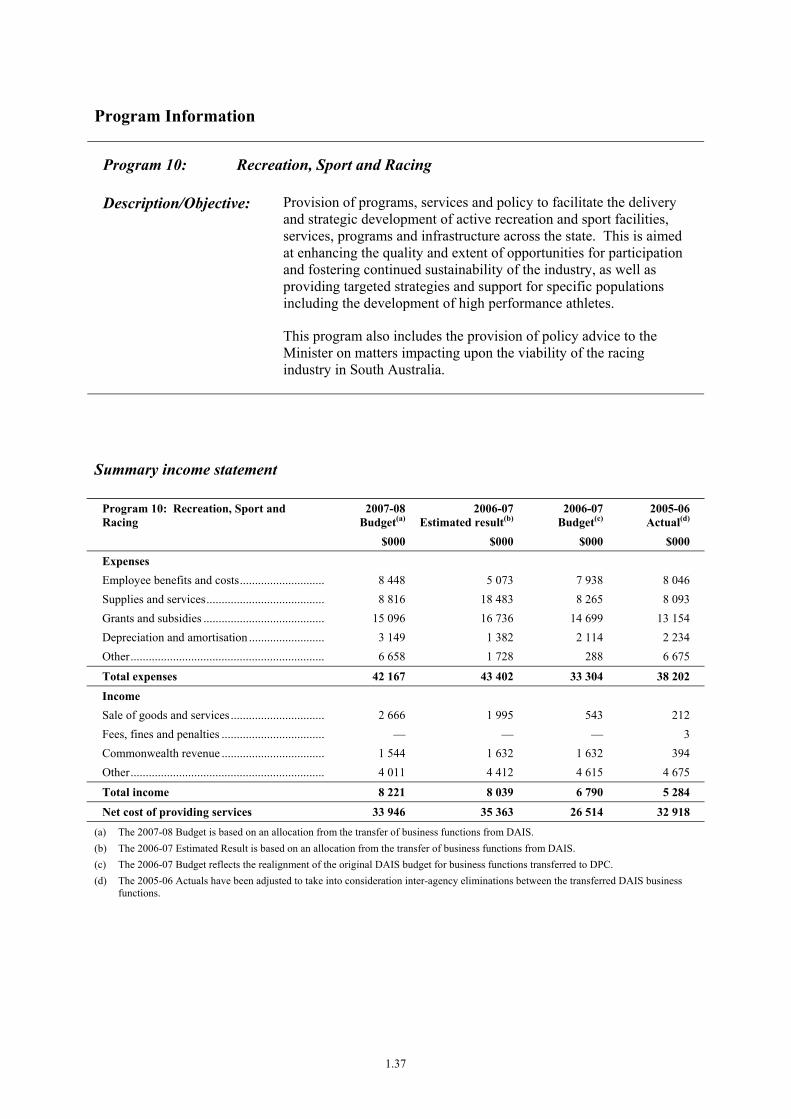
Program Information
Program 10: Recreation, Sport and Racing
Description/Objective: Provision of programs, services and policy to facilitate the delivery and strategic development of active recreation and sport facilities, services, programs and infrastructure across the state. This is aimed at enhancing the quality and extent of opportunities for participation and fostering continued sustainability of the industry, as well as providing targeted strategies and support for specific populations including the development of high performance athletes.
This program also includes the provision of policy advice to the Minister on matters impacting upon the viability of the racing industry in South Australia.
Summary income statement
Program 10: Recreation, Sport and Racing
2007-08 Budget(a)
2006-07Estimated result(b)
2006-07 Budget(c)
2005-06 Actual(d)
$000 $000 $000 $000
Expenses Employee benefits and costs............................. 8 448 5 073 7 938 8 046 Supplies and services........................................ 8 816 18 483 8 265 8 093 Grants and subsidies ......................................... 15 096 16 736 14 699 13 154 Depreciation and amortisation .......................... 3 149 1 382 2 114 2 234 Other................................................................. 6 658 1 728 288 6 675
Total expenses 42 167 43 402 33 304 38 202
Income Sale of goods and services................................ 2 666 1 995 543 212 Fees, fines and penalties ................................... — — — 3 Commonwealth revenue ................................... 1 544 1 632 1 632 394 Other................................................................. 4 011 4 412 4 615 4 675
Total income 8 221 8 039 6 790 5 284
Net cost of providing services 33 946 35 363 26 514 32 918 (a) The 2007-08 Budget is based on an allocation from the transfer of business functions from DAIS. (b) The 2006-07 Estimated Result is based on an allocation from the transfer of business functions from DAIS. (c) The 2006-07 Budget reflects the realignment of the original DAIS budget for business functions transferred to DPC. (d) The 2005-06 Actuals have been adjusted to take into consideration inter-agency eliminations between the transferred DAIS business
functions.
1.37

Sub-program information
Sub-program: 10.1 Recreation and Sport
Provision of programs, services and policy to facilitate the delivery and strategic development of active recreation and sport facilities, services, programs and infrastructure across the state. It includes improving opportunities for participation, fostering continued sustainability of the industry and providing targeted strategies and support for specific populations including the development of high performance athletes.
2007-08 Budget
2006-07 Estimated result
2006-07 Budget
2005-06 Actual
Net cost of sub-program $33 495 000(a) $34 922 000(b) $25 994 000 $32 128 000
Performance Commentary This program benefited the community by providing a coordinated approach to the development, promotion, implementation and evaluation of sport, active recreation and physical activity initiatives and services across government, industry and the wider community from the grass roots level to elite level. The Office for Recreation and Sport provided critical leadership and resourcing in meeting Target 2.3 of South Australia’s Strategic Plan through the implementation of the State Physical Activity Strategy, the ‘be active’ initiative and the broader programs and services of the Office. Sport and recreation organisations, programs and facilities were supported through funding programs including the new ‘Inclusive Recreation, Inclusive Sport’ program. The grant programs are subject to community demand and the number of applications varies as a consequence. Training and development services provided to the industry are dependent on demand from the industry and the general community. Our elite athletes and coaches continued preparations for, and competed in, national and international competitions.
Performance Indicators 2007-08 Target
2006-07 Estimated result
2006-07 Target
2005-06 Actual
No. of grant applications evaluated 1 467 1 450 1 500 1 452
No. of community participation programs managed
177 177 175 175
No. of training and development services provided to the active recreation and sport industry
208(c) 180(d) 147 147
No. of state active recreation and sport facilities developed or maintained
24 24 24 29
No. of non-grant program/service agreements managed
50(e) 44(f) 47 47
No. of athletes scholarships and services provided
643 643 630 632
No. of high performance sports programs conducted
18 18 18 18
Footnotes (a) The 2006-07 Budget includes once-off expenditure relating to the write down of an asset in 2007-08.
(b) The 2006-07 Estimated Result includes once-off expenditure towards the Adelaide Oval Redevelopment.
(c) Increase due to the expected introduction of the Essentials for Coaching Children program.
(d) Variation due to additional Child Protection and Mandated Reported training.
(e) Increase due to the expected introduction of new program agreements.
(f) Variation due to some program contracts not being executed.
1.38

Sub-program: 10.2 Racing Policy
The provision of strategic policy advice to the government through the Minister for Recreation, Sport and Racing on matters relating to, and affecting, the South Australian racing industry.
2007-08 Budget
2006-07 Estimated result
2006-07 Budget
2005-06 Actual
Net cost of sub-program $451 000 $441 000 $520 000 $790 000
Performance Commentary The Office for Racing continued to work closely with the racing industry through the development and implementation of racing industry policy. This involved consultation and collaboration with relevant industry stakeholders including participation in national conferences with State Government racing ministers and officials. The Office continued to monitor national and international issues that had the potential to affect the South Australian racing and wagering industries. Work will continue with the racing and wagering industries to resolve outstanding issues relating to betting exchanges and on the amendments to the Lottery and Gaming Act 1936 relating to the prohibition of betting exchanges and the unauthorised publication of South Australian race fields.
Performance Indicators 2007-08 Target
2006-07 Estimated result
2006-07 Target
2005-06 Actual
Number of consultations with racing and wagering industry organisations(a)
32 32 25 25
Footnotes (a) While the performance indicator has been expanded to better reflect the work performed, in substance, it is identical to the previous
year’s performance indicator.
1.39
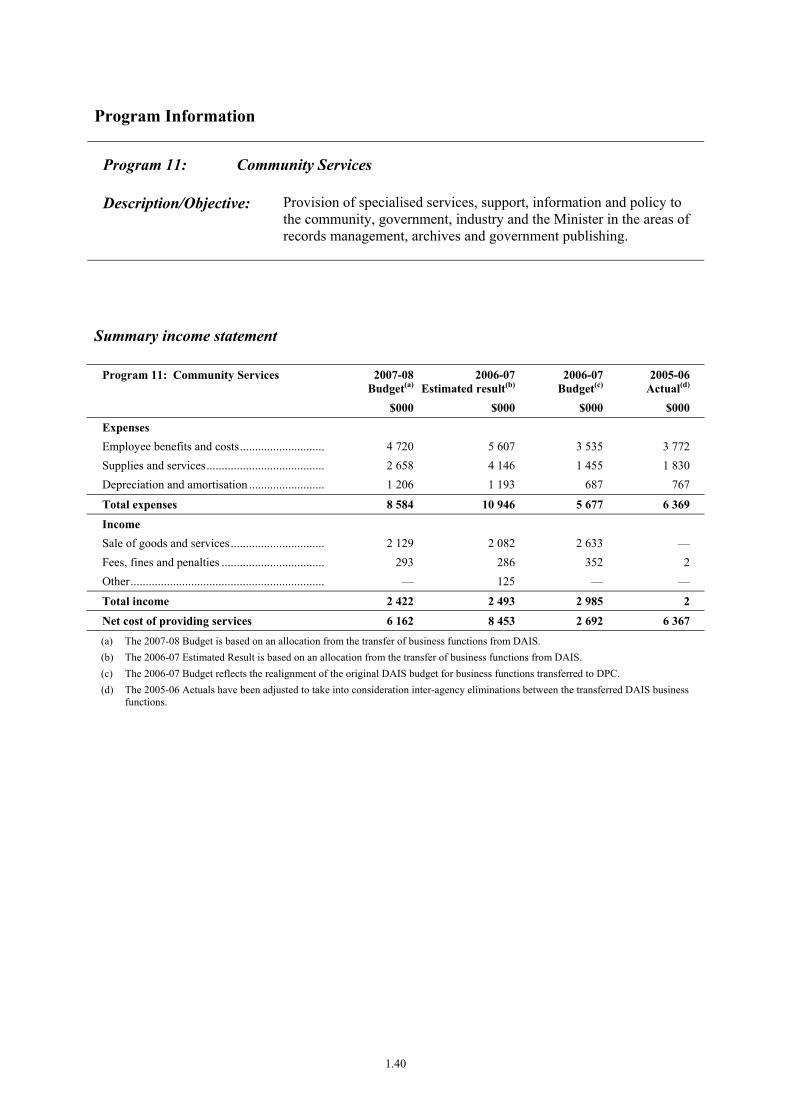
Program Information
Program 11: Community Services
Description/Objective: Provision of specialised services, support, information and policy to the community, government, industry and the Minister in the areas of records management, archives and government publishing.
Summary income statement
Program 11: Community Services 2007-08Budget(a)
2006-07Estimated result(b)
2006-07 Budget(c)
2005-06 Actual(d)
$000 $000 $000 $000
Expenses Employee benefits and costs............................. 4 720 5 607 3 535 3 772 Supplies and services........................................ 2 658 4 146 1 455 1 830 Depreciation and amortisation .......................... 1 206 1 193 687 767
Total expenses 8 584 10 946 5 677 6 369
Income Sale of goods and services................................ 2 129 2 082 2 633 — Fees, fines and penalties ................................... 293 286 352 2 Other................................................................. — 125 — —
Total income 2 422 2 493 2 985 2
Net cost of providing services 6 162 8 453 2 692 6 367
(a) The 2007-08 Budget is based on an allocation from the transfer of business functions from DAIS. (b) The 2006-07 Estimated Result is based on an allocation from the transfer of business functions from DAIS. (c) The 2006-07 Budget reflects the realignment of the original DAIS budget for business functions transferred to DPC. (d) The 2005-06 Actuals have been adjusted to take into consideration inter-agency eliminations between the transferred DAIS business
functions.
1.40

Sub-program information
Sub-program: 11.1 Government Publishing
Production and distribution of government and parliamentary publications.
2007-08 Budget
2006-07 Estimated result
2006-07 Budget
2005-06 Actual
Net cost of sub-program $103 000 $162 000 -$274 000 $287 000
Performance Commentary Government Publishing South Australia ensured the continuation of activities related to the upgrade of equipment and machinery to enhance production capabilities. The Government Publishing unit’s output increased from the 2005-06 levels, primarily due to the increased level of parliamentary activity and the consequent demand for printing. Electronic capabilities continued to be developed, particularly in relation to scanning of documents and the high level formatting of source files.
Performance Indicators 2007-08 Target
2006-07 Estimated result
2006-07 Target
2005-06 Actual
Impressions produced internally 23 000 000 22 640 000 23 000 000 —(a)
Cost per impression $0.091 $0.087(b) $0.092 —(a)
Total impressions produced per FTE 1 600 000 1 655 320 1 600 000 —(a)
Sales per FTE 134 000 144 255 130 000 —(a)
Footnotes (a) Performance indicators were only introduced in the 2006-07 Portfolio Statement.
(b) The 2006-07 Estimated Result for costs per impression has been achieved through reducing the requirement for external print services and some temporary reductions in cost.
1.41

Sub-program: 11.2 Archives and Records Management
Provision of statutory services for the management of, and access to, the state’s archival records collection of state and local government records and provision of advice on records and information management, legislation, policy and practices. Administration of the state’s Freedom of Information and privacy regimes and copyright agreements.
2007-08 Budget
2006-07 Estimated result
2006-07 Budget
2005-06 Actual
Net cost of sub-program $6 059 000 $8 291 000(a) $2 966 000 $6 080 000
Performance Commentary The demand for access to records in the archival collection continued to be significant, particularly requests to support the requirements of the Children in State Care - Commission of Inquiry directly or through subsequent investigations, and native title discovery efforts of the Attorney General’s Department. The majority of archive retrievals were for State Government agencies while public researcher retrievals and visits were steady. The State Records website and collection database search tool ArchivesSearch, were successful in enabling customers to progress their research online, including ordering records for viewing. The figures for hits on, and downloads from, the website continue to grow annually.
Transfers to the archive are growing as a result of the implementation of across-government Records Management Strategy audits and education. It is estimated that the repository at Gepps Cross will reach capacity around 2012 and strategies are under development to address this.
Performance Indicators 2007-08 Target
2006-07 Estimated result
2006-07 Target
2005-06 Actual
No. of Visitors to:
• Leigh Street Research Centre 1 700 1 520(b) 2 000 1 301
• Gepps Cross Research Centre 1 700 1 570(b) 2 000 1 532
No. of archived items retrieved:
• Leigh Street Research Centre 3 500 2 900 2 000 1 659
• Gepps Cross Research Centre 14 000 14 500(c) 14 000 13 455
No. of new public registered users 1 500 1 288(b) 2 000 1 446
% of Gepps Cross Repository storage space utilised
92% 89% 90% 85%
Footnotes (a) The 2006-07 Estimated Result includes once-off expenditure for Copyright Print Material.
(b) The reduced number of visitors and corresponding reduction in the number of new public registered users can be directly attributed to an increase in the number of customers that access services online.
(c) The increase in 2006-07 Estimated Result is due to an increase in requests for records in relation to specific court cases and inquiries. It is not anticipated that this level of record retrieval will continue in 2007-08.
1.42

Program Information
Program 12: Capital City
Description/Objective: Support the Capital City Committee, a legislated partnership between the Adelaide City Council and the State Government, by providing executive support to the Committee, and ensuring coordination between the strategic objectives of the state and the council to identify opportunities for the City.
Summary income statement
Program 12: Capital City 2007-08Budget
2006-07Estimated result
2006-07 Budget
2005-06 Actual
$000 $000 $000 $000
Expenses Employee benefits and costs............................. 326 331 316 524 Supplies and services........................................ 176 187 1 193 135 Grants and subsidies ......................................... 50 950 — —
Total expenses 552 1 468 1 509 659
Income Other................................................................. 245 240 240 239
Total income 245 240 240 239
Net cost of providing services 307 1 228 1 269 420
1.43

Program performance information
Program: 12 Capital City
2007-08 Budget
2006-07 Estimated result
2006-07 Budget
2005-06 Actual
Net cost of program(a) $307 000(b) $1 228 000 $1 269 000 $420 000
Performance Commentary Highlights for 2006-07 include the trialling, monitoring and measurement of five micro wind generators; finalisation of the three year Building Tune Ups project; hosting and follow up of a Student Housing Forum; and facilitation of agreement by metropolitan mayors to a Film Friendly Strategy. Facilitation of major infrastructure projects such as the Adelaide Airport Solar Project and the Keswick Railway Terminal upgrade as well as oversight of the North Terrace Development Stage 2 and the Riverbank Precinct upgrade. Organisation for the third International Solar Congress 2008, the most significant event to be hosted by the Capital City Committee, is well underway, with high profile keynote speakers and sponsors secured and marketing plans in place. In conjunction with this an International Solar Schools Competition will be held with guidelines delivered in collaboration with the Department of Education and Children’s Services and the International Solar Energy Society.
In 2007-08 the Solar Congress will be held in conjunction with a Sustainability Festival. The Film Friendly strategy will be rolled out across the state and marketed aggressively by the South Australian Film Corporation. Further work on attracting government employees into the City and work on the Geographic Area Land Use Assessment database will be completed and the West End concept plan will have received endorsement by the Capital City Committee.
Footnotes
(a) All indirect costs for this program are included within Program 7 Support Services. This presentation ensures consistency with the department’s annual financial statements.
(b) The decrease in the 2007-08 Budget is as a result of the completion of the Adelaide Airport Solar Panel project.
1.44

Program Information
Program 13: Aboriginal Affairs and Reconciliation
Description/Objective: Provision of high level strategic policy advice and across government coordination and monitoring, facilitation of community development initiatives, protection of Aboriginal culture and heritage, management of essential services and community infrastructure, and support for the state’s landholding authorities to improve the wellbeing of Aboriginal people.
Summary income statement
Program 13: Aboriginal Affairs and Reconciliation
2007-08Budget
2006-07Estimated result
2006-07 Budget
2005-06 Actual
$000 $000 $000 $000
Expenses Employee benefits and costs............................. 4 645 4 846 4 634 5 135 Supplies and services........................................ 13 152 12 337 5 052 5 188 Grants and subsidies ......................................... 5 571 5 695 16 540 4 464 Depreciation and amortisation .......................... 109 150 150 52 Other................................................................. — — — 258
Total expenses 23 477 23 028 26 376 15 097
Income Sale of goods and services................................ — — — 250 Interest .............................................................. — — — 72
Commonwealth revenue ................................... — 145 687 198 Other................................................................. 549 1 492 317 1 110
Total income 549 1 637 1 004 1 630
Net cost of providing services 22 928 21 391 25 372 13 467
1.45

Program performance information
Program: 13 Aboriginal Affairs and Reconciliation
2007-08 Budget
2006-07 Estimated result
2006-07 Budget
2005-06 Actual
Net cost of program(a) $22 928 000 $21 391 000(b) $25 372 000(c) $13 467 000
Performance Commentary In 2006-07, the achievements of the Aboriginal Affairs and Reconciliation Division include:
• overseeing the implementation of programs and services in the APY Lands and in other communities across the state; • working across government to monitor and report on initiatives to improve the wellbeing of Aboriginal people in South Australia; • strengthening the protection and preservation of Aboriginal culture and heritage and improving the administration of the Aboriginal
Heritage Act 1988; • commissioned the new APY Central Power Station, commenced the electrical distribution line connection of Aboriginal communities
to the power station and managed a range of other essential services and community infrastructure projects; • provided high level strategic policy advice and facilitated community development initiatives focusing on governance arrangements
in landholding communities; • commenced implementation of the Housing and Community Infrastructure bilateral agreement; and • continued to support the Aboriginal Advisory Council and the state’s three statutory landholding authorities.
In 2007-08, the Division will:
• focus on implementing plans to achieve Targets 5.7 ‘Aboriginal leadership’, 6.1 ‘Aboriginal Wellbeing’ and 6.24 ‘Aboriginal Employment’ as stated in South Australia’s Strategic Plan;
• continue to oversee the implementation of programs and services in the APY Lands and in other communities across the state; • continue to strengthen the protection and preservation of Aboriginal culture and heritage and improve the administration of the
Aboriginal Heritage Act 1988; • complete the electrical distribution lines to connect the majority of Aboriginal communities to the Central Power Station on the
APY Lands and continue to manage a range of other essential services and community infrastructure projects; • provide high level strategic policy advice and continue to facilitate community development initiatives focussing on governance
arrangements in landholding communities; • continue implementation of the Housing and Community Infrastructure bilateral agreement; and • continue to support the Aboriginal Advisory Council and the state’s three statutory landholding authorities.
Footnotes (a) All indirect costs for this program are included within Program 7 Support Services. This presentation ensures consistency with the
department’s annual financial statements.
(b) The decrease in operating result is due to the carry forward of expenditure for the APY Central Power Station – Stage 3 Distribution Line System from 2006-07 into 2007-08.
(c) The increase in 2006-07 Budget is due to the APY Central Power Station – Stage 3 Distribution line System being reclassified from investing to operating expenditure, and the approval of additional operating expenditure to complete Stage 3 of the project.
1.46
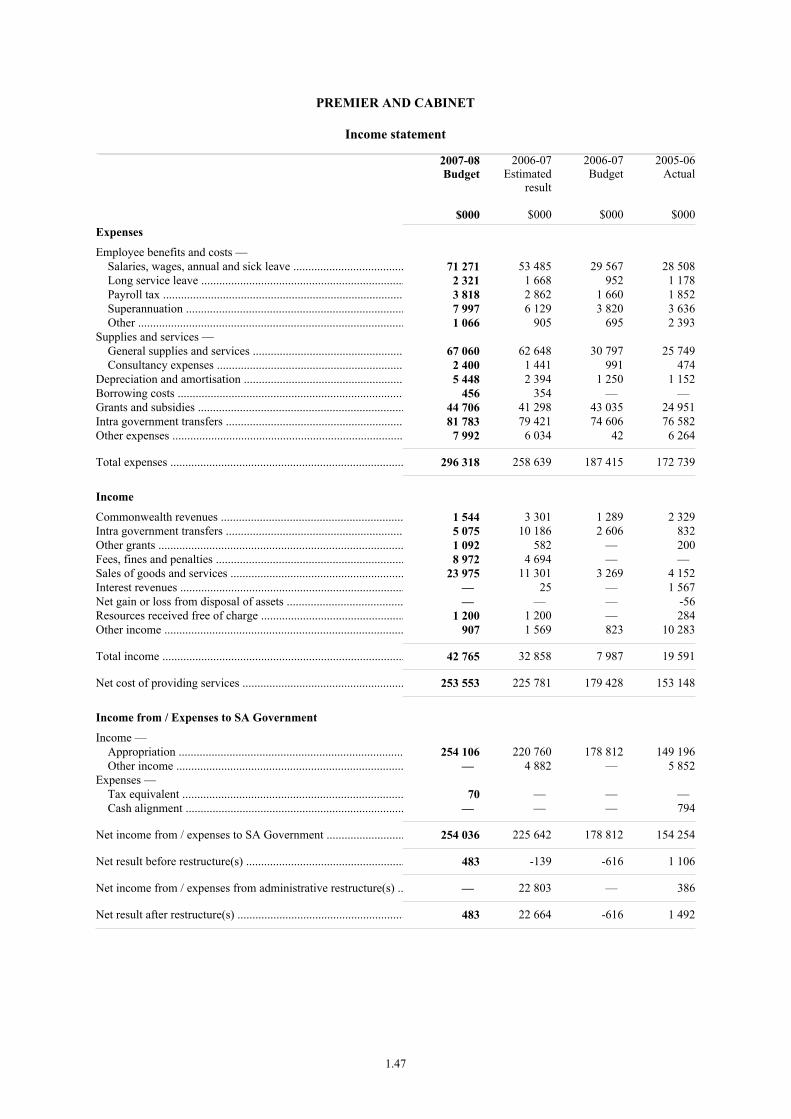
PREMIER AND CABINET
Income statement__________________________________________________________________________________________________________________________________________________________________________________________________________________________________
2007-08Budget
$000
2006-07Estimated
result
$000
2006-07Budget
$000
2005-06Actual
$000Expenses
Employee benefits and costs — Salaries, wages, annual and sick leave ..................................... 71 271 53 485 29 567 28 508 Long service leave .................................................................... 2 321 1 668 952 1 178 Payroll tax ................................................................................ 3 818 2 862 1 660 1 852 Superannuation ......................................................................... 7 997 6 129 3 820 3 636 Other ......................................................................................... 1 066 905 695 2 393Supplies and services — General supplies and services .................................................. 67 060 62 648 30 797 25 749 Consultancy expenses .............................................................. 2 400 1 441 991 474Depreciation and amortisation ..................................................... 5 448 2 394 1 250 1 152Borrowing costs ............................................................................ 456 354 — — Grants and subsidies ..................................................................... 44 706 41 298 43 035 24 951Intra government transfers ........................................................... 81 783 79 421 74 606 76 582Other expenses ............................................................................. 7 992 6 034 42 6 264
Total expenses .............................................................................. 296 318 258 639 187 415 172 739
Income
Commonwealth revenues ............................................................. 1 544 3 301 1 289 2 329Intra government transfers ........................................................... 5 075 10 186 2 606 832Other grants .................................................................................. 1 092 582 — 200Fees, fines and penalties ............................................................... 8 972 4 694 — — Sales of goods and services .......................................................... 23 975 11 301 3 269 4 152Interest revenues ........................................................................... — 25 — 1 567Net gain or loss from disposal of assets ....................................... — — — -56Resources received free of charge ................................................ 1 200 1 200 — 284Other income ................................................................................ 907 1 569 823 10 283
Total income ................................................................................. 42 765 32 858 7 987 19 591
Net cost of providing services ...................................................... 253 553 225 781 179 428 153 148
Income from / Expenses to SA Government
Income — Appropriation ........................................................................... 254 106 220 760 178 812 149 196 Other income ............................................................................ — 4 882 — 5 852Expenses — Tax equivalent .......................................................................... 70 — — — Cash alignment ......................................................................... — — — 794
Net income from / expenses to SA Government .......................... 254 036 225 642 178 812 154 254
Net result before restructure(s) ..................................................... 483 -139 -616 1 106
Net income from / expenses from administrative restructure(s) .. — 22 803 — 386
Net result after restructure(s) ........................................................ 483 22 664 -616 1 492
1.47
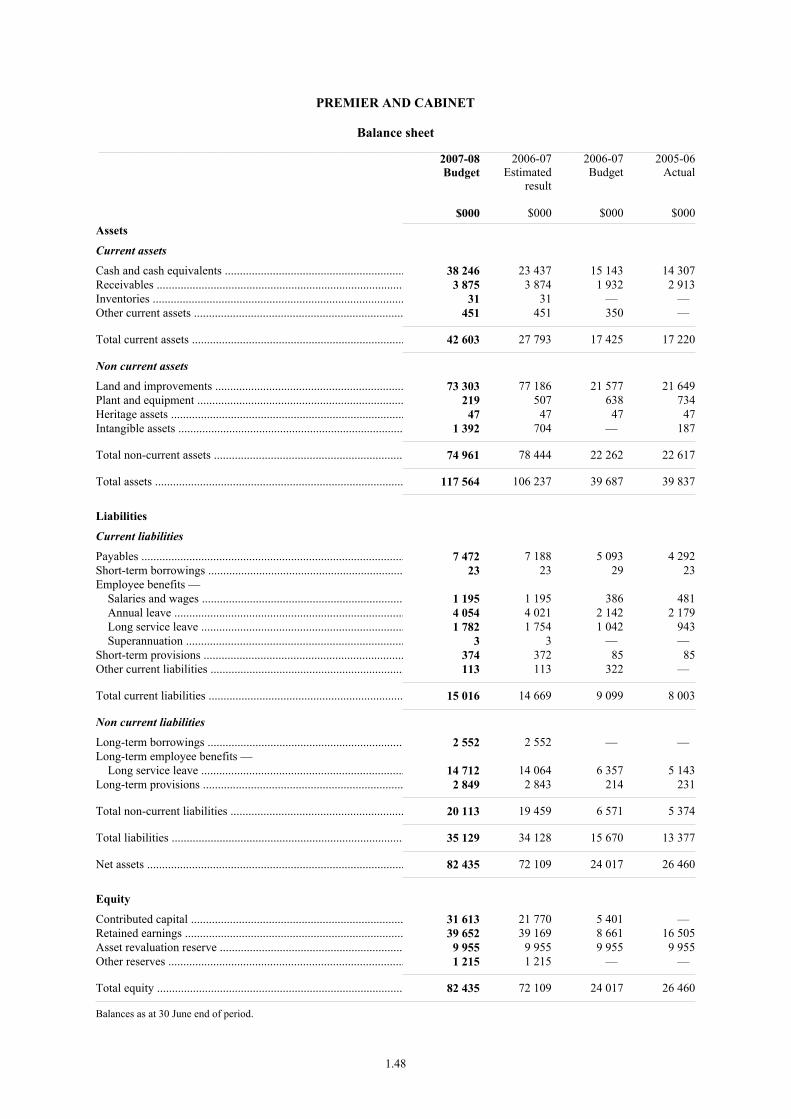
PREMIER AND CABINET
Balance sheet__________________________________________________________________________________________________________________________________________________________________________________________________________________________________
2007-08Budget
$000
2006-07Estimated
result
$000
2006-07Budget
$000
2005-06Actual
$000Assets
Current assets
Cash and cash equivalents ............................................................ 38 246 23 437 15 143 14 307Receivables ................................................................................... 3 875 3 874 1 932 2 913Inventories .................................................................................... 31 31 — — Other current assets ...................................................................... 451 451 350 —
Total current assets ....................................................................... 42 603 27 793 17 425 17 220
Non current assets
Land and improvements ............................................................... 73 303 77 186 21 577 21 649Plant and equipment ..................................................................... 219 507 638 734Heritage assets .............................................................................. 47 47 47 47Intangible assets ........................................................................... 1 392 704 — 187
Total non-current assets ............................................................... 74 961 78 444 22 262 22 617
Total assets ................................................................................... 117 564 106 237 39 687 39 837
Liabilities
Current liabilities
Payables ........................................................................................ 7 472 7 188 5 093 4 292Short-term borrowings ................................................................. 23 23 29 23Employee benefits — Salaries and wages ................................................................... 1 195 1 195 386 481 Annual leave ............................................................................. 4 054 4 021 2 142 2 179 Long service leave .................................................................... 1 782 1 754 1 042 943 Superannuation ......................................................................... 3 3 — — Short-term provisions ................................................................... 374 372 85 85Other current liabilities ................................................................. 113 113 322 —
Total current liabilities ................................................................. 15 016 14 669 9 099 8 003
Non current liabilities
Long-term borrowings .................................................................. 2 552 2 552 — — Long-term employee benefits — Long service leave .................................................................... 14 712 14 064 6 357 5 143Long-term provisions ................................................................... 2 849 2 843 214 231
Total non-current liabilities .......................................................... 20 113 19 459 6 571 5 374
Total liabilities .............................................................................. 35 129 34 128 15 670 13 377
Net assets ...................................................................................... 82 435 72 109 24 017 26 460
Equity
Contributed capital ....................................................................... 31 613 21 770 5 401 — Retained earnings ......................................................................... 39 652 39 169 8 661 16 505Asset revaluation reserve ............................................................. 9 955 9 955 9 955 9 955Other reserves ............................................................................... 1 215 1 215 — —
Total equity .................................................................................. 82 435 72 109 24 017 26 460
Balances as at 30 June end of period.
1.48

PREMIER AND CABINET
Statement of changes in equity__________________________________________________________________________________________________________________________________________________________________________________________________________________________________
Contributedcapital
$000
Assetrevaluation
reserve
$000
Retainedearnings
$000
Total
$000
Balance at 30 June 2006 ............................................................... — 9 955 16 505 26 460Adjustments .................................................................................. — — — —
Restated balance at June 2006 ...................................................... — 9 955 16 505 26 460
Net gain/loss on revaluation of property, plant and equipment during 2006-07 ............................................................................ — — — — Net changes in reserves ................................................................ 21 597 — 1 215 22 812
Net income/expense recognised directly in equity for 2006-07 ... 21 597 — 1 215 22 812Net result after restructure for 2006-07 ........................................ — — 22 664 22 664
Total recognised income and expense for 2006-07 21 597 — 23 879 45 476
Equity contributions from SA Government ................................. 173 — — 173Repayment of equity contributions from SA Government .......... — — — —
Estimated balance at 30 June 2007 21 770 9 955 40 384 72 109
Net gain/loss on revaluation of property, plant and equipment during 2007-08 ............................................................................ — — — — Net changes in reserves ................................................................ — — — —
Net income/expense recognised directly in equity for 2007-08 ... — — — — Net result after restructure for 2007-08 ........................................ — — 483 483
Total recognised income and expense for 2007-08 — — 483 483
Equity contributions from SA Government ................................. 9 843 — — 9 843Repayment of equity contributions from SA Government .......... — — — —
Estimated balance at 30 June 2008 31 613 9 955 40 867 82 435
1.49

PREMIER AND CABINET
Cash flow statement__________________________________________________________________________________________________________________________________________________________________________________________________________________________________
2007-08Budget
$000
2006-07Estimated
result
$000
2006-07Budget
$000
2005-06Actual
$000
OPERATING ACTIVITIES:
Cash outflows
Employee payments ..................................................................... 85 829 64 425 35 901 36 329Supplies and services ................................................................... 68 168 63 021 31 696 26 626Borrowing costs ............................................................................ 456 354 — — Grants and subsidies ..................................................................... 44 706 41 298 43 035 25 504Net GST paid ................................................................................ — — — 9 949Intra government transfers ........................................................... 81 783 79 421 74 606 76 582Other payments ............................................................................ 1 167 5 558 -60 6 177
Cash used in operations ................................................................ 282 109 254 077 185 178 181 167
Cash inflows
Intra government transfers ........................................................... 5 075 10 186 2 606 835Commonwealth receipts ............................................................... 1 544 3 301 1 289 2 329Other grants .................................................................................. 1 092 582 — 275Fees, fines and penalties ............................................................... 8 972 4 694 — — Sales of goods and services .......................................................... 23 975 11 301 3 269 3 792Interest received ........................................................................... — 54 29 1 538Net GST received ......................................................................... — — — 9 840Other receipts ............................................................................... 696 1 416 822 10 186
Cash generated from operations ................................................... 41 354 31 534 8 015 28 795
SA GOVERNMENT:
Appropriation ............................................................................... 254 106 220 760 178 812 148 591Other receipts ............................................................................... — 4 882 — 5 852Payments — Tax equivalents ........................................................................ 70 — — — Cash alignment ......................................................................... — — — 794
Net cash provided by SA Government ......................................... 254 036 225 642 178 812 153 649
Net cash provided by (+) / used (-) in operating activities ........... 13 281 3 099 1 649 1 277
INVESTING ACTIVITIES:
Cash outflows
Purchase of property, plant and equipment .................................. 11 215 780 416 16
Cash used in investing activities .................................................. 11 215 780 416 16
Cash inflows
Proceeds from sale of property, plant and equipment .................. 2 900 — — —
Cash generated from investing activities ..................................... 2 900 — — —
Net cash provided by (+) / used in (-) investing activities ........... -8 315 -780 -416 -16
1.50
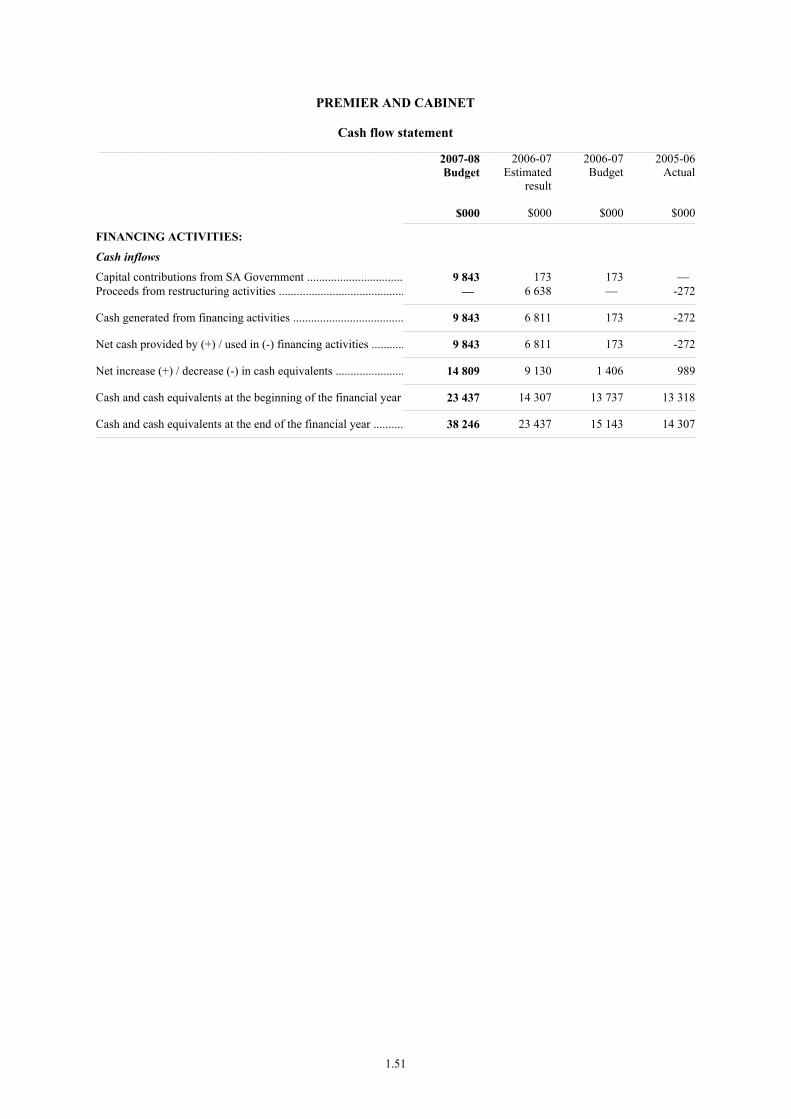
PREMIER AND CABINET
Cash flow statement__________________________________________________________________________________________________________________________________________________________________________________________________________________________________
2007-08Budget
$000
2006-07Estimated
result
$000
2006-07Budget
$000
2005-06Actual
$000
FINANCING ACTIVITIES:
Cash inflows
Capital contributions from SA Government ................................ 9 843 173 173 — Proceeds from restructuring activities .......................................... — 6 638 — -272
Cash generated from financing activities ..................................... 9 843 6 811 173 -272
Net cash provided by (+) / used in (-) financing activities ........... 9 843 6 811 173 -272
Net increase (+) / decrease (-) in cash equivalents ....................... 14 809 9 130 1 406 989
Cash and cash equivalents at the beginning of the financial year 23 437 14 307 13 737 13 318
Cash and cash equivalents at the end of the financial year .......... 38 246 23 437 15 143 14 307
1.51
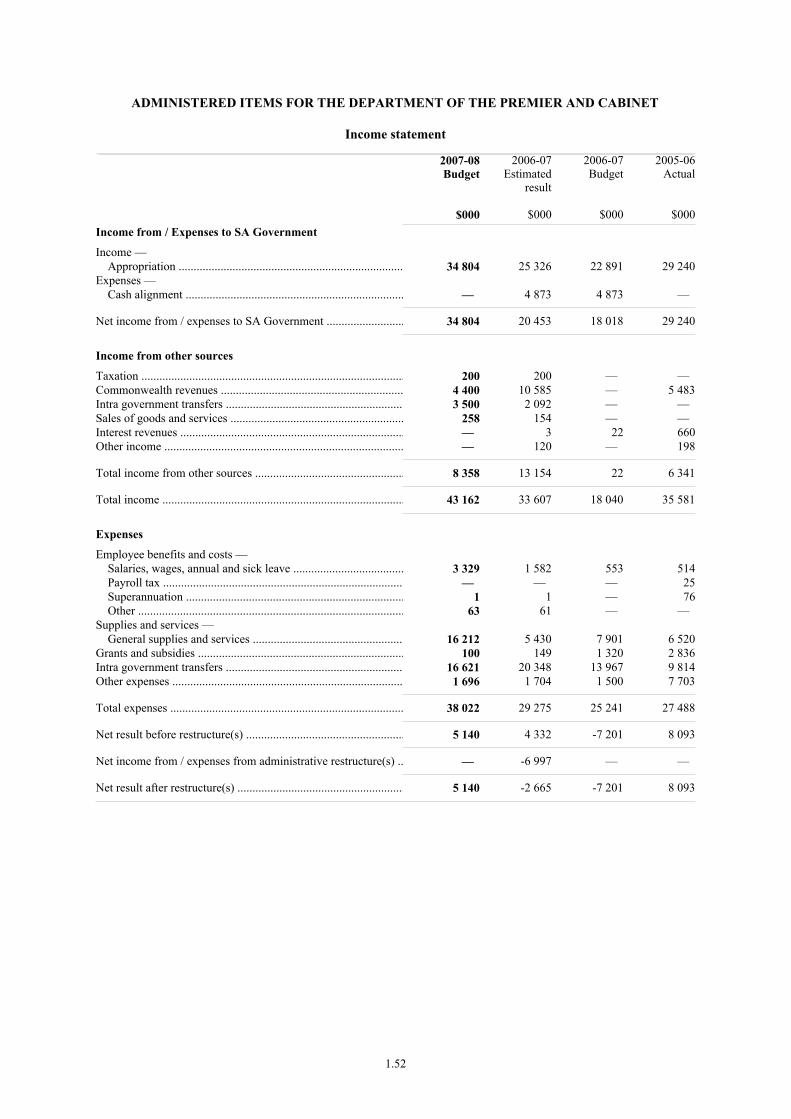
ADMINISTERED ITEMS FOR THE DEPARTMENT OF THE PREMIER AND CABINET
Income statement__________________________________________________________________________________________________________________________________________________________________________________________________________________________________
2007-08Budget
$000
2006-07Estimated
result
$000
2006-07Budget
$000
2005-06Actual
$000Income from / Expenses to SA Government
Income — Appropriation ........................................................................... 34 804 25 326 22 891 29 240Expenses — Cash alignment ......................................................................... — 4 873 4 873 —
Net income from / expenses to SA Government .......................... 34 804 20 453 18 018 29 240
Income from other sources
Taxation ........................................................................................ 200 200 — — Commonwealth revenues ............................................................. 4 400 10 585 — 5 483Intra government transfers ........................................................... 3 500 2 092 — — Sales of goods and services .......................................................... 258 154 — — Interest revenues ........................................................................... — 3 22 660Other income ................................................................................ — 120 — 198
Total income from other sources .................................................. 8 358 13 154 22 6 341
Total income ................................................................................. 43 162 33 607 18 040 35 581
Expenses
Employee benefits and costs — Salaries, wages, annual and sick leave ..................................... 3 329 1 582 553 514 Payroll tax ................................................................................ — — — 25 Superannuation ......................................................................... 1 1 — 76 Other ......................................................................................... 63 61 — — Supplies and services — General supplies and services .................................................. 16 212 5 430 7 901 6 520Grants and subsidies ..................................................................... 100 149 1 320 2 836Intra government transfers ........................................................... 16 621 20 348 13 967 9 814Other expenses ............................................................................. 1 696 1 704 1 500 7 703
Total expenses .............................................................................. 38 022 29 275 25 241 27 488
Net result before restructure(s) ..................................................... 5 140 4 332 -7 201 8 093
Net income from / expenses from administrative restructure(s) .. — -6 997 — —
Net result after restructure(s) ........................................................ 5 140 -2 665 -7 201 8 093
1.52
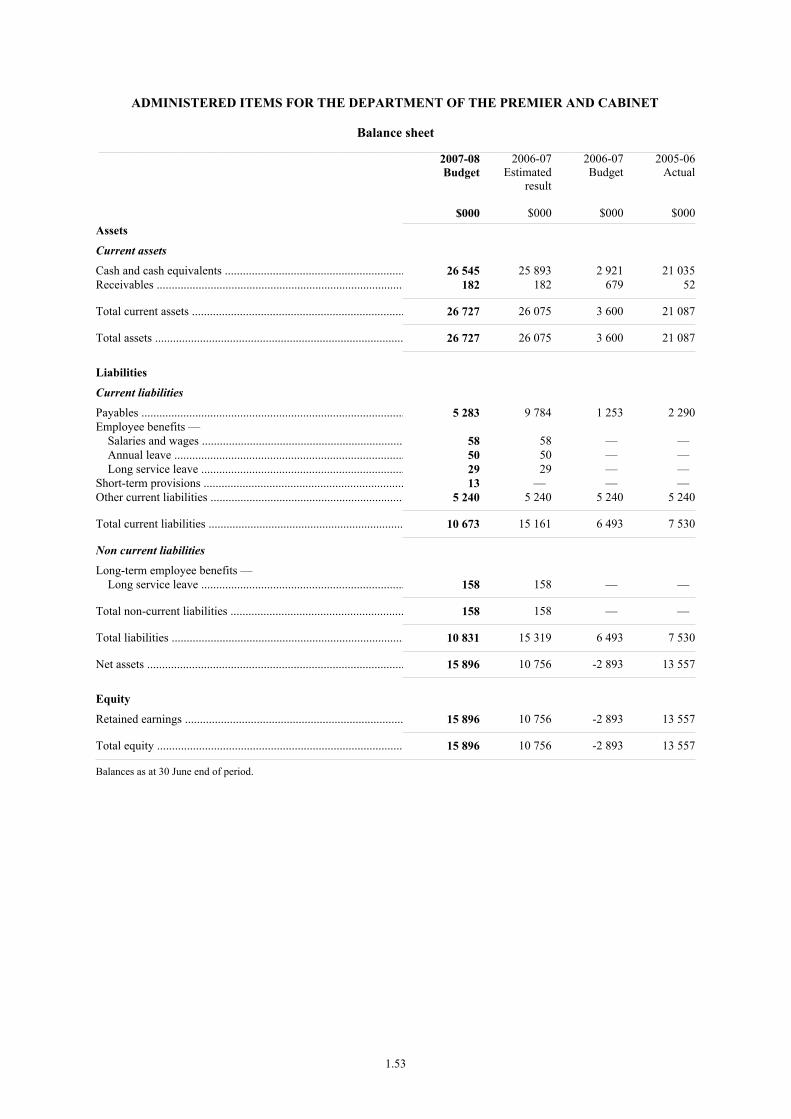
ADMINISTERED ITEMS FOR THE DEPARTMENT OF THE PREMIER AND CABINET
Balance sheet__________________________________________________________________________________________________________________________________________________________________________________________________________________________________
2007-08Budget
$000
2006-07Estimated
result
$000
2006-07Budget
$000
2005-06Actual
$000Assets
Current assets
Cash and cash equivalents ............................................................ 26 545 25 893 2 921 21 035Receivables ................................................................................... 182 182 679 52
Total current assets ....................................................................... 26 727 26 075 3 600 21 087
Total assets ................................................................................... 26 727 26 075 3 600 21 087
Liabilities
Current liabilities
Payables ........................................................................................ 5 283 9 784 1 253 2 290Employee benefits — Salaries and wages ................................................................... 58 58 — — Annual leave ............................................................................. 50 50 — — Long service leave .................................................................... 29 29 — — Short-term provisions ................................................................... 13 — — — Other current liabilities ................................................................. 5 240 5 240 5 240 5 240
Total current liabilities ................................................................. 10 673 15 161 6 493 7 530
Non current liabilities
Long-term employee benefits — Long service leave .................................................................... 158 158 — —
Total non-current liabilities .......................................................... 158 158 — —
Total liabilities .............................................................................. 10 831 15 319 6 493 7 530
Net assets ...................................................................................... 15 896 10 756 -2 893 13 557
Equity
Retained earnings ......................................................................... 15 896 10 756 -2 893 13 557
Total equity .................................................................................. 15 896 10 756 -2 893 13 557
Balances as at 30 June end of period.
1.53
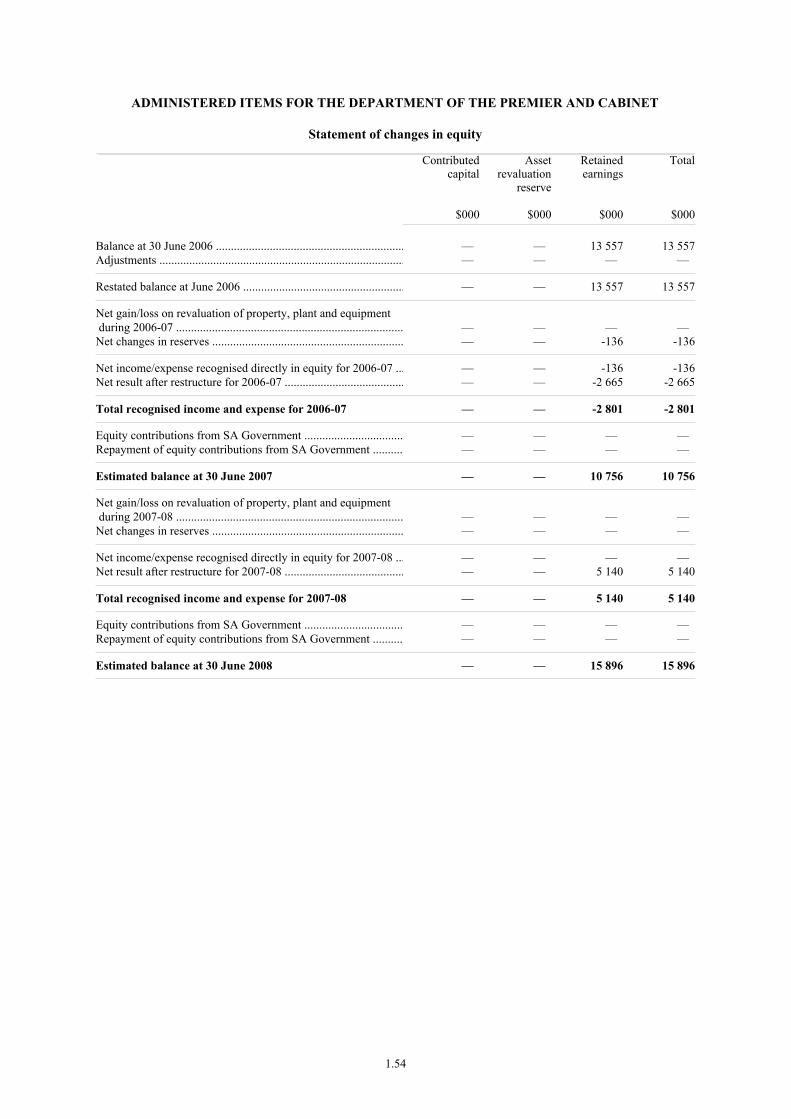
ADMINISTERED ITEMS FOR THE DEPARTMENT OF THE PREMIER AND CABINET
Statement of changes in equity__________________________________________________________________________________________________________________________________________________________________________________________________________________________________
Contributedcapital
$000
Assetrevaluation
reserve
$000
Retainedearnings
$000
Total
$000
Balance at 30 June 2006 ............................................................... — — 13 557 13 557Adjustments .................................................................................. — — — —
Restated balance at June 2006 ...................................................... — — 13 557 13 557
Net gain/loss on revaluation of property, plant and equipment during 2006-07 ............................................................................ — — — — Net changes in reserves ................................................................ — — -136 -136
Net income/expense recognised directly in equity for 2006-07 ... — — -136 -136Net result after restructure for 2006-07 ........................................ — — -2 665 -2 665
Total recognised income and expense for 2006-07 — — -2 801 -2 801
Equity contributions from SA Government ................................. — — — — Repayment of equity contributions from SA Government .......... — — — —
Estimated balance at 30 June 2007 — — 10 756 10 756
Net gain/loss on revaluation of property, plant and equipment during 2007-08 ............................................................................ — — — — Net changes in reserves ................................................................ — — — —
Net income/expense recognised directly in equity for 2007-08 ... — — — — Net result after restructure for 2007-08 ........................................ — — 5 140 5 140
Total recognised income and expense for 2007-08 — — 5 140 5 140
Equity contributions from SA Government ................................. — — — — Repayment of equity contributions from SA Government .......... — — — —
Estimated balance at 30 June 2008 — — 15 896 15 896
1.54
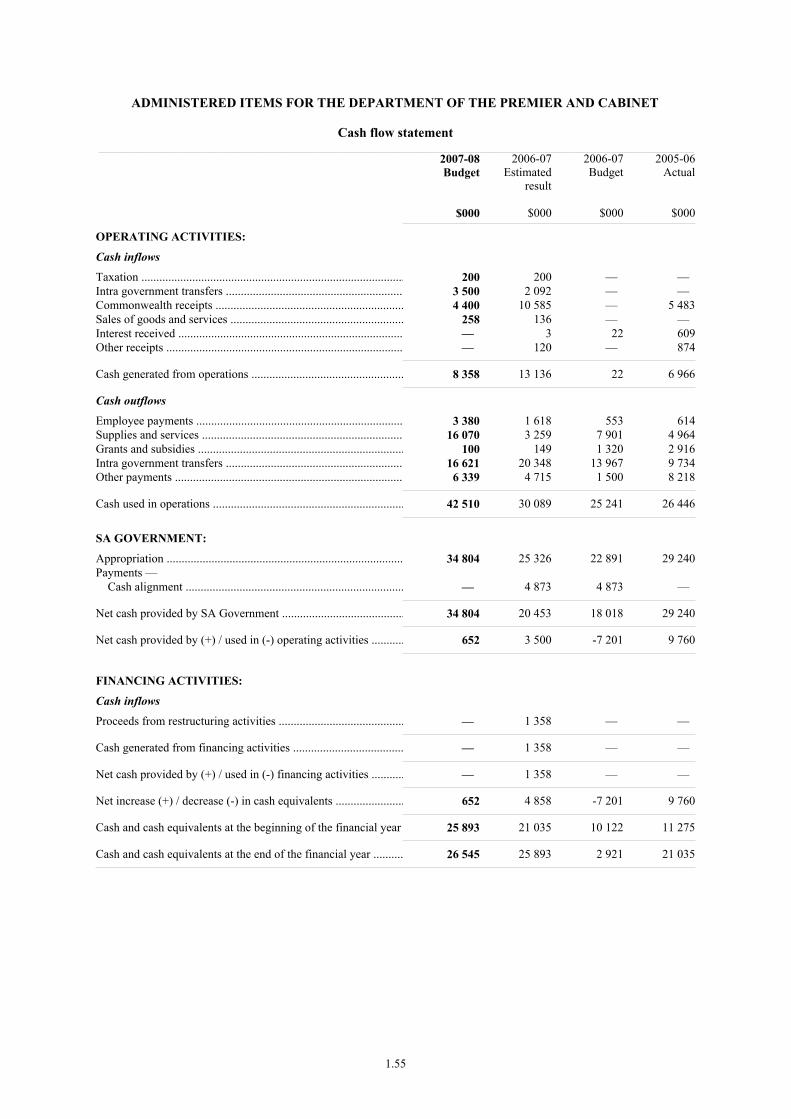
ADMINISTERED ITEMS FOR THE DEPARTMENT OF THE PREMIER AND CABINET
Cash flow statement__________________________________________________________________________________________________________________________________________________________________________________________________________________________________
2007-08Budget
$000
2006-07Estimated
result
$000
2006-07Budget
$000
2005-06Actual
$000
OPERATING ACTIVITIES:
Cash inflows
Taxation ........................................................................................ 200 200 — — Intra government transfers ........................................................... 3 500 2 092 — — Commonwealth receipts ............................................................... 4 400 10 585 — 5 483Sales of goods and services .......................................................... 258 136 — — Interest received ........................................................................... — 3 22 609Other receipts ............................................................................... — 120 — 874
Cash generated from operations ................................................... 8 358 13 136 22 6 966
Cash outflows
Employee payments ..................................................................... 3 380 1 618 553 614Supplies and services ................................................................... 16 070 3 259 7 901 4 964Grants and subsidies ..................................................................... 100 149 1 320 2 916Intra government transfers ........................................................... 16 621 20 348 13 967 9 734Other payments ............................................................................ 6 339 4 715 1 500 8 218
Cash used in operations ................................................................ 42 510 30 089 25 241 26 446
SA GOVERNMENT:
Appropriation ............................................................................... 34 804 25 326 22 891 29 240Payments — Cash alignment ......................................................................... — 4 873 4 873 —
Net cash provided by SA Government ......................................... 34 804 20 453 18 018 29 240
Net cash provided by (+) / used in (-) operating activities ........... 652 3 500 -7 201 9 760
FINANCING ACTIVITIES:
Cash inflows
Proceeds from restructuring activities .......................................... — 1 358 — —
Cash generated from financing activities ..................................... — 1 358 — —
Net cash provided by (+) / used in (-) financing activities ........... — 1 358 — —
Net increase (+) / decrease (-) in cash equivalents ....................... 652 4 858 -7 201 9 760
Cash and cash equivalents at the beginning of the financial year 25 893 21 035 10 122 11 275
Cash and cash equivalents at the end of the financial year .......... 26 545 25 893 2 921 21 035
1.55
AGENCY: DEPARTMENT OF THE PREMIER AND CABINET
Financial Commentary — major variations
The following commentary relates to the Agency Financial Statements presented in the previous section. The discussion relates to the major variations between the 2006-07 Estimated Result and the 2007-08 Budget.
Income statement — Controlled
On 1 January 2007 various business units transferred from the Department for Administrative and Information Services (DAIS) to the Department of the Premier and Cabinet (DPC). This significantly increased the budget and operations of the department. The transfer of business functions from DAIS is a significant source of variation between the 2006-07 Budget, the 2006-07 Estimated Result and the 2007-08 Budget. The 2006-07 Estimated Result reflects transactions from 1 January 2007 to 30 June 2007 for the business units transferred into DPC. The 2007-08 Budget reflects the full year budget for these units.
In relation to specific variations in the Income statement:
• the increase in employee benefits between the 2006-07 Estimated Result and the 2007-08 Budget reflects the transfer of business units from DAIS, which has been partially offset by savings associated with the restructure of the Public Sector Workforce unit;
• the increase in supplies and services between the 2006-07 Estimated Result and the 2007-08 Budget reflects the transfer of business units from DAIS, funding received to finalise the APY Central Power – Stage 3 Distribution Line system, and funding received for new initiatives including: the Adelaide and Monarto Zoo redevelopment; the Climate Change Community Awareness Raising and Behaviour Change program; and the Occupational Health, Safety and Welfare Mass Media Advertising Campaign to be undertaken by SafeWork SA. This increase has been partially offset by savings associated with the restructure of the Public Sector Workforce Management unit and the abolition of the Security and Emergency Management Office;
• the increase in depreciation and amortisation expenditure between the 2006-07 Estimated Result and the 2007-08 Budget reflects asset transfer associated with the transfer of business units from DAIS;
• the increase in grants and subsidies and intra-government transfers between the 2006-07 Estimated Result and the 2007-08 Budget reflects the transfer of the business units from DAIS, new initiative funding including: Indigenous Arts Leadership and Development package; the establishment of the Biodiversity Gallery at the SA Museum; specific funding for critical safety requirements and protecting state collections; the Adelaide Festival Centre New Directions Revival Strategy; and higher expenditure 2007-08 for the Adelaide Festival Centre upgrade. This increase is partially offset by once-off grant funding provided in 2006-07 for the Adelaide Oval Redevelopment;
• the increase in other expenses between the 2006-07 Estimated Result and the 2007-08 Budget reflects the transfer of business units from DAIS and the Dean Rifle Range asset write down. This increase is partially offset by once-off expenditure for specific university projects particularly targeting key skills development in South Australia’s strategic defence and electronics industries during 2006-07;
1.56
• the increase in sales of goods and services between the 2006-07 Estimated Result and the 2007-08 Budget reflects the transfer of business units from DAIS;
• the decrease in intra-government transfers between the 2006-07 Estimated Result and the 2007-08 Budget reflects once-off funding received in 2006-07 from the APY Taskforce for delivery of various projects and programs on the APY Lands, and once-off funding received for the Social Inclusion initiative – Alcohol Education Rehabilitation Foundation and related programs. This decrease is partially offset by the transfer of business units from DAIS; and
• the increase in fees and fines revenues between the 2006-07 Estimated Result and the 2007-08 Budget reflects the transfer of business units from DAIS.
Balance sheet — Controlled
The variations in the Balance sheet predominantly reflect the transfer of opening balances of the assets and liabilities of the business units from DAIS to DPC as at 1 January 2007.
Current assets have increased between the 2006-07 Estimated Result and the 2007-08 Budget due to movements in cash at bank. Refer to the Cash flow statement for further information.
Statement of changes in equity — Controlled
The increase in equity position is largely due to the movement in retained earnings and contributed capital as a result of the transfer of business units from DAIS to DPC as at 1 January 2007. Refer to Controlled Income statement for further information.
Cash flow statement — Controlled
Operating Cash flow variances reflect the variances discussed above in relation to the Controlled Income statement. Refer to this section for further information.
Income statement — Administered Items
On 1 January 2007 business units from DAIS were transferred to DPC. The restructure is a significant source of variation between the 2006-07 Budget, the 2006-07 Estimated Result and the 2007-08 Budget. The 2006-07 Estimated Result reflects transactions from 1 January 2007 to 30 June 2007 for the business units transferred to DPC. The 2007-08 Budget reflects the full year budget for these units.
In relation to specific variations in the Income statement:
• the increase in expenditure between the 2006-07 Estimated Result and the 2007-08 Budget is due to the transfer of items for the DAIS Administered items into the DPC Administered items on 1 January 2007. Expenditure also increases as a result of the construction of swimming pools at Yalata and Pipalyatjara, the construction of staff accommodation for the Rehabilitation Facility at Amata, an extension of the APY Service Coordinators Program and the continuation and expansion of capital works programs which were funded by the Commonwealth in prior years. This increase is partially offset by the finalisation of the School Retention program in 2007-08;
1.57

• the decrease in income from other sources between the 2006-07 Estimated Result and the 2007-08 Budget is due to additional Commonwealth revenue in 2006-07 for Commonwealth Essential Works Programs, construction of swimming pools at Yalata and Pipalyatjara, construction of staff accommodation for the Rehabilitation Facility at Amata and an extension of the APY service Coordinators Program. This is partially offset by the transfer of items for DAIS Administered items to DPC Administered items on 1 January 2007; and
• the increase in income from government between the 2006-07 Estimated Result and the 2007-08 Budget relates to additional expenditure for capital works programs which were funded by the Commonwealth in prior years, as outlined above.
Refer to Additional Information for Administered Items for the Department of the Premier and Cabinet for further details.
In line with the Cash Alignment Policy, surplus cash was returned to government in 2006-07. The surplus cash for 2007-08 has not yet been determined.
Balance sheet — Administered Items
Current assets have increased between the 2006-07 Estimated Result and the 2007-08 Budget due to movements in cash at bank. Refer to the Cash flow statement for further information.
Current liabilities have decreased between the 2006-07 Estimated Result and the 2007-08 Budget due to the transfer of items for the DAIS Administered Items and the correction of discrepancies in transferred Balance sheet items.
Statement of changes in equity — Administered Items
The increase in equity position between the 2006-07 Estimated Result and the 2007-08 Budget is due to the movement in retained earnings. Refer to the Administered Income statement for further information.
Cash flow statement — Administered Items
Operating Cash flow variances reflect the variances discussed above in relation to the Administered Income statement. Refer to this section for further information and the Additional Information for Administered Items for further information.
Additional Information for Administered Items
Detailed information on Administered Items is included in the following table.
1.58
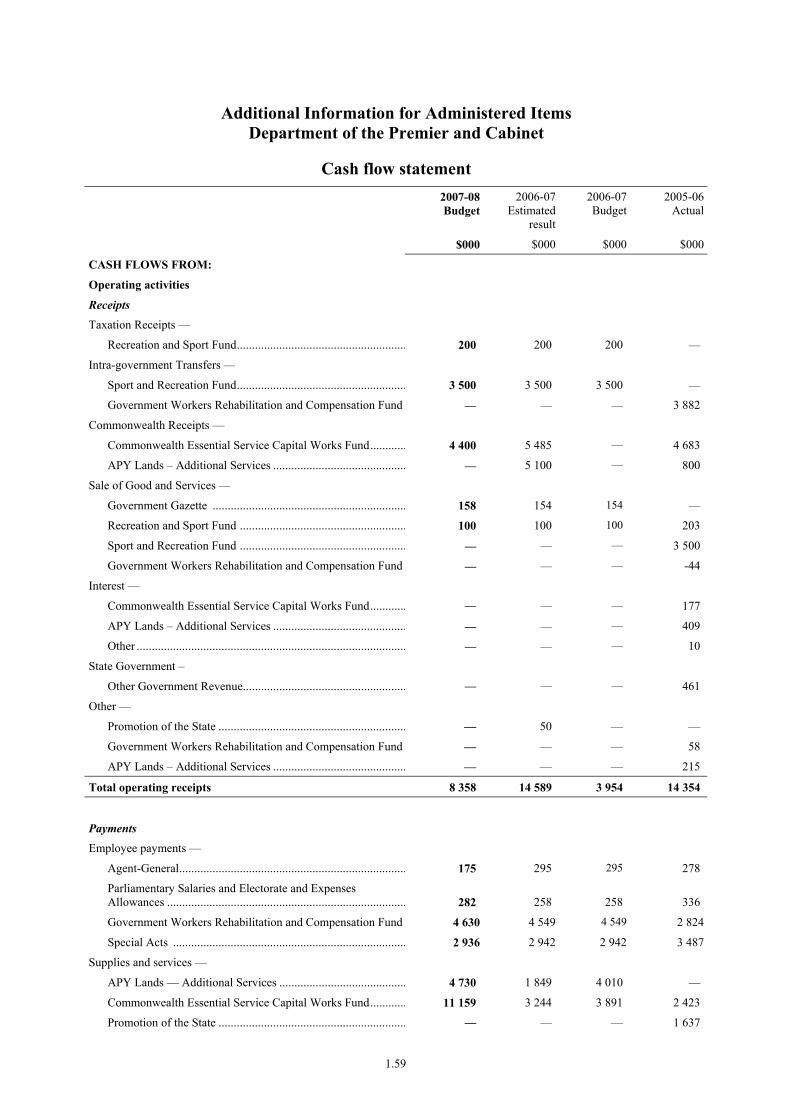
Additional Information for Administered Items Department of the Premier and Cabinet
Cash flow statement
2007-08Budget
2006-07Estimated
result
2006-07 Budget
2005-06Actual
$000 $000 $000 $000
CASH FLOWS FROM:
Operating activities
Receipts
Taxation Receipts —
Recreation and Sport Fund........................................................ 200 200 200 —
Intra-government Transfers —
Sport and Recreation Fund........................................................ 3 500 3 500 3 500 —
Government Workers Rehabilitation and Compensation Fund — — — 3 882
Commonwealth Receipts —
Commonwealth Essential Service Capital Works Fund............ 4 400 5 485 — 4 683
APY Lands – Additional Services ............................................ — 5 100 — 800
Sale of Good and Services —
Government Gazette ................................................................ 158 154 154 —
Recreation and Sport Fund ....................................................... 100 100 100 203
Sport and Recreation Fund ....................................................... — — — 3 500
Government Workers Rehabilitation and Compensation Fund — — — -44
Interest —
Commonwealth Essential Service Capital Works Fund............ — — — 177
APY Lands – Additional Services ............................................ — — — 409
Other ......................................................................................... — — — 10
State Government –
Other Government Revenue...................................................... — — — 461
Other —
Promotion of the State .............................................................. — 50 — —
Government Workers Rehabilitation and Compensation Fund — — — 58
APY Lands – Additional Services ............................................ — — — 215
Total operating receipts 8 358 14 589 3 954 14 354
Payments
Employee payments —
Agent-General........................................................................... 175 295 295 278
Parliamentary Salaries and Electorate and Expenses Allowances ............................................................................... 282 258 258 336
Government Workers Rehabilitation and Compensation Fund 4 630 4 549 4 549 2 824
Special Acts ............................................................................. 2 936 2 942 2 942 3 487
Supplies and services —
APY Lands — Additional Services .......................................... 4 730 1 849 4 010 —
Commonwealth Essential Service Capital Works Fund............ 11 159 3 244 3 891 2 423
Promotion of the State .............................................................. — — — 1 637
1.59
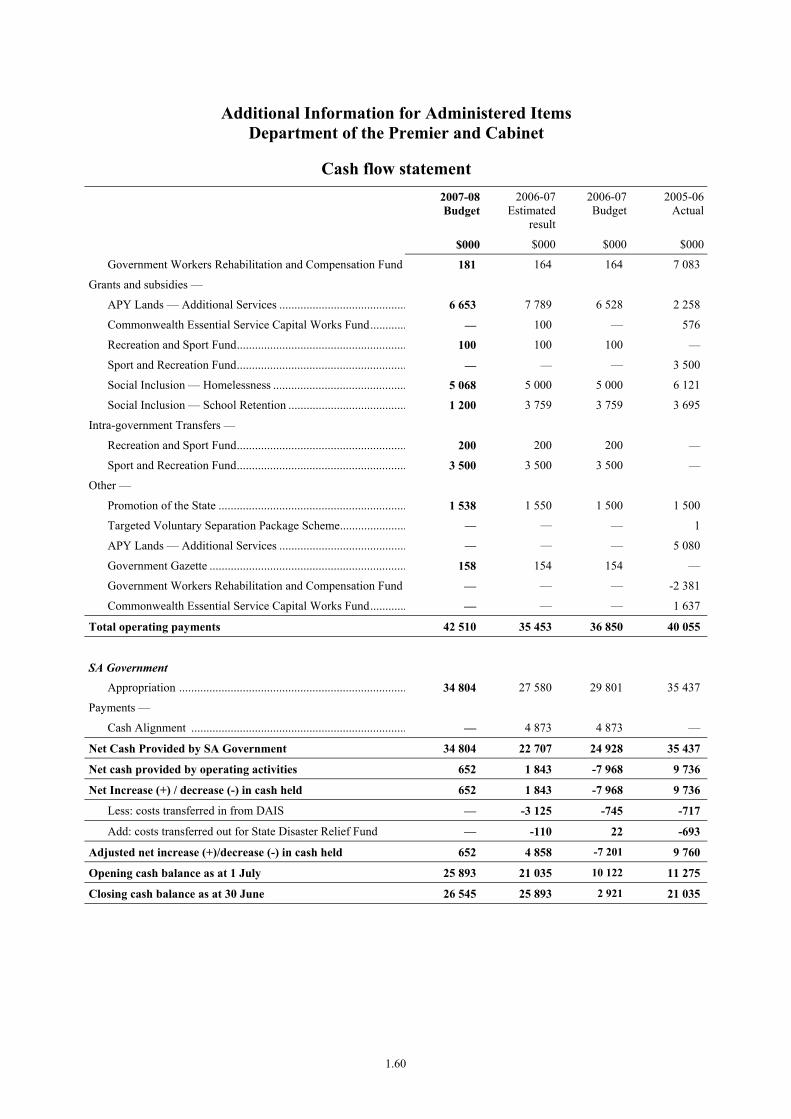
Additional Information for Administered Items Department of the Premier and Cabinet
Cash flow statement
2007-08Budget
2006-07Estimated
result
2006-07 Budget
2005-06Actual
$000 $000 $000 $000
Government Workers Rehabilitation and Compensation Fund 181 164 164 7 083
Grants and subsidies —
APY Lands — Additional Services .......................................... 6 653 7 789 6 528 2 258
Commonwealth Essential Service Capital Works Fund............ — 100 — 576
Recreation and Sport Fund........................................................ 100 100 100 —
Sport and Recreation Fund........................................................ — — — 3 500
Social Inclusion — Homelessness ............................................ 5 068 5 000 5 000 6 121
Social Inclusion — School Retention ....................................... 1 200 3 759 3 759 3 695
Intra-government Transfers —
Recreation and Sport Fund........................................................ 200 200 200 —
Sport and Recreation Fund........................................................ 3 500 3 500 3 500 —
Other —
Promotion of the State .............................................................. 1 538 1 550 1 500 1 500
Targeted Voluntary Separation Package Scheme...................... — — — 1
APY Lands — Additional Services .......................................... — — — 5 080
Government Gazette ................................................................. 158 154 154 —
Government Workers Rehabilitation and Compensation Fund — — — -2 381
Commonwealth Essential Service Capital Works Fund............ — — — 1 637
Total operating payments 42 510 35 453 36 850 40 055
SA Government
Appropriation ........................................................................... 34 804 27 580 29 801 35 437
Payments —
Cash Alignment ....................................................................... — 4 873 4 873 —
Net Cash Provided by SA Government 34 804 22 707 24 928 35 437
Net cash provided by operating activities 652 1 843 -7 968 9 736
Net Increase (+) / decrease (-) in cash held 652 1 843 -7 968 9 736
Less: costs transferred in from DAIS — -3 125 -745 -717
Add: costs transferred out for State Disaster Relief Fund — -110 22 -693
Adjusted net increase (+)/decrease (-) in cash held 652 4 858 -7 201 9 760
Opening cash balance as at 1 July 25 893 21 035 10 122 11 275
Closing cash balance as at 30 June 26 545 25 893 2 921 21 035
1.60

Additional Information for Administered Items
Reconciliation to Cash flow statement
2007-08Budget
2006-07Estimated
result
2006-07 Budget
2005-06Actual
$000 $000 $000 $000
Reconciliation to operating receipts (as per Administered Items Cash flow statement)
Operating receipts (as per Additional Information for Administered Items) ............. 8 358 14 589 3 954 14 354
Add: Costs transferred out
State Disaster Relief Fund......................................................... — 123 22 211
Subtotal 8 358 14 712 3 976 14 565
Less: Costs transferred in from DAIS Administered Items
Government Workers Rehabilitation and Compensation Fund. — 18(a) — 3 896
Recreation and Sport Fund........................................................ — 100(a) 300 203
Government Gazette ................................................................. — — 154 —
Sport and Recreation Fund........................................................ — 1 458(a) 3 500 3 500
Equals: Operating receipts (as per Administered Items Cash flow statement)
8 358 13 136 22 6 966
Reconciliation to operating payments (as per Administered Items Cash flow statement)
Operating payments (as per Additional Information for Administered Items) ............... 42 510 35 453 36 850 40 055
Add: Costs transferred out
State Disaster Relief Fund......................................................... — 97 — 904
Subtotal 42 510 35 550 36 850 40 959
Less: Costs transferred in from DAIS Administered Items
Government Workers Rehabilitation and Compensation Fund. — 3 584(a) 4 713 7 526
Recreation and Sport Fund........................................................ — — 300 —
Government Gazette ................................................................. — — 154 —
Sport and Recreation Fund........................................................ — — 3 500 3 500
Special Acts Salaries................................................................. — 1 877(a) 2 942 3 487
Equals: Operating payments (as per Administered Items Cash flow statement)
42 510 30 089 25 241 26 446
(a) Transfers for the 2006–07 Estimated Result represent the payments for the period 1 July 2006 to 31 December 2006 reflected in the Cash flow statement for the Administered Items for the Department for Administrative and Information Services.
1.61

Additional Information for Administered Items
Reconciliation to Cash flow statement Reconciliation to financing activities (as per Administered Items Cash flow statement)
Financing activities (as per Additional Information for Administered Items) — — — —
Add: Costs transferred out
State Disaster Relief Fund......................................................... — -136 — —
Subtotal — -136 — —
Less: Costs transferred in from DAIS Administered Items
Proceeds from restructuring ..................................................... — -1 494(a) — —
Equals: Financing activities (as per Administered Items Cash flow statement)
— 1 358 — —
(a) Transfers for the 2006–07 Estimated Result represent the payments for the period 1 July 2006 to 31 December 2006 reflected in the Cash flow statement for the Administered Items for the Department for Administrative and Information Services.
1.62

1.63
Portfolio: Trade and Economic Development
Minister for Economic Development Minister for Industry and Trade Minister for Regional Development Minister for Small Business


TABLE OF CONTENTS
PORTFOLIO SUMMARY
Ministerial Responsibilities..................................................................................................2.1
Portfolio Net Cost of Services Summary .............................................................................2.2
Investing Payments Summary ..............................................................................................2.2
Workforce Summary ............................................................................................................2.2
Agency Summaries
Department of Trade and Economic Development .............................................................2.4
Port Adelaide Maritime Corporation....................................................................................2.36
Office of the Venture Capital Board ....................................................................................2.52

PORTFOLIO: TRADE AND ECONOMIC DEVELOPMENT
MINISTERIAL RESPONSIBILITIES
Minister Agency Programs Department of Trade and Economic Development
1. Economic Strategy and Policy Development 2. Defence Industry Development
The Hon. Michael Rann Minister for Economic Development Port Adelaide Maritime
Corporation(a) 1. Strategy and Policy 2. Precinct Development and Operation 3. Workforce Development
Department of Trade and Economic Development
3. Business Growth 4. International Market Development 5. Investment Attraction 6. Corporate Leadership, Governance and Support 9. Population and Migration
The Hon. Kevin Foley Minister for Industry and Trade
Office of the Venture Capital Board
1. Venture Capital
The Hon. Karlene Maywald Minister for Regional Development Minister for Small Business
Department of Trade and Economic Development
7. Small Business Growth 8. Regional Development
(a) The Minister for Economic Development has delegated all commercial and financial responsibilities for the Port Adelaide Maritime Corporation to the Treasurer.
Administered items
In addition to the above responsibilities the Portfolio has administered the following item on behalf of Ministers.
• Minister’s salary and allowances pursuant to Parliamentary Remuneration Act 1990.
Statutes
The Department of the Premier and Cabinet maintains a list of statutes applicable to Ministers.
2.1

PORTFOLIO NET COST OF SERVICES SUMMARY
2007-08 Budget
2006-07Estimated result
2006-07 Budget
2005-06 Actual
Agency $000 $000 $000 $000 Department of Trade and Economic Development............................................
69 699 68 106 66 625 59 244
Port Adelaide Maritime Corporation ....... 6 710 2 404 8 255 1 790 Office of the Venture Capital Board........ 1 579 1 556 1 547 1 209
Total 77 988 72 066 76 427 62 243
INVESTING PAYMENTS SUMMARY
2007-08 Budget
2006-07Estimated result
2006-07 Budget
2005-06 Actual
Agency $000 $000 $000 $000 Department of Trade and Economic Development............................................
— — — 414
Port Adelaide Maritime Corporation ....... 155 592 84 854 94 919 1 667 Office of the Venture Capital Board........ 1 100 2 878 8 000 —
Total 156 692 87 732 102 919 2 081
WORKFORCE SUMMARY
FTEs as at 30 June
Agency 2007-08
Budget estimate 2006-07
Estimated result 2005-06 Actual
Department of Trade and Economic Development(a) ................................................. 206.0 180.0 157.8
Port Adelaide Maritime Corporation ................ 17.4 17.4 10.0 Office of the Venture Capital Board................. 6.0 6.0 5.0
Total 229.4 203.4 172.8 (a) The 2006-07 Estimated Result and the 2007-08 Budget Estimate include employees associated with the functional responsibilities
transferred from the Department for Administrative and Information Services to the Department of Trade and Economic Development.
2.2

2.3

TABLE OF CONTENTS
AGENCY: DEPARTMENT OF TRADE AND ECONOMIC DEVELOPMENT
Objective ........................................................................................................................................2.5
Targets / Highlights ........................................................................................................................2.6
Program Net Cost of Services Summary........................................................................................2.8
Investing Payments Summary ........................................................................................................2.9
Program Information — includes description/objective, Summary income statement, sub-program information including performance criteria
1. Economic Strategy and Policy Development................................................................2.10
2. Defence Industry Development ....................................................................................2.12
3. Business Growth ...........................................................................................................2.14
4. International Market Development ...............................................................................2.16
5. Investment Attraction ...................................................................................................2.18
6. Corporate Leadership, Governance and Support ..........................................................2.20
7. Small Business Growth.................................................................................................2.22
8. Regional Development..................................................................................................2.24
9. Population and Migration .............................................................................................2.26
Financial Statements
Income statement .................................................................................................................2.28
Balance sheet........................................................................................................................2.29
Statement of changes in equity ............................................................................................2.30
Cash flow statement .............................................................................................................2.31
Income statement — Administered Items............................................................................2.32
Cash flow statement — Administered Items .......................................................................2.33
Financial Commentary ...................................................................................................................2.34
2.4

PORTFOLIO: TRADE AND ECONOMIC DEVELOPMENT
AGENCY: DEPARTMENT OF TRADE AND ECONOMIC DEVELOPMENT
Objective
The Department of Trade and Economic Development (DTED) will facilitate the long-term sustainable economic development of South Australia by working in partnership with industry and other stakeholders, and provide leadership across government on economic development.
The department’s objectives are to:
• maintain an internationally competitive business environment;
• increase business investment and facilitate major projects;
• foster the development of innovative, globally competitive businesses;
• increase international trade;
• develop a vibrant and entrepreneurial small business sector;
• ensure the supply of a highly skilled workforce to meet the needs of business;
• build sustainable communities in regional South Australia;
• deliver highly valued services and advice to government and industry; and
• develop an organisational environment that is consistent with its guiding principles and enables the department to conduct its business in an effective and efficient way.
2.5

2007-08 Targets / 2006-07 Highlights
Targets 2007-08 Highlights 2006-07
• Facilitate BHP Billiton’s pre-feasibility study and Environmental Impact Statement, and conduct negotiations over the Roxby Downs (Indenture Ratification) Act
• Facilitate major projects of economic significance, including Ausbird Memorandum of Understanding ($300 million), Bradken Foundry expansion ($40 million) and Timbercorp Two Wells Glasshouse ($30 million)
• Develop a business case for a Secure Electronic Common User Facility under South Australia’s Complex Military System Flagship
• Continue to support the Stewart & Stevenson bid for Land 121 • Increase the supply of skilled workers in local advanced
manufacturing companies through the Northern Advanced Manufacturing Industry Group (NAMIG) and other initiatives
• Establish a range of new initiatives to develop the digital content and screen industries in South Australia
• Deliver $1 million in export grants to South Australia’s small to medium enterprises via the Market Access Program
• Complete master planning for the Science Park precinct, located at Tonsley Park
• Maximise the economic benefit to the state through the Investment and Innovation Fund for South Australia
• Expand the relationship of Industry Capability Network SA with the defence and resources sectors to gain access for South Australian companies to major projects at Prominent Hill, Roxby Downs and Techport Australia
• Secure the South Australian based Carnegie Mellon Software Engineering Institute under the University City Project
• Support the development of regional industries through the Regional Infrastructure Development Fund and the Upper Spencer Gulf and Outback Enterprise Zone fund
• Assist South Australian businesses to export for the first time through the TradeStart program
• Identify and champion initiatives to reduce business-related red tape and enhance South Australia’s business competitiveness in line with South Australia’s Strategic Plan target to reduce government red tape by at least 25 per cent by July 2008
• Increase the uptake of the full range of visa options for migrants to South Australia
• Strengthen and increase South Australia’s competitive position against other states for interstate and overseas migrants
• Implement pilot projects which are critical to the successful achievement of South Australia’s Strategic Plan targets and the expansion of capacity in regional communities
• Expand the Young Indigenous Entrepreneurs Program into additional regional centres
• Host the Defence and Industry Conference in Adelaide in August 2007
• Australia-India International Trade and Investment Conference to be held in January 2008
• Small Business Month 2007 to be held in October • Progress negotiations on the development of a desalination
plant in the Upper Spencer Gulf with BHP Billiton • Launch of the Bollywood film ‘Love Story 2050’ and major
trade and investment promotions in India
• Established a dedicated team to facilitate BHP Billiton’s proposed $7 billion Olympic Dam expansion
• Delivered $1 million in export grants to 312 of South Australia’s small to medium enterprises via the Market Access Program
• Regional Development Infrastructure Fund and Upper Spencer Gulf and Outback Enterprise Zone Fund assisted in the realisation of projects in regional areas in excess of $122 million
• Supported the development of Skills for South Australia – Building on Strong Foundations addressing workforce development issues and committing $52.1 million in defence, mineral resources, manufacturing and construction sectors
• Supported General Motors Holden with $3.4 million to assist research and development focused on reducing vehicle emissions
• Commenced development of a significant Rural Town Development Fund project with the Port Augusta City Council
• Released Innovation Commercialisation and Development Grants assisting small to medium enterprises to commercialise and finance new products and services
• Delivered the Investment and Innovation Fund for South Australia
• Developed a state investment attraction strategy with a focus on the target sectors of resources, defence, information and communication technology (ICT) and services
• Launched South Australia’s Aviation Strategy and worked to attract additional air services to South Australia
• Established an agreement with the Commonwealth to proceed with a business case for establishing a Software Engineering Institute (Aust) in South Australia
• Feasibility study developed for a Secure Electronic Common User Facility in South Australia
• Supported Stewart & Stevenson’s bid for Land 121 • Established the Mineral Resources and Heavy Engineering
Skills Centre • Developed the Centre for Innovation to increase the success
rate of commercialisation processes in South Australia, and to leverage access to other state and Commonwealth programs
• Supported the case for the Army to establish a new Mechanised Battalion at Edinburgh
• Secured Harley Davidson as the new operator of the former Castalloy plant at North Plympton
• Increased the number of manufacturers engaged in green manufacturing
• Established the Competitiveness Council to drive an agenda of decreasing business compliance costs across government (reducing red tape)
• Collaboratively supported the ongoing supply of competitively priced industrial land and related infrastructure through the development of an Industrial Land Strategy and planning studies for Greater Edinburgh Parks, Northern Lefevre Peninsula, Thebarton Biotechnology and Advanced Manufacturing Precinct and Science Park (Bedford Park)
• Established a government-wide Case Management Framework • Developed the relationship between Industry Capability
Network SA and the defence and resources sectors to promote SA capability
• Established a memorandum of understanding between South Australia and Regione Apulia Italy underpinned by trade, cultural and research and development activities
2.6
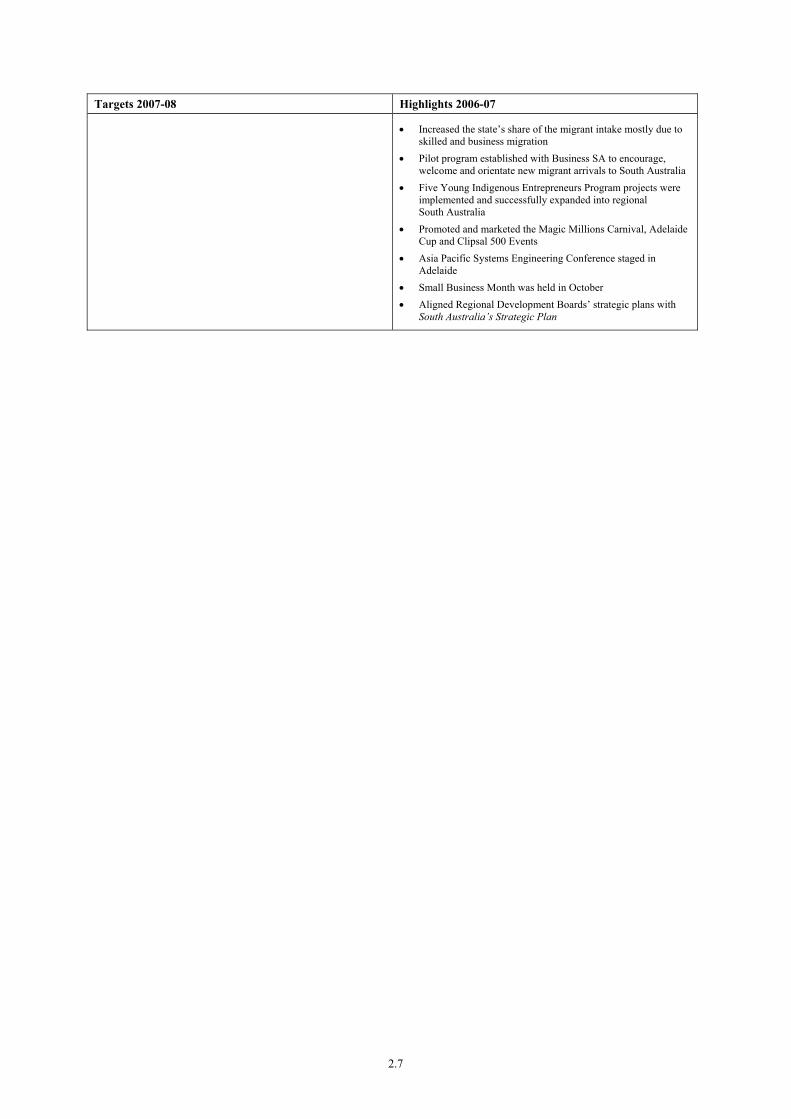
Targets 2007-08 Highlights 2006-07
• Increased the state’s share of the migrant intake mostly due to skilled and business migration
• Pilot program established with Business SA to encourage, welcome and orientate new migrant arrivals to South Australia
• Five Young Indigenous Entrepreneurs Program projects were implemented and successfully expanded into regional South Australia
• Promoted and marketed the Magic Millions Carnival, Adelaide Cup and Clipsal 500 Events
• Asia Pacific Systems Engineering Conference staged in Adelaide
• Small Business Month was held in October • Aligned Regional Development Boards’ strategic plans with
South Australia’s Strategic Plan
2.7

Program net cost of services summary
Net Cost of Services
2007-08Budget
2006-07Estimated result
2006-07 Budget
2005-06 Actual
Program $000 $000 $000 $000 1. Economic Strategy and Policy
Development .............................................. 6 058 4 585 5 306 4 610
2. Defence Industry Development .................. 5 489 5 263 5 138 6 487 3. Business Growth ........................................ 9 674 10 583 9 379 7 419 4. International Market Development............. 9 714 8 334 8 800 8 154 5. Investment Attraction ................................. 5 685 5 205 6 385 2 619 6. Corporate Leadership, Governance and Support ....................................................... 10 546 9 639 9 799 6 837
7. Small Business Growth .............................. 2 862 4 072 2 824 5 629 8. Regional Development ............................... 11 659 13 190 12 311 10 079 9. Population and Migration ........................... 8 012 7 235 6 683 7 410
Total 69 699 68 106 66 625 59 244
Reconciliation to agency net cost of providing services (as per agency Summary income statement)
Add: Net cost of programs/functions transferred out
Minister’s Office transferred to the Department of Primary Industries and Resources ................................................... — — — 1 079
Subtotal — — — 1 079 Less: Net cost of programs/functions transferred in
Immigration SA and Population Policy Unit transferred from the Department of the Premier and Cabinet ............................. — — — 979
Restructure of the Department for Administrative and Information Services... — 188 377 350
Equals: Net cost of providing services (as per agency Summary income statement)
69 699 67 918 66 248 58 994
2.8
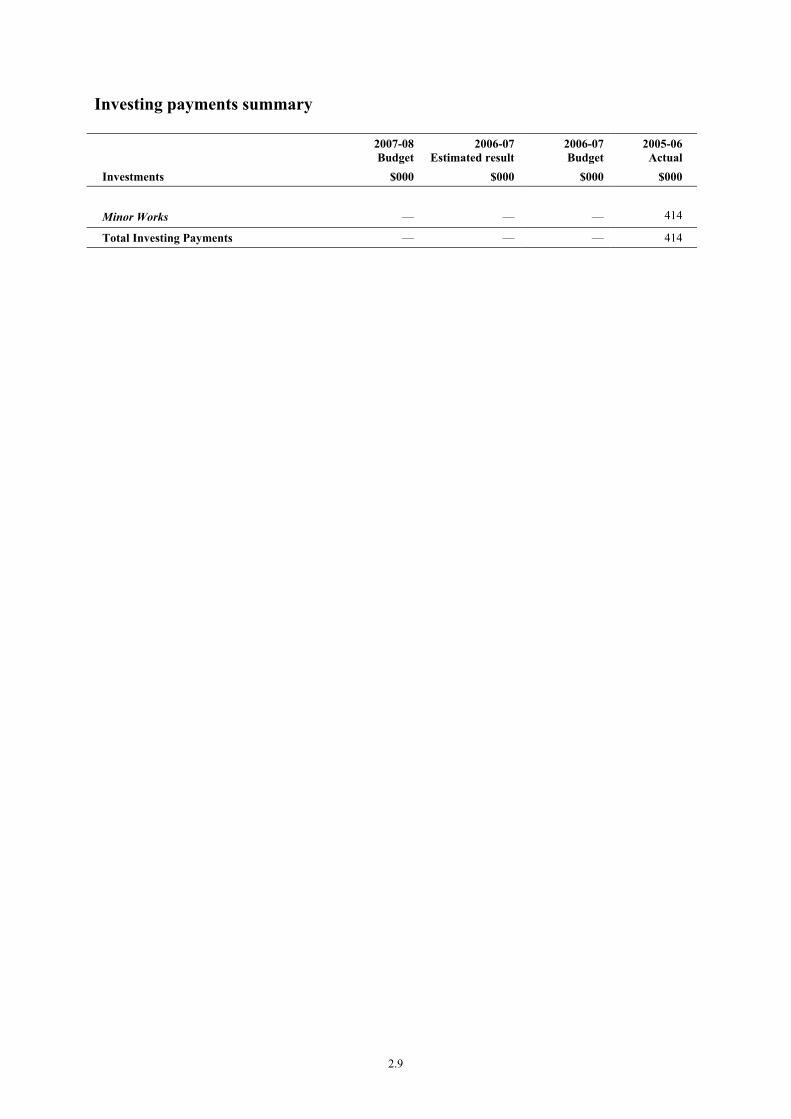
Investing payments summary
2007-08Budget
2006-07Estimated result
2006-07 Budget
2005-06 Actual
Investments $000 $000 $000 $000
Minor Works — — — 414
Total Investing Payments — — — 414
2.9
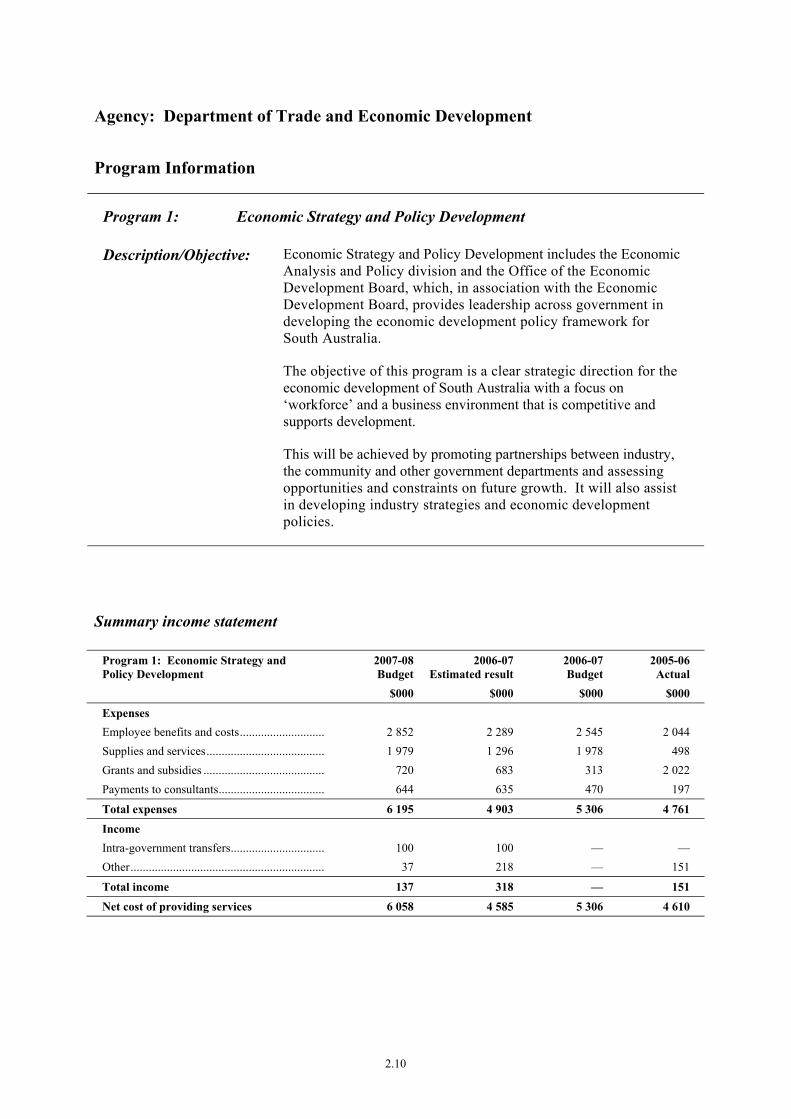
Agency: Department of Trade and Economic Development
Program Information
Program 1: Economic Strategy and Policy Development
Description/Objective: Economic Strategy and Policy Development includes the Economic Analysis and Policy division and the Office of the Economic Development Board, which, in association with the Economic Development Board, provides leadership across government in developing the economic development policy framework for South Australia.
The objective of this program is a clear strategic direction for the economic development of South Australia with a focus on ‘workforce’ and a business environment that is competitive and supports development.
This will be achieved by promoting partnerships between industry, the community and other government departments and assessing opportunities and constraints on future growth. It will also assist in developing industry strategies and economic development policies.
Summary income statement
Program 1: Economic Strategy and Policy Development
2007-08Budget
2006-07Estimated result
2006-07 Budget
2005-06 Actual
$000 $000 $000 $000
Expenses Employee benefits and costs............................. 2 852 2 289 2 545 2 044 Supplies and services........................................ 1 979 1 296 1 978 498 Grants and subsidies ......................................... 720 683 313 2 022 Payments to consultants.................................... 644 635 470 197
Total expenses 6 195 4 903 5 306 4 761
Income Intra-government transfers................................ 100 100 — — Other................................................................. 37 218 — 151
Total income 137 318 — 151
Net cost of providing services 6 058 4 585 5 306 4 610
2.10
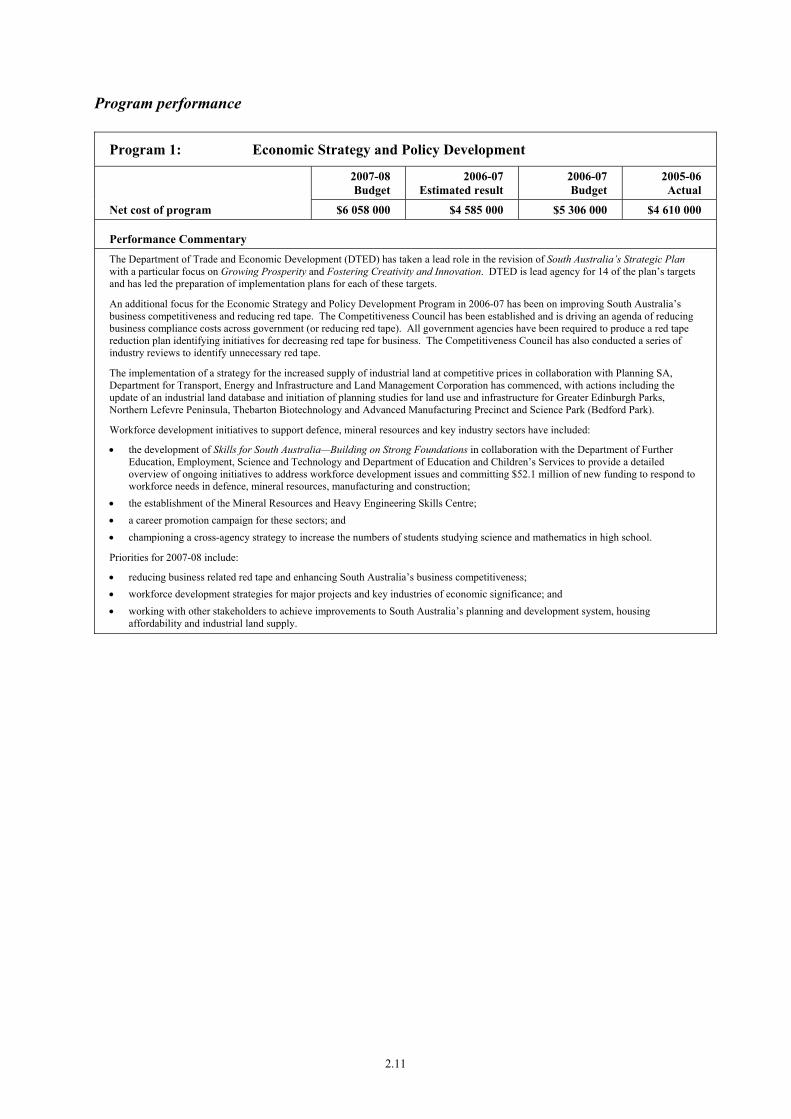
Program performance
Program 1: Economic Strategy and Policy Development
2007-08 Budget
2006-07 Estimated result
2006-07 Budget
2005-06 Actual
Net cost of program $6 058 000 $4 585 000 $5 306 000 $4 610 000
Performance Commentary The Department of Trade and Economic Development (DTED) has taken a lead role in the revision of South Australia’s Strategic Plan with a particular focus on Growing Prosperity and Fostering Creativity and Innovation. DTED is lead agency for 14 of the plan’s targets and has led the preparation of implementation plans for each of these targets.
An additional focus for the Economic Strategy and Policy Development Program in 2006-07 has been on improving South Australia’s business competitiveness and reducing red tape. The Competitiveness Council has been established and is driving an agenda of reducing business compliance costs across government (or reducing red tape). All government agencies have been required to produce a red tape reduction plan identifying initiatives for decreasing red tape for business. The Competitiveness Council has also conducted a series of industry reviews to identify unnecessary red tape.
The implementation of a strategy for the increased supply of industrial land at competitive prices in collaboration with Planning SA, Department for Transport, Energy and Infrastructure and Land Management Corporation has commenced, with actions including the update of an industrial land database and initiation of planning studies for land use and infrastructure for Greater Edinburgh Parks, Northern Lefevre Peninsula, Thebarton Biotechnology and Advanced Manufacturing Precinct and Science Park (Bedford Park).
Workforce development initiatives to support defence, mineral resources and key industry sectors have included:
• the development of Skills for South Australia—Building on Strong Foundations in collaboration with the Department of Further Education, Employment, Science and Technology and Department of Education and Children’s Services to provide a detailed overview of ongoing initiatives to address workforce development issues and committing $52.1 million of new funding to respond to workforce needs in defence, mineral resources, manufacturing and construction;
• the establishment of the Mineral Resources and Heavy Engineering Skills Centre; • a career promotion campaign for these sectors; and • championing a cross-agency strategy to increase the numbers of students studying science and mathematics in high school.
Priorities for 2007-08 include:
• reducing business related red tape and enhancing South Australia’s business competitiveness; • workforce development strategies for major projects and key industries of economic significance; and • working with other stakeholders to achieve improvements to South Australia’s planning and development system, housing
affordability and industrial land supply.
2.11

AGENCY: DEPARTMENT OF TRADE AND ECONOMIC DEVELOPMENT
Program Information
Program 2: Defence Industry Development
Description/Objective: This program consists of the Government of South Australia’s Defence Unit, which assists the Defence Industry Advisory Board in the development and implementation of strategies to further grow defence business opportunities in South Australia.
The objective of this program is to double defence industry contribution to Gross State Product and increase defence employment in South Australia over the coming decade.
To achieve these goals the Defence Unit will focus policy initiatives on a detailed plan to help industry take advantage of defence business opportunities. This plan focuses on the four defence sectors — naval, land force, aerospace and electronics, as well as identifying strategic workforce development requirements within the South Australian defence industry.
Summary income statement
Program 2: Defence Industry Development
2007-08Budget
2006-07Estimated result
2006-07 Budget
2005-06 Actual
$000 $000 $000 $000
Expenses Employee benefits and costs............................. 1 048 886 1 128 726 Supplies and services........................................ 2 915 2 197 1 596 2 194 Grants and subsidies ......................................... 1 502 1 738 1 871 2 970 Payments to consultants.................................... 24 442 543 942
Total expenses 5 489 5 263 5 138 6 832
Income Other................................................................. — — — 345
Total income — — — 345
Net cost of providing services 5 489 5 263 5 138 6 487
2.12
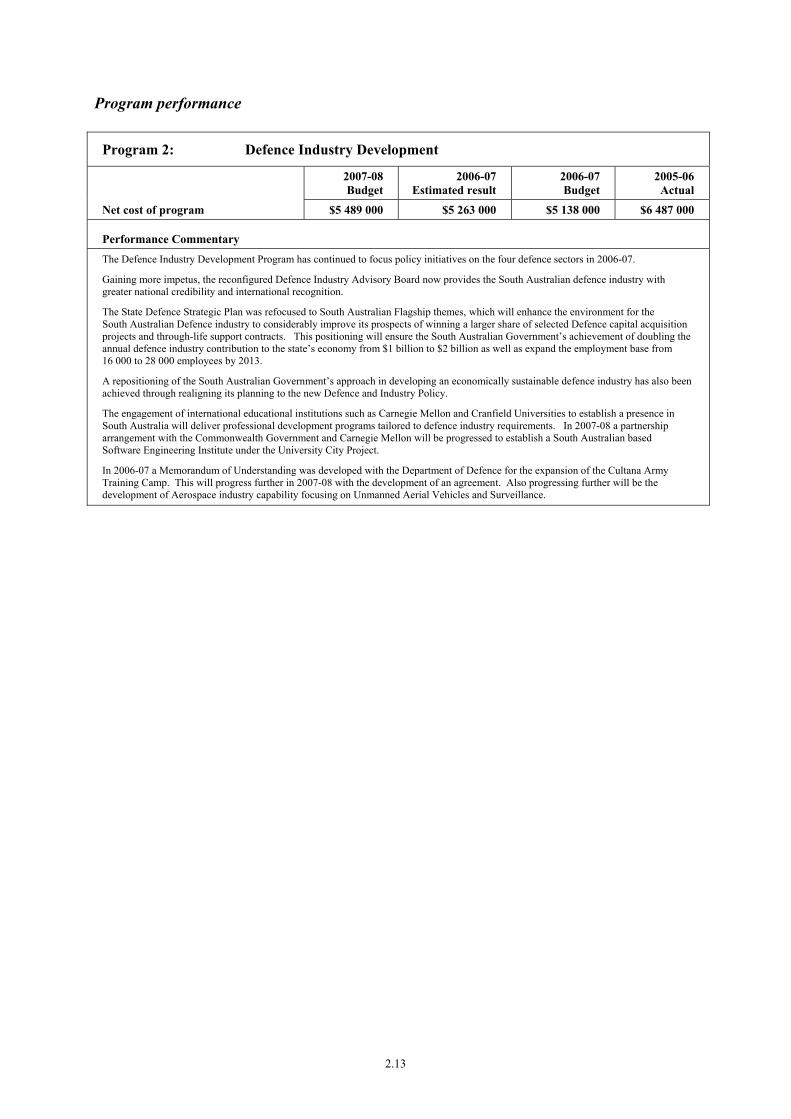
Program performance
Program 2: Defence Industry Development
2007-08 Budget
2006-07 Estimated result
2006-07 Budget
2005-06 Actual
Net cost of program $5 489 000 $5 263 000 $5 138 000 $6 487 000
Performance Commentary The Defence Industry Development Program has continued to focus policy initiatives on the four defence sectors in 2006-07.
Gaining more impetus, the reconfigured Defence Industry Advisory Board now provides the South Australian defence industry with greater national credibility and international recognition.
The State Defence Strategic Plan was refocused to South Australian Flagship themes, which will enhance the environment for the South Australian Defence industry to considerably improve its prospects of winning a larger share of selected Defence capital acquisition projects and through-life support contracts. This positioning will ensure the South Australian Government’s achievement of doubling the annual defence industry contribution to the state’s economy from $1 billion to $2 billion as well as expand the employment base from 16 000 to 28 000 employees by 2013.
A repositioning of the South Australian Government’s approach in developing an economically sustainable defence industry has also been achieved through realigning its planning to the new Defence and Industry Policy.
The engagement of international educational institutions such as Carnegie Mellon and Cranfield Universities to establish a presence in South Australia will deliver professional development programs tailored to defence industry requirements. In 2007-08 a partnership arrangement with the Commonwealth Government and Carnegie Mellon will be progressed to establish a South Australian based Software Engineering Institute under the University City Project.
In 2006-07 a Memorandum of Understanding was developed with the Department of Defence for the expansion of the Cultana Army Training Camp. This will progress further in 2007-08 with the development of an agreement. Also progressing further will be the development of Aerospace industry capability focusing on Unmanned Aerial Vehicles and Surveillance.
2.13

AGENCY: DEPARTMENT OF TRADE AND ECONOMIC DEVELOPMENT
Program Information
Program 3: Business Growth
Description/Objective: Business Growth is made up of the Manufacturing and Business Services division which includes the Office of Manufacturing, who in association with the Manufacturing Consultative Council, contribute to the competitiveness and growth of the manufacturing and trade services sectors, the Centre for Innovation and the Industry Capability Network SA.
The goal of this program is to promote a competitive and vibrant manufacturing and trade services sector and work with industry and other stakeholders in addressing issues and promoting growth.
This will be achieved by promoting the development and uptake of new technologies in partnership with tertiary institutions, facilitating import replacement, and maximising Australian content in major investment projects and developing and implementing the strategy for manufacturing.
Summary income statement
Program 3: Business Growth 2007-08Budget
2006-07Estimated result
2006-07 Budget
2005-06 Actual
$000 $000 $000 $000
Expenses Employee benefits and costs............................. 2 857 2 855 2 806 2 622 Supplies and services........................................ 1 895 2 223 1 980 2 142 Grants and subsidies ......................................... 4 742 5 804 4 293 2 706 Payments to consultants.................................... 200 67 300 123
Total expenses 9 694 10 949 9 379 7 593
Income Other................................................................. 20 366 — 174
Total income 20 366 — 174
Net cost of providing services 9 674 10 583 9 379 7 419
2.14

Program performance
Program 3: Business Growth
2007-08 Budget
2006-07 Estimated result
2006-07 Budget
2005-06 Actual
Net cost of program $9 674 000 $10 583 000 $9 379 000 $7 419 000
Performance Commentary Completed Stage One occupancy of Edinburgh Parks with 16 companies now established.
Developed the capability of the Centre for Innovation offices in Mawson Lakes and Science Park and their working relationship with DTED’s Centre for Innovation hub.
Delivered a comprehensive Growing Global Business Program for the ICT and Creative Industry sectors. The program ranges from widely available workshops attended by over 500 people, to programs tailored to the needs of over 60 rapid growth companies covering areas such as marketing, strategic planning, leadership and managing growth.
Facilitated participation by 11 South Australian companies in the national ICT CeBIT exhibition and participation by four South Australian companies in the Anzatech Gateway program marketing to the US and supporting companies participating in the Hong Kong ICT Expo.
Conducted a wide range of awareness raising forums covering specialist areas and international developments, which were attended by over 1700 people and registered a satisfaction rating of over 85 per cent.
Introduced the Innovation Commercialisation and Development Grants to assist small to medium enterprises to develop and finance new products and services to bring them to market.
Delivered a range of Product Development Programs covering creating and filtering new ideas, improving product development processes and case studies utilising local businesses to demonstrate innovation and best practice. Over 100 companies have been assisted through these programs.
Introduced the Innovation Showcase Program enabling local businesses to carry out on-site visits to exemplar companies and apply the learning to their own situation. Over 80 companies have been assisted through this program.
The TechFast Program aimed at linking business with research has formally engaged ten companies to commercialise technology from Australian universities and research institutions.
Established the Lean Education and Application Network to promote, with support of a key stakeholder group including Cardiff University and the Fraunhofer Institute, lean techniques to manufacturing and service industries in South Australia.
Assisted over 50 companies in implementing lean manufacturing and process engineering improvement techniques.
Delivery of the Quick Change Over competition with 31 participating companies and generating savings of over $9 million to industry.
Facilitated over $22 million of business to South Australian companies via the Industry Capability Network SA promoting local participation in major South Australian projects.
2.15
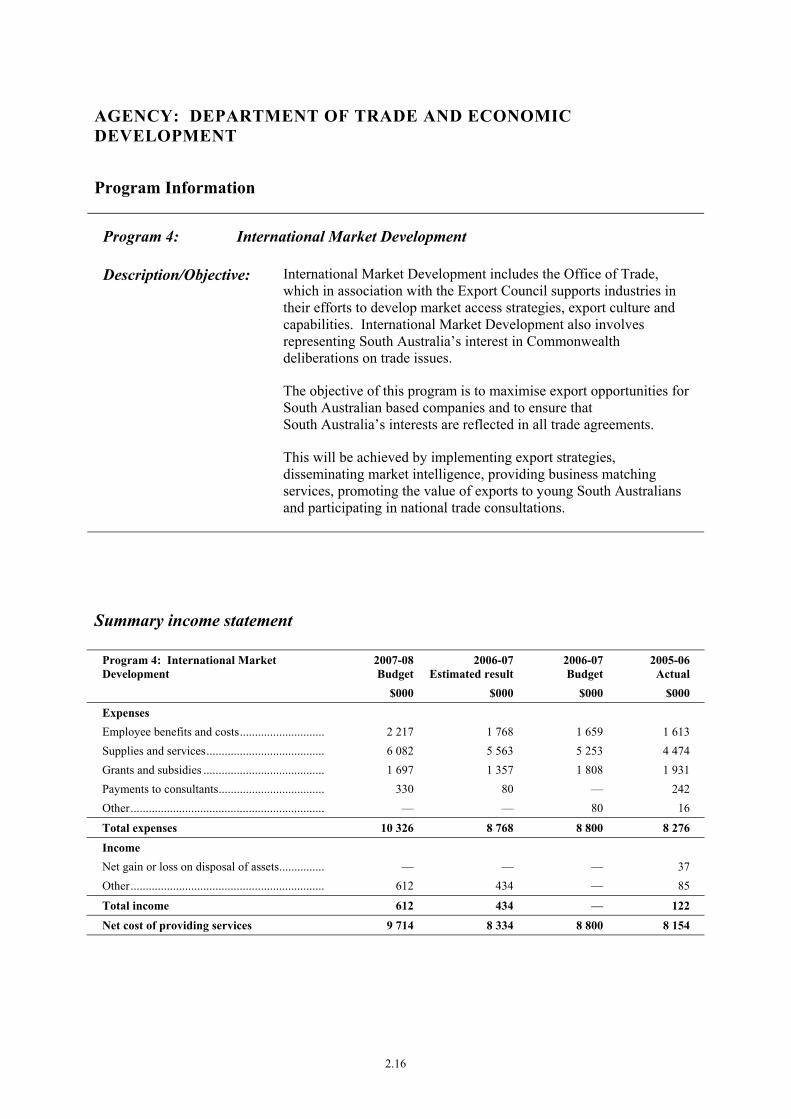
AGENCY: DEPARTMENT OF TRADE AND ECONOMIC DEVELOPMENT
Program Information
Program 4: International Market Development
Description/Objective: International Market Development includes the Office of Trade, which in association with the Export Council supports industries in their efforts to develop market access strategies, export culture and capabilities. International Market Development also involves representing South Australia’s interest in Commonwealth deliberations on trade issues.
The objective of this program is to maximise export opportunities for South Australian based companies and to ensure that South Australia’s interests are reflected in all trade agreements.
This will be achieved by implementing export strategies, disseminating market intelligence, providing business matching services, promoting the value of exports to young South Australians and participating in national trade consultations.
Summary income statement
Program 4: International Market Development
2007-08Budget
2006-07Estimated result
2006-07 Budget
2005-06 Actual
$000 $000 $000 $000
Expenses Employee benefits and costs............................. 2 217 1 768 1 659 1 613 Supplies and services........................................ 6 082 5 563 5 253 4 474 Grants and subsidies ......................................... 1 697 1 357 1 808 1 931 Payments to consultants.................................... 330 80 — 242 Other................................................................. — — 80 16
Total expenses 10 326 8 768 8 800 8 276
Income Net gain or loss on disposal of assets................ — — — 37 Other................................................................. 612 434 — 85
Total income 612 434 — 122
Net cost of providing services 9 714 8 334 8 800 8 154
2.16
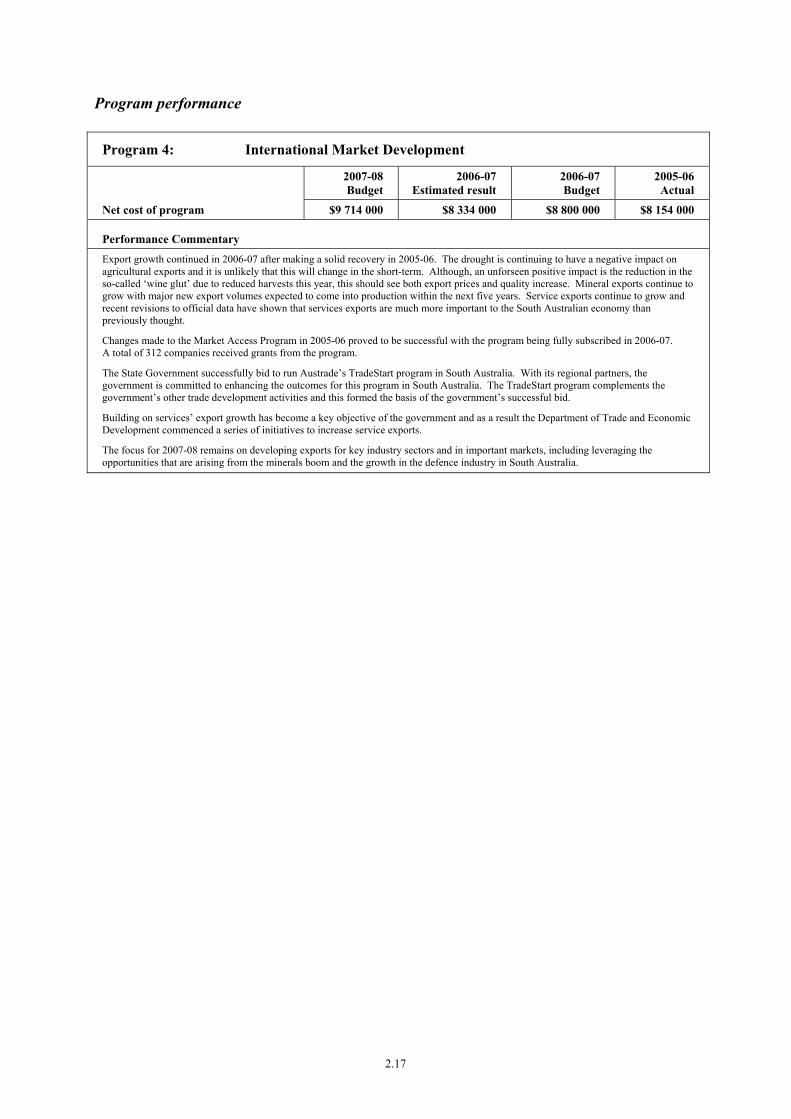
Program performance
Program 4: International Market Development
2007-08 Budget
2006-07 Estimated result
2006-07 Budget
2005-06 Actual
Net cost of program $9 714 000 $8 334 000 $8 800 000 $8 154 000
Performance Commentary Export growth continued in 2006-07 after making a solid recovery in 2005-06. The drought is continuing to have a negative impact on agricultural exports and it is unlikely that this will change in the short-term. Although, an unforseen positive impact is the reduction in the so-called ‘wine glut’ due to reduced harvests this year, this should see both export prices and quality increase. Mineral exports continue to grow with major new export volumes expected to come into production within the next five years. Service exports continue to grow and recent revisions to official data have shown that services exports are much more important to the South Australian economy than previously thought.
Changes made to the Market Access Program in 2005-06 proved to be successful with the program being fully subscribed in 2006-07. A total of 312 companies received grants from the program.
The State Government successfully bid to run Austrade’s TradeStart program in South Australia. With its regional partners, the government is committed to enhancing the outcomes for this program in South Australia. The TradeStart program complements the government’s other trade development activities and this formed the basis of the government’s successful bid.
Building on services’ export growth has become a key objective of the government and as a result the Department of Trade and Economic Development commenced a series of initiatives to increase service exports.
The focus for 2007-08 remains on developing exports for key industry sectors and in important markets, including leveraging the opportunities that are arising from the minerals boom and the growth in the defence industry in South Australia.
2.17
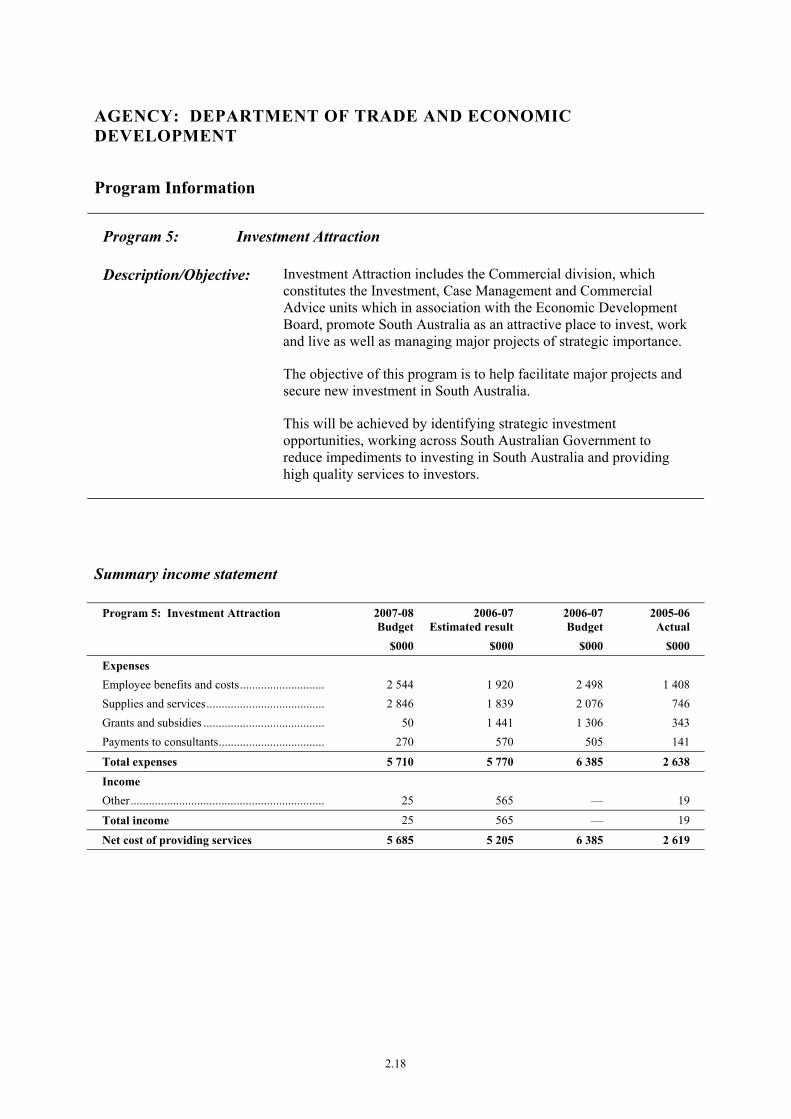
AGENCY: DEPARTMENT OF TRADE AND ECONOMIC DEVELOPMENT
Program Information
Program 5: Investment Attraction
Description/Objective: Investment Attraction includes the Commercial division, which constitutes the Investment, Case Management and Commercial Advice units which in association with the Economic Development Board, promote South Australia as an attractive place to invest, work and live as well as managing major projects of strategic importance.
The objective of this program is to help facilitate major projects and secure new investment in South Australia.
This will be achieved by identifying strategic investment opportunities, working across South Australian Government to reduce impediments to investing in South Australia and providing high quality services to investors.
Summary income statement
Program 5: Investment Attraction 2007-08Budget
2006-07Estimated result
2006-07 Budget
2005-06 Actual
$000 $000 $000 $000
Expenses Employee benefits and costs............................. 2 544 1 920 2 498 1 408 Supplies and services........................................ 2 846 1 839 2 076 746 Grants and subsidies ......................................... 50 1 441 1 306 343 Payments to consultants.................................... 270 570 505 141
Total expenses 5 710 5 770 6 385 2 638
Income Other................................................................. 25 565 — 19
Total income 25 565 — 19
Net cost of providing services 5 685 5 205 6 385 2 619
2.18
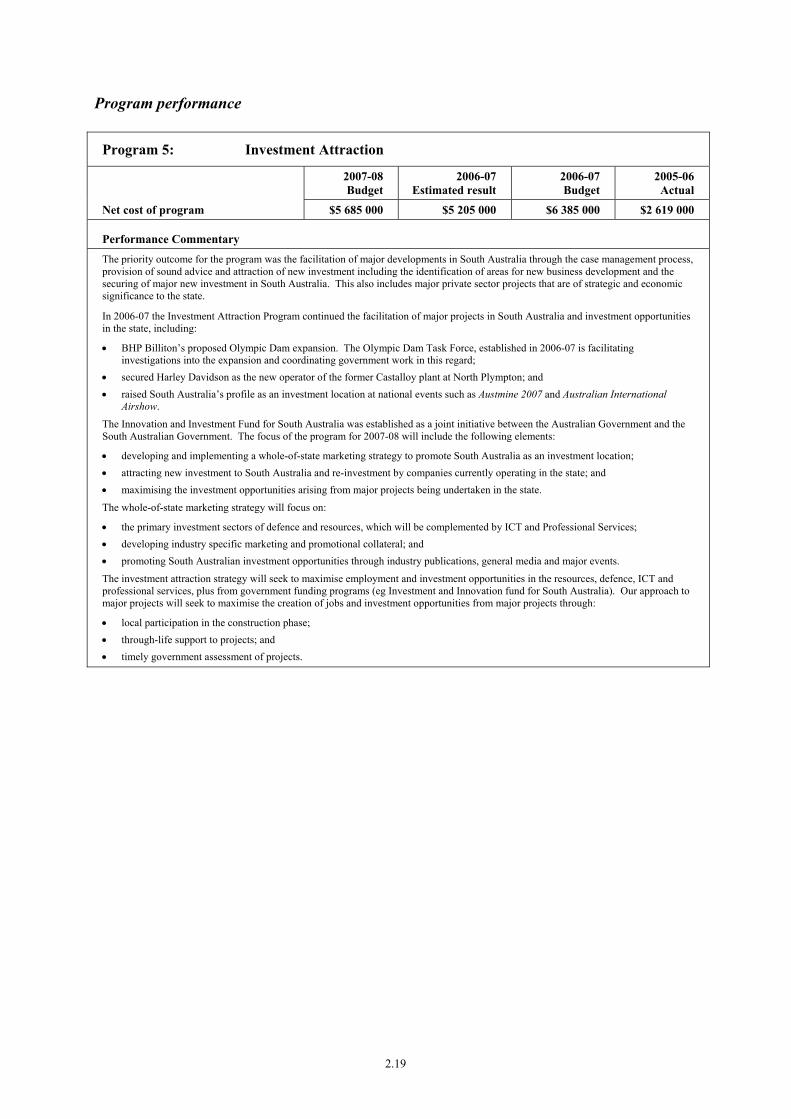
Program performance
Program 5: Investment Attraction
2007-08 Budget
2006-07 Estimated result
2006-07 Budget
2005-06 Actual
Net cost of program $5 685 000 $5 205 000 $6 385 000 $2 619 000
Performance Commentary The priority outcome for the program was the facilitation of major developments in South Australia through the case management process, provision of sound advice and attraction of new investment including the identification of areas for new business development and the securing of major new investment in South Australia. This also includes major private sector projects that are of strategic and economic significance to the state.
In 2006-07 the Investment Attraction Program continued the facilitation of major projects in South Australia and investment opportunities in the state, including:
• BHP Billiton’s proposed Olympic Dam expansion. The Olympic Dam Task Force, established in 2006-07 is facilitating investigations into the expansion and coordinating government work in this regard;
• secured Harley Davidson as the new operator of the former Castalloy plant at North Plympton; and • raised South Australia’s profile as an investment location at national events such as Austmine 2007 and Australian International
Airshow.
The Innovation and Investment Fund for South Australia was established as a joint initiative between the Australian Government and the South Australian Government. The focus of the program for 2007-08 will include the following elements:
• developing and implementing a whole-of-state marketing strategy to promote South Australia as an investment location; • attracting new investment to South Australia and re-investment by companies currently operating in the state; and • maximising the investment opportunities arising from major projects being undertaken in the state.
The whole-of-state marketing strategy will focus on:
• the primary investment sectors of defence and resources, which will be complemented by ICT and Professional Services; • developing industry specific marketing and promotional collateral; and • promoting South Australian investment opportunities through industry publications, general media and major events.
The investment attraction strategy will seek to maximise employment and investment opportunities in the resources, defence, ICT and professional services, plus from government funding programs (eg Investment and Innovation fund for South Australia). Our approach to major projects will seek to maximise the creation of jobs and investment opportunities from major projects through:
• local participation in the construction phase; • through-life support to projects; and • timely government assessment of projects.
2.19
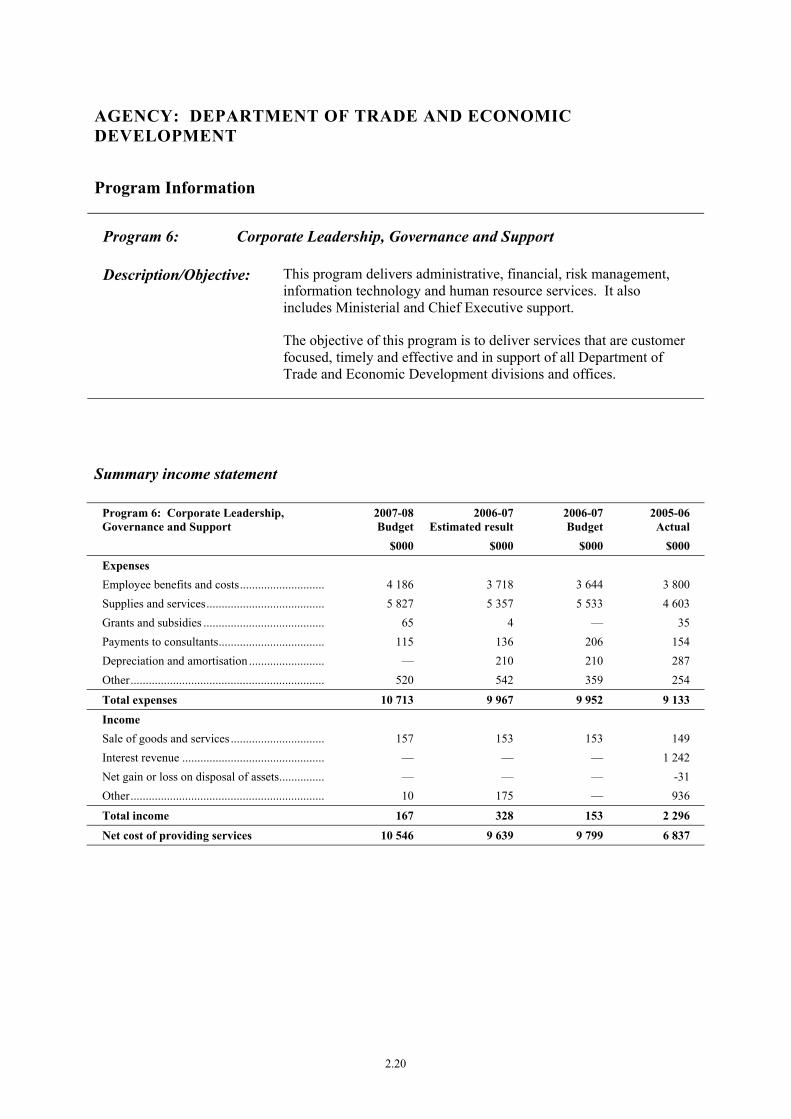
AGENCY: DEPARTMENT OF TRADE AND ECONOMIC DEVELOPMENT
Program Information
Program 6: Corporate Leadership, Governance and Support
Description/Objective: This program delivers administrative, financial, risk management, information technology and human resource services. It also includes Ministerial and Chief Executive support.
The objective of this program is to deliver services that are customer focused, timely and effective and in support of all Department of Trade and Economic Development divisions and offices.
Summary income statement
Program 6: Corporate Leadership, Governance and Support
2007-08Budget
2006-07Estimated result
2006-07 Budget
2005-06 Actual
$000 $000 $000 $000
Expenses Employee benefits and costs............................. 4 186 3 718 3 644 3 800 Supplies and services........................................ 5 827 5 357 5 533 4 603 Grants and subsidies ......................................... 65 4 — 35 Payments to consultants.................................... 115 136 206 154 Depreciation and amortisation .......................... — 210 210 287 Other................................................................. 520 542 359 254
Total expenses 10 713 9 967 9 952 9 133
Income Sale of goods and services................................ 157 153 153 149 Interest revenue ................................................ — — — 1 242 Net gain or loss on disposal of assets................ — — — -31 Other................................................................. 10 175 — 936
Total income 167 328 153 2 296
Net cost of providing services 10 546 9 639 9 799 6 837
2.20
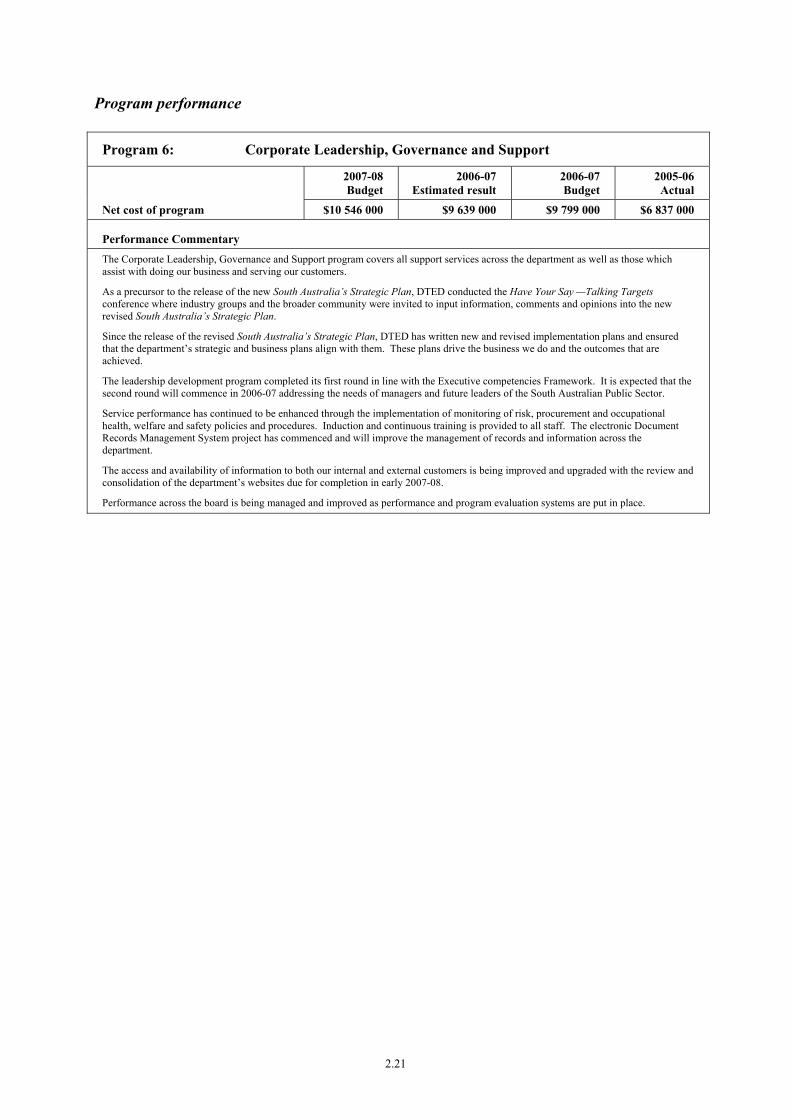
Program performance
Program 6: Corporate Leadership, Governance and Support
2007-08 Budget
2006-07 Estimated result
2006-07 Budget
2005-06 Actual
Net cost of program $10 546 000 $9 639 000 $9 799 000 $6 837 000
Performance Commentary The Corporate Leadership, Governance and Support program covers all support services across the department as well as those which assist with doing our business and serving our customers.
As a precursor to the release of the new South Australia’s Strategic Plan, DTED conducted the Have Your Say —Talking Targets conference where industry groups and the broader community were invited to input information, comments and opinions into the new revised South Australia’s Strategic Plan.
Since the release of the revised South Australia’s Strategic Plan, DTED has written new and revised implementation plans and ensured that the department’s strategic and business plans align with them. These plans drive the business we do and the outcomes that are achieved.
The leadership development program completed its first round in line with the Executive competencies Framework. It is expected that the second round will commence in 2006-07 addressing the needs of managers and future leaders of the South Australian Public Sector.
Service performance has continued to be enhanced through the implementation of monitoring of risk, procurement and occupational health, welfare and safety policies and procedures. Induction and continuous training is provided to all staff. The electronic Document Records Management System project has commenced and will improve the management of records and information across the department.
The access and availability of information to both our internal and external customers is being improved and upgraded with the review and consolidation of the department’s websites due for completion in early 2007-08.
Performance across the board is being managed and improved as performance and program evaluation systems are put in place.
2.21

AGENCY: DEPARTMENT OF TRADE AND ECONOMIC DEVELOPMENT
Program Information
Program 7: Small Business Growth
Description/Objective: This program includes the Office of Small Business, which supports the Small Business Development Council and provides Small Business Advocate services and emergency management response. It also includes small business services provided by the Business Development Services division and working with the various Business Enterprise Centres in delivering services to small business.
The objective of the Small Business program is to ensure that small business issues are represented at the State Government level and that their interests are taken into account in the delivery of programs or development of policies.
Through partnerships and networks, this program will deliver advice and training on business management and skills, on the ground support in emergencies and the promotion of small business in South Australia.
Summary income statement
Program 7: Small Business Growth 2007-08Budget
2006-07Estimated result
2006-07 Budget
2005-06 Actual
$000 $000 $000 $000
Expenses Employee benefits and costs............................. 1 351 1 389 1 208 1 214 Supplies and services........................................ 1 511 1 464 1 600 1 786 Grants and subsidies ......................................... 177 1 445 65 2 721 Payments to consultants.................................... 13 5 21 23
Total expenses 3 052 4 303 2 894 5 744
Income Sales of goods and services .............................. — — 70 — Other................................................................. 190 231 — 115
Total income 190 231 70 115
Net cost of providing services 2 862 4 072 2 824 5 629
2.22

Program performance
Program 7: Small Business Growth
2007-08 Budget
2006-07 Estimated result
2006-07 Budget
2005-06 Actual
Net cost of program $2 862 000 $4 072 000 $2 824 000 $5 629 000
Performance Commentary The Small Business Development Council initiative, SA Small Business Month 2006 was held in October 2006. Small Business Month 2007 will be held in October 2007.
The event will include a high number of workshops and information sessions delivered across metropolitan and regional South Australia. The event will be held in collaboration with the Business Enterprise Centre (BEC) Network and the Regional Development Boards.
BEC Managers and Business Advisers have continued to receive comprehensive training during the second year of the funding agreements to assist in the delivery of quality services to clients.
For the 2006-07 year, BECs in South Australia have:
• provided advice and assistance to 3000 target enterprises; • enrolled 180 businesses in the Business Owners’ Coaching Program; • facilitated 40 Better Business Series (BBS) workshops attended by 480 attendees; • facilitated 100 Starting Your Own Business (SYOB) workshops attended by 1500 participants; • engaged in 45 000 telephone contacts; • assisted 250 new businesses to become established; • assisted in the creation of 250 full time jobs; • assisted in the creation of 75 part time jobs; • referred 50 businesses to DTED Specialist Services; • facilitated 3000 people at training programs other than KPI programs; and • provided 800 Business Licence Information Service (BLIS) packages.
In addition to the programs delivered by BECs, DTED continues to deliver workshops and services to small businesses. Services delivered and assistance provided include:
• delivery of 250 BBS workshops attended by 3750 participants; • 80 Business Development skills workshops attended by 800 participants; • fielding 8000 telephone calls for information services; • provision of 7000 SYOB and information kits to enquirers; and • provision of 2500 BLIS packages.
2.23

AGENCY: DEPARTMENT OF TRADE AND ECONOMIC DEVELOPMENT
Program Information
Program 8: Regional Development
Description/Objective: Regional Development includes the Office of Regional Affairs, which in association with the Regional Communities Consultative Council and the Regional Development Board network actively promotes sustainable development of regional communities in South Australia.
The objective of this program is to improve economic, social and environmental wellbeing in South Australia’s regions.
This will be achieved by working in partnership with the three spheres of government and local communities, in addition to the enhancement of community and business capacity and the improved coordination of government activities impacting on regions.
Summary income statement
Program 8: Regional Development 2007-08Budget
2006-07Estimated result
2006-07 Budget
2005-06 Actual
$000 $000 $000 $000
Expenses Employee benefits and costs............................. 1 628 1 434 1 407 1 105 Supplies and services........................................ 768 663 636 464 Grants and subsidies ......................................... 8 983 10 968 10 083 8 493 Payments to consultants.................................... 320 220 260 76
Total expenses 11 699 13 285 12 386 10 138
Income Other................................................................. 40 95 75 59
Total income 40 95 75 59
Net cost of providing services 11 659 13 190 12 311 10 079
2.24

Program 8: Regional Development
2007-08 Budget
2006-07 Estimated result
2006-07 Budget
2005-06 Actual
Net cost of program $11 659 000 $13 190 000 $12 311 000 $10 079 000
Performance Commentary The Regional Development Program continues to deliver jobs and new investment into regional South Australia. Direct investment via the Regional Development Infrastructure Fund and the Upper Spencer Gulf and Outback Enterprise Zone Fund has assisted in the realisation of projects in regional areas valued in excess of $122 million.
The state’s Regional Development Board (RDB) network report that they have assisted in the facilitation of over $121 million in investment in regional South Australia with the result of more than 700 full time equivalent job outcomes.
DTED will contribute to South Australia’s Strategic Plan targets through the location of five new regionally based positions and through the on-going funding of RDB outcomes. Furthermore, a pilot project to assess feasibility for creating strategic opportunities to build capacity in regional communities will commence. Communities and stakeholders will be involved in the implementation of South Australia’s Strategic Plan targets in country South Australia through the establishment of a pilot fund. Initiatives which are expected to be in the range of possible three pilot projects supported by the fund will:
• enable regional communities to become more resilient in the face of structural changes in the economy due to drought / climate change;
• leverage the emergence of new opportunities, eg resource, defence, sustainability (such as improved water technology), market changes or new market opportunities and renewable industries;
• encourage leadership and community engagement; and • support enterprise development in Aboriginal lands.
DTED has been working with Planning SA in the development of a government-wide strategy to maintain regional South Australia’s share of the population (18 per cent), in line with Target 5.9 of South Australia’s Strategic Plan, through migrant attraction and retention and economic and community capacity development. The target will be supported by the continuing development of Olympic Dam and other mining ventures in the Northern region, as well as the development of targeted growth management plans for regional centres.
The term of the Regional Communities Consultative Council (RCCC) was extended for one year to 31 December 2007 with 19 members reappointed and two new members appointed. The RCCC continues to provide timely advice to the government on regional issues and opportunities, has had significant involvement in the update of South Australia’s Strategic Plan and made recommendations to the Minister for Regional Development on key issues including drought and native vegetation.
2.25

AGENCY: DEPARTMENT OF TRADE AND ECONOMIC DEVELOPMENT
Program Information
Program 9: Population and Migration
Description/Objective: The Population and Migration program includes Immigration SA, the Population Policy unit and Marketing — Adelaide. Make the Move and focuses on migration, fertility and ageing, intertwined with labour force and skills development.
The objective of this program is to work in partnership with the Population Advisory Group and other government agencies to meet the targets in Prosperity through People — A Population Policy for South Australia.
This will be achieved by encouraging, promoting and supporting increased overseas/interstate migration to South Australia, through positive messages about South Australia’s job opportunities, housing affordability, quality education systems, lifestyle and recreational advantages. Population Policy unit will also take a lead role across government in Prosperity through People — A Population Policy for South Australia.
Summary income statement
Program 9: Population and Migration 2007-08Budget
2006-07Estimated result
2006-07 Budget
2005-06 Actual
$000 $000 $000 $000
Expenses Employee benefits and costs............................. 1 965 1 512 1 698 1 409 Supplies and services........................................ 3 718 3 213 2 941 3 696 Grants and subsidies ......................................... 2 179 2 527 1 873 2 288 Payments to consultants.................................... 150 2 171 46
Total expenses 8 012 7 254 6 683 7 439
Income Other................................................................. — 19 — 29
Total income — 19 — 29
Net cost of providing services 8 012 7 235 6 683 7 410
2.26

Program performance
Program 9: Population and Migration
2007-08 Budget
2006-07 Estimated result
2006-07 Budget
2005-06 Actual
Net cost of program $8 012 000 $7 235 000 $6 683 000 $7 410 000
Performance Commentary The Population and Migration program in 2006-07 continued to support the population targets in South Australia’s Strategic Plan, expanded collaboration with industry on recruitment and workforce issues and increased its focus on policies to influence the state’s age profile.
South Australia’s permanent migration intake—represented by settler arrivals— improved from 2004-05 to 2005-06 by 43 per cent, from 6364 to 9099. Importantly, a large part of this increase occurred within the skilled migration streams, which increased in the same period by 87 per cent, from 2871 to 5383. Another 604 migrants were in the business skills category, itself an increase of 35 per cent from 2004-05.
From July to December 2006, a total of 5744 permanent or provisional visas were granted by the Department of Immigration and Citizenship to potential migrants seeking residence in South Australia, around 8.5 per cent of the national total. Among these, 4532 visas were for skilled and business migrants and their families (79 per cent) while 1207 were for family reunions. The number of visa grants in 2006-07 is already achieved and the ongoing level of interest in migration to South Australia indicates that the current level of growth will be maintained in 2007-08.
The state’s effective use of South Australia’s regional status for migration purposes and state-specific and Regional Migration schemes has been instrumental in this achievement. Ongoing promotion of South Australia as a migration destination has also supported this achievement. Road shows promoting migration to South Australia have taken place in key overseas markets including UK, Ireland, Netherlands, China, Korea and India.
In September 2006, Skills for South Australia—Building on Strong Foundations announced a commitment to provide better systems for international student transition to the local workforce. DTED engaged universities and key industries to discuss and begin to develop these systems.
DTED also supported the addition to South Australia’s Strategic Plan of a new population target to maintain the state’s fertility rate. In pursuit of that target, DTED drove cross-government consultation on strategies that would support South Australians to have the number of children they desire, affecting beneficial changes to the state’s age profile.
South Australia continued to make inroads to the state’s historic pattern of interstate population outflow. The interstate migration program includes the Adelaide. Make the Move campaign, which targets an audience of 30 to 45 year old, family-oriented professionals. The program has received more than 12 000 enquiries to date in response to promotional activity.
In 2006-07 the campaign increased its emphasis on skills attraction particularly by participating in skill and industry expos in other states, promoting the blend of jobs and lifestyle in South Australia.
Since January 2006 there have been 50 820 visits to the Adelaide. Make the Move homepage. Those indicating they wish to move to South Australia want to do so quickly; 82 per cent of respondents in this period have indicated that they would like to move to South Australia within the year and 15 per cent said they would like to move within three months.
In 2007-08 a project to strengthen and increase South Australia’s competitive position against other states for interstate and overseas migrants will be undertaken. It will provide a key point of differentiation for South Australia, making it a destination of choice. Initiatives will include:
• facilitating migrants into employment; • facilitating access for employers to recent arrivals; • supporting employers’ overseas and interstate recruitment efforts; and • facilitating access for new arrivals to temporary, private accommodation.
2.27

DEPARTMENT OF TRADE AND ECONOMIC DEVELOPMENT
Income statement__________________________________________________________________________________________________________________________________________________________________________________________________________________________________
2007-08Budget
$000
2006-07Estimated
result
$000
2006-07Budget
$000
2005-06Actual
$000Expenses
Employee benefits and costs — Salaries, wages, annual and sick leave ..................................... 16 196 13 615 14 469 11 610 Long service leave .................................................................... 581 515 398 419 Payroll tax ................................................................................ 997 898 778 888 Superannuation ......................................................................... 1 590 1 392 1 218 1 421 Other ......................................................................................... 1 284 1 163 1 353 1 774Supplies and services — General supplies and services .................................................. 27 541 23 815 23 593 20 391 Consultancy expenses .............................................................. 2 066 2 157 2 476 1 944Depreciation and amortisation ..................................................... — 210 210 287Grants and subsidies ..................................................................... 18 023 22 465 19 391 20 219Intra government transfers ........................................................... 2 092 3 502 2 221 3 081Other expenses ............................................................................. 520 542 439 270
Total expenses .............................................................................. 70 890 70 274 66 546 62 304
Income
Intra government transfers ........................................................... 100 100 — — Sales of goods and services .......................................................... 157 153 223 149Interest revenues ........................................................................... — — — 1 242Net gain or loss from disposal of assets ....................................... — — — 6Other income ................................................................................ 934 2 103 75 1 913
Total income ................................................................................. 1 191 2 356 298 3 310
Net cost of providing services ...................................................... 69 699 67 918 66 248 58 994
Income from / Expenses to SA Government
Income — Appropriation ........................................................................... 67 366 61 939 60 261 45 536 Other income ............................................................................ — 167 — 732
Net income from / expenses to SA Government .......................... 67 366 62 106 60 261 46 268
Net result before restructure(s) ..................................................... -2 333 -5 812 -5 987 -12 726
Net income from / expenses from administrative restructure(s) .. — — — -6 203
Net result after restructure(s) ........................................................ -2 333 -5 812 -5 987 -18 929
2.28
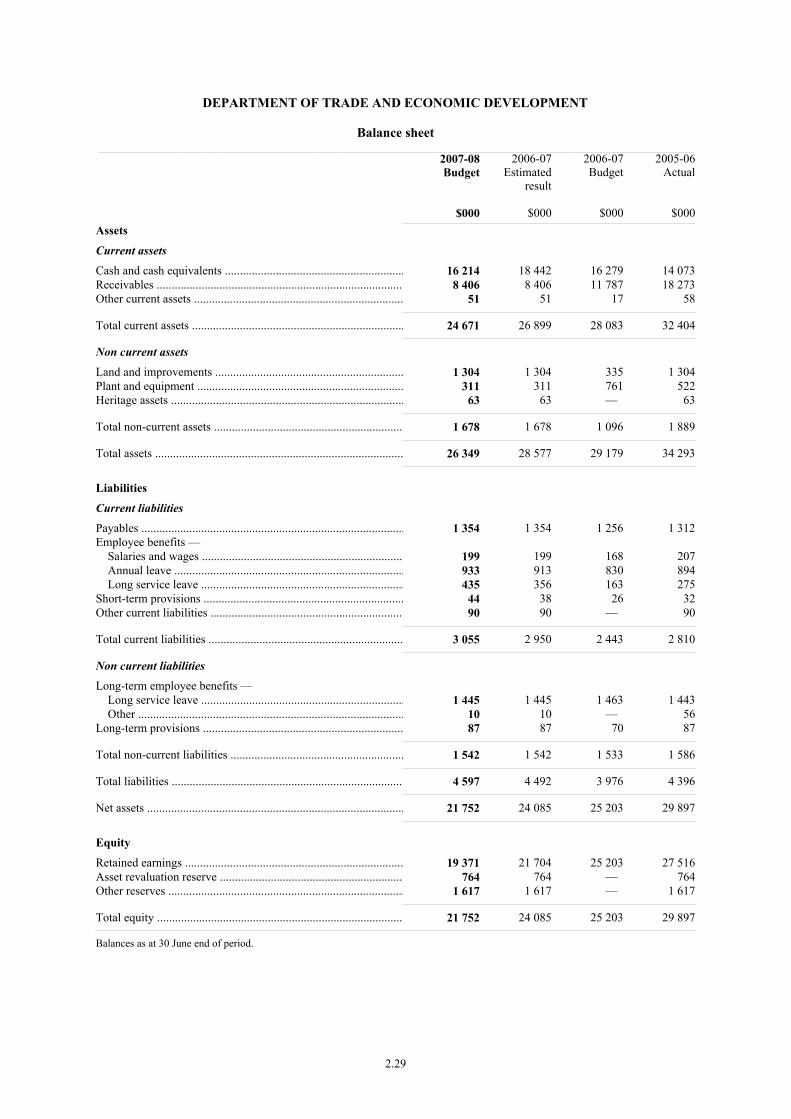
DEPARTMENT OF TRADE AND ECONOMIC DEVELOPMENT
Balance sheet__________________________________________________________________________________________________________________________________________________________________________________________________________________________________
2007-08Budget
$000
2006-07Estimated
result
$000
2006-07Budget
$000
2005-06Actual
$000Assets
Current assets
Cash and cash equivalents ............................................................ 16 214 18 442 16 279 14 073Receivables ................................................................................... 8 406 8 406 11 787 18 273Other current assets ...................................................................... 51 51 17 58
Total current assets ....................................................................... 24 671 26 899 28 083 32 404
Non current assets
Land and improvements ............................................................... 1 304 1 304 335 1 304Plant and equipment ..................................................................... 311 311 761 522Heritage assets .............................................................................. 63 63 — 63
Total non-current assets ............................................................... 1 678 1 678 1 096 1 889
Total assets ................................................................................... 26 349 28 577 29 179 34 293
Liabilities
Current liabilities
Payables ........................................................................................ 1 354 1 354 1 256 1 312Employee benefits — Salaries and wages ................................................................... 199 199 168 207 Annual leave ............................................................................. 933 913 830 894 Long service leave .................................................................... 435 356 163 275Short-term provisions ................................................................... 44 38 26 32Other current liabilities ................................................................. 90 90 — 90
Total current liabilities ................................................................. 3 055 2 950 2 443 2 810
Non current liabilities
Long-term employee benefits — Long service leave .................................................................... 1 445 1 445 1 463 1 443 Other ......................................................................................... 10 10 — 56Long-term provisions ................................................................... 87 87 70 87
Total non-current liabilities .......................................................... 1 542 1 542 1 533 1 586
Total liabilities .............................................................................. 4 597 4 492 3 976 4 396
Net assets ...................................................................................... 21 752 24 085 25 203 29 897
Equity
Retained earnings ......................................................................... 19 371 21 704 25 203 27 516Asset revaluation reserve ............................................................. 764 764 — 764Other reserves ............................................................................... 1 617 1 617 — 1 617
Total equity .................................................................................. 21 752 24 085 25 203 29 897
Balances as at 30 June end of period.
2.29

DEPARTMENT OF TRADE AND ECONOMIC DEVELOPMENT
Statement of changes in equity__________________________________________________________________________________________________________________________________________________________________________________________________________________________________
Contributedcapital
$000
Assetrevaluation
reserve
$000
Retainedearnings
$000
Total
$000
Balance at 30 June 2006 ............................................................... — 764 29 133 29 897Adjustments .................................................................................. — — — —
Restated balance at June 2006 ...................................................... — 764 29 133 29 897
Net gain/loss on revaluation of property, plant and equipment during 2006-07 ............................................................................ — — — — Net changes in reserves ................................................................ — — — —
Net income/expense recognised directly in equity for 2006-07 ... — — — — Net result after restructure for 2006-07 ........................................ — — -5 812 -5 812
Total recognised income and expense for 2006-07 — — -5 812 -5 812
Equity contributions from SA Government ................................. — — — — Repayment of equity contributions from SA Government .......... — — — —
Estimated balance at 30 June 2007 — 764 23 321 24 085
Net gain/loss on revaluation of property, plant and equipment during 2007-08 ............................................................................ — — — — Net changes in reserves ................................................................ — — — —
Net income/expense recognised directly in equity for 2007-08 ... — — — — Net result after restructure for 2007-08 ........................................ — — -2 333 -2 333
Total recognised income and expense for 2007-08 — — -2 333 -2 333
Equity contributions from SA Government ................................. — — — — Repayment of equity contributions from SA Government .......... — — — —
Estimated balance at 30 June 2008 — 764 20 988 21 752
2.30

DEPARTMENT OF TRADE AND ECONOMIC DEVELOPMENT
Cash flow statement__________________________________________________________________________________________________________________________________________________________________________________________________________________________________
2007-08Budget
$000
2006-07Estimated
result
$000
2006-07Budget
$000
2005-06Actual
$000
OPERATING ACTIVITIES:
Cash outflows
Employee payments ..................................................................... 20 549 17 492 18 216 15 998Supplies and services ................................................................... 29 607 25 972 26 069 22 844Grants and subsidies ..................................................................... 18 023 22 465 19 391 23 110Net GST paid ................................................................................ — — — 4 365Intra government transfers ........................................................... 2 092 3 502 2 221 — Other payments ............................................................................ 514 536 439 —
Cash used in operations ................................................................ 70 785 69 967 66 336 66 317
Cash inflows
Intra government transfers ........................................................... 100 100 — — Sales of goods and services .......................................................... 157 153 223 — Interest received ........................................................................... — 21 21 1 331Net GST received ......................................................................... — — — 3 699Other receipts ............................................................................... 934 11 956 9 928 5 455
Cash generated from operations ................................................... 1 191 12 230 10 172 10 485
SA GOVERNMENT:
Appropriation ............................................................................... 67 366 61 939 60 261 45 536Other receipts ............................................................................... — 167 — 732
Net cash provided by SA Government ......................................... 67 366 62 106 60 261 46 268
Net cash provided by (+) / used (-) in operating activities ........... -2 228 4 369 4 097 -9 564
INVESTING ACTIVITIES:
Cash outflows
Purchase of property, plant and equipment .................................. — — — 414
Cash used in investing activities .................................................. — — — 414
Cash inflows
Proceeds from sale of property, plant and equipment .................. — — — 2 183
Cash generated from investing activities ..................................... — — — 2 183
Net cash provided by (+) / used in (-) investing activities ........... — — — 1 769
Net increase (+) / decrease (-) in cash equivalents ....................... -2 228 4 369 4 097 -7 795
Cash and cash equivalents at the beginning of the financial year 18 442 14 073 12 182 21 868
Cash and cash equivalents at the end of the financial year .......... 16 214 18 442 16 279 14 073
2.31

ADMINISTERED ITEMS FOR THE DEPARTMENT OF TRADEAND ECONOMIC DEVELOPMENT
Income statement__________________________________________________________________________________________________________________________________________________________________________________________________________________________________
2007-08Budget
$000
2006-07Estimated
result
$000
2006-07Budget
$000
2005-06Actual
$000Income from SA Government
Income — Appropriation ........................................................................... — — — 395
Net income from / expenses to SA Government .......................... — — — 395
Total income ................................................................................. — — — 395
Expenses
Employee benefits and costs — Salaries, wages, annual and sick leave ..................................... — — — 165
Total expenses .............................................................................. — — — 165
Net result ...................................................................................... — — — 230
2.32
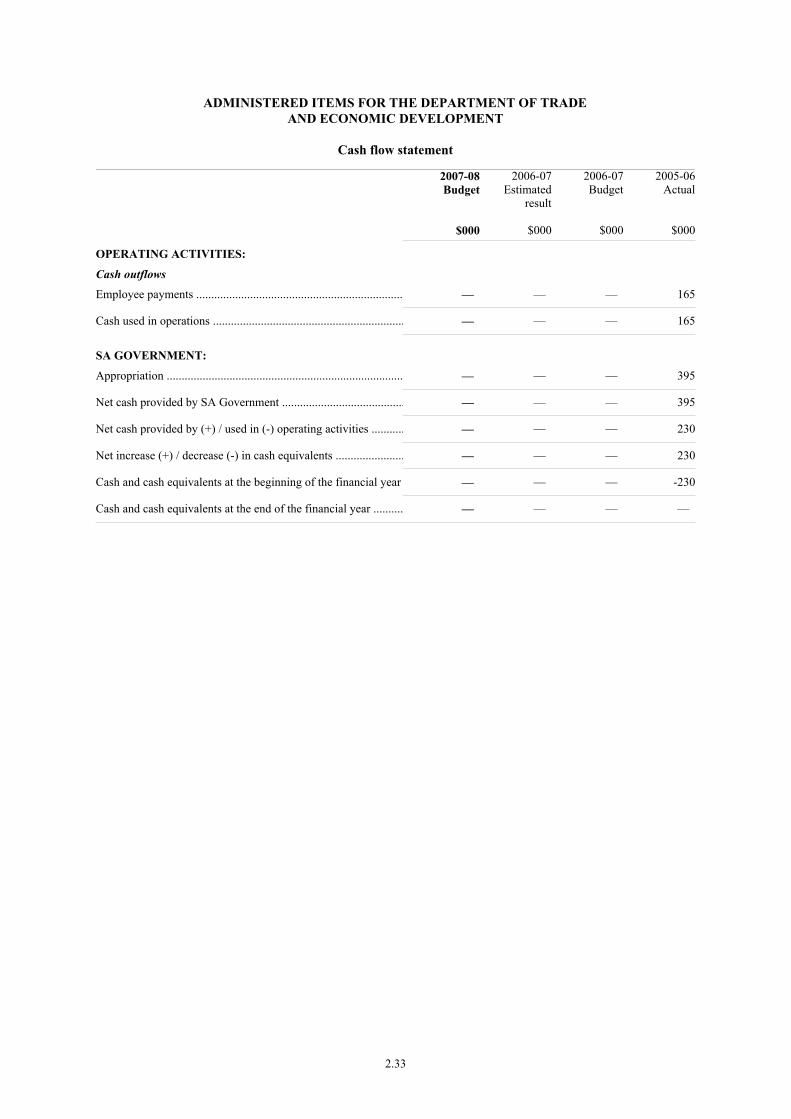
ADMINISTERED ITEMS FOR THE DEPARTMENT OF TRADEAND ECONOMIC DEVELOPMENT
Cash flow statement__________________________________________________________________________________________________________________________________________________________________________________________________________________________________
2007-08Budget
$000
2006-07Estimated
result
$000
2006-07Budget
$000
2005-06Actual
$000
OPERATING ACTIVITIES:
Cash outflows
Employee payments ..................................................................... — — — 165
Cash used in operations ................................................................ — — — 165
SA GOVERNMENT:
Appropriation ............................................................................... — — — 395
Net cash provided by SA Government ......................................... — — — 395
Net cash provided by (+) / used in (-) operating activities ........... — — — 230
Net increase (+) / decrease (-) in cash equivalents ....................... — — — 230
Cash and cash equivalents at the beginning of the financial year — — — -230
Cash and cash equivalents at the end of the financial year .......... — — — —
2.33
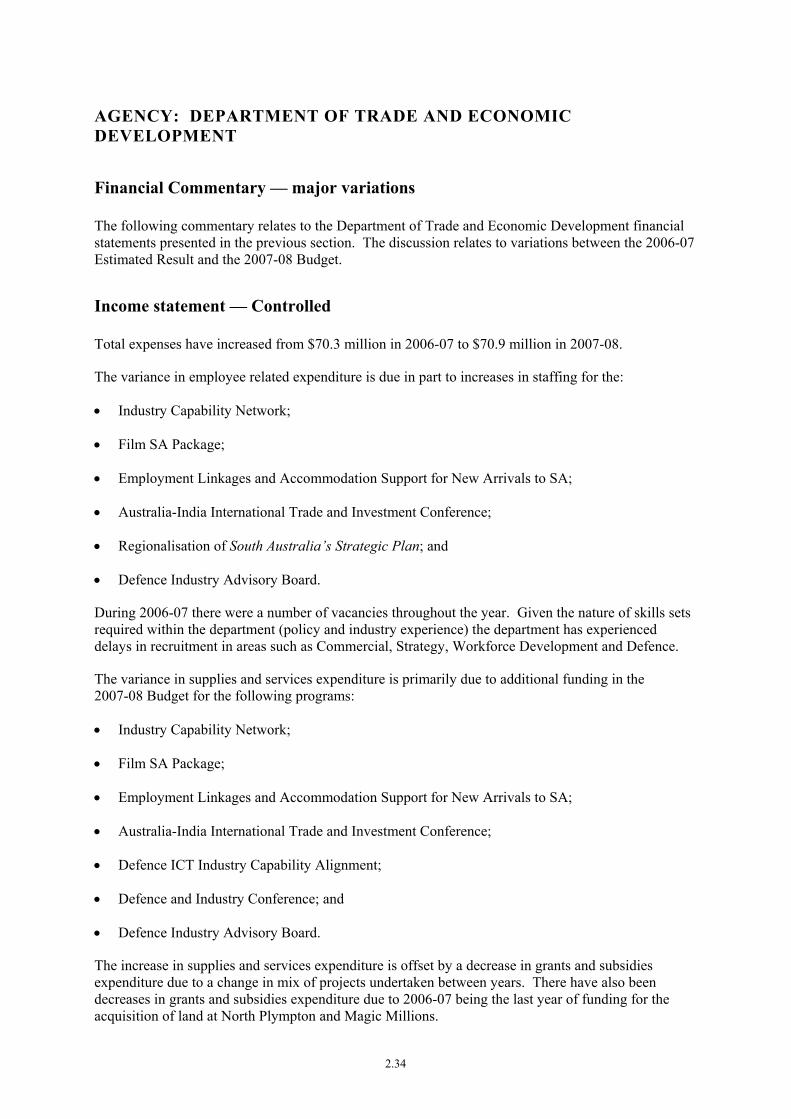
AGENCY: DEPARTMENT OF TRADE AND ECONOMIC DEVELOPMENT
Financial Commentary — major variations
The following commentary relates to the Department of Trade and Economic Development financial statements presented in the previous section. The discussion relates to variations between the 2006-07 Estimated Result and the 2007-08 Budget.
Income statement — Controlled
Total expenses have increased from $70.3 million in 2006-07 to $70.9 million in 2007-08.
The variance in employee related expenditure is due in part to increases in staffing for the:
• Industry Capability Network;
• Film SA Package;
• Employment Linkages and Accommodation Support for New Arrivals to SA;
• Australia-India International Trade and Investment Conference;
• Regionalisation of South Australia’s Strategic Plan; and
• Defence Industry Advisory Board.
During 2006-07 there were a number of vacancies throughout the year. Given the nature of skills sets required within the department (policy and industry experience) the department has experienced delays in recruitment in areas such as Commercial, Strategy, Workforce Development and Defence.
The variance in supplies and services expenditure is primarily due to additional funding in the 2007-08 Budget for the following programs:
• Industry Capability Network;
• Film SA Package;
• Employment Linkages and Accommodation Support for New Arrivals to SA;
• Australia-India International Trade and Investment Conference;
• Defence ICT Industry Capability Alignment;
• Defence and Industry Conference; and
• Defence Industry Advisory Board.
The increase in supplies and services expenditure is offset by a decrease in grants and subsidies expenditure due to a change in mix of projects undertaken between years. There have also been decreases in grants and subsidies expenditure due to 2006-07 being the last year of funding for the acquisition of land at North Plympton and Magic Millions.
2.34
The increase in appropriation income reflects the programs approved in the 2007-08 Budget as detailed above.
The decrease in other income is due to once-off rental receipts in 2006-07 in relation to the acquisition of land at North Plympton and revenue received for the Greater Edinburgh Parks Project. There were a number of other minor once-off recoveries in 2006-07 which are not expected to continue in 2007-08.
Balance sheet — Controlled
There are no major variances reported in the Balance sheet.
Cash flow statement — Controlled
The trend reflected in the Cash flow statement is consistent with trends reflected in the Income statement and Balance sheet.
Administered Items
The Minister’s Office was transferred to the Department of Primary Industries and Resources during 2005-06 and therefore there is no budget reported for 2006-07 or 2007-08.
2.35

TABLE OF CONTENTS
AGENCY: PORT ADELAIDE MARITIME CORPORATION
Objective ........................................................................................................................................2.37
Targets / Highlights ........................................................................................................................2.38
Program Net Cost of Services Summary........................................................................................2.39
Investing Payments Summary ........................................................................................................2.39
Program Information — includes description/objective, Summary income statement, sub-program information including performance criteria
1. Strategy and Policy .......................................................................................................2.40
2. Precinct Development and Operation ...........................................................................2.42
3. Workforce Development...............................................................................................2.44
Financial Statements
Income statement .................................................................................................................2.46
Balance sheet........................................................................................................................2.47
Statement of changes in equity ............................................................................................2.48
Cash flow statement .............................................................................................................2.49
Financial Commentary ...................................................................................................................2.50
2.36
PORTFOLIO: TRADE AND ECONOMIC DEVELOPMENT
AGENCY: PORT ADELAIDE MARITIME CORPORATION
Objective
The Port Adelaide Maritime Corporation (PAMC) as a statutory authority established under the Public Corporations (Port Adelaide Maritime Corporation) Regulations 2005, is responsible for the coordination of the Government of South Australia’s commitments to the Royal Australian Navy’s Air Warfare Destroyer program and to ensure the development of a sustainable naval and defence industry hub, Techport Australia, at Osborne South Australia.
PAMC is responsible for the development, governance, delivery and operations of the:
• state’s infrastructure commitment at Techport Australia, including common user shipbuilding facilities;
• Techport Australia industrial park including the Suppliers’ Precinct and Commercial and Education Precinct;
• Techport Australia workforce development program, including the Maritime Skills Centre; and
• Air Warfare Destroyer Systems Centre.
PAMC is also responsible for:
• working with industry to facilitate the ongoing consolidation of naval shipbuilding expertise in South Australia;
• the design, construction, operation and maintenance of the new Common User Facility under various forms of contractual arrangements with other parties;
• maximising economic, social and environmental benefits for South Australia through the managed development of Techport Australia and the Northern Lefevre Peninsula; and
• positioning PAMC and South Australia to take advantage of opportunities that may emerge from the proposed sale of ASC Pty Ltd by the Australian Government.
2.37
2007-08 Targets / 2006-07 Highlights
Targets 2007-08 Highlights 2006-07
• Commence construction of the Common User Facility (CUF) at Techport Australia
• Complete the upgrade of stormwater, sewer, water and electricity infrastructure at Techport Australia precincts and commence road infrastructure improvements
• Complete site preparation works for the Commercial and Education Precinct (Victoria Road site) and stage 2 of the Suppliers’ Precinct
• Appoint a strategic partner for the development of the Techport Australia precincts and secure early tenant commitment
• Complete construction of the Maritime Skills Centre (MSC) to deliver trade and technical requirements for the Air Warfare Destroyer (AWD) program
• Continued targeted marketing to potential Techport Australia tenants and infrastructure users
• Commence construction of purpose-built facilities to house the high-tech AWD Systems Centre at Techport Australia
• Provide continued support for AWD Alliance member organisations to meet AWD program skills requirements
• Work closely with government and industry to integrate and increase defence industries workforce development and planning and implementation to meet growing skill demand
• Develop a holistic master plan to guide long-term sustainable development of the Northern Lefevre Peninsula
• Completed planning, preliminary design and pre-construction of the CUF at Techport Australia
• Completed planning and design of the ship lift and transfer system for the CUF
• Progressed planning and design of the Techport Australia Commercial and Education Precinct and Suppliers’ Precinct and commenced the upgrade of stormwater, sewer, water and electricity infrastructure
• Completed site preparation works for the Commercial and Education Precinct (Mersey Road site), using fill from the Largs North Marina Adelaide project
• Commenced site preparation works for stage 2 of the Suppliers’ Precinct
• Commenced construction of the MSC • Supported rapid staff growth at the AWD Systems Centre in
interim facilities at Felixstow, including provision of case-managed settlement services to interstate and overseas recruits
• Supported ASC Pty Ltd and other AWD Alliance members to meet AWD program skills requirements
• Established high calibre Board to oversee management and operations of the MSC at Techport Australia
• Continued promotion of local industry participation in the AWD program and Techport Australia infrastructure developments
• Secured strong early interest in tenancy opportunities at Techport Australia
• Progressed consolidation of strategic government land holdings on the Northern Lefevre Peninsula and Gilman to PAMC
• Commenced planning and design of purpose-built facilities to house the AWD Systems Centre at Techport Australia
2.38
Program net cost of services summary
Net Cost of Services
2007-08Budget
2006-07Estimated result
2006-07 Budget
2005-06 Actual
Program $000 $000 $000 $000 1. Strategy and Policy..................................... 3 128 -452 -700 1 401
2. Precinct Development and Operation......... 870 1 603 6 824 331
3. Workforce Development ............................ 2 712 1 253 2 131 58
Total 6 710 2 404 8 255 1 790
Investing payments summary
2007-08Budget
2006-07Estimated result
2006-07 Budget
2005-06 Actual
Investments $000 $000 $000 $000 New works
Techport Australia – Air Warfare Destroyer Systems Centre .......................... 9 300 — — —
Total New Works 9 300 — — —
Works in Progress
Techport Australia – Common User Facility........................................................ 124 096 12 750 17 140 836 Techport Australia – Commercial and Education Precinct and Suppliers’ Precinct....................................................... 12 606 8 261 7 381 820
Techport Australia – Maritime Skills Centre ......................................................... 4 000 910 3 475 — Northern Lefevre Peninsula Master Plan.... 5 590 62 933 66 923 —
Total Works in Progress 146 292 84 854 94 919 1 656
Minor Works
Total Minor Works — — — 11
Total Investing Payments 155 592 84 854 94 919 1 667
2.39
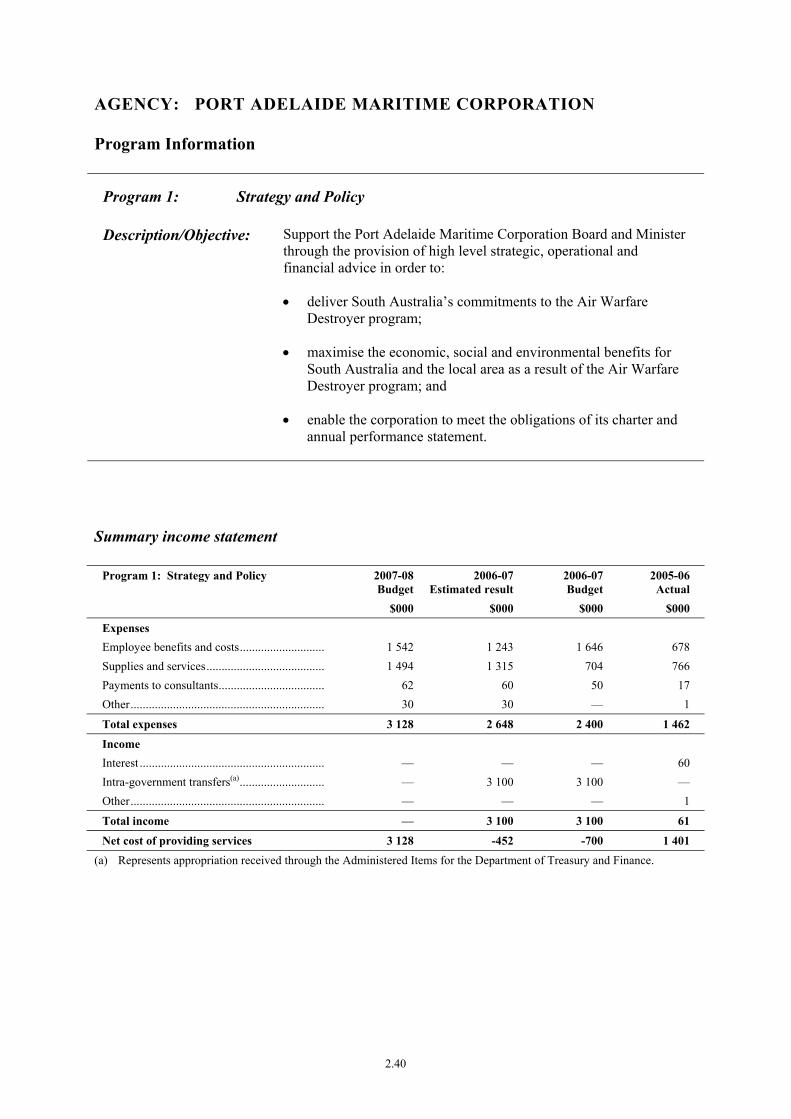
AGENCY: PORT ADELAIDE MARITIME CORPORATION
Program Information
Program 1: Strategy and Policy
Description/Objective: Support the Port Adelaide Maritime Corporation Board and Minister through the provision of high level strategic, operational and financial advice in order to:
• deliver South Australia’s commitments to the Air Warfare Destroyer program;
• maximise the economic, social and environmental benefits for South Australia and the local area as a result of the Air Warfare Destroyer program; and
• enable the corporation to meet the obligations of its charter and annual performance statement.
Summary income statement
Program 1: Strategy and Policy 2007-08Budget
2006-07Estimated result
2006-07 Budget
2005-06 Actual
$000 $000 $000 $000
Expenses Employee benefits and costs............................. 1 542 1 243 1 646 678 Supplies and services........................................ 1 494 1 315 704 766 Payments to consultants.................................... 62 60 50 17 Other................................................................. 30 30 — 1
Total expenses 3 128 2 648 2 400 1 462
Income Interest .............................................................. — — — 60 Intra-government transfers(a)............................. — 3 100 3 100 — Other................................................................. — — — 1
Total income — 3 100 3 100 61
Net cost of providing services 3 128 -452 -700 1 401 (a) Represents appropriation received through the Administered Items for the Department of Treasury and Finance.
2.40
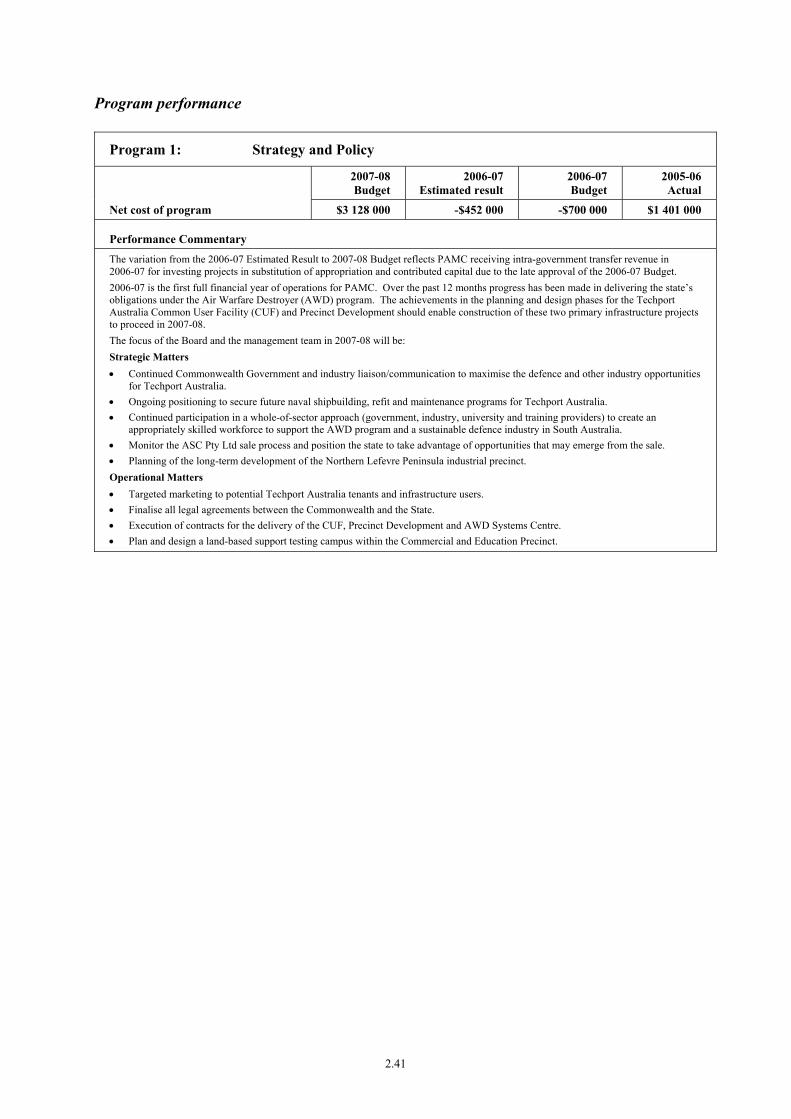
Program performance
Program 1: Strategy and Policy
2007-08 Budget
2006-07 Estimated result
2006-07 Budget
2005-06 Actual
Net cost of program $3 128 000 -$452 000 -$700 000 $1 401 000
Performance Commentary The variation from the 2006-07 Estimated Result to 2007-08 Budget reflects PAMC receiving intra-government transfer revenue in 2006-07 for investing projects in substitution of appropriation and contributed capital due to the late approval of the 2006-07 Budget. 2006-07 is the first full financial year of operations for PAMC. Over the past 12 months progress has been made in delivering the state’s obligations under the Air Warfare Destroyer (AWD) program. The achievements in the planning and design phases for the Techport Australia Common User Facility (CUF) and Precinct Development should enable construction of these two primary infrastructure projects to proceed in 2007-08. The focus of the Board and the management team in 2007-08 will be: Strategic Matters • Continued Commonwealth Government and industry liaison/communication to maximise the defence and other industry opportunities
for Techport Australia. • Ongoing positioning to secure future naval shipbuilding, refit and maintenance programs for Techport Australia. • Continued participation in a whole-of-sector approach (government, industry, university and training providers) to create an
appropriately skilled workforce to support the AWD program and a sustainable defence industry in South Australia. • Monitor the ASC Pty Ltd sale process and position the state to take advantage of opportunities that may emerge from the sale. • Planning of the long-term development of the Northern Lefevre Peninsula industrial precinct. Operational Matters • Targeted marketing to potential Techport Australia tenants and infrastructure users. • Finalise all legal agreements between the Commonwealth and the State. • Execution of contracts for the delivery of the CUF, Precinct Development and AWD Systems Centre. • Plan and design a land-based support testing campus within the Commercial and Education Precinct.
2.41
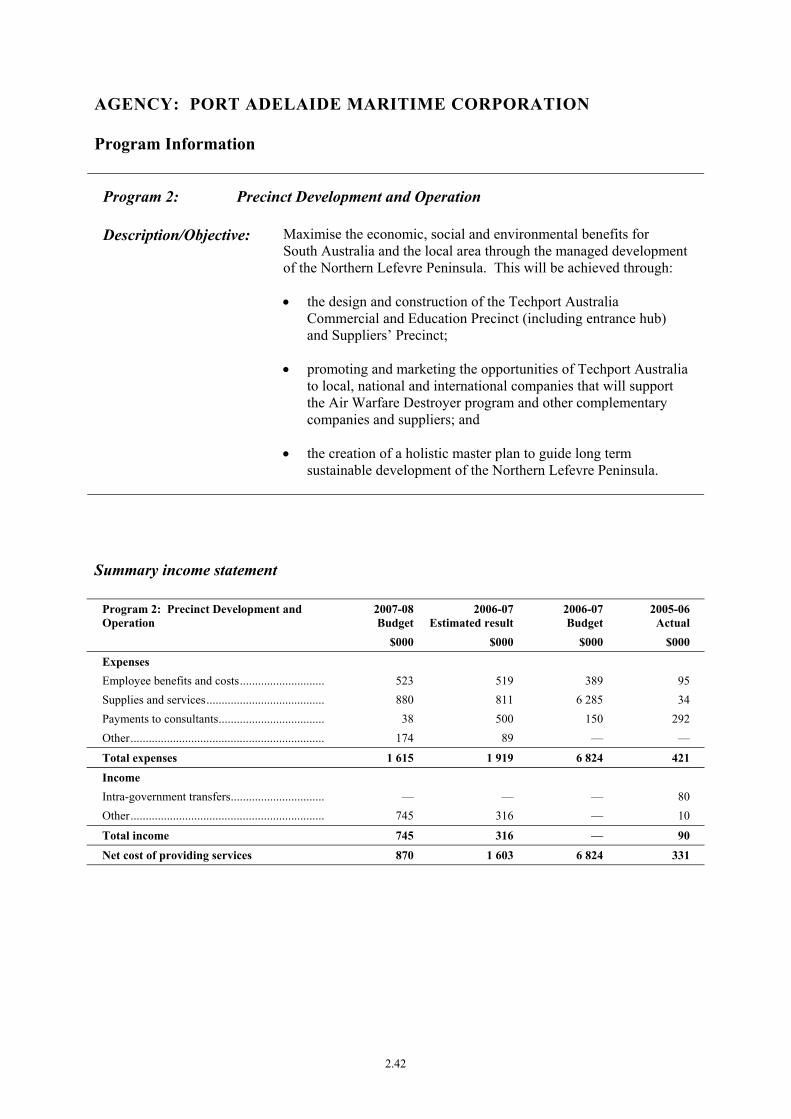
AGENCY: PORT ADELAIDE MARITIME CORPORATION
Program Information
Program 2: Precinct Development and Operation
Description/Objective: Maximise the economic, social and environmental benefits for South Australia and the local area through the managed development of the Northern Lefevre Peninsula. This will be achieved through:
• the design and construction of the Techport Australia Commercial and Education Precinct (including entrance hub) and Suppliers’ Precinct;
• promoting and marketing the opportunities of Techport Australia to local, national and international companies that will support the Air Warfare Destroyer program and other complementary companies and suppliers; and
• the creation of a holistic master plan to guide long term sustainable development of the Northern Lefevre Peninsula.
Summary income statement
Program 2: Precinct Development and Operation
2007-08Budget
2006-07Estimated result
2006-07 Budget
2005-06 Actual
$000 $000 $000 $000
Expenses Employee benefits and costs............................. 523 519 389 95 Supplies and services........................................ 880 811 6 285 34 Payments to consultants.................................... 38 500 150 292 Other................................................................. 174 89 — —
Total expenses 1 615 1 919 6 824 421
Income Intra-government transfers................................ — — — 80 Other................................................................. 745 316 — 10
Total income 745 316 — 90
Net cost of providing services 870 1 603 6 824 331
2.42

Program performance
Program 2: Precinct Development and Operation
2007-08 Budget
2006-07 Estimated result
2006-07 Budget
2005-06 Actual
Net cost of program $870 000 $1 603 000 $6 824 000 $331 000
Performance Commentary The significant variation between the 2006-07 Budget and Estimated Result reflects that planning and design costs, head work and service upgrades will be capitalised in accordance with Australian accounting standards. These costs were originally budgeted as operating expenses. Commercial and Education Precinct and Suppliers’ Precinct • Land division approval was secured for the Suppliers’ Precinct subdivision and the creation of the Commercial and Education
Precinct (Mersey Road site). Detailed environmental investigations and geotechnical site preparation trials undertaken to determine strategies for environmental management and site preparatory works.
• Innovative geotechnical site preparation strategies were implemented for the Mersey Road site of the Commercial and Education Precinct and the general industry area of the Suppliers’ Precinct. This will enable PAMC to supply development ready land and capitalise on the interest in Techport Australia.
• Detailed head works and sub-division planning and design were completed and approvals provided by key authorities including SA Water Corporation, Department for Transport, Energy and Infrastructure and the City of Port Adelaide Enfield.
• The Commercial and Education Precinct concept was expanded to include land adjacent to Victoria Road to allow for the expansion of development opportunities. A Ministerial Plan Amendment Report was completed for the Victoria Road site to create a Policy Area where Commercial and Retail land uses are complying uses within the Light Industry Zone.
• A two-stage process to appoint a private sector development partner for the two precincts commenced. Following short-listing and the completion of the second stage of the process the preferred partner is expected to be selected in June 2007.
• Commenced the process (in consultation with ASC Pty Ltd as the principal customer) to identify an operator and developer of a Blast and Paint facility to be constructed on land within the Suppliers’ Precinct.
Maritime Skills Centre • Planning and detailed design of the facility completed. • Secured development approval. • Commenced construction with completion due in the first quarter of 2008. Air Warfare Destroyer Systems Centre • Concept development for the AWD Systems Centre and detailed planning for associated facilities on the Commercial and Education
Precinct sites commenced in consultation with representatives of the Commonwealth. Northern Lefevre Peninsula Master Plan • Transfer of strategic government land holdings to PAMC will be finalised in early 2007-08. • Completion of a high level review of industrial land capacity as a precursor to the development of the Northern Lefevre Peninsula
Master Plan. • Commencement of community and industry engagement for the development of the master plan. • Coordination and chairing of an inter-government agency Steering Committee to provide inputs into the development of the master
plan.
2.43
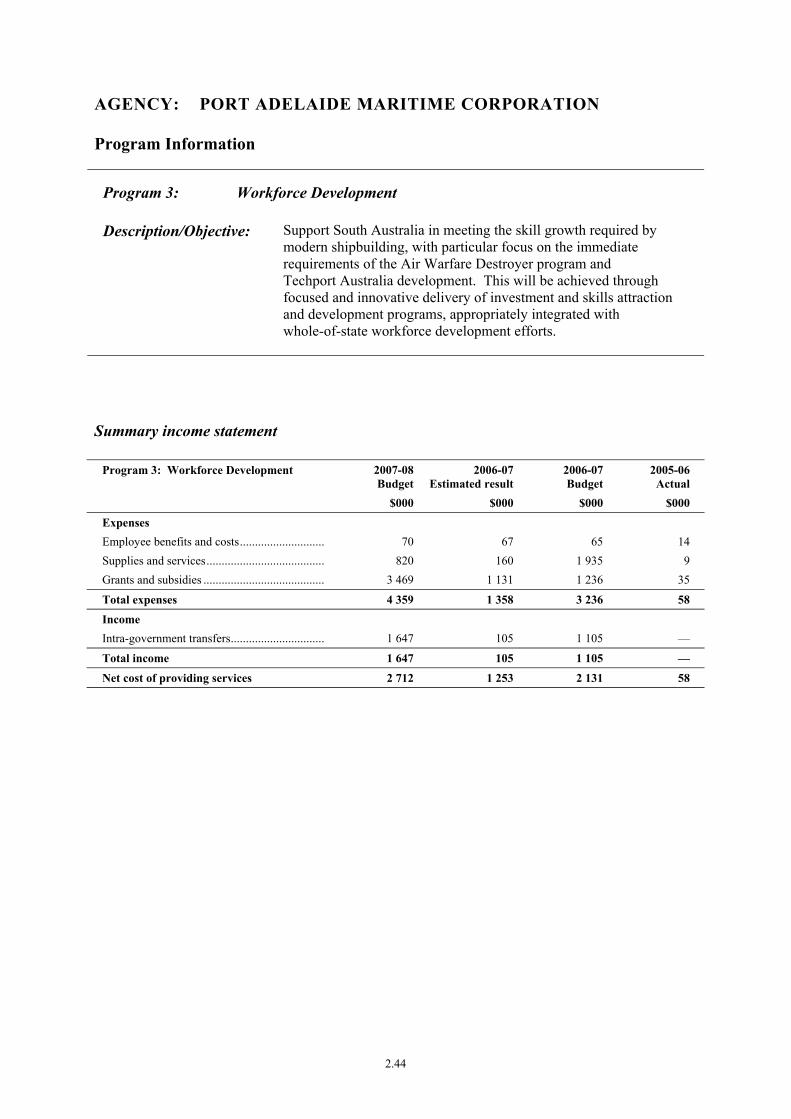
AGENCY: PORT ADELAIDE MARITIME CORPORATION
Program Information
Program 3: Workforce Development
Description/Objective: Support South Australia in meeting the skill growth required by modern shipbuilding, with particular focus on the immediate requirements of the Air Warfare Destroyer program and Techport Australia development. This will be achieved through focused and innovative delivery of investment and skills attraction and development programs, appropriately integrated with whole-of-state workforce development efforts.
Summary income statement
Program 3: Workforce Development 2007-08Budget
2006-07Estimated result
2006-07 Budget
2005-06 Actual
$000 $000 $000 $000
Expenses Employee benefits and costs............................. 70 67 65 14 Supplies and services........................................ 820 160 1 935 9 Grants and subsidies ......................................... 3 469 1 131 1 236 35
Total expenses 4 359 1 358 3 236 58
Income Intra-government transfers................................ 1 647 105 1 105 —
Total income 1 647 105 1 105 —
Net cost of providing services 2 712 1 253 2 131 58
2.44

Program performance
Program: 3 Workforce Development
2007-08 Budget
2006-07 Estimated result
2006-07 Budget
2005-06 Actual
Net cost of program $2 712 000 $1 253 000 $2 131 000 $58 000
Performance Commentary Construction has commenced on the purpose-built Maritime Skills Centre (MSC), which will deliver trade and technical skills required for the Air Warfare Destroyer (AWD) program and Techport Australia development from early 2008. The MSC will be established as a centre of excellence in maritime construction training and, where capacity permits, will also be used for training to benefit wider industry. PAMC continues to support ASC Pty Ltd and other AWD program participants to meet AWD project skills requirements. Programs in 2006-07 focused on delivery of innovative recruitment, skilled migration and relocation services to support the rapid growth of the AWD Systems Centre headquarters for the AWD program and housing over 300 defence and industry participants working together to bring the successful AWD design to life. PAMC will continue to actively promote and contribute to a strategic and integrated whole-of-state approach to workforce development efforts, particularly with respect to the defence industries.
2.45

PORT ADELAIDE MARITIME CORPORATION
Income statement__________________________________________________________________________________________________________________________________________________________________________________________________________________________________
2007-08Budget
$000
2006-07Estimated
result
$000
2006-07Budget
$000
2005-06Actual
$000Expenses
Employee benefits and costs — Salaries, wages, annual and sick leave ..................................... 1 618 1 324 1 540 582 Long service leave .................................................................... 13 16 — 57 Payroll tax ................................................................................ 104 89 100 35 Superannuation ......................................................................... 155 157 160 62 Other ......................................................................................... 245 243 300 51Supplies and services — General supplies and services .................................................. 3 194 2 286 8 924 809 Consultancy expenses .............................................................. 100 560 200 309Depreciation and amortisation ..................................................... — — — 1Grants and subsidies ..................................................................... 3 469 1 131 1 236 35Other expenses ............................................................................. 204 119 — —
Total expenses .............................................................................. 9 102 5 925 12 460 1 941
Income
Intra government transfers ........................................................... 1 647 3 205 4 205 80Interest revenues ........................................................................... — — — 60Other income ................................................................................ 745 316 — 11
Total income ................................................................................. 2 392 3 521 4 205 151
Net cost of providing services ...................................................... 6 710 2 404 8 255 1 790
Income from / Expenses to SA Government
Income — Appropriation ........................................................................... 6 710 11 555 10 395 3 596 Other income ............................................................................ — 37 — —
Net income from / expenses to SA Government .......................... 6 710 11 592 10 395 3 596
Net result ...................................................................................... — 9 188 2 140 1 806
2.46
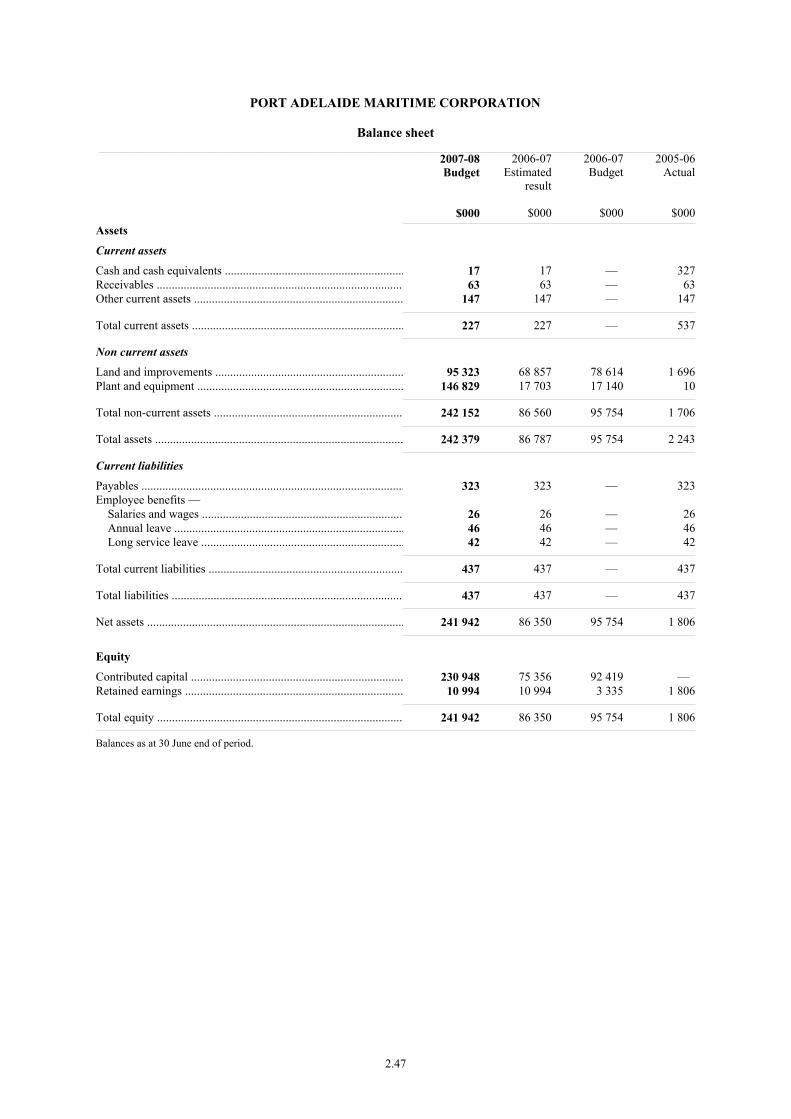
PORT ADELAIDE MARITIME CORPORATION
Balance sheet__________________________________________________________________________________________________________________________________________________________________________________________________________________________________
2007-08Budget
$000
2006-07Estimated
result
$000
2006-07Budget
$000
2005-06Actual
$000Assets
Current assets
Cash and cash equivalents ............................................................ 17 17 — 327Receivables ................................................................................... 63 63 — 63Other current assets ...................................................................... 147 147 — 147
Total current assets ....................................................................... 227 227 — 537
Non current assets
Land and improvements ............................................................... 95 323 68 857 78 614 1 696Plant and equipment ..................................................................... 146 829 17 703 17 140 10
Total non-current assets ............................................................... 242 152 86 560 95 754 1 706
Total assets ................................................................................... 242 379 86 787 95 754 2 243
Current liabilities
Payables ........................................................................................ 323 323 — 323Employee benefits — Salaries and wages ................................................................... 26 26 — 26 Annual leave ............................................................................. 46 46 — 46 Long service leave .................................................................... 42 42 — 42
Total current liabilities ................................................................. 437 437 — 437
Total liabilities .............................................................................. 437 437 — 437
Net assets ...................................................................................... 241 942 86 350 95 754 1 806
Equity
Contributed capital ....................................................................... 230 948 75 356 92 419 — Retained earnings ......................................................................... 10 994 10 994 3 335 1 806
Total equity .................................................................................. 241 942 86 350 95 754 1 806
Balances as at 30 June end of period.
2.47

PORT ADELAIDE MARITIME CORPORATION
Statement of changes in equity__________________________________________________________________________________________________________________________________________________________________________________________________________________________________
Contributedcapital
$000
Assetrevaluation
reserve
$000
Retainedearnings
$000
Total
$000
Balance at 30 June 2006 ............................................................... — — 1 806 1 806Adjustments .................................................................................. — — — —
Restated balance at June 2006 ...................................................... — — 1 806 1 806
Net gain/loss on revaluation of property, plant and equipment during 2006-07 ............................................................................ — — — — Net changes in reserves ................................................................ — — — —
Net income/expense recognised directly in equity for 2006-07 ... — — — — Net result after restructure for 2006-07 ........................................ — — 9 188 9 188
Total recognised income and expense for 2006-07 — — 9 188 9 188
Equity contributions from SA Government ................................. 75 356 — — 75 356Repayment of equity contributions from SA Government .......... — — — —
Estimated balance at 30 June 2007 75 356 — 10 994 86 350
Net gain/loss on revaluation of property, plant and equipment during 2007-08 ............................................................................ — — — — Net changes in reserves ................................................................ — — — —
Net income/expense recognised directly in equity for 2007-08 ... — — — — Net result after restructure for 2007-08 ........................................ — — — —
Total recognised income and expense for 2007-08 — — — —
Equity contributions from SA Government ................................. 155 592 — — 155 592Repayment of equity contributions from SA Government .......... — — — —
Estimated balance at 30 June 2008 230 948 — 10 994 241 942
2.48

PORT ADELAIDE MARITIME CORPORATION
Cash flow statement__________________________________________________________________________________________________________________________________________________________________________________________________________________________________
2007-08Budget
$000
2006-07Estimated
result
$000
2006-07Budget
$000
2005-06Actual
$000
OPERATING ACTIVITIES:
Cash outflows
Employee payments ..................................................................... 2 135 1 829 2 100 651Supplies and services ................................................................... 3 294 2 846 9 124 873Grants and subsidies ..................................................................... 3 469 1 131 1 236 35Net GST paid ................................................................................ — — — 258Other payments ............................................................................ 204 119 — —
Cash used in operations ................................................................ 9 102 5 925 12 460 1 817
Cash inflows
Intra government transfers ........................................................... 1 647 3 205 4 205 50Interest received ........................................................................... — — — 60Other receipts ............................................................................... 745 316 — 105
Cash generated from operations ................................................... 2 392 3 521 4 205 215
SA GOVERNMENT:
Appropriation ............................................................................... 6 710 11 555 10 395 3 596Other receipts ............................................................................... — 37 — —
Net cash provided by SA Government ......................................... 6 710 11 592 10 395 3 596
Net cash provided by (+) / used (-) in operating activities ........... — 9 188 2 140 1 994
INVESTING ACTIVITIES:
Cash outflows
Purchase of property, plant and equipment .................................. 155 592 84 854 94 919 1 667
Cash used in investing activities .................................................. 155 592 84 854 94 919 1 667
Net cash provided by (+) / used in (-) investing activities ........... -155 592 -84 854 -94 919 -1 667
FINANCING ACTIVITIES:
Cash inflows
Capital contributions from SA Government ................................ 155 592 75 356 92 419 —
Cash generated from financing activities ..................................... 155 592 75 356 92 419 —
Net cash provided by (+) / used in (-) financing activities ........... 155 592 75 356 92 419 —
Net increase (+) / decrease (-) in cash equivalents ....................... — -310 -360 327
Cash and cash equivalents at the beginning of the financial year 17 327 360 —
Cash and cash equivalents at the end of the financial year .......... 17 17 — 327
2.49

AGENCY: PORT ADELAIDE MARITIME CORPORATION
Financial Commentary — major variations
The following commentary relates to the Port Adelaide Maritime Corporation financial statements presented in the previous section. The discussion relates to variations between the 2006-07 Estimated Result and the 2007-08 Budget.
Income statement
The increase in expenditure is predominantly due to the carry over from 2006-07 into 2007-08 of workforce development and relocation programs and the furniture and equipment costs for the MSC fit-out.
The reduction in income reflects that some of the government funding for investing projects in 2006-07 was provided as appropriation or an intra-government transfer. This was required due to the late approval of the 2006-07 Budget.
Balance sheet
Increase in non-current assets reflects the commencement of construction for the Common User Facility, MSC, Precinct Development and AWD Systems Centre.
The increase in contributed capital reflects the funding source for the above-mentioned projects.
Statement of changes in equity
The majority of PAMC’s equity has been sourced through government contributions to fund infrastructure projects.
Cash flow statement
The lower net cash from operations reflects the carryover impact outlined in the Income statement commentary. The large investing and contributed capital estimates reflect the expenditure cash flow profile of the projects highlighted in the Balance sheet commentary.
2.50

2.51

TABLE OF CONTENTS
AGENCY: OFFICE OF THE VENTURE CAPITAL BOARD
Objective ........................................................................................................................................2.53
Targets / Highlights ........................................................................................................................2.54
Program Net Cost of Services Summary........................................................................................2.55
Investing Payments Summary ........................................................................................................2.55
Program Information — includes description/objective, Summary income statement, sub-program information including performance criteria
1. Venture Capital .............................................................................................................2.56
Financial Statements
Income statement .................................................................................................................2.58
Balance sheet........................................................................................................................2.59
Statement of changes in equity ............................................................................................2.60
Cash flow statement .............................................................................................................2.61
Financial Commentary ...................................................................................................................2.62
2.52
PORTFOLIO: TRADE AND ECONOMIC DEVELOPMENT
AGENCY: OFFICE OF THE VENTURE CAPITAL BOARD
Objective
The Office of the Venture Capital Board (OVCB) assists the Venture Capital Board, in response to South Australia’s Strategic Plan, to develop a strong private equity industry in South Australia. The objective is to positively influence innovation and development in the local business community and develop an entrepreneurial culture. A key objective is to grow South Australia’s share of the Australian professional private equity market from:
• $36.7 million (three year average to 30 June 2003) to over $90 million (three year average to 30 June 2009) invested in South Australia; and
• 5.3 per cent (average three years to 30 June 2003) to over 9 per cent (average three years to 30 June 2009) for the number of investments made in South Australia.
The Venture Capital Board has the following objectives:
• increase the supply of private equity in South Australia, including regional South Australia;
• achieve South Australia’s Strategic Plan 2007 venture capital target (T4.12): ‘South Australia’s share of Australian Government-administered venture capital program funds to reach 7 per cent by 2010, and be maintained thereafter’;
• manage the government’s investment, via the original South Australian Private Equity (SAPE) Program, in the Paragon Private Equity Fund 1;
• provide a more coordinated and improved approach to educating and training South Australian businesses seeking private equity;
• coordinate and develop networking opportunities for private equity firms and private investors seeking investments in South Australia;
• assist South Australian businesses to present their expansion plans to private equity firms and private investors, so as to improve their chances of attracting investment; and
• influence a culture of innovation and small business development, and facilitate commercialisation opportunities in South Australia’s educational and research institutions.
2.53
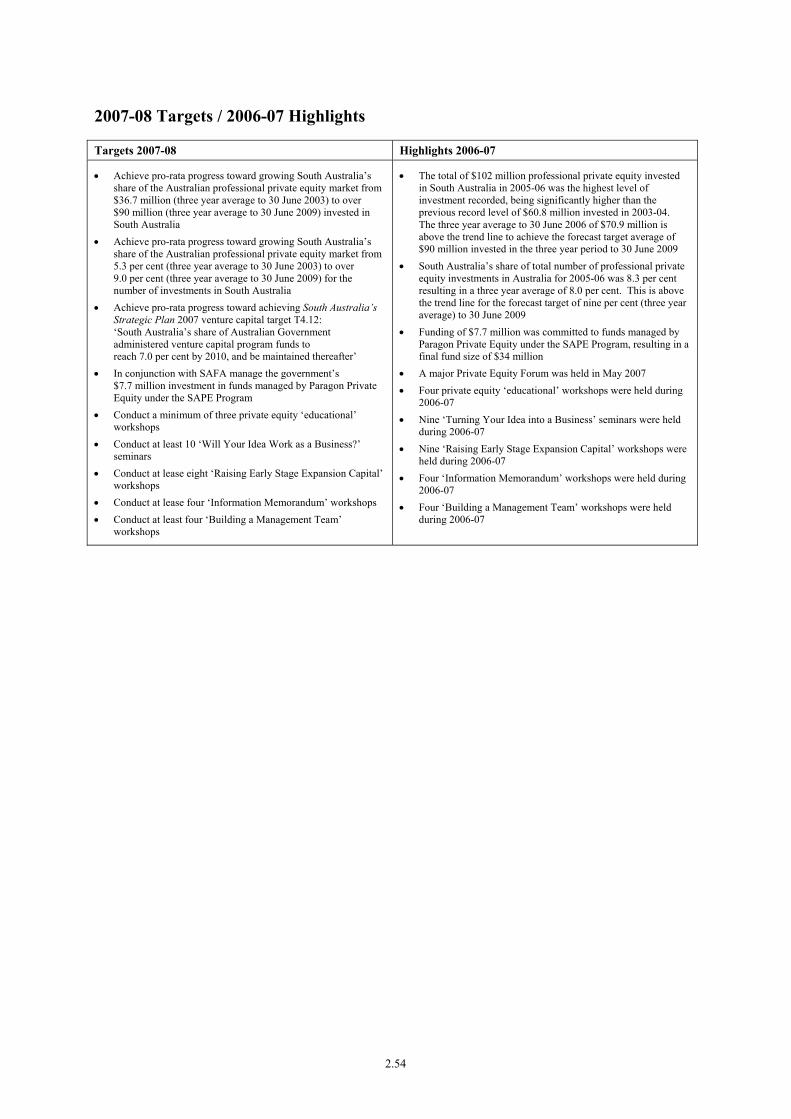
2007-08 Targets / 2006-07 Highlights
Targets 2007-08 Highlights 2006-07
• Achieve pro-rata progress toward growing South Australia’s share of the Australian professional private equity market from $36.7 million (three year average to 30 June 2003) to over $90 million (three year average to 30 June 2009) invested in South Australia
• Achieve pro-rata progress toward growing South Australia’s share of the Australian professional private equity market from 5.3 per cent (three year average to 30 June 2003) to over 9.0 per cent (three year average to 30 June 2009) for the number of investments in South Australia
• Achieve pro-rata progress toward achieving South Australia’s Strategic Plan 2007 venture capital target T4.12: ‘South Australia’s share of Australian Government administered venture capital program funds to reach 7.0 per cent by 2010, and be maintained thereafter’
• In conjunction with SAFA manage the government’s $7.7 million investment in funds managed by Paragon Private Equity under the SAPE Program
• Conduct a minimum of three private equity ‘educational’ workshops
• Conduct at least 10 ‘Will Your Idea Work as a Business?’ seminars
• Conduct at lease eight ‘Raising Early Stage Expansion Capital’ workshops
• Conduct at lease four ‘Information Memorandum’ workshops • Conduct at least four ‘Building a Management Team’
workshops
• The total of $102 million professional private equity invested in South Australia in 2005-06 was the highest level of investment recorded, being significantly higher than the previous record level of $60.8 million invested in 2003-04. The three year average to 30 June 2006 of $70.9 million is above the trend line to achieve the forecast target average of $90 million invested in the three year period to 30 June 2009
• South Australia’s share of total number of professional private equity investments in Australia for 2005-06 was 8.3 per cent resulting in a three year average of 8.0 per cent. This is above the trend line for the forecast target of nine per cent (three year average) to 30 June 2009
• Funding of $7.7 million was committed to funds managed by Paragon Private Equity under the SAPE Program, resulting in a final fund size of $34 million
• A major Private Equity Forum was held in May 2007 • Four private equity ‘educational’ workshops were held during
2006-07 • Nine ‘Turning Your Idea into a Business’ seminars were held
during 2006-07 • Nine ‘Raising Early Stage Expansion Capital’ workshops were
held during 2006-07 • Four ‘Information Memorandum’ workshops were held during
2006-07 • Four ‘Building a Management Team’ workshops were held
during 2006-07
2.54
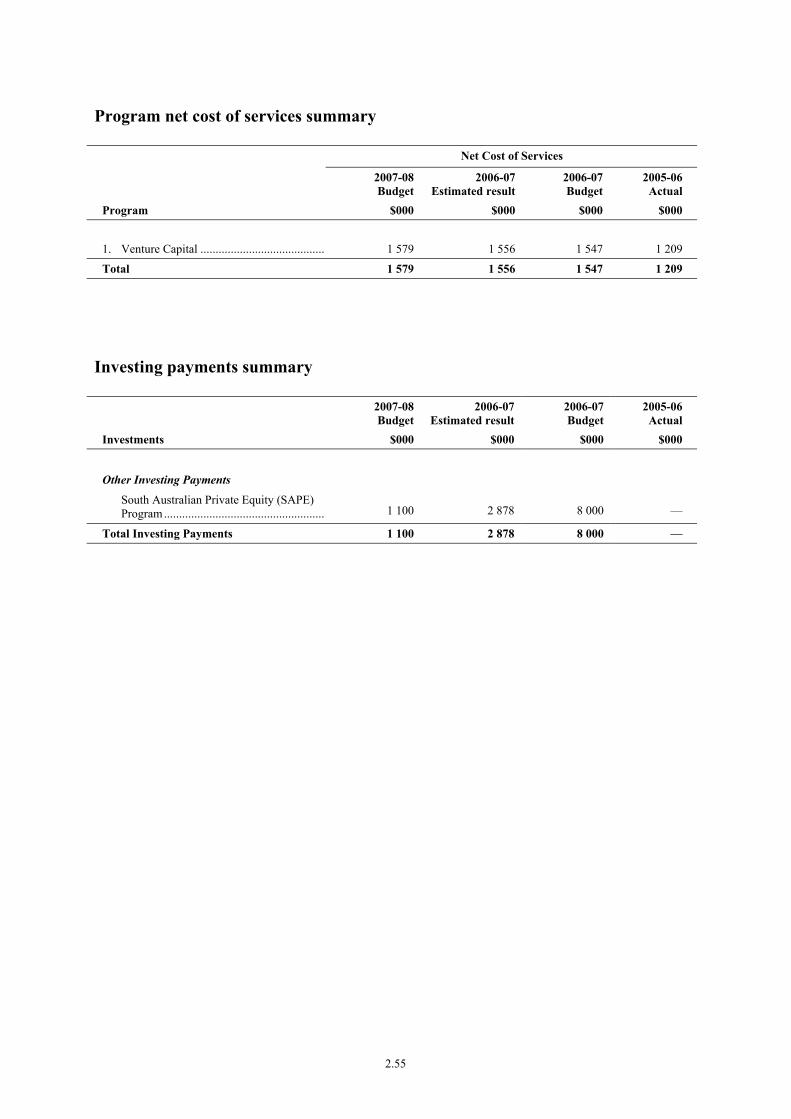
Program net cost of services summary
Net Cost of Services
2007-08Budget
2006-07Estimated result
2006-07 Budget
2005-06 Actual
Program $000 $000 $000 $000 1. Venture Capital .......................................... 1 579 1 556 1 547 1 209
Total 1 579 1 556 1 547 1 209
Investing payments summary
2007-08Budget
2006-07Estimated result
2006-07 Budget
2005-06 Actual
Investments $000 $000 $000 $000
Other Investing Payments
South Australian Private Equity (SAPE) Program...................................................... 1 100 2 878 8 000 —
Total Investing Payments 1 100 2 878 8 000 —
2.55

AGENCY: OFFICE OF THE VENTURE CAPITAL BOARD
Program Information
Program 1: Venture Capital
Description/Objective: The Office of the Venture Capital Board (OVCB) assists the Venture Capital Board, in response to South Australia’s Strategic Plan to develop a strong private equity industry in South Australia. The objective is to positively influence innovation and development in the local business community and develop an entrepreneurial culture.
A key objective is to grow South Australia’s share of the Australian professional private equity market from $36.7 million (three year average to 30 June 2003) to over $90 million (three year average to 30 June 2009) invested in South Australia and 5.3 per cent (average three years to 30 June 2003) to over 9 per cent (average three years to 30 June 2009) for the number of investments made in South Australia.
A sub-set of the key objective is to achieve South Australia’s Strategic Plan 2007 venture capital target (T4.12): ‘South Australia’s share of Australian Government-administered venture capital program funds to reach 7 per cent by 2010, and be maintained thereafter.’
The OVCB aims to achieve this through the South Australian Private Equity Program and a range of education, networking and commercialisation initiatives in the private equity ‘space’, some delivered in conjunction with other government agencies.
2.56

Summary income statement
Program 1: Venture Capital 2007-08Budget
2006-07Estimated result
2006-07 Budget
2005-06 Actual
$000 $000 $000 $000
Expenses Employee benefits and costs............................. 842 826 817 623 Supplies and services........................................ 614 608 608 596 Grants and subsidies ......................................... 69 68 68 66 Payments to consultants.................................... 49 49 49 17 Other................................................................. 5 5 5 7
Total expenses 1 579 1 556 1 547 1 309
Income Interest revenues ............................................... — — — 98 Other................................................................. — — — 2
Total income — — — 100
Net cost of providing services 1 579 1 556 1 547 1 209
Program performance
Program 1: Venture Capital
2007-08 Budget
2006-07 Estimated result
2006-07 Budget
2005-06 Actual
Net cost of program $1 579 000 $1 556 000 $1 547 000 $1 209 000
Performance Commentary The South Australian Private Equity (SAPE) Program, along with the comprehensive range of private equity educational and networking activities undertaken during the year continued to receive positive feedback from industry participants and has played a major role in raising the profile and interest in private equity amongst the South Australian business community.
Funding of $7.7 million was committed to funds managed by Paragon Private Equity under the SAPE Program resulting in a final fund size of $34 million.
The total of $102 million professional private equity invested in South Australia in 2005-06 was the highest level of investment recorded, being significantly higher than the previous record level of $60.8 million invested in 2003-04. The three year average to 30 June 2006 of $70.9 million is above the trend line to achieve the forecast target average of $90 million invested in the three year period to 30 June 2009. In terms of number of professional private equity investments undertaken in the 2005-06 year, South Australia’s share was 8.3 per cent for a three year average of 8.0 per cent which is above the trend line of the Venture Capital Board’s (VCB) key objective of achieving a three year average of nine per cent by 30 June 2009. The number of full time private equity investment managers, excluding the government owned Playford Capital, has increased from nil in 2003, when the VCB was established, to seven FTEs by 30 June 2007. Two local private equity investment managers attended the 32nd Venture Capital Institute educational program in Atlanta, Georgia, USA in September 2006 as part of the Venture Capital Board Scholarship Program, together with three other local private equity industry participants. For 32 years the United States based Venture Capital Institute has provided sound educational training for over 4000 professionals from around the world. A total of nine local private equity industry participants have now attended this educational program, as a result of the Scholarship Program which commenced in 2004-05. The third Venture Capital Board/AVCAL Private Equity Forum was held in May 2007. VCB played a lead sponsorship role in establishing a private sector ‘mentoring for securing private equity’ program run by Matthew Michalewicz, which has also received sponsorship from Minter Ellison Lawyers, BDO Kendalls, Madderns Patent and Trade Mark Attorneys, Inventure Partners and the University of Adelaide and Playford Capital. This program will provide group and individual mentoring to South Australian entrepreneurs as they seek to raise private equity.
2.57
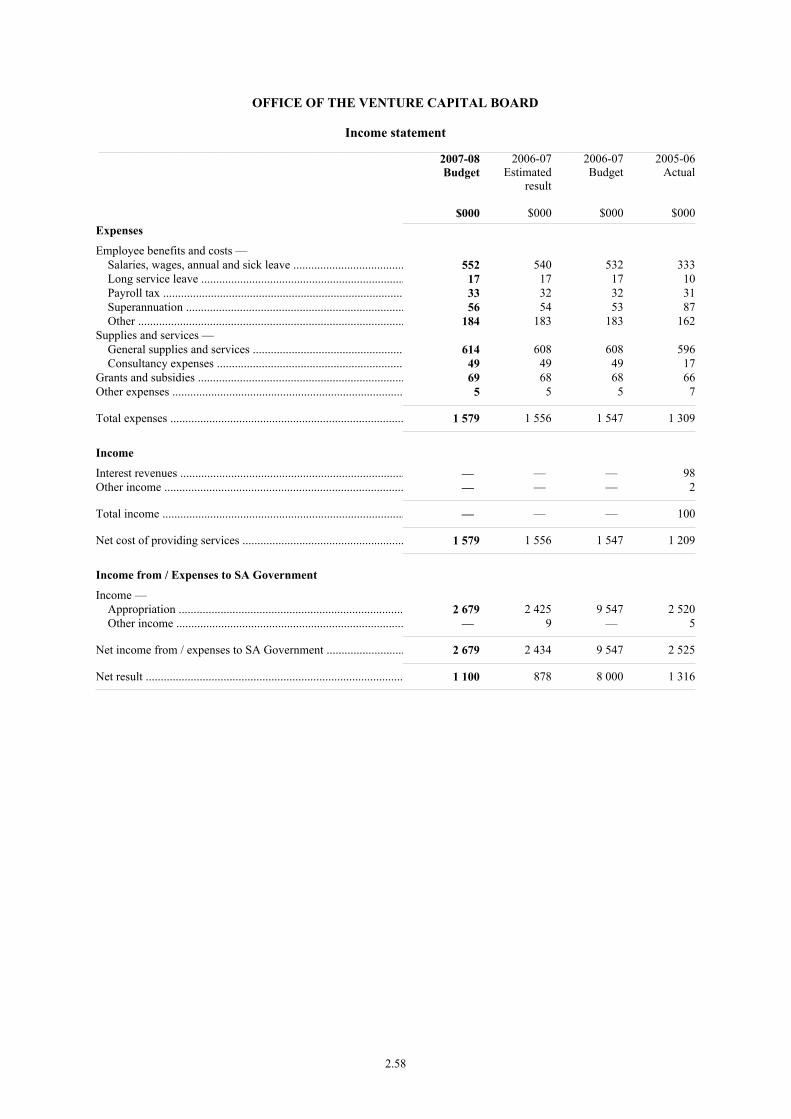
OFFICE OF THE VENTURE CAPITAL BOARD
Income statement__________________________________________________________________________________________________________________________________________________________________________________________________________________________________
2007-08Budget
$000
2006-07Estimated
result
$000
2006-07Budget
$000
2005-06Actual
$000Expenses
Employee benefits and costs — Salaries, wages, annual and sick leave ..................................... 552 540 532 333 Long service leave .................................................................... 17 17 17 10 Payroll tax ................................................................................ 33 32 32 31 Superannuation ......................................................................... 56 54 53 87 Other ......................................................................................... 184 183 183 162Supplies and services — General supplies and services .................................................. 614 608 608 596 Consultancy expenses .............................................................. 49 49 49 17Grants and subsidies ..................................................................... 69 68 68 66Other expenses ............................................................................. 5 5 5 7
Total expenses .............................................................................. 1 579 1 556 1 547 1 309
Income
Interest revenues ........................................................................... — — — 98Other income ................................................................................ — — — 2
Total income ................................................................................. — — — 100
Net cost of providing services ...................................................... 1 579 1 556 1 547 1 209
Income from / Expenses to SA Government
Income — Appropriation ........................................................................... 2 679 2 425 9 547 2 520 Other income ............................................................................ — 9 — 5
Net income from / expenses to SA Government .......................... 2 679 2 434 9 547 2 525
Net result ...................................................................................... 1 100 878 8 000 1 316
2.58

OFFICE OF THE VENTURE CAPITAL BOARD
Balance sheet__________________________________________________________________________________________________________________________________________________________________________________________________________________________________
2007-08Budget
$000
2006-07Estimated
result
$000
2006-07Budget
$000
2005-06Actual
$000Assets
Current assets
Cash and cash equivalents ............................................................ 790 790 327 2 790Receivables ................................................................................... 17 17 26 17
Total current assets ....................................................................... 807 807 353 2 807
Non current assets
Financial assets ............................................................................. 3 978 2 878 10 000 —
Total non-current assets ............................................................... 3 978 2 878 10 000 —
Total assets ................................................................................... 4 785 3 685 10 353 2 807
Liabilities
Current liabilities
Payables ........................................................................................ 180 180 42 181Employee benefits — Salaries and wages ................................................................... 6 6 7 7 Annual leave ............................................................................. 51 51 72 51 Long service leave .................................................................... 16 16 6 13Short-term provisions ................................................................... 1 1 1 1Other current liabilities ................................................................. — — — 1
Total current liabilities ................................................................. 254 254 128 254
Non current liabilities
Long-term employee benefits — Long service leave .................................................................... 68 68 55 65 Other ......................................................................................... — — — 3Long-term provisions ................................................................... 2 2 2 2
Total non-current liabilities .......................................................... 70 70 57 70
Total liabilities .............................................................................. 324 324 185 324
Net assets ...................................................................................... 4 461 3 361 10 168 2 483
Equity
Retained earnings ......................................................................... 4 461 3 361 10 168 2 483
Total equity .................................................................................. 4 461 3 361 10 168 2 483
Balances as at 30 June end of period.
2.59

OFFICE OF THE VENTURE CAPITAL BOARD
Statement of changes in equity__________________________________________________________________________________________________________________________________________________________________________________________________________________________________
Contributedcapital
$000
Assetrevaluation
reserve
$000
Retainedearnings
$000
Total
$000
Balance at 30 June 2006 ............................................................... — — 2 483 2 483Adjustments .................................................................................. — — — —
Restated balance at June 2006 ...................................................... — — 2 483 2 483
Net gain/loss on revaluation of property, plant and equipment during 2006-07 ............................................................................ — — — — Net changes in reserves ................................................................ — — — —
Net income/expense recognised directly in equity for 2006-07 ... — — — — Net result after restructure for 2006-07 ........................................ — — 878 878
Total recognised income and expense for 2006-07 — — 878 878
Equity contributions from SA Government ................................. — — — — Repayment of equity contributions from SA Government .......... — — — —
Estimated balance at 30 June 2007 — — 3 361 3 361
Net gain/loss on revaluation of property, plant and equipment during 2007-08 ............................................................................ — — — — Net changes in reserves ................................................................ — — — —
Net income/expense recognised directly in equity for 2007-08 ... — — — — Net result after restructure for 2007-08 ........................................ — — 1 100 1 100
Total recognised income and expense for 2007-08 — — 1 100 1 100
Equity contributions from SA Government ................................. — — — — Repayment of equity contributions from SA Government .......... — — — —
Estimated balance at 30 June 2008 — — 4 461 4 461
2.60
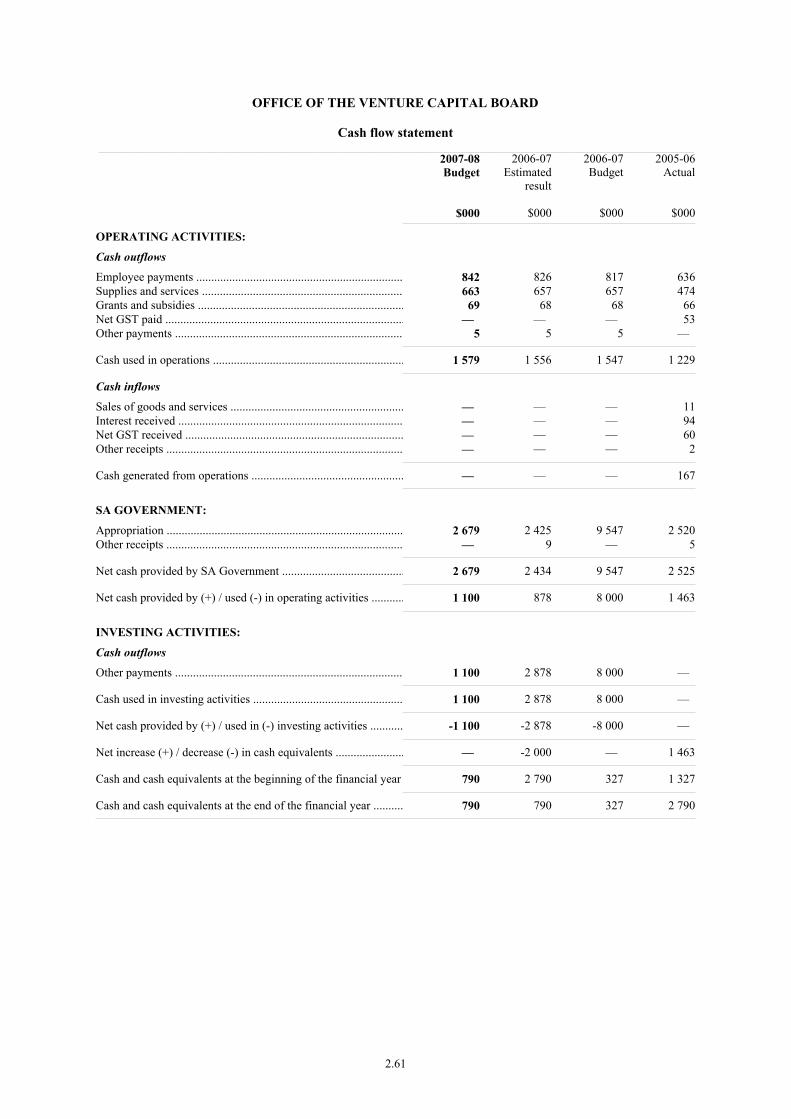
OFFICE OF THE VENTURE CAPITAL BOARD
Cash flow statement__________________________________________________________________________________________________________________________________________________________________________________________________________________________________
2007-08Budget
$000
2006-07Estimated
result
$000
2006-07Budget
$000
2005-06Actual
$000
OPERATING ACTIVITIES:
Cash outflows
Employee payments ..................................................................... 842 826 817 636Supplies and services ................................................................... 663 657 657 474Grants and subsidies ..................................................................... 69 68 68 66Net GST paid ................................................................................ — — — 53Other payments ............................................................................ 5 5 5 —
Cash used in operations ................................................................ 1 579 1 556 1 547 1 229
Cash inflows
Sales of goods and services .......................................................... — — — 11Interest received ........................................................................... — — — 94Net GST received ......................................................................... — — — 60Other receipts ............................................................................... — — — 2
Cash generated from operations ................................................... — — — 167
SA GOVERNMENT:
Appropriation ............................................................................... 2 679 2 425 9 547 2 520Other receipts ............................................................................... — 9 — 5
Net cash provided by SA Government ......................................... 2 679 2 434 9 547 2 525
Net cash provided by (+) / used (-) in operating activities ........... 1 100 878 8 000 1 463
INVESTING ACTIVITIES:
Cash outflows
Other payments ............................................................................ 1 100 2 878 8 000 —
Cash used in investing activities .................................................. 1 100 2 878 8 000 —
Net cash provided by (+) / used in (-) investing activities ........... -1 100 -2 878 -8 000 —
Net increase (+) / decrease (-) in cash equivalents ....................... — -2 000 — 1 463
Cash and cash equivalents at the beginning of the financial year 790 2 790 327 1 327
Cash and cash equivalents at the end of the financial year .......... 790 790 327 2 790
2.61
AGENCY: OFFICE OF THE VENTURE CAPITAL BOARD
Financial Commentary — major variations
The following commentary relates to the Office of the Venture Capital Board financial statements presented in the previous section. The discussion relates to variations between the 2006-07 Estimated Result and the 2007-08 Budget.
Income statement — Controlled
There are no major variances in the Income statement. The minor increase from the 2006-07 Estimated Result to the 2007-08 Budget reflects normal CPI increases between financial years.
Balance sheet — Controlled
The major variance relates to the increase in financial assets due to the investment in the SAPE program.
Statement of changes in equity — Controlled
The increase in equity reflects the investment in the SAPE program.
Cash flow statement — Controlled
The trends reflected in the Cash flow statement are consistent with the trends reflected in the Income statement and the Balance sheet.
2.62

Portfolio: Treasury and Finance
Treasurer Minister for Finance Minister for Gambling


TABLE OF CONTENTS
PORTFOLIO SUMMARY
Ministerial Responsibilities..................................................................................................3.1
Workforce Summary ............................................................................................................3.2
Ministerial Office Resources ...............................................................................................3.2
Agency Summaries
Department of Treasury and Finance ...................................................................................3.4

PORTFOLIO: TREASURY AND FINANCE
MINISTERIAL RESPONSIBILITIES
Minister Agency Programs Sub-Programs 1. Accountability for
Public Sector Resources 1.1 Policy Analysis and
Advice 1.2 Budget and Financial
Management
The Hon. Kevin Foley Treasurer
Department of Treasury and Finance
2. Financial Services Provision
2.1 Revenue Collection and Management
2.2 Financing Services 2.3 Superannuation
Services 2.4 Insurance Services 2.5 Ministerial Support
Services
3. Shared Services Reform Nil The Hon. Michael Wright Minister for Finance
Department of Treasury and Finance 4. State Procurement and
Support Operations 4.1 Contract and
Procurement Services 4.2 Light Motor Vehicle
Fleet 4.3 Vehicles for Ministers,
Parliamentarians and VIPs
4.4 Support Operations
The Hon. Paul Caica Minister for Gambling
Department of Treasury and Finance
5. Gambling Policy Nil
Statutes
The Department of the Premier and Cabinet maintains a list of statutes applicable to Ministers.
3.1
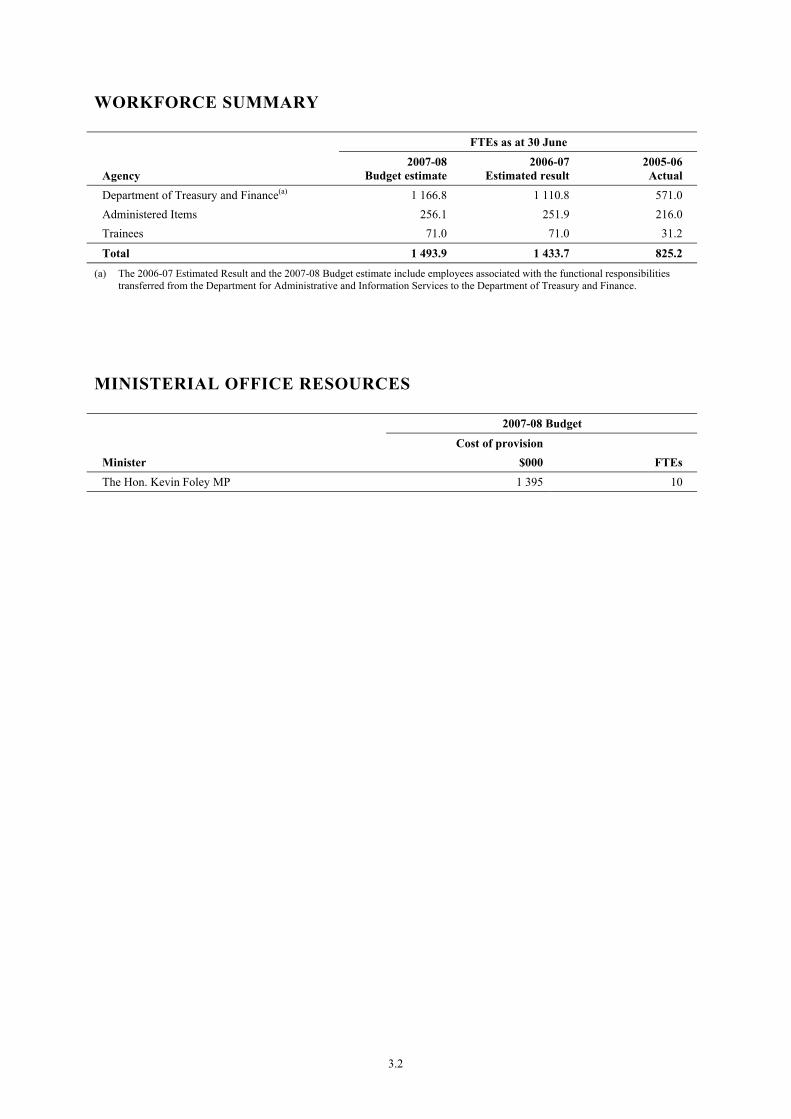
WORKFORCE SUMMARY
FTEs as at 30 June
Agency 2007-08
Budget estimate 2006-07
Estimated result 2005-06 Actual
Department of Treasury and Finance(a) 1 166.8 1 110.8 571.0 Administered Items 256.1 251.9 216.0 Trainees 71.0 71.0 31.2
Total 1 493.9 1 433.7 825.2
(a) The 2006-07 Estimated Result and the 2007-08 Budget estimate include employees associated with the functional responsibilities transferred from the Department for Administrative and Information Services to the Department of Treasury and Finance.
MINISTERIAL OFFICE RESOURCES
2007-08 Budget
Cost of provision Minister $000 FTEs The Hon. Kevin Foley MP 1 395 10
3.2

3.3

TABLE OF CONTENTS
AGENCY: DEPARTMENT OF TREASURY AND FINANCE
Objective ........................................................................................................................................3.5
Targets / Highlights ........................................................................................................................3.5
Program Net Cost of Services Summary........................................................................................3.7
Investing Payments Summary ........................................................................................................3.8
Program Information — includes description/objective, Summary income statement, sub-program information including performance criteria
1. Accountability for Public Sector Resources .................................................................3.9
2. Financial Services Provision.........................................................................................3.11
3. Shared Services Reform................................................................................................3.16
4. State Procurement and Support Operations ..................................................................3.18
5. Gambling Policy ...........................................................................................................3.22
Financial Statements
Income statement .................................................................................................................3.24
Balance sheet........................................................................................................................3.25
Statement of changes in equity ............................................................................................3.26
Cash flow statement .............................................................................................................3.27
Income statement — Administered Items............................................................................3.29
Balance sheet — Administered Items ..................................................................................3.30
Statement of changes in equity — Administered Items.......................................................3.31
Cash flow statement — Administered Items — Consolidated Account Items ....................3.32
Cash flow statement — Administered Items — Administered Items Account ...................3.37
Cash flow statement — Administered Items — Other Accounts ........................................3.40
Additional Information for Administered Items — Other Accounts ...................................3.44
Financial Commentary ...................................................................................................................3.45
3.4

PORTFOLIO: TREASURY AND FINANCE
AGENCY: DEPARTMENT OF TREASURY AND FINANCE
Objective
To ensure that the South Australian public sector is accountable in both policy and financial terms to the government of the day. To provide economic and financial services to, and on behalf of, the Government of South Australia.
2007-08 Targets / 2006-07 Highlights
Targets 2007-08 Highlights 2006-07
• Continue to support implementation of South Australia’s Strategic Plan Objectives
• Continue to provide analysis and advice on key policy issues across the full range of government activities
• Continue to provide advice in relation to Council of Australian Governments (COAG) human capital and related reforms
• Production of the 2008-09 State Budget • Continue improvement of the annual State Budget process and
delivery of budget strategies consistent with maintaining the Government’s AAA credit rating
• Continue support of the Enterprise Bargaining framework through advice to the Treasurer and the government on policy, costing and provision issues for setting remuneration rates and employment conditions for the government’s workforce
• Critical analysis of agency financial performance and further improvements to monthly monitoring of agency budgets
• Monitoring and analysis of whole of government full time equivalent staff budgets and actual data for reporting to the Treasurer and Expenditure Review and Budget Cabinet Committee (ERBCC)
• Finalise arrangements for quarterly monitoring of consolidated financial reports for the general government sector
• Complete review of the existing Financial Management Framework, conduct agency liaison and education sessions on revisions
• Oversight of Public Private Partnership projects including new schools, facilities for correctional services and a youth detention facility
• Develop and implement shared services reform across government
• Implement Red Tape Reduction initiatives in accordance with approved plan
• Implement payroll tax harmonisation reforms • Contribute to the development of proposals for national
consistency in urban water and wastewater pricing, in respect of the National Water Initiative and, including water scarcity issues
• Continue the Procurement Reform program, including implementation of Stage 2
• Continued to support implementation of South Australia’s Strategic Plan Objectives
• Assisted with the transfer of functions from the Department for Administrative and Information Services through allocation of approved budgets to agencies receiving functional responsibilities
• Successfully produced 2006-07 and 2007-08 State Budgets
• Supported the government in ensuring budget processes and outcomes continue to be consistent with government priorities and a sound financial position for the state
• Establishment of full time equivalent staff caps for all general government sector agencies, developed in consultation with the respective agencies
• Supported the Enterprise Bargaining framework through policy, costing and provision of advice to the Treasurer and the government
• Contributed to development and publication of National Performance Report 2005-06 for both Major and Non-Major Water Utilities
• Provided analysis and advice on key policy issues across the full range of government activities
• Provided advice in relation to COAG human capital and related reforms
• Assisted South Australian Government agencies in the development of prospective projects under the Partnerships SA program
• Provided oversight of the Education Works and Correctional Services Public Private Partnership projects
• Establishment of the Shared Services Reform Office (SSRO) with approved governance and consultation arrangements
• Data collection exercise undertaken to provide information to the SSRO to assist in the implementation of shared services across government
• Identified eight initiatives for inclusion in the government’s Red Tape Reduction Plan
• The Stamp Duties (Land Rich Entities) Act 2006 was assented to on 23 November 2006 and restores the integrity of the land rich provisions to ensure the equitable tax treatment of transactions
• A number of improvements were made to invalidity and income protection insurance for the Triple S – Super Scheme. This included extending the age limits, amending eligibility criteria, and increasing the income protection benefits and benefit period
3.5
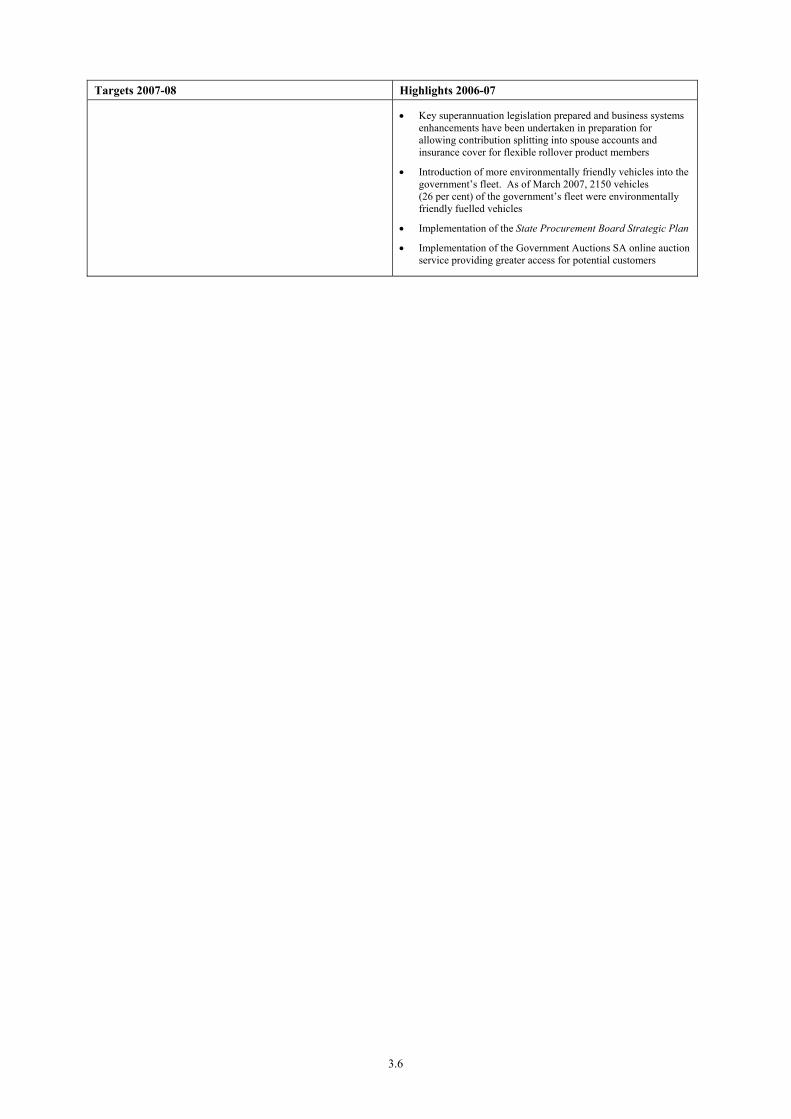
Targets 2007-08 Highlights 2006-07
• Key superannuation legislation prepared and business systems enhancements have been undertaken in preparation for allowing contribution splitting into spouse accounts and insurance cover for flexible rollover product members
• Introduction of more environmentally friendly vehicles into the government’s fleet. As of March 2007, 2150 vehicles (26 per cent) of the government’s fleet were environmentally friendly fuelled vehicles
• Implementation of the State Procurement Board Strategic Plan
• Implementation of the Government Auctions SA online auction service providing greater access for potential customers
3.6
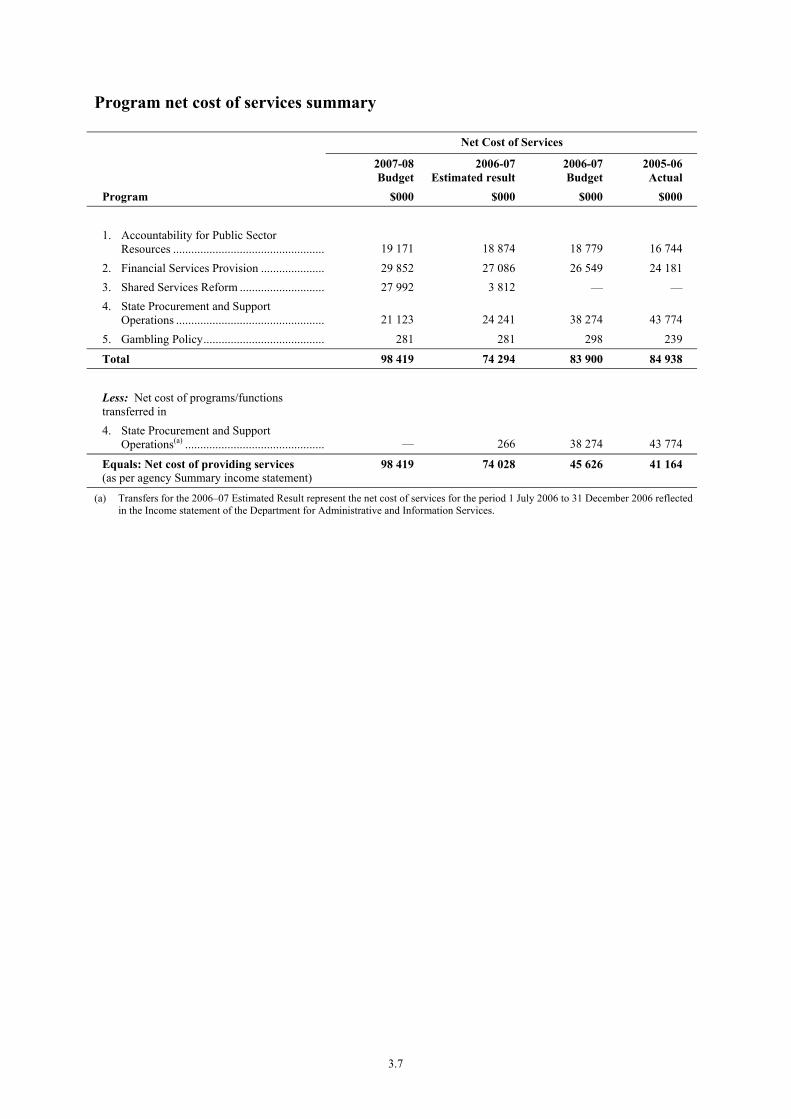
Program net cost of services summary
Net Cost of Services
2007-08Budget
2006-07Estimated result
2006-07 Budget
2005-06 Actual
Program $000 $000 $000 $000 1. Accountability for Public Sector
Resources ................................................... 19 171 18 874 18 779 16 744
2. Financial Services Provision ...................... 29 852 27 086 26 549 24 181 3. Shared Services Reform ............................. 27 992 3 812 — — 4. State Procurement and Support
Operations .................................................. 21 123 24 241 38 274 43 774
5. Gambling Policy......................................... 281 281 298 239
Total 98 419 74 294 83 900 84 938
Less: Net cost of programs/functions transferred in
4. State Procurement and Support Operations(a) ............................................... — 266 38 274 43 774
Equals: Net cost of providing services (as per agency Summary income statement)
98 419 74 028 45 626 41 164
(a) Transfers for the 2006–07 Estimated Result represent the net cost of services for the period 1 July 2006 to 31 December 2006 reflected in the Income statement of the Department for Administrative and Information Services.
3.7
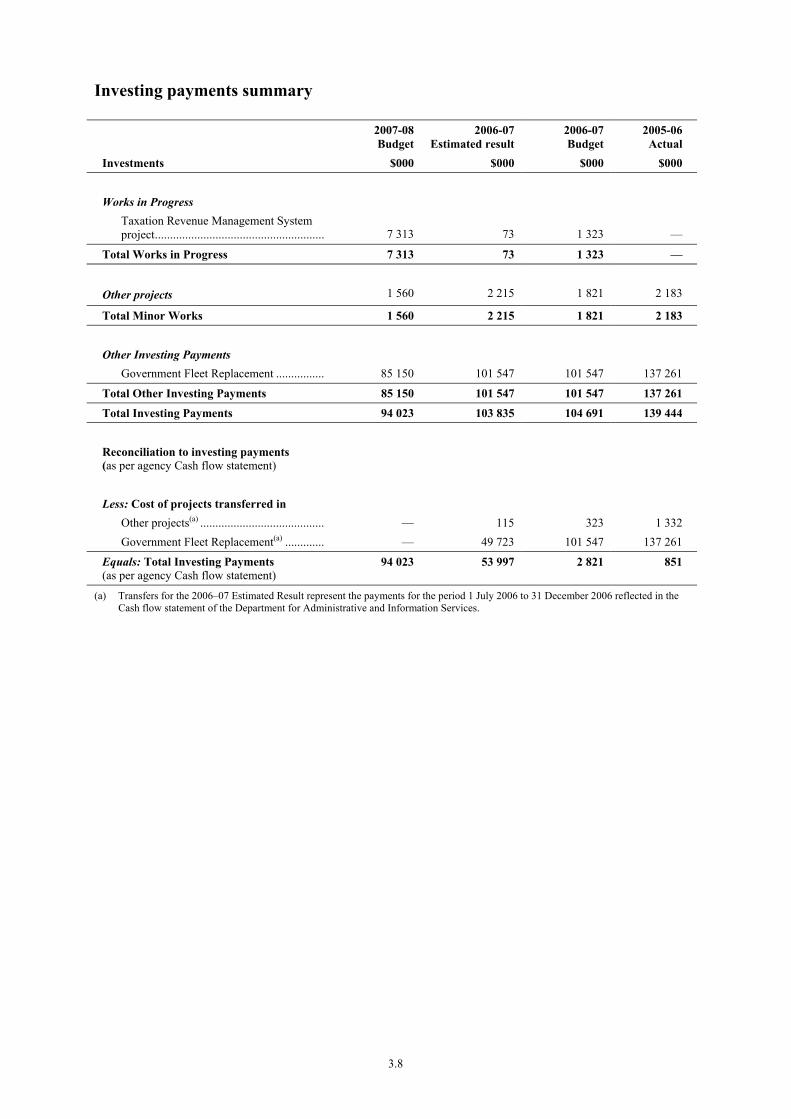
Investing payments summary
2007-08Budget
2006-07Estimated result
2006-07 Budget
2005-06 Actual
Investments $000 $000 $000 $000
Works in Progress
Taxation Revenue Management System project......................................................... 7 313 73 1 323 —
Total Works in Progress 7 313 73 1 323 —
Other projects 1 560 2 215 1 821 2 183
Total Minor Works 1 560 2 215 1 821 2 183 Other Investing Payments
Government Fleet Replacement ................ 85 150 101 547 101 547 137 261
Total Other Investing Payments 85 150 101 547 101 547 137 261
Total Investing Payments 94 023 103 835 104 691 139 444
Reconciliation to investing payments (as per agency Cash flow statement)
Less: Cost of projects transferred in
Other projects(a) ......................................... — 115 323 1 332 Government Fleet Replacement(a) ............. — 49 723 101 547 137 261
Equals: Total Investing Payments (as per agency Cash flow statement)
94 023 53 997 2 821 851
(a) Transfers for the 2006–07 Estimated Result represent the payments for the period 1 July 2006 to 31 December 2006 reflected in the Cash flow statement of the Department for Administrative and Information Services.
3.8

AGENCY: DEPARTMENT OF TREASURY AND FINANCE
Program Information
Program 1: Accountability for Public Sector Resources
Description/Objective: Treasury and Finance has the role of ensuring accountability for public sector resources through providing policy, economic and financial advice to the government and coordinating resource allocations for government programs and priorities at the whole of government level.
Summary income statement
Program 1: Accountability for Public Sector Resources
2007-08Budget
2006-07Estimated result
2006-07 Budget
2005-06 Actual
$000 $000 $000 $000
Expenses Employee benefits and costs............................. 15 150 14 445 14 337 13 435 Supplies and services........................................ 4 205 4 604 4 528 4 609 Depreciation and amortisation .......................... 711 764 849 729 Other................................................................. 205 207 176 2
Total expenses 20 271 20 020 19 890 18 775
Income Sale of goods and services................................ 899 1 007 829 1 610 Other................................................................. 201 139 282 421
Total income 1 100 1 146 1 111 2 031
Net cost of providing services 19 171 18 874 18 779 16 744
3.9
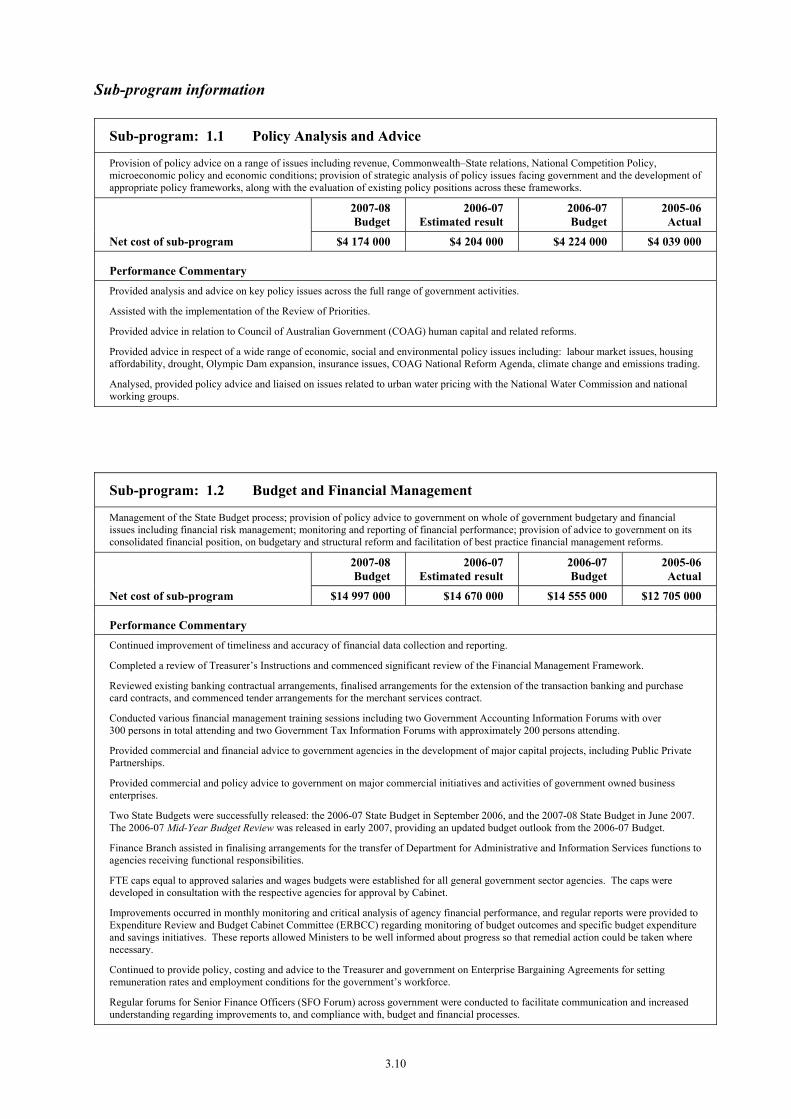
Sub-program information
Sub-program: 1.1 Policy Analysis and Advice
Provision of policy advice on a range of issues including revenue, Commonwealth–State relations, National Competition Policy, microeconomic policy and economic conditions; provision of strategic analysis of policy issues facing government and the development of appropriate policy frameworks, along with the evaluation of existing policy positions across these frameworks.
2007-08 Budget
2006-07 Estimated result
2006-07 Budget
2005-06 Actual
Net cost of sub-program $4 174 000 $4 204 000 $4 224 000 $4 039 000
Performance Commentary Provided analysis and advice on key policy issues across the full range of government activities.
Assisted with the implementation of the Review of Priorities.
Provided advice in relation to Council of Australian Government (COAG) human capital and related reforms.
Provided advice in respect of a wide range of economic, social and environmental policy issues including: labour market issues, housing affordability, drought, Olympic Dam expansion, insurance issues, COAG National Reform Agenda, climate change and emissions trading.
Analysed, provided policy advice and liaised on issues related to urban water pricing with the National Water Commission and national working groups.
Sub-program: 1.2 Budget and Financial Management
Management of the State Budget process; provision of policy advice to government on whole of government budgetary and financial issues including financial risk management; monitoring and reporting of financial performance; provision of advice to government on its consolidated financial position, on budgetary and structural reform and facilitation of best practice financial management reforms.
2007-08 Budget
2006-07 Estimated result
2006-07 Budget
2005-06 Actual
Net cost of sub-program $14 997 000 $14 670 000 $14 555 000 $12 705 000
Performance Commentary Continued improvement of timeliness and accuracy of financial data collection and reporting.
Completed a review of Treasurer’s Instructions and commenced significant review of the Financial Management Framework.
Reviewed existing banking contractual arrangements, finalised arrangements for the extension of the transaction banking and purchase card contracts, and commenced tender arrangements for the merchant services contract.
Conducted various financial management training sessions including two Government Accounting Information Forums with over 300 persons in total attending and two Government Tax Information Forums with approximately 200 persons attending.
Provided commercial and financial advice to government agencies in the development of major capital projects, including Public Private Partnerships.
Provided commercial and policy advice to government on major commercial initiatives and activities of government owned business enterprises.
Two State Budgets were successfully released: the 2006-07 State Budget in September 2006, and the 2007-08 State Budget in June 2007. The 2006-07 Mid-Year Budget Review was released in early 2007, providing an updated budget outlook from the 2006-07 Budget.
Finance Branch assisted in finalising arrangements for the transfer of Department for Administrative and Information Services functions to agencies receiving functional responsibilities.
FTE caps equal to approved salaries and wages budgets were established for all general government sector agencies. The caps were developed in consultation with the respective agencies for approval by Cabinet.
Improvements occurred in monthly monitoring and critical analysis of agency financial performance, and regular reports were provided to Expenditure Review and Budget Cabinet Committee (ERBCC) regarding monitoring of budget outcomes and specific budget expenditure and savings initiatives. These reports allowed Ministers to be well informed about progress so that remedial action could be taken where necessary.
Continued to provide policy, costing and advice to the Treasurer and government on Enterprise Bargaining Agreements for setting remuneration rates and employment conditions for the government’s workforce.
Regular forums for Senior Finance Officers (SFO Forum) across government were conducted to facilitate communication and increased understanding regarding improvements to, and compliance with, budget and financial processes.
3.10
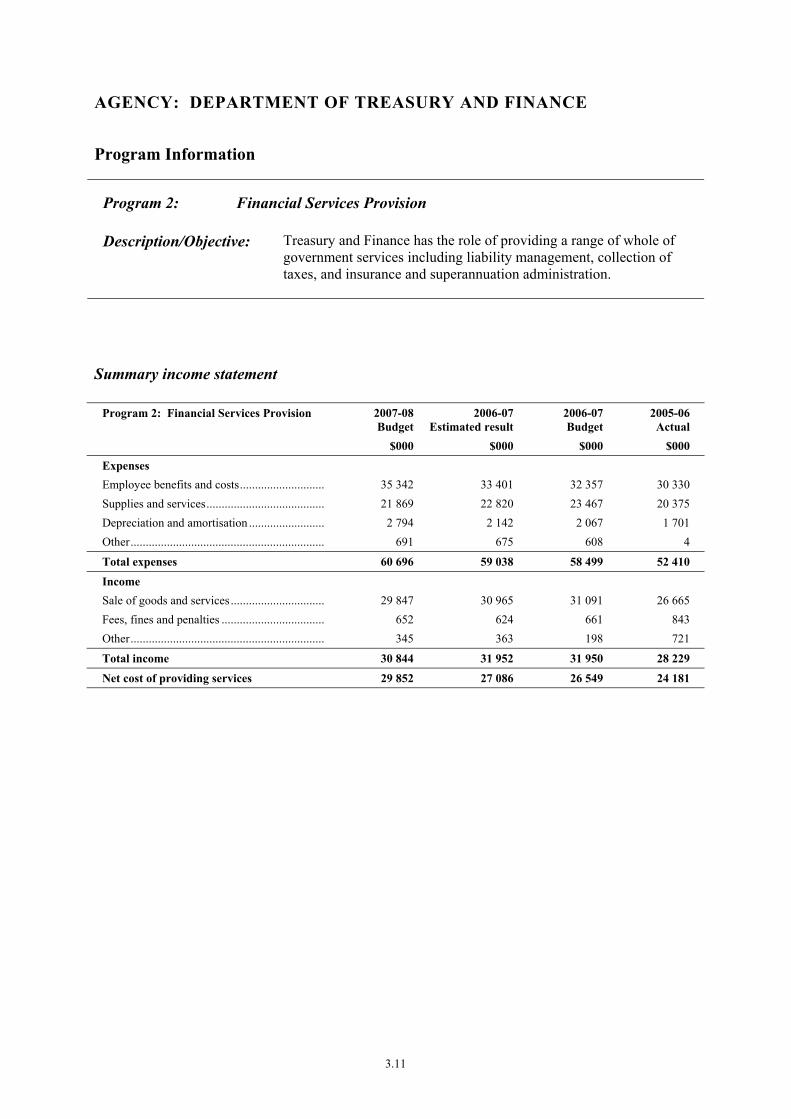
AGENCY: DEPARTMENT OF TREASURY AND FINANCE
Program Information
Program 2: Financial Services Provision
Description/Objective: Treasury and Finance has the role of providing a range of whole of government services including liability management, collection of taxes, and insurance and superannuation administration.
Summary income statement
Program 2: Financial Services Provision 2007-08Budget
2006-07Estimated result
2006-07 Budget
2005-06 Actual
$000 $000 $000 $000
Expenses Employee benefits and costs............................. 35 342 33 401 32 357 30 330 Supplies and services........................................ 21 869 22 820 23 467 20 375 Depreciation and amortisation .......................... 2 794 2 142 2 067 1 701 Other................................................................. 691 675 608 4
Total expenses 60 696 59 038 58 499 52 410
Income Sale of goods and services................................ 29 847 30 965 31 091 26 665 Fees, fines and penalties ................................... 652 624 661 843 Other................................................................. 345 363 198 721
Total income 30 844 31 952 31 950 28 229
Net cost of providing services 29 852 27 086 26 549 24 181
3.11
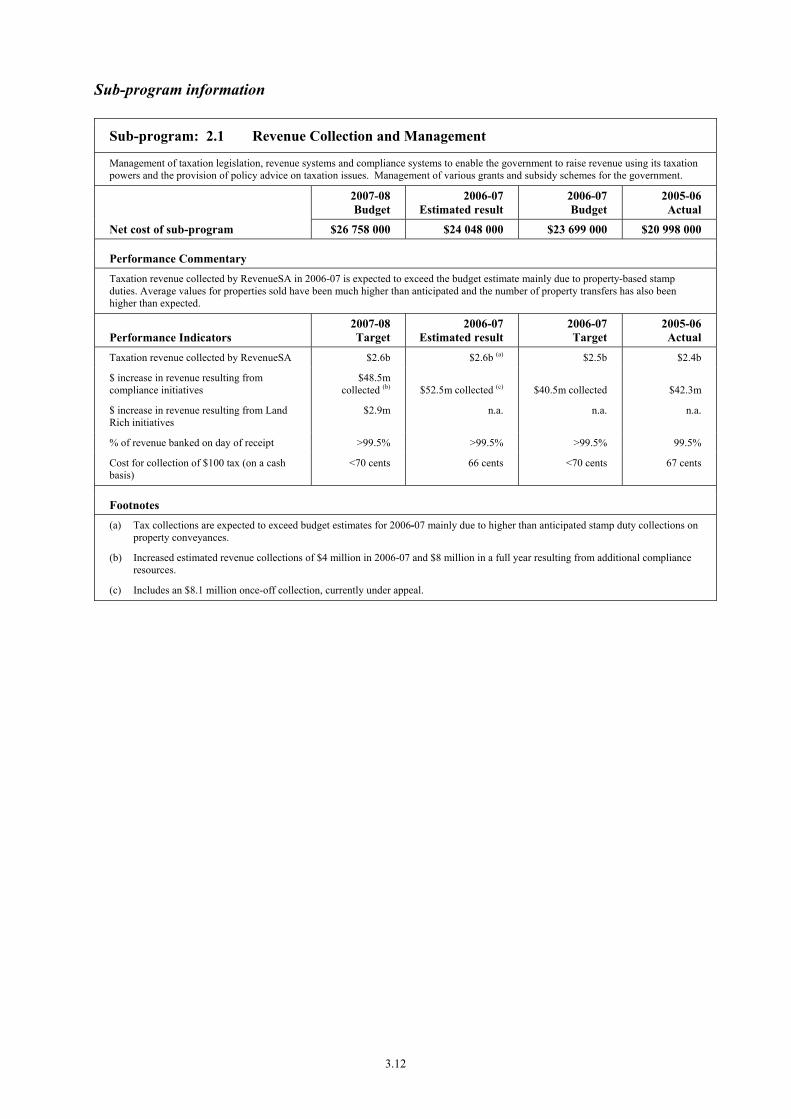
Sub-program information
Sub-program: 2.1 Revenue Collection and Management
Management of taxation legislation, revenue systems and compliance systems to enable the government to raise revenue using its taxation powers and the provision of policy advice on taxation issues. Management of various grants and subsidy schemes for the government.
2007-08 Budget
2006-07 Estimated result
2006-07 Budget
2005-06 Actual
Net cost of sub-program $26 758 000 $24 048 000 $23 699 000 $20 998 000
Performance Commentary Taxation revenue collected by RevenueSA in 2006-07 is expected to exceed the budget estimate mainly due to property-based stamp duties. Average values for properties sold have been much higher than anticipated and the number of property transfers has also been higher than expected.
Performance Indicators 2007-08 Target
2006-07 Estimated result
2006-07 Target
2005-06 Actual
Taxation revenue collected by RevenueSA $2.6b $2.6b (a) $2.5b $2.4b
$ increase in revenue resulting from compliance initiatives
$ increase in revenue resulting from Land Rich initiatives
$48.5m collected (b)
$2.9m
$52.5m collected (c)
n.a.
$40.5m collected
n.a.
$42.3m
n.a.
% of revenue banked on day of receipt >99.5% >99.5% >99.5% 99.5%
Cost for collection of $100 tax (on a cash basis)
<70 cents 66 cents <70 cents 67 cents
Footnotes (a) Tax collections are expected to exceed budget estimates for 2006-07 mainly due to higher than anticipated stamp duty collections on
property conveyances.
(b) Increased estimated revenue collections of $4 million in 2006-07 and $8 million in a full year resulting from additional compliance resources.
(c) Includes an $8.1 million once-off collection, currently under appeal.
3.12
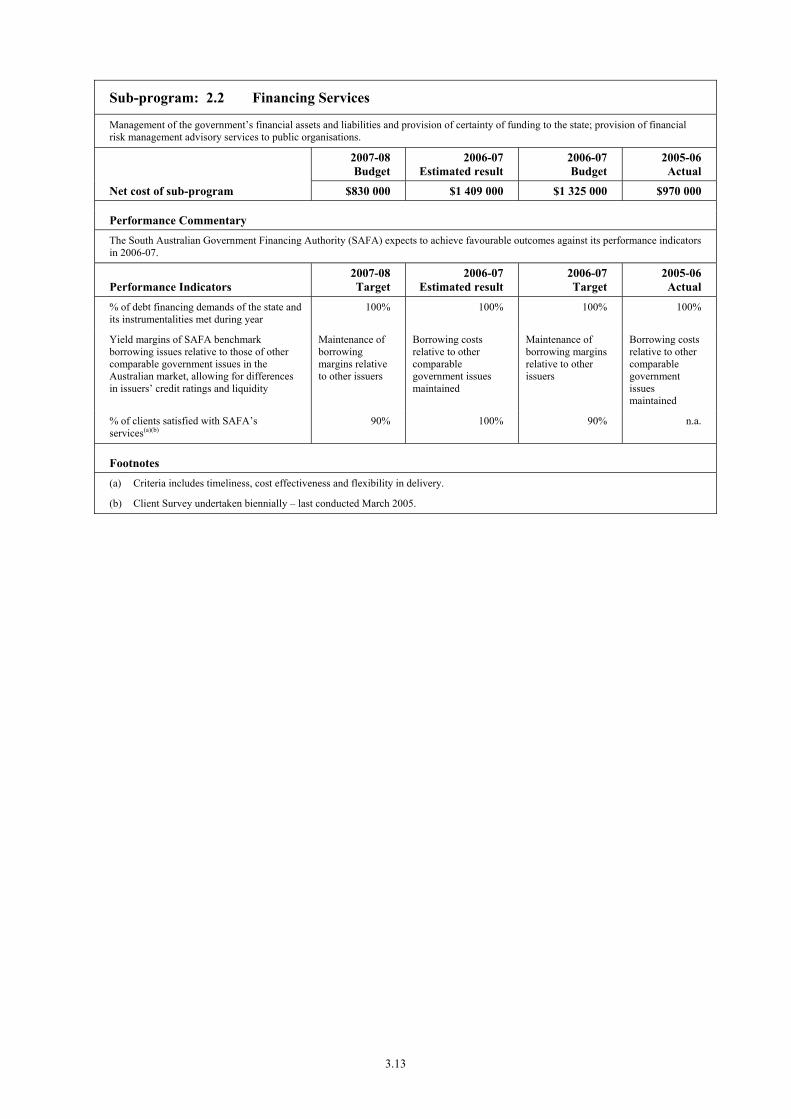
Sub-program: 2.2 Financing Services
Management of the government’s financial assets and liabilities and provision of certainty of funding to the state; provision of financial risk management advisory services to public organisations.
2007-08 Budget
2006-07 Estimated result
2006-07 Budget
2005-06 Actual
Net cost of sub-program $830 000 $1 409 000 $1 325 000 $970 000
Performance Commentary The South Australian Government Financing Authority (SAFA) expects to achieve favourable outcomes against its performance indicators in 2006-07.
Performance Indicators 2007-08 Target
2006-07 Estimated result
2006-07 Target
2005-06 Actual
% of debt financing demands of the state and its instrumentalities met during year
100% 100% 100% 100%
Yield margins of SAFA benchmark borrowing issues relative to those of other comparable government issues in the Australian market, allowing for differences in issuers’ credit ratings and liquidity
Maintenance of borrowing margins relative to other issuers
Borrowing costs relative to other comparable government issues maintained
Maintenance of borrowing margins relative to other issuers
Borrowing costs relative to other comparable government issues maintained
% of clients satisfied with SAFA’s services(a)(b)
90% 100% 90% n.a.
Footnotes (a) Criteria includes timeliness, cost effectiveness and flexibility in delivery.
(b) Client Survey undertaken biennially – last conducted March 2005.
3.13

Sub-program: 2.3 Superannuation Services
Administration of the various public sector superannuation schemes for the Superannuation Board, as well as the superannuation arrangements for parliamentarians, judges and governors; provision of superannuation policy and legislative advice to the Superannuation Board, the Under Treasurer and the Treasurer.
2007-08 Budget
2006-07 Estimated result
2006-07 Budget
2005-06 Actual
Net cost of sub-program $319 000 -$377 000 -$429 000 $445 000
Performance Commentary Super SA has maintained a high quality and low cost service to its members on an ongoing basis with the offering of cost effective and favourably comparable post-retirement products to members, the provision of better or equivalent superannuation services at a lower cost and enhancements of Triple S insurance.
Performance Indicators 2007-08 Target
2006-07 Estimated result
2006-07 Target
2005-06 Actual
No. of contributors/members in state schemes (activity level indicator)
170 000 members including 27 700 active contributors to the Triple S Scheme
169 000 members including 27 000 active contributors to the Triple S Scheme
165 000 members including 25 200 active contributors to the Triple S Scheme
167 500 members including 25 600 active contributors to the Triple S Scheme
% achievement of service level standards agreed with Super SA Board by 30 June each year
95% 97.6% 95% 96.8%
Issue of member statements 95% issued by 31 August 2007
95% issued by 31 August 2006
95% issued by 31 August 2006
98% issued by 30 September 2005
Issue of Superannuant Group Certificates 100% issued within 7 business days from 1 July
100% issued within 7 business days from 1 July
100% issued by 14 July 2006
100% issued by 14 July 2005
Benchmarking of administrative costs with industry standards
Continue to remain in the lowest quartile of industry standards while providing additional services to members
Continued to remain in the lowest quartile of industry standards while providing additional services to members
Continue to remain in the lowest quartile of industry standards while providing additional services to members
Continued to remain in the lowest quartile of industry standards while providing additional services to members
3.14

Sub-program: 2.4 Insurance Services
Provision of insurance cover to government agencies through the insurance and reinsurance of government risks; provision of advice to the government on issues relating to the insurance and management of those risks.
2007-08 Budget
2006-07 Estimated result
2006-07 Budget
2005-06 Actual
Net cost of sub-program $12 000 $75 000 $40 000 $21 000
Performance Commentary The government’s reinsurance program was successfully renewed in September/October 2006 with the same levels of cover at a reduced cost.
Performance Indicators 2007-08 Target
2006-07 Estimated result
2006-07 Target
2005-06 Actual
No. of clients issued with agency agreements 145 149 145 137
Comprehensive government catastrophe reinsurance program at a competitive market price
Selected catastrophic risks covered at competitive market prices
Reinsurance program fully placed at competitive price
Selected catastrophic risks covered at competitive market prices
Reinsurance program fully placed at competitive price
% of clients provided with agency agreements/renewal certificates and invoices by 31 July
80% 80%(a) 80% 83%
$ operating expense per $100 premium revenue
<$4.00 $3.06 <$4.00 $2.87
Footnotes (a) Based on number of questionnaires returned from agencies as at 31 July 2006.
Sub-program: 2.5 Ministerial Support Services
Operation of Treasurer’s Office including departmental support.
2007-08 Budget
2006-07 Estimated result
2006-07 Budget
2005-06 Actual
Net cost of sub-program $1 933 000 $1 931 000 $1 914 000 $1 747 000
Performance Commentary The Treasurer’s Office has operated effectively.
3.15

AGENCY: DEPARTMENT OF TREASURY AND FINANCE
Program Information
Program 3: Shared Services Reform
Description/Objective: Design, development and implementation of shared services across government.
Summary income statement
Program 3: Shared Services Reform 2007-08Budget
2006-07Estimated result
2006-07 Budget
2005-06 Actual
$000 $000 $000 $000
Expenses Employee benefits and costs............................. 6 269 2 003 — — Supplies and services........................................ 21 699 1 800 — — Depreciation and amortisation .......................... 20 10 — — Other................................................................. 26 9 — —
Total expenses 28 014 3 822 — —
Income Sale of goods and services................................ 2 10 — — Other................................................................. 20 — — —
Total income 22 10 — —
Net cost of providing services 27 992 3 812 — —
3.16

Program information
Program: 3 Shared Services Reform
2007-08 Budget
2006-07 Estimated result
2006-07 Budget
2005-06 Actual
Net cost of program $27 992 000 $3 812 000 — —
Performance Commentary The Department of Treasury and Finance established the Shared Services Reform Office (SSRO) in October 2006 to develop the strategy and, once approved, implement the shared services reforms.
Cabinet approved the governance arrangements for shared services reform on 6 November 2006. The Chief Executive Shared Services Steering Committee is the lead governance group and provides Chief Executive stewardship, ensures risks are managed and provides strategic oversight for the scope of services and projects undertaken by the SSRO.
Information Communication and Technology Services, Human Resources, Finance, Procurement and other corporate and business services are currently being investigated for possible delivery via a shared services model.
Shared services reform planning is based around the following five phases - information gathering, strategy development, detailed design and development, implement and migrate, operate and improve.
The current information gathering phase has included an across government data collection exercise, which was approved by Cabinet on 6 November 2006.
The SSRO is concurrently working on the strategy development phase, which will include developing the initial scope of services, program feasibility, a high level operating model, transition and workforce strategy.
3.17

AGENCY: DEPARTMENT OF TREASURY AND FINANCE
Program Information
Program 4: State Procurement and Support Operations
Description/Objective: Treasury and Finance has the role of providing a range of services to other government agencies including contract and procurement management, fleet management and a range of corporate transaction services.
Summary income statement
Program 4: State Procurement and Support Operations
2007-08Budget
2006-07Estimated result
2006-07 Budget
2005-06 Actual
$000 $000 $000 $000
Expenses Employee benefits and costs............................. 31 900 32 829 30 528 35 701 Supplies and services........................................ 61 568 59 723 54 986 57 236 Grants and subsidies ......................................... — 2 569 5 092 2 710 Depreciation and amortisation .......................... 42 846 42 971 42 868 36 668 Other................................................................. 23 491 24 360 19 984 27 296
Total expenses 159 805 162 452 153 458 159 611
Income Sale of goods and services................................ 137 823 137 363 115 184 117 349 Other................................................................. 859 848 — -1 512
Total income 138 682 138 211 115 184 115 837
Net cost of providing services 21 123 24 241 38 274 43 774
3.18

Sub-program information
Sub-program: 4.1 Contract and Procurement Services
Support the State Procurement Board in the delivery of its key objectives. Support the Board in developing the strategic direction for procurement operations across government, focusing on policy and guidelines development, capability development, and facilitating procurement across government.
2007-08 Budget
2006-07 Estimated result
2006-07 Budget
2005-06 Actual
Net cost of sub-program $7 314 000 $7 033 000 $3 647 000 $6 980 000
Performance Commentary Significant progress has been made on a number of key strategic across-government contracts. A program of achievements was agreed with the State Procurement Board that included significant savings on major across government electricity contracts. The goals of this program are being met with the majority of electricity services covered by new contracts.
The policy development framework for public procurement was finalised.
A mobility program that enables procurement graduates to rotate between agencies was established.
A framework for the ongoing review and benchmarking of agency procurement activities was developed.
The purchase of renewable energy through across-government energy contracts was facilitated with the aim of assisting the public sector, including local government authorities, meet the government’s state-wide renewable energy targets. Significant local government authority use of the contracts has been realised.
Performance Indicators 2007-08 Target
2006-07 Estimated result
2006-07 Target
2005-06 Actual
No. of contracts managed 70 60 70(a) 55
Value of contracts managed $964m $919m $808m(b) $1 118m
Management cost per dollar value of contract $0.0087 $0.0094 $0.01 $0.0087
Footnotes (a) During 2006-07 Contract Services implemented additional strategic contracts. While of strategic importance, they were generally of
lower value, hence the higher management cost per dollar of contract value.
(b) The across-government contracts for personal computers and photocopiers were transferred to the ICT group, reducing the total value of contracts managed.
3.19
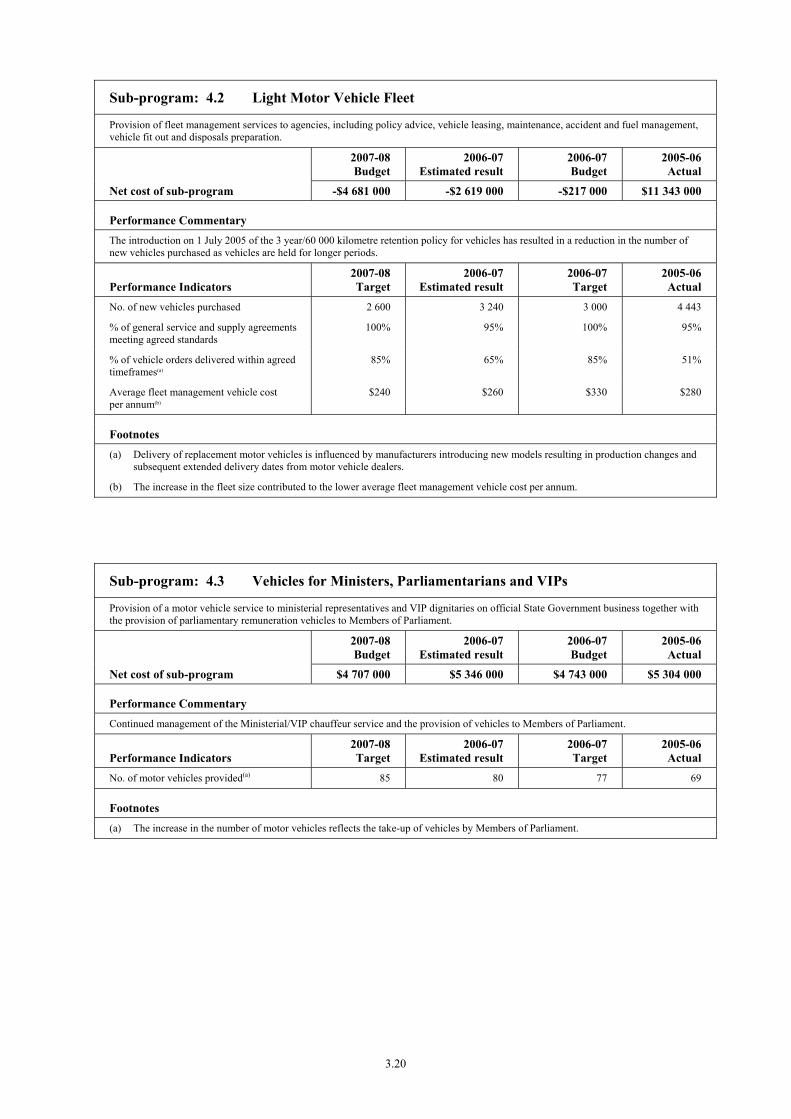
Sub-program: 4.2 Light Motor Vehicle Fleet
Provision of fleet management services to agencies, including policy advice, vehicle leasing, maintenance, accident and fuel management, vehicle fit out and disposals preparation.
2007-08 Budget
2006-07 Estimated result
2006-07 Budget
2005-06 Actual
Net cost of sub-program -$4 681 000 -$2 619 000 -$217 000 $11 343 000
Performance Commentary The introduction on 1 July 2005 of the 3 year/60 000 kilometre retention policy for vehicles has resulted in a reduction in the number of new vehicles purchased as vehicles are held for longer periods.
Performance Indicators 2007-08 Target
2006-07 Estimated result
2006-07 Target
2005-06 Actual
No. of new vehicles purchased 2 600 3 240 3 000 4 443
% of general service and supply agreements meeting agreed standards
100% 95% 100% 95%
% of vehicle orders delivered within agreed timeframes(a)
85% 65% 85% 51%
Average fleet management vehicle cost per annum(b)
$240 $260 $330 $280
Footnotes (a) Delivery of replacement motor vehicles is influenced by manufacturers introducing new models resulting in production changes and
subsequent extended delivery dates from motor vehicle dealers.
(b) The increase in the fleet size contributed to the lower average fleet management vehicle cost per annum.
Sub-program: 4.3 Vehicles for Ministers, Parliamentarians and VIPs
Provision of a motor vehicle service to ministerial representatives and VIP dignitaries on official State Government business together with the provision of parliamentary remuneration vehicles to Members of Parliament.
2007-08 Budget
2006-07 Estimated result
2006-07 Budget
2005-06 Actual
Net cost of sub-program $4 707 000 $5 346 000 $4 743 000 $5 304 000
Performance Commentary Continued management of the Ministerial/VIP chauffeur service and the provision of vehicles to Members of Parliament.
Performance Indicators 2007-08 Target
2006-07 Estimated result
2006-07 Target
2005-06 Actual
No. of motor vehicles provided(a) 85 80 77 69
Footnotes (a) The increase in the number of motor vehicles reflects the take-up of vehicles by Members of Parliament.
3.20

Sub-program: 4.4 Support Operations
Provision of a comprehensive, cost efficient range of corporate services including the provision of payroll, e-procurement, human resources, ICT support and accounting and financial services to various government agencies and business units.
2007-08 Budget
2006-07 Estimated result
2006-07 Budget
2005-06 Actual
Net cost of sub-program $13 783 000 $14 481 000 $30 101 000 $20 147 000
Performance Commentary In 2006-07 a new version of e-Financials was successfully introduced for all former Department for Administrative and Information Services business units.
Parliament SA with 125 employees moved their payroll processing to DTF Support Operations.
Significant work was undertaken in payroll, financial services and e-procurement to ensure that the transition of DAIS business units to their new agencies was seamless, professional and met all aspects of the regulatory environment.
Considerable effort was made by all groups in collecting data to assist in the Shared Services initiative.
Performance Indicators 2007-08 Target
2006-07 Estimated result
2006-07 Target
2005-06 Actual
No. of government agencies provided with shared services
27 27 26 26
No. of IT helpdesk calls answered per annum 40 000 36 500 42 000 40 235
No. of payroll transactions processed per annum
325 000 321 716 291 400 316 320
No. of accounts payable transactions processed per annum
210 000 213 542 220 000 221 084
3.21
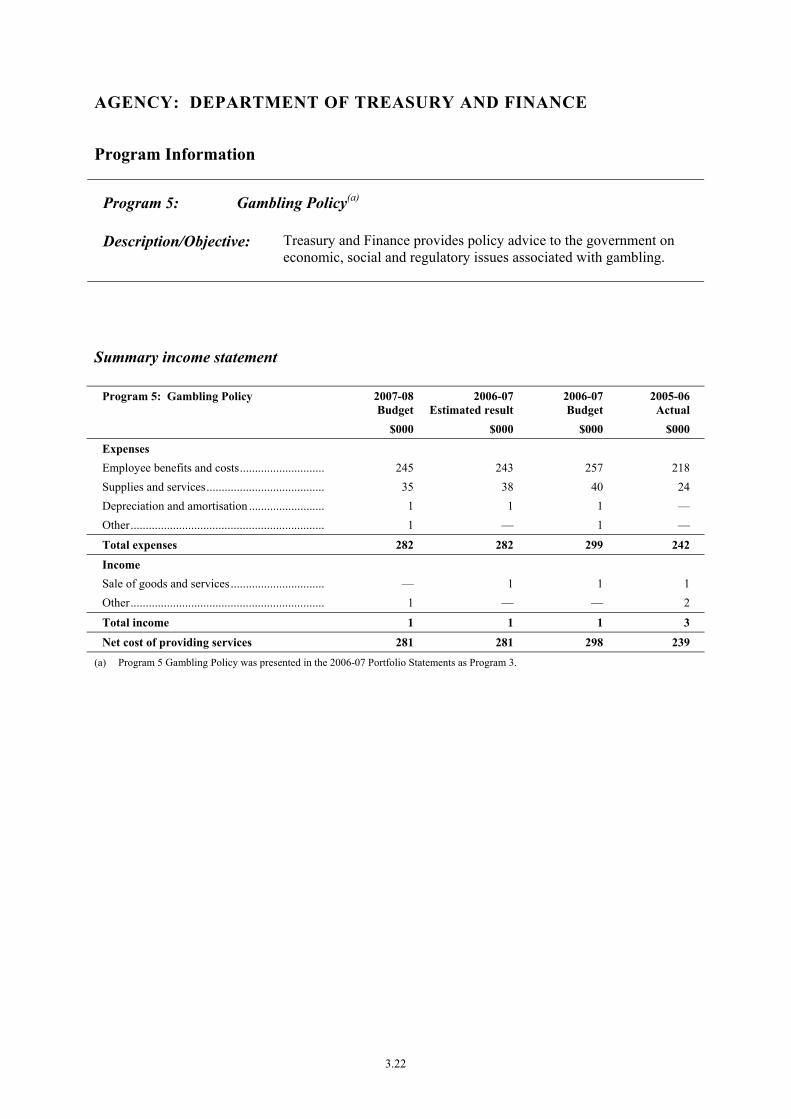
AGENCY: DEPARTMENT OF TREASURY AND FINANCE
Program Information
Program 5: Gambling Policy(a)
Description/Objective: Treasury and Finance provides policy advice to the government on economic, social and regulatory issues associated with gambling.
Summary income statement
Program 5: Gambling Policy 2007-08Budget
2006-07Estimated result
2006-07 Budget
2005-06 Actual
$000 $000 $000 $000
Expenses Employee benefits and costs............................. 245 243 257 218 Supplies and services........................................ 35 38 40 24 Depreciation and amortisation .......................... 1 1 1 — Other................................................................. 1 — 1 —
Total expenses 282 282 299 242
Income Sale of goods and services................................ — 1 1 1 Other................................................................. 1 — — 2
Total income 1 1 1 3
Net cost of providing services 281 281 298 239
(a) Program 5 Gambling Policy was presented in the 2006-07 Portfolio Statements as Program 3.
3.22

Program information
Program: 5 Gambling Policy
2007-08 Budget
2006-07 Estimated result
2006-07 Budget
2005-06 Actual
Net cost of program $281 000 $281 000 $298 000 $239 000
Performance Commentary The department completed a thorough review of the Lottery and Gaming Regulations 1993. The review addressed 10 key areas including licensing and financial limits, distribution of proceeds, scope of approved purpose and age restrictions. New regulations are currently being drafted.
Legislation to amend the Collections for Charitable Purpose Act 1939 to improve disclosure by the charity sector in relation to fundraising collections and events was completed. It is expected that the new disclosure requirements for the charity sector will commence in the new financial year.
The Responsible Gambling Working Party has been established to look at pre-commitment strategies for implementation in clubs and hotels, which will enable gaming machine players to pre-commit expenditure on gaming machines.
Advice was also provided to the Minister and Cabinet on a range of gambling issues that arose throughout the year.
3.23
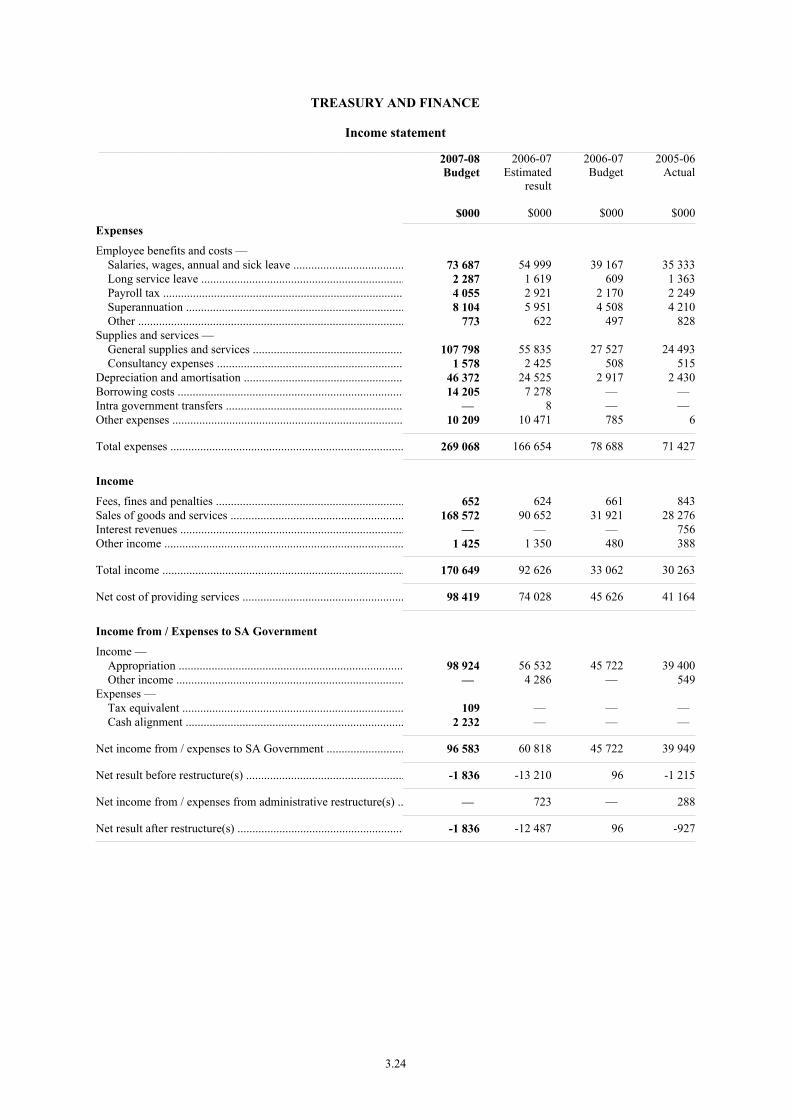
TREASURY AND FINANCE
Income statement__________________________________________________________________________________________________________________________________________________________________________________________________________________________________
2007-08Budget
$000
2006-07Estimated
result
$000
2006-07Budget
$000
2005-06Actual
$000Expenses
Employee benefits and costs — Salaries, wages, annual and sick leave ..................................... 73 687 54 999 39 167 35 333 Long service leave .................................................................... 2 287 1 619 609 1 363 Payroll tax ................................................................................ 4 055 2 921 2 170 2 249 Superannuation ......................................................................... 8 104 5 951 4 508 4 210 Other ......................................................................................... 773 622 497 828Supplies and services — General supplies and services .................................................. 107 798 55 835 27 527 24 493 Consultancy expenses .............................................................. 1 578 2 425 508 515Depreciation and amortisation ..................................................... 46 372 24 525 2 917 2 430Borrowing costs ............................................................................ 14 205 7 278 — — Intra government transfers ........................................................... — 8 — — Other expenses ............................................................................. 10 209 10 471 785 6
Total expenses .............................................................................. 269 068 166 654 78 688 71 427
Income
Fees, fines and penalties ............................................................... 652 624 661 843Sales of goods and services .......................................................... 168 572 90 652 31 921 28 276Interest revenues ........................................................................... — — — 756Other income ................................................................................ 1 425 1 350 480 388
Total income ................................................................................. 170 649 92 626 33 062 30 263
Net cost of providing services ...................................................... 98 419 74 028 45 626 41 164
Income from / Expenses to SA Government
Income — Appropriation ........................................................................... 98 924 56 532 45 722 39 400 Other income ............................................................................ — 4 286 — 549Expenses — Tax equivalent .......................................................................... 109 — — — Cash alignment ......................................................................... 2 232 — — —
Net income from / expenses to SA Government .......................... 96 583 60 818 45 722 39 949
Net result before restructure(s) ..................................................... -1 836 -13 210 96 -1 215
Net income from / expenses from administrative restructure(s) .. — 723 — 288
Net result after restructure(s) ........................................................ -1 836 -12 487 96 -927
3.24

TREASURY AND FINANCE
Balance sheet__________________________________________________________________________________________________________________________________________________________________________________________________________________________________
2007-08Budget
$000
2006-07Estimated
result
$000
2006-07Budget
$000
2005-06Actual
$000Assets
Current assets
Cash and cash equivalents ............................................................ 26 085 27 518 11 026 11 354Receivables ................................................................................... 18 952 18 910 967 1 719Inventories .................................................................................... 2 324 2 324 — — Other current assets ...................................................................... 1 948 1 948 944 —
Total current assets ....................................................................... 49 309 50 700 12 937 13 073
Non current assets
Land and improvements ............................................................... 1 339 1 339 — — Plant and equipment ..................................................................... 236 979 225 788 4 295 1 140Intangible assets ........................................................................... 4 315 7 587 3 987 6 958
Total non-current assets ............................................................... 242 633 234 714 8 282 8 098
Total assets ................................................................................... 291 942 285 414 21 219 21 171
Liabilities
Current liabilities
Payables ........................................................................................ 23 401 23 372 2 771 2 641Short-term borrowings ................................................................. 102 604 102 604 — — Employee benefits — Salaries and wages ................................................................... 2 614 1 862 1 962 632 Annual leave ............................................................................. 3 988 3 932 2 614 2 593 Long service leave .................................................................... 969 924 727 597Short-term provisions ................................................................... 275 269 — 54Other current liabilities ................................................................. 140 205 48 —
Total current liabilities ................................................................. 133 991 133 168 8 122 6 517
Non current liabilities
Long-term borrowings .................................................................. 133 289 126 269 — — Long-term employee benefits — Long service leave .................................................................... 16 394 15 873 8 299 8 069Long-term provisions ................................................................... 2 555 2 555 — 147Other non-current liabilities ......................................................... — — 123 —
Total non-current liabilities .......................................................... 152 238 144 697 8 422 8 216
Total liabilities .............................................................................. 286 229 277 865 16 544 14 733
Net assets ...................................................................................... 5 713 7 549 4 675 6 438
Equity
Contributed capital ....................................................................... 13 428 13 428 — — Retained earnings ......................................................................... -7 993 -6 157 4 567 6 330Asset revaluation reserve ............................................................. 108 108 108 108Other reserves ............................................................................... 170 170 — —
Total equity .................................................................................. 5 713 7 549 4 675 6 438
Balances as at 30 June end of period.
3.25

TREASURY AND FINANCE
Statement of changes in equity__________________________________________________________________________________________________________________________________________________________________________________________________________________________________
Contributedcapital
$000
Assetrevaluation
reserve
$000
Retainedearnings
$000
Total
$000
Balance at 30 June 2006 ............................................................... — 108 6 330 6 438Adjustments .................................................................................. — — — —
Restated balance at June 2006 ...................................................... — 108 6 330 6 438
Net gain/loss on revaluation of property, plant and equipment during 2006-07 ............................................................................ — — — — Net changes in reserves ................................................................ 13 428 — 170 13 598
Net income/expense recognised directly in equity for 2006-07 ... 13 428 — 170 13 598Net result after restructure for 2006-07 ........................................ — — -12 487 -12 487
Total recognised income and expense for 2006-07 13 428 — -12 317 1 111
Equity contributions from SA Government ................................. — — — — Repayment of equity contributions from SA Government .......... — — — —
Estimated balance at 30 June 2007 13 428 108 -5 987 7 549
Net gain/loss on revaluation of property, plant and equipment during 2007-08 ............................................................................ — — — — Net changes in reserves ................................................................ — — — —
Net income/expense recognised directly in equity for 2007-08 ... — — — — Net result after restructure for 2007-08 ........................................ — — -1 836 -1 836
Total recognised income and expense for 2007-08 — — -1 836 -1 836
Equity contributions from SA Government ................................. — — — — Repayment of equity contributions from SA Government .......... — — — —
Estimated balance at 30 June 2008 13 428 108 -7 823 5 713
3.26

TREASURY AND FINANCE
Cash flow statement__________________________________________________________________________________________________________________________________________________________________________________________________________________________________
2007-08Budget
$000
2006-07Estimated
result
$000
2006-07Budget
$000
2005-06Actual
$000
OPERATING ACTIVITIES:
Cash outflows
Employee payments ..................................................................... 87 512 64 866 45 515 42 869Supplies and services ................................................................... 109 376 51 129 28 035 25 763Borrowing costs ............................................................................ 14 205 7 278 — — Net GST paid ................................................................................ — — — 4 152Intra government transfers ........................................................... — 8 — — Other payments ............................................................................ 10 070 9 897 785 —
Cash used in operations ................................................................ 221 163 133 178 74 335 72 784
Cash inflows
Fees, fines and penalties ............................................................... 652 624 661 843Sales of goods and services .......................................................... 168 572 90 652 31 921 28 417Interest received ........................................................................... — 47 53 761Net GST received ......................................................................... — — — 4 091Other receipts ............................................................................... 1 194 1 293 430 417
Cash generated from operations ................................................... 170 418 92 616 33 065 34 529
SA GOVERNMENT:
Appropriation ............................................................................... 98 924 56 532 45 722 39 400Other receipts ............................................................................... — 4 286 — 549 Tax equivalents ........................................................................ 109 — — — Cash alignment ......................................................................... 2 232 — — —
Net cash provided by SA Government ......................................... 96 583 60 818 45 722 39 949
Net cash provided by (+) / used (-) in operating activities ........... 45 838 20 256 4 452 1 694
INVESTING ACTIVITIES:
Cash outflows
Purchase of property, plant and equipment .................................. 94 023 53 997 2 821 851
Cash used in investing activities .................................................. 94 023 53 997 2 821 851
Cash inflows
Proceeds from sale of property, plant and equipment .................. 39 732 31 790 — —
Cash generated from investing activities ..................................... 39 732 31 790 — —
Net cash provided by (+) / used in (-) investing activities ........... -54 291 -22 207 -2 821 -851
3.27

TREASURY AND FINANCE
Cash flow statement__________________________________________________________________________________________________________________________________________________________________________________________________________________________________
2007-08Budget
$000
2006-07Estimated
result
$000
2006-07Budget
$000
2005-06Actual
$000
FINANCING ACTIVITIES:
Cash outflows
Repayment of borrowings ............................................................ 31 163 31 421 — —
Cash used in financing activities .................................................. 31 163 31 421 — —
Cash inflows
Proceeds from borrowings ........................................................... 38 183 36 937 — — Proceeds from restructuring activities .......................................... — 12 599 — —
Cash generated from financing activities ..................................... 38 183 49 536 — —
Net cash provided by (+) / used in (-) financing activities ........... 7 020 18 115 — —
Net increase (+) / decrease (-) in cash equivalents ....................... -1 433 16 164 1 631 843
Cash and cash equivalents at the beginning of the financial year 27 518 11 354 9 395 10 511
Cash and cash equivalents at the end of the financial year .......... 26 085 27 518 11 026 11 354
3.28

ADMINISTERED ITEMS FOR THE DEPARTMENT OF TREASURY AND FINANCE
Income statement(a)
2007-08Budget
$000
2006-07Estimated
result$000
2006-07Budget
$000
2005-06Actual
$000Income from SA Government
Income — Appropriation .............................................................................. 1 136 612 1 173 995 966 742 1 107 341
Net income from / expenses to SA Government ............................. 1 136 612 1 173 995 966 742 1 107 341
Income from other sources
Taxation ........................................................................................... 2 720 165 2 696 851 2 570 837 2 503 669Tax equivalent revenues(b) ............................................................... 132 448 149 873 157 973 174 518Commonwealth revenues ................................................................ 3 874 945 3 610 763 3 596 063 3 570 003Intra government transfers ............................................................... 9 258 9 151 9 423 28 604Fees, fines and penalties .................................................................. 20 261 19 584 18 238 19 623Sales of goods and services ............................................................. 156 151 151 190Interest revenues .............................................................................. 107 890 118 680 103 495 72 835Dividend income(c) .......................................................................... 276 895 332 333 348 367 431 511Other income ................................................................................... 97 612 97 436 85 081 120 468
Total income from other sources ..................................................... 7 239 630 7 034 822 6 889 628 6 921 421
Total income .................................................................................... 8 376 242 8 208 817 7 856 370 8 028 762
Expenses
Employee benefits and costs — Salaries, wages, annual and sick leave ........................................ 245 240 240 241 Superannuation ............................................................................ 2 303 - 468 505 2 261 -1 165 141Supplies and services — General supplies and services ...................................................... 48 379 47 609 47 259 46 632Borrowing costs ............................................................................... 501 418 533 357 512 568 609 684Grants and subsidies ........................................................................ 622 716 320 700 145 126 135 383Intra government transfers ............................................................... 298 034 265 178 288 753 368 121Other expenses ................................................................................. 7 481 695 7 272 930 7 084 795 7 137 895
Total expenses ................................................................................. 8 954 790 7 971 509 8 081 002 7 132 815
Net result ......................................................................................... - 578 548 237 308 - 224 632 895 947
(a) This statement reflects the consolidated transactions of the Department of Treasury and Finance Consolidated Account Items and the Treasury and Finance Administered Items Account.
(b) Tax equivalent revenues were previously included in total taxation. The 2006-07 Budget data has been recast consistent with this presentation.
(c) Dividend income was previously included in other income. The 2006-07 Budget data has been recast consistent with this presentation.
3.29

2007-08Budget
$000
2006-07Estimated
result$000
2006-07Budget
$000
2005-06Actual
$000Assets
Current assets
Cash and cash equivalents ............................................................. 1 713 114 1 675 084 1 645 578 1 773 261Receivables ................................................................................... 1 031 112 1 181 639 1 261 049 1 235 278
Total current assets ........................................................................ 2 744 226 2 856 723 2 906 627 3 008 539
Non current assets
Financial assets ............................................................................. 977 837 1 000 441 822 357 1 035 807
Total non-current assets ................................................................ 977 837 1 000 441 822 357 1 035 807
Total assets .................................................................................... 3 722 063 3 857 164 3 728 984 4 044 346
Liabilities
Current liabilities
Payables ........................................................................................ 18 049 18 049 22 443 28 080Short-term borrowings .................................................................. 1 693 971 1 656 263 1 637 232 1 776 650Employee benefits — Superannuation .......................................................................... 244 486 235 098 261 900 252 195Other current liabilities ................................................................. 31 995 31 995 669 8 946
Total current liabilities .................................................................. 1 988 501 1 941 405 1 922 244 2 065 871
Non current liabilities
Long-term borrowings .................................................................. 3 034 070 2 677 776 2 571 466 2 589 527Long-term employee benefits — Superannuation .......................................................................... 5 546 084 5 506 027 5 950 700 5 894 300Long-term provisions .................................................................... — — 55 660 — Other non-current liabilities .......................................................... — — 31 419 —
Total non-current liabilities ........................................................... 8 580 154 8 183 803 8 609 245 8 483 827
Total liabilities .............................................................................. 10 568 655 10 125 208 10 531 489 10 549 698
Net assets ....................................................................................... -6 846 592 -6 268 044 -6 802 505 -6 505 352
Equity
Retained earnings .......................................................................... -6 846 592 -6 268 044 -6 802 505 -6 505 352
Total equity ................................................................................... -6 846 592 -6 268 044 -6 802 505 -6 505 352
Balances as at 30 June end of period.
(a) This statement reflects the consolidated transactions of the Department of Treasury and Finance Consolidated Account Items and the Treasury and Finance Administered Items Account.
ADMINISTERED ITEMS FOR THE DEPARTMENT OF TREASURY AND FINANCE
Balance sheet(a)
3.30

Contributed capital
$000
Asset revaluation
reserve
$000
Retained earnings
$000
Total
$000
Balance at 30 June 2006 .................................................................... — — -6 505 352 -6 505 352Adjustments ....................................................................................... — — — —
Restated balance at June 2006............................................................ — — -6 505 352 -6 505 352
Net gain/loss on revaluation of property, plant and equipment during 2006-07.................................................................................. — — — — Net changes in reserves ..................................................................... — — — —
Net income/expense recognised directly in equity for 2006-07 ........ — — — — Net result after restructure for 2006-07 ............................................. — — 237 308 237 308
Total recognised income and expense for 2006-07 — — 237 308 237 308
Equity contributions from SA Government ...................................... — — — — Repayment of equity contributions from SA Government ............... — — — —
Estimated balance at 30 June 2007 — — -6 268 044 -6 268 044
Net gain/loss on revaluation of property, plant and equipment during 2007-08 ................................................................................. — — — — Net changes in reserves ..................................................................... — — — —
Net income/expense recognised directly in equity for 2007-08 ........ — — — — Net result after restructure for 2007-08 ............................................. — — - 578 548 - 578 548
Total recognised income and expense for 2007-08 — — - 578 548 - 578 548
Equity contributions from SA Government ...................................... — — — — Repayment of equity contributions from SA Government ............... — — — —
Estimated balance at 30 June 2008 — — -6 846 592 -6 846 592
(a) This statement reflects the consolidated transactions of the Department of Treasury and Finance Consolidated Account Items and the Treasury and Finance Administered Items Account.
ADMINISTERED ITEMS FOR THE DEPARTMENT OF TREASURY AND FINANCE
Statement of changes in equity(a)
3.31
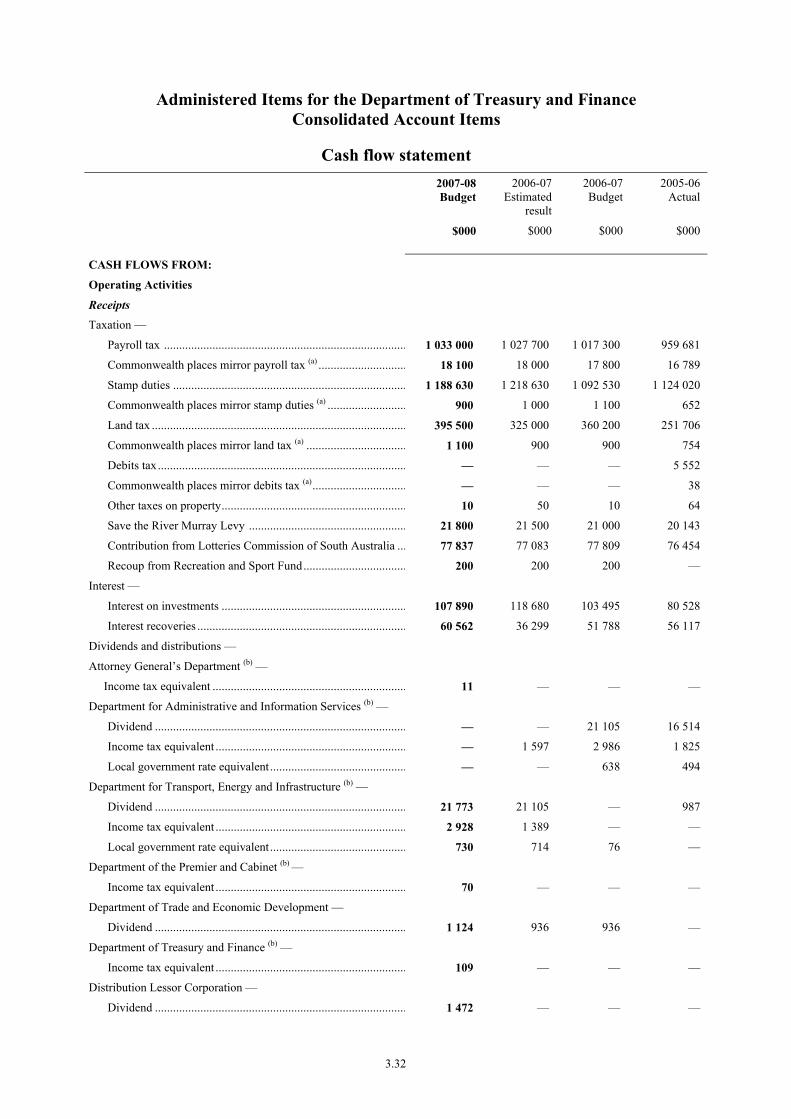
Administered Items for the Department of Treasury and Finance Consolidated Account Items
Cash flow statement
2007-08Budget
2006-07Estimated
result
2006-07 Budget
2005-06Actual
$000 $000 $000 $000
CASH FLOWS FROM:
Operating Activities
Receipts
Taxation —
Payroll tax ................................................................................ 1 033 000 1 027 700 1 017 300 959 681
Commonwealth places mirror payroll tax (a) ............................. 18 100 18 000 17 800 16 789
Stamp duties ............................................................................. 1 188 630 1 218 630 1 092 530 1 124 020
Commonwealth places mirror stamp duties (a) .......................... 900 1 000 1 100 652
Land tax .................................................................................... 395 500 325 000 360 200 251 706
Commonwealth places mirror land tax (a) ................................. 1 100 900 900 754
Debits tax.................................................................................. — — — 5 552
Commonwealth places mirror debits tax (a)............................... — — — 38
Other taxes on property............................................................. 10 50 10 64
Save the River Murray Levy .................................................... 21 800 21 500 21 000 20 143
Contribution from Lotteries Commission of South Australia ... 77 837 77 083 77 809 76 454
Recoup from Recreation and Sport Fund.................................. 200 200 200 —
Interest —
Interest on investments ............................................................. 107 890 118 680 103 495 80 528
Interest recoveries ..................................................................... 60 562 36 299 51 788 56 117
Dividends and distributions —
Attorney General’s Department (b) —
Income tax equivalent ................................................................ 11 — — —
Department for Administrative and Information Services (b) —
Dividend ................................................................................... — — 21 105 16 514
Income tax equivalent ............................................................... — 1 597 2 986 1 825
Local government rate equivalent ............................................. — — 638 494
Department for Transport, Energy and Infrastructure (b) —
Dividend ................................................................................... 21 773 21 105 — 987
Income tax equivalent ............................................................... 2 928 1 389 — —
Local government rate equivalent ............................................. 730 714 76 —
Department of the Premier and Cabinet (b) —
Income tax equivalent ............................................................... 70 — — —
Department of Trade and Economic Development —
Dividend ................................................................................... 1 124 936 936 —
Department of Treasury and Finance (b) —
Income tax equivalent ............................................................... 109 — — —
Distribution Lessor Corporation —
Dividend ................................................................................... 1 472 — — —
3.32

Administered Items for the Department of Treasury and Finance Consolidated Account Items
Cash flow statement
2007-08Budget
2006-07Estimated
result
2006-07 Budget
2005-06Actual
$000 $000 $000 $000
ForestrySA —
Dividend ................................................................................... 19 487 33 756 29 220 34 665
Income tax equivalent ............................................................... 10 645 13 633 12 276 15 521
Local government rate equivalent ............................................. — 1 037 1 027 —
Funds SA —
Local government rate equivalent ............................................. 154 150 175 142
Generation Lessor Corporation —
Dividend ................................................................................... 304 1 400 — —
HomeStart Finance —
Income tax equivalent ............................................................... 1 590 2 033 1 169 2 012
Land Management Corporation —
Dividend ................................................................................... 28 396 43 800 63 015 35 686
Income tax equivalent .............................................................. 15 956 15 545 18 949 5 584
Local government rate equivalent ............................................. 257 347 350 114
Lotteries Commission of South Australia —
Income tax equivalent ............................................................... 7 909 7 760 7 877 7 760
Local government rate equivalent ............................................. 4 4 13 —
Police Security Services —
Income tax equivalent .............................................................. 140 131 131 165
Port Adelaide Maritime Corporation —
Local government rate equivalent ............................................. 160 75 — —
Private —
Local government rate equivalent ............................................. 195 188 189 —
Public Trustee Office —
Dividend ................................................................................... 1 290 704 704 1 195
Income tax equivalent .............................................................. 765 460 502 1 410
Local government rate equivalent ............................................. 30 28 28 25
SA Water Corporation —
Dividend ................................................................................... 189 375 203 901 211 301 217 455
Income tax equivalent .............................................................. 85 742 105 788 92 720 95 399
Local government rate equivalent ............................................. 2 005 1 978 1 978 —
South Australian Asset Management Corporation —
Dividend ................................................................................... 4 000 12 300 10 864 6 000
South Australian Government Captive Insurance Corporation —
Income tax equivalent ............................................................... — — — 3 916
South Australian Government Employee Residential Properties —
Dividend ................................................................................... 1 156 1 156 1 156 1 156
Income tax equivalent ............................................................... 1 956 1 744 1 942 257
3.33
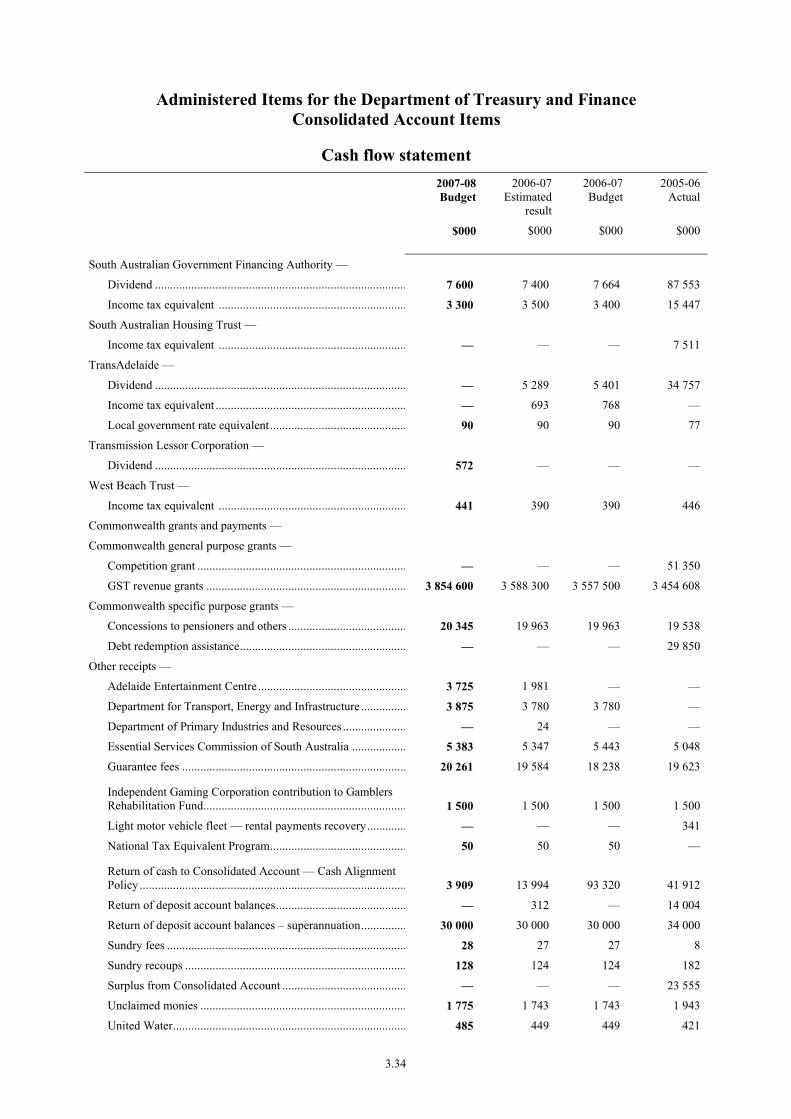
Administered Items for the Department of Treasury and Finance Consolidated Account Items
Cash flow statement
2007-08Budget
2006-07Estimated
result
2006-07 Budget
2005-06Actual
$000 $000 $000 $000
South Australian Government Financing Authority —
Dividend ................................................................................... 7 600 7 400 7 664 87 553
Income tax equivalent .............................................................. 3 300 3 500 3 400 15 447
South Australian Housing Trust —
Income tax equivalent .............................................................. — — — 7 511
TransAdelaide —
Dividend ................................................................................... — 5 289 5 401 34 757
Income tax equivalent ............................................................... — 693 768 —
Local government rate equivalent ............................................. 90 90 90 77
Transmission Lessor Corporation —
Dividend ................................................................................... 572 — — —
West Beach Trust —
Income tax equivalent .............................................................. 441 390 390 446
Commonwealth grants and payments —
Commonwealth general purpose grants —
Competition grant ..................................................................... — — — 51 350
GST revenue grants .................................................................. 3 854 600 3 588 300 3 557 500 3 454 608
Commonwealth specific purpose grants —
Concessions to pensioners and others ....................................... 20 345 19 963 19 963 19 538
Debt redemption assistance....................................................... — — — 29 850
Other receipts —
Adelaide Entertainment Centre ................................................. 3 725 1 981 — —
Department for Transport, Energy and Infrastructure ............... 3 875 3 780 3 780 —
Department of Primary Industries and Resources ..................... — 24 — —
Essential Services Commission of South Australia .................. 5 383 5 347 5 443 5 048
Guarantee fees .......................................................................... 20 261 19 584 18 238 19 623
Independent Gaming Corporation contribution to Gamblers Rehabilitation Fund...................................................................
1 500
1 500 1 500
1 500
Light motor vehicle fleet — rental payments recovery............. — — — 341
National Tax Equivalent Program............................................. 50 50 50 —
Return of cash to Consolidated Account — Cash Alignment Policy ........................................................................................
3 909
13 994 93 320
41 912
Return of deposit account balances........................................... — 312 — 14 004
Return of deposit account balances – superannuation............... 30 000 30 000 30 000 34 000
Sundry fees ............................................................................... 28 27 27 8
Sundry recoups ......................................................................... 128 124 124 182
Surplus from Consolidated Account ......................................... — — — 23 555
Unclaimed monies .................................................................... 1 775 1 743 1 743 1 943
United Water............................................................................. 485 449 449 421
3.34
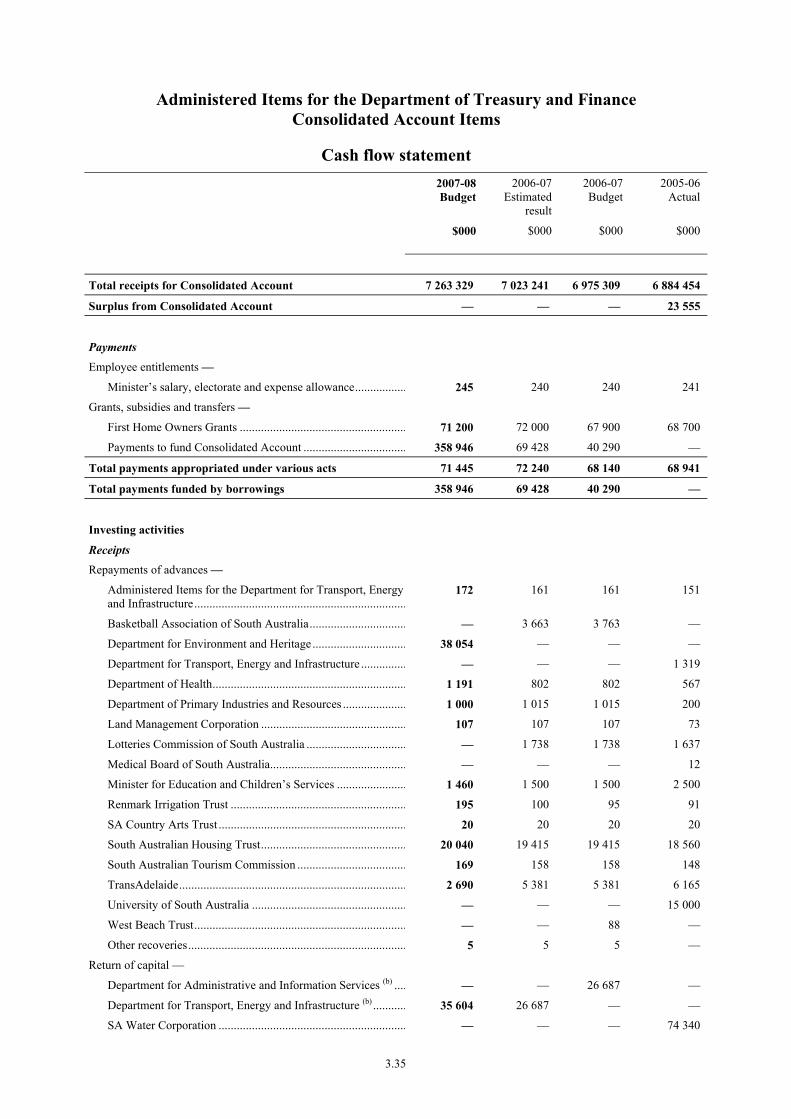
Administered Items for the Department of Treasury and Finance Consolidated Account Items
Cash flow statement
2007-08Budget
2006-07Estimated
result
2006-07 Budget
2005-06Actual
$000 $000 $000 $000
Total receipts for Consolidated Account 7 263 329 7 023 241 6 975 309 6 884 454
Surplus from Consolidated Account — — — 23 555
Payments
Employee entitlements —
Minister’s salary, electorate and expense allowance................. 245 240 240 241
Grants, subsidies and transfers —
First Home Owners Grants ....................................................... 71 200 72 000 67 900 68 700
Payments to fund Consolidated Account .................................. 358 946 69 428 40 290 —
Total payments appropriated under various acts 71 445 72 240 68 140 68 941
Total payments funded by borrowings 358 946 69 428 40 290 —
Investing activities
Receipts
Repayments of advances —
Administered Items for the Department for Transport, Energy and Infrastructure......................................................................
172 161 161 151
Basketball Association of South Australia................................ — 3 663 3 763 —
Department for Environment and Heritage ............................... 38 054 — — —
Department for Transport, Energy and Infrastructure ............... — — — 1 319
Department of Health................................................................ 1 191 802 802 567
Department of Primary Industries and Resources ..................... 1 000 1 015 1 015 200
Land Management Corporation ................................................ 107 107 107 73
Lotteries Commission of South Australia ................................. — 1 738 1 738 1 637
Medical Board of South Australia............................................. — — — 12
Minister for Education and Children’s Services ....................... 1 460 1 500 1 500 2 500
Renmark Irrigation Trust .......................................................... 195 100 95 91
SA Country Arts Trust .............................................................. 20 20 20 20
South Australian Housing Trust................................................ 20 040 19 415 19 415 18 560
South Australian Tourism Commission .................................... 169 158 158 148
TransAdelaide........................................................................... 2 690 5 381 5 381 6 165
University of South Australia ................................................... — — — 15 000
West Beach Trust...................................................................... — — 88 —
Other recoveries........................................................................ 5 5 5 —
Return of capital —
Department for Administrative and Information Services (b) .... — — 26 687 —
Department for Transport, Energy and Infrastructure (b) ........... 35 604 26 687 — —
SA Water Corporation .............................................................. — — — 74 340
3.35

Administered Items for the Department of Treasury and Finance Consolidated Account Items
Cash flow statement
2007-08Budget
2006-07Estimated
result
2006-07 Budget
2005-06Actual
$000 $000 $000 $000
South Australian Asset Management Corporation .................... — 8 679 8 679 —
South Australia Police............................................................... — — — 6 256
Sales of property —
Proceeds from sale of residual CBA Lease vehicles ................. — — — 11 108
Total receipts for Consolidated Account 100 707 69 431 69 614 138 147
Financing Activities
Receipts
Borrowings —
Borrowings to fund Consolidated Account ............................... 358 946 69 428 40 290 —
Other —
Deposits with Treasurer ............................................................ 380 807 185 324 245 666 601 880
Total borrowings 358 946 69 428 40 290 —
Total receipts re: cash and deposits 380 807 185 324 245 666 601 880
Payments
Repayments of borrowings —
South Australian Government Financing Authority.................. — — — 23 555
Deposits with Treasurer ............................................................ 342 777 283 501 286 011 368 955
Total payments funded by Consolidated Account Surplus — — — 23 555
Total payments re: cash and deposits 342 777 283 501 286 011 368 955
Net impact on Consolidated Account 7 292 591 7 020 432 6 976 783 6 930 105
Net impact on cash and deposits 38 030 -98 177 -40 345 232 925 (a) Taxes akin to state taxes are levied on activities conducted on Commonwealth places under authority of Commonwealth mirror tax
legislation. Revenue is retained by the state. (b) Functional responsibilities of the Department for Administrative and Information Services (DAIS) were transferred to the portfolios of
Premier and Cabinet, Trade and Economic Development, Treasury and Finance, Justice and Transport, Energy and Infrastructure effective 1 January 2007. Distributions to the Consolidated Account formerly from DAIS are now shown under those portfolios to which the relevant DAIS functions were transferred.
3.36
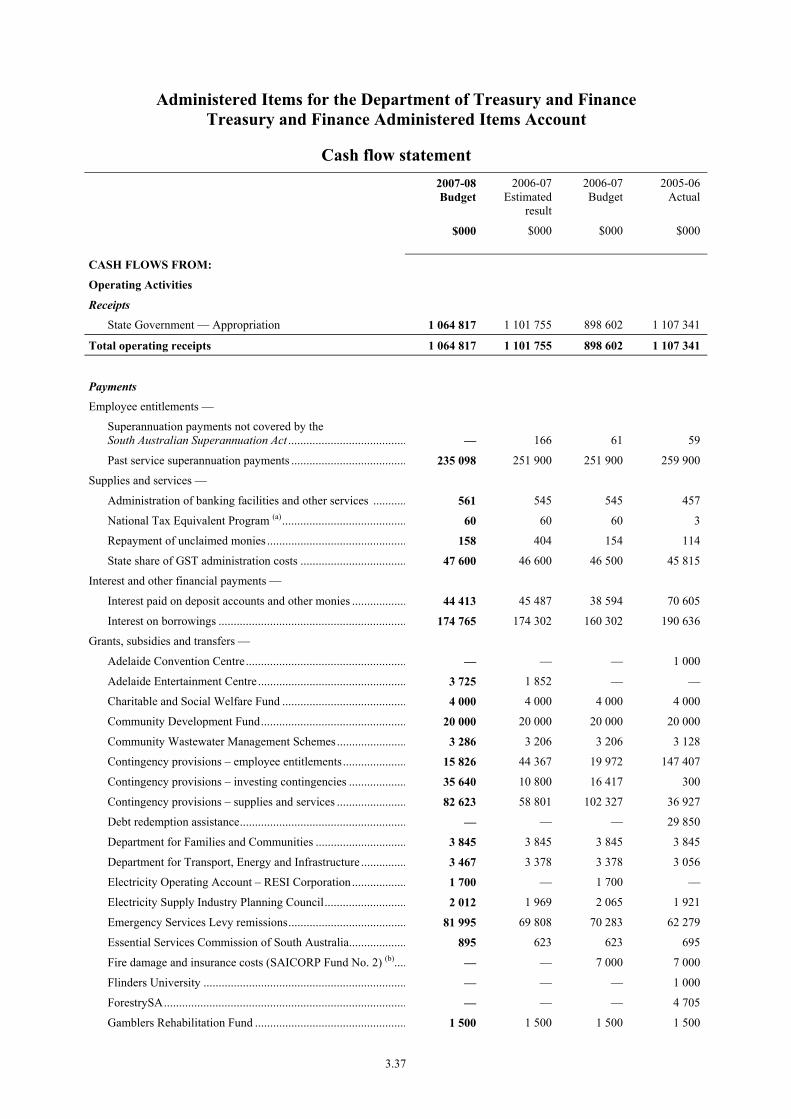
Administered Items for the Department of Treasury and Finance Treasury and Finance Administered Items Account
Cash flow statement
2007-08Budget
2006-07Estimated
result
2006-07 Budget
2005-06Actual
$000 $000 $000 $000
CASH FLOWS FROM:
Operating Activities
Receipts
State Government — Appropriation 1 064 817 1 101 755 898 602 1 107 341
Total operating receipts 1 064 817 1 101 755 898 602 1 107 341
Payments
Employee entitlements —
Superannuation payments not covered by the South Australian Superannuation Act ....................................... — 166 61 59
Past service superannuation payments ...................................... 235 098 251 900 251 900 259 900
Supplies and services —
Administration of banking facilities and other services ........... 561 545 545 457
National Tax Equivalent Program (a)......................................... 60 60 60 3
Repayment of unclaimed monies .............................................. 158 404 154 114
State share of GST administration costs ................................... 47 600 46 600 46 500 45 815
Interest and other financial payments —
Interest paid on deposit accounts and other monies .................. 44 413 45 487 38 594 70 605
Interest on borrowings .............................................................. 174 765 174 302 160 302 190 636
Grants, subsidies and transfers —
Adelaide Convention Centre..................................................... — — — 1 000
Adelaide Entertainment Centre ................................................. 3 725 1 852 — —
Charitable and Social Welfare Fund ......................................... 4 000 4 000 4 000 4 000
Community Development Fund................................................ 20 000 20 000 20 000 20 000
Community Wastewater Management Schemes....................... 3 286 3 206 3 206 3 128
Contingency provisions – employee entitlements..................... 15 826 44 367 19 972 147 407
Contingency provisions – investing contingencies ................... 35 640 10 800 16 417 300
Contingency provisions – supplies and services ....................... 82 623 58 801 102 327 36 927
Debt redemption assistance....................................................... — — — 29 850
Department for Families and Communities .............................. 3 845 3 845 3 845 3 845
Department for Transport, Energy and Infrastructure ............... 3 467 3 378 3 378 3 056
Electricity Operating Account – RESI Corporation.................. 1 700 — 1 700 —
Electricity Supply Industry Planning Council........................... 2 012 1 969 2 065 1 921
Emergency Services Levy remissions....................................... 81 995 69 808 70 283 62 279
Essential Services Commission of South Australia................... 895 623 623 695
Fire damage and insurance costs (SAICORP Fund No. 2) (b).... — — 7 000 7 000
Flinders University ................................................................... — — — 1 000
ForestrySA................................................................................ — — — 4 705
Gamblers Rehabilitation Fund .................................................. 1 500 1 500 1 500 1 500
3.37
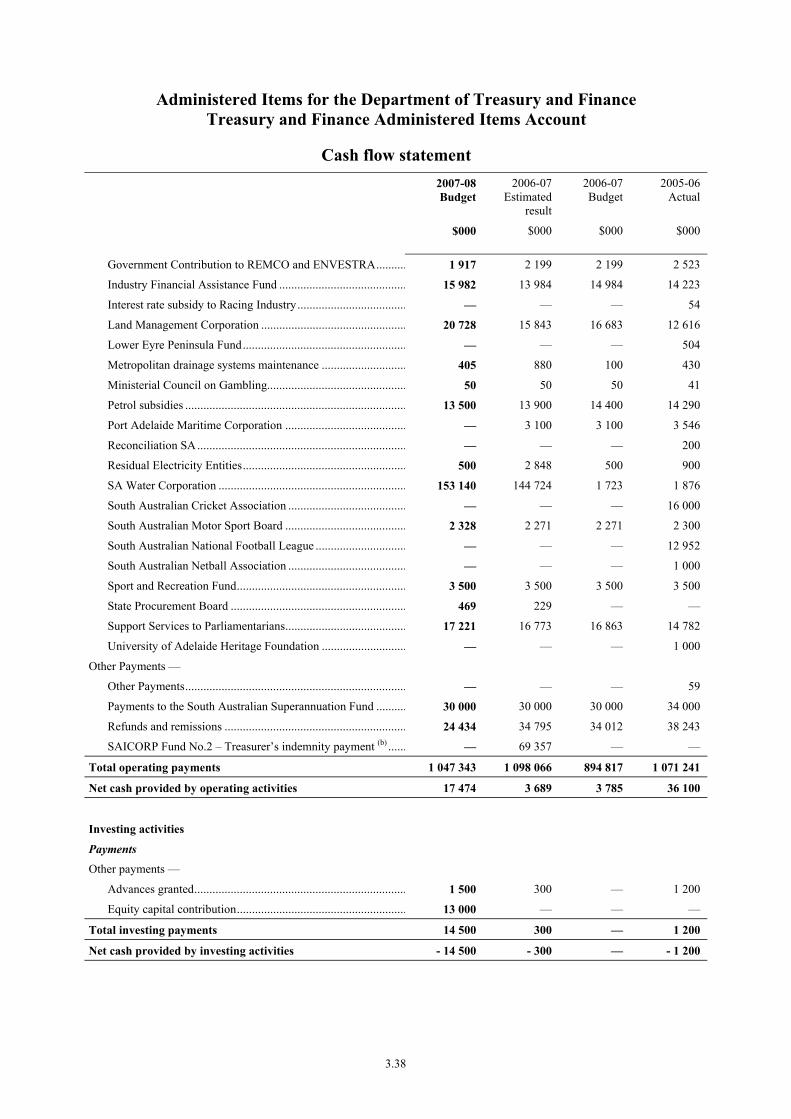
Administered Items for the Department of Treasury and Finance Treasury and Finance Administered Items Account
Cash flow statement
2007-08Budget
2006-07Estimated
result
2006-07 Budget
2005-06Actual
$000 $000 $000 $000
Government Contribution to REMCO and ENVESTRA.......... 1 917 2 199 2 199 2 523
Industry Financial Assistance Fund .......................................... 15 982 13 984 14 984 14 223
Interest rate subsidy to Racing Industry.................................... — — — 54
Land Management Corporation ................................................ 20 728 15 843 16 683 12 616
Lower Eyre Peninsula Fund...................................................... — — — 504
Metropolitan drainage systems maintenance ............................ 405 880 100 430
Ministerial Council on Gambling.............................................. 50 50 50 41
Petrol subsidies ......................................................................... 13 500 13 900 14 400 14 290
Port Adelaide Maritime Corporation ........................................ — 3 100 3 100 3 546
Reconciliation SA..................................................................... — — — 200
Residual Electricity Entities...................................................... 500 2 848 500 900
SA Water Corporation .............................................................. 153 140 144 724 1 723 1 876
South Australian Cricket Association ....................................... — — — 16 000
South Australian Motor Sport Board ........................................ 2 328 2 271 2 271 2 300
South Australian National Football League .............................. — — — 12 952
South Australian Netball Association ....................................... — — — 1 000
Sport and Recreation Fund........................................................ 3 500 3 500 3 500 3 500
State Procurement Board .......................................................... 469 229 — —
Support Services to Parliamentarians........................................ 17 221 16 773 16 863 14 782
University of Adelaide Heritage Foundation ............................ — — — 1 000
Other Payments —
Other Payments......................................................................... — — — 59
Payments to the South Australian Superannuation Fund .......... 30 000 30 000 30 000 34 000
Refunds and remissions ............................................................ 24 434 34 795 34 012 38 243
SAICORP Fund No.2 – Treasurer’s indemnity payment (b) ...... — 69 357 — —
Total operating payments 1 047 343 1 098 066 894 817 1 071 241
Net cash provided by operating activities 17 474 3 689 3 785 36 100
Investing activities
Payments
Other payments —
Advances granted...................................................................... 1 500 300 — 1 200
Equity capital contribution........................................................ 13 000 — — —
Total investing payments 14 500 300 — 1 200
Net cash provided by investing activities - 14 500 - 300 — - 1 200
3.38

Administered Items for the Department of Treasury and Finance Treasury and Finance Administered Items Account
Cash flow statement
2007-08Budget
2006-07Estimated
result
2006-07 Budget
2005-06Actual
$000 $000 $000 $000
Financing Activities
Payments
Payments for finance leases —
Termination of State Vehicle Fleet CBA Lease ........................ — — — 16 875
Repayment of borrowings —
South Australian Government Financing Authority.................. 2 974 3 413 3 785 18 026
Total financing payments 2 974 3 413 3 785 34 900
Net cash provided by financing activities - 2 974 - 3 413 - 3 785 - 34 900
Net increase (+) / decrease (-) in cash held — - 24 — —
Opening cash balance as at 1 July — 24 — 24
Closing cash balance as at 30 June — — — 24 (a) National Tax Equivalent Program has been reclassified from grants, subsidies and transfers to supplies and services. The
2006-07 Budget and 2005-06 Actuals data have been presented on this basis for presentation and comparative purposes. (b) Before 1 July 2006, SAICORP Fund No. 2 was funded by annual payments of $7 million from Administered Items for the Department
of Treasury and Finance. From 1 July 2006, the Treasurer has indemnified the financial outcomes of Fund No. 2. In 2006-07, pursuant to this indemnity, the Treasurer is expected to pay $69.357 million to the Fund. This represents the negative net asset position of Fund No. 2 at 1 July 2006.
3.39

Administered Items for the Department of Treasury and Finance Other Accounts
Cash flow statement
2007-08Budget
2006-07Estimated
result
2006-07 Budget
2005-06Actual
$000 $000 $000 $000
CASH FLOWS FROM:
Operating Activities
Receipts
Taxation —
Emergency Services Levy — State Government ...................... 1 973 1 876 2 083 1 814
Emergency Services Levy — Other ......................................... 79 996 76 508 76 891 72 753
Sale of goods and services —
Essential Services Commission of South Australia .................. 44 43 — 89
Gaming Machines Operations Deposit Account ....................... 27 736 27 060 27 060 23 597
Housing Loans Redemption Fund ............................................ 2 3 3 3
Industry Financial Assistance Deposit Account........................ — — — 237
Miscellaneous .......................................................................... 8 10 10 —
South Australian Government Captive Insurance Corporation (a) ........................................................................... — — — 38 535
South Australian Motor Sport Board ....................................... 19 289 18 818 13 962 15 531
State Government Auctions ..................................................... — — — 6 754
State Procurement Board .......................................................... — 236 — 119
Support Services to Parliamentarians........................................ — — — 1 961
Interest —
Community Emergency Services Fund .................................... — — — 143
Country Price Equalisation Scheme ......................................... — — — 632
Gaming Machines Operations Deposit Account ....................... — — — 106
Home Purchase Assistance Account ........................................ 10 12 12 12
Housing Loans Redemption Fund ............................................ 440 416 416 400
Independent Gambling Authority ............................................ — — — 73
Industry Financial Assistance Deposit Account........................ — — — 112
Local Government Disaster Fund ............................................ 2 132 2 015 2 015 2 392
South Australian Government Captive Insurance Corporation (a) ........................................................................... — — — 1 724
South Australian Motor Sport Board ....................................... 323 305 — 356
Intra-government transfers —
Community Development Fund ............................................... 20 000 20 000 20 000 20 000
Community Emergency Services Fund — State Government 3 584 3 079 2 883 2 455
Community Emergency Services Fund — Other ..................... 78 411 66 729 67 400 59 824
Electricity Supply Industry Planning Council .......................... 2 012 1 969 2 065 1 921
Essential Services Commission of South Australia .................. 895 623 623 695
Industry Financial Assistance Deposit Account ....................... 15 982 13 984 14 984 14 583
Local Government Concessions ............................................... 2 255 2 200 2 200 2 021
South Australian Government Captive Insurance Corporation (a) ........................................................................... — — — 7 000
3.40
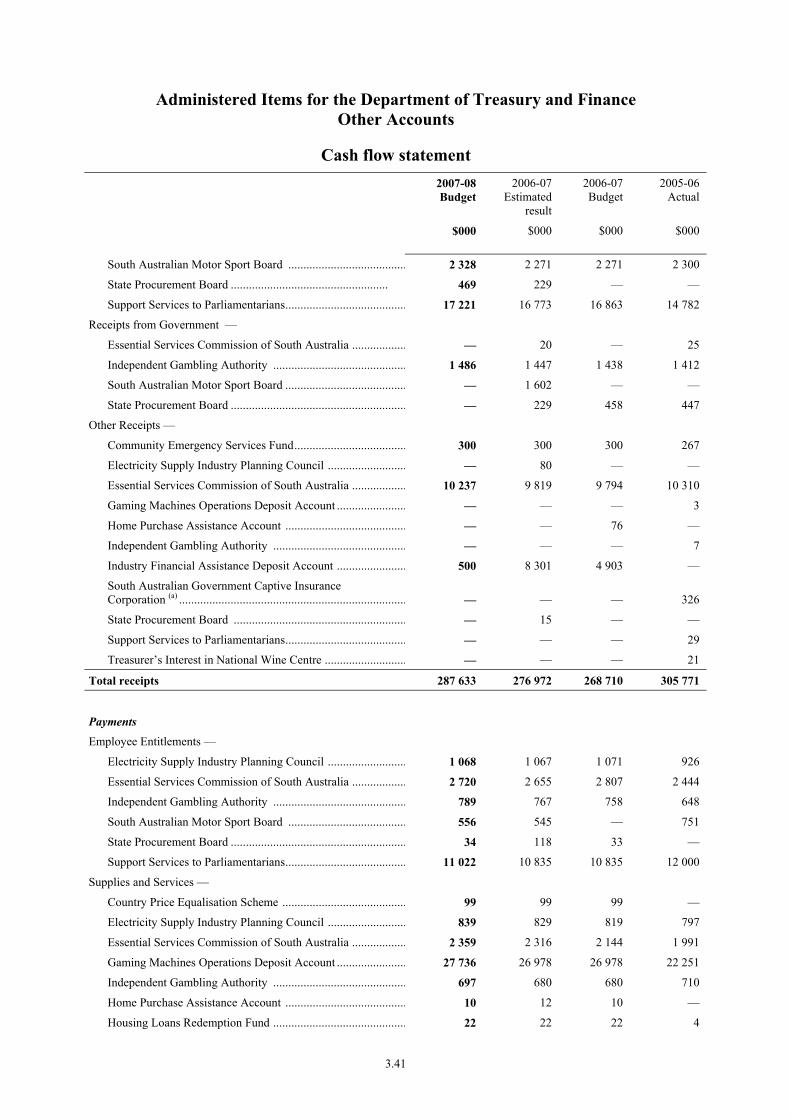
Administered Items for the Department of Treasury and Finance Other Accounts
Cash flow statement
2007-08Budget
2006-07Estimated
result
2006-07 Budget
2005-06Actual
$000 $000 $000 $000
South Australian Motor Sport Board ....................................... 2 328 2 271 2 271 2 300
State Procurement Board .................................................... 469 229 — —
Support Services to Parliamentarians........................................ 17 221 16 773 16 863 14 782
Receipts from Government —
Essential Services Commission of South Australia .................. — 20 — 25
Independent Gambling Authority ............................................ 1 486 1 447 1 438 1 412
South Australian Motor Sport Board ........................................ — 1 602 — —
State Procurement Board .......................................................... — 229 458 447
Other Receipts —
Community Emergency Services Fund..................................... 300 300 300 267
Electricity Supply Industry Planning Council .......................... — 80 — —
Essential Services Commission of South Australia .................. 10 237 9 819 9 794 10 310
Gaming Machines Operations Deposit Account ....................... — — — 3
Home Purchase Assistance Account ........................................ — — 76 —
Independent Gambling Authority ............................................ — — — 7
Industry Financial Assistance Deposit Account ....................... 500 8 301 4 903 —
South Australian Government Captive Insurance Corporation (a) ........................................................................... — — — 326
State Procurement Board ......................................................... — 15 — —
Support Services to Parliamentarians........................................ — — — 29
Treasurer’s Interest in National Wine Centre ........................... — — — 21
Total receipts 287 633 276 972 268 710 305 771
Payments
Employee Entitlements —
Electricity Supply Industry Planning Council .......................... 1 068 1 067 1 071 926
Essential Services Commission of South Australia .................. 2 720 2 655 2 807 2 444
Independent Gambling Authority ............................................ 789 767 758 648
South Australian Motor Sport Board ....................................... 556 545 — 751
State Procurement Board .......................................................... 34 118 33 —
Support Services to Parliamentarians........................................ 11 022 10 835 10 835 12 000
Supplies and Services —
Country Price Equalisation Scheme ......................................... 99 99 99 —
Electricity Supply Industry Planning Council .......................... 839 829 819 797
Essential Services Commission of South Australia .................. 2 359 2 316 2 144 1 991
Gaming Machines Operations Deposit Account ....................... 27 736 26 978 26 978 22 251
Independent Gambling Authority ............................................ 697 680 680 710
Home Purchase Assistance Account ........................................ 10 12 10 —
Housing Loans Redemption Fund ............................................ 22 22 22 4
3.41

Administered Items for the Department of Treasury and Finance Other Accounts
Cash flow statement
2007-08Budget
2006-07Estimated
result
2006-07 Budget
2005-06Actual
$000 $000 $000 $000
Local Government Disaster Fund ............................................ 40 40 40 40
Miscellaneous .......................................................................... -2 — — -1
South Australian Government Captive Insurance Corporation (a) ........................................................................... — — — 34 479
State Government Auctions ..................................................... — — — 6 548
South Australian Motor Sport Board ....................................... 20 648 21 745 16 212 15 858
State Procurement Board .......................................................... 320 466 315 655
Support Services to Parliamentarians ....................................... 6 199 5 902 6 028 4 770
Treasurer’s Interest in National Wine Centre ........................... 34 33 33 62
Interest —
Home Purchase Assistance Account ........................................ — — 78 —
Intra-government transfers —
Community Development Fund ............................................... 20 000 20 000 20 000 20 000
Community Emergency Services Fund .................................... 164 264 148 492 149 557 137 113
Essential Services Commission of South Australia .................. 5 383 5 347 5 443 4 977
Industry Financial Assistance Deposit Account........................ 1 540 — 1 000 —
Local Government Disaster Fund ............................................ — 150 — —
Support Services to Parliamentarians........................................ — 36 — —
Grants and subsidies —
Electricity Supply Industry Planning Council .......................... — — — 5
Independent Gambling Authority ............................................ — — — 163
Industry Financial Assistance Deposit Account........................ 7 538 7 782 13 172 6 317
Local Government Concessions ............................................... 2 255 2 200 2 200 1 846
Local Government Disaster Fund ............................................ 6 219 1 039 1 189 2 626
Tax Equivalent Payments —
South Australian Government Captive Insurance Corporation (a) ........................................................................... — — — 3 916
Other Payments —
Essential Services Commission of South Australia .................. — — — 72
Gaming Machines Operations Deposit Account ....................... — — — 1 224
Home Purchase Assistance Account ........................................ — — — 12
Industry Financial Assistance Deposit Account........................ 500 6 981 5 698 —
Miscellaneous .......................................................................... 10 10 10 —
South Australian Motor Sport Board ....................................... 20 20 21 —
State Procurement Board .......................................................... 11 11 11 —
Total payments 282 930 267 177 267 263 283 204
Net cash provided by operating activities 4 703 9 795 1 447 22 567
3.42

Administered Items for the Department of Treasury and Finance Other Accounts
Cash flow statement
2007-08Budget
2006-07Estimated
result
2006-07 Budget
2005-06Actual
$000 $000 $000 $000
Investing Activities
Receipts
Proceeds from other financial assets —
Industry Financial Assistance Deposit Account........................ — — — 3 646
Total receipts — — — 3 646
Payments
Purchase of Plant and Equipment —
Electricity Supply Industry Planning Council .......................... 74 72 72 16
Essential Services Commission of South Australia .................. 96 50 50 18
South Australian Motor Sport Board ....................................... 410 400 — 582
Purchase of other financial assets —
Industry Financial Assistance Deposit Account........................ — — — 513
Total payments 580 522 122 1 129
Net cash provided by investing activities –580 –522 -122 2 517
Financing Activities
Receipts
Proceeds from Other Financial Assets —
Home Purchase Assistance Account ......................................... — — — 108
Total receipts — — — 108
Payments
Repayment of Interest Bearing Liabilities —
Home Purchase Assistance Account ........................................ — — — 108
Total payments — — — 108
Net cash provided by financing activities — — — —
Net increase (+) / decrease (-) in cash held 4 123 9 273 1 325 25 084
Opening cash balance as at 1 July —
Closing cash balance as at 30 June 4 123 9 273 1 325 25 084 (a) On 1 July 2006, the South Australian Captive Insurance Corporation was transferred from the general government sector to the public
financial corporation sector.
3.43

Additional Information for Administered Items
Other Accounts
Reconciliation to Cash flow statement
2007-08Budget
2006-07Estimated
result
2006-07 Budget
2005-06Actual
$000 $000 $000 $000
Reconciliation to operating receipts
Operating receipts (as per Administered Items Cash flow statement) 287 633 276 972 268 710 305 771
Less: Costs transferred in from DAIS Administered Items
Gaming Machines Operations Deposit Account ...................... — 10 268 27 060 23 706
Miscellaneous ......................................................................... — — 10 —
State Government Auctions (a) ................................................. — — — 6 754
State Procurement Board (a) ..................................................... — 480 458 566
Equals: Operating receipts 287 633 266 224 241 182 274 745
Reconciliation to operating payments
Operating payments (as per Administered Items Cash flow statement) 282 930 267 177 267 263 283 204
Less: Costs transferred in from DAIS Administered Items
Gaming Machines Operations Deposit Account (a) .................. — 10 860 26 978 23 475
Miscellaneous (a) ..................................................................... — — 10 -1
State Government Auctions (a) ................................................. — -32 — 6 548
State Procurement Board (a) ..................................................... — 381 359 655
Equals: Operating payments 282 930 255 968 239 916 252 527
Reconciliation to financing activities
Financing activities (as per Administered Items Cash flow statement) — — — —
Less: Costs transferred in from DAIS Administered Items
Miscellaneous (a) ...................................................................... — - 1 378 — —
Equals: Financing activities — 1 378 — —
(a) Transfers for the 2006–07 Estimated Result represent the payments for the period 1 July 2006 to 31 December 2006 reflected in the Cash flow statement for the Administered Items for the Department for Administrative and Information Services.
3.44

AGENCY: DEPARTMENT OF TREASURY AND FINANCE
Financial Commentary — major variations
The following commentary relates to the Agency Financial statements presented in the previous section. The discussion relates to variations between the 2006-07 Estimated Result and the 2007-08 Budget. The 2006-07 Estimated Result is based on the 2006-07 Budget with approved variations.
Income statement — Controlled
Expenses are estimated to increase by $102.4 million, from the Estimated Result of $166.7 million in 2006-07 to $269.1 million in 2007-08. The increase mainly relates to:
• increased expenditure of $76.0 million reflecting the full impact of the transfer of State Procurement and Support Operations to the Department of Treasury and Finance from 1 January 2007 as a result of the transfer of business functions from the Department for Administrative and Information Services. The functions that transferred include Contract and Procurement Services, Light Motor Vehicle Fleet, Vehicles for Ministers, Parliamentarians and VIPs and Support Operations;
• increased expenditure of $23.5 million for the Shared Services Reform Office on further reform initiatives as well as service delivery initiatives from the implementation of shared services reforms during 2007-08;
• increased expenditure due to allowances for salary increases and indexation on goods and services of approximately $1.7 million;
• increased expenditure of $737 000 by RevenueSA for the introduction of anti avoidance provisions under the Land Tax Act; and
• increased expenditure of $586 000 for the provision of additional resources for the Public Private Partnership projects.
Income is expected to increase by $78.0 million, from the Estimated Result of $92.6 million in 2006-07 to $170.6 million in 2007-08. The increase mainly relates to increased income of $79.3 million reflecting the full impact of the transfer of State Procurement and Support Operations to the Department of Treasury and Finance from 1 January 2007 as a result of the transfer of business functions from the Department for Administrative and Information Services. This is offset by a reduction in revenue from Super SA as a result of the recovery for the establishment of the new office accommodation in 2006-07.
Income from / expenses to the Government of South Australia is estimated to increase by $35.8 million from $60.8 million in the 2006-07 Estimated Result to $96.6 million in 2007-08, due primarily to:
• additional appropriation of $8.2 million reflecting the full impact of the transfer of State Procurement and Support Operations to the Department of Treasury and Finance from 1 January 2007 as a result of the transfer of business functions from the Department for Administrative and Information Services;
• additional appropriation of $23.5 million for the Shared Services Reform Office on further reform initiatives as well as service delivery initiatives from the implementation of shared services reforms during 2007-08;
3.45
• impact on appropriation of $2.5 million due to expenditure carryover of $1.25 million from 2006-07 for the Taxation Revenue Management System project;
• additional appropriation of approximately $1.6 million due to allowances for salary increases and adjustments to employee liabilities;
• additional appropriation of $737 000 for the introduction of anti-avoidance provisions under the Land Tax Act;
• additional appropriation of $586 000 for the provision of additional resources for the Public Private Partnership projects; and
• reduction in appropriation of $2.2 million due to repayment of surplus cash under the Cash Alignment policy.
Balance Sheet — Controlled
The net asset position of the department is estimated to decrease by $1.8 million, from $7.5 million in 2006-07 to $5.7 million in 2007-08.
Total assets are estimated to increase by $6.5 million in 2007-08. The variance is mainly due to the full impact of the transfer of State Procurement and Support Operations to the Department of Treasury and Finance from 1 January 2007 and the capitalisation of costs associated with the Taxation Revenue Management System project.
Total liabilities are estimated to increase by $8.4 million in 2007-08 mainly because of an increase in accrued employee entitlements and long term borrowings.
Statement of changes in equity — Controlled
The changes in equity are mainly as a result of the transfer of State Procurement and Support Operations to the Department of Treasury and Finance from 1 January 2007.
Cash flow statement — Controlled
The cash flows from operating activities are consistent with the discussion on the Income statement.
The investing cash flows reflect the Light Motor Vehicle Fleet and continued activity on the Taxation Revenue Management System project.
Administered Items
Discussion of Trends
The Administered Items for the Department of Treasury and Finance include Consolidated Account Items, Special Deposit Accounts and the assets and liabilities held on behalf of the state by the Treasurer. The more significant assets and liabilities include cash and deposits at call, loans made to government entities and past superannuation liabilities and borrowings. For presentation purposes, three Cash flow statements have been prepared: one for the Consolidated Account items, a second for the Treasury and Finance Administered Items Account and a third set for the remaining Administered Items. This format has been used to provide clarity given the volume of items administered by the department.
3.46
The Consolidated Account Items Cash flow statement presents administered receipts collected on behalf of the government and paid to the Consolidated Account. The statement also includes administered payments that are funded by specific appropriation authorised in various Acts.
The Treasury and Finance Administered Items Account Cash flow statement presents payments administered on behalf of the government and funded by appropriation authorised in the annual Appropriation Act.
The Other Accounts Cash flow statement presents the receipts and payments for the remaining Administered Items special deposit accounts.
Cash flow statement — Consolidated Account Items
Factors contributing to major movements between the Estimated Result for 2006-07 and the 2007-08 Budget for receipt lines include:
• limited growth in payroll tax receipts (private and government) reflecting the first stage of payroll tax rate relief measures commencing from 1 July 2007;
• a fall in stamp duty receipts reflecting the phased reduction in mortgage and rental duty rates commencing 1 July 2007 together with a projected stabilisation in conveyance duty revenue;
• growth in land tax receipts (private and government) due to higher land valuations and timing effects due to some land tax receipts relating to 2006-07 not expected to be received until 2007-08;
• higher interest recoveries, largely reflecting higher interest receipts on Treasurer’s loans to the South Australian Housing Trust;
• lower dividends from the Land Management Corporation, following the payment of a special dividend in 2006-07 associated with the sale of land to the Port Adelaide Maritime Corporation;
• lower dividends and distributions from SA Water, reflecting higher income tax equivalent receipts in 2006-07 relating to SA Water’s 2005-06 Result, and the impact of increased water restrictions on dividends and income tax equivalents in 2007-08;
• growth in the GST revenue pool and revenue gains from the Commonwealth Grants Commission’s 2007 Relativity Update impacting on GST Revenue Grants;
• the repayment in full of the former Department of Lands loan liability by the Department for Environment and Heritage in 2007-08; and
• higher receipts from borrowings from the South Australian Government Financing Authority in 2007-08 to fund the consolidated account deficit.
Cash flow statement — Treasury and Finance Administered Items Account
Factors contributing to major movements between the 2006-07 Estimated Result and the 2007-08 Budget for payment lines include:
• a lower past service superannuation payment in 2007-08, reflecting the significant earnings on superannuation assets, above the long-term earnings assumption, achieved in 2006-07;
• higher contingency provisions in 2007-08;
3.47
• higher cost of remissions because expenditure on emergency services is growing at a faster rate than underlying property value growth. Remission rates are set to fund the shortfall between emergency services expenditure and actual levy collections from property holders;
• the cash payment in 2007-08 for accrued land tax refunds and remissions;
• a payment to SAFA in 2006-07, to fund the negative asset position of SAICORP Insurance Fund 2 as at 1 July 2006, pursuant to the Treasurer’s indemnity of the Fund; and
• an equity capital contribution to TransAdelaide in 2007-08, associated with the transfer of rail related assets from TransAdelaide to the Department for Transport, Energy and Infrastructure.
Cash flow statement — Other Accounts
Major variations between the 2006-07 Estimated Result and the 2007-08 Budget for operating receipts include:
• an increase of $3.6 million in Emergency Services Levy (ESL) taxation receipts from private and government fixed property taxpayers in 2007-08 mainly due to growth in capital values. Effective ESL rates on fixed property will remain unchanged from their level in 2006-07;
• an increase of $12.2 million in intra-government transfers for ESL remissions in respect of private and government taxpayers. Remission rates are set to fund the shortfall between emergency services expenditure and actual levy collections from property holders. In 2007-08, growth in emergency services expenditure is expected to significantly exceed growth in actual levy collections from property holders, leading to an increase in remissions; and
• a reduction of $7.8 million in expected receipts to the Industry Financial Assistance Deposit Account reflecting the high level of recoveries achieved in 2006-07 and the associated progress in winding down the Industry Assistance Attraction Fund and the Rail Reform Transition Program, both of which are closed schemes.
Major variations between the 2006-07 Estimated Result and the 2007-08 Budget for operating payments include:
• an increase of $15.8 million in intra-government transfers to the Community Emergency Services Fund. The increase is mainly due to rise in remission costs and, to a lesser extent, growth in tax collections (because the capital value of land and buildings has increased);
• a reduction of $6.5 million in other payments for the Industry Financial Assistance Deposit Account to reflect estimates for lower payroll tax refunds and remissions; and
• an increase of $5.0 million in grants and subsidy payments by the Local Government Disaster Fund to repair council roads damaged during floods in January 2007.
3.48

3.49

Portfolio: Justice
Minister for Police Attorney-General Minister for Justice Minister for Multicultural Affairs Minister for Emergency Services Minister for Correctional Services Minister for the Status of Women Minister for Volunteers Minister for Consumer Affairs Minister for Gambling

TABLE OF CONTENTS
PORTFOLIO SUMMARY
Ministerial Responsibilities..................................................................................................4.1
Portfolio Net Cost of Services Summary .............................................................................4.5
Investing Payments Summary ..............................................................................................4.5
Portfolio Financial Statements
Income statement.....................................................................................................4.6
Balance sheet...........................................................................................................4.7
Statement of changes in equity................................................................................4.9
Cash flow statement ................................................................................................4.10
Workforce Summary ............................................................................................................4.12
Ministerial Offices Resources .............................................................................................4.12
Agency Summaries
South Australia Police ..........................................................................................................4.14
Attorney-General’s Department ...........................................................................................4.50
Courts Administration Authority..........................................................................................4.106
State Electoral Office ...........................................................................................................4.130
Department for Correctional Services ..................................................................................4.146
South Australian Fire and Emergency Services Commission ..............................................4.160
South Australian Metropolitan Fire Service.........................................................................4.178
Country Fire Service ............................................................................................................4.192
State Emergency Service......................................................................................................4.206
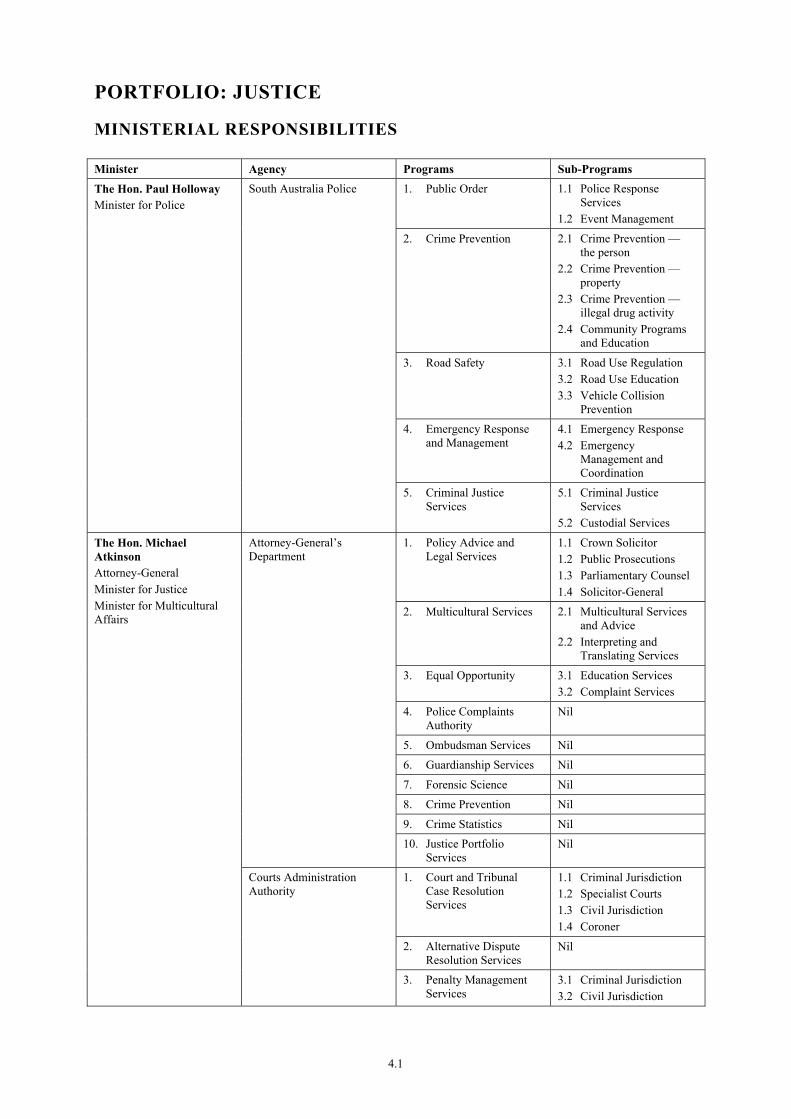
PORTFOLIO: JUSTICE
MINISTERIAL RESPONSIBILITIES
Minister Agency Programs Sub-Programs 1. Public Order 1.1 Police Response
Services 1.2 Event Management
2. Crime Prevention 2.1 Crime Prevention — the person
2.2 Crime Prevention — property
2.3 Crime Prevention — illegal drug activity
2.4 Community Programs and Education
3. Road Safety 3.1 Road Use Regulation 3.2 Road Use Education 3.3 Vehicle Collision
Prevention
4. Emergency Response and Management
4.1 Emergency Response 4.2 Emergency
Management and Coordination
The Hon. Paul Holloway Minister for Police
South Australia Police
5. Criminal Justice Services
5.1 Criminal Justice Services
5.2 Custodial Services
1. Policy Advice and Legal Services
1.1 Crown Solicitor 1.2 Public Prosecutions 1.3 Parliamentary Counsel 1.4 Solicitor-General
2. Multicultural Services 2.1 Multicultural Services and Advice
2.2 Interpreting and Translating Services
3. Equal Opportunity 3.1 Education Services 3.2 Complaint Services
4. Police Complaints Authority
Nil
5. Ombudsman Services Nil
6. Guardianship Services Nil
7. Forensic Science Nil
8. Crime Prevention Nil
9. Crime Statistics Nil
Attorney-General’s Department
10. Justice Portfolio Services
Nil
1. Court and Tribunal Case Resolution Services
1.1 Criminal Jurisdiction 1.2 Specialist Courts 1.3 Civil Jurisdiction 1.4 Coroner
2. Alternative Dispute Resolution Services
Nil
The Hon. Michael Atkinson Attorney-General Minister for Justice Minister for Multicultural Affairs
Courts Administration Authority
3. Penalty Management Services
3.1 Criminal Jurisdiction 3.2 Civil Jurisdiction
4.1
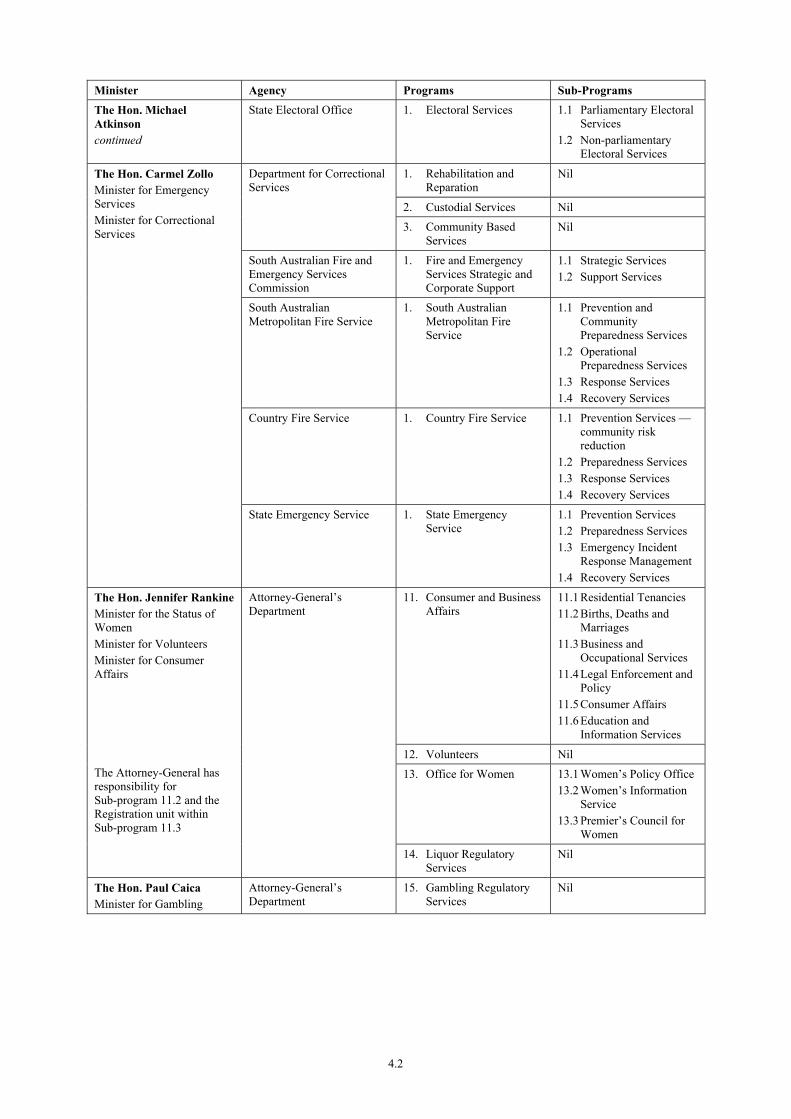
Minister Agency Programs Sub-Programs
The Hon. Michael Atkinson continued
State Electoral Office 1. Electoral Services 1.1 Parliamentary Electoral Services
1.2 Non-parliamentary Electoral Services
1. Rehabilitation and Reparation
Nil
2. Custodial Services Nil
Department for Correctional Services
3. Community Based Services
Nil
South Australian Fire and Emergency Services Commission
1. Fire and Emergency Services Strategic and Corporate Support
1.1 Strategic Services 1.2 Support Services
South Australian Metropolitan Fire Service
1. South Australian Metropolitan Fire Service
1.1 Prevention and Community Preparedness Services
1.2 Operational Preparedness Services
1.3 Response Services 1.4 Recovery Services
Country Fire Service 1. Country Fire Service 1.1 Prevention Services — community risk reduction
1.2 Preparedness Services 1.3 Response Services 1.4 Recovery Services
The Hon. Carmel Zollo Minister for Emergency Services Minister for Correctional Services
State Emergency Service 1. State Emergency Service
1.1 Prevention Services 1.2 Preparedness Services 1.3 Emergency Incident
Response Management 1.4 Recovery Services
11. Consumer and Business Affairs
11.1 Residential Tenancies 11.2 Births, Deaths and
Marriages 11.3 Business and
Occupational Services 11.4 Legal Enforcement and
Policy 11.5 Consumer Affairs 11.6 Education and
Information Services
12. Volunteers Nil
13. Office for Women 13.1 Women’s Policy Office 13.2 Women’s Information
Service 13.3 Premier’s Council for
Women
The Hon. Jennifer Rankine Minister for the Status of Women Minister for Volunteers Minister for Consumer Affairs The Attorney-General has responsibility for Sub-program 11.2 and the Registration unit within Sub-program 11.3
Attorney-General’s Department
14. Liquor Regulatory Services
Nil
The Hon. Paul Caica Minister for Gambling
Attorney-General’s Department
15. Gambling Regulatory Services
Nil
4.2

Administered Items
In addition to the above responsibilities the Portfolio administers the following items on behalf of Ministers.
Attorney-General’s Department
• Agents Indemnity Fund
• Bodies in the Barrel Case
• Child Abuse Program
• Children in State Care Commission of Inquiry
• Companies Liquidation Account
• Compensation — Companies Regulation
• Computer Aided Dispatch Project
• Consumer Credit Fund
• Contribution to the Legal Services Commission for Legal Aid
• Cooperatives Liquidation Account
• Crown Solicitor’s Trust Account
• Expensive State Criminal Cases
• HIH Fund
• Legal Practitioners Act Fund
• Payment of Liquor Subsidies to Licensees
• Portfolio Radio and Telecommunications Project
• State Rescue Helicopter Service
• Remission of Fees and Charges
• Residential Tenancies Trust Account
• Retail Shop Leases Trust Account
• Second-hand Motor Vehicles Dealers Compensation Fund
• Special Acts - Ministerial salary and allowances, Statutory Officer salaries (Ombudsman and Solicitor-General)
• Taxation Receipts (Casino, Gaming, Lottery Licences)
• Victims of Crime Fund
4.3

• Wangary Coronial Inquest
• War Graves
Courts Administration Authority
• Court Fees and Fines
• Judicial Salaries and Expenses
• Probate Fees
• Transcript Fees and Expenses
South Australian Fire and Emergency Services Commission
• Community Emergency Services Fund
South Australia Police
• Exhibit Monies
• Grant to the Australian Crime Prevention Council
• Grant to Safer Communities Australia Inc
• Australian Crime Commission secondments/references
• Statutory Officer salaries (Police Commissioner)
• Revenue from Expiation Notices
• SA Water Corporation — water rate concession for emergency services
• Unclaimed Monies
State Electoral Office
• Electoral Districts Boundaries Commission
• Statutory Officer salaries (Electoral Commissioner and Deputy Electoral Commissioner)
Statutes
The Department of the Premier and Cabinet maintains a list of statutes applicable to Ministers.
4.4
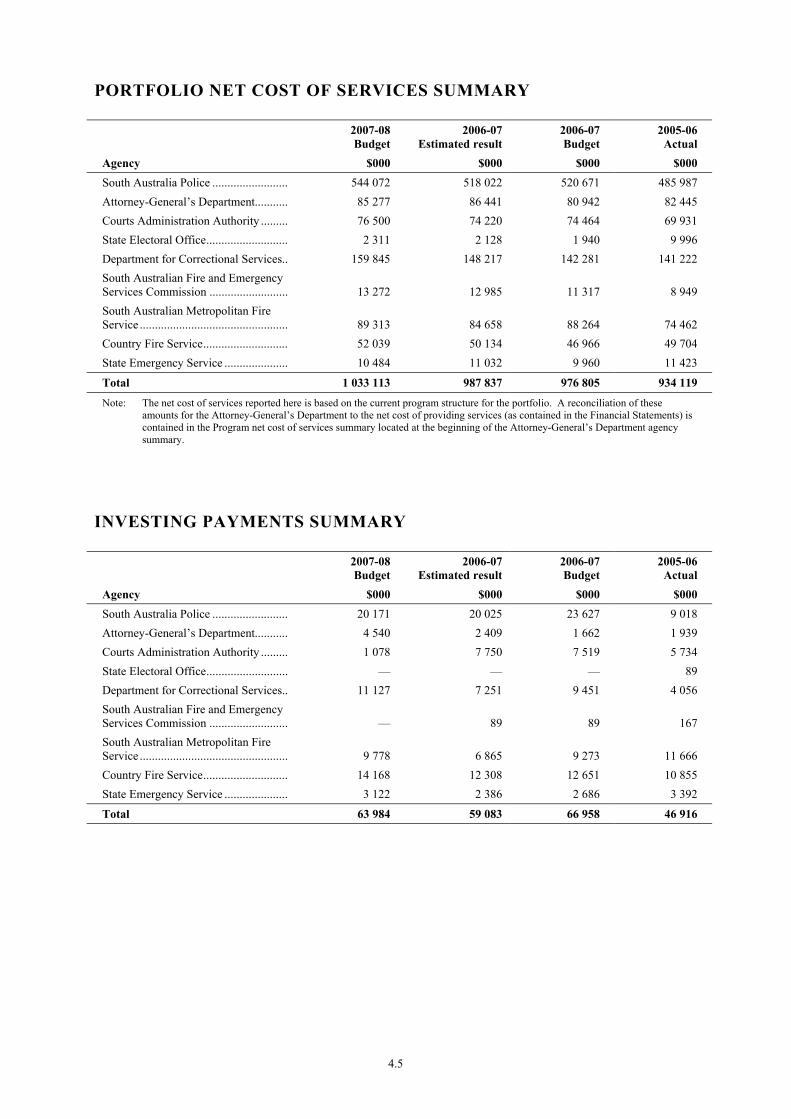
PORTFOLIO NET COST OF SERVICES SUMMARY
2007-08 Budget
2006-07Estimated result
2006-07 Budget
2005-06 Actual
Agency $000 $000 $000 $000 South Australia Police ......................... 544 072 518 022 520 671 485 987 Attorney-General’s Department........... 85 277 86 441 80 942 82 445 Courts Administration Authority ......... 76 500 74 220 74 464 69 931 State Electoral Office........................... 2 311 2 128 1 940 9 996 Department for Correctional Services.. 159 845 148 217 142 281 141 222 South Australian Fire and Emergency Services Commission .......................... 13 272 12 985 11 317 8 949 South Australian Metropolitan Fire Service ................................................. 89 313 84 658 88 264 74 462 Country Fire Service............................ 52 039 50 134 46 966 49 704 State Emergency Service ..................... 10 484 11 032 9 960 11 423
Total 1 033 113 987 837 976 805 934 119
Note: The net cost of services reported here is based on the current program structure for the portfolio. A reconciliation of these amounts for the Attorney-General’s Department to the net cost of providing services (as contained in the Financial Statements) is contained in the Program net cost of services summary located at the beginning of the Attorney-General’s Department agency summary.
INVESTING PAYMENTS SUMMARY
2007-08 Budget
2006-07Estimated result
2006-07 Budget
2005-06 Actual
Agency $000 $000 $000 $000 South Australia Police ......................... 20 171 20 025 23 627 9 018 Attorney-General’s Department........... 4 540 2 409 1 662 1 939 Courts Administration Authority ......... 1 078 7 750 7 519 5 734 State Electoral Office........................... — — — 89 Department for Correctional Services.. 11 127 7 251 9 451 4 056 South Australian Fire and Emergency Services Commission .......................... — 89 89 167 South Australian Metropolitan Fire Service ................................................. 9 778 6 865 9 273 11 666 Country Fire Service............................ 14 168 12 308 12 651 10 855 State Emergency Service ..................... 3 122 2 386 2 686 3 392
Total 63 984 59 083 66 958 46 916
4.5

JUSTICE
Income statement__________________________________________________________________________________________________________________________________________________________________________________________________________________________________
2007-08Budget
$000
2006-07Estimated
result
$000
2006-07Budget
$000
2005-06Actual
$000Expenses
Employee benefits and costs — Salaries, wages, annual and sick leave ..................................... 631 874 600 376 603 188 568 155 Long service leave .................................................................... 26 080 24 065 19 894 14 735 Payroll tax ................................................................................ 39 475 37 225 37 091 36 051 Superannuation ......................................................................... 81 417 76 785 77 895 73 868 Other ......................................................................................... 4 291 4 200 4 786 23 066Supplies and services — General supplies and services .................................................. 276 696 265 172 264 483 271 668 Consultancy expenses .............................................................. 2 437 1 496 689 1 182Depreciation and amortisation ..................................................... 52 320 47 195 46 963 42 200Borrowing costs ............................................................................ 1 239 1 267 1 251 1 304Grants and subsidies ..................................................................... 13 115 11 708 11 921 12 093Intra government transfers ........................................................... 3 622 4 177 1 314 1 326Other expenses ............................................................................. 23 704 23 501 4 325 1 707
Total expenses .............................................................................. 1 156 270 1 097 167 1 073 800 1 047 355
Income
Commonwealth revenues ............................................................. 6 686 5 905 4 886 5 039Intra government transfers ........................................................... 232 124 221 723 218 546 214 398Other grants .................................................................................. 61 60 — 203Fees, fines and penalties ............................................................... 37 124 34 284 32 885 32 681Sales of goods and services .......................................................... 60 432 61 167 56 939 53 431Interest revenues ........................................................................... 1 783 1 766 738 8 804Net gain or loss from disposal of assets ....................................... 1 106 89 934 7Resources received free of charge ................................................ — — — 1 162Other income ................................................................................ 8 140 7 118 6 801 18 882
Total income ................................................................................. 347 456 332 112 321 729 334 607
Net cost of providing services ...................................................... 808 814 765 055 752 071 712 748
Income from / Expenses to SA Government
Income — Appropriation ........................................................................... 816 926 747 231 753 417 709 616 Other income ............................................................................ — 6 464 — 6 550Expenses — Tax equivalent .......................................................................... 151 131 131 106 Cash alignment ......................................................................... 821 2 541 472 22 271
Net income from / expenses to SA Government .......................... 815 954 751 023 752 814 693 789
Net result before restructure(s) ..................................................... 7 140 -14 032 743 -18 959
Net income from / expenses from administrative restructure(s) .. — -3 581 — 20 904
Net result after restructure(s) ........................................................ 7 140 -17 613 743 1 945
4.6

JUSTICE
Balance sheet__________________________________________________________________________________________________________________________________________________________________________________________________________________________________
2007-08Budget
$000
2006-07Estimated
result
$000
2006-07Budget
$000
2005-06Actual
$000Assets
Current assets
Cash and cash equivalents ............................................................ 139 506 121 350 125 198 129 600Receivables ................................................................................... 16 206 16 119 15 645 18 245Inventories .................................................................................... 869 864 881 859Financial assets ............................................................................. 2 014 2 014 — 1Other current assets ...................................................................... 3 219 3 116 2 553 1 120
Total current assets ....................................................................... 161 814 143 463 144 277 149 825
Non current assets
Land and improvements ............................................................... 601 832 592 327 553 055 576 192Plant and equipment ..................................................................... 160 898 158 314 164 308 166 780Heritage assets .............................................................................. 77 77 621 77Intangible assets ........................................................................... 5 034 6 444 — 4 845Other non-current assets ............................................................... 216 216 103 216
Total non-current assets ............................................................... 768 057 757 378 718 087 748 110
Total assets ................................................................................... 929 871 900 841 862 364 897 935
Liabilities
Current liabilities
Payables ........................................................................................ 50 689 49 855 51 965 48 958Short-term borrowings ................................................................. — — 200 — Employee benefits — Salaries and wages ................................................................... 16 227 15 589 13 278 14 856 Sick leave ................................................................................. 1 1 — 1 Annual leave ............................................................................. 35 486 34 904 36 246 39 949 Long service leave .................................................................... 14 471 13 288 12 067 10 925 Other ......................................................................................... 461 234 666 1Short-term provisions ................................................................... 27 045 25 700 16 271 19 427Other current liabilities ................................................................. 1 903 1 801 3 267 1 907
Total current liabilities ................................................................. 146 283 141 372 133 960 136 024
Non current liabilities
Long-term borrowings .................................................................. 20 088 21 007 21 054 21 876Long-term employee benefits — Annual leave ............................................................................. 92 92 2 220 558 Long service leave .................................................................... 169 219 154 740 142 182 135 895 Other ......................................................................................... 20 12 16 4Long-term provisions ................................................................... 85 039 81 224 78 805 82 617Other non-current liabilities ......................................................... 215 619 17 650
Total non-current liabilities .......................................................... 274 673 257 694 244 294 241 600
Total liabilities .............................................................................. 420 956 399 066 378 254 377 624
Net assets ...................................................................................... 508 915 501 775 484 110 520 311
4.7

JUSTICE
Balance sheet__________________________________________________________________________________________________________________________________________________________________________________________________________________________________
2007-08Budget
$000
2006-07Estimated
result
$000
2006-07Budget
$000
2005-06Actual
$000Equity
Contributed capital ....................................................................... 7 147 7 147 3 294 3 140Retained earnings ......................................................................... 292 671 285 531 318 857 303 144Asset revaluation reserve ............................................................. 208 976 208 976 161 842 213 906Other reserves ............................................................................... 121 121 117 121
Total equity .................................................................................. 508 915 501 775 484 110 520 311
Balances as at 30 June end of period.
4.8

JUSTICE
Statement of changes in equity__________________________________________________________________________________________________________________________________________________________________________________________________________________________________
Contributedcapital
$000
Assetrevaluation
reserve
$000
Retainedearnings
$000
Total
$000
Balance at 30 June 2006 ............................................................... 3 140 213 906 303 265 520 311Adjustments .................................................................................. — — — —
Restated balance at June 2006 ...................................................... 3 140 213 906 303 265 520 311
Net gain/loss on revaluation of property, plant and equipment during 2006-07 ............................................................................ — -4 930 — -4 930Net changes in reserves ................................................................ 3 853 — — 3 853
Net income/expense recognised directly in equity for 2006-07 ... 3 853 -4 930 — -1 077Net result after restructure for 2006-07 ........................................ — — -17 613 -17 613
Total recognised income and expense for 2006-07 3 853 -4 930 -17 613 -18 690
Equity contributions from SA Government ................................. 154 — — 154Repayment of equity contributions from SA Government .......... — — — —
Estimated balance at 30 June 2007 7 147 208 976 285 652 501 775
Net gain/loss on revaluation of property, plant and equipment during 2007-08 ............................................................................ — — — — Net changes in reserves ................................................................ — — — —
Net income/expense recognised directly in equity for 2007-08 ... — — — — Net result after restructure for 2007-08 ........................................ — — 7 140 7 140
Total recognised income and expense for 2007-08 — — 7 140 7 140
Equity contributions from SA Government ................................. — — — — Repayment of equity contributions from SA Government .......... — — — —
Estimated balance at 30 June 2008 7 147 208 976 292 792 508 915
4.9

JUSTICE
Cash flow statement__________________________________________________________________________________________________________________________________________________________________________________________________________________________________
2007-08Budget
$000
2006-07Estimated
result
$000
2006-07Budget
$000
2005-06Actual
$000
OPERATING ACTIVITIES:
Cash outflows
Employee payments ..................................................................... 764 719 726 998 734 504 680 812Supplies and services ................................................................... 278 808 267 337 264 926 270 075Borrowing costs ............................................................................ 1 239 1 267 1 251 1 304Grants and subsidies ..................................................................... 13 115 11 708 11 921 12 093Net GST paid ................................................................................ — — — 15 784Intra government transfers ........................................................... 3 622 4 177 1 314 1 326Other payments ............................................................................ 19 730 19 483 1 353 11 099
Cash used in operations ................................................................ 1 081 233 1 030 970 1 015 269 992 493
Cash inflows
Intra government transfers ........................................................... 232 124 221 723 218 546 214 398Commonwealth receipts ............................................................... 6 686 5 905 4 886 5 039Other grants .................................................................................. 61 60 — 203Fees, fines and penalties ............................................................... 37 124 34 284 32 885 32 677Sales of goods and services .......................................................... 60 136 60 961 56 733 54 286Interest received ........................................................................... 1 783 1 962 942 8 798Net GST received ......................................................................... — — — 15 463Other receipts ............................................................................... 8 292 7 269 6 951 13 694
Cash generated from operations ................................................... 346 206 332 164 320 943 344 558
SA GOVERNMENT:
Appropriation ............................................................................... 816 926 747 231 753 417 709 616Other receipts ............................................................................... — 6 464 — 6 550Payments — Tax equivalents ........................................................................ 151 131 131 106 Cash alignment ......................................................................... 821 2 541 472 22 271
Net cash provided by SA Government ......................................... 815 954 751 023 752 814 693 789
Net cash provided by (+) / used (-) in operating activities ........... 80 927 52 217 58 488 45 854
INVESTING ACTIVITIES:
Cash outflows
Purchase of property, plant and equipment .................................. 63 984 58 881 66 082 45 447Other payments ............................................................................ — — — 1
Cash used in investing activities .................................................. 63 984 58 881 66 082 45 448
Cash inflows
Proceeds from sale of property, plant and equipment .................. 2 082 296 296 3 129
Cash generated from investing activities ..................................... 2 082 296 296 3 129
Net cash provided by (+) / used in (-) investing activities ........... -61 902 -58 585 -65 786 -42 319
4.10

JUSTICE
Cash flow statement__________________________________________________________________________________________________________________________________________________________________________________________________________________________________
2007-08Budget
$000
2006-07Estimated
result
$000
2006-07Budget
$000
2005-06Actual
$000
FINANCING ACTIVITIES:
Cash outflows
Repayment of borrowings ............................................................ — — — 5 226Repayment of SA Government contributed capital ..................... — — — 6 256Finance lease payments ................................................................ 869 823 777 777
Cash used in financing activities .................................................. 869 823 777 12 259
Cash inflows
Capital contributions from SA Government ................................ — 154 154 3 140Proceeds from restructuring activities .......................................... — 800 — —
Cash generated from financing activities ..................................... — 954 154 3 140
Net cash provided by (+) / used in (-) financing activities ........... -869 131 -623 -9 119
Net increase (+) / decrease (-) in cash equivalents ....................... 18 156 -6 237 -7 921 -5 584
Cash and cash equivalents at the beginning of the financial year 121 350 127 587 133 119 135 184
Cash and cash equivalents at the end of the financial year .......... 139 506 121 350 125 198 129 600
4.11

WORKFORCE SUMMARY
FTEs as at 30 June
Agency 2007-08
Budget estimate 2006-07
Estimated result 2005-06 Actual
South Australia Police ......................... 5 358.3 5 275.7 5 116.4 Attorney-General’s Department(a)........ 1 202.1 1 219.1 1 037.2 Courts Administration Authority ......... 832.8 845.8 782.1 State Electoral Office........................... 22.0 22.0 25.0 Department for Correctional Services.. 1 516.0 1 456.5 1 409.2 South Australian Fire and Emergency Services Commission .......................... 116.0 114.0 98.2 South Australian Metropolitan Fire Service ................................................. 856.0 838.0 834.7
Country Fire Service............................ 113.9 110.0 101.1 State Emergency Service ..................... 39.0 39.0 36.4
Total 10 056.1 9 920.1 9 440.3
(a) The 2006-07 Estimated Result and the 2007-08 Budget Estimate include employees associated with the functional responsibilities transferred from the Department for Administrative and Information Services to the Attorney-General’s Department.
MINISTERIAL OFFICES RESOURCES
2007-08 Budget
Cost of provision Minister $000 FTEs The Hon. Michael Atkinson 1 382 11.0 The Hon. Carmel Zollo 1 196 10.5
4.12

4.13
TABLE OF CONTENTS
AGENCY: SOUTH AUSTRALIA POLICE
Objective ........................................................................................................................................4.15
Targets / Highlights ........................................................................................................................4.16
Program Net Cost of Services Summary........................................................................................4.17
Investing Payments Summary ........................................................................................................4.18
Program Information — includes description/objective, Summary income statement, sub-program information including performance criteria
1. Public Order..................................................................................................................4.19
2. Crime Prevention ..........................................................................................................4.22
3. Road Safety...................................................................................................................4.27
4. Emergency Response and Management .......................................................................4.30
5. Criminal Justice Services..............................................................................................4.33
Financial Statements
Income statement .................................................................................................................4.36
Balance sheet........................................................................................................................4.37
Statement of changes in equity ............................................................................................4.38
Cash flow statement .............................................................................................................4.39
Income statement — Administered Items............................................................................4.41
Balance sheet — Administered Items ..................................................................................4.42
Statement of changes in equity — Administered Items.......................................................4.43
Cash flow statement — Administered Items .......................................................................4.44
Financial Commentary ...................................................................................................................4.45
4.14

PORTFOLIO: JUSTICE
AGENCY: SOUTH AUSTRALIA POLICE
Objectives
To prevent crime, uphold the law, preserve the peace, assist the public in emergency situations, coordinate and manage emergency incidents, regulate road use and prevent vehicle collisions.
4.15

2007-08 Targets / 2006-07 Highlights
Targets 2007-08 Highlights 2006-07
• Continue recruiting an extra 400 police by 2010 • Continue to implement & monitor the South Australia Police
(SAPOL) Road Safety Strategy for enhanced road safety across the state
• Continue the Rural Highway Saturation Management Plan for enhanced rural road safety
• Expand the random drug testing of drivers • Complete the implementation of SAPOL’s Domestic Violence
Strategy • Build new or upgraded police facilities including at Roxby
Downs and Christies Beach • Under the new Criminal Law (Forensic Procedures)
Consolidation Act 2007, ensure the requisite collection of DNA samples to realise the full potential of the database
• Participate in the CrimTrac Police Reference System program to improve operational access to nationwide information in the Minimum Nationwide Person Profile & the Australian National Child Offender Register
• Implement SAPOL’s Customer Service Framework • Enhance existing security arrangements eg training and
arrangements under the Terrorism (Prevention Detection) Act 2005 & the Terrorism (Police Powers) Act 2005
• Continue to participate in state based arrangements for counter terrorism, for example, training in the `securing our regional skies' program & furthering the `joint cooperative working group'
• Enhance the participation of volunteers in policing • Continue with Operation Nomad to further reduce bushfire
incidents • Implement SAPOL’s Future Directions Strategy 2007-2010 • Implement the SAPOL Crime Faculty • Implement the SAPOL Centre for Leadership • Continue to participate in the Cross Border Justice Project to
provide structure and practices for the uniform application of justice services to the central Australia region
• Continue to participate in the tri-state Operation Mid Realm to combat smuggling of drugs, alcohol and petrol into Aboriginal communities in the central Australia region
• Continued support of a range of community programs, a major highlight being to mark the 25 year anniversary since the foundation of Blue Light
• Commenced recruiting 400 extra police over four years • Implemented the SAPOL Road Safety Strategy • Continued the Rural Highway Saturation Management Plan
which increased rural road safety • Commenced the random drug testing of drivers • Commenced implementation of SAPOL’s Domestic Violence
Strategy • New or upgraded police facilities, for example, Golden Grove,
Aldinga & Naracoorte • Implemented changes to the DNA management system to
provide better linkages with Forensic Science South Australia and meet new legislative requirements
• Commenced adaptation of SAPOL systems to exchange information with national CrimTrac systems in the Minimum Nationwide Person Profile and the Australian National Child Offender Register
• Developed a Customer Service Framework and community engagement processes
• Provided security arrangements, for example, training and arrangements under the Terrorism (Prevention Detection) Act 2005 & the Terrorism (Police Powers) Act 2005
• Participated in state based arrangements for counter terrorism, for example, training in the `securing our regional skies' program
• Developed and implemented strategies for the broader use of volunteers in SAPOL
• Took delivery of a new police response aircraft • Reduced the instances of bushfires whilst increasing the
number of offenders apprehended for fire related offences in Operation Nomad
• Continued support of a range of community programs, a major highlight being hosting the Australasian Neighbourhood Watch Conference in October 2006
• Hosted the International Emergency Management Conference and Exhibition at the Adelaide Convention Centre in March 2007
• Hosted the World Police and Fire Games in Adelaide in March 2007
• Hosted the Australasian Police Ministers’ Council in November 2006
• Participated in the Cross Border Justice Project to provide structure and practices for the uniform application of justice services to the central Australia region
• Participated in the tri-state Operation Mid Realm to combat smuggling of drugs, alcohol and petrol into Aboriginal communities in the central Australia region
• The SAPOL Police Band attended the dedication of the National Police Memorial in Canberra 28-30th September 2006
• Participated in the Officer Exchange Program involving partner police organisations from the UK, NZ, Singapore and Canada
4.16
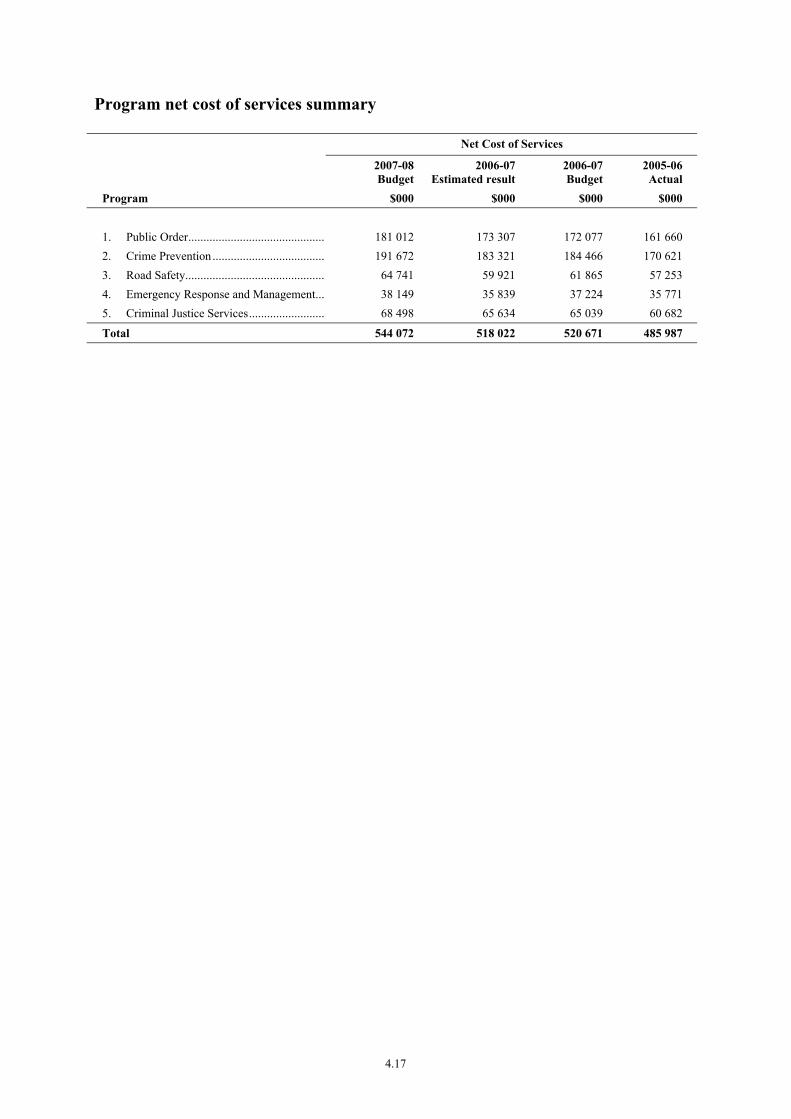
Program net cost of services summary
Net Cost of Services
2007-08Budget
2006-07Estimated result
2006-07 Budget
2005-06 Actual
Program $000 $000 $000 $000 1. Public Order.............................................. 181 012 173 307 172 077 161 660 2. Crime Prevention ...................................... 191 672 183 321 184 466 170 621 3. Road Safety............................................... 64 741 59 921 61 865 57 253 4. Emergency Response and Management.... 38 149 35 839 37 224 35 771 5. Criminal Justice Services.......................... 68 498 65 634 65 039 60 682
Total 544 072 518 022 520 671 485 987
4.17

Investing payments summary
2007-08Budget
2006-07Estimated result
2006-07 Budget
2005-06 Actual
Investments $000 $000 $000 $000
New Works Communications Infrastructure .................. 1 347 — — — Vessel Replacement – STAR Group .......... 1 125 — — — Roxby Downs Police Station...................... 750 — — — Unregistered / Uninsured Vehicle Initiative .....................................................
419
—
—
—
Second-hand Dealers and Pawnbrokers Initiative .....................................................
280
—
—
—
Vehicle for Driver Drug Testing ................ 240 — — —
Total New Works 4 161 — — —
New Works carried forward Anangu Pitjantjatjara Yankunytjatjara (APY) Lands Police Station Upgrade.........
1 250
—
1 000
—
Christies Beach Police Complex ................ 2 500 40 500 —
Total New Works carried forward 3 750 40 1 500 —
Works in Progress Recruit 400 ................................................. 2 470 397 2 179 — Road Safety and Speed Detection Equipment ..................................................
3 222
—
2 175
—
National Exchange – Police Data ............... 1 347 580 2 282 117 Additional Police Shop Fronts.................... 350 100 450 — Australian National Child Offender Register ......................................................
258
94
352
6
Replacement Aircraft ................................. — 4 699 4 700 1 Golden Grove, Para Hills and Aldinga Police Stations ............................................
—
4 676
1 810
1 521
CCTV Station Surveillance Replacement... — 2 218 — — Mobile data terminals ................................. — 678 734 903 Refurbish PPSB Security Control Centre ... — 625 625 — Expiation Notices Branch Systems Enhancements.............................................
—
436
436
—
Human Resource Management Information System ....................................
—
208
217
670
Counter terrorism and state disaster response......................................................
—
—
—
232
Total Works in Progress 7 647 14 711 15 960 3 450
Minor Works
Annual Programs........................................ 4 613 5 274 6 167 5 568
Total Minor Works 4 613 5 274 6 167 5 568
Total Investing Payments 20 171 20 025 23 627 9 018
4.18

AGENCY: SOUTH AUSTRALIA POLICE
Program Information
Program 1: Public Order
Description/Objective: In support of South Australia’s Strategic Plan Objective 2: ‘Improving Wellbeing’, provision of police services to the community, the investigation and management of public order offences and the management of major events in the state. The outcome is a community that is reassured and protected from crime and disorder, making South Australia a safe place to live, visit and conduct business.
Summary income statement
Program 1: Public Order 2007-08Budget
2006-07Estimated result
2006-07 Budget
2005-06 Actual
$000 $000 $000 $000
Expenses Employee benefits and costs............................. 152 181 145 178 147 776 143 317 Supplies and services........................................ 35 724 34 628 33 730 31 957 Grants and subsidies ......................................... — 43 — — Depreciation and amortisation .......................... 3 937 3 109 3 655 3 261 Other................................................................. 4 575 4 447 1 146 —
Total expenses 196 417 187 405 186 307 178 535
Income Sale of goods and services................................ 11 967 11 122 11 040 8 971 Fees, fines and penalties ................................... 3 103 2 976 2 867 2 737 Other................................................................. 335 — 323 5 167
Total income 15 405 14 098 14 230 16 875
Net cost of providing services 181 012 173 307 172 077 161 660
4.19

Sub-program information
Sub-program: 1.1 Police Response Services
This sub-program includes providing accessible customer-focused police station services, providing a responsive, visible and accessible police presence through directed patrols and targeting public order offences. By providing services that protect the public from crime and disorder, SAPOL contributes positively to the economic, social and cultural security and well being of the South Australian community.
2007-08 Budget
2006-07 Estimated result
2006-07 Budget
2005-06 Actual
Net cost of sub-program $168 252 000 $161 184 000 $159 936 000 $150 239 000
Performance Commentary Providing accessible police services through initiatives such as the 131 444 police assistance telephone number, and taking Police Incident Reports (PIRs) at the Call Centre continues to provide an efficient means of responding to calls for police assistance. SAPOL continues to work towards achieving a consistently high standard for the level of community satisfaction with policing services.
Performance Indicators 2007-08 Target
2006-07 Estimated result
2006-07 Target
2005-06 Actual
Number of patrol taskings in the metropolitan area(a)
— 332 020 — 319 101
% of Call Centre calls answered within 10 seconds
≥90% Target achieved ≥90% Target achieved
Number of PIRs taken by the Call Centre as a % of all PIRs recorded by police
— 24.4% — 22.1%
Number of offences against public order recorded per 100 000 head of population(b)
≥35.93 3 422.0 ≥3 591.8 3 430.5
Number of operational stations 140 136 139 136
Level of community satisfaction with police services
≥75% 72% ≥75.0% 74.7%
Number of priority B taskings in the metropolitan area
— 242 223 — 233 934
Footnotes (a) Change to wording, from ‘Number of police patrol taskings in the metropolitan area’. (b) 2007-08 Target changed to ‘per 1000’ from ‘per 100 000’ to align with South Australia’s Strategic Plan reporting requirement.
4.20
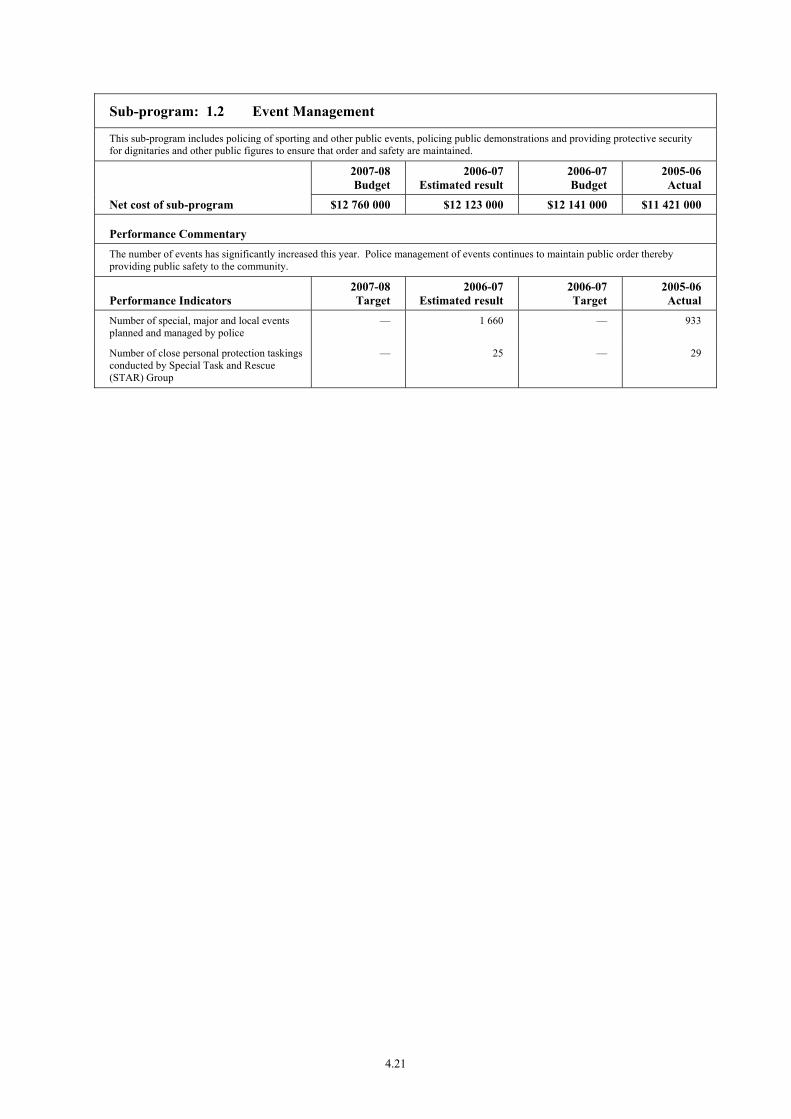
Sub-program: 1.2 Event Management
This sub-program includes policing of sporting and other public events, policing public demonstrations and providing protective security for dignitaries and other public figures to ensure that order and safety are maintained.
2007-08 Budget
2006-07 Estimated result
2006-07 Budget
2005-06 Actual
Net cost of sub-program $12 760 000 $12 123 000 $12 141 000 $11 421 000
Performance Commentary The number of events has significantly increased this year. Police management of events continues to maintain public order thereby providing public safety to the community.
Performance Indicators 2007-08 Target
2006-07 Estimated result
2006-07 Target
2005-06 Actual
Number of special, major and local events planned and managed by police
— 1 660 — 933
Number of close personal protection taskings conducted by Special Task and Rescue (STAR) Group
— 25 — 29
4.21
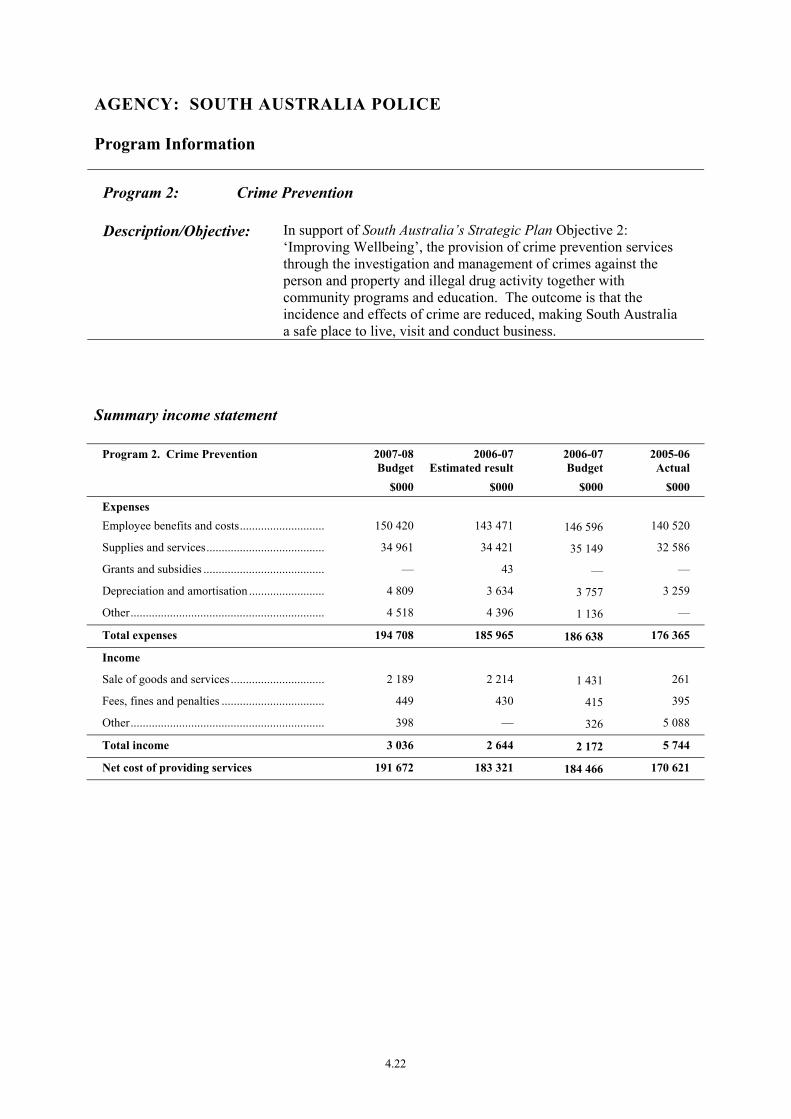
AGENCY: SOUTH AUSTRALIA POLICE
Program Information
Program 2: Crime Prevention
Description/Objective: In support of South Australia’s Strategic Plan Objective 2: ‘Improving Wellbeing’, the provision of crime prevention services through the investigation and management of crimes against the person and property and illegal drug activity together with community programs and education. The outcome is that the incidence and effects of crime are reduced, making South Australia a safe place to live, visit and conduct business.
Summary income statement
Program 2. Crime Prevention 2007-08Budget
2006-07Estimated result
2006-07 Budget
2005-06 Actual
$000 $000 $000 $000
Expenses Employee benefits and costs............................. 150 420 143 471 146 596 140 520
Supplies and services........................................ 34 961 34 421 35 149 32 586
Grants and subsidies ......................................... — 43 — —
Depreciation and amortisation .......................... 4 809 3 634 3 757 3 259
Other................................................................. 4 518 4 396 1 136 —
Total expenses 194 708 185 965 186 638 176 365
Income
Sale of goods and services................................ 2 189 2 214 1 431 261
Fees, fines and penalties ................................... 449 430 415 395
Other................................................................. 398 — 326 5 088
Total income 3 036 2 644 2 172 5 744
Net cost of providing services 191 672 183 321 184 466 170 621
4.22
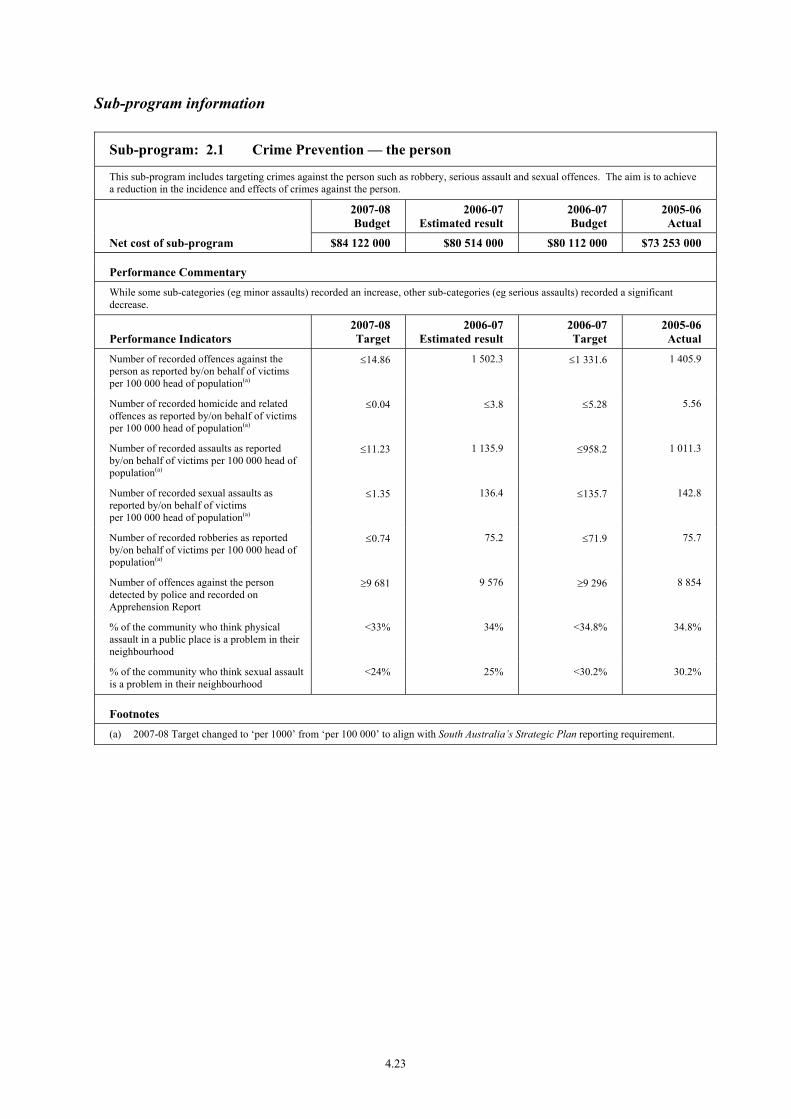
Sub-program information
Sub-program: 2.1 Crime Prevention — the person
This sub-program includes targeting crimes against the person such as robbery, serious assault and sexual offences. The aim is to achieve a reduction in the incidence and effects of crimes against the person.
2007-08 Budget
2006-07 Estimated result
2006-07 Budget
2005-06 Actual
Net cost of sub-program $84 122 000 $80 514 000 $80 112 000 $73 253 000
Performance Commentary While some sub-categories (eg minor assaults) recorded an increase, other sub-categories (eg serious assaults) recorded a significant decrease.
Performance Indicators 2007-08 Target
2006-07 Estimated result
2006-07 Target
2005-06 Actual
Number of recorded offences against the person as reported by/on behalf of victims per 100 000 head of population(a)
≤14.86 1 502.3 ≤1 331.6 1 405.9
Number of recorded homicide and related offences as reported by/on behalf of victims per 100 000 head of population(a)
≤0.04 ≤3.8 ≤5.28 5.56
Number of recorded assaults as reported by/on behalf of victims per 100 000 head of population(a)
≤11.23 1 135.9 ≤958.2 1 011.3
Number of recorded sexual assaults as reported by/on behalf of victims per 100 000 head of population(a)
≤1.35 136.4 ≤135.7 142.8
Number of recorded robberies as reported by/on behalf of victims per 100 000 head of population(a)
≤0.74 75.2 ≤71.9 75.7
Number of offences against the person detected by police and recorded on Apprehension Report
≥9 681 9 576 ≥9 296 8 854
% of the community who think physical assault in a public place is a problem in their neighbourhood
<33% 34% <34.8% 34.8%
% of the community who think sexual assault is a problem in their neighbourhood
<24% 25% <30.2% 30.2%
Footnotes (a) 2007-08 Target changed to ‘per 1000’ from ‘per 100 000’ to align with South Australia’s Strategic Plan reporting requirement.
4.23

Sub-program: 2.2 Crime Prevention — property
This sub-program includes targeting crimes against property such as serious criminal trespass, theft of and from motor vehicles. The aim is to achieve a reduction in the incidence and effects of crimes against property.
2007-08 Budget
2006-07 Estimated result
2006-07 Budget
2005-06 Actual
Net cost of sub-program $61 784 000 $59 082 000 $56 506 000 $52 956 000
Performance Commentary The overall result shows a flat trend in the rate of recorded offences against property.
Performance Indicators 2007-08 Target
2006-07 Estimated result
2006-07 Target
2005-06 Actual
Number of recorded offences against property as reported by/on behalf of victims per 100 000 head of population(a)
≤89.97 9 097.8 ≤8 712.4 9 189
Number of recorded theft offences (excluding theft of motor vehicle) as reported by/on behalf of victims per 100 000 head of population(a)
≤39.95 4 039 ≤3 922.7 4 140.4
Number of recorded motor vehicle thefts/illegal use of motor vehicles as reported by/on behalf of victims per 100 000 head of population(a)
≤5.23 528.8 ≤493.8 519.8
Number of recorded serious criminal trespass offences as reported by/on behalf of victims per 100 000 head of population(a)
≤14.44 1 460.1 ≤1 480.6 1 559.3
Number of recorded property damage offences as reported by/on behalf of victims per 100 000 head of population(a)
≤24.58 2 485.1 ≤2 287.6 2 409.6
Number of recorded deception/manipulation offences as reported by/on behalf of victims per 100 000 head of population(a)
≤2.39 242.0 ≤240.3 256.7
Number of offences against property detected by police and recorded on Apprehension Report
≥20 450 20 225 ≥20 540 19 802
% of the community who think motor vehicle theft is a problem in their neighbourhood
<49% 50% <55.6% 55.6%
% of the community who think housebreaking is a problem in their neighbourhood
<59% 60% <63.4% 63.4%
Footnotes (a) 2007-08 Target changed to ‘per 1000’ from ‘per 100 000’ to align with South Australia’s Strategic Plan reporting requirement.
4.24
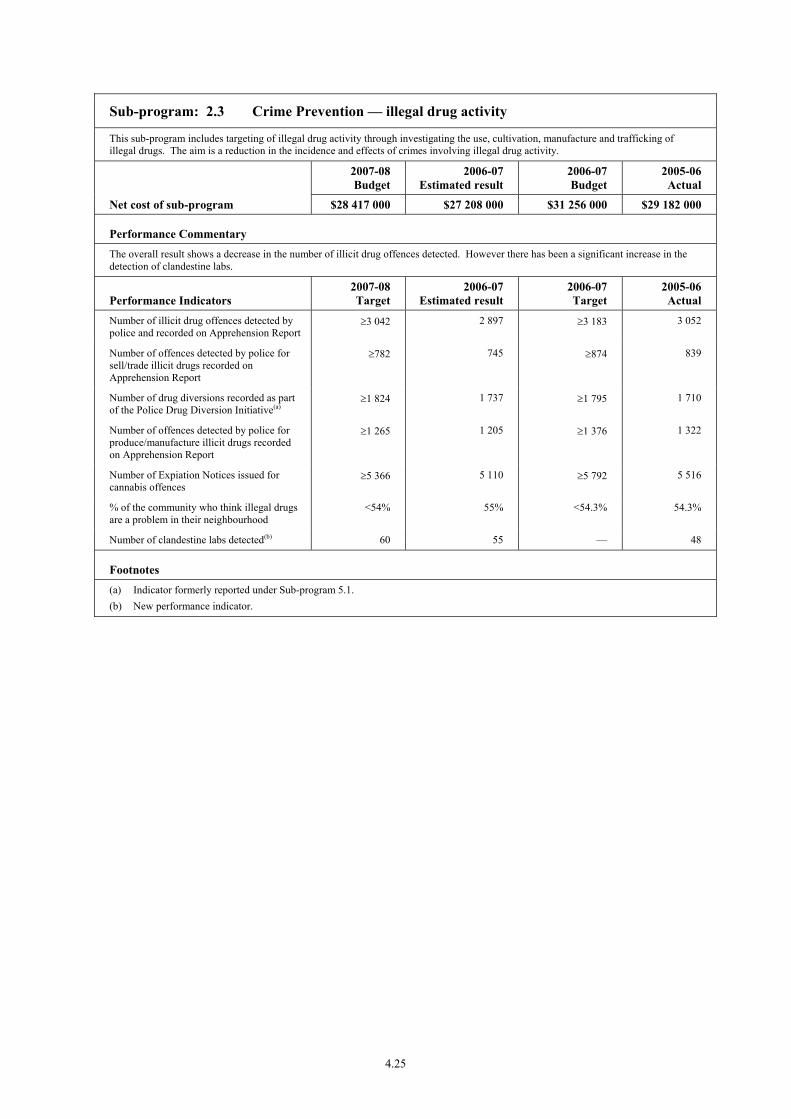
Sub-program: 2.3 Crime Prevention — illegal drug activity
This sub-program includes targeting of illegal drug activity through investigating the use, cultivation, manufacture and trafficking of illegal drugs. The aim is a reduction in the incidence and effects of crimes involving illegal drug activity.
2007-08 Budget
2006-07 Estimated result
2006-07 Budget
2005-06 Actual
Net cost of sub-program $28 417 000 $27 208 000 $31 256 000 $29 182 000
Performance Commentary The overall result shows a decrease in the number of illicit drug offences detected. However there has been a significant increase in the detection of clandestine labs.
Performance Indicators 2007-08 Target
2006-07 Estimated result
2006-07 Target
2005-06 Actual
Number of illicit drug offences detected by police and recorded on Apprehension Report
≥3 042 2 897 ≥3 183 3 052
Number of offences detected by police for sell/trade illicit drugs recorded on Apprehension Report
≥782 745 ≥874 839
Number of drug diversions recorded as part of the Police Drug Diversion Initiative(a)
≥1 824 1 737 ≥1 795 1 710
Number of offences detected by police for produce/manufacture illicit drugs recorded on Apprehension Report
≥1 265 1 205 ≥1 376 1 322
Number of Expiation Notices issued for cannabis offences
≥5 366 5 110 ≥5 792 5 516
% of the community who think illegal drugs are a problem in their neighbourhood
<54% 55% <54.3% 54.3%
Number of clandestine labs detected(b) 60 55 — 48
Footnotes (a) Indicator formerly reported under Sub-program 5.1. (b) New performance indicator.
4.25

Sub-program: 2.4 Community Programs and Education
Through this sub-program SAPOL works together with other agencies and the community to ensure effective crime reduction strategies through shared problem solving approaches. The aims are a reduction in the incidence and fear of crime. SAPOL continues to develop new and innovative programs with the community (eg Transit Watch). Since its inception in 1982, Blue Light Discos and camps have seen in excess of 1.2 million attendees.
2007-08 Budget
2006-07 Estimated result
2006-07 Budget
2005-06 Actual
Net cost of sub-program $17 349 000 $16 517 000 $16 592 000 $15 230 000
Performance Commentary SAPOL provides support for Watch groups and other community programs, as part of continuing to work towards achieving a consistently high standard for the level of community satisfaction with police support of community programs.
Performance Indicators 2007-08 Target
2006-07 Estimated result
2006-07 Target
2005-06 Actual
Number of participants attending Blue Light functions
≥45 000 41 000 ≥50 000 54 566
Number of active Watch groups 580 572 ≥571 562
Number of Watch areas launched/relaunched 12 12 ≥10 14
Number of calls to BankSA Crime Stoppers ≥18 145 18 053 ≥15 900 15 147
Ratio of apprehensions to actions sent out by Crime Stoppers
— 1:7 — 1:11
% of the community who are satisfied with police support of community programs
≥75% 73% ≥75.0% 78.4%
4.26
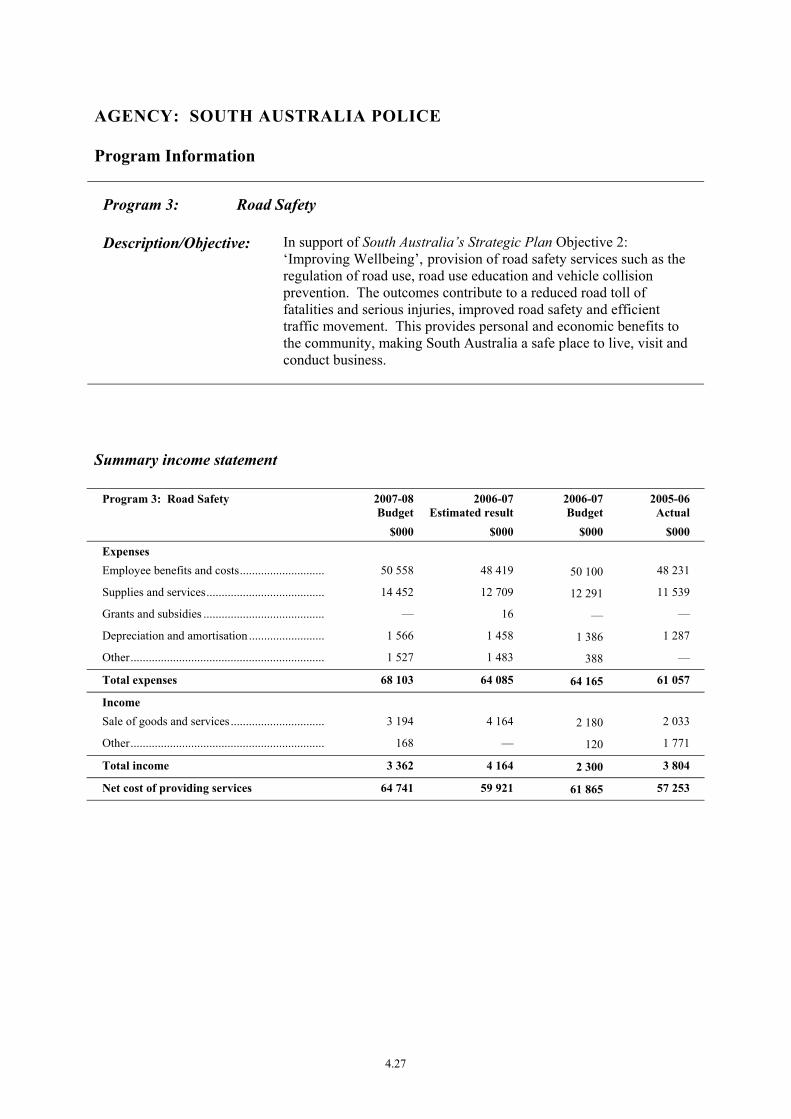
AGENCY: SOUTH AUSTRALIA POLICE
Program Information
Program 3: Road Safety
Description/Objective: In support of South Australia’s Strategic Plan Objective 2: ‘Improving Wellbeing’, provision of road safety services such as the regulation of road use, road use education and vehicle collision prevention. The outcomes contribute to a reduced road toll of fatalities and serious injuries, improved road safety and efficient traffic movement. This provides personal and economic benefits to the community, making South Australia a safe place to live, visit and conduct business.
Summary income statement
Program 3: Road Safety 2007-08Budget
2006-07Estimated result
2006-07 Budget
2005-06 Actual
$000 $000 $000 $000
Expenses Employee benefits and costs............................. 50 558 48 419 50 100 48 231
Supplies and services........................................ 14 452 12 709 12 291 11 539
Grants and subsidies ......................................... — 16 — —
Depreciation and amortisation .......................... 1 566 1 458 1 386 1 287
Other................................................................. 1 527 1 483 388 —
Total expenses 68 103 64 085 64 165 61 057
Income Sale of goods and services................................ 3 194 4 164 2 180 2 033
Other................................................................. 168 — 120 1 771
Total income 3 362 4 164 2 300 3 804
Net cost of providing services 64 741 59 921 61 865 57 253
4.27

Sub-program information
Sub-program: 3.1 Road Use Regulation
This sub-program includes targeted, directed and general traffic patrols, operating speed cameras and random mobile and static breath testing stations, and controlling traffic at incidents and special events. The aims are increased detection of drivers exceeding speed limits and/or affected by alcohol and other drugs, improved driver behaviour and efficient traffic movement.
2007-08 Budget
2006-07 Estimated result
2006-07 Budget
2005-06 Actual
Net cost of sub-program $45 415 000 $41 330 000 $43 969 000 $40 825 000
Performance Commentary SAPOL has continued to take a proactive, problem-solving approach to road safety issues. Examples include targeted operations during Christmas 2006 and Easter 2007 combined with traffic enforcement and driver education to improve driver behaviour. Speed detection, random breath testing, and enhancing community awareness through enforcement of road traffic legislation aims to reduce the number of offending road users. 2006-07 has seen a decrease in the number of road fatalities.
Performance Indicators 2007-08 Target
2006-07 Estimated result
2006-07 Target
2005-06 Actual
Number of traffic offences detected by police and recorded on Apprehension Report
≥58 690 55 895 ≥64 909 62 051
Number of drink driving related offences detected by police and recorded on Apprehension Report
≥9 197 8 759 ≥9 097 8 692
Number of drink driving related offences detected by police and recorded on expiation notice(a)
≥2 764 2 632 — —
Number of drug driving related offences detected by the Driver Drug Testing Group and recorded on expiation notice and Apprehension report(a)
≥440 248 — —
Number of speed detection hours (mobile cameras, mobile radars and lasers)
≥125 000 116 282 ≥125 000 114 090
Number of traffic offences issued on Expiation Notices
426 000 410 000 406 000 359 279
Number of Random Breath Tests conducted ≥600 000 650 000 ≥600 000 665 455
Number of detections as a percentage of the number of vehicles passing speed cameras
≤0.8% 1.06% ≤0.75% 0.75%
Static Random Breath Test (RBT) detection rate as a percentage of the number of drivers tested
≤0.53% 0.52% ≤0.50% 0.71%
Mobile RBT detection rate as a % of the number of drivers tested
4.0% 3.32% 3.32% 3.32%
Number of drivers treated at hospital following a casualty crash recording a Blood Alcohol Concentration exceeding the prescribed concentration of alcohol(b)
— 223 ≤286 348
Number of fatalities per 100 000 head of population (a) (c)
6.45 6.67 6.88 7.31
Number of serious injuries per 100 000 head of population (a) (c)
76.4 89.6 82.6 88.9
Footnotes (a) New performance indicator. (b) Performance indicator previously shown under Sub-program 3.3. (c) These performance indicators are also relevant to Sub-program 3.3.
4.28
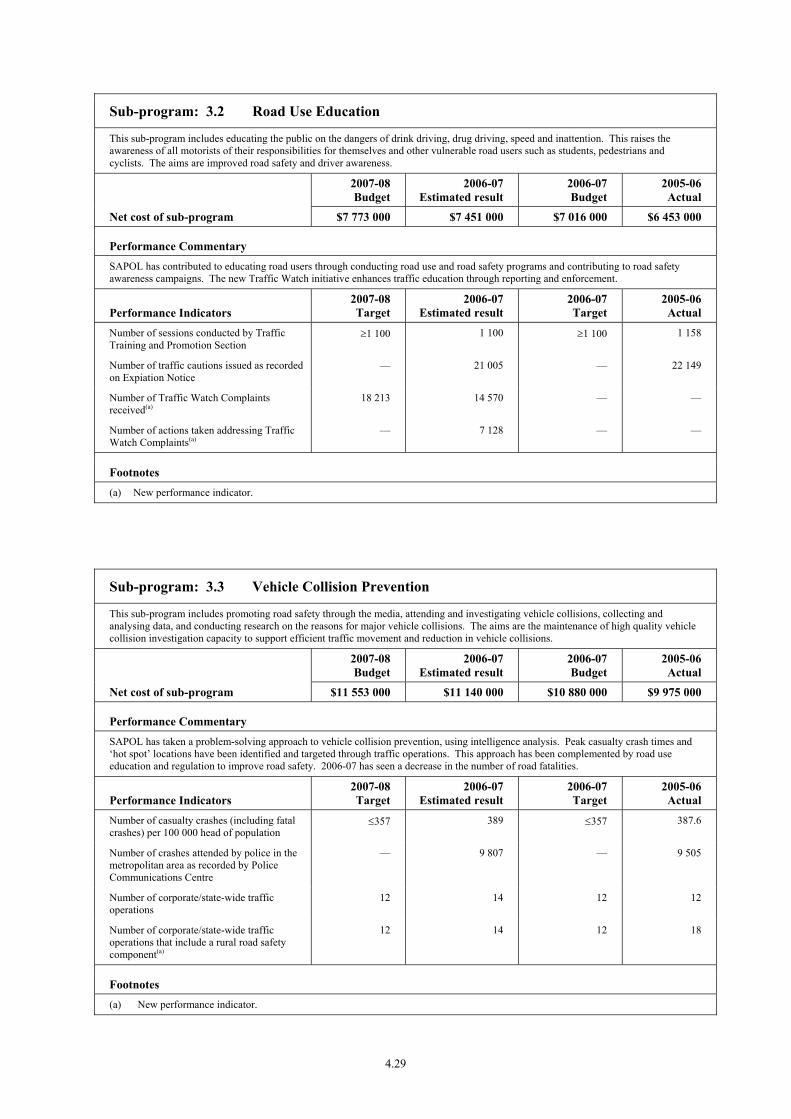
Sub-program: 3.2 Road Use Education
This sub-program includes educating the public on the dangers of drink driving, drug driving, speed and inattention. This raises the awareness of all motorists of their responsibilities for themselves and other vulnerable road users such as students, pedestrians and cyclists. The aims are improved road safety and driver awareness.
2007-08 Budget
2006-07 Estimated result
2006-07 Budget
2005-06 Actual
Net cost of sub-program $7 773 000 $7 451 000 $7 016 000 $6 453 000
Performance Commentary SAPOL has contributed to educating road users through conducting road use and road safety programs and contributing to road safety awareness campaigns. The new Traffic Watch initiative enhances traffic education through reporting and enforcement.
Performance Indicators 2007-08 Target
2006-07 Estimated result
2006-07 Target
2005-06 Actual
Number of sessions conducted by Traffic Training and Promotion Section
≥1 100 1 100 ≥1 100 1 158
Number of traffic cautions issued as recorded on Expiation Notice
— 21 005 — 22 149
Number of Traffic Watch Complaints received(a)
18 213 14 570 — —
Number of actions taken addressing Traffic Watch Complaints(a)
— 7 128 — —
Footnotes (a) New performance indicator.
Sub-program: 3.3 Vehicle Collision Prevention
This sub-program includes promoting road safety through the media, attending and investigating vehicle collisions, collecting and analysing data, and conducting research on the reasons for major vehicle collisions. The aims are the maintenance of high quality vehicle collision investigation capacity to support efficient traffic movement and reduction in vehicle collisions.
2007-08 Budget
2006-07 Estimated result
2006-07 Budget
2005-06 Actual
Net cost of sub-program $11 553 000 $11 140 000 $10 880 000 $9 975 000
Performance Commentary SAPOL has taken a problem-solving approach to vehicle collision prevention, using intelligence analysis. Peak casualty crash times and ‘hot spot’ locations have been identified and targeted through traffic operations. This approach has been complemented by road use education and regulation to improve road safety. 2006-07 has seen a decrease in the number of road fatalities.
Performance Indicators 2007-08 Target
2006-07 Estimated result
2006-07 Target
2005-06 Actual
Number of casualty crashes (including fatal crashes) per 100 000 head of population
≤357 389 ≤357 387.6
Number of crashes attended by police in the metropolitan area as recorded by Police Communications Centre
— 9 807 — 9 505
Number of corporate/state-wide traffic operations
12 14 12 12
Number of corporate/state-wide traffic operations that include a rural road safety component(a)
12 14 12 18
Footnotes (a) New performance indicator.
4.29

AGENCY: SOUTH AUSTRALIA POLICE
Program Information
Program 4: Emergency Response and Management
Description/Objective: In support of South Australia’s Strategic Plan Objective 2: ‘Improving Wellbeing’, provision of rapid and effective management and response services to reduce the incidence and effects of emergencies, thereby maximising the capacity to receive and manage calls for assistance. The outcome is that the effects on individuals and the community from emergency and disaster situations are minimised, making South Australia a safe place to live, visit and conduct business.
Summary income statement
Program 4: Emergency Response and Management
2007-08Budget
2006-07Estimated result
2006-07 Budget
2005-06 Actual
$000 $000 $000 $000
Expenses Employee benefits and costs............................. 27 596 26 140 26 979 26 211
Supplies and services........................................ 8 491 8 036 9 189 8 739
Grants and subsidies ......................................... — 10 — —
Depreciation and amortisation .......................... 1 233 852 847 821
Other................................................................. 829 801 209 —
Total expenses 38 149 35 839 37 224 35 771
Total income — — — —
Net cost of providing services 38 149 35 839 37 224 35 771
4.30
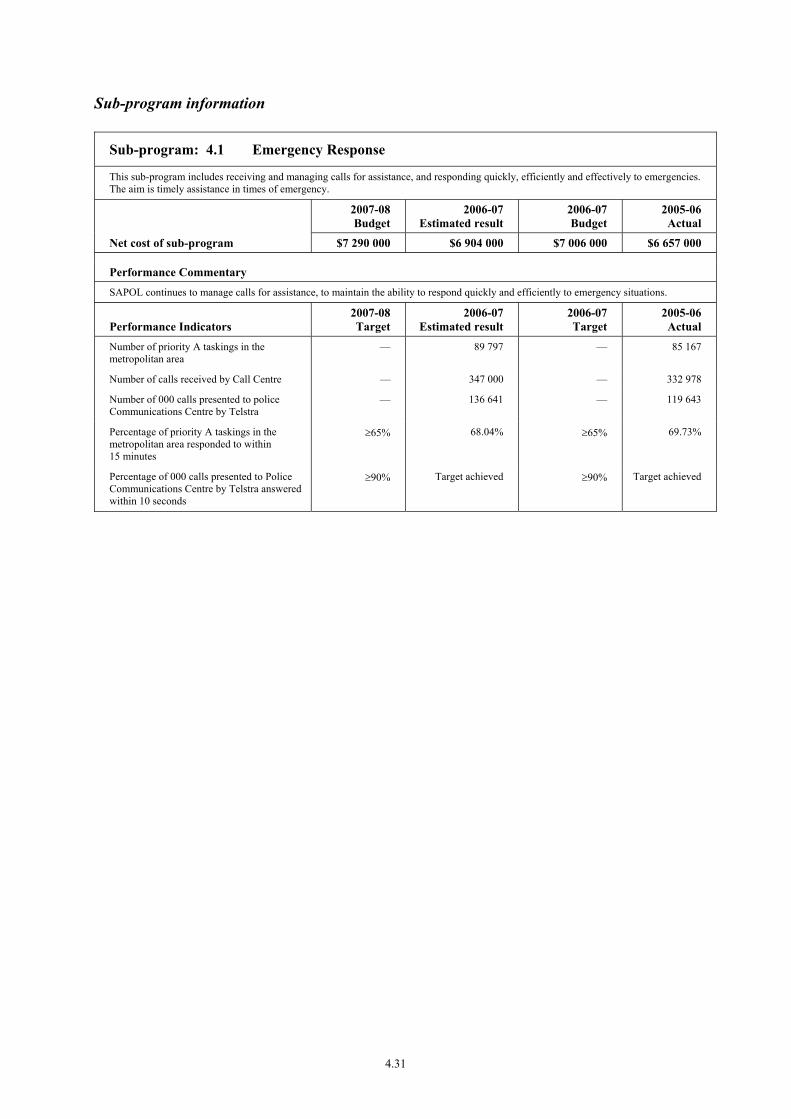
Sub-program information
Sub-program: 4.1 Emergency Response
This sub-program includes receiving and managing calls for assistance, and responding quickly, efficiently and effectively to emergencies. The aim is timely assistance in times of emergency.
2007-08 Budget
2006-07 Estimated result
2006-07 Budget
2005-06 Actual
Net cost of sub-program $7 290 000 $6 904 000 $7 006 000 $6 657 000
Performance Commentary SAPOL continues to manage calls for assistance, to maintain the ability to respond quickly and efficiently to emergency situations.
Performance Indicators 2007-08 Target
2006-07 Estimated result
2006-07 Target
2005-06 Actual
Number of priority A taskings in the metropolitan area
— 89 797 — 85 167
Number of calls received by Call Centre — 347 000 — 332 978
Number of 000 calls presented to police Communications Centre by Telstra
— 136 641 — 119 643
Percentage of priority A taskings in the metropolitan area responded to within 15 minutes
≥65% 68.04% ≥65% 69.73%
Percentage of 000 calls presented to Police Communications Centre by Telstra answered within 10 seconds
≥90% Target achieved ≥90% Target achieved
4.31
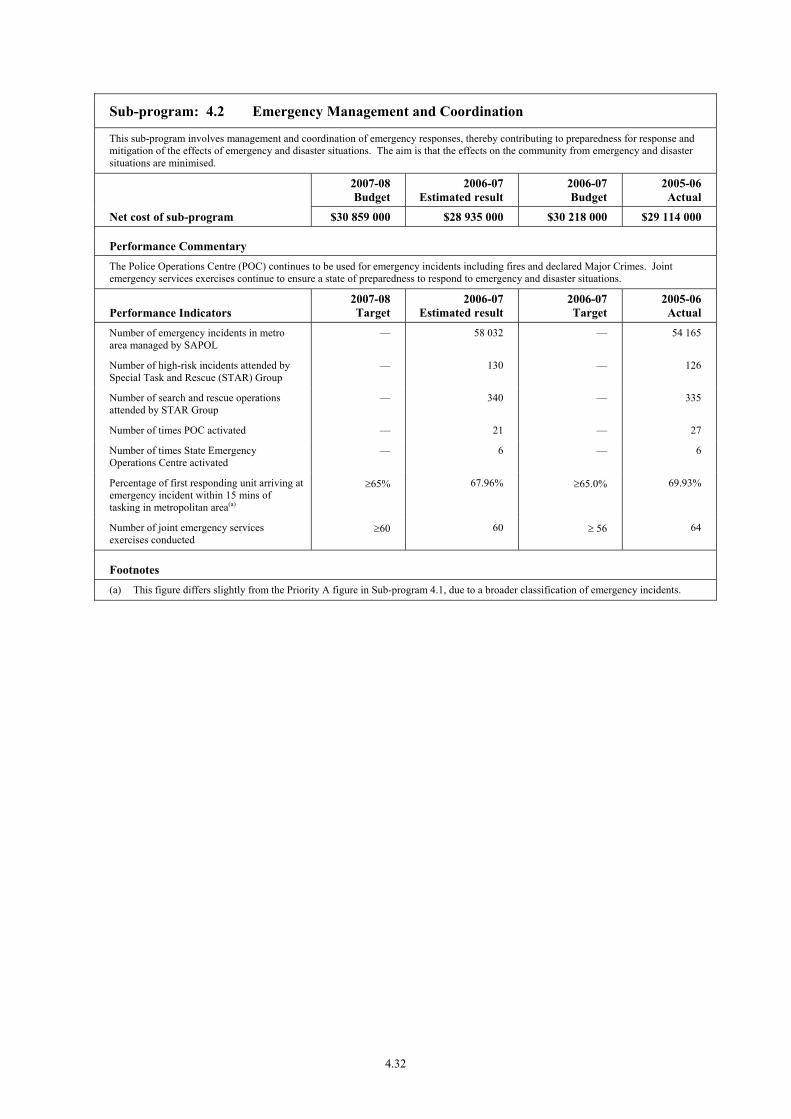
Sub-program: 4.2 Emergency Management and Coordination
This sub-program involves management and coordination of emergency responses, thereby contributing to preparedness for response and mitigation of the effects of emergency and disaster situations. The aim is that the effects on the community from emergency and disaster situations are minimised.
2007-08 Budget
2006-07 Estimated result
2006-07 Budget
2005-06 Actual
Net cost of sub-program $30 859 000 $28 935 000 $30 218 000 $29 114 000
Performance Commentary The Police Operations Centre (POC) continues to be used for emergency incidents including fires and declared Major Crimes. Joint emergency services exercises continue to ensure a state of preparedness to respond to emergency and disaster situations.
Performance Indicators 2007-08 Target
2006-07 Estimated result
2006-07 Target
2005-06 Actual
Number of emergency incidents in metro area managed by SAPOL
— 58 032 — 54 165
Number of high-risk incidents attended by Special Task and Rescue (STAR) Group
— 130 — 126
Number of search and rescue operations attended by STAR Group
— 340 — 335
Number of times POC activated — 21 — 27
Number of times State Emergency Operations Centre activated
— 6 — 6
Percentage of first responding unit arriving at emergency incident within 15 mins of tasking in metropolitan area(a)
≥65% 67.96% ≥65.0% 69.93%
Number of joint emergency services exercises conducted
≥60 60 ≥ 56 64
Footnotes (a) This figure differs slightly from the Priority A figure in Sub-program 4.1, due to a broader classification of emergency incidents.
4.32
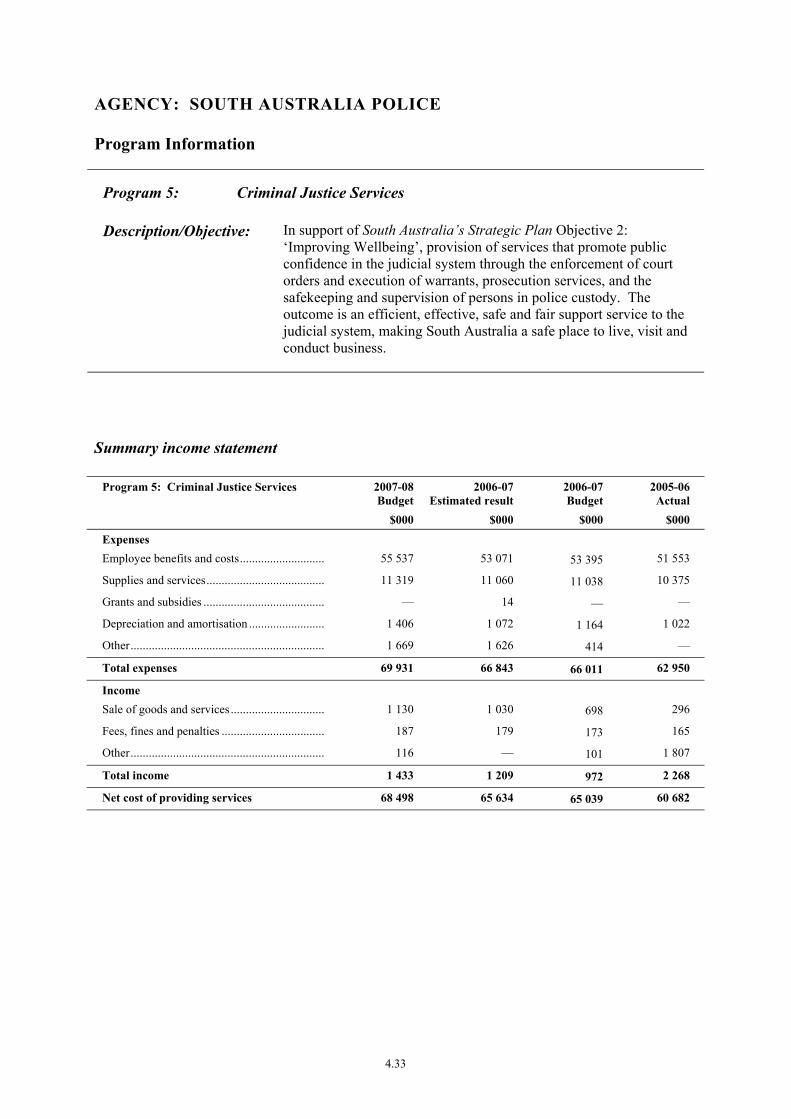
AGENCY: SOUTH AUSTRALIA POLICE
Program Information
Program 5: Criminal Justice Services
Description/Objective: In support of South Australia’s Strategic Plan Objective 2: ‘Improving Wellbeing’, provision of services that promote public confidence in the judicial system through the enforcement of court orders and execution of warrants, prosecution services, and the safekeeping and supervision of persons in police custody. The outcome is an efficient, effective, safe and fair support service to the judicial system, making South Australia a safe place to live, visit and conduct business.
Summary income statement
Program 5: Criminal Justice Services 2007-08Budget
2006-07Estimated result
2006-07 Budget
2005-06 Actual
$000 $000 $000 $000
Expenses Employee benefits and costs............................. 55 537 53 071 53 395 51 553
Supplies and services........................................ 11 319 11 060 11 038 10 375
Grants and subsidies ......................................... — 14 — —
Depreciation and amortisation .......................... 1 406 1 072 1 164 1 022
Other................................................................. 1 669 1 626 414 —
Total expenses 69 931 66 843 66 011 62 950
Income Sale of goods and services................................ 1 130 1 030 698 296
Fees, fines and penalties ................................... 187 179 173 165
Other................................................................. 116 — 101 1 807
Total income 1 433 1 209 972 2 268
Net cost of providing services 68 498 65 634 65 039 60 682
4.33
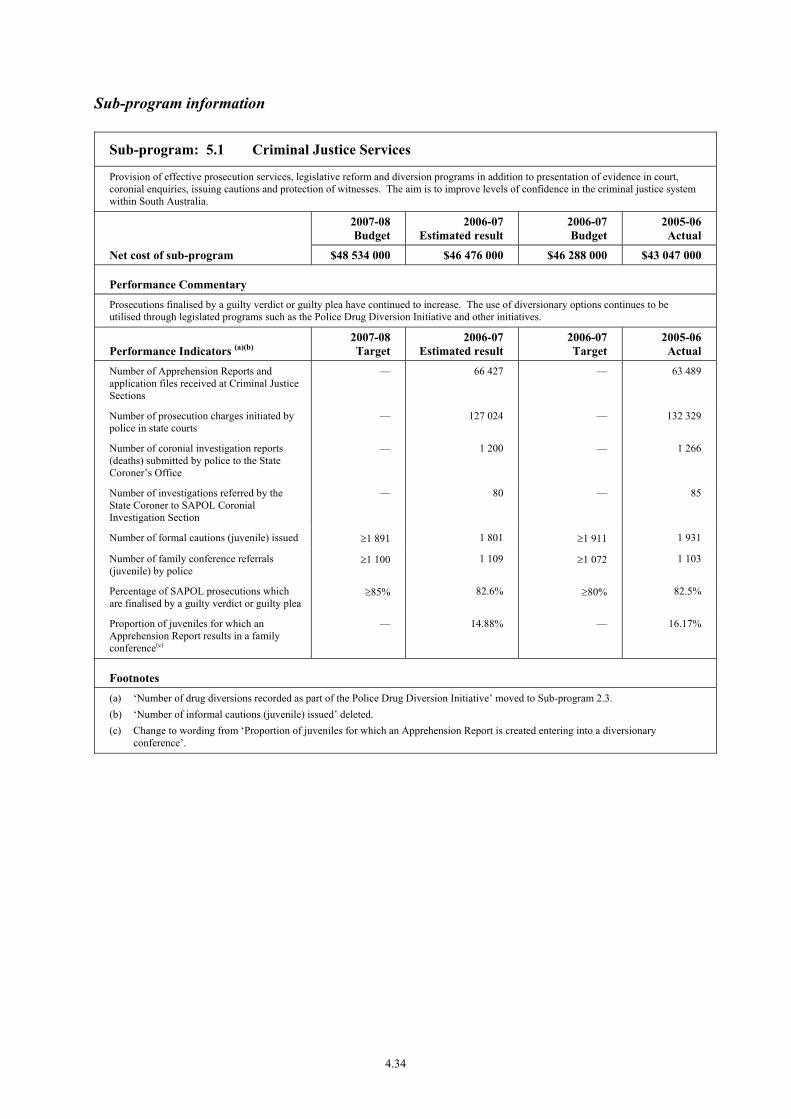
Sub-program information
Sub-program: 5.1 Criminal Justice Services
Provision of effective prosecution services, legislative reform and diversion programs in addition to presentation of evidence in court, coronial enquiries, issuing cautions and protection of witnesses. The aim is to improve levels of confidence in the criminal justice system within South Australia.
2007-08 Budget
2006-07 Estimated result
2006-07 Budget
2005-06 Actual
Net cost of sub-program $48 534 000 $46 476 000 $46 288 000 $43 047 000
Performance Commentary Prosecutions finalised by a guilty verdict or guilty plea have continued to increase. The use of diversionary options continues to be utilised through legislated programs such as the Police Drug Diversion Initiative and other initiatives.
Performance Indicators (a)(b) 2007-08 Target
2006-07 Estimated result
2006-07 Target
2005-06 Actual
Number of Apprehension Reports and application files received at Criminal Justice Sections
— 66 427 — 63 489
Number of prosecution charges initiated by police in state courts
— 127 024 — 132 329
Number of coronial investigation reports (deaths) submitted by police to the State Coroner’s Office
— 1 200 — 1 266
Number of investigations referred by the State Coroner to SAPOL Coronial Investigation Section
— 80 — 85
Number of formal cautions (juvenile) issued ≥1 891 1 801 ≥1 911 1 931
Number of family conference referrals (juvenile) by police
≥1 100 1 109 ≥1 072 1 103
Percentage of SAPOL prosecutions which are finalised by a guilty verdict or guilty plea
≥85% 82.6% ≥80% 82.5%
Proportion of juveniles for which an Apprehension Report results in a family conference(c)
— 14.88% — 16.17%
Footnotes (a) ‘Number of drug diversions recorded as part of the Police Drug Diversion Initiative’ moved to Sub-program 2.3. (b) ‘Number of informal cautions (juvenile) issued’ deleted. (c) Change to wording from ‘Proportion of juveniles for which an Apprehension Report is created entering into a diversionary
conference’.
4.34

Sub-program: 5.2 Custodial Services
This sub-program includes providing a safe environment for all prisoners and visitors to police holding facilities, efficient suspect and offender processing, and bail and warrant processing. The aim is that a safe environment is maintained for persons held in police custody and while being transported by police.
2007-08 Budget
2006-07 Estimated result
2006-07 Budget
2005-06 Actual
Net cost of sub-program $19 964 000 $19 158 000 $18 751 000 $17 635 000
Performance Commentary SAPOL has continued to be diligent in providing a safe environment for persons in police custody by undertaking Commissioner’s Inquiries into incidents with serious consequences and implications.
Performance Indicators 2007-08 Target
2006-07 Estimated result
2006-07 Target
2005-06 Actual
Number of prisoners processed through police holding facilities
— 34 225
— 31 569
Number of (unnatural) deaths in police custody(a)
— 5
— 4
Number of self-harm (full) in police custody (b)
— 3 — 4
Number of self-harm (preliminary) in police custody(c)(d)
— 36 — —
Number of self-harm (incident) in police custody(c)
— 45 — 68
Number of escapes from police holding facilities(e)
— 1 — 0
Number of Commissioner’s Inquiries for police custody-related matters(f)
— 6 — 7
Footnotes (a) Change to wording, with the addition of ‘(unnatural)’ before ‘deaths in police custody’. (b) Formerly ‘Number of attempted suicides in police custody’. (c) New performance indicator. (d) This performance indicator is a sub-set of ‘Number of self-harm (incidents) in police custody’. (e) Change to wording, with the addition of ‘police’ before ‘holding facilities’. (f) Change to wording, with the addition of ‘police’ before ‘custody-related matters’.
4.35

SOUTH AUSTRALIA POLICE
Income statement__________________________________________________________________________________________________________________________________________________________________________________________________________________________________
2007-08Budget
$000
2006-07Estimated
result
$000
2006-07Budget
$000
2005-06Actual
$000Expenses
Employee benefits and costs — Salaries, wages, annual and sick leave ..................................... 348 244 333 011 341 793 316 568 Long service leave .................................................................... 15 118 14 200 11 621 7 433 Payroll tax ................................................................................ 22 269 21 087 21 663 20 341 Superannuation ......................................................................... 50 661 47 967 49 769 47 805 Other ......................................................................................... — 14 — 17 685Supplies and services — General supplies and services .................................................. 104 842 100 749 101 292 95 120 Consultancy expenses .............................................................. 105 105 105 76Depreciation and amortisation ..................................................... 12 951 10 125 10 809 9 650Grants and subsidies ..................................................................... — 126 — — Intra government transfers ........................................................... — 29 — — Other expenses ............................................................................. 13 118 12 753 3 293 —
Total expenses .............................................................................. 567 308 540 166 540 345 514 678
Income
Intra government transfers ........................................................... 53 417 53 033 53 884 52 227Fees, fines and penalties ............................................................... 3 739 3 585 3 455 3 297Sales of goods and services .......................................................... 18 480 18 530 15 349 11 561Interest revenues ........................................................................... — — — 3 397Net gain or loss from disposal of assets ....................................... 1 017 — 870 -26Other income ................................................................................ — — — 10 462
Total income ................................................................................. 76 653 75 148 73 558 80 918
Net cost of providing services ...................................................... 490 655 465 018 466 787 433 760
Income from / Expenses to SA Government
Income — Appropriation ........................................................................... 490 795 455 813 466 918 428 023 Other income ............................................................................ — 680 — — Expenses — Tax equivalent .......................................................................... 140 131 131 106 Cash alignment ......................................................................... — — — 17 005
Net income from / expenses to SA Government .......................... 490 655 456 362 466 787 410 912
Net result ...................................................................................... — -8 656 — -22 848
4.36

SOUTH AUSTRALIA POLICE
Balance sheet__________________________________________________________________________________________________________________________________________________________________________________________________________________________________
2007-08Budget
$000
2006-07Estimated
result
$000
2006-07Budget
$000
2005-06Actual
$000Assets
Current assets
Cash and cash equivalents ............................................................ 40 440 33 294 41 191 38 648Receivables ................................................................................... 4 483 4 289 4 831 6 427Inventories .................................................................................... 157 157 203 157Other current assets ...................................................................... 2 598 2 568 1 553 644
Total current assets ....................................................................... 47 678 40 308 47 778 45 876
Non current assets
Land and improvements ............................................................... 142 040 138 098 145 795 131 755Plant and equipment ..................................................................... 42 262 37 842 43 219 34 187Intangible assets ........................................................................... 2 918 4 328 — 4 586
Total non-current assets ............................................................... 187 220 180 268 189 014 170 528
Total assets ................................................................................... 234 898 220 576 236 792 216 404
Liabilities
Current liabilities
Payables ........................................................................................ 24 233 23 676 21 121 23 540Short-term borrowings ................................................................. — — 200 — Employee benefits — Salaries and wages ................................................................... 12 472 11 978 9 979 11 527 Sick leave ................................................................................. 1 1 — 1 Annual leave ............................................................................. 17 944 17 639 17 751 20 606 Long service leave .................................................................... 8 099 7 495 7 140 6 203 Other ......................................................................................... 54 30 268 — Short-term provisions ................................................................... 12 783 12 002 10 267 10 354Other current liabilities ................................................................. 224 208 593 —
Total current liabilities ................................................................. 75 810 73 029 67 319 72 231
Non current liabilities
Long-term employee benefits — Annual leave ............................................................................. — — 756 — Long service leave .................................................................... 108 824 99 645 90 017 87 590Long-term provisions ................................................................... 51 186 48 824 49 085 48 820Other non-current liabilities ......................................................... — — — 29
Total non-current liabilities .......................................................... 160 010 148 469 139 858 136 439
Total liabilities .............................................................................. 235 820 221 498 207 177 208 670
Net assets ...................................................................................... -922 -922 29 615 7 734
Equity
Retained earnings ......................................................................... -22 799 -22 799 8 778 -14 143Asset revaluation reserve ............................................................. 21 877 21 877 20 837 21 877
Total equity .................................................................................. -922 -922 29 615 7 734
Balances as at 30 June end of period.
4.37

SOUTH AUSTRALIA POLICE
Statement of changes in equity__________________________________________________________________________________________________________________________________________________________________________________________________________________________________
Contributedcapital
$000
Assetrevaluation
reserve
$000
Retainedearnings
$000
Total
$000
Balance at 30 June 2006 ............................................................... — 21 877 -14 143 7 734Adjustments .................................................................................. — — — —
Restated balance at June 2006 ...................................................... — 21 877 -14 143 7 734
Net gain/loss on revaluation of property, plant and equipment during 2006-07 ............................................................................ — — — — Net changes in reserves ................................................................ — — — —
Net income/expense recognised directly in equity for 2006-07 ... — — — — Net result after restructure for 2006-07 ........................................ — — -8 656 -8 656
Total recognised income and expense for 2006-07 — — -8 656 -8 656
Equity contributions from SA Government ................................. — — — — Repayment of equity contributions from SA Government .......... — — — —
Estimated balance at 30 June 2007 — 21 877 -22 799 -922
Net gain/loss on revaluation of property, plant and equipment during 2007-08 ............................................................................ — — — — Net changes in reserves ................................................................ — — — —
Net income/expense recognised directly in equity for 2007-08 ... — — — — Net result after restructure for 2007-08 ........................................ — — — —
Total recognised income and expense for 2007-08 — — — —
Equity contributions from SA Government ................................. — — — — Repayment of equity contributions from SA Government .......... — — — —
Estimated balance at 30 June 2008 — 21 877 -22 799 -922
4.38

SOUTH AUSTRALIA POLICE
Cash flow statement__________________________________________________________________________________________________________________________________________________________________________________________________________________________________
2007-08Budget
$000
2006-07Estimated
result
$000
2006-07Budget
$000
2005-06Actual
$000
OPERATING ACTIVITIES:
Cash outflows
Employee payments ..................................................................... 425 105 405 949 420 903 388 735Supplies and services ................................................................... 104 420 100 406 100 949 95 249Grants and subsidies ..................................................................... — 126 — — Net GST paid ................................................................................ — — — 10 350Intra government transfers ........................................................... — 29 — — Other payments ............................................................................ 10 556 10 568 — —
Cash used in operations ................................................................ 540 081 517 078 521 852 494 334
Cash inflows
Intra government transfers ........................................................... 53 417 53 033 53 884 52 227Fees, fines and penalties ............................................................... 3 739 3 585 3 455 3 293Sales of goods and services .......................................................... 18 294 18 434 15 253 18 488Interest received ........................................................................... — 167 167 3 407Net GST received ......................................................................... — — — 10 331Other receipts ............................................................................... 8 7 7 7
Cash generated from operations ................................................... 75 458 75 226 72 766 87 753
SA GOVERNMENT:
Appropriation ............................................................................... 490 795 455 813 466 918 428 023Other receipts ............................................................................... — 680 — — Payments — Tax equivalents ........................................................................ 140 131 131 106 Cash alignment ......................................................................... — — — 17 005
Net cash provided by SA Government ......................................... 490 655 456 362 466 787 410 912
Net cash provided by (+) / used (-) in operating activities ........... 26 032 14 510 17 701 4 331
INVESTING ACTIVITIES:
Cash outflows
Purchase of property, plant and equipment .................................. 20 171 20 025 23 627 9 018
Cash used in investing activities .................................................. 20 171 20 025 23 627 9 018
Cash inflows
Proceeds from sale of property, plant and equipment .................. 1 285 161 161 215
Cash generated from investing activities ..................................... 1 285 161 161 215
Net cash provided by (+) / used in (-) investing activities ........... -18 886 -19 864 -23 466 -8 803
4.39

SOUTH AUSTRALIA POLICE
Cash flow statement__________________________________________________________________________________________________________________________________________________________________________________________________________________________________
2007-08Budget
$000
2006-07Estimated
result
$000
2006-07Budget
$000
2005-06Actual
$000
FINANCING ACTIVITIES:
Cash outflows
Repayment of SA Government contributed capital ..................... — — — 6 256
Cash used in financing activities .................................................. — — — 6 256
Net cash provided by (+) / used in (-) financing activities ........... — — — -6 256
Net increase (+) / decrease (-) in cash equivalents ....................... 7 146 -5 354 -5 765 -10 728
Cash and cash equivalents at the beginning of the financial year 33 294 38 648 46 956 49 376
Cash and cash equivalents at the end of the financial year .......... 40 440 33 294 41 191 38 648
4.40

ADMINISTERED ITEMS FOR SOUTH AUSTRALIA POLICE
Income statement__________________________________________________________________________________________________________________________________________________________________________________________________________________________________
2007-08Budget
$000
2006-07Estimated
result
$000
2006-07Budget
$000
2005-06Actual
$000Income from SA Government
Income — Appropriation ........................................................................... 605 592 592 6 971
Net income from / expenses to SA Government .......................... 605 592 592 6 971
Income from other sources
Intra government transfers ........................................................... 1 819 1 550 — 512Fees, fines and penalties ............................................................... 71 741 60 990 80 093 52 877Sales of goods and services .......................................................... 95 90 — 2 143
Total income from other sources .................................................. 73 655 62 630 80 093 55 532
Total income ................................................................................. 74 260 63 222 80 685 62 503
Expenses
Employee benefits and costs — Salaries, wages, annual and sick leave ..................................... 251 246 246 572Supplies and services — General supplies and services .................................................. 2 021 1 746 205 6 845Grants and subsidies ..................................................................... 152 150 141 96Intra government transfers ........................................................... 5 925 2 923 3 782 2 463Other expenses ............................................................................. 65 911 58 469 76 311 52 457
Total expenses .............................................................................. 74 260 63 534 80 685 62 433
Net result ...................................................................................... — -312 — 70
4.41

ADMINISTERED ITEMS FOR SOUTH AUSTRALIA POLICE
Balance sheet__________________________________________________________________________________________________________________________________________________________________________________________________________________________________
2007-08Budget
$000
2006-07Estimated
result
$000
2006-07Budget
$000
2005-06Actual
$000Assets
Current assets
Cash and cash equivalents ............................................................ 8 315 8 315 5 996 8 627Receivables ................................................................................... 132 132 2 653 132
Total current assets ....................................................................... 8 447 8 447 8 649 8 759
Total assets ................................................................................... 8 447 8 447 8 649 8 759
Liabilities
Current liabilities
Payables ........................................................................................ 4 645 4 645 8 427 3 795Employee benefits — Salaries and wages ................................................................... 6 6 — 6 Annual leave ............................................................................. 38 38 — 38Other current liabilities ................................................................. 3 670 3 670 — 4 520
Total current liabilities ................................................................. 8 359 8 359 8 427 8 359
Non current liabilities
Long-term employee benefits — Long service leave .................................................................... 98 98 — 98
Total non-current liabilities .......................................................... 98 98 — 98
Total liabilities .............................................................................. 8 457 8 457 8 427 8 457
Net assets ...................................................................................... -10 -10 222 302
Equity
Retained earnings ......................................................................... -10 -10 222 302
Total equity .................................................................................. -10 -10 222 302
Balances as at 30 June end of period.
4.42

ADMINISTERED ITEMS FOR SOUTH AUSTRALIA POLICE
Statement of changes in equity__________________________________________________________________________________________________________________________________________________________________________________________________________________________________
Contributedcapital
$000
Assetrevaluation
reserve
$000
Retainedearnings
$000
Total
$000
Balance at 30 June 2006 ............................................................... — — 302 302Adjustments .................................................................................. — — — —
Restated balance at June 2006 ...................................................... — — 302 302
Net gain/loss on revaluation of property, plant and equipment during 2006-07 ............................................................................ — — — — Net changes in reserves ................................................................ — — — —
Net income/expense recognised directly in equity for 2006-07 ... — — — — Net result after restructure for 2006-07 ........................................ — — -312 -312
Total recognised income and expense for 2006-07 — — -312 -312
Equity contributions from SA Government ................................. — — — — Repayment of equity contributions from SA Government .......... — — — —
Estimated balance at 30 June 2007 — — -10 -10
Net gain/loss on revaluation of property, plant and equipment during 2007-08 ............................................................................ — — — — Net changes in reserves ................................................................ — — — —
Net income/expense recognised directly in equity for 2007-08 ... — — — — Net result after restructure for 2007-08 ........................................ — — — —
Total recognised income and expense for 2007-08 — — — —
Equity contributions from SA Government ................................. — — — — Repayment of equity contributions from SA Government .......... — — — —
Estimated balance at 30 June 2008 — — -10 -10
4.43

ADMINISTERED ITEMS FOR SOUTH AUSTRALIA POLICE
Cash flow statement__________________________________________________________________________________________________________________________________________________________________________________________________________________________________
2007-08Budget
$000
2006-07Estimated
result
$000
2006-07Budget
$000
2005-06Actual
$000
OPERATING ACTIVITIES:
Cash inflows
Intra government transfers ........................................................... 1 819 1 550 — 512Fees, fines and penalties ............................................................... 71 741 60 990 80 093 52 877Sales of goods and services .......................................................... 95 90 — 2 011Other receipts ............................................................................... — — — 2 772
Cash generated from operations ................................................... 73 655 62 630 80 093 58 172
Cash outflows
Employee payments ..................................................................... 251 246 246 396Supplies and services ................................................................... 2 021 1 746 205 5 677Grants and subsidies ..................................................................... 152 150 141 96Intra government transfers ........................................................... 5 925 2 923 3 782 2 485Other payments ............................................................................ 65 911 58 469 76 311 53 868
Cash used in operations ................................................................ 74 260 63 534 80 685 62 522
SA GOVERNMENT:
Appropriation ............................................................................... 605 592 592 6 971
Net cash provided by SA Government ......................................... 605 592 592 6 971
Net cash provided by (+) / used in (-) operating activities ........... — -312 — 2 621
Net increase (+) / decrease (-) in cash equivalents ....................... — -312 — 2 621
Cash and cash equivalents at the beginning of the financial year 8 315 8 627 5 996 6 006
Cash and cash equivalents at the end of the financial year .......... 8 315 8 315 5 996 8 627
4.44

AGENCY: SOUTH AUSTRALIA POLICE
Financial Commentary — major variations
The following commentary relates to the Agency Financial Statements presented in the previous section. The discussion relates to variations between the 2006-07 Estimated Result and the 2007-08 Budget.
Income statement — Controlled
The increase in 2007-08 total expenses reflects enterprise bargaining wage increases, indexation of supplies and services expenditure and approved budget initiatives such as the expansion of drug driver testing and the Roxby Downs police station. Increased expenditure also reflects increased employee entitlement liabilities, higher depreciation and the phasing in of 400 additional police. The increase in Other Expenses from the 2006-07 Budget to the 2006-07 Estimated Result mainly reflects a reclassification of workers compensation expenditure from employee benefits and costs.
The increase in State Government appropriation includes funding for enterprise bargaining wage increases, indexation of supplies and services expenditure and approved initiatives. Appropriation has been provided for communications infrastructure, the replacement of a police vessel, expansion of the Roxby Downs police station, the unregistered / uninsured vehicle initiative, the second-hand dealers and pawnbrokers initiative and a vehicle for drug driver testing. There is also continued investment over and above that shown in the 2006-07 Estimated Result for the Christies Beach police complex, equipment purchases and building works associated with the phasing in of the 400 police initiative, National Exchange – Police Data, road safety and speed detector equipment, Anangu Pitjantjatjara Yankunytjatjara (APY) Lands police station upgrade and additional police shopfronts in Hallet Cove, Munno Para and Campbelltown area. This is offset by an appropriation adjustment to achieve efficiency and cost savings measures approved in the 2006-07 Budget and funding no longer required for completed capital projects including the police aircraft, Golden Grove and Aldinga police stations.
Balance sheet — Controlled
The increase in current assets mainly reflects an increase in accrual appropriation reserves, which are reported in ‘cash and cash equivalents’.
The increase in non-current assets mainly reflects the replacement of communications infrastructure and a police vessel, expansion of the Roxby Downs police station, the unregistered / uninsured vehicle and second-hand dealers and pawnbrokers initiatives and a vehicle for drug driver testing. There is also continued investment over and above that shown in the 2006-07 Estimated Result for the Christies Beach police complex, equipment purchases and building works associated with the phasing in of the 400 police initiative, National Exchange – Police Data, road safety and speed detection equipment, APY Lands police station upgrade and additional police shopfronts in Hallet Cove, Munno Para and Campbelltown area. This is partly offset by increased depreciation expenses.
The increase in liabilities mainly reflects an adjustment for workers compensation, long service leave, annual leave and other employee entitlement liabilities.
The decrease in total equity from the 2006-07 Budget to the 2006-07 Estimated Result mainly reflects a decrease in non-current assets for carryovers in relation to major capital projects and an increase in liabilities reflecting an adjustment for workers compensation, long service leave and other employee entitlement liabilities. In addition, the 2006-07 Estimated Result also reflects opening balance adjustments at 30 June 2006 which include lower cash balances recognising payments to the government in 2005-06 pursuant to the cash alignment policy which was implemented in 2004-05.
4.45
Statement of changes in equity — Controlled
The net result for the 2006-07 Estimated Result mainly reflects reduced appropriation and grant revenue as a result of slippage in major capital projects and an increase in expenses reflecting an adjustment for workers compensation, long service leave and other employee entitlement liabilities.
Cash flow statement — Controlled
Inflows and outflows in the Cash flow statement are consistent with income and expenses in the Income statement as outlined above. This excludes the impact of non-cash adjustments such as higher depreciation expenses.
The increase in proceeds from the sale of property, plant and equipment reflects the sale of Para Hills police station and police aircraft.
Administered
Income statement — Administered Items
The increase in fines and penalties reflects the impact of Road Safety Reform initiatives, including increased enforcement through additional red light and speed cameras, the rural highway saturation plan and random drug testing.
The increase in other expenses mainly reflects payments to the consolidated account associated with increased expiation revenue.
The increase in intra-government transfers reflects increased Victims of Crime levy payments to the Attorney-General’s Department for depositing in the Victims of Crime Fund as a result of increased expiations.
Balance sheet — Administered Items
The decrease in retained earnings from the 2006-07 Budget to the 2006-07 Estimated Result mainly reflects intra-government transfer payments to the Attorney-General’s Department for the transfer of the State Rescue Helicopter Service partly offset by opening balance adjustments reflecting a higher than budgeted net result in 2005-06.
No change is projected to the Balance sheet in 2007-08.
Statement of changes in equity — Administered Items
Retained earning shifts are consistent with those in the Balance sheet as outlined above.
Cash flow statement — Administered Items
Inflows and outflows in the Cash flow statement are consistent with income and expenses in the Income statement as outlined above.
Additional Information for Administered Items
Detailed information on Administered Items is included in the following table.
4.46
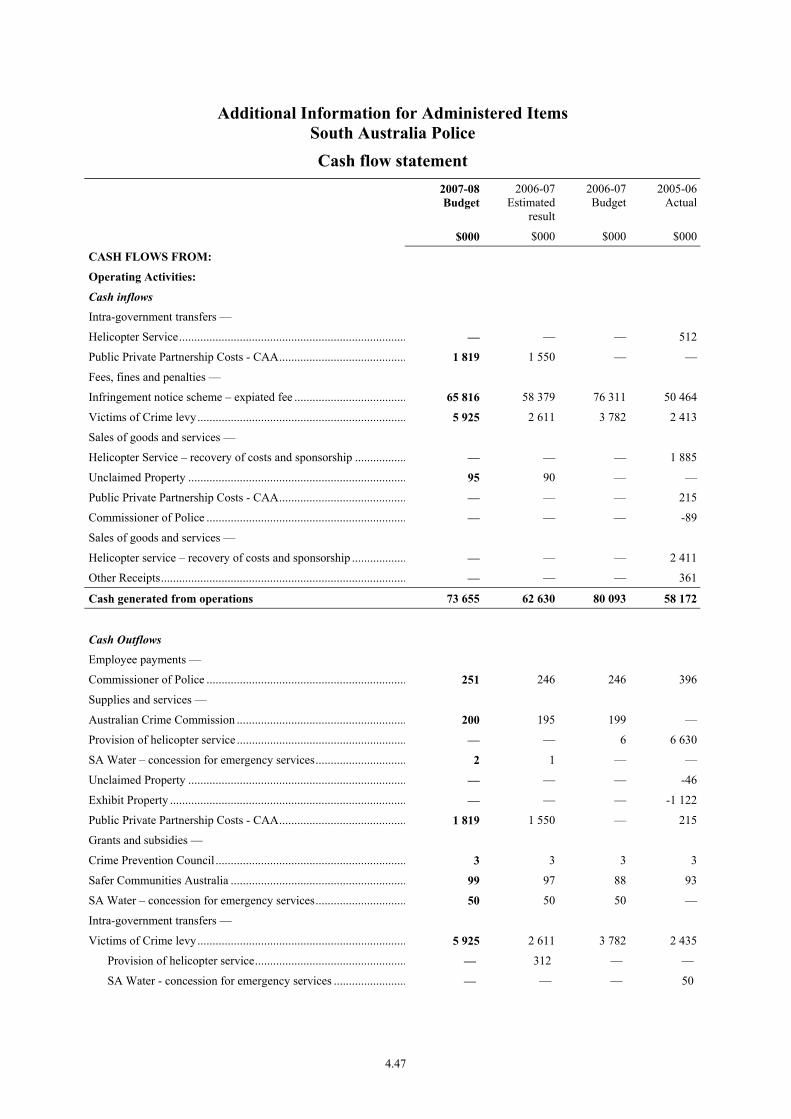
Additional Information for Administered Items South Australia Police Cash flow statement
2007-08Budget
2006-07Estimated
result
2006-07 Budget
2005-06Actual
$000 $000 $000 $000
CASH FLOWS FROM:
Operating Activities:
Cash inflows
Intra-government transfers —
Helicopter Service........................................................................... — — — 512
Public Private Partnership Costs - CAA.......................................... 1 819 1 550 — —
Fees, fines and penalties —
Infringement notice scheme – expiated fee ..................................... 65 816 58 379 76 311 50 464
Victims of Crime levy..................................................................... 5 925 2 611 3 782 2 413
Sales of goods and services —
Helicopter Service – recovery of costs and sponsorship ................. — — — 1 885
Unclaimed Property ........................................................................ 95 90 — —
Public Private Partnership Costs - CAA.......................................... — — — 215
Commissioner of Police .................................................................. — — — -89
Sales of goods and services —
Helicopter service – recovery of costs and sponsorship .................. — — — 2 411
Other Receipts................................................................................. — — — 361
Cash generated from operations 73 655 62 630 80 093 58 172
Cash Outflows
Employee payments —
Commissioner of Police .................................................................. 251 246 246 396
Supplies and services —
Australian Crime Commission ........................................................ 200 195 199 —
Provision of helicopter service ........................................................ — — 6 6 630
SA Water – concession for emergency services.............................. 2 1 — —
Unclaimed Property ........................................................................ — — — -46
Exhibit Property .............................................................................. — — — -1 122
Public Private Partnership Costs - CAA.......................................... 1 819 1 550 — 215
Grants and subsidies —
Crime Prevention Council ............................................................... 3 3 3 3
Safer Communities Australia .......................................................... 99 97 88 93
SA Water – concession for emergency services.............................. 50 50 50 —
Intra-government transfers —
Victims of Crime levy..................................................................... 5 925 2 611 3 782 2 435
Provision of helicopter service.................................................. — 312 — —
SA Water - concession for emergency services ........................ — — — 50
4.47
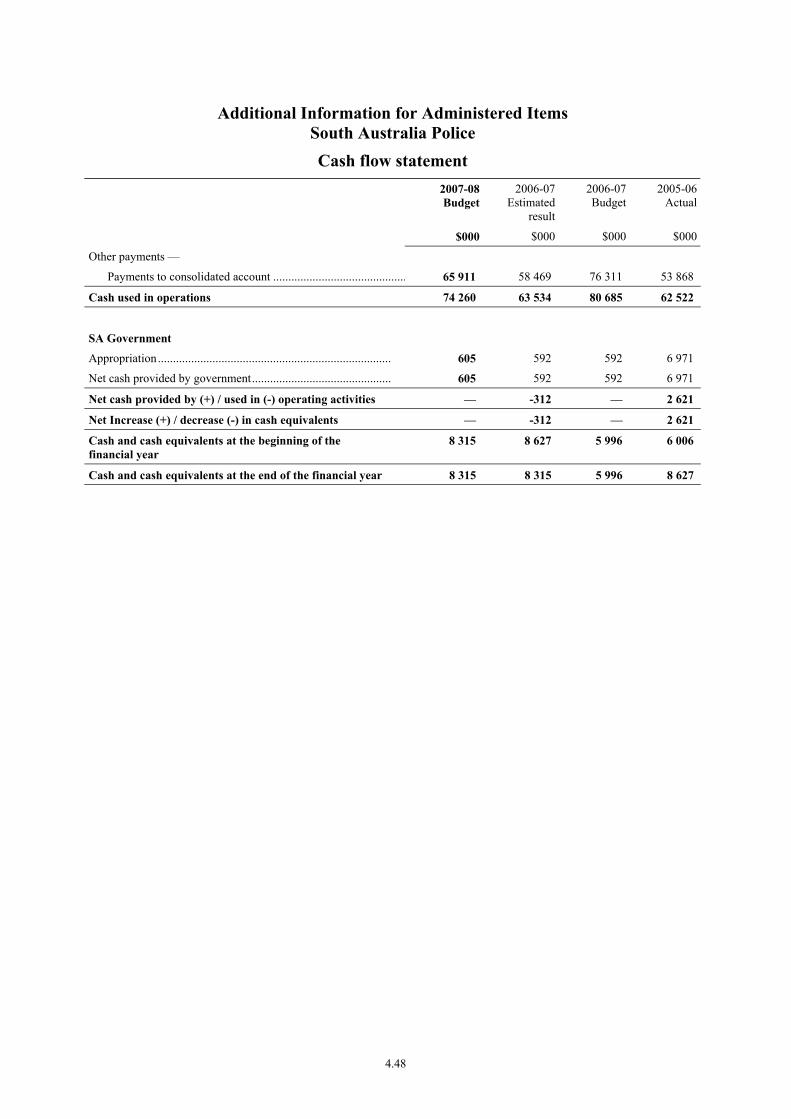
Additional Information for Administered Items South Australia Police Cash flow statement
2007-08Budget
2006-07Estimated
result
2006-07 Budget
2005-06Actual
$000 $000 $000 $000
Other payments —
Payments to consolidated account ............................................ 65 911 58 469 76 311 53 868
Cash used in operations 74 260 63 534 80 685 62 522
SA Government
Appropriation............................................................................. 605 592 592 6 971
Net cash provided by government.............................................. 605 592 592 6 971
Net cash provided by (+) / used in (-) operating activities — -312 — 2 621
Net Increase (+) / decrease (-) in cash equivalents — -312 — 2 621
Cash and cash equivalents at the beginning of the financial year
8 315 8 627 5 996 6 006
Cash and cash equivalents at the end of the financial year 8 315 8 315 5 996 8 627
4.48

4.49
TABLE OF CONTENTS
AGENCY: ATTORNEY-GENERAL’S DEPARTMENT
Objective ........................................................................................................................................4.52
Targets / Highlights ........................................................................................................................4.53
Program Net Cost of Services Summary........................................................................................4.55
Investing Payments Summary ........................................................................................................4.56
Program Information — includes description/objective, Summary income statement, sub-program information including performance criteria
1. Policy Advice and Legal Services ................................................................................4.57
2. Multicultural Services...................................................................................................4.61
3. Equal Opportunity.........................................................................................................4.64
4. Police Complaints Authority.........................................................................................4.67
5. Ombudsman Services ...................................................................................................4.69
6. Guardianship Services ..................................................................................................4.71
7. Forensic Science ...........................................................................................................4.72
8. Crime Prevention ..........................................................................................................4.74
9. Crime Statistics .............................................................................................................4.75
10. Justice Portfolio Services..............................................................................................4.76
11. Consumer and Business Affairs....................................................................................4.77
12. Volunteers.....................................................................................................................4.82
13. Office for Women.........................................................................................................4.84
14. Liquor Regulatory Services ..........................................................................................4.88
15. Gambling Regulatory Services .....................................................................................4.90
Financial Statements
Income statement .................................................................................................................4.92
Balance sheet........................................................................................................................4.93
Statement of changes in equity ............................................................................................4.94
Cash flow statement .............................................................................................................4.95
4.50
Income statement — Administered Items............................................................................4.97
Balance sheet — Administered Items ..................................................................................4.98
Statement of changes in equity — Administered Items.......................................................4.99
Cash flow statement — Administered Items .......................................................................4.100
Financial Commentary ...................................................................................................................4.101
4.51
PORTFOLIO: JUSTICE
AGENCY: ATTORNEY-GENERAL’S DEPARTMENT
Objective
The aim of the Attorney-General’s Department — together with the broader Justice Portfolio — is to help create a safe and secure environment in which the public of South Australia can live and work and where the rights of individuals are protected; and to advise government agencies and statutory authorities in minimisation of the government’s exposure to legal and business risk.
The Attorney-General’s Department aims to provide:
• a legal infrastructure for South Australia that fosters:
– a legislative framework that is just, equitable, robust and appropriate for our state;
– increased understanding and adoption of crime prevention strategies, and timely and just resolution of cases before the courts;
– increased public and industry awareness of their rights and responsibilities; and
– an inclusive, fair and cohesive society where cultural, linguistic and religious diversity is supported and valued.
• public access to:
– impartial, timely and appropriate resolution of complaints;
– improved systems and processes to reduce causes of complaints;
– a fair and balanced market place;
– increased public confidence in the protection of people’s rights; and
– equitable services for all South Australians regardless of culture, language, religion or English language proficiency.
4.52

2007-08 Targets / 2006-07 Highlights
Targets 2007-08 Highlights 2006-07
Policy, Planning and Legislation • Commence implementation of the recommendations of the
Criminal Justice Ministerial Taskforce • Develop strategies to better address serious repeat offenders • Develop a strategy to trial anti-social behaviour orders • Introduce legislation to:
− establish a Commissioner for Victims’ Rights, to strengthen victims’ rights and reform sentencing laws to be more victim-oriented;
− create a specific offence of cultivating cannabis hydroponically, to ban the sale of drug paraphernalia and to require the courts to treat all serious illicit drugs (except cannabis) as of equivalent seriousness for the purposes of sentence;
− extend the impounding provisions and allow for home wheel-clamping as an alternative penalty for hoon drivers; and
− reform liability laws to allow for donations of charitable food.
• Review and introduce legislation to reform laws relating to domestic violence
• Implement reforms for vulnerable witnesses and rape and sexual assault laws
• Improve the information available for assessing applications for bail
Crown Solicitor’s Office • Undertake increased industrial safety prosecutions as a result of
Safework SA reforms, to enhance the commitment to safe and secure communities
Forensic Science SA • Introduction of a robotic management system to allow DNA
samples to be managed, interpreted and controlled Multicultural SA • Expand work with ethnic communities, in particular new and
emerging communities, to improve awareness of multiculturalism
• Establish a Youth Advisory Committee to the South Australian Multicultural and Ethnic Affairs Commission
Office of Consumer and Business Affairs • Increased detection of unlicensed operators to ensure only
appropriate, qualified people can contract for, or perform, regulated work
• Successful introduction of improved regulations for the Real Estate Industry
• Participate in national reviews of Product Safety, Trade Measurement and Business Names
Office of the Liquor and Gambling Commissioner • Continue to work with local communities to address alcohol
abuse and promote responsible drinking initiatives Office for Volunteers • Establish a network of volunteer resource centres throughout
South Australia through the provision of seed funding to selected local/district councils
• Continue to improve access to volunteer related training opportunities as well as providing relevant and up to date information for use by volunteer organisations
Office for Women • Continue expanding outreach work through the provision of
information, referrals and support to women in South Australia • Lead the trial of the Family Safety Framework across the
South Australian Government, to provide the best possible outcomes for those families who have a high risk of experiencing family violence
Policy, Planning and Legislation • Established a high level task force to address recommendations
made by the Hon. Judge Rice concerning eliminating the backlog of criminal cases in the higher courts
• Developed and implemented Crime Prevention and Community Safety grants program
• Enacted legislation to: − reform the laws governing the use of suppression orders; − allow remand appearances in the Magistrates Court by
video conference; − create a new offence of drink or food spiking; − reform and clarify the law dealing with gatecrashers; − extend DNA testing to a wider range of offences; and − remove unjustified legislative discrimination against
domestic partners. • Developed and introduced legislation to:
− amend the laws relating to rape and sexual assault; and − improve the way witnesses, especially vulnerable
witnesses, are treated in court. Crown Solicitor’s Office • Worked on high level government initiatives such as the
Olympic Dam Project and commenced the Public Private Partnership (PPP) projects for prisons and schools
Forensic Science SA • Implemented the Drugs in Drivers analytical service Office of the Director of Public Prosecutions (ODPP) • Finalisation of consultant’s organisational review into the
ODPP • Recruitment of additional executive staff including the
appointment of a Deputy Director Multicultural SA • Provided additional grants to the Multicultural Communities
Council and the Migrant Resource Centre • Implemented the endorsed actions of the South Australian
Government Muslim Reference Group Plan Office of Consumer and Business Affairs • In collaboration with other agencies, developed and delivered
corporate governance education for Aboriginal communities • Developed and commenced implementation of initiatives to
address fringe credit provision and telemarketing • Implemented a number of new initiatives aimed at reducing the
impact of scams and get rich quick schemes, particularly those aimed at the elderly
Office of the Liquor and Gambling Commissioner • Improved accountability of Councils through ensuring the
monitoring and evaluation of the effectiveness of dry areas Office for Volunteers • Completed development of the national Emergency
Management Australia (EMA) award winning Volunteer Emergency Recovery Information System
• Established the ‘Community Voices’ grants program in collaboration with Flinders University
• Further developed the Community Webs Program, in partnership with University of South Australia, into a broader program, Online Community Engagement
Office for Women • Achieved a strong increase in the number of women on
South Australian Government boards and committees and the number of women chairing these boards and committees
• Led the implementation of the Women’s Safety Strategy across the South Australian Government
4.53

Targets 2007-08 Highlights 2006-07
• Hosted the State Aboriginal Women’s Gathering and the National Indigenous Women’s Gathering in Adelaide, focusing on Local Solutions to Indigenous Family Violence
• Continued to provide services through the Women’s Information Service, including the ‘Court Support Program’, as well as commencing outreach services at three Children’s Centres
4.54

Program net cost of services summary
Net Cost of Services
2007-08Budget
2006-07Estimated result
2006-07 Budget
2005-06 Actual
Program $000 $000 $000 $000 1. Policy Advice and Legal Services .............. 40 220 40 373 37 936 35 995 2. Multicultural Services ................................ 3 407 3 396 3 298 3 654 3. Equal Opportunity ...................................... 2 328 2 379 2 338 2 197 4. Police Complaints Authority ...................... 1 295 1 277 1 245 1 260 5. Ombudsman Services ................................. 1 677 1 656 1 622 1 663 6. Guardianship Services................................ 3 993 3 934 3 868 3 569 7. Forensic Science......................................... 13 937 13 188 10 266 11 957 8. Crime Prevention........................................ 1 780 1 808 1 791 1 437 9. Crime Statistics .......................................... 1 557 1 636 1 762 1 544 10. Justice Portfolio Services ........................... 12 867 13 046 12 952 17 925 11. Consumer and Business Affairs ................. -7 365 -6 323 -6 014 -7 550 12. Volunteers .................................................. 1 654 1 472 1 444 1 077 13. Office for Women ...................................... 2 093 2 121 2 092 2 149 14. Liquor Regulatory Services ........................ 3 173 3 233 3 451 2 852 15. Gambling Regulatory Services................... 2 661 3 245 2 891 2 716
Total 85 277 86 441 80 942 82 445
Reconciliation to agency net cost of providing services (as per agency Summary income statement)
Less: Net cost of programs/functions transferred in
Forensic Science unit from the Department for Administrative and Information Services .................................. — 6 815 10 266 11 957
Office for Women unit from the Department for Families and Communities .............................................. — 2 121 2 092 2 149
Office for Volunteers unit from Primary Industries and Resources ............................ — 1 472 1 444 1 077
Equals: Net cost of providing services (as per agency Summary income statement)
85 277 76 033 67 140 67 262
4.55

Investing payments summary
2007-08Budget
2006-07Estimated result
2006-07 Budget
2005-06 Actual
Investments $000 $000 $000 $000
New Works
Bail application and information systems 1 000 — — — Expanding DNA Services..................... 1 223 — — — Expansion of Drug Driver Testing........ 545 — — —
Total New Works 2 768 — — —
Works in Progress
DNA Testing ........................................ 159 41 100 —
Total Works in Progress 159 41 100 —
Minor Works
Annual programs .................................. 1 613 2 368 1 562 1 939
Total Minor Works 1 613 2 368 1 562 1 939
Total Investing Payments 4 540 2 409 1 662 1 939
Reconciliation to investing payments (as per agency Cash flow statement)
Less: Cost of projects transferred in
Forensic Science transferred from the Department for Administrative and Information Services ............................ — 202(a) 876 1 468
Equals: Total Investing Payments (as per agency Cash flow statement)
4 540 2 207 786 471
(a) Transfers for the 2006–07 Estimated Result represent the payments for the period 1 July 2006 to 31 December 2006 reflected in the Cash flow statement for the Department for Administrative and Information Services.
4.56
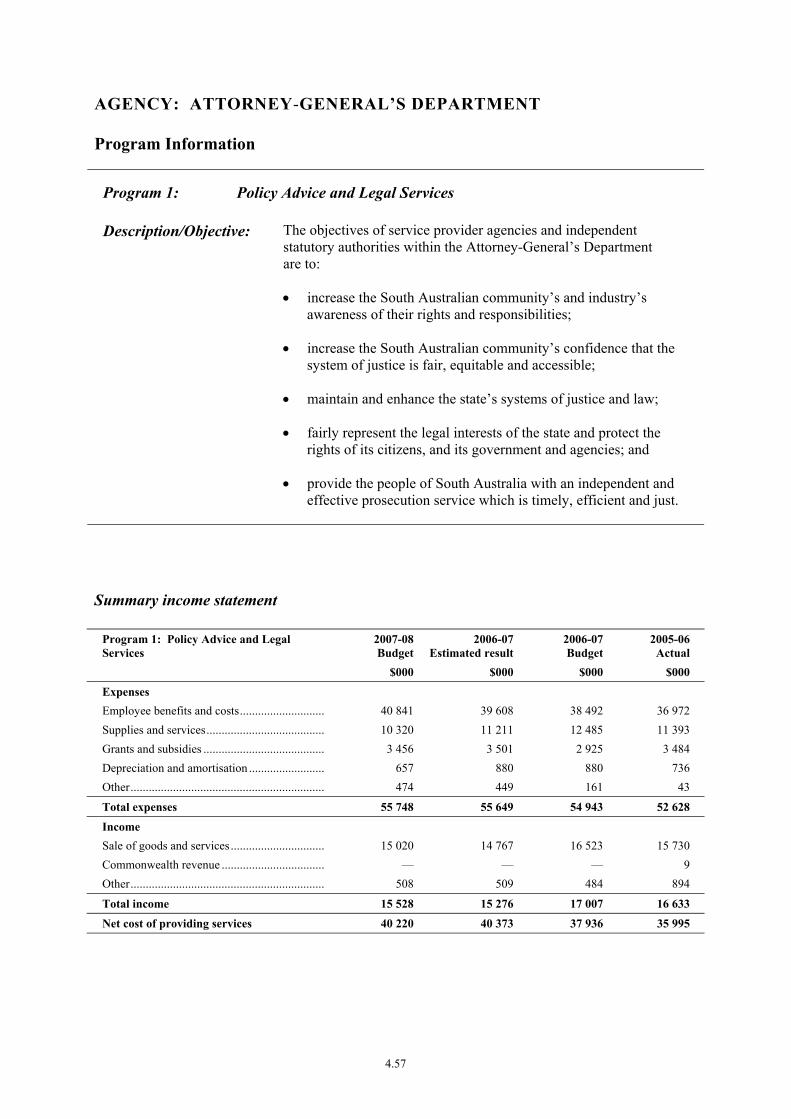
AGENCY: ATTORNEY-GENERAL’S DEPARTMENT
Program Information
Program 1: Policy Advice and Legal Services
Description/Objective: The objectives of service provider agencies and independent statutory authorities within the Attorney-General’s Department are to:
• increase the South Australian community’s and industry’s awareness of their rights and responsibilities;
• increase the South Australian community’s confidence that the system of justice is fair, equitable and accessible;
• maintain and enhance the state’s systems of justice and law;
• fairly represent the legal interests of the state and protect the rights of its citizens, and its government and agencies; and
• provide the people of South Australia with an independent and effective prosecution service which is timely, efficient and just.
Summary income statement
Program 1: Policy Advice and Legal Services
2007-08Budget
2006-07Estimated result
2006-07 Budget
2005-06 Actual
$000 $000 $000 $000
Expenses Employee benefits and costs............................. 40 841 39 608 38 492 36 972 Supplies and services........................................ 10 320 11 211 12 485 11 393 Grants and subsidies ......................................... 3 456 3 501 2 925 3 484 Depreciation and amortisation .......................... 657 880 880 736 Other................................................................. 474 449 161 43
Total expenses 55 748 55 649 54 943 52 628
Income Sale of goods and services................................ 15 020 14 767 16 523 15 730 Commonwealth revenue ................................... — — — 9 Other................................................................. 508 509 484 894
Total income 15 528 15 276 17 007 16 633
Net cost of providing services 40 220 40 373 37 936 35 995
4.57
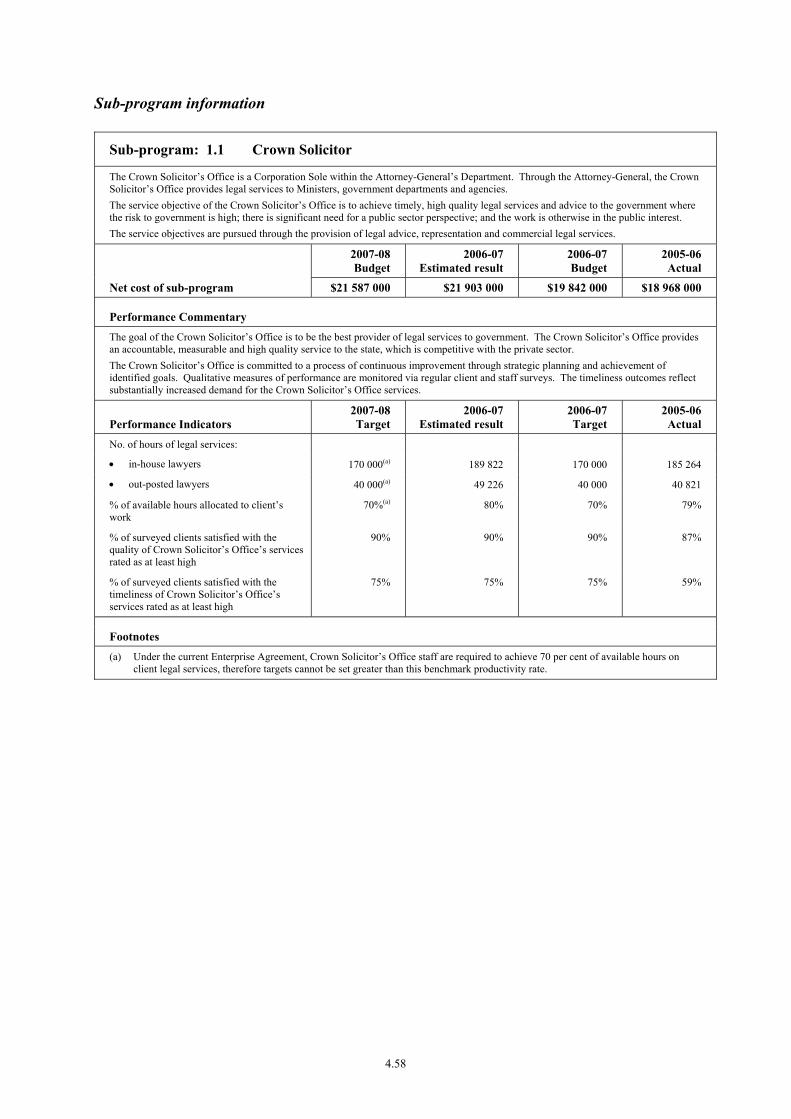
Sub-program information
Sub-program: 1.1 Crown Solicitor
The Crown Solicitor’s Office is a Corporation Sole within the Attorney-General’s Department. Through the Attorney-General, the Crown Solicitor’s Office provides legal services to Ministers, government departments and agencies. The service objective of the Crown Solicitor’s Office is to achieve timely, high quality legal services and advice to the government where the risk to government is high; there is significant need for a public sector perspective; and the work is otherwise in the public interest. The service objectives are pursued through the provision of legal advice, representation and commercial legal services.
2007-08 Budget
2006-07 Estimated result
2006-07 Budget
2005-06 Actual
Net cost of sub-program $21 587 000 $21 903 000 $19 842 000 $18 968 000
Performance Commentary The goal of the Crown Solicitor’s Office is to be the best provider of legal services to government. The Crown Solicitor’s Office provides an accountable, measurable and high quality service to the state, which is competitive with the private sector. The Crown Solicitor’s Office is committed to a process of continuous improvement through strategic planning and achievement of identified goals. Qualitative measures of performance are monitored via regular client and staff surveys. The timeliness outcomes reflect substantially increased demand for the Crown Solicitor’s Office services.
Performance Indicators 2007-08 Target
2006-07 Estimated result
2006-07 Target
2005-06 Actual
No. of hours of legal services:
• in-house lawyers 170 000(a) 189 822 170 000 185 264
• out-posted lawyers 40 000(a) 49 226 40 000 40 821
% of available hours allocated to client’s work
70%(a) 80% 70% 79%
% of surveyed clients satisfied with the quality of Crown Solicitor’s Office’s services rated as at least high
90% 90% 90% 87%
% of surveyed clients satisfied with the timeliness of Crown Solicitor’s Office’s services rated as at least high
75% 75% 75% 59%
Footnotes (a) Under the current Enterprise Agreement, Crown Solicitor’s Office staff are required to achieve 70 per cent of available hours on
client legal services, therefore targets cannot be set greater than this benchmark productivity rate.
4.58
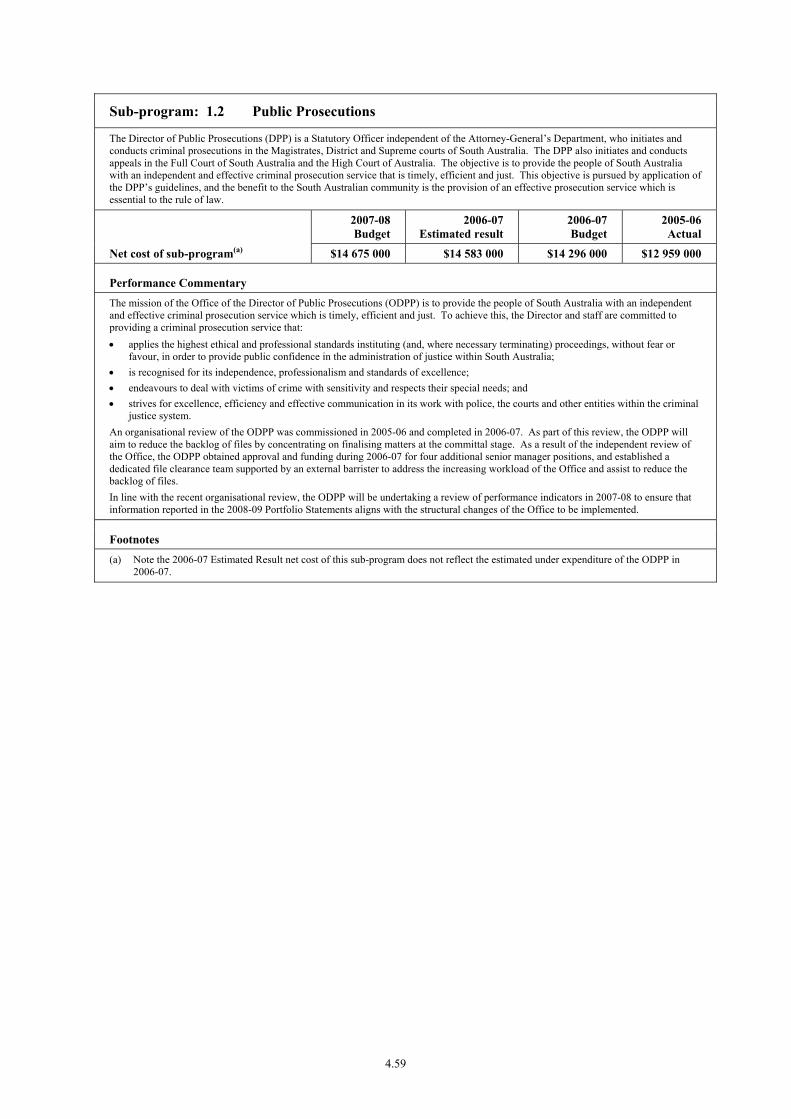
Sub-program: 1.2 Public Prosecutions
The Director of Public Prosecutions (DPP) is a Statutory Officer independent of the Attorney-General’s Department, who initiates and conducts criminal prosecutions in the Magistrates, District and Supreme courts of South Australia. The DPP also initiates and conducts appeals in the Full Court of South Australia and the High Court of Australia. The objective is to provide the people of South Australia with an independent and effective criminal prosecution service that is timely, efficient and just. This objective is pursued by application of the DPP’s guidelines, and the benefit to the South Australian community is the provision of an effective prosecution service which is essential to the rule of law.
2007-08 Budget
2006-07 Estimated result
2006-07 Budget
2005-06 Actual
Net cost of sub-program(a) $14 675 000 $14 583 000 $14 296 000 $12 959 000
Performance Commentary The mission of the Office of the Director of Public Prosecutions (ODPP) is to provide the people of South Australia with an independent and effective criminal prosecution service which is timely, efficient and just. To achieve this, the Director and staff are committed to providing a criminal prosecution service that: • applies the highest ethical and professional standards instituting (and, where necessary terminating) proceedings, without fear or
favour, in order to provide public confidence in the administration of justice within South Australia; • is recognised for its independence, professionalism and standards of excellence; • endeavours to deal with victims of crime with sensitivity and respects their special needs; and • strives for excellence, efficiency and effective communication in its work with police, the courts and other entities within the criminal
justice system. An organisational review of the ODPP was commissioned in 2005-06 and completed in 2006-07. As part of this review, the ODPP will aim to reduce the backlog of files by concentrating on finalising matters at the committal stage. As a result of the independent review of the Office, the ODPP obtained approval and funding during 2006-07 for four additional senior manager positions, and established a dedicated file clearance team supported by an external barrister to address the increasing workload of the Office and assist to reduce the backlog of files. In line with the recent organisational review, the ODPP will be undertaking a review of performance indicators in 2007-08 to ensure that information reported in the 2008-09 Portfolio Statements aligns with the structural changes of the Office to be implemented.
Footnotes (a) Note the 2006-07 Estimated Result net cost of this sub-program does not reflect the estimated under expenditure of the ODPP in
2006-07.
4.59
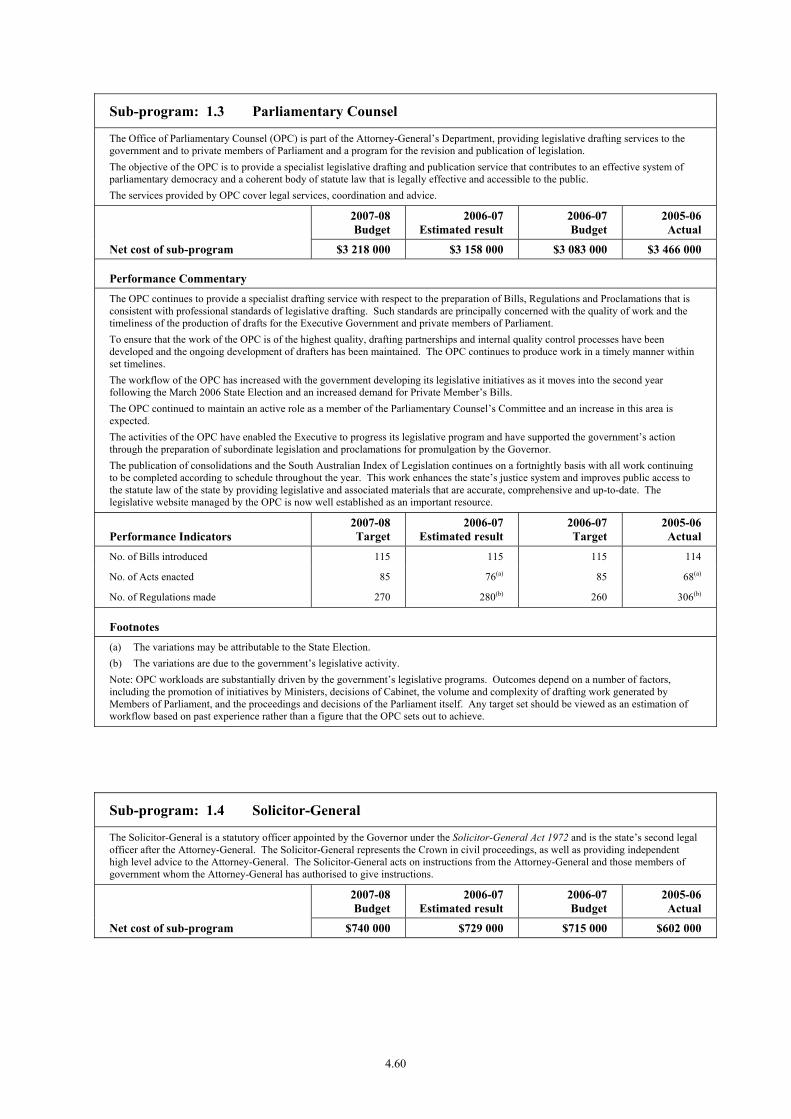
Sub-program: 1.3 Parliamentary Counsel
The Office of Parliamentary Counsel (OPC) is part of the Attorney-General’s Department, providing legislative drafting services to the government and to private members of Parliament and a program for the revision and publication of legislation. The objective of the OPC is to provide a specialist legislative drafting and publication service that contributes to an effective system of parliamentary democracy and a coherent body of statute law that is legally effective and accessible to the public. The services provided by OPC cover legal services, coordination and advice.
2007-08 Budget
2006-07 Estimated result
2006-07 Budget
2005-06 Actual
Net cost of sub-program $3 218 000 $3 158 000 $3 083 000 $3 466 000
Performance Commentary The OPC continues to provide a specialist drafting service with respect to the preparation of Bills, Regulations and Proclamations that is consistent with professional standards of legislative drafting. Such standards are principally concerned with the quality of work and the timeliness of the production of drafts for the Executive Government and private members of Parliament. To ensure that the work of the OPC is of the highest quality, drafting partnerships and internal quality control processes have been developed and the ongoing development of drafters has been maintained. The OPC continues to produce work in a timely manner within set timelines. The workflow of the OPC has increased with the government developing its legislative initiatives as it moves into the second year following the March 2006 State Election and an increased demand for Private Member’s Bills. The OPC continued to maintain an active role as a member of the Parliamentary Counsel’s Committee and an increase in this area is expected. The activities of the OPC have enabled the Executive to progress its legislative program and have supported the government’s action through the preparation of subordinate legislation and proclamations for promulgation by the Governor. The publication of consolidations and the South Australian Index of Legislation continues on a fortnightly basis with all work continuing to be completed according to schedule throughout the year. This work enhances the state’s justice system and improves public access to the statute law of the state by providing legislative and associated materials that are accurate, comprehensive and up-to-date. The legislative website managed by the OPC is now well established as an important resource.
Performance Indicators 2007-08 Target
2006-07 Estimated result
2006-07 Target
2005-06 Actual
No. of Bills introduced 115 115 115 114
No. of Acts enacted 85 76(a) 85 68(a)
No. of Regulations made 270 280(b) 260 306(b)
Footnotes (a) The variations may be attributable to the State Election. (b) The variations are due to the government’s legislative activity. Note: OPC workloads are substantially driven by the government’s legislative programs. Outcomes depend on a number of factors, including the promotion of initiatives by Ministers, decisions of Cabinet, the volume and complexity of drafting work generated by Members of Parliament, and the proceedings and decisions of the Parliament itself. Any target set should be viewed as an estimation of workflow based on past experience rather than a figure that the OPC sets out to achieve.
Sub-program: 1.4 Solicitor-General
The Solicitor-General is a statutory officer appointed by the Governor under the Solicitor-General Act 1972 and is the state’s second legal officer after the Attorney-General. The Solicitor-General represents the Crown in civil proceedings, as well as providing independent high level advice to the Attorney-General. The Solicitor-General acts on instructions from the Attorney-General and those members of government whom the Attorney-General has authorised to give instructions.
2007-08 Budget
2006-07 Estimated result
2006-07 Budget
2005-06 Actual
Net cost of sub-program $740 000 $729 000 $715 000 $602 000
4.60
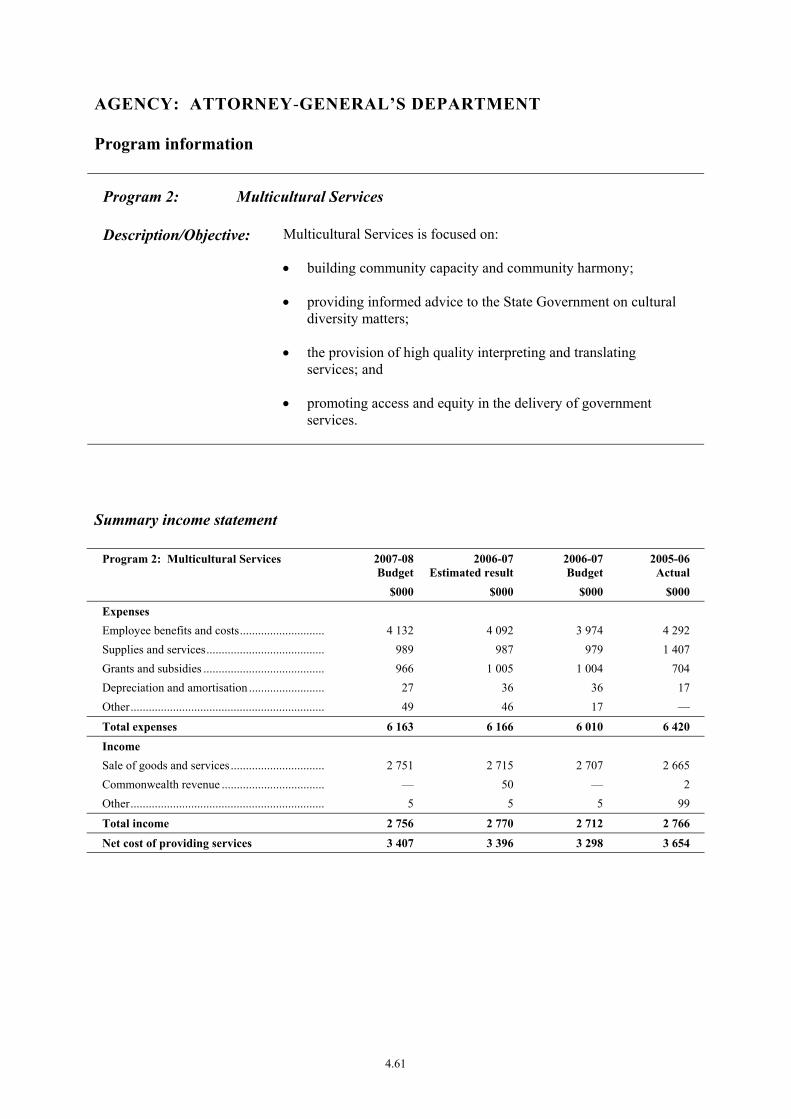
AGENCY: ATTORNEY-GENERAL’S DEPARTMENT
Program information
Program 2: Multicultural Services
Description/Objective: Multicultural Services is focused on:
• building community capacity and community harmony;
• providing informed advice to the State Government on cultural diversity matters;
• the provision of high quality interpreting and translating services; and
• promoting access and equity in the delivery of government services.
Summary income statement
Program 2: Multicultural Services 2007-08Budget
2006-07Estimated result
2006-07 Budget
2005-06 Actual
$000 $000 $000 $000
Expenses Employee benefits and costs............................. 4 132 4 092 3 974 4 292 Supplies and services........................................ 989 987 979 1 407 Grants and subsidies ......................................... 966 1 005 1 004 704 Depreciation and amortisation .......................... 27 36 36 17 Other................................................................. 49 46 17 —
Total expenses 6 163 6 166 6 010 6 420
Income Sale of goods and services................................ 2 751 2 715 2 707 2 665 Commonwealth revenue ................................... — 50 — 2 Other................................................................. 5 5 5 99
Total income 2 756 2 770 2 712 2 766
Net cost of providing services 3 407 3 396 3 298 3 654
4.61

Sub-program information
Sub-program: 2.1 Multicultural Services and Advice
The objectives of this sub-program are to: • provide advice to government on matters relating to multicultural and ethnic affairs; • build the capacity of community organisations to provide social and cultural support to their communities; • foster community harmony; and • report on and influence the provision of equitable access to government services for people from culturally and
linguistically diverse backgrounds.
2007-08 Budget
2006-07 Estimated result
2006-07 Budget
2005-06 Actual
Net cost of sub-program $3 268 000 $3 276 000 $3 237 000 $3 368 000
Performance Commentary Multicultural SA continued to meet the objectives of this sub program, as highlighted below: Provide advice to government on matters relating to multicultural and ethnic affairs The number (and composition) of migrants and refugees settling in South Australia has continued to increase significantly. As a result, advice has been provided to government agencies on the settlement needs of the new arrivals. Build the capacity of community organisations to provide social and cultural support to their communities Community organisations rely on effective leadership to ensure the provision of appropriate social and cultural support and there are relatively few women filling leadership roles in migrant communities. In 2006-07 a leadership course was held in Adelaide for culturally and linguistically diverse women. In the previous year a course was held in the Riverland. Foster community harmony Global and national media coverage of some events has created some misperceptions about Muslims and the Islamic faith within society. In response, the South Australian Government Muslim Reference Group was established to provide advice on strategies to develop a balanced understanding of Islam and Muslim communities in South Australia. An Action Plan was developed based on the advice from the Reference Group and is being implemented. Report on and influence the provision of equitable access to government services for people from culturally and linguistically diverse backgrounds For several years South Australian Government agencies have reported on initiatives they have taken to ensure access and equity to government services for people of culturally and linguistically diverse backgrounds. Following a review of emerging issues, agencies have now been asked to include in their reports specific measures of workforce profiles and training, use of interpreting services and use of the ethnic media. This additional information has been incorporated in the 2005-06 Access and Equity Report and is being analysed to identify areas for possible improvement.
4.62

Sub-program: 2.2 Interpreting and Translating Services
Provides a range of services including conference, telephone and face-to-face interpreting as well as legal, medical, business and other specialist translations.
2007-08 Budget
2006-07 Estimated result
2006-07 Budget
2005-06 Actual
Net cost of sub-program $139 000 $120 000 $61 000 $286 000
Performance Commentary The Interpreting and Translating Centre provides high quality and timely interpreting and translating services to State Government Departments including Health, Courts, Police, Education and private businesses and individuals. These services include face-to-face interpreting, phone interpreting, liaison and business interpreting, translations proofreading and voice-overs. During 2006-07, the Centre has managed the training of interpreters in new and emerging languages in the community. The Centre has also implemented a new web based Interpreting and Translating Centre Management System that improves the efficiency of business processes, enables clients to book interpreters/translators online and allows interpreters/translators to communicate online with the Interpreting and Translating Centre.
Performance Indicators 2007-08 Target
2006-07 Estimated result
2006-07 Target
2005-06 Actual
No. of interpreting assignments 37 500 36 000 31 000 34 669
No. of translating assignments 3 100 3 314 3 750 3 516
% of clients satisfied with accuracy of services
96% 96% 96% 96%
% of assignments completed to agreed or standard timelines
98% 98% 98% 98%
4.63

AGENCY: ATTORNEY-GENERAL’S DEPARTMENT
Program Information
Program 3: Equal Opportunity
Description/Objective: The Equal Opportunity Commission is a division of the Attorney-General’s Department. The Commissioner for Equal Opportunity is an independent statutory appointment with responsibility to administer the Equal Opportunity Act 1984.
The objective of the program is to promote equality of opportunity for all South Australians through the administration of anti-discrimination legislation. This is achieved through:
• promoting equal opportunity principles to all South Australians;
• examining and responding to complaints of discrimination; and
• providing information, education and training to encourage compliance with the legislation.
Summary income statement
Program 3: Equal Opportunity 2007-08Budget
2006-07Estimated result
2006-07 Budget
2005-06 Actual
$000 $000 $000 $000
Expenses Employee benefits and costs............................. 1 642 1 665 1 637 1 610 Supplies and services........................................ 688 687 686 897 Depreciation and amortisation .......................... 89 119 119 93 Other................................................................. 20 19 7 —
Total expenses 2 439 2 490 2 449 2 600
Income Commonwealth revenue ................................... — — — 69 Other................................................................. 111 111 111 334
Total income 111 111 111 403
Net cost of providing services 2 328 2 379 2 338 2 197
4.64
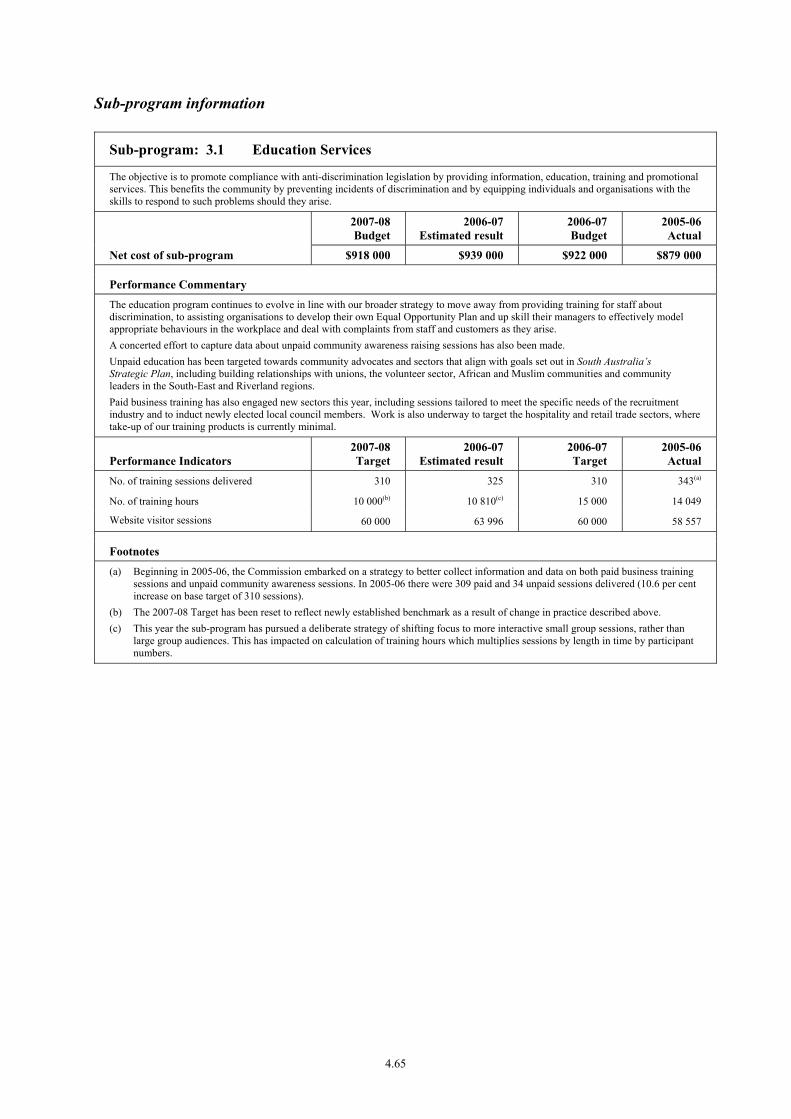
Sub-program information
Sub-program: 3.1 Education Services
The objective is to promote compliance with anti-discrimination legislation by providing information, education, training and promotional services. This benefits the community by preventing incidents of discrimination and by equipping individuals and organisations with the skills to respond to such problems should they arise.
2007-08 Budget
2006-07 Estimated result
2006-07 Budget
2005-06 Actual
Net cost of sub-program $918 000 $939 000 $922 000 $879 000
Performance Commentary The education program continues to evolve in line with our broader strategy to move away from providing training for staff about discrimination, to assisting organisations to develop their own Equal Opportunity Plan and up skill their managers to effectively model appropriate behaviours in the workplace and deal with complaints from staff and customers as they arise. A concerted effort to capture data about unpaid community awareness raising sessions has also been made. Unpaid education has been targeted towards community advocates and sectors that align with goals set out in South Australia’s Strategic Plan, including building relationships with unions, the volunteer sector, African and Muslim communities and community leaders in the South-East and Riverland regions. Paid business training has also engaged new sectors this year, including sessions tailored to meet the specific needs of the recruitment industry and to induct newly elected local council members. Work is also underway to target the hospitality and retail trade sectors, where take-up of our training products is currently minimal.
Performance Indicators 2007-08 Target
2006-07 Estimated result
2006-07 Target
2005-06 Actual
No. of training sessions delivered 310 325 310 343(a)
No. of training hours 10 000(b) 10 810(c) 15 000 14 049
Website visitor sessions 60 000 63 996 60 000 58 557
Footnotes (a) Beginning in 2005-06, the Commission embarked on a strategy to better collect information and data on both paid business training
sessions and unpaid community awareness sessions. In 2005-06 there were 309 paid and 34 unpaid sessions delivered (10.6 per cent increase on base target of 310 sessions).
(b) The 2007-08 Target has been reset to reflect newly established benchmark as a result of change in practice described above. (c) This year the sub-program has pursued a deliberate strategy of shifting focus to more interactive small group sessions, rather than
large group audiences. This has impacted on calculation of training hours which multiplies sessions by length in time by participant numbers.
4.65

Sub-program: 3.2 Complaint Services
The Equal Opportunity Act 1984 requires the Commissioner for Equal Opportunity to receive complaints of discrimination and try to resolve them. This service provides a free and confidential opportunity for people to address unfair treatment that they have experienced.
2007-08 Budget
2006-07 Estimated result
2006-07 Budget
2005-06 Actual
Net cost of sub-program $1 410 000 $1 440 000 $1 416 000 $1 318 000
Performance Commentary The Equal Opportunity Commission continues to provide a high quality complaint handling service that assists people to resolve their discrimination concerns in a private, free, impartial and conciliatory manner. There has been an increase in the number of cases that have not been resolved through conciliation and are being referred to the Equal Opportunity Tribunal for determination. This is impacting on both complaint completion timelines and legal costs. However, it should be noted that the percentage of discrimination complaints that are resolved in South Australia through conciliation remains high by national standards. A rise in sex discrimination cases has been recorded this year, with distinct patterns emerging. Common concerns raised by women included experiencing difficulty when trying to return to work after maternity leave or being turned down for promotions into roles considered ‘men’s jobs’ or those requiring ‘toughness’. On the other hand, a series of complaints have been lodged by men about discriminatory entry and dress policies at pubs and clubs. The continuing series of community radio sessions, coupled with increasing use of the website has seen the number of enquires stabilise for the first time, after a long term declining trend. Additionally, in recent months a small but noticeable increase in the number of complaints being lodged electronically using the online complaint form now available on our website has been observed.
Performance Indicators 2007-08 Target
2006-07 Estimated result
2006-07 Target
2005-06 Actual
No. of enquiries 2 230 2 228 2 250 2 291
No. of accepted complaints 130 132 130 144
% of accepted complaints that are conciliated 50% 48% 50% 47%
Average complaint completion time(a) 4 months 5.3 months(b) 4 months 4.2 months
Footnotes (a) The figures being reported here are medians. (b) Timelines this year are unusually affected by a cluster of complaints resulting from a class action. These cases have all been referred
to the Equal Opportunity Tribunal for determination and are awaiting hearing dates being set down by the District Court.
4.66
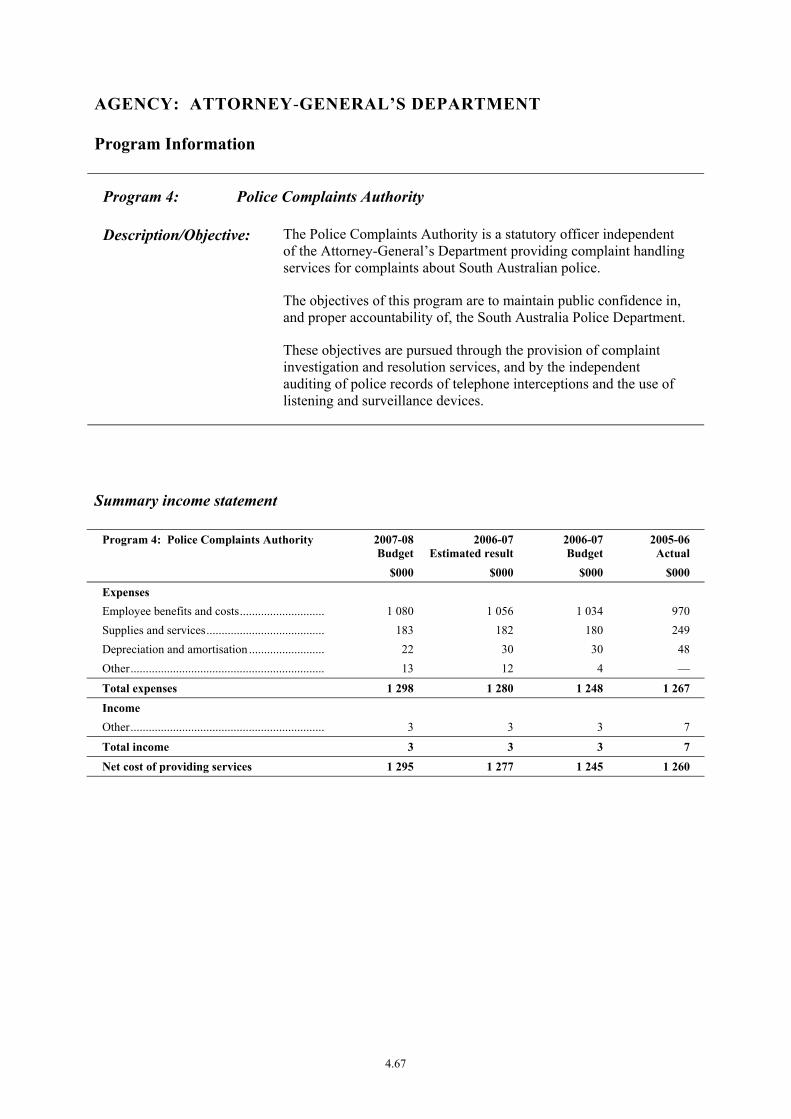
AGENCY: ATTORNEY-GENERAL’S DEPARTMENT
Program Information
Program 4: Police Complaints Authority
Description/Objective: The Police Complaints Authority is a statutory officer independent of the Attorney-General’s Department providing complaint handling services for complaints about South Australian police.
The objectives of this program are to maintain public confidence in, and proper accountability of, the South Australia Police Department.
These objectives are pursued through the provision of complaint investigation and resolution services, and by the independent auditing of police records of telephone interceptions and the use of listening and surveillance devices.
Summary income statement
Program 4: Police Complaints Authority 2007-08Budget
2006-07Estimated result
2006-07 Budget
2005-06 Actual
$000 $000 $000 $000
Expenses Employee benefits and costs............................. 1 080 1 056 1 034 970 Supplies and services........................................ 183 182 180 249 Depreciation and amortisation .......................... 22 30 30 48 Other................................................................. 13 12 4 —
Total expenses 1 298 1 280 1 248 1 267
Income Other................................................................. 3 3 3 7
Total income 3 3 3 7
Net cost of providing services 1 295 1 277 1 245 1 260
4.67

Program performance information
Program: 4 Police Complaints Authority
2007-08 Budget
2006-07 Estimated result
2006-07 Budget
2005-06 Actual
Net cost of program $1 295 000 $1 277 000 $1 245 000 $1 260 000
Performance Commentary This program is driven by complaints and applications from members of the public. The variations in new complaints and applications are within the expected range as are the finalisation rates.
Performance Indicators 2007-08 Target
2006-07 Estimated result
2006-07 Target
2005-06 Actual
No. of cases/complaints received 1 200 1 156 1 250 1 223
No. of FOI reviews conducted 25 20 25 36
% of complaints finalised(a) 80% 78% 80% 77%
% of cases finalised within 28 days(a) 85% 88% 85% 92%
Footnotes (a) The indicator ‘% of complaints finalised’ refers to finalisation from initial receipt of the complaint. The indicator ‘% of cases
finalised with 28 days’ refers to finalisation with 28 days of receipt of completed investigation from SAPOL.
4.68
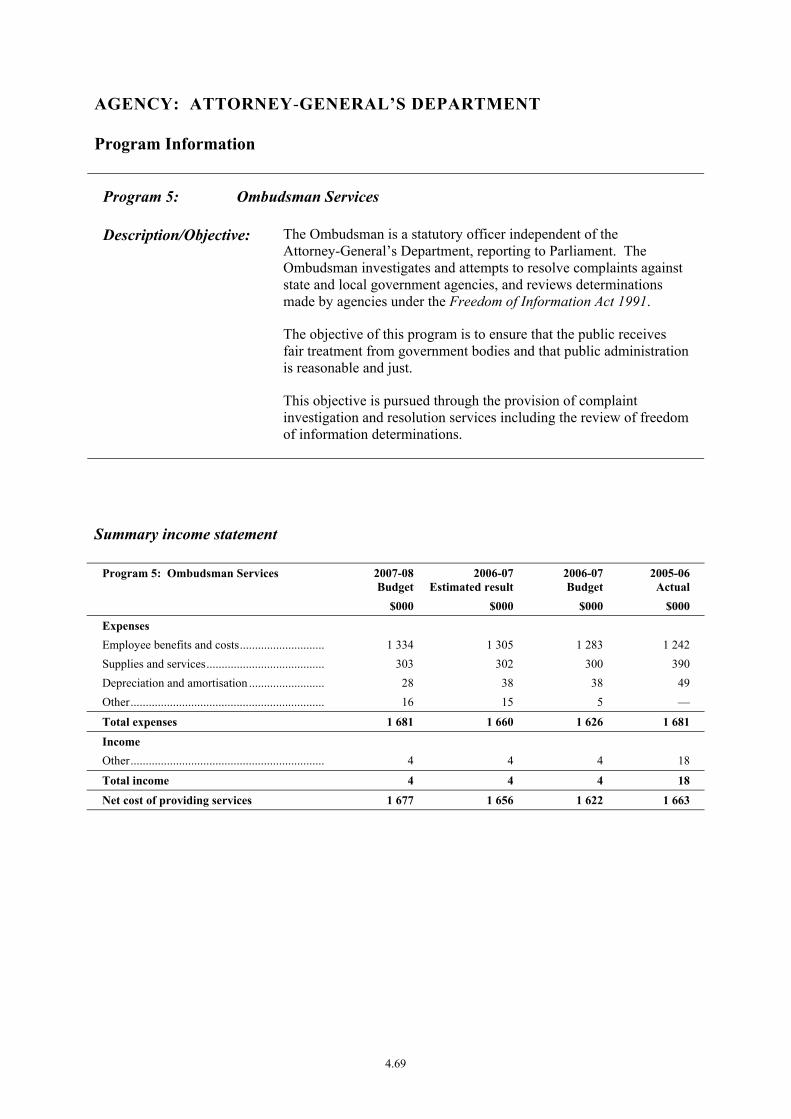
AGENCY: ATTORNEY-GENERAL’S DEPARTMENT
Program Information
Program 5: Ombudsman Services
Description/Objective: The Ombudsman is a statutory officer independent of the Attorney-General’s Department, reporting to Parliament. The Ombudsman investigates and attempts to resolve complaints against state and local government agencies, and reviews determinations made by agencies under the Freedom of Information Act 1991.
The objective of this program is to ensure that the public receives fair treatment from government bodies and that public administration is reasonable and just.
This objective is pursued through the provision of complaint investigation and resolution services including the review of freedom of information determinations.
Summary income statement
Program 5: Ombudsman Services 2007-08Budget
2006-07Estimated result
2006-07 Budget
2005-06 Actual
$000 $000 $000 $000
Expenses Employee benefits and costs............................. 1 334 1 305 1 283 1 242 Supplies and services........................................ 303 302 300 390 Depreciation and amortisation .......................... 28 38 38 49 Other................................................................. 16 15 5 —
Total expenses 1 681 1 660 1 626 1 681
Income Other................................................................. 4 4 4 18
Total income 4 4 4 18
Net cost of providing services 1 677 1 656 1 622 1 663
4.69

Program performance information
Program: 5 Ombudsman Services
2007-08 Budget
2006-07 Estimated result
2006-07 Budget
2005-06 Actual
Net cost of program $1 677 000 $1 656 000 $1 622 000 $1 663 000
Performance Commentary The Ombudsman Office continued to provide effective complaint investigation and resolution services to the community, and to conduct reviews of Freedom of Information (FOI) determinations. The number of complaints received fell this year, resulting in a reduction in the backlog of matters under investigation and a decrease in the number of older matters on hand. The permanent funding of a third officer to conduct reviews under the FOI Act assisted in the management of this function. A significant turnover of legal officers in this area caused a temporary decrease in the number of matters finalised, but with a full staff complement, this will improve next year. The Office hopes to provide more assistance to agencies by engaging in training activities during the coming year.
Performance Indicators 2007-08 Target
2006-07 Estimated result
2006-07 Target
2005-06 Actual
Ombudsman Investigations:
• No. of complaints received 1 700 1 359 1 900 1 574
• No. of open investigations(a) 170 175 180 198
• No. of investigations over 9 months old(b)
20 20 30 44
• No. of complaints finalised 1 700 1 380 1 900 1 581
FOI Reviews:
• No. of reviews received 70 54 100 141
• No. of open reviews(a) 45 50 45 60
• No. of reviews over 9 months old(b) 5 15 5 7
• No. of reviews finalised 70 66 100 128
Footnotes (a) Investigations or reviews on hand at the end of the year. (b) Investigations or reviews on hand at the end of the year which are over 9 months old.
4.70

AGENCY: ATTORNEY-GENERAL’S DEPARTMENT
Program Information
Program 6: Guardianship Services
Description/Objective: The Guardianship Board and the Office of the Public Advocate are serviced by the Attorney-General’s Department, and provide services to promote and protect the rights and interests of people with reduced mental capacity and, where appropriate, their carers. The Guardianship Board is a court like tribunal which has the power to make important decisions affecting the lives and property of persons over whom it has jurisdiction. The Office of the Public Advocate provides education, investigation, advocacy and guardianship services in accordance with its statutory functions. Both entities exist under the Guardianship and Administration Act 1993.
The objectives of this program are:
• to provide information and advice about the operation of state mental health and guardianship laws and related issues;
• ensure persons with a mental capacity are afforded proper care and protection; and
• to offer guidance and assistance on legal and medical issues.
Summary income statement
Program 6: Guardianship Services 2007-08Budget
2006-07Estimated result
2006-07 Budget
2005-06 Actual
$000 $000 $000 $000
Expenses Employee benefits and costs............................. 2 639 2 579 2 532 2 432 Supplies and services........................................ 1 287 1 284 1 285 1 113 Grants and subsidies ......................................... 26 28 27 27 Depreciation and amortisation .......................... 10 13 13 11 Other................................................................. 31 30 11 —
Total expenses 3 993 3 934 3 868 3 583
Income Other................................................................. — — — 14
Total income — — — 14
Net cost of providing services 3 993 3 934 3 868 3 569
4.71

AGENCY: ATTORNEY-GENERAL’S DEPARTMENT
Program Information
Program 7: Forensic Science
Description/Objective: Provision of forensic science services, primarily in relation to coronial and police investigations.
Summary income statement
Program 7: Forensic Science 2007-08Budget
2006-07Estimated result
2006-07 Budget
2005-06 Actual
$000 $000 $000 $000
Expenses Employee benefits and costs............................. 8 946 10 538 9 289 8 095 Supplies and services........................................ 6 209 4 356 2 026 2 211 Grants and subsidies ......................................... — — — 26 Depreciation and amortisation .......................... 1 992 1 402 776 1 832 Other................................................................. 3 9 — —
Total expenses 17 150 16 305 12 091 12 164
Income Sale of goods and services................................ 3 213 3 117 1 825 206 Other................................................................. — — — 1
Total income 3 213 3 117 1 825 207
Net cost of providing services 13 937 13 188 10 266 11 957
4.72

Sub-program information
Program: 7 Forensic Science
2007-08 Budget
2006-07 Estimated result
2006-07 Budget
2005-06 Actual
Net cost of program $13 937 000 $13 188 000 $10 266 000 $11 957 000
Performance Commentary Testing of samples under the Road Traffic Act 1961 commenced in July 2006. The introduction of the Criminal Law (Forensic Procedures) Act 2007 simplified responsibilities for the maintenance and administration of the DNA database and permitted the upload of profiles to the National DNA database. Forensic Science SA is collaborating in several nationally funded research grants encompassing DNA, explosives and field deployable instruments. This program was transferred to the Attorney-General’s Department during 2006-07.
Performance Indicators 2007-08 Target
2006-07 Estimated result
2006-07 Target
2005-06 Actual
Total no. of police cases referred each year 4 100 4 040 4 150 3 763
Total no. of DNA Database Reference Samples submitted each year(a)
10 500(b) 8 060 10 000 8 208
Total no. of coronial cases referred each year (including reviews)(c)
1 650 1 610 1 650 1 670
% of successful proficiency tests on cases 100% 95% 100% 94%
% of cases/investigations completed within 42 days of lodgement
30% 27% 30% 20%
Footnotes (a) Does not include blood alcohol or drugs in drivers testing. Changes to the Road Traffic Act 1961 may dramatically increase the
number of samples submitted. (b) The predicted increase in number of person samples submitted is due to the introduction of the new Criminal Law
(Forensic Procedures) Act 2007. (c) The number of medical reviews conducted, to determine if a post mortem may be required, has increased substantially in the past
two years. A part-time resource has been appointed to assist with the conduct of these reviews.
4.73

AGENCY: ATTORNEY-GENERAL’S DEPARTMENT
Program Information
Program 8: Crime Prevention
Description/Objective: The Crime Prevention Unit is part of the Attorney-General’s Department, initiating and supporting crime prevention projects and local crime prevention programs.
The objective of this program is to achieve a prevention or reduction in crime through working with a range of partners to develop appropriate crime prevention strategies and improved crime prevention practices. This objective is pursued through the provision of various crime prevention support services.
Summary income statement
Program 8: Crime Prevention 2007-08Budget
2006-07Estimated result
2006-07 Budget
2005-06 Actual
$000 $000 $000 $000
Expenses Employee benefits and costs............................. 491 657 646 472 Supplies and services........................................ 173 194 193 145 Grants and subsidies ......................................... 1 182 1 021 1 021 892 Depreciation and amortisation .......................... 6 8 8 9 Other................................................................. 8 8 3 —
Total expenses 1 860 1 888 1 871 1 518
Income Other................................................................. 80 80 80 81
Total income 80 80 80 81
Net cost of providing services 1 780 1 808 1 791 1 437
4.74

AGENCY: ATTORNEY-GENERAL’S DEPARTMENT
Program Information
Program 9: Crime Statistics
Description/Objective: The Office of Crime Statistics is part of the Attorney-General’s Department, providing monitoring, research and evaluation into crime and criminal justice.
The objective of this program is to achieve accurate and timely reporting on trends in crime and criminal justice; effective evaluation of the impact of, and the need for change to, criminal justice policy; and improved public understanding of criminal justice policy.
Summary income statement
Program 9: Crime Statistics 2007-08Budget
2006-07Estimated result
2006-07 Budget
2005-06 Actual
$000 $000 $000 $000
Expenses Employee benefits and costs............................. 1 111 1 387 1 364 1 464 Supplies and services........................................ 755 543 703 457 Grants and subsidies ......................................... 22 24 23 31 Depreciation and amortisation .......................... 40 54 54 80 Other................................................................. 17 16 6 —
Total expenses 1 945 2 024 2 150 2 032
Income Other................................................................. 388 388 388 488
Total income 388 388 388 488
Net cost of providing services 1 557 1 636 1 762 1 544
4.75

AGENCY: ATTORNEY-GENERAL’S DEPARTMENT
Program Information
Program 10: Justice Portfolio Services
Description/Objective: The objective of this program is to provide excellence in customer service in the delivery of the following Justice Portfolio wide support services: financial; procurement and contract management; information and communications technology; human resources; policy, planning and legislation; Ministerial offices and Ministerial support; Justice Executive; legal community centre; and other grants.
This objective is pursued through the provision of corporate support services and advice on policy and direction.
Summary income statement
Program 10: Justice Portfolio Services 2007-08Budget
2006-07Estimated result
2006-07 Budget
2005-06 Actual
$000 $000 $000 $000
Expenses Employee benefits and costs............................. 12 493 12 427 12 216 12 092 Supplies and services........................................ 11 460 11 682 10 199 15 020 Grants and subsidies ......................................... 5 474 5 320 5 449 5 367 Depreciation and amortisation .......................... 443 593 593 691 Other................................................................. 150 141 51 —
Total expenses 30 020 30 163 28 508 33 170
Income Sale of goods and services................................ 10 691 10 712 9 166 9 752 Fees, fines and penalties ................................... — — — 2 Commonwealth revenue ................................... 3 081 3 005 3 005 2 947 Other................................................................. 3 381 3 400 3 385 2 544
Total income 17 153 17 117 15 556 15 245
Net cost of providing services 12 867 13 046 12 952 17 925
4.76
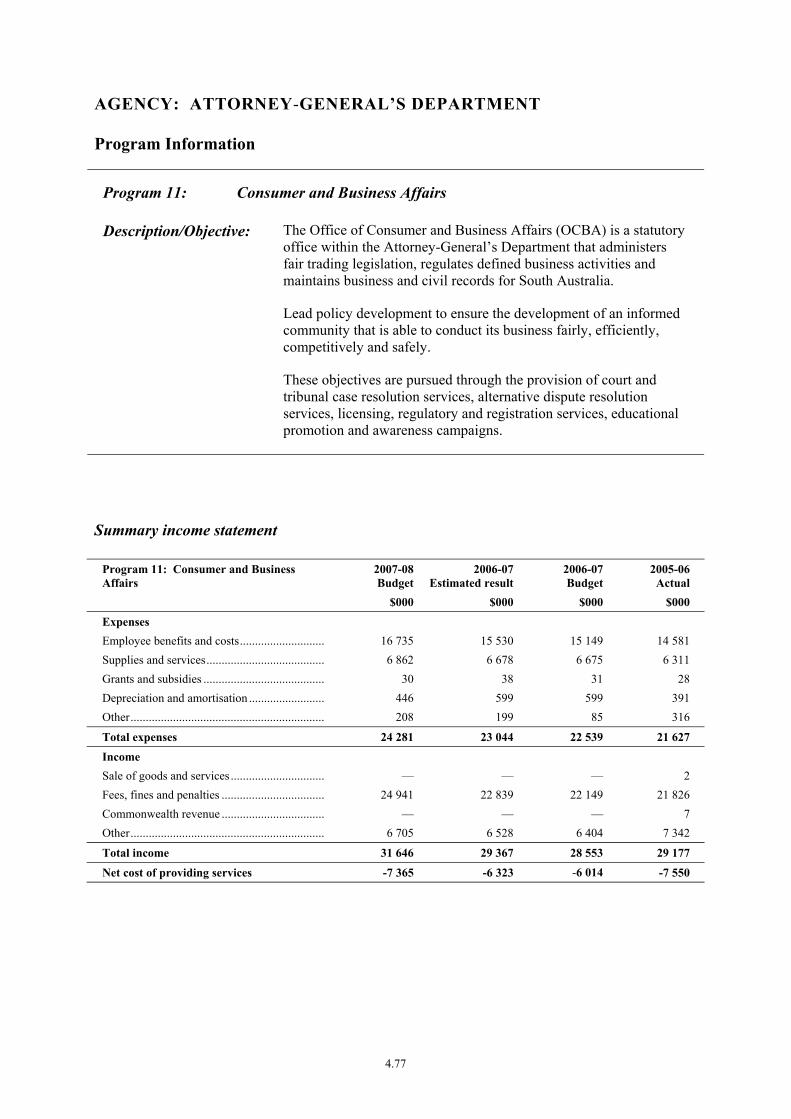
AGENCY: ATTORNEY-GENERAL’S DEPARTMENT
Program Information
Program 11: Consumer and Business Affairs
Description/Objective: The Office of Consumer and Business Affairs (OCBA) is a statutory office within the Attorney-General’s Department that administers fair trading legislation, regulates defined business activities and maintains business and civil records for South Australia.
Lead policy development to ensure the development of an informed community that is able to conduct its business fairly, efficiently, competitively and safely.
These objectives are pursued through the provision of court and tribunal case resolution services, alternative dispute resolution services, licensing, regulatory and registration services, educational promotion and awareness campaigns.
Summary income statement
Program 11: Consumer and Business Affairs
2007-08Budget
2006-07Estimated result
2006-07 Budget
2005-06 Actual
$000 $000 $000 $000
Expenses Employee benefits and costs............................. 16 735 15 530 15 149 14 581 Supplies and services........................................ 6 862 6 678 6 675 6 311 Grants and subsidies ......................................... 30 38 31 28 Depreciation and amortisation .......................... 446 599 599 391 Other................................................................. 208 199 85 316
Total expenses 24 281 23 044 22 539 21 627
Income Sale of goods and services................................ — — — 2 Fees, fines and penalties ................................... 24 941 22 839 22 149 21 826 Commonwealth revenue ................................... — — — 7 Other................................................................. 6 705 6 528 6 404 7 342
Total income 31 646 29 367 28 553 29 177
Net cost of providing services -7 365 -6 323 -6 014 -7 550
4.77
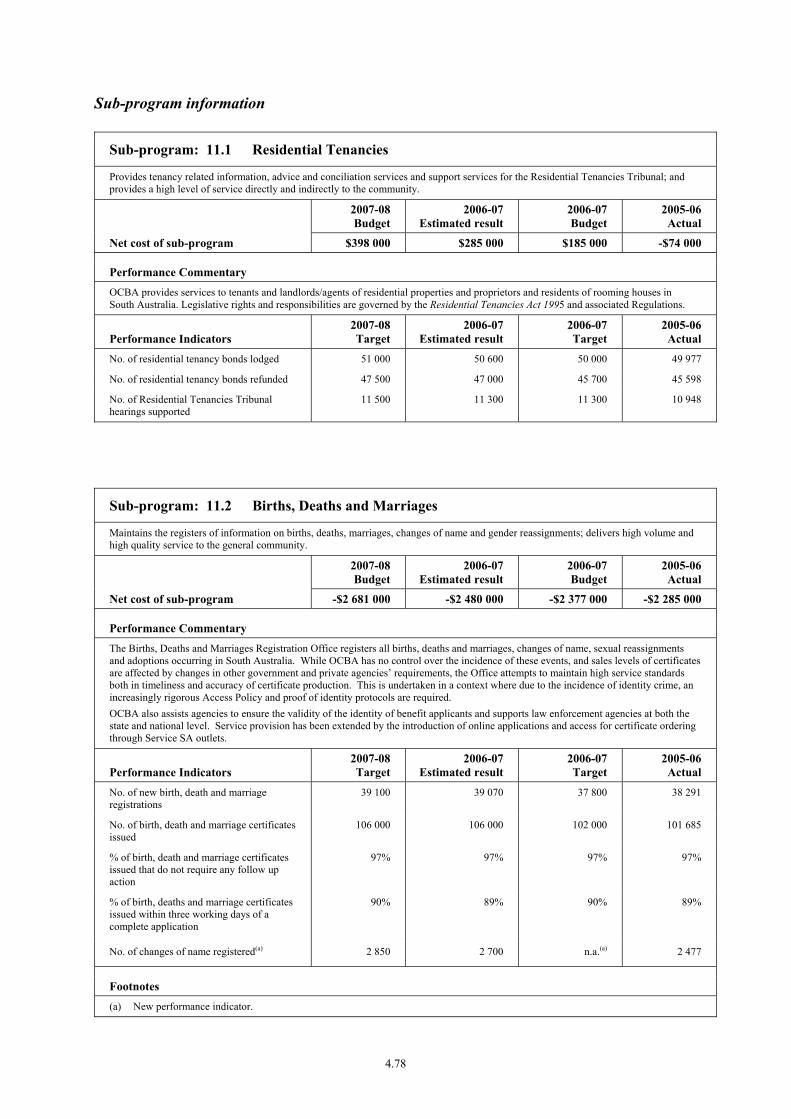
Sub-program information
Sub-program: 11.1 Residential Tenancies
Provides tenancy related information, advice and conciliation services and support services for the Residential Tenancies Tribunal; and provides a high level of service directly and indirectly to the community.
2007-08 Budget
2006-07 Estimated result
2006-07 Budget
2005-06 Actual
Net cost of sub-program $398 000 $285 000 $185 000 -$74 000
Performance Commentary OCBA provides services to tenants and landlords/agents of residential properties and proprietors and residents of rooming houses in South Australia. Legislative rights and responsibilities are governed by the Residential Tenancies Act 1995 and associated Regulations.
Performance Indicators 2007-08 Target
2006-07 Estimated result
2006-07 Target
2005-06 Actual
No. of residential tenancy bonds lodged 51 000 50 600 50 000 49 977
No. of residential tenancy bonds refunded 47 500 47 000 45 700 45 598
No. of Residential Tenancies Tribunal hearings supported
11 500 11 300 11 300 10 948
Sub-program: 11.2 Births, Deaths and Marriages
Maintains the registers of information on births, deaths, marriages, changes of name and gender reassignments; delivers high volume and high quality service to the general community.
2007-08 Budget
2006-07 Estimated result
2006-07 Budget
2005-06 Actual
Net cost of sub-program -$2 681 000 -$2 480 000 -$2 377 000 -$2 285 000
Performance Commentary The Births, Deaths and Marriages Registration Office registers all births, deaths and marriages, changes of name, sexual reassignments and adoptions occurring in South Australia. While OCBA has no control over the incidence of these events, and sales levels of certificates are affected by changes in other government and private agencies’ requirements, the Office attempts to maintain high service standards both in timeliness and accuracy of certificate production. This is undertaken in a context where due to the incidence of identity crime, an increasingly rigorous Access Policy and proof of identity protocols are required. OCBA also assists agencies to ensure the validity of the identity of benefit applicants and supports law enforcement agencies at both the state and national level. Service provision has been extended by the introduction of online applications and access for certificate ordering through Service SA outlets.
Performance Indicators 2007-08 Target
2006-07 Estimated result
2006-07 Target
2005-06 Actual
No. of new birth, death and marriage registrations
39 100 39 070 37 800 38 291
No. of birth, death and marriage certificates issued
106 000 106 000 102 000 101 685
% of birth, death and marriage certificates issued that do not require any follow up action
97% 97% 97% 97%
% of birth, deaths and marriage certificates issued within three working days of a complete application
90% 89% 90% 89%
No. of changes of name registered(a) 2 850 2 700 n.a.(a) 2 477
Footnotes (a) New performance indicator.
4.78
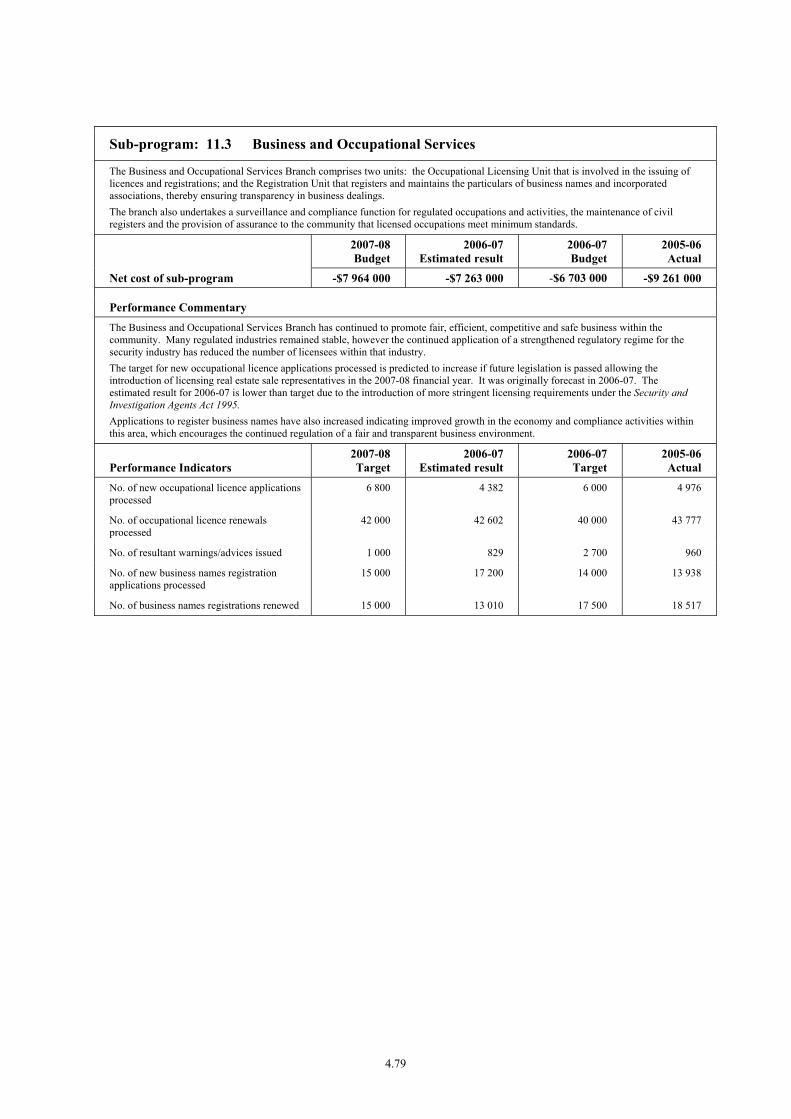
Sub-program: 11.3 Business and Occupational Services
The Business and Occupational Services Branch comprises two units: the Occupational Licensing Unit that is involved in the issuing of licences and registrations; and the Registration Unit that registers and maintains the particulars of business names and incorporated associations, thereby ensuring transparency in business dealings. The branch also undertakes a surveillance and compliance function for regulated occupations and activities, the maintenance of civil registers and the provision of assurance to the community that licensed occupations meet minimum standards.
2007-08 Budget
2006-07 Estimated result
2006-07 Budget
2005-06 Actual
Net cost of sub-program -$7 964 000 -$7 263 000 -$6 703 000 -$9 261 000
Performance Commentary The Business and Occupational Services Branch has continued to promote fair, efficient, competitive and safe business within the community. Many regulated industries remained stable, however the continued application of a strengthened regulatory regime for the security industry has reduced the number of licensees within that industry. The target for new occupational licence applications processed is predicted to increase if future legislation is passed allowing the introduction of licensing real estate sale representatives in the 2007-08 financial year. It was originally forecast in 2006-07. The estimated result for 2006-07 is lower than target due to the introduction of more stringent licensing requirements under the Security and Investigation Agents Act 1995. Applications to register business names have also increased indicating improved growth in the economy and compliance activities within this area, which encourages the continued regulation of a fair and transparent business environment.
Performance Indicators 2007-08 Target
2006-07 Estimated result
2006-07 Target
2005-06 Actual
No. of new occupational licence applications processed
6 800 4 382 6 000 4 976
No. of occupational licence renewals processed
42 000 42 602 40 000 43 777
No. of resultant warnings/advices issued 1 000 829 2 700 960
No. of new business names registration applications processed
15 000 17 200 14 000 13 938
No. of business names registrations renewed 15 000 13 010 17 500 18 517
4.79

Sub-program: 11.4 Legal Enforcement and Policy
The Legal Enforcement component of this sub-program monitors compliance with legislation, investigates breaches of legislation and takes appropriate action. The Policy area provides policy and legal advice to the Minister and the Commissioner for Consumer Affairs and develops legislative review initiatives.
2007-08 Budget
2006-07 Estimated result
2006-07 Budget
2005-06 Actual
Net cost of sub-program -$3 004 000 -$2 838 000 -$2 892 000 -$1 745 000
Performance Commentary The sub-program measures compliance through the number of warnings issued, the extent of the investigations through the number of prima facie breaches investigated, and the number of enforcement sanctions applied. The sub-program also provides a rating of efficiency in regard to the completion of investigation matters. In 2005-06 Legal Enforcement and Policy issued expiation notices for breaches of the Residential and Tenancies Act 1995. This responsibility now rests with the Residential Tenancies Branch.
Performance Indicators 2007-08 Target
2006-07 Estimated result
2006-07 Target
2005-06 Actual
No. of alleged prima facie breaches investigated
400 350 350 375
No. of warning letters issued 150 120 120 152
No. of assurances taken 30 33 30 29
No. of expiation notices issued 15 4 15 40
No. of disciplines and prosecution briefs prepared
45 48 40 40
% of investigations completed within 120 days of receipt by Compliance Unit
62% 64% 60% 62%
4.80
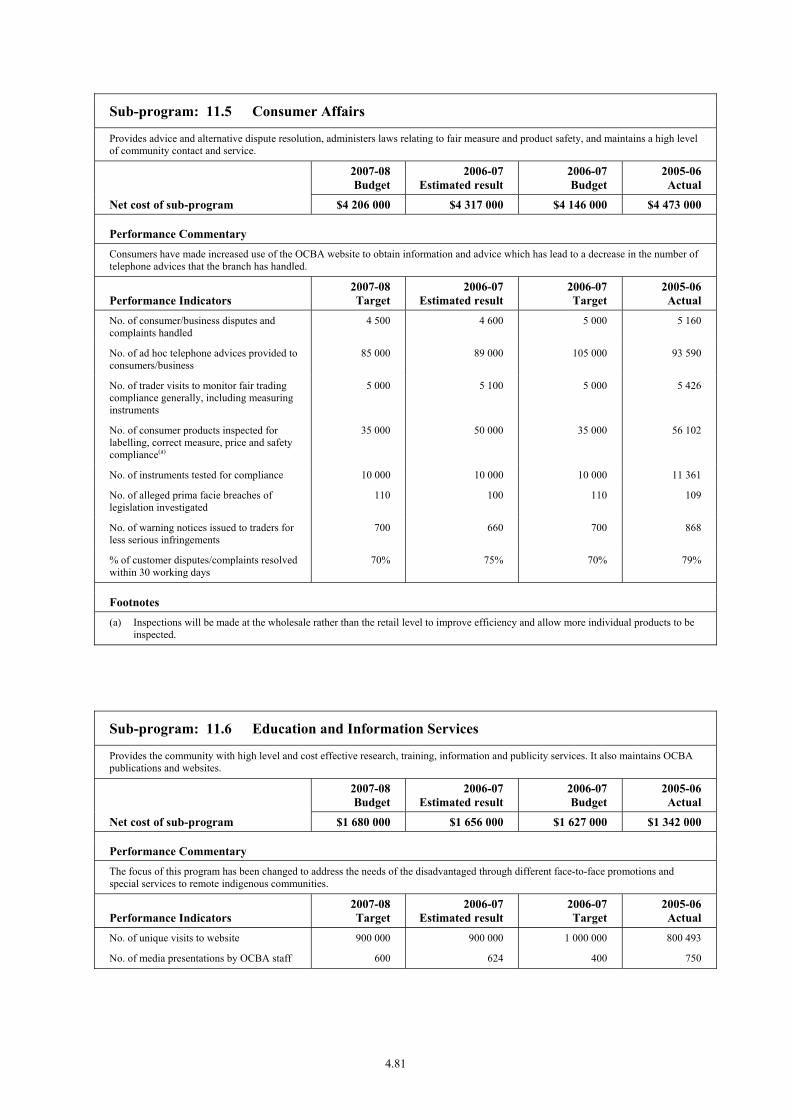
Sub-program: 11.5 Consumer Affairs
Provides advice and alternative dispute resolution, administers laws relating to fair measure and product safety, and maintains a high level of community contact and service.
2007-08 Budget
2006-07 Estimated result
2006-07 Budget
2005-06 Actual
Net cost of sub-program $4 206 000 $4 317 000 $4 146 000 $4 473 000
Performance Commentary Consumers have made increased use of the OCBA website to obtain information and advice which has lead to a decrease in the number of telephone advices that the branch has handled.
Performance Indicators 2007-08 Target
2006-07 Estimated result
2006-07 Target
2005-06 Actual
No. of consumer/business disputes and complaints handled
4 500 4 600 5 000 5 160
No. of ad hoc telephone advices provided to consumers/business
85 000 89 000 105 000 93 590
No. of trader visits to monitor fair trading compliance generally, including measuring instruments
5 000 5 100 5 000 5 426
No. of consumer products inspected for labelling, correct measure, price and safety compliance(a)
35 000 50 000 35 000 56 102
No. of instruments tested for compliance 10 000 10 000 10 000 11 361
No. of alleged prima facie breaches of legislation investigated
110 100 110 109
No. of warning notices issued to traders for less serious infringements
700 660 700 868
% of customer disputes/complaints resolved within 30 working days
70% 75% 70% 79%
Footnotes (a) Inspections will be made at the wholesale rather than the retail level to improve efficiency and allow more individual products to be
inspected.
Sub-program: 11.6 Education and Information Services
Provides the community with high level and cost effective research, training, information and publicity services. It also maintains OCBA publications and websites.
2007-08 Budget
2006-07 Estimated result
2006-07 Budget
2005-06 Actual
Net cost of sub-program $1 680 000 $1 656 000 $1 627 000 $1 342 000
Performance Commentary The focus of this program has been changed to address the needs of the disadvantaged through different face-to-face promotions and special services to remote indigenous communities.
Performance Indicators 2007-08 Target
2006-07 Estimated result
2006-07 Target
2005-06 Actual
No. of unique visits to website 900 000 900 000 1 000 000 800 493
No. of media presentations by OCBA staff 600 624 400 750
4.81
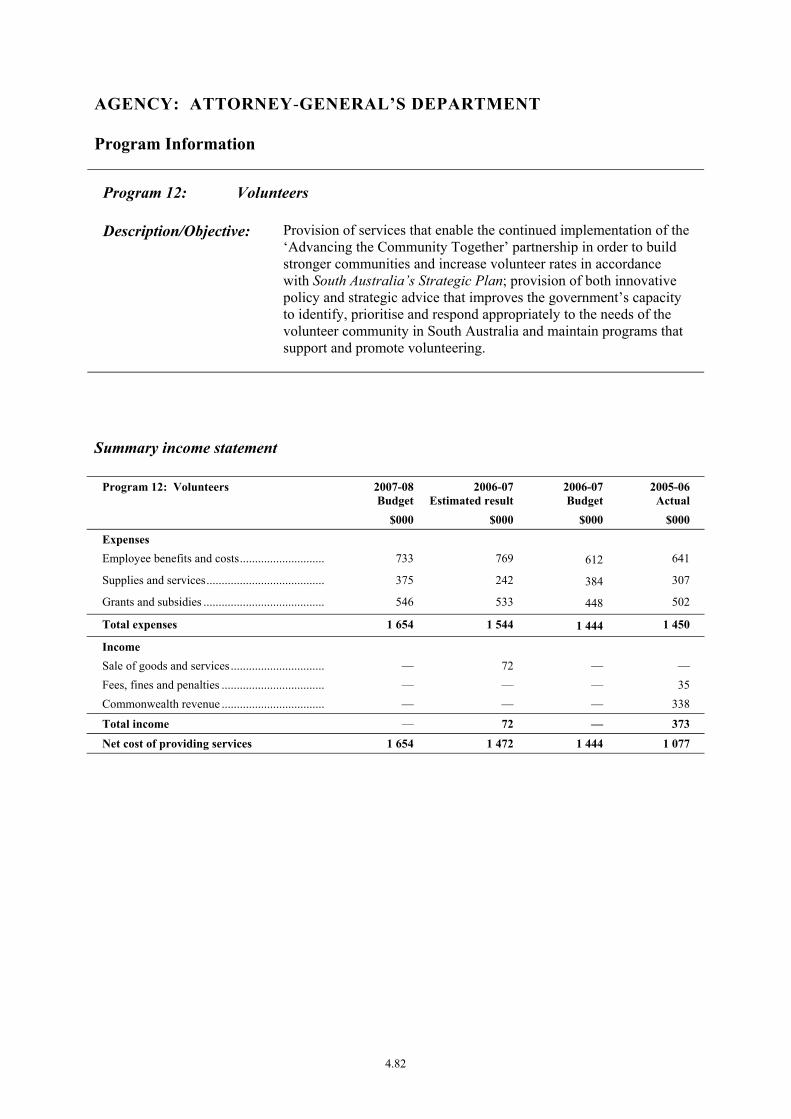
AGENCY: ATTORNEY-GENERAL’S DEPARTMENT
Program Information
Program 12: Volunteers
Description/Objective: Provision of services that enable the continued implementation of the ‘Advancing the Community Together’ partnership in order to build stronger communities and increase volunteer rates in accordance with South Australia’s Strategic Plan; provision of both innovative policy and strategic advice that improves the government’s capacity to identify, prioritise and respond appropriately to the needs of the volunteer community in South Australia and maintain programs that support and promote volunteering.
Summary income statement
Program 12: Volunteers 2007-08Budget
2006-07Estimated result
2006-07 Budget
2005-06 Actual
$000 $000 $000 $000
Expenses Employee benefits and costs............................. 733 769 612 641
Supplies and services........................................ 375 242 384 307
Grants and subsidies ......................................... 546 533 448 502
Total expenses 1 654 1 544 1 444 1 450
Income Sale of goods and services................................ — 72 — — Fees, fines and penalties ................................... — — — 35 Commonwealth revenue ................................... — — — 338
Total income — 72 — 373
Net cost of providing services 1 654 1 472 1 444 1 077
4.82
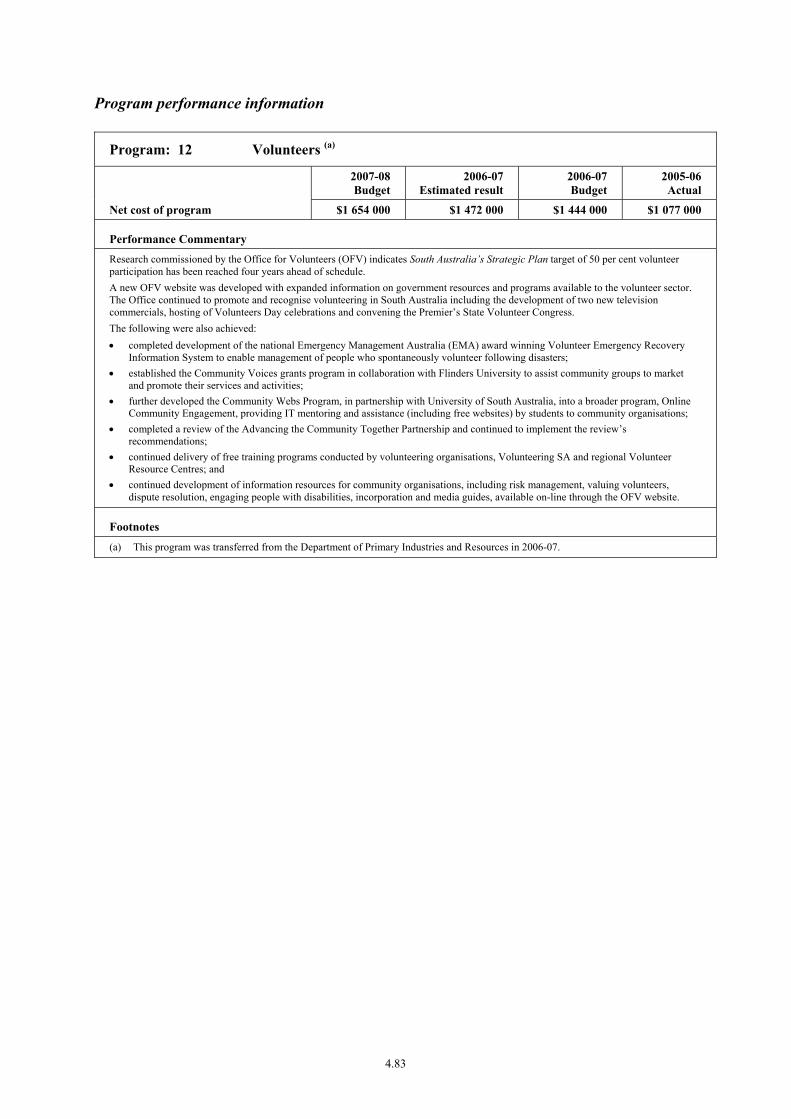
Program performance information
Program: 12 Volunteers (a)
2007-08 Budget
2006-07 Estimated result
2006-07 Budget
2005-06 Actual
Net cost of program $1 654 000 $1 472 000 $1 444 000 $1 077 000
Performance Commentary Research commissioned by the Office for Volunteers (OFV) indicates South Australia’s Strategic Plan target of 50 per cent volunteer participation has been reached four years ahead of schedule. A new OFV website was developed with expanded information on government resources and programs available to the volunteer sector. The Office continued to promote and recognise volunteering in South Australia including the development of two new television commercials, hosting of Volunteers Day celebrations and convening the Premier’s State Volunteer Congress. The following were also achieved: • completed development of the national Emergency Management Australia (EMA) award winning Volunteer Emergency Recovery
Information System to enable management of people who spontaneously volunteer following disasters; • established the Community Voices grants program in collaboration with Flinders University to assist community groups to market
and promote their services and activities; • further developed the Community Webs Program, in partnership with University of South Australia, into a broader program, Online
Community Engagement, providing IT mentoring and assistance (including free websites) by students to community organisations; • completed a review of the Advancing the Community Together Partnership and continued to implement the review’s
recommendations; • continued delivery of free training programs conducted by volunteering organisations, Volunteering SA and regional Volunteer
Resource Centres; and • continued development of information resources for community organisations, including risk management, valuing volunteers,
dispute resolution, engaging people with disabilities, incorporation and media guides, available on-line through the OFV website.
Footnotes
(a) This program was transferred from the Department of Primary Industries and Resources in 2006-07.
4.83
AGENCY: ATTORNEY-GENERAL’S DEPARTMENT
Program Information
Program 13: Office for Women
Description/Objective: Pursuit of the full and equal participation of women in the social and economic life of the state by providing innovative and balanced public policy advice to government. Providing high quality statewide information and referral services through the Women’s Information Service.
Summary income statement
Program 13: Office for Women 2007-08Budget
2006-07Estimated result
2006-07 Budget
2005-06 Actual
$000 $000 $000 $000
Expenses Employee benefits and costs............................. 1 540 1 691 1 522 1 444
Supplies and services........................................ 519 418 537 838
Grants and subsidies ......................................... 51 50 50 43
Total expenses 2 110 2 159 2 109 2 325
Income
Sale of goods and services................................ 17 38 — 167
Other................................................................. — — 17 9
Total income 17 38 17 176
Net cost of providing services 2 093 2 121 2 092 2 149
4.84
Sub-program information
Sub-program: 13.1 Women’s Policy Office(a)
Provision of policy advice to government on the interests and concerns of South Australian women.
2007-08 Budget
2006-07 Estimated result
2006-07 Budget
2005-06 Actual
Net cost of sub-program $1 241 000 $1 326 000 $1 302 000 $1 424 000
Performance Commentary The Office for Women has lead responsibility for increasing women’s contribution as leaders and key decision makers in the South Australian community, with a focus on the women’s leadership targets in South Australia’s Strategic Plan. In 2006 the Office for Women established the Women in Leadership SA Whole of Government Reference Group to provide a whole of government focus on women’s leadership initiatives. As at 1 May 2007, the percentage of women on South Australian Government boards and committees was 42 per cent and the percentage of women chairing these boards and committees was 31 per cent. These levels represent a 24 per cent increase in women holding positions on State Government boards and committees and a 31 per cent increase in women holding Chair positions on State Government boards and committees since the introduction of South Australia’s Strategic Plan and are amongst the highest levels in Australia. A key tool to increase the number of women in leadership positions is the Premier’s Women’s Directory. As at 1 May 2007 the Premier’s Women’s Directory profiled over 400 women who are suitable for board and committee positions with a range of diverse skill sets and backgrounds. The Office for Women leads the Women’s Safety Strategy which provides a whole-of-government approach to the critical issues surrounding women’s safety. Highlights of 2006-07 include: • hosting a Women’s Safety Strategy conference in November 2006 which brought together practitioners, academics and policy makers
focused on improving women’s safety; • reporting on the highlights and outcomes of the Women’s Safety Strategy first two years of operation in the Women’s Safety
Snapshots publication; • highlighting the issues around drink spiking and the new anti-drink spiking laws with a community education drink coaster
campaign; and • promotion of the International Day for the Elimination of Violence Against Women – White Ribbon Day, the Sixteen Days of
Activism Against Gendered Violence from 25 November to 10 December, and Reclaim the Night at the end of October 2006. The Office for Women has made the following achievements for Aboriginal and Torres Strait Islander women in 2006-07: • hosted and funded the State Aboriginal Women’s Gathering and the National Indigenous Women’s Gathering in Adelaide, with the
theme of both Gatherings centred on addressing Indigenous Family Violence through local solutions; • coordinated a whole-of-government response to the recommendation of previous State Aboriginal Women’s Gatherings which was
provided to all delegates to the 2006 State Aboriginal Women’s Gathering; and • organised and hosted the National Indigenous Women’s Gathering at Tandanya, Adelaide, bringing together Indigenous women from
around Australia. During 2007-08 the following objectives will be achieved: • increase the leadership opportunities for women in South Australia, with a key focus on increasing the representation of women on
South Australian Government boards and committees, the percentage of women chairing these committees and engaging the private sector;
• lead the trial of the Family Safety Framework across the South Australian Government, to provide the best possible outcomes for women and children at a high risk of experiencing family violence; and
• hosting the State Aboriginal Women’s Gathering bringing together delegates from across rural, regional, remote and metropolitan South Australia.
Footnotes
(a) This sub-program was transferred from the Department for Families and Communities in 2006-07.
4.85
Sub-program: 13.2 Women’s Information Service(a)
Provision of high quality, statewide information and referral services through the Women’s Information Service.
2007-08 Budget
2006-07 Estimated result
2006-07 Budget
2005-06 Actual
Net cost of sub-program $607 000 $541 000 $557 000 $525 000
Performance Commentary The Women’s Information Service continues to provide information, referral and support services to women throughout South Australia. The key issues that women sought assistance from the Women’s Information Service for included employment, education, housing, family violence issues, legal advice and assistance, finance, emotional well-being, relationships and health issues. The Women’s Information Service provides a number of activities and programs directly to women in South Australia, including: • the Family Court Support Program, assisting women who have experienced domestic violence in their attendance at the Family Court; • the Women’s Information Service volunteer program, with approximately 70 hours of training provided to volunteers who wish to
work in the service. Approximately 20 women currently volunteer with the Women’s Information Service in the Shopfront and approximately 15 volunteers provide court support;
• providing direct access to the Women’s Information Services to a wide range of women, via attendance at field days and events across regional South Australia, information stalls at a wide range of locations and providing information directly at a large range of conferences, events and expos;
• basic Internet, Word and computer training and access; • after hours telephone legal advice; and • a Tax Help program with expertise provided by volunteer taxation experts. During 2007-08 the following objectives will be achieved: • continue to provide a high quality information and referral service to the women of South Australia; • expand the Women’s Information Service outreach service in the South Australian community, including providing services through
the newly established Children’s Centres and other locations; and • continue to deliver support services for women attending the Family Court.
Performance Indicators 2007-08 Target
2006-07 Estimated result
2006-07 Target
2005-06 Actual
No. of enquiries 25 000 20 000 25 000 19 916
Footnotes (a) This sub-program was transferred from the Department for Families and Communities in 2006-07.
4.86
Sub-program: 13.3 Premier’s Council for Women(a)
Progressing the development of sound policy for South Australian women through advice and recommendations to the Premier and the Minister for the Status of Women, in accordance with the Council’s terms of reference and in support of South Australia’s Strategic Plan priorities.
2007-08 Budget
2006-07 Estimated result
2006-07 Budget
2005-06 Actual
Net cost of sub-program $245 000 $254 000 $233 000 $200 000
Performance Commentary The Premier’s Council for Women is currently in its third term, and currently has 14 members, including three Aboriginal and Torres Strait Islander women. Achievements for 2006-07 include: • providing advice on women’s issues as a public policy priority to the Premier and Minister for the Status of Women; • establishing the Gender Indicators Online web-based tool to enable gender disaggregated information on a range of key policy issues
affecting South Australia; • hosting a forum for women, safety and sport in November 2006 — the forum was attended by over 100 people including
representatives from sporting bodies and the media as well as women in the news and elite athletes; and • initiating a snapshot survey into the representation of women in the media – the representation of female sport in all major daily
national Australian newspapers was examined over a month. The Premier’s Council for Women has provided leadership for women in relation to South Australia’s Strategic Plan, including: • supporting the review of South Australia’s Strategic Plan, as one of the peak government advisory bodies with a number of
representatives on the leadership update team; and • hosting metropolitan and regional ‘Women’s Voices’ forums for women’s organisations focussed on the targets in the updated
South Australia’s Strategic Plan. The Premier’s Council for Women has also provided submissions to the Review of South Australian Rape and Sexual Assault Law – Discussion Paper (July 2006); the Children in State Care Commission of Inquiry (April 2007); and provided written and verbal evidence to the Report of the Senate Environment, Communications, Information Technology and the Arts References Committee About Time! Women in sport and recreation in Australia (Sept 2006). During 2007-08 the following objectives will be achieved: • providing a focus and ongoing leadership on key issues in relation to the equality of women and men in South Australia; • monitoring the progress towards equality for women in South Australia, including a focus on the key areas set out in South Australia’s
Strategic Plan; and • monitoring the progress of rape, sexual assault and domestic violence law and associated reforms.
Footnotes
(a) This sub-program was transferred from the Department for Families and Communities in 2006-07.
4.87
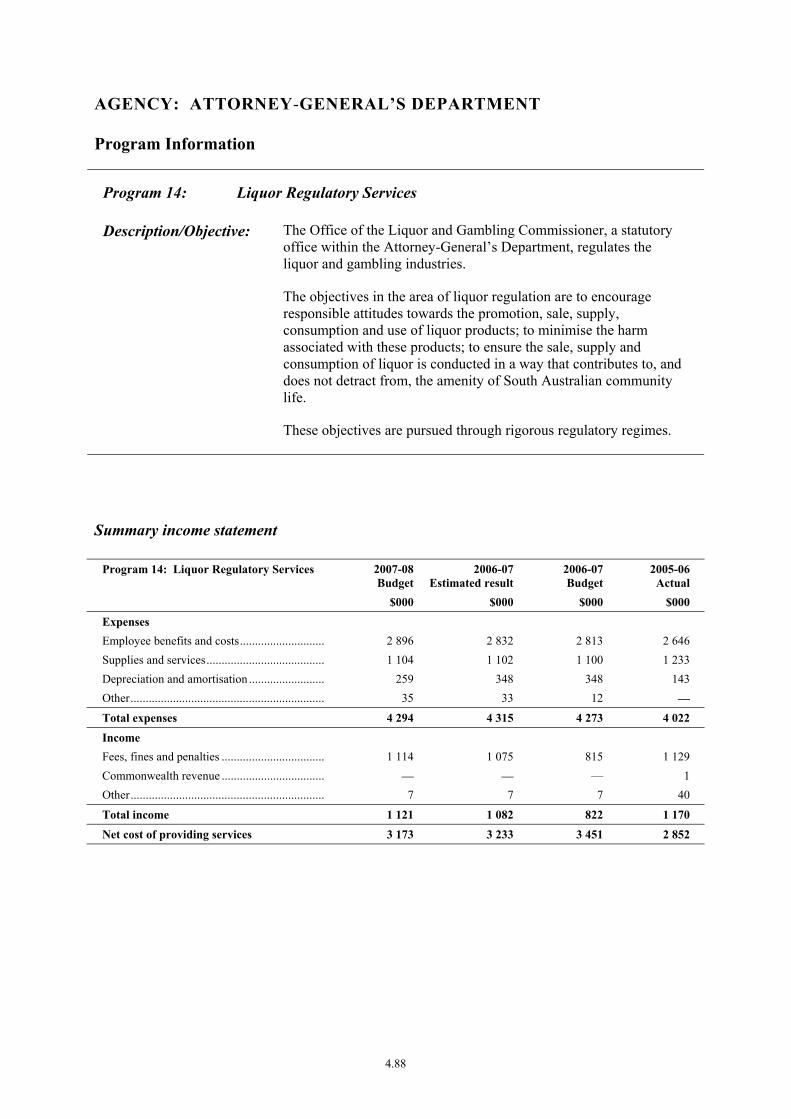
AGENCY: ATTORNEY-GENERAL’S DEPARTMENT
Program Information
Program 14: Liquor Regulatory Services
Description/Objective: The Office of the Liquor and Gambling Commissioner, a statutory office within the Attorney-General’s Department, regulates the liquor and gambling industries.
The objectives in the area of liquor regulation are to encourage responsible attitudes towards the promotion, sale, supply, consumption and use of liquor products; to minimise the harm associated with these products; to ensure the sale, supply and consumption of liquor is conducted in a way that contributes to, and does not detract from, the amenity of South Australian community life.
These objectives are pursued through rigorous regulatory regimes.
Summary income statement
Program 14: Liquor Regulatory Services 2007-08Budget
2006-07Estimated result
2006-07 Budget
2005-06 Actual
$000 $000 $000 $000
Expenses Employee benefits and costs............................. 2 896 2 832 2 813 2 646 Supplies and services........................................ 1 104 1 102 1 100 1 233 Depreciation and amortisation .......................... 259 348 348 143 Other................................................................. 35 33 12 —
Total expenses 4 294 4 315 4 273 4 022
Income Fees, fines and penalties ................................... 1 114 1 075 815 1 129 Commonwealth revenue ................................... — — — 1 Other................................................................. 7 7 7 40
Total income 1 121 1 082 822 1 170
Net cost of providing services 3 173 3 233 3 451 2 852
4.88

Program performance information
Program: 14 Liquor Regulatory Services
2007-08 Budget
2006-07 Estimated result
2006-07 Budget
2005-06 Actual
Net cost of program $3 173 000 $3 233 000 $3 451 000 $2 852 000
Performance Commentary The Office of the Liquor and Gambling Commissioner (OLGC) continues to have a high success rate in conciliating contested applications and complaints for licensed premises. OLGC has exceeded the 2006-07 Targets for both these performance indicators. The standard of licensed premises in South Australia continues to be maintained at a high level. OLGC learning and communication unit has attended a variety of major community events and seminars to educate the community and industry on the role of OLGC and promote awareness of responsible use of alcohol.
Performance Indicators 2007-08 Target
2006-07 Estimated result
2006-07 Target
2005-06 Actual
% of contested applications conciliated 90% 93%(a) 90% 88%
% of complaints conciliated 95% 96%(a) 95% 99%
No. of licensed premises inspected by risk category:
• Priority 1(b) 1 100 1 031 1 190 1 063
• Priority 2(c) 1 150 1 173(d) 300 244
• Priority 3(c) 300 175(d) 450 433
No. of major community events and seminars in which the Office has participated
18 18 18 18
Footnotes (a) This figure does not include conciliations which have been adjourned. (b) Priority 1 is premises scheduled for inspection at least once every 12 months. (c) Priority 2 and 3 are premises scheduled for inspection at least once every 24 months. Priority 3 is lower risk premises. (d) The priority 2 and 3 premises are reassessed on a regular basis and inspected accordingly. This has resulted in the reallocation of
many priority 3 premises to priority 2 status during 2006-07.
4.89

AGENCY: ATTORNEY-GENERAL’S DEPARTMENT
Program Information
Program 15: Gambling Regulatory Services
Description/Objective: The Office of the Liquor and Gambling Commissioner, a statutory office within the Attorney-General’s Department, regulates the liquor and gambling industries.
The objectives in the area of gambling regulation are to encourage responsible attitudes towards the promotion, sale, supply and use of gambling products; to minimise the harm associated with these products; and to maintain public confidence in the state’s gambling industries.
These objectives are pursued through rigorous regulatory regimes.
Summary income statement
Program 15: Gambling Regulatory Services
2007-08Budget
2006-07Estimated result
2006-07 Budget
2005-06 Actual
$000 $000 $000 $000
Expenses Employee benefits and costs............................. 3 241 3 170 3 117 3 156 Supplies and services........................................ 1 010 1 008 1 004 731 Depreciation and amortisation .......................... 41 55 55 121 Other................................................................. 38 36 13 —
Total expenses 4 330 4 269 4 189 4 008
Income Sale of goods and services................................ — — — 20 Fees, fines and penalties ................................... 55 80 355 272 Commonwealth revenue ................................... — — — 1 Other................................................................. 1 614 944 943 999
Total income 1 669 1 024 1 298 1 292
Net cost of providing services 2 661 3 245 2 891 2 716
4.90

Program performance information
Program: 15 Gambling Regulatory Services
2007-08 Budget
2006-07 Estimated result
2006-07 Budget
2005-06 Actual
Net cost of program $2 661 000 $3 245 000 $2 891 000 $2 716 000
Performance Commentary The Office of the Liquor and Gambling Commissioner has a role in ensuring that South Australia has a gaming industry that promotes and delivers products and services in a responsible manner, which minimises harm and reflects community values and expectations.
Performance Indicators 2007-08 Target
2006-07 Estimated result
2006-07 Target
2005-06 Actual
No. of inspections of gaming venues 600 650 590 619
No. of wagering compliance assessments 500 497 500 514
No. of Casino checks on compliance requirements
2 300 2 291 2 100 1 924
No. of lottery licences processed within 21 days of receipt
95% 96% 95% 93%
4.91

ATTORNEY-GENERAL'S DEPARTMENT
Income statement__________________________________________________________________________________________________________________________________________________________________________________________________________________________________
2007-08Budget
$000
2006-07Estimated
result
$000
2006-07Budget
$000
2005-06Actual
$000Expenses
Employee benefits and costs — Salaries, wages, annual and sick leave ..................................... 81 889 74 692 68 721 65 232 Long service leave .................................................................... 3 036 2 609 2 758 2 273 Payroll tax ................................................................................ 4 459 4 110 3 814 4 274 Superannuation ......................................................................... 9 360 8 726 8 659 7 786 Other ......................................................................................... 1 110 1 038 305 2 364Supplies and services — General supplies and services .................................................. 41 875 38 778 35 458 38 971 Consultancy expenses .............................................................. 338 336 331 375Depreciation and amortisation ..................................................... 4 060 3 646 2 773 2 389Borrowing costs ............................................................................ 24 5 — — Grants and subsidies ..................................................................... 10 053 8 730 9 166 9 207Intra government transfers ........................................................... 1 700 2 368 1 314 1 326Other expenses ............................................................................. 1 062 1 004 375 359
Total expenses .............................................................................. 158 966 146 042 133 674 134 556
Income
Commonwealth revenues ............................................................. 3 081 3 055 3 005 3 036Intra government transfers ........................................................... 6 514 7 818 6 595 6 619Fees, fines and penalties ............................................................... 26 110 23 994 23 319 23 229Sales of goods and services .......................................................... 31 692 29 887 28 396 28 169Interest revenues ........................................................................... — — — 1 186Net gain or loss from disposal of assets ....................................... — — -25 — Other income ................................................................................ 6 292 5 255 5 244 5 055
Total income ................................................................................. 73 689 70 009 66 534 67 294
Net cost of providing services ...................................................... 85 277 76 033 67 140 67 262
Income from / Expenses to SA Government
Income — Appropriation ........................................................................... 85 288 76 419 67 728 68 634 Other income ............................................................................ — 1 212 — 2 637Expenses — Tax equivalent .......................................................................... 11 — — — Cash alignment ......................................................................... 821 2 541 472 3 962
Net income from / expenses to SA Government .......................... 84 456 75 090 67 256 67 309
Net result before restructure(s) ..................................................... -821 -943 116 47
Net income from / expenses from administrative restructure(s) .. — -3 581 — —
Net result after restructure(s) ........................................................ -821 -4 524 116 47
4.92
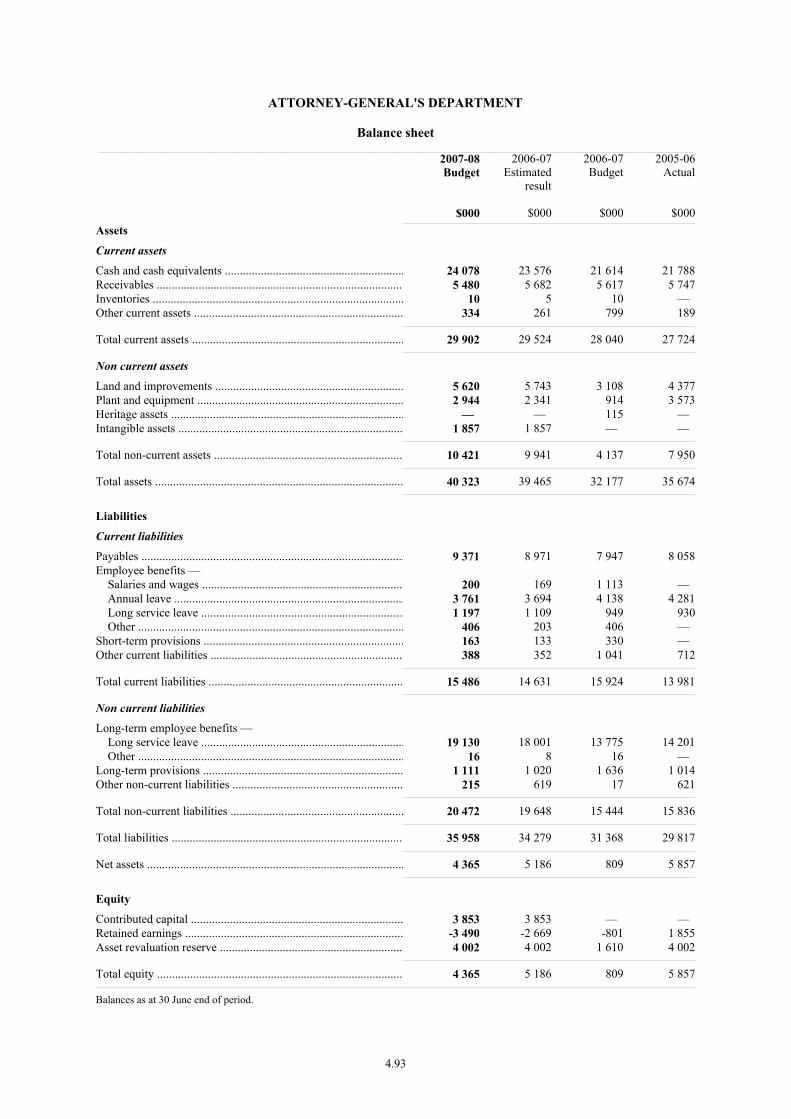
ATTORNEY-GENERAL'S DEPARTMENT
Balance sheet__________________________________________________________________________________________________________________________________________________________________________________________________________________________________
2007-08Budget
$000
2006-07Estimated
result
$000
2006-07Budget
$000
2005-06Actual
$000Assets
Current assets
Cash and cash equivalents ............................................................ 24 078 23 576 21 614 21 788Receivables ................................................................................... 5 480 5 682 5 617 5 747Inventories .................................................................................... 10 5 10 — Other current assets ...................................................................... 334 261 799 189
Total current assets ....................................................................... 29 902 29 524 28 040 27 724
Non current assets
Land and improvements ............................................................... 5 620 5 743 3 108 4 377Plant and equipment ..................................................................... 2 944 2 341 914 3 573Heritage assets .............................................................................. — — 115 — Intangible assets ........................................................................... 1 857 1 857 — —
Total non-current assets ............................................................... 10 421 9 941 4 137 7 950
Total assets ................................................................................... 40 323 39 465 32 177 35 674
Liabilities
Current liabilities
Payables ........................................................................................ 9 371 8 971 7 947 8 058Employee benefits — Salaries and wages ................................................................... 200 169 1 113 — Annual leave ............................................................................. 3 761 3 694 4 138 4 281 Long service leave .................................................................... 1 197 1 109 949 930 Other ......................................................................................... 406 203 406 — Short-term provisions ................................................................... 163 133 330 — Other current liabilities ................................................................. 388 352 1 041 712
Total current liabilities ................................................................. 15 486 14 631 15 924 13 981
Non current liabilities
Long-term employee benefits — Long service leave .................................................................... 19 130 18 001 13 775 14 201 Other ......................................................................................... 16 8 16 — Long-term provisions ................................................................... 1 111 1 020 1 636 1 014Other non-current liabilities ......................................................... 215 619 17 621
Total non-current liabilities .......................................................... 20 472 19 648 15 444 15 836
Total liabilities .............................................................................. 35 958 34 279 31 368 29 817
Net assets ...................................................................................... 4 365 5 186 809 5 857
Equity
Contributed capital ....................................................................... 3 853 3 853 — — Retained earnings ......................................................................... -3 490 -2 669 -801 1 855Asset revaluation reserve ............................................................. 4 002 4 002 1 610 4 002
Total equity .................................................................................. 4 365 5 186 809 5 857
Balances as at 30 June end of period.
4.93
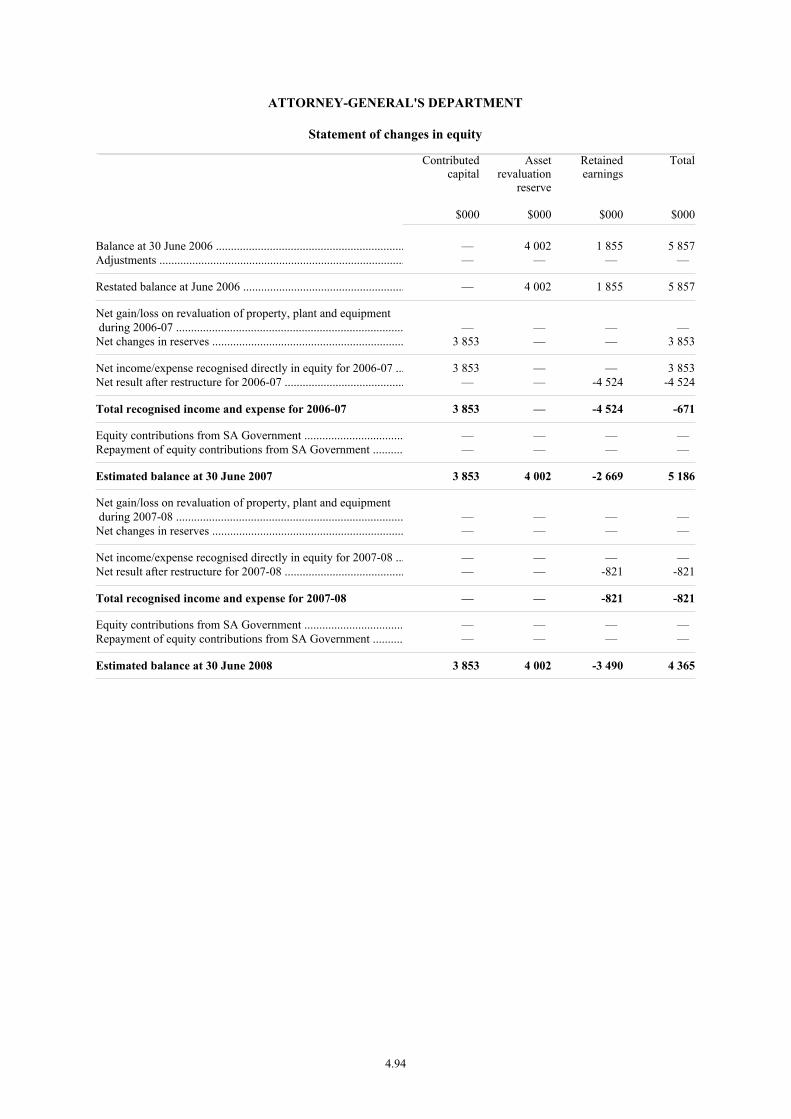
ATTORNEY-GENERAL'S DEPARTMENT
Statement of changes in equity__________________________________________________________________________________________________________________________________________________________________________________________________________________________________
Contributedcapital
$000
Assetrevaluation
reserve
$000
Retainedearnings
$000
Total
$000
Balance at 30 June 2006 ............................................................... — 4 002 1 855 5 857Adjustments .................................................................................. — — — —
Restated balance at June 2006 ...................................................... — 4 002 1 855 5 857
Net gain/loss on revaluation of property, plant and equipment during 2006-07 ............................................................................ — — — — Net changes in reserves ................................................................ 3 853 — — 3 853
Net income/expense recognised directly in equity for 2006-07 ... 3 853 — — 3 853Net result after restructure for 2006-07 ........................................ — — -4 524 -4 524
Total recognised income and expense for 2006-07 3 853 — -4 524 -671
Equity contributions from SA Government ................................. — — — — Repayment of equity contributions from SA Government .......... — — — —
Estimated balance at 30 June 2007 3 853 4 002 -2 669 5 186
Net gain/loss on revaluation of property, plant and equipment during 2007-08 ............................................................................ — — — — Net changes in reserves ................................................................ — — — —
Net income/expense recognised directly in equity for 2007-08 ... — — — — Net result after restructure for 2007-08 ........................................ — — -821 -821
Total recognised income and expense for 2007-08 — — -821 -821
Equity contributions from SA Government ................................. — — — — Repayment of equity contributions from SA Government .......... — — — —
Estimated balance at 30 June 2008 3 853 4 002 -3 490 4 365
4.94

ATTORNEY-GENERAL'S DEPARTMENT
Cash flow statement__________________________________________________________________________________________________________________________________________________________________________________________________________________________________
2007-08Budget
$000
2006-07Estimated
result
$000
2006-07Budget
$000
2005-06Actual
$000
OPERATING ACTIVITIES:
Cash outflows
Employee payments ..................................................................... 97 951 89 661 83 584 83 172Supplies and services ................................................................... 42 199 40 015 35 775 39 145Borrowing costs ............................................................................ 24 5 — — Grants and subsidies ..................................................................... 10 053 8 730 9 166 9 207Net GST paid ................................................................................ — — — -529Intra government transfers ........................................................... 1 700 2 368 1 314 1 326Other payments ............................................................................ 1 305 1 261 716 —
Cash used in operations ................................................................ 153 232 142 040 130 555 132 321
Cash inflows
Intra government transfers ........................................................... 6 514 7 818 6 595 6 619Commonwealth receipts ............................................................... 3 081 3 055 3 005 3 036Fees, fines and penalties ............................................................... 26 110 23 994 23 319 23 229Sales of goods and services .......................................................... 31 677 29 872 28 381 22 830Interest received ........................................................................... — 7 7 1 177Other receipts ............................................................................... 6 436 5 399 5 388 10 466
Cash generated from operations ................................................... 73 818 70 145 66 695 67 357
SA GOVERNMENT:
Appropriation ............................................................................... 85 288 76 419 67 728 68 634Other receipts ............................................................................... — 1 212 — 2 637Payments — Tax equivalents ........................................................................ 11 — — — Cash alignment ......................................................................... 821 2 541 472 3 962
Net cash provided by SA Government ......................................... 84 456 75 090 67 256 67 309
Net cash provided by (+) / used (-) in operating activities ........... 5 042 3 195 3 396 2 345
INVESTING ACTIVITIES:
Cash outflows
Purchase of property, plant and equipment .................................. 4 540 2 207 786 471
Cash used in investing activities .................................................. 4 540 2 207 786 471
Net cash provided by (+) / used in (-) investing activities ........... -4 540 -2 207 -786 -471
4.95

ATTORNEY-GENERAL'S DEPARTMENT
Cash flow statement__________________________________________________________________________________________________________________________________________________________________________________________________________________________________
2007-08Budget
$000
2006-07Estimated
result
$000
2006-07Budget
$000
2005-06Actual
$000
FINANCING ACTIVITIES:
Cash inflows
Proceeds from restructuring activities .......................................... — 800 — —
Cash generated from financing activities ..................................... — 800 — —
Net cash provided by (+) / used in (-) financing activities ........... — 800 — —
Net increase (+) / decrease (-) in cash equivalents ....................... 502 1 788 2 610 1 874
Cash and cash equivalents at the beginning of the financial year 23 576 21 788 19 004 19 914
Cash and cash equivalents at the end of the financial year .......... 24 078 23 576 21 614 21 788
4.96
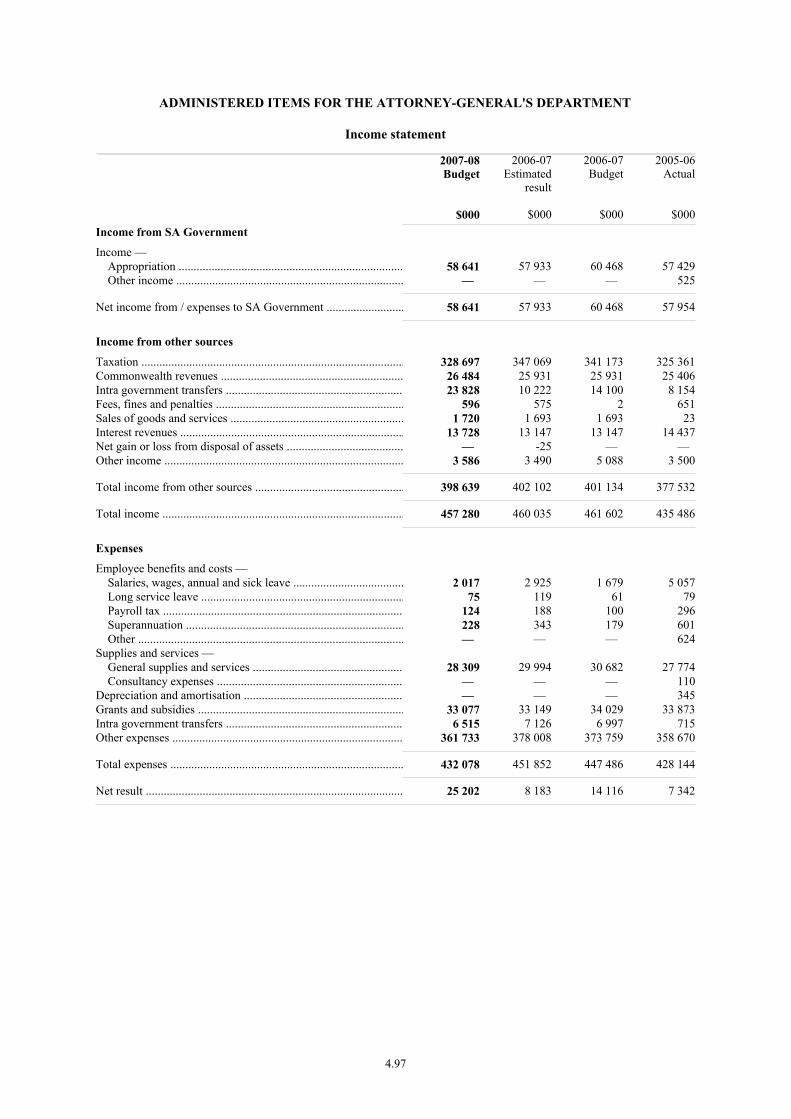
ADMINISTERED ITEMS FOR THE ATTORNEY-GENERAL'S DEPARTMENT
Income statement__________________________________________________________________________________________________________________________________________________________________________________________________________________________________
2007-08Budget
$000
2006-07Estimated
result
$000
2006-07Budget
$000
2005-06Actual
$000Income from SA Government
Income — Appropriation ........................................................................... 58 641 57 933 60 468 57 429 Other income ............................................................................ — — — 525
Net income from / expenses to SA Government .......................... 58 641 57 933 60 468 57 954
Income from other sources
Taxation ........................................................................................ 328 697 347 069 341 173 325 361Commonwealth revenues ............................................................. 26 484 25 931 25 931 25 406Intra government transfers ........................................................... 23 828 10 222 14 100 8 154Fees, fines and penalties ............................................................... 596 575 2 651Sales of goods and services .......................................................... 1 720 1 693 1 693 23Interest revenues ........................................................................... 13 728 13 147 13 147 14 437Net gain or loss from disposal of assets ....................................... — -25 — — Other income ................................................................................ 3 586 3 490 5 088 3 500
Total income from other sources .................................................. 398 639 402 102 401 134 377 532
Total income ................................................................................. 457 280 460 035 461 602 435 486
Expenses
Employee benefits and costs — Salaries, wages, annual and sick leave ..................................... 2 017 2 925 1 679 5 057 Long service leave .................................................................... 75 119 61 79 Payroll tax ................................................................................ 124 188 100 296 Superannuation ......................................................................... 228 343 179 601 Other ......................................................................................... — — — 624Supplies and services — General supplies and services .................................................. 28 309 29 994 30 682 27 774 Consultancy expenses .............................................................. — — — 110Depreciation and amortisation ..................................................... — — — 345Grants and subsidies ..................................................................... 33 077 33 149 34 029 33 873Intra government transfers ........................................................... 6 515 7 126 6 997 715Other expenses ............................................................................. 361 733 378 008 373 759 358 670
Total expenses .............................................................................. 432 078 451 852 447 486 428 144
Net result ...................................................................................... 25 202 8 183 14 116 7 342
4.97

ADMINISTERED ITEMS FOR THE ATTORNEY-GENERAL'S DEPARTMENT
Balance sheet__________________________________________________________________________________________________________________________________________________________________________________________________________________________________
2007-08Budget
$000
2006-07Estimated
result
$000
2006-07Budget
$000
2005-06Actual
$000Assets
Current assets
Cash and cash equivalents ............................................................ 96 234 80 034 86 586 75 008Receivables ................................................................................... 31 944 31 104 29 102 26 534Financial assets ............................................................................. 27 661 27 609 21 553 27 557Other current assets ...................................................................... 1 357 1 356 10 312 3 182
Total current assets ....................................................................... 157 196 140 103 147 553 132 281
Non current assets
Financial assets ............................................................................. 79 892 77 534 77 153 75 176Land and improvements ............................................................... 492 492 325 478Plant and equipment ..................................................................... 9 567 1 017 4 207 229
Total non-current assets ............................................................... 89 951 79 043 81 685 75 883
Total assets ................................................................................... 247 147 219 146 229 238 208 164
Liabilities
Current liabilities
Payables ........................................................................................ 63 805 63 785 3 039 63 765Employee benefits — Salaries and wages ................................................................... 4 2 103 — Annual leave ............................................................................. 173 173 167 173 Long service leave .................................................................... 25 22 22 19Other current liabilities ................................................................. 12 429 9 837 90 328 7 245
Total current liabilities ................................................................. 76 436 73 819 93 659 71 202
Non current liabilities
Long-term employee benefits — Long service leave .................................................................... 328 313 279 298 Other ......................................................................................... 8 4 8 — Other non-current liabilities ......................................................... 35 460 35 297 30 026 35 134
Total non-current liabilities .......................................................... 35 796 35 614 30 313 35 432
Total liabilities .............................................................................. 112 232 109 433 123 972 106 634
Net assets ...................................................................................... 134 915 109 713 105 266 101 530
Equity
Retained earnings ......................................................................... 126 524 101 322 100 040 93 139Asset revaluation reserve ............................................................. 8 391 8 391 5 226 8 391
Total equity .................................................................................. 134 915 109 713 105 266 101 530
Balances as at 30 June end of period.
4.98

ADMINISTERED ITEMS FOR THE ATTORNEY-GENERAL'S DEPARTMENT
Statement of changes in equity__________________________________________________________________________________________________________________________________________________________________________________________________________________________________
Contributedcapital
$000
Assetrevaluation
reserve
$000
Retainedearnings
$000
Total
$000
Balance at 30 June 2006 ............................................................... — 8 391 93 139 101 530Adjustments .................................................................................. — — — —
Restated balance at June 2006 ...................................................... — 8 391 93 139 101 530
Net gain/loss on revaluation of property, plant and equipment during 2006-07 ............................................................................ — — — — Net changes in reserves ................................................................ — — — —
Net income/expense recognised directly in equity for 2006-07 ... — — — — Net result after restructure for 2006-07 ........................................ — — 8 183 8 183
Total recognised income and expense for 2006-07 — — 8 183 8 183
Equity contributions from SA Government ................................. — — — — Repayment of equity contributions from SA Government .......... — — — —
Estimated balance at 30 June 2007 — 8 391 101 322 109 713
Net gain/loss on revaluation of property, plant and equipment during 2007-08 ............................................................................ — — — — Net changes in reserves ................................................................ — — — —
Net income/expense recognised directly in equity for 2007-08 ... — — — — Net result after restructure for 2007-08 ........................................ — — 25 202 25 202
Total recognised income and expense for 2007-08 — — 25 202 25 202
Equity contributions from SA Government ................................. — — — — Repayment of equity contributions from SA Government .......... — — — —
Estimated balance at 30 June 2008 — 8 391 126 524 134 915
4.99

ADMINISTERED ITEMS FOR THE ATTORNEY-GENERAL'S DEPARTMENT
Cash flow statement__________________________________________________________________________________________________________________________________________________________________________________________________________________________________
2007-08Budget
$000
2006-07Estimated
result
$000
2006-07Budget
$000
2005-06Actual
$000
OPERATING ACTIVITIES:
Cash inflows
Taxation ........................................................................................ 328 697 345 164 339 822 326 872Intra government transfers ........................................................... 23 828 10 222 14 100 8 154Commonwealth receipts ............................................................... 26 484 25 931 25 931 25 406Fees, fines and penalties ............................................................... 596 575 2 1 698Sales of goods and services .......................................................... 1 720 1 693 1 693 23Interest received ........................................................................... 13 728 13 147 13 147 14 704Other receipts ............................................................................... 2 745 2 649 4 247 9 852
Cash generated from operations ................................................... 397 798 399 381 398 942 386 709
Cash outflows
Employee payments ..................................................................... 2 419 3 550 1 994 6 709Supplies and services ................................................................... 28 290 29 975 30 663 28 447Grants and subsidies ..................................................................... 33 077 33 149 34 029 33 873Net GST paid ................................................................................ — — — -21Intra government transfers ........................................................... 6 515 7 126 6 997 715Other payments ............................................................................ 358 978 375 253 371 004 369 865
Cash used in operations ................................................................ 429 279 449 053 444 687 439 588
SA GOVERNMENT:
Appropriation ............................................................................... 58 641 57 933 60 468 57 429Other receipts ............................................................................... — — — 525
Net cash provided by SA Government ......................................... 58 641 57 933 60 468 57 954
Net cash provided by (+) / used in (-) operating activities ........... 27 160 8 261 14 723 5 075
INVESTING ACTIVITIES:
Cash inflows
Proceeds from sale of property, plant and equipment .................. — — — 2
Cash generated from investing activities ..................................... — — — 2
Cash outflows
Purchase of property, plant and equipment .................................. 8 550 825 3 000 31Other payments ............................................................................ 2 410 2 410 2 410 6 108
Cash used in investing activities .................................................. 10 960 3 235 5 410 6 139
Net cash provided by (+) / used in (-) investing activities ........... -10 960 -3 235 -5 410 -6 137
Net increase (+) / decrease (-) in cash equivalents ....................... 16 200 5 026 9 313 -1 062
Cash and cash equivalents at the beginning of the financial year 80 034 75 008 77 273 76 070
Cash and cash equivalents at the end of the financial year .......... 96 234 80 034 86 586 75 008
4.100

AGENCY: ATTORNEY-GENERAL’S DEPARTMENT
Financial Commentary — major variations
The following commentary relates to the Agency Financial Statements presented in the previous section. The discussion relates to variations between the 2006-07 Estimated Result and the 2007-08 Budget.
Income statement — Controlled
The major variation in operating expenses relates to an increase in Employee benefits and costs. This is mainly due to the full year impact in 2007-08 of the transfer of Forensic Science SA from the Department for Administrative and Information Services, the Office for Women unit transferred from the Department for Families and Communities and the Office for Volunteers unit transferred from the Department of Primary Industries and Resources. This increase also includes additional funding provided for Safework SA Prosecutions and to support changes to the Real Estate Reform Bill.
The increase in Fees, fines and penalties in the 2007-08 Budget mainly reflects additional activity for licence applications within the Office of Consumer and Business Affairs and the Office of the Liquor and Gambling Commissioner.
Balance sheet — Controlled
The reduction in net assets is mainly due to an increase in long service leave liability. This is partially offset by an increase in plant and equipment. The changes are mainly due to the transfer of the Forensic Science SA unit from the Department for Administrative and Information Services.
Statement of changes in equity — Controlled
The decrease in equity in the 2007-08 Budget represents the impact of the 2007-08 Budget net result (refer Income statement).
Cash flow statement — Controlled
Changes to operating receipts and payments are consistent with the issues affecting the Income statement’s income and expenses, as reported above.
The increase in investing activities in the 2007-08 Budget is mainly due to new funding for Forensic Science SA and improving the information available for assessing applications for bail.
4.101

Administered
Income statement — Administered Items
The decrease in revenue in the 2007-08 Budget is mainly due to a decrease in Gambling Tax revenue, which is in part offset by an increase in Victims of Crime Levies (Intra-Government Transfers).
The decrease in other expenses in the 2007-08 Budget is mainly due to the corresponding payments of the Gambling Tax revenue to Consolidated Account.
Balance sheet — Administered Items
The increase in Plant and Equipment in the 2007-08 Budget is due to additional budgeted expenditure on the Computer Aided Dispatch project for 2007-08.
The increase in cash in the 2007-08 Budget is mainly due to the increase in Victims of Crime Levies.
Statement of changes in equity — Administered Items
The increase in equity in the 2007-08 Budget represents the impact of the 2007-08 Budget net result (refer Income statement).
Cash flow statement — Administered Items
Changes to operating receipts and payments are consistent with the issues affecting the Income statement’s income and expenses, as reported above.
Additional Information for Administered Items
Detailed information on Administered Items is included in the following table.
4.102
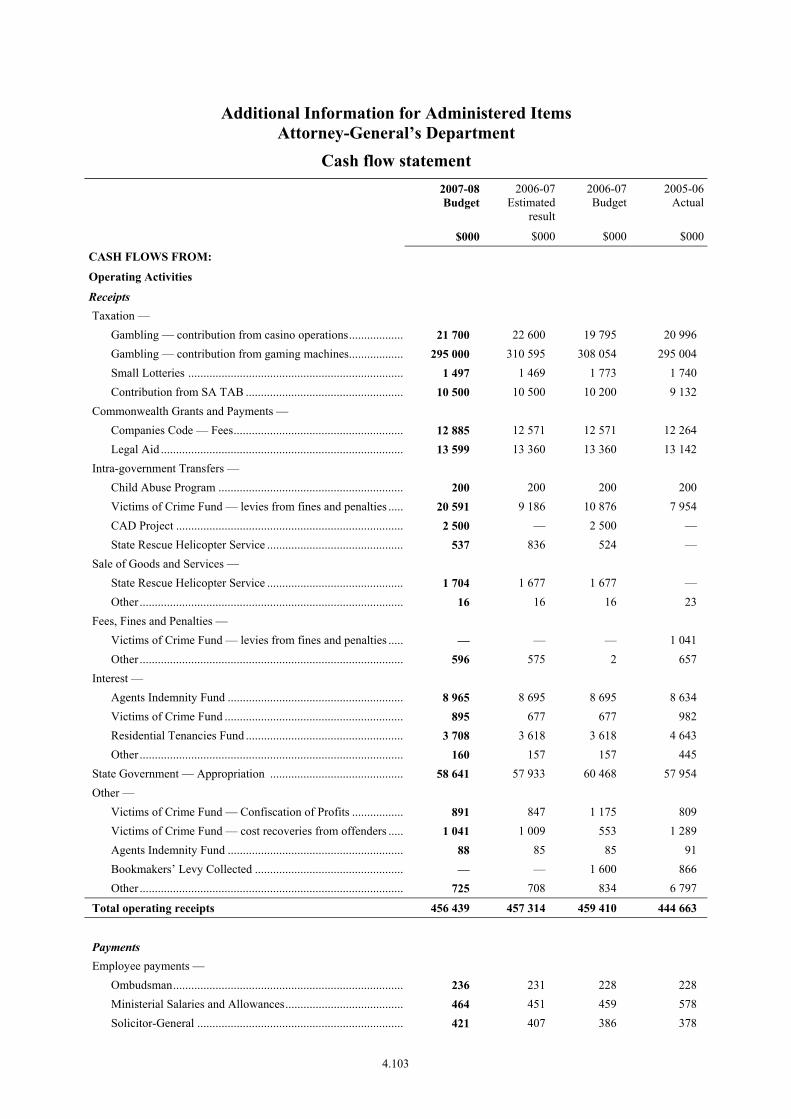
Additional Information for Administered Items Attorney-General’s Department
Cash flow statement
2007-08Budget
2006-07Estimated
result
2006-07 Budget
2005-06Actual
$000 $000 $000 $000
CASH FLOWS FROM:
Operating Activities
Receipts Taxation —
Gambling — contribution from casino operations................... 21 700 22 600 19 795 20 996 Gambling — contribution from gaming machines................... 295 000 310 595 308 054 295 004 Small Lotteries ........................................................................ 1 497 1 469 1 773 1 740 Contribution from SA TAB ..................................................... 10 500 10 500 10 200 9 132
Commonwealth Grants and Payments — Companies Code — Fees......................................................... 12 885 12 571 12 571 12 264 Legal Aid ................................................................................. 13 599 13 360 13 360 13 142
Intra-government Transfers — Child Abuse Program .............................................................. 200 200 200 200 Victims of Crime Fund — levies from fines and penalties ...... 20 591 9 186 10 876 7 954 CAD Project ............................................................................ 2 500 — 2 500 — State Rescue Helicopter Service .............................................. 537 836 524 —
Sale of Goods and Services — State Rescue Helicopter Service .............................................. 1 704 1 677 1 677 — Other ........................................................................................ 16 16 16 23
Fees, Fines and Penalties — Victims of Crime Fund — levies from fines and penalties ...... — — — 1 041 Other ........................................................................................ 596 575 2 657
Interest — Agents Indemnity Fund ........................................................... 8 965 8 695 8 695 8 634 Victims of Crime Fund ............................................................ 895 677 677 982 Residential Tenancies Fund ..................................................... 3 708 3 618 3 618 4 643 Other ........................................................................................ 160 157 157 445
State Government — Appropriation ............................................. 58 641 57 933 60 468 57 954 Other —
Victims of Crime Fund — Confiscation of Profits .................. 891 847 1 175 809 Victims of Crime Fund — cost recoveries from offenders ...... 1 041 1 009 553 1 289 Agents Indemnity Fund ........................................................... 88 85 85 91 Bookmakers’ Levy Collected .................................................. — — 1 600 866 Other ........................................................................................ 725 708 834 6 797
Total operating receipts 456 439 457 314 459 410 444 663 Payments Employee payments —
Ombudsman............................................................................. 236 231 228 228 Ministerial Salaries and Allowances........................................ 464 451 459 578 Solicitor-General ..................................................................... 421 407 386 378
4.103
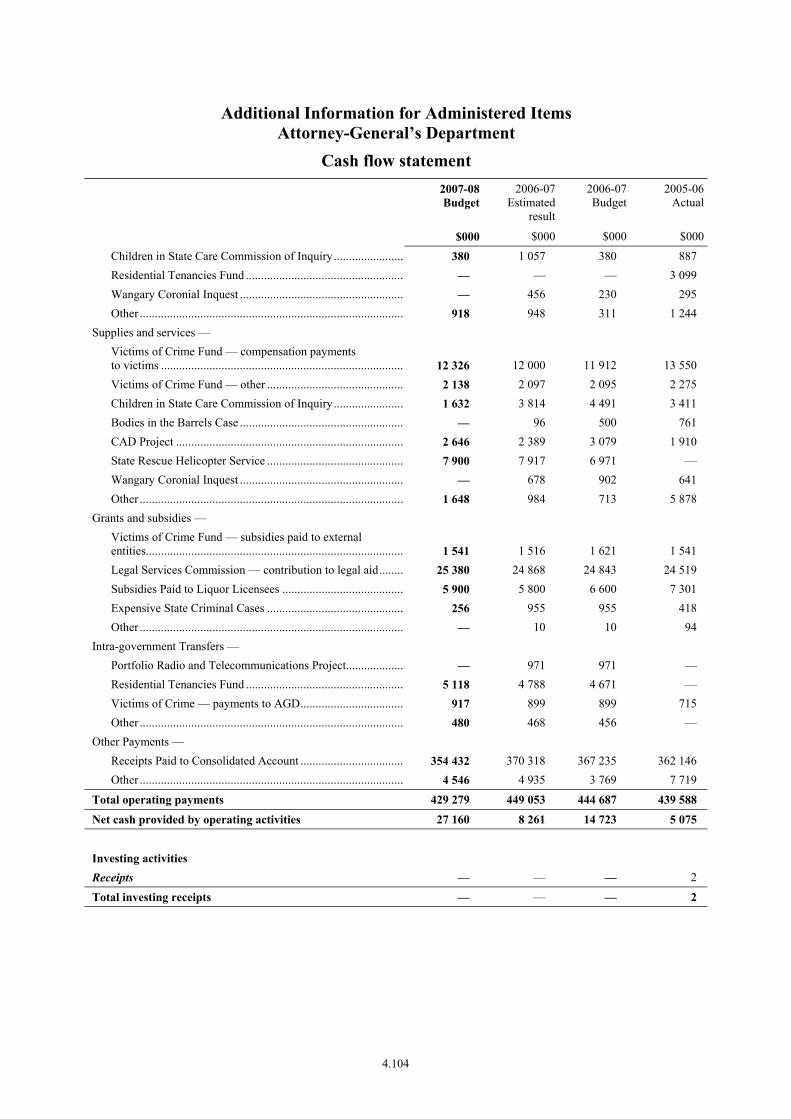
Additional Information for Administered Items Attorney-General’s Department
Cash flow statement
2007-08Budget
2006-07Estimated
result
2006-07 Budget
2005-06Actual
$000 $000 $000 $000
Children in State Care Commission of Inquiry........................ 380 1 057 380 887 Residential Tenancies Fund ..................................................... — — — 3 099 Wangary Coronial Inquest ....................................................... — 456 230 295 Other ........................................................................................ 918 948 311 1 244
Supplies and services — Victims of Crime Fund — compensation payments to victims ................................................................................. 12 326 12 000 11 912 13 550 Victims of Crime Fund — other .............................................. 2 138 2 097 2 095 2 275 Children in State Care Commission of Inquiry........................ 1 632 3 814 4 491 3 411 Bodies in the Barrels Case ....................................................... — 96 500 761 CAD Project ............................................................................ 2 646 2 389 3 079 1 910 State Rescue Helicopter Service .............................................. 7 900 7 917 6 971 — Wangary Coronial Inquest ....................................................... — 678 902 641 Other ........................................................................................ 1 648 984 713 5 878
Grants and subsidies — Victims of Crime Fund — subsidies paid to external entities...................................................................................... 1 541 1 516 1 621 1 541 Legal Services Commission — contribution to legal aid......... 25 380 24 868 24 843 24 519 Subsidies Paid to Liquor Licensees ......................................... 5 900 5 800 6 600 7 301 Expensive State Criminal Cases .............................................. 256 955 955 418 Other ........................................................................................ — 10 10 94
Intra-government Transfers — Portfolio Radio and Telecommunications Project.................... — 971 971 — Residential Tenancies Fund ..................................................... 5 118 4 788 4 671 — Victims of Crime — payments to AGD................................... 917 899 899 715 Other ........................................................................................ 480 468 456 —
Other Payments — Receipts Paid to Consolidated Account ................................... 354 432 370 318 367 235 362 146 Other ........................................................................................ 4 546 4 935 3 769 7 719
Total operating payments 429 279 449 053 444 687 439 588
Net cash provided by operating activities 27 160 8 261 14 723 5 075 Investing activities Receipts — — — 2
Total investing receipts — — — 2
4.104

Additional Information for Administered Items Attorney-General’s Department
Cash flow statement
2007-08Budget
2006-07Estimated
result
2006-07 Budget
2005-06Actual
$000 $000 $000 $000
Payments Purchase of Property, Plant and Equipment —
CAD Project ............................................................................ 8 200 800 3 000 17 Other ........................................................................................ 350 25 — 14
Purchase of Shares and Investments — Agents Indemnity Fund ........................................................... 2 410 2 410 2 410 2 115 Residential Tenancies Fund ..................................................... — — — 3 708 Other ........................................................................................ — — — 285
Total investing payments 10 960 3 235 5 410 6 139
Net cash provided by investing activities -10 960 -3 235 -5 410 -6 137
Net Increase (+) / decrease (-) in cash held 16 200 5 026 9 313 -1 062
Opening cash balance as at 1 July 80 034 75 008 77 273 76 070
Closing cash balance as at 30 June 96 234 80 034 86 586 75 008
4.105

TABLE OF CONTENTS
AGENCY: COURTS ADMINISTRATION AUTHORITY
Objective ........................................................................................................................................4.107
Targets / Highlights ........................................................................................................................4.107
Program Net Cost of Services Summary........................................................................................4.108
Investing Payments Summary ........................................................................................................4.108
Program Information — includes description/objective, Summary income statement, sub-program information including performance criteria
1. Court and Tribunal Case Resolution Services ..............................................................4.109
2. Alternative Dispute Resolution Services ......................................................................4.114
3. Penalty Management Services ......................................................................................4.116
Financial Statements
Income statement .................................................................................................................4.118
Balance sheet........................................................................................................................4.119
Statement of changes in equity ............................................................................................4.120
Cash flow statement .............................................................................................................4.121
Income statement — Administered Items............................................................................4.123
Balance sheet — Administered Items ..................................................................................4.124
Statement of changes in equity — Administered Items.......................................................4.125
Cash flow statement — Administered Items .......................................................................4.126
Financial Commentary ...................................................................................................................4.127
4.106

PORTFOLIO: JUSTICE
AGENCY: COURTS ADMINISTRATION AUTHORITY
Objectives
The South Australian courts exist to administer justice on behalf of the people of South Australia.
The State Courts Administration Council, directly and through the efforts of all the staff and volunteers of the Courts Administration Authority, aims to:
• provide administrative support to the courts of this state;
• increase the community’s understanding of the operations of the courts and provide new avenues for community comment on the operations of the courts and their registries;
• improve court facilities;
• foster an environment in which judicial officers, staff and volunteers can contribute to improved performance of the courts system;
• keep up to date with technological developments and apply those that are appropriate to improve the performance of the courts system; and
• co-operate with other parts of the justice system to improve access to justice and the overall performance of the justice system.
2007-08 Targets / 2006-07 Highlights
Targets 2007-08 Highlights 2006-07
• Implement remaining recommendations of the Criminal Listings Review
• Assess the impact of the recommendations of the Criminal Justice Ministerial Task Force
• Implementation of the Evidence (Suppression Orders) Amendment Act 2007
• Establish dedicated court facilities at Amata • Commence implementation and installation of video
conferencing facilities in courts • Increase use of Special Justice of the Peace courts • Audit of court infrastructure • Increase the maximum amount payable to jurors for income
reimbursement and travel expenses
• Partially implemented recommendations of the Criminal Listings Review
• Established Court Assessment and Referral Drug Scheme at Mount Gambier
• Introduced a drug intervention program into the Nunga Court at Port Adelaide
• Completed the Port Augusta and Port Lincoln Courts developments
• Implemented the use of electronic transcripts in the Court of Criminal Appeal as a cost effective method of improving courtroom and administrative staff efficiency
• Establishment of Special Justices of the Peace in Magistrates Courts at Elizabeth and Port Adelaide
• Appointment of two part-time Stipendiary Magistrates
4.107
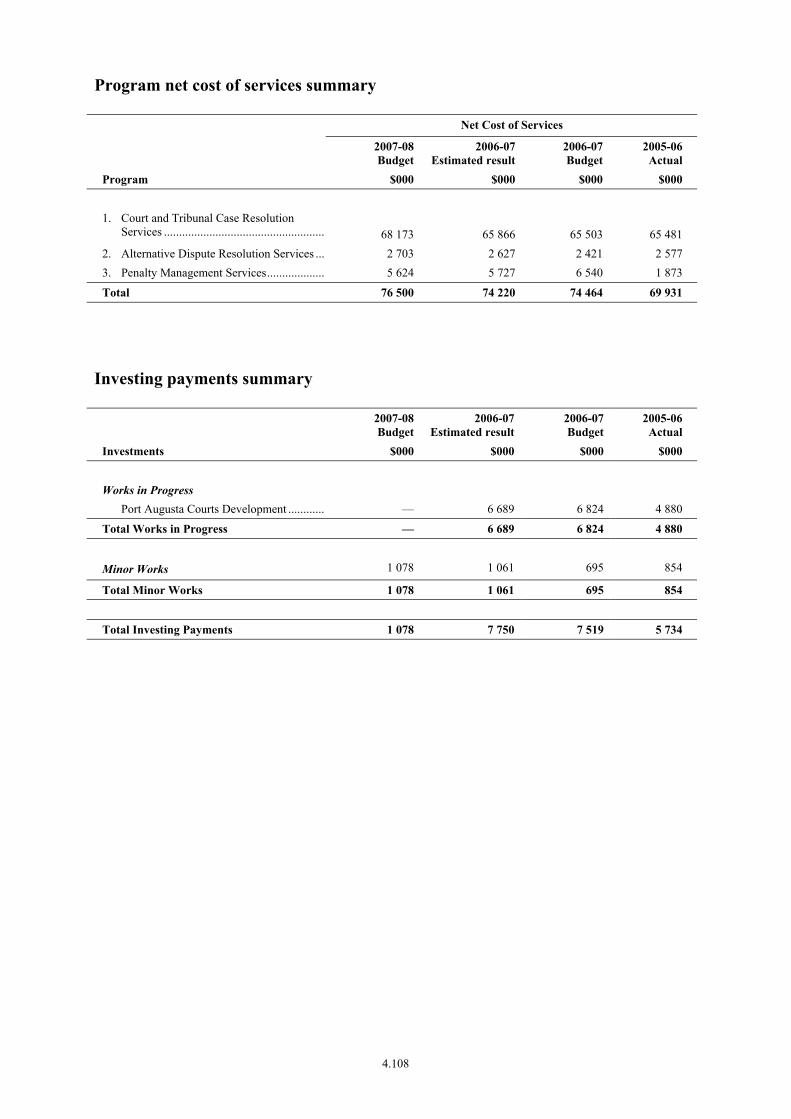
Program net cost of services summary
Net Cost of Services
2007-08Budget
2006-07Estimated result
2006-07 Budget
2005-06 Actual
Program $000 $000 $000 $000 1. Court and Tribunal Case Resolution
Services ......................................................
68 173
65 866
65 503
65 481 2. Alternative Dispute Resolution Services .... 2 703 2 627 2 421 2 577 3. Penalty Management Services.................... 5 624 5 727 6 540 1 873
Total 76 500 74 220 74 464 69 931
Investing payments summary
2007-08Budget
2006-07Estimated result
2006-07 Budget
2005-06 Actual
Investments $000 $000 $000 $000
Works in Progress
Port Augusta Courts Development ............ — 6 689 6 824 4 880
Total Works in Progress — 6 689 6 824 4 880
Minor Works 1 078 1 061 695 854
Total Minor Works 1 078 1 061 695 854
Total Investing Payments 1 078 7 750 7 519 5 734
4.108
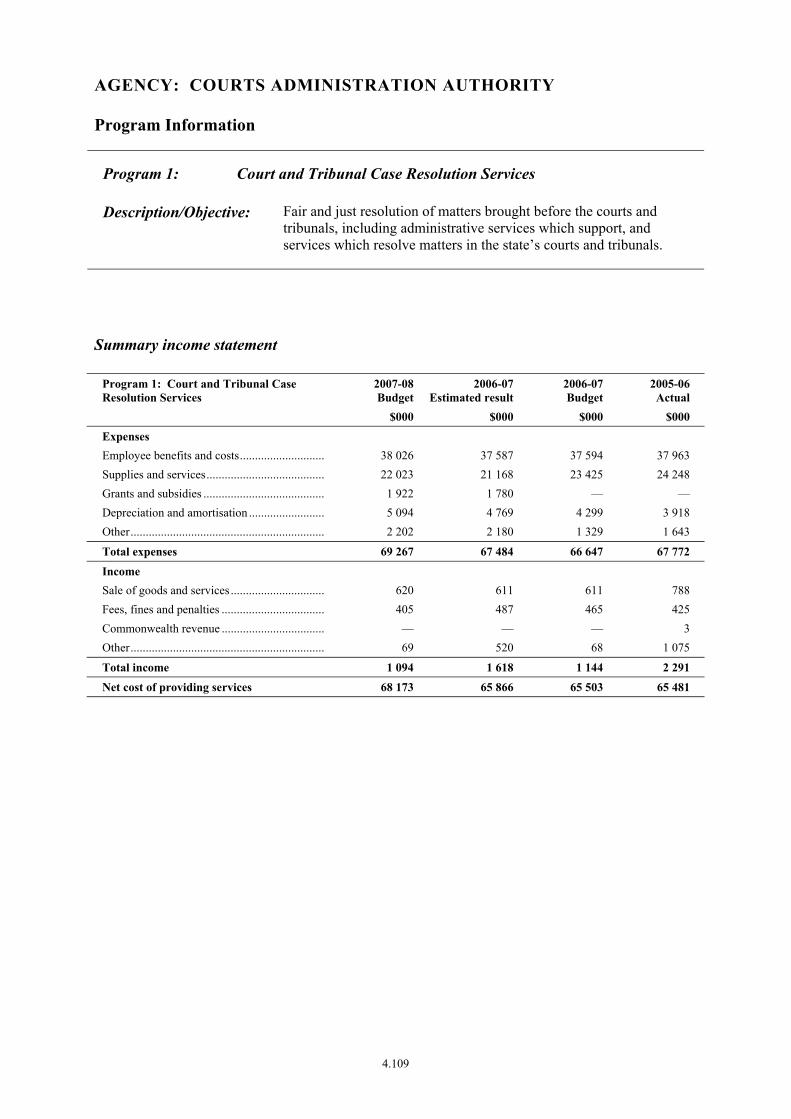
AGENCY: COURTS ADMINISTRATION AUTHORITY
Program Information
Program 1: Court and Tribunal Case Resolution Services
Description/Objective: Fair and just resolution of matters brought before the courts and tribunals, including administrative services which support, and services which resolve matters in the state’s courts and tribunals.
Summary income statement
Program 1: Court and Tribunal Case Resolution Services
2007-08Budget
2006-07Estimated result
2006-07 Budget
2005-06 Actual
$000 $000 $000 $000
Expenses Employee benefits and costs............................. 38 026 37 587 37 594 37 963 Supplies and services........................................ 22 023 21 168 23 425 24 248 Grants and subsidies ......................................... 1 922 1 780 — — Depreciation and amortisation .......................... 5 094 4 769 4 299 3 918 Other................................................................. 2 202 2 180 1 329 1 643
Total expenses 69 267 67 484 66 647 67 772
Income Sale of goods and services................................ 620 611 611 788 Fees, fines and penalties ................................... 405 487 465 425 Commonwealth revenue ................................... — — — 3 Other................................................................. 69 520 68 1 075
Total income 1 094 1 618 1 144 2 291
Net cost of providing services 68 173 65 866 65 503 65 481
4.109
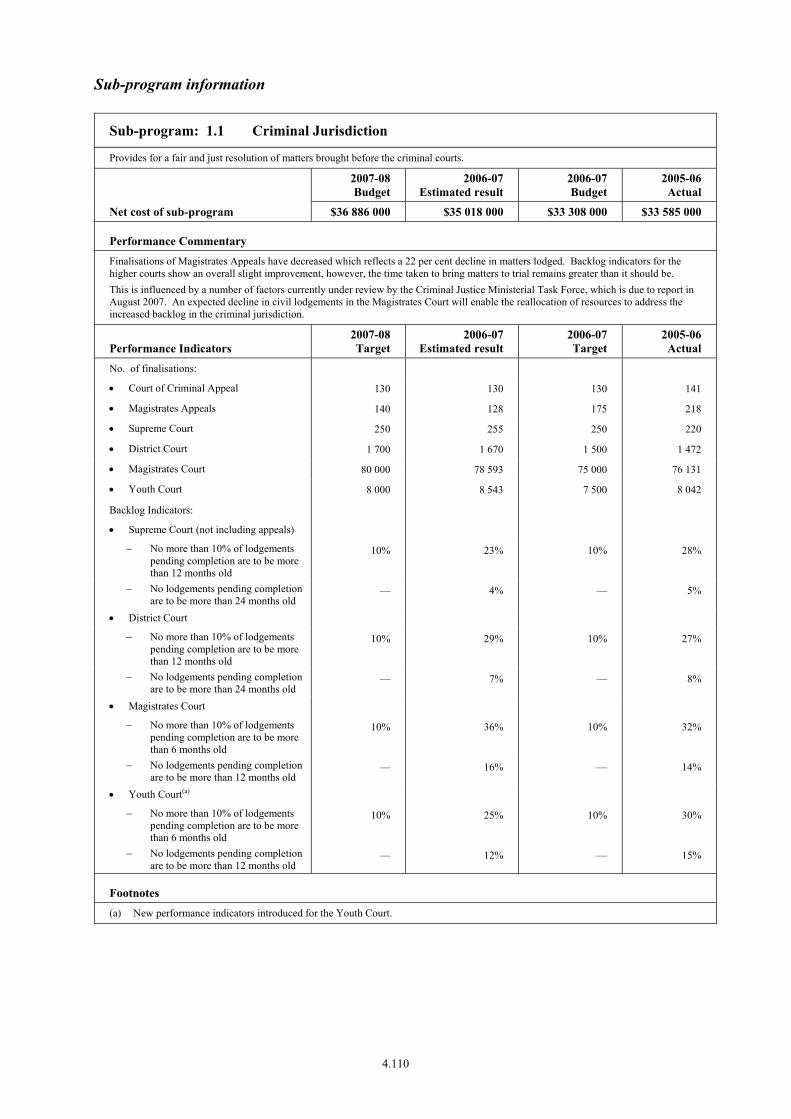
Sub-program information
Sub-program: 1.1 Criminal Jurisdiction
Provides for a fair and just resolution of matters brought before the criminal courts.
2007-08 Budget
2006-07 Estimated result
2006-07 Budget
2005-06 Actual
Net cost of sub-program $36 886 000 $35 018 000 $33 308 000 $33 585 000
Performance Commentary Finalisations of Magistrates Appeals have decreased which reflects a 22 per cent decline in matters lodged. Backlog indicators for the higher courts show an overall slight improvement, however, the time taken to bring matters to trial remains greater than it should be. This is influenced by a number of factors currently under review by the Criminal Justice Ministerial Task Force, which is due to report in August 2007. An expected decline in civil lodgements in the Magistrates Court will enable the reallocation of resources to address the increased backlog in the criminal jurisdiction.
Performance Indicators 2007-08 Target
2006-07 Estimated result
2006-07 Target
2005-06 Actual
No. of finalisations:
• Court of Criminal Appeal 130 130 130 141
• Magistrates Appeals 140 128 175 218
• Supreme Court 250 255 250 220
• District Court 1 700 1 670 1 500 1 472
• Magistrates Court 80 000 78 593 75 000 76 131
• Youth Court 8 000 8 543 7 500 8 042
Backlog Indicators:
• Supreme Court (not including appeals)
− No more than 10% of lodgements pending completion are to be more than 12 months old
10% 23% 10% 28%
− No lodgements pending completion are to be more than 24 months old
— 4% — 5%
• District Court
− No more than 10% of lodgements pending completion are to be more than 12 months old
10% 29% 10% 27%
− No lodgements pending completion are to be more than 24 months old
— 7% — 8%
• Magistrates Court
− No more than 10% of lodgements pending completion are to be more than 6 months old
10% 36% 10% 32%
− No lodgements pending completion are to be more than 12 months old
— 16% — 14%
• Youth Court(a)
− No more than 10% of lodgements pending completion are to be more than 6 months old
10% 25% 10% 30%
− No lodgements pending completion are to be more than 12 months old
— 12% — 15%
Footnotes (a) New performance indicators introduced for the Youth Court.
4.110
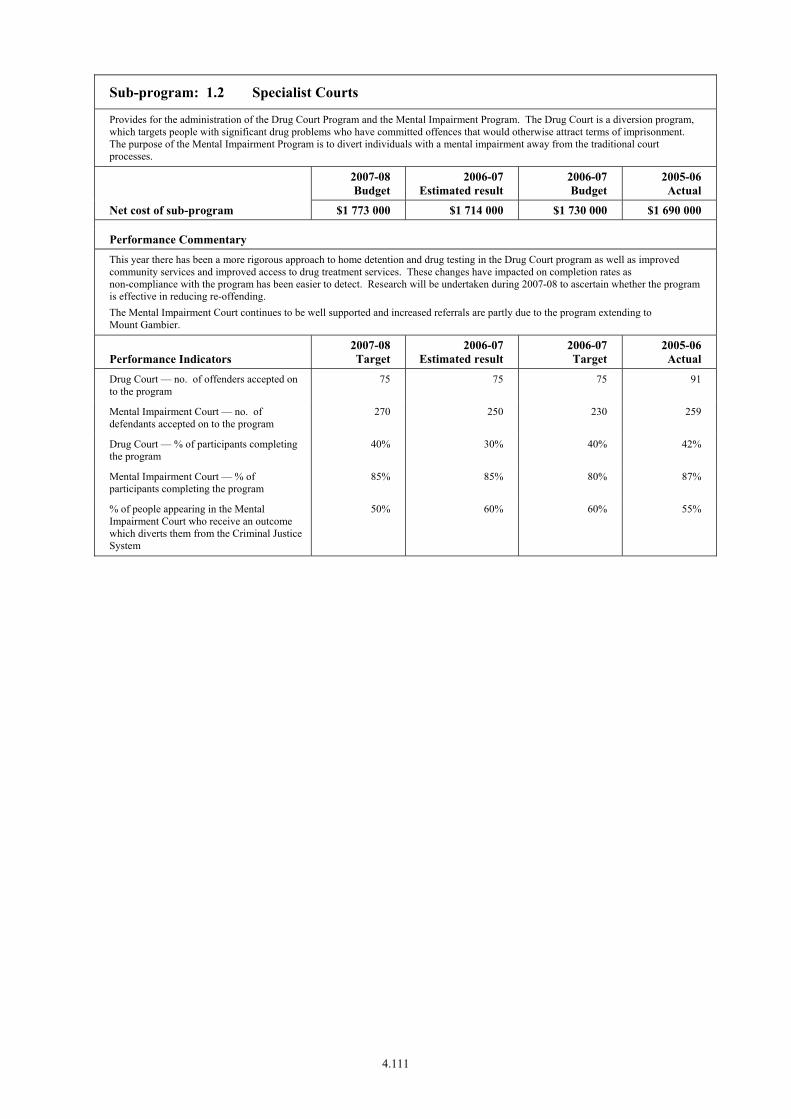
Sub-program: 1.2 Specialist Courts
Provides for the administration of the Drug Court Program and the Mental Impairment Program. The Drug Court is a diversion program, which targets people with significant drug problems who have committed offences that would otherwise attract terms of imprisonment. The purpose of the Mental Impairment Program is to divert individuals with a mental impairment away from the traditional court processes.
2007-08 Budget
2006-07 Estimated result
2006-07 Budget
2005-06 Actual
Net cost of sub-program $1 773 000 $1 714 000 $1 730 000 $1 690 000
Performance Commentary This year there has been a more rigorous approach to home detention and drug testing in the Drug Court program as well as improved community services and improved access to drug treatment services. These changes have impacted on completion rates as non-compliance with the program has been easier to detect. Research will be undertaken during 2007-08 to ascertain whether the program is effective in reducing re-offending. The Mental Impairment Court continues to be well supported and increased referrals are partly due to the program extending to Mount Gambier.
Performance Indicators 2007-08 Target
2006-07 Estimated result
2006-07 Target
2005-06 Actual
Drug Court — no. of offenders accepted on to the program
75 75 75 91
Mental Impairment Court — no. of defendants accepted on to the program
270 250 230 259
Drug Court — % of participants completing the program
40% 30% 40% 42%
Mental Impairment Court — % of participants completing the program
85% 85% 80% 87%
% of people appearing in the Mental Impairment Court who receive an outcome which diverts them from the Criminal Justice System
50% 60% 60% 55%
4.111
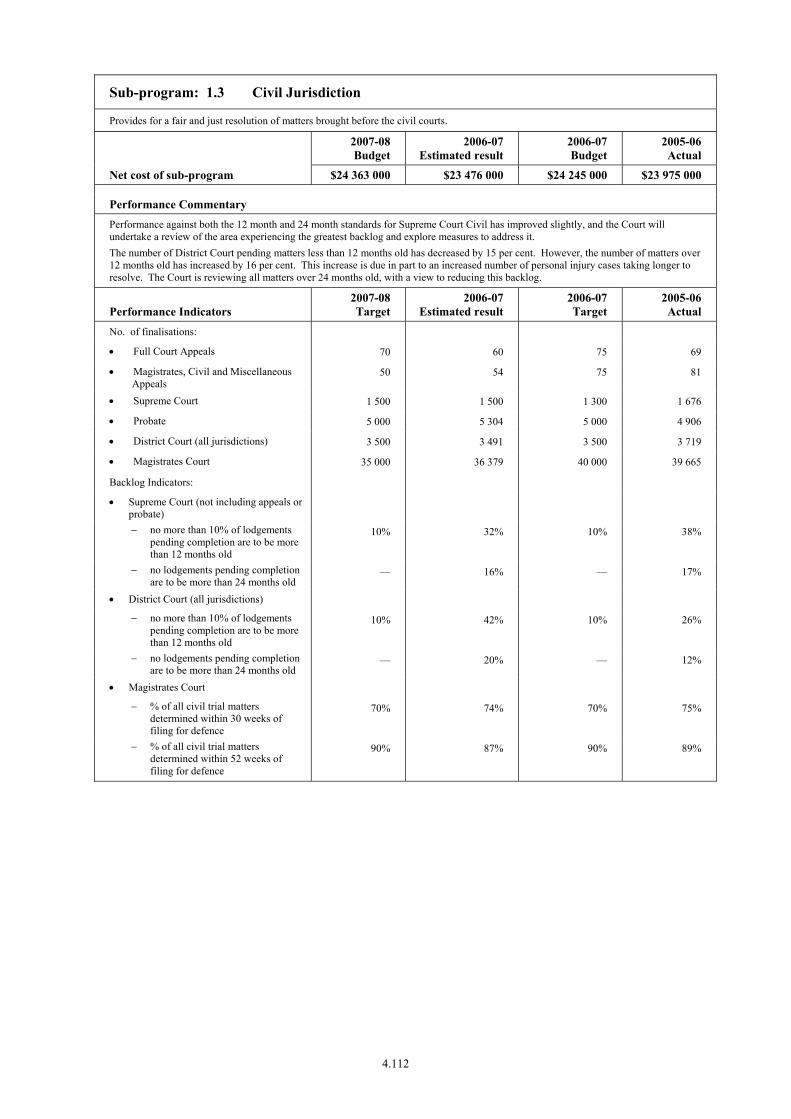
Sub-program: 1.3 Civil Jurisdiction
Provides for a fair and just resolution of matters brought before the civil courts.
2007-08 Budget
2006-07 Estimated result
2006-07 Budget
2005-06 Actual
Net cost of sub-program $24 363 000 $23 476 000 $24 245 000 $23 975 000
Performance Commentary Performance against both the 12 month and 24 month standards for Supreme Court Civil has improved slightly, and the Court will undertake a review of the area experiencing the greatest backlog and explore measures to address it. The number of District Court pending matters less than 12 months old has decreased by 15 per cent. However, the number of matters over 12 months old has increased by 16 per cent. This increase is due in part to an increased number of personal injury cases taking longer to resolve. The Court is reviewing all matters over 24 months old, with a view to reducing this backlog.
Performance Indicators 2007-08 Target
2006-07 Estimated result
2006-07 Target
2005-06 Actual
No. of finalisations:
• Full Court Appeals 70 60 75 69
• Magistrates, Civil and Miscellaneous Appeals
50 54 75 81
• Supreme Court 1 500 1 500 1 300 1 676
• Probate 5 000 5 304 5 000 4 906
• District Court (all jurisdictions) 3 500 3 491 3 500 3 719
• Magistrates Court 35 000 36 379 40 000 39 665
Backlog Indicators:
• Supreme Court (not including appeals or probate)
− no more than 10% of lodgements pending completion are to be more than 12 months old
10% 32% 10% 38%
− no lodgements pending completion are to be more than 24 months old
— 16% — 17%
• District Court (all jurisdictions)
− no more than 10% of lodgements pending completion are to be more than 12 months old
10% 42% 10% 26%
− no lodgements pending completion are to be more than 24 months old
— 20% — 12%
• Magistrates Court
− % of all civil trial matters determined within 30 weeks of filing for defence
70% 74% 70% 75%
− % of all civil trial matters determined within 52 weeks of filing for defence
90% 87% 90% 89%
4.112

Sub-program: 1.4 Coroner
Provides for the independent enquiry and investigation of matters relating to the loss of life, disappearance of individuals and injury to people and property from accidents and fires.
2007-08 Budget
2006-07 Estimated result
2006-07 Budget
2005-06 Actual
Net cost of sub-program $5 151 000 $5 658 000 $6 220 000 $6 231 000
Performance Commentary It has taken time for the full impact of legislative changes made to be reflected in the number of cases reported to the Coroner. The delay in completing matters is primarily as a result of increased time taken by external parties to lodge expert opinion reports to the Coroner.
Performance Indicators 2007-08 Target
2006-07 Estimated result
2006-07 Target
2005-06 Actual
No. of finalisations:
• Coroner 1 700 1 764 2 400 2 239
Backlog Indicators:
• No more than 10% of lodgements pending completion are to be more than 12 months old
10% 21% 10% 29%
• No lodgements pending completion are to be more than 24 months old
— 9% — 13%
4.113
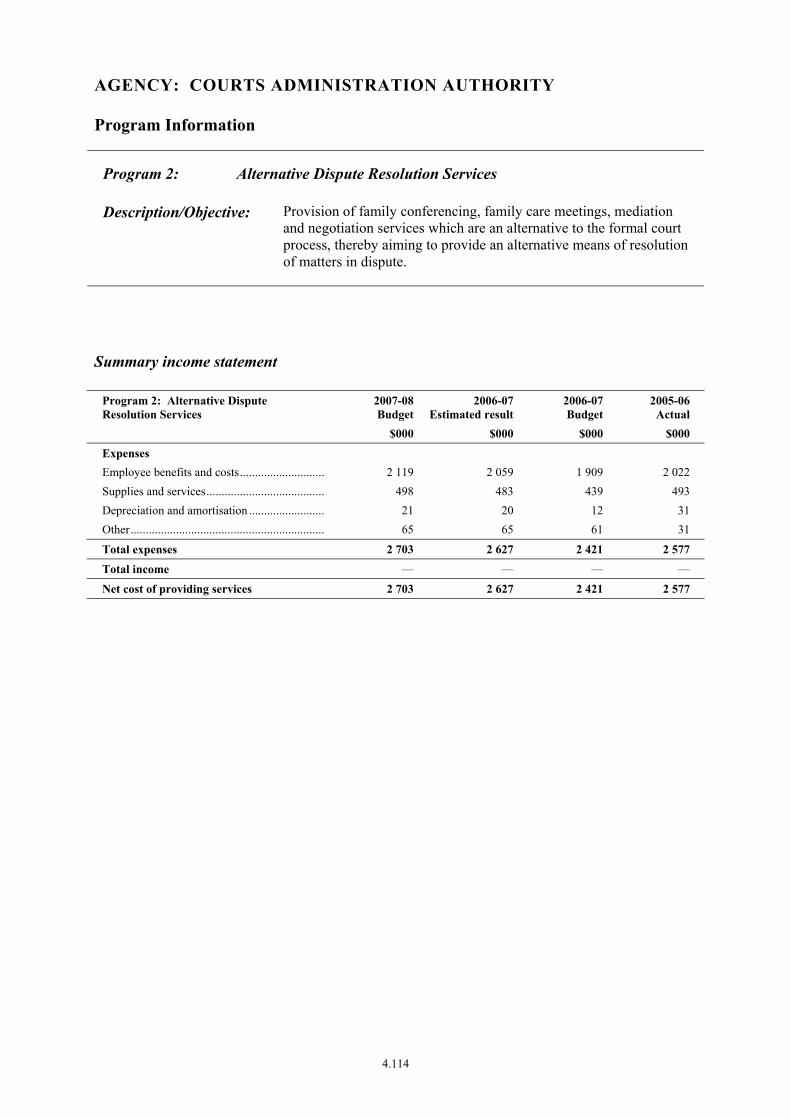
AGENCY: COURTS ADMINISTRATION AUTHORITY
Program Information
Program 2: Alternative Dispute Resolution Services
Description/Objective: Provision of family conferencing, family care meetings, mediation and negotiation services which are an alternative to the formal court process, thereby aiming to provide an alternative means of resolution of matters in dispute.
Summary income statement
Program 2: Alternative Dispute Resolution Services
2007-08Budget
2006-07Estimated result
2006-07 Budget
2005-06 Actual
$000 $000 $000 $000
Expenses Employee benefits and costs............................. 2 119 2 059 1 909 2 022 Supplies and services........................................ 498 483 439 493 Depreciation and amortisation .......................... 21 20 12 31 Other................................................................. 65 65 61 31
Total expenses 2 703 2 627 2 421 2 577
Total income — — — —
Net cost of providing services 2 703 2 627 2 421 2 577
4.114
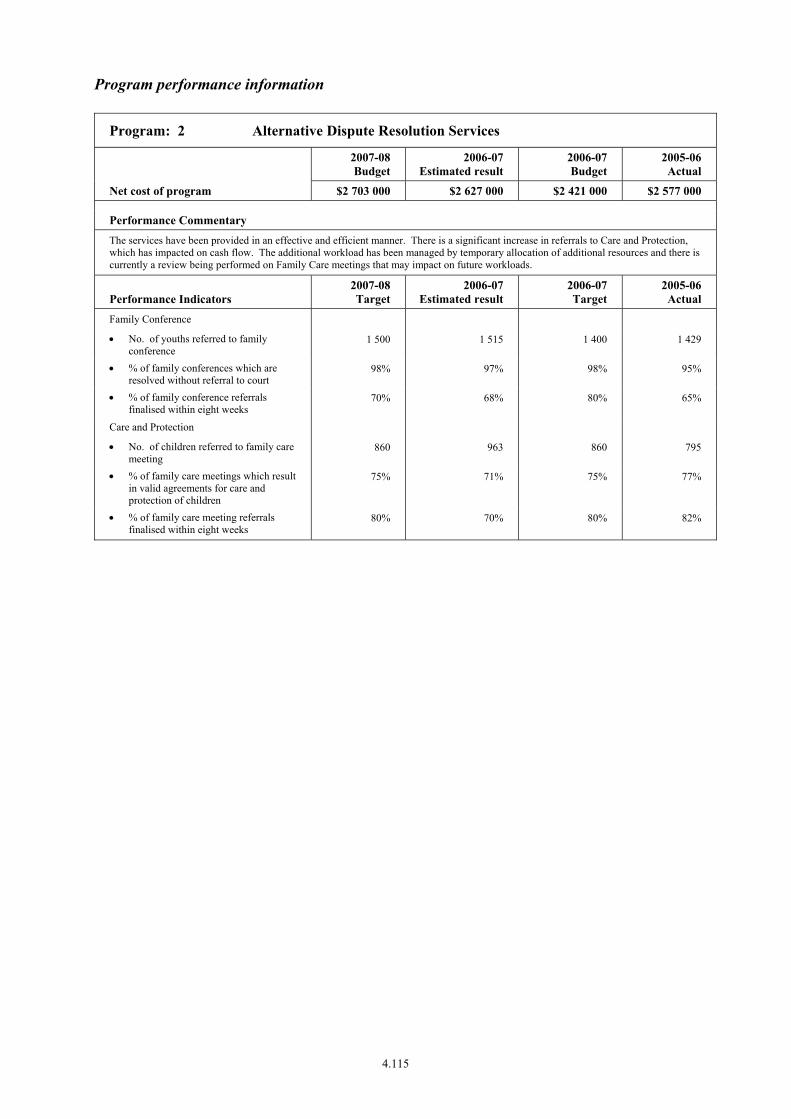
Program performance information
Program: 2 Alternative Dispute Resolution Services
2007-08 Budget
2006-07 Estimated result
2006-07 Budget
2005-06 Actual
Net cost of program $2 703 000 $2 627 000 $2 421 000 $2 577 000
Performance Commentary The services have been provided in an effective and efficient manner. There is a significant increase in referrals to Care and Protection, which has impacted on cash flow. The additional workload has been managed by temporary allocation of additional resources and there is currently a review being performed on Family Care meetings that may impact on future workloads.
Performance Indicators 2007-08 Target
2006-07 Estimated result
2006-07 Target
2005-06 Actual
Family Conference
• No. of youths referred to family conference
1 500 1 515 1 400 1 429
• % of family conferences which are resolved without referral to court
98% 97% 98% 95%
• % of family conference referrals finalised within eight weeks
70% 68% 80% 65%
Care and Protection
• No. of children referred to family care meeting
860 963 860 795
• % of family care meetings which result in valid agreements for care and protection of children
75% 71% 75% 77%
• % of family care meeting referrals finalised within eight weeks
80% 70% 80% 82%
4.115

AGENCY: COURTS ADMINISTRATION AUTHORITY
Program Information
Program 3: Penalty Management Services
Description/Objective: Dealing with penalties arising from court orders, the enforcement of court orders, recovery of debts and the administration and execution of warrants, thus managing the finalisation of penalties imposed by the courts.
Summary income statement
Program 3: Penalty Management Services
2007-08Budget
2006-07Estimated result
2006-07 Budget
2005-06 Actual
$000 $000 $000 $000
Expenses Employee benefits and costs............................. 6 693 6 446 7 792 3 685 Supplies and services........................................ 2 852 2 766 1 846 1 830 Depreciation and amortisation .......................... 86 81 46 70 Other................................................................. 309 306 156 182
Total expenses 9 940 9 599 9 840 5 767
Income Sale of goods and services................................ 19 19 19 532 Fees, fines and penalties ................................... 4 297 3 853 3 281 3 233 Other................................................................. — — — 129
Total income 4 316 3 872 3 300 3 894
Net cost of providing services 5 624 5 727 6 540 1 873
4.116
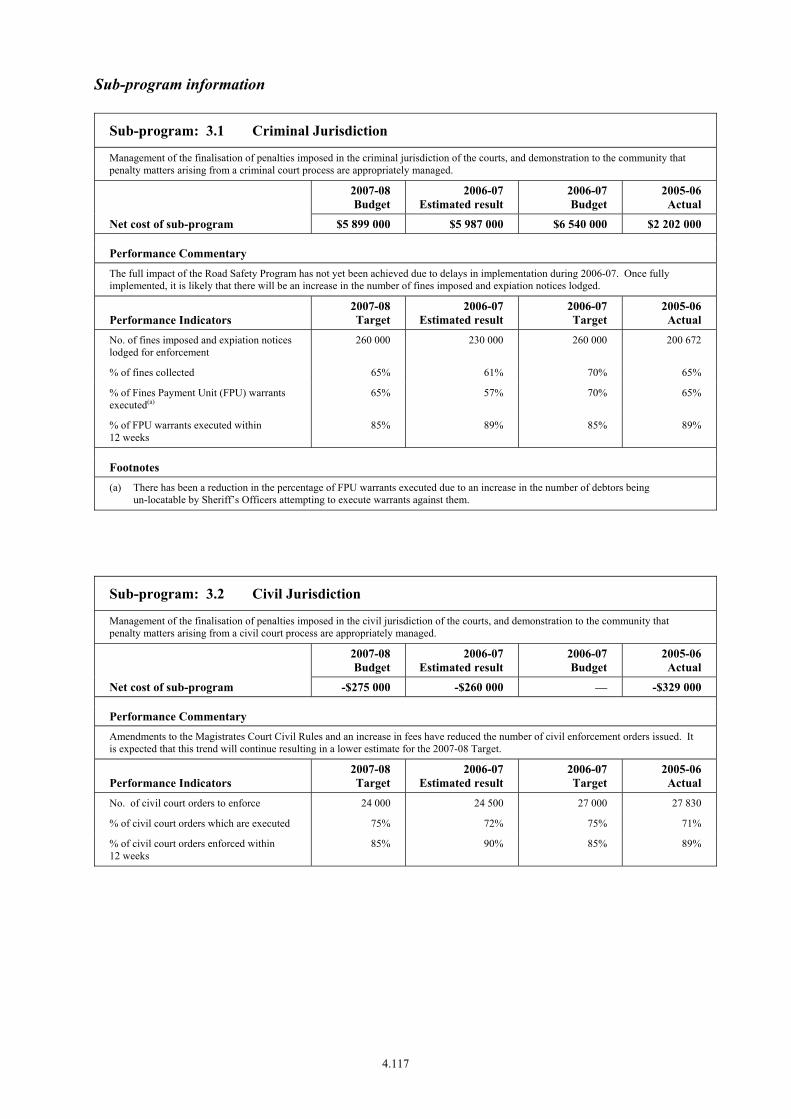
Sub-program information
Sub-program: 3.1 Criminal Jurisdiction
Management of the finalisation of penalties imposed in the criminal jurisdiction of the courts, and demonstration to the community that penalty matters arising from a criminal court process are appropriately managed.
2007-08 Budget
2006-07 Estimated result
2006-07 Budget
2005-06 Actual
Net cost of sub-program $5 899 000 $5 987 000 $6 540 000 $2 202 000
Performance Commentary The full impact of the Road Safety Program has not yet been achieved due to delays in implementation during 2006-07. Once fully implemented, it is likely that there will be an increase in the number of fines imposed and expiation notices lodged.
Performance Indicators 2007-08 Target
2006-07 Estimated result
2006-07 Target
2005-06 Actual
No. of fines imposed and expiation notices lodged for enforcement
260 000 230 000 260 000 200 672
% of fines collected 65% 61% 70% 65%
% of Fines Payment Unit (FPU) warrants executed(a)
65% 57% 70% 65%
% of FPU warrants executed within 12 weeks
85% 89% 85% 89%
Footnotes (a) There has been a reduction in the percentage of FPU warrants executed due to an increase in the number of debtors being
un-locatable by Sheriff’s Officers attempting to execute warrants against them.
Sub-program: 3.2 Civil Jurisdiction
Management of the finalisation of penalties imposed in the civil jurisdiction of the courts, and demonstration to the community that penalty matters arising from a civil court process are appropriately managed.
2007-08 Budget
2006-07 Estimated result
2006-07 Budget
2005-06 Actual
Net cost of sub-program -$275 000 -$260 000 — -$329 000
Performance Commentary Amendments to the Magistrates Court Civil Rules and an increase in fees have reduced the number of civil enforcement orders issued. It is expected that this trend will continue resulting in a lower estimate for the 2007-08 Target.
Performance Indicators 2007-08 Target
2006-07 Estimated result
2006-07 Target
2005-06 Actual
No. of civil court orders to enforce 24 000 24 500 27 000 27 830
% of civil court orders which are executed 75% 72% 75% 71%
% of civil court orders enforced within 12 weeks
85% 90% 85% 89%
4.117
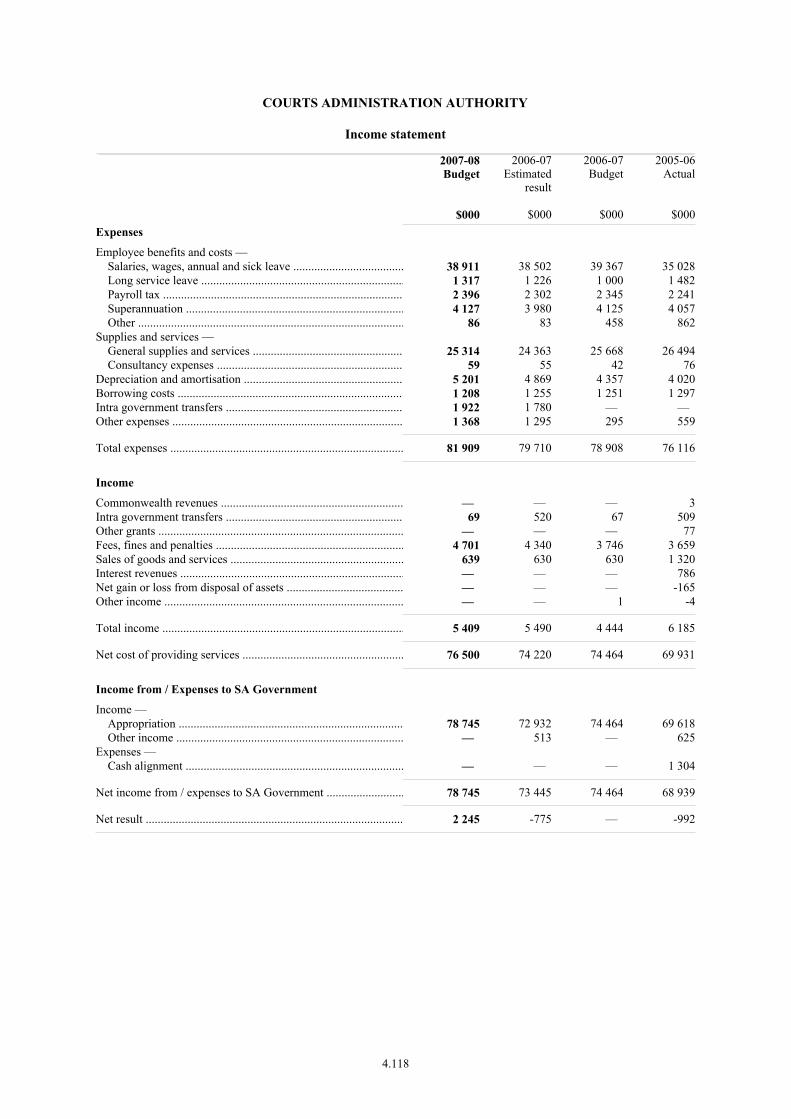
COURTS ADMINISTRATION AUTHORITY
Income statement__________________________________________________________________________________________________________________________________________________________________________________________________________________________________
2007-08Budget
$000
2006-07Estimated
result
$000
2006-07Budget
$000
2005-06Actual
$000Expenses
Employee benefits and costs — Salaries, wages, annual and sick leave ..................................... 38 911 38 502 39 367 35 028 Long service leave .................................................................... 1 317 1 226 1 000 1 482 Payroll tax ................................................................................ 2 396 2 302 2 345 2 241 Superannuation ......................................................................... 4 127 3 980 4 125 4 057 Other ......................................................................................... 86 83 458 862Supplies and services — General supplies and services .................................................. 25 314 24 363 25 668 26 494 Consultancy expenses .............................................................. 59 55 42 76Depreciation and amortisation ..................................................... 5 201 4 869 4 357 4 020Borrowing costs ............................................................................ 1 208 1 255 1 251 1 297Intra government transfers ........................................................... 1 922 1 780 — — Other expenses ............................................................................. 1 368 1 295 295 559
Total expenses .............................................................................. 81 909 79 710 78 908 76 116
Income
Commonwealth revenues ............................................................. — — — 3Intra government transfers ........................................................... 69 520 67 509Other grants .................................................................................. — — — 77Fees, fines and penalties ............................................................... 4 701 4 340 3 746 3 659Sales of goods and services .......................................................... 639 630 630 1 320Interest revenues ........................................................................... — — — 786Net gain or loss from disposal of assets ....................................... — — — -165Other income ................................................................................ — — 1 -4
Total income ................................................................................. 5 409 5 490 4 444 6 185
Net cost of providing services ...................................................... 76 500 74 220 74 464 69 931
Income from / Expenses to SA Government
Income — Appropriation ........................................................................... 78 745 72 932 74 464 69 618 Other income ............................................................................ — 513 — 625Expenses — Cash alignment ......................................................................... — — — 1 304
Net income from / expenses to SA Government .......................... 78 745 73 445 74 464 68 939
Net result ...................................................................................... 2 245 -775 — -992
4.118

COURTS ADMINISTRATION AUTHORITY
Balance sheet__________________________________________________________________________________________________________________________________________________________________________________________________________________________________
2007-08Budget
$000
2006-07Estimated
result
$000
2006-07Budget
$000
2005-06Actual
$000Assets
Current assets
Cash and cash equivalents ............................................................ 21 920 14 322 11 395 17 534Receivables ................................................................................... 684 684 404 682Other current assets ...................................................................... 162 162 175 162
Total current assets ....................................................................... 22 766 15 168 11 974 18 378
Non current assets
Land and improvements ............................................................... 118 749 122 573 106 763 118 908Plant and equipment ..................................................................... 10 226 11 142 4 866 11 926Heritage assets .............................................................................. 69 69 498 69
Total non-current assets ............................................................... 129 044 133 784 112 127 130 903
Total assets ................................................................................... 151 810 148 952 124 101 149 281
Liabilities
Current liabilities
Payables ........................................................................................ 3 484 3 437 2 418 3 388Employee benefits — Salaries and wages ................................................................... 1 625 1 516 723 1 407 Annual leave ............................................................................. 1 703 1 673 2 078 2 314 Long service leave .................................................................... 819 770 533 653 Other ......................................................................................... — — -8 — Short-term provisions ................................................................... 738 694 453 501Other current liabilities ................................................................. 919 869 867 823
Total current liabilities ................................................................. 9 288 8 959 7 064 9 086
Non current liabilities
Long-term borrowings .................................................................. 20 088 21 007 21 054 21 876Long-term employee benefits — Annual leave ............................................................................. 92 92 238 330 Long service leave .................................................................... 9 658 8 589 6 963 7 003Long-term provisions ................................................................... 2 233 2 099 2 339 2 005
Total non-current liabilities .......................................................... 32 071 31 787 30 594 31 214
Total liabilities .............................................................................. 41 359 40 746 37 658 40 300
Net assets ...................................................................................... 110 451 108 206 86 443 108 981
Equity
Contributed capital ....................................................................... 3 140 3 140 3 140 3 140Retained earnings ......................................................................... 77 756 75 511 75 934 76 286Asset revaluation reserve ............................................................. 29 555 29 555 7 369 29 555
Total equity .................................................................................. 110 451 108 206 86 443 108 981
Balances as at 30 June end of period.
4.119

COURTS ADMINISTRATION AUTHORITY
Statement of changes in equity__________________________________________________________________________________________________________________________________________________________________________________________________________________________________
Contributedcapital
$000
Assetrevaluation
reserve
$000
Retainedearnings
$000
Total
$000
Balance at 30 June 2006 ............................................................... 3 140 29 555 76 286 108 981Adjustments .................................................................................. — — — —
Restated balance at June 2006 ...................................................... 3 140 29 555 76 286 108 981
Net gain/loss on revaluation of property, plant and equipment during 2006-07 ............................................................................ — — — — Net changes in reserves ................................................................ — — — —
Net income/expense recognised directly in equity for 2006-07 ... — — — — Net result after restructure for 2006-07 ........................................ — — -775 -775
Total recognised income and expense for 2006-07 — — -775 -775
Equity contributions from SA Government ................................. — — — — Repayment of equity contributions from SA Government .......... — — — —
Estimated balance at 30 June 2007 3 140 29 555 75 511 108 206
Net gain/loss on revaluation of property, plant and equipment during 2007-08 ............................................................................ — — — — Net changes in reserves ................................................................ — — — —
Net income/expense recognised directly in equity for 2007-08 ... — — — — Net result after restructure for 2007-08 ........................................ — — 2 245 2 245
Total recognised income and expense for 2007-08 — — 2 245 2 245
Equity contributions from SA Government ................................. — — — — Repayment of equity contributions from SA Government .......... — — — —
Estimated balance at 30 June 2008 3 140 29 555 77 756 110 451
4.120

COURTS ADMINISTRATION AUTHORITY
Cash flow statement__________________________________________________________________________________________________________________________________________________________________________________________________________________________________
2007-08Budget
$000
2006-07Estimated
result
$000
2006-07Budget
$000
2005-06Actual
$000
OPERATING ACTIVITIES:
Cash outflows
Employee payments ..................................................................... 45 547 44 997 46 884 41 652Supplies and services ................................................................... 25 326 24 371 25 663 25 798Borrowing costs ............................................................................ 1 208 1 255 1 251 1 297Net GST paid ................................................................................ — — — 3 304Intra government transfers ........................................................... 1 922 1 780 — — Other payments ............................................................................ 1 223 1 171 294 497
Cash used in operations ................................................................ 75 226 73 574 74 092 72 548
Cash inflows
Intra government transfers ........................................................... 69 520 67 509Commonwealth receipts ............................................................... — — — 3Other grants .................................................................................. — — — 77Fees, fines and penalties ............................................................... 4 701 4 340 3 746 3 659Sales of goods and services .......................................................... 639 630 630 1 200Interest received ........................................................................... — — — 772Net GST received ......................................................................... — — — 3 161Other receipts ............................................................................... — — — -10
Cash generated from operations ................................................... 5 409 5 490 4 443 9 371
SA GOVERNMENT:
Appropriation ............................................................................... 78 745 72 932 74 464 69 618Other receipts ............................................................................... — 513 — 625Payments — Cash alignment ......................................................................... — — — 1 304
Net cash provided by SA Government ......................................... 78 745 73 445 74 464 68 939
Net cash provided by (+) / used (-) in operating activities ........... 8 928 5 361 4 815 5 762
INVESTING ACTIVITIES:
Cash outflows
Purchase of property, plant and equipment .................................. 1 078 7 750 7 519 5 734
Cash used in investing activities .................................................. 1 078 7 750 7 519 5 734
Cash inflows
Proceeds from sale of property, plant and equipment .................. 617 — — 30
Cash generated from investing activities ..................................... 617 — — 30
Net cash provided by (+) / used in (-) investing activities ........... -461 -7 750 -7 519 -5 704
4.121
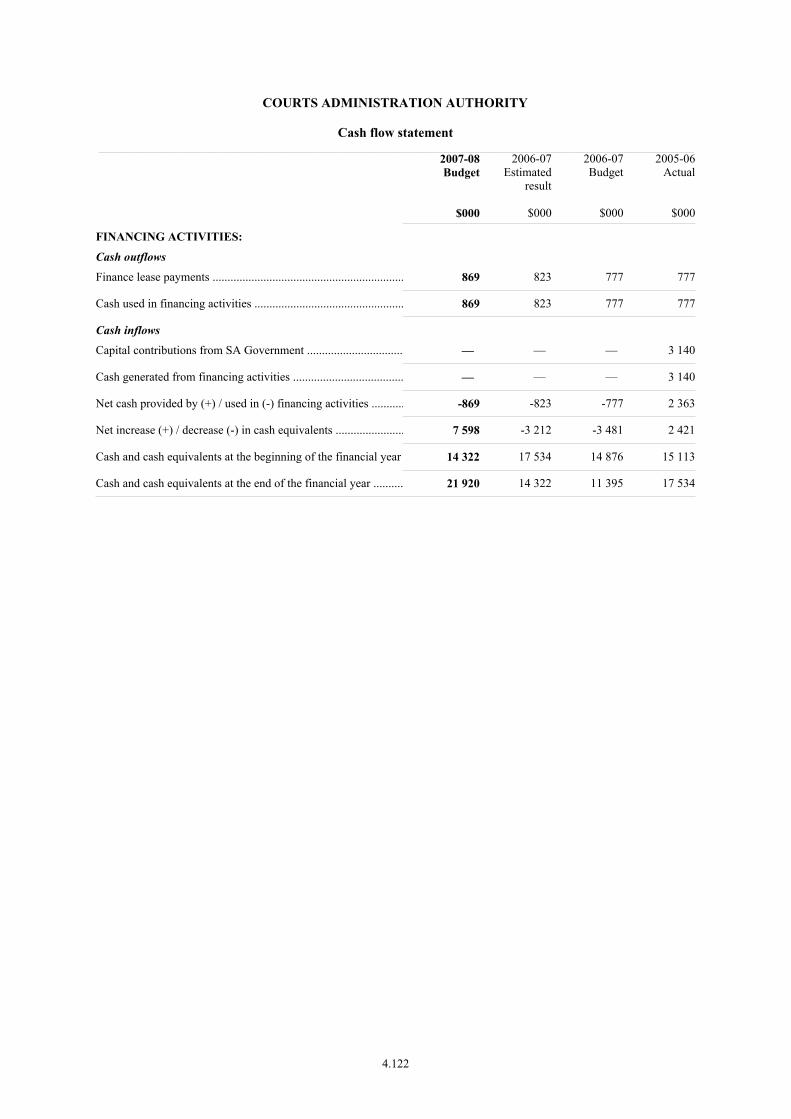
COURTS ADMINISTRATION AUTHORITY
Cash flow statement__________________________________________________________________________________________________________________________________________________________________________________________________________________________________
2007-08Budget
$000
2006-07Estimated
result
$000
2006-07Budget
$000
2005-06Actual
$000
FINANCING ACTIVITIES:
Cash outflows
Finance lease payments ................................................................ 869 823 777 777
Cash used in financing activities .................................................. 869 823 777 777
Cash inflows
Capital contributions from SA Government ................................ — — — 3 140
Cash generated from financing activities ..................................... — — — 3 140
Net cash provided by (+) / used in (-) financing activities ........... -869 -823 -777 2 363
Net increase (+) / decrease (-) in cash equivalents ....................... 7 598 -3 212 -3 481 2 421
Cash and cash equivalents at the beginning of the financial year 14 322 17 534 14 876 15 113
Cash and cash equivalents at the end of the financial year .......... 21 920 14 322 11 395 17 534
4.122

ADMINISTERED ITEMS FOR THE COURTS ADMINISTRATION AUTHORITY
Income statement__________________________________________________________________________________________________________________________________________________________________________________________________________________________________
2007-08Budget
$000
2006-07Estimated
result
$000
2006-07Budget
$000
2005-06Actual
$000Income from SA Government
Income — Appropriation ........................................................................... 30 170 29 312 27 333 26 781
Net income from / expenses to SA Government .......................... 30 170 29 312 27 333 26 781
Income from other sources
Intra government transfers ........................................................... 581 567 — 701Fees, fines and penalties ............................................................... 69 032 51 780 54 986 45 533Sales of goods and services .......................................................... 1 235 1 235 1 235 —
Total income from other sources .................................................. 70 848 53 582 56 221 46 234
Total income ................................................................................. 101 018 82 894 83 554 73 015
Expenses
Supplies and services — General supplies and services .................................................. 581 567 — 554Intra government transfers ........................................................... 14 668 6 575 7 094 5 615Other expenses ............................................................................. 85 769 75 752 77 042 67 377
Total expenses .............................................................................. 101 018 82 894 84 136 73 546
Net result ...................................................................................... — — -582 -531
4.123
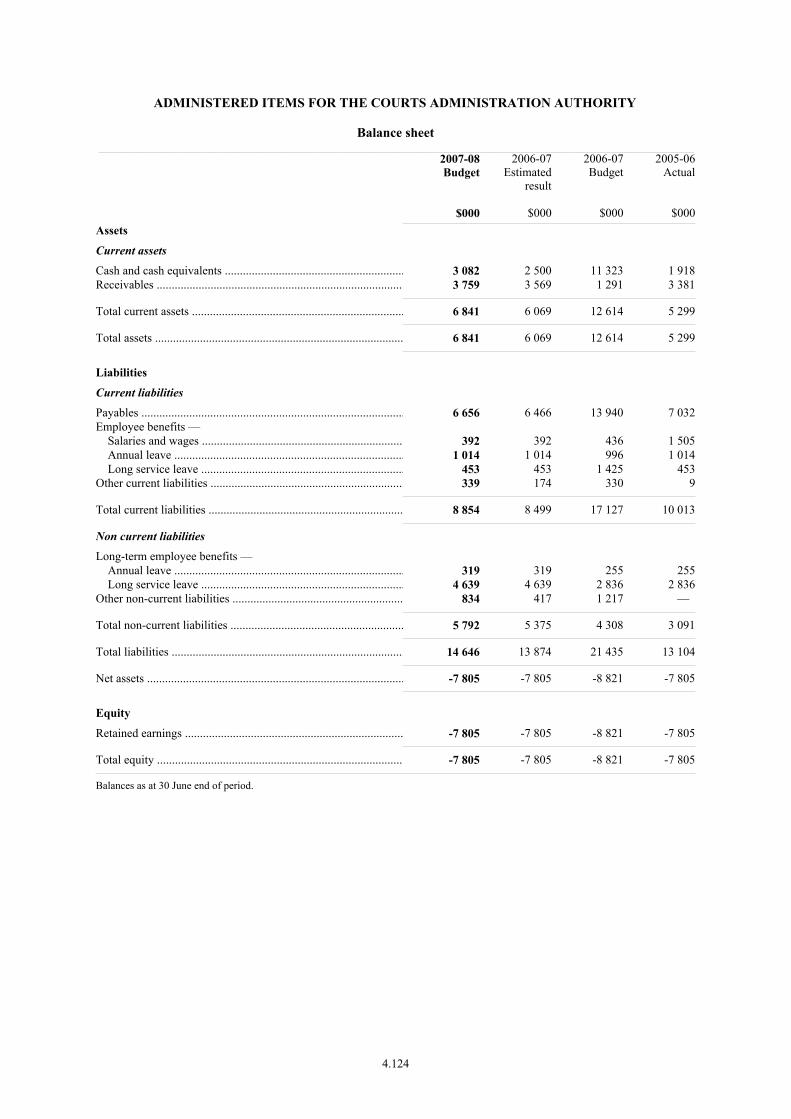
ADMINISTERED ITEMS FOR THE COURTS ADMINISTRATION AUTHORITY
Balance sheet__________________________________________________________________________________________________________________________________________________________________________________________________________________________________
2007-08Budget
$000
2006-07Estimated
result
$000
2006-07Budget
$000
2005-06Actual
$000Assets
Current assets
Cash and cash equivalents ............................................................ 3 082 2 500 11 323 1 918Receivables ................................................................................... 3 759 3 569 1 291 3 381
Total current assets ....................................................................... 6 841 6 069 12 614 5 299
Total assets ................................................................................... 6 841 6 069 12 614 5 299
Liabilities
Current liabilities
Payables ........................................................................................ 6 656 6 466 13 940 7 032Employee benefits — Salaries and wages ................................................................... 392 392 436 1 505 Annual leave ............................................................................. 1 014 1 014 996 1 014 Long service leave .................................................................... 453 453 1 425 453Other current liabilities ................................................................. 339 174 330 9
Total current liabilities ................................................................. 8 854 8 499 17 127 10 013
Non current liabilities
Long-term employee benefits — Annual leave ............................................................................. 319 319 255 255 Long service leave .................................................................... 4 639 4 639 2 836 2 836Other non-current liabilities ......................................................... 834 417 1 217 —
Total non-current liabilities .......................................................... 5 792 5 375 4 308 3 091
Total liabilities .............................................................................. 14 646 13 874 21 435 13 104
Net assets ...................................................................................... -7 805 -7 805 -8 821 -7 805
Equity
Retained earnings ......................................................................... -7 805 -7 805 -8 821 -7 805
Total equity .................................................................................. -7 805 -7 805 -8 821 -7 805
Balances as at 30 June end of period.
4.124
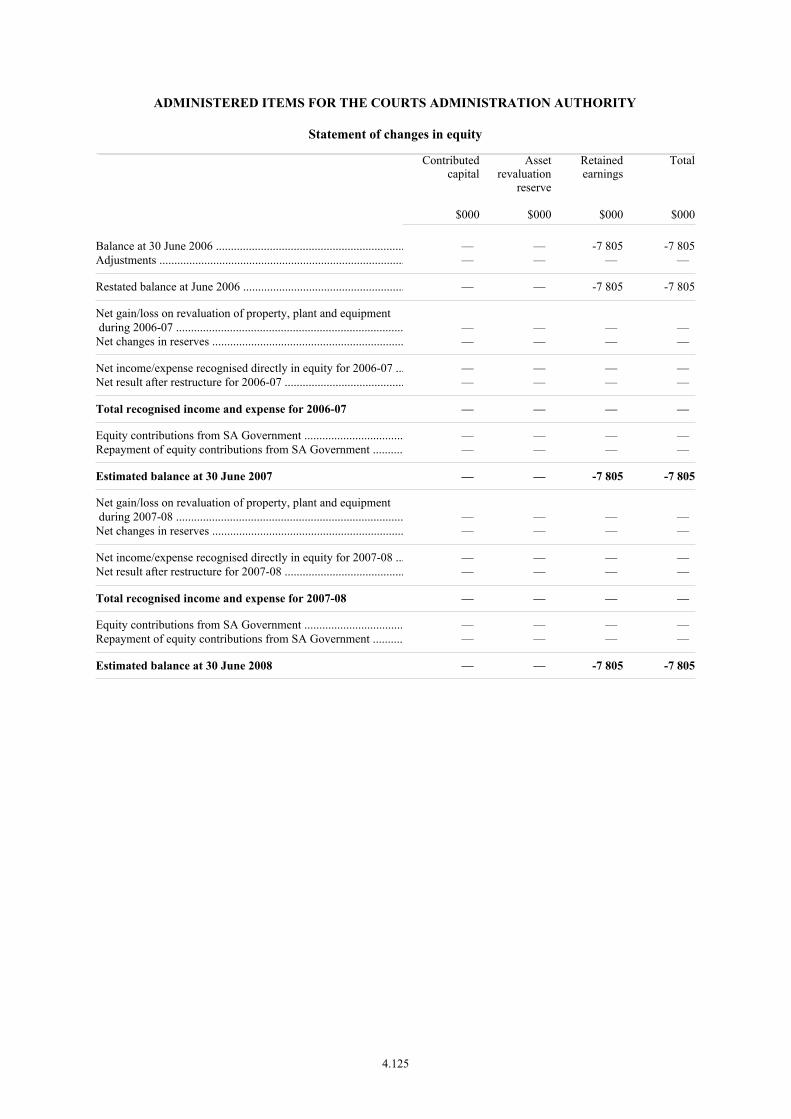
ADMINISTERED ITEMS FOR THE COURTS ADMINISTRATION AUTHORITY
Statement of changes in equity__________________________________________________________________________________________________________________________________________________________________________________________________________________________________
Contributedcapital
$000
Assetrevaluation
reserve
$000
Retainedearnings
$000
Total
$000
Balance at 30 June 2006 ............................................................... — — -7 805 -7 805Adjustments .................................................................................. — — — —
Restated balance at June 2006 ...................................................... — — -7 805 -7 805
Net gain/loss on revaluation of property, plant and equipment during 2006-07 ............................................................................ — — — — Net changes in reserves ................................................................ — — — —
Net income/expense recognised directly in equity for 2006-07 ... — — — — Net result after restructure for 2006-07 ........................................ — — — —
Total recognised income and expense for 2006-07 — — — —
Equity contributions from SA Government ................................. — — — — Repayment of equity contributions from SA Government .......... — — — —
Estimated balance at 30 June 2007 — — -7 805 -7 805
Net gain/loss on revaluation of property, plant and equipment during 2007-08 ............................................................................ — — — — Net changes in reserves ................................................................ — — — —
Net income/expense recognised directly in equity for 2007-08 ... — — — — Net result after restructure for 2007-08 ........................................ — — — —
Total recognised income and expense for 2007-08 — — — —
Equity contributions from SA Government ................................. — — — — Repayment of equity contributions from SA Government .......... — — — —
Estimated balance at 30 June 2008 — — -7 805 -7 805
4.125
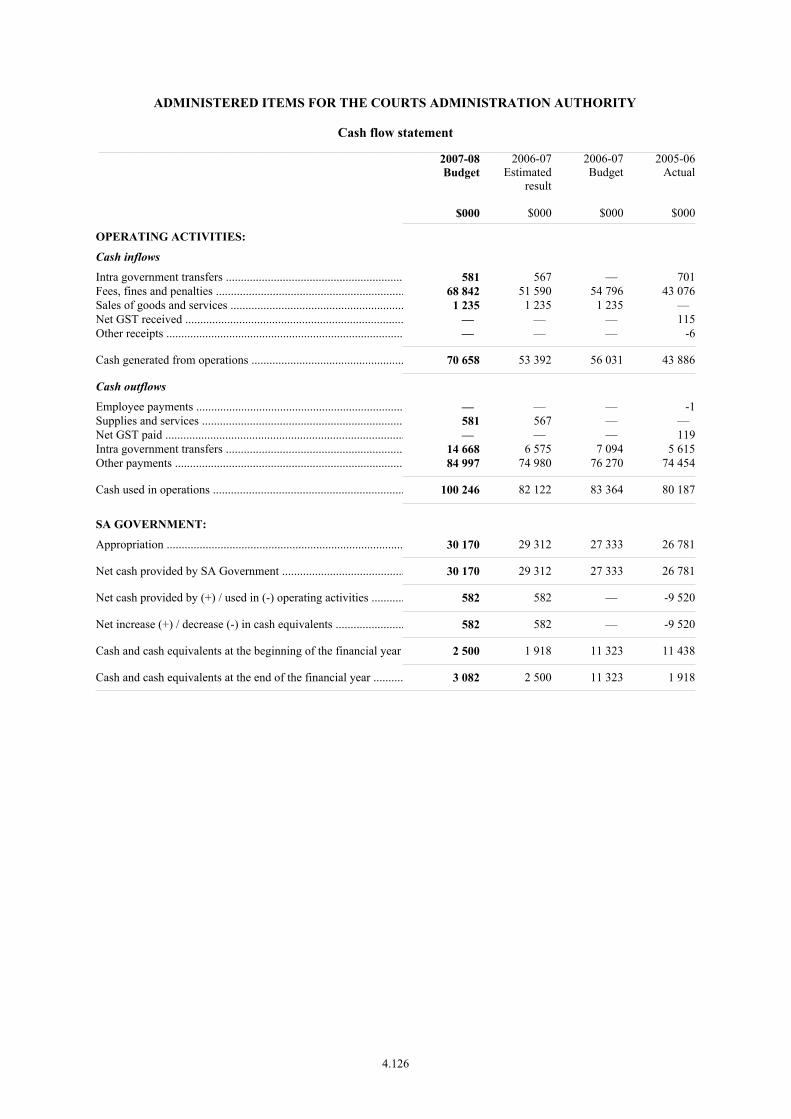
ADMINISTERED ITEMS FOR THE COURTS ADMINISTRATION AUTHORITY
Cash flow statement__________________________________________________________________________________________________________________________________________________________________________________________________________________________________
2007-08Budget
$000
2006-07Estimated
result
$000
2006-07Budget
$000
2005-06Actual
$000
OPERATING ACTIVITIES:
Cash inflows
Intra government transfers ........................................................... 581 567 — 701Fees, fines and penalties ............................................................... 68 842 51 590 54 796 43 076Sales of goods and services .......................................................... 1 235 1 235 1 235 — Net GST received ......................................................................... — — — 115Other receipts ............................................................................... — — — -6
Cash generated from operations ................................................... 70 658 53 392 56 031 43 886
Cash outflows
Employee payments ..................................................................... — — — -1Supplies and services ................................................................... 581 567 — — Net GST paid ................................................................................ — — — 119Intra government transfers ........................................................... 14 668 6 575 7 094 5 615Other payments ............................................................................ 84 997 74 980 76 270 74 454
Cash used in operations ................................................................ 100 246 82 122 83 364 80 187
SA GOVERNMENT:
Appropriation ............................................................................... 30 170 29 312 27 333 26 781
Net cash provided by SA Government ......................................... 30 170 29 312 27 333 26 781
Net cash provided by (+) / used in (-) operating activities ........... 582 582 — -9 520
Net increase (+) / decrease (-) in cash equivalents ....................... 582 582 — -9 520
Cash and cash equivalents at the beginning of the financial year 2 500 1 918 11 323 11 438
Cash and cash equivalents at the end of the financial year .......... 3 082 2 500 11 323 1 918
4.126

AGENCY: COURTS ADMINISTRATION AUTHORITY
Financial Commentary — major variations
The following commentary relates to the Agency Financial Statements presented in the previous section. The discussion relates to variations between the 2006-07 Estimated Result and the 2007-08 Budget.
Income statement — Controlled
The increase in budgeted employee expenses is mainly due to the approved 2007-08 Enterprise Bargaining Award supplementation.
The increase in budgeted supplies and services expense is mainly due to CPI increases and increased payments to jurors approved from 2007-08.
Balance sheet — Controlled
The increase in current assets is mainly due to an increase in accrual appropriation.
Statement of changes in equity — Controlled
No major variations.
Cash flow statement — Controlled
Refer to commentary under Income statement.
Reduction in payments for property, plant and equipment are due to the completion of the Port Augusta Courts Development in March 2007.
Proceeds from the sale of property, plant and equipment in 2007-08 refer to the sale of the old Port Augusta court sites.
Administered
Income statement — Administered Items
The increase in budgeted revenue is due to additional fines expected from more red-light and speed cameras in operation as part of the road safety program, an increase in civil and summary fees as part of the 2006-07 Budget, and the increase of the Victims of Crime Levy.
The increase in budgeted expenses for intra-government transfers relates to the increase of the Victims of Crime Levy which is collected by the Courts Administration Authority and transferred to the Attorney-General’s Department for depositing into the Victims of Crime Fund.
The increase in budgeted Other Expenses relates to wage supplementation for judicial officers and the increased payment made to the consolidated account of budgeted additional revenue collections as indicated above.
Balance sheet — Administered Items
No major variations.
4.127

Statement of changes in equity — Administered Items
No major variations.
Cash flow statement — Administered Items
Refer to commentary under Income statement.
Additional Information for Administered Items
Detailed information on Administered Items is included in the following table.
4.128

Additional Information for Administered Items Courts Administration Authority
Cash flow statement
2007-08Budget
2006-07Estimated
result
2006-07 Budget
2005-06Actual
$000 $000 $000 $000
CASH FLOWS FROM:
Operating Activities
Receipts
Sales of goods and services —
Transcript Fees — Government ................................................ 380 380 380 —
Transcript Fees — Non Government ........................................ 855 855 855 —
Fees, Fines and Penalties —
Fines and Penalties ................................................................... 32 779 26 572 36 163 18 112
Regulatory Fee — Summary Fees ............................................ 11 239 8 715 9 424 9 930
Regulatory Fee — Civil Fees.................................................... 7 247 6 423 6 423 5 875
Regulatory Fee — Probate Fees................................................ 2 909 2 786 2 786 2 865
Regulatory Fee — Transcript Fees ........................................... — — — 920
Regulatory Fee — Victims of Crime Levy ............................... 14 668 7 094 — 5 483
Other Receipts —
Transfer Revenues .................................................................... 581 567 — 701
State Government – Appropriation ................................................. 30 170 29 312 27 333 26 781
Total operating receipts 100 828 82 704 83 364 70 667
Payments
Other Supplies and Services............................................................ 581 567 — —
Transfer Payments........................................................................... 14 668 6 575 7 094 5 615
Other —
Transfer of Revenue to Consolidated Account ......................... 55 599 46 440 47 892 47 179
Judicial Entitlements................................................................. 29 398 28 540 28 378 27 393
Total operating payments 100 246 82 122 83 364 80 187
Net cash provided by operating activities 582 582 — -9 520
Net Increase (+) / decrease (-) in cash held 582 582 — -9 520
Opening cash balance as at 1 July 2 500 1 918 11 323 11 438
Closing cash balance as at 30 June 3 082 2 500 11 323 1 918
4.129

TABLE OF CONTENTS
AGENCY: STATE ELECTORAL OFFICE
Objective ........................................................................................................................................4.131
Targets / Highlights ........................................................................................................................4.131
Program Net Cost of Services Summary........................................................................................4.132
Investing Payments Summary ........................................................................................................4.132
Program Information — includes description/objective, Summary income statement, sub-program information including performance criteria
1. Electoral Services .........................................................................................................4.133
Financial Statements
Income statement .................................................................................................................4.136
Balance sheet.........................................................................................................................4.137
Statement of changes in equity ............................................................................................4.138
Cash flow statement .............................................................................................................4.139
Income statement — Administered Items............................................................................4.140
Balance sheet — Administered Items ..................................................................................4.141
Statement of changes in equity — Administered Items.......................................................4.142
Cash flow statement — Administered Items .......................................................................4.143
Financial Commentary ...................................................................................................................4.144
4.130

PORTFOLIO: JUSTICE
AGENCY: STATE ELECTORAL OFFICE
Objectives
To provide services which enable the fair and independent election of government and governing bodies and which help and encourage the community to participate with confidence and trust in the democratic processes of representation.
2007-08 Targets / 2006-07 Highlights
Targets 2007-08 Highlights 2006-07
• Contribute to achieving South Australia’s Strategic Plan target on youth enrolment. This will be facilitated by exploring and implementing strategies for increasing the proportion of eligible young South Australians (18–19 years) who are enrolled to vote and maintaining the state’s higher than national average youth enrolment rate
• Complete a report on the conduct and outcomes of the 2006 periodic elections for local government
• Certify a review of representation for Adelaide City Council • Provide input to the local government elections review
commissioned by the Minister for State/Local Government Relations and the President of the Local Government Association
• Develop model guidelines for local government representation reviews
• Provide assistance to the Australian Electoral Commission for the conduct of the federal election
• Redevelop state specific software for the Electoral Education Centre to complement the curriculum framework
• Conduct a review of the organisational structure of the State Electoral Office to ensure the office continues to effectively perform electoral activities, uphold legislative responsibilities and meet the changing needs of electors and the wider community
• Undertake strategic planning activities in order to set the State Electoral Office’s strategic directions for 2007-10
• Prepare and plan for the relocation and refurbishment of the SEO’s head office
• Planned and implemented programs for the conduct of elections for: − the South Australian Superannuation Board and
Superannuation Funds Management Corporation of South Australia Board in August 2006; and
− 66 local government councils in November 2006 • Provided support for electors voting in elections in
New South Wales, Victoria and Queensland • Finalised research relating to the first bi-cameral elections in
South Australia in 1856 and the establishment of an independent electoral office in 1907
• Co-sponsored with the History Trust an exhibition and conference to mark the 150th anniversary of South Australia’s democracy
• Completed evaluation and reporting of the conduct of the 2006 state elections and contributed to legislative discussions on the Electoral Act 1985
• Implemented enhancements to local government election software, maintained election hardware and ICT support for local government election processes and continued ICT transition processes
• Improved integration of financial systems and reporting and ensured appropriate systems were in place to achieve full cost recovery in local government elections
• Provided support to the 2006-07 Electoral Districts Boundaries Commission
4.131
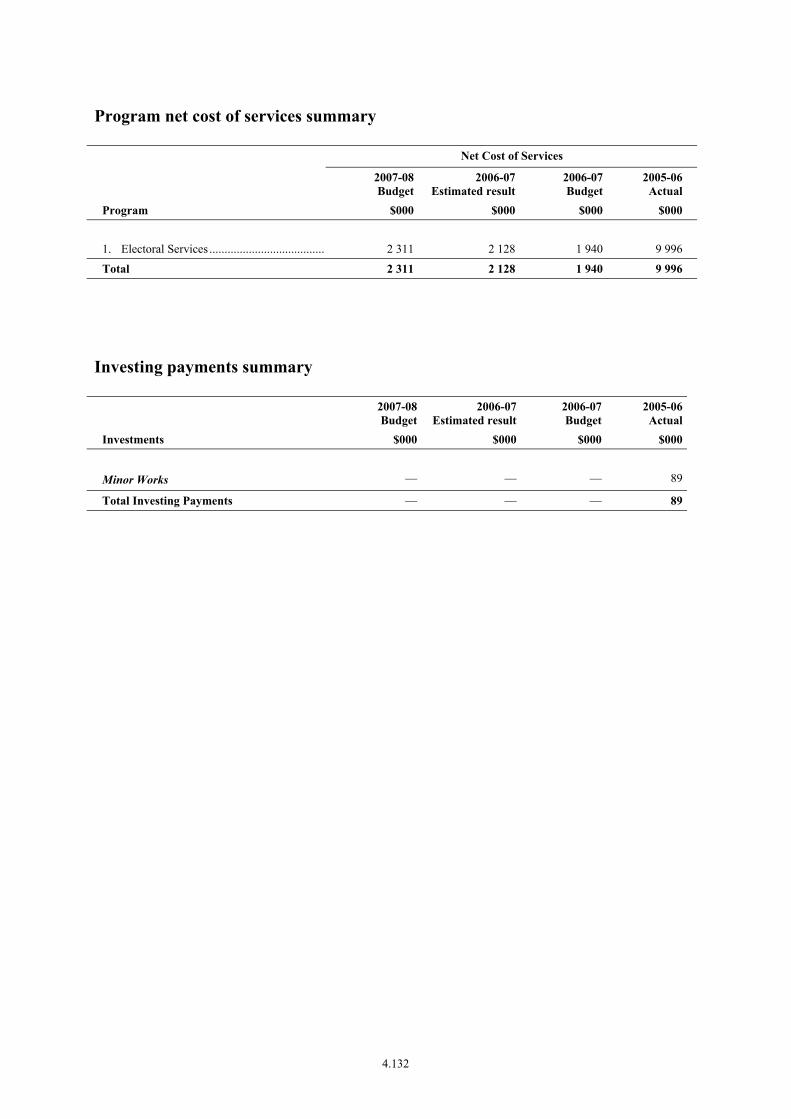
Program net cost of services summary
Net Cost of Services
2007-08Budget
2006-07Estimated result
2006-07 Budget
2005-06 Actual
Program $000 $000 $000 $000 1. Electoral Services ....................................... 2 311 2 128 1 940 9 996
Total 2 311 2 128 1 940 9 996
Investing payments summary
2007-08Budget
2006-07Estimated result
2006-07 Budget
2005-06Actual
Investments $000 $000 $000 $000
Minor Works — — — 89
Total Investing Payments — — — 89
4.132

AGENCY: STATE ELECTORAL OFFICE
Program Information
Program 1: Electoral Services
Description/Objective: The State Electoral Office (SEO) conducts fair and independent state, local government and nominated agency government elections and utilises its skill base to support non-government electoral activities and offer electoral advice across all community sectors.
A range of electoral services and products is provided, covering the parliamentary (funded) and non-parliamentary (unfunded) sectors:
• conduct of elections for representatives to sit in the State Parliament, local government authorities and other organisations (attendance or postal);
• electoral education and information provision for the South Australian community;
• research and evaluation of electoral matters;
• roll products and maps; and
• support for parliamentary electoral district boundary and council boundary representation reviews.
Summary income statement
Program 1: Electoral Services 2007-08Budget
2006-07Estimated result
2006-07 Budget
2005-06 Actual
$000 $000 $000 $000
Expenses Employee benefits and costs............................. 1 275 1 785 1 287 5 361 Supplies and services........................................ 1 985 4 612 4 997 5 323 Depreciation and amortisation .......................... 70 60 60 67
Total expenses 3 330 6 457 6 344 10 751
Income Sale of goods and services................................ 1 019 4 329 4 404 755
Total income 1 019 4 329 4 404 755
Net cost of providing services 2 311 2 128 1 940 9 996
4.133
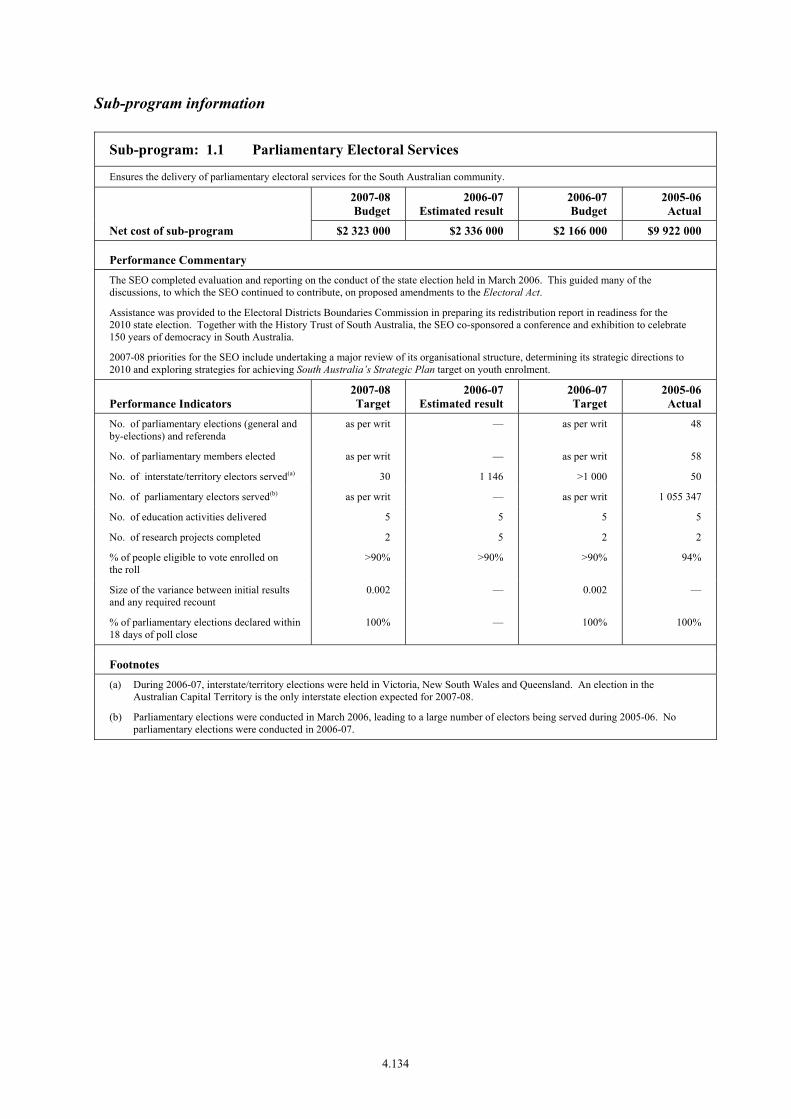
Sub-program information
Sub-program: 1.1 Parliamentary Electoral Services
Ensures the delivery of parliamentary electoral services for the South Australian community.
2007-08 Budget
2006-07 Estimated result
2006-07 Budget
2005-06 Actual
Net cost of sub-program $2 323 000 $2 336 000 $2 166 000 $9 922 000
Performance Commentary The SEO completed evaluation and reporting on the conduct of the state election held in March 2006. This guided many of the discussions, to which the SEO continued to contribute, on proposed amendments to the Electoral Act.
Assistance was provided to the Electoral Districts Boundaries Commission in preparing its redistribution report in readiness for the 2010 state election. Together with the History Trust of South Australia, the SEO co-sponsored a conference and exhibition to celebrate 150 years of democracy in South Australia.
2007-08 priorities for the SEO include undertaking a major review of its organisational structure, determining its strategic directions to 2010 and exploring strategies for achieving South Australia’s Strategic Plan target on youth enrolment.
Performance Indicators 2007-08 Target
2006-07 Estimated result
2006-07 Target
2005-06 Actual
No. of parliamentary elections (general and by-elections) and referenda
as per writ — as per writ 48
No. of parliamentary members elected as per writ — as per writ 58
No. of interstate/territory electors served(a) 30 1 146 >1 000 50
No. of parliamentary electors served(b) as per writ — as per writ 1 055 347
No. of education activities delivered 5 5 5 5
No. of research projects completed 2 5 2 2
% of people eligible to vote enrolled on the roll
>90% >90% >90% 94%
Size of the variance between initial results and any required recount
0.002 — 0.002 —
% of parliamentary elections declared within 18 days of poll close
100% — 100% 100%
Footnotes (a) During 2006-07, interstate/territory elections were held in Victoria, New South Wales and Queensland. An election in the
Australian Capital Territory is the only interstate election expected for 2007-08.
(b) Parliamentary elections were conducted in March 2006, leading to a large number of electors being served during 2005-06. No parliamentary elections were conducted in 2006-07.
4.134

Sub-program: 1.2 Non-parliamentary Electoral Services
The delivery of non-parliamentary electoral services for South Australian organisations and the community at large.
2007-08 Budget
2006-07 Estimated result
2006-07 Budget
2005-06 Actual
Net cost of sub-program -$12 000 -$208 000 -$226 000 $74 000
Performance Commentary The SEO conducted elections for the Physiotherapy, Podiatry and Occupational Therapy Boards of South Australia, the South Australian Superannuation Board and the Superannuation Funds Management Corporation of South Australia Board, the Anangu Pitjantjatjara Yankunytjatjara Council and the South Australian Government Enterprise Agreement ballot.
Also in 2006-07, the SEO conducted elections for 66 local government councils in November 2006, and will release a report on the election process and outcomes in early 2007-08. The SEO will conduct the Adelaide City Council election, due by November 2007. For the first time, the SEO will conduct elections for the South Australian Psychological Board and the Optometry Board of South Australia.
Key areas of focus for 2007-08 include participating in the independent review of local government elections and developing model guidelines for local government councils on conducting their own representation reviews.
Performance Indicators 2007-08 Target
2006-07 Estimated result
2006-07 Target
2005-06 Actual
No. of local government elections and polls 12 258(a) >250 12
No. of non-parliamentary elections prescribed by Acts of Parliament
3 7 5 4
No. of commercial services provided for client organisations
11 11 12 11
No. of members elected:
• Local Government >20 732 >700 14
• non-government 20 26 >25 57
No. of electors served:
• Local Government >60 000 1 204 420(b) >1 200 000 71 140
• non-government 25 000 395 000 >300 000 40 000
No. of information and research programs 2 2 2 2
No. of local government representation reviews certified
0 1 1 17
Size of the variance between initial results and any required recount
0.002 0.004(c) 0.002 n/a
% of non-parliamentary elections and polls provisionally declared within:
• 12 working hours from poll close 95% 62% 95% 100%
• 24 working hours from poll close 100% 100% 100% 100%
Footnotes (a) No. of elections includes contested and uncontested elections:
− periodic elections: 196 contested and 56 elected unopposed. Two ineligible elections are not included; and − supplementary elections: two contested and four elected unopposed.
(b) Contested elections only.
(c) Excludes supplementary election for Corporation of the Town of Walkerville – Walkerville Ward, as polling day is 12 June 2007.
4.135

STATE ELECTORAL OFFICE
Income statement__________________________________________________________________________________________________________________________________________________________________________________________________________________________________
2007-08Budget
$000
2006-07Estimated
result
$000
2006-07Budget
$000
2005-06Actual
$000Expenses
Employee benefits and costs — Salaries, wages, annual and sick leave ..................................... 1 064 1 519 1 088 4 656 Long service leave .................................................................... 22 20 20 47 Payroll tax ................................................................................ 68 97 65 279 Superannuation ......................................................................... 121 149 114 298 Other ......................................................................................... — — — 81Supplies and services — General supplies and services .................................................. 1 985 4 612 4 997 5 297Depreciation and amortisation ..................................................... 70 60 60 67Other expenses ............................................................................. — — — 26
Total expenses .............................................................................. 3 330 6 457 6 344 10 751
Income
Fees, fines and penalties ............................................................... — — — 4Sales of goods and services .......................................................... 1 019 4 329 4 404 561Interest revenues ........................................................................... — — — 66Other income ................................................................................ — — — 124
Total income ................................................................................. 1 019 4 329 4 404 755
Net cost of providing services ...................................................... 2 311 2 128 1 940 9 996
Income from / Expenses to SA Government
Income — Appropriation ........................................................................... 2 253 2 026 2 026 9 972 Other income ............................................................................ — 18 — 129
Net income from / expenses to SA Government .......................... 2 253 2 044 2 026 10 101
Net result ...................................................................................... -58 -84 86 105
4.136
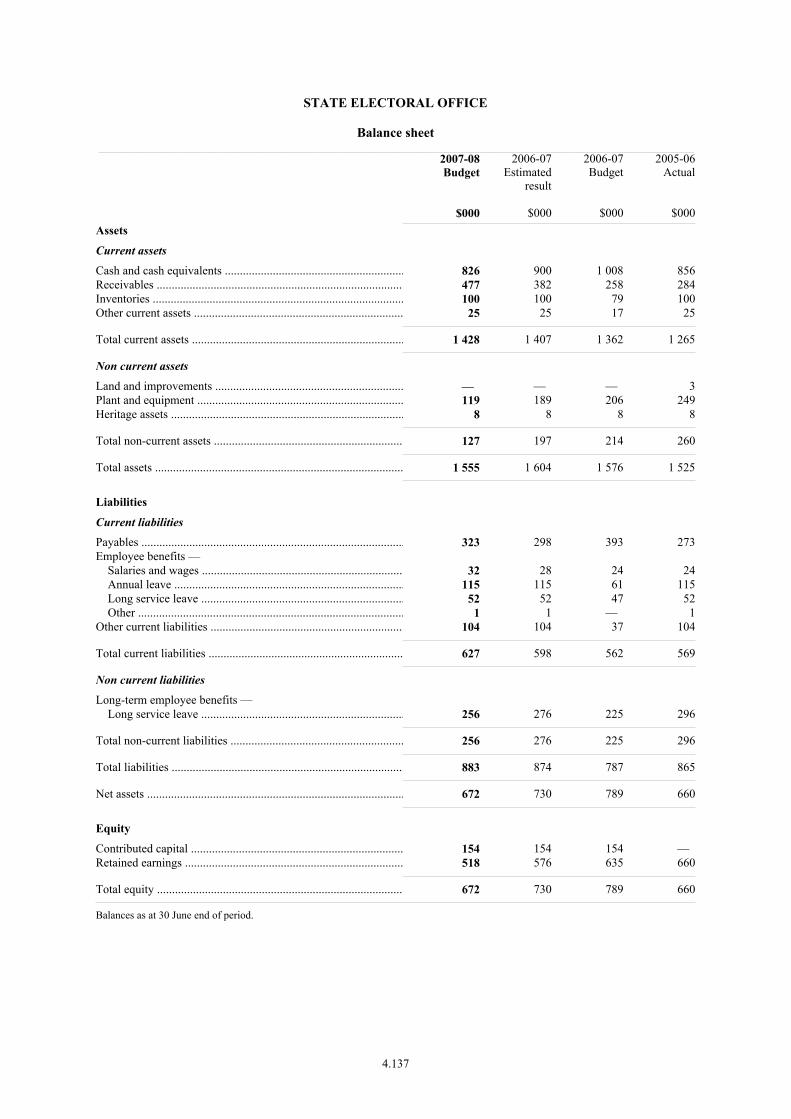
STATE ELECTORAL OFFICE
Balance sheet__________________________________________________________________________________________________________________________________________________________________________________________________________________________________
2007-08Budget
$000
2006-07Estimated
result
$000
2006-07Budget
$000
2005-06Actual
$000Assets
Current assets
Cash and cash equivalents ............................................................ 826 900 1 008 856Receivables ................................................................................... 477 382 258 284Inventories .................................................................................... 100 100 79 100Other current assets ...................................................................... 25 25 17 25
Total current assets ....................................................................... 1 428 1 407 1 362 1 265
Non current assets
Land and improvements ............................................................... — — — 3Plant and equipment ..................................................................... 119 189 206 249Heritage assets .............................................................................. 8 8 8 8
Total non-current assets ............................................................... 127 197 214 260
Total assets ................................................................................... 1 555 1 604 1 576 1 525
Liabilities
Current liabilities
Payables ........................................................................................ 323 298 393 273Employee benefits — Salaries and wages ................................................................... 32 28 24 24 Annual leave ............................................................................. 115 115 61 115 Long service leave .................................................................... 52 52 47 52 Other ......................................................................................... 1 1 — 1Other current liabilities ................................................................. 104 104 37 104
Total current liabilities ................................................................. 627 598 562 569
Non current liabilities
Long-term employee benefits — Long service leave .................................................................... 256 276 225 296
Total non-current liabilities .......................................................... 256 276 225 296
Total liabilities .............................................................................. 883 874 787 865
Net assets ...................................................................................... 672 730 789 660
Equity
Contributed capital ....................................................................... 154 154 154 — Retained earnings ......................................................................... 518 576 635 660
Total equity .................................................................................. 672 730 789 660
Balances as at 30 June end of period.
4.137

STATE ELECTORAL OFFICE
Statement of changes in equity__________________________________________________________________________________________________________________________________________________________________________________________________________________________________
Contributedcapital
$000
Assetrevaluation
reserve
$000
Retainedearnings
$000
Total
$000
Balance at 30 June 2006 ............................................................... — — 660 660Adjustments .................................................................................. — — — —
Restated balance at June 2006 ...................................................... — — 660 660
Net gain/loss on revaluation of property, plant and equipment during 2006-07 ............................................................................ — — — — Net changes in reserves ................................................................ — — — —
Net income/expense recognised directly in equity for 2006-07 ... — — — — Net result after restructure for 2006-07 ........................................ — — -84 -84
Total recognised income and expense for 2006-07 — — -84 -84
Equity contributions from SA Government ................................. 154 — — 154Repayment of equity contributions from SA Government .......... — — — —
Estimated balance at 30 June 2007 154 — 576 730
Net gain/loss on revaluation of property, plant and equipment during 2007-08 ............................................................................ — — — — Net changes in reserves ................................................................ — — — —
Net income/expense recognised directly in equity for 2007-08 ... — — — — Net result after restructure for 2007-08 ........................................ — — -58 -58
Total recognised income and expense for 2007-08 — — -58 -58
Equity contributions from SA Government ................................. — — — — Repayment of equity contributions from SA Government .......... — — — —
Estimated balance at 30 June 2008 154 — 518 672
4.138

STATE ELECTORAL OFFICE
Cash flow statement__________________________________________________________________________________________________________________________________________________________________________________________________________________________________
2007-08Budget
$000
2006-07Estimated
result
$000
2006-07Budget
$000
2005-06Actual
$000
OPERATING ACTIVITIES:
Cash outflows
Employee payments ..................................................................... 1 287 1 797 1 299 5 248Supplies and services ................................................................... 1 964 4 591 4 976 5 413Net GST paid ................................................................................ — — — 43Other payments ............................................................................ — — — 44
Cash used in operations ................................................................ 3 251 6 388 6 275 10 748
Cash inflows
Fees, fines and penalties ............................................................... — — — 4Sales of goods and services .......................................................... 924 4 234 4 309 475Interest received ........................................................................... — — — 65Net GST received ......................................................................... — — — 26Other receipts ............................................................................... — — — 84
Cash generated from operations ................................................... 924 4 234 4 309 654
SA GOVERNMENT:
Appropriation ............................................................................... 2 253 2 026 2 026 9 972Other receipts ............................................................................... — 18 — 129
Net cash provided by SA Government ......................................... 2 253 2 044 2 026 10 101
Net cash provided by (+) / used (-) in operating activities ........... -74 -110 60 7
INVESTING ACTIVITIES:
Cash outflows
Purchase of property, plant and equipment .................................. — — — 89
Cash used in investing activities .................................................. — — — 89
Net cash provided by (+) / used in (-) investing activities ........... — — — -89
FINANCING ACTIVITIES:
Cash inflows
Capital contributions from SA Government ................................ — 154 154 —
Cash generated from financing activities ..................................... — 154 154 —
Net cash provided by (+) / used in (-) financing activities ........... — 154 154 —
Net increase (+) / decrease (-) in cash equivalents ....................... -74 44 214 -82
Cash and cash equivalents at the beginning of the financial year 900 856 794 938
Cash and cash equivalents at the end of the financial year .......... 826 900 1 008 856
4.139
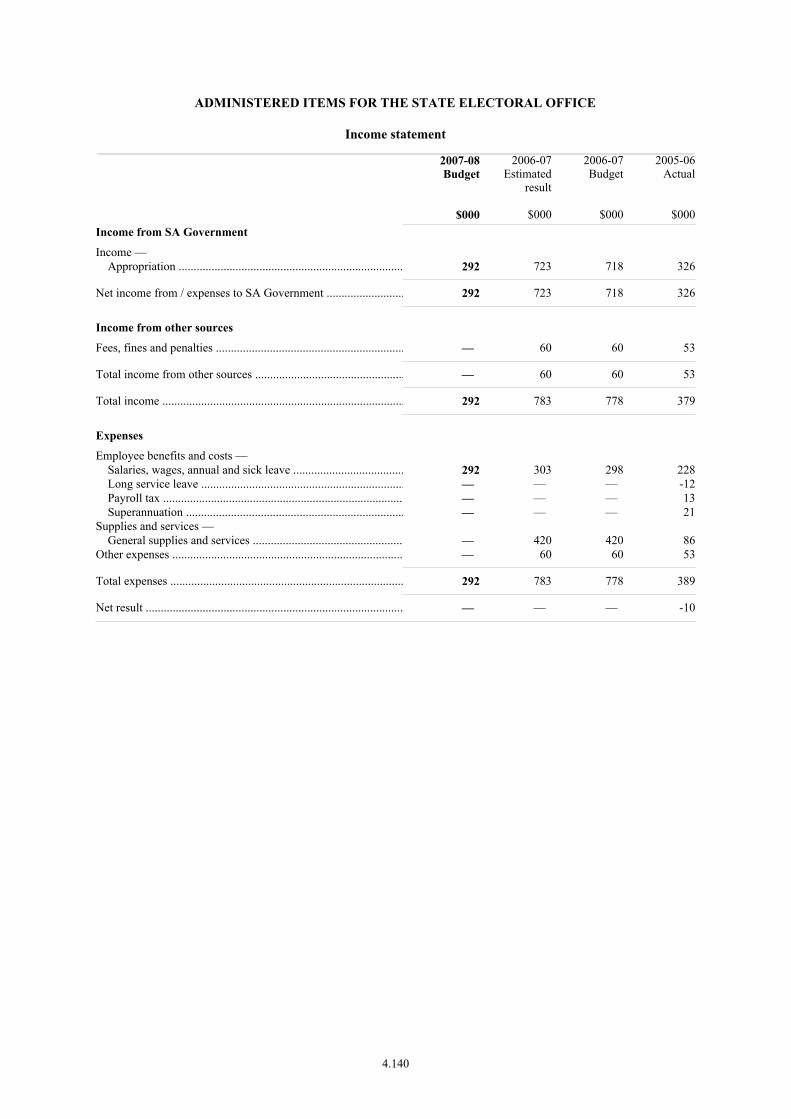
ADMINISTERED ITEMS FOR THE STATE ELECTORAL OFFICE
Income statement__________________________________________________________________________________________________________________________________________________________________________________________________________________________________
2007-08Budget
$000
2006-07Estimated
result
$000
2006-07Budget
$000
2005-06Actual
$000Income from SA Government
Income — Appropriation ........................................................................... 292 723 718 326
Net income from / expenses to SA Government .......................... 292 723 718 326
Income from other sources
Fees, fines and penalties ............................................................... — 60 60 53
Total income from other sources .................................................. — 60 60 53
Total income ................................................................................. 292 783 778 379
Expenses
Employee benefits and costs — Salaries, wages, annual and sick leave ..................................... 292 303 298 228 Long service leave .................................................................... — — — -12 Payroll tax ................................................................................ — — — 13 Superannuation ......................................................................... — — — 21Supplies and services — General supplies and services .................................................. — 420 420 86Other expenses ............................................................................. — 60 60 53
Total expenses .............................................................................. 292 783 778 389
Net result ...................................................................................... — — — -10
4.140

ADMINISTERED ITEMS FOR THE STATE ELECTORAL OFFICE
Balance sheet__________________________________________________________________________________________________________________________________________________________________________________________________________________________________
2007-08Budget
$000
2006-07Estimated
result
$000
2006-07Budget
$000
2005-06Actual
$000Assets
Current assets
Cash and cash equivalents ............................................................ 16 16 2 16Receivables ................................................................................... 135 135 128 134
Total current assets ....................................................................... 151 151 130 150
Total assets ................................................................................... 151 151 130 150
Liabilities
Current liabilities
Payables ........................................................................................ 44 44 12 43Employee benefits — Salaries and wages ................................................................... 5 5 2 5 Annual leave ............................................................................. 16 16 9 16 Long service leave .................................................................... 11 11 13 11
Total current liabilities ................................................................. 76 76 36 75
Non current liabilities
Long-term employee benefits — Long service leave .................................................................... 65 65 74 65
Total non-current liabilities .......................................................... 65 65 74 65
Total liabilities .............................................................................. 141 141 110 140
Net assets ...................................................................................... 10 10 20 10
Equity
Retained earnings ......................................................................... 10 10 20 10
Total equity .................................................................................. 10 10 20 10
Balances as at 30 June end of period.
4.141

ADMINISTERED ITEMS FOR THE STATE ELECTORAL OFFICE
Statement of changes in equity__________________________________________________________________________________________________________________________________________________________________________________________________________________________________
Contributedcapital
$000
Assetrevaluation
reserve
$000
Retainedearnings
$000
Total
$000
Balance at 30 June 2006 ............................................................... — — 10 10Adjustments .................................................................................. — — — —
Restated balance at June 2006 ...................................................... — — 10 10
Net gain/loss on revaluation of property, plant and equipment during 2006-07 ............................................................................ — — — — Net changes in reserves ................................................................ — — — —
Net income/expense recognised directly in equity for 2006-07 ... — — — — Net result after restructure for 2006-07 ........................................ — — — —
Total recognised income and expense for 2006-07 — — — —
Equity contributions from SA Government ................................. — — — — Repayment of equity contributions from SA Government .......... — — — —
Estimated balance at 30 June 2007 — — 10 10
Net gain/loss on revaluation of property, plant and equipment during 2007-08 ............................................................................ — — — — Net changes in reserves ................................................................ — — — —
Net income/expense recognised directly in equity for 2007-08 ... — — — — Net result after restructure for 2007-08 ........................................ — — — —
Total recognised income and expense for 2007-08 — — — —
Equity contributions from SA Government ................................. — — — — Repayment of equity contributions from SA Government .......... — — — —
Estimated balance at 30 June 2008 — — 10 10
4.142
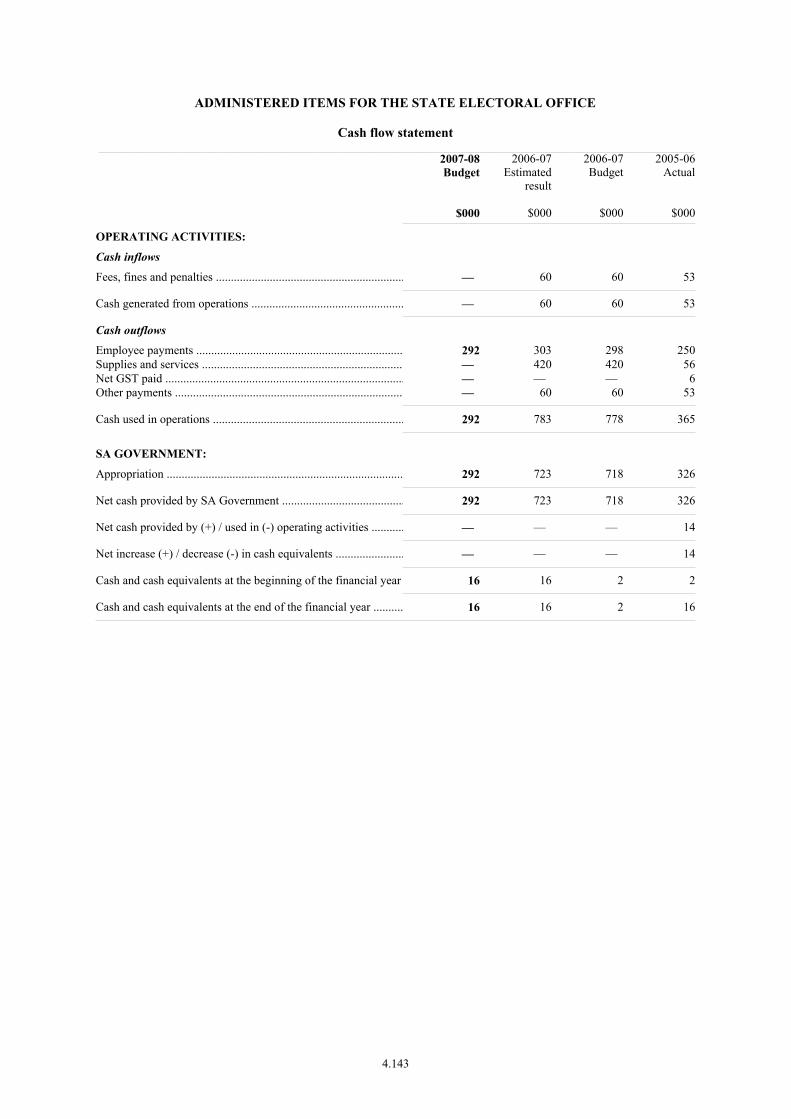
ADMINISTERED ITEMS FOR THE STATE ELECTORAL OFFICE
Cash flow statement__________________________________________________________________________________________________________________________________________________________________________________________________________________________________
2007-08Budget
$000
2006-07Estimated
result
$000
2006-07Budget
$000
2005-06Actual
$000
OPERATING ACTIVITIES:
Cash inflows
Fees, fines and penalties ............................................................... — 60 60 53
Cash generated from operations ................................................... — 60 60 53
Cash outflows
Employee payments ..................................................................... 292 303 298 250Supplies and services ................................................................... — 420 420 56Net GST paid ................................................................................ — — — 6Other payments ............................................................................ — 60 60 53
Cash used in operations ................................................................ 292 783 778 365
SA GOVERNMENT:
Appropriation ............................................................................... 292 723 718 326
Net cash provided by SA Government ......................................... 292 723 718 326
Net cash provided by (+) / used in (-) operating activities ........... — — — 14
Net increase (+) / decrease (-) in cash equivalents ....................... — — — 14
Cash and cash equivalents at the beginning of the financial year 16 16 2 2
Cash and cash equivalents at the end of the financial year .......... 16 16 2 16
4.143

AGENCY: STATE ELECTORAL OFFICE
Financial Commentary — major variations
The following commentary relates to the Agency Financial Statements presented in the previous section. The discussion relates to variations between the 2006-07 Estimated Result and the 2007-08 Budget.
Income statement — Controlled
The reduction in operating expenses and income results from 2007-08 not being a state election year and reflects the cyclical nature of expenditure to conduct local government periodic elections.
Balance sheet — Controlled
No major variations.
Statement of changes in equity — Controlled
No major variations.
Cash flow statement — Controlled
Refer to commentary under Income statement.
Administered
Income statement — Administered Items
There is no budget for supplies and services in 2007-08 due to the completion of the Electoral Districts Boundaries Commission’s review in 2006-07. The reduction in fees and fines in 2007-08 is due to the final processing of election non-voter expiation notices during 2006-07.
The employee payments and appropriation in 2007-08 are for statutory officers employed under the Electoral Act 1985.
Balance sheet — Administered Items
No major variations.
Statement of changes in equity — Administered Items
No major variations.
Cash flow statement — Administered Items
Refer to commentary under Income statement.
4.144

4.145

TABLE OF CONTENTS
AGENCY: DEPARTMENT FOR CORRECTIONAL SERVICES
Objective ........................................................................................................................................4.147
Targets / Highlights ........................................................................................................................4.147
Program Net Cost of Services Summary........................................................................................4.148
Investing Payments Summary ........................................................................................................4.148
Program Information — includes description/objective, Summary income statement, sub-program information including performance criteria
1. Rehabilitation and Reparation.......................................................................................4.149
2. Custodial Services.........................................................................................................4.151
3. Community Based Services ..........................................................................................4.153
Financial Statements
Income statement .................................................................................................................4.155
Balance sheet........................................................................................................................4.156
Statement of changes in equity ............................................................................................4.157
Cash flow statement .............................................................................................................4.158
Financial Commentary ...................................................................................................................4.159
4.146

PORTFOLIO: JUSTICE
AGENCY: DEPARTMENT FOR CORRECTIONAL SERVICES
Objectives
The Department for Correctional Services is responsible for the provision of custodial services, community based supervision services and rehabilitation services to offenders in South Australia.
The primary objective of the department is to work to contribute to creating a safer community while assisting to rebuild lives affected by crime.
2007-08 Targets / 2006-07 Highlights
Targets 2007-08 Highlights 2006-07
• Implement additional capacity for the accommodation of prisoners
• Continue to upgrade kitchens and air treatment systems in prisons
• Commission Mobilong Prison centre support facilities • Commence upgrade of prison security systems • Commence upgrade of the Port Pirie Community Corrections
Centre • Progress the tender process for a Public Private Partnership
(PPP) for a new Men’s prison, Women’s prison and pre-release centre
• Investigate the feasibility of introducing classified GPS technology for offender monitoring in the community
• Continue the implementation of risk based assessment for prisoners and offenders
• Commission new accommodation at the Adelaide Women’s Prison
• Commenced implementation of risk based assessment for prisoners and offenders
• Continued to manage Social Inclusion Board initiatives • Procured a new electronic rostering system for prison staffing • Commenced prison kitchen upgrades • Commenced air treatment systems upgrades • Conducted audit of prison fire safety systems • Commenced construction of Mobilong Prison centre support
facilities • Implemented remote area indigenous offender initiative in
central Australian communities • Constructed additional accommodation at the Adelaide
Women’s Prison • Commenced PPP project for new Men’s and Women’s prisons
and a new pre-release centre
4.147
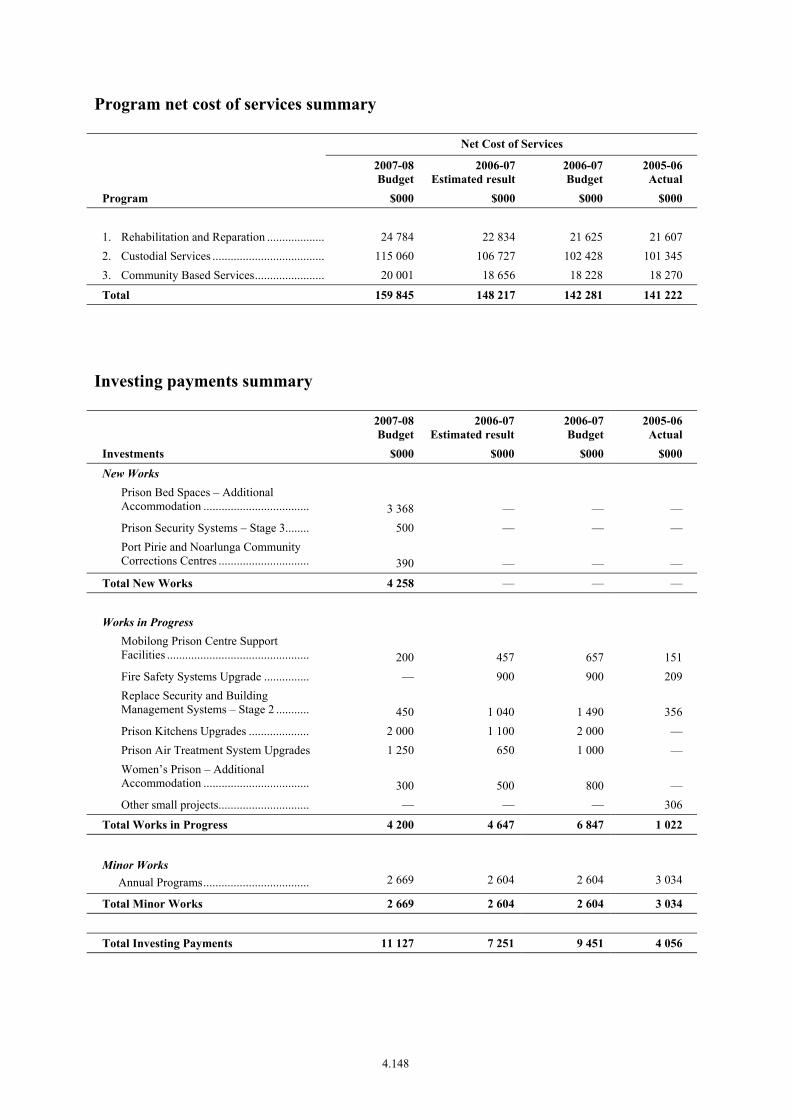
Program net cost of services summary
Net Cost of Services
2007-08Budget
2006-07Estimated result
2006-07 Budget
2005-06 Actual
Program $000 $000 $000 $000 1. Rehabilitation and Reparation .................... 24 784 22 834 21 625 21 607 2. Custodial Services ...................................... 115 060 106 727 102 428 101 345 3. Community Based Services........................ 20 001 18 656 18 228 18 270
Total 159 845 148 217 142 281 141 222
Investing payments summary
2007-08Budget
2006-07Estimated result
2006-07 Budget
2005-06 Actual
Investments $000 $000 $000 $000
New Works Prison Bed Spaces – Additional Accommodation ...................................
3 368
—
—
—
Prison Security Systems – Stage 3........ 500 — — — Port Pirie and Noarlunga Community Corrections Centres ..............................
390
—
—
—
Total New Works 4 258 — — —
Works in Progress
Mobilong Prison Centre Support Facilities ...............................................
200
457
657
151
Fire Safety Systems Upgrade ............... — 900 900 209 Replace Security and Building Management Systems – Stage 2 ...........
450
1 040
1 490
356
Prison Kitchens Upgrades .................... 2 000 1 100 2 000 — Prison Air Treatment System Upgrades 1 250 650 1 000 — Women’s Prison – Additional Accommodation ...................................
300
500
800
—
Other small projects.............................. — — — 306
Total Works in Progress 4 200 4 647 6 847 1 022
Minor Works Annual Programs...................................
2 669
2 604
2 604
3 034
Total Minor Works 2 669 2 604 2 604 3 034
Total Investing Payments 11 127 7 251 9 451 4 056
4.148
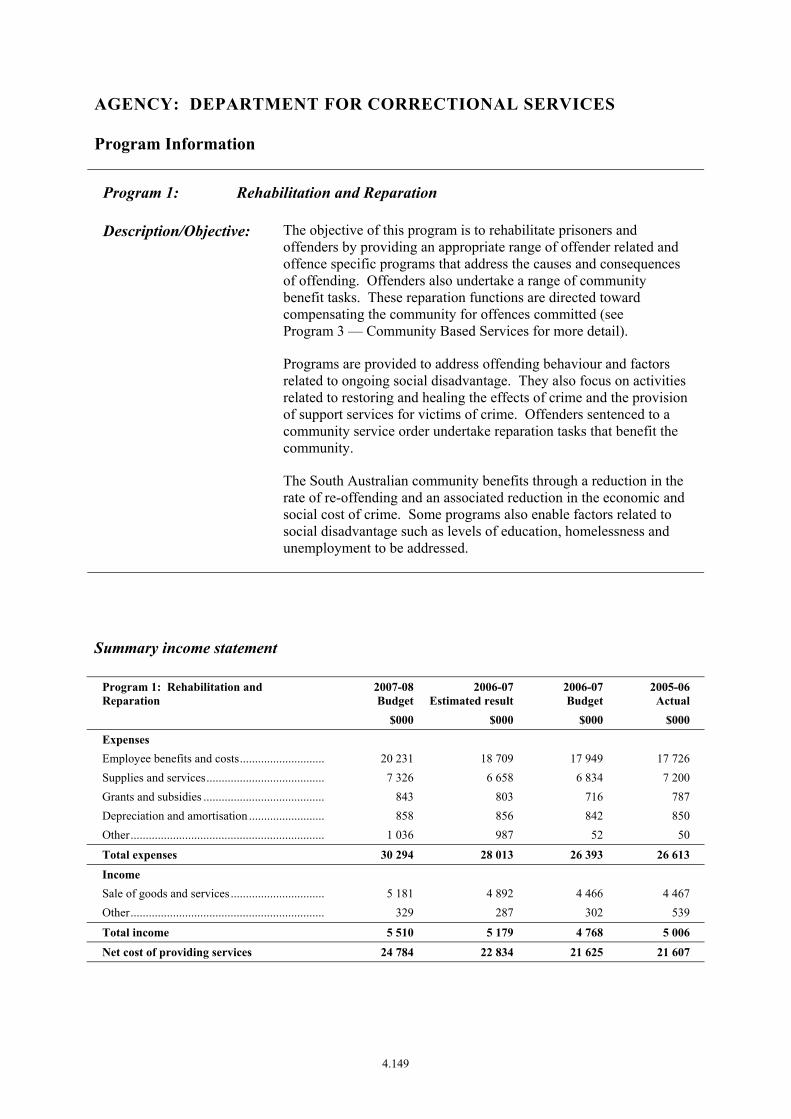
AGENCY: DEPARTMENT FOR CORRECTIONAL SERVICES
Program Information
Program 1: Rehabilitation and Reparation
Description/Objective: The objective of this program is to rehabilitate prisoners and offenders by providing an appropriate range of offender related and offence specific programs that address the causes and consequences of offending. Offenders also undertake a range of community benefit tasks. These reparation functions are directed toward compensating the community for offences committed (see Program 3 — Community Based Services for more detail).
Programs are provided to address offending behaviour and factors related to ongoing social disadvantage. They also focus on activities related to restoring and healing the effects of crime and the provision of support services for victims of crime. Offenders sentenced to a community service order undertake reparation tasks that benefit the community.
The South Australian community benefits through a reduction in the rate of re-offending and an associated reduction in the economic and social cost of crime. Some programs also enable factors related to social disadvantage such as levels of education, homelessness and unemployment to be addressed.
Summary income statement
Program 1: Rehabilitation and Reparation
2007-08Budget
2006-07Estimated result
2006-07 Budget
2005-06 Actual
$000 $000 $000 $000
Expenses Employee benefits and costs............................. 20 231 18 709 17 949 17 726 Supplies and services........................................ 7 326 6 658 6 834 7 200 Grants and subsidies ......................................... 843 803 716 787 Depreciation and amortisation .......................... 858 856 842 850 Other................................................................. 1 036 987 52 50
Total expenses 30 294 28 013 26 393 26 613
Income Sale of goods and services................................ 5 181 4 892 4 466 4 467 Other................................................................. 329 287 302 539
Total income 5 510 5 179 4 768 5 006
Net cost of providing services 24 784 22 834 21 625 21 607
4.149

Program performance information
Program: 1 Rehabilitation and Reparation
Effective rehabilitation programs focused on offender specific and offence related factors reduce re-offending and the economic and social cost of crime to the community. The objectives are to provide prisoners and offenders with: • appropriate rehabilitation programs in areas such as sexual offending, alcohol and drug abuse, anger management, domestic violence,
reasoning and victim awareness; • pre-release, re-socialisation and life-skills programs. These may also include personal development by undertaking community
service; • educational programs in literacy and numeracy, and pre-certificate, secondary and higher education; • vocational programs to enhance employment opportunities through nationally accredited courses; and • opportunities to enhance work skills through duty assignments in prison industries and prison services.
2007-08 Budget
2006-07 Estimated result
2006-07 Budget
2005-06 Actual
Net cost of program $24 784 000 $22 834 000 $21 625 000 $21 607 000
Performance Commentary The Department for Correctional Services (DCS) has maintained its efforts in delivering programs to assist prisoners and offenders in order to address their anti-social behaviour. These programs benefit the community by reducing the likelihood of re-offending. The provision of skills training and educational opportunities through prison industries, services and educational systems serves to enhance a prisoner’s chance of employment once released. The community benefits through improved re-integration and a reduced likelihood of re-offending. The results achieved by DCS have largely been consistent with the targets set.
Performance Indicators 2007-08 Target
2006-07 Estimated result
2006-07 Target
2005-06 Actual
Offence focused programs:
• Offence focused programs available(a) 19 19 19 19
• No. of prisoners/offenders commencing offence focused programs
3 100 3 000 3 100 3 095
• No. of offenders/prisoners completing offence focused programs during the financial year
2 950 2 900 2 800 3 120
• % of offenders/prisoners successfully completing offence focused programs
80% 79% 80% 83%
Educational/vocational programs:
• Educational programs available 14 14 14 14
• No. of prisoners/offenders enrolled in educational/vocational programs
1 650 1 650 1 595 1 623
• % of education and vocational enrolments successfully completed
60% 53%(b) 60% 46%
On the job work skills programs:
• Average no. of eligible prisoners with duty assignments
770 779 740 760
• % of eligible prisoners with duty assignments
80% 80% 80% 85%
Footnotes (a) Includes four programs that specifically target serious offenders including those who commit sexual and violent offences. (b) Current bed space management and resultant prisoner movement have had an impact on the ability to undertake assessments of
prisoners vocational skill development.
4.150

AGENCY: DEPARTMENT FOR CORRECTIONAL SERVICES
Program Information
Program 2: Custodial Services
Description/Objective: The objective of the Custodial Services Program is to provide an effective and appropriate custodial environment that maintains public and prisoner safety in accordance with the orders of the Courts.
The community benefits through the containment of prisoners and the implementation of a range of security and management regimes that ensure risks are managed and the prison environment is secure, safe and humane.
Summary income statement
Program 2: Custodial Services 2007-08Budget
2006-07Estimated result
2006-07 Budget
2005-06 Actual
$000 $000 $000 $000
Expenses Employee benefits and costs............................. 66 693 61 674 62 495 61 632 Supplies and services........................................ 37 453 33 932 35 792 37 072 Grants and subsidies ......................................... 2 139 1 969 1 971 2 016 Depreciation and amortisation .......................... 6 504 6 487 5 932 5 987 Other................................................................. 6 049 5 766 212 220
Total expenses 118 838 109 828 106 402 106 927
Income Sale of goods and services................................ 2 387 1 890 2 705 3 444 Other................................................................. 1 391 1 211 1 269 2 138
Total income 3 778 3 101 3 974 5 582
Net cost of providing services 115 060 106 727 102 428 101 345
4.151
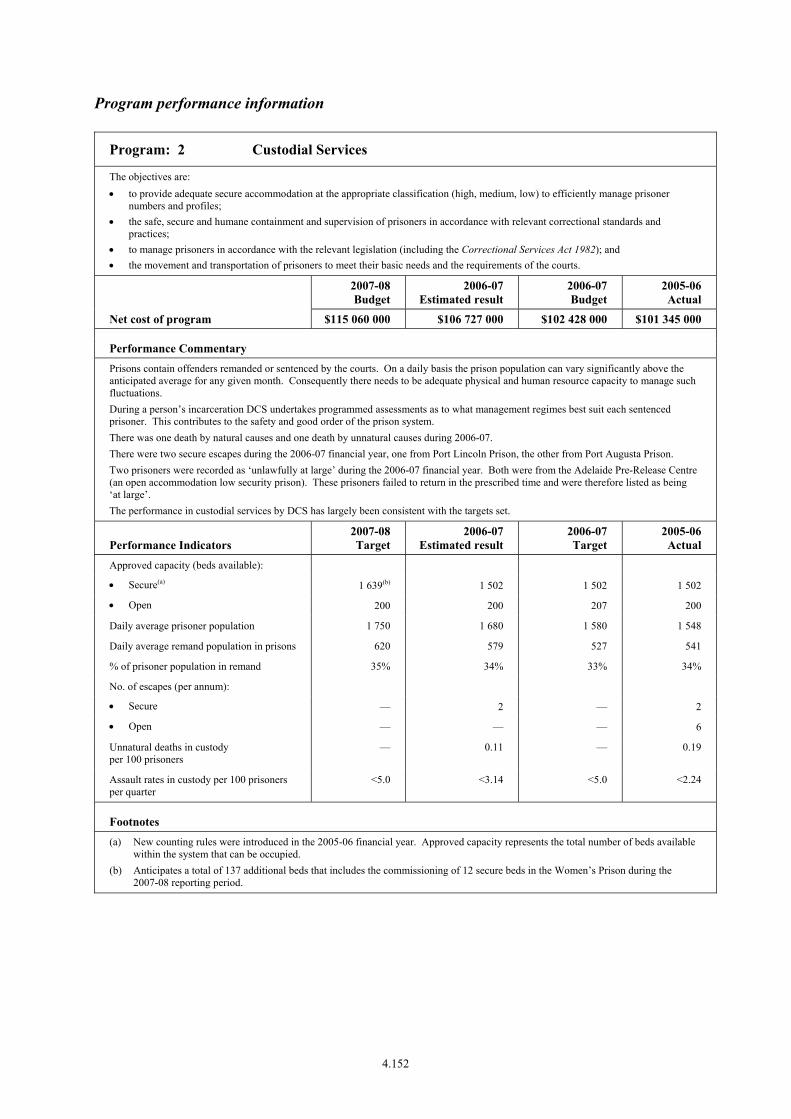
Program performance information
Program: 2 Custodial Services
The objectives are: • to provide adequate secure accommodation at the appropriate classification (high, medium, low) to efficiently manage prisoner
numbers and profiles; • the safe, secure and humane containment and supervision of prisoners in accordance with relevant correctional standards and
practices; • to manage prisoners in accordance with the relevant legislation (including the Correctional Services Act 1982); and • the movement and transportation of prisoners to meet their basic needs and the requirements of the courts.
2007-08 Budget
2006-07 Estimated result
2006-07 Budget
2005-06 Actual
Net cost of program $115 060 000 $106 727 000 $102 428 000 $101 345 000
Performance Commentary Prisons contain offenders remanded or sentenced by the courts. On a daily basis the prison population can vary significantly above the anticipated average for any given month. Consequently there needs to be adequate physical and human resource capacity to manage such fluctuations. During a person’s incarceration DCS undertakes programmed assessments as to what management regimes best suit each sentenced prisoner. This contributes to the safety and good order of the prison system. There was one death by natural causes and one death by unnatural causes during 2006-07. There were two secure escapes during the 2006-07 financial year, one from Port Lincoln Prison, the other from Port Augusta Prison. Two prisoners were recorded as ‘unlawfully at large’ during the 2006-07 financial year. Both were from the Adelaide Pre-Release Centre (an open accommodation low security prison). These prisoners failed to return in the prescribed time and were therefore listed as being ‘at large’. The performance in custodial services by DCS has largely been consistent with the targets set.
Performance Indicators 2007-08 Target
2006-07 Estimated result
2006-07 Target
2005-06 Actual
Approved capacity (beds available):
• Secure(a) 1 639(b) 1 502 1 502 1 502
• Open 200 200 207 200
Daily average prisoner population 1 750 1 680 1 580 1 548
Daily average remand population in prisons 620 579 527 541
% of prisoner population in remand 35% 34% 33% 34%
No. of escapes (per annum):
• Secure — 2 — 2
• Open — — — 6
Unnatural deaths in custody per 100 prisoners
— 0.11 — 0.19
Assault rates in custody per 100 prisoners per quarter
<5.0 <3.14 <5.0 <2.24
Footnotes (a) New counting rules were introduced in the 2005-06 financial year. Approved capacity represents the total number of beds available
within the system that can be occupied. (b) Anticipates a total of 137 additional beds that includes the commissioning of 12 secure beds in the Women’s Prison during the
2007-08 reporting period.
4.152

AGENCY: DEPARTMENT FOR CORRECTIONAL SERVICES
Program Information
Program 3: Community Based Services
Description/Objective: The objective of this program is to supervise offenders in a community based setting as required by orders of the Courts or Parole Board.
Community based supervision of offenders is an important part of correctional service delivery. The department’s community based services include home detention, bail supervision, intensive bail supervision, parole and probation services, community services and the preparation of court reports.
The community benefits as community based penalties provide an effective and appropriate environment in which an offender is subject to supervision but is otherwise able to live within the community.
Summary income statement
Program 3: Community Based Services 2007-08Budget
2006-07Estimated result
2006-07 Budget
2005-06 Actual
$000 $000 $000 $000
Expenses Employee benefits and costs............................. 15 472 14 308 13 726 13 555 Supplies and services........................................ 4 678 4 286 4 435 4 879 Grants and subsidies ......................................... 80 80 68 83 Depreciation and amortisation .......................... 218 217 286 289 Other................................................................. 875 834 37 36
Total expenses 21 323 19 725 18 552 18 842
Income Sale of goods and services................................ 195 197 168 246 Commonwealth revenue ................................... 830 613 — — Other................................................................. 297 259 156 326
Total income 1 322 1 069 324 572
Net cost of providing services 20 001 18 656 18 228 18 270
4.153

Program performance information
Program: 3 Community Based Services
The objectives are: • to provide efficient and effective supervision to offenders under a community based order; • the safe and humane supervision of offenders in accordance with relevant correctional standards and practices; • to supervise offenders in accordance with the relevant legislation (including the Correctional Services Act 1982); and • the preparation of reports for the courts.
2007-08 Budget
2006-07 Estimated result
2006-07 Budget
2005-06 Actual
Net cost of program $20 001 000 $18 656 000 $18 228 000 $18 270 000
Performance Commentary The Courts and Parole Board require a significant number of offenders to be managed in the community. The supervision of community offenders enables improved outcomes in the rehabilitation of the offender and can provide reparation to the community. The performance in community based services by DCS has largely been consistent with the targets set.
Performance Indicators 2007-08 Target
2006-07 Estimated result
2006-07 Target
2005-06 Actual
Community based order commencements (excluding interstate and other orders):
• Community service 2 500 2 379 2 500 2 384
• Intensive bail supervision 700(b) 801(a) 600 677
• Home detention 150(b) 145(a) 195 184
• Bail supervision 1 600 1 782(a) 1 400 1 529
• Parole 560 574 560 550
• Probation 1900 1 984 1 800 1 855
No. of reports completed for Courts, Parole Board and Prisoner Assessment Committees:
• Pre-sentence 1 050 1 143 1 000 1 115
• Bail enquiry 1 150 1 203(a) 1 050 1 123
• Intensive bail supervision 1 670 1 709 1 600 1 649
• Parole 600 599 625 602
% of community based orders completed successfully:
• Community service 60% 58% 60% 54%
• Intensive bail supervision 55% 66% 55% 63%
• Home detention 80% 85% 80% 88%
• Bail supervision 60% 59% 60% 61%
• Parole 70% 73% 70% 76%
• Probation 75% 85% 75% 79%
% of court ordered reports completed on time 90% 97% 90% 97%
Footnotes (a) Community based orders can fluctuate significantly over time and may also vary as a consequence of changes in prisoner profiles
and numbers, enabling legislation and sentencing trends. (b) Intensive bail (electronic monitored supervision) has increased significantly, consistent with changes in court sentencing profiles
(intensive bail supervision is ordered by a court). Home detention supervision has consequently decreased.
4.154

DEPARTMENT FOR CORRECTIONAL SERVICES
Income statement__________________________________________________________________________________________________________________________________________________________________________________________________________________________________
2007-08Budget
$000
2006-07Estimated
result
$000
2006-07Budget
$000
2005-06Actual
$000Expenses
Employee benefits and costs — Salaries, wages, annual and sick leave ..................................... 84 601 78 567 79 286 78 325 Long service leave .................................................................... 3 394 2 971 1 367 968 Payroll tax ................................................................................ 5 618 5 145 4 977 4 728 Superannuation ......................................................................... 8 783 8 008 7 700 7 298 Other ......................................................................................... — — 840 1 594Supplies and services — General supplies and services .................................................. 47 654 44 066 46 851 48 758 Consultancy expenses .............................................................. 1 803 810 210 393Depreciation and amortisation ..................................................... 7 580 7 560 7 060 7 126Grants and subsidies ..................................................................... 3 062 2 852 2 755 2 886Other expenses ............................................................................. 7 960 7 587 301 306
Total expenses .............................................................................. 170 455 157 566 151 347 152 382
Income
Commonwealth revenues ............................................................. 830 613 — — Intra government transfers ........................................................... 1 242 982 952 1 082Other grants .................................................................................. — — — 69Sales of goods and services .......................................................... 7 763 6 979 7 339 8 157Interest revenues ........................................................................... — — — 1 136Net gain or loss from disposal of assets ....................................... — — — -30Other income ................................................................................ 775 775 775 746
Total income ................................................................................. 10 610 9 349 9 066 11 160
Net cost of providing services ...................................................... 159 845 148 217 142 281 141 222
Income from / Expenses to SA Government
Income — Appropriation ........................................................................... 159 845 140 041 142 281 133 369 Other income ............................................................................ — 4 041 — 3 159
Net income from / expenses to SA Government .......................... 159 845 144 082 142 281 136 528
Net result ...................................................................................... — -4 135 — -4 694
4.155
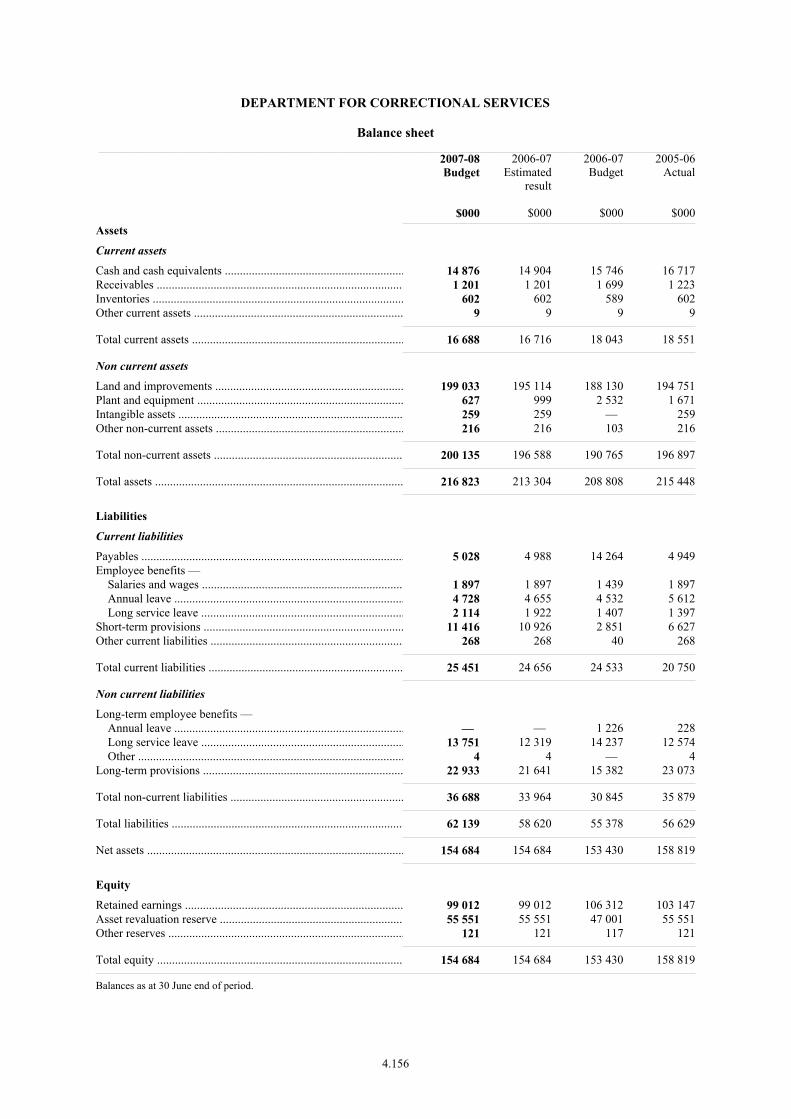
DEPARTMENT FOR CORRECTIONAL SERVICES
Balance sheet__________________________________________________________________________________________________________________________________________________________________________________________________________________________________
2007-08Budget
$000
2006-07Estimated
result
$000
2006-07Budget
$000
2005-06Actual
$000Assets
Current assets
Cash and cash equivalents ............................................................ 14 876 14 904 15 746 16 717Receivables ................................................................................... 1 201 1 201 1 699 1 223Inventories .................................................................................... 602 602 589 602Other current assets ...................................................................... 9 9 9 9
Total current assets ....................................................................... 16 688 16 716 18 043 18 551
Non current assets
Land and improvements ............................................................... 199 033 195 114 188 130 194 751Plant and equipment ..................................................................... 627 999 2 532 1 671Intangible assets ........................................................................... 259 259 — 259Other non-current assets ............................................................... 216 216 103 216
Total non-current assets ............................................................... 200 135 196 588 190 765 196 897
Total assets ................................................................................... 216 823 213 304 208 808 215 448
Liabilities
Current liabilities
Payables ........................................................................................ 5 028 4 988 14 264 4 949Employee benefits — Salaries and wages ................................................................... 1 897 1 897 1 439 1 897 Annual leave ............................................................................. 4 728 4 655 4 532 5 612 Long service leave .................................................................... 2 114 1 922 1 407 1 397Short-term provisions ................................................................... 11 416 10 926 2 851 6 627Other current liabilities ................................................................. 268 268 40 268
Total current liabilities ................................................................. 25 451 24 656 24 533 20 750
Non current liabilities
Long-term employee benefits — Annual leave ............................................................................. — — 1 226 228 Long service leave .................................................................... 13 751 12 319 14 237 12 574 Other ......................................................................................... 4 4 — 4Long-term provisions ................................................................... 22 933 21 641 15 382 23 073
Total non-current liabilities .......................................................... 36 688 33 964 30 845 35 879
Total liabilities .............................................................................. 62 139 58 620 55 378 56 629
Net assets ...................................................................................... 154 684 154 684 153 430 158 819
Equity
Retained earnings ......................................................................... 99 012 99 012 106 312 103 147Asset revaluation reserve ............................................................. 55 551 55 551 47 001 55 551Other reserves ............................................................................... 121 121 117 121
Total equity .................................................................................. 154 684 154 684 153 430 158 819
Balances as at 30 June end of period.
4.156
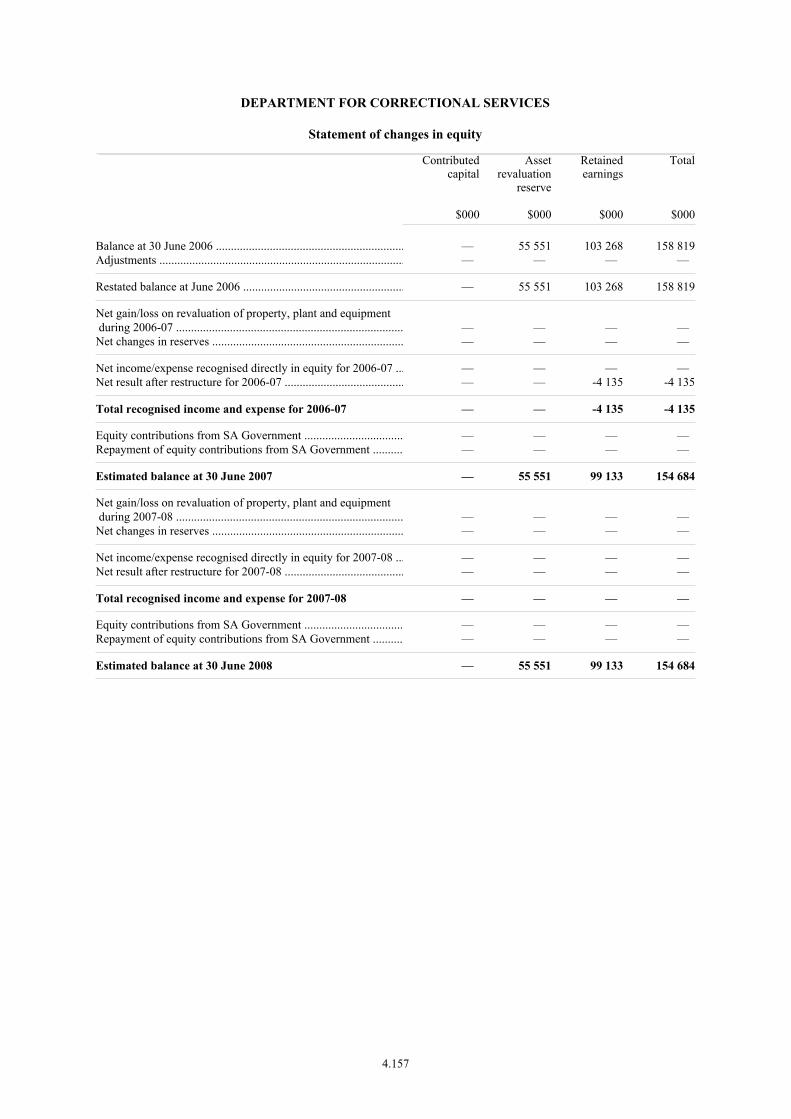
DEPARTMENT FOR CORRECTIONAL SERVICES
Statement of changes in equity__________________________________________________________________________________________________________________________________________________________________________________________________________________________________
Contributedcapital
$000
Assetrevaluation
reserve
$000
Retainedearnings
$000
Total
$000
Balance at 30 June 2006 ............................................................... — 55 551 103 268 158 819Adjustments .................................................................................. — — — —
Restated balance at June 2006 ...................................................... — 55 551 103 268 158 819
Net gain/loss on revaluation of property, plant and equipment during 2006-07 ............................................................................ — — — — Net changes in reserves ................................................................ — — — —
Net income/expense recognised directly in equity for 2006-07 ... — — — — Net result after restructure for 2006-07 ........................................ — — -4 135 -4 135
Total recognised income and expense for 2006-07 — — -4 135 -4 135
Equity contributions from SA Government ................................. — — — — Repayment of equity contributions from SA Government .......... — — — —
Estimated balance at 30 June 2007 — 55 551 99 133 154 684
Net gain/loss on revaluation of property, plant and equipment during 2007-08 ............................................................................ — — — — Net changes in reserves ................................................................ — — — —
Net income/expense recognised directly in equity for 2007-08 ... — — — — Net result after restructure for 2007-08 ........................................ — — — —
Total recognised income and expense for 2007-08 — — — —
Equity contributions from SA Government ................................. — — — — Repayment of equity contributions from SA Government .......... — — — —
Estimated balance at 30 June 2008 — 55 551 99 133 154 684
4.157

DEPARTMENT FOR CORRECTIONAL SERVICES
Cash flow statement__________________________________________________________________________________________________________________________________________________________________________________________________________________________________
2007-08Budget
$000
2006-07Estimated
result
$000
2006-07Budget
$000
2005-06Actual
$000
OPERATING ACTIVITIES:
Cash outflows
Employee payments ..................................................................... 100 329 93 938 92 807 81 677Supplies and services ................................................................... 49 457 44 876 47 061 47 855Grants and subsidies ..................................................................... 3 062 2 852 2 755 2 886Net GST paid ................................................................................ — — — 689Other payments ............................................................................ 6 508 6 349 301 9 134
Cash used in operations ................................................................ 159 356 148 015 142 924 142 241
Cash inflows
Intra government transfers ........................................................... 1 242 982 952 1 082Commonwealth receipts ............................................................... 830 613 — — Other grants .................................................................................. — — — 69Sales of goods and services .......................................................... 7 763 6 979 7 339 8 010Interest received ........................................................................... — 22 30 1 144Other receipts ............................................................................... 775 775 775 2 346
Cash generated from operations ................................................... 10 610 9 371 9 096 12 651
SA GOVERNMENT:
Appropriation ............................................................................... 159 845 140 041 142 281 133 369Other receipts ............................................................................... — 4 041 — 3 159
Net cash provided by SA Government ......................................... 159 845 144 082 142 281 136 528
Net cash provided by (+) / used (-) in operating activities ........... 11 099 5 438 8 453 6 938
INVESTING ACTIVITIES:
Cash outflows
Purchase of property, plant and equipment .................................. 11 127 7 251 9 451 4 056
Cash used in investing activities .................................................. 11 127 7 251 9 451 4 056
Cash inflows
Proceeds from sale of property, plant and equipment .................. — — — -30
Cash generated from investing activities ..................................... — — — -30
Net cash provided by (+) / used in (-) investing activities ........... -11 127 -7 251 -9 451 -4 086
Net increase (+) / decrease (-) in cash equivalents ....................... -28 -1 813 -998 2 852
Cash and cash equivalents at the beginning of the financial year 14 904 16 717 16 744 13 865
Cash and cash equivalents at the end of the financial year .......... 14 876 14 904 15 746 16 717
4.158
AGENCY: DEPARTMENT FOR CORRECTIONAL SERVICES
Financial Commentary — major variations
The following commentary relates to the Agency Financial Statements presented in the previous section. The discussion relates to variations between the 2006-07 Estimated Result and the 2007-08 Budget.
Income statement — Controlled
The increase in employee expenses is due to costs associated with increases in prisoner numbers and Enterprise Bargaining award supplementation.
The increase in appropriation is due to funding for wage increases, increases in prisoner numbers, supervision in prisons and costs associated with the new prisons project.
Balance sheet — Controlled
The increase in non-current assets relates to several new capital initiatives approved for 2007-08, as well as the carryover of some capital initiatives from 2006-07.
Statement of changes in equity — Controlled
No major variations.
Cash flow statement — Controlled
Investing payments have increased due to several new initiatives approved for 2007-08 and the carryover of some initiatives from 2006-07.
4.159

TABLE OF CONTENTS
AGENCY: SOUTH AUSTRALIAN FIRE AND EMERGENCY SERVICES COMMISSION
Objective ........................................................................................................................................4.161
Targets / Highlights ........................................................................................................................4.161
Program Net Cost of Services Summary........................................................................................4.162
Investing Payments Summary ........................................................................................................4.162
Program Information — includes description/objective, Summary income statement, sub-program information including performance criteria
1. Fire and Emergency Services Strategic and Corporate Support ...................................4.163
Financial Statements
Income statement .................................................................................................................4.166
Balance sheet........................................................................................................................4.167
Statement of changes in equity ............................................................................................4.168
Cash flow statement .............................................................................................................4.169
Income statement — Administered Items............................................................................4.170
Balance sheet — Administered Items ..................................................................................4.171
Statement of changes in equity — Administered Items.......................................................4.172
Cash flow statement — Administered Items ......................................................................4.173
Financial Commentary ...................................................................................................................4.174
4.160
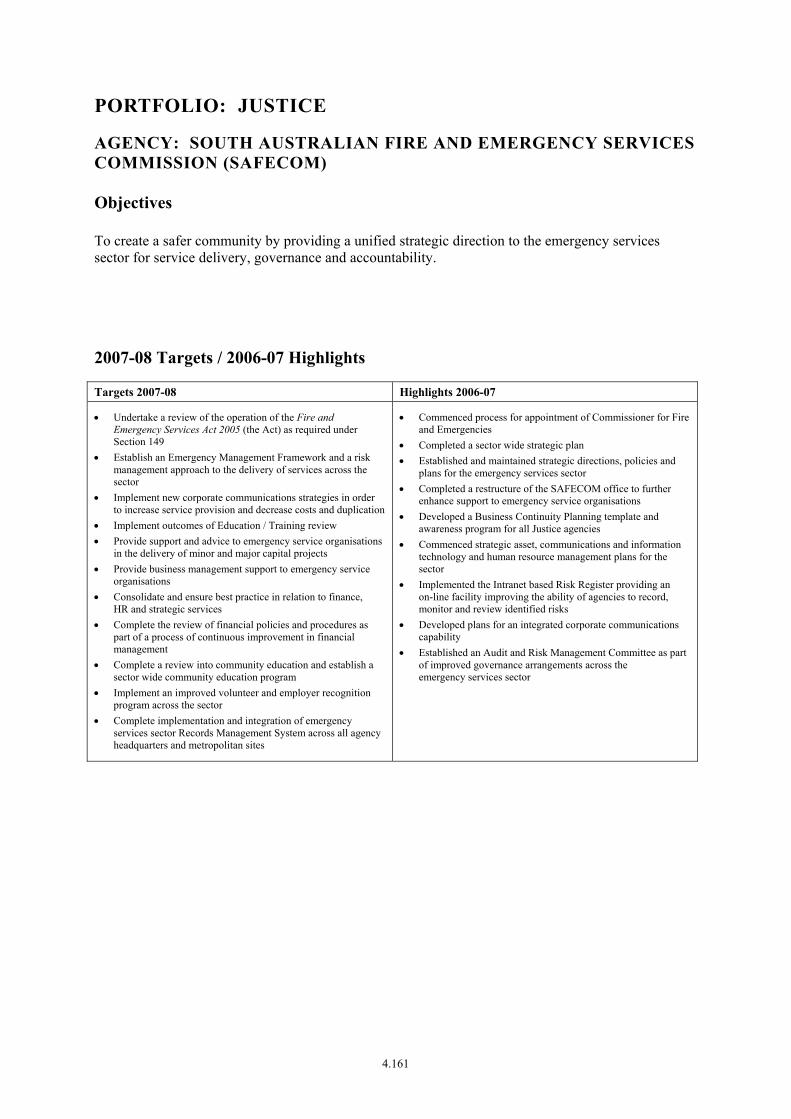
PORTFOLIO: JUSTICE
AGENCY: SOUTH AUSTRALIAN FIRE AND EMERGENCY SERVICES COMMISSION (SAFECOM)
Objectives
To create a safer community by providing a unified strategic direction to the emergency services sector for service delivery, governance and accountability.
2007-08 Targets / 2006-07 Highlights
Targets 2007-08 Highlights 2006-07
• Undertake a review of the operation of the Fire and Emergency Services Act 2005 (the Act) as required under Section 149
• Establish an Emergency Management Framework and a risk management approach to the delivery of services across the sector
• Implement new corporate communications strategies in order to increase service provision and decrease costs and duplication
• Implement outcomes of Education / Training review • Provide support and advice to emergency service organisations
in the delivery of minor and major capital projects • Provide business management support to emergency service
organisations • Consolidate and ensure best practice in relation to finance,
HR and strategic services • Complete the review of financial policies and procedures as
part of a process of continuous improvement in financial management
• Complete a review into community education and establish a sector wide community education program
• Implement an improved volunteer and employer recognition program across the sector
• Complete implementation and integration of emergency services sector Records Management System across all agency headquarters and metropolitan sites
• Commenced process for appointment of Commissioner for Fire and Emergencies
• Completed a sector wide strategic plan • Established and maintained strategic directions, policies and
plans for the emergency services sector • Completed a restructure of the SAFECOM office to further
enhance support to emergency service organisations • Developed a Business Continuity Planning template and
awareness program for all Justice agencies • Commenced strategic asset, communications and information
technology and human resource management plans for the sector
• Implemented the Intranet based Risk Register providing an on-line facility improving the ability of agencies to record, monitor and review identified risks
• Developed plans for an integrated corporate communications capability
• Established an Audit and Risk Management Committee as part of improved governance arrangements across the emergency services sector
4.161
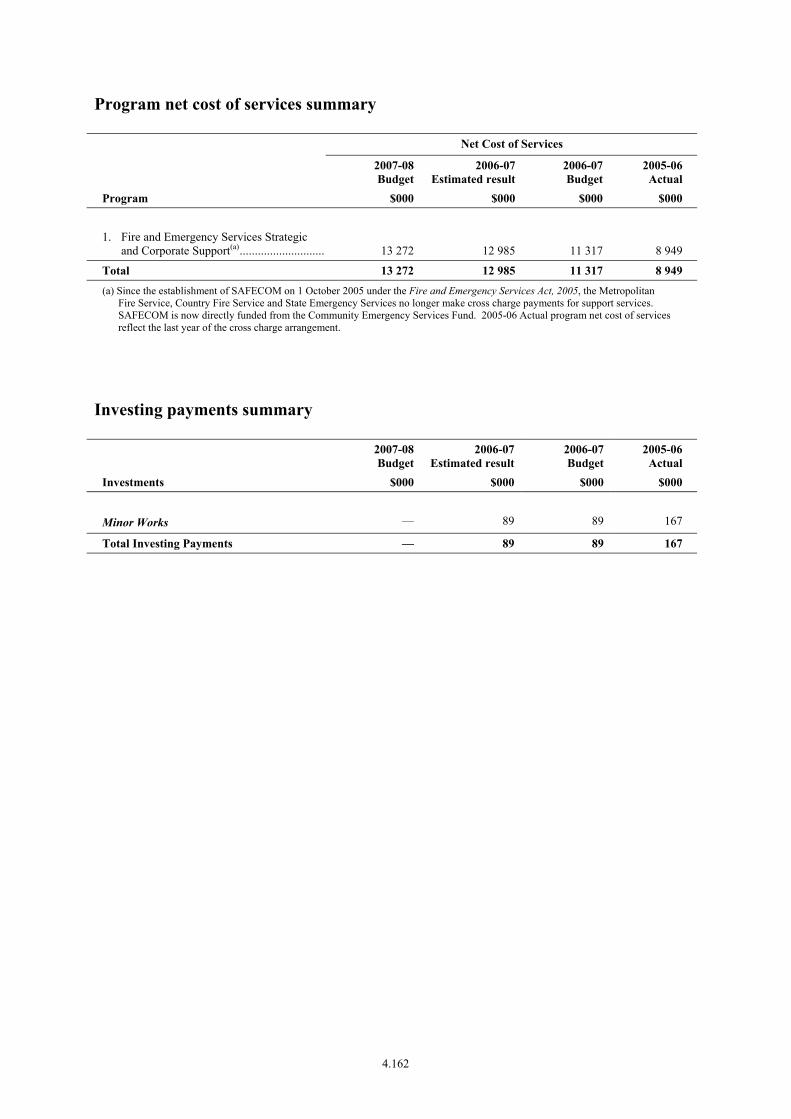
Program net cost of services summary
Net Cost of Services
2007-08Budget
2006-07Estimated result
2006-07 Budget
2005-06 Actual
Program $000 $000 $000 $000 1. Fire and Emergency Services Strategic
and Corporate Support(a)............................. 13 272 12 985 11 317 8 949
Total 13 272 12 985 11 317 8 949
(a) Since the establishment of SAFECOM on 1 October 2005 under the Fire and Emergency Services Act, 2005, the Metropolitan Fire Service, Country Fire Service and State Emergency Services no longer make cross charge payments for support services. SAFECOM is now directly funded from the Community Emergency Services Fund. 2005-06 Actual program net cost of services reflect the last year of the cross charge arrangement.
Investing payments summary
2007-08Budget
2006-07Estimated result
2006-07 Budget
2005-06 Actual
Investments $000 $000 $000 $000
Minor Works — 89 89 167
Total Investing Payments — 89 89 167
4.162

AGENCY: SOUTH AUSTRALIAN FIRE AND EMERGENCY SERVICES COMMISSION
Program Information
Program 1: Fire and Emergency Services Strategic and Corporate Support
Description/Objective: The emergency services sector is comprised of the Commission, the South Australian Metropolitan Fire Service, the Country Fire Service and the State Emergency Service. SAFECOM performs the following functions for the sector:
• the development and implementation of an Emergency Management framework for South Australia in the national context;
• the development and maintenance of a strategic and policy framework across the emergency services sector;
• the development and implementation of a framework of sound corporate governance and business services across the emergency services sector; and
• the provision of appropriate strategic, administrative, and other support services to the emergency services sector.
Summary income statement
Program 1: Fire and Emergency Services Strategic and Corporate Support
2007-08Budget
2006-07Estimated result
2006-07 Budget
2005-06 Actual
$000 $000 $000 $000
Expenses Employee benefits and costs............................. 9 473 9 207 8 086 8 042 Supplies and services........................................ 4 679 3 963 3 776 3 917 Depreciation and amortisation .......................... 52 52 52 131 Other................................................................. 89 416 — 62
Total expenses 14 293 13 638 11 914 12 152
Income Sale of goods and services................................ 500 487 487 3 008 Commonwealth revenue ................................... 360 — — — Other................................................................. 161 166 110 195
Total income 1 021 653 597 3 203
Net cost of providing services 13 272 12 985 11 317 8 949
4.163

Sub-program information
Sub-program: 1.1 Strategic Services
Develop and implement a comprehensive Emergency Management Framework in consultation with the emergency services sector, government agencies, Local Government and the community. Provide high-level strategic advice and services to the Board and emergency services sector agencies and manage SAFECOM’s governance processes. Provide state-level policy advice for emergency management, representing South Australia on Council of Australian Governments’ emergency management forums.
2007-08 Budget
2006-07 Estimated result
2006-07 Budget
2005-06 Actual
Net cost of sub-program $1 857 000 $1 604 000 $1 518 000 $1 353 000
Performance Commentary In 2006, SAFECOM was given responsibility for Emergency Management policy functions including national liaison, across-government preparedness and sector wide collaboration. SAFECOM has worked with its Board and key stakeholders to develop and implement its strategic plan, with objectives and strategies to achieve specified public safety outcomes by 2015. These objectives and strategies are organised under the following themes: Sustaining Corporate Governance, Engaging Communities & Aligning Services to Needs, Integrating Service Delivery, and Developing Our Capacity. Within these themes, the Board has implemented action plans and monitors, reviews and reports progress each quarter. SAFECOM has prepared a Charter relating to its functions and operations to meet the requirements of Sections 8(3) and (4) of the Act. SAFECOM’s Charter explains its role, responsibilities and accountabilities in common language and sets clear service standards, being a vehicle for communicating, maintaining and reviewing client service arrangements.
Performance Indicators 2007-08 Target
2006-07 Estimated result
2006-07 Target
2005-06 Actual
% of strategies endorsed and implemented by SAFECOM’s Board(a)
95% 90% 90% n.a.
Footnotes (a) New performance indicator.
4.164
Sub-program: 1.2 Support Services
Provide support services to the emergency services sector. These services are strategic development, financial, asset management, human resources (including volunteer management), information technology and client services.
2007-08 Budget
2006-07 Estimated result
2006-07 Budget
2005-06 Actual
Net cost of sub-program $11 415 000 $11 381 000 $9 799 000 $7 596 000
Performance Commentary During 2006-07, SAFECOM provided support services to the emergency services sector, including: • completed a restructure of the SAFECOM Office further enhancing support to emergency service organisations; • with the devolution of the Security and Emergency Management Office (SEMO), key emergency management functions have
transferred to SAFECOM requiring the establishment of an emergency management capability within SAFECOM with links to the emergency service organisations and other government departments;
• implemented an Audit and Risk Management Committee as part of continuous strengthening of the sector’s governance arrangements;
• as part of a continuous improvement program to improve financial and human resource management and governance across the emergency services sector, policies and procedures were reviewed and updated;
• developed and implemented a Financial Management Risk Register, incorporating findings from internal and external audit and addressing other opportunities for improvement;
• reviewed and reported on the emergency services sectors corporate communications capacity; • established improved insurance arrangements for the emergency services sector; • upgraded SES incident management database; • updated and implemented future ICT contracts; and • developed a Business Continuity Planning template and awareness program for all emergency services sector agencies.
4.165
SOUTH AUSTRALIAN FIRE AND EMERGENCY SERVICES COMMISSION
Income statement__________________________________________________________________________________________________________________________________________________________________________________________________________________________________
2007-08Budget
$000
2006-07Estimated
result
$000
2006-07Budget
$000
2005-06Actual
$000Expenses
Employee benefits and costs — Salaries, wages, annual and sick leave ..................................... 7 507 7 292 6 671 6 563 Long service leave .................................................................... 296 292 340 289 Payroll tax ................................................................................ 467 452 278 389 Superannuation ......................................................................... 815 787 503 708 Other ......................................................................................... 388 384 294 93Supplies and services — General supplies and services .................................................. 4 583 3 869 3 776 3 798 Consultancy expenses .............................................................. 96 94 — 119Depreciation and amortisation ..................................................... 52 52 52 131Borrowing costs ............................................................................ 7 7 — — Other expenses ............................................................................. 82 409 — 62
Total expenses .............................................................................. 14 293 13 638 11 914 12 152
Income
Commonwealth revenues ............................................................. 360 — — — Intra government transfers ........................................................... 12 769 12 307 10 922 8 654Sales of goods and services .......................................................... 500 487 487 3 008Interest revenues ........................................................................... 51 59 3 71Other income ................................................................................ 110 107 107 124
Total income ................................................................................. 13 790 12 960 11 519 11 857
Net cost of providing services ...................................................... 503 678 395 295
Net result before restructure(s) ..................................................... -503 -678 -395 -295
Net income from / expenses from administrative restructure(s) .. — — — 3 270
Net result after restructure(s) ........................................................ -503 -678 -395 2 975
4.166

SOUTH AUSTRALIAN FIRE AND EMERGENCY SERVICES COMMISSION
Balance sheet__________________________________________________________________________________________________________________________________________________________________________________________________________________________________
2007-08Budget
$000
2006-07Estimated
result
$000
2006-07Budget
$000
2005-06Actual
$000Assets
Current assets
Cash and cash equivalents ............................................................ 1 903 1 985 1 021 2 026Receivables ................................................................................... 516 516 411 516Other current assets ...................................................................... 1 1 — 1
Total current assets ....................................................................... 2 420 2 502 1 432 2 543
Non current assets
Land and improvements ............................................................... 209 181 221 233Plant and equipment ..................................................................... 1 90 388 340
Total non-current assets ............................................................... 210 271 609 573
Total assets ................................................................................... 2 630 2 773 2 041 3 116
Liabilities
Current liabilities
Payables ........................................................................................ 755 724 679 711Employee benefits — Salaries and wages ................................................................... 1 1 — 1 Annual leave ............................................................................. 668 668 632 668 Long service leave .................................................................... 100 100 101 100Short-term provisions ................................................................... 99 99 119 99
Total current liabilities ................................................................. 1 623 1 592 1 531 1 579
Non current liabilities
Long-term employee benefits — Long service leave .................................................................... 2 436 2 107 2 305 1 785Long-term provisions ................................................................... 396 396 540 396
Total non-current liabilities .......................................................... 2 832 2 503 2 845 2 181
Total liabilities .............................................................................. 4 455 4 095 4 376 3 760
Net assets ...................................................................................... -1 825 -1 322 -2 335 -644
Equity
Retained earnings ......................................................................... -1 825 -1 322 -2 335 -644
Total equity .................................................................................. -1 825 -1 322 -2 335 -644
Balances as at 30 June end of period.
4.167

SOUTH AUSTRALIAN FIRE AND EMERGENCY SERVICES COMMISSION
Statement of changes in equity__________________________________________________________________________________________________________________________________________________________________________________________________________________________________
Contributedcapital
$000
Assetrevaluation
reserve
$000
Retainedearnings
$000
Total
$000
Balance at 30 June 2006 ............................................................... — — -644 -644Adjustments .................................................................................. — — — —
Restated balance at June 2006 ...................................................... — — -644 -644
Net gain/loss on revaluation of property, plant and equipment during 2006-07 ............................................................................ — — — — Net changes in reserves ................................................................ — — — —
Net income/expense recognised directly in equity for 2006-07 ... — — — — Net result after restructure for 2006-07 ........................................ — — -678 -678
Total recognised income and expense for 2006-07 — — -678 -678
Equity contributions from SA Government ................................. — — — — Repayment of equity contributions from SA Government .......... — — — —
Estimated balance at 30 June 2007 — — -1 322 -1 322
Net gain/loss on revaluation of property, plant and equipment during 2007-08 ............................................................................ — — — — Net changes in reserves ................................................................ — — — —
Net income/expense recognised directly in equity for 2007-08 ... — — — — Net result after restructure for 2007-08 ........................................ — — -503 -503
Total recognised income and expense for 2007-08 — — -503 -503
Equity contributions from SA Government ................................. — — — — Repayment of equity contributions from SA Government .......... — — — —
Estimated balance at 30 June 2008 — — -1 825 -1 825
4.168

SOUTH AUSTRALIAN FIRE AND EMERGENCY SERVICES COMMISSION
Cash flow statement__________________________________________________________________________________________________________________________________________________________________________________________________________________________________
2007-08Budget
$000
2006-07Estimated
result
$000
2006-07Budget
$000
2005-06Actual
$000
OPERATING ACTIVITIES:
Cash outflows
Employee payments ..................................................................... 9 113 8 873 7 752 7 156Supplies and services ................................................................... 4 679 3 962 3 775 3 912Borrowing costs ............................................................................ 7 7 — — Other payments ............................................................................ 73 70 — 63
Cash used in operations ................................................................ 13 872 12 912 11 527 11 131
Cash inflows
Intra government transfers ........................................................... 12 769 12 307 10 922 8 654Commonwealth receipts ............................................................... 360 — — — Sales of goods and services .......................................................... 500 487 487 2 949Interest received ........................................................................... 51 59 3 71Net GST received ......................................................................... — — — -352Other receipts ............................................................................... 110 107 107 120
Cash generated from operations ................................................... 13 790 12 960 11 519 11 442
Net cash provided by (+) / used (-) in operating activities ........... -82 48 -8 311
INVESTING ACTIVITIES:
Cash outflows
Purchase of property, plant and equipment .................................. — 89 89 167
Cash used in investing activities .................................................. — 89 89 167
Net cash provided by (+) / used in (-) investing activities ........... — -89 -89 -167
Net increase (+) / decrease (-) in cash equivalents ....................... -82 -41 -97 144
Cash and cash equivalents at the beginning of the financial year 1 985 2 026 1 118 1 882
Cash and cash equivalents at the end of the financial year .......... 1 903 1 985 1 021 2 026
4.169
ADMINISTERED ITEMS FOR THE SOUTH AUSTRALIAN FIREAND EMERGENCY SERVICES COMMISSION
Income statement__________________________________________________________________________________________________________________________________________________________________________________________________________________________________
2007-08Budget
$000
2006-07Estimated
result
$000
2006-07Budget
$000
2005-06Actual
$000Income from other sources
Intra government transfers ........................................................... 201 566 185 293 186 357 173 400Fees, fines and penalties ............................................................... 300 300 — 362Sales of goods and services .......................................................... — — 300 — Interest revenues ........................................................................... 2 200 2 200 2 200 2 291
Total income from other sources .................................................. 204 066 187 793 188 857 176 053
Total income ................................................................................. 204 066 187 793 188 857 176 053
Expenses
Supplies and services — General supplies and services .................................................. 9 732 10 438 8 655 7 325Grants and subsidies ..................................................................... 1 882 3 493 3 456 2 253Intra government transfers ........................................................... 194 871 177 766 179 911 173 713
Total expenses .............................................................................. 206 485 191 697 192 022 183 291
Net result ...................................................................................... -2 419 -3 904 -3 165 -7 238
4.170
ADMINISTERED ITEMS FOR THE SOUTH AUSTRALIAN FIREAND EMERGENCY SERVICES COMMISSION
Balance sheet__________________________________________________________________________________________________________________________________________________________________________________________________________________________________
2007-08Budget
$000
2006-07Estimated
result
$000
2006-07Budget
$000
2005-06Actual
$000Assets
Current assets
Cash and cash equivalents ............................................................ 4 049 6 468 6 668 10 372Receivables ................................................................................... 1 083 1 083 — 1 088
Total current assets ....................................................................... 5 132 7 551 6 668 11 460
Total assets ................................................................................... 5 132 7 551 6 668 11 460
Liabilities
Current liabilities
Payables ........................................................................................ 1 134 1 134 — 1 139
Total current liabilities ................................................................. 1 134 1 134 — 1 139
Total liabilities .............................................................................. 1 134 1 134 — 1 139
Net assets ...................................................................................... 3 998 6 417 6 668 10 321
Equity
Retained earnings ......................................................................... 3 998 6 417 6 668 10 321
Total equity .................................................................................. 3 998 6 417 6 668 10 321
Balances as at 30 June end of period.
4.171
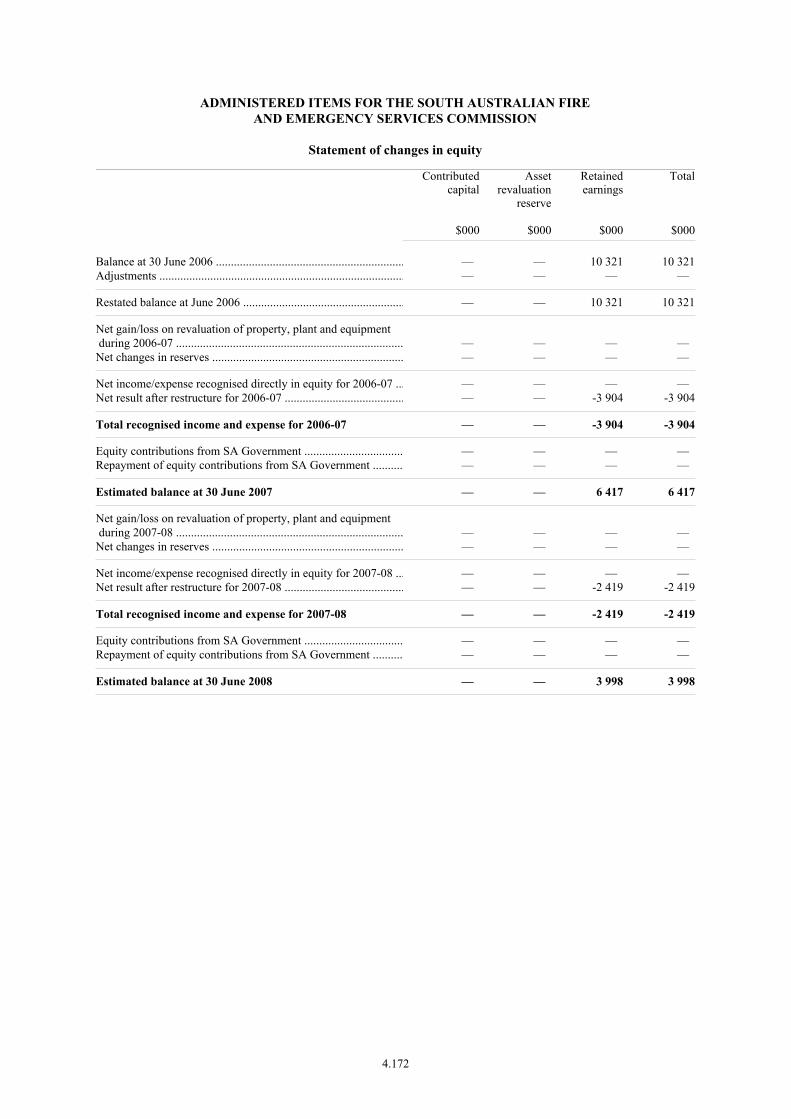
ADMINISTERED ITEMS FOR THE SOUTH AUSTRALIAN FIREAND EMERGENCY SERVICES COMMISSION
Statement of changes in equity__________________________________________________________________________________________________________________________________________________________________________________________________________________________________
Contributedcapital
$000
Assetrevaluation
reserve
$000
Retainedearnings
$000
Total
$000
Balance at 30 June 2006 ............................................................... — — 10 321 10 321Adjustments .................................................................................. — — — —
Restated balance at June 2006 ...................................................... — — 10 321 10 321
Net gain/loss on revaluation of property, plant and equipment during 2006-07 ............................................................................ — — — — Net changes in reserves ................................................................ — — — —
Net income/expense recognised directly in equity for 2006-07 ... — — — — Net result after restructure for 2006-07 ........................................ — — -3 904 -3 904
Total recognised income and expense for 2006-07 — — -3 904 -3 904
Equity contributions from SA Government ................................. — — — — Repayment of equity contributions from SA Government .......... — — — —
Estimated balance at 30 June 2007 — — 6 417 6 417
Net gain/loss on revaluation of property, plant and equipment during 2007-08 ............................................................................ — — — — Net changes in reserves ................................................................ — — — —
Net income/expense recognised directly in equity for 2007-08 ... — — — — Net result after restructure for 2007-08 ........................................ — — -2 419 -2 419
Total recognised income and expense for 2007-08 — — -2 419 -2 419
Equity contributions from SA Government ................................. — — — — Repayment of equity contributions from SA Government .......... — — — —
Estimated balance at 30 June 2008 — — 3 998 3 998
4.172

ADMINISTERED ITEMS FOR THE SOUTH AUSTRALIAN FIREAND EMERGENCY SERVICES COMMISSION
Cash flow statement__________________________________________________________________________________________________________________________________________________________________________________________________________________________________
2007-08Budget
$000
2006-07Estimated
result
$000
2006-07Budget
$000
2005-06Actual
$000
OPERATING ACTIVITIES:
Cash inflows
Intra government transfers ........................................................... 201 566 185 293 186 357 173 285Fees, fines and penalties ............................................................... 300 300 — 362Sales of goods and services .......................................................... — — 300 — Interest received ........................................................................... 2 200 2 200 2 200 1 869
Cash generated from operations ................................................... 204 066 187 793 188 857 175 516
Cash outflows
Supplies and services ................................................................... 9 732 10 438 8 655 7 264Grants and subsidies ..................................................................... 1 882 3 493 3 456 2 253Intra government transfers ........................................................... 194 871 177 766 179 911 172 700
Cash used in operations ................................................................ 206 485 191 697 192 022 182 217
Net cash provided by (+) / used in (-) operating activities ........... -2 419 -3 904 -3 165 -6 701
Net increase (+) / decrease (-) in cash equivalents ....................... -2 419 -3 904 -3 165 -6 701
Cash and cash equivalents at the beginning of the financial year 6 468 10 372 9 833 17 073
Cash and cash equivalents at the end of the financial year .......... 4 049 6 468 6 668 10 372
4.173
AGENCY: SOUTH AUSTRALIAN FIRE AND EMERGENCY SERVICES COMMISSION
Financial Commentary — major variations
The following commentary relates to the Financial Statements presented in the previous section.
Income statement — Controlled
The $0.238 million variance between the 2005-06 Actual and 2006-07 Budget for total expenses relates mainly to the restructure and establishment of SAFECOM which involved the transfer of some staff to emergency service agencies.
The $1.724 million variance between the 2006-07 Budget and the 2006-07 Estimated Result for total expenses relates mainly to the transfer of Commonwealth funded projects for the National Disaster Mitigation and Bushfire Mitigation Programs, and enterprise bargaining wage increases.
The $0.655 million variance between the 2006-07 Estimated Result and 2007-08 Budget for total expenses relates mainly to additional Commonwealth funded projects for the National Disaster Mitigation and Bushfire Mitigation Programs, inflation supplementation on supplies and services expenditure and enterprise bargaining wage increases.
Balance sheet — Controlled
Total assets have decreased from $3.1 million in 2005-06 to $2.0 million in the 2006-07 Budget mainly due to an estimated decrease in cash of $1.0 million.
Total liabilities have increased from $3.8 million in 2005-06 to $4.4 million in the 2006-07 Budget mainly due to an estimated increase in long service leave liability.
There are no significant variations between the 2006-07 Estimated Result and the 2007-08 Budget.
Statement of changes in equity — Controlled
Net changes in equity are the result of the restructure and establishment of SAFECOM.
Cash flow statement — Controlled
Movements in cash flows are consistent with movements in the Income statement as outlined above.
4.174

Administered
Income statement — Administered Items
Operating revenue for the Community Emergency Services Fund (‘the Fund’) is projected to increase from $187.8 million in the 2006-07 Estimated Result to $204.1 million in 2007-08 mainly due to additional levy collections and remissions.
Operating payments from the Fund are projected to increase from $191.7 million in 2006-07 to $206.5 million in 2007-08 primarily due to $2.5 million in expenditure carried over from 2006-07 into 2007-08, $4.8 million in additional expenditure approved for the emergency services sector, $2.5 million in capital expenditure in the Metropolitan Fire Service brought forward from 2009-10 and general inflation on the costs of providing emergency services.
Balance sheet — Administered Items
The Fund’s cash balance is expected to be reduced from $6.5 million at 30 June 2007 to $4.0 million at 30 June 2008 mainly due to carryover expenditure being funded by cash balances.
Statement of changes in equity — Administered Items
The reduction in equity from $6.4 million at 30 June 2007 to $4.0 million at 30 June 2008 is due to the reduction in cash balances used to fund expenditure carried over from 2006-07.
Cash flow statement — Administered Items
Movement in cash flows are consistent with movements in the Income statement as outlined above.
Additional Information for Administered Items
Detailed information on Administered Items is included in the following table.
4.175

Additional Information for Administered Items South Australian Fire and Emergency Services Commission
Cash flow statement
2007-08Budget
2006-07Estimated
result
2006-07 Budget
2005-06Actual
$000 $000 $000 $000
CASH FLOWS FROM: Operating activities Receipts Emergency Services Levy —
Fixed Property collections (government) ................................ 1 973 1 876 2 083 1 814 Fixed Property collections (Private – including local government) ................................................................... 73 798 70 449 70 342 66 581 Mobile Property ...................................................................... 28 400 28 000 28 000 27 575 Remissions .............................................................................. 91 196 78 908 79 383 71 143 Pensioner Concessions............................................................. 6 199 6 060 6 549 6 172
Fees, fines and penalties ESL — Certificate Sales and other .......................................... 300 300 300 362
Interest — Community Emergency Services Fund.................................... 2 200 2 200 2 200 1 869
Total operating receipts 204 066 187 793 188 857 175 516
Payments Community Emergency Services Fund payments —
Emergency Services agencies .................................................. 170 882 156 779 156 424 153 275 Emergency Services provided by other government agencies ................................................................................... 21 489 20 987 20 987 19 424 Levy Collection ....................................................................... 6 519 6 598 6 598 6 706 Other expenses and projects..................................................... 3 000 487 2 987 458 Other supplies and services...................................................... 2 713 3 353 1 570 101
Grants and subsidies — Volunteer Support and Community grants ............................. 1 882 3 493 3 456 2 253
Total operating payments 206 485 191 697 192 022 182 217
Net cash provided by operating activities -2 419 -3 904 -3 165 -6 701
Net Increase (+) / decrease (-) in cash held -2 419 -3 904 -3 165 -6 701
Opening cash balance as at 1 July 6 468 10 372 9 833 17 073
Closing cash balance as at 30 June 4 049 6 468 6 668 10 372
4.176

4.177

TABLE OF CONTENTS
AGENCY: SOUTH AUSTRALIAN METROPOLITAN FIRE SERVICE
Objective ........................................................................................................................................4.179
Targets / Highlights ........................................................................................................................4.179
Program Net Cost of Services Summary........................................................................................4.180
Investing Payments Summary ........................................................................................................4.180
Program Information — includes description/objective, Summary income statement, sub-program information including performance criteria
1. South Australian Metropolitan Fire Service .................................................................4.181
Financial Statements
Income statement .................................................................................................................4.186
Balance sheet........................................................................................................................4.187
Statement of changes in equity ............................................................................................4.188
Cash flow statement .............................................................................................................4.189
Financial Commentary ...................................................................................................................4.190
4.178

PORTFOLIO: JUSTICE
AGENCY: SOUTH AUSTRALIAN METROPOLITAN FIRE SERVICE
Objectives
The South Australian Metropolitan Fire Service (MFS) is a statutory authority committed to protecting life, property and the environment from fire and other emergencies. The objectives of the MFS are to:
• effectively plan to identify and meet community and stakeholder needs;
• minimise the frequency and impacts of emergencies through regulation, support and education;
• prepare to the highest standards to ensure excellence in the provision of emergency services to the South Australian community;
• provide a response service that reduces death, injury, property loss and protects the environment;
• provide a recovery service that reduces the economic and social impacts of emergencies; and
• provide leadership and excel in service, innovation and business efficiencies.
2007-08 Targets / 2006-07 Highlights
Targets 2007-08 Highlights 2006-07
• Commence construction of a new fire station as part of the joint emergency service facility at Port Lincoln, to replace the ageing station, due for completion in June 2009
• Enable the MFS to address the emerging risk of high-rise development in Port Lincoln by the acquisition of an additional firefighting appliance with a telescopic aerial boom
• Facilitate improved response capability by completing and commissioning the Beulah Park fire station
• Maintain pilot delivery of the Road Accident and Awareness Prevention Program to reach 45 per cent of year 11 students throughout South Australia
• Enhance operational effectiveness by deploying an aerial appliance in the Adelaide City location
• Provide more efficient interface with the dispatch of emergency crews by completing the transfer of Country Fire Service call receipt and dispatch operations to the Wakefield Street Communications Centre
• Ensure continued regeneration of the MFS operational firefighting workforce by conducting multiple recruit courses
• Commence negotiations for a new Enterprise Agreement for MFS firefighters
• Develop and deliver specialised fire and emergency management training to meet increasing emergency management responsibilities
• Continued pilot delivery of the Road Accident and Awareness Prevention Program to reach 45 per cent of year 11 students throughout South Australia
• Reduced the number of fire related deaths and injuries by 2 per cent during 2006-07
• Decreased the time MFS Appliances are off-road due to maintenance through completing the construction of a new purpose built engineering workshop at Angle Park with the capability to carry out maintenance and refurbishment of emergency services appliances
• Significantly enhanced the ability to control large-scale emergencies through the commissioning of a new incident control appliance enabling real time dissemination of information
• Provided improved protection to Mount Gambier by commencing a full-time paid MFS day crew
• Contributed to the improvement of MFS response times by installing mobile computer terminals in MFS response vehicles
• Improved community confidence in the MFS by marketing and providing support services during the successful World Police and Fire Games held in Adelaide
4.179

Program net cost of services summary
Net Cost of Services
2007-08Budget
2006-07Estimated result
2006-07 Budget
2005-06 Actual
Program $000 $000 $000 $000 1. South Australian Metropolitan Fire
Service........................................................ 89 313 84 658 88 264 74 462
Total 89 313 84 658 88 264 74 462
Investing payments summary
2007-08Budget
2006-07Estimated result
2006-07 Budget
2005-06 Actual
Investments $000 $000 $000 $000
New Works
Port Lincoln Fire Station ............................ 2 500 — — — Port Lincoln Firefighting Appliance........... 513 — — —
Total New Works 3 013 — — —
Works in Progress
Beulah Park Station .................................... 3 280 720 1 400 — Metropolitan Adelaide Firefighting Appliance ................................................... 1 220 234 634 —
Paradise Fire Station................................... 402 100 — — Portfolio Radio and Telecommunications .. 180 170 350 559 SAMFS Engineering Workshop Facility.... 102 1 745 2 662 1 208
Total Works in Progress 5 184 2 969 5 046 1 767
Minor Works
Annual Programs........................................ 1 581 3 896 4 227 8 935
Total Minor Works 1 581 3 896 4 227 8 935 Other Investing Payments
Glen Osmond Land Purchase ..................... — — — 964
Total Other Investing Programs — — — 964
Total Investing Payments 9 778 6 865 9 273 11 666
4.180
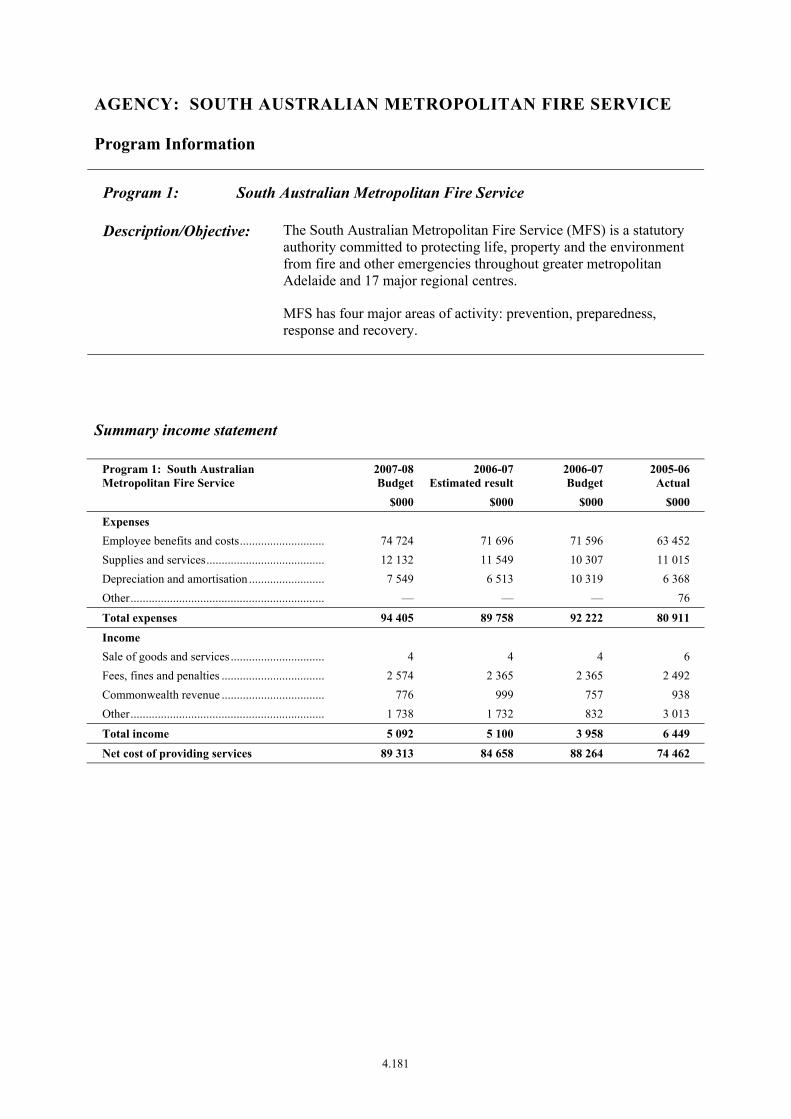
AGENCY: SOUTH AUSTRALIAN METROPOLITAN FIRE SERVICE
Program Information
Program 1: South Australian Metropolitan Fire Service
Description/Objective: The South Australian Metropolitan Fire Service (MFS) is a statutory authority committed to protecting life, property and the environment from fire and other emergencies throughout greater metropolitan Adelaide and 17 major regional centres.
MFS has four major areas of activity: prevention, preparedness, response and recovery.
Summary income statement
Program 1: South Australian Metropolitan Fire Service
2007-08Budget
2006-07Estimated result
2006-07 Budget
2005-06 Actual
$000 $000 $000 $000
Expenses Employee benefits and costs............................. 74 724 71 696 71 596 63 452 Supplies and services........................................ 12 132 11 549 10 307 11 015 Depreciation and amortisation .......................... 7 549 6 513 10 319 6 368 Other................................................................. — — — 76
Total expenses 94 405 89 758 92 222 80 911
Income Sale of goods and services................................ 4 4 4 6 Fees, fines and penalties ................................... 2 574 2 365 2 365 2 492 Commonwealth revenue ................................... 776 999 757 938 Other................................................................. 1 738 1 732 832 3 013
Total income 5 092 5 100 3 958 6 449
Net cost of providing services 89 313 84 658 88 264 74 462
4.181

Sub-program information
Sub-program: 1.1 Prevention and Community Preparedness Services
It is a goal of the MFS to minimise the frequency and impacts of emergencies through regulation, support and education. Community safety programs focus on engaging the community and other partners to increase awareness of risk and deliver measurable improvements in community safety. Key services include community education, fire investigation, inspection and commissioning of building fire safety systems.
2007-08 Budget
2006-07 Estimated result
2006-07 Budget
2005-06 Actual
Net cost of sub-program $8 485 000 $8 043 000 $8 385 000 $7 074 000
Performance Commentary South Australia’s Strategic Plan sets the target of decreasing road fatalities to less than 90 per annum and decreasing road accident related injuries to less than 1000 per annum by 2010. The MFS Community Safety Department contributes to this target by fostering behaviours that increase community preparedness.
Key projects such as the Road Accident and Awareness Prevention Program have provided information to approximately 7100 targeted members of the South Australian community in addition to school and kindergarten visits as well as regional fairs and the Royal Adelaide Show during 2006-07. It is expected that a similar number will be reached during 2007-08.
The MFS contributes to the state’s goal of ‘Improving Wellbeing’ by ensuring that South Australian environs are safe places to live and work. During 2006-07 the MFS has inspected an estimated 600 places of public entertainment, an increase of 300 inspections or 50 per cent on the stated target. This increase was achieved through an initiative that uses MFS operational crews to assist in the inspection process. It is predicted that during 2007-08 the MFS will achieve a further increase in the number of inspections conducted.
Performance Indicators 2007-08 Target
2006-07 Estimated result
2006-07 Target
2005-06 Actual
Identify risks associated with fire and other emergencies
• No. of fires investigated (MFS) 210 210 210 203
• No. of fires investigated (CFS) 70 70 70 69
• Deliberate/Accidental/Undetermined 100/140/40 110/145/40 100/140/40 95/141/36
Foster behaviours that increase community preparedness
• No. of educational visits to community groups, including schools
600 600 500 628
• No of participants at educational visits to community groups, including schools
100 000 100 000 85 000 129 012
Ensure South Australian environs are safe places to live and work
• No. of building development proposals assessed
160 160 160 160
• No. of public entertainment places inspected
900(a) 600(a) 300 281
• No. of hazard complaints investigated 100 100 100 91
• No. of fire safety surveys including education and health facilities inspected
300 280 300 316
• % of building development assessments appealed
— — — —
• % of building development assessments completed within 28 days
100% 100% 100% 100%
• No. of Booster/Hydrant Tests/Commissioning
160 180 160 162
• No. of fire alarm inspections and connections
250 240 250 253
• No. of Building Fire Safety Committee Meetings/Inspections
200 200 200 206
Footnotes (a) Commencing in 2006-07, an MFS initiative to include operational crews as well as Fire Investigators in the important task of
inspecting places of public entertainment resulted in more than doubling inspections carried out in 2005-06. This is a significant contributor to public safety, which is to continue in 2007-08.
4.182
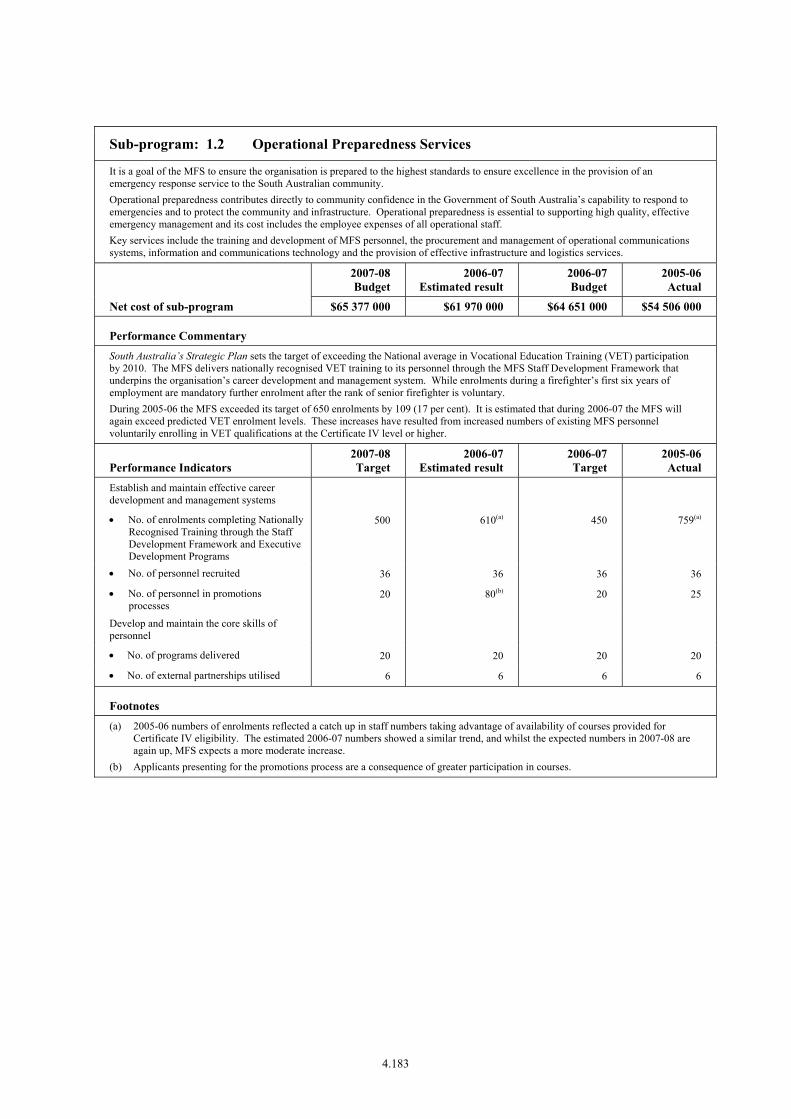
Sub-program: 1.2 Operational Preparedness Services
It is a goal of the MFS to ensure the organisation is prepared to the highest standards to ensure excellence in the provision of an emergency response service to the South Australian community. Operational preparedness contributes directly to community confidence in the Government of South Australia’s capability to respond to emergencies and to protect the community and infrastructure. Operational preparedness is essential to supporting high quality, effective emergency management and its cost includes the employee expenses of all operational staff. Key services include the training and development of MFS personnel, the procurement and management of operational communications systems, information and communications technology and the provision of effective infrastructure and logistics services.
2007-08 Budget
2006-07 Estimated result
2006-07 Budget
2005-06 Actual
Net cost of sub-program $65 377 000 $61 970 000 $64 651 000 $54 506 000
Performance Commentary South Australia’s Strategic Plan sets the target of exceeding the National average in Vocational Education Training (VET) participation by 2010. The MFS delivers nationally recognised VET training to its personnel through the MFS Staff Development Framework that underpins the organisation’s career development and management system. While enrolments during a firefighter’s first six years of employment are mandatory further enrolment after the rank of senior firefighter is voluntary. During 2005-06 the MFS exceeded its target of 650 enrolments by 109 (17 per cent). It is estimated that during 2006-07 the MFS will again exceed predicted VET enrolment levels. These increases have resulted from increased numbers of existing MFS personnel voluntarily enrolling in VET qualifications at the Certificate IV level or higher.
Performance Indicators 2007-08 Target
2006-07 Estimated result
2006-07 Target
2005-06 Actual
Establish and maintain effective career development and management systems
• No. of enrolments completing Nationally Recognised Training through the Staff Development Framework and Executive Development Programs
500 610(a) 450 759(a)
• No. of personnel recruited 36 36 36 36
• No. of personnel in promotions processes
20 80(b) 20 25
Develop and maintain the core skills of personnel
• No. of programs delivered 20 20 20 20
• No. of external partnerships utilised 6 6 6 6
Footnotes (a) 2005-06 numbers of enrolments reflected a catch up in staff numbers taking advantage of availability of courses provided for
Certificate IV eligibility. The estimated 2006-07 numbers showed a similar trend, and whilst the expected numbers in 2007-08 are again up, MFS expects a more moderate increase.
(b) Applicants presenting for the promotions process are a consequence of greater participation in courses.
4.183

Sub-program: 1.3 Response Services
It is a goal of the MFS to provide a response service that minimises the effects of emergencies on the community. Key services include Metropolitan and Regional Operations.
2007-08 Budget
2006-07 Estimated result
2006-07 Budget
2005-06 Actual
Net cost of sub-program $10 092 000 $9 566 000 $9 933 000 $8 414 000
Performance Commentary The MFS protects the wellbeing of the South Australian community through the provision of a response service that minimises the effects of emergencies. The MFS measures both the total number of responses provided to emergencies and the appropriateness of the response as measured by the time taken to arrive at each incident. Benchmark targets for response times are based on established targets set by the Australian Productivity Commission. The MFS will continue to review response times to ensure that documented targets are met or mitigating circumstances are identified and rectified.
Performance Indicators 2007-08 Target
2006-07 Estimated result
2006-07 Target
2005-06 Actual
Ensure appropriate response is committed to all incident types:
• No. of responses to structure fires 1 600 1 700 1 500 1 528
• No. of responses to vehicle fires 1 200 1 200 1 100 1 083
• No. of responses to other fires 3 000 4 000 2 800 2 774
• No. of responses to dangerous substances
1 200 1 200 1 100 1 118
• No. of responses to rescues 2 400 2 400 2 300 2 269
• No. of responses to fire alarms 9 000 8 600 10 000 8 614
• No. of other responses 3 000 3 400 1 500 2 814
• Total number of incidents generating a response
21 400 22 500 20 300 20 200
Ensure Response provided within appropriate timeframes:
• % of MFS arrivals within 7 minutes of callout in a metropolitan area with a fulltime MFS crew (a)
75% 75% 75% 68%
• % of MFS arrivals within 11 minutes of callout in a regional area with a retained MFS crew (a)
75% 75% 75% 69%
• % of MFS arrivals within 11 minutes of callout in a town / area with an MFS brigade (a)
95% 95% 95% 93%
Footnotes (a) Targeted response timeframes include priority 1 incidents, where MFS is responding under lights and sirens, and priority 2 incidents,
where response is restricted to normal road speed. Consequently, the proportion of priority 2 incidents in a year will affect the % indicator.
4.184
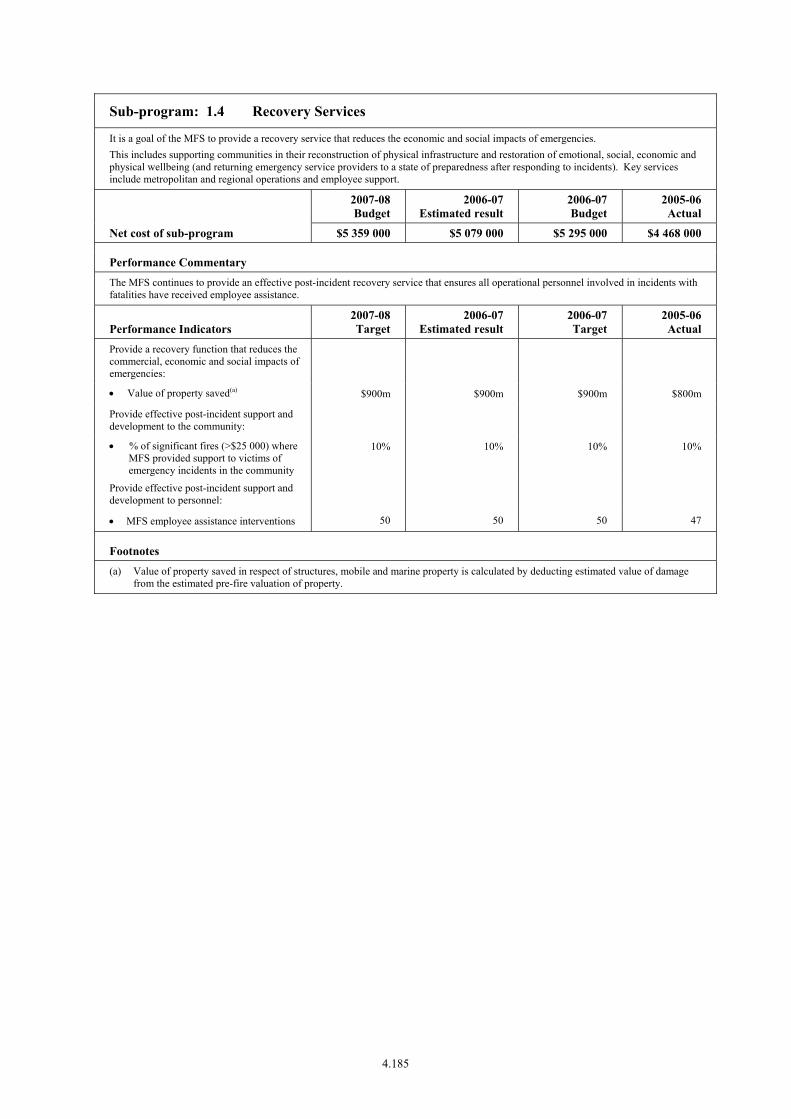
Sub-program: 1.4 Recovery Services
It is a goal of the MFS to provide a recovery service that reduces the economic and social impacts of emergencies. This includes supporting communities in their reconstruction of physical infrastructure and restoration of emotional, social, economic and physical wellbeing (and returning emergency service providers to a state of preparedness after responding to incidents). Key services include metropolitan and regional operations and employee support.
2007-08 Budget
2006-07 Estimated result
2006-07 Budget
2005-06 Actual
Net cost of sub-program $5 359 000 $5 079 000 $5 295 000 $4 468 000
Performance Commentary The MFS continues to provide an effective post-incident recovery service that ensures all operational personnel involved in incidents with fatalities have received employee assistance.
Performance Indicators 2007-08 Target
2006-07 Estimated result
2006-07 Target
2005-06 Actual
Provide a recovery function that reduces the commercial, economic and social impacts of emergencies:
• Value of property saved(a) $900m $900m $900m $800m
Provide effective post-incident support and development to the community:
• % of significant fires (>$25 000) where MFS provided support to victims of emergency incidents in the community
10% 10% 10% 10%
Provide effective post-incident support and development to personnel:
• MFS employee assistance interventions 50 50 50 47
Footnotes (a) Value of property saved in respect of structures, mobile and marine property is calculated by deducting estimated value of damage
from the estimated pre-fire valuation of property.
4.185

SOUTH AUSTRALIAN METROPOLITAN FIRE SERVICE
Income statement__________________________________________________________________________________________________________________________________________________________________________________________________________________________________
2007-08Budget
$000
2006-07Estimated
result
$000
2006-07Budget
$000
2005-06Actual
$000Expenses
Employee benefits and costs — Salaries, wages, annual and sick leave ..................................... 59 511 57 107 57 021 53 039 Long service leave .................................................................... 2 735 2 591 2 591 1 831 Payroll tax ................................................................................ 3 623 3 483 3 478 3 280 Superannuation ......................................................................... 6 602 6 264 6 255 5 051 Other ......................................................................................... 2 253 2 251 2 251 251Supplies and services — General supplies and services .................................................. 12 132 11 549 10 307 10 948 Consultancy expenses .............................................................. — — — 67Depreciation and amortisation ..................................................... 7 549 6 513 10 319 6 368Other expenses ............................................................................. — — — 76
Total expenses .............................................................................. 94 405 89 758 92 222 80 911
Income
Commonwealth revenues ............................................................. 776 999 757 938Intra government transfers ........................................................... 92 846 86 053 85 584 82 293Fees, fines and penalties ............................................................... 2 574 2 365 2 365 2 492Sales of goods and services .......................................................... 4 4 4 6Interest revenues ........................................................................... 1 500 1 500 600 1 708Net gain or loss from disposal of assets ....................................... — — — 275Other income ................................................................................ 238 232 232 1 030
Total income ................................................................................. 97 938 91 153 89 542 88 742
Net cost of providing services ...................................................... -3 533 -1 395 2 680 -7 831
Net result before restructure(s) ..................................................... 3 533 1 395 -2 680 7 831
Net income from / expenses from administrative restructure(s) .. — — — -115
Net result after restructure(s) ........................................................ 3 533 1 395 -2 680 7 716
4.186
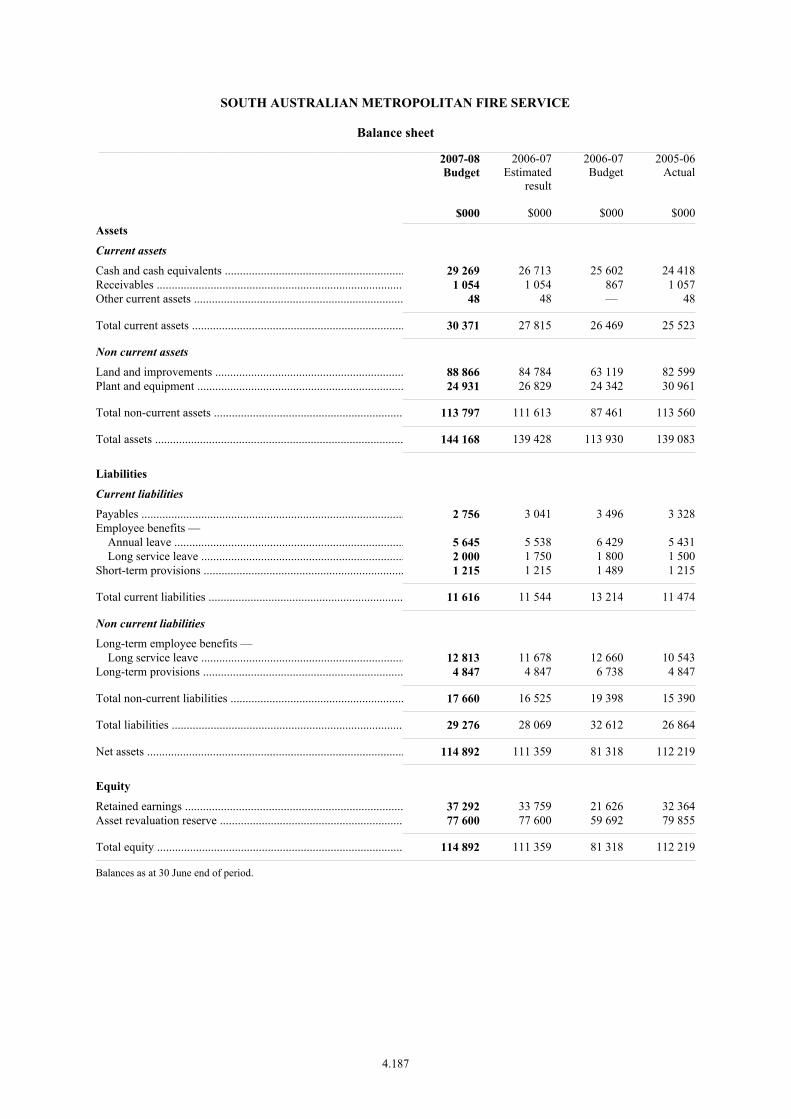
SOUTH AUSTRALIAN METROPOLITAN FIRE SERVICE
Balance sheet__________________________________________________________________________________________________________________________________________________________________________________________________________________________________
2007-08Budget
$000
2006-07Estimated
result
$000
2006-07Budget
$000
2005-06Actual
$000Assets
Current assets
Cash and cash equivalents ............................................................ 29 269 26 713 25 602 24 418Receivables ................................................................................... 1 054 1 054 867 1 057Other current assets ...................................................................... 48 48 — 48
Total current assets ....................................................................... 30 371 27 815 26 469 25 523
Non current assets
Land and improvements ............................................................... 88 866 84 784 63 119 82 599Plant and equipment ..................................................................... 24 931 26 829 24 342 30 961
Total non-current assets ............................................................... 113 797 111 613 87 461 113 560
Total assets ................................................................................... 144 168 139 428 113 930 139 083
Liabilities
Current liabilities
Payables ........................................................................................ 2 756 3 041 3 496 3 328Employee benefits — Annual leave ............................................................................. 5 645 5 538 6 429 5 431 Long service leave .................................................................... 2 000 1 750 1 800 1 500Short-term provisions ................................................................... 1 215 1 215 1 489 1 215
Total current liabilities ................................................................. 11 616 11 544 13 214 11 474
Non current liabilities
Long-term employee benefits — Long service leave .................................................................... 12 813 11 678 12 660 10 543Long-term provisions ................................................................... 4 847 4 847 6 738 4 847
Total non-current liabilities .......................................................... 17 660 16 525 19 398 15 390
Total liabilities .............................................................................. 29 276 28 069 32 612 26 864
Net assets ...................................................................................... 114 892 111 359 81 318 112 219
Equity
Retained earnings ......................................................................... 37 292 33 759 21 626 32 364Asset revaluation reserve ............................................................. 77 600 77 600 59 692 79 855
Total equity .................................................................................. 114 892 111 359 81 318 112 219
Balances as at 30 June end of period.
4.187

SOUTH AUSTRALIAN METROPOLITAN FIRE SERVICE
Statement of changes in equity__________________________________________________________________________________________________________________________________________________________________________________________________________________________________
Contributedcapital
$000
Assetrevaluation
reserve
$000
Retainedearnings
$000
Total
$000
Balance at 30 June 2006 ............................................................... — 79 855 32 364 112 219Adjustments .................................................................................. — — — —
Restated balance at June 2006 ...................................................... — 79 855 32 364 112 219
Net gain/loss on revaluation of property, plant and equipment during 2006-07 ............................................................................ — -2 255 — -2 255Net changes in reserves ................................................................ — — — —
Net income/expense recognised directly in equity for 2006-07 ... — -2 255 — -2 255Net result after restructure for 2006-07 ........................................ — — 1 395 1 395
Total recognised income and expense for 2006-07 — -2 255 1 395 -860
Equity contributions from SA Government ................................. — — — — Repayment of equity contributions from SA Government .......... — — — —
Estimated balance at 30 June 2007 — 77 600 33 759 111 359
Net gain/loss on revaluation of property, plant and equipment during 2007-08 ............................................................................ — — — — Net changes in reserves ................................................................ — — — —
Net income/expense recognised directly in equity for 2007-08 ... — — — — Net result after restructure for 2007-08 ........................................ — — 3 533 3 533
Total recognised income and expense for 2007-08 — — 3 533 3 533
Equity contributions from SA Government ................................. — — — — Repayment of equity contributions from SA Government .......... — — — —
Estimated balance at 30 June 2008 — 77 600 37 292 114 892
4.188

SOUTH AUSTRALIAN METROPOLITAN FIRE SERVICE
Cash flow statement__________________________________________________________________________________________________________________________________________________________________________________________________________________________________
2007-08Budget
$000
2006-07Estimated
result
$000
2006-07Budget
$000
2005-06Actual
$000
OPERATING ACTIVITIES:
Cash outflows
Employee payments ..................................................................... 73 232 70 204 70 104 63 569Supplies and services ................................................................... 12 417 11 834 10 592 12 968Net GST paid ................................................................................ — — — 1 927Other payments ............................................................................ — — — 1 000
Cash used in operations ................................................................ 85 649 82 038 80 696 79 464
Cash inflows
Intra government transfers ........................................................... 92 846 86 053 85 584 82 293Commonwealth receipts ............................................................... 776 999 757 938Fees, fines and penalties ............................................................... 2 574 2 365 2 365 2 492Sales of goods and services .......................................................... 4 4 4 6Interest received ........................................................................... 1 500 1 500 600 1 708Net GST received ......................................................................... — — — 1 755Other receipts ............................................................................... 238 232 232 504
Cash generated from operations ................................................... 97 938 91 153 89 542 89 696
Net cash provided by (+) / used (-) in operating activities ........... 12 289 9 115 8 846 10 232
INVESTING ACTIVITIES:
Cash outflows
Purchase of property, plant and equipment .................................. 9 778 6 865 9 273 11 666
Cash used in investing activities .................................................. 9 778 6 865 9 273 11 666
Cash inflows
Proceeds from sale of property, plant and equipment .................. 45 45 45 2 051
Cash generated from investing activities ..................................... 45 45 45 2 051
Net cash provided by (+) / used in (-) investing activities ........... -9 733 -6 820 -9 228 -9 615
FINANCING ACTIVITIES:
Cash outflows
Repayment of borrowings ............................................................ — — — 5 226
Cash used in financing activities .................................................. — — — 5 226
Net cash provided by (+) / used in (-) financing activities ........... — — — -5 226
Net increase (+) / decrease (-) in cash equivalents ....................... 2 556 2 295 -382 -4 609
Cash and cash equivalents at the beginning of the financial year 26 713 24 418 25 984 29 027
Cash and cash equivalents at the end of the financial year .......... 29 269 26 713 25 602 24 418
4.189

AGENCY: SOUTH AUSTRALIAN METROPOLITAN FIRE SERVICE
Financial Commentary — major variations
The following commentary relates to the Agency Financial Statements presented in the previous section. The discussion relates to variations between the 2006-07 Estimated Result and the 2007-08 Budget.
Income statement — Controlled
Operating expenditure is projected to increase from $89.8 million in 2006-07 to $94.4 million in 2007-08. In addition, total income is projected to increase from $91.2 million in 2006-07 to $97.9 million in 2007-08.
Increased operating expenditure in 2007-08 is primarily due to approved employee entitlement increases included in the three year Enterprise Agreement ($3.0 million) and the transfer from the Department of the Premier and Cabinet of supplies and services expenditure for urban search and rescue training ($1.2 million).
Depreciation expense is budgeted to increase from $6.5 million in 2006-07 to $7.5 million in 2007-08.
After excluding CPI growth, increased income in 2007-08 relates primarily to additional funding for the abovementioned expenditure initiatives and investing projects included in the 2007-08 Budget.
Balance sheet — Controlled
Net Assets are projected to increase from $111.4 million as at 30 June 2007 to $114.9 million as at 30 June 2008.
This increase in net assets is primarily due to an increase in total assets. Total assets are projected to increase by approximately $4.7 million during 2007-08 due to a net increase in non-current assets of $2.2 million following investment expenditure of $9.8 million (relating to the acquisition of buildings, communications and operational equipment, fire appliances and minor works) and an increase in cash reserves of $2.5 million.
Statement of changes in equity — Controlled
No major variations.
Cash flow statement — Controlled
Net cash provided by operating activities is budgeted to be $12.3 million in 2007-08, compared with an estimated $9.1 million in 2006-07.
Investing cash outflows for the purchase of property, plant and equipment are projected to increase from $6.9 million in 2006-07 to $9.8 million in 2007-08 primarily due to the payments for buildings, appliances and equipment (see Investing Payments Summary).
4.190

4.191
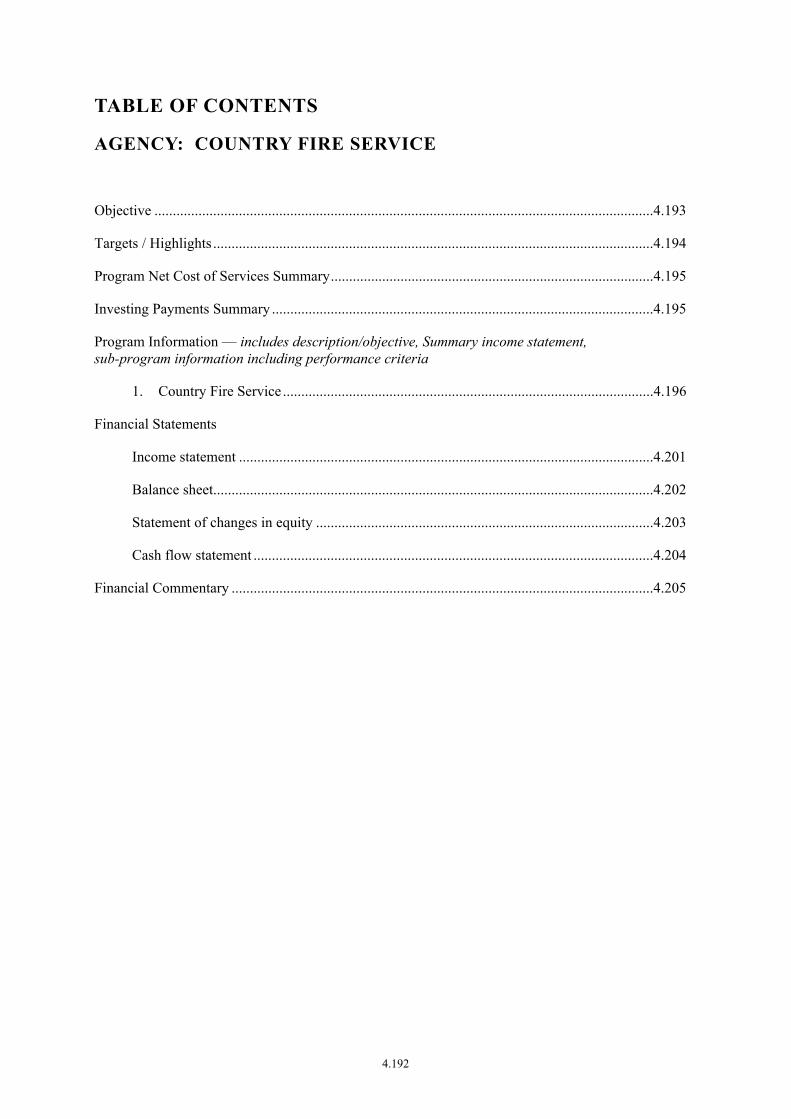
TABLE OF CONTENTS
AGENCY: COUNTRY FIRE SERVICE
Objective ........................................................................................................................................4.193
Targets / Highlights ........................................................................................................................4.194
Program Net Cost of Services Summary........................................................................................4.195
Investing Payments Summary ........................................................................................................4.195
Program Information — includes description/objective, Summary income statement, sub-program information including performance criteria
1. Country Fire Service .....................................................................................................4.196
Financial Statements
Income statement .................................................................................................................4.201
Balance sheet........................................................................................................................4.202
Statement of changes in equity ............................................................................................4.203
Cash flow statement .............................................................................................................4.204
Financial Commentary ...................................................................................................................4.205
4.192

PORTFOLIO: JUSTICE
AGENCY: COUNTRY FIRE SERVICE
Objectives
To address key strategic priorities of the Government, the South Australian Country Fire Service’s (CFS) primary objectives are to:
• provide emergency services delivery in regional South Australia and the outer metropolitan areas of Adelaide;
• reduce loss and damage from avoidable fires and emergencies;
• ensure CFS personnel are competent to combat emergencies effectively and efficiently;
• minimise the impact of fire and other emergencies by appropriate organisational and community preparedness and response to incidents;
• support and develop the role of volunteers in emergency services;
• provide resources that are allocated on a risk-based and risk mitigation approach; and
• promote a culture of safety, excellence and continuous improvement.
4.193
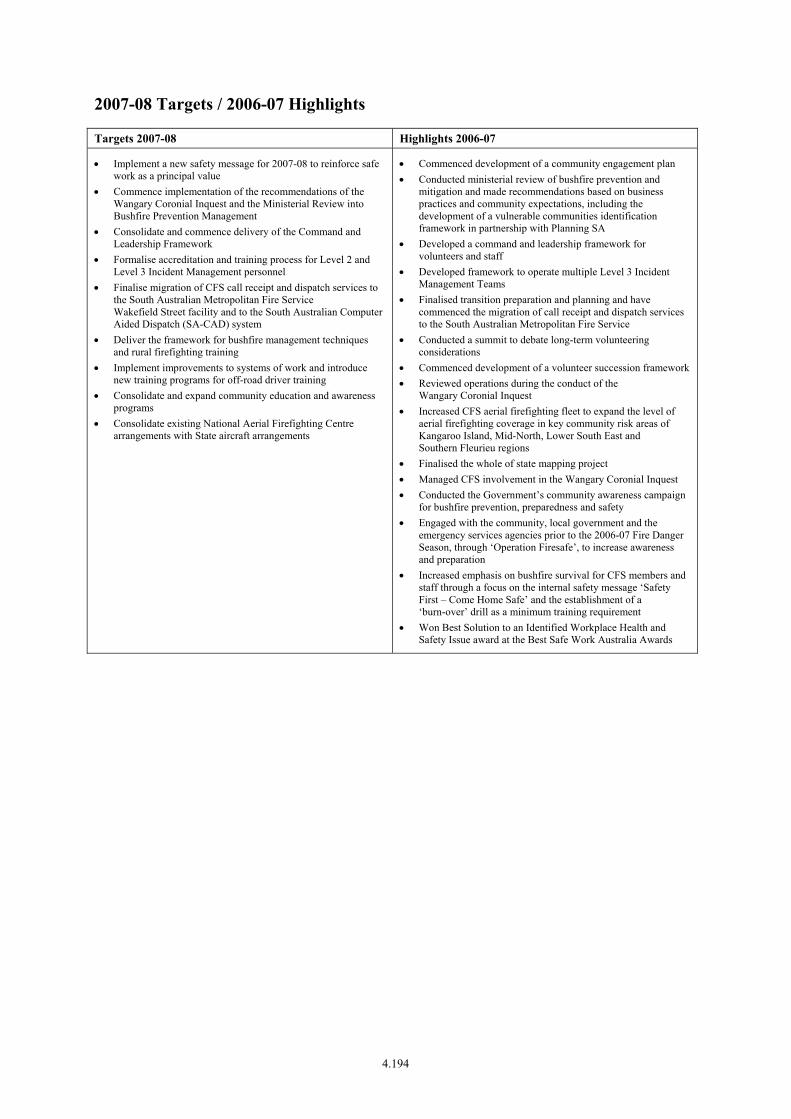
2007-08 Targets / 2006-07 Highlights
Targets 2007-08 Highlights 2006-07
• Implement a new safety message for 2007-08 to reinforce safe work as a principal value
• Commence implementation of the recommendations of the Wangary Coronial Inquest and the Ministerial Review into Bushfire Prevention Management
• Consolidate and commence delivery of the Command and Leadership Framework
• Formalise accreditation and training process for Level 2 and Level 3 Incident Management personnel
• Finalise migration of CFS call receipt and dispatch services to the South Australian Metropolitan Fire Service Wakefield Street facility and to the South Australian Computer Aided Dispatch (SA-CAD) system
• Deliver the framework for bushfire management techniques and rural firefighting training
• Implement improvements to systems of work and introduce new training programs for off-road driver training
• Consolidate and expand community education and awareness programs
• Consolidate existing National Aerial Firefighting Centre arrangements with State aircraft arrangements
• Commenced development of a community engagement plan • Conducted ministerial review of bushfire prevention and
mitigation and made recommendations based on business practices and community expectations, including the development of a vulnerable communities identification framework in partnership with Planning SA
• Developed a command and leadership framework for volunteers and staff
• Developed framework to operate multiple Level 3 Incident Management Teams
• Finalised transition preparation and planning and have commenced the migration of call receipt and dispatch services to the South Australian Metropolitan Fire Service
• Conducted a summit to debate long-term volunteering considerations
• Commenced development of a volunteer succession framework • Reviewed operations during the conduct of the
Wangary Coronial Inquest • Increased CFS aerial firefighting fleet to expand the level of
aerial firefighting coverage in key community risk areas of Kangaroo Island, Mid-North, Lower South East and Southern Fleurieu regions
• Finalised the whole of state mapping project • Managed CFS involvement in the Wangary Coronial Inquest • Conducted the Government’s community awareness campaign
for bushfire prevention, preparedness and safety • Engaged with the community, local government and the
emergency services agencies prior to the 2006-07 Fire Danger Season, through ‘Operation Firesafe’, to increase awareness and preparation
• Increased emphasis on bushfire survival for CFS members and staff through a focus on the internal safety message ‘Safety First – Come Home Safe’ and the establishment of a ‘burn-over’ drill as a minimum training requirement
• Won Best Solution to an Identified Workplace Health and Safety Issue award at the Best Safe Work Australia Awards
4.194
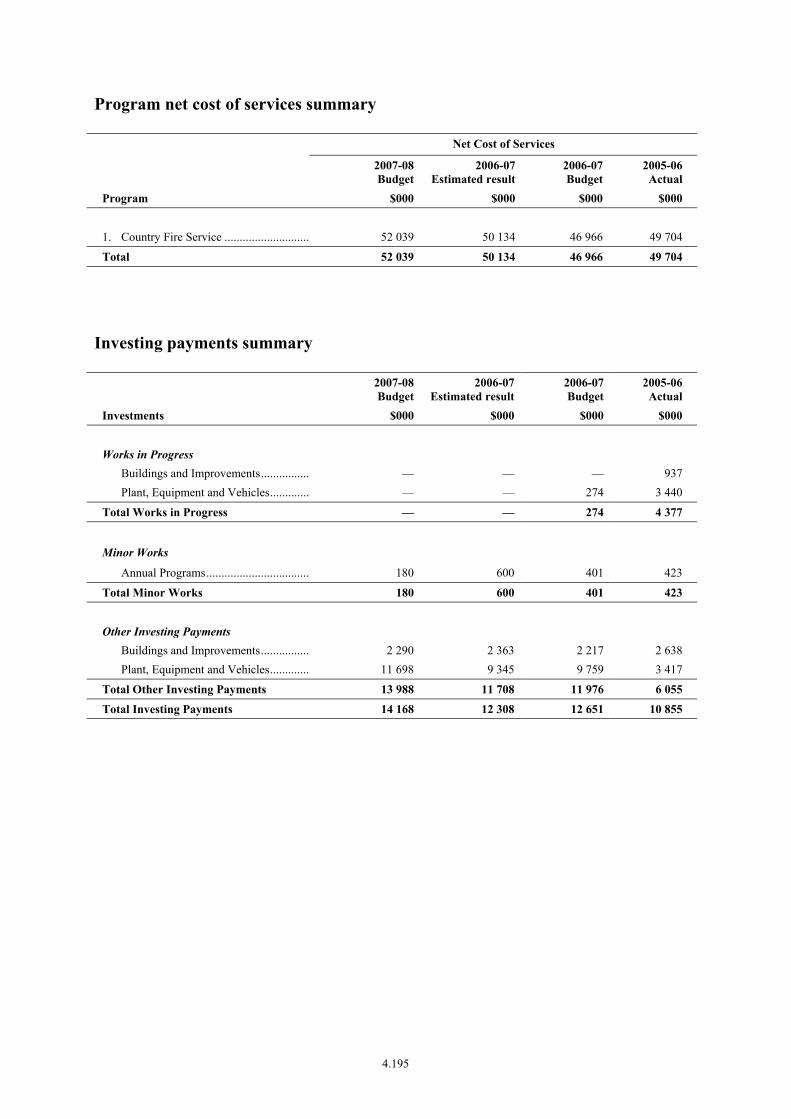
Program net cost of services summary
Net Cost of Services
2007-08Budget
2006-07Estimated result
2006-07 Budget
2005-06 Actual
Program $000 $000 $000 $000 1. Country Fire Service ............................ 52 039 50 134 46 966 49 704
Total 52 039 50 134 46 966 49 704
Investing payments summary
2007-08Budget
2006-07Estimated result
2006-07 Budget
2005-06 Actual
Investments $000 $000 $000 $000
Works in Progress
Buildings and Improvements................ — — — 937 Plant, Equipment and Vehicles............. — — 274 3 440
Total Works in Progress — — 274 4 377
Minor Works
Annual Programs.................................. 180 600 401 423
Total Minor Works 180 600 401 423 Other Investing Payments
Buildings and Improvements................ 2 290 2 363 2 217 2 638 Plant, Equipment and Vehicles............. 11 698 9 345 9 759 3 417
Total Other Investing Payments 13 988 11 708 11 976 6 055
Total Investing Payments 14 168 12 308 12 651 10 855
4.195

AGENCY: COUNTRY FIRE SERVICE
Program Information
Program 1: Country Fire Service
Description/Objective: The South Australian Country Fire Service (CFS) is a statutory authority with an operational workforce of approximately 114 Full Time Equivalent staff and 15 500 volunteers providing fire and emergency services to over 430 communities across South Australia.
With a vision of a safer community, the CFS mission is to protect life, property and the environment from fire and other emergencies, while protecting and supporting CFS personnel and continuously improving operational capabilities. Key result areas for the CFS include:
• reducing loss and damage from avoidable fires and other emergencies through prevention and community safety activities;
• minimising the impact of fire and other emergencies (including floods, storm damage, hazardous material incidents and motor vehicle accidents) by appropriate operational preparedness and response to incidents;
• ensuring that CFS personnel are equipped, trained and competent to safely combat emergencies effectively and efficiently; and
• supporting and developing CFS volunteers/employees and maintaining community safety infrastructure.
The contribution of CFS volunteers is vital in ensuring ongoing delivery of emergency services and community safety services to rural and regional communities of South Australia.
4.196
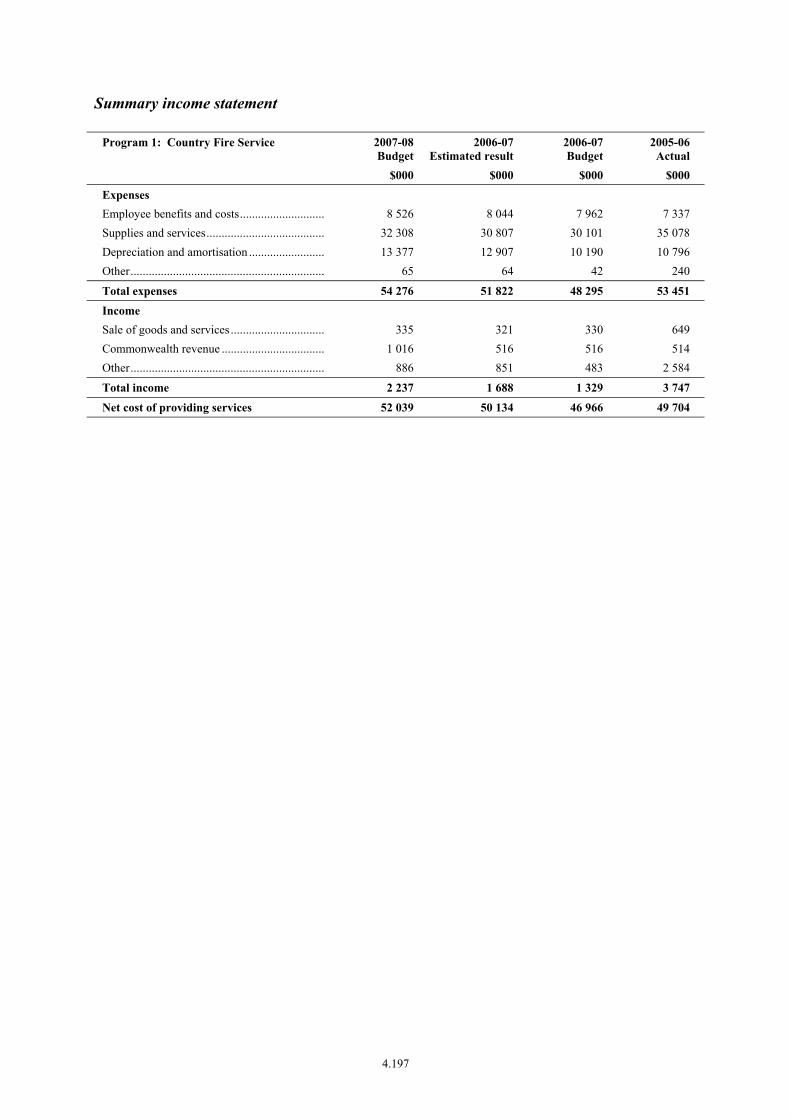
Summary income statement
Program 1: Country Fire Service 2007-08Budget
2006-07Estimated result
2006-07 Budget
2005-06 Actual
$000 $000 $000 $000
Expenses Employee benefits and costs............................. 8 526 8 044 7 962 7 337 Supplies and services........................................ 32 308 30 807 30 101 35 078 Depreciation and amortisation .......................... 13 377 12 907 10 190 10 796 Other................................................................. 65 64 42 240
Total expenses 54 276 51 822 48 295 53 451
Income Sale of goods and services................................ 335 321 330 649 Commonwealth revenue ................................... 1 016 516 516 514 Other................................................................. 886 851 483 2 584
Total income 2 237 1 688 1 329 3 747
Net cost of providing services 52 039 50 134 46 966 49 704
4.197
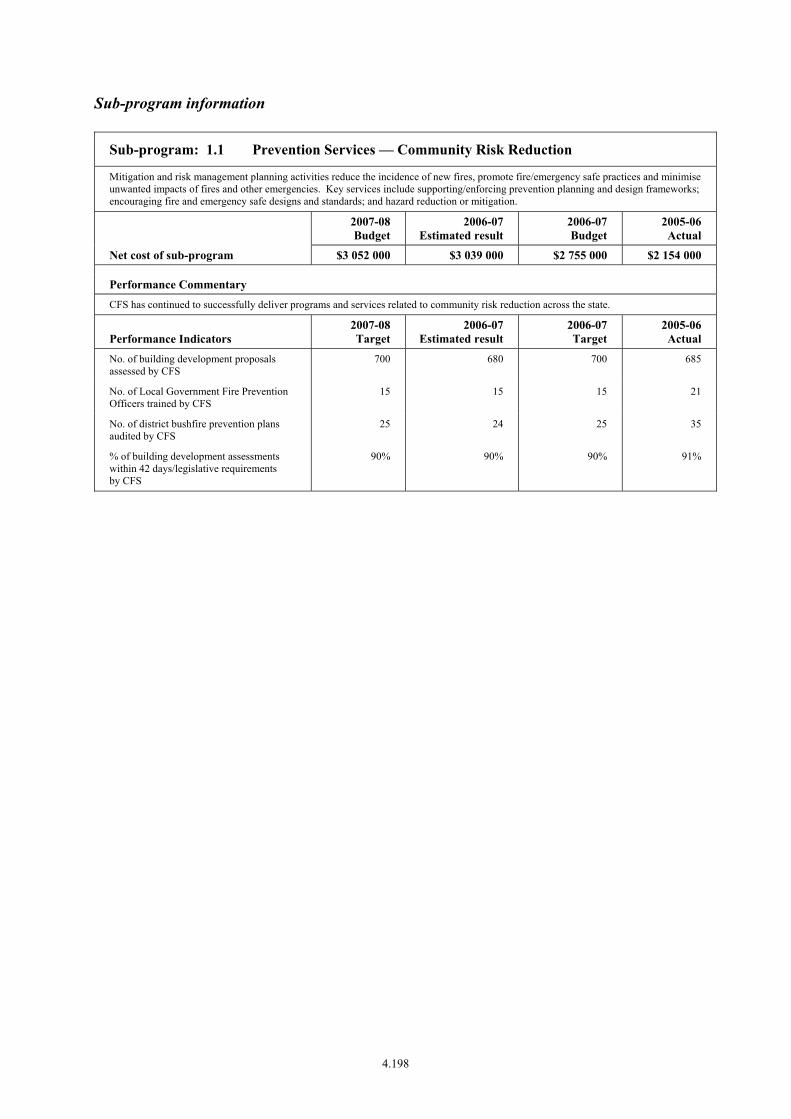
Sub-program information
Sub-program: 1.1 Prevention Services — Community Risk Reduction
Mitigation and risk management planning activities reduce the incidence of new fires, promote fire/emergency safe practices and minimise unwanted impacts of fires and other emergencies. Key services include supporting/enforcing prevention planning and design frameworks; encouraging fire and emergency safe designs and standards; and hazard reduction or mitigation.
2007-08 Budget
2006-07 Estimated result
2006-07 Budget
2005-06 Actual
Net cost of sub-program $3 052 000 $3 039 000 $2 755 000 $2 154 000
Performance Commentary CFS has continued to successfully deliver programs and services related to community risk reduction across the state.
Performance Indicators 2007-08 Target
2006-07 Estimated result
2006-07 Target
2005-06 Actual
No. of building development proposals assessed by CFS
700 680 700 685
No. of Local Government Fire Prevention Officers trained by CFS
15 15 15 21
No. of district bushfire prevention plans audited by CFS
25 24 25 35
% of building development assessments within 42 days/legislative requirements by CFS
90% 90% 90% 91%
4.198
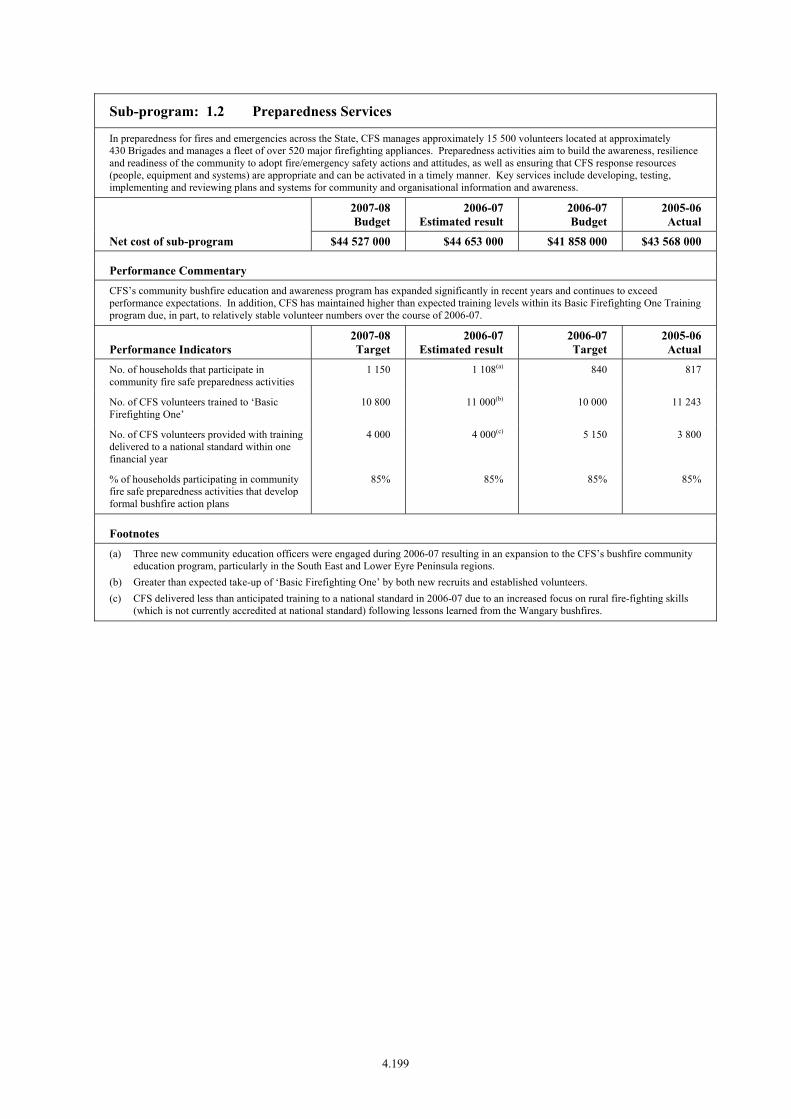
Sub-program: 1.2 Preparedness Services
In preparedness for fires and emergencies across the State, CFS manages approximately 15 500 volunteers located at approximately 430 Brigades and manages a fleet of over 520 major firefighting appliances. Preparedness activities aim to build the awareness, resilience and readiness of the community to adopt fire/emergency safety actions and attitudes, as well as ensuring that CFS response resources (people, equipment and systems) are appropriate and can be activated in a timely manner. Key services include developing, testing, implementing and reviewing plans and systems for community and organisational information and awareness.
2007-08 Budget
2006-07 Estimated result
2006-07 Budget
2005-06 Actual
Net cost of sub-program $44 527 000 $44 653 000 $41 858 000 $43 568 000
Performance Commentary CFS’s community bushfire education and awareness program has expanded significantly in recent years and continues to exceed performance expectations. In addition, CFS has maintained higher than expected training levels within its Basic Firefighting One Training program due, in part, to relatively stable volunteer numbers over the course of 2006-07.
Performance Indicators 2007-08 Target
2006-07 Estimated result
2006-07 Target
2005-06 Actual
No. of households that participate in community fire safe preparedness activities
1 150 1 108(a) 840 817
No. of CFS volunteers trained to ‘Basic Firefighting One’
10 800 11 000(b) 10 000 11 243
No. of CFS volunteers provided with training delivered to a national standard within one financial year
4 000 4 000(c) 5 150 3 800
% of households participating in community fire safe preparedness activities that develop formal bushfire action plans
85% 85% 85% 85%
Footnotes (a) Three new community education officers were engaged during 2006-07 resulting in an expansion to the CFS’s bushfire community
education program, particularly in the South East and Lower Eyre Peninsula regions. (b) Greater than expected take-up of ‘Basic Firefighting One’ by both new recruits and established volunteers. (c) CFS delivered less than anticipated training to a national standard in 2006-07 due to an increased focus on rural fire-fighting skills
(which is not currently accredited at national standard) following lessons learned from the Wangary bushfires.
4.199
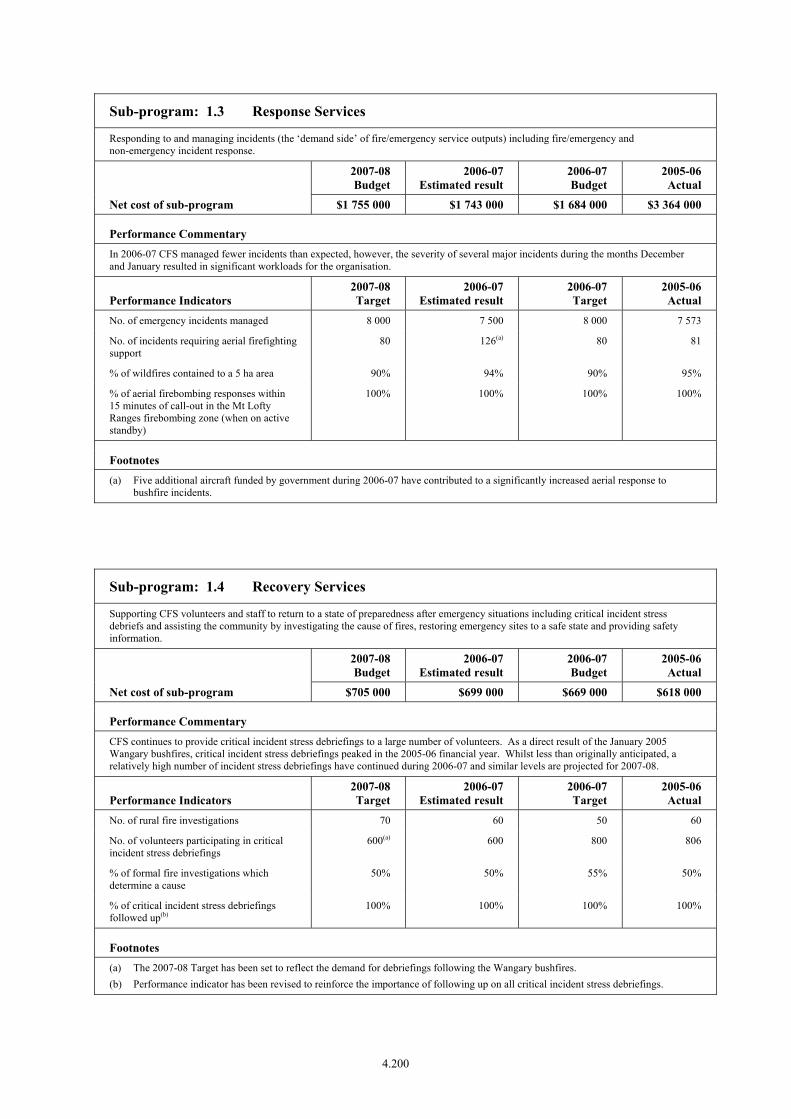
Sub-program: 1.3 Response Services
Responding to and managing incidents (the ‘demand side’ of fire/emergency service outputs) including fire/emergency and non-emergency incident response.
2007-08 Budget
2006-07 Estimated result
2006-07 Budget
2005-06 Actual
Net cost of sub-program $1 755 000 $1 743 000 $1 684 000 $3 364 000
Performance Commentary In 2006-07 CFS managed fewer incidents than expected, however, the severity of several major incidents during the months December and January resulted in significant workloads for the organisation.
Performance Indicators 2007-08 Target
2006-07 Estimated result
2006-07 Target
2005-06 Actual
No. of emergency incidents managed 8 000 7 500 8 000 7 573
No. of incidents requiring aerial firefighting support
80 126(a) 80 81
% of wildfires contained to a 5 ha area 90% 94% 90% 95%
% of aerial firebombing responses within 15 minutes of call-out in the Mt Lofty Ranges firebombing zone (when on active standby)
100% 100% 100% 100%
Footnotes (a) Five additional aircraft funded by government during 2006-07 have contributed to a significantly increased aerial response to
bushfire incidents.
Sub-program: 1.4 Recovery Services
Supporting CFS volunteers and staff to return to a state of preparedness after emergency situations including critical incident stress debriefs and assisting the community by investigating the cause of fires, restoring emergency sites to a safe state and providing safety information.
2007-08 Budget
2006-07 Estimated result
2006-07 Budget
2005-06 Actual
Net cost of sub-program $705 000 $699 000 $669 000 $618 000
Performance Commentary CFS continues to provide critical incident stress debriefings to a large number of volunteers. As a direct result of the January 2005 Wangary bushfires, critical incident stress debriefings peaked in the 2005-06 financial year. Whilst less than originally anticipated, a relatively high number of incident stress debriefings have continued during 2006-07 and similar levels are projected for 2007-08.
Performance Indicators 2007-08 Target
2006-07 Estimated result
2006-07 Target
2005-06 Actual
No. of rural fire investigations 70 60 50 60
No. of volunteers participating in critical incident stress debriefings
600(a) 600 800 806
% of formal fire investigations which determine a cause
50% 50% 55% 50%
% of critical incident stress debriefings followed up(b)
100% 100% 100% 100%
Footnotes (a) The 2007-08 Target has been set to reflect the demand for debriefings following the Wangary bushfires. (b) Performance indicator has been revised to reinforce the importance of following up on all critical incident stress debriefings.
4.200

COUNTRY FIRE SERVICE
Income statement__________________________________________________________________________________________________________________________________________________________________________________________________________________________________
2007-08Budget
$000
2006-07Estimated
result
$000
2006-07Budget
$000
2005-06Actual
$000Expenses
Employee benefits and costs — Salaries, wages, annual and sick leave ..................................... 7 064 6 668 6 543 6 454 Long service leave .................................................................... 82 77 119 286 Payroll tax ................................................................................ 417 394 318 390 Superannuation ......................................................................... 632 593 462 596 Other ......................................................................................... 331 312 520 -389Supplies and services — General supplies and services .................................................. 32 272 30 711 30 100 35 029 Consultancy expenses .............................................................. 36 96 1 49Depreciation and amortisation ..................................................... 13 377 12 907 10 190 10 796Borrowing costs ............................................................................ — — — 5Other expenses ............................................................................. 65 64 42 235
Total expenses .............................................................................. 54 276 51 822 48 295 53 451
Income
Commonwealth revenues ............................................................. 1 016 516 516 514Intra government transfers ........................................................... 53 152 49 571 49 404 51 130Other grants .................................................................................. 61 60 — 53Sales of goods and services .......................................................... 335 321 330 649Interest revenues ........................................................................... 174 158 105 348Net gain or loss from disposal of assets ....................................... 44 44 44 -174Resources received free of charge ................................................ — — — 1 162Other income ................................................................................ 607 589 334 1 195
Total income ................................................................................. 55 389 51 259 50 733 54 877
Net cost of providing services ...................................................... -1 113 563 -2 438 -1 426
Net result before restructure(s) ..................................................... 1 113 -563 2 438 1 426
Net income from / expenses from administrative restructure(s) .. — — — -172
Net result after restructure(s) ........................................................ 1 113 -563 2 438 1 254
4.201
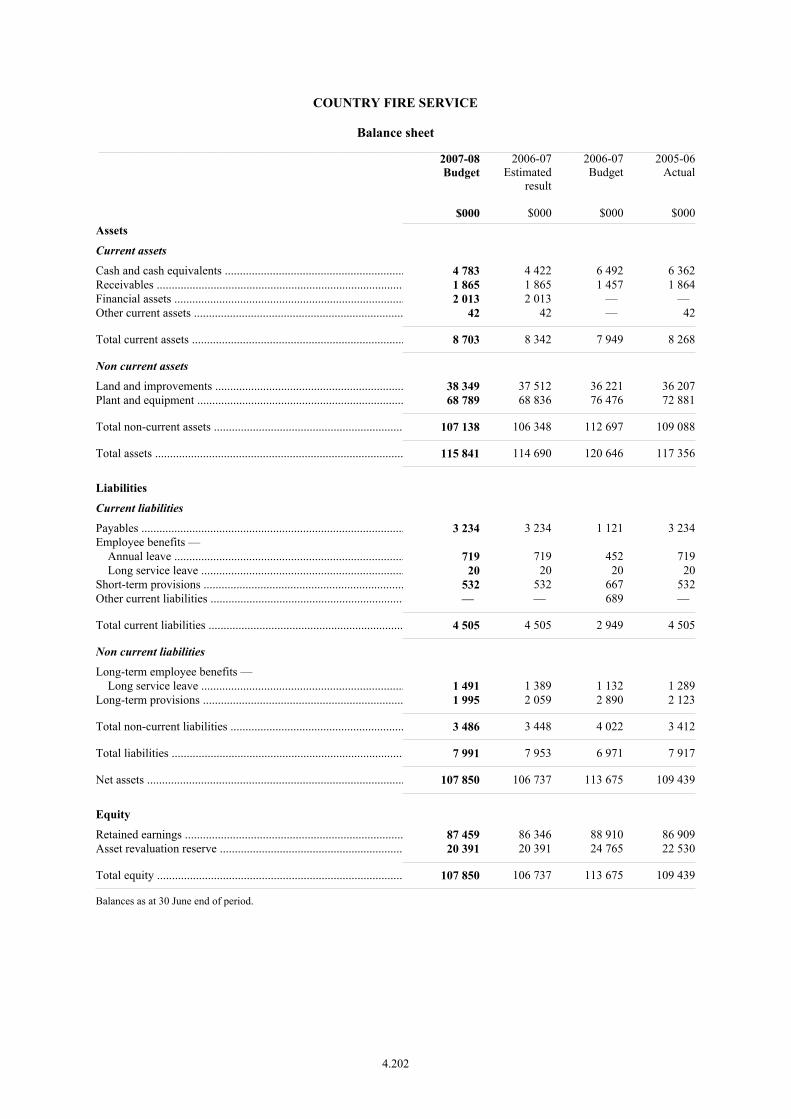
COUNTRY FIRE SERVICE
Balance sheet__________________________________________________________________________________________________________________________________________________________________________________________________________________________________
2007-08Budget
$000
2006-07Estimated
result
$000
2006-07Budget
$000
2005-06Actual
$000Assets
Current assets
Cash and cash equivalents ............................................................ 4 783 4 422 6 492 6 362Receivables ................................................................................... 1 865 1 865 1 457 1 864Financial assets ............................................................................. 2 013 2 013 — — Other current assets ...................................................................... 42 42 — 42
Total current assets ....................................................................... 8 703 8 342 7 949 8 268
Non current assets
Land and improvements ............................................................... 38 349 37 512 36 221 36 207Plant and equipment ..................................................................... 68 789 68 836 76 476 72 881
Total non-current assets ............................................................... 107 138 106 348 112 697 109 088
Total assets ................................................................................... 115 841 114 690 120 646 117 356
Liabilities
Current liabilities
Payables ........................................................................................ 3 234 3 234 1 121 3 234Employee benefits — Annual leave ............................................................................. 719 719 452 719 Long service leave .................................................................... 20 20 20 20Short-term provisions ................................................................... 532 532 667 532Other current liabilities ................................................................. — — 689 —
Total current liabilities ................................................................. 4 505 4 505 2 949 4 505
Non current liabilities
Long-term employee benefits — Long service leave .................................................................... 1 491 1 389 1 132 1 289Long-term provisions ................................................................... 1 995 2 059 2 890 2 123
Total non-current liabilities .......................................................... 3 486 3 448 4 022 3 412
Total liabilities .............................................................................. 7 991 7 953 6 971 7 917
Net assets ...................................................................................... 107 850 106 737 113 675 109 439
Equity
Retained earnings ......................................................................... 87 459 86 346 88 910 86 909Asset revaluation reserve ............................................................. 20 391 20 391 24 765 22 530
Total equity .................................................................................. 107 850 106 737 113 675 109 439
Balances as at 30 June end of period.
4.202

COUNTRY FIRE SERVICE
Statement of changes in equity__________________________________________________________________________________________________________________________________________________________________________________________________________________________________
Contributedcapital
$000
Assetrevaluation
reserve
$000
Retainedearnings
$000
Total
$000
Balance at 30 June 2006 ............................................................... — 22 530 86 909 109 439Adjustments .................................................................................. — — — —
Restated balance at June 2006 ...................................................... — 22 530 86 909 109 439
Net gain/loss on revaluation of property, plant and equipment during 2006-07 ............................................................................ — -2 139 — -2 139Net changes in reserves ................................................................ — — — —
Net income/expense recognised directly in equity for 2006-07 ... — -2 139 — -2 139Net result after restructure for 2006-07 ........................................ — — -563 -563
Total recognised income and expense for 2006-07 — -2 139 -563 -2 702
Equity contributions from SA Government ................................. — — — — Repayment of equity contributions from SA Government .......... — — — —
Estimated balance at 30 June 2007 — 20 391 86 346 106 737
Net gain/loss on revaluation of property, plant and equipment during 2007-08 ............................................................................ — — — — Net changes in reserves ................................................................ — — — —
Net income/expense recognised directly in equity for 2007-08 ... — — — — Net result after restructure for 2007-08 ........................................ — — 1 113 1 113
Total recognised income and expense for 2007-08 — — 1 113 1 113
Equity contributions from SA Government ................................. — — — — Repayment of equity contributions from SA Government .......... — — — —
Estimated balance at 30 June 2008 — 20 391 87 459 107 850
4.203

COUNTRY FIRE SERVICE
Cash flow statement__________________________________________________________________________________________________________________________________________________________________________________________________________________________________
2007-08Budget
$000
2006-07Estimated
result
$000
2006-07Budget
$000
2005-06Actual
$000
OPERATING ACTIVITIES:
Cash outflows
Employee payments ..................................................................... 8 488 8 008 7 926 7 691Supplies and services ................................................................... 32 308 30 807 30 101 33 708Borrowing costs ............................................................................ — — — 5Other payments ............................................................................ 65 64 42 277
Cash used in operations ................................................................ 40 861 38 879 38 069 41 681
Cash inflows
Intra government transfers ........................................................... 53 152 49 571 49 404 51 130Commonwealth receipts ............................................................... 1 016 516 516 514Other grants .................................................................................. 61 60 — 53Sales of goods and services .......................................................... 335 321 330 328Interest received ........................................................................... 174 158 105 348Net GST received ......................................................................... — — — 898Other receipts ............................................................................... 607 589 334 39
Cash generated from operations ................................................... 55 345 51 215 50 689 53 310
Net cash provided by (+) / used (-) in operating activities ........... 14 484 12 336 12 620 11 629
INVESTING ACTIVITIES:
Cash outflows
Purchase of property, plant and equipment .................................. 14 168 12 308 12 651 10 855
Cash used in investing activities .................................................. 14 168 12 308 12 651 10 855
Cash inflows
Proceeds from sale of property, plant and equipment .................. 45 45 45 519
Cash generated from investing activities ..................................... 45 45 45 519
Net cash provided by (+) / used in (-) investing activities ........... -14 123 -12 263 -12 606 -10 336
Net increase (+) / decrease (-) in cash equivalents ....................... 361 73 14 1 293
Cash and cash equivalents at the beginning of the financial year 4 422 4 349 6 478 5 069
Cash and cash equivalents at the end of the financial year .......... 4 783 4 422 6 492 6 362
4.204
AGENCY: COUNTRY FIRE SERVICE
Financial Commentary — major variations
The following commentary relates to the Agency Financial Statements presented in the previous section. The discussion relates to variations between the 2006-07 Estimated Result and the 2007-08 Budget.
Income statement — Controlled
Operating expenditure is projected to increase from $51.8 million in 2006-07 to $54.3 million in 2007-08. In addition, total income is projected to increase from $51.3 million in 2006-07 to $55.4 million in 2007-08. After excluding CPI growth, increased operating expenditure in 2007-08 is primarily due to approved expenditure initiatives for increased aerial firefighting capacity ($1 million), enhanced community education and awareness programs for bushfire prevention and preparedness ($0.5 million) and accredited rural fire fighting training ($0.6 million). After excluding CPI growth, increased income in 2007-08 relates primarily to additional funding for the abovementioned expenditure initiatives. In addition, incremental investment funding has been provided for the replacement of GRN radios ($1.4 million).
Balance sheet — Controlled
Net Assets are projected to increase from $106.7 million as at 30 June 2007 to $107.9 million as at 30 June 2008. This increase in net assets is primarily due to an increase in non-current assets. Non-current assets are projected to increase by approximately $0.8 million during 2007-08 due to anticipated investment expenditure of $14.2 million (relating to the replacement of buildings, communications, appliances and minor works), offset by anticipated depreciation of $13.4 million.
Statement of changes in equity — Controlled
Equity is projected to increase from $106.7 million as at 30 June 2007 to $107.9 million as at 30 June 2008 due to an anticipated operating net surplus of $1.1 million in 2007-08.
Cash flow statement — Controlled
For explanations concerning cash flows from operating activities refer to the commentary above within the second paragraph of Income statement – Controlled. Investing cash outflows for the purchase of property, plant and equipment are projected to increase from $12.3 million in 2006-07 to $14.2 million in 2007-08 primarily due to the replacement of GRN radios ($1.4 million).
4.205
TABLE OF CONTENTS
AGENCY: STATE EMERGENCY SERVICE
Objective ........................................................................................................................................4.207
Targets / Highlights ........................................................................................................................4.208
Program Net Cost of Services Summary........................................................................................4.209
Investing Payments Summary ........................................................................................................4.209
Program Information — includes description/objective, Summary income statement, sub-program information including performance criteria
1. State Emergency Service ..............................................................................................4.210
Financial Statements
Income statement .................................................................................................................4.215
Balance sheet........................................................................................................................4.216
Statement of changes in equity ............................................................................................4.217
Cash flow statement .............................................................................................................4.218
Financial Commentary ...................................................................................................................4.219
4.206

PORTFOLIO: JUSTICE
AGENCY: STATE EMERGENCY SERVICE (SES)
Objectives
On 1 October 2005, the Fire and Emergency Services Act 2005 came into operation. This Act provides for the State Emergency Service (SES) to:
• assist the Commissioner of Police in dealing with any emergency;
• assist the State Co-ordinator, in accordance with the State Emergency Management Plan, in carrying out prevention, preparedness, response or recovery operations under the Emergency Management Act 2004;
• assist the South Australian Metropolitan Fire Service (MFS) and Country Fire Service (CFS) in dealing with any emergency;
• deal with any emergency caused by flood or storm damage, or where there is no other body or person with lawful authority to assume control of operations for dealing with the emergency;
• deal with any emergency until such time as any other body or person that has lawful authority to assume control of operations for dealing with the emergency has assumed control;
• respond to emergency calls and, where appropriate, provide assistance in any situation of need (whether or not the situation constitutes an emergency); and
• undertake rescues.
In 2005-06, SES embarked on a program of enhancing capabilities to provide a more comprehensive approach to incident management. SES has adopted the Prevention, Preparedness, Response and Recovery approach in the planning and management of taskings.
Accredited SES rescue units are strategically deployed in both urban and rural centres across South Australia. SES regularly reviews the locations of units and the resources allocated to ensure assets and resources are strategically located to mitigate community risk.
SES currently consists of 67 units (54 units are based in rural areas) and approximately 1909 volunteers. The SES also provides support for South Australia’s Volunteer Marine Rescue organisations. In the future SES aims to develop its capabilities both in disaster management and planning to reduce the impact of changing hazard profiles on the community.
4.207

2007-08 Targets / 2006-07 Highlights
Targets 2007-08 Highlights 2006-07
• Deliver a new vessel to the Port Lincoln Unit which will result in the redeployment of an existing vessel to Kingston SE
• Complete building works for the SES units at Mount Gambier, Tea Tree Gully, Snowtown, Port Pirie and Port Lincoln
• Complete refurbishment and upgrade of Berri Unit • Refine the operation of the activity based funding model • Investigate the creation of Community Response Teams in
western regions of the state, including the APY Lands • Realign regional boundaries to match State Government policy • Review operations in light of the transition of communications
to the computer aided dispatch system • Finalise and submit the SES application for registered training
organisation status • Establish an external review group consisting of key SES
stakeholders • Roll out program to train volunteers in media management • Review and update the Flood Response Plan to enhance the
ability of the SES to fulfil its role as the flood control agency for South Australia
• Develop a severe weather hazard plan to enable SES to fulfil its role as Severe Weather Hazard leader for South Australia
• Review and improve asset monitoring and allocation systems • Develop and roll out new Training Resource Kits to SES
volunteers • Conduct a full review of Risk Management plans within SES • Finalisation of strategic asset audits on all SES buildings • Progress the implementation of the Australasian Inter-service
Incident Management System • Participate in national biannual disaster rescue challenge • Develop and rollout a new system of service directives,
policies and procedures • Implement remote area High Frequency communications
system
• Completed building works for SES units at Kapunda, Clare, Hallett, Andamooka and Wattle Range
• Delivered a new rescue vessel to the Ceduna Unit • Implemented the extension of an activity based funding model
across the state • Expanded the number of Community Response Teams in the
remote areas of Arkaroola, Parachilna/Angorichina and Wirrealpa
• Developed SES operational management guidelines • Conducted a review of SES’s standards of emergency response • Conducted a review of SES’s interoperability with all
stakeholders • Conducted a strategic review of SES’s current resources • Developed a strategy to conduct comprehensive community
and locality risk assessments • Implemented Phase 2 of the incident reporting system • Identified the information needs of SES to facilitate
implementation of the records management system • Progressed the development of policies, and structures
necessary to attain registered training organisation status • Conducted a stakeholder satisfaction survey of SES staff,
volunteers and community organisations • Conducted a ‘values assessment’ of staff and volunteers • Reviewed SES’s mission and vision at corporate and functional
levels • Developed a strategy for effective community engagement • Conducted a pilot program to train volunteers in media
relations • Formed a working party to progress the standardisation of
equipment within SES
4.208

Program net cost of services summary
Net Cost of Services
2007-08Budget
2006-07Estimated result
2006-07 Budget
2005-06 Actual
Program $000 $000 $000 $000 1. State Emergency Service............................ 10 484 11 032 9 960 11 423
Total 10 484 11 032 9 960 11 423
Investing payments summary
2007-08Budget
2006-07Estimated result
2006-07 Budget
2005-06 Actual
Investments $000 $000 $000 $000
New Works
Port Lincoln Rescue Vessel ................. 350 — — — GRN radio handset replacement .......... 318 — — — Other Projects ...................................... 2 454 757 2 586 2 556
Total New Works 3 122 757 2 586 2 556
Works in Progress
Other Works in Progress ...................... — 1 629 — 836
Total Works in Progress — 1 629 — 836
Minor Works — — 100 —
Total Minor Works — — 100 —
Total Investing Payments 3 122 2 386 2 686 3 392
4.209

AGENCY: STATE EMERGENCY SERVICE
Program Information
Program 1: State Emergency Service
Description/Objective: The SES provides a community-based emergency response service across the state. Units are particularly active in mitigating the effects of floods, storms, and respond to a broad range of other rescue tasks. SES units also support the activities of the MFS, CFS and South Australia Police.
The range of rescue and support services SES volunteer units provide include:
• road crash rescue;
• storm damage and flood mitigation;
• land search;
• structural collapse rescue;
• animal rescue;
• vertical rescue of all forms (cliffs, caves and structures);
• marine search and rescue (rivers, lakes and sea); and
• general and disaster rescue.
Summary income statement
Program 1: State Emergency Service 2007-08Budget
2006-07Estimated result
2006-07 Budget
2005-06 Actual
$000 $000 $000 $000
Expenses Employee benefits and costs............................. 3 760 3 681 3 355 3 339 Supplies and services........................................ 6 039 6 475 6 034 7 280 Depreciation and amortisation .......................... 1 480 1 463 1 343 1 653 Other................................................................. 49 389 19 86
Total expenses 11 328 12 008 10 751 12 358
Income Commonwealth revenue ................................... 623 722 608 548 Other................................................................. 221 254 183 387
Total income 844 976 791 935
Net cost of providing services 10 484 11 032 9 960 11 423
4.210
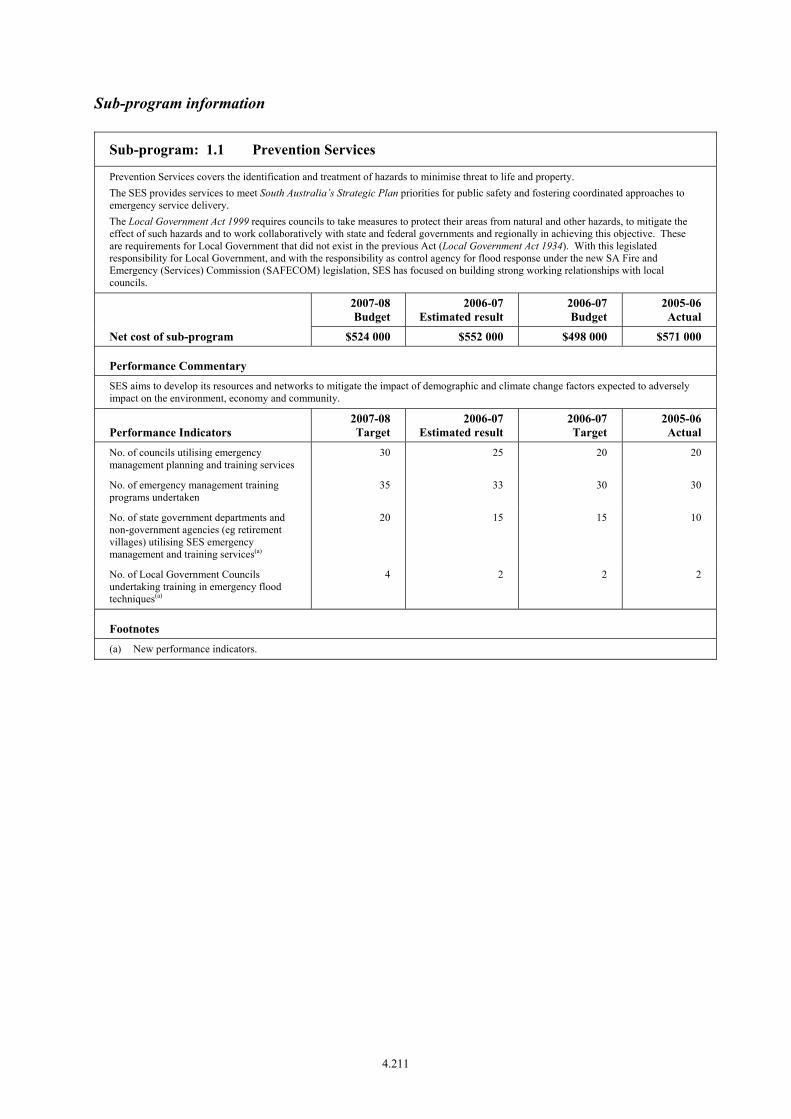
Sub-program information
Sub-program: 1.1 Prevention Services
Prevention Services covers the identification and treatment of hazards to minimise threat to life and property. The SES provides services to meet South Australia’s Strategic Plan priorities for public safety and fostering coordinated approaches to emergency service delivery. The Local Government Act 1999 requires councils to take measures to protect their areas from natural and other hazards, to mitigate the effect of such hazards and to work collaboratively with state and federal governments and regionally in achieving this objective. These are requirements for Local Government that did not exist in the previous Act (Local Government Act 1934). With this legislated responsibility for Local Government, and with the responsibility as control agency for flood response under the new SA Fire and Emergency (Services) Commission (SAFECOM) legislation, SES has focused on building strong working relationships with local councils.
2007-08 Budget
2006-07 Estimated result
2006-07 Budget
2005-06 Actual
Net cost of sub-program $524 000 $552 000 $498 000 $571 000
Performance Commentary SES aims to develop its resources and networks to mitigate the impact of demographic and climate change factors expected to adversely impact on the environment, economy and community.
Performance Indicators 2007-08 Target
2006-07 Estimated result
2006-07 Target
2005-06 Actual
No. of councils utilising emergency management planning and training services
30 25 20 20
No. of emergency management training programs undertaken
35 33 30 30
No. of state government departments and non-government agencies (eg retirement villages) utilising SES emergency management and training services(a)
20 15 15 10
No. of Local Government Councils undertaking training in emergency flood techniques(a)
4 2 2 2
Footnotes (a) New performance indicators.
4.211
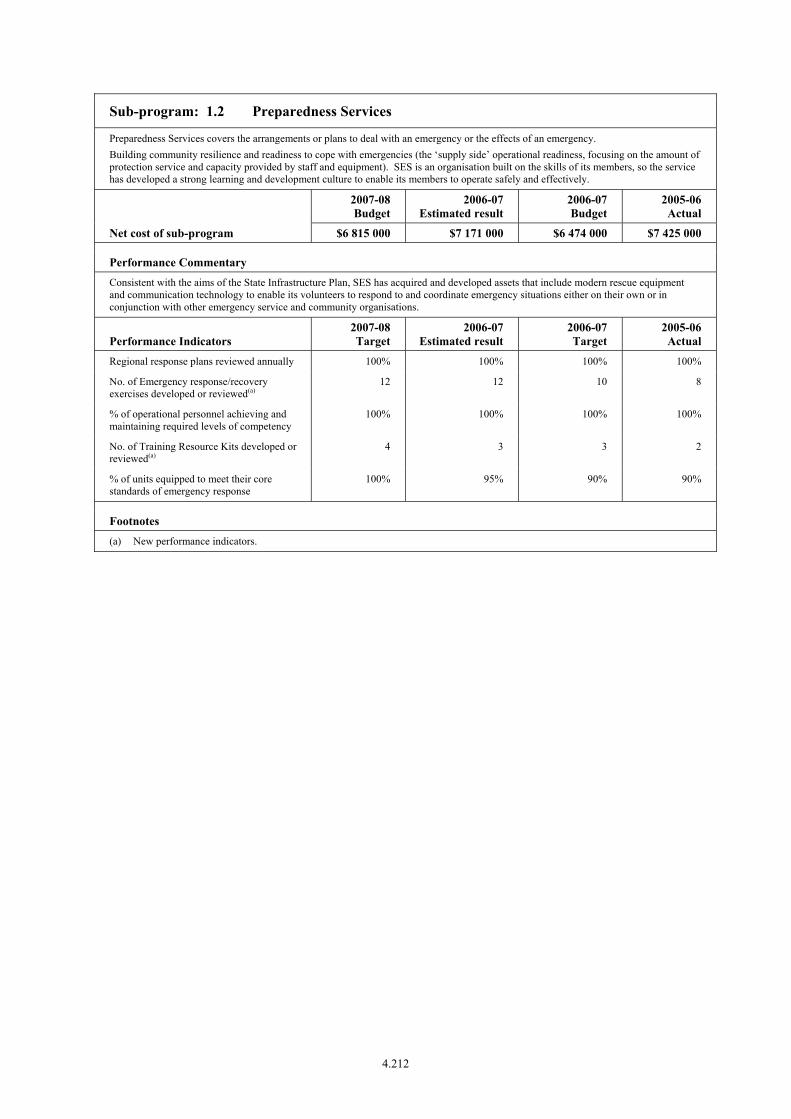
Sub-program: 1.2 Preparedness Services
Preparedness Services covers the arrangements or plans to deal with an emergency or the effects of an emergency. Building community resilience and readiness to cope with emergencies (the ‘supply side’ operational readiness, focusing on the amount of protection service and capacity provided by staff and equipment). SES is an organisation built on the skills of its members, so the service has developed a strong learning and development culture to enable its members to operate safely and effectively.
2007-08 Budget
2006-07 Estimated result
2006-07 Budget
2005-06 Actual
Net cost of sub-program $6 815 000 $7 171 000 $6 474 000 $7 425 000
Performance Commentary Consistent with the aims of the State Infrastructure Plan, SES has acquired and developed assets that include modern rescue equipment and communication technology to enable its volunteers to respond to and coordinate emergency situations either on their own or in conjunction with other emergency service and community organisations.
Performance Indicators 2007-08 Target
2006-07 Estimated result
2006-07 Target
2005-06 Actual
Regional response plans reviewed annually 100% 100% 100% 100%
No. of Emergency response/recovery exercises developed or reviewed(a)
12 12 10 8
% of operational personnel achieving and maintaining required levels of competency
100% 100% 100% 100%
No. of Training Resource Kits developed or reviewed(a)
4 3 3 2
% of units equipped to meet their core standards of emergency response
100% 95% 90% 90%
Footnotes (a) New performance indicators.
4.212

Sub-program: 1.3 Emergency Incident Response Management
Response Management covers the process of combating the hazard, providing immediate relief to affected people and minimising the impact on property. Responding to and managing incidents (the ‘demand side’ of fire/emergency service outputs) including fire/emergency and non emergency incident response. Due to the range of incidents that the SES responds to, demand for SES services tends to be relatively uniform throughout the year.
2007-08 Budget
2006-07 Estimated result
2006-07 Budget
2005-06 Actual
Net cost of sub-program $2 621 000 $2 758 000 $2 490 000 $2 856 000
Performance Commentary The floods that occurred during January 2007 in the north of the state demonstrate, along with the Bookmark fires and the Renmark storms, that devastating natural events can occur at any time. The January floods were particularly instructive of the need to retain a significant response capability in all parts of the state as they occurred during a period of prolonged drought.
Performance Indicators 2007-08 Target
2006-07 Estimated result
2006-07 Target
2005-06 Actual
% of SES responses meeting standards of emergency response of callouts to Priority A incidents (life threatening) in a town/area with an SES unit
>90% >90% >90% >90%
Operational Response Measures: • Total Incidents(a)
4 821
4 538
4 526
5 744
• Total Operational Hours(b) — 66 754 — 78 000
Footnotes (a) New performance indicator. As an emergency response organisation SES activities are driven by community demand. The targets
listed are estimates based on historical experience (five year rolling average of incidents). Total numbers of incidents and operational hours have fluctuated in the past as a result of variations in response requests (and are expected to fluctuate in the future). The general trend is for an increase in overall service demand, particularly in the areas of Road Crash Rescue, Flooding and Wind and Storm damage. This performance measure is included to provide an approximation of community service provision.
(b) New performance indicator. This performance measure is included to provide an approximation of community service provision.
4.213
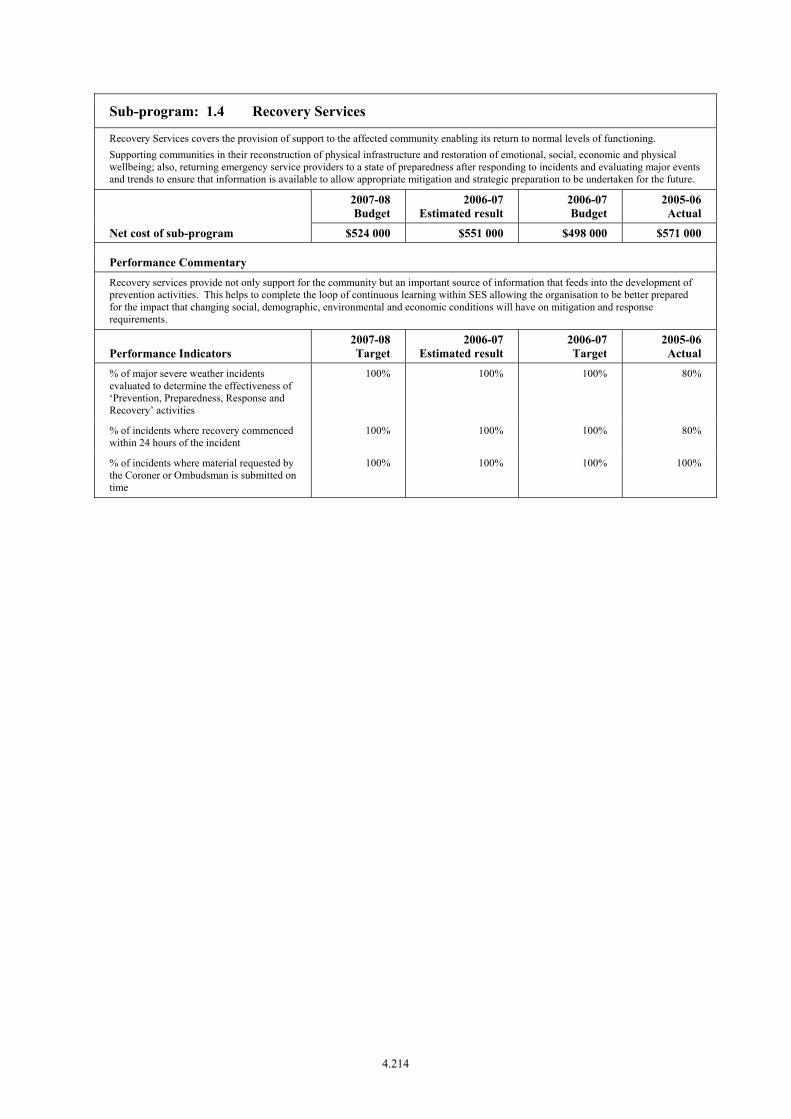
Sub-program: 1.4 Recovery Services
Recovery Services covers the provision of support to the affected community enabling its return to normal levels of functioning. Supporting communities in their reconstruction of physical infrastructure and restoration of emotional, social, economic and physical wellbeing; also, returning emergency service providers to a state of preparedness after responding to incidents and evaluating major events and trends to ensure that information is available to allow appropriate mitigation and strategic preparation to be undertaken for the future.
2007-08 Budget
2006-07 Estimated result
2006-07 Budget
2005-06 Actual
Net cost of sub-program $524 000 $551 000 $498 000 $571 000
Performance Commentary Recovery services provide not only support for the community but an important source of information that feeds into the development of prevention activities. This helps to complete the loop of continuous learning within SES allowing the organisation to be better prepared for the impact that changing social, demographic, environmental and economic conditions will have on mitigation and response requirements.
Performance Indicators 2007-08 Target
2006-07 Estimated result
2006-07 Target
2005-06 Actual
% of major severe weather incidents evaluated to determine the effectiveness of ‘Prevention, Preparedness, Response and Recovery’ activities
100% 100% 100% 80%
% of incidents where recovery commenced within 24 hours of the incident
100% 100% 100% 80%
% of incidents where material requested by the Coroner or Ombudsman is submitted on time
100% 100% 100% 100%
4.214
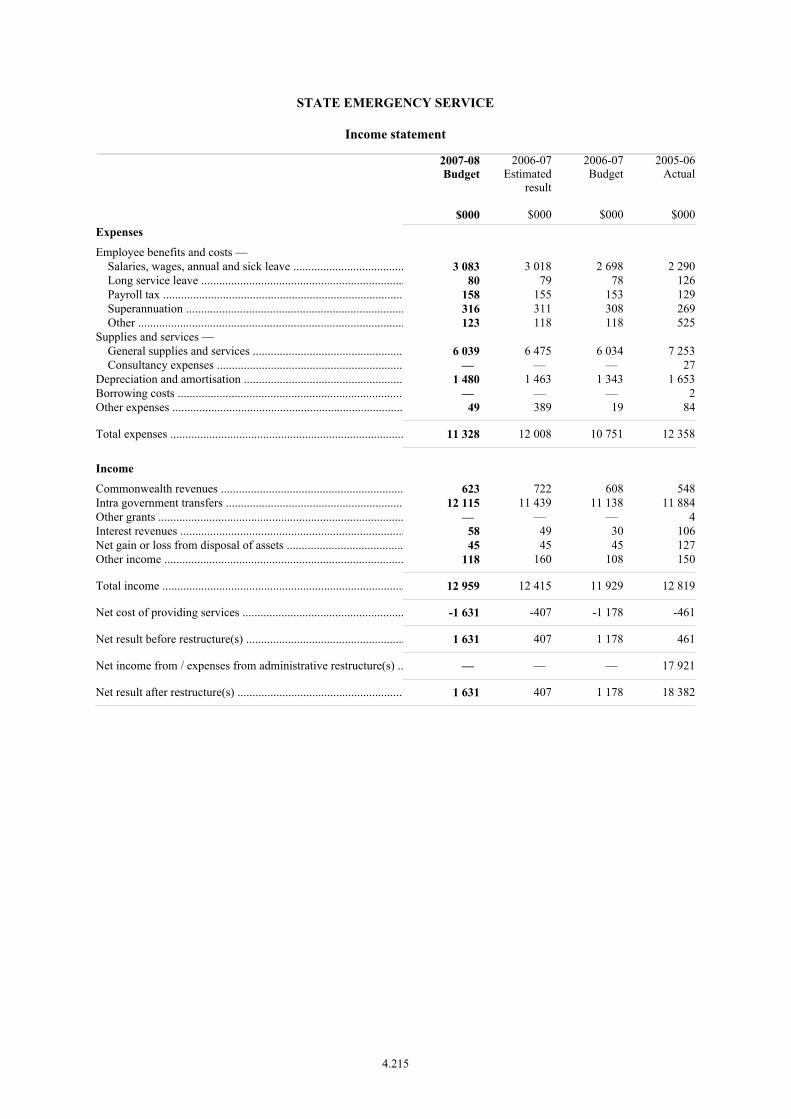
STATE EMERGENCY SERVICE
Income statement__________________________________________________________________________________________________________________________________________________________________________________________________________________________________
2007-08Budget
$000
2006-07Estimated
result
$000
2006-07Budget
$000
2005-06Actual
$000Expenses
Employee benefits and costs — Salaries, wages, annual and sick leave ..................................... 3 083 3 018 2 698 2 290 Long service leave .................................................................... 80 79 78 126 Payroll tax ................................................................................ 158 155 153 129 Superannuation ......................................................................... 316 311 308 269 Other ......................................................................................... 123 118 118 525Supplies and services — General supplies and services .................................................. 6 039 6 475 6 034 7 253 Consultancy expenses .............................................................. — — — 27Depreciation and amortisation ..................................................... 1 480 1 463 1 343 1 653Borrowing costs ............................................................................ — — — 2Other expenses ............................................................................. 49 389 19 84
Total expenses .............................................................................. 11 328 12 008 10 751 12 358
Income
Commonwealth revenues ............................................................. 623 722 608 548Intra government transfers ........................................................... 12 115 11 439 11 138 11 884Other grants .................................................................................. — — — 4Interest revenues ........................................................................... 58 49 30 106Net gain or loss from disposal of assets ....................................... 45 45 45 127Other income ................................................................................ 118 160 108 150
Total income ................................................................................. 12 959 12 415 11 929 12 819
Net cost of providing services ...................................................... -1 631 -407 -1 178 -461
Net result before restructure(s) ..................................................... 1 631 407 1 178 461
Net income from / expenses from administrative restructure(s) .. — — — 17 921
Net result after restructure(s) ........................................................ 1 631 407 1 178 18 382
4.215

STATE EMERGENCY SERVICE
Balance sheet__________________________________________________________________________________________________________________________________________________________________________________________________________________________________
2007-08Budget
$000
2006-07Estimated
result
$000
2006-07Budget
$000
2005-06Actual
$000Assets
Current assets
Cash and cash equivalents ............................................................ 1 411 1 234 1 129 1 251Receivables ................................................................................... 446 446 101 445Financial assets ............................................................................. 1 1 — 1
Total current assets ....................................................................... 1 858 1 681 1 230 1 697
Non current assets
Land and improvements ............................................................... 8 966 8 322 9 698 7 359Plant and equipment ..................................................................... 10 999 10 046 11 365 10 992
Total non-current assets ............................................................... 19 965 18 368 21 063 18 351
Total assets ................................................................................... 21 823 20 049 22 293 20 048
Liabilities
Current liabilities
Payables ........................................................................................ 1 505 1 486 526 1 477Employee benefits — Annual leave ............................................................................. 203 203 173 203 Long service leave .................................................................... 70 70 70 70Short-term provisions ................................................................... 99 99 95 99
Total current liabilities ................................................................. 1 877 1 858 864 1 849
Non current liabilities
Long-term employee benefits — Long service leave .................................................................... 860 736 868 614Long-term provisions ................................................................... 338 338 195 339
Total non-current liabilities .......................................................... 1 198 1 074 1 063 953
Total liabilities .............................................................................. 3 075 2 932 1 927 2 802
Net assets ...................................................................................... 18 748 17 117 20 366 17 246
Equity
Retained earnings ......................................................................... 18 748 17 117 19 798 16 710Asset revaluation reserve ............................................................. — — 568 536
Total equity .................................................................................. 18 748 17 117 20 366 17 246
Balances as at 30 June end of period.
4.216
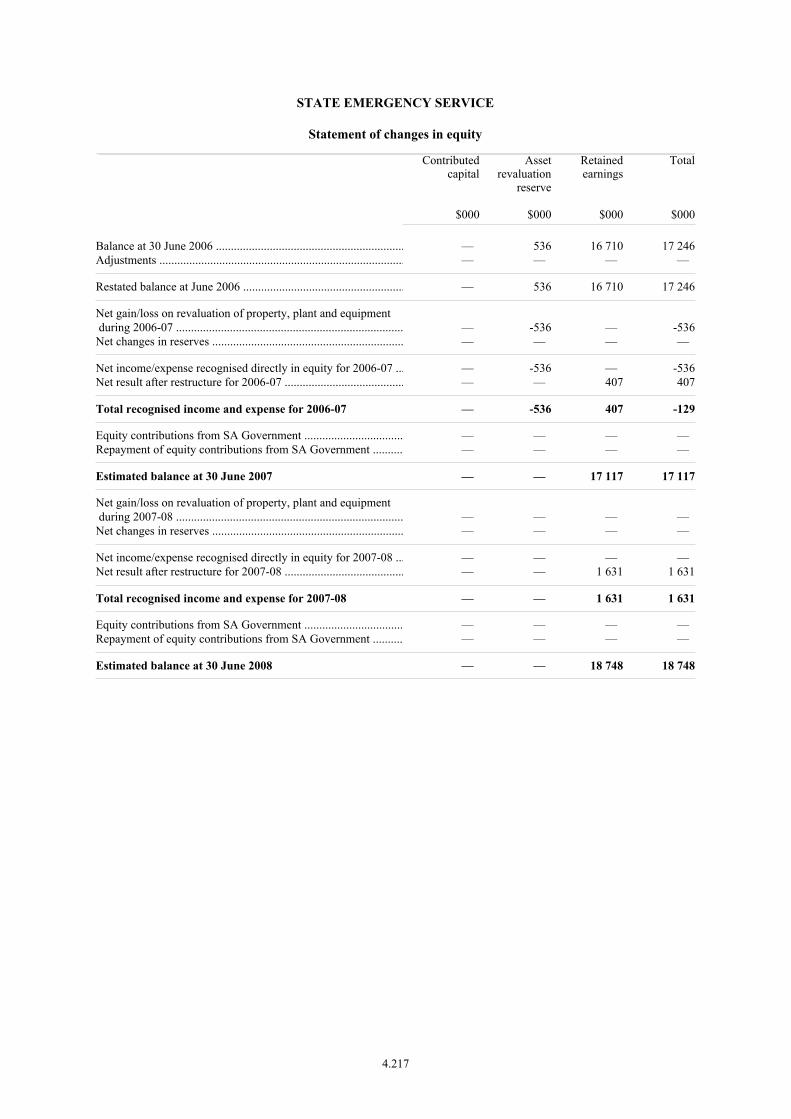
STATE EMERGENCY SERVICE
Statement of changes in equity__________________________________________________________________________________________________________________________________________________________________________________________________________________________________
Contributedcapital
$000
Assetrevaluation
reserve
$000
Retainedearnings
$000
Total
$000
Balance at 30 June 2006 ............................................................... — 536 16 710 17 246Adjustments .................................................................................. — — — —
Restated balance at June 2006 ...................................................... — 536 16 710 17 246
Net gain/loss on revaluation of property, plant and equipment during 2006-07 ............................................................................ — -536 — -536Net changes in reserves ................................................................ — — — —
Net income/expense recognised directly in equity for 2006-07 ... — -536 — -536Net result after restructure for 2006-07 ........................................ — — 407 407
Total recognised income and expense for 2006-07 — -536 407 -129
Equity contributions from SA Government ................................. — — — — Repayment of equity contributions from SA Government .......... — — — —
Estimated balance at 30 June 2007 — — 17 117 17 117
Net gain/loss on revaluation of property, plant and equipment during 2007-08 ............................................................................ — — — — Net changes in reserves ................................................................ — — — —
Net income/expense recognised directly in equity for 2007-08 ... — — — — Net result after restructure for 2007-08 ........................................ — — 1 631 1 631
Total recognised income and expense for 2007-08 — — 1 631 1 631
Equity contributions from SA Government ................................. — — — — Repayment of equity contributions from SA Government .......... — — — —
Estimated balance at 30 June 2008 — — 18 748 18 748
4.217

STATE EMERGENCY SERVICE
Cash flow statement__________________________________________________________________________________________________________________________________________________________________________________________________________________________________
2007-08Budget
$000
2006-07Estimated
result
$000
2006-07Budget
$000
2005-06Actual
$000
OPERATING ACTIVITIES:
Cash outflows
Employee payments ..................................................................... 3 667 3 571 3 245 1 912Supplies and services ................................................................... 6 038 6 475 6 034 6 027Borrowing costs ............................................................................ — — — 2Other payments ............................................................................ — — — 84
Cash used in operations ................................................................ 9 705 10 046 9 279 8 025
Cash inflows
Intra government transfers ........................................................... 12 115 11 439 11 138 11 884Commonwealth receipts ............................................................... 623 722 608 548Other grants .................................................................................. — — — 4Interest received ........................................................................... 58 49 30 106Net GST received ......................................................................... — — — -356Other receipts ............................................................................... 118 160 108 138
Cash generated from operations ................................................... 12 914 12 370 11 884 12 324
Net cash provided by (+) / used (-) in operating activities ........... 3 209 2 324 2 605 4 299
INVESTING ACTIVITIES:
Cash outflows
Purchase of property, plant and equipment .................................. 3 122 2 386 2 686 3 391Other payments ............................................................................ — — — 1
Cash used in investing activities .................................................. 3 122 2 386 2 686 3 392
Cash inflows
Proceeds from sale of property, plant and equipment .................. 90 45 45 344
Cash generated from investing activities ..................................... 90 45 45 344
Net cash provided by (+) / used in (-) investing activities ........... -3 032 -2 341 -2 641 -3 048
Net increase (+) / decrease (-) in cash equivalents ....................... 177 -17 -36 1 251
Cash and cash equivalents at the beginning of the financial year 1 234 1 251 1 165 —
Cash and cash equivalents at the end of the financial year .......... 1 411 1 234 1 129 1 251
4.218
AGENCY: STATE EMERGENCY SERVICE
Financial Commentary — major variations
The following commentary relates to the Financial Statements presented in the previous section. The discussion relates to variations between the 2006-07 Estimated Result and the 2007-08 Budget.
Income statement — Controlled
The $0.680 million reduction in expenses between the 2007-08 Budget and the 2006-07 Estimated Result is primarily due to the write off of assets that occurred in 2006-07 as a result of a change in asset recognition policy ($0.370 million) and reductions in expenses due to the cessation of a number of corporate and Commonwealth funded activities ($0.166 million).
Balance sheet — Controlled
Total assets are expected to increase from $20.049 million in 2006-07 to $21.823 million in 2007-08 primarily due to the acquisition of new buildings, plant and equipment for SES units across the state.
Statement of changes in equity — Controlled
Results reported in the Statement of changes in equity reflect those in the Income statement as outlined above.
Cash flow statement — Controlled
Variations in the Cash flow statement reflect those in the Income statement as outlined above.
4.219
ACCOUNTING STANDARDS
ACCOUNTING STANDARDS
Estimates in these portfolio statements have been prepared on a basis consistent with Australian equivalents to International Financial Reporting Standards (AIFRS), except where these notes indicate otherwise.
The financial statements included in the portfolio statements are special purpose financial reports.
Basis of Measurement
One or more of the following measurement bases have been adopted for assets of an agency recognised in the financial statements:
• fair value – means the amount for which an asset could be exchanged, or a liability settled, between knowledgeable, willing parties in an arm’s length transaction (in many cases agencies use written-down current cost as an estimate of fair value)
• deprival value – assets are valued with reference to the current cost of replacing the future economic benefits that can be obtained from the remaining useful lives of the assets
• acquisition cost • written-down historical cost • an amount recognised in the accounts of a transferor entity upon a restructure.
All non-current tangible assets, with a cost of acquisition greater than $1 million and a useful life of more than three years, are required to be valued at fair value unless excluded from the scope of Australian Accounting Standard AASB 116 Property, Plant and Equipment or an alternative valuation is specified by another accounting standard.
Depreciation and Amortisation of Non-Current Assets
All non-current assets having limited useful lives are systematically depreciated/amortised over their useful lives in a manner that reflects the consumption of their service potential. The most common methods used for calculating depreciation expense are straight line and diminishing balance.
Certain heritage assets have very long and indeterminate useful lives. Their service potential has not, in any material sense, been consumed during the reporting period. As such, no amount for depreciation has been recognised in respect of those assets.
Assets acquired under finance leases are amortised in a manner consistent with Australian Accounting Standard AASB 117 Leases.
Reporting Entities
Reporting Entities for Budget Purposes
In accordance with Australian Accounting Standard AASB 127 Consolidated and Separate Financial Statements, the financial reports include all assets, liabilities, income and expenses of individual entities and portfolio agencies (administrative groupings of entities).
In the process of reporting on portfolios, agencies or other entities as single economic entities, transactions and balances between controlled entities are eliminated.

The commentary at the commencement of the portfolio statement for each portfolio identifies which entities have been included in the consolidated reports for that portfolio.
Separation of Disclosure
The statements provide disclosure through the separation of activities defined as controlled and administered.
Activities that are ‘controlled’ are those where the agency delivers services and governs the financial and operating policies so as to obtain benefits from these activities and assets in the pursuit of its objectives.
Generally, activities that are ‘administered’ on behalf of the government are where an agency has no discretion to alter the resources provided or determine how they are spent.
Employee Benefits
Employee benefits (including salaries and wages, annual leave, long-service leave, sick leave and superannuation benefits) reflect those benefits accrued as a result of services provided by employees up to the reporting date.
Short-term employee benefits (fall due within twelve months) are measured at a nominal amount based on the remuneration rates an agency expects to pay. Examples of short-term employee benefits include salaries and wages and annual leave.
Long-term employee benefits (fall due later than twelve months) are measured as the present value of estimated future cash flows. An example of a long-term employee benefit is long service leave.
Sick leave
For the majority of agencies, no liability will be recognised for sick leave.
There is no liability for non-vesting sick leave (a non-vesting entitlement is that which does not constitute a legal obligation of the employing agency until a valid claim is made by an employee or an event has occurred) if, on average, sick leave taken is less than total entitlements accruing.
Vesting sick leave entitlements are rare for South Australian Government employees.
Superannuation
For most South Australian Government controlled agencies, the Treasurer assumes the accrued superannuation liability in return for periodic payments from agencies. Therefore, unless there are contributions due but not yet paid at the reporting date, there is no superannuation liability recorded for the agency.
Two types of superannuation plans are in operation currently in the public sector: defined benefit plans and defined contribution plans. In a defined benefit plan, a member’s entitlement is determined by reference to a formula based on years of membership and/or salary levels. In a defined contribution plan, a member’s entitlement is determined by reference to accumulated contributions made to the plan together with investment earnings thereon.
Under existing arrangements, the Treasurer is liable for any net deficiency in assets for the defined benefits plans. Deficits in defined benefit superannuation plans are recognised as liabilities in the

Balance sheet for the Treasurer. The deficits are measured as the excess of employees’ accrued benefits resulting from services up to the reporting date over the net market value of the plan’s assets as at the reporting date.
Income recognition
Wherever possible, income is recognised when the transaction or event giving rise to the income occurs. As a result, all items of income are normally reported in the Income statement when an agency obtains control over the respective amounts. In circumstances where it is not possible to determine objectively when control over the asset passes to the agency, the amounts are recognised upon receipt.
Appropriation
The investment program requirements for agencies included in the portfolio statements may be funded through operating appropriation, operating receipts, the proceeds of asset sales, grants and through Commonwealth payments. Where the investment requirements of an agency are not funded from these sources, the State Government funding of an agency’s investment program will generally be treated as an equity contribution from the government, as representative owner. These contributions are treated as contributions to equity rather than operating revenue in an agency.
Funds appropriated, but not required to meet current year cash outflows will be deposited with the Treasurer and will show as an asset in the agency’s Balance sheet.
Cash Alignment Policy
Where agencies have returned excess cash held to the Treasurer in accordance with the Cash Alignment Policy, the payment is generally recorded as a ‘payment to government’ in the Income statement. Some agencies have elected to repay debt or return contributed capital with excess cash balances. These transactions will be reflected in the Balance sheet or the Statement of Changes in Equity.
Rounding
All amounts in the financial reports have been rounded to the nearest thousand dollars, unless otherwise indicated.
Due to rounding, there may be instances where financial statements and tables do not add correctly.
Presentation
The format used in these portfolio statements is consistent with the Model Financial Reports (prepared by the Department of Treasury and Finance for statutory reporting requirements) and is consistent with the requirements of: AASB 101 Presentation of Financial Statements and AASB 107 Cash Flow Statements.

BUDGET OVERVIEW
2007 08
BUDGET PAPER 1