Embed Size (px)
Citation preview

28Glossary . . . . . . . . . . . . . . . . . . . . . . . . . . . . . . . . . . . . . . . . . . . . . .23Explanatory Notes . . . . . . . . . . . . . . . . . . . . . . . . . . . . . . . . . . . . . . . .
A D D I T I O N A L I N F O R M A T I O N
14Bookshops3 . . . . . . . . . . . . . . . . . . . . . . . . . . . . . . . . . . . . . . . . . .6Book retailers2 . . . . . . . . . . . . . . . . . . . . . . . . . . . . . . . . . . . . . . . . .4Introduction1 . . . . . . . . . . . . . . . . . . . . . . . . . . . . . . . . . . . . . . . . . .
C H A P T E R S
3List of tables . . . . . . . . . . . . . . . . . . . . . . . . . . . . . . . . . . . . . . . . . . . .2Notes . . . . . . . . . . . . . . . . . . . . . . . . . . . . . . . . . . . . . . . . . . . . . . . .
page
C O N T E N T S
E M B A R G O : 1 1 . 3 0 A M ( C A N B E R R A T I M E ) T U E S 2 0 S E P 2 0 0 5
BOOK RETAILERS A U S T R A L I A
1371.02 0 0 3 – 0 4
For further informationabout these and relatedstatistics, contact theNational Information andReferral Service on1300 135 070 orTammie Smallacombe onAdelaide (08) 8237 7329.
I N Q U I R I E S
w w w . a b s . g o v . a u
Where figures have been rounded, minor discrepancies may occur between the sums of
the component items and the totals. Published percentages are calculated prior to
rounding of the figures and therefore some discrepancy may occur between these
percentages and those which could be calculated from the rounded figures.
RO U N D I N G
This publication presents the results from the 2003–04 Book Retailers Survey which
collected information from businesses in four retail industries: Newspaper, book and
stationery retailing, where all employing businesses were in scope; Department stores;
Supermarket and grocery stores; and Retailing n.e.c., where only businesses employing
200 or more people were in scope. Sales of books by these businesses is estimated to
cover the vast majority of book sales by employing businesses to final consumers in
Australia, with the most recent estimate being 97% in 1998–99.
The publication provides details on the number and value of books purchased and sold,
as well as information on the book related operations of the four industries named
above. In addition, information is provided on the detailed operations of bookshops,
including their employment, expenses and income.
The survey was conducted by the Australian Bureau of Statistics (ABS) with funding
provided by the Department of Communications, Information Technology and the Arts
as part of the Book Industry Assistance Plan.
AB O U T TH I S PU B L I C A T I O N
type of activity unitTAU
standard errorSE
relative standard errorRSE
not elsewhere classifiedn.e.c.
electronic funds transfer at point of saleEFTPOS
Australian Taxation OfficeATO
Australian and New Zealand Standard Industrial ClassificationANZSIC
Australian Bureau of StatisticsABS
Australian Business NumberABN
million dollars$mAB B R E V I A T I O N S
De n n i s T r e w i n
Au s t r a l i a n S t a t i s t i c i a n
2 A B S • B O O K R E T A I L E R S • 1 3 7 1 . 0 • 2 0 0 3 – 0 4
N O T E S
L I S T OF TA B L E S . . . . . . . . . . . . . . . . . . . . . . . . . . . . . . . . . . . . . .
22Use of technology, by employment size3.9 . . . . . . . . . . . . . . . . . . . . . .21Selected key aggregates, by state and territory3.8 . . . . . . . . . . . . . . . . . .20Employment, at end of June 20043.7 . . . . . . . . . . . . . . . . . . . . . . . . . .20Capital expenditure, by employment size3.6 . . . . . . . . . . . . . . . . . . . . .19Value of inventories, by employment size3.5 . . . . . . . . . . . . . . . . . . . . .19Operating expenses, by employment size3.4 . . . . . . . . . . . . . . . . . . . . .18Components of income, by employment size3.3 . . . . . . . . . . . . . . . . . . .17Summary of operations, by employment size3.2 . . . . . . . . . . . . . . . . . . .16Summary of operations – 2001–02 to 2003–043.1 . . . . . . . . . . . . . . . . . .
BO O K S H O P S
13Use of technology, by type of book retailer2.5 . . . . . . . . . . . . . . . . . . . .12Location of supplier, by type of book retailer2.4 . . . . . . . . . . . . . . . . . . .11Components of income, by type of book retailer2.3 . . . . . . . . . . . . . . . . .11Key aggregates, by type of other bookseller2.2 . . . . . . . . . . . . . . . . . . . .9Key aggregates, by type of book retailer – 2001–02 to 2003–042.1 . . . . . . . . .
BO O K RE T A I L E R S
page
A B S • B O O K R E T A I L E R S • 1 3 7 1 . 0 • 2 0 0 3 – 0 4 3
CHAP T E R 1 IN T R O D U C T I O N . . . . . . . . . . . . . . . . . . . . . . . . . . . . . . . . . . . . . . .
This publication presents data in respect of the 2003–04 financial year from an Australian
Bureau of Statistics survey of employing businesses involved in the retail sales of books.
The survey is based on data collected from businesses classified to the following
industries in the Australian and New Zealand Standard Industrial Classification (ANZSIC)
(see paragraph 2 of the Explanatory Notes):
! Supermarket and grocery stores (ANZSIC 5110)
! Department stores (ANZSIC 5210)
! Newspaper, book and stationery retailing (ANZSIC 5243)
! Retailing n.e.c. (ANZSIC 5259).
Only the larger retailing businesses (those with 200 or more employees) classified as
Supermarkets and grocery stores; Department stores; and Retailers n.e.c. have been
included as the book retailing activity of smaller businesses in these industries is
negligible.
Businesses classed as Newspaper, book and stationery retailing (ANZSIC 5243) have
been further categorised as either ‘Bookshops’ or ‘Newsagents’ based on their level of
bookselling activity. In this ANZSIC class, those businesses with new book sales
comprising at least 50% of their total income have been categorised as ‘Bookshops’ while
those with less than 50% have been categorised as ‘Newsagents’ (see paragraph 8 of the
Explanatory Notes).
Many businesses operate from more than one location; however, only the activity of
locations in Australia have been included in the collection. All book sales by overseas
businesses selling directly to final consumers through the Internet or mail order have
been excluded from the collection.
SC O P E
4 A B S • B O O K R E T A I L E R S • 1 3 7 1 . 0 • 2 0 0 3 – 0 4
Chapter 2 of this publication summarises the book retailing activities of all book retailers
indicated above. Apart from providing data on the number and value of books sold, the
Chapter gives selected financial information on the book related operations of retailers.
Information is also provided on the adoption of technology by these booksellers.
Many of the book retailers included in the survey sell a variety of other goods often
making it difficult to separate the costs involved and levels of employment associated
with just the sale of books. Consequently, detailed information is only presented on the
business operations of retailers with a predominant activity of selling books
(i.e. bookshops). Chapter 3 focuses on these bookshops which were responsible for the
majority (78%) of the value of new book sales in 2003–04.
CO N T E N T
A B S • B O O K R E T A I L E R S • 1 3 7 1 . 0 • 2 0 0 3 – 0 4 5
CH A P T E R 1 • I N T R O D U C T I O N
CHAP T E R 2 BO O K RE T A I L E R S . . . . . . . . . . . . . . . . . . . . . . . . . . . . . . . . . . . .
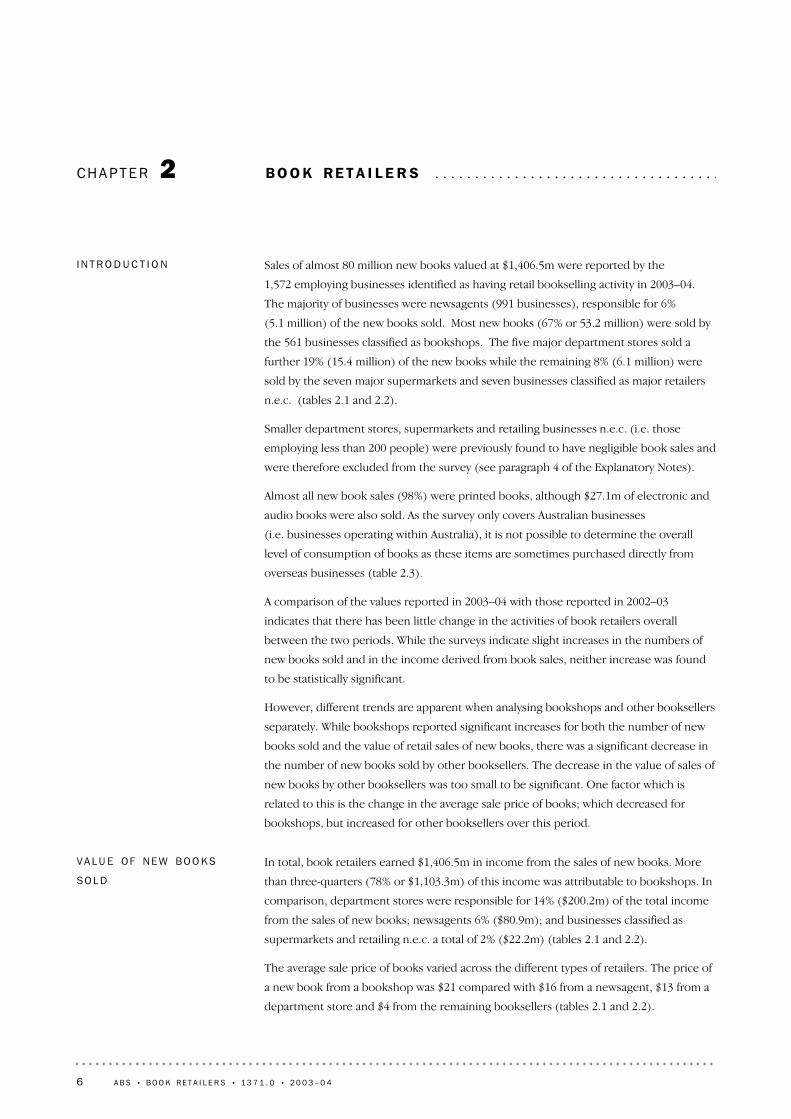
In total, book retailers earned $1,406.5m in income from the sales of new books. More
than three-quarters (78% or $1,103.3m) of this income was attributable to bookshops. In
comparison, department stores were responsible for 14% ($200.2m) of the total income
from the sales of new books; newsagents 6% ($80.9m); and businesses classified as
supermarkets and retailing n.e.c. a total of 2% ($22.2m) (tables 2.1 and 2.2).
The average sale price of books varied across the different types of retailers. The price of
a new book from a bookshop was $21 compared with $16 from a newsagent, $13 from a
department store and $4 from the remaining booksellers (tables 2.1 and 2.2).
VA L U E OF NE W BO O K S
SO L D
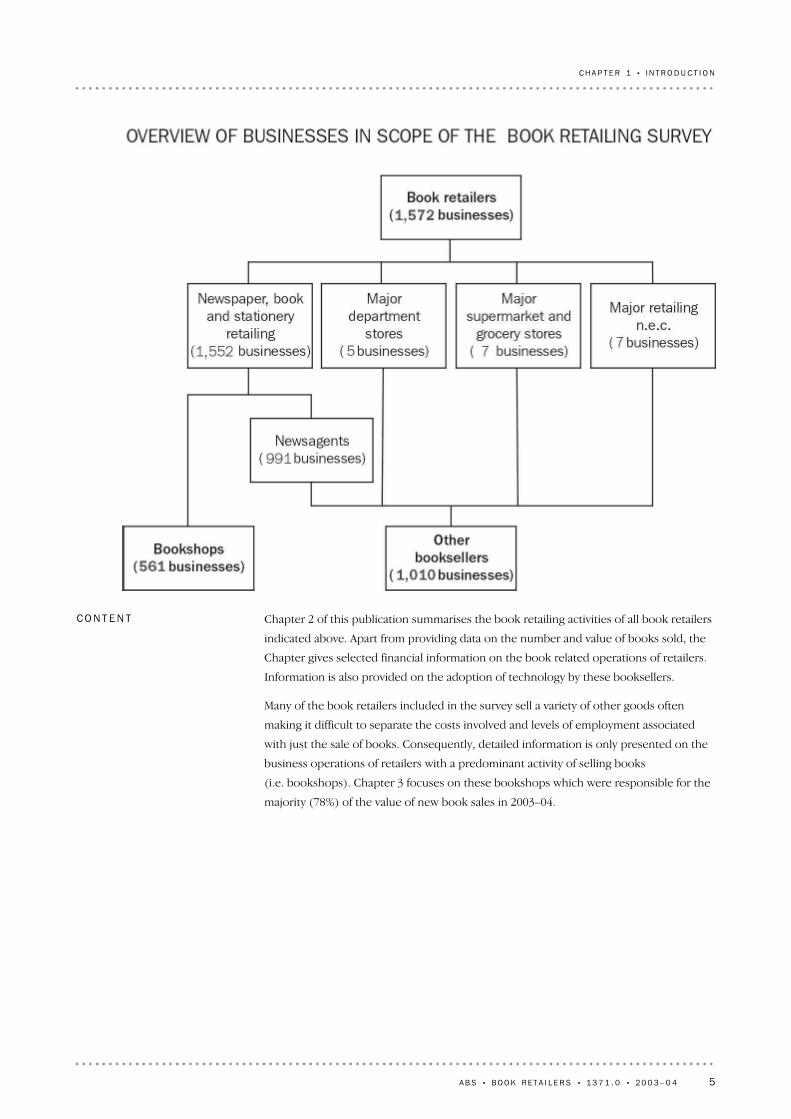
Sales of almost 80 million new books valued at $1,406.5m were reported by the
1,572 employing businesses identified as having retail bookselling activity in 2003–04.
The majority of businesses were newsagents (991 businesses), responsible for 6%
(5.1 million) of the new books sold. Most new books (67% or 53.2 million) were sold by
the 561 businesses classified as bookshops. The five major department stores sold a
further 19% (15.4 million) of the new books while the remaining 8% (6.1 million) were
sold by the seven major supermarkets and seven businesses classified as major retailers
n.e.c. (tables 2.1 and 2.2).
Smaller department stores, supermarkets and retailing businesses n.e.c. (i.e. those
employing less than 200 people) were previously found to have negligible book sales and
were therefore excluded from the survey (see paragraph 4 of the Explanatory Notes).
Almost all new book sales (98%) were printed books, although $27.1m of electronic and
audio books were also sold. As the survey only covers Australian businesses
(i.e. businesses operating within Australia), it is not possible to determine the overall
level of consumption of books as these items are sometimes purchased directly from
overseas businesses (table 2.3).
A comparison of the values reported in 2003–04 with those reported in 2002–03
indicates that there has been little change in the activities of book retailers overall
between the two periods. While the surveys indicate slight increases in the numbers of
new books sold and in the income derived from book sales, neither increase was found
to be statistically significant.
However, different trends are apparent when analysing bookshops and other booksellers
separately. While bookshops reported significant increases for both the number of new
books sold and the value of retail sales of new books, there was a significant decrease in
the number of new books sold by other booksellers. The decrease in the value of sales of
new books by other booksellers was too small to be significant. One factor which is
related to this is the change in the average sale price of books; which decreased for
bookshops, but increased for other booksellers over this period.
I N T R O D U C T I O N
6 A B S • B O O K R E T A I L E R S • 1 3 7 1 . 0 • 2 0 0 3 – 0 4
While book retailers reported a total income of $61,134.4m, the majority of that amount
($59,727.9m or 98%) was not from the sale of new books. The importance of new book
sales to the overall operations of businesses varied substantially for the different types of
book retailers. Bookshops generated 85% of their income from the sale of new books. In
contrast, newsagents relied on new book sales for 7% of their income while for
department stores and combined supermarkets and retailing businesses n.e.c., new book
sales were 1% or less of the total income (tables 2.1 and 2.2).
On average, individual bookshops reported income of $2.0m from the sale of new books
and another $0.3m from other sales and services. In comparison, each newsagent earned
on average $0.1m from book sales and $1.1m from other activities. While the five larger
department stores reported an average value of new book sales of $40.0m, this was
relatively small when compared to their overall average income of $2,955.5m. The larger
supermarkets reported an average value of new book sales of $1.2m and the larger
retailing businesses n.e.c. an average of $1.9m – both also relatively small figures
compared to their overall incomes of $6,052.1m and $216.8m respectively
(tables 2.1 and 2.2).
In 2000–01, the Educational Textbook Subsidy Scheme was introduced to assist students
at Australian educational institutions. Under the Scheme, book retailers gave discounts
to students for textbooks on prescribed lists and then claimed back the value of the
discount from the Australian Government. In 2003–04, book retailers claimed $9.6m in
return for discounts provided to students. Bookshops claimed $9.3m of this amount,
compared with $0.4m by other booksellers (table 2.3).
I N C O M E
Bookshops
Newsagents
Department stores
Supermarkets and retailing n.e.c.
0 250 500 750 1000 1250$m
VALUE OF NEW BOOK SALES, By type of reta i l e r
Final consumers also purchased books from other sources, including directly from book
publishers. Estimates in the ABS publication, Book Publishers, Australia, 2003–04
(cat. no. 1363.0), show sales of books from book publishers to final consumers
generated $305.9m in 2003–04.
VA L U E OF NE W BO O K S
SO L D c o n t i n u e d
A B S • B O O K R E T A I L E R S • 1 3 7 1 . 0 • 2 0 0 3 – 0 4 7
CH A P T E R 2 • B O O K R E T A I L E R S
EFTPOS
Internet
Computer for stock control
Barcoding and scanning
Security tags etc.
0 20 40 60 80 100%
BookshopsOther booksellers
USE OF TECHNOLOGY, By type of reta i l e r
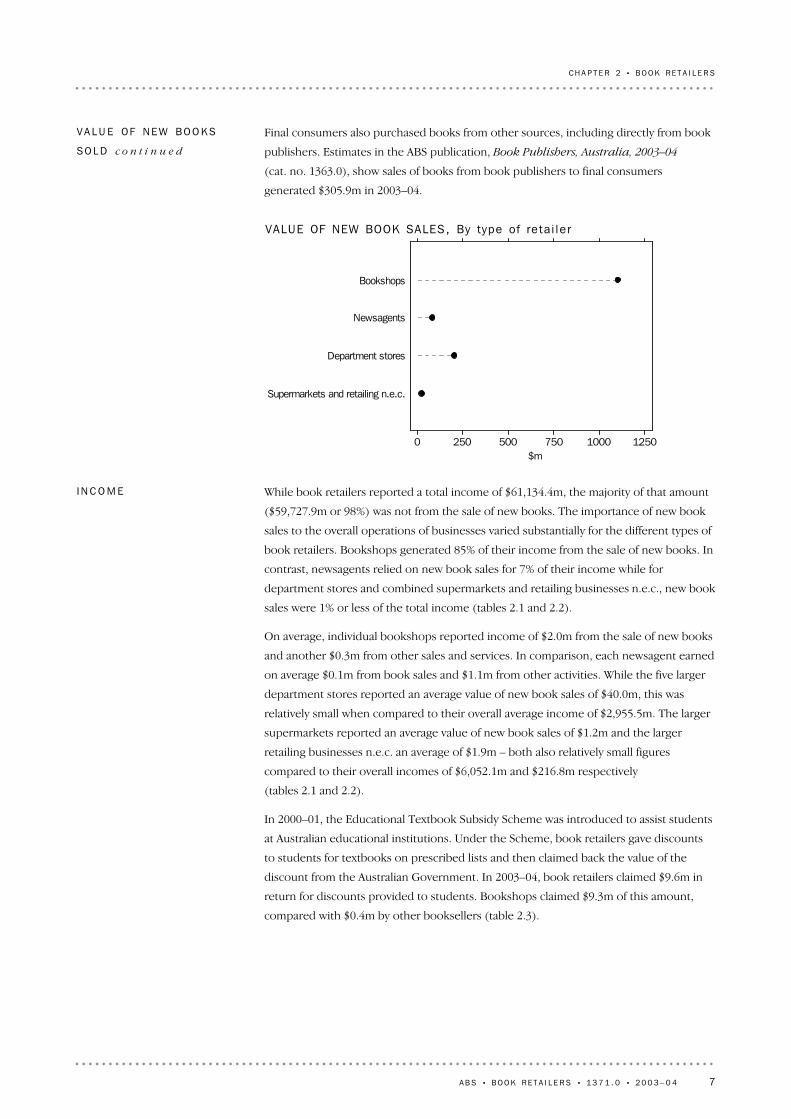
In 2003–04, 96% of book retailers used computers and a range of selected other
technologies, including EFTPOS (Electronic funds transfer at point of sale), barcode
scanning systems and electronic security systems, in the operation of their business.
Almost all (98%) of the bookshops reported using at least one of the technologies, as did
the majority (96%) of the other booksellers (table 2.5).
Over 83% of the book retailers had EFTPOS devices allowing consumers to purchase
books using their credit or debit cards. Barcoding and scanning systems, used to record
revenue and also for stock control, were used by 63% of businesses while electronic
article surveillance or security tag systems were used by 11% of businesses (table 2.5).
US E OF TE C H N O L O G Y
For most book retailers, it is not possible to separate expenditure on bookselling from
expenditure on the sales of other products. This is particularly true for department
stores and supermarkets which sell a wide range of products and for which new book
sales are generally only a very small part of their total sales. Therefore, of the total
expenditure of book retailers as a whole ($59,035.6m), the sale of books is a very small
component.
One distinguishable book related expense for book retailers is the purchase of books. In
2003–04, book retailers spent $940.6m or 2% of their total expenditure on purchasing
new books. In contrast, for bookshops, purchases of books was 53% of their total
expenditure. On average, bookshops spent $1.2m each, or a total of $678.4m, on the
purchase of new books, while the other book retailers spent an average of $0.3m each or
a total of $262.1m (tables 2.1 and 2.2).
Bookshops purchased a total of 46.4 million new books at an average price of $15. By
comparison, other book retailers purchased 35.2 million books at an average price of $7.
Book retailers purchased most (89% or $600.9m) of their new books from Australian
suppliers (table 2.4).
EX P E N S E S
8 A B S • B O O K R E T A I L E R S • 1 3 7 1 . 0 • 2 0 0 3 – 0 4
CH A P T E R 2 • B O O K R E T A I L E R S
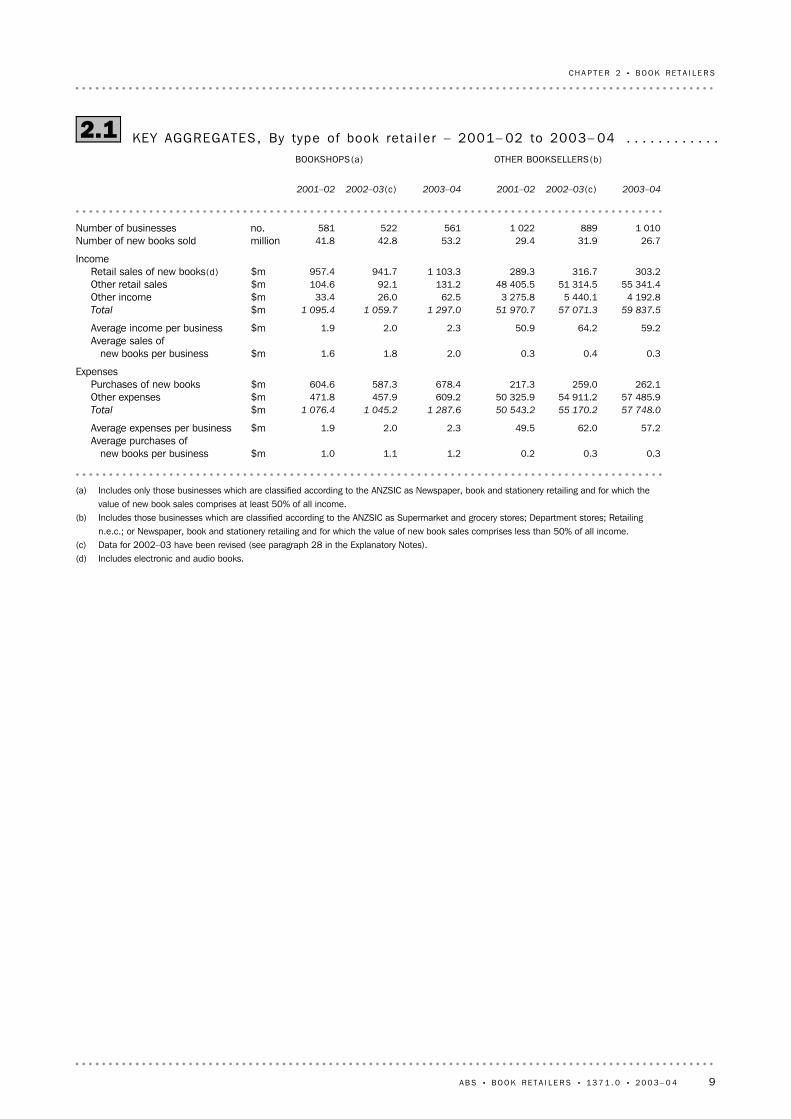
(a) Includes only those businesses which are classified according to the ANZSIC as Newspaper, book and stationery retailing and for which thevalue of new book sales comprises at least 50% of all income.
(b) Includes those businesses which are classified according to the ANZSIC as Supermarket and grocery stores; Department stores; Retailingn.e.c.; or Newspaper, book and stationery retailing and for which the value of new book sales comprises less than 50% of all income.
(c) Data for 2002–03 have been revised (see paragraph 28 in the Explanatory Notes).(d) Includes electronic and audio books.
0.30.30.21.21.11.0$mAverage purchases of
new books per business
57.262.049.52.32.01.9$mAverage expenses per business
57 748.055 170.250 543.21 287.61 045.21 076.4$mTotal
57 485.954 911.250 325.9609.2457.9471.8$mOther expenses262.1259.0217.3678.4587.3604.6$mPurchases of new books
Expenses
0.30.40.32.01.81.6$mAverage sales of
new books per business
59.264.250.92.32.01.9$mAverage income per business
59 837.557 071.351 970.71 297.01 059.71 095.4$mTotal
4 192.85 440.13 275.862.526.033.4$mOther income55 341.451 314.548 405.5131.292.1104.6$mOther retail sales
303.2316.7289.31 103.3941.7957.4$mRetail sales of new books(d)Income
26.731.929.453.242.841.8millionNumber of new books sold1 0108891 022561522581no.Number of businesses
2003–042002–03(c)2001–022003–042002–03(c)2001–02
OTHER BOOKSELLERS(b)BOOKSHOPS(a)
KEY AGGREGATES, By type of book reta i l e r – 2001– 02 to 2003– 042.1 . . . . . . . . . . . .
A B S • B O O K R E T A I L E R S • 1 3 7 1 . 0 • 2 0 0 3 – 0 4 9
CH A P T E R 2 • B O O K R E T A I L E R S

(a) Data for 2002–03 have been revised (see paragraph 28 in the Explanatory Notes).(b) Includes electronic and audio books.
0.60.60.5$mAverage purchases of
new books per business
37.639.832.2$mAverage expenses per business
59 035.656 215.451 619.6$mTotal
58 095.155 369.150 797.7$mOther expenses940.6846.3821.9$mPurchases of new books
Expenses
0.90.90.8$mAverage sales of
new books per business
38.941.233.1$mAverage income per business
61 134.458 131.053 066.1$mTotal
4 255.35 466.03 309.2$mOther income55 472.651 406.648 510.2$mOther retail sales
1 406.51 258.41 246.7$mRetail sales of new books(b)Income
79.974.771.2millionNumber of new books sold1 5721 4111 603no.Number of businesses
2003–042002–03(a)2001–02
TOTAL BUSINESSES
KEY AGGREGATES, By type of book reta i l e r – 2001– 02 to 2003– 04 co n t i n u e d2.1 . . . .
10 A B S • B O O K R E T A I L E R S • 1 3 7 1 . 0 • 2 0 0 3 – 0 4
CH A P T E R 2 • B O O K R E T A I L E R S
np not available for publication but included in totals where applicable, unless otherwise indicated(a) Includes those businesses which are classified according to the ANZSIC as Newspaper, book and stationery retailing and for which the value of new book
sales comprises less than 50% of all income.
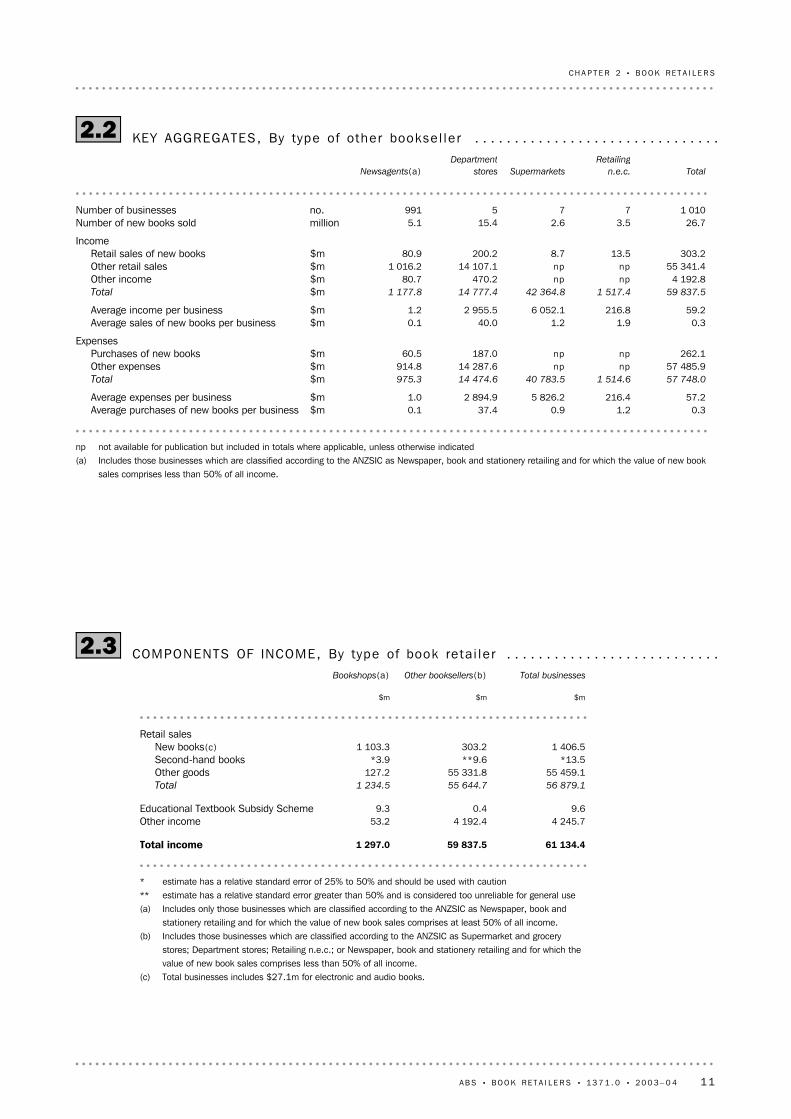
0.31.20.937.40.1$mAverage purchases of new books per business57.2216.45 826.22 894.91.0$mAverage expenses per business
57 748.01 514.640 783.514 474.6975.3$mTotal
57 485.9npnp14 287.6914.8$mOther expenses262.1npnp187.060.5$mPurchases of new books
Expenses
0.31.91.240.00.1$mAverage sales of new books per business59.2216.86 052.12 955.51.2$mAverage income per business
59 837.51 517.442 364.814 777.41 177.8$mTotal
4 192.8npnp470.280.7$mOther income55 341.4npnp14 107.11 016.2$mOther retail sales
303.213.58.7200.280.9$mRetail sales of new booksIncome
26.73.52.615.45.1millionNumber of new books sold1 010775991no.Number of businesses
Total
Retailing
n.e.c.Supermarkets
Department
storesNewsagents(a)
KEY AGGREGATES, By type of other bookse l le r2.2 . . . . . . . . . . . . . . . . . . . . . . . . . . . . . . .
* estimate has a relative standard error of 25% to 50% and should be used with caution** estimate has a relative standard error greater than 50% and is considered too unreliable for general use(a) Includes only those businesses which are classified according to the ANZSIC as Newspaper, book and
stationery retailing and for which the value of new book sales comprises at least 50% of all income.(b) Includes those businesses which are classified according to the ANZSIC as Supermarket and grocery
stores; Department stores; Retailing n.e.c.; or Newspaper, book and stationery retailing and for which thevalue of new book sales comprises less than 50% of all income.
(c) Total businesses includes $27.1m for electronic and audio books.
61 134.459 837.51 297.0Total income
4 245.74 192.453.2Other income9.60.49.3Educational Textbook Subsidy Scheme
56 879.155 644.71 234.5Total
55 459.155 331.8127.2Other goods*13.5**9.6*3.9Second-hand books
1 406.5303.21 103.3New books(c)Retail sales
$m$m$m
Total businessesOther booksellers(b)Bookshops(a)
COMPONENTS OF INCOME, By type of book reta i l e r2.3 . . . . . . . . . . . . . . . . . . . . . . . . . . .
A B S • B O O K R E T A I L E R S • 1 3 7 1 . 0 • 2 0 0 3 – 0 4 11
CH A P T E R 2 • B O O K R E T A I L E R S
(a) Includes only those businesses which are classified according to the ANZSIC as Newspaper, book andstationery retailing and for which the value of new book sales comprises at least 50% of all income.
(b) Includes those businesses which are classified according to the ANZSIC as Supermarket and grocerystores; Department stores; Retailing n.e.c.; or Newspaper, book and stationery retailing and for whichthe value of new book sales comprises less than 50% of all income.
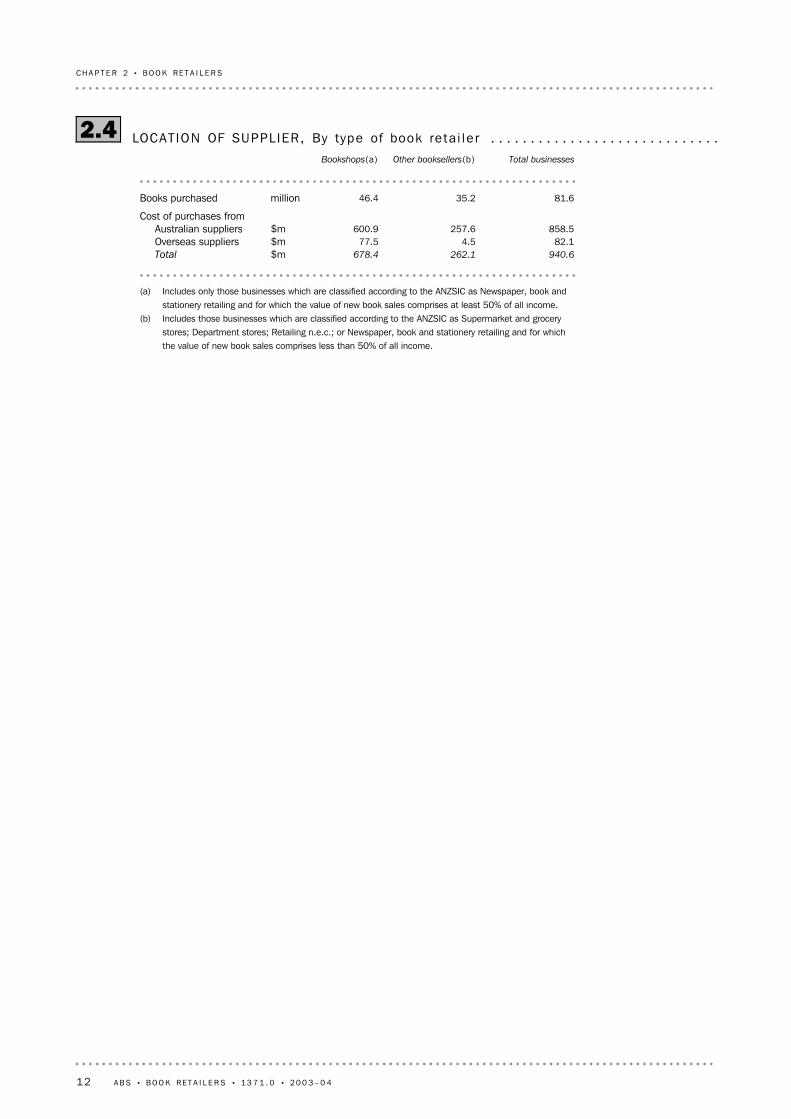
940.6262.1678.4$mTotal
82.14.577.5$mOverseas suppliers858.5257.6600.9$mAustralian suppliers
Cost of purchases from
81.635.246.4millionBooks purchased
Total businessesOther booksellers(b)Bookshops(a)
LOCAT ION OF SUPPL IER, By type of book reta i l e r2.4 . . . . . . . . . . . . . . . . . . . . . . . . . . . . .
12 A B S • B O O K R E T A I L E R S • 1 3 7 1 . 0 • 2 0 0 3 – 0 4
CH A P T E R 2 • B O O K R E T A I L E R S

* estimate has a relative standard error of 25% to 50% and should be used with caution** estimate has a relative standard error greater than 50% and is considered too unreliable for general use(a) Includes only those businesses which are classified according to the ANZSIC as Newspaper, book and stationery retailing and which the
value of new book sales comprises at least 50% of all income.(b) Includes those businesses which are classified according to the ANZSIC as Supermarket and grocery stores; Department stores; Retailing
n.e.c.; or Newspaper, book and stationery retailing and for which the value of new book sales comprises less than 50% of all income.
96.495.598.1Businesses using one or more of the above technologies *3.6*4.5**1.9Businesses not counted in at least one of the above technologies
9.5*11.3*6.3None of the above11.3*7.518.2Electronic article surveillance or security tags83.580.089.6EFTPOS 63.159.070.4Barcoding and scanning systems
Businesses using the following technologies32.719.356.7
Businesses having a web site, home page or other web presence(including a presence on another entity's web site)
25.231.913.3None of the above
*0.9*1.1**0.7Other57.850.271.4Banking and financial services 24.411.048.6Advertising or promotion 35.016.668.2Bibliographic and other information71.363.285.9Email
General
22.918.830.3Seeking after sales service6.95.3*9.8Receiving products electronically
41.539.345.5Making payments and/or authorisations38.739.237.7Receiving invoices42.032.858.5Ordering goods or services44.829.672.3Researching the availability or cost of goods or services
Purchasing goods and services
13.9*7.725.0Providing after sales service*1.4*0.5**2.9Delivering products electronically34.430.142.2Receiving payments and/or authorisations
9.5*6.1*15.6Sending invoices to customers33.625.248.7Receiving orders for goods and services
Selling goods and servicesBusinesses using the Internet for
59.550.975.0Businesses using a computer for stock control
%%%
Total businessesOther booksellers(b)Bookshops(a)
USE OF TECHNOLOGY, By type of book reta i l e r2.5 . . . . . . . . . . . . . . . . . . . . . . . . . . . . . . .
A B S • B O O K R E T A I L E R S • 1 3 7 1 . 0 • 2 0 0 3 – 0 4 13
CH A P T E R 2 • B O O K R E T A I L E R S
CHAP T E R 3 BO O K S H O P S . . . . . . . . . . . . . . . . . . . . . . . . . . . . . . . . . . . . . . . . . .
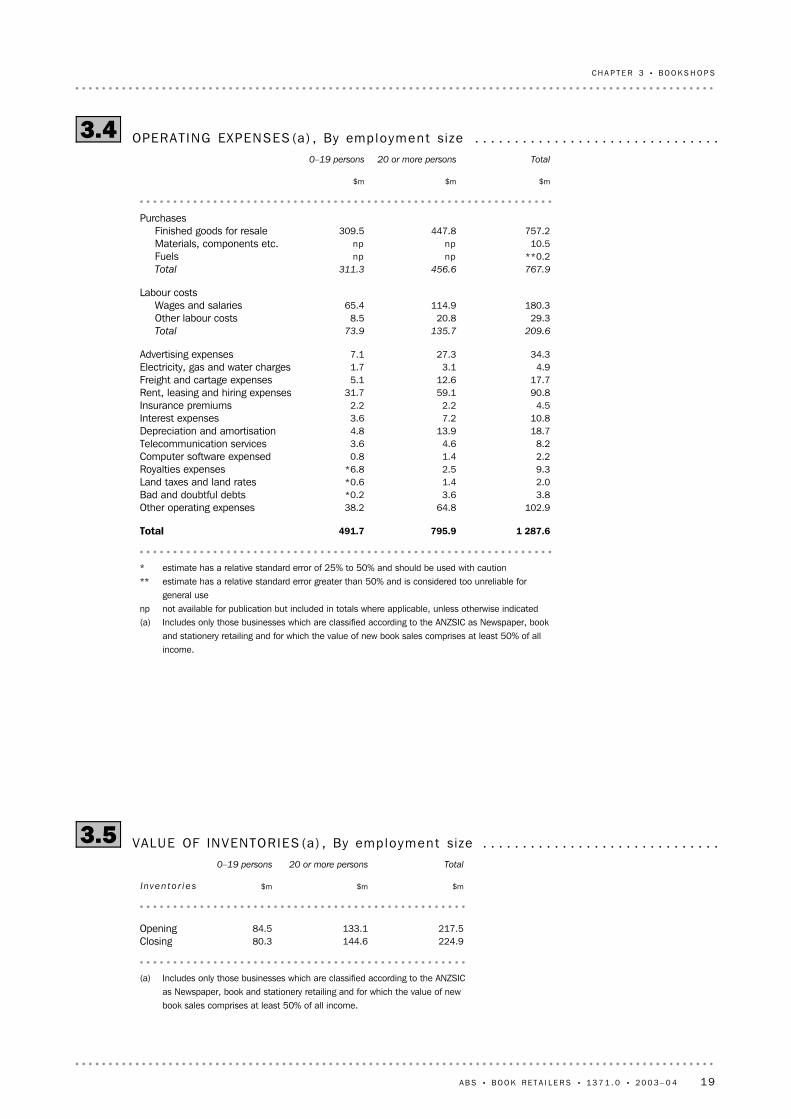
The total expenses for bookshops were $1,287.6m in 2003–04. The purchase of goods for
resale represented 59% ($757.2m) of total expenses, which included $678.4m for the
purchase of new books. Wages and salaries were 14% ($180.3m) of total expenses. A
further 2% ($29.3m) was spent on other labour costs. There was a range of items
covering the remaining 25% of costs, including: $90.8m for rent, leasing and hiring;
$34.3m for advertising and $18.7m for depreciation and amortisation (tables 3.2 and 3.4).
EX P E N S E S
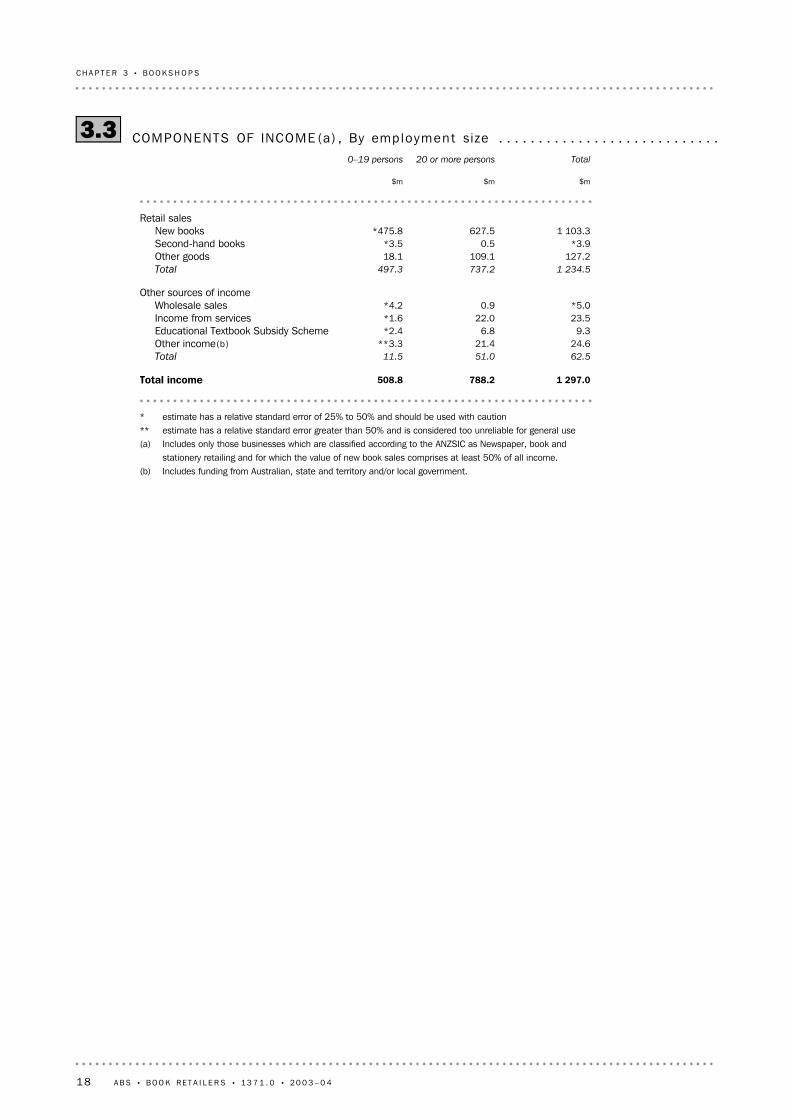
Bookshops reported a total income of $1,297.0m of which 85% ($1.103.3m) was from
retail sales of new books. New book sales were supplemented by retail sales of other
goods (including second-hand books) ($131.1m); the sale of services ($23.5m); the
Educational Textbook Subsidy Scheme ($9.3m); and other sources such as wholesale
sales and income from royalties ($29.6m) (table 3.3).
I N C O M E
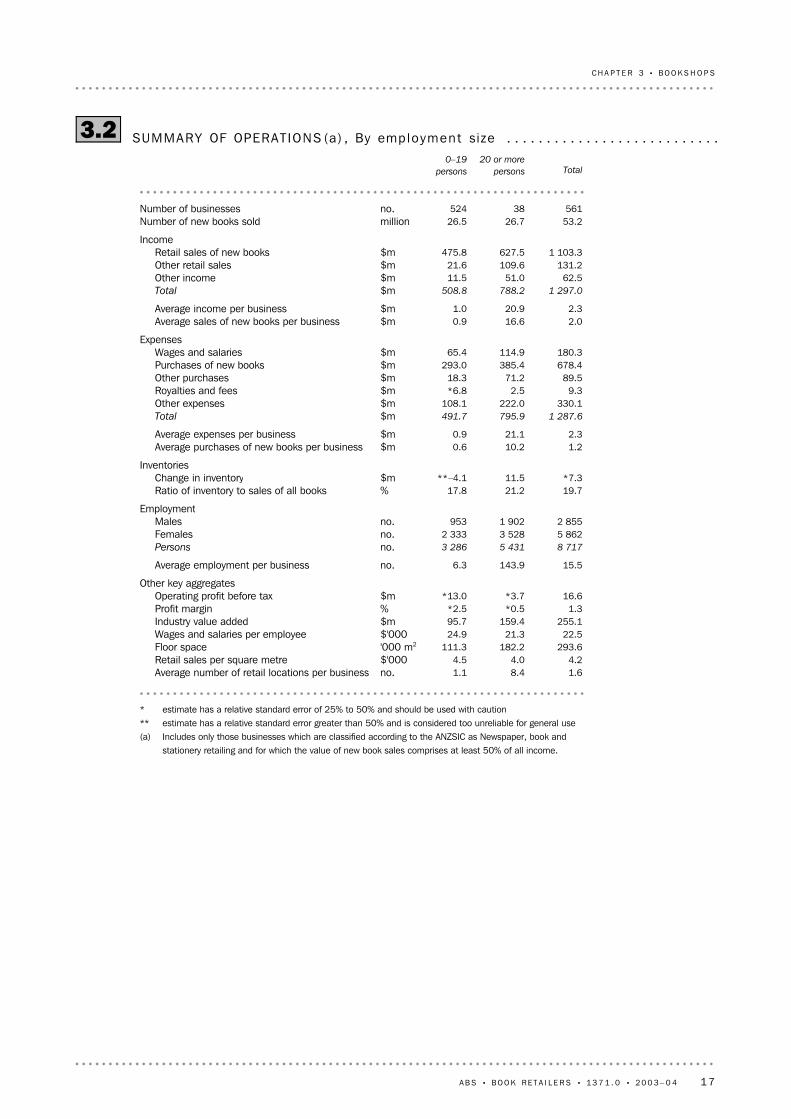
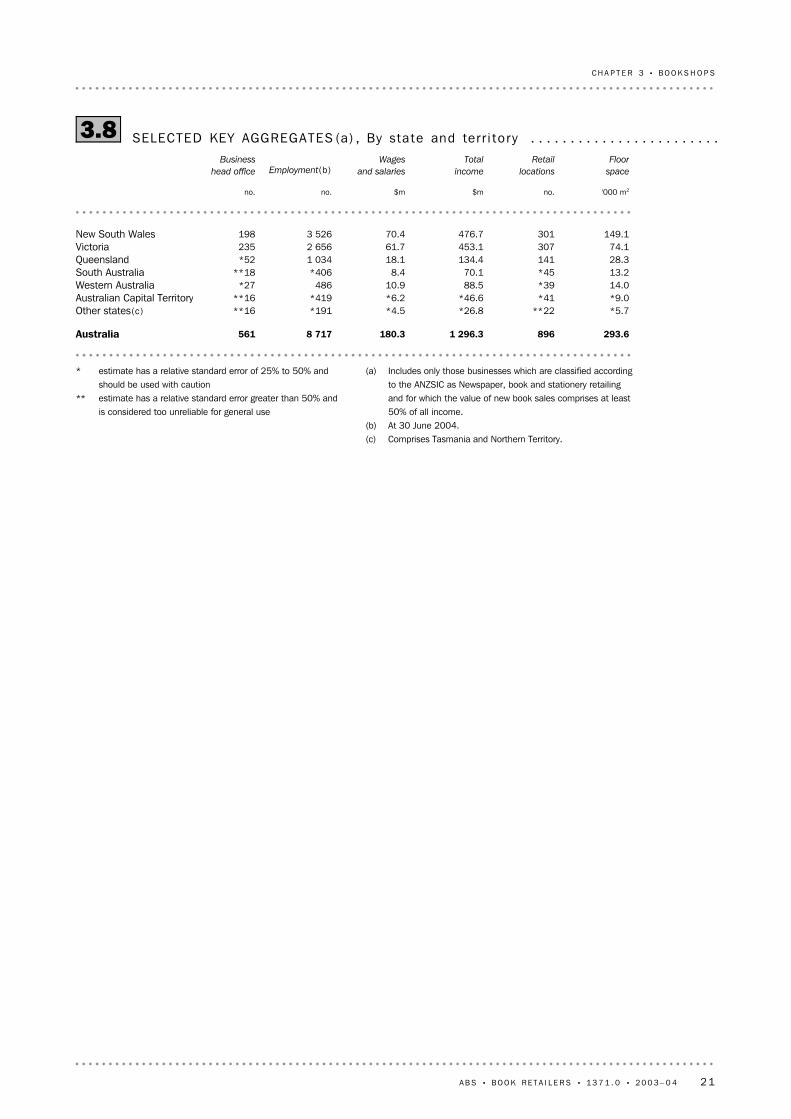
In 2003–04, there were 561 employing businesses classified as bookshops because they
reported that their new book sales were at least 50% of their total income. These
businesses operated from 896 retail locations around Australia (table 3.8). The larger
businesses (those with 20 or more people in employment), while representing only
7% (38 businesses) of the total number of bookshops, had 57% ($627.5m) of the total
income from new book sales and sold 50% (26.7 million) of the books. They also
incurred 62% ($795.9m) of the expenses (table 3.2).
For 2003–04, bookshops recorded an operating profit before tax of $16.6m and a profit
margin of 1.3%, which was not statistically significant from the previous year, when the
profit margin was 1.9%. Despite their higher proportion of total income, larger
businesses did not generate a higher profit margin than the smaller businesses (those
with 0–19 persons employed). The profit margin for smaller businesses was 2.5%, while
the larger businesses reported a profit margin of 0.5% (table 3.2).
Bookshops recorded changes for most data items between 2002–03 and 2003–04,
although not all were statistically significant (see paragraph 27 of the Explanatory Notes).
Two changes that were significant were the increase in the number of new books sold
(from 42.8m in 2003–03 to 53.5m in 2003–04) and associated with that, the increase in
the value of retail sales of new books (up by 17% over the same period, from $941.7m to
$1,103.3m). Total income and expenditure also increased significantly, by 22% and 23%
respectively.
OV E R V I E W
This Chapter provides detailed information on the operation of bookshops including
their income, expenditure, profitability and employment.
I N T R O D U C T I O N
14 A B S • B O O K R E T A I L E R S • 1 3 7 1 . 0 • 2 0 0 3 – 0 4
Researching availability
Banking services
Information searches
Ordering goods
Receiving orders
Advertising
Making payments
No internet use
0 20 40 60 80 100%
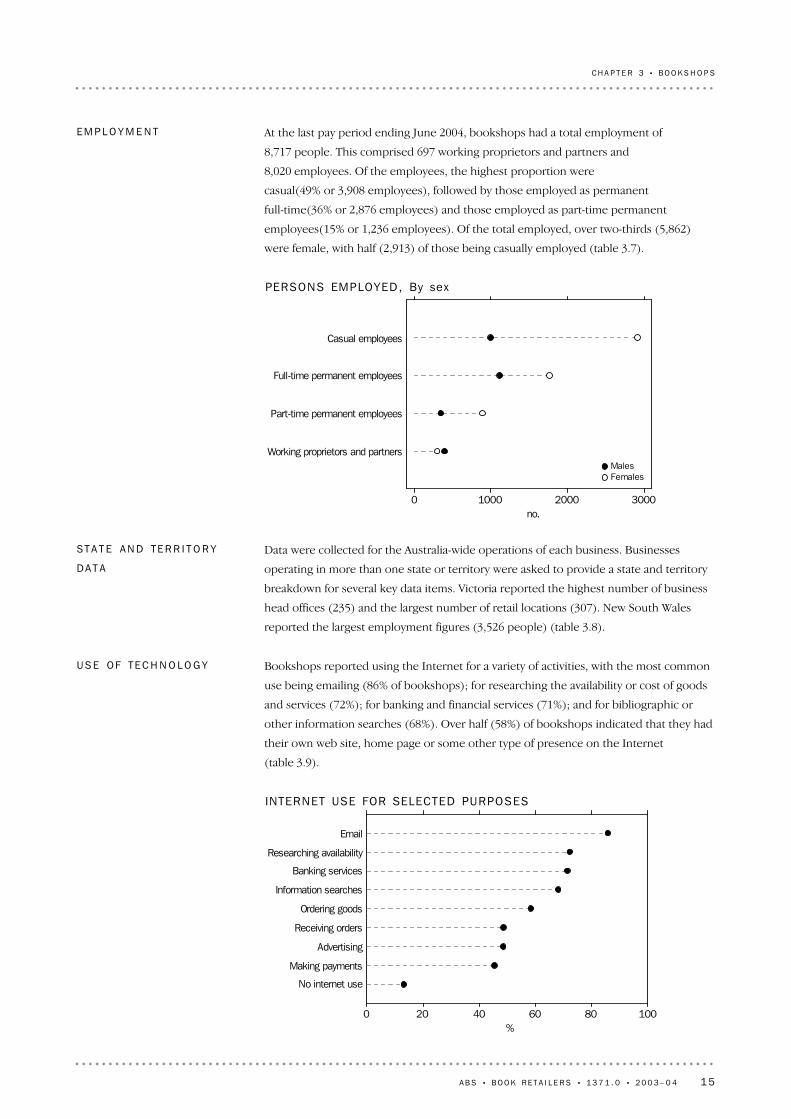
INTERNET USE FOR SELECTED PURPOSES
Bookshops reported using the Internet for a variety of activities, with the most common
use being emailing (86% of bookshops); for researching the availability or cost of goods
and services (72%); for banking and financial services (71%); and for bibliographic or
other information searches (68%). Over half (58%) of bookshops indicated that they had
their own web site, home page or some other type of presence on the Internet
(table 3.9).
US E OF TE C H N O L O G Y
Data were collected for the Australia-wide operations of each business. Businesses
operating in more than one state or territory were asked to provide a state and territory
breakdown for several key data items. Victoria reported the highest number of business
head offices (235) and the largest number of retail locations (307). New South Wales
reported the largest employment figures (3,526 people) (table 3.8).
ST A T E AN D TE R R I T O R Y
DA T A
Casual employees
Full-time permanent employees
Part-time permanent employees
Working proprietors and partners
0 1000 2000 3000no.
MalesFemales
PERSONS EMPLOYED, By sex
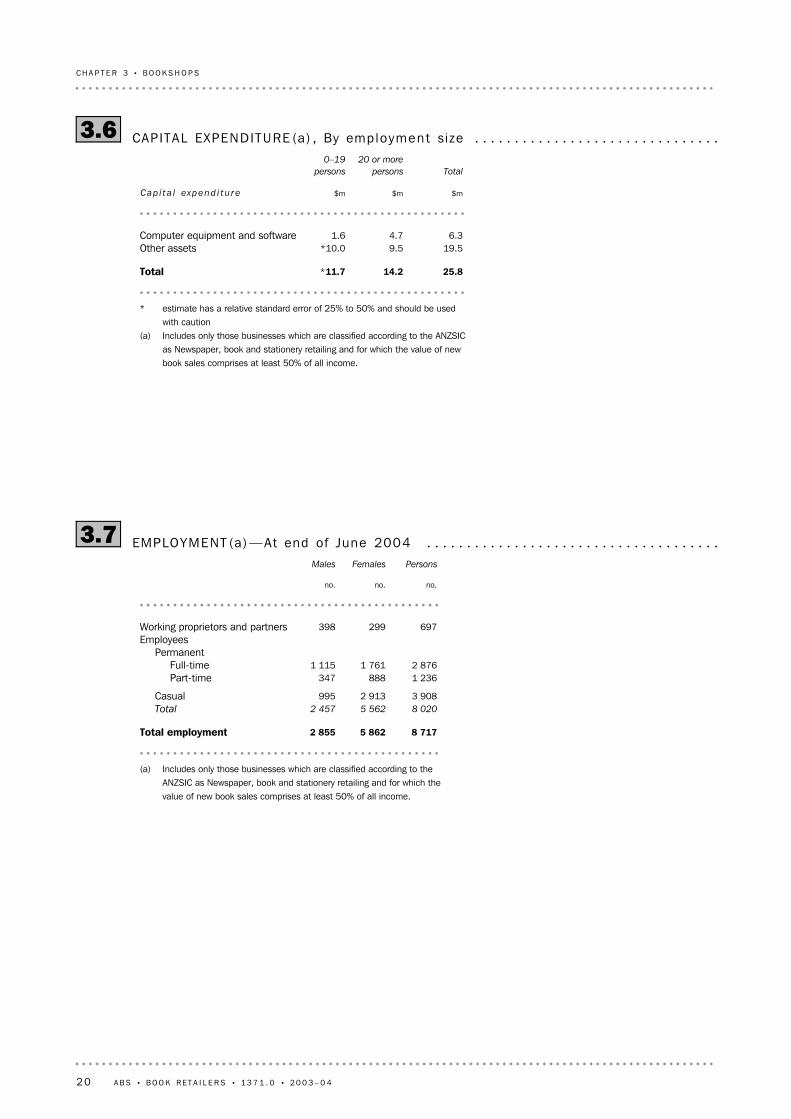
At the last pay period ending June 2004, bookshops had a total employment of
8,717 people. This comprised 697 working proprietors and partners and
8,020 employees. Of the employees, the highest proportion were
casual(49% or 3,908 employees), followed by those employed as permanent
full-time(36% or 2,876 employees) and those employed as part-time permanent
employees(15% or 1,236 employees). Of the total employed, over two-thirds (5,862)
were female, with half (2,913) of those being casually employed (table 3.7).
EM P L O Y M E N T
A B S • B O O K R E T A I L E R S • 1 3 7 1 . 0 • 2 0 0 3 – 0 4 15
CH A P T E R 3 • B O O K S H O P S

* estimate has a relative standard error of 25% to 50% and should be used with caution** estimate has a relative standard error greater than 50% and is considered too unreliable for general use(a) Includes only those businesses which are classified according to the ANZSIC as Newspaper, book and stationery
retailing and for which the value of new book sales comprises at least 50% of all income.(b) Data for 2002–03 have been revised (see paragraph 28 in the Explanatory Notes).
1.61.61.5no.Average number of retail locations per business 4.24.04.1$'000Retail sales per square metre
293.6257.5257.4'000 m2Floor space22.521.622.9$'000Wages and salaries per employee
255.1206.6221.9$mIndustry value added1.31.93.6%Profit margin
16.619.739.0$mOperating profit before taxOther key aggregates
15.514.112.2no.Average employment per business8 7177 3367 083no.Persons
5 8624 9534 685no.Females2 8552 3832 398no.Males
Employment
19.720.518.2%Ratio of inventory to sales of new books*7.3**5.2*20.0$mChange in inventory
Inventories
1.21.11.0$mAverage purchases of new books per business2.32.01.9$mAverage expenses per business
1 287.61 045.21 076.4$mTotal
330.1230.1244.5$mOther expenses9.3*3.55.9$mRoyalties and fees
89.578.372.4$mOther purchases678.4587.3604.6$mPurchases of new books180.3145.9149.0$mWages and salaries
Expenses
2.01.81.6$mAverage sales of new books per business2.32.01.9$mAverage income per business
1 297.01 059.71 095.4$mTotal
62.526.033.4$mOther income131.292.1104.6$mOther retail sales
1 103.3941.7957.4$mRetail sales of new booksIncome
53.242.841.8millionNumber of new books sold561522581no.Number of businesses
2003–042002–03(b)2001–02
SUMMARY OF OPERAT IONS (a) —2001– 02 to 2003– 043.1 . . . . . . . . . . . . . . . . . . . . . . . .
16 A B S • B O O K R E T A I L E R S • 1 3 7 1 . 0 • 2 0 0 3 – 0 4
CH A P T E R 3 • B O O K S H O P S
* estimate has a relative standard error of 25% to 50% and should be used with caution** estimate has a relative standard error greater than 50% and is considered too unreliable for general use(a) Includes only those businesses which are classified according to the ANZSIC as Newspaper, book and
stationery retailing and for which the value of new book sales comprises at least 50% of all income.
1.68.41.1no.Average number of retail locations per business4.24.04.5$'000Retail sales per square metre
293.6182.2111.3'000 m2Floor space22.521.324.9$'000Wages and salaries per employee
255.1159.495.7$mIndustry value added1.3*0.5*2.5%Profit margin
16.6*3.7*13.0$mOperating profit before taxOther key aggregates
15.5143.96.3no.Average employment per business
8 7175 4313 286no.Persons
5 8623 5282 333no.Females2 8551 902953no.Males
Employment
19.721.217.8%Ratio of inventory to sales of all books*7.311.5**–4.1$mChange in inventory
Inventories
1.210.20.6$mAverage purchases of new books per business2.321.10.9$mAverage expenses per business
1 287.6795.9491.7$mTotal
330.1222.0108.1$mOther expenses9.32.5*6.8$mRoyalties and fees
89.571.218.3$mOther purchases678.4385.4293.0$mPurchases of new books180.3114.965.4$mWages and salaries
Expenses
2.016.60.9$mAverage sales of new books per business2.320.91.0$mAverage income per business
1 297.0788.2508.8$mTotal
62.551.011.5$mOther income131.2109.621.6$mOther retail sales
1 103.3627.5475.8$mRetail sales of new booksIncome
53.226.726.5millionNumber of new books sold56138524no.Number of businesses
Total
20 or more
persons
0–19
persons
SUMMARY OF OPERAT IONS (a) , By employment size3.2 . . . . . . . . . . . . . . . . . . . . . . . . . . .
A B S • B O O K R E T A I L E R S • 1 3 7 1 . 0 • 2 0 0 3 – 0 4 17
CH A P T E R 3 • B O O K S H O P S
* estimate has a relative standard error of 25% to 50% and should be used with caution** estimate has a relative standard error greater than 50% and is considered too unreliable for general use(a) Includes only those businesses which are classified according to the ANZSIC as Newspaper, book and
stationery retailing and for which the value of new book sales comprises at least 50% of all income.(b) Includes funding from Australian, state and territory and/or local government.
1 297.0788.2508.8Total income
62.551.011.5Total
24.621.4**3.3Other income(b)9.36.8*2.4Educational Textbook Subsidy Scheme
23.522.0*1.6Income from services*5.00.9*4.2Wholesale sales
Other sources of income
1 234.5737.2497.3Total
127.2109.118.1Other goods*3.90.5*3.5Second-hand books
1 103.3627.5*475.8New booksRetail sales
$m$m$m
Total20 or more persons0–19 persons
COMPONENTS OF INCOME (a) , By employment size3.3 . . . . . . . . . . . . . . . . . . . . . . . . . . . .
18 A B S • B O O K R E T A I L E R S • 1 3 7 1 . 0 • 2 0 0 3 – 0 4
CH A P T E R 3 • B O O K S H O P S
* estimate has a relative standard error of 25% to 50% and should be used with caution** estimate has a relative standard error greater than 50% and is considered too unreliable for
general usenp not available for publication but included in totals where applicable, unless otherwise indicated(a) Includes only those businesses which are classified according to the ANZSIC as Newspaper, book
and stationery retailing and for which the value of new book sales comprises at least 50% of allincome.
1 287.6795.9491.7Total
102.964.838.2Other operating expenses3.83.6*0.2Bad and doubtful debts2.01.4*0.6Land taxes and land rates9.32.5*6.8Royalties expenses2.21.40.8Computer software expensed8.24.63.6Telecommunication services
18.713.94.8Depreciation and amortisation10.87.23.6Interest expenses
4.52.22.2Insurance premiums90.859.131.7Rent, leasing and hiring expenses17.712.65.1Freight and cartage expenses
4.93.11.7Electricity, gas and water charges34.327.37.1Advertising expenses
209.6135.773.9Total
29.320.88.5Other labour costs180.3114.965.4Wages and salaries
Labour costs
767.9456.6311.3Total
**0.2npnpFuels10.5npnpMaterials, components etc.
757.2447.8309.5Finished goods for resalePurchases
$m$m$m
Total20 or more persons0–19 persons
OPERAT ING EXPENSES (a) , By employment si ze3.4 . . . . . . . . . . . . . . . . . . . . . . . . . . . . . . .
(a) Includes only those businesses which are classified according to the ANZSICas Newspaper, book and stationery retailing and for which the value of newbook sales comprises at least 50% of all income.
224.9144.680.3Closing217.5133.184.5Opening
$m$m$m
Total20 or more persons0–19 persons
Inven t o r i e s
VALUE OF INVENTORIES (a) , By employment size3.5 . . . . . . . . . . . . . . . . . . . . . . . . . . . . . .
A B S • B O O K R E T A I L E R S • 1 3 7 1 . 0 • 2 0 0 3 – 0 4 19
CH A P T E R 3 • B O O K S H O P S
* estimate has a relative standard error of 25% to 50% and should be usedwith caution
(a) Includes only those businesses which are classified according to the ANZSICas Newspaper, book and stationery retailing and for which the value of newbook sales comprises at least 50% of all income.
25.814.2*11.7Total
19.59.5*10.0Other assets6.34.71.6Computer equipment and software
$m$m$m
Total
20 or more
persons
0–19
persons
Cap i t a l expend i t u r e
CAPITAL EXPENDITURE (a) , By employment si ze3.6 . . . . . . . . . . . . . . . . . . . . . . . . . . . . . . .
(a) Includes only those businesses which are classified according to theANZSIC as Newspaper, book and stationery retailing and for which thevalue of new book sales comprises at least 50% of all income.
8 7175 8622 855Total employment
8 0205 5622 457Total
3 9082 913995Casual
1 236888347Part-time2 8761 7611 115Full-time
PermanentEmployees
697299398Working proprietors and partners
no.no.no.
PersonsFemalesMales
EMPLOYMENT (a) —At end of June 20043.7 . . . . . . . . . . . . . . . . . . . . . . . . . . . . . . . . . . . . .
20 A B S • B O O K R E T A I L E R S • 1 3 7 1 . 0 • 2 0 0 3 – 0 4
CH A P T E R 3 • B O O K S H O P S
(a) Includes only those businesses which are classified accordingto the ANZSIC as Newspaper, book and stationery retailingand for which the value of new book sales comprises at least50% of all income.
(b) At 30 June 2004.(c) Comprises Tasmania and Northern Territory.
* estimate has a relative standard error of 25% to 50% andshould be used with caution
** estimate has a relative standard error greater than 50% andis considered too unreliable for general use
293.68961 296.3180.38 717561Australia
*5.7**22*26.8*4.5*191**16Other states(c)*9.0*41*46.6*6.2*419**16Australian Capital Territory14.0*3988.510.9486*27Western Australia13.2*4570.18.4*406**18South Australia28.3141134.418.11 034*52Queensland74.1307453.161.72 656235Victoria
149.1301476.770.43 526198New South Wales
'000 m2no.$m$mno.no.
Floor
space
Retail
locations
Total
income
Wages
and salariesEmployment(b)Business
head office
SELECTED KEY AGGREGATES (a) , By state and ter r i to r y3.8 . . . . . . . . . . . . . . . . . . . . . . . .
A B S • B O O K R E T A I L E R S • 1 3 7 1 . 0 • 2 0 0 3 – 0 4 21
CH A P T E R 3 • B O O K S H O P S

* estimate has a relative standard error of 25% to 50% and should be used with caution** estimate has a relative standard error greater than 50% and is considered too unreliable for general use— nil or rounded to zero (including null cells)(a) Includes only those businesses which are classified according to the ANZSIC as Newspaper, book and
stationery retailing and for which the value of new book sales comprises at least 50% of all income.
98.1100.097.9Businesses using one or more of the above technologies**1.9—**2.1Businesses not counted in at least one of the above technologies
*6.32.7**6.6None of the above18.259.215.3Electronic article surveillance or security tags89.697.389.0EFTPOS70.492.068.8Barcoding and scanning systems
Businesses using the following technologies56.793.554.1
Businesses having a web site, home page or other web presence(including a presence on another entity's web site)
13.3—14.2None of the above
**0.73.4**0.5Other71.487.970.2Banking and financial services48.683.446.1Advertising or promotion68.281.967.2Bibliographic and other information searches 85.9100.084.8Email
General
30.333.630.1Seeking after sales service*9.85.3*10.1Receiving products electronically45.546.445.4Making payments and/or authorisations37.736.637.7Receiving invoices58.556.158.7Ordering goods or services72.369.072.5Researching the availability or cost of goods or services
Purchasing goods and services
25.040.423.9Providing after sales service**2.98.7**2.5Delivering products electronically42.261.540.8Receiving payments and/or authorisations
*15.6*18.5*15.4Sending invoices to customers48.772.447.0Receiving orders for goods and services
Selling goods and servicesBusinesses using the Internet for
75.0100.073.2Businesses using a computer for stock control
%%%
Total
20 or more
persons
0–19
persons
USE OF TECHNOLOGY (a) , By employment size3.9 . . . . . . . . . . . . . . . . . . . . . . . . . . . . . . . .
22 A B S • B O O K R E T A I L E R S • 1 3 7 1 . 0 • 2 0 0 3 – 0 4
CH A P T E R 3 • B O O K S H O P S
EX P L A N A T O R Y NO T E S . . . . . . . . . . . . . . . . . . . . . . . . . . . . . . . .
1 This publication presents results, in respect of the 2003–04 financial year, from a survey
conducted by the Australian Bureau of Statistics (ABS) of employing businesses with book
retailing activity.
2 Book retailing activity is not confined to any one industry. Information from the
1998–99 Retail Industry Survey estimated that businesses (as classified on the ABS
Australian Business Register) in four retail industries were responsible for nearly all book
sales by employing businesses to final consumers in Australia. Those industries, and their
Australian and New Zealand Standard Industrial Classification (ANZSIC) classes, are as
follows:
! Supermarket and grocery stores (ANZSIC 5110) which consists of businesses mainly
engaged in retailing groceries or non-specialised food lines, whether or not the selling
is organised on a self-service basis.
! Department stores (ANZSIC 5210) which consists of businesses mainly engaged in
retailing a variety of goods (clothing; china, glassware and houseware; furniture;
household appliances; etc.) normally sold by separate departments or sections within
the store with accounting and other records maintained on a departmentalised basis.
! Newspaper, book and stationery retailing (ANZSIC 5243) which consists of businesses
mainly engaged in retailing books, periodicals, newspapers, stationery and religious
goods.
! Retailing n.e.c. (ANZSIC 5259) which consists of businesses mainly engaged in retailing
goods not classified to the other retailing categories of ANZSIC.
3 The Book Retailers Survey is based on businesses classified to these four industries.
4 The 1998–99 Retail Industry Survey also found that in three of the four industries
(namely, ANZSIC 5110, 5210 and 5259) businesses with less than 200 employees had
negligible book sales (1% of total book sales). These businesses were excluded from the
population frame for this survey.
5 Thus the population frame for the Book Retailers Survey consists of businesses with
ANZSIC classes of 5110, 5210 or 5259 with 200 or more employees, and all employing
businesses with an ANZSIC class of 5243. These businesses cover an estimated 97% of book
sales to final consumers.
6 All businesses with an ANZSIC class of 5110, 5210 or 5259 and with 200 or more
employees were contacted in relation to the survey. Similarly, all businesses with an ANZSIC
class of 5243 and with 20 or more employees were contacted to determine their retail book
sales. Data were obtained from a sample of businesses with an ANZSIC class of 5243 and
less than 20 employees. Data from this sample were weighted to represent all businesses in
Australia with an ANZSIC class of 5243 and less than 20 employees.
7 Data for the entire operations of businesses with an ANZSIC class of 5243 and with
book sales comprising at least 50% of all their income were included in the survey results.
For all other businesses, only data in respect of their book retailing activity were included.
Please note that this is the same as in previous editions, in which this was incorrectly
labelled as at least 50% of retail sales.
SC O P E AN D CO V E R A G E
A B S • B O O K R E T A I L E R S • 1 3 7 1 . 0 • 2 0 0 3 – 0 4 23

12 For the population of businesses where the ABN unit is not suitable for ABS
statistical requirements, the ABS will maintain its own units structure through direct
contact with the business. These businesses constitute the ABS Maintained
Population. This population consists typically of large, complex and diverse
businesses. The new statistical units model described below has been introduced to
cover such businesses.
13 Enterprise Group: This is a unit covering all the operations in Australia of one or
more legal entities under common ownership and/or control. It covers all the
operations in Australia of legal entities which are related in terms of the current
Corporations Law (as amended by the Corporations Legislation Amendment Act
1991), including legal entities such as companies, trusts, and partnerships. Majority
ownership is not required for control to be exercised.
14 Enterprise: The enterprise is an institutional unit comprising (i) a single legal
entity or business entity, or (ii) more than one legal entity or business entity within
the same Enterprise Group and in the same institutional subsector (i.e. they are all
classified to a single Standard Institutional Sector Classification of Australia subsector).
15 Type of Activity Unit (TAU): The TAU is comprised of one or more business
entities, sub-entities or branches of a business entity within an Enterprise Group that
can report production and employment data for similar economic activities. When a
minimum set of data items are available, a TAU will be created which covers all the
operations within an industry subdivision (and the TAU will be classified to the
relevant subdivision of the Australian and New Zealand Standard Industrial
Classification). Where a business cannot supply adequate data for each industry, a TAU
will be formed which contains activity in more than one industry subdivision.
ABS Maintained Populat ion
11 Most businesses and organisations in Australia need to obtain an Australian
Business Number (ABN), and are then included on the ATO Australian Business
Register. Most of these businesses have simple structures; therefore the unit
registered for an ABN will satisfy ABS statistical requirements. For these businesses,
the ABS is aligning its statistical units structure with the ABN unit. The businesses with
simple structures constitute the ATO Maintained Population, and the ABN unit will be
used as the economic statistics unit for all economic collections.
ATO Maintained Populat ion
9 The ABS uses an economic statistics units model on the ABS Business Register to
describe the characteristics of businesses, and the structural relationships between
related businesses. The units model is also used to break groups of related businesses
into relatively homogeneous components that can provide data to the ABS.
10 In mid-2002, to better use the information available as a result of The New Tax
System, the ABS changed its economic statistics units model. The new units model
allocates businesses to one of two sub-populations. The vast majority of businesses are
in what is called the Australian Taxation Office (ATO) Maintained Population, while
the remaining businesses are in the ABS Maintained Population. Together, these two
sub-populations make up the ABS Business Register population.
ST A T I S T I C A L UN I T S DE F I N E D
ON TH E AB S BU S I N E S S
RE G I S T E R
8 Estimates in this publication are presented at a sub-industry level for businesses
with an ANZSIC class of 5243. Businesses with an ANZSIC class of 5243 and with book
sales comprising at least 50% of their income have been categorised as ‘Bookshops’.
Tables 3.1 to 3.9 in this publication relate only to the operations of these bookshops.
Businesses with an ANZSIC class of 5243 and with book sales comprising less than 50%
of their income have been categorised as ‘Newsagents’. Unless identified separately,
newsagents are included with ‘Other booksellers’ for tables 2.1 to 2.5 presented in this
publication. Please note that this is the same as in previous editions, in which this was
incorrectly labelled being based on retail sales, rather than total income.
I N T E R P R E T A T I O N OF DA T A
24 A B S • B O O K R E T A I L E R S • 1 3 7 1 . 0 • 2 0 0 3 – 0 4
EX P L A N A T O R Y N O T E S

5.65.65.48.37.77.78.28.47.9Average purchases of
new books per business
5.55.75.17.47.67.08.38.37.9Average expenses per business
0.10.10.20.10.10.14.45.04.6Total
0.10.10.10.10.10.13.74.34.7Other expenses4.14.13.95.54.14.95.45.75.1Purchases of new books
Expenses
5.55.65.37.47.36.68.18.37.7Average sales of
new books per business
5.55.75.17.47.67.08.28.47.8Average income per business
0.20.10.20.10.10.14.55.04.7Total
0.40.30.50.40.30.55.19.78.1Other income0.10.10.10.10.10.13.75.26.4Other retail sales4.04.03.83.63.02.85.05.24.9Retail sales of new books
Income
5.63.43.42.01.51.58.35.85.7Number of books sold5.96.04.97.98.06.611.010.99.2Number of businesses
%%%%%%%%%
2003-042002-032001-022003-042002-032001-022003-042002-032001-02
TOTAL BUSINESSESOTHER BOOKSELLERSBOOKSHOPS
RELAT IVE STANDARD ERRORS, Tab le 2.1 Book reta i le rs
19 Some of the estimates in this publication are based on information obtained from a
sample of businesses (those with an ANZSIC class of 5243 and less than 20 employees). The
estimates based on these sampled businesses are subject to sampling variability. That is,
they may differ from the figures that would have been obtained if the survey had included
all in-scope businesses. One measure of the likely difference is given by the standard error
(SE), which indicates the extent to which an estimate might have varied by chance because
information was collected from only a sample of businesses.
20 There are about 2 chances in 3 that a sample estimate will differ by less than one SE
from the figure that would have been obtained if all businesses in the population had been
included in the survey, and approximately 19 chances in 20 that the difference will be less
than two SEs.
21 Sampling variability can be measured by using the relative standard error (RSE) which
is obtained by expressing the SE as a percentage of the estimate to which it refers. The RSE
is a useful measure in that it provides an immediate indication of the percentage errors
likely to have occurred due to sampling and hence does not require reference to the size of
the estimate.
22 The following tables show the RSEs for some of the statistics presented in this
publication.
RE L I A B I L I T Y OF DA T A
16 For more information on the impacts of the introduction of the new economic
statistics units model, refer to Information Paper: Improvements in ABS Economic
Statistics [Arising from The New Tax System] (cat. no. 1372.0).
17 Data in this publication have been adjusted to allow for lags in processing new
businesses to the ABS Business Register, and the omission of some businesses from the
register.
18 Prior to 2001–02, the Book Retailers Survey used the management unit as the
statistical unit. For issues of this publication relating to 2001–02 onwards, the statistical unit
in the Book Retailers Survey is the ABN unit for businesses with simple structures, and the
TAU for businesses with complex structures. In most cases, ABN/TAU units will concord
with the management units used prior to 2001–02.
ABS Maintained Populat ion
continued
A B S • B O O K R E T A I L E R S • 1 3 7 1 . 0 • 2 0 0 3 – 0 4 25
EX P L A N A T O R Y N O T E S
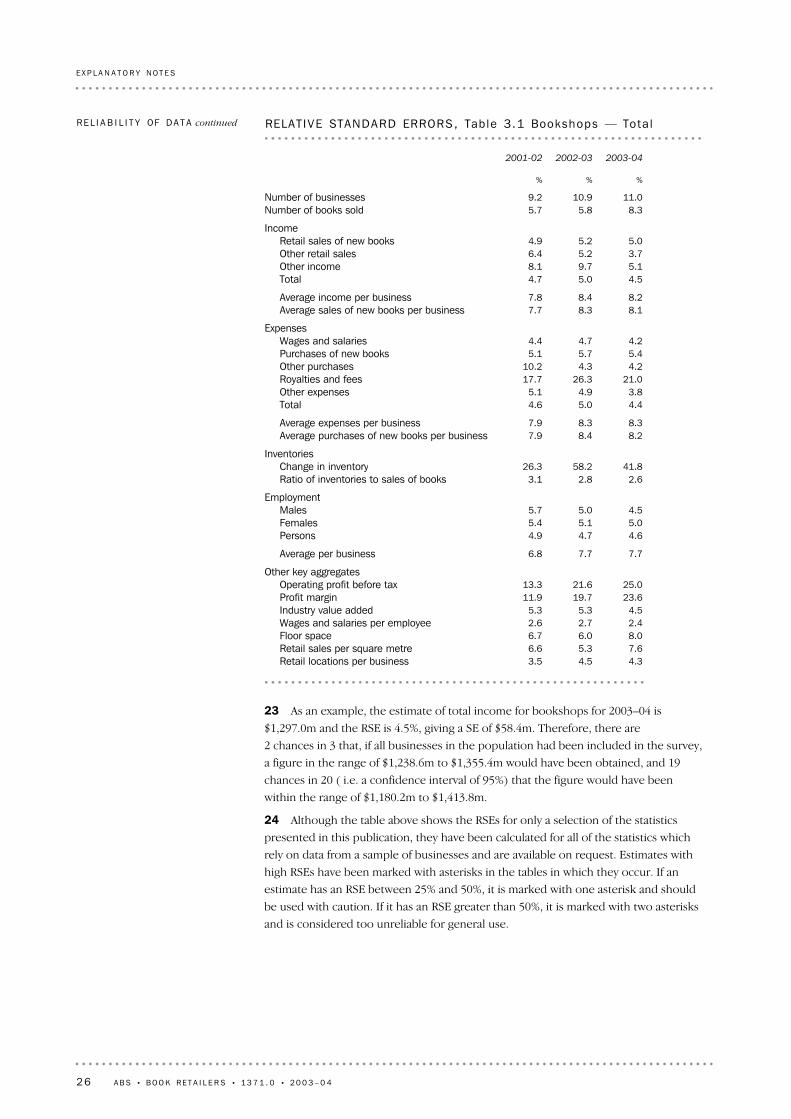
23 As an example, the estimate of total income for bookshops for 2003–04 is
$1,297.0m and the RSE is 4.5%, giving a SE of $58.4m. Therefore, there are
2 chances in 3 that, if all businesses in the population had been included in the survey,
a figure in the range of $1,238.6m to $1,355.4m would have been obtained, and 19
chances in 20 ( i.e. a confidence interval of 95%) that the figure would have been
within the range of $1,180.2m to $1,413.8m.
24 Although the table above shows the RSEs for only a selection of the statistics
presented in this publication, they have been calculated for all of the statistics which
rely on data from a sample of businesses and are available on request. Estimates with
high RSEs have been marked with asterisks in the tables in which they occur. If an
estimate has an RSE between 25% and 50%, it is marked with one asterisk and should
be used with caution. If it has an RSE greater than 50%, it is marked with two asterisks
and is considered too unreliable for general use.
4.34.53.5Retail locations per business7.65.36.6Retail sales per square metre8.06.06.7Floor space2.42.72.6Wages and salaries per employee4.55.35.3Industry value added
23.619.711.9Profit margin25.021.613.3Operating profit before tax
Other key aggregates
7.77.76.8Average per business
4.64.74.9Persons5.05.15.4Females4.55.05.7Males
Employment
2.62.83.1Ratio of inventories to sales of books41.858.226.3Change in inventory
Inventories
8.28.47.9Average purchases of new books per business8.38.37.9Average expenses per business
4.45.04.6Total 3.84.95.1Other expenses
21.026.317.7Royalties and fees4.24.310.2Other purchases5.45.75.1Purchases of new books4.24.74.4Wages and salaries
Expenses
8.18.37.7Average sales of new books per business8.28.47.8Average income per business
4.55.04.7Total 5.19.78.1Other income3.75.26.4Other retail sales5.05.24.9Retail sales of new books
Income
8.35.85.7Number of books sold11.010.99.2Number of businesses
%%%
2003-042002-032001-02
RELAT IVE STANDARD ERRORS, Tab le 3.1 Bookshops — Tota lRE L I A B I L I T Y OF DA T A continued
26 A B S • B O O K R E T A I L E R S • 1 3 7 1 . 0 • 2 0 0 3 – 0 4
EX P L A N A T O R Y N O T E S
32 ABS publications draw extensively on information provided freely by individuals,
businesses, governments and other organisations. Their continued cooperation is very
much appreciated. Without it, the wide range of statistics published by the ABS would not
be available. Information received by the ABS is treated in strict confidence as required by
the Census and Statistics Act 1905.
AC K N O W L E D G M E N T
31 As well as the statistics included in this and related publications, the ABS may have
other relevant data available. Inquiries about such data should be made to the contact
person noted in the Inquiries box on the front cover.
AB S DA T A AV A I L A B L E ON
RE Q U E S T
29 ABS publications which may be of interest include:
Book Retailers, Australia, 2002–03, cat. no. 1371.0
Book Publishers, Australia, 2003–04, cat. no. 1363.0
Retail Trade, Australia, June 2005, cat. no. 8501.0
Retail Industry, Australia, 1998–99, cat. no. 8622.0
Retail Industry, Australia: Commodity Sales, 1998–99, cat. no. 8624.0.
30 Current publications produced by the ABS are listed in the Catalogue of Publications
and Products (cat. no. 1101.0). The catalogue is available from any ABS office or the ABS
web site <http://www.abs.gov.au>. The ABS also issues a daily Release Advice on the web
site which details products to be released in the week ahead.
RE L A T E D PU B L I C A T I O N S
28 The data for 2002–03 have been revised to include corrections to figures previously
reported by businesses to the ABS. These revisions are reflected in the 2002–03 data
presented in tables 2.1 and 3.1.
RE V I S I O N S TO 20 0 2 – 0 3
DA T A
SE(x− y)= [SE(x)]2 + [SE(y)]2
27 Care should be taken when comparing figures as it is not correct to assume that a
difference between figures is statistically significant. An approximate SE of the difference
between two estimates (x-y) may be calculated by the following formula:
CO M P A R I S O N W I T H PR E V I O U S
DA T A
26 Some data have been suppressed to prevent disclosure, either directly or by inference,
of information relating to individual businesses. These data have been replaced by the
symbol 'n.p.', but are included in totals.
SU P P R E S S I O N OF DA T A
25 Errors other than those due to sampling may occur because of deficiencies in the
coverage of the collection, imperfections in reporting by respondents or non-response.
Inaccuracies of this kind are referred to as non-sampling errors and they may occur in any
collection, whether it be a census or a sample survey. Every effort is made to reduce
non-sampling error to a minimum by careful design and testing of questionnaires, efficient
operating procedures and systems, and appropriate methodology.
RE L I A B I L I T Y OF DA T A continued
A B S • B O O K R E T A I L E R S • 1 3 7 1 . 0 • 2 0 0 3 – 0 4 27
EX P L A N A T O R Y N O T E S
GL O S S A R Y . . . . . . . . . . . . . . . . . . . . . . . . . . . . . . . . . . . . . . . . . . . .
Devices designed to detect the illegal removal of products from retail premises.Electronic article surveillanceor security tags
Electronic fund transfer at point of sale.EFTPOS
Payments made to booksellers from a Commonwealth Government program whichassists students studying at Australian educational institutions by subsidising the cost ofeducational textbooks included on prescribed textbook lists or recommended readinglists at Australian educational institutions. Under the Scheme booksellers give thediscount subsidy to the student (or their parents/guardians) at the point of sale and thenclaim the subsidy back from the Commonwealth Government.
Educational Textbook SubsidyScheme
The financial charges made to the accounts to reflect that part of the value of the assetwhich may be regarded as having been used up in producing revenue in a particularaccounting period. These items represent the accounting process of systematicallyallocating the cost of a non-current asset over its expected useful life.
Depreciation and amortisation
Businesses mainly engaged in retailing a variety of goods (clothing; china, glassware andhouseware; furniture; household appliances; etc.) normally sold by separatedepartments or sections within the store with accounting and other records maintainedon a departmentalised basis. Only the major department stores, those with 200 or moreemployees, were included in the survey.
Department stores
Inventories of materials, finished goods and work-in-progress held at the end of thereference period.
Closing inventories
Closing inventories minus opening inventories.Change in inventories
Employees who are not entitled to paid holidays or paid sick leave days.Casual employees
Outlays on capital equipment and other capital assets, including all costs capitalised inthe account books of a business, e.g. legal fees, real estate transfer costs and assetsacquired under finance leases.
Capital expenditure
A management unit within scope of the collection. An individual business may operate ata number of physical sites from which goods and services are provided. Only the activityof locations in Australia has been included in the collection.
Business
Businesses categorised as being part of the ‘Newspaper, book and stationery retailing’industry and with new book sales comprising at least 50% of their total income.
Bookshops
A book can be printed on paper, be available in an electronic format such as on acomputer file (an electronic book) or be a recording of someone reading text (an audiobook). A book will usually have an International Standard Book Number.
Book
Devices designed to read a barcode (an identifier unique to a book or other product).The device is primarily used for revenue recording and stock control.
Barcoding and scanningsystems
A book which is made available in the form of a recording of someone reading the text.Audio book
Includes expenses associated with the promotion and publicity of the business and itsproducts. It includes expenses paid to advertising agencies and direct payments to radio,television and print media businesses.
Advertising expenses
28 A B S • B O O K R E T A I L E R S • 1 3 7 1 . 0 • 2 0 0 3 – 0 4
Sales of goods to final consumers, i.e. sales of goods to the public (including deliverycharges not separately invoiced to customers), and export sales.
Retail sales
The physical sites from which the business provides goods and services on a relativelyregular basis.
Retail locations
Costs for renting, leasing (except finance leases) and hiring of land, buildings and otherstructures, hiring of vehicles, plant, machinery, equipment and other rent, leasing andhiring expenses from other businesses or individuals.
Rent, leasing and hiringexpenses
Consists mainly of goods purchased for resale. Also included are electricity, gas andwater charges, petroleum products and other fuel purchases of container and packagingmaterials, materials and components used in repair and manufacturing activity.
Purchases
Operating profit before tax as a percentage of total income.Profit margin
Employees who are entitled to paid holidays and paid sick leave days.Permanent employees
Employees who work less than 35 hours per week.Part-time employees
A measure of profit (or loss) before extraordinary items are brought to account and priorto the deduction of income tax and appropriation to owners. It is derived as total incomeminus total expenses plus closing inventories minus opening inventories (see separateentries in the Glossary for these components).
Operating profit before tax
Inventories of materials, finished goods and work-in-progress held at the beginning ofthe reference period.
Opening inventories
A book which has not previously been sold by a retail establishment.New book
Businesses categorised as being part of the ‘Newspaper, book and stationery retailing’industry and with new book sales comprising less than 50% of their total income.
Newsagents
A worldwide collection of computers which are linked together to form a repository ofstored information and to provide a range of communication services. The servicesinclude, but are not limited to, the World Wide Web, File Transfer Protocol and SimpleMail Transport Protocol.
Internet
Includes interest on bank loans, on loans made from related and unrelated businesses ororganisations, and interest in respect of finance leases, interest paid to loans frompartners, interest equivalents (such as hedging costs) and expenses associated withdiscounted bills. It excludes bank charges and capital repayments.
Interest expenses
The value added to the economy by the industry. It is equal to the sales of goods andservices plus government subsidies and changes in the levels of trading inventories,minus purchases and other selected expenses.
Industry value added
Employees who work 35 hours per week or more.Full-time employees
Includes selling space, office space, storage space, basements and non-residential upperfloor areas.
Floorspace
Individuals or organisations which are the end users of books. That is, they do notpurchase books for the primary purpose of selling to other consumers.
Final consumer
Includes working proprietors and working partners of unincorporated businesses,working directors of incorporated companies and trusts, and all employees working forbusinesses during the last pay period ending in June 2004.
Employment
A book which is made available in an electronic format. This may be in the form of acomputer file delivered via the Internet or as a CD-ROM, floppy disk or other datamedium. The text of these books must be read from a computer screen or specialhand-held electronic device.
Electronic book
A B S • B O O K R E T A I L E R S • 1 3 7 1 . 0 • 2 0 0 3 – 0 4 29
GL O S S A R Y
Sum of all income items, i.e. retail and wholesale sales of books and other products,income from services, funding from the Educational Textbook Subsidy Scheme, royaltiesincome, and any other sources of income, with the exception of extraordinary itemswhich are excluded.
Total income
Sum of expense items including wages and salaries, other labour costs, cost of purchasedgoods for resale, royalties, advertising expenses, telecommunication services, freight andcartage expenses, land taxes and land rates, insurance premiums, interest expenses,depreciation and amortisation, bad and doubtful debts, computer software expensed andall other expenses not excluded. Expenses excluded are extraordinary items, excise duty,dividends, income and other direct tax, costs associated with the transfer of real estate,unrealised gains/losses from revaluation of assets, change in inventories, donations,capital repayments and Goods and Services Tax where this is recoverable as an input taxcredit.
Total expenses
Businesses mainly engaged in retailing groceries or non specialised food lines, whetheror not the selling is organised on a self service basis. Supermarkets includes grocerystores. Only the major supermarkets and grocery stores, those with 200 or moreemployees, were included in the survey.
Supermarkets
Businesses mainly engaged in retailing goods not classified to any other retailingcategory of the Australian and New Zealand Standard Industrial Classification. Only themajor businesses classified as Retailing n.e.c., those with 200 or more employees, wereincluded in the survey.
Retailing n.e.c.
30 A B S • B O O K R E T A I L E R S • 1 3 7 1 . 0 • 2 0 0 3 – 0 4
GL O S S A R Y

www.abs.gov.auWEB ADDRESS
All ABS publications can be downloaded free of chargefrom the ABS web site.
F R E E A C C E S S T O P U B L I C A T I O N S
Client Services, ABS, GPO Box 796, Sydney NSW 2001POST
1300 135 211FAX
1300 135 070PHONE
Data already published that can be provided within fiveminutes will be free of charge. Our information consultantscan also help you to access the full range of ABSinformation—ABS user pays services can be tailored toyour needs, time frame and budget. Publications may bepurchased. Specialists are on hand to help you withanalytical or methodological advice.
I N F O R M A T I O N S E R V I C E
This service now provides only current Consumer PriceIndex statistics call 1900 986 400 (call cost 77c perminute).
DIAL-A-STATISTIC
For current and historical Consumer Price Index data, call1902 981 074 (call cost 77c per minute).
CPI INFOLINE
A range of ABS publications is available from public andtertiary libraries Australia-wide. Contact your nearest libraryto determine whether it has the ABS statistics you require,or visit our web site for a list of libraries.
LIBRARY
www.abs.gov.au the ABS web site is the best place tostart for access to summary data from our latestpublications, information about the ABS, advice aboutupcoming releases, our catalogue, and Australia Now—astatistical profile.
INTERNET
F O R M O R E I N F O R M A T I O N . . .
ISSN 1832 73032137100007030
13
71
.0
•
BO
OK
R
ET
AI
LE
RS
, A
US
TR
AL
IA
•
20
03
–0
4
RRP $22.00
© Commonwealth of Australia 2005Produced by the Australian Bureau of Statistics